Embed Size (px)
Citation preview
The International Conference
“Baltic-Petrol’2010”
on “Geology, Ecology and Petroleum
Exploration Perspectives in the Baltic Region”
Book of Programme and Abstracts
Gdańsk - Kraków, 2010
The International Conference “Baltic-Petrol'2010” 28 September – 1 October, 2010 - Gdańsk, Poland
2
Technical editors: M.J. Kotarba and M. Wróbel
Cover design: W. Więcław
©Copyright 2010
All rights reserved.
Society of Research on Environmental Changes “GEOSFERA”
al. Mickiewicza 30, 30-059 Kraków, Poland
tel./fax (012) 623-78-28
ISBN 978-83-915765-8-8
The International Conference “Baltic-Petrol'2010” 28 September – 1 October, 2010 - Gdańsk, Poland
3
SEPTEMBER 29 (WEDNESDAY, MORNING)
9:15 – 10:20 Opening Ceremony
Maciej J. KOTARBA – Chairman of the Conference – Welcome Speech
Henryk Jacek JEZIERSKI – Undersecretary of State, Chief National Geologist,
Ministry of Environment
Roman ZABOROWSKI – Governor of Pomerania Region
Maciej KALISKI – Director of Oil and Gas Department, Ministry of Economy
REPRESENTATIVE of Ministry of Science and High Education
Antoni TAJDUŚ – Rector of AGH University of Science and Technology
Jerzy NAWROCKI – Director of Polish Geological Institute – National Research Institute
Paweł OLECHNOWICZ – President of the Board and Chief Executive Officer,
Grupa LOTOS S.A.
Paweł SIEMEK – President of the Board of LOTOS Petrobaltic S.A.
Waldemar WÓJCIK – Vice President of Polish Oil and Gas Company (PGNiG S.A.)
PLENARY SESSION
In Chair: John B. CURTIS (U.S.A.) and Leszek PIKULSKI (Poland)
10:20 Hydrocarbon Exploration, Production, Transport and Potential of the Baltic Sea Region
Hilmar REMPEL
10:40 Geogenic Pollution of the Southern Baltic Sea – Underestimated Ecological Threat
Krzysztof JAWOROWSKI and Ryszard WAGNER
11:00 Petroleum System and Potential of Hydrocarbon Exploration in the Lower Palaeozoic
Strata of the Polish Baltic Basin
Maciej J. KOTARBA, Paweł KOSAKOWSKI, Dariusz WIĘCŁAW,
Magdalena WRÓBEL and Adam KOWALSKI
11:20 – 11:50 Coffee break
EXPLORATION AND PRODUCTION SESSION
In Chair: Sergei KANEV (Lithuania) and Krzysztof JAWOROWSKI (Poland)
11:50 LOTOS Petrobaltic S.A. Company – Petroleum Exploration and Production: Yesterday,
Today and Tomorrow
Paweł SIEMEK, Leszek PIKULSKI and Waldemar PLATA
12:10 Experience of Environmental Monitoring of Marine Oil Production at the Kravtsovskoye
Oil field (D-6)
Olga PICHUZHKINA, Vadim SIVKOV, Elena BULYCHEVA and Victoria ALEXEEVA
12:30 Oil and Gas Exploration and Production in NE Germany and Adjacent Baltic Sea Area
Karsten OBST
12:50 – 14:20 Lunch

The International Conference “Baltic-Petrol'2010” 28 September – 1 October, 2010 - Gdańsk, Poland
4
The International Conference “Baltic-Petrol'2010” 28 September – 1 October, 2010 - Gdańsk, Poland
5
HYDROCARBON EXPLORATION, PRODUCTION, TRANSPORT AND POTENTIAL
OF THE BALTIC SEA REGION
Hilmar REMPEL
Federal Institute for Geosciences and Natural Resources (BGR), Stilleweg 2, 30655 Hannover, Germany;
Introduction
The study area is the Baltic Sea and adjacent onshore areas. Baltic Sea covers an area of 413,000 km²
with a maximum water depth of 459 m and an average of 52 m. The area of the adjacent counties amounts
about 1.8 million km² (from Russia included only adjacent to the Baltic Sea districts) with a population of
about 155 million peoples.
Seen in a global framework, the hydrocarbon reserves and production of these countries are small; the
hydrocarbon consumption is high and exceeds nearly 5 % of world consumption.
Geological setting
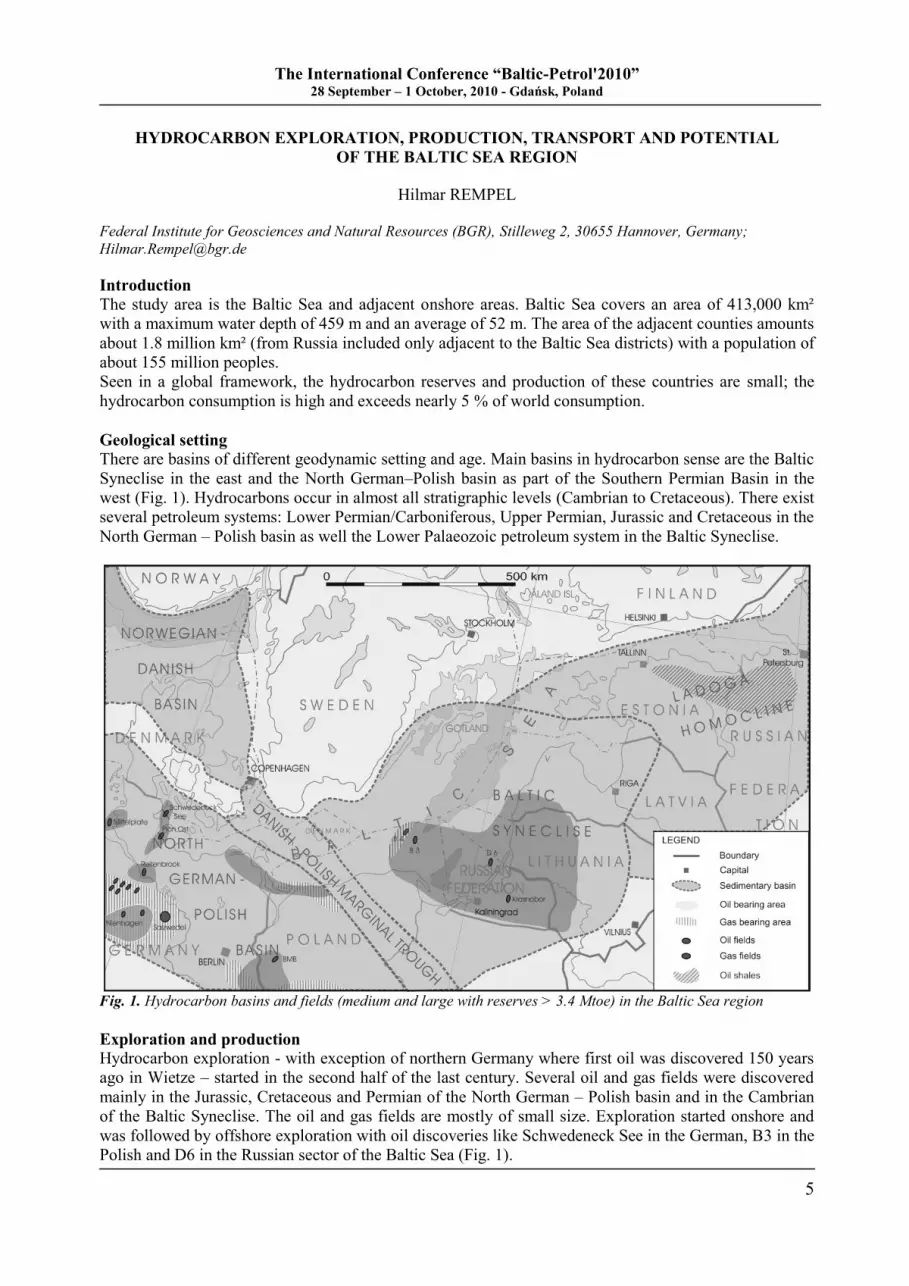
There are basins of different geodynamic setting and age. Main basins in hydrocarbon sense are the Baltic
Syneclise in the east and the North German–Polish basin as part of the Southern Permian Basin in the
west (Fig. 1). Hydrocarbons occur in almost all stratigraphic levels (Cambrian to Cretaceous). There exist
several petroleum systems: Lower Permian/Carboniferous, Upper Permian, Jurassic and Cretaceous in the
North German – Polish basin as well the Lower Palaeozoic petroleum system in the Baltic Syneclise.
Fig. 1. Hydrocarbon basins and fields (medium and large with reserves > 3.4 Mtoe) in the Baltic Sea region
Exploration and production
Hydrocarbon exploration - with exception of northern Germany where first oil was discovered 150 years
ago in Wietze – started in the second half of the last century. Several oil and gas fields were discovered
mainly in the Jurassic, Cretaceous and Permian of the North German – Polish basin and in the Cambrian
of the Baltic Syneclise. The oil and gas fields are mostly of small size. Exploration started onshore and
was followed by offshore exploration with oil discoveries like Schwedeneck See in the German, B3 in the
Polish and D6 in the Russian sector of the Baltic Sea (Fig. 1).
The International Conference “Baltic-Petrol'2010” 28 September – 1 October, 2010 - Gdańsk, Poland
6
In 2008 the oil production (excluding Denmark) stood at about 5 Mt with a 30 % share of offshore
production. The natural gas production was at about 20 billion m³ with Germany and Poland as producers.
There was only a small production from offshore.
Hydrocarbon potential
In comparison with other regions, e.g. the North Sea, Caspian Sea and Black Sea regions the hydrocarbon
potential of the Baltic region is very small. The common reserves (without Denmark) exceed 73 Mt of oil
and 264 billion m³ of natural gas. The resource estimated are 135 Mt and 295 billion m³, respectively. The
share on global reserves and resources is less than 0.3 %.
The region is prospective for non-conventional oil and gas. Main sources for non-conventional oil in the
Baltic Sea region are oil shale in Estonia and in the Leningrad district of the Russian Federation. Sources
for non-conventional gas are coal bed methane in Poland and Germany. Shale gas may be a topic in the
near future.
Hydrocarbon consumption and transport
The states of the Baltic Sea region are important oil and gas consumers. They consumed in 2008 about
180 Mt of oil (4.6 % of world consumption) and about 130 billion m³ (4.3 %) of natural gas. Main
suppliers are Russia and Norway.
There exists a good developed pipeline network linking the producer and the consumer centres. Some
new pipeline projects, especially for gas, are under construction or consideration. The Baltic countries
will be of importance for transit of oil and gas.
Conclusions
Despite a long production history a potential for future hydrocarbon exploration exists.
The hydrocarbon potential is significantly lower than the potential of the Caspian and the North Sea
regions and lower than the potential of the Black Sea region.
The region will still stay a hydrocarbon consuming in the future too.
The region is of importance for the transit of Russian oil and gas to Western Europe.
Unconventional oil and gas can be an object of future investigations.
References
BGR (Bundesanstalt für Geowissenschaften und Rohstoffe), 2009. Annual Report: Reserves, Resources
and Availability of Energy Resources, 86 p.
LBEG (Landesamt für Bergbau und Energie), 2009. Erdöl und Erdgas in der Bundesrepublik Deutschland
2008, 59 p.
Państwowy Instytut Geologiczny, 2009. Bilans zasobów kopalin i wód podziemnych w Polsce wg stanu
na 31.12 2008 r., http://www.pgi.gov.pl/surowce_mineralne/Do_pobrania.htm.
Rempel H., Schmodt-Thomé M., 2004. Hydrocarbon Potential of the Baltic Sea Region. [In:] Harff J.,
Emlyanov E., Schmidt-Thomé M., Spiridonov M. (coordinators). Mineral Resources of the Baltic Sea
– Exploration, Exploitation and Sustainable Development. ZaG Sonderheft 2, 17-27.
Rempel H., 2007. Hydrocarbon Potential of the Baltic Region. Oral presentation at GeoPomerania 2007.
The International Conference “Baltic-Petrol'2010” 28 September – 1 October, 2010 - Gdańsk, Poland
7
GEOGENIC POLLUTION OF THE SOUTHERN BALTIC SEA – UNDERESTIMATED
ECOLOGICAL THREAT
Krzysztof JAWOROWSKI and Ryszard WAGNER
Polish Geological Institute – National Research Institute, ul. Rakowiecka 4, 00-975 Warszawa, Poland;
Introduction
The Baltic Sea as the intracontinental semi-closed sea basin is one of Europe‟s marine ecosystem most
seriously threatened by pollution. Up till now, harmfulness of geogenic substances, though not denied,
was underestimated in any pollution assessment of this basin. Geogenic substance is here understood as
gaseous or liquid matter whose formation, chemical composition and physical properties result from
natural geological processes.
The present paper presents briefly results of the project: “Geochemical investigations of the southern
Baltic Sea to assess geogenic pollution and petroleum prospectivity” given in part I of project report
entitled: “The risk of sea water pollution by geogenic substances”. The project was carried out in the
period of 2005 – 2008 by a special consortium including the Polish Geological Institute – National
Research Institute, Warszawa (project leader); ”Petrobaltic” Oil and Gas Exploration and Exploitation
Joint Stock Company, Gdańsk; ”Kronos” Geological Services Company Ltd., Gdańsk; Society of
Research on Environmental Changes ”Geosphere”, Kraków and Geosynoptics Society ”Geos”, Kraków.
Particular stress was placed upon: geological structure of bedrock (deep substratum) of the southern
Baltic Sea (Jaworowski & Wagner, eds., 2008; Kramarska et al., 1999); present-day results of
prospecting for hydrocarbon deposits (Anolik & Karczewska, eds., 2008); contents of liquid and gaseous
hydrocarbons in near-bottom waters and bottom sediments (Jaworowski & Wagner, eds., 2008; Anolik &
Karczewska, eds., 2008); contents of strontium and vanadium in bottom sediments (Uścinowicz et al.,
2004); all available hydrogeological data coming mostly from boreholes drilled onshore along the
southern Baltic Sea coast (Bojarski, ed., 1996; Jaworowski & Wagner, eds., 2008).
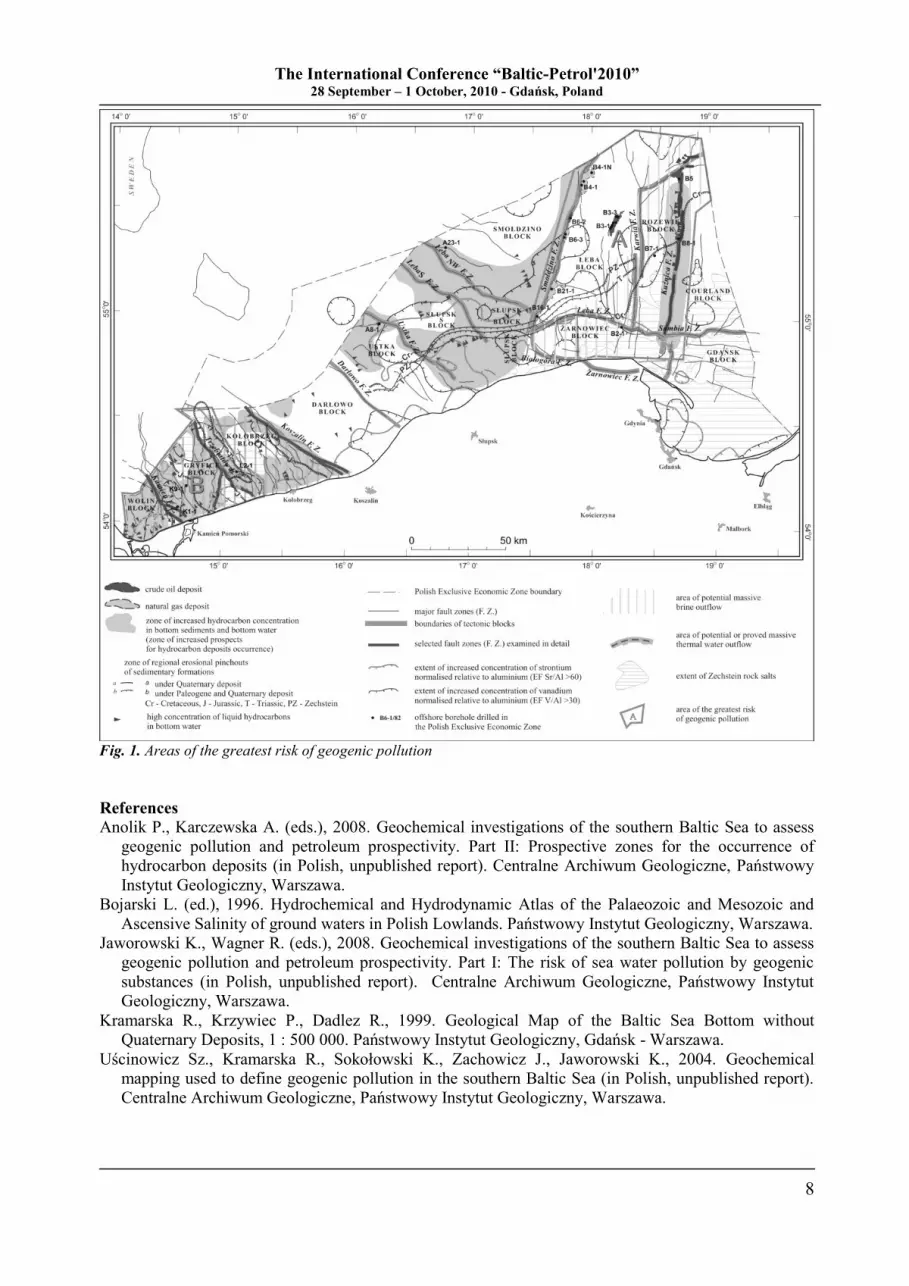
As a result (Fig. 1), modern migration of harmful geogenic substances into bottom sediments and bottom
waters has been proved in the southern Baltic Sea (Jaworowski & Wagner, eds., 2008). The bedrock of
the Baltic Sea contains rocks which are the sources of geogenic pollutants migrating along fault zones and
pinchouts of sedimentary formations. The pollutant source rocks include: oil- and gas-bearing reservoir
rocks (Middle Cambrian, Rotliegend, Zechstein and Carboniferous); black shales (lower Palaeozoic);
effusive rocks (Rotliegend); salts (Zechstein), reservoir rocks for mineral and thermal waters (Palaeozoic
and Mesozoic). The main sources of geogenic contamination are crude oil and natural gas deposits as well
as zones prospective for hydrocarbon accumulations because they produce increased concentrations of
liquid and gaseous hydrocarbons in bottom sediments and bottom water. Hydrocarbons cause a lethal
deficit of oxygen in bottom water. The migration activity of the fault zones and regional pinchouts is
proved i.a. by increased concentrations of strontium and vanadium in bottom sediments. They are derived
from Zechstein salts (Sr) and Lower Palaeozoic black shales (V). The whole southern Baltic Sea zone is
at risk of geogenic pollution. The greatest risk of such pollution (Fig. 1) is to be expected in both the
eastern part (East European Craton: western part of the Courland Block, Rozewie Block, Łeba Block,
eastern part of the Żarnowiec Block) and the western part of the zone (European Palaeozoic Platform:
western part of the Kołobrzeg Block, and Gryfice and Wolin blocks).
The International Conference “Baltic-Petrol'2010” 28 September – 1 October, 2010 - Gdańsk, Poland
8
Fig. 1. Areas of the greatest risk of geogenic pollution
References
Anolik P., Karczewska A. (eds.), 2008. Geochemical investigations of the southern Baltic Sea to assess
geogenic pollution and petroleum prospectivity. Part II: Prospective zones for the occurrence of
hydrocarbon deposits (in Polish, unpublished report). Centralne Archiwum Geologiczne, Państwowy
Instytut Geologiczny, Warszawa.
Bojarski L. (ed.), 1996. Hydrochemical and Hydrodynamic Atlas of the Palaeozoic and Mesozoic and
Ascensive Salinity of ground waters in Polish Lowlands. Państwowy Instytut Geologiczny, Warszawa.
Jaworowski K., Wagner R. (eds.), 2008. Geochemical investigations of the southern Baltic Sea to assess
geogenic pollution and petroleum prospectivity. Part I: The risk of sea water pollution by geogenic
substances (in Polish, unpublished report). Centralne Archiwum Geologiczne, Państwowy Instytut
Geologiczny, Warszawa.
Kramarska R., Krzywiec P., Dadlez R., 1999. Geological Map of the Baltic Sea Bottom without
Quaternary Deposits, 1 : 500 000. Państwowy Instytut Geologiczny, Gdańsk - Warszawa.
Uścinowicz Sz., Kramarska R., Sokołowski K., Zachowicz J., Jaworowski K., 2004. Geochemical
mapping used to define geogenic pollution in the southern Baltic Sea (in Polish, unpublished report).
Centralne Archiwum Geologiczne, Państwowy Instytut Geologiczny, Warszawa.
The International Conference “Baltic-Petrol'2010” 28 September – 1 October, 2010 - Gdańsk, Poland
9
PETROLEUM SYSTEM AND POTENTIAL OF HYDROCARBON EXPLORATION
IN THE LOWER PALAEOZOIC STRATA OF THE POLISH BALTIC BASIN
Maciej J. KOTARBA, Paweł KOSAKOWSKI, Dariusz WIĘCŁAW, Magdalena WRÓBEL
and Adam KOWALSKI
AGH University of Science and Technology, al. Mickiewicza 30, 30-059 Kraków, Poland; [email protected]
Introduction
Baltic Basin (Syneclise) is an oval depression in the East European Platform, covering NE part of Poland,
the southern part of the Baltic Sea, the Kaliningrad district of Russia, Lithuania, Latvia and Estonia
(Ulmishek, 1991). In the onshore part of the Polish Baltic Basin, a small Żarnowiec oil accumulation was
first discovered in 1970. Later, in this area three small accumulations of oil at Dębki in 1971 and
Białogóra in 1991, and gas-condensate at Żarnowiec-West in 1987 were discovered. In the offshore part
of the Polish Baltic Basin, three oil accumulations at B3 in 1981, B8 in 1983, and B24 in 1996, and four
gas-condensate accumulations at B4 in 1991, B6 in 1982, B16 in 1985, and B21 in 1996 were discovered
in Middle Cambrian sandstone reservoirs (Fig. 1). From 1964, more than 30 oil fields and a few gas fields
were discovered in the Russian, Lithuanian and Latvian parts of the Baltic Basin. The objective of this
study is determine and discuss: (i) elements and processes of petroleum system, (ii) source rock-oil-gas
correlation and (iii) potential of hydrocarbon exploration of the Lower Palaeozoic complex in the Polish
Baltic Basin.
Source rock-oil and gas correlation and petroleum system
The best source-rocks are in the Upper Cambrian-Tremadocian complex in the Precambrian
Platform. The Middle Cambrian, Caradocian and Llandovery strata can be also considered as source of
hydrocarbons (Więcław et al., 2010a). The potential source rock horizons in the Palaeozoic Platform
(Gryfice and Kołobrzeg blocks) were documented geochemically only within the Caradocian strata.
Organic carbon content (TOC) is low, usually less than 0.3 wt.%, and hydrocarbon potential does not
exceed 250 mg HC/g TOC (Kosakowski et al., 2010a). Oil, condensate and gas accumulated in the
Middle Cambrian sandstone reservoirs in onshore deposits and offshore deposits in Łeba Block have a
multi-stage origin. Methane, besides the thermogenic component, also contains microbial component
which indicates that the traps within the Middle Cambrian sandstone reservoir were already been formed
and sealed when migration of microbial methane took place. Succesively, the traps were supplied by
newly generated amounts of thermogenic gaseous hydrocarbons as well as early condensate and oil
(Kotarba, 2010). Oil and gas from both onshore and offshore accumulations were generated by oil-prone
Type II kerogen (Więcław et al., 2010b). The petroleum system of the Lower Paleozoic complex in the
Polish Baltic Basin was identified by accounting for the functional scheme of threshold parameters of
development of hydrocarbon generation, expulsion, migration and accumulation processes (Magoon &
Dow, 1994) and criteria of distribution of source potential index (SPI). Traps formed from the end of
Silurian to the end of Carboniferous (Westphalian?). Moreover, in the southern zone of study area uplift
movements were observed at the turn of Cretaceous and Paleogene, resulted in rebuilding of traps.
Results of 1-D and 2-D modelling reveal (Kosakowski et al., 2010a, b; Wróbel & Kosakowski, 2010) that
hydrocarbon generation, expulsion and migration processes took place between Devonian and
Carboniferous time. Renewal of tectonics of the area and possible restructuring of the traps resulted in
preservation of hydrocarbon accumulation finally took place after post-Cretaceous inversion. The critical
moment is attributed to the time of maximal subsidence of the basin, i.e. at the end of the Westphalian.
Hydrocarbon exploration potential
Based on source rock-oil-gas correlation (Kotarba, 2010; Więcław et al. 2010a, b), one- and two-
dimensional modelling (Kosakowski et al., 2010a, b; Wróbel & Kosakowski, 2010) and analysis of the
petroleum system ranking of areas of prospectives for petroleum exploration were established in
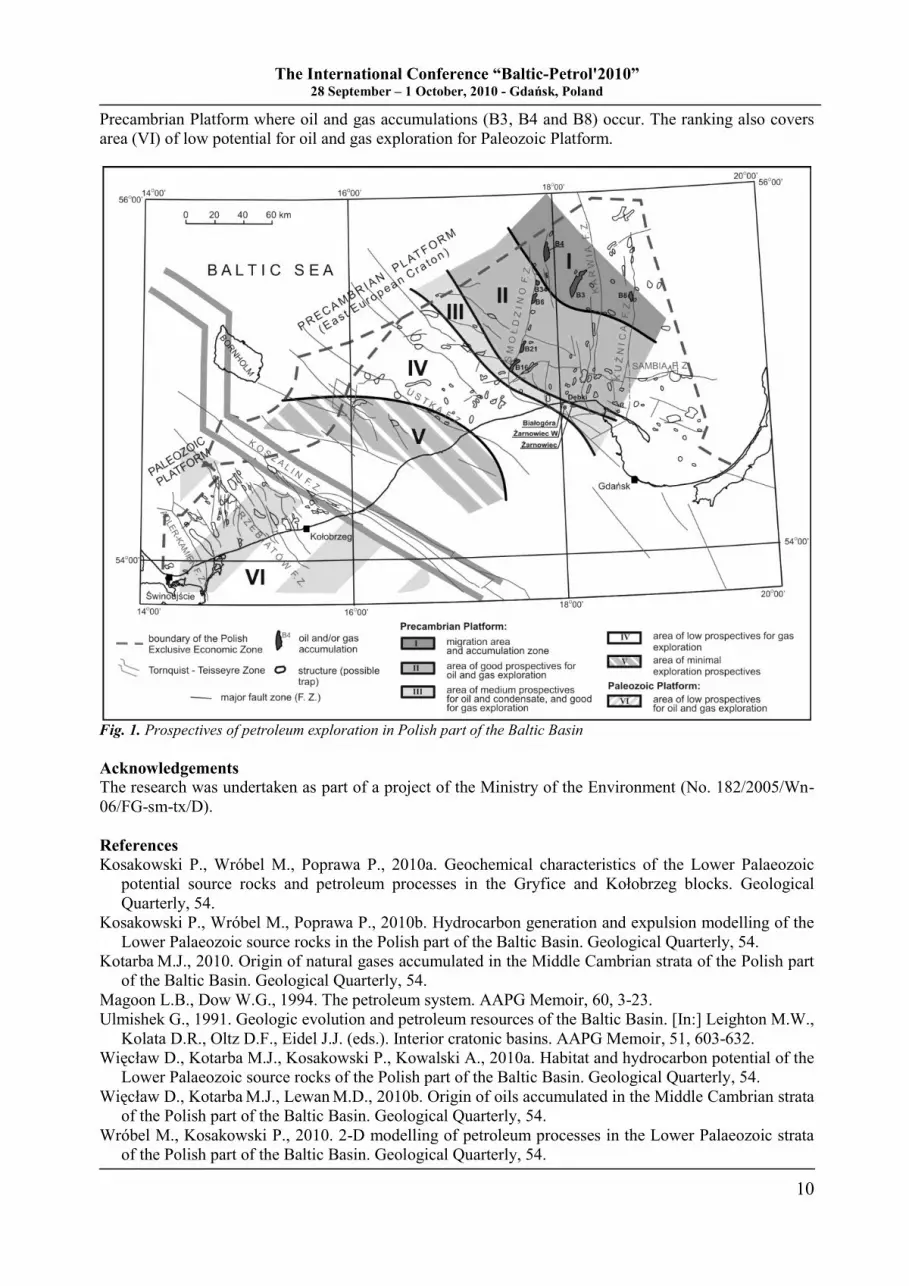
Precambrian Platform (Fig. 1): (II) good for oil and gas, (III) medium for oil and condensate and good for
gas, (IV), low for gas, and (V) minimal for oil and gas. Moreover, a migration area (I) was established in
The International Conference “Baltic-Petrol'2010” 28 September – 1 October, 2010 - Gdańsk, Poland
10
Precambrian Platform where oil and gas accumulations (B3, B4 and B8) occur. The ranking also covers
area (VI) of low potential for oil and gas exploration for Paleozoic Platform.
Fig. 1. Prospectives of petroleum exploration in Polish part of the Baltic Basin
Acknowledgements
The research was undertaken as part of a project of the Ministry of the Environment (No. 182/2005/Wn-
06/FG-sm-tx/D).
References
Kosakowski P., Wróbel M., Poprawa P., 2010a. Geochemical characteristics of the Lower Palaeozoic
potential source rocks and petroleum processes in the Gryfice and Kołobrzeg blocks. Geological
Quarterly, 54.
Kosakowski P., Wróbel M., Poprawa P., 2010b. Hydrocarbon generation and expulsion modelling of the
Lower Palaeozoic source rocks in the Polish part of the Baltic Basin. Geological Quarterly, 54.
Kotarba M.J., 2010. Origin of natural gases accumulated in the Middle Cambrian strata of the Polish part
of the Baltic Basin. Geological Quarterly, 54.
Magoon L.B., Dow W.G., 1994. The petroleum system. AAPG Memoir, 60, 3-23.
Ulmishek G., 1991. Geologic evolution and petroleum resources of the Baltic Basin. [In:] Leighton M.W.,
Kolata D.R., Oltz D.F., Eidel J.J. (eds.). Interior cratonic basins. AAPG Memoir, 51, 603-632.
Więcław D., Kotarba M.J., Kosakowski P., Kowalski A., 2010a. Habitat and hydrocarbon potential of the
Lower Palaeozoic source rocks of the Polish part of the Baltic Basin. Geological Quarterly, 54.
Więcław D., Kotarba M.J., Lewan
M.D., 2010b. Origin of oils accumulated in the Middle Cambrian strata
of the Polish part of the Baltic Basin. Geological Quarterly, 54.
Wróbel M., Kosakowski P., 2010. 2-D modelling of petroleum processes in the Lower Palaeozoic strata
of the Polish part of the Baltic Basin. Geological Quarterly, 54.
The International Conference “Baltic-Petrol'2010” 28 September – 1 October, 2010 - Gdańsk, Poland
11
EXPERIENCE OF ENVIRONMENTAL MONITORING OF MARINE OIL PRODUCTION
AT THE KRAVTSOVSKOE OIL FIELD (D-6)
Olga PICHUZHKINA1, Vadim SIVKOV
2, Elena BULYCHEVA
2 and Victoria ALEXEEVA
1
1LUKOIL-KMN, Ltd., Kievskaya 2, Kaliningrad, Russia; [email protected]
2Shirshov Institute of Oceanology of RAS, Mira 1, Kaliningrad, Russia
Introduction
The biggest offshore Kravtsovskoe (D-6) oil field on the continental shelf of the south-eastern Baltic Sea
was discovered in 1983 and exploited by LUKOIL-KMN, Ltd. The necessity of environmental
monitoring organization during construction and operation of oil fields is under condition of provisions of
the Russian Federation laws and the international conventions. The rogram of industrial environmental
monitoring of the oil field D-6 was developed in 2003. Characteristics and tendencies that manifest
themselves in many recent national and international environmental monitoring programs were taken into
account during its developing.
Methods and/or theory
Environmental monitoring is divided into three main types: monitoring of the areas of local influence,
regional monitoring of “survey” type, and background monitoring of adjacent areas. The main purpose of
local monitoring is to identify the areas and effects of marine environment changes in depending on the
influence intensity as well as monitoring compliance of environmental regulation, standards and
requirements. Regional monitoring is carried out to identify the long-term trends of the main ecosystem
parameters under the influence of natural and anthropogenic factors. According to its aims, objectives and
methodology, the regional monitoring approaches to long-term ecosystem-related research programs
(Israel & Ciban, 1989).
Regional monitoring aimed to identify the cumulative ecological effects and consequences, usually slow
growing (and so subtle) and gradually covering the entire region of observations. Oil production on the
shelf is only a fragment of the total maritime activities (shipping, fishing, sand and gravel extraction,
dredging, etc.). Monitoring of adjacent areas involves long-term periodic surveillance in areas where
economical activities are prohibited or minimized (nature reserves, habitats of rare and endangered
species, pelagic areas of the sea). Its aim is to obtain information on background characteristics of the
marine environment or the status of populations of vulnerable species of flora and fauna. Adjacent area of
Kravtsovskoe oil field is Curonian Spit National Park which is Russian-Lithuanian natural and cultural
World Heritage Site by UNESCO and world-famous point of passage a great number of birds.
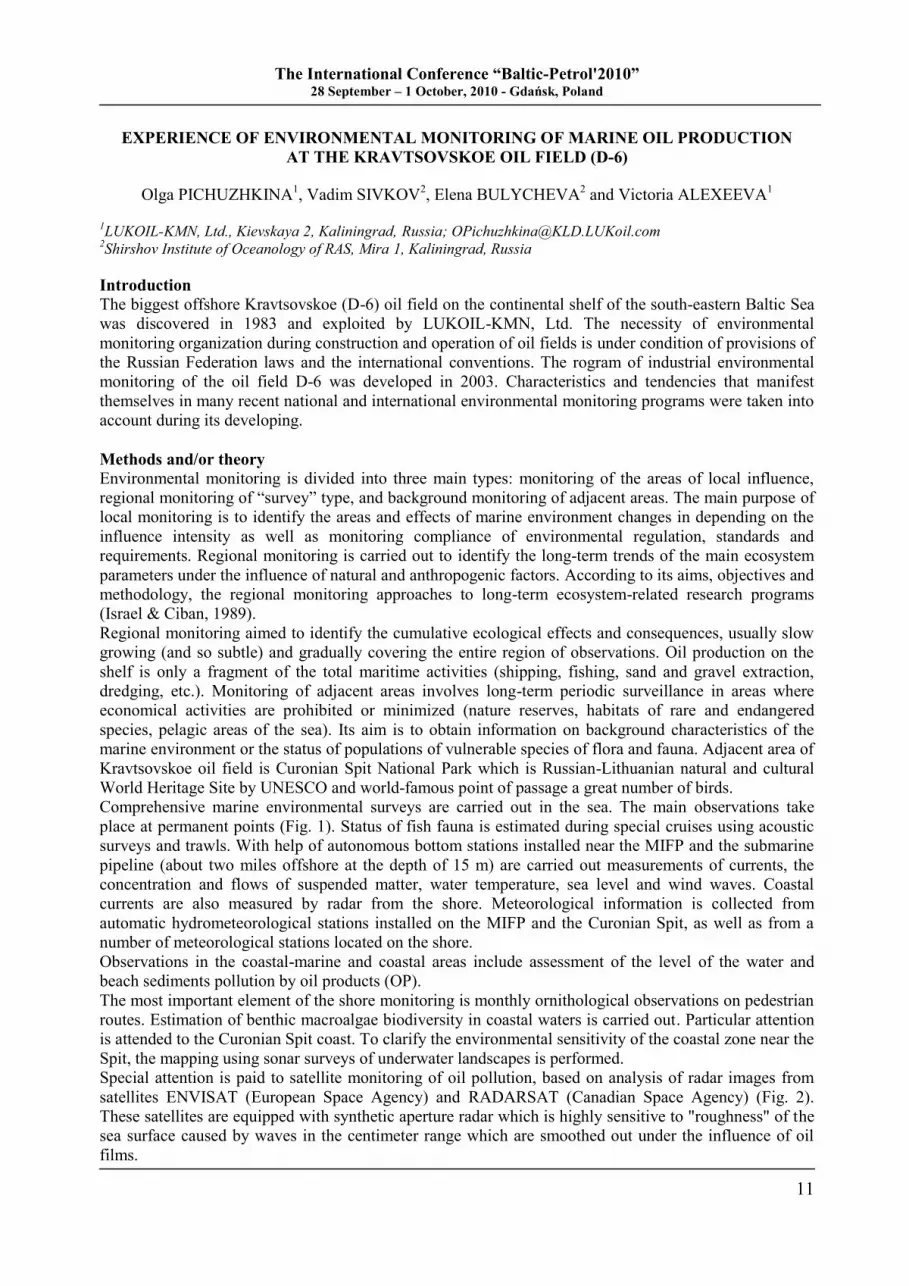
Comprehensive marine environmental surveys are carried out in the sea. The main observations take
place at permanent points (Fig. 1). Status of fish fauna is estimated during special cruises using acoustic
surveys and trawls. With help of autonomous bottom stations installed near the MIFP and the submarine
pipeline (about two miles offshore at the depth of 15 m) are carried out measurements of currents, the
concentration and flows of suspended matter, water temperature, sea level and wind waves. Coastal
currents are also measured by radar from the shore. Meteorological information is collected from
automatic hydrometeorological stations installed on the MIFP and the Curonian Spit, as well as from a
number of meteorological stations located on the shore.
Observations in the coastal-marine and coastal areas include assessment of the level of the water and
beach sediments pollution by oil products (OP).
The most important element of the shore monitoring is monthly ornithological observations on pedestrian
routes. Estimation of benthic macroalgae biodiversity in coastal waters is carried out. Particular attention
is attended to the Curonian Spit coast. To clarify the environmental sensitivity of the coastal zone near the
Spit, the mapping using sonar surveys of underwater landscapes is performed.
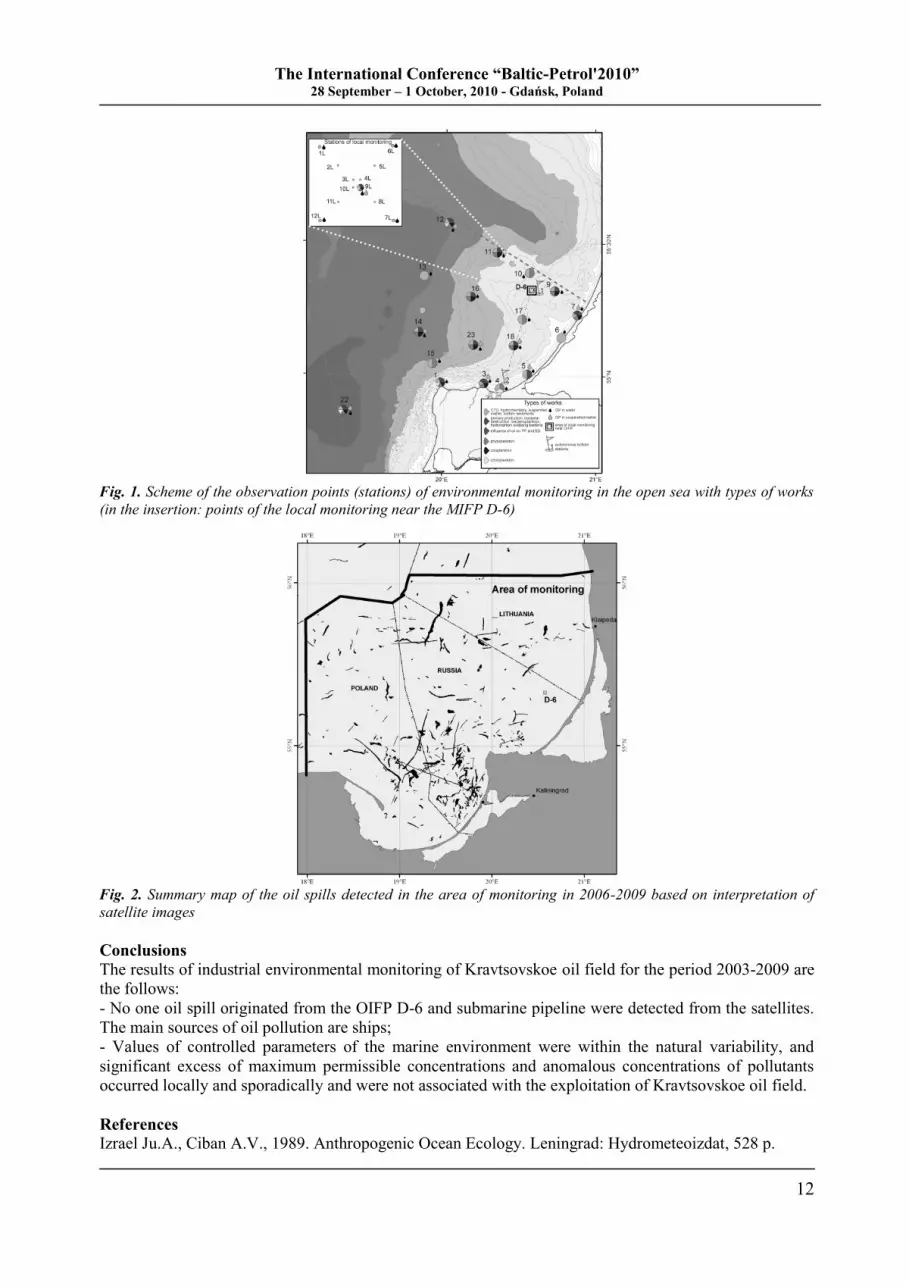
Special attention is paid to satellite monitoring of oil pollution, based on analysis of radar images from
satellites ENVISAT (European Space Agency) and RADARSAT (Canadian Space Agency) (Fig. 2).
These satellites are equipped with synthetic aperture radar which is highly sensitive to "roughness" of the
sea surface caused by waves in the centimeter range which are smoothed out under the influence of oil
films.
The International Conference “Baltic-Petrol'2010” 28 September – 1 October, 2010 - Gdańsk, Poland
12
Fig. 1. Scheme of the observation points (stations) of environmental monitoring in the open sea with types of works
(in the insertion: points of the local monitoring near the MIFP D-6)
Fig. 2. Summary map of the oil spills detected in the area of monitoring in 2006-2009 based on interpretation of
satellite images
Conclusions
The results of industrial environmental monitoring of Kravtsovskoe oil field for the period 2003-2009 are
the follows:
- No one oil spill originated from the OIFP D-6 and submarine pipeline were detected from the satellites.
The main sources of oil pollution are ships;
- Values of controlled parameters of the marine environment were within the natural variability, and
significant excess of maximum permissible concentrations and anomalous concentrations of pollutants
occurred locally and sporadically and were not associated with the exploitation of Kravtsovskoe oil field.
References
Izrael Ju.A., Ciban A.V., 1989. Anthropogenic Ocean Ecology. Leningrad: Hydrometeoizdat, 528 p.
The International Conference “Baltic-Petrol'2010” 28 September – 1 October, 2010 - Gdańsk, Poland
13
OIL AND GAS EXPLORATION AND PRODUCTION IN NE GERMANY
AND ADJACENT BALTIC SEA AREA
Karsten OBST
Geologischer Dienst, LUNG M-V, Goldberger Str. 12, D-18273 Güstrow, Germany;
Introduction
Oil and gas exploration in north-eastern Germany started in the 1950s. Oil was first found near
Reinkenhagen in 1961. The largest deposit with an area of 3 km2, total oil in place of 4.25 million tons
and total gas in place of 830 million m3 was discovered at Lütow on the Baltic Sea island of Usedom in
1965 (Rasch et al., 1993). Although different Late Palaeozoic (Devonian to Permian) and Mesozoic
source and reservoir rocks have been investigated by numerous wells in the German Federal State of
Mecklenburg-Vorpommern until 1990, small oil accumulations often accompanied by gas occurrences
have only been found in Zechstein reservoirs in depths between 2000 and 3000 m, especially in the
Stassfurt carbonates at the platform margin (e.g. Lütow, Heringsdorf) and at the slope (e.g. Grimmen,
Reinkenhagen). Gas reservoirs enriched in nitrogen (90-98 % N2) also occur in Rotliegend sediments (e.g.
Krummin).
The peak of oil and gas production was already reached in the late 1960s or early 1970s. Production rate
has been steadily decreasing since that time. After the German reunification production in most oil fields
was shut down. Nevertheless high oil prices encouraged new players to invest money in oil exploration
on- and offshore. Seismic programs are the basis for new exploration wells that will be drilled within the
next few years.
Geology of Zechstein source and reservoir rocks
The North German Basin (NGB) is one of the largest sub-basins of the Central European Basin System
(CEBS) containing mostly 2 to 10 km of Permian to Cenozoic deposits. The stage of main subsidence
started after an Autunian (Lower Rotliegend) volcanic rift phase in the Saxonian II (Upper Rotliegend II)
and lasted until the end of the Middle Buntsandstein. It is followed by the stage of basin differentiation
until the early Upper Cretaceous. Marine ingressions occurred several times from the Arctic ocean in the
north and from the Tethyan ocean in the south. Especially during the Zechstein, sedimentation
commenced when the sub sea-level areas of the CEBS were flooded through a combination of subsidence
and eustatic sea level rise. Up to eight large depositional cycles can be distinguished. Their total thickness
varies considerably from some tens of meters in the marginal areas up to 3500 meters in troughs and
grabens in the central parts of the basin system. Each cycle typically starts with a transgressive non-
evaporitic clay, followed by carbonates, and culminates in thick evaporites (mostly anhydrite and halite).
A few cycles finish with a regressive sequence of halite and anhydrite/clay.
The thickness of the Zechstein succession is reduced at the north-eastern margin of the NGB, where only
the lower five cycles occur. The evaporite platform of the Werra sequence (z1) is overlain by carbonates
of the Stassfurt sequence (z2). This Stassfurt carbonate is both a source and a reservoir rock of varying
quality. Three facies types can be distinguished: basin, slope and platform facies. The basin facies
typically has a thickness of 6-15 m. It comprises dark coloured, bituminous, finely laminated argillaceous
limestone, the so-called Stinkschiefer (fetid shale). These rocks have source rock potential for oil and gas,
with a TOC content of up to 1.2 wt.% (cf. Gerling et al., 1996). The platform facies, however, is
characterized by a light grey to light brown, clay-poor massive dolomite to oolitic grainstone. This so-
called Hauptdolomit facies is characterized by carbonate sand bars that may be up to 100 m in thickness
at the platform margin running nearly parallel to the coast. In between, the slope facies is 20-30 m in
thickness and consists of light-coloured limestone and dolomite, and re-deposited platform sediments by
slumps, grain and mass flows.
The known oil and gas reservoirs occur either in carbonate shoals of the platform margin, with high
porosities of 10-25 % and 30-50 m effective thickness, or in turbidite grainstone, with a thickness of 3-10
m and similar porosities, forming interbeds in a 10-30 km wide zone of the lower platform slope.
Fractured reservoirs are known near local highs or in the vicinity of faults (Schretzenmayr, 2004).
The International Conference “Baltic-Petrol'2010” 28 September – 1 October, 2010 - Gdańsk, Poland
14
Structural traps developed during the course of the basin inversion during the Late Cretaceous. The
largest subsidence of the carbonate interval occurred at the beginning of Late Cretaceous time. The oil
window and, locally, the beginning of the gas window were reached. The seals for the oil and gas
reservoirs are upper Zechstein salt and anhydrite (cf. Wagner et al., 2001).
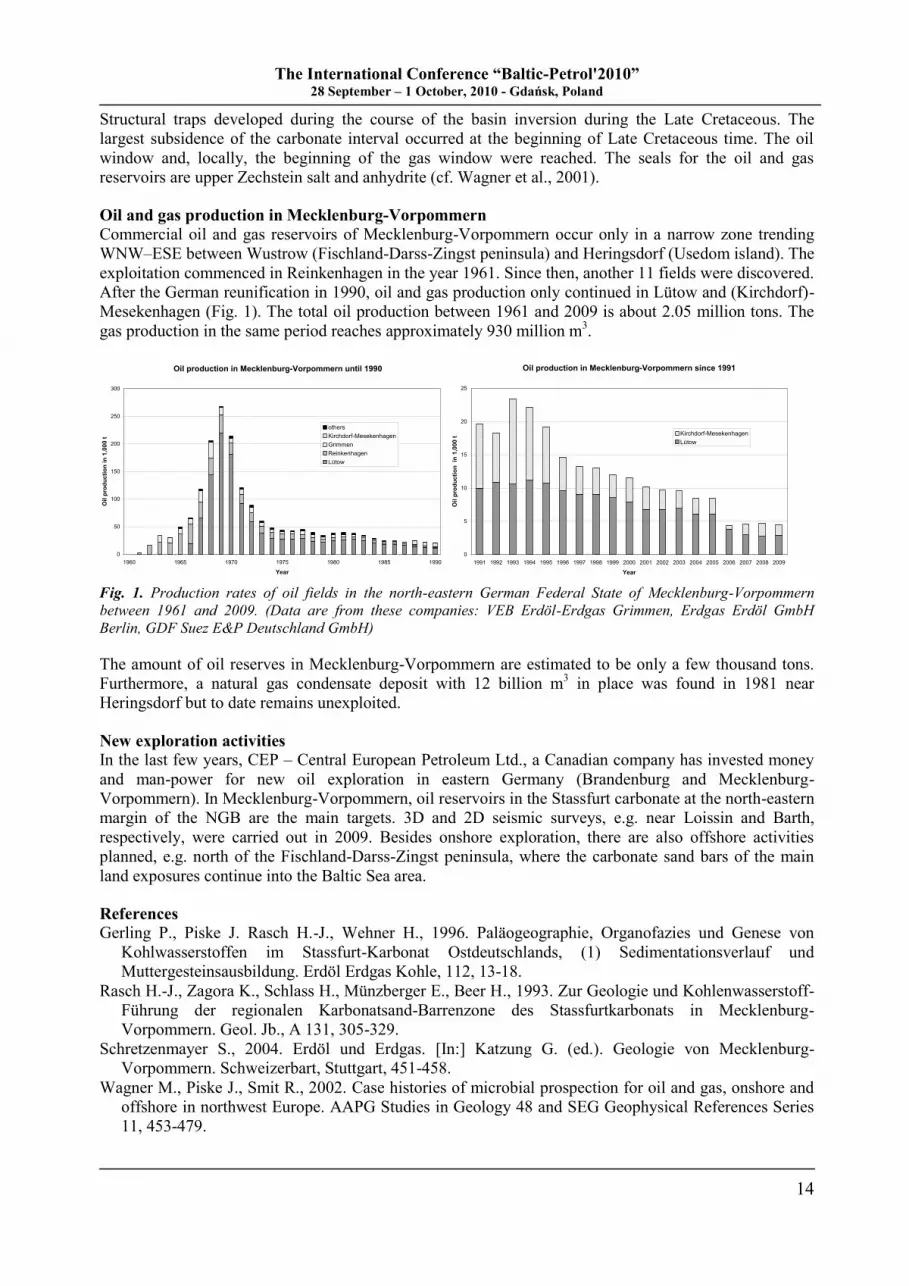
Oil and gas production in Mecklenburg-Vorpommern
Commercial oil and gas reservoirs of Mecklenburg-Vorpommern occur only in a narrow zone trending
WNW–ESE between Wustrow (Fischland-Darss-Zingst peninsula) and Heringsdorf (Usedom island). The
exploitation commenced in Reinkenhagen in the year 1961. Since then, another 11 fields were discovered.
After the German reunification in 1990, oil and gas production only continued in Lütow and (Kirchdorf)-
Mesekenhagen (Fig. 1). The total oil production between 1961 and 2009 is about 2.05 million tons. The
gas production in the same period reaches approximately 930 million m3.
Oil production in Mecklenburg-Vorpommern until 1990
0
50
100
150
200
250
300
1960 1965 1970 1975 1980 1985 1990
Year
Oil
pro
du
cti
on
in
1,0
00
t
others
Kirchdorf-Mesekenhagen
Grimmen
Reinkenhagen
Lütow
Oil production in Mecklenburg-Vorpommern since 1991
0
5
10
15
20
25
1991 1992 1993 1994 1995 1996 1997 1998 1999 2000 2001 2002 2003 2004 2005 2006 2007 2008 2009
Year
Oil
pro
du
cti
on
in
1,0
00
t
Kirchdorf-Mesekenhagen
Lütow
Fig. 1. Production rates of oil fields in the north-eastern German Federal State of Mecklenburg-Vorpommern
between 1961 and 2009. (Data are from these companies: VEB Erdöl-Erdgas Grimmen, Erdgas Erdöl GmbH
Berlin, GDF Suez E&P Deutschland GmbH)
The amount of oil reserves in Mecklenburg-Vorpommern are estimated to be only a few thousand tons.
Furthermore, a natural gas condensate deposit with 12 billion m3 in place was found in 1981 near
Heringsdorf but to date remains unexploited.
New exploration activities
In the last few years, CEP – Central European Petroleum Ltd., a Canadian company has invested money
and man-power for new oil exploration in eastern Germany (Brandenburg and Mecklenburg-
Vorpommern). In Mecklenburg-Vorpommern, oil reservoirs in the Stassfurt carbonate at the north-eastern
margin of the NGB are the main targets. 3D and 2D seismic surveys, e.g. near Loissin and Barth,
respectively, were carried out in 2009. Besides onshore exploration, there are also offshore activities
planned, e.g. north of the Fischland-Darss-Zingst peninsula, where the carbonate sand bars of the main
land exposures continue into the Baltic Sea area.
References
Gerling P., Piske J. Rasch H.-J., Wehner H., 1996. Paläogeographie, Organofazies und Genese von
Kohlwasserstoffen im Stassfurt-Karbonat Ostdeutschlands, (1) Sedimentationsverlauf und
Muttergesteinsausbildung. Erdöl Erdgas Kohle, 112, 13-18.
Rasch H.-J., Zagora K., Schlass H., Münzberger E., Beer H., 1993. Zur Geologie und Kohlenwasserstoff-
Führung der regionalen Karbonatsand-Barrenzone des Stassfurtkarbonats in Mecklenburg-
Vorpommern. Geol. Jb., A 131, 305-329.
Schretzenmayer S., 2004. Erdöl und Erdgas. [In:] Katzung G. (ed.). Geologie von Mecklenburg-
Vorpommern. Schweizerbart, Stuttgart, 451-458.
Wagner M., Piske J., Smit R., 2002. Case histories of microbial prospection for oil and gas, onshore and
offshore in northwest Europe. AAPG Studies in Geology 48 and SEG Geophysical References Series
11, 453-479.
The International Conference “Baltic-Petrol'2010” 28 September – 1 October, 2010 - Gdańsk, Poland
15
SEPTEMBER 29 (WEDNESDAY, AFTERNOON)
PETROLEUM EXPLORATION AND SHALE GAS SESSION
In Chair: Michael D. LEWAN (U.S.A.) and Piotr GLINIAK (Poland)
14:20 Petroleum Exploration in the Polish Part of the Baltic Region
Paweł H. KARNKOWSKI, Leszek PIKULSKI and Tadeusz WOLNOWSKI
14:40 Oil and Gas in Germany - an Overview
Juergen MESSNER
15:00 Shale Gas and Shale Oil Exploration in the Lower Palaeozoic Complex of the Baltic
Basin
Paweł POPRAWA
15:20 Source Rock - Based Evaluation of Shale Gas Prospects, Mid-Polish and Lublin Troughs,
Poland
John B. CURTIS and John E. ZUMBERGE
15:40 Studies of the Organic Matter of the Lower Silurian Shales of Western Lithuania in
Terms of Shale Gas Potential
Jurga LAZAUSKIENE and Onytė ZDANAVICIUTE
16:00 – 16:30 Coffee break
ORGANIC GEOCHEMISTRY SESSION
In Chair: Juergen KOESTER (Germany) and Stig BERGSETH (Norway)
16:30 Hydrocarbon Potential of the Lower Palaeozoic Sequence of the Polish Baltic Basin
Dariusz WIĘCŁAW, Maciej J. KOTARBA, Paweł KOSAKOWSKI, Adam KOWALSKI
and Piotr ANOLIK
16:50 Source Rock Evaluation of the Alum and Dictyonema Shales (Upper Cambrian-Lower
Ordovician) in the Baltic and Podlasie Basin
Paweł KOSAKOWSKI, Maciej J. KOTARBA, Alla SHOGENOVA and Dariusz WIĘCŁAW
17:10 Geochemistry of Oils and Petroleum Potential of the Middle Cambrian Succession in the
Central Part of the Baltic Basin
Onyte ZDANAVICIUTE, Jurga LAZAUSKIENE, Anatoly KHOUBLDIKOV
and Marina DAKHNOVA
17:30 Comparison of Oils Accumulated in the Polish Baltic Basin with Hydrous Pyrolysis Oils
Expelled from the Cambrian and Ordovician Rocks
Dariusz WIĘCŁAW, Maciej J. KOTARBA, Michael D. LEWAN
and Alicja KARCZEWSKA
17:50 Comparison of Natural and Hydrous Pyrolysis Gases (Lower Palaeozoic Sequence,
Polish Baltic Basin)
Maciej J. KOTARBA and Michael D. LEWAN
19:30 Conference Dinner at the Polish Baltic Philharmonic

The International Conference “Baltic-Petrol'2010” 28 September – 1 October, 2010 - Gdańsk, Poland
16

The International Conference “Baltic-Petrol'2010” 28 September – 1 October, 2010 - Gdańsk, Poland
17
PETROLEUM EXPLORATION IN THE POLISH PART OF THE BALTIC REGION
Paweł H. KARNKOWSKI1,2
, Leszek PIKULSKI3 and Tadeusz WOLNOWSKI
4
1Institute of Geology, Warsaw University, al. Żwirki i Wigury 93, 02-089 Warszawa, Poland;
[email protected] 2Polish Oil and Gas Company, ul. Kasprzaka 25, 01-242 Warszawa, Poland
3LOTOS Petrobaltic S.A., ul. Stary Dwór 9, 80-958 Gdańsk, Poland
4Polish Oil and Gas Company-Zielona Góra Branch, Plac Staszica 9, 64-920 Piła, Poland
Polish part of the Baltic region is located within the contact zone between two large geologic units:
Precambrian Platform and Palaeozoic Platform. It comprises the Polish sector of the Southern Baltic Sea
and the adjacent onshore of northern Poland (Western and Eastern Pomerania). Fundamental geological
pattern is defined by the Teisseyre-Tornquist Zone, separating the East European Craton from the
Palaeozoic Platform. Area located eastward from the T-T Zone is named the Peribaltic Syneclise (Eastern
Pomerania). Palaeozoic deposits of the Peribaltic Syneclise are mainly the product of the Baltic Basin
evolution initiated in the late Vendian. Westward from the T-T Zone main structural features of Western
Pomerania are determined by the consolidated Caledonian basement. The Devonian-Carboniferous-
Rotliegend complex lying on the folded Caledonides is overlain by the Zechstein-Mesozoic one with
almost horizontal beds.
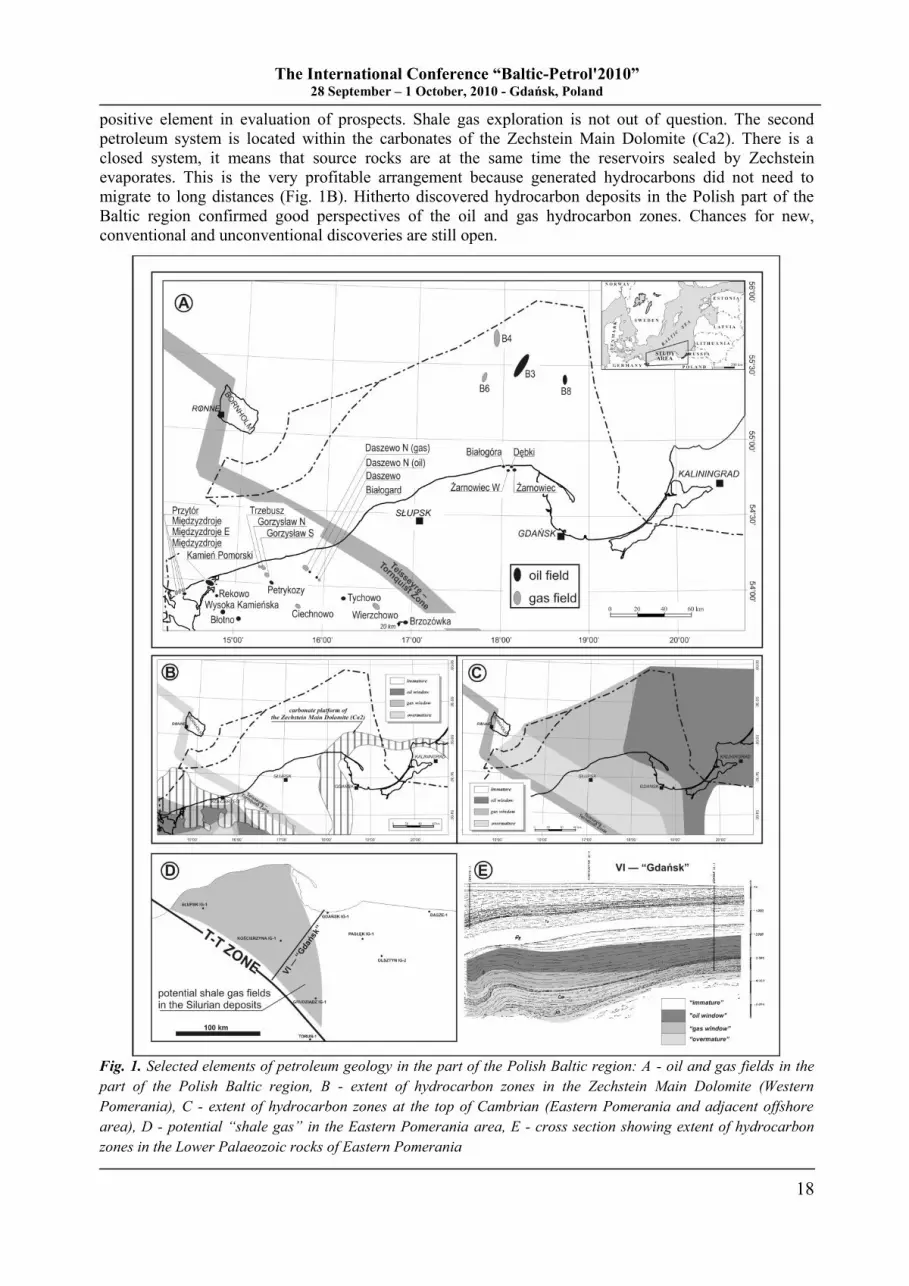
In the result of exploration activity in the onshore Pomerania region four oil fields in the
Cambrian sandstones and seven gas fields in the Carboniferous sandstones, and six gas fields in the
Rotliegend sandstones, and eleven oil fields within the Zechstein Main Dolomite horizon were discovered
(Fig. 1A). The occurrence of oil fields in the Eastern Pomerania is limited mainly to the coast and
offshore Baltic area in the Polish economic sector (Fig. 1A). Offshore in the Pomerania Bay is an
exploration challenge.
At present, forecasting of hydrocarbon-bearing zones is elaborated by methodology named "basin
analysis". Principles of this procedure are to integrate multidisciplinary geological, geophysical and
geochemical data into the petroleum play concept. The results of computer-aid modelling and play
procedures allow to predict hydrocarbon zones. One of the present author (Karnkowski) made a lot of
petroleum modelling for the Pomerania region (1996-2003).
Petroleum play of the Southern Baltic and adjacent areas must be considered separately for Eastern and
Western Pomerania (Fig. 1B, C). In the Peribaltic Syneclise we can only take into consideration organic
matter appearing in lower Palaeozoic rocks. The best source rocks are the upper Cambrian and
Tremadocian deposits where TOC content is 1-18 wt.% (kerogen type II). Geothermal history of Southern
Baltic and of the adjacent areas in context of hydrocarbons generation refers to the relatively long time
period: from the Vendian up to Recent. The image of heat field variability in geological time was divided
into two parts: the first episode lasted from the Vendian until the end of Carboniferous and the second one
– from the Permian up to Recent. The analysis of burial and thermal history of the Peribaltic Syneclise
shows a vast area of the “oil window” (Fig. 1C). It is much greater than in the onshore area what well
explains the occurrence of oil fields in the Baltic offshore.
In the area of “gas window” and “dry gas” (Fig. 1C) reservoir properties of the Cambrian rocks are rather
low due to intensive diagenetic processes. Acquisition of gas should be possible by processes of hydraulic
stimulation (tight gas). Lower Palaeozoic rocks rich in organic matter, especially in the border zone of the
EEC (Ro > 1.3 %) could be an area of unconventional gas fields (shale gas) (Fig. 1C, D, E). Hitherto
discovered hydrocarbons deposits in the Cambrian rocks, especially within the offshore, confirmed good
perspectives of the Gdańsk Petroleum Province.
Western Pomerania petroleum play shows two separate source rocks series. The older one
embraces Carboniferous deposits with organic matter of terrestrial origin and generated gases
accumulated in the Rotliegend and Carboniferous traps. Thickness of the Upper Carboniferous deposits is
about 500 m (with 1 wt.% TOC average) and the Lower one has 2000 m with av. 0.5 wt.% TOC.
Carboniferous-Rotliegend petroleum system in the Southern Baltic is weakly explored. Rotliegend clastic
rocks there are partly eroded or non-deposited. Pomeranian Carboniferous rocks are strong dislocated
what make difficult exploration of gas fields. Content of gas with more than 50 % of methane could be a
The International Conference “Baltic-Petrol'2010” 28 September – 1 October, 2010 - Gdańsk, Poland
18
positive element in evaluation of prospects. Shale gas exploration is not out of question. The second
petroleum system is located within the carbonates of the Zechstein Main Dolomite (Ca2). There is a
closed system, it means that source rocks are at the same time the reservoirs sealed by Zechstein
evaporates. This is the very profitable arrangement because generated hydrocarbons did not need to
migrate to long distances (Fig. 1B). Hitherto discovered hydrocarbon deposits in the Polish part of the
Baltic region confirmed good perspectives of the oil and gas hydrocarbon zones. Chances for new,
conventional and unconventional discoveries are still open.
Fig. 1. Selected elements of petroleum geology in the part of the Polish Baltic region: A - oil and gas fields in the
part of the Polish Baltic region, B - extent of hydrocarbon zones in the Zechstein Main Dolomite (Western
Pomerania), C - extent of hydrocarbon zones at the top of Cambrian (Eastern Pomerania and adjacent offshore
area), D - potential “shale gas” in the Eastern Pomerania area, E - cross section showing extent of hydrocarbon
zones in the Lower Palaeozoic rocks of Eastern Pomerania
The International Conference “Baltic-Petrol'2010” 28 September – 1 October, 2010 - Gdańsk, Poland
19
OIL AND GAS IN GERMANY – AN OVERVIEW
Juergen MESSNER
LBEG, State Authority for Mining, Energy & Geology, Hanover, Germany; [email protected]
Introduction
Like many other industrialized countries Germany highly depends on energy resources such as oil and gas
for its primary energy supply. In 2008 the national crude oil production amounted to about 3 million
tonnes which covered less than 3 % of the entire annual demand. During the past years Germany‟s natural
gas production has declined to 16.4 billion m3 thus contributing about 16 % to the national gas
requirements. The balance (oil and gas) had to be imported from a number of countries, particularly
Russia and Norway.
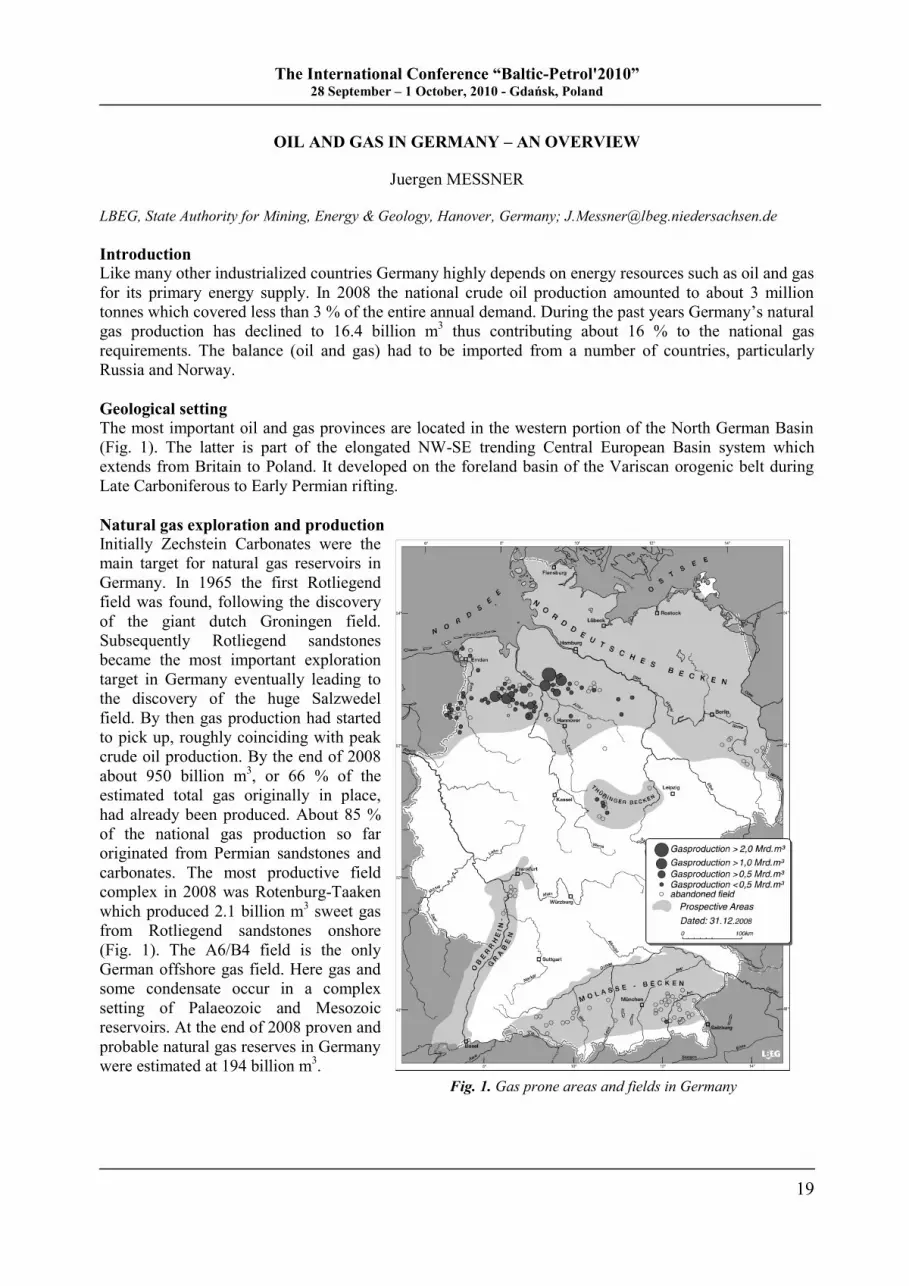
Geological setting
The most important oil and gas provinces are located in the western portion of the North German Basin
(Fig. 1). The latter is part of the elongated NW-SE trending Central European Basin system which
extends from Britain to Poland. It developed on the foreland basin of the Variscan orogenic belt during
Late Carboniferous to Early Permian rifting.
Natural gas exploration and production
Initially Zechstein Carbonates were the
main target for natural gas reservoirs in
Germany. In 1965 the first Rotliegend
field was found, following the discovery
of the giant dutch Groningen field.
Subsequently Rotliegend sandstones
became the most important exploration
target in Germany eventually leading to
the discovery of the huge Salzwedel
field. By then gas production had started
to pick up, roughly coinciding with peak
crude oil production. By the end of 2008
about 950 billion m3, or 66 % of the
estimated total gas originally in place,
had already been produced. About 85 %
of the national gas production so far
originated from Permian sandstones and
carbonates. The most productive field
complex in 2008 was Rotenburg-Taaken
which produced 2.1 billion m3 sweet gas
from Rotliegend sandstones onshore
(Fig. 1). The A6/B4 field is the only
German offshore gas field. Here gas and
some condensate occur in a complex
setting of Palaeozoic and Mesozoic
reservoirs. At the end of 2008 proven and
probable natural gas reserves in Germany
were estimated at 194 billion m3.
Fig. 1. Gas prone areas and fields in Germany
The International Conference “Baltic-Petrol'2010” 28 September – 1 October, 2010 - Gdańsk, Poland
20
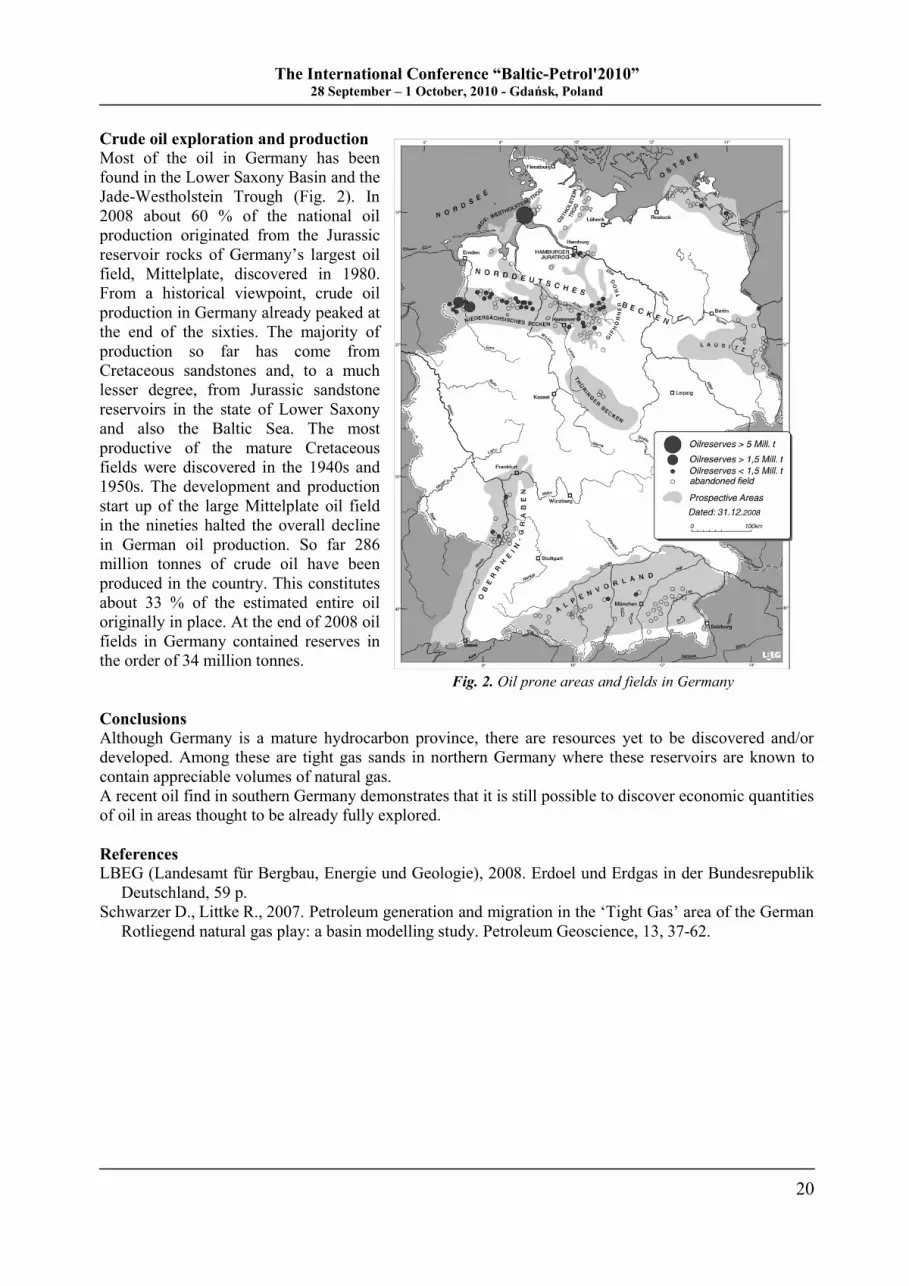
Crude oil exploration and production
Most of the oil in Germany has been
found in the Lower Saxony Basin and the
Jade-Westholstein Trough (Fig. 2). In
2008 about 60 % of the national oil
production originated from the Jurassic
reservoir rocks of Germany‟s largest oil
field, Mittelplate, discovered in 1980.
From a historical viewpoint, crude oil
production in Germany already peaked at
the end of the sixties. The majority of
production so far has come from
Cretaceous sandstones and, to a much
lesser degree, from Jurassic sandstone
reservoirs in the state of Lower Saxony
and also the Baltic Sea. The most
productive of the mature Cretaceous
fields were discovered in the 1940s and
1950s. The development and production
start up of the large Mittelplate oil field
in the nineties halted the overall decline
in German oil production. So far 286
million tonnes of crude oil have been
produced in the country. This constitutes
about 33 % of the estimated entire oil
originally in place. At the end of 2008 oil
fields in Germany contained reserves in
the order of 34 million tonnes.
Conclusions Although Germany is a mature hydrocarbon province, there are resources yet to be discovered and/or
developed. Among these are tight gas sands in northern Germany where these reservoirs are known to
contain appreciable volumes of natural gas.
A recent oil find in southern Germany demonstrates that it is still possible to discover economic quantities
of oil in areas thought to be already fully explored.
References
LBEG (Landesamt für Bergbau, Energie und Geologie), 2008. Erdoel und Erdgas in der Bundesrepublik
Deutschland, 59 p.
Schwarzer D., Littke R., 2007. Petroleum generation and migration in the „Tight Gas‟ area of the German
Rotliegend natural gas play: a basin modelling study. Petroleum Geoscience, 13, 37-62.
Fig. 2. Oil prone areas and fields in Germany
The International Conference “Baltic-Petrol'2010” 28 September – 1 October, 2010 - Gdańsk, Poland
21
SHALE GAS AND SHALE OIL EXPLORATION IN THE LOWER PALAEOZOIC COMPLEX
OF THE BALTIC BASIN
Paweł POPRAWA
Polish Geological Institute – National Research Institute, ul. Rakowiecka 4, 00-975 Warszawa, Poland;
Introduction
The Lower Palaeozoic basins at the western slope of the East European Craton (EEC), including Baltic
Basin, are currently one of the most interesting areas for shale gas exploration in Europe. The potential
reservoir formation is mainly the Upper Ordovician and/or Lower Silurian graptolitic shale (Poprawa &
Kiersnowski, 2008; Poprawa, 2010). Locally, in the northern part of the Baltic Basin, an additional target
is the Upper Cambrian–Tremadocian Alum shale. The current paper presents general geological and
geochemical characteristics of this formation with the aim to constrain its shale gas potential.
Thickness and geochemical characteristics
The Lower Palaeozoic shale at the western slope of the EEC is characterized by broad later extend and
relatively quite tectonic setting (Fig. 1). Appearance of the organic rich shale within the Lower Palaeozoic
section is diachronic. In the Łeba Elevation (NW onshore Baltic Basin) intervals richest in organic are
recognized in the Upper Cambrian–Tremadocian and Upper Llanvirn–Caradoc shale. In the central part
of the basin richest in organic interval are observed within Llandovery section, while in the eastern part
within Wenlock. Organic matter of the shale is characterized by II type of kerogen.
Average TOC contents of the Upper Cambrian to Tremadocian shale is high (3-12 wt.%) (Więcław et al.,
2010), however its thickness very low (a few to several meters only). Thickness of the Caradoc shale
varies from several meters to more than 50 m, while its average TOC contents varies from less than 1
wt.% to nearly 4 wt.%. The Llandovery shale is the main regional potential shale gas formation (Poprawa,
2010). Thickness of the Llandovery shale increases from east to west to approximately 70 m at most,
however at the major part of the discussed area it falls into range of 20-40 m. Average TOC within
individual section of the Llandovery is usually equal to 1 wt.% do 2.5 wt.%. (Fig. 1). Thickness of the
Wenlock sediments increases from some 120 m in the east to more than 1000 m in the western part of the
Baltic Basin. Average organic matter contents for the individual Wenlock sections in the central and
western part of the Baltic Basin usually is in a range of 0.5 wt.% do 1.3 wt.% TOC. In the eastern part of
the Baltic Basin it is higher and equal to approximately 1-1.7 wt.% TOC.
Burial depth and thermal maturity
In the Baltic Basin lateral changes of thermal maturity correspond to changes of present day burial. In the
zones were low burial depth allows to keep exploration costs at low level the thermal maturity of shale is
too low for gas generation. Maturity increases to the west, as the burial does, and in the western part of
the studied area potential shale gas accumulation could be present at the depth too high for commercial
gas exploration and exploitation. In between of zone of too low maturity for shale gas development and
too high burial depth for its exploration there is a broad zone of the Lower Palaeozoic shale having high
shale gas exploration potential (Fig. 1) (Poprawa, 2010).
In the zones characterized by thermal maturity within a range of 0.8-1.1 % Ro and by very high TOC
contents, exceeding 15 wt.% at maximum, there is a potential for oils shale exploration. The zones with
the highest potential is the eastern Baltic Basin in the SW Lithuania.
Hydrocarbon shows within the Lower Palaeozoic complex
Hydrocarbon shows and their composition in the Lower Palaeozoic section are strictly related to thermal
maturity of the source rock. In the zones of low maturity there are almost exclusively oil shows
documented. Further west, in the zone transitional to the gas window area, gas is wet and contains
significant contribution of hydrocarbon gases higher than methane. Within the gas window zone there are
almost exclusively methane shows observed. Moreover within the zones of low maturity a high Nitrogen
contents is documented (Poprawa, 2010).
The International Conference “Baltic-Petrol'2010” 28 September – 1 October, 2010 - Gdańsk, Poland
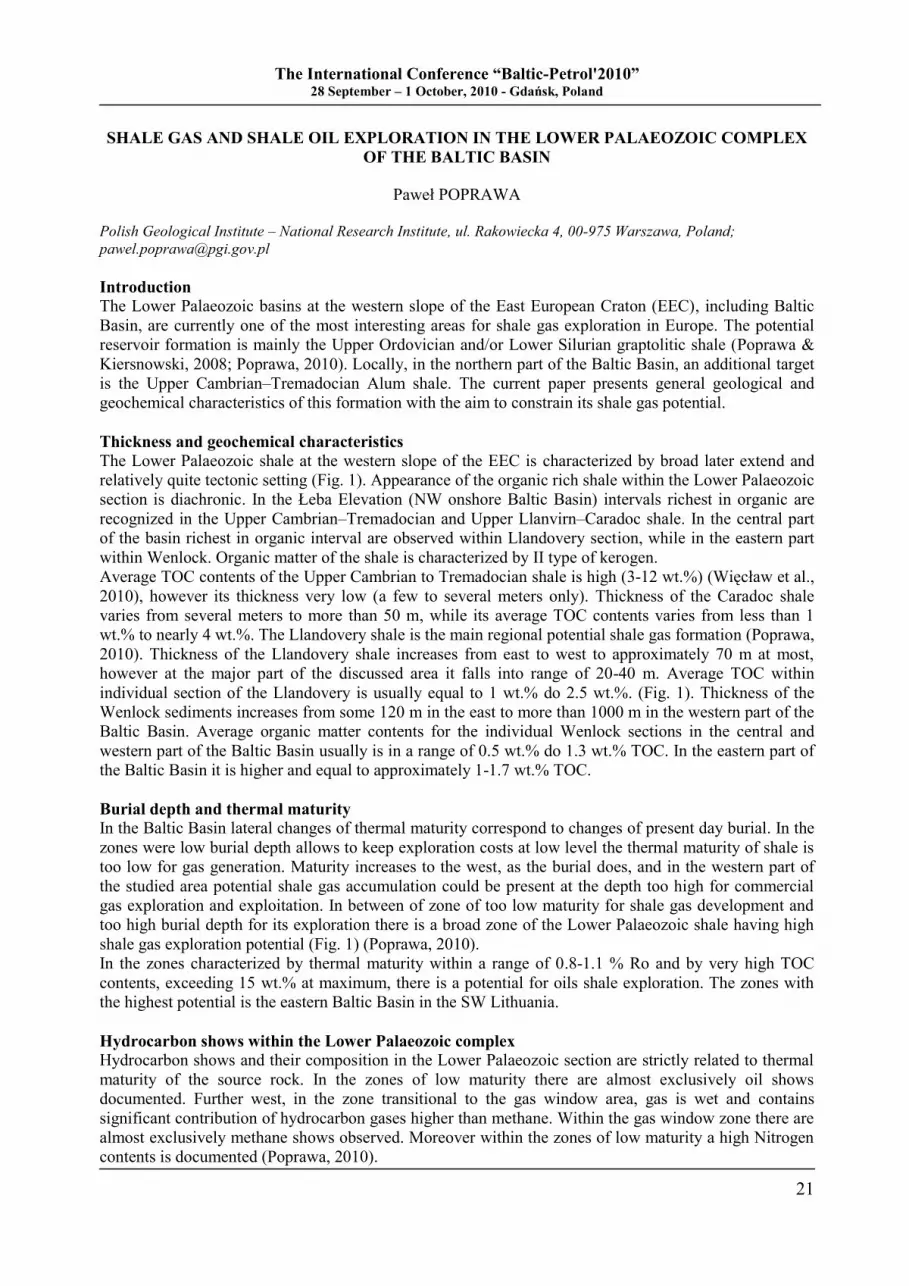
22
Fig. 1. Geological and geochemical shale gas exploration risk assessment. Example for the Upper Ordovician
and/or Lower Silurian strata in the central part of the Baltic Basin after Poprawa (2010)
Exploration risk factors
Lower Palaeozoic complex in Poland have some characteristics which points to elevated exploration risk.
With compare to classic examples of gas shales, like e.g. Barnett shale, the average TOC contents is
lower. Moreover in the zone of optimal burial depth (less than 3000-3500 m) thermal maturity is lower
than in a case of Barnett shale core area. An important risk factor is also limited amount, as well as
limited resources of conventional gas fields in the Lower Palaeozoic complex. Amount and intensity of
gas shows from the Lower Palaeozoic shale are also relatively low, and there is no evidences for presence
of overpressure in this complex. In the eastern part of the western slope of the EEC an additional risk
factor is relatively high contents of nitrogen in gas.
Conclusions
In central part of the Baltic Basin there is a considerable acreage with the Lower Palaeozoic complex
characterized by high shale gas exploration potential (Fig. 1). In that zone burial depth of the shale is no
too deep for commercial gas production (2500-4000 m), thermal maturity is sufficient for generation of
gas, thickness of shale interval is relatively high (several tens of meters) and average TOC exceeds 1-2
wt.% TOC. Gas shows were documented for the Lower Palaeozoic shale in that zone, and well test results
for the conventional reservoirs below allows to expect good quality dry gas with no nitrogen.
In the zones characterized by thermal maturity within a range of 0.8-1.1 % Ro and by very high TOC
contents values there is a potential for oils shale exploration. This concerns in particular the eastern Baltic
Basin in the SW Lithuania, as well as eastern Podlasie depression out of the studied area.
References
Poprawa P., 2010. Shale gas potential of the Lower Palaeozoic complex in the Baltic Basin and Lublin-
Podlasie Basin (Poland). Geological Review, 58, 226-249 (in Polish with English summary).
Poprawa P., Kiersnowski H., 2008. Potential for shale gas and tight gas exploration in Poland. Biul.
Państw. Inst. Geol., 429, 145-152 (in Polish with English summary).
Więcław D., Kotarba M., Kosakowski P., Kowalski A., 2010. Habitat and hydrocarbon potential of the
Lower Paleozoic source rocks of the Polish sector of the Balic region. Geological Quaterly, 54.
The International Conference “Baltic-Petrol'2010” 28 September – 1 October, 2010 - Gdańsk, Poland
23
SOURCE ROCK – BASED EVALUATION OF SHALE GAS PROSPECTS,
MID-POLISH AND LUBLIN TROUGHS, POLAND
John B. CURTIS1 and John E. ZUMBERGE
2
1Colorado School of Mines, Dept. of Geology and Geological Engineering, Golden, CO 80401, USA;
[email protected] 2GeoMark Research, Ltd., 9748 Whithorn Drive, Houston, TX 77095, USA
Introduction
The first natural gas well in North America was drilled into a Devonian shale formation near Fredonia,
New York, USA in 1821. Shale gas production comprised only a small percentage of US production for
the next 180 years, at which time a combination of technologies – primarily horizontal drilling
improvements and development of multi-stage hydraulic fracturing for such wellbores – allowed what
was predominantly gas-in-place to become economic production. Shale gas now accounts for 11 % of US
gas production and 34 % of technically recoverable resource (Curtis et al., 2009).
A model for shale-gas producibility (Hill et al., 2008) requires sufficient shale thickness, organic
content (ideally hydrogen-rich), and an adequate level of thermal maturity to generate economic gas
volumes. Additionally, the mineral composition of the rock matrix (ideally silica-rich and clay-poor) must
impart sufficient brittleness to enhance the effectiveness of stimulation treatments. Increased pore
pressure (e.g., almost twice hydrostatic in the Jurassic Haynesville Formation of east Texas and north
Louisiana, USA) will also enhance the nano- to micro-Darcy matrix permeability. An initial screening of
basins and sub-basins for potential shale-gas therefore requires an understanding of the geochemical
nature of the potential source rocks through time. After that understanding is reached, the mineralogic
composition, rock mechanics nature and porosity/permeability of the identified source rocks would be
investigated. This study addresses the required geochemical work.
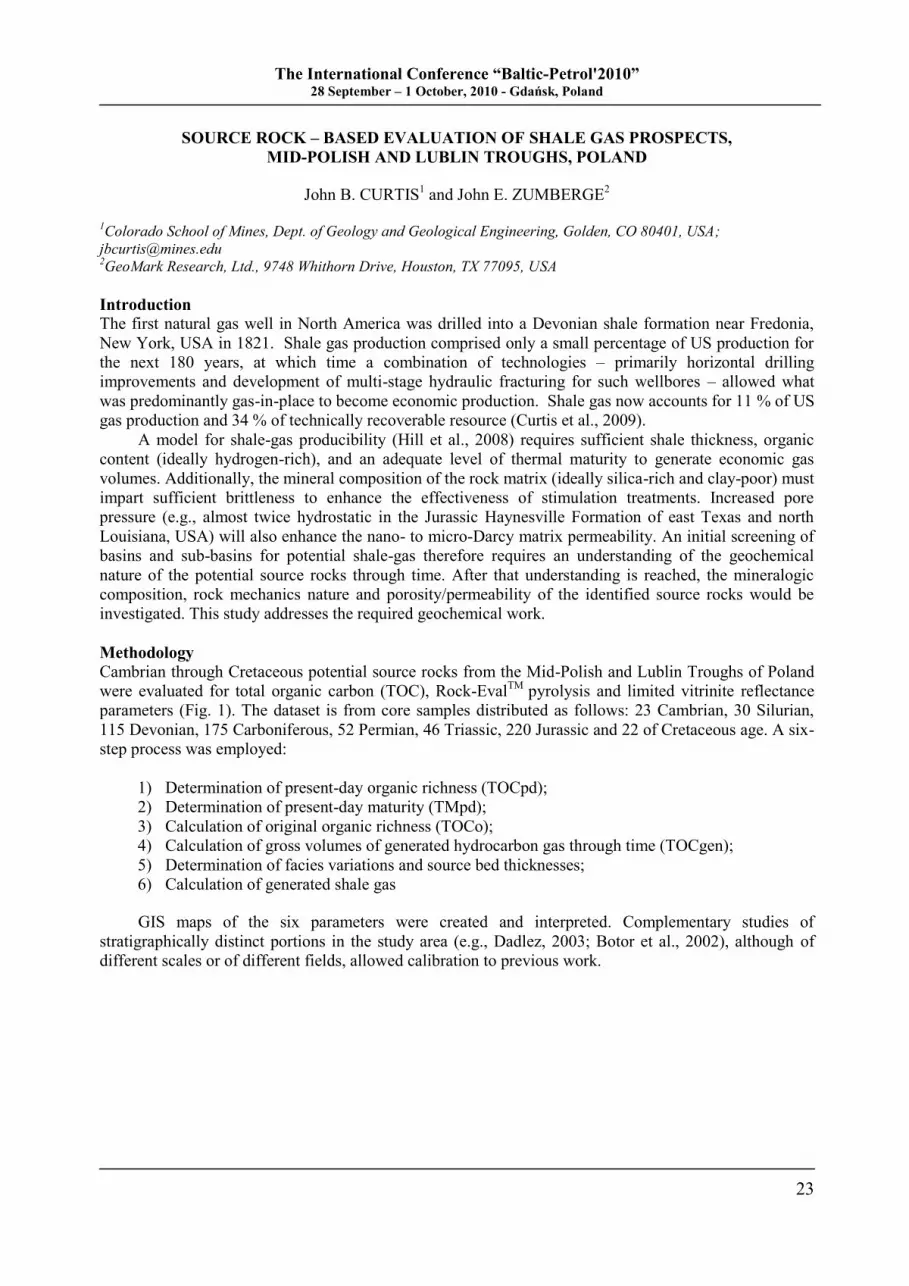
Methodology
Cambrian through Cretaceous potential source rocks from the Mid-Polish and Lublin Troughs of Poland
were evaluated for total organic carbon (TOC), Rock-EvalTM
pyrolysis and limited vitrinite reflectance
parameters (Fig. 1). The dataset is from core samples distributed as follows: 23 Cambrian, 30 Silurian,
115 Devonian, 175 Carboniferous, 52 Permian, 46 Triassic, 220 Jurassic and 22 of Cretaceous age. A six-
step process was employed:
1) Determination of present-day organic richness (TOCpd);
2) Determination of present-day maturity (TMpd);
3) Calculation of original organic richness (TOCo);
4) Calculation of gross volumes of generated hydrocarbon gas through time (TOCgen);
5) Determination of facies variations and source bed thicknesses;
6) Calculation of generated shale gas
GIS maps of the six parameters were created and interpreted. Complementary studies of
stratigraphically distinct portions in the study area (e.g., Dadlez, 2003; Botor et al., 2002), although of
different scales or of different fields, allowed calibration to previous work.
The International Conference “Baltic-Petrol'2010” 28 September – 1 October, 2010 - Gdańsk, Poland
24
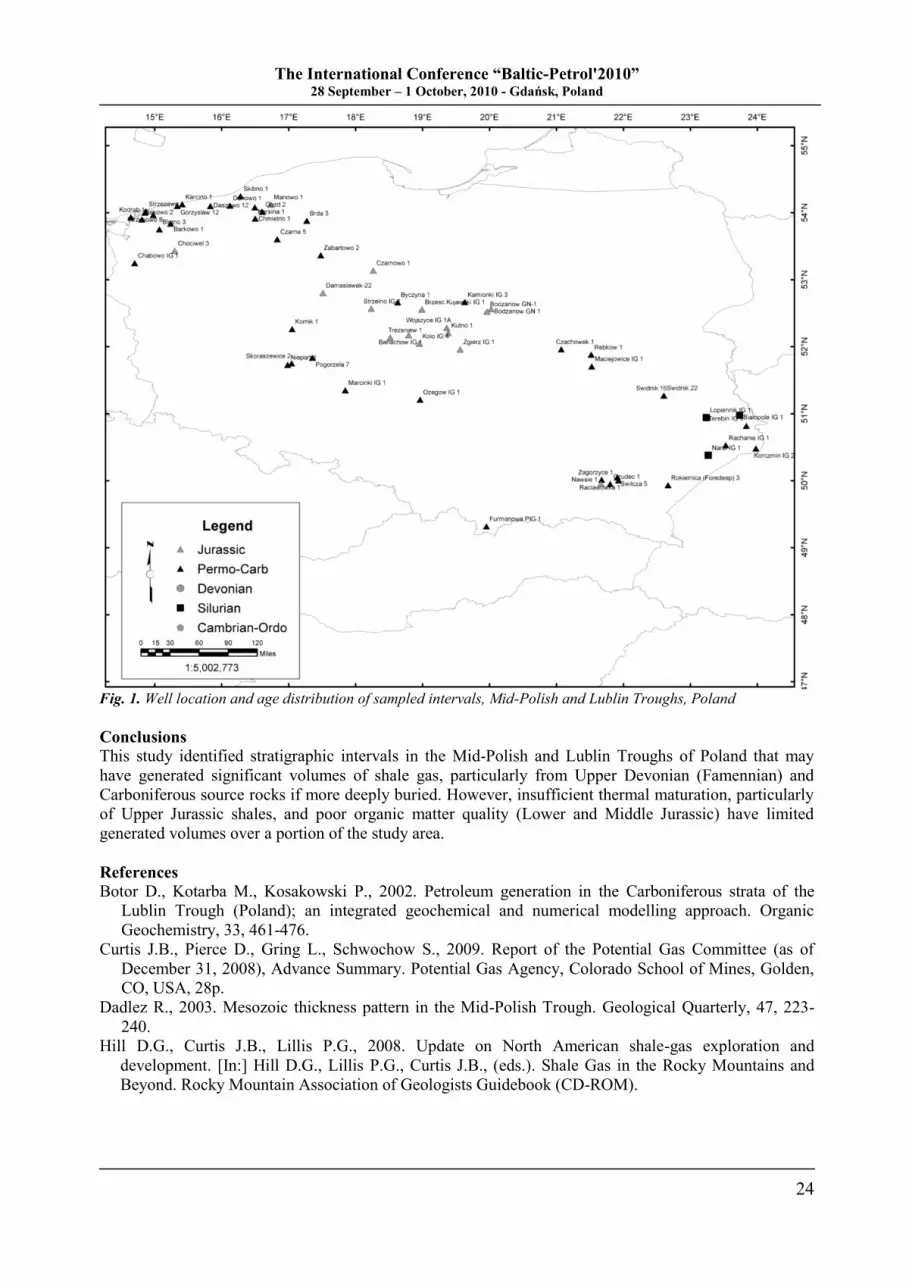
Fig. 1. Well location and age distribution of sampled intervals, Mid-Polish and Lublin Troughs, Poland
Conclusions
This study identified stratigraphic intervals in the Mid-Polish and Lublin Troughs of Poland that may
have generated significant volumes of shale gas, particularly from Upper Devonian (Famennian) and
Carboniferous source rocks if more deeply buried. However, insufficient thermal maturation, particularly
of Upper Jurassic shales, and poor organic matter quality (Lower and Middle Jurassic) have limited
generated volumes over a portion of the study area.
References
Botor D., Kotarba M., Kosakowski P., 2002. Petroleum generation in the Carboniferous strata of the
Lublin Trough (Poland); an integrated geochemical and numerical modelling approach. Organic
Geochemistry, 33, 461-476.
Curtis J.B., Pierce D., Gring L., Schwochow S., 2009. Report of the Potential Gas Committee (as of
December 31, 2008), Advance Summary. Potential Gas Agency, Colorado School of Mines, Golden,
CO, USA, 28p.
Dadlez R., 2003. Mesozoic thickness pattern in the Mid-Polish Trough. Geological Quarterly, 47, 223-
240.
Hill D.G., Curtis J.B., Lillis P.G., 2008. Update on North American shale-gas exploration and
development. [In:] Hill D.G., Lillis P.G., Curtis J.B., (eds.). Shale Gas in the Rocky Mountains and
Beyond. Rocky Mountain Association of Geologists Guidebook (CD-ROM).
The International Conference “Baltic-Petrol'2010” 28 September – 1 October, 2010 - Gdańsk, Poland
25
STUDIES OF THE ORGANIC MATTER OF THE EARLY SILURIAN SHALES
OF WESTERN LITHUANIA IN TERMS OF SHALE GAS POTENTIAL
Jurga LAZAUSKIENE1 and Onytė ZDANAVICIUTE
2
1Vilnius University, Čiurlionio 21/27, 03223 Vilnius, Lithuania; Lithuanian Geological Survey, S. Konarskio 35,
03223 Vilnius, Lithuania; [email protected] 2Nature Research Centre Institute of Geology and Geography, T. Ńevčenkos 13, 03223 Vilnius, Lithuania
Introduction
The Early Palaeozoic organic rich Upper Cambrian–Tremadocian black shales (Alum shales) and the
Early Silurian graptolite shales are considered as the most prospective for the shale gas potential in the
Baltic Sea region. While the Alum shales occur mostly in Scandinavia, the Silurian shales are distributed
over the territory of Lithuania. Within the Silurian succession in Lithuania the oil source rocks comprise
the Llandovery, Wenlock and the Early Ludlow shales. In result of recent hydrocarbon exploration
activities, the Silurian succession has been quite intensively studied, but only in terms of conventional
hydrocarbons potential (mostly lithofacies, diagenesis and reservoir properties). For the evaluation of the
shale gas potential the key issues are to predict the volume of gas in place and reservoir qualities of shale
layers. Gas generation potential of gas shales is mostly controlled by the total organic carbon (TOC)
content, type and maturity of the organic matter. In this presentation the results of geochemical studies are
summarized in order to evaluate the shale gas potential.
Methods applied
The analytic studies were performed on selected samples of organic matter dispersed in the clayey-muddy
Silurian deposits. In total 80 core samples from of 20 boreholes from W Lithuania were analyzed.
Vitrinite reflectance data, TOC analysis data, RockEval pyrolisis, determination of the composition of
saturated hydrocarbons by means of gas chromatography (GC) and biomarker analysis by means of gas
chromatography-mass spectrometry (GCMS – 12 samples) has been carried out.
Results and discussion
The Silurian succession is characterized by Llandovery, Wenlock and Ludlow source rocks, composed of
dark grey and black clayey marlstones and shales. The amount of organic matter (OM) within the Early
Silurian rocks varies considerably. In terms of petrography, the OM is dominated by syngenetic,
sapropelic and marine material, together with vitrinite-like particles and abundant faunal remains. Detrital
sapropel is scattered as very fine-grained particles and lenses. Liptinite (up to 20 %) generally occurs
together with dispersed liptodetrinite in sapropelic OM, or more rarely as scattered particles. Well-
preserved fragments of Tasmanites, particularly in sediments of sapropelic origin, were frequently
observed, while sporinite, kutinite and materials, derived from resins and waxes were quite rare
(Zdanavičiūtė & Swadowska, 2002).
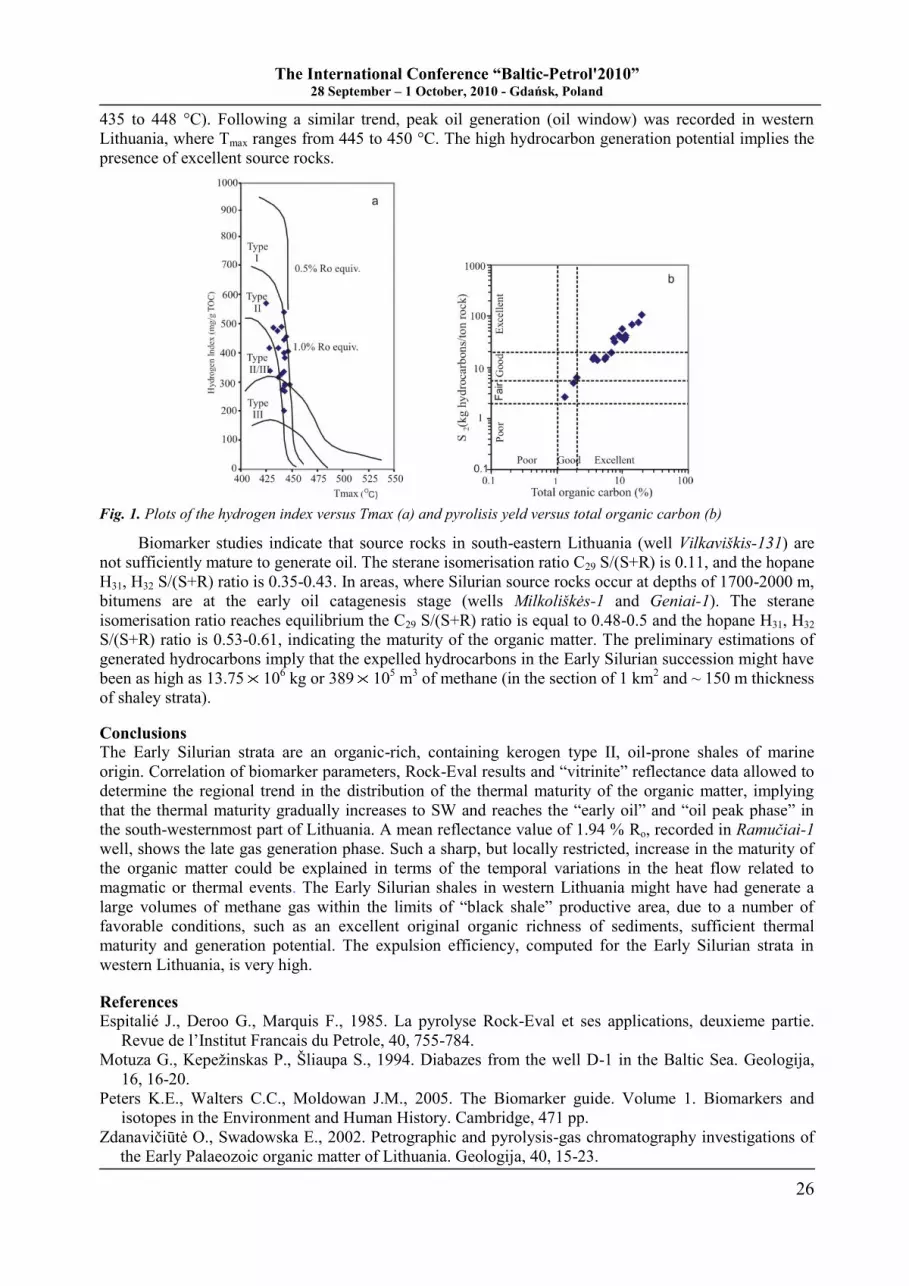
The TOC content in Llandovery, Wenlock and Ludlow sections ranges from 0.7 to 9-11 wt.% (max
16 wt.%). The oil and gas generation potential (based on Rock-Eval S1+S2) of Silurian strata ranges from
7-10 to 57 kg HC/trock, and the Hydrogen Index (HI) ranges from 294 to 571. The organic matter has been
attributed to sapropelic organic matter of Type II kerogen, as classified by Espitalie et al. (1985) (Fig. 1).
Type II kerogen originates from mixed phytoplankton, zooplankton, and bacterial debris usually in
marine sediments (Peters et al., 2005). The reflectance of the “vitrinite-like” macerals in W Lithuania has
been measured, showing the reflectance values varying in a range of 0.7–1.94 % Ro. The reflectance
values implying the thermal maturities beyond the peak of liquid hydrocarbons generation were recorded
in Aukńtupiai-1 (1.0 % Ro), Gorainiai-1 (1.2 % Ro), Vainutas-3 (1.15 % Ro), Rukai-1 (1.01 % Ro) wells.
The measurements from Ramučiai-1 well showed reflectance values of 1.94 % Ro that correspond to the
late gas generation phase. Such a considerably increased value of organic matter maturity can be
explained in terms of magmatic intrusions or the geothermal anomalies, related to the anarogenic granites
(Motuza et al., 2003). Tmax and production index (PI) of the Silurian samples (TOC > 1 %) increase with
depth. Thus, the maturity of the Silurian source rocks increases to the SW, ranging from immature in
eastern Lithuania (Tmax < 435 °C), to early oil phase in central and southern Lithuania (Tmax ranges from
The International Conference “Baltic-Petrol'2010” 28 September – 1 October, 2010 - Gdańsk, Poland
26
435 to 448 °C). Following a similar trend, peak oil generation (oil window) was recorded in western
Lithuania, where Tmax ranges from 445 to 450 °C. The high hydrocarbon generation potential implies the
presence of excellent source rocks.
Fig. 1. Plots of the hydrogen index versus Tmax (a) and pyrolisis yeld versus total organic carbon (b)
Biomarker studies indicate that source rocks in south-eastern Lithuania (well Vilkavińkis-131) are
not sufficiently mature to generate oil. The sterane isomerisation ratio C29 S/(S+R) is 0.11, and the hopane
H31, H32 S/(S+R) ratio is 0.35-0.43. In areas, where Silurian source rocks occur at depths of 1700-2000 m,
bitumens are at the early oil catagenesis stage (wells Milkolińkės-1 and Geniai-1). The sterane
isomerisation ratio reaches equilibrium the C29 S/(S+R) ratio is equal to 0.48-0.5 and the hopane H31, H32
S/(S+R) ratio is 0.53-0.61, indicating the maturity of the organic matter. The preliminary estimations of
generated hydrocarbons imply that the expelled hydrocarbons in the Early Silurian succession might have
been as high as 13.75 106 kg or 389 10
5 m
3 of methane (in the section of 1 km
2 and ~ 150 m thickness
of shaley strata).
Conclusions
The Early Silurian strata are an organic-rich, containing kerogen type II, oil-prone shales of marine
origin. Correlation of biomarker parameters, Rock-Eval results and “vitrinite” reflectance data allowed to
determine the regional trend in the distribution of the thermal maturity of the organic matter, implying
that the thermal maturity gradually increases to SW and reaches the “early oil” and “oil peak phase” in
the south-westernmost part of Lithuania. A mean reflectance value of 1.94 % Ro, recorded in Ramučiai-1
well, shows the late gas generation phase. Such a sharp, but locally restricted, increase in the maturity of
the organic matter could be explained in terms of the temporal variations in the heat flow related to
magmatic or thermal events. The Early Silurian shales in western Lithuania might have had generate a
large volumes of methane gas within the limits of “black shale” productive area, due to a number of
favorable conditions, such as an excellent original organic richness of sediments, sufficient thermal
maturity and generation potential. The expulsion efficiency, computed for the Early Silurian strata in
western Lithuania, is very high.
References
Espitalié J., Deroo G., Marquis F., 1985. La pyrolyse Rock-Eval et ses applications, deuxieme partie.
Revue de l‟Institut Francais du Petrole, 40, 755-784.
Motuza G., Kepežinskas P., Ńliaupa S., 1994. Diabazes from the well D-1 in the Baltic Sea. Geologija,
16, 16-20.
Peters K.E., Walters C.C., Moldowan J.M., 2005. The Biomarker guide. Volume 1. Biomarkers and
isotopes in the Environment and Human History. Cambridge, 471 pp.
Zdanavičiūtė O., Swadowska E., 2002. Petrographic and pyrolysis-gas chromatography investigations of
the Early Palaeozoic organic matter of Lithuania. Geologija, 40, 15-23.
The International Conference “Baltic-Petrol'2010” 28 September – 1 October, 2010 - Gdańsk, Poland
27
HYDROCARBON POTENTIAL OF THE LOWER PALAEOZOIC SEQUENCE
OF THE POLISH BALTIC BASIN
Dariusz WIĘCŁAW1, Maciej J. KOTARBA
1, Paweł KOSAKOWSKI
1, Adam KOWALSKI
1
and Piotr ANOLIK2
1AGH University of Science and Technology, al. Mickiewicza 30, 30-059 Kraków, Poland; [email protected]
2LOTOS Petrobaltic S.A., ul. Stary Dwór 9, 80-958 Gdańsk, Poland
Introduction
The Upper Cambrian-Tremadocian black shale complex is considered as main source rock (e.g. Schleicher et
al., 1998) for oil and gas accumulated in the Middle Cambrian reservoirs. It has 5 to 40 metres thickness and
the total organic carbon (TOC) content up to 12 wt.%. Also Middle Cambrian, Caradocian (Ordovician)
and Llandovery (Silurian) strata are locally enriched in organic matter and considered as source rocks
(e.g. Schleicher et al., 1998). Previous studies in the Polish part of the basin show that the maturity of the
organic matter ranges from the initial phase of the “oil window” (low-temperature thermogenic processes)
to overmature (e.g. Grotek, 2006).
The main objective of our study is to revise previous data and define the petroleum potential of the
Lower Palaeozoic strata of the Polish part of the Baltic Basin. The large number of analysed samples
enables us to locate the levels of the best source-rocks in the Lower Palaeozoic strata.
Samples and methods
A total of 1377 rock samples collected from 38 wells in the onshore and offshore areas of the Polish
part of the Baltic Basin were geochemically examined. The samples range in age from the Lower
Cambrian to uppermost part of the Silurian (Pridoli) Screening pyrolysis analyses were carried on with a
Rock-Eval II instrument equipped with a TOC module. Bitumen were extracted with
dichloromethane:methanol (93:7 v/v) in a SOXTEC™ apparatus. The asphaltene fraction was precipitated
with n-hexane. The remaining maltenes were then separated into saturated hydrocarbons (HC), aromatic
HC and resins by column chromatography. The fractions were eluted with n-hexane, toluene, and
toluene:methanol (1:1 v/v), respectively. Stable carbon isotope analyses of kerogen, bitumen and bitumen
fractions were performed using a Finnigan Delta Plus mass spectrometer. Biomarker distributions were
determined by analyzing the maltene fractions on a computerized GC-mass spectrometer (MS) system
using a Hewlett Packard 6890 GC directly coupled to a JEOL GC-Mate magnetic sector MS. The
aromatic hydrocarbon fraction of the extracted bitumen were analysed by a Hewlett Packard type 5890
Series II GC equipped with FID. The uranium and thorium contents in rocks were determined by
instrumental neutron activation analysis (INAA). Measurements of mean random reflectance (Ro) of
vitrinite-like macerals were carried out with a Zeiss-Opton microphotometer at a wave-length of 546 nm,
in oil. Elemental analysis of isolated kerogen (C, H, N and S) was determined with the Carlo Erba EA
1108 elemental analyser.
Results and discussion The best source rocks were found in the Upper Cambrian-Tremadocian complex having total organic
carbon (TOC) content up to ca. 18 wt.%. The initial organic carbon (TOC0) contents were even higher
and reached up to ca. 20 wt.%. The residual hydrocarbon potential is also very high. It ranges usually
from 20 to 50 mg HC/g rock with a maximum of 75 mg HC/g rock. The best source-rocks occur in the
offshore area of the Łeba Block (Fig. 1). The present mean TOC contents in the individual wells is 6.6 to
13.2 wt.% (average 10.3 wt.%). The estimated initial organic carbon content varies from 12 to 20 wt.%
(average 16 wt.%). In the other parts of the study area lower TOC values are noted. They result from the
higher maturity of organic matter and only partially reflect the initial hydrocarbon potential. The
estimated median TOC0 values are also high (6 to 14 wt.%, average 10 wt.%).
Caradocian strata have average thickness of 25 m and can be considered as an additional source of
hydrocarbons. The median TOC content in this source-rock level, varies in the individual wells from 0.5
to 3 wt.%. The median of initial organic carbon contents usually varies from 1 to 2.5 wt.%. The best
source-rocks within this level occur in the offshore area of the Łeba and Żarnowiec blocks. Estimated
The International Conference “Baltic-Petrol'2010” 28 September – 1 October, 2010 - Gdańsk, Poland
28
initial TOC0 values vary from 2 to 6 wt.%. The Llandovery strata have fair and locally good hydrocarbon
potential. Present TOC content reaches locally 10 wt.% and is usually 1 – 2 wt.%. Low hydrocarbon
potential, rarely exceeding 10 mg HC/g rock indicates that these strata only are secondary source of
hydrocarbons. Medians of the estimated initial organic carbon contents in the individual wells usually
vary from 1 to 2 wt.%, locally reaching even 7 wt.% in the Żarnowiec Block. Another possible source of
hydrocarbons are the clayey intercalations within the Middle Cambrian strata. Organic matter content
rarely exceeds 1 wt.%. This is often a result of the high level of the organic matter transformation.
Estimated initial TOC0 values vary in individual wells from 0.5 to 1.7 wt.% indicating a fair initial
hydrocarbon potential of the Middle Cambrian.
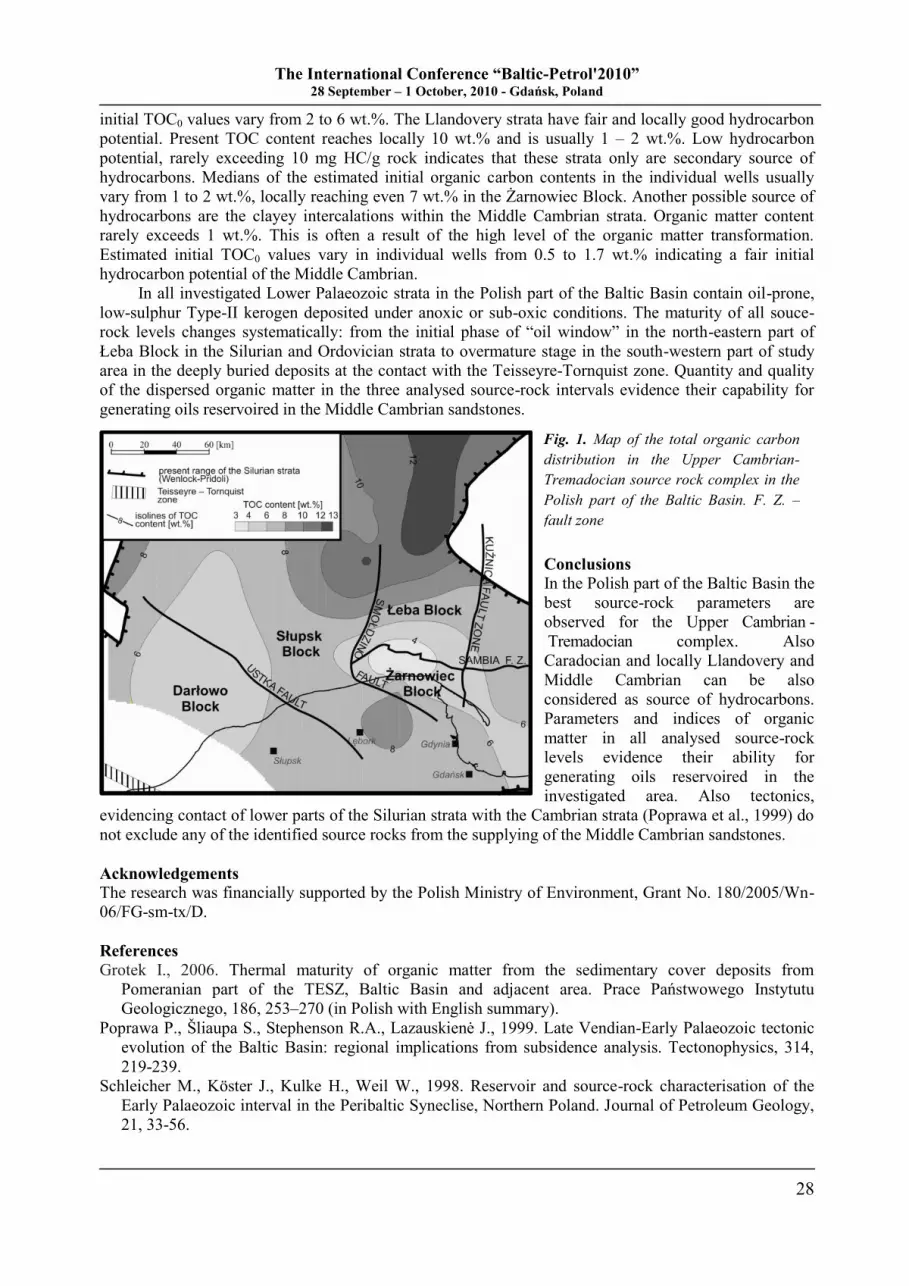
In all investigated Lower Palaeozoic strata in the Polish part of the Baltic Basin contain oil-prone,
low-sulphur Type-II kerogen deposited under anoxic or sub-oxic conditions. The maturity of all souce-
rock levels changes systematically: from the initial phase of “oil window” in the north-eastern part of
Łeba Block in the Silurian and Ordovician strata to overmature stage in the south-western part of study
area in the deeply buried deposits at the contact with the Teisseyre-Tornquist zone. Quantity and quality
of the dispersed organic matter in the three analysed source-rock intervals evidence their capability for
generating oils reservoired in the Middle Cambrian sandstones.
Conclusions
In the Polish part of the Baltic Basin the
best source-rock parameters are
observed for the Upper Cambrian -
Tremadocian complex. Also
Caradocian and locally Llandovery and
Middle Cambrian can be also
considered as source of hydrocarbons.
Parameters and indices of organic
matter in all analysed source-rock
levels evidence their ability for
generating oils reservoired in the
investigated area. Also tectonics,
evidencing contact of lower parts of the Silurian strata with the Cambrian strata (Poprawa et al., 1999) do
not exclude any of the identified source rocks from the supplying of the Middle Cambrian sandstones.
Acknowledgements
The research was financially supported by the Polish Ministry of Environment, Grant No. 180/2005/Wn-
06/FG-sm-tx/D.
References
Grotek I., 2006. Thermal maturity of organic matter from the sedimentary cover deposits from
Pomeranian part of the TESZ, Baltic Basin and adjacent area. Prace Państwowego Instytutu
Geologicznego, 186, 253–270 (in Polish with English summary).
Poprawa P., Ńliaupa S., Stephenson R.A., Lazauskienė J., 1999. Late Vendian-Early Palaeozoic tectonic
evolution of the Baltic Basin: regional implications from subsidence analysis. Tectonophysics, 314,
219-239.
Schleicher M., Köster J., Kulke H., Weil W., 1998. Reservoir and source-rock characterisation of the
Early Palaeozoic interval in the Peribaltic Syneclise, Northern Poland. Journal of Petroleum Geology,
21, 33-56.
Fig. 1. Map of the total organic carbon
distribution in the Upper Cambrian-
Tremadocian source rock complex in the
Polish part of the Baltic Basin. F. Z. –
fault zone
The International Conference “Baltic-Petrol'2010” 28 September – 1 October, 2010 - Gdańsk, Poland
29
SOURCE ROCK EVALUATION OF THE ALUM AND DICTYONEMA SHALES
(UPPER CAMBRIAN–LOWER ORDOVICIAN) IN THE BALTIC AND PODLASIE BASIN
Paweł KOSAKOWSKI1, Maciej J. KOTARBA
1, Alla SHOGENOVA
2 and Dariusz WIĘCŁAW
1
1AGH University of Science and Technology, al. Mickiewicza 30, 30-059 Kraków, Poland; [email protected]
2Institute of Geology, Tallin University of Technology, Ehitajate tee 5, 19086 Tallinn, Estonia
Introduction
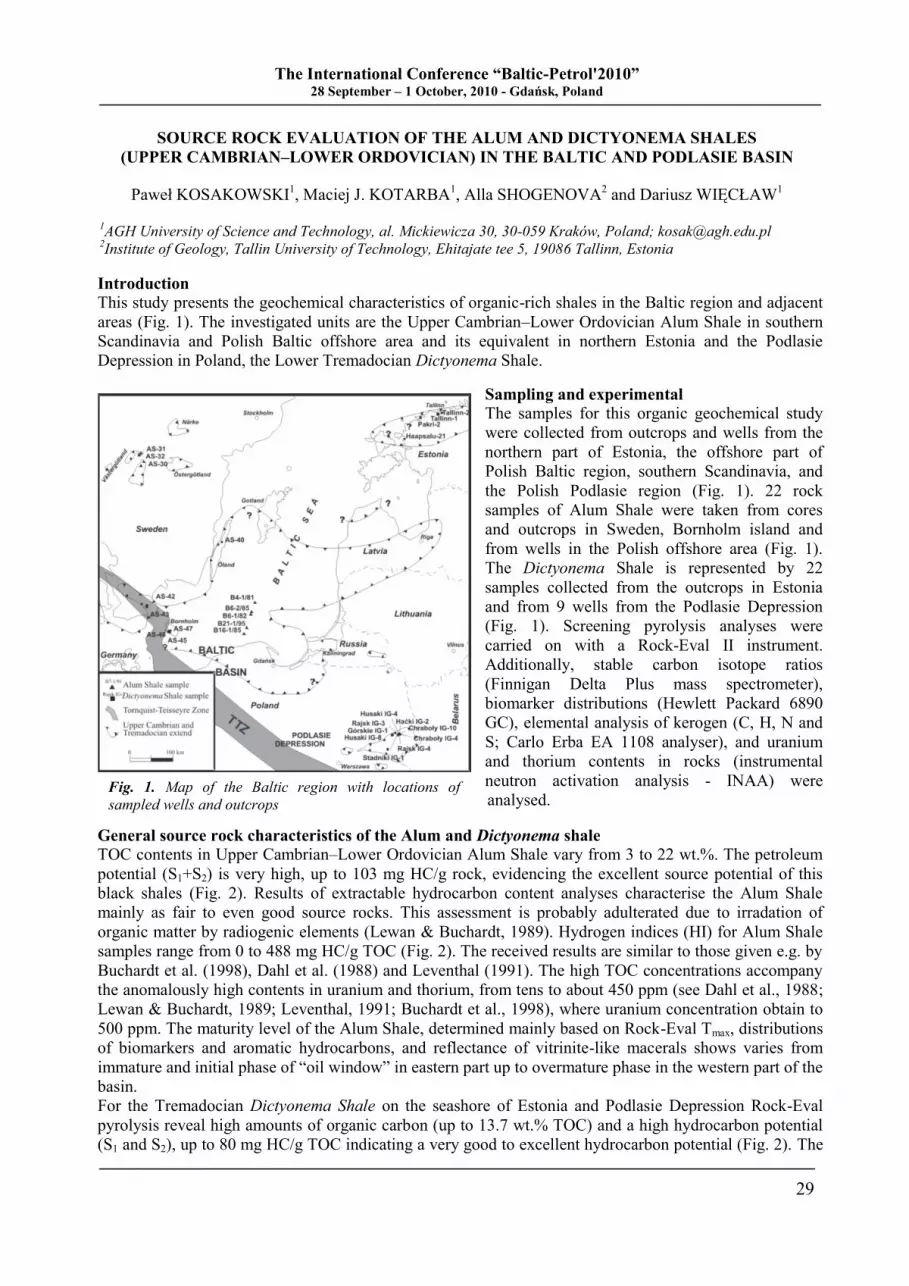
This study presents the geochemical characteristics of organic-rich shales in the Baltic region and adjacent
areas (Fig. 1). The investigated units are the Upper Cambrian–Lower Ordovician Alum Shale in southern
Scandinavia and Polish Baltic offshore area and its equivalent in northern Estonia and the Podlasie
Depression in Poland, the Lower Tremadocian Dictyonema Shale.
Sampling and experimental
The samples for this organic geochemical study
were collected from outcrops and wells from the
northern part of Estonia, the offshore part of
Polish Baltic region, southern Scandinavia, and
the Polish Podlasie region (Fig. 1). 22 rock
samples of Alum Shale were taken from cores
and outcrops in Sweden, Bornholm island and
from wells in the Polish offshore area (Fig. 1).
The Dictyonema Shale is represented by 22
samples collected from the outcrops in Estonia
and from 9 wells from the Podlasie Depression
(Fig. 1). Screening pyrolysis analyses were
carried on with a Rock-Eval II instrument.
Additionally, stable carbon isotope ratios
(Finnigan Delta Plus mass spectrometer),
biomarker distributions (Hewlett Packard 6890
GC), elemental analysis of kerogen (C, H, N and
S; Carlo Erba EA 1108 analyser), and uranium
and thorium contents in rocks (instrumental
neutron activation analysis - INAA) were
analysed.
General source rock characteristics of the Alum and Dictyonema shale
TOC contents in Upper Cambrian–Lower Ordovician Alum Shale vary from 3 to 22 wt.%. The petroleum
potential (S1+S2) is very high, up to 103 mg HC/g rock, evidencing the excellent source potential of this
black shales (Fig. 2). Results of extractable hydrocarbon content analyses characterise the Alum Shale
mainly as fair to even good source rocks. This assessment is probably adulterated due to irradation of
organic matter by radiogenic elements (Lewan & Buchardt, 1989). Hydrogen indices (HI) for Alum Shale
samples range from 0 to 488 mg HC/g TOC (Fig. 2). The received results are similar to those given e.g. by
Buchardt et al. (1998), Dahl et al. (1988) and Leventhal (1991). The high TOC concentrations accompany
the anomalously high contents in uranium and thorium, from tens to about 450 ppm (see Dahl et al., 1988;
Lewan & Buchardt, 1989; Leventhal, 1991; Buchardt et al., 1998), where uranium concentration obtain to
500 ppm. The maturity level of the Alum Shale, determined mainly based on Rock-Eval Tmax, distributions
of biomarkers and aromatic hydrocarbons, and reflectance of vitrinite-like macerals shows varies from
immature and initial phase of “oil window” in eastern part up to overmature phase in the western part of the
basin.
For the Tremadocian Dictyonema Shale on the seashore of Estonia and Podlasie Depression Rock-Eval
pyrolysis reveal high amounts of organic carbon (up to 13.7 wt.% TOC) and a high hydrocarbon potential
(S1 and S2), up to 80 mg HC/g TOC indicating a very good to excellent hydrocarbon potential (Fig. 2). The
Fig. 1. Map of the Baltic region with locations of
sampled wells and outcrops
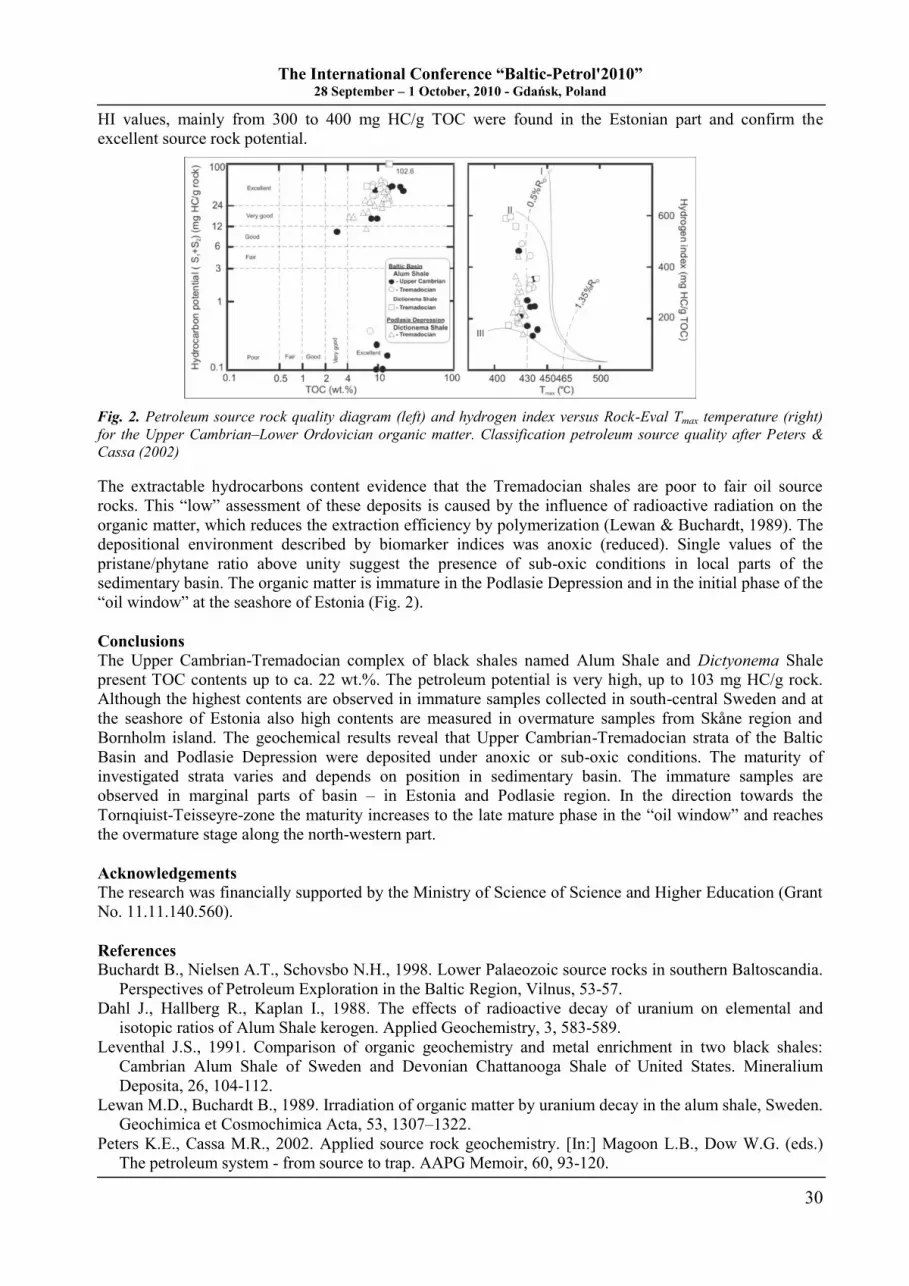
The International Conference “Baltic-Petrol'2010” 28 September – 1 October, 2010 - Gdańsk, Poland
30
HI values, mainly from 300 to 400 mg HC/g TOC were found in the Estonian part and confirm the
excellent source rock potential.
Fig. 2. Petroleum source rock quality diagram (left) and hydrogen index versus Rock-Eval Tmax temperature (right)
for the Upper Cambrian–Lower Ordovician organic matter. Classification petroleum source quality after Peters &
Cassa (2002)
The extractable hydrocarbons content evidence that the Tremadocian shales are poor to fair oil source
rocks. This “low” assessment of these deposits is caused by the influence of radioactive radiation on the
organic matter, which reduces the extraction efficiency by polymerization (Lewan & Buchardt, 1989). The
depositional environment described by biomarker indices was anoxic (reduced). Single values of the
pristane/phytane ratio above unity suggest the presence of sub-oxic conditions in local parts of the
sedimentary basin. The organic matter is immature in the Podlasie Depression and in the initial phase of the
“oil window” at the seashore of Estonia (Fig. 2).
Conclusions
The Upper Cambrian-Tremadocian complex of black shales named Alum Shale and Dictyonema Shale
present TOC contents up to ca. 22 wt.%. The petroleum potential is very high, up to 103 mg HC/g rock.
Although the highest contents are observed in immature samples collected in south-central Sweden and at
the seashore of Estonia also high contents are measured in overmature samples from Skåne region and
Bornholm island. The geochemical results reveal that Upper Cambrian-Tremadocian strata of the Baltic
Basin and Podlasie Depression were deposited under anoxic or sub-oxic conditions. The maturity of
investigated strata varies and depends on position in sedimentary basin. The immature samples are
observed in marginal parts of basin – in Estonia and Podlasie region. In the direction towards the
Tornqiuist-Teisseyre-zone the maturity increases to the late mature phase in the “oil window” and reaches
the overmature stage along the north-western part.
Acknowledgements
The research was financially supported by the Ministry of Science of Science and Higher Education (Grant
No. 11.11.140.560).
References
Buchardt B., Nielsen A.T., Schovsbo N.H., 1998. Lower Palaeozoic source rocks in southern Baltoscandia.
Perspectives of Petroleum Exploration in the Baltic Region, Vilnus, 53-57.
Dahl J., Hallberg R., Kaplan I., 1988. The effects of radioactive decay of uranium on elemental and
isotopic ratios of Alum Shale kerogen. Applied Geochemistry, 3, 583-589.
Leventhal J.S., 1991. Comparison of organic geochemistry and metal enrichment in two black shales:
Cambrian Alum Shale of Sweden and Devonian Chattanooga Shale of United States. Mineralium
Deposita, 26, 104-112.
Lewan M.D., Buchardt B., 1989. Irradiation of organic matter by uranium decay in the alum shale, Sweden.
Geochimica et Cosmochimica Acta, 53, 1307–1322.
Peters K.E., Cassa M.R., 2002. Applied source rock geochemistry. [In:] Magoon L.B., Dow W.G. (eds.)
The petroleum system - from source to trap. AAPG Memoir, 60, 93-120.
The International Conference “Baltic-Petrol'2010” 28 September – 1 October, 2010 - Gdańsk, Poland
31
GEOCHEMISTRY OF OILS AND PETROLEUM POTENTIAL OF THE MIDDLE CAMBRIAN
SUCCESSION IN THE CENTRAL PART OF THE BALTIC BASIN
Onyte ZDANAVICIUTE1, Jurga LAZAUSKIENE
2, Anatoly KHOUBLDIKOV
3
and Marina DAKHNOVA4
1Nature Research Centre Institute of Geology and Geography, Ńevčenkos 13, LT-03223 Vilnius, Lithuania;
[email protected] 2Vilnius University, Čiurlionio 21/27, LT-03223 Vilnius, Lithuania
3Lukoil-Kaliningradmorneft Plc.23 Kievskaya, 236039 Kaliningrad, Russia
4All-Russia Research Geological Oil Institute (VNIGNI) Varshavskoje shose, 36, Moscow, Russia
Introduction
More than 50 years history of petroleum exploration and production is recorded in the southwestern part of
the Baltic Basin that comprises territories of Latvia, Western Lithuania, Russian Kaliningrad district, north-
west Poland and adjacent Baltic offshore areas. The hydrocarbon accumulations have been discovered in
the fractured Precambrian crystalline basement, Cambrian, Ordovician, Silurian and Devonian strata of the
Baltic Basin. Therefore, all producing oil fields in the central part of the Baltic Basin are related to the
Middle Cambrian sandstone reservoirs. Two different petroleum provinces, related to the territories of
Kaliningrad district and Western Lithuania have been selected to illustrate the peculiarities of hydrocarbon
potential in the Baltic Basin. Nowadays 13 oil fields are producing in Lithuania and 37 oil fields were
discovered in Kaliningrad district: 26 of them, including offshore Baltic located local structure D-6
(Kravtsovkoe oil field), are producing now. In total more than 35 million tons of oil have been produced
since the beginning of oil exploitation: i.e.> 30 years in Kaliningrad district and ~ 20 years in Lithuania.
According to the prognoses, this amount comprises less than 25 % of all the prognostic recoverable
resources of oil (150 millions tones), estimated offshore and onshore of the study area (Desiatkov et al.,
2006, Zdanaviciute & Sakalauskas, eds., 2001).
Methods applied
Well, core, well log and seismic data have been used to describe the general structure, occurrence and
composition of the Middle Cambrian succession. The porosity and permeability of core samples also the
physical and chemical properties of the crude oil were studied at the Institute of Geology and Geography
(Vilnius). The detail geochemical studies of oils composition has been carried out in cooperation with
Russian researchers at the Geochemical Centre of the All-Russia Research Geological Oil Institute
(Moscow). The composition of saturated hydrocarbons has been determined applying gas chromatography,
biomarker analysis – gas chromatography-mass spectrometry methods. In total 28 oil samples from the
Western Lithuania and Kaliningrad district has been analyzed.
Results and discussion
The Cambrian oils of the central part of Baltic Basin have a moderate density (790.5–857.8 kg/m3), low or
average amount of asphaltenes (0–4.7 %) and a small amount of sulphur (0.04–0.44 %). Oil viscosity,
amount of sulphur, tars and asphaltenes depend on oil density, thus, are decreasing with depth of the
occurrence. The petrol content is rather high and ranges within the range 12–45 %.
Based on the group hydrocarbons composition, oils have a high amount of saturate hydrocarbons up
to 57–77 %. The highest content of saturate hydrocarbons usually is recorded for oils with lower density.
All studied oil samples contain reduced amount of the aromatic hydrocarbons (16–24 %). The ratio of
saturate and aromatic hydrocarbons varies in a range of 2.0–4.7.
Gas-chromatography analyses of saturate fractions of Cambrian indicate oil composition being
dominated by n-alkanes, with the maxima at C13–C15 and reduced abundance in the range C20–C35. With the
exception of oil from J. Olimpijskoe and Z. Uńakovskoe oil fields (Kaliningrad district), the maxima of n-
alkanes distribution is determined at n-С8–n-C11, also the higher concentration of n-C15 is recorded. The
ratio of odd and even n-alkanes, estimated for C23–C33 n-alkanes is close to unity. The content of
isoprenoides is considerably smaller than that one of n-alkanes, and their ratio is very stable (0.13–0.27).
The pristane and phytane ratio is also very stable and ranges from 2.17 to 2.67. The saturated fractions of
Cambrian oils clearly indicate the tendency of decreasing amount of n-alkanes, varying from 56.09 to 48.60
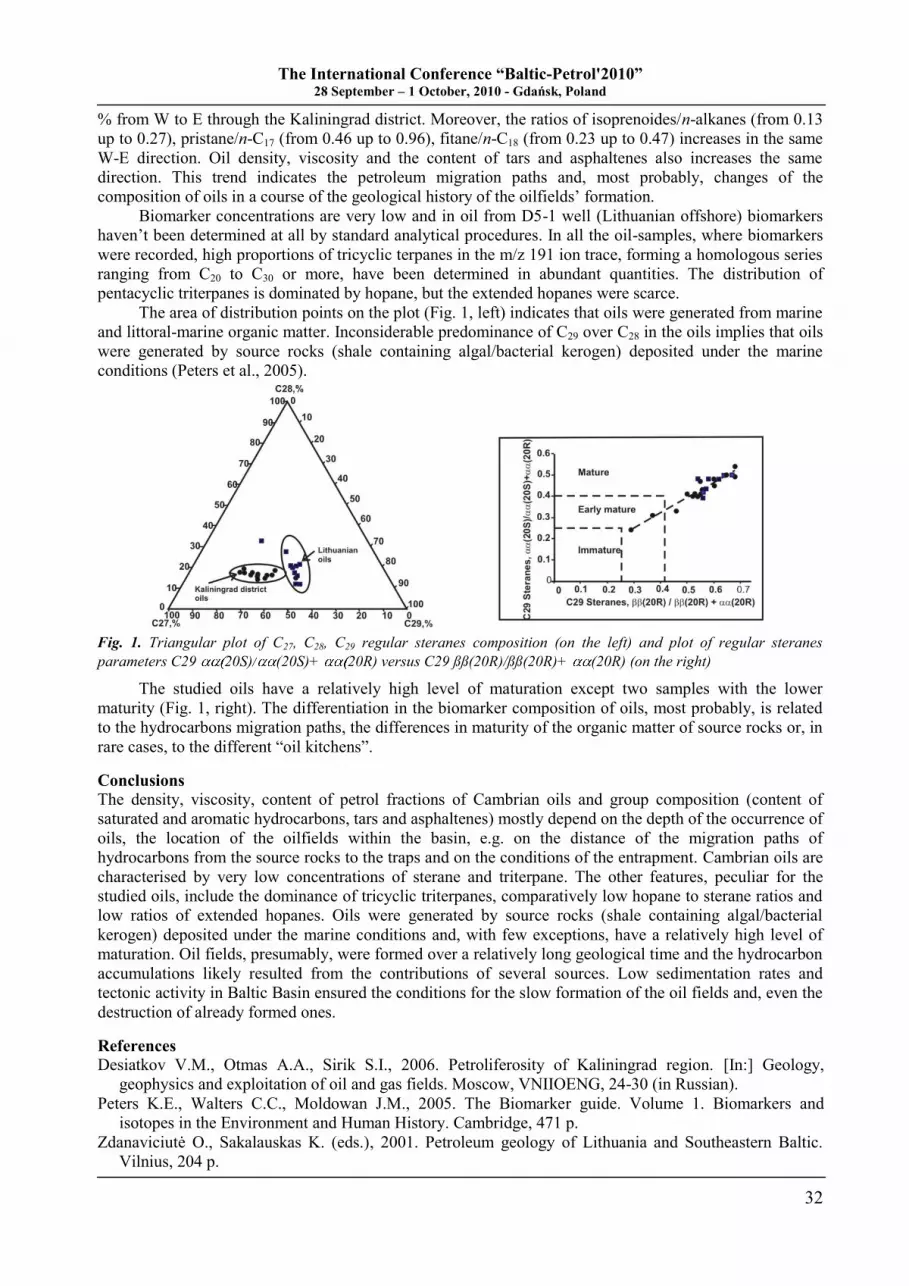
The International Conference “Baltic-Petrol'2010” 28 September – 1 October, 2010 - Gdańsk, Poland
32
% from W to E through the Kaliningrad district. Moreover, the ratios of isoprenoides/n-alkanes (from 0.13
up to 0.27), pristane/n-С17 (from 0.46 up to 0.96), fitane/n-С18 (from 0.23 up to 0.47) increases in the same
W-E direction. Oil density, viscosity and the content of tars and asphaltenes also increases the same
direction. This trend indicates the petroleum migration paths and, most probably, changes of the
composition of oils in a course of the geological history of the oilfields‟ formation.
Biomarker concentrations are very low and in oil from D5-1 well (Lithuanian offshore) biomarkers
haven‟t been determined at all by standard analytical procedures. In all the oil-samples, where biomarkers
were recorded, high proportions of tricyclic terpanes in the m/z 191 ion trace, forming a homologous series
ranging from C20 to C30 or more, have been determined in abundant quantities. The distribution of
pentacyclic triterpanes is dominated by hopane, but the extended hopanes were scarce.
The area of distribution points on the plot (Fig. 1, left) indicates that oils were generated from marine
and littoral-marine organic matter. Inconsiderable predominance of C29 over C28 in the oils implies that oils
were generated by source rocks (shale containing algal/bacterial kerogen) deposited under the marine
conditions (Peters et al., 2005).
Fig. 1. Triangular plot of C27, C28, C29 regular steranes composition (on the left) and plot of regular steranes
parameters C29 20S)/ (20S)+ 20R) versus C29 ßß(20R)/ßß(20R)+ (20R) (on the right)
The studied oils have a relatively high level of maturation except two samples with the lower
maturity (Fig. 1, right). The differentiation in the biomarker composition of oils, most probably, is related
to the hydrocarbons migration paths, the differences in maturity of the organic matter of source rocks or, in
rare cases, to the different “oil kitchens”.
Conclusions
The density, viscosity, content of petrol fractions of Cambrian oils and group composition (content of
saturated and aromatic hydrocarbons, tars and asphaltenes) mostly depend on the depth of the occurrence of
oils, the location of the oilfields within the basin, e.g. on the distance of the migration paths of
hydrocarbons from the source rocks to the traps and on the conditions of the entrapment. Cambrian oils are
characterised by very low concentrations of sterane and triterpane. The other features, peculiar for the
studied oils, include the dominance of tricyclic triterpanes, comparatively low hopane to sterane ratios and
low ratios of extended hopanes. Oils were generated by source rocks (shale containing algal/bacterial
kerogen) deposited under the marine conditions and, with few exceptions, have a relatively high level of
maturation. Oil fields, presumably, were formed over a relatively long geological time and the hydrocarbon
accumulations likely resulted from the contributions of several sources. Low sedimentation rates and
tectonic activity in Baltic Basin ensured the conditions for the slow formation of the oil fields and, even the
destruction of already formed ones.
References
Desiatkov V.M., Otmas A.A., Sirik S.I., 2006. Petroliferosity of Kaliningrad region. [In:] Geology,
geophysics and exploitation of oil and gas fields. Moscow, VNIIOENG, 24-30 (in Russian).
Peters K.E., Walters C.C., Moldowan J.M., 2005. The Biomarker guide. Volume 1. Biomarkers and
isotopes in the Environment and Human History. Cambridge, 471 p.
Zdanaviciutė O., Sakalauskas K. (eds.), 2001. Petroleum geology of Lithuania and Southeastern Baltic.
Vilnius, 204 p.
The International Conference “Baltic-Petrol'2010” 28 September – 1 October, 2010 - Gdańsk, Poland
33
COMPARISON OF OILS ACCUMULATED IN THE POLISH BALTIC BASIN
WITH HYDROUS PYROLYSIS OILS EXPELLED FROM THE CAMBRIAN
AND ORDOVICIAN ROCKS
Dariusz WIĘCŁAW1, Maciej J. KOTARBA
1, Michael D. LEWAN
2 and Alicja KARCZEWSKA
3
1AGH University of Science and Technology, al. Mickiewicza 30, 30-059 Kraków, Poland; [email protected]
2U.S. Geological Survey, P.O. Box 25046, MS 977, Federal Center, Denver, CO 80225, USA
3LOTOS Petrobaltic S.A., ul. Stary Dwór 9, 80-958 Gdańsk, Poland
Introduction
In the 1970s four small oil accumulations (Żarnowiec, Żarnowiec W, Dębki and Białogóra) have been discovered
in the Polish onshore area and oil shows in the Malbork IG 1 well have been reported. The first offshore oil was
discovered in 1981 (B3 structure). Apart from this, oil deposits (B6, B8, B16, B24 and B34 structures) and
gas-condensate deposits (B4, B6, B16 and B21 structures) were discovered (e.g. Domżalski et al., 2004).
All discovered on- and offshore oil and gas accumulations are in the Paradoxides paradoxissimus zone of
the Middle Cambrian sandstones. Total reserves of discovered accumulations reach 10 Gm3 of gas and ca.
30 Mt of oil. The undiscovered hydrocarbons in the Polish Exclusive Economic Zone are estimated at ca.
100 Gm3 of gas and several hundred-million metric tonnes of oil (Domżalski et al., 2004).
The main purpose of the present study is characterisation of oils reservoired in the Polish part of the
Baltic Basin, identify of their source rocks, maturity, migration distance, and secondary alteration processes
based on results of geochemical analyses of crude oils as well as immiscible oils generated during hydrous
pyrolysis (HP) experiments from Upper Cambrian-Tremadocian source rocks.
Samples and methods
16 crude oil samples were collected from onshore wells (7 samples) and offshore wells (9 samples).
Oils were analysed for API gravity according to the Polish standard PN-90/C-04004 and for sulphur
content with a Leco SR-12 analyser. The whole oil GC analysis was made on a Hewlett Packard 5890
series II apparatus coupled with FID. Before the deasphalting, they were topped under nitrogen (5 hrs) at a
temperature of 60 °C. The asphaltene fraction was precipitated with n-hexane. The remaining maltenes
were then separated into saturated HC, aromatic HC and resins by column chromatography. The fractions
were eluted with n-hexane, toluene, and toluene:methanol (1:1 v/v), respectively. Stable carbon isotope
analyses of oils and their fraction were performed using a Finnigan Delta Plus mass spectrometer.
Biomarker distributions were determined by analyzing the maltene fraction on a computerized GC-mass
spectrometer (MS) system using a Hewlett Packard 6890 GC directly interfaced to a JEOL GC-Mate
magnetic sector MS. The aromatic hydrocarbon fraction was analysed by a Hewlett Packard type 5890
Series II GC equipped with FID.
Hydrous pyrolysis experiments were conducted for one sample of Upper Cambrian and two samples
of Tremadocian source rocks. The immiscible oils generated during HP experiments were analyzed
identically as crude oils but without topping before fractionation. The uranium and thorium contents in
rocks were determined by instrumental neutron activation analysis (INAA).
Results and discussion Oil accumulations in the Middle Cambrian sandstones in the Polish Baltic Basin have very similar
geochemical characteristics and were generated from probably the same source rock. They are typical
normal oils with maximum intensities at n-C6H14 – n-C7H16 hydrocarbons. Evaporative fractionation and
biodegradation processes were evidenced only in oil collected from B4-N1/01 well. The low content of 3-
and 4-methyldiamantanes evidence the absence of thermal cracking processes. A low density below 0.82
g/cm3 and very low sulphur content below 0.3 wt.% suggest their source rock contains low-sulphur kerogen
deposited in claystones and mudstones.
The analysed oils have very low contents of asphaltenes, usually below 0.2 wt.% and high values
of the saturated hydrocarbons to aromatic hydrocarbons ratio (usually above 9), evidencing their long way
of migration. Oils from Żarnowiec and B16 deposits probably migrated on the longest distance.

The International Conference “Baltic-Petrol'2010” 28 September – 1 October, 2010 - Gdańsk, Poland
34
The marine origin (Type-II kerogen) of organic matter dispersed in clastic source rocks of the
analysed oils is supported by the distribution of n-alkanes, isoprenoids, steranes, diasteranes, and tricyclic
and tetracyclic terpanes (Fig. 1). The stable carbon isotope composition confirms the suggestions based on
biomarkers and identifies one genetic type of source organic matter of algal origin. Thermal maturity
biomarker indices show that oils accumulated in the Polish Baltic Basin were generated in the middle phase
of the “oil window”. Distribution of methylphenanterenes evidence their generation at maturities from ca.
0.75 to ca. 1.05 % in the Ro scale. The lowest mature oils are accumulated in B3 and B4 deposits and the
highest – in B6, B16, Dębki and Żarnowiec deposits.
Oils generated during HP experiments from the Upper
Cambrian and Tremadocian source rocks have
comparable characteristics to crude oils. They contain
also low content of sulphur, suggesting presence of low-
sulphur kerogen in the sampled source rock. Stable
carbon isotope composition of HP oils slightly differs
from crude oils what is probably caused by irradiation
from radioactive elements present sometimes in
significant concentrations in Upper Cambrian-
Tremadocian source rocks (Lewan & Buchardt, 1989).
Presence of U and Th in rock probably induced also
thermal cracking of the oils generated during HP
experiments evidenced by the high concentrations of
diamandoids in these oils. Values of n-alkane and
isoprenoid indices and biomarkers ratios generally do not
differ for crude oils and immiscible oils generated during
HP experiments (Fig. 1).
Maturity indices of HP immiscible oils show comparable
values to crude oils and evidence their generation at peak
and late stages of oil window.
Conclusions
The presented study on crude oils and oils generated from potential source rocks during HP experiments
evidence the usefulness of these investigations in oil-source rock correlations. All the crude oils have
similar parameters and indices which suggests a generation from one common source. The secondary
processes were affirmed only in oil collected from B4-N1/01 well. The analysed crude oils were generated
from an algal organic matter deposited in a clastic environment. Maturity of the analysed oils varies, from
ca. 0.75 to ca. 1.05 % in the vitrinite reflectance scale. Immiscible oils generated during HP experiments
are similar to the crude oils. The presented study shows a good genetic correlation of organic matter
dispersed in Upper Cambrian-Tremadocian source rocks and crude oils trapped in the reservoirs of the
Polish Baltic Basin.
Acknowledgements
This research was financially supported by the Polish Ministry of Environment grant No. 180/2005/Wn-
06/FG-sm-tx/D.
References
Domżalski J., Górecki W., Mazurek A., Myśko A., Strzetelski W., Szamałek K., 2004. The prospects for
petroleum exploration in the eastern sector of Southern Baltic as revealed by sea bottom geochemical
survey correlated with seismic data. Geological Review, 52, 792-799.
Lewan M.D., Buchardt B., 1989. Irradiation of organic matter by uranium decay in the Alum Shale,
Sweden. Geochimica et Cosmochimica Acta, 53, 1307-1322.
Obermajer M., Fowler M.G., Snowdon L.R., 1999. Depositional environment and oil generation in
Ordovician source rocks from southwestern Ontario, Canada: organic geochemical and petrological
approach. AAPG Bulletin, 83, 1426-1453.
Fig. 1. Genetic characterization of crude and
immiscible oils generated during HP experiments
in terms of pristane/n-C17 and phytane/n-C18
according to the categories of Obermajer et al.
(1999)
The International Conference “Baltic-Petrol'2010” 28 September – 1 October, 2010 - Gdańsk, Poland
35
COMPARISON OF NATURAL AND HYDROUS PYROLYSIS GASES
(LOWER PALAEOZOIC SEQUENCE, POLISH BALTIC BASIN)
Maciej J. KOTARBA1 and Michael D. LEWAN
2
1AGH University of Science and Technology, al. Mickiewicza 30, 30-059 Kraków, Poland; [email protected]
2US Geological Survey, P.O. Box 25046, MS 977, Federal Center, Denver, CO 80225, USA
Introduction
In the onshore part of the Polish Baltic Basin, a small Żarnowiec oil accumulation was first
discovered in 1970. Later, in this area three small accumulations of oil at Dębki in 1971 and Białogóra in
1991, and gas-condensate at Żarnowiec-West in 1987 were discovered. In the offshore part of the Polish
Baltic Basin, three oil accumulations at B3 in 1981, B8 in 1983, and B24 in 1996, and four gas-condensate
accumulations at B4 in 1991, B6 in 1982, B16 in 1985, and B21 in 1996 were discovered in Middle
Cambrian sandstone reservoirs. The Upper Cambrian-Tremadocian (Lower Ordovician) strata contain the
best source-rocks with low-organic sulphur, oil-prone Type-II kerogen and are considered to the most
likely source of these offshore petroleum accumulations (Więcław et al., 2010). The objective of this study
is to determine the origin of the hydrocarbon gases dissolved in oil and in gas-condensate accumulations of
Middle Cambrian sandstone reservoirs of the Polish Baltic Basin. The study involves molecular and stable-
isotope characterization of natural gases and gases generated from Upper Cambrian-Ordovician source
rocks by hydrous pyrolysis method.
Samples and methods
Hydrous pyrolysis (HP) experiments were conducted at time 72 h and temperatures 330 °C and
355 °C for five thermally immature samples representing Upper Cambrian (1 sample) and Tremadocian
shales (3 samples) and Upper Ordovician kukersite (1 sample). Three core samples are from offshore wells
(B4-N1, B6-2 and B7-1) in the Polish sector of the Baltic Sea and two samples from Pakri outcrop (Pa-1)
and Kivioli kukersite (Ki-B) open-pit in Estonia. Details of HP procedure are described by Lewan (1993)
and Kotarba et al. (2009). Thirteen natural gas samples were collected from Middle Cambrian sandstones
in the Polish Baltic region. Six of the samples are from offshore wells (B3-4, B3-6, B3-7, B3-9 and two
intervals in B7-1), and seven samples are from onshore wells (Bg 3, Db 2, Db 5K, Db 7K, Mb IG 1 and
two intervals in Zn 7 wells). Molecular compositions of the gases (C1 to C6 saturated and unsaturated
hydrocarbons, H2S, CO2, O2, H2, N2, He and Ar) were analysed by a set of columns on Hewlett Packard
6890 and 5890 Series II and Chrom 5 gas chromatographs. Stable carbon isotope analyses of methane,
ethane, propane, butanes, pentanes and carbon dioxide, stable hydrogen isotope analyses of methane and
stable nitrogen isotope analyses of gaseous nitrogen were performed using Finnigan Delta Plus and
Micromass VG Optima mass spectrometers.
Discussion and conclusions
Results of the investigation indicate that there exist distinct δ13
C signatures but non-distinct
molecular compositions of gases generated by hydrous pyrolysis of representative Upper Cambrian-
Tremadocian complex containing Type-II kerogen. In particular, the trend between δ13
C of methane,
ethane, propane, butanes and pentanes and their reciprocal carbon number is not always linear as prescribed
by some investigators. Instead, a “dog-leg” trend may exist and shift in δ13
C with the δ13
C of the source
rock kerogen (Fig. 1). The Type-II trend is based on the average δ13
C value (-29.0 ± 1.02 ‰) of kerogen
from the Upper Cambrian-Tremadocian source rock complex (Więcław et al., 2010). Experimental
determining this trend and establishing how it changes during petroleum generation provides a correlation
parameter that can help assess thermogenic gas end members and microbial gas input in natural gases. This
approach cannot account for the isotopic changes. Natural gas may incur during migration and in-reservoir
alterations, but it does provide an isotopic signature of the primary gas generated from a source rock at pre-
oil-cracking thermal maturities (Kotarba et al., 2009).
Isotopic characterization of natural hydrocarbon gases accumulated in the Middle Cambrian
sandstone reservoirs as compared to hydrous pyrolysis gases in the Polish Baltic Basin revealed that
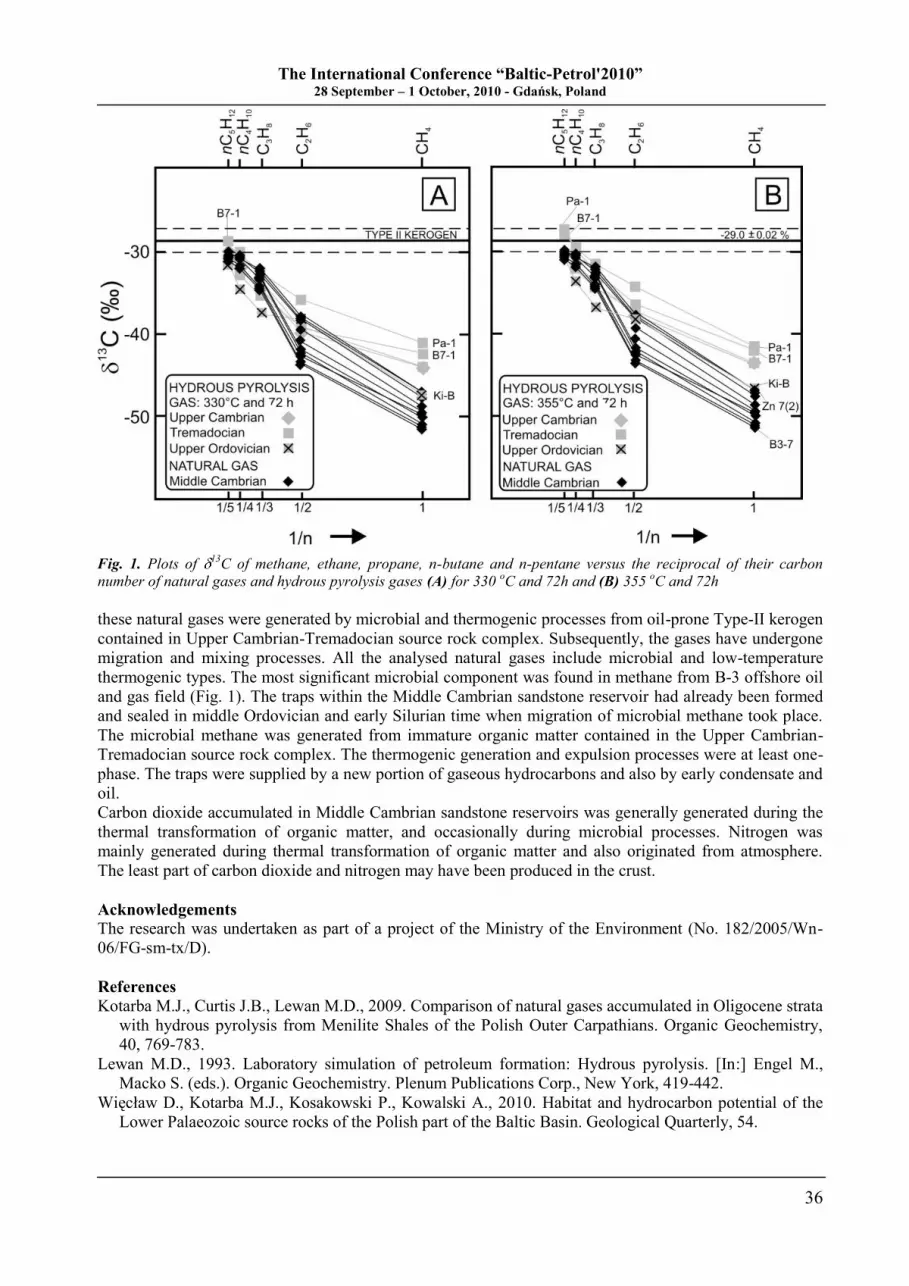
The International Conference “Baltic-Petrol'2010” 28 September – 1 October, 2010 - Gdańsk, Poland
36
Fig. 1. Plots of 13
C of methane, ethane, propane, n-butane and n-pentane versus the reciprocal of their carbon
number of natural gases and hydrous pyrolysis gases (A) for 330 oC and 72h and (B) 355
oC and 72h
these natural gases were generated by microbial and thermogenic processes from oil-prone Type-II kerogen
contained in Upper Cambrian-Tremadocian source rock complex. Subsequently, the gases have undergone
migration and mixing processes. All the analysed natural gases include microbial and low-temperature
thermogenic types. The most significant microbial component was found in methane from B-3 offshore oil
and gas field (Fig. 1). The traps within the Middle Cambrian sandstone reservoir had already been formed
and sealed in middle Ordovician and early Silurian time when migration of microbial methane took place.
The microbial methane was generated from immature organic matter contained in the Upper Cambrian-
Tremadocian source rock complex. The thermogenic generation and expulsion processes were at least one-
phase. The traps were supplied by a new portion of gaseous hydrocarbons and also by early condensate and
oil.
Carbon dioxide accumulated in Middle Cambrian sandstone reservoirs was generally generated during the
thermal transformation of organic matter, and occasionally during microbial processes. Nitrogen was
mainly generated during thermal transformation of organic matter and also originated from atmosphere.
The least part of carbon dioxide and nitrogen may have been produced in the crust.
Acknowledgements
The research was undertaken as part of a project of the Ministry of the Environment (No. 182/2005/Wn-
06/FG-sm-tx/D).
References
Kotarba M.J., Curtis J.B., Lewan M.D., 2009. Comparison of natural gases accumulated in Oligocene strata
with hydrous pyrolysis from Menilite Shales of the Polish Outer Carpathians. Organic Geochemistry,
40, 769-783.
Lewan M.D., 1993. Laboratory simulation of petroleum formation: Hydrous pyrolysis. [In:] Engel M.,
Macko S. (eds.). Organic Geochemistry. Plenum Publications Corp., New York, 419-442.
Więcław D., Kotarba M.J., Kosakowski P., Kowalski A., 2010. Habitat and hydrocarbon potential of the
Lower Palaeozoic source rocks of the Polish part of the Baltic Basin. Geological Quarterly, 54.
The International Conference “Baltic-Petrol'2010” 28 September – 1 October, 2010 - Gdańsk, Poland
37
SEPTEMBER 30 (THURSDAY, MORNING)
THERMAL HISTORY AND PETROLEUM MODELLING SESSION
In Chair: Jorgen A. BOJESEN-KOEFOED (Denmark) and Paweł KARNKOWSKI (Poland)
08:30 Thermal History of the Lower Palaeozoic Sediments of the Baltic Basin and the Baltic
Shield Based on XRD and K-Ar of Illite-Smectite
Jan ŚRODOŃ, Norbert CLAUER, Warren HUFF, Teresa DUDEK and Michał BANAŚ
08:50 Burial and Thermal History of the Baltic Basin – Constraints from 1-D Maturity Modelling
Paweł POPRAWA, Paweł KOSAKOWSKI and Izabella GROTEK
09:10 Estimation of Kinetic Parameters for Cambrian and Ordovician Kerogen of the Baltic
Region: Hydrous Pyrolysis and Organic Sulphur Approach
Dariusz WIĘCŁAW, Michael D. LEWAN and Maciej J. KOTARBA
09:30 1-D Modelling of Petroleum Processes for the Lower Palaeozoic Source Rocks in
the Polish Baltic Basin
Paweł KOSAKOWSKI, Magdalena WRÓBEL, Paweł POPRAWA and Leszek PIKULSKI
09:50 Expulsion, Migration and Accumulation Processes in the Lower Palaeozoic Strata of
the Polish Baltic Basin (2-D modelling)
Magdalena WRÓBEL, Paweł KOSAKOWSKI and Eugeniusz ŻURAWSKI
10:10 – 10:50 Coffee break
RESERVOIR AND GEOLOGY SESSION
In Chair: Henrik CARLSEN (Norway) and Jan ŚRODOŃ (Poland)
10:50 A Pore Space Development of the Cambrian Sandstones and Their Transport System of
Reservoir Fluids
Alicja KARCZEWSKA, Grzegorz LEŚNIAK, Piotr SUCH and Eugeniusz ŻURAWSKI
11:10 Parameters Controlling Regional and Local Variations of Quartz Cementation
of Cambrian Sandstones of the Baltic Basin
Saulius SLIAUPA and Nicolaas MOLENAAR
11:30 AVO Inversion - A Suitable Tool for Seismic Reservoir Characterization in the Ancient
Reservoirs of the Baltic Syneclise?
Sabine KLARNER, Olga ZABRODOTSKAYA, Jolanta ZIELIŃSKA-PIKULSKA
and Edyta NOWAK-KOSZLA
11:50 B8 Crude Oil Field Development - Concept and Basic Design Assumption
Krzysztof BOROWIEC, Piotr ANOLIK, Barbara ZARĘBSKA and Artur SOWIŃSKI
12:10 The Geological Image within the Area of Polish Economical Zone of the Baltic Sea
Anna BRZYSKA and Aneta KUBALA
12:30 Field Multiphase Measurement - Nearest Future on the Baltic Sea Production Plans
Artur WÓJCIKOWSKI
12:50 – 14:20 Lunch

The International Conference “Baltic-Petrol'2010” 28 September – 1 October, 2010 - Gdańsk, Poland
38
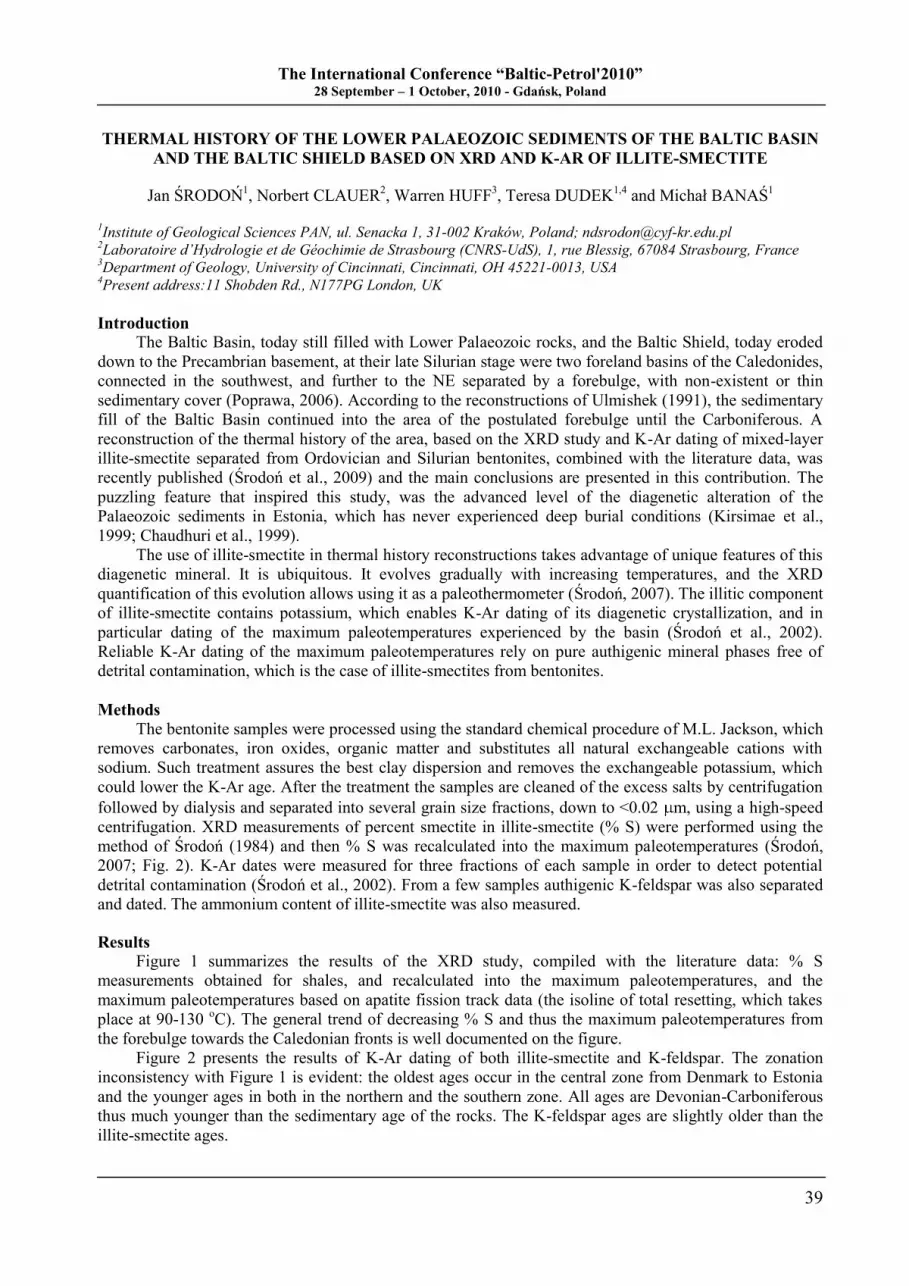
The International Conference “Baltic-Petrol'2010” 28 September – 1 October, 2010 - Gdańsk, Poland
39
THERMAL HISTORY OF THE LOWER PALAEOZOIC SEDIMENTS OF THE BALTIC BASIN
AND THE BALTIC SHIELD BASED ON XRD AND K-AR OF ILLITE-SMECTITE
Jan ŚRODOŃ1, Norbert CLAUER
2, Warren HUFF
3, Teresa DUDEK
1,4 and Michał BANAŚ
1
1Institute of Geological Sciences PAN, ul. Senacka 1, 31-002 Kraków, Poland; [email protected]
2Laboratoire d’Hydrologie et de Géochimie de Strasbourg (CNRS-UdS), 1, rue Blessig, 67084 Strasbourg, France
3Department of Geology, University of Cincinnati, Cincinnati, OH 45221-0013, USA
4Present address:11 Shobden Rd., N177PG London, UK
Introduction
The Baltic Basin, today still filled with Lower Palaeozoic rocks, and the Baltic Shield, today eroded
down to the Precambrian basement, at their late Silurian stage were two foreland basins of the Caledonides,
connected in the southwest, and further to the NE separated by a forebulge, with non-existent or thin
sedimentary cover (Poprawa, 2006). According to the reconstructions of Ulmishek (1991), the sedimentary
fill of the Baltic Basin continued into the area of the postulated forebulge until the Carboniferous. A
reconstruction of the thermal history of the area, based on the XRD study and K-Ar dating of mixed-layer
illite-smectite separated from Ordovician and Silurian bentonites, combined with the literature data, was
recently published (Środoń et al., 2009) and the main conclusions are presented in this contribution. The
puzzling feature that inspired this study, was the advanced level of the diagenetic alteration of the
Palaeozoic sediments in Estonia, which has never experienced deep burial conditions (Kirsimae et al.,
1999; Chaudhuri et al., 1999).
The use of illite-smectite in thermal history reconstructions takes advantage of unique features of this
diagenetic mineral. It is ubiquitous. It evolves gradually with increasing temperatures, and the XRD
quantification of this evolution allows using it as a paleothermometer (Środoń, 2007). The illitic component
of illite-smectite contains potassium, which enables K-Ar dating of its diagenetic crystallization, and in
particular dating of the maximum paleotemperatures experienced by the basin (Środoń et al., 2002).
Reliable K-Ar dating of the maximum paleotemperatures rely on pure authigenic mineral phases free of
detrital contamination, which is the case of illite-smectites from bentonites.
Methods
The bentonite samples were processed using the standard chemical procedure of M.L. Jackson, which
removes carbonates, iron oxides, organic matter and substitutes all natural exchangeable cations with
sodium. Such treatment assures the best clay dispersion and removes the exchangeable potassium, which
could lower the K-Ar age. After the treatment the samples are cleaned of the excess salts by centrifugation
followed by dialysis and separated into several grain size fractions, down to <0.02 m, using a high-speed
centrifugation. XRD measurements of percent smectite in illite-smectite (% S) were performed using the
method of Środoń (1984) and then % S was recalculated into the maximum paleotemperatures (Środoń,
2007; Fig. 2). K-Ar dates were measured for three fractions of each sample in order to detect potential
detrital contamination (Środoń et al., 2002). From a few samples authigenic K-feldspar was also separated
and dated. The ammonium content of illite-smectite was also measured.
Results
Figure 1 summarizes the results of the XRD study, compiled with the literature data: % S
measurements obtained for shales, and recalculated into the maximum paleotemperatures, and the
maximum paleotemperatures based on apatite fission track data (the isoline of total resetting, which takes
place at 90-130 oC). The general trend of decreasing % S and thus the maximum paleotemperatures from
the forebulge towards the Caledonian fronts is well documented on the figure.
Figure 2 presents the results of K-Ar dating of both illite-smectite and K-feldspar. The zonation
inconsistency with Figure 1 is evident: the oldest ages occur in the central zone from Denmark to Estonia
and the younger ages in both in the northern and the southern zone. All ages are Devonian-Carboniferous
thus much younger than the sedimentary age of the rocks. The K-feldspar ages are slightly older than the
illite-smectite ages.
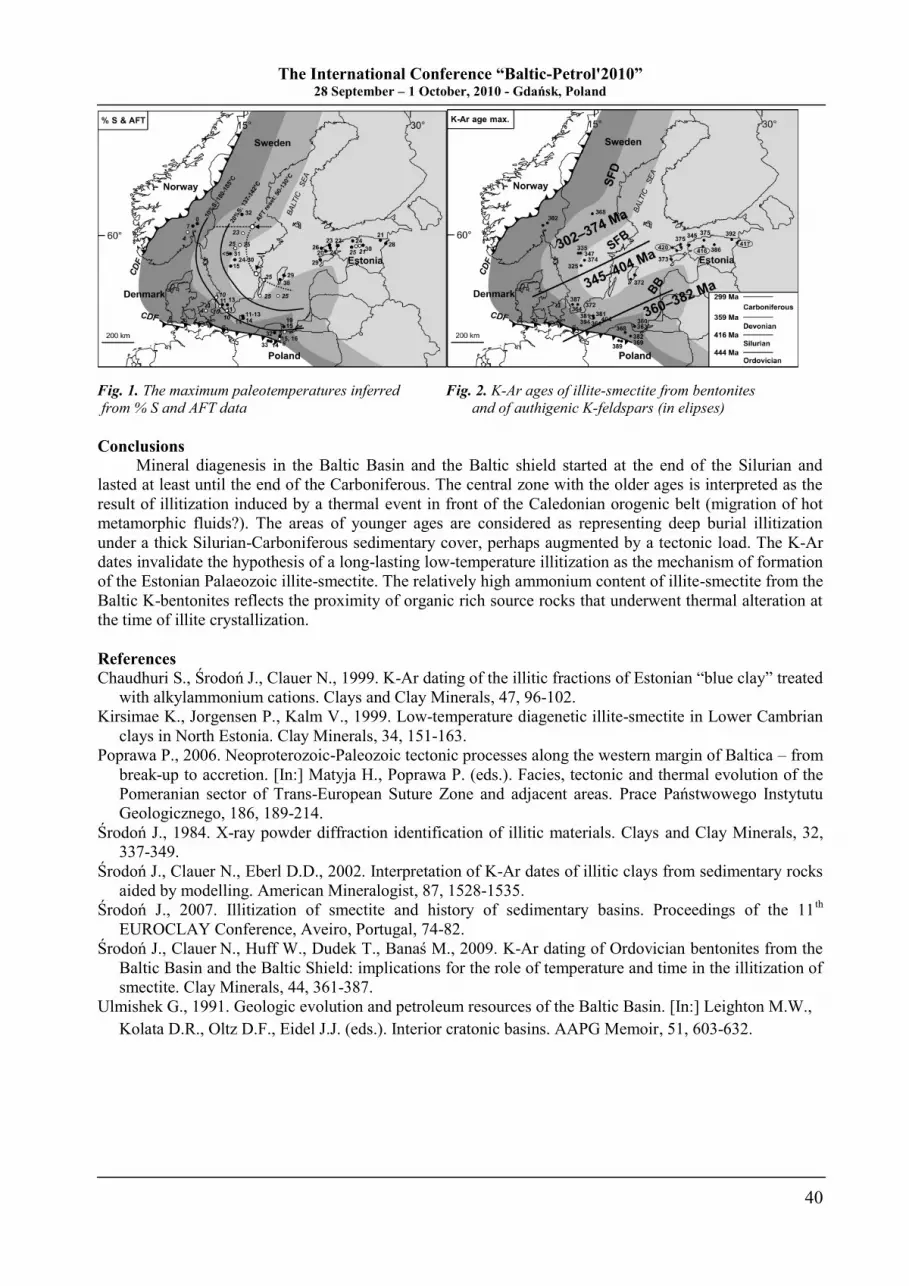
The International Conference “Baltic-Petrol'2010” 28 September – 1 October, 2010 - Gdańsk, Poland
40
Fig. 1. The maximum paleotemperatures inferred Fig. 2. K-Ar ages of illite-smectite from bentonites
from % S and AFT data and of authigenic K-feldspars (in elipses)
Conclusions
Mineral diagenesis in the Baltic Basin and the Baltic shield started at the end of the Silurian and
lasted at least until the end of the Carboniferous. The central zone with the older ages is interpreted as the
result of illitization induced by a thermal event in front of the Caledonian orogenic belt (migration of hot
metamorphic fluids?). The areas of younger ages are considered as representing deep burial illitization
under a thick Silurian-Carboniferous sedimentary cover, perhaps augmented by a tectonic load. The K-Ar
dates invalidate the hypothesis of a long-lasting low-temperature illitization as the mechanism of formation
of the Estonian Palaeozoic illite-smectite. The relatively high ammonium content of illite-smectite from the
Baltic K-bentonites reflects the proximity of organic rich source rocks that underwent thermal alteration at
the time of illite crystallization.
References
Chaudhuri S., Środoń J., Clauer N., 1999. K-Ar dating of the illitic fractions of Estonian “blue clay” treated
with alkylammonium cations. Clays and Clay Minerals, 47, 96-102.
Kirsimae K., Jorgensen P., Kalm V., 1999. Low-temperature diagenetic illite-smectite in Lower Cambrian
clays in North Estonia. Clay Minerals, 34, 151-163.
Poprawa P., 2006. Neoproterozoic-Paleozoic tectonic processes along the western margin of Baltica – from
break-up to accretion. [In:] Matyja H., Poprawa P. (eds.). Facies, tectonic and thermal evolution of the
Pomeranian sector of Trans-European Suture Zone and adjacent areas. Prace Państwowego Instytutu
Geologicznego, 186, 189-214.
Środoń J., 1984. X-ray powder diffraction identification of illitic materials. Clays and Clay Minerals, 32,
337-349.
Środoń J., Clauer N., Eberl D.D., 2002. Interpretation of K-Ar dates of illitic clays from sedimentary rocks
aided by modelling. American Mineralogist, 87, 1528-1535.
Środoń J., 2007. Illitization of smectite and history of sedimentary basins. Proceedings of the 11th
EUROCLAY Conference, Aveiro, Portugal, 74-82.
Środoń J., Clauer N., Huff W., Dudek T., Banaś M., 2009. K-Ar dating of Ordovician bentonites from the
Baltic Basin and the Baltic Shield: implications for the role of temperature and time in the illitization of
smectite. Clay Minerals, 44, 361-387.
Ulmishek G., 1991. Geologic evolution and petroleum resources of the Baltic Basin. [In:] Leighton M.W.,
Kolata D.R., Oltz D.F., Eidel J.J. (eds.). Interior cratonic basins. AAPG Memoir, 51, 603-632.
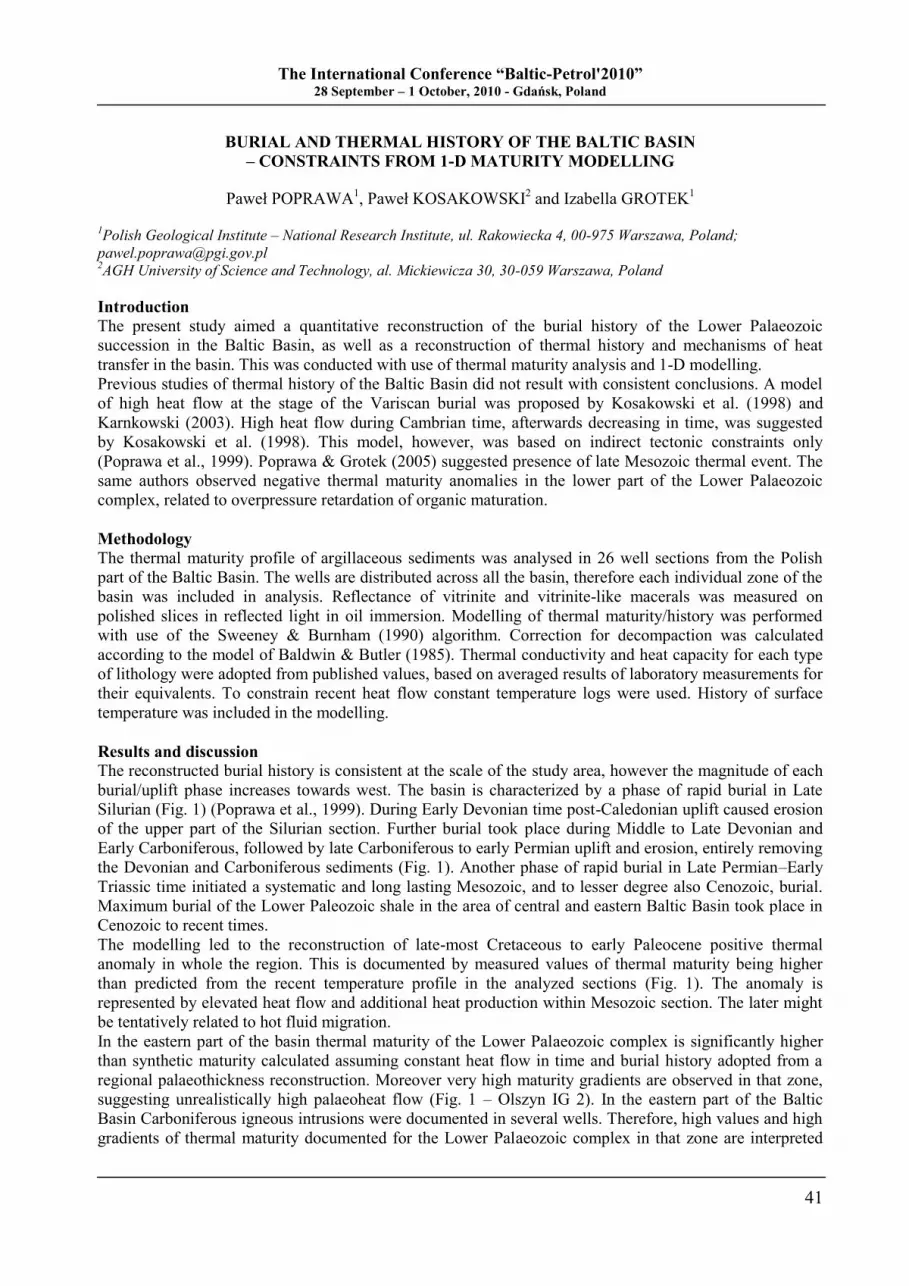
The International Conference “Baltic-Petrol'2010” 28 September – 1 October, 2010 - Gdańsk, Poland
41
BURIAL AND THERMAL HISTORY OF THE BALTIC BASIN
– CONSTRAINTS FROM 1-D MATURITY MODELLING
Paweł POPRAWA1, Paweł KOSAKOWSKI
2 and Izabella GROTEK
1
1Polish Geological Institute – National Research Institute, ul. Rakowiecka 4, 00-975 Warszawa, Poland;
[email protected] 2AGH University of Science and Technology, al. Mickiewicza 30, 30-059 Warszawa, Poland
Introduction
The present study aimed a quantitative reconstruction of the burial history of the Lower Palaeozoic
succession in the Baltic Basin, as well as a reconstruction of thermal history and mechanisms of heat
transfer in the basin. This was conducted with use of thermal maturity analysis and 1-D modelling.
Previous studies of thermal history of the Baltic Basin did not result with consistent conclusions. A model
of high heat flow at the stage of the Variscan burial was proposed by Kosakowski et al. (1998) and
Karnkowski (2003). High heat flow during Cambrian time, afterwards decreasing in time, was suggested
by Kosakowski et al. (1998). This model, however, was based on indirect tectonic constraints only
(Poprawa et al., 1999). Poprawa & Grotek (2005) suggested presence of late Mesozoic thermal event. The
same authors observed negative thermal maturity anomalies in the lower part of the Lower Palaeozoic
complex, related to overpressure retardation of organic maturation.
Methodology
The thermal maturity profile of argillaceous sediments was analysed in 26 well sections from the Polish
part of the Baltic Basin. The wells are distributed across all the basin, therefore each individual zone of the
basin was included in analysis. Reflectance of vitrinite and vitrinite-like macerals was measured on
polished slices in reflected light in oil immersion. Modelling of thermal maturity/history was performed
with use of the Sweeney & Burnham (1990) algorithm. Correction for decompaction was calculated
according to the model of Baldwin & Butler (1985). Thermal conductivity and heat capacity for each type
of lithology were adopted from published values, based on averaged results of laboratory measurements for
their equivalents. To constrain recent heat flow constant temperature logs were used. History of surface
temperature was included in the modelling.
Results and discussion
The reconstructed burial history is consistent at the scale of the study area, however the magnitude of each
burial/uplift phase increases towards west. The basin is characterized by a phase of rapid burial in Late
Silurian (Fig. 1) (Poprawa et al., 1999). During Early Devonian time post-Caledonian uplift caused erosion
of the upper part of the Silurian section. Further burial took place during Middle to Late Devonian and
Early Carboniferous, followed by late Carboniferous to early Permian uplift and erosion, entirely removing
the Devonian and Carboniferous sediments (Fig. 1). Another phase of rapid burial in Late Permian–Early
Triassic time initiated a systematic and long lasting Mesozoic, and to lesser degree also Cenozoic, burial.
Maximum burial of the Lower Paleozoic shale in the area of central and eastern Baltic Basin took place in
Cenozoic to recent times.
The modelling led to the reconstruction of late-most Cretaceous to early Paleocene positive thermal
anomaly in whole the region. This is documented by measured values of thermal maturity being higher
than predicted from the recent temperature profile in the analyzed sections (Fig. 1). The anomaly is
represented by elevated heat flow and additional heat production within Mesozoic section. The later might
be tentatively related to hot fluid migration.
In the eastern part of the basin thermal maturity of the Lower Palaeozoic complex is significantly higher
than synthetic maturity calculated assuming constant heat flow in time and burial history adopted from a
regional palaeothickness reconstruction. Moreover very high maturity gradients are observed in that zone,
suggesting unrealistically high palaeoheat flow (Fig. 1 – Olszyn IG 2). In the eastern part of the Baltic
Basin Carboniferous igneous intrusions were documented in several wells. Therefore, high values and high
gradients of thermal maturity documented for the Lower Palaeozoic complex in that zone are interpreted

The International Conference “Baltic-Petrol'2010” 28 September – 1 October, 2010 - Gdańsk, Poland
42
here as resulting from impact of igneous intrusions and associated hot fluids on paleotemperature regime of
the basin.
Fig. 1. (A) Reconstructed burial history (base Silurian), (B) preferred surface heat flow history and (C) thermal
maturity profile with measurements used for the model’s calibration for Gdańsk IG 1 and Olsztyn IG 2 wells
Significant negative anomalies of thermal maturity are observed in well sections for the lower part of the
Silurian, the Ordovician and, in a few cases, also the Cambrian intervals (Poprawa & Grotek, 2005). This
was interpreted as an effect of retardation of organic maturation by palaeopressure. The overpressure
development was related to very high deposition rate of the Upper Silurian sediments (Poprawa & Grotek,
2005). This interpretation assumed however that overpressures, which developed in the late Silurian time,
retained until the time when ultimate maturation of the succession developed. Alternatively, overpressure
might be related to hydrocarbon generation in the Upper Ordovician–Lower Silurian source rock,
presumably during Variscan and late Mesozoic thermal events.
References
Baldwin B., Butler C.O., 1985. Compaction curves. AAPG Bulletin, 69, 622-626.
Karnkowski P.H., 2003. Modelling of hydrocarbon generating conditions within Lower Palaeozoic strata in
the western part of the Baltic Basin. Geological Review, 51, 756-763 (in Polish with English summary).
Kosakowski P., Poprawa P., Botor D., 1998. Modelowanie historii generowania węglowodorów w
zachodniej części syneklizy perybałtyckiej. [In:] Geochemiczne Badania Skał Macierzystych dla
Węglowodorów, Geonafta, Ustroń, Book of Abstracts (in Polish).
Poprawa P., Grotek I., 2005. Revealing palaeo-heat flow and paleooverpressures in the Baltic Basin from
thermal maturity modelling. Mineralogical Society of Poland, Special Papers, 26, 235-238.
Poprawa P., Ńliaupa S., Stephenson R.A., Lazauskienė J., 1999. Late Vendian-Early Palaeozoic tectonic
evolution of the Baltic Basin: regional implications from subsidence analysis. Tectonophysics, 314,
219-239.
Sweeney J.J., Burnham A.K., 1990. Evaluation of a simple model of vitrinite reflectance based on chemical
kinetics. AAPG Bulletin, 74, 1559-1570.
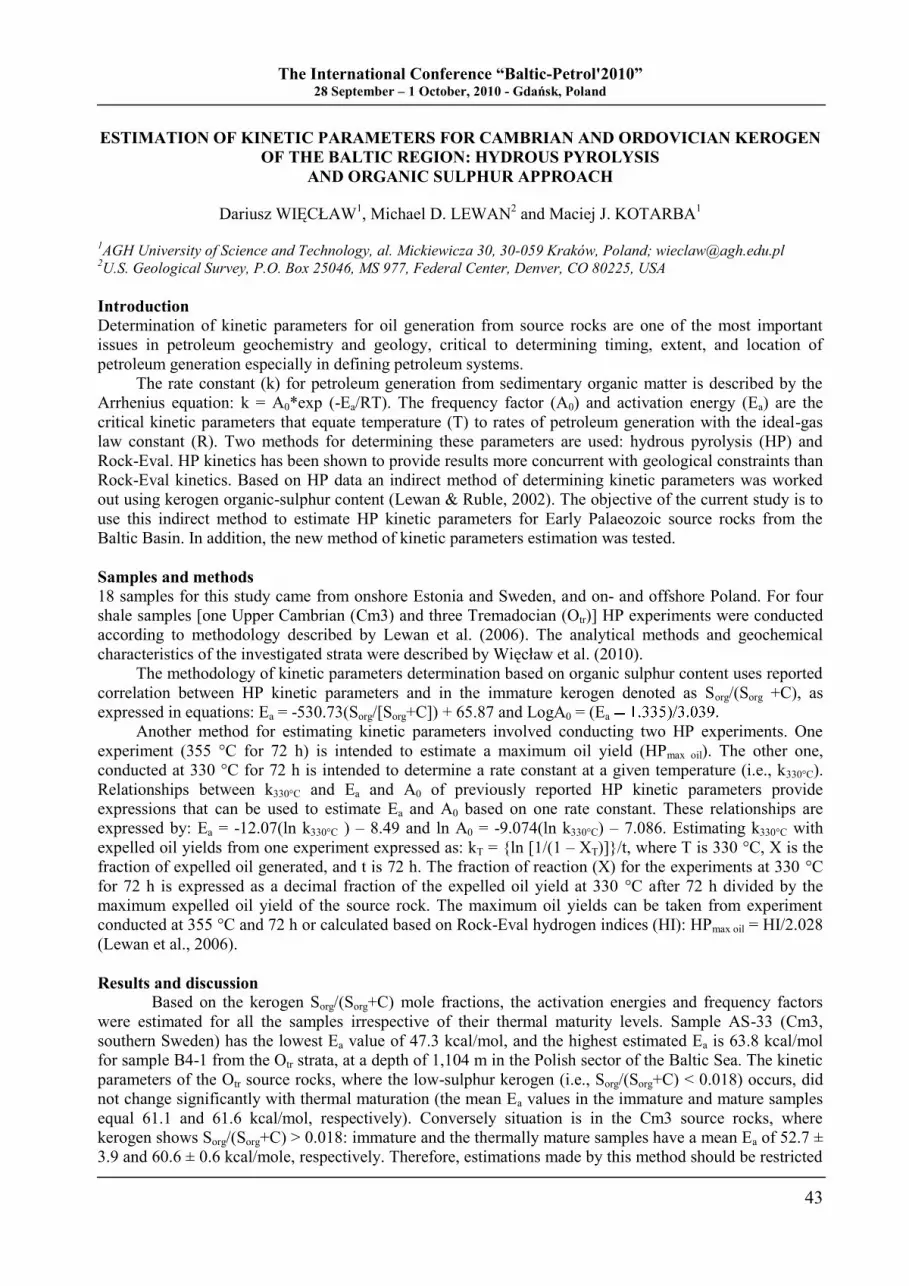
The International Conference “Baltic-Petrol'2010” 28 September – 1 October, 2010 - Gdańsk, Poland
43
ESTIMATION OF KINETIC PARAMETERS FOR CAMBRIAN AND ORDOVICIAN KEROGEN
OF THE BALTIC REGION: HYDROUS PYROLYSIS
AND ORGANIC SULPHUR APPROACH
Dariusz WIĘCŁAW1, Michael D. LEWAN
2 and Maciej J. KOTARBA
1
1AGH University of Science and Technology, al. Mickiewicza 30, 30-059 Kraków, Poland; [email protected]
2U.S. Geological Survey, P.O. Box 25046, MS 977, Federal Center, Denver, CO 80225, USA
Introduction
Determination of kinetic parameters for oil generation from source rocks are one of the most important
issues in petroleum geochemistry and geology, critical to determining timing, extent, and location of
petroleum generation especially in defining petroleum systems.
The rate constant (k) for petroleum generation from sedimentary organic matter is described by the
Arrhenius equation: k = A0*exp (-Ea/RT). The frequency factor (A0) and activation energy (Ea) are the
critical kinetic parameters that equate temperature (T) to rates of petroleum generation with the ideal-gas
law constant (R). Two methods for determining these parameters are used: hydrous pyrolysis (HP) and
Rock-Eval. HP kinetics has been shown to provide results more concurrent with geological constraints than
Rock-Eval kinetics. Based on HP data an indirect method of determining kinetic parameters was worked
out using kerogen organic-sulphur content (Lewan & Ruble, 2002). The objective of the current study is to
use this indirect method to estimate HP kinetic parameters for Early Palaeozoic source rocks from the
Baltic Basin. In addition, the new method of kinetic parameters estimation was tested.
Samples and methods
18 samples for this study came from onshore Estonia and Sweden, and on- and offshore Poland. For four
shale samples [one Upper Cambrian (Cm3) and three Tremadocian (Otr)] HP experiments were conducted
according to methodology described by Lewan et al. (2006). The analytical methods and geochemical
characteristics of the investigated strata were described by Więcław et al. (2010).
The methodology of kinetic parameters determination based on organic sulphur content uses reported
correlation between HP kinetic parameters and in the immature kerogen denoted as Sorg/(Sorg +C), as
expressed in equations: Ea = -530.73(Sorg/[Sorg+C]) + 65.87 and LogA0 = (Ea
Another method for estimating kinetic parameters involved conducting two HP experiments. One
experiment (355 °C for 72 h) is intended to estimate a maximum oil yield (HPmax oil). The other one,
conducted at 330 °C for 72 h is intended to determine a rate constant at a given temperature (i.e., k330°C).
Relationships between k330°C and Ea and A0 of previously reported HP kinetic parameters provide
expressions that can be used to estimate Ea and A0 based on one rate constant. These relationships are
expressed by: Ea = -12.07(ln k330°C ) – 8.49 and ln A0 = -9.074(ln k330°C) – 7.086. Estimating k330°C with
expelled oil yields from one experiment expressed as: kT = {ln [1/(1 – XT)]}/t, where T is 330 °C, X is the
fraction of expelled oil generated, and t is 72 h. The fraction of reaction (X) for the experiments at 330 °C
for 72 h is expressed as a decimal fraction of the expelled oil yield at 330 °C after 72 h divided by the
maximum expelled oil yield of the source rock. The maximum oil yields can be taken from experiment
conducted at 355 °C and 72 h or calculated based on Rock-Eval hydrogen indices (HI): HPmax oil = HI/2.028
(Lewan et al., 2006).
Results and discussion Based on the kerogen Sorg/(Sorg+C) mole fractions, the activation energies and frequency factors
were estimated for all the samples irrespective of their thermal maturity levels. Sample AS-33 (Cm3,
southern Sweden) has the lowest Ea value of 47.3 kcal/mol, and the highest estimated Ea is 63.8 kcal/mol
for sample B4-1 from the Otr strata, at a depth of 1,104 m in the Polish sector of the Baltic Sea. The kinetic
parameters of the Otr source rocks, where the low-sulphur kerogen (i.e., Sorg/(Sorg+C) < 0.018) occurs, did
not change significantly with thermal maturation (the mean Ea values in the immature and mature samples
equal 61.1 and 61.6 kcal/mol, respectively). Conversely situation is in the Cm3 source rocks, where
kerogen shows Sorg/(Sorg+C) > 0.018: immature and the thermally mature samples have a mean Ea of 52.7 ±
3.9 and 60.6 ± 0.6 kcal/mole, respectively. Therefore, estimations made by this method should be restricted
The International Conference “Baltic-Petrol'2010” 28 September – 1 October, 2010 - Gdańsk, Poland
44
to immature source rocks unless prior knowledge of how their kerogen Sorg/(Sorg+C) mole fractions behave
with increasing maturity is established.
The second method uses results from two hydrous pyrolysis experiments to determine a rate
constant at 330 °C (k330°C). In this calculating the maximum yield of expelled oil is required (HPmax oil). The
assumption that the maximum yield could be determined by a second hydrous pyrolysis experiment at 355
°C for 72 h proved not to be valid. The most reasonable k330°C values are obtained calculating HPmax oil
based on Rock-Eval HI values (Lewan et al., 2006). The estimated HP kinetic parameters for the two
immature samples were in good agreement with those estimated by the first method (Fig. 1). The Cm3 and
Otr source rocks had estimated Ea values of 57.5 and 61.9 kcal/mol and A0 values of 2.594 x 1028
and 7.073
x 1029
my-1
, respectively. However, the estimated HP kinetic parameters for the mature samples consistently
gave lower values than those estimated from the first method based on kerogen Sorg/(Sorg+C) mole fractions
(Fig. 1). This difference increased with increasing thermal maturity of the source rock. The overall results
indicate that only one hydrous pyrolysis experiment at 330 °C for 72 h is required with the use of
relationship between HI and maximum hydrous-pyrolysis yields (Lewan et al., 2006).
Fig. 1. Plot of (A) activation energies (Ea) and (B) Log of
frequency factors (A0) estimated by kerogen Sorg/(Sorg+C) mole
fractions (solid circles connected with solid line) and by HP
experimentally determined k330°C (open circles connected with
dashed line) versus reflectance of vitrinite-like macerals
Conclusions
Two methods were used to estimate kinetic parameters of
kerogen from the Baltic region. The first method uses the
Sorg/(Sorg+C) mole fractions of immature kerogen and the
second one, results of one HP experiment. The mean
estimated Ea values of the Baltic Cm3 and Otr source rocks
from the both methods are 59.0 ± 4.1 and 57.4 ± 3.8
kcal/mol and Log A0 values of 18.97 ± 1.35 and 18.43 ±
1.24 (Log [1/h]), respectively.
Both methods of estimating HP kinetic parameters for
source rocks with Type-II kerogen are applicable when
small amounts of sample and limited time restrict
determinations by a complete series of HP experiments.
The values estimated for the Baltic source rocks predict
that Cm3 source rocks will generate expelled oil at notably lower thermal maturities than overlying Otr
source rocks.
Acknowledgements
The research was financially supported by the Polish Ministry of Environment, Grant No. 180/2005/Wn-
06/FG-sm-tx/D.
References
Lewan M.D., Ruble T.E., 2002. Comparison of petroleum generation kinetics by isothermal hydrous and
nonisothermal open-system pyrolysis. Organic Geochemistry, 33, 1457-1475.
Lewan M.D., Kotarba M.J., Curtis J.B., Więcław D., Kosakowski P., 2006. Oil generation kinetics for
organic facies with Type-II and -IIS kerogen in the Menilite Shales of the Polish Carpathians.
Geochimica et Cosmochimica Acta, 70, 3351-3368.
Więcław D., Kotarba M.J., Kosakowski P., Kowalski A., Anolik P., 2010. Hydrocarbon potential of the
Lower Palaeozoic sequence of the Polish Baltic Basin. Abstracts of Baltic-Petrol‟2010 Conference,
28.09-1.10, Gdańsk (this volume).
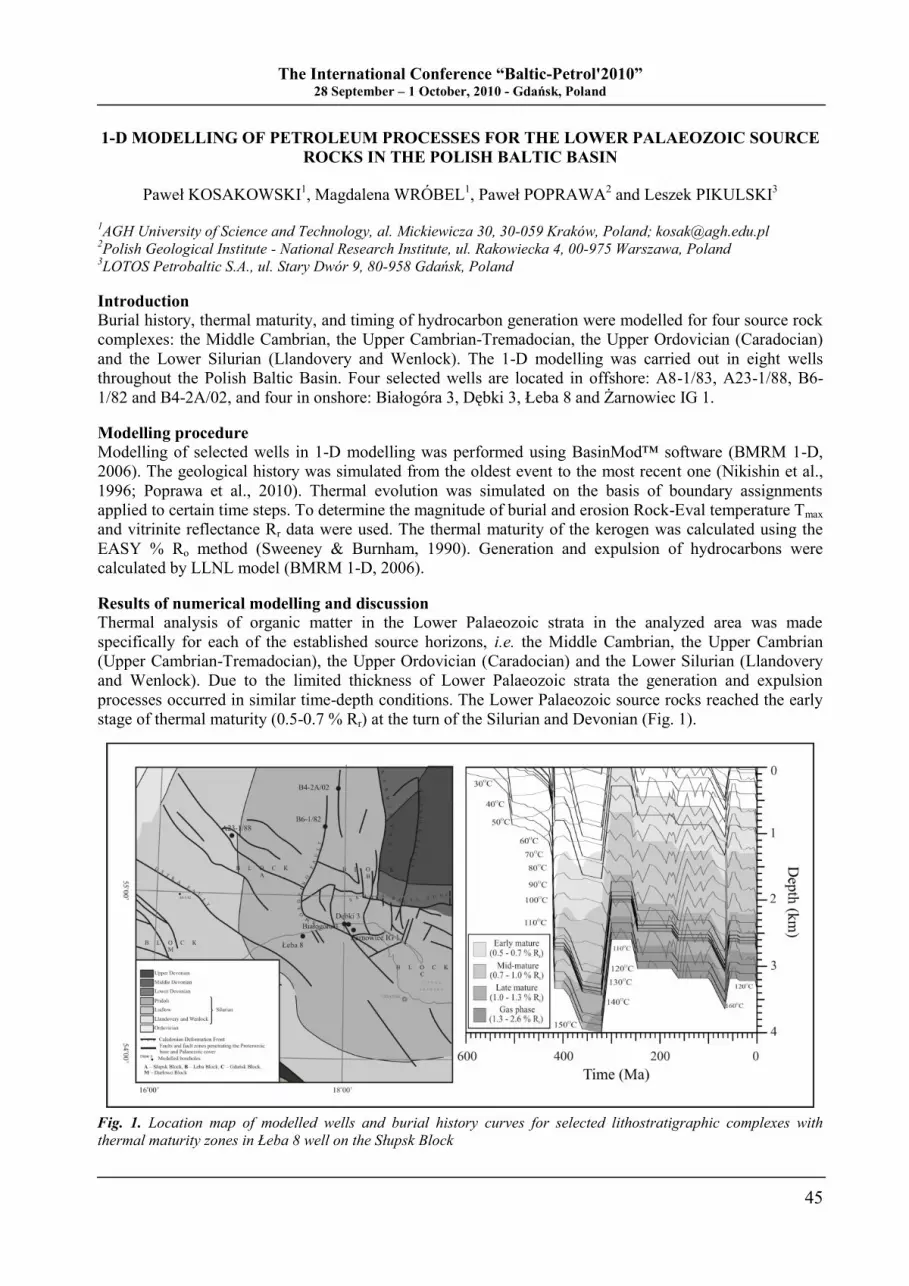
The International Conference “Baltic-Petrol'2010” 28 September – 1 October, 2010 - Gdańsk, Poland
45
1-D MODELLING OF PETROLEUM PROCESSES FOR THE LOWER PALAEOZOIC SOURCE
ROCKS IN THE POLISH BALTIC BASIN
Paweł KOSAKOWSKI1, Magdalena WRÓBEL
1, Paweł POPRAWA
2 and Leszek PIKULSKI
3
1AGH University of Science and Technology, al. Mickiewicza 30, 30-059 Kraków, Poland; [email protected]
2Polish Geological Institute - National Research Institute, ul. Rakowiecka 4, 00-975 Warszawa, Poland
3LOTOS Petrobaltic S.A., ul. Stary Dwór 9, 80-958 Gdańsk, Poland
Introduction
Burial history, thermal maturity, and timing of hydrocarbon generation were modelled for four source rock
complexes: the Middle Cambrian, the Upper Cambrian-Tremadocian, the Upper Ordovician (Caradocian)
and the Lower Silurian (Llandovery and Wenlock). The 1-D modelling was carried out in eight wells
throughout the Polish Baltic Basin. Four selected wells are located in offshore: A8-1/83, A23-1/88, B6-
1/82 and B4-2A/02, and four in onshore: Białogóra 3, Dębki 3, Łeba 8 and Żarnowiec IG 1.
Modelling procedure
Modelling of selected wells in 1-D modelling was performed using BasinMod™ software (BMRM 1-D,
2006). The geological history was simulated from the oldest event to the most recent one (Nikishin et al.,
1996; Poprawa et al., 2010). Thermal evolution was simulated on the basis of boundary assignments
applied to certain time steps. To determine the magnitude of burial and erosion Rock-Eval temperature Tmax
and vitrinite reflectance Rr data were used. The thermal maturity of the kerogen was calculated using the
EASY % Ro method (Sweeney & Burnham, 1990). Generation and expulsion of hydrocarbons were
calculated by LLNL model (BMRM 1-D, 2006).
Results of numerical modelling and discussion Thermal analysis of organic matter in the Lower Palaeozoic strata in the analyzed area was made
specifically for each of the established source horizons, i.e. the Middle Cambrian, the Upper Cambrian
(Upper Cambrian-Tremadocian), the Upper Ordovician (Caradocian) and the Lower Silurian (Llandovery
and Wenlock). Due to the limited thickness of Lower Palaeozoic strata the generation and expulsion
processes occurred in similar time-depth conditions. The Lower Palaeozoic source rocks reached the early
stage of thermal maturity (0.5-0.7 % Rr) at the turn of the Silurian and Devonian (Fig. 1).
Fig. 1. Location map of modelled wells and burial history curves for selected lithostratigraphic complexes with
thermal maturity zones in Łeba 8 well on the Słupsk Block
The International Conference “Baltic-Petrol'2010” 28 September – 1 October, 2010 - Gdańsk, Poland
46
Modelling of generation of hydrocarbons from the Lower Palaeozoic source rocks revealed that the source
rocks passed through the entire generation range from the early to the late stage. In the Darłowo Block, in
A8-1/83 well, the source rocks reached the early phase of generation (10-25 % of generation potential)
during Famennian, at a burial depth below 3100 m and in temperature above 120 oC (Fig. 1). The main
phase (25-65 % of generation potential) was reached at the beginning of the Tournaisian, and the final
phase (65-90 % of generation potential) at the end of the Tournaisian. In the Darłowo Block, in the vicinity
of the A8-1/83 well generation potential was depleted at the turn of the Tournaisian and Visean In the
Słupsk Block (A23-1/88 and Łeba 8 wells) the source rocks reached the early stage of maturity at the
beginning of the Devonian at a burial depth of 2400-3100 m and temperature over 120 oC (Fig. 1). The
main and late stages were reached during the Pragian time, at a depth of 2400-3100 m and temperature over
140 oC, exhausting their generation potential at the turn of the Devonian and Carboniferous periods (Fig.
1). In the offshore part of the Łeba Block, the Middle Cambrian source rocks reached the initial stage of
hydrocarbon generation, or even entering the main stage in a casae of B6-1/82 well, during time interval of
the Tournaisian and Visean (Fig. 1). In the onshore part the source rocks realised their entire generation
potential from the early to the main stage, and locally even late stage. In in the vicinity of the Białogóra 3
and Dębki 3 wells the early stage was reached in Lochkovian and Eifelian at burial depth ca 2700 and 3000
m respectively and temperature over 120 oC. The main stage of hydrocarbon generation took place in the
Pragian and Famennian, whereas the late stage was reached in the Eifelian and Tournaisian, totally
exhausting the generation potential of source rocks encountered in both wells. As far as kinetic
transformations go a slightly different history of hydrocarbon generation was observed in the profile of the
Żarnowiec IG 1 well, resulting from a considerably higher rate of kerogen transformation compared to the
Białogóra 3 and Dębki 3 wells. In the Żarnowiec IG 1 well the early stage was reached at the beginning of
the Lochkovian below 3200 m of depth and temperature over 130 oC (Fig. 1). The main stage was reached
at the turn of the Lochkovian and Pragian, and the late stage in Pragian. Kinetic transformations resulted in
complete transformation of the Middle Cambrian kerogen in Żarnowiec IG 1 well.
Conclusions
Analysis of hydrocarbon generation and expulsion in the Lower Palaeozoic sequence in northern Poland
showed that these processes were initiated at 0.8 % Rr of kerogen maturity and lasted to ca. 1.1 % Rr. The
modelling revealed that the source rocks passed through the complete generation interval from early to late
stage. The whole range of generation was reached by the source rocks during time interval from the
beginning of Devonian to the beginning of the late Carboniferous. The source rocks on offshore part of the
Łeba Block saw the lowest degree of thermal maturity and transformation of the kerogen.
Acknowledgements
The research was financially supported by the Polish Ministry of Environment, Grant No. 180/2005/Wn-
06/FG-sm-tx/D.
References
BMRM 1-D, 2006. BasinMod™ 1-D Reference Manual. Platte River Association, Boulder, Colorado.
Nikishin A.M., Ziegler P.A., Stephenson R.A., Cloethingh S.A.P.L., Furne A.V., Foki P.A., Ershov A.V.,
Bolotov S. N., Korotaev M.V., Alekseev A.S., Gorbachev V.I., Shipilov E.V., Lankreijer A.,
Bembinova E.YU., Shalimov I.V., 1996. Late Permian to Triassic history of the East European Craton:
dynamics of sedimentary basin evolution. Tectonophysics, 268, 23-63.
Poprawa P., Kosakowski P., Wróbel M., 2010. Subsidence, burial and thermal history of the western part of
the Baltic Basin. Geological Quarterly, 54.
Sweeney J.J., Burnham A.K., 1990. Evaluation of a simple model of vitrinite reflectance based on chemical
kinetics. AAPG Bulletin, 74, 1559-1570.
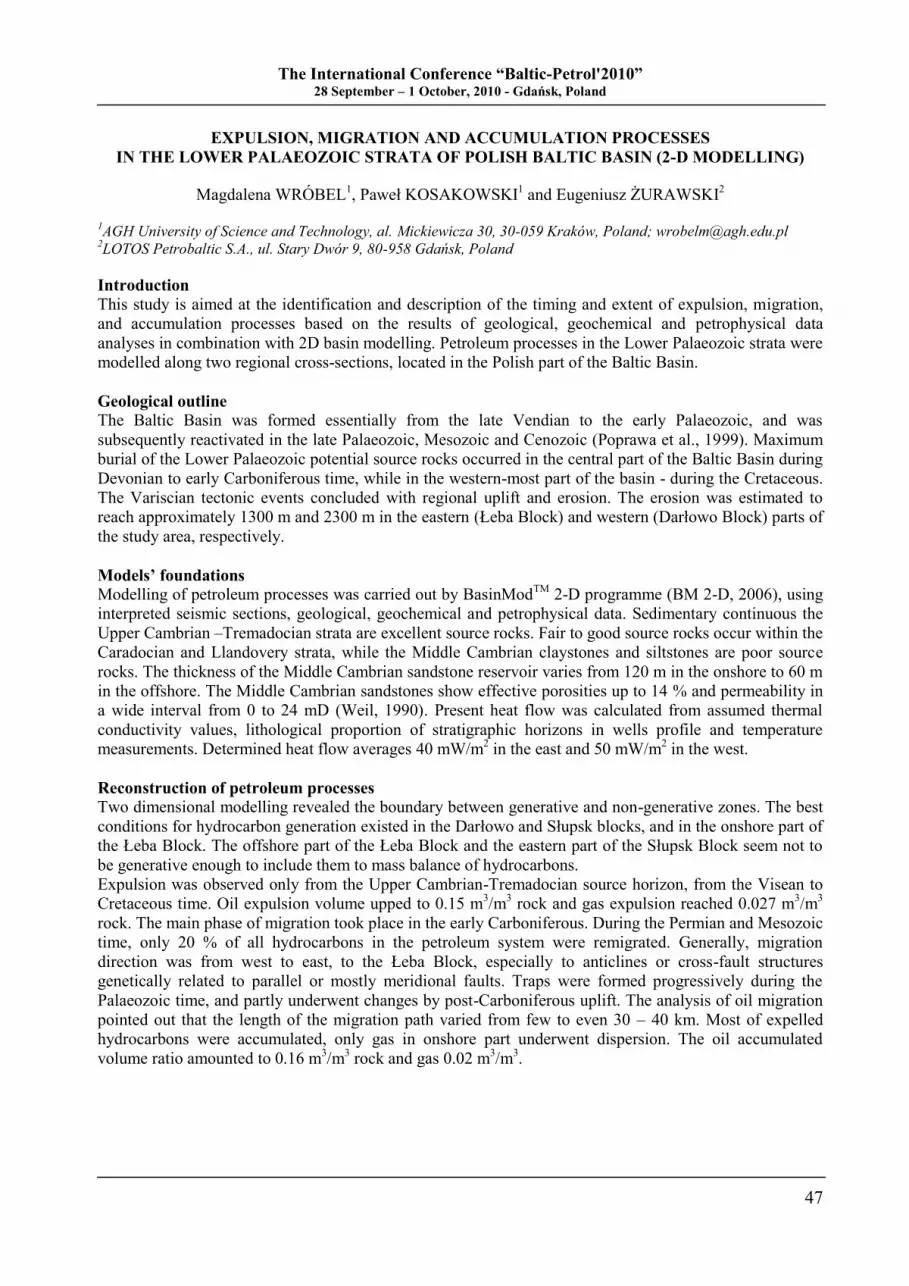
The International Conference “Baltic-Petrol'2010” 28 September – 1 October, 2010 - Gdańsk, Poland
47
EXPULSION, MIGRATION AND ACCUMULATION PROCESSES
IN THE LOWER PALAEOZOIC STRATA OF POLISH BALTIC BASIN (2-D MODELLING)
Magdalena WRÓBEL1, Paweł KOSAKOWSKI
1 and Eugeniusz ŻURAWSKI
2
1AGH University of Science and Technology, al. Mickiewicza 30, 30-059 Kraków, Poland; [email protected]
2LOTOS Petrobaltic S.A., ul. Stary Dwór 9, 80-958 Gdańsk, Poland
Introduction
This study is aimed at the identification and description of the timing and extent of expulsion, migration,
and accumulation processes based on the results of geological, geochemical and petrophysical data
analyses in combination with 2D basin modelling. Petroleum processes in the Lower Palaeozoic strata were
modelled along two regional cross-sections, located in the Polish part of the Baltic Basin.
Geological outline
The Baltic Basin was formed essentially from the late Vendian to the early Palaeozoic, and was
subsequently reactivated in the late Palaeozoic, Mesozoic and Cenozoic (Poprawa et al., 1999). Maximum
burial of the Lower Palaeozoic potential source rocks occurred in the central part of the Baltic Basin during
Devonian to early Carboniferous time, while in the western-most part of the basin - during the Cretaceous.
The Variscian tectonic events concluded with regional uplift and erosion. The erosion was estimated to
reach approximately 1300 m and 2300 m in the eastern (Łeba Block) and western (Darłowo Block) parts of
the study area, respectively.
Models’ foundations
Modelling of petroleum processes was carried out by BasinModTM
2-D programme (BM 2-D, 2006), using
interpreted seismic sections, geological, geochemical and petrophysical data. Sedimentary continuous the
Upper Cambrian –Tremadocian strata are excellent source rocks. Fair to good source rocks occur within the
Caradocian and Llandovery strata, while the Middle Cambrian claystones and siltstones are poor source
rocks. The thickness of the Middle Cambrian sandstone reservoir varies from 120 m in the onshore to 60 m
in the offshore. The Middle Cambrian sandstones show effective porosities up to 14 % and permeability in
a wide interval from 0 to 24 mD (Weil, 1990). Present heat flow was calculated from assumed thermal
conductivity values, lithological proportion of stratigraphic horizons in wells profile and temperature
measurements. Determined heat flow averages 40 mW/m2 in the east and 50 mW/m
2 in the west.
Reconstruction of petroleum processes
Two dimensional modelling revealed the boundary between generative and non-generative zones. The best
conditions for hydrocarbon generation existed in the Darłowo and Słupsk blocks, and in the onshore part of
the Łeba Block. The offshore part of the Łeba Block and the eastern part of the Słupsk Block seem not to
be generative enough to include them to mass balance of hydrocarbons.
Expulsion was observed only from the Upper Cambrian-Tremadocian source horizon, from the Visean to
Cretaceous time. Oil expulsion volume upped to 0.15 m3/m
3 rock and gas expulsion reached 0.027 m
3/m
3
rock. The main phase of migration took place in the early Carboniferous. During the Permian and Mesozoic
time, only 20 % of all hydrocarbons in the petroleum system were remigrated. Generally, migration
direction was from west to east, to the Łeba Block, especially to anticlines or cross-fault structures
genetically related to parallel or mostly meridional faults. Traps were formed progressively during the
Palaeozoic time, and partly underwent changes by post-Carboniferous uplift. The analysis of oil migration
pointed out that the length of the migration path varied from few to even 30 – 40 km. Most of expelled
hydrocarbons were accumulated, only gas in onshore part underwent dispersion. The oil accumulated
volume ratio amounted to 0.16 m3/m
3 rock and gas 0.02 m
3/m
3.
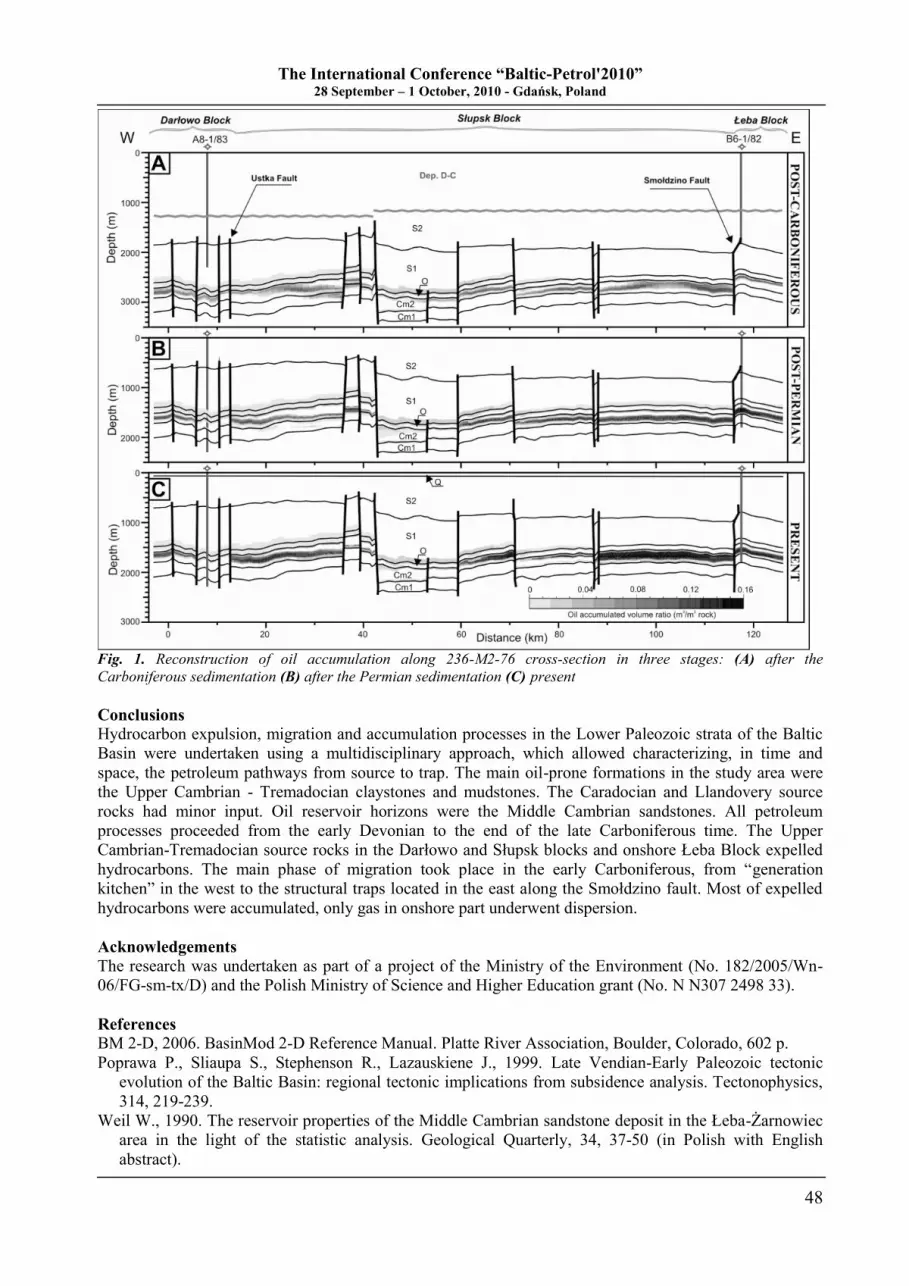
The International Conference “Baltic-Petrol'2010” 28 September – 1 October, 2010 - Gdańsk, Poland
48
Fig. 1. Reconstruction of oil accumulation along 236-M2-76 cross-section in three stages: (A) after the
Carboniferous sedimentation (B) after the Permian sedimentation (C) present
Conclusions
Hydrocarbon expulsion, migration and accumulation processes in the Lower Paleozoic strata of the Baltic
Basin were undertaken using a multidisciplinary approach, which allowed characterizing, in time and
space, the petroleum pathways from source to trap. The main oil-prone formations in the study area were
the Upper Cambrian - Tremadocian claystones and mudstones. The Caradocian and Llandovery source
rocks had minor input. Oil reservoir horizons were the Middle Cambrian sandstones. All petroleum
processes proceeded from the early Devonian to the end of the late Carboniferous time. The Upper
Cambrian-Tremadocian source rocks in the Darłowo and Słupsk blocks and onshore Łeba Block expelled
hydrocarbons. The main phase of migration took place in the early Carboniferous, from “generation
kitchen” in the west to the structural traps located in the east along the Smołdzino fault. Most of expelled
hydrocarbons were accumulated, only gas in onshore part underwent dispersion.
Acknowledgements
The research was undertaken as part of a project of the Ministry of the Environment (No. 182/2005/Wn-
06/FG-sm-tx/D) and the Polish Ministry of Science and Higher Education grant (No. N N307 2498 33).
References
BM 2-D, 2006. BasinMod 2-D Reference Manual. Platte River Association, Boulder, Colorado, 602 p.
Poprawa P., Sliaupa S., Stephenson R., Lazauskiene J., 1999. Late Vendian-Early Paleozoic tectonic
evolution of the Baltic Basin: regional tectonic implications from subsidence analysis. Tectonophysics,
314, 219-239.
Weil W., 1990. The reservoir properties of the Middle Cambrian sandstone deposit in the Łeba-Żarnowiec
area in the light of the statistic analysis. Geological Quarterly, 34, 37-50 (in Polish with English
abstract).
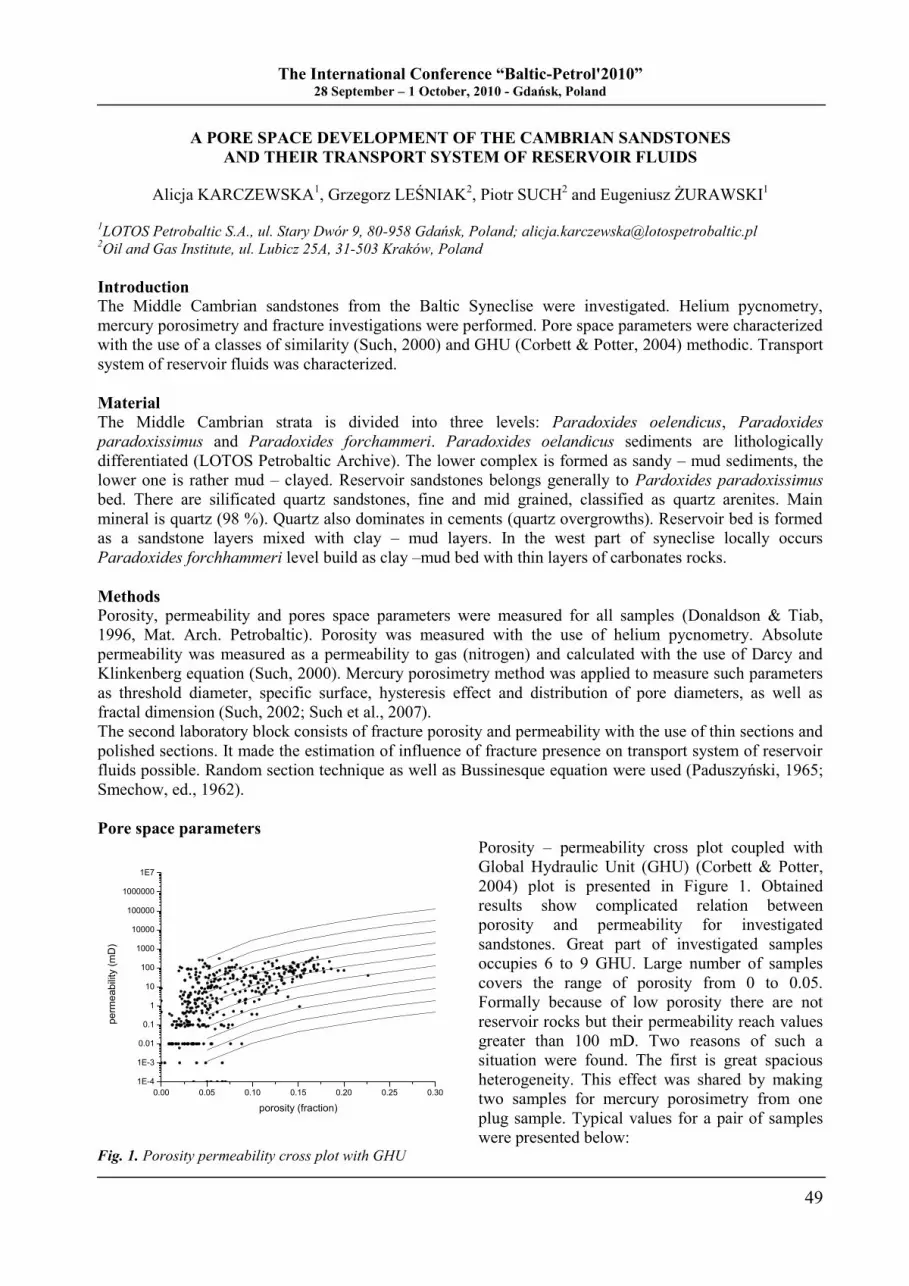
The International Conference “Baltic-Petrol'2010” 28 September – 1 October, 2010 - Gdańsk, Poland
49
A PORE SPACE DEVELOPMENT OF THE CAMBRIAN SANDSTONES
AND THEIR TRANSPORT SYSTEM OF RESERVOIR FLUIDS
Alicja KARCZEWSKA1, Grzegorz LEŚNIAK
2, Piotr SUCH
2 and Eugeniusz ŻURAWSKI
1
1LOTOS Petrobaltic S.A., ul. Stary Dwór 9, 80-958 Gdańsk, Poland; [email protected]
2Oil and Gas Institute, ul. Lubicz 25A, 31-503 Kraków, Poland
Introduction
The Middle Cambrian sandstones from the Baltic Syneclise were investigated. Helium pycnometry,
mercury porosimetry and fracture investigations were performed. Pore space parameters were characterized
with the use of a classes of similarity (Such, 2000) and GHU (Corbett & Potter, 2004) methodic. Transport
system of reservoir fluids was characterized.
Material
The Middle Cambrian strata is divided into three levels: Paradoxides oelendicus, Paradoxides
paradoxissimus and Paradoxides forchammeri. Paradoxides oelandicus sediments are lithologically
differentiated (LOTOS Petrobaltic Archive). The lower complex is formed as sandy – mud sediments, the
lower one is rather mud – clayed. Reservoir sandstones belongs generally to Pardoxides paradoxissimus
bed. There are silificated quartz sandstones, fine and mid grained, classified as quartz arenites. Main
mineral is quartz (98 %). Quartz also dominates in cements (quartz overgrowths). Reservoir bed is formed
as a sandstone layers mixed with clay – mud layers. In the west part of syneclise locally occurs
Paradoxides forchhammeri level build as clay –mud bed with thin layers of carbonates rocks.
Methods
Porosity, permeability and pores space parameters were measured for all samples (Donaldson & Tiab,
1996, Mat. Arch. Petrobaltic). Porosity was measured with the use of helium pycnometry. Absolute
permeability was measured as a permeability to gas (nitrogen) and calculated with the use of Darcy and
Klinkenberg equation (Such, 2000). Mercury porosimetry method was applied to measure such parameters
as threshold diameter, specific surface, hysteresis effect and distribution of pore diameters, as well as
fractal dimension (Such, 2002; Such et al., 2007).
The second laboratory block consists of fracture porosity and permeability with the use of thin sections and
polished sections. It made the estimation of influence of fracture presence on transport system of reservoir
fluids possible. Random section technique as well as Bussinesque equation were used (Paduszyński, 1965;
Smechow, ed., 1962).
Pore space parameters
Porosity – permeability cross plot coupled with
Global Hydraulic Unit (GHU) (Corbett & Potter,
2004) plot is presented in Figure 1. Obtained
results show complicated relation between
porosity and permeability for investigated
sandstones. Great part of investigated samples
occupies 6 to 9 GHU. Large number of samples
covers the range of porosity from 0 to 0.05.
Formally because of low porosity there are not
reservoir rocks but their permeability reach values
greater than 100 mD. Two reasons of such a
situation were found. The first is great spacious
heterogeneity. This effect was shared by making
two samples for mercury porosimetry from one
plug sample. Typical values for a pair of samples
were presented below: Fig. 1. Porosity permeability cross plot with GHU
0.00 0.05 0.10 0.15 0.20 0.25 0.30
1E-4
1E-3
0.01
0.1
1
10
100
1000
10000
100000
1000000
1E7
pe
rme
ab
ility
(m
D)
porosity (fraction)
The International Conference “Baltic-Petrol'2010” 28 September – 1 October, 2010 - Gdańsk, Poland
50
the first sample – porosity 17.4 %, threshold diameter 25 m, the second – porosity 4.4 %, threshold
diameter 4 m – both cut from the same plug sample.
Tab. 1. Correlation GHU and classes of similarity
Class Porosity
[%]
Treshold diameter
[ m]
Fractal dimension GHU
IA
IB
IIA
IIB
III
IV
>5
>5
>5
>5
>5
<5
18-20
18-20
8-12
8-12
2-8
2-8
>2.96
<2.92
>2.96
<2.90
<2.88
<2.7
9
8
7
6
5
4
Classes of similarity of pore space were shared (Such, 2000). Then obtained classes were correlated with
GHU. The results are presented in Table 1. It was shown that there is a good correlation between classes
and GHU. The base correlation parameters are threshold diameter and fractal dimension.
The second factor affecting permeability is presence of microfractures. Numerous analyses of fracture
permeability were done. Fracture systems are present in all part of the Baltic Syneclise mainly in top and
middle part of investigated layers. Fracture permeability changes in the wide range of values from zero to
290 mD. Also average values of this parameters for single boreholes change from 9.9 mD to 59.6 mD. It
means that transport system of reservoir fluids has mixed porous fracture character.
Conclusions
1. Correlation between GHU and classes of similarity of pore space was found. Threshold diameter and
fractal dimension steer filtration properties.
2. Great heterogeneity of pore space parameters depends on burial depth, and on number of cements.
3. Fractures plays a big role in transport system.
References
Corbett P.W.M., Potter D.K., 2004. Petrotyping: a basemap and atlas for navigatingthrough permeability
and porosity data for reservoir comparison and permeability prediction, SCA Papers, 385 – 396.
Donaldson E.C., Tiabb D., 1996. Petrophysics. Gulf Publishing Comp. Houston, Texas.
LOTOS Petrobaltic S.A. Archive
Paduszyński J., 1965. Szacowanie gęstości mikroszczelin metodą trawersów losowych. Nafta, 1, 2-3.
Smechov J.M. (ed.), 1962. Treńčinovatost‟ gornych porod i treńčinnovye kollektory. Trudy WNIGRI,
Leningrad, 193, 1-120. Such P., 2000. The pore space investigations for geological and field engineering purposes. Prace IGNiG,
104, 95p.
Such P., Leśniak G., Budak P., 2007. Complex methodic of investigations of petrophysical properties of
rocks. Prace IGNiG, 142, 69p.
Such P., 2002. Investigations of a pore space of reservoir rocks with the use of the fractal approach. Prace
IGNiG, 115, 28p.
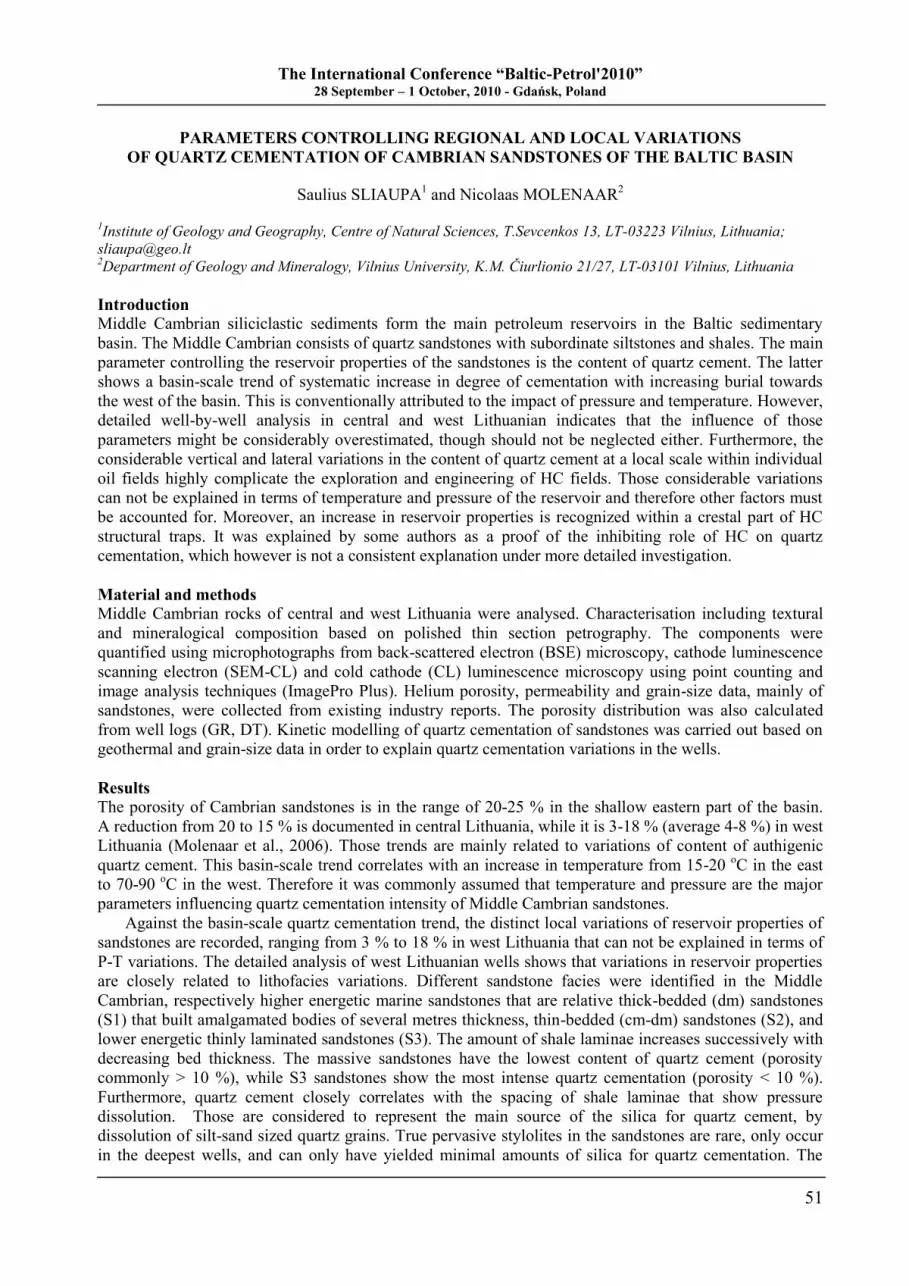
The International Conference “Baltic-Petrol'2010” 28 September – 1 October, 2010 - Gdańsk, Poland
51
PARAMETERS CONTROLLING REGIONAL AND LOCAL VARIATIONS
OF QUARTZ CEMENTATION OF CAMBRIAN SANDSTONES OF THE BALTIC BASIN
Saulius SLIAUPA1 and Nicolaas MOLENAAR
2
1Institute of Geology and Geography, Centre of Natural Sciences, T.Sevcenkos 13, LT-03223 Vilnius, Lithuania;
[email protected] 2Department of Geology and Mineralogy, Vilnius University, K.M. Čiurlionio 21/27, LT-03101 Vilnius, Lithuania
Introduction
Middle Cambrian siliciclastic sediments form the main petroleum reservoirs in the Baltic sedimentary
basin. The Middle Cambrian consists of quartz sandstones with subordinate siltstones and shales. The main
parameter controlling the reservoir properties of the sandstones is the content of quartz cement. The latter
shows a basin-scale trend of systematic increase in degree of cementation with increasing burial towards
the west of the basin. This is conventionally attributed to the impact of pressure and temperature. However,
detailed well-by-well analysis in central and west Lithuanian indicates that the influence of those
parameters might be considerably overestimated, though should not be neglected either. Furthermore, the
considerable vertical and lateral variations in the content of quartz cement at a local scale within individual
oil fields highly complicate the exploration and engineering of HC fields. Those considerable variations
can not be explained in terms of temperature and pressure of the reservoir and therefore other factors must
be accounted for. Moreover, an increase in reservoir properties is recognized within a crestal part of HC
structural traps. It was explained by some authors as a proof of the inhibiting role of HC on quartz
cementation, which however is not a consistent explanation under more detailed investigation.
Material and methods
Middle Cambrian rocks of central and west Lithuania were analysed. Characterisation including textural
and mineralogical composition based on polished thin section petrography. The components were
quantified using microphotographs from back-scattered electron (BSE) microscopy, cathode luminescence
scanning electron (SEM-CL) and cold cathode (CL) luminescence microscopy using point counting and
image analysis techniques (ImagePro Plus). Helium porosity, permeability and grain-size data, mainly of
sandstones, were collected from existing industry reports. The porosity distribution was also calculated
from well logs (GR, DT). Kinetic modelling of quartz cementation of sandstones was carried out based on
geothermal and grain-size data in order to explain quartz cementation variations in the wells.
Results
The porosity of Cambrian sandstones is in the range of 20-25 % in the shallow eastern part of the basin.
A reduction from 20 to 15 % is documented in central Lithuania, while it is 3-18 % (average 4-8 %) in west
Lithuania (Molenaar et al., 2006). Those trends are mainly related to variations of content of authigenic
quartz cement. This basin-scale trend correlates with an increase in temperature from 15-20 oC in the east
to 70-90 oC in the west. Therefore it was commonly assumed that temperature and pressure are the major
parameters influencing quartz cementation intensity of Middle Cambrian sandstones.
Against the basin-scale quartz cementation trend, the distinct local variations of reservoir properties of
sandstones are recorded, ranging from 3 % to 18 % in west Lithuania that can not be explained in terms of
P-T variations. The detailed analysis of west Lithuanian wells shows that variations in reservoir properties
are closely related to lithofacies variations. Different sandstone facies were identified in the Middle
Cambrian, respectively higher energetic marine sandstones that are relative thick-bedded (dm) sandstones
(S1) that built amalgamated bodies of several metres thickness, thin-bedded (cm-dm) sandstones (S2), and
lower energetic thinly laminated sandstones (S3). The amount of shale laminae increases successively with
decreasing bed thickness. The massive sandstones have the lowest content of quartz cement (porosity
commonly > 10 %), while S3 sandstones show the most intense quartz cementation (porosity < 10 %).
Furthermore, quartz cement closely correlates with the spacing of shale laminae that show pressure
dissolution. Those are considered to represent the main source of the silica for quartz cement, by
dissolution of silt-sand sized quartz grains. True pervasive stylolites in the sandstones are rare, only occur
in the deepest wells, and can only have yielded minimal amounts of silica for quartz cementation. The
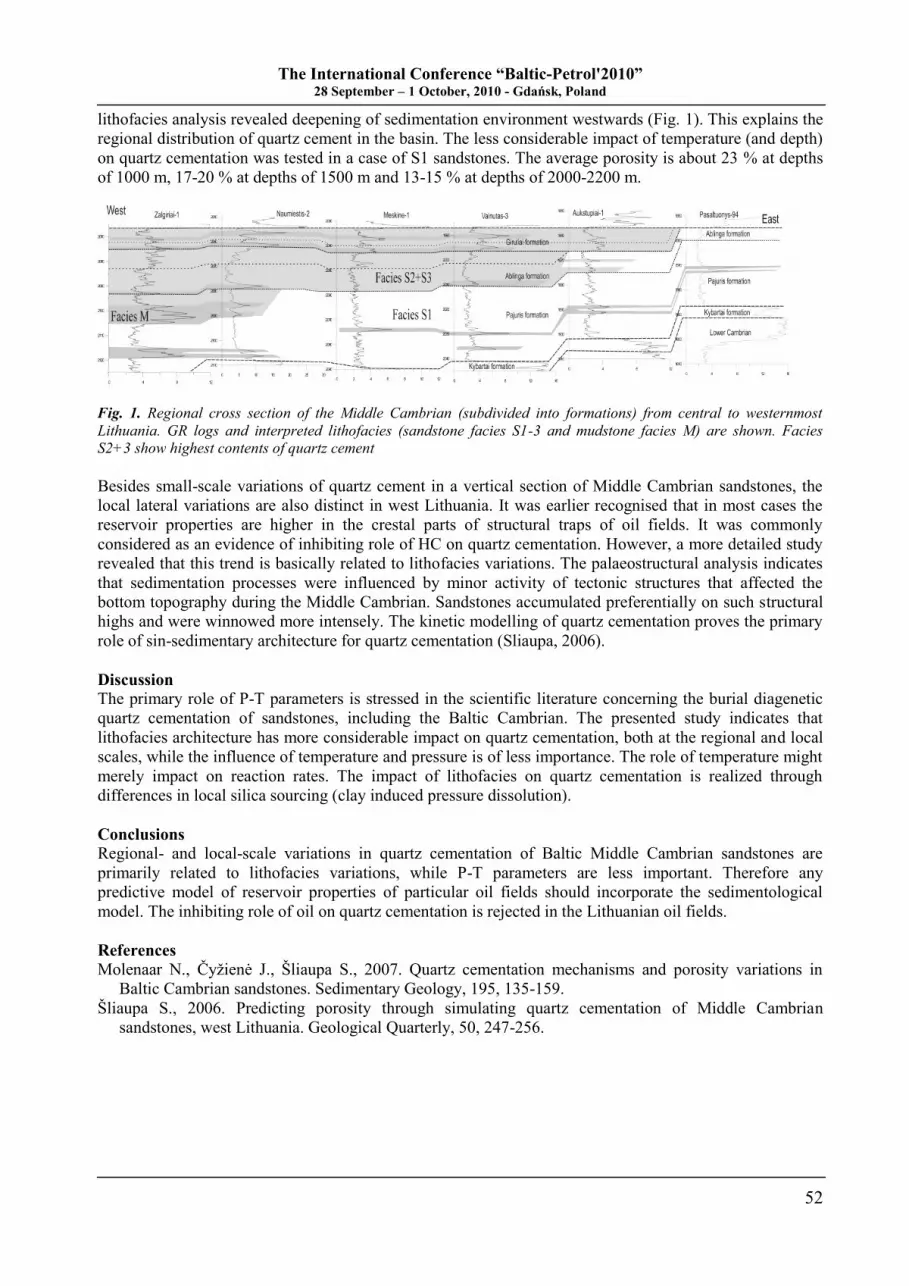
The International Conference “Baltic-Petrol'2010” 28 September – 1 October, 2010 - Gdańsk, Poland
52
lithofacies analysis revealed deepening of sedimentation environment westwards (Fig. 1). This explains the
regional distribution of quartz cement in the basin. The less considerable impact of temperature (and depth)
on quartz cementation was tested in a case of S1 sandstones. The average porosity is about 23 % at depths
of 1000 m, 17-20 % at depths of 1500 m and 13-15 % at depths of 2000-2200 m.
Fig. 1. Regional cross section of the Middle Cambrian (subdivided into formations) from central to westernmost
Lithuania. GR logs and interpreted lithofacies (sandstone facies S1-3 and mudstone facies M) are shown. Facies
S2+3 show highest contents of quartz cement
Besides small-scale variations of quartz cement in a vertical section of Middle Cambrian sandstones, the
local lateral variations are also distinct in west Lithuania. It was earlier recognised that in most cases the
reservoir properties are higher in the crestal parts of structural traps of oil fields. It was commonly
considered as an evidence of inhibiting role of HC on quartz cementation. However, a more detailed study
revealed that this trend is basically related to lithofacies variations. The palaeostructural analysis indicates
that sedimentation processes were influenced by minor activity of tectonic structures that affected the
bottom topography during the Middle Cambrian. Sandstones accumulated preferentially on such structural
highs and were winnowed more intensely. The kinetic modelling of quartz cementation proves the primary
role of sin-sedimentary architecture for quartz cementation (Sliaupa, 2006).
Discussion
The primary role of P-T parameters is stressed in the scientific literature concerning the burial diagenetic
quartz cementation of sandstones, including the Baltic Cambrian. The presented study indicates that
lithofacies architecture has more considerable impact on quartz cementation, both at the regional and local
scales, while the influence of temperature and pressure is of less importance. The role of temperature might
merely impact on reaction rates. The impact of lithofacies on quartz cementation is realized through
differences in local silica sourcing (clay induced pressure dissolution).
Conclusions
Regional- and local-scale variations in quartz cementation of Baltic Middle Cambrian sandstones are
primarily related to lithofacies variations, while P-T parameters are less important. Therefore any
predictive model of reservoir properties of particular oil fields should incorporate the sedimentological
model. The inhibiting role of oil on quartz cementation is rejected in the Lithuanian oil fields.
References
Molenaar N., Čyžienė J., Ńliaupa S., 2007. Quartz cementation mechanisms and porosity variations in
Baltic Cambrian sandstones. Sedimentary Geology, 195, 135-159.
Ńliaupa S., 2006. Predicting porosity through simulating quartz cementation of Middle Cambrian
sandstones, west Lithuania. Geological Quarterly, 50, 247-256.
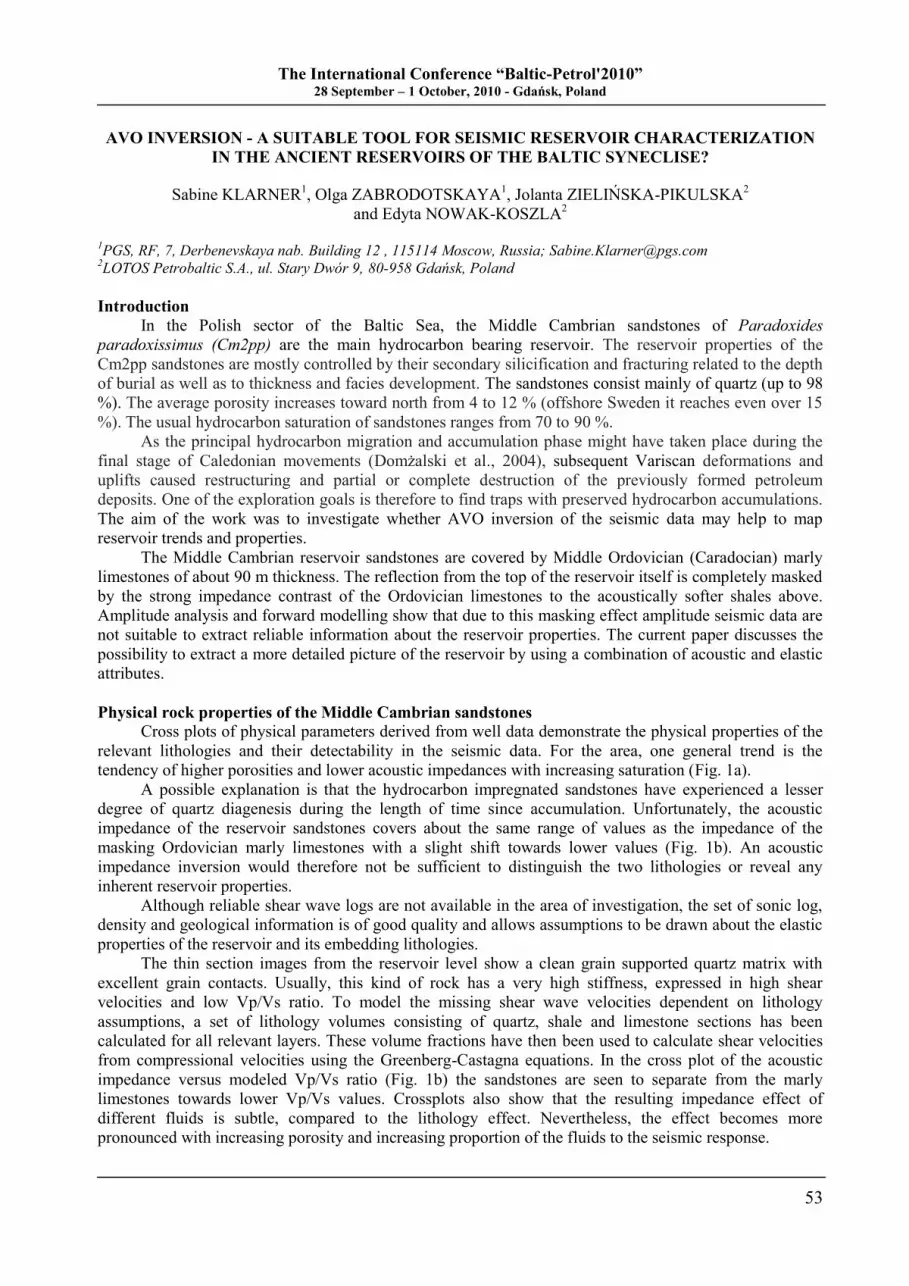
The International Conference “Baltic-Petrol'2010” 28 September – 1 October, 2010 - Gdańsk, Poland
53
AVO INVERSION - A SUITABLE TOOL FOR SEISMIC RESERVOIR CHARACTERIZATION
IN THE ANCIENT RESERVOIRS OF THE BALTIC SYNECLISE?
Sabine KLARNER1, Olga ZABRODOTSKAYA
1, Jolanta ZIELIŃSKA-PIKULSKA
2
and Edyta NOWAK-KOSZLA2
1PGS, RF, 7, Derbenevskaya nab. Building 12 , 115114 Moscow, Russia; [email protected]
2LOTOS Petrobaltic S.A., ul. Stary Dwór 9, 80-958 Gdańsk, Poland
Introduction
In the Polish sector of the Baltic Sea, the Middle Cambrian sandstones of Paradoxides
paradoxissimus (Cm2pp) are the main hydrocarbon bearing reservoir. The reservoir properties of the
Cm2pp sandstones are mostly controlled by their secondary silicification and fracturing related to the depth
of burial as well as to thickness and facies development. The sandstones consist mainly of quartz (up to 98
%). The average porosity increases toward north from 4 to 12 % (offshore Sweden it reaches even over 15
%). The usual hydrocarbon saturation of sandstones ranges from 70 to 90 %.
As the principal hydrocarbon migration and accumulation phase might have taken place during the
final stage of Caledonian movements (Domżalski et al., 2004), subsequent Variscan deformations and
uplifts caused restructuring and partial or complete destruction of the previously formed petroleum
deposits. One of the exploration goals is therefore to find traps with preserved hydrocarbon accumulations.
The aim of the work was to investigate whether AVO inversion of the seismic data may help to map
reservoir trends and properties.
The Middle Cambrian reservoir sandstones are covered by Middle Ordovician (Caradocian) marly
limestones of about 90 m thickness. The reflection from the top of the reservoir itself is completely masked
by the strong impedance contrast of the Ordovician limestones to the acoustically softer shales above.
Amplitude analysis and forward modelling show that due to this masking effect amplitude seismic data are
not suitable to extract reliable information about the reservoir properties. The current paper discusses the
possibility to extract a more detailed picture of the reservoir by using a combination of acoustic and elastic
attributes.
Physical rock properties of the Middle Cambrian sandstones
Cross plots of physical parameters derived from well data demonstrate the physical properties of the
relevant lithologies and their detectability in the seismic data. For the area, one general trend is the
tendency of higher porosities and lower acoustic impedances with increasing saturation (Fig. 1a).
A possible explanation is that the hydrocarbon impregnated sandstones have experienced a lesser
degree of quartz diagenesis during the length of time since accumulation. Unfortunately, the acoustic
impedance of the reservoir sandstones covers about the same range of values as the impedance of the
masking Ordovician marly limestones with a slight shift towards lower values (Fig. 1b). An acoustic
impedance inversion would therefore not be sufficient to distinguish the two lithologies or reveal any
inherent reservoir properties.
Although reliable shear wave logs are not available in the area of investigation, the set of sonic log,
density and geological information is of good quality and allows assumptions to be drawn about the elastic
properties of the reservoir and its embedding lithologies.
The thin section images from the reservoir level show a clean grain supported quartz matrix with
excellent grain contacts. Usually, this kind of rock has a very high stiffness, expressed in high shear
velocities and low Vp/Vs ratio. To model the missing shear wave velocities dependent on lithology
assumptions, a set of lithology volumes consisting of quartz, shale and limestone sections has been
calculated for all relevant layers. These volume fractions have then been used to calculate shear velocities
from compressional velocities using the Greenberg-Castagna equations. In the cross plot of the acoustic
impedance versus modeled Vp/Vs ratio (Fig. 1b) the sandstones are seen to separate from the marly
limestones towards lower Vp/Vs values. Crossplots also show that the resulting impedance effect of
different fluids is subtle, compared to the lithology effect. Nevertheless, the effect becomes more
pronounced with increasing porosity and increasing proportion of the fluids to the seismic response.
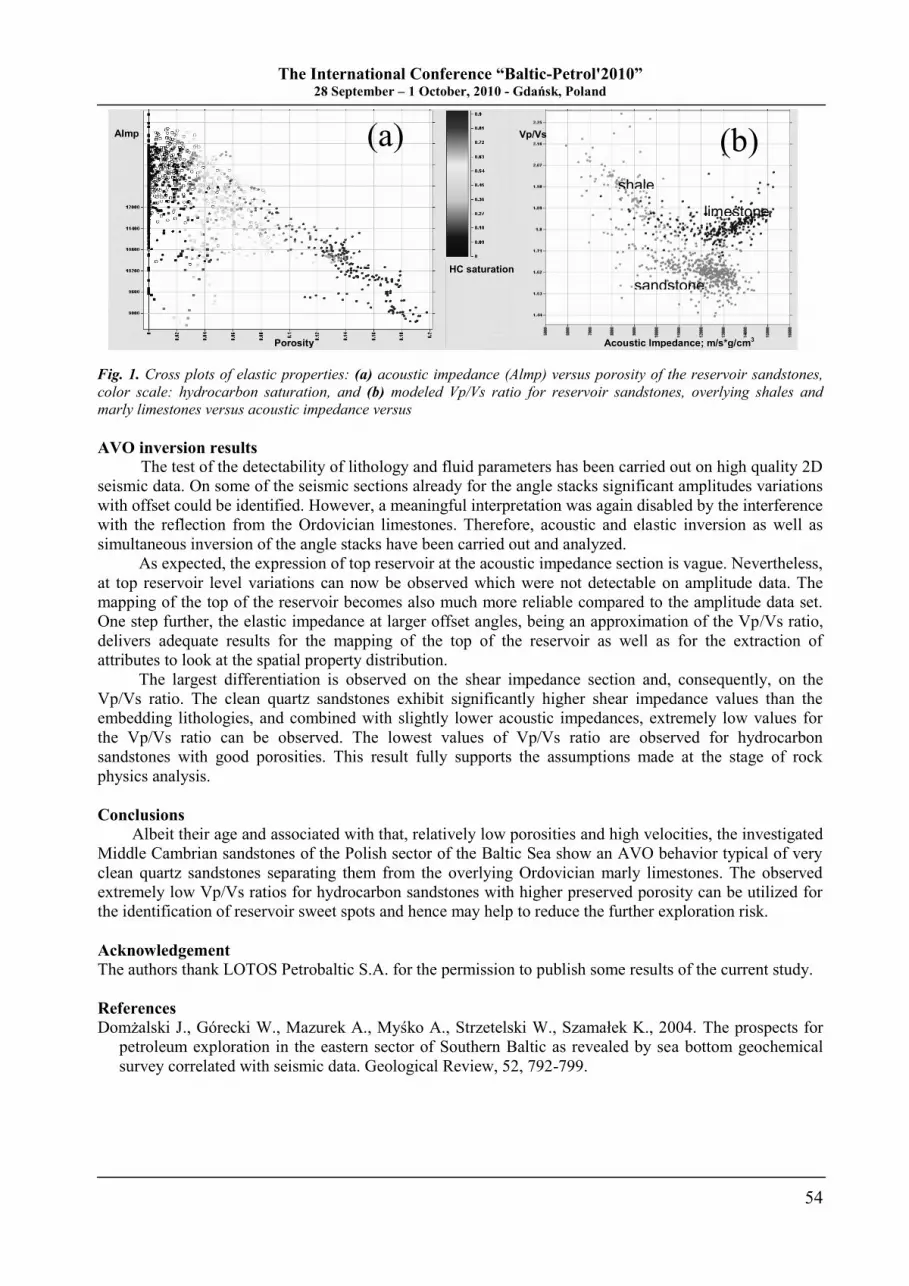
The International Conference “Baltic-Petrol'2010” 28 September – 1 October, 2010 - Gdańsk, Poland
54
Fig. 1. Cross plots of elastic properties: (a) acoustic impedance (Almp) versus porosity of the reservoir sandstones,
color scale: hydrocarbon saturation, and (b) modeled Vp/Vs ratio for reservoir sandstones, overlying shales and
marly limestones versus acoustic impedance versus
AVO inversion results
The test of the detectability of lithology and fluid parameters has been carried out on high quality 2D
seismic data. On some of the seismic sections already for the angle stacks significant amplitudes variations
with offset could be identified. However, a meaningful interpretation was again disabled by the interference
with the reflection from the Ordovician limestones. Therefore, acoustic and elastic inversion as well as
simultaneous inversion of the angle stacks have been carried out and analyzed.
As expected, the expression of top reservoir at the acoustic impedance section is vague. Nevertheless,
at top reservoir level variations can now be observed which were not detectable on amplitude data. The
mapping of the top of the reservoir becomes also much more reliable compared to the amplitude data set.
One step further, the elastic impedance at larger offset angles, being an approximation of the Vp/Vs ratio,
delivers adequate results for the mapping of the top of the reservoir as well as for the extraction of
attributes to look at the spatial property distribution.
The largest differentiation is observed on the shear impedance section and, consequently, on the
Vp/Vs ratio. The clean quartz sandstones exhibit significantly higher shear impedance values than the
embedding lithologies, and combined with slightly lower acoustic impedances, extremely low values for
the Vp/Vs ratio can be observed. The lowest values of Vp/Vs ratio are observed for hydrocarbon
sandstones with good porosities. This result fully supports the assumptions made at the stage of rock
physics analysis.
Conclusions
Albeit their age and associated with that, relatively low porosities and high velocities, the investigated
Middle Cambrian sandstones of the Polish sector of the Baltic Sea show an AVO behavior typical of very
clean quartz sandstones separating them from the overlying Ordovician marly limestones. The observed
extremely low Vp/Vs ratios for hydrocarbon sandstones with higher preserved porosity can be utilized for
the identification of reservoir sweet spots and hence may help to reduce the further exploration risk.
Acknowledgement
The authors thank LOTOS Petrobaltic S.A. for the permission to publish some results of the current study.
References
Domżalski J., Górecki W., Mazurek A., Myśko A., Strzetelski W., Szamałek K., 2004. The prospects for
petroleum exploration in the eastern sector of Southern Baltic as revealed by sea bottom geochemical
survey correlated with seismic data. Geological Review, 52, 792-799.
Acoustic Impedance; m/s*g/cm3
Vp/Vs
shale
s
sandstone
s
limestone
s
Porosity
AImp
HC saturation
(a) (b)
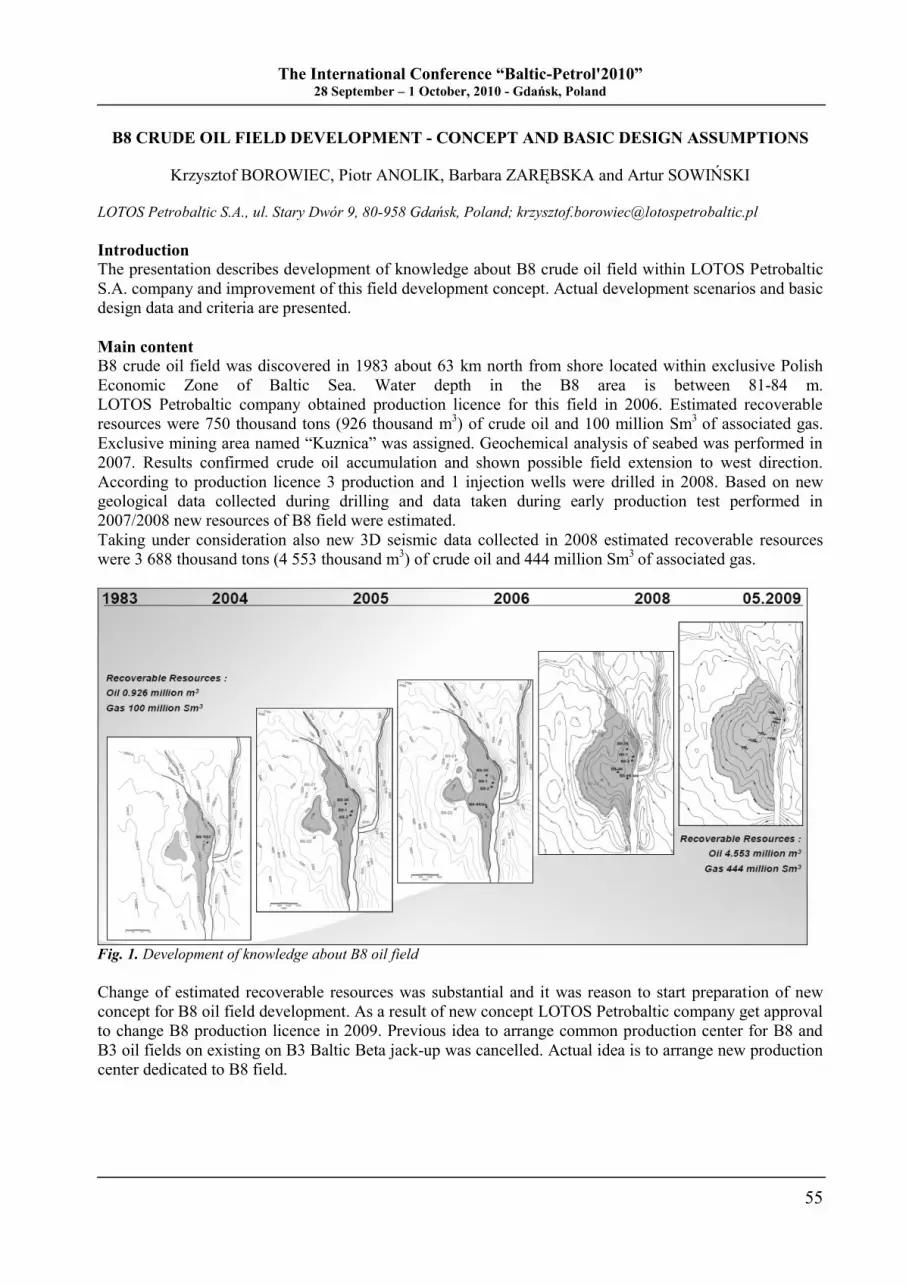
The International Conference “Baltic-Petrol'2010” 28 September – 1 October, 2010 - Gdańsk, Poland
55
B8 CRUDE OIL FIELD DEVELOPMENT - CONCEPT AND BASIC DESIGN ASSUMPTIONS
Krzysztof BOROWIEC, Piotr ANOLIK, Barbara ZARĘBSKA and Artur SOWIŃSKI
LOTOS Petrobaltic S.A., ul. Stary Dwór 9, 80-958 Gdańsk, Poland; [email protected]
Introduction
The presentation describes development of knowledge about B8 crude oil field within LOTOS Petrobaltic
S.A. company and improvement of this field development concept. Actual development scenarios and basic
design data and criteria are presented.
Main content
B8 crude oil field was discovered in 1983 about 63 km north from shore located within exclusive Polish
Economic Zone of Baltic Sea. Water depth in the B8 area is between 81-84 m.
LOTOS Petrobaltic company obtained production licence for this field in 2006. Estimated recoverable
resources were 750 thousand tons (926 thousand m3) of crude oil and 100 million Sm
3 of associated gas.
Exclusive mining area named “Kuznica” was assigned. Geochemical analysis of seabed was performed in
2007. Results confirmed crude oil accumulation and shown possible field extension to west direction.
According to production licence 3 production and 1 injection wells were drilled in 2008. Based on new
geological data collected during drilling and data taken during early production test performed in
2007/2008 new resources of B8 field were estimated.
Taking under consideration also new 3D seismic data collected in 2008 estimated recoverable resources
were 3 688 thousand tons (4 553 thousand m3) of crude oil and 444 million Sm
3 of associated gas.
Fig. 1. Development of knowledge about B8 oil field
Change of estimated recoverable resources was substantial and it was reason to start preparation of new
concept for B8 oil field development. As a result of new concept LOTOS Petrobaltic company get approval
to change B8 production licence in 2009. Previous idea to arrange common production center for B8 and
B3 oil fields on existing on B3 Baltic Beta jack-up was cancelled. Actual idea is to arrange new production
center dedicated to B8 field.

The International Conference “Baltic-Petrol'2010” 28 September – 1 October, 2010 - Gdańsk, Poland
56
Fig. 2. Actual options for production facility for B8 oil field development
Conclusions
As a result of LOTOS Petrobaltic activity between 2006-2008 on B8 estimated recoverable resources were
verified and actual resources are three times higher then it was calculated before. Change of estimated
recoverable resources was substantial and it was reason to change philosophy for field development also.
Actual concept were prepared taking under consideration dedicated to B8 field production center facility
equipped with the most important production systems (crude oil separation, water injection and associated
gas compression and transmission) and installations for crude oil transmission and storage.
References
Anolik J., Borowiec K., Sowiński A., 2008. Field B8 – Field Development Study. Unpublished report.
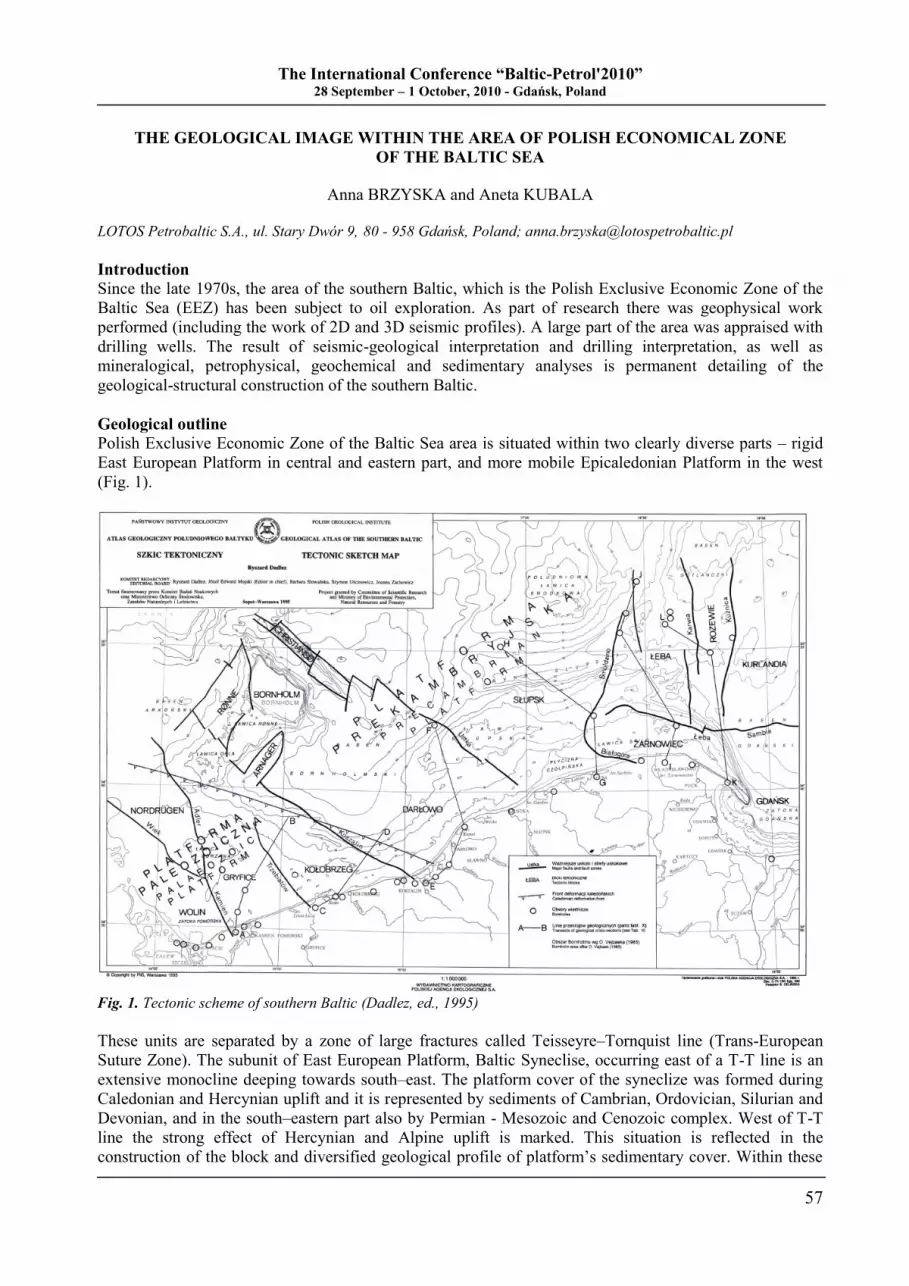
The International Conference “Baltic-Petrol'2010” 28 September – 1 October, 2010 - Gdańsk, Poland
57
THE GEOLOGICAL IMAGE WITHIN THE AREA OF POLISH ECONOMICAL ZONE
OF THE BALTIC SEA
Anna BRZYSKA and Aneta KUBALA
LOTOS Petrobaltic S.A., ul. Stary Dwór 9, 80 - 958 Gdańsk, Poland; [email protected]
Introduction
Since the late 1970s, the area of the southern Baltic, which is the Polish Exclusive Economic Zone of the
Baltic Sea (EEZ) has been subject to oil exploration. As part of research there was geophysical work
performed (including the work of 2D and 3D seismic profiles). A large part of the area was appraised with
drilling wells. The result of seismic-geological interpretation and drilling interpretation, as well as
mineralogical, petrophysical, geochemical and sedimentary analyses is permanent detailing of the
geological-structural construction of the southern Baltic.
Geological outline
Polish Exclusive Economic Zone of the Baltic Sea area is situated within two clearly diverse parts – rigid
East European Platform in central and eastern part, and more mobile Epicaledonian Platform in the west
(Fig. 1).
Fig. 1. Tectonic scheme of southern Baltic (Dadlez, ed., 1995)
These units are separated by a zone of large fractures called Teisseyre–Tornquist line (Trans-European
Suture Zone). The subunit of East European Platform, Baltic Syneclise, occurring east of a T-T line is an
extensive monocline deeping towards south–east. The platform cover of the syneclize was formed during
Caledonian and Hercynian uplift and it is represented by sediments of Cambrian, Ordovician, Silurian and
Devonian, and in the south–eastern part also by Permian - Mesozoic and Cenozoic complex. West of T-T
line the strong effect of Hercynian and Alpine uplift is marked. This situation is reflected in the
construction of the block and diversified geological profile of platform‟s sedimentary cover. Within these
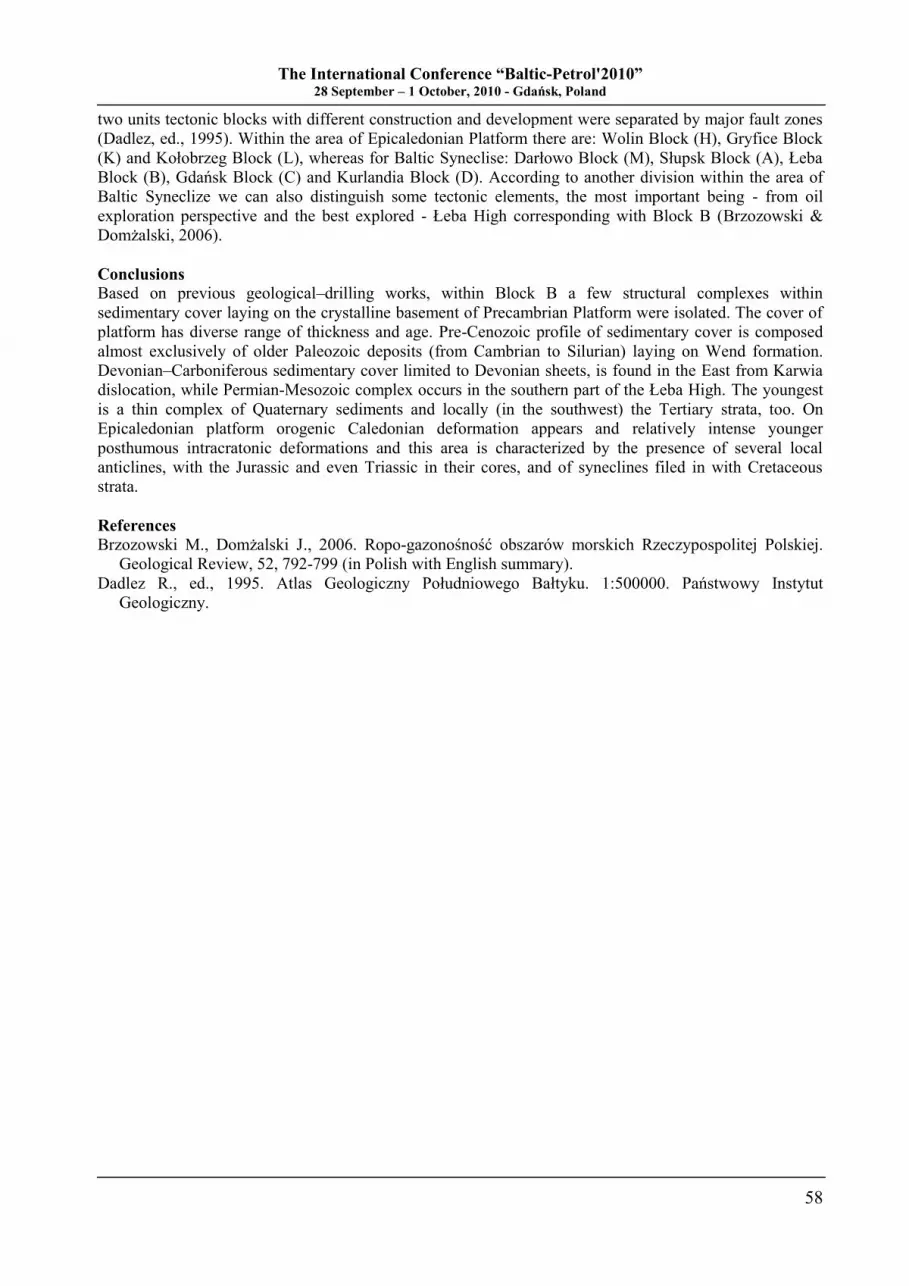
The International Conference “Baltic-Petrol'2010” 28 September – 1 October, 2010 - Gdańsk, Poland
58
two units tectonic blocks with different construction and development were separated by major fault zones
(Dadlez, ed., 1995). Within the area of Epicaledonian Platform there are: Wolin Block (H), Gryfice Block
(K) and Kołobrzeg Block (L), whereas for Baltic Syneclise: Darłowo Block (M), Słupsk Block (A), Łeba
Block (B), Gdańsk Block (C) and Kurlandia Block (D). According to another division within the area of
Baltic Syneclize we can also distinguish some tectonic elements, the most important being - from oil
exploration perspective and the best explored - Łeba High corresponding with Block B (Brzozowski &
Domżalski, 2006).
Conclusions
Based on previous geological–drilling works, within Block B a few structural complexes within
sedimentary cover laying on the crystalline basement of Precambrian Platform were isolated. The cover of
platform has diverse range of thickness and age. Pre-Cenozoic profile of sedimentary cover is composed
almost exclusively of older Paleozoic deposits (from Cambrian to Silurian) laying on Wend formation.
Devonian–Carboniferous sedimentary cover limited to Devonian sheets, is found in the East from Karwia
dislocation, while Permian-Mesozoic complex occurs in the southern part of the Łeba High. The youngest
is a thin complex of Quaternary sediments and locally (in the southwest) the Tertiary strata, too. On
Epicaledonian platform orogenic Caledonian deformation appears and relatively intense younger
posthumous intracratonic deformations and this area is characterized by the presence of several local
anticlines, with the Jurassic and even Triassic in their cores, and of syneclines filed in with Cretaceous
strata.
References
Brzozowski M., Domżalski J., 2006. Ropo-gazonośność obszarów morskich Rzeczypospolitej Polskiej.
Geological Review, 52, 792-799 (in Polish with English summary).
Dadlez R., ed., 1995. Atlas Geologiczny Południowego Bałtyku. 1:500000. Państwowy Instytut
Geologiczny.
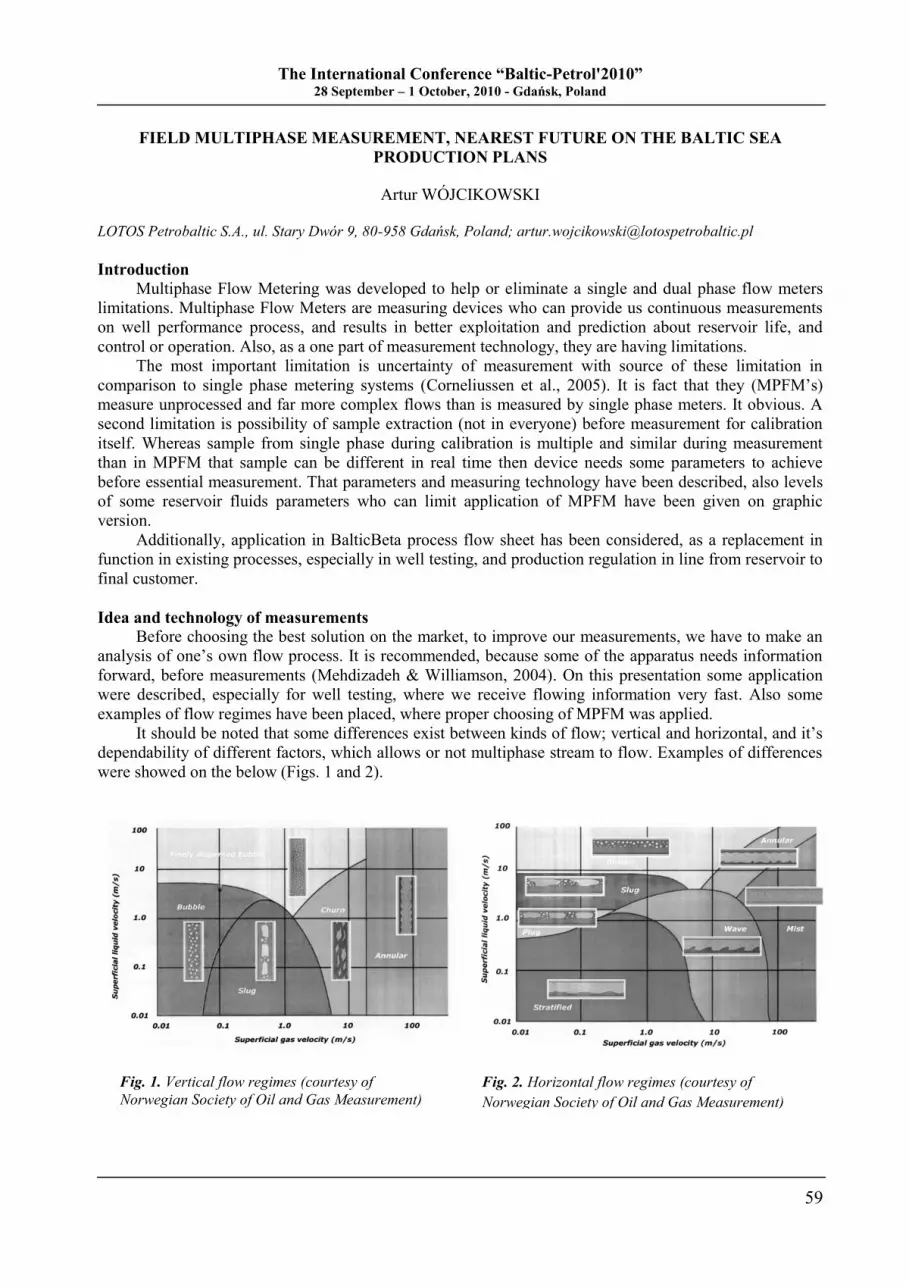
The International Conference “Baltic-Petrol'2010” 28 September – 1 October, 2010 - Gdańsk, Poland
59
FIELD MULTIPHASE MEASUREMENT, NEAREST FUTURE ON THE BALTIC SEA
PRODUCTION PLANS
Artur WÓJCIKOWSKI
LOTOS Petrobaltic S.A., ul. Stary Dwór 9, 80-958 Gdańsk, Poland; [email protected]
Introduction
Multiphase Flow Metering was developed to help or eliminate a single and dual phase flow meters
limitations. Multiphase Flow Meters are measuring devices who can provide us continuous measurements
on well performance process, and results in better exploitation and prediction about reservoir life, and
control or operation. Also, as a one part of measurement technology, they are having limitations.
The most important limitation is uncertainty of measurement with source of these limitation in
comparison to single phase metering systems (Corneliussen et al., 2005). It is fact that they (MPFM‟s)
measure unprocessed and far more complex flows than is measured by single phase meters. It obvious. A
second limitation is possibility of sample extraction (not in everyone) before measurement for calibration
itself. Whereas sample from single phase during calibration is multiple and similar during measurement
than in MPFM that sample can be different in real time then device needs some parameters to achieve
before essential measurement. That parameters and measuring technology have been described, also levels
of some reservoir fluids parameters who can limit application of MPFM have been given on graphic
version.
Additionally, application in BalticBeta process flow sheet has been considered, as a replacement in
function in existing processes, especially in well testing, and production regulation in line from reservoir to
final customer.
Idea and technology of measurements
Before choosing the best solution on the market, to improve our measurements, we have to make an
analysis of one‟s own flow process. It is recommended, because some of the apparatus needs information
forward, before measurements (Mehdizadeh & Williamson, 2004). On this presentation some application
were described, especially for well testing, where we receive flowing information very fast. Also some
examples of flow regimes have been placed, where proper choosing of MPFM was applied.
It should be noted that some differences exist between kinds of flow; vertical and horizontal, and it‟s
dependability of different factors, which allows or not multiphase stream to flow. Examples of differences
were showed on the below (Figs. 1 and 2).
Fig. 2. Horizontal flow regimes (courtesy of
Norwegian Society of Oil and Gas Measurement) Fig. 1. Vertical flow regimes (courtesy of
Norwegian Society of Oil and Gas Measurement)
The International Conference “Baltic-Petrol'2010” Gdańsk, Poland, 28 September – 1 October, 2010
60
To reach a flow structure it needs to employ a some measurement technologies together in one measuring
devices, also main aim of that measurement is to calculate the velocity of each flowing phase. As it was
wrote above the fastest way to achieve expected results is compilation of different methods, what was
also described in the article, with categorization on separated method used sometimes in oil and gas
production plants as a single phase flow metering instruments, for oil gas and water but after
separation process. In entire production environment there are plenty of solutions for multiphase
applications. We can find separation type MPFM‟s, in-line meters, partial separation, separation
in sample line (parallel), and others. Scope of this was shortly described in mentioned
presentation.
Examples
Generally method employs a EM method (electro-magnetic) more closer microwave technology of
scanning the flowing stream, as it known. The microwave ways meet a strong barrier in water, an they are
attenuated, in oil and gas phases, those waves are shifted in phase, than we use a microwave technology
to measure the WLR (Corneliussen et al., 2005). It is not the end, additionally a capacitance and
conductance technology should be applied. To reach a rest of exist phases we have to use a gamma
spectroscopy (density), change of pressure on the pressure restriction, ultrasonic, and finally a cross-
correlation of above technologies in flow computer. That situation is generally present in whole
multiphase meters, but we know a some other types of meters based on the above rule. For example,
partial separate type instruments, make a separation of fluid on the gas and oil phase on typical single
phase oil and gas meters or oil water in oil and water meters, give us information about two existing
phase. It also known, partial separation meters, which separate only a little part of gas, than we decrease a
GVF and can measure a rest of that stream in designed envelope of the flow meter. Also known someone
other separation MPFM‟s, with separation in the sample line, which operates in by-pass line, and results
from both sources are assumed (Corneliussen et al., 2005). Generally, kind of measurement devices
employ in multiphase flow meters depends on type of chosen multiphase meter.
Upon analysis of exampled flow process, user can choose optimal type to use in his own process.
Performance problem was focused on this presentation, what is important especially when we can find
plenty of similar devices on the market. Intuitionally, it is simple that kind of instrument usually works in
specific conditions, especially in danger area. From this, it needs a specific maintenance and control,
because that complex system employs few instruments who has to fit a special requirements. Author, in
presentation try to describe a process of choosing and make a localization of MPFM in BalticBeta
(LOTOS Petrobaltic Company) crude oil and gas flow process, based on polish regulations (CE) and
ATEX rules what is almost equal as well.
Conclusions
Final users will be strongly supported, when it would has been introduced on the Baltic Sea oil and
gas crude oil plants. Form wide perspective we can eliminate some huge separation elements from flow
process installation, where we can place some other measurement instruments. Up to now, there are
plenty of applications of MPFM‟s in the World, from that flows a know-how, what is not hidden, but
wide presented. Application of that, yields a profit and positive influence of well performance with fast
answer, after well test and production, what straight helps in better reservoir recognition and higher final
production of oil and gas.
References
Corneliussen S., Coupt J-P., Dahl E., Dykesteen E., Frøysa K.E., Malde E., Moestue H., Moksnes P.O.,
Scheers L., Tunheim H., 2005. Handbook of Multiphase Flow Metering. Norwegian Society for Oil
and Gas Measurement & Norwegian Society of Chartered Technical and Scientific Professionals, 18-
52.
Mehdizadeh P., Williamson J., 2004. Principles of multiphase measurements, State of Alaska. Alaska Oil
& Gas Conservation Commission, 11-30.
The International Conference “Baltic-Petrol'2010” Gdańsk, Poland, 28 September – 1 October, 2010
61
SEPTEMBER 30 (THURSDAY, AFTERNOON)
GEOPHYSICS SESSION
In Chair: Vadim SIVKOV (Russia) and Paweł KOSAKOWSKI (Poland)
14:20 Interpretation of Palaeozoic Structures in Eastern Pomerania Based on Gravity
and Magnetotelluric Data
Michał STEFANIUK, Tomasz CZERWIŃSKI, Cezary OSTROWSKI,
Marek WOJDYŁA and Tadeusz WOLNOWSKI
14:40 2D and 3D Seismic Acquisition in the Polish Economic Zone of the Baltic Sea in Last
Decade
Marek ZAJĄCZKOWSKI, Grzegorz BRZYSKI and Edyta NOWAK-KOSZLA
15:00 Methodology of Processing, Interpretation and Inversion of Seismic 2D and 3D Data,
Currently Used in the Polish Economic Zone of the Baltic Sea
Edyta NOWAK-KOSZLA, Marek ZAJĄCZKOWSKI and Sabine KLARNER
15:20 Methodology of Geophysical Well Logging Carried Out in Recent Years on the Block B
Located in the Baltic Sea
Krzysztof OLESIŃSKI and Edyta NOWAK-KOSZLA
15:40 Application of Geophysical Survey Equipment for Marine Engineering Geology
Grzegorz ZAJFERT
16:00 – 16:30 Coffee break
MISCELLANEOUS SESSION
In Chair: Hilmar REMPEL (Germany) and Dariusz WIĘCŁAW (Poland)
16:30 The Activites and License Portefolio of Lotos EPN
Stig BERGSETH and Henrik CARLSEN
16:50 Microbial and Geochemical Surveys in the Polish Economical Zone of the Baltic Sea
Aneta KUBALA and Anna BRZYSKA
17:10 A High Level Overview of Exploration in the Norwegian Continental Shelf
Stig BERGSETH
17:30 – 18:30 POSTER SESSION (I)
19:30 – 20:30 Concert at the Academy of Music

The International Conference “Baltic-Petrol'2010” Gdańsk, Poland, 28 September – 1 October, 2010
62
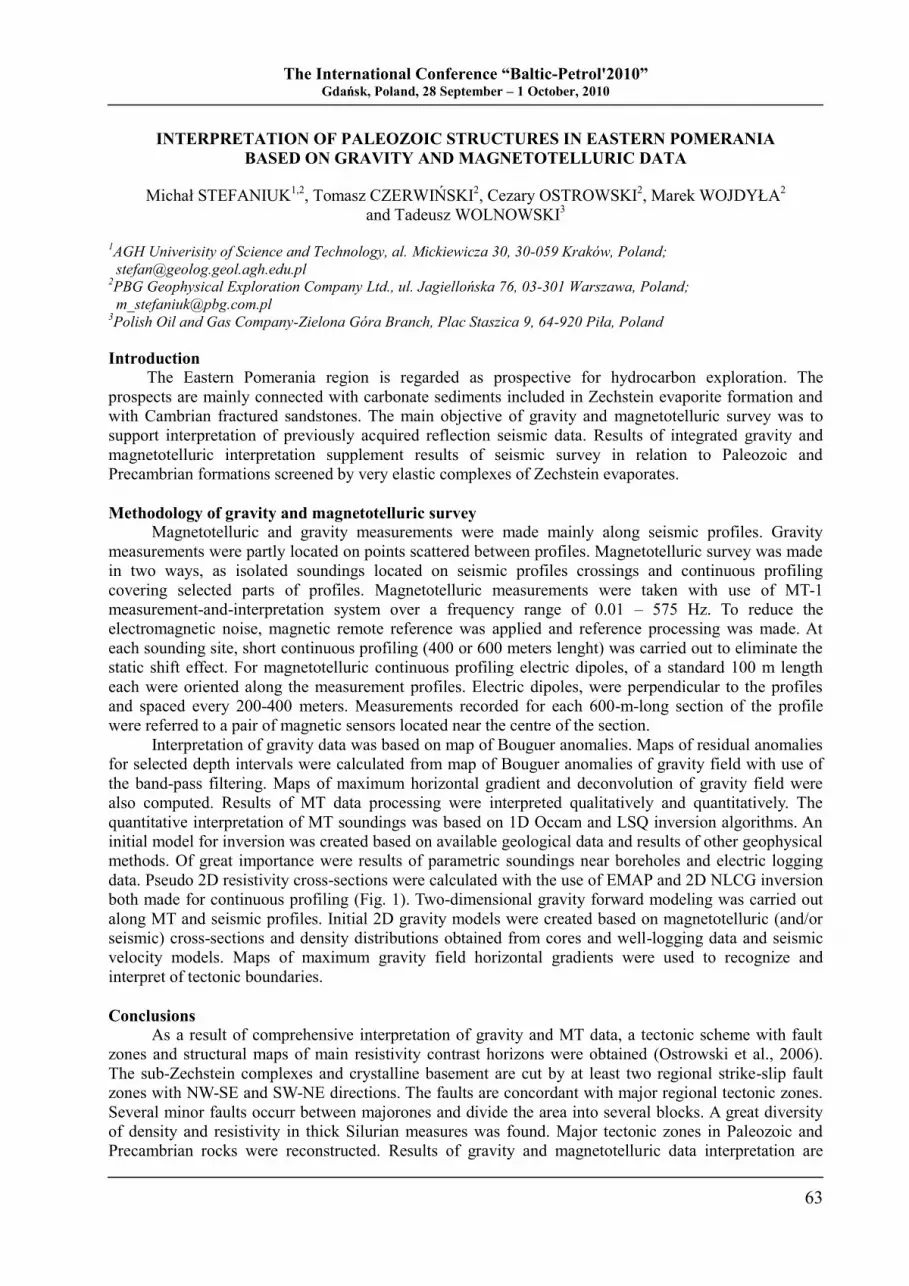
The International Conference “Baltic-Petrol'2010” Gdańsk, Poland, 28 September – 1 October, 2010
63
INTERPRETATION OF PALEOZOIC STRUCTURES IN EASTERN POMERANIA
BASED ON GRAVITY AND MAGNETOTELLURIC DATA
Michał STEFANIUK1,2
, Tomasz CZERWIŃSKI2, Cezary OSTROWSKI
2, Marek WOJDYŁA
2
and Tadeusz WOLNOWSKI3
1AGH Univerisity of Science and Technology, al. Mickiewicza 30, 30-059 Kraków, Poland;
[email protected] 2PBG Geophysical Exploration Company Ltd., ul. Jagiellońska 76, 03-301 Warszawa, Poland;
[email protected] 3Polish Oil and Gas Company-Zielona Góra Branch, Plac Staszica 9, 64-920 Piła, Poland
Introduction
The Eastern Pomerania region is regarded as prospective for hydrocarbon exploration. The
prospects are mainly connected with carbonate sediments included in Zechstein evaporite formation and
with Cambrian fractured sandstones. The main objective of gravity and magnetotelluric survey was to
support interpretation of previously acquired reflection seismic data. Results of integrated gravity and
magnetotelluric interpretation supplement results of seismic survey in relation to Paleozoic and
Precambrian formations screened by very elastic complexes of Zechstein evaporates.
Methodology of gravity and magnetotelluric survey
Magnetotelluric and gravity measurements were made mainly along seismic profiles. Gravity
measurements were partly located on points scattered between profiles. Magnetotelluric survey was made
in two ways, as isolated soundings located on seismic profiles crossings and continuous profiling
covering selected parts of profiles. Magnetotelluric measurements were taken with use of MT-1
measurement-and-interpretation system over a frequency range of 0.01 – 575 Hz. To reduce the
electromagnetic noise, magnetic remote reference was applied and reference processing was made. At
each sounding site, short continuous profiling (400 or 600 meters lenght) was carried out to eliminate the
static shift effect. For magnetotelluric continuous profiling electric dipoles, of a standard 100 m length
each were oriented along the measurement profiles. Electric dipoles, were perpendicular to the profiles
and spaced every 200-400 meters. Measurements recorded for each 600-m-long section of the profile
were referred to a pair of magnetic sensors located near the centre of the section.
Interpretation of gravity data was based on map of Bouguer anomalies. Maps of residual anomalies
for selected depth intervals were calculated from map of Bouguer anomalies of gravity field with use of
the band-pass filtering. Maps of maximum horizontal gradient and deconvolution of gravity field were
also computed. Results of MT data processing were interpreted qualitatively and quantitatively. The
quantitative interpretation of MT soundings was based on 1D Occam and LSQ inversion algorithms. An
initial model for inversion was created based on available geological data and results of other geophysical
methods. Of great importance were results of parametric soundings near boreholes and electric logging
data. Pseudo 2D resistivity cross-sections were calculated with the use of EMAP and 2D NLCG inversion
both made for continuous profiling (Fig. 1). Two-dimensional gravity forward modeling was carried out
along MT and seismic profiles. Initial 2D gravity models were created based on magnetotelluric (and/or
seismic) cross-sections and density distributions obtained from cores and well-logging data and seismic
velocity models. Maps of maximum gravity field horizontal gradients were used to recognize and
interpret of tectonic boundaries.
Conclusions
As a result of comprehensive interpretation of gravity and MT data, a tectonic scheme with fault
zones and structural maps of main resistivity contrast horizons were obtained (Ostrowski et al., 2006).
The sub-Zechstein complexes and crystalline basement are cut by at least two regional strike-slip fault
zones with NW-SE and SW-NE directions. The faults are concordant with major regional tectonic zones.
Several minor faults occurr between majorones and divide the area into several blocks. A great diversity
of density and resistivity in thick Silurian measures was found. Major tectonic zones in Paleozoic and
Precambrian rocks were reconstructed. Results of gravity and magnetotelluric data interpretation are
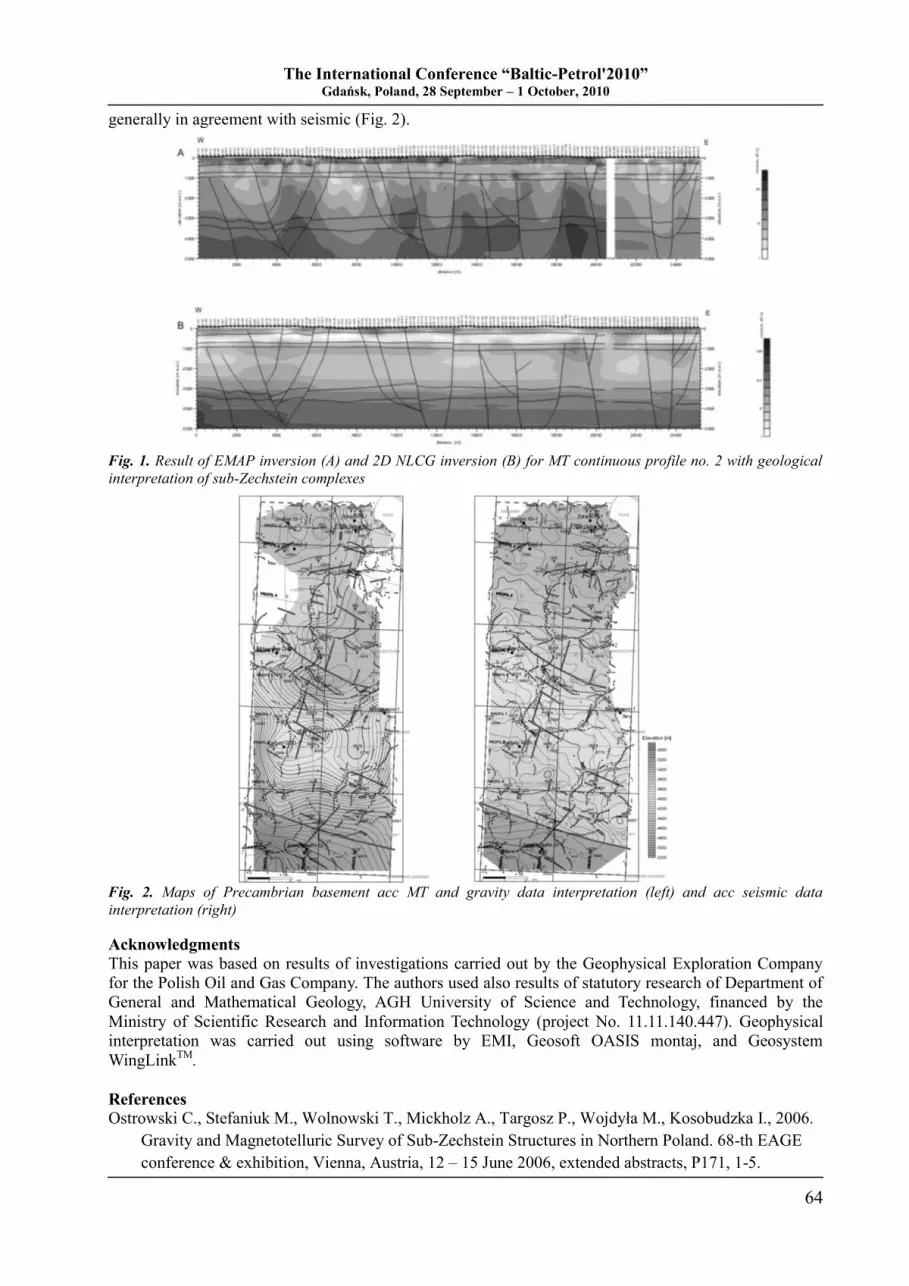
The International Conference “Baltic-Petrol'2010” Gdańsk, Poland, 28 September – 1 October, 2010
64
generally in agreement with seismic (Fig. 2).
Fig. 1. Result of EMAP inversion (A) and 2D NLCG inversion (B) for MT continuous profile no. 2 with geological
interpretation of sub-Zechstein complexes
Fig. 2. Maps of Precambrian basement acc MT and gravity data interpretation (left) and acc seismic data
interpretation (right)
Acknowledgments
This paper was based on results of investigations carried out by the Geophysical Exploration Company
for the Polish Oil and Gas Company. The authors used also results of statutory research of Department of
General and Mathematical Geology, AGH University of Science and Technology, financed by the
Ministry of Scientific Research and Information Technology (project No. 11.11.140.447). Geophysical
interpretation was carried out using software by EMI, Geosoft OASIS montaj, and Geosystem
WingLinkTM
.
References
Ostrowski C., Stefaniuk M., Wolnowski T., Mickholz A., Targosz P., Wojdyła M., Kosobudzka I., 2006.
Gravity and Magnetotelluric Survey of Sub-Zechstein Structures in Northern Poland. 68-th EAGE
conference & exhibition, Vienna, Austria, 12 – 15 June 2006, extended abstracts, P171, 1-5.
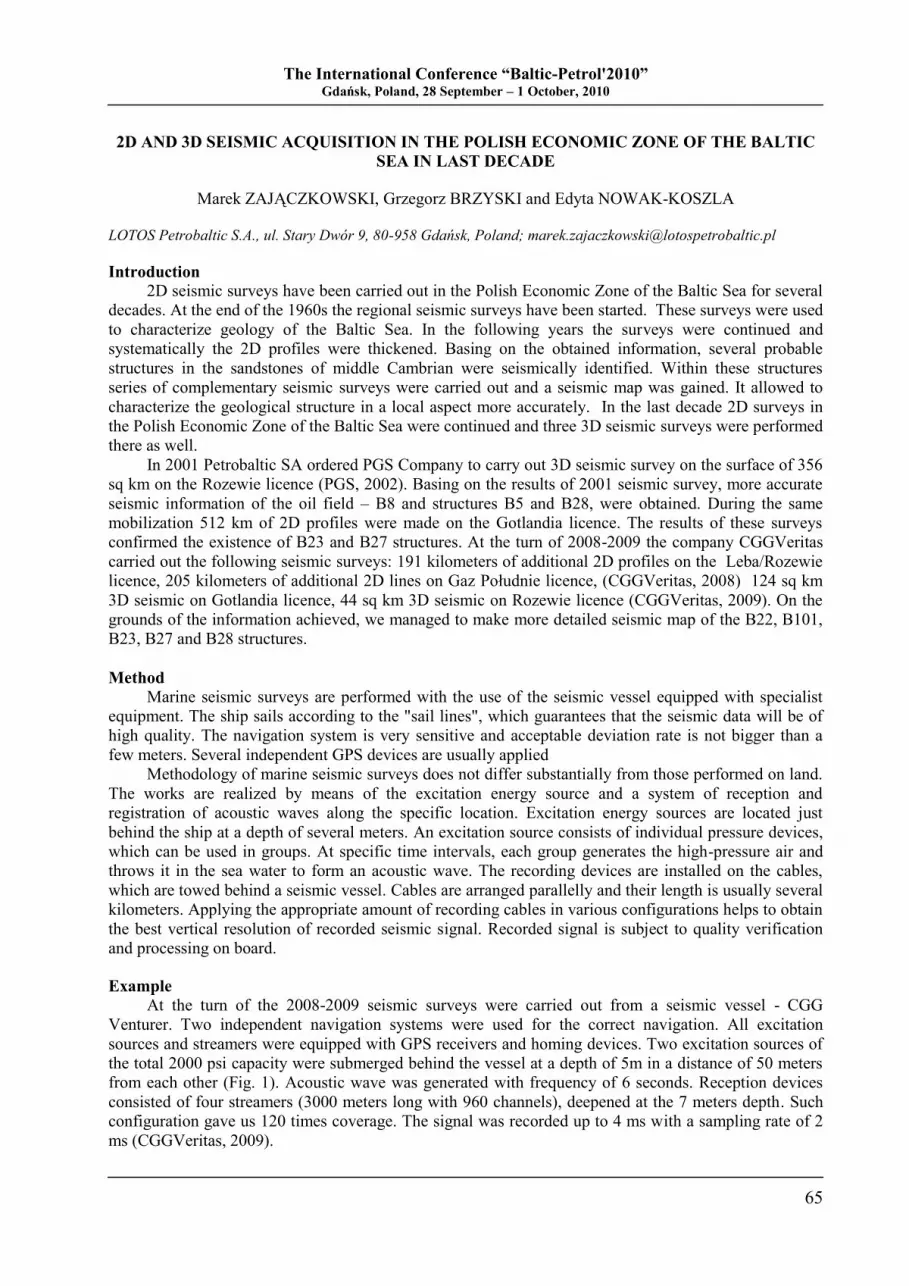
The International Conference “Baltic-Petrol'2010” Gdańsk, Poland, 28 September – 1 October, 2010
65
2D AND 3D SEISMIC ACQUISITION IN THE POLISH ECONOMIC ZONE OF THE BALTIC
SEA IN LAST DECADE
Marek ZAJĄCZKOWSKI, Grzegorz BRZYSKI and Edyta NOWAK-KOSZLA
LOTOS Petrobaltic S.A., ul. Stary Dwór 9, 80-958 Gdańsk, Poland; [email protected]
Introduction
2D seismic surveys have been carried out in the Polish Economic Zone of the Baltic Sea for several
decades. At the end of the 1960s the regional seismic surveys have been started. These surveys were used
to characterize geology of the Baltic Sea. In the following years the surveys were continued and
systematically the 2D profiles were thickened. Basing on the obtained information, several probable
structures in the sandstones of middle Cambrian were seismically identified. Within these structures
series of complementary seismic surveys were carried out and a seismic map was gained. It allowed to
characterize the geological structure in a local aspect more accurately. In the last decade 2D surveys in
the Polish Economic Zone of the Baltic Sea were continued and three 3D seismic surveys were performed
there as well.
In 2001 Petrobaltic SA ordered PGS Company to carry out 3D seismic survey on the surface of 356
sq km on the Rozewie licence (PGS, 2002). Basing on the results of 2001 seismic survey, more accurate
seismic information of the oil field – B8 and structures B5 and B28, were obtained. During the same
mobilization 512 km of 2D profiles were made on the Gotlandia licence. The results of these surveys
confirmed the existence of B23 and B27 structures. At the turn of 2008-2009 the company CGGVeritas
carried out the following seismic surveys: 191 kilometers of additional 2D profiles on the Leba/Rozewie
licence, 205 kilometers of additional 2D lines on Gaz Południe licence, (CGGVeritas, 2008) 124 sq km
3D seismic on Gotlandia licence, 44 sq km 3D seismic on Rozewie licence (CGGVeritas, 2009). On the
grounds of the information achieved, we managed to make more detailed seismic map of the B22, B101,
B23, B27 and B28 structures.
Method
Marine seismic surveys are performed with the use of the seismic vessel equipped with specialist
equipment. The ship sails according to the "sail lines", which guarantees that the seismic data will be of
high quality. The navigation system is very sensitive and acceptable deviation rate is not bigger than a
few meters. Several independent GPS devices are usually applied
Methodology of marine seismic surveys does not differ substantially from those performed on land.
The works are realized by means of the excitation energy source and a system of reception and
registration of acoustic waves along the specific location. Excitation energy sources are located just
behind the ship at a depth of several meters. An excitation source consists of individual pressure devices,
which can be used in groups. At specific time intervals, each group generates the high-pressure air and
throws it in the sea water to form an acoustic wave. The recording devices are installed on the cables,
which are towed behind a seismic vessel. Cables are arranged parallelly and their length is usually several
kilometers. Applying the appropriate amount of recording cables in various configurations helps to obtain
the best vertical resolution of recorded seismic signal. Recorded signal is subject to quality verification
and processing on board.
Example
At the turn of the 2008-2009 seismic surveys were carried out from a seismic vessel - CGG
Venturer. Two independent navigation systems were used for the correct navigation. All excitation
sources and streamers were equipped with GPS receivers and homing devices. Two excitation sources of
the total 2000 psi capacity were submerged behind the vessel at a depth of 5m in a distance of 50 meters
from each other (Fig. 1). Acoustic wave was generated with frequency of 6 seconds. Reception devices
consisted of four streamers (3000 meters long with 960 channels), deepened at the 7 meters depth. Such
configuration gave us 120 times coverage. The signal was recorded up to 4 ms with a sampling rate of 2
ms (CGGVeritas, 2009).
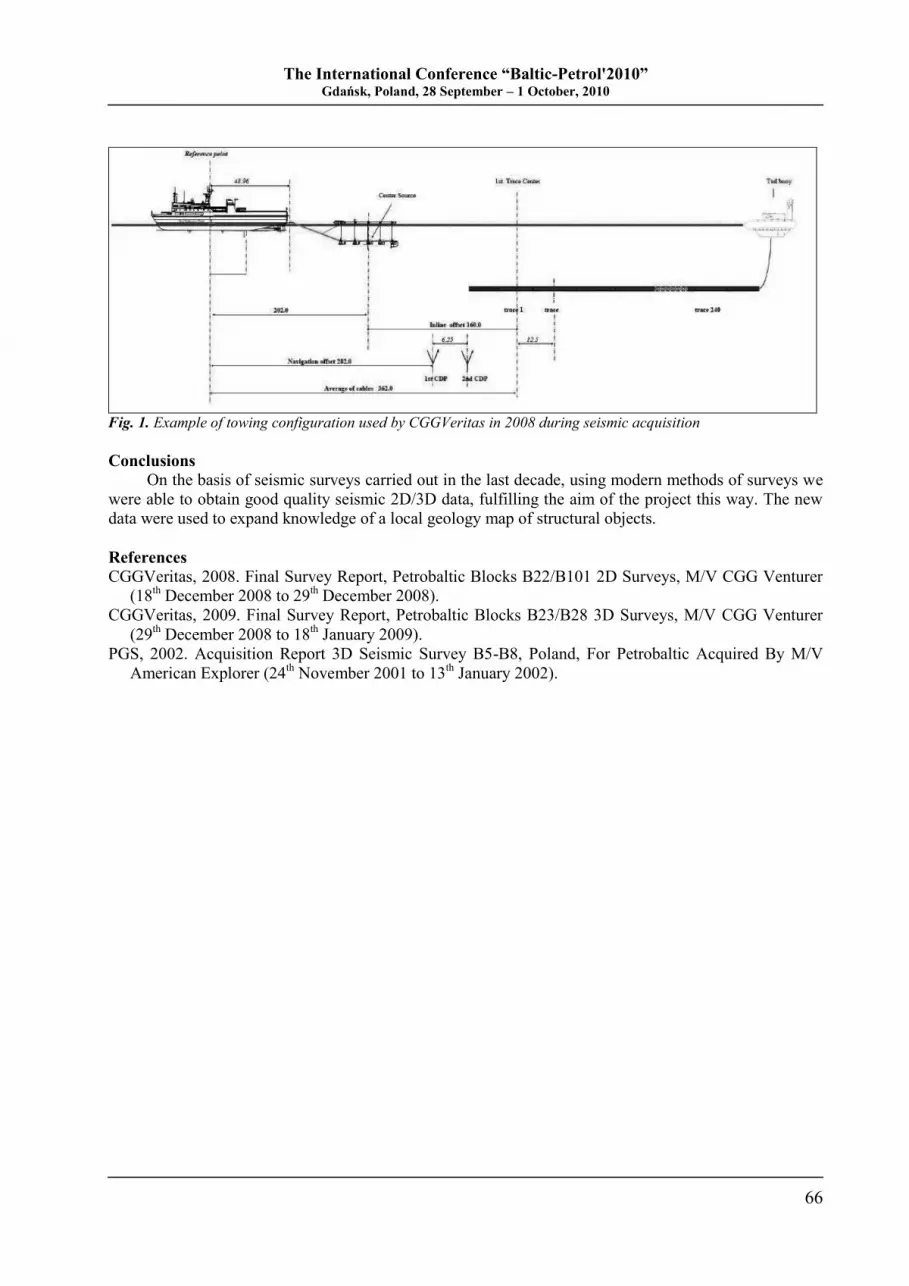
The International Conference “Baltic-Petrol'2010” Gdańsk, Poland, 28 September – 1 October, 2010
66
Fig. 1. Example of towing configuration used by CGGVeritas in 2008 during seismic acquisition
Conclusions
On the basis of seismic surveys carried out in the last decade, using modern methods of surveys we
were able to obtain good quality seismic 2D/3D data, fulfilling the aim of the project this way. The new
data were used to expand knowledge of a local geology map of structural objects.
References
CGGVeritas, 2008. Final Survey Report, Petrobaltic Blocks B22/B101 2D Surveys, M/V CGG Venturer
(18th December 2008 to 29
th December 2008).
CGGVeritas, 2009. Final Survey Report, Petrobaltic Blocks B23/B28 3D Surveys, M/V CGG Venturer
(29th December 2008 to 18
th January 2009).
PGS, 2002. Acquisition Report 3D Seismic Survey B5-B8, Poland, For Petrobaltic Acquired By M/V
American Explorer (24th November 2001 to 13
th January 2002).
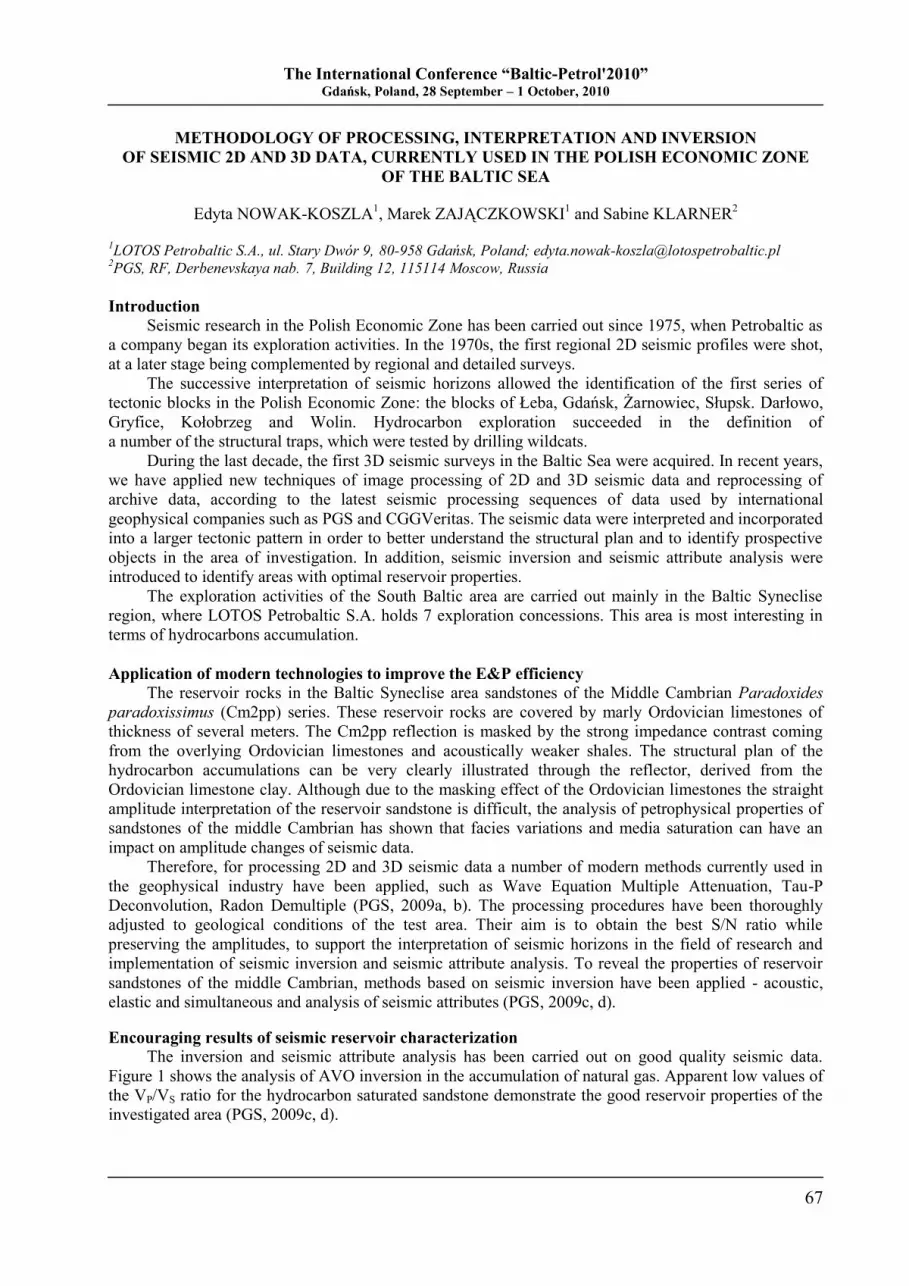
The International Conference “Baltic-Petrol'2010” Gdańsk, Poland, 28 September – 1 October, 2010
67
METHODOLOGY OF PROCESSING, INTERPRETATION AND INVERSION
OF SEISMIC 2D AND 3D DATA, CURRENTLY USED IN THE POLISH ECONOMIC ZONE
OF THE BALTIC SEA
Edyta NOWAK-KOSZLA1, Marek ZAJĄCZKOWSKI
1 and Sabine KLARNER
2
1LOTOS Petrobaltic S.A., ul. Stary Dwór 9, 80-958 Gdańsk, Poland; [email protected]
2PGS, RF, Derbenevskaya nab. 7, Building 12, 115114 Moscow, Russia
Introduction
Seismic research in the Polish Economic Zone has been carried out since 1975, when Petrobaltic as
a company began its exploration activities. In the 1970s, the first regional 2D seismic profiles were shot,
at a later stage being complemented by regional and detailed surveys.
The successive interpretation of seismic horizons allowed the identification of the first series of
tectonic blocks in the Polish Economic Zone: the blocks of Łeba, Gdańsk, Żarnowiec, Słupsk. Darłowo,
Gryfice, Kołobrzeg and Wolin. Hydrocarbon exploration succeeded in the definition of
a number of the structural traps, which were tested by drilling wildcats.
During the last decade, the first 3D seismic surveys in the Baltic Sea were acquired. In recent years,
we have applied new techniques of image processing of 2D and 3D seismic data and reprocessing of
archive data, according to the latest seismic processing sequences of data used by international
geophysical companies such as PGS and CGGVeritas. The seismic data were interpreted and incorporated
into a larger tectonic pattern in order to better understand the structural plan and to identify prospective
objects in the area of investigation. In addition, seismic inversion and seismic attribute analysis were
introduced to identify areas with optimal reservoir properties.
The exploration activities of the South Baltic area are carried out mainly in the Baltic Syneclise
region, where LOTOS Petrobaltic S.A. holds 7 exploration concessions. This area is most interesting in
terms of hydrocarbons accumulation.
Application of modern technologies to improve the E&P efficiency
The reservoir rocks in the Baltic Syneclise area sandstones of the Middle Cambrian Paradoxides
paradoxissimus (Cm2pp) series. These reservoir rocks are covered by marly Ordovician limestones of
thickness of several meters. The Cm2pp reflection is masked by the strong impedance contrast coming
from the overlying Ordovician limestones and acoustically weaker shales. The structural plan of the
hydrocarbon accumulations can be very clearly illustrated through the reflector, derived from the
Ordovician limestone clay. Although due to the masking effect of the Ordovician limestones the straight
amplitude interpretation of the reservoir sandstone is difficult, the analysis of petrophysical properties of
sandstones of the middle Cambrian has shown that facies variations and media saturation can have an
impact on amplitude changes of seismic data.
Therefore, for processing 2D and 3D seismic data a number of modern methods currently used in
the geophysical industry have been applied, such as Wave Equation Multiple Attenuation, Tau-P
Deconvolution, Radon Demultiple (PGS, 2009a, b). The processing procedures have been thoroughly
adjusted to geological conditions of the test area. Their aim is to obtain the best S/N ratio while
preserving the amplitudes, to support the interpretation of seismic horizons in the field of research and
implementation of seismic inversion and seismic attribute analysis. To reveal the properties of reservoir
sandstones of the middle Cambrian, methods based on seismic inversion have been applied - acoustic,
elastic and simultaneous and analysis of seismic attributes (PGS, 2009c, d).
Encouraging results of seismic reservoir characterization
The inversion and seismic attribute analysis has been carried out on good quality seismic data.
Figure 1 shows the analysis of AVO inversion in the accumulation of natural gas. Apparent low values of
the VP/VS ratio for the hydrocarbon saturated sandstone demonstrate the good reservoir properties of the
investigated area (PGS, 2009c, d).
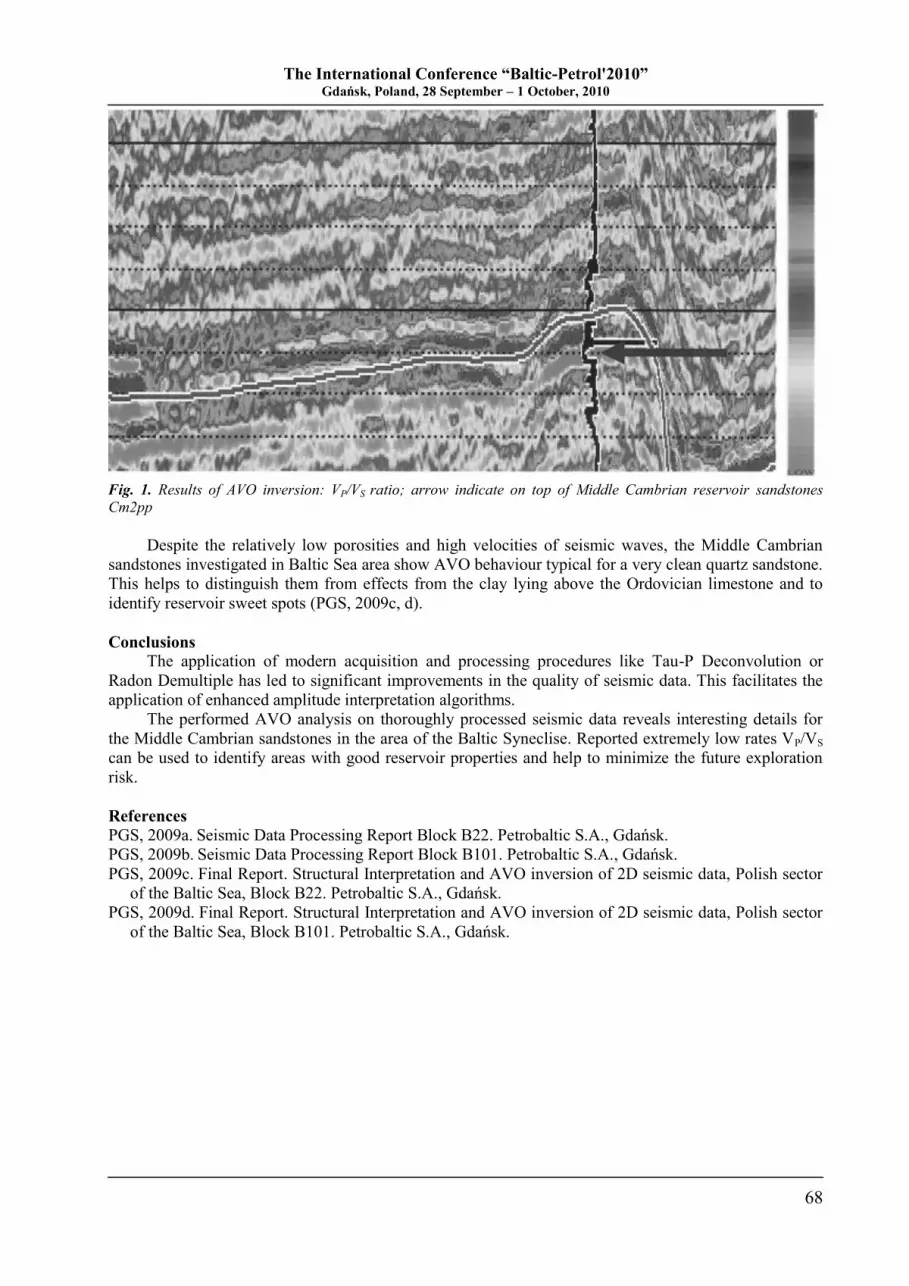
The International Conference “Baltic-Petrol'2010” Gdańsk, Poland, 28 September – 1 October, 2010
68
Fig. 1. Results of AVO inversion: VP/VS ratio; arrow indicate on top of Middle Cambrian reservoir sandstones
Cm2pp
Despite the relatively low porosities and high velocities of seismic waves, the Middle Cambrian
sandstones investigated in Baltic Sea area show AVO behaviour typical for a very clean quartz sandstone.
This helps to distinguish them from effects from the clay lying above the Ordovician limestone and to
identify reservoir sweet spots (PGS, 2009c, d).
Conclusions
The application of modern acquisition and processing procedures like Tau-P Deconvolution or
Radon Demultiple has led to significant improvements in the quality of seismic data. This facilitates the
application of enhanced amplitude interpretation algorithms.
The performed AVO analysis on thoroughly processed seismic data reveals interesting details for
the Middle Cambrian sandstones in the area of the Baltic Syneclise. Reported extremely low rates VP/VS
can be used to identify areas with good reservoir properties and help to minimize the future exploration
risk.
References
PGS, 2009a. Seismic Data Processing Report Block B22. Petrobaltic S.A., Gdańsk.
PGS, 2009b. Seismic Data Processing Report Block B101. Petrobaltic S.A., Gdańsk.
PGS, 2009c. Final Report. Structural Interpretation and AVO inversion of 2D seismic data, Polish sector
of the Baltic Sea, Block B22. Petrobaltic S.A., Gdańsk.
PGS, 2009d. Final Report. Structural Interpretation and AVO inversion of 2D seismic data, Polish sector
of the Baltic Sea, Block B101. Petrobaltic S.A., Gdańsk.
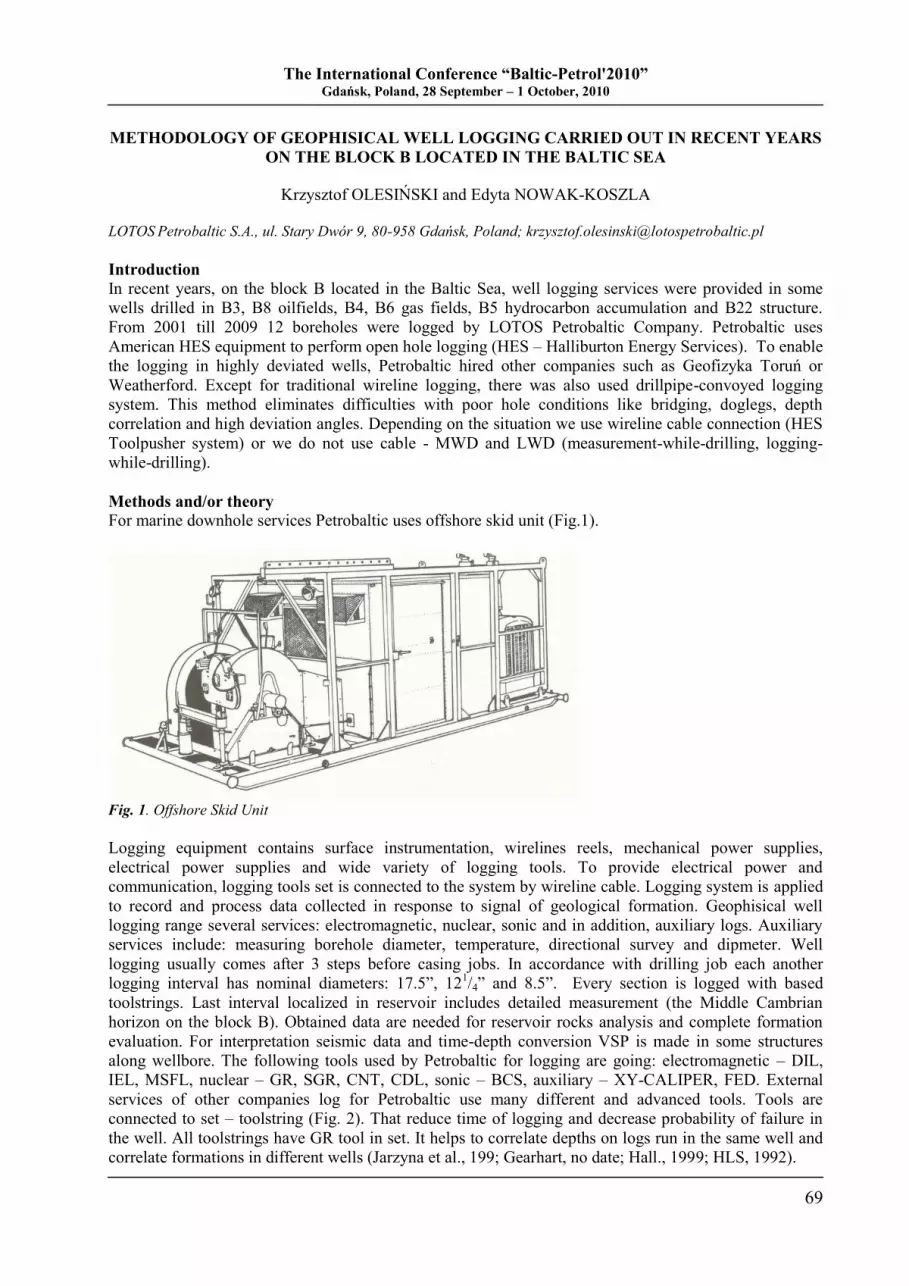
The International Conference “Baltic-Petrol'2010” Gdańsk, Poland, 28 September – 1 October, 2010
69
METHODOLOGY OF GEOPHISICAL WELL LOGGING CARRIED OUT IN RECENT YEARS
ON THE BLOCK B LOCATED IN THE BALTIC SEA
Krzysztof OLESIŃSKI and Edyta NOWAK-KOSZLA
LOTOS Petrobaltic S.A., ul. Stary Dwór 9, 80-958 Gdańsk, Poland; [email protected]
Introduction
In recent years, on the block B located in the Baltic Sea, well logging services were provided in some
wells drilled in B3, B8 oilfields, B4, B6 gas fields, B5 hydrocarbon accumulation and B22 structure.
From 2001 till 2009 12 boreholes were logged by LOTOS Petrobaltic Company. Petrobaltic uses
American HES equipment to perform open hole logging (HES – Halliburton Energy Services). To enable
the logging in highly deviated wells, Petrobaltic hired other companies such as Geofizyka Toruń or
Weatherford. Except for traditional wireline logging, there was also used drillpipe-convoyed logging
system. This method eliminates difficulties with poor hole conditions like bridging, doglegs, depth
correlation and high deviation angles. Depending on the situation we use wireline cable connection (HES
Toolpusher system) or we do not use cable - MWD and LWD (measurement-while-drilling, logging-
while-drilling).
Methods and/or theory
For marine downhole services Petrobaltic uses offshore skid unit (Fig.1).
Fig. 1. Offshore Skid Unit
Logging equipment contains surface instrumentation, wirelines reels, mechanical power supplies,
electrical power supplies and wide variety of logging tools. To provide electrical power and
communication, logging tools set is connected to the system by wireline cable. Logging system is applied
to record and process data collected in response to signal of geological formation. Geophisical well
logging range several services: electromagnetic, nuclear, sonic and in addition, auxiliary logs. Auxiliary
services include: measuring borehole diameter, temperature, directional survey and dipmeter. Well
logging usually comes after 3 steps before casing jobs. In accordance with drilling job each another
logging interval has nominal diameters: 17.5”, 121/4” and 8.5”. Every section is logged with based
toolstrings. Last interval localized in reservoir includes detailed measurement (the Middle Cambrian
horizon on the block B). Obtained data are needed for reservoir rocks analysis and complete formation
evaluation. For interpretation seismic data and time-depth conversion VSP is made in some structures
along wellbore. The following tools used by Petrobaltic for logging are going: electromagnetic – DIL,
IEL, MSFL, nuclear – GR, SGR, CNT, CDL, sonic – BCS, auxiliary – XY-CALIPER, FED. External
services of other companies log for Petrobaltic use many different and advanced tools. Tools are
connected to set – toolstring (Fig. 2). That reduce time of logging and decrease probability of failure in
the well. All toolstrings have GR tool in set. It helps to correlate depths on logs run in the same well and
correlate formations in different wells (Jarzyna et al., 199; Gearhart, no date; Hall., 1999; HLS, 1992).
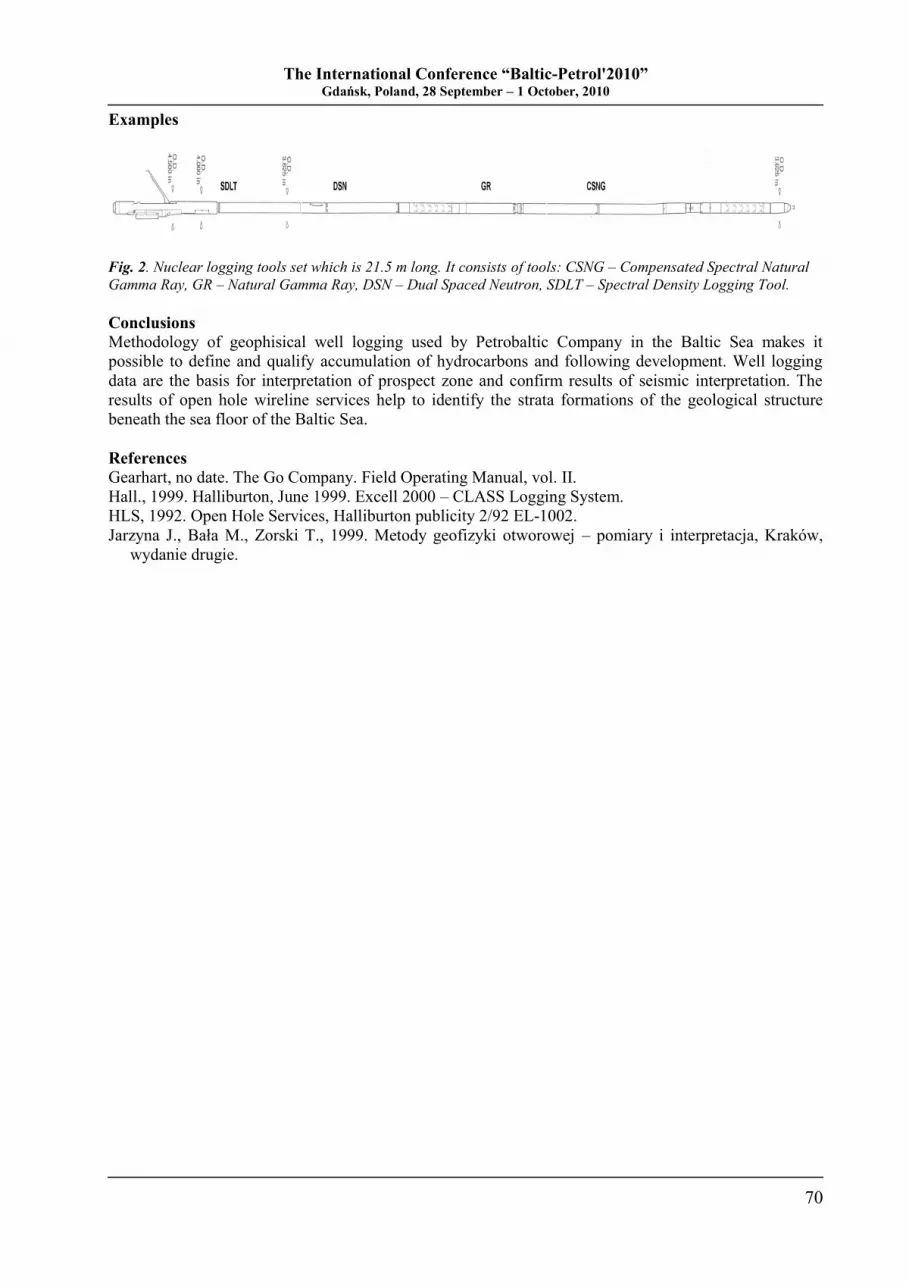
The International Conference “Baltic-Petrol'2010” Gdańsk, Poland, 28 September – 1 October, 2010
70
Examples
Fig. 2. Nuclear logging tools set which is 21.5 m long. It consists of tools: CSNG – Compensated Spectral Natural
Gamma Ray, GR – Natural Gamma Ray, DSN – Dual Spaced Neutron, SDLT – Spectral Density Logging Tool.
Conclusions
Methodology of geophisical well logging used by Petrobaltic Company in the Baltic Sea makes it
possible to define and qualify accumulation of hydrocarbons and following development. Well logging
data are the basis for interpretation of prospect zone and confirm results of seismic interpretation. The
results of open hole wireline services help to identify the strata formations of the geological structure
beneath the sea floor of the Baltic Sea.
References
Gearhart, no date. The Go Company. Field Operating Manual, vol. II.
Hall., 1999. Halliburton, June 1999. Excell 2000 – CLASS Logging System.
HLS, 1992. Open Hole Services, Halliburton publicity 2/92 EL-1002.
Jarzyna J., Bała M., Zorski T., 1999. Metody geofizyki otworowej – pomiary i interpretacja, Kraków,
wydanie drugie.
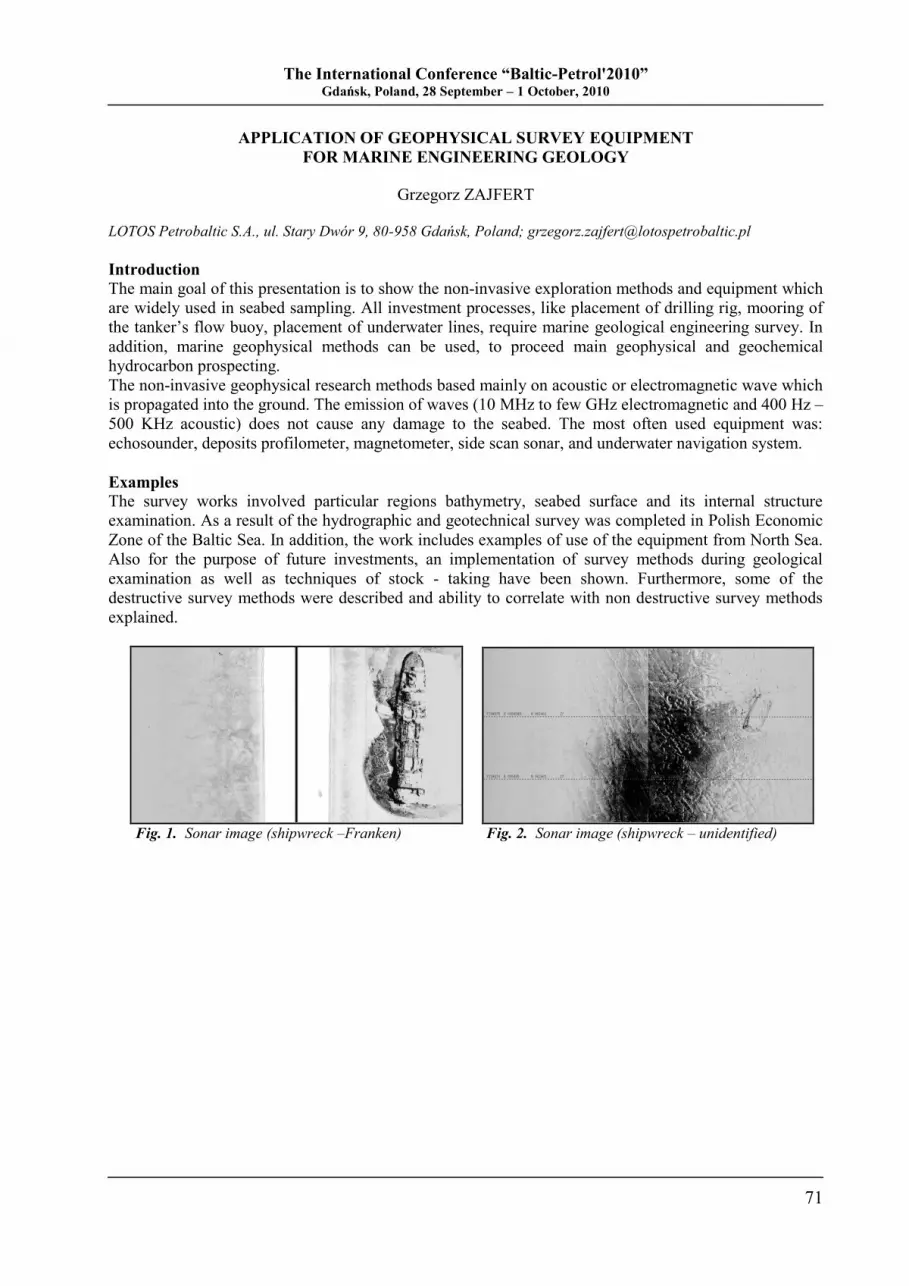
The International Conference “Baltic-Petrol'2010” Gdańsk, Poland, 28 September – 1 October, 2010
71
APPLICATION OF GEOPHYSICAL SURVEY EQUIPMENT
FOR MARINE ENGINEERING GEOLOGY
Grzegorz ZAJFERT
LOTOS Petrobaltic S.A., ul. Stary Dwór 9, 80-958 Gdańsk, Poland; [email protected]
Introduction
The main goal of this presentation is to show the non-invasive exploration methods and equipment which
are widely used in seabed sampling. All investment processes, like placement of drilling rig, mooring of
the tanker‟s flow buoy, placement of underwater lines, require marine geological engineering survey. In
addition, marine geophysical methods can be used, to proceed main geophysical and geochemical
hydrocarbon prospecting.
The non-invasive geophysical research methods based mainly on acoustic or electromagnetic wave which
is propagated into the ground. The emission of waves (10 MHz to few GHz electromagnetic and 400 Hz –
500 KHz acoustic) does not cause any damage to the seabed. The most often used equipment was:
echosounder, deposits profilometer, magnetometer, side scan sonar, and underwater navigation system.
Examples
The survey works involved particular regions bathymetry, seabed surface and its internal structure
examination. As a result of the hydrographic and geotechnical survey was completed in Polish Economic
Zone of the Baltic Sea. In addition, the work includes examples of use of the equipment from North Sea.
Also for the purpose of future investments, an implementation of survey methods during geological
examination as well as techniques of stock - taking have been shown. Furthermore, some of the
destructive survey methods were described and ability to correlate with non destructive survey methods
explained.
Fig. 1. Sonar image (shipwreck –Franken) Fig. 2. Sonar image (shipwreck – unidentified)
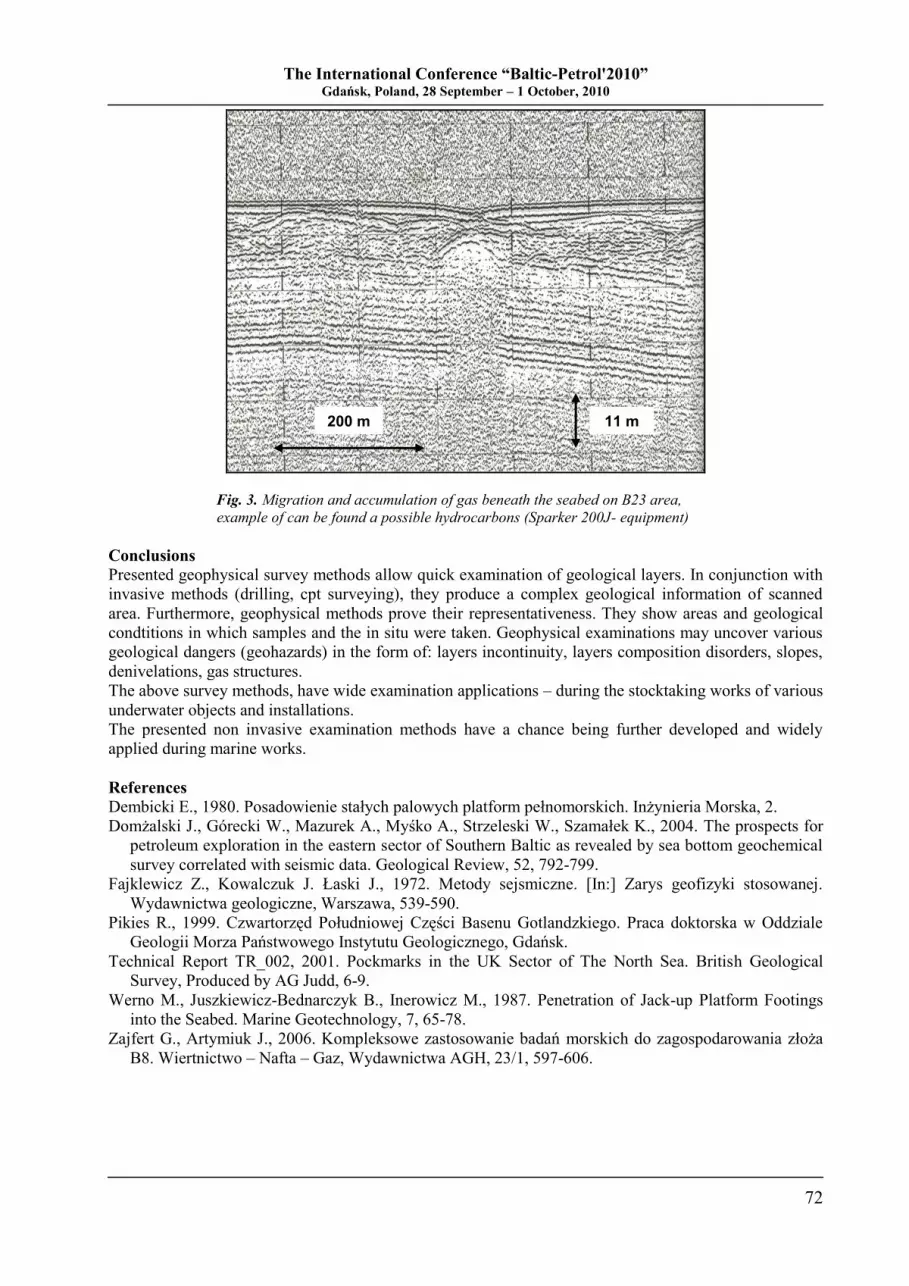
The International Conference “Baltic-Petrol'2010” Gdańsk, Poland, 28 September – 1 October, 2010
72
Fig. 3. Migration and accumulation of gas beneath the seabed on B23 area,
example of can be found a possible hydrocarbons (Sparker 200J- equipment)
Conclusions
Presented geophysical survey methods allow quick examination of geological layers. In conjunction with
invasive methods (drilling, cpt surveying), they produce a complex geological information of scanned
area. Furthermore, geophysical methods prove their representativeness. They show areas and geological
condtitions in which samples and the in situ were taken. Geophysical examinations may uncover various
geological dangers (geohazards) in the form of: layers incontinuity, layers composition disorders, slopes,
denivelations, gas structures.
The above survey methods, have wide examination applications – during the stocktaking works of various
underwater objects and installations.
The presented non invasive examination methods have a chance being further developed and widely
applied during marine works.
References Dembicki E., 1980. Posadowienie stałych palowych platform pełnomorskich. Inżynieria Morska, 2.
Domżalski J., Górecki W., Mazurek A., Myśko A., Strzeleski W., Szamałek K., 2004. The prospects for
petroleum exploration in the eastern sector of Southern Baltic as revealed by sea bottom geochemical
survey correlated with seismic data. Geological Review, 52, 792-799.
Fajklewicz Z., Kowalczuk J. Łaski J., 1972. Metody sejsmiczne. [In:] Zarys geofizyki stosowanej.
Wydawnictwa geologiczne, Warszawa, 539-590.
Pikies R., 1999. Czwartorzęd Południowej Części Basenu Gotlandzkiego. Praca doktorska w Oddziale
Geologii Morza Państwowego Instytutu Geologicznego, Gdańsk.
Technical Report TR_002, 2001. Pockmarks in the UK Sector of The North Sea. British Geological
Survey, Produced by AG Judd, 6-9.
Werno M., Juszkiewicz-Bednarczyk B., Inerowicz M., 1987. Penetration of Jack-up Platform Footings
into the Seabed. Marine Geotechnology, 7, 65-78.
Zajfert G., Artymiuk J., 2006. Kompleksowe zastosowanie badań morskich do zagospodarowania złoża
B8. Wiertnictwo – Nafta – Gaz, Wydawnictwa AGH, 23/1, 597-606.
200 m 11 m
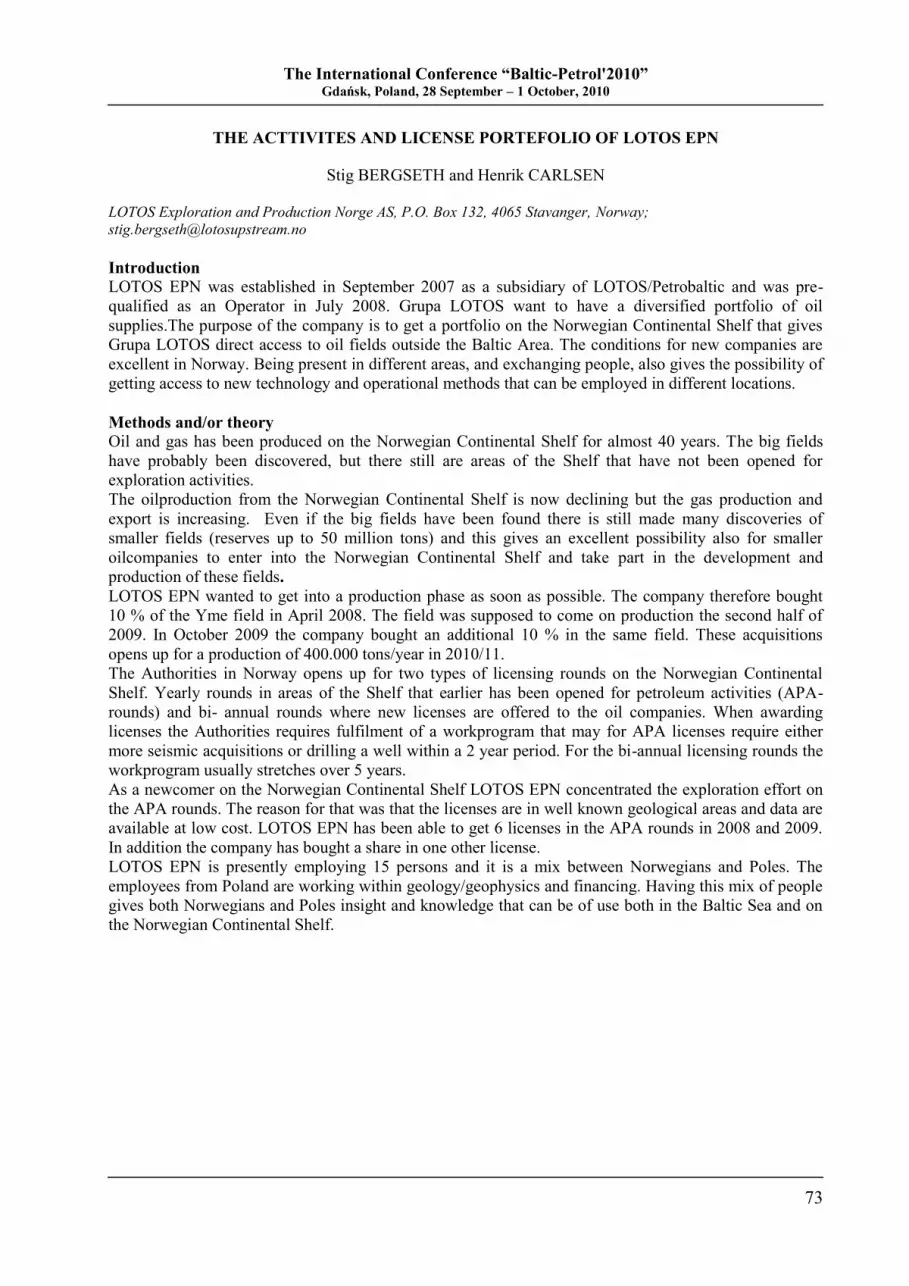
The International Conference “Baltic-Petrol'2010” Gdańsk, Poland, 28 September – 1 October, 2010
73
THE ACTTIVITES AND LICENSE PORTEFOLIO OF LOTOS EPN
Stig BERGSETH and Henrik CARLSEN
LOTOS Exploration and Production Norge AS, P.O. Box 132, 4065 Stavanger, Norway;
Introduction
LOTOS EPN was established in September 2007 as a subsidiary of LOTOS/Petrobaltic and was pre-
qualified as an Operator in July 2008. Grupa LOTOS want to have a diversified portfolio of oil
supplies.The purpose of the company is to get a portfolio on the Norwegian Continental Shelf that gives
Grupa LOTOS direct access to oil fields outside the Baltic Area. The conditions for new companies are
excellent in Norway. Being present in different areas, and exchanging people, also gives the possibility of
getting access to new technology and operational methods that can be employed in different locations.
Methods and/or theory
Oil and gas has been produced on the Norwegian Continental Shelf for almost 40 years. The big fields
have probably been discovered, but there still are areas of the Shelf that have not been opened for
exploration activities.
The oilproduction from the Norwegian Continental Shelf is now declining but the gas production and
export is increasing. Even if the big fields have been found there is still made many discoveries of
smaller fields (reserves up to 50 million tons) and this gives an excellent possibility also for smaller
oilcompanies to enter into the Norwegian Continental Shelf and take part in the development and
production of these fields.
LOTOS EPN wanted to get into a production phase as soon as possible. The company therefore bought
10 % of the Yme field in April 2008. The field was supposed to come on production the second half of
2009. In October 2009 the company bought an additional 10 % in the same field. These acquisitions
opens up for a production of 400.000 tons/year in 2010/11.
The Authorities in Norway opens up for two types of licensing rounds on the Norwegian Continental
Shelf. Yearly rounds in areas of the Shelf that earlier has been opened for petroleum activities (APA-
rounds) and bi- annual rounds where new licenses are offered to the oil companies. When awarding
licenses the Authorities requires fulfilment of a workprogram that may for APA licenses require either
more seismic acquisitions or drilling a well within a 2 year period. For the bi-annual licensing rounds the
workprogram usually stretches over 5 years.
As a newcomer on the Norwegian Continental Shelf LOTOS EPN concentrated the exploration effort on
the APA rounds. The reason for that was that the licenses are in well known geological areas and data are
available at low cost. LOTOS EPN has been able to get 6 licenses in the APA rounds in 2008 and 2009.
In addition the company has bought a share in one other license.
LOTOS EPN is presently employing 15 persons and it is a mix between Norwegians and Poles. The
employees from Poland are working within geology/geophysics and financing. Having this mix of people
gives both Norwegians and Poles insight and knowledge that can be of use both in the Baltic Sea and on
the Norwegian Continental Shelf.
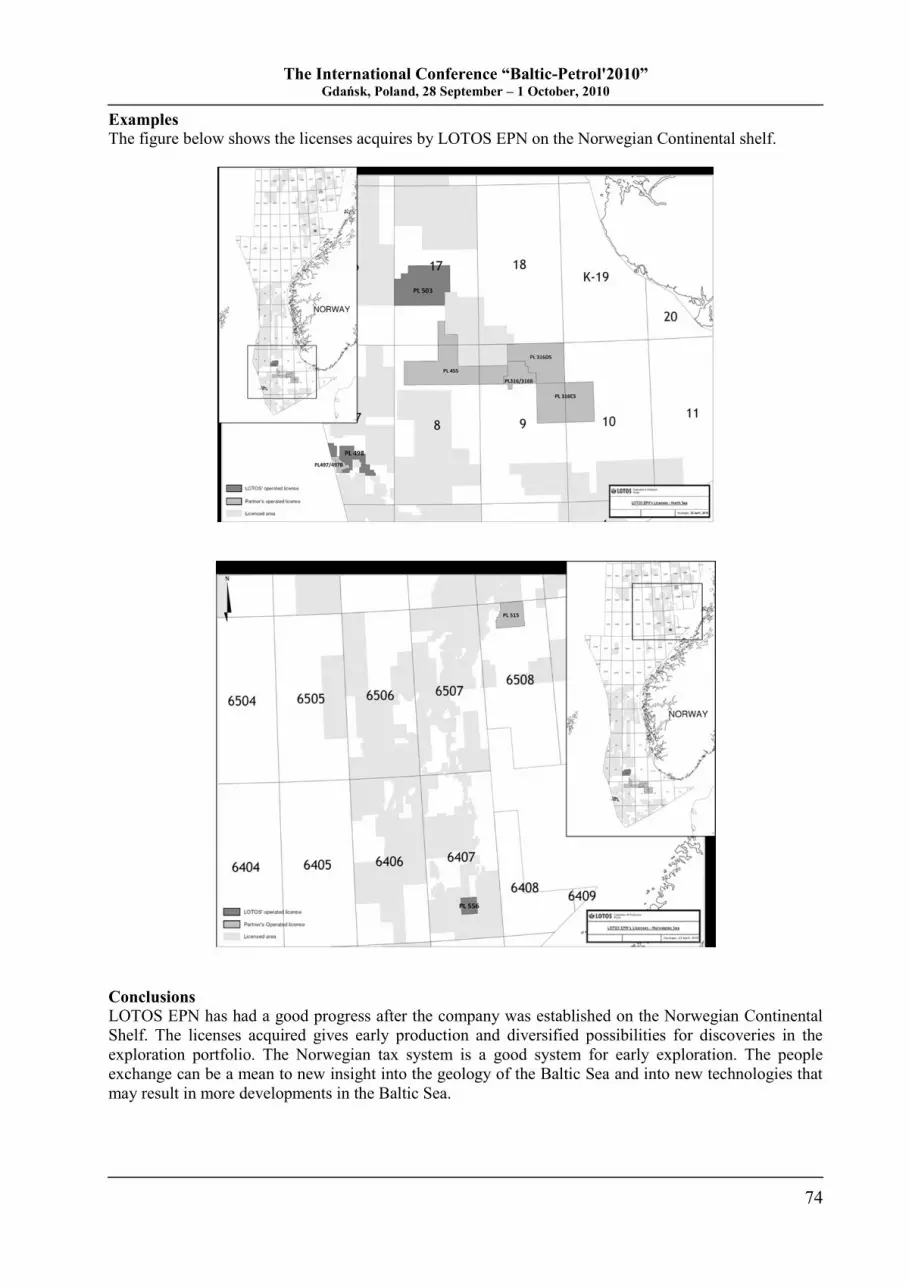
The International Conference “Baltic-Petrol'2010” Gdańsk, Poland, 28 September – 1 October, 2010
74
Examples
The figure below shows the licenses acquires by LOTOS EPN on the Norwegian Continental shelf.
Conclusions
LOTOS EPN has had a good progress after the company was established on the Norwegian Continental
Shelf. The licenses acquired gives early production and diversified possibilities for discoveries in the
exploration portfolio. The Norwegian tax system is a good system for early exploration. The people
exchange can be a mean to new insight into the geology of the Baltic Sea and into new technologies that
may result in more developments in the Baltic Sea.
The International Conference “Baltic-Petrol'2010” Gdańsk, Poland, 28 September – 1 October, 2010
75
MICROBIAL AND GEOCHEMICAL SURVEYS
IN THE POLISH ECONOMICAL ZONE OF THE BALTIC SEA
Aneta KUBALA and Anna BRZYSKA
LOTOS Petrobaltic S.A., ul. Stary Dwór 9, 80 - 958 Gdańsk, Poland; [email protected]
Introduction
Geo-microbial prospecting for hydrocarbons (MPOG) is an exploration method based on the premise that
light hydrocarbons from oil and gas fields migrate upward from subsurface petroleum accumulation by
diffusion and effusion to earth‟s surface. The increased hydrocarbon supply above the hydrocarbon
accumulation creates conditions favorable for the development of highly specialized hydrocarbon-
oxidizing bacteria that utilize (feed) light hydrocarbons.
Hydrocarbons generated in petroliferous basins are composed of a large range of components, from the
simplest, lightest methane molecule to very large and complex molecular structures. The light
hydrocarbons (C1-C4), methane, ethane, propane and butane, migrate in the subsurface in gaseous form.
Heavier hydrocarbons (C5+) migrate in the liquid phase.
This leads to significant increases in the microbial cell numbers and cell activity of these specialized
microbes (GMT, 2007, 2008a, 2008b, 2008c).
Methods of geochemical prospecting
Marine geo-microbial prospecting for hydrocarbons (MPOG) and geochemical survey on exploration
concession of LOTOS Petrobaltic S.A. were carried out in years 2007 and 2008 by American company
Geo-Microbial Technologies, Inc. (GMT). Regional and detailed geochemical surveys were made on
potentially positive objects and on one of the oil fields as well (Fig. 1)
The main goals of exploration surveys were to determine the presence and range of significant
geochemical anomalies on sea bottom deposits in a designed grid of undisturbed samples, to identify the
hydrocarbons composition and to localize areas which substantiate carrying out additionally geological,
geophysical and detailed geochemical surveys.
Statistical analysis and results interpretation were carried out in GMT‟s laboratories in Houston using two
methods: Microbial Oil Survey Technique (MOST) relying on detection of microbiology anomalies in
microbe concentration in shallow sea bottom deposits and Sorbed Soil Gas (SSG) method relying on
quantitative analysis of gas absorbed in deposits (C1, C2, C3 and heavier components of C5+) (GMT,
2007, 2008a, 2008b, 2008c).
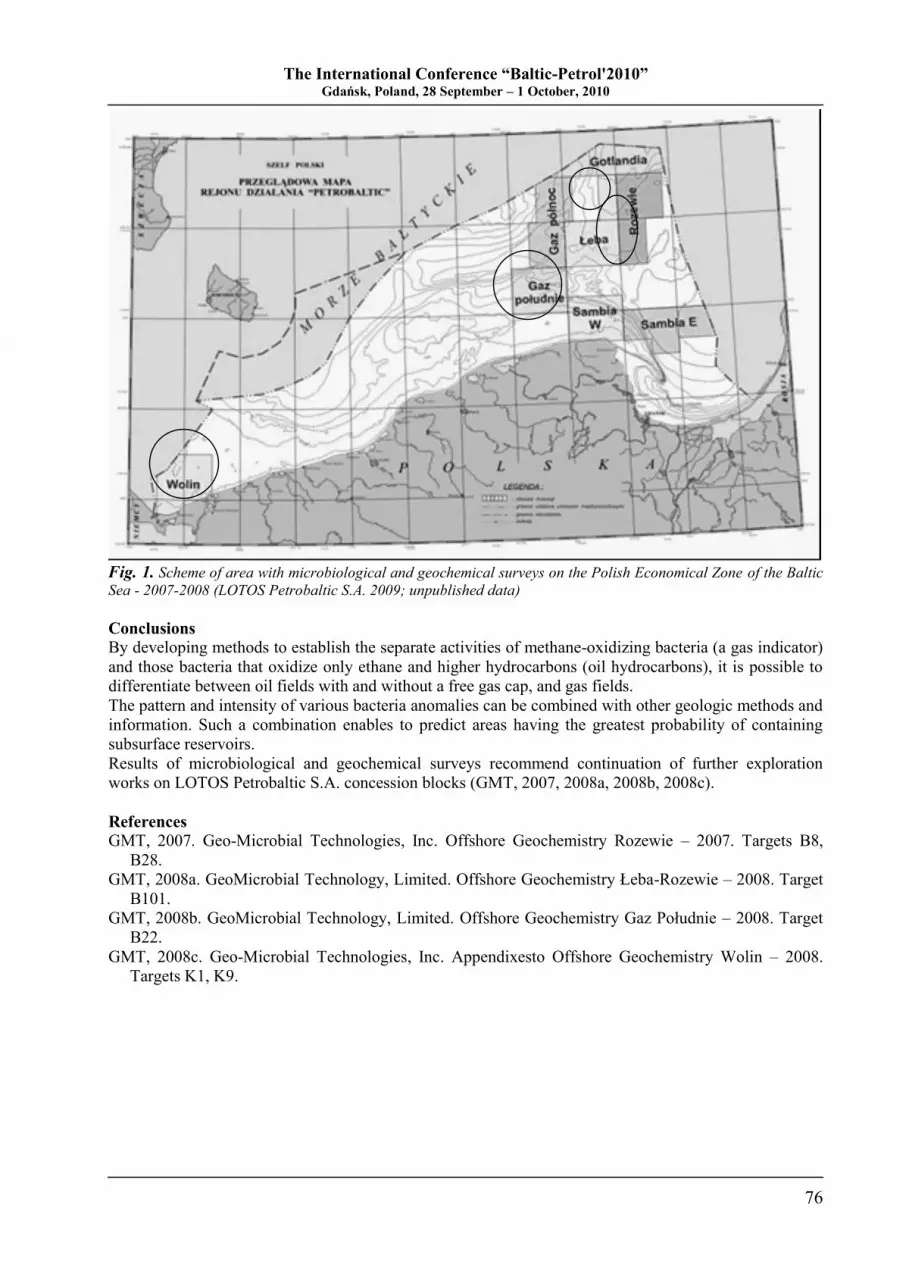
The International Conference “Baltic-Petrol'2010” Gdańsk, Poland, 28 September – 1 October, 2010
76
Fig. 1. Scheme of area with microbiological and geochemical surveys on the Polish Economical Zone of the Baltic
Sea - 2007-2008 (LOTOS Petrobaltic S.A. 2009; unpublished data)
Conclusions
By developing methods to establish the separate activities of methane-oxidizing bacteria (a gas indicator)
and those bacteria that oxidize only ethane and higher hydrocarbons (oil hydrocarbons), it is possible to
differentiate between oil fields with and without a free gas cap, and gas fields.
The pattern and intensity of various bacteria anomalies can be combined with other geologic methods and
information. Such a combination enables to predict areas having the greatest probability of containing
subsurface reservoirs.
Results of microbiological and geochemical surveys recommend continuation of further exploration
works on LOTOS Petrobaltic S.A. concession blocks (GMT, 2007, 2008a, 2008b, 2008c).
References
GMT, 2007. Geo-Microbial Technologies, Inc. Offshore Geochemistry Rozewie – 2007. Targets B8,
B28.
GMT, 2008a. GeoMicrobial Technology, Limited. Offshore Geochemistry Łeba-Rozewie – 2008. Target
B101.
GMT, 2008b. GeoMicrobial Technology, Limited. Offshore Geochemistry Gaz Południe – 2008. Target
B22.
GMT, 2008c. Geo-Microbial Technologies, Inc. Appendixesto Offshore Geochemistry Wolin – 2008.
Targets K1, K9.
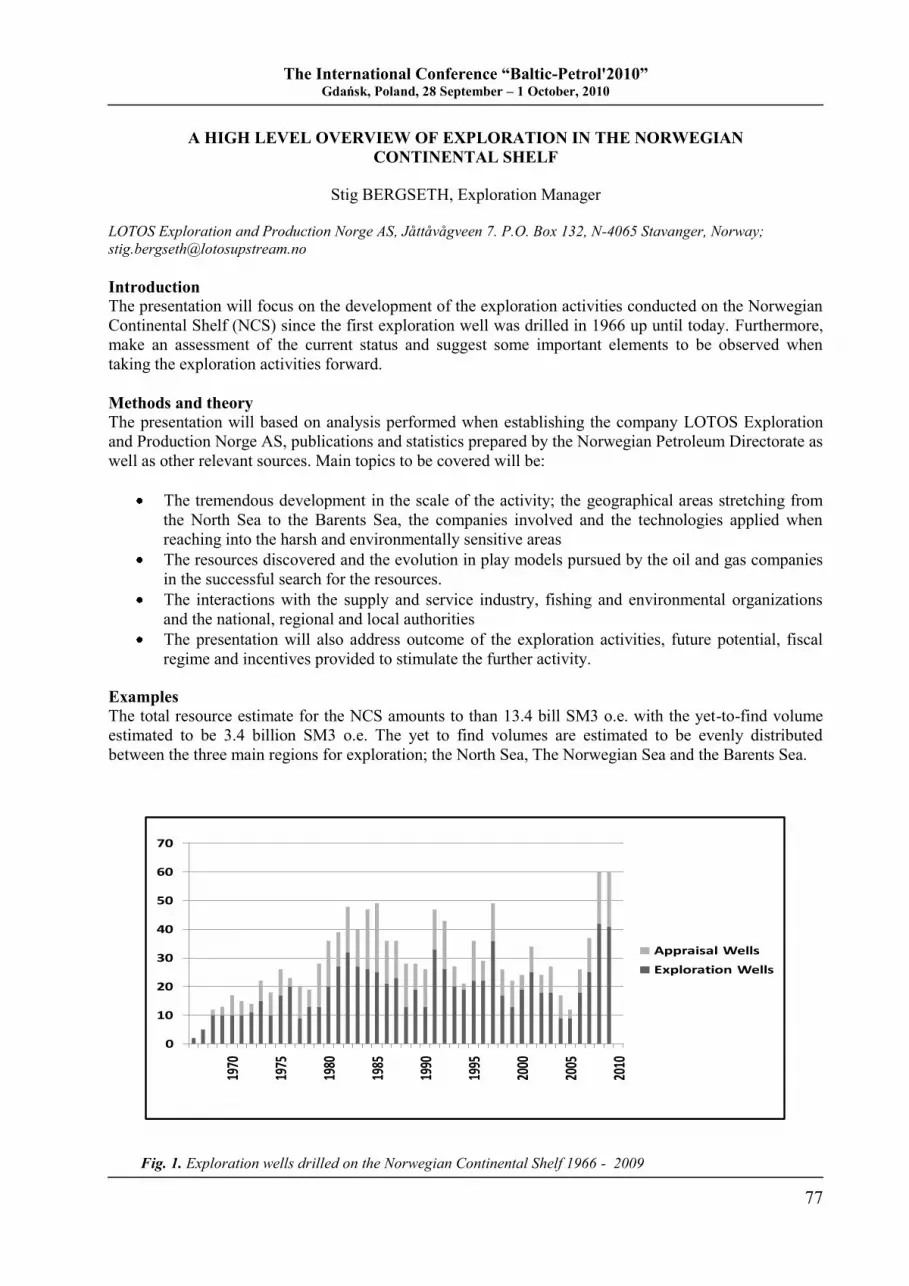
The International Conference “Baltic-Petrol'2010” Gdańsk, Poland, 28 September – 1 October, 2010
77
A HIGH LEVEL OVERVIEW OF EXPLORATION IN THE NORWEGIAN
CONTINENTAL SHELF
Stig BERGSETH, Exploration Manager
LOTOS Exploration and Production Norge AS, Jåttåvågveen 7. P.O. Box 132, N-4065 Stavanger, Norway;
Introduction
The presentation will focus on the development of the exploration activities conducted on the Norwegian
Continental Shelf (NCS) since the first exploration well was drilled in 1966 up until today. Furthermore,
make an assessment of the current status and suggest some important elements to be observed when
taking the exploration activities forward.
Methods and theory
The presentation will based on analysis performed when establishing the company LOTOS Exploration
and Production Norge AS, publications and statistics prepared by the Norwegian Petroleum Directorate as
well as other relevant sources. Main topics to be covered will be:
The tremendous development in the scale of the activity; the geographical areas stretching from
the North Sea to the Barents Sea, the companies involved and the technologies applied when
reaching into the harsh and environmentally sensitive areas
The resources discovered and the evolution in play models pursued by the oil and gas companies
in the successful search for the resources.
The interactions with the supply and service industry, fishing and environmental organizations
and the national, regional and local authorities
The presentation will also address outcome of the exploration activities, future potential, fiscal
regime and incentives provided to stimulate the further activity.
Examples
The total resource estimate for the NCS amounts to than 13.4 bill SM3 o.e. with the yet-to-find volume
estimated to be 3.4 billion SM3 o.e. The yet to find volumes are estimated to be evenly distributed
between the three main regions for exploration; the North Sea, The Norwegian Sea and the Barents Sea.
0
10
20
30
40
50
60
70
1970
1975
1980
1985
1990
1995
2000
2005
2010
Appraisal Wells
Exploration Wells
Fig. 1. Exploration wells drilled on the Norwegian Continental Shelf 1966 - 2009

The International Conference “Baltic-Petrol'2010” Gdańsk, Poland, 28 September – 1 October, 2010
78
In total 68 exploration play models have been identified on the NCS. 33 of these have been proved as
effective through discovery of petroleum in them, whereas the remaining 35 has yet to prove their
effectiveness as petroleum trapping mechanisms.
Conclusions
There are yet-to-find volumes of such a magnitude on the NCS that exploration activities will be taking
place for several decades into the future. New and innovative technologies, skilled individuals and
companies with the willingness to invest the capital required will have numerous opportunities to
participate in the value creation potential represented by these petroleum resources.
The International Conference “Baltic-Petrol'2010” Gdańsk, Poland, 28 September – 1 October, 2010
79
SEPTEMBER 30 (THURSDAY)
17:30 – 18:30
OCTOBER 1 (FRIDAY)
08:15 – 09:15
POSTER SESSIONS
P1 An Approach to Natural Valuation of the Polish Marine Areas (Case Study – the Słupsk
Bank Boulder Area)
Magdalena BŁEŃSKA, Andrzej OSOWIECKI, Lidia KRUK-DOWGIAŁŁO,
Paulina BRZESKA, Regina KRAMARSKA, Joanna ZACHOWICZ, Wojciech JEGLIŃSKI
and Jarosław NOWAK
P2 The History of Drilling Works Carried Out by Petrobaltic in the Polish Economical Zone
of the Baltic Sea
Grzegorz BRZYSKI and Aneta KUBALA
P3 Sequence Stratigraphy of Upper Silurian Reefs of Lithuania
Paulius CERNAKAUSKAS, Donatas KAMINSKAS and Saulius SLIAUPA
P4 Molecular Assessment of Crude Oil Source, Migration, Biodegradation and Maturity for
Selected Boreholes from the Polish Part of the Baltic Region
Franciszek CZECHOWSKI, Cezary GRELOWSKI and Marek HOJNIAK
P5 A Fluid Inclusion Contribution to Studies on Quartz Cements in the Middle Cambrian
Sandstones
Katarzyna JARMOŁOWICZ-SZULC
P6 Geochemistry of Oils and Source Rocks of the Early Palaeozoic Interval in the Baltic Sea,
Northern Poland
Alicja KARCZEWSKA, Irena MATYASIK and Eugeniusz ŻURAWSKI
P7 Application of BSC & EVA Indicators in Managing Value of Oil Producing Company
Arūnas KLEINAS
P8 The Influence of Macroeconomic Changes on the Development of Oil Resources in
Lithuania
Arūnas KLEINAS
P9 Hydrocarbon Processes for the Lower Palaeozoic Potential Source Rocks in the Gryfice
and Kołobrzeg Blocks (SW Baltic Sea)
Paweł KOSAKOWSKI, Magdalena WRÓBEL, Paweł POPRAWA and Jerzy DOMŻALSKI
P10 Isotopic Characteristics of Oils from the Iranian Sector of the Persian Gulf
Maciej J. KOTARBA and Ahmad R. RABBANI
P11 The Influence of Diagenesis on the Reservoir Quality of the Pennsylvanian and the Upper
Rotliegend Sandstones from Western Pomerania (Poland)
Aleksandra KOZŁOWSKA and Marta KUBERSKA
The International Conference “Baltic-Petrol'2010” Gdańsk, Poland, 28 September – 1 October, 2010
80
P12 Oil and Gas Prospects Operative Assessment of Exploration Areas in Arctic and Antarctic
Regions
Sergey LEVASHOV, Nikolay YAKYMCHUK, Ignat KORCHAGIN, Dmitriy BOZHEZHA
and Vitaliy ZHURAVLEV
P13 Lithology and Depositional Features of the Lower Palaeozoic Strata in the Polish Part of
the Baltic Region
Zdzisław MODLIŃSKI and Teresa PODHALAŃSKA
P14 Geophysical Methods in Geotechnical works - Experience from Polish Inshore Waters
Piotr PRZEZDZIECKI
P15 Porosimetry and Well Logging for Determination of Reservoir Parameters of Lower
Palaeozoic Beds in Polish Part of Baltic Basin
Roman SEMYRKA, Jadwiga JARZYNA, Grażyna SEMYRKA, Monika KAŹMIERCZUK
and Leszek PIKULSKI
P16 New Possibilities of Geotechnical Site Investigations from “Santa Barbara” Research
Vessel
Paweł SOKÓLSKI
P17 Trans-European Suture Zone at the Pomerania Section in the Interpretation of Regional
Magnetotelluric Profiles
Michał STEFANIUK, Jędrzej POKORSKI and Marek WOJDYŁA
P18 Llandovery in the Łysogóry Region (Holy Cross Mountains, Poland): Sedimentary Record
in Response to Climatic and Sea-Level Changes
Wiesław TRELA and Teresa PODHALAŃSKA
P19 Source Rock Properties of the Lower Palaeozoic Strata in Selected Wells from the Eastern
Pomerania (Northern Poland)
Dariusz WIĘCŁAW, Justyna NOSAL and Łukasz SŁOWIK
P20 Comparison of North American and European Shale Gas and Oil Resource Systems
John E. ZUMBERGE and John B. CURTIS
The International Conference “Baltic-Petrol'2010” Gdańsk, Poland, 28 September – 1 October, 2010
81
AN APPROACH TO NATURAL VALUATION OF THE POLISH MARINE AREAS
(CASE STUDY – THE SŁUPSK BANK BOULDER AREA)
Magdalena BŁEŃSKA1, Andrzej OSOWIECKI
1, Lidia KRUK-DOWGIAŁŁO
1,
Paulina BRZESKA1, Regina KRAMARSKA
2, Joanna ZACHOWICZ
2,
Wojciech JEGLIŃSKI2 and Jarosław NOWAK
1
1Maritime Institute in Gdańsk, ul. Długi Targ 41/42, 80 – 830 Gdańsk, Poland; [email protected]
2Polish Geological Institute – National Research Institute, Marine Geology Branch, ul. Kościerska 5, 80–328
Gdańsk, Poland
Introduction
Delimitation of marine areas representing varying degrees of natural value can be regarded as a key
element in preparation of the protection plans for marine areas of Natura 2000, the national and landscape
parks, as well as spatial planning in marine areas.
The aim of the paper was to present a new method of the natural valuation of the Polish Marine Areas and
testing it in the boulder area of the Słupsk Bank. Such type of hard bottom is considered unique in the
southern Baltic Sea because of its geological structure, the type of bedrock (Kramarska, 1991) and natural
uniqueness (Andrulewicz et al., 2004). Surface of the bottom covered with boulders represents 14 % of
the total area of the Słupsk Bank, which has been protected since 2002 under the Bird Directive and the
Habitat Directive within the European Ecological Network Natura 2000 (area code: PLC 990001).
Method of natural valuation
The method is based on the quantitative and qualitative assessment of the benthic macroflora and
macrofauna communities. It consists of three consecutive phases (Fig. 1), with the final product being a
vector map showing the five-scale gradation of natural values within the study area. Areas representing
4th and 5
th class are considered the most precious and should be excluded from economic activity. In areas
representing 1st, 2
nd and 3
rd class, including Natura 2000 areas, such activity can be sanctioned once
Environmental Impact Assessment procedure is implemented.
Natural values of the Słupsk Bank boulder area
Natural valuation of the Słupsk Bank boulder area showed that the regions of the highest natural value (4th
and 5th class) were located in its central-western part, inhabited by diverse communities of bottom
macroflora and macrofauna, including 16 macroalgae taxa, among them 2 protected and 6 rare species as
well as 29 macrozoobenthos taxa. The values of macroflora biomass were among the highest found in the
Polish sector of the Baltic Sea. High values of the biotic index B, based on benthic invertebrates, indicate
a significant share of species sensitive to pollution.
Conclusions
The method of natural valuation based on assessment of benthic macroflora and macrofauna communities
proved its effectiveness in the Słupsk Bank boulder area, thus it can be successfully applied to other parts
of the Polish Marine Areas. Presentation of the assessment results in a form of a vector map, clearly
showing spectrum of natural values in a five-degree scale and borders of delimited areas, should be
utilized in the process of marine spatial planning and elaboration of the marine area conservation plans.
Acknowledgements
This study was supported by a grant from Iceland, Lichtenstein and Norway through the EEA Financial
Mechanisms (project: “Ecosystem approach to marine spatial planning – Polish marine areas and the
Natura 2000 network”).
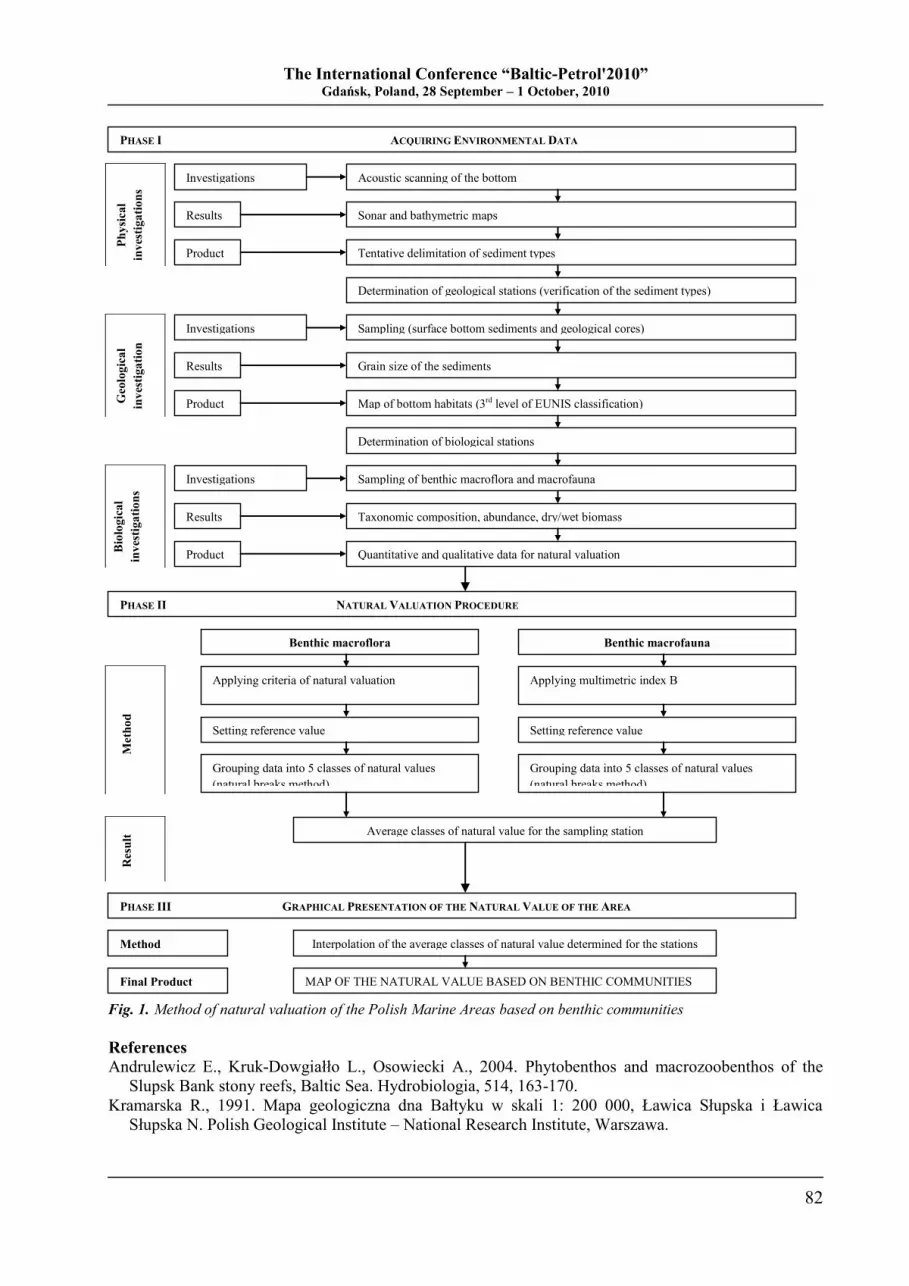
The International Conference “Baltic-Petrol'2010” Gdańsk, Poland, 28 September – 1 October, 2010
82
Fig. 1. Method of natural valuation of the Polish Marine Areas based on benthic communities
References
Andrulewicz E., Kruk-Dowgiałło L., Osowiecki A., 2004. Phytobenthos and macrozoobenthos of the
Slupsk Bank stony reefs, Baltic Sea. Hydrobiologia, 514, 163-170.
Kramarska R., 1991. Mapa geologiczna dna Bałtyku w skali 1: 200 000, Ławica Słupska i Ławica
Słupska N. Polish Geological Institute – National Research Institute, Warszawa.
PHASE I ACQUIRING ENVIRONMENTAL DATA
PHASE II NATURAL VALUATION PROCEDURE
PHASE III GRAPHICAL PRESENTATION OF THE NATURAL VALUE OF THE AREA
Ph
ysi
cal
inv
esti
ga
tio
ns
Product
Results
Investigations
środowiskowe
Geolo
gic
al
inv
esti
ga
tio
n
Bio
logic
al
inv
esti
ga
tio
ns
Acoustic scanning of the bottom
Sonar and bathymetric maps
Tentative delimitation of sediment types
Investigations
środowiskowe
Investigations
środowiskowe
Results
Results
Determination of geological stations (verification of the sediment types)
Product
Sampling (surface bottom sediments and geological cores)
Grain size of the sediments
Map of bottom habitats (3rd level of EUNIS classification)
Determination of biological stations
Sampling of benthic macroflora and macrofauna
Taxonomic composition, abundance, dry/wet biomass
Benthic macroflora Benthic macrofauna
Product
Quantitative and qualitative data for natural valuation
Grouping data into 5 classes of natural values
(natural breaks method)
(met. „natural breaks”)
Setting reference value Setting reference value
Grouping data into 5 classes of natural values
(natural breaks method)
(met. „natural breaks”)
Average classes of natural value for the sampling station
Interpolation of the average classes of natural value determined for the stations
MAP OF THE NATURAL VALUE BASED ON BENTHIC COMMUNITIES
Applying criteria of natural valuation Applying multimetric index B
Resu
lt
Meth
od
Method
Final Product
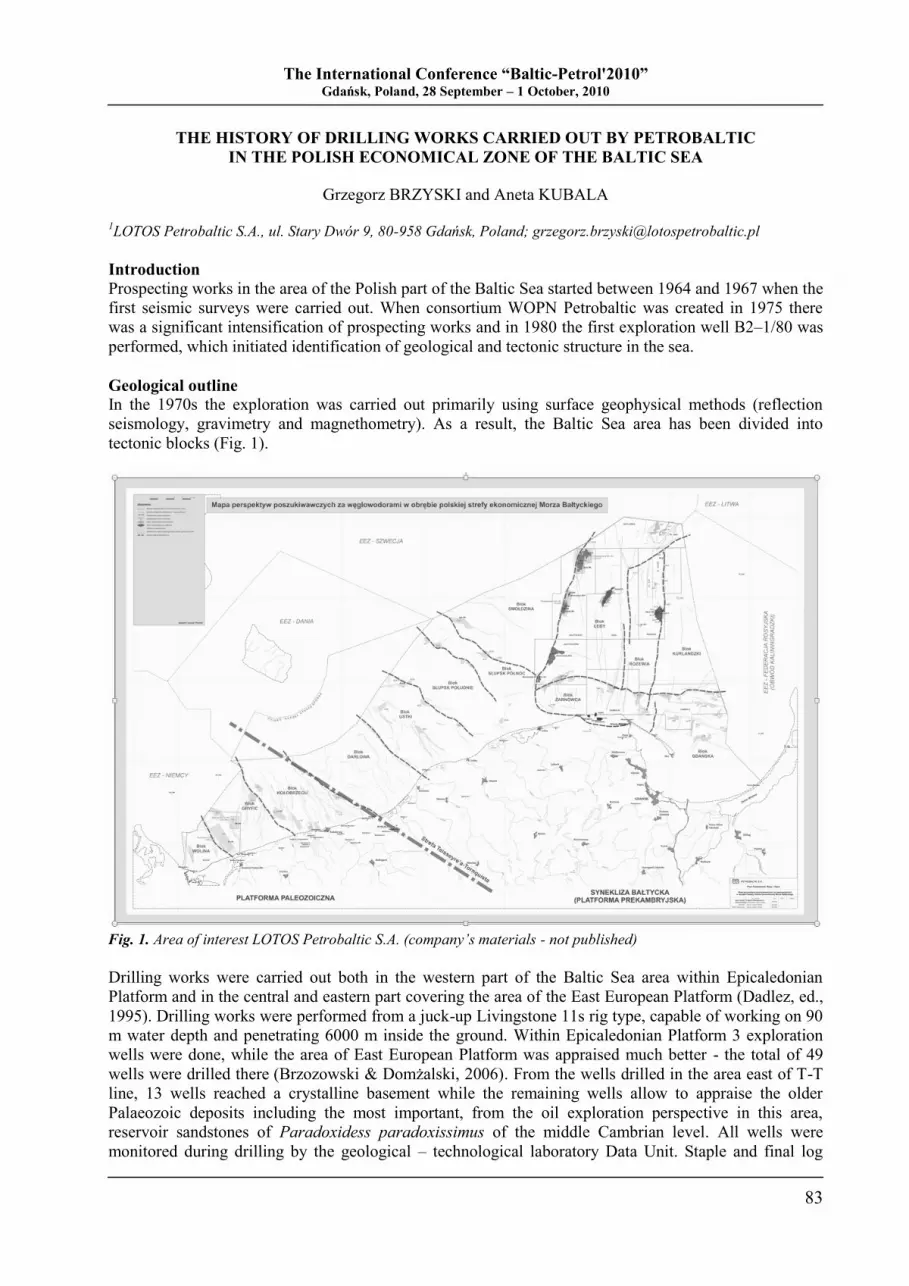
The International Conference “Baltic-Petrol'2010” Gdańsk, Poland, 28 September – 1 October, 2010
83
THE HISTORY OF DRILLING WORKS CARRIED OUT BY PETROBALTIC
IN THE POLISH ECONOMICAL ZONE OF THE BALTIC SEA
Grzegorz BRZYSKI and Aneta KUBALA
1LOTOS Petrobaltic S.A., ul. Stary Dwór 9, 80-958 Gdańsk, Poland; [email protected]
Introduction
Prospecting works in the area of the Polish part of the Baltic Sea started between 1964 and 1967 when the
first seismic surveys were carried out. When consortium WOPN Petrobaltic was created in 1975 there
was a significant intensification of prospecting works and in 1980 the first exploration well B2–1/80 was
performed, which initiated identification of geological and tectonic structure in the sea.
Geological outline In the 1970s the exploration was carried out primarily using surface geophysical methods (reflection
seismology, gravimetry and magnethometry). As a result, the Baltic Sea area has been divided into
tectonic blocks (Fig. 1).
Fig. 1. Area of interest LOTOS Petrobaltic S.A. (company’s materials - not published)
Drilling works were carried out both in the western part of the Baltic Sea area within Epicaledonian
Platform and in the central and eastern part covering the area of the East European Platform (Dadlez, ed.,
1995). Drilling works were performed from a juck-up Livingstone 11s rig type, capable of working on 90
m water depth and penetrating 6000 m inside the ground. Within Epicaledonian Platform 3 exploration
wells were done, while the area of East European Platform was appraised much better - the total of 49
wells were drilled there (Brzozowski & Domżalski, 2006). From the wells drilled in the area east of T-T
line, 13 wells reached a crystalline basement while the remaining wells allow to appraise the older
Palaeozoic deposits including the most important, from the oil exploration perspective in this area,
reservoir sandstones of Paradoxidess paradoxissimus of the middle Cambrian level. All wells were
monitored during drilling by the geological – technological laboratory Data Unit. Staple and final log
The International Conference “Baltic-Petrol'2010” Gdańsk, Poland, 28 September – 1 October, 2010
84
were performed during drilling, and for many wells also vertical seismic profiling was done. Sampling
and production tests were carried out on the project assumptions. In statistical terms, for 23 wild cats and
appraisal wells the industrial flows of hydrocarbons was obtained from fourteen ones and in three of them
flows were at a trace level, and in six the lack of flow is probably connected with poor reservoir
properties of Cambrian sandstones. For most wells the mineralogical – petrographical, petrophysical,
geochemical, sedimentological, and rock – fluids analyses were performed. The results of these studies
helped to get to know the geological structure of this part of the Baltic Sea, and as a consequence this
exploration let discover three oil fields (B3, B8, B34) two gas fields (B4, B6) and two hydrocarbon
accumulations (B16, B21) (Domżalski & Mazurek, 2004).
Conclusions
Drilling works carried out by Petrobaltic allowed to identify significant exploration and apprising of
Paradoxides paradoxissimus of the middle Cambrian hydrocarbon reservoir level, especially in the area
of Łeba High, the area of most Petrobaltic works. Drilling new wells on prospects outlined on the basis of
seismic interpretation may allow to discover new hydrocarbons fields and certainly will supplement the
knowledge of the stratigraphy and lithology of the Paleozoic sediments.
References
Brzozowski M., Domżalski, J., 2006. Ropo-gazonośność obszarów morskich Rzeczypospolitej Polskiej.
Geological Review, 52, 792-799 (in Polish with English summary).
Dadlez R., ed., 1995. Atlas Geologiczny Południowego Bałtyku. 1:500000. Państwowy Instytut
Geologiczny
Domżalski J., Mazurek A., 2004. Prognozy wydobycia węglowodorów ze złóż Obszarów Morskich RP.
Gospodarka Surowcami Mineralnymi, 20, 3.
The International Conference “Baltic-Petrol'2010” Gdańsk, Poland, 28 September – 1 October, 2010
85
SEQUENCE STRATIGRAPHY OF UPPER SILURIAN REEFS OF LITHUANIA
Paulius CERNAKAUSKAS1, Donatas KAMINSKAS
1 and Saulius SLIAUPA
1,2
1Department of Geology and Mineralogy, Vilnius University, K.M. Čiurlionio 21/27, LT-03101 Vilnius, Lithuania;
[email protected]; 2Institute of Geology and Geography, Centre of Natural Sciences, T.Sevcenkos 13, LT-03223 Vilnius, Lithuania
Introduction
The Silurian petroleum play is an important part of the petroleum system of the Baltic basin. The Silurian
shales comprise the major source rock volume of the Lower Palaeozoic system. Several oil accumulations
were discovered in middle Lithuania. The major type of reservoirs is represented by Upper Silurian
biostromes, while fractured micritic calcarenites and bioclastic limestones are of less importance. The
reefs compose N-S trending belt which is a part of the larger belt extending from Lithuania to Latvia,
Estonia, and Gotland. This belt marks a transition zone from shale-dominated deep-water facies in the
west and shallow-water carbonate facies in the east (Bičkauskas & Molenaar, 2008). The lateral
distribution of organogenic build-ups shows certain regularities that correlate with transgression-
regression events of the basin. The development of more precise predictive models is important for more
successful oil exploration, as the Silurian play is the second (besides to Cambrian) important exploration
target in Lithuania. The sequence stratigraphy approach provides a powerfully tool for analysing
carbonate systems. The basin-scale Silurian sequence stratigraphy model was developed previously by
(Lazauskienė et al., 2003). However, a more detailed model is required for identification of controlling
parameters of Upper Silurian reefs, which is a target of presented study.
Material and methods
The regional west-east profile comprising more than a dozen wells was analysed. The profile extends
from west Lithuania and east Lithuania, crossing the Silurian reef belt in central Lithuania. The Upper
Silurian was drilled with core sampling that provides important material for lithological studies.
Furthermore, the shale content was calculated using GR well logs. Logs were calibrated to rock chemical
analysis available from industrial reports. The palaeonthological data provided important framework for
stratigraphic subdivision of wells and palaeoecological interpretation of different lithologies. The rock
porosities were calculated from DT and NGR well logs that were combined with analytical petrophysical
estimates. The data were interpreted using Geographix software.
Results and discussion
The first evidences of reef occurrence are registered in Wenlock section of east Lithuania. However, those
are small and insignificant bodies that have no oil exploration prospects. The reefs became significant in
the Upper Silurian. Majority of reefs are composed of stromatoporoids intercalating to crinoid detritus.
The corals, sponges and brachiopods comprise less than 10 % of the reef bodies. The drilling and seismic
data indicate that reefs are mainly of bioherm type. The thickness is in the range of a few meters to 35 m.
The Kudirka reef represents an exception attaining 95 m in thickness.
Two types of reefs can be defined in terms of oil exploration prospects. The lower-middle Ludlow
reefs show good reservoir properties which is attributed to intense dolomitisation of limestones. However,
they have no oil prospects due to absence of cap rocks, as the back-reef facies are also dominated by
high-porosity dolomitized limestones. Reefs show prograding pattern that correlates to general regression
of the basin. This part of the section is attributed to the highstand system tract of the Sequence 1, which is
represented by falling stage (forced regression) in the uppermost part of the section. This uppermost part
is composed of prograding shallowing upwards set of parasequences reflected in decreasing clay content
and increasing carbonate content (Fig. 1).
The Sequence 2 represents the major exploration target. Biostromes have lower reservoir properties
than those of Sequence 1, however some oil accumulations have been discovered that is attributed to
better sealing of reefs. The reefs of the lowstand part of the Sequence 2 are distributed in the westernmost
part of the Upper Silurian reef belt (Ventspils Fm). The majority of reefs are related to the TST part of the
Sequence 2 (referred to as Minija Fm). They show systematic shift to the east that correlates with
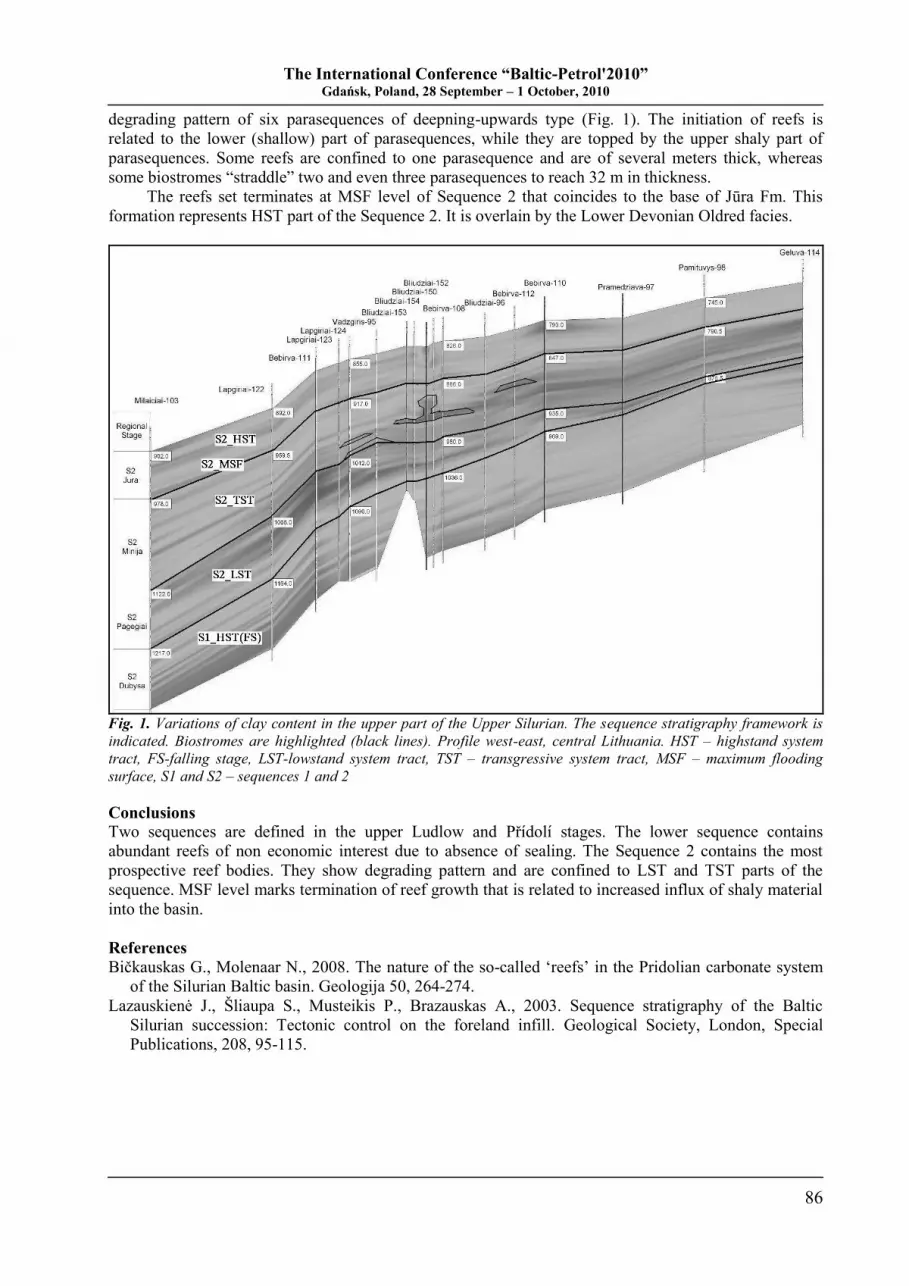
The International Conference “Baltic-Petrol'2010” Gdańsk, Poland, 28 September – 1 October, 2010
86
degrading pattern of six parasequences of deepning-upwards type (Fig. 1). The initiation of reefs is
related to the lower (shallow) part of parasequences, while they are topped by the upper shaly part of
parasequences. Some reefs are confined to one parasequence and are of several meters thick, whereas
some biostromes “straddle” two and even three parasequences to reach 32 m in thickness.
The reefs set terminates at MSF level of Sequence 2 that coincides to the base of Jūra Fm. This
formation represents HST part of the Sequence 2. It is overlain by the Lower Devonian Oldred facies.
Fig. 1. Variations of clay content in the upper part of the Upper Silurian. The sequence stratigraphy framework is
indicated. Biostromes are highlighted (black lines). Profile west-east, central Lithuania. HST – highstand system
tract, FS-falling stage, LST-lowstand system tract, TST – transgressive system tract, MSF – maximum flooding
surface, S1 and S2 – sequences 1 and 2
Conclusions
Two sequences are defined in the upper Ludlow and Přídolí stages. The lower sequence contains
abundant reefs of non economic interest due to absence of sealing. The Sequence 2 contains the most
prospective reef bodies. They show degrading pattern and are confined to LST and TST parts of the
sequence. MSF level marks termination of reef growth that is related to increased influx of shaly material
into the basin.
References
Bičkauskas G., Molenaar N., 2008. The nature of the so-called „reefs‟ in the Pridolian carbonate system
of the Silurian Baltic basin. Geologija 50, 264-274.
Lazauskienė J., Ńliaupa S., Musteikis P., Brazauskas A., 2003. Sequence stratigraphy of the Baltic
Silurian succession: Tectonic control on the foreland infill. Geological Society, London, Special
Publications, 208, 95-115.
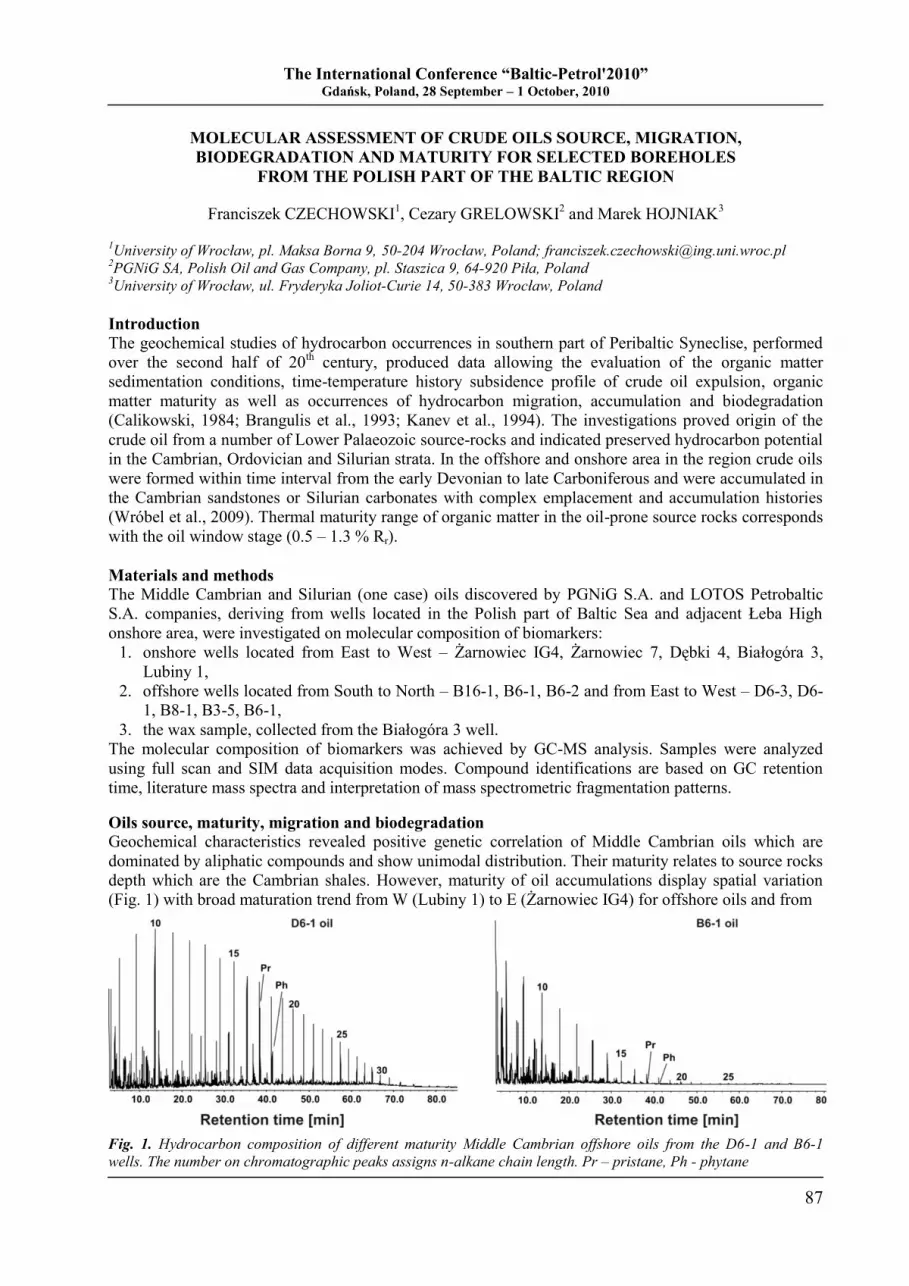
The International Conference “Baltic-Petrol'2010” Gdańsk, Poland, 28 September – 1 October, 2010
87
MOLECULAR ASSESSMENT OF CRUDE OILS SOURCE, MIGRATION,
BIODEGRADATION AND MATURITY FOR SELECTED BOREHOLES
FROM THE POLISH PART OF THE BALTIC REGION
Franciszek CZECHOWSKI1, Cezary GRELOWSKI
2 and Marek HOJNIAK
3
1University of Wrocław, pl. Maksa Borna 9, 50-204 Wrocław, Poland; [email protected]
2PGNiG SA, Polish Oil and Gas Company, pl. Staszica 9, 64-920 Piła, Poland
3University of Wrocław, ul. Fryderyka Joliot-Curie 14, 50-383 Wrocław, Poland
Introduction
The geochemical studies of hydrocarbon occurrences in southern part of Peribaltic Syneclise, performed
over the second half of 20th century, produced data allowing the evaluation of the organic matter
sedimentation conditions, time-temperature history subsidence profile of crude oil expulsion, organic
matter maturity as well as occurrences of hydrocarbon migration, accumulation and biodegradation
(Calikowski, 1984; Brangulis et al., 1993; Kanev et al., 1994). The investigations proved origin of the
crude oil from a number of Lower Palaeozoic source-rocks and indicated preserved hydrocarbon potential
in the Cambrian, Ordovician and Silurian strata. In the offshore and onshore area in the region crude oils
were formed within time interval from the early Devonian to late Carboniferous and were accumulated in
the Cambrian sandstones or Silurian carbonates with complex emplacement and accumulation histories
(Wróbel et al., 2009). Thermal maturity range of organic matter in the oil-prone source rocks corresponds
with the oil window stage (0.5 – 1.3 % Rr).
Materials and methods
The Middle Cambrian and Silurian (one case) oils discovered by PGNiG S.A. and LOTOS Petrobaltic
S.A. companies, deriving from wells located in the Polish part of Baltic Sea and adjacent Łeba High
onshore area, were investigated on molecular composition of biomarkers:
1. onshore wells located from East to West – Żarnowiec IG4, Żarnowiec 7, Dębki 4, Białogóra 3,
Lubiny 1,
2. offshore wells located from South to North – B16-1, B6-1, B6-2 and from East to West – D6-3, D6-
1, B8-1, B3-5, B6-1,
3. the wax sample, collected from the Białogóra 3 well.
The molecular composition of biomarkers was achieved by GC-MS analysis. Samples were analyzed
using full scan and SIM data acquisition modes. Compound identifications are based on GC retention
time, literature mass spectra and interpretation of mass spectrometric fragmentation patterns.
Oils source, maturity, migration and biodegradation
Geochemical characteristics revealed positive genetic correlation of Middle Cambrian oils which are
dominated by aliphatic compounds and show unimodal distribution. Their maturity relates to source rocks
depth which are the Cambrian shales. However, maturity of oil accumulations display spatial variation
(Fig. 1) with broad maturation trend from W (Lubiny 1) to E (Żarnowiec IG4) for offshore oils and from
Fig. 1. Hydrocarbon composition of different maturity Middle Cambrian offshore oils from the D6-1 and B6-1
wells. The number on chromatographic peaks assigns n-alkane chain length. Pr – pristane, Ph - phytane
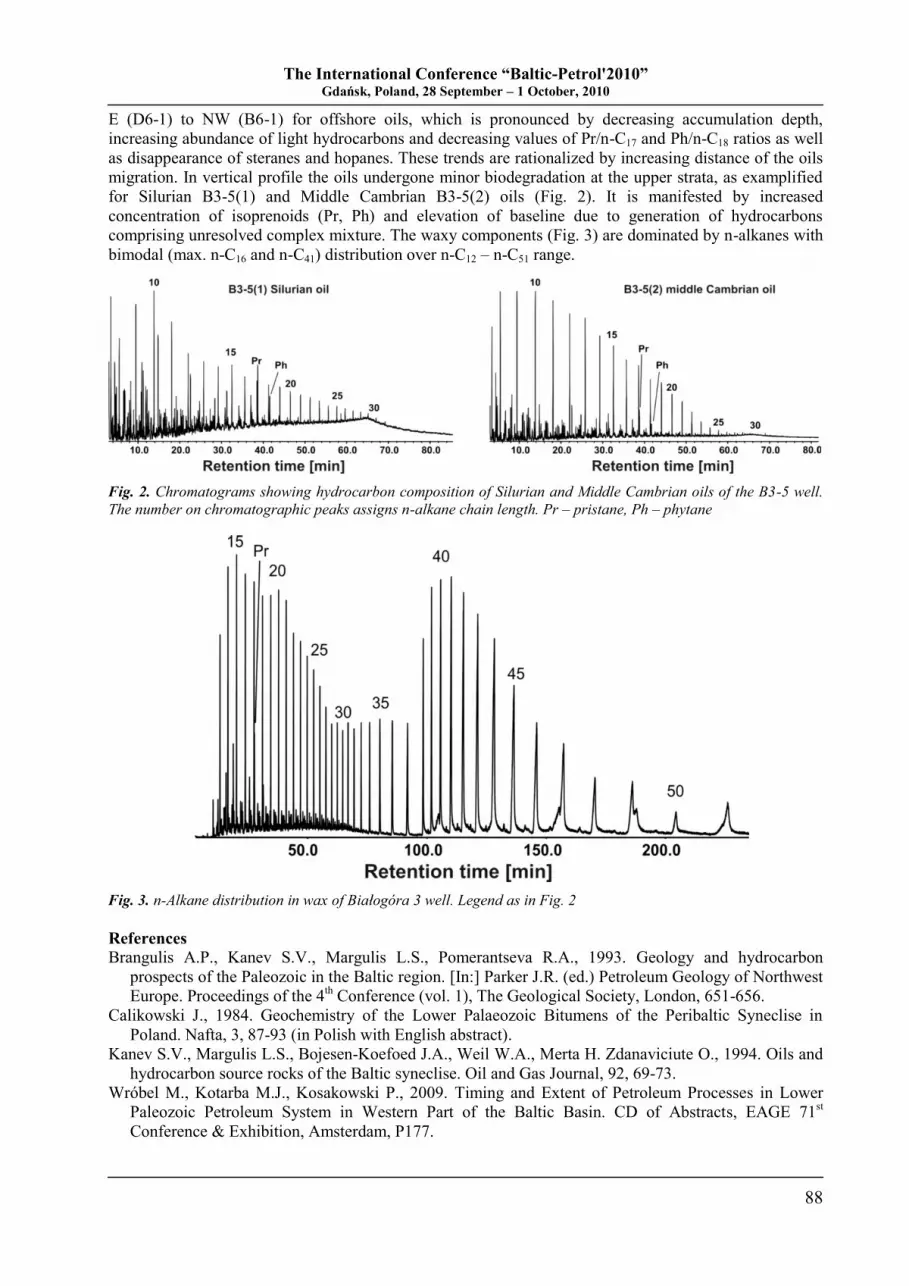
The International Conference “Baltic-Petrol'2010” Gdańsk, Poland, 28 September – 1 October, 2010
88
E (D6-1) to NW (B6-1) for offshore oils, which is pronounced by decreasing accumulation depth,
increasing abundance of light hydrocarbons and decreasing values of Pr/n-C17 and Ph/n-C18 ratios as well
as disappearance of steranes and hopanes. These trends are rationalized by increasing distance of the oils
migration. In vertical profile the oils undergone minor biodegradation at the upper strata, as examplified
for Silurian B3-5(1) and Middle Cambrian B3-5(2) oils (Fig. 2). It is manifested by increased
concentration of isoprenoids (Pr, Ph) and elevation of baseline due to generation of hydrocarbons
comprising unresolved complex mixture. The waxy components (Fig. 3) are dominated by n-alkanes with
bimodal (max. n-C16 and n-C41) distribution over n-C12 – n-C51 range.
Fig. 2. Chromatograms showing hydrocarbon composition of Silurian and Middle Cambrian oils of the B3-5 well.
The number on chromatographic peaks assigns n-alkane chain length. Pr – pristane, Ph – phytane
Fig. 3. n-Alkane distribution in wax of Białogóra 3 well. Legend as in Fig. 2
References
Brangulis A.P., Kanev S.V., Margulis L.S., Pomerantseva R.A., 1993. Geology and hydrocarbon
prospects of the Paleozoic in the Baltic region. [In:] Parker J.R. (ed.) Petroleum Geology of Northwest
Europe. Proceedings of the 4th Conference (vol. 1), The Geological Society, London, 651-656.
Calikowski J., 1984. Geochemistry of the Lower Palaeozoic Bitumens of the Peribaltic Syneclise in
Poland. Nafta, 3, 87-93 (in Polish with English abstract).
Kanev S.V., Margulis L.S., Bojesen-Koefoed J.A., Weil W.A., Merta H. Zdanaviciute O., 1994. Oils and
hydrocarbon source rocks of the Baltic syneclise. Oil and Gas Journal, 92, 69-73.
Wróbel M., Kotarba M.J., Kosakowski P., 2009. Timing and Extent of Petroleum Processes in Lower
Paleozoic Petroleum System in Western Part of the Baltic Basin. CD of Abstracts, EAGE 71st
Conference & Exhibition, Amsterdam, P177.
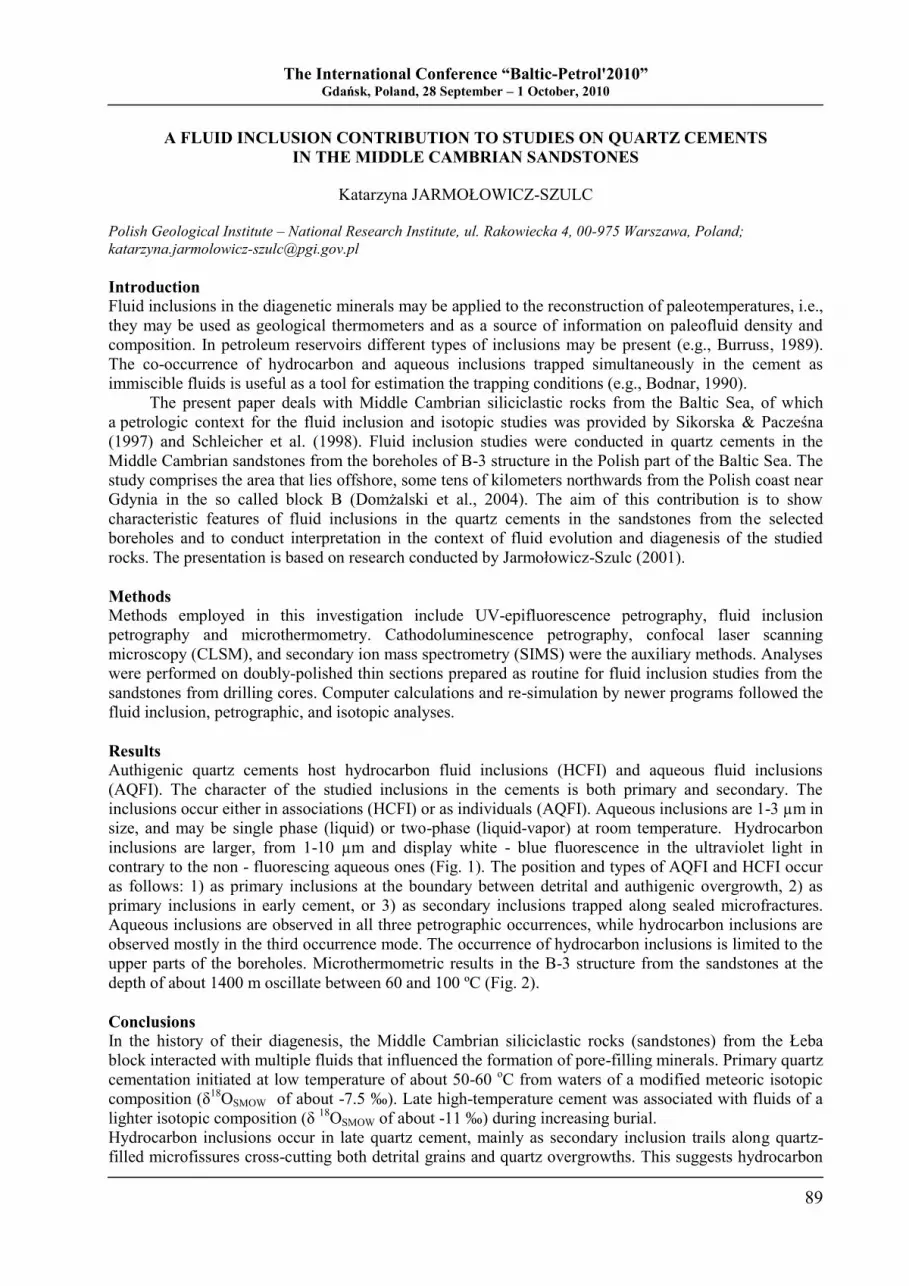
The International Conference “Baltic-Petrol'2010” Gdańsk, Poland, 28 September – 1 October, 2010
89
A FLUID INCLUSION CONTRIBUTION TO STUDIES ON QUARTZ CEMENTS
IN THE MIDDLE CAMBRIAN SANDSTONES
Katarzyna JARMOŁOWICZ-SZULC
Polish Geological Institute – National Research Institute, ul. Rakowiecka 4, 00-975 Warszawa, Poland;
Introduction
Fluid inclusions in the diagenetic minerals may be applied to the reconstruction of paleotemperatures, i.e.,
they may be used as geological thermometers and as a source of information on paleofluid density and
composition. In petroleum reservoirs different types of inclusions may be present (e.g., Burruss, 1989).
The co-occurrence of hydrocarbon and aqueous inclusions trapped simultaneously in the cement as
immiscible fluids is useful as a tool for estimation the trapping conditions (e.g., Bodnar, 1990).
The present paper deals with Middle Cambrian siliciclastic rocks from the Baltic Sea, of which
a petrologic context for the fluid inclusion and isotopic studies was provided by Sikorska & Pacześna
(1997) and Schleicher et al. (1998). Fluid inclusion studies were conducted in quartz cements in the
Middle Cambrian sandstones from the boreholes of B-3 structure in the Polish part of the Baltic Sea. The
study comprises the area that lies offshore, some tens of kilometers northwards from the Polish coast near
Gdynia in the so called block B (Domżalski et al., 2004). The aim of this contribution is to show
characteristic features of fluid inclusions in the quartz cements in the sandstones from the selected
boreholes and to conduct interpretation in the context of fluid evolution and diagenesis of the studied
rocks. The presentation is based on research conducted by Jarmołowicz-Szulc (2001).
Methods
Methods employed in this investigation include UV-epifluorescence petrography, fluid inclusion
petrography and microthermometry. Cathodoluminescence petrography, confocal laser scanning
microscopy (CLSM), and secondary ion mass spectrometry (SIMS) were the auxiliary methods. Analyses
were performed on doubly-polished thin sections prepared as routine for fluid inclusion studies from the
sandstones from drilling cores. Computer calculations and re-simulation by newer programs followed the
fluid inclusion, petrographic, and isotopic analyses.
Results
Authigenic quartz cements host hydrocarbon fluid inclusions (HCFI) and aqueous fluid inclusions
(AQFI). The character of the studied inclusions in the cements is both primary and secondary. The
inclusions occur either in associations (HCFI) or as individuals (AQFI). Aqueous inclusions are 1-3 µm in
size, and may be single phase (liquid) or two-phase (liquid-vapor) at room temperature. Hydrocarbon
inclusions are larger, from 1-10 µm and display white - blue fluorescence in the ultraviolet light in
contrary to the non - fluorescing aqueous ones (Fig. 1). The position and types of AQFI and HCFI occur
as follows: 1) as primary inclusions at the boundary between detrital and authigenic overgrowth, 2) as
primary inclusions in early cement, or 3) as secondary inclusions trapped along sealed microfractures.
Aqueous inclusions are observed in all three petrographic occurrences, while hydrocarbon inclusions are
observed mostly in the third occurrence mode. The occurrence of hydrocarbon inclusions is limited to the
upper parts of the boreholes. Microthermometric results in the B-3 structure from the sandstones at the
depth of about 1400 m oscillate between 60 and 100 ºC (Fig. 2).
Conclusions
In the history of their diagenesis, the Middle Cambrian siliciclastic rocks (sandstones) from the Łeba
block interacted with multiple fluids that influenced the formation of pore-filling minerals. Primary quartz
cementation initiated at low temperature of about 50-60 oC from waters of a modified meteoric isotopic
composition (δ18
OSMOW of about -7.5 ‰). Late high-temperature cement was associated with fluids of a
lighter isotopic composition (δ 18
OSMOW of about -11 ‰) during increasing burial.
Hydrocarbon inclusions occur in late quartz cement, mainly as secondary inclusion trails along quartz-
filled microfissures cross-cutting both detrital grains and quartz overgrowths. This suggests hydrocarbon
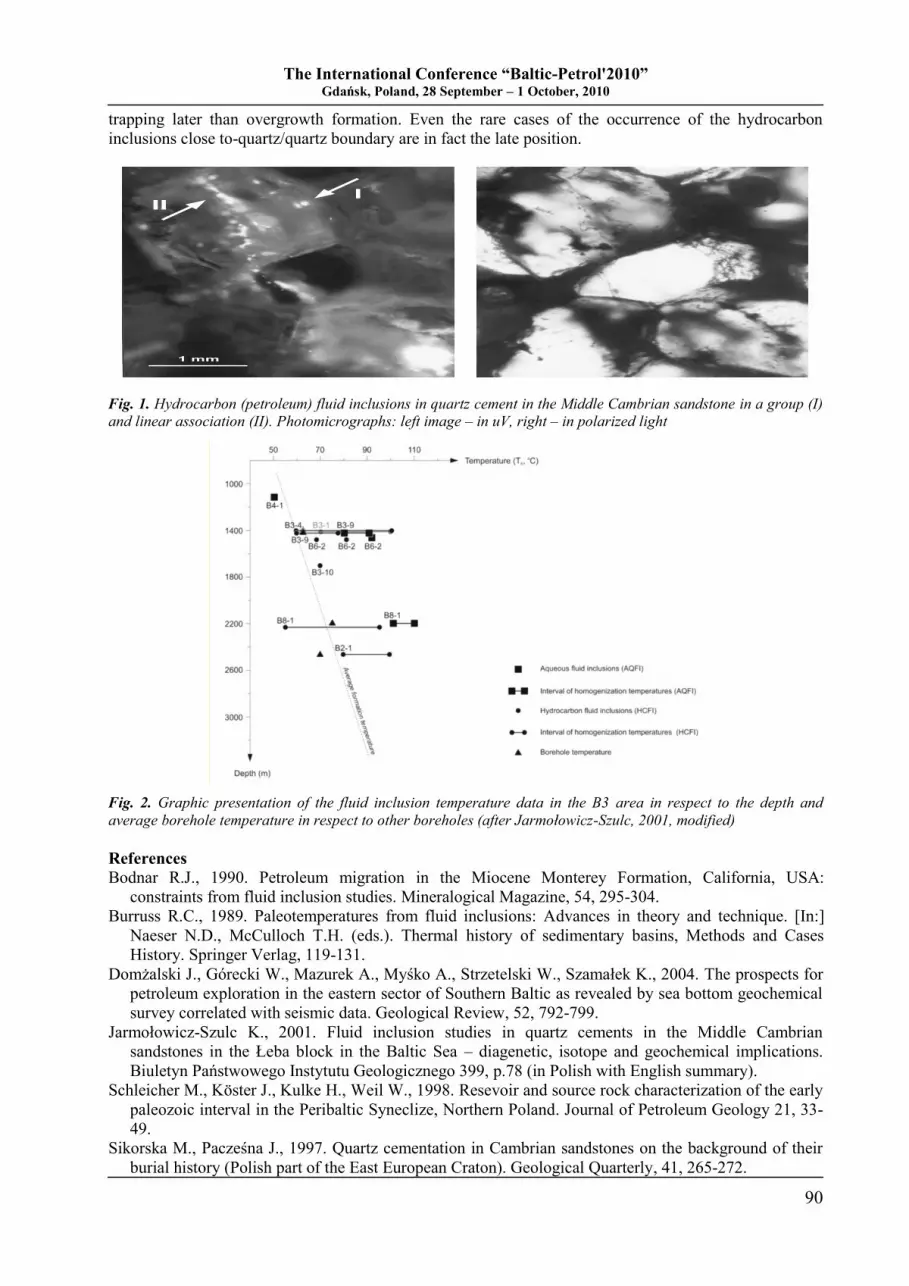
The International Conference “Baltic-Petrol'2010” Gdańsk, Poland, 28 September – 1 October, 2010
90
trapping later than overgrowth formation. Even the rare cases of the occurrence of the hydrocarbon
inclusions close to-quartz/quartz boundary are in fact the late position.
1 mm
III
Fig. 1. Hydrocarbon (petroleum) fluid inclusions in quartz cement in the Middle Cambrian sandstone in a group (I)
and linear association (II). Photomicrographs: left image – in uV, right – in polarized light
Fig. 2. Graphic presentation of the fluid inclusion temperature data in the B3 area in respect to the depth and
average borehole temperature in respect to other boreholes (after Jarmołowicz-Szulc, 2001, modified)
References
Bodnar R.J., 1990. Petroleum migration in the Miocene Monterey Formation, California, USA:
constraints from fluid inclusion studies. Mineralogical Magazine, 54, 295-304.
Burruss R.C., 1989. Paleotemperatures from fluid inclusions: Advances in theory and technique. [In:]
Naeser N.D., McCulloch T.H. (eds.). Thermal history of sedimentary basins, Methods and Cases
History. Springer Verlag, 119-131.
Domżalski J., Górecki W., Mazurek A., Myśko A., Strzetelski W., Szamałek K., 2004. The prospects for
petroleum exploration in the eastern sector of Southern Baltic as revealed by sea bottom geochemical
survey correlated with seismic data. Geological Review, 52, 792-799.
Jarmołowicz-Szulc K., 2001. Fluid inclusion studies in quartz cements in the Middle Cambrian
sandstones in the Łeba block in the Baltic Sea – diagenetic, isotope and geochemical implications.
Biuletyn Państwowego Instytutu Geologicznego 399, p.78 (in Polish with English summary).
Schleicher M., Köster J., Kulke H., Weil W., 1998. Resevoir and source rock characterization of the early
paleozoic interval in the Peribaltic Syneclize, Northern Poland. Journal of Petroleum Geology 21, 33-
49.
Sikorska M., Pacześna J., 1997. Quartz cementation in Cambrian sandstones on the background of their
burial history (Polish part of the East European Craton). Geological Quarterly, 41, 265-272.
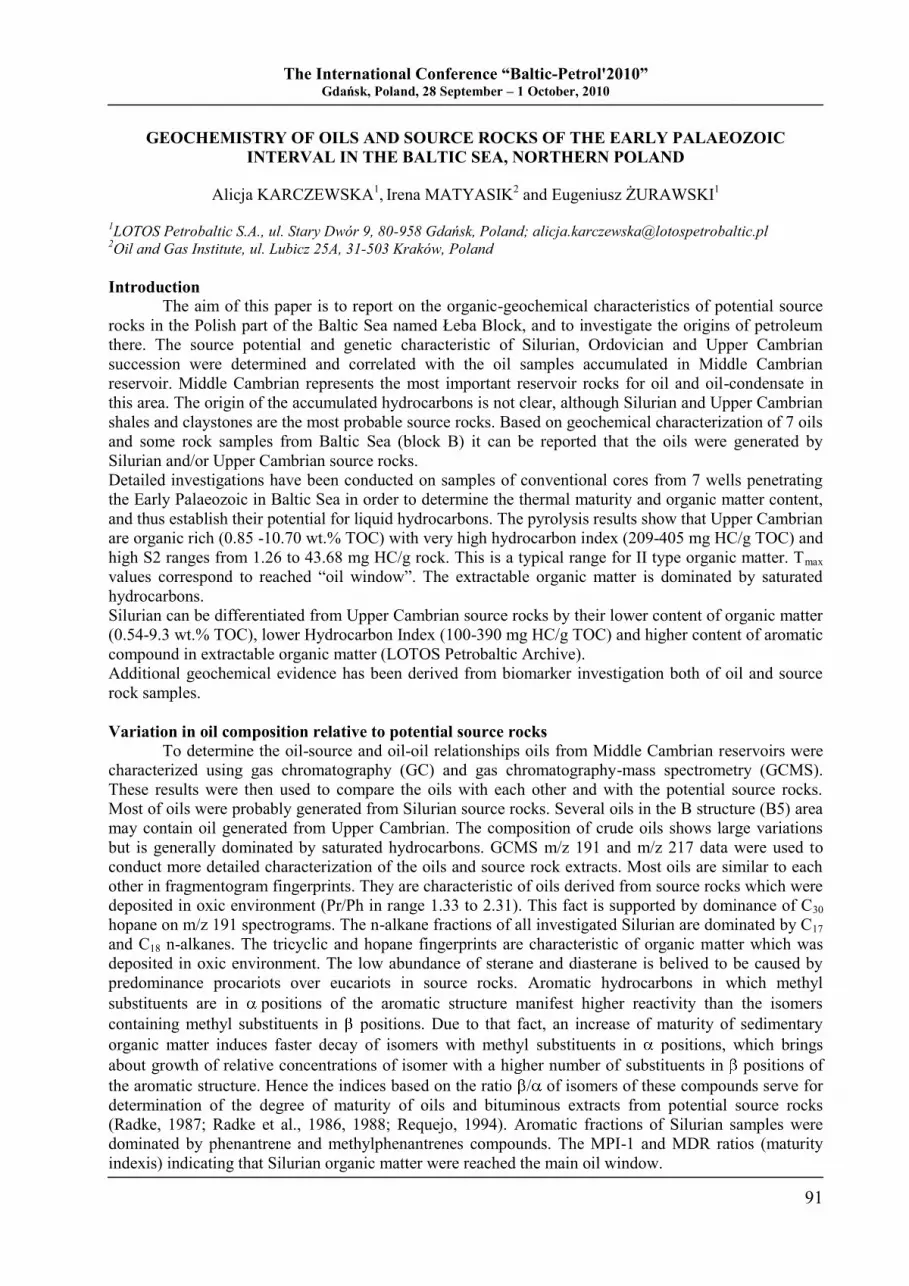
The International Conference “Baltic-Petrol'2010” Gdańsk, Poland, 28 September – 1 October, 2010
91
GEOCHEMISTRY OF OILS AND SOURCE ROCKS OF THE EARLY PALAEOZOIC
INTERVAL IN THE BALTIC SEA, NORTHERN POLAND
Alicja KARCZEWSKA1, Irena MATYASIK
2 and Eugeniusz ŻURAWSKI
1
1LOTOS Petrobaltic S.A., ul. Stary Dwór 9, 80-958 Gdańsk, Poland; [email protected]
2Oil and Gas Institute, ul. Lubicz 25A, 31-503 Kraków, Poland
Introduction
The aim of this paper is to report on the organic-geochemical characteristics of potential source
rocks in the Polish part of the Baltic Sea named Łeba Block, and to investigate the origins of petroleum
there. The source potential and genetic characteristic of Silurian, Ordovician and Upper Cambrian
succession were determined and correlated with the oil samples accumulated in Middle Cambrian
reservoir. Middle Cambrian represents the most important reservoir rocks for oil and oil-condensate in
this area. The origin of the accumulated hydrocarbons is not clear, although Silurian and Upper Cambrian
shales and claystones are the most probable source rocks. Based on geochemical characterization of 7 oils
and some rock samples from Baltic Sea (block B) it can be reported that the oils were generated by
Silurian and/or Upper Cambrian source rocks.
Detailed investigations have been conducted on samples of conventional cores from 7 wells penetrating
the Early Palaeozoic in Baltic Sea in order to determine the thermal maturity and organic matter content,
and thus establish their potential for liquid hydrocarbons. The pyrolysis results show that Upper Cambrian
are organic rich (0.85 -10.70 wt.% TOC) with very high hydrocarbon index (209-405 mg HC/g TOC) and
high S2 ranges from 1.26 to 43.68 mg HC/g rock. This is a typical range for II type organic matter. Tmax
values correspond to reached “oil window”. The extractable organic matter is dominated by saturated
hydrocarbons.
Silurian can be differentiated from Upper Cambrian source rocks by their lower content of organic matter
(0.54-9.3 wt.% TOC), lower Hydrocarbon Index (100-390 mg HC/g TOC) and higher content of aromatic
compound in extractable organic matter (LOTOS Petrobaltic Archive). Additional geochemical evidence has been derived from biomarker investigation both of oil and source
rock samples.
Variation in oil composition relative to potential source rocks
To determine the oil-source and oil-oil relationships oils from Middle Cambrian reservoirs were
characterized using gas chromatography (GC) and gas chromatography-mass spectrometry (GCMS).
These results were then used to compare the oils with each other and with the potential source rocks.
Most of oils were probably generated from Silurian source rocks. Several oils in the B structure (B5) area
may contain oil generated from Upper Cambrian. The composition of crude oils shows large variations
but is generally dominated by saturated hydrocarbons. GCMS m/z 191 and m/z 217 data were used to
conduct more detailed characterization of the oils and source rock extracts. Most oils are similar to each
other in fragmentogram fingerprints. They are characteristic of oils derived from source rocks which were
deposited in oxic environment (Pr/Ph in range 1.33 to 2.31). This fact is supported by dominance of C30
hopane on m/z 191 spectrograms. The n-alkane fractions of all investigated Silurian are dominated by C17
and C18 n-alkanes. The tricyclic and hopane fingerprints are characteristic of organic matter which was
deposited in oxic environment. The low abundance of sterane and diasterane is belived to be caused by
predominance procariots over eucariots in source rocks. Aromatic hydrocarbons in which methyl
substituents are in positions of the aromatic structure manifest higher reactivity than the isomers
containing methyl substituents in positions. Due to that fact, an increase of maturity of sedimentary
organic matter induces faster decay of isomers with methyl substituents in positions, which brings
about growth of relative concentrations of isomer with a higher number of substituents in positions of
the aromatic structure. Hence the indices based on the ratio / of isomers of these compounds serve for
determination of the degree of maturity of oils and bituminous extracts from potential source rocks
(Radke, 1987; Radke et al., 1986, 1988; Requejo, 1994). Aromatic fractions of Silurian samples were
dominated by phenantrene and methylphenantrenes compounds. The MPI-1 and MDR ratios (maturity
indexis) indicating that Silurian organic matter were reached the main oil window.
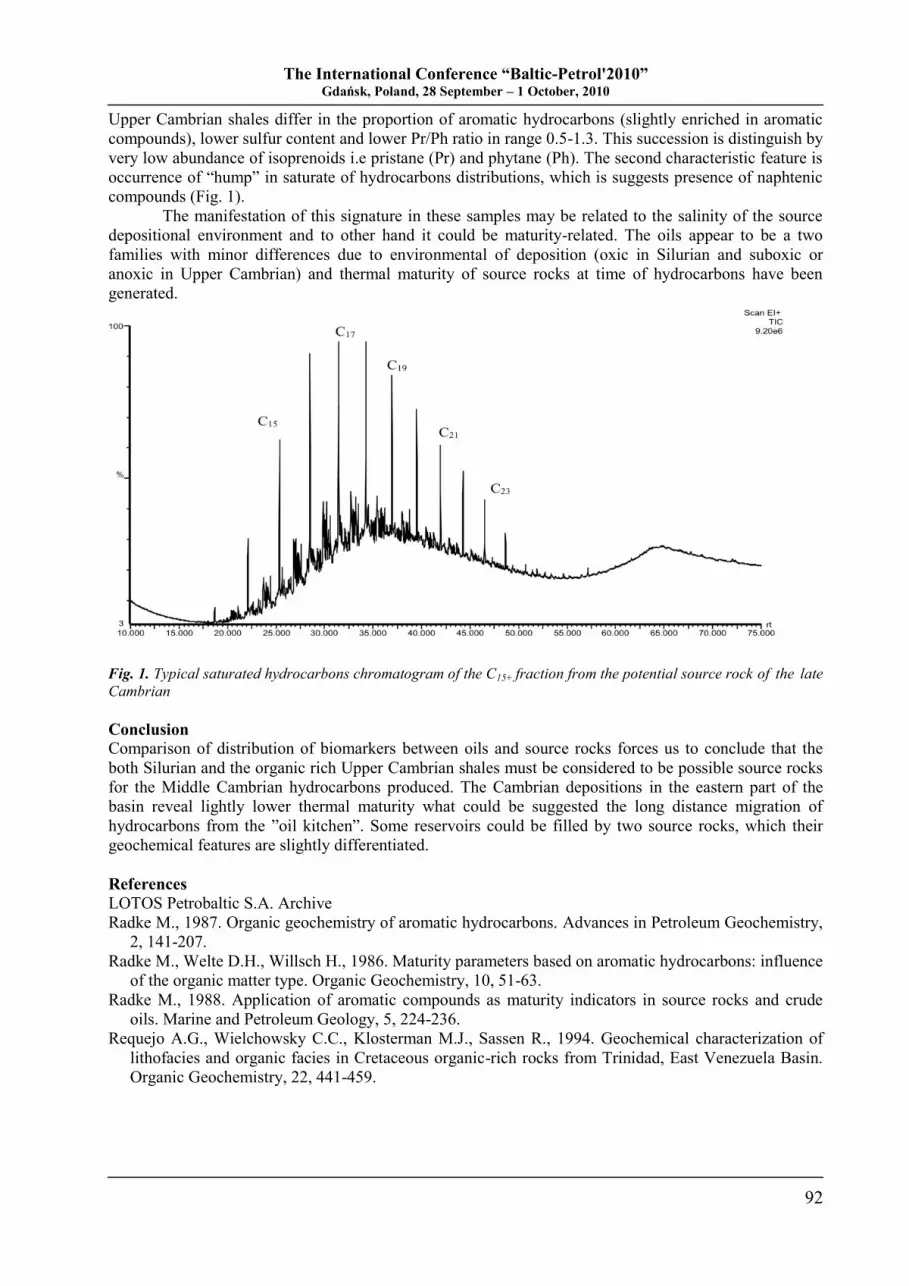
The International Conference “Baltic-Petrol'2010” Gdańsk, Poland, 28 September – 1 October, 2010
92
Upper Cambrian shales differ in the proportion of aromatic hydrocarbons (slightly enriched in aromatic
compounds), lower sulfur content and lower Pr/Ph ratio in range 0.5-1.3. This succession is distinguish by
very low abundance of isoprenoids i.e pristane (Pr) and phytane (Ph). The second characteristic feature is
occurrence of “hump” in saturate of hydrocarbons distributions, which is suggests presence of naphtenic
compounds (Fig. 1).
The manifestation of this signature in these samples may be related to the salinity of the source
depositional environment and to other hand it could be maturity-related. The oils appear to be a two
families with minor differences due to environmental of deposition (oxic in Silurian and suboxic or
anoxic in Upper Cambrian) and thermal maturity of source rocks at time of hydrocarbons have been
generated.
Fig. 1. Typical saturated hydrocarbons chromatogram of the C15+ fraction from the potential source rock of the late
Cambrian
Conclusion
Comparison of distribution of biomarkers between oils and source rocks forces us to conclude that the
both Silurian and the organic rich Upper Cambrian shales must be considered to be possible source rocks
for the Middle Cambrian hydrocarbons produced. The Cambrian depositions in the eastern part of the
basin reveal lightly lower thermal maturity what could be suggested the long distance migration of
hydrocarbons from the ”oil kitchen”. Some reservoirs could be filled by two source rocks, which their
geochemical features are slightly differentiated.
References
LOTOS Petrobaltic S.A. Archive
Radke M., 1987. Organic geochemistry of aromatic hydrocarbons. Advances in Petroleum Geochemistry,
2, 141-207.
Radke M., Welte D.H., Willsch H., 1986. Maturity parameters based on aromatic hydrocarbons: influence
of the organic matter type. Organic Geochemistry, 10, 51-63.
Radke M., 1988. Application of aromatic compounds as maturity indicators in source rocks and crude
oils. Marine and Petroleum Geology, 5, 224-236.
Requejo A.G., Wielchowsky C.C., Klosterman M.J., Sassen R., 1994. Geochemical characterization of
lithofacies and organic facies in Cretaceous organic-rich rocks from Trinidad, East Venezuela Basin.
Organic Geochemistry, 22, 441-459.
The International Conference “Baltic-Petrol'2010” Gdańsk, Poland, 28 September – 1 October, 2010
93
APPLICATION OF BSC & EVA INDICATORS IN MANAGING VALUE
OF OIL PRODUCING COMPANY
Arūnas KLEINAS1,2,3
1Klaipėda University, Herkaus Manto str. 84, LT – 92294 Klaipėda, Lithuania
2Institute of Geology & Geography, Nature Research Center, T. Ńevčenkos str. 13, LT – 03223 Vilnius, Lithuania
3Oil Company MANIFOLDAS, Klaipėdos str. 30, LT – 96123 Gargždai, Lithuania; [email protected]
Introduction
Maximization of value or value-based management today is a strategic task for enterprisers in different
sectors of industry including oil sector. It is necessary to be aware of the changes of company‟s value
induced by certain decisions. It can be achieved through an effective and coordinated with the specific
character of a company yet simple value-based management. Performance of a company can be very
successfully measured using EVA and BSC indicators.
The systemic character of performance management tool BSC is its advantage. The EVA indicator
is easy to understand. Understanding of the both indicators does not require special financial knowledge.
Individual application of the both indicators has weak points. Yet combination of BSC and EVA
eliminates the demerits and strengthens merits. The greatest merit of the combination is that EVA
becomes the ultimate strategic goal, i.e. financial BSC perspective. The coordination of BSC system with
the strategic goal increases performance value what is in accord with the value-based management
(Stepanov, 2006).
This presentation introduces the logic of BSC and EVA indicators application in value-based
management of oil producing company focussing on the intrinsic processes creating value and on their
limitations. Research results have been obtained by Company “Manifoldas”.
Principles of application of BSC and EVA indicators
Firstly, the value-based management of a company is concurrent with the strategic analysis aimed at
finding out the external conditions for operation of the company and internal processes for development
of value maximization strategy. When a company is in a stage of growing, the strategy of value
maximization through increase of income (growth strategy) is more attractive. For mature company or
company in the phase of ageing, the issues of optimization of costs (efficiency strategy) become more
relevant. A company must choose the path to value maximization.
For maximization of company value, the following prerequisites are necessary:
- Implemetation of innovations (elimination of activity limits; increasing of production rates, know-how,
etc.);
- Optimization of the cycle of prospecting and developing of a new group of resources raising maximal
total economic value added;
- Optimization of labour costs (activity, production, minimization of alternative costs);
- Effective use of human, technical and financial resources;
- Optimization of investment risks (selective management securing the maximal EVA from every
process/project/decision);
- Development of cooperation (useful cooperation/ partnership) and communication competences.
The BSC system is designed for establishing company‟s perspective and strategic objectives. The
implementation of strategic objectives is mapped in four perspectives. The traditional perspectives
distinguished by BSC are: finances, customers, processes and personnel. In the case of oil producing
company, the customers‟ perspective is regarded as one of little importance. In order to emphasize the
influence of external conditions for company activity, a perspective of external factors is included in the
BSC system (Fig. 1).
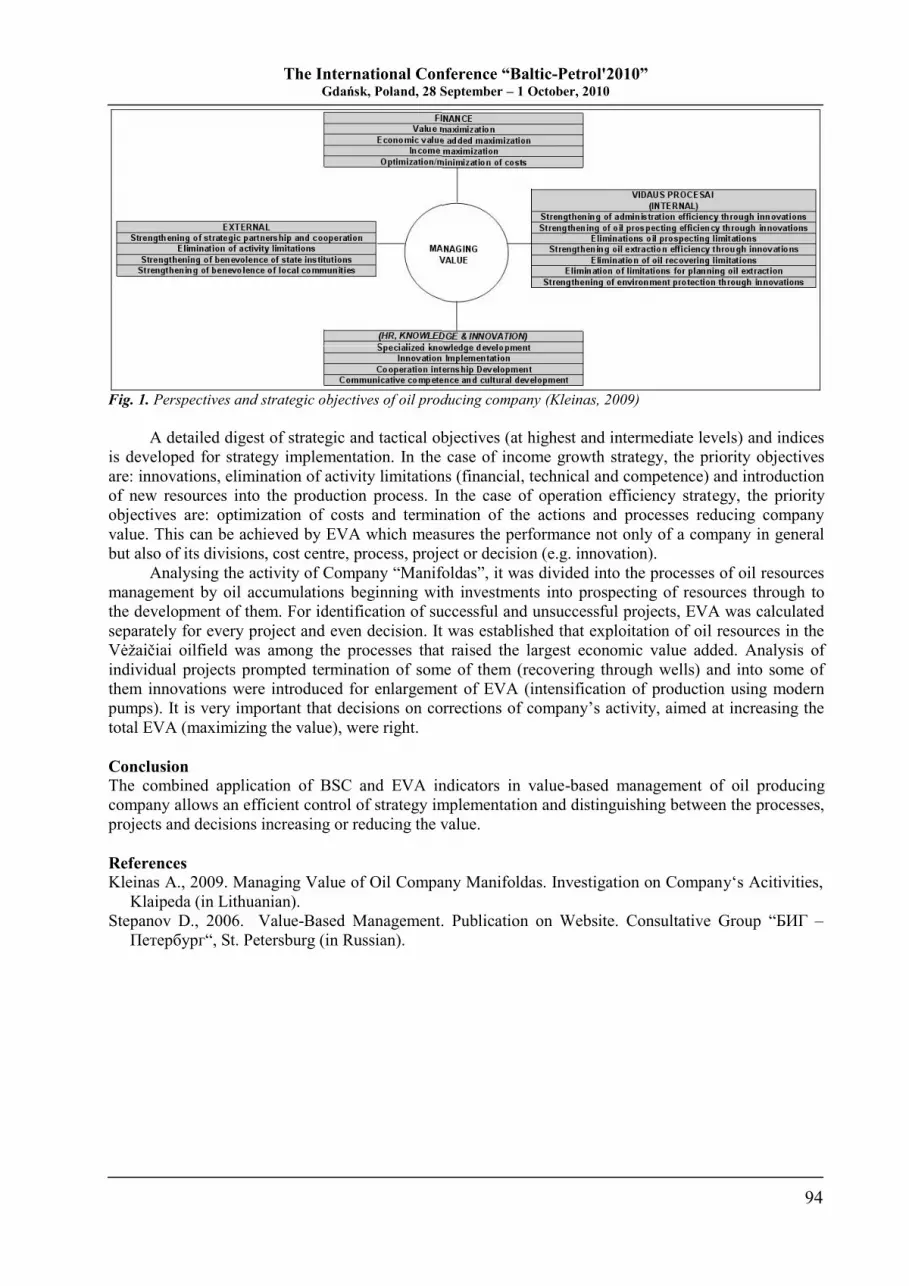
The International Conference “Baltic-Petrol'2010” Gdańsk, Poland, 28 September – 1 October, 2010
94
Fig. 1. Perspectives and strategic objectives of oil producing company (Kleinas, 2009)
A detailed digest of strategic and tactical objectives (at highest and intermediate levels) and indices
is developed for strategy implementation. In the case of income growth strategy, the priority objectives
are: innovations, elimination of activity limitations (financial, technical and competence) and introduction
of new resources into the production process. In the case of operation efficiency strategy, the priority
objectives are: optimization of costs and termination of the actions and processes reducing company
value. This can be achieved by EVA which measures the performance not only of a company in general
but also of its divisions, cost centre, process, project or decision (e.g. innovation).
Analysing the activity of Company “Manifoldas”, it was divided into the processes of oil resources
management by oil accumulations beginning with investments into prospecting of resources through to
the development of them. For identification of successful and unsuccessful projects, EVA was calculated
separately for every project and even decision. It was established that exploitation of oil resources in the
Vėžaičiai oilfield was among the processes that raised the largest economic value added. Analysis of
individual projects prompted termination of some of them (recovering through wells) and into some of
them innovations were introduced for enlargement of EVA (intensification of production using modern
pumps). It is very important that decisions on corrections of company‟s activity, aimed at increasing the
total EVA (maximizing the value), were right.
Conclusion
The combined application of BSC and EVA indicators in value-based management of oil producing
company allows an efficient control of strategy implementation and distinguishing between the processes,
projects and decisions increasing or reducing the value.
References
Kleinas A., 2009. Managing Value of Oil Company Manifoldas. Investigation on Company„s Acitivities,
Klaipeda (in Lithuanian).
Stepanov D., 2006. Value-Based Management. Publication on Website. Consultative Group “БИГ –
Петербург“, St. Petersburg (in Russian).
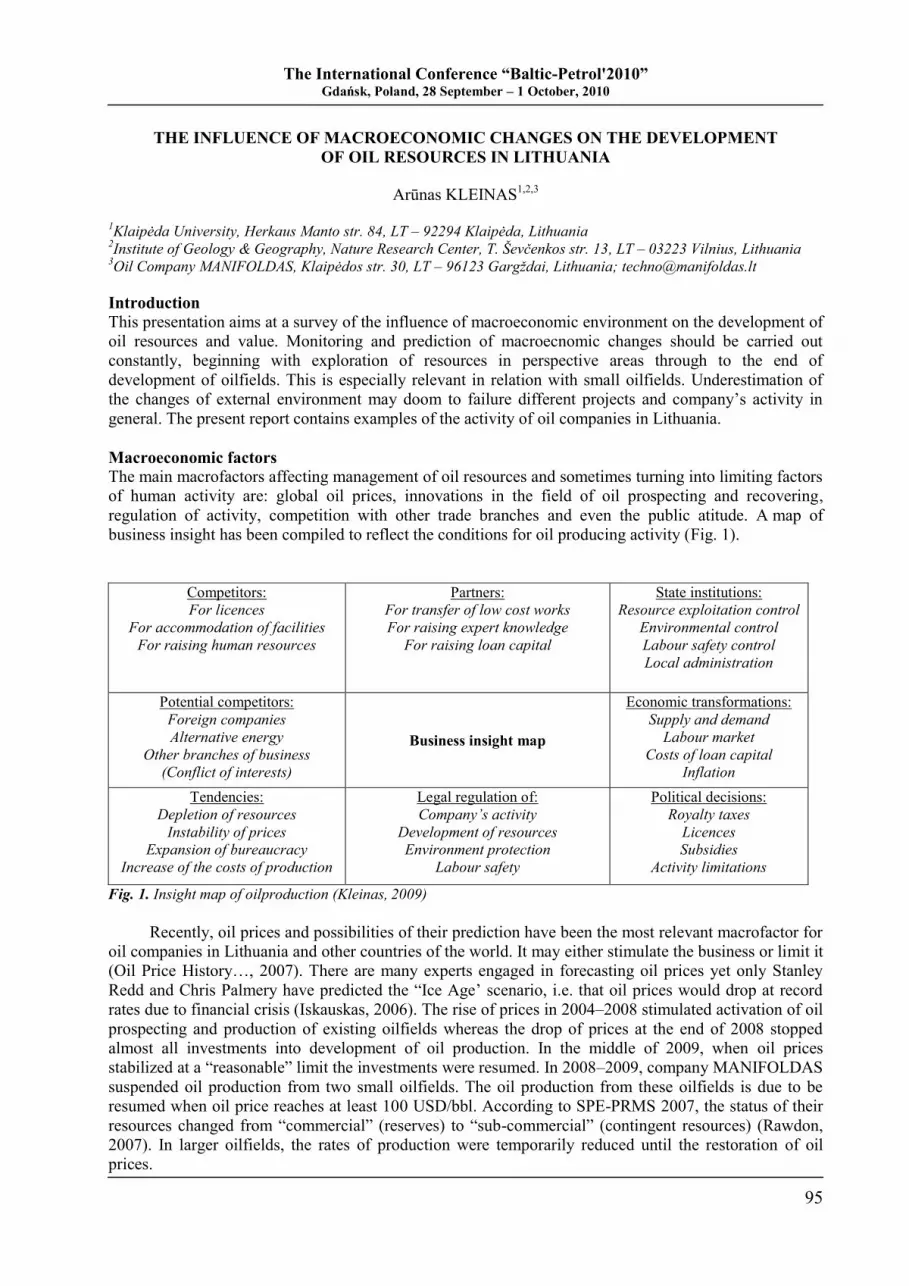
The International Conference “Baltic-Petrol'2010” Gdańsk, Poland, 28 September – 1 October, 2010
95
THE INFLUENCE OF MACROECONOMIC CHANGES ON THE DEVELOPMENT
OF OIL RESOURCES IN LITHUANIA
Arūnas KLEINAS1,2,3
1Klaipėda University, Herkaus Manto str. 84, LT – 92294 Klaipėda, Lithuania
2Institute of Geology & Geography, Nature Research Center, T. Ńevčenkos str. 13, LT – 03223 Vilnius, Lithuania
3Oil Company MANIFOLDAS, Klaipėdos str. 30, LT – 96123 Gargždai, Lithuania; [email protected]
Introduction
This presentation aims at a survey of the influence of macroeconomic environment on the development of
oil resources and value. Monitoring and prediction of macroecnomic changes should be carried out
constantly, beginning with exploration of resources in perspective areas through to the end of
development of oilfields. This is especially relevant in relation with small oilfields. Underestimation of
the changes of external environment may doom to failure different projects and company‟s activity in
general. The present report contains examples of the activity of oil companies in Lithuania.
Macroeconomic factors
The main macrofactors affecting management of oil resources and sometimes turning into limiting factors
of human activity are: global oil prices, innovations in the field of oil prospecting and recovering,
regulation of activity, competition with other trade branches and even the public atitude. A map of
business insight has been compiled to reflect the conditions for oil producing activity (Fig. 1).
Competitors:
For licences
For accommodation of facilities
For raising human resources
Partners:
For transfer of low cost works
For raising expert knowledge
For raising loan capital
State institutions:
Resource exploitation control
Environmental control
Labour safety control
Local administration
Potential competitors:
Foreign companies
Alternative energy
Other branches of business
(Conflict of interests)
Business insight map
Economic transformations:
Supply and demand
Labour market
Costs of loan capital
Inflation
Tendencies:
Depletion of resources
Instability of prices
Expansion of bureaucracy
Increase of the costs of production
Legal regulation of:
Company’s activity
Development of resources
Environment protection
Labour safety
Political decisions:
Royalty taxes
Licences
Subsidies
Activity limitations
Fig. 1. Insight map of oilproduction (Kleinas, 2009)
Recently, oil prices and possibilities of their prediction have been the most relevant macrofactor for
oil companies in Lithuania and other countries of the world. It may either stimulate the business or limit it
(Oil Price History…, 2007). There are many experts engaged in forecasting oil prices yet only Stanley
Redd and Chris Palmery have predicted the “Ice Age‟ scenario, i.e. that oil prices would drop at record
rates due to financial crisis (Iskauskas, 2006). The rise of prices in 2004–2008 stimulated activation of oil
prospecting and production of existing oilfields whereas the drop of prices at the end of 2008 stopped
almost all investments into development of oil production. In the middle of 2009, when oil prices
stabilized at a “reasonable” limit the investments were resumed. In 2008–2009, company MANIFOLDAS
suspended oil production from two small oilfields. The oil production from these oilfields is due to be
resumed when oil price reaches at least 100 USD/bbl. According to SPE-PRMS 2007, the status of their
resources changed from “commercial” (reserves) to “sub-commercial” (contingent resources) (Rawdon,
2007). In larger oilfields, the rates of production were temporarily reduced until the restoration of oil
prices.

The International Conference “Baltic-Petrol'2010” Gdańsk, Poland, 28 September – 1 October, 2010
96
Subsidies of oil prospecting introduced in the middle of 2003 is another important macrofactor for
Lithuanian oil production. The state and companies go halves into prospecting new oil resources. This
served as a strong stimulus for development of oil prospecting. Even small geological structures – with oil
resources even smaller than 100 thou t – have been viewed as promising. In the last five years,
MANIFOLDAS alone has found even 7 geological structures of this kind. The drafts of laws about
cancelling the subsidies stimulated oil prospecting even more. Companies (e.g. GEONAFTA and
MANIFOLDAS) do their best at least to finish prospecting the known oilfields. Cancelling of subsidies
would turn the projects into risk ones and the already known resources would likely not overpass the
category of “sub-commercial”.
Planning of oil production plays an ever increasing role in development of resources. The growing
complexity of territorial planning process and bureaucratic obstacles increase the alternative costs.
Despite that all companies through competition have gained rights to prospect and exploit the licensed
oilfields their activities often are stonewalled by local communities and administration or other branches
of business (recreation). The obstacles of oil prospecting and production vary. They are: expansion of
residential areas (especially during the period of economic rise in 2004–2008), proximity of preserved
territories, development within Natura 2000 (since accession to the EU), etc. As an example MINIJOS
NAFTA can be mentioned. Its attempt to plan oil production in the Lithuanian coastal area near the
Curonian Lagoon hit the headlines. The local community rejects all terms of compensation or support.
After a series of legal proceedings, oil production was disapproved. In order to avoid the conflicting
situations, special attention should be paid to selection of optimal site for prospecting well not only in
terms of geological setting but also in terms of surface conditions. MANIFOLDAS, for example, have
stricken even a few promising geological structures which are underlying the territories of nature reserves
meaning that the oil resources in them would have to be extracted using long oriented wells (oil
production in nature reserves is prohibited) what converts the possible reserves into “non-commercial” or
“sub-commercial” resources.
Conclusions
Macroeconomic conditions play an important role in development of oil resources. Yet their prediction is
related with growing difficulties. Thus oil companies are required not only to focus on oil prospecting and
production and introduction of management novelties but also on readjusting to macro-environment
changes. These challenges stimulate development of cooperation competence and search for improvement
of business conditions in Lithuania.
References
Iskauskas C., 2006. Oil prices: there is no point to have illusions. Public Institution "Center for
Geopolitical Studies”, Vilnius (in Lithuanian).
Kleinas A., 2009. Managing Value of Oil Company Manifoldas. Investigation on Company„s Acitivities,
Klaipeda (in Lithuanian).
Oil Price History and Analysis, 2007. Publicated on WTRG Economics Website, London.
Seager R.J.H., 2007. Petroleum Resources Management System. Publicated on Society of Petroleum
Engineers (SPE), website: www.spe.org/industry/reserves/docs/Petroleum_Resources_
Management_System_2007.pdf.
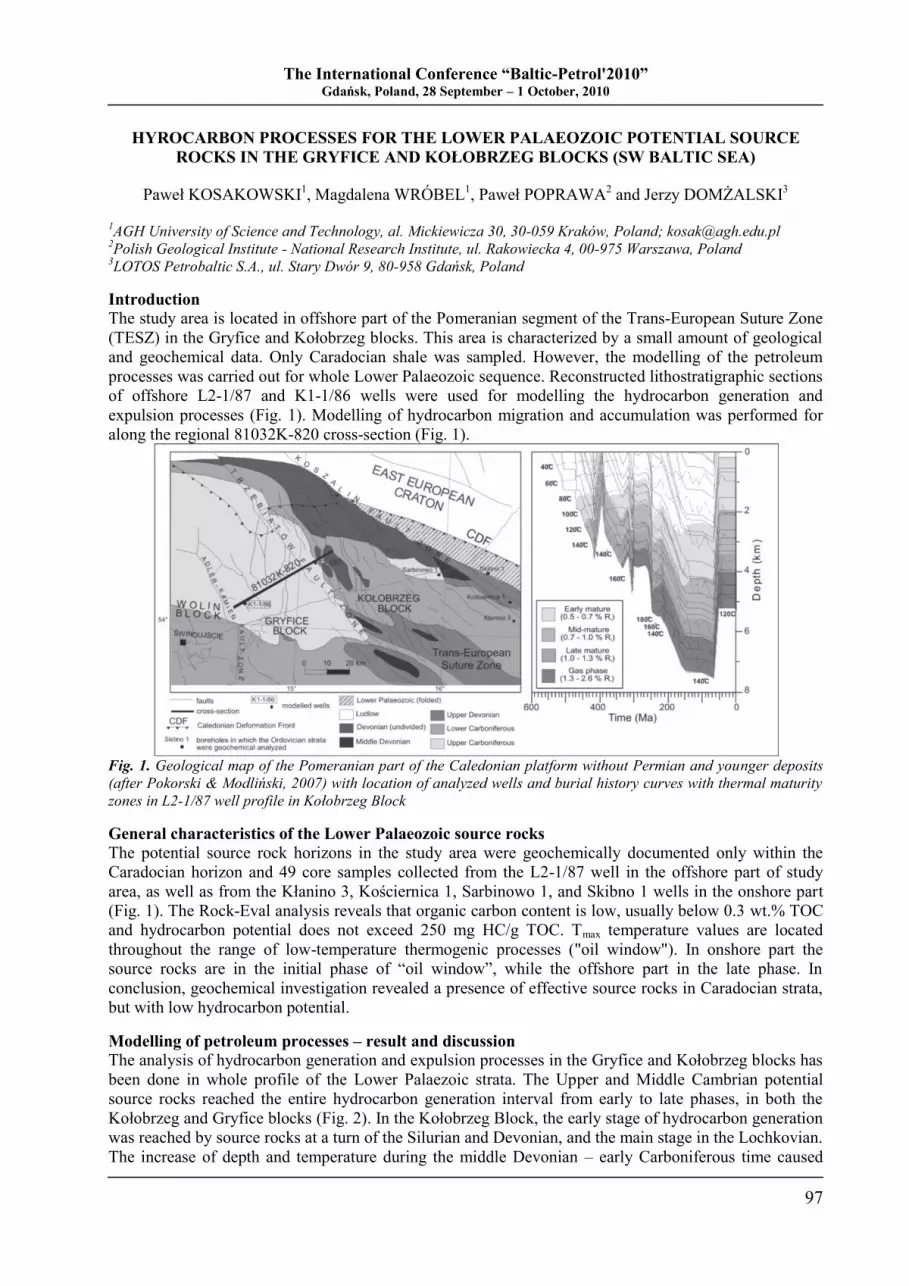
The International Conference “Baltic-Petrol'2010” Gdańsk, Poland, 28 September – 1 October, 2010
97
HYROCARBON PROCESSES FOR THE LOWER PALAEOZOIC POTENTIAL SOURCE
ROCKS IN THE GRYFICE AND KOŁOBRZEG BLOCKS (SW BALTIC SEA)
Paweł KOSAKOWSKI1, Magdalena WRÓBEL
1, Paweł POPRAWA
2 and Jerzy DOMŻALSKI
3
1AGH University of Science and Technology, al. Mickiewicza 30, 30-059 Kraków, Poland; [email protected]
2Polish Geological Institute - National Research Institute, ul. Rakowiecka 4, 00-975 Warszawa, Poland
3LOTOS Petrobaltic S.A., ul. Stary Dwór 9, 80-958 Gdańsk, Poland
Introduction
The study area is located in offshore part of the Pomeranian segment of the Trans-European Suture Zone
(TESZ) in the Gryfice and Kołobrzeg blocks. This area is characterized by a small amount of geological
and geochemical data. Only Caradocian shale was sampled. However, the modelling of the petroleum
processes was carried out for whole Lower Palaeozoic sequence. Reconstructed lithostratigraphic sections
of offshore L2-1/87 and K1-1/86 wells were used for modelling the hydrocarbon generation and
expulsion processes (Fig. 1). Modelling of hydrocarbon migration and accumulation was performed for
along the regional 81032K-820 cross-section (Fig. 1).
Fig. 1. Geological map of the Pomeranian part of the Caledonian platform without Permian and younger deposits
(after Pokorski & Modliński, 2007) with location of analyzed wells and burial history curves with thermal maturity
zones in L2-1/87 well profile in Kołobrzeg Block
General characteristics of the Lower Palaeozoic source rocks
The potential source rock horizons in the study area were geochemically documented only within the
Caradocian horizon and 49 core samples collected from the L2-1/87 well in the offshore part of study
area, as well as from the Kłanino 3, Kościernica 1, Sarbinowo 1, and Skibno 1 wells in the onshore part
(Fig. 1). The Rock-Eval analysis reveals that organic carbon content is low, usually below 0.3 wt.% TOC
and hydrocarbon potential does not exceed 250 mg HC/g TOC. Tmax temperature values are located
throughout the range of low-temperature thermogenic processes ("oil window"). In onshore part the
source rocks are in the initial phase of “oil window”, while the offshore part in the late phase. In
conclusion, geochemical investigation revealed a presence of effective source rocks in Caradocian strata,
but with low hydrocarbon potential.
Modelling of petroleum processes – result and discussion The analysis of hydrocarbon generation and expulsion processes in the Gryfice and Kołobrzeg blocks has
been done in whole profile of the Lower Palaezoic strata. The Upper and Middle Cambrian potential
source rocks reached the entire hydrocarbon generation interval from early to late phases, in both the
Kołobrzeg and Gryfice blocks (Fig. 2). In the Kołobrzeg Block, the early stage of hydrocarbon generation
was reached by source rocks at a turn of the Silurian and Devonian, and the main stage in the Lochkovian.
The increase of depth and temperature during the middle Devonian – early Carboniferous time caused
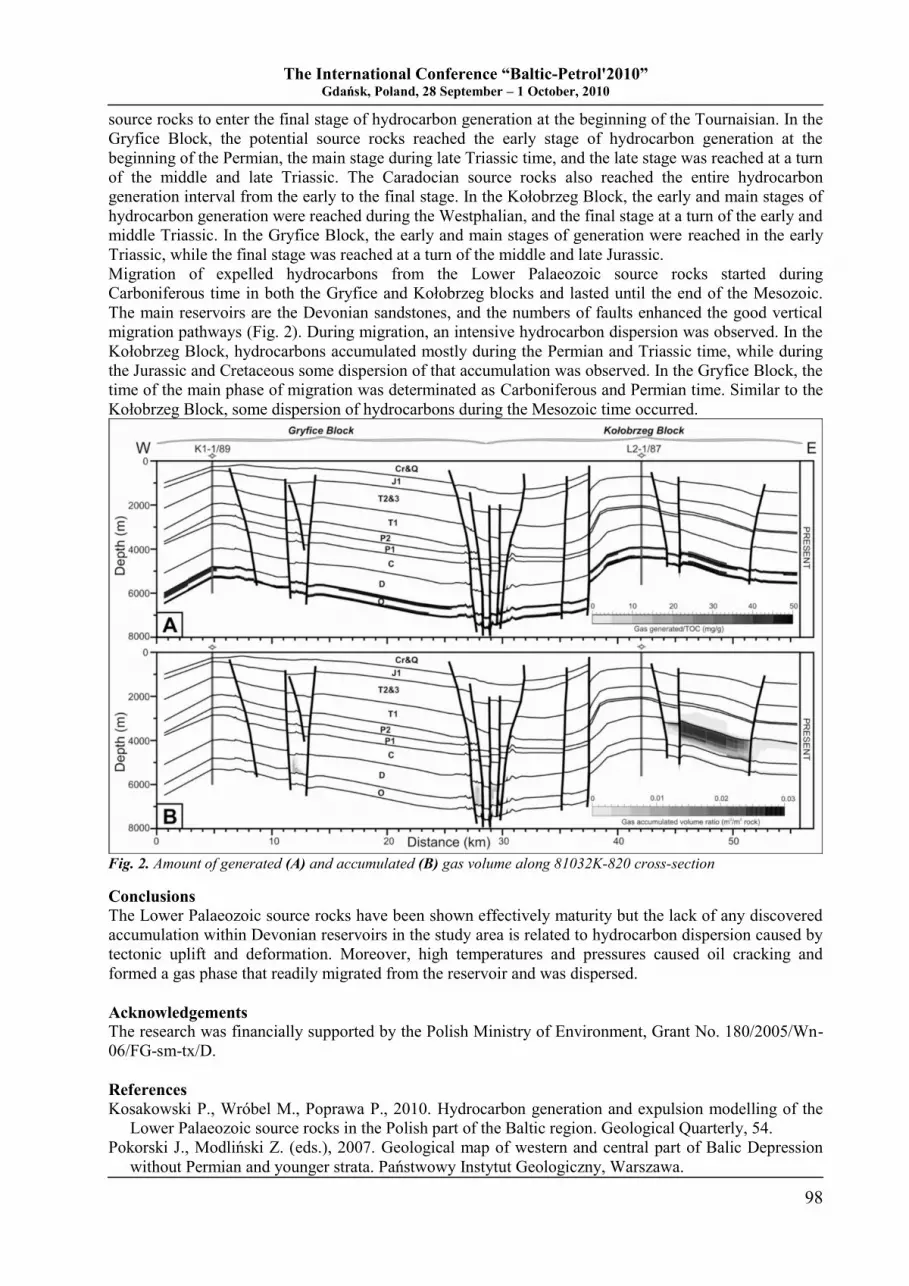
The International Conference “Baltic-Petrol'2010” Gdańsk, Poland, 28 September – 1 October, 2010
98
source rocks to enter the final stage of hydrocarbon generation at the beginning of the Tournaisian. In the
Gryfice Block, the potential source rocks reached the early stage of hydrocarbon generation at the
beginning of the Permian, the main stage during late Triassic time, and the late stage was reached at a turn
of the middle and late Triassic. The Caradocian source rocks also reached the entire hydrocarbon
generation interval from the early to the final stage. In the Kołobrzeg Block, the early and main stages of
hydrocarbon generation were reached during the Westphalian, and the final stage at a turn of the early and
middle Triassic. In the Gryfice Block, the early and main stages of generation were reached in the early
Triassic, while the final stage was reached at a turn of the middle and late Jurassic.
Migration of expelled hydrocarbons from the Lower Palaeozoic source rocks started during
Carboniferous time in both the Gryfice and Kołobrzeg blocks and lasted until the end of the Mesozoic.
The main reservoirs are the Devonian sandstones, and the numbers of faults enhanced the good vertical
migration pathways (Fig. 2). During migration, an intensive hydrocarbon dispersion was observed. In the
Kołobrzeg Block, hydrocarbons accumulated mostly during the Permian and Triassic time, while during
the Jurassic and Cretaceous some dispersion of that accumulation was observed. In the Gryfice Block, the
time of the main phase of migration was determinated as Carboniferous and Permian time. Similar to the
Kołobrzeg Block, some dispersion of hydrocarbons during the Mesozoic time occurred.
Fig. 2. Amount of generated (A) and accumulated (B) gas volume along 81032K-820 cross-section
Conclusions
The Lower Palaeozoic source rocks have been shown effectively maturity but the lack of any discovered
accumulation within Devonian reservoirs in the study area is related to hydrocarbon dispersion caused by
tectonic uplift and deformation. Moreover, high temperatures and pressures caused oil cracking and
formed a gas phase that readily migrated from the reservoir and was dispersed.
Acknowledgements
The research was financially supported by the Polish Ministry of Environment, Grant No. 180/2005/Wn-
06/FG-sm-tx/D.
References
Kosakowski P., Wróbel M., Poprawa P., 2010. Hydrocarbon generation and expulsion modelling of the
Lower Palaeozoic source rocks in the Polish part of the Baltic region. Geological Quarterly, 54.
Pokorski J., Modliński Z. (eds.), 2007. Geological map of western and central part of Balic Depression
without Permian and younger strata. Państwowy Instytut Geologiczny, Warszawa.
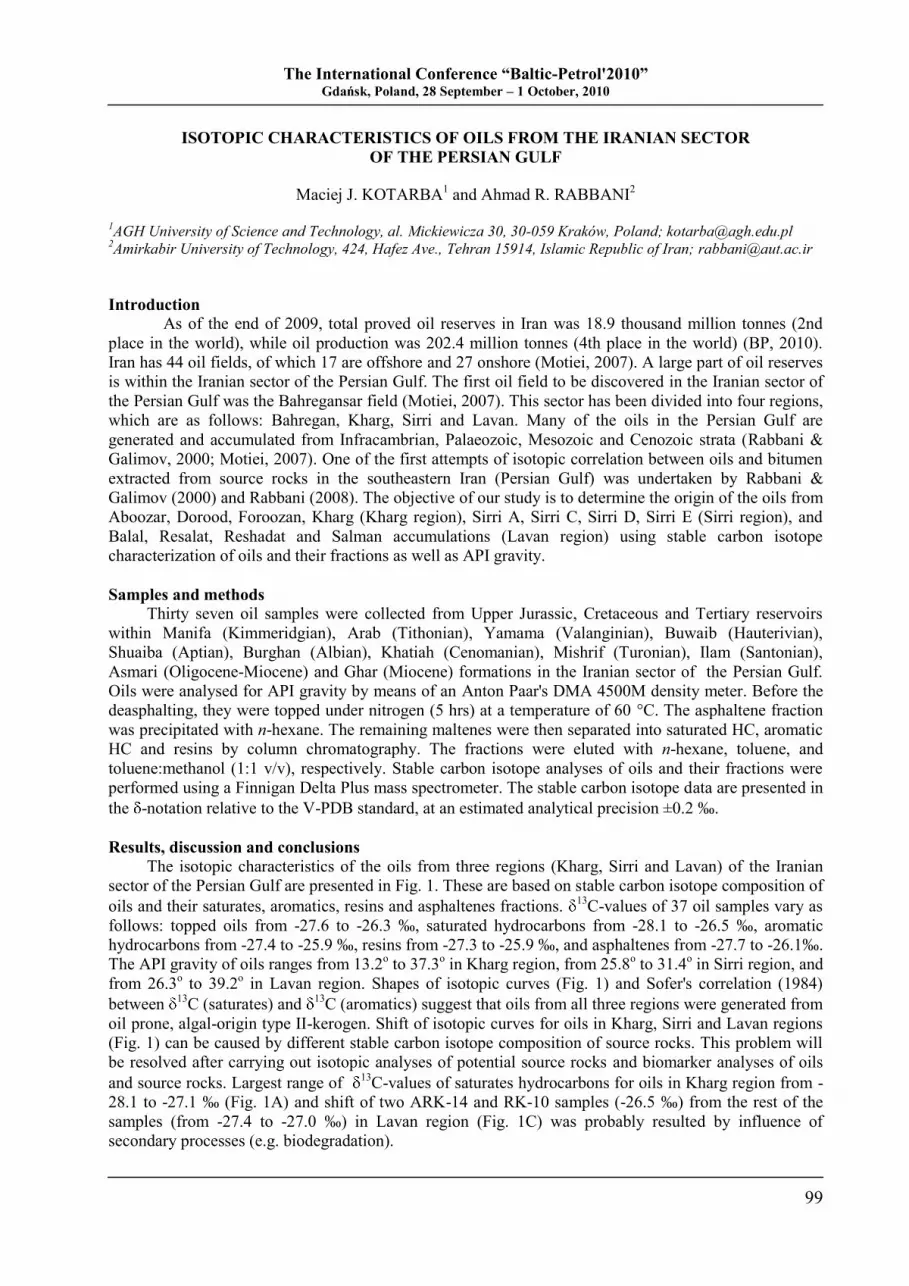
The International Conference “Baltic-Petrol'2010” Gdańsk, Poland, 28 September – 1 October, 2010
99
ISOTOPIC CHARACTERISTICS OF OILS FROM THE IRANIAN SECTOR
OF THE PERSIAN GULF
Maciej J. KOTARBA1 and Ahmad R. RABBANI
2
1AGH University of Science and Technology, al. Mickiewicza 30, 30-059 Kraków, Poland; [email protected]
2Amirkabir University of Technology, 424, Hafez Ave., Tehran 15914, Islamic Republic of Iran; [email protected]
Introduction
As of the end of 2009, total proved oil reserves in Iran was 18.9 thousand million tonnes (2nd
place in the world), while oil production was 202.4 million tonnes (4th place in the world) (BP, 2010).
Iran has 44 oil fields, of which 17 are offshore and 27 onshore (Motiei, 2007). A large part of oil reserves
is within the Iranian sector of the Persian Gulf. The first oil field to be discovered in the Iranian sector of
the Persian Gulf was the Bahregansar field (Motiei, 2007). This sector has been divided into four regions,
which are as follows: Bahregan, Kharg, Sirri and Lavan. Many of the oils in the Persian Gulf are
generated and accumulated from Infracambrian, Palaeozoic, Mesozoic and Cenozoic strata (Rabbani &
Galimov, 2000; Motiei, 2007). One of the first attempts of isotopic correlation between oils and bitumen
extracted from source rocks in the southeastern Iran (Persian Gulf) was undertaken by Rabbani &
Galimov (2000) and Rabbani (2008). The objective of our study is to determine the origin of the oils from
Aboozar, Dorood, Foroozan, Kharg (Kharg region), Sirri A, Sirri C, Sirri D, Sirri E (Sirri region), and
Balal, Resalat, Reshadat and Salman accumulations (Lavan region) using stable carbon isotope
characterization of oils and their fractions as well as API gravity.
Samples and methods
Thirty seven oil samples were collected from Upper Jurassic, Cretaceous and Tertiary reservoirs
within Manifa (Kimmeridgian), Arab (Tithonian), Yamama (Valanginian), Buwaib (Hauterivian),
Shuaiba (Aptian), Burghan (Albian), Khatiah (Cenomanian), Mishrif (Turonian), Ilam (Santonian),
Asmari (Oligocene-Miocene) and Ghar (Miocene) formations in the Iranian sector of the Persian Gulf.
Oils were analysed for API gravity by means of an Anton Paar's DMA 4500M density meter. Before the
deasphalting, they were topped under nitrogen (5 hrs) at a temperature of 60 °C. The asphaltene fraction
was precipitated with n-hexane. The remaining maltenes were then separated into saturated HC, aromatic
HC and resins by column chromatography. The fractions were eluted with n-hexane, toluene, and
toluene:methanol (1:1 v/v), respectively. Stable carbon isotope analyses of oils and their fractions were
performed using a Finnigan Delta Plus mass spectrometer. The stable carbon isotope data are presented in
the -notation relative to the V-PDB standard, at an estimated analytical precision ±0.2 ‰.
Results, discussion and conclusions
The isotopic characteristics of the oils from three regions (Kharg, Sirri and Lavan) of the Iranian
sector of the Persian Gulf are presented in Fig. 1. These are based on stable carbon isotope composition of
oils and their saturates, aromatics, resins and asphaltenes fractions. 13
C-values of 37 oil samples vary as
follows: topped oils from -27.6 to -26.3 ‰, saturated hydrocarbons from -28.1 to -26.5 ‰, aromatic
hydrocarbons from -27.4 to -25.9 ‰, resins from -27.3 to -25.9 ‰, and asphaltenes from -27.7 to -26.1‰.
The API gravity of oils ranges from 13.2o to 37.3
o in Kharg region, from 25.8
o to 31.4
o in Sirri region, and
from 26.3o to 39.2
o in Lavan region. Shapes of isotopic curves (Fig. 1) and Sofer's correlation (1984)
between 13
C (saturates) and 13
C (aromatics) suggest that oils from all three regions were generated from
oil prone, algal-origin type II-kerogen. Shift of isotopic curves for oils in Kharg, Sirri and Lavan regions
(Fig. 1) can be caused by different stable carbon isotope composition of source rocks. This problem will
be resolved after carrying out isotopic analyses of potential source rocks and biomarker analyses of oils
and source rocks. Largest range of 13
C-values of saturates hydrocarbons for oils in Kharg region from -
28.1 to -27.1 ‰ (Fig. 1A) and shift of two ARK-14 and RK-10 samples (-26.5 ‰) from the rest of the
samples (from -27.4 to -27.0 ‰) in Lavan region (Fig. 1C) was probably resulted by influence of
secondary processes (e.g. biodegradation).
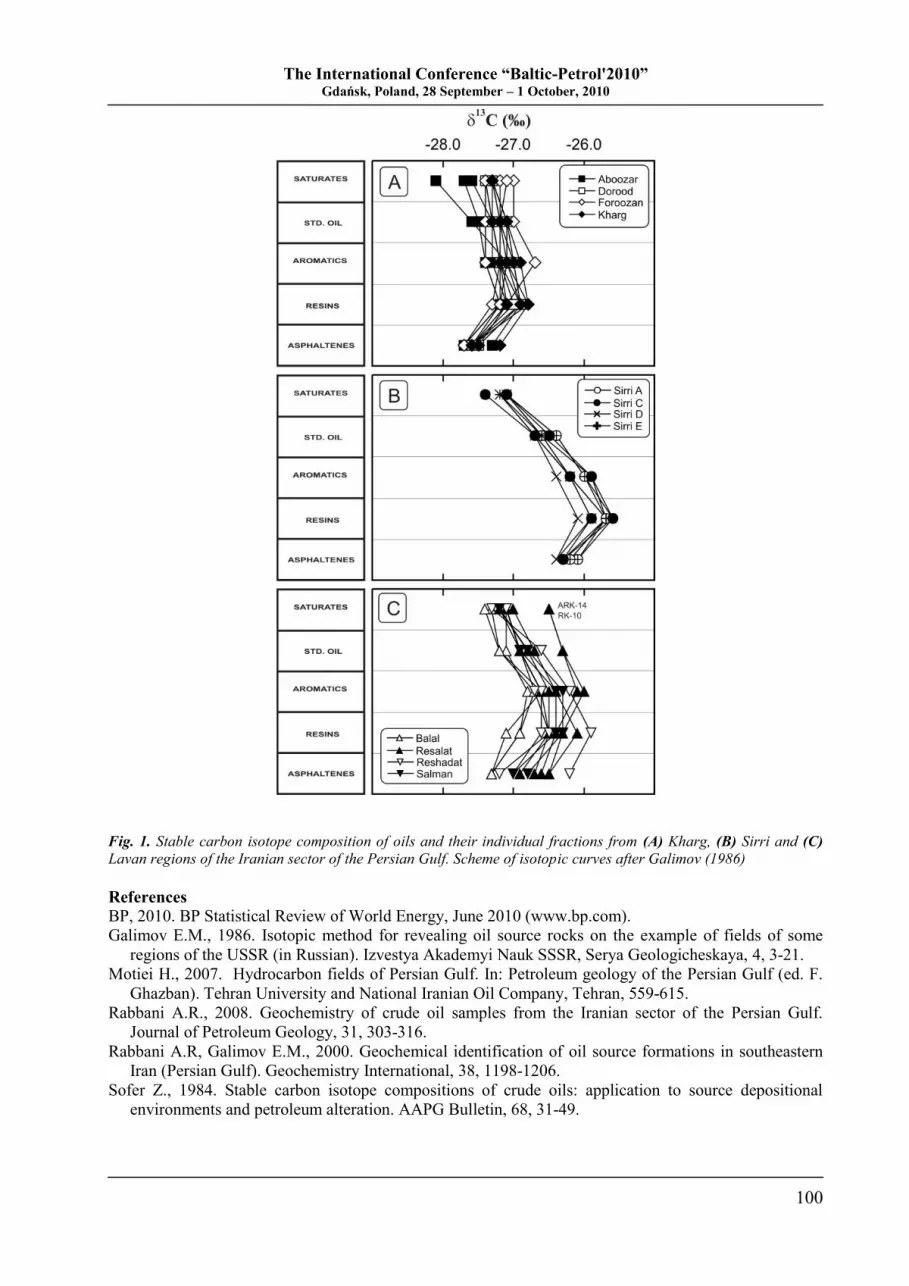
The International Conference “Baltic-Petrol'2010” Gdańsk, Poland, 28 September – 1 October, 2010
100
Fig. 1. Stable carbon isotope composition of oils and their individual fractions from (A) Kharg, (B) Sirri and (C)
Lavan regions of the Iranian sector of the Persian Gulf. Scheme of isotopic curves after Galimov (1986)
References
BP, 2010. BP Statistical Review of World Energy, June 2010 (www.bp.com).
Galimov E.M., 1986. Isotopic method for revealing oil source rocks on the example of fields of some
regions of the USSR (in Russian). Izvestya Akademyi Nauk SSSR, Serya Geologicheskaya, 4, 3-21.
Motiei H., 2007. Hydrocarbon fields of Persian Gulf. In: Petroleum geology of the Persian Gulf (ed. F.
Ghazban). Tehran University and National Iranian Oil Company, Tehran, 559-615.
Rabbani A.R., 2008. Geochemistry of crude oil samples from the Iranian sector of the Persian Gulf.
Journal of Petroleum Geology, 31, 303-316.
Rabbani A.R, Galimov E.M., 2000. Geochemical identification of oil source formations in southeastern
Iran (Persian Gulf). Geochemistry International, 38, 1198-1206.
Sofer Z., 1984. Stable carbon isotope compositions of crude oils: application to source depositional
environments and petroleum alteration. AAPG Bulletin, 68, 31-49.
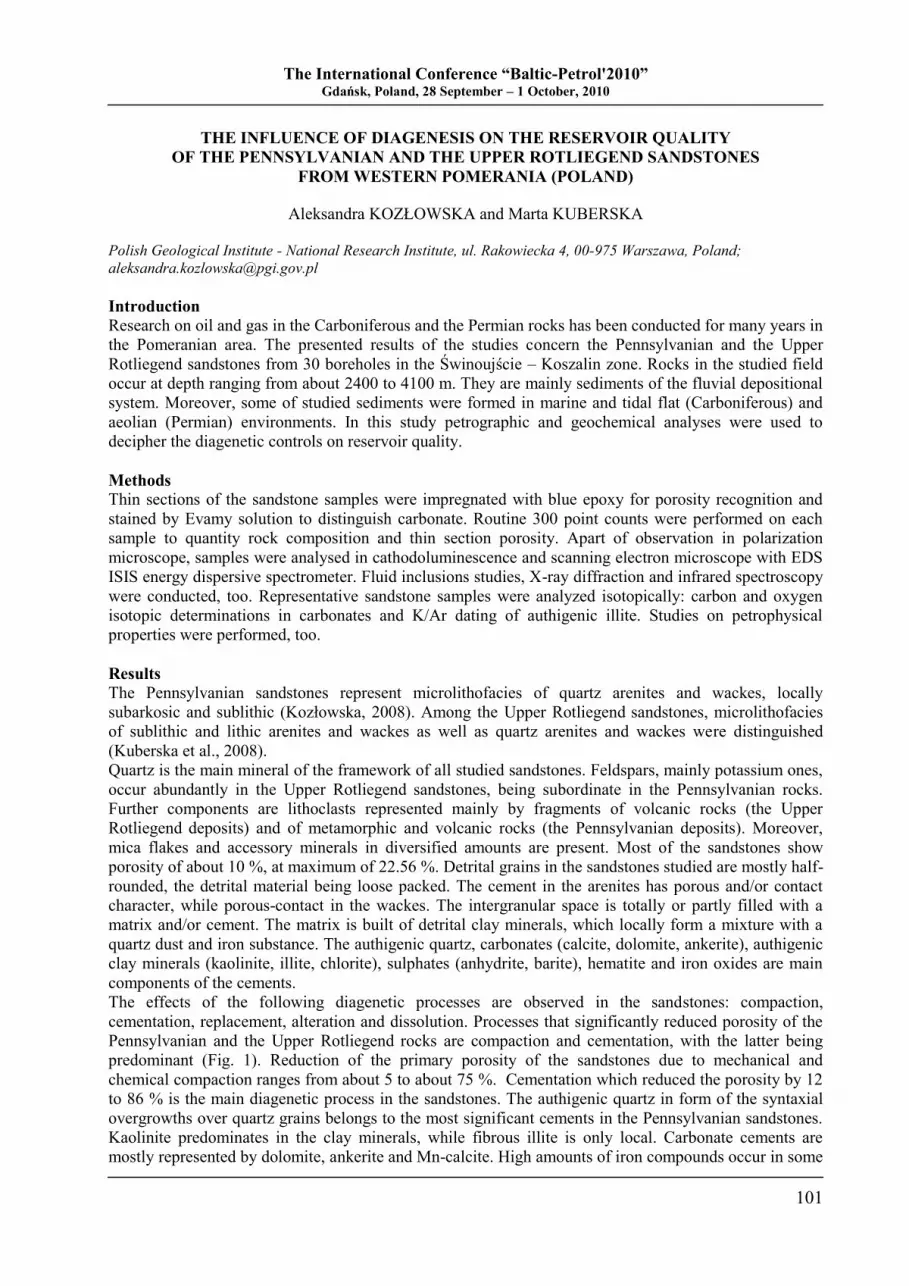
The International Conference “Baltic-Petrol'2010” Gdańsk, Poland, 28 September – 1 October, 2010
101
THE INFLUENCE OF DIAGENESIS ON THE RESERVOIR QUALITY
OF THE PENNSYLVANIAN AND THE UPPER ROTLIEGEND SANDSTONES
FROM WESTERN POMERANIA (POLAND)
Aleksandra KOZŁOWSKA and Marta KUBERSKA
Polish Geological Institute - National Research Institute, ul. Rakowiecka 4, 00-975 Warszawa, Poland;
Introduction Research on oil and gas in the Carboniferous and the Permian rocks has been conducted for many years in
the Pomeranian area. The presented results of the studies concern the Pennsylvanian and the Upper
Rotliegend sandstones from 30 boreholes in the Świnoujście – Koszalin zone. Rocks in the studied field
occur at depth ranging from about 2400 to 4100 m. They are mainly sediments of the fluvial depositional
system. Moreover, some of studied sediments were formed in marine and tidal flat (Carboniferous) and
aeolian (Permian) environments. In this study petrographic and geochemical analyses were used to
decipher the diagenetic controls on reservoir quality.
Methods
Thin sections of the sandstone samples were impregnated with blue epoxy for porosity recognition and
stained by Evamy solution to distinguish carbonate. Routine 300 point counts were performed on each
sample to quantity rock composition and thin section porosity. Apart of observation in polarization
microscope, samples were analysed in cathodoluminescence and scanning electron microscope with EDS
ISIS energy dispersive spectrometer. Fluid inclusions studies, X-ray diffraction and infrared spectroscopy
were conducted, too. Representative sandstone samples were analyzed isotopically: carbon and oxygen
isotopic determinations in carbonates and K/Ar dating of authigenic illite. Studies on petrophysical
properties were performed, too.
Results
The Pennsylvanian sandstones represent microlithofacies of quartz arenites and wackes, locally
subarkosic and sublithic (Kozłowska, 2008). Among the Upper Rotliegend sandstones, microlithofacies
of sublithic and lithic arenites and wackes as well as quartz arenites and wackes were distinguished
(Kuberska et al., 2008).
Quartz is the main mineral of the framework of all studied sandstones. Feldspars, mainly potassium ones,
occur abundantly in the Upper Rotliegend sandstones, being subordinate in the Pennsylvanian rocks.
Further components are lithoclasts represented mainly by fragments of volcanic rocks (the Upper
Rotliegend deposits) and of metamorphic and volcanic rocks (the Pennsylvanian deposits). Moreover,
mica flakes and accessory minerals in diversified amounts are present. Most of the sandstones show
porosity of about 10 %, at maximum of 22.56 %. Detrital grains in the sandstones studied are mostly half-
rounded, the detrital material being loose packed. The cement in the arenites has porous and/or contact
character, while porous-contact in the wackes. The intergranular space is totally or partly filled with a
matrix and/or cement. The matrix is built of detrital clay minerals, which locally form a mixture with a
quartz dust and iron substance. The authigenic quartz, carbonates (calcite, dolomite, ankerite), authigenic
clay minerals (kaolinite, illite, chlorite), sulphates (anhydrite, barite), hematite and iron oxides are main
components of the cements.
The effects of the following diagenetic processes are observed in the sandstones: compaction,
cementation, replacement, alteration and dissolution. Processes that significantly reduced porosity of the
Pennsylvanian and the Upper Rotliegend rocks are compaction and cementation, with the latter being
predominant (Fig. 1). Reduction of the primary porosity of the sandstones due to mechanical and
chemical compaction ranges from about 5 to about 75 %. Cementation which reduced the porosity by 12
to 86 % is the main diagenetic process in the sandstones. The authigenic quartz in form of the syntaxial
overgrowths over quartz grains belongs to the most significant cements in the Pennsylvanian sandstones.
Kaolinite predominates in the clay minerals, while fibrous illite is only local. Carbonate cements are
mostly represented by dolomite, ankerite and Mn-calcite. High amounts of iron compounds occur in some
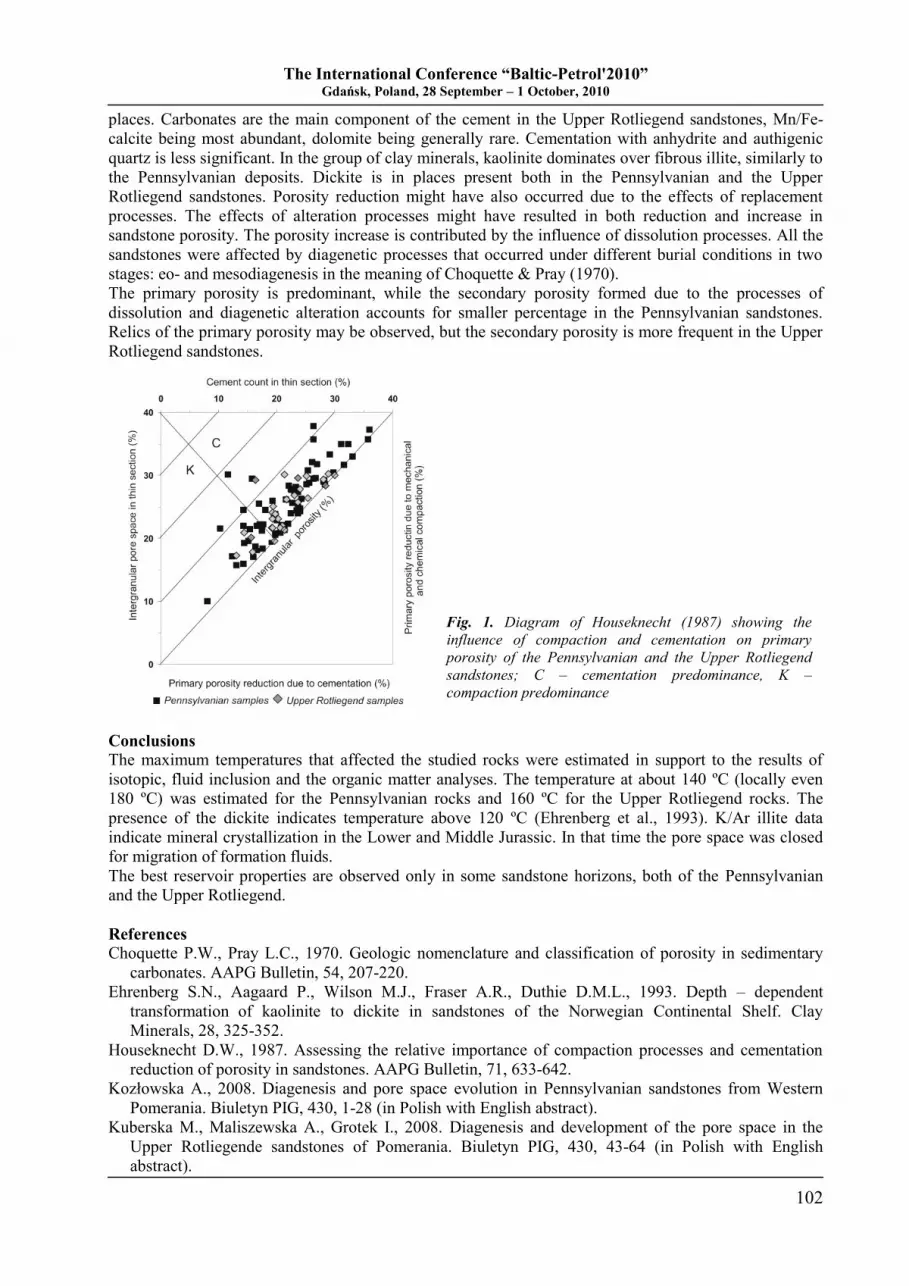
The International Conference “Baltic-Petrol'2010” Gdańsk, Poland, 28 September – 1 October, 2010
102
places. Carbonates are the main component of the cement in the Upper Rotliegend sandstones, Mn/Fe-
calcite being most abundant, dolomite being generally rare. Cementation with anhydrite and authigenic
quartz is less significant. In the group of clay minerals, kaolinite dominates over fibrous illite, similarly to
the Pennsylvanian deposits. Dickite is in places present both in the Pennsylvanian and the Upper
Rotliegend sandstones. Porosity reduction might have also occurred due to the effects of replacement
processes. The effects of alteration processes might have resulted in both reduction and increase in
sandstone porosity. The porosity increase is contributed by the influence of dissolution processes. All the
sandstones were affected by diagenetic processes that occurred under different burial conditions in two
stages: eo- and mesodiagenesis in the meaning of Choquette & Pray (1970).
The primary porosity is predominant, while the secondary porosity formed due to the processes of
dissolution and diagenetic alteration accounts for smaller percentage in the Pennsylvanian sandstones.
Relics of the primary porosity may be observed, but the secondary porosity is more frequent in the Upper
Rotliegend sandstones.
Conclusions
The maximum temperatures that affected the studied rocks were estimated in support to the results of
isotopic, fluid inclusion and the organic matter analyses. The temperature at about 140 ºC (locally even
180 ºC) was estimated for the Pennsylvanian rocks and 160 ºC for the Upper Rotliegend rocks. The
presence of the dickite indicates temperature above 120 ºC (Ehrenberg et al., 1993). K/Ar illite data
indicate mineral crystallization in the Lower and Middle Jurassic. In that time the pore space was closed
for migration of formation fluids.
The best reservoir properties are observed only in some sandstone horizons, both of the Pennsylvanian
and the Upper Rotliegend.
References
Choquette P.W., Pray L.C., 1970. Geologic nomenclature and classification of porosity in sedimentary
carbonates. AAPG Bulletin, 54, 207-220.
Ehrenberg S.N., Aagaard P., Wilson M.J., Fraser A.R., Duthie D.M.L., 1993. Depth – dependent
transformation of kaolinite to dickite in sandstones of the Norwegian Continental Shelf. Clay
Minerals, 28, 325-352.
Houseknecht D.W., 1987. Assessing the relative importance of compaction processes and cementation
reduction of porosity in sandstones. AAPG Bulletin, 71, 633-642.
Kozłowska A., 2008. Diagenesis and pore space evolution in Pennsylvanian sandstones from Western
Pomerania. Biuletyn PIG, 430, 1-28 (in Polish with English abstract).
Kuberska M., Maliszewska A., Grotek I., 2008. Diagenesis and development of the pore space in the
Upper Rotliegende sandstones of Pomerania. Biuletyn PIG, 430, 43-64 (in Polish with English
abstract).
Fig. 1. Diagram of Houseknecht (1987) showing the
influence of compaction and cementation on primary
porosity of the Pennsylvanian and the Upper Rotliegend
sandstones; C – cementation predominance, K –
compaction predominance
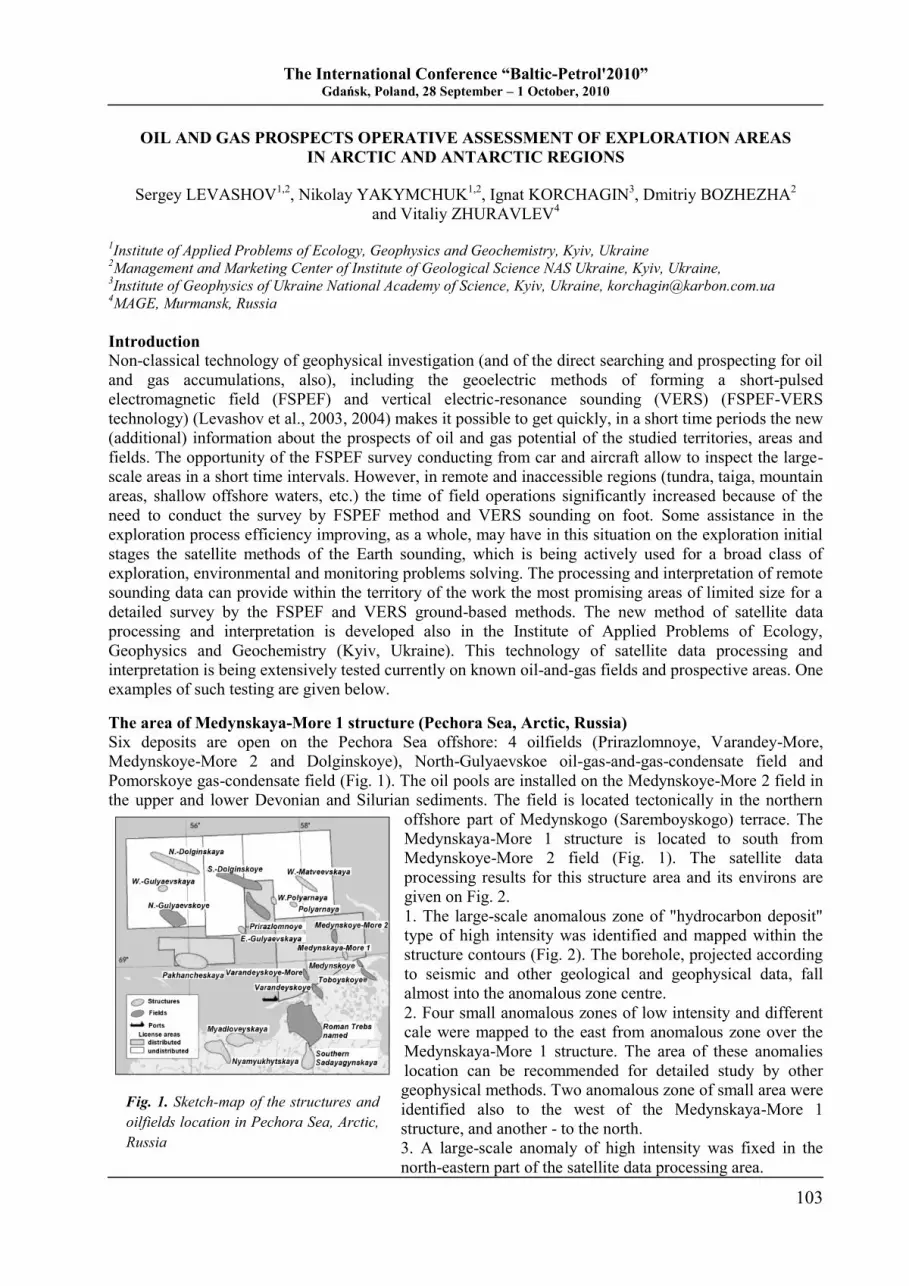
The International Conference “Baltic-Petrol'2010” Gdańsk, Poland, 28 September – 1 October, 2010
103
OIL AND GAS PROSPECTS OPERATIVE ASSESSMENT OF EXPLORATION AREAS
IN ARCTIC AND ANTARCTIC REGIONS
Sergey LEVASHOV1,2
, Nikolay YAKYMCHUK1,2
, Ignat KORCHAGIN3, Dmitriy BOZHEZHA
2
and Vitaliy ZHURAVLEV4
1Institute of Applied Problems of Ecology, Geophysics and Geochemistry, Kyiv, Ukraine
2Management and Marketing Center of Institute of Geological Science NAS Ukraine, Kyiv, Ukraine,
3Institute of Geophysics of Ukraine National Academy of Science, Kyiv, Ukraine, [email protected]
4MAGE, Murmansk, Russia
Introduction
Non-classical technology of geophysical investigation (and of the direct searching and prospecting for oil
and gas accumulations, also), including the geoelectric methods of forming a short-pulsed
electromagnetic field (FSPEF) and vertical electric-resonance sounding (VERS) (FSPEF-VERS
technology) (Levashov et al., 2003, 2004) makes it possible to get quickly, in a short time periods the new
(additional) information about the prospects of oil and gas potential of the studied territories, areas and
fields. The opportunity of the FSPEF survey conducting from car and aircraft allow to inspect the large-
scale areas in a short time intervals. However, in remote and inaccessible regions (tundra, taiga, mountain
areas, shallow offshore waters, etc.) the time of field operations significantly increased because of the
need to conduct the survey by FSPEF method and VERS sounding on foot. Some assistance in the
exploration process efficiency improving, as a whole, may have in this situation on the exploration initial
stages the satellite methods of the Earth sounding, which is being actively used for a broad class of
exploration, environmental and monitoring problems solving. The processing and interpretation of remote
sounding data can provide within the territory of the work the most promising areas of limited size for a
detailed survey by the FSPEF and VERS ground-based methods. The new method of satellite data
processing and interpretation is developed also in the Institute of Applied Problems of Ecology,
Geophysics and Geochemistry (Kyiv, Ukraine). This technology of satellite data processing and
interpretation is being extensively tested currently on known oil-and-gas fields and prospective areas. One
examples of such testing are given below.
The area of Medynskaya-More 1 structure (Pechora Sea, Arctic, Russia)
Six deposits are open on the Pechora Sea offshore: 4 oilfields (Prirazlomnoye, Varandey-More,
Medynskoye-More 2 and Dolginskoye), North-Gulyaevskoe oil-gas-and-gas-condensate field and
Pomorskoye gas-condensate field (Fig. 1). The oil pools are installed on the Medynskoye-More 2 field in
the upper and lower Devonian and Silurian sediments. The field is located tectonically in the northern
offshore part of Medynskogo (Saremboyskogo) terrace. The
Medynskaya-More 1 structure is located to south from
Medynskoye-More 2 field (Fig. 1). The satellite data
processing results for this structure area and its environs are
given on Fig. 2.
1. The large-scale anomalous zone of "hydrocarbon deposit"
type of high intensity was identified and mapped within the
structure contours (Fig. 2). The borehole, projected according
to seismic and other geological and geophysical data, fall
almost into the anomalous zone centre.
2. Four small anomalous zones of low intensity and different
cale were mapped to the east from anomalous zone over the
Medynskaya-More 1 structure. The area of these anomalies
location can be recommended for detailed study by other
geophysical methods. Two anomalous zone of small area were
identified also to the west of the Medynskaya-More 1
structure, and another - to the north.
3. A large-scale anomaly of high intensity was fixed in the
north-eastern part of the satellite data processing area.
Fig. 1. Sketch-map of the structures and
oilfields location in Pechora Sea, Arctic,
Russia
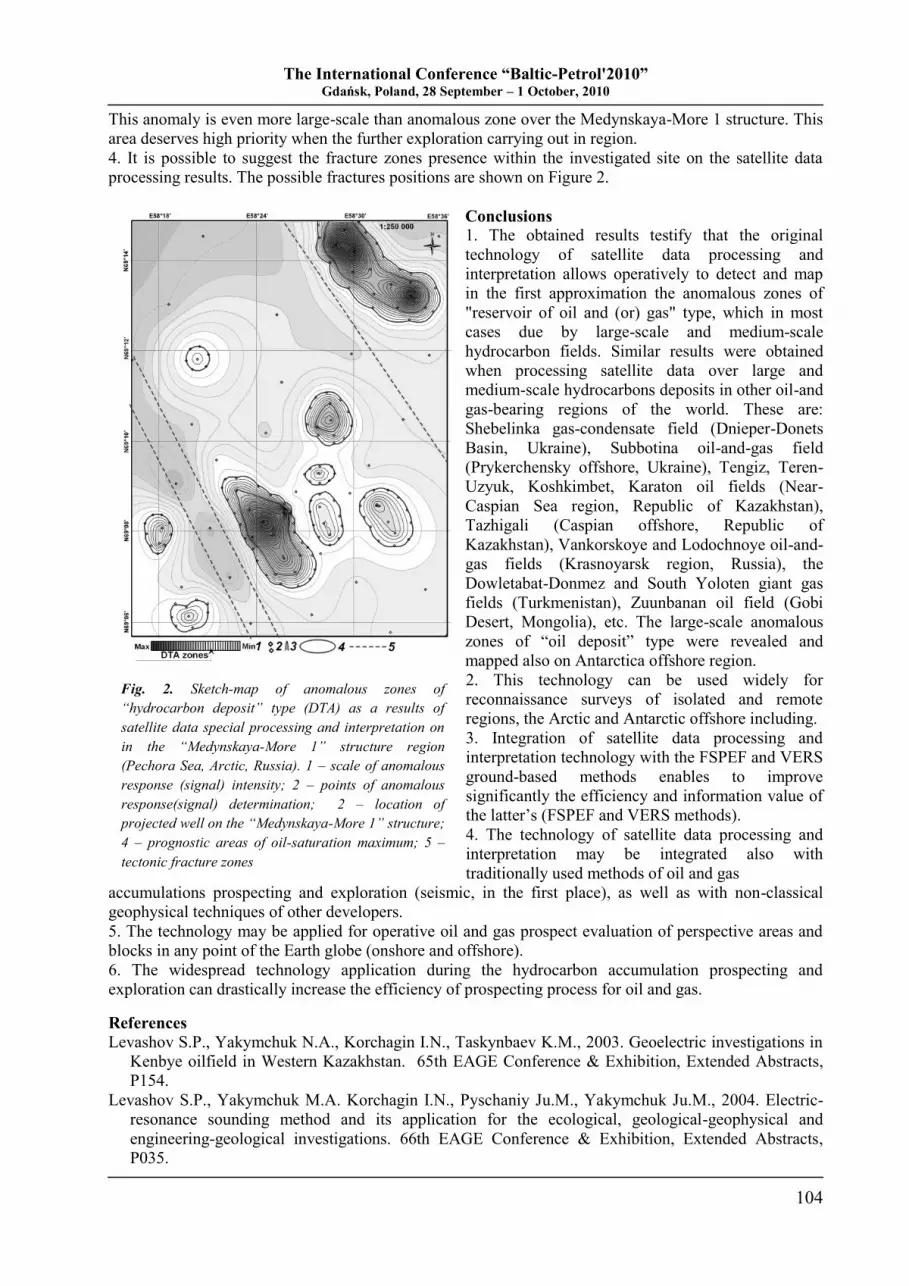
The International Conference “Baltic-Petrol'2010” Gdańsk, Poland, 28 September – 1 October, 2010
104
This anomaly is even more large-scale than anomalous zone over the Medynskaya-More 1 structure. This
area deserves high priority when the further exploration carrying out in region.
4. It is possible to suggest the fracture zones presence within the investigated site on the satellite data
processing results. The possible fractures positions are shown on Figure 2.
Conclusions
1. The obtained results testify that the original
technology of satellite data processing and
interpretation allows operatively to detect and map
in the first approximation the anomalous zones of
"reservoir of oil and (or) gas" type, which in most
cases due by large-scale and medium-scale
hydrocarbon fields. Similar results were obtained
when processing satellite data over large and
medium-scale hydrocarbons deposits in other oil-and
gas-bearing regions of the world. These are:
Shebelinka gas-condensate field (Dnieper-Donets
Basin, Ukraine), Subbotina oil-and-gas field
(Prykerchensky offshore, Ukraine), Tengiz, Teren-
Uzyuk, Koshkimbet, Karaton oil fields (Near-
Caspian Sea region, Republic of Kazakhstan),
Tazhigali (Caspian offshore, Republic of
Kazakhstan), Vankorskoye and Lodochnoye oil-and-
gas fields (Krasnoyarsk region, Russia), the
Dowletabat-Donmez and South Yoloten giant gas
fields (Turkmenistan), Zuunbanan oil field (Gobi
Desert, Mongolia), etc. The large-scale anomalous
zones of “oil deposit” type were revealed and
mapped also on Antarctica offshore region.
2. This technology can be used widely for
reconnaissance surveys of isolated and remote
regions, the Arctic and Antarctic offshore including.
3. Integration of satellite data processing and
interpretation technology with the FSPEF and VERS
ground-based methods enables to improve
significantly the efficiency and information value of
the latter‟s (FSPEF and VERS methods).
4. The technology of satellite data processing and
interpretation may be integrated also with
traditionally used methods of oil and gas
accumulations prospecting and exploration (seismic, in the first place), as well as with non-classical
geophysical techniques of other developers.
5. The technology may be applied for operative oil and gas prospect evaluation of perspective areas and
blocks in any point of the Earth globe (onshore and offshore).
6. The widespread technology application during the hydrocarbon accumulation prospecting and
exploration can drastically increase the efficiency of prospecting process for oil and gas.
References
Levashov S.P., Yakymchuk N.A., Korchagin I.N., Taskynbaev K.M., 2003. Geoelectric investigations in
Kenbye oilfield in Western Kazakhstan. 65th EAGE Conference & Exhibition, Extended Abstracts,
P154.
Levashov S.P., Yakymchuk M.A. Korchagin I.N., Pyschaniy Ju.M., Yakymchuk Ju.M., 2004. Electric-
resonance sounding method and its application for the ecological, geological-geophysical and
engineering-geological investigations. 66th EAGE Conference & Exhibition, Extended Abstracts,
P035.
Fig. 2. Sketch-map of anomalous zones of
“hydrocarbon deposit” type (DTA) as a results of
satellite data special processing and interpretation on
in the “Medynskaya-More 1” structure region
(Pechora Sea, Arctic, Russia). 1 – scale of anomalous
response (signal) intensity; 2 – points of anomalous
response(signal) determination; 2 – location of
projected well on the “Medynskaya-More 1” structure;
4 – prognostic areas of oil-saturation maximum; 5 –
tectonic fracture zones
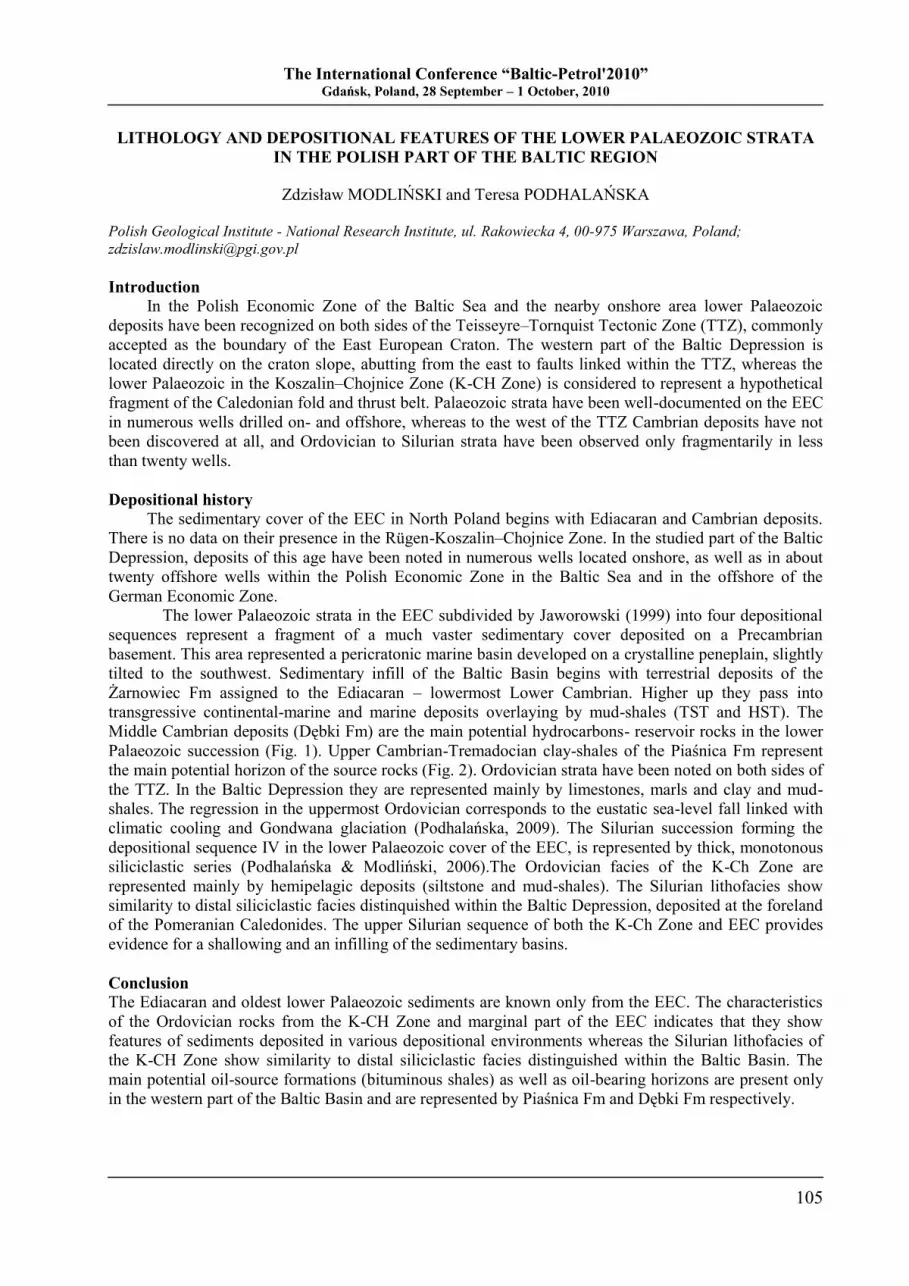
The International Conference “Baltic-Petrol'2010” Gdańsk, Poland, 28 September – 1 October, 2010
105
LITHOLOGY AND DEPOSITIONAL FEATURES OF THE LOWER PALAEOZOIC STRATA
IN THE POLISH PART OF THE BALTIC REGION
Zdzisław MODLIŃSKI and Teresa PODHALAŃSKA
Polish Geological Institute - National Research Institute, ul. Rakowiecka 4, 00-975 Warszawa, Poland;
Introduction
In the Polish Economic Zone of the Baltic Sea and the nearby onshore area lower Palaeozoic
deposits have been recognized on both sides of the Teisseyre–Tornquist Tectonic Zone (TTZ), commonly
accepted as the boundary of the East European Craton. The western part of the Baltic Depression is
located directly on the craton slope, abutting from the east to faults linked within the TTZ, whereas the
lower Palaeozoic in the Koszalin–Chojnice Zone (K-CH Zone) is considered to represent a hypothetical
fragment of the Caledonian fold and thrust belt. Palaeozoic strata have been well-documented on the EEC
in numerous wells drilled on- and offshore, whereas to the west of the TTZ Cambrian deposits have not
been discovered at all, and Ordovician to Silurian strata have been observed only fragmentarily in less
than twenty wells.
Depositional history
The sedimentary cover of the EEC in North Poland begins with Ediacaran and Cambrian deposits.
There is no data on their presence in the Rügen-Koszalin–Chojnice Zone. In the studied part of the Baltic
Depression, deposits of this age have been noted in numerous wells located onshore, as well as in about
twenty offshore wells within the Polish Economic Zone in the Baltic Sea and in the offshore of the
German Economic Zone.
The lower Palaeozoic strata in the EEC subdivided by Jaworowski (1999) into four depositional
sequences represent a fragment of a much vaster sedimentary cover deposited on a Precambrian
basement. This area represented a pericratonic marine basin developed on a crystalline peneplain, slightly
tilted to the southwest. Sedimentary infill of the Baltic Basin begins with terrestrial deposits of the
Żarnowiec Fm assigned to the Ediacaran – lowermost Lower Cambrian. Higher up they pass into
transgressive continental-marine and marine deposits overlaying by mud-shales (TST and HST). The
Middle Cambrian deposits (Dębki Fm) are the main potential hydrocarbons- reservoir rocks in the lower
Palaeozoic succession (Fig. 1). Upper Cambrian-Tremadocian clay-shales of the Piaśnica Fm represent
the main potential horizon of the source rocks (Fig. 2). Ordovician strata have been noted on both sides of
the TTZ. In the Baltic Depression they are represented mainly by limestones, marls and clay and mud-
shales. The regression in the uppermost Ordovician corresponds to the eustatic sea-level fall linked with
climatic cooling and Gondwana glaciation (Podhalańska, 2009). The Silurian succession forming the
depositional sequence IV in the lower Palaeozoic cover of the EEC, is represented by thick, monotonous
siliciclastic series (Podhalańska & Modliński, 2006).The Ordovician facies of the K-Ch Zone are
represented mainly by hemipelagic deposits (siltstone and mud-shales). The Silurian lithofacies show
similarity to distal siliciclastic facies distinquished within the Baltic Depression, deposited at the foreland
of the Pomeranian Caledonides. The upper Silurian sequence of both the K-Ch Zone and EEC provides
evidence for a shallowing and an infilling of the sedimentary basins.
Conclusion
The Ediacaran and oldest lower Palaeozoic sediments are known only from the EEC. The characteristics
of the Ordovician rocks from the K-CH Zone and marginal part of the EEC indicates that they show
features of sediments deposited in various depositional environments whereas the Silurian lithofacies of
the K-CH Zone show similarity to distal siliciclastic facies distinguished within the Baltic Basin. The
main potential oil-source formations (bituminous shales) as well as oil-bearing horizons are present only
in the western part of the Baltic Basin and are represented by Piaśnica Fm and Dębki Fm respectively.
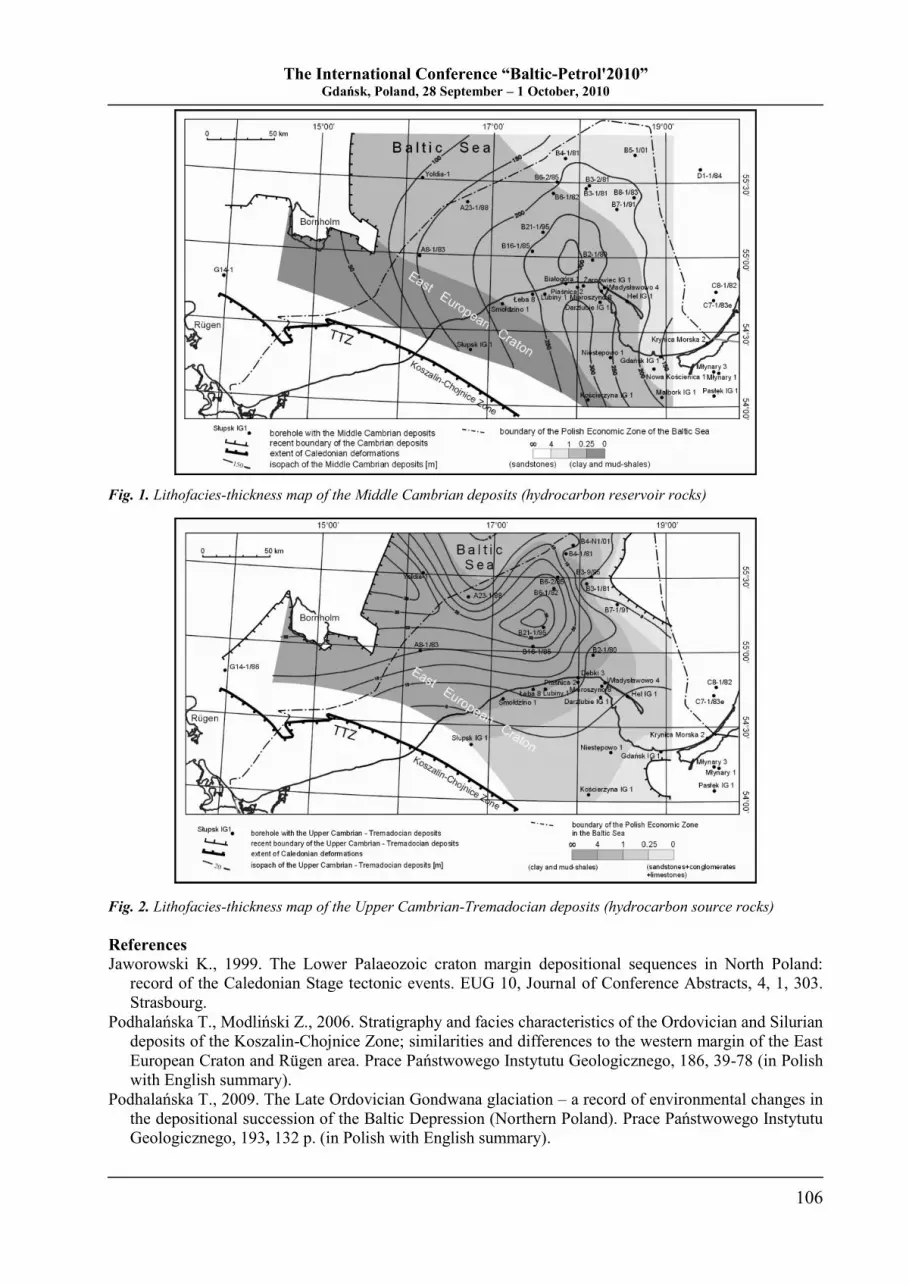
The International Conference “Baltic-Petrol'2010” Gdańsk, Poland, 28 September – 1 October, 2010
106
Fig. 1. Lithofacies-thickness map of the Middle Cambrian deposits (hydrocarbon reservoir rocks)
Fig. 2. Lithofacies-thickness map of the Upper Cambrian-Tremadocian deposits (hydrocarbon source rocks)
References
Jaworowski K., 1999. The Lower Palaeozoic craton margin depositional sequences in North Poland:
record of the Caledonian Stage tectonic events. EUG 10, Journal of Conference Abstracts, 4, 1, 303.
Strasbourg.
Podhalańska T., Modliński Z., 2006. Stratigraphy and facies characteristics of the Ordovician and Silurian
deposits of the Koszalin-Chojnice Zone; similarities and differences to the western margin of the East
European Craton and Rügen area. Prace Państwowego Instytutu Geologicznego, 186, 39-78 (in Polish
with English summary).
Podhalańska T., 2009. The Late Ordovician Gondwana glaciation – a record of environmental changes in
the depositional succession of the Baltic Depression (Northern Poland). Prace Państwowego Instytutu
Geologicznego, 193, 132 p. (in Polish with English summary).
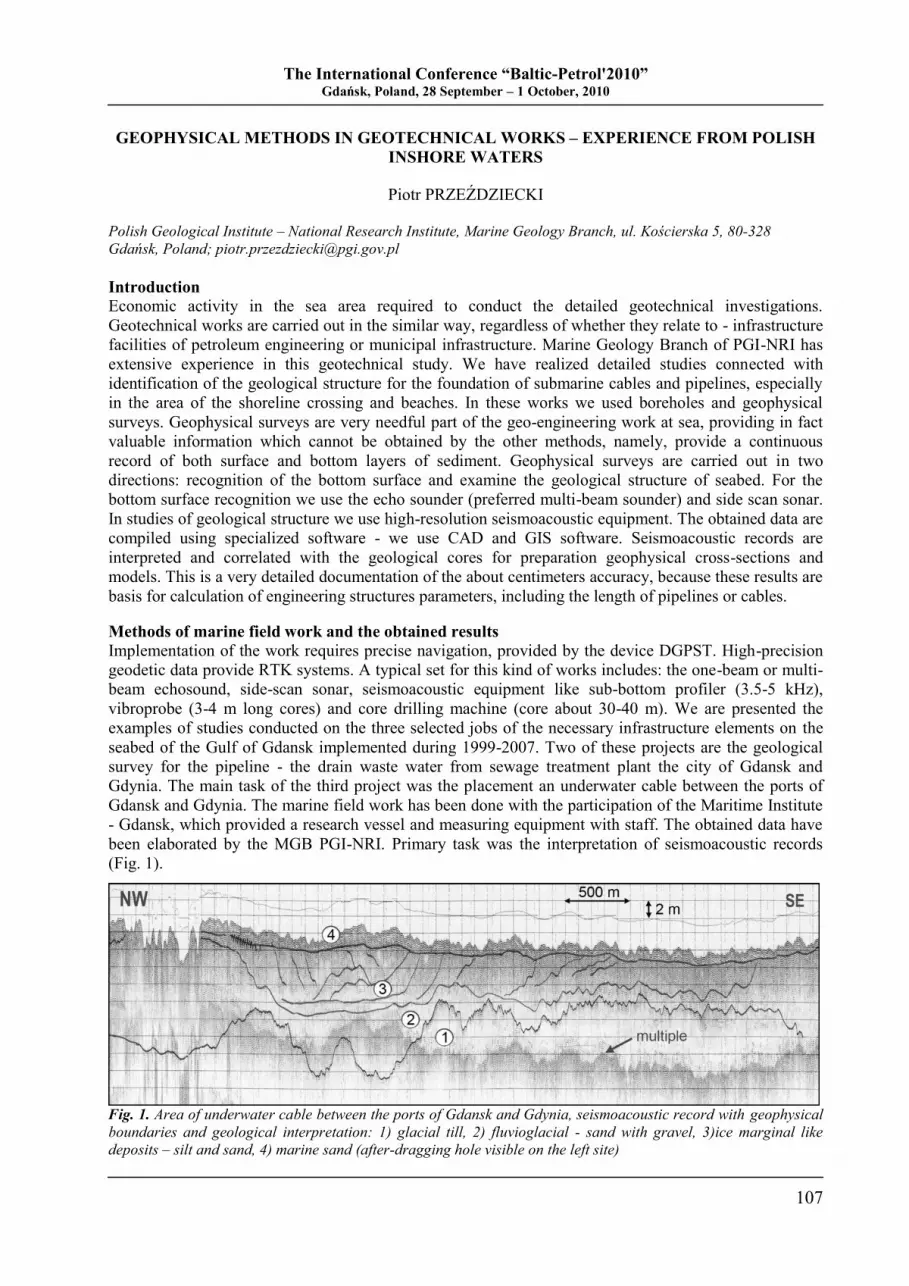
The International Conference “Baltic-Petrol'2010” Gdańsk, Poland, 28 September – 1 October, 2010
107
GEOPHYSICAL METHODS IN GEOTECHNICAL WORKS – EXPERIENCE FROM POLISH
INSHORE WATERS
Piotr PRZEŹDZIECKI
Polish Geological Institute – National Research Institute, Marine Geology Branch, ul. Kościerska 5, 80-328
Gdańsk, Poland; [email protected]
Introduction
Economic activity in the sea area required to conduct the detailed geotechnical investigations.
Geotechnical works are carried out in the similar way, regardless of whether they relate to - infrastructure
facilities of petroleum engineering or municipal infrastructure. Marine Geology Branch of PGI-NRI has
extensive experience in this geotechnical study. We have realized detailed studies connected with
identification of the geological structure for the foundation of submarine cables and pipelines, especially
in the area of the shoreline crossing and beaches. In these works we used boreholes and geophysical
surveys. Geophysical surveys are very needful part of the geo-engineering work at sea, providing in fact
valuable information which cannot be obtained by the other methods, namely, provide a continuous
record of both surface and bottom layers of sediment. Geophysical surveys are carried out in two
directions: recognition of the bottom surface and examine the geological structure of seabed. For the
bottom surface recognition we use the echo sounder (preferred multi-beam sounder) and side scan sonar.
In studies of geological structure we use high-resolution seismoacoustic equipment. The obtained data are
compiled using specialized software - we use CAD and GIS software. Seismoacoustic records are
interpreted and correlated with the geological cores for preparation geophysical cross-sections and
models. This is a very detailed documentation of the about centimeters accuracy, because these results are
basis for calculation of engineering structures parameters, including the length of pipelines or cables.
Methods of marine field work and the obtained results
Implementation of the work requires precise navigation, provided by the device DGPST. High-precision
geodetic data provide RTK systems. A typical set for this kind of works includes: the one-beam or multi-
beam echosound, side-scan sonar, seismoacoustic equipment like sub-bottom profiler (3.5-5 kHz),
vibroprobe (3-4 m long cores) and core drilling machine (core about 30-40 m). We are presented the
examples of studies conducted on the three selected jobs of the necessary infrastructure elements on the
seabed of the Gulf of Gdansk implemented during 1999-2007. Two of these projects are the geological
survey for the pipeline - the drain waste water from sewage treatment plant the city of Gdansk and
Gdynia. The main task of the third project was the placement an underwater cable between the ports of
Gdansk and Gdynia. The marine field work has been done with the participation of the Maritime Institute
- Gdansk, which provided a research vessel and measuring equipment with staff. The obtained data have
been elaborated by the MGB PGI-NRI. Primary task was the interpretation of seismoacoustic records
(Fig. 1).
Fig. 1. Area of underwater cable between the ports of Gdansk and Gdynia, seismoacoustic record with geophysical
boundaries and geological interpretation: 1) glacial till, 2) fluvioglacial - sand with gravel, 3)ice marginal like
deposits – silt and sand, 4) marine sand (after-dragging hole visible on the left site)
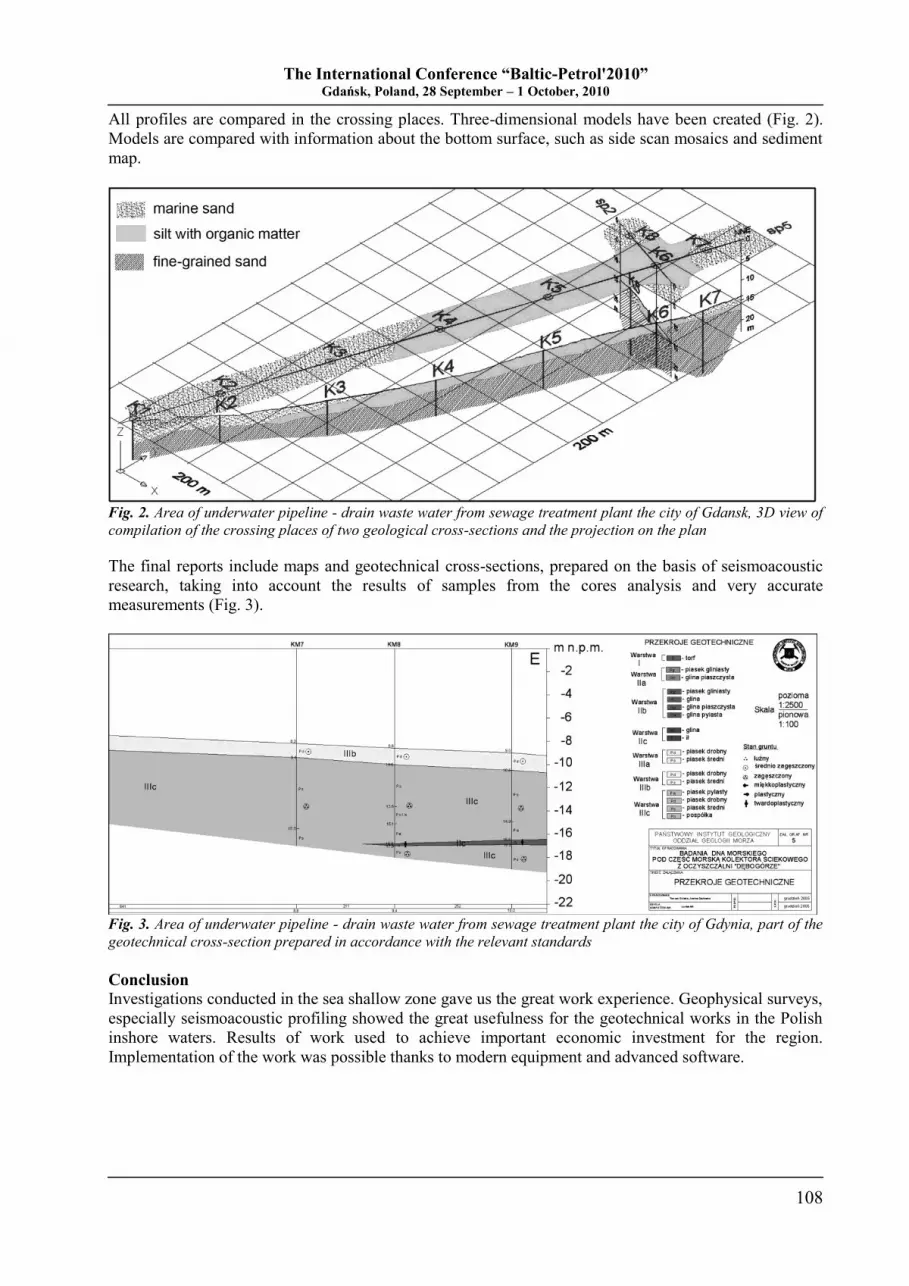
The International Conference “Baltic-Petrol'2010” Gdańsk, Poland, 28 September – 1 October, 2010
108
All profiles are compared in the crossing places. Three-dimensional models have been created (Fig. 2).
Models are compared with information about the bottom surface, such as side scan mosaics and sediment
map.
Fig. 2. Area of underwater pipeline - drain waste water from sewage treatment plant the city of Gdansk, 3D view of
compilation of the crossing places of two geological cross-sections and the projection on the plan
The final reports include maps and geotechnical cross-sections, prepared on the basis of seismoacoustic
research, taking into account the results of samples from the cores analysis and very accurate
measurements (Fig. 3).
Fig. 3. Area of underwater pipeline - drain waste water from sewage treatment plant the city of Gdynia, part of the
geotechnical cross-section prepared in accordance with the relevant standards
Conclusion
Investigations conducted in the sea shallow zone gave us the great work experience. Geophysical surveys,
especially seismoacoustic profiling showed the great usefulness for the geotechnical works in the Polish
inshore waters. Results of work used to achieve important economic investment for the region.
Implementation of the work was possible thanks to modern equipment and advanced software.
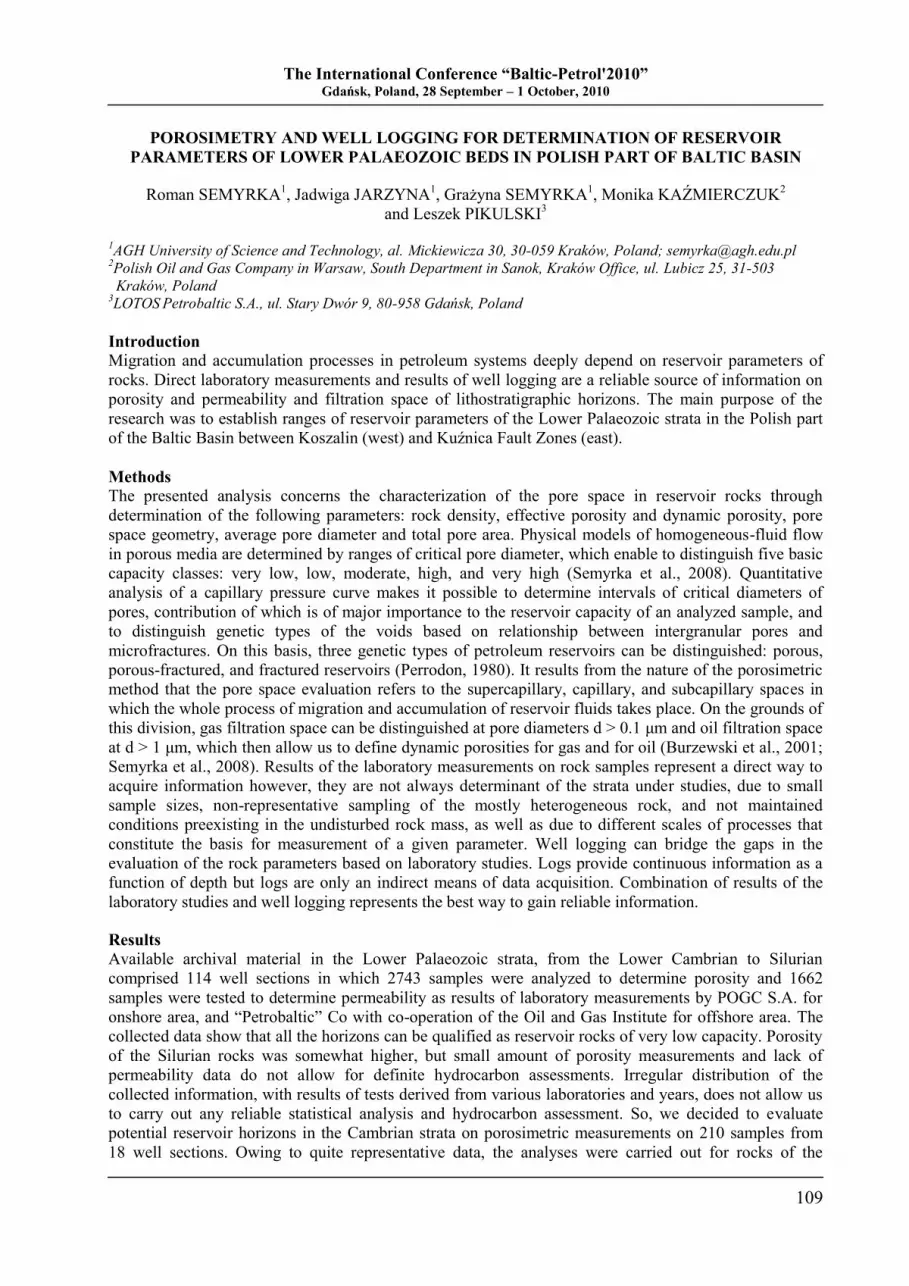
The International Conference “Baltic-Petrol'2010” Gdańsk, Poland, 28 September – 1 October, 2010
109
POROSIMETRY AND WELL LOGGING FOR DETERMINATION OF RESERVOIR
PARAMETERS OF LOWER PALAEOZOIC BEDS IN POLISH PART OF BALTIC BASIN
Roman SEMYRKA1, Jadwiga JARZYNA
1, Grażyna SEMYRKA
1, Monika KAŹMIERCZUK
2
and Leszek PIKULSKI3
1AGH University of Science and Technology, al. Mickiewicza 30, 30-059 Kraków, Poland; [email protected]
2Polish Oil and Gas Company in Warsaw, South Department in Sanok, Kraków Office, ul. Lubicz 25, 31-503
Kraków, Poland 3LOTOS
Petrobaltic S.A., ul. Stary Dwór 9, 80-958 Gdańsk, Poland
Introduction
Migration and accumulation processes in petroleum systems deeply depend on reservoir parameters of
rocks. Direct laboratory measurements and results of well logging are a reliable source of information on
porosity and permeability and filtration space of lithostratigraphic horizons. The main purpose of the
research was to establish ranges of reservoir parameters of the Lower Palaeozoic strata in the Polish part
of the Baltic Basin between Koszalin (west) and Kuźnica Fault Zones (east).
Methods
The presented analysis concerns the characterization of the pore space in reservoir rocks through
determination of the following parameters: rock density, effective porosity and dynamic porosity, pore
space geometry, average pore diameter and total pore area. Physical models of homogeneous-fluid flow
in porous media are determined by ranges of critical pore diameter, which enable to distinguish five basic
capacity classes: very low, low, moderate, high, and very high (Semyrka et al., 2008). Quantitative
analysis of a capillary pressure curve makes it possible to determine intervals of critical diameters of
pores, contribution of which is of major importance to the reservoir capacity of an analyzed sample, and
to distinguish genetic types of the voids based on relationship between intergranular pores and
microfractures. On this basis, three genetic types of petroleum reservoirs can be distinguished: porous,
porous-fractured, and fractured reservoirs (Perrodon, 1980). It results from the nature of the porosimetric
method that the pore space evaluation refers to the supercapillary, capillary, and subcapillary spaces in
which the whole process of migration and accumulation of reservoir fluids takes place. On the grounds of
this division, gas filtration space can be distinguished at pore diameters d > 0.1 μm and oil filtration space
at d > 1 μm, which then allow us to define dynamic porosities for gas and for oil (Burzewski et al., 2001;
Semyrka et al., 2008). Results of the laboratory measurements on rock samples represent a direct way to
acquire information however, they are not always determinant of the strata under studies, due to small
sample sizes, non-representative sampling of the mostly heterogeneous rock, and not maintained
conditions preexisting in the undisturbed rock mass, as well as due to different scales of processes that
constitute the basis for measurement of a given parameter. Well logging can bridge the gaps in the
evaluation of the rock parameters based on laboratory studies. Logs provide continuous information as a
function of depth but logs are only an indirect means of data acquisition. Combination of results of the
laboratory studies and well logging represents the best way to gain reliable information.
Results
Available archival material in the Lower Palaeozoic strata, from the Lower Cambrian to Silurian
comprised 114 well sections in which 2743 samples were analyzed to determine porosity and 1662
samples were tested to determine permeability as results of laboratory measurements by POGC S.A. for
onshore area, and “Petrobaltic” Co with co-operation of the Oil and Gas Institute for offshore area. The
collected data show that all the horizons can be qualified as reservoir rocks of very low capacity. Porosity
of the Silurian rocks was somewhat higher, but small amount of porosity measurements and lack of
permeability data do not allow for definite hydrocarbon assessments. Irregular distribution of the
collected information, with results of tests derived from various laboratories and years, does not allow us
to carry out any reliable statistical analysis and hydrocarbon assessment. So, we decided to evaluate
potential reservoir horizons in the Cambrian strata on porosimetric measurements on 210 samples from
18 well sections. Owing to quite representative data, the analyses were carried out for rocks of the

The International Conference “Baltic-Petrol'2010” Gdańsk, Poland, 28 September – 1 October, 2010
110
Paradoxides paradoxissimus Superzone. The representative relations for the reservoirs from the
mentioned superzones are presented in Figure 1.
Distinct anomalies on well logs have
confirmed the correctness of the
stratigraphic divisions, particularly in
the Cambrian formations. Sandstones
of the Paradoxides paradoxissimus
Superzone (Cm2 p.p.), with small
proportion of claystone intercalations,
represent an oil-saturated reservoir
horizon in all wells. On well logs this
horizon is marked out with decreased
natural radioactivity (GR) in all wells
that penetrated the Cambrian strata.
The underlying Eccaparadoxides
oelandicus Superzone represents a
sealing horizon. This zone is
composed of claystones, siltstones,
and shaly sandstones.
Fig. 1. A – cumulative intrusion, B – incremental intrusion versus diameter from porosimetric investigations of
rocks of the Middle Cambrian Paradoxides paradoxissimus Superzone in the B6-1/82 well at depth of 1478.4 m
Conclusions
The porosimetric measurement and their qualitative and quantitative analyses evidence the strongly
heterogeneous character of the pore space in the Cambrian rocks. The variable anomalies observed on
well logs confirm the diversified lithologic development and reservoir properties of the Middle Cambrian
sandstones. Gamma ray logs provide information on clay content and neutron logs – on variable porosity.
Anomalies on well logs were also the basis for correlation of depicted Middle Cambrian strata. The
results of the studies have demonstrated that the reservoirs of the Paradoxides paradoxissimus Superzone
should be classified among rocks with very low or low capacity for gas and oil. Analysis of the
distribution of the pore-space geometry has evidenced predominance of complex fractured – porous and
simple fractured types, with fewer porous-type rocks. Petrophysical parameters in sandstone reservoirs of
the Eccaparadoxides oelandicus superzone evidenced as low or very low for gas and oil should be treated
as approximate because the small amount of tests is poorly representative. Qualitatively, the pore space
analysis have evidenced its fractured – porous, fractured, and porous character. The Upper Cambrian
reservoirs encountered in two well profiles represented sandstones with very low capacity and complex
porous, porous – fractured, and fractured pore space.
References
Burzewski W., Semyrka R., Słupczyński K., 2001. Kwalifikacja naftowa przestrzeni porowej skał
zbiornikowych. Polish Journal of Mineral Resources. Geosynoptics Society ”Geos”, 3, 185-189 (in
Polish with English abstract).
Perrodon A., 1980. Geodynamique petroliere. Elf – Aquitane, Paris.
Semyrka R., Semyrka G., Zych I., 2008. Zmienność parametrów petrofizycznych subfacji dolomitu
głównego, zachodniej strefy półwyspu Grotowa w świetle badań porozymetrycznych. Kwartalnik
AGH, Geologia, 34, 445 – 468 (in Polish with English abstract).
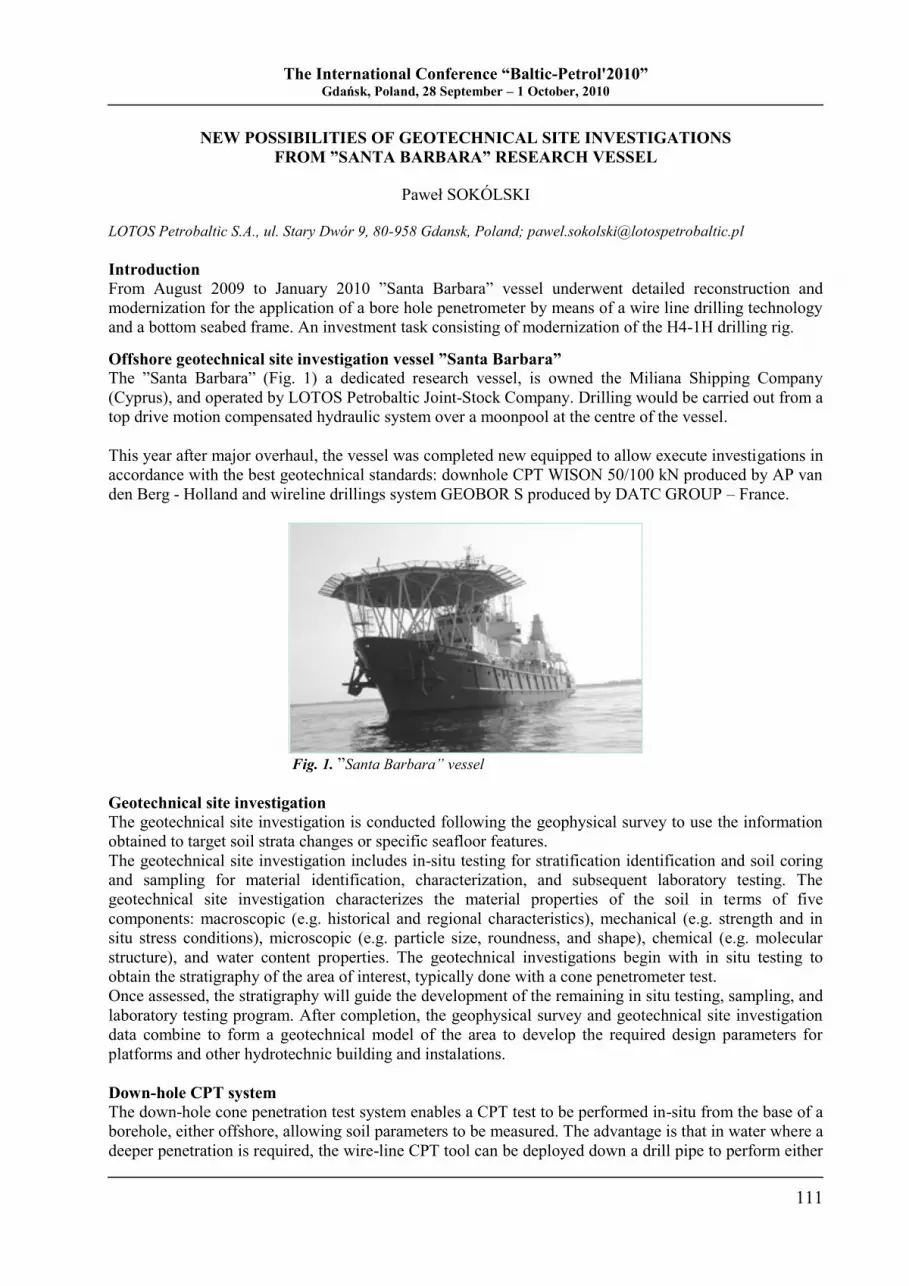
The International Conference “Baltic-Petrol'2010” Gdańsk, Poland, 28 September – 1 October, 2010
111
NEW POSSIBILITIES OF GEOTECHNICAL SITE INVESTIGATIONS
FROM ”SANTA BARBARA” RESEARCH VESSEL
Paweł SOKÓLSKI
LOTOS Petrobaltic S.A., ul. Stary Dwór 9, 80-958 Gdansk, Poland; [email protected]
Introduction
From August 2009 to January 2010 ”Santa Barbara” vessel underwent detailed reconstruction and
modernization for the application of a bore hole penetrometer by means of a wire line drilling technology
and a bottom seabed frame. An investment task consisting of modernization of the H4-1H drilling rig.
Offshore geotechnical site investigation vessel ”Santa Barbara”
The ”Santa Barbara” (Fig. 1) a dedicated research vessel, is owned the Miliana Shipping Company
(Cyprus), and operated by LOTOS Petrobaltic Joint-Stock Company. Drilling would be carried out from a
top drive motion compensated hydraulic system over a moonpool at the centre of the vessel.
This year after major overhaul, the vessel was completed new equipped to allow execute investigations in
accordance with the best geotechnical standards: downhole CPT WISON 50/100 kN produced by AP van
den Berg - Holland and wireline drillings system GEOBOR S produced by DATC GROUP – France.
Fig. 1. ”Santa Barbara” vessel
Geotechnical site investigation
The geotechnical site investigation is conducted following the geophysical survey to use the information
obtained to target soil strata changes or specific seafloor features.
The geotechnical site investigation includes in-situ testing for stratification identification and soil coring
and sampling for material identification, characterization, and subsequent laboratory testing. The
geotechnical site investigation characterizes the material properties of the soil in terms of five
components: macroscopic (e.g. historical and regional characteristics), mechanical (e.g. strength and in
situ stress conditions), microscopic (e.g. particle size, roundness, and shape), chemical (e.g. molecular
structure), and water content properties. The geotechnical investigations begin with in situ testing to
obtain the stratigraphy of the area of interest, typically done with a cone penetrometer test.
Once assessed, the stratigraphy will guide the development of the remaining in situ testing, sampling, and
laboratory testing program. After completion, the geophysical survey and geotechnical site investigation
data combine to form a geotechnical model of the area to develop the required design parameters for
platforms and other hydrotechnic building and instalations.
Down-hole CPT system
The down-hole cone penetration test system enables a CPT test to be performed in-situ from the base of a
borehole, either offshore, allowing soil parameters to be measured. The advantage is that in water where a
deeper penetration is required, the wire-line CPT tool can be deployed down a drill pipe to perform either

The International Conference “Baltic-Petrol'2010” Gdańsk, Poland, 28 September – 1 October, 2010
112
a 1 or 3 m CPT. The CPT tool can then be deployed down the drill pipe again to perform the next CPT
test.
The umbilical cable houses a hydraulic hose which powers the tool and the communication cable so that
the test results can be seen in real time. The system is used in conjunction with a rotary drilling system
and open bit (Fig. 2). After the borehole has been advanced to the required test level, it is cleaned by mud
flushing. The tool is lowered by its self-tensioning winch to the bit, where it seats and latches under its
own weight.
The operator starts the test from the control cabin and the cone penetrometer is hydraulically pushed into
the soil at a constant rate of 20 mm/sec (Fig. 3). The movement of a hydraulic ram on the winch, logs the
depth which is proportional to the movement of the cone. Throughout the test the measurements of cone
tip resistance, sleeve friction and pore water pressures are displayed graphically in the control cabin.
Fig. 2. Rotary drilling system Fig. 3. The press of the cone
Conclusions
Through the use of new equipment on the vessel Santa Barbara obtained: increasing its effectiveness
through shortening the drilling time, maintaining full technical efficiency of equipment, increase of
effectiveness of the conducted geodetic research by application of a bore hole penetrometer in order to
guarantee the highest quality of geodetic research related to the development programs and fulfilment of
international standards and requirements regarding geotechnical research for consulting companies acting
on behalf of the insurer of drilling platforms, e.g. Noble Denton Int. Ltd.
References
Borel D., Puech A., 2004. La place de la géotechnique dans le processus de planification, conception et
construction des fermes éoliennes offshore. Colloque Energies Renouvelables en Mer, Brest, France,
12p.
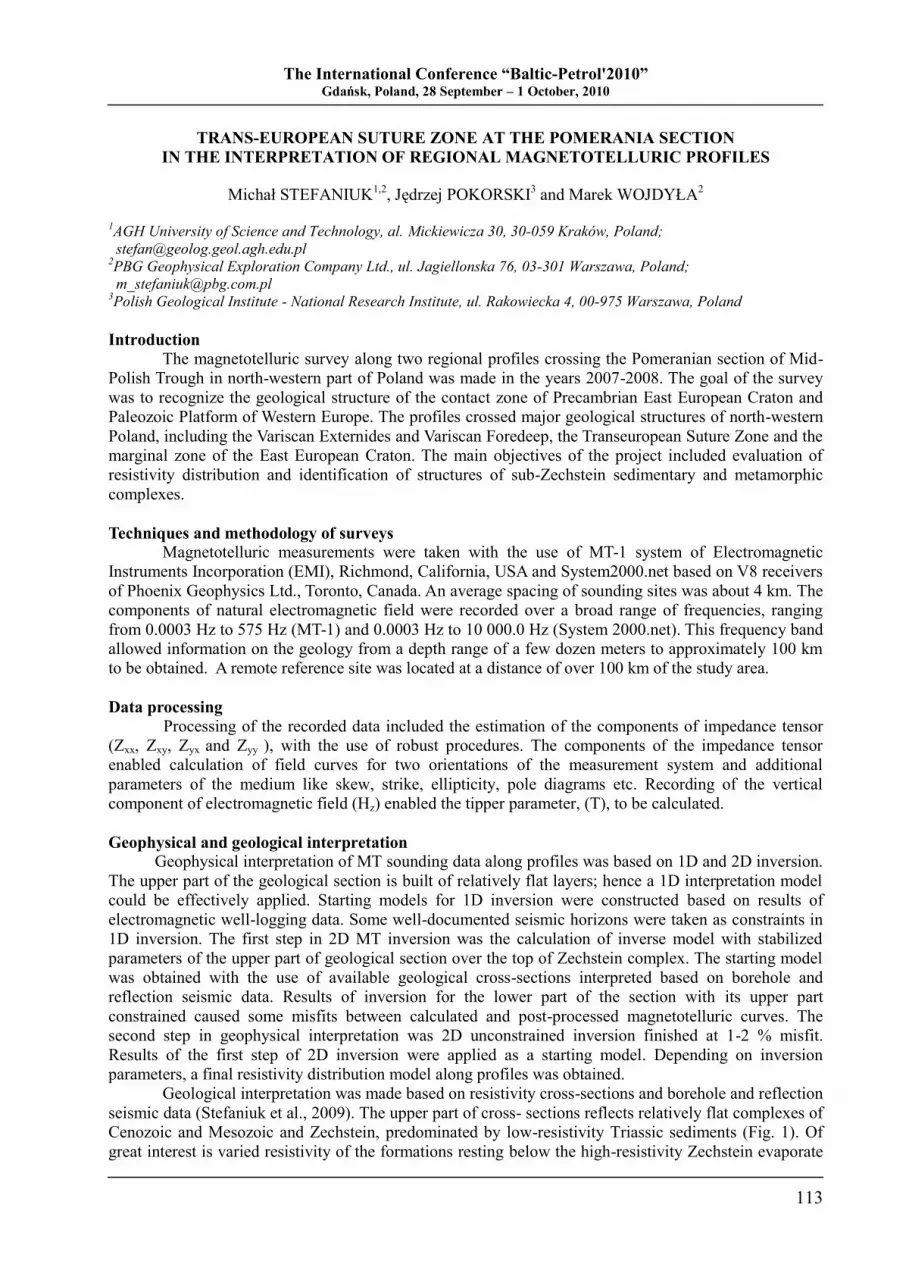
The International Conference “Baltic-Petrol'2010” Gdańsk, Poland, 28 September – 1 October, 2010
113
TRANS-EUROPEAN SUTURE ZONE AT THE POMERANIA SECTION
IN THE INTERPRETATION OF REGIONAL MAGNETOTELLURIC PROFILES
Michał STEFANIUK1,2
, Jędrzej POKORSKI3 and Marek WOJDYŁA
2
1AGH University of Science and Technology, al. Mickiewicza 30, 30-059 Kraków, Poland;
[email protected] 2PBG Geophysical Exploration Company Ltd., ul. Jagiellonska 76, 03-301 Warszawa, Poland;
[email protected] 3Polish Geological Institute - National Research Institute, ul. Rakowiecka 4, 00-975 Warszawa, Poland
Introduction
The magnetotelluric survey along two regional profiles crossing the Pomeranian section of Mid-
Polish Trough in north-western part of Poland was made in the years 2007-2008. The goal of the survey
was to recognize the geological structure of the contact zone of Precambrian East European Craton and
Paleozoic Platform of Western Europe. The profiles crossed major geological structures of north-western
Poland, including the Variscan Externides and Variscan Foredeep, the Transeuropean Suture Zone and the
marginal zone of the East European Craton. The main objectives of the project included evaluation of
resistivity distribution and identification of structures of sub-Zechstein sedimentary and metamorphic
complexes.
Techniques and methodology of surveys
Magnetotelluric measurements were taken with the use of MT-1 system of Electromagnetic
Instruments Incorporation (EMI), Richmond, California, USA and System2000.net based on V8 receivers
of Phoenix Geophysics Ltd., Toronto, Canada. An average spacing of sounding sites was about 4 km. The
components of natural electromagnetic field were recorded over a broad range of frequencies, ranging
from 0.0003 Hz to 575 Hz (MT-1) and 0.0003 Hz to 10 000.0 Hz (System 2000.net). This frequency band
allowed information on the geology from a depth range of a few dozen meters to approximately 100 km
to be obtained. A remote reference site was located at a distance of over 100 km of the study area.
Data processing
Processing of the recorded data included the estimation of the components of impedance tensor
(Zxx, Zxy, Zyx and Zyy ), with the use of robust procedures. The components of the impedance tensor
enabled calculation of field curves for two orientations of the measurement system and additional
parameters of the medium like skew, strike, ellipticity, pole diagrams etc. Recording of the vertical
component of electromagnetic field (Hz) enabled the tipper parameter, (T), to be calculated.
Geophysical and geological interpretation Geophysical interpretation of MT sounding data along profiles was based on 1D and 2D inversion.
The upper part of the geological section is built of relatively flat layers; hence a 1D interpretation model
could be effectively applied. Starting models for 1D inversion were constructed based on results of
electromagnetic well-logging data. Some well-documented seismic horizons were taken as constraints in
1D inversion. The first step in 2D MT inversion was the calculation of inverse model with stabilized
parameters of the upper part of geological section over the top of Zechstein complex. The starting model
was obtained with the use of available geological cross-sections interpreted based on borehole and
reflection seismic data. Results of inversion for the lower part of the section with its upper part
constrained caused some misfits between calculated and post-processed magnetotelluric curves. The
second step in geophysical interpretation was 2D unconstrained inversion finished at 1-2 % misfit.
Results of the first step of 2D inversion were applied as a starting model. Depending on inversion
parameters, a final resistivity distribution model along profiles was obtained.
Geological interpretation was made based on resistivity cross-sections and borehole and reflection
seismic data (Stefaniuk et al., 2009). The upper part of cross- sections reflects relatively flat complexes of
Cenozoic and Mesozoic and Zechstein, predominated by low-resistivity Triassic sediments (Fig. 1). Of
great interest is varied resistivity of the formations resting below the high-resistivity Zechstein evaporate
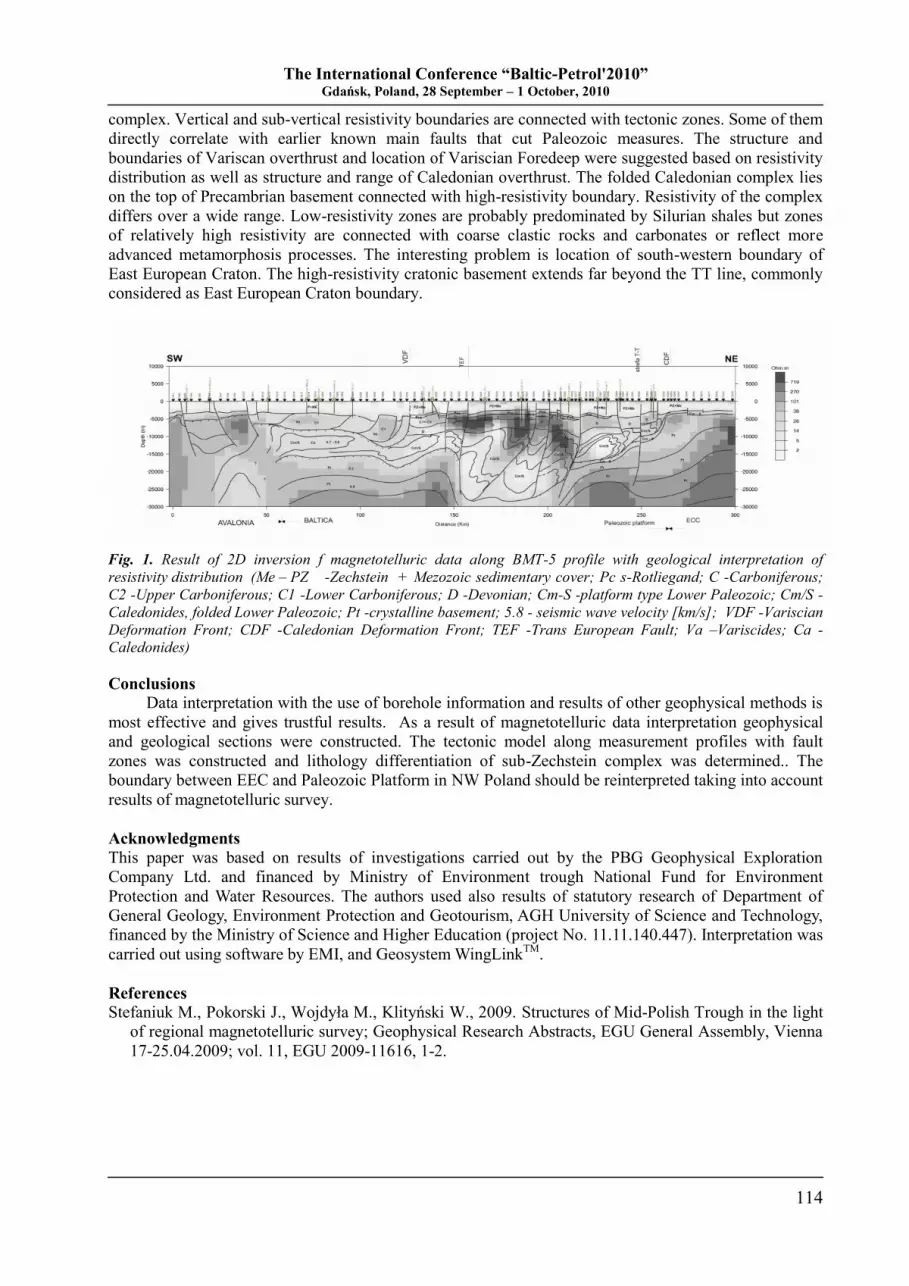
The International Conference “Baltic-Petrol'2010” Gdańsk, Poland, 28 September – 1 October, 2010
114
complex. Vertical and sub-vertical resistivity boundaries are connected with tectonic zones. Some of them
directly correlate with earlier known main faults that cut Paleozoic measures. The structure and
boundaries of Variscan overthrust and location of Variscian Foredeep were suggested based on resistivity
distribution as well as structure and range of Caledonian overthrust. The folded Caledonian complex lies
on the top of Precambrian basement connected with high-resistivity boundary. Resistivity of the complex
differs over a wide range. Low-resistivity zones are probably predominated by Silurian shales but zones
of relatively high resistivity are connected with coarse clastic rocks and carbonates or reflect more
advanced metamorphosis processes. The interesting problem is location of south-western boundary of
East European Craton. The high-resistivity cratonic basement extends far beyond the TT line, commonly
considered as East European Craton boundary.
Fig. 1. Result of 2D inversion f magnetotelluric data along BMT-5 profile with geological interpretation of
resistivity distribution (Me – PZ -Zechstein + Mezozoic sedimentary cover; Pc s-Rotliegand; C -Carboniferous;
C2 -Upper Carboniferous; C1 -Lower Carboniferous; D -Devonian; Cm-S -platform type Lower Paleozoic; Cm/S -
Caledonides, folded Lower Paleozoic; Pt -crystalline basement; 5.8 - seismic wave velocity [km/s]; VDF -Variscian
Deformation Front; CDF -Caledonian Deformation Front; TEF -Trans European Fault; Va –Variscides; Ca -
Caledonides)
Conclusions
Data interpretation with the use of borehole information and results of other geophysical methods is
most effective and gives trustful results. As a result of magnetotelluric data interpretation geophysical
and geological sections were constructed. The tectonic model along measurement profiles with fault
zones was constructed and lithology differentiation of sub-Zechstein complex was determined.. The
boundary between EEC and Paleozoic Platform in NW Poland should be reinterpreted taking into account
results of magnetotelluric survey.
Acknowledgments
This paper was based on results of investigations carried out by the PBG Geophysical Exploration
Company Ltd. and financed by Ministry of Environment trough National Fund for Environment
Protection and Water Resources. The authors used also results of statutory research of Department of
General Geology, Environment Protection and Geotourism, AGH University of Science and Technology,
financed by the Ministry of Science and Higher Education (project No. 11.11.140.447). Interpretation was
carried out using software by EMI, and Geosystem WingLinkTM
.
References
Stefaniuk M., Pokorski J., Wojdyła M., Klityński W., 2009. Structures of Mid-Polish Trough in the light
of regional magnetotelluric survey; Geophysical Research Abstracts, EGU General Assembly, Vienna
17-25.04.2009; vol. 11, EGU 2009-11616, 1-2.
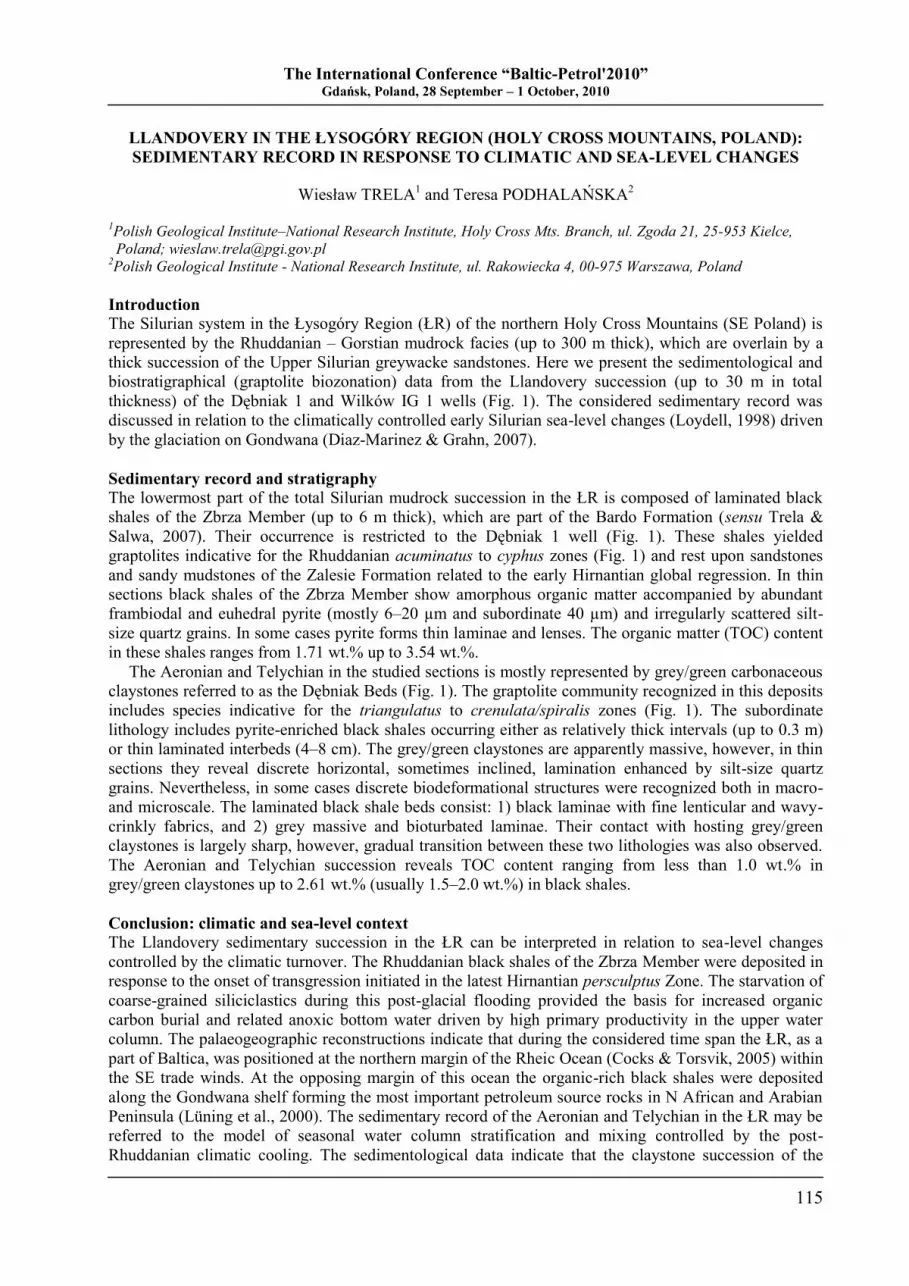
The International Conference “Baltic-Petrol'2010” Gdańsk, Poland, 28 September – 1 October, 2010
115
LLANDOVERY IN THE ŁYSOGÓRY REGION (HOLY CROSS MOUNTAINS, POLAND):
SEDIMENTARY RECORD IN RESPONSE TO CLIMATIC AND SEA-LEVEL CHANGES
Wiesław TRELA1 and Teresa PODHALAŃSKA
2
1Polish Geological Institute–National Research Institute, Holy Cross Mts. Branch, ul. Zgoda 21, 25-953 Kielce,
Poland; [email protected] 2Polish Geological Institute - National Research Institute, ul. Rakowiecka 4, 00-975 Warszawa, Poland
Introduction
The Silurian system in the Łysogóry Region (ŁR) of the northern Holy Cross Mountains (SE Poland) is
represented by the Rhuddanian – Gorstian mudrock facies (up to 300 m thick), which are overlain by a
thick succession of the Upper Silurian greywacke sandstones. Here we present the sedimentological and
biostratigraphical (graptolite biozonation) data from the Llandovery succession (up to 30 m in total
thickness) of the Dębniak 1 and Wilków IG 1 wells (Fig. 1). The considered sedimentary record was
discussed in relation to the climatically controlled early Silurian sea-level changes (Loydell, 1998) driven
by the glaciation on Gondwana (Diaz-Marinez & Grahn, 2007).
Sedimentary record and stratigraphy
The lowermost part of the total Silurian mudrock succession in the ŁR is composed of laminated black
shales of the Zbrza Member (up to 6 m thick), which are part of the Bardo Formation (sensu Trela &
Salwa, 2007). Their occurrence is restricted to the Dębniak 1 well (Fig. 1). These shales yielded
graptolites indicative for the Rhuddanian acuminatus to cyphus zones (Fig. 1) and rest upon sandstones
and sandy mudstones of the Zalesie Formation related to the early Hirnantian global regression. In thin
sections black shales of the Zbrza Member show amorphous organic matter accompanied by abundant
frambiodal and euhedral pyrite (mostly 6–20 µm and subordinate 40 µm) and irregularly scattered silt-
size quartz grains. In some cases pyrite forms thin laminae and lenses. The organic matter (TOC) content
in these shales ranges from 1.71 wt.% up to 3.54 wt.%.
The Aeronian and Telychian in the studied sections is mostly represented by grey/green carbonaceous
claystones referred to as the Dębniak Beds (Fig. 1). The graptolite community recognized in this deposits
includes species indicative for the triangulatus to crenulata/spiralis zones (Fig. 1). The subordinate
lithology includes pyrite-enriched black shales occurring either as relatively thick intervals (up to 0.3 m)
or thin laminated interbeds (4–8 cm). The grey/green claystones are apparently massive, however, in thin
sections they reveal discrete horizontal, sometimes inclined, lamination enhanced by silt-size quartz
grains. Nevertheless, in some cases discrete biodeformational structures were recognized both in macro-
and microscale. The laminated black shale beds consist: 1) black laminae with fine lenticular and wavy-
crinkly fabrics, and 2) grey massive and bioturbated laminae. Their contact with hosting grey/green
claystones is largely sharp, however, gradual transition between these two lithologies was also observed.
The Aeronian and Telychian succession reveals TOC content ranging from less than 1.0 wt.% in
grey/green claystones up to 2.61 wt.% (usually 1.5–2.0 wt.%) in black shales.
Conclusion: climatic and sea-level context
The Llandovery sedimentary succession in the ŁR can be interpreted in relation to sea-level changes
controlled by the climatic turnover. The Rhuddanian black shales of the Zbrza Member were deposited in
response to the onset of transgression initiated in the latest Hirnantian persculptus Zone. The starvation of
coarse-grained siliciclastics during this post-glacial flooding provided the basis for increased organic
carbon burial and related anoxic bottom water driven by high primary productivity in the upper water
column. The palaeogeographic reconstructions indicate that during the considered time span the ŁR, as a
part of Baltica, was positioned at the northern margin of the Rheic Ocean (Cocks & Torsvik, 2005) within
the SE trade winds. At the opposing margin of this ocean the organic-rich black shales were deposited
along the Gondwana shelf forming the most important petroleum source rocks in N African and Arabian
Peninsula (Lüning et al., 2000). The sedimentary record of the Aeronian and Telychian in the ŁR may be
referred to the model of seasonal water column stratification and mixing controlled by the post-
Rhuddanian climatic cooling. The sedimentological data indicate that the claystone succession of the
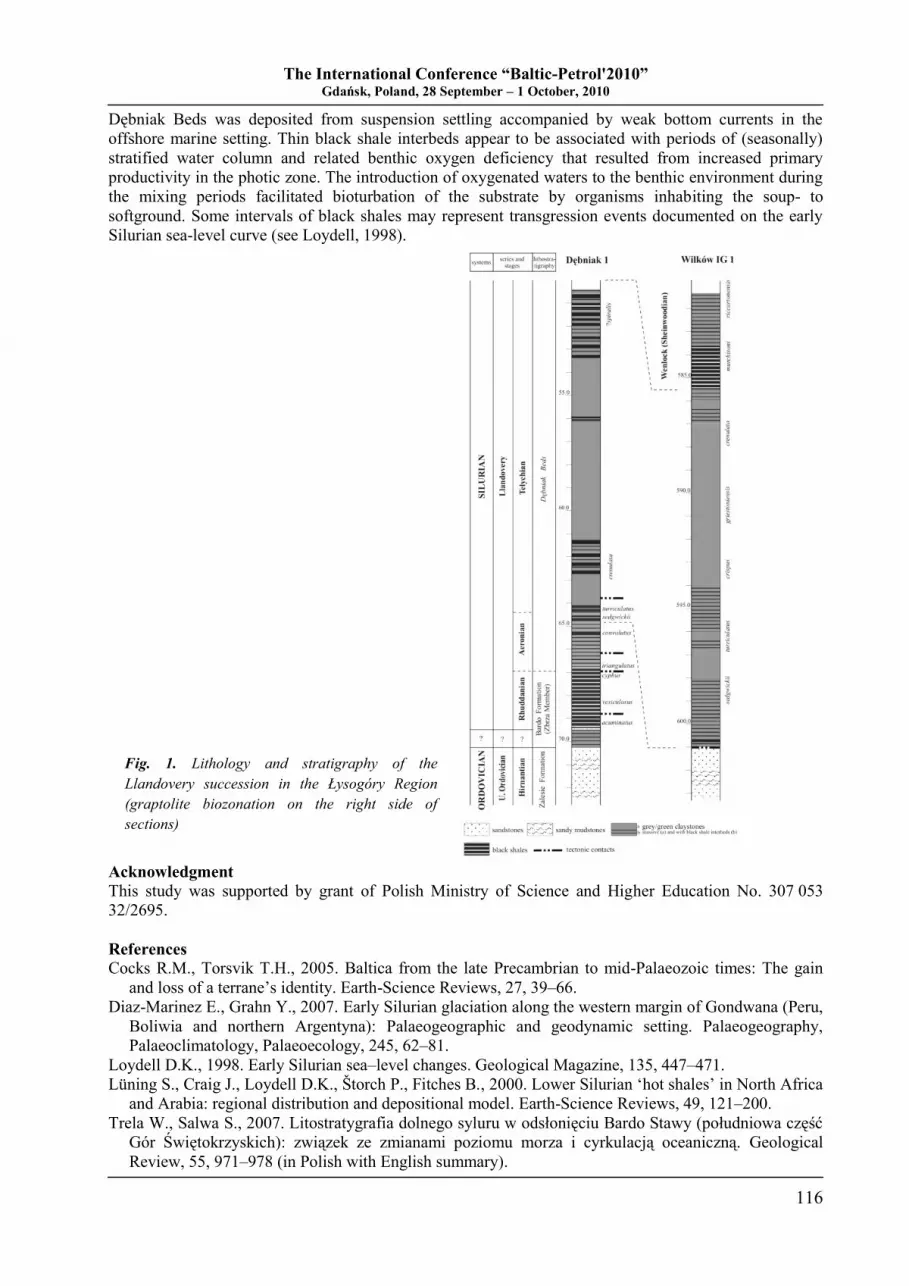
The International Conference “Baltic-Petrol'2010” Gdańsk, Poland, 28 September – 1 October, 2010
116
Dębniak Beds was deposited from suspension settling accompanied by weak bottom currents in the
offshore marine setting. Thin black shale interbeds appear to be associated with periods of (seasonally)
stratified water column and related benthic oxygen deficiency that resulted from increased primary
productivity in the photic zone. The introduction of oxygenated waters to the benthic environment during
the mixing periods facilitated bioturbation of the substrate by organisms inhabiting the soup- to
softground. Some intervals of black shales may represent transgression events documented on the early
Silurian sea-level curve (see Loydell, 1998).
Acknowledgment
This study was supported by grant of Polish Ministry of Science and Higher Education No. 307 053
32/2695.
References
Cocks R.M., Torsvik T.H., 2005. Baltica from the late Precambrian to mid-Palaeozoic times: The gain
and loss of a terrane‟s identity. Earth-Science Reviews, 27, 39–66.
Diaz-Marinez E., Grahn Y., 2007. Early Silurian glaciation along the western margin of Gondwana (Peru,
Boliwia and northern Argentyna): Palaeogeographic and geodynamic setting. Palaeogeography,
Palaeoclimatology, Palaeoecology, 245, 62–81.
Loydell D.K., 1998. Early Silurian sea–level changes. Geological Magazine, 135, 447–471.
Lüning S., Craig J., Loydell D.K., Ńtorch P., Fitches B., 2000. Lower Silurian „hot shales‟ in North Africa
and Arabia: regional distribution and depositional model. Earth-Science Reviews, 49, 121–200.
Trela W., Salwa S., 2007. Litostratygrafia dolnego syluru w odsłonięciu Bardo Stawy (południowa część
Gór Świętokrzyskich): związek ze zmianami poziomu morza i cyrkulacją oceaniczną. Geological
Review, 55, 971–978 (in Polish with English summary).
Fig. 1. Lithology and stratigraphy of the
Llandovery succession in the Łysogóry Region
(graptolite biozonation on the right side of
sections)
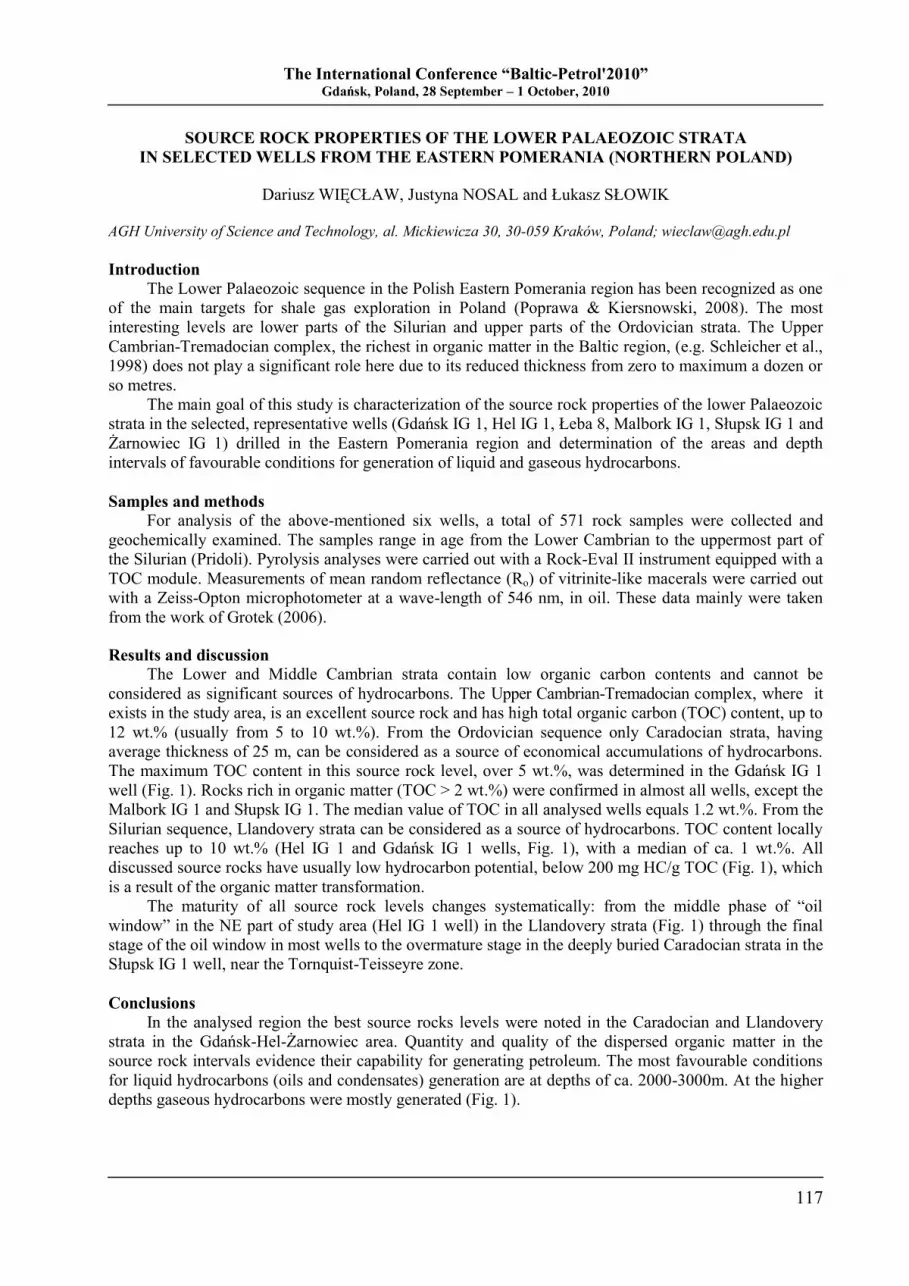
The International Conference “Baltic-Petrol'2010” Gdańsk, Poland, 28 September – 1 October, 2010
117
SOURCE ROCK PROPERTIES OF THE LOWER PALAEOZOIC STRATA
IN SELECTED WELLS FROM THE EASTERN POMERANIA (NORTHERN POLAND)
Dariusz WIĘCŁAW, Justyna NOSAL and Łukasz SŁOWIK
AGH University of Science and Technology, al. Mickiewicza 30, 30-059 Kraków, Poland; [email protected]
Introduction
The Lower Palaeozoic sequence in the Polish Eastern Pomerania region has been recognized as one
of the main targets for shale gas exploration in Poland (Poprawa & Kiersnowski, 2008). The most
interesting levels are lower parts of the Silurian and upper parts of the Ordovician strata. The Upper
Cambrian-Tremadocian complex, the richest in organic matter in the Baltic region, (e.g. Schleicher et al.,
1998) does not play a significant role here due to its reduced thickness from zero to maximum a dozen or
so metres.
The main goal of this study is characterization of the source rock properties of the lower Palaeozoic
strata in the selected, representative wells (Gdańsk IG 1, Hel IG 1, Łeba 8, Malbork IG 1, Słupsk IG 1 and
Żarnowiec IG 1) drilled in the Eastern Pomerania region and determination of the areas and depth
intervals of favourable conditions for generation of liquid and gaseous hydrocarbons.
Samples and methods
For analysis of the above-mentioned six wells, a total of 571 rock samples were collected and
geochemically examined. The samples range in age from the Lower Cambrian to the uppermost part of
the Silurian (Pridoli). Pyrolysis analyses were carried out with a Rock-Eval II instrument equipped with a
TOC module. Measurements of mean random reflectance (Ro) of vitrinite-like macerals were carried out
with a Zeiss-Opton microphotometer at a wave-length of 546 nm, in oil. These data mainly were taken
from the work of Grotek (2006).
Results and discussion
The Lower and Middle Cambrian strata contain low organic carbon contents and cannot be
considered as significant sources of hydrocarbons. The Upper Cambrian-Tremadocian complex, where it
exists in the study area, is an excellent source rock and has high total organic carbon (TOC) content, up to
12 wt.% (usually from 5 to 10 wt.%). From the Ordovician sequence only Caradocian strata, having
average thickness of 25 m, can be considered as a source of economical accumulations of hydrocarbons.
The maximum TOC content in this source rock level, over 5 wt.%, was determined in the Gdańsk IG 1
well (Fig. 1). Rocks rich in organic matter (TOC > 2 wt.%) were confirmed in almost all wells, except the
Malbork IG 1 and Słupsk IG 1. The median value of TOC in all analysed wells equals 1.2 wt.%. From the
Silurian sequence, Llandovery strata can be considered as a source of hydrocarbons. TOC content locally
reaches up to 10 wt.% (Hel IG 1 and Gdańsk IG 1 wells, Fig. 1), with a median of ca. 1 wt.%. All
discussed source rocks have usually low hydrocarbon potential, below 200 mg HC/g TOC (Fig. 1), which
is a result of the organic matter transformation.
The maturity of all source rock levels changes systematically: from the middle phase of “oil
window” in the NE part of study area (Hel IG 1 well) in the Llandovery strata (Fig. 1) through the final
stage of the oil window in most wells to the overmature stage in the deeply buried Caradocian strata in the
Słupsk IG 1 well, near the Tornquist-Teisseyre zone.
Conclusions
In the analysed region the best source rocks levels were noted in the Caradocian and Llandovery
strata in the Gdańsk-Hel-Żarnowiec area. Quantity and quality of the dispersed organic matter in the
source rock intervals evidence their capability for generating petroleum. The most favourable conditions
for liquid hydrocarbons (oils and condensates) generation are at depths of ca. 2000-3000m. At the higher
depths gaseous hydrocarbons were mostly generated (Fig. 1).
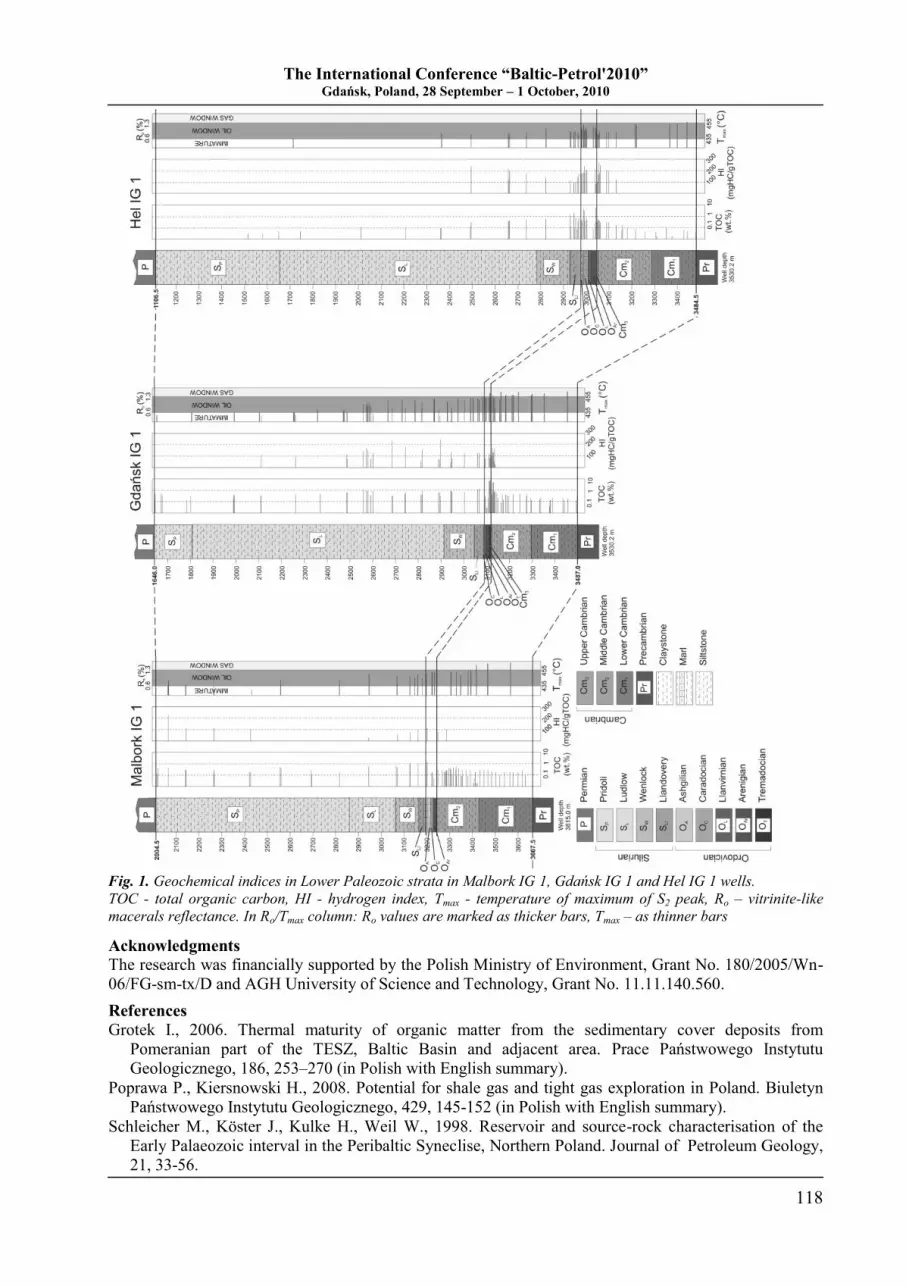
The International Conference “Baltic-Petrol'2010” Gdańsk, Poland, 28 September – 1 October, 2010
118
Fig. 1. Geochemical indices in Lower Paleozoic strata in Malbork IG 1, Gdańsk IG 1 and Hel IG 1 wells.
TOC - total organic carbon, HI - hydrogen index, Tmax - temperature of maximum of S2 peak, Ro – vitrinite-like
macerals reflectance. In Ro/Tmax column: Ro values are marked as thicker bars, Tmax – as thinner bars
Acknowledgments
The research was financially supported by the Polish Ministry of Environment, Grant No. 180/2005/Wn-
06/FG-sm-tx/D and AGH University of Science and Technology, Grant No. 11.11.140.560.
References
Grotek I., 2006. Thermal maturity of organic matter from the sedimentary cover deposits from
Pomeranian part of the TESZ, Baltic Basin and adjacent area. Prace Państwowego Instytutu
Geologicznego, 186, 253–270 (in Polish with English summary).
Poprawa P., Kiersnowski H., 2008. Potential for shale gas and tight gas exploration in Poland. Biuletyn
Państwowego Instytutu Geologicznego, 429, 145-152 (in Polish with English summary).
Schleicher M., Köster J., Kulke H., Weil W., 1998. Reservoir and source-rock characterisation of the
Early Palaeozoic interval in the Peribaltic Syneclise, Northern Poland. Journal of Petroleum Geology,
21, 33-56.
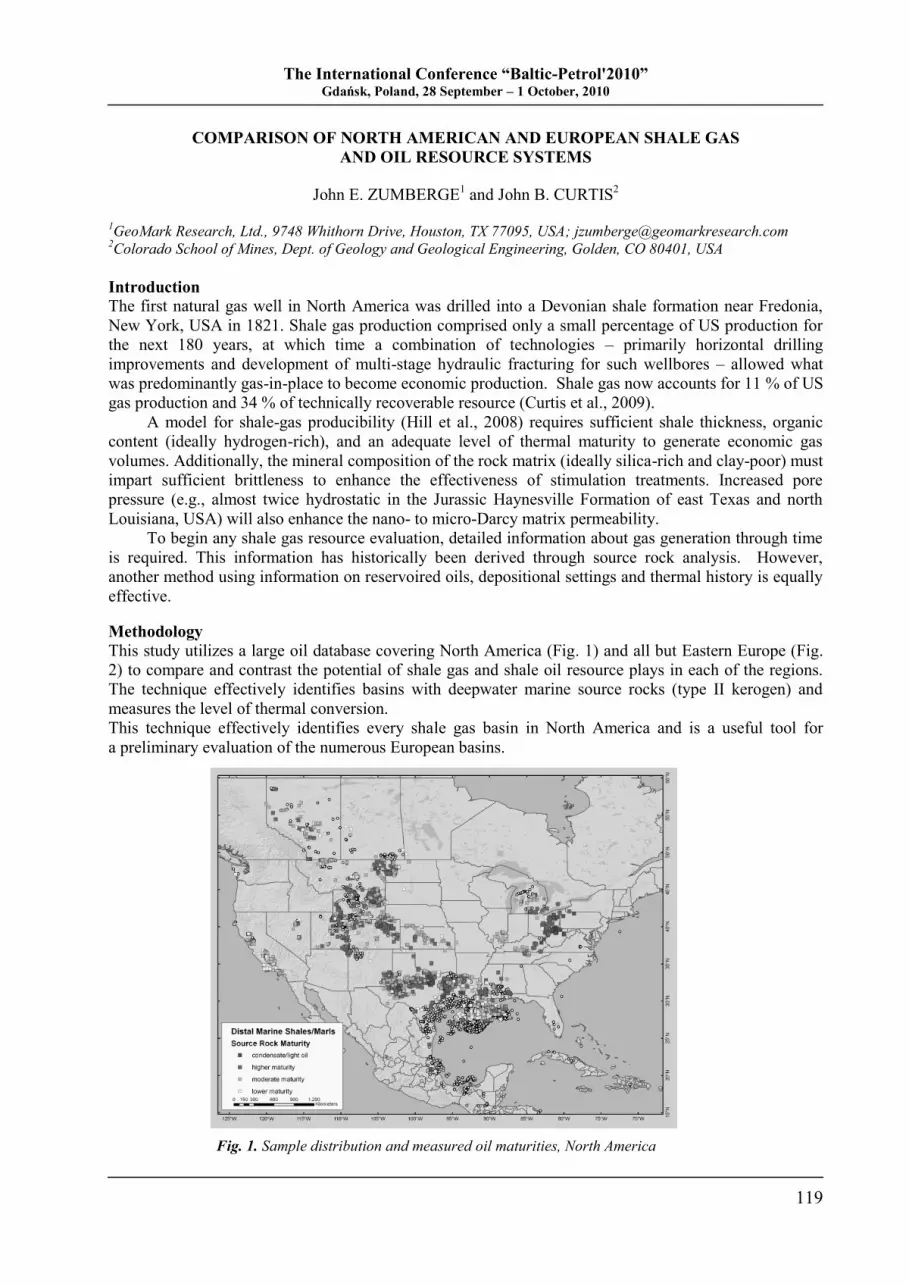
The International Conference “Baltic-Petrol'2010” Gdańsk, Poland, 28 September – 1 October, 2010
119
COMPARISON OF NORTH AMERICAN AND EUROPEAN SHALE GAS
AND OIL RESOURCE SYSTEMS
John E. ZUMBERGE1 and John B. CURTIS
2
1GeoMark Research, Ltd., 9748 Whithorn Drive, Houston, TX 77095, USA; [email protected]
2Colorado School of Mines, Dept. of Geology and Geological Engineering, Golden, CO 80401, USA
Introduction The first natural gas well in North America was drilled into a Devonian shale formation near Fredonia,
New York, USA in 1821. Shale gas production comprised only a small percentage of US production for
the next 180 years, at which time a combination of technologies – primarily horizontal drilling
improvements and development of multi-stage hydraulic fracturing for such wellbores – allowed what
was predominantly gas-in-place to become economic production. Shale gas now accounts for 11 % of US
gas production and 34 % of technically recoverable resource (Curtis et al., 2009).
A model for shale-gas producibility (Hill et al., 2008) requires sufficient shale thickness, organic
content (ideally hydrogen-rich), and an adequate level of thermal maturity to generate economic gas
volumes. Additionally, the mineral composition of the rock matrix (ideally silica-rich and clay-poor) must
impart sufficient brittleness to enhance the effectiveness of stimulation treatments. Increased pore
pressure (e.g., almost twice hydrostatic in the Jurassic Haynesville Formation of east Texas and north
Louisiana, USA) will also enhance the nano- to micro-Darcy matrix permeability.
To begin any shale gas resource evaluation, detailed information about gas generation through time
is required. This information has historically been derived through source rock analysis. However,
another method using information on reservoired oils, depositional settings and thermal history is equally
effective.
Methodology This study utilizes a large oil database covering North America (Fig. 1) and all but Eastern Europe (Fig.
2) to compare and contrast the potential of shale gas and shale oil resource plays in each of the regions.
The technique effectively identifies basins with deepwater marine source rocks (type II kerogen) and
measures the level of thermal conversion.
This technique effectively identifies every shale gas basin in North America and is a useful tool for
a preliminary evaluation of the numerous European basins.
Fig. 1. Sample distribution and measured oil maturities, North America
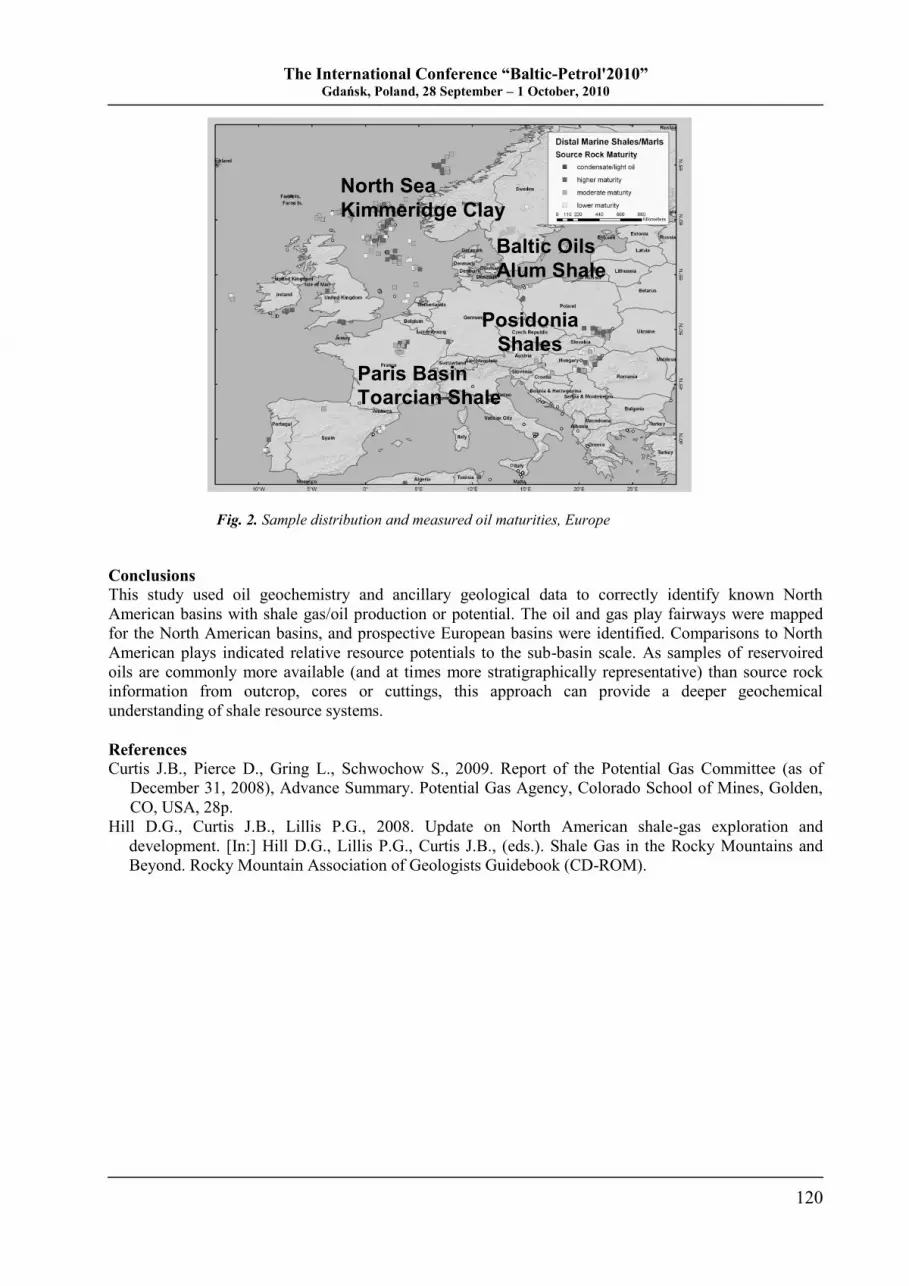
The International Conference “Baltic-Petrol'2010” Gdańsk, Poland, 28 September – 1 October, 2010
120
Fig. 2. Sample distribution and measured oil maturities, Europe
Conclusions
This study used oil geochemistry and ancillary geological data to correctly identify known North
American basins with shale gas/oil production or potential. The oil and gas play fairways were mapped
for the North American basins, and prospective European basins were identified. Comparisons to North
American plays indicated relative resource potentials to the sub-basin scale. As samples of reservoired
oils are commonly more available (and at times more stratigraphically representative) than source rock
information from outcrop, cores or cuttings, this approach can provide a deeper geochemical
understanding of shale resource systems.
References
Curtis J.B., Pierce D., Gring L., Schwochow S., 2009. Report of the Potential Gas Committee (as of
December 31, 2008), Advance Summary. Potential Gas Agency, Colorado School of Mines, Golden,
CO, USA, 28p.
Hill D.G., Curtis J.B., Lillis P.G., 2008. Update on North American shale-gas exploration and
development. [In:] Hill D.G., Lillis P.G., Curtis J.B., (eds.). Shale Gas in the Rocky Mountains and
Beyond. Rocky Mountain Association of Geologists Guidebook (CD-ROM).
Paris Basin
Toarcian Shale
North Sea
Kimmeridge Clay
Baltic Oils
Alum Shale
Posidonia
Shales
Paris Basin
Toarcian Shale
North Sea
Kimmeridge Clay
Baltic Oils
Alum Shale
Posidonia
Shales

The International Conference “Baltic-Petrol'2010” Gdańsk, Poland, 28 September – 1 October, 2010
121
AUTHOR INDEX

The International Conference “Baltic-Petrol'2010” Gdańsk, Poland, 28 September – 1 October, 2010
122
The International Conference “Baltic-Petrol'2010” Gdańsk, Poland, 28 September – 1 October, 2010
123
Alexeeva V. 11
Anolik P. 27, 55
Banaś M. 39
Bergseth S. 73, 77
Błeńska M. 81
Borowiec K. 55
Bozhezha D. 103
Brzeska P. 81
Brzyska A. 57, 75
Brzyski G. 65, 83
Bulycheva E. 11
Carlsen H. 73
Cernakauskas P. 85
Clauer N. 39
Curtis J.B. 23, 119
Czechowski F. 87
Czerwiński T. 63
Dakhnova M. 31
Domżalski J. 97
Dudek T. 39
Grelowski C. 87
Grotek I. 41
Hojniak M. 87
Huff W. 39
Jarmołowicz-Szulc K. 89
Jarzyna J. 109
Jaworowski K. 7
Jegliński W. 81
Kaminskas D. 85
Karczewska A. 33, 49, 91
Karnkowski P.H. 17
Kaźmierczuk M. 109
Khoubldikov A. 31
Klarner S. 53, 67
Kleinas A. 93, 95
Korchagin I. 103
Kosakowski P. 9, 27, 29, 41, 45, 47, 97

The International Conference “Baltic-Petrol'2010” Gdańsk, Poland, 28 September – 1 October, 2010
124
Kotarba M.J. 9, 27, 29, 33, 35, 43, 99
Kowalski A. 9, 27
Kozłowska A. 101
Kramarska R. 81
Kruk-Dowgiałło L. 81
Kubala A. 57, 75, 83
Kuberska M. 101
Lazauskiene J. 25, 31
Leśniak G. 49
Levashov S. 103
Lewan M.D. 33, 35, 43
Matyasik I. 91
Messner J. 19
Modliński Z. 105
Molenaar N. 51
Nosal J. 117
Nowak J. 81
Nowak-Koszla E. 53, 65, 67, 69
Obst K. 13
Olesiński K. 69
Osowiecki A. 81
Ostrowski C. 63
Pichuzhkina O. 11
Pikulski L. 17, 45, 109
Podhalańska T. 105, 115
Pokorski J. 113
Poprawa P. 21, 41, 45, 97
Przeździecki P. 107
Rabbani A.R. 99
Rempel H. 5
Semyrka G. 109
Semyrka R. 109
Shogenova A. 29
Sivkov V. 11
Sliaupa S. 51, 85
Słowik Ł. 117
Sokólski P. 111
The International Conference “Baltic-Petrol'2010” Gdańsk, Poland, 28 September – 1 October, 2010
125
Sowiński A. 55
Stefaniuk M. 63, 113
Such P. 49
Środoń J. 39
Trela W. 115
Wagner R. 7
Więcław D. 9, 27, 29, 33, 43, 117
Wojdyła M. 63, 113
Wolnowski T. 17, 63
Wójcikowski A. 59
Wróbel M. 9, 45, 47, 97
Yakymchuk N. 103
Zabrodotskaya O. 53
Zachowicz J. 81
Zajączkowski M. 65, 67
Zajfert G. 71
Zarębska B. 55
Zdanaviciute O. 25, 31
Zhuravlev V. 103
Zielińska-Pikulska J. 53
Zumberge J.E. 23, 119
Żurawski E. 47, 49, 91

The International Conference “Baltic-Petrol'2010” Gdańsk, Poland, 28 September – 1 October, 2010
126


