Embed Size (px)
Citation preview
18
86
Research ArticleReceived: 28 January 2010 Revised: 30 April 2010 Accepted: 2 May 2010 Published online in Wiley Interscience: 22 June 2010
(www.interscience.wiley.com) DOI 10.1002/jsfa.4029
Isolation and physicochemical characterisationof starch from cocoyam (Colocasia esculenta)grown in MalawiDavies E Mweta,a∗ Maryke T Labuschagne,a Susanna Bonnet,b
Jannie Swartsb and John D K Sakac
Abstract
BACKGROUND: The aim of this study was to determine the physicochemical properties of starches isolated from Malawiancocoyams and compare them with those of cassava and corn starches.
RESULTS: The purity of the isolated starches varied from 851 to 947 g kg−1 and pH from 4.93 to 6.95. Moisture, ash, protein, fatand amylose contents ranged from 104 to 132, 0.3 to 1.5, 3.5 to 8.4, 0.9 to 1.6, and 111 to 237 g kg−1, respectively. Cocoyamstarches gave higher potassium and phosphorus but lower calcium levels than the other starches. The shape of starch granulesvaried from spherical to polygonal with cocoyam starches displaying smaller-sized granules than cassava and corn starches.Cocoyam starches gave a higher wavelength of maximum iodine absorption and blue value but lower reducing capacityvalues than cassava and corn starches. The extent of acid hydrolysis of the starches also differed. Cocoyam starches exhibitedamylopectin molecules of higher molecular weights but amylose molecules of lower molecular weights than cassava and cornstarches. Cocoyam starches exhibited lower water absorption capacity and swelling power, paste clarity and viscosity buthigher solubility, gelatinisation temperatures and retrogradation tendencies than cassava and corn starches.
CONCLUSIONS: The physicochemical properties of native Malawian cocoyam starches vary among the different accessions anddiffer from those of cassava and corn starches.c© 2010 Society of Chemical Industry
Keywords: cocoyam; cassava; corn; starch; physicochemical properties
INTRODUCTIONCocoyam (Colocasia esculenta L. Schott), a member of the Araceaefamily, is an important tuber crop worldwide mostly grown intropical and subtropical countries for its edible corms and leaves.It is an important food crop in many Pacific Island countries, partsof Africa, Asia and the Caribbean. Ranking as the fourteenth mostconsumed vegetable worldwide, cocoyam is largely produced inAfrica accounting for 60% of the world cocoyam production andAsia and the Pacific the remaining 40%.1 In Malawi, cocoyam ranksthird after cassava and sweetpotato and is mainly grown as a foodcrop.2
Cocoyam has a great potential as a source of starch that couldreplace commercial starches in various industrial applications.Its corms are known to have a high content of tiny, easilydigestible, starch grains ranging between 22% and 40% idealfor use in food and cosmetic formulations, and pharmaceuticalproducts.3 – 5 However corn, potato and wheat still remain the mostpredominant sources for the commercial starches.6 In Malawi, theindustry predominantly depends on imported maize starch tomeet its ever-increasing demand for starch. Therefore, there existsan opportunity for local Malawians and the country at large tobenefit from the commercialisation of locally grown crops such ascocoyam through starch production.
Several investigations into the characteristic properties ofcocoyam starches have been conducted and the results of suchinvestigations have shown that physicochemical properties ofcocoyam starches vary with cultivar.4,7,8 Comparison studies havealso revealed that cocoyam starches exhibit properties differentfrom those of starches from other crops.3,9,10 However, none ofthese studies document the characteristic properties of Malawiancocoyam starches hence limiting their utilisation in the industry.Since starches from different botanical sources have their owncharacteristics, there is a need for determining the characteristicproperties of starches isolated from cocoyam grown in Malawi soas to unravel their potential and increase their competitiveness on
∗ Correspondence to: Davies E Mweta, Plant Sciences Department, University ofthe Free State, P.O. Box 339, Bloemfontein 9300, South Africa.E-mail: [email protected]
a Plant Sciences Department, University of the Free State, P.O. Box 339,Bloemfontein 9300, South Africa
b Chemistry Department, University of the Free State, P.O. Box 339, Bloemfontein9300, South Africa
c Chemistry Department, Chancellor College, University of Malawi, P.O. Box 280,Zomba, Malawi
J Sci Food Agric 2010; 90: 1886–1896 www.soci.org c© 2010 Society of Chemical Industry
18
87
Properties of Malawian cocoyam starches www.soci.org
the commercial market. This paper therefore reports the results ofa study undertaken to determine the characteristic properties ofnative starch isolated from cocoyam grown in Malawi.
EXPERIMENTALMaterialsSeven starches from different cocoyam accessions were used inthis study. Cocoyam tubers were harvested from fields of localfarmers in seven different cocoyam growing districts of Malawi:Chitipa, Mzimba (Mzuzu), Nkhotakota, Machinga, Mulanje, Thyoloand Zomba in May 2008. Starch was isolated from the fresh tubersas described by Benesi et al.11 Starches from five different cassavavarieties (Gomani, Maunjili, Mbundumali, Mkondezi and Sauti)and commercial corn starch from earlier starch studies in Malawi11
were used for comparison.
Proximate compositionMoisture content, pH and protein content of the starcheswere determined as described by Benesi et al.11 Fat contentwas determined by Soxhlet extraction of 3 g of dried starchusing hexane for 3 h. Ash content was determined by weightdifference after ashing 2–3 g of dried starch samples in a mufflefurnace at 525 ◦C for 5 h. Amylose content was determinedusing an Amylose/Amylopectin Assay Kit (Megazyme InternationalIreland Ltd, Bray, Ireland). Purity of the isolated starches wasdetermined by determining total starch using the Megazymeenzymatic/colorimetric method.12
Mineral contentStarch samples for mineral content determination were preparedfollowing the method of Njoku and Ohia.13 Phosphorus contentin the samples was determined by the ascorbic acid colorimetricmethod. The metal ions sodium (Na), potassium (K), iron (Fe), zinc(Zn), magnesium (Mg), manganese (Mn) and calcium (Ca) wereanalysed on a Varian SpectrAA 300 spectrometer (Varian TechtronPty Limited, Mulgrave, Victoria, Australia) using an air–acetyleneflame.
Granular morphologyThe granular morphology was studied using a Jeol ScanningElectron Microscope (JSM-6400, Tokyo, Japan). Starch granuleswere mounted on circular aluminium stubs using adhesive, coatedwith a thin layer of gold using a Bio-Rad sputter coating system andthen examined at several magnifications and photographed. Therange of the granule size was determined by measuring the lengthand width of 150 granules from the pictures. Size distributions ofthe starch granules were estimated by classifying the size of starchgranules into four groups: large (>25 µm), medium (10–25 µm),small (5–10 µm) and very small (<5 µm).14
Reducing capacity, iodine absorption spectra and blue valueThe starch samples for the determination of reducing capacitywere prepared according to the method of Singh et al.15 andthe reducing capacity of the starch samples was determined(as glucose equivalent) using the modified Park and Johnsonmethod.16 Iodine spectra of the native starches were determinedfollowing the dimethyl sulfoxide–urea method17 and the bluevalue (BV) was measured as absorbance at 680 nm.
Acid hydrolysisAcid hydrolysis of the starches was performed for 1, 2, 3, 4, 6, 8, 12and 16 days following the procedure of Jayakody et al.18 The extentof acid hydrolysis of the starches was determined by measuringthe total carbohydrates in the aliquot of the acid digest using theanthrone method19 and expressing the total carbohydrates as apercentage of the initial starch.
Molecular weight distributionMolecular weight distribution of the starches was determinedusing high-performance size-exclusion chromatography (HPSEC).Starch solutions were prepared according to the method ofChung and Lai20 and filtered through a 25 mm 0.45 µm syringefilter (Acrodisc; PALL Life Sciences, Ann Arbor, MI, USA). Forchromatographic analysis, 20 µL of the filtrate was injected into anHPSEC system consisting of a HPLC system (Shimadzu Corporation,Kyoto, Japan) equipped with a low temperature evaporative lightscattering (ELSD) detector (ELSD-LT II; Shimadzu Corporation) setat 80 ◦C and a series of TSK gel columns – TSK-PWH guard, TSKgel G5000PW, TSK gel G3000PW and TSK gel G2500PW (TSKgel; TOSOH Bioscience GmbH, Stuttgart, Germany) – connectedin series and maintained at 40?C in an oven. The columns wereeluted with 500 mmol L−1 ammonium acetate (pH 6.5) at a flowrate of 1.0 mL min−1. The system was calibrated with Pullulanstandards (Polymer Standards services, Sigma-Aldrich Production,St Louis, MO, USA) P5, P10, P20, P50, P100, P200, P400 and P800covering molecular weight from 5900 to 788 000. The standardswere dissolved in deionised distilled water. A calibration curveof log molecular weight vs. elution time was drawn from theresulting elution profiles. The retention time at the maximumheight of each peak was taken to represent the retention time forthat particular molecular weight and the average molecular weight(Mw), number-average molecular weight (Mn), and polydispersityindices (PDI) were determined.21
Water absorption capacity, swelling power and solubilityWater absorption capacity (WAC) of the starches was determinedin triplicate at 50, 70 and 90 ◦C using 2.5% starch suspensionsfollowing the method of Mishra and Rai.22 Swelling and solubilityof the starches were also determined in triplicate at 50, 70 and90 ◦C using the method of Kojima et al.23
Paste clarity and viscosityPaste clarity of the starches was determined using a 1% aqueoussuspension.24 The percentage transmittance (%T) was measuredat 650 nm against a water blank on a Spectronic Unicamspectrophotometer (Heλios, Cambridge, UK). The InternationalStarch Institute method (ISI 17-1e)25 was used to determine theviscosity of the starch pastes. The paste viscosity was measurein centipoises (cP) at 50 ◦C using a Brookfield Digital Viscometermodel RTDV II (Brookfield Engineering Laboratories Inc, Stoughton,MA, USA) with spindle no. 2 at 100 revolutions per minute (rpm).
Thermal propertiesThermal properties of raw and retrograded starches weredetermined using differential scanning calorimetry (DSC 822e;Mettler, Toledo, Switzerland). Triplicate 3.0 mg starch sampleswere weighed into DSC aluminium pans and distilled water addedusing an Eppendorf pipette to make a starch : water ratio of 1 : 3.The pans were hermetically sealed and samples left to stand for 1 h
J Sci Food Agric 2010; 90: 1886–1896 c© 2010 Society of Chemical Industry www.interscience.wiley.com/jsfa
18
88
www.soci.org DE Mweta et al.
at room temperature for moisture equilibration. The sealed panswere heated from 20 ◦C to 95 ◦C under nitrogen gas at a heatingrate of 10 ◦C min−1 to gelatinise the starch samples. From the DSCthermograms, the onset temperature (T0), peak temperature (Tp),conclusion temperature (Tc) and enthalpy of gelatinisation (�HG)were determined using STARe SW 9.00 software. Temperaturerange and peak height index (PHI) were also calculated as Tc − T0
and as the ratio �HG/(Tp − T0), respectively. The gelatinisedsamples were stored at 4 ◦C for 7 days for retrogradation studies.The pans were then equilibrated at room temperature for 2 h,and then rescanned in the DSC from 20 to 95 ◦C at 10 ◦C min−1 tomeasure the retrogradation transition temperatures and enthalpy.The degree of retrogradation was determined as the ratio ofenthalpy change of retrograded starch to enthalpy change ofgelatinised starch.26
Data analysisThe data was subjected to analysis of variance (ANOVA) usingStatistix 8 for Windows (Analytical Software, Tallahassee, USA).Pearson correlation coefficients for relationships between variousstarch properties were also calculated.
RESULTS AND DISCUSSIONChemical compositionThe purity of the isolated starches determined as total starchcontent varied from 851–947 g kg−1 (Table 1). These levels arelower than those reported for cocoyam (989 g kg−1), makal(970 g kg−1) and sorghum starches (933–941 g kg−1) in theliterature but comparable with those of maca root starch(878 g kg−1).10,27 – 29 On average, corn starch displayed the highestpurity (947 g kg−1) than cassava (892 g kg−1) and cocoyam(876 g kg−1) starches. The amylose content was the lowest inNkhotakota cocoyam starch (106 g kg−1) and the highest inGomani cassava starch (237 g kg−1). Generally, cocoyam starchesdisplayed lower amylose content than those of cassava and cornstarches. On the contrary, other researchers have reported higherlevels of amylose in cocoyam starch than in cassava starch.3,9
The moisture content of the starches fell within the prescribed
industrial specification required for safe storage of starches toprevent deterioration in starch quality30 ranging from 104 to132 g kg−1 for cocoyam starches, 124 to 130 g kg−1 for cassavastarches and 113 g kg−1 for corn starch. The pH of the starchesranged from 5.18 to 6.95 for cocoyam starches, 4.93 to 5.70 forcassava starches and 5.98 for corn starch which is within theacceptable range for low acid food starches.31
The starches exhibited low levels of ash, protein and fat. Theash content ranged from 0.30 to 1.57 g kg−1 and was generallyhigher in cocoyam starches (1.44 g kg−1) than in cassava starches(1.09 g kg−1). Similar trend was reported by Perez et al.;10 however,Nwokocha et al.9 reported the opposite. Fat content of the starchesranged from 1.07 to 1.60 g kg−1 within the cocoyam accessions,0.87 to 1.40 g kg−1 within the cassava cultivar and was 1.30 g kg−1
for corn starch. Cocoyam starches displayed higher protein levels(4.4–8.4 g kg−1) than cassava (3.5–3.9 g kg−1) but similar to thatof corn starch (7.2 g kg−1).
Phosphorus content of the starches varied from 92.7 to110.1 mg kg−1 within the cocoyam accessions and 67.3 to121.3 mg kg−1 among the cassava cultivars (Table 2). These re-sults fall within the reported phosphorus contents of cocoyam andcassava starches.30 Generally, the phosphorus contents of the co-coyam and cassava starches were comparable but higher than thatof corn starch. Higher levels of potassium were found in cocoyamthan in cassava and corn starches. Calcium content was compara-tively higher in cassava starches than in cocoyam and corn starches.Magnesium and sodium were present in intermediate levels whileiron, zinc and manganese were present in very low amounts withmanganese being the lowest (Table 2). Levels of minerals obtainedin this study are lower than those reported for canna and arrowrootstarches except for potassium levels that were higher.32
Iodine absorption spectra and reducing capacityThere was significant variation (P < 0.001) in the iodine absorptionspectra and reducing capacity of the starches (Table 3). Cocoyamstarches displayed higher wavelength of maximum absorptionand blue values than cassava starches. Corn starch exhibitedintermediate values. These results suggest that cocoyam starchesin this study contain longer chain starch molecules than cassava
Table 1. Total starch, pH, moisture (MC), ash, fat, protein, and amylose contents of cocoyam, cassava and corn starches∗
Botanicalsource Accession/genotype
Total starch(g kg−1)
Amylose(g kg−1)
MC(g kg−1) pH
Ash(g kg−1)
Fat(g kg−1)
Protein(g kg−1)
Cocoyam Chitipa 909bc 161e 132a 6.38de 1.37abc 1.50b 5.5d
Machinga 860fg 136f 111gh 6.32e 1.53a 1.33de 7.1bc
Mulanje 875ef 111g 109h 6.54c 1.33abc 1.60a 4.5f
Mzuzu 869ef 155e 126cd 6.46cd 1.50ab 1.37de 4.4f
Nkhotakota 861fg 106g 121f 6.68b 1.33abc 1.07f 7.0c
Thyolo 865fg 161e 104i 5.18j 1.57a 1.47bc 8.4a
Zomba 894cd 210b 122ef 6.95a 1.43abc 1.30e 4.9e
Cassava Gomani 921b 237a 124de 5.52hi 1.33abc 0.87g 3.7hi
Maunjili 883de 177d 129ab 4.93k 1.20cd 1.40cd 3.7h
Mbundumali 903c 196c 127bc 5.43i 1.27bcd 1.10f 3.5j
Mkondezi 851g 194c 128bc 5.60gh 0.30e 1.10f 3.9g
Sauti 900cd 133f 130ab 5.70g 1.33abc 0.90g 3.5ij
Corn – 947a 202bc 113g 5.98f 1.07d 1.30e 7.2b
Means followed by the same letter (a–k) within the same column are not significantly different from each other (P ≤ 0.05).∗ Values are means of three determinations.
www.interscience.wiley.com/jsfa c© 2010 Society of Chemical Industry J Sci Food Agric 2010; 90: 1886–1896
18
89
Properties of Malawian cocoyam starches www.soci.org
Table 2. Mineral content (in mg kg−1) of the cocoyam, cassava and corn starches∗
Botanicalsource Accession/genotype P Ca K Mg Na Fe Zn Mn
Cocoyam Chitipa 106.9abcd 48.0ef 368.8ab 30.0d 27.0de 9.3cd 2.09bcd 0.41cde
Machinga 110.1abc 42.6efg 381.9a 40.3c 21.6e 8.5cde 2.35ab 0.43cd
Mulanje 99.1cdef 29.0g 293.7c 30.9d 31.5bcd 6.2ef 1.29g 0.39de
Mzuzu 116.2ab 26.0g 346.3b 20.9f 29.1cd 10.7bc 1.78def 0.43cd
Nkhotakota 102.5bcde 28.7g 376.9ab 27.2de 26.0de 7.5de 1.76ef 0.39de
Thyolo 92.7def 37.2fg 357.4ab 57.1a 51.3a 4.4f 2.54a 0.39de
Zomba 105.8bcde 58.7de 288.3c 31.2d 51.9a 7.8de 1.56fg 0.79s
Cassava Gomani 108.9abc 124.0b 64.1e 55.0a 57.2a 17.8a 2.11bc 0.75a
Maunjili 86.9fg 85.9c 38.4e 47.1b 36.9b 12.2b 1.56fg 0.37de
Mbundumali 92.2ef 141.7a 40.5e 4.3 32.3bcd 10.0bcd 2.06bcde 0.39de
Mkondezi 67.3h 50.8def 32.0e 23.9ef 29.9bcd 7.9de 1.32g 0.35e
Sauti 121.3a 132.3ab 42.6e 47.3b 31.4bcd 16.7a 1.42g 0.52b
Corn – 75.9gh 67.1d 219.2d 37.8c 35.5bc 9.9bcd 1.82cdef 0.47bc
Means followed by the same letter (a–h) within the same column are not significantly different from each other (P ≤ 0.05).∗ Values are means of three determinations.
Table 3. Reducing capacity (RC), wavelength of maximum iodine absorption (λmax), blue values (BV) and the extent of acid hydrolysis of thecocoyam, cassava and corn starches∗
Extent of acid hydrolysis (%)
Botanical source Accession/genotype λmax (nm) BV Reducing capacity Day 1 Day 2 Day 4 Day 6 Day 8 Day 12 Day 16
Cocoyam Chitipa 605a 0.365bc 5.2fg 2.2c 3.5cd 5.0cd 7.8a 9.2cd 22.5ab 24.8cd
Machinga 596c 0.356c 7.0e 2.7a 4.7a 6.1b 6.5bc 10.9a 23.6a 25.8bcd
Mulanje 602b 0.373b 6.5efg 2.2c 4.2b 4.9cde 6.0cde 9.8bc 21.3abc 24.0de
Mzuzu 594c 0.333d 5.0g 1.6e 4.0b 5.5c 8.2a 10.1abc 20.9bcd 21.5f
Nkhotakota 588d 0.334d 7.4e 1.9d 4.0b 5.0cd 7.0b 10.4ab 20.2bcde 21.9ef
Thyolo 603b 0.372bc 13.5b 2.4b 3.9b 4.3efg 7.9a 10.9a 19.3cdef 25.0bcd
Zomba 607a 0.408a 5.6fg 1.1f 3.9b 4.5def 5.8de 8.5de 17.9efg 20.4f
Cassava Gomani 574g 0.250f 10.8c 1.0g 2.6f 3.9fgh 6.2cde 7.9ef 17.3fg 24.4cd
Maunjili 577fg 0.265f 6.6ef 2.2c 3.1e 3.5h 5.7e 7.6ef 15.7g 28.0a
Mbundumali 579ef 0.290e 17.0a 0.9h 3.3de 4.0fgh 6.5bc 7.5f 17.3fg 27.0ab
Mkondezi 576fg 0.255f 9.3d 0.9h 3.0e 3.7gh 6.3cde 8.2ef 18.6def 26.5abc
Sauti 570h 0.226g 16.9a 2.7a 4.7a 7.1a 8.3a 9.3cd 21.5abc 28.1a
Corn – 582e 0.296e 9.5cd 0.6i 3.2e 5.4c 7.8a 9.2cd 17.7fg 25.1bcd
Means followed by the same letter (a–h) within the same column are not significantly different from each other (P ≤ 0.05) by LSD test.∗ All values are means of three replicates of each sample.
and corn starches.33 Mbundumali cassava starch exhibited thehighest reducing capacity value while Mzuzu cocoyam starch gavethe lowest. Cocoyam starches on average gave lower reducingcapacity values than cassava and corn starches. This indicates thepresence of starch molecules of higher molecular weights thancassava and corn starches as the reducing number is inverselyrelated to the molecular weight. These results are consistentwith the differences in iodine binding capacity of the starchesand confirm the existence of structural differences between thecocoyam, cassava and corn starches.17
Acid hydrolysisThe results of acid solubilisation revealed a steady increase inacid hydrolysis in the first 8 days with a large increase observedbetween 8 and 12 days of acid hydrolysis (Table 3). This pattern
is different from one reported in literature.34 The extent ofacid hydrolysis differed significantly (P < 0.001) among thestarches suggesting differences in the packing and orientation ofstarch chains in the amorphous regions of the different starches,however no consistent trends were observed. After 16 days of acidsolubilisation, the extent of hydrolysis varied from 20.4% for Zombacocoyam starch to 28.1% for Sauti cassava starch. This range ofvalues is lower than those reported for other root and tuber cropsindicating much stronger chain interactions in the amorphous andcrystalline regions of the Malawian cocoyam and cassava starchescompared to other root and tuber crop starches reported.35
Molecular weight distribution of the starchesThe elution profiles of the standards showed a decrease inretention time with increasing molecular weight and the
J Sci Food Agric 2010; 90: 1886–1896 c© 2010 Society of Chemical Industry www.interscience.wiley.com/jsfa
18
90
www.soci.org DE Mweta et al.
(a) Chitipa
(b) Machinga
(c) Mzuzu
(d) Nkhotakota
(e) Thyolo
(f) Zomba
(g) Gomani
(h) Maunjili
(i) Mbundumali
(j) Mkondezi
(k) Sauti
(l) Corn
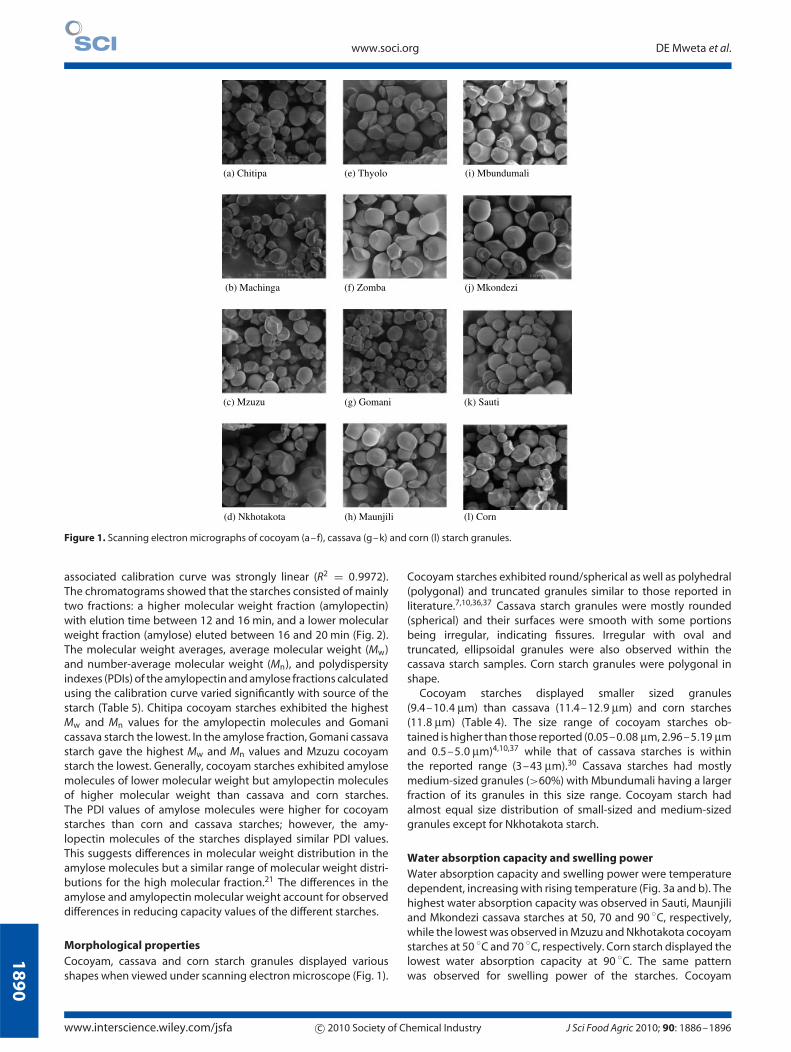
Figure 1. Scanning electron micrographs of cocoyam (a–f), cassava (g–k) and corn (l) starch granules.
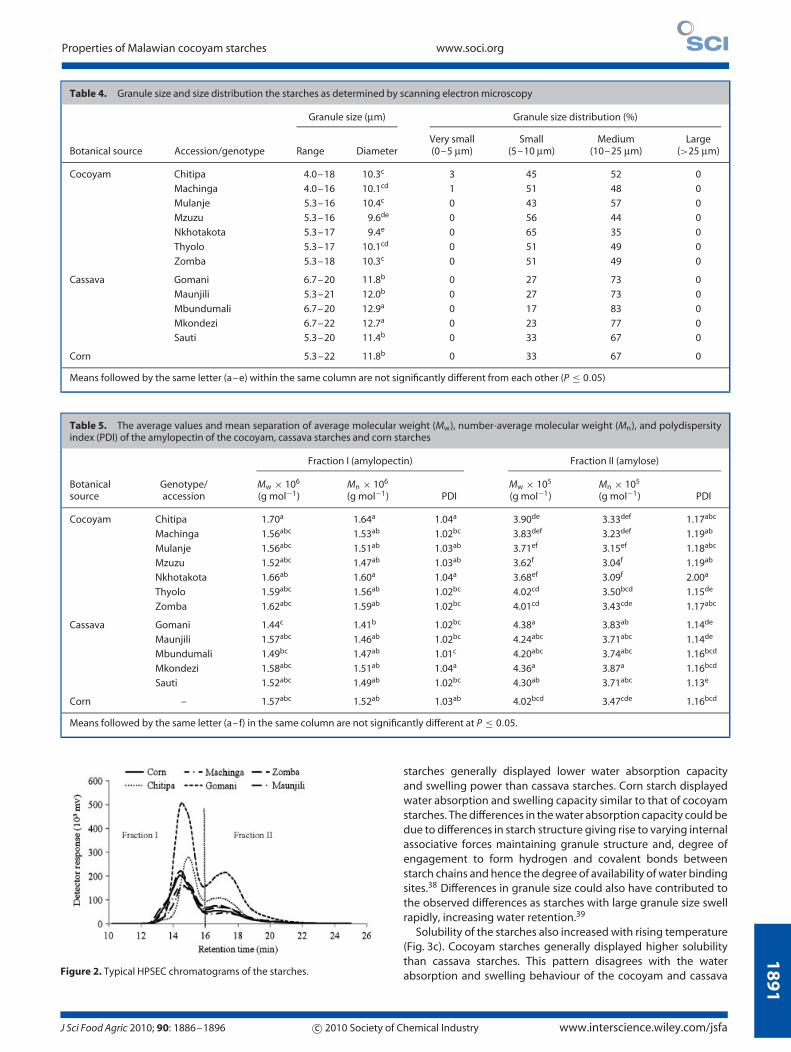
associated calibration curve was strongly linear (R2 = 0.9972).The chromatograms showed that the starches consisted of mainlytwo fractions: a higher molecular weight fraction (amylopectin)with elution time between 12 and 16 min, and a lower molecularweight fraction (amylose) eluted between 16 and 20 min (Fig. 2).The molecular weight averages, average molecular weight (Mw)and number-average molecular weight (Mn), and polydispersityindexes (PDIs) of the amylopectin and amylose fractions calculatedusing the calibration curve varied significantly with source of thestarch (Table 5). Chitipa cocoyam starches exhibited the highestMw and Mn values for the amylopectin molecules and Gomanicassava starch the lowest. In the amylose fraction, Gomani cassavastarch gave the highest Mw and Mn values and Mzuzu cocoyamstarch the lowest. Generally, cocoyam starches exhibited amylosemolecules of lower molecular weight but amylopectin moleculesof higher molecular weight than cassava and corn starches.The PDI values of amylose molecules were higher for cocoyamstarches than corn and cassava starches; however, the amy-lopectin molecules of the starches displayed similar PDI values.This suggests differences in molecular weight distribution in theamylose molecules but a similar range of molecular weight distri-butions for the high molecular fraction.21 The differences in theamylose and amylopectin molecular weight account for observeddifferences in reducing capacity values of the different starches.
Morphological propertiesCocoyam, cassava and corn starch granules displayed variousshapes when viewed under scanning electron microscope (Fig. 1).
Cocoyam starches exhibited round/spherical as well as polyhedral(polygonal) and truncated granules similar to those reported inliterature.7,10,36,37 Cassava starch granules were mostly rounded(spherical) and their surfaces were smooth with some portionsbeing irregular, indicating fissures. Irregular with oval andtruncated, ellipsoidal granules were also observed within thecassava starch samples. Corn starch granules were polygonal inshape.
Cocoyam starches displayed smaller sized granules(9.4–10.4 µm) than cassava (11.4–12.9 µm) and corn starches(11.8 µm) (Table 4). The size range of cocoyam starches ob-tained is higher than those reported (0.05–0.08 µm, 2.96–5.19 µmand 0.5–5.0 µm)4,10,37 while that of cassava starches is withinthe reported range (3–43 µm).30 Cassava starches had mostlymedium-sized granules (>60%) with Mbundumali having a largerfraction of its granules in this size range. Cocoyam starch hadalmost equal size distribution of small-sized and medium-sizedgranules except for Nkhotakota starch.
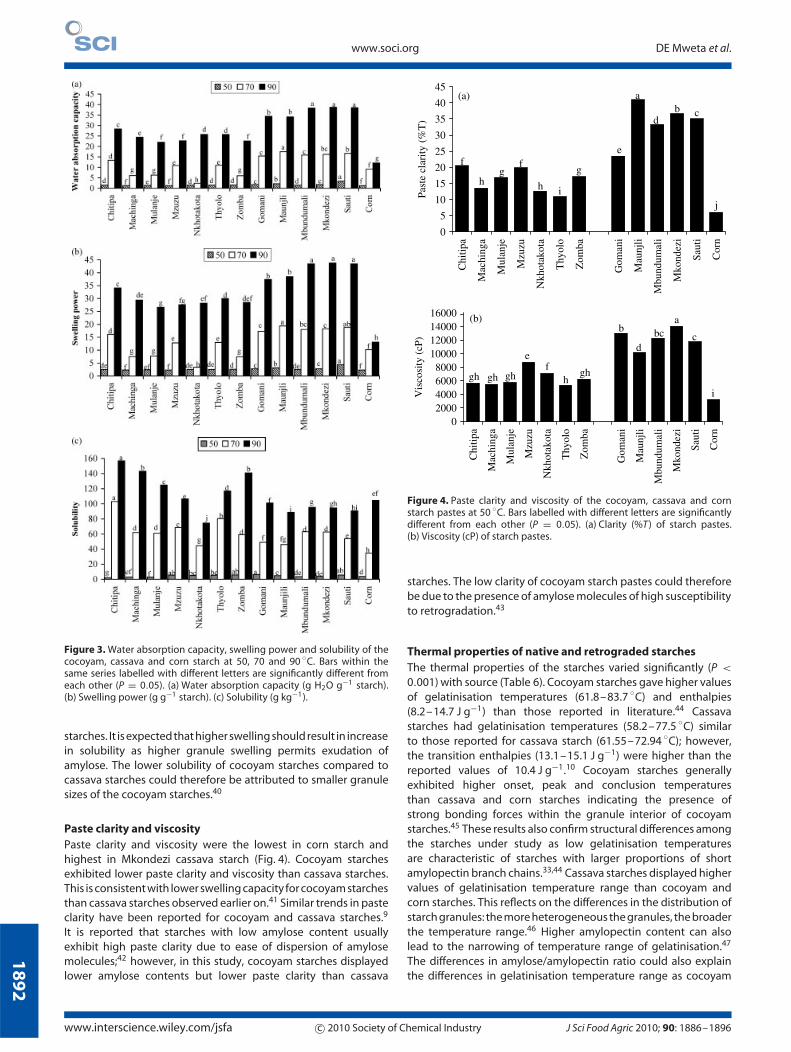
Water absorption capacity and swelling powerWater absorption capacity and swelling power were temperaturedependent, increasing with rising temperature (Fig. 3a and b). Thehighest water absorption capacity was observed in Sauti, Maunjiliand Mkondezi cassava starches at 50, 70 and 90 ◦C, respectively,while the lowest was observed in Mzuzu and Nkhotakota cocoyamstarches at 50 ◦C and 70 ◦C, respectively. Corn starch displayed thelowest water absorption capacity at 90 ◦C. The same patternwas observed for swelling power of the starches. Cocoyam
www.interscience.wiley.com/jsfa c© 2010 Society of Chemical Industry J Sci Food Agric 2010; 90: 1886–1896
18
91
Properties of Malawian cocoyam starches www.soci.org
Table 4. Granule size and size distribution the starches as determined by scanning electron microscopy
Granule size (µm) Granule size distribution (%)
Botanical source Accession/genotype Range DiameterVery small(0–5 µm)
Small(5–10 µm)
Medium(10–25 µm)
Large(>25 µm)
Cocoyam Chitipa 4.0–18 10.3c 3 45 52 0
Machinga 4.0–16 10.1cd 1 51 48 0
Mulanje 5.3–16 10.4c 0 43 57 0
Mzuzu 5.3–16 9.6de 0 56 44 0
Nkhotakota 5.3–17 9.4e 0 65 35 0
Thyolo 5.3–17 10.1cd 0 51 49 0
Zomba 5.3–18 10.3c 0 51 49 0
Cassava Gomani 6.7–20 11.8b 0 27 73 0
Maunjili 5.3–21 12.0b 0 27 73 0
Mbundumali 6.7–20 12.9a 0 17 83 0
Mkondezi 6.7–22 12.7a 0 23 77 0
Sauti 5.3–20 11.4b 0 33 67 0
Corn 5.3–22 11.8b 0 33 67 0
Means followed by the same letter (a–e) within the same column are not significantly different from each other (P ≤ 0.05)
Table 5. The average values and mean separation of average molecular weight (Mw), number-average molecular weight (Mn), and polydispersityindex (PDI) of the amylopectin of the cocoyam, cassava starches and corn starches
Fraction I (amylopectin) Fraction II (amylose)
Botanicalsource
Genotype/accession
Mw × 106
(g mol−1)Mn × 106
(g mol−1) PDIMw × 105
(g mol−1)Mn × 105
(g mol−1) PDI
Cocoyam Chitipa 1.70a 1.64a 1.04a 3.90de 3.33def 1.17abc
Machinga 1.56abc 1.53ab 1.02bc 3.83def 3.23def 1.19ab
Mulanje 1.56abc 1.51ab 1.03ab 3.71ef 3.15ef 1.18abc
Mzuzu 1.52abc 1.47ab 1.03ab 3.62f 3.04f 1.19ab
Nkhotakota 1.66ab 1.60a 1.04a 3.68ef 3.09f 2.00a
Thyolo 1.59abc 1.56ab 1.02bc 4.02cd 3.50bcd 1.15de
Zomba 1.62abc 1.59ab 1.02bc 4.01cd 3.43cde 1.17abc
Cassava Gomani 1.44c 1.41b 1.02bc 4.38a 3.83ab 1.14de
Maunjili 1.57abc 1.46ab 1.02bc 4.24abc 3.71abc 1.14de
Mbundumali 1.49bc 1.47ab 1.01c 4.20abc 3.74abc 1.16bcd
Mkondezi 1.58abc 1.51ab 1.04a 4.36a 3.87a 1.16bcd
Sauti 1.52abc 1.49ab 1.02bc 4.30ab 3.71abc 1.13e
Corn – 1.57abc 1.52ab 1.03ab 4.02bcd 3.47cde 1.16bcd
Means followed by the same letter (a–f) in the same column are not significantly different at P ≤ 0.05.
Figure 2. Typical HPSEC chromatograms of the starches.
starches generally displayed lower water absorption capacityand swelling power than cassava starches. Corn starch displayedwater absorption and swelling capacity similar to that of cocoyamstarches. The differences in the water absorption capacity could bedue to differences in starch structure giving rise to varying internalassociative forces maintaining granule structure and, degree ofengagement to form hydrogen and covalent bonds betweenstarch chains and hence the degree of availability of water bindingsites.38 Differences in granule size could also have contributed tothe observed differences as starches with large granule size swellrapidly, increasing water retention.39
Solubility of the starches also increased with rising temperature(Fig. 3c). Cocoyam starches generally displayed higher solubilitythan cassava starches. This pattern disagrees with the waterabsorption and swelling behaviour of the cocoyam and cassava
J Sci Food Agric 2010; 90: 1886–1896 c© 2010 Society of Chemical Industry www.interscience.wiley.com/jsfa
18
92
www.soci.org DE Mweta et al.
Figure 3. Water absorption capacity, swelling power and solubility of thecocoyam, cassava and corn starch at 50, 70 and 90 ◦C. Bars within thesame series labelled with different letters are significantly different fromeach other (P = 0.05). (a) Water absorption capacity (g H2O g−1 starch).(b) Swelling power (g g−1 starch). (c) Solubility (g kg−1).
starches. It is expected that higher swelling should result in increasein solubility as higher granule swelling permits exudation ofamylose. The lower solubility of cocoyam starches compared tocassava starches could therefore be attributed to smaller granulesizes of the cocoyam starches.40
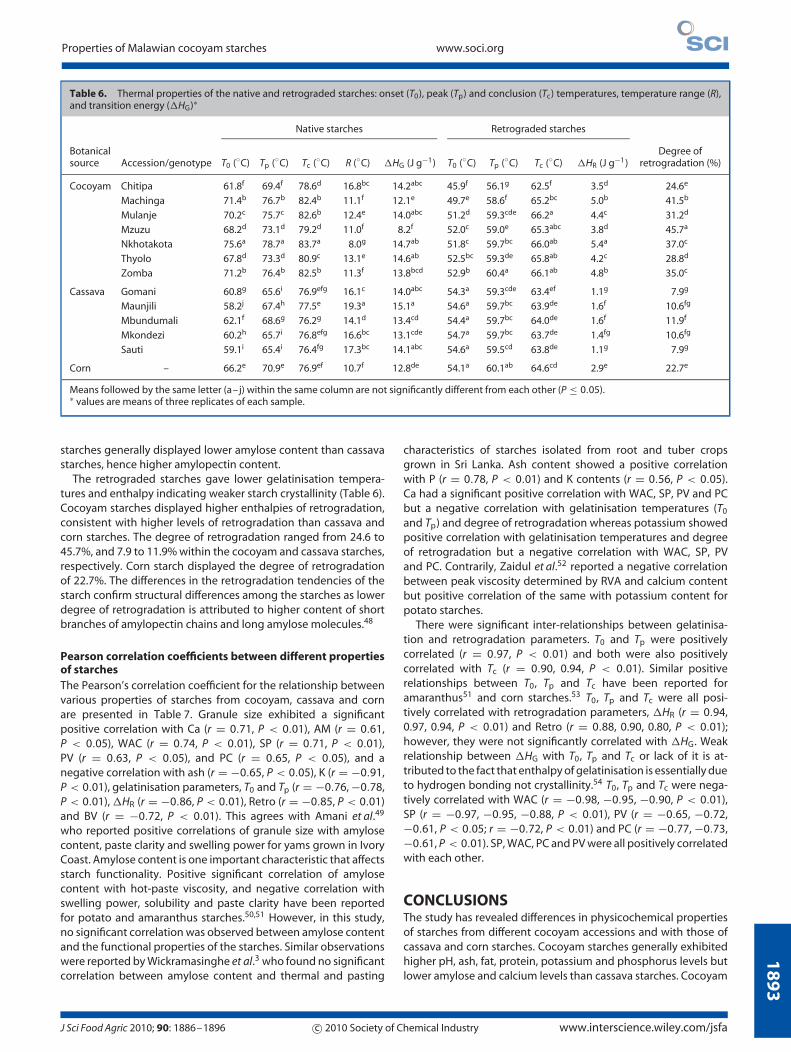
Paste clarity and viscosityPaste clarity and viscosity were the lowest in corn starch andhighest in Mkondezi cassava starch (Fig. 4). Cocoyam starchesexhibited lower paste clarity and viscosity than cassava starches.This is consistent with lower swelling capacity for cocoyam starchesthan cassava starches observed earlier on.41 Similar trends in pasteclarity have been reported for cocoyam and cassava starches.9
It is reported that starches with low amylose content usuallyexhibit high paste clarity due to ease of dispersion of amylosemolecules;42 however, in this study, cocoyam starches displayedlower amylose contents but lower paste clarity than cassava
j
cbd
a
e
g
ih
fg
h
f
0
5
10
15
20
25
30
35
40
45
Chi
tipa
Mac
hing
a
Mul
anje
Mzu
zu
Nkh
otak
ota
Thy
olo
Zom
ba
Gom
ani
Mau
njli
Mbu
ndum
ali
Mko
ndez
i
Saut
i
Cor
n
Past
e cl
arity
(%
T)
(a)
i
c
abc
d
b
ghh
fe
ghghgh
02000400060008000
10000120001400016000
Chi
tipa
Mac
hing
a
Mul
anje
Mzu
zu
Nkh
otak
ota
Thy
olo
Zom
ba
Gom
ani
Mau
njli
Mbu
ndum
ali
Mko
ndez
i
Saut
i
Cor
n
Vis
cosi
ty (
cP)
(b)
Figure 4. Paste clarity and viscosity of the cocoyam, cassava and cornstarch pastes at 50 ◦C. Bars labelled with different letters are significantlydifferent from each other (P = 0.05). (a) Clarity (%T) of starch pastes.(b) Viscosity (cP) of starch pastes.
starches. The low clarity of cocoyam starch pastes could thereforebe due to the presence of amylose molecules of high susceptibilityto retrogradation.43
Thermal properties of native and retrograded starchesThe thermal properties of the starches varied significantly (P <
0.001) with source (Table 6). Cocoyam starches gave higher valuesof gelatinisation temperatures (61.8–83.7 ◦C) and enthalpies(8.2–14.7 J g−1) than those reported in literature.44 Cassavastarches had gelatinisation temperatures (58.2–77.5 ◦C) similarto those reported for cassava starch (61.55–72.94 ◦C); however,the transition enthalpies (13.1–15.1 J g−1) were higher than thereported values of 10.4 J g−1.10 Cocoyam starches generallyexhibited higher onset, peak and conclusion temperaturesthan cassava and corn starches indicating the presence ofstrong bonding forces within the granule interior of cocoyamstarches.45 These results also confirm structural differences amongthe starches under study as low gelatinisation temperaturesare characteristic of starches with larger proportions of shortamylopectin branch chains.33,44 Cassava starches displayed highervalues of gelatinisation temperature range than cocoyam andcorn starches. This reflects on the differences in the distribution ofstarch granules: the more heterogeneous the granules, the broaderthe temperature range.46 Higher amylopectin content can alsolead to the narrowing of temperature range of gelatinisation.47
The differences in amylose/amylopectin ratio could also explainthe differences in gelatinisation temperature range as cocoyam
www.interscience.wiley.com/jsfa c© 2010 Society of Chemical Industry J Sci Food Agric 2010; 90: 1886–1896
18
93
Properties of Malawian cocoyam starches www.soci.org
Table 6. Thermal properties of the native and retrograded starches: onset (T0), peak (Tp) and conclusion (Tc) temperatures, temperature range (R),and transition energy (�HG)∗
Native starches Retrograded starches
Botanicalsource Accession/genotype T0 (◦C) Tp (◦C) Tc (◦C) R (◦C) �HG (J g−1) T0 (◦C) Tp (◦C) Tc (◦C) �HR (J g−1)
Degree ofretrogradation (%)
Cocoyam Chitipa 61.8f 69.4f 78.6d 16.8bc 14.2abc 45.9f 56.1g 62.5f 3.5d 24.6e
Machinga 71.4b 76.7b 82.4b 11.1f 12.1e 49.7e 58.6f 65.2bc 5.0b 41.5b
Mulanje 70.2c 75.7c 82.6b 12.4e 14.0abc 51.2d 59.3cde 66.2a 4.4c 31.2d
Mzuzu 68.2d 73.1d 79.2d 11.0f 8.2f 52.0c 59.0e 65.3abc 3.8d 45.7a
Nkhotakota 75.6a 78.7a 83.7a 8.0g 14.7ab 51.8c 59.7bc 66.0ab 5.4a 37.0c
Thyolo 67.8d 73.3d 80.9c 13.1e 14.6ab 52.5bc 59.3de 65.8ab 4.2c 28.8d
Zomba 71.2b 76.4b 82.5b 11.3f 13.8bcd 52.9b 60.4a 66.1ab 4.8b 35.0c
Cassava Gomani 60.8g 65.6i 76.9efg 16.1c 14.0abc 54.3a 59.3cde 63.4ef 1.1g 7.9g
Maunjili 58.2j 67.4h 77.5e 19.3a 15.1a 54.6a 59.7bc 63.9de 1.6f 10.6fg
Mbundumali 62.1f 68.6g 76.2g 14.1d 13.4cd 54.4a 59.7bc 64.0de 1.6f 11.9f
Mkondezi 60.2h 65.7i 76.8efg 16.6bc 13.1cde 54.7a 59.7bc 63.7de 1.4fg 10.6fg
Sauti 59.1i 65.4i 76.4fg 17.3bc 14.1abc 54.6a 59.5cd 63.8de 1.1g 7.9g
Corn – 66.2e 70.9e 76.9ef 10.7f 12.8de 54.1a 60.1ab 64.6cd 2.9e 22.7e
Means followed by the same letter (a–j) within the same column are not significantly different from each other (P ≤ 0.05).∗ values are means of three replicates of each sample.
starches generally displayed lower amylose content than cassavastarches, hence higher amylopectin content.
The retrograded starches gave lower gelatinisation tempera-tures and enthalpy indicating weaker starch crystallinity (Table 6).Cocoyam starches displayed higher enthalpies of retrogradation,consistent with higher levels of retrogradation than cassava andcorn starches. The degree of retrogradation ranged from 24.6 to45.7%, and 7.9 to 11.9% within the cocoyam and cassava starches,respectively. Corn starch displayed the degree of retrogradationof 22.7%. The differences in the retrogradation tendencies of thestarch confirm structural differences among the starches as lowerdegree of retrogradation is attributed to higher content of shortbranches of amylopectin chains and long amylose molecules.48
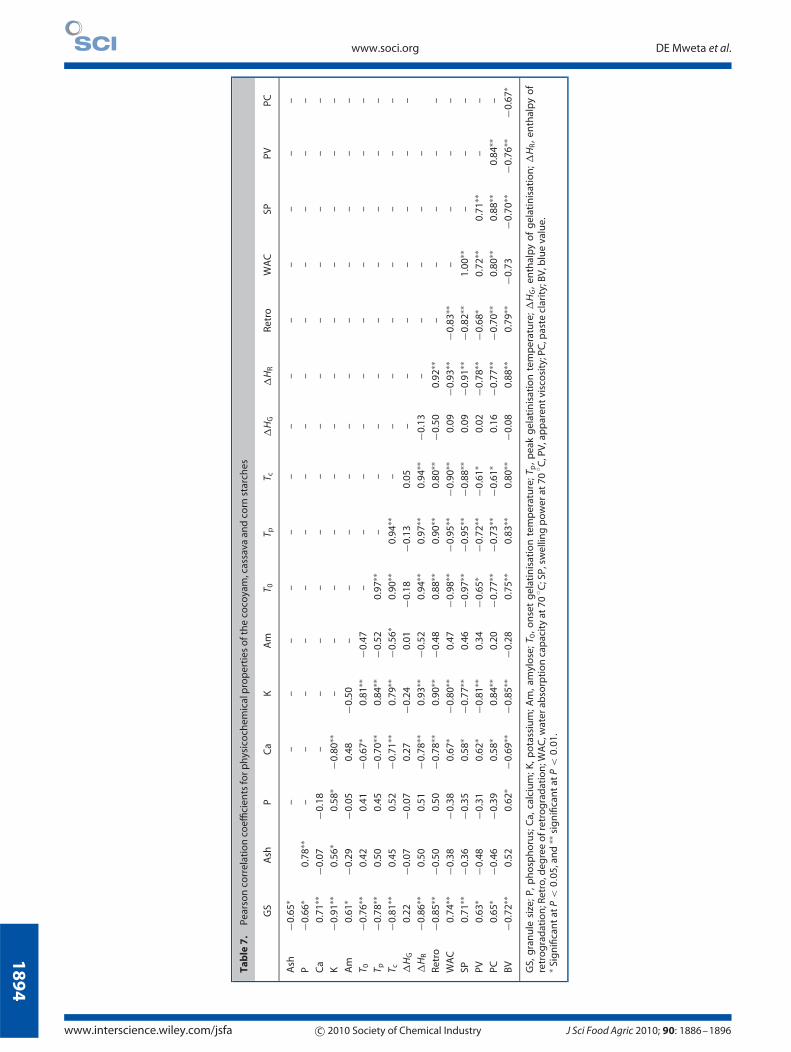
Pearson correlation coefficients between different propertiesof starchesThe Pearson’s correlation coefficient for the relationship betweenvarious properties of starches from cocoyam, cassava and cornare presented in Table 7. Granule size exhibited a significantpositive correlation with Ca (r = 0.71, P < 0.01), AM (r = 0.61,P < 0.05), WAC (r = 0.74, P < 0.01), SP (r = 0.71, P < 0.01),PV (r = 0.63, P < 0.05), and PC (r = 0.65, P < 0.05), and anegative correlation with ash (r = −0.65, P < 0.05), K (r = −0.91,P < 0.01), gelatinisation parameters, T0 and Tp (r = −0.76, −0.78,P < 0.01), �HR (r = −0.86, P < 0.01), Retro (r = −0.85, P < 0.01)and BV (r = −0.72, P < 0.01). This agrees with Amani et al.49
who reported positive correlations of granule size with amylosecontent, paste clarity and swelling power for yams grown in IvoryCoast. Amylose content is one important characteristic that affectsstarch functionality. Positive significant correlation of amylosecontent with hot-paste viscosity, and negative correlation withswelling power, solubility and paste clarity have been reportedfor potato and amaranthus starches.50,51 However, in this study,no significant correlation was observed between amylose contentand the functional properties of the starches. Similar observationswere reported by Wickramasinghe et al.3 who found no significantcorrelation between amylose content and thermal and pasting
characteristics of starches isolated from root and tuber cropsgrown in Sri Lanka. Ash content showed a positive correlationwith P (r = 0.78, P < 0.01) and K contents (r = 0.56, P < 0.05).Ca had a significant positive correlation with WAC, SP, PV and PCbut a negative correlation with gelatinisation temperatures (T0
and Tp) and degree of retrogradation whereas potassium showedpositive correlation with gelatinisation temperatures and degreeof retrogradation but a negative correlation with WAC, SP, PVand PC. Contrarily, Zaidul et al.52 reported a negative correlationbetween peak viscosity determined by RVA and calcium contentbut positive correlation of the same with potassium content forpotato starches.
There were significant inter-relationships between gelatinisa-tion and retrogradation parameters. T0 and Tp were positivelycorrelated (r = 0.97, P < 0.01) and both were also positivelycorrelated with Tc (r = 0.90, 0.94, P < 0.01). Similar positiverelationships between T0, Tp and Tc have been reported foramaranthus51 and corn starches.53 T0, Tp and Tc were all posi-tively correlated with retrogradation parameters, �HR (r = 0.94,0.97, 0.94, P < 0.01) and Retro (r = 0.88, 0.90, 0.80, P < 0.01);however, they were not significantly correlated with �HG. Weakrelationship between �HG with T0, Tp and Tc or lack of it is at-tributed to the fact that enthalpy of gelatinisation is essentially dueto hydrogen bonding not crystallinity.54 T0, Tp and Tc were nega-tively correlated with WAC (r = −0.98, −0.95, −0.90, P < 0.01),SP (r = −0.97, −0.95, −0.88, P < 0.01), PV (r = −0.65, −0.72,−0.61, P < 0.05; r = −0.72, P < 0.01) and PC (r = −0.77, −0.73,−0.61, P < 0.01). SP, WAC, PC and PV were all positively correlatedwith each other.
CONCLUSIONSThe study has revealed differences in physicochemical propertiesof starches from different cocoyam accessions and with those ofcassava and corn starches. Cocoyam starches generally exhibitedhigher pH, ash, fat, protein, potassium and phosphorus levels butlower amylose and calcium levels than cassava starches. Cocoyam
J Sci Food Agric 2010; 90: 1886–1896 c© 2010 Society of Chemical Industry www.interscience.wiley.com/jsfa
18
94
www.soci.org DE Mweta et al.
Tab
le7
.Pe
arso
nco
rrel
atio
nco
effic
ien
tsfo
rph
ysic
och
emic
alp
rop
erti
eso
fth
eco
coya
m,c
assa
vaan
dco
rnst
arch
es
GS
Ash
PC
aK
Am
T 0T p
T c�
HG
�H
RRe
tro
WA
CSP
PVPC
Ash
−0.6
5∗–
––
––
––
––
––
––
–
P−0
.66∗
0.78
∗∗–
––
––
––
––
––
––
–
Ca
0.71
∗∗−0
.07
−0.1
8–
––
––
––
––
––
––
K−0
.91∗∗
0.56
∗0.
58∗
−0.8
0∗∗–
––
––
––
––
––
–
Am
0.61
∗−0
.29
−0.0
50.
48−0
.50
––
––
––
––
––
–
T 0−0
.76∗∗
0.42
0.41
−0.6
7∗0.
81∗∗
−0.4
7–
––
––
––
––
–
T p−0
.78∗∗
0.50
0.45
−0.7
0∗∗0.
84∗∗
−0.5
20.
97∗∗
––
––
––
––
–
T c−0
.81∗∗
0.45
0.52
−0.7
1∗∗0.
79∗∗
−0.5
6∗0.
90∗∗
0.94
∗∗–
––
––
––
–
�H
G0.
22−0
.07
−0.0
70.
27−0
.24
0.01
−0.1
8−0
.13
0.05
––
––
––
–
�H
R−0
.86∗∗
0.50
0.51
−0.7
8∗∗0.
93∗∗
−0.5
20.
94∗∗
0.97
∗∗0.
94∗∗
−0.1
3–
––
––
Retr
o−0
.85∗∗
−0.5
00.
50−0
.78∗∗
0.90
∗∗−0
.48
0.88
∗∗0.
90∗∗
0.80
∗∗−0
.50
0.92
∗∗–
––
––
WA
C0.
74∗∗
−0.3
8−0
.38
0.67
∗−0
.80∗∗
0.47
−0.9
8∗∗−0
.95∗∗
−0.9
0∗∗0.
09−0
.93∗∗
−0.8
3∗∗–
––
–
SP0.
71∗∗
−0.3
6−0
.35
0.58
∗−0
.77∗∗
0.46
−0.9
7∗∗−0
.95∗∗
−0.8
8∗∗0.
09−0
.91∗∗
−0.8
2∗∗1.
00∗∗
––
–
PV0.
63∗
−0.4
8−0
.31
0.62
∗−0
.81∗∗
0.34
−0.6
5∗−0
.72∗∗
−0.6
1∗0.
02−0
.78∗∗
−0.6
8∗0.
72∗∗
0.71
∗∗–
–
PC0.
65∗
−0.4
6−0
.39
0.58
∗0.
84∗∗
0.20
−0.7
7∗∗−0
.73∗∗
−0.6
1∗0.
16−0
.77∗∗
−0.7
0∗∗0.
80∗∗
0.88
∗∗0.
84∗∗
–
BV
−0.7
2∗∗0.
520.
62∗
−0.6
9∗∗−0
.85∗∗
−0.2
80.
75∗∗
0.83
∗∗0.
80∗∗
−0.0
80.
88∗∗
0.79
∗∗−0
.73
−0.7
0∗∗−0
.76∗∗
−0.6
7∗
GS,
gra
nu
lesi
ze;P
,ph
osp
ho
rus;
Ca,
calc
ium
;K,p
ota
ssiu
m;A
m,a
myl
ose
;T0
,on
set
gel
atin
isat
ion
tem
per
atu
re;T
p,p
eak
gel
atin
isat
ion
tem
per
atu
re;�
HG
,en
thal
py
of
gel
atin
isat
ion
;�H
R,e
nth
alp
yo
fre
tro
gra
dat
ion
;Ret
ro,d
egre
eo
fret
rog
rad
atio
n;W
AC
,wat
erab
sorp
tio
nca
pac
ity
at70
◦ C;S
P,sw
ellin
gp
ow
erat
70◦ C
,PV
,ap
par
entv
isco
sity
;PC
,pas
tecl
arit
y;B
V,b
lue
valu
e.∗ Si
gn
ifica
nt
atP
<0.
05,a
nd
∗∗si
gn
ifica
nt
atP
<0.
01.
www.interscience.wiley.com/jsfa c© 2010 Society of Chemical Industry J Sci Food Agric 2010; 90: 1886–1896
18
95
Properties of Malawian cocoyam starches www.soci.org
starches displayed smaller-sized granules than cassava and cornstarches. Cocoyam starches have different structures from cassavaand corn starches as evidenced by differences in the wavelengthof maximum iodine absorption, blue value, reducing capacity,extent of acid hydrolysis and the carbohydrate profiles. Cocoyamstarches had higher gelatinisation temperatures and solubilitybut lower water absorption capacity and swelling power, pasteclarity and viscosity but higher solubility than cassava and cornstarches. Cocoyam starches also displayed higher retrogradationtendencies than cassava starches.
ACKNOWLEDEGMENTSThe authors would like to thank International Programme inChemical Sciences (IPICS), Uppsala University in Sweden forfinancing this research through the Malawi 01 ‘Genetics andChemistry of Root and Tuber Crops’ project.
REFERENCES1 FAO Statistics, Food and Agriculture Organization, Data base
results, (2003).2 Sandifolo VS, Paper 15: Estimation of crop losses due to
different causes in root and tuber crops: The case ofMalawi, Proceedings of the Expert Consultation on root cropstatistics, Harare, Zimbabwe, 3–6 December (2002). Available:http://www.fao.org/docrep/005/Y9422E/y9422e0f.htm [12 June2007].
3 Wickramasinghe HAM, Takigawa S, Matsuura-Endo C, Yamauchi Hand Noda T, Comparative analysis of starch properties of differentroot and tuber crops of Sri Lanka. Food Chem 112:98–103 (2009).
4 Moorthy SN, Pillai PKT and Unnikrishnan M, Variability in starchextracted from taro. Carbohydr Polym 20:169–173 (1993).
5 Subhashirasakul S, Yuenyoungsawad S, Ketjinda W, Phadoongsom-but N and Faroongsang D, Study on tablet binding and disinte-grating properties of alternative starches prepared from taro andsweetpotato tubers. Drug Dev Ind Pharm 27:81–87 (2001).
6 Ellis RP, Cochrane MP, Dale MFB, Duffus CM, Lynn A, Morrison IM, et al,Starch production and industrial use. J Sci Food Agric 77:289–311(1998).
7 Jane J, Shen L, Chen J, Lim S, Kasemsuwan T and Nip WK, Physicaland chemical studies of taro starches and flours. Cereal Chem69:528–535 (1992).
8 Aboubakar • Njitang YN, Scher J and Mbofung CMF, Physicochemical,thermal properties and microstructure of six varieties of taro(Colocasia esculenta L. Schott) flours and starches, J Food Eng86:294–305 (2008).
9 Nwokocha LM, Aviara NA, Senan C and Williams PA, A comparativestudy of some properties of cassava (Manihot esculenta, Crantz)and cocoyam (Colocasia esculenta, Linn) starches. Carbohydr Polym76:362–367 (2009).
10 Perez E, Schultz FS and de Delahaye EP, Characterisation of someproperties of starches isolated from Xanthosoma sagittifolium(tannia) and Colocasiaesculenta (taro). CarbohydrPolym 60:139–145(2005).
11 Benesi IRM, Labuschagne MT, Dixon AGO and Mahungu NM, Stabilityof native starch quality parameters, starch extraction and root drymatter of cassava genotypes in different environments. J Sci FoodAgric 84:1381–1388 (2004).
12 McCleary BV, Solah V and Gibson TS, Quantitative measurement oftotal starch in cereal flours and products. J Cereal Sci 20:51–58(1994).
13 Njoku PC and Ohia CC, Spectrophotometric estimation studies ofmineral nutrient in three cocoyam cultivars. Pak J Nutr 6:616–619(2007).
14 Lindeboom N, Chang PR and Tyler RT, Analytical, biochemical andphysicochemical aspects of starch granule size, with emphasis onsmall granule starches: A review. Starch/Starke 56:89–99 (2004).
15 Singh N, Inouchi N and Nishinari K, Morphological, structural, thermal,and rheological characteristics of starches separated from applesof different cultivars. J Agric Food Chem 53:10193–10199 (2005).
16 Hizukuri S, Takeda Y, Yasuda M and Suzuki A, Multibranched natureof amylose and the action of debranching enzymes. Carbohydr Res94:205–213 (1981).
17 Van Hung P and Morita N, Physicochemical properties and enzymaticdigestibility of starch from edible canna (Canna edulis) grown inVietnam. Carbohydr Polym 61:314–321 (2005).
18 Jayakody L, Hoover R, Liu Q and Donner E, Studies on tuber starches II.Molecular structure, composition and physicochemical propertiesof yam (Dioscorea sp.) starches grown in Sri Lanka. Carbohydr Polym69:148–163 (2007).
19 Brook JR, Griffin VK and Kattan W, A modified method for totalcarbohydrate analysis of glucose syrups, maltodextrins and otherstarch hydrolysis products. Cereal Chem 63:465–467 (1986).
20 Chung Y-L and Lai H-M, Molecular and granular characteristics ofcorn starch modified by HCl–methanol method at differenttemperatures. Carbohydr Polym 63:527–534 (2006).
21 Lehtonen P, Effect of method of solution on observed molecularweight distribution of barley starch and starch derivatives in sizeexclusion chromatography. Chromatographia 26:157–159 (1988).
22 Mishra S and Rai T, Morphology and functional properties of corn,potato and tapioca starches. Food Hydrocolloids 20:557–566 (2006).
23 Kojima M, Shimizu H, Ohashi M and Ohba K, Physico-chemicalproperties and digestibility of pulse starch after four differenttreatments. J Appl Glycosci 53:105–110 (2006).
24 Craig SAS, Maningat CC, Seib PA and Hoseney RC, Starch paste clarity.Cereal Chem 66:173–182 (1989).
25 International Starch Institute, ISI 17-1e: Determination ofviscosity of starch by Brookfield Viscometer (2002). Available:http://www.starch.dk/isi/methods/17brookfield.htm [17 January2008].
26 Peroni FH, Rocha TS and Franco CM, Some structural andphysicochemical characteristics of tuber and root starches. FoodSci Technol Int 12:505–512 (2006).
27 Rondan-Sanabria GG and Finardi-Filho F, Physical–chemical andfunctional of maca root starch (Lepidium meyenii Walpers). FoodChem 114:492–498 (2009).
28 Boudries N, Belhaneche N, Nadjemi B, Deroanne C, Mathlouthi M,Roger B, et al, Physicochemical and functional properties of starchesfrom sorghum cultivated in the Sahara of Algeria. Carbohydr Polym78:475–480 (2009).
29 Torruco-Uco JG and Betancur-Ancona D, Physicochemical andfunctional properties of Makal (Xanthosoma yucatanensis) starch.Food Chem 101:1319–1326 (2007).
30 Moorthy SN, Physicochemical and functional properties of tropicaltuber starches: A review. Starch/Starke 54:559–593 (2002).
31 Moore CO, Tuschhoff JV, Hastings CW and Schanefelt RV, Applicationsof starches in foods, in Starch: Chemistry and Technology, ed.by Whistler RL, Bemiller JN and Pascall EF. Academic Press Inc.,Orlando, FL, pp. 575–591 (1984).
32 Perez E and Lares M, Chemical composition, mineral profile, andfunctional properties of canna (Canna edulis) and arrowroot(Maranta spp) starches. Plant Food Hum Nutr 60:113–116 (2005).
33 Tetchi FA, Rolland-Sabate A, Amani NG and Colona P, Molecular andphysicochemical characterization of starches from yam, cocoyam,cassava, sweetpotato and ginger produced in Ivory Coast. J Sci FoodAgric 87:1906–1916 (2007).
34 Hoover R, Acid-treated starches, Food Rev Int 16:369–392 (2000).35 Jayakody L, Hoover R, Liu Q and Weber E, Studies on tuber and root
starches. I. Structure and physicochemical properties of innala(Solenostemon rotundifolius) starches grown in Sri Lanka. Food ResInt 38:615–629 (2005).
36 Huang C-C, Physicochemical, pasting and thermal properties of tuberstarches as modified by guar gum and locust bean gum. Int J FoodSci Technol 44:50–58 (2008).
37 Sefa-Dedeh S and Kofi-Agyir Sackey E, Starch structure and someproperties of cocoyam (Xanthosoma sagittifolium and Colocasiaesculenta) starch and raphides. Food Chem 79:435–444 (2002).
38 Hoover R and Sosulski F, Effect of cross linking on functional propertiesof legume starches. Starch/Starke 38:149–155 (1986).
39 Akalu G, Tufvesson F, Jonsson C and Nair BM, Physicochemicalcharacteristics and functional properties of starch and dietary fibrein grass pea seeds. Starch/Starke 50:374–382 (1998).
40 Tian SJ, Rickard JE and Blanshard JM, Physicochemical properties ofsweet potato starch. J Sci Food Agric 57:451–491 (1991).
41 Hoover R, Sailaja Y and Solsuski F, Characterization of starches fromwild and long grain brown rice. Food Res Int 29:99–107 (1996).
J Sci Food Agric 2010; 90: 1886–1896 c© 2010 Society of Chemical Industry www.interscience.wiley.com/jsfa
18
96
www.soci.org DE Mweta et al.
42 Wang LZ and White PJ, Structure and physicochemical propertiesof starches from oats with different lipid content. Cereal Chem71:443–450 (1994).
43 Melo EA, Stamford TLM, Silva MPC, Krieger N and Stamford NP,Functional properties of yam bean (Pachyrizus erosus) starch.Bioresource Technol 89:103–106 (2003).
44 Jane J, Chen YY, Lee LF, McPherson AE, Wong KS and Radosavljevic M,Effects of amylopectin branch chain length and amylose contenton the gelatinization and pasting properties of starch. Cereal Chem76:629–637 (1999).
45 Tester RF and Morrison WR, Swelling and gelatinization of cerealstarches. I. Effects of amylopectin, amylose and lipids. Cereal Chem60:551–557 (1990).
46 Sandhu KS, Singh N and Malhi NS, Physicochemical and thermalproperties of starches separated from corn produced from crossesof two germ pools. Food Chem 89:541–548 (2005).
47 Krueger BR, Knutson CA, Inglett GE and Walker CE, A differentialscanning calorimetry study on the effect of annealing ongelatinization behaviour of corn starch. J Food Sci 52:715–718(1987).
48 Spence KE and Jane J, Chemical and physical properties of ginkgo(Ginkgo biloba) starch. Carbohydr Polym 40:261–269 (1999).
49 Amani N’GG, Buleon A, Kamenan A and Collona P, Variability in starchphysicochemical and functional properties of yam (Dioscorea sp.)cultivated in Ivory Coast. J Sci Food Agric 84:2085–2096 (2004).
50 Kaur A, Singh N, Ezekiel R and Guraya HS, Physicochemical, thermaland pasting properties of starches separated from different potatocultivars grown at different locations. Food Chem 101:643–645(2007).
51 Kong X, Bao J and Corke H, Physical properties of Amaranthus starch.Food Chem 113:371–376 (2009).
52 Zaidul ISM, Norulaini N, Omar MOK, Yamauchi H and Noda T,Correlations of the composition, minerals, and RVA pastingproperties of various potato starches. Starch/Starke 59:269–276(2007).
53 Sandhu KS and Singh N, Some properties of corn starches II:Physicochemical, gelatinisation, retrogradation, pasting and geltextural properties. Food Chem 101:1499–1507 (2007).
54 Singh J, McCarthy OJ and Singh H, Physico-chemical andmorphological characteristics of New Zealand Taewa (Maori potato)starches. Carbohydr Polym 64:569–581 (2006).
www.interscience.wiley.com/jsfa c© 2010 Society of Chemical Industry J Sci Food Agric 2010; 90: 1886–1896