Embed Size (px)
Citation preview

Citation Kengne Fotsing J Foto
Menbohan S Meyer A Leprecirctre
A Usseglio-Polatera P
Relationships between
Physico-Chemical Parameters and
Taxonomic Structure of Benthic
Macroinvertebrate Assemblages in
Streams of West Cameroon Water
2022 14 1490 httpsdoiorg
103390w14091490
Academic Editor Nisikawa Usio
Received 8 March 2022
Accepted 3 May 2022
Published 6 May 2022
Publisherrsquos Note MDPI stays neutral
with regard to jurisdictional claims in
published maps and institutional affil-
iations
Copyright copy 2022 by the authors
Licensee MDPI Basel Switzerland
This article is an open access article
distributed under the terms and
conditions of the Creative Commons
Attribution (CC BY) license (https
creativecommonsorglicensesby
40)
water
Article
Relationships between Physico-Chemical Parameters andTaxonomic Structure of Benthic MacroinvertebrateAssemblages in Streams of West CameroonJoseacutephine Kengne Fotsing 12 Samuel Foto Menbohan 1 Albin Meyer 34 Alain Leprecirctre 2
and Philippe Usseglio-Polatera 3
1 Laboratoire drsquoHydrobiologie et Environnement Faculteacute des Sciences Universiteacute Yaoundeacute 1Yaoundeacute BP 812 Cameroon sfotomenbohanyahoocom
2 LGCgE CNRS Universiteacute Lille 1 F-59655 Villeneuve drsquoAscq France alainlepretreuniv-lillefr3 LIEC Universiteacute de Lorraine CNRS F-57000 Metz France albmeyhotmailcom (AM)
philippeusseglio-polaterauniv-lorrainefr (PU-P)4 EABX INRAE F-33612 Cestas France Correspondence josephinefotsingyahoofr
Abstract Tropical rivers are strongly influenced by stormwaters pollutants and agro-pastoral activi-ties These systems are no longer able to maintain their native biota Therefore it seems important tounderstand how biological assemblages are driven by environmental gradients at different spatialscales However information on the relationships between the distribution of aquatic macroinverte-brates and environmental variables remains scarce in Cameroon To improve our knowledge on thedrivers of such distributions a study was carried out at 11 contrasted sites from three catchmentslocated in West Cameroon This study aimed at understanding the spatio-temporal variations of19 taxonomic metrics calculated for the benthic macroinvertebrate assemblages of these sites sampledduring 13 months concurrently with physico-chemical analyses of water quality Two hundred andtwelve taxa were caught Diptera(rf-S) Shannon-Wiener diversity 1ndashGOLD total richness Pielouevenness and Heteroptera(rf-S) revealed their high ability to respond to anthropogenic pressuresor disturbances Conductivity water temperature dissolved oxygen nitrates total hardness andalkalinity were identified as the main physico-chemical drivers of the taxonomic structure of ben-thic assemblages These results will allow further exploration of the implementation of a tool formonitoring the ecological quality of West Cameroon rivers
Keywords urbanization macroinvertebrate community spatial distribution metrics environmentalvariables bioassessment
1 Introduction
Nowadays running waters are impaired by multiple stressors acting simultane-ously [1ndash4] or sequentially [5] Climate change increasing urbanization and intensiveagro-pastoral activities which have adverse effects on stream biota [67] are the mostimportant stressors of small tropical streams The physico-chemical and hydromorpho-logical stream impairments that specifically occur in urbanized watersheds have beenlabeled the ldquourban stream syndromerdquo [89] These human-induced environmental changescause local habitat degradation and fragmentation as well as longitudinal connectivityloss which can profoundly alter the structure and composition of aquatic assemblages andlead to the decline of biodiversity in many rivers of developing countries [1011] Waterpollution assessment and control are also major and widespread challenges in developingcountries because water can indirectly favor the transmission of many diseases [1213]Thus various methods have been developed to analyze water quality impairment Watertemperature dissolved oxygen pH conductivity suspended matter nutrients (including
Water 2022 14 1490 httpsdoiorg103390w14091490 httpswwwmdpicomjournalwater
Water 2022 14 1490 2 of 26
ammonium nitrites nitrates and orthophosphates (eg [1415])) and sometimes micropollu-tants (eg [1617]) have been routinely measured in several tropical streams Unfortunatelysuch analyses are expensive and routine surveys of pollutant concentrations (which maygreatly vary both temporally and spatially) in tropical areas are scarce and cannot allowefficient detection of diffuse andor episodic contaminations when based only on one-offmeasures [1819]
Adding biological parameters related to the structure and the composition of aquaticassemblages to the physico-chemical assessment of rivers has proven its efficiency in fullyassessing the impact of anthropogenic stressors [2021] Benthic macroinvertebrates arethe most frequently used biological indicators of river conditions because they are diverselong-lived rather sedentary and they react rapidly and often predictably to anthropogenicpressures [2223] Benthic macroinvertebrates also play an important role in freshwaterecosystem functioning They contribute to carbon and nitrogen cycles by (i) feeding onalgae coarse detritus or fine particulate organic matter [2425] and (ii) providing food tohigher trophic levels They are also taxonomically diverse and relatively easy to identify(at least at the genus or family level) Invertebrate assemblages integrate environmen-tal changes over several months [26] and examining the structure and composition ofsuch assemblages has the potential to relevantly inform on the ecological status of wa-ter bodies [1927ndash31] and to demonstrate the effects of past and present environmentaldegradation [3132]
Several studies in sub-Saharan Africa have demonstrated that stream biomonitoringbased on benthic macroinvertebrates is clearly in progress (eg [33ndash38]) In southeasternIvory Coast Edia et al (2013 [39]) randomly sampled the aquatic invertebrates of eightsites on eight occasions (including the rainy and dry seasons) and related the presenceof several genera of Diptera and Ephemeroptera to the most and weakly mineralizedsites respectively Kaboreacute et al (2016 [40]) related the taxonomic and functional struc-ture of macroinvertebrate assemblages to watershed habitat use in 29 semi-arid streamreaches of Burkina Faso They found (i) a gradual decline of collector-filterers and habitat-sensitive Ephemeroptera and Trichoptera (mainly the Baetidae and Hydropsychidae fami-lies) and (ii) a gradual increase in the relative abundance of tolerant Diptera (ChironomidaeCulicidae Psychodidae and Syrphidae) from the least impaired river reaches to reachessubjected to intensive agriculture or urban pressure However taxonomic richness theShannon-Wiener index or the proportion of the dominant tolerant Diptera did not distin-guish invertebrate assemblages of ldquoprotectedrdquo or ldquoextensive agriculturerdquo areas from thoseof ldquointensive agriculturerdquo because high organic matter and fertilizer inputs in the secondgroup of reaches had increased both macrophytic and periphytic production enhancinghabitat heterogeneity and the development of molluscs and coleopterans [40] Those specieshave compensated for the loss of water quality sensitive taxa [40] In Cameroon Menbohanet al (2013 [41]) and Tchakonteacute et al (2015 [42]) related the high abundance of EPT taxa tovery low anthropogenic pressures in the peri-urban streams of Yaoundeacute and in the foreststreams of Douala respectively Tchakonteacute et al (2015 [42]) considered (i) the absence ofEPT species and some coleopteran and hemipteran families and (ii) the decrease of bothshredders (indicators of riparian vegetation health) and predators as good predictors ofsevere anthropogenic pressures
In Cameroon aquatic environment management and protection have taken placeslowly due to a lack of cooperation and synergy between the various stakeholders fromgovernmental and non-governmental institutions Anthropogenic pressures on riversremain high There is still direct dumping of solid wastes and liquid wastewaters fromhouseholds agriculture and industries into streams In the Bafoussam region agro-pastoralactivities have accelerated this degradation of natural environments favoring the leach-ing and drainage of fertilizers in streams during intense rain events [4344] In additionthe lack of wastewater treatment plants often converts streams into dumping groundsof various kinds of wastes described by Parent-Raoult and Boisson (2007 [45]) as ldquour-ban discharges in rainy weatherrdquo and representing a certain health risk for local popula-
Water 2022 14 1490 3 of 26
tions (eg proliferation of mosquitoes epidemics and parasitic diseases) and ecosystems(eg biodiversity loss)
In this context understanding how watershed anthropogenic level can influence waterquality and macroinvertebrate diversity in a tropical stream and identifying the majorenvironmental drivers of invertebrate community structure could therefore be a majorchallenge for freshwater managers in Cameroon and other tropical regions
The aim of our study was to (i) diagnose the water quality in the different riversub-catchments of the Bafoussam region (ii) highlight the main relationships betweenwater quality descriptors and macroinvertebrate community-based metrics (iii) identifywhich metrics could be the best candidates for a regional bioassessment tool of streamsin this area and (iv) rank such metrics according to their ability to discriminate ldquoleastimpactedrdquo conditions from conditions ldquosignificantly impactedrdquo by anthropogenic activitiesdespite the low knowledge level on life history traits and ecological preferences of localmacroinvertebrate species
2 Material and Methods21 Study Area and Human Pressure-Based Typology of Sites
The western region whose chief town is Bafoussam (Mifi County) covers about13892 km2 Roughly this area is between the latitudes 524primendash533prime N and the longitudes1021primendash1034prime E with an average altitude of 1450 m (Figure 1) This region benefits mainlyfrom (i) agriculture involving the utilization of natural (compost) and chemical (industrial)fertilizers (ii) livestock farming and (iii) primary trade of local products Urban andindustrial areas are also developing rapidly at the expense of natural vegetation cover Thisregion is located in a tropical climate zone [46] characterized by a long and abundant wetseason from March to October (rainfall ranging from 848 to 2714 mm monthminus1) and a dryseason from November to February (67ndash501 mm monthminus1) The average annual rainfalland temperature (over the 1995ndash2005 period) were 17418 mm and 210 C respectively(meteorological station in Bafoussam)
Eleven sites were selected in three sub-catchments of Mifi County to optimally illus-trate gradients of various anthropogenic pressures occurring in this region (eg domesticindustrial physical and agro-pastoral contaminations) from Least Impacted River Reaches(LIRRs) often located in rural zones with low population density to severely Impacted RiverReaches (sIRRs) often located in more urbanized areas (Table 1 Figure 1) Three samplingsites (S01 S02 and S03) expected as severely impaired by anthropogenic pressures werechosen in the sub-catchment Nlem They were situated in an urban zone gathering brew-eries a soap factory and an agricultural cooperative These industries located upstreamfrom riparian residential areas and city drainage services were directly discharging theirwastewaters in the river Five sampling sites (S04 to S08 Table 1) were located on tributariesof the Kena River in a rural zone where farming and traditional breeding are the mainactivities Except for site S04 draining an intensively cropped area (coffee and vegetablesthat require fertilizers) with cattle breeding domestic discharge and boulder extraction allthese sites were subjected to limited anthropogenic pressures (Table 1) Three sampling siteswere located on the Famlem stream which takes its source in an urban zone (S09) beforeflowing in a least impaired rural area (S10 and S11) Food crop cultivation and local sandextraction (leading to substrate clogging) are the main activities along this stream (Table 1)All the study sites were situated between an altitude of 1117 m (S11) and 1466 m (S01)
Because no precise information was locally available for quantifying the intensity ofthe different sources of anthropogenic pressures on sites we decided to describe semi-quantitatively the potential impact of anthropogenic pressures using three (lowmoderatehigh) impact levels for eight pressure categories (Table S1 in Supplementary Material)These pressure categories were related to the importance of ldquourbanrdquo areas ldquofood cropsrdquoldquocash cropsrdquo ldquocattle and poultryrdquo breeding untreated ldquodomestic municipal and agricul-turalrdquo or ldquoindustrialrdquo wastewater effluents riverine ldquofactoriesrdquo and ldquocivil engineeringand miningrdquo at reach scale The corresponding array (11 sites times 24 modalities from eight
Water 2022 14 1490 4 of 26
pressure categories) was analyzed by Multiple Correspondence Analysis (MCA [47]) Thensampling sites were hierarchically clustered based on Euclidean distances calculated be-tween site locations on the MCA first factorial plane and applying the complete linkagemethod [48]
Water 2022 14 x 4 of 28
Figure 1 Locations of the sampling area (AndashC) and the sampling sites ((D) S01ndashS11) in Mifi County of the West Region Cameroon in Africa (A) the West Region in Cameroon (B) and Mifi County in the West Region (C) LIRR = Least Impacted River Reach mIRR = moderately Impacted River Reach sIRR = severely Impacted River Reach Black stars are the main local industries close to the streams
Because no precise information was locally available for quantifying the intensity of the different sources of anthropogenic pressures on sites we decided to describe semi-quantitatively the potential impact of anthropogenic pressures using three (lowmoderatehigh) impact levels for eight pressure categories (Table S1 in Supplementary Material) These pressure categories were related to the importance of ldquourbanrdquo areas ldquofood cropsrdquo ldquocash cropsrdquo ldquocattle and poultryrdquo breeding untreated ldquodomestic municipal and agriculturalrdquo or ldquoindustrialrdquo wastewater effluents riverine ldquofactoriesrdquo and ldquocivil engineering and miningrdquo at reach scale The corresponding array (11 sites times 24 modalities from eight pressure categories) was analyzed by Multiple Correspondence Analysis (MCA [47]) Then sampling sites were hierarchically clustered based on Euclidean distances calculated between site locations on the MCA first factorial plane and applying the complete linkage method [48]
22 Benthic Macroinvertebrate Sampling and Community Structure Description Invertebrate sampling was performed by kick sampling using a hand net (30 times 30 cm
opening conical thread mesh size 400 μm) applying the multi-habitat approach described by Stark et al (2001 [49]) Site sampling was performed in a 100 m stretch for an approximate total sampled surface of 3 m2
Figure 1 Locations of the sampling area (AndashC) and the sampling sites ((D) S01ndashS11) in Mifi Countyof the West Region Cameroon in Africa (A) the West Region in Cameroon (B) and Mifi County inthe West Region (C) LIRR = Least Impacted River Reach mIRR = moderately Impacted River ReachsIRR = severely Impacted River Reach Black stars are the main local industries close to the streams
22 Benthic Macroinvertebrate Sampling and Community Structure Description
Invertebrate sampling was performed by kick sampling using a hand net (30 times 30 cmopening conical thread mesh size 400 microm) applying the multi-habitat approach de-scribed by Stark et al (2001 [49]) Site sampling was performed in a 100 m stretch for anapproximate total sampled surface of 3 m2
All the available habitats within each study site were sampled including bouldersgravel sand mud macrophyte beds leaf packs branches and rafts Substrate sampleswere sieved (mesh size 400 microm) Large invertebrates were sorted by the naked eyewhereas the smaller ones were sorted under a dissecting microscope The sorted organismswere fixed with 10 formalin They were identified to the genus or species level (whenpossible) based on Durand and Leacutevecircque (1981 [51]) Day et al (2002 [52]) De Moorand Day (2002 [53]) De Moor et al (2003aampb [5455]) and Tachet et al (2010 [56])Invertebrate assemblages were sampled monthly from December 2015 to December 2016(ie 13 sampling campaigns)
Water 2022 14 1490 5 of 26
Table 1 Description of the 11 sampling sites The expected ecological status was evaluated basedon a multivariate analysis taking into account anthropogenic pressures at the reach scale (seeSection 21 for further details) LIRR = Least Impacted River Reach mIRR = moderately ImpactedRiver Reach sIRR = severely Impacted River Reach laquoHighraquo population density corresponds toldquogt200 inhabitants kmminus2rdquo and laquoLowraquo to ldquole200 inhabitants kmminus2rdquo (adapted from [50]) Types ofwaste deposits ldquoardquo = agricultural ldquodrdquo = domestic ldquoirdquo = industrial and ldquomrdquo = municipal
CatchmentWater Courses
SamplingSites
GPSCoordinates
(LatitudeLongitude)
PopulationDensity
AnthropogenicActivities in the
Watershed andorDirectly in the Stream
Nature of theStream Bed
ExpectedEcological
Status
Nlem
S01 0528prime10primeprime85 N1024prime47primeprime91 E high
food crops agriculturalcooperative of planterswaste deposits (d m i)
and cattle farming
waste and mud sIRR
S02 0527prime58primeprime16 N1024prime13primeprime80 E high
soap factory breweryof Cameroon waste
deposits (d m i)
boulders sandand waste sIRR
S03 0527prime17primeprime08 N1024prime08primeprime08 E high
construction of aretaining wall foodcrop and society of
coffee company
mud and sand sIRR
Kena
S04 0530prime38primeprime03 N1023prime10primeprime60 E low
rock extractionvegetable farming
waste deposits (d a)gravel and sand sIRR
S05 0530prime43primeprime85 N1022prime16primeprime62 E low food crops root mats
and sand LIRR
S06 0531prime33primeprime01 N1021prime52primeprime79 E low swampy area mud and sand LIRR
S07 0531prime33primeprime69 N1023prime08primeprime77 E low food crops sand LIRR
S08 0530prime54primeprime46 N1024prime23primeprime54 E low food crops sand LIRR
Famlem
S09 0528prime43primeprime38 N1026prime40primeprime62 E high waste deposits (d m)
and food cropswaste deposits
and mud sIRR
S10 0529prime20primeprime31 N1028prime00primeprime46 N low sand mining activities
and food crops sand mIRR
S11 0530prime40primeprime15 N1028prime43primeprime38 E low sand mining activities sand and
boulders mIRR
Because of the lack of precise information on the biological traits and ecological prefer-ences of the Cameroonian macrobenthic fauna only 19 metrics describing the taxonomicstructure and composition of benthic macroinvertebrate assemblages were selected (Table 2)These taxonomy-based metrics included total richness the relative richness of thirteentaxonomic groups (eg Coleoptera Ephemeroptera Odonata Heteroptera) the richness(EPT) or the abundance (log10(EPTD + 1) 1-GOLD) of combinations of these groups andthe Shannon-Wiener diversity and Pielou evenness indices
Water 2022 14 1490 6 of 26
Table 2 Taxonomy-based metrics calculated on benthic macroinvertebrate assemblages of three rivercatchments of the West Cameroon Region rf-S = relative frequency of the taxon in the assemblage interms of taxonomic richness The variation of individual metrics was predicted along an increasinganthropogenic pressure gradient (right column) D = Diptera E = Ephemeroptera P = Plecopteraand T = Trichoptera
Metric Name Short Description Reference PredictedVariation
Total richness The number of taxa within an assemblage Barbour et al 1999 [57] decrease
Shannon-Wienerdiversity (H)
H accounts for taxonomic richness and relativetaxon abundance distribution Shannon 1948 [58] decrease
Pielou evenness (J) J = HHmax (Feld et al 2014 [59]) Pielou 1966 [60] decrease
Bivalvia(rf-S) Relative richness of this taxonomic group in theinvertebrate assemblage (relative frequency) increase
Coleoptera(rf-S) idem decrease
Dictyoptera(rf-S) idem increase
Diptera(rf-S) idem increase
Ephemeroptera(rf-S) idem [57] decrease
Gastropoda(rf-S) idem increase
Heteroptera(rf-S) idem decrease
Hirudinea(rf-S) idem increase
Odonata(rf-S) idem decrease
Oligochaeta(rf-S) idem increase
Plecoptera(rf-S) idem [57] decrease
Trichoptera(rf-S) idem [57] decrease
Turbellaria(rf-S) idem decrease
EPT Family richness Number of Ephemeroptera Plecoptera andTrichoptera families [57] decrease
log10(EPTD + 1)
Log-transformed sum of the abundances of aselection of insect families HeptageniidaeEphemeridae Leptophlebiidae (E)Brachycentridae Goeridae PolycentropodidaeLimnephilidae Odontoceridae (T)Dolichopodidae Stratiomyidae DixidaeEmpididae Athericidae (D) and Nemouridae (P)
Buffagni et al 2006 [61] decrease
1-GOLD 1mdashrelative abundance of GastropodaOligochaeta and Diptera [61] decrease
23 Physico-Chemical Parameters
Seventeen physico-chemical variables were measured in the field (ie during the13 invertebrate sampling campaigns) or at the laboratory with standard methods for water(cf [6263] for protocols) Dissolved oxygen and conductivity (HACH multiparameterprobe HACH Dubai United Arab Emirates) pH (pH-meter CG 818 model SCHOTTGeraumlte Gmbh SCHOTT France SAS Colombes France) and water temperature (hand-held thermometer plusmn01 C) were measured in situ If daytime variation in dissolvedoxygen concentration (DO) was not controlled during the sampling design the studysites nearest to Bafoussam (eg S01 to S03) which belong to sIRRs were the last sitessampled in the afternoon (ie in the most favorable DO measurement conditions) to avoida confounding effect of daytime variation if a DO deficit was observed Water sampleswere collected in polyethylene bottles (1000 mL) and were stored in refrigerated enclosuresBack to the laboratory concentrations of nitrates nitrites ammonium and orthophosphates
Water 2022 14 1490 7 of 26
were measured using a HACH DR2800 spectrophotometer as well as suspended matterwater color and turbidity The Biological Oxygen Demand (BOD5) was measured with aLiebherr BOD analyzer whereas alkalinity total hardness oxidizability (per permanganatemethod) chlorophyll a and dissolved CO2 were measured by volumetric methods Theconcentrations of micropollutants were not measured during the study
24 Environmental and Faunal Data Analyses
Non-parametric Friedman tests with blocks were applied to evaluate the statisticalsignificance of differences among sites for physico-chemical parameters and invertebrate-based metrics Season was the repeated measure defining block and sites were regardedas different ldquotreatmentsrdquo within each block Significant Friedman tests were followed bypairwise comparisons using Nemenyi post-hoc tests for unreplicated blocked data [64]
A normalized Principal Component Analysis (nPCA) was applied to the array[143 samples (ie 11 sites times 13 campaigns) times 10 environmental variables with significantbetween-sites differences based on the Friedman test results] to compare the abiotic char-acteristics of sampling sites Five samples were excluded from the final analysis due toextreme values (S02 and S03 in February and May and S02 in December 2016) Using thesame matrix sampling sites were hierarchically clustered based on Euclidean distances cal-culated between site locations on the nPCA first factorial plane and applying the completelinkage method [48]
An nPCA was applied also to the array [143 samples times 17 taxonomic metrics withsignificant between-sites differences based on the Friedman test results] Preliminaryldquowithin-siterdquo and ldquowithin-seasonrdquo nPCA analyses [65] were performed on both datasetsThey demonstrated a low effect of ldquoseasonrdquo on (i) the typology of sites based on taxonomicmetrics and (ii) physico-chemical parameter variations (Figures S1 and S2 in SupplementaryMaterial) Sampling sites were also clustered based on the taxonomic structure of theirassemblages using the same procedure as above (ie applying the complete linkage methodon a matrix of Euclidean distances between site locations on the first factorial plane of thetaxonomy-based nPCA)
Finally the relationships between abiotic parameters and taxonomy-based metricswere analyzed with redundancy analysis (RDA [66]) and sampling sites were clusteredbased on their locations on the RDA first factorial plane (similarly as above) The Discrimi-nation Efficiency (DE) of each metric was also calculated The DE of a given metric is theproportion of IRRs that exhibited values (i) lower than the first quartile of the LIRR valuedistribution (for metrics decreasing in impaired conditions) or (ii) higher than the thirdquartile of the LIRR value distribution (for metrics increasing in impaired conditions)
Analyses were conducted with the packages ade4 [67] and vegan [68] using thesoftware R (version 341 [69])
3 Results31 Human Pressure-Based Typology of Sites
The MCA provided a typology of sampling sites based on the description of anthro-pogenic pressures potentially impairing water quality and habitat integrity (Figure 2) Thefirst factorial plane (F1-F2 Figure 2A) explained 591 of the total inertia Axis F1 discrim-inated S01-S03 S09 (F1 lt 0 F2 gt 0) and S04 (F1 and F2 lt 0) by high population densityand moderate to high level of pressure for most of the anthropogenic pressure categories(see Figure S3) S05 to S08 (F1 and F2 gt 0) by low population density and low level ofpressure for most of the pressure categories and S10 and S11 (F1 gt 0 F2 lt 0) by only highlyimpaired by sediment mining and civil engineering According to the correlations ratios(cr [70]) factories (cr = 0948) industrial and domesticmunicipalagricultural (cr = 0909)or industrial (cr = 0908) wastewater effluents and cattlepoultry breeding (cr = 0763)best discriminated the sites along the F1 axis Riverine factories (cr = 0870) cash crop(cr = 0842) civil engineering and sediment mining (cr = 0692) and urban areas (cr = 0621)best discriminated the sites along the F2 axis
Water 2022 14 1490 8 of 26
Water 2022 14 x 8 of 28
3 Results 31 Human Pressure-Based Typology of Sites
The MCA provided a typology of sampling sites based on the description of anthropogenic pressures potentially impairing water quality and habitat integrity (Figure 2) The first factorial plane (F1-F2 Figure 2A) explained 591 of the total inertia Axis F1 discriminated S01-S03 S09 (F1 lt 0 F2 gt 0) and S04 (F1 and F2 lt 0) by high population density and moderate to high level of pressure for most of the anthropogenic pressure categories (see Figure S3) S05 to S08 (F1 and F2 gt 0) by low population density and low level of pressure for most of the pressure categories and S10 and S11 (F1 gt 0 F2 lt 0) by only highly impaired by sediment mining and civil engineering According to the correlations ratios (cr [70]) factories (cr = 0948) industrial and domesticmunicipalagricultural (cr = 0909) or industrial (cr = 0908) wastewater effluents and cattlepoultry breeding (cr = 0763) best discriminated the sites along the F1 axis Riverine factories (cr = 0870) cash crop (cr = 0842) civil engineering and sediment mining (cr = 0692) and urban areas (cr = 0621) best discriminated the sites along the F2 axis
Figure 2 Ordination of sites by Multiple Correspondence Analysis (MCA) based on eight anthropogenic pressure categories (A) Projection of 11 sites (S01 to S11) on the first factorial plane (F1-F2) (B) Dendrogram based on the Euclidean distance (calculated between sites according to their coordinates on the first factorial plane of the MCA) and the complete linkage method highlighting the similarity of the 11 study sites considering the intensity of anthropogenic pressure categories LIRRs = Least Impacted River Reaches mIRRs = moderately Impacted River Reaches sIRRs = severely Impacted River Reaches See Table S1 Figure S3 and the text for further details
The cluster analysis (Figure 2B) highlighted three main groups of sites The first group gathered sites weakly urbanized and located in rural zones (S05 to S08) which could be considered as ldquoLeast Impacted River Reachesrdquo (LIRRs) The second group
AS01
S02
S03
S04
S05
S06
S07
S08
S09
S10S11
-2
1-14 12
F1 (316 )
F2 (2
75
)
S01 S02 S03S04 S05 S06S07 S08S09 S10S11
mIRRs
10Distan
ce
sIRRs LIRRs
0
B
Figure 2 Ordination of sites by Multiple Correspondence Analysis (MCA) based on eight anthro-pogenic pressure categories (A) Projection of 11 sites (S01 to S11) on the first factorial plane (F1-F2)(B) Dendrogram based on the Euclidean distance (calculated between sites according to their co-ordinates on the first factorial plane of the MCA) and the complete linkage method highlightingthe similarity of the 11 study sites considering the intensity of anthropogenic pressure categoriesLIRRs = Least Impacted River Reaches mIRRs = moderately Impacted River Reaches sIRRs = severelyImpacted River Reaches See Table S1 Figure S3 and the text for further details
The cluster analysis (Figure 2B) highlighted three main groups of sites The first groupgathered sites weakly urbanized and located in rural zones (S05 to S08) which could beconsidered as ldquoLeast Impacted River Reachesrdquo (LIRRs) The second group consisted of twosites (S10 and S11) only moderately impacted by anthropogenic pressures (mIRRs) Thethird group included five sites (S01 to S04 and S09) more severely impaired by differentcombinations of anthropogenic pressures (sIRRs) S04 the most impacted site was includedin this third group
32 Physico-Chemical Characteristics of Streams
The highest electrical conductivity values were obtained in the tributary of the Nlemstream the site S02 exhibiting values up to 1470 microS cmminus1 in December 2016 Similarly thepH values in this sub-catchment reached 113 at site S02 and 108 at site S03 reflecting thebasic character of the effluents received by this stream Dissolved oxygen concentrationwas low in this sub-catchment (lt50 Table 3) In contrast the Kena tributaries (S05 toS08) exhibited the highest dissolved oxygen concentrations (gt50) Significantly higherdissolved oxygen concentration and lower temperature conductivity and total hardnesswere observed in sites with the LIRR status (Figure 3 Table 3) It was more difficult to relatesignificant variation of other parameters to the LIRR vs IRR status based on Nemenyipost-hoc test results (Figure S4 in Supplementary Material) No significant between-sitesdifferences in turbidity suspended matter dissolved CO2 orthophosphates chlorophyll aand BOD5 were identified
Water 2022 14 1490 9 of 26
Table 3 Mean values (plusmnstandard deviation) of physico-chemical parameters for the 11 sampling sites over the study period Asterisks indicate significant differencesamong sites based on Friedmanrsquos tests ( p lt 0001 p lt 001 p lt 005) Parameters exhibiting significant differences are those included in the nPCA (seeSection 32) and RDA (see Section 35) See text for further details
Nlem Stream Kena Stream Famlem Stream
Sampling Sites S01 S02 S03 S04 S05 S06 S07 S08 S09 S10 S11
Physico-chemicalparametersT (C) 228 plusmn 19 219 plusmn 23 223 plusmn18 208 plusmn19 196 plusmn15 201 plusmn15 213 plusmn12 210 plusmn22 227 plusmn08 228 plusmn 13 219 plusmn 12pH 70 plusmn 05 80 plusmn 17 79 plusmn 14 73 plusmn 06 70 plusmn 06 69 plusmn 06 74 plusmn 04 73 plusmn 03 65 plusmn 06 70 plusmn 06 76 plusmn 05Dissolved O2 () 419 plusmn 102 388 plusmn 99 394 plusmn 116 422 plusmn 87 580 plusmn 87 536 plusmn 69 640 plusmn 78 570 plusmn 88 407 plusmn 84 556 plusmn 92 571 plusmn 69Conductivity (microScm) 3423 plusmn 757 3583 plusmn 3563 2997 plusmn 1689 2819 plusmn 417 2228 plusmn 456 1648 plusmn 311 1808 plusmn 407 1769 plusmn 509 2724 plusmn 436 2250 plusmn 554 1792 plusmn 547Total hardness (mgL) 761 plusmn 166 570 plusmn 192 564 plusmn 334 581 plusmn 177 514 plusmn 144 340 plusmn 99 425 plusmn 169 349 plusmn 152 479 plusmn 160 466 plusmn 98 404 plusmn 119Color (mgL) 1008 plusmn 621 2107 plusmn 3947 1675 plusmn 2321 748 plusmn 859 1024 plusmn 834 605 plusmn 410 841 plusmn 937 1081 plusmn 1314 925 plusmn 1137 1381 plusmn 1425 1900 plusmn 1953Dissolved CO2 (mgL) 107 plusmn 78 93 plusmn 96 100 plusmn 83 100 plusmn 80 112 plusmn 76 104 plusmn 76 100 plusmn 73 99 plusmn 64 115 plusmn 62 87 plusmn 56 87 plusmn 57Alkalinity (mgL) 322 plusmn 383 348 plusmn 435 305 plusmn 372 328 plusmn 428 302 plusmn 374 289 plusmn 375 243 plusmn 343 254 plusmn 336 202 plusmn 236 223 plusmn 277 231 plusmn 308Suspended matter (mgL) 242 plusmn 347 478 plusmn 442 413 plusmn 615 284 plusmn 366 343 plusmn 458 307 plusmn 467 393 plusmn 606 295 plusmn 442 304 plusmn 647 754 plusmn 1030 511 plusmn 684Turbidity (mgL) 281 plusmn 260 603 plusmn 1133 320 plusmn 269 263 plusmn 239 302 plusmn 383 275 plusmn 234 387 plusmn 535 416 plusmn 669 264 plusmn 372 392 plusmn 506 574 plusmn 710Nitrate (mgL NO3
minus) 23 plusmn 12 52 plusmn 84 32 plusmn 33 23 plusmn 12 18 plusmn 13 15 plusmn 11 25 plusmn 19 17 plusmn 09 30 plusmn 19 30 plusmn 16 30 plusmn 23Orthophophate (mgL PO4
3minus) 19 plusmn 22 27 plusmn 36 25 plusmn 43 08 plusmn 10 11 plusmn13 05 plusmn 08 05 plusmn 05 07 plusmn 12 06 plusmn 10 16 plusmn 20 10 plusmn 14Nitrite (mgL NO2
minus) 12 plusmn 15 45 plusmn 77 57 plusmn 88 19 plusmn 25 16 plusmn 22 25 plusmn 43 12 plusmn 23 13 plusmn 33 10 plusmn 13 38 plusmn 49 30 plusmn 47Ammonium (mgL NH4
+) 13 plusmn 14 07 plusmn 07 10 plusmn 12 13 plusmn 10 10 plusmn 08 06 plusmn 10 05 plusmn 04 05 plusmn 06 04 plusmn 04 11 plusmn 14 10 plusmn 13BOD5 (mgL O2) 392 plusmn 338 404 plusmn 278 324 plusmn 243 446 plusmn 325 519 plusmn 3009 483 plusmn 230 262 plusmn 195 354 plusmn 239 538 plusmn 406 381 plusmn 214 573 plusmn 672Chlorophyll a (microgL) 02 plusmn 02 02 plusmn 02 02 plusmn 03 01 plusmn 03 02 plusmn 03 01 plusmn 02 00 plusmn 00 00 plusmn 00 01 plusmn 02 02 plusmn 02 01 plusmn 02Oxidizability (mgL) 46 plusmn 36 51 plusmn 36 64 plusmn 60 65 plusmn 31 54 plusmn 37 46 plusmn 29 43 plusmn 27 47 plusmn 26 34 plusmn 19 40 plusmn 41 35 plusmn 25
Water 2022 14 1490 10 of 26
For alkalinity and nitrites even if the Friedman test identified a significant heterogene-ity among sites Nemenyi post-hoc tests were unable to identify precisely the correspondingsignificant differences (probably due to beta errors in post-hoc test statistical decisions)
Water 2022 14 x 9 of 28
consisted of two sites (S10 and S11) only moderately impacted by anthropogenic pressures (mIRRs) The third group included five sites (S01 to S04 and S09) more severely impaired by different combinations of anthropogenic pressures (sIRRs) S04 the most impacted site was included in this third group
32 Physico-Chemical Characteristics of Streams The highest electrical conductivity values were obtained in the tributary of the Nlem
stream the site S02 exhibiting values up to 1470 μS cmminus1 in December 2016 Similarly the pH values in this sub-catchment reached 113 at site S02 and 108 at site S03 reflecting the basic character of the effluents received by this stream Dissolved oxygen concentration was low in this sub-catchment (lt50 Table 3) In contrast the Kena tributaries (S05 to S08) exhibited the highest dissolved oxygen concentrations (gt50) Significantly higher dissolved oxygen concentration and lower temperature conductivity and total hardness were observed in sites with the LIRR status (Figure 3 Table 3) It was more difficult to relate significant variation of other parameters to the LIRR vs IRR status based on Nemenyi post-hoc test results (Figure S4 in Supplementary Material) No significant between-sites differences in turbidity suspended matter dissolved CO2 orthophosphates chlorophyll a and BOD5 were identified
For alkalinity and nitrites even if the Friedman test identified a significant heterogeneity among sites Nemenyi post-hoc tests were unable to identify precisely the corresponding significant differences (probably due to beta errors in post-hoc test statistical decisions)
Figure 3 Box-plots (MinQ25MedianQ75Max) describing the distribution of values of ldquodissolved oxygenrdquo (in saturation) and conductivity (in μS cmminus1) over a period of thirteen months for 11 study sites (S01 to S11) laquoaraquo laquobraquo laquocraquo laquodraquo and laquoeraquo are distinct groups identified by post-hoc Nemenyi tests applied after identifying for a given parameter a significant difference among sites by a non-parametric Friedman test Outliers (open circles) are out of the 15 interquartile range See text for further details
Figure 3 Box-plots (MinQ25MedianQ75Max) describing the distribution of values of ldquodissolvedoxygenrdquo (in saturation) and conductivity (in microS cmminus1) over a period of thirteen months for11 study sites (S01 to S11) laquoaraquo laquobraquo laquocraquo laquodraquo and laquoeraquo are distinct groups identified by post-hocNemenyi tests applied after identifying for a given parameter a significant difference among sites bya non-parametric Friedman test Outliers (open circles) are out of the 15 interquartile range See textfor further details
33 Abiotic Typology of Sampling Sites
The nPCA provided a typology of sampling sites based on their physico-chemicalcharacteristics (Figure 4) The first factorial plane (F1-F2) explained 385 of the total inertiaAxis F1 discriminated sites exhibiting high percentage of dissolved oxygen (S05 S07 andS08 F1 gt 0) from sites with high conductivity and total hardness (S01 and S04 F1 lt 0) AxisF2 mainly opposed S09 (F2 gt 0) sites with rather low pH and oxidizability values to theother sites
The cluster analysis (Figure S5) highlighted two main groups of sites The first groupgathered sites weakly urbanized and located in rural zones ie S05 to S08 (LIRRs) andS11 (mIRR) The second group consisted of sites located in more urbanized areas with twosub-groups S01 and S04 (sIRRs) on the one hand and S02 and S03 (sIRRs) with S09 andS10 (mIRRs) on the other hand
34 Taxonomic Structure of Stream Benthic Macroinvertebrate Assemblages
A total of 31099 organisms were sorted and identified distributed in 5 phyla 8 classes25 orders and 98 families Insects the most diversified group (11 orders 76 families and177 taxa) represented 865 of the total abundance
Among the most representative taxa the genus Chironomus (Diptera) was found inalmost all the sampling sites (except S05 S07 and S08) with a global occurrence frequency(OF) of 76 The genus Coenagrion (Odonata) was also highly common (57) and mainlyfound in S05 to S08 and S11 The genera Physa (Gastropoda) Caenis Baetis (Ephemeroptera)Polymorphanisus (Trichoptera) Eurymetra Rhagovelia Limnogonus (Heteroptera) OrthetrumPseudagrion (Odonata) Dineutus (Coleoptera) and the families Lumbriculidae (Oligochaeta)and Simuliidae (Diptera) were rather commonly found (25 lt OF lt 50) Significantlyhigher values of taxonomic richness and diversity (Shannon-Wiener index) evenness(Pielou index) EPT richness (mainly due to Ephemeroptera) 1-GOLD index and sig-
Water 2022 14 1490 11 of 26
nificantly lower values of Diptera richness seemed related to the LIRR status of sites(Table 4 Figure 5 and Figure S6 in Supplementary Material) Even if taxonomic richnessof Ephemeroptera Odonata Heteroptera Hirudinea and Gastropoda significantly variedamong sites it was much more difficult to relate these variations to clear differences in sitestatus (Figure S6 in Supplementary Material)
Water 2022 14 x httpsdoiorg103390xxxxx wwwmdpicomjournalwater
33 Abiotic Typology of Sampling Sites The nPCA provided a typology of sampling sites based on their physico-chemical
characteristics (Figure 4) The first factorial plane (F1-F2) explained 385 of the total inertia Axis F1 discriminated sites exhibiting high percentage of dissolved oxygen (S05 S07 and S08 F1 gt 0) from sites with high conductivity and total hardness (S01 and S04 F1 lt 0) Axis F2 mainly opposed S09 (F2 gt 0) sites with rather low pH and oxidizability values to the other sites
The cluster analysis (Figure S5) highlighted two main groups of sites The first group gathered sites weakly urbanized and located in rural zones ie S05 to S08 (LIRRs) and S11 (mIRR) The second group consisted of sites located in more urbanized areas with two sub-groups S01 and S04 (sIRRs) on the one hand and S02 and S03 (sIRRs) with S09 and S10 (mIRRs) on the other hand
Figure 4 Ordination of sites by nPCA based on 10 physico-chemical parameters (A) Projection of physico-chemical parameters on the first correlation circle (BndashD) Locations of sites (S01 to S11) on the first factorial plane at the weighted average of the locations of corresponding monthly sampling events (solid points) Each sampling event is linked by a line to the mean location of the corresponding site Ellipses of inertia (95) are provided by site Sites are gathered according to anthropogenic pressure level LIRRs = Least Impacted River Reaches mIRRs = moderately Impacted River Reaches sIRRs = severely Impacted River Reaches See Table 1 and Figure 1 for the description and location of sites
Figure 4 Ordination of sites by nPCA based on 10 physico-chemical parameters (A) Projection ofphysico-chemical parameters on the first correlation circle (BndashD) Locations of sites (S01 to S11) onthe first factorial plane at the weighted average of the locations of corresponding monthly samplingevents (solid points) Each sampling event is linked by a line to the mean location of the correspondingsite Ellipses of inertia (95) are provided by site Sites are gathered according to anthropogenicpressure level LIRRs = Least Impacted River Reaches mIRRs = moderately Impacted River ReachessIRRs = severely Impacted River Reaches See Table 1 and Figure 1 for the description and locationof sites
Water 2022 14 1490 12 of 26
Table 4 Mean values (plusmnstandard deviation) of invertebrate-based metrics for the 11 sampling sites over the study period Asterisks indicate significant differencesamong sites based on Friedman tests ( p lt 0001 p lt 001 p lt 005) Metrics exhibiting significant differences are those included in the taxonomy-based nPCA(see Section 34) and RDA (see Section 35) Richnesses were expressed in terms of relative frequencies (rf-S) See text for further details
Nlem Stream Kena Stream Famlem Stream
Sampling Sites S01 S02 S03 S04 S05 S06 S07 S08 S09 S10 S11
MetricsTotal richness 862 plusmn 375 669 plusmn 401 738 plusmn 475 1131 plusmn 507 1746 plusmn 371 1469 plusmn 642 2069 plusmn 636 1738 plusmn 384 669 plusmn 455 1123 plusmn 626 1331 plusmn 541
Shannon diversity 092 plusmn 060 048 plusmn 044 069 plusmn 062 071 plusmn 047 194 plusmn 029 194 plusmn 061 227 plusmn 056 241 plusmn 033 058 plusmn 063 123 plusmn 059 172 plusmn 042Evenness (Pielou) 042 plusmn 025 023 plusmn 017 035 plusmn 026 029 plusmn 016 068 plusmn 008 076 plusmn 015 076 plusmn 015 085 plusmn 008 030 plusmn 020 054 plusmn 017 069 plusmn 012
Bivalvia(rf-S) 000 plusmn 000 000 plusmn 000 000 plusmn 000 000 plusmn 000 001 plusmn 002 001 plusmn 003 000 plusmn 001 000 plusmn 000 000 plusmn 000 000 plusmn 000 000 plusmn 000Coleoptera(rf-S) 013 plusmn 011 010 plusmn 016 009 plusmn 010 007 plusmn 006 007 plusmn 006 018 plusmn 012 014 plusmn 008 015 plusmn 009 019 plusmn 018 010 plusmn 012 010 plusmn 007Dictyoptera(rf-S) 001 plusmn 003 000 plusmn 000 002 plusmn 003 000 plusmn 000 000 plusmn 000 000 plusmn 000 001 plusmn 001 000 plusmn 001 000 plusmn 001 000 plusmn 002 000 plusmn 002Diptera(rf-S) 021 plusmn 017 046 plusmn 026 032 plusmn 014 028 plusmn 012 006 plusmn 006 011 plusmn 008 006 plusmn 004 005 plusmn 005 034 plusmn 012 031 plusmn 017 015 plusmn 007
Ephemeroptera(rf-S) 001 plusmn 004 003 plusmn 006 006 plusmn 014 007 plusmn 008 011 plusmn 005 005 plusmn 008 016 plusmn 010 014 plusmn 011 004 plusmn 007 020 plusmn 011 025 plusmn 016Gastropoda(rf-S) 017 plusmn 017 003 plusmn 005 012 plusmn 011 012 plusmn 005 013 plusmn 005 009 plusmn 006 004 plusmn 004 006 plusmn 005 003 plusmn 007 006 plusmn 006 006 plusmn 008Heteroptera(rf-S) 014 plusmn 012 005 plusmn 008 010 plusmn 011 014 plusmn 009 024 plusmn 008 023 plusmn 012 026 plusmn 008 029 plusmn 009 009 plusmn 012 005 plusmn 008 012 plusmn 010Hirudinea(rf-S) 001 plusmn 003 008 plusmn 014 006 plusmn 007 013 plusmn 007 003 plusmn 003 000 plusmn 000 000 plusmn 000 001 plusmn 003 001 plusmn 003 006 plusmn 007 004 plusmn 006Odonata(rf-S) 023 plusmn 015 018 plusmn 014 016 plusmn 018 015 plusmn 009 027 plusmn 009 026 plusmn 010 023 plusmn 013 023 plusmn 008 007 plusmn 011 010 plusmn 010 013 plusmn 011
Oligochaeta(rf-S) 008 plusmn 009 007 plusmn 009 007 plusmn 012 003 plusmn 005 001 plusmn 003 002 plusmn 004 001 plusmn 002 001 plusmn 003 015 plusmn 015 007 plusmn 011 006 plusmn 005Plecoptera(rf-S) 000 plusmn 000 000 plusmn 000 000 plusmn 000 000 plusmn 000 000 plusmn 000 000 plusmn 000 001 plusmn 001 000 plusmn 000 000 plusmn 000 000 plusmn 000 000 plusmn 000
Trichoptera(rf-S) 000 plusmn 000 000 plusmn 000 000 plusmn 000 000 plusmn 000 005 plusmn 005 003 plusmn 005 005 plusmn 005 004 plusmn 004 000 plusmn 001 000 plusmn 000 003 plusmn 004Turbellaria(rf-S) 000 plusmn 000 000 plusmn 000 000 plusmn 000 001 plusmn 004 000 plusmn 002 000 plusmn 001 002 plusmn 003 001 plusmn 003 007 plusmn 010 000 plusmn 001 005 plusmn 006
EPT Family 008 plusmn 028 031 plusmn 063 038 plusmn 065 092 plusmn 119 231 plusmn 085 100 plusmn 129 308 plusmn 144 262 plusmn 171 046 plusmn 113 169 plusmn 095 262 plusmn 112log([EPTD + 1]) 002 plusmn 008 025 plusmn 024 011 plusmn 023 018 plusmn 025 000 plusmn 000 002 plusmn 008 013 plusmn 021 000 plusmn 000 004 plusmn 013 011 plusmn 023 002 plusmn 008
1ndashGOLD 054 plusmn 021 044 plusmn 024 049 plusmn 024 056 plusmn 014 079 plusmn 009 078 plusmn 007 089 plusmn 008 089 plusmn 006 048 plusmn 023 056 plusmn 023 074 plusmn 012
Water 2022 14 1490 13 of 26
Water 2022 14 x 2 of 28
34 Taxonomic Structure of Stream Benthic Macroinvertebrate Assemblages A total of 31099 organisms were sorted and identified distributed in 5 phyla 8
classes 25 orders and 98 families Insects the most diversified group (11 orders 76 families and 177 taxa) represented 865 of the total abundance
Among the most representative taxa the genus Chironomus (Diptera) was found in almost all the sampling sites (except S05 S07 and S08) with a global occurrence frequency (OF) of 76 The genus Coenagrion (Odonata) was also highly common (57) and mainly found in S05 to S08 and S11 The genera Physa (Gastropoda) Caenis Baetis (Ephemeroptera) Polymorphanisus (Trichoptera) Eurymetra Rhagovelia Limnogonus (Heteroptera) Orthetrum Pseudagrion (Odonata) Dineutus (Coleoptera) and the families Lumbriculidae (Oligochaeta) and Simuliidae (Diptera) were rather commonly found (25 lt OF lt 50) Significantly higher values of taxonomic richness and diversity (Shannon-Wiener index) evenness (Pielou index) EPT richness (mainly due to Ephemeroptera) 1-GOLD index and significantly lower values of Diptera richness seemed related to the LIRR status of sites (Table 4 Figures 5 and S6 in Supplementary Material) Even if taxonomic richness of Ephemeroptera Odonata Heteroptera Hirudinea and Gastropoda significantly varied among sites it was much more difficult to relate these variations to clear differences in site status (Figure S6 in Supplementary Material)
Figure 5 Box-plots (MinQ25MedianQ75Max) describing the distribution of values of taxonomic richness (A) Shannon-Wiener index (B) Diptera richness (Diptera(rf-S) in proportion of the total richness) (C) and 1-GOLD index (D) over a period of thirteen months for 11 study sites (S01 to S11) laquoaraquo laquobraquo laquocraquo and laquodraquo are distinct groups identified by post-hoc Nemenyi tests applied after identifying for a given metric a significant difference among sites by a non-parametric Friedman test Outliers (open circles) are out of the 15 interquartile range See text for further details
Figure 5 Box-plots (MinQ25MedianQ75Max) describing the distribution of values of taxonomicrichness (A) Shannon-Wiener index (B) Diptera richness (Diptera(rf-S) in proportion of the totalrichness) (C) and 1-GOLD index (D) over a period of thirteen months for 11 study sites (S01 toS11) laquoaraquo laquobraquo laquocraquo and laquodraquo are distinct groups identified by post-hoc Nemenyi tests applied afteridentifying for a given metric a significant difference among sites by a non-parametric Friedmantest Outliers (open circles) are out of the 15 interquartile range See text for further details
The nPCA first factorial plane providing the ordination of site assemblages accordingto 17 taxonomic metrics (Table 2) explained 453 of the total inertia (Figure 6) Threegroups of sites were identified Along the first axis S05-S08 and S11 (F1 lt 0) exhibitingthe highest values of Shannon-Wiener diversity Pielou evenness total and EPT Familyrichness 1-GOLD Heteroptera(rf-S) and Trichoptera(rf-S) were opposed to S01ndashS04 andS09 (F1 gt 0) having the highest values of Diptera(rf-S) and Oligochaeta(rf-S) Axis F2mainly opposed S10-S11 (F2 lt 0) with the highest values of Ephemeroptera(rf-S) to S06(F2 gt 0) which exhibited a high proportion of Odonata
The cluster analysis based on taxonomic criteria (Figure S7) clearly separated siteswith an expected LIRR status (ie S05 to S08) from severely (sIRRs S01ndashS04 and S09) ormoderately (mIRRs S10ndashS11) impaired sites
Water 2022 14 1490 14 of 26
Water 2022 14 x 3 of 28
The nPCA first factorial plane providing the ordination of site assemblages according to 17 taxonomic metrics (Table 2) explained 453 of the total inertia (Figure 6) Three groups of sites were identified Along the first axis S05-S08 and S11 (F1 lt 0) exhibiting the highest values of Shannon-Wiener diversity Pielou evenness total and EPT Family richness 1-GOLD Heteroptera(rf-S) and Trichoptera(rf-S) were opposed to S01ndashS04 and S09 (F1 gt 0) having the highest values of Diptera(rf-S) and Oligochaeta(rf-S) Axis F2 mainly opposed S10-S11 (F2 lt 0) with the highest values of Ephemeroptera(rf-S) to S06 (F2 gt 0) which exhibited a high proportion of Odonata
Figure 6 Ordination of sites by nPCA based on 17 taxonomy-based metrics (A) Projection of taxonomic metrics on the first correlation circle (BndashD) Locations of sites (large labels S01 to S11) on the first factorial plane at the weighted average of the locations of corresponding monthly sampling events (solid points) Each sampling event is linked by a line to the mean location of the corresponding site Ellipses of inertia (95) are provided by site Sites are gathered according to anthropogenic pressure level LIRRs = Least Impacted River Reaches mIRRs = moderately Impacted River Reaches sIRRs = severely Impacted River Reaches See Table 1 and Figure 1 for the description and location of sites
Figure 6 Ordination of sites by nPCA based on 17 taxonomy-based metrics (A) Projection oftaxonomic metrics on the first correlation circle (BndashD) Locations of sites (large labels S01 to S11) onthe first factorial plane at the weighted average of the locations of corresponding monthly samplingevents (solid points) Each sampling event is linked by a line to the mean location of the correspondingsite Ellipses of inertia (95) are provided by site Sites are gathered according to anthropogenicpressure level LIRRs = Least Impacted River Reaches mIRRs = moderately Impacted River ReachessIRRs = severely Impacted River Reaches See Table 1 and Figure 1 for the description and locationof sites
35 Relationships between Physico-Chemical Parameters and the Taxonomic Metrics of BenthicMacroinvertebrate Assemblages
The influence of physico-chemical parameters on the taxonomic metrics describ-ing stream invertebrate assemblages was examined using redundancy analysis (RDAFigure 7) The first two factorial axes accounted for 879 of total inertia and ANOVA-like permutation tests showed that both the model and the first axis were significant(p-value(model) lt 0001 p-value(F1) lt 0001) The model explained 208 of the variancein taxonomic metric values (adjusted R2)
Water 2022 14 1490 15 of 26Water 2022 14 x 2 of 28
Figure 7 Ordination of sites by Redundancy Analysis (RDA) based on 17 taxonomic metrics Factorial axes are linear combinations of 10 physico-chemical parameters (A) Canonical weights of physico-chemical parameters Only the main parameters are labeled (B) location of metrics on the first factorial plane (CndashE) locations of sites (large labels) on the first factorial plane at the weighted average of the locations of corresponding monthly sampling events (solid points) Each event is linked by a line to the mean location of the corresponding site Labels corresponding to the mean locations of S01 and S02 are partially masked by S03 and S04 labels respectively Ellipses of inertia (95) are provided by site Sites are gathered according to anthropogenic pressure level LIRRs = Least Impacted River Reaches mIRRs = moderately Impacted River Reaches sIRRs = severely Impacted River Reaches See Table 1 and Figure 1 for the description and location of sites
Figure 7 Ordination of sites by Redundancy Analysis (RDA) based on 17 taxonomic metrics Factorialaxes are linear combinations of 10 physico-chemical parameters (A) Canonical weights of physico-chemical parameters Only the main parameters are labeled (B) location of metrics on the firstfactorial plane (CndashE) locations of sites (large labels) on the first factorial plane at the weightedaverage of the locations of corresponding monthly sampling events (solid points) Each event islinked by a line to the mean location of the corresponding site Labels corresponding to the meanlocations of S01 and S02 are partially masked by S03 and S04 labels respectively Ellipses of inertia(95) are provided by site Sites are gathered according to anthropogenic pressure level LIRRs = LeastImpacted River Reaches mIRRs = moderately Impacted River Reaches sIRRs = severely ImpactedRiver Reaches See Table 1 and Figure 1 for the description and location of sites
Water 2022 14 1490 16 of 26
Three groups of sites were distinguished on the first factorial plane Axis 1 opposedS05ndashS08 (F1 gt 0) to S01ndashS04 (F1 lt 0) S05ndashS08 exhibited mainly high water oxygenationThey were associated with the highest values of the Shannon-Wiener and Pielou indicestotal richness 1-GOLD index Trichoptera(rf-S) Heteroptera(rf-S) and EPT Family richness(see also Table S2 in Supplementary Material) In contrast S01-S04 were characterized byhigh mineralization and high nitrate load and exhibited the highest values of Diptera(rf-S)Along the F2 axis S09ndashS11 (F2 lt 0) were characterized by the highest levels of temperaturenitrate concentration and dissolved oxygen concentration S10 and S11 were associated withthe highest proportion of Ephemeroptera(rf-S) and opposed mainly to S01 S04 and S06
The cluster analysis based on the RDA results (Figure S8) clearly separated S01ndashS04expected as severely impacted sites from other sites subdivided in two sub-groups Thefirst sub-group gathered sites expected as least impacted sites (ie S05ndashS08) and the secondsub-group gathering sites expected as only moderately (S10ndashS11) or more severely impacted(S09) by anthropogenic activities
36 The Discrimination Efficiency (DE) of the Metrics Describing Benthic Invertebrate Assemblages
The DE of the 19 calculated metrics ranged from 0000 for Bivalvia(rf-S) and Plecoptera(rf-S)to 0934 for Diptera(rf-S) Only 10 out of 19 metrics exhibited a DE value greater than05 which are (in decreasing order) Diptera(rf-S) (0934) Shannon-Wiener diversity(0879) 1-GOLD (0835) total richness (0813) Heteroptera(rf-S) and Pielou evenness (0802)Odonata(rf-S) (0593) EPT Family and Ephemeroptera(rf-S) (0527) and Oligochaeta(rf-S)(0505) Among these 10 metrics only Diptera(rf-S) and Oligochaeta(rf-S) increased withsite degradation (Figure 8) as expected in Table 2
Water 2022 14 x 3 of 28
Figure 8 Box-plots (MinQ25MedianQ75Max) of the most discriminant (DE gt 05) macroinvertebrate-based metrics in the LIRRs (Least Impacted River Reaches) and IRRs (moderately and severely Impacted River Reaches) Discrimination Efficiency (DE) values are given in the top-left part of each subplot Outliers are out of the 15 interquartile range
4 Discussion 41 Physico-Chemical Characteristics of Streams
Some river reaches of the streams in Mifi County (western region of Cameroon) are clearly impacted by anthropogenic activities occurring in or near the city of Bafoussam The studied sites were mainly discriminated according to their degree of contamination by factory effluents and waste waters (both domesticmunicipalagricultural and industrial) cattlepoultry breeding and their location in either densely or sparsely populated areas
Based on the pressure description (MCA in Section 31) and physico-chemical criteria (nPCA in Section 32) sites located on the Kena stream and its tributaries (S04 to S08) were globally distinguished from the other sites by better water quality illustrated by significantly higher oxygen concentration and lower mineralization In this catchment only S04 exhibited poor water quality Thus S05 to S08 represented the less polluted and impacted reaches within the sampling design and seemed to be good candidates for defining reference conditions for wadeable rivers in this area
The upper reaches of the Famlem stream (S09) located in an urban area were subjected to fertilized agriculture and various forms of domestic and commercial activities In S10 and mainly S11 located in a rural area the water quality increased due to decantation or sedimentation of matter on the stream bed and dilution of watershed
Figure 8 Box-plots (MinQ25MedianQ75Max) of the most discriminant (DE gt 05) macroinvertebrate-based metrics in the LIRRs (Least Impacted River Reaches) and IRRs (moderately and severelyImpacted River Reaches) Discrimination Efficiency (DE) values are given in the top-left part of eachsubplot Outliers are out of the 15 interquartile range
Water 2022 14 1490 17 of 26
4 Discussion41 Physico-Chemical Characteristics of Streams
Some river reaches of the streams in Mifi County (western region of Cameroon) areclearly impacted by anthropogenic activities occurring in or near the city of BafoussamThe studied sites were mainly discriminated according to their degree of contamination byfactory effluents and waste waters (both domesticmunicipalagricultural and industrial)cattlepoultry breeding and their location in either densely or sparsely populated areas
Based on the pressure description (MCA in Section 31) and physico-chemical criteria(nPCA in Section 32) sites located on the Kena stream and its tributaries (S04 to S08)were globally distinguished from the other sites by better water quality illustrated bysignificantly higher oxygen concentration and lower mineralization In this catchmentonly S04 exhibited poor water quality Thus S05 to S08 represented the less pollutedand impacted reaches within the sampling design and seemed to be good candidates fordefining reference conditions for wadeable rivers in this area
The upper reaches of the Famlem stream (S09) located in an urban area were sub-jected to fertilized agriculture and various forms of domestic and commercial activities InS10 and mainly S11 located in a rural area the water quality increased due to decantationor sedimentation of matter on the stream bed and dilution of watershed inputs alongthe stream The Nlem tributary (S01 to S03) was subjected to high anthropogenic pres-sure mainly related to industrial and domestic effluents which resulted in high valuesof conductivity and nutrient concentrations These sites were located in the densely pop-ulated surroundings of Bafoussam City where several industries were known to releasewastewaters in the stream Moreover many domestic effluents (eg latrines in the riparianarea [50]) were directly discharged into the stream enriching it with nitrogen and organicmatter The IRR vs LIRR status allocated to sites based on MCA results was confirmed byphysico-chemical characterization for most of the sites Only S11 considered as moderatelyimpaired (mIRR) based on potential anthropogenic pressures was gathered with LIRRsbased on physico-chemical criteria (Figure S5)
The accuracy of this physico-chemical characterization indeed relies on the availabilityof data used to characterize anthropogenic pressures One of the caveats of our characteri-zation is that micropollutant concentrations were not measured due to the expensive costof analyses Data on water concentrations of pesticides are extremely rare in CameroonHowever Galani et al (2018 [71]) measured the residues of 99 pesticides in samples of12 local agricultural products collected in the western highlands of Cameroon includingthe Bafoussam region They found in the Bafoussam region 182 of measured pesticideresidue concentrations above the Maximum Residue Levels fixed by the European Unionincluding three fungicides (captan hexachlorobenzene and matalaxyl) three herbicides(alachlor chlorotoluron and terbuthylazine) and seven insecticides (aldrin cypermethrindieldrin malathion methoxychlor pprsquo-DDT and γ-HCH) indicating that such micropollu-tants were used in the agricultural areas of the studied watersheds They could thereforebe present in some sections of the rivers of the Bafoussam region and should be taken intoaccount in further studies
42 Invertebrate-Based Metrics and Their Relationships with Physico-Chemical Parameters
Overall the benthic fauna present in the different sites during this study exhibiteda composition rather similar to that of invertebrate communities found in other Africanrivers [7273] Insects had the highest diversity in the three catchments due to their highcapacity to colonize various ecological niches with specific mesohabitat conditions [74ndash76]Diptera Coleoptera Heteroptera Ephemeroptera Odonata (Insecta) and gastropods werethe most abundant groups
Site typologies provided by multivariate analyses based on physico-chemical parame-ters (nPCA Figure S5) taxonomy-based metrics (nPCA Figure S7) and taxonomy-basedmetrics related to physico-chemical parameters (RDA Figure S8) were not similar Sitesmoderately impacted by anthropogenic activities (mIRRs) were indeed gathered with least
Water 2022 14 1490 18 of 26
impacted (S11 based on physico-chemical criteria Figure S5) or severely impacted (S11based on taxonomic criteria Figure S7) river reaches However relating taxonomy-basedmetrics to the physico-chemical parameters by RDA highlighted three groups of sites highlycoherent with their expected ecological status (Figure S8)
The first group gathered weakly mineralized and well oxygenated sites (S05 to S08)from the Kena stream located in rural areas where anthropogenic pressures were low(eg low nutrient concentrations and conductivity) These sites hosted pollution-sensitiveorganisms (high EPT family richness Shannon-Wiener diversity Heteroptera(rf-S) and1-GOLD values) highlighting their good water quality Similarly Qu et al (2010 [77])Rawson et al (2010 [78]) Arimoro et al (2010 [79]) Shelly et al (2011 [80]) Myers et al(2011 [81]) and Kaboreacute et al (2016 [82]) identified higher abundance of pollution-sensitiveinsects in reaches with predominantly preserved habitats Moreover Duka et al (2017 [83])already observed a drastic decrease in the taxonomic richness of sensitive organisms withincreasing watershed urbanization In Cameroon Menbohan et al (2013 [41]) and Tchatchoet al (2014 [84]) reported similar results in the peri-urban forested rivers of Yaoundeacute
The second group aggregated to the first one was represented by the sites on theFamlem stream (S09ndashS11) with increasing water quality along the upstreamdownstreamlongitudinal gradient explained by both the self-purifying capacity of the river and thedilution of anthropogenic inputs along the longitudinal gradient Diptera was the mostabundant group of organisms upstream (in S09 situated in the urban zone) while a highertaxonomic diversity was observed downstream due to partial recolonization of the lowerreaches by more pollution-sensitive taxa This pattern was confirmed by the high richnessof Ephemeroptera at S11
The third group included the sites located on the tributaries of the Nlem (S01 toS03) and Kena (S04) streams These sites hosted mainly pollution-tolerant taxa (eg highDiptera(rf-S)) and can be considered as disturbed reaches with poor water quality due todomestic and industrial waste contamination Solid and liquid wastes were dumped intothe streams impairing water quality and favoring resistant organism proliferation (Diptera)Such pollution has already been associated with macroinvertebrate local extinctions andorbiodiversity decline [85] Rawson et al (2010 [78]) and Dar and Reshi (2014 [86]) alsoconsidered that urbanization-related variations in water physico-chemical characteristicsreduce the abundance of sensitive taxa and promote the development of more tolerantorganisms including Oligochaeta (Lumbriculidae) Diptera and Gastropoda Moreoverhabitat degradation contributes in many cases to benthic mosaic homogenization Mudwas the dominant substrate in most of these stream sites offering a very low diversity ofpotential ecological niches for benthic invertebrates Similarly Doretto et al (2018 [87]) ob-served a reduction in taxonomic richness and abundance of macroinvertebrates (especiallyEPT) when a high level of siltation occurred in a stream reach
43 Metrics of Interest for Future Biomonitoring Tool
The total taxonomic richness EPT family richness Shannon-Wiener diversity Pielouevenness 1-GOLD Ephemeroptera(rf-S) Heteroptera(rf-S) Odonata(rf-S) Diptera(rf-S)and Oligochaeta(rf-S) were the ten metrics best responding to anthropogenic pressurescommonly acting on streams of the West Cameroon region based on their efficiency inthe discrimination of LIRRs from IRRs (DE Figure 8) Six of these metrics exhibited aDE value greater than 08 indicating their especially high capacity to discriminate IRRsfrom LIRRs They can be ranked along a decreasing order of discrimination efficiencyDiptera(rf-S) gt Shannon-Wiener diversity gt 1-GOLD gt total richness gt Pielou evenness =Heteroptera(rf-S) These metrics should provide the best overview of the water qualityof sampled sites due also to their high relationship with some of the physico-chemicalvariables measured (Table S2) They could correspond to the best set of candidate taxo-nomic metrics for inclusion in an invertebrate-based multimetric bioassessment tool forthe wadeable streams of the West Cameroon region Following Mondy et al (2012 [88])reference values (ie values expected in reference conditions) and four ecological qual-
Water 2022 14 1490 19 of 26
ity class boundaries (delimiting lsquohighrsquo lsquogoodrsquo lsquomoderatersquo lsquopoorrsquo and lsquobadrsquo classes) weredefined for each of these metrics (the detailed procedure and corresponding values areprovided in Table S3 in the Supplementary Material) Such values will help in the ecologicaldiagnostics of river reaches in the Bafoussam region based on the taxonomic structure ofmacroinvertebrate assemblages taking into account the original ecological informationprovided by each of these metrics
The total taxonomic richness ShannonndashWiener diversity and Pielou evenness describethe taxonomic characteristics of an assemblage driven by both habitat complexity andstability [88ndash91] As expected (Table 2) the sites less exposed to anthropogenic pressures(S05 to S08) had far higher values of these three metrics than sites moderately and severelyexposed (S10ndashS11 and S01ndashS04 + S09 respectively)
Based on EPT family richness Tchatcho et al (2014 [84]) and Kaboreacute et al (2016 [82])already efficiently monitored forest streams in the peri-urban area of Yaoundeacute (Cameroon)and streams in protected zones of Burkina Faso respectively This metric has been usedworldwide for assessing the biological condition of streams [57] in North America [92]South America [93] Europe [94ndash96] Asia [97] and Australia [98] often in combination withEphemeroptera(rf-S) [99100] However this metric exhibited a rather low discriminationefficiency (DE = 0527) in the Bafoussam region probably due to the low family richness ofthe EPT assemblage (zero to five families) even in reference conditions
Dias-Silva et al (2010 [101]) and Vieira et al (2014 [102]) already considered Het-eroptera as indicators of good water quality in Brazilian streams because they are sensitiveto the anthropogenic alteration of the riparian aquatic vegetation that would provide themfood and offer shelter against predators or during heavy rains Tchakonteacute et al (2015 [42])concluded similarly based on the invertebrate assemblages of forest streams of Douala(Cameroon) We confirmed the high efficiency of this metric in the discrimination of LIRRsfrom IRRs in the Bafoussam region (DE gt 08)
1-GOLD and Diptera(rf-S) were two metrics best reacting to stream degradation(DE = 0835 and 0934 respectively) The 1-GOLD metric gathers information from Gas-tropoda Oligochaeta and Diptera three groups of rather pollution-tolerant organismsGastropoda and Oligochaeta were involved in the multimetric index evaluating the ecolog-ical quality of drainage ditch systems in the Netherlands [103] or siliceous river systems inPortugal [104] and in the identification of metal contamination of soft sediments in Frenchand Swiss rivers [105ndash107] Diptera dominated by Chironomidae (especially Chironomus)were found in almost all the sites This wide distribution can be explained by their ubiqui-tous traits and their capacity to rapidly colonize new environments Moreover Chironomusrsquosability to capture in water and carry dissolved oxygen with hemolymphic hemoglobingives it a high physiological tolerance even in environments with very low oxygen con-centration [28108109] This collector-filterer is already considered as highly tolerant topollution in many African tropical streams [110111] as are the Oligochaeta [41]
Odonata generally exhibiting a long period of larval development are good witnessesof river habitat quality and stability and are extremely diverse in tropical areas [112]Odonata(rf-S) can provide a reliable measure of anthropogenic impact In particular distur-bance of the riparian vegetation has a direct effect on the structure of the adult dragonflycommunity potentially impairing larval populations [113] Miguel et al (2017 [114])and De Oliveira-Junior et al (2017 [115]) noticed their high sensitivity to the degrada-tion of riparian vegetation potentially altered by the local use of streams by riverinehuman populations
44 Seasonal Effect on Macroinvertebrate-Based Metrics
Our results demonstrate only a moderate influence of ldquoseasonrdquo on invertebrate-basedmetric variations in the studied streams of West Cameroon Even though Tonkin et al(2017 [116]) and Dalu et al (2017 [117]) pointed out the driving force of seasonality onstream community dynamics its effects on invertebrate assemblages of West Cameroonrivers seem to be modulated by the high predictability of the successive hydrological events
Water 2022 14 1490 20 of 26
(rainy season vs dry season) However such events can lead to some structural andcompositional changes within benthic communities (eg a decrease in taxonomic richnessand total abundance) via the physical disturbance of bottom substrates due to faster currentvelocity and higher water level in the rainy season [118] This rather moderate effect ofseason on aquatic invertebrate community structure may be explained also by the absenceof strong between-season variation in the physico-chemical characteristics of water IfMasese et al (2014 [111]) found a high influence of season on the structural and functionalorganization of macroinvertebrate assemblages in Kenyan highland streams (due to theexacerbation of differences in water quality and habitat characteristics) a moderate effectof season was already pointed out by Tonkin et al (2016 [119]) and Dalu et al (2017 [120])in Afrotropical Nigerian streams and in an austral South African stream respectively Thisrather low influence of seasonality on the taxonomic structure of invertebrate assemblagesshould facilitate the development of a future biotic index for West Cameroon rivers
5 Conclusions
In conclusion human activities in and around streams (farming vegetation clearancesand extraction bathing laundry riparian culture and effluent discharge from householdsand industries) drastically reduce the within-stream invertebrate biodiversity in the WestRegion of Cameroon An urgent need for the conservation and wise use of the watercoursesin this area was highlighted We identified the main relationships between pressure-sensitive invertebrate-based metrics and physico-chemical characteristics of streams Thisidentification will facilitate the selection of the scale at which efforts for protection andorrehabilitation should be directed to best improve andor maintain sustainable ecologicalconditions in West Cameroon streams Invertebrate-based biomonitoring of these streamsseems very promising several taxonomic metrics clearly varying according to the inten-sity of human impacts Diptera(rf-S) Shannon-Wiener diversity 1-GOLD total richnessPielou evenness and Heteroptera(rf-S) seem the most promising metrics for identifying asignificant anthropogenic impairment The selection of these best candidate metrics is thefirst significant step towards the construction of an invertebrate-based multimetric indexefficiently assessing the ecological status of streams in this region
Supplementary Materials The following supporting information can be downloaded at httpswwwmdpicomarticle103390w14091490s1 Figure S1 Ordination of sites by a ldquowithin-seasonrdquo nPCAbased on 17 taxonomy-based metrics (A) Projection of taxonomic metrics on the first correlation circle(F1-F2) (B C and D) Locations of sites (large labels) on the first factorial plane F1-F2 at the weightedaverage of the locations of corresponding monthly sampling events (solid points) Each event is linkedby a line to the mean position of the corresponding site Ellipses of inertia (95) are provided bysite Sites are gathered according to anthropogenic pressure level Figure S2 Ordination of sites by alaquowithin-seasonraquo nPCA based on 10 physico-chemical parameters (A) Projection of physico-chemicalparameters on the first correlation circle (F1-F2) (B C and D) Locations of sites (large labels) on thefirst factorial plane at the weighted average of the locations of corresponding monthly samplingevents (solid points) Figure S3 Ordination of impact levels (three categories lowmoderatehigh)of eight pressure categories by Multiple Correspondence Analysis (MCA) based on the descriptionof 11 study sites Figure S4 Box-plots (MinQ25MedianQ75Max) describing the distributionof values of the remaining physico-chemical parameters exhibiting significant differences amongsites over a period of thirteen months for 11 study sites (S01 to S11) laquo a raquo laquo b raquo laquo c raquo and laquo d raquo aredistinct groups identified by post-hoc Nemenyi tests applied after identifying for a given parametera significant difference among sites by a non-parametric Friedman test Figure S5 Dendrogrambased on the Euclidean distance (calculated between sites according to their coordinates on thefirst factorial plane of the nPCA) and the complete linkage method highlighting the similarity ofthe 11 study sites (S01 to S11) considering their physico-chemical characteristics during the studyperiod Figure S6 Box-plots (MinQ25MedianQ75Max) describing the distribution of values ofthe remaining taxonomy-based metrics exhibiting significant differences among sites over a periodof thirteen months for 11 study sites (S01 to S11) ldquoardquo ldquobrdquo ldquocrdquo and ldquodrdquo are distinct groups identifiedby post-hoc Nemenyi tests applied after identifying for a given parameter a significant difference
Water 2022 14 1490 21 of 26
among sites by a non-parametric Friedman test Figure S7 Dendrogram based on the Euclideandistance (calculated between sites according to their coordinates on the first factorial plane of thenPCA) and the complete linkage method highlighting the similarity of the 11 study sites (S01 toS11) considering the structure of their macroinvertebrate assemblage described by 17 taxonomy-based metrics Figure S8 Dendrogram based on the Euclidean distance and the complete linkagemethod applied to sampling events coordinates on the first factorial plane of the RDA highlightingthe similarity of the 11 study sites (S01 to S11) based on the structure of their macroinvertebrateassemblage described by 17 taxonomy-based metrics explained by 10 physico-chemical variablesTable S1 Semi-quantitative description of eight categories of anthropogenic pressures for 11 samplingsites (S01-S11) in three catchments of the Bafoussam region (West Cameroon) The potential intensityof each pressure category has been described using three modalities 1 = low 2 = moderate and3 = high The eight pressure categories are related to the importance of ldquourbanrdquo areas ldquofood croprdquoldquocash croprdquo ldquocattle and poultryrdquo breeding untreated ldquodomestic municipal and agriculturalrdquo orldquoindustrialrdquo wastewater effluents riverine ldquofactoriesrdquo and ldquocivil engineering and miningrdquo at reachscale Table S2 Correlations (Spearmanrsquos rho coefficient) between the 19 tested macroinvertebrate-based metrics and the environmental parameters Table S3 Proposed reference values and ecologicalquality class boundaries for the ten metrics exhibiting significantly different ranges of values betweenLIRRs and IRRs in wadeable rivers of the Bafoussam Region Ecological class boundaries have beendefined following Mondy et al (2012 [88]) As recommended by the WFD ecological quality classboundaries (ie delimiting lsquohighrsquo lsquogoodrsquo lsquomoderatersquo lsquopoorrsquo and lsquobadrsquo classes) have been definedbased on the distribution of each metric values from the LIRR data set For each metric decreasingwith increasing anthropogenic pressures (ie all the metrics except Diptera(rf-S) and Oligochaeta(rf-S) cf Figure 8) the 95th 75th and 25th percentiles of the metric value distribution in the LIRRs werecalculated These values have been considered as the reference value the lsquohighndashgoodrsquo boundaryand the lsquogoodndashmoderatersquo boundary respectively For the two metrics increasing with increasinganthropogenic pressures (ie Diptera(rf-S) and Oligochaeta(rf-S)) the 5th 25th and 75th percentilesof the metric value distribution in the LIRRs were considered as the reference value the lsquohighndashgoodrsquoboundary and the lsquogoodndashmoderatersquo boundary respectively For defining the lsquomoderatendashpoorrsquo andthe lsquopoorndashbadrsquo boundaries we divided the metric scoring range between the minimal possiblevalue (decreasing metric) or the maximal possible value (increasing metric) and the lsquogoodndashmoderatersquoboundary in three equal classes
Author Contributions JKF conceptualization data acquisition data analysis writingmdashoriginaldraft and validation SFM data acquisition writingmdashoriginal draft and validation AM conceptu-alization methodology data analysis writingmdashoriginal draft and validation AL writingmdashoriginaldraft and validation PU-P conceptualization methodology data analysis writingmdashoriginal draftand validation All authors have read and agreed to the published version of the manuscript
Funding This study was made possible by the funding accorded to Josephine Kengne Fotsing by themobility program Knowledge Integration and Transparency in Education (KITE) Scholarship
Institutional Review Board Statement Not applicable
Informed Consent Statement Not applicable
Data Availability Statement Contact the correspondence author for data
Acknowledgments We would like to thank all the staff of the ldquoHydrobiology and EnvironmentrdquoLaboratory of the Universiteacute of Yaoundeacute 1 in Cameroon especially Eric Biram and Donald Nyamefor their help during the sampling campaigns We would like also to thank Serge H Zeacutebaze TogouetGideon A Ajeagah and Roger Feumba for giving us the possibility of carrying out the physico-chemical survey of sites by lending their measuring devices
Conflicts of Interest The authors declare no conflict of interest
References1 Townsend CR Uhlmann SS Matthaei CD Individual and combined responses of stream ecosystems to multiple stressors
J Appl Ecol 2008 45 1810ndash1819 [CrossRef]2 Ormerod SJ Dobson M Hildrew AG Townsend CR Multiple stressors in freshwater ecosystems Freshw Biol 2010 55 1ndash4
[CrossRef]
Water 2022 14 1490 22 of 26
3 Notildeges P Argillier C Borja A Garmendia JM Hanganu J Kodes V Pletterbauer F Sagouis A Birk S Quantified bioticand abiotic responses to multiple stress in freshwater marine and ground waters Sci Total Environ 2015 540 43ndash52 [CrossRef][PubMed]
4 De Castro DMP de Carvalho DR dos Santos Pompeu P Moreira MZ Nardoto GB Callisto M Land use influences nichesize and the assimilation of resources by benthic macroinvertebrates in tropical headwater streams PLoS ONE 2016 11 e0150527
5 Christensen MR Graham MD Vinebrooke RD Findlay DL Paterson MJ Turner MA Multiple anthropogenic stressorscause ecological surprises in boreal lakes Glob Chang Biol 2006 12 2316ndash2322 [CrossRef]
6 Sirombra MG Mesa LM A method for assessing the ecological quality of riparian forests in subtropical Andean streamsQBRy index Ecol Indic 2012 20 324ndash331 [CrossRef]
7 Taniwaki RH Piggott JJ Ferraz SF Matthaei CD Climate change and multiple stressors in small tropical streamsHydrobiologia 2017 793 41ndash53 [CrossRef]
8 Meyer JL Paul MJ Taulbee WK Stream ecosystem function in urbanizing landscapes J N Am Benthol Soc 200524 602ndash612 [CrossRef]
9 Walsh CJ Roy AH Feminella JW Cottingham PD Groffman PM Morgan II RP The urban stream syndrome Currentknowledge and the search for a cure J N Am Benthol Soc 2005 24 706ndash723 [CrossRef]
10 Cuffney TF Brightbill RA May JT Waite IR Responses of benthic macroinvertebrates to environmental changes associatedwith urbanization in nine metropolitan areas Ecol Appl 2010 20 1384ndash1401 [CrossRef]
11 Holland-Clift S OrsquoDowd DJ Mac Nally R Impacts of an invasive willow (Salix times rubens) on riparian bird assemblages insouth-eastern Australia Austral Ecol 2011 36 511ndash520 [CrossRef]
12 Kouam Kenmogne GR Rosillon F Nono A Nzeukou Nzeugang A Mpakam HG Les maladies hydriques agrave lrsquoeacutepreuve de lagestion des ressources en eau dans une zone urbaine drsquoun pays en deacuteveloppement Cas de la ville de Yaoundeacute (Centre-Cameroun)Eur J Water Qual 2011 42 35ndash49 [CrossRef]
13 Aazami J Esmaili-Sari A Abdoli A Sohrabi H Van den Brink PJ Monitoring and assessment of water health quality inthe Tajan River Iran using physicochemical fish and macroinvertebrates indices J Environ Health Sci Eng 2015 13 260ndash269[CrossRef] [PubMed]
14 Aweng ER Ismid MS Maketab M The effect of land uses on physicochemical water quality at three rivers in Sungai Endauwatershed Kluang Johor Malaysia Aust J Basic Appl Sci 2011 5 923ndash932
15 Zarei H Pourreza Bilondi M Factor analysis of chemical composition in the Karoon River basin southwest of Iran Appl WaterSci 2013 3 753ndash761 [CrossRef]
16 Bere T Dalu T Mwedzi T Detecting the impact of heavy metal contaminated sediment on benthic macroinvertebratecommunities in tropical streams Sci Total Environ 2016 572 147ndash156 [CrossRef]
17 Unyimadu JP Osibanjo O Babayemi JO Selected persistent organic pollutants (POPs) in water of River Niger Occurrenceand distribution Environ Monit Assess 2018 190 6 [CrossRef]
18 Heatherly T Whiles MR Royer TV David MB Relationships between water quality habitat quality and macroinvertebrateassemblages in Illinois streams J Environ Qual 2007 36 1653ndash1660 [CrossRef]
19 Deborde DDD Hernandez MBM Magbanua FS Benthic macroinvertebrate community as an indicator of stream healthThe effects of land use on stream benthic macroinvertebrates Sci Diliman 2016 28 5ndash26
20 Borisko JP Kilgour B Stanfield LW Jones FC An evaluation of rapid bioassessment protocols for stream benthic invertebratesin Southern Ontario Canada Water Qual Res J Can 2007 42 184ndash193 [CrossRef]
21 Buss DF Vitorino AS Rapid bioassessment protocols using benthic macroinvertebrates in Brazil Evaluation of taxonomicsufficiency J N Am Benthol Soc 2010 29 562ndash571 [CrossRef]
22 Gupta M Paliwal A Role of aquatic insects of water quality in related to physico-chemical parameters in Yamuna River atdistrict Firozabad (UP) Adv Biores 2010 1 70ndash73
23 Mackintosh TJ Davis JA Thompson RM The influence of urbanisation on macroinvertebrate biodiversity in constructedstormwater wetlands Sci Total Environ 2015 536 527ndash537 [CrossRef]
24 Mermillod-Blondin F The functional significance of bioturbation and biodeposition on biogeochemical processes at the waterndashsediment interface in freshwater and marine ecosystems J N Am Benthol Soc 2011 30 770ndash778 [CrossRef]
25 Mereta ST Boets P Bayih AA Malu A Ephrem Z Sisay A Endale H Yitbarek M Jemal A De Meester L et alAnalysis of environmental factors determining the abundance and diversity of macroinvertebrate taxa in natural wetlands ofSouthwest Ethiopia Ecol Inform 2012 7 52ndash61 [CrossRef]
26 Floury M Usseglio-Polatera P Feacuterreacuteol M Delattre C Souchon Y Global climate change in large European rivers Long-termeffects on macroinvertebrate communities and potential local confounding factors Glob Chang Biol 2013 19 1085ndash1099[CrossRef]
27 Friberg N Bonada N Bradley DC Dunbar MJ Edwards FK Grey J Hayes RB Hildrew AG Lamouroux NTrimmer M et al Biomonitoring of human impacts in freshwater ecosystems The good the bad and the ugly Adv Ecol Res2011 44 1ndash68
28 Colas F Archaimbault V Feacuterard J-F Bouquerel J Roger M-C Devin S Benthic indicators of sediment quality associatedwith run-of-river reservoirs Hydrobiologia 2013 703 149ndash164
Water 2022 14 1490 23 of 26
29 Ferreira A Cyrino JEP Duarte-Neto PJ Martinelli LA Permeability of riparian forest strips in agricultural small subtropicalwatersheds in south-eastern Brazil Mar Freshw Res 2013 63 1272ndash1282 [CrossRef]
30 Dallas HF Rivers-Moore N Ecological consequences of global climate change for freshwater ecosystems in South Africa S AfrJ Sci 2014 110 1ndash11 [CrossRef]
31 Xu M Wang Z Duan X Pan B Effects of pollution on macroinvertebrates and water quality bio-assessment Hydrobiologia2014 729 247ndash259 [CrossRef]
32 Graeber D Jensen TM Rasmussen JJ Riis T Wiberg-Larsen P Baattrup-Pedersen A Multiple stress response of lowlandstream benthic macroinvertebrates depends on habitat type Sci Total Environ 2017 599ndash600 1517ndash1523 [CrossRef] [PubMed]
33 Tafangenyasha C Dzinomwa T Land-use impacts on river water quality in lowveld sand river systems in south-east ZimbabweLand Use Water Resour Res 2005 5 31ndash310
34 Adandedjan D Lalegraveyegrave P Ouattara A Gourene G Distribution of benthic insect fauna in a West African lagoon ThePorto-Novo Lagoon in Beacutenin Asian J Biol Sci 2011 4 116ndash127 [CrossRef]
35 Kilonzo F Masese FO Van Griensven A Bauwens W Obando J Lens PNL Spatialndashtemporal variability in water qualityand macro-invertebrate assemblages in the Upper Mara River basin Kenya Phys Chem Earth Parts ABC 2014 67ndash69 93ndash104[CrossRef]
36 Mutonkole Senga P Tshitenge Mbuebue J-M Masamba Lulendo N Benthic macroinvertebrates as indicators of water qualityA case-study of urban Funa stream (in Kinshasa Democratic Republic of Congo) Open J Water Pollut Treat 2015 2 8ndash24
37 Onana FM Zeacutebazeacute Togouet SH Koji E Nyamsi Tchatcho NL Tchakonteacute S Influence of municipal and industrial pollutionon the diversity and the structure of benthic macro-invertebrates community of an urban river in Douala Cameroon J BiodiversEnviron Sci 2016 8 120ndash133
38 Koji E Noah Ewoti OV Onana FM Tchakonteacute S Lontsi Djimeli C Tamsa Arfao A Bricheux G Sime-Ngando T Nola MInfluence of anthropogenic pollution on the abundance dynamics of some freshwater invertebrates in the coastal area of CameroonJ Environ Prot 2017 8 810ndash829 [CrossRef]
39 Edia OE Bony KY Konan KF Ouattara A Gouregravene G Distribution of aquatic insects among four costal river habitats(Cocircte drsquoIvoire West-Africa) Bull Env Pharmacol Life Sci 2013 2 68ndash77
40 Kaboreacute I Moog O Alp M Guenda W Koblinger T Mano K Oueacuteda A Oueacutedraogo R Trauner D Melcher AHUsing macroinvertebrates for ecosystem health assessment in semi-arid streams of Burkina Faso Hydrobiologia 2016 766 57ndash74[CrossRef]
41 Foto Menbohan S Tchakonteacute S Ajeagah GA Zeacutebazeacute Togouet SH Bilong Bilong CF Njineacute T Water quality assessmentusing benthic macroinvertebrates in a peri-urban stream (Cameroon) Int J Biotechnol 2013 2 91ndash104
42 Tchakonteacute S Ajeagah GA Camara AI Diomandeacute D Nyamsi Tchatcho NL Ngassam P Impact of urbanization on aquaticinsect assemblages in the coastal zone of Cameroon The use of biotraits and indicator taxa to assess environmental pollutionHydrobiologia 2015 755 123ndash144 [CrossRef]
43 Heino J Virkkala R Toivonen H Climate change and freshwater biodiversity Detected patterns future trends and adaptationsin northern regions Biol Rev 2009 84 39ndash54 [CrossRef]
44 Poulton BC Graham JL Rasmussen TJ Stone ML Responses of macroinvertebrate community metrics to a wastewaterdischarge in the Upper Blue River of Kansas and Missouri USA J Water Resour Prot 2015 7 1195ndash1220 [CrossRef]
45 Parent-Raoult C Boisson JC Impacts des rejets urbains de temps de pluie (RUTP) sur les milieux aquatiques Eacutetat desconnaissances Rev Sci Eau 2007 20 229ndash239
46 Olivry JC Fleuves et Riviegraveres du Cameroun Edition Mesres-Orstom Paris France 1986 733p47 Abdi H Valentin D Multiple Correspondence Analysis In Encyclopedia of Measurement and Statistics Salkind N Ed Sage
Thousand Oaks CA USA 200748 Borcard D Gillet F Legendre P Numerical Ecology with R Springer New York NY USA 2011 319p49 Stark JD Boothroyd KG Harding JS Maxted JR Scarsbrook MR Protocols for Sampling Macroinvertebrates in Wadeable
Streams New Zealand Macro-Invertebrates Working Group Report No1 Ministry for the Environment and SustainableManagement Fund Project n 5103 2001 Available online httpsriversgrouporgnzwp-contentuploads201806413-macroinvertebrate-samplingpdf (accessed on 5 September 2015)
50 Mpakam HG Water Resource Vulnerability to Pollution in the Bafoussam Region (West Cameroon) and Socio-Economic andHealth Effects Sanitation Procedures PhD Thesis University of Yaoundeacute I Yaoundeacute Cameroon 2009
51 Durand JR Leacutevecircque C Flore et Faune Aquatiques de lrsquoAfrique Saheacutelo-Soudanienne Tome II Edition de lrsquoORSTOM Paris France1981 517p
52 Day JA Harrison AD de Moor IJ Guides to the freshwater invertebrates of Southern Africa Volume 9 Diptera In WaterResearch Commission Report No TT 20102 Water Research Commission Pretoria South Africa 2002 210p
53 De Moor IJ Day JA Guides to the freshwater invertebrates of Southern Africa Volume 6 Arachnida amp Mollusca Chapter3 Mollusca In Water Research Commission Report No TT 18202 Water Research Commission Pretoria South Africa 2002pp 42ndash125
54 De Moor IJ Day JA De Moor FC Guides to the freshwater invertebrates of Southern Africa Volume 7 Insecta IEphemeroptera Odonata amp Plecoptera In Water Research Commission Report No TT 20703 Water Research CommissionPretoria South Africa 2003 301p
Water 2022 14 1490 24 of 26
55 De Moor IJ Day JA De Moor FC Guides to the freshwater invertebrates of Southern Africa Volume 8 Insecta II HemipteraMegaloptera Neuroptera Trichoptera amp Lepidoptera In Water Research Commission Report No TT 21403 Water ResearchCommission Pretoria South Africa 2003 219p
56 Tachet H Richoux P Bournaud M Usseglio-Polatera P Inverteacutebreacutes drsquoEau Douce Systeacutematique Biologie Eacutecologie CNRS EacuteditionsParis France 2010 600p
57 Barbour MT Gerritsen J Snyder BD Stribling JB Rapid Bioassessment Protocols for Use in Streams and Wadeable RiversPeriphyton Benthic Macroinvertebrates and Fish (Volume 339) US Environmental Protection Agency Office of Water WashingtonDC USA 1999
58 Shannon CE A mathematical theory of communication Bell Syst Tech J 1948 27 379ndash423 [CrossRef]59 Feld CK de Bello F Doleacutedec S Biodiversity of traits and species both show weak responses to hydromorphological alteration
in lowland river macroinvertebrates Freshw Biol 2014 59 233ndash248 [CrossRef]60 Pielou EC The measurement of diversity in different types of biological collections J Theor Biol 1966 13 131ndash144 [CrossRef]61 Buffagni A Erba S Cazzola M Murray-Bligh J Soszka H Genoni P The STAR common metrics approach to the WFD
intercalibration process Full application for small lowland rivers in three European countries Hydrobiologia 2006 566 379ndash399[CrossRef]
62 APHA Standard Method for Examination of Water and Wastewater 20th ed American Public Health Association Washington DCUSA 1998 1150p
63 Rodier J Legube B Marlet N Brunet R LrsquoAnalyse de lrsquoEau 9th ed Dunod Paris France 2009 1579p64 Siegel S Castellan NJ Non Parametric Statistics for the Behavioral Sciences McGraw-Hill New York NY USA 1988 399p65 Doleacutedec S Chessel D Rythmes saisonniers et composantes stationnelles en milieu aquatique II Prise en compte et eacutelimination
drsquoeffets dans un tableau faunistique Acta Oecol Oecol Gen 1989 10 207ndash23266 Legendre P Anderson MJ Distance-based redundancy analysis Testing multispecies responses in multifactorial ecological
experiments Ecol Monogr 1999 69 1ndash24 [CrossRef]67 Dray S Dufour AB The ade4 package Implementing the duality diagram for ecologists J Stat Softw 2007 22 1ndash20 [CrossRef]68 Dixon P VEGAN a package of R functions for community ecology J Veg Sci 2003 14 927ndash930 [CrossRef]69 R Development Core Team R A Language and Environment for Statistical Computing R Foundation for Statistical Computing
Vienna Austria 201570 Chevenet F Doleacutedec S Chessel D A fuzzy coding approach for the analysis of long-term ecological data Freshw Biol 1994
31 295ndash309 [CrossRef]71 Galani JH Houbraken M Wumbei A Djeugap JF Fotio D Spanoghe P Evaluation of 99 pesticide residues in major
agricultural products from the Western Highlands Zone of Cameroon using QuEChERS method extraction and LC-MSMS andGC-ECD analyses Foods 2018 7 184 [CrossRef]
72 Oscoz J Galicia D Miranda R (Eds) Identification Guide of Freshwater Macroinvertebrates of Spain Springer Dordrecht TheNetherlands 2011 45p
73 Morrissey CA Boldt A Mapstone A Newton J Ormerod SJ Stable isotopes as indicators of wastewater effects on themacroinvertebrates of urban rivers Hydrobiologia 2013 700 231ndash244 [CrossRef]
74 Varandas SG Cortes RMV Evaluating macroinvertebrate biological metrics for ecological assessment of streams in northernPortugal Environ Monit Assess 2010 166 201ndash221 [CrossRef]
75 Hepp LU Restello RM Milesi SV Biasi C Molozzi J Distribution of aquatic insects in urban headwater streams ActaLimnol Bras 2013 25 1ndash9 [CrossRef]
76 Prommi T Payakka A Aquatic insect biodiversity and water quality parameters of streams in Northern Thailand Sains Malays2015 44 707ndash717 [CrossRef]
77 Qu X Wu N Tang T Cai Q Park YS Effects of heavy metals on benthic macroinvertebrate communities in high mountainstreams Ann Limnol 2010 46 291ndash302 [CrossRef]
78 Rawson CA Lim RP Tremblay LA Warne MSJ Ying GG Laginestra E Chapman JC Benthic macroinvertebrateassemblages in remediated wetlands around Sydney Australia Ecotoxicology 2010 19 1589ndash1600 [CrossRef] [PubMed]
79 Arimoro FO Muller WJ Mayfly (Insecta Ephemeroptera) community structure as an indicator of the ecological status of astream in the Niger Delta area of Nigeria Environ Monit Assess 2010 166 581ndash594 [CrossRef] [PubMed]
80 Shelly SY Mirza ZB Bashir S Comparative ecological study of aquatic macroinvertebrates of Mangla dam and Chashmabarrage wetland areas J Anim Plant Sci 2011 21 340ndash350
81 Myers LW Kondratieff BC Mihuc TB Ruiter DE The mayflies (Ephemeroptera) stoneflies (Plecoptera) and caddisflies(Trichoptera) of the Adirondack Park (New York State) Trans Am Entomol Soc 2011 137 63ndash140 [CrossRef]
82 Kaboreacute I Oueacutedraogo I Tampo L Oueacuteda A Moog O Guenda W Melcher AH Composition and dynamic of benthicmacroinvertebrates community in semi-arid area rivers of Burkina Faso (West Africa) Int J Biol Chem Sci 2016 10 1542ndash1561[CrossRef]
83 Duka S Pepa B Keci E Paparisto A Lazo P Biomonitoring of water quality of the Osumi Devolli and Shkumbini riversthrough benthic macroinvertebrates and chemical parameters J Environ Sci Health Part A 2017 52 471ndash478 [CrossRef]
Water 2022 14 1490 25 of 26
84 Nyamsi Tchatcho NL Foto Menbohan S Zeacutebazeacute Togouet SH Onana FM Adandedjan D Tchakonteacute S Yeacutemeacuteleacute Tsago CKoji E Njineacute T Indice multimeacutetrique des macroinverteacutebreacutes benthiques yaoundeacuteens (IMMY) pour lrsquoeacutevaluation biologique de laqualiteacute des eaux des cours drsquoeau de la reacutegion du Centre Sud Forestier du Cameroun Eur J Sci Res 2014 123 412ndash430
85 Cook SE Fisher MJ Andersson MS Rubiano J Giordano M Water food and livelihoods in river basins Water Int 200934 13ndash29 [CrossRef]
86 Dar PA Reshi ZA Components processes and consequences of biotic homogenization A review Contemp Probl Ecol 20147 123ndash136 [CrossRef]
87 Doretto A Piano E Bona F Fenoglio S How to assess the impact of fine sediments on the macroinvertebrate communities ofalpine streams A selection of the best metrics Ecol Indic 2018 84 60ndash69 [CrossRef]
88 Mondy CP Villeneuve B Archaimbault V Usseglio-Polatera P A new macroinvertebrate-based multimetric index (I2M2) toevaluate ecological quality of French wadeable streams fulfilling the WFD demands A taxonomical and trait approach EcolIndic 2012 18 452ndash467 [CrossRef]
89 Warwick RM Clarke KR New lsquobiodiversityrsquo measures reveal a decrease in taxonomic distinctness with increasing stress MarEcol Prog Ser 1995 129 301ndash305 [CrossRef]
90 Boumlhmer J Rawer-Jost C Zenker A Multimetric assessment of data provided by water managers from Germany Assessment ofseveral different types of stressors with macrozoobenthos communities Hydrobiologia 2004 516 215ndash228 [CrossRef]
91 Dedieu N Clavier S Vigouroux R Cerdan P Ceacutereacuteghino R A multimetric macroinvertebrate index for the implementation ofthe European Water Framework Directive in French Guiana East Amazonia River Res Appl 2016 32 501ndash515 [CrossRef]
92 Stoddard JL Herlihy AT Peck DV Hughes RM Whittier TR Tarquinio E A process for creating multimetric indices forlarge-scale aquatic surveys J N Am Benthol Soc 2008 27 878ndash891 [CrossRef]
93 Pereira PS Souza NF Baptista DF Oliveira JLM Buss DF Incorporating natural variability in the bioassessment of streamcondition in the Atlantic Forest biome Brazil Ecol Indic 2016 69 606ndash616 [CrossRef]
94 Brabec K Zahraacutedkovaacute S Nemejcovaacute D Paril P Kokeš J Jarkovskyacute J Assessment of organic pollution effect consideringdifferences between lotic and lentic stream habitats Hydrobiologia 2004 516 331ndash346 [CrossRef]
95 Ofenboumlck T Moog O Gerritsen J Barbour M A stressor specific multimetric approach for monitoring running waters inAustria using benthic macroinvertebrates Hydrobiologia 2004 516 251ndash268 [CrossRef]
96 Hering D Feld CK Moog O Ofenboumlck T Cook book for the development of a multimetic index for biological conditionof aquatic ecosystems Experiences from the European AQEM and STAR projects and related initiatives Hydrobiologia 2006566 311ndash324 [CrossRef]
97 Chen K Hughes RM Xu S Zhang J Cai D Wang B Evaluating performance of macroinvertebrate-based adjusted andunadjusted multi-metric indices (MMI) using multi-season and multi-year samples Ecol Indic 2014 36 142ndash151 [CrossRef]
98 Chessman BC Thurtell LA Royal MJ Bioassessment in a harsh environment A comparison of macroinvertebrate as-semblages at reference and assessment sites in an Australian inland river system Environ Monit Assess 2006 119 303ndash330[CrossRef]
99 Pond GJ Biodiversity loss in Appalachian headwater streams (Kentucky USA) Plecoptera and Trichoptera communitiesHydrobiologia 2012 679 97ndash117 [CrossRef]
100 Buffagni A Erba S Cazzola M Kemp JL The AQEM multimetric system for the southern Italian Apennines Assessingthe impact of water quality and habitat degradation on pool macroinvertebrates in Mediterranean rivers Hydrobiologia 2004516 313ndash329 [CrossRef]
101 Dias-Silva K Cabette HSR Juen L De Marco P Jr The influence of habitat integrity and physical-chemical water variableson the structure of aquatic and semi-aquatic Heteroptera Zoologia (Curitiba) 2010 27 918ndash930 [CrossRef]
102 Vieira TB Dias-Silva K Paciacutefico ES Effects of riparian vegetation integrity on fish and Heteroptera communities Appl EcolEnviron Res 2014 13 53ndash65
103 Verdonschot RCM Keizer-Vlek HE Verdonschot PFM Development of a multimetric index based on macroinvertebratesfor drainage ditch networks in agricultural areas Ecol Indic 2012 13 232ndash242 [CrossRef]
104 Pinto P Rosado J Morais M Antunes I Assessment methodology for southern siliceous basins in Portugal Hydrobiologia2004 516 191ndash214 [CrossRef]
105 Lafont M Camus JC Rosso A Superficial and hyporheic oligochaete communities as indicators of pollution and waterexchange in the River Moselle France Hydrobiologia 1996 334 147ndash155 [CrossRef]
106 Prygiel J Rosso-Darmet A Laffont M Lesniak C Durbec A Ouddane B Use of oligochaete communities for assessmentof ecotoxicological risk in fine sediment of rivers and canals of the Artois-Picardie water basin (France) Hydrobiologia 1999410 25ndash37 [CrossRef]
107 Vivien R Tixier G Lafont M Use of oligochaete communities for assessing the quality of sediments in watercourses of theGeneva area (Switzerland) and Artois-Picardie basin (France) Proposition of heavy metal toxicity thresholds Ecohydrol Hydrobiol2014 14 142ndash151 [CrossRef]
108 Failla AJ Vasquez AA Fujimoto M Ram JL The ecological economic and public health impacts of nuisance chironomidsand their potential as aquatic invaders Aquat Invasions 2015 10 1ndash15 [CrossRef]
Water 2022 14 1490 26 of 26
109 Machado NG Nassarden DCS dos Santos F Boaventura ICG Perrier G de Souza FSC de Lima Martins E Biudes MSChironomus larvae (Chironomidae Diptera) as water quality indicators along an environmental gradient in a neotropical urbanstream Rev Ambient Agua 2015 10 298ndash309 [CrossRef]
110 Odume ON Muller WJ Diversity and structure of Chironomidae communities in relation to water quality differences in theSwartkops River Phys Chem Earth Parts ABC 2011 36 929ndash938 [CrossRef]
111 Masese FO Kitaka N Kipkemboi J Gettel GM Irvine K McClain ME Macroinvertebrate functional feeding groups inKenyan highland streams Evidence for a diverse shredder guild Freshw Sci 2014 33 435ndash450 [CrossRef]
112 Kalkman VJ Clausnitzer V Dijkstra KDB Orr AG Paulson DR van Tol J Global diversity of dragonflies (Odonata) infreshwater Hydrobiologia 2008 595 351ndash363 [CrossRef]
113 Samways MJ Steytler NS Dragonfly (Odonata) distribution patterns in urban and forest landscapes and recommendationsfor riparian management Biol Conserv 1996 78 279ndash288 [CrossRef]
114 Miguel TB Oliveira-Junior JMB Ligeiro R Juen L Odonata (Insecta) as a tool for the biomonitoring of environmentalquality Ecol Indic 2017 81 555ndash566 [CrossRef]
115 De Oliveira Junior JMB Shimano Y Gardner TA Hughes RM Marco Juacutenior P Juen L Neotropical dragonflies (InsectaOdonata) as indicators of ecological condition of small streams in the eastern Amazon Austral Ecol 2015 40 733ndash744 [CrossRef]
116 Tonkin JD Bogan MT Bonada N Rios-Touma B Lytle DA Seasonality and predictability shape temporal species diversityEcology 2017 98 1201ndash1216 [CrossRef]
117 Dalu T Wasserman RJ Tonkin JD Mwedzi T Magoro ML Weyl OLF Water or sediment Partitioning the role of watercolumn and sediment chemistry as drivers of macroinvertebrate communities in an austral South African stream Sci TotalEnviron 2017 607ndash608 317ndash325 [CrossRef]
118 Callisto M Goulart M Medeiros AO Moreno P Rosa CA Diversity assessment of benthic macroinvertebrates yeastsand microbiological indicators along a longitudinal gradient in Serra Do Cipoacute Brazil Braz J Biol 2004 64 743ndash755 [CrossRef][PubMed]
119 Tonkin JD Arimoro FO Haase P Exploring stream communities in a tropical biodiversity hotspot Biodiversity regionaloccupancy niche characteristics and environmental correlates Biodivers Conserv 2016 25 975ndash993 [CrossRef]
120 Dalu T Wasserman RJ Tonkin JD Alexander ME Dalu MTB Motitsoe SN Manungo KI Bepe O Dube T Assessingdrivers of benthic macroinvertebrate community structure in African highlands An exploration using multivariate analysis SciTotal Environ 2017 601ndash602 1340ndash1348 [CrossRef] [PubMed]
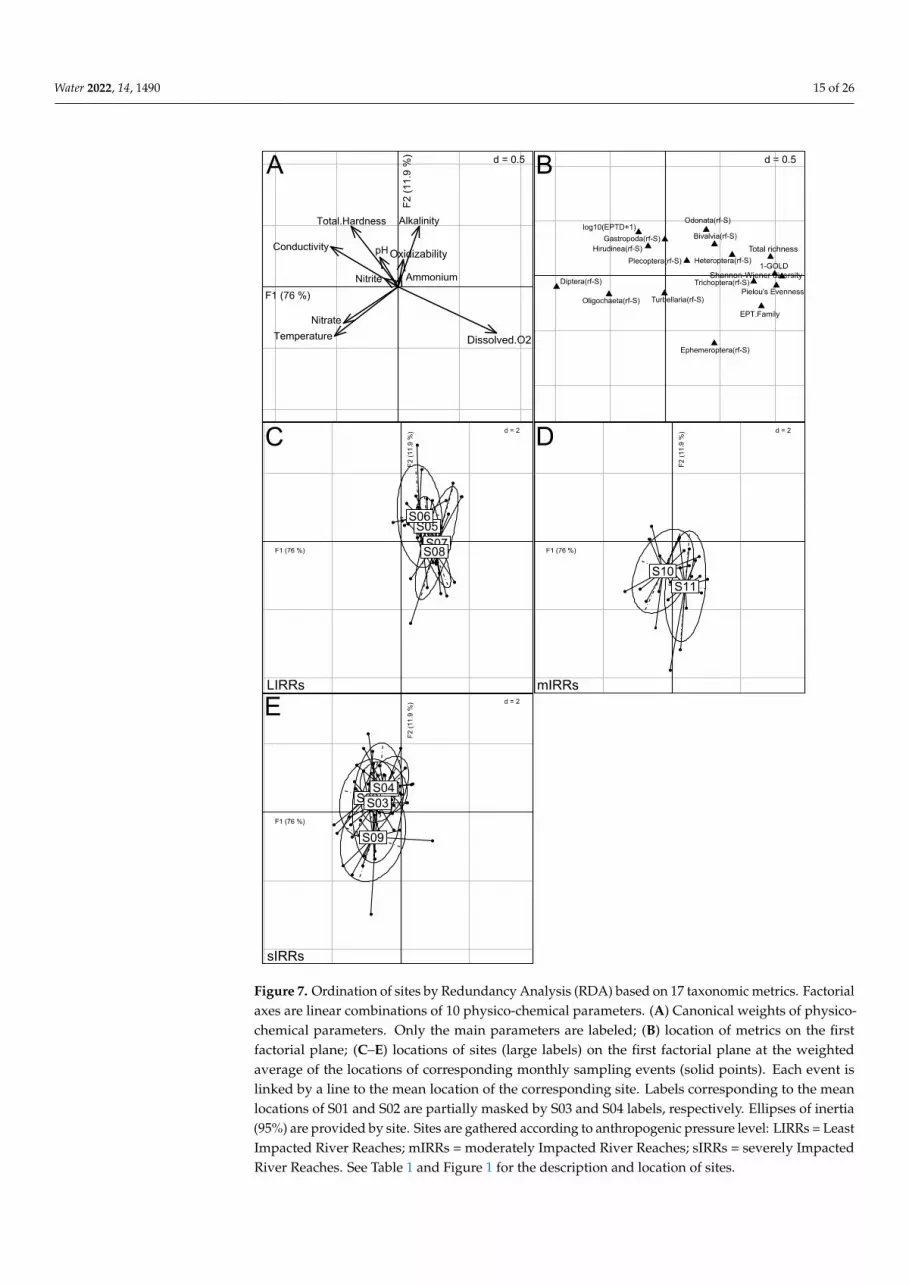


