Embed Size (px)
Citation preview
Financial Management (MKAM1103)
1.0 Introduction
Malaysian economy continued to expand despite the morechallenging external environment. The real Gross Domestic Product(GDP) recorded a growth of 5.1 per cent in 2011. Despite thechallenging environment, the Malaysian economy registered ahigher growth due to stronger domestic demand. The robustdomestic demand was driven by an expansion in both household andbusiness spending as well as higher public sector expenditure.
Basically Good infrastructure is critical for the long termeconomic development of a country. Key infrastructure assetscreate additional economic benefits by supporting urbanizationand industrial growth and providing better access to adjoiningcountries and stronger trade links.This, in turn, accelerates growth in GDP per capita and thereforethe ability to derive greater financial returns. Underlying theseneeds are other core infrastructure requirements from energygeneration and distribution systems to water supply, sanitationand social infrastructure such as schools and hospitals.
Meanwhile, this report is addressing the issues related toinvestment in Malaysian construction sector particularly, theinvestment in Green Buildings, However, the report highlights therelationship between the privet and public investmentspecifically in agriculture, industrial and trade, transportationand communication and construction sectors, Apart from that itillustrate the financial structure and the corporate performancein Malaysian construction sector.
2.0 The Global Index for financial Investment
The Global Infrastructure Investment Index ranks the world’s41 most dynamic countries with the greatest potential for growthand investment in their economic infrastructure. Economicinfrastructure comprises the infrastructure that makes business
Page 1
Financial Management (MKAM1103)
activity possible such as transportation, communication,distribution and energy assets. A total of 26 individual criteriain five key areas are analysed and given a weighting which thencreates an overall score for each market. The indicators selectedare those most pertinent to investors when making an investmentin infrastructure.
Most weighting goes to indicators of dynamism but theoverall blend creates the final ranking.
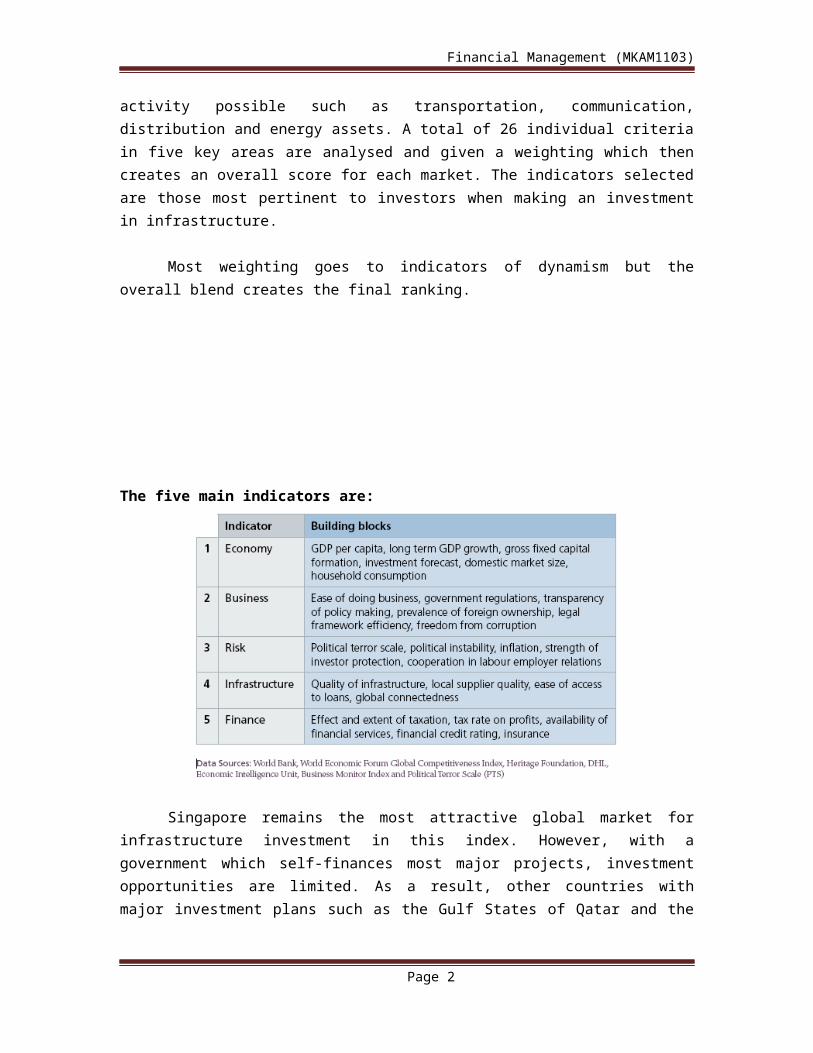
The five main indicators are:
Singapore remains the most attractive global market forinfrastructure investment in this index. However, with agovernment which self-finances most major projects, investmentopportunities are limited. As a result, other countries withmajor investment plans such as the Gulf States of Qatar and the
Page 2
Financial Management (MKAM1103)
UAE, alongside developing Asian markets such as Malaysia and thePhilippines, are more promising for investors.
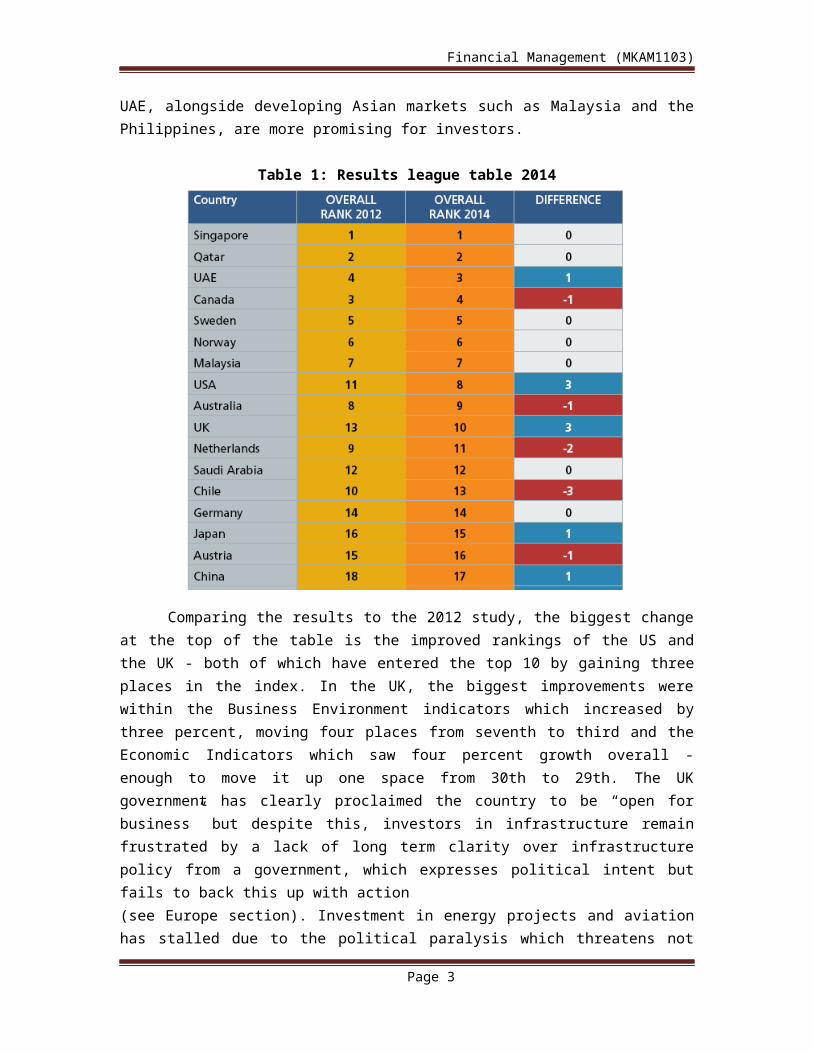
Table 1: Results league table 2014
Comparing the results to the 2012 study, the biggest changeat the top of the table is the improved rankings of the US andthe UK - both of which have entered the top 10 by gaining threeplaces in the index. In the UK, the biggest improvements werewithin the Business Environment indicators which increased bythree percent, moving four places from seventh to third and theEconomic Indicators which saw four percent growth overall -enough to move it up one space from 30th to 29th. The UKgovernment has clearly proclaimed the country to be “open forbusiness” but despite this, investors in infrastructure remainfrustrated by a lack of long term clarity over infrastructurepolicy from a government, which expresses political intent butfails to back this up with action(see Europe section). Investment in energy projects and aviationhas stalled due to the political paralysis which threatens not
Page 3
Financial Management (MKAM1103)
only the UK’s international competitiveness but also its abilityto “keep the lights on” post 2015.
At the same time, the US has seen significant improvementsin its infrastructure and economic environments, having made athree percent gain and moving its Infrastructure ranking from12th to 10th. Key to this increased attractiveness is the ongoingeconomic stability and the huge investment needed ininfrastructure. The American Society for
Civil Engineers (ASCE) estimated in its latest report cardthat $3.6trillion was needed by 2020 across 16 key asset sectors.With only $2trillion in investment forecast the US is expected toincreasingly call on private finance.
Other countries making significant gains on theircomparative attractiveness in 2012 include South Africa, thePhilippines and Indonesia. Asian markets in particular aregenerating a lot of interest among investors thanks to theirlarge infrastructure construction programmes, coupled with stronggrowth potential. However, returns must outweigh the businessrisks, which are significant, including corruption. Attempts totackle this are ongoing and success in this area would see thesecountries rise further up the index.
By analysis of total overall scores, Colombia recorded thebiggest increase in performance with a 6 percent rise compared to2012. This reflects the strong economic expansion that thecountry has recently experienced with increased foreign directinvestment over the past few years. Investment as a percentage offiscal spending has grown from 10 percent to 15 percent in thelast decade. In the main growth has been driven by the oil andgas, mining and agriculture sectors. According to the ColombianOil Association a further $120billion in investment is requiredover the next decade, highlighting vast opportunities forconstruction players.
Page 4
Financial Management (MKAM1103)
2.1 Asia Pacific Region
It is not surprising to see Singapore continuing to be aworld leader in terms of attractiveness to investors. It is oneof the few places in the world where there is a truly integratedstrategic plan which links infrastructure planning with businessand social requirements. The government is very pro-business andin terms of value of built assets (see ARCADIS Global Built AssetWealth Index) the country has the highest value per capita in theworld at US$156,000. This demonstrates the commitment toinfrastructure investment pursued by the government to promotethe quality of life that its population requires.
As part of its long term plan the government wants toincrease Singapore’s population from 5.5million to 7million by2030 and it has planned the infrastructure accordingly. Thismeans doubling the length of the Singapore Mass Rapid Transit(MRT) system to 360km, building new airport terminals and a thirdrunway as well as relocating the main container port to Tuas inorder to almost double container capacity and free up primedevelopment land.
Singapore’s affluence means that opportunities to invest arehowever limited as mature government entities finance and managemajor projects. One foray into private investment to date hasbeen the Singapore Sports Hub, a 35 hectare complex including anew 55,000 seat National Stadium in Kallang which opened in June2014. A consortium of international companies including equityinvestors, contractors, event organisers and facilitiesmanagement firms delivered the project under a design, build,finance and operate (DBFO) structure for client Sports Singapore.However, this kind of opportunity is limited and investors haveturned to more commercial investment in property as a way tocapitalise on the country’s growth potential. As a result, othercountries in Asia offer more opportunities for investors ininfrastructure.
Page 5
Financial Management (MKAM1103)
Neighbouring Malaysia for example, which ranks seventh inthe global index, is using its 10th five year development plan(2011-2015) to build infrastructure which promotes economicgrowth and productivity. It is also actively seeking to improvethe business environment and attract more foreign investment. Itscores highly across the investment criteria, with its economicranking improving from 11th in the index in 2012 to seventh in2014. Investment plans include a high speed rail link toSingapore, major investment in roads, rail and ports andupgrading Kuala Lumpar International Airport along with otheraviation spending.
Other Asian markets such as Indonesia and the Philippinesalso offer major infrastructure investment opportunities andgovernments are actively encouraging the private sector to take adelivery role, however they are higher risk from a businessperspective. Suggestions of corruption have historically stifledinvestor involvement and keep these markets in the second half ofthe index at 23rd and 29th respectively. However both countrieshave moved up three places with the Philippines in particularshowing major economic improvement since 2012.
By economic ranking alone the Philippines ranked 19th in2012 and has moved to 12th in 2014 thanks to increases ininternal investment and household consumption. What is more, thecountry has taken a proactive stand on corruption with PresidentBenigno Aquino III actively pursuing an anti-corruption agenda. Adedicated PPP unit is now engaging private finance models as aroute to getting infrastructure on track. Investment is neededacross all sectors from power and energy to transport, waterdistribution and social infrastructure.
Indonesia too has massive infrastructure needs, among thebiggest in the region. It is seeking to become one of the 10largest economies in the world by 2025 and has produced plans
Page 6
Financial Management (MKAM1103)
that list over 900 priority infrastructure projects. Despitethis, investors will remain cautious until alleged corruption istackled and until then, they should look make use of skills andinsight available to manage and mitigate risks which have thepower to outweigh potential returns.
China remains in the top 20, moving up one place to 17th inthe ranking. Its dynamic domestic market, including itspopulation growth and accompanying increases in urbanisation plusthe rise of the middle classes, particularly in in the Westernregion is leading to higher consumer consumption, which increasesits attractiveness to private investors as the need forinfrastructure to facilitate growth does not wain. Governmenttransparency and the ease with which foreign investors can investin infrastructure projects in China still lags some way behindits Asian neighbours, Malaysia and Singapore.
2.2 Middle East Region
The most dynamic infrastructure investment markets in theMiddle East are located in the Gulf with Qatar, the United ArabEmirates and Saudi Arabia all scoring in the top third of theindex. These cash rich, economic powerhouses have some of thehighest investment profiles of anywhere in the globe with averagegrowth in construction services reaching double digits.
Despite their cash-rich, hydrocarbon enriched positionsthese countries are all experienced in harnessing privateinvestment, with the UAE and Qatar in particular having relied onaccess to cheap debt to finance investment. Looking ahead, thereare expectations that governments will seek to diversify fundingstreams further, accessing capital market finance to supportspending plans. The power sector is particularly mature in thisregard with the Middle East having a long history of IndependentWater and Power Projects (IWPPs). In August 2013 Ruwais PowerCompany in Abu Dhab in secured $825million in project bonds to
Page 7
Financial Management (MKAM1103)
support its Shuweihat 2 power and desalination plant refinancing,a move that Standard & Poor’s says could kick-start project bondsas a finance mechanism.
Access to finance will be critical as these countries scaleup investment. In Qatar and the UAE in particular, nationalvision strategies combined with major international events haveled to expectations of phenomenal peak spend in the next 4-5years.
Almost half of the investment planned relates totransportation, with every major city in the region planning tofollow Dubai in building a metro system with lines beingconstructed simultaneously in a relatively short period of time.At the same time ports, airports and a heavy rail network are allunder construction leading to increased competition forresources. The key risk in these markets therefore is inflationin construction resources from manpower and specialist skills toconstruction commodities.
In its “Qatar: Avoiding the Inflation Bubble” report from 2012,ARCADIS predicted that inflation could reach 18 percent between2016 and 2019. However, given overall investment levels aroundthe region mean up to 20 percent construction inflation is moreprobable. This is compounded because of the firm deadlines aroundprojects related to Qatar’s 2022 FIFA World Cup and Dubai’s 2020World Expo.
Although not planning to host global events, the Kingdom ofSaudi Arabia has its own unique drivers for pursuinginfrastructure, including the young population and need todiversify its incomes beyond oil and gas. Its population of29.2million makes it the largest market in the Gulf and with halfof the population being under 25 there is a pressing need tocreate jobs and opportunities for future generations.
Page 8
Financial Management (MKAM1103)
The Kingdom is seeking to grow the private sector andstimulate more job creation; however, higher political risksdetract from the attractiveness of the financial and economicindicators. What the three Gulf countries have in their favor istheir clear vision strategies delivered through five-yearinvestment plans which do offer certainty to investors.Theirstrong credit ratings and enviable taxation regimes will continueto appeal to investors despite the potential for risinginflation.
2.3 Europe Region
European countries present a mixed picture in theirattractiveness to investors. At the top of the table low riskmarkets like Sweden and Norway remain stable at fifth and sixthcompared to 2012. Both have highly efficient businessenvironments with transparency in regulation and efficient legalsystems. Sweden ranks as the least corrupt country in the index.However, both countries have small populations and highconstruction costs (see ARCADIS International Construction Costreport) resulting in limited investment potential.
Of the middle ranking European countries, the UK rankshighest at number 10, improving three spaces from its ranking of13th in 2012. Marginal improvements across all businessindicators and an improved financial and taxation environmentincreased its overall score. However, investors remain frustratedby a lack of long term clarity on infrastructure policy fromgovernment, which expresses political intent but fails to backthis up with action. Investment in energy projects and aviationhas stalled due to the political paralysis which threatens notonly the UK’s international competitiveness but also its abilityto “keep the lights on” post 2015 as its ageing power stationsare decommissioned. Politicians have shied away from makingpolicy decisions because they know that this will increase thecosts to consumers, regardless of the models implemented to
Page 9
Financial Management (MKAM1103)
finance the much needed new assets. In addition, the regulatorymodel in key sectors is becoming overly prescriptive.
3.0 Public and Private Investment in Malaysia
3.1 Macro facts of capital expenditures in Malaysia
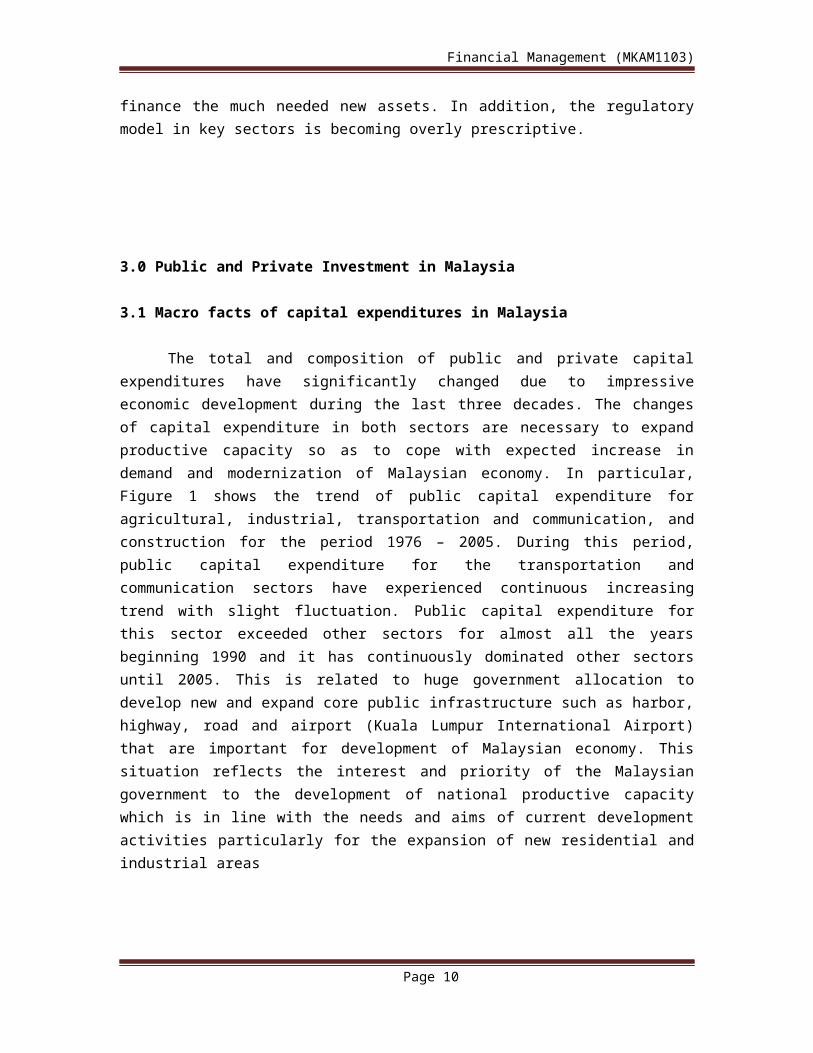
The total and composition of public and private capitalexpenditures have significantly changed due to impressiveeconomic development during the last three decades. The changesof capital expenditure in both sectors are necessary to expandproductive capacity so as to cope with expected increase indemand and modernization of Malaysian economy. In particular,Figure 1 shows the trend of public capital expenditure foragricultural, industrial, transportation and communication, andconstruction for the period 1976 – 2005. During this period,public capital expenditure for the transportation andcommunication sectors have experienced continuous increasingtrend with slight fluctuation. Public capital expenditure forthis sector exceeded other sectors for almost all the yearsbeginning 1990 and it has continuously dominated other sectorsuntil 2005. This is related to huge government allocation todevelop new and expand core public infrastructure such as harbor,highway, road and airport (Kuala Lumpur International Airport)that are important for development of Malaysian economy. Thissituation reflects the interest and priority of the Malaysiangovernment to the development of national productive capacitywhich is in line with the needs and aims of current developmentactivities particularly for the expansion of new residential andindustrial areas
Page 10
Financial Management (MKAM1103)
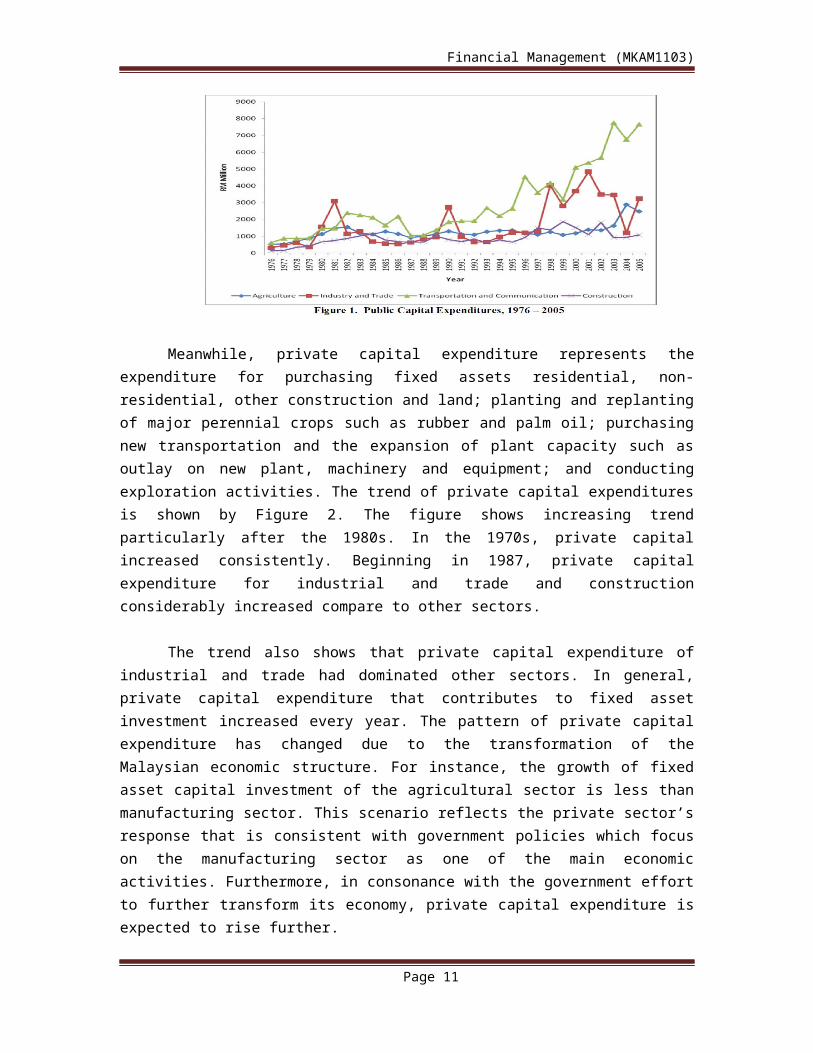
Meanwhile, private capital expenditure represents theexpenditure for purchasing fixed assets residential, non-residential, other construction and land; planting and replantingof major perennial crops such as rubber and palm oil; purchasingnew transportation and the expansion of plant capacity such asoutlay on new plant, machinery and equipment; and conductingexploration activities. The trend of private capital expendituresis shown by Figure 2. The figure shows increasing trendparticularly after the 1980s. In the 1970s, private capitalincreased consistently. Beginning in 1987, private capitalexpenditure for industrial and trade and constructionconsiderably increased compare to other sectors.
The trend also shows that private capital expenditure ofindustrial and trade had dominated other sectors. In general,private capital expenditure that contributes to fixed assetinvestment increased every year. The pattern of private capitalexpenditure has changed due to the transformation of theMalaysian economic structure. For instance, the growth of fixedasset capital investment of the agricultural sector is less thanmanufacturing sector. This scenario reflects the private sector’sresponse that is consistent with government policies which focuson the manufacturing sector as one of the main economicactivities. Furthermore, in consonance with the government effortto further transform its economy, private capital expenditure isexpected to rise further.
Page 11
Financial Management (MKAM1103)
3.2 Relationship between public and private investment inMalaysia
Public investment is argued as one of the important businessstimulus to private investment. Public and private investment maybe linked by a complementarity relationship if public capitalexerts positive stimulus on the private sector. Aschauer (1989a)claims that the positive influence of public investment towardsprivate investment can be explained by the public capitalhypothesis. According to this hypothesis, an increase in publicinvestment results in an increase in private investment as theavailability of economic and social infrastructure may createconducive condition for private decision to invest by offeringessential services to the production system both in the short-runand the long-run. However, this hypothesis still remains acontroversy as there is no consensus and convergence of opinionsespecially in terms of empirical evidence.
Sallahuddin Hassan claimed that public investment,particularly investment in industrial and trade, transportationand communication, and construction sectors has positive effecton private investment in all the four sectors. Public investmentin construction sector has contributed the largest effect ondomestic private investment followed by services sector. One
Page 12
Financial Management (MKAM1103)
percent increase in public investment in construction sectorcause a 1.9 percent increase in domestic private investment. Theresults obtained by Sallahuddin Hassan’s study are consistentwith the public capital hypothesis and other studies such as byBarth dan Cordes (1980) and Blejer and Khan (1984). Barth danCordes (1980) suggested that capital financed by the publicsector must be a catalyst to the private sector investment andoutput. Policy and incentives designed by the government gearedtowards a change in the economic structure result in a change inthe government expenditure composition. The governmentexpenditure encourage more private investment if focus is giventowards productive expenditure. A productive and large scalegovernment expenditure will have an impact on an increase inprivate investment activities.
Consequently, the level and composition of governmentexpenditure must be harmonized with the policy framework of anadjustment program, specifically for programs that influencedomestic private investment. Government expenditure analysis mustbe undertaken as part of the economic sector performanceanalysis. Specifically, the analysis will be able to evaluate andidentify the disparity and imbalance in allocation between andwithin sectors. Private investors will associate their investmentdecisions with the expenditure allocation by sectors. Sectorswhich receive a high allocation normally will be the focal pointof current economic change framework.
Finally, the step to reorientate public investment is veryimportant in influencing the development of economic sectors.Consistent with the change in focus of economic sectors or sectorshift, public investments in sectors which are very sensitive todomestic private investment change are very important. Sectorshift may cause a fluctuation in aggregate demand andconsequently cause a shift in investment.
Page 13
Financial Management (MKAM1103)
4.0 Capital Structure and Corporate Performance of MalaysianConstruction Sector
4.1 An Overview of Capital Structure and Corporate Performance
Capital structure refers to the firm’s financial frameworkwhich consists of the debt and equity used to finance the firm.Capital structure is one of the popular topics among the scholarsin finance field. The ability of companies to carry out theirstakeholders’ needs is tightly related to capital structure.Therefore, this derivation is an important fact that we cannotomit. Capital structure in financial term means the way a firmfinances their assets through the combination of equity, debt, orhybrid securities (Saad, 2010). In short, capital structure is amixture of a company’s debts (long-term and short-term), commonequity and preferred equity. Capital structure is essential onhow a firm finances its overall operations and growth by usingdifferent sources of funds. Modigliani-Miller (MM) theorem is thebroadly accepted capital structure theory because is it theorigin theory of capital structure theory which had been used bymany researchers. According to MM Theorem, these capitalstructure theories operate under perfect market. Variousassumptions of perfect market such as no taxes, rationalinvestors, perfect competition, absence of bankruptcy costs andefficient market. MM Theorem states that capital structure orfinances of a firm is not related to its value in perfect market.
In reality, capital structure of a firm is difficult todetermine. Financial managers are difficult to exactly determinethe optimal capital structure. A firm has to issue varioussecurities in a countless mixture to come across particularcombinations that can maximum its overall value which meansoptimal capital structure. Optimal capital structure means with aminimum weighted-average cost of capital and thereby maximize thevalue of firms. Although optimal capital structure is a topicthat had widely done in many researches, we cannot find anyformula or theory that decisively provides optimal capital
Page 14
Financial Management (MKAM1103)
structure for a firm. If irrelevant of capital structure to firmvalue in perfect market, then imperfections that exist in realitymay cause of its relevancy. Capital structure is closed link withcorporate performance (Tian and Zeitun, 2007). Corporateperformance can be measured by variables which involveproductivity, profitability, growth or, even, customers’satisfaction. These measures are related among each other.Financial measurement is one of the tools which indicate thefinancial strengths, weaknesses, opportunities and threats. Thosemeasurements are return on investment (ROI), residual income(RI), earning per share (EPS), dividend yield, price earningsratio, growth in sales, market capitalization etc (Barbosa &Louri, 2005).
4.2 Issue of the capital structure toward the performance ofcorporate
Based on Ebaid (2009) research, capital structure has weak-to-no influence on the financial performance of listed firms inEgypt. By using three accounting-based measurement of financialperformance which is Return On Asset (ROA), Return On Equity(ROE), and Gross Margin (GM), the empirical tests come put withthe result that capital structure (particularly short-term debtand total debt) which is measure by ROA have a negative impact onan organization’s performance. Apart from that, capital structure(including short-term debt, long-term debt and total debt) whichis measure by ROE and GM have no significant impact on anorganization’s performance. Zeitun and Tian (2007) find out thatfirm’s capital structure have a significant and negative impacton the firm’s performance measures in both the accounting andmarket measures. Apart from that, the short-term debt per totalasset (STDTA) has a significant relationship with the marketperformance measure (Tobin’s Q). The results also recommendedthat the Gulf Crisis on year 1990 to year1991 have effect on theJordanian firms' performance in a positive way. Furthermore, theperformance and leverage of Jordanian companies had increasedthroughout the Gulf Crisis. Zeitun and Tian (2007) also come out
Page 15
Financial Management (MKAM1103)
with the result that firm size has a positive impact on a firm’sperformance, as large firms have low bankruptcy costs. In otherwords, bankruptcy costs increases when firm size decreases,therefore, bankruptcy costs have negative effect on firm’sperformance. The standard of increasing capital in Malaysia willbecame higher hard achieve due to the higher risk premier.Although capital structure and the impact of the value andperformance had been study for many years, researchers stillcannot agree on the extent of the impact.
4.3 Relationship between capital performance of firms inconstruction sector
Basically, the are some elements to be identified in lightwith comparison between the duration before & after the worldfinancial cries (2005-2008), The Elements which have beenaddressed in the relevant article are the following :
The nature of relationship between capital structure andcorporate performance of firm inconstruction sector before and during crisis. The interdependence between capital structure and corporateperformance of firm in construction sector.
The stability of the companies’ capital structure in theconstruction sectors.There are many variables in a capital structure choice andstructure of debt maturity which will affect a company’sperformance. Debt maturity will influence a company’s option ininvesting. Furthermore, tax rate will also affect company’sperformance.
A study had been done by Abor (2005) on the influence ofcapital structure on profitability of listed companies on theGhana Stock Exchange during a five-year period. He found out thatthere is significant positively interrelated between SDA and ROEand shows that firms which earn a lot use more short-term debt tofinance their business. In other words, short-term debt is an
Page 16
Financial Management (MKAM1103)
essential source of financing in favor of Ghanaian companies, byrepresenting 85 percent of total debt financing. Yet, the resultsshowed the adverse relation between LDA and ROE. The regressionoutput showed that there is positive relationship between DA andROE which measure the relationship between total debt andprofitability,. This indicates that firms which earn a lot aredepending on debt as their key financing option
A study (Akintoye, 2008) had been done on sensitivity ofperformance to capital structure on selected food and beveragecompany in Nigeria. The result shows that performance indicatorsto turnover ( Earnings Before Interest and Taxes, Earninig PerShare and Dividend Per Share) and the measures of leverage(Degree of Operating Leverage, Degree of Financial Leverage andDividend Per Share) are significantly sensitive.
There are many approaches in examining firm performance.Berger and Bonaccorsi (2006) had used profit efficiency as theperformance measure. Manager’s performance were evaluate by usingprofit efficiency because profit efficiency counter for theeffectiveness of manager to raise revenue and control cost and isclose to the concept of value maximization. By measuring theprofit efficiency, shareholder losses from agency costs arerelatively close to the losses of potential accounting profits.The result shows that neither higher leverage nor lower equitycapital ratio are connected with higher profit efficiency for allrange of data.
4.4 Capital Structure and Corporate Performance for Malaysianconstruction sector
Financial crisis 2007, is an important incident which causesby a shortfall in United States banking system and consequentlyleads to the collapse of huge financial institutions and downturnof stock markets worldwide. Financial crisis is likely to bestrongly related with corporate poor performance. A study done byClaessens, Djankov and Xu, (2000) had compared the growth and
Page 17
Financial Management (MKAM1103)
financing patterns of East Asian corporations for the year beforecrisis with corporation in other countries. The sample was from850 public listed firms in the four countries which were alsoinfluence by crisis, there are Indonesia, Malaysia, the Republicof Korea, and Thailand and two comparators, Hong Kong (China) aswell as Singapore. The result show that firm-specific weaknesseswhich already in exist before the crisis were essential factorsin the failing performance of the corporate sector. Based on Suto(2003) study on capital structure for 1997 crisis, the key factorwhich accelerated economic distress is due to increase dependencyon debt financing. The dependency had led to excess investmentbefore the crisis and also instability in the Malaysia economy.
The banks’ capabilities to get information of monitoringborrowers were overestimated before crisis. Furthermore, it alsocannot be correctly estimated due to the protection by governmentfor domestic banking sectors. This occasion had weakened thecorporate governance function on lenders.
Basically, the research conducted by San Ong & Heng Teh(2011), has focused on the 49 (all) listed construction companiesin Main Board of Bursa Malaysia. As of August 2010, there are 49construction companies in Bursa Malaysia Main Board. Constructionindustry and construction activities are one of the major sourcesof economic growth, development and economic activities inMalaysia.
Other than that, construction and engineering servicesindustry have an important position in the economic growth anddevelopment of the country (Khan, 2008). Hence, the constructionindustry could be described as a substantial economic driver forMalaysia. After financial crisis in Year 1997, the whole worldsuffered another global crisis in the middle of Year 2007 andinto Year 2008. Financial crisis 2008 initiated from UnitedStates and spread to all over the world. This incident had led tothe deceleration of economic activities to because internationaltrades and the financial systems were interrelated. Safeinvestment and combinations of capital structure is effect after
Page 18
Financial Management (MKAM1103)
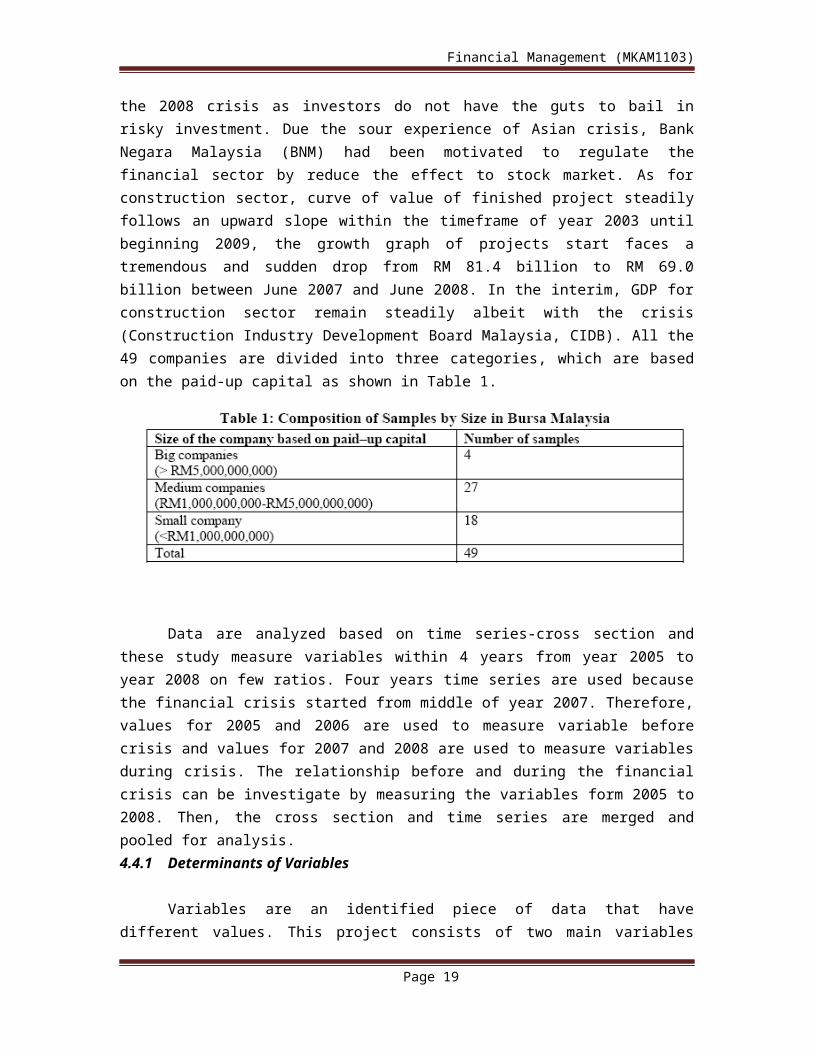
the 2008 crisis as investors do not have the guts to bail inrisky investment. Due the sour experience of Asian crisis, BankNegara Malaysia (BNM) had been motivated to regulate thefinancial sector by reduce the effect to stock market. As forconstruction sector, curve of value of finished project steadilyfollows an upward slope within the timeframe of year 2003 untilbeginning 2009, the growth graph of projects start faces atremendous and sudden drop from RM 81.4 billion to RM 69.0billion between June 2007 and June 2008. In the interim, GDP forconstruction sector remain steadily albeit with the crisis(Construction Industry Development Board Malaysia, CIDB). All the49 companies are divided into three categories, which are basedon the paid-up capital as shown in Table 1.
Data are analyzed based on time series-cross section andthese study measure variables within 4 years from year 2005 toyear 2008 on few ratios. Four years time series are used becausethe financial crisis started from middle of year 2007. Therefore,values for 2005 and 2006 are used to measure variable beforecrisis and values for 2007 and 2008 are used to measure variablesduring crisis. The relationship before and during the financialcrisis can be investigate by measuring the variables form 2005 to2008. Then, the cross section and time series are merged andpooled for analysis. 4.4.1 Determinants of Variables
Variables are an identified piece of data that havedifferent values. This project consists of two main variables
Page 19
Financial Management (MKAM1103)
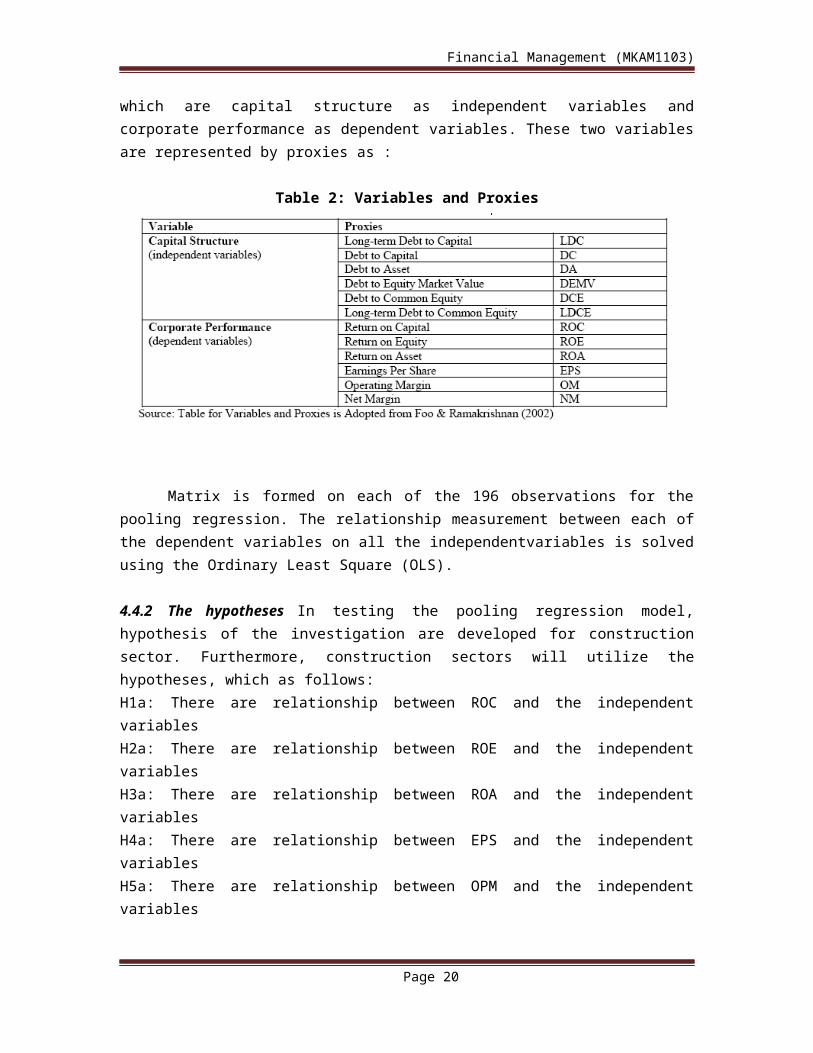
which are capital structure as independent variables andcorporate performance as dependent variables. These two variablesare represented by proxies as :
Table 2: Variables and Proxies
Matrix is formed on each of the 196 observations for thepooling regression. The relationship measurement between each ofthe dependent variables on all the independentvariables is solvedusing the Ordinary Least Square (OLS).
4.4.2 The hypotheses In testing the pooling regression model,hypothesis of the investigation are developed for constructionsector. Furthermore, construction sectors will utilize thehypotheses, which as follows:H1a: There are relationship between ROC and the independentvariables H2a: There are relationship between ROE and the independentvariables H3a: There are relationship between ROA and the independentvariables H4a: There are relationship between EPS and the independentvariables H5a: There are relationship between OPM and the independentvariables
Page 20
Financial Management (MKAM1103)
H6a: There are relationship between NM and the independentvariables Statistically the test hypothesis is: Ha: β ≠ 0, i =1,2,3,4,5,6. There is a relationship between capital structureand corporate performance of a company if β is positive ornegative and statistically significant at the confidence level of95%.
4.5 Discussions
A trend analysis was performed for the period from year 2005to year 2008. The average level of each proxies of corporateperformance is pooled again the time. The movements of theseproxies are explained and the outputs of the results of thestatistical analysis are presented. The pooling regression wasdone separately base on size of the firm which is small, mediumand large company.
4.6 Trend Analysis for the Performance of Construction Companies
The occurrence of global crisis on 2007/2008 had led toslowdown of economic globally. The crisis had led to down turnsof stock market worldwide, bailout of banks by US government aswell as collapse of big financial institutions. In the interim,the housing markets are also affected by the crisis which had ledto many evictions. This crisis is also affected Malaysia’seconomy which had resulted in unsatisfied performance of most ofthe company in Malaysia.
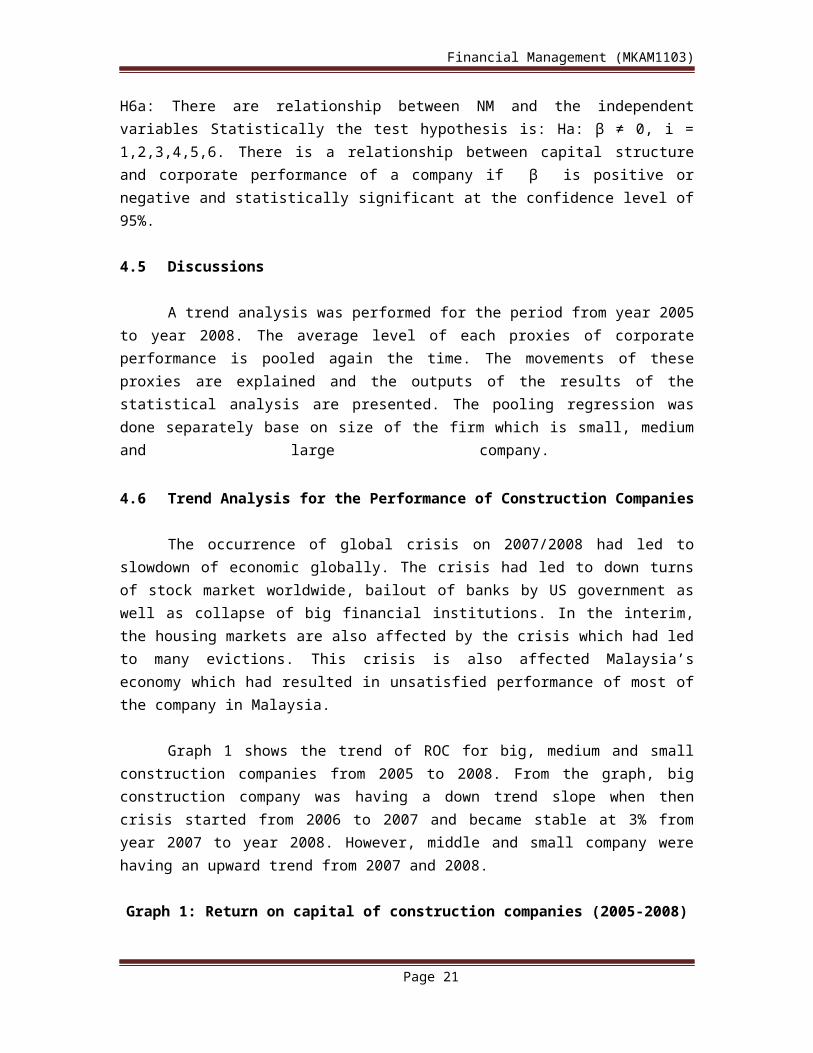
Graph 1 shows the trend of ROC for big, medium and smallconstruction companies from 2005 to 2008. From the graph, bigconstruction company was having a down trend slope when thencrisis started from 2006 to 2007 and became stable at 3% fromyear 2007 to year 2008. However, middle and small company werehaving an upward trend from 2007 and 2008.
Graph 1: Return on capital of construction companies (2005-2008)
Page 21
Financial Management (MKAM1103)
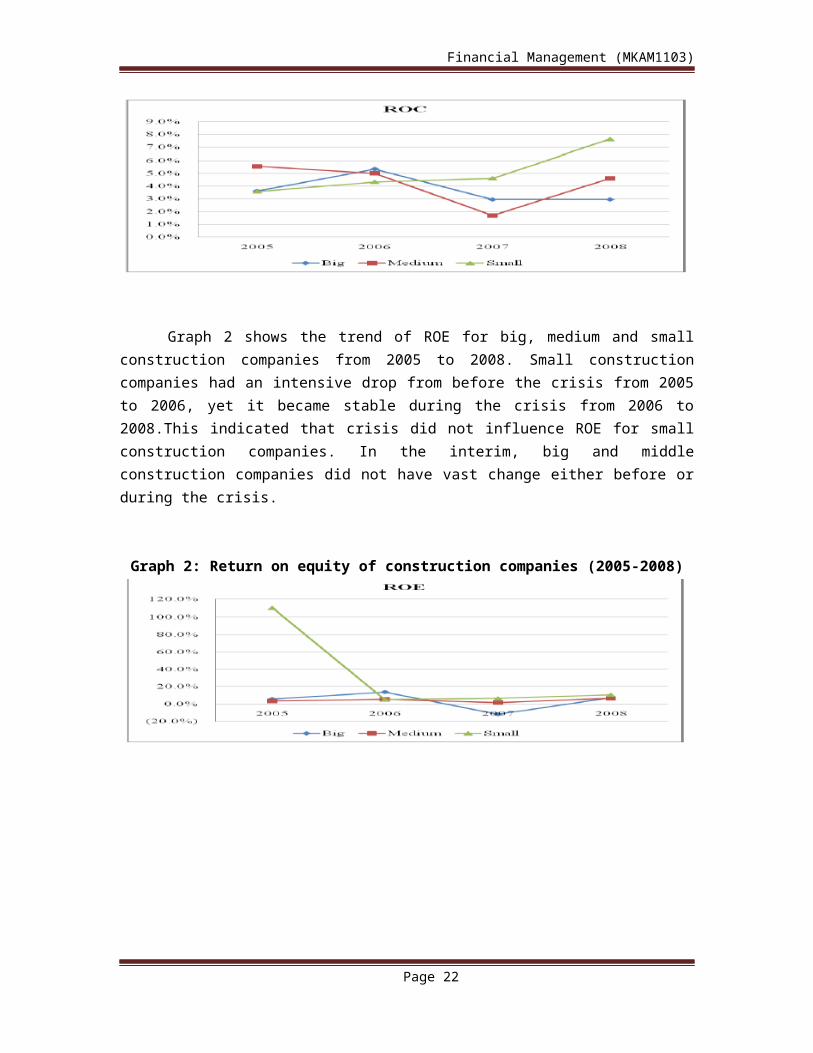
Graph 2 shows the trend of ROE for big, medium and smallconstruction companies from 2005 to 2008. Small constructioncompanies had an intensive drop from before the crisis from 2005to 2006, yet it became stable during the crisis from 2006 to2008.This indicated that crisis did not influence ROE for smallconstruction companies. In the interim, big and middleconstruction companies did not have vast change either before orduring the crisis.
Graph 2: Return on equity of construction companies (2005-2008)
Page 22
Financial Management (MKAM1103)
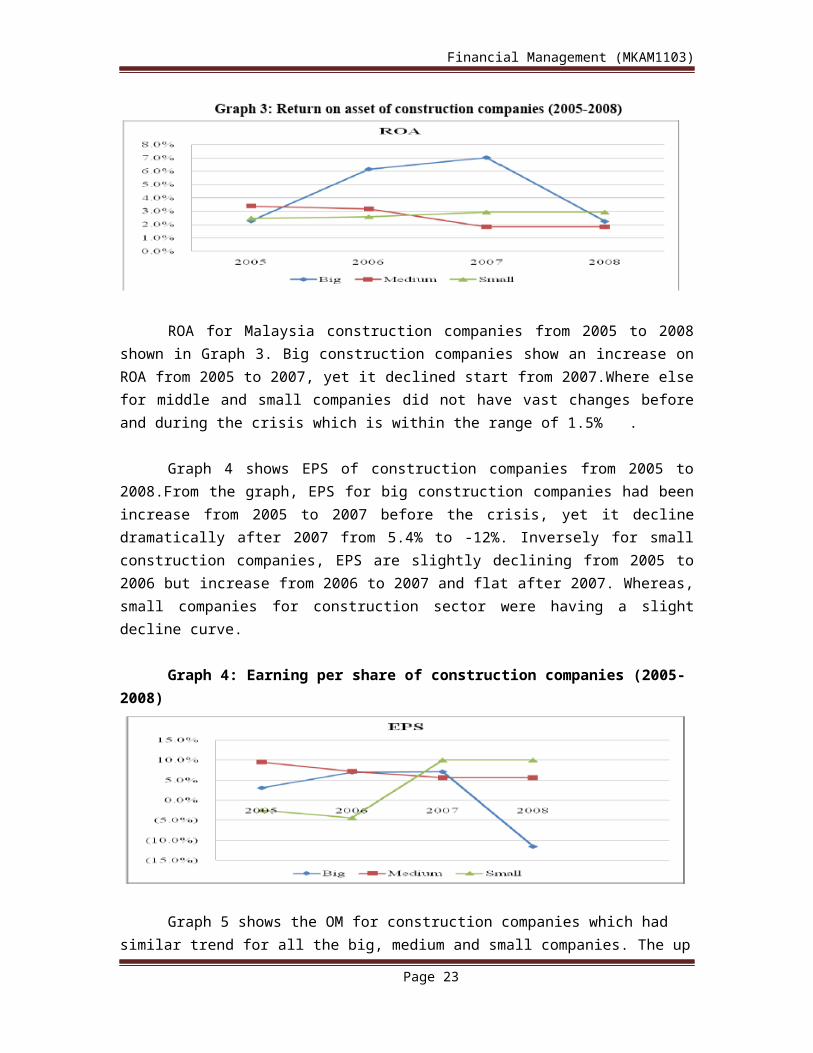
ROA for Malaysia construction companies from 2005 to 2008shown in Graph 3. Big construction companies show an increase onROA from 2005 to 2007, yet it declined start from 2007.Where elsefor middle and small companies did not have vast changes beforeand during the crisis which is within the range of 1.5% .
Graph 4 shows EPS of construction companies from 2005 to2008.From the graph, EPS for big construction companies had beenincrease from 2005 to 2007 before the crisis, yet it declinedramatically after 2007 from 5.4% to -12%. Inversely for smallconstruction companies, EPS are slightly declining from 2005 to2006 but increase from 2006 to 2007 and flat after 2007. Whereas,small companies for construction sector were having a slightdecline curve.
Graph 4: Earning per share of construction companies (2005-2008)
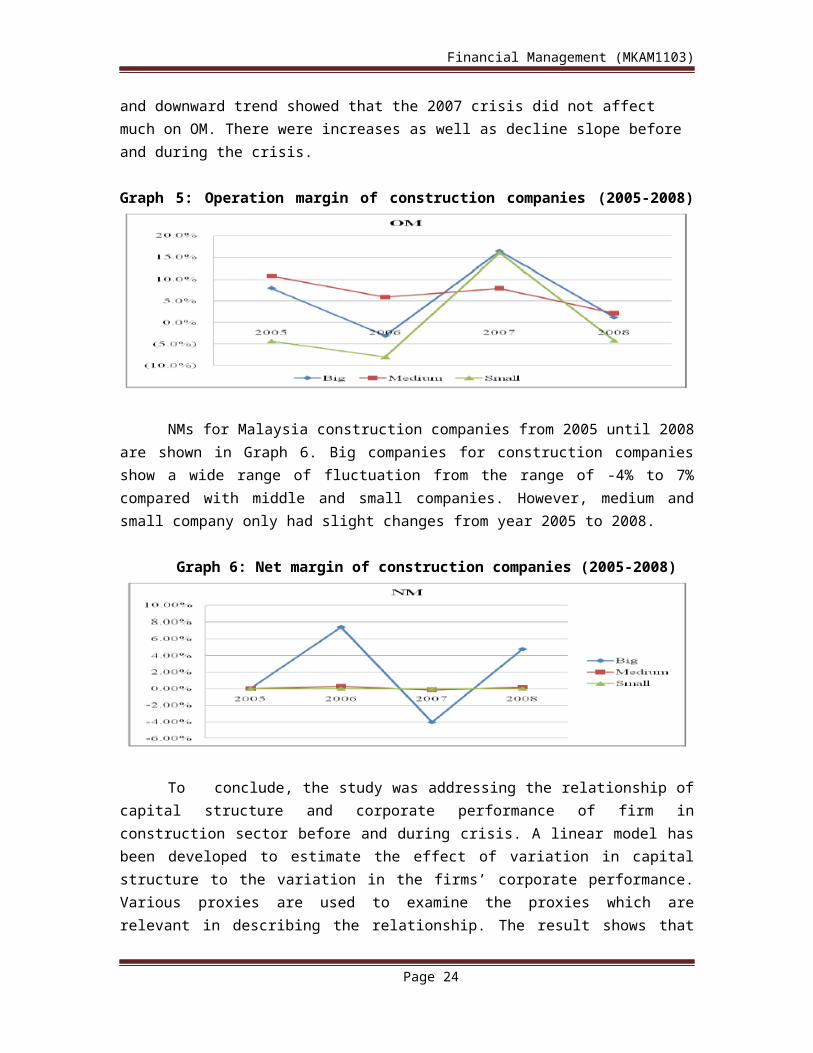
Graph 5 shows the OM for construction companies which had similar trend for all the big, medium and small companies. The up
Page 23
Financial Management (MKAM1103)
and downward trend showed that the 2007 crisis did not affect much on OM. There were increases as well as decline slope before and during the crisis.
Graph 5: Operation margin of construction companies (2005-2008)
NMs for Malaysia construction companies from 2005 until 2008are shown in Graph 6. Big companies for construction companiesshow a wide range of fluctuation from the range of -4% to 7%compared with middle and small companies. However, medium andsmall company only had slight changes from year 2005 to 2008.
Graph 6: Net margin of construction companies (2005-2008)
To conclude, the study was addressing the relationship ofcapital structure and corporate performance of firm inconstruction sector before and during crisis. A linear model hasbeen developed to estimate the effect of variation in capitalstructure to the variation in the firms’ corporate performance.Various proxies are used to examine the proxies which arerelevant in describing the relationship. The result shows that
Page 24
Financial Management (MKAM1103)
there is relationship between firms’ capital structure andcorporate performance. In the interim, the result also indicatesthat there are no relationships between the various variablesthat have been examined. Different proxies of capital structurewill retort differently to the proxies of corporate performance.For big construction companies, only ROC and EPS for largeconstruction companies have significant relationship with capitalstructure. Comparatively, ROC and DEMV are the most correlatedand depicting the strongest relationship among all the variablesexamined.
Basically, DEMV, LDC and DC have direct impact on corporateperformance of large companies and other independent variables donot affect the dependent variables. Where else for mediumconstruction companies, only OM has significant relationship withcapital structure. Basically, LDCE have direct impact oncorporate performance of medium companies. However, otherindependent variables do not affect the dependent variables.Besides that, only EPS for small construction companies havesignificant relationship with capital structure. Basically, DChas direct impact on corporate performance of small companies andyet other independent variables do not affect the dependentvariables
5.0 Green Building / Sustainable Building Investment
Green buildings are the result of innovative designs thatintegrate green elements to improve building performance with theaspiration of better future returns. Green building investmentpaves the way for new perspectives in the field of real estateinvestment. In the real estate sector, green office buildings, orsustainable buildings, refer to buildings that have thecharacteristics of greenness and have secured recognition from anappropriate green eco labeling agency. Investment in greenbuildings encompasses corporate responsibility strategies as aresponse to sustainable issues such as the effects of global
Page 25
Financial Management (MKAM1103)
warming and the minimization of harmful effects on theenvironment.
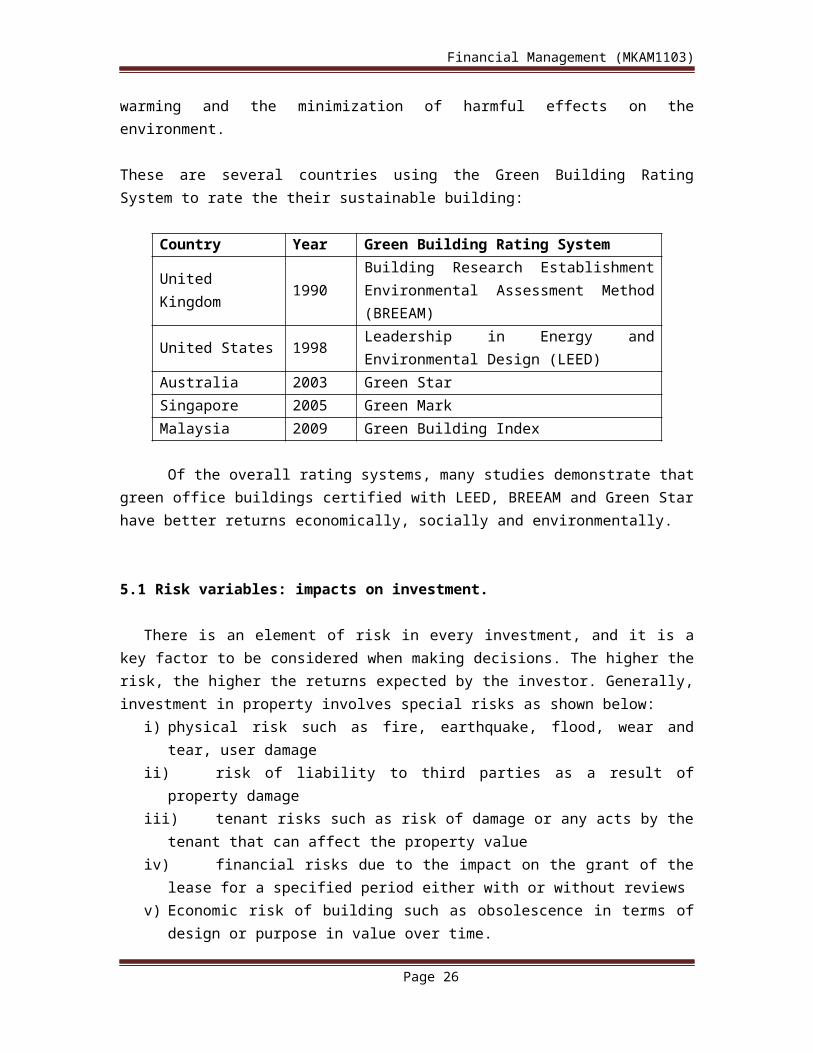
These are several countries using the Green Building RatingSystem to rate the their sustainable building:
Country Year Green Building Rating System
UnitedKingdom 1990
Building Research EstablishmentEnvironmental Assessment Method(BREEAM)
United States 1998 Leadership in Energy andEnvironmental Design (LEED)
Australia 2003 Green StarSingapore 2005 Green MarkMalaysia 2009 Green Building Index
Of the overall rating systems, many studies demonstrate thatgreen office buildings certified with LEED, BREEAM and Green Starhave better returns economically, socially and environmentally.
5.1 Risk variables: impacts on investment.
There is an element of risk in every investment, and it is akey factor to be considered when making decisions. The higher therisk, the higher the returns expected by the investor. Generally,investment in property involves special risks as shown below:
i) physical risk such as fire, earthquake, flood, wear andtear, user damage
ii) risk of liability to third parties as a result ofproperty damage
iii) tenant risks such as risk of damage or any acts by thetenant that can affect the property value
iv) financial risks due to the impact on the grant of thelease for a specified period either with or without reviews
v) Economic risk of building such as obsolescence in terms ofdesign or purpose in value over time.
Page 26
Financial Management (MKAM1103)
vi) Other risk factors related to investment are theinflation rate, liquidity and financing risks. In aninflationary environment – where the return on investment islower than the inflation rates the purchasing power perRinggit Malaysia (RM) will be reduced. In such a situation,there is no effective way for investors to dispose ofproperty in the shortest possible time to recover capital.As for investments that were acquired through loanfinancing, investors will have to bear with a higherfinancing cost if the interest rate escalates.
Whether the property is green or non-green, they share suchsimilar risk investment factors.
5.2 Return (benefits) on Green Building Investment
Overall performance of a green building relies on thefunctionality, flexibility and accessibility, as well as economicand environmental performances including social performances suchas comfort, health and social compatibility of the building. Thereal return is measured based on the performance of the building,and that of the market translated into financial accomplishment.
i) Occupancy rate, market and rental value
One of the investment indicators that reflect office propertymarket performance is the occupancy rate. The occupancy rate isutilized as a micro analysis to evaluate the latest office trend.
Green accreditation of office buildings contribute to a 5%-7% (LEED) and 1.5%-3.5% (Energy Star) higher occupancy ratefor office buildings situated within the submarket
Energy Star and LEED office buildings registered a highoccupancy rate of 91.5% and 92% respectively.
This revelation led to a direct positive impact on the marketand rental values of the buildings
Page 27
Financial Management (MKAM1103)
.In Australia, office buildings certified by NABERS energyrating recorded higher market values ranging from 4% to 21%higher for green premium office buildings compared to non-green office buildings.
This means the green certification such as by LEED and EnergyStar in the US resulted in positive occupancy effects.
ii) Yield
Yield plays a prominent role in the conversion of the expectedincome stream from commercial property into an estimate ofcapital value. The net operating income stream is divided by thecapitalization rate. In the case of green office buildings, theyield at the time of sale should be lower because of lower risks.Therefore, return factors such as market value, rental rate,yield and occupancy rate, for sustainable office buildings shouldbe clear in determining the value.
The availability of green property transactions will providepositive indicators on value stabilisation and at the same timeminimize investment risk.
iii) Cost saving
One of the key differences between green and conventionalbuilding investments is cost savings. The main benefit ofinvesting in green buildings is energy efficiency that reducesdirectly costs and increases the net income of the building. Costsavings through the conservation of energy and water, reductionof waste, reduction of operational and maintenance costs, gains
Page 28
Financial Management (MKAM1103)
in production, as well as improvement in the health of buildingoccupants. With energy conservation, investors enjoy societalbenefits such as lower greenhouse gas emissions, less waterpollution and better public health.
Green buildings certified by LEEDS or Energy Star can saveapproximately 20% to 35% in annual energy costs.
iv) Social and environmental benefits
Buildings are excellent investments as they are painstakinglydesigned for good ventilation thus making them attractive totenants who prioritize a healthy lifestyle. Due to the benefitsthat come with green office buildings, it is foreseen that buyerwould be willing to pay more. Green office buildings are designedto achieve energy efficiency, provide thermal comfort, promotehealthy living, and lower heating cost to the satisfaction ofusers.
Green office building owned by the Ministry of Energy, GreenTechnology and Water (KeTTHA) revealed that natural lightingand ample space positively affect user satisfaction towardsbetter working conditions.
From an environmental perspective, the main contribution ofgreen buildings is the reduction of pollution. This can beattributed to the characteristics of sustainable buildings withappropriate designs and the environmentally friendly materialsused in construction.
5.3 Case Study: Residential Green Building Investment
Page 29
Financial Management (MKAM1103)
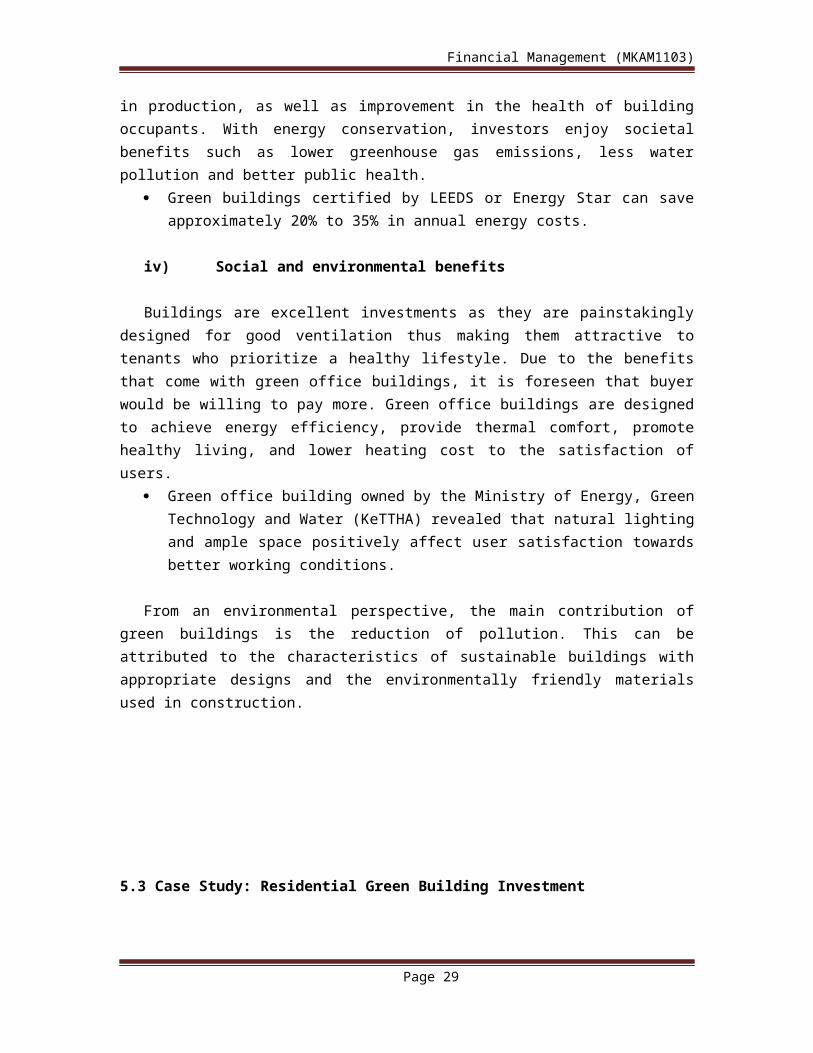
Singapore's residential housing market, where the Green Mark(GM) system for rating and evaluating the sustainability andenergy efficiency of buildings is used. Sample period (fromJanuary 2000 to June 2010), 18,224 GM-rated residential units in62 complexes were transacted.
match the non- GM-rated units to GM-rated units usingpropensity-score matching procedures
Figure 1: Distribution of the sample
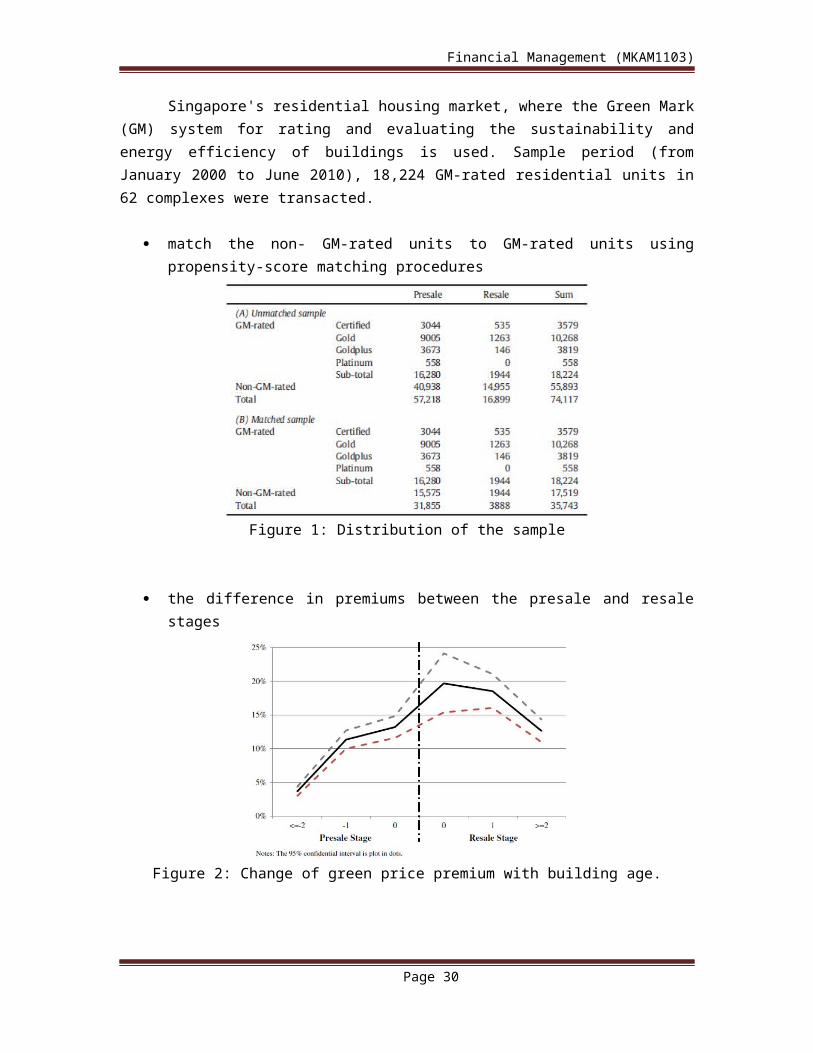
the difference in premiums between the presale and resalestages
Figure 2: Change of green price premium with building age.
Page 30
Financial Management (MKAM1103)
5.3.1 Why the green premium is substantially smaller at thepresale stage compared with the resale stage.
i) The learning process in understand and accept theeffectiveness of green houses.
ii) Households can immediately move in if they purchase aresale unit, but need to wait for a substantial period ifthey purchase a unit from the presale market.
iii) GM-rated housing complexes, since they are not able todirectly observe the effectiveness of such green housingtechniques before the buildings are completed.
iv) The green house units have been relatively higher inthe presale market during the sample period rather thanconventional building, which also results in a lower greenprice premium in the presale sector.
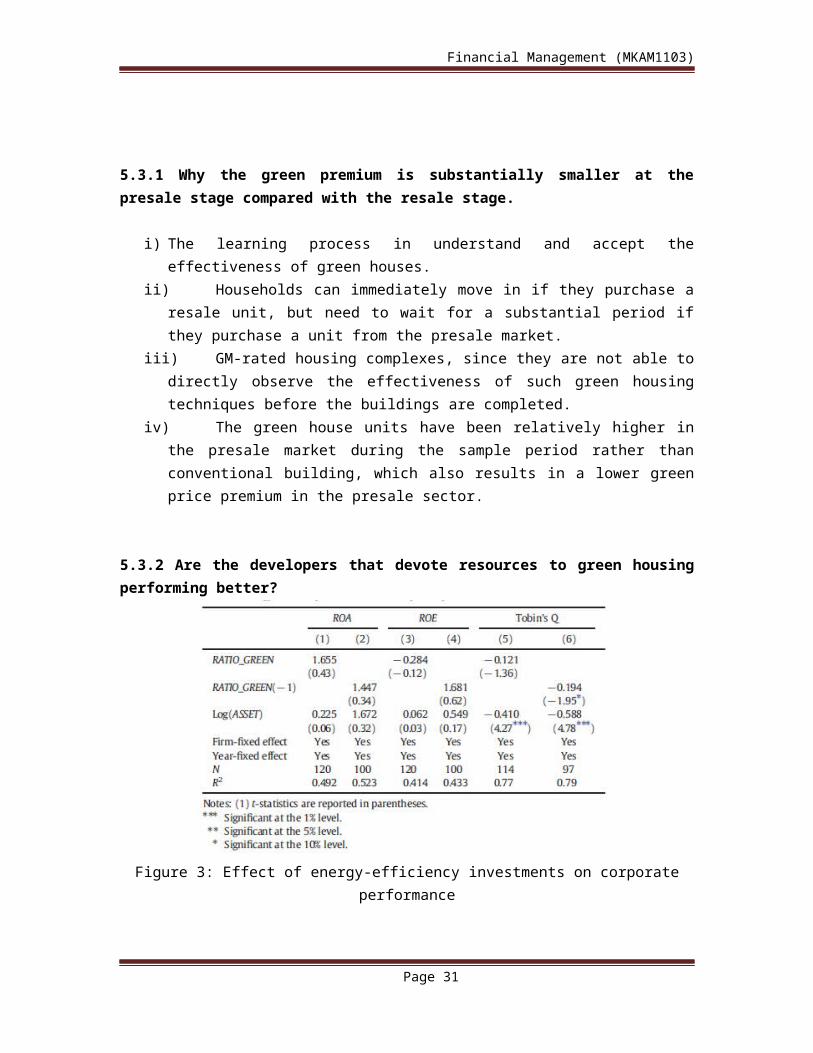
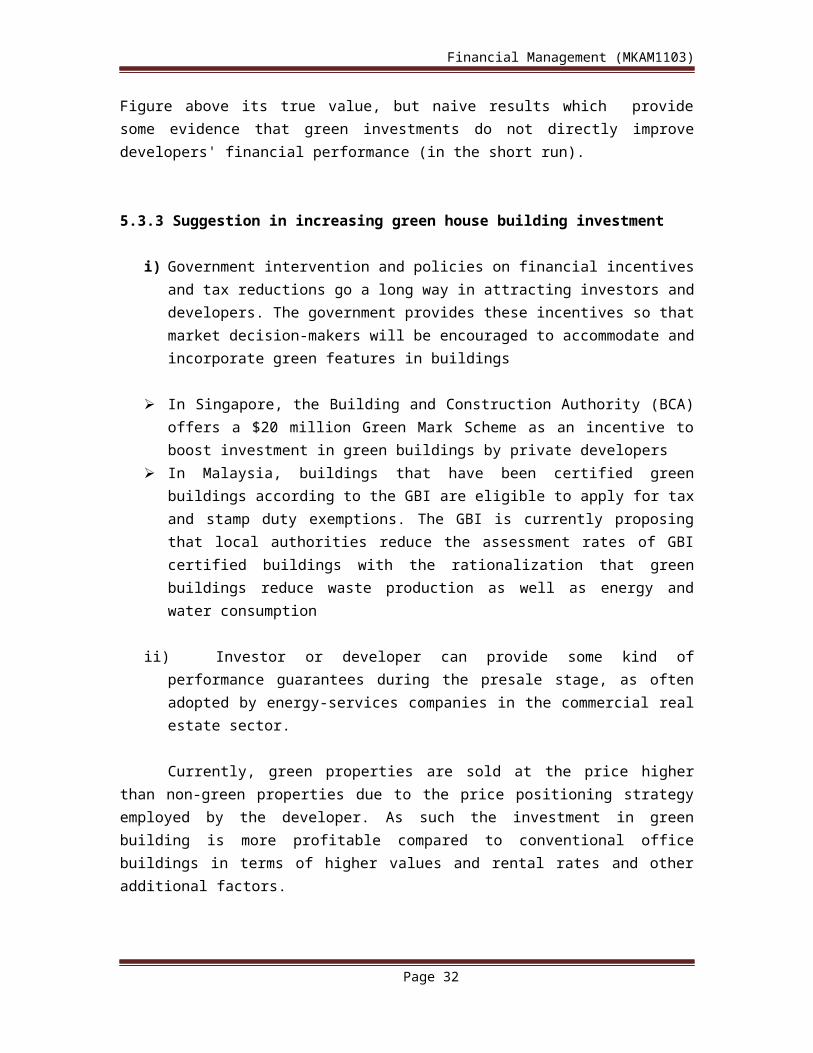
5.3.2 Are the developers that devote resources to green housingperforming better?
Figure 3: Effect of energy-efficiency investments on corporateperformance
Page 31
Financial Management (MKAM1103)
Figure above its true value, but naive results which providesome evidence that green investments do not directly improvedevelopers' financial performance (in the short run).
5.3.3 Suggestion in increasing green house building investment
i) Government intervention and policies on financial incentivesand tax reductions go a long way in attracting investors anddevelopers. The government provides these incentives so thatmarket decision-makers will be encouraged to accommodate andincorporate green features in buildings
In Singapore, the Building and Construction Authority (BCA)offers a $20 million Green Mark Scheme as an incentive toboost investment in green buildings by private developers
In Malaysia, buildings that have been certified greenbuildings according to the GBI are eligible to apply for taxand stamp duty exemptions. The GBI is currently proposingthat local authorities reduce the assessment rates of GBIcertified buildings with the rationalization that greenbuildings reduce waste production as well as energy andwater consumption
ii) Investor or developer can provide some kind ofperformance guarantees during the presale stage, as oftenadopted by energy-services companies in the commercial realestate sector.
Currently, green properties are sold at the price higherthan non-green properties due to the price positioning strategyemployed by the developer. As such the investment in greenbuilding is more profitable compared to conventional officebuildings in terms of higher values and rental rates and otheradditional factors.
Page 32
Financial Management (MKAM1103)
6.0 Conclusion
Infrastructure investment models also require complexanalysis from a financial perspective and vary from using debtand traditional borrowing to taking equity positions indevelopment companies to capital market mechanisms. Strategiesvary from market to market. Whatever the mechanism used, thetypical infrastructure investors - pension funds, sovereignwealth and life companies - are ultimately seeking long term,stable opportunities and therefore the importance ofunderstanding the asset life cycle and maximizing operationalefficiencies is vital.
The most attractive markets for investment in infrastructurecombine strong growth potential and high levels of investmentwith low risk, business friendly environments. In general terms,as the index descends the risk profiles of the countriesincrease, so therefore, must the returns sought by investors.Thus Green buildings is considered as a promising horizon forinvestment in construction.
Page 33
Financial Management (MKAM1103)
Reference
Sallahuddin Hassan (2011) Private and Public Investment in Malaysia: APanel Time-Series Analysis. International Journal of Economics and Financial Issues,Vol. 1, No. 4, 2011, pp.199-210
San Ong Tze & Heng The Boon (2011) Capital Structure and Corporate Performance of Malaysian Construction Sector Mooren Rob (2014) Second Global Infrastructure Investment Index 2014 –competing for private finance
Mona Isa, Megat Mohamed Ghazali Megat Abd. Rahman, Ibrahim Sipan, TingKien Hwa (2013) Factors affecting Green Office Building Investment inMalaysia: Procedia - Social and Behavioral Sciences 105 (2013) 138 – 148
Yongheng Deng & Jing Wu (2013) Economic returns to residential green building investment: The developers' perspective: Regional Science and Urban Economics 47 (2014) 35–44
Page 34


