Embed Size (px)
Citation preview

INVESTIGATION INTO ALTERNATIVES TO
FETAL CALF SERUM IN ANIMAL CELL CULTURE
B y Joanne K e e n a n B.Sc.
A thesis submitted for the degree of Ph. D .
Dublin City University.
T h e research w o r k described in this thesis w a s carried out under the
supervision of Professor Martin Clynes Ph. D.
National Cell and Tissue Culture Centre,
School of Biological Sciences.
June 1994.

I hereby certify that this material, w h i c h I n o w
submit for assessment o n the p r o g r a m m e of study
leading to the a w a r d of P h D . is entirely m y o w n
w o r k and has not b e e n taken f r o m the w o r k of
others save and to the extent that such w o r k has
b e e n cited and a c knowledged within the text of m y
work.

1
22389
1111121212121416161617171819
212223242427
28
32323335
39394040
TITLE
ABBREVIATIONS
INTRODUCTION
BACKGROUND Problems with FCSDevelopment of serum-free/serum-reduced media Advantages to growing cells in SFM Problems with SFM
MEDIA SUPPLEMENTS Growth promoters
EGF PDGF FGFHormones
Attachment factors Collagen Fibronectin LaminmOther attachment factors
Vitamins Trace elements Lipids
INDUSTRIAL OVERVIEW Monoclonal antibody production Expression o f recombinant proteins Virus productionEconomic feasibility o f SFM on a large-scale Problems with using SFM on a large-scale
COMMERCIALLY AVAILABLE SFM
THE ROLE OF INSULIN IN SFM Structure o f insulin, IGF-I and IGF-II Receptor bindingMechanisms of the mitogenic action o f insuhn
THE ROLE OF TRANSFERRIN IN SFM Background Transferrin structure Transferrin receptor
ACKNOWLEDGMENTS
1 7 THE ROLE OF ALBUMIN IN SFM 451 7 1 Background 451 7 2 Structure 451 7 3 Ligand binding 461 7 3 1 Fatty acid binding 471 7 3 2 Other ligands 471 7 4 Biological activity associated with BSA 481 7 5 Replacement o f BSA 49
1 8 INTRODUCTION TO RESEARCH WORK CARRIED OUT IN THE THESIS
52
2.0 M ATERIALS AND M ETHODS 54
2 1 WATER 54
2 2 GLASSWARE 54
2 3 MEDIA PREPARATION 54
2 4 REAGENTS AND THEIR RECONSTITUTION 55
2 5 CELL LINES 592 5 1 Cell Growth/Maintenance 602 5 2 Cell Subculture routine 602 5 3 Cell Storage 612 5 3 1 Cell freezing procedure 612 5 3 2 Cell thawing procedure 62
2 6 MYCOPLASMA ANALYSIS 622 6 1 Indirect staining for mycoplasma 622 6 2 Direct staining for mycoplasma 62
2 7 MICROPIPETTE ACCURACY 63
2 8 GROWTH STIMULATORY ASSAYS 632 8 1 Miniaturized Assay systems 632 8 1 1 Sample preparation 642 8 1 2 Cell stock preparation 652 8 2 Subculture Experiments 65
2 9 EXPERIMENTAL END POINTS 662 9 1 Image Analysis 662 9 2 Dye elution 672 9 3 Coulter counts 672 9 4 Haemocytometer counts 672 9 5 96-well acid phosphatase 682 9 6 96-well crystal violet dye elution 68
2 10 ALBUMIN LOADING EXPERIMENTS 682 10 1 Method 1 (Jager Method) 682 10 2 Method 2 (Watt and Davis Method) 69
6969
697070707171717273
7374747575
75
76
76
7677777778
78787878
79797979
798081
81
81
82
83
BIORAD PROTEIN ASSAY Procedure
AFFINITY CHROMATOGRAPHY USING HS CL-6B Preparation of small-scale columns Application o f sample Step-wise elution Regeneration o f column Diafiltration o f samples Preparation of filter Protein determination Large-scale columns
SDS-PAGE Preparation o f resolving gel Preparation o f stacking gel Sample preparationSilver stain for protein detection on SDS-PAGE gels
LY OPHILIZATION
DESALTING OF SAMPLES
DIALYSIS
RP-HPLCSolventsColumn efficiency Priming system Sample preparation
STABILITY STUDIES Trypsin digestion Pepsin digestion pH stability
ANALYTICAL ASSAYS Fatty acid determination Phospholipid analysis Citrate determination
GEL FILTRATION Packing and calibration o f column Sample apphcation
DIAFILTRATION EXPERIMENTS
EXTRACTION
THYMIDINE INCORPORATION ASSAY
STATISTICAL ANALYSIS
84858585858590929698
101103105
107
109113114
116116117119121121121125128128131133133133137
140
141141141146146146146147147147147155
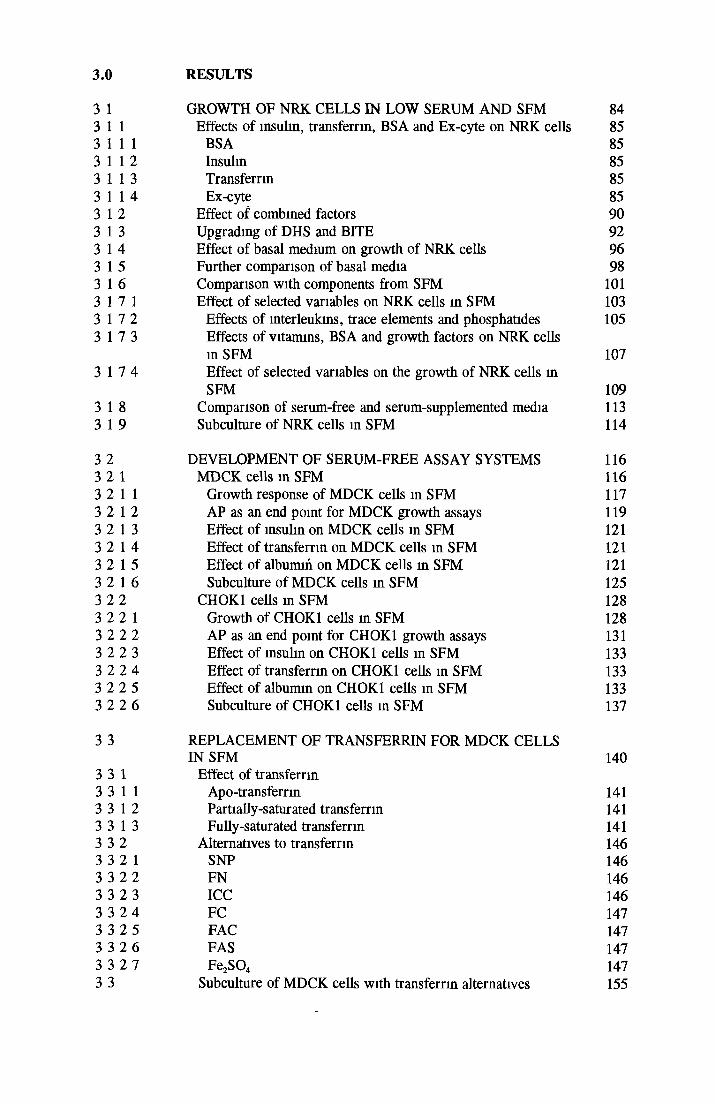
RESULTS
GROWTH OF NRK CELLS IN LOW SERUM A N D SFM Effects o f insulin, transferrin, BSA and Ex-cyte on NRK cells
BSA Insulin Transferrin Ex-cyte
Effect of combined factors Upgrading of DHS and BITE Effect o f basal medium on growth o f NRK cells Further comparison of basal media Comparison with components from SFM Effect o f selected variables on NRK cells in SFM
Effects o f interleukins, trace elements and phosphatides Effects o f vitamins, BSA and growth factors on NRK cells in SFMEffect of selected variables on the growth o f NRK cells in SFM
Comparison of serum-free and serum-supplemented media Subculture of NRK cells in SFM
DEVELOPMENT OF SERUM-FREE ASSAY SYSTEMS MDCK cells m SFM
Growth response o f MDCK cells in SFM AP as an end point for MDCK growth assays Effect o f insulin on MDCK cells in SFM Effect o f transferrin on MDCK cells in SFM Effect o f albumin on MDCK cells in SFM Subculture o f MDCK cells in SFM
CHOK1 cells in SFM Growth o f CHOK1 cells in SFM AP as an end point for CHOK1 growth assays Effect o f insulin on CHOK1 cells in SFM Effect o f transferrin on CHOK1 cells in SFM Effect o f albumin on CHOK1 cells in SFM Subculture o f CHOK1 cells in SFM
REPLACEMENT OF TRANSFERRIN FOR MDCK CELLSIN SFM
Effect of transferrin Apo-transferrm Partially-saturated transferrin Fully-saturated transferrin
Alternatives to transferrin SNP FN ICC FC FAC FAS Fe2S 0 4
Subculture of MDCK cells with transferrin alternatives
159160165166167167168168174178
180181183186189192197199200200201201201207
212212212213217
221222223224225225227
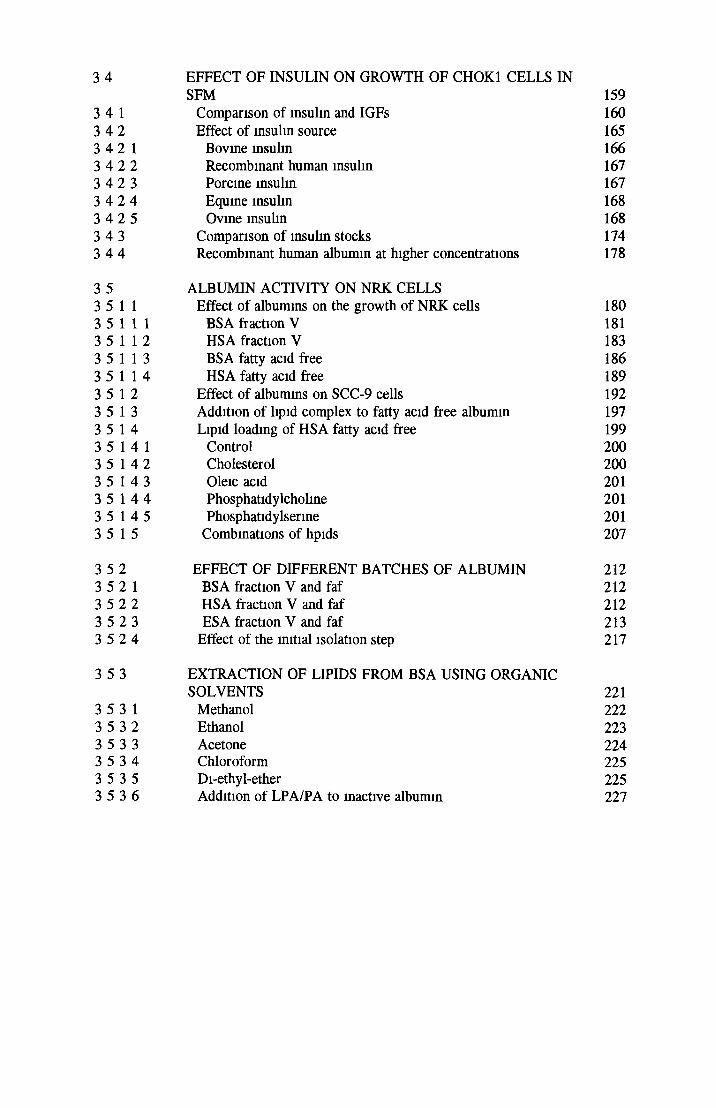
EFFECT OF INSULIN ON GROWTH OF CHOK1 CELLS IN SFM
Comparison o f insulin and IGFs Effect o f insulin source
Bovine insulin Recombinant human insulin Porcine insulin Equine insulin Ovine msuhn
Comparison o f msuhn stocksRecombinant human albumin at higher concentrations
ALBUMIN ACTIVITY ON NRK CELLS Effect o f albumins on the growth o f NRK cells
BSA fraction V HSA fraction V BSA fatty acid free HSA fatty acid free
Effect o f albumins on SCC-9 cells Addition of lipid complex to fatty acid free albumin Lipid loading of HSA fatty acid free
Control Cholesterol Oleic acid Phosphatidylcholine Phosphatidylserine
Combinations o f hpids
EFFECT OF DIFFERENT BATCHES OF ALBUMIN BSA fraction V and faf HSA fraction V and faf ESA fraction V and faf
Effect o f the initial isolation step
EXTRACTION OF LIPIDS FROM BSA USING ORGANIC SOLVENTS
Methanol Ethanol Acetone Chloroform Di-ethyl-etherAddition o f LPA/PA to inactive albumin
229229235239
247253255258260
261262264265266267268270270272
273273275277281287
295295296303308313318
320322
331338345352356359
362364366366
368369
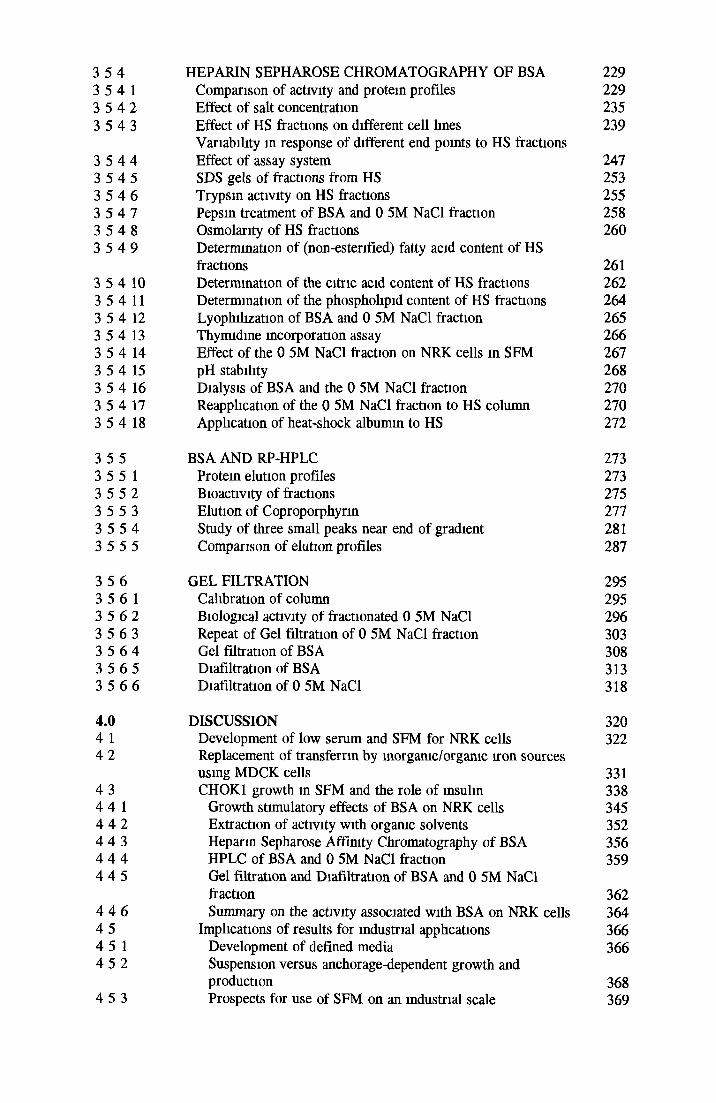
HEPARIN SEPHAROSE CHROMATOGRAPHY OF BSA Comparison o f activity and protein profiles Effect o f salt concentration Effect of HS fractions on different cell lines Variability in response of different end points to HS fractions Effect o f assay system SDS gels o f fractions from HS Trypsm activity on HS fractions Pepsm treatment of BSA and 0 5M NaCl fraction Osmolarity o f HS fractionsDetermination o f (non-estenfied) fatty acid content o f HS fractionsDetermination of the citric acid content of HS fractions Determination o f the phosphohpid content o f HS fractions Lyophilization o f BSA and 0 5M NaCl fraction Thymidine incorporation assay Effect o f the 0 5M NaCl fraction on NRK cells in SFM pH stabihtyDialysis of BSA and the 0 5M NaCl fraction Reapplication of the 0 5M NaCl fraction to HS column Application of heat-shock albumin to HS
BSA AND RP-HPLC Protein elution profiles Bioactivity o f fractions Elution of Coproporphyrm Study of three small peaks near end o f gradient Comparison o f elution profiles
GEL FILTRATION Calibration o f columnBiological activity of fractionated 0 5M NaCl Repeat o f Gel filtration of 0 5M NaCl fraction Gel filtration o f BSA Diafiltration of BSA Diafiltration of 0 5M NaCl
DISCUSSIONDevelopment of low serum and SFM for NRK cells Replacement o f transferrin by morganic/orgamc iron sources using MDCK cellsCHOK1 growth in SFM and the role o f insuhn
Growth stimulatory effects o f BSA on NRK cells Extraction of activity with organic solvents Heparm Sepharose Affinity Chromatography o f BSA HPLC of BSA and 0 5M NaCl fraction Gel filtration and Diafiltration of BSA and 0 5M NaCl fractionSummary on the activity associated with BSA on NRK cells
Implications o f results for industrial apphcations Development of defined media Suspension versus anchorage-dependent growth and productionProspects for use of SFM on an industrial scale
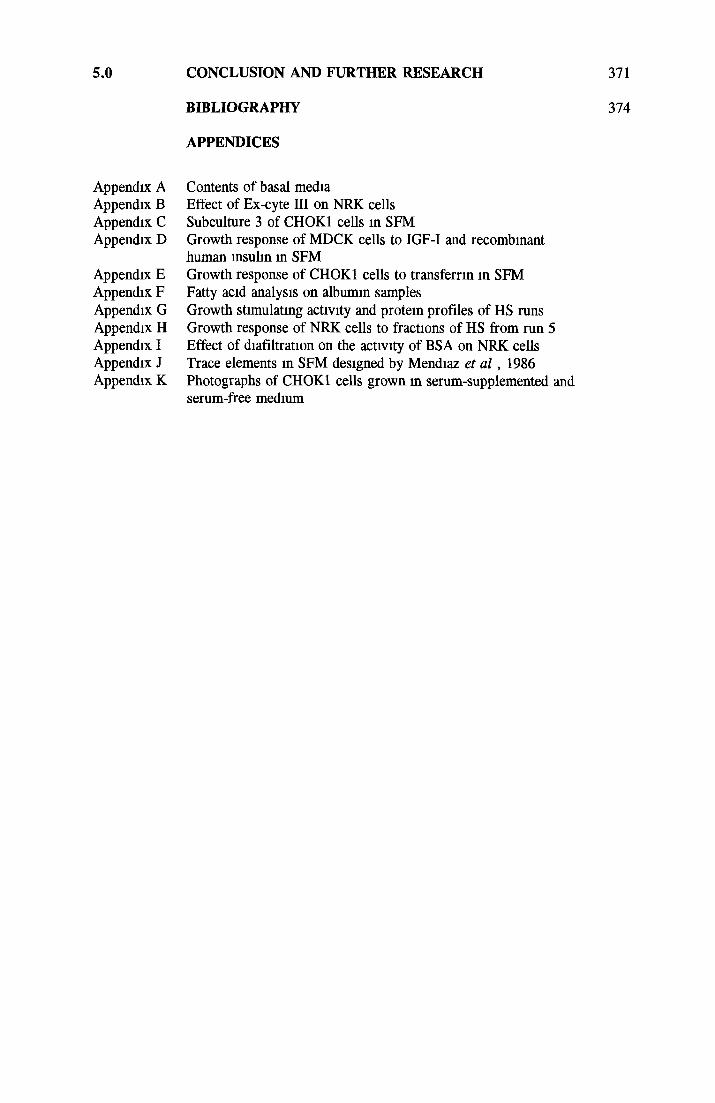
5.0 CONCLUSION AND FURTHER RESEARCH 371
Appendix A Appendix B Appendix C Appendix D
Appendix E Appendix F Appendix G Appendix H Appendix I Appendix J Appendix K
BIBLIOGRAPHY 374
APPENDICES
Contents o f basal mediaEffect o f Ex-cyte III on NRK cellsSubculture 3 of CHOK1 cells in SFMGrowth response of MDCK cells to IGF-I and recombinanthuman insulin in SFMGrowth response o f CHOK1 cells to transferrin in SFM Fatty acid analysis on albumin samples Growth stimulating activity and protein profiles o f HS runs Growth response o f NRK cells to fractions o f HS from run 5 Effect o f diafiltration on the activity o f BSA on NRK cells Trace elements in SFM designed by Mendiaz et a l , 1986 Photographs of CHOK1 cells grown in serum-supplemented and serum-free medium

ACKNOWLEDGMENTS
I w ould like to thank m y supervisor, Professor M artin C lynes for all his guidance and encouragem ent throughout this thesis and especia lly during the write-up period
I w ou ld also like to thank D r. M argaret D o o ley w ho taught m e everything I needed to know about anim al ce ll culture and m ore besides' V ery special thanks are due to D r Gerry D oherty w h o w as m y mentor in relation to protem purification and w ho p ro o f read m y R esults and D iscu ssion sections
M any thanks m ust go to the m em bers o f the N C T C C , both present and past, for their friendship and scien tific contributions, esp ecia lly M ary H eenan, Shirley M cBride, G eraldm e Grant, Carm el D aly and Seam us C oyle
N o acknow ledgm ents w ou ld be com plete w ithout show ing m y appreciation to c lo se friends and fam ily Special thanks m ust g o to N o e l S w eeney not on ly for p ro o f reading and advice but for his friendship over the years T o L ouise Carney and G il D onohue, thanks for the contm uous support and encouragem ent
A b o v e a ll, I take m y hat o f f to m y parents w ho provided everything for m e, including a good education. This thesis is dedicated to Liam and A nne, to w hom I ow e everything

ABBREVIATIONS
A A Amino acidACE AcetoneACN AcetomtrdeAcyl-CoA Acyl Coenzyme AAMP Adenosine monophosphateAP Acid phosphataseapoTf apo-transferrinATP Adenosine tri-phosphateBME Basal Medium EagleBSA Bovine serum albuminBSA faf Bovine serum albumin fatty acid freeBSE Bovine spongiform encephalopathyCIV Collagen type IVcAMP cyclic adenosine mono-phosphateCC Cell countCHOK1 Chinese Hamster Ovary K -lCHCI3 ChloroformCN Cell numberCOOH Carboxylco2 Carbon dioxideCPSR Controlled process serum replacementsCT Cholera toxinCV Coefficient of variationDE D ye elutionDEE Di-ethyl-etherDex DexamethazoneDHS Donor horse serumdhfr-MTX di-hydrofolate reductase - MetothrexateD N A Deoxyrebonucleic acidDME Dulbecco’s modified Eagle’s mediumDMSO Di-methyl sulfoximideEA EthanolamineECM Extracellular matrixEDTA Ethylenediaminetetraacetic acidEGF Epidermal growth factorEPO ErythropoietineRDF enhanced RDF (RPMI DME Ham’s F12) mediumßES fl-EstradiolESA Equine serum albuminESA faf Equine serum albumin fatty acid freeESG Ewing’s sarcoma growth factorEtOH ethanolFAC Ferric ammonium citrateFAS Ferric ammonium sulfateFbn fibronectinFBS Fetal bovine serumFC Ferric citrateFCS Fetal calf serumFePIH Ferric pyndoxal isomcotinoyl hydrazoneFeSIH Ferric sahcylaldehyde isomcotinoyl hydrazoneFGF Fibroblast growth factor
FN Ferric nitrateFu FetuinGH Growth hormoneGL GlycogenGMP guanosine mono-phosphateGTP guanosme tri-phosphateHAT Hypoxanthine - Ammopterin - thyroxineHBGF Heparin binding growth factorHbsAg Hepatitis b surface antigenHC HydrocortisoneHDL High density lipoproteinHEPES N-[2-Hydroxyethyl]piperazine-N’-[2-ethanesulfomc acid]HPLC High performance liquid chromatographyHS Heparin sepharoseHSA Human serum albuminHSA faf Human serum albumin fatty acid freeIA Image analysisICC Iron choline citrateIg ImmunoglobulinIGF Insulin-like growth factorIL InterleukinINF InterferonIns InsulinIns-R Insulin receptorIMDM Iscove’s modified DMEIPSF Immunoglobulin production stimulating factorIRE Iron responsive elementIRE-BP Iron responsive element - binding protein1RS Insulin receptor substratekDa kilodaltonLA Linoleic acidLC Liquid chromatographyLDL Low density lipoproteinL-Glut 1-glutamineLH Luteinizing hormoneLM lamimnLP lipoproteinLPA lysophosphatidic acidLPSR low protein serum replacementsmA milli-AmpsmAbs monoclonal antibodiesMAP-kinase Microtubule associated protein kinaseM-CSF Macrophage colony stimulating factorMDCK Madm-Darby canine kidneyfi-ME fi-mercaptoethanolMeOH MethanolMEM minimal essential mediummRNA messanger RNAM6P Mannose-6-phosphateNADH Nicotinamide adenine dinucleotideNa-K Sodium-potassiumNapi Sodium phosphateNCTCC National Cell and Tissue Culture Centre
NEAA Non-essential amino acidsNRK Normal rat kidneyNSCLC Non-small cell lung cancer0 Oleic acidOD Optical densityP PyruvatePA Phosphatidic acidPal Palmitic acidPBS Phosphate buffered salinePEA PhosphoethanolammePDGF Platelet-derived growth factorPGE ProstaglandinPNP Para-mtro-phenolPrl ProlactinPu PutrescineRGD Arg-Gly-Asp, based on alphabetical code for ammo acidsRME Receptor mediated endocytosisRNA Ribonucleic acidrp-HPLC reverse phase HPLCSCC-9 Squamous cell carcmoma-9SDS-PAGE Sodium dodecyl sulfate - polyacrylamide gel electrophoresisSel seleniumSFM Serum-free medium/mediaSNP Sodium mtroprussideSSM Serum-supplemented mediumT TriiodothreomneTE Trace elementsTEMED N ,N ,N ’ ,N ’ ,-Tetramethyl-ethylenediamineT f TransferrinTFA Trifluoroacetic acidTGF Transforming growth factorTI Trypsm inhibitorTNF Tumour necrosis factorTSH Thyroid stimulating hormonetRNA transfer RNATV Trypsm verseneUP UltrapureUV UltravioletVe Elution volumeVo Void volumew /v weight/volume

C H A P T E R O N E
I N T R O D U C T I O N

1.0 INTRODUCTION
Mammalian cell culture has wide and expanding applications in both research and
biotechnological/pharmaceutical industries The development and routine use o f serum-free
media (SFM) is a high priority for cell culture from both an industrial and scientific point of
view as evidenced by the literature and the ever increasing supply o f commercial preparations
designed to bulk up growth in serum-free systems Production o f vaccines, therapeutics and
monoclonal antibodies for diagnostic and therapeutic purposes are just some o f the many
applications in which mammalian cell culture can dominate
For cell culture products to be o f diagnostic and therapeutic use, the quahty o f these
biomaterials need to meet the highest standards In addition to precise process control during
isolation o f the product, the milieu in which the cells are active is o f prime importance
The complexity and undefined nature o f serum has been recognised for some time Several
approaches have been taken to deal with this, including reduction or total elimination o f serum
from the medium With the development o f SFM, problems have been encountered Cell types
exhibit different nutritional and supplemental requirements With the amount of variables in
ever increasing combinations and numbers that can be used, the task o f finding a SFM for a
particular cell line is daunting
In this literature survey, the problems associated with the use o f serum and the development of
more defined culture conditions are discussed An overview o f the factors generally used in
the replacement o f serum are presented The possible advantages o f using serum-free medium
on an industrial scale are investigated An outline of commercially avadable serum-free
medium is given
A detaded review o f three of the most commonly used factors in serum-free medium, insulin,
transferrin and bovine serum albumin (BSA) is presented with a view to replacing these
components with non-ammal-denved products m order to develop more defined media
1

1 .1 . BACKGROUND
In vitro, the external medium must be able to provide all the requirements that cells would
normally obtain in vivo for growth. In the early stages o f animal cell culture, it was discovered
that a small amount o f serum in the basal medium would support the growth and proliferation
o f cells. Other body fluids such as amniotic fluid (Barnes and Sato, 1980a), milk and chicken
egg yolk (Fujii and Gospodarowicz, 1983) and bovine colostrum (Pakkanen et al., 1992) were
tried but serum proved to be the most efficient at supporting growth. The most commonly used
serum was/is fetal calf serum (FCS) because of its effectiveness. It typically constitutes 5-10%
vol/vol o f the growth medium for cells.
1 .1 .1 Problems with FCS
There are disadvantages associated with the use of serum, especially FCS. It is not adequately
chemically defined. For most cells, serum is not the physiological fluid in which the cells are
maintained as it contains many factors released in vivo during wound healing and blood clotting
processes. Indeed, cells grown regularly in serum-supplemented medium may change by
adaption or selection from the primary cells from which they were originally derived.
Studies o f the mechanisms and actions o f hormones and growth factors are hampered by the
presence o f serum (use of charcoal-treated or heat-inactivated serum has been used to study
hormonal and growth factor actions respectively (Hayashi and Sato, 1979; Price and Gregory,
1982)). The interaction o f hormones, growth and attachment factors is hard to detail due to the
ill-defined nutritional environment o f cells.
Serum is a potential source o f toxins and growth inhibitors (chalones, selective inhibitors and
toxins, for example, polyamine oxidase which catalyses the formation o f toxic
polyaminoaldehydes from polyamines is present in FCS (Allen et al., 1979)). Serum is a
potential source o f bacterial, viral and mycoplasma contamination e.g. bovine spongiform
encephalopathy (BSE) and mycoplasma (Phillpotts, 1989; Hodgson, 1990; Sasaki et al., 1984).
In addition to mycoplasma using up components o f the medium required by cells, mycoplasma
products such as arginine deaminase often have detrimental effects on cell growth (Sasaki et al.,
1984). Transforming Growth Factor - B (TGF-fl), which is present in serum, is growth
inhibitory to many cells of epithelial and neuroectodermal origin (Miyazaki and Horio, 1989).
The presence of TGF-B may reduce the growth stimulatory ability of serum. Berthier et al.
2
(1993) found human megakaryocyte progenitor cells to grow better in SFM than in plasma-
supplemented medium There was an increase in growth in the plasma-supplemented media on
the incorporation o f TGF-B neutralizing antibodies Other factors present in serum including
glucocorticoids and serum lipoproteins (Ito et al, 1982) have also been found to exert inhibitory
action over some cell hnes In addition, serum components can cause undesirable effects such
as cellular differentiation as seen with murine megakaryocyte progenitor cells (Tsukada et al,
1992)
Serum can be costly In a large-scale operation, FCS can account for up to 84% of the media
costs (Griffiths, 1986) However the cost o f using SFM will depend on the ability o f the cells
to grow in defined conditions Some cells require the introduction o f growth factor
combinations in addition to other usual components ever present in the medium, thus resulting
in more expensive alternatives to serum, while other cells which produce their own growth
factors w ill grow in a relatively inexpensive SFM Hybridomas and myelomas have been found
in general, to be less fastidious and will grow in SFM with minimal additions and little
dependence on growth factors
Serum suffers from batch-to-batch variations in biological activity, protein concentrations etc ,
and this can cause significant problems on an industrial scale In addition to inter-batch
variations, fluctuations m commercial availability (demand often exceeds supply) can drastically
affect the production costs Serum can also act as a source o f potentially contaminating antigens
in monoclonal antibody production The use o f donor serum, for example Donor Horse Serum
(DHS) can partially alleviate some o f these problems The fact that the animal is not killed
means that a well controlled herd can be used to supply a large amount o f serum over a period
of time and as a result there are no limitations to availability The use of a ’disease free’ herd
and clean handling o f sera can reduce potential contaminants
1.1.2 Development of serum-free/serum-reduced media}
There are many detailed reviews which outhne the progress made in the development o f SFM
(Barnes and Sato, 1980b, Mather, 1984, Hewlett et al , 1989), while other reviews focus on
growth o f specific cell types in SFM (Miyazaki et al, 1984, Bjare, 1992, Sandstrom et al,
1994)
3
In the formulation o f a SFM, there are two main points to consider, the basal nutrient medium
and the supplements (Dulbecco, 1970) The composition o f both may vary from cell type to
cell type and also on the desired result Basal nutrient media are multifactored providing most
of the nutrients required by the cell These factors include amino acids (both essential and
non-essential), vitamins (especially B group), nucleic acids, lipids (essential fatty acids,
glycerides etc), inorganic salts (as buffering agents, co-enzymes and co-factors) and an energy
source (usually glucose or fructose) Addition o f serum then provides factors not included m
the basal media Factors include hormones / growth factors, attachment factors, transport
proteins and detoxifying agents, purines and primidines, nutrients/energy source, protease
inhibitors, trace elements o f organic and inorganic compounds Basal media are not always
optimized for a particular cell hne, so addition of vitamins, ammo acids or trace elements may
be required for optimizing growth Developing the basal medium for a particular cell line can
reduce the number o f additional serum-free components However, due to the extent o f factors
m serum, it has not been possible to identify them all and develop a universal SFM which will
provide the support required for the majority of cell hnes In general, the more defined a SFM
becomes, the more specific it becomes for a given cell hne
A number of different approaches to replace FCS have been undertaken The amount o f serum
in the medium can be reduced or replaced by a less expensive undefined components Eagle
(1955) developed a basal medium which would support the minimum growth o f cells (Eagles
MEM) This medium consisted o f 13 ammo acids, 8 vitamins, 6 ionic species and glucose
Supplementation with dialysed serum allowed the growth o f L and HeLa cells Guilbert and
Iscove (1976) were able to reduce the serum level from 15% to 1% with the incorporation of
transferrin, sodium selenite, BSA and lecithin to grow erythroid cells derived from BDF mice
Peehl and Ham (1979) used small amounts o f dialysed fetal bovine serum with hydrocortisone
to stimulate growth of human epidermal keratmocytes Shipley and Ham (1981) grew Swiss
mouse 3T3 cells in medium with a serum protein concentration as low as 125jig/ml
Use o f alternative sera which are cheaper and suffer less from batch-to-batch variation
(including bovine, new born calf serum, human (Emerman et a l , 1987), equine (McKeehan et
al 1982), porcine and lamb serum) have also been investigated
Two broad categories o f SFM can be distinguished on the basis o f cell type and requirement
for substratum adherence Anchorage-independent cells (hybndomas and myelomas) are in
general, less fastidious than many o f the anchorage-dependent cell types It has been easier,
4
not only to develop SFM but to design low protem (Blasey and Winzer, 1989) or protein-free
media (Kovar, 1989, Darfler, 1990, Cleveland et a l , 1983) which support growth and
monoclonal antibody production In addition to reducing costs and having more definition, the
use o f low protein/protem-free media also means less problems in downstream processing Not
only are most o f these SFM totally defined, they are also relatively cheap, usually comprising
low molecular weight components and defined polymers with no added proteins and so are
ideally suited to industrial use However, these SFM are limited to a few estabhshed cell lines
Anchorage-dependent cell lines often require growth factors and attachment factors as w ell as
other nutrients and trace elements In general, transformed cell lines have simpler requirements
than untransformed cells Some systems have been developed to allow long-term growth m
SFM by either transforming cells with carcinogens e g benz[a]pyrene (Stampfer and Bartley,
1985) or transfecting cells with oncogenes (Reddel et a l , 1988)
The tissue from which the cell hne has been derived may also affect the ability o f the cell to
grow in SFM While primary cultures from colon, mammary and lung require growth factors
and attachment factors, many hepatoma primary cell hnes can be cultured without such additives
due to the large number o f factors produced and secreted by both normal and neoplastic
hepatocytes (Yano et a l , 1986, Dufresne et a l , 1993) This reflects the dynamic in vivo
situation o f hepatic cells
Table 1 1 shows some o f the many SFM developed Insulin, transferrin and selenium appear
most often A wide range o f growth factors (including EGF, PDGF, IGF, FGFs and TGFs),
hormones (dexamethazone, hydrocortisone, B-estradiol and prostaglandins) and attachment
factors (fibronectin, collagen and laminm) are listed
5
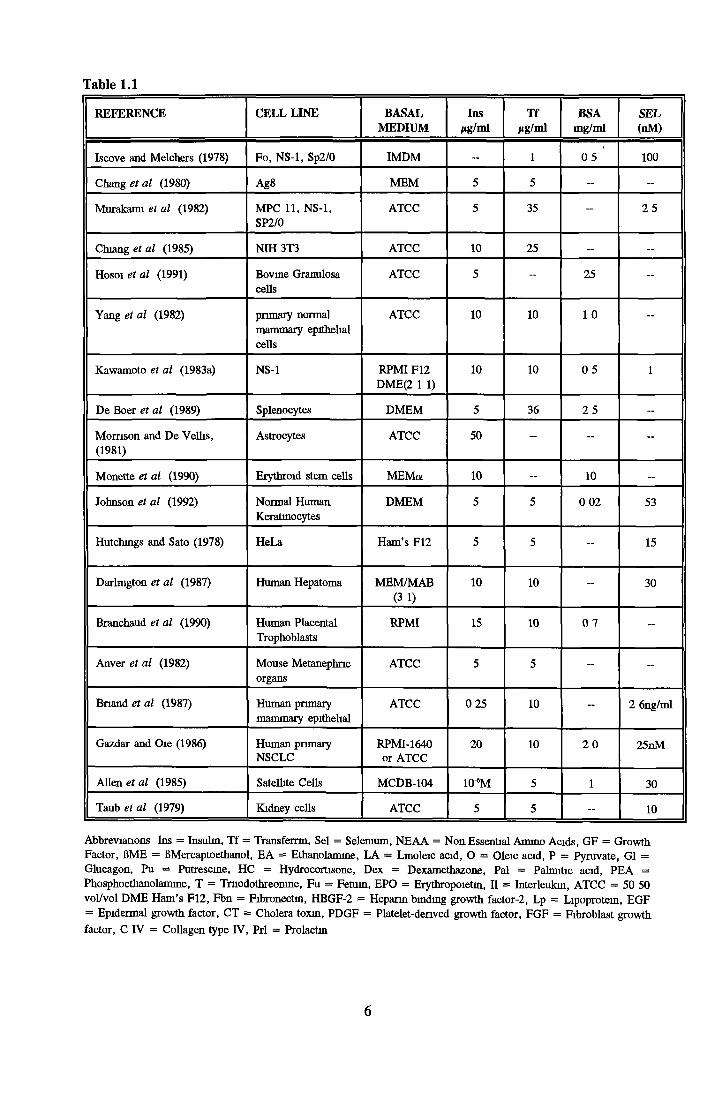
Table 1.1
REFERENCE CELL LINE BASALMEDIUM
Insjig/ml
TfHg/ml
BSAmg/ml
SEL(nM)
Iscove and Melchers (1978) Fo, NS-1, Sp2/0 IMDM — 1 05 100
Chang et al (1980) Ag8 MEM 5 5 - -
Murakami et al (1982) MPC 11, NS-1, SP2/0
ATCC 5 35 - 25
Chiang et al (1985) NIH3T3 ATCC 10 25 - -
Hosoi et al (1991) Bovine Granulosa cells
ATCC 5 - 25 -
Yang et al (1982) primary normal mammary epithelial cells
ATCC 10 10 1 0 -
Kawamoto et al (1983a) NS-1 RPMI F12 DME(2 1 1)
10 10 0 5 1
De Boer et al (1989) Splenocytes DMEM 5 36 2 5 —
Momson and De Velhs, (1981)
Astrocytes ATCC 50 - - -
Monette et al (1990) Erythroid stem cells MEMa 10 - 10 —
Johnson et al (1992) Normal Human Keratmocytes
DMEM 5 5 002 53
Hutchings and Sato (1978) HeLa Ham’s F12 5 5 - 15
Darlington et al (1987) Human Hepatoma MEM/MAB (3 1)
10 10 - 30
Branchaud et al (1990) Human Placental Trophoblasts
RPMI 15 10 0 7 -
Anver et al (1982) Mouse Metanephnc organs
ATCC 5 5 - -
Bnand et al (1987) Human primary mammary epithelial
ATCC 0 25 10 - 2 6ng/ml
Gazdar and Oie (1986) Human primary NSCLC
RPMI-1640 or ATCC
20 10 2 0 25nM
Allen et al (1985) Satellite Cells MCDB-104 lO^M 5 1 30
Taub et al (1979) Kidney cells ATCC 5 5 - 10
Abbreviations Ins = Insulin, Tf = Transfemn, Sei = Selenium, NEAA = Non Essential Amino Acids, GF = Growth Factor, ßME = ßMercaptoethanol, EA = Ethanolamme, LA = Lmoleic acid, O = Oleic acid, P = Pyruvate, G1 = Glucagon, Pu = Putrescine, HC = Hydrocortisone, Dex = Dexamethazone, Pal = Palmitic acid, PEA = Phosphoethanolamine, T = Tmodothreonme, Fu = Fetuin, EPO = Erythropoietin, II = Interleukin, ATCC - 50 50 vol/vol DME Ham’s F12, Fbn = Fibronectm, HBGF-2 = Heparin binding growth factor-2, Lp = Lipoprotein, EGF = Epidermal growth factor, CT = Cholera toxin, PDGF = Platelet-denved growth factor, FGF = Fibroblast growth factor, C IV = Collagen type IV, Prl = Prolactin
6

Table 1.1 continued
REFERENCE- GROWTHFACTORS
HORMONES TRACEELEMENTS
OTHERS
Iscove and Melchers(1978)
-- -- - 50|tM BME
Chang et al (1980) - — - NEAA
Murakami et al (1982)
Pu -- 20fiM EA 0 5mM P 40ng/ml LA
Chiang et al (1985) 10ng/ml EGF -- - 5ftg/ml Fbn 25/xg/ml HDL
Hosoi et al (1991) 500ng/ml Aprotnun 10ng/ml HBGF-2
-- - 25/ig/ml Lp
Yang et al (1982) 10ng/ml EGF lfig/ml Cortisol - lOng/ml CT Collagen Gel
Matrix
Kawamoto et al (1983a)
-- -- 10/iM EA ImM P
De Boer et al (1989)
-- -- 20/iM EA 1/ig/ml LA 1/ig/ml O
1/ig/ml Pal
Momson and De Velhs (1981)
lOOnMPu 500ng/ml PDGF 100ng/ml FGF
50nM HC -- --
Monette et al (1990) 2U/ml EPO 50U/ml IL-3
-- -- 0 lmM iiME NEAA
Johnson et al (1992) 10ng/ml 0 4/ig/ml HC 20pM T
lOmM SnCl2 0 lrnM EA 0 lmM PEA
Hutchings et al (1978) 30ng/ml EGF 30mM HC Ni2S04, MnCl2, NH4Mo20 7,SnCl2,
Ht^SO,, CdS04 Na2Si03,NaHV04,
Darlington et al (1987)
-- lftg/ml Gl, GH 1/iM T, Dex
-- 1/ig/ml LA
Branchaud et al (1990)
- - - 1-2/ig/ml LDL
Avner et al (1982) 25ng/ml PGE 3 2pg/mlT 5fig/ml HC
-- -
Bnand et al (1987) 100ng/ml EGF lfiMHC 5/xg/ml Prl 0 InM ßEs
-2mM 1-Glut
CIV
Gazdar and Oie (1986) lng/ml EGF 50nM HC lOOpMT
0 5M P 10mM EA, PE
2mM 1-Glut C IV
Allen et al (1985) 0 5mg/ml Fu lOOng/mlFGF
lOOnM Dex - -
Taub et al (1979) 25ng/ml PGE 50pM T 50nM HC
-- --
7
1.1.3 Advantages to growing cells in SFM
There are many advantages to growing cells in serum-free conditions As a defined system,
the use o f SFM can be manipulated to obtain growth of a particular cell line from a mixture of
cells i e selective growth, which takes advantage o f different rates o f cellular attachment to a
substratum or different growth rates (Suzuki et a l , 1989, Birkenfeld et a l , 1988, Kuneko and
Goshina, 1982) This is typically seen in primary cultures where undesirable fibroblast
contamination can prevent the isolation o f epithelial cells (Bottenstein and Sato, 1978) As
epithelial cells attach more slowly than fibroblastic cells to a substratum, epithelial cells can be
easily removed by shght agitation or very short exposure to trypsin Selective growth has been
used with a variety of cell types including primary culture o f embryonic chick dorsal root
ganglia (Barnes and Sato, 1980b), ovarian epithelial cells (Orly et a l , 1980) and human non
small cell lung cancer cells (Brower et a l , 1986) SFM have also been used to permit selective
growth o f tumours from fresh clinical specimens (Van der Basch, 1984, and Carney et a l ,
1984)
Yabe et al (1986), developed a SFM for the establishment and selection o f mouse hybridomas
without the presence o f HAT (hypoxanthine, aminopterin and thymidine) called NYSF-404
The rate o f hybridoma formation was found to be twice as good as that observed using
traditional cloning techniques requiring serum and HAT-supplemented medium
Other means o f selection based on the selective depletion o f specific factors from the medium
have also been developed Hepatocytes can be isolated from a liver culture using the
conversion o f L-ormthine to L-argmine as a basis o f selection By using argimne-free ornithine
containing medium, only hepatocytes (which contain transcarboxyamylase) w ill grow (Salas-
Prato, 1982) Use o f D-valme instead o f L-valine in SFM preferentially allowed the growth of
human and rodent epithelial cells (Gilbert and Migeon, 1975) The fibroblasts, which lack the
essential ammo acid oxidase, cannot convert D-vahne to L-valine and thus cannot grow
However, this may not be true for all fibroblasts as it was recently reported that anterior
pituitary adenoma fibroblast cells were not inhibited in serum-free medium containing D-valine
(Masson et a l , 1993)
Beattie et al (1990) used a specific cytotoxin to cells expressing the basic fibroblast growth
factor (fi-FGF) receptor by conjugating the growth factor to Saporm-6 , a ribosome-mactivatmg
protein for 96 hours. This allowed pancreatic islet cell growth in the absence o f fibroblasts
8
Chemically defined media may be used to control the differentiation o f cells (Rahenchilla et a l ,
1989, Reyne et a l , 1989, Najar et a l , 1990) For example, calcium ions control the
differentiation o f normal human keratinocytes in SFM (Pillai et a l , 1990)
Serum was routinely used in combination with di-methyl-sulphoxide (DMSO) to protect cells
during cryopreservation Methylcellulose, casein and various SFM have been used to replace
serum to allow ’defined’ cryopreservation o f cells grown in SFM (Yoshida and Takeuchi, 1991,
Li et a l , 1993, Johnson et a l , 1992) This means that cells need not be contaminated with
serum components during cryopreservation
1.1.4 Problems with Serum-free media
The development o f SFM for anchorage-dependent cells has had varied success Some cell lines
like HeLa (Hutchings and Sato, 1978) and MDCK (Taub et a l , 1979) have been found to grow
as w ell in SFM as in serum-supplemented medium even over extended periods (many
subcultures) Continuous growth in SFM has been reported for other cell hnes where growth
is only slightly less than that obtained in serum-supplemented medium including HT-29 colon
carcinoma and TWI melanoma cells (Zirvi et a l , 1986), Oat cell carcinoma cells (Simms et a l ,
1980) and non-mahgnant human squamous cells (Rikimaru et a l , 1990) In some cases
however, although long-term subculture has been reported, the use o f serum or Pedersons
Fetuin to inactivate trypsin while subculturing, means that there may be some residual serum
being carried through with each successive passage (Oda and Watson, 1990, Malan-Shibley and
Iype, 1983)
However, the success with anchorage-dependent cells is not as extensive Many o f the
anchorage-dependent cells are more fastidious growers and a simple combination o f factors
cannot totally replace serum As a result, growth is often slower m SFM (Ahearn et a l , 1992)
In some cases ’SFM ’ have been developed where the cells must first be plated in medium
containing serum and allowed to attach The supernatant is then removed and replaced by a
SFM which supports growth (Jozan et a l , 1992)
Use o f ill-defined components to supplement media includes Pedersens Fetuin (Elliot and
Auersperg, 1993), bovine bram extract (Maciag, 1981), crude membrane extracts (Saad et a l ,
9
1993) and bovine pituitary extract (Bertolero et al ,1984, W ille et a l , 1984, Kirk et a l , 1985,
Gilchrest et a l , 1982 and Peehl and Stamey, 1986) Use o f peptones as serum substitutes
reduce costs and the possibility of contamination because they are autoclavable (Rutzky, 1981)
Adaption o f cells to growing in a SFM often occurs This may involve the initiation of
autocrine systems, synthesis of components o f the extracellular matrix or using initial substrates
of biosynthetic pathways instead o f the intermediates normally provided by serum As a result
of these activities, a slower initial growth o f cells in SFM w ill be seen followed by sustained
growth The use o f high cell densities is often required so as not to dilute down autocrine
factors beyond a critical level
Kaighn et al (1988) looked at changes in the karyotype o f two mouse keratinocytes, MK1 and
MKDC4, to see what effect growth in SFM would have MK1 and MKDC4 cells could
undergo 400 and 200 doubhngs respectively but significant karyotypic changes occurred at
passages 4 and 7 The cell chromosome number increased from diploid to near tetraploid with
less dependence on bovme pituitary extract after several doublings This corresponded to the
time taken for the cells to adapt to growing in SFM Guhe and Follmann (1994) when
investigating the characteristics o f porcine urinary bladder epithelial cells found that for up to
4 weeks that cells exhibited simriar marker enzymes and that after the first 5 weeks, there was
an increase in polyploid and polynucleated cells Jefferson et al (1985) noticed considerable
changes in protein synthetic patterns in MDCK cells between passages 1 and 10 in SFM
Retention of normal cellular functioning is important especially when a product is desired as
in the case o f hybridoma production o f monoclonal antibodies MDCK and Opossum kidney
retained their ability to form hemicysts, while Hela-S3 continued to produce a-subumt of
glycoprotein hormones in a SFM but after 4 days production was only 50-80% o f that seen m
serum-supplemented medium (Taub et a l , 1979, Leiderman et a l , 1989, Morrow et a l , 1981)
10

Cellular requirements w ill differ depending on the following the embryonic origin o f the cells
(ecto, meso or endodermal), species specific requirements, and whether the cells are normal or
transformed Therefore the media supplements required w ill vary from cell type to cell type
In addition, many cells grown in SFM are much more density-dependent than cells grown in
serum-supplemented medium As early as 1962, Eagle and Piez found that cultured mammalian
cells synthesised serine but if the cell density was too low, the amount o f serine released to the
medium was insufficient for the survival o f cells
Media supplements can be categorised as follows transporters, growth promoters
(hormones and growth factors), attachment factors, vitamins, trace elements and lipids
Transporter molecules include transferrin and albumin which transport iron and most lipids
respectively These w ill be discussed in more detail in section 1 6 and 1 7
1.2.1 Growth Promoters
Dulbecco (1970), found that many cells exhibited a low level dependence on the serum
concentration for the initiation o f D N A synthesis but were strongly dependent on the serum
level to undergo mitosis Proliferation and differentiation o f animal cells is regulated by the
events leading to DN A synthesis i e the exit from the G1 phase and entry into the S phase
This is controlled by external conditions affecting cells Hormones and growth factors which
are present in serum are known to exert control over cell division Such factors must be
incorporated into many SFM to allow rephcation o f cells
Growth promoters include insulin, IGFs, EGF, PDGF, FGF, estradiol, dexamethazone and
prostaglandins Insulin is used almost universally in SFM and its role is discussed later Most
growth factors present in serum are in ng/ml concentrations Detailed information about growth
factors can be found in Ham (1981), Habemcht (1990) and the 1994 R and D Systems catalogue
(R and D Systems Europe)
1.2 MEDIA SUPPLEMENTS
11
1.2.1.1 Epidermal Growth Factor (EGF)
EGF is a 6kDa protein with a single peptide of 53 amino acid residues It is found in all body
fluids under normal physiological conditions The almost universal importance is seen m its
incorporation into most SFM EGF works by increasing the cell cycling fraction as observed
m human diploid fibroblasts (increasing the move of cells from the G1 phase into the S phase)
It can operate synergistically with msuhn or IGF-I by reducing the lag time before D N A
synthesis for the growth o f Balb/c 3T3 cells (Pledger et al 1978, Brown and H olley, 1979)
1.2.1.2 Platelet-derived Growth factor (PDGF)
PDGF is a serum protein derived from platelets (a-granules o f platelets) during the clotting
process (Stiles, 1983) It is a heterodimer o f 30kDa which may consist o f a and/or ft chains
depending on the species It is extremely cationic and hydrophobic and as such requires a
carrier protein (usually BSA) for proper functioning It is a potent mitogen for connective
tissue smooth muscle cells, fibroblasts and glial cells (Koher and Lipton, 1974) It stimulates
the transition from G1 to S phase but does not increase the cell cychng fraction It also
stimulates ammo acid uptake, the Na-K pump and increases the number of somatomedin surface
receptors PDGF has been produced m an autocrine fashion by endothelial cells (Dicohleto and
Bowen-Pope, 1983), osteosarcoma cells (Heldm et al 1980), and SV-40 transformed BHK cells
(Dicher et a l , 1981) When PDGF was incorporated into the medium, a lower level o f EGF
was required for growth of mouse CBH/10T1/2 cells (Carpenter and Cohen, 1979)
1.2.1.3 Fibroblast Growth Factors (FGF)
Acidic and basic FGFs are single chain polypeptides with molecular weights o f 16 and 14 5kDa
respectively They were originally isolated from bovine bram extract (Gospodarowicz et al ,
1982) They are potent mitogens for endothelial, mesoderm and neuroectoderm-derived cells
Both have been used to stimulate the growth o f normal human keratmocytes and fibroblasts in
SFM (Shipley et a l , 1989) Heparin sulphate has been implicated in stabilizing the activity of
a-FGF
1.2.1.4 Hormones
Hormones w ill have different effects depending on the cell system Steroid hormones like
estrogen were shown to stimulate growth o f human endometrial cells B-estradiol stimulated
growth by reducing the length o f the G phase, much like insulin Estrogen in a SFM was
shown to exert a mitogemc effect on MCF-7 cells but not on Ishikawa cells (Huff et a l , 1986,
12

Dickson et a l , 1986) Not only is varied response seen depending on the cell hne, the basal
medium may also dictate activity Holinka et al (1989) found that when minimal essential
media (MEM) was used as the basal medium, no response to estradiol was seen, regardless of
concentration, but when Earls basal medium (BME) was used, stimulation by estradiol
occurred Nishizawa et al (1989) found that androgen and estrogen enhanced growth through
unique receptors on transformed mouse leydig cells For human mammary breast cells,
oestrogenic hormones were found to stimulate growth while androgens inhibited growth
(Maclndoe and Eitre, 1980) The converse has been found for prostate cancerous cells Mice
mammary tumour (Shiongi carcinoma 115) cells were markedly stimulated by androgen and
estrogens (Noguchi et a l , 1985) This indicates that hormonal interactions with cells may be
species specific or site specific m their interactions
Glucocorticoids can have a variety o f effects depending on the cell type and the presence of
other factors They can modulate cell proliferation by altering the cells’ responsiveness to other
hormones or growth factors (Baker et a l , 1978) For example, dexamethazone acted
synergistically with IGF-I to stimulate the growth o f smooth muscle cells (Conover et a l , 1983)
and cardiac myocytes (Suzuki et a l , 1989) but down-regulated the insulin receptor substrate-I
in 3T3-L1 adipocytes (Turnbow et a l , 1994) Glucocorticoids are also involved in modulating
the production o f metabolites in a SFM (Coezy et al ,1984, Beuhmck and Cassio, 1983 and
Togami et al ,1988) and growth promoting factors such as IGF binding proteins (Okazakai et
a l , 1994) The use o f serum-free medium increased the sensitivity o f CEM-C7 cells to
dexamethazone (Chilton et a l , 1990)
For other cell lines, autocrine production becomes turned on, enabling the cells to survive in
defined medium with little or no additional growth promoters required (Matsuda et a l , 1989,
Soma and Grotendorst, 1989) Human skin fibroblasts were observed to produce an IGF-hke
peptide (Clemmons, 1984) while Reuber H-35 rat hepatoma cells were found to secrete
transferrin in SFM (Shapiro and Wagner, 1989) The extent o f autocrine production varies
Human non-functional pituitary adenoma cells were found to produce EGF, TG F-a, IGF and
fl-FGF (Renner et a l , 1993) and human non small cell lung carcinoma cells were found to
produce B-FGF, IGF-I and II, EGF, TGF-B2, TN F-a, TGF-fil and PDGF (Occleston and
Walker, 1993) fi-FGF is produced by renal carcinoma cells (Mydlo et a l , 1993) and human
osteosarcoma cells (Nishikawa et a l , 1993)
13

Transformed cells like Swiss 3T3 and Balb/c 3T3 have a lower requirement for serum (Clark,
1970, Dulbecco, 1970) The loss or reduction in requirement o f exogenous growth factors may
be due to an increase the number of high affinity cell surface receptors (Chermgton and Purdee,
1980), production o f transforming growth factors or alterations m the ability o f cell surface
receptors to initiate signal transduction etc
1.2.2 Attachment factors
The attachment of cells to their surrounding is important in determining cell shape and in
maintaining proper cell function and tissue integrity Serum provides required attachment
factors such as fibronectin and vitronectin which allow the cells to attach quickly M ost cells
are capable o f producing attachment factors but attachment is in general, greatly stimulated by
the presence o f exogenous attachment factors So, the absence o f serum from media not only
affects growth and differentiation but has consequences for cell attachment The development
of SFM and the initial widespread use o f attachment factors has allowed a greater understanding
of the chemistry and mechanisms o f cellular adhesion and attachment, embryogenesis,
morphogenesis, homeostatic processes, organ stability and tumour metastasis
Due to the fact that cells can synthesise attachment factors and all or most o f the requirements
for the extracellular matrix (ECM), many SFM no longer incorporate exogenous attachment
factors but depend on the capabilities o f the cells (Taub et al, 1979, M onta et al, 1993,
Golombick et al, 1990, Hahm et al, 1990) However, addition o f ECM components or
attachment factors have been found to be necessary for the long-term growth o f some
established and primary cell lines (Gospodarowicz et al, 1981, Bridges et al, 1993, Baeza-
Squiban et al , 1994) as these cells could not produce sufficient components to form their own
ECM
When exogenous attachment factors are provided or when the cells synthesise attachment
factors, an ECM is deposited The ECM is a complex network o f secreted proteins and
carbohydrates that fill the spaces between cells in vivo and between the cell and substratum in
vitro which consists o f a combination of collagens, proteoglycans and various glycoproteins such
as fibronectin and lamimn The ECM can act as positive or negative regulators o f cell growth
and/or differentiation, by interacting with hormones and growth factors (Tokiwa et al, 1988,
Sarubbi et al, 1990, Lin and Bissell, 1993, Nagano et al, 1993, Nugent and Newman, 1989)
14

Two forms o f adhesion were identified The first involves electrostatic interactions between the
substratum (surface) and the cell, a process known as passive adhesion The second involves
binding o f the cell to a substratum via a protein coat (typically provided by serum) This is
referred to as active adhesion
In passive adhesion, negatively charged cytoplasmic micro-extensions from the cell bind to a
positively charged substratum The positively charged substratum can be achieved by chemical
etching or physical treatment, e g , bombarding with electrons (Grinnell, 1978, Ramierez e ta l ,
1984) or use o f basic polymers such as polylysine, protamine or polyargimne (McKeehan and
Ham, 1976) This provides a positive charge at physiological pH to which the cells can attach
The use o f negative charges has also been reported but the basis o f adhesion is unknown since
cells have a net negative charge at physiological pH (Maroudas, 1975) Serum factors or
proteins inhibit passive adhesion by binding to the surface first and preventing electrostatic
interactions between the cell and substratum
Active adhesion requires specific co-factors (usually supplied by serum), cytoplasmic
components and particular cell surface receptors It is a slower process than passive adhesion,
is energy dependent and requires cations (Mg2+, Ca2+ and sometimes Mn2+) It involves the
laying down o f the ECM, a general reorganisation o f microtubules and microfilaments that
comprise the cytoskeleton, and binding, via specific receptors to the ECM Serum components
known to be involved include collagen, fibronectin and vitronectin These factors are all
glycoproteins and most have been found to contain a specific sequence for recognition on the
cell surface The site contains the short amino acid sequence Arg-Gly-Asp which is called the
RGD (based on the alphabetical code for ammo acids) site and is necessary for active binding
RGD sequences have been found on vitronectin and lamimn (Cheresh et a l , 1989),
thrombospondin, fibrinogen, collagen and osteopoitm (Ruoslahti 1987, 1988), and on platelet-
derived glycoprotein GpIIB/IIIa (Pytela et a l , 1986) These all belong to a super family of
factors, the Integral family (Hynes, 1987) Differences in specificity of the factors is thought
to be caused by neighbouring ammo acid sequences
15
1.2.2.1 Collagen
Of these factors, collagen is the most abundant protein in the basement membrane o f the cell
It is a glycoprotein present in 5 major forms (types I to V) A ll consist o f three a-helical chains
bound together They are similar m form and action but have specificity for different cell
types Type I and III are involved in attachment o f fibroblastic and endothelial cells (Tseng et
a l , 1981) Type II is involved m the attachment o f chondrocytes (Kidwell et a l , 1984) Type
IV is involved in the binding o f epithelial carcinoma cells (Palm and Furcht, 1982) Type V
is involved in the binding o f epidermal cells (Altalo et a l , 1982) Collagen was shown to
provide extended proliferation for mammary epithelia cells in SFM either exogenously or
synthesised in vitro (Kidwell et a l , 1982) Factors which stimulate collagen production include
EGF, PGEj, FGF, glucocorticoids and msulin-hke peptides (Salomon et a l , 1981) It can be
used in the native form or can be denatured to form a gel which acts as a precoat for cells
Native collagen has been used to form beads and act as microcarriers for suspending cells m
solution (Yang et a l , 1982) Type IV is probably the most common collagen used m SFM
1.2.2.2 Fibronectin
Fibronectin is also a basement membrane protein consisting o f a dimer of a and B chains of
unequal length, linked together at the carboxyl end by disulphide bonds It is a glycoprotein
(5-10% carbohydrate) o f 550kDa molecular weight and is principally derived from plasma
Structural variations exist depending on the source (due to alternative mRNA splicing) It is
probably the most used adhesive factor in cell biology (Ruoslahti, 1988, Barnes et a l , 1983,
Burrill et a l , 1981) It contains binding domains for fibrin, heparin, collagen, the cell (via
RGD sites) and also to a DNA-binding domain
1.2.2.3 Laminin
Lammin is a large molecular weight (106) glycoprotein found exclusively in the basement
membrane in vivo (Timpl et a l , 1979) It consists o f four subunits, bound by disulphide bonds
which form a cruciform shape There is one a chain (400kDa) and three B chains (200kDa)
The short arms are involved in cell binding, probably via the two globular domains It has been
shown to promote binding o f epithelial cells PAM 212 to collagen type IV (Terranova et al
1980), hepatocytes (Carlsson et al 1981), interstitial epithelial cells (Burrill et al 1981) and
Schwann cells (Palm and Furcht, 1982) Very little is found in serum It forms large polymers
m the basement membrane and the ability to polymerise is dependent on the presence o f divalent
cations Lammin binds collagen type IV, heparin and proteoglycans
16
1.2.2.4 Other Attachment Factors
Chondronectin is a glycoprotein (180kDa) which is produced by chondrocytes and is found m
the pericellular network (Hewitt et a l , 1982) Its binding capacity is enhanced by collagen type
II and proteoglycans It is found in the serum at levels o f 1-20/ig/ml
Other factors include Epibolin (65kDa) which provides attachment for epidermal cells Fetuin
is a major protein o f FCS and it too has adhesive functions There is also Vitronectin (serum
spreading factor) which is found in the human serum, ammotic fluid and urinary proteins
(Shaffer et al 1984) This has very similar activity to fibronectm and binds
glycosylaminoglycans and heparm.
Proteoglycans contain a protein core to which glycosaminoglycan is added e g chondroitin
sulphate, dermatin sulphate, keratin sulphate and heparan sulphate These interact weakly with
lamimn, fibronectm and collagen type IV
For anchorage-independent cells, no attachment factors are required for growth m suspension
In vivo, however, for tumour cells to be metastatic, adhesion factors are needed in order for
cells to leave the site o f origin and travel through the blood stream to a secondary target site
Metastatic tumours have been shown to use the above factors and some even produce their own
adhesive factors (Liotha et a l , 1986, Pande and Khur, 1988, David et a l , 1994) The human
squamous carcinoma cells produce thrombospondin (Varam et al 1986)
1.2.3 Vitamins
Vitamins are required for proper cellular functioning by acting as co-factors and co-enzymes
in metabolic reactions They are components in all basal cell culture media (mostly B
vitamins) The levels of vitamins may not be optimal for all cell lines, for example, Matsuya
and Yamane (1986) found addition o f Vitamin B12 to be necessary to supplement growth of
several mouse cell types at low cell densities, while combination of choline and myo-inositol
were found to improve the growth o f human epithehal keratmocytes (Gordon et al, 1988) In
addition to low cell densities, vitamin limitation may affect cell growth at high cell densities
(Evans and Williams, 1988) Due to instability, some water soluble vitamin groups B and C
had to be added to ATCC medium during the culture o f CHO cells in SFM (Kurano et a l ,
1990)
17

Although vitamin C and E (a-tocopherol) have been used as antioxidants (Barnes, 1987), they
are not always growth stimulatory Vitamin C was found to decrease the cell proliferation of
post-embryo growth plate chondrocytes (Hennig et a l , 1989) but increase arachidonic acid
uptake, PGE2 production and increase adenylate cyclase activity m B16 melanoma and non-
mahgnant LLCMK cells (Stoll et a l , 1994) Vitamin E was found to be inhibitory alone for
rat mammary tumour line 64-24 cells but was necessary for growth stimulation with a lipid
complex containing sphingomyelin, phosphatidylcholine, phosphatidylethanolamine and
phosphoethanolamine (Van der Haegan et a l , 1989), probably by acting as an antioxidant It
also inhibited the stimulation o f c-fos mRNA levels in MCF-7 cells induced by IGF-I (Li et a l ,
1994)
Vitamin A has been found to induce differentiation o f neuroblastoma (Ueno et a l , 1993) and
T47D cells (Thiele et a l , 1988) but to prevent differentiation o f lung carcinomas (Miyazaki et
a l , 1984) Combinations o f vitamins A and E in SFM with Na2Se03 or vitamin C were found
to prolong the growth o f primary cultures o f adrenocortical cells (Simonian, 1982) and
hepatocytes (Miyazaki et a l , 1991) respectively Vitamin A alone inhibited TGF-B stimulation
o f human mammary carcinoma cells (Halter et a l , 1993)
Vitamin D was found to be inhibitory for a number of cell hnes including human keratmocytes
(Kobayashi et a l , 1993), human leukemic cells (Reitma et a l , 1983) and a breast cancer cell
line (Eisman et a l , 1989), but stimulated DN A synthesis m alveolar type-II cells (Edelson et
a l , 1994) Vitamin D was also found to reduce tissue plasminogen activator stimulated
production of IL-6 and IL-8 in human fibroblast cell hnes (Srivastava et a l , 1994)
1.2.4 Trace Elements
Trace elements regularly used in SFM include Cu, Sn, Co Mn, M o, Va, N i, Zn and Se It has
been found that by designing a SFM with a greater variety o f trace elements, the requirement
for albumin, insulin and transferrin could be eliminated (Cleveland et a l , 1983, Darfler, 1990)
Selenium is an essential trace element for many mammalian cells (Ganther et a l , 1976, Iscove,
1984) Inclusion o f selenium in media may be beneficial because o f its ability to prevent the
oxidation o f lipids by functioning as a component o f systems involving gluthatione peroxidase
and superoxide dismutase (Hewlett, 1991) Indeed, Hatfield et al (1991) found transfer o f cells
from a selenium-free to a selenium containing medium resulted in an increase in selenocysteme
18
tRNA[Ser]S6C (initially aminoacylates with serine and the serine moiety is subsequently converted
to selenocysteine, therefore designated as tRNA[Ser,Sec) which controls the transcription and
translation o f glutathione peroxidase Growth stimulation effects o f selenium have also been
reported (McKeehan and Ham, 1976, Peehl and Stamey, 1986, Zhu et a l , 1992), probably
through its protection from oxidative radicals Iron is another trace element that may be added
to serum-free medium to replace transferrin (see section 1 6) Calcium levels not only affect
attachment and act as a co-factor for many enzymes, but have also been reported to enhance cell
growth o f some cell hnes in SFM (Praeger and Cnstofalo, 1986, Robinson and W u, 1991)
1.2.5 Lipids
Serum contains two classes o f lipid transport proteins and their hpid components albumm,
which carries free fatty acids, and lipoproteins, which carry phospholipids, triglycerides and
cholesterol Although lipid requirements vary for different cell types, it is more economical
for cells to use intermediates o f hpid metabolism, (e g cholesterol, long-chain fatty acids and
glycerides), than to start from scratch, provided that the cells are not auxotrophic for a
particular hpid Lipid requirements and especially fatty acid requirements are traditionally
supplied by using albumm as the hpid carrier Albumin substitutes include polyethylene glycol
(PEG), carboxymethyl cellulose (Blasey and Winzer, 1989, Shmtam et a l , 1988), hposomes
(Darfler, 1990), and a and B cyclodextrins (Ohmori, 1988)
Cholesterol is a requirement for all growing and dividing cells as it is the mam component of
the cellular membrane, precursors for prostaglandin synthesis and is an alternative source of
energy (Kan and Yamane, 1982, Saier, 1984, Sato et a l , 1987) Many cells can synthesise
cholesterol but some cells are auxotrophic and require exogenous addition (Chen and
Kandutsch, 1983) Cholesterol alone can have a negative effect on cell proliferation
(Buntemeyer et a l , 1993)
Free fatty acids are essential nutrients for other cells, especially linoleic acid, arachidonate,
palmitic and oleic acid (Ham, 1963, Spieker-Polet and Polet, 1981)
Lipoproteins are required by some cells in SFM (Tauber et a l , 1981, Gospodarowicz and
Cheng, 1987) For human arterial smooth muscle and lung fibroblasts, lipoproteins were found
to be primary mitogens and growth promoters while cholesterol or essential fatty acids were not
19
(Bjorkerud and Bjorkerud, 1994) Not only is it sometimes necessary for growth but HDL was
found to enhance the production o f IL-1 in A431 human keratinocytes (Blasey and Winzer,
1989) Phospholipids were found to have a stimulatory effect on MDCK and normal kidney
cells in SFM by interacting synergistically with insulin (Bashir et a l , 1992)
A variety o f commercially available lipoprotein complexes can be used to support the growth
o f a variety o f cells without having to worry about solubility, e g Ex-cyte Ex-cyte
encompasses a variety o f hpoprotein mixtures which haven been found not only to promote
growth but also to improve metabolite production (Blasey and Winzer, 1989, Hewlett et a l ,
1989, Belisle et a l , 1990)
20
1.3 INDUSTRIAL OVERVIEW
There is huge potential for the use o f mammalian cell culture m the production o f a wide range
of commercially valuable products for the veterinary and pharmaceutical industries (Spier and
Griffiths, 1988) Much progress over the past 15-20 years has occurred in the development of
systems for growing anchorage-dependent and anchorage-independent mammalian cells for
example, in the use o f large-scale computer controlled bioreactors (as large as 10,000L) and
high density systems which can maintain cell densities o f 10* cells/ml for long periods (for
references see Griffiths, 1992) Improvements and advances have been made m the
developments o f new media for growth and production and in advances in genetic engineering,
both of which, have not only increased the range of products but also the yield The
improvements in media optimization and increased yields have considerably reduced the
advantage that bacterial systems had over mammalian cells in terms o f productivity and cost
Mammalian cell products include vaccines, monoclonal antibodies (mAbs), interferons, other
lymphokines, urokinase, tissue plasminogen activator and human fertility hormones Two
traditional methods o f production exist Monoclonal antibody production by hybridomas and
myelomas and expression o f recombinant gene products from genetically engineered cells
Typically there are two categories o f media used m large-scale fermentations, the growth
medium and the production medium The growth medium usually contains 5-15 % serum while
the production medium contains a much smaller amount (less than 5% serum) Some systems
have taken advantage o f this by using a serum-supplemented medium for the growth phase,
followed by the introduction o f a SFM for the production phase In designing a SFM, the
requirements for growth and production may vary
The cost o f the basal medium is about the same as that for a microbial system, but the addition
o f various supplements (serum and antibiotics) make the medium up to 15 times more expensive
(Griffiths, 1986) So although there are advantages to the large-scale use o f SFM, the cost must
be o f high priority so that manufacture can be as economic as possible In addition to labour
and time being required for the transfer from the growth to the production medium, there is also
the increased risk o f contamination It has also been reported that serum seemed to inhibit mAb
production in comparison to SFM (Tharakan et a l , 1986)
21
In addition to the cost, the purity o f products obtained from mammalian cells growing in serum-
free medium is important, since the quality of pharmacological products could be significantly
affected by minute amounts of serum components International regulations for good
manufacturing procedures (GMP) restrict the amount of serum constituents in the final product
when making injectable vaccine products as allergic reactions could be induced
1.3.1 Monoclonal Antibody Production
One o f the biggest successes for SFM has been in the production of monoclonal antibodies
(mAbs) Immunoglobulins (Igs) are in great demand due to their medical, clinical and
analytical applications For a large variety o f the hybridomas grown in SFM, there is little
variation in the medium composition Only four basal media are extensively used DMEM,
Ham’s F-12, RPMI-1640 and IMDM The supplements are almost always msulm, transferrin
and ethanolamme (Murakami et a l , 1982) In many cases BSA is included also For spinner
cultures, phosphoethanolamine or phosphatidylglycerol may also be added Kawamoto et al
(1983b) suggested that some hybridomas required low density-lipoproteins or fatty acids such
as oleic and linoleic acid, however, the requirement for lipids is not universal (Chang et
al ,1980) These hybridomas are not fastidious and so SFM are relatively cheap in comparison
to SFM designed for growth o f anchorage-dependent cells (few growth factors and no
attachment factors)
Not only has it been possible to grow hybndoma cells m SFM, but low protein (Blasey and
Winzer, 1989, Jager et a l , 1988) and protein-free (Darfler, 1990) media have also been
developed to maximise production (equivalent titres o f mAbs seen in SFM and SSM) and
minimise downstream processing costs In addition there may be fewer problems with Federal
Drug Agency (FDA) approval and less potential for carry-over o f adventituous agents In some
situations, the use o f a protein-free medium is not viable Chua et al (1994) reported that for
the hybridoma cell line 2H G 11, IgG production in the basal medium eRDF (RPMI DM E Ham’s
F12 in 2 1 1 enhanced with glucose, amino acids and vitamins) was similar in serum-free and
serum-supplemented media but that removal of BSA from the SFM resulted in a much lower
titre o f IgG Ozturk and Polsson (1990) also reported similar findings
Optimization of production is o f prime importance In vivo, one plasma B cell m the lymph)
nodes secretes about 2,000 antibodies per second (McKeehan et a l , 1990) This is equivalent
22

to 1 7 x l0 8 molecules or 43pg/cell/day In vitro however, at 106 cells/m l only 1 gram of IgG
is produced by 1011 cells/day i e lOpg/cell/day It is obvious that many of the systems used
are not optimized for the production o f antibodies
Optimization o f medium usage has led to the development o f high cell densities Namalwa, a
human lymphoblastoid cell line has been grown m SFM in perfusion cultures (cell densities
higher than 107 cells/ml) to produce human B-mterferon and human lymphotoxin (Miyaji et a l ,
1990a,b,c, Hosoi et a l , 1991) Human hybridomas were grown in SFM to produce anti-tetanus
toxoid and anti-HBsAg human mAbs (Kitano et a l , 1991) However, this SFM required the
addition o f a stimulatory fraction from adult bovine serum or a combination o f polyethylene
glycol and swine LDL to stimulate good growth and mAb production
1.3.2 Expression of recombinant proteins
Bacterial and yeast expression systems have been used successfully to synthesise a variety of
recombinant gene products However, post-translational modification in higher eukaryotes is
more complex than in lower eukaryotes counter parts So where post-translational modification
(e g glycosylation) is necessary for proper biological activity o f the product, mammalian
systems are often the preferred choice (Goto et a l , 1988) Animal cells provide an ideal
environment in which recombinant proteins can be properly transcribed and glycosylated A
variety o f cell lines including CHO, Vero, CV-1, Namalwa (lymphoblastoid) and C127 cells
have been found to be suitable recipient mammalian hosts to accommodate transfection and
expression o f a variety o f recombinant gene products These products include interferon
(Chernajovsky et a l , 1984, Mitram-Rosenbaum et a l , 1984), tissue plasminogen activator
(Kaufman et a l , 1983), growth hormone (Pavlakis and Hamer, 1983), polio vaccine (Larsson
and Litwin, 1987), rabies vaccine and hepatitis B antigen (Michel et a l , 1985, Christman et
al , 1982), erythropoietin and interleukin-2 (Conradt et al , 1986), human renin (Asselbergs et
a l , 1994), and a - 1-antitrypsin (Paterson et a l , 1994)
Large-scale cultivation o f anchorage-dependent cells usually involves the use o f microcarriers
for adherence Satoh et al (1991) carried out extensive research to design a suitable large-scale
SF cultivation o f TRC-29SF (human renal carcinoma) to produce human macrophage colony
stimulating factor (M-CSF) The M-CSF production was improved by gene amplification with
dhfr-MTX system (Satoh et a l , 1991) The cells were grown in SFM in a perfusion culture
on microcarriers with a final cell density o f greater than 107cells/ml
23
1.3.3 Virus Production
The development o f serum-free nutrient media for the production o f human and veterinary
viruses is not as simple as that seen in the production o f monoclonal antibodies Many o f the
cells used in viral production are anchorage-dependent
Although the absence o f adventitious (especially viral) contaminants and antibodies is o f prime
importance, the prohibitive cost and the regulatory surveillance o f the industry restricts the
broad adoption o f serum-free media FCS has been replaced by cheaper sources o f serum (e g
bovine and equme) which are usually chemically treated or gamma-irradiated to destroy any
possible viral contamination Commercially available SFM like OptiMEM™ is a nutrient-
enriched medium which has been found to support virus production in W I-38, MCR-5, IMR-90,
Vero, MDBK, BHK and other primary and estabhshed cell lines (Jayme, 1991) Human
immunodeficency virus production has been successfully carried out in HUT 78 cells in a
serum-free medium (AIM-V)
Mention should also be given to the use o f insect cell cultures in the large-scale production o f
medical, diagnostic and veterinary products The baculovirus expression system has been used
m insect cells such as Spodopteran frugiperda (SF9 or SF21) cells
A large number o f recombinant products have been produced e g a-interferon (Maeda et a l ,
1985), hepatitus B surface antigen (Kang et a l , 1987), lymphocytic choriomeningitis virus G
protein (Matsuura et a l , 1987), interleukin 2 (Smith et a l , 1985), thrombomodulin (Ogata et
a l , 1993), and interferon-B (Smith et a l , 1983) The ability of these cells to grow w ell on a
large-scale (Murhammer and Goochee, 1988, Maiorella et a l , 1988) and in serum-free medium
(Vaughn and Fan, 1989, Hink, 1991) offers a comparatively inexpensive system of production
However, although invertebrate cells have a greater capacity for post-translational modification
than microbial systems, very complex glycosylations which are sometimes necessary for
biological activity, cannot be carried out
1.3.4 Economic feasibility of SFM on large-scale
As mentioned earlier, the use o f serum in large-scale processes can be costly Incorporation
o f the high cost o f growth factors and attachment factors together with the preparation time it
requires to make up these often complicated media, may make the SFM as expensive or more
expensive than serum-supplemented media
24
To overcome the expense, less fastidious cells should be chosen This can be seen with the
myelomas and hybridomas used in the large-scale production o f monoclonal antibodies They
have no requirement for attachment factors and little requirement for expensive growth
supplements
Optimization of the medium is also a way of cutting production costs A knowledge of the
growth requirements o f the cells can be used to optimize basal media For example
depletion o f ammo acids correlated to a decrease in culture viability and biological productivity
(Luan et a l , 1987a, Jager et a l , 1988) By incorporating or adding more amino acids, growth
and production can be continued without a significant increase in cost The rapid breakdown
of glucose to lactic acid can be reduced by the partial replacement o f glucose by other hexoses
(e g mannose) This has helped to maintain growth and productivity in high density cultures
Immobilization o f growth factors to a membrane surface has allowed for the development of
alternative ’protein-free’ media Liu et al (1993) coimmobilized insulin and collagen on the
surface o f a hydrolysed polymer membrane to support the growth of anchorage-dependent cells
(STO and 3T3-LI) and a fibroic sarcoma The cell growth was found to be accelerated more
strongly by immobilized than by free proteins The membrane could be repeatedly used up to
12 times without a significant loss in activity By immobilising growth factors or hormones on
a membrane, they do not interfere with downstream processing This method would be ideally
suited for use in a perfusion system where the expensive proteins could be immobilized on a
membrane and an inexpensive protein-free medium could be used to perfuse the cells
The formation of ammonia from the deamination o f glutamine can prematurely induce cell
senescence Replacement o f glutamine by a di-peptide, glycyl-L-glutamine (Jayme, 1991)
resulted m reduced ammonia build up and enhanced mAb production Geaugey et al (1989)
found that enrichment o f hybridoma medium with glutamic acid during the culture period
improved cell viability and mAb production However, Schlaeger et al (1994) reported that
when dipeptide L-alanyl-L-glutamine replaced glutamine, there was a decrease m ammonium
production but also a decrease of more than 30% in the production o f thyroid stimulating
hormone antibody, with only a shght reduction in cell density It was further suggested that
glutamine appeared to be the critical nutrient due to high accumulation o f ammonia
25
For mAb production there is also the potential to use immunoglobulin production stimulating
factors (IPSF) Additives which have been found to contain IPSF include chicken egg yolk
lipoprotein, Royal jelly and casein However, most IPSFs so far reported, stimulate IgM
production predominately (Murakami et a l , 1991)
There are many commercial products for growing such cells in serum-free medium Aside from
the proprietary retention o f information on some o f the factors in the SFM, most o f these
products are suitable for small-scale to moderate-scale use The cost may be prohibitive for
large-scale productions Griffith (1986) reported that medium costs using FCS were £700 per
40L fermentation, while the cost o f SFM were much more expensive, about £600 per litre
This SFM included EGF, FGF, PDGF, transferrin and fibronectin Obviously, the cost w ill
depend on the requirements o f the cells under serum-free conditions For CHOK1 cells, the
SFM designed by Mendiaz et al (1986), cost around £350 per 40L while serum at a
concentration o f 5% vol/vol cost between £320 - £400, depending on the quality o f the serum
(costs determined on 1994 Sterhng prices and not including the basal medium)
The use o f high density cultures has also been used to reduce the cost o f medium High
densities have been attained by use o f encapsulation techniques and growth o f cells m hollow
fibre and packed bed fermentations Shirai et al (1989) immobilized cells in calcium alginate
beads m a SFM Recombinant von Willebrand factor was produced by CHO cells cultured in
macroporous microcarriers in SFM (Mignot et a l , 1990) Liu et al (1991) used a large-scale
hollow fibre bioreactor for the long-term cultivation o f HepG2 cells which produced a crude
conditioned medium protein Production o f this factor was as good when the cells were grown
m serum-free as in serum-supplemented medium
Bliem et al (1990) used a packed bed reactor for the mAb production under serum-free and
protem-free conditions Over a 4 week period over 110g o f antibody was produced under
serum-free conditions but only 25% of the activity was seen under protem-free conditions On
transfer from serum-free to protein-free conditions, the drop m antibody production occurred
with a drop in metabohc activity Cells initially grew m SFM (insulin, transferrin and albumin
in RPMI/DME medium) When the SFM was replaced with a basal medium (RPMI/DME),
a dramatic drop in growth and metabohc activity was seen When a combination o f Coon’s
F12/DM E was added, 25% o f the antibody producing activity was retained As these cells had
not adapted to growth m protein-free medium, it may be that some factor required to stimulate
26
the production o f antibodies was absent or limiting in the two combinations o f basal media
Recently, Lee and Palsson (1993) reported that entrapment o f cells m calcium alginate beads
(in theory any other form o f entrapment) prevented a non-producing population o f hybridomas
from taking over the producing population by limiting the growth o f the non-producing
population This led to a stabihty in monoclonal antibody production
Another possibility to reduce costs is the extractions of multiple products from the same broth
and the use o f high cell densities e g perfused systems In a closed perfused system, 3-fold
to 4-fold savings could be made on medium (Griffiths et a l , 1982) However, this would mean
increased downstream processing problems in order to isolate each individual factor and would
probably yield a smaller quantity o f each product
1.3.5 Problems with using SFM on a large-scale
W hen a cell line is used in a production process, not only should the cell grow in the SFM but
it would be necessary to test the cells on a technical scale equivalent to the final production
process in order to ensure the performance o f the cells is not suffering from mechanical
shearing It may also be necessary to examine the character o f the product itself as Moellering
et al (1990) suggested that the composition o f the medium could affect the physicochemical
properties o f the products The biochemical properties o f some cell lines do remain the same
e g , GH3 rat pituitary carcinoma cells secrete both prolactin and growth hormone in culture
medium Production o f prolactin in SFM is about 70% of that seen in serum-supplemented
medium (Wu and Sato, 1978) On the other hand, Chang et al (1980) grew a number of
hybridomas m SFM and found that one o f the adapted hybridomas was able to secrete for more
than 3 months whereas the parental myeloma could only secrete for 6 days
In addition, factors that protect the cells from shearing effect may also need to be incorporated
(Papoutsakis, 1991), for example Pluromc F68 (Marquis et a l , 1989), a co-polymer of
polyoxyethylene and polyoxypropylene or polyvinylpyrrolidone (Gurhan and Ozdural, 1990)
Another problem with SFM is its stabihty Due to the requirement for hormones and growth
factors, many SFM have a limited shelf-life and also require much time and manpower to
produce An ideal SFM product should be easily made up, preferably autoclavable and have
27
a stable shelf-life o f at least 2-3 months To this end, the development and use o f synthetic
compounds which can replace the more time and temperature labile proteins is o f great interest
Minamoto et a l , (1991) used Gly-L-Glutamme and L-Ala-L-Glutamine to replace the
L-Glutamine usually used in culture media These compounds could withstand autoclaving and
were stable on storage at 37°C for 4 months More importantly, they were effective on cells
in culture a-Cyclodextrm was substituted for BSA and Fe-gluconate could replace transferrin
Insulin was found to be stable in the presence of Fe-gluconate Such a SFM has obvious
advantages over use o f serum
1.4 COMMERCIALLY AVAILABLE SFM
Commercially available SFM are now produced by companies including Sigma, Boehrmger
Mannheim, Costar, Flow Laboratories, Hyclone, New Brunswick and many more The result
is a large selection o f commercially available serum-free media which are designed for specific
cell lines Table 1 4 shows the variety of commercially available SFM supplements complete
media that are available
Three groups o f commercially available SFM medium exist
1 SFM additives These are designed to be used instead o f serum with the basal medium of
choice These ’SFM additives’ are not as such serum-free, but do have some advantages over
traditionally serum-supplemented medium including lower protein and lower immunoglobulin
content These SF additives are not as selective as traditional SFM and may be used for a wide
variety o f cell types However, the additives consist o f fractionated or modified serum
components (for example, CPSR, and LPSR from Sigma)
2 Serum-free supplements These usually consist o f a combination o f the more commonly used
SF components hke msuhn, transferrin, selenium, growth factors, hormones and trace elements
They are usually used in combination with ATCC (1 1 v /v Dulbeccos MEM Ham’s F I2) as the
basal medium
3 Completely defined SFM These media are usually optimized for the growth o f a specific
cell hne or cell type Increasing the reliance on the ability o f the basal medium to supply
nutrients and/or trace elements has been investigated in order to eliminate the requirement for
serum. This means that little or no additives hke growth factors or hormones are needed to be
28
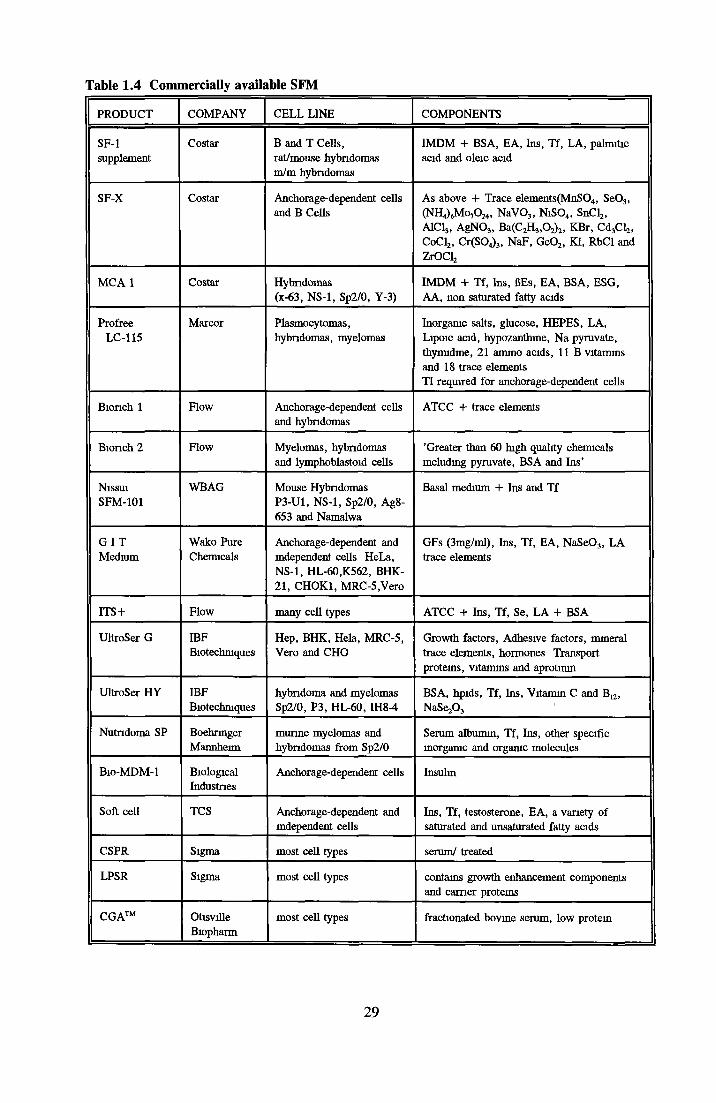
Table 1.4 Commercially available SFM
PRODUCT COMPANY CELL LINE COMPONENTS
SF-1supplement
Costar B and T Cells, rat/mouse hybndomas m/m hybndomas
IMDM + BSA, EA, Ins, Tf, LA, palmitic acid and oleic acid
SF-X Costar Anchorage-dependent cells and B Cells
As above + Trace elemenls(MnS04> Se03, (NH4)6Mo70 24, NaV03, NiS04, SnCl2, AlClj, AgN03, Ba(C2H3,02)2, KBr, Cd3Cl2, CoCl2, Cr(S04)3, NaF, Ge02, iQ, RbCl and ZrOCl2
MCA 1 Costar Hybndomas(x-63, NS-1, Sp2/0, Y-3)
IMDM + Tf, Ins, BEs, EA, BSA, ESG, AA, non saturated fatty acids
ProfreeLC-115
Marcor Plasmocytomas, hybndomas, myelomas
Inorganic salts, glucose, HEPES, LA, Lipoic acid, hypozanlhine, Na pyruvate, thymidme, 21 ammo acids, 11 B vitamins and 18 trace elements 11 required for anchorage-dependent cells
Bionch 1 Flow Anchorage-dependent cells and hybndomas
ATCC + trace elements
Bionch 2 Flow Myelomas, hybndomas and lymphoblastoid cells
’Greater than 60 high quality chemicals mcludmg pyruvate, BSA and Ins’
Nissui SFM-101
WBAG Mouse Hybndomas P3-U1, NS-1, Sp2/0, Ag8- 653 and Namalwa
Basal medium + Ins and Tf
G ITMedium
Wako Pure Chemicals
Anchorage-dependent and mdependent cells HeLa, NS-1, HL-60,K562, BHK- 21, CHOK1, MRC-5,Vero
GFs (3mg/ml), Ins, Tf, EA, NaSe03, LA trace elements
ITS + Flow many cell types ATCC + Ins, Tf, Se, LA + BSA
UltroSer G IBFBiotechmques
Hep, BHK, Hela, MRC-5, Vero and CHO
Growth factors, Adhesive factors, m ineral trace elements, hormones Transport proteins, vitamins and aprotmin
UltroSer HY IBFBiotechmques
hybndoma and myelomas Sp2/0, P3, HL-60, IH84
BSA, hpids, Tf, Ins, Vitamin C and B12,NaSejOj
Nutndoma SP BoehnngerMannheim
munne myelomas and hybndomas from Sp2/0
Serum albumin, Tf, Ins, other specific inorganic and organic molecules
Bio-MDM-1 BiologicalIndustries
Anchorage-dependent cells Insulin
Soft cell TCS Anchorage-dependent and mdependent cells
Ins, Tf, testosterone, EA, a vanety of saturated and unsaturated fatty acids
CSPR Sigma most cell types serum/ treated
LPSR Sigma most cell types contains growth enhancement components and earner proteins
CGA™ OtisvilleBiopharm
most cell types fractionated bovine serum, low protein
29
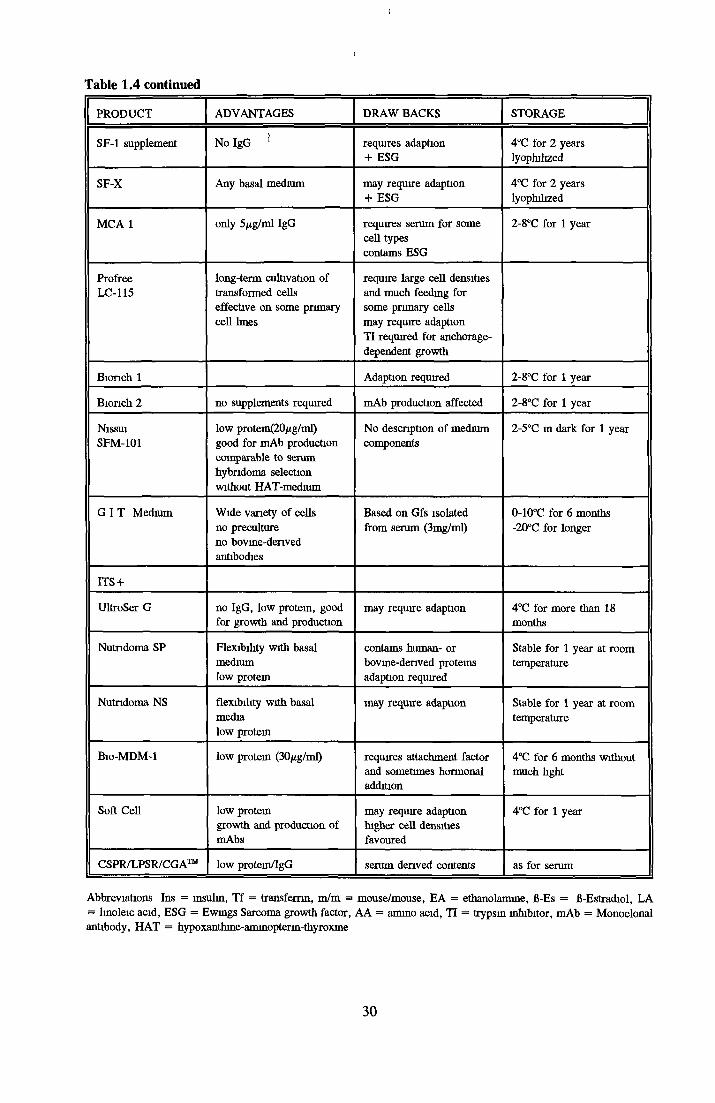
!
Table 1.4 continued
PRODUCT ADVANTAGES DRAW BACKS STORAGE
SF-1 supplement No IgG 1 requires adaption + ESG
4°C for 2 years lyophilized
SF-X Any basal medium may require adaption + ESG
4°C for 2 years lyophilized
MCA 1 only 5/ig/ml IgG requires serum for some cell types contains ESG
2-8°C for 1 year
ProfreeLC-115
long-term cultivation of transformed cells effective on some primary cell lines
require large cell densities and much feeding for some primary cells may require adaption TI required for anchorage- dependent growth
Biorich 1 Adaption required 2-8°C for 1 year
Bionch 2 no supplements required mAb production affected 2-8°C for 1 year
NissuiSFM-101
low protein(20/¿g/ml) good for mAb production comparable to serum hybndoma selection without HAT-medium
No description of medium components
2-5°C in dark for 1 year
G I T Medium Wide variety of cells no preculture no bovme-denved antibodies
Based on Gfs isolated from serum (3mg/ml)
0-10°C for 6 months -20°C for longer
ITS+
UltroSer G no IgG, low protein, good for growth and production
may require adaption 4°C for more than 18 months
Nutndoma SP Flexibility with basalmediumlow protein
contains human- or bovine-denved proteins adaption required
Stable for 1 year at room temperature
Nutndoma NS flexibility with basalmedialow protein
may require adaption Stable for 1 year at room temperature
Bio-MDM-1 low protein (30/xg/ml) requires attachment factor and sometimes hormonal addition
4°C for 6 months without much light
Soft Cell low proteingrowth and production of mAbs
may require adaption higher cell densities favoured
4°C for 1 year
CSPR/LPSR/CGA™ low protein/IgG serum derived contents as for serum
Abbreviations Ins = insulin, Tf = transferrin, m/m = mouse/mouse, EA = ethanolamme, B-Es = B-Estradiol, LA — linoleic acid, ESG = Ewings Sarcoma growth factor, AA = amino acid, IT = trypsin inhibitor, mAb - Monoclonal antibody, HAT = hypoxanlhme-aminoptenn-thyroxine
30
incorporated into the medium for growth (Darfler, 1990) Ham’s F12 was originally developed
for the growth of CHO cells in SFM on this basis Commercially available SFM like the
MCDB series have been developed for use with a variety of cell lines
Another example is the series o f Ultroser products, which have been used for example in
growth and prostaglandin production in mouse embryo fibroblasts (Durant et a l , 1989) These
formulations normally contain quite a variety of trace elements, ammo acids and vitamins in
addition to the factors used in SFM supplements However, a problem with some o f these SFM
is that the exact composition is not made available to the user
In addition to the advantages o f working in a more defined environment, the intensive work
involved in designing and producing SFM is gone For companies, the specificity o f SFM for
certain cell hnes means that there are plenty o f niches for product expansion
Commercial SFM alternatives have disadvantages Many cells need a period o f adaption to the
SFM The higher the purity of the product, the more expensive to SFM Some companies do
not divulge information on the full composition o f the SFM Recently, a complete cell culture
system was made available EpipackR and Bronchialpack are supplied by Clonetics, contain
SFM and the adapted cells e g normal human keratmocytes and bronchial/tracheal epithelial
cells respectively
31
1.5 THE ROLE OF INSULIN IN SERUM-FREE MEDIUM
Insulin or insulin-like growth factor I (IGF-I) is required for growth by virtually all cell types
In many SFM, msuhn is used at superphysiological levels (1-20/ig/ml) At such high
concentrations mitogenic activity is observed In many cases it was found that IGF-I or IGF-II
could replace insulin at normal physiological concentrations (ng/ml) The possibility o f using
IGFs instead o f insuhn would mean a reduction m the protein concentration o f SFM In
addition, replacing bovine-derived insulin with recombinant insulin or recombinant IGFs would
lead to a more defined medium The question was then asked, does msuhn have mitogenic
activity o f its own or is the mitogenic effect observed because msuhn mediates D N A synthesis
through the IGF receptors9 To answer this question, a knowledge about the structure and
functions o f msuhn and the IGFs is required
Insulin, IGF-I and IGF-II are members o f a class o f growth factors Although there is
considerable homology among the three proteins, great variability exists in their biological effect
(both metabolic and mitogenic) Insulin and IGF-I are involved in ammo acid uptake, control
of fatty acid metabohsm and D N A synthesis for many cell hnes (Pledger et al, 1978,
Cherington and Purdee, 1980, Hoffmann et al, 1989, Conover et al, 1985) The function of
IGF-II is less well understood, although its mitogenic activity is usually associated with cells
at a fetal stage o f development
1.5.1 Structure of Insulin, IGF-I and II
Insuhn and the IGFs are single-gene products from separate genes (Ullrich et al, 1985)
Expression o f different transcripts occur due to differences in exon splicing between species,
different transcription start sites (Simmons et al ,1993) or incomplete processing or truncation
at one o f the termini (Ogasawara et al, 1989)
Insuhn is a polypeptide (Mw of about 5,700) with two subunits, while IGF-I and II are single
polypeptides (Mw of about 7,500) The three show considerable amino acid homology, with
strict conservation o f the structurally important ammo acids such as cysteine for mtra-chain
disulphide bridges, and glycine in the hydrophobic core This ensures that the tertiary
structures are very similar A ll are synthesized as pro-proteins and cleaved to yield the active
protein The source and secretion o f these polypeptides in vivo are varied Insulin is secreted
by they? cells in the pancreas and this secretion is controlled/affected by physiological glucose
32

and amino acid levels IGF-I is secreted from liver cells into the blood, where it acts as an
endocrine hormone, mediating the anabolic actions o f the pituitary growth hormone In vivo,
its production is controlled from the pituitary by feed back inhibition IGF-I is also secreted
by a variety o f other cell types and tissues, where it can act as a paracrine or autocrine growth
factor locally IGF-bmding proteins are used to control the activity between source and the site
of action (Clemmons, 1993)
IGFs are major tumour growth factors whose autocrine activity has been associated with lung,
breast and gut (Jing et a l , 1991, Ohmura et a l , 1990, Chung and Antomades, 1992, Favom
et a l , 1994) In the lung, a combination of overproduction o f IGFs and low levels o f IGF-
binding proteins, results in uncontrolled growth In the breast, increases m receptor number
or receptor sensitivity, make the cells more sensitive to IGFs
The source and secretion o f IGF-II is most commonly associated with the fetal stage of
development (Powellbraxton et a l , 1993) Some transformed cells also produce IGF-II-hke
autocrine and paracrine factors e g neuroblastoma BE(2)-C cells (El-Bradry et a l , 1991)
Other growth factors and hormones have profound effects on the mode and the extent o f activity
of insulin and the IGFs For example, when Balb/c-3T3 cells are grown in serum-free medium
IGF-I acts as a progression factor taking competent cells through the Gt phase (Pledger et a l ,
1978) However to make the cells competent PDGF or EGF was also required (Stiles, 1983)
This has been reported for many other cell types (Alkhalof et a l , 1991, Van der Burg et a l ,
1988) T N F-a was found to suppress tyrosine phosphorylation o f the B-subumt o f the insulin
receptor and the insulin receptor substrate (IRS-I) (one o f the post-membrane proteins involved
in signal transduction of the insulin signal) protem in Fao cells (Feinstein et a l , 1993) Allen
and Boxhorn (1989) found that IGF-I caused minimal proliferation but stimulated differentiation
m skeletal muscle satellite cells
1.5.2 Receptor Binding
Receptor binding studies have revealed three distinct receptors based on their affinity for insulin
and the IGFs Each has high specific activity for its own receptor with a low cross reactivity
for the other receptors Insuhn and IGF-I receptors represent a subclass o f the receptor tyrosine
kinases Investigations have revealed sequence homologies to human EGF receptor and the
33
members o f the src family o f oncogene products (Ullrich et a l , 1985) Insulin and IGF-I
receptors are present in nearly all tissues IGF-II receptors were originally thought to have a
similar structure to the mannose-6-phosphate (M6P) receptor, but was recently shown to be the
same receptor The IGF-II/M6P receptor exhibits no tyrosine kinase activity
The msuhn receptor (IR) has been extensively studied and the postulated model consists o f an
immunoglobuhn-hke structure (B-S-S-a)-S-S-(a-S-S-fl) in which a and ft are glycoprotein
subunits with apparent molecular weight o f 125,000 and 90,000 respectively The receptor
components are derived from a single glycosylated precursor The structure is symmetrical with
the a-subumt as the extracellular component and the ft-subunit comprising the transmembrane
and cytoplasmic domains Subsequent studies revealed that the IGF-I receptor was structurally
homologous to the Insuhn receptor (for references see Czech, 1982, 1988, 1989) with the same
molecular weight and physical properties A maximum homology o f 85% is found in the
tyrosine kinase domain (Ullrich et a l , 1985) The receptors, like the proteins are derived from
individual genes on separate chromosomes
The IR acts hke an allosteric enzyme When msuhn binds, a conformational change results in
the a subunit This causes activation and autophosphorylation o f tyrosine and serine residues
on the ft-subunit This leads to the activation o f tyrosine residues o f several proteins including
Insuhn receptor substrate-1 (IRS-1) (Waters et a l , 1993, Rose et a l , 1994), MAP kinase
(Microtubule associated protein kinase), phosphotidyhnositol-3-kinase, pp l75 (insoluble
cytoskeleton associated protein (McClam et a l , 1990), pp60, p p l20 (Najjar et a l , 1993) and
pp220 (Condorelli, 1989) and inositol nucleotide phosphohpids (Gilmore, 1988) It is also
believed that activation o f normal p21-H Ras G-protein may be involved in signal transduction
of insulin and IGF stimulation (Medema et a l , 1993, Jhun et a l , 1994) Beyond kinase
activation, the signal transduction path is poorly understood Nuclear proteins called lamms and
immediate early genes which encode the proto-oncogenes c-jun and c-fos are known to be
associated with insulin stimulation (Ong et a l , 1987, Chio and Chang, 1992)
Less reference is made to IGF-II in SFM The physiological role o f IGF-II is as yet unclear
but is usually associated with cells at the fetal stage o f development (Ferguson et a l , 1992)
It has a higher affinity for the msuhn receptor than IGF-I does (Czech, 1989) The IGF-II
receptor is divergent from the msuhn and IGF-I receptors in structure and signal transduction
34

It consists o f a predominantly extracellular single poly-peptide with a molecular weight of
approx 250,000 and shows no structural relationship with IGF-I It has a higher affinity for
binding IGF-II than IGF-I and very little affinity for binding insulin with no apparent intrinsic
tyrosine kinase activity but serves as a substrate for membrane associated tyrosine kinase
activity Although the IGF-II and M6P share the same cell surface receptor, the M6P and IGF-
II binding domain on the M6P receptor were found to be distinct (Dahms et a l , 1994) In rats
IGF-n is not solely associated with the fetal stage, IGF-II mRNAs were also found in adult
tissue from the central nervous system (Lund et al ,1986)
Controversy over the mitogemc or other activities o f IGF-II exists It is mitogemc for
numerous cell types (Humbel, 1990) although most o f the activity has been found to be through
the IGF-I receptor (Casella et a l , 1986, Czech, 1989) It can also act as an autocrine factor
m cellular differentiation, as seen with myoblast differentiation (Flormi et a l , 1991) Others
postulate that the activity o f IGF-II is by its own receptor Murayama (1990) suggested that
coupling o f IGF-II to the IGF-II/M6P receptor stimulated a guanine nucleotide binding protein
with an 40kDa a-subumt, Ga protein which could provide a mechanism for signal transduction
Human erythroleukemic cells were found to be stimulated by IGF-II through its own receptor
(Hartmann, 1992)
1.5.3 Mechanisms of mitogenic action of Insulin
The mechanisms of mitogemc action of insulin vary from cell type to cell type M ost studies
show msuhn as a mitogemc factor by mediating its effect through the IGF-I receptor
Studies o f the overlapping functions o f insulin and IGF receptors in 3T3-L1 adipocytes
suggested that the a subunit o f the msuhn and IGF-I receptors have equal potential to stimulate
metabolic and mitogemc responses For the NIH-3T3 cells both insulin and IGF-I were able
to ehcit immediate response (glucose transport) but exerted different mitogemc signalling
potentials (Lammers et a l , 1989) Through the use of synthetic receptors they found that the
differential effects o f the two peptides were related to the cytoplasmic domain (6 subunit) o f the
receptor only Tartare et al (1994) suggested that the carboxyl (COOH) terminal domain of
the insulin receptor was more tightly coupled to the stimulation o f glycogen synthesis than the
IGF-I receptor in NIH-3T3 cells, while both exhibited similar mitogemc activity MaGoffin and
Erickson (1988), compared growth stimulating effect o f various insulins and IGF-I on primary
ovarian interstitial cells and found msuhn was most effective at fig quantities while IGF-I was
35
as effective at ng quantities These results were also observed on fetal rat epithelial cell (Jassal
et a l , 1991) and oligodendrocyte development (McMorns et a l , 1986), normal adult human
keratinocytes (Neely et a l , 1991), canine tracheal smooth muscle cells (Yang and Chou, 1993)
and neuroblastoma (Megham et a l , 1993)
Verspohl et al (1988) suggested that differences in the biological activity o f insulin and IGFs
is more likely due to cellular distribution than to a fundamental difference in action For
example, classical metabolic target tissues for insulin include fat and liver These cells have
many insulin receptors and few IGF-I receptors, while fibroblasts have mostly IGF-I receptors
The mitogemc effects o f insulin have been reported to be mediated through the IGF-I-R while
the metabolic activities o f IGF-I were mediated through the IR (Conover et a l , 1989, Oonk et
a l , 1989) However McClain et al (1990) suggested that IGF-I could stimulate metabohc
activities through its own receptor
Others have reported insulin as being effective at ng levels Nagarajan and Anderson (1982)
found that insulin could stimulate growth of F9 embryonal carcinoma cells apparently through
its own receptor Mamounas et al (1989), suggested that insulin acted through its own receptor
at physiological levels to stimulate growth o f CHO-K1 cells in SFM as insulin showed poor
competition for the IGF-I receptor at these concentrations Affinity labelling showed the
receptor to which insulin bound to be typical o f the a-subumt o f the msuhn receptor
Loo et al (1990) reported that the growth response of serum-free mouse embryo cells to insulin
and IGF-I was similar over a range o f 0 001 - 1 0 /ig/ml Rat hepatoma, pre-implantation
mouse embryo (Harvey and Kaye, 1992) and porcine granulosa (Barano and Hammond, 1984)
cell lines have been found similarly to use insulin at low physiological levels
Flier et al (1986) used an IGF-I receptor antibody aIR-3 to show that insuhn acts at its own
receptor to stimulate thymidine incorporation at concentrations o f less than 1 ¿ig/ml but at
higher concentrations, the action is suggested to be mediated through the IGF receptor in human
skm fibroblasts
Where insulin-stimulated mitogemc activity occurred at physiological concentrations, a variety
o f mechanisms are presented The ability of F-9 and SF mouse embryo cells may be related
36
to the fetal stage o f development, at which stage, several investigators have found variations in
the fi-subumt o f the IGF-receptor For example, Van Obberghen-Schilling and Pouyssegur
(1983) found two types o f IGF receptors One was insulin sensitive (similar to IR) and other
was insulin insensitive Jonas and Harrison (1985) also found two types of IGF-I receptors in
placental cells Alexandrides and Smith (1989) found a novel IGF-I receptor in fetal muscle
Both IGF-I and insuhn could stimulate a mitogemc response at physiological concentrations in
fetal muscle The novel fetal B-receptor subunit (105kDa) was found to be more closely
associated with the IGF-I than the insuhn receptor After two weeks, decreased expression of
a novel IGF-I receptor (not present in adult cells) resulted m reduced responsiveness to insuhn
Mutations in the carboxyl region o f the fi-subumt may also result m a mitogemc signal from
insuhn at low concentrations Takata et al (1992) characterized a mutant IR which had two
tyrosines in the carboxyl-terminus replaced by phenylanahne Compared to the wild type,
enhanced sensitivity to insuhn stimulated D NA synthesis was seen without affecting glucose
uptake Enhanced activity of the S6 kinase protein also occurred Thies et al (1989) observed
similar changes in carboxyl terminal deletions in Rat-1 fibroblasts It was proposed that the
carboxyl terminal existed as an inhibitor o f the mitogemc activity o f insuhn and that removal
of the carboxyl domain released the receptor from regulator constraints However, recent
suggestions indicate that the extracellular portion o f the B-subumt has been implicated in
receptor signalling and internalization Condorelh et al (1994) reported the existence o f two
alternatively sphced human IGF receptor mRNA transcripts which differed by a 3 nucleotide
(CAG) start site on the fi-subumt The CAG (-) receptor showed a 2-fold increase in tyrosine
auto-phosphorylation, IRS-1 tyrosine phosphorylation and thymidine incorporation relative to
the CAG ( + ) receptor
Lammers et al (1989) constructed chimeras in which the cytoplasmic domain of insulin and
IGF-I receptors were switched, the ability to stimulate growth was shown to reside in the
cytoplasmic domain Maegawa et al (1988) also observed an increase m mitogemc activity and
no change in metabolic activity when the carboxyl terminal was altered
Interplay o f insuhn and IGF-I receptor chains has also been found to result in mitogemc activity
at physiological concentrations Cross phosphorylation can occur which leads to the
phosphorylated IGF-I receptor activating the insuhn receptor Heterodimers of the insuhn and
IGF-I receptor have been reported (Moxham et a l , 1989, Treadway et a l , 1989, Schaffer et
37
a l , 1993) In this scenario an a-fl heterodimer of an insulin receptor and an a-B heterodimer
of an IGF-I receptor form a hybrid This has been observed for a number o f other cell lines
in which a heterodimer o f IGF/msulin or two distinct IGFs are formed, including NIH3T3
cells, HepG2 cells and Human placental cells (Jonas and Harrison, 1985), IM-9 lymphoid cells
(Roth et a l , 1986) and adult forebrain synaptosomes (Moss and Livingstone, 1993, Shaffer et
a l , 1984) As w ell as the formation o f heterodimers (Balloti et a l , 1989), intermolecular
transphosphorylation between IR and EGF-Ins hybrid receptor in NIH3T3 has also been
reported
In general it would appear that most o f the stimulatory activity associated with insulin is
mediated via the IGF receptor Where insulin acts at physiological concentrations, additional
or novel IGF-I receptors are often reported These novel or modified receptors may reflect
variations in the requirement of insulin during the fetal stages o f growth or specific
requirements for certain cell types eg m the brain
With the production o f recombinant insulin and IGFs, other fields o f investigation have yielded
interesting information Recombinant IGF-Is can be made with lower cross reactivity with IGF-
II receptors (Rosenfeld, 1982) Other investigators have replaced individual ammo acids to
produce a recombinant IGF with greater activation/ stability than the natural product
38

1.6 THE ROLE OF TRANSFERRIN IN SERUM-FREE MEDIUM
Iron is required by eukaryotic and prokaryotic cells where it has several important functions
a medium for transport of electrons in the cell and as co-factors for enzymatic reactions Iron
has been closely associated with cell growth and DN A synthesis (Anderson et a l , 1982) In
cell culture and especially in SFM the most commonly used chelator o f iron is transferrin
(Mather and Sato, 1979) Transferrin is also thought to act in the removal o f toxic compounds
There is interest as to whether the carrier protein or the iron is the important part Much
research now suggests that it is the iron which is required by the cell but that the transferrin
protein regulates the avadability o f iron (Laskey et a l , 1988) If iron itself is the important
component, it should be possible to ehminate the use o f transferrin from SFM This is
especially desirable since the most widely used source is of human origin, human transferrin
is used more often than bovine as it is less expensive and more effective If a chelator is
required to regulate bioavailabihty o f iron, use o f synthetic compounds would result in a more
defined medium, and would be perceived as safer by regulatory authorities
1.6.1 Background
Iron can exist in aqueous solution in two oxidation states Fe2+ and Fe3+ In solution,
hydrolysis and polymerization o f aqueous Fe3+ to insoluble ferric hydroxides and oxyhydroxides
can reduce the potential biological accessibility o f iron To avoid this, transferrin has been
traditionally used as a means o f supplying biologically available iron to cells m culture
Transferrins may be divided into several classes depending on the source and the extent o f iron
bound Within vertebrates there are three classes serum transferrin is the prototype protein in
plasma (about 3% of total plasma protein) which mediates transfer o f iron to and from various
sites in the body, lactoferrm is the iron-binding protein found in milk, granulocytes and other
body secretions e g tears, ovotransferrin is a major avian protein found m egg white For
more detailed information on iron proteins and transport, see Crichton and Charloteaux-Wauters
(1987), Thorstensen and Romslo (1990) Iron when conjugated with oxygen can generate
hydroxyl radicals, which have a variety o f toxic effects on cells (Gutteridge, 1981) Such
peroxide formation occurs when synthetic cell culture media are exposed to light The absence
of the protective effect o f serum or transferrin can make cells grown in SFM very susceptible
to peroxide damage
39
1.6.2 Transferrin Structure
Human serum transferrin is a glycoprotein o f 679 amino acids (Mw about 79,500) It is a
single poly-peptide and is synthesized primarily in the hver but also in the spleen and bone
marrow Transferrin exists in varying sizes and this is thought to be due to varying sialic acid
content
The tertiary structure consists o f two globular domains (often referred to as N and C termini)
each o f which contains a binding site for one trivalent atom o f iron At both the N and C
termini region o f transferrin, iron is directly co-ordmated to two tyrosines, one histidine and
one aspartic acid and indirectly to an arginine via the bicarbonate anion (Thorstensen and
Romslo, 1990) The affinity o f the ferric iron is so high at physiological pH that there are
virtually no free ions in serum Due to the highly amomc state o f the oxygen ligands, Fe3+ is
bound in preference to Fe2+ The binding o f iron is accompanied by the concomitant binding
of a bicarbonate ion for each iron atom bound The binding o f the two molecules o f iron does
not appear to occur to the same degree in ovotransferrm (Butterworth et a l , 1975) For serum-
derived transferrin the C terminal appears to hold a greater affinity for iron The strength of
affinities were found to vary depending on the pH
1.6.3 Transferrin Receptor
Transferrin receptors (TRs) are cell surface proteins present in high numbers on healthy
dividing cells and their presence is greatly reduced or absent in quiescent non-proliferating cells
In structure, the TR is a homodimeric transmembrane glycoprotein covalently bound by one
disulphide bond The two subunits have molecular weight o f 90 kDa Virtually all cells have
TRs and most use the endocytic transferrin cycle for iron uptake (Harford et a l , 1990)
There are three domains, the C terminal extracellular part (591 amino acid residues), the
transmembrane segment consisting o f 26 ammo acids and the N terminal cytoplasmic domain
which has 62 ammo acids Like asialoglycoprotein receptors the C terminus is extracellular
This part o f the subunit is very sensitive to exogenously added trypsin This is unlike many
growth factor receptors including EGF and IGF, m which the N terminus is the extracellular
component
There are four potential phosphorylation sites but only one serine at position 24 appears to be
a target for protein kinase C phosphorylation Expression o f transferrin receptor is partially
controlled by iron responsive elements Other factors like cytokmes may affect transferrin
receptor levels II-IB and T N F-a decreased the transferrin uptake rate by reducing the number
40

of receptors on U937 macrophages (Fahmy and Young, 1993) IFN-7 decreased the
incorporation by down-regulating the intracellular concentration o f ferritin (the major iron
storage protein) Effects are specific for different cell types IL-lfi, IL-6 and TN F-a increased
the uptake o f transferrin into HepG2 cells by increasing the number o f receptors (Hirayama et
a l , 1993) Calcium was found to enhance iron uptake by modulating the membrane fluidity
(Wright et a l , 1986)
Transferrin receptors have been studied and two processes describing the release o f iron from
transferrm-transferrin receptors have been postulated Receptor Mediated Endocytosis (RME)
and the Redox Method (Straford-May and Cuatrecasas, 1985, Testa et a l , 1993)
In the RME scenario, transferrin loaded with iron, binds to the TR at the cell surface The
receptor complex then becomes trapped within endocytic vesicles termed endosomes, via coated
pits and vesicles By means of a proton pumping ATPase o f the endosomal membrane, the
vesicle becomes rapidly acidified (pH 5 - 5 5 ) At this pH, the iron has little affinity for
transferrin and is mobilized from transferrin and transported across the endosomal membrane
into the cytosol By unknown means the apotransferrm - TR (apoTf-TR) complex is sorted into
endocytic vesicles and escapes lysosomal degradation The endocytic vesicles interface with the
plasma membrane and the apoTf-TR complex is exposed to the extracellular pH At this pH,
apoTf has lost its affinity for the TR and dissociates This has been suggested for K562 cells
(Klausner et a l , 1983)
There are several problems with this proposed mechanism for some cell lines (Morley and
Bezkorovainy, 1985) The uptake of iron takes only a matter o f minutes (3 - 4) at 37°C The
time taken for the pH in the vesicles to be reduced would take considerably longer Also
lowering o f the extracellular pH is insufficient to cause release o f the iron (Thorstensen and
Romslo, 1990)
The Redox method centres around the oxidative potential o f the iron molecule itself The
process o f endocytosis is the same as for RME Before the transferrm-transferrin receptor (Tf-
TR) becomes trapped with endocytic vesicles, separation o f the iron from the Tf-TR complex
is proposed to be due to the concerted action o f protons and reducing equivalents which are
furnished by a nearby NADH ferricyamde oxidoreductase redox system The change in redox
potential causes a destabilization o f the iron-Tf bond and results m the reduction o f the iron
41
molecule The iron may then be bound to a membrane carrier specific for Fe2+ The iron
would then be translocated across the membrane to the cytosol where it is picked up by an iron
acceptor
How the iron signal is directed into the cell remains unclear (Crichton and Charloteaux-
Wauters, 1987, Klausner et a l , 1993) When iron is released from the T f - Tf-receptor
complex, there are three target pools The iron may be utilized as a component or co-factor
of cellular proteins It may be stored, primarily by ferritin (also m haemosiderin) This may
occur by the assembly o f apoferritin subunits surrounding preformed micellar iron complexes
or by the entry o f Fe2+ into a protein shell o f the apoferritin where it is oxidized, hydrolysed
and finally polymerized into a ferric oxyhydroxy polymer (Crichton and Charloteaux-Wauters,
1987) The resulting polymer would be too big to escape from the ferritin complex Iron may
be used in the regulatory pool where there is interplay between iron responsive element-binding
proteins (IRE-BPs) and iron responsive elements to control the levels o f iron in the cell When
there is plenty o f cellular iron, IRE-BPs have a high affinity for acomtase activity and little
affinity for RNA binding When iron becomes depleted, the IRE-BPs have little affinity for
acomtase and high affinity for binding RNA By binding to the mRNA of ferritin, a positive
translation promoting site is blocked, thereby reducing the biosynthesis o f ferritin IRE-BPs
also bind to a 5 ’ untranslated region of the transferrin receptor mRNA, blocking the binding
of instability determinants thereby stabilizing the RNA transcript This results in increased
receptor transcription (Hirhng et a l , 1994)
Cellular uptake o f iron via transferrin does not account for all the iron uptake processes Other
mechanisms which are TR-independent and transferrm-mdependent have been reported for a
wide variety o f cells including cultured fibroblasts (Oshiro et a l , 1993), HL60 lymphoblastic
cells (Chitambar and Zivkovic, 1987), K562 Cells (Inman and W esslmg-Resmck, 1993), human
hybridoma cells (111 et a l , 1988), rat hepatocytes (Thornstensen and Romslo, 1988), L1210
leukemia cells (Basset et a l , 1986), human melanoma cells (Richardson and Baker, 1992),
CHO cells (Chan et a l , 1992) and reticulocytes (Hodgson et a l , 1994) Bradbury et al
(1994) found that transferrin-dependent and transferrm-mdependent mechanisms existed m a
variety o f cell types of which the greatest capacity for non transferrin-bound iron were cells
from liver and renal cortex A combination o f uptake mechanisms may be used by cells such
as hepatocytes (Thorstensen and Romslo, 1990) Some cell hnes produce their own transferrin
e g Reuber Liver cells (Shapiro and Wagner, 1989), mammary epithelial cells (Lee et a l ,
42
1987), C D 4+ lymphocytes (Lum et a l , 1986), HeLa (Kriegerbeckova et a l , 1993), rat
hepatocytes (Mitaka et a l , 1993) and Rhodamine fibrosarcoma cells (Nagao and Nishikawa,
1989) Chitambar et al (1987, 1989, 1990) found that HL60 cells contained soluble transferrin
receptors in the conditioned medium These soluble transferrin receptors occur by proteolytic
digestion at the extracellular plasma membrane and may have a role in scavenging iron from
the environment This has also been observed for erythroid progenitor cells during
differentiation (Shintam et a l , 1994)
Conrad et al (1994) suggested a transferrin-independent iron transport system which was
mediated by a sequential passage o f iron to integrin, mobilferrm and ferritin in a human-derived
erythroleukemia cell line
Amounc et al (1984) found that two iron solutions o f ferrous sulphate and ferric chloride could
replace transferrin in supporting the growth o f a human colon adenocarcinoma cell line (HT
29) The ability o f simple ferric compounds to replace transferrin has been reported for a
variety o f other cells (Brock and Stevenson, 1987 and Laskey et a l , 1988) Insoluble iron has
even been suggested to stimulate growth in a mouse hybridoma, PLV-01 (Kovar, 1990)
Where simple iron salts were insufficient to replace transferrin, more complex synthetic
chelators have been used Tsao et al (1987) found that while, several inorganic iron salts
(ferric ammonium citrate and ferrous sulfate) could not support the growth of non-tumorigemc
anchorage-dependent hepatic epithelial cells in SFM, ferric pyndoxal isomcotinoyl hydrazone
(Fe-PIH), a lipophilic iron complexing agent, could be used but at a 1000-fold increase in
concentration
Laskey et al (1988) looked at the effect o f an iron chelator to stimulate the growth o f Friend
murine erythroleukemia (mel) cells, Raji cells (B lymphoblast from Burkitts lymphoma) and
human peripheral blood lymphocytes The chelator, ferric salicylaldehyde isomcotinoyl
hydrazone (Fe-SIH) was shown to promote growth independently o f the TRs While Fe-PIH '
could replace transferrin for embryonic metaphremc mouse cells (Landschulz et a l , 1984), it
could not be substituted for transferrin on embryogemc mesoderm cells on a hydrated collagen
matrix (Sanders and Cheung, 1988)
43
In trying to replace human transferrin, 111 et al (1988) found that while human x human and
human x mouse hybndomas could grow in SFM with iron complexes (ferric citrate, iron
choline citrate and Fe-PIH), no growth was observed with mouse x mouse hybridomas
Replacement o f transferrin did not affect monoclonal antibody production However, others
have been able to grow mouse hybridomas without transferrin Yabe et al (1987) looked at
the effect o f low molecular weight chelators such as Fe(III)-glycylglycine, Fe(III)-immodiacetic
acid and Fe(III)-dihydroxethylglycine When growing mouse hybridomas, these chelators could
replace transferrin Darfler (1990) used sodium mtroprusside instead for the growth of murine
hybridomas without affecting monoclonal antibody production
Kovar and Franek (1987), used ferric citrate and found that over 30 passages, growth and
monoclonal antibody production was maintained, indicating that the ability to support growth
was not due to residual transferrin Fe2S0 4 was also used to replace transferrin for the growth
o f mouse hybridomas (Shinmoto et a l , 1988)
Metcalfe et al (1994) found that 4 alternatives to transferrin including ammonium ferrous
citrate could support growth in a static culture but only 2-hydroxy-2,4,6-cyclohepatrin-l-one
(Tropolone) could replace transferrin in large-scale agitated cultures o f mouse myeloma cells
This could imply that precipitation o f the iron molecule is important for the uptake o f iron So
although simple iron complexes may replace transferrin in static cultures, more complex iron
carriers may be needed for suspension cultures
For many cell hnes, the abihty to use simple ferric salts or more complex synthetic chelators
as an iron source, regardless of the method o f uptake has removed the requirement for
transferrin In some cases where the role o f transferrin cannot be replaced by other chemical
chelators, bovine-derived as opposed to human transferrin, or the use o f lactoferrm (bovine or
recombinant) may be an alternative (Perez-Infante and Mather, 1982, Hashizume et al ,1983,
111 et a l , 1988 and Yamada et a l , 1990)
44
1.7 THE ROLE OF BOVINE SERUM ALBUM IN IN SERUM -FREE M EDIUM
Serum albumin is the most abundant protein in blood plasma. In vivo, albumin has many
functions. It provides approximately 80% of the osmotic pressure in blood and contributes to
cellular nutrition. It regulates free calcium concentrations and transport of fatty acids,
tryptophan, toxic compounds, steroid hormones and metal ions and acts as a source o f amino
acids following proteolysis.
Albumin has many uses. Thousands o f kilograms are produced a year for therapeutic purposes
(for example to improve circulatory performance, a blood extender). It is used as a growth
support for mammalian cells and microorganisms, as a carrier/stabilizer o f growth factors and
hormones and as a blocker in immunological studies (as a non specific binder in
radioimmunoassays and separation processes). BSA has been incorporated into SFM for a
variety o f cell lines including human muscle satellite cells (Ham et al., 1988), mouse vaginal
epithelial cells (Iguchi et al., 1987) and haempoietic cells (Guilbert and Iscove, 1976) and some
hybridomas (Jäger et al., 1988).
1 .7 .1 Background
BSA was originally isolated on a large-scale by Cohn et al. (1946) using low temperature
ethanol precipitation. Other methods o f isolation have since been developed (heat-shock
treatment and salt fractionation). Due to the ’stickiness’ of albumin, a completely pure
preparation is difficult to obtain, generally between 96 to 99% albumin. The remaining
contaminants o f the albumin are naturally bound ligands such as bilirubin, fatty acids,
hormones, globulins and metal ions. Chromatography is becoming a viable alternative to the
more traditional methods. Stoltz et al. (1989) used chromatographic techniques to obtain human
albumin from plasma with 99 - 100% purity.
1 .7 .2 Structure
Albumin is a non-glycosylated single chain protein of about 585 amino acids residues. Serum
albumins belong to a multigene family o f proteins that include a-protein and vitamin D binding
protein. Its chief traits are those of an acidic, very soluble, stable protein. At low pH (1-2),
the albumin molecule can reversibly denature and renature. At high pH (9-11), it is relatively
unharmed but can undergo deamination o f disulphide bonds. It is one o f the few secreted
proteins which lack carbohydrate. It contains 17 disulphide bonds which influence the structure
45
and stability of the protein. The 17 disulphide bonds determine the formation o f a series o f nine
loops, which are broken up as three domains of three loops. The three domains are
semiautonomous but homologous. They are capable o f folding to form hydrophobic pockets.
In addition to stability, the total high charge (about 185 ions per molecule at pH 7) make it
very soluble. There is evidence to suggest the existence of albumin specific cell surface
receptors. Schnitzer et al. (1988) found a single 60kDa cell surface glycoprotein which was
precipitated in common with three agglutinins that competed with albumin for uptake in
monolayers o f microlayers o f microvascular endothelial cells. This was later called Albondin.
Other putative albumin-binding proteins (SPARC (secreted protein acidic and rich in cysteine),
gp60, gp30 and gp l8) have been found. It was suggested that albondin mediates native albumin
binding which enhances its transcytosis and capillary permeability, while gp30 and gp l8
mediated the binding, endocytosis and degradation o f modified albumins (Schnitzer and Oh,
1994). These receptors would be necessary as part of the cellular function of endothelial cells
in the transport from capillary vessels to interstitial fluids. Albondin and SPARC appears to
be selectively expressed in tissues with microvascular beds lined with a continuous endothelium
which bind and transcytose albumin. The albumin-binding proteins gp30 and g p l8 have been
found on fibroblasts and macrophages which may indicate a scavenging role for these cells
(Sage et al., 1984; Goldblum et al. , 1994; Schnitzer and Bravo, 1993; Schnitzer et al., 1992).
Species differences exist in the structure o f albumin and as a result the extent o f ligand binding
varies. Alignment o f human, bovine and rat albumin shows about 80% homology between
human and bovine albumins, 80% between human and rat, and 63% homology conserved in
all three. For a more detailed information on albumin, its structure and ligand binding
properties see reviews by Peters (1985), Kragh-Hansen (1981) and Brown and Shockley (1977).
1 .7 .3 Ligand Binding
The most unique feature o f albumin is its ability to bind a wide variety o f biological materials,
generally it has highest affinity for small negatively-charged hydrophobic molecules. The
flexibility o f the molecule means it can bind a wide variety of compounds. The presence of
hydrophobic pockets makes it an ideal carrier o f compounds which have limited solubility in
aqueous solutions. Interactions may have low or high specificity. Despite the similarities of
amino-acid sequences and the retention of the characteristic repeating series of disulphide bonds
in mammalian albumins, there may be marked differences in ligand binding e.g. palmitate binds
46
more tightly to bovine than to human or murine albumins and vice versa for oleate (Richieri et
a l , 1993), bilirubin binds more strongly and in a different rotation to human than to bovine
albumin Hematin is tightly bound only to albumins derived from primates (Adams and
Berman, 1980)
1.7.3.1 Fatty acid binding
Long-chain fatty acids are quantitatively the most important component bound to albumin
Albumin by binding to fatty acids can control the amount of free fatty acids For cells growing
in culture, fatty acids become toxic if the concentration is too high At a cellular level, fatty
acids affect the oxidative phosphorylation processes in the mitochondria Albumin thus acts as
a pool o f fatty acids When the free fatty acids are used up, thermodynamics cause some o f
the bound fatty acids to be released and hence available to the cells
The normal loading is about 2 fatty acid molecules per molecule albumin Serum albumin can
bind up to 6 fatty acids strongly and about 20 weakly The extent o f fatty acid binding depends
on the aliphatic chain length The longer the fatty acid chain, the stronger the binding affinity
Fatty acids such as oleic, stearic, palmitic and linoleic acid bind relatively tightly, while
decanoic and octanoic bind at lower affinities
D e Miranda et al (1976) suggested that a separate binding site existed for fatty acids containing
4 or less carbon atoms The primary binding sites on bovine albumin are located at the C
terminal loops, 7 and 8 Attachment o f one or two long-chain fatty acids is known to be
important m maintaining the native structure o f albumin Their binding causes the protein to
become more spherical and thus less susceptible to proteolysis Esterified fatty acids also bind
to albumin but with lower affinities
1.7.3.2 Other ligands
Albumin has two binding sites for bilirubin These are non-competitive with fatty acids unless
there is a high concentration o f the latter Bilirubin binding occurs near loop 4 o f bovine
albumin
Steroid hormones bind to albumin with a low affinity These include estradiol, aldosterone,
testosterone and progesterone There is no specific site for steroid binding Progesterone and
deoxycorticosterone bind to the same site while testosterone binds to a different site Steroid
hormones may compete with fatty acids and bilirubin for binding
47

L-Tryptophan and L-thyroxine are the only amino acids which bind to albumin They share the
same binding site with each other and compete with short-chain fatty acids and numerous
organic anions for these sites Thus the amount o f ammo acids bound to albumin w ill vary
depending on the amount of other ligands present Other analogues o f tryptophan and thyroxine
also bind weakly These include catecholamines, folate and vitamin B-12
The N-terminal provides binding sites for a variety o f metal ions including Ca2+, Cu2+, Zn2+,
Ni2+ and Co2+ About half the plasma calcium is bound to albumin but the binding is not
strong or specific Only 10% of plasma copper binds to albumin
Albumin also binds a variety o f drugs (penicillin, barbiturates, salicylate, warfarin and
digitoxin) and polyaromatic dyes such as fluorescein and bromocresol green Most are bound
at low specificity sites, probably m the region o f hydrophobic domains
1.7.4 Biological activity associated with albumin
With the ligand binding capabilities o f serum albumin, it is no wonder that it is so commonly
used in cell culture and especially in serum-free medium However, the exact role o f albumin
in such systems is ambiguous Mitogemc activity has been associated with albumin, but is this
due to the albumin molecule itself or as a result o f the ligands it carries? To add to the
confusion, the effects appear to vary depending on cell type and the purity of the albumin
Reports appear regularly in the literature comparing different batches o f albumin Not only is
the growth affected by the different methods o f purification, but also by batch-to-batch
variations from company to company
The fact that BSA is used in milligram quantities in culture as opposed to microgram quantities
for growth factors, has led some researchers to beheve that the growth stimulating ability of
albumin is due to some as yet unidentified contaminating factor
Nilausen (1978) investigated the role o f fatty acids (lysolecithin in particular) m the growth
promoting effects o f serum albumin on hamster cells Dialysed serum albumin had growth
stimulating activity but this was lost when the fatty acids were removed When the isolated and
purified fatty acids were recombined with the fatty acid free albumin, the growth promoting
activity was restored A ll unsaturated fatty acids were stimulatory whereas, all saturated fatty
acids were growth inhibitory except stearic acid which was stimulatory at low concentrations
48
When comparing dialysed to untreated albumin, the dialysed albumin was found to have double
the growth promoting activity of the untreated albumin for nearly all concentrations tested
This was presumably due to the removal o f some inhibitory factor Indeed, Hanson and Ballard
(1968) suggested that dialysis removed citrate, lactate, pyruvate and some ferric ions which may
have been inhibitory
Ham (1963) used hnoleic acid corn oil to replace albumin for the growth o f a Chinese hamster
strain (CHD-3) Oleic acid and esters o f hnoleic acid and linolemc acid could not replace BSA
For HeLa cells, arachidomc acid and hnoleic acid coupled to albumin were found to stimulate
growth while the albumin alone was not (Gershenson et al ,1967) Jager et al (1988) found
BSA-oleic acid complex was important for the long-term (more than 10 passages) growth of
Ag8-myeloma cells in SFM BSA without oleic acid had no affect on the growth o f these cells
Similar results supporting the role o f lipids in the action attributed to albumin were obtained
with Yoshida sarcoma cells (Yamane et a l , 1975), SV40 transformed cells (Rockwell et al ,
1980) and human diploid fibroblasts (Kan and Yamane, 1982) Supporting the idea o f ligands
rather than the albumin being responsible for the biological activity associated with BSA, batch-
to-batch variability as been reported (McKiernan and Bavister, 1992, Tomooka et a l , 1985)
1.7.5 Replacement of BSA
Where fatty acids have been found to be responsible for the activity associated with albumin,
a variety o f hpid binding molecules have been utilized to replace albumin fi-lactoglobuhn
which possesses the ability to bind and release fatty acids like albumin, could be used to replace
fatty acid free albumin with the same growth stimulation Anderson et al (1990) reported that
casein could replace BSA in SFM to cause contraction o f human foreskin fibroblasts and rabbit
aortic smooth muscle cells
Cyclodextrins have also been used to replace albumin Oleic acid and hnoleic acid were
complexed to B-cyclodextrm and used to promote the growth o f human lymphoblast cells
(100/ig/ml) and human diploid fibroblasts (Szejth, 1986) In addition a-cyclodextrin was used
to prolong growth and monoclonal antibody production (Minamoto and Matsugi, 1984)
49
In some cases however, the presence o f fatty acids was either not responsible for the activity
associated with BSA or was inhibitory Norkin et al (1965) reported that growth of
macrophages was enhanced slightly when fatty acids were removed from albumin without
denaturing The improvement in growth was not necessarily due to the albumin molecule itself
being stimulatory The basal medium contained 30% chicken serum from which the albumin
could have been binding some inhibitory component in place o f the fatty acids
Chiang et al (1993), observed a higher inward Ca2+ current m chicken granulosa cells when
using BSA fatty acid free (BSA-faf) than BSA Addition o f oleic acid decreased the potency
of BSA-faf
Melsert et al (1989) found albumin from rat testicular fluid to enhance leutimzing hormone-
stimulated pregnenolone production by immature Leydig cells in vitro The stimulatory activity
was not due to fatty acid or the source o f albumin as albumin from rat, bovine, and human sera
were as good, suggesting that the activity was due to the albumin itself
Polet and Spieker-Polet (1975) and Spieker-Polet and Polet (1976) found that serum albumin
was essential for the growth o f activated human lymphocytes Comparing rabbit, human and
bovine serum albumin revealed no difference in growth stimulating ability BSA fraction V and
BSA-faf stimulated DN A synthesis suggesting that the fatty acids were not the basis o f the
growth-stimulating effect Similarly incorporation o f growth factors and hormones had no
effect on the ability o f albumin to stimulate growth This led to the conclusion that either the
albumin molecule itself was responsible (directly or by permissive means) for growth or that
some other stimulatory factor was tightly bound to albumin
Further investigations into the role o f albumin revealed that albumin from several sources
(human, bovine and rabbit) could stimulate growth equally w ell at low concentrations At
higher levels, the results varied This was suspected to be due to artifacts By means of
molecular sieving, ion exchange chromatography, isoelectric focusing, charcoal treatment,
acetone precipitation and reduction, no other factor was found to be responsible for growth
stimulation
In addition to the presence o f fatty acids, investigators have found a variety o f other ligands to
be responsible for the activity o f albumin Congote (1984) extracted erythrotropm from fetal
bovine serum and found it could stimulate fetal calf hver cells In a subsequent experiment,
Congote (1987) was able to isolate an erythrotropin-like factor from BSA fraction V Although
50
all preparations stimulated thymidine uptake in erythroid cells from fetal bovine liver, cruder
preparations showed greater stimulation Purification of albumin using reverse phase HPLC
revealed a factor that was very similar to bovine serum erythrotropin Congote concluded that
the growth stimulating effect o f many albumins may be due to the presence of erythrotropin-like
factors
Thomassen (1989) investigated the variable responses o f Rat Tracheal Epithelial cells (RTE) to
BSA m serum-free culture He compared crude fraction V , essentially globulin-free, fatty acid
free, and essentially globuhn and fatty acid free BSA Growth response was found to vary
depending on the purity o f the albumin, on the concentration and on the presence or absence
of cholera toxin
Barlian and Bols (1991) investigated the growth promoting effect o f BSAs which could support
salmomd cells in serum-free culture They found differences existed in the growth stimulatory
activity depending not only the purity of the albumins but also in the method o f preparation
Albumins initially purified by cold alcohol precipitation were found to be more stimulatory than
those prepared by heat shock treatment
Kane (1990) investigated the growth control in pre-implantation embryos Blastocyte growth
in medium tended to be variable and this was pinned down to variations m the batches o f BSA
used Further investigations revealed that the contaminating factor was citrate Whether the
total activity o f albumin m this system is due to citrate is unknown Citrate may help to
transport ions or stimulate fatty acid synthesis
Tigyi and Miledi (1992) found lysophosphatides bound to BSA to be responsible for activating
membrane currents in Xenopus Oocytes and to cause neurite retraction in PC 12
Pheochromocytoma cells Extraction o f hpids with methanol removed activity When synthetic
lysophosphatides were added to inactive BSA-faf, activity was restored
The evidence to date would support the fact that it is the impurities bound to albumin which
have growth stimulating effects on cells in culture However for some cell hnes it may be the
molecule itself which is stimulatory as suggested by Polet and Spieker-Polet (1975) How the
albumin molecule itself could exert a stimulatory effect is, as yet, not known
51
1.8 INTRODUCTION TO THE RESEARCH WORK CARRIED OUT IN THIS THESIS
In this thesis, alternatives to fetal bovine/calf serum in mammalian cell culture were
investigated As outhned in section 1 1, there are many disadvantages to the use o f serum in
supporting growth and metabolic activities o f cells in culture However, the design o f a SFM
for a particular cell line may in itself be problematic
The aims o f this thesis were as follows
1 To develop a SFM for normal rat kidney (NRK) cells A SFM had been designed for
a subclone o f the cell line, NRK - 49F cells (Rizzino, 1984) However, when tested, the
parental cells did not grow in this SFM As the NRK cells would not even remain viable in
the basal medium alone, an alternative approach was devised Cells were grown in the presence
of small amounts o f serum, to detect factors which were important for cell growth by adding
growth stimulatory factors The level o f serum could be reduced while still maintaining growth
and viability The eventual aim was to delete the serum totally from the medium, which would
result in the formulation of a SFM that would support the growth of the parental NRK cells
When a SFM was obtained, it would be necessary to ensure that the growth promoting effects
were not due to serum contaminants residing in the cells This would be done by subcultunng
the cells through several passages
2 As a result o f experiments carried out in the earlier stages o f the thesis on NRK cells
in a low serum-supplemented medium, BSA was found to be stimulatory It was hoped to see
if the activity associated with BSA could be isolated from the BSA molecule As mentioned m
section 1 7 , BSA is a very sticky molecule and its apparent activity has most commonly been
due to the factors that it carries rather than the albumin molecule itself e g fatty acids,
phosphohpids, citrate and factors produced during the clotting process Methods already used
to isolate the activity from albumin that would be attempted, included the following hpid
extraction, reverse-phase HPLC, gel filtration In addition, affinity chromatography would also
be used
If it were possible to separate the activity from the BSA molecule, it was hoped to replace the
active component with a synthetic analogue and incorporate it into a SFM for NRK cells If
the BSA molecule was found to be necessary for biological activity o f the active factor, then
it may be possible to replace albumin with other carrier molecules, for example cyclodextrins
52
For some existing SFM, it was hoped to replace the two most universally used components m
SFM, insulin and transferrin to produce a defined medium devoid o f animal-derived proteins
The two cell lines chosen were Chinese Hamster Ovary (CHOK1) and Madm-Darby Canine
Kidney (MDCK) cells
3 CHOK1 cells are industrially important due to their growth characteristics, safety, ease
of transfection and high productivity o f recombinant gene products Several SFM existed for
CHO cells but all required insulin and/or transferrin The SFM designed by Mendiaz et al
(1986) was chosen as it was based on CHOK1 cells and because insulin and transferrin were
the only ammal-denved proteins present m the medium The SFM contained bovine-derived
insulin and transferrin and growth was found to be dependent on msuhn If the bovine-derived
msuhn could be replaced with a recombinant IGF or recombinant msuhn, then a SFM devoid
of animal-derived proteins would be formed as CHOK1 cells had been shown not to depend on
transferrin when ferrous sulphate was present in the medium
4 MDCK cells are industrially important in the production o f canine vaccines MDCK
cells have been grown in a SFM designed by Taub et al (1979) The cells were found to be
very dependent on the presence o f human transferrin with little dependence on msuhn The
removal o f msuhn and the replacement o f transferrin would upgrade the SFM to being devoid
of animal-derived proteins It was intended to try to replace transferrin with simple inorganic
and organic iron salts and compounds If these were not found to be successful, more complex
synthetic chelators would be attempted If a replacement were found it would be necessary to
prove the continued ability o f the compound to support growth in the absence o f transferrin by
subculturing the cells for several passages with the transferrin replacement
53

2.0 MATERIALS AND METHODS
2.1 WATER
For all reagents and media, water was purified by a reverse osmosis system (Millipore, Elgastat
UHP) to produce ultrapure water ( 1 2 - 1 8 mfl-cm resistance)
2.2 GLASSWARE
A ll glassware which was to come m contact with cells was treated in the following way The
bottles and lids were soaked in a 0 2% warm solution o f RBS (AGB Scientific) for 60 to 90
minutes This is a deproteimzing agent which removes proteinous material from the bottles
Following scrubbing and several rmses m tap water, the bottles were cleaned m a washing
machine The first cycle used NEODISHER, an organic, phosphate-based acid detergent A
further cycle o f two rmses in distilled and one in ultrapure water left the bottles ready for use
Bottles were sterilized by autoclavmg for 15 minutes under pressure o f lbar at 121°C
Bottles used for the storage of media for serum-free work were purchased specially for the
purpose These bottles were not allowed to come in contact with serum containing media The
bottles were soaked and washed as above except that there were four rinsing stages after which
the bottles and lids were dried out The bottles and lids were then rinsed three times in
ultrapure water and sterilized by autoclavmg
2.3 MEDIA PREPARATION
Media for general cell culture purposes were made up in 5L volumes according to standard
laboratory practices (see Table 2 3) The pH was adjusted by the addition o f sterile 1 5N
NaOH or 1 5N HC1 and brought up to a final volume of 5 litres Although all components and
additives were sterile, the IX media was filtered through a 0 22fim filter and stored in 500ml
bottles at 4°C Sterility checks carried out included, turbidity, pH change, Columbia blood agar
plates, Sabauraud dextrose and Thioglycollate broths
The expiry date on all 10X media was checked and at least a 2-months leaway was given so that
media components should not have broken down and resulted in a loss of activity For the
different cell lines, variations in the buffering of the media were cited when making up a SFM
To allow for this, 500ml of 10X media was made up to 4 5 litres i e a 1 IX stock When the
appropriate concentrations o f buffering agents were added depending on the cell line, the pH
of the medium was adjusted The basal medium was brought to a lx stock by addition o f sterile
ultrapure H20
54
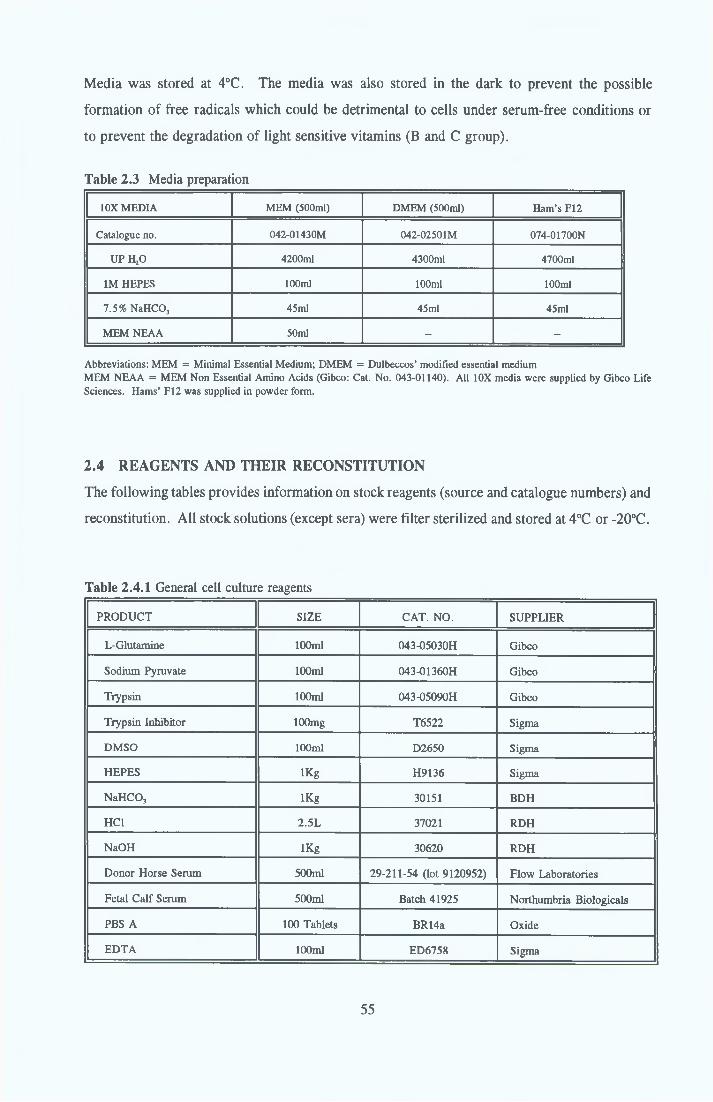
Media was stored at 4°C. The media was also stored in the dark to prevent the possible
formation of free radicals which could be detrimental to cells under serum-free conditions or
to prevent the degradation of light sensitive vitamins (B and C group).
Table 2.3 Media preparation
10X MEDIA MEM (500ml) DMEM (500ml) Ham’s F12
Catalogue no. 042-01430M 042-02501M 074-01700N
UP HjO 4200ml 4300ml 4700ml
IM HEPES 100ml 100ml 100ml
7.5% NaHCO, 45ml 45ml 45ml
MEM NEAA 50ml -- -
Abbreviations: MEM = Minimal Essential Medium; DMEM = Dulbeccos’ modified essential mediumMEM NEAA = MEM Non Essential Amino Acids (Gibco: Cat. No. 043-01140). All 10X media were supplied by Gibco Life Sciences. Hams’ F12 was supplied in powder form.
2.4 REAGENTS AND THEIR RECONSTITUTIONThe following tables provides information on stock reagents (source and catalogue numbers) and
reconstitution. All stock solutions (except sera) were filter sterilized and stored at 4°C or -20°C.
Table 2.4.1 General cell culture reagents
PRODUCT SIZE CAT. NO. SUPPLIER
L-Glutamine 100ml 043-05030H Gibco
Sodium Pyruvate 100ml 043-01360H Gibco
Trypsin 100ml 043-05090H Gibco
Trypsin Inhibitor 100mg T6522 Sigma
DMSO 100ml D2650 Sigma
HEPES lKg H9136 Sigma
NaHCO, lKg 30151 BDH
HC1 2.5L 37021 RDH
NaOH lKg 30620 RDH
Donor Horse Serum 500ml 29-211-54 (lot 9120952) Flow Laboratories
Fetal Calf Serum 500ml Batch 41925 Northumbria Biologicals
PBS A 100 Tablets BR14a Oxide
EDTA 100ml ED6758 Sigma
55
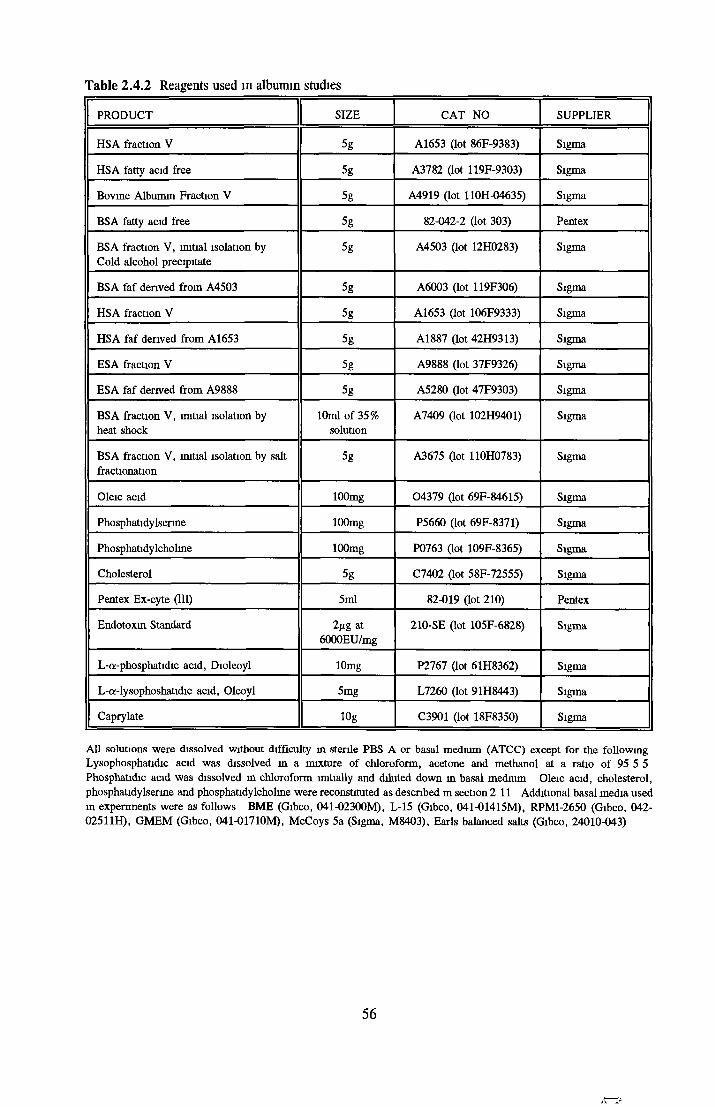
Table 2.4.2 Reagents used in albumin studies
PRODUCT SIZE CAT NO SUPPLIER
HSA fraction V 5g A1653 (lot 86F-9383) Sigma
HSA fatty acid free 5g A3782 (lot 119F-9303) Sigma
Bovine Albumin Fraction V 5g A4919 (lot 110H-04635) Sigma
BSA fatty acid free 5g 82-042-2 (lot 303) Pentex
BSA fraction V, initial isolation by Cold alcohol precipitate
5g A4503 (lot 12H0283) Sigma
BSA faf derived from A4503 5g A6003 (lot 119F306) Sigma
HSA fraction V 5g A1653 (lot 106F9333) Sigma
HSA faf derived from A1653 5g A1887 (lot 42H9313) Sigma
ESA fraction V 5g A9888 (lot 37F9326) Sigma
ESA faf derived from A9888 5g A5280 (lot 47F9303) Sigma
BSA fraction V, initial isolation by heat shock
10ml of 35% solution
A7409 (lot 102H9401) Sigma
BSA fraction V, initial isolation by salt fractionation
5g A3675 (lot 110H0783) Sigma
Oleic acid lOOmg 04379 (lot 69F-84615) Sigma
Phosphatidylsenne lOOmg P5660 (lot 69F-8371) Sigma
Phosphatidylcholine lOOmg P0763 (lot 109F-8365) Sigma
Cholesterol 5g C7402 (lot 58F-72555) Sigma
Pentex Ex-cyte (III) 5ml 82-019 (lot 210) Pentex
Endotoxin Standard 2/xg at 6000EU/mg
210-SE (lot 105F-6828) Sigma
L-a-phosphatidic acid, Dioleoyl lOmg P2767 (lot 61H8362) Sigma
L-a-lysophoshatidic acid, Oleoyl 5mg L7260 (lot 91H8443) Sigma
Caprylate 10g C3901 (lot 18F8350) Sigma
All solutions were dissolved without difficulty m sterile PBS A or basal medium (ATCC) except for the following Lysophosphatidic acid was dissolved in a mixture of chloroform, acetone and methanol at a ratio of 95 5 5 Phosphatidic acid was dissolved m chloroform initially and diluted down in basal medium Oleic acid, cholesterol, phosphatidylsenne and phosphatidylcholine were reconstituted as described m section 2 11 Additional basal media used m experiments were as follows BME (Gibco, 041-02300M), L-15 (Gibco, 041-01415M), RPMI-2650 (Gibco, 042- 02511H), GMEM (Gibco, 041-01710M), McCoys 5a (Sigma, M8403), Earls balanced salts (Gibco, 24010-043)
56

Table 2.4.3 Reagents used in insulin studies
PRODUCT SIZE CAT NO RECONSTITUTION
Bovine Insulin 100mg 11882 (lotll2H9402) reconstitute in lOOptl glacial acetic acid and dilute down in PBS A initially to 5mg/ml
Hybnmax bovme Insulin
100mg 14011 (lot 79F00925)
rec human IGF-I 10/ig 1048058 (lotl4706100) Reconstitute m 5/A lOmM HC1 Dilute down in PBS A
rec human IGF-II 10|ig 12139 (lot 62H00501) Reconstitute in 1ml of lmg/ml BSA faf and 1 5M HC1 Dilute down in basal medium
human rec Insulin 100/ig50mg
10259 (lot 44F01563) 10259 (lot 53H0057)
Reconstitute m lOnM HC1 and dilute down in PBS A to 500fxg/ml
Ovine Insulin 5mg 19254 (lot 57F0667) Reconstitute in 7^1 of 1 5M NaOH and dilute down with PBS A to 500/jg/ml
Equine Insulin 5mg 19129 (lot 80H0492) Reconstitute in 7 ¡A 1 5M HC1 and dilute down in PBS A to 500/ig/ml
Porcine Insulin 5mg 13505 (lot 50H0774) Reconstitute mto 6^1 of 0 01M HC1 and dilute down in PBS A
Except for recombinant human IGF-I, all other insulins and IGF-II were supplied by Sigma IGF-I was supplied by Boehrmger Mannheim
Table 2.4.4 Reagents used in transferrin studies
PRODUCT SIZE CAT NO SUPPLIER
apo - Transferrin 5g T8027 Sigma
partially-saturated Transfemn 5g 82-0425-02 Pentex
fully-saturated Transferrin 5g T1283 (lot 30H00155) Sigma
Sodium mtroprusside 25g S0501 (lot 121H2608) Sigma
Iron choline citrate 100g 17756 (lot 84F06371) Sigma
Feme citrate 100g F2877 (lot 82H0695) Sigma
Ferric nitrate 100g F8508 (lot 31H05066) Sigma
Feme ammonium sulphate 250g F8884 (lot 119F06215) Sigma
Feme ammonium citrate 100g F5879 (lot 82H0217) Sigma
Ferrous sulphate 250g F8633 (lot 50H08335) Sigma
All transferrins were dissolved into ATCC and stored at 5mg/ml stock solutions All iron compounds were dissolved in ultrapure H20 at 5mg/ml Dilution to lmg/ml was made m ultrapure H20 and all subsequent dilutions were made in basal medium
57
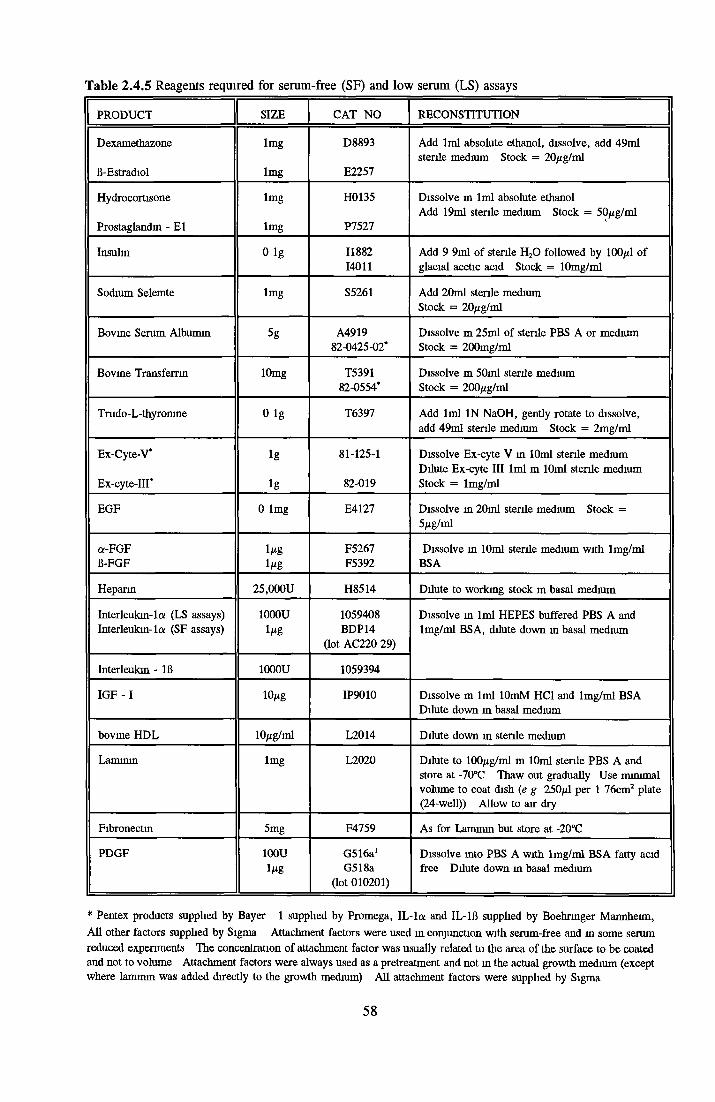
Table 2.4.5 Reagents required for serum-free (SF) and low serum (LS) assays
PRODUCT SIZE CAT NO RECONSTITUTION
Dexamethazone
ß-Estradiol
lmg
Img
D8893
E2257
Add 1ml absolute ethanol, dissolve, add 49ml sterile medium Stock = 20/ig/ml
Hydrocortisone
Prostaglandin - El
lmg
lmg
H0135
P7527
Dissolve in 1ml absolute ethanolAdd 19ml stenie medium Stock = 50/ig/ml
Insulin Olg 1188214011
Add 9 9ml of sterile H20 followed by 100/il of glacial acetic acid Stock = lOmg/ml
Sodium Selemte lmg S5261 Add 20ml sterile medium Stock = 20/ig/ml
Bovine Serum Albumin 5g A491982-0425-02*
Dissolve m 25ml of sterile PBS A or medium Stock = 200mg/ml
Bovme Transferrin 10mg T539182-0554*
Dissolve m 50ml sterile medium Stock = 200^g/ml
Trudo-L-thyronine O lg T6397 Add 1ml IN NaOH, gently rotate to dissolve, add 49ml stenie medium Stock = 2mg/ml
Ex-Cyte-V*
Ex-cyte-III*
lg
lg
81-125-1
82-019
Dissolve Ex-cyte V in 10ml stenie medium Dilute Ex-cyte III 1ml m 10ml stenie medium Stock = lmg/ml
EGF 0 lmg E4127 Dissolve in 20ml stenie medium Stock 5j.li: nil
a-FGFß-FGF
l/*gl/tg
F5267F5392
Dissolve in 10ml stenie medium with lmg/ml BSA
Heparin 25.000U H8514 Dilute to working stock m basal medium
Interleukin-lo: (LS assays) Interleukm-la (SF assays)
1000UiMg
1059408 BDP14
(lot AC220 29)
Dissolve m 1ml HEPES buffered PBS A and lmg/ml BSA, dilute down in basal medium
Interleukin - lß 1000U 1059394
IG F -I 10*tg IP9010 Dissolve m 1ml lOmM HC1 and lmg/ml BSA Dilute down in basal medium
bovme HDL 10^g/ml L2014 Dilute down in stenie medium
Lammm lmg L2020 Dilute to 100/ig/ml m 10ml stenie PBS A and store at -70°C Thaw out gradually Use minimal volume to coat dish (e g 250^1 per 1 76cm2 plate (24-well)) Allow to air dry
Fibronectin 5mg F4759 As for Laminin but store at -20°C
PDGF 100Ul^g
G516a‘ G518a
(lot 010201)
Dissolve into PBS A with lmg/ml BSA fatty acid free Dilute down in basal medium
* Pentex products supplied by Bayer 1 supplied by Promega, IL-la and IL-1B supplied by Boehnnger Mannheim, All other factors supplied by Sigma Attachment factors were used in conjunction with serum-free and in some serum reduced experiments The concentration of attachment factor was usually related to the area of the surface to be coated and not to volume Attachment factors were always used as a pretreatment and not in the actual growth medium (except where laminm was added directly to the growth medium) All attachment factors were supplied by Sigma
58
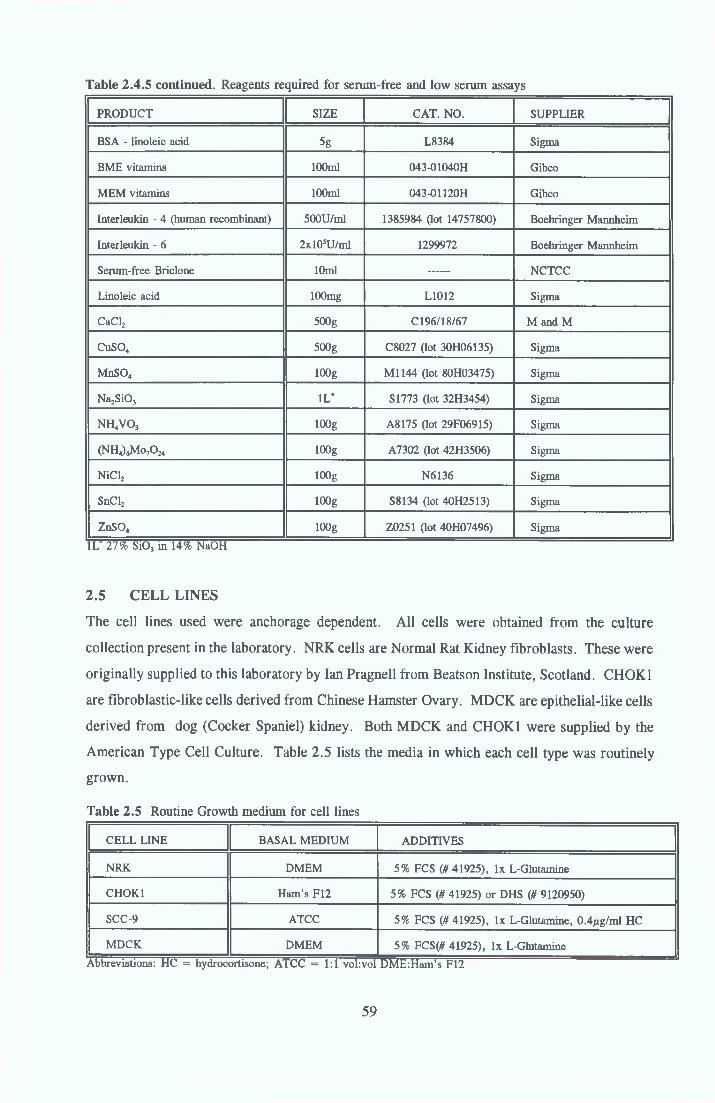
Table 2.4.5 continued. Reagents required for serum-free and low serum assays
PRODUCT SIZE CAT. NO. SUPPLIER
BSA - linoleic acid 5g L8384 Sigma
BME vitamins 100ml 043-01040H Gibco
MEM vitamins 100ml 043-01120H Gibco
Interleukin - 4 (human recombinant) 500U/ml 1385984 (lot 14757800) Boehringer Mannheim
Interleukin - 6 2xl05U/ml 1299972 Boehringer Mannheim
Serum-free Briclone 10ml NCTCC
Linoleic acid lOOmg L1012 Sigma
CaCl2 500g Cl 96/18/67 M and M
CuS04 500g C8027 (lot 30H06135) Sigma
MnSO„ 100g Ml 144 (lot 80H03475) Sigma
Na2Si03 1L* S1773 (lot 32H3454) Sigma
NH4VO, lOOg A8175 (lot 29F06915) Sigma
(NH4)6Mo70 24 100g A7302 (lot 42H3506) Sigma
NiCl2 100g N6136 Sigma
SnCl2 lOOg S8134 (lot 40H2513) Sigma
ZnS04 lOOg Z0251 (lot 40H07496) SigmaIL’ 27% SiO, in 14% NaOH
2.5 CELL LINESThe cell lines used were anchorage dependent. All cells were obtained from the culture
collection present in the laboratory. NRK cells are Normal Rat Kidney fibroblasts. These were
originally supplied to this laboratory by Ian Pragnell from Beatson Institute, Scotland. CHOK1
are fibroblastic-like cells derived from Chinese Hamster Ovary. MDCK are epithelial-like cells
derived from dog (Cocker Spaniel) kidney. Both MDCK and CHOK1 were supplied by the
American Type Cell Culture. Table 2.5 lists the media in which each cell type was routinely
grown.
Table 2.5 Routine Growth medium for cell lines
CELL LINE BASAL MEDIUM ADDITIVES
NRK DMEM 5% FCS (tt 41925), lx L-Glutamine
CHOK1 Ham’s F12 5% FCS (tt 41925) or DHS (tt 9120950)
SCC-9 ATCC 5% FCS (tt 41925), lx L-Glutamine, 0.4/xg/ml HC
MDCK DMEM 5% FCS (tt 41925), lx L-GlutamineAbbreviations: HC = hydrocortisone; ATCC = 1:1 vol:vol DME:Ham’s F12
59
2.5.1 Cell Growth / Maintenance
Cells were routinely maintained in the respective media described in Table 2 5 (8-9ml medium
per 25cm2 flask) The cells were incubated at 37°C in tissue culture grade flasks Cells were
grown to confluency with feeding All fresh media used for feeding cells was incubated at 37°C
before use All manipulations involving cells were carried out using aseptic techniques in a
class 2 laminar flow Every item entering the laminar flow was swabbed m 70% Industrial
Methylated Spirits (IMS) If deahng with several different cell lines, a waiting period of 15-20
minutes ensured no cross contamination of cell lines When large volumes of cells were
required, cells were seeded into larger flasks (75cm2 flasks) or roller bottles Where 2xl07 or
more cells were required, cells were grown in roller bottles with 100ml of growth medium and
a minimum seeding density of 5x10® cells An initial rotation speed of 0 25rpm was used to
allow the cells to attach and after 24 hours the rotation speed was increased to 0 75rpm on the
roller bottle apparatus at 37°C
2.5.2 Cell Subculture Routine
When cells became subconfluent, flasks or roller bottles were trypsimzed with a 0 25 % trypsm
versene (TV) solution The procedure described here is for a 25cm2 flask but is the same for
larger flasks and roller bottles Waste medium was removed from the cells The cells were
washed m a pre-warmed TV solution, to remove any residual serum which contains enzymes
that inhibit the action of trypsm 2ml of fresh TV was added The flask was incubated at 37°C
for 5 - 10 minutes until the cells began to detach When a single cell suspension was attained,
serum-containing medium was used to inactivate the trypsin The resulting solution was
centrifuged at lOOOrpm for 5 minutes The pellet was resuspended in fresh medium and
counted Trypsm versene was prepared as follows
50mls of porcine trypsm was filter sterilized through a 0 2 2 f j , m low-protein binding filter and
added to 439mls of sterile PBS A 1 lmls of 1 % EDTA solution brought the final volume to
500ml The TV solution was dispensed into 20 ml volumes and stored at -20°C
2.5.3 Subculture of cells in Serum-Free Medium
As no serum could be used to inactivate trypsm whde passaging cells in SFM, trypsm inhibitor
(TI) was made up such that a lx volume would inhibit the action of lx volume of trypsm
Media was removed from cells and the cells rmsed in pre-warmed trypsm This was removed
and 500/il TV was added per 25cm2 flask, allowed to cover the entire surface and incubated
until the cells began to detach (often less than 5 minutes for NRK and CHOK1 cells, but up to
60
10 minutes for MDCK cells depending on the extent of confluency). 500/xl of pre-warmed TI
was added into flasks and gently mixed. This was then removed to a universal. Fresh medium
(about 4mls) was added into the flask to wash out any residual cells. This was added to the cell
suspension and immediately centrifuged at l,500rpm for 10 minutes at 4°C. All of the
supernatant was gently removed and the pellet resuspended in 4ml of fresh medium. The cells
were then re-centrifuged but only for 5 minutes. All the supernatant was removed and the cells
resuspended gently in fresh medium. IMPORTANT: This process was always carried out as
quickly and gently as possible to limit damage to the cells.
Trypsin inhibitor was made up as follows: 1.8g of TI will inhibit 1 mg/ml trypsin.
The stock trypsin was 2.5mg/ml so 1.39mg/ml TI was required to inhibit when using equi-
volumes. lOOmg was diluted down into 7.2ml ATCC, filter-sterilized, aliquoted and stored at -
20°C. These lOx stocks were thawed when required.
2.5.4 Cell StorageCells were routinely stored for indefinite periods of time in liquid nitrogen at -196°C. For each
cell line, a master stock was kept in a separate culture collection. From the master stock, a
working stock was obtained and this was kept separate from the master stock. Special care was
taken with cell storage to ensure viability and absence of contamination when thawed down.
The cryopreservative used in this laboratory is DiMethyl Sulf-Oxide (DMSO).
2.5.4.1 Cell Freezing ProcedureCells to be frozen had to be in the log phase of growth. They were screened to ensure the
absence of mycoplasma contamination. Cells to be frozen were routinely grown up in 75cm2
flasks or roller bottles. Cells were trypsinized and resuspended in medium supplemented with
5% FCS. A viable cell count of at least 5xl06 cells/ml was required (about 3-5ml from a 75cm2
flask and 8-10ml from a roller bottle). The cryopreservative solution was made up with 10%
DMSO and 50% FCS. The remaining 40% was medium supplemented with 5% FCS. 10ml
stocks of the cryopreservation solution were made up and stored at -20°C.
Slowly, in a dropwise manner, the DMSO solution was added to the cells in a swirling motion.
This step was very important as DMSO is toxic to cells. When added slowly the cells had a
period to adapt to the presence of DMSO, otherwise the cells may have lysed. The suspension
was then aliquoted into sterile cryovials. The cells were slowly frozen in the vapour phase of
the liquid nitrogen for 3 hours and then stored in compartments in the liquid phase. Shortly
after freezing, the viability was tested and usually found to be greater than 90%.
61
2.5.4.2 Cell Thawing Procedure
A vial of cells was removed from the liquid nitrogen and thawed quickly at 37°C Immediately
upon thawing, the cells were transferred to a sterile universal containing serum-supplemented
medium and centrifuged at lOOOrpm for 5 minutes to remove DMSO which is toxic to cells at
room temperature The cell stock was then resuspended in 8 - 9mls of growth medium and
inoculated into a 25cm2 flask
2.6 MYCOPLASM A ANALYSIS
Two methods were used to detect mycoplasma Routine mycoplasma analysis (every 6 to 8
weeks) was carried out by Una Gilvarry-Quigley or Cathy Halhgan
2.6.1 Indirect Staining fo r Mycoplasma
In this method, conditioned media was collected from the cells to be tested and incubated with
NRK cells previously shown to be mycoplasma negative After 5 days, the cells were stained
with Hoechst 33258 (binds specifically to DNA) The presence of fluorescent bodies seen
outside the cells was an indication of mycoplasma contamination Hoescht stain is a potential
carcinogen and so was handled with due care
Procedure NRK cells, lower than passage 21 were inoculated at lx l0 3 cells/ml and grown on
sterile cover slips in 30mm petri-dishes overnight The cells to be assayed had to be growing
for at least 3 to 5 passages after thawing (to allow mycoplasma, if present to recover from
freezing) Conditioned medium was obtained from the test cells and centrifuged at lOOOrpm
for 5 minutes 1ml of conditioned media was added to the NRK cells and allowed to incubate
for about 5 days The waste medium was removed and cells were washed twice in PBS and
once in a cold PBS/Carnoys (50/50) solution Immediately after this, the cells were fixed in
Carnoys solution for 10 minutes (Carnoys fixative - Acetic acid Methanol-1 3) This prevented
the cells from drying out The fixative was removed and the shdes were air-dried After two
washes i n deionized water, 2ml of Hoechst 33258 s t a m ( 1 m 2 0 0 0 dilution to 50ng/ml) was
added The shdes were stained for 10 minutes in the dark, as the fluorescence was slowly
quenched when exposed to light After a further 3 rinses in deionized water, the slides were
mounted in PBS A at pH 7 4 The slides were then examined under 400X and 1000X oil under
a fluorescent microscope using a UV filter
2.6.2 D irect Culture o f Mycoplasma
In this method, the conditioned medium from the test cells was inoculated into broths or agars
62

designed specifically to enrich mycoplasmic growth Mycoplasma Agar (CM401) and Broth
(CM403) base are supplied by Oxoid To 9mls of sterile agar or broth base, the following
supplements were added 2ml Horse serum, 1ml fresh yeast extract (0 25g/ml), 25/xl penicillin
and 130/xl of 0 2% DNA (BDH,42026) Note Agar is first melted and then allowed to cool
before addition of supplements
The test sample was then inoculated onto plates and into broth and allowed to incubate at 37°C
for 3 weeks The plates were incubated in sealed C 02 jars to prevent contamination Broths
and plates were then checked regularly under a microscope for growth
2.7 M ICROPIPETTE ACCURACY CHECKS
Accuracy checks were carried out on all micropipettes and multi-channel pipetters The
accuracy and precision of lOOOjal and 100/xl pipettes were determined by standard methods
involving repeatedly pipetting specific quantities of water and weighing them The
specifications for these tests were supplied by Gilson
For multi-channel pipetters the above checks were carried out for the whole instrument (i e all
8 tip holders) together The suppliers (Brownes) recommended a precision check for the user
and this was adapted to look at variation between individual ’channels’
The method involved aliquoting out a dye and reading the absorbances Stock neutral red (at
0 4%) was diluted down 1/10 in PBS and mixed The same volume was repeatedly pipetted
onto a 96-well plate The results were then read at a dual wavelength of 570nm and 620nm on
the ELISA plate reader The coefficient of variation (CV) was calculated as follows
% CV = (standard deviation) x 100 / mean For good user pipetting, the CV of the various
columns should be less than 2 0% Between the 8 tip channels the CV should be less than 2%
2.8 GROWTH STIM ULATORY ASSAYS
Growth stimulation assays were carried out using miniaturized assay systems to screen a wide
variety of factors, while subculture assays were used to assess the effect of selected variables
over a long period of time
2.8.1 M iniaturized Assay systems
Miniaturized assays were of two types, depending on plate size (24- and 96-well plate) For
24-well plate assays, results were determined by protein staining techniques or haemocytometer
counts For 96-well plates, results were determined by cell counts, acid phosphatase activity or
crystal violet dye elution The preparation of these assays was divided into two parts, sample
63

preparation and cell preparation This is demonstrated below in the preparation of a typical
albumin screening assay
2.8.1.1 Sample Preparation
Stock components were made up in ATCC medium and diluted down as 200X or 1000X stocks
of the final desired concentration and stored at -20°C The relevant stocks were thawed gently
at 4°C and prepared as 100X stocks A ’Master Cocktail’ was then made up of the appropriate
components to give a final 2X sample This was made up on the day of the experiment The
master cocktail contained all relevant factors, DHS (supplied by Flow), L-glutamme, albumins
and lipids or Ex-cyte All assays were carried out without the addition of antibiotics or
fungicidal agents
The 24-well plates were divided up so that each variable was set up in triplicate per plate with
8 variables per plate 0 5ml of each albumin solution was added to each of the triplicate wells
The 96-well plates were divided so that each variable was set up with 8 repeats and 12 variables
per plate Sample and control stocks were made up identically for 24- and 96-well plate
experiments 0 5ml sample was aliquoted per 24-well plate and 100/xl sample per 96-well plate
Two controls were set up on every plate, a positive control of 5 % FCS and a negative control
The negative control was usually the background serum concentration or the SFM
A serial dilution curve of serum was included which was used to compare the extent of cell
growth in experimental variables In Table 2 8 1, an example of making up an albumin dilution
curve is given The final solutions are a 2X of the final desired concentration, so that when
added to the cell suspension the albumin concentrations would be 0 5, 1 0, 2 0, 5 0 and
lOmg/ml albumin with a 2% DHS background When all the variables were plated out, the
plates were placed in a C02 incubator, for pH and temperature equilibration
Table 2 8 1 Sample preparation for setting up miniaturized assays
Sample label Final 2X Albumin conc
(mg/ml)
StocklOOmg/ml
ATCCml
Aml
Bml
Cml
Dml
40% DHS (vol/vol)
ml
A 20 0 2ml 7 0 — — — — 1 0
B 10 0 — 4 5 5 0 — — — 0 5
C 4 0 - 8 1 - 60 — - 0 9
D 2 0 - 4 5 - - 5 0 — 05
E 1 0 - 1 8 - -- - 2 0 0 2
64
2.8.1.2 Cell Stock Preparation
All cells used in growth stimulation assays were pretreated so that they were m the exponential
phase of growth This was carried out by setting the cells up at a suitable concentration (1 x
105 cells per 25cm2 flask) so that two to three days later, they were 50-70% confluent The
cells were fed and the following day used in the experiment All experiments except where
stated, were carried out three times, requiring three separate stocks of cells and test samples for
each experiment
Cells were trypsinized as described m sections 2 5 3 and 2 5 4 depending on the assay system
After centrifuging, the cells were resuspended in the appropriate basal medium Viable cell
counts were carried out using trypan blue staining in duplicate If the coefficient of variation
between counts was greater than 10%, an additional count was carried out
A master stock of cells was made up sufficient to carry out the entire experiment For 24- and
96-well plate experiments, the appropriate concentration for the various cell hnes was used
For 24-well plates, all cells were set up at 5x10’ cells per well ( i e 0 5ml of lxlO4 stock cell
suspension) For 96-well plates, final cell densities of 5xlCF, 8x10* and lxlO3 cells per well
were required for CHOK1 / MDCK, NRK and SCC-9 cells respectively
Cells were kept in a homogenous suspension by means of gentle inversion For 24-well plate
assays, approximately 14ml aliquots were dispensed into sterile umversals, one for each plate
in the experiment For 96-well plate assays, 11ml aliquots were used Experience has shown
that this method gave a more uniform result throughout the experiment
When all the cell suspensions had been ahquoted, a gentle mixing pattern (backward and
forward, left to right) was used to evenly disperse the cells m the well
The plates were then placed on trays and covered in tin-foil (protection from contamination)
The assays were incubated m 5 % C02 at 37°C for 3 to 5 days until confluency was reached
(depending on the cell line and assay conditions) Experiments were then taken down Results
were obtained as described in ’Experiment End Points’, section 2 9
2.8.2 Subculture Experiments
To study the long-term effect of selected factors, subculture experiments were required For
serum-free systems, vented 25cm2 flasks were used (due to uncontrollable increases in pH when
MDCK cells were inoculated in a non-vented flask under serum-free conditions) Fresh media
65
was made up the day before use and sterility checked overnight to ensure no gross
contamination had taken place (normally sterihty checks are incubated for two weeks)
Subculture experiments were incubated at 37°C and 5% C 02 Media was made up so that all
factors would be at IX concentration
For MDCK and CHOK1 cells, an inoculation density of 2x10s cells/flask was used 8ml of pre
warmed test media were added per flask The cells were incubated for 4 days The day before
subculturing, 4ml of medium was removed and replaced with fresh medium Cells were
trypsmized as described in section 2 5 4 When the cell number was determined, fresh flasks
were inoculated with 2xl05 cells/flask Each variable was assayed separately three times
For NRK cells, serum-free subculture was carried out exactly as described above except that
6-well plates were used Subculturing in 6-well plates, reduced the cost of SFM (cost of FGF
and PDGF) For 6-well plates, triplicate wells of two variables were assayed The wells were
inoculated with 3xl04 cells per well (a total of 2ml per well) Each well was treated as totally
separate, being trypsmized, counted and re-inoculated into fresh plates as separate variables
As the depth of these wells was very low, these plates were always covered in parafilm to
reduce evaporation of the media
2.9 EXPERIM ENTAL END POINTS
2.9.1 Image Analysis
Image Analysis was used to measure cell area or colony number, on 24-well plates Crystal
violet (BDH, 42555) was used to stain the cells Crystal violet was made up as a 0 25%
solution in ultrapure H20 and filtered before use This is a non specific protein binding dye
For this reason, sufficient washing steps before staining, were carried out to remove serum
proteins which could interfere in analysis
Waste media was removed and the wells were washed 3 times in PBS A (approximately 0 5ml
per well) 0 5ml of 0 25 % crystal violet stain was added to each well and left to develop for
5 - 1 0 minutes The crystal violet was then decanted and the plates washed with tap water to
remove any unbound crystal violet The plates were left to dry before being analyzed using an
image analyzer Crystal violet dye could be filtered and reused
66

2.9.2 Dye elution
After image analysis, the crystal violet dye was eluted from the plates, by adding 250/il of 33%
glacial acetic acid to each well 100/xl samples were ahquoted into a 96-well plate (2 samples
from each 24-well plate) The absorbance was read on an ELISA plate reader at dual
wavelength of 570nm and 620nm, 570nm is the wavelength specific for maximum absorbance
of the crystal violet dye and 620nm is the wavelength which is specific for absorbance from the
plastic in the plates themselves
2.9.3 Coulter Counts
Total cell counts were carried out using a ZR Coulter counter Cells were trypsimzed m the
usual way Where 24-well plates were involved, 0 5ml of TV was used to detach the cells
0 5ml of a single cell suspension was added to 19 5ml Isoton in a diluvial The diluviáis were
gently inverted and read on the coulter counter To calculate the cell number per well, the
following was taken into account 0 5ml of cell sample was diluted into 20ml The coulter
counter only measures the number of cells in 0 5ml This made the multiplication factor 40
For the 96-well plates 200/¿l was added per well The eight samples were then pooled and
added to 18 4ml Isoton The multiplication factor for the number of cells per well was 3 125
This was determined as follows 1 6ml cell solution was diluted into 20ml as before the coulter
only counts the number of cells in 0 5ml 8 wells were combined Multiplication factor = (20
x 2) / (8 x 1 6) = 3 125
2.9.4 Haemocytometer Counts
Plates were washed first m a small volume of TV This was totally removed 100/xl was added
per well for 24-well plates The plates were covered in parafilm to prevent evaporation of TV
After 5 - 1 0 minutes incubation at 37°C, 50/¿l of serum-supplemented medium was added The
solution m each well was pipetted up and down to ensure a homogenous cell suspension Cells
were then counted on a haemocytometer Using a haemocytometer, cell counts are given per
ml In the squares on the haemocytometer, the volume occupied by the sample is determined
by the width (0 1cm) and the depth (0 01cm) So in the square, a total of 0 0001cm3 or
0 0001ml is present When the number of cells in the well were counted, the count is divided
by the volume (0 0001ml), to give the cell number per ml However, only 150/xl volumes were
present per well Results were then multiplied by 6 66 to give the cell count per well
67
2.9.5 96-well Acid Phosphatase Assay
The acid phosphatase assay is based on the activity of cellular acid phosphatases which can be
related to cell number It was first developed by Connolly e t a l in 1985 An adaption of this
method which was developed by Martin and Clynes (1991), was used in this study
For this procedure a para-nitro-phenyl phosphate buffer was required The buffer was made
up with 0 1% Triton X-100 (Sigma, lot 119F0733) and 0 1M sodium acetate (Riedel-deHaen,
32318) at pH 5 5 This was stored at 4°C in the dark The substrate for the reaction para-
mtro-phenyl (PNP) (Sigma, C104), was added just before use The complete PNP buffer was
stored in the dark as it was light sensitive Waste medium was removed and the cells rinsed
twice in 100/zl PBS per well 100^1 of freshly prepared PNP buffer (see above) was added to
each well This buffer contained Triton X which lysed the cells and exposed cellular
phosphatases to the phosphatase substrate The reaction was incubated in the dark at 37°C for
2 hours The reaction was stopped by addition of 50/xl of 1M NaOH to each well The results
were read on a Titertek plate reader at a dual wavelength of 405nm and 620nm, 405nm is the
wavelength of maximum absorbance for the dye and 620nm is'the wavelength specific for
maximum absorbance of the plastic m the plates themselves
2.9.6 96-well Crystal Violet Dye elution
This was carried out essentially as described for 24-well plates except that a smaller volume
(about 40 - 50 /xl) of dye was required per well After incubation for 5 - 1 0 minutes, the dye
was washed off the plates and were left to dry 100 .1 of 33% glacial acetic acid was added per
well The plates were swirled to elute the dye into the acetic acid and the plates were then read
as before
2.10 ALBUMIN LOADING EXPERIMENTS
Albumin loading experiments were carried out to see if the incorporation of fatty acids,
cholesterol and phospholipids could improve the growth stimulating ability of fatty acid free
albumin Two methods were employed, the Jager method and the Watt method
2.10.1 Method 1 (Jager e t a l . , 1988)
20/il of a freshly diluted stock of oleic acid (20mg/ml m ethanol) was slowly added per ml of
fatty acid free-BSA (50mg/ml in PBS A) The mixture was then allowed to complex overnight
at 4°C by gentle end over end rotation The mixture was then filter sterilized and stored at 4°C
until use
68
Phospholipids and cholesterol were first dissolved in chloroform and then dried under a stream
of nitrogen gas Lipids were then dissolved in ethanol and complexed in the same manner as
oleic acid
2.10.2 Method 2 (W att and Davis, 1989)
Lipids were dissolved in a few drops of chloroform at room temperature or in ethanol at 50°C
in a 25ml glass beaker The solvent was then completely removed under a stream of nitrogen
gas, leaving a film of lipid at the bottom of the beaker
10ml bicarbonate-free DME at pH 5 1 containing 1% delipidated albumin was added The
beaker was immersed in ice and sonicated under air for 10 minutes at maximum energy (just
below the foaming point) so that the lipids formed small micelles The solution was then
filtered through a 0 22/xm filter and stored at 4°C until use
2.11 BIORAD PROTEIN ASSAY
The BioRad Protein (Cat No 500-0006) Assay is a dye-binding assay in which albumin was
used to construct the standard curve The protein content of test samples were then read from
the standard curve
2.11.1 Procedure
Serial dilutions of BSA were made up in duplicate in sterile PBS A The concentration range
was from 0 2 to 1 2mg/ml Test samples were diluted appropriately 0 1ml of either test
sample or standard was added to clean labelled test tubes The dye was diluted 1 in 5 m PBS
A and filtered through Whatman filter paper immediately before use 5ml of diluted dye was
added per test tube The samples and standards were vortexed gently to form a homogenous
solution After a period of 5 minutes to 1 hour, the OD was read at 595nm against a reagent
blank The OD was plotted versus known concentrations and the unknowns were determined
from the standard curve
2.12 A FFIN ITY CHROMATOGRAPHY USING HEPARIN-SEPHAROSE CI-6B
Heparin Sepharose (HS) consists of a cross-linked sepharose matrix to which heparin is
covalently linked using the cyanogen bromide method Heparin is a naturally occurring
mucopolysaccharide which is polyamomc in nature and thus reacts with many cationic
compounds Heparin Sepharose is supplied by Pharmacia in a freeze-dried form (code no 17-
69
0467-01, lot no SL 208990) lg HS powder gives about 4ml swollen gel To remove
additives, the gel is washed on a sintered glass filter with about 200ml starting buffer per gram
powder
2.12.1 Preparation o f small-scale columns
The initial chromatography columns were run in 20ml capacity Econo-Pac disposable columns
(cat no 732-1010) supplied by Bio-Rad 3 75g HS powder was allowed to swell for 15
minutes m the starting buffer (50mM Sodium Phosphate Buffer (NajHPC or NaPi for short)
at pH 7 4) NaPi was supplied by BDH (cat no 10245, lot 26218802) Instead of washing on
a sintered glass filter, the swollen matrix was placed in one of the Econo-columns The matrix
was then washed with small amounts of starting buffer, with occasional gentle inversion, until
a total of 750ml was passed through the column The column was then stored at 4°C until use
Indeed, once the sample had been applied to the column, all subsequent steps were carried out
at 4°C
2.12.2 Application o f sample
A 40ml solution of 15mg/ml BSA fraction V (Sigma cat no A4919, lot 100H04635) was
made up in 50mM NaPi, pH 7 4 15-18ml of the BSA solution was added to a column that had
been allowed to nearly run dry (the remainder was kept as the BSA control) The column was
stoppered and gently inverted to form a homogenous solution The matrix/albumin solution was
removed to a clean 100ml beaker As the matrix settled out of solution, some of the solution
was aspirated off and used to rinse out the column The solution was then mixed gently over
night at 4°C
2.12.3 Step-wise Elution
The following day the mixture was transferred back into the column Some of the unbound
fraction was used to rmse out the beaker and so, collect any residual matrix The unbound
fraction was collected (approximately 18ml) and stored
The second step involved washing the column with 40ml starting buffer (50mM NaPi, pH 7 4)
The first 8ml eluted (which was estimated to be the void volume) was added to the unbound
fraction
The third, fourth and fifth steps involved elution at increasing salt concentrations The
concentrations used were 0 5, 1 0 and 2 0M NaCl For the 0 5 and 1 0M NaCl, washes were
70

carried out as for the Buffer wash, with the first 8mls of each eluate being added to the previous
one In the last step, 48ml 2 OM NaCl was used to wash out the column and the final volume
was about 40mls After being analyzed for protein content (absorbance at 279nm), the samples
were filter sterilized and kept at 4°C, until ready for diafiltration
2.12.4 Regeneration o f column
The HS matrix is reusable once it is properly cleaned and stored The matrix was initially
washed with 120ml 0 1M Tris-HCl, 0 5M NaCl, pH 8 5 The matrix was then washed with
160ml 0 1M sodium acetate in 0 5M NaCl at pH 5 5 Finally the column was washed out with
a 20% (vol/vol) ethanol in ultra-pure water The column was sealed and stored in this solution
at 4°C
2.12.5 D ia filtra tion o f samples
The samples were diafiltered in order to replace the buffer in which the samples were collected
with the growth medium required by the cells and to reduce the salt concentration The final
salt concentration required for assaying was 0 02M NaCl, as is present in ATCC medium
2.12.6 Preparation o f filte r
Two types of filter were used, initially a YM5 (An 02361A) and then a YM3 (An 06177A)
These Diaflo ultrafilters were supplied by Amicon The membranes were prepared for use by
rinsing in ultra-pure water to remove the sodium azide, which is used as a preservative The
filter was handled very gently to avoid scratching the glossy (skin) side The membrane was
rmsed glossy side down in a large beaker of UP water for at least one hour, changing the water
three times The filter was then mounted in the ultrafiltration cell and rinsed again by running
100ml UP water through the system under 50psi (provided by N2 gas)
Before diafiltermg a sample, all the pieces of the ultrafiltration cell were rmsed 3 times m UP
H20 The filter was placed glossy side up, so that it would be in contact with the medium
The sample was applied, diluted to the appropriate volume (see Table 2 12) with ATCC medium
at pH 7 4 (Table 2 12) Pressure of 50psi was applied to the ultrafiltration cell and the solution
was continuously stirred The filtrate was collected and tested for protein content At the end
of the filtration when about 15mls were left in the cell, the retentate was transferred to a 50ml
sterile centrifuge tube The ultrafiltration cell was rmsed out with an appropriate volume of
filtrate and added to the retentate to bring the final volume of retentate to the volume of the
71
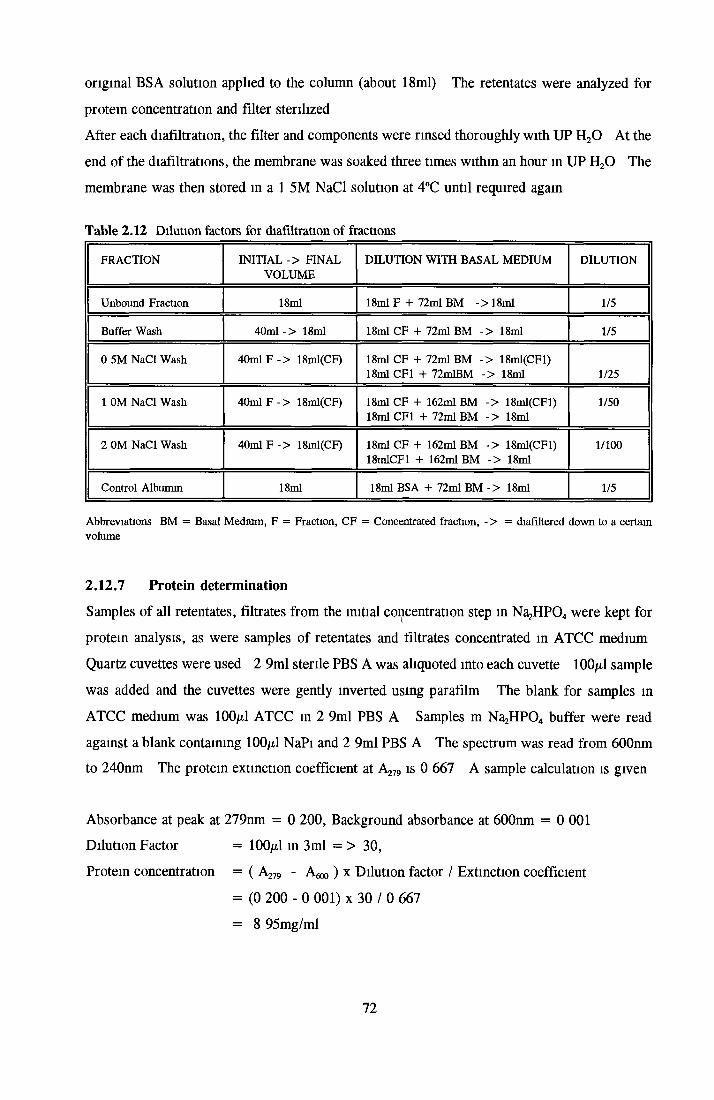
original BSA solution applied to the column (about 18ml) The retentates were analyzed for
protein concentration and filter sterilized
After each diafiltration, the filter and components were rinsed thoroughly with UP H20 At the
end of the diafiltrations, the membrane was soaked three times within an hour m UP H20 The
membrane was then stored in a 1 5M NaCl solution at 4°C until required again
Table 2.12 Dilution factors for diafiltration of fractions
FRACTION INITIAL -> FINAL VOLUME
DILUTION WITH BASAL MEDIUM DILUTION
Unbound Fraction 18ml 18ml F + 72ml BM ->18ml 1/5
Buffer Wash 40ml -> 18ml 18ml CF + 72ml BM -> 18ml 1/5
0 5M NaCl Wash 40ml F -> 18ml(CF) 18ml CF + 72ml BM -> 18ml(CFl) 18ml CF1 + 72mlBM -> 18ml 1/25
1 0M NaCl Wash 40ml F -> 18ml(CF) 18ml CF + 162ml BM -> 18ml(CFl) 18ml CF1 + 72ml BM -> 18ml
1/50
2 0M NaCl Wash 40ml F -> 18ml(CF) 18ml CF + 162ml BM -> 18ml(CFl) 18mlCFl + 162ml BM -> 18ml
1/100
Control Albumin 18ml 18ml BSA + 72ml BM -> 18ml 1/5
Abbreviations BM = Basal Medium, F = Fraction, CF = Concentrated fraction, - > = diafiltered down to a certain volume
2.12.7 Protein determination
Samples of all retentates, filtrates from the initial concentration step m Na^PC^ were kept for
protein analysis, as were samples of retentates and filtrates concentrated in ATCC medium
Quartz cuvettes were used 2 9ml sterile PBS A was aliquoted into each cuvette 100/xl sample
was added and the cuvettes were gently inverted using parafilm The blank for samples m
ATCC medium was 100/xl ATCC in 2 9ml PBS A Samples m Na^PC^ buffer were read
against a blank containing 100/xl NaPi and 2 9ml PBS A The spectrum was read from 600nm
to 240nm The protein extinction coefficient at A279 is 0 667 A sample calculation is given
Absorbance at peak at 279nm = 0 200, Background absorbance at 600nm = 0 001
Dilution Factor = 100/xl in 3ml = > 30,
Protein concentration = ( A279 - h .m ) ) x Dilution factor / Extinction coefficient
= (0 200 - 0 001) x 30 / 0 667
= 8 95mg/ml
72
For the 0 5, 1 0 and 2 OM NaCl fractions, either neat or 1 in 2 dilutions of the samples were
made The controls varied accordingly
2.12.8 Large-Scale Columns
To obtain larger volumes of each fraction, the column was scaled up to make use of the
Biopilot The Biopilot is an automated liquid chromatography system supplied by Pharmacia
(Code No 18-4600-06) The Biopilot consists of a liquid column chromatography controller,
pH, conductivity and UV monitors, two pumps, a fraction collector and a variety of columns
types Programs were designed to control the sequential elution of buffers
The preparations and applications of a sample to the matrix were as described above with the
exception that everything was scaled up approximately 2 5-fold All buffers were filtered and
degassed to ensure no solids could clog the small bore tubing used on the Biopilot
lOg HS matrix was allowed to swell 1 5L ultrapure H20 was used to rinse the column,
followed by 500ml starting buffer (50mM NaPi at pH 7 4) 87 ml of a 15mg/ml BSA solution
was made up and 53ml were mixed gently with the matrix overnight
Due to the larger volume of buffer required for the elution, the process was split up over 2
days On the first day, all fractions except the 2 0M NaCl were run 2 0M NaCl at 4°C over
a period of time will form crystals which could block the small bore tubing in the Biopilot For
this reason the last wash with the 2 0M NaCl was left for the following day The 2 0M NaCl
buffer was left at room temperature overnight, to prevent the formation of solids 120ml of
each of the NaCl buffers were used in the separation Diafiltration was carried out as described
above except that the volumes were initially concentrated to 25ml 20ml was taken for
diafiltration and where previously 72ml ATCC had been added, now 80ml ATCC was added
2.13 SDS-PAGE
The Laemmli method (Laemmli and Favre, 1973) was used The system described here is
based on running two vertical gels (about 20ml total volume) Stock solutions include
1 Stock Acrylamide 30% acrylamide (Riedal-deHaen, 62021), 0 8% NN-bis-methyl-
acrylamide (Sigma, M2022)
2 Stock Tns-HCl 1 5M Tns-HCl (Sigma 7-9, T1378), pH 8 8
3 Stock 10% SDS (Riedal-deHaen, 62862)
4 Stock Tns-HCl 0 5M Tns-HCl, pH 6 8
73
5 Tank Buffer 0 05M Tris-HCl, 0 384M glycine (Riedal-deHaen, 33226), 0 1 % SDS (2X used
by Laemmli and Favre)
6 10% (w/v) Ammonium persulphate (LKB Bromma, 1820-103) (freshly made just before use)
7 0 1% (w/v) Bromophenol blue (LKB Bromma, 1840-901)
2.13.1 Preparation o f Resolving Gel
Before making up the resolving gel, it was necessary to ensure that all stocks were present and
to clean the gel apparatus (cleaned with water and wiped down with methanol) The following
mixture was enough to make up 2 gels
15ml stock acrylamide
11 25ml stock Tris-HCl, pH 8 8
0 45ml 10% SDS
17 80ml Ultrapure H20
The solution was gently mixed To this was added in order 45/z.l TEMED (Aldrich T2,250-0)
and 450/xl ammonium persulphate The solution was degassed and about 15ml was applied per
gel A 0 1 % SDS solution was made up and used to level out the top of the resolving gel
Although the gel normally set within 45 minutes, it was usually left overnight
2.13.2 Preparation o f Stacking Gel
Before applying the stacking gel, the 0 1% SDS solution left on top of the resolving gel
overnight was removed and rinsed with ultrapure H20 The stacking gel was made up as
follows
2ml stock acrylamide
2 5ml stock Tris-HCl, pH 6 8
0 1ml 10% SDS
5 29ml Ultrapure H20
To this was added 10/ 1 TEMED and 100/xl 10% ammonium persulphate The solution was
degassed for 40 seconds and applied on top of the resolving gel The combs were put in place
carefully to avoid creating any bubbles The stacking gel took about 3 hours to set
When the gels were set, the combs and the gaskets around the edge of the gel plates were
removed The plates were carefully placed in the tank ensuring that no bubbles were present
under the gels Once secured, sufficient tank buffer was applied to cover the tops of the gels
The samples could then be applied to the gel
74
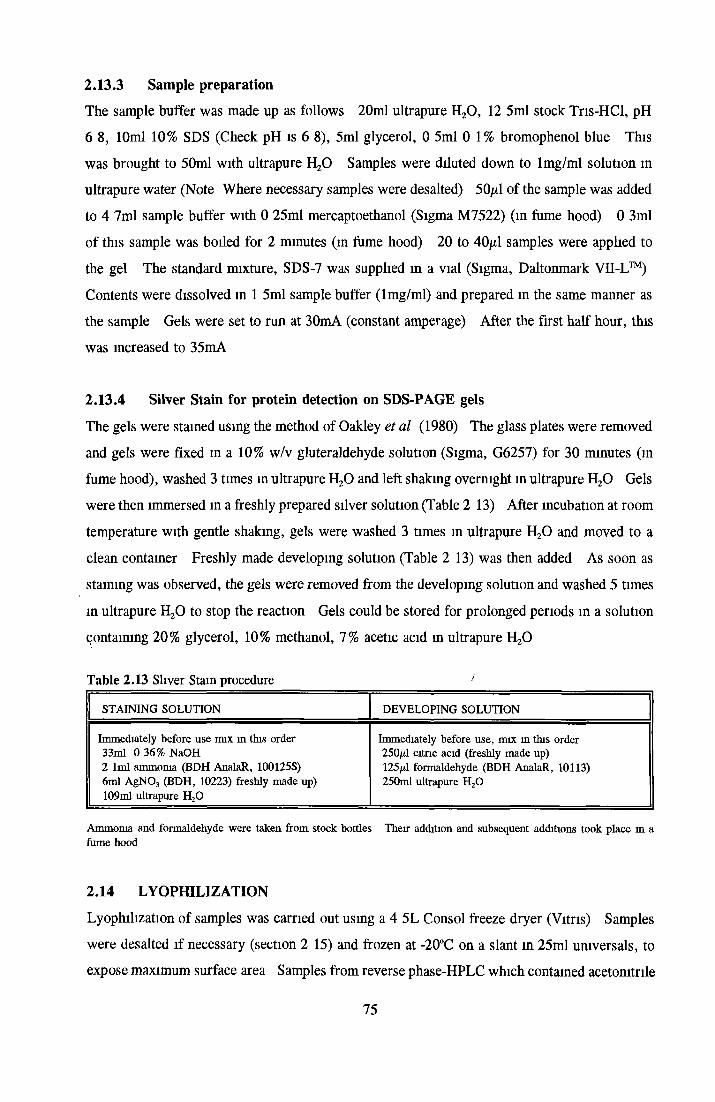
2.13.3 Sample preparationThe sample buffer was made up as follows 20ml ultrapure H20, 12 5ml stock Tris-HCl, pH 6 8, 10ml 10% SDS (Check pH is 6 8), 5ml glycerol, 0 5ml 0 1% bromophenol blue This was brought to 50ml with ultrapure H20 Samples were diluted down to 1 mg/ml solution m ultrapure water (Note Where necessary samples were desalted) 50/tl of the sample was added to 4 7ml sample buffer with 0 25ml mercaptoethanol (Sigma M7522) (in fume hood) 0 3ml
of this sample was boiled for 2 minutes (m fume hood) 20 to 40/xl samples were applied to
the gel The standard mixture, SDS-7 was supplied in a vial (Sigma, Daltonmark VII-L™) Contents were dissolved in 1 5ml sample buffer (1 mg/ml) and prepared in the same manner as
the sample Gels were set to run at 30mA (constant amperage) After the first half hour, this was increased to 35mA
2.13.4 Silver Stain for protein detection on SDS-PAGE gelsThe gels were stained using the method of Oakley et al (1980) The glass plates were removed and gels were fixed in a 10% w/v gluteraldehyde solution (Sigma, G6257) for 30 minutes (in fume hood), washed 3 times m ultrapure H20 and left shaking overnight m ultrapure H20 Gels were then immersed in a freshly prepared silver solution (Table 2 13) After incubation at room
temperature with gentle shaking, gels were washed 3 times in ultrapure H20 and moved to a
clean container Freshly made developing solution (Table 2 13) was then added As soon as staining was observed, the gels were removed from the developing solution and washed 5 times
in ultrapure H20 to stop the reaction Gels could be stored for prolonged periods in a solution containing 20% glycerol, 10% methanol, 7% acetic acid in ultrapure H20
Table 2.13 Sliver Stain procedure
STAINING SOLUTION DEVELOPING SOLUTION
Immediately before use mix m this order 33ml 0 36% NaOH2 1ml ammonia (BDH AnalaR, 100125S) 6ml AgNO, (BDH, 10223) freshly made up) 109ml ultrapure H20
Immediately before use, mix in this order 250/il citnc acid (freshly made up)125/d formaldehyde (BDH AnalaR, 10113) 250ml ultrapure H20
Ammonia and formaldehyde were taken from stock bottles Their addition and subsequent additions took place in a fume hood
2.14 LYOPHILIZATIONLyophilization of samples was carried out using a 4 5L Consol freeze dryer (Vitris) Samples
were desalted if necessary (section 2 15) and frozen at -20°C on a slant in 25ml umversals, to expose maximum surface area Samples from reverse phase-HPLC which contained acetomtrile
75

and trifluoroacetic acid were frozen at -70°C The lids of the umversals were removed and
parafilm punctured with tiny holes was used to cover the tops of the umversals The freeze
drying cycle generally lasted for 35 hours For samples containing solvents, a solvent trap, based on liquid nitrogen was used to remove harmful solvents from the vacuum before they
reached the pump
2.15 DESALTING OF SAMPLESDesalting of samples was carried out using Econo-Pac™ columns The columns were
disposable desalting columns (Biorad, cat no 732-2010) with a gel volume of lOmls The
packing material was supplied fully hydrated in lOmM NaHP04, lOmM NaCl, pH 7 0 and
0 02% NaN3 and was covered by a frit to prevent the gel from drying out The columns were
first washed with ultrapure H20 to remove the storage buffer The H20 was allowed to run
completely through the columns 3ml of sample was applied and allowed to run through the column This was discarded and the sample eluted from the column with 4ml ultrapure H20
2.16 DIALYSISDialysis was carried out using tubmg with a 10,000 molecular weight cut off membrane
Dialysis tubmg was boiled in a lOmM EDTA solution at pH 7 4 for 5 minutes and washed through with ultrapure H20 three times The tubmg was then left soaking overnight m ultrapure
H20 Dialysis tubing was double knotted and the samples were applied Dialysis was allowed to continue overnight at 4°C with gentle mixing m sufficient ATCC medium
Samples were then removed, filter-sterilized and assayed for bioactivity
2.17 REVERSE PHASE - HIGH PERFORMANCE LIQUID CHROMATOGRAPHYReverse phase-High Performance Liquid Chromatography (rp-HPLC) was carried out on the
basis of the work described by Congote (1987) This involved running a mobile phase of 20 - 80% acetomtrile (ACN) and 0 1% trifluoroacetic acid (TFA) in ultrapure H20 through a C18
column A linear gradient of 20-80% ACN was used for 40 minutes at 2 5ml/min (Congote) However, due to the smaller size of the column used in these experiements and to limitations m the HPLC equipment (Waters Model 660 solvent programmer, Model 510 Mixer, Lambda- Max (Model 481) LC Spectrophotometer), the gradient was run for 26 minutes at lml/min A
pre-guard column (Guard-Pak™ ^Bondapak™ Cl8, P/N 88070) was placed in front of the column
76
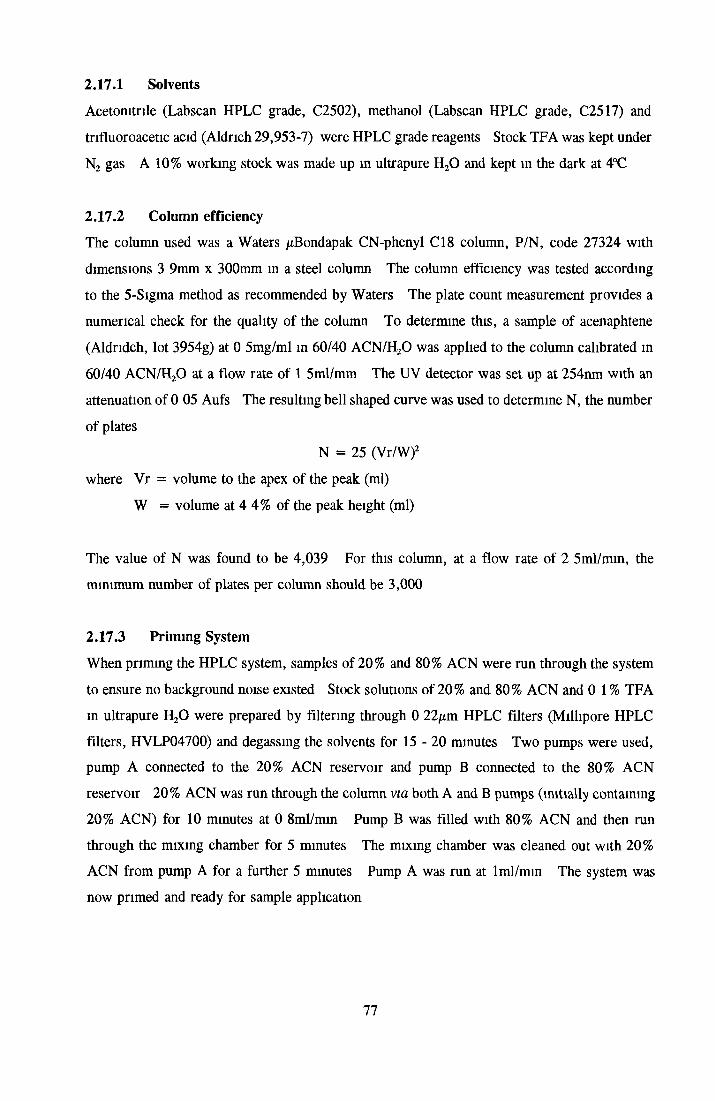
2.17.1 SolventsAcetomtrile (Labscan HPLC grade, C2502), methanol (Labscan HPLC grade, C2517) and trifluoroacetic acid (Aldrich 29,953-7) were HPLC grade reagents Stock TFA was kept under
N2 gas A 10% working stock was made up m ultrapure H20 and kept in the dark at 4°C
2.17.2 Column efficiencyThe column used was a Waters /¿Bondapak CN-phenyl C18 column, P/N, code 27324 with dimensions 3 9mm x 300mm in a steel column The column efficiency was tested according
to the 5-Sigma method as recommended by Waters The plate count measurement provides a numerical check for the quality of the column To determine this, a sample of acenaphtene (Aldridch, lot 3954g) at 0 5mg/ml in 60/40 ACN/H20 was applied to the column calibrated m
60/40 ACN/H20 at a flow rate of 1 5ml/mm The UV detector was set up at 254nm with an attenuation of 0 05 Aufs The resulting bell shaped curve was used to determine N, the number of plates
N = 25 (Vr/W)2
where Vr = volume to the apex of the peak (ml)
W = volume at 4 4% of the peak height (ml)
The value of N was found to be 4,039 For this column, at a flow rate of 2 5ml/min, the minimum number of plates per column should be 3,000
2.17.3 Priming SystemWhen priming the HPLC system, samples of 20% and 80% ACN were run through the system to ensure no background noise existed Stock solutions of 20% and 80% ACN and 0 1 % TFA m ultrapure H20 were prepared by filtering through 0 22j«m HPLC filters (Millipore HPLC filters, HVLP04700) and degassing the solvents for 15 - 20 minutes Two pumps were used, pump A connected to the 20% ACN reservoir and pump B connected to the 80% ACN
reservoir 20% ACN was run through the column via both A and B pumps (initially containing 20% ACN) for 10 minutes at 0 8ml/min Pump B was filled with 80% ACN and then runthrough the mixing chamber for 5 minutes The mixing chamber was cleaned out with 20%ACN from pump A for a farther 5 minutes Pump A was run at lml/min The system was now primed and ready for sample application
77

2.17.4 Sample PreparationSamples of BSA or the 0 5M NaCl fraction to be loaded onto the column were made up in a stock solution of 400mg/ml BSA (for 0 5M NaCl fraction, 20mg/ml) m 10% ACN and 0 1% TFA in ultrapure H20 These solutions were filtered through HPLC filters and kept on ice until injection As the injection loop only had a capacity for 20/xl, any number from 12 to 20 runs were required to get a sufficient sample concentration to test for bioactivity
When the sample was injected, the gradient program and the UV chart recorder were started
simultaneously The exhaust from the column was connected up to a fraction collector which
collected 2ml fractions These fractions were transferred to a plastic universal, labelled and frozen on a slant at -70°C These fractions were subsequently lyophilized to remove ACN and TFA which would interfere in growth stimulatory assaysProtein concentration was monitored at 280nm by a UV spectrophotometer and recorded on a
chart recorder running at 5mm/min with varying detection range (usually 0 -2 Aufs) When
Coproporphyrin (Sigma, cat no COP-1-5) was run as a control at 0 2mg/ml to determine the elution position of erythrotropin-like factor, the detection was set at 440nm
2.18 STABILITY STUDIES
2.18.1 Trypsin digestionTrypsin digestion was carried out by incubating a 15mg/ml BSA solution for 2 hours at 37°C
with 10^g/ml trypsin The digestion was stopped by addition of sufficient trypsin inhibitor to inactivate the trypsin
2.18.2 Pepsin digestionPepsin digestion was carried out as described by Polet and Spieker-Polet (1975) Albumin was digested with pepsin at a concentration of 1 - 2% of the total protein for 1 hour at 37°C at pH 2 6 With 1 5ml of lOmg/ml BSA, 100/xl of 0 3mg/ml pepsin was added The pH was gradually reduced to 2 6 by addition of 10/xl aliquots of 1M HC1 After incubation, the digestion was stopped by bringing the pH up gradually to 7 4 by 10/d additions of 1M NaOH
2.18.3 pH stabilitySamples of BSA or 0 5M NaCl fraction were dispensed out into universals The pH of each sample was adjusted by small additions (10/d at a time) of 1M HC1 or 1M NaOH, gently mixing and reading the pH After 2 hours incubation at 37°C, the pH was readjusted The total
78

volume of acid or base added was recorded, and all the samples were brought up to the same concentration before filter-sterilizing and assaying
2.19 ANALYTICAL ASSAYSBiochemical determination kits were used for the determination of citrate, fatty acid and phospholipid content of the fractions obtained from affinity chromatography of BSA on a heparin sepharose column All fractions were at a concentration equivalent to 25mg/ml BSA
Procedures for determinations were carried out as described in each kit
2.19.1 Fatty acid determinationFatty acid determination was based on the measurement of non-esterified fatty acids (Boehringer Mannheim, cat no 1,383,175) The principle behind detection was based on the conversion of free fatty acids to acyl-coenzyme A (acyl-CoA) in the presence of acyl-CoA synthetase and ATP The resulting acyl-CoA was oxidized in the presence of acyl-CoA oxidase to produce
H20 2 which reacted with a dye to produce a colour complex measured at 546nm The linearity
was up to 1 5mM free fatty acids
2.19.2 Phospholipid analysisPhospholipid analysis was carried out using an enzymatic determination kit (bioMerieux, Phospholipids enzymatiques PAP 150, cat no 6,149,1) which measures the presence of lecithin, lysolecithm and sphingomyelin The measurement was based on the hydrolysis of
phospholipids by phospholipase D to yield choline Choline was then used as the substrate for a colour change measured at 505nm The linearity was between 0 - lOmM
2.19.3 Citrate DeterminationAn enzymatic UV determination kit supplied by Boehringer Mannheim (cat no 139076) was used determine the level of citrate in samples The method was based on the conversion of citrate to oxaloacetate (catalysed by citrate lyase) The oxaloacetate and its decarboxylative product, pyruvate were reduced The amount of NADH consumed in the reduction was used as the basis of determining the amount of citrate present (absorbance at 340nm)
2.20 GEL FILTRATIONGel filtration was carried out using sephacryl 200 packing material The system was automated by use of the Biopilot
79
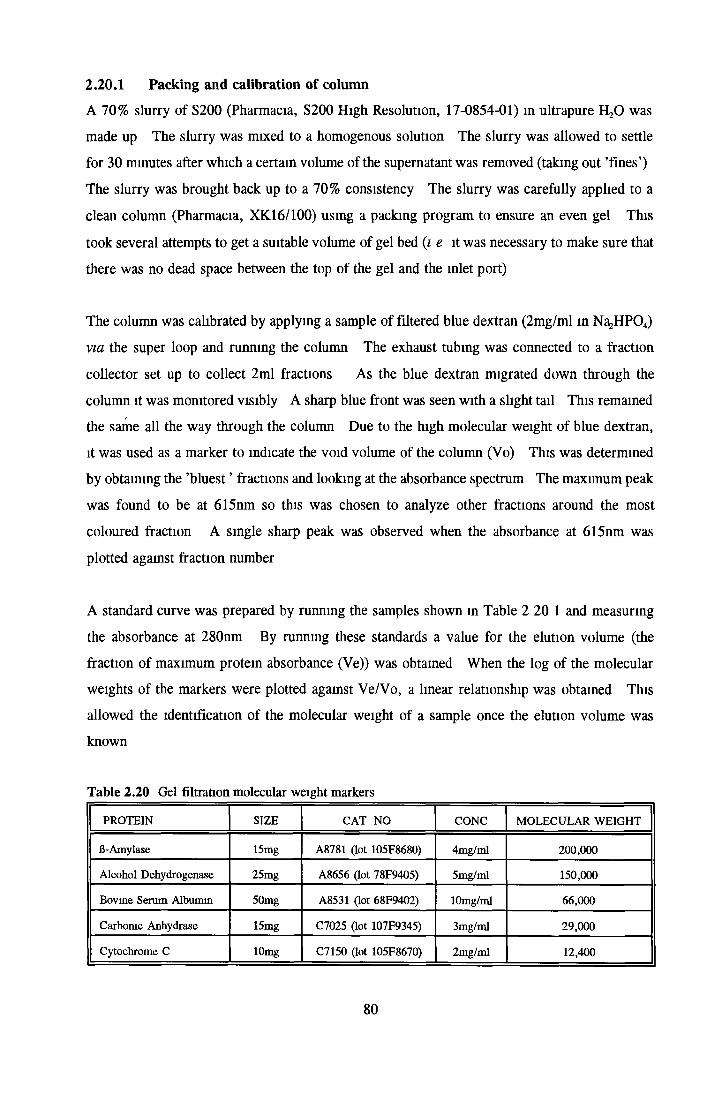
2.20.1 Packing and calibration of columnA 70% slurry of S200 (Pharmacia, S200 High Resolution, 17-0854-01) in ultrapure H20 was made up The slurry was mixed to a homogenous solution The slurry was allowed to settle
for 30 minutes after which a certain volume of the supernatant was removed (taking out ’fines’)
The slurry was brought back up to a 70% consistency The slurry was carefully applied to a
clean column (Pharmacia, XK16/100) using a packing program to ensure an even gel This
took several attempts to get a suitable volume of gel bed (i e it was necessary to make sure that there was no dead space between the top of the gel and the inlet port)
The column was cahbrated by applying a sample of filtered blue dextran (2mg/ml in Na¡HP04) via the super loop and running the column The exhaust tubing was connected to a fraction
collector set up to collect 2ml fractions As the blue dextran migrated down through the
column it was monitored visibly A sharp blue front was seen with a shght tail This remained the same all the way through the column Due to the high molecular weight of blue dextran, it was used as a marker to indicate the void volume of the column (Vo) This was determined by obtaining the ’bluest ’ fractions and looking at the absorbance spectrum The maximum peak
was found to be at 615nm so this was chosen to analyze other fractions around the most
coloured fraction A single sharp peak was observed when the absorbance at 615nm was
plotted against fraction number
A standard curve was prepared by running the samples shown in Table 2 20 1 and measuring the absorbance at 280nm By running these standards a value for the elution volume (the
fraction of maximum protein absorbance (Ve)) was obtained When the log of the molecular weights of the markers were plotted against Ve/Vo, a linear relationship was obtained This allowed the identification of the molecular weight of a sample once the elution volume was known
Table 2.20 Gel filtration molecular weight markersPROTEIN SIZE CAT NO CONC MOLECULAR WEIGHT
ß-Amylase 15mg A8781 (lot 105F8680) 4mg/ml 200,000
Alcohol Dehydrogenase 25mg A8656 (lot 78F9405) 5mg/ml 150,000
Bovme Serum Albumin 50mg A8531 (lot 68F9402) 10mg/ml 66,000
Carbonic Anhydrase 15mg C7025 (lot 107F9345) 3mg/ml 29,000
Cytochrome C 10mg C7150 (lot 105F8670) 2mg/ml 12,400
80
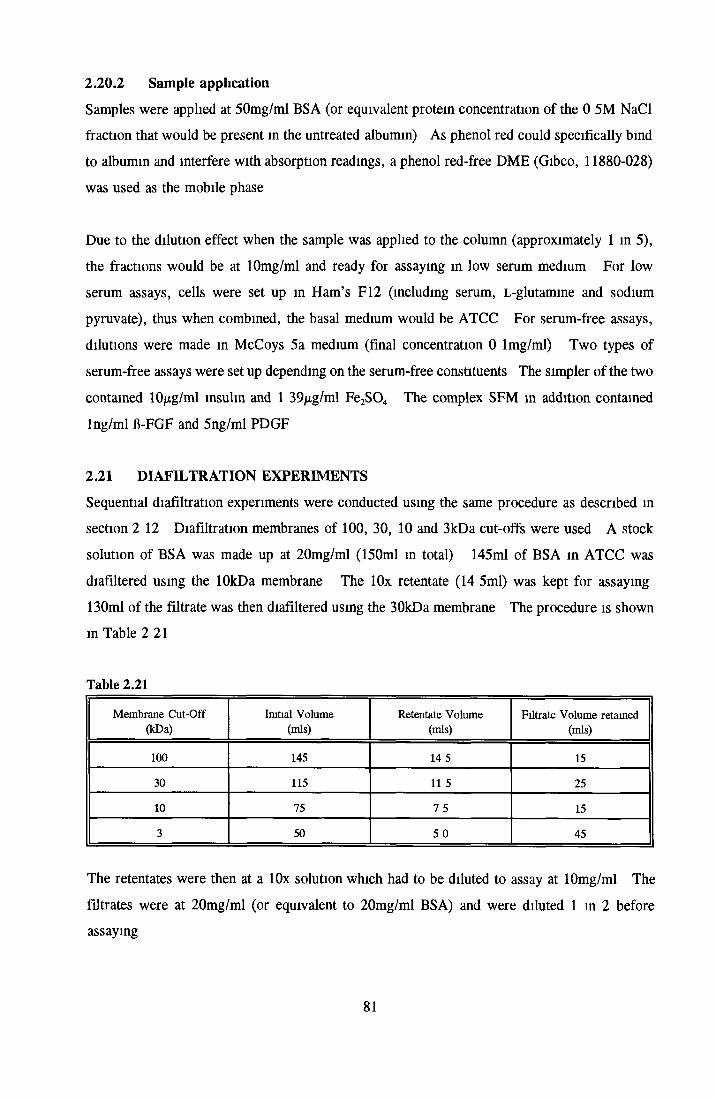
2.20.2 Sample applicationSamples were applied at 50mg/ml BSA (or equivalent protein concentration of the 0 5M NaCl fraction that would be present in the untreated albumin) As phenol red could specifically bind to albumin and interfere with absorption readings, a phenol red-free DME (Gibco, 11880-028)
was used as the mobile phase
Due to the dilution effect when the sample was applied to the column (approximately 1 in 5), the fractions would be at lOmg/ml and ready for assaying in low serum medium For low serum assays, cells were set up in Ham’s F12 (including serum, L-glutamine and sodium pyruvate), thus when combined, the basal medium would be ATCC For serum-free assays, dilutions were made in McCoys 5a medium (final concentration 0 lmg/ml) Two types of
serum-free assays were set up depending on the serum-free constituents The simpler of the two
contained 10^g/ml insulin and 1 39/xg/ml Fe2S04 The complex SFM m addition contained lng/ml fi-FGF and 5ng/ml PDGF
2.21 DIAFILTRATION EXPERIMENTSSequential diafiltration experiments were conducted using the same procedure as described in section 2 12 Diafiltration membranes of 100, 30, 10 and 3kDa cut-offs were used A stock solution of BSA was made up at 20mg/ml (150ml m total) 145ml of BSA in ATCC was
diafiltered using the lOkDa membrane The lOx retentate (14 5ml) was kept for assaying 130ml of the filtrate was then diafiltered using the 30kDa membrane The procedure is shown in Table 2 21
Table 2.21Membrane Cut-Off
(kDa)Initial Volume
(mis)Retentate Volume
(mis)Filtrate Volume retamed
(mis)
100 145 14 5 15
30 115 11 5 25
10 75 7 5 15
3 50 5 0 45
The retentâtes were then at a lOx solution which had to be diluted to assay at 10mg/ml The
filtrates were at 20mg/ml (or equivalent to 20mg/ml BSA) and were diluted 1 in 2 before assaying
81

2.22 EXTRACTIONExtraction of albumin with organic solvents was based on the procedure used by Tigyi and
Miledi (1992) Each extraction involved three separate extractions using the same sample of
albumin and combining the organic phase from the three extractions For each lOOmg protein,
lml of organic solvent was used The organic solvents used were methanol (Labscan HPLC grade C2517), ethanol (Merk, 986 2500), chloroform (BDH AnalaR, 10077), acetone (BDR
AnalaR, 10003) and di-ethy 1-ether (BDH AnalaR, 10094)
lml of each solvent was added to lOOmg of crystalline BSA (cat no A4919, lot 110H-04635)
in a glass universal and allowed to stir very vigorously at room temperature for 1 hour Due to the rate at which di-ethyl-ether and chloroform evaporate, all umversals were covered in
parafilm Each solution was then transferred to an eppendorf and centrifuged down for 10
minutes at 5,000 - 10,000g in a Biofuge
Supernatents were removed to a fresh glass universal and the pellet was resuspended in lml
fresh solvent This procedure was repeated two more times All the supernatents from each
extraction were pooled together and the solvent was evaporated off under stream of N2 gas m
a fume hood The pellets were resuspended in the appropriate solvent and also dried under a
stream of N2 gas All solvent and protein residues were reconstituted into 2ml ATCC (50mg/ml albumin) and biological activity was assayed at 5mg/ml Dilutions were based on the initial protein concentration being lOOmg
2.23 THYMIDINE INCORPORATION ASSAY
The ability of samples to induce uptake of exogenous thymidine, an indication of DNA synthesis
was measured by assessing pH]-thymidine incorporation into the DNA under continuous labelling conditions NOTE Great care was taken when handling radio-active material At all times when handling plates immediately before or after addition of 3H-thymidine, two pairs of gloves were worn and work was carried out in a well labelled, protective hood University guide lines were followed during use and disposal of cells and waste containing 3H-thymidine
The assay procedure involved setting up NRK cells at 2x10* cells/well in 96-well plates As
these cells were in SFM (McCoys 5a + insulin and Fe^SOJ, the cells did not require to be starved of serum factors After 18-24 hours, the medium was removed Fresh medium and
the factors to be tested (100^1) were added. Approximately 4 hours later, 5¡A thymidine was
82
added (100/iCi) to each wellThe plates were incubated for a further 24 hours after which the assay was harvested Waste
media containing 3H-thymidine was removed to a beaker containing RBS to deactivate the thymidine The plates were washed once in PBS A The waste was again removed to a beaker
containing RBS 200/xl 1M potassium hydroxide was added per well to lyse the cells The
plates were incubated at 37°C for 1 hourAfter the contents of each well were thoroughly mixed, 100 1 aliquots per well were added to
5ml scintillation fluid (Ecolite ICN cat no 882475) The disintegrations per minute were counted using a scintillation counter
2.24 STATISTICAL ANALYSISStatistical analysis was carried out as follows For assays in which N (the number of wells pervariable) was greater than or equal to 3, the average and standard deviation was obtained
according to the equation (Freund, 1979)
s = ((n(Ex2) - (Ex)2) / n(n-l))where s = standard deviation
n = number of variables x = numerical values
For most experiments, each assay was repeated 3 times The average and standard deviation of these three separate assays were expressed as the average percentage growth relative to the
growth obtained by a control on each plate This meant that for every variable, there were
three separate values of the average and standard deviation A standard error of the mean was not used m general as this would not take into account the deviation of the control As growth in low serum and serum-free medium could result in variable growth per assay, the results for three different assays were given and in some instances a graph of the assay that was most representative of the results obtained Where a standard error of the mean was obtained (see sections 3 3 and 3 4), the deviation from each variable was not taken into account
When there were only 2 wells per variable, the average of the two results was given with the actual results (as a percentage growth relative to a control) in brackets
83
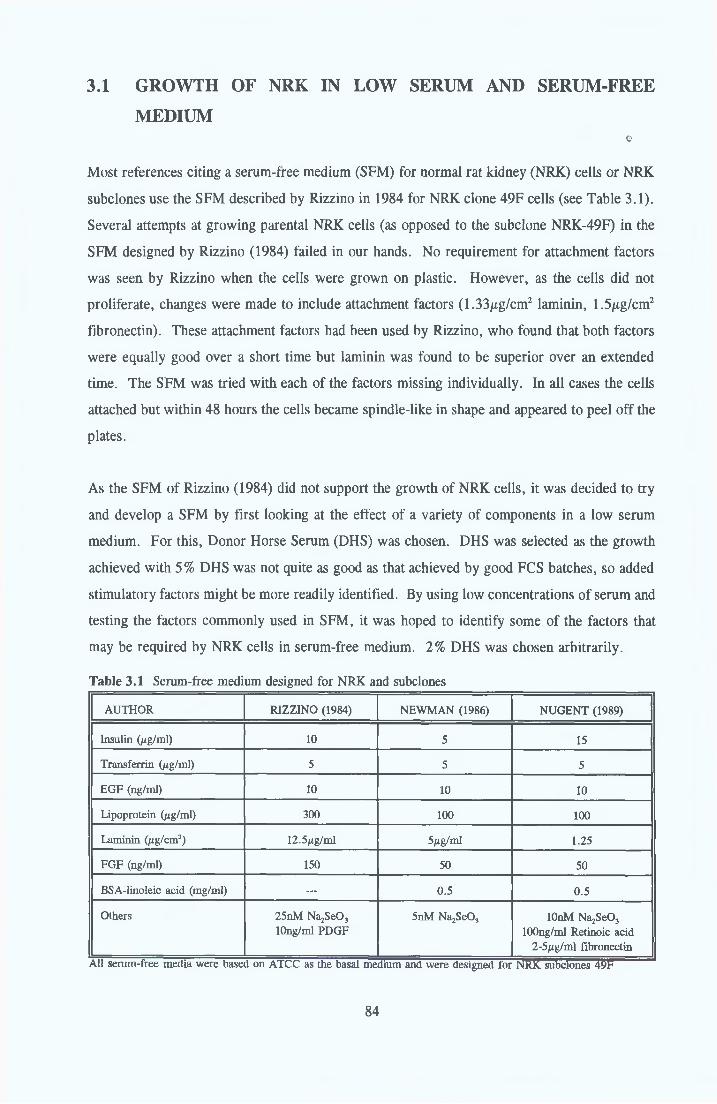
3.1 GROWTH OF NRK IN LOW SERUM AND SERUM-FREE
MEDIUM©
Most references citing a serum-free medium (SFM) for normal rat kidney (NRK) cells or NRK
subclones use the SFM described by Rizzino in 1984 for NRK clone 49F cells (see Table 3.1).
Several attempts at growing parental NRK cells (as opposed to the subclone NRK-49F) in the
SFM designed by Rizzino (1984) failed in our hands. No requirement for attachment factors
was seen by Rizzino when the cells were grown on plastic. However, as the cells did not proliferate, changes were made to include attachment factors (1.33/xg/cm2 laminin, 1.5/ig/cm2
fibronectin). These attachment factors had been used by Rizzino, who found that both factors were equally good over a short time but laminin was found to be superior over an extended time. The SFM was tried with each of the factors missing individually. In all cases the cells
attached but within 48 hours the cells became spindle-like in shape and appeared to peel off the
plates.
As the SFM of Rizzino (1984) did not support the growth of NRK cells, it was decided to try
and develop a SFM by first looking at the effect of a variety of components in a low serum
medium. For this, Donor Horse Serum (DHS) was chosen. DHS was selected as the growth
achieved with 5% DHS was not quite as good as that achieved by good FCS batches, so added
stimulatory factors might be more readily identified. By using low concentrations of serum and testing the factors commonly used in SFM, it was hoped to identify some of the factors that may be required by NRK cells in serum-free medium. 2% DHS was chosen arbitrarily.
Table 3.1 Serum-free medium designed for NRK and subclones
AUTHOR RIZZINO (1984) NEWMAN (1986) NUGENT (1989)
Insulin Oig/ml) 10 5 15
Transferrin (/jg/ml) 5 5 5
EGF (ng/ml) 10 10 10
Lipoprotein (¿ig/ml) 300 100 100
Laminin (/xg/cm2) 12.5/ig/ml 5/ig/ml 1.25
FGF (ng/ml) 150 50 50
BSA-linoleic acid (mg/ml) . . . 0.5 0.5
Others 25nM NajSeO, 10ng/ml PDGF
5nM NajSeOj lOnM NajSeOj 100ng/ml Retinoic acid
2-5/ig/ml fibronectinAll serum-free media were based on ATCC as the basal medium and were designed for NRK subclones 49F
84

3.1.1 EFFECTS OF INSULIN, TRANSFERRIN, BSA AND EX-CYTE ON NRK CELLS
The most common additives in serum-free medium described m the literature were found to be albumin, insulin and transferrin and some lipid source The ranges of concentrations for these components used were, 0 5 - 2 Omg/ml bovine serum albumin (BSA), 1 - 10^g/ml insulin (bovme pancreas) and 1 - 10/xg/ml transferrin (human transferrin) It was decided to test the
most common factors over a range of concentrations with 2% DHS background For the lipid source, a commercial lipoprotein preparation called Ex-cyte (Pentex product, supplied by Miles
Diagnostics) was used Growth stimulatory assays were carried out in 24-well plates and analyzed using image analysis (section 2 9) The results are shown in Figures 3 111-4
3.1.1.1 BSAFigure 3 111 shows BSA fraction V to be stimulatory The stimulatory effects were seen at lower concentrations (05 - 2 5mg/ml) with a maximum stimulation of about 2-fold over the
control (2% DHS only) At higher concentrations, the BSA either lost its stimulatory effect or became inhibitory At concentrations of 1 Omg/ml the cells appeared to be peeling off the plates
3.1.1.2 InsulinThe results for insulin showed the highest stimulation of the four components tested (Figure 3 112) Stimulatory activity was seen in the microgram range with maximum growth
at 20/xg/ml, the highest concentration tested Results varied between three separate experiments but maximum stimulation was about 5-fold to 8 5-fold over the control (2% DHS) Unlike BSA, no inhibition was seen at higher concentrations
3.1.1.3 TransferrinThe results for bovme transferrin are shown in Figure 3 113 The levels of stimulation were slightly lower than those obtained with BSA Maximum growth appeared at concentrations of 2 5 to 10/ig/ml Above 10/xg/ml, transferrin became less stimulatory
3.1.1.4 Ex-cyteEx-cyte results (Figure 3 114) showed consistently better stimulation at the higher
concentrations tested (20 - 40/xg/ml) A plateau effect was seen at 30 - 40/xg/ml with maximum
activity of between 1 6-fold and 2 7-fold stimulation over the control depending on the assay
85
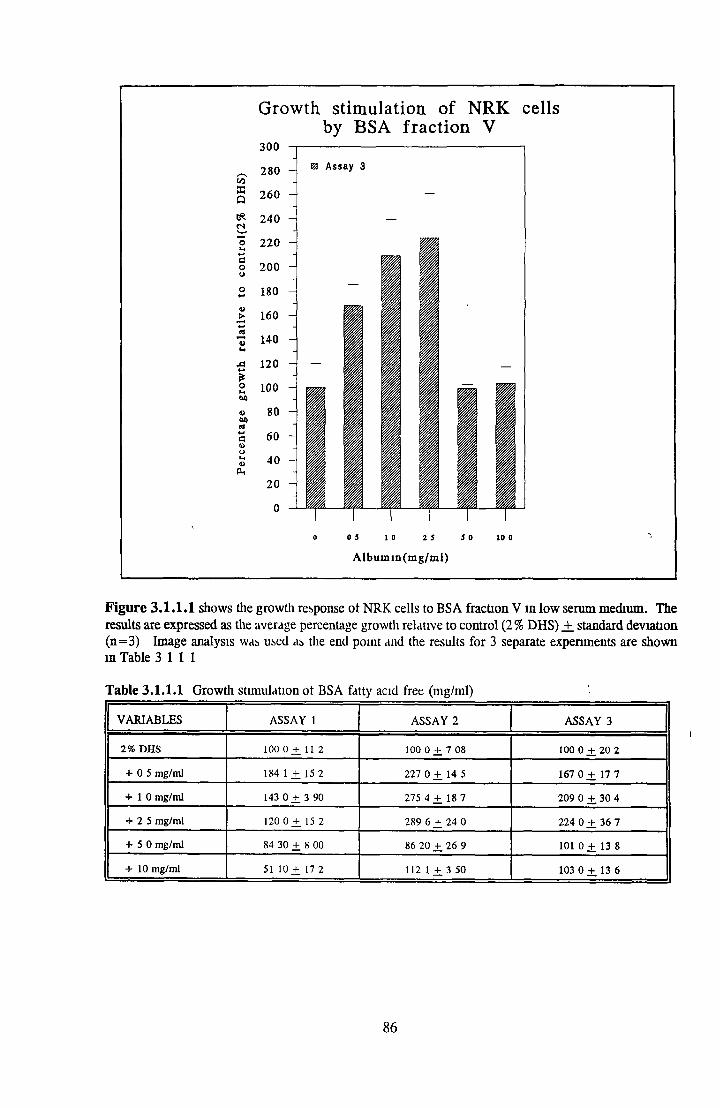
300
Growth stimulation of NRK cellsby BSA fraction V
COEQ
coo
«OI*
A%O
4>at
O
Assay 3
0 5 1 0 2 5 so
A lbum m (m g/m l)
Figure 3.1.1.1 shows the growth response ot NRK cells to BSA fraction V in low serum medium. The results are expressed as the average percentage growth relative to control (2% DHS) +. standard deviation (n=3) Image analysis was used as the end point and the results for 3 separate experiments are shown in Table 3 111
Table 3.1.1.1 Growth stimulation ot BSA fatty acid free (mg/ml)
VARIABLES ASSAY 1 ASSAY 2 ASSAY 3
2% DHS 100 0 ^ 11 2 100 0 +. 7 08 100 0 j f 20 2
+ 05 mg/ml 184 1 + 15 2 227 0 + 14 5 167 0 + 17 7
+ 10 mg/ml 143 0 + 3 90 275 4 + 18 7 209 0 ± 30 4
+ 25 mg/ml 120 0 + 15 2 289 6 ± 24 0 224 0 +. 36 7
+ 50 mg/ml 84 30 + 8 00 86 20 + 26 9 101 0 + 13 8
+ 10 mg/ml 51 10+ . 17 2 112 1 + 3 50 103 0 +. 13 6
86

1
840 ^ 800
M 760Q 720^ 680 r)■3 640- 6002 560o 520
o 4 8 0■S 440
- | 400* 360| 3202 280 BO
2 4 0S? 200g 1602 120 u
80 40
0
Growth stimulation of NRK cellsin low serum medium by Insulin
Figure 3.1.1.2 shows the growth response of NRK cells to bovine insulin in low serum medium The results are expressed as the average percentage growth relative to control (2 % DHS) .+ standard deviation (n=3) Image analysis was used as the end point and the results for 3 separate experiments are shown m Table 3 1 1 2
Table 3.1 1.2 Growth stimulation ot insulin (/xg/ml)
VARIABLES ASSAY 1 ASSAY 2 ASSAY 3
2% DHS 100 0 + 0 34 1000 + 9 00 100 0 + 12 8
+ 0 5 itg/ml 354 9 + 70 9 89 10 + 11 1 226 2 + 28 8
+ 1 0 fig/ml 4X7 0 + 47 9 397 9 ± 0 64
+ 2 5 jig/ml 774 9 + 162 2 354 4 ± 55 4 585 3 + 43 3
+ 5 0 ftg/ml 702 2 + 53 7 454 5 + 52 0 551 2 +, 6 07
+ 10 0 fig /m l 678 2 ± 17 0 430 0 ± 63 1 643 9 + 117 4
+ 20 0 iig/ml 858 8 + 15 4 496 0 + 10 9 732 9 + 71 5
87
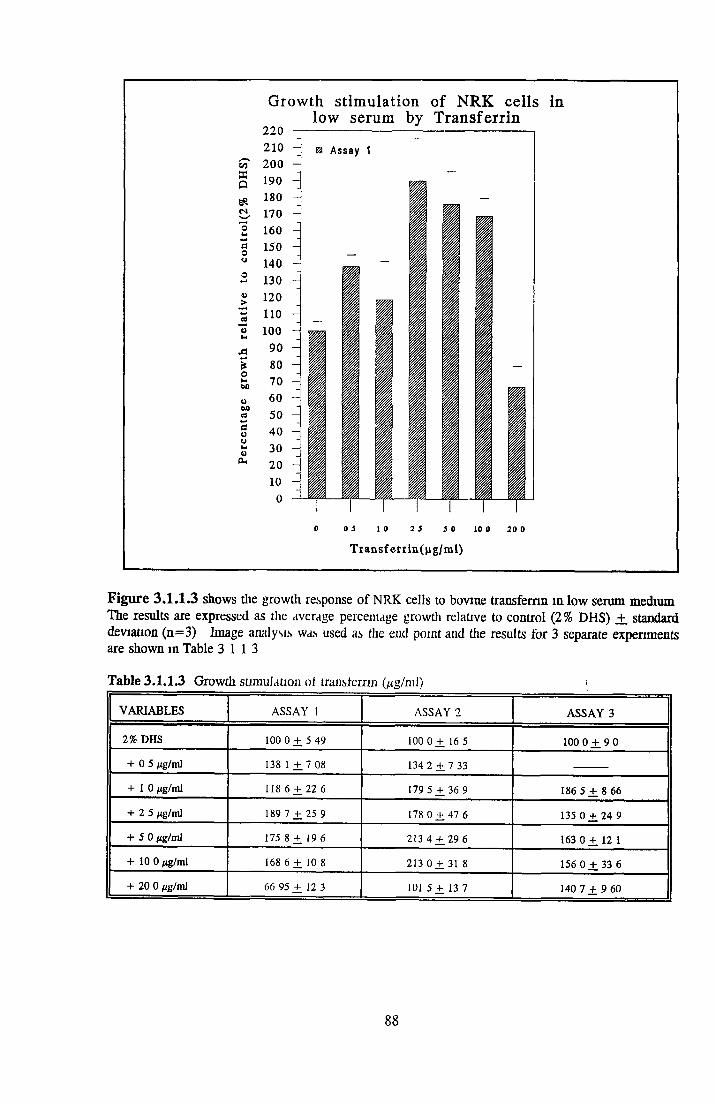
Growth stimulation of NRK cells in low serum by Transferrin
0 0 5 1 0 2 5 5 0 10 0 20 0
Transferrin(ng/m l)
Figure 3.1.1.3 shows the growth response of NRK cells to bovine transferrin m low serum medium The results are expressed as the average percentage growth relative to control (2% DHS) +. standard deviation (n=3) Image analysis was used as the end point and the results for 3 separate experiments are shown m Table 3 1 1 3
Table 3.1.1.3 Growth stimulation at transferrin (¿¿g/nil)
VARIABLES ASSAY 1 ASSAY 2 ASSAY 3
2% DHS 100 0 + 5 49 100 0 + 16 5 100 0 + 9 0
+ 0 5 ¿ig/ml 138 1 + 7 08 134 2 + 7 33
+ 1 0 fig/ml 118 6 + 22 6 179 5 + 36 9 186 5 + 8 66
+ 2 5 fig/mi 189 7 ± 2 5 9 178 0 + 47 6 135 0 + 24 9
+ 5 0 fig/ml 175 8 + 19 6 213 4 + 29 6 163 0 + 12 1
+ 10 0 fig/mi 168 6 + 10 8 213 0 + 31 8 156 0 + 33 6
+ 20 0 fig/ml 66 95 + 12 3 101 5 + 13 7 140 7 ± 9 60
88

COXQ<NO
Growth stimulation of NRK cells in low serum medium by Ex-cyte300
Ai*o
oOSaeuuaP.
280
260
240
220
200180
160
•3 140 -
120
100
E3 Assay 3
Ex-cyte(ng/m l)
Figure 3.1.1.4 shows the growth response of NRK cells to Ex-cyte V m low serum medium The results are expressed as the average percentage growtli relative to control (2 % DHS) +. standard deviation (n=3) Image analysis was used as the end point and the results lor 3 separate experiments are shown in Table 3 1 1 4
Table 3.1.1.4 Growth stimulation ot Ex-cyte (/¿g/nil) t
VARIABLES ASSAY 1 ASSAY 2 ASSAY 3
2% DHS 100 0 + 30 0 100 0 + 9 80 100 0 ± 30 3
+ 5 /ig/ml 77 00 + 26 0 135 0 ± 12 3 82 10 + 26 2
+ 10 fig/ml 77 10 + 5 85 129 0 + 10 4 96 08 + 0 98
+ 20 fig/ml 101 1 ± 14 9 83 10 + 2 13 82 87 + 24 6
+ 30 jig/ml 275 0 + 24 8 160 1 + 30 1 204 2 ± 14 8
+ 40 fig/ml 178 7 + 28 7 159 8 + 6 89 208 0 + 28 7
89
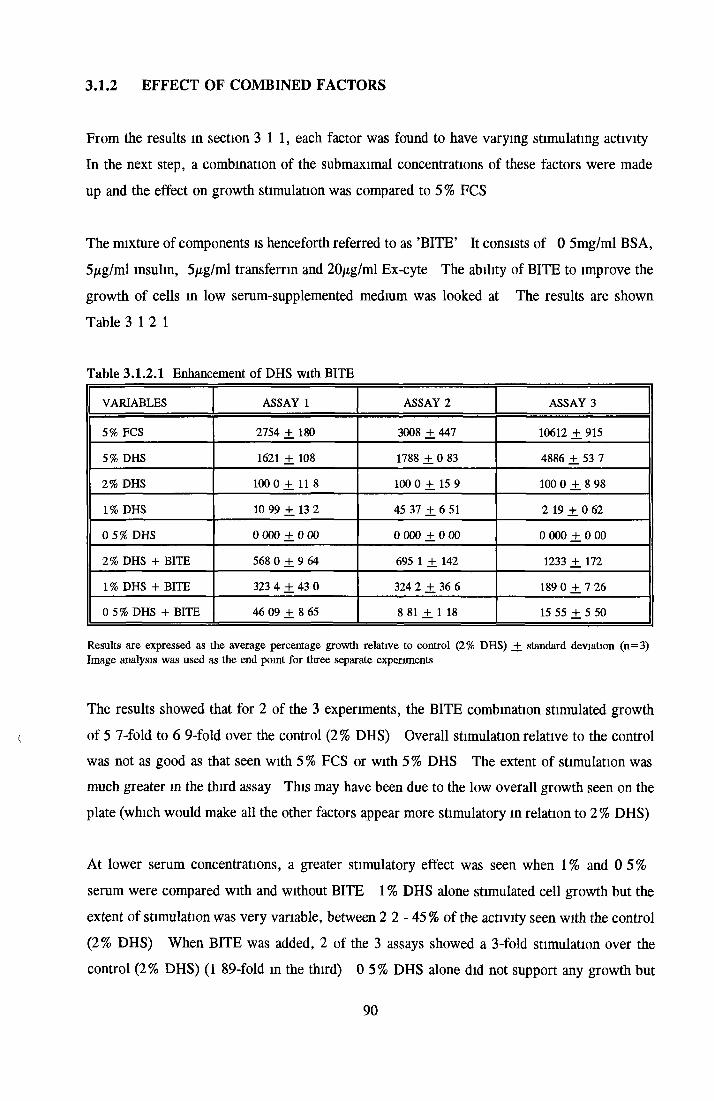
3.1.2 EFFECT OF COMBINED FACTORS
From the results in section 3 11, each factor was found to have varying stimulating activity In the next step, a combination of the submaximal concentrations of these factors were made up and the effect on growth stimulation was compared to 5% FCS
The mixture of components is henceforth referred to as ’BITE’ It consists of 0 5mg/ml BSA, 5/xg/ml insulin, 5/ig/ml transferrin and 20/xg/ml Ex-cyte The ability of BITE to improve the
growth of cells in low serum-supplemented medium was looked at The results are shown
Table 3 12 1
Table 3.1.2.1 Enhancement of DHS with BITE
VARIABLES ASSAY 1 ASSAY 2 ASSAY 3
5% FCS 2754 ± 180 3008 ± 447 10612 + 915
5% DHS 1621 + 108 1788 + 0 83 4886 + 53 7
2% DHS 100 0 + 11 8 100 0 + 15 9 100 0 ± 8 98
1% DHS 10 99 ± 13 2 45 37 + 6 51 2 19 ± 0 62
0 5% DHS 0 000 + 0 00 0000 + 0 0 0 0 000 ± 0 00
2% DHS + BITE 568 0 + 9 64 695 1 + 142 1233 + 172
1% DHS + BITE 323 4 + 43 0 324 2 + 36 6 189 0 ± 7 26
0 5% DHS + BITE 46 09 + 8 65 8 81 + 1 18 15 55 + 5 50
Results are expressed as the average percentage growth relative to control (2% DHS) _+ standard deviation (n=3) Image analysis was used as the end point for three separate experiments
The results showed that for 2 of the 3 experiments, the BITE combination stimulated growth
of 5 7-fold to 6 9-fold over the control (2% DHS) Overall stimulation relative to the control was not as good as that seen with 5% FCS or with 5% DHS The extent of stimulation was much greater in the third assay This may have been due to the low overall growth seen on the plate (which would make all the other factors appear more stimulatory in relation to 2% DHS)
At lower serum concentrations, a greater stimulatory effect was seen when 1% and 0 5% serum were compared with and without BITE 1 % DHS alone stimulated cell growth but the extent of stimulation was very variable, between 2 2 - 45% of the activity seen with the control
(2% DHS) When BITE was added, 2 of the 3 assays showed a 3-fold stimulation over the control (2% DHS) (1 89-fold in the third) 0 5% DHS alone did not support any growth but
90
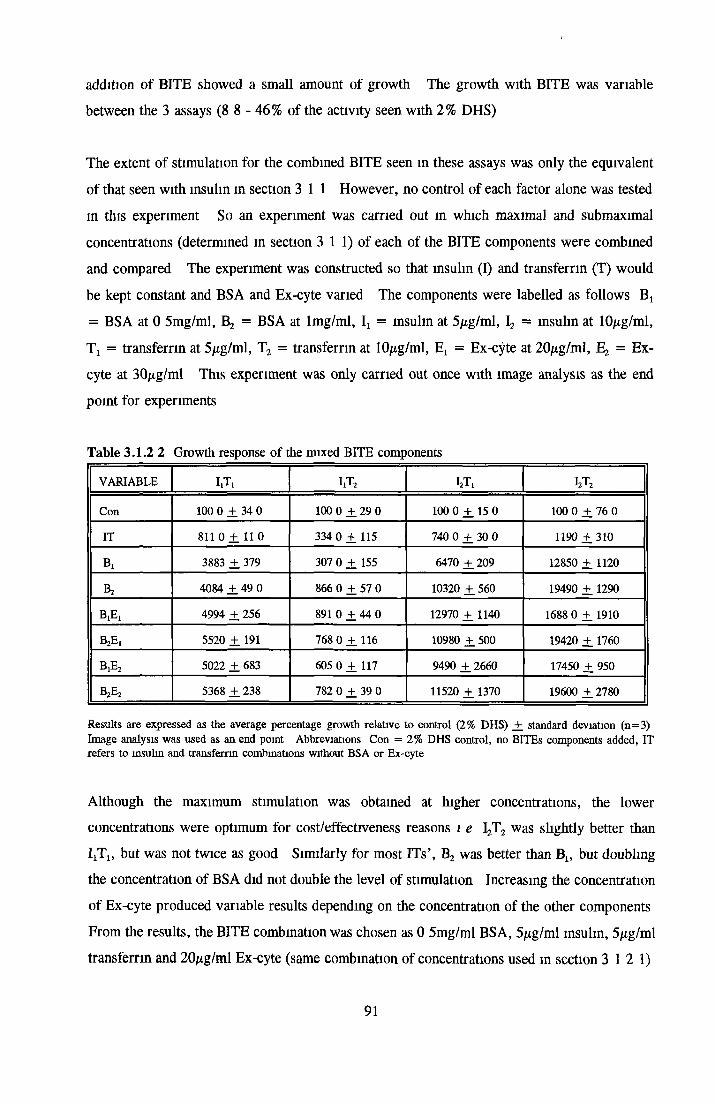
addition of BITE showed a small amount of growth The growth with BITE was variable between the 3 assays (8 8 - 46% of the activity seen with 2% DHS)
The extent of stimulation for the combined BITE seen in these assays was only the equivalent
of that seen with insulin m section 3 1 1 However, no control of each factor alone was tested
m this experiment So an experiment was carried out in which maximal and submaximal
concentrations (determined in section 3 1 1) of each of the BITE components were combined and compared The experiment was constructed so that insulin (I) and transferrin (T) would
be kept constant and BSA and Ex-cyte varied The components were labelled as follows Bj = BSA at 0 5mg/ml, B2 = BSA at lmg/ml, It = insulin at 5/ig/ml, I2 = insulin at lO ig/ml,
Tj = transferrin at 5/ig/ml, T2 = transferrin at 10/xg/ml, E: = Ex-cyte at 20/xg/ml, = Ex-
cyte at 30/x.g/ml This experiment was only carried out once with image analysis as the end
point for experiments
Table 3.1.2 2 Growth response of the mixed BITE components
VARIABLE I.T, i ,t2 i2t , i2t 2
Con 100 0 ± 34 0 100 0 + 29 0 100 0 ± 15 0 100 0 ± 76 0
IT 811 0 ± 11 0 334 0 + 115 740 0 ^ 30 0 1190 + 310
8» 3883 ± 379 307 0 + 155 6470 ± 209 12850 + 1120
4084 + 49 0 866 0 + 57 0 10320 + 560 19490 + 1290
4994 + 256 891 0 ± 44 0 12970 +. 1140 1688 0 + 1910
B2E, 5520 ± 191 768 0 + 116 10980 + 500 19420 + 1760
B.E, 5022 + 683 605 0 + 117 9490 ± 2660 17450 +. 950
B A 5368 + 238 782 0 ± 39 0 11520 ± 1370 19600 + 2780
Results are expressed as the average percentage growth relative to control (2% DHS) _+ standard deviation (n=3) Image analysis was used as an end point Abbreviations Con = 2% DHS control, no BITEs components added, IT refers to insulin and transferrin combinations without BSA or Ex-cyte
Although the maximum stimulation was obtained at higher concentrations, the lower concentrations were optimum for cost/effectiveness reasons i e I2T2 was shghtly better than ^Tj, but was not twice as good Similarly for most ITs’, B2 was better than B1( but doubling the concentration of BSA did not double the level of stimulation Increasing the concentration
of Ex-cyte produced variable results depending on the concentration of the other components
From the results, the BITE combination was chosen as 0 5mg/ml BSA, 5/xg/ml insulin, 5^g/ml transferrin and 20/xg/ml Ex-cyte (same combination of concentrations used in section 3 12 1)
91

3.1.3 UPGRADING OF DHS AND BITE
In this experiment a variety of growth factors and hormones were assayed for their growth stimulating ability on NRK cells using a 2% DHS background Due to the high number of
variables, all experiments were carried out in 96-well plates and acid phosphatase and coulter
counts were used as the end points (see section 2 9) Acid phosphatase has been shown to be a suitable end point for NRK cells (Martin and Clynes 1991) The results are shown in Tables
3 1 3 1 to 3
Table 3.1.3.1 Growth response of NRK cells to growth factors and hormones in low serum medium
VARIABLES ASSAY 1 ASSAY 2 ASSAY 3
AP CC AP CC AP CC
2% DHS + B 100 0 +_ 5 00 100 0 100 0 ± 3 9 2 100 0 100 0 +. 11 9 100 0
+ 10fig/ml Dex 125 4 +. 14 5 61 00 54 77 + 7 24 56 76 92 18 ± 1 98 28 60
+ 50/ig/ml Dex 106 9 ± 8 16 64 27 45 12 + 4 32 41 17 82 08 ± 0 99 23 60
+ 0 5U IL-la 129 6 ^ 1 6 6 53 59 72 46 + 9 65 145 4 117 6 ± 1 98 48 80
+ 1 OU IL-la 117 2+ .8 16 63 83 83 42 + 14 4 142 7 105 4 ± 1 98 56 74
+ 0 5U IL-lfi 174 6 ± 8 97 66 77 63 72 + 11 0 173 3 147 9 +. 1 98 77 35
+ 1 OU IL-1B 164 6 ± 17 5 85 18 106 3 + 19 2 165 2 142 0 ± 1 98 66 42
+ 1 Ong/ml EGF + lng/ml a-FGF + Hep
288 2 +. 22 9 278 7 114 2 + 13 1 236 9 125 6 +_ 1 98 106 0
+ 1 Ong/ml EGF + 1 Ong/ml Dex
337 5 ± 20 8 126 4 177 9 + 21 8 152 5 220 0 +_ 32 9 80 28
+ 1 Ong/ml EGF + lng/ml B-FGF
228 7 _+ 10 6 255 4 93 97 + 6 23 289 8 111 9 +_17 1 69 12
+ 1 Ong/ml EGF + lOnM BEs 256 2 + 40 2 267 6 127 4 + 33 5 252 3 136 6 ± 2 1 9 155 3
Results for acid phosphatase experiments are expressed as the average percentage growth relative to control (2% DHS + BITE) +_ standard deviation (n=8) Only one reading was obtained when coulter counts were used as the end point Results for these are expressed as the percentage growth relative to 2% DHS + BITE Abbreviations EGF = Epidermal growth factor, BEs = Estradiol, FGF = Fibroblastic growth factor, Hep = Heparin, B = BITE combination, IL = Interleukin, Dex = Dexamethazone
The combination of lOng/ml EGF, lOng/ml Dexamethazone and BITE showed the best growth with acid phosphatase as the end point Coulter count (CC) results showed the two combinations of EGF, fl-FGF and BITE or EGF, a-FGF, Heparm and BITE to be the best Dexamethazone alone showed variable inhibition in all assays with CC as the end point and in two of three assays with AP as the end point
Interleukin-IB showed 40-74% stimulation above the control for 2 of 3 assays with AP as the end point Using CC as the end point, 15 - 33% inhibition was seen in 2 of 3 assays. IL-la
92
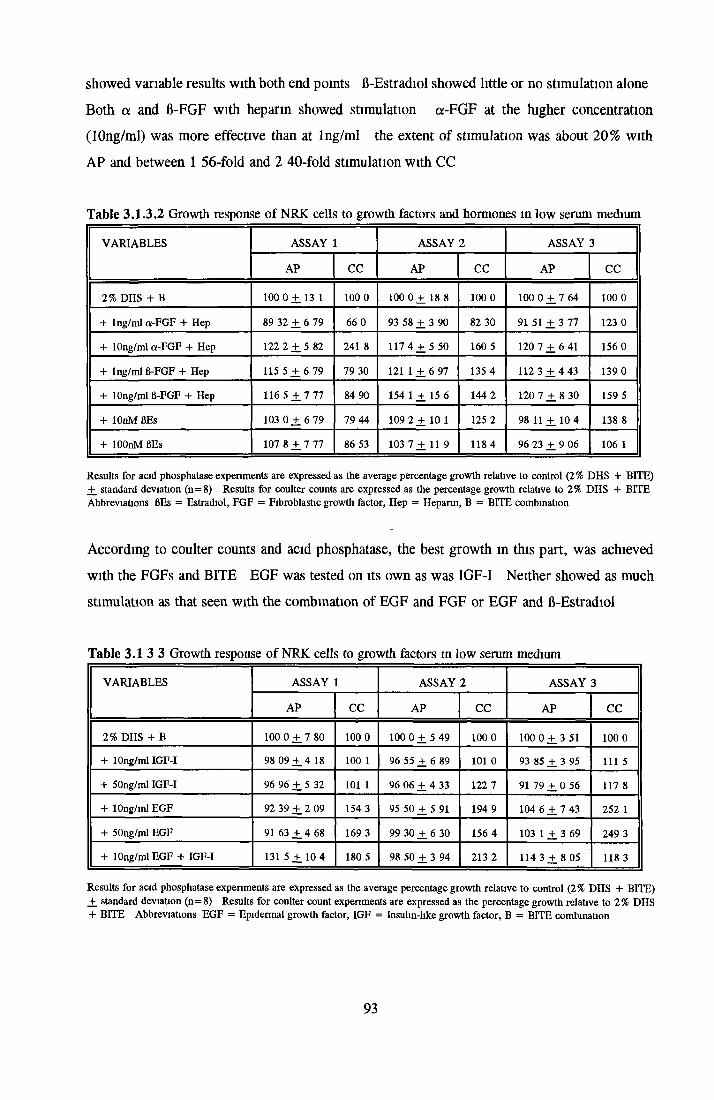
showed variable results with both end points fl-Estradiol showed little or no stimulation alone
Both a and fl-FGF with heparin showed stimulation a-FGF at the higher concentration (lOng/ml) was more effective than at lng/ml the extent of stimulation was about 20% with
AP and between 1 56-fold and 2 40-fold stimulation with CC
Table 3.1.3.2 Growth response of NRK cells to growth factors and hormones in low serum medium
VARIABLES ASSAY 1 ASSAY 2 ASSAY 3
AP CC AP CC AP CC
2% DHS + B 100 0 ± 13 1 100 0 100 0 + 18 8 100 0 100 0 ± 7 64 100 0
+ lng/ml a-FGF + Hep 89 32 ± 6 79 66 0 93 58 ± 3 90 82 30 91 51 ± 3 77 123 0
+ 10ng/ml a-FGF + Hep 122 2 ± 5 82 241 8 117 4 + 5 50 160 5 120 7 ± 6 41 156 0
+ lng/ml ß-FGF + Hep 115 5 ± 6 79 79 30 121 1 ± 6 97 135 4 112 3 ± 4 43 139 0
+ 10ng/ml ß-FGF + Hep 116 5 ± 7 77 84 90 154 1 ± 15 6 144 2 120 7 ± 8 30 159 5
+ lOnM ßEs 103 0 ± 6 79 79 44 109 2 + 10 1 125 2 98 11 ± 10 4 138 8
+ lOOnM ßEs 107 8 + 7 77 86 53 103 7 + 11 9 118 4 96 23 + 9 06 106 1
Results for acid phosphatase experiments are expressed as the average percentage growth relative to control (2% DHS + BITE) ± standard deviation (n=8) Results for coulter counts are expressed as the percentage growth relative to 2% DHS + BITE Abbreviations ßEs = Estradiol, FGF = Fibroblastic growth factor, Hep = Hepann, B = BITE combination
According to coulter counts and acid phosphatase, the best growth in this part, was achieved with the FGFs and BITE EGF was tested on its own as was IGF-I Neither showed as much stimulation as that seen with the combination of EGF and FGF or EGF and B-Estradiol
Table 3.13 3 Growth response of NRK cells to growth factors m low serum medium
VARIABLES ASSAY 1 ASSAY 2 ASSAY 3
AP CC AP CC AP CC
2% DHS + B 100 0 ± 7 80 100 0 100 0 ± 5 49 100 0 100 0 ± 3 51 100 0
+ 10ng/ml IGF-I 98 09 ± 4 18 100 1 96 55 ± 6 89 101 0 93 85 ± 3 95 111 5
+ 50ng/ml IGF-I 96 96 ± 5 32 101 1 96 06 ± 4 33 122 7 91 79 ± 0 56 117 8
+ 10ng/ml EGF 92 39 ± 2 09 154 3 95 50 ± 5 91 194 9 104 6 ± 7 43 252 1
+ 50ng/ml EGF 91 63 ± 4 68 169 3 99 30 ± 6 30 156 4 103 1 ± 3 69 249 3
+ 10ng/ml EGF + IGF-I 131 5 ± 10 4 180 5 98 50 ± 3 94 213 2 114 3 ± 8 05 118 3
Results for acid phosphatase experiments are expressed as the average percentage growth relative to control (2% DHS + BITE) ± standard deviation (n=8) Results for coulter count experiments are expressed as the percentage growth relative to 2% DHS + BITE Abbreviations EGF = Epidermal growth factor, IGF = Insulin-like growth factor, B = BITE combination
93
The components which showed repeatedly good activity for both end points were fl-Estradiol and EGF, EGF, a-FGF and heparm, and EGF and Dexamethazone Surprisingly, when EGF was tested alone, no growth stimulation was seen with AP as the end point When CC was used as the end point, consistent stimulation was seen Overall, the most stimulatory combinations were EGF and Dexamethazone and EGF and lOnM B-Estradiol
From the results obtained in section 3 1 3 1, it was decided to have a closer look at EGF, as EGF alone in the previous experiment showed good stimulation according to the cell counts but
not with AP Triplicate repeats of each assay were set up in 96-well plates using AP activity
as the end point A serial dilution of EGF was tested with and without BITE addition The
level of serum was reduced to 1 % DHS due to the high level of stimulation seen in section 3 1 3
EGF showed significant activity (Figure 3 13 5) EGF is a powerful mitogen and has been shown to elicit stimulatory and inhibitory effects on various cell types NRK cells showed
significant stimulation with EGF on its own with best growth at l-10ng/ml When BITE and
EGF were combined, synergism occurred and the growth achieved was greater than that of 5%
FCS
The work described above resulted in the development of a low serum medium (1 % DHS) supplemented with BITE and EGF which stimulates growth as good as that achieved by 5 % FCS
94
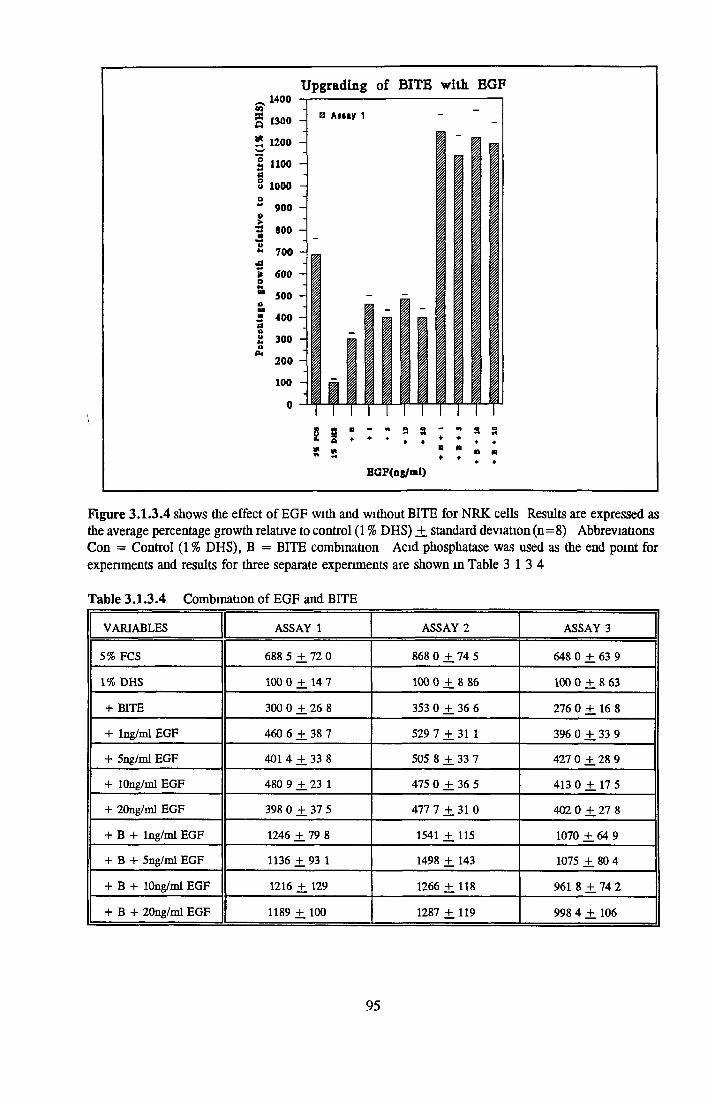
Upgrading of BITE with. EGF- .1 4 0 0 01
§ 1300
2 1200
2 i io o £3 iooo
5 900 o■2 800 n8 700J3S 600
s »o u2 400 <a2 300o A*
200
100
A m y 1
I
i
i.
I
uMiwB G F (n g/m l)
Figure 3.1.3.4 shows the effect of EGF with and without BITE for NRK cells Results are expressed as the average percentage growth relative to control (1 % DHS) +. standard deviation (n=8) Abbreviations Con = Control (1% DHS), B = BITE combination Acid phosphatase was used as the end point for experiments and results for three separate experiments are shown in Table 3 13 4
Table 3.1.3.4 Combination of EGF and BITE
VARIABLES ASSAY 1 ASSAY 2 ASSAY 3
5% FCS 688 5 +_ 72 0 868 0 ± 74 5 648 0 ± 63 9
1% DHS 100 0 ± 14 7 100 0 ± 8 86 100 0 ± 8 63
+ BITE 300 0 +. 26 8 353 0 ± 36 6 276 0 ± 16 8
+ lng/ml EGF 460 6 ± 38 7 529 7 ± 31 1 396 0 ± 33 9
+ 5ng/ml EGF 401 4 ± 33 8 505 8 +. 33 7 427 0 ± 2 8 9
+ lOng/ml EGF 480 9 ± 23 1 475 0 ± 36 5 413 0 ± 17 5
+ 20ng/ml EGF 398 0 +. 37 5 477 7 ± 31 0 402 0 ± 2 7 8
+ B + lng/ml EGF 1246 + 79 8 1541 ± 115 1070 ± 64 9
+ B + 5ng/ml EGF 1136 ± 9 3 1 1498 ± 143 1075 ± 80 4
+ B + lOng/ml EGF 1216 ± 129 1266 ± 118 961 8 ± 74 2
+ B + 20ng/ml EGF 1189 ± 100 1287 +.119 998 4 ± 106
95
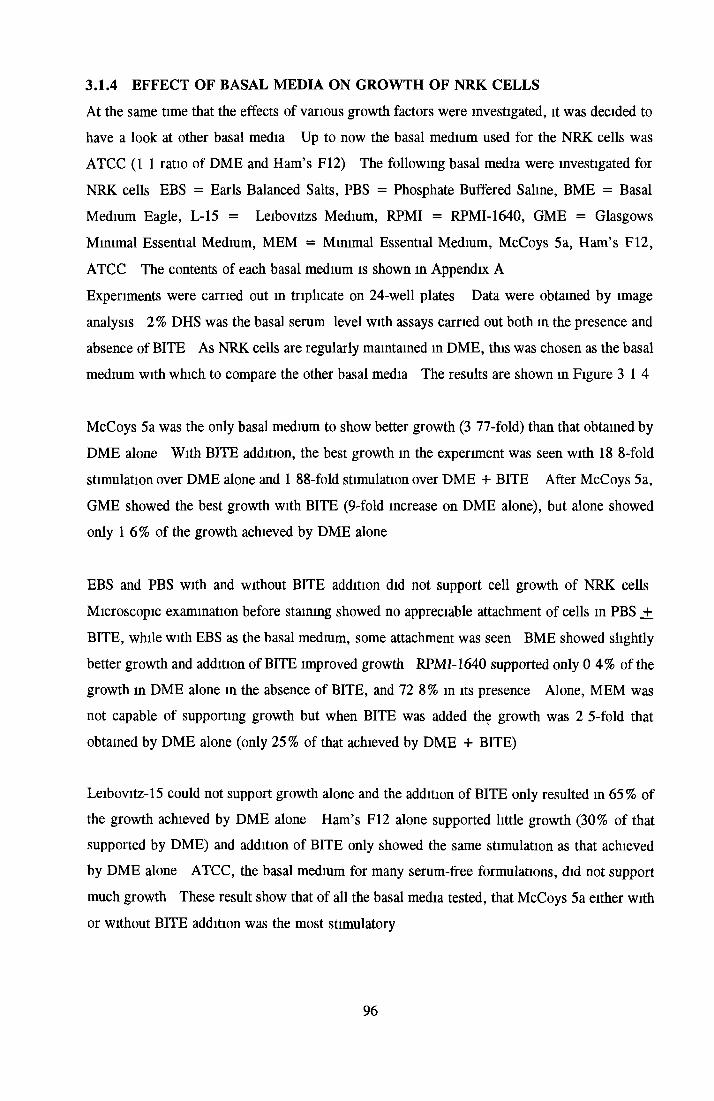
3.1.4 EFFECT OF BASAL MEDIA ON GROWTH OF NRK CELLSAt the same time that the effects of various growth factors were investigated, it was decided to have a look at other basal media Up to now the basal medium used for the NRK cells was ATCC (1 1 ratio of DME and Ham’s F12) The following basal media were investigated for
NRK cells EBS = Earls Balanced Salts, PBS = Phosphate Buffered Saline, BME = Basal Medium Eagle, L-15 = Leibovitzs Medium, RPMI = RPMI-1640, GME = Glasgows
Minimal Essential Medium, MEM = Minimal Essential Medium, McCoys 5a, Ham’s F12,
ATCC The contents of each basal medium is shown m Appendix A
Experiments were carried out m triplicate on 24-well plates Data were obtained by image analysis 2% DHS was the basal serum level with assays carried out both in the presence and absence of BITE As NRK cells are regularly maintained in DME, this was chosen as the basal medium with which to compare the other basal media The results are shown in Figure 3 14
McCoys 5a was the only basal medium to show better growth (3 77-fold) than that obtained by DME alone With BITE addition, the best growth in the experiment was seen with 18 8-fold
stimulation over DME alone and 1 88-fold stimulation over DME + BITE After McCoys 5a,
GME showed the best growth with BITE (9-fold increase on DME alone), but alone showed only 1 6% of the growth achieved by DME alone
EBS and PBS with and without BITE addition did not support cell growth of NRK cells Microscopic examination before staining showed no appreciable attachment of cells m PBS _+
BITE, while with EBS as the basal medium, some attachment was seen BME showed slightly
better growth and addition of BITE improved growth RPMI-1640 supported only 0 4% of the growth in DME alone in the absence of BITE, and 72 8% in its presence Alone, MEM was not capable of supporting growth but when BITE was added the growth was 2 5-fold that
obtained by DME alone (only 25% of that achieved by DME + BITE)
Leibovitz-15 could not support growth alone and the addition of BITE only resulted m 65% of the growth achieved by DME alone Ham’s F12 alone supported little growth (30% of that supported by DME) and addition of BITE only showed the same stimulation as that achieved by DME alone ATCC, the basal medium for many serum-free formulations, did not support
much growth These result show that of all the basal media tested, that McCoys 5a either with or without BITE addition was the most stimulatory
96
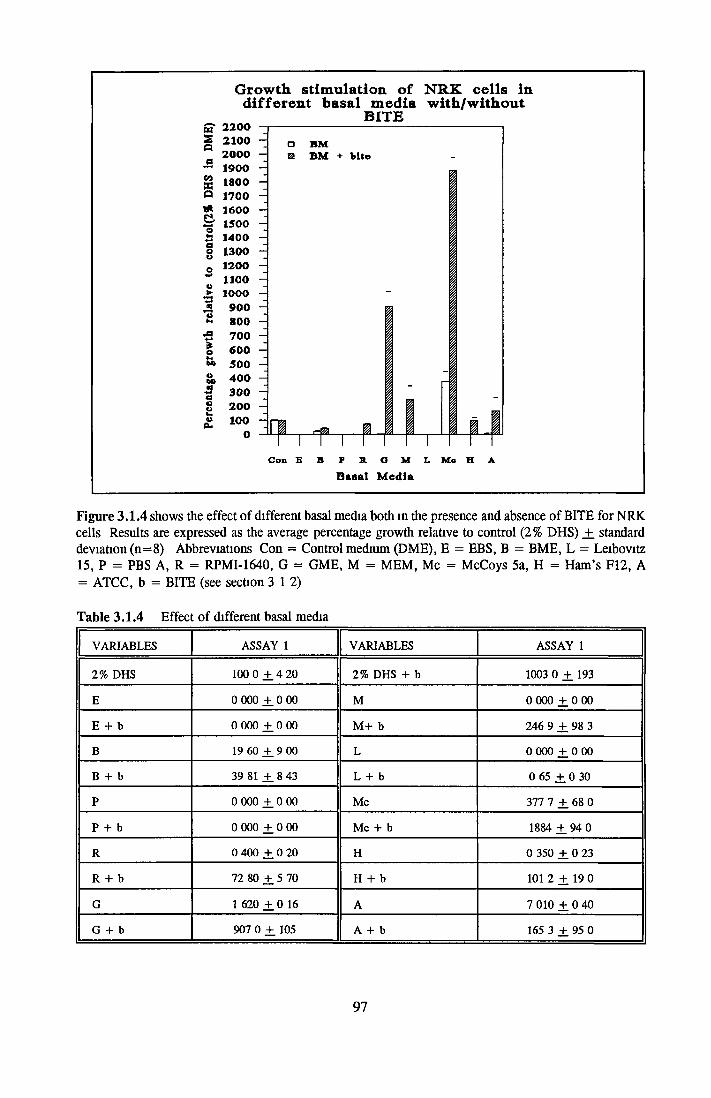
Growth stim ulation o f NRK c e lls In d ifferen t basal m edia w ith /w ithout
BITE2 * 2200S 2100
2000~ 1900 -£ 1800 -P 1700 ^* 1600 - nig 1500 -a 14 0 0 -
g 1300 0 1200 -
*“ 1100 - J 1000 ~5 900 -" 800 - •2 700 -1 600 ^6 500 -S, 4 0 0 - 2 300 -8 200 -
6 1000 -
C o n B B P R G M L M e H A
Basal Media
Figure 3.1.4 shows the effect of different basal media both in the presence and absence of BITE for NRK cells Results are expressed as the average percentage growth relative to control (2% DHS) ± standard deviation (n=8) Abbreviations Con = Control medium (DME), E = EBS, B = BME, L = Leibovitz 15, P = PBS A, R = RPMI-1640, G = GME, M = MEM, Me = McCoys 5a, H = Ham’s F12, A = ATCC, b = BITE (see section 3 12)
Table 3.1.4 Effect of different basal media
VARIABLES ASSAY 1 VARIABLES ASSAY 1
2% DHS 100 0 ± 4 20 2% DHS + b 1003 0 ± 193
E 0 000 ± 0 00 M 0 000 ± 0 0 0
E + b 0 000 ± 0 0 0 M+ b 246 9 ± 98 3
B 19 60 ± 9 00 L 0 000 ± 0 0 0
B + b 39 81 ± 8 43 L + b 0 65 ± 0 30
P 0 000 ± 0 00 Me 377 7 ± 68 0
P + b 0 000 ± 0 0 0 Me + b 1884 ± 94 0
R 0 400 ± 0 20 H 0 350 ± 0 23
R + b 72 80 ± 5 70 H + b 101 2 ± 19 0
G 1 620 ± 0 16 A 7 010 ± 0 40
G + b 907 0 + 105 A + b 165 3 + 95 0--------------------------------------------------------
97

3.1.5 FURTHER COMPARISON OF ATCC AND McCOYS 5a
From the results obtained in section 3 1 3, the combination EGF and BITE showed better growth than 5% FCS In section 3 1 4, it was found that McCoys 5a as the basal medium
supported better growth of NRK cells than ATCC either with or without BITE
It was decided to remove serum altogether and study the combined effects of EGF and McCoys 5a medium As Ex-cyte V was known to contain BSA fraction V and since BSA was already in the BITE combination, it was decided to try a different Ex-cyte Ex-cyte III, which
contained the same lipoprotein mixture but no BSA This was not found to be stimulatory (Appendix B) and as a result was subsequently left out With the removal of serum, the
concentrations of BSA and insulin were increased
The ability of the two basal media, ATCC and McCoys 5a, to support growth under serum
limiting conditions were investigated Both basal media were examined m the presence of mixtures of insulin (lOjtg/ml), transferrin (5^g/ml), EGF (lOng/ml), BSA (lmg/ml) and laminin (100/ig/ml) This is BITE plus EGF, plus lammin and minus Ex-cyte The lamimn was
incorporated into the assay to see if attachment factors were necessary for growth in totally
serum-free conditions Laminm can be added to the plate and allowed to dry before adding the
cells or it can be incorporated into the growth medium In this assay, laminm was included in
the mediumIn preliminary experiments, it had been found that NRK cells did not form a large pellet when trypsin inhibitor was used to stop the action of trypsin It may have been that trypsin-trypsm
inhibitor complexes impeded the settling of cells It was also possible that the trypsin inhibitor was not fully successful in deactivating the trypsin, resulting in some continued proteolytic activity on the cells To overcome this problem, 5% DHS was used to stop the action of
trypsin After centrifuging, all the supernatant was removed, the cells were resuspended m 10ml basal medium (without serum) The cells were centrifuged again, the supernatant decanted and the cells were resuspended in basal medium without serum In subsequent assays using trypsin inhibitor, it was found that by increasing the centrifugal speed to 1,500rpm it was possible to get a good pellet (comparable to that obtained when serum was used to inactivate trypsin)
The results are shown in Figure 3 15 1 Using ATCC as the basal medium, insulin alone or the combination of insulin, transferrin and EGF were found to be most stimulatory, either with
98
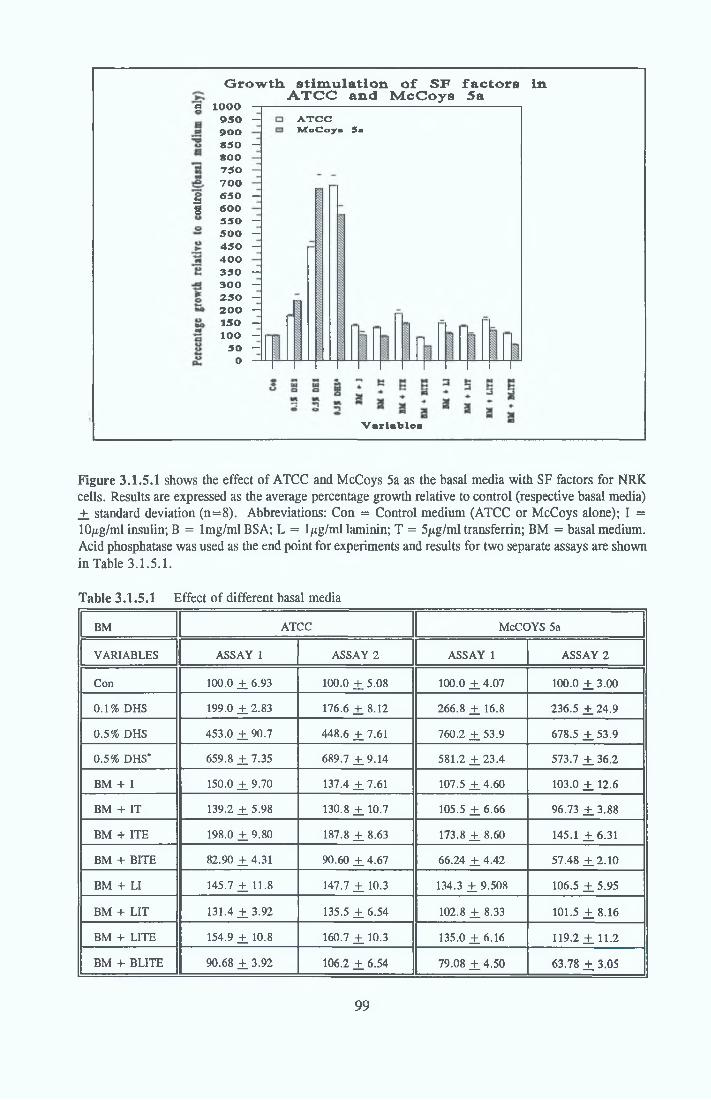
S 1000Growth stimulation of SF factors
ATCC and McCoys 5ain
a€
950 - 900 «50 — 800 750 — 700 «50 — 600 550 - 500 — 450 - 400 350 - 300 — 250 — 200 -
150 - lOO -
50 — O
ATCC MoCoys 5«
Variable!
Figure 3.1.5.1 shows the effect of ATCC and McCoys 5a as the basal media with SF factors for NRK cells. Results are expressed as the average percentage growth relative to control (respective basal media) ± standard deviation (n=8). Abbreviations: Con = Control medium (ATCC or McCoys alone); I = 10/ig/ml insulin; B = 1 mg/ml BSA; L = 1/xg/ml laminin; T = 5/tg/ml transferrin; BM = basal medium. Acid phosphatase was used as the end point for experiments and results for two separate assays are shown in Table 3.1.5.1.
Table 3.1.5.1 Effect of different basal mediaBM ATCC McCOYS 5a
VARIABLES ASSAY 1 ASSAY 2 ASSAY 1 ASSAY 2
Con 100.0 ± 6 . 9 3 100.0 ± 5.08 100.0 ± 4 .07 100.0 ± 3 . 0 0
0.1% DHS 199.0 ± 2 . 8 3 176.6 ± 8 . 1 2 266.8 ± 16.8 236.5 ± 2 4 . 9
0.5% DHS 453.0 ± 9 0 . 7 448.6 ± 7 . 6 1 760.2 ± 5 3 . 9 678.5 ± 5 3 . 9
0.5% DHS* 659.8 ± 7 . 3 5 689.7 ± 9 . 1 4 581.2 ± 2 3 . 4 573.7 ± 36.2
BM + I 150.0 ± 9.70 137.4 ± 7 . 6 1 107.5 ± 4 . 6 0 103.0 ± 12.6
BM + IT 139.2 ± 5 . 9 8 130.8 ± 10.7 105.5 ± 6 . 6 6 96.73 ± 3 . 8 8
BM + ITE 198.0 ± 9 . 8 0 187.8 ± 8.63 173.8 ± 8.60 145.1 ± 6 . 3 1
BM + BITE 82.90 ± 4 . 3 1 90.60 ± 4 . 6 7 66.24 ± 4 .42 57.48 ± 2 . 1 0
BM + LI 145.7 ± 11.8 147.7 ± 10.3 134.3 ± 9.508 106.5 ± 5 . 9 5
BM + LIT 131.4 ± 3 . 9 2 135.5 ± 6 . 5 4 102.8 ± 8 . 3 3 101.5 ± 8 . 1 6
BM + LITE 154.9 ± 10.8 160.7 ± 10.3 135.0 ± 6 . 1 6 119.2 ± 1 1 . 2
BM + BLITE 90.68 ± 3 . 9 2 106.2 ± 6.54 79.08 ± 4 . 5 0 63.78 ± 3.05
99
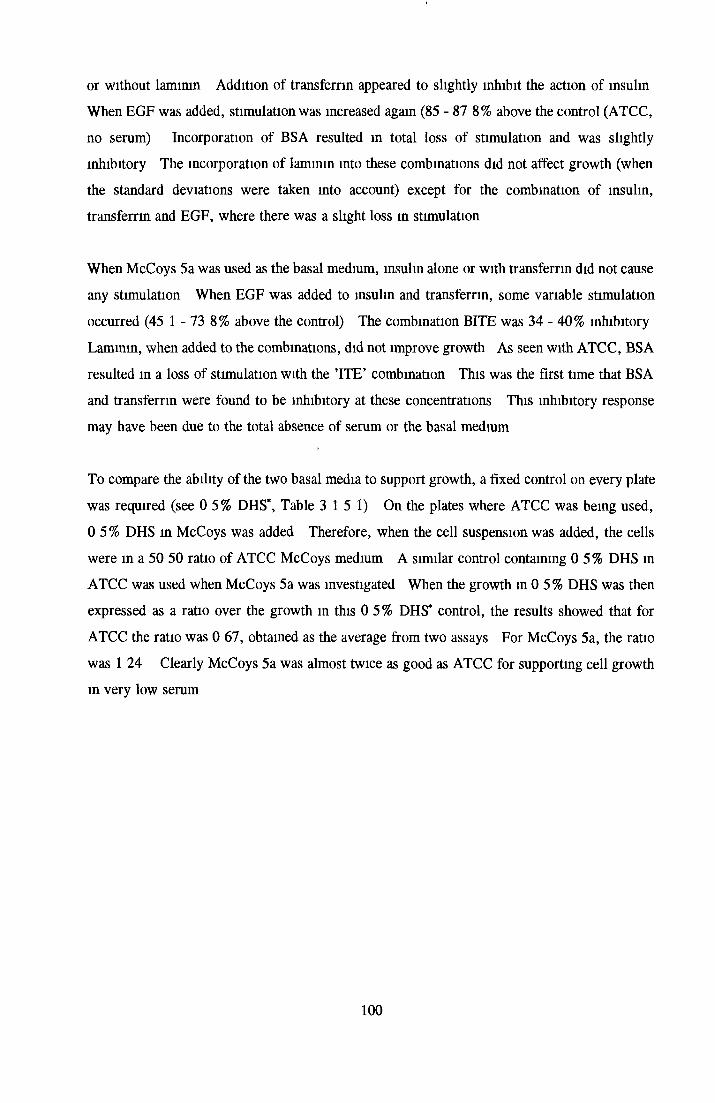
or without lamimn Addition of transferrin appeared to slightly inhibit the action of insulin When EGF was added, stimulation was increased again (85 - 87 8% above the control (ATCC, no serum) Incorporation of BSA resulted m total loss of stimulation and was slightly inhibitory The incorporation of lamimn into these combinations did not affect growth (when the standard deviations were taken into account) except for the combination of insulin, transferrin and EGF, where there was a slight loss in stimulation
When McCoys 5a was used as the basal medium, insulin alone or with transferrin did not cause any stimulation When EGF was added to insuhn and transferrin, some variable stimulation
occurred (45 1 - 73 8% above the control) The combination BITE was 34 -40% inhibitory Lamimn, when added to the combinations, did not improve growth As seen with ATCC, BSA
resulted in a loss of stimulation with the ’ITE’ combination This was the first time that BSA and transferrin were found to be inhibitory at these concentrations This inhibitory response may have been due to the total absence of serum or the basal medium
To compare the ability of the two basal media to support growth, a fixed control on every plate
was required (see 0 5% DHS*, Table 3 15 1) On the plates where ATCC was being used,
0 5 % DHS in McCoys was added Therefore, when the cell suspension was added, the cells were in a 50 50 ratio of ATCC McCoys medium A similar control containing 0 5% DHS in ATCC was used when McCoys 5a was investigated When the growth in 0 5 % DHS was then
expressed as a ratio over the growth in this 0 5% DHS* control, the results showed that for ATCC the ratio was 0 67, obtained as the average from two assays For McCoys 5a, the ratio
was 1 24 Clearly McCoys 5a was almost twice as good as ATCC for supporting cell growth in very low serum
100

3.1.6 COMPARISON WITH COMPONENTS FROM OTHER SFM
As MDCK and CHOK1 cells grew successfully in the serum-free media cited for each, it was decided to try the components used m these SF media on NRK cells under serum-free conditions From previous experiments (sections 3 14 -315 ) , McCoys 5a medium was found to support growth better than ATCC in the presence of very low serum concentrations
Therefore, each set of variables was tested with three different basal media i e the basal media for the two SFM (ATCC and Ham’s F12) and McCoys 5a In addition, EGF which had been
found to be very stimulatory for NRK cells (Figure 3 13 2), was added in to the SF media This experiment was only carried out once Trypsin inhibitor was added to the serum-free cell stocks to protect the cells from the possible proteolytic action of trypsin on cells under serum- free conditions The results are shown in Tables 3 16 1 and 2
Looking at the 1% DHS controls for the different basal medium, both Ham’s F12 and ATCC show a 2-fold to 3-fold increase in growth over the SFM, while for McCoys 5a there was a 7-
fold to 8-fold increase (Tables 3 16 1 and 2) In section 3 14, McCoys 5a was shown to be twice as good as ATCC These results could indicate that there may be some factor affecting cell growth adversely in ATCC or Ham’s F12, that the addition of serum did not totally
overcome McCoys 5a may also have some factor(s) not present in the other basal media which is(are) important for the growth and maintenance of NRK cells
Table 3.1 6.1 Growth response of NRK cells to components in MDCK SFM
VARIABLES ATCC Ham’s F12 McCoys 5a
1% DHS 257 0 ± 12 0 276 2 ± 11 9 882 6 ± 34 8
Basal medium 112 0 +.2 00 113 9 ± 1 98 84 06 ± 4 35
SFM 100 0 ± 2 00 100 0 ± 0 99 100 0 + 2 89
- 5/ig/ml Insulin 104 0 ± 3 00 108 9 ± 1 98 78 26 ± 3 81
- 5/tg/ml Transferrin 97 00 ± 2 00 98 02 ± 1 98 101 4 ± 2 89
- 25ng/ml PGE, 97 00 ± 3 00 98 02 ± 1 98 96 38 ± 6 52
- 50nM Hydrocortisone 96 00 ± 3 00 97 03 ± 1 98 99 27 ± 5 07
- 5pM Tmodothromne 95 00 ± 4 00 95 05 ± 1 98 94 20 ± 7 25
+ lOng/ml EGF 113 0 ± 4 00 108 9 ± 2 97 123 9 ± 3 62
Results are expressed as the average percentage growth Relative to control (SFM as described by Taub et al (1979) with three different basal media ATCC, Ham’s F12 and McCoys 5a) ± standard deviation (n=8) Acid phosphatase was used as the end point for assays Abbreviations PGE, = Prostaglandin E,
101
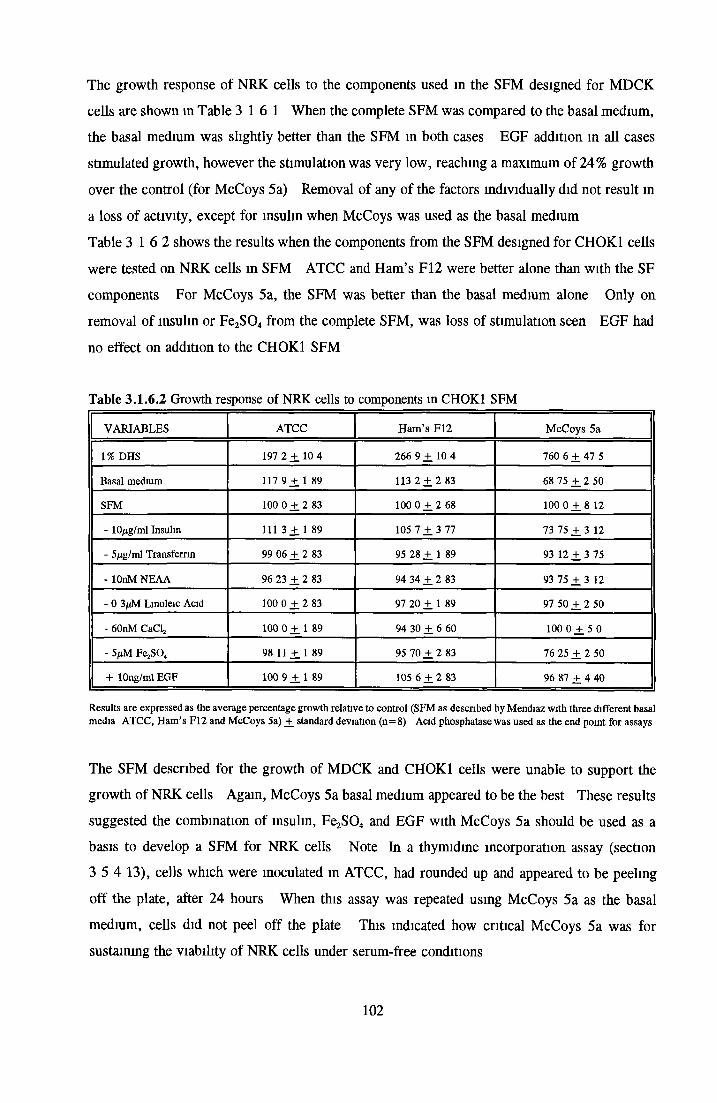
The growth response of NRK cells to the components used in the SFM designed for MDCK cells are shown m Table 3 16 1 When the complete SFM was compared to the basal medium, the basal medium was slightly better than the SFM m both cases EGF addition in all cases stimulated growth, however the stimulation was very low, reaching a maximum of 24% growth
over the control (for McCoys 5a) Removal of any of the factors individually did not result in
a loss of activity, except for insulin when McCoys was used as the basal medium Table 3 16 2 shows the results when the components from the SFM designed for CHOK1 cells
were tested on NRK cells in SFM ATCC and Ham’s F12 were better alone than with the SF components For McCoys 5a, the SFM was better than the basal medium alone Only on removal of insulin or Fe2S04 from the complete SFM, was loss of stimulation seen EGF had
no effect on addition to the CHOK1 SFM
Table 3.1.6.2 Growth response of NRK cells to components in CHOK1 SFM
VARIABLES ATCC Ham’s F12 McCoys 5a
\% DHS 197 2 ± 1 0 4 266 9 ± 10 4 760 6 ± 47 5
Basal medium 117 9 ± 1 89 113 2 ± 2 83 68 75 ± 2 50
SFM 100 0 ± 2 83 100 0 ± 2 68 100 0 ± 8 12
- 10/ig/ml Insulin 111 3 ± 1 89 105 7 ± 3 77 73 75 ± 3 12
- 5/ig/ml Transferrin 99 06 ± 2 83 95 28 ± 1 89 93 12 ± 3 75
- lOnM NEAA 96 23 ± 2 83 94 34 ± 2 83 93 75 ± 3 12
- 0 3;uM Linoleic Acid 100 0 ± 2 83 97 20 ± 1 89 97 50 ± 2 50
- 60nM CaClj 100 0 ± 1 89 94 30 ± 6 60 100 0 ± 5 0
- 5|iM Fc.2S04 98 11 ± 1 89 95 70 ± 2 83 76 25 ± 2 50
+ lOng/ml EGF 100 9 ± 1 89 105 6 ± 2 83 96 87 ± 4 40
Results are expressed as the average percentage growth relative to control (SFM as described by Mendiaz with three different basal media ATCC, Ham’s F12 and McCoys 5a) ± standard deviation (n=8) Acid phosphatase was used as the end point for assays
The SFM described for the growth of MDCK and CHOK1 cells were unable to support the growth of NRK cells Again, McCoys 5a basal medium appeared to be the best These results suggested the combination of insulin, FejSO,» and EGF with McCoys 5a should be used as a basis to develop a SFM for NRK cells Note In a thymidine incorporation assay (section 3 5 4 13), cells which were inoculated in ATCC, had rounded up and appeared to be peeling off the plate, after 24 hours When this assay was repeated using McCoys 5a as the basal
medium, cells did not peel off the plate This indicated how critical McCoys 5a was for sustaining the viability of NRK cells under serum-free conditions
102
3.1.7.1 EFFECTS OF SELECTED VARIABLES ON NRK CELLS IN SFM
Following from section 3 15, McCoys 5a was used as the basal medium supplemented with insulin, Fe2S0 4 and EGF The addition of trypsin inhibitor and EDTA were investigated Trypsin inhibitor was added to the SF stocks of cells in section 3 1 5 in order to protect the
cells from the effect of residual trypsin No control had been included to see if trypsin inhibitor
had an adverse effect EDTA was included as it has been reported (Bertheussen, 1993) to act as a chelator of toxic factors The experiment was set up using all these factors in the serum- free medium Each factor was left out individually to see what the impact on cell growth would be The results are shown in Figure 3 17 1
As seen before, the complete serum-free medium was only 10% better than the basal medium
alone This appeared disappointing until the effect of the omission of EGF was noted When EGF was left out, there was a significant increase in growth (even though the standard
deviations were high) When insulin or Fe^Q* were left out individually, there was a 25 - 30% and 15 - 25 % reduction m growth respectively The incorporation of trypsin inhibitor appeared to have no effect in 2 of the 3 assays, with only a small increase in the third assay Thus, it was not necessary for cell growth/maintenance in SFM Omission of EDTA showed statistically insignificant differences (given errors on the control as well as on the ’EDTA’ results The effect of EDTA would have to be re-evaluated
103
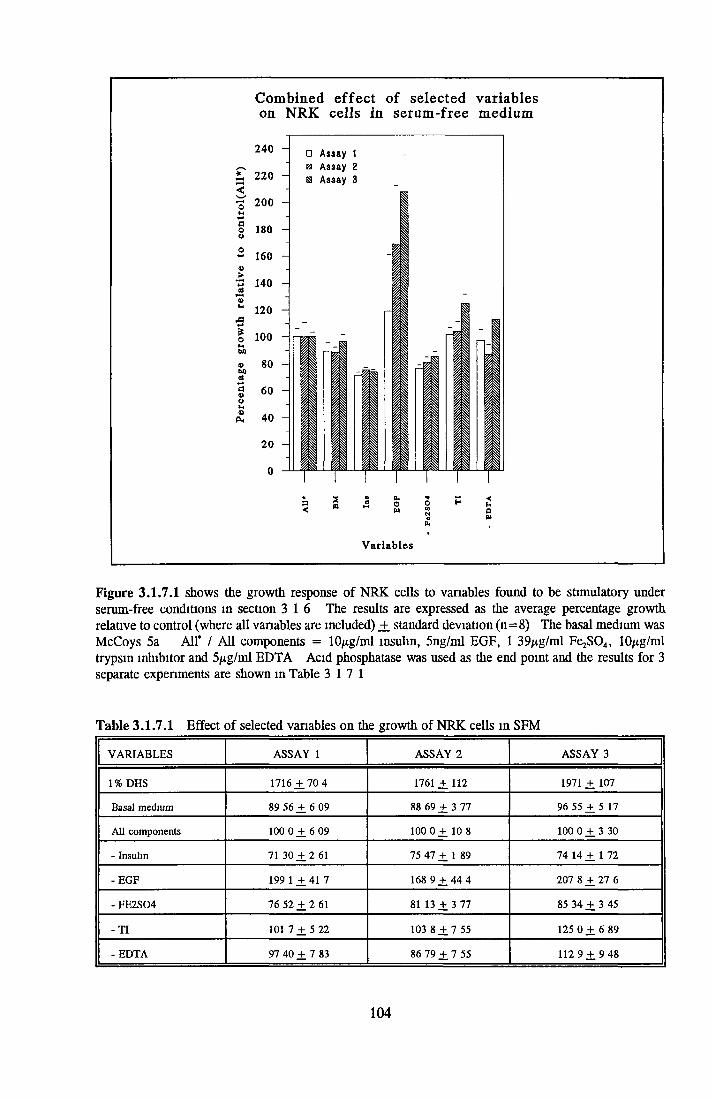
Figure 3.1.7.1 shows the growth response of NRK cells to variables found to be stimulatory under serum-free conditions in section 3 16 The results are expressed as the average percentage growth relative to control (where all variables are included) +. standard deviation (n=8) The basal medium was McCoys 5a All* / All components = 10/ig/ml insulin, 5ng/ml EGF, 1 39/xg/ml FejSO,,, lOpig/ml trypsin inhibitor and 5/ig/ml EDTA Acid phosphatase was used as the end point and the results for 3 separate experiments are shown m Table 3 17 1
Table 3.1.7.1 Effect of selected variables on the growth of NRK cells in SFM
VARIABLES ASSAY 1 ASSAY 2 ASSAY 3
1% DHS 1716 ± 7 0 4 1761 ± 112 1971 ± 107
Basal medium 89 56 ± 6 09 88 69 ± 3 77 96 55 ± 5 17
All components 100 0 ± 6 09 100 0 ± 10 8 100 0 ± 3 30
- Insulin 71 30 ± 2 61 75 47 ± 1 89 74 14 ± 1 72
-EGF 199 1 ± 41 7 168 9 ± 44 4 207 8 ± 27 6
- FE2S04 76 5 2 ± 2 61 81 13 ± 3 77 85 34 ± 3 45
- TI 101 7 ± 5 22 103 8 ± 7 55 125 0 ± 6 89
- EDTA 97 40 + 7 83 86 79 + 7 55 112 9 + 9 48-------------------------------------------------
104
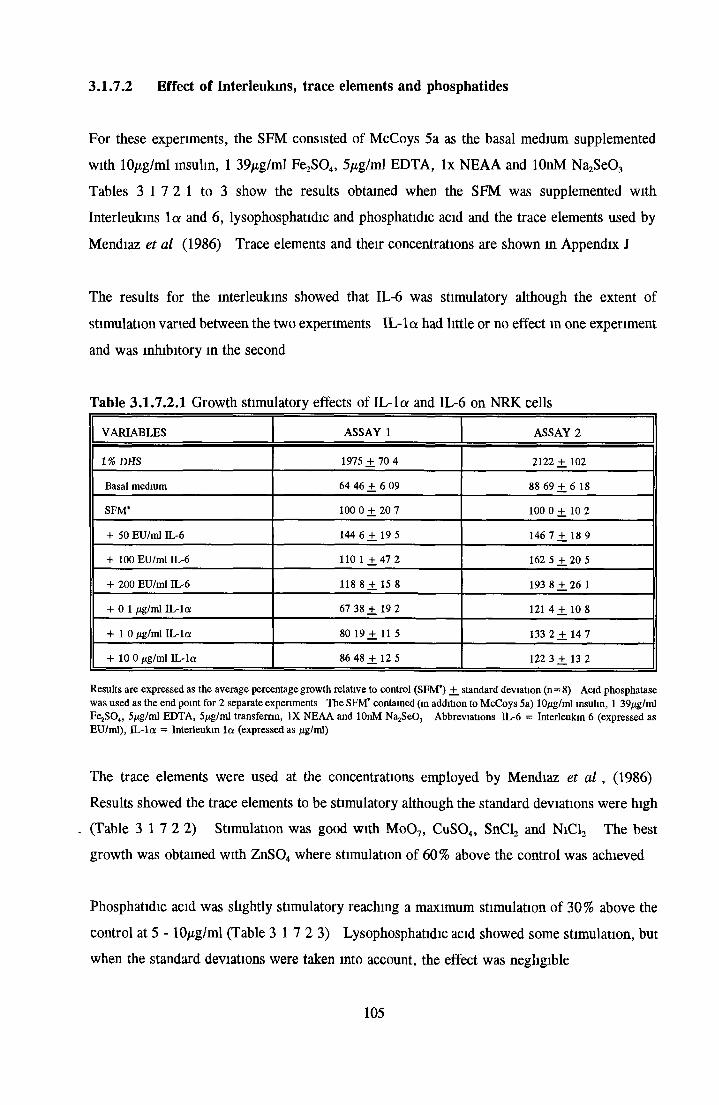
3.1.7.2 Effect of Interleukins, trace elements and phosphatides
For these experiments, the SFM consisted of McCoys 5a as the basal medium supplemented with 10/ig/ml insulin, 1 39/ig/ml Fe2S04, 5//g/ml EDTA, lx NEAA and lOnM NaaSeC Tables 3 17 2 1 to 3 show the results obtained when the SFM was supplemented with Interleukins la and 6 , lysophosphatidic and phosphatidic acid and the trace elements used by
Mendiaz et al (1986) Trace elements and their concentrations are shown in Appendix J
The results for the interleukins showed that IL-6 was stimulatory although the extent of
stimulation varied between the two experiments IL-la had little or no effect m one experiment
and was inhibitory in the second
Table 3.1.7.2.1 Growth stimulatory effects of IL-la and IL-6 on NRK cells
VARIABLES ASSAY 1 ASSAY 2
1% DHS 1975 + 70 4 2122 ± 102
Basal medium 64 46 + 6 09 88 69 ± 6 18
SFM* 100 0 + 20 7 100 0 +. 10 2
+ 50 EU/ml IL-6 144 6 + 19 5 146 7 +.18 9
+ 100 EU/ml IL-6 110 1 + 472 162 5 +. 20 5
+ 200 EU/ml IL-6 118 8 + 15 8 193 8 + 26 1
+ 01 /ig/ml IL-la 67 38 + 19 2 121 4 + 10 8
+ 10 /Lig/ml IL-la 80 19 + 11 5 133 2 ± 1 4 7
+ 10 0 /ig/ml IL-la 86 48 + 12 5 122 3 + 13 2
Results are expressed as the average percentage growth relative to control (SFM*) +_ standard deviation (n=8) Acid phosphatase was used as the end point for 2 separate experiments The SFM* contained (in addition to McCoys 5a) 10^g/ml insulin, 1 39^g/ml Fe^O,,, 5/ig/ml EDTA, 5/jg/ml transferrin, IX NEAA and lOnM Na2SeO, Abbreviations IL-6 = Interleukin 6 (expressed as EU/ml), IL-la = Interleukin la (expressed as /tg/ml)
The trace elements were used at the concentrations employed by Mendiaz et al , (1986) Results showed the trace elements to be stimulatory although the standard deviations were high
- (Table 3 1 7 2 2) Stimulation was good with Mo07, CuS04, SnCl2 and NiC12 The best growth was obtained with ZnS04 where stimulation of 60% above the control was achieved
Phosphatidic acid was slightly stimulatory reaching a maximum stimulation of 30% above the
control at 5 - 10jug/ml (Table 3 1 7 2 3) Lysophosphatidic acid showed some stimulation, but when the standard deviations were taken into account, the effect was negligible
105
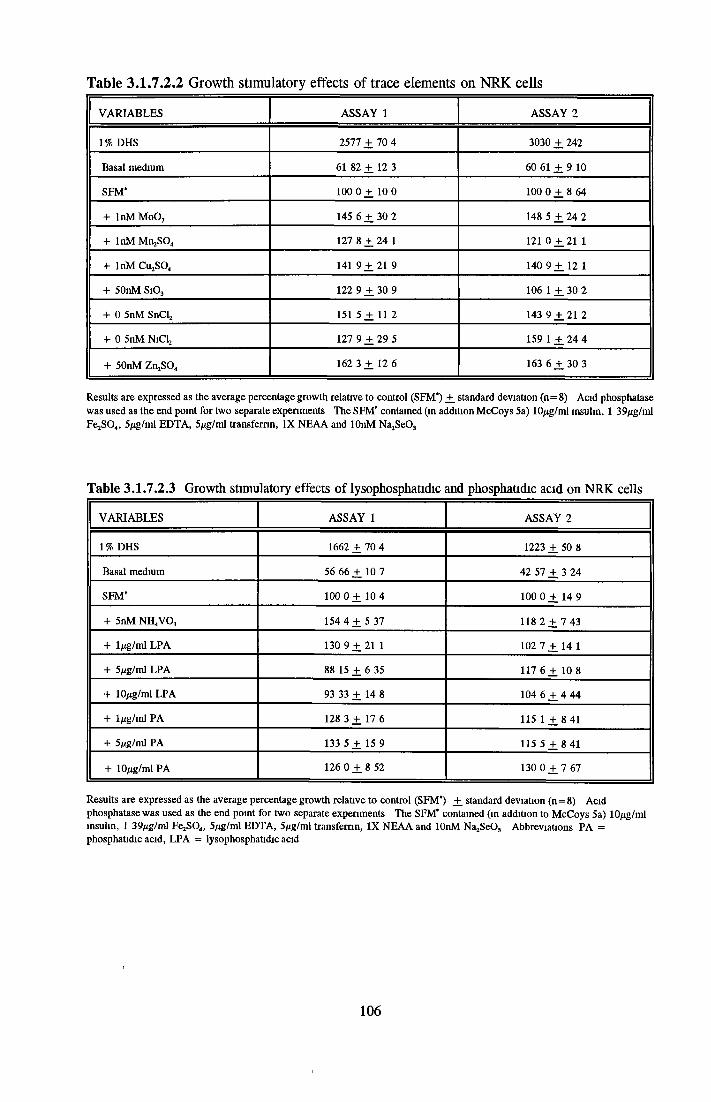
Table 3.1.7.2.2 Growth stimulatory effects of trace elements on NRK cells
VARIABLES ASSAY 1 ASSAY 2
1% DHS 2577 ± 70 4 3030 ± 242
Basal medium 61 82 ± 12 3 60 61 ± 9 10
SFM' 100 0 + 10 0 100 0 ± 8 64
+ InMMoO, 145 6 ± 30 2 148 5 ± 24 2
+ lnM Mn SO,, 127 8 ± 24 1 121 0 ± 21 1
+ lnM CujSQ, 141 9 ± 2 1 9 140 9 ± 12 1
+ 50nM Si03 122 9 ± 30 9 106 1 ± 30 2
+ 0 5nM SnClj 151 5 ± 11 2 143 9 ± 21 2
+ 0 5nM NiCt 127 9 ± 29 5 159 1 ± 24 4
+ 50nM ZnjS04 162 3 ± 12 6 163 6 ± 3 0 3
Results are expressed as the average percentage growth relative to control (SFM*) ± standard deviation (n=8) Acid phosphatase was used as the end point for two separate experiments The SFM’ contained (in addition McCoys 5a) 10/tg/ml insulin, 1 39/jg/ml FejSOj, 5/ig/ml EDTA, 5/xg/ml transferrin, IX NEAA and lOnM NajSeO,
Table 3.1.7.2.3 Growth stimulatory effects of lysophosphatidic and phosphatidic acid on NRK cells
VARIABLES ASSAY 1 ASSAY 2
1% DHS 1662 ± 7 0 4 1223 ± 50 8
Basal medium 56 66 ± 10 7 42 57 ± 3 24
SFM' 100 0 ± 10 4 100 0 + 14 9
+ 5nM NH4V03 154 4 ± 5 37 118 2 ± 7 43
+ 1/ig/ml LPA 130 9 ± 21 1 102 7 ± 14 1
+ 5/xg/ml LPA 88 15 ± 6 35 117 6 ± 10 8
+ 10/tg/ml LPA 93 33 ± 14 8 104 6 ± 4 44
+ lfig/ml PA 128 3 ± 17 6 115 1 ± 8 41
+ 5/ig/ml PA 133 5 ± 15 9 115 5 ± 8 41
+ 10/ig/ml PA 126 0 ± 8 52 130 0 ± 7 67
Results are expressed as the average percentage growth relative to control (SFM') ± standard deviation (n= 8) Acid phosphatase was used as the end point for two separate experiments The SFM' contained (in addition to McCoys 5a) 10/ig/ml insulin, 1 39/ig/ml Fe2S04, 5/ig/ml EDTA, 5/ig/ml transferrin, IX NEAA and lOnM Na2Se03 Abbreviations PA = phosphatidic acid, LPA = lysophosphatidic acid
106
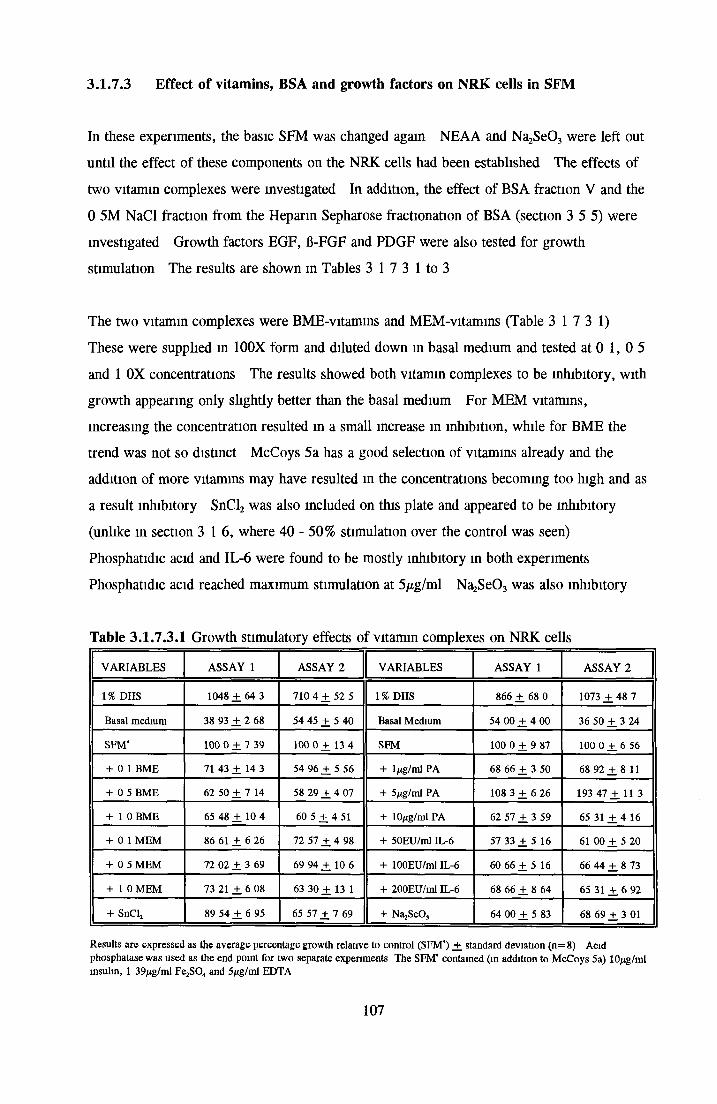
3.1.7.3 Effect of vitamins, BSA and growth factors on NRK cells in SFM
In these experiments, the basic SFM was changed again NEAA and NazSeC were left out
until the effect of these components on the NRK cells had been established The effects of two vitamin complexes were investigated In addition, the effect of BSA fraction V and the
0 5M NaCl fraction from the Heparin Sepharose fractionation of BSA (section 3 5 5) were
investigated Growth factors EGF, B-FGF and PDGF were also tested for growth stimulation The results are shown m Tables 3 1 7 3 1 to 3
The two vitamin complexes were BME-vitamins and MEM-vitamins (Table 3 17 3 1)
These were supplied in 100X form and diluted down in basal medium and tested at 0 1,0 5 and 1 OX concentrations The results showed both vitamin complexes to be inhibitory, with
growth appearing only slightly better than the basal medium For MEM vitamins, increasing the concentration resulted in a small increase in inhibition, while for BME the trend was not so distinct McCoys 5a has a good selection of vitamins already and the
addition of more vitamins may have resulted in the concentrations becoming too high and as
a result inhibitory SnCl2 was also included on this plate and appeared to be inhibitory (unlike m section 3 16, where 40 -50% stimulation over the control was seen)
Phosphatidic acid and IL-6 were found to be mostly inhibitory in both experiments
Phosphatidic acid reached maximum stimulation at 5^g/ml NajSeOa was also inhibitory
Table 3.1.7.3.1 Growth stimulatory effects of vitamin complexes on NRK cells
VARIABLES ASSAY 1 ASSAY 2 VARIABLES ASSAY 1 ASSAY 2
1% DHS 1048 ± 64 3 710 4 + 52 5 1% DHS 866 + 68 0 1073 + 48 7
Basal medium 38 93 + 2 68 54 45 + 5 40 Basal Medium 54 00 + 4 00 36 50 ± 3 24
SFM* 100 0 + 7 39 100 0 + 13 4 SFM 100 0 ± 9 87 100 0 +. 6 56
+ 0 1 BME 71 43 + 14 3 54 96 + 5 56 + 1 fig/ml PA 68 66 + 3 50 68 92 ± 8 11
+ 05 BME 62 50 + 7 14 58 29 + 4 07 + 5¿¿g/ml PA 108 3 + 6 26 193 47 + 11 3
+ 1 0 BME 65 48 ± 10 4 60 5 + 4 51 + 10/ig/ml PA 62 57 + 3 59 65 31 ± 4 16
+ 0 1 MEM 86 61 ± 6 26 72 57 + 4 98 + 50EU/ml IL-6 57 33 + 5 16 61 00 ± 5 20
+ 05 MEM 72 02 ± 3 69 69 94 + 10 6 + 100EU/ml IL-6 60 66 + 5 16 66 44 ± 8 73
+ 1 0MEM 73 21 + 6 08 63 30 + 13 1 + 200EU/ml IL-6 68 66 + 8 64 65 31 ± 6 92
+ SnClj 89 54 + 6 95 65 57 + 7 69 + Na^eO., 64 00 + 5 83 68 69 +_ 3 01
Results are expressed as the average percentage growth relative to control (SFM*) +_ standard deviation (n=8) Acid phosphatase was used as the end point for two separate experiments The SFM’ contained (in addition to McCoys 5a) lOjug/ml insulin, 1 39jug/ml Fe SO,, and 5/ig/ml EDTA
107

Both BSA and the 0 5M NaCl fraction showed increasing inhibition with increasing
concentrations The 0 5M NaCl fraction was less inhibitory at 0 1 and 0 5mg/ml than the BSA itself but at 1 Omg/ml equal inhibition was exhibited by both In this experiment, all trace elements were inhibitory
Table 3.1.7.3.2 Growth response of NRK cells BSA, 0 5M NaCl fraction and trace elements
VARIABLES ASSAY 1 ASSAY 2 VARIABLES ASSAY 1 ASSAY 2
1 % DHS 1027 ± 76 7 914 1 ± 6 2 1 1% DHS 643 1 ± 41 2 1003 ± 43 8
Basal medium 66 85 ± 7 65 36 19+ 4 18 Basal Medium 49 02 ± 3 92 38 36± 4 11
SFM* 100 0 ± 7 72 100 0 ± 9 50 SFM* 100 0 ± 8 12 100 0 ± 1 09
+ 0 1 BSA 35 77 ± 5 82 57 06 ± 10 4 + MoO, 62 74 ± 7 84 77 85 ± 9 06
+ 05 BSA -6 39 ± 2 14 2 660 ± 1 69 + Si03 53 27 ± 3 59 66 57± 3 15
+ 1 0 BSA -102 + 2 55 -0 44 ± 1 08 + SnClj 41 45 ± 2 87 63 40 ± 1 74
+ 0 1 BSAf 55 18 + 8 19 1111 ± 1 43 + nh4vo3 37 91 ± 5 03 61 37± 2 81
+ 05 BSAf 0 730 ± 4 59 12 00 ± 8 00 + MnS04 36 97 ± 3 48 67 46 ± 7 53
+ 1 0 BSAf -10 2 ± 2 55 1 330 ± 4 00 + CuS04 39 49 ± 2 64 61 18 ± 2 24
+ All* 66 42 + 5 11 58 00 + 7 20 + NiClj 35 95 + 2 95 60 27 + 12 3
Results are expressed as the average percentage growth relative to control (SFM*) ± standard deviation (n=8) Acid phosphatase was used as the end point for two separate experiments The SFM* contained (in addition to McCoys 5a) 10fig/ml insulin, 1 39/ig/ml FejS04 and 5/ig/ml EDTA Abbreviations BSAf = 0 5M NaCl fraction from Hepann Sepharose experiments (see section 3 5 4), AH' as before
Table 3.1.7.3.3 Growth stimulatory effects of growth factors on NRK cells
VARIABLES ASSAY 1 ASSAY 2
1% DHS 1115 ± 2 9 7 967 1 ± 64 5
Basal medium 62 02 ± 5 05 34 21 ± 1 31
SFM* 100 0 ± 9 02 100 0 ± 6 27
+ lng/ml EGF 91 28 ± 8 89 57 89 ± 1 06
+ 10ng/ml EGF 97 97 ± 10 3 69 36 ± 6 82
+ lng/ml B-FGF 229 3 ± 21 9 167 3 ± 16 2
+ 10ng/ml B-FGF 214 9 ± 11 3 143 2 ± 15 6
+ 50ng/ml B-FGF 110 7 ± 1 2 1 66 58 ± 4 71
+ lng/ml PDGF 89 19 ± 9 84 68 20 ± 5 29
+ 10ng/ml PDGF 150 8 ± 8 37 148 5 ± 10 7
Results are expressed as the average percentage growth relative to control (SFM*) ± standard deviation (n=8) Acid phosphatase was used as the end point for two separate experiments The SFM* contained (in addition to McCoys 5a) 10fig/ml insulin, 1 39/xg/ml FcjS04 and 5(ig/ml EDTA
108

For the growth factors, EGF was found to be slightly inhibitory while fi-FGF and PDGF were found to be stimulatory. EGF was found to exhibit 10-40% inhibition in the concentration range 1 - lOng/ml. fi-FGF was stimulatory at 1 - lOng/ml with the best
growth at lng/ml (1.67-fold to 2.30-fold over the control). At lOng/ml, fi-FGF was only
slightly less stimulatory, but at 50ng/ml, it had either lost its stimulatory ability or had become inhibitory. PDGF was tested at 1 - lOng/ml. Best growth was observed at lOng/ml
with 50% stimulation above the control.
3.1 .7 .4 Effect of selected variables on the growth of NRK cells in SFM
With the fact that so many of the factors were inhibitory in these experiments and
stimulatory in earlier experiments (section 3.1.7), it was necessary to re-examine some of the factors. It may be that in the presence of different components in the SFM or the
different basal media, factors may exhibit stimulatory or inhibitory effects.
Na2Se03 and NEAA showed the most consistent stimulation. The extent of stimulation was
low, about 40% above the control. The trace elements were tested again. ZnS04, Mo07,
SnCl2 and CuS04 showed stimulation in one of the assays and no effect in the other. The complete cocktail of trace elements (referred to as All*) was no more stimulatory than
NEAA. In addition, IL-4 and serum-free Briclone were also tested. Briclone is a SF supplement produced in the NCTCC which is known to contain IL-6 (normally used at 5 % (vol/vol) concentration).
Table 3.1.7.4.1 Growth response of NRK cells to selected variables
VARIABLES ASSAY 1 ASSAY 2 VARIABLES ASSAY 1 ASSAY 2
SFM’ 100.0 + 11.3 100.0 ±8.34 SFM 100.0 ± 11.9 100.0 ± 10.9
+ NiCl2 133.5 + 10.9 134.8 ± 17.6 + 5^g/ml Tf 120.9 ± 10.4 108.3 ± 18.1
+ SnCl2 124.3 + 10.6 94.53 ± 10.1 + 84.12/ig/ml LA 114.2 ± 12.6 104.5 ±9.05
+ CuS04 137.8+15.4 92.81 ± 6.75 + 1/ig/ml PA 107.8 ± 8.46 87.91 + 11.5
+ MoO, 133.5 ± 17.8 105.9 ±4.80 + 5ng/ml PA 99.39 ± 10.6 90.84 ± 8.86
+ ZnS04 134.8 ± 13.1 104.3 ± 7.07 + 10/ig/ml PA 77.72 ± 9.97 81.68 ±6.12
+ All* 122.6+9.84 95.62 ±6.91 + 0.01/ig/ml HDL 134.6 ± 15.6 63.74 ±4.39
+ NEAA(IX) 114.6 + 16.9 118.7 ± 11.5 + 0.05Mg/ml HDL 53.93 ±9.14 21.97 ±4.01
+ Na2Se03 144.9 ± 13.7 135.2 ±8.73 + 1.0/jg/ml HDL 14.45 ± 1.59 4.39 ± 2.19
phosphatase was used as the end point for two separate experiments. The SFM' contained (in addition to McCoys 5a) lO/ig/ml insulin, 1.39/ig/mI F&.SO, and 5/ig/ml EDTA. Abbreviations: HDL = Bovine derived high density lipoprotein; PA = phosphatidic acid; LPA = lysophosphatidic acid; LA = linoleic acid; All* = all trace elements used by Mendiaz (Appendix I)
109
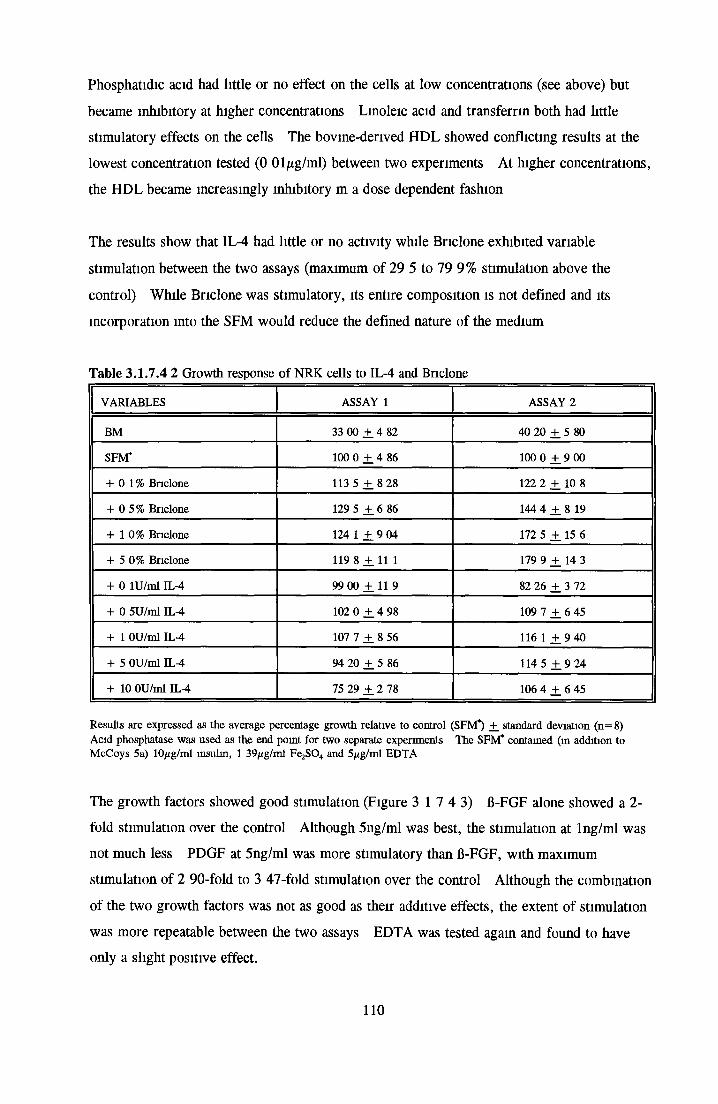
Phosphatidic acid had little or no effect on the cells at low concentrations (see above) but became inhibitory at higher concentrations Linoleic acid and transferrin both had little stimulatory effects on the cells The bovine-derived HDL showed conflicting results at the lowest concentration tested (0 01 tg/ml) between two experiments At higher concentrations, the HDL became increasingly inhibitory m a dose dependent fashion
The results show that IL-4 had little or no activity while Briclone exhibited variable
stimulation between the two assays (maximum of 29 5 to 79 9% stimulation above the
control) While Briclone was stimulatory, its entire composition is not defined and its incorporation into the SFM would reduce the defined nature of the medium
Table 3.1.7.4 2 Growth response of NRK cells to IL-4 and Bnclone
VARIABLES ASSAY 1 ASSAY 2
BM 33 00 ± 4 82 40 20 ± 5 80
SFM* 100 0 ± 4 86 100 0 ± 9 00
+ 0 1% Bnclone 113 5 ± 8 2 8 122 2 ± 10 8
+ 0 5% Bnclone 129 5 ± 6 86 144 4 ± 8 19
+ 10% Briclone 124 1 ± 9 04 172 5 ± 15 6
+ 5 0% Bnclone 119 8 ± 1 1 1 179 9 ± 14 3
+ 0 lU/ml IL-4 99 00 ± 1 1 9 82 26 ± 3 72
+ 0 5U/ml IL-4 102 0 ± 4 98 109 7 ± 6 45
+ 1 OU/ml IL-4 107 7 ± 8 56 116 1 ± 9 40
+ 5 OU/ml IL-4 94 20 ± 5 86 114 5 ± 9 24
+ 10 OU/ml IL-4 75 29 + 2 78 106 4 + 6 45--------------------------------------------------------------------
Results are expressed as the average percentage growth relative to control (SFM*) ± standard deviation (n= 8) Acid phosphatase was used as the end point for two separate experiments The SFM* contained (in addition to McCoys 5a) 10/ig/ml insulin, 1 39/ig/ml FejSO., and 5/ig/ml EDTA
The growth factors showed good stimulation (Figure 3 1 7 4 3) fi-FGF alone showed a 2- fold stimulation over the control Although 5ng/ml was best, the stimulation at lng/ml was not much less PDGF at 5ng/ml was more stimulatory than fi-FGF, with maximum stimulation of 2 90-fold to 3 47-fold stimulation over the control Although the combination
of the two growth factors was not as good as their additive effects, the extent of stimulation was more repeatable between the two assays EDTA was tested again and found to have only a slight positive effect.
110

Effect of growth factors on the growth of NRK cells in serum-free
medium
400 -
360 -
320
280 -
240
200 -
160
120
80
40
0
□ A ssay 1
0 A ssay 2
1m
I
I
i
I
I
A
Variables
Figure 3.1.7.4.3 shows the growth response of NRK cells to growth factors in serum-free media The results are expressed as the average percentage growth relative to control (serum-free medium*) ±_ standard deviation (n=8) Acid phosphatase was used as the end point and the results for 2 separate experiments are shown in Table 3 1 7 4 3 Abbreviations SFM* was 10/xg/ml insulin and 1 39/xg/ml FejSC in McCoys 5a basal medium
Table 3.1.7.4.3 Effect of growth factors on NRK cells
VARIABLES ASSAY 1 ASSAY 2
SFM 100 0 ± 1 0 4 100 0 ± 2 71
+ lng/ml ß-FGF 198 8 ± 16 9 174 8 ± 15 9
+ 5ng/ml ß-FGF 210 2 ± 3 0 9 207 9 ± 17 5
+ 5ng/ml PDGF 346 6 ± 30 4 269 2 ± 52 4
+ 5ng/ml PDGF+ 5ng/ml ß-FGF 384 7 ± 28 9 371 9 ± 4 53
+ EDTA 102 8 + 7 49 103 3 + 11 9
111

When the effects of the trace elements m the absence of Na^eOj and NEAA were
investigated (Table 3 17 4 1), there was some differences from the results obtained in the
presence of Na2Se0 3 and NEAA (see Table 3 1 7 2 2) Therefore, from all the experiments carried out, a ratio of the growth achieved in SFM to the growth achieved in basal medium
was obtained The ratios for each experiment and the components of each SFM are shown m Table 3 1 7 4 4 By far the best ratio was the combination of 10fig/m 1 insulin,1 39/ig/ml Fe2S04 and ljig/ml EDTA
Table 3.1.7.4.4 Comparison of SFM to BM
EXPERIMENT SFM/BM RATIO COMPONENTS OF SFM
3 1 6 1 19 Ins/Tf/PGE/HC/T,
145 Ins/Tf/NEAA/LA/CaCl2/Fe2S04
3 17 1 1 096 ± 0 05 Ins/Fe2S04/EGF/TI/EDTA
3 1 7 2 2 09 + 0 17 Ins/FejSO/TI/EDTA
3 17 3 1 68 + 0 39 Ins/Tf/Na2Se03/NEAA/Fe2S04/EDTA
3 1 7 4 2 24 + 0 49 Ins/Fe2S04/EDTA
112
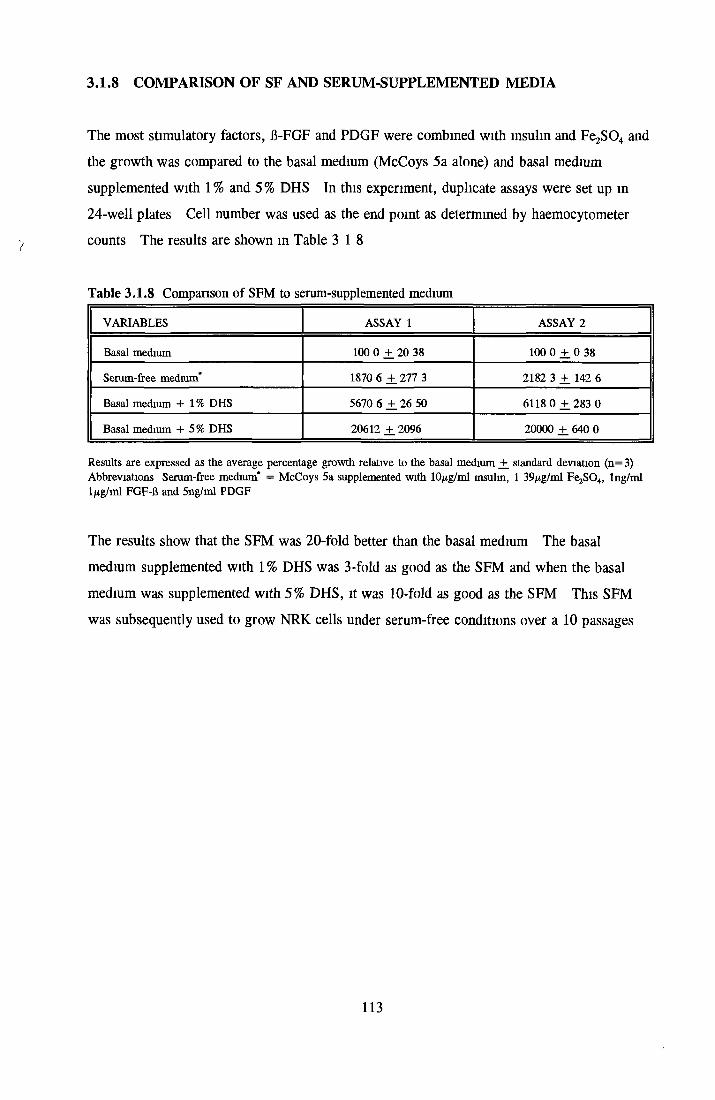
3.1.8 COMPARISON OF SF AND SERUM-SUPPLEMENTED MEDIA
The most stimulatory factors, fi-FGF and PDGF were combined with insulin and Fe2S04 and
the growth was compared to the basal medium (McCoys 5a alone) and basal medium supplemented with 1 % and 5 % DHS In this experiment, duplicate assays were set up in 24-well plates Cell number was used as the end point as determined by haemocytometer counts The results are shown in Table 3 18
Table 3.1.8 Comparison of SFM to serum-supplemented medium
VARIABLES ASSAY 1 ASSAY 2
Basal medium 100 0 ± 20 38 100 0 +. 0 38
Serum-free medium* 1870 6 +. 277 3 2182 3 ± 142 6
Basal medium + 1 % DHS 5670 6 ± 26 50 6118 0 ± 2 8 3 0
Basal medium + 5% DHS 20612 ± 2096 20000 ± 640 0
Results are expressed as the average percentage growth relative to the basal medium _+ standard deviation (n=3) Abbreviations Serum-free medium* - McCoys 5a supplemented with 10/xg/ml insulin, 1 39/ig/ml Fe^O,,, lng/ml 1/ig/ml FGF-fl and 5ng/ml PDGF
The results show that the SFM was 20-fold better than the basal medium The basal medium supplemented with 1 % DHS was 3-fold as good as the SFM and when the basal medium was supplemented with 5% DHS, it was 10-fold as good as the SFM This SFM
was subsequently used to grow NRK cells under serum-free conditions over a 10 passages
113
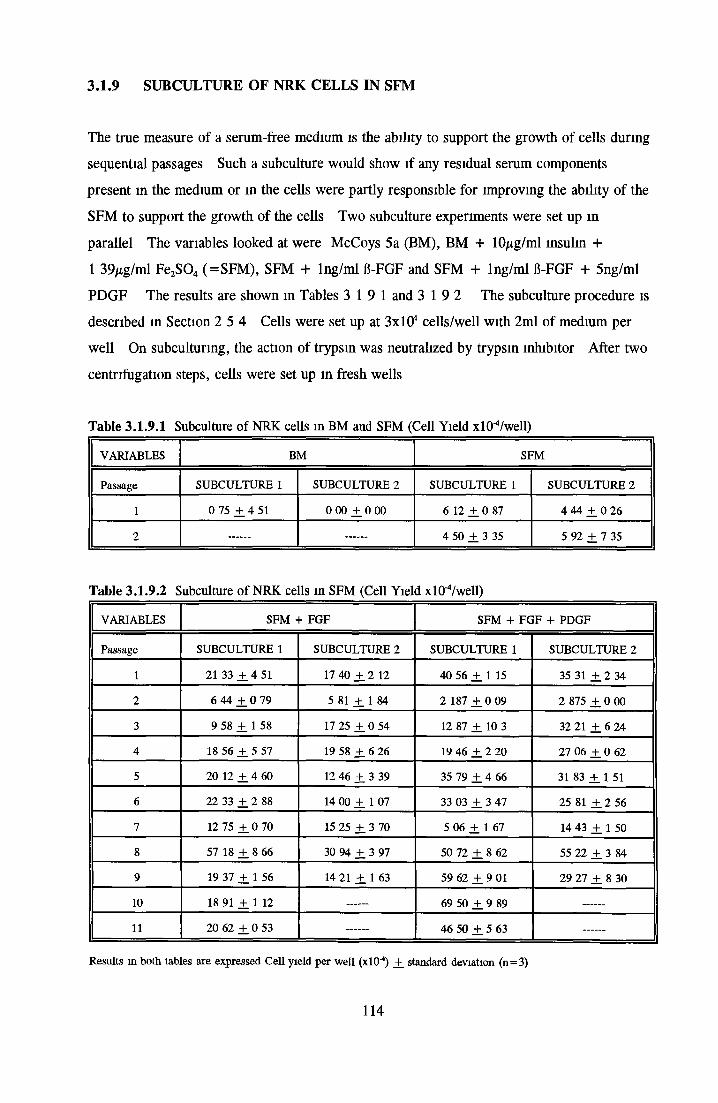
3.1.9 SUBCULTURE OF NRK CELLS IN SFM
The true measure of a serum-free medium is the ability to support the growth of cells during sequential passages Such a subculture would show if any residual serum components
present in the medium or in the cells were partly responsible for improving the ability of the
SFM to support the growth of the cells Two subculture experiments were set up in
parallel The variables looked at were McCoys 5a (BM), BM + lOjtg/ml insulin +1 39/xg/ml Fe2S04 (=SFM), SFM + lng/ml fi-FGF and SFM + lng/ml B-FGF + 5ng/ml
PDGF The results are shown in Tables 3 19 1 and 3 19 2 The subculture procedure is described in Section 2 5 4 Cells were set up at 3x10* cells/well with 2ml of medium per
well On subculturing, the action of trypsin was neutralized by trypsin inhibitor After two centrifugation steps, cells were set up in fresh wells
Table 3.1.9.1 Subculture of NRK cells in BM and SFM (Cell Yield xlO^/well)
VARIABLES BM SFM
Passage SUBCULTURE 1 SUBCULTURE 2 SUBCULTURE 1 SUBCULTURE 2
1 0 75 ± 4 51 0 00 ± 0 00 6 12 + 0 87 4 44 ± 0 26
2 4 50 ± 3 35 5 92 + 7 35
Table 3.1.9.2 Subculture of NRK cells in SFM (Cell Yield xl(TVwell)
VARIABLES SFM + FGF SFM + FGF + PDGF
Passage SUBCULTURE 1 SUBCULTURE 2 SUBCULTURE 1 SUBCULTURE 2
1 21 33 ± 4 51 17 40 ± 2 12 40 56 ± 1 15 35 31 +. 2 34
2 6 44 ± 0 79 5 81 1 84 2 187 ± 0 09 2 875 +_ 0 00
3 9 58 ± 1 58 17 25 ± 0 54 12 87 ± 10 3 32 21 ± 6 24
4 18 56 ± 5 57 19 58 ± 6 26 19 46 +. 2 20 27 06 ± 0 62
5 20 12 ± 4 60 12 46 ± 3 39 35 79 ± 4 66 31 83 + 1 51
6 22 33 ± 2 88 14 00 ± 1 07 33 03 ± 3 47 25 81 ± 2 56
7 12 75 +. 0 70 15 25 +_ 3 70 5 06 + 1 67 14 43 ± 1 50
8 57 18 ± 8 66 30 94 ± 3 97 50 72 ± 8 62 55 22 +. 3 84
9 19 37 +. 1 56 14 21 ± 1 63 59 62 ± 9 01 29 27 ± 8 30
10 18 91 ± 1 12 69 50 ± 9 89
11 20 62 ± 0 53 46 50 ± 5 63
Results in both tables are expressed Cell yield per well (xlC) +_ standard deviation (n=3)
114
{
The results show that the SFM when supplemented with FGF or FGF and PDGF could support the growth of NRK cells in SFM, although the growth was low at times The basal medium alone could not support growth In the SFM (McCoys 5a + 10/zg/ml insulin +
1 39/xg/ml Fe2S04), growth was low and only continued through two passages, becoming increasingly variable in its ability to support growth For the more complex SFM
(incorporating B-FGF or fi-FGF and PDGF) growth continued until the end of the
experiment After inoculation at passage 10, assay 2 became contaminated In general growth was better m subculture 1 than subculture 2
In the second passage, the growth was very low This may have been due to the cells properly adapting to serum-free conditions Up until passage 7, cells were fed every 4 days with fresh medium When this was then stopped a big increase of nearly 2-fold relative to
earlier passages was seen in the SFM containing FGF and PDGF Although an increase was
seen in passage 7 for the SFM containing B-FGF, it was not maintained through to further passages, while continued high growth activity in the SFM with B-FGF and PDGF was seen This may indicate the presence of some autocrine activity for the NRK cells It was interesting that this increased activity only occurred with the combination of FGF and
PDGF In addition, at passages 9 - 11, it was observed that the medium containing FGF and PDGF had much fewer cells floating in suspension than in the SFM with FGF only
In conclusion for this section, we set out to grow NRK cells m a SFM described in the literature (Rizzino, 1984) for the NRK subclone 49F When the NRK cells would not grow
in this SFM, it was decided to develop a new SFM Thus two media have been developed to grow NRK cells in low serum and serum-free medium In low serum, 1 % DHS
supplemented with 0 5mg/ml BSA, 5/xg/ml insulin, 5/ig/ml transferrin and lng/ml EGF, was more stimulatory than 5% FCS In serum-free medium, McCoys 5a supplemented with 10/xg/ml msulm, 1 39jug/ml Fe^C^, lng/ml B-FGF and 5ng/ml PDGF, was capable of supporting the growth of NRK cells at low initial cell densities through 10 passages However, the extent of growth was much lower than that obtained in the serum- supplemented medium (10-fold less as seen in section 3 1 8)
115
3.2 DEVELOPMENT OF SERUM-FREE ASSAY SYSTEMS
Two new cell lines were introduced into the investigations, Madin-Darby Canine Kidney (MDCK) and Chinese Hamster Ovary (CHOK1) cells For both cell lines, serum-free media have been reported It was hoped to use these established serum-free systems to investigate the possibility of replacing animal-derived proteins with either recombinant proteins or with non-
ammal-derived compounds For MDCK, a SFM was developed by Taub et al in 1979 The
most important components in the medium were found to be transferrin and prostaglandin This therefore appeared to be a suitable system to study the replacement of transferrin However,
before this could be done it was necessary to ensure that a suitable assay system was used which could detect the effects of varying transferrin or its concentrations in serum-free medium All subsequent investigations with MDCK refer to the SFM described by Taub in 1979
For CHOK1 cells several serum-free media were reported (Mendiaz et a l , 1986, Hamilton and Ham, 1977 and Darfler, 1990) Some investigations found that insulin-independent mutants
developed in serum-free medium spontaneously even though insulin was incorporated into the
SFM (Mendiaz et a l , 1986) Transferrin was found not to be necessary but was still incorporated into the SFM since it had some stimulatory effect at low concentrations of Fe^O,, If the insulin and transferrin could either be removed or replaced by recombinant products or
non animal-derived compounds, the SFM would be devoid of any animal-derived component It was necessary first to get the cells to grow under serum-free conditions, before discovering
whether any of these systems were suitable for further investigations
3.2.1 MDCK CELLS IN SFM
The serum-free medium initially described by Taub et al m 1979 uses ATCC as the basal medium (ATCC = 11 vol/vol DMEM Ham’s F12) The medium was buffered with 15mM HEPES and 1 lmg/ml NaHC03 The additional factors were lOnM Na2Se0 3, 5/ig/ml insulin, 5/ig/ml transferrin, 25ng/ml prostaglandin E1; 5pM tri-iodothyromne and 50nM Hydrocortisone This SFM had been used already in this laboratory by Edel Murphy (1986) She found that while the SFM promoted growth in open systems, problems existed when attempts were made to subculture the cells in tissue culture flasks
116

3.2.1.1 Growth response of M DCK cells in SFM
A growth curve experiment was set up to find out how effectively the serum-free medium
worked Three parameters were investigated over a period o f 8 days basal medium, SFM and
serum-supplemented medium The basal medium consisted of ATCC supplemented with
HEPES, N aH C 02 and Na^eC^ as above and 1-glutamine The serum-supplemented medium
consisted o f ATCC, 7 5% NaH C02, lOmM HEPES, 5% FCS (#109) and 1-glutamine Cells
were set up at 5 x l0 3 cells/w ell in 24-well plates Triphcate assays of SFM and serum-
supplemented medium (SSM) were carried out, with only duplicates o f the basal medium
After several intervals o f time the plates were taken down and the viable cell number per well
was determined using a haemocytometer Cell counts were chosen as no comparison o f image
analysis or acid phosphatase had been carried out The results are shown in Figure 3 2 1 1
Over a period o f 8 days the basal medium could not support cell growth and division It did
however, support cell viability After a lag phase o f 4 to 5 days in the SFM, the cell number
began to increase and on day 8 showed a slightly higher cell number than that obtained in the
SSM on day 8 The SSM also showed a lag phase o f about 2 days, after which exponential
growth appeared until day 5 Between day 5 and 8, the rate of growth appeared to have
decreased
These results show that the SFM described by Taub supported the growth of MDCK cells The
growth was initially slower than in SSM but by day 8, good growth was obtained The
observation that growth in SFM was better than in SSM by day 8 may have been due to the
possibility o f the cells in SSM being in a decline phase Peak growth m SSM probably
occurred between days 5 and 8
Table 3 2.1.1 Growth curve of different media (Cells per well xlO-4)
SSM ASSAY 1 ASSAY 2 ASSAY 3
Day 2 1 900 + 0 44 1 760 ± 0 451 1 933 ± 1 069
Day 3 5 952 ± 0 88 5 967 + 1 136 5 560 +_ 0 950
Day 4 15 60 + 0 14 19 56 + 2 800 20 28 + 2 940
Day 5 30 97 + 4 76 33 80 + 6 210 33 83 + 4 040
Day 8 43 45 ± 1 91 43 70 + 7 562 38 30 +_ 0 608
Results are expressed as cell number (xlO4) _+ standard deviation (n=3) Abbreviations SSM = Serum-supplemented medium
117
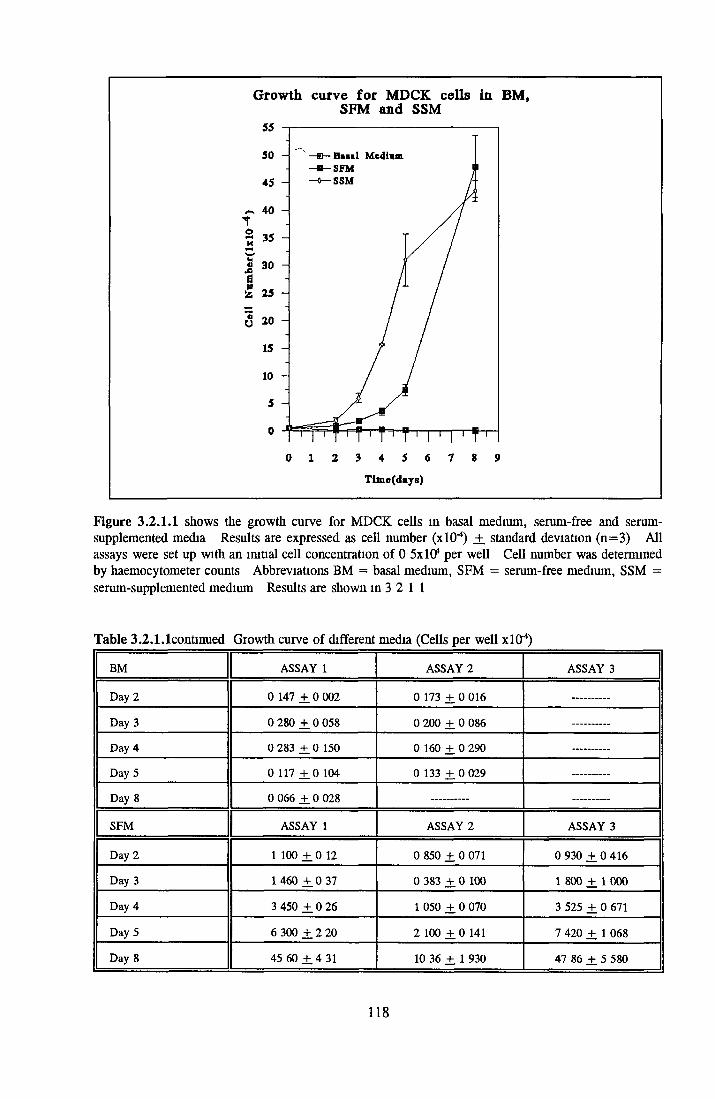
Growth curve for MDCK cells in BM, SFM and SSM
0 1 2 3 4 5 6 7 8 9Tilne(days)
Figure 3.2.1.1 shows the growth curve for MDCK cells in basal medium, serum-free and serum- supplemented media Results are expressed as cell number (xlO-4) _+ standard deviation (n=3) All assays were set up with an initial cell concentration of 0 5x10* per well Cell number was determined by haemocytometer counts Abbreviations BM = basal medium, SFM = serum-free medium, SSM = serum-supplemented medium Results are shown in 3 2 1 1
Table 3 .2 .1 .lcontmued Growth curve of different media (Cells per well xlO"4)
BM ASSAY 1 ASSAY 2 ASSAY 3
Day 2 0 147 ± 0 002 0 173 + 0 016
Day 3 0 280 ± 0 058 0 200 + 0 086
Day 4 0 283 +. 0 150 0 160 + 0 290 -------------
Day 5 0 117 ± 0 104 0 133 + 0 029
Day 8 0 066 +. 0 028
SFM ASSAY 1 ASSAY 2 ASSAY 3
Day 2 1 100 ± 0 12 0 850 + 0 071 0 930 ± 0 416
Day 3 1 460 + 0 37 0 383 + 0 100 1 800 + 1 000
Day 4 3 450 ± 0 26 1 050 + 0 070 3 525 ± 0 671
Day 5 6 300 +. 2 20 2 100 + 0 141 7 420 + 1 068
Day 8 45 60 + 4 31 10 36 ± 1 930 47 86 ± 5 580
118
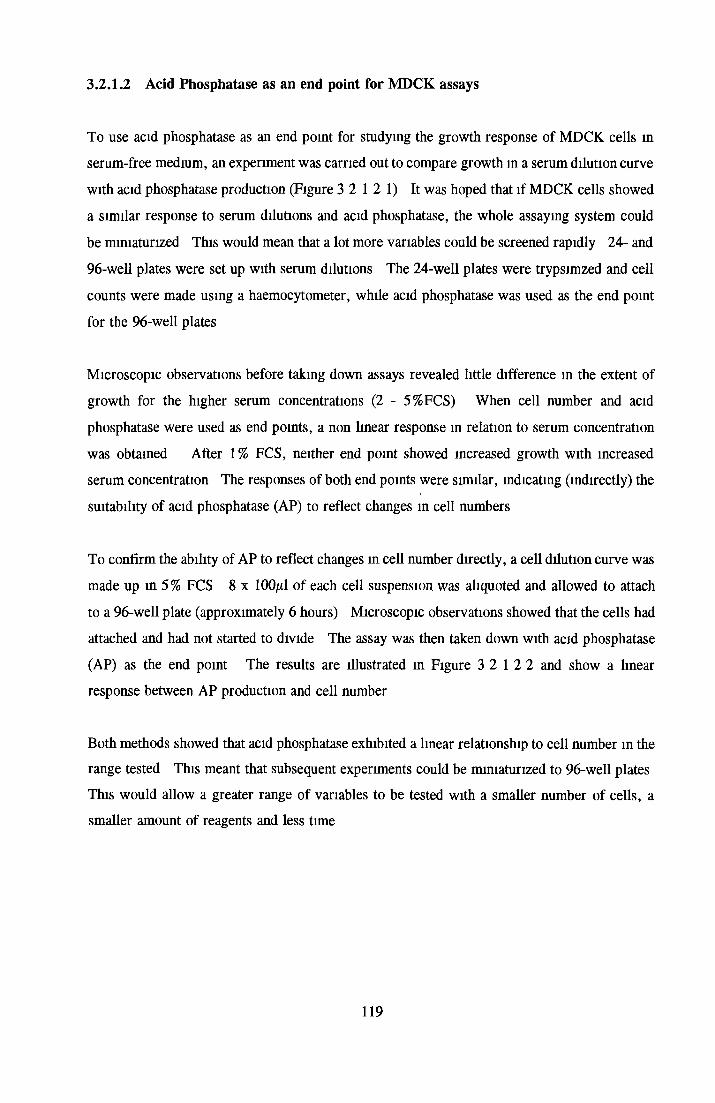
3.2.1.2 Acid Phosphatase as an end point for MDCK assays
To use acid phosphatase as an end point for studying the growth response o f MDCK cells in
serum-free medium, an experiment was carried out to compare growth in a serum dilution curve
with acid phosphatase production (Figure 3 2 1 2 1) It was hoped that if MDCK cells showed
a similar response to serum dilutions and acid phosphatase, the whole assaying system could
be miniaturized This would mean that a lot more variables could be screened rapidly 24- and
96-well plates were set up with serum dilutions The 24-well plates were trypsimzed and cell
counts were made using a haemocytometer, while acid phosphatase was used as the end point
for the 96-well plates
Microscopic observations before taking down assays revealed little difference in the extent of
growth for the higher serum concentrations (2 - 5%FCS) When cell number and acid
phosphatase were used as end points, a non linear response in relation to serum concentration
was obtained After 1% FCS, neither end point showed increased growth with increased
serum concentration The responses of both end points were similar, indicating (indirectly) the
suitability o f acid phosphatase (AP) to reflect changes in cell numbers
To confirm the ability o f AP to reflect changes in cell number directly, a cell dilution curve was
made up in 5% FCS 8 x lOO/il o f each cell suspension was aliquoted and allowed to attach
to a 96-well plate (approximately 6 hours) Microscopic observations showed that the cells had
attached and had not started to divide The assay was then taken down with acid phosphatase
(AP) as the end point The results are illustrated in Figure 3 2 1 2 2 and show a linear
response between AP production and cell number
Both methods showed that acid phosphatase exhibited a linear relationship to cell number in the
range tested This meant that subsequent experiments could be miniaturized to 96-well plates
This would allow a greater range o f variables to be tested with a smaller number of cells, a
smaller amount of reagents and less time
119
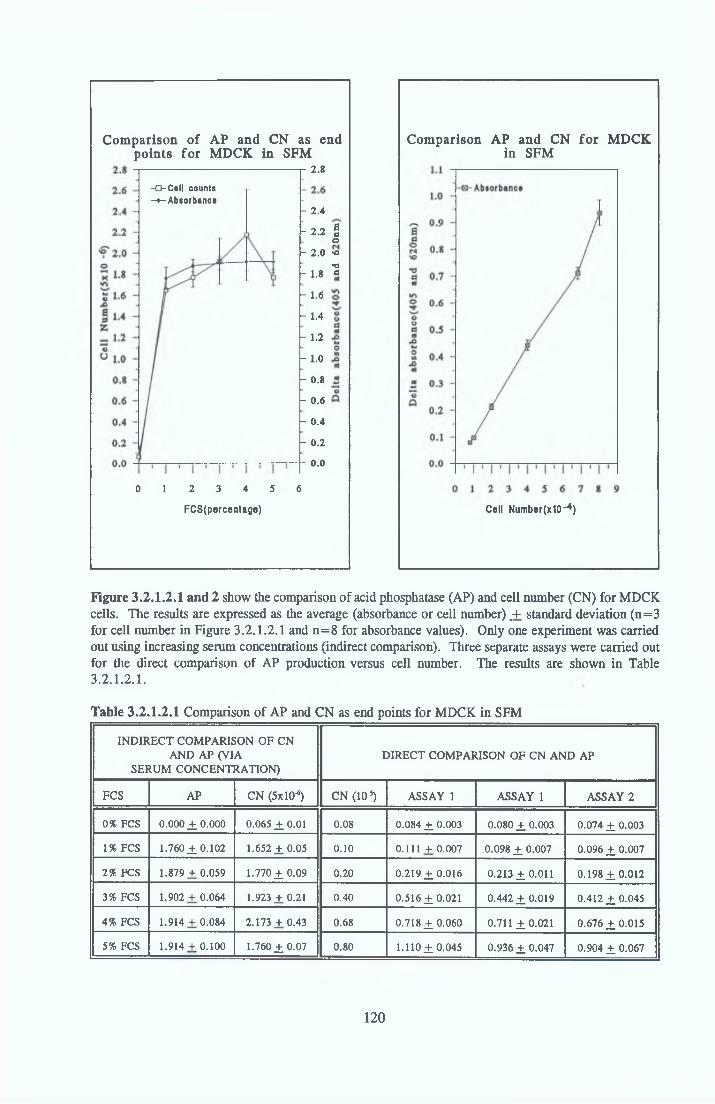
-D -C e ll counts -» -A b « o rb » n ce
Comparison of AP and CN as end points for MDCK in SFM
2.8
0 1 2 3 4 5
FCS(percentage)
- 2.4
- 2.2
- 2.0
- 1.8
- 1.6
- 1.4
- 1.2
- 1.0
- 0.8
- 0 .6
- 0.4
- 0.2
- 0.0
6
adoO*T3tí
Comparison AP and CN for MDCK in SFM
Cell Number(x10"4)
Figure 3.2.1.2.1 and 2 show the comparison of acid phosphatase (AP) and cell number (CN) for MDCK cells. The results are expressed as the average (absorbance or cell number) _+ standard deviation (n=3 for cell number in Figure 3.2.1.2.1 and n=8 for absorbance values). Only one experiment was carried out using increasing serum concentrations (indirect comparison). Three separate assays were carried out for die direct comparison of AP production versus cell number. The results are shown in Table 3.2.1.2.1.
Table 3.2.1.2.1 Comparison of AP and CN as end points for MDCK in SFM
INDIRECT COMPARISON OF CN AND AP (VIA
SERUM CONCENTRATION)DIRECT COMPARISON OF CN AND AP
FCS AP CN (5x10*) CN (10-5) ASSAY 1 ASSAY 1 ASSAY 2
0% FCS 0.000 ± 0.000 0.065 ± 0.01 0.08 0.084 ± 0.003 0.080 ± 0.003 0.074 ± 0.003
1% FCS 1.760 ±0.102 1.652 + 0.05 0.10 0.111 + 0.007 0.098 ± 0.007 0.096 ±0.007
2% FCS 1.879 + 0.059 1.770 ± 0.09 0.20 0.219 ±0.016 0.213 ±0.011 0.198 ±0.012
3% FCS 1.902 + 0.064 1.923 + 0.21 0.40 0.516 ±0.021 0.442 ± 0.019 0.412 ±0.045
4% FCS 1.914 + 0.084 2.173 + 0.43 0.68 0.718 ±0.060 0.711 ±0.021 0.676 ±0.015
5% FCS 1.914 + 0.100 1.760 ±0.07 0.80 1.110 ± 0.045 0.936 ±0.047 0.904 ±0.067
120
3.2.1.3 Effect of insulin on MDCK cells m SFM
Initial studies were carried out to investigate the response of MDCK cells to varied concentrations of bovine insulin The results are shown in Figure 3 2 13 Assays were set up so that the only variable component of the SFM was insulin
The results show that increasing concentrations of insulin resulted m increased growth up to
approximately 5 to 10/ig/ml where maximum activity was seen The extent of stimulation varied between 1 9-fold and 2 5-fold over the control (no insulin) In all (discounting standard
deviations) assays, the extent of stimulation decreased between 10 to 20/ng/ml
3.1.2.4 Effect of transferrin on MDCK cells in SFM
Initial studies were carried out to see how responsive MDCK cells were to bovine transferrin
Taub (1979) reported that transferrin was the second most important component m the serum-
free medium after prostaglandin The results are shown in Figure 3 2 14 Assays were set up so that transferrin was the only variable component m the SFM
The results showed that increasing concentrations of transferrin resulted in increased growth Maximum stimulation occurred at 5 - 20/xg/ml The extent of maximum stimulation varied
between assays, 1 37-fold to 4-fold stimulation over the control (no transferrin) In contrast
with the results obtained for insulin, no loss of stimulation was seen at the highest concentration tested (20/xg/ml)
3.2.1.5 Effect of bovine serum albumin on MDCK cells in SFM
The effects of BSA fraction V and fatty acid free on the growth of MDCK cells in SFM were investigated (Figure 3 2 15) In three of four assays, BSA fatty acid free was marginally more stimulatory than BSA fraction V Both showed stimulation at the lower concentrations (0 1 and 0 5mg/ml) but the extent of stimulation was low, only reaching a maximum of 24 2 to 52 6% for fraction V and 33 2 - 63 9% for fatty acid free growth above the control (SFM, no added BSA) At higher concentrations both became increasingly inhibitory BSA fraction V was more inhibitory than BSA fatty acid free at these concentrations and marginally less stimulatory at the lower concentrations
121
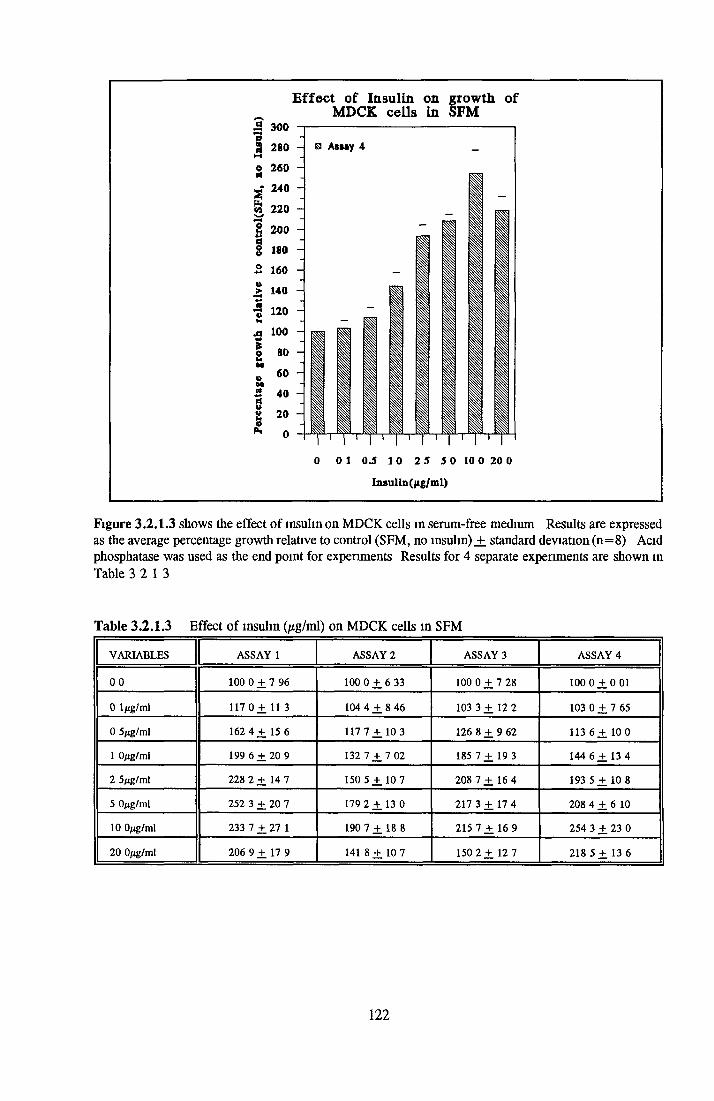
Figure 3.2.1.3 shows the effect of insulin on MDCK cells in serum-free medium Results are expressed as the average percentage growth relative to control (SFM, no insulin) _+ standard deviation (n=8) Acid phosphatase was used as the end point for experiments Results for 4 separate experiments are shown in Table 3 2 13
Table 3.2.1.3 Effect of insulin (/xg/ml) on MDCK cells in SFM
VARIABLES ASSAY 1 ASSAY 2 ASSAY 3 ASSAY 4
0 0 100 0 + 7 96 100 0 ± 6 33 100 0 ± 7 28 100 0 ± 0 01
0 1/ig/ml 117 0 + 11 3 104 4 ± 8 46 103 3 ± 12 2 103 0 ± 7 65
0 5fig/ml 162 4 + 15 6 117 7 + 10 3 126 8 ± 9 62 113 6 ± 100
1 0/ig/ml 199 6 4:20 9 132 7 ± 7 02 185 7 ± 19 3 144 6 ± 13 4
2 5/xg/ml 228 2 + 147 150 5 ± 1 0 7 208 7 ± 1 6 4 193 5 ± 10 8
5 0/ig/ml 252 3 ± 20 7 179 2 ± 13 0 217 3 ± 1 7 4 208 4 ± 6 10
10 0/ig/ml 233 7 ± 27 1 190 7 ± 1 8 8 215 7 ± 16 9 254 3 ± 23 0
20 0/ig/ml 206 9 ± 17 9 141 8 ± 1 0 7 150 2 ± 12 7 218 5 ± 13 6
122

Figure 3.2.1.4 shows the effect of transferrin on MDCK cells in serum-free medium Results are expressed as the average percentage growth relative to control (SFM, no transferrin) ±_ standard deviation (n=8) Acid phosphatase was used as the end point for experiments Results for 4 separate experiments are shown in Table 3 2 14
Table 3.2.1.4 Effect of transfemn (¿tg/ml) on MDCK cells in SFM
VARIABLES ASSAY 1 ASSAY 2 ASSAY 3 ASSAY 4
0 0 100 0 + 11 8 100 0 ± 3 95 100 0 ± 9 57 100 0 + 5 08
0 1 fig/ml 130 5 + 10 7 100 8 ± 7 39 110 0 .+ 9 22 104 3 + 11 4
0 5/ig/ml 238 6 ± 20 2 125 2 ± 9 22 122 8 + 6 69 128 2 ± 13 8
1 0/ug/ml 273 1 ± 16 6 127 8 ± 8 70 168 9 ± 14 2 152 8 + 14 6
2 5/xg/ml 310 8 ± 14 3 135 9 + 7 79 175 9 ± 15 2 165 7 + 9 80
5 0/ig/ml 317 5 + 22 9 137 9 + 9 87 214 2 ± 20 1 202 1 + 18 9
10 0/ig/ml 408 1 ± 14 6 136 9 + 9 48 230 9 ± 17 3 211 4 ± 2 1 5
20 0/ig/ml 405 0 + 19 3 130 3 ± 10 1 232 8 4 :18 3 229 1 ± 17 9
123

« 220Effect of albumin on growth of
MDCK cells In SFMno - loo -190 - 180 - 170 160 - 150 - 140 -j 130 - 120 -
110 -
100 -
90 - 80 - 70 60 - 5040 -30 20 -
10 -
0 -
□ A m j 4t B3A fraction V□ A m y 4t BSA f i l
1
1
0 0 1 0 3 IX) 1 3 5 0 10 0
Albumin (mg/ml)
Figure 3.2.1.5 shows the effect of BSA fraction V and fatty acid free on MDCK cells in serum-free medium Results are expressed as the average percentage growth relative to control (SFM, no BSA) _+ standard deviation (n=8) Abbreviations Con = Control (no BSA) Acid phosphatase was used as the end point for experiments Results for 4 separate experiments are shown in Tables 3 2 1 5a and b
Table 3.2 1.5a Effect of BSA fraction V (mg/ml) on MDCK cells in SFM
VARIABLES ASSAY 1 ASSAY 2 ASSAY 3 ASSAY 4
0 0 1000 + 3 30 100 0 ± 7 80 100 0 ± 6 21 100 0 ± 7 66
0 1 mg/ml 152 6 + 9 2 4 116 8 + 9 87 120 5 12 5 129 2 ± 7 36
0 5mg/ml 138 9 ± 10 3 125 4 ± 16 6 124 2 ± 12 9 105 1 ± 9 44
1 Omg/ml 111 7 + 9 88 107 0 ± 11 6 100 0 ± 1 3 0 84 46 ± 7 49
2 5mg/ml 84 59 ± 6 16 79 00 ± 34 4 75 18 ± 6 81 34 05 ± 6 09
5 Omg/ml 58 70 ± 4 17 1000 + 5 60 70 54 ± 11 1 9 620 ± 0 48
10 Omg/ml 30 65 ± 3 94 85 83 ± 5 60 65 89 ± 13 9 0 010 ± 0 24
Table 3.2.1.5b Effect of BSA fatty acid free (mg/ml) on MDCK cells in SFM
VARIABLES ASSAY 1 ASSAY 2 ASSAY 3 ASSAY 4
0 0 100 0 ± 17 5 100 0 ± 6 69 100 0 ± 8 40 100 0 ± 5 56
0 1 mg/ml 163 9 ± 18 2 89 46 ± 5 77 122 8 ± 11 5 133 2 ± 5 46
0 5mg/ml 145 2 ± 9 04 136 4 ± 10 4 149 1 ± 14 9 113 9 ± 8 66
1 Omg/ml 116 8 ± 7 84 156 5 ± 7 90 130 7 ± 1 4 8 93 52 ± 7 51
2 5mg/ml 79 47 ± 6 88 159 9 ± 7 15 117 2 ± 7 95 52 20 ± 3 38
5 Omg/ml 58 38 ± 4 27 137 3 ± 10 1 108 2 ± 8 96 37 31 ± 1 73
10 Omg/ml 42 01 ± 3 10 110 6 ± 9 80 94 60 ± 5 18 21 98 ± 3 23
124

3.2.1.6 Subculture of MDCK cells in SFM
The results described above confirm that MDCK cells grow well in SFM However, the real
test of a SFM is the ability of the medium to support growth and proliferation over a period of
time Figure 3 2 1 6 shows the result of triplicate experiments in which three flasks per assay
were subcultured 9 times After the first 4 days in serum-free medium, cells appeared 90%
confluent, so subsequent subcultures were carried out every 4 days For each experiment,
400ml of SFM was made up These were aliquoted out for each subculture and frozen at -
20°C Sufficient media was then thawed down slowly at 4°C before use Cell counts were
determined using a haemocytometer Fresh flasks were inoculated with 2xl05 cells per flask
at each subculture
In an initial experiment, MDCK cells were set up in closed flasks The medium turned basic
and the cells would not grow (previously reported by Edel Murphy, 1986) However, in an
open system as seen with petri dishes, 24-well and 96-well plates, good growth occurred
There was obviously something causing the pH to rise It may be that either HEPES or
sodium bicarbonate is inhibitory to MDCK cells under closed serum-free conditions (as m a
closed buffered system) Indeed HEPES has been found to be inhibitory to some cells under
serum-free conditions (Bowman e t a l , 1985, Bell and Quinton, 1991) It may also be that,
under closed serum-free conditions, either of or both of the buffers could react adversely with
some other component of the serum-free medium As there were many possible reasons for the
change in pH, it was decided to try vented flasks The cells grew well, so it was decided to
use vented flasks in the subculture experiment
Microscopic observations showed no significant difference between cells in serum-free medium
and serum-supplemented medium In addition, growth was almost as good as that seen with
5 % FCS This was observed in the first three subcultures as flasks with serum containing
media required trypsmizing every three to four days However, no cell count was made
The results show that the cells did not appear to need a period of adaption to grow m SFM
The cells were passaged 9 times over a period of 40 days (subcultured at 2x10s cells per 25cm2
flask every four days) This meant that the cells could be grown in SFM for several passages
before being used m an assay which in turn meant that no carry over from the serum could
affect the experiment
125
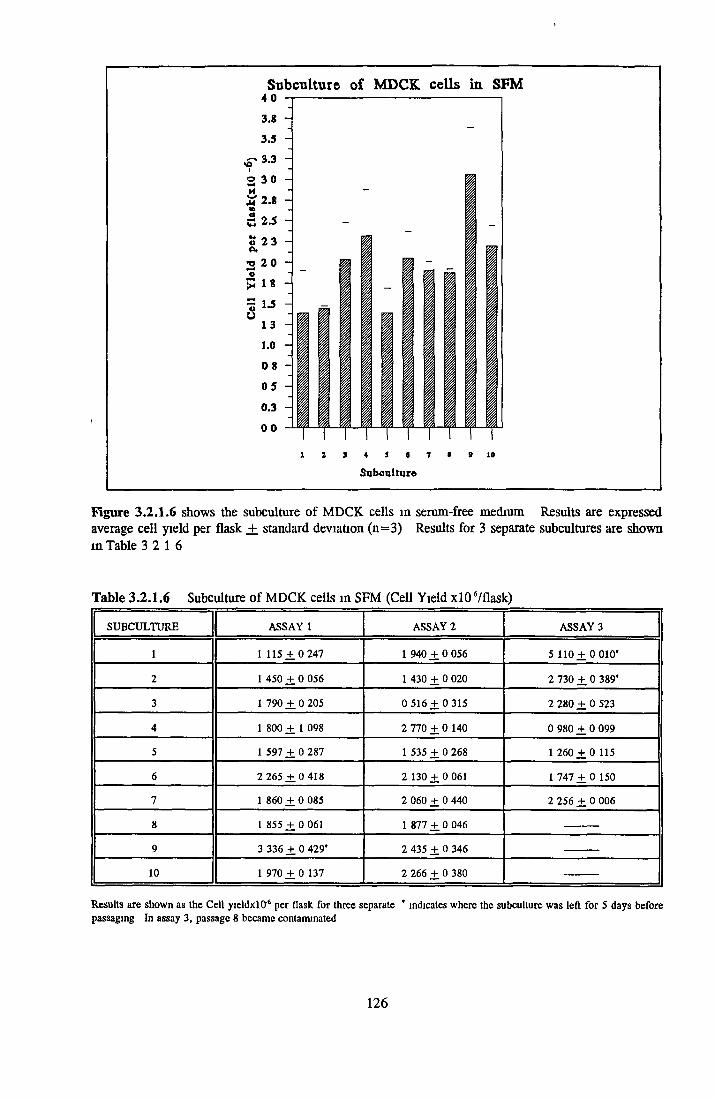
Subculture of MDCK cells in SFM 4 o
3.8
3.5
f 3-3 2 3 0HM 2.8
1 2.5« 2 3(V.2 20 «S 1«
= 1-5U1 3
1.0
0 8
0 5
0.3
001 Z J 4 5 0 7 I 9 10
Subculture
Figure 3.2.1.6 shows the subculture of MDCK cells in serum-free medium Results are expressed average cell yield per flask _± standard deviation (a=3) Results for 3 separate subcultures are shown m Table 3 2 1 6
Table 3.2.1.6 Subculture of MDCK cells in SFM (Cell Yield xlO Vflask)
SUBCULTURE ASSAY 1 ASSAY 2 ASSAY 3
1 1 115 ± 0 247 1 940 ± 0 056 5 110 ± 0 010'
2 1 450 ± 0 056 1 430 ± 0 020 2 730 ± 0 389’
3 1 790 ± 0 205 0 516 ± 0 315 2 280 ± 0 523
4 1 800 ± 1 098 2 770 ± 0 140 0 980 ± 0 099
5 1 597 ± 0 287 1 535 ± 0 268 1 260 ± 0 115
6 2 265 ± 0 418 2 130 ± 0 061 1 747 ± 0 150
7 1 860 ± 0 085 2 060 ± 0 440 2 256 ± 0 006
8 1 855 ± 0 061 1 877 ± 0 046
9 3 336 ± 0 429* 2 435 ± 0 346
10 1 970 ± 0 137 2 266 ± 0 380
Results are shown as the Cell yieldxlCT6 per flask for three separate ' indicates where the subculture was left for 5 days before passaging In assay 3, passage 8 became contaminated
126
In summary, the results show that MDCK cells could be grown in the SFM described by Taub (1979) The assay procedure was miniaturized with acid phosphatase as the end point Varying both insulin and transferrin showed growth response and indicated that both could be used as a basis for studying the removal of animal-derived products from SFM Albumin, either BSA
fraction V or fatty acid free, had very little stimulatory effect at low concentrations and became increasingly inhibitory at higher concentrations
The MDCK cells were subcultured in SFM for 9 passages and showed no significant adaption period The ability of the cells to grow for many passages m serum-free medium meant that the cells could be grown for one passage in SFM before assaying for insulin or transferrin
replacements This would ensure the absence of residual serum contaminants (present inside
the cells) which could otherwise interfere with results
127
3.2.2 CHOK1 CELLS IN SFM
Many SFM have been cited to support the growth of CHOK1 cells Ham’s F12 was originally designed to support the clonal growth of such cells in defined medium (Ham, 1965) Later,
however, this basal medium on its own was found not to be sufficient to support growth (Hamilton and Ham, 1977) For the present studies, a modified Ham’s F12 developed by
Mendiaz et al (1986) was assessed Ham’s F12 was buffered by 1 176 g/1 NaHC03 and 7 55 mM HEPES The medium was further supplemented with 3xl02 /xM Na^eC^, 5/jlM FeS04, 5/xg/ml transferrin, 10/xg/ml insulin, 0 3/*M linoleic acid, lxlO'^M NEAA and 6xlO‘2/xM
CaCl2 The trace elements quoted by Mendiaz (Appendix J) were omitted initially as these were
added only to ensure reproducibility between différent batches of Ham’s F12
3.2.2.1 Growth response of CHOK1 cells in SFM
Several attempts were made to get CHOK1 cells to grow in the SFM described The cells did not attach and spread Two attachment factors, fibronectm and lamimn, were used to try and
increase attachment, but no improvement was seen This suggested that after trypsinizmg and
the initial centrifugation, some residual trypsin may have remained in the medium preventing proper attachment Two centrifugation steps were introduced In the first step, trypsm inhibitor was added to the trypsmized cells and centrifuged at lOOOrpm for 5 minutes The supernatant was removed, the pellet was resuspended m basal medium only and spun as before This time the cells attached and grew m the SFM both with and without fibronectm as an
attachment factor Consequently, two centrifugation steps became part of the standard procedure for setting up CHOK1 cells in SF experiments
A growth curve was set up to compare growth m basal medium, serum-free and serum- supplemented medium Fibronectm was used as the attachment factor, with several plates as controls without fibronectm The experiment was carried out in 24-well plates with three wells per variable m three separate assays The plates were set up with 5xl03 cells per well The cells were trypsmized in 100/xl TV until detached and 100/xl of 5% FCS m basal medium was added to stop the action of trypsm Cell counts were determined using a haemocytometer The results are shown in Figure 3 2 2 1
128

Growth curve fox CHOK1 cellB in BM, SFM and SSM
Tlme(days)
Figure 3.2.2.1 shows the growth curve for CHOK1 cells in basal medium, serum-free and serum- supplemented media Results are expressed as the average cell number (xlO4) +_ standard deviation (n=3) All assays were set up with an initial cell concentration of 0 5x10* per well Cell number was determined by haemocytometer counts Results for two to three separate experiments are shown m Tables 3 2 2 la to d Abbreviations BM = basal medium, SFM + Fbn = serum-free medium + fibronectin, SSM = serum-supplemented medium, SFM = SFM without attachment factors, Fbn = fibronectin
Table 3.2.2.1a Growth curve of different media (Cells per well xlO"4)
BM ASSAY 1 ASSAY 2 ASSAY 3
Day 2 0 06 ± 0 058 0 083 + 0 029
Day 3 0 33 +. 0 189 0 220 +. 0 161
Day 4 1 47 ± 0 035 1 066 ± 0 115
Day 5 1 85 ± 0 212 1 130 +. 0 153
Day 6 3 86 ± 0 534 1 924 ± 0 460
Day 7 4 06 + 1 030 2 300 + 0 150
Day 8 6 90 +. 0 710 2 750 + 0 210
Day 9 10 0 ± 0 560 5 100 + 0 452
129
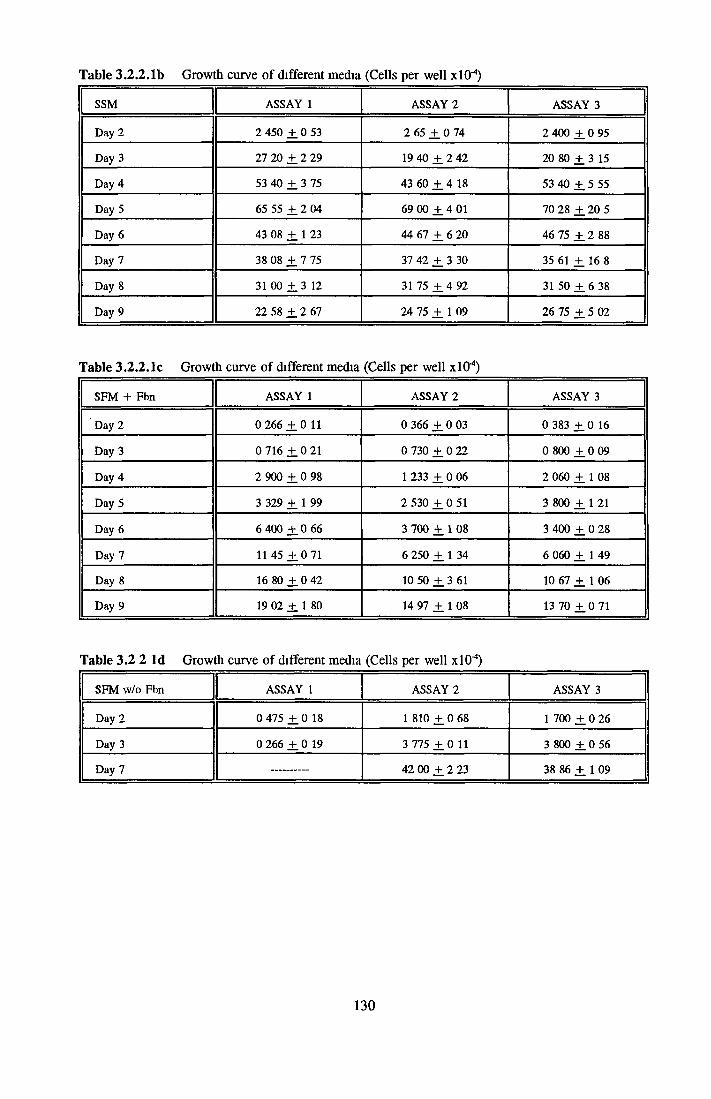
Table 3.2.2.1b Growth curve of different media (Cells per well xlO 1)
SSM ASSAY 1 ASSAY 2 ASSAY 3
Day 2 2 450 ± 0 53 2 65 ± 0 74 2 400 ± 0 95
Day 3 27 20 ± 2 29 19 40 ± 2 42 20 80 ± 3 15
Day 4 53 40 ± 3 75 43 60 ± 4 18 53 40 ± 5 55
Day 5 65 55 ± 2 04 69 00 ± 4 01 70 28 ± 20 5
Day 6 43 08 ± 1 23 44 67 ± 6 20 46 75 ± 2 88
Day 7 38 08 ± 7 75 37 42 ± 3 30 35 61 ± 16 8
Day 8 31 00 ± 3 12 31 75 ± 4 92 31 50 ± 6 38
Day 9 22 58 ± 2 67 24 75 ± 1 09 26 75 ± 5 02
Table 3.2.2.1c Growth curve of different media (Cells per well xlO4)
SFM + Fbn ASSAY 1 ASSAY 2 ASSAY 3
'Day 2 0 266 ± 0 11 0 366 ± 0 03 0 383 ± 0 16
Day 3 0 716 ± 0 21 0 730 ± 0 22 0 800 ± 0 09
Day 4 2 900 ± 0 98 1 233 ± 0 06 2 060 ± 1 08
Day 5 3 329 ± 1 99 2 530 ± 0 51 3 800 ± 1 21
Day 6 6 400 ± 0 66 3 700 ± 1 08 3 400 ± 0 28
Day 7 11 45 ± 0 71 6 250 ± 1 34 6 060 ± 1 49
Day 8 16 80 ± 0 42 10 50 ± 3 61 10 67 ± 1 06
Day 9 19 02 ± 1 80 14 97 ± 1 08 13 70 ± 0 71
Table 3.2 2 Id Growth curve of different media (Cells per well xlO-4)
SFM w/o Fbn ASSAY 1 ASSAY 2 ASSAY 3
Day 2 0 475 ± 0 18 1 810 ± 0 68 1 700 ± 0 26
Day 3 0 266 ± 0 19 3 775 ± 0 11 3 800 ± 0 56
Day 7 42 00 ± 2 23 38 86 ± 1 09
130
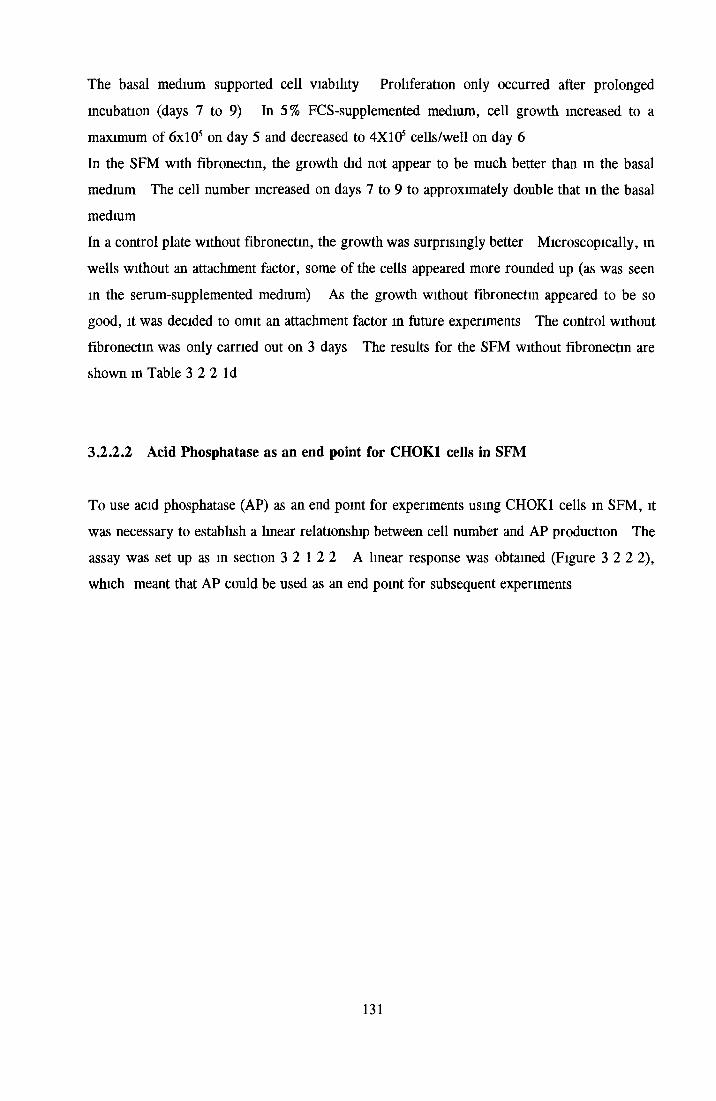
The basal medium supported cell viability Proliferation only occurred after prolonged incubation (days 7 to 9) In 5% FCS-supplemented medium, cell growth increased to a
maximum of 6x10s on day 5 and decreased to 4X10⁵ cells/well on day 6
In the SFM with fibronectin, the growth did not appear to be much better than in the basal medium The cell number increased on days 7 to 9 to approximately double that in the basal mediumIn a control plate without fibronectin, the growth was surprisingly better Microscopically, in wells without an attachment factor, some of the cells appeared more rounded up (as was seen
in the serum-supplemented medium) As the growth without fibronectin appeared to be so
good, it was decided to omit an attachment factor in future experiments The control without fibronectin was only carried out on 3 days The results for the SFM without fibronectin are shown in Table 3 2 2 Id
3.2.2.2 Acid Phosphatase as an end point for CHOK1 cells in SFM
To use acid phosphatase (AP) as an end point for experiments using CHOK1 cells in SFM, it was necessary to establish a linear relationship between cell number and AP production The
assay was set up as in section 3 2 1 2 2 A linear response was obtained (Figure 3 2 2 2), which meant that AP could be used as an end point for subsequent experiments
131
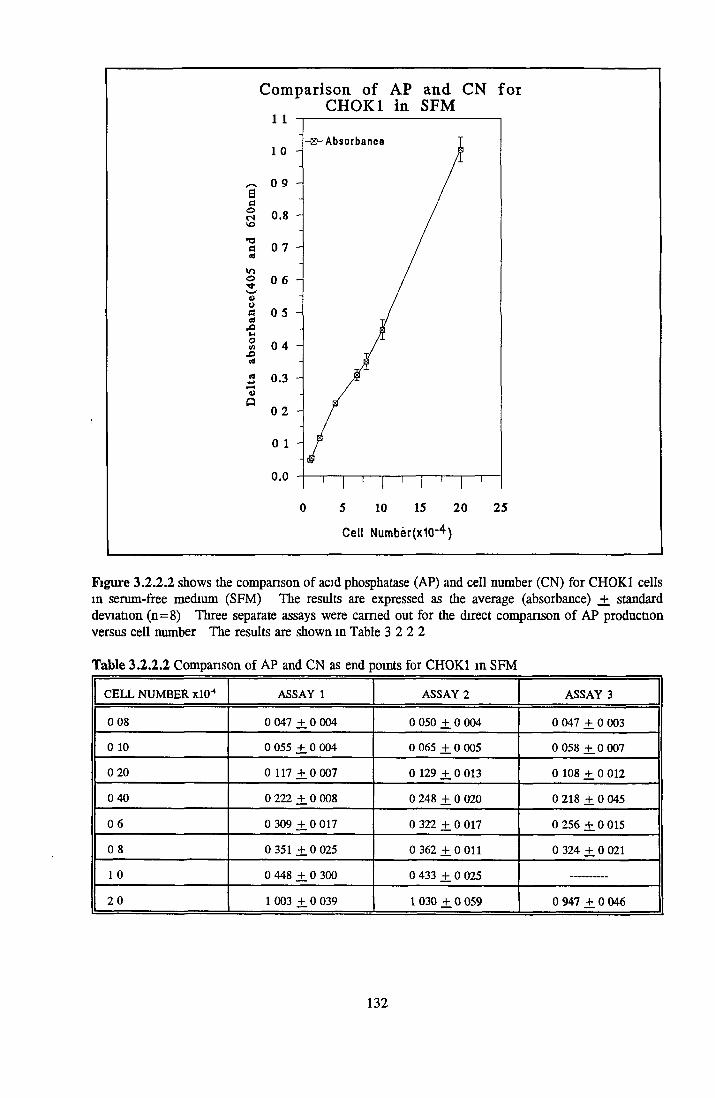
C o m p a riso n o f AP and C N fo r C H O K 1 in SFM
Ba©CNVOa«VIotTV—/4>aco
.oid
4)Û
Cell Numbèr(x10‘ 4 )
Figure 3.2.2.2 shows the comparison of acid phosphatase (AP) and cell number (CN) for CH0K1 cells m serum-free medium (SFM) The results are expressed as the average (absorbance) _+ standard deviation (n = 8) Three separate assays were earned out for the direct comparison of AP production versus cell number The results are shown in Table 3 2 2 2
Table 3.2.2.2 Comparison of AP and CN as end points for CHOK1 in SFM
CELL NUMBER xlO" ASSAY 1 ASSAY 2 ASSAY 3
0 08 0 047 ± 0 004 0 050 ± 0 004 0 047 ± 0 003
0 10 0 055 ± 0 004 0 065 ± 0 005 0 058 ± 0 007
0 20 0 117 ± 0 007 0 129 ± 0 013 0 108 ± 0 012
040 0 222 ± 0 008 0 248 ± 0 020 0 218 ± 0 045
0 6 0 309 ± 0 017 0 322 ± 0 017 0 256 ± 0 015
0 8 0 351 ± 0 025 0 362 ± 0 011 0 324 ± 0 021
1 0 0 448 ± 0 300 0 433 ± 0 025
2 0 1 003 ± 0 039 1 030 ± 0 059 0 947 ± 0 046
132
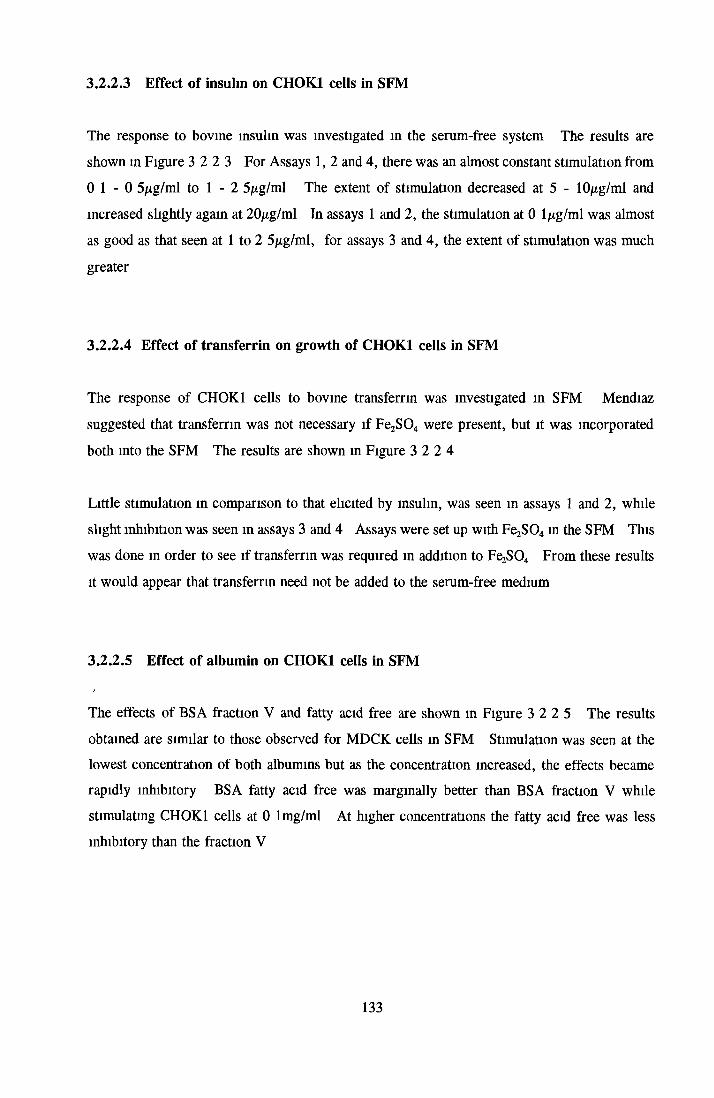
3.2.2.3 Effect of insulin on CHOK1 cells in SFM
The response to bovine insulin was investigated m the serum-free system The results are shown m Figure 3 2 2 3 For Assays 1, 2 and 4, there was an almost constant stimulation from 0 1 - 0 5/xg/ml to 1 - 2 5/ig/ml The extent of stimulation decreased at 5 - 10^g/ml and increased slightly again at 20/ig/ml In assays 1 and 2, the stimulation at 0 1/xg/ml was almost as good as that seen at 1 to 2 5/xg/ml, for assays 3 and 4, the extent of stimulation was much
greater
3.2.2.4 Effect o f transferrin on growth of CHOK1 cells in SFM
The response of CHOK1 cells to bovine transferrin was investigated m SFM Mendiaz
suggested that transferrin was not necessary if Fe2S04 were present, but it was incorporated both into the SFM The results are shown in Figure 3 2 2 4
Little stimulation in comparison to that elicited by insulin, was seen in assays 1 and 2, while slight inhibition was seen in assays 3 and 4 Assays were set up with FejSO,, in the SFM This was done in order to see if transferrin was required in addition to F^S04 From these results it would appear that transferrin need not be added to the serum-free medium
3.2.2.5 Effect o f albumin on CHOK1 cells in SFM
The effects of BSA fraction V and fatty acid free are shown in Figure 3 2 2 5 The results obtained are similar to those observed for MDCK cells in SFM Stimulation was seen at the lowest concentration of both albumins but as the concentration increased, the effects became rapidly inhibitory BSA fatty acid free was marginally better than BSA fraction V while stimulating CHOK1 cells at 0 1 mg/ml At higher concentrations the fatty acid free was less inhibitory than the fraction V
133
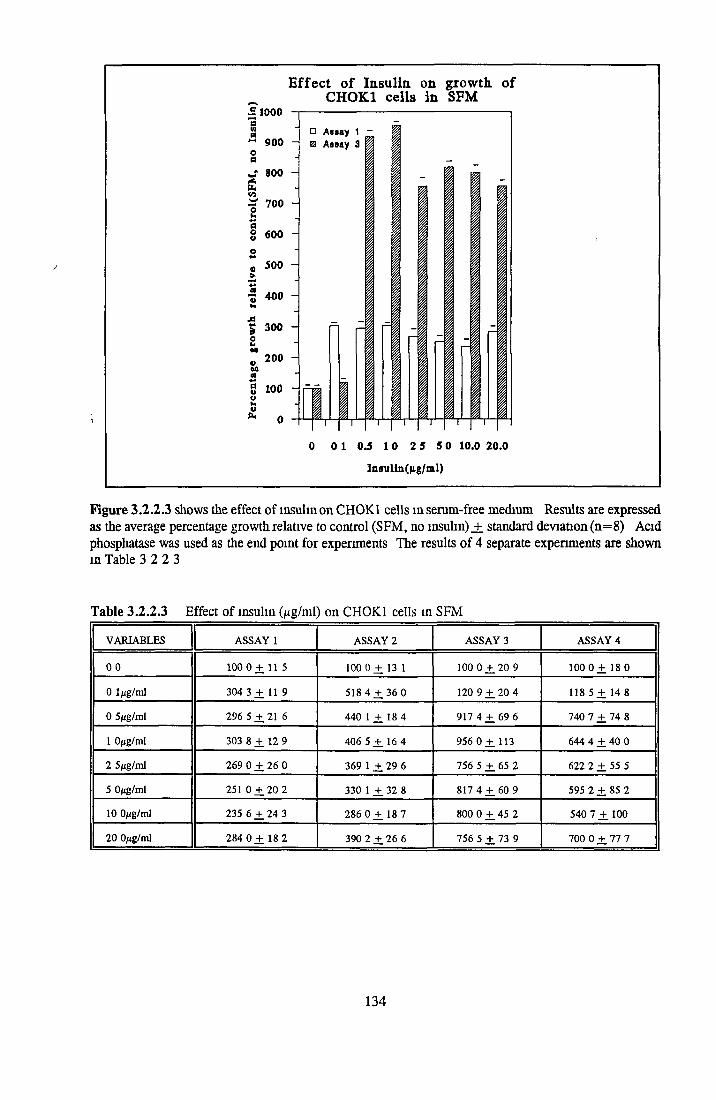
\
Figure 3.1.23 shows the effect of insulin on CHOK1 cells m serum-free medium Results are expressed as the average percentage growth relative to control (SFM, no insulin) _+ standard deviation (n = 8) Acid phosphatase was used as the end point for experiments The results of 4 separate experiments are shown m Table 3 2 2 3
Table 3.2.2.3 Effect of insulin (jug/ml) on CHOK1 cells in SFM
VARIABLES ASSAY 1 ASSAY 2 ASSAY 3 ASSAY 4
00 1000 + 11 5 100 0 + 13 1 100 0 ± 20 9 100 0 ± 1 8 0
0 l ig/ml 304 3 ± 11 9 518 4 + 36 0 120 9 ± 2 0 4 118 5 ± 14 8
0 5/ g/ml 296 5 ± 21 6 440 1 + 18 4 917 4 ± 6 9 6 740 7 ± 74 8
1 Ofig/ml 303 8 ± 12 9 406 5 ± 16 4 956 0 ± 113 644 4 ± 40 0
2 5#ig/ml 269 0 ± 26 0 369 1 ± 29 6 756 5 ± 65 2 622 2 ± 55 5
5 O g/ml 251 0 + 202 330 1 ± 32 8 817 4 ± 6 0 9 595 2 ± 85 2
10 Ofig/ml 235 6 ± 24 3 286 0 + 18 7 800 0 ± 45 2 540 7 ± 100
20 0/ig/ml 284 0 + 18 2 390 2 ± 26 6 756 5 ± 73 9 700 0 ± 77 7
E ffec t o f InBulin on CHOK1 cells in
£ 1000 *3n* 900 -
m" 800A ft «0^ 700 - oflg 600
o 500
1 « .
300 -
200
S ioo -p.
growth o f SFM
□ As«ay 1 0 Aiuy 3
II
I
I
I
0 0 1 OJ 1 0 2 5 5 0 10.0 20.0
Inaulin(|ig/ml)
134

Figure 3.2.2.4 shows the effect of transferrin on CHOK1 cells in serum-free medium Results are expressed as the average percentage growth relative to control (SFM, no transferrin) _+ standard deviation (n = 8) Acid phosphatase was used as the end point for experiments The results for 4 separate assays are shown in Table 3 2 2 4
Table 3.2.2.4 Effect of transferrin (¿tg/ml) on CHOK1 cells m SFM
VARIABLES ASSAY 1 ASSAY 2 ASSAY 3 ASSAY 4
00 100 0 + 8 69 100 0 + 8 85 100 0 i 7 48 1000 + 5 01
0 1/ug/ml 102 3 + 8 39 99 71 + 9 28 91 76 ± 8 98 86 74 + 6 06
0 5/ g/ml 94 04 + 5 80 94 67 + 8 03 94 37 +_ 7 86 94 32 + 5 01
1 0/ig/ml 91 75 + 8 25 99 58 + 7 06 92 88 +. 8 61 87 88 + 7 58
2 5 fig/mi 88 14 + 5 34 106 1 + 8 78 91 01 + 7 34 87 12 + 6 44
5 0/ig/ml 92 89 J: 8 88 112 2j+ 6 00 88 76 + 2 99 84 85 + 6 82
10 Ofig/ml 120 6 + 4 92 110 7 + 1 0 5 85 77 +. 8 99 87 88 + 8 71
20 0/ig/ml 160 9 + 12 9 131 5 + 3 83 91 76 ± 5 99 98 86 + 9 47
135
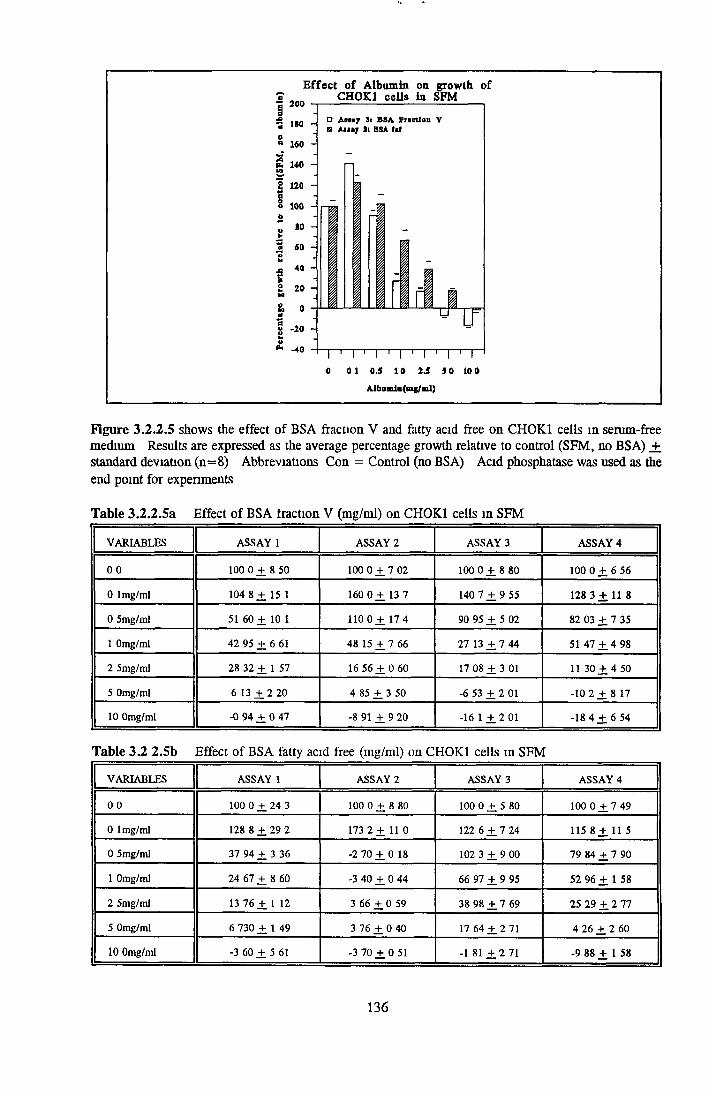
Effect of Albumin on growth of
Alb Dmin(ngf ml)
Figure 3.2.2.5 shows the effect of BSA fraction V and fatty acid free on CHOK1 cells in serum-free medium Results are expressed as the average percentage growth relative to control (SFM, no BSA) _+ standard deviation (n = 8) Abbreviations Con = Control (no BSA) Acid phosphatase was used as the end point for experiments
Table 3.2.2.5a Effect of BSA traction V (mg/ml) on CHOK1 cells in SFM
VARIABLES ASSAY 1 ASSAY 2 ASSAY 3 ASSAY 4
0 0 100 0 ± 8 50 1000 + 702 100 0 ± 8 80 100 0 + 6 56
0 1 mg/ml 104 8 ± 15 1 160 0 + 13 7 140 7 ± 9 55 128 3 ± 11 8
0 5mg/ml 51 60 + 10 1 110 0 + 1 7 4 90 95 ± 5 02 82 03 + 7 35
1 Omg/ml 42 95 ± 6 61 48 15 ± 7 66 27 13 ± 7 44 51 47 + 4 98
2 5mg/ml 28 32 ± 1 57 16 56 ± 0 60 17 08 ± 3 01 11 30 + 4 50
5 Omg/ml 6 13 ± 2 20 4 85 ± 3 50 -6 53 ± 2 01 -10 2 ± 8 17
10 Omg/ml -0 94 ± 0 47 -8 91 ± 9 20 -16 1 ± 2 01 -184 + 6 54
Table 3.2 2.5b Effect of BSA fatty acid free (mg/ml) on CHOK1 cells m SFM
VARIABLES ASSAY 1 ASSAY 2 ASSAY 3 ASSAY 4
0 0 100 0 ± 24 3 100 0 ± 8 80 100 0 ± 5 80 100 0 ± 7 49
0 1 mg/ml 128 8 ± 2 9 2 173 2 ± 11 0 122 6 ± 7 24 115 8 ± 11 5
0 5mg/ml 37 94 ± 3 36 -2 70 ± 0 18 102 3 ± 9 00 79 84 ± 7 90
1 Omg/ml 24 67 ± 8 60 -3 40 ± 0 44 66 97 ± 9 95 52 96 ± 1 58
2 5mg/ml 13 76 ± 1 12 3 66 ± 0 59 38 98 ± 7 69 25 29 ± 2 77
5 Omg/ml 6 730 ± 1 49 3 76 ± 0 40 17 64 ± 2 71 4 26 ± 2 60
10 Omg/ml -3 60 + 5 61 -3 70 + 0 51 -1 81 ± 2 71 -9 88 ± 1 58
136
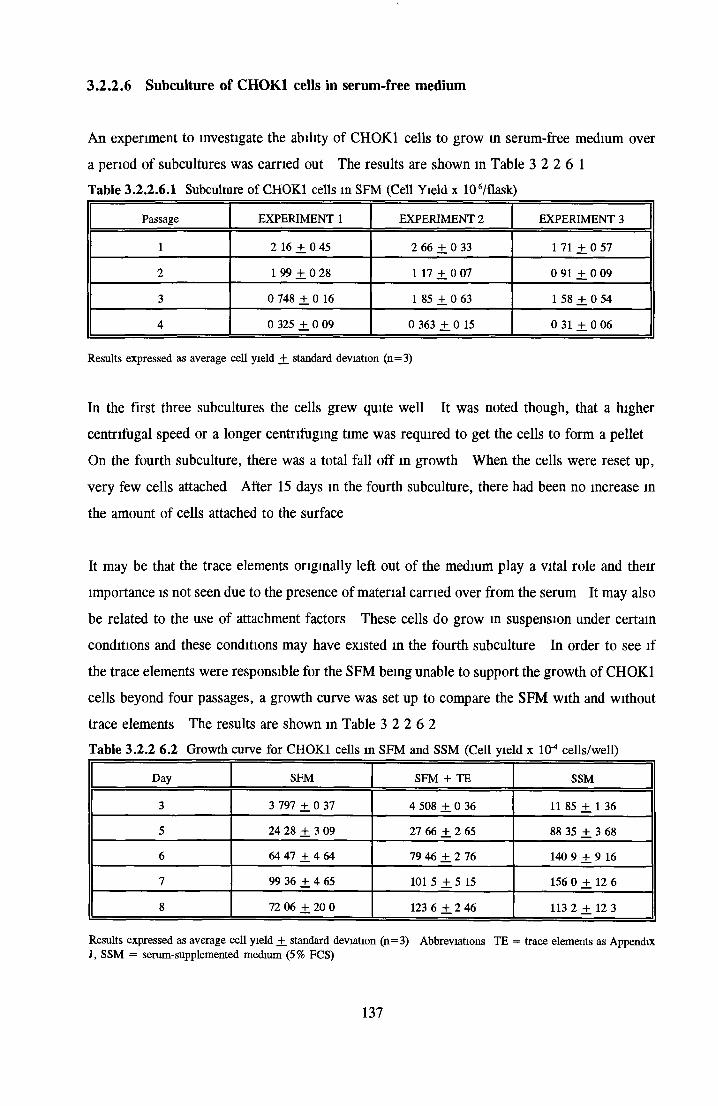
3.2.2.6 Subculture of CHOK1 cells in serum-free medium
An experiment to investigate the ability of CHOK1 cells to grow in serum-free medium over a period of subcultures was carried out The results are shown in Table 3 2 2 6 1 Table 3.2.2.6.1 Subculture of CHOK1 cells m SFM (Cell Yield x 10s/flask)
Passage EXPERIMENT 1 EXPERIMENT 2 EXPERIMENT 3
1 2 16 ± 0 45 2 66 + 0 33 1 71 + 0 57
2 1 99 + 0 28 1 17 ± 0 07 0 91 + 0 09
3 0 748 + 0 16 1 85 + 0 63 1 58 + 0 54
4 0 325 + 0 09 0 363 ± 0 15 0 31 + 0 06
Results expressed as average œil yield +. standard deviation (n=3)
In the first three subcultures the cells grew quite well It was noted though, that a higher
centrifugal speed or a longer centrifuging time was required to get the cells to form a pellet
On the fourth subculture, there was a total fall off in growth When the cells were reset up, very few cells attached After 15 days in the fourth subculture, there had been no increase in
the amount of cells attached to the surface
It may be that the trace elements originally left out of the medium play a vital role and their
importance is not seen due to the presence of material carried over from the serum It may also be related to the use of attachment factors These cells do grow in suspension under certain
conditions and these conditions may have existed in the fourth subculture In order to see if
the trace elements were responsible for the SFM being unable to support the growth of CHOK1 cells beyond four passages, a growth curve was set up to compare the SFM with and without trace elements The results are shown in Table 3 2 2 6 2Table 3.2.2 6.2 Growth curve for CHOK1 cells in SFM and SSM (Cell yield x 10-4 cells/well)
Day SFM SFM + TE SSM
3 3 797 ± 0 37 4 508 ± 0 36 11 85 ± 1 36
5 24 28 + 3 09 27 66 ± 2 65 88 35 ± 3 68
6 64 47 + 4 64 79 46 ± 2 76 140 9 + 9 16
7 99 36 ± 4 65 101 5 ± 5 15 156 0 + 12 6
8 72 06 + 20 0 123 6 ± 2 46 113 2 + 12 3
Results expressed as average cell yield ±_ standard deviation (n=3) Abbreviations TE = trace elements as Appendix J, SSM = serum-supplemented medium (5% FCS)
137

These results show that the addition of trace elements resulted in slightly better growth than the
SFM alone. Growth in comparison to the serum control appears better than that obtained in
section 3.2.2.1. When the CHOK1 cells were subcultured in the SFM with trace elements, the cells grew for up to 5 passages before dying away (Table 3.2.2.6 .3). In this subculture
experiment, cells in the SFM medium without trace elements only grew for 3 passages. No
attachment was seen in the fourth passage or in passage 6 for the cells in the SFM with the trace elements. In the subcultures, an overall increase in growth was observed in the second last passage. When the cells were passaged into a new flask, growth was very low or totally stopped (it appeared as if the cells did not attach to the flask). In a subsequent subculture experiment (Appendix C), growth was maintained for 9 subcultures before cells stopped growing. Why there was a sudden increase in growth in the second last passage is unknown.
It may be that the cells used up some cellularly stored component which was necessary for
growth. The lack of growth regulating factors may also have made the cells more susceptible to cell death.
Table 3.2.2.6.3 Subculture for CHOK1 cells in SFM (Cell yield x 10'6)
SERUM-FREE MEDIUM WITHOUT TE
PASSAGE EXPERIMENT 1 EXPERIMENT 2 EXPERIMENT 3
1 1.687 + 0.03 1.415 ± 0 .0 2 1.220 ±0.003
2 1.210 + 0.15 1.410 ± 0 .0 3 1.378 ± 0 .0 4
3 3.930 + 2.26 3.747 ± 0 .0 9 3.835 ± 0 .0 9
SERUM-FREE MEDIUM WITH TE
PASSAGE EXPERIMENT 1 EXPERIMENT 2 EXPERIMENT 3
1 2.092 ± 0.04 1.305 ± 0 .21 1.475 ± 0 .0 7
2 1.833 + 0.03 2.012 ± 0 .0 4 1.645 ± 0 .2 5
3 1.825 ± 0 .2 2 1.930 ± 0 .0 3 1.905 ± 0 .2 0
4 0.907 ± 0 .0 3 0.577 ± 0 .0 6 0.532 ± 0.08
5 0.493 ± 0.05 1.650 ± 0 .01 1.005 ± 0 .0 3
Results expressed as average cell yield ± standard deviation (n=3). Abbreviations: TE = trace elements as Appendix J.
In summary, for CHOK1 cells the SFM designed by Mendiaz was able to support growth, but
not always over long periods of time (the longest subculture was over 9 passages and 36 days). Acid phosphatase production showed a linear relationship to cell number and so was used to see
how responsive the CHOK1 cells were to insulin, transferrin and albumin. Insulin showed
138
increasing stimulation with increasing concentration Transferrin elicited variable results but
the extent of which was negligible when the errors were taken into account Albumin, either
BSA fraction V or fatty acid free, showed little or no effect at low concentrations and increasing inhibition at higher concentrations Thus we had a system in which the cells could be
subcultured for one passage before assaying the effects of insulin and transferrin and studying
the possible replacements of these serum-derived proteins
139

3.3 REPLACEMENT OF TRANSFERRIN IN SFM FOR MDCK CELLS
Early reports showed the that difernc transferrin was necessary for growth of many cells under serum-free conditions (Barnes and Sato, 1980(a,b), Laskey et al 1988, Hashizuma et al 1983)
In later studies, transferrin was replaced by a wide range of compounds including simple soluble iron salts e g FejSC (Mendiaz et al 1986) and ferric citrate (Amouric et al 1984),
insoluble iron e g ferric hydroxide (Kovar, 1990), and complex iron chelators e g ferric
salicylaldehyde and ferric pyridoxal isonicotmoyl hydrazone (Laskey et al 1988, Landschulz et a l , 1984)
Transferrin can carry out two functions in a serum-free medium Predominately it acts as a
source and carrier of iron It may also act as a detoxifying agent, by inhibiting lipid peroxidation (Gutteridge, 1981) or by chelating other metals Iron can be transported into the cell in one of two ways, via a specific mechanism which involves endocytosis of transferrin -
transferrin receptor complexes, or via non transferrin-receptor-specific means (Richardson and Baker, 1992, Kaplan, 1991)
For MDCK cells, transferrin and PGEj were found to be the most important components of the
serum-free medium designed by Taub et a l , (1979) The relationship between apo- and difernc-transferrin was investigated for MDCK cells in iron poor medium by Eby et al (1992)
They found that diferric-transferrin was able to support growth at concentrations up to 50 -
100/ig/ml, while the apo-transferrin was inactive over the whole concentration range tested (0 05 - 100/xg/ml) ^
In this section a comparison of apo-, partially- and fully-saturated bovine transferrin was made, to see how the quantity of iron bound to transferrin affected its activity In the following section, a variety of iron containing complexes were investigated in serum-free medium to see if any or all of these complexes could replace transferrin On the basis of these results, selected complexes were tested over an extended period of time to see if the activity seen in a once off experiment could be maintained through several subcultures in serum-free medium
140

3.3.1.1 Apo-transferrin
The results for apo-transferrin are shown in Figure 3 3 11 At low concentrations of apo- transferrin (0 05 to 0 5/xg/ml), no stimulation was seen in two of three separate assays with 30% inhibition relative to the control (no transferrin) seen in the third At higher
concentrations, the transferrin became stimulatory, reaching maximum stimulation at 5 to
10/xg/ml (Note the concentration of Fe^C^ in the basal medium was 0 417/xg/ml according to the Sigma catalogue) The extent of maximum stimulation varied from assay to assay (4 3-fold
to 12-fold over the control) Apo-transferrin was as stimulatory as the control transferrin (partially-saturated) at 5/xg/ml Thereafter, the extent of activity decreased at 50/xg/ml
3.3.1.2 Partially-saturated Transferrin
The results for the effect of partially-saturated transferrin are shown m Figure 3 3 12 At the lowest concentrations tested (0 05 - 0 1/xg/ml), inhibition of up to 24% was seen The
transferrin then became stimulatory at 0 5 - 1/xg/ml and continued to stimulate growth in a
concentration-dependent manner reaching maximum stimulation at 10/xg/ml At 50/xg/ml, there
was a loss of stimulation with inhibition seen in two of the three assays The serum-free control
contained 5/xg/ml of partially-saturated transferrin and the activity in the assays at 5/xg/ml showed similar stimulation to the Tf control
3.3.1.3 Fully-saturated Transferrin
At the lowest concentrations of fully-saturated transferrin tested (0 05 - 0 5jxg/ml), inhibition was seen (Figure 3 3 13) Thereafter, stimulation occurred and increased sharply between 1
and 5/xg/ml After this, the increase in stimulation was more gradual, reaching maximum stimulation at the highest concentration tested (50/xg/ml) At 5/xg/ml, fully-saturated transferrin was less stimulatory than the partially-saturated transferrin at 5/xg/ml Maximum stimulation of up to and over 5-fold over the control was achieved The extent of stimulation varied from assay to assay
The results show that all of the transferrins were equally stimulatory at concentrations of 5 - 10/xg/ml At higher concentrations of 50/xg/ml, the apo- and partially-saturated transferrin became less stimulatory or inhibitory, while the fully-saturated transferrin continued to be stimulatory
The extent of stimulation by the fully-saturated transferrin compared favourably with the diferric
form used by Eby et a l , (1992) In the case of apo-transferrin and partially-saturated
141
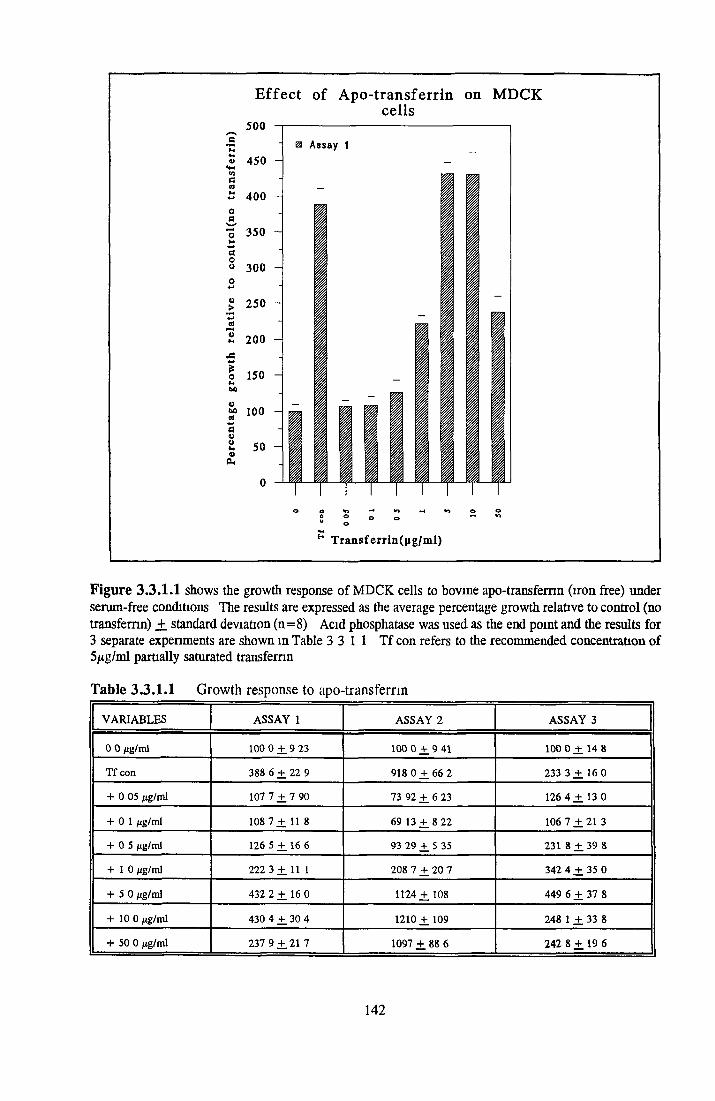
Figure 3 .3 .1 .1 shows the growth response of MDCK cells to bovme apo-transfemn (iron free) under serum-free conditions The results are expressed as the average percentage growth relative to control (no transferrin) +. standard deviation (n = 8) Acid phosphatase was used as the end point and the results for 3 separate experiments are shown in Table 3 3 1 1 Tf con refers to the recommended concentration of 5/xg/ml partially saturated transferrin
Table 3 .3 .1 .1 Growth response to apo-transferrin
VARIABLES ASSAY 1 ASSAY 2 ASSAY 3
0 0 /ig/ml 100 0 ± 9 23 100 O ± 9 41 100 0 + 14 8
Tf con 388 6 ± 2 2 9 918 0 ± 6 6 2 233 3 ± 16 0
+ 0 05 fjg/ml 107 7 ± 7 90 73 92 ± 6 23 126 4 + 13 0
+ 01 /ig/ml 108 7 ± 11 8 69 13 ± 8 22 106 7 ± 2 1 3
+ 05 jxg/ml 126 5 ± 16 6 93 29 ± 5 35 231 8 ± 39 8
+ 10 /xg/ml 222 3 ± 11 1 208 7 ± 20 7 342 4 ± 35 0
+ 50 jug/ml 432 2 + 16 0 1124 ± 108 449 6 ± 37 8
+ 10 0 /ig/ml 430 4 ± 30 4 1210 ± 109 248 1 ± 33 8
+ 50 0 fig/ml 237 9 ± 21 7 1097 ± 88 6 242 8 + 19 6
142

Effect of partially saturated Transferrin on MDCK cells
H T ransferrin(ng/m l)
Figure 3.3.1.2 shows the growth response of MDCK cells to partially-saturated bovine transferrin under serum-free conditions. The results are expressed as the average percentage growth relative to control (no transferrin) +. standard deviation (n=8). Acid phosphatase was used as the end point and the results for 3 separate experiments are shown in Table 3.3.1.2. Tf con refers to the recommended concentration of 5/ig/ml partially-saturated transferrin.
Table 3.3.1.2 Growth response to partially-saturated transferrin
VARIABLES ASSAY 1 ASSAY 2 ASSAY 3
0.0 /ig/ml 100.0 + 8.49 100.0 ± 8.86 100.0 ± 8.25
Tf con 473.0 ± 44.2 318.3 ±38.9 448.9 ±21.9
+ 0.05 /ig/ml 96.43 ±9.88 76.28 ±6.74 94.33 ±7.80
+ 0.1 /ig/ml 103.8 ± 11.5 72.04 ± 4.67 104.2 ±7.09
+ 0.5 /ig/ml 121.1 + 8.49 95.08 ±6.79 143.3 ±7.09
+ 1.0 /ig/ml 199.0 ± 18.3 179.5 ± 18.3 220.2 + 25.2
+ 5.0 /xg/ml 449.5 ± 37.7 344.3 ± 32.2 555.3 ±43.3
+ 10.0 /ig/ml 506.7 ±21.1 398.1 ±30.5 586.5 ±38.3
+ 50.0 /ig/ml 92.94 ±20.7 242.5 ±41.4 45.63 ± 4.72
143

Figure 3.3.1.3 shows the growth response of MDCK cells to fully-saturated bovine transferrin under serum-free conditions The results are expressed as the average percentage growth relative to control (no transferrin) _+ standard deviation (n = 8) Acid phosphatase was used as the end point and the results for 3 separate experiments are shown in Table 3 3 1 3 Tf con refers to the recommended concentration of 5/ig/ml partially-saturated transferrin
Table 3.3.1.3 Growth response to fully-saturated transferrin
VARIABLES ASSAY 1 ASSAY 2 ASSAY 3
0 0 jug/ml 100 0 ± 4 78 100 0 ± 5 30 100 0 + 5 47
Tf con 418 8 + 23 1 493 8 ± 34 6 356 6 + 37 6
+ 0 05 itg/ml 92 47 ± 8 06 84 77 ± 7 56 73 96 ± 4 73
+ 01 fig/ml 93 00 ± 5 38 86 4 2 ± 6 17 78 69 ± 5 32
+ 05 fig/ml 118 3 +.7 53 95 55 +. 8 31 87 57 + 8 28
+ 10 ¿ig/ml 155 1 ± 4 15 149 4 ± 11 1 128 4 + 6 51
+ 50 ixg/ml 425 8 ± 26 3 446 9 +_ 45 7 281 7 ± 2 1 3
+ 10 0 fig/ml 459 7 ± 32 3 464 4 +. 36 8 350 0 ± 33 7
+ 50 0 /tg/ml 527 9 ± 25 3 497 5 +. 48 1 370 0 + 28 9
144
transferrin, the inhibition seen at higher concentrations may have been due to the two species
removing iron from the medium which would under normal circumstances have entered by transferrin-mdependent means and so making iron less available to the cells It was also possible that the tranferrin at high concentrations had some other adverse effects on cell growth
e g binding other metals required for growth
It was evident from these results that up to a concentration of 5-10/xg/ml, the apo- and partially-
saturated transferrins were as active as the fully-saturated transferrin This indicated that
regardless of the level of iron saturation, transferrin was chelating iron from the medium and delivering it to the cells It was of interest, therefore, to see how MDCK cells responded to a variety of iron containing complexes
145
3.3.2 ALTERNATIVES TO TRANSFERRIN
In the previous section, the importance of transferrin to MDCK cells was shown All
transferrins, regardless of the level of iron saturation were able to stimulate growth to a similar extent in the range 5 - 10/ig/ml This stimulation may have been due to a combination of iron
delivery and detoxification It was therefore of interest to see if simple ferric salts or ferric complexes could stimulate such activity The following factors were chosen sodium
nitroprusside, ferric nitrate, iron cholme citrate, ferric citrate, ferric ammonium citrate, ferric
ammonium sulphate and ferrous sulphate
3.3.2.1 Sodium nitroprusside (SNP)The effect of SNP on the growth of MDCK cells is shown in Figure 3 3 2 1 Some inhibition at 0 05/ig/ml was seen but at higher concentrations, stimulation occurred and increased with increasing concentration to reach a maximum stimulation of 3-fold to 5-fold over the control
at 1/xg/ml Between 1 - 10/xg/ml the stimulation decreased By 50jug/ml, inhibition of 40 -
70% was seen depending on the assay Growth at 1/xg/ml was not quite as good as that seen with the Tf control containing 5/ig/ml partially-saturated transferrin The ratio of highest stimulation to the Tf control was 1 29, 0 56 and 0 856 for the three independent assays (average _+ standard deviation of 0 902 _+ 0 367)
3.3.2.2 Ferric Nitrate (FN)
No inhibition was seen at lower concentrations (Figure 3 3 2 2) Maximum stimulation was seen at 0 5/xg/ml with a 2 6-fold to 3-fold stimulation over the control (no transferrin) By 5/xg/ml, the ferric nitrate had become inhibitory and increasing the concentration resulted in increased inhibition, with a maximum inhibition of 60 - 90% seen at 50/zg/ml The ratio of highest stimulation to the Tf control was 0 752, 0 585 and 0 634 for the three independent assays (average _+ standard deviation of 0 657 _+ 0 0858)
3.3.2.3 Iron choline citrate (ICC)At the lowest concentrations tested (0 05 - 0 l^g/ml), some slight inhibition was seen (Figure 3 3 2 3) From 0 1/ig/ml stimulation occurred, reaching a maximum at 1 0/xg/ml and then decreasing and increasing again in the range 5 - 50/xg/ml At l^g/ml, ICC was almost as good
as the Tf control The ratio of highest stimulation to the Tf control was 0 962, 0 93 and 0 762 for the three independent assays (average +. standard deviation of 0 885 ± 0 107)
146
3.3.2.4 Ferric Citrate (FC)
The effect of ferric citrate is shown m Figure 3 3 2 4 On addition of 0 05/xg/mI FC, a 2-fold increase in growth was observed A similarly high stimulation at the lowest concentration was
seen with FAS, FN and Fe2S04 Stimulation increased gradually reaching a maximum of 2 7-
fold to 3 1-fold over the control at 0 1 -1 0/ig/ml At higher concentrations (5 - 50/xg/ml), FC
became inhibitory with up to 80% inhibition seen in two of the three assays at 50/xg/ml In
comparison to the Tf control, maximum growth with FC was 60 - 80% of that achieved by the
Tf control (ratios of highest stimulation of FC to Tf control were 0 604, 0 591 and 0 82
average _+ standard deviation of 0 672 +_ 0 129)
3.3.2.5 Ferric Ammonium Citrate (FAC)
FAC showed little stimulation at 0 05 - 0 1/ig/ml (Figure 3 3 2 5) At 0 5/ig/ml a 3-fold to 4-
fold increase m growth was seen over the control At higher concentrations the extent of
stimulation tailed off, with the exception of a slight increase occurring between 10 and 50/ig/ml
The ratio of highest stimulation to the Tf control was 0 864, 0 547 and 0 607 for the three
independent assays (average +_ standard deviation of 0 673 _+ 0 168)
3.3.2.6 Ferric Ammonium Sulphate (FAS)
The effect of FAS on the growth of MDCK cells is shown in Figure 3 3 2 6 No inhibition was
seen at the lowest concentration tested (0 05/ig/ml) Increasing the concentration gave
increasing growth with a maximum stimulation of 3-fold to 4-fold over the control (without
transferrin) at 1/ig/ml Abruptly at 5/ig/ml, FAS became inhibitory, with 75 - 87% inhibition
occurring at 50/ig/ml In comparison to the Tf control, growth was almost as good as with 5/ig/ml partially-saturated transferrin (the ratios of maximum stimulation to Tf control were 0 954, 0 904 and 0 807 average +. standard deviation of 0 888 +_ 0 075)
3.3.2.7 Ferrous Sulfate (FejSO,,)
The effect of FezSC on the growth of MDCK cells is shown m Figure 3 3 2 7 At the lowest concentration tested (0 05/ig/ml), a 2-fold stimulation over the control (without transferrin) was seen Stimulation increased with increasing concentration, up to a maximum reached at 0 5/tg/ml At 5/xg/ml, FejSC became inhibitory, with a maximum inhibition of 87 - 96% at 50/ig/ml The ratio of maximum stimulation to the Tf control was 1 387, 0 810 and 0 952 for the three assays, showing it to be almost as good as transferrin (average +_ standard deviation of 1 049 ± 0 301)
147
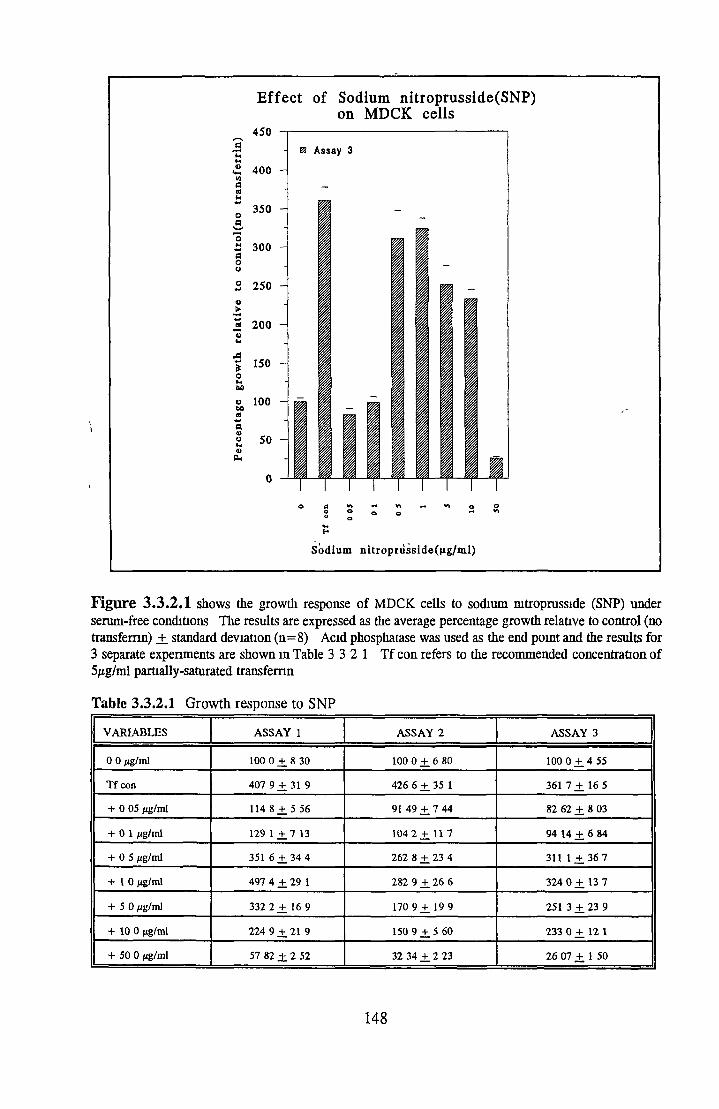
F ig u re 3 .3 .2 .1 shows the growth response of MDCK cells to sodium mtroprusside (SNP) under serum-free conditions The results are expressed as the average percentage growth relative to control (no transferrin) _+ standard deviation (n = 8) Acid phosphatase was used as the end point and the results for 3 separate experiments are shown in Table 3 3 2 1 Tf con refers to the recommended concentration of 5/ig/ml partially-saturated transferrin
Table 3.3.2.1 Growth response to SNP
VARIABLES ASSAY 1 ASSAY 2 ASSAY 3
0 0 fig/ml 100 0 ± 8 30 100 0 ± 6 80 100 0 ± 4 55
Tf con 407 9 ± 31 9 426 6 ± 35 1 361 7 ± 16 5
+ 0 05 /ig/ml 114 8 ± 5 56 91 49 ± 7 44 82 62 ± 8 03
+ 01 fig/ml 129 1 ± 7 13 104 2 ± 11 7 94 14 ± 6 84
+ 05 /tg/ml 351 6 ± 3 4 4 262 8 ± 23 4 311 1 ± 36 7
+ 10 ng/ml 497 4 ± 29 1 282 9 ± 26 6 324 0 ± 13 7
+ 50 fig/tnl 332 2 ± 16 9 170 9 ± 19 9 251 3 ± 23 9
+ 10 0 ng/ml 224 9 ± 21 9 150 9 ± 5 60 233 0 ± 12 1
+ 50 0 /xg/ml 57 82 ± 2 52 32 34 ± 2 23 26 07 ± 1 50
148
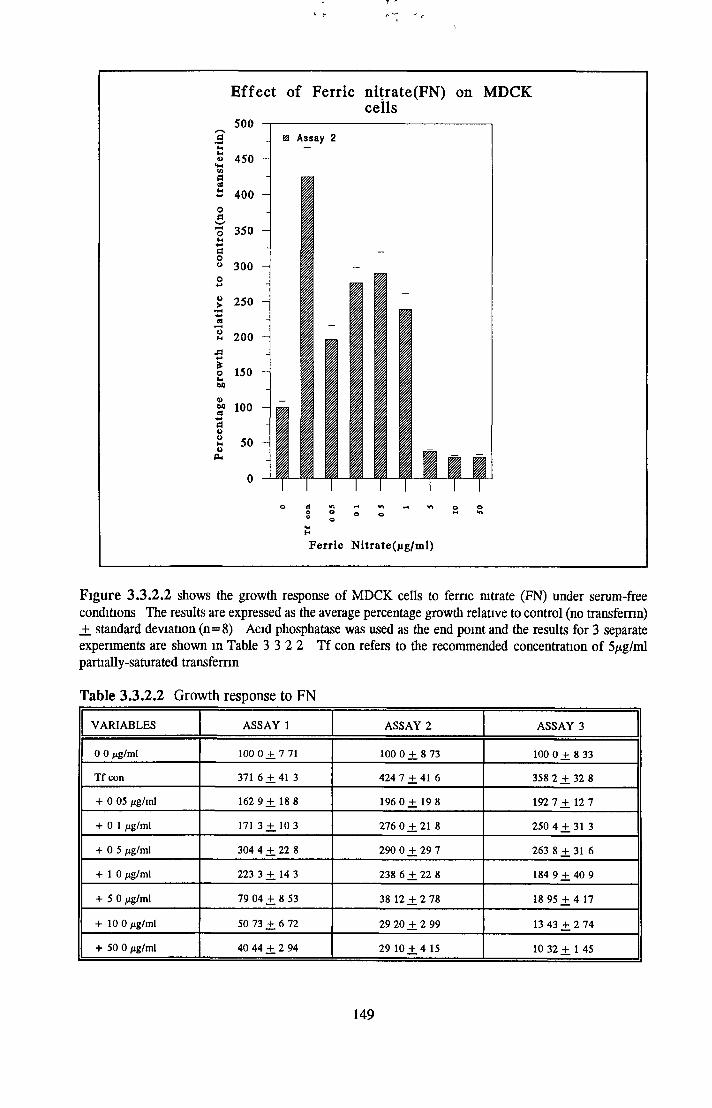
Figure 3 .3 .2 .2 shows the growth response of MDCK cells to feme nitrate (FN) under serum-free conditions The results are expressed as the average percentage growth relative to control (no transferrin) _+ standard deviation (n = 8) Acid phosphatase was used as the end point and the results for 3 separate experiments are shown in Table 3 3 2 2 Tf con refers to the recommended concentration of 5/xg/ml partially-saturated transferrin
Table 3.3.2.2 Growth response to FN
VARIABLES ASSAY 1 ASSAY 2 ASSAY 3
0 0 /ig/ml 100 0 ± 7 71 100 0 ± 8 73 100 0 ± 8 33
Tf con 371 6 ± 41 3 424 7 ± 41 6 358 2 ± 32 8
+ 0 05 /ig/ml 162 9 ± 18 8 196 0 ± 19 8 192 7 ± 12 7
+ 01 fig/ml 171 3 ± 1 0 3 276 0 ± 21 8 250 4 ± 3 1 3
+ 05 /jg/ml 304 4 ± 22 8 290 0 ± 29 7 263 8 ± 31 6
+ 10 f;g/ml 223 3 ± 14 3 238 6 ± 22 8 184 9 ± 4 0 9
+ 50 /ig/ml 79 04 ± 8 53 38 12 ± 2 78 18 95 ± 4 17
+ 10 0 /tg/ml 50 73 ± 6 72 29 2 0 ± 2 99 13 43 ± 2 74
+ 50 0 /ig/ml 40 44 ± 2 94 29 10 ± 4 15 10 32 ± 1 45
149
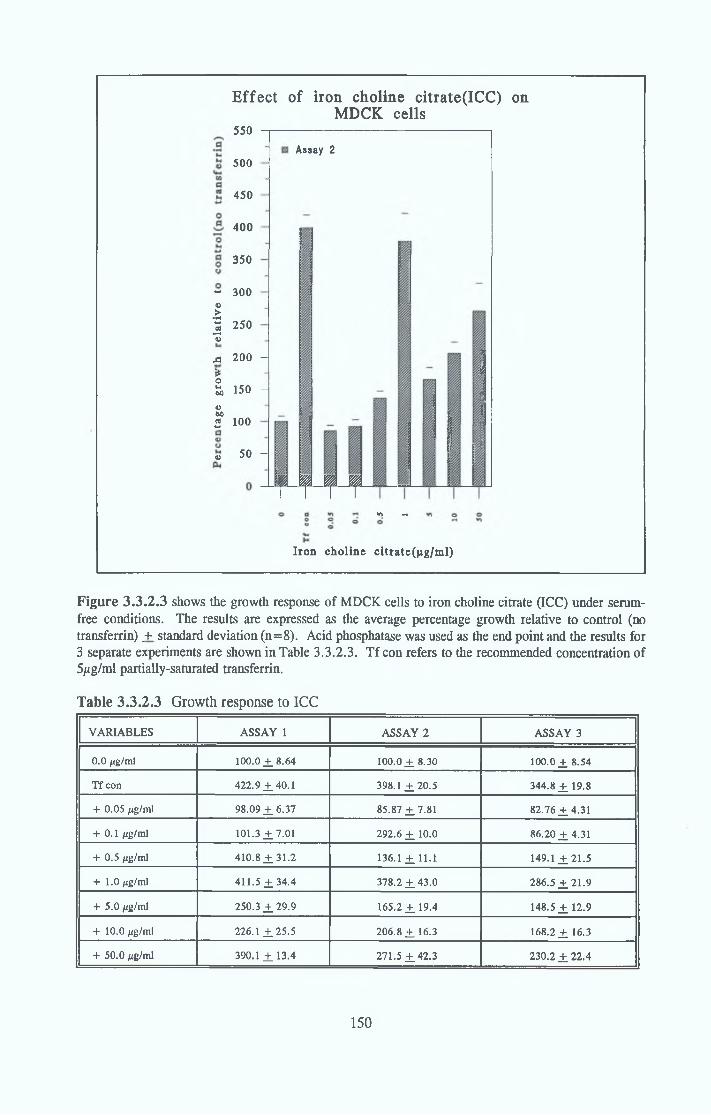
<u
E ffec t o f iron choline citrate(ICC) on MDCK cells
550
500
450
400
350
- 300 ©
I 2 5 0”3A 200 -
*| 150 Ha an5 100
50 -
Assay 2
f T T T»O T*
Iron choline cltrate(ng/m l)
Figure 3.3.2.3 shows the growth response of MDCK cells to iron choline citrate (ICC) under serum- free conditions. The results are expressed as the average percentage growth relative to control (no transferrin) _+ standard deviation (n=8). Acid phosphatase was used as the end point and the results for 3 separate experiments are shown in Table 3.3.2.3. Tf con refers to the recommended concentration of 5/ig/ml partially-saturated transferrin.
Table 3.3.2.3 Growth response to ICC
VARIABLES ASSAY 1 ASSAY 2 ASSAY 3
0.0 /jg/ml 100.0 ±8.64 100.0 ±8.30 100.0 ± 8.54
Tf con 422.9 ±40.1 398.1 ±20.5 344.8 ± 19.8
+ 0.05 /tg/ml 98.09 ±6.37 85.87 ±7.81 82.76 ±4.31
+ 0.1 /ig/ml 101.3 ±7.01 292.6 ± 10.0 86.20 ±4.31
+ 0.5 /ig/ml 410.8 ±31.2 136.1 ± 11.1 149.1 ±21.5
+ 1.0 /ig/ml 411.5 ± 34.4 378.2 ±43.0 286.5 ±21.9
+ 5.0 /xg/ml 250.3 ± 29.9 165.2 ± 19.4 148.5 ± 12.9
+ 10.0 /ig/ml 226.1 ±25.5 206.8 ± 16.3 168.2 ± 16.3
+ 50.0 /jg/ml 390.1 ±13.4 271.5 ±42.3 230.2 ±22.4
150

Figure 3 .3.2.4 shows the growth response of MDCK cells to ferric citrate (FC) under serum-free conditions. The results are expressed as the average percentage growth relative to control (no transferrin) +. standard deviation (n=8). Acid phosphatase was used as the end point and the results for 3 separate experiments are shown in Table 3.3.2.4. Tf con refers to the recommended concentration of 5/tg/ml partially-saturated transferrin.
Table 3 .3 .2 .4 Growth response to FC
Variables ASSAY 1 ASSAY 2 ASSAY 3
0.0 ¡ig/ml 100.0 +.6.05 100.0 ±9.50 100.0 + 7.98
Tfcon 387.0 ±35.8 464.9 ± 19.2 326.1 ±33.5
+ 0.05 /ig/ml 222.3 ± 15.8 246.9 ±25.0 206.3 ±20.5
+ 0.1 /ig/ml 241.4 ±26.5 315.6 ±29.2 264.6 ±25.2
+ 0.5 /ig/ml 273.4 ±27.8 301.3 ±24.1 285.8 ±20.5
+ 1.0 /ig/ml 272.4 ±9.17 214.1 ± 18.3 178.7 ± 16.5
+ 5.0 /ig/ml 43.82 ±5.50 25.87 ± 2.75 25.19 ±2.36
+ 10.0 /ig/ml 46.29 ±6.80 25.00 ±3.15 24.41 ±2.36
+ 50.0 /ig/ml 46.91 ±4.30 19.05 ±2.67 19.68 ± 1.57
151
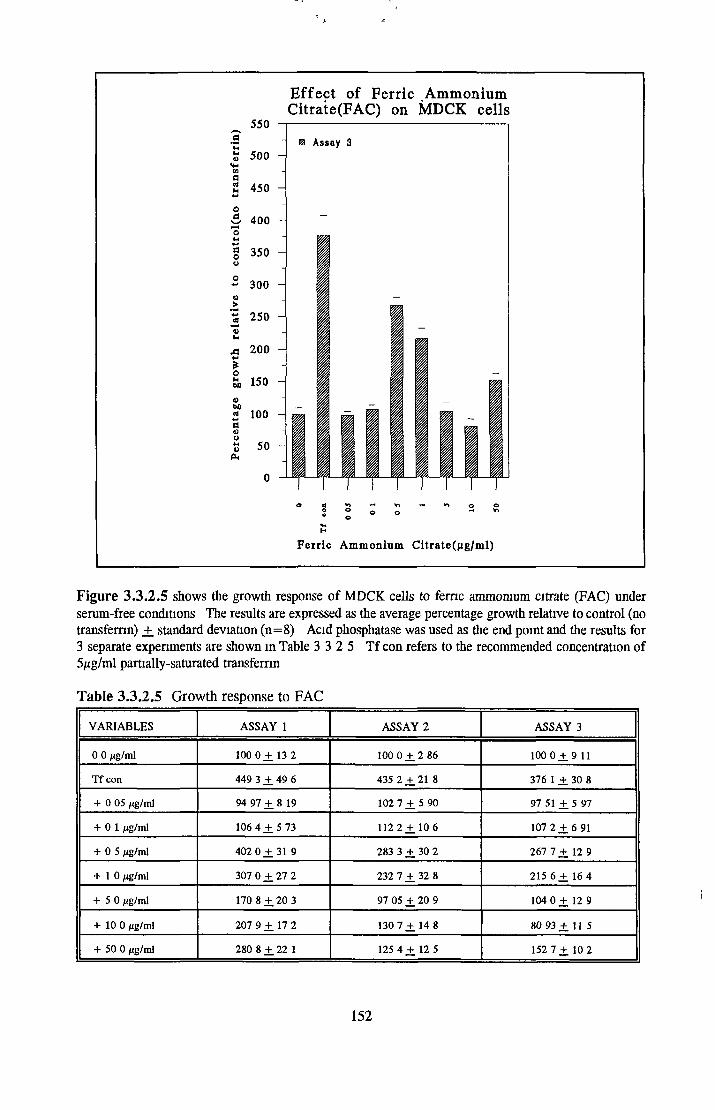
Figure 3 .3 .2 .5 shows the growth response of MDCK cells to ferric ammonium citrate (FAC) under serum-free conditions The results are expressed as the average percentage growth relative to control (no transferrin) +_ standard deviation (n = 8) Acid phosphatase was used as the end point and the results for 3 separate experiments are shown in Table 3 3 2 5 Tf con refers to the recommended concentration of 5/tg/ml partially-saturated transferrin
Table 3 .3 .2 .5 Growth response to FAC
VARIABLES ASSAY 1 ASSAY 2 ASSAY 3
0 0 /tg/ml 100 0 ± 13 2 100 0 ± 2 86 100 0 ± 9 11
Tf con 449 3 ± 49 6 435 2 ± 21 8 376 1 ± 30 8
+ 0 05 /ig/ml 94 97 ± 8 19 102 7 ± 5 90 97 51 ± 5 97
+ 01 /ig/ml 106 4 +. 5 73 112 2 ± 10 6 107 2 ± 6 91
+ 05 /ig/ml 402 0 ± 31 9 283 3 ± 30 2 267 7 ± 12 9
+ 10 /ig/ml 307 0 ± 27 2 232 7 ± 32 8 215 6 ± 16 4
+ 50 /ig/ml 170 8 ± 20 3 97 05 ± 20 9 104 0 ± 12 9
+ 10 0 /ig/ml 207 9 ± 17 2 130 7 ± 14 8 80 93 ± 11 5
+ 50 0 /ig/ml 280 8 ± 22 1 125 4 ± 12 5 152 7 ± 10 2
152

Figure 3 .3 .2 .6 shows the growth response of MDCK cells to ferric ammonium sulphate (FAS) under serum-free conditions The results are expressed as the average percentage growth relative to control (no transfemn) _+ standard deviation (n = 8) Acid phosphatase was used as the end point and the results for 3 separate experiments are shown in Table 3 3.2 6 Tf con refers to the recommended concentration of 5/xg/ml partially-saturated transfemn
Table 3.3.2.6 Growth response to FAS
VARIABLES ASSAY 1 ASSAY 2 ASSAY 3
0 0 ftg/ml 100 0 +_ 6 35 100 0 +.7 58 100 0 +. 7 77
Tf con 461 0 Hr 44 6 470 0 +. 26 2 351 0 ± 2 3 4
+ 0 05 fig/ml 155 9+. 14 2 247 6 +_ 25 5 187 6 + 17 1
+ 01 jtig/ml 278 1 +. 17 5 334 5 +_ 30 9 224 2 + 14 8
+ 05 jug/ml 403 2 +. 37 4 382 1 +. 30 9 298 2 +. 24 1
+ 10 /ig/ml 444 4 +. 33 3 434 5 +. 29 8 302 5 ± 6 91
+ 50 ng/ml 85 53 ± 8 18 35 42 ± 3 10 48 60 + 4 20
+ 10 0 jig/ml 3113 ± 2 58 25 99 +. 1 90 21 67 +. 3 09
+ 50 0 ¿ig/ml 24 53 ± 3 14 17 38 +. 3 82 13 00 + 1 78
153
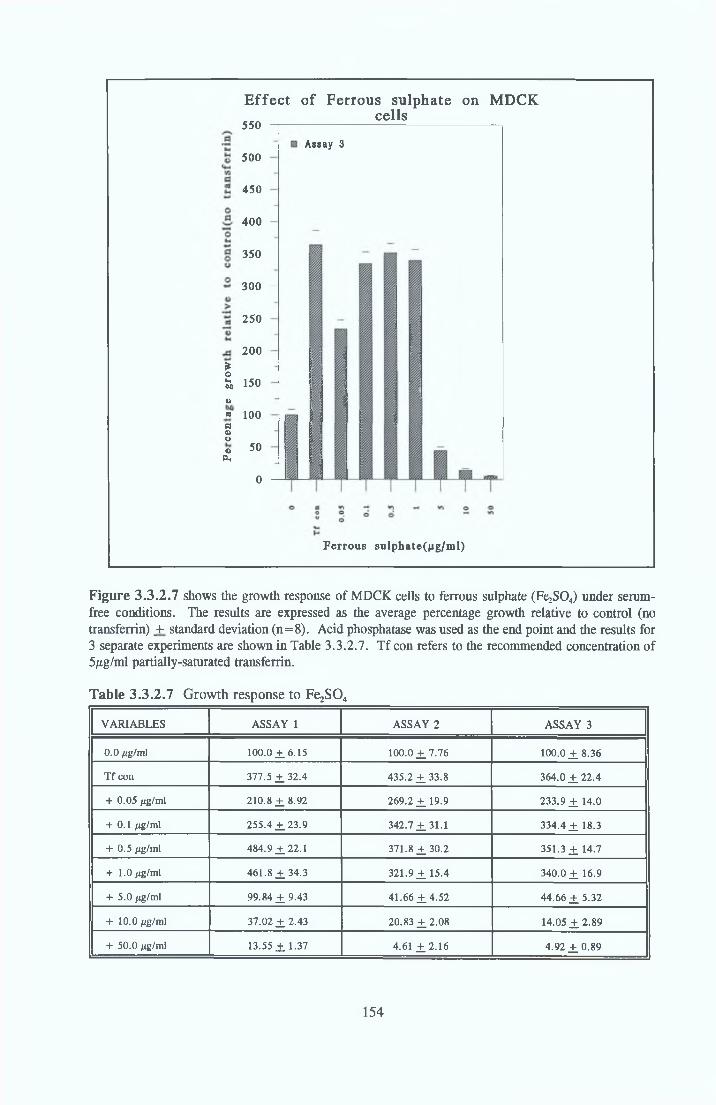
Effect of Ferrous sulphate on MDCK cells
550
*ot-i6«anaouoPh
500
450
400
350 -
300 -
250
200
150
100
50
0
Assay 3
Ferrous sulphate(}ig/ml)
Figure 3 .3 .2 .7 shows the growth response of MDCK cells to ferrous sulphate (FejSO4) under serum- free conditions. The results are expressed as the average percentage growth relative to control (no transferrin) _+ standard deviation (n = 8). Acid phosphatase was used as the end point and the results for 3 separate experiments are shown in Table 3.3.2.7. Tf con refers to the recommended concentration of 5/ig/ml partially-saturated transferrin.
Table 3.3.2.7 Growth response to Fe2S 0 4
VARIABLES ASSAY 1 ASSAY 2 ASSAY 3
0.0 /ig/mi 100.0 ¿ 6 .1 5 100.0 ± 7 .7 6 100.0 ± 8.36
Tf con 377.5 ± 3 2 .4 435.2 ± 3 3 .8 364.0 ± 2 2 .4
+ 0.05 pg/ml 210.8 ± 8 .9 2 269.2 ± 19.9 233.9 ± 14.0
+ 0.1 j^g/ml 255.4 ± 2 3 .9 342.7 ± 3 1 .1 334.4 ± 18.3
+ 0.5 /ig/ml 484.9 ± 2 2 .1 371.8 ± 3 0 .2 351.3 ± 14.7
+ 1.0 /ig/ml 461.8 ± 3 4 .3 321.9 ± 1 5 .4 340.0 ± 16.9
+ 5.0 ¿;g/ml 99.84 ± 9 .4 3 41.66 ± 4 .5 2 44.66 ± 5 .3 2
+ 10.0 ¿ig/ml 37.02 ± 2 .4 3 20.83 ± 2 .0 8 14.05 ± 2 .8 9
+ 50.0 Mg/ml 13.55 ± 1.37 4.61 ± 2 .1 6 4.92 ± 0 .8 9
154
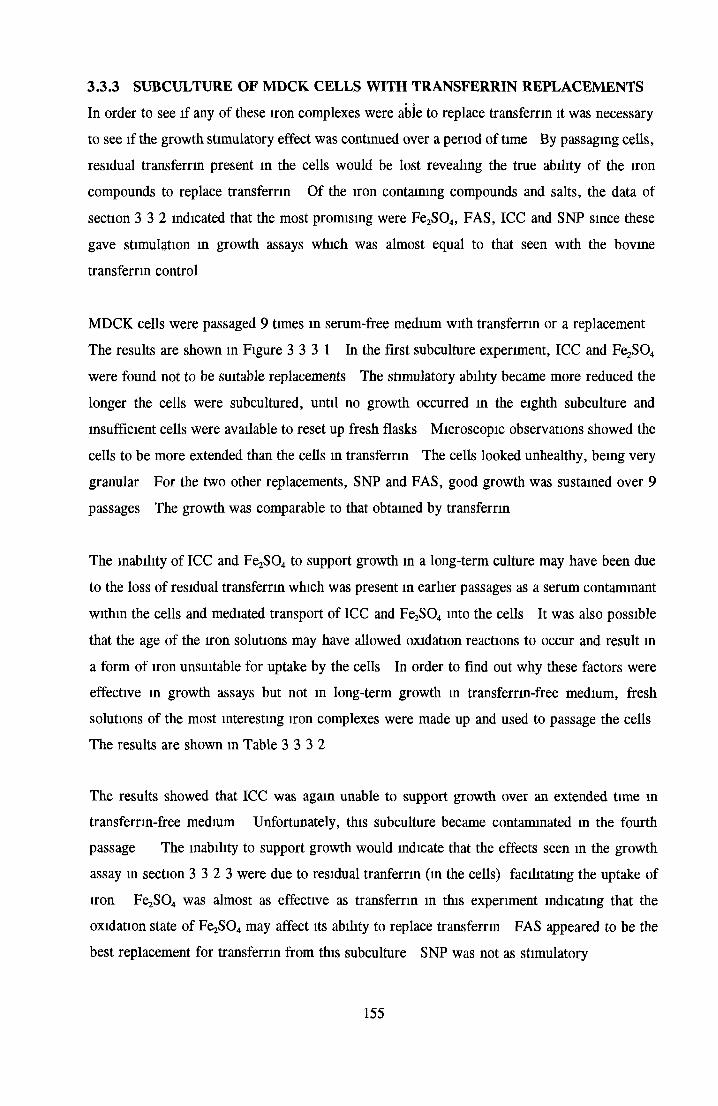
3 .3 .3 SUBCULTURE OF M DCK CELLS W ITH TRANSFERRIN REPLACEM ENTS
In order to see if any of these iron complexes were able to replace transferrin it was necessary to see if the growth stimulatory effect was continued over a period of time By passaging cells,
residual transferrin present in the cells would be lost revealing the true ability of the iron
compounds to replace transferrin Of the iron containing compounds and salts, the data of
section 3 3 2 indicated that the most promising were Fe2S04, FAS, ICC and SNP since these gave stimulation in growth assays which was almost equal to that seen with the bovine
transferrin control
MDCK cells were passaged 9 times in serum-free medium with transferrin or a replacement
The results are shown in Figure 3 3 3 1 In the first subculture experiment, ICC and Fe2S0 4
were found not to be suitable replacements The stimulatory ability became more reduced the
longer the cells were subcultured, until no growth occurred in the eighth subculture and insufficient cells were available to reset up fresh flasks Microscopic observations showed the cells to be more extended than the cells in transferrin The cells looked unhealthy, being very
granular For the two other replacements, SNP and FAS, good growth was sustained over 9 passages The growth was comparable to that obtained by transferrin
The inability of ICC and FejSO,* to support growth in a long-term culture may have been due
to the loss of residual transferrin which was present in earlier passages as a serum contaminant
within the cells and mediated transport of ICC and Fe2S0 4 into the cells It was also possible
that the age of the iron solutions may have allowed oxidation reactions to occur and result in
a form of iron unsuitable for uptake by the cells In order to find out why these factors were effective in growth assays but not in long-term growth in transferrin-free medium, fresh
solutions of the most interesting iron complexes were made up and used to passage the cells The results are shown m Table 3 3 3 2
The results showed that ICC was again unable to support growth over an extended time in transferrin-free medium Unfortunately, this subculture became contaminated in the fourth passage The inability to support growth would indicate that the effects seen in the growth assay in section 3 3 2 3 were due to residual tranferrin (in the cells) facilitating the uptake of
iron Fe2S0 4 was almost as effective as transferrin in this experiment indicating that the oxidation state of Fe2S0 4 may affect its ability to replace transferrin FAS appeared to be the
best replacement for transferrin from this subculture SNP was not as stimulatory
155
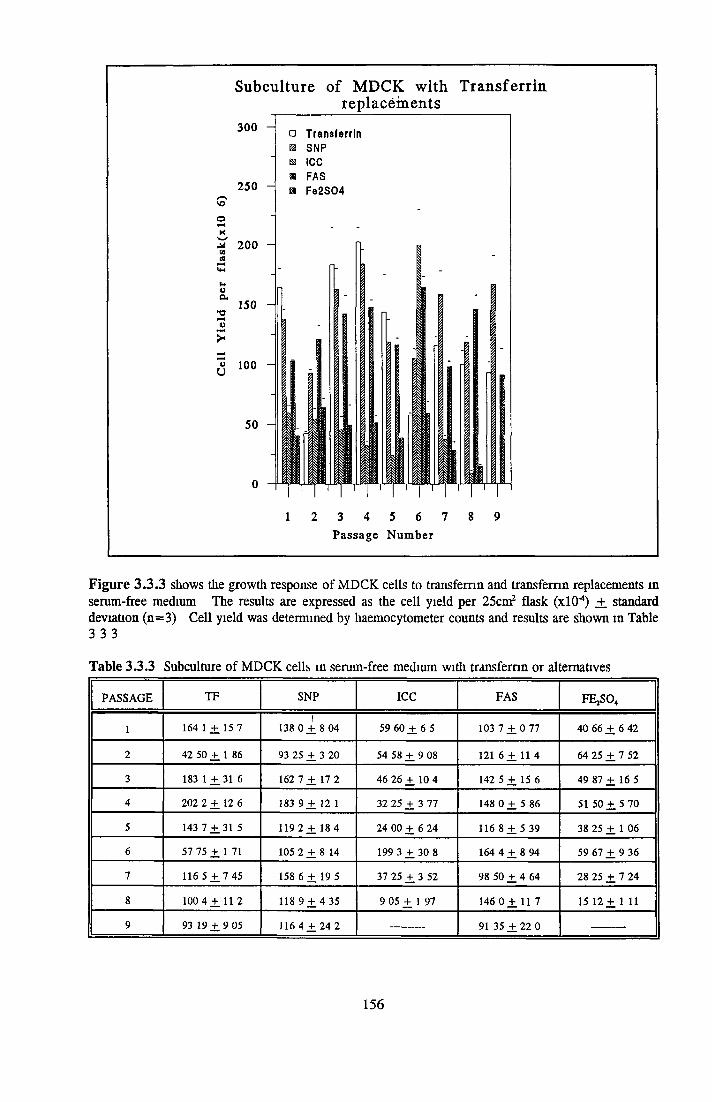
S u bcu ltu re o f M D C K w ith T ra n s fe r r in rep lacem ents
9Passage N um ber
Figure 3 .3 .3 shows the growth response of MDCK cells to transferrin and transferrin replacements in serum-free medium The results are expressed as the cell yield per 25cm2 flask (xlO^) +. standard deviation (n=3) Cell yield was determined by haemocytometer counts and results are shown m Table 3 3 3
Table 3.3.3 Subculture of MDCK cells in serum-free medium with transferrin or alternatives
PASSAGE TF SNP ICC FAS FEjSC^
1 164 1 + 15 71
138 0 + 8 04 59 60 + 6 5 103 7 + 0 77 40 66 + 6 42" “
2 42 50 + 1 86 93 25 + 3 20 54 58 + 9 08 121 6 + 1 1 4 64 25 + 7 52
3 183 1 + 31 6 162 7 + 17 2 46 26 + 10 4 142 5 + 15 6 49 87 + 16 5
4 202 2 + 12 6 183 9 + 12 1 32 25 + 3 77 148 0 + 5 86 51 50 + 5 70
5 143 7 + 31 5 1192 + 1 8 4 24 00 + 6 24 116 8 + 5 39 38 25 + 1 06
6 57 75 + 1 71 105 2 + 8 14 199 3 + 30 8 164 4 + 8 94 59 67 + 9 36
7 116 5 + 7 45 158 6 + 19 5 37 25 + 3 52 98 50 + 4 64 28 25 + 7 24
8 100 4 + 11 2 118 9 + 4 35 9 05 + 1 97 146 0 + 11 7 15 12 + 1 11
9 93 19 ± 9 05 116 4 ± 2 4 2 91 35 + 22 0
300 -
250
Ocu
U?4>U
□ T ra n s fe rr inæ SNP S ICC a FAS ra Fe 2S 04
VOoXM 200 to a
150
100
50 -
o -F y . ,, y q - f y
1 2 3 4 5 6 7 8
156
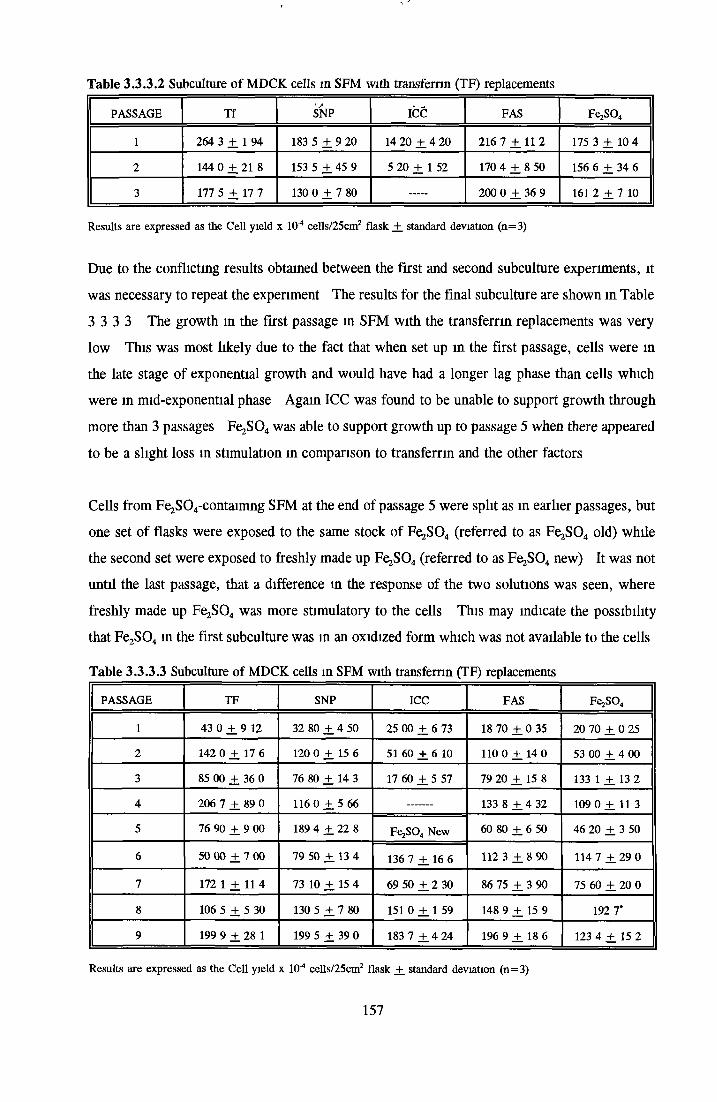
Table 3.3.3.2 Subculture of MDCK cells m SFM with transferrin (TF) replacements
PASSAGE Tf SNP ICC FAS FejSO.,
1 264 3 ± 1 94 183 5 ± 9 20 14 20 ± 4 20 216 7 ± 1 1 2 175 3 ± 10 4
2 144 0 ± 21 8 153 5 ± 45 9 5 20 ± 1 52 170 4 ± 8 50 156 6 ± 34 6
3 177 5 + 17 7 130 0 + 7 80 200 0 + 36 9 161 2 + 7 10--------------- — -------------
Results are expressed as the Cell yield x lO4 cells/25cm2 flask ± standard deviation (n=3)
Due to the conflicting results obtained between the first and second subculture experiments, it
was necessary to repeat the experiment The results for the final subculture are shown in Table
3 3 3 3 The growth in the first passage m SFM with the transferrin replacements was very
low This was most likely due to the fact that when set up in the first passage, cells were m
the late stage of exponential growth and would have had a longer lag phase than cells which
were in mid-exponential phase Again ICC was found to be unable to support growth through
more than 3 passages FejSC was able to support growth up to passage 5 when there appeared
to be a slight loss in stimulation in comparison to transferrin and the other factors
Cells from Fe2S 04-contaimng SFM at the end of passage 5 were split as in earlier passages, but
one set of flasks were exposed to the same stock of Fe^S04 (referred to as FejSQj old) while
the second set were exposed to freshly made up FejSO,, (referred to as Fe^SO* new) It was not
until the last passage, that a difference in the response of the two solutions was seen, where
freshly made up Fe^O,, was more stimulatory to the cells This may indicate the possibility
that Fe2S04 in the first subculture was in an oxidized form which was not available to the cells
Table 3.3.3.3 Subculture of MDCK cells in SFM with transferrin (TF) replacements
PASSAGE TF SNP ICC FAS FejSO,
1 43 0 ± 9 12 32 80 ± 4 50 25 00 ± 6 73 18 70 ± 0 35 20 70 ± 0 25
2 142 0 ± 17 6 120 0 ± 15 6 51 60 ± 6 10 110 0 ± 1 4 0 53 00 ± 4 00
3 85 00 ± 36 0 76 80 ± 14 3 17 60 ± 5 57 79 20 ± 15 8 133 1 ± 13 2
4 206 7 ± 89 0 116 0 ± 5 66 133 8 ± 4 32 109 0 ± 11 3
5 76 90 ± 9 00 189 4 ± 22 8 FejSO,, New 60 80 ± 6 50 46 20 ± 3 50
6 50 00 ± 7 00 79 50 ± 13 4 136 7 ± 16 6 112 3 ± 8 90 114 7 ± 2 9 0
7 172 1 ± 11 4 73 10 ± 15 4 69 50 ± 2 30 86 75 ± 3 90 75 60 ± 20 0
8 106 5 ± 5 30 130 5 ± 7 80 151 0 ± 1 59 148 9 ± 15 9 192 7*
9 199 9 + 28 1 199 5 + 39 0 183 7 + 4 24 196 9 + 18 6 123 4 + 15 2---------------—________ ___________ ,_________
Results are expressed as the Cell yield x 104 cells/25cm2 flask ± standard deviation (n=3)
157
In summary, it was possible to replace transferrin with SNP or FAS in SFM FejSC was also a possible replacement for transferrin but it would be necessary to make up fresh stocks every 3 - 4 weeks ICC was not suitable a suitable replacement for transferrin over a long-term
period
With the low stimulatory effect of insulin (Appendix D) and the ability to replace natural PGE
with synthetic PGE or di-butyryl-cAMP (Taub et a l , 1984), it is possible to grow MDCK cells
in a SFM devoid of animal-derived products
158
3.4 EFFECT OF INSULIN ON GROWTH OF CHOK1 CELLS IN SFM
Insulin is, in general, one of the major components of serum-free media The use of insulin at microgram/ml levels which are supraphysiological (normal blood levels are 4 to 30/iU/ml), has led to investigations into the biological activity of insulin For many cell types, insulin was
found to exert a mitogenic effect only at high concentrations because it was cross-reacting with
the IGF-I receptor For a small number of cell lines, the insulin was found to be active at
nanogram levels, via its own receptor
In growing CHOK1 and MDCK cells in serum-free media, it was found that CHOK1 cells were
very responsive to insulin Mendiaz et al (1986) found that CHOK1 cells showed a significant
increase in growth rate at insulin concentrations of 1 to 5ng/ml There after, the growth rate
was more gradual and reached a saturation point at 10/xg/ml In support of this, Mamounas et al (1989) found that insulin acted at its own receptor with a half maximum stimulation of 14ng/ml In addition, it was found that IGF-I had little or no effect on DNA synthesis until concentrations of 225ng/ml, while IGF-II showed some stimulation of DNA synthesis with a half maximum activity at 75ng/ml
Mendiaz also presented information on the existence of msulm-independent mutants, which could become predominant in the serum-free medium cited without the presence of insulin
However, the morphological descriptions of the cells under serum-free with and without insulin were at odds with the observations made here Mendiaz observed that CHOK1 cells grown in the serum- free medium cited, without insulin were elongated and fibroblastic in nature, while in the presence of msulm, the cells appeared round to cuboidThe CHOK1 cells in this laboratory were found to be fibroblastic in shape both with and without insulin present Only when 80 - 90% confluency was reached, did cells round up or when cells were inoculated at an exceedingly low density At a low seeding density, cells rounded up, formed clusters and detached from the surface of the plate
The aim of this section was to investigate (as Mendiaz did) whether insulin could be replacedtby nanogram levels of either IGF-I or IGF-II In addition, a comparison of bovine-derived insulin and insulins from other sources were compared with the intention of replacing the bovine-derived msulm with a recombinant insulin As microscopic observations of the cells in
serum-free medium with and without msulm were apparently different to the CHOK1 cells
159
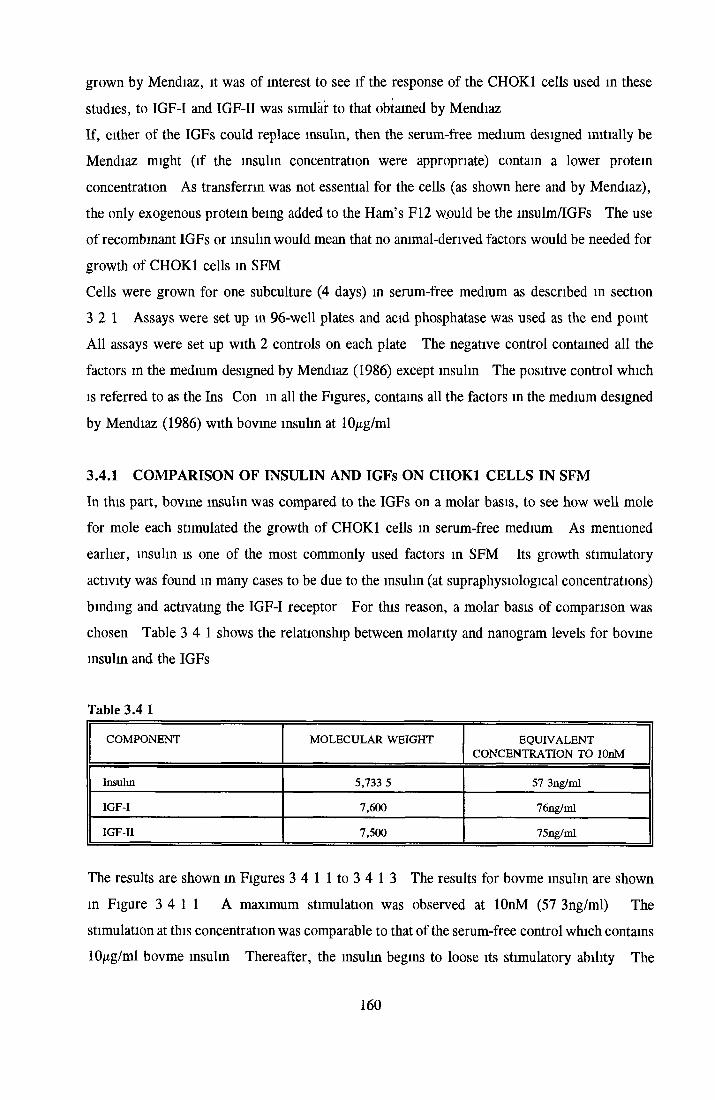
grown by Mendiaz, it was of interest to see if the response of the CHOK1 cells used in these
studies, to IGF-I and IGF-II was similar to that obtained by Mendiaz If, either of the IGFs could replace insulin, then the serum-free medium designed initially be Mendiaz might (if the insulin concentration were appropriate) contain a lower protein concentration As transferrin was not essential for the cells (as shown here and by Mendiaz),
the only exogenous protein being added to the Ham’s F12 would be the insulm/IGFs The use of recombinant IGFs or insulin would mean that no animal-derived factors would be needed for growth of CHOK1 cells in SFMCells were grown for one subculture (4 days) in serum-free medium as described in section 3 2 1 Assays were set up m 96-well plates and acid phosphatase was used as the end point All assays were set up with 2 controls on each plate The negative control contained all the
factors m the medium designed by Mendiaz (1986) except insulin The positive control which is referred to as the Ins Con in all the Figures, contains all the factors in the medium designed
by Mendiaz (1986) with bovine insulin at 10/xg/ml
3.4 .1 COM PARISON OF INSULIN AND IGFs ON CHOK1 CELLS IN SFM
In this part, bovme insulin was compared to the IGFs on a molar basis, to see how well mole for mole each stimulated the growth of CHOK1 cells in serum-free medium As mentioned earlier, insulin is one of the most commonly used factors in SFM Its growth stimulatory
activity was found in many cases to be due to the insulin (at supraphysiological concentrations) binding and activating the IGF-I receptor For this reason, a molar basis of comparison was chosen Table 3 4 1 shows the relationship between molarity and nanogram levels for bovine insulin and the IGFs
Table 3.4 1
COMPONENT MOLECULAR WEIGHT EQUIVALENT CONCENTRATION TO lOnM
Insulin 5,733 5 57 3ng/ml
IGF-I 7,600 76ng/ml
IGF-II 7,500 75ng/ml
The results are shown in Figures 3 4 1 1 to 3 4 1 3 The results for bovme insulin are shown in Figure 3 4 11 A maximum stimulation was observed at lOnM (57 3ng/ml) The stimulation at this concentration was comparable to that of the serum-free control which contains 10/xg/ml bovme insulin Thereafter, the insulin begins to loose its stimulatory ability The
160
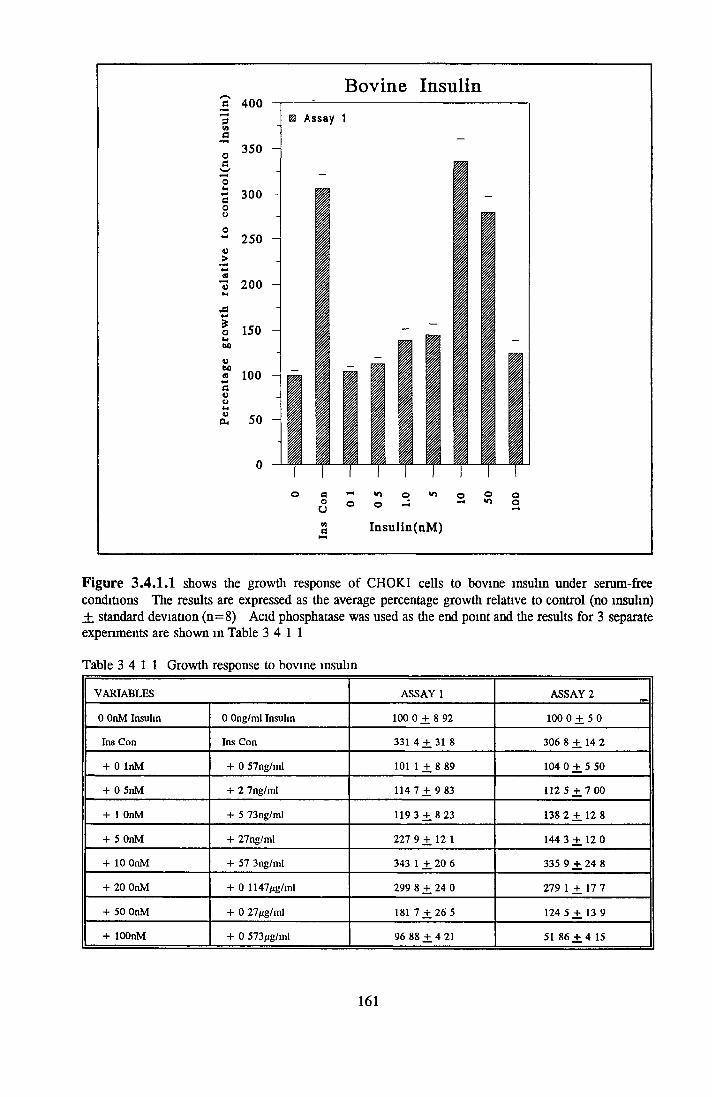
Figure 3 .4 .1 .1 shows the growth response of CHOK1 cells to bovine insulin under serum-free conditions The results are expressed as the average percentage growth relative to control (no insulin) _+ standard deviation (n = 8) Acid phosphatase was used as the end point and the results for 3 separate experiments are shown in Table 3 4 11
Table 3 4 11 Growth response to bovine insulin
VARIABLES ASSAY 1 ASSAY 2
0 OnM Insulin 0 Ong/ml Insulin 100 0 ± 8 92 100 0 ± 5 0
Ins Con Ins Con 331 4 ± 31 8 306 8 ± 14 2
+ 0 InM + 0 57ng/ml 101 1± 8 89 104 0 ± 5 50
+ 0 5nM + 2 7ng/ml 114 7 ± 9 83 112 5 + 7 00
+ 1 OnM + 5 73ng/ml 119 3 ± 8 23 138 2 ± 1 2 8
+ 5 OnM + 27ng/ml 227 9 ± 12 1 144 3 ± 12 0
+ 10 OnM + 57 3ng/ml 343 1 ± 20 6 335 9 ± 24 8
+ 20 OnM + 0 1147/xg/ml 299 8 ± 24 0 279 1 ± 17 7
+ 50 OnM + 0 27/ig/ml 181 7 ± 26 5 124 5 ± 13 9
+ lOOnM + 0 573/ig/ml 96 88 ± 4 21 51 86 ± 4 15
161
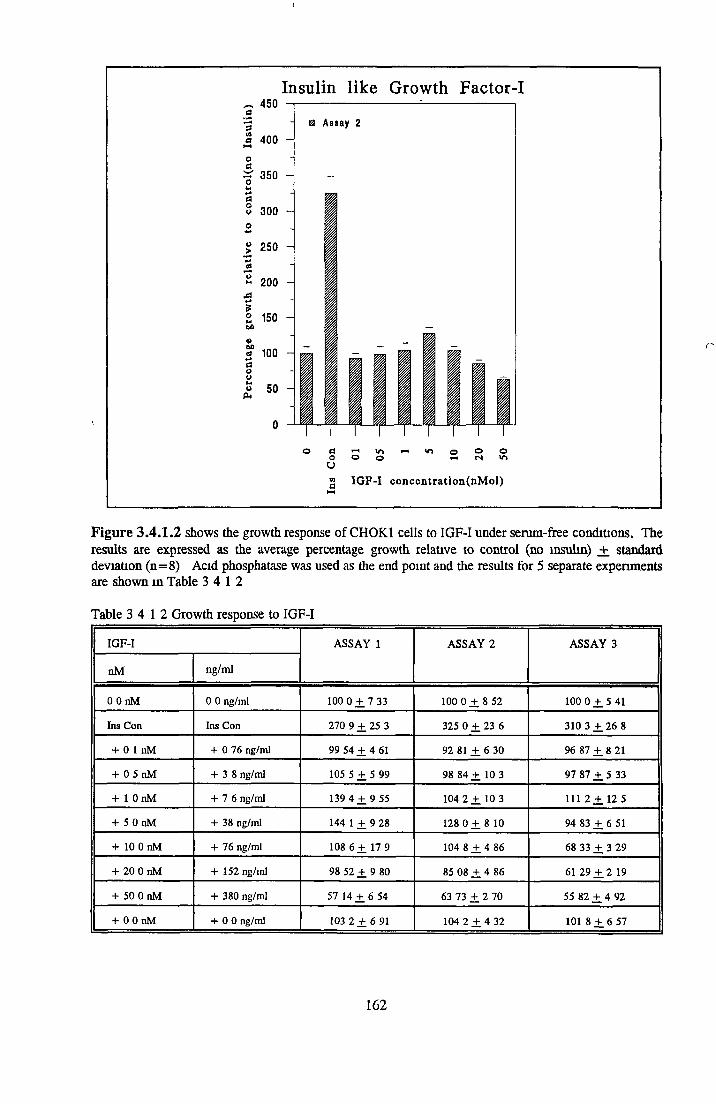
i
Figure 3 .4 .1 .2 shows the growth response of CHOK1 cells to IGF-I under serum-free conditions. The results are expressed as the average percentage growth relative to control (no insulin) +. standard deviation (n = 8) Acid phosphatase was used as the end point and the results for 5 separate experiments are shown in Table 3 4 1 2
Table 3 4 1 2 Growth response to IGF-I
IGF-I ASSAY 1 ASSAY 2 ASSAY 3
nM ng/ml
0 OnM 0 0 ng/ml 100 0 + 7 33 100 0 + 8 52 100 0 +.5 41
Ins Con Ins Con 270 9 + 25 3 325 0 + 23 6 310 3 +.26 8
+ 0 1 nM + 0 76 ng/ml 99 54 + 4 61 92 81 + 6 30 96 87 +. 8 21
+ 0 5 nM + 38 ng/ml 105 5 + 5 99 98 84 ± 10 3 97 87 ± 5 33
+ 1 OnM + 76 ng/ml 139 4 + 9 55 104 2 +. 10 3 111 2 ± 12 5
+ 50nM + 38 ng/ml 144 1 +. 9 28 128 0 + 8 10 94 83 ± 6 51
+ 10 0 nM + 76 ng/ml 108 6 + 17 9 104 8 + 4 86 68 33 ± 3 29
+ 20 OnM + 152 ng/ml 98 52 + 9 80 85 08 + 4 86 61 29+.2 19
+ 50 OnM + 380 ng/ml 57 14 ± 6 54 63 73 + 2 70 55 82 ± 4 92
+ 0 0 nM + 00 ng/ml 103 2 + 6 91 104 2 +. 4 32 101 8 +.6 57
162

Insulin like Growth Factor-II450
itotauto«a
a 400 Ho£ 350
aS 300 - o
200
150 -
100
50 -
0 I G F - I I ( A s s a y 1) □ Albumin contro l
i .
o o U o
3 IGF-II concentratlon(nMol)
Figure 3 .4 .1 .3 shows the growth response of CHOK1 cells to IGF-II under serum- results are expressed as the average percentage growth relative to control (no deviation (n = 8) Acid phosphatase was used as the end point and the results for 3 are shown m Tables 3 4 1 3a to c.
free conditions The insulin) +. standard separate experiments
Table 3 4 1 3a Growth response to IGF-II
VARIABLES ASSAY 1 ASSAY 2 ASSAY 3
0 OnM 0 Ong/ml 100 0 ± 5 70 100 0 ± 8 24 100 0 ± 8 69
Ins Con Ins Con 284 4 + 12 2 282 9 + 18 9 248 3 + 12 6
+ 0 InM + 0 75ng/ml 96 79 + 6 36 94 49 + 7 58 96 96 + 7 23
+ 0 5nM + 3 75ng/ml 121 8 + 10 5 92 58 ± 6 42 96 13 ± 9 96
+ 1 OnM + 7 5ng/ml 137 7 + 5 41 94 88 + 7 33 104 8 + 3 28
+ 5 OnM + 37 5ng/ml 88 53 ± 4 20 120 1 ± 9 24 108 7 ± 6 28
+ 10 OnM + 75ng/ml 72 48 + 3 67 113 1 + 665 103 9 + 7 25
+ 20 OnM + 150ng/ml 61 93 + 3 39 67 38 ± 4 22 105 8 + 5 79
+ 50 OnM + 375ng/ml 55 88 + 3 29 56 38 + 5 50 114 6 + 12 0
+ 0 OnM + 0 0ng/ml 101 4 + 642 1004 + 825 106 6 + 6 92
163
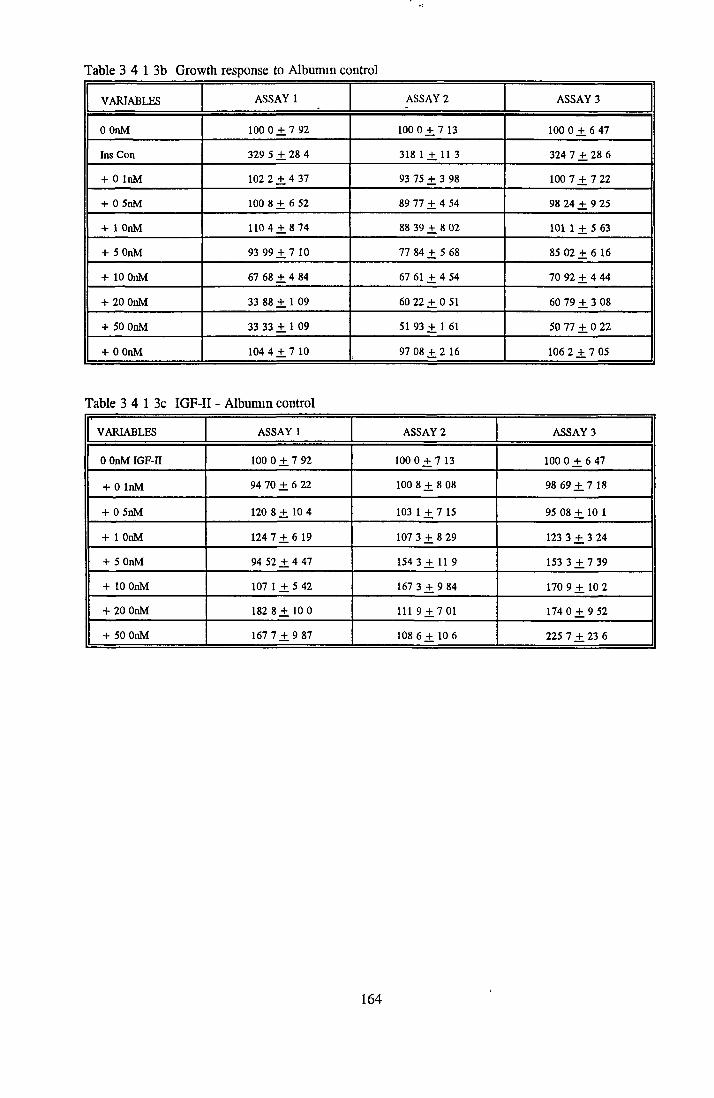
Table 3 4 1 3b Growth response to Albumin control
VARIABLES ASSAY 1 ASSAY 2 ASSAY 3
0 OnM 100 0 + 7 92 1000 + 7 13 100 0 +. 6 47
Ins Con 329 5 + 28 4 318 1 + 11 3 324 7 + 28 6
+ 0 InM 102 2 + 4 37 93 75 + 3 98 100 7 + 7 22
+ 0 5nM 100 8 ± 6 52 89 77 + 4 54 98 24 + 9 25
+ 1 OnM 110 4 + 874 88 39 + 8 02 101 1 + 5 63
+ 5 OnM 93 99 + 7 10 77 84 + 5 68 85 02 + 6 16
+ 10 OnM 67 68 + 4 84 67 61 + 4 54 70 92 + 4 44
+ 20 OnM 33 88 + 1 09 60 22 + 0 51 60 79 + 3 08
+ 50 OnM 33 33 + 1 09 51 93 + 1 61 50 77 + 0 22
+ 0 OnM 104 4 + 7 10 97 08 + 2 16 106 2 + 7 05
Table 3 4 1 3c IGF-II - Albumin control
VARIABLES ASSAY 1 ASSAY 2 ASSAY 3
0 OnM IGF-II 100 0 + 7 92 1000 + 7 13 100 0 + 6 47
+ 0 InM 94 70 + 6 22 100 8 + 8 08 98 6 9 ± 7 18
+ 0 5nM 120 8 + 104 103 1+. 7 15 95 08 + 10 1
+ 1 OnM 1247 + 6 19 107 3 + 8 29 123 3 + 3 24
+ 5 OnM 94 52 + 4 47 154 3 + 11 9 153 3 ± 7 39
+ 10 OnM 107 1 + 5 42 167 3 + 9 84 170 9 +. 10 2
+ 20 OnM 182 8 + 10 0 111 9 + 7 01 174 0 ± 9 52
+ 50 OnM 167 7 + 9 87 108 6 + 10 6 225 7 + 23 6
164
discrepancy between the lack of stimulation of insulin at microgram levels and the 10/xg/ml control is discussed in section 4 3 (page 343)
The results showed that at the concentrations tested, IGF-I and IGF-II were not very stimulatory to cell growth (Figure 3 4 12 and 3 4 13) For IGF-I, variations in maximum stimulation occurred from experiment to experiment, but reached a maximum of 28 to 44% stimulation over the control (no insulin) at a concentration of 5nM (38ng/ml) in two of the three assays At higher concentrations (about 380ng/ml) the IGF became slightly inhibitory
In Figure 3 4 1 3, the effect of IGF-II appeared to be very low However, bovine serum albumin-fatty acid free was required to act as a stabilizer for the IGF-II The albumin alone
was inhibitory to the cells and so any stimulatory effect of the IGF-II may have been masked
Table 3 4 1 3c shows the stimulatory effect when the albumin was taken into account Stimulation was greater than that seen for the IGF-I Maximum stimulation varied from experiment to experiment reaching values of 167 3 to 225 7 % stimulation relative to the control (no insulin) The concentration range m which the stimulation occurred between 5 and 50nM (37 5 and 375ng/ml) The half maximum activity for the three experiments were 109, 24 32 and 57 82ng/ml for experiments 1 to 3
These results correlate to the findings of Mamounas (1989), that insulin would appear not to exert its growth stimulatory effect through the IGF-I receptor If this had been so, IGF-I should have been as stimulatory at nanogram levels as insulin was at microgram levels
3 .4 .2 EFFECT OF THE INSULIN SOURCE ON CHOK1 CELLS IN SFM
In order to compare the growth of different sources of insulin with slight variations in molecular weight, it was decided to compare them on the basis of international units (IU) An international unit is defined as the activity contained in 0 04167mg of fourth international standard preparation of bioassay (Pharmacopia, 1958) The standard contains 52% bovine and 48% porcine insulm with an equivalent 24 umts/mg In addition to bovine and recombinant human insulin, ovine, porcine and equine-derived insulins were also investigated Assays were
set up using the procedure described in section 3 4 1 The relationships between international units and mg/ml concentrations are shown in Table 3 4 2 The results are shown in Figures 3 4 2 1 to 3 4 2 5
165
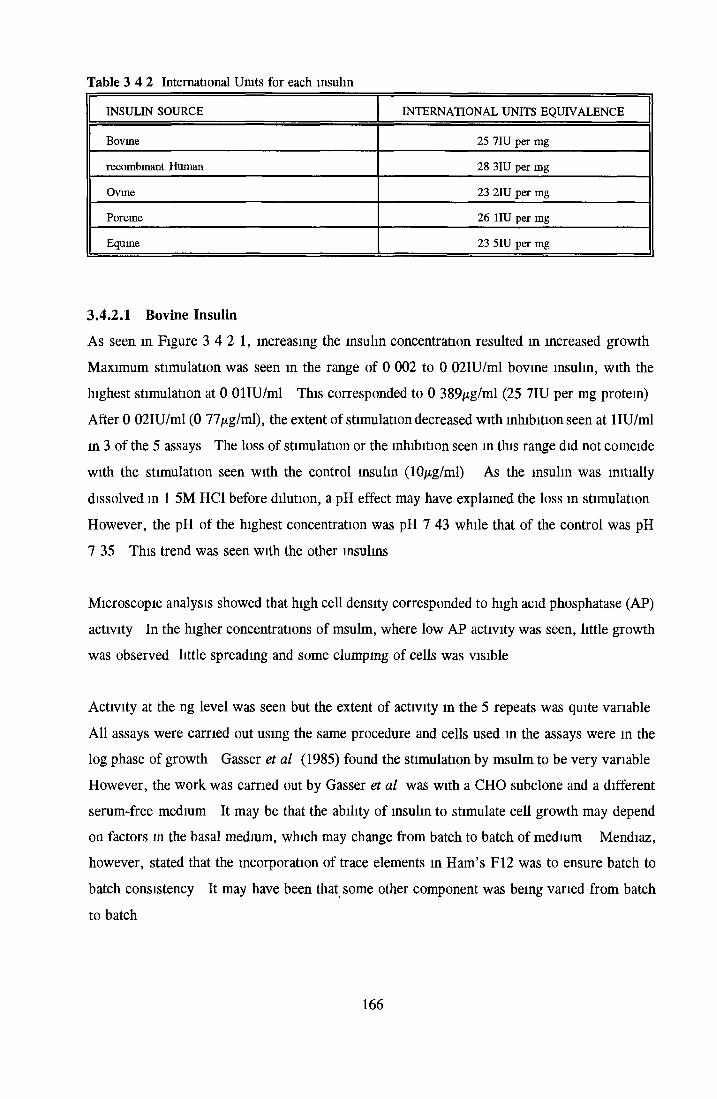
Table 3 4 2 International Umts for each insulin
INSULIN SOURCE INTERNATIONAL UNITS EQUIVALENCE
Bovme 25 7IU per mg
recombinant Human 28 3IU per mg
Ovine 23 2IU per mg
Porcine 26 1IU per mg
Equine 23 5IU per mg
3.4.2.1 Bovine InsulinAs seen in Figure 3 4 2 1, increasing the insulin concentration resulted in increased growth
Maximum stimulation was seen in the range of 0 002 to 0 02IU/ml bovine insulin, with the highest stimulation at 0 OllU/ml This corresponded to 0 389/ig/ml (25 7IU per mg protein)
After 0 02IU/ml (0 77/xg/ml), the extent of stimulation decreased with inhibition seen at llU/ml in 3 of the 5 assays The loss of stimulation or the inhibition seen m this range did not coincide with the stimulation seen with the control insulin (lOptg/ml) As the msulm was initially
dissolved in 1 5M HC1 before dilution, a pH effect may have explained the loss m stimulation However, the pH of the highest concentration was pH 7 43 while that of the control was pH 7 35 This trend was seen with the other insulins
Microscopic analysis showed that high cell density corresponded to high acid phosphatase (AP) activity In the higher concentrations of msulm, where low AP activity was seen, little growth was observed little spreading and some clumping of cells was visible
Activity at the ng level was seen but the extent of activity in the 5 repeats was quite variable All assays were carried out using the same procedure and cells used in the assays were in the log phase of growth Gasser et al (1985) found the stimulation by msulm to be very variable However, the work was carried out by Gasser et al was with a CHO subclone and a different serum-free medium It may be that the ability of insulin to stimulate cell growth may depend on factors m the basal medium, which may change from batch to batch of medium Mendiaz, however, stated that the incorporation of trace elements in Ham’s F12 was to ensure batch to batch consistency It may have been that some other component was being varied from batch to batch
166

For the 5 experiments, the extent of stimulation varied between 3-fold and 6-fold stimulation The half maximum activity of each run was 40, 17 5, 127, 47 and 103ng/ml for runs 1 to 5 respectively However, when the ratios of maximum stimulation were compared to the insulin
control, the results appeared less variable For assays 1 to 5, ratios were 1 476, 1 588, 1 52, 1 02 and 1 21 respectively, with an average and standard deviation of 1 36 jf 0 238
Compared to the results obtained by Mendiaz, the insulin was less stimulatory overall and appeared to require a higher concentration to elicit the same effect Unlike Mendiaz, at the
higher concentrations, some loss of stimulation or inhibition was observed in these experiments In addition, cells with or without insulin appeared elongated and fibroblastic like
3 .4 .2 .2 Recombinant Human Insulin
Recombinant human insulin was growth stimulatory in a concentration-dependent manner The results are shown in Figure 3 4 2 2 Maximum stimulation was between 0 01 and 0 llU/ml (concentration 0 283 to 2 83/xg/ml) After this the recombinant insulin became less stimulatory
Microscopic observations showed that strong AP production corresponded to good growth and spreading while low AP production corresponded to little growth (very little spreading and the presence of clumps of cells) Activity was seen at slightly higher the physiological
concentrations of 0 01 to 0 02IU/ml (283 to 566ng/ml) In this range the recombinant human insulin was as good, if not better than the 10/ig/ml bovine insulin control The half maximum activities for each experiment were very variable, being 52, 41, 127 5, 241 and 462ng/ml
respectively Except for runs 4 and 5, the other half maximum activities occurred around the same concentration as those for the respective bovine insulin experiments For assays 1 to 5 the ratios of maximum stimulation to the insulin control were 1 513, 1 377, 1 383, 0 899 and 0 981 (average and standard deviation of 1 231 _+ 0 272)
3 .4 .2 .3 Porcine Insulin
Porcine insulin stimulated growth in a concentration-dependent manner (Figure 3 4 2 3) at concentrations up to 0 002 to 0 02IU/ml A plateau effect was seen in 3 of 5 assays at 0 OllU/ml These concentrations correspond to 76 6 to 766ng/ml (26 1 IU per mg protein) Porcine insulin was slightly more effective at low physiological concentrations than bovine
insulin This was reflected in the half maximum activity for each experiment (6 87, 26 55,
167
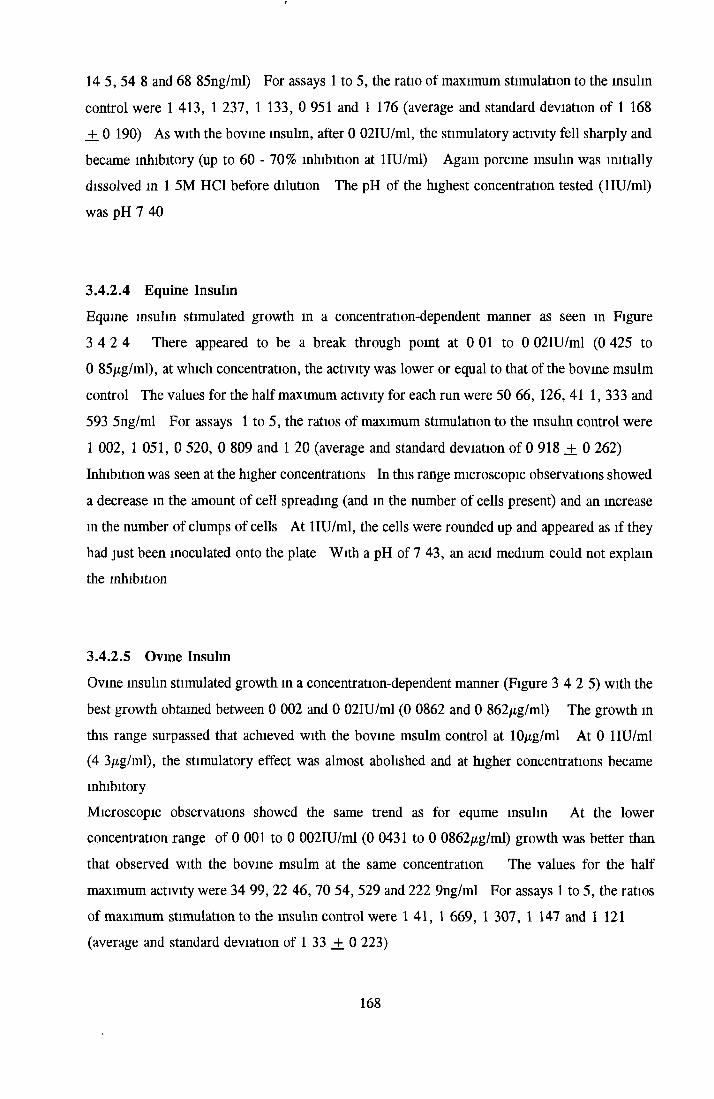
14 5, 54 8 and 68 85ng/ml) For assays 1 to 5, the ratio of maximum stimulation to the insulin
control were 1 413, 1 237, 1 133, 0 951 and 1 176 (average and standard deviation of 1 168 +. 0 190) As with the bovine insulin, after 0 02IU/ml, the stimulatory activity fell sharply and became inhibitory (up to 60 - 70% inhibition at llU/ml) Again porcine insulin was initially dissolved m 1 5M HC1 before dilution The pH of the highest concentration tested (llU/ml) was pH 7 40
3 .4 .2 .4 Equine Insulin
Equme msulm stimulated growth in a concentration-dependent manner as seen in Figure 3 4 2 4 There appeared to be a break through point at 0 01 to 0 02IU/ml (0 425 to0 85/xg/ml), at which concentration, the activity was lower or equal to that of the bovine msulm
control The values for the half maximum activity for each run were 50 66, 126, 41 1, 333 and
593 5ng/ml For assays 1 to 5, the ratios of maximum stimulation to the insulin control were
1 002, 1 051, 0 520, 0 809 and 1 20 (average and standard deviation of 0 918 0 262)
Inhibition was seen at the higher concentrations In this range microscopic observations showed
a decrease in the amount of cell spreading (and in the number of cells present) and an increase m the number of clumps of cells At llU/ml, the cells were rounded up and appeared as if they had just been inoculated onto the plate With a pH of 7 43, an acid medium could not explain the inhibition
3 .4 .2 .5 Ovine Insulin
Ovine msulm stimulated growth in a concentration-dependent manner (Figure 3 4 2 5) with the best growth obtained between 0 002 and 0 02IU/ml (0 0862 and 0 862/tg/ml) The growth in this range surpassed that achieved with the bovine msulm control at 10/ig/ml At 0 llU/ml (4 3/xg/ml), the stimulatory effect was almost abolished and at higher concentrations became inhibitory
Microscopic observations showed the same trend as for equme insulin At the lower concentration range of 0 001 to 0 002IU/ml (0 0431 to 0 0862/ig/ml) growth was better than that observed with the bovine msulm at the same concentration The values for the half maximum activity were 34 99,22 46, 70 54, 529 and 222 9ng/ml For assays 1 to 5, the ratios of maximum stimulation to the msulm control were 1 41, 1 669, 1 307, 1 147 and 1 121 (average and standard deviation of 1 33 _+ 0 223)
168
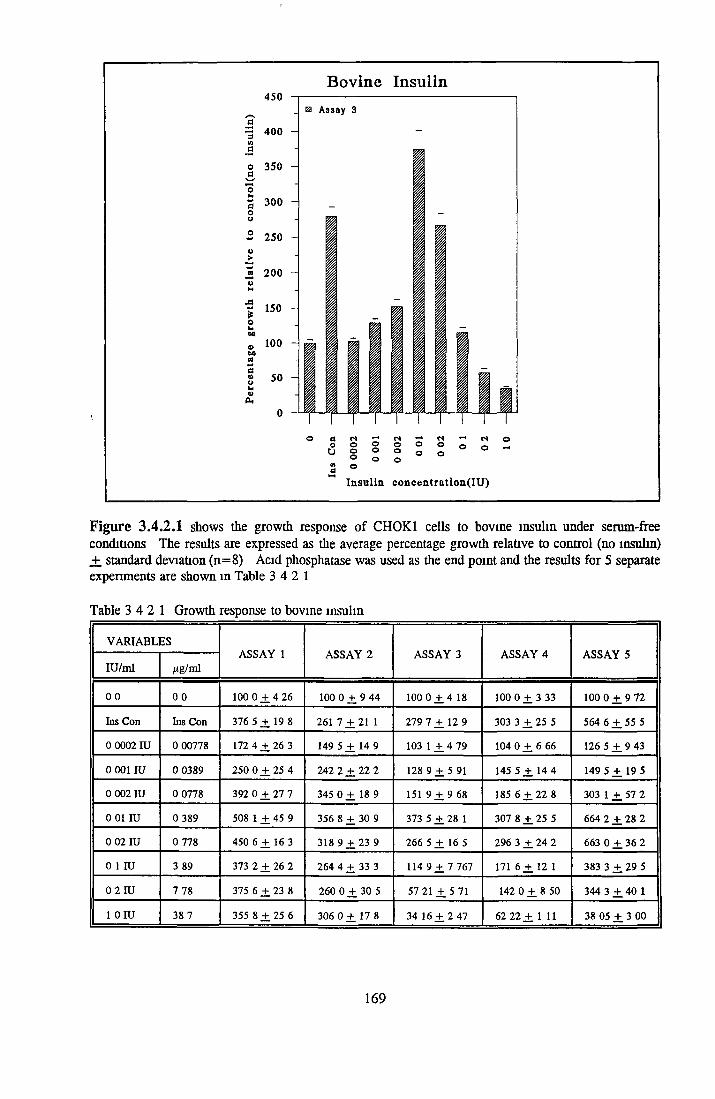
Bovine Insulin450
4)toA%O
doU o oo oo oo o ® o o
cs o o -H
o ©Insulin concentration(IU)
Figure 3 .4 .2 .1 shows the growth response of CH0K1 cells to bovine insulin under serum-free conditions The results are expressed as the average percentage growth relative to control (no insulin) +, standard deviation (n = 8) Acid phosphatase was used as the end point and the results for 5 separate experiments are shown in Table 3 4 2 1
Table 3 4 2 1 Growth response to bovine insulin
VARIABLESASSAY 1 ASSAY 2 ASSAY 3 ASSAY 4 ASSAY 5
IU/ml fig/ml
00 0 0 100 0 ± 4 26 100 0 ± 9 44 1000 + 4 18 100 0 + 3 33 100 0 +. 9 72
Ins Con Ins Con 376 5 ± 19 8 261 7 + 21 1 279 7 + 12 9 303 3 +. 25 5 564 6 +. 55 5
0 0002IU 0 00778 172 4 ± 26 3 149 5 ± 14 9 103 1 ± 4 79 104 0 +, 6 66 126 5 +. 9 43
0 001IU 0 0389 250 0 ± 25 4 242 2 ± 22 2 128 9 + 5 91 145 5 + 14 4 149 5 + 19 5
0 002 IU 0 0778 392 0 ± 27 7 345 0 ± 18 9 151 9 + 9 68 185 6 ± 2 2 8 303 1 +. 57 2
0 01 IU 0 389 508 1 ± 45 9 356 8 ± 30 9 373 5 + 28 1 307 8 + 25 5 664 2 ± 28 2
0 02 IU 0 778 450 6 ± 16 3 318 9 ± 2 3 9 266 5 + 16 5 296 3 + 24 2 663 0 +. 36 2
0 1 IU 3 89 373 2 ± 26 2 264 4 + 33 3 114 9 ± 7 767 171 6+. 12 1 383 3 +. 29 5
0 2 IU 7 78 375 6 ± 23 8 260 0 ± 30 5 57 21 ± 5 71 142 0 +. 8 50 344 3 ± 4 0 1
1 0IU 38 7 355 8 + 25 6 306 0 + 17 8 34 16 + 2 47 62 22 + 1 11 38 05 + 3 00
169
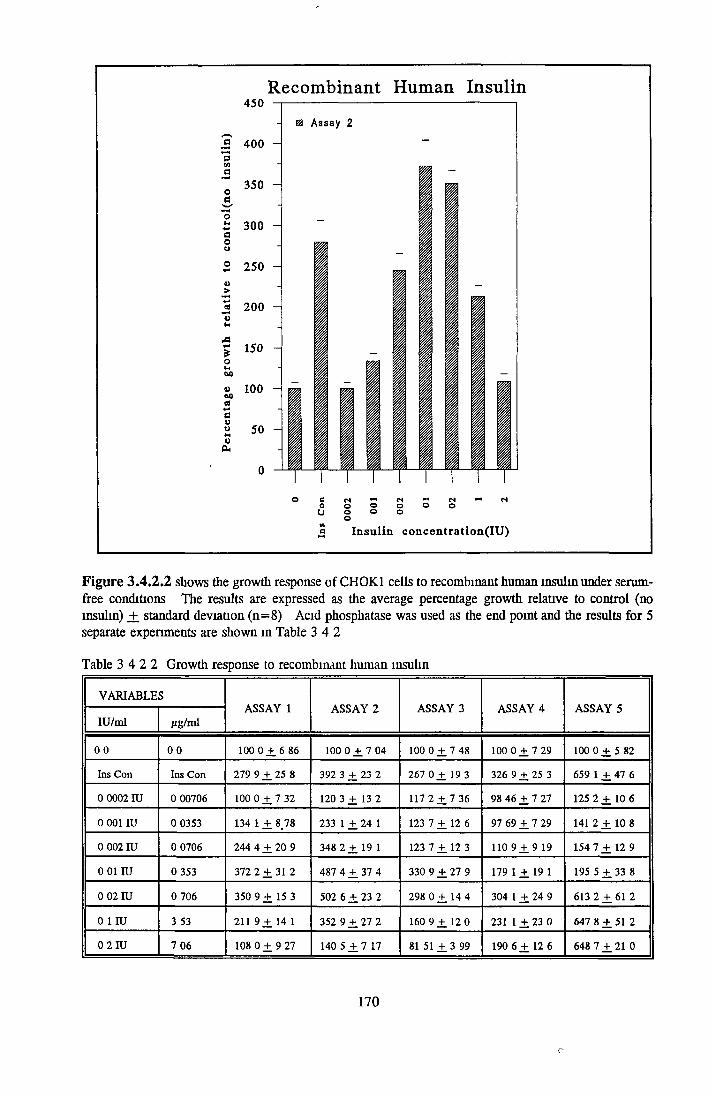
Figure 3 .4 .2 .2 shows the growth response of CHOK1 cells to recombinant human insulmunder serum- free conditions The results are expressed as the average percentage growth relative to control (no insulin) _+ standard deviation (n = 8) Acid phosphatase was used as the end point and the results for 5 separate experiments are shown in Table 3 4 2
Table 3 4 2 2 Growth response to recombinant human insulin
VARIABLESASSAY 1 ASSAY 2 ASSAY 3 ASSAY 4 ASSAY 5
IU/ml Mg/ml
0 0 00 100 0 ± 6 86 100 0 ± 7 04 100 0 ± 7 48 100 0 + 729 100 0 + 5 82
Ins Con Ins Con 279 9 ± 25 8 392 3 ± 23 2 267 0 ± 19 3 326 9 ± 2 5 3 659 1 ± 47 6
0 0002IU 0 00706 100 0 ± 7 32 120 3 ± 13 2 117 2 ± 7 36 98 46 ± 7 27 125 2 + 10 6
0 001 IU 0 0353 134 1 ± 878 233 1 ± 24 1 123 7 ± 12 6 97 69 ± 7 29 141 2 + 10 8
0 002 IU 0 0706 244 4 ± 20 9 348 2 + 19 1 123 7 + 12 3 1109 + 9 19 154 7 + 12 9
0 01 IU 0 353 372 2 ± 31 2 487 4 ± 37 4 330 9 ± 27 9 179 1 + 19 1 195 5 ± 3 3 8
0 02 IU 0 706 350 9 ± 15 3 502 6 ± 23 2 298 0 ± 14 4 304 1 +. 24 9 613 2 ± 6 1 2
0 1IU 3 53 211 9 ± 14 1 352 9 ± 27 2 160 9 ± 12 0 231 1 + 23 0 647 8 ± 51 2
0 2 IU 7 06 108 0 + 9 27 140 5 + 7 17 81 51 + 3 99 190 6 + 12 6 648 7 + 21 0
170
C
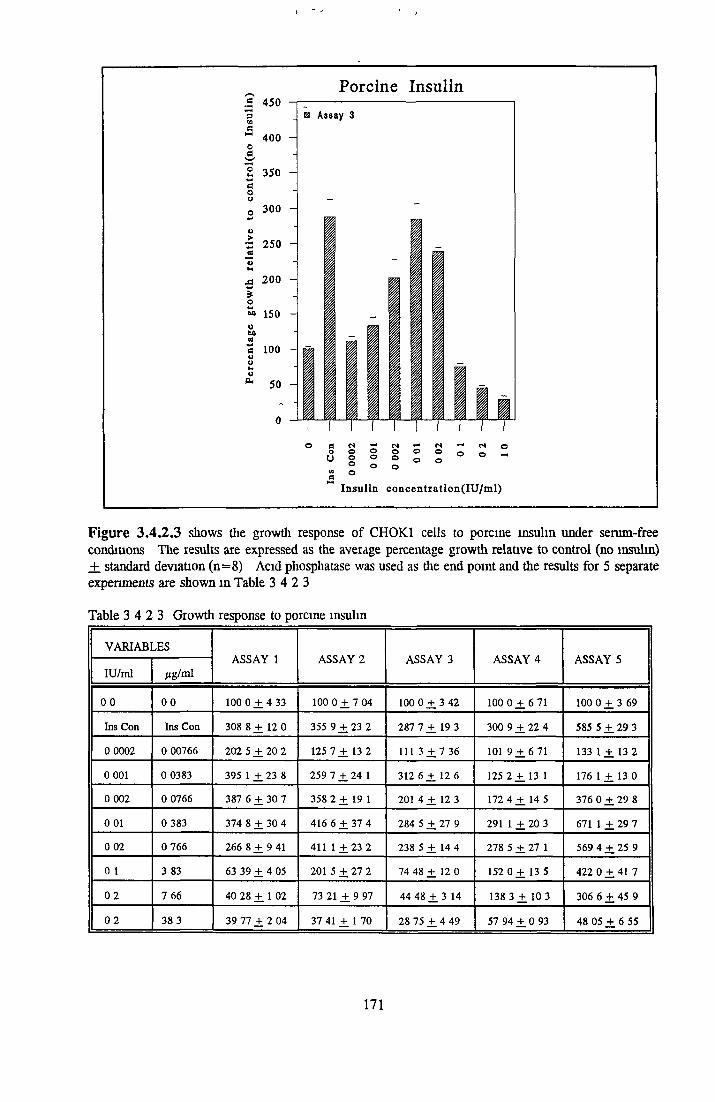
Figure 3 .4 .2 .3 shows the growth response of CHOK1 cells to porcine insulin under serum-free conditions The results are expressed as die average percentage growth relative to control (no insulin) +. standard deviation (n = 8) Acid phosphatase was used as the end point and the results for 5 separate experiments are shown in Table 3 4 2 3
Table 3 4 2 3 Growth response to porcine insulin
VARIABLESASSAY 1 ASSAY 2 ASSAY 3 ASSAY 4 ASSAY 5
lU/ml Mg/ml
00 00 100 0 ± 4 33 100 0 ± 1 04 100 0 ± 3 42 100 0 + 671 100 0 ± 3 69
Ins Con Ins Con 308 8 + 12 0 355 9 + 23 2 287 7 ± 19 3 300 9 ± 22 4 585 5 ± 29 3
0 0002 0 00766 202 5 ± 20 2 125 7 ± 13 2 111 3 + 7 36 101 9 ± 6 71 133 1 ± 13 2
0 001 0 0383 395 1 ± 23 8 259 7 ± 24 1 312 6 ± 12 6 125 2 ± 1 3 1 176 1 ± 13 0
0 002 0 0766 387 6 ± 30 7 358 2 + 19 1 201 4 + 12 3 172 4 ± 14 5 376 0 ± 29 8
0 01 0 383 374 8 ± 30 4 416 6 + 37 4 284 5 ± 27 9 291 1 ± 20 3 671 1 ± 29 7
0 02 0 766 266 8 ± 9 41 411 1 +23 2 238 5 ± 14 4 278 5 ± 27 1 569 4 ± 25 9
0 1 3 83 63 39 ± 4 05 201 5 ± 27 2 74 48 ± 12 0 152 0 ± 13 5 422 0 ± 41 7
02 7 66 40 28 ± 1 02 73 21 ± 9 97 44 48 ± 3 14 138 3 ± 1 0 3 306 6 ± 45 9
02 38 3 39 77 + 2 04 37 41 + 1 70 28 75 + 4 49 57 94 + 0 93 48 05 + 6 55
171
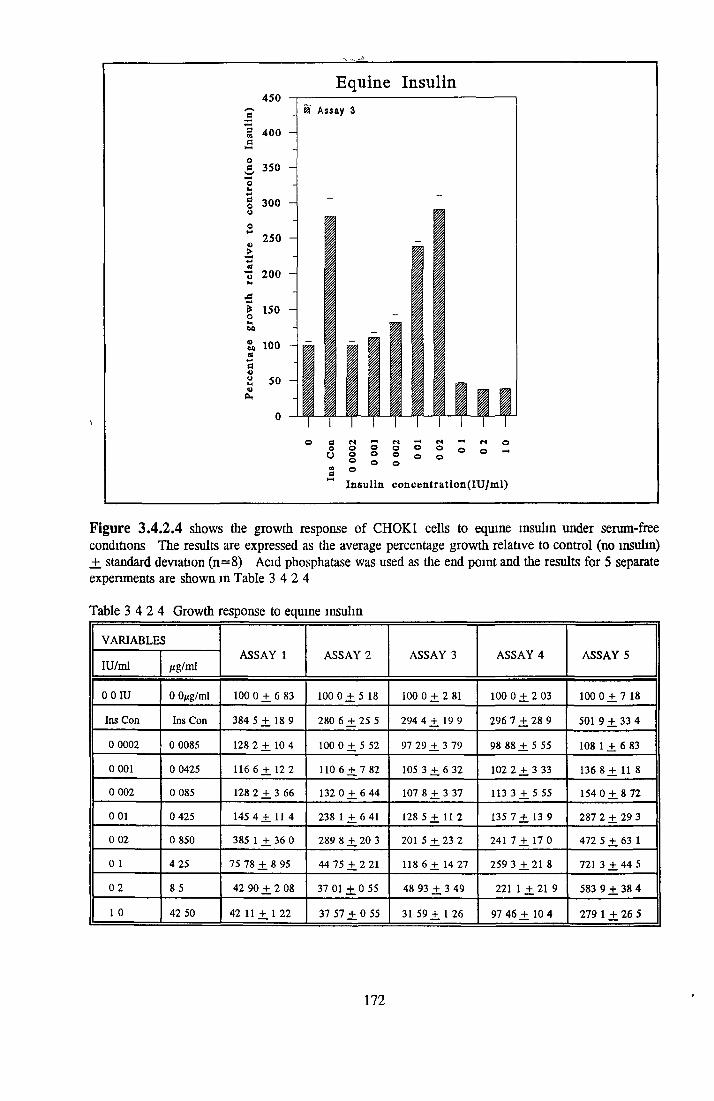
Figure 3A.2.4 shows the growth response of CHOK1 cells to equine insulin under serum-free conditions The results are expressed as die average percentage growth relative to control (no insulin) +. standard deviation (n = 8) Acid phosphatase was used as the end point and the results for 5 separate experiments are shown in Table 3 4 2 4
Table 3 4 2 4 Growth response to equine insulin
VARIABLESASSAY 1 ASSAY 2 ASSAY 3 ASSAY 4 ASSAY 5
IU/ml Mg/ml
0 OIU 0 0/xg/ml 100 0 ± 6 83 100 0 ± 5 18 100 0 ± 2 81 100 0 ± 2 03 100 0 ± 7 18
Ins Con Ins Con 384 5 ± 18 9 280 6 ± 25 5 294 4 ± 19 9 296 7 ± 28 9 501 9 + 33 4
0 0002 0 0085 128 2 ± 1 0 4 100 0 ± 5 52 97 29 ± 3 79 98 88 ± 5 55 108 1 ± 6 83
0 001 0 0425 116 6 ± 12 2 110 6 ± 7 82 105 3 ± 6 32 102 2 ± 3 33 136 8 ± 11 8
0 002 0 085 128 2 ± 3 66 132 0 ± 6 44 107 8 ± 3 37 113 3 ± 5 55 154 0 ± 8 72
0 01 0 425 145 4 ± 11 4 238 1 ± 6 41 128 5 ± 11 2 135 7 ± 13 9 287 2 ± 29 3
0 02 0 850 385 1 ± 36 0 289 8 ± 20 3 201 5 ± 2 3 2 241 7 ± 17 0 472 5 ± 63 1
0 1 4 25 75 78 ± 8 95 44 75 ± 2 21 118 6 ± 14 27 259 3 ± 2 1 8 721 3 ± 44 5
02 8 5 42 90 ± 2 08 37 01 ± 0 55 48 93 ± 3 49 221 1 ± 21 9 583 9 ± 38 4
1 0 42 50 42 11 ± 1 22 37 57 ± 0 55 31 59 ± 1 26 97 46 ± 10 4 279 1 + 26 5
172
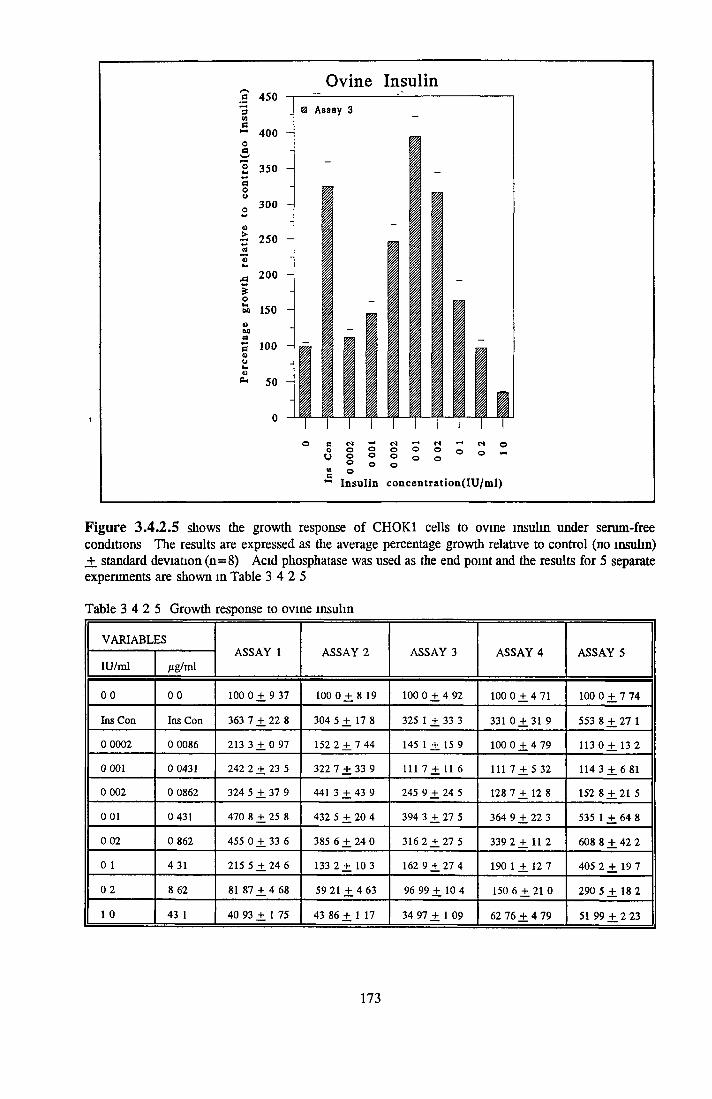
Figure 3 .4 .2 .5 shows the growth response of CHOK1 cells to ovine insulin under serum-free conditions The results are expressed as the average percentage growth relative to control (no insulin) +. standard deviation (n = 8) Acid phosphatase was used as the end point and the results for 5 separate experiments are shown in Table 3 4 2 5
Table 3 4 2 5 Growth response to ovine insulin
VARIABLESASSAY 1 ASSAY 2 ASSAY 3 ASSAY 4 ASSAY 5
IU/ml Mg/ml
00 0 0 100 0 ± 9 37 100 0 + 8 19 100 0 ± 4 92 1000 + 4 71 100 0 ± 7 74
Ins Con Ins Con 363 7 ± 22 8 304 5 ± 17 8 325 1 ± 33 3 331 0 ±31 9 553 8 ± 27 1
0 0002 0 0086 213 3 ± 0 97 152 2 + 7 44 145 1 ± 15 9 100 0 ± 4 79 113 0 ± 13 2
0 001 0 0431 242 2 ± 23 5 322 7 ± 33 9 111 7 + 11 6 111 7 ± 5 32 114 3 ± 6 81
0 002 0 0862 324 5 ± 37 9 441 3 +.43 9 245 9 ± 24 5 128 7 ± 12 8 152 8 ± 2 1 5
0 01 0 431 470 8 ± 25 8 432 5 ± 20 4 394 3 ± 27 5 364 9 ± 22 3 535 1 ± 64 8
0 02 0 862 455 0 + 33 6 385 6 ± 24 0 316 2 + 27 5 339 2 ± 11 2 608 8 ± 42 2
0 1 4 31 215 5 ± 24 6 133 2 + 10 3 162 9 + 27 4 190 1 ± 12 7 405 2 ± 1 9 7
0 2 8 62 81 87 ± 4 68 59 21 ¿ 4 63 96 99 ± 10 4 150 6 ±21 0 290 5 ± 1 8 2
1 0 43 1 40 93 ± 1 75 43 86 + 1 17 34 97 ± 1 09 62 76 ± 4 79 51 99 ± 2 23
173

3.4.3 COMPARISON OF INSULIN STOCKS
In order to investigate the discrepancy between the activity seen with the bovine insulin control and bovine insulin assayed, new stocks of bovine insulin (14011 and 11882) were obtained The activity of the new and old stocks were compared to determine if the loss of activity was due to a deterioration m the activity of the older stocks
The results are shown Figure 3 4 3 1 and Table 3 4 3 1 In these experiments the extent of stimulation by all stocks of bovine insulin were much higher than that observed in section 3 4 1
(as much as a 3-fold increase) Both new stocks and old stocks showed good stimulation with the newer stocks being only slightly more stimulatory
Looking at a serial dilution of the old stock, the activity reached a maximum stimulation of 8 8-
fold to 9 7-fold over the control (no insulin) for three separate repeats Above this concentration, the activity was lower, ranging between 7 1-fold and 8 3-fold stimulation at
concentrations of 5 to 10/xg/ml
With the new stocks of insulin, a similar trend was seen Maximum stimulation of 9 6-fold to
11-fold and 9 6-fold to 12-fold was seen for 14011 and 11882 respectively at 1/xg/ml Thereafter, the activity decreased at 5/xg/ml and increased slightly again at 10/ig/ml
These results show that maximum stimulation occurred at 1/ig/ml in the concentration range tested Inhibition was not seen at 5 to 10/xg/ml as in section 3 4 1, but the extent of stimulation appeared to decrease slightly Thus the inhibition seen in section 3 4 1 was not due to the insulin stock Why there was inhibition in this section is not known It may have been due to some inhibitory factor being incorporated into the 10X stocks on initial dilution That the bovine and human stocks did not appear inhibitory at higher concentrations in later experiments could indicate this to be the case
However, the extent of stimulation between the two sets of experiments was quite distinct In this section, CHOK1 cells of passage 6 were used while in section 3 4 1, passage 11-13 cells were used The extent of stimulation in section 3 4 3 may have been due to the use of a lower passage number or it could have been due to changes in the serum-free medium composition
(i e if vitamins or other unstable compounds lost their ability to function) As a result, cells of two different passage numbers were compared to see if passage number could explain the variations m stimulation The results are shown in Figure 3 4 3 2
174

Effect of Insulin stock on CHOK1 cells
Insulin concentratlon(ng/ml)
Figure 3 .4 .3 .1 shows the growth response of CHOK1 cells to old and new stocks of bovine insulin under serum-free conditions The results are expressed as the average percentage growth relative to control (no insulin) ± standard deviation (n = 8) Acid phosphatase was used as the end point and the results for 3 separate experiments are shown in Tables 3 4 3 la to c
Table 3 4 3 la Old insulin stock
VARIABLES ASSAY 1 ASSAY 2 ASSAY 3
0 Oftg/ml 100 0 + 102 100 0 + 10 4 100 0 + 5 50
Ins Con 1152 0 + 40 4 1257 9 + 59 6 1054 0 + 46 7
0 5/ig/ml 825 9 + 63 9 804 9 + 79 0 810 1 + 79 0
1 0/jg/ml 967 7 + 75 6 879 2 ± 67 5 953 4 + 82 5
5 0/tg/ml 788 4 + 67 8 733 8 + 49 3 820 7 + 88 6
10 Ofig/ml 714 5 + 58 5 735 0 + 67 5 834 6 + 70 4
175

Table 3.4.3.1b New Insulin stock (11882)
VARIABLES ASSAY 1 ASSAY 2 ASSAY 3
0 0 /tg/ml 100 0 ± 8 71 100 0 ± 9 72 100 0 ± 7 17
Ins Con 1015 4 ± 102 1376 1 ± 128 1162 5 + 48 1
0 5 /tg/ml 795 9 ± 60 9 964 9 ± 107 898 2 ± 87 2
1 0 /tg/ml 962 6 ± 78 1 11192 + 75 5 1131 ± 8 5 9
5 0 /tg/ml 755 0 + 81 3 922 5 ± 94 3 774 6 ± 31 7
10 0 /tg/ml 847 1 ± 78 0 1080 6 ± 73 1 908 5 ± 71 9
Table 3.4.3.1c New Insulin stock (14011)
VARIABLES ASSAY 1 ASSAY 2 ASSAY 3
0 0 /ng/ml 100 0 ± 8 71 100 0 ± 9 72 100 0 ± 7 17
Ins Con 1015 4 ± 102 1376 1 ± 128 1162 5 ± 4 8 1
0 5 /tg/ml 810 6 ± 72 4 860 6 ± 30 1 900 4 ± 66 0
1 0 jig/ml 966 7 ± 98 7 1223 ± 141 1074 ± 64 4
5 0 /tg/ml 818 7 ± 8 9 4 879 0 ± 32 9 751 0 ± 71 1
10 0 /tg/ml 784 5 ± 59 3 1256 ± 87 0 804 0 ± 77 9
For earlier passage cells (passage 4), maximum stimulation of 8 9-fold to 9 7-fold over the
control occurred at 1/ig/ml with some loss in stimulation at 5 to 10/ig/ml For later passage
cells (passage 14), maximum stimulation of 11-fold to 17-fold stimulation occurred at 1 - 5/xg/ml, with little loss of activity at 10/zg/ml These results would suggest that at the higher passage number, the cells had been stimulated to a greater extent by the insulin, or were more dependent on insulin Indeed, the insulin controls for the later passage showed a higher stimulation relative to the control than the earlier passage cells However, this does not account for the change in stimulation seen between sections 3 4 1 and 3 4 2 This would suggest that some factor or factors other than insulin were important for regulating the response of CHOK1 cells to insulin Different stocks of basal media were used in the two sections As Mendiaz recommended, the additional trace elements had been incorporated mto the serum-free medium to ensure batch to batch consistency It may be that some of the other elements became deactivated
176

Figure 3 .4 .3 .2 shows the growth response of CHOK1 cells to bovine insulin under serum-free conditions. The results are expressed as the average percentage growth relative to control (no insulin) +, standard deviation (n = 8). The results shown are taken from Assay 3. Acid phosphatase was used as the end point and the results for 3 separate experiments are shown in Table 3.4.3.2.
Table 3.4.3.2 Effect of passage number on growth response of CHOK1 cells to insulin
Passage No. Insulin ASSAY 1 ASSAY 2 ASSAY 3
4 0.0/ig/ml 100.0 ± 9.04 100.0 ± 7 .3 8 100.0 ± 7.94
Ins Con 978.7 ± 116 1017.5 ± 113 1054.5 ± 77.9
0.1/tg/ml 133.9 + 9.00 143.7 ± 35.9 124.9 ± 13.0
0.5/ig/ml 503.5 + 48.9 524.7 + 69.9 602.4 ± 29.3
1.0/ig/ml 893.3 ± 66.4 972.4 + 68.2 929.3 ± 68.0
5.0/xg/ml 587.7 ± 53.2 684.6 + 129 498.7 ± 84.9
10.0/ig/ml 734.4 ± 63.8 629.4 + 27.6 680.7 ± 9 5 .1
14 0.0^g/ml 100.0 + 6.79 100.0 ± 8 .1 0 100.0 ± 9 .1 7
Ins Con 1918.0 + 63.2 1184.4 ± 7 9 .9 1463.0 ± 9 1 .7
0.1 g/ml 173.2 ± 17.6 125.9 ± 19.8 215.3 ± 2 4 .9
0.5 jig/ml 1000.0 ± 112.9 780.9 ± 59.0 933.4 ± 69.9
1.0/xg/ml 1701.0 ± 141.7 1013.0 ± 5 7 .0 1348.0 ± 104
5.0/ig/ml 1379.0 ± 150.1 1152.0 ± 5 2 .1 1026.8 ± 82.9
10.0/ig/ml 1547.7 ± 136.1 952.8 ± 3.96 1189.3 ± 9 1 .9
177
3.4.4 RECOMBINANT HUMAN INSULIN AT HIGHER CONCENTRATIONS
In section 3 4 1, the concentration range tested using the recombinant insulin was lower than
that of the bovine insulin In order to see how the activity varied at higher concentrations, a range of 0 0002 to 1 OlU/ml with new stocks was tested The results are shown in Figure 3 4 4
As seen in section 3 4 3, the extent of stimulation by the bovme msulm control was about 3- fold higher than that observed in sections 3 4 1 and 3 4 2 The recombinant msulm was stimulatory in a concentration-dependent manner reaching a maximum stimulation of 10 to
13 8-fold over the control at concentrations of 0 02 - 0 llU/ml (0 566 - 2 83/ig/ml) After this, the stimulation was slightly reduced In 3 of the 5 experiments in section 3 4 2 2, the loss of stimulation at concentrations above 0 02IU/ml was much greater than the loss seen at concentrations of 0 1 to llU/ml in 3 4 4
The fact that the stimulation was so high in section 3 4 4, may have been due to a greater dependence on msulm Maximal stimulation occurred between 0 01-0 llU/ml in section 3 4 2 2 and between 0 02 - 0 llU/ml in section 3 4 4 For the recombinant insulin in section 3 4 4, the ratios of maximum activity compared to the insulin control were 1 350,1 152 and 1 016 (average and standard deviation of 1 173 _+ 0 168) The average ratio compares favourably to the ratio obtained for the recombinant insulin m section 3 4 2 2
(1 153 _+ 0 183) The ratios of maximum activity versus the msulm control, showed that the activity of both insulins had not changed relative to each other This meant that the change in the extent of stimulation was due to some factor(s) other than msulm
These results show that the activity of the recombinant msulm reaches maximum activity between 0 01-0 llU/ml from both sections and the maximum stimulation was as good if not better than the bovme msulm
The results show that the IGFs are not a suitable replacement for the CHOK1 cells Comparison of the various sources of msulm show that recombinant human insulin can be
used as a replacement for bovme-derived msulm The results show changes in the maximum stimulatory concentration of msulm and a difference in morphology to that observed by Mendiaz
178

R e c o m b i n a n t H u m a n Insulin1400
1300/•"Sa% 1200CQ* 1100 o^ 1000 oa 900 ooO 800
£ 700
!um 500
2 400W>£> 300cd
g 200u| 100
0
o o o o o o u o o o o
5 Insulin concentration(IU )
Figure 3.4.4 shows the growth response of CH0K1 cells to recombinant human insulin under serum- free conditions The results are expressed as the average percentage growth relative to control (no insulin) _+ standard deviation (n=8) Acid phosphatase was used as the end point and the results for 3 separate experiments are shown in Table 3 4 4
Table 3 4 4 Growth response to recombinant human insulin
VARIABLES ASSAY 1 ASSAY 2 ASSAY 3
0 0IU/ml 100 0 ± 5 10 100 0 + 21 4 100 0 ± 9 81
Ins Con 1050 0 ± 49 9 955 5 + 115 1107 4 ± 116
0 0002IU/ml 278 3 ± 21 1 202 9 + 11 4 337 6 ± 73 6
0 00IIU/ml 400 0 ± 55 6 453 7 + 44 5 641 4 ± 54 7
0 002IU/ml 656 0 ± 75 0 675 0 + 51 5 711 8 ± 8 0 2
0 01IU/ml 840 4 ± 70 0 877 3 + 144 959 6 ± 70 8
0 02IU/ml 958 6 ± 44 2 1085 5 ± 7 5 9 1124 6 ± 59 8
0 lIU/ml 1382 5 + 62 0 815 6 ± 7 0 2 988 4 ± 43 9
0 2IU/ml 1345 0 + 127 911 8 ± 157 943 5 ± 65 8
1 0IU/ml 1094 6 + 64 6 853 5 ± 101 967 6 ± 52 6
179

3.5.1 EFFECT OF ALBUMINS ON THE GROWTH OF NRK CELLS
BSA has been found to be stimulatory for many cell lines (Nilausen, 1978, Kan and Yamane, 1982, Barlian et a l , 1993) Due to the ’stickmess’ of BSA, it can carry a wide variety of
contaminating factors The activity of the albumin is most often related to factors which the albumin carries rather than the albumin molecule itself Fatty acids are most commonly cited as the source of the activity The results outlined in section 3 1 show that bovme serum
albumin (BSA) fraction V was stimulatory for NRK cells at concentrations in the range of 0 5
to lOmg/ml with a 2% Donor Horse Serum (DHS) background In order to determine if the activity was due to the presence of fatty acids, a comparison of human and bovme fraction V and fatty acid free albumins was made
This section describes a number of investigations which were carried out to try and determine the cause of the stimulatory activity associated with BSA for NRK cells in low serum- supplemented medium
180

3.5.1.1.1 Bovine Serum Albumin - Fraction V
The growth response of NRK cells to BSA fraction V (Sigma A4919, lot 110H - 04635) is shown in Figure 3 5 111 and Tables 3 5 111a and b Two independent experiments showed that increasing the albumin concentration resulted m increased stimulation withm the
concentration range tested The extent of stimulation varied between the two experiments With dye elution or acid phosphatase as the end point, stimulation varied between 2-fold and 2 5-fold stimulation over the control (2% DHS), while for image analysis, the effect of BSA fraction V was much greater, with a 2-fold to 10-fold stimulation over the control at 2 5 -
5 Omg/ml
T able 3 .5 1 1 1 a Effect o f BSA - fraction V (mg/ml) on NRK cells
ASSAY 1 ACIDPHOSPHATASE
CELL NUMBER DYE ELUTION IMAGEANALYSIS
2% DHS 100 0 ± 13 8 100 0 (110 4 , 89 40) 100 0 ± 3 51 100 0 ± 8 46
+ 0 5 A 106 0 ± 15 7 110 0 (123 2 , 99 10) 176 6 + 3 76 707 0 ± 28 8
+ 1 0 A 120 0 ± 1 63 122 0 (146 9, 96 70) 185 2 + 2 65 724 0 ± 64 1
+ 2 5 A 132 0 ± 11 6 118 0 (133 6, 103 0) 234 8 ± 10 6 1033 ± 60 2
+ 5 0 A 165 0 + 16 9 150 9 (157 4 , 144 5) 246 8 + 4 32 937 0 ± 2 86
+ 10 0 A 177 0 ± 12 6 149 6 (138 9, 160 4) 214 2 ± 15 7 573 0 +. 48 8
5% DHS 183 3 _+_ 11 8 186 0 (191 0 , 203 2) 189 3 31 3 715 0 + 50 2
All results except those for cell number are expressed as the average percentage growth relative to the control (2% DHS) _+ standard deviation (n = 8 for acid phosphatase, n = 6 for dye elution and n = 3 for image analysis) Results for cell number are expressed as the average percentage growth relative to control (2% DHS) As there were only two values for each assay condition, a standard deviation was not earned out Instead, the results of the two separate readmgs were expressed as the percentage growth relative to average growth obtained with the control, 2% DHS Abbreviations A = m g/m l albumin, BSA fraction V
The results show similar trends in the two assays for acid phosphatase, cell number and dye elution When image analysis was used as the end point, the extent of stimulation was much greater than that seen with the other end points Yet, when the dye was eluted off the plates that were read on the image analyser, the extent of stimulation was lower As image analysis measures colony area as a basis of comparison, the results would indicate that the BSA was not only promoting cell growth but was also promoting cell spreading
181
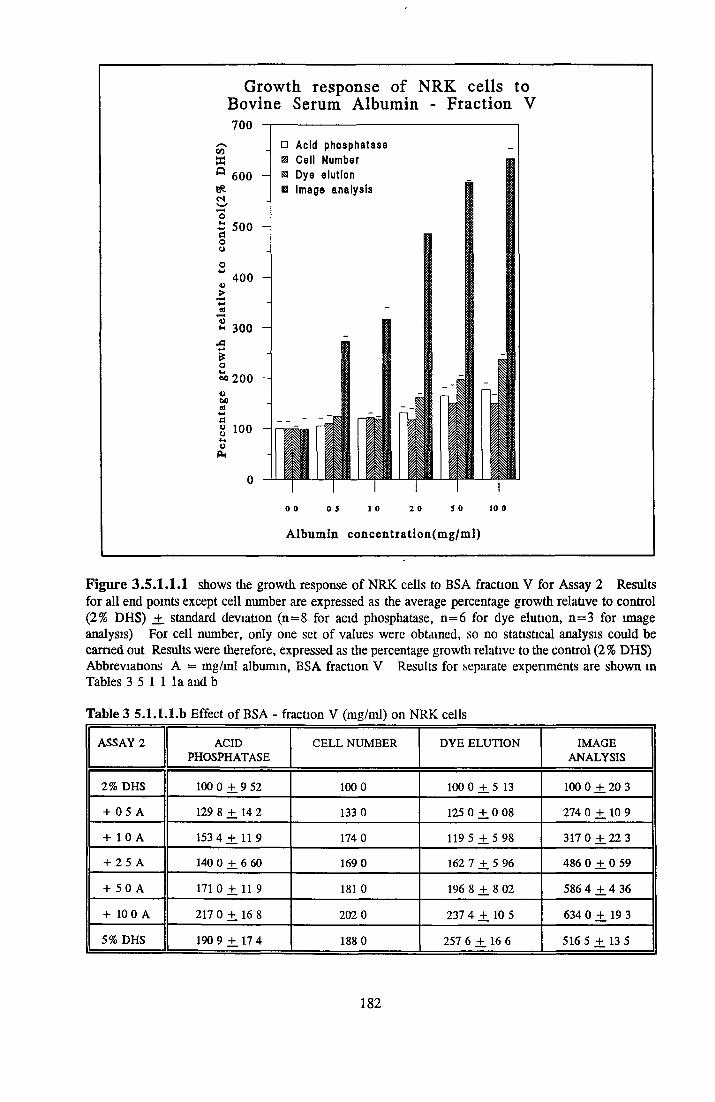
Growth response of NRK cells toBovine Serum Albumin - Fraction V7 0 0
CO
Q
«s6 0 0 -
S 5 0 0doo
4 0 0 -
3 0 0
EtoSo 200oMleS4-t
" 100o
0 5
Album in concentration(m g/m l)
Figure 3.5.1.1.1 shows the growth response of NRK cells to BSA fraction V for Assay 2 Results for all end points except cell number are expressed as the average percentage growth relative to control (2% DHS) ± standard deviation (n=8 for acid phosphatase, n=6 for dye elution, n=3 for image analysis) For cell number, only one set of values were obtained, so no statistical analysis could be earned out Results were therefore, expressed as the percentage growth relative to the control (2% DHS) Abbreviations A = mg/ml albumin, BSA fraction V Results for separate experiments are shown in Tables 3 5 1 1 la and b
Table 3 5.1.1.1.b Effect of BSA - fraction V (mg/ml) on NRK cells
ASSAY 2 ACIDPHOSPHATASE
CELL NUM BER DYE ELUTION IMAGEANALYSIS
2% DHS 100 0 ± 9 52 100 0 100 0 ± 5 13 100 0 ± 20 3
+ 0 5 A 129 8 ± 14 2 133 0 125 0 ± 0 08 274 0 + . 10 9
+ 1 0 A 153 4 ± 11 9 174 0 119 5 ± 5 98 317 0 ± 2 2 3
+ 2 5 A 140 0 ± 6 60 169 0 162 7 ± 5 96 486 0 ± 0 59
+ 5 0 A 1 7 1 0 + .1 1 9 181 0 196 8 ± 8 02 586 4 ± 4 36
+ 10 0 A 217 0 ± 16 8 202 0 237 4 +. 10 5 634 0 ± 19 3
5% DHS 190 9 ± 17 4 188 0 257 6 + . 16 6 516 5 ± 13 5
182
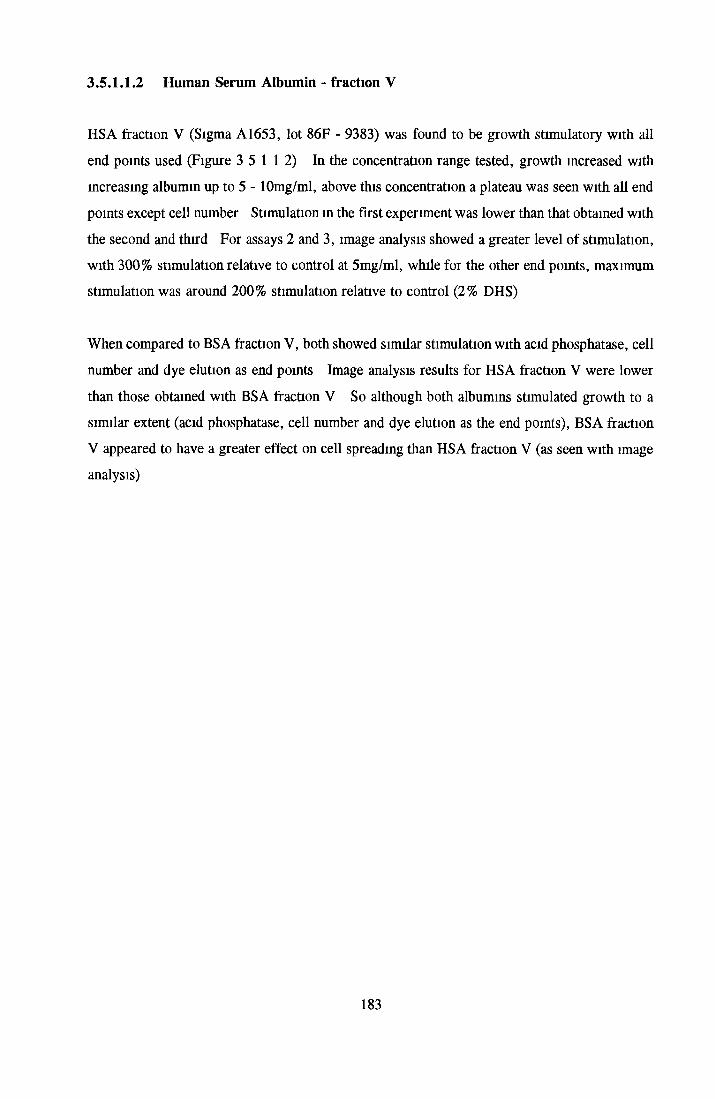
3.5.1.1.2 Human Serum Albumin - fraction V
HSA fraction V (Sigma A1653, lot 86F - 9383) was found to be growth stimulatory with all
end points used (Figure 3 5 112) In the concentration range tested, growth increased with increasing albumin up to 5 - lOmg/ml, above this concentration a plateau was seen with all end points except cell number Stimulation in the first experiment was lower than that obtained with
the second and third For assays 2 and 3, image analysis showed a greater level of stimulation, with 300% stimulation relative to control at 5mg/ml, while for the other end points, maximum stimulation was around 200% stimulation relative to control (2% DHS)
When compared to BSA fraction V, both showed similar stimulation with acid phosphatase, cell number and dye elution as end points Image analysis results for HSA fraction V were lower
than those obtained with BSA fraction V So although both albumins stimulated growth to a similar extent (acid phosphatase, cell number and dye elution as the end points), BSA fraction V appeared to have a greater effect on cell spreading than HSA fraction V (as seen with image analysis)
183
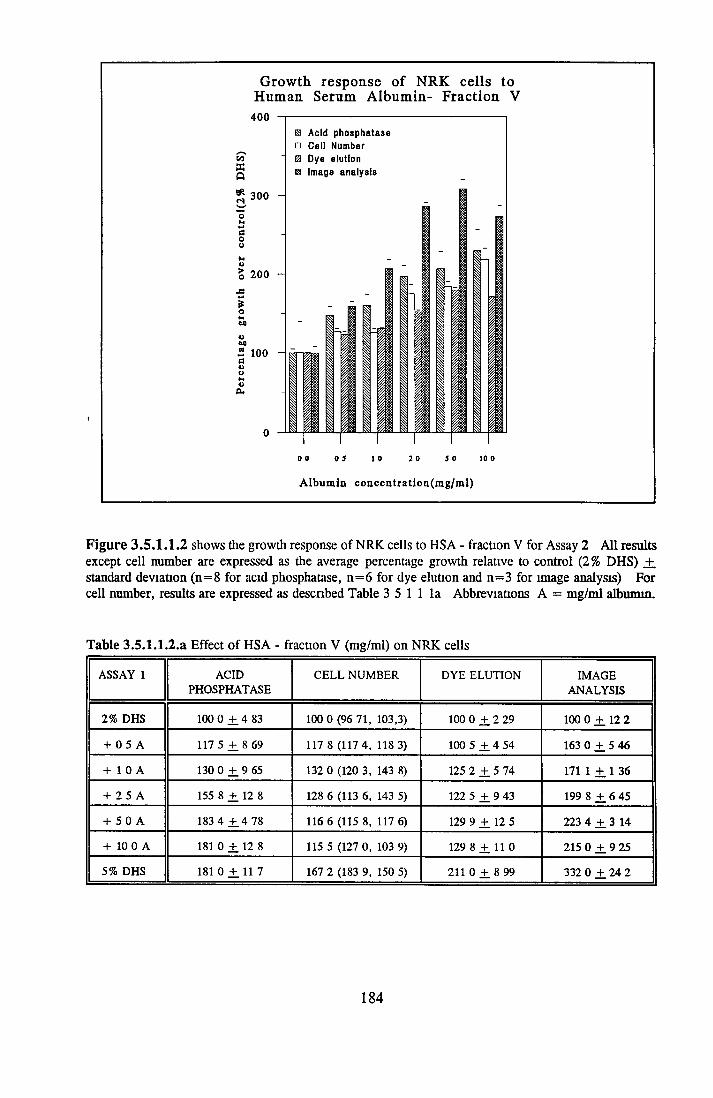
1
Growth, response of NRK cells to Human Serum Albumin- Fraction V
400
Wa
H Acid phosphatase □ Cell Number a Dye elution a Image analysis
Albumin concentratlon(mg/ml)
Figure 3.5.1.1.2 shows the growth response of NRK cells to HSA - fraction V for Assay 2 All results except cell number are expressed as the average percentage growth relative to control (2% DHS) +. standard deviation (n=8 for acid phosphatase, n=6 for dye elution and n=3 for image analysis) For cell number, results are expressed as described Table 3 5 1 1 la Abbreviations A = mg/ml albumin.
Table 3.5.1.1.2.a Effect of HSA - fraction V (mg/ml) on NRK cells
ASSAY 1 ACIDPHOSPHATASE
CELL NUMBER DYE ELUTION IMAGEANALYSIS
2% DHS 100 0 ± 4 83 100 0 (96 71, 103,3) 100 0 + 2 29 100 0 ± 12 2
+ 0 5 A 117 5 ± 8 69 117 8 (117 4, 118 3) 100 5 + 4 54 163 0 ± 5 46
+ 1 0 A 130 0 ± 9 65 132 0 (120 3, 143 8) 125 2 ± 5 74 171 1 +. 1 36
+ 2 5 A 155 8 + 12 8 128 6 (113 6, 143 5) 122 5 + 9 43 199 8 +. 6 45
+ 5 0 A 183 4 ± 4 78 116 6 (115 8, 117 6) 129 9 ± 12 5 223 4 ± 3 14
+ 10 0 A 181 0 + 12 8 115 5 (127 0, 103 9) 129 8 + 11 0 215 0 ± 9 25
5% DHS 181 0 ± 11 7 167 2 (183 9, 150 5) 211 0 + 8 99 332 0 ± 24 2
184
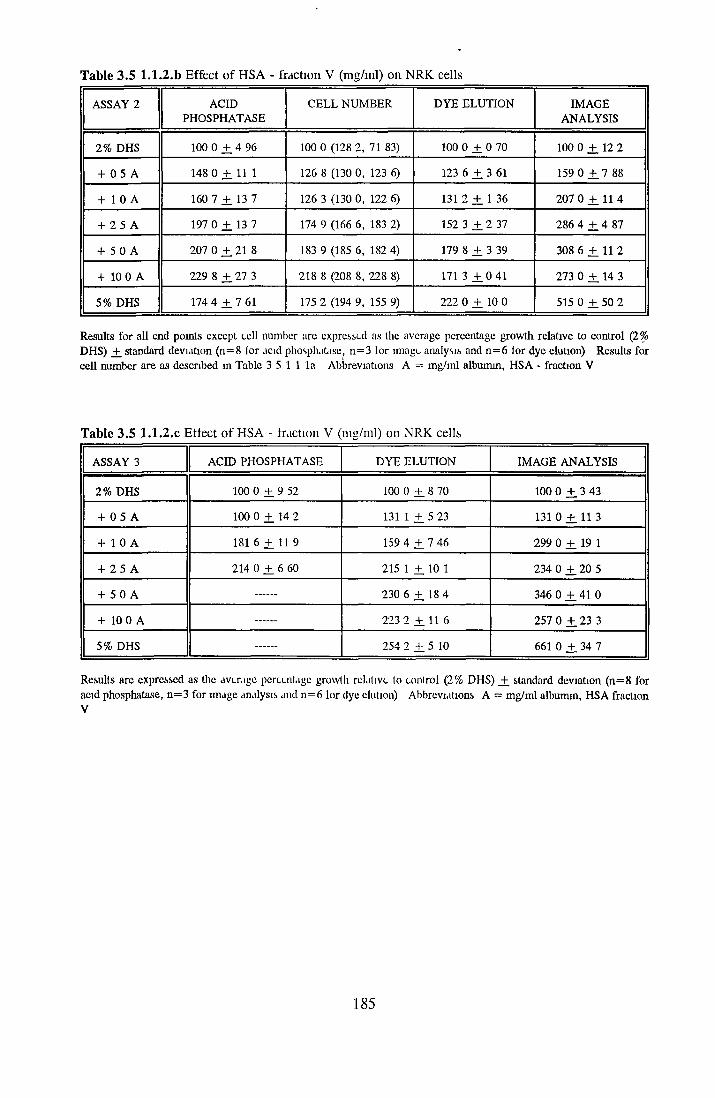
Table 3.5 1.1.2.b Effect of HSA - fraction V (mg/ml) on NRK cells
ASSAY 2 ACIDPH OSPHATASE
C E L L N U M B ER DY E E LU TIO N IM A GEANALYSIS
2% DHS 100 0 ± 4 96 100 0 (128 2 , 71 83) 100 0 ± 0 70 100 0 ± 12 2
+ 0 5 A 148 0 ± 11 1 126 8 (130 0, 123 6) 123 6 ± 3 61 159 0 ± 1 88
+ 1 0 A 160 7 ± 13 7 126 3 (130 0, 122 6) 131 2 ± 1 36 207 0 ± 1 1 4
+ 2 5 A 197 0 ± 13 7 174 9 (166 6 , 183 2) 152 3 ± 2 37 286 4 ± 4 87
+ 5 0 A 207 0 ± 21 8 183 9 (185 6, 182 4) 179 8 ± 3 39 308 6 ± 11 2
+ 10 0 A 229 8 ± 2 7 3 218 8 (208 8, 228 8) 171 3 + 0 4 1 273 0 ± 14 3
5% DHS 174 4 ± 1 61 175 2 (194 9, 155 9) 222 0 ± 10 0 515 0 ± 50 2
Results fo r all end points except cell num ber are expressed as the average percentage grow th relative to control (2% DHS) ± standard deviation (n=8 lo r acid phosphatase, n = 3 lo r image analysis and n = 6 lo r dye elution) R esults for cell num ber are as described in Table 3 5 1 1 l a Abbreviations A = m g/m l album in, H SA - fraction V
Table 3.5 1.1.2.C Effect of HSA - fraction V (mg/ml) on NRK cells
ASSAY 3 ACID PHOSPHATASE DY E ELU TIO N IM A GE ANALYSIS
2% DHS 100 0 ± 9 52 100 0 ± 8 70 100 0 ± 3 43
+ 0 5 A 100 0 ± 14 2 131 1 + 5 23 1 3 1 0 ± 1 1 3
+ 1 0 A 181 6 ± 11 9 159 4 ± 1 46 299 0 ± 19 1
+ 2 5 A 214 0 ± 6 60 215 1 ± 10 1 234 0 ± 20 5
+ 5 0 A 230 6 ± 18 4 346 0 ± 41 0
+ 10 0 A 223 2 + 11 6 257 0 ± 23 3
5% DHS 254 2 ± 5 10 661 0 ± 34 7
Results are expressed as the average percentage growth relative to control (2% DHS) ± standard deviation (n= 8 for acid phosphatase, n = 3 fo r image analysis and n =6 lo r dye elution) Abbreviations A = m g/m l album in, H SA fraction V
1 8 5

3.5.1.1.3 Bovine Serum Albumin - fatty acid free
BSA fatty acid free (Pentex 82-042-2, lot 303) showed growth stimulation m three separate
experiments for all end points except image analysis Results are shown in Figure 3 5 113 and Tables 3 5 1 1 3a and b The stimulation increased with increasing albumin concentration
but was not strictly linear The extent of stimulation varied between experiments In two of
three assays using image analysis as the end point, inhibition occurred while in Assay 2 huge
stimulation of up to 10-fold was seen For acid phosphatase as the end point, maximum stimulation of 51 to 207% above the control (2% DHS) was seen at 5 - lOmg/ml For cell
number and dye elution, the stimulation was lower (37% to 83% stimulatm above the control)
When the dye was eluted from the plates read on an image analyser and the absorbance measured, stimulation was seen in the three assays BSA fatty acid free was not as stimulatory
as BSA fraction V While BSA fraction V caused stimulation when image analysis was used
as the end point, BSA fatty acid free showed inhibition in Assay 2 It would appear that BSA fatty acid free was not stimulatory to cell spreading but did promote cell growth
186

Growth response of fa tty acid
NRKs to BSA free
cnXaSR
ao
o>
*o
OCL,
200190180170160150140130120110100
9080706050403020100
□ Acid phosphatase 0 Cell Number & Dye elution
n Image analysis
IIIf tI
0 0 0 5 1 0 2 0 5 0 10 0
Albumin concentration(m g/m l)
F ig u re 3 .5 .1 .1 .3 shows the growth response o f NRK cells to BSA fatty acid free from Assay 1 A ll results except cell number are expressed as the average percentage growth relative to control (2% DHS) +. standard deviation (n = 8 for acid phosphatase, n = 6 for dye elution and n = 3 for Image analysis) For cell number, results are expressed as described in Table 3 5 1 1 la Abbreviations A = m g/m l albumin, BSA fatty acid free
T able 3 .5 .1 .1 .3 .a Effect o f BSA - fatty acid free (mg/ml) on NRK cells
ASSAY 1 ACIDPHOSPHATASE
CELL NUMBER DYEELUTION
IMAGEANALYSIS
2% DHS 100 0 ± 9 14 100 0 (98 34, 101 6) 100 0 ¿ 4 25 100 0 ¿ 2 1 7
+ 0 5 A 116 2 ¿ 1 5 3 137 9 (139 4, 136 4) 116 1 ¿ 4 49 70 30 ¿ 6 56
+ 1 0 A 134 3 + 14 2 121 1 (125 6, 116 5) 131 4 ¿ 4 75 106 0 ¿ 13 1
+ 2 5 A 135 7 ¿ 1 1 2 145 6 (161 6, 129 7) 120 4 ¿ 9 65 56 12 ¿ 9 30
+ 5 0 A 142 0 ¿ 13 1 141 9 (131 4, 152 2) 126 0 ¿ 7 20 42 14 ¿ 5 68
-1- 10 0 A 1510 ¿ 2 0 3 150 4 (156 8, 144 1) 127 9 ¿ 7 90 97 90 ¿ 2 5 9
5% DHS 158 0 ¿ 14 4 239 7 (236 4, 243 0) 241 0 ¿ 8 02 332 0 ¿ 2 4 4
187
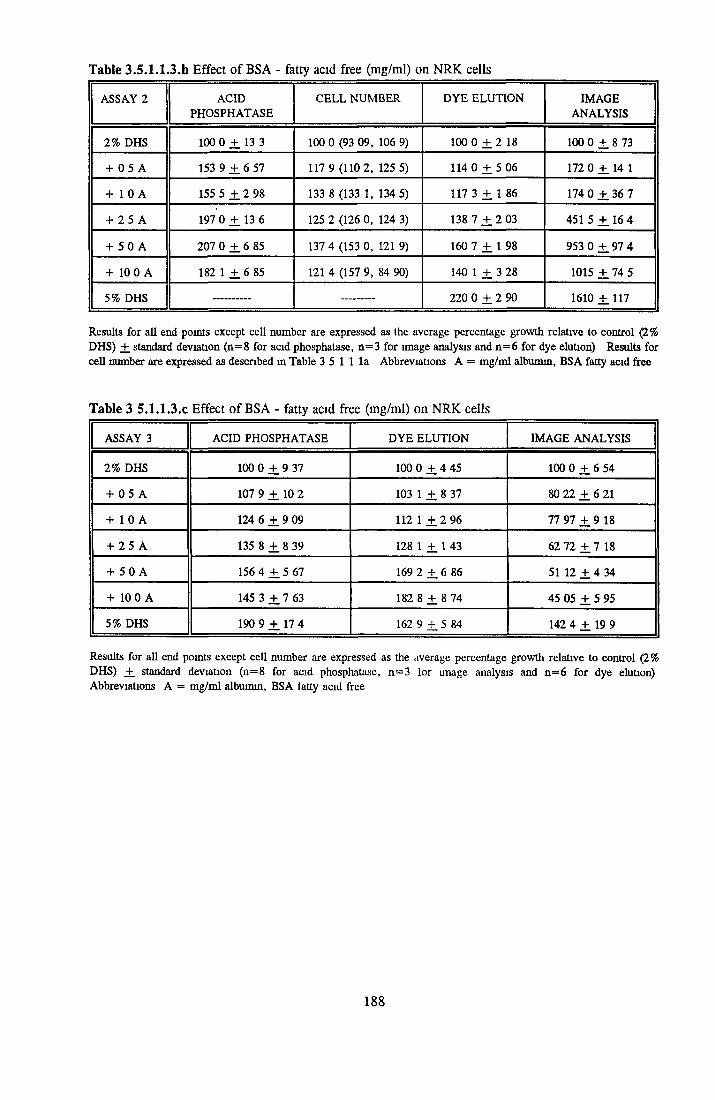
Table 3.5.1.1.3.b Effect o f BSA - fatty acid free (mg/ml) on NRK cells
ASSAY 2 ACIDPHOSPHATASE
CELL NUM BER DYE ELUTION IMAGEANALYSIS
2% DHS 100 0 ± 13 3 100 0 (93 09, 106 9) 100 0 + 2 18 100 0 + 8 73
+ 0 5 A 153 9 ± 6 57 117 9 (110 2 , 125 5) 1 1 4 0 + 5 06 172 0 +. 14 1
+ 1 0 A 155 5 ± 2 98 133 8 (133 1, 134 5) 117 3 + 1 86 174 0 + . 36 7
+ 2 5 A 197 0 + 13 6 125 2 (126 0, 124 3) 138 7 ± 2 03 451 5 ± 16 4
+ 5 0 A 207 0 ± 6 85 137 4 (153 0 , 121 9) 160 7 + 1 98 953 0 + . 97 4
+ 10 0 A 182 1 ± 6 85 121 4 (157 9, 84 90) 140 1 + 3 28 1015 ± 74 5
5% DHS ----------- 220 0 + 2 90 1610 + 117
Results for all end points except cell number are expressed as the average percentage growth relative to control (2% DHS) _+ standard deviation (n = 8 for acid phosphatase, n = 3 for image analysis and n = 6 for dye elution) Results for cell number are expressed as described in Table 3 5 1 1 1 a Abbreviations A = m g/m l albumin, BSA fatty acid free
Table 3 5.1.1.3.C Effect of BSA - fatty acid free (mg/ml) on NRK cells
ASSAY 3 ACID PHOSPHATASE DYE ELUTION IMAGE ANALYSIS
2% DHS 100 0 ± 9 37 100 0 +. 4 45 100 0 ± 6 54
+ 0 5 A 107 9 + 10 2 103 1 +. 8 37 80 22 +. 6 21
+ 1 0 A 124 6 ± 9 09 112 1 ± 2 96 77 97 ± 9 18
+ 2 5 A 135 8 ± 8 39 128 1 ± 1 43 62 72 + 7 18
+ 5 0 A 156 4 + . 5 67 169 2 +. 6 86 51 12 + 4 34
+ 10 0 A 145 3 ± 7 63 182 8 + 8 74 45 05 + 5 95
5% DHS 190 9 ± 17 4 162 9 +_ 5 84 142 4 + 19 9
Results for all end points except cell number are expressed as the average percentage growth relative to control (2% DHS) +_ standard deviation (n = 8 for acid phosphatase, n = 3 lor unage analysis and n = 6 for dye elution) Abbreviations A = m g/m l albumin, BSA fatty acid free
188
3.5.1.1.4 Human Serum Albumin - fatty acid free
Human Serum Albumin (HSA) fatty acid free (Sigma A3782, lot 119F9303) was found to be
inhibitory on the growth of NRK cells The results for three replicate experiments are shown in Figure 3 5 11 4 and Tables 3 5 1 1 4a to c For acid phosphatase, cell number and dye elution, increasing the albumin concentration generally resulted in reduced growth with 15 - 20%, 27 -30% and 40 - 45 % inhibition obtained respectively, at the highest concentration tested
(lOmg/ml) The results obtained from image analysis showed stimulation in two of three assays
with inhibition in the third When the crystal violet dye was eluted from the plates which had been read on an image analyser, the same inhibitory trend was seen with dye elution for each
experiment However, the extent of inhibition with dye elution was less than that obtained with
image analysis
HSA fatty acid free was like BSA fatty acid free (m two of three assays) in that image analysis results showed the two fatty acid free albumins to be inhibitory to NRK cells when colony area
was used as the basis of measurement (image analysis) However, while BSA fatty acid free was stimulatory with the rest of the end points used, HSA fatty acid free was inhibitory
Having looked at bovine and human derived albumins, both fraction V and fatty acid free, the order of activity (stimulation to inhibition) was BSA fraction V > HSA fraction V > BSA-faf
> HSA-faf The fact that the fraction Vs were better than the fatty acid free albumins, suggest that some active factor was lost during removal of fatty acids Also the bovine- derived albumins were better than the human-derived albumins The difference in response may depend on the source of the albumin and thus what factors it was carrying or it may have been due to batch to batch variability of albumins
189

Growth response of NRK cells to Human Serum Albumin - fa tty acid
free140
g 130 Q 120
^ 110 H
I .00O° 9 00 +*
» 8»1o* 6 0 A% 5 0oS> 4 09i5? 3 0dg 20UO* 10
0
□ Acid phosphatase & Cell Number
0 Dye elution h Image analysisI
I
III I
iIII III
I I
!ii
Im
ii
0 0 0 5 1 0 2 0 5 0 10 0
A lb u m in c o n c e n t r a t io n ( m g /m l)
Figure 3 .5 .1 .1 .4 shows the growth response ot NRK cells to HSA fatty acid free A ll results except for cell number are expressed as the average percentage growth relative to control (2% DHS) +_ standard deviation (n = 8 for acid phosphatase, n = 6 tor dye elution and n = 3 for image analysis) For cell number, results are expressed as described in Table 3 5 1 1 la Abbreviations A = m g/m l albumin, HSA fatty acid free
T able 3 .5 .1 1 4a Effect o f HSA-fatty acid free (mg/ml) on NRK cells
ASSAY 1 ACIDPHOSPHATASE
CELL NUM BER DYEELUTION
IMAGEANALYSIS
2% DHS 100 0 ± 7 84 100 0 (105 6, 94 43) 100 0 ± 6 77 100 0 ± 7 34
+ 0 5 A 93 55 + .6 11 71 10 (68 80, 73 60) 99 60 + 4 82 86 25 ± 6 46
+ 1 0 A 92 73 + . 9 40 75 60 (71 50, 79 60) 88 25 + 1 07 84 24 + 10 0
+ 2 5 A 84 79 ± 5 78 72 18 (77 70, 66 66) 93 82 ± 5 40 58 74 ± 3 43
+ 5 0 A 85 62 ± 6 07 64 91 (68 85, 60 97) 83 72 + 0 69 48 20 ± 6 94
+ 10 0 A 81 79 ± 6 05 73 76 (67 88, 79 64) 64 83 + 6 86 30 66 ± 5 87
5% DHS 168 0 +. 17 5 178 6 (172 0, 185 0) 199 2 ± 4 11 302 0 ± 1 34
190

Table 3.5 1 1.4b Effect of HSA-fatty acid tree (mg/ml) on NRK cells
ASSAY 2 ACIDPHOSPHATASE
CELL NUMBER DYE ELUTION IMAGEANALYSIS
2% DHS 100 0 +. 7 14 100 0 (110 1, 89 94) 100 0 ± 4 61 100 0 ± 1 37
+ 0 5 A 109 5 .+ 4 78 104 0 (111 9, 96 20) 89 99 + 2 88 120 0 +. 15 3
+ 1 0 A 99 55 + 8 48 101 9 (104 7, 99 10) 88 89 + 3 79 115 0 +_ 11 4
+ 2 5 A 103 0 ± 8 03 78 93 (76 10, 81 70) 83 93 ± 2 16 139 0 ± 5 37
+ 5 0 A 88 14 ± 2 01 58 30 (52 83, 63 83) 79 10 + 4 55 100 0 +. 4 47
+ 10 0 A 85 27 +. 7 14 71 07 (72 30, 69 49) 69 83 + 5 11 71 70 ± 5 34
5% DHS 178 0 ± 24 1 262 0 (251 2, 272 9) 216 0 + 4 73 402 0 +. 24 7
Results for all end points except cell number are expressed as the average percentage growth relative to control (2% DHS) +_ standard deviation (n = 8 lor acid phosphatase, n = 3 lor image analysis and n = 6 for dye elution) Results for cell number are expressed as described in Table 3 5 1 1 1 a Abbreviations A = albumin (in this case H SA - fatty acid free)
Table 3.5.1.1.4c Effect of HSA-fatty acid free (mg/ml) on NRK cells
ASSAY 3 ACID PHOSPHATASE DYE ELUTION IMAGE ANALYSIS
2% DHS 100 0 ± 5 00 100 0 + 4 32 100 0 + 10 8
+ 0 5 A 87 75 ± 2 52 77 74 + 6 81 88 04 + 5 59
+ 1 0 A 85 22 + 6 30 75 07 + 2 44 147 5 + 14 5
+ 2 5 A 85 22 ± 4 14 79 56 + 5 27 148 9 + 15 9
+ 5 0 A 77 29 + 5 04 77 06 + 5 39 334 4 + 26 9
+ 10 0 A 69 55 + 4 86 71 15 ± 5 66 379 5 + 6 48
5% DHS 125 4 + 12 0 146 6 + 12 8 246 2 + 22 5
Results for all end points are expressed as the average percentage growth relative to control (2% DHS) _+ standard deviation (n = 8 for acid phosphatase, n = 3 for image analysis and n = 6 lor dye elution) Abbreviations A = mg/ml album in, H SA - fatty acid free
191
3.5.1.2 EFFECT OF ALBUMIN ON SCC-9 CELLS
SCC-9 is a human squamous carcinoma of the tongue which had previously shown a growth response to albumin (Eunan MaGlinchy, Masters thesis in process of submission) The effects of the bovine and human albumins used in section 3 5 1 on the growth of SCC-9 cells were
compared
Experiments were set up slightly differently to those for NRK cells The SCC-9 cells were set
up with a 0 25 % background of FCS in 96-well plates The concentration range of albumin tested was 20 - 1000/zg/ml as this was the concentration range in which activity was observed for SCC-9 cells After 7 days’ incubation at 37°C and 5 % C02, the assays were read using acid
phosphatase as the end point The results are shown m Figures 3 5 1 2 1 to 4
The results are shown in Figures 3 5 1 2 1 to 4 Unlike the NRK cells (section 3 5 11), the fatty acid free (faf) albumins gave the best stimulation Of the fatty acid free albumins, BSA faf showed the best stimulation of all the albumins tested on SCC-9 cells At 500/ig/ml an optimum stimulation was seen with growth between 2-fold and 3 5-fold stimulation over controlHSA fraction V (Figure 3 5 1 2 2) showed similar stimulation to that seen with HSA - fatty acid
free (Figure 3 5 1 2 4) with a maximum stimulation of 2-fold over the control (0 25 % FCS)
BSA - fraction V was least stimulatory with a maximum stimulation of 60% over control at 100 - 500/xg/ml
For SCC-9 cells, the order of stimulatory activity for the albumins was different to that obtained by NRK cells The order was BSA-faf > HSA fraction V = HSA-faf > BSA fraction V
192

Effect of Bovine Serum Albumin - fraction V on SCC-9 cells
COOh
cso
o>
PV4Vi(913hAoH00«BOa«->doou»ft.
200
180
180
140
120
100
80
60
40
20
0
□ Assay 1 h Assay 2 0 Assay 3
liI I
!
i¡II
i
I I
1I I
I I
I
I0 20
Album in
I
1
IRj:50 100 500 1000
oonoentration(ug/m l)
F ig u r e 3 .5 .1 .2 .1 shows the growth response o f SCC-9 cells to bovine serum albnmin - fraction V 1000jng/ml BSA was not tested in Assay 1 Figure and Table 3 5 1 2 1 show results for three independent experiments Results are expressed as the average percentage growth relative to control (0 25 % FCS) +_ standard deviation ( n = 8) Acid phosphatase was used as the end point Abbreviations A = albumin, BSA fraction V
T able 3 5 1 .2 .1 Effect o f BSA-fraction V on SCC-9 cells
VARIABLES ASSAY 1 ASSAY 2 ASSAY 3
0 25% FCS 100 0 ± 34 4 100 0 + 12 4 100 0 ± 16 0
+ 2(tyig/ml A 88 69 + 25 2 130 0 + 16 0 126 2 +_ 14 7
+ 50/ig/m l A 90 50 + 6 19 128 6 + 17 2 147 0 ± 12 2
+ 100/ig/ml A 90 50 + 14 4 140 0 + 15 6 159 5 ± 11 3
+ 500/^g/ml A 107 0 + 11 3 158 6 + 11 9 124 0 ± 18 0
+ 1000^g/ml A 135 0 + 12 1 116 0 ± 1 5 7
193
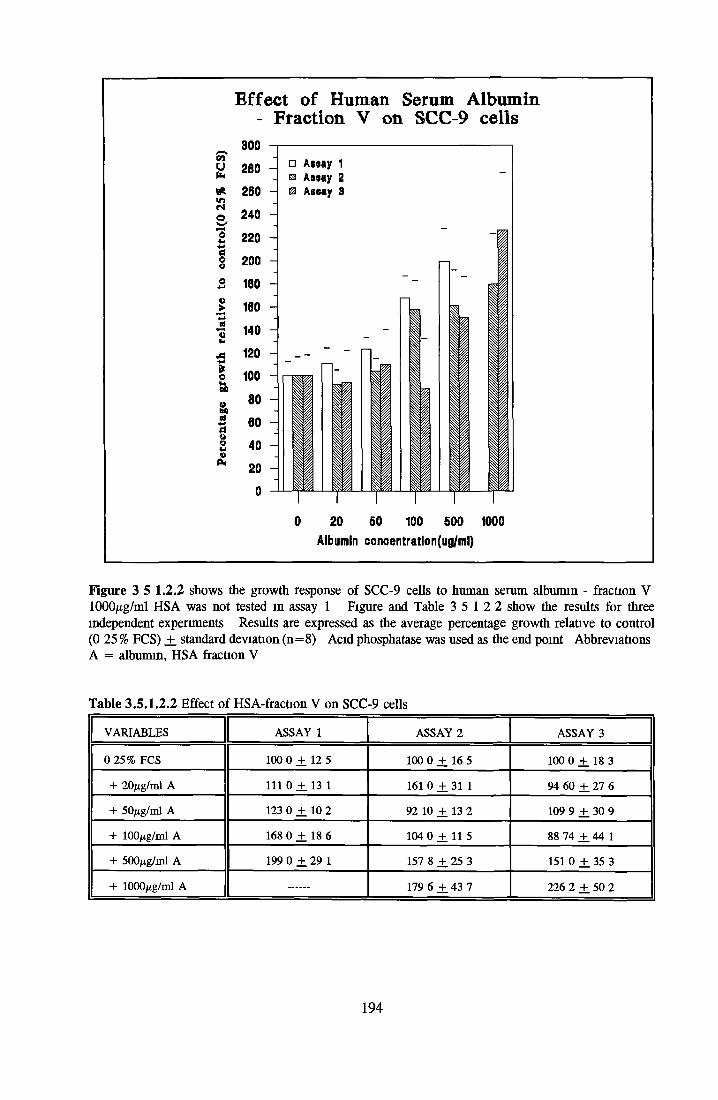
3005*g 260* 260ViS 240w
2 220 ■w
g 200
5 180
I 1801 140
M 120
o 100bO„ 80
S 60o£ 40o* 20
0
0 20 50 100 500 1000Album in conoentratlon(ug/m l)
Effect of Human Serum Albumin- Fraction V on SCC-9 cells
J p Aisay 1- s Assay 2
- 0 Assay 3
Figure 3 5 1 .2 .2 shows the growth response o f SCC-9 cells to human serum albumin - fraction V 1000jiig/ml HSA was not tested in assay 1 Figure and Table 3 5 1 2 2 show the results for three independent experiments Results are expressed as the average percentage growth relative to control (0 25 % FCS) ±_ standard deviation ( n = 8) Acid phosphatase was used as the end point Abbreviations A = albumin, HSA fraction V
T able 3 .5 .1 .2 .2 Effect o f HSA-fraction V on SCC-9 cells
VARIABLES ASSAY 1 ASSAY 2 ASSAY 3
0 25% FCS 100 0 ± 12 5 100 0 + 16 5 100 0 + 18 3
+ 20/ig/m l A 1 1 1 0 + 13 1 161 0 ± 3 1 1 94 60 ± 27 6
+ 50/ig/m l A 123 0 + 10 2 92 10 + 13 2 109 9 + . 30 9
+ 100fig/ml A 168 0 ± 18 6 104 0 + 11 5 88 74 + . 44 1
+ 500/ig/m l A 199 0 ± 29 1 157 8 + 25 3 151 0 + . 35 3
+ 1000/ig/ml A ------ 179 6 ± 43 7 226 2 ± 50 2
194

Effect of Bovine Serum Albumin- fatty acid free on SCC-9 cells
0 20 50 100 500 1000Album in con centration (ug/ml)
Figure 3 .5 .1 .2 .3 shows the growth response o f SCC-9 cells to bovine serum albumin - fatty acid free 1000/xg/ml BSA was not tested in Assay 1 Figure and Table 3 5 1 2 3 show the results for three independent experiments Results are expressed as the average percentage growth relative control (0 25 % FCS) ± standard deviation ( n = 8) Acid phosphatase was used as the end point Abbreviations A = albumin, BSA fatty acid free
Table 3 .5 .1 .2 .3 Effect o f BSA-fatty acid free on SCC-9 cells
VARIABLES ASSAY 1 ASSAY 2 ASSAY 3
0 25% FCS 100 0 ± 12 5 100 0 ± 16 5 100 0 ± 18 3
+ 20/ig/m l A 151 4 ± 2 1 1 114 0 ± 12 6 102 0 ± 26 5
+ 50/ig/m l A 158 7 ± 4 37 106 0 ± 19 1 116 7 ± 12 9
+ 100/ig/ml A 202 3 ± 29 1 121 7 ± 18 7 135 7 ± 30 9
+ 500/ig/m l A 354 0 ± 24 4 202 0 ± 2 9 1 281 6 ± 75 5
+ 1000jug/ml A 204 0 ± 22 2 234 0 ± 38 8
195

Effect of fatty acid free- human albumin on SCC-9 cells
OiUpH*<nwa
aoa
ou«0oeoaHooVI«1(X*
300
2B0
260
240
220
200
180
160
140
120
100
00
60
40
20
0
□ Assay 1 h Assay 2 S Assay 3
f
sr
ii
p0 20
Albumin50 100 500 1000
concentration(ug/ml)
Figure 3 .5 .1 .2 .4 shows the growth response o f SCC-9 cells to human serum albumin - fatty acid free 1000/ig/m l BSA was not tested in Assay 1 Figure and Table 3 5 1 2 4 show results for three independent experiments Results are expressed as the average percentage growth relative to control (0 25 % FCS) _+ standard deviation ( n = 8) Acid phosphatase was used as the end point o f experiments Abbreviations A = Albumin, HSA fatty acid free
T able 3 .5 .1 .2 .4 Effect o f HSA-fatty acid free on SCC-9 cells
VARIABLES ASSAY 1 ASSAY 2 ASSAY 3
0 25% FCS 100 0 ± 10 8 100 0 + 12 4 100 0 ± 16 0
+ 20/^g/ml A 104 0 + 11 6 119 6 + 18 6 112 0 + 14 4
+ 50fig/ml A 100 0 ± 7 30 126 2 + 17 4 126 0 + 2 59
+ 100fig/ml A 127 0 + 19 3 155 7 + 17 5 150 7 ± 22 2
+ 500/ig/m l A 182 5 + 29 1 191 0 + 32 8 173 2 + 22 7
+ 1000^ g/m lA 186 4 + 22 8 214 9 + 28 2
196
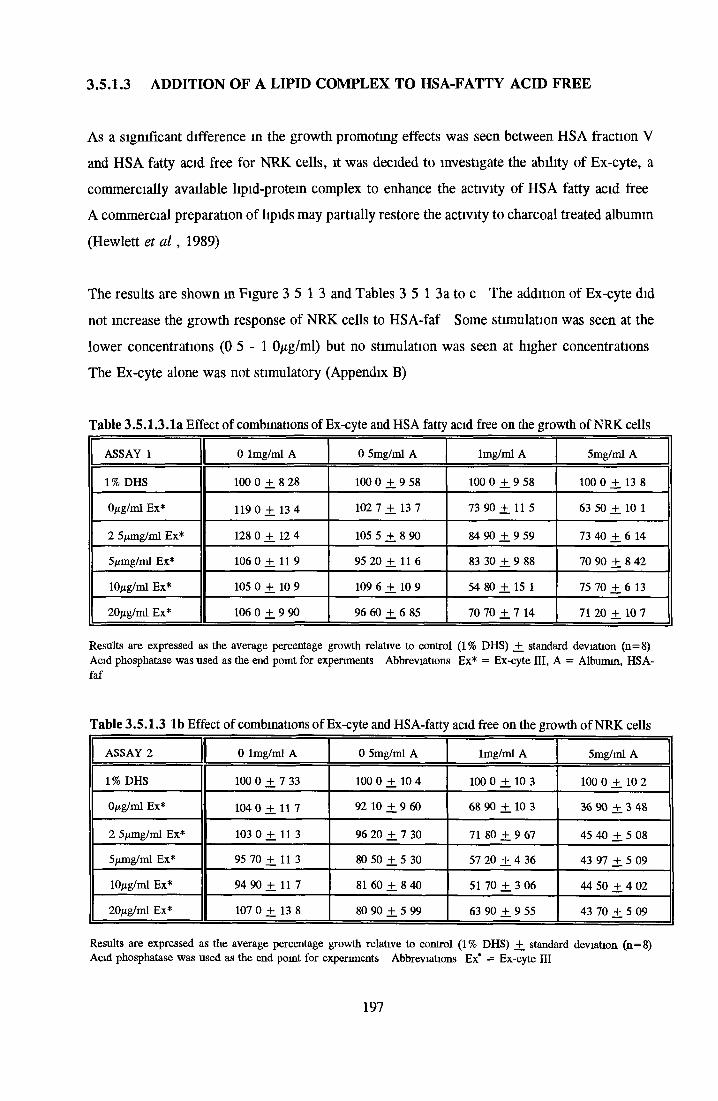
3.5.1.3 ADDITION OF A LIPID COMPLEX TO HSA-FATTY ACID FREE
As a significant difference m the growth promoting effects was seen between HSA fraction V and HSA fatty acid free for NRK cells, it was decided to investigate the ability of Ex-cyte, a commercially available lipid-protein complex to enhance the activity of HSA fatty acid free A commercial preparation of lipids may partially restore the activity to charcoal treated albumin
(Hewlett et a l , 1989)
The results are shown in Figure 3 5 13 and Tables 3 5 1 3a to c The addition of Ex-cyte did not increase the growth response of NRK cells to HSA-faf Some stimulation was seen at the lower concentrations ( 0 5 - 1 Opig/ml) but no stimulation was seen at higher concentrations
The Ex-cyte alone was not stimulatory (Appendix B)
T able 3 .5 .1 .3 .1 a Effect o f combinations o f Ex-cyte and HSA fatty acid free on the growth o f NRK cells
ASSAY 1 0 lm g/m l A 0 5mg/ml A lm g/m l A 5m g/m l A
1% DHS 100 0 + 8 28 100 0 + 9 58 100 0 ± 9 58 100 0 + 13 8
0/ig/m l Ex* 119 0 + 13 4 102 7 ± 13 7 73 90 ± 11 5 63 50 + 10 1
2 5/iing/ml Ex* 128 0 ± 12 4 105 5 + 8 90 84 90 ± 9 59 73 40 + 6 14
5/im g/m l Ex* 106 0 + 11 9 95 20 + 11 6 83 30 ± 9 88 70 90 + 8 42
10/ig/ml Ex* 105 0 + 10 9 109 6 + 10 9 54 80 ± 15 1 75 70 ± 6 13
20/ig/m l Ex* 106 0 + 9 90 96 60 + 6 85 70 70 ± 7 14 71 20 + 10 7
Results are expressed as the average percentage growth relative to control (1% DHS) _+ standard deviation (n= 8) Acid phosphatase was used as the end point for experiments Abbreviations Ex* = Ex-cyte III, A = Albumin, HSA- faf
Table 3 .5 .1 .3 lb Effect o f combinations o f Ex-cyte and HSA-fatty acid free on the growth o f NRK cells
ASSAY 2 0 lm g/m l A 0 5mg/ml A lm g/m l A 5m g/m l A
1% DHS 100 0 + 7 33 100 0 + 10 4 100 0 ± 10 3 100 0 + 10 2
0/xg/ml Ex* 104 0 + 11 7 92 10 + 9 60 68 90 +_ 10 3 36 90 + 3 48
2 5/xmg/ml Ex* 103 0 +. 11 3 96 20 + 7 30 71 80 ± 9 67 45 40 + 5 08
5/img/ml Ex* 95 70 + 11 3 80 50 ± 5 30 57 20 ± 4 36 43 97 + 5 09
10/ig/ml Ex* 94 90 + 11 7 81 60 + 8 40 51 70 ± 3 06 44 50 ± 4 02
20/ig/m l Ex* 107 0 + 13 8 80 90 + 5 99 63 90 ± 9 55 43 70 + 5 09
Results are expressed as the average percentage growth relative to control (1% DHS) _+ standard deviation (n = 8) Acid phosphatase was used as the end point for experiments Abbreviations Ex* = Ex-cyte III
197
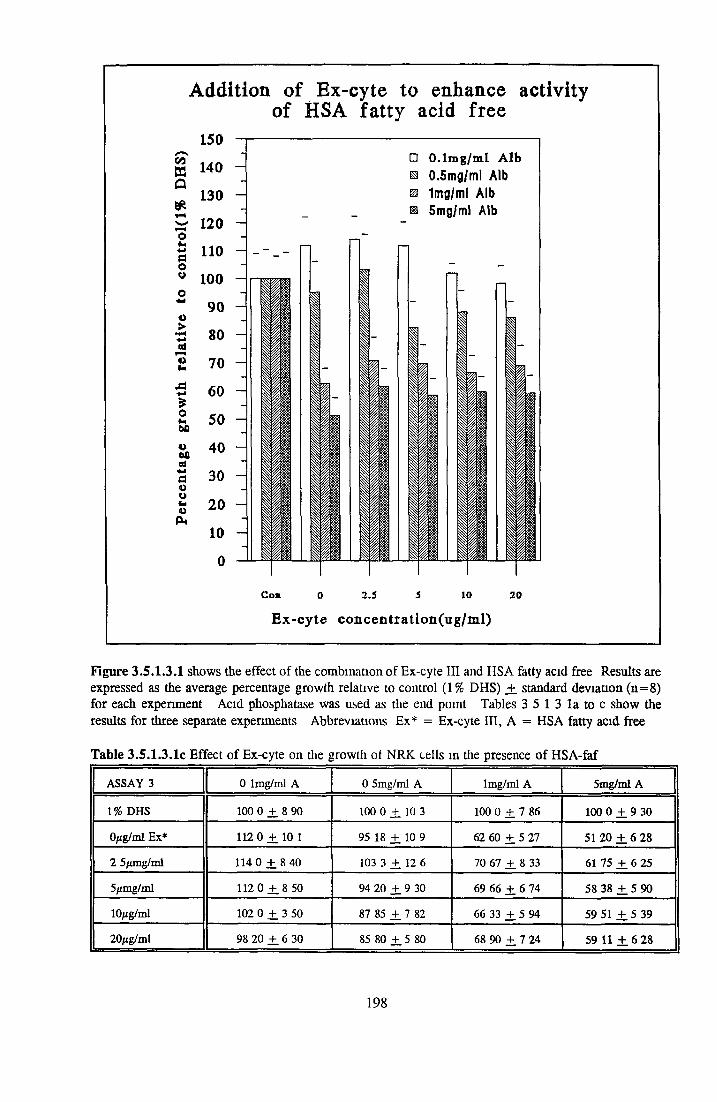
Addition of Ex- of HSA
SOHa
O«*«J0Ov
o>•iH■4-ied*3
o«*60
V00edMaoo«4«>Pi
cyte to enhance activity fatty acid free
□ 0 .lmg/ml Alb 0.5mg/ml Alb 1mg/ml Alb 5mg/ml Alb
Con 0 2.5 S 10 20
Ex-cyte concentratlon(ug/ml)
Figure 3 .5 .1 .3 .1 shows the effect o f the combination o f Ex-cyte III and HSA fatty acid free Results are expressed as the average percentage growth relative to control (1 % DHS) ±_ standard deviation ( n = 8) for each experiment Acid phosphatase was used as the end point Tables 3 5 1 3 1 a to c show the results for three separate experiments Abbreviations Ex* = Ex-cyte III, A = HSA fatty acid free
T able 3 .5 .1 .3 .1 c Effect o f Ex-cyte on the growth of NRK cells in the presence o f HSA-faf
ASSAY 3 0 lm g/m l A 0 5mg/ml A lm g/m l A 5m g/m l A
1% DHS 100 0 ± 8 90 100 0 ± 10 3 100 0 ± 7 86 100 0 ± 9 30
0/ig/m l Ex* 112 0 ± 1 0 1 95 18 ± 10 9 62 60 ± 5 27 51 20 ± 6 28
2 5ftmg/ml 114 0 ± 8 40 103 3 ± 12 6 70 67 ± 8 33 61 75 ± 6 25
5/xmg/ml 1 1 2 0 ± 8 50 94 20 ± 9 30 69 66 ± 6 74 58 38 ± 5 90
10/xg/ml 102 0 ± 3 50 87 85 ± 7 82 66 33 ± 5 94 59 51 ± 5 39
2Ctyig/ml 98 20 ± 6 30 85 80 ± 5 80 68 90 ± 7 24 59 11 ± 6 28
198
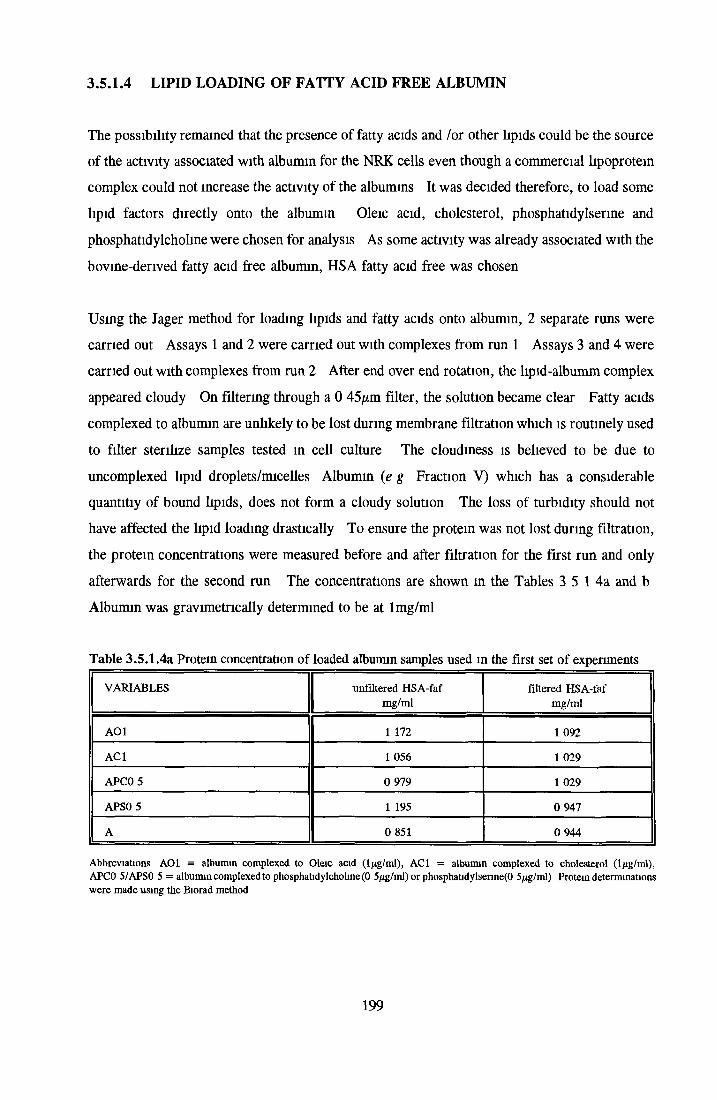
3.5.1.4 LIPID LOADING OF FATTY ACID FREE ALBUMIN
The possibility remained that the presence of fatty acids and /or other lipids could be the source of the activity associated with albumin for the NRK cells even though a commercial lipoprotein complex could not increase the activity of the albumins It was decided therefore, to load some
lipid factors directly onto the albumin Oleic acid, cholesterol, phosphatidylserine and phosphatidylcholine were chosen for analysis As some activity was already associated with the
bovine-derived fatty acid free albumin, HSA fatty acid free was chosen
Using the Jager method for loading lipids and fatty acids onto albumin, 2 separate runs were carried out Assays 1 and 2 were carried out with complexes from run 1 Assays 3 and 4 were carried out with complexes from run 2 After end over end rotation, the lipid-albumm complex
appeared cloudy On filtering through a 0 45/xm filter, the solution became clear Fatty acids complexed to albumin are unlikely to be lost during membrane filtration which is routinely used
to filter sterilize samples tested in cell culture The cloudiness is believed to be due to
uncomplexed lipid droplets/micelles Albumin (e g Fraction V) which has a considerable quantitiy of bound lipids, does not form a cloudy solution The loss of turbidity should not have affected the lipid loading drastically To ensure the protein was not lost during filtration, the protein concentrations were measured before and after filtration for the first run and only
afterwards for the second run The concentrations are shown m the Tables 3 5 1 4a and b Albumin was gravimetrically determined to be at 1 mg/ml
T able 3 .5 .1 .4 a Protein concentration o f loaded albumin samples used in the first set o f experiments
VARIABLES unfiltered HSA-faf mg/ml
filtered HSA-faf m g/m l
A O l 1 172 1 092
AC1 1 056 1 029
APCO 5 0 979 1 029
APSO 5 1 195 0 947
A 0 851 0 944
Abbreviations AOl = albumin complexed to Oleic acid (ljig/ml), AC1 = albumin complexed to cholesterol (lpg/ml), APCO 5/APSO 5 = albumin complexed to phosphatidylcholine(0 5/ig/ml) or phosphatidylserine(0 5/xg/ml) Protein determinations were made using the Biorad method
199

No significant loss of protein occurred on filtering during run 1 In the second loading experiment, mixtures of the lipids were also loaded onto HSA-faf Table 3 5 1 4b shows the protein profile of the complexes after filtering All albumin solutions were set up so that the final concentration would be 1 mg/ml albumin
Table 3.5.1.4b Protein concentration of loaded albumin samples used in second set of experiments
VARIABLES filtered HSA m g/ml
VARIABLES filtered HSA m g/m l
C l 0 999 PS1 0 961
C4 0 958 PS5 0 908
CIO 1 045 B 0 950
PCO 5 0 945 C 1 101
PCI 0 0 957 D 1 102
PC5 0 972 E 0 969
O l 0 975 F 1 085
0 4 1 021 G 1 136
0 1 0 1 071 H 1 029
PSO 5 0 965 I 0 949
J 0 975
Abbreviations as described in Table 3 5 1 5 la Protein determinations were made using the Biorad method
Using the samples from the two separate albumin loading runs, two assays per run (4 assays in total) were set up to determine if loading of the lipid factors onto albumin would affect the activity of HSA fatty acid free
3.5.1.4.1 Control plateControl plates for each of the four experiments were set up to include a serum dilution and the dilution effect of BSA and HSA fraction V Three of the four control plates showed a similar trend (Figure 3 5 1 4 2), while a significantly higher rate of stimulation was seen in the fourth (probably due to a lower initial cell density)
3.5.1.4.2 CholesterolCholesterol alone had no effect on the growth of the cells (Figure 3 5 1 4 2) When allowed to complex overnight to the fatty acid free albumin, some stimulation over the albumin control
200

subjected to overnight end-over-end rotation was seen The effect was not strong enough to overcome the inhibition of the untreated albumin When cholesterol was added to the albumin without time for overnight complexation, the growth was the same as when the cholesterol was allowed to complex overnight, suggesting no complexation took place or that complexation took
place very quickly (i e , m both samples, the cholesterol may have been complexed to the albumin) Also, the untreated albumin control which did not undergo overnight rotation at 4°C was less inhibitory than the albumin that did undergo overnight rotation
3.5.1.4.3 Oleic AcidOleic acid alone had no stimulatory effect on cell growth (Figure 3 5 1 4 3) When complexed to the fatty acid free albumin, it did not cause any stimulation at 1 and 4^g/ml At 10/xg/ml
(the highest concentration tested) the combination became inhibitory, while 10/xg/ml oleic acid alone was not inhibitory Combination of the oleic acid and albumin just before addition to the cells, showed the same effect as if the combination had been left to complex overnight, indicating that complexation took place very quickly Alternatively, a co-effect may explain the inhibitory effect of the combination of albumin and 10/xg/ml oleic acid
3.5.1.4.4 PhosphatidylcholinePhosphatidylcholine alone did not have any effect on cell growth in the concentration range 0 5 - 5 0/xg/ml (Figure 3 5 1 4 5) When allowed to complex to HSA - fatty acid free, there was a slight stimulation, but this was negligible when the standard deviations were taken into account Growth was better when mixing overnight occurred than just combining the two
immediatedly before addition to the cells This may have been due to complexation or to some co-effect between phosphatidylcholine and HSA fatty acid free
3.5.1.4.5 PhosphatidylserinePhosphatidylsenne was only assayed twice In these assays, variable results were obtained for the phosphatidylserine alone When complexed to HSA - fatty acid free, stimulation over the control was seen at the lower concentration tested At higher concentrations, the slight stimulatory action was lost
201
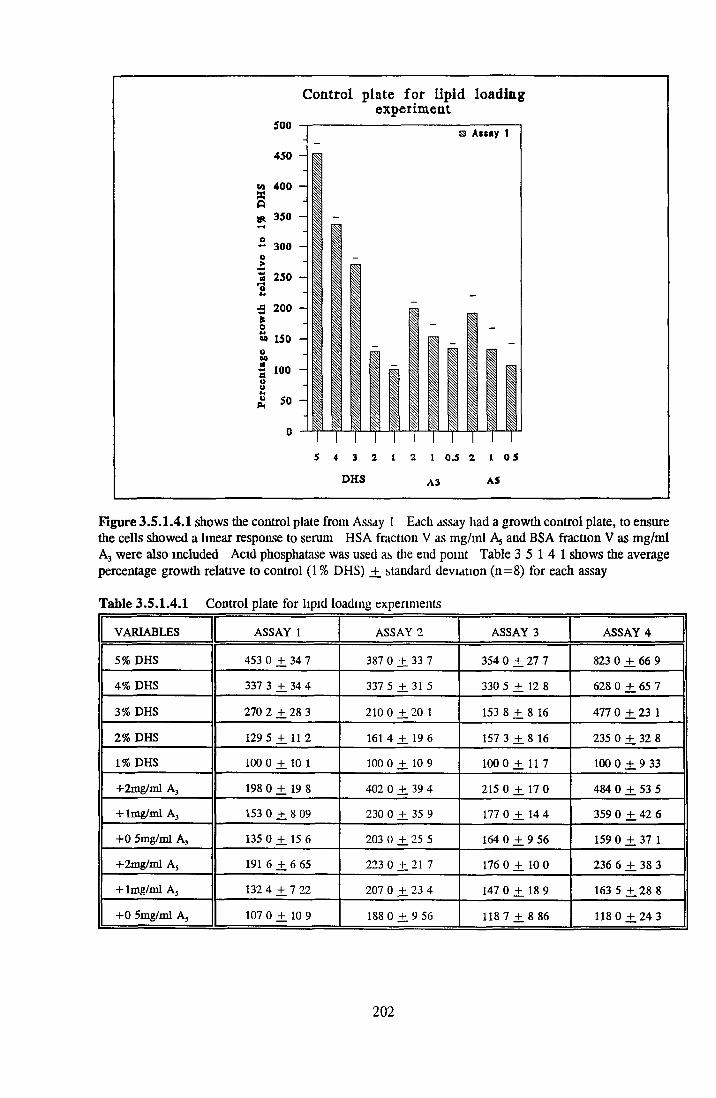
Control plate for lipid loading
500
450
co 400
(ft 350Ho~ 300o>? 250r«*o«45 200*o« 150o»s 100
I-o
DHS A3 AS
e x p e r im e n t
5 4 3 2 1 2 1 0.5 2 1 0 S
Figure 3 .5 .1 .4 .1 shows the control plate from Assay 1 Each assay had a growth control plate, to ensure the cells showed a linear response to serum HSA fraction V as m g/m l A, and BSA fraction V as m g/m l A3 were also included Acid phosphatase was used as the end point Table 3 5 1 4 1 shows the average percentage growth relative to control (1 % DHS) ± standard deviation ( n = 8) for each assay
T able 3 .5 .1 .4 .1 Control plate for lipid loading experiments
VARIABLES ASSAY 1 ASSAY 2 ASSAY 3 ASSAY 4
5% DHS 453 0 ± 34 7 387 0 ± 33 7 354 0 ± 27 7 823 0 ± 66 9
4% DHS 337 3 ± 34 4 337 5 ± 31 5 330 5 ± 12 8 628 0 ± 65 7
3% DHS 270 2 ± 28 3 210 0 ± 20 1 153 8 ± 8 16 477 0 ± 2 3 1
2% DHS 129 5 ± 1 1 2 161 4 ± 19 6 157 3 ± 8 16 235 0 ± 32 8
1% DHS 100 0 ± 10 1 100 0 ± 10 9 100 0 ± 11 7 100 0 ± 9 33
+2m g/m l A , 198 0 ± 19 8 402 0 ± 39 4 215 0 ± 17 0 484 0 ± 53 5
+ lfflg/m l A3 153 0 ± 8 09 230 0 ± 35 9 177 0 ± 14 4 359 0 ± 42 6
+ 0 5m g/m l A , 135 0 ± 15 6 203 0 ± 25 5 164 0 ± 9 56 159 0 ± 37 1
+2m g/m l A5 191 6 ± 6 65 223 0 ± 2 1 7 176 0 ± 10 0 236 6 ± 38 3
+ lm g/m l As 132 4 ± 7 22 207 0 ± 23 4 147 0 ± 18 9 163 5 ± 2 8 8
+ 0 5m g/m l A5 107 0 ± 10 9 188 0 ± 9 56 118 7 ± 8 86 118 0 ± 2 4 3
202

Cholesterol and H S A - fatty acid f te e
140130 -
120nW noO« 100 H0 90•W
S 801 ™«faa 60I 50*4DO
40
30
20
10
o»<d■**A9Ofao*
□ Awayl
ii ! I
I .
IIii
o ü 5 “ u 3 ^ 5 o u < « u “
Figure 3 .5 .1 .4 .2 shows the effect on growth when cholesterol was complexed to HSA-fatty acid free Results are expressed as the average percentage growth relative to control (1% DHS) _+ standard deviation ( n = 8) Results for each experiment are shown in Table 3 5 1 4 2 Acid phosphatase was used as the end point Assay 2 is not shown Abbreviations C l, C4 and CIO are cholesterol at 1, 4 and 10 /ig /m l,A = albumin (subjected end-over-end m ixing overnight, control for complexation procedure), A + C 4 = albu m in and cholesterol combined without allowing overnight complexation to occur, Aun = untreated albumin
Table 3 .5 .1 .4 .2 Effect o f cholesterol complexation to HSA-faf
VARIABLES ASSAY 1 ASSAY 3 ASSAY 4
1% DHS 100 0 + 7 24 100 0 + 7 09 100 0 ± 12 6
+ C l 91 98 + 9 16 80 93 + 5 40 109 3 ± 12 6
+ C4 88 54 + 8 51 102 0 + 11 2 117 8 ± 12 1
+ CIO 84 78 + 7 69 99 75 + 10 7 113 5 + 12 6
+ AC1 67 92 + 6 71 89 24 + 8 55 93 46 ± 5 14
+ AC4 64 65 + 5 24 78 00 + 5 62 117 3 + 12 1
+ AC 10 63 67 + 6 55 88 75 ± 6 11 118 7 + 5 61
+ A 56 48 + 6 71 71 88 + 8 80
+ A + C4 88 54 ± 9 16 73 35 + 6 11 108 8 + 10 7
+ Aun 83 14 ± 5 07 105 1 + 8 41
203
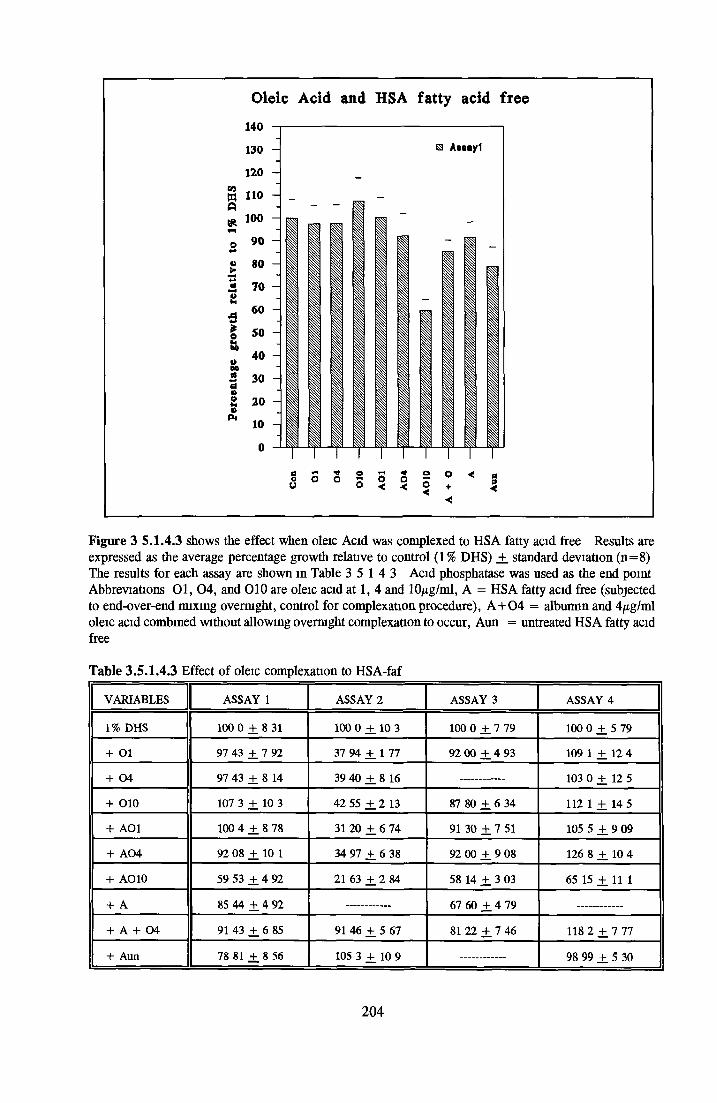
Figure 3 5 .1 .4 .3 shows the effect when oleic Acid was complexed to HSA fatty acid free Results are expressed as the average percentage growth relative to control (1 % DHS) +_ standard deviation ( n = 8) The results for each assay are shown in Table 3 5 1 4 3 Acid phosphatase was used as the end point Abbreviations 0 1 , 0 4 , and 0 1 0 are oleic acid at 1, 4 and 10/ig/ml, A = H SA fatty acid free (subjected to end-over-end m ixing overnight, control for complexation procedure), A + 0 4 = albumin and 4/ig/m l oleic acid combined without allowing overnight complexation to occur, Aun = untreated H SA fatty acid free
T able 3 .5 .1 .4 .3 Effect o f oleic complexation to HSA-faf
VARIABLES ASSAY 1 ASSAY 2 ASSAY 3 ASSAY 4
1% DHS 100 0 + 8 31 100 0 ± 10 3 100 0 + 7 79 100 0 ± 5 79
+ O l 97 43 + 7 92 37 94 +_ 1 77 92 00 ± 4 93 109 1 + 12 4
+ 0 4 97 43 + 8 14 39 40 ± 8 16 103 0 + 12 5
+ 0 1 0 107 3 _+ 10 3 42 55 ± 2 13 87 80 + 6 34 112 1 + 14 5
+ A O l 100 4 + 8 78 31 20 ± 6 74 91 30 + 7 51 105 5 + 9 09
+ A 0 4 92 08 + 10 1 34 97 ± 6 38 92 00 ± 9 08 126 8 + 10 4
+ AO 10 59 53 + 4 92 21 63 ± 2 84 58 14 + 3 03 65 15 + 11 1
+ A 85 44 + 4 92 67 60 + 4 79
+ A + 0 4 91 43 + 6 85 91 46 ± 5 67 81 22 + 7 46 118 2 + 7 77
+ Aun 78 81 +, 8 56 105 3 ± 10 9 98 99 + 5 30
204
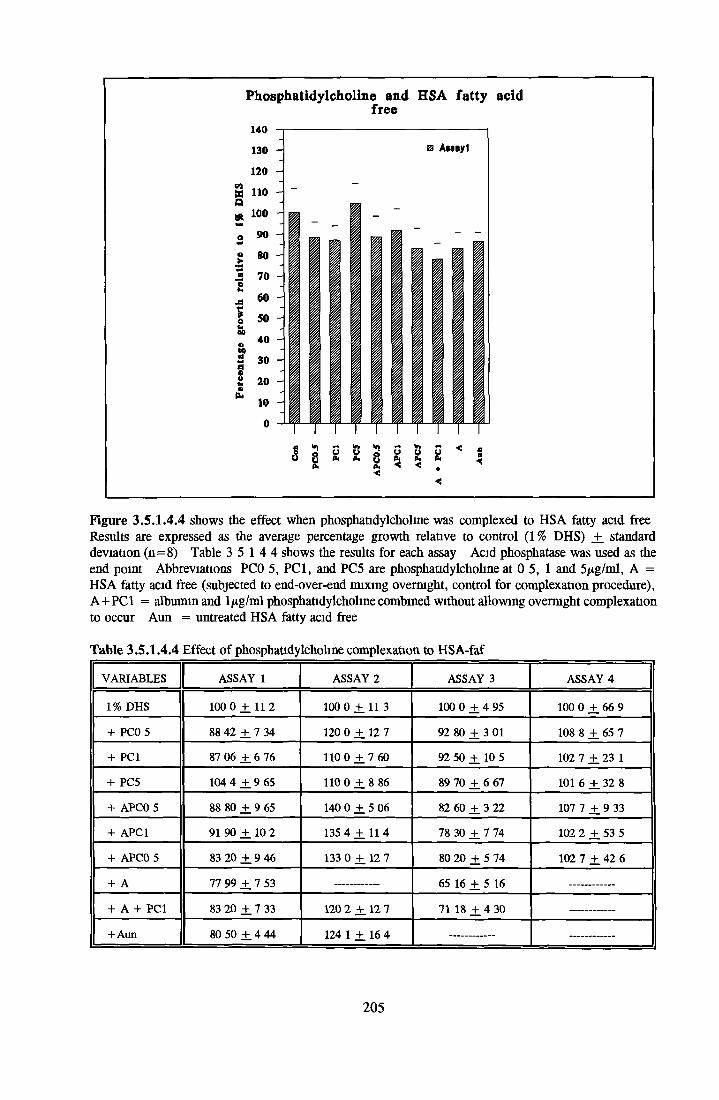
Phosphatidylcholine and HSA fatty acid free
140
130 - 0 AMsyl120 H
w no a « 100
O
»o<•no
90 -
80
70
60
50
40
30
20
10I
1
I I III
I g Sflu
5 8 2
I
i
I
I
II
I
Figure 3 .5 .1 .4 .4 shows the effect when phosphatidylcholine was complexed to H SA fatty acid free Results are expressed as the average percentage growth relative to control (1% DHS) ± standard deviation ( n = 8) Table 3 5 1 4 4 shows the results for each assay Acid phosphatase was used as the end point Abbreviations PCO 5, PC I, and PC5 are phosphatidylcholine at 0 5, 1 and 5/ig/m l, A = H SA fatty acid free (subjected to end-over-end m ixing overnight, control for complexation procedure), A + P C 1 = albumin and l^ g/m l phosphatidylcholine combined without allowing overnight complexation to occur Aun = untreated H SA fatty acid free
T able 3 .5 .1 .4 .4 Effect o f phosphatidylcholine complexation to HSA-faf
VARIABLES ASSAY 1 ASSAY 2 ASSAY 3 ASSAY 4
1% DHS 100 0 ± 11 2 100 0 ± 1 1 3 100 0 ± 4 95 100 0 ± 66 9
+ PCO 5 88 42 ± 1 34 120 0 ± 12 7 92 80 ± 3 01 108 8 ± 65 7
+ PCI 87 06 ± 6 76 110 0 ± 7 60 92 50 ± 10 5 102 7 ± 23 1
+ PC5 104 4 ± 9 65 110 0 ± 8 86 89 70 ± 6 67 101 6 ± 32 8
+ APC0 5 88 80 ± 9 65 140 0 ± 5 06 82 60 ± 3 22 107 7 ± 9 33
+ APC1 91 90 ± 10 2 135 4 ± 1 1 4 78 30 ± 7 74 102 2 ± 53 5
+ APC0 5 83 20 ± 9 46 133 0 ± 12 7 80 20 ± 5 74 102 7 ± 42 6
+ A 77 99 ± 7 53 65 16 ± 5 16
+ A + PCI 83 20 ± 7 33 120 2 ± 12 7 71 18 ± 4 30
+A un 80 50 ± 4 44 124 1 ± 16 4
205
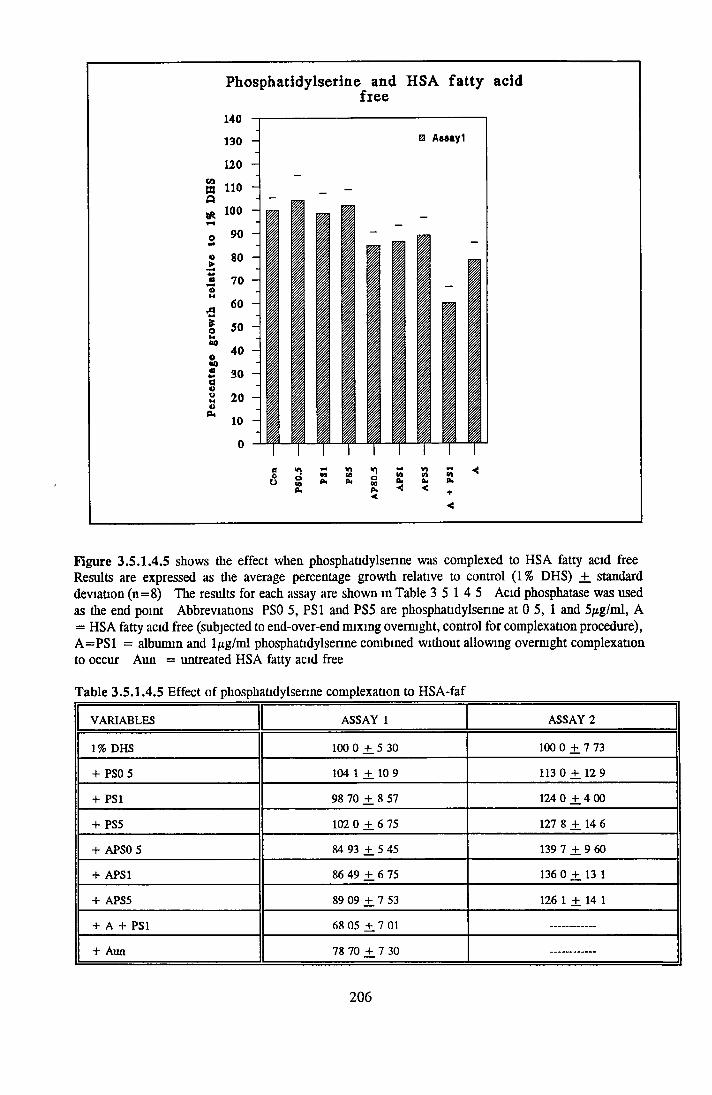
Figure 3 .5 .1 .4 .5 shows the effect when phosphatidylsenne was com plexed to HSA fatty acid free Results are expressed as the average percentage growth relative to control (1% DHS) +. standard deviation ( n = 8) The results for each assay are shown in Table 3 5 1 4 5 Acid phosphatase was used as the end point Abbreviations PSO 5, PS1 and PS5 are phosphatidylsenne at 0 5, 1 and 5/ig/m l, A = HSA fatty acid free (subjected to end-over-end m ixing overnight, control for complexation procedure), A = P S 1 = albumin and 1 /tg/m l phosphatidylsenne combined without allowing overnight complexation to occur Aun = untreated HSA fatty acid free
T able 3 .5 .1 .4 .5 Effect o f phosphatidylsenne complexation to H SA-faf
VARIABLES ASSAY 1 ASSAY 2
1% DHS 100 0 ± 5 30 100 0 +. 7 73
+ PSO 5 104 1 + 10 9 113 0 + 12 9
+ PS1 98 70 + 8 57 124 0 + 4 00
+ PS5 102 0 + 6 75 127 8 + 14 6
+ APS0 5 84 93 + 5 45 139 7 + 9 60
+ APS1 86 49 + 6 75 136 0 + 13 1
+ APS5 89 09 + 7 53 126 1 + 14 1
+ A + PS1 68 05 ± 7 01
+ Aun 78 70 + . 7 30
206
3.5.1.5 COMBINATION OF LIPIDS
The results of combinations of lipids complexed with HSA - fatty acid free and those without are shown in Table 3 5 1 5 lb Table 3 5 1 5 la shows the composition of the different combinations With or without any albumin, little or no stimulation was seen with any of the factors in combination
From the results obtained in section 3 5 14, selected variables were assayed using 24-well
plates (Figure 3 5 1 5 2 and 3) The results were read using image analysis and then the crystal violet dye was eluted off the plates and the absorbance was measured on an ELISA plate reader
Looking at image analysis as the end point, a combination of both phosphatidylsenne and phosphatidylcholine allowed to complex to albumin overnight showed better growth than the combination without overnight mixing The best stimulation of the combinations were with I
(4/ig/ml oleic acid and 1/xg/ml phosphatidylcholine) and J (1/xg/ml phosphatidylcholine and
1/xg/ml phosphatidylsenne) and equal stimulation was effected by phosphatidylsenne at 0 5/ig/ml - 1/ig/ml alone When the dye was eluted off the plate, phosphatidylsenne still
showed the best stimulation However, the extent of stimulation was lower when dye elution was used as the end point These results would suggest that phosphatidylcholine and phosphatidylsenne are more important in cell spreading than in cell division
207
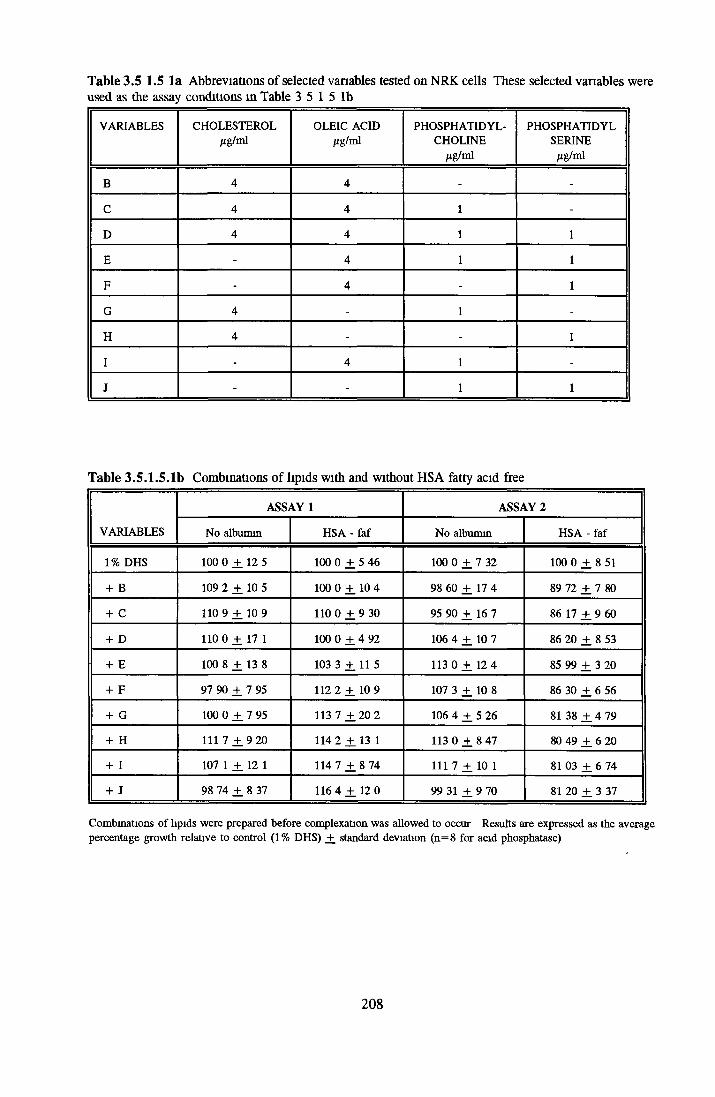
T able 3 .5 1 .5 l a Abbreviations o f selected variables tested on NRK cells These selected variables were used as the assay conditions in Table 3 5 1 5 lb
VARIABLES CHOLESTEROL/ig/m l
OLEIC ACID Mg/ml
PHOSPHATIDYLCHOLINE
Mg/ml
PHOSPHATIDYLSERINE
Mg/ml
B 4 4 - -
C 4 4 1 -
D 4 4 1 1
E - 4 1 1
F - 4 - 1
G 4 - 1 -
H 4 - - 1
I - 4 1 -
J - - 1 1
Table 3 .5 .1 .5 .1 b Combinations o f lipids with and without HSA fatty acid free
VARIABLES
ASSAY 1 ASSAY 2
No albumin HSA - faf N o albumin HSA - faf
1% DHS 100 0 ± 12 5 100 0 ± 5 46 100 0 ± 7 32 100 0 ± 8 51
+ B 109 2 ± 10 5 100 0 ± 10 4 98 60 ± 17 4 89 72 ± 7 80
+ C 110 9 ± 1 0 9 110 0 ± 9 30 95 90 ± 16 7 86 17 ± 9 60
+ D 110 0 ± 17 1 100 0 ± 4 92 106 4 ± 10 7 86 20 ± 8 53
+ E 100 8 ± 13 8 103 3 ± 11 5 113 0 ± 1 2 4 85 99 ± 3 20
+ F 97 90 ± 7 95 112 2 ± 1 0 9 107 3 ± 10 8 86 30 ± 6 56
+ G 100 0 ± 7 95 113 7 ± 2 0 2 106 4 ± 5 26 81 38 ± 4 79
+ H 111 7 ± 9 20 114 2 ± 1 3 1 113 0 ± 8 4 7 80 49 ± 6 20
+ I 107 1 ± 12 1 114 7 ± 8 74 111 7 ± 10 1 81 03 ± 6 74
+ J 98 74 ± 8 37 116 4 ± 12 0 99 31 ± 9 70 81 20 ± 3 37
Combinations o f lipids were prepared before complexation was allowed to occur Results are expressed as the average percentage growth relative to control (1% DHS) ± standard deviation (n = 8 for acid phosphatase)
208
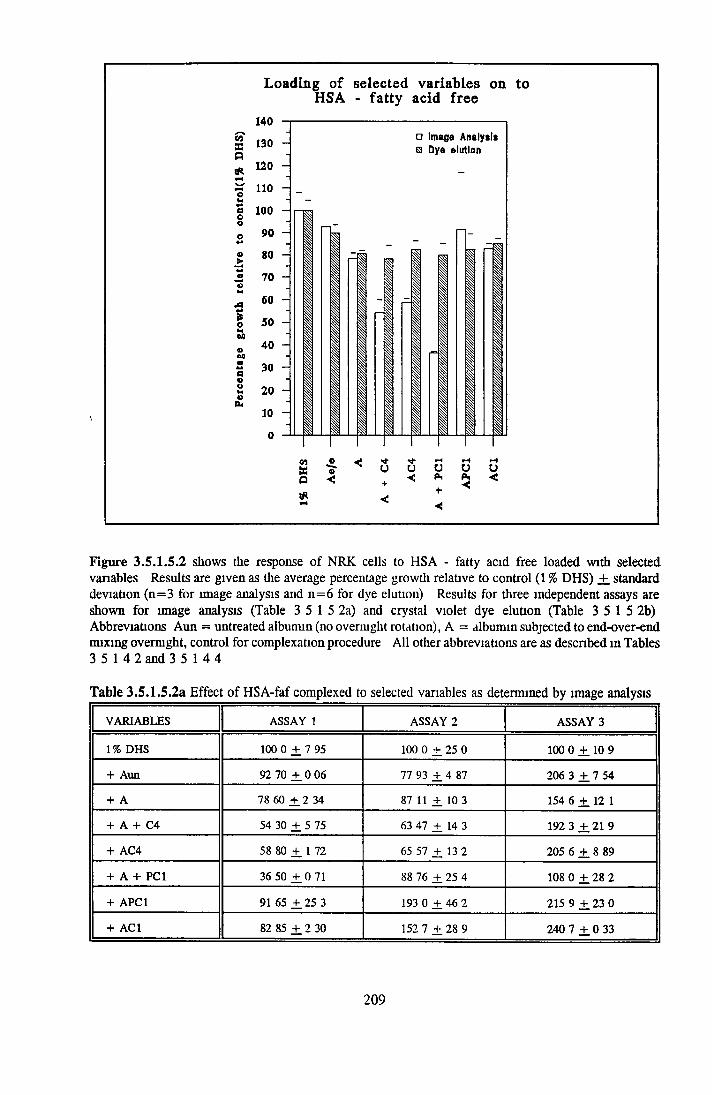
\
L o a d in g o f H S A
140COEa
aoÖMOPU
selected variables on to- fatty acid free
130 -
120 -
no -
100 -
90 -
80 -
70 -
60 -
50 -
40 -
30
20 H
10
0
I ■
□ Im age A n a ly s is□ D y a e lu tio n
I
1
I
I
<n ®tti «Q <*
u< u<
Figure 3 .5 .1 .5 .2 shows the response o f NRK cells to HSA - fatty acid free loaded with selected variables Results are given as the average percentage growth relative to control (1 % DHS) ± standard deviation (n = 3 for image analysis and n = 6 for dye elution) Results for three independent assays are shown for image analysis (Table 3 5 1 5 2a) and crystal violet dye elution (Table 3 5 1 5 2b) Abbreviations Aun = untreated albumin (no overnight rotation), A = albumin subjected to end-over-end m ixing overnight, control for complexation procedure A ll other abbreviations are as described in Tables 3 5 1 4 2 and 3 5 1 4 4
T able 3 .5 .1 .5 .2 a Effect o f HSA-faf complexed to selected variables as determined by image analysis
VARIABLES ASSAY 1 ASSAY 2 ASSAY 3
1% DHS 100 0 ± 1 95 100 0 + 25 0 100 0 ± 10 9
+ Aun 92 70 ± 0 06 77 93 ± 4 87 206 3 ± 7 54
+ A 78 60 ± 2 34 87 11 ± 10 3 154 6 + . 12 1
+ A + C4 54 30 ± 5 75 63 47 + 14 3 192 3 + .2 1 9
+ AC4 58 80 +. 1 72 65 57 ± 13 2 205 6 + . 8 89
+ A + PCI 36 50 ± 0 71 88 76 + 25 4 108 0 ± 2 8 2
+ APC1 91 65 + .2 5 3 193 0 + 46 2 215 9 ± 2 3 0
+ AC1 82 85 ± 2 30 152 7 + 28 9 240 7 ± 0 33
209
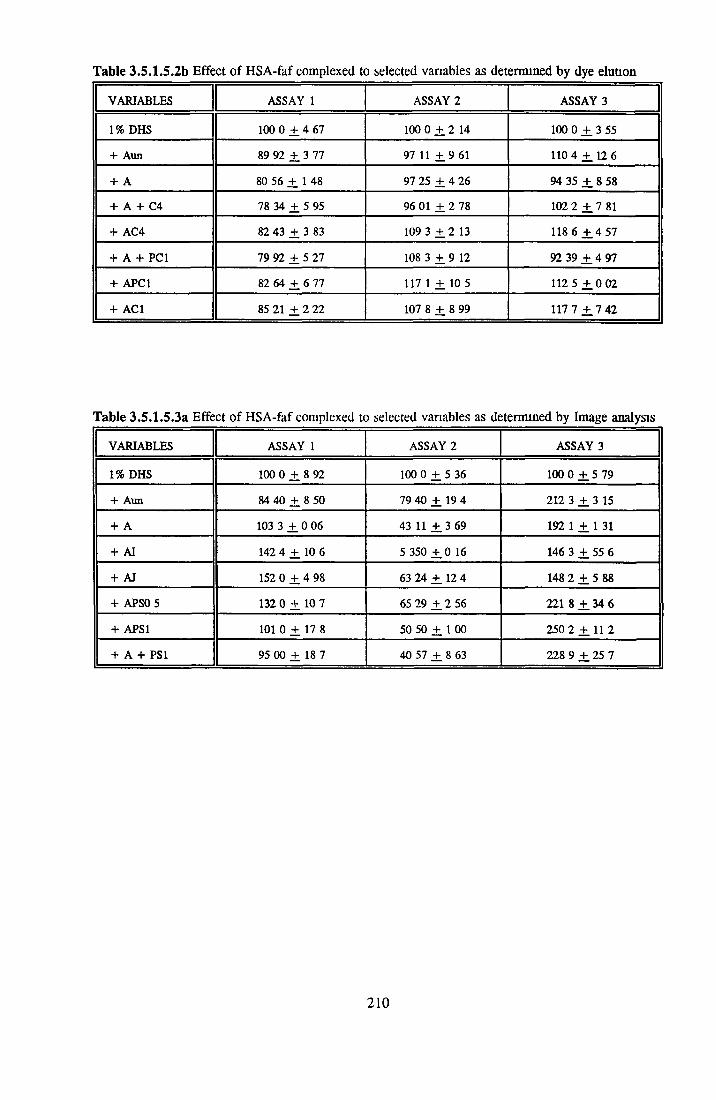
Table 3.5.1.5.2b Effect of HSA-faf complexed to selected variables as determined by dye elution
VARIABLES ASSAY 1 ASSAY 2 ASSAY 3
1% DHS 100 0 ± 4 67 100 0 ± 2 14 100 0 ± 3 55
+ Aun 89 92 ± 3 77 97 11 + 9 61 110 4 ± 12 6
+ A 80 56 ± 1 48 97 25 ± 4 26 94 35 ± 8 58
+ A + C4 78 34 ± 5 95 96 01 + 2 78 102 2 ± 7 81
+ AC4 82 43 ± 3 83 109 3 + 2 13 118 6 ± 4 57
+ A + PCI 79 92 ± 5 27 108 3 ± 9 12 92 39 ± 4 97
+ APC1 82 64 ± 6 77 117 1 ± 10 5 112 5 ± 0 02
+ AC1 85 21 ± 2 22 107 8 ± 8 99 117 7 ± 7 42
T able 3 .5 .1 .5 .3 a Effect o f H SA-faf complexed to selected variables as determined by Image analysis
VARIABLES ASSAY 1 ASSAY 2 ASSAY 3
1% DHS 100 0 ± 8 92 100 0 ± 5 36 100 0 ± 5 79
+ Aun 84 40 ± 8 50 79 40 ± 19 4 212 3 ± 3 15
+ A 103 3 ± 0 06 43 11 ± 3 69 192 1 ± 1 31
+ AI 142 4 + 10 6 5 350 ± 0 16 146 3 ± 55 6
+ AJ 152 0 + 4 98 63 24 ± 12 4 148 2 ± 5 88
+ APS0 5 132 0 + 10 7 65 29 ± 2 56 221 8 ± 34 6
+ APS1 101 0 + 17 8 50 50 ± 1 00 250 2 ± 1 1 2
+ A + PS1 95 00 + 18 7 40 57 ± 8 63 228 9 ± 25 7
210
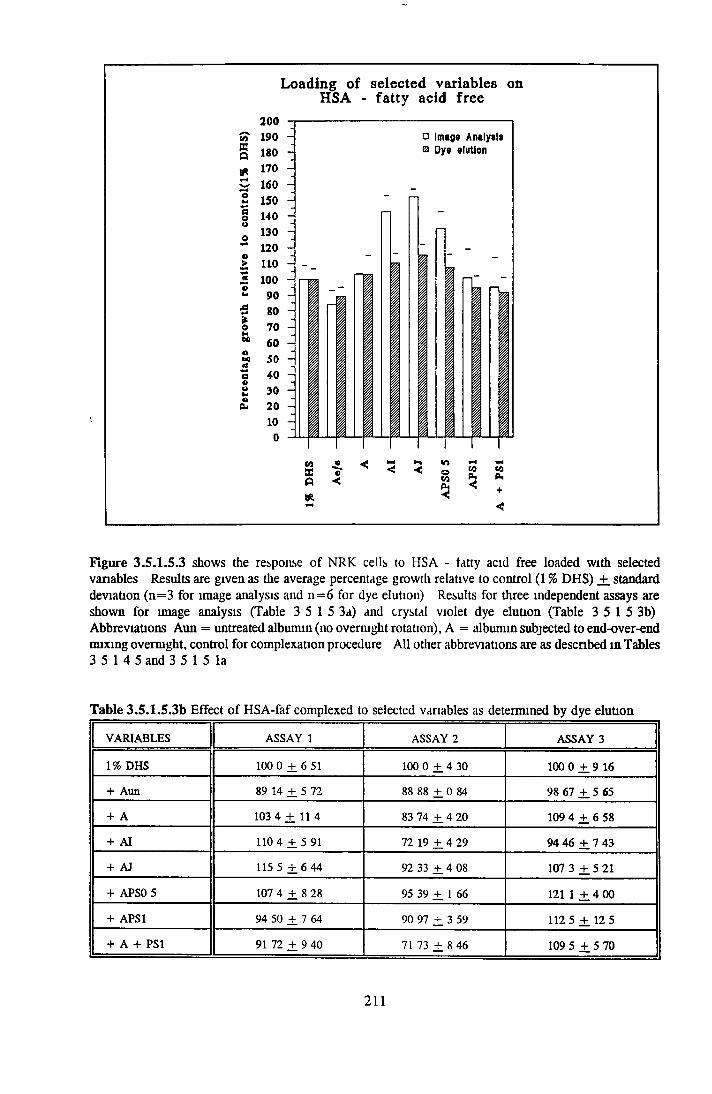
Loading of selected variables onHSA - fatty acid free
200 S? 190
o i80 ~ « 170 C 160 - 2 150 ^ g 140 -
oo>ouA*Oamid*-*aoo«•oHi
130 -j 120 -
110 -
100 -j90 -j 80 - 70 - 60 5° -j 4030 - 20 - 10 - 0
I 1
□ Image A naly tit b Dye elution
ta •a »■a <*
<r>owP<<
CO (0
Figure 3 .5 .1 .5 .3 shows the response o f NRK cells to HSA - tatty acid free loaded with selected variables Results are given as the average percentage growth relative to control (1 % DHS) +. standard deviation (n = 3 for image analysis and n = 6 for dye elution) Results for three independent assays are shown for image analysis (Table 3 5 1 5 3a) and crystal violet dye elution (Table 3 5 1 5 3b) Abbreviations Aim = untreated albumin (no overnight rotation), A = albumin subjected to end-over-end m ixing overnight, control for complexation procedure A ll other abbreviations are as described in Tables 3 5 1 4 5 and 3 5 1 5 l a
T able 3 .5 .1 .5 .3 b Effect o f H SA -faf com plexed to selected variables as determined by dye elution
VARIABLES ASSAY 1 ASSAY 2 ASSAY 3
1% DHS 100 0 + 6 51 100 0 + 4 30 100 0 ± 9 16
+ Aun 89 14 + 5 72 88 88 + 0 84 98 67 ± 5 65
+ A 103 4 + 11 4 83 74 + 4 20 109 4 ± 6 58
+ AI 110 4 ± 5 91 72 19 + 4 29 94 46 + 7 43
+ AJ 115 5 + 6 44 92 33 + 4 08 107 3 ± 5 21
+ APS0 5 107 4 + 8 28 95 39 ± 1 66 121 1 ± 4 00
+ APS1 94 50 ± 7 64 90 97 + 3 59 112 5 ± 12 5
+ A + PS1 91 72 + 9 40 71 73 + 8 46 109 5 + . 5 70
211
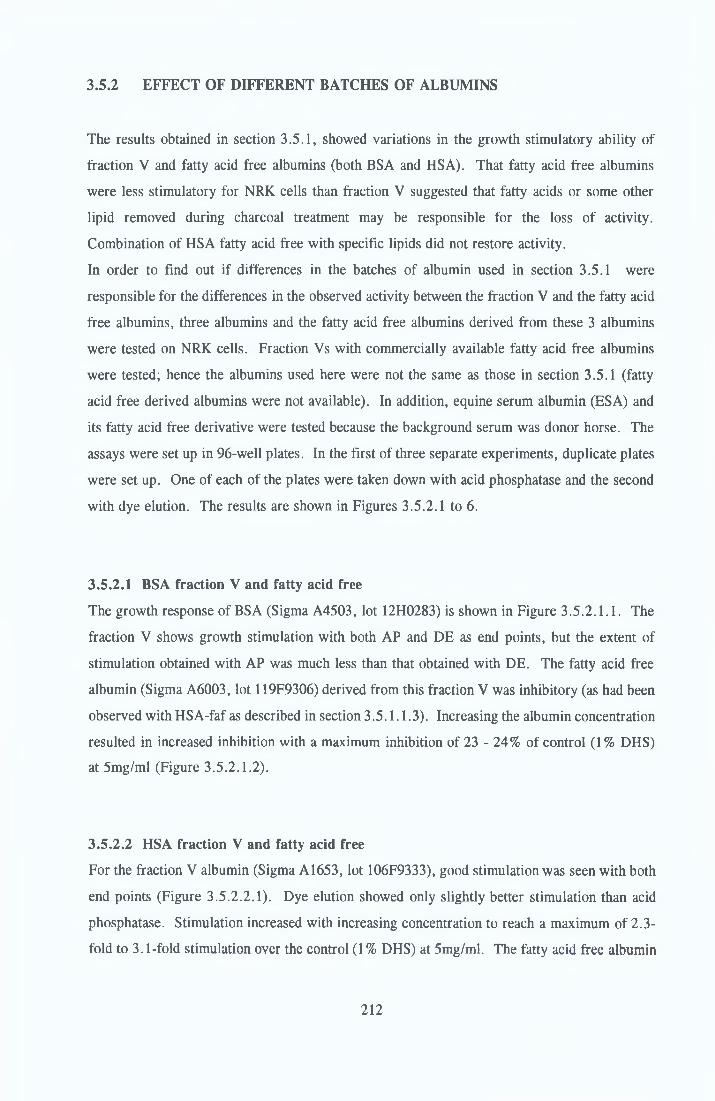
3.5.2 EFFECT OF DIFFERENT BATCHES OF ALBUMINS
The results obtained in section 3.5.1, showed variations in the growth stimulatory ability of fraction V and fatty acid free albumins (both BSA and HSA). That fatty acid free albumins were less stimulatory for NRK cells than fraction V suggested that fatty acids or some other lipid removed during charcoal treatment may be responsible for the loss of activity. Combination of HSA fatty acid free with specific lipids did not restore activity.In order to find out if differences in the batches of albumin used in section 3.5.1 were
responsible for the differences in the observed activity between the fraction V and the fatty acid free albumins, three albumins and the fatty acid free albumins derived from these 3 albumins were tested on NRK cells. Fraction Vs with commercially available fatty acid free albumins were tested; hence the albumins used here were not the same as those in section 3.5.1 (fatty acid free derived albumins were not available). In addition, equine serum albumin (ESA) and its fatty acid free derivative were tested because the background serum was donor horse. The
assays were set up in 96-well plates. In the first of three separate experiments, duplicate plates were set up. One of each of the plates were taken down with acid phosphatase and the second with dye elution. The results are shown in Figures 3.5.2.1 to 6 .
3.5.2.1 BSA fraction V and fatty acid freeThe growth response of BSA (S igma A4503, lot 12H0283) is shown in Figure 3.5.2.1.1. The fraction V shows growth stimulation with both AP and DE as end points, but the extent of stimulation obtained with AP was much less than that obtained with DE. The fatty acid free
albumin (Sigma A6003, lot 119F9306) derived from this fraction V was inhibitory (as had been observed with HSA-faf as described in section 3.5.1.1.3). Increasing the albumin concentration resulted in increased inhibition with a maximum inhibition of 23 - 24% of control (1% DHS) at 5mg/ml (Figure 3.5.2.1.2).
3.5.2.2 HSA fraction V and fatty acid freeFor the fraction V albumin (Sigma A1653, lot 106F9333), good stimulation was seen with both end points (Figure 3.5.2.2.1). Dye elution showed only slightly better stimulation than acid phosphatase. Stimulation increased with increasing concentration to reach a maximum of 2.3- fold to 3.1-fold stimulation over the control (1 % DHS) at 5mg/ml. The fatty acid free albumin
212
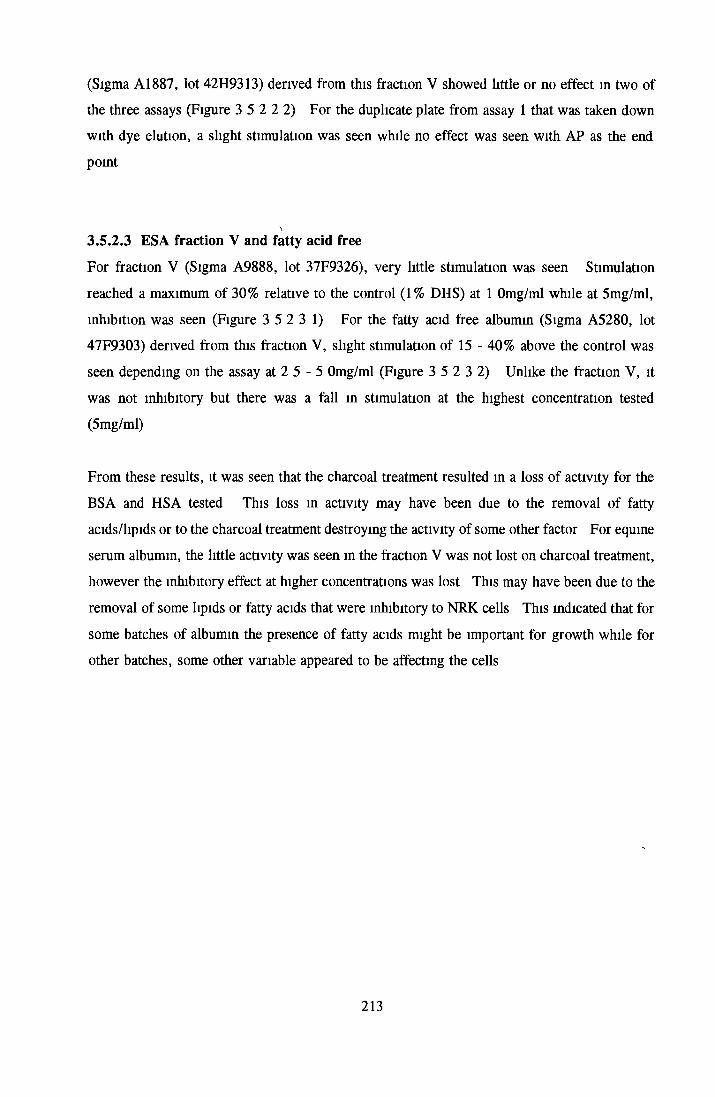
(Sigma A1887, lot 42H9313) derived from this fraction V showed little or no effect m two of the three assays (Figure 3 5 2 2 2) For the duplicate plate from assay 1 that was taken down with dye elution, a slight stimulation was seen while no effect was seen with AP as the end point
S3.5.2.3 ESA fraction V and fatty acid freeFor fraction V (Sigma A9888, lot 37F9326), very little stimulation was seen Stimulation
reached a maximum of 30% relative to the control (1% DHS) at 1 Omg/ml while at 5mg/ml, inhibition was seen (Figure 3 5 2 3 1) For the fatty acid free albumin (Sigma A5280, lot 47F9303) derived from this fraction V, slight stimulation of 15 - 40% above the control was seen depending on the assay at 2 5 - 5 Omg/ml (Figure 3 5 2 3 2) Unlike the fraction V, it was not inhibitory but there was a fall in stimulation at the highest concentration tested (5mg/ml)
From these results, it was seen that the charcoal treatment resulted in a loss of activity for the
BSA and HSA tested This loss in activity may have been due to the removal of fatty acids/hpids or to the charcoal treatment destroying the activity of some other factor For equine serum albumin, the little activity was seen in the fraction V was not lost on charcoal treatment,
however the inhibitory effect at higher concentrations was lost This may have been due to the removal of some lipids or fatty acids that were inhibitory to NRK cells This indicated that for
some batches of albumin the presence of fatty acids might be important for growth while for other batches, some other variable appeared to be affecting the cells
213
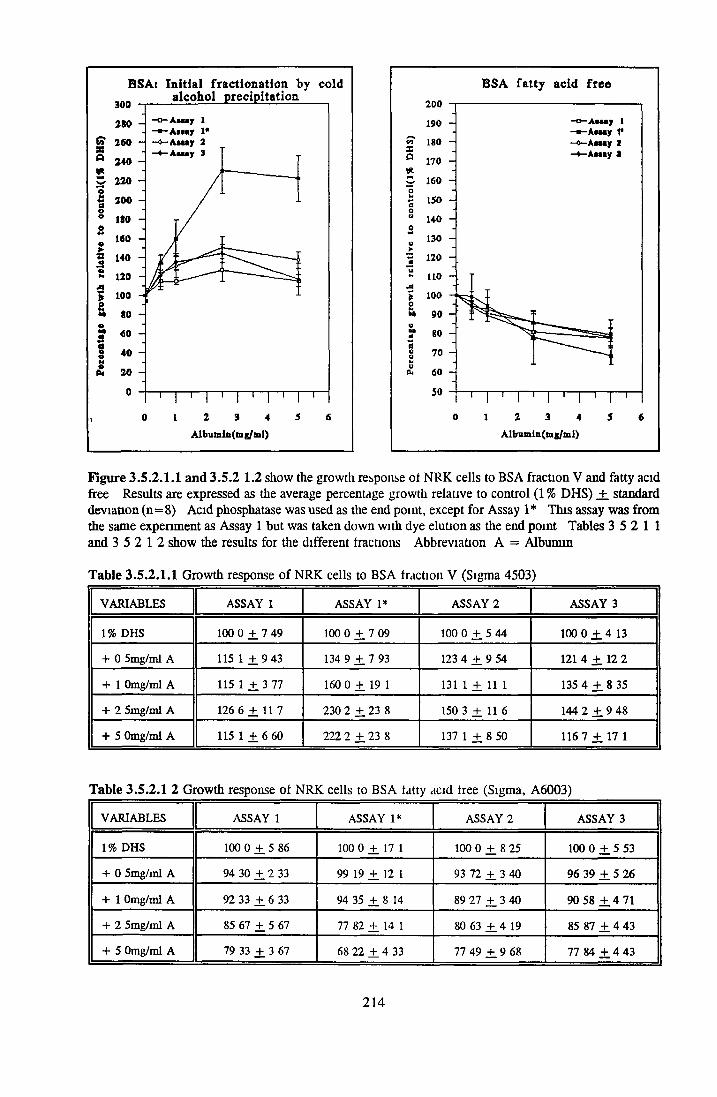
Figure 3 .5 .2 .1 .1 and 3 .5 .2 1 .2 show the growth response of NRK cells to BSA fraction V and fatty acid free Results are expressed as the average percentage growth relative to control (1 % DH S) +. standard deviation ( n = 8) Acid phosphatase was used as the end point, except for Assay 1 * This assay was from the same experiment as Assay 1 but was taken down with dye elution as the end point Tables 3 5 2 1 1 and 3 5 2 1 2 show the results for the different fractions Abbreviation A = Albumin
T able 3 .5 .2 .1 .1 Growth response o f NRK cells to BSA traction V (Sigma 4503)
VARIABLES ASSAY 1 ASSAY 1* ASSAY 2 ASSAY 3
1% DHS 100 0 ± 7 49 100 0 ± 7 09 100 0 ± 5 44 100 0 ± 4 13
+ 0 5m g/m l A 115 1 ± 9 43 134 9 ± 7 93 123 4 ± 9 54 121 4 ± 12 2
+ 1 Omg/ml A 115 1 ± 3 77 160 0 ± 19 1 131 1 ± 11 1 135 4 + 8 35
+ 2 5m g/m l A 126 6 ± 11 7 230 2 ± 23 8 150 3 + 11 6 144 2 ± 9 48
+ 5 Omg/ml A 115 1 ± 6 60 222 2 ± 23 8 137 1 ± 8 50 116 7 + 17 1
T able 3 .5 .2 .1 2 Growth response ot NRK cells to BSA tatty acid tree (Sigma, A6003)
VARIABLES ASSAY 1 ASSAY 1* ASSAY 2 ASSAY 3
1% DHS 100 0 ± 5 86 100 0 ± 17 1 100 0 +. 8 25 100 0 ± 5 53
+ 0 5m g/m l A 94 30 ± 2 33 99 19 ± 12 1 93 72 ± 3 40 96 39 ± 5 26
+ 1 Omg/ml A 92 33 ± 6 33 94 35 ± 8 14 89 27 + . 3 40 90 58 ± 4 71
+ 2 5m g/m l A 85 67 ± 5 67 77 82 ± 14 1 80 63 ± 4 19 85 87 ± 4 43
+ 5 Omg/ml A 79 33 ± 3 67 68 22 ± 4 33 77 49 ± 9 68 77 84 ± 4 43
214

HSA fraction V
A lb n m in (m g /m l)
HSA fatty acid free
A lb u m ln (m g /m l)
Figure 3 .5 .2 .2 .1 and 3 5 .2 .2 .2 show the growth response o f NRK cells to the HSA fraction V and fatty acid free Results are expressed as the average percentage growth relative to control (1 % DHS) +. standard deviation ( n = 8) A cid phosphatase was used as the end point, except for Assay 1* This assay was from the same experiment as Assay 1 but was taken down with dye elution as the end point Tables 3 5 2 2 1 and 3 5 2 2 2 show the results for the different fractions Abbreviation A = m g/m l albumin
T able 3 .5 .2 .2 .1 Growth response o f NRK cells to HSA traction V (Sigma A1653)
VARIABLES ASSAY 1 ASSAY 1* ASSAY 2 ASSAY 3
1% DHS 100 0 +. 5 28 100 0 + 9 73 100 0 ± 7 35 100 0 + 5 41
+ 0 5mg/ml A 101 2 + 7 69 138 5 + 8 46 126 8 +. 13 4 122 0 + 10 0
+ 1 Omg/ml A 125 9 + 8 61 151 6 + 15 2 160 0 + . 13 0 143 4 + 9 21
+ 2 5m g/m l A 156 2 ± 5 89 209 9 + 18 7 182 5 + .1 7 9 184 5 + 13 3
+ 5 Omg/ml A 230 9 + 16 3 312 8 + 19 3 276 3 +. 29 7 261 5 ± 19 5
T able 3 .5 .2 .2 .2 Growth response o f NRK cells to HSA tatty acid free (Sigma A1887)
VARIABLES ASSAY 1 ASSAY 1* ASSAY 2 ASSAY 3
1% DHS 100 0 ± 5 28 100 0 ± 9 73 100 0 + 7 35 100 0 ± 5 41
+ 0 5m g/m l A 100 0 ± 6 34 120 5 + 9 32 120 3 + 9 89 105 1 + 2 71
+ 1 Omg/ml A 98 71 ± 6 34 123 1 ± 15 4 120 3 +. 10 5 100 8 ± 5 69
+ 2 5mg/ml A 96 45 ± 1 69 115 4 + 1 5 4 121 6 + 8 90 102 2 ± 7 05
+ 5 Omg/ml A 91 92 + 3 62 141 5 + 8 77 116.7 + 11.2 89 90 + 7 86
215
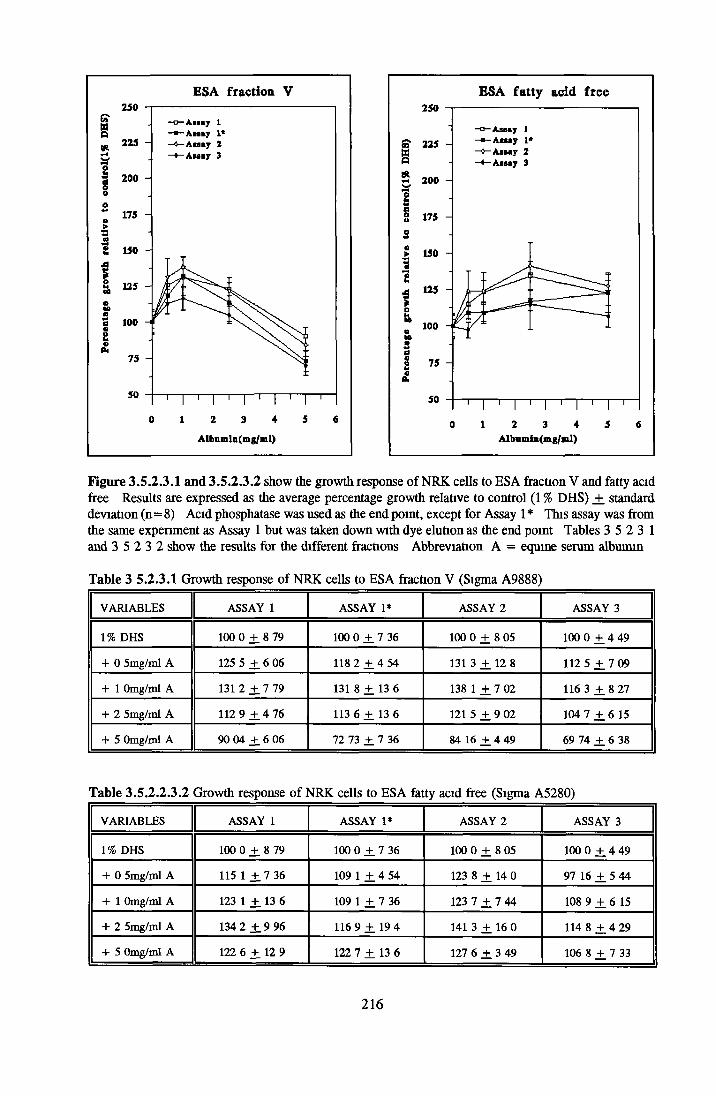
ESA fiactioa V
(n8ft
>0wm•
aePi
A lb um in (m g /m l)
ESA fatty acid free
A lb n m in (m g /m l)
Figure 3 .5 .2 .3 .1 and 3 .5 .2 .3 .2 show the growth response o f NRK cells to ESA fraction V and fatty acid free Results are expressed as the average percentage growth relative to control (1 % DHS) _+ standard deviation ( n = 8) Acid phosphatase was used as the end point, except for Assay 1 * This assay was from the same experiment as Assay 1 but was taken down with dye elution as the end point Tables 3 5 2 3 1 and 3 5 2 3 2 show the results for the different fractions Abbreviation A = equine serum albumin
Table 3 5 .2 .3 .1 Growth response o f NRK cells to ESA fraction V (Sigma A9888)
VARIABLES ASSAY 1 ASSAY 1* ASSAY 2 ASSAY 3
1% DHS 100 0 ± 8 79 100 0 + 7 36 100 0 + 8 05 100 0 ± 4 49
+ 0 5m g/m l A 125 5 +. 6 06 118 2 + 4 54 131 3 + 12 8 112 5 ± 1 09
+ 1 Omg/ml A 131 2 ± 7 79 131 8 + 13 6 138 1 + 7 02 116 3 ± 8 27
+ 2 5m g/m l A 112 9 ± 4 76 113 6 + 13 6 121 5 + 9 02 104 7 Hh 6 15
+ 5 Omg/ml A 90 04 ± 6 06 72 73 ± 7 36 84 16 + 4 49 69 74 ± 6 38
T able 3 .5 .2 .2 .3 .2 Growth response o f NRK cells to ESA fatty acid free (Sigma A5280)
VARIABLES ASSAY 1 ASSAY 1* ASSAY 2 ASSAY 3
1% DHS 100 0 ± 8 79 100 0 + 7 36 100 0 + 8 05 100 0 ± 4 49
+ 0 5m g/m l A 115 1 ± 1 36 109 1 + 4 54 123 8 + 14 0 97 16 ± 5 44
+ 1 Omg/ml A 123 1 ± 13 6 109 1 + 7 36 123 7 + 7 44 108 9 ± 6 15
+ 2 5m g/m l A 134 2 ± 9 96 116 9 + 19 4 141 3 + 16 0 114 8 ± 4 29
+ 5 Omg/ml A 122 6 +. 12 9 122 7 ± 13 6 127 6 +. 3 49 106 8 +_ 7 33
216
3.5.2.4 EFFECT OF INITIAL ISOLATION STEP ON ALBUMIN ACTIVITY
To see if the method of isolation could be related to variations in activity, albumin prepared
using the three most commonly used initial isolation steps, cold alcohol precipitation, heat shock and salt fractionation, were tested The results are shown in Figures 3 5 2 4 1 to 3
As seen in section 3 5 2 4 1 cold alcohol precipitation was the method of initial fractionation
used for BSA fraction V in the previous two sections Marginal stimulation of 26 - 50% relative to the control was observed with acid phosphatase (Figure 3 5 2 4 1) For dye elution, the extent of stimulation was much higher, reaching a maximum of 2 3-fold stimulation over
the control (1 % DHS) at 2 5mg/ml The results for dye elution corresponded favourably with the results obtained m section 3 5 11 and 3 5 12 1 When salt fractionation was used as the initial fractionation step (Figure 3 5 2 4 2), a total loss m stimulation was observed, however
no inhibition was seen For heat-shock treatment the stimulation was much higher than that seen previously (Figure 3 5 2 4 3) Increasing the concentration resulted in increased growth reaching a maximum of 3 5-fold to 4 3-fold stimulation over the control at 5 Omg/ml (the highest concentration tested) This is higher than the activity seen with BSA in the section
3 5 1
These results show that the activity observed can depend on the initial fractionation step However, only one batch from each initial fractionation step was tested, so there was no way of knowing if they were from the same batch originally
217

BSAt In itia l fractionation by cold
A lbum in(m g/m l)
F igure 3 5 .2 .4 .1 shows the growth response o f NRK cells to BSA with an initial fractionation step by cold alcohol precipitation Results are expressed as the average percentage growth relative to the control (1 % DHS) + . standard deviation ( n = 8) Results were taken down using acid phosphatase as the end point except Assay 1*, which was identical to Assay 1 but it was taken down using dye elution Table 3 5 2 4 1 below shows the results for three separate experiments Abbreviations A = m g/m l Albumin
T able 3 .5 .2 .4 .1 Albumin prepared by Cold A lcohol Precipiation (Sigma A4503)
VARIABLES ASSAY 1 ASSAY 1* ASSAY 2 ASSAY 3
1% DHS 100 0 + 7 49 100 0 + 7 09 100 0 + 5 44 100 0 ± 4 13
+ 0 5 mg/ml A 115 1 + 9 4 3 134 9 + 7 93 123 4 + . 9 54 121 4 + 12 2
+ 1 Omg/ml A 115 1 + 3 77 160 0 + 19 1 131 1 + 11 1 135 4 + 8 35
+ 2 5m g/m l A 126 7 + 11 7 230 2 +. 23 8 150 3 + 11 6 144 2 + 9 48
+ 5 Omg/ml A 115 1 ± 6 60 222 2 + 23 8 137 1 + 8 50 116 7 + 17 1
218
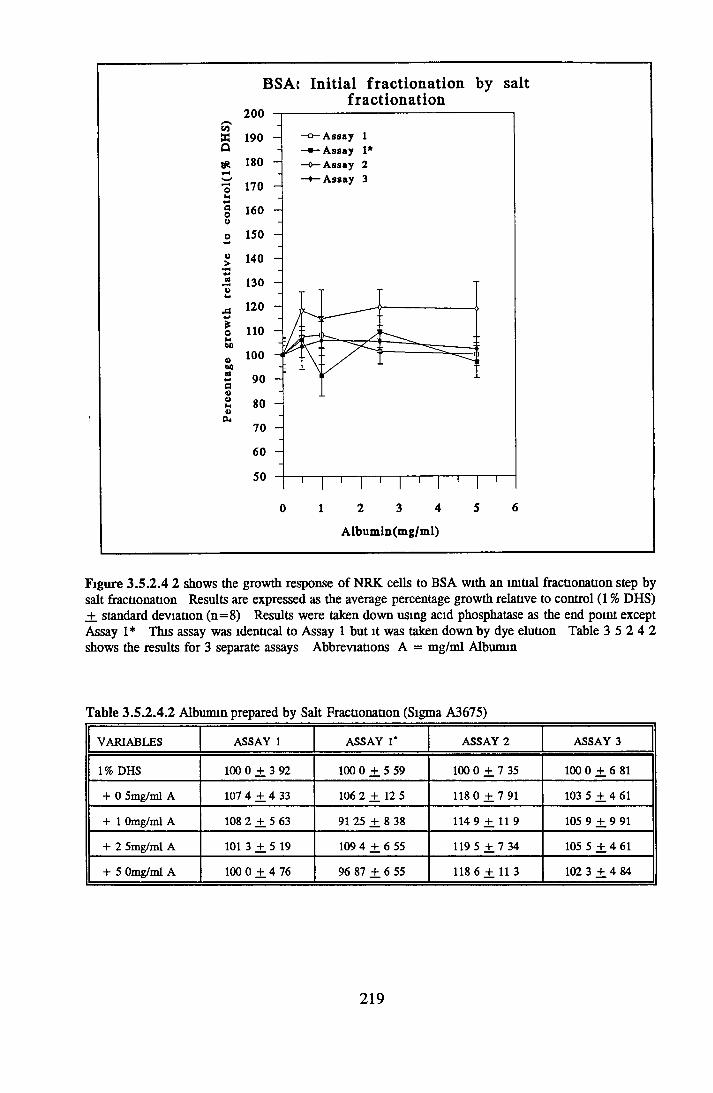
BSAc In itia l fractionation by salt fractionation
Vi«a
iso
oMst«-*aoafrHuCk
A lbum in(m g/m l)
Figure 3 .5 .2 .4 2 shows the growth response o f NRK cells to BSA with an initial fractionation step by salt fractionation Results are expressed as the average percentage growth relative to control (1 % DHS) +. standard deviation ( n = 8) Results were taken down using acid phosphatase as the end point except Assay 1* This assay was identical to Assay 1 but it was taken down by dye elution Table 3 5 2 4 2 shows the results for 3 separate assays Abbreviations A = m g/m l Albumin
T able 3 .5 .2 .4 .2 Albumin prepared by Salt Fractionation (Sigma A3675)
VARIABLES ASSAY 1 ASSAY 1* ASSAY 2 ASSAY 3
1% DHS 100 0 + 3 92 100 0 ± 5 59 100 0 + 7 35 100 0 + 6 81
+ 0 5m g/m l A 107 4 ± 4 33 106 2 ± 12 5 1 1 8 0 + 7 91 103 5 + 4 61
+ 1 Omg/ml A 108 2 ± 5 63 91 25 + 8 38 114 9 ± 1 1 9 105 9 + 9 91
+ 2 5m g/m l A 101 3 + 5 19 109 4 + 6 55 119 5 ± 7 34 105 5 + 4 61
+ 5 Omg/ml A 100 0 + 4 76 96 87 + 6 55 118 6 + 1 1 3 102 3 ± 4 84
219
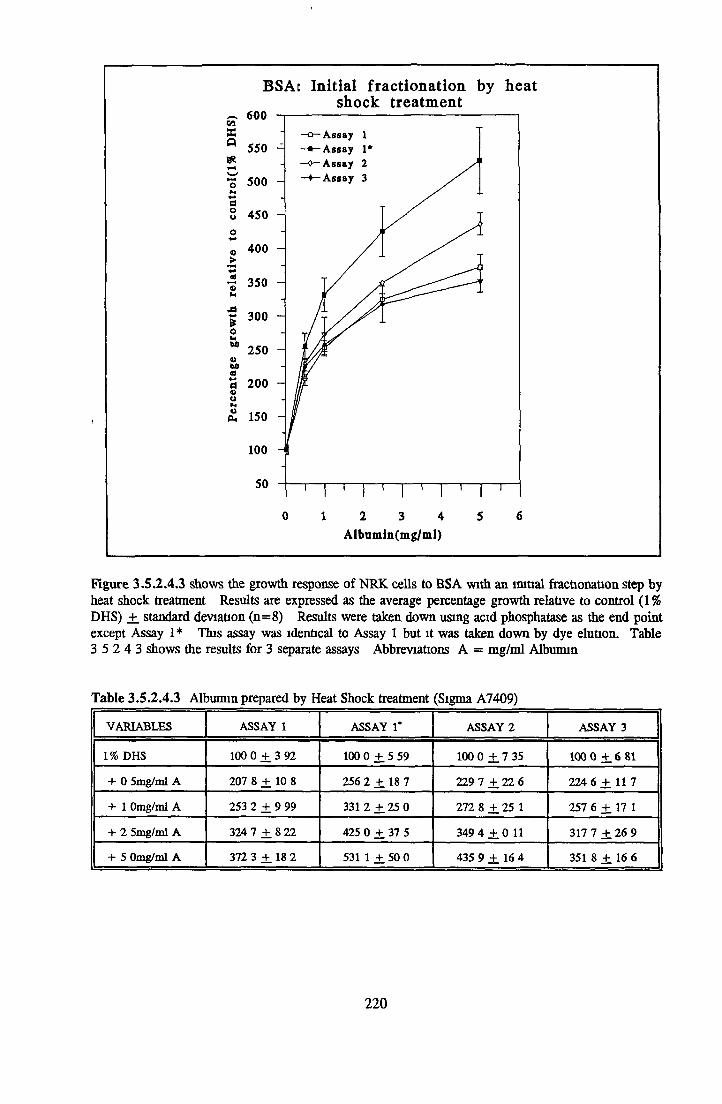
1
BSA: In itia l fractionation by heat shock treatment
COsQ«
aoo
o>
«toaa•aun«Ph
A lbum in(m g/m l)
F igure 3 .5 .2 .4 .3 shows the growth response o f NRK cells to BSA w ith an initial fractionation step by heat shock treatment Results are expressed as the average percentage growth relative to control (1 % DHS) _+ standard deviation ( n = 8) Results were taken down using acid phosphatase as the end point except Assay 1* This assay was identical to Assay 1 but it was taken down by dye elution. Table 3 5 2 4 3 shows the results for 3 separate assays Abbreviations A = m g/m l Albumin
T able 3 .5 .2 .4 .3 Albumin prepared by Heat Shock treatment (Sigma A7409)
VARIABLES ASSAY 1 ASSAY 1* ASSAY 2 ASSAY 3
1% DHS 100 0 ± 3 92 100 0 + 5 59 100 0 + 7 35 100 0 + 6 81
+ 0 5m g/m l A 207 8 +. 10 8 256 2 ± 18 7 229 7 + 22 6 224 6 + 11 7
+ 1 Omg/ml A 253 2 + 9 99 331 2 + 25 0 272 8 + 25 1 257 6 + 17 1
+ 2 5m g/m l A 324 7 + 8 22 425 0 + 37 5 3 4 9 4 + 0 11 317 7 + 26 9
+ 5 Omg/ml A 372 3 + . 18 2 531 1 ± 50 0 435 9 + 16 4 351 8 +. 16 6
220
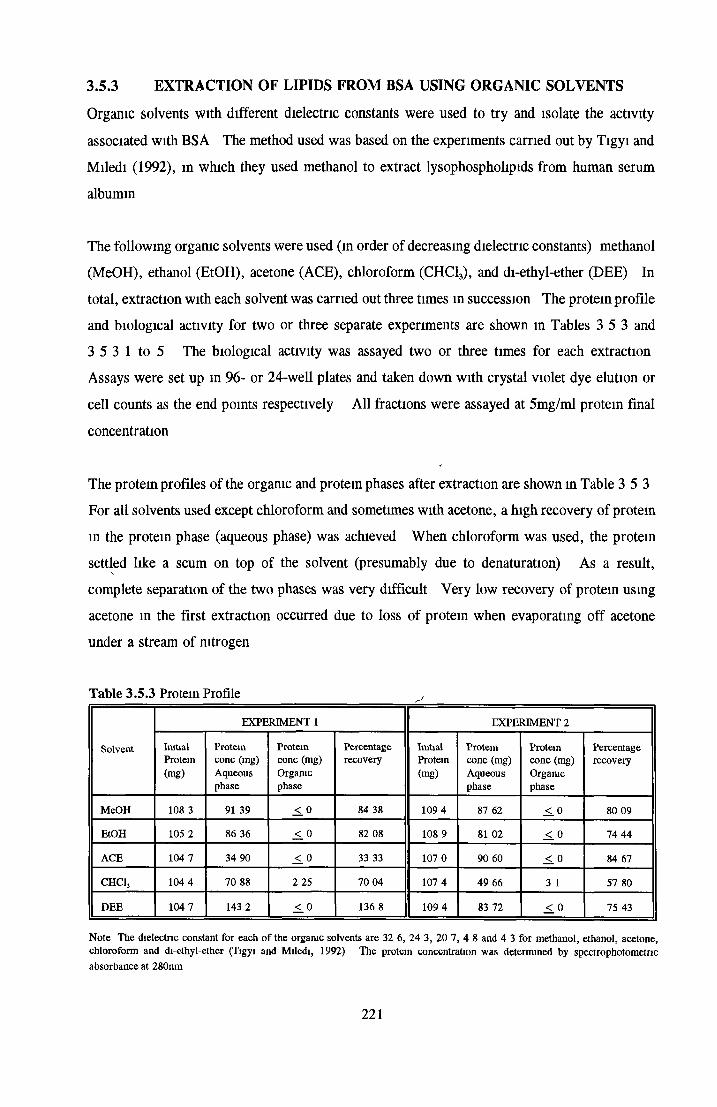
3.5.3 EXTRACTION OF LIPIDS FROM BSA USING ORGANIC SOLVENTSOrganic solvents with different dielectric constants were used to try and isolate the activity
associated with BSA The method used was based on the experiments carried out by Tigyi and
Miledi (1992), in which they used methanol to extract lysophospholipids from human serum
albumin
The following organic solvents were used (in order of decreasing dielectric constants) methanol (MeOH), ethanol (EtOH), acetone (ACE), chloroform (CHC13), and di-ethyl-ether (DEE) In
total, extraction with each solvent was carried out three times in succession The protein profile
and biological activity for two or three separate experiments are shown in Tables 3 5 3 and 3 5 3 1 to 5 The biological activity was assayed two or three times for each extraction
Assays were set up m 96- or 24-well plates and taken down with crystal violet dye elution or
cell counts as the end points respectively All fractions were assayed at 5mg/ml protein final
concentration
The protein profiles of the organic and protein phases after extraction are shown in Table 3 5 3 For all solvents used except chloroform and sometimes with acetone, a high recovery of protein
in the protein phase (aqueous phase) was achieved When chloroform was used, the protein
settled like a scum on top of the solvent (presumably due to denaturation) As a result,
complete separation of the two phases was very difficult Very low recovery of protein using
acetone in the first extraction occurred due to loss of protein when evaporating off acetone under a stream of nitrogen
Table 3.5.3 Protein Profile
EXPERIMENT 1 EXPERIMENT 2
Solvent Initial Protein Protein Percentage Initial Protein Protein PercentageProtein conc (mg) conc (mg) recovery Protein conc (mg) conc (mg) recovery(mg) Aqueous Organic (mg) Aqueous Organic
phase phase phase phase
MeOH 108 3 91 39 < .0 84 38 109 4 87 62 < .0 80 09
EtOH 105 2 86 36 < .0 82 08 108 9 81 02 < .0 74 44
ACE 104 7 34 90 < .0 33 33 107 0 90 60 < .0 84 67
CHC1, 104 4 70 88 2 25 70 04 107 4 49 66 3 1 57 80
DEE 104 7 143 2 < 0 136 8 109 4 83 72 < 0 75 43
Note The dielectric constant for each of the organic solvents are 32 6, 24 3, 20 7, 4 8 and 4 3 for methanol, ethanol, acetone, chloroform and di-ethyl-ether (Tigyi and Miledi, 1992) The protein concentration was determined by spectrophotometnc absorbance at 280nm
221

3.5.3.1 Methanol
The growth stimulating effect of BSA after methanol extraction is shown in Table 3 5 3 1a and
b The methanol control was slightly stimulatory in experiment 1 but not in experiment 2
With the organic phase, no activity was seen in experiment 1 but varying stimulation m
experiment 2 (25 and 77% stimulation above the control respectively) Of the activity
associated with the BSA control, only 32 7 - 40 5% was retained m the protein phase after the
first experiment and 82 - 83 9% after the second experiment Combination of the organic and protein phases showed similar stimulation to that of the protein phase alone, but both were less
active than the BSA control in the first experiment and almost as active as the control m the second experimentComparison of the activity in the protein phase to the percentage of protein recovered, shows that 84% and 80 1% protein was recovered in the two experiments respectively This could explain the loss of activity relative to the untreated BSA control in the second experiment but
not in the first experiment
Table 3 .5 .3 .1 a Results for extraction with methanol
VARIABLES EXPERIMENT 1 EXPERIMENT 2
Assay 1 Assay 2 Assay 1 Assay 2
1% DHS 100 0 + 7 26 1000 + 841 100 0 + 6 52 100 0 ± 9 22
+ BSA Con 283 3 + 20 0 364 2 + 3 9 7 341 0 ± 3 0 2 338 4 ± 17 1
+ MeOH Con 1100 + 120 135 0 + 10 0 98 81 ± 10 9 109 2 ± 1 0 1
+ MeOH P 160 0 + 16 7 207 1 ± 23 3 297 6 + 25 9 300 0 ± 16 3
+ MeOH OP 100 0 + 10 0 127 5 + 14 4 125 0 + 14 3 111 5 ± 12 2
+ MeOH POP 156 7 + 10 0 235 1 + 30 0 345 2 + 19 8 295 9 ± 26 5
Results are shown as the average percentage growth relative to control (1 % DHS) _+ standard deviation (n=8) Crystal violet dye elution was used as the end point Abbreviations MeOH con = solvent control without albumin, dried under stream of nitrogen and reconstituted in medium, P = protein phase o f the extraction, OP = organic phase o f the extraction, POP = combination of organic and protem phases after extraction process, BSA con = 5mg/ml untreated BSA
As some activity was seen in the organic phase using dye elution as the end point, the experiment was repeated This time however, cell number was used as the end point The results are shown in Table 3 5 3 lb Most or all of the activity was retained within the protem phase (106 9 and 85 5% relative to the BSA control), with little or no activity seen m the
organic phase Combination of the organic and protein phase did not result in increased activity (reduction in activity in the first assay and no change in the second assay) The BSA stirring control, which was exposed to 3 x 1 hour stirring at room temperature, showed no growth at
222

all with either assay Although some cells appeared to have attached, no cell spreading
occurred In addition no increase in cell number was detected in the supernatant The fact that
some cells attached but did not spread, would indicate that the albumin in some way prevented or inhibited the laying down of an extracellular matrix
Table 3 .5 .3 .1 b Results for extraction with methanol
VARIABLES ASSAY 1 ASSAY 2
1% DHS 100 0 + 12 3 100 0 J: 10 6
+ BSA Con 226 1 + 26 4 282 0 ± 28 3
+ BSA stirr con 0 00 + 0 00 0 00 ± 0 00
+ MeOH Con 130 4 + 18 4 80 50 + 4 80
+ MeOH P 234 8 ± 43 5 255 5 + 16 4
+ MeOH OP 118 8 + 15 3 82 03 + 6 63
+ MeOH POP 213 0 + 41 4 255 5 + 21 5--------------------------------------------------------------------
Results are shown as the average percentage growth relative to control (1 % DHS) _+ standard deviation (n = 3) Cell number was used as the end point Abbreviations as before, BSA stirr con = untreated BSA exposed to 3 x lHr stirrings at room temperature, also tested at 5mg/ml
3.5.3.2 Ethanol
The effect of ethanol extractions on the growth stimulating ability of BSA are shown in Table 3 5 3 2 The ethanol control showed 20 to 70% stimulation above the control (1% DHS) m
experiment 1 but no stimulation in experiment 2 The organic phase showed no activity in the
first experiment when the standard deviations were taken into account In the second experiment, varying inhibition was observed The amount of growth stimulating activity relative to the untreated BSA was low in the protein phase of the first experiment (47 8 and
65 6% for assays 1 and 2 respectively) and mixed in the second experiment (68 4 and 109 7% for assays 1 and 2 respectively) The combination of the organic and protein phase was slightly less stimulatory than the protein phase alone (in 3 of 4 assays)
The percentage protein recovered after each experiment could account for some of the loss in stimulation relative to the untreated BSA in the first experiment, 82% protein recovered and 74 4% protein recovery in the second experiment
223
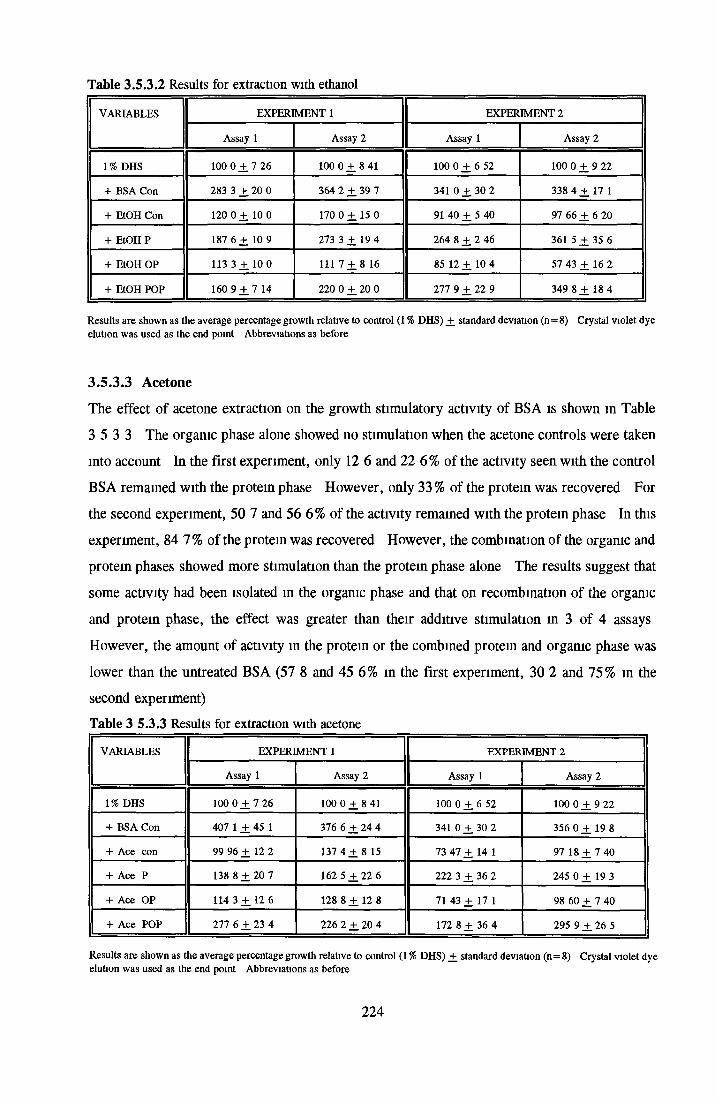
Table 3.5.3.2 Results for extraction with ethanol
VARIABLES EXPERIMENT 1 EXPERIMENT 2
Assay 1 Assay 2 Assay 1 Assay 2
1% DHS 100 0 + 7 26 100 0 ± 8 41 100 0 ± 6 52 100 0 ± 9 22
+ BSA Con 283 3 ± 20 0 364 2 ± 39 7 341 0 + 30 2 338 4 ± 17 1
+ EtOH Con 120 0 + 10 0 170 0 ± 1 5 0 91 40 ± 5 40 97 66 + 6 20
+ EtOH P 187 6 + 10 9 273 3 ± 19 4 264 8 + 2 46 361 5 ± 3 5 6
+ EtOH OP 113 3 + 10 0 111 7 + 8 16 85 1 2 + 1 0 4 57 43 ± 16 2
+ EtOH POP 160 9 + 7 14 220 0 + 20 0 277 9 + 22 9 349 8 + 18 4— ----------------- ----------------- -------------------:------------------
Results are shown as the average percentage growth relative to control (1 % DHS) _+ standard deviation (n=8) Crystal violet dye elution was used as the end point Abbreviations as before
3 .5 .3 .3 A ce to n e
The effect of acetone extraction on the growth stimulatory activity of BSA is shown m Table 3 5 3 3 The organic phase alone showed no stimulation when the acetone controls were taken into account In the first experiment, only 12 6 and 22 6% of the activity seen with the control
BSA remained with the protein phase However, only 33 % of the protein was recovered For the second experiment, 50 7 and 56 6 % of the activity remained with the protein phase In this experiment, 84 7 % of the protein was recovered However, the combination of the organic and protein phases showed more stimulation than the protein phase alone The results suggest that
some activity had been isolated in the organic phase and that on recombination of the organic and protein phase, the effect was greater than their additive stimulation in 3 of 4 assays
However, the amount of activity in the protein or the combined protein and organic phase was
lower than the untreated BSA (57 8 and 45 6 % in the first experiment, 30 2 and 75% in the second experiment)Table 3 5 .3 .3 Results for extraction with acetone
VARIABLES EXPERIMENT 1 EXPERIMENT 2
Assay 1 Assay 2 Assay 1 Assay 2
1% DHS 100 0 + 7 26 100 0 ± 8 41 100 0 + 6 52 100 0 ± 9 22
+ BSA Con 407 1 + 45 1 376 6 ± 24 4 341 0 ± 30 2 356 0 + 19 8
+ Ace con 99 96 ± 12 2 137 4 ± 8 15 73 47 + 14 1 97 18 + 7 40
+ Ace P 138 8 + 2 0 7 162 5 ± 22 6 222 3 + 36 2 245 0 + 19 3
+ Ace OP 114 3 ± 12 6 128 8 ± 12 8 71 43 + 17 1 98 60 + 7 40
+ Ace POP 277 6 + 23 4 226 2 ± 20 4 172 8 ± 36 4 295 9 + 26 5
Results are shown as the average percentage growth relative to control (1 % DHS) ± standard deviation (n=8) Crystal violet dye elution was used as the end point Abbreviations as before
224
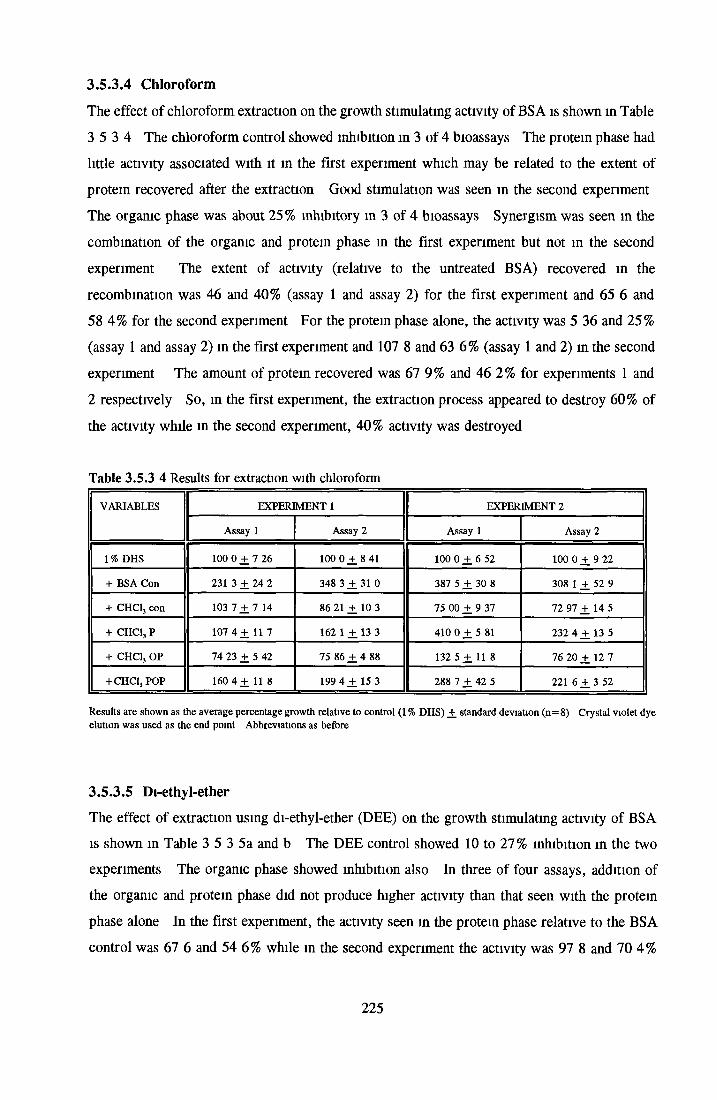
3.5.3.4 Chloroform
The effect of chloroform extraction on the growth stimulating activity of BSA is shown in Table 3 5 3 4 The chloroform control showed inhibition in 3 of 4 bioassays The protein phase had little activity associated with it m the first experiment which may be related to the extent of protein recovered after the extraction Good stimulation was seen in the second experiment The organic phase was about 25% inhibitory m 3 of 4 bioassays Synergism was seen in the combination of the organic and protein phase in the first experiment but not m the second
experiment The extent of activity (relative to the untreated BSA) recovered in the
recombination was 46 and 40% (assay 1 and assay 2) for the first experiment and 65 6 and 58 4% for the second experiment For the protein phase alone, the activity was 5 36 and 25% (assay 1 and assay 2) in the first experiment and 107 8 and 63 6% (assay 1 and 2) in the second
experiment The amount of protein recovered was 67 9% and 46 2% for experiments 1 and 2 respectively So, in the first experiment, the extraction process appeared to destroy 60% of
the activity while in the second experiment, 40% activity was destroyed
Table 3.5.3 4 Results for extraction with chloroform
VARIABLES EXPERIMENT 1 EXPERIMENT 2
Assay 1 Assay 2 Assay 1 Assay 2
1 % DHS 100 0 + 7 26 100 0 +. 8 41 100 0 ± 6 52 100 0 + 9 22
+ BSA Con 231 3 + 24 2 348 3 ± 3 1 0 387 5 + 30 8 308 1 ± 52 9
+ CHClj con 103 1 ± 7 14 86 21 ± 10 3 75 00 ± 9 37 72 97 + 14 5
+ CHC13 P 107 4 + U 7 162 1 ± 13 3 410 0 + 5 81 232 4 + 13 5
+ CHC13 OP 74 23 + 5 42 75 86 ± 4 88 132 5 + 11 8 76 20 + 12 7
+ CHC13 POP 160 4 + 11 8 199 4 ± 15 3 288 7 + 42 5 221 6 Hr 3 52
Results are shown as the average percentage growth relative to control (1 % DHS) ±_ standard deviation (n = 8) Crystal violet dye elution was used as the end point Abbreviations as before
3.5.3.5 Di-ethyl-etherThe effect of extraction using di-ethyl-ether (DEE) on the growth stimulating activity of BSA is shown m Table 3 5 3 5a and b The DEE control showed 10 to 27% inhibition in the two experiments The organic phase showed inhibition also In three of four assays, addition of the organic and protein phase did not produce higher activity than that seen with the protein phase alone In the first experiment, the activity seen in the protein phase relative to the BSA control was 67 6 and 54 6% while in the second experiment the activity was 97 8 and 70 4%
225
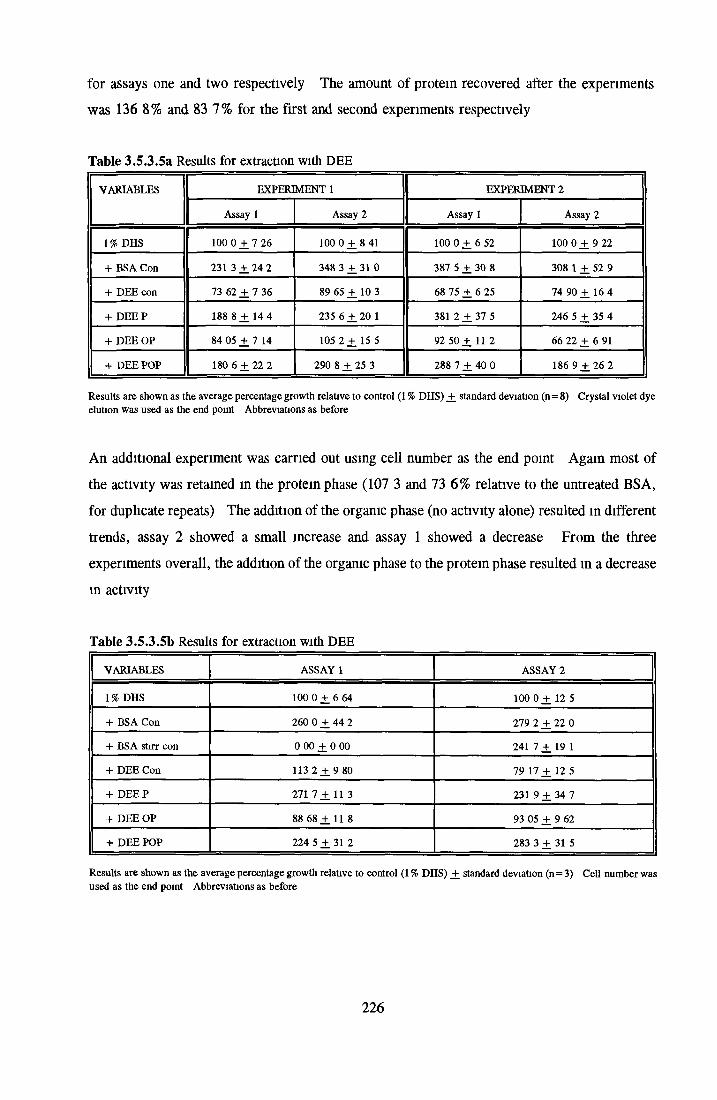
for assays one and two respectively The amount of protein recovered after the experiments was 136 8% and 83 7% for the first and second experiments respectively
T able 3 .5 .3 .5 a Results for extraction with DEE
VARIABLES EXPERIMENT 1 EXPERIMENT 2
Assay 1 Assay 2 Assay 1 Assay 2
1 % DHS 100 0 + 7 26 100 0 +. 8 41 100 0 + 6 52 100 0 + 9 22
+ BSA Con 231 3 + 24 2 348 3 +. 31 0 387 5 ± 30 8 308 1 +. 52 9
+ DEE con 73 62 + 7 36 89 65 ± 10 3 68 75 + 6 25 74 90 + 16 4
+ DEEP 188 8 + 14 4 235 6 ± 20 1 381 2 + 37 5 246 5 ± 35 4
+ DEE OP 84 05 + 7 14 105 2 + 15 5 92 50 ± 11 2 66 22 +. 6 91
+ DEE POP 180 6 + 22 2 290 8 + 25 3 288 7 + 40 0 186 9 + 26 2--------------------,----------.------
Results are shown as the average percentage growth relative to control (1 % DHS) +_ standard deviation (n=8) Crystal violet dye elution was used as the end point Abbreviations as before
An additional experiment was carried out using cell number as the end point Again most of the activity was retained in the protein phase (107 3 and 73 6 % relative to the untreated BSA,
for duplicate repeats) The addition of the organic phase (no activity alone) resulted in different
trends, assay 2 showed a small increase and assay 1 showed a decrease From the three experiments overall, the addition of the organic phase to the protein phase resulted m a decrease m activity
Table 3 .5 .3 .5 b Results for extraction with DEE
VARIABLES ASSAY 1 ASSAY 2
1% DHS 100 0 + 6 64 100 0 + 12 5
+ BSA Con 260 0 + 44 2 279 2 + 22 0
+ BSA stirr con 0 00 + 0 00 241 7 +. 19 1
+ DEE Con 113 2 + 9 80 79 17 + 12 5
+ DEEP 271 7 + 11 3 231 9 + 34 7
+ DEE OP 88 68 + 11 8 93 05 + 9 62
+ DEE POP 224 5 + 31 2 283 3 + 31 5
Results are shown as the average percentage growth relative to control (1 % DHS) _+ standard deviation (n= 3) Cell number was used as the end point Abbreviations as before
226
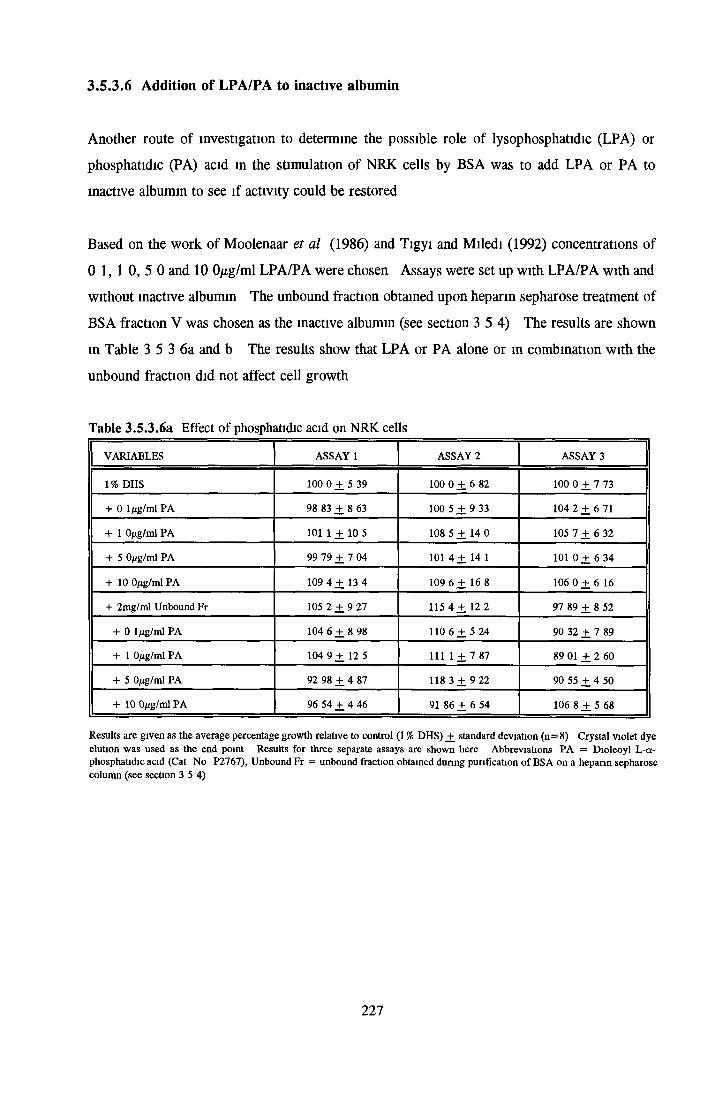
3.5.3.6 Addition of LPA/PA to inactive albumin
Another route of investigation to determine the possible role of lysophosphatidic (LPA) or phosphatidic (PA) acid in the stimulation of NRK cells by BSA was to add LPA or PA to inactive albumin to see if activity could be restored
Based on the work of Moolenaar et al (1986) and Tigyi and Miledi (1992) concentrations of
0 1 , 10 , 5 0 and 10 0/ig/ml LPA/PA were chosen Assays were set up with LPA/PA with and without inactive albumin The unbound fraction obtained upon heparin sepharose treatment of BSA fraction V was chosen as the inactive albumin (see section 3 5 4) The results are shown
in Table 3 5 3 6a and b The results show that LPA or PA alone or m combination with the
unbound fraction did not affect cell growth
T able 3 .5 .3 .6 a Effect o f phosphatidic acid on NRK cells
VARIABLES ASSAY 1 ASSAY 2 ASSAY 3
1% DHS 100 0 + 5 39 100 0 + 6 82 100 0 + 7 73
+ 0 1 Mg/ml PA 98 83 + 8 63 100 5 + 9 33 1042 + 6 71
+ 1 Ojtg/ml PA 101 1 + 10 5 108 5 + 14 0 105 7 + 6 32
+ 5 0/ig/ml PA 99 79 + 7 04 101 4 + 14 1 101 0 + 6 3 4
+ 10 0/xg/ml PA 109 4 + 13 4 109 6 + 16 8 1060 + 6 16
+ 2mg/ml Unbound Fr 105 2 + 9 27 115 4 +. 12 2 97 89 + 8 52
+ 0 ljig/ml PA 104 6 + 8 98 110 6 + 5 24 90 32 + 7 89
+ 1 0/tg/ml PA 104 9 + 12 5 111 1 + 7 87 89 01 + 2 60
+ 5 0/ug/ml PA 92 98 ± 4 87 118 3 + 9 22 90 55 + 4 50
+ 10 0/tg/ml PA 96 54 + 4 46 91 86 ± 6 54 106 8 + 5 68
Results are given as the average percentage growth relative to control (1 % DHS) _+ standard deviation (n=8) Crystal violet dye elution was used as the end point Results for three separate assays are shown here Abbreviations PA = Dioleoyl L-a- phosphatidic acid (Cat No P2767), Unbound Fr = unbound fraction obtained during purification of BSA on a hepann sepharose column (see section 3 5 4)
227
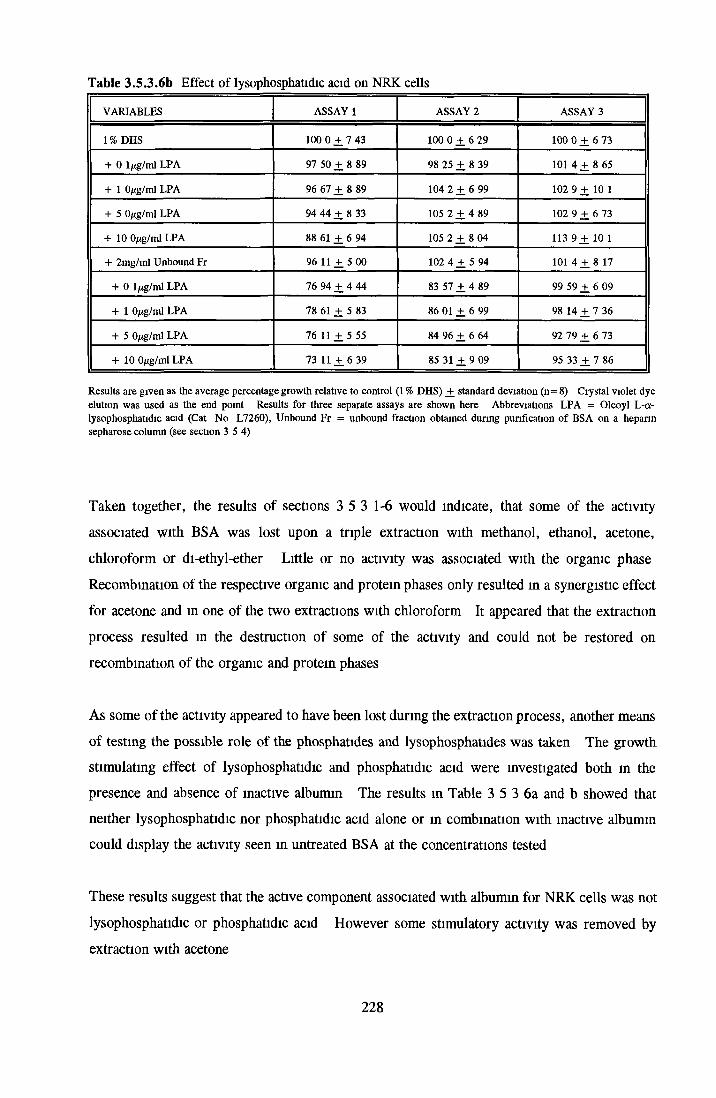
Table 3.5.3.6b Effect of lysophosphatidic acid on NRK cells
VARIABLES ASSAY 1 ASSAY 2 ASSAY 3
1% DHS 100 0 + 7 43 100 0 + 6 29 100 0 + 6 73
+ 0 1 jug/ml LPA 97 50 + 8 89 98 25 + 8 39 101 4 + 8 65
+ 1 O ig/ml LPA 96 67 + 8 89 104 2 ± 6 99 102 9 + 10 1
+ 5 0/tg/ml LPA 94 44 + 8 33 105 2 + 4 89 102 9 + 6 73
+ 10 0Mg/ml LPA 88 61 + 6 94 105 2 + 8 04 113 9 ± 10 1
+ 2mg/ml Unbound Fr 96 11 + 5 00 102 4 + 5 94 101 4 + 8 17
+ 0 lfig/ml LPA 76 94 + 4 44 83 57 + 4 89 99 59 + 6 09
+ 1 0/ig/ml LPA 78 61 + 5 83 86 01 + 6 99 98 14 + 7 36
+ 5 0/ig/ml LPA 76 11 ± 5 55 84 96 + 6 64 92 79 + 6 73
+ 10 0/ig/ml LPA 73 U + 6 39 85 31 ± 9 09 95 33 ± 7 86
Results are given as the average percentage growth relative to control (1 % DHS) _+ standard deviation (n = 8) Crystal violet dye elution was used as the end point Results for three separate assays are shown here Abbreviations LPA = Oleoyl L-a- lysophosphatidic acid (Cat No L7260), Unbound Fr = unbound fraction obtained during purification of BSA on a hepann sepharose column (see section 3 5 4)
Taken together, the results of sections 3 5 3 1-6 would indicate, that some of the activity associated with BSA was lost upon a triple extraction with methanol, ethanol, acetone, chloroform or di-ethyl-ether Little or no activity was associated with the organic phase Recombination of the respective organic and protein phases only resulted in a synergistic effect for acetone and in one of the two extractions with chloroform It appeared that the extraction process resulted in the destruction of some of the activity and could not be restored on recombination of the organic and protein phases
As some of the activity appeared to have been lost during the extraction process, another means of testing the possible role of the phosphatides and lysophosphatides was taken The growth stimulating effect of lysophosphatidic and phosphatidic acid were investigated both in the presence and absence of inactive albumin The results in Table 3 5 3 6a and b showed that neither lysophosphatidic nor phosphatidic acid alone or in combination with inactive albumin could display the activity seen in untreated BSA at the concentrations tested
These results suggest that the active component associated with albumin for NRK cells was not lysophosphatidic or phosphatidic acid However some stimulatory activity was removed by extraction with acetone
228
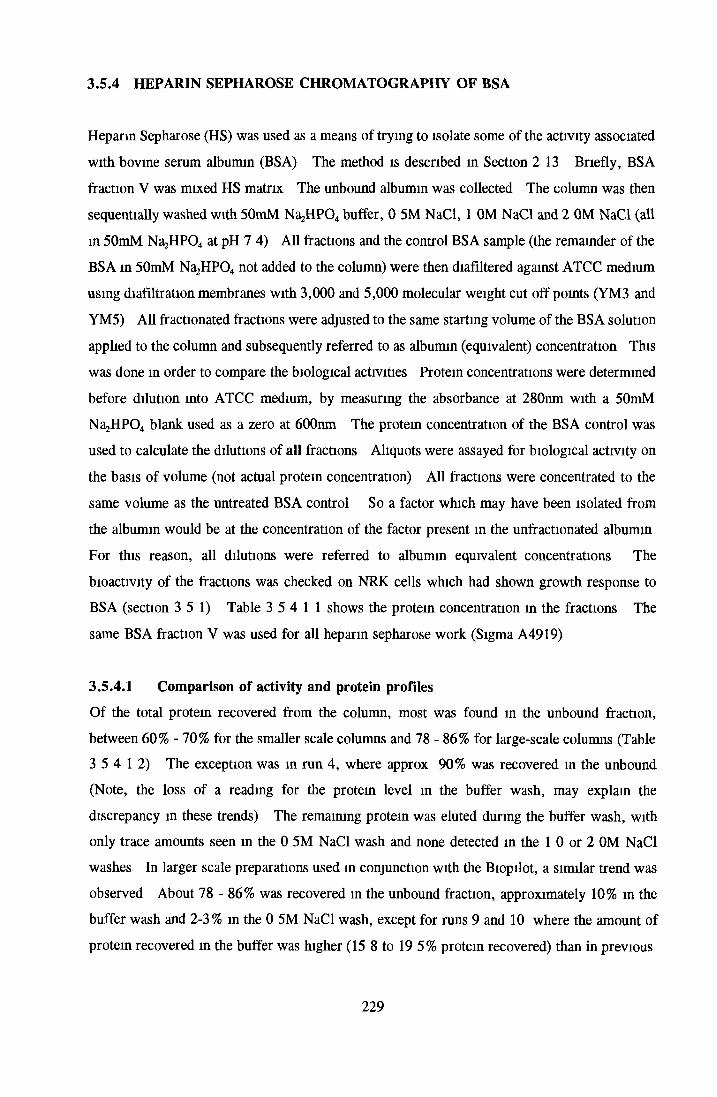
3.5.4 HEPARIN SEPHAROSE CHROMATOGRAPHY OF BSA
Heparm Sepharose (HS) was used as a means of trying to isolate some of the activity associated
with bovine serum albumin (BSA) The method is described in Section 2 13 Briefly, BSA
fraction V was mixed HS matrix The unbound albumin was collected The column was then sequentially washed with 50mM Na2HP0 4 buffer, 0 5M NaCl, 1 OM NaCl and 2 OM NaCl (all in 50mM Na2HP0 4 at pH 7 4) All fractions and the control BSA sample (the remainder of the BSA m 50mM Na2HP0 4 not added to the column) were then diafiltered against ATCC medium using diafiltration membranes with 3,000 and 5,000 molecular weight cut off points (YM3 and
YM5) All fractionated fractions were adjusted to the same starting volume of the BSA solution applied to the column and subsequently referred to as albumin (equivalent) concentration This was done m order to compare the biological activities Protein concentrations were determined before dilution into ATCC medium, by measuring the absorbance at 280nm with a 50mM NajHPO* blank used as a zero at 600nm The protein concentration of the BSA control was used to calculate the dilutions of all fractions Aliquots were assayed for biological activity on the basis of volume (not actual protein concentration) All fractions were concentrated to the
same volume as the untreated BSA control So a factor which may have been isolated from the albumin would be at the concentration of the factor present in the unfractionated albumin
For this reason, all dilutions were referred to albumin equivalent concentrations The bioactivity of the fractions was checked on NRK cells which had shown growth response to BSA (section 3 5 1) Table 3 5 4 1 1 shows the protein concentration in the fractions The
same BSA fraction V was used for all heparin sepharose work (Sigma A4919)
3.5.4.1 Comparison of activity and protein profilesOf the total protein recovered from the column, most was found in the unbound fraction, between 60% - 70% for the smaller scale columns and 78-86% for large-scale columns (Table 3 5 4 1 2) The exception was in run 4, where approx 90% was recovered in the unbound (Note, the loss of a reading for the protein level in the buffer wash, may explain the discrepancy in these trends) The remaining protein was eluted during the buffer wash, with only trace amounts seen in the 0 5M NaCl wash and none detected in the 1 0 or 2 0M NaCl washes In larger scale preparations used in conjunction with the Biopilot, a similar trend was
observed About 78 - 86% was recovered in the unbound fraction, approximately 10% in the buffer wash and 2-3% in the 0 5M NaCl wash, except for runs 9 and 10 where the amount of protein recovered in the buffer was higher (15 8 to 19 5% protein recovered) than in previous
229
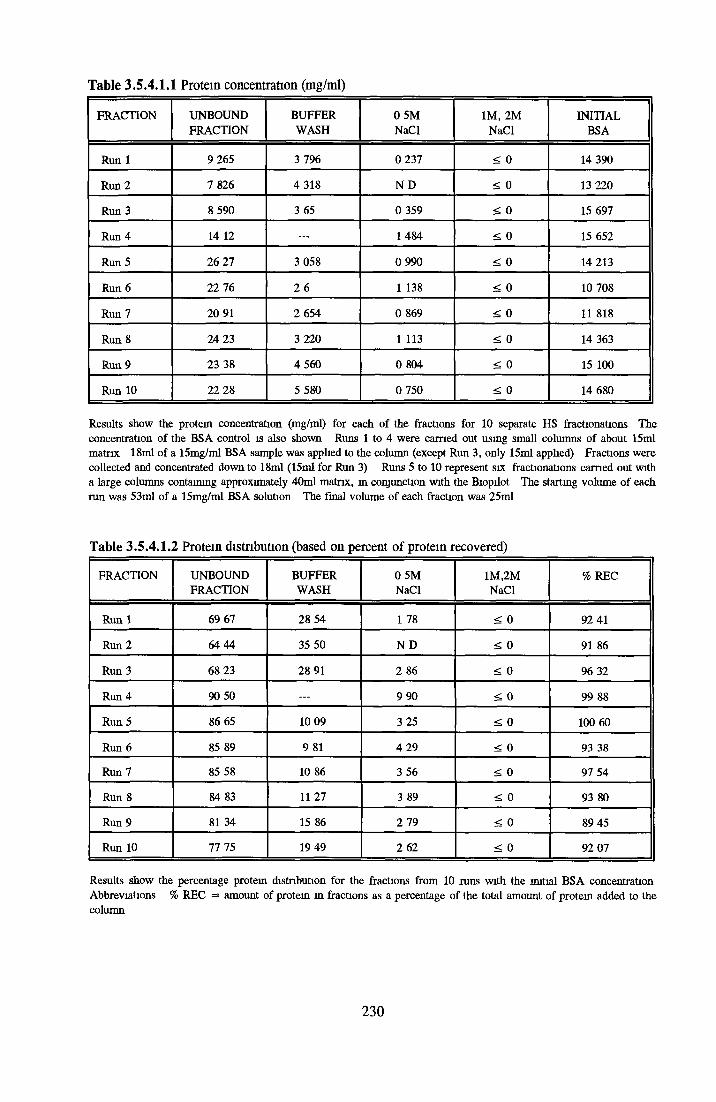
Table 3.5.4.1.1 Protein concentration (mg/ml)
FRACTION UNBOUNDFRACTION
BUFFERWASH
0 5M NaCl
IM , 2M NaCl
INITIALBSA
Run 1 9 265 3 796 0 237 £ 0 14 390
Run 2 7 826 4 318 N D < 0 13 220
Run 3 8 590 3 65 0 359 < 0 15 697
Run 4 14 12 — 1 484 < 0 15 652
Run 5 26 27 3 058 0 990 < 0 14 213
Run 6 22 76 2 6 1 138 < 0 10 708
Run 7 20 91 2 654 0 869 < 0 11 818
Run 8 24 23 3 220 1 113 < 0 14 363
Run 9 23 38 4 560 0 804 < 0 15 100
Run 10 22 28 5 580 0 750 < 0 14 680
Results show the protein concentration (mg/ml) for each o f the fractions for 10 separate HS fractionations The concentration o f the BSA control is also shown Runs 1 to 4 were earned out using small columns o f about 15ml matrix 18ml of a 15mg/ml BSA sample was applied to the column (except Run 3, only 15ml applied) Fractions were collected and concentrated down to 18ml (15ml for Run 3) Runs 5 to 10 represent six fractionations earned out with a large columns containing approximately 40m l matrix, in conjunction with the Biopilot The starting volume o f each run was 53m l o f a 15mg/ml BSA solution The final volume o f each fraction was 25m l
Table 3 .5 .4 .1 .2 Protein distribution (based on percent o f protein recovered)
FRACTION UNBOUNDFRACTION
BUFFERWASH
0 5M NaCl
1M .2MNaCl
% REC
Run 1 69 67 28 54 1 78 < 0 92 41
Run 2 64 44 35 50 N D < 0 91 86
Run 3 68 23 28 91 2 86 < 0 96 32
Run 4 90 50 . . . 9 90 < 0 99 88
Run 5 86 65 10 09 3 25 < 0 100 60
Run 6 85 89 9 81 4 29 < 0 93 38
Run 7 85 58 10 86 3 56 < 0 97 54
Run 8 84 83 11 27 3 89 < 0 93 80
Run 9 81 34 15 86 2 79 < 0 89 45
Run 10 77 75 19 49 2 62 < 0 92 07
Results show the percentage protein distnbution for the fractions from 10 runs with the initial BSA concentration Abbreviations % REC = amount of protein in fractions as a percentage of the total amount o f protein added to the column
230

runs on the biopilot The total recovery of protein as a percentage of the amount applied was
greater than 90% recovery on both small and large-scale fractionations
Note It was necessary to establish that diafiltration did not result in a loss of activity This was shown to be the case for NRK cells using membranes with l,000Da and 5,000Da molecular weight cut off (Appendix I)
After diafiltering, analysis of the bioactivity of the fractions was carried out using NRK cells with a background of 1 % DHS Serial dilutions with a concentration range of 0 5 - 5 Omg/ml were tested Acid phosphatase was used as the end point for runs 1 to 6 For remaining runs, dye elution from 96-well plates and cell number from 24-well plates were used as end points
When the protein concentrations were superimposed on the biological activity of the fractions,
the results were very interesting (Appendix G) The maximum biological activity did not correspond to the bulk of protein recovered (Figure 3 5 4 1 3) Little growth stimulation or growth inhibition was seen in the unbound fractions and buffer washes, where greater than 95 % protein was recovered The level of this inhibition varied from run to run Activity similar to that of the control albumin was seen in the 0 5M NaCl fraction in all but two runs In the first
run on the Biopilot, the 0 5M NaCl fraction was nearly diafiltered dry In the third run on the smaller column, the activity was present in the 1 0M NaCl fraction Some activity was also seen m the 2 0M NaCl wash in Run 3 Figure 3 5 4 1 4 shows the typical growth response of NRK cells to dilutions of each fraction
For all fractionation processes (Runs), best stimulation of the 0 5M NaCl fraction occurred at 5mg/ml equivalent concentration This concentration was used for further analysis of the active component
231

Table 3 5.4.1.3 Biological activity of fractions obtained from HS chromatography on NRK cells
RUN BSACONTROL
UNBOUNDFRACTION
BUFFERWASH
0 5M NaCl 1M NaCl 2M NaCl
Run 1 127 7 ± 19 0 48 9 ± 3 9 72 8 + 4 7 112 0 ± 8 90 9 1 7 + 4 6 84 7 ± 7 5
Run 2 183 5 ± 12 4 98 0 ± 5 2 76 1 + 7 9 205 0 ± 12 4 94 9 ± 5 6 89 2 ± 4 3
Run 3 157 4 4: 11 9 67 3 ± 5 4 72 7 ± 5 2 101 0 ± 6 50 150 0 ± 9 3 138 0 + 11 8
Run 4 148 5 ± 9 70 94 7 ± 12 0 105 0 ± 4 2 169 0 + 14 4 113 0 ± 7 3 109 0 + 10 2
Run 5 127 1 + 8 93 53 7 ± I 90 75 6 + 4 4 121 0 + 9 40 99 9 + 7 0 108 0 ± 6 64
Run 6 164 8 ± 9 13 92 7 ± 8 00 93 0 + 4 2 120 0 ± 8 6 91 7 + 5 9 91 1 + 2 9
Run 7 205 3 ± 1 1 9 103 0 + 18 1 123 0 + 9 6 321 0 ± 35 2 91 9 ± 12 0 109 0 ± 9 67
Run 8 286 9 ± 28 3 97 0 ± 8 4 109 0 + 6 4 177 0 + 7 21 100 0 ± 12 8 106 0 ± 6 12
Run 9 175 0 ± 23 7 45 4 ± 18 0 79 5 + 9 6 176 0 + 11 2 71 2 ± 3 50 92 4 ± 12 5
Run 10 349 7 ± 26 5 73 8 ± 11 6 74 3 + 5 0 337 0 ± 16 5 85 6 ± 5 39
Results are given as the average percentage growth relative to control (1 % DHS = 100%) _+ standard deviation (n = 8) One set of results typical o f each run are shown Acid phosphatase was used as the end point for assays in runs 1 - 6 Dye elution was used as the end point for assays in runs 7 - 1 0 All results shown here are at 5mg/ml (equivalent) albumin concentration
232

1
Bio activity of fractions from Run 2
Albumin (equivalent) conceatratlon(mg/ml)
F ig u r e 3 .5 .4 .1 .3 shows the growth response o f NRK cells to a dilution curve o f each fraction obtained from Run 2 (Assay 2). Results are expressed as the average percentage growth relative to control (1 % DHS) +. standard deviation ( n = 8) Acid phosphatase was used as the end point The results for two separate assays are shown in Table 3 5 4 1 3
T able 3 .5 .4 .1 .3 Growth response o f NRK cells to all the fractions at albumm(equivalent) concentration
ASSAY 1 BSAControl
Unboundfraction
BufferWash
0 5M NaCl Wash
1M NaCl Wash
2M NaCl Wash
0 Omg/ml 100 +. 8 76 100 0 +. 8 76 100 0 + 9 94 100 0 + 9 94 100 0 +. 3 60 100 0 + 3 60
0 5mg/ml 151 ± 14 4 123 4 + 8 11 101 0 + 9 4 0 197 2 + 8 86 98 63 +. 4 90 107 0 + 7 80
1 Omg/ml 1 6 5 + 1 3 7 117 7 + 1 0 5 88 73 + 15 2 101 0 + 5 63 108 1 + 5 62 1144 + 4 66
2 5mg/ml 176 ± 11 4 98 56 + 9 42 89 30 + 6 80 113 6 + 9 10 103 6 + 4 60 103 8 ± 10 8
5 Omg/ml 143 +. 12 4 112 6 + 0 65 66 62 +. 4 20 150 0 + 9 80 105 1 + .7 40 107 7 + 7 94
ASSAY 2 BSAControl
Unboundfraction
BufferWash
0 5M NaCl Wash
1M NaCl Wash
2M NaCl Wash
0 Omg/ml 100 +. 6 85 100 0 + 6 85 100 0 + 12 9 100 0 + 12 9 100 0 +. 6 60 100 0 + 6 60
0 Smg/ml 144 +. 7 40 117 8 + 5 20 107 0 + 10 9 121 0 + 14 8 95 15 ± 5 30 103 0 + 9 70
1 Omg/ml 151 ± 8 80 106 0 + 5 70 103 3 + 10 7 124 5 + 11 8 92 84 + 3 35 107 0 + 8 31
2 5mg/ml 160 +_ 14 9 98 12 6 46 91 76 + 11 5 149 9 + 15 9 101 6 +. 6 47 102 2 + 8 08
5 Omg/ml 184 ± 12 4 98 00 +. 5 20 76 10 + 7 97 205 5 + 12 4 100 9 +. 5 60 76 25 +_ 8 54
233

<Ü
Activity and Protein profile for Run 2
WXQ* sc >2 §a * o ^
o o ► fto Ol6 a£ - 2 g60 o
I*u o 60 O,Au
Fractions
Figures 3 .5 .4 .1 .4 shows the biological activity and the corresponding protein concentration o f each fraction from run 2 The biological activity was measured on NRK cells at a concentration o f 5m g/ml Assays were read using acid phosphatase as the end point The values for the BSA and ATCC controls are shown in Table 3 5 4 1 3 Results for biological activity are expressed as the average percentage growth relative to control (1 % DHS) +_ standard deviation ( n = 8) Abbreviations A = unbound fraction, B = buffer wash, C = 0 5M NaCl, D = 1 0M NaCl and E = 2 0M NaCl wash % Protein concentration is the protein concentration (determined spectrophotometncally), present m each fraction as a percentage o f the total protein recovered from the column
T able 3 .5 .4 .1 .3 shows the growth response o f NRK cells to all the fractions at 5m g/m l albumin (equivalent) concentration
ATCCControl
BSAControl
UnboundFraction
BufferWash
0 5M NaCl Wash
1 0M NaCl Wash
2 0M NaCl Wash
1 100 ± 8 7 176 2 + 11 4 98 6 ± 9 4 66 6 ± 4 2 150 + 9 8 105 + 7 4 108 7 9
2 100 ± 6 8 183 5 ± 12 4 98 0 ± 5 2 16 I ± 1 9 205 ± 12 4 94 9 + 5 6 89 2 ± 4 3
234

3.5.4.2 Effect of salt concentration on HS Activity
To investigate the possibility that the apparent activity in HS fractions was due to some artifact of the fractionation procedure, a second sample without albumin (50mM NazHPC only) was
run in parallel with Run 4 (i e two fractionations, one with 15mg/ml BSA m 50mM N%HP04
as the starting material and the second with the buffer alone) Each sample was fractionated
identically on the HS column The results are shown in Figures 3 5 4 2 1 to 3 5 4 2 6
The results showed that the major activity was eluted off in the 0 5M NaCl wash, with smaller
activity in the 1 0 and 2 OM NaCl washes So, in the three runs in which activity was detected, the bulk of activity was present m the 0 5 and 1 OM NaCl washes
The salt did appear to have a slight stimulatory effect in the 1 0 and 2 OM NaCl washes (Figures 3 5 4 2 5 and 3 5 2 6), 19% and 10% stimulation over the control, respectively These results could explain the stimulatory activity seen in the 1 and 2M NaCl fractions in this run However, the extent of stimulation in Run 3 was much greater, indicating that the salt alone was not responsible for the activity
Stimulation was also seen in the unbound fraction (10 - 20%) and no inhibition in the buffer wash It appeared that the salt and the Na^HPC buffer had a slight stimulatory effect (Figures 3 5 4 2 1 and 3 5 4 2 2) In the 0 5M NaCl wash without albumin, 10% inhibition was seen
(Figure 3 5 4 2 4) The activity seen with the 0 5M NaCl fraction with albumin was high The
difference between the two was significant, indicating no stimulatory effect by the 0 5M NaCl alone
In conclusion for this run, the effect of the background salt concentration was found to have a slight effect for the 1 0 and 2 OM NaCl fractions No stimulation by the salt was seen in the 0 5M NaCl fraction where the majority of the activity was seen
235
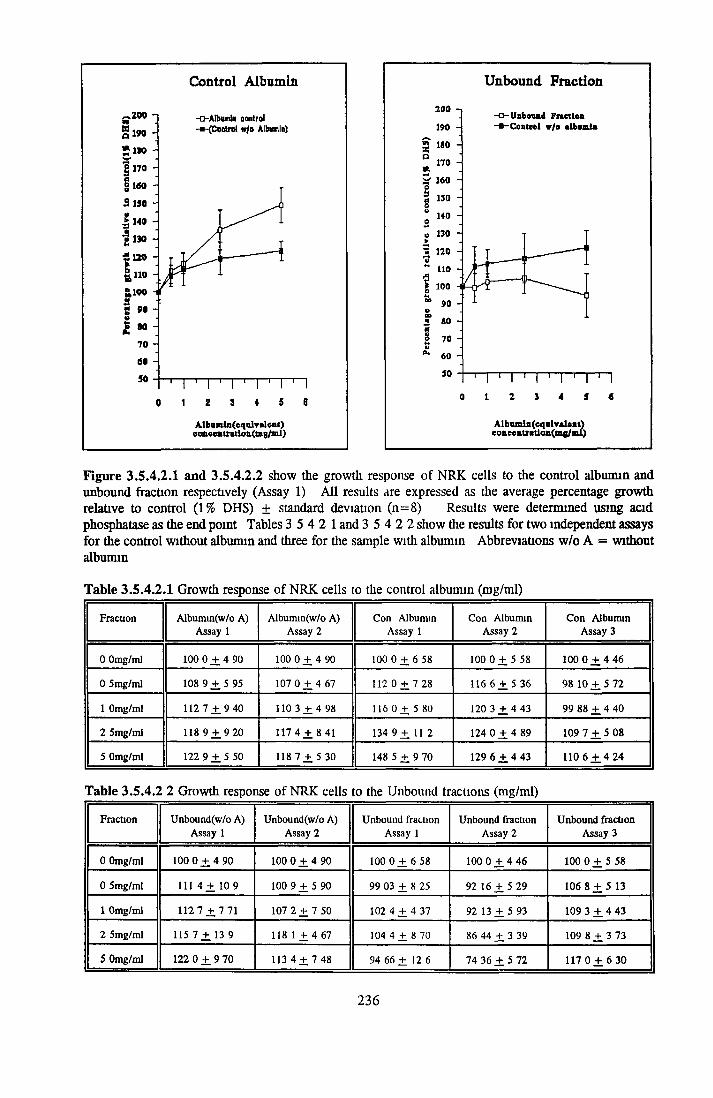
Control Albumin
f f 2 0 0 1 -O-Albunla control
g 190 - -•-{Control w/o Albumin)
S « 0 -V1 170 -
8 wo -S iso -! 140 -
f 1 » ^
¿ 1 2 0 -
| i » -
t f 100 H3 90 -V5 so -m
70 -
60 - (A3V
1 I 1 I 1 1 1 1 1 1 1
0 1 2 a + 5 s
Albumln(eqnlv«leBi)conocntritlommg/ml)
Figure 3 .5 .4 .2 .1 and 3 .5 .4 .2 .2 show the growth response o f NRK cells to the control albumin and unbound fraction respectively (Assay 1) A ll results are expressed as the average percentage growth relative to control (1% DHS) ± standard deviation ( n = 8) Results were determined using acid phosphatase as the end point Tables 3 5 4 2 1 and 3 5 4 2 2 show die results for two independent assays for the control without albumin and three for the sample with albumin Abbreviations w /o A = without albumin
T able 3 .5 .4 .2 .1 Growth response o f NRK cells to the control albumin (mg/ml)
Fraction Albumin(w/o A) Assay 1
Albumin(w/o A) Assay 2
Con Albumin Assay 1
Con Albumin Assay 2
Con Albumin Assay 3
0 Omg/ml 100 0 +. 4 90 1000 + 4 90 100 0 + 6 58 100 0 +. 5 58 100 0 +. 4 46
0 5mg/ml 108 9 ± 5 95 107 0 ± 4 67 112 0 + 7 28 116 6 HH 5 36 98 10 ± 5 72
1 Omg/ml 112 1 ± 9 40 110 3 + 4 98 116 0 +. 5 80 120 3 ± 4 43 99 88 + 4 40
2 5mg/ml 118 9 ± 9 20 1174 + 8 41 134 9 + 11 2 124 0 + 4 89 109 7 ± 5 08
5 Omg/ml 122 9 ± 5 50 118 7 + 5 30 148 5 + 9 70 129 6 + 4 43 110 6 + 4 2 4
T able 3 .5 .4 .2 2 Growth response o f NRK cells to the Unbound tractions (mg/ml)
Fraction Unbound(w/o A) Assay 1
Unbound(w/o A) Assay 2
Unbound fraction Assay 1
Unbound fraction Assay 2
Unbound fraction Assay 3
0 Omg/ml 100 0 ± 4 90 100 0 + 4 90 100 0 + 6 58 100 0 + 4 46 100 0 + 5 58
0 5mg/ml 111 4 + 10 9 100 9 + 5 90 99 03 + 8 25 92 16 + 5 29 106 8 + 5 13
1 Omg/ml 1127 + 7 71 107 2 + 7 50 102 4 + 4 37 92 13 + 5 93 109 3 + 4 43
2 5mg/ml 115 1 ± 13 9 118 1 + 4 67 104 4 + 8 70 86 44 + 3 39 109 8 +. 3 73
5 Omg/ml 122 0 + 9 70 113 4 + 7 48 94 66 + 12 6 74 36 + 5 72 117 0 + 6 30
236

0 5M NaCl Wash
Albsmlli(eqidralent)c o n c e l i t r a t i o i L ( n i B / n i l )
Figure 3 .5 .4 .2 .3 and 3 .5 .4 .2 .4 show the growth response o f NRK cells to the buffer and 0 5M NaCl washes respectively (Assay 1) A ll results are expressed as the average percentage growth relative to control (1 % DHS) ± standard deviation ( n = 8) Results were determined using acid phosphatase as the end point Tables 3 5 4 2 3 and 3 5 4 2 4 show the results for two independent assays for the control without albumin and three for the sample with albumin Abbreviations w /o A = without albumin
T able 3 .5 .4 .2 .3 Growth response o f NRK cells to the buffer wash
Fraction Albumin(w/o A) Assay 1
Albumm(w/o A) Assay 2
Con Albumin Assay 1
Con Albumin Assay 2
Con Albumin Assay 3
0 Omg/ml 100 0 ± 6 28 100 0 + 8 20 100 0 + 4 49 100 0 + 7 98 100 0 ± 6 57
0 5mg/ml 111 7 +. 4 56 111 0 + 104 100 9 + 6 63 102 0 + 8 91 106 2 +. 7 44
1 Omg/ml 109 0 +. 5 21 110 3 + 7 30 100 0 + 4 24 108 0 ± 8 41 104 6 +. 6 38
2 5mg/ml 108 0 ± 8 14 114 9 ± 6 46 102 0 + 4 42 1180 + 6 93 108 5 +. 6 91
5 Omg/ml 110 0 + 7 82 110 1 + 7 3 0 1062 + 2 3 9 125 0 + 6 93 105 5 ± 5 67
Table 3 .5 .4 .2 .4 Growth response o f NRK cells to the 0 5M NaCl wash
Fraction Unbound(w/o A) Assay 1
Unbound(w/o A) Assay 2
Unbound fraction Assay 1
Unbound fraction Assay 2
Unbound fraction Assay 3
0 Omg/ml 100 0 ± 8 20 100 0 + 6 28 100 0 ± 7 98 100 0 + 6 57 100 0 ± 4 49
0 5mg/ml 92 13 + 4 77 92 83 + 3 91 115 8 + 10 9 111 7 ± 6 91 109 8 +_ 7 00
1 Omg/ml 89 89 + 4 77 90 88 + 4 89 122 8 + 1 0 4 1184 + 9 7 5 1144 + 6 08
2 5mg/ml 93 82 + 2 50 91 86 + 3 58 141 1 + 10 9 135 6 ± 8 51 133 0 ± 5 16
5 Omg/ml 93 54 + 4 21 96 09 + 4 23 169 3 + 14 4 160 8 + 12 4 160 3 + 10 3
237

IM NaCl Wash
Albumin (equivalent) concentration(mg/ml)
2M NaCl Wash
Alt)UinU(cqutvalcnt) concentration (mg/ml)
Figure 3 .5 .4 .2 .5 and 3 .5 .4 2 .6 show the growth response ot NRK cells to the 1 0 and 2 OM NaCl washes respectively (Assay 2) A ll results are expressed as the average percentage growth relative to control (1 % DH S) ± standard deviation ( n = 8) Results were determined using acid phosphatase as the end point Tables 3 5 4 2 5 and 3 5 4 2 6 show the results tor two independent assays for the control without albumin and three for the sample with albumin Abbreviations w /o A = without albumin
T able 3 .5 .4 .2 .5 Growth response o f NRK cells to the 1 OM NaCl wash
Fraction Albumm(w/o A) Assay 1
Albumin(w/o A) Assay 2
Coil Albumin Assay 1
Con Albumin Assay 2
Con Albumin Assay 3
0 Omg/ml 100 0 ± 7 16 100 0 + 8 03 100 0 + 7 68 100 0 +. 7 37 100 0 +. 3 30
0 5mg/ml 99 70 + 4 40 106 0 +. 4 66 104 4 + 7 28 111 8 ± 4 28 99 66 + 4 38
1 Omg/ml 109 3 + 5 25 106 6 + 7 00 104 4 +. 9 71 116 9 + 4 60 105 2 ± 4 38
2 5mg/ml 115 2 ± 2 90 108 6 +. 8 33 110 7 + 9 71 116 9 + 4 2 8 113 3 ± 6 41
5 Omg/ml 1187 + .3 21 111 3 + 7 66 113 1 + 7 2 8 116 9 +. 5 70 118 8 +. 5 90
T able 3 .5 .4 .2 .6 Growth response ot NRK cells to the 2 OM NaCl wash
Fraction Unbound(w/o A) Assay 1
Unbound(w/o A) Assay 2
Unbound traction Ass iv 1
Unbound fraction Assay 2
Unbound fraction Assay 3
0 Omg/ml 100 0 + 7 16 100 0 + 8 03 100 0 ^ 7 68 100 0 + 7 37 100 0 ± 3 30
0 5mg/ml 103 5 +. 4 40 100 0 + 9 00 109 7 +. 8 70 114 3 + 3 87 108 0 + 3 03
1 Omg/ml 100 3 +. 3 21 106 6 + 8 00 1082 + 7 28 116 0 + 5 90 1147 + 3 20
2 5mg/ml 106 1 + 3 21 108 6 + 7 66 107 6 + 10 X 121 7 + 3 60 123 4 + 3 65
5 Omg/ml 109 0 +. 6 12 115 0 + 2 66 108 7 + 10 2 129 7 +. 3 05 126 3 +, 9 61
238
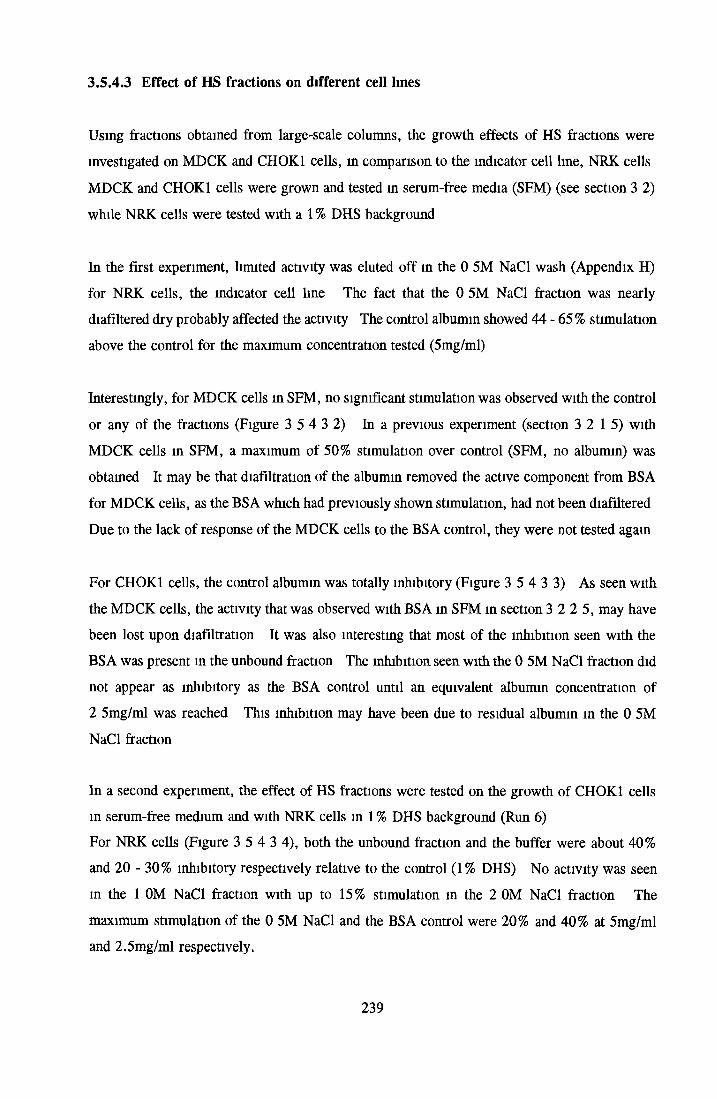
3.S.4.3 Effect of HS fractions on different cell lines
Using fractions obtained from large-scale columns, the growth effects of HS fractions were investigated on MDCK and CHOK1 cells, in comparison to the indicator cell line, NRK cells
MDCK and CHOK1 cells were grown and tested in serum-free media (SFM) (see section 3 2) while NRK cells were tested with a 1 % DHS background
In the first experiment, limited activity was eluted off in the 0 5M NaCl wash (Appendix H) for NRK cells, the indicator cell line The fact that the 0 5M NaCl fraction was nearly diafiltered dry probably affected the activity The control albumin showed 44 - 65 % stimulation above the control for the maximum concentration tested (5mg/ml)
Interestingly, for MDCK cells m SFM, no significant stimulation was observed with the control or any of the fractions (Figure 3 5 4 3 2) In a previous experiment (section 3 2 1 5 ) with
MDCK cells in SFM, a maximum of 50% stimulation over control (SFM, no albumin) was obtained It may be that diafiltration of the albumin removed the active component from BSA for MDCK cells, as the BSA which had previously shown stimulation, had not been diafiltered
Due to the lack of response of the MDCK cells to the BSA control, they were not tested again
For CHOK1 cells, the control albumin was totally inhibitory (Figure 3 5 4 3 3) As seen with the MDCK cells, the activity that was observed with BSA in SFM in section 3 2 2 5, may have been lost upon diafiltration It was also interesting that most of the inhibition seen with the BSA was present in the unbound fraction The inhibition seen with the 0 5M NaCl fraction did not appear as inhibitory as the BSA control until an equivalent albumin concentration of 2 5mg/ml was reached This inhibition may have been due to residual albumin m the 0 5M NaCl fraction
In a second experiment, the effect of HS fractions were tested on the growth of CHOK1 cells in serum-free medium and with NRK cells m 1 % DHS background (Run 6)For NRK cells (Figure 3 5 4 3 4), both the unbound fraction and the buffer were about 40% and 20 - 30% inhibitory respectively relative to the control (1% DHS) No activity was seen m the 1 0M NaCl fraction with up to 15% stimulation m the 2 0M NaCl fraction The
maximum stimulation of the 0 5M NaCl and the BSA control were 20% and 40% at 5mg/ml and 2.5mg/ml respectively.
239

Bioactivity of fractions from Run 5 for MDCK cells
A l b u m i n ( e q u i v a l e n t ) c o n c e n t r a t i o n ( m g / m l )
F ig u r e 3 .5 .4 .3 .1 shows the growth response o f M DCK cells to a dilution curve o f each fraction obtained from Run 5 on the HS column (Assay 1) Results are expressed as the average percentage growth relative to control (SFM , no albumin) _+ standard deviation ( n = 8) A cid phosphatase was used as the end point Results from three independent assays were are shown in Tables 3 5 4 3 l a t o c
Table 3 .5 .4 .3 l a Growth response o f M DCK cells to all fractions at albumin (equivalent) concentration
ASSAY 1 BSAControl
Unboundfraction
BufferWash
0 5M NaCl Wash
1M NaCl Wash
2M NaCl Wash
0 0 m g/m l 100 + 2 53 100 0 + 3 45 100 0 + 3 45 100 0 ± 2 32 100 0 ± 2 32 100 0 + 2 53
0 1 mg/ml 109 + 2 53 103 4 + 3 45 109 2 + 5 75 102 3 ± 3 45 105 8 + 4 65 101 3 + 2 5 3
0 5 mg/ml 104 + 1 27 103 4 + 4 59 106 9 + 4 59 101 2 + 3 45 105 8 +_ 4 65 102 5 + 2 53
1 0 mg/ml 103 + 2 53 104 6 + 4 59 108 0 + 4 59 101 2 + .3 45 106 9 ± 4 65 101 3 + 1 27
2 5 mg/ml 103 ± 2 53 105 7 + 4 59 106 9 + 4 59 101 2 ± 4 65 105 8 + 4 65 102 5 + 2 53
240

Table 3.5.4.3.1b Growth response of MDCK cells to all fractions at albumin (equivalent) concentration
ASSAY 2 BSAControl
Unboundfraction
BufferWash
0 5M NaCl Wash
1M NaCl Wash
2M NaCl Wash
0 0 mg/ml 100 +. 5 88 100 o +. 4 08 100 0 +. 4 08 100 0 +. 5 88 100 0 ± 5 88 100 0 +. 5 88
0 1 mg/ml 92 2 + 1 96 97 96 + 2 04 97 96 + 2 04 1000 + 5 88 98 04 + 5 88 94 12 ± 1 96
0 5 mg/ml 90 2 ± 1 96 95 92 + 2 04 93 88 + 2 04 100 0 + 5 88 100 0 + 3 92 94 12+ 1 96
1 0 mg/ml 96 1 +. 3 92 95 92 + 2 04 95 92 ± 2 04 94 12 + 3 92 100 0 ± 3 92 98 04 ± 5 88
2 5 mg/ml 94 1 ± 1 96 95 12 + 2 04 93 88 + 2 04 94 12 + 5 88 102 2 ± 3 92 94 12 + 1 96
Table 3.5.4.3.1c Growth response of MDCK cells to all fractions at albumin (equivalent) concentration
ASSAY 3 BSAControl
Unboundfraction
BufferWash
0 5M NaCl Wash
1M NaCl Wash
2M NaCl Wash
0 0 mg/ml 100 ± 5 77 100 0 + 1 92 100 0 ± 1 92 100 0 + 6 12 100 0 +. 6 12 100 0 +. 5 77
0 1 ra g /m l 92 3 +. 3 85 96 15 ± 1 92 96 15 ± 1 92 96 50 + 2 82 97 96 + 4 08 94 23 ± 3 85
0 5 m g /m l 94 2 ± 1 92 94 23 + 1 92 94 23 + 3 85 95 92 + 2 04 97 96 + 4 08 94 23 + 1 92
1 0 m g /m l 92 3 +. 3 85 96 15 + 1 92 98 08 + 3 85 95 92 + 6 12 106 1 + 4 08 94 23 +. 3 85
2 5 m g /m l 90 4 +. 1 92 94 23 + 3 85 96 15 + 3 85 97 96 ± 4 08 100 0 + 4 08 94 23 ± 1 92
Table 3.5.4.3.2b Growth response of CHOK1 cells to all the fractions at albumin (equivalent) concentration
ASSAY 2 BSAControl
Unboundfraction
BufferWash
0 5M NaCl Wash
1M NaCl Wash
2M NaCl Wash
0 0 mg/ml 100 + 6 71 100 0 + . 4 50 100 0 + 4 50 100 0 + . 3 68 100 0 + 3 68 100 0 + 6 71
0 1 m g /m l 110 ± 1 69 117 6 +, 6 09 119 5 + 770 130 0 + 5 52 98 62 + 4 14 104 8 + 4 76
0 5 m g /m l 21 4 + 1 44 57 70 + 9 29 100 1 + 8 09 94 50 ± 5 86 95 17 + 5 86 91 57 + 3 30
1 0 m g /m l 24 5 + 1 10 16 02 + 6 40 89 56 + 5 22 52 24 + 5 87 95 17 + 6 89 89 38 + 3 30
2 5 m g /m l 17 9 + 0 73 14 74 + 6 40 19 87 + 2 56 17 24 + 1 38 86 21 + 5 52 78 02 + 3 30
Table 3.5.4.3.2c Growth response of CHOK1 cells to all the fractions at albumin (equivalent) concentration
ASSAY 3 BSAControl
Unboundfraction
BufferWash
0 5M NaCl Wash
1M NaCl Wash
2M NaCl Wash
0 0 mg/ml 100 +. 4 69 1000 + 4 51 1000 + 4 51 100 0 + 6 30 100 0 +. 6 30 100 0 + 4 69
0 1 mg/ml 99 5 ± 3 50 105 2 + 3 64 1100 + 6 54 87 90 ± 3 19 93 62 +. 6 30 95 55 + 5 53
0 5 mg/ml 60 5 +. 5 98 89 47 ± 2 91 99 31 + 5 26 82 27 + 3 90 102 5 + 6 74 97 02 + 4 06
1 0 mg/ml 34 9 + 3 67 12 22 + 0 71 85 54 + 6 17 16 31 + 0 71 91 13 + 4 60 94 85 + 6 38
2 5 mg/ml 11 3+ .3 75 4 410.+0 13 29 17+. 1 81 17 35 + 0 71 75 53 ± 3 90 91 0 2 ± 4 91
241

Figure 3.5.4.3.2 shows the response of CHOK1 cells to dilutions of each fraction from Run 1 (Assay 1) Results are expressed as the average growth relative to control (serum-free medium without albumin) _+ standard deviation (n = 8) Results were split into two graphs to allow a clearer view of each dose response curve The results for three separate assays are shown in Tables 3 5 4 3 2a - c
Table 3.5.4.3.2a Growth response of CHOK1 cells to all the fractions at albumin (equivalent) concentration
ASSAY 1 BSAControl
Unboundfraction
BufferWash
0 5M NaCl Wash
1M NaCl Wash
2M NaCl Wash
0 0 mg/ml 100 ± 1 01 100 0 + 6 55 100 0 + 6 55 100 0 + 8 49 100 0 ± 8 49 100 0 + 9 80
0 1 mg/ml 93 4 ± 17 1 109 0 + 9 02 103 0 + 3 25 115 3 + 24 3 99 00 ± 6 07 108 2 ± 7 01
0 5 mg/ml 26 3 j t 1 61 22 00 ± 1 80 84 66 + 7 21 99 00 + 8 09 105 2 _+ 14 2 97 40 + 10 8
1 0 mg/ml 26 3 ± 1 61 18 77 + 1 80 69 21 + 11 3 97 10 ± 8 09 103 0 ± 6 07 97 12 + 7 76
2 5 mg/ml 24 7 ± 2 13 18 77 + 1 40 18 77 ± 2 53 99 00 + 10 1 103 8 + 1 65 27 93 ± 2 65
242
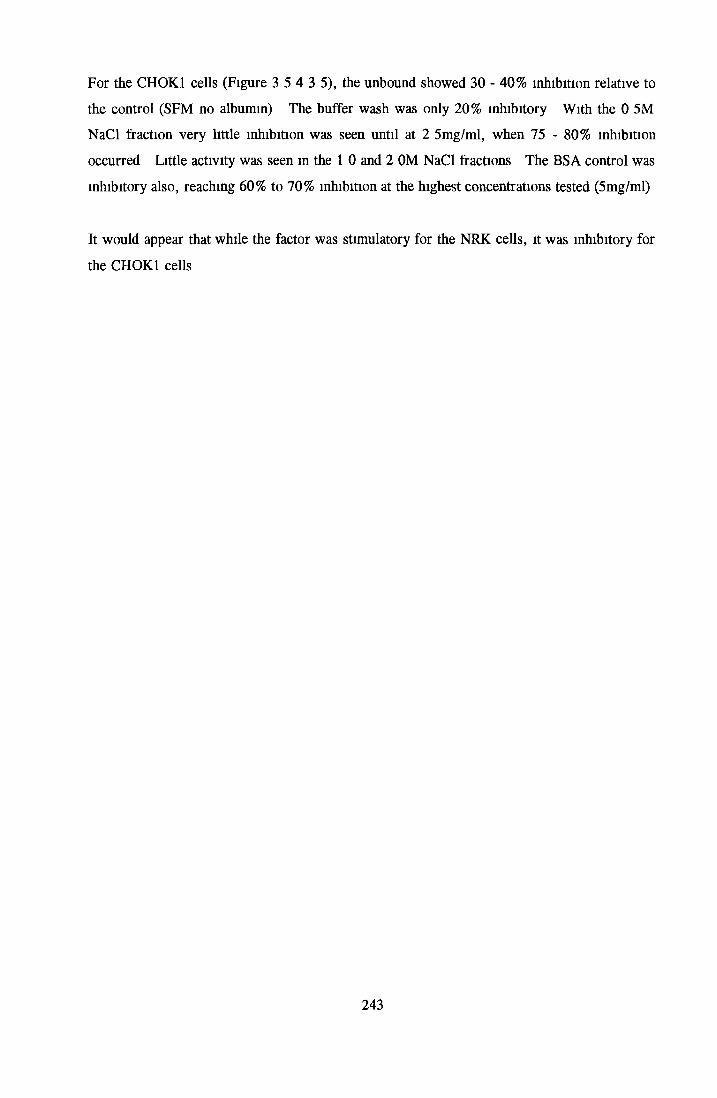
For the CHOK1 cells (Figure 3 5 4 3 5), the unbound showed 30 - 40% inhibition relative to
the control (SFM no albumin) The buffer wash was only 20% inhibitory With the 0 5M
NaCl fraction very little inhibition was seen until at 2 5mg/ml, when 75 - 80% inhibition
occurred Little activity was seen in the 1 0 and 2 0M NaCl fractions The BSA control was
inhibitory also, reaching 60% to 70% inhibition at the highest concentrations tested (5mg/ml)
It would appear that while the factor was stimulatory for the NRK cells, it was inhibitory for
the CHOK1 cells
243
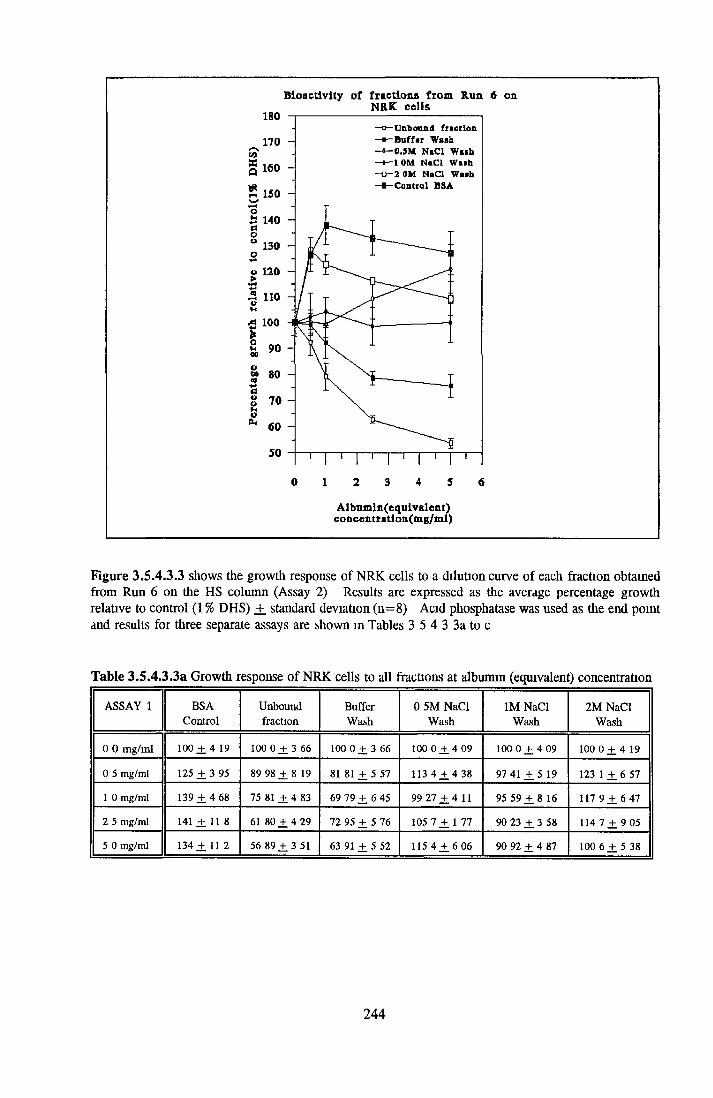
Figure 3.5.4.3.3 shows the growth response of NRK cells to a dilution curve of each fraction obtained from Run 6 on the HS column (Assay 2) Results are expressed as the average percentage growth relative to control (1 % DHS) _+ standard deviation (n = 8) Acid phosphatase was used as the end point and results for three separate assays are shown m Tables 3 5 4 3 3a to c
Table 3.5.4.3.3a Growth response of N RK cells to all fractions at albumin (equivalent) concentration
ASSAY 1 BSAControl
Unboundfraction
BufferWash
0 5M NaCl Wash
1M NaCl Wash
2M NaCl Wash
0 0 mg/ml 100 _+ 4 19 100 0 + 3 66 100 0 + 3 66 100 0 +. 4 09 100 0 ^ 4 09 100 0 ± 4 19
0 5 mg/ml 125 + 3 95 89 98 + 8 19 81 81 + 5 57 113 4 ± 4 38 97 41 + 5 19 123 1 + 6 57
1 0 mg/ml 139 ± 4 68 75 81 + 4 83 69 79 + 6 45 99 27 ± 4 11 95 59 + 8 16 117 9 +. 6 47
2 5 mg/ml 141 _+ 11 8 61 80 ± 4 29 72 95 + 5 76 105 7 +. 1 77 90 23 + 3 58 114 7 + 9 05
5 0 mg/ml 134+11 2 56 89 +.3 51 63 91 +. 5 52 115 4 ± 6 06 90 92 + 4 87 100 6 ± 5 38
244
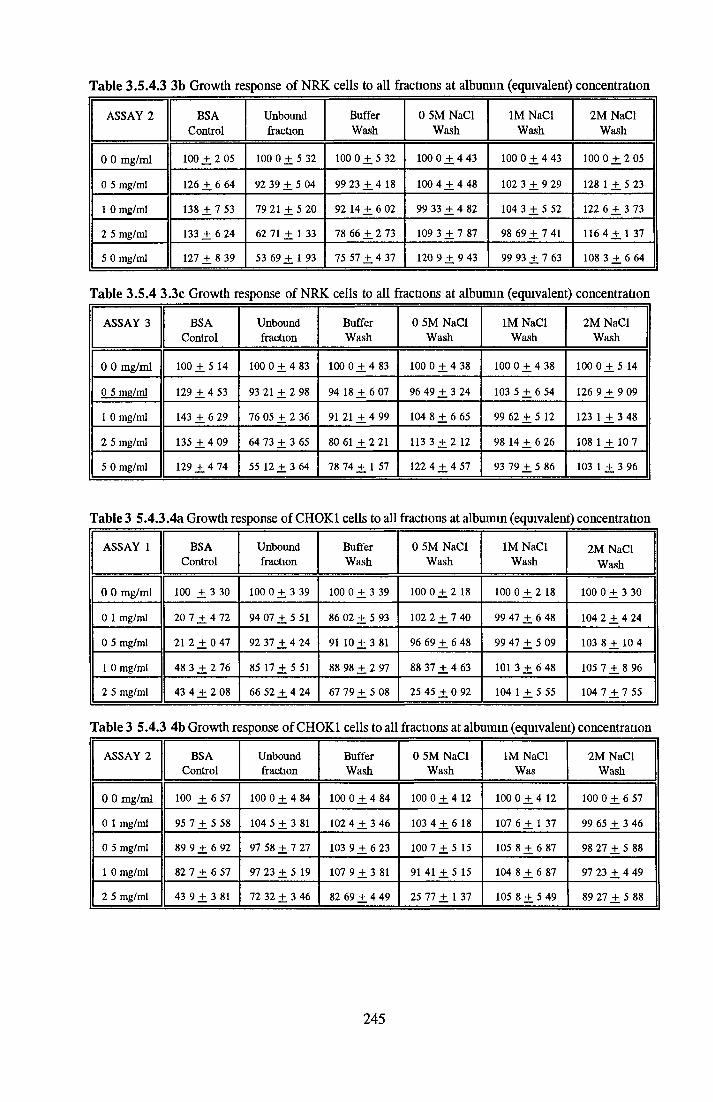
Table 3.5.4.3 3b Growth response of NRK cells to all fractions at albumin (equivalent) concentration
ASSAY 2 BSAControl
Unboundfraction
BufferWash
0 5M NaCl Wash
1M NaCl Wash
2M NaCl Wash
0 0 mg/ml 100 + 2 05 100 0 ± 5 32 100 0.+ 5 32 100 0 + 4 43 100 0 ± 4 43 1000 + 205
0 5 mg/ml 126 ± 6 64 92 39 + 5 04 99 23 ± 4 18 100 4 + 4 48 102 3 + 9 29 128 1 ± 5 23
1 0 mg/ml 138 ± 7 53 79 21 + 5 20 92 14 ± 6 02 99 33 + 4 82 104 3 ± 5 52 122 6 + 3 73
2 5 mg/ml 133 + 6 24 62 71 ± 1 33 78 66 ± 2 73 109 3 ± 7 87 98 69 ± 7 41 116 4 + 1 37
5 0 mg/ml 127 ± 8 39 53 69 + 1 93 75 57 + 4 37 120 9 + 9 43 99 93 + 7 63 108 3 +. 6 64
Table 3.5.4 3.3c Growth response of NRK cells to all fractions at albumin (equivalent) concentration
ASSAY 3 BSAControl
Unboundfraction
BufferWash
0 5M NaCl Wash
1M NaCl Wash
2M NaCl Wash
0 0 mg/ml 100 + 5 14 100 0 + 4 83 100 0 + 4 83 100 0 ± 4 38 1000 + 4 38 100 0 + 5 14
0 5 me/ml 129 + 4 53 93 21 + 2 98 94 18 + 6 07 96 49 ± 3 24 103 5 + 6 54 126 9 + 9 09
1 0 mg/ml 143 + 6 29 76 05 + 2 36 91 21 + 4 99 104 8 ± 6 65 99 62 + 5 12 123 1 + 3 48
2 5 mg/ml 135 + 4 09 64 73 + 3 65 80 61 + 2 21 113 3 ± 2 12 98 14 + 6 26 108 1 ± 10 7
5 0 mg/ml 129 + 4 74 55 12 + 3 64 78 74 + 1 57 122 4 _+ 4 57 93 79 ± 5 86 103 1 + 3 96
Table 3 5.4.3.4a Growth response of CHOK1 cells to all fractions at albumin (equivalent) concentration
ASSAY 1 BSAControl
Unboundfraction
BufferWash
0 5M NaCl Wash
1M NaCl Wash
2M NaCl Wash
0 0 mg/ml 100 +. 3 30 100 0 + 3 39 100 0 ± 3 39 100 0 ± 2 18 100 0 + 2 18 100 0 + 3 30
0 1 mg/ml 20 7 + 4 72 94 07 + 5 51 86 02 + 5 93 102 2 + 7 40 99 47 + 6 48 104 2 + 4 24
0 5 mg/ml 21 2 + 0 47 92 37 ± 4 24 91 10+ 3 81 96 69 ± 6 48 99 47 + 5 09 103 8 + 104
1 0 mg/ml 48 3 ± 2 76 85 17 + 5 51 88 98 + 2 97 88 37 + 4 63 101 3 + 6 48 105 7 ± 8 96
2 5 mg/ml 43 4 + 2 08 66 52 + 4 24 67 79 + 5 08 25 45 + 0 92 104 1 ± 5 55 104 7 + 7 55
Table 3 5.4.3 4b Growth response of CHOK1 cells to all fractions at albumin (equivalent) concentration
ASSAY 2 BSAControl
Unboundfraction
BufferWash
0 5M NaCl Wash
1M NaCl Was
2M NaCl Wash
0 0 mg/ml 100 + 6 57 100 0 + 4 84 100 0 + 4 84 100 0 +. 4 12 1000 + 4 12 100 0 ± 6 57
0 1 mg/ml 95 7 + 5 58 104 5 + 3 81 102 4 + 3 46 103 4 +. 6 18 107 6 ± 1 37 99 65 + 3 46
0 5 mg/ml 89 9 + 6 92 97 58 + 7 27 103 9 + 6 23 100 1 ± 5 15 105 8 + 6 87 98 27 + 5 88
1 0 mg/ml 82 7 +. 6 57 97 23 + 5 19 107 9 + 3 81 91 41 ± 5 15 104 8 ± 6 87 97 23 + 4 49
2 5 mg/ml 43 9 + 3 81 72 32 + 3 46 82 69 + 4 49 25 77 ± 1 37 105 8 + 5 49 89 27 ± 5 88
245
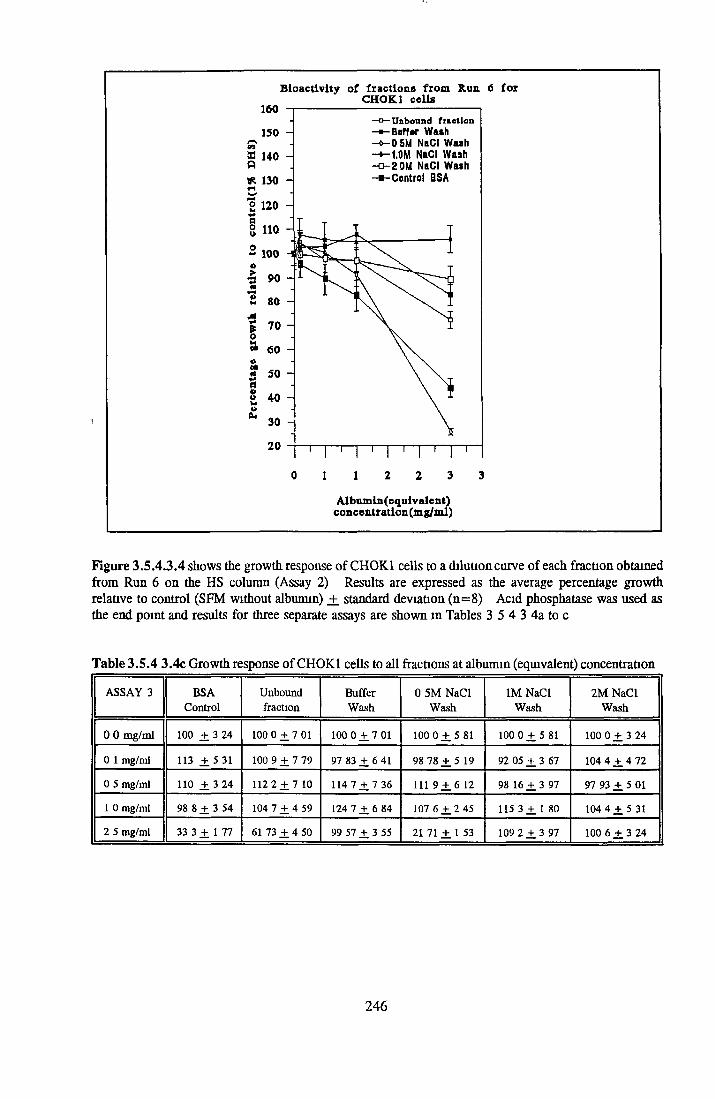
Bioactivity of fractious from Run 6 fox CHOK.1 cells
Albumla(cqulvalcnt)concemr&tion(mg/ml)
Figure 3.5.4.3.4 shows the growth response of CHOK1 cells to a dilution curve of each fraction obtained from Run 6 on the HS column (Assay 2) Results are expressed as the average percentage growth relative to control (SFM without albumin) _+ standard deviation (n = 8) Acid phosphatase was used as the end point and results for three separate assays are shown in Tables 3 5 4 3 4a to c
Table 3.5.4 3.4c Growth response of CHOK1 cells to all fractions at albumin (equivalent) concentration
ASSAY 3 BSAControl
Unboundfraction
BufferWash
0 5M NaCl Wash
1M NaCl Wash
2M NaCl Wash
0 0 mg/ml 100 +, 3 24 1000 + 7 01 100 0 + 7 01 1000 + 5 81 1000 + 5 81 100 0 + 3 24
0 1 mg/ml 113 ± 5 31 100 9 + 7 79 97 83 + 6 41 98 78 ± 5 19 92 05 + 3 67 104 4 _+ 4 72
0 5 mg/ml 110 ± 3 24 1122 + 7 10 1147 + 7 36 111 9 +. 6 12 98 16 + 3 97 97 93 + 5 01
1 0 mg/ml 98 8 + 3 54 104 7 ± 4 59 124 7 + 6 84 107 6 ± 2 45 115 3 _+ 1 80 1044 + 5 31
2 5 mg/ml 33 3 + 1 77 61 73 + 4 50 99 57 + 3 55 21 71 ± 1 53 109 2 + 3 97 100 6 +. 3 24
246
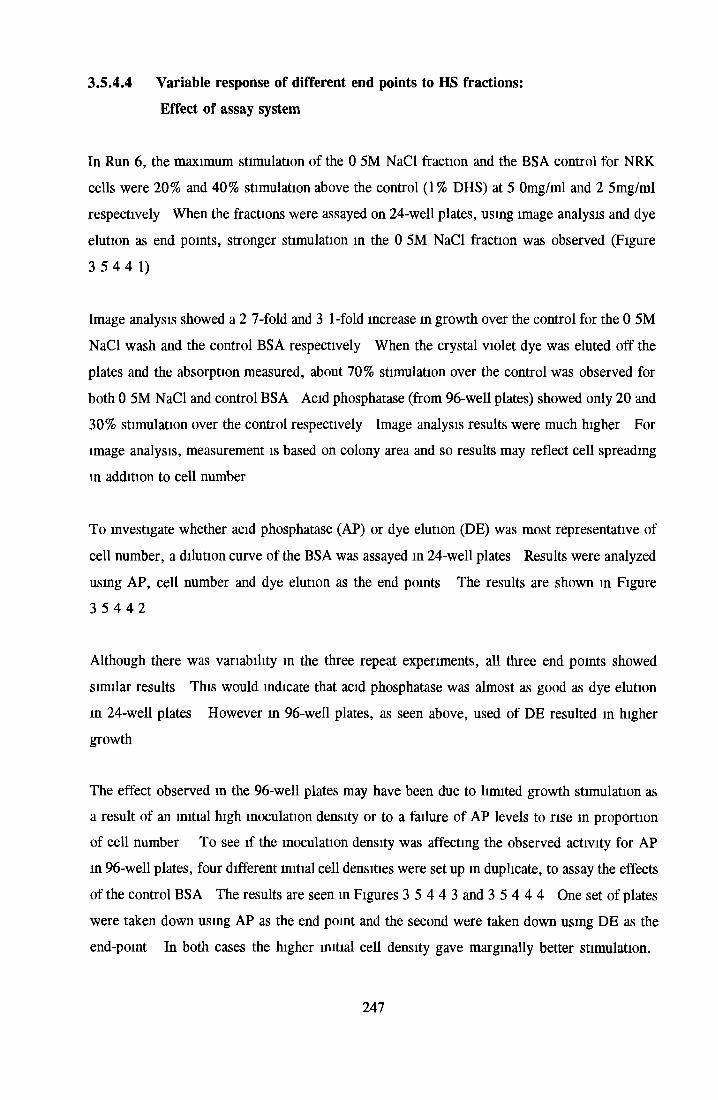
3.5.4.4 Variable response o f different end points to HS fractions:
Effect o f assay system
In Run 6 , the maximum stimulation o f the 0 5M NaCl fraction and the BSA control for NRK
cells were 20% and 40% stimulation above the control (1% DHS) at 5 Omg/ml and 2 5mg/ml
respectively When the fractions were assayed on 24-well plates, using image analysis and dye
elution as end points, stronger stimulation in the 0 5M NaCl fraction was observed (Figure
3 5 4 4 1)
Image analysis showed a 2 7-fold and 3 1-fold increase in growth over the control for the 0 5M
NaCl wash and the control BSA respectively When the crystal violet dye was eluted off the
plates and the absorption measured, about 70% stimulation over the control was observed for
both 0 5M NaCl and control BSA Acid phosphatase (from 96-well plates) showed only 20 and
30% stimulation over the control respectively Image analysis results were much higher For
image analysis, measurement is based on colony area and so results may reflect cell spreading
in addition to cell number
To investigate whether acid phosphatase (AP) or dye elution (DE) was most representative of
cell number, a dilution curve o f the BSA was assayed m 24-well plates Results were analyzed
using AP, cell number and dye elution as the end points The results are shown in Figure
3 5 4 4 2
Although there was variability in the three repeat experiments, all three end points showed
similar results This would indicate that acid phosphatase was almost as good as dye elution
in 24-well plates However in 96-well plates, as seen above, used o f DE resulted in higher
growth
The effect observed m the 96-well plates may have been due to limited growth stimulation as
a result o f an initial high inoculation density or to a failure o f AP levels to rise m proportion
of cell number To see if the inoculation density was affecting the observed activity for AP
in 96-well plates, four different initial cell densities were set up in duplicate, to assay the effects
of the control BSA The results are seen in Figures 3 5 4 4 3 and 3 5 4 4 4 One set o f plates
were taken down using AP as the end point and the second were taken down using DE as the
end-point In both cases the higher initial cell density gave marginally better stimulation.
247
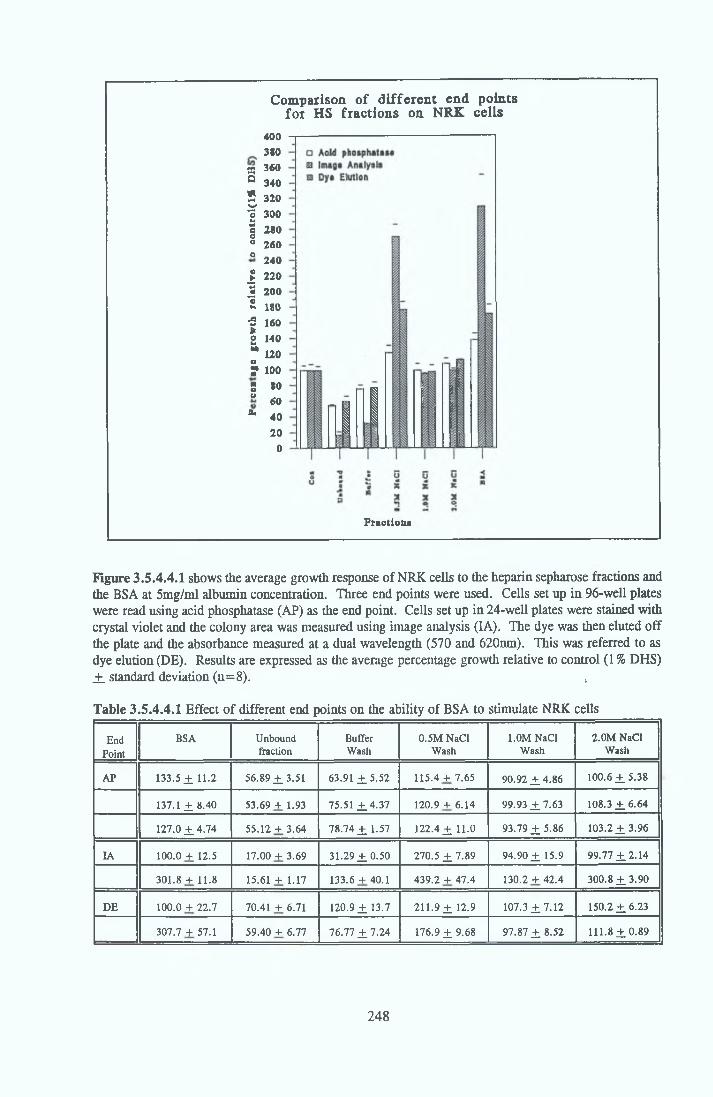
Comparison o f d ifferen t end points for HS fractions on NRK ce lls
400310
X 360Q 340*HW 320"314 300**ao 240o 260o 240o£ 220♦Jm*3
200V 180■fl
s160
Ou 140Mo 120«•M 100a« SOo
60flu 40
20o
Fraction«
Figure 3.5.4.4.1 shows the average growth response of NRK cells to the heparin sepharose fractions and the BSA at 5mg/ml albumin concentration. Three end points were used. Cells set up in 96-well plates were read using acid phosphatase (AP) as die end point. Cells set up in 24-well plates were stained with crystal violet and the colony area was measured using image analysis (IA). The dye was then eluted off the plate and the absorbance measured at a dual wavelength (570 and 620nm). This was referred to as dye elution (DE). Results are expressed as the average percentage growth relative to control (1 % DHS) ± standard deviation (n=8). t
Table 3.5.4.4.1 Effect of different end points on the ability of BSA to stimulate NRK cells
EndPoint
BSA Unboundfraction
BufferWash
0.5M NaCl Wash
l.OMNaCIWash
2.0M NaCI Wash
AP 133.5 ± 11.2 56.89 ± 3.51 63.91 ±5.52 115.4 + 7.65 90.92 ±4.86 100.6 ±5.38
137.1 ± 8.40 53.69 + 1.93 75.51 ±4.37 120.9 + 6.14 99.93 ±7.63 108.3 ± 6.64
127.0 ± 4.74 55.12+3.64 78.74 ± 1.57 122.4 ± 11.0 93.79 ±5.86 103.2 ±3.96
IA 100.0 + 12.5 17.00 + 3.69 31.29 ±0.50 270.5 ± 7.89 94.90 ± 15.9 99.77 ±2.14
301.8+11.8 15.61 + 1.17 133.6 + 40.1 439.2 + 47.4 130.2 + 42.4 300.8 ±3.90
DE 100.0 + 22.7 70.41 + 6.71 120.9 ± 13.7 211.9 ± 12.9 107.3 ±7.12 150.2 ±6.23
307.7 + 57.1 59.40 + 6.77 76.77 ± 7.24 176.9 ±9.68 97.87 ± 8.52 111.8 ± 0.89
248

Figure 3.5.4.4.2 shows the average growth response of NRK cells to mg/ml albumin concentrations using different end points (Assay 2). Results are expressed as the average percentage growth relative to control (1 % DHS) +. standard deviation (n=8). Abbreviations: AP = acid phosphatase; DE = dye elution; CN = cell number.
Table 3.5.4.4.2 Effect of different end points on the ability of BSA to stimulate NRK cells (mg/ml)
END POINT ASSAY 1 ASSAY 2 ASSAY 3
AP: O.Omg/ml 100.0 ± 7.26 100.0 + 7.65 100.0 + 6.58
2.5mg/ml 204.2 + 41.9 208.6 ±6.14 194.0 + 24.1
5.0mg/ml 250.3 + 24.4 274.0 + 12.5 238.2 ± 17.9
7.5mg/ml 268.4 ± 39.3 316.5 + 11.0 330.4 + 3.45
DE: O.Omg/ml 100.0 ± 12.5 100.0 + 7.89 100.0 ± 5.80
2.5mg/ml 288.5 + 31.4 281.2 + 42.4 258.4 ±71.9
5.0mg/ml 303.3 + 7.75 312.1 + 31.5 346.1 ± 9.52
7.5mg/ml 301.8+11.8 321.1 + 47.4 372.2 + 61.5
CN: O.Omg/ml 100.0 + 22.7 100.0 ± 12.9 100.0 ±23.6
2.5mg/ml 246.6 ± 62.4 327.0 ± 25.7 394.4 ±25.5
5.0mg/ml 280.3 + 21.3 400.0 + 25.7 441.7 ± 11.8
7.5mg/ml 307.7 + 57.1 459.1 ± 19.3 491.7 + 35.3
249
However, the extent of stimulation with DE was approximately twice that observed with AP
Thus the initial cell density did not account for the differences in results obtained with the two
end points, as lower initial cell densities did not result in better stimulation
Investigation into the end point used for the detection of bioactivity showed that while in 24-well
plates, acid phosphatase, dye elution and cell number all showed good stimulation, the extent
of stimulation seen with acid phosphatase in 96-well plates was much lower Crystal violet dye
elution from 96-well plates showed similar results to those obtained for cell counts in 24-well
plates The possibility that the initial seeding density of NRK cells was too high was also
investigated (Figures 3 5 4 4 3 and 3 5 4 4 4) The higher cell density showed better growth
than the lower cell densities tested However, cells were normally plated at 8x10* cells/ml
Why acid phosphatase appeared to give greater stimulation relative to the control (1 % DHS) in
24-well than in 96-well plates is unknown As crystal violet dye elution from 96-well plates
showed the same trend as that obtained by cell number, dye elution from 96-well plates was
chosen as the end point for future assays
250
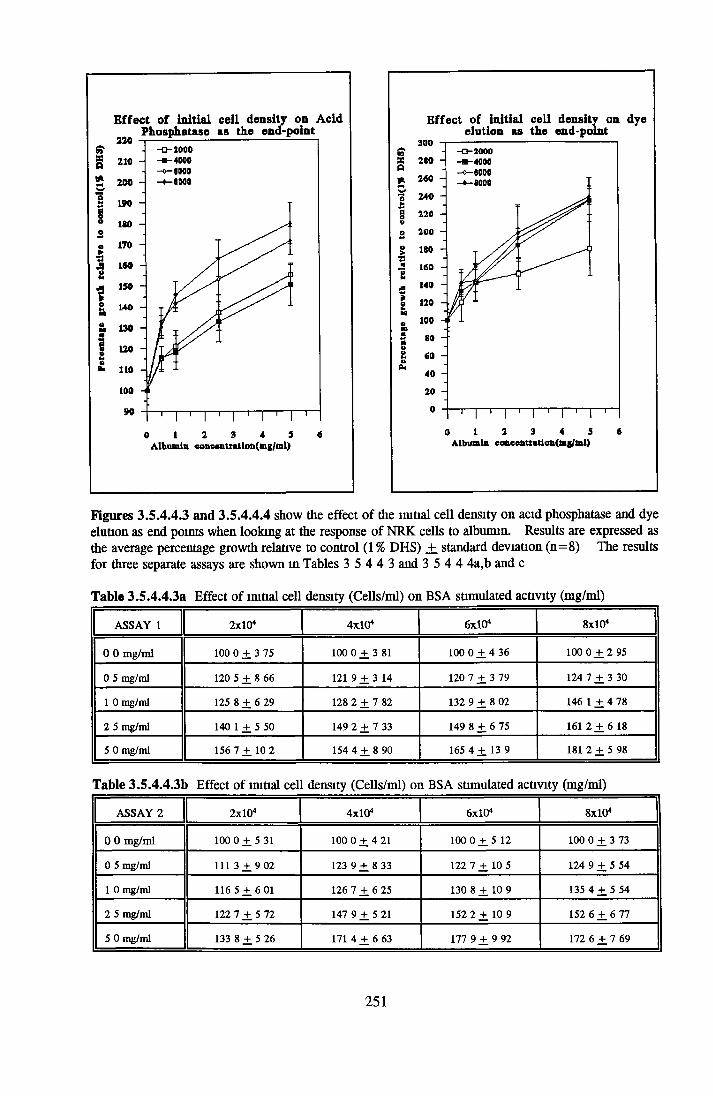
Effect of initial cell density on Acid Phosphatase as the end-point
09
g 210 2 200wa 190
©: 170 ►13Jt 190
I -a 1«S , 130
i 120*4o* 110
100 90
0 1 2 3 4 3 6Albumin concBiiUmtloli(lng/lnl)
Effect of initial cell density on dye elution as the end-point
Albumin caaieeattmll<)a(Bi|/tiil)
Figures 3.5.4.4.3 and 3.5.4.4.4 show the effect of the initial cell density on acid phosphatase and dye elution as end points when looking at the response of NRK cells to albumin. Results are expressed as the average percentage growth relative to control (1 % DHS) +. standard deviation (n=8) The resultsfor three separate assays are shown in Tables 3 5 4 4 3 and 3 5 4 4 4a,b and c
Table 3.5.4.4.3a Effect of initial cell density (Cells/ml) on BSA stimulated activity (mg/ml)
ASSAY 1 2x10* 4x10* 6xl04 8X10⁴
0 0 mg/ml 100 0 ± 3 75 100 0 + 3 81 1000 + 4 36 100 0 + 2 95
0 5 mg/ml 120 5 + 8 66 121 9 + 3 14 120 7 + 3 79 124 7 + 3 30
1 0 mg/ml 125 8 + 6 29 128 2 + 7 82 132 9 + 8 02 146 1 + 4 78
2 5 mg/ml 140 1 + 5 50 149 2 + 7 33 149 8 +. 6 75 161 2 + 6 18
5 0 mg/ml 156 7 + 10 2 154 4 +. 8 90 165 4 + 13 9 181 2 + 5 98
Table 3.5.4.4.3b Effect of initial cell density (Cells/ml) on BSA stimulated activity (mg/ml)
ASSAY 2 2 x l04 4x10* 6x l04 8X10⁴
0 0 mg/m l 100 0 + 5 31 100 0 +, 4 21 100 0 + 5 12 100 0 +. 3 73
0 5 m g /m l 111 3 + 902 123 9 + 8 33 122 7 + 10 5 124 9 +. 5 54
1 0 m g /m l 116 5 + 601 126 7 + 6 25 130 8 + 10 9 135 4 + 5 54
2 5 m g /m l 122 7 + 5 72 147 9 + 5 21 152 2 + 10 9 152 6 + 677
5 0 m g /m l 133 8 + 5 26 171 4 + 6 63 177 9 + .9 92 172 6 +. 7 69
251

Table 3.5.4.4.3c Effect of initial cell (cells/ml) density on BSA stimulated activity (mg/ml)
ASSAY 3 2 x l0 4 4x10" 6x l04 8x l04
0 0 mg/m l 100 0 ± 6 86 100 0 + 6 71 100 0 ± 3 86 100 0 ± 3 67
0 5 mg/ml 115 2 + 5 93 115 6 + 5 38 132 9 ± 6 76 130 5 ± 5 50
1 0 rag/ml 121 2 ± 7 63 118 3 + 8 06 141 9 ± 4 05 145 9 + 6 25
2 5 mg/ml 137 3 ± 8 47 132 8 + 9 68 153 1 ± 10 4 163 2 + 8 82
5 0 mg/ml 155 1 ± 5 08 150 5 ± 10 2 171 6 + 676 179 8 ± 9 93
Table 3.5.4.4.4a Effect of initial cell density (cells/ml) on BSA stimulated activity (mg/ml)
ASSAY 1 2 x l04 4x l04 6x l04 8x l04
0 0 mg/ml 100 0 + 12 1 100 0 ± 18 3 100 0 ± 8 22 100 0 ± 8 69
0 5 mg/ml 120 0 ± 21 4 132 9 ± 5 51 142 3 ± 14 6 141 2 ± 11 8
1 0 mg/ml 141 7 ± 20 0 142 2 ± 21 5 144 0 ± 12 4 159 7 ± 8 61
2 5 mg/ml 151 7 ± 18 1 183 9 ± 18 6 191 7 ± 37 1 197 5 ± 16 9
5 0 mg/ml 180 0 ± 3 0 0 234 1 ± 16 0 235 0 ± 24 7 238 6 ± 29 2
Table 3.5.4.4.4b Effect of initial cell density (cells/ml) on BSA stimulated activity (mg/ml)
ASSAY 2 2x10* 4X104 6X10⁴ 8xl04
0 0 mg/ml 100 0 ± 1 5 7 100 0 ± 3 52 100 0 ± 8 89 100 0 ± 9 64
0 5 mg/ml 125 0 + 16 7 139 3 ± 28 9 153 8 ± 15 9 153 4 ± 13 5
1 0 mg/ml 125 0 ± 16 7 146 1 ± 16 2 177 6 ± 1 9 2 175 9 ± 13 5
2 5 mg/ml 141 7 ± 16 7 209 4 ± 3 1 4 217 4 ± 25 9 230 1 ± 27 7
5 0 mg/ml 200 0 ± 25 0 234 7 ± 20 4 272 7 ± 2 72 270 7 ± 1 3 5
Table 3.5.4.4.4c Effect of initial cell density (cells/ml) on BSA stimulated activity (mg/ml)
ASSAY 3 2x l04 4x l04 6x l04 8x l04
0 0 mg/ml 100 0 ± 11 4 100 0 ± 7 32 100 0 ± 7 88 100 0 ± 11 8
0 5 mg/ml 122 7 ± 21 6 117 9 + 107 225 0 ± 20 4 141 4 ± 10 3
1 0 mg/ml 137 1 ± 11 8 133 9 ± 2 6 7 262 9 ± 22 6 158 6 ± 10 3
2 5 mg/ml 170 8 ± 13 4 182 1 ± 21 4 231 8 ± 13 6 186 2 ± 16 9
5 0 mg/ml 164 8 ± 14 0 219 6 ± 2 1 4 320 4 ± 34 1 213 8 + 6 89
252
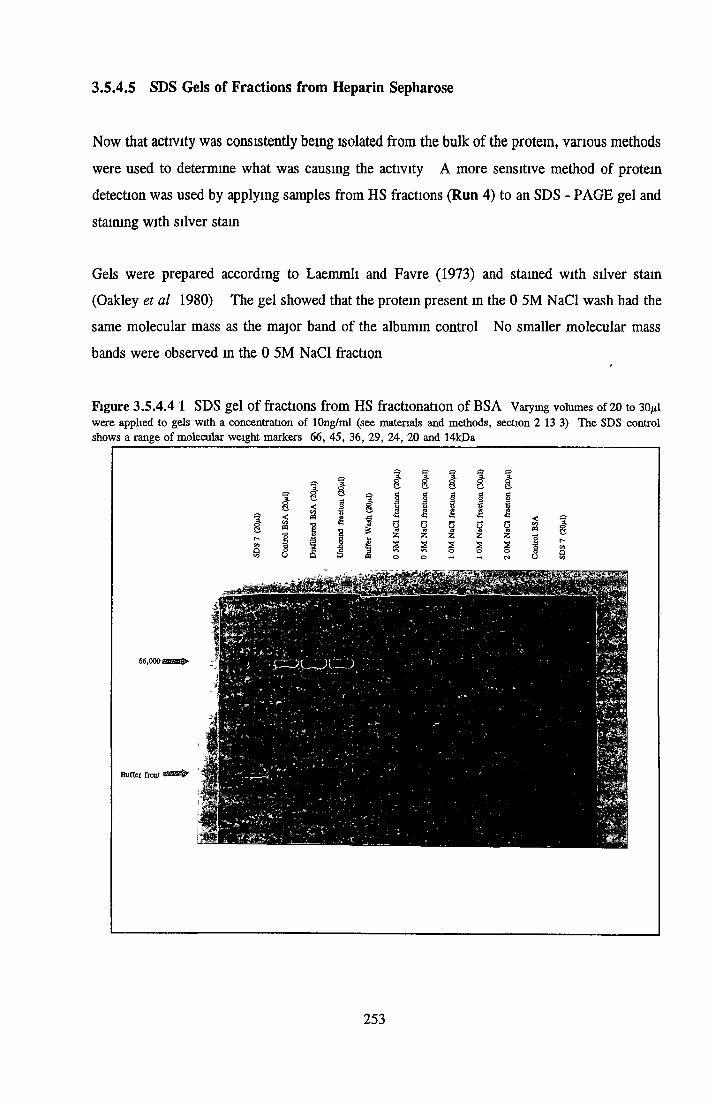
3.5.4.5 SDS Gels of Fractions from Heparin Sepharose
Now that activity was consistently being isolated from the bulk o f the protein, various methods
were used to determine what was causing the activity A more sensitive method o f protein
detection was used by applying samples from HS fractions (Run 4) to an SDS - PAGE gel and
staining with silver stain
Gels were prepared according to Laemmh and Favre (1973) and stained with silver stam
(Oakley et al 1980) The gel showed that the protein present in the 0 5M NaCl wash had the
same molecular mass as the major band o f the albumin control No smaller molecular mass
bands were observed in the 0 5M NaCl fraction
Figure 3.5.4.4 1 SDS gel o f fractions from HS fractionation o f BSA Varying volumes of 20 to 30^1 were applied to gels with a concentration of lOng/ml (see materials and methods, section 2 13 3) The SDS control shows a range of molecular weight markers 66, 45, 36, 29, 24, 20 and 14kDa
253
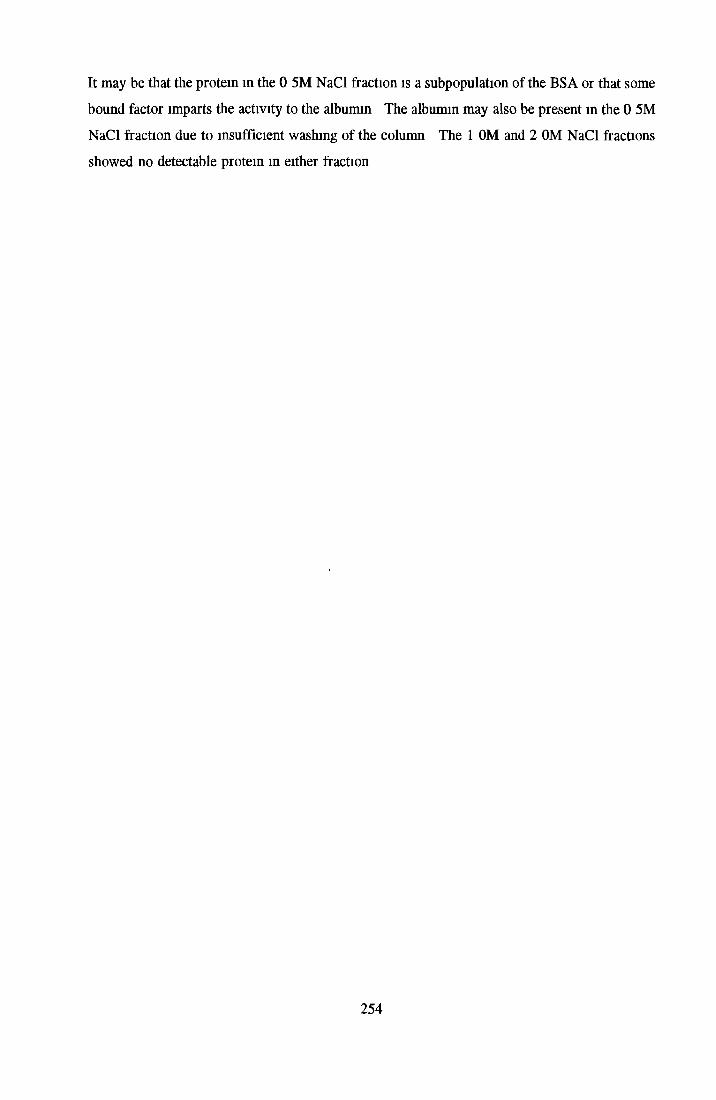
It may be that the protein in the 0 5M NaCl fraction is a subpopulation of the BSA or that some
bound factor imparts the activity to the albumin The albumin may also be present in the 0 5M
NaCl fraction due to insufficient washing of the column The 1 OM and 2 OM NaCl fractions
showed no detectable protein in either fraction
254

3.5.4.6 Trypsin Activity on HS Fractions
In two of the four previous experiments, the biological activity of albumin was isolated in the
0 5M NaCl fraction In an attempt to ascertain whether or not the activity was due to the small
amount of protein sometimes measured in the 0 5M NaCl wash, it was decided to subject the
fraction to trypsin digestion The 0 5M NaCl fraction from RUN 4 was used The resulting
digest was assayed for bioactivity on NRK cells as before The digest was also run on an SDS-
PAGE gel and stained with silver stain (as m 3 5 4 5)
Trypsin digestion was carried out as described in Section 2 18 Briefly, the samples were
exposed to trypsin, allowed to incubate for 2hrs at 37°C Trypsin inhibitor was then added The
results for two separate experiments are shown in Tables 3 5 4 6 1 and 2
In the first experiment (Table 3 5 4 6 1), growth stimulation seen with the BSA and 0 5M NaCl
fraction was very low, making trends difficult to observe The low activity was most likely due
to the use of acid phosphatase as the end point
Table 3.5.4.10.1 Effect of trypsin digestion on HS fractions
VARIABLES SAMPLE A B C
ATCC 100 0 + 3 0 97 6 + 3 6 101 2 + 18 95 5 +. 1 8
0 5M NaCl 127 0+. 2 4 143 3 +, 7 3 46 3 +. 7 3 82 9 +. 1 2
0 5M NaCl* 90 2 ± 10 4 90 8 + 3 0 87 2 + 3 0 87 8 + 2 4
Control BSA 109 9 ± 6 4 119 9 + 74 107 4 + 2 5 45 9 + 0 6
New BSA 129 2 +. 5 6 132 3 + 3 7 130 4 + 4 9 125 5 + 4 9
Results show the effect of trypsin digestion on the heparin sepharose fractions from run 4 0 5M NaCl* refers to the 0 5M fraction obtained when the column was run without albumin Growth is expressed as the average percentage growth relative to the control (ATCC + 1 % DHS) +. standard deviation (n=8) Acid phosphatase was used as the end point Abbreviations A = sample plus trypsin inhibitor, B = sample plus trypsin, incubated for 2hrs before addition of trypsin inhibitor, C = sample plus trypsin inhibitor, followed by addition of trypsin, New BSA = fresh stock of BSA
To see how effective trypsin and pepsin were at degrading BSA, samples were exposed to each
and the resulting digests were run on an SDS gel The results are shown in the gel in Table
3 5 4 6 1 Trypsin after 1 hour, had not caused any change in the migration position of the
albumin However, after 18hrs, a second smaller band appeared The second band was even
more distinct at 24hrs Pepsin was much more effective After only one hour, no protein was
detectable at the position to which albumin normally migrated No other distinct bands were
visible
255

These results indicated that trypsin did have an effect on albumin over extended incubation
times As Pepsin was too harsh, it was hoped that the shorter times of 1 to 2hrs with trypsm
should affect any protein that the albumin was carrying
Figure 3.5.4.6.1 Gel showing trypsin and pepsin digests Samples were applied at 30^1 per well with a concentration of lOng/ml (see materials and methods 2 13 3) The SDS control shows a range of molecular weight markers 66, 45, 36, 29, 24, 20 and 14kDa Abbreviations T = trypsm, TI = trypsm inhibitor, PI, 2 and 3 = three different stocks of pepsin
In a second experiment, samples from Run 7 were exposed to trypsm digestion The results
from this experiment showed that trypsin appeared to have some effect on the 0 5M NaCl
fraction, but not on the BSA control or on the ATCC control (Table 3 5 4 6 2)
Addition of trypsin resulted in a loss of stimulation 30 6 % , 54 5% and 40 5% stimulation
relative to the undigested 0 5M NaCl fraction for assays 1, 2 and 3 respectively relative to the
control 0 5M NaCl If the trypsm inhibitor control were used as a basis of determining loss
of activity, 23 3, 43 8 and 39 7% of the activity remained after treatment with trypsm for the
three separate assays respectively The results for the 0 5M NaCl were complicated for two
256

reasons When the trypsin inhibitor was added before the trypsm, a decrease in activity of 20 -
30% was still seen This decrease was not seen in the BSA and ATCC controls This could
indicate that the 0 5M NaCl fraction sufficient trypsin inhibitor was not present to inactivate the
trypsin immediately or that some of the active component in the 0 5M NaCl fraction was
susceptible to trypsm However, the trypsm was apparently inactivated by the trypsm inhibitor
as seen in the ATCC controls The fact that there was a lower amount of protein in the 0 5M
NaCl fraction may have made the active fraction more susceptible to the action of trypsm than
the BSA
In addition, the effect of the trypsm inhibitor again appeared to cause an increase m growth
response This increase was variable between the three assays, up to 30% For ATCC, the
stimulation was variable also (no greater than 30%) For the BSA, stimulation doubled over
the BSA on its own (2 4-, 2 56- and 3 68-fold increase for the three assays respectively)
Table 3.5.4.6.2. Effect of trypsm digestion on bioactivity of HS fractions from run 7
VARIABLES SAMPLE A B C
Assay 1 BSA 158 3 +_ 16 0 240 0 ± 16 3 157 0 ± 18 6 168 0 ± 16 0
0 5M NaCl 246 6 ± 17 0 293 0 ± 27 0 145 0 +. 13 8 190 0 + 18 9
ATCC 93 6 + 10 6 114 0 ± 0 0 101 5 + 9 9 96 50 + 10 7
Assay 2 BSA 194 1 ± 30 4 341 2 ± 23 5 174 5 ± 25 1 243 1 + 28 5
0 5M NaCl 297 1 +. 33 8 350 0 ± 36 4 209 4 ± 21 0 230 6 + 19 7
ATCC 74 6 + 7 46 80 60 +_ 6 2 74 6 _+ 8 2 80 60 + 8 2
Assay 3 BSA 165 0 +_ 12 5 339 3 ± 41 1 173 2 ± 15 2 179 2 + 18 8
0 5M NaCl 353 1 ± 2 1 7 358 3 ± 2 1 0 202 5 ± 10 5 245 6 + 17 1
ATCC 96 60 + 8 2 130 0 + 12 2 101 6 + 4 1 100 0 + 6 3________________________
Results from three separate assays are shown Growth is expressed as the average percentage growth relative the control (ATCC + 1% DHS) _+ standard deviation (n=8) Dye elution was used as the end point Abbreviations A = sample plus trypsin inhibitor, B = sample plus trypsm, mcubated for 2hrs before addition of trypsm inhibitor, C = sample plus trypsm inhibitor, followed by addition of trypsm
In conclusion for both experiments, a decrease in activity was seen with the 0 5M NaCl
fraction However, addition of trypsm inhibitor interferred with results (the trypsm inhibitor
was stimulatory to NRK cells both in the presence and absence of BSA or the 0 5M NaCl
fraction) To overcome this problem, it was decided to use pepsin as a means of digestion
257

3.5.4.7 Pepsin Treatment of BSA and 0.5M NaCl Fraction
Samples of the BSA and 0 5M NaCl fraction were exposed to pepsin (2% wt/vol of the protein
concentration) after the pH was adjusted to 2 6 The samples were mcubated for 1 hour at
37°C The pH was re-adjusted to 7 4 The samples were filter sterilized and assayed for
growth stimulation The experiment was carried out with BSA at an earlier stage where acid
phosphatase was used as an end point, which may explain the low stimulation obtained with the
BSA control Dye elution was used as the end point for the experiment with the 0 5M NaCl
fraction The results are shown m Table 3 5 4 7
The results showed that the lowering of the pH caused a reduction in activity of the 0 5M NaCl,
but no reduction in the native BSA Pepsin caused only a slight further decrease in the activity
of the 0 5M NaCl fraction The pepsin control in which ATCC was subjected to pepsin
treatment, showed no variation from the growth seen with 1 % DHS only
Table 3.5.4.7 Effect of pepsin digestion on the activity of BSA and the 0 5M NaCl fraction
SAMPLE ASSAY 1 ASSAY 2 ASSAY 3
BSA 162 4 ± 3 76 170 3 + 9 19 168 9 + 10 5
BSA at pH2 6 158 6 ± 5 38 157 8 + 5 94 151 1 + 5 00
BSA + Pep 145 7 ± 8 06 160 5 + 9 19 156 7 + 8 33
ATCC + Pep 105 9 +. 7 79 106 5 + 7 03 107 2 + 6 66
0 5M NaCl 194 0 +. 13 9 204 7 + 29 5 215 8 _+ 23 3
0 5M NaCl at pH2 6 114 8 +. 9 86 136 1 + 13 7 169 2 + 17 5
0 5M NaCl + Pep 110 1 ± 1 3 1 112 6 + 25 4 126 0 + 8 84
Results show the average percentage growth relative to control (1 % DHS) ±_ standard deviation (n=8) Acid phosphatase was used as the end point for three separate assays for BSA while the 0 5M NaCl samples were earned out using dye elution as the end point The ’BSA and 0 5M NaCl at Ph 2 6’ refers to a control in which each sample was exposed to pH2 6 as if pepsin were present After a lhr incubation, the pH was returned to 7 4
The results showed that 20% of the activity associated with the BSA was lost after pepsin
digestion relative to the BSA control (even though the pepsin appeared to digest fully the BSA
on the SDS gel) For the 0 5M NaCl fraction, only 10-22% of the activity seen in the 0 5M
NaCl control was left after digestion The results also suggested that the 0 5M NaCl fraction
unlike the BSA may have been acid labile If this was the case, then the loss of stimulation
seen with pepsin digestion may be due to pH
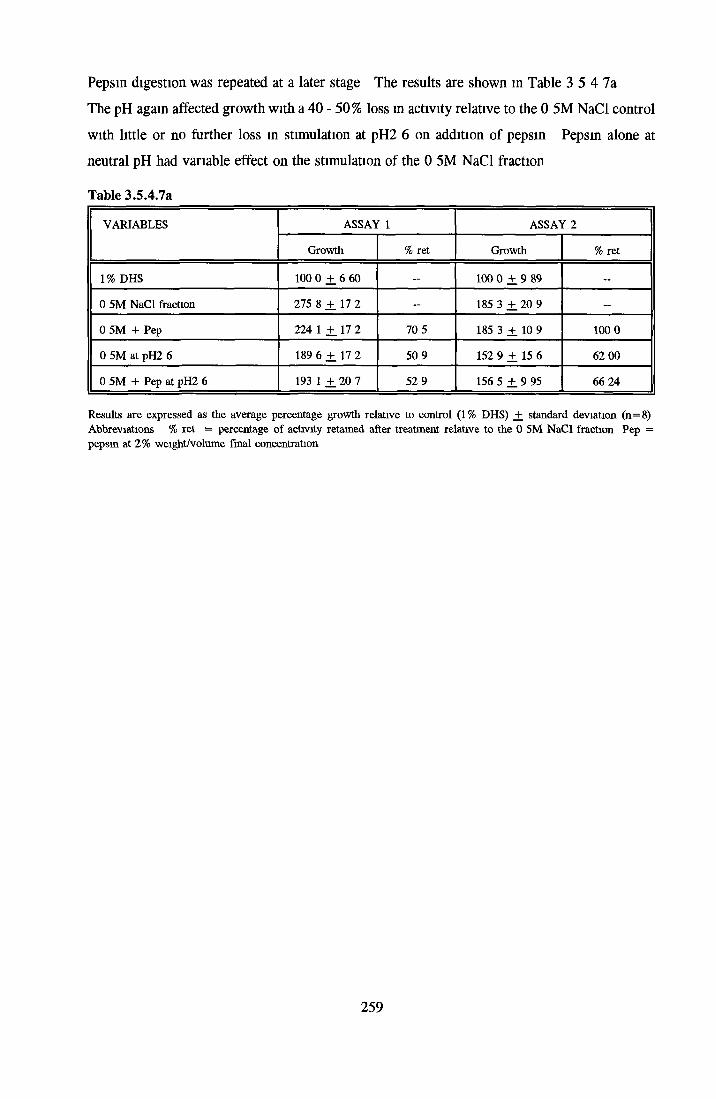
Pepsin digestion was repeated at a later stage The results are shown in Table 3 5 4 7a
The pH again affected growth with a 40 - 50% loss m activity relative to the 0 5M NaCl control
with little or no farther loss in stimulation at pH2 6 on addition of pepsin Pepsin alone at
neutral pH had variable effect on the stimulation of the 0 5M NaCl fraction
Table 3.5.4.7a
VARIABLES ASSAY 1 ASSAY 2
Growth % ret Growth % ret
1% DHS 100 0 ± 6 60 — 100 0 ± 9 89 —
0 5M NaCl fraction 275 8 ± 17 2 - 185 3 ± 20 9 -
0 5M + Pep 224 1 ± 17 2 70 5 185 3 ± 10 9 100 0
0 5M at pH2 6 189 6 ± 17 2 50 9 152 9 + 15 6 62 00
0 5M + Pep at pH2 6 193 1 ± 20 7 52 9 156 5 ± 9 95 66 24
Results are expressed as the average percentage growth relative to control (1% DHS) _+ standard deviation (n=8) Abbreviations % ret = percentage of activity retained after treatment relative to the 0 5M NaCl fraction Pep = pepsin at 2% weight/volume final concentration
259
3.5.4.8 Osmolarity of HS Fractions
As elution of the activity occurred with increasing salt concentration, the possibility that
increases in the osmolarity were responsible for activity were investigated Fractions from runs
2 to 8 were tested using an osmometer Dilutions of each fraction were made so that albumm
concentration was at 5mg/ml (the highest concentration tested on the cells)
Table 3.5 4.8 Osmolarity for HS fractions (Osmols/Kg)
RUN BSA UNBOUNDFRACTION
BUFFERWASH
0 5M NaCl WASH
1 0M NaCl WASH
2 0M NaCl WASH
1 0 331 0 315 0 300 0 327 0 349 —
2 0 348 0 322 0 321 0 362 0 339 0 351
3 0 314 0 313 0 311 0 328 0 319 0 330
4 0 284 0 279 0 290 0 292 0 293 0 282
5 0 315 0 299 0 299 0 313 0 316 0 317
6 0 303 0 307 0 341 0 325 0 318
7 0 328 0 299 0 292 . . . 0 316 0 315
8 0 324 0 294 0 294 0 313 0 298 0 312
The embolded figures show the fractions which gave maximal stimulation The underlined
figures show the fractions which had the highest osmolarity readings Excluding run 7 (as no
sample was remaining to test the osmolarity), 3 of the 7 runs showed maximal activity to
correspond with highest osmolarity If high osmolarity was responsible for the activity, then
increasing the osmolarity would have resulted m increased activity However, some of the
fractions showed high osmolarity but little or no stimulation, for example the 2 OM NaCl wash
in run 2 had a maximum of 10% stimulation above the control while the osmolarity was quite
high In addition, the differences in osmolarity readings were so small, that it was unlikely to
affect cell growth to any large extent
260
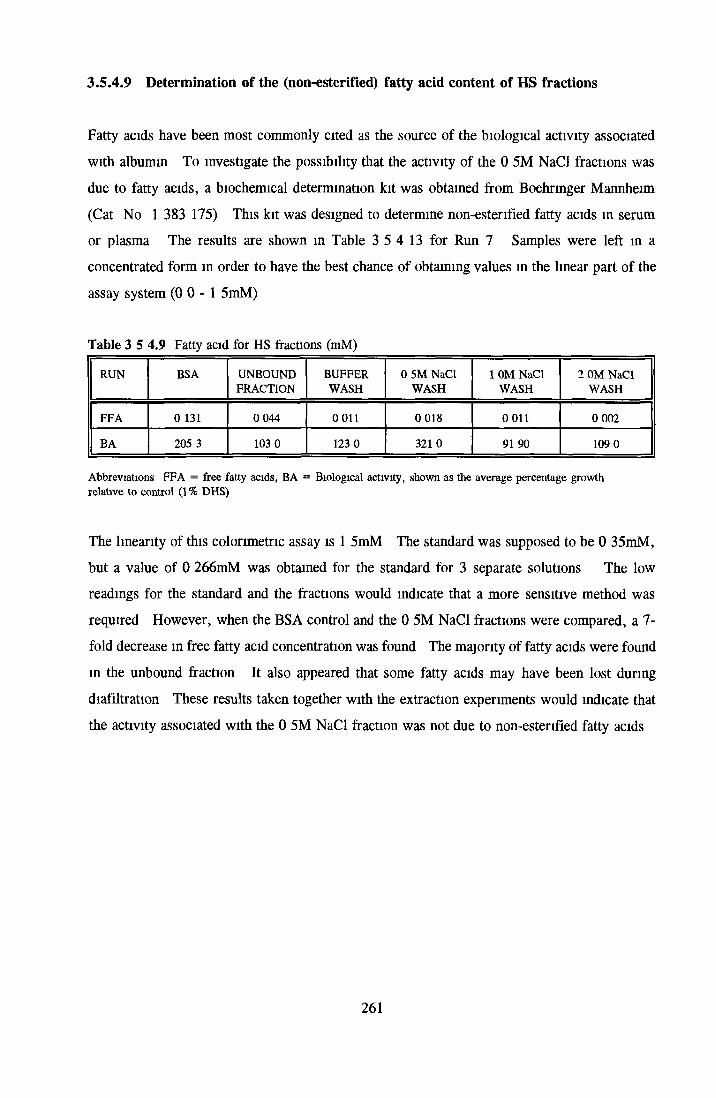
3.5.4.9 Determination of the (non-esterified) fatty acid content of HS fractions
Fatty acids have been most commonly cited as the source of the biological activity associated
with albumin To investigate the possibility that the activity of the 0 5M NaCl fractions was
due to fatty acids, a biochemical determination kit was obtained from Boehringer Mannheim
(Cat No 1 383 175) This kit was designed to determine non-esterified fatty acids in serum
or plasma The results are shown in Table 3 5 4 13 for Run 7 Samples were left in a
concentrated form in order to have the best chance of obtaining values in the linear part of the
assay system ( 0 0 - 1 5mM)
Table 3 5 4.9 Fatty acid for HS fractions (mM)
RUN BSA UNBOUNDFRACTION
BUFFERWASH
0 5M NaCl WASH
1 0M NaCl WASH
2 0M NaCl WASH
FFA 0 131 0 044 0 011 0 018 0 011 0 002
BA 205 3 103 0 123 0 321 0 91 90 109 0
Abbreviations FFA = free fatty acids, BA = Biological activity, shown as the average percentage growth relative to control (1% DHS)
The linearity of this colorimetric assay is 1 5mM The standard was supposed to be 0 35mM,
but a value of 0 266mM was obtained for the standard for 3 separate solutions The low
readings for the standard and the fractions would indicate that a more sensitive method was
required However, when the BSA control and the 0 5M NaCl fractions were compared, a 7-
fold decrease m free fatty acid concentration was found The majority of fatty acids were found
in the unbound fraction It also appeared that some fatty acids may have been lost during
diafiltration These results taken together with the extraction experiments would indicate that
the activity associated with the 0 5M NaCl fraction was not due to non-esterified fatty acids
261

3.5.4.10 Determination of the citric acid content of HS fractions
Citrate has been mentioned as a contaminant of albumins from plasma purifications (Hanson and
Ballard, 1968) Citrate was shown to be the stimulatory fraction of BSA for rabbit pre
imp lantation blastocytes (Kane, 1990) In order to investigate the possibility that citrate was
responsible for the activity, samples from HS fractions before diafiltration against ATCC were
assayed for citrate
A kit for the determination of citrate was supplied by Boehringer Mannheim (Cat No 139076)
The method was based on the conversion of citric acid (citrate) to oxaloacetate and acetate in
the presence of the enzyme, citrate lyase The oxaloactete and NADH were the substrates for
the second reaction catalysed by malate dehydrogenase and led to the formation of malate and
NAD+ The amount of NAD+ produced was stoichiometric to the amount of citrate present and
was measured by absorbance at 340nm The results are shown below in Table 3 5 4 14
Table 3.5.4 10.1 Citrate concentration in HS fractions from RUN 4
VARIABLES CITRATE (mg/ml) BIOACTIVITY (%)
BSA control 0 001 163 8 ± 13 3
Unbound Fraction 0 005 94 66 + 12 62
Buffer Wash 0 005 105 5 + 5 67
0 5M NaCl Wash 0 005 169 3 + 2 53
1 0M NaCl Wash 0 005 113 1 + 7 2 8
2 OM NaCl Wash 0 000 108 7 + 10 20
NaPi Buffer 0 005
Citrate standard 0 454
Results show the concentrations of citrate present inHS fractions before diafiltration Bioactivity is given as the average percentage growth relative to control (1 % DHS) _+ standard deviation (n=8) as determined with growth of NRK cells
The results indicated that very little citrate was present in any of the samples Indeed, more
citrate appeared in the fractions eluting off the column than was in the BSA control Growth
stimulation did not coincide with increased citrate levels A low level of citrate was present m
the Na2HP0 4 buffer, and this may have been responsible for the presence of citrate m all
fractions, except the BSA control and the 2 0M NaCl fraction The very low absorbances
measured may have led to such minor discrepancies
262
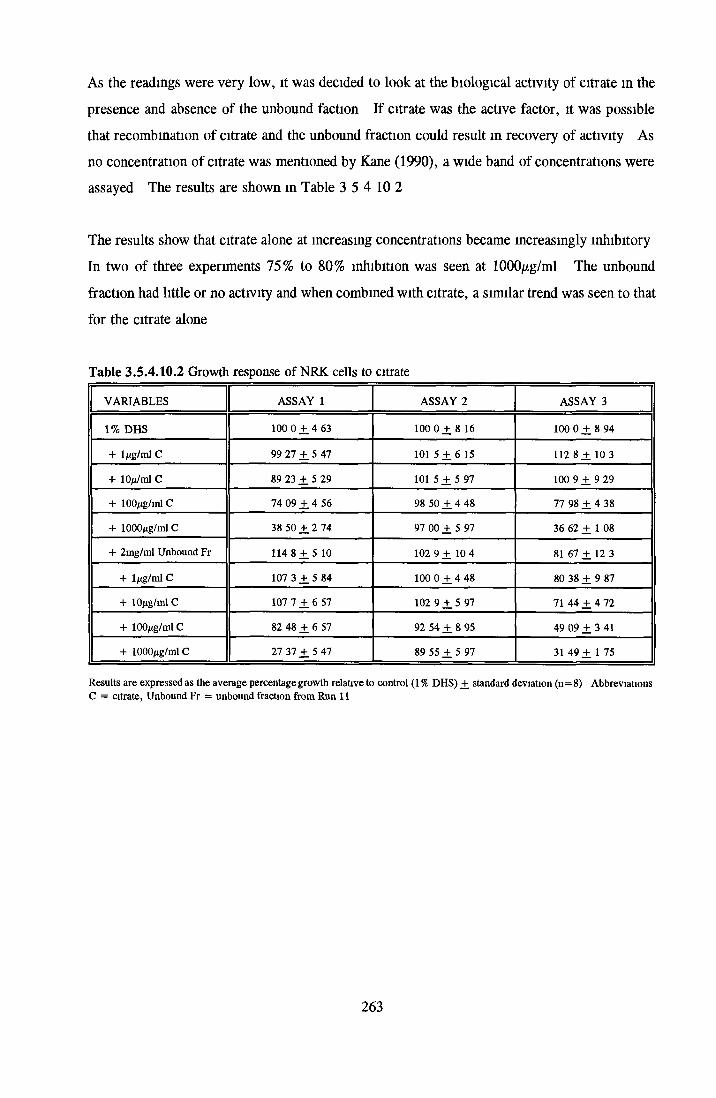
As the readings were very low, it was decided to look at the biological activity of citrate m the
presence and absence of the unbound faction If citrate was the active factor, it was possible
that recombination of citrate and the unbound fraction could result m recovery of activity As
no concentration of citrate was mentioned by Kane (1990), a wide band of concentrations were
assayed The results are shown in Table 3 5 4 10 2
The results show that citrate alone at increasing concentrations became increasingly inhibitory
In two of three experiments 75% to 80% inhibition was seen at 1000^g/ml The unbound
fraction had little or no activity and when combined with citrate, a similar trend was seen to that
for the citrate alone
Table 3.5.4.10.2 Growth response of NRK cells to citrate
VARIABLES ASSAY 1 ASSAY 2 ASSAY 3
1% DHS 100 0 +. 4 63 100 0 ± 8 16 100 0 + 8 94
+ 1/ig/ml C 99 27 ± 5 47 101 5 + 6 15 112 8 ± 10 3
+ 10/it/ml C 89 23 ± 5 29 101 5 ± 5 97 100 9 + 9 29
+ 100/ug/ml C 74 09 ± 4 56 98 50 + 4 48 77 98 + 4 38
+ 1000/ig/ml C 38 50 ± 2 74 97 00 ± 5 97 36 62 + 1 08
+ 2mg/ml Unbound Fr 114 8 ± 5 10 102 9 + 10 4 81 67 + 12 3
+ 1 fig/ml C 107 3 ± 5 84 100 0 + 4 48 80 38 + 9 87
+ lOfig/ml C 107 7 ± 6 57 102 9 + 5 97 71 44 + 4 72
+ 100fig/ml C 82 48 ± 6 57 92 54 + 8 95 49 09 + 3 41
+ 1000/ig/ml C 27 37 ± 5 47 89 55 ± 5 97 31 49 + 1 75
Results are expressed as the average percentage growth relative to control (1 % DHS) _+ standard deviation (n=8) Abbreviations C = citrate, Unbound Fr = unbound fraction from Run 11
263
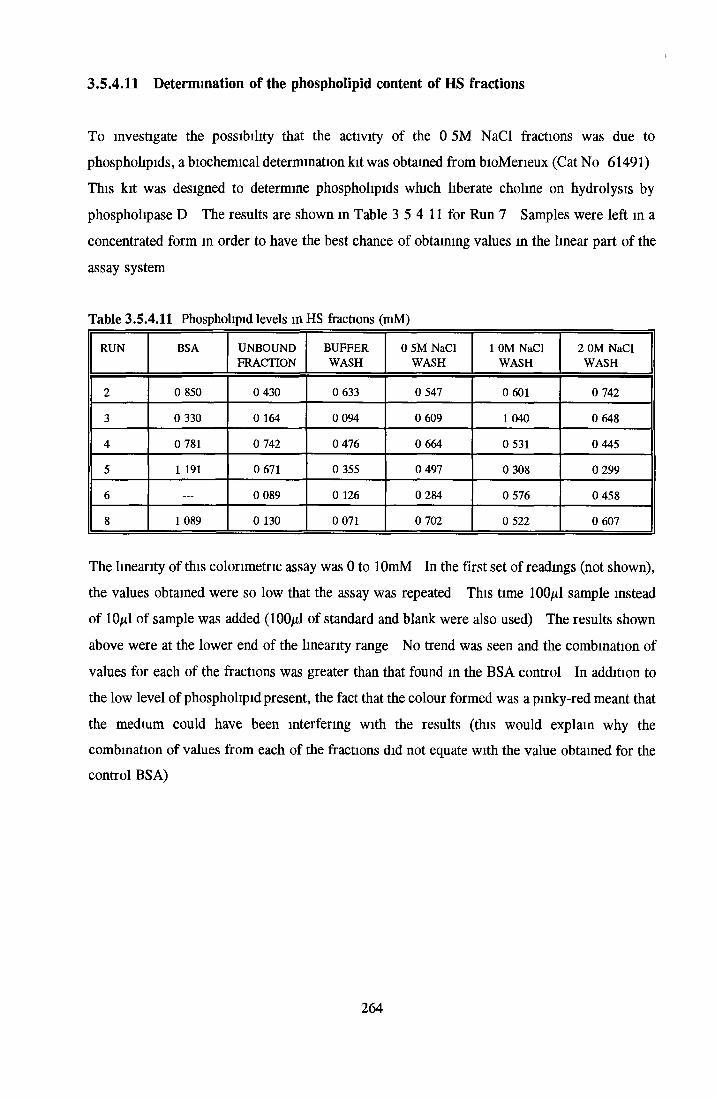
To investigate the possibility that the activity of the 0 5M NaCl fractions was due to
phospholipids, a biochemical determination kit was obtained from bioMerieux (Cat No 61491)
This kit was designed to determine phospholipids which liberate choline on hydrolysis by
phospholipase D The results are shown in Table 3 5 4 11 for Run 7 Samples were left in a
concentrated form in order to have the best chance of obtaining values in the linear part of the
assay system
3.5.4.11 Determination of the phospholipid content of HS fractions
Table 3.5.4.11 Phospholipid levels in HS fractions (mM)
RUN BSA UNBOUNDFRACTION
BUFFERWASH
0 5M NaCl WASH
1 0M NaCl WASH
2 0M NaCl WASH
2 0 850 0 430 0 633 0 547 0 601 0 742
3 0 330 0 164 0 094 0 609 1 040 0 648
4 0 781 0 742 0 476 0 664 0 531 0 445
5 1 191 0 671 0 355 0 497 0 308 0 299
6 . . . 0 089 0 126 0 284 0 576 0 458
8 1 089 0 130 0 071 0 702 0 522 0 607
The linearity of this colorimetric assay was 0 to lOmM In the first set of readings (not shown),
the values obtained were so low that the assay was repeated This time 100/d sample instead
of 10/il of sample was added (100/7,1 of standard and blank were also used) The results shown
above were at the lower end of the linearity range No trend was seen and the combination of
values for each of the fractions was greater than that found in the BSA control In addition to
the low level of phospholipid present, the fact that the colour formed was a pinky-red meant that
the medium could have been interfering with the results (this would explain why the
combination of values from each of the fractions did not equate with the value obtained for the
control BSA)
264

3.5.4.12 Lyophilisation of BSA and 0.5M NaCl Fraction
It was considered that further purification of the growth stimulating activity might be effected
by HPLC However, in order to use the HPLC, it was necessary to see if the activity of the
0 5M NaCl fraction was retained after lyophilization Lyophilization was carried out as
described in section 2 14 The BSA and 0 5M NaCl fractions were first desalted and then split
into 2 Both samples were lyophilized overnight One sample was dissolved back up in ATCC
The second was dissolved into a solution of 80% acetomtrile (ACN) and 0 1% tnfluoroacetic
acid (TFA) This was the highest concentration of acetomtrile that samples would be exposed
to during HPLC fractionation This sample was lyophilized again and dissolved into ATCC
The results are shown in Table 3 5 4 12 1 For the BSA there was a decrease from the
untreated BSA to the lyophilized BSA (30-38%) and a further decrease in activity for the sample
exposed to ACN/TFA This sample was extremely acidic when reconstituted, as indicated by
the yellow colour of the sample when it was reconstituted m ATCC medium For the 0 5M
NaCl fraction, there was no decrease for the initial lyophilization However, there was a
decrease when the sample was exposed to ACN/TFA (40 - 50%) before lyophilisation
These results indicated that both the BSA and 0 5M NaCl fractions were sensitive to
lyophilization after exposure to acetomtrile The BSA appeared to be more susceptible to loss
of activity than the 0 5M NaCl fraction The acidic nature of the BSA solution indicated that
the low activity may have been due to residual ACN/TFA which may not have fully lyophilized
from the sample It would appear that both would lose some activity if HPLC was used as a
means of trying to isolate out the active fraction
Table 3.5.4.12 Effect of lyophilisation on the activity of BSA and the 0 5M NaCl fraction
SAMPLE ASSAY 1 ASSAY 2 ASSAY 3
1% DHS 100 0 ± 8 22 100 0 ± 7 89 100 0 ± 12 0
BSA control 324 3 ± 2 1 9 280 0 ± 20 0 267 6 ± 17 9
BSA lyo 204 4 ± 14 6 174 4 ± 9 81 189 2 ± 18 4
BSA lyo (Acn) 79 49 ± 11 6 73 30 ± 13 3 69 37 ± 7 72
0 5M NaCl con 255 4 ± 29 9 240 0 ± 21 5 189 2 ± 6 89
0 5M NaCl lyo 262 8 ± 12 3 228 9 ± 20 1 189 2 ± 18 2
0 5M NaCl lyo (Acn) 180 2 ± 22 2 138 8 ± 15 4 97 30 ± 13 0
Results show the average growth relative to control (1 % DHS) ± standard deviation (n=8) Dye elution was used as the end point for assays Abbreviations lyo = lyophilised, lyo (Acn) = lyophilised m an 80% Acetomtnle(0 1% TFA) solution
265
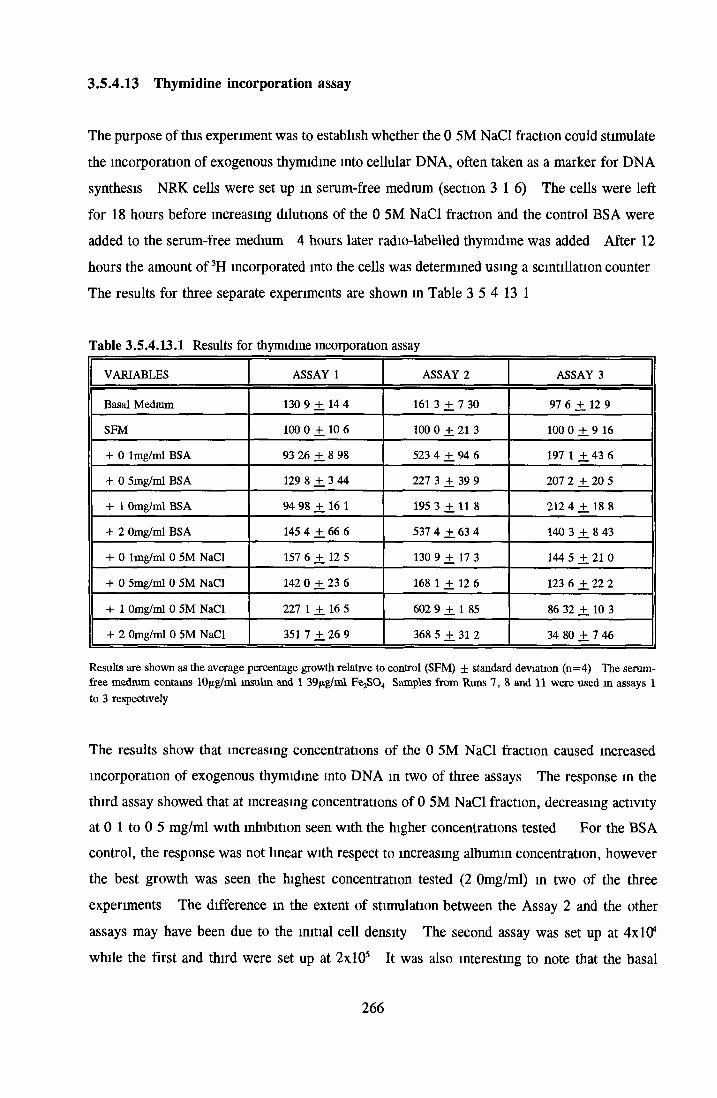
3.5.4.13 Thymidine incorporation assay
The purpose of this experiment was to establish whether the 0 5M NaCl fraction could stimulate
the incorporation of exogenous thymidine into cellular DNA, often taken as a marker for DNA
synthesis NRK cells were set up in serum-free medium (section 3 16) The cells were left
for 18 hours before increasing dilutions of the 0 5M NaCl fraction and the control BSA were
added to the serum-free medium 4 hours later radio-labelled thymidme was added After 12
hours the amount of 3H incorporated into the cells was determined using a scintillation counter
The results for three separate experiments are shown in Table 3 5 4 13 1
Table 3.5.4.13.1 Results for thymidine incorporation assay
VARIABLES ASSAY 1 ASSAY 2 ASSAY 3
Basal Medium 130 9 ± 14 4 161 3 ± 7 30 97 6 ± 12 9
SFM 100 0 ± 10 6 100 0 ± 21 3 100 0 ± 9 16
+ 0 lmg/ml BSA 93 26 ± 8 98 523 4 ± 94 6 197 1 ± 43 6
+ 0 5mg/ml BSA 129 8 ± 3 44 227 3 ± 39 9 207 2 ± 20 5
+ 1 Omg/ml BSA 94 98 ± 16 1 195 3 ± 11 8 212 4 ± 18 8
+ 2 Omg/ml BSA 145 4 ± 66 6 537 4 ± 63 4 140 3 ± 8 43
+ 0 lmg/ml 0 5M NaCl 157 6 ± 12 5 130 9 ± 17 3 144 5 ± 2 1 0
+ 0 5mg/ml 0 5M NaCl 142 0 ± 23 6 168 1 ± 12 6 123 6 ± 22 2
+ 1 Omg/ml 0 5M NaCl 227 1 ± 16 5 602 9 ± 1 85 86 32 ± 10 3
+ 2 Omg/ml 0 5M NaCl 351 7 ± 2 6 9 368 5 ± 31 2 34 80 ± 7 46
Results are shown as the average percentage growth relative to control (SFM) ± standard deviation (n=4) The serum- free medium contains 10j*g/ml insulin and 1 39ftg/ml Fe2S04 Samples from Runs 7, 8 and 11 were used in assays 1 to 3 respectively
The results show that increasing concentrations of the 0 5M NaCl fraction caused increased
incorporation of exogenous thymidine into DNA in two of three assays The response m the
third assay showed that at increasing concentrations of 0 5M NaCl fraction, decreasing activity
at 0 1 to 0 5 mg/ml with inhibition seen with the higher concentrations tested For the BSA
control, the response was not linear with respect to increasing albumin concentration, however
the best growth was seen the highest concentration tested (2 Omg/ml) in two of the three
experiments The difference in the extent of stimulation between the Assay 2 and the other
assays may have been due to the initial cell density The second assay was set up at 4x10*
while the first and third were set up at 2x10s It was also interesting to note that the basal
266

medium allowed for more incorporation of exogenous thymidine into DNA synthesises than the
serum-free medium
Taken together, the results from the thymidine incorporation assays appeared to be quite
variable The 0 5M NaCl fraction allowed for greater stimulation of exogenous thymidine mto
the DNA than BSA in two of three assays
3 .5 .4 .1 4 Effect o f 0 .5M NaCl fraction on NRK cells m SFM
With the positive stimulation observed with the BSA and 0 5M NaCl fraction for the NRK cells
in the thymidine incorporation assay, it was decided to see if the factors increased growth of
the cells over an extended period in SFM
Previous assays using BSA showed growth inhibition of NRK cells under serum-free conditions
(section 3 1 7 3) In the thymidine incorporation assay the factors to be tested were not added
until 18hours after plating It was thought that the inhibitory action may have been due to the
albumin interfering with attachment of the cells With this in mind, cells were set up at 1x10*
cells per well in 96-well plates in the SFM After 18 hours, the BSA and 0 5M NaCl fractions
were added in serum-free medium The cells were incubated for 4 more days The assays was
read using acid phosphatase as the end point The results are shown in Table 3 5 4 14
Table 3.5.4 14 Results for serum-free assay
VARIABLES ASSAY 1 ASSAY 2 ASSAY 3 ASSAY 4
SFM 100 0 ± 3 78 100 0 + 3 78 100 0 + 8 40 100 0 ± 6 20
+ 0 lmg/ml BSA 109 7 + 4 99 201 6 + 9 16 110 7 + 7 71
+ 0 5mg/ml BSA 77 59 + 8 37 100 0 + 4 99 43 08 ± 4 93 90 48 ± 11 9
+ 1 Omg/ml BSA 64 94 + 5 52 100 0 + 7 23 36 50 + 4 68 79 80 ± 6 18
+ 2 Omg/ml BSA 44 83 + 3 45 109 1 + 8 39 74 80 + 12 6
+ 0 lmg/ml 0 5M NaCl ------- 92 73 + 1 21 209 4 + 4 15 71 62 + 8 01
+ 0 5mg/ml 0 5M NaCl 66 66 + 5 63 83 03 ± 3 64 36 70 + 4 61 64 91 + 5 80
+ 1 Omg/ml 0 5M NaCl 61 58 + 7 29 79 39 + 4 14 25 5 ± 2 55 60 70 + 5 90
+ 2 Omg/ml 0 5M NaCl 33 33 +. 5 19 76 12 + 4 06 33 33 + 5 19
Results are shown as the average percentage growth relative to control (SFM) ± standard deviation (n= 8) The serum- free medium contains 10/tg/ml insulin and 1 39/ig/ml FejSO,, Samples fromruns 7, 8, 11 and 12 were used for assays 1 to 4 respectively
267
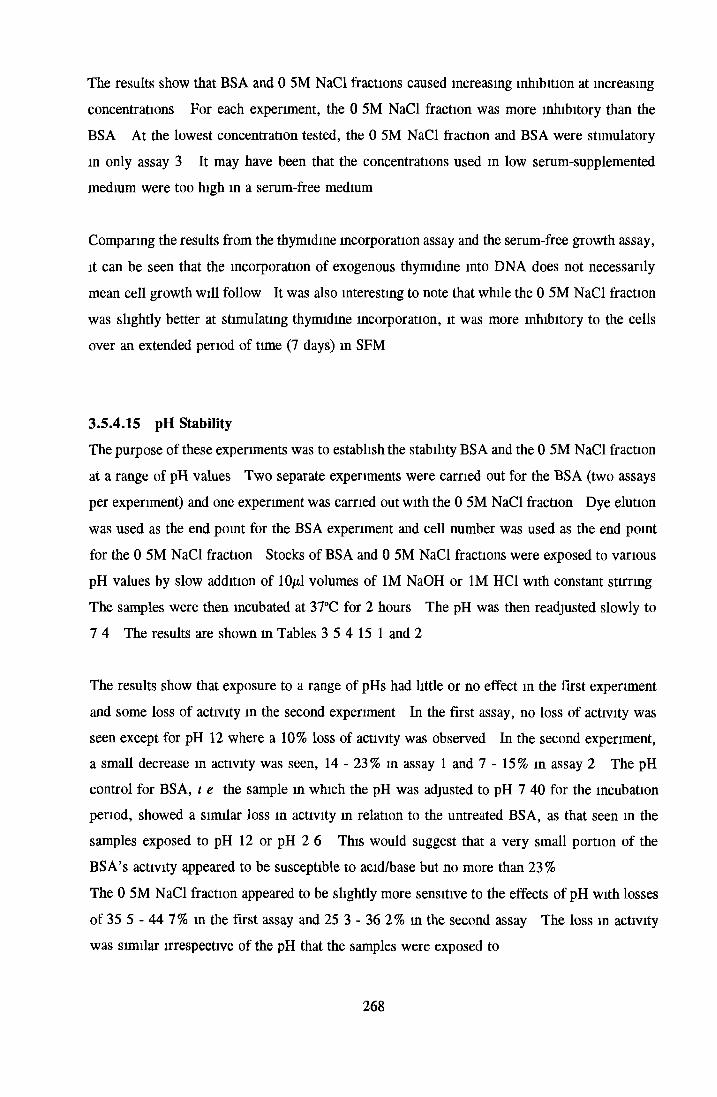
The results show that BSA and 0 5M NaCl fractions caused increasing inhibition at increasing
concentrations For each experiment, the 0 5M NaCl fraction was more inhibitory than the
BSA At the lowest concentration tested, the 0 5M NaCl fraction and BSA were stimulatory
in only assay 3 It may have been that the concentrations used m low serum-supplemented
medium were too high in a serum-free medium
Comparing the results from the thymidine incorporation assay and the serum-free growth assay,
it can be seen that the incorporation of exogenous thymidine into DNA does not necessarily
mean cell growth will follow It was also interesting to note that while the 0 5M NaCl fraction
was slightly better at stimulating thymidine incorporation, it was more inhibitory to the cells
over an extended period of time (7 days) m SFM
3.5.4.15 pH Stability
The purpose of these experiments was to establish the stability BSA and the 0 5M NaCl fraction
at a range of pH values Two separate experiments were carried out for the BSA (two assays
per experiment) and one experiment was carried out with the 0 5M NaCl fraction Dye elution
was used as the end point for the BSA experiment and cell number was used as the end point
for the 0 5M NaCl fraction Stocks of BSA and 0 5M NaCl fractions were exposed to various
pH values by slow addition of 10/tl volumes of 1M NaOH or 1M HC1 with constant stirring
The samples were then incubated at 37°C for 2 hours The pH was then readjusted slowly to
7 4 The results are shown in Tables 3 5 4 15 1 and 2
The results show that exposure to a range of pHs had little or no effect m the first experiment
and some loss of activity in the second experiment In the first assay, no loss of activity was
seen except for pH 12 where a 10% loss of activity was observed In the second experiment,
a small decrease in activity was seen, 14 - 23% m assay 1 and 7 - 15% in assay 2 The pH
control for BSA, i e the sample in which the pH was adjusted to pH 7 40 for the incubation
period, showed a similar loss in activity in relation to the untreated BSA, as that seen in the
samples exposed to pH 12 or pH 2 6 This would suggest that a very small portion of the
BSA’s activity appeared to be susceptible to acid/base but no more than 23%
The 0 5M NaCl fraction appeared to be slightly more sensitive to the effects of pH with losses
of 35 5 - 44 7% in the first assay and 25 3 - 36 2% in the second assay The loss in activity
was similar irrespective of the pH that the samples were exposed to
268
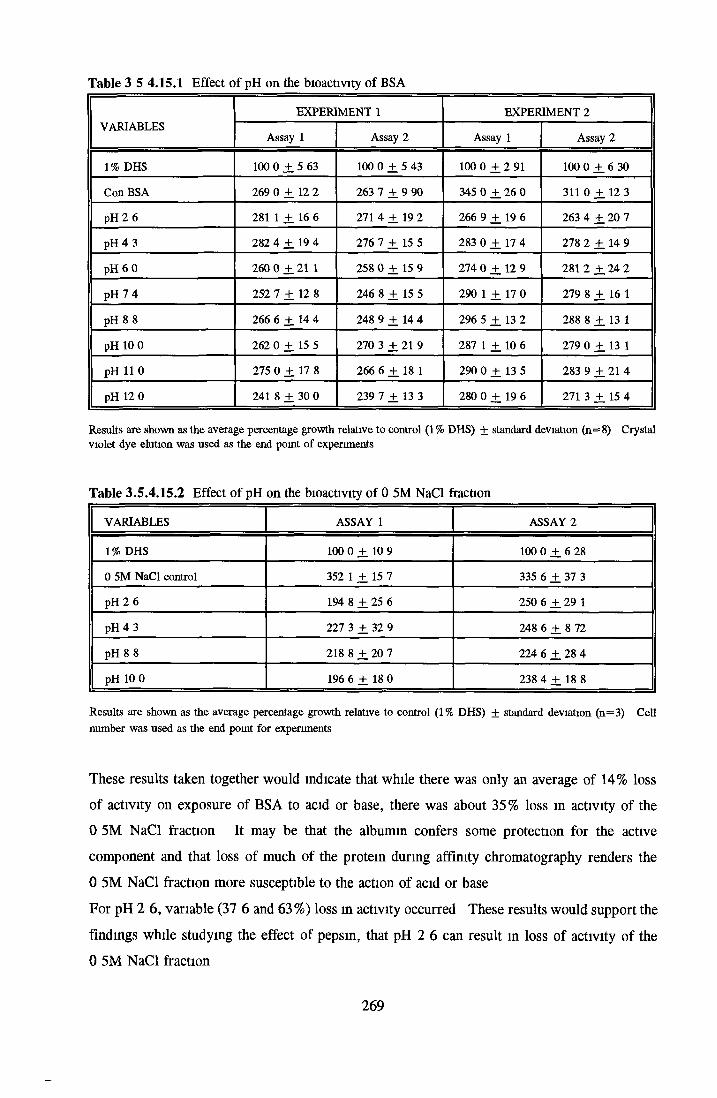
Table 3 5 4.15.1 Effect of pH on the bioactivity of BSA
VARIABLESEXPERIMENT 1 EXPERIMENT 2
Assay 1 Assay 2 Assay 1 Assay 2
1% DHS 100 0 + 5 63 100 0 + 5 43 100 0 + 2 91 100 0 ± 6 30
Con BSA 269 0 + 12 2 263 7 + 9 90 345 0 + 26 0 311 0 ± 12 3
pH 2 6 281 1 + 16 6 271 4 ± 19 2 266 9 + 19 6 263 4 ± 20 7
pH 4 3 282 4 ± 19 4 276 7 + 15 5 283 0 ± 17 4 278 2 +. 14 9
pH 6 0 260 0 + 21 1 258 0 + 15 9 274 0 + 12 9 2812 +.24 2
pH 7 4 252 7 + 12 8 246 8 + 15 5 290 1 + 17 0 279 8 +. 16 1
pH 8 8 266 6 ± 14 4 248 9 + 14 4 296 5 + 13 2 288 8 +. 13 1
pH 10 0 262 0 + 15 5 270 3 ± 21 9 287 1 + 10 6 279 0 +. 13 1
pH 11 0 275 0 + 17 8 266 6 + 18 1 290 0 + 13 5 283 9 +. 21 4
pH 12 0 241 8 + 30 0 239 7 ± 13 3 280 0 + 19 6 271 3 +. 15 4
Results are shown as the average percentage growth relative to control (1 % DHS) + standard deviation (n= 8) Crystal violet dye elution was used as the end point of experiments
Table 3.5.4.15.2 Effect of pH on the bioactivity of 0 5M NaCl fraction
VARIABLES ASSAY 1 ASSAY 2
1% DHS 100 0 + 10 9 100 0 + 6 28
0 5M NaCl control 352 1 ± 15 7 335 6 + 37 3
pH 2 6 194 8 + 25 6 250 6 + 29 1
pH 4 3 227 3 + 32 9 248 6 + 8 72
pH 8 8 218 8 + 20 7 224 6 ± 28 4
pH 10 0 196 6 + 18 0 238 4 + 18 8
Results are shown as the average percentage growth relative to control (1% DHS) + standard deviation (n=3) Cell number was used as the end point for experiments
These results taken together would indicate that while there was only an average of 14% loss
of activity on exposure of BSA to acid or base, there was about 35 % loss in activity of the
0 5M NaCl fraction It may be that the albumin confers some protection for the active
component and that loss of much of the protein during affinity chromatography renders the
0 5M NaCl fraction more susceptible to the action of acid or base
For pH 2 6, variable (37 6 and 63%) loss in activity occurred These results would support the
findings while studying the effect of pepsin, that pH 2 6 can result in loss of activity of the
0 5M NaCl fraction
269
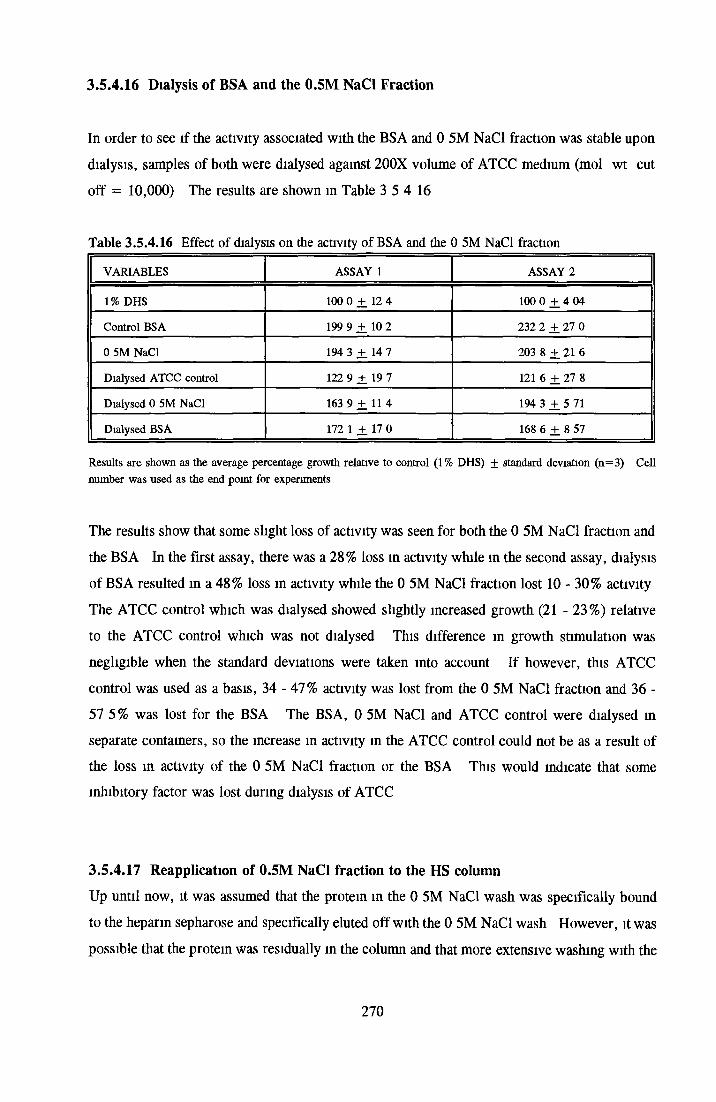
3.5.4.16 Dialysis of BSA and the 0.5M NaCl Fraction
In order to see if the activity associated with the BSA and 0 5M NaCl fraction was stable upon
dialysis, samples of both were dialysed against 200X volume of ATCC medium (mol wt cut
off = 10,000) The results are shown in Table 3 5 4 16
Table 3.5.4.16 Effect of dialysis on the activity of BSA and the 0 5M NaCl fraction
VARIABLES ASSAY 1 ASSAY 2
1% DHS 100 0 + 12 4 100 0 + 4 04
Control BSA 199 9 + 10 2 232 2 + 27 0
0 5M NaCl 194 3 + 14 7 203 8 + 21 6
Dialysed ATCC control 122 9 ± 19 7 121 6 + 27 8
Dialysed 0 5M NaCl 163 9 + 11 4 194 3 + 5 71
Dialysed BSA 172 1 + 17 0 168 6 + 8 57
Results are shown as the average percentage growth relative to control (1 % DHS) ± standard deviation (n= 3) Cell number was used as the end point for experiments
The results show that some slight loss of activity was seen for both the 0 5M NaCl fraction and
the BSA In the first assay, there was a 28% loss in activity while in the second assay, dialysis
of BSA resulted m a 48% loss in activity while the 0 5M NaCl fraction lost 10 - 30% activity
The ATCC control which was dialysed showed slightly increased growth (21 - 23%) relative
to the ATCC control which was not dialysed This difference in growth stimulation was
negligible when the standard deviations were taken into account If however, this ATCC
control was used as a basis, 34 -47% activity was lost from the 0 5M NaCl fraction and 36 -
57 5 % was lost for the BSA The BSA, 0 5M NaCl and ATCC control were dialysed in
separate containers, so the increase in activity in the ATCC control could not be as a result of
the loss in activity of the 0 5M NaCl fraction or the BSA This would indicate that some
inhibitory factor was lost during dialysis of ATCC
3.5.4.17 Reapplication o f 0.5M NaCl fraction to the HS column
Up until now, it was assumed that the protein in the 0 5M NaCl wash was specifically bound
to the heparin sepharose and specifically eluted off with the 0 5M NaCl wash However, it was
possible that the protein was residually in the column and that more extensive washing with the
270

NajHPOi buffer may have removed it In order to determine the specificity of binding of the
0 5M NaCI fraction, a sample of the 0 5M NaCl fraction was reapplied to the HS column This
fraction was treated as if it were the unfractionated BSA Two separate experiments were
carried out The results of the second experiment are shown in Table 3 5 4 17 1
The results for the first reapplication experiment were disappointing in that the level of activity
of the 0 5M NaCl fraction from the first application was very low and all the factors appeared
inhibitory on the reapplication However, the protein profile showed that the only detectable
amount of protein which was measured in the reapplied sample was eluted off in the 0 5M NaCl
wash, supporting the idea that the activity was indeed specifically eluted off in the 0 5M NaCl
wash
In the second reapplication experiment, good activity was seen in the 0 5M NaCl wash in both
applications The results are shown in Table 3 5 4 17 2 The activity m the 0 5M NaCl wash
on reapplication was better than that in the first application Inhibition ranging from 13% to
70 0% was seen in the remaining fractions after the reapplication
Table 3.5.4 17.2 Reapplication of the 0 5M NaCl fraction to HS column
VARIABLES BSA 0 5M NaCl BSA 0 5M NaCl
1% DHS 100 0 ± 7 31 100 0 ± 17 9 100 0 ± 14 7 100 0 ± 12 9
Control BSA 214 9 ± 56 9 193 8 ± 9 23 262 3 ± 20 7 196 3 ± 25 1
Unbound fraction 63 79 ± 12 2 30 00 + 3 99 69 45 ± 11 9 82 27 ± 6 12
Buffer Wash 31 00 + .2 44 54 23 ± 1 63 42 11 ± 11 9 65 38 ± 1 02
0 5M NaCl Wash 199 0 ± 13 1 290 8 ± 26 0 216 7 ± 10 3 278 8 ± 29 5
1 0M NaCl Wash 102 3 ± 15 4 86 92 ± 8 74 114 7 ± 1 9 3 62 50 ± 8 33
2 0M NaCl Wash 83 30 ± 6 97 46 92 ± 9 32 110 8 ± 7 40 39 42 ± 10 9
Results are shown as the average percentage growth relative to control (1% DHS) + standard deviation (n=8) Cell number was used as the end pomt for experiments The protein concentrations for the samples are BSA = 7 6mg/ml, unbound fraction = 6 Omg/ml, buffer wash = 1 163mg/ml, 0 5M NaCl fraction = 0 38mg/ml and all the samples for the reapplication had no detectable protem concentrations
However, although the protein concentration of the initial BSA solution was gravimetrically,
15mg/ml, spectrophotometrically the concentration was only 7 6mg/ml As a result of the low
initial protem concentrations, no protein was detected in the reapplied samples
271

The results show that for heparin sepharose the activity of the 0 5M NaCl fraction specifically
eluted m the 0 5M NaCl wash It also shows that further purification of the 0 5M NaCl
fraction resulted in increased activity in the second assay It may be that reapplication of the
0 5M NaCl removed some factor(s) that maybe inhibitory
3.5.4.18 Application o f heat-shock albumin to heparin sepharose
As the ’heat-shock’ albumin (Figure 3 5 2 4) showed greater stimulation than the Cohn fraction
V albumins, it was of interest to subject this albumin to HS chromatography to see if the same
trend were observed with BSA fraction V (A4919) The results are shown in Table 3 5 4 18
Table 3 5 4 18
FRACTION ASSAY 1 ASSAY 2
1% DHS 100 0 + 10 2 100 0 ± 7 70
+ BSA Con 485 5 ± 2 6 1 181 3 ± 1 6 5
+ Unbound Fraction 182 5 ± 12 7 95 10 ± 8 41
+ Buffer Wash 115 9 + 26 9 68 61 ± 5 18
+ 0 5M NaCl 250 9 ± 21 8 136 1 ± 2 43
+ 1 OM NaCl 203 6 ± 52 7 109 8 ± 8 10
+ 2 OM NaCl 158 0 + 23 2 91 60 + 6 06---------------------- :_______________
Results are shown as the average percentage growth relative to control (1% DHS) ± standard deviation (n=8) Cell number was used as the end point for experiments
The results show very different trends between the two experiments In the first assay, very
good stimulation was seen in all fractions except the buffer wash The cell growth in this assay
was very low In the second assay, the extent of stimulation was very low, with only a fraction
of the activity being isolated in the 0 5M NaCl fraction
The presence of activity in the other fractions obtained with this albumin m assay 1, may
indicate that for the heat-shock albumin, a number of factors are contributing to the activity,
including the factor eluted m the 0 5M NaCl wash The amount of activity isolated in the 0 5M
NaCl fraction was 44% of the control according to both assays So it would appear that the
heat-shock albumin would not be a more plentiful source of the active factor associated with the
0 5M NaCl fraction than the albumin used in these studies
272

3.5.5 BSA AND REVERSE PHASE - HPLC
Congote (1987) found the contaminating factor associated with BSA which stimulated thymidine
incorporation into rat erythroid cells in serum-free medium to be an erythrotropin-like factor
Reverse phase HPLC was used as the initial purification step in isolating the active factor This
technique was used to see if the BSA fraction active for NRK cells was related to the
erythrotropin-like factor
A C18 ptbondapak column was used with a linear gradient of 20% to 80% vol/vol acetonitrile
(ACN) with 0 1 % trifluoroacetic acid (TFA) in ultrapure H20 The gradient program was run
for 26 minutes at a flow rate of 1 Oml/min A solution of 200mg/ml BSA (A4919, lot 110H
04635) was made up and 50/d was added to the 20f d injection loop per run An additional 5-6
minutes were allowed for all peaks to elute off the column Fractions were lyophilized to
remove the acetonitrile before testing for bioactivity
3.5.5.1 Protein E lution Profiles
In order to get enough sample to test the bioactivity of the fractions, it was necessary to carry
out 26 runs on the HPLC column The elution profiles of absorbance at 280nm from the 26
runs showed very consistent results One of the elution profiles is shown in Figure 3 5 5 1
For all runs a small blip occurred at 27 - 30%ACN The mam protein peak eluted off in
fractions 50 - 60%ACN There was always a small lip in front of the mam peak, after which,
the main peak rose abruptly and then showed a tailing effect as the absorbance returned to base
level Three small peaks were present at the end of the gradient varying between fractions 13,
14 and 15 and fractions 12, 13 and 15
One sample of BSA-coproporphyrin 1 mixture was run and the detection at 400nm was
measured Coproporphyrin was applied as Congote found the erythrotropm-like factor to elute
at the same point as coproporphyrin A dip and peak was seen around 30% ACN Another
peak was seen at 50% ACN which coincided with the mam albumin protein peak
Comparison of the elution profile (Figure 3 5 5 3 2) obtained with Congote’s elution profile
showed differences m the position of the mam albumin peak and the coproporphyrin peak In
these studies, the major protein peak was eluted off at 50% ACN, as compared to a value of
30% ACN reported by Congote The elution profile obtained at 400nm with the
coproporphyrin sample, showed one mam peak at 27% ACN followed by a trough, with a
273
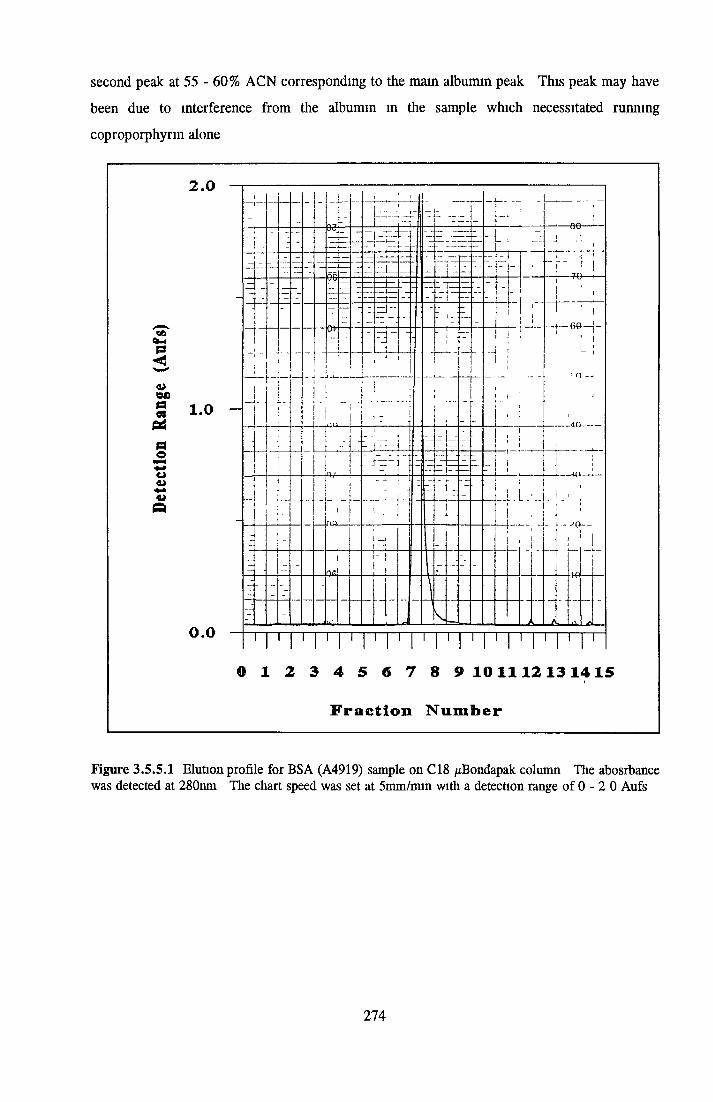
second peak at 55 -60% ACN corresponding to the main albumin peak This peak may have
been due to interference from the albumin m the sample which necessitated running
coproporphyrin alone
2.0
O 1 2 3 4 5 6 7 8 9 10 1112 131415
Fraction Number
Figure 3.5.5.1 Elution profile for BSA (A4919) sample on C18 /¿Bondapak column The abosrbance was detected at 280nm The chart speed was set at 5mm/min with a detection range of 0 - 2 0 Aufs
274
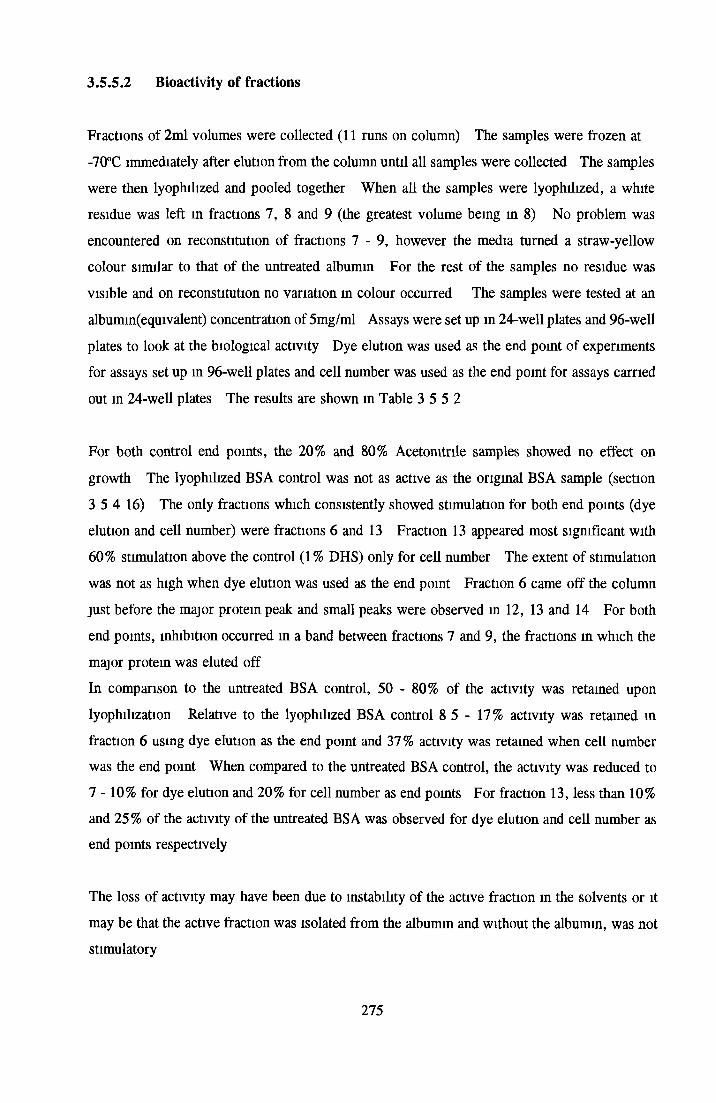
3.5.S.2 Bioactivity of fractions
Fractions of 2ml volumes were collected (11 runs on column) The samples were frozen at
-70°C immediately after elution from the column until all samples were collected The samples
were then lyophilized and pooled together When all the samples were lyophilized, a white
residue was left in fractions 7, 8 and 9 (the greatest volume being in 8) No problem was
encountered on reconstitution of fractions 7 - 9 , however the media turned a straw-yellow
colour similar to that of the untreated albumin For the rest of the samples no residue was
visible and on reconstitution no variation in colour occurred The samples were tested at an
albumin(equivalent) concentration of 5mg/ml Assays were set up in 24-well plates and 96-well
plates to look at the biological activity Dye elution was used as the end point of experiments
for assays set up in 96-well plates and cell number was used as the end point for assays carried
out in 24-well plates The results are shown in Table 3 5 5 2
For both control end points, the 20% and 80% Acetomtrile samples showed no effect on
growth The lyophilized BSA control was not as active as the original BSA sample (section
3 5 4 16) The only fractions which consistently showed stimulation for both end points (dye
elution and cell number) were fractions 6 and 13 Fraction 13 appeared most significant with
60% stimulation above the control (1 % DHS) only for cell number The extent of stimulation
was not as high when dye elution was used as the end point Fraction 6 came off the column
just before the major protein peak and small peaks were observed m 12, 13 and 14 For both
end points, inhibition occurred in a band between fractions 7 and 9, the fractions in which the
major protein was eluted off
In comparison to the untreated BSA control, 50 - 80% of the activity was retained upon
lyophilization Relative to the lyophilized BSA control 8 5 - 17% activity was retained in
fraction 6 using dye elution as the end point and 37 % activity was retained when cell number
was the end point When compared to the untreated BSA control, the activity was reduced to
7 - 10% for dye elution and 20% for cell number as end points For fraction 13, less than 10%
and 25 % of the activity of the untreated BSA was observed for dye elution and cell number as
end points respectively
The loss of activity may have been due to instability of the active fraction in the solvents or it
may be that the active fraction was isolated from the albumin and without the albumin, was not
stimulatory
275

There may also have been some loss of activity in the albumin itself when exposed to increasing
acetonitrile concentrations In addition, it took 36 hours for the samples to be lyophilized
From previous results it was known that lyophilization did reduce the activity of the albumin
but not the 0 5M NaCl fraction On exposure to acetonitrile before lyophilization, both showed
reduced stimulation (section 3 5 4 12)
Table 3 5 5.2 Bioactivity of HPLC fractions
VARIABLES DE/ ASSAY 1 DE/ ASSAY 2 CN/ ASSAY 1
1% DHS 1000 + 8 16 100 0 + 11 9 100 0 + 17 6
+ 20% ACN Con 109 9 + 12 3 99 26 + 4 75 104 4 ± 16 8
+ 80% ACN Con 104 3 ± 12 5 96 29 + 9 99 100 0 + 26 7
+ BSA Con 395 5 + 23 6 303 7 i 27 2 347 7 + 23 6
+ BSA (lyo) 335 2 + 14 1 223 3 + 19 0 225 0 + 19 3
+ fraction 1 117 1 ± 6 33 103 4 + 6 82 95 45 ± 11 8
+ fraction 2 100 7 + 2 67 88 57 + 6 70 93 18 + 15 7
+ fraction 3 102 4 + 6 59 99 05 + 12 2 106 1 + 27 8
+ fraction 4 106 7 + 10 0 90 61 + 10 4 129 5 + 29 7
+ fraction 5 90 00 + 5 16 94 28 + 8 57 106 8 + 20 8
+ fraction 6 120 0 + 10 0 120 9 + 14 9 146 7 + 20 2
+ fraction 7 76 66 + 4 71 40 95 ± 6 68 40 00 + 10 0
+ fraction 8 70 00 + 6 66 57 62 + 5 83 43 33 + 15 3
+ fraction 9 93 83 ± 7 28 86 73 + 7 63 73 33 + 10 4
+ fraction 10 100 6 + 5 93 99 26 +. 9 14 66 66 + 27 5
+ fraction 11 122 9 + 7 12 103 3 + 12 8 76 66 + 5 77
+ fraction 12 1185 + 102 107 9 + 6 64 131 1 + 10 2
+ fraction 13 124 4 ± 7 68 118 9 + 12 6 163 3 + 14 1
+ fraction 14 104 3 + 12 7 105 7 + 7 97 122 2 + 13 9
+ fraction 15 113 1 + 8 28 96 75 + 7 96 131 1 + 19 2
Results are expressed as the average percentage growth relative to control (1 % DHS) +. standard deviation (n=8 for DE and n=3 for CN) Abbreviations DE = dye elution, CN = cell number, BSA con = untreated BSA at 5mg/ml, BSA (lyo) = BSA which has been lyophilized, tested at 5mg/ml, 20% and 80% ACN con = solvent control to ensure no residue from the solvent affected growth (20% ACN at beginning and 80% at end of gradient)
276
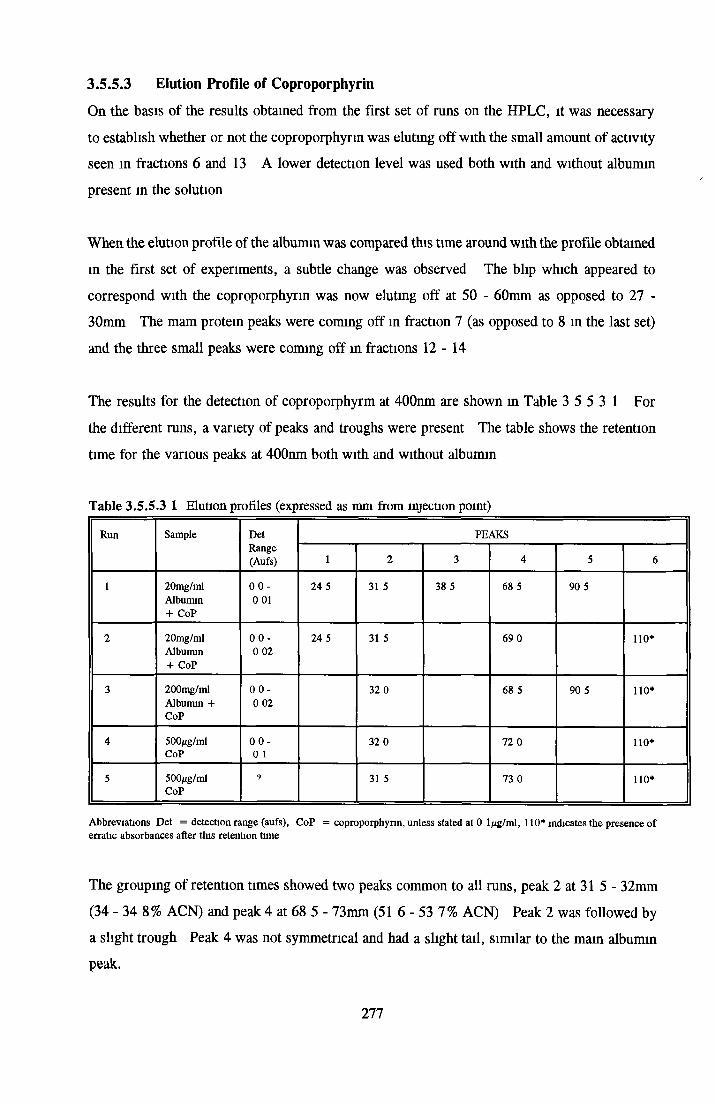
3.5.S.3 E lution Profile o f Coproporphyrin
On the basis of the results obtained from the first set of runs on the HPLC, it was necessary
to establish whether or not the coproporphyrm was eluting off with the small amount of activity
seen in fractions 6 and 13 A lower detection level was used both with and without albumin
present in the solution
When the elution profile of the albumin was compared this time around with the profile obtained
in the first set of experiments, a subtle change was observed The blip which appeared to
correspond with the coproporphyrin was now elutmg off at 50 - 60mm as opposed to 27 -
30mm The mam protein peaks were coming off in fraction 7 (as opposed to 8 in the last set)
and the three small peaks were coming off in fractions 1 2 - 1 4
The results for the detection of coproporphyrm at 400nm are shown in Table 3 5 5 3 1 For
the different runs, a variety of peaks and troughs were present The table shows the retention
time for the various peaks at 400nm both with and without albumin
Table 3.5.5.3 1 Elution profiles (expressed as mm from injection point)
Run Sample Det PEAKSRange(Aufs) 1 2 3 4 5 6
1 20mg/ml Albumin + CoP
0 0 - 0 01
24 5 31 5 38 5 68 5 90 5
2 20mg/ml Albumin + CoP
0 0 - 0 02
24 5 31 5 69 0 110*
3 200mg/ml Albumin + CoP
0 0- 0 02
32 0 68 5 90 5 110*
4 500jtg/mlCoP
0 0 - 0 1
32 0 72 0 n o *
5 500/ig/mlCoP
9 31 5 73 0 110*
Abbreviations Det = detection range (aufs), CoP = coproporphyrm, unless stated at 0 lftg/ml, 110* indicates the presence of erratic absorbances after this retention time
The grouping of retention times showed two peaks common to all runs, peak 2 at 31 5 - 32mm
(34 - 34 8 % ACN) and peak 4 at 68 5 - 73mm (51 6 - 53 7 % ACN) Peak 2 was followed by
a slight trough Peak 4 was not symmetrical and had a slight tail, similar to the main albumin
peak.
277
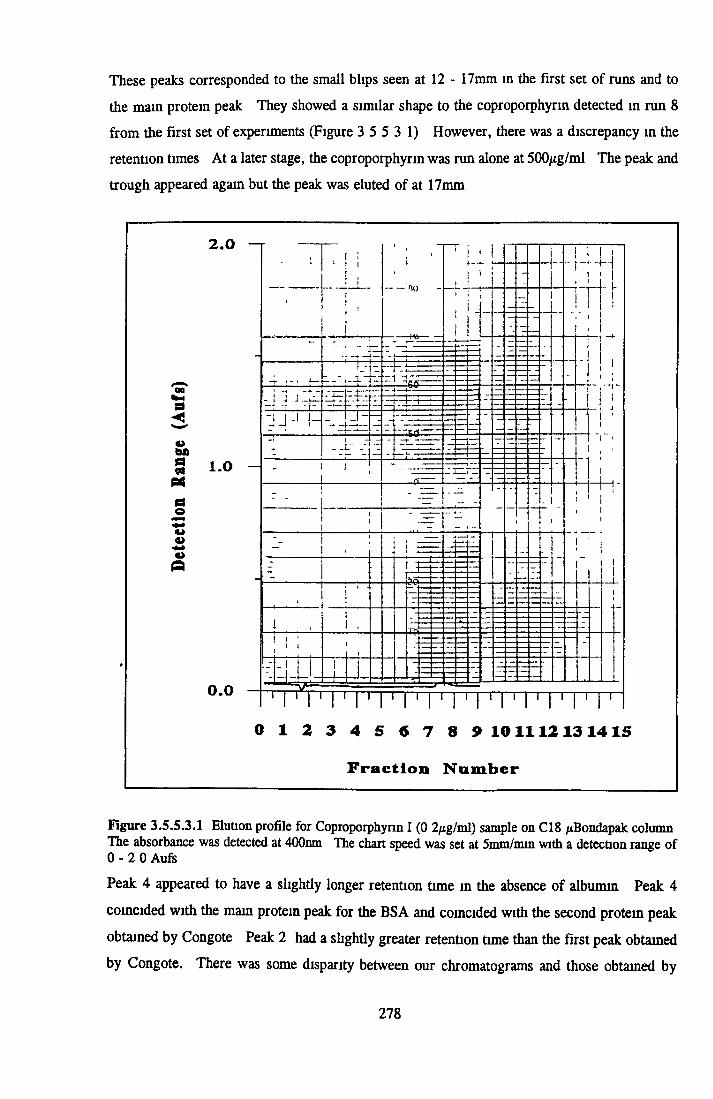
These peaks corresponded to the small blips seen at 12 - 17mm in the first set o f runs and to
the main protein peak They showed a similar shape to the coproporphyrm detected in run 8
from the first set o f experiments (Figure 3 5 5 3 1) However, there was a discrepancy m the
retention times At a later stage, the coproporphyrm was run alone at 500/zg/ml The peak and
trough appeared again but the peak was eluted o f at 17mm
Figure 3.5.5.3.1 Elution profile for Coproporphyrm I (0 2/tg/ml) sample on C18 /tBondapak column The absorbance was detected at 400nm The chart speed was set at 5mm/min with a detection range of 0 - 2 0 Aufs
Peak 4 appeared to have a slightly longer retention time in the absence o f albumin Peak 4
coincided with the mam protein peak for the BSA and coincided with the second protein peak
obtained by Congote Peak 2 had a slightly greater retention time than the first peak obtained
by Congote. There was some disparity between our chromatograms and those obtained by
278
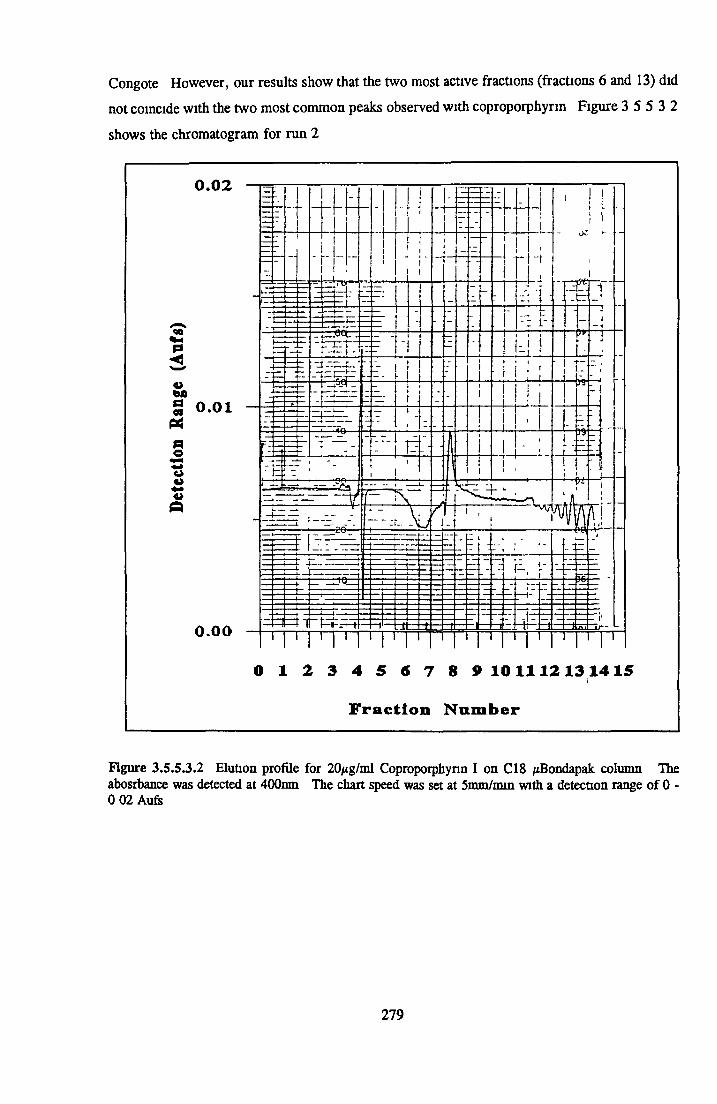
Congote However, our results show that the two most active fractions (fractions 6 and 13) did
not coincide with the two most common peaks observed with coproporphyrin Figure 3 5 5 3 2
shows the chromatogram for run 2
Figure 3.5.S.3.2 Elution profile for 20/tg/ml Coproporphyrin I on C18 /¿Bondapak column The abosrbance was detected at 400nm The chart speed was set at 5mm/min with a detection range o f 0 - 0 02 Aufs
279
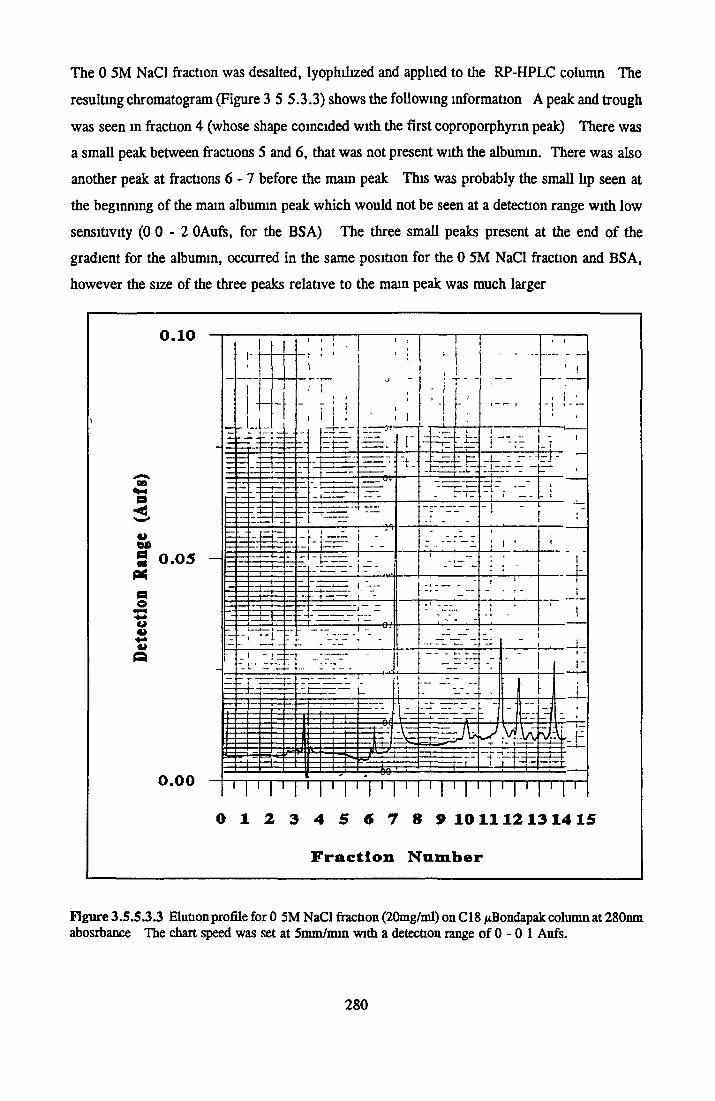
The 0 5M NaCl fraction was desalted, lyophiiized and applied to the RP-HPLC column The
resulting chromatogram (Figure 3 5 5 .3 .3 ) shows the following information A peak and trough
was seen in fraction 4 (whose shape coincided with the first coproporphyrin peak) There was
a small peak between fractions 5 and 6 , that was not present with the albumin. There was also
another peak at fractions 6 - 7 before the mam peak This was probably the small lip seen at
the beginning o f the mam albumin peak which would not be seen at a detection range with low
sensitivity ( 0 0 - 2 OAufs, for the BSA) The three small peaks present at the end o f the
gradient for the albumin, occurred in the same position for the 0 5M NaCl fraction and BSA,
however the size o f the three peaks relative to the mam peak was much larger
Fraction Number
Figure 3.5.5.3.3 Elution profile for 0 5M NaCl fraction (20mg/ml) onC18 /xBondapak column at 280nm abosrbance The chart speed was set at 5mm/min with a detection range of 0 - 0 1 Aufs.
280
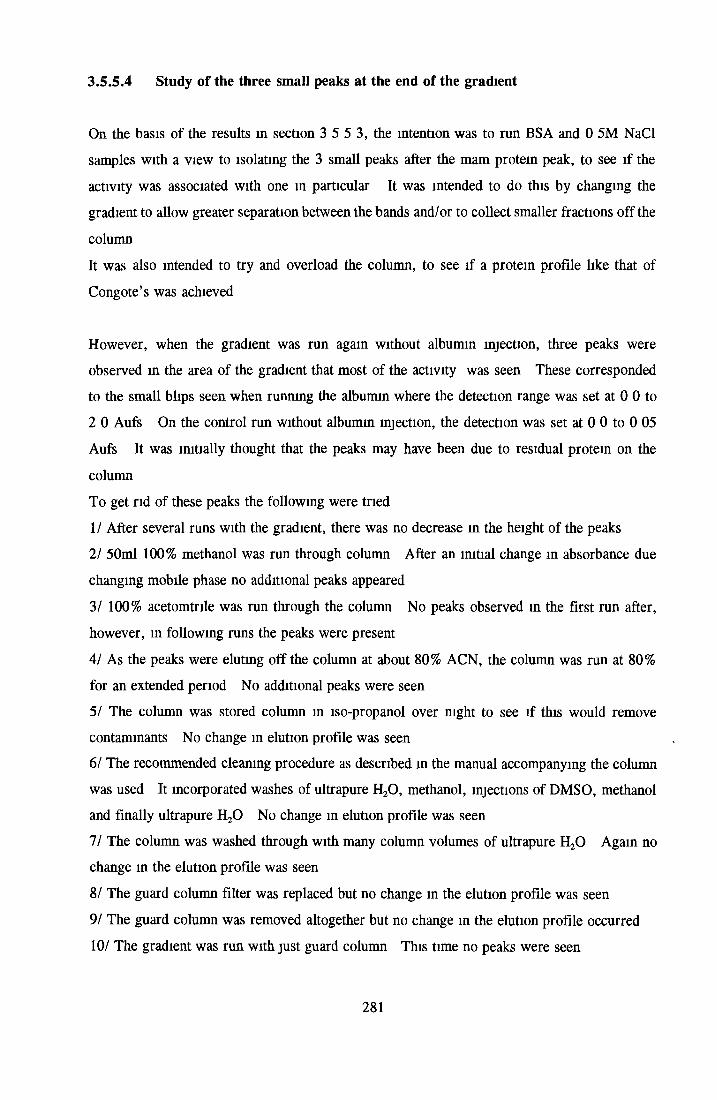
3.5.5.4 Study of the three small peaks at the end of the gradient
On the basis o f the results in section 3 5 5 3, the intention was to run BSA and 0 5M NaCl
samples with a view to isolating the 3 small peaks after the mam protein peak, to see if the
activity was associated with one in particular It was intended to do this by changing the
gradient to allow greater separation between the bands and/or to collect smaller fractions o ff the
column
It was also intended to try and overload the column, to see if a protein profile like that of
Congote’s was achieved
However, when the gradient was run again without albumin injection, three peaks were
observed in the area o f the gradient that most o f the activity was seen These corresponded
to the small blips seen when running the albumin where the detection range was set at 0 0 to
2 0 Aufs On the control run without albumin injection, the detection was set at 0 0 to 0 05
Aufs It was initially thought that the peaks may have been due to residual protein on the
column
To get rid o f these peaks the following were tried
1/ After several runs with the gradient, there was no decrease in the height o f the peaks
2/ 50ml 100% methanol was run through column After an initial change m absorbance due
changing mobile phase no additional peaks appeared
3/ 100% acetomtrile was run through the column No peaks observed in the first run after,
however, in following runs the peaks were present
4 / As the peaks were eluting off the column at about 80% ACN, the column was run at 80%
for an extended period No additional peaks were seen
5/ The column was stored column in iso-propanol over night to see if this would remove
contaminants No change in elution profile was seen
6/ The recommended cleaning procedure as described in the manual accompanying the column
was used It incorporated washes of ultrapure H20 , methanol, injections o f DMSO, methanol
and finally ultrapure H20 No change in elution profile was seen
7 / The column was washed through with many column volumes of ultrapure H20 Again no
change in the elution profile was seen
8/ The guard column filter was replaced but no change in the elution profile was seen
91 The guard column was removed altogether but no change in the elution profile occurred
10/ The gradient was run with just guard column This time no peaks were seen
281

11/ A different source of acetonitrile was tried Again no change in the elution profile was
seen
12/ A Novopak Clg column was used Peaks appeared in the same place even though the
Novopak was never exposed to albumin
13/ Finally a cleaning procedure supplied by Waters was tried This cleaning procedure was
similar to the one above, but had an additional washing phase with chloroform Still no change
in the elution profile was seen
Several runs without albumin injection were carried out and fractions were lyophilized No
protein bands were observed in the albumin position in fractions 11 to 15 The bioactivity of
these fractions were tested and the results are shown m Table 3 5 5 4 1
Table 3.5.5.4.1 Bioactivity of HPLC fractions
VARIABLES DE/ ASSAY 1 DE/ ASSAY 2 CN/ ASSAY 1
1% DHS 100 0 ± 16 7 100 0 ± 16 6 100 0 ± 6 75
+ fraction 1 40 00 ± 6 67 44 44 ± 13 9 43 72 ± 4 17
+ fraction 2 36 66 ± 10 0 36 11 ± 11 1 41 99 ± 4 17
+ fraction 3 30 00 ± 6 67 25 00 ± 5 55 33 77 ± 0 00
+ fraction 4 36 66 ± 10 0 33 00 ± 1 1 1 35 50 ± 9 75
+ fraction 5 40 00 ± 13 3 33 00 ± 1 1 1 34 20 ± 0 75
+ fraction 6 26 66 ± 6 67 27 78 ± 8 33 24 00 ± 0 92
+ fraction 7 30 00 ± 6 67 30 55 ± 11 1 40 00 ± 4 04
+ fraction 8 23 33 ± 6 67 13 90 ± 8 33 25 71 ± 0 00
+ fraction 9 56 50 ± 8 70 52 02 ± 13 9 60 00 ± 6 06
+ fraction 10 52 20 ± 8 70 58 96 ± 10 4 61 43 ± 8 08
+ fraction 11 52 20 ± 13 0 83 24 ± 13 9 57 62 ± 12 5
+ fraction 12 56 50 ± 8 70 90 17 ± 17 3 79 52 ± 4 59
+ fraction 13 69 56 ± 17 4 104 0 ± 20 8 92 00 ± 13 1
+ fraction 14 73 90 ± 26 1 65 89 ± 13 9 52 00 ± 17 5
+ fraction 15 69 56 ± 17 4 65 90 ± 6 94 68 00 ± 14 1
5% DHS 443 5 + 30 4 360 1 + 39 7 440 7 + 33 5
Results are expressed as the average percentage growth relative to control (1% DHS) ± standard deviation (n=8 for DE and n=3 for CN) Abbreviations DE = dye elution, CN = cell number
The results were surprising in that most of the fractions showed growth inhibition in comparison
to the control (1% DHS) It was as if some residual acetonitrile or TFA had not been fully
282
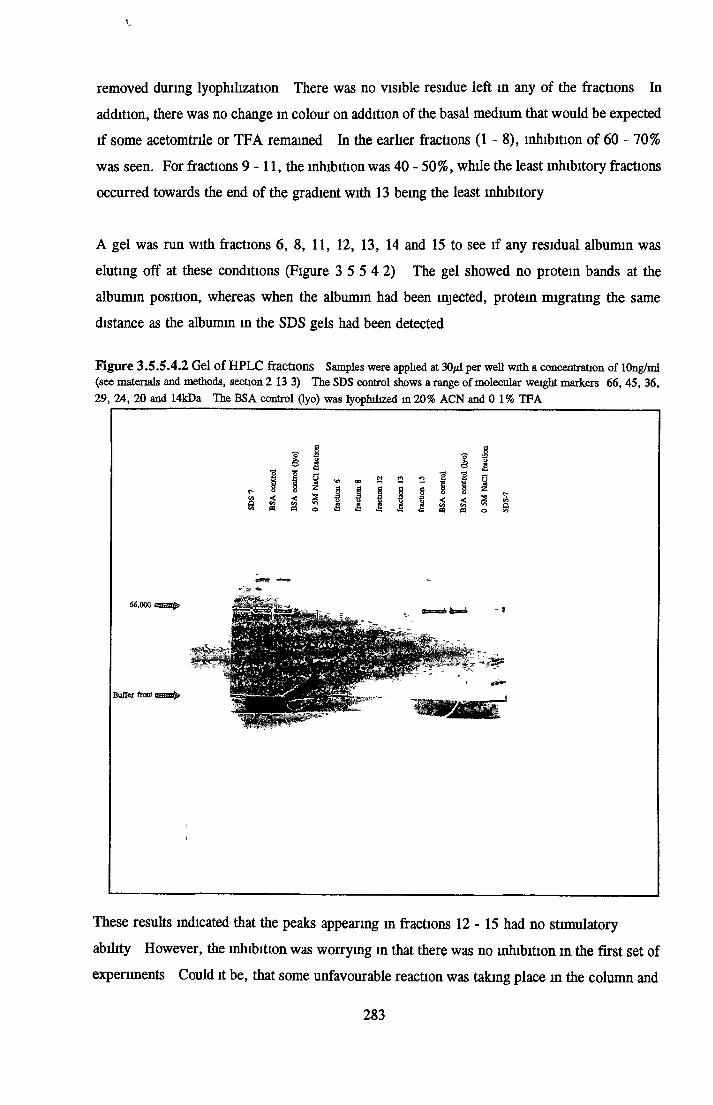
V
removed during lyophilization There was no visible residue left in any o f the fractions In
addition, there was no change in colour on addition of the basal medium that would be expected
if some acetomtrile or TFA remained In the earlier fractions (1 - 8), inhibition o f 60 -70%
was seen. For fractions 9 - 1 1 , the inhibition was 4 0 - 5 0 % , while the least inhibitory fractions
occurred towards the end o f the gradient with 13 being the least inhibitory
A gel was run with fractions 6 , 8, 11, 12, 13, 14 and 15 to see if any residual albumin was
eluting off at these conditions (Figure 3 5 5 4 2) The gel showed no protein bands at the
albumin position, whereas when the albumin had been injected, protein migratmg the same
distance as the albumin in the SDS gels had been detected
Figure 3.5.5.4.2 Gel of HPLC fractions Samples were applied at 30/zl per well with a concentration of lOng/ml (see materials and methods, section 2 13 3) The SDS control shows a range of molecular weight markers 66, 45, 36, 29, 24, 20 and 14kDa The BSA control (lyo) was lyophihzed in 20% ACN and 0 1 % TFA
These results indicated that the peaks appearing m fractions 12 - 15 had no stimulatory
ability However, the inhibition was worrying in that there was no inhibition m the first set of
experiments Could it be, that some unfavourable reaction was taking place m the column and
283
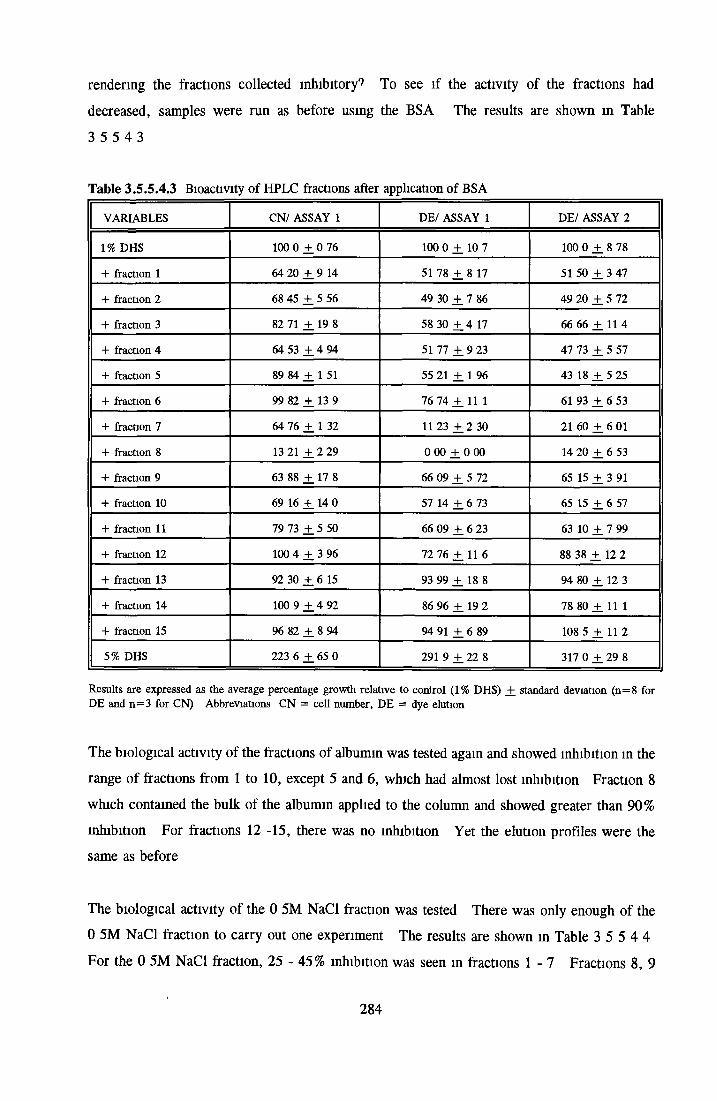
rendering the fractions collected inhibitory? To see if the activity of the fractions had
decreased, samples were run as before using the BSA The results are shown in Table
3 5 5 4 3
Table 3.5.5.4.3 Bioactivity of HPLC fractions after application of BSA
VARIABLES CN/ ASSAY 1 DE/ ASSAY 1 DE/ ASSAY 2
1% DHS 100 0 ± 0 76 100 0 ± 10 7 100 0 ± 8 78
+ fraction 1 64 20 ± 9 14 51 78 ± 8 17 51 50 ± 3 47
+ fraction 2 68 45 ± 5 56 49 30 ± 7 86 49 20 ± 5 72
+ fraction 3 82 71 ± 19 8 58 30 ± 4 17 66 66 ± 11 4
+ fraction 4 64 53 ± 4 94 51 77 ± 9 23 47 73 ± 5 57
+ fraction 5 89 84 ± 1 51 55 21 ± 1 96 43 18 ± 5 25
+ fraction 6 99 82 ± 13 9 76 74 ± 1 1 1 61 93 ± 6 53
+ fraction 7 64 76 ± 1 32 11 23 ± 2 30 21 60 ± 6 01
+ fraction 8 13 21 +.2 29 0 00 + 0 00 14 20 ± 6 53
+ fraction 9 63 88 ± 17 8 66 09 ± 5 72 65 15 ± 3 91
+ fraction 10 69 16 ± 14 0 57 14 ± 6 73 65 15 ± 6 57
+ fraction 11 79 73 ± 5 50 66 09 ± 6 23 63 10 ± 7 99
+ fraction 12 100 4 ± 3 96 72 76 ± 1 1 6 88 38 ± 12 2
+ fraction 13 92 30 ± 6 15 93 99 ± 18 8 94 80 ± 12 3
+ fraction 14 100 9 ± 4 92 86 96 ± 19 2 78 80 ± 1 1 1
+ fraction 15 96 82 ± 8 94 94 91 ± 6 89 108 5 ± 11 2
5% DHS 223 6 ± 65 0 291 9 ± 22 8 317 0 ± 29 8
Results are expressed as the average percentage growth relative to control (1% DHS) ± standard deviation (n=8 for DE and n=3 for CN) Abbreviations CN = cell number, DE = dye elution
The biological activity of the fractions of albumin was tested again and showed inhibition in the
range of fractions from 1 to 10, except 5 and 6, which had almost lost inhibition Fraction 8
which contained the bulk of the albumin applied to the column and showed greater than 90%
inhibition For fractions 12 -15, there was no inhibition Yet the elution profiles were the
same as before
The biological activity of the 0 5M NaCl fraction was tested There was only enough of the
0 5M NaCl fraction to carry out one experiment The results are shown in Table 3 5 5 4 4
For the 0 5M NaCl fraction, 25 - 45% inhibition was seen in fractions 1 - 7 Fractions 8, 9
284
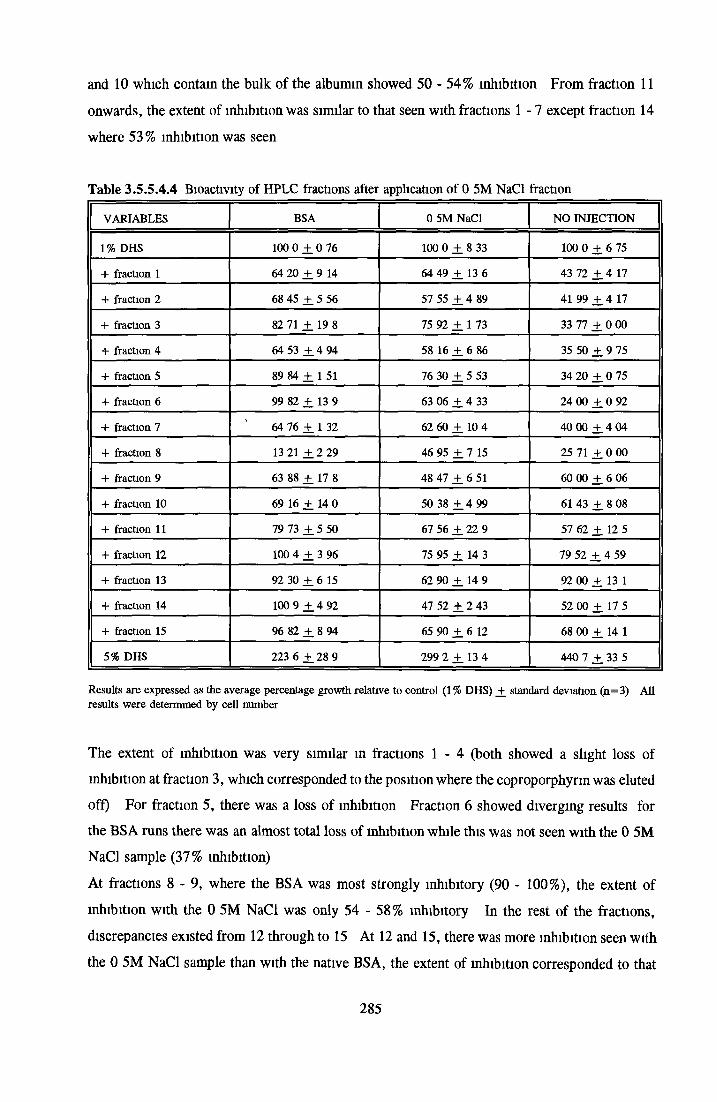
and 10 which contain the bulk of the albumin showed 50 -54% inhibition From fraction 11
onwards, the extent of inhibition was similar to that seen with fractions 1 - 7 except fraction 14
where 53% inhibition was seen
Table 3.5.5.4.4 Bioactivity of HPLC fractions after application of 0 5M NaCl fraction
VARIABLES BSA 0 5M NaCl NO INJECTION
1% DHS 100 0 ± 0 76 100 0 ± 8 33 100 0 + 6 75
+ fraction 1 64 20 ± 9 14 64 49 ± 13 6 43 72 + 4 17
+ fraction 2 68 45 ± 5 56 57 55 ± 4 89 41 99 ± 4 17
+ fraction 3 82 71 ± 19 8 75 92 ± 1 73 33 77 ± 0 00
+ fraction 4 64 53 ± 4 94 58 16 ± 6 86 35 50 + 9 75
+ fraction 5 89 84 ± 1 51 76 30 ± 5 53 34 20 ± 0 75
+ fraction 6 99 82 ± 13 9 63 06 ± 4 33 24 00 ± 0 92
+ fraction 7 ' 64 76 ± 1 32 62 60 ± 10 4 40 00 ± 4 04
+ fraction 8 13 21 ± 2 29 46 95 ± 7 15 25 71 + 0 00
+ fraction 9 63 88 ± 17 8 48 47 ± 6 51 60 00 ± 6 06
+ fraction 10 69 16 ± 14 0 50 38 ± 4 99 61 43 + 8 08
+ fraction 11 79 73 ± 5 50 67 56 ± 22 9 57 62 + 12 5
+ fraction 12 100 4 ± 3 96 75 95 ± 14 3 79 52 + 4 59
+ fraction 13 92 30 ± 6 15 62 90 ± 14 9 92 00 + 13 1
+ fraction 14 100 9 ± 4 92 47 52 ± 2 43 52 00 ± 17 5
+ fraction 15 96 82 ± 8 94 65 90 ± 6 12 68 00 + 14 1
5% DHS 223 6 ± 2 8 9 299 2 +. 13 4 440 7 + 33 5
Results are expressed as the average percentage growth relative to control (1 % DHS) ±_ standard deviation (n=3) All results were determined by cell number
The extent of inhibition was very similar in fractions 1 - 4 (both showed a slight loss of
inhibition at fraction 3, which corresponded to the position where the coproporphyrm was eluted
off) For fraction 5, there was a loss of inhibition Fraction 6 showed diverging results for
the BSA runs there was an almost total loss of inhibition while this was not seen with the 0 5M
NaCl sample (37% inhibition)
At fractions 8 - 9 , where the BSA was most strongly inhibitory (90 - 100%), the extent of
inhibition with the 0 5M NaCl was only 54 - 58% inhibitory In the rest of the fractions,
discrepancies existed from 12 through to 15 At 12 and 15, there was more inhibition seen with
the 0 5M NaCl sample than with the native BSA, the extent of inhibition corresponded to that
285
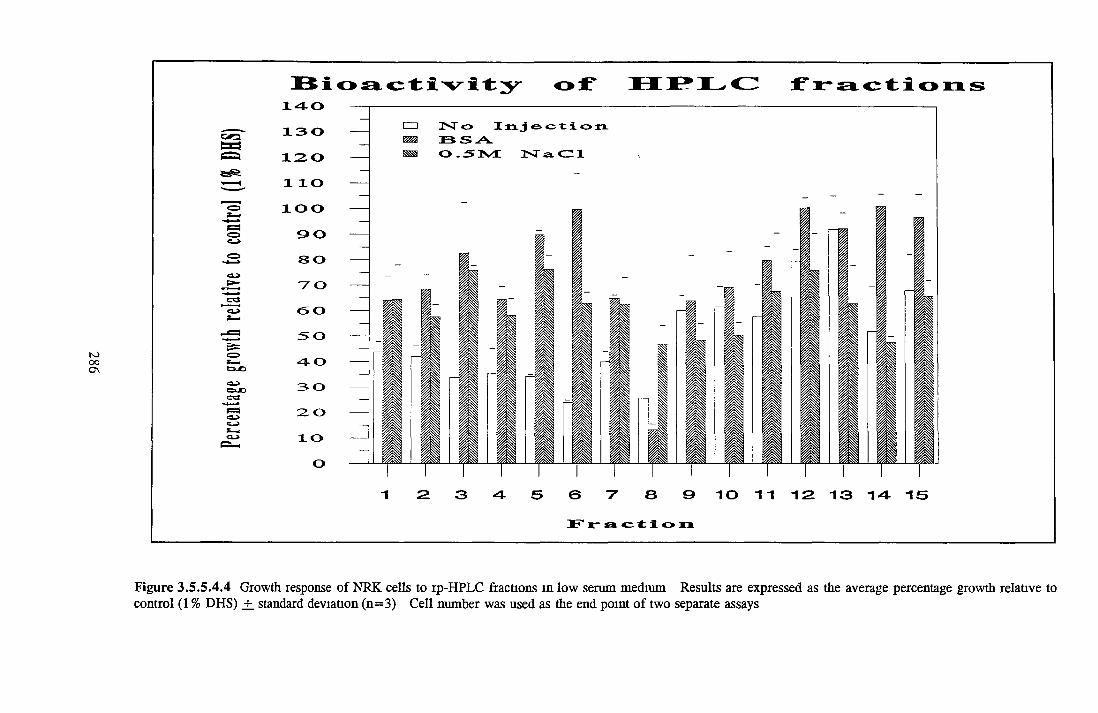
286
4J>&JD*=3
a c t i v i t y o f H P L C F r a c t i o n s
□ No Injection ^ 1 5 S A .ESS 0 . 5 1 V t 3ST sl d 1
1 2 3 4 5 6 7 8 O 10 11 12 13 14- 15
F r a c t i o n
Figure 3 .5.5.4.4 Growth response of NRK cells to rp-HPLC fractions m low serum medium Results are expressed as the average percentage growth relative to control (1 % DHS) +. standard deviation (n=3) Cell number was used as the end point of two separate assays
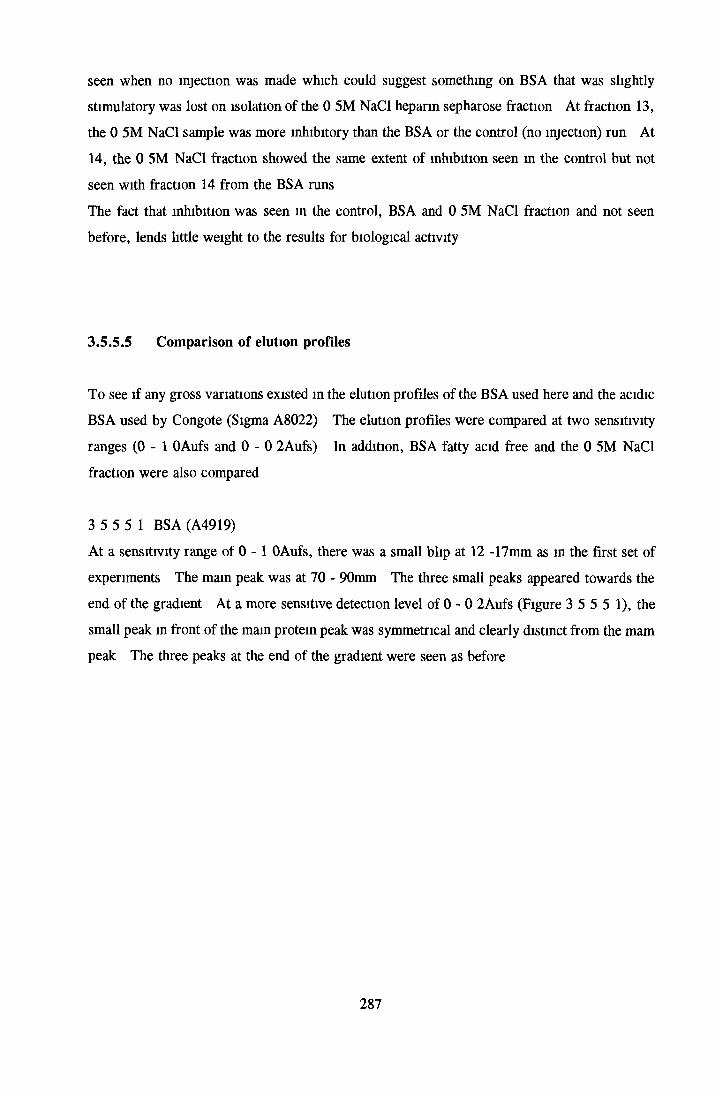
seen when no injection was made which could suggest something on BSA that was slightly
stimulatory was lost on isolation of the 0 5M NaCl heparin sepharose fraction At fraction 13,
the 0 5M NaCl sample was more inhibitory than the BSA or the control (no injection) run At
14, the 0 5M NaCl fraction showed the same extent of inhibition seen m the control but not
seen with fraction 14 from the BSA runs
The fact that inhibition was seen m the control, BSA and 0 5M NaCl fraction and not seen
before, lends little weight to the results for biological activity
3.5.5.5 Comparison o f elution profiles
To see if any gross variations existed in the elution profiles of the BSA used here and the acidic
BSA used by Congote (Sigma A8022) The elution profiles were compared at two sensitivity
ranges ( 0 - 1 OAufs and 0 - 0 2Aufs) In addition, BSA fatty acid free and the 0 5M NaCl
fraction were also compared
3 5 5 5 1 BSA (A4919)
At a sensitivity range of 0 -1 OAufs, there was a small blip at 12 -17mm as m the first set of
experiments The mam peak was at 70 - 90mm The three small peaks appeared towards the
end of the gradient At a more sensitive detection level of 0 - 0 2Aufs (Figure 3 5 5 5 1), the
small peak in front of the main protein peak was symmetrical and clearly distinct from the mam
peak The three peaks at the end of the gradient were seen as before
287
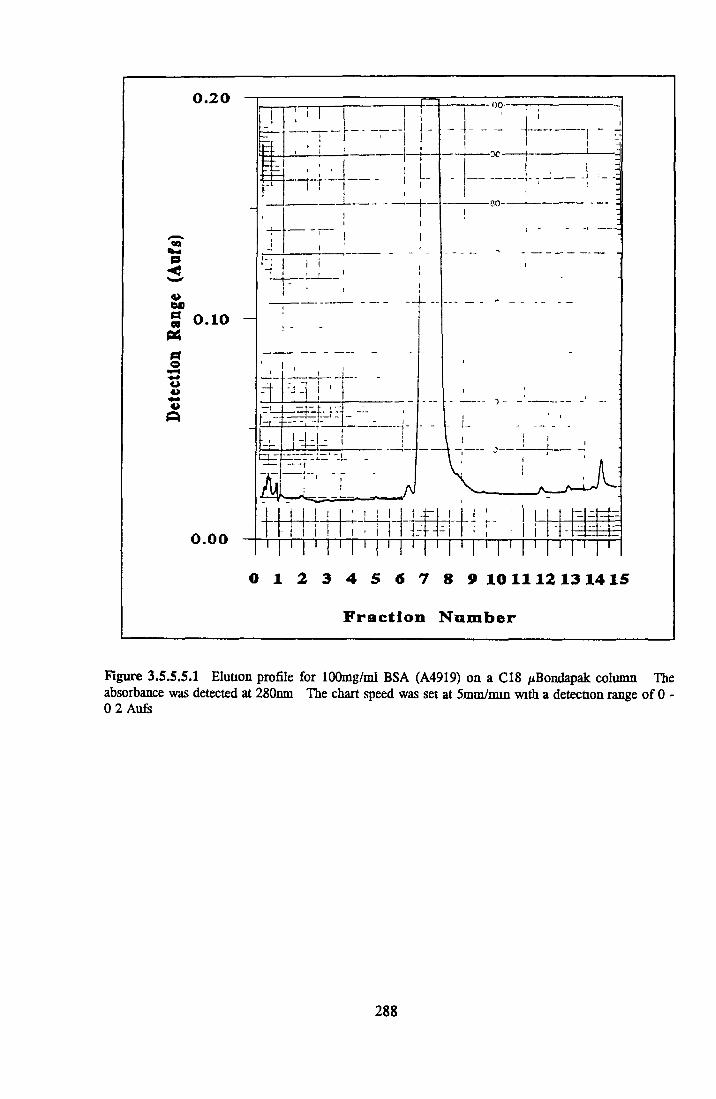
Figure 3.5.5.5.1 Elution profile for 100mg/ml BSA (A4919) ou a C18 /¿Bondapak column The absorbance was detected at 280nm The chart speed was set at 5mm/min with a detection range of 0 - 0 2 Aufs
288
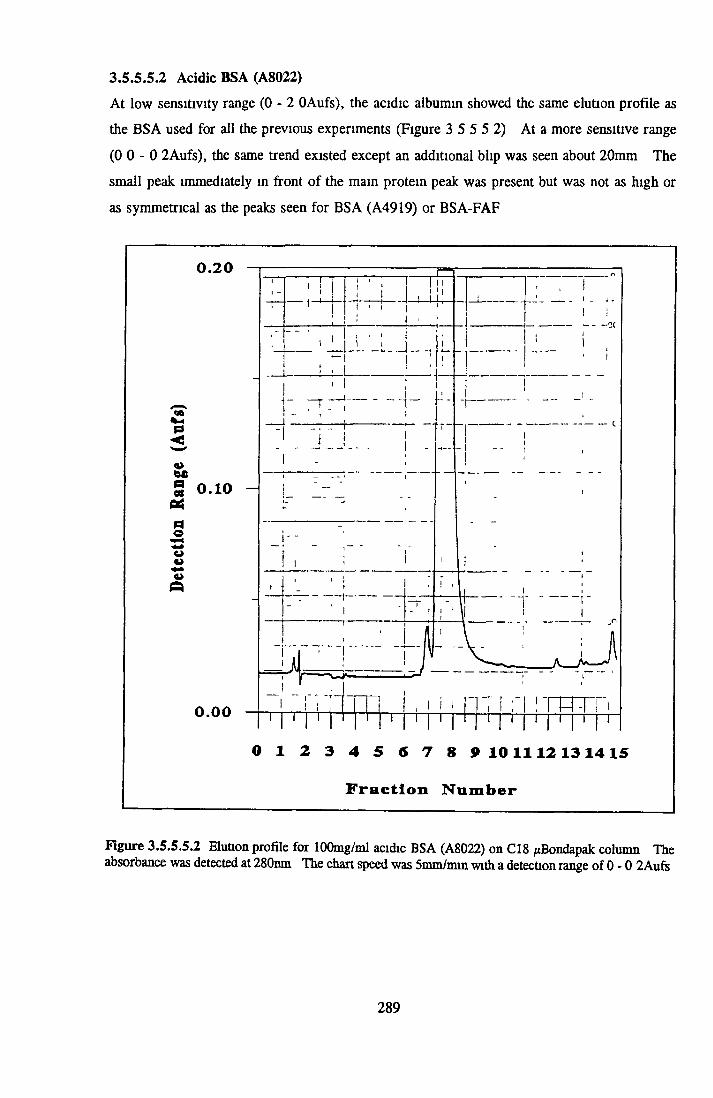
3 .5 .5 .5 .2 Acidic BSA (A8022)
At low sensitivity range ( 0 - 2 OAufs), the acidic albumin showed the same elution profile as
the BSA used for all the previous experiments (Figure 3 5 5 5 2) At a more sensitive range
( 0 0 - 0 2Aufs), the same trend existed except an additional blip was seen about 20mm The
small peak immediately m front o f the mam protein peak was present but was not as high or
as symmetrical as the peaks seen for BSA (A4919) or BSA-FAF
Fraction Number
Figure 3.5.5.S.2 Elution profile for lOOmg/ml acidic BSA (A8022) on C18 /¿Bondapak column Theabsorbance was detected at 280nm The chart speed was 5mm/min with a detection range of 0 - 0 2Aufs
289
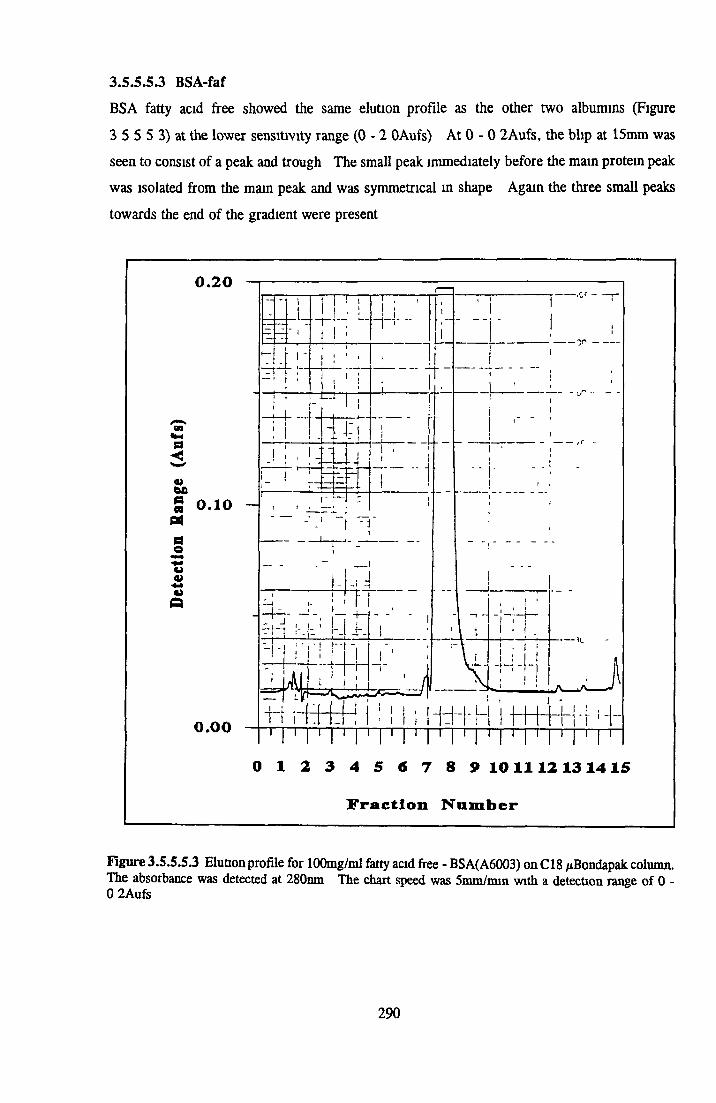
3.5.5.S.3 BSA-faf
BSA fatty acid free showed the same elution profile as the other two albumins (Figure
3 5 5 5 3) at the lower sensitivity range (0 - 2 OAufs) At 0 - 0 2Aufs, the blip at 15mm was
seen to consist o f a peak and trough The small peak immediately before the mam protein peak
was isolated from the mam peak and was symmetrical m shape Again the three small peaks
towards the end o f the gradient were present
a
«b£a
doU4><+*Q
Fraction Number
Figure 3.5.S.5.3 Elution profile for lOOmg/ml fatty acid free - BSA(A6003) on C18 /tBondapak column.The absorbance was detected at 280nm The chart speed was Smm/mm with a detection range of 0 -0 2Aufs
290
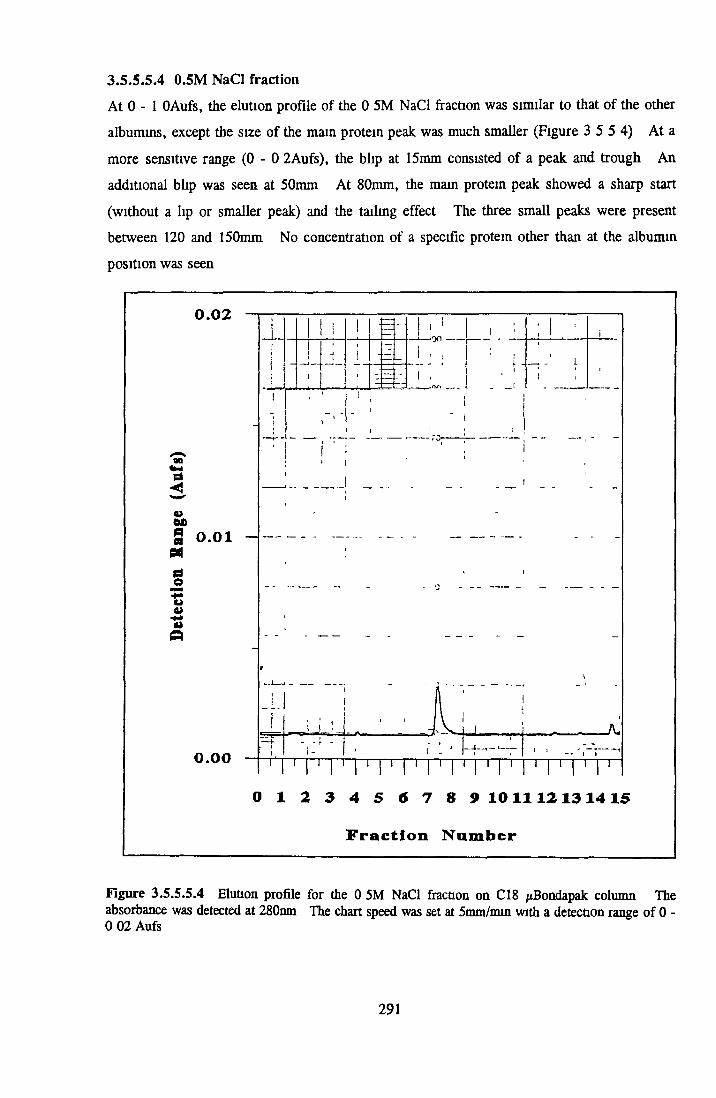
3.5.5.5.4 0.5M NaCI fraction
At 0 - 1 OAufs, the elution profile o f the 0 5M NaCI fraction was similar to that o f the other
albumins, except the size o f the mam protein peak was much smaller (Figure 3 5 5 4) At a
more sensitive range ( 0 - 0 2Aufs), the blip at 15mm consisted o f a peak and trough An
additional blip was seen at 50mm At 80mm, the mam protein peak showed a sharp start
(without a lip or smaller peak) and the tailing effect The three small peaks were present
between 120 and 150mm No concentration o f a specific protein other than at the albumin
position was seen
a tu>
dey4>
Fraction Number
Figure 3.S.5.5.4 Elution profile for the 0 5M NaCI fraction on C18 /tBondapak column The absorbance was detected at 280nm The chart speed was set at 5mm/min with a detection range o f 0 - 0 02 Aufs
291

In addition, coproporhyrin was run again alone (Figure 3.5.5.5.5). A peak and trough were
seen at 15mm with a small asymmetrical bump at 80mm. When a control (no injection) was
run immediately after these samples (Figure 3.5.5.5.6), the presence of a small peak at 80mm
indicated the presence of residual protein on the column. The three peaks at the end of the
gradient were there as before.
Figure 3.5.5.5.5 Elution profile for 500/ig/ml Coproporphyrin on C18 /tBondapak column. Theabsorbance was detected at 400nm. The chart speed was set at 5nun/min with a detection range of 0 -0.02 Aufs.
292
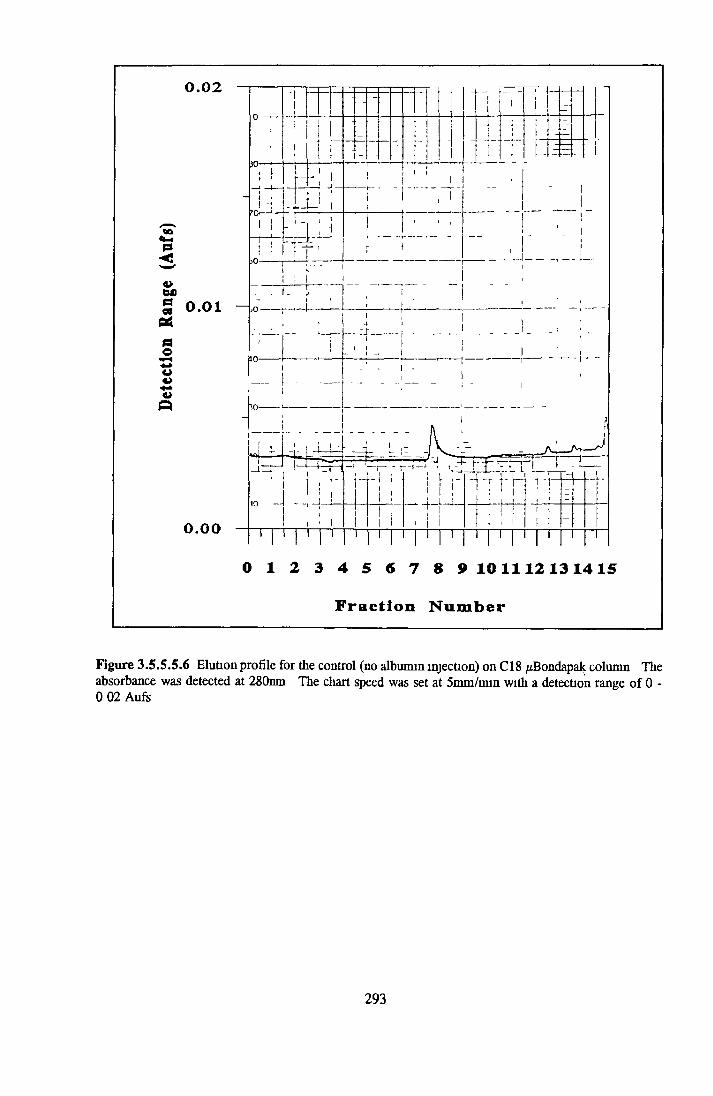
Fraction Number
Figure 3.5.S.5.6 Elution profile for the control (no albumin injection) on C18 /¿Bondapak column The absorbance was detected at 280nm The chart speed was set at 5mm/min with a detection range of 0 - 0 02 Aufs
293
In conclusion, reverse phase HPLC was not a successful means of trying to isolate the activity
from BSA based on the procedure used by Congote (1987) For the first experiment, activity
was seen in two fractions (fraction 6 and 12) Neither coincided with the fraction m which the
bulk of protein or coproporphynn were eluted from the column, while inhibition was seen with
the bulk of albumin The second set of experiments were run because of the presence of three
persistent small peaks between fractions 12 and 15 even when no albumin was being injected
onto the column The control run (without albumin injection), the BSA and the 0 5M NaCl
fraction were run and all fractions obtained showed varying degrees of inhibition Due to the
variability in the biological response of the NRK cells, no more separations were tested on the
cells
The elution profile for the BSA was different to that obtained by Congote It was not due to
differences m the albumin used, as acidic BSA (A8022), the albumin used by Congote showed
the same profile as the BSA used here (Figure 3 5 5 5 1 and 2)
The size of the column and the alterations in the programme could also have affected the elution
profile Care was taken to ensure that the column (half the diameter of Congote’s and therefore
a quarter of the volume) was not overloaded with albumin
294
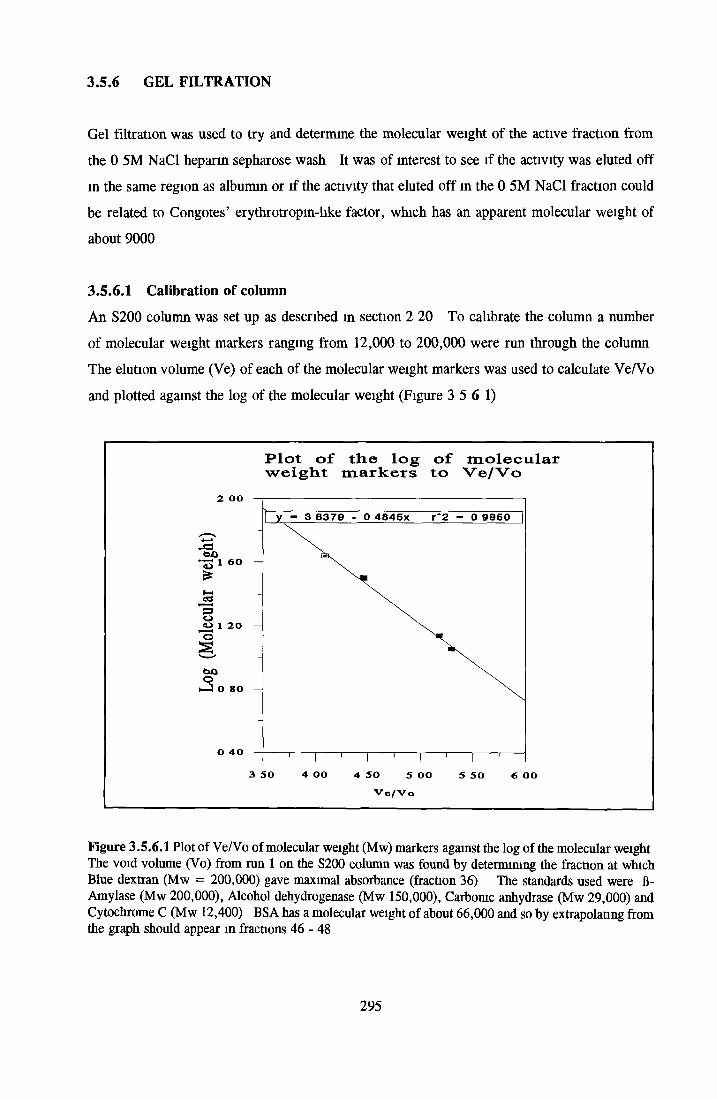
3.5.6 GEL FILTRATION
Gel filtration was used to try and determine the molecular weight of the active fraction from
the 0 5M NaCl heparin sepharose wash It was of interest to see if the activity was eluted off
in the same region as albumin or if the activity that eluted off in the 0 5M NaCl fraction could
be related to Congotes’ erythrotropm-like factor, which has an apparent molecular weight of
about 9000
3.5.6.1 Calibration of column
An S200 column was set up as described in section 2 20 To calibrate the column a number
of molecular weight markers ranging from 12,000 to 200,000 were run through the column
The elution volume (Ve) of each of the molecular weight markers was used to calculate Ve/Vo
and plotted against the log of the molecular weight (Figure 3 5 6 1)
Plot of the log of molecular weight markers to Ve/Vo
V e/Vo
Figure 3.5.6.1 Plot of Ve/Vo of molecular weight (Mw) markers against the log of the molecular weight The void volume (Vo) from run 1 on the S200 column was found by determining the fraction at which Blue dextran (Mw = 200,000) gave maximal absorbance (fraction 36) The standards used were B- Amylase (Mw 200,000), Alcohol dehydrogenase (Mw 150,000), Carbonic anhydrase (Mw 29,000) and Cytochrome C (Mw 12,400) BSA has a molecular weight of about 66,000 and so by extrapolating from the graph should appear in fractions 46 - 48
295
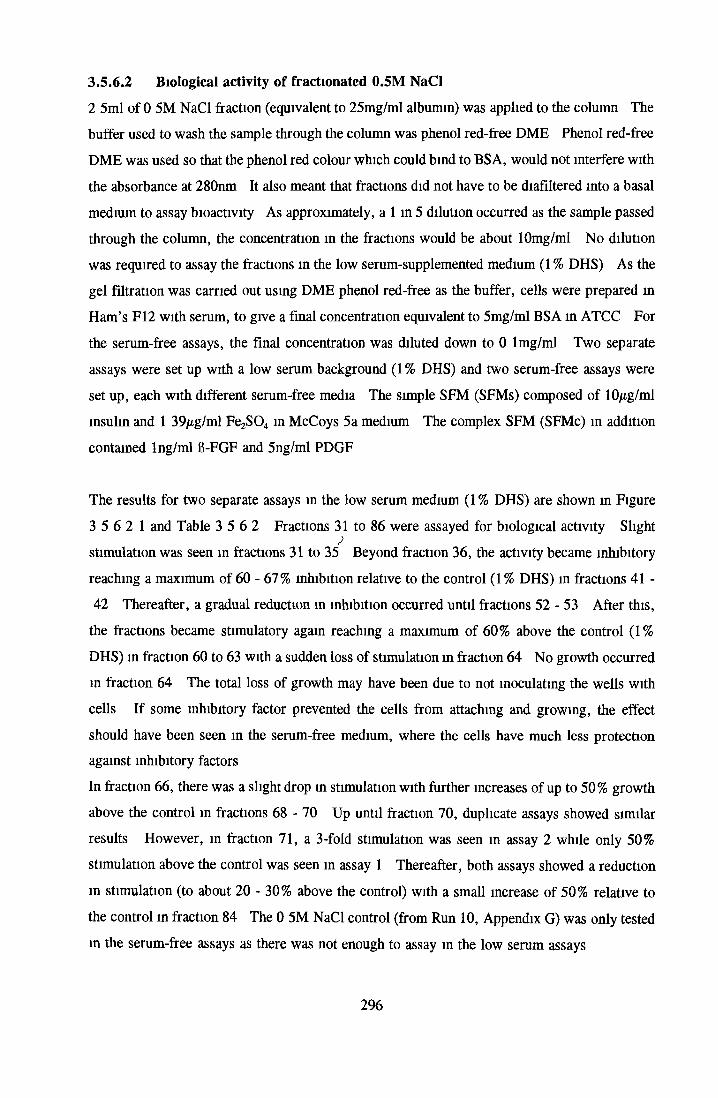
3.5.6.2 Biological activity o f fractionated 0.5M NaCl
2 5ml of 0 5M NaCl fraction (equivalent to 25mg/ml albumin) was applied to the column The
buffer used to wash the sample through the column was phenol red-free DME Phenol red-free
DME was used so that the phenol red colour which could bind to BSA, would not interfere with
the absorbance at 280nm It also meant that fractions did not have to be diafiltered into a basal
medium to assay bioactivity As approximately, a 1 in 5 dilution occurred as the sample passed
through the column, the concentration in the fractions would be about lOmg/ml No dilution
was required to assay the fractions m the low serum-supplemented medium (1 % DHS) As the
gel filtration was carried out using DME phenol red-free as the buffer, cells were prepared m
Ham’s F12 with serum, to give a final concentration equivalent to 5mg/ml BSA in ATCC For
the serum-free assays, the final concentration was diluted down to 0 lmg/ml Two separate
assays were set up with a low serum background (1% DHS) and two serum-free assays were
set up, each with different serum-free media The simple SFM (SFMs) composed of 10/ig/ml
insulin and 1 39/*g/ml Fe2S04 in McCoys 5a medium The complex SFM (SFMc) in addition
contained lng/ml fi-FGF and 5ng/ml PDGF
The results for two separate assays in the low serum medium (1 % DHS) are shown m Figure
3 5 6 2 1 and Table 3 5 6 2 Fractions 31 to 86 were assayed for biological activity Slight
stimulation was seen in fractions 31 to 35 Beyond fraction 36, the activity became inhibitory
reaching a maximum of 60 - 67% inhibition relative to the control (1 % DHS) in fractions 41 -
42 Thereafter, a gradual reduction in inhibition occurred until fractions 52 - 53 After this,
the fractions became stimulatory again reaching a maximum of 60% above the control (1%
DHS) in fraction 60 to 63 with a sudden loss of stimulation in fraction 64 No growth occurred
m fraction 64 The total loss of growth may have been due to not inoculating the wells with
cells If some inhibitory factor prevented the cells from attaching and growing, the effect
should have been seen in the serum-free medium, where the cells have much less protection
against inhibitory factors
In fraction 66, there was a slight drop in stimulation with further increases of up to 50% growth
above the control in fractions 68 - 70 Up until fraction 70, duplicate assays showed similar
results However, in fraction 71, a 3-fold stimulation was seen in assay 2 while only 50%
stimulation above the control was seen in assay 1 Thereafter, both assays showed a reduction
in stimulation (to about 20 - 30% above the control) with a small increase of 50% relative to
the control m fraction 84 The 0 5M NaCl control (from Run 10, Appendix G) was only tested
m the serum-free assays as there was not enough to assay in the low serum assays
296
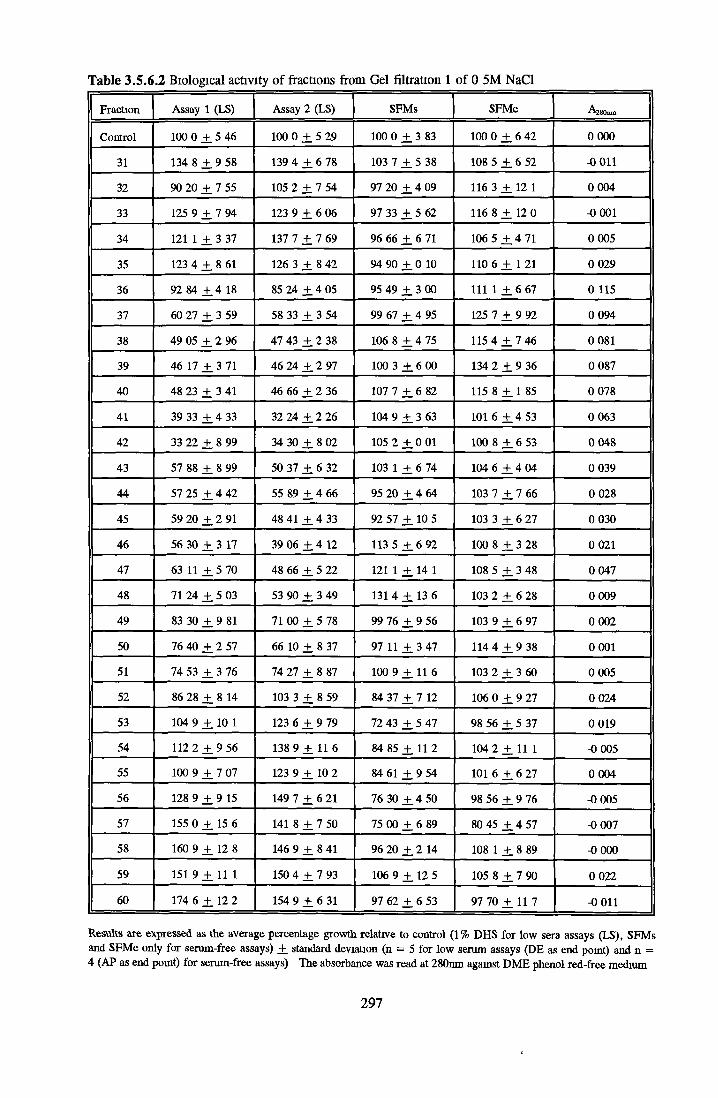
Table 3.5.6.2 Biological activity of fractions from Gel filtration 1 of 0 5M NaCl
Fraction Assay 1 (LS) Assay 2 (LS) SFMs SFMc A28O11H1
Control 100 0 ± 5 46 100 0 ± 5 29 100 0 ± 3 83 100 0 ± 6 42 0 000
31 134 8 ± 9 58 139 4 ± 6 78 103 7 ± 5 38 108 5 ± 6 52 -0 011
32 90 20 ± 7 55 105 2 ± 7 54 97 20 ± 4 09 116 3 ± 1 2 1 0 004
33 125 9 ± 7 94 123 9 ± 6 06 97 33 ± 5 62 116 8 ± 1 2 0 -0 001
34 121 1 ± 3 37 137 7 ± 7 69 96 66 ± 6 71 106 5 ± 4 71 0 005
35 123 4 ± 8 61 126 3 ± 8 42 94 90 ± 0 10 110 6 ± 1 21 0 029
36 92 84 ± 4 18 85 24 ± 4 05 95 49 ± 3 00 111 1 ± 6 67 0 115
37 60 27 ± 3 59 58 33 ± 3 54 99 67 ± 4 95 125 7 ± 9 92 0 094
38 49 05 ± 2 96 47 43 ± 2 38 106 8 ± 4 75 115 4 ± 7 46 0 081
39 46 17 ± 3 71 46 24 ± 2 97 100 3 ± 6 00 134 2 ± 9 36 0 087
40 48 23 ± 3 41 46 66 ± 2 36 107 7 ± 6 82 115 8 ± 1 85 0 078
41 39 33 ± 4 33 32 24 ± 2 26 104 9 ± 3 63 101 6 ± 4 53 0 063
42 33 22 ± 8 99 34 30 ± 8 02 105 2 ± 0 01 100 8 ± 6 53 0 048
43 57 88 ± 8 99 50 37 ± 6 32 103 1 + 6 74 104 6 ± 4 04 0 039
44 57 25 ± 4 42 55 89 ± 4 66 95 20 ± 4 64 103 7 ± 7 66 0 028
45 59 20 ± 2 91 48 41 ± 4 33 92 57 ± 10 5 103 3 ± 6 27 0 030
46 56 30 ± 3 17 39 06 ± 4 12 113 5 ± 6 92 100 8 ± 3 28 0 021
47 63 11 ± 5 70 48 66 ± 5 22 121 1 ± 14 1 108 5 ± 3 48 0 047
48 71 24 ± 5 03 53 90 ± 3 49 131 4 ± 1 3 6 103 2 ± 6 28 0 009
49 83 30 ± 9 81 71 00 ± 5 78 99 76 ± 9 56 103 9 ± 6 97 0 002
50 76 40 ± 2 57 66 10 ± 8 37 97 11 ± 3 47 114 4 ± 9 38 0 001
51 74 53 ± 3 76 74 27 ± 8 87 100 9 ± 11 6 103 2 ± 3 60 0 005
52 86 28 ± 8 14 103 3 + 8 59 84 37 ± 7 12 106 0 ± 9 27 0 024
53 104 9 ± 10 1 123 6 ± 9 79 72 43 ± 5 47 98 56 ± 5 37 0 019
54 112 2 ± 9 56 138 9 ± 11 6 84 85 ± 11 2 104 2 ± 11 1 -0 005
55 100 9 ± 7 07 123 9 + 10 2 84 61 ± 9 54 101 6 ± 6 27 0 004
56 128 9 ± 9 15 149 7 ± 6 21 76 30 ± 4 50 98 56 ± 9 76 -0 005
57 155 0 ± 15 6 141 8 + 7 50 75 00 ± 6 89 80 45 ± 4 57 -0 007
58 160 9 ± 12 8 146 9 + 8 41 96 20 ± 2 14 108 1 ± 8 89 -0 000
59 151 9 ± 11 1 150 4 + 7 93 106 9 ± 12 5 105 8 ± 7 90 0 022
60 174 6 ± 12 2 154 9 + 6 31 97 62 ± 6 53 97 70 ± 1 1 7 -0 011
Results are expressed as the average percentage growth relative to control (1% DHS for low sera assays (LS), SFMs and SFMc only for serum-free assays) ± standard deviation (n = 5 for low serum assays (DE as end point) and n = 4 (AP as end point) for serum-free assays) The absorbance was read at 280nm against DME phenol red-free medium
297
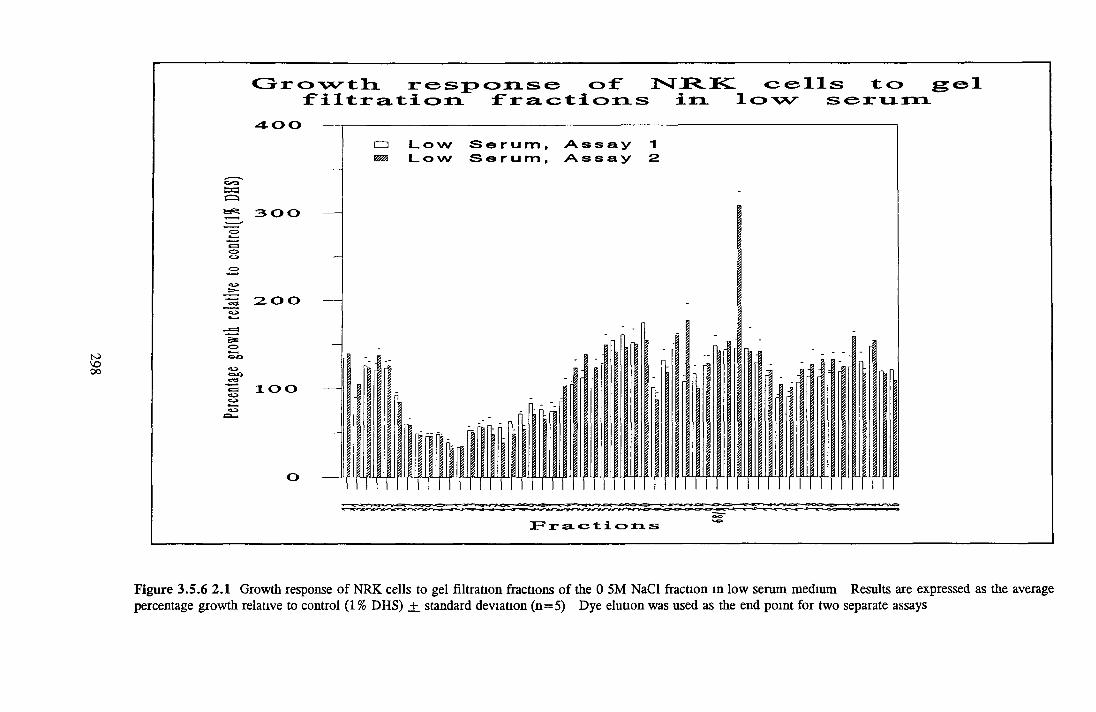
toVO00
Growth r esp ons e o f 1ST R K cell;filtration fractions in low ;
; to gel erum
4-00
0 3
oo
3 0 0
200
oooo03a 1 O O
o
F ractions
Figure 3.5.6 2.1 Growth response of NRK cells to gel filtration fractions of the 0 5M NaCl fraction in low serum medium Results are expressed as the average percentage growth relative to control (1 % DHS) _±_ standard deviation (n=5) Dye eluuon was used as the end point for two separate assays
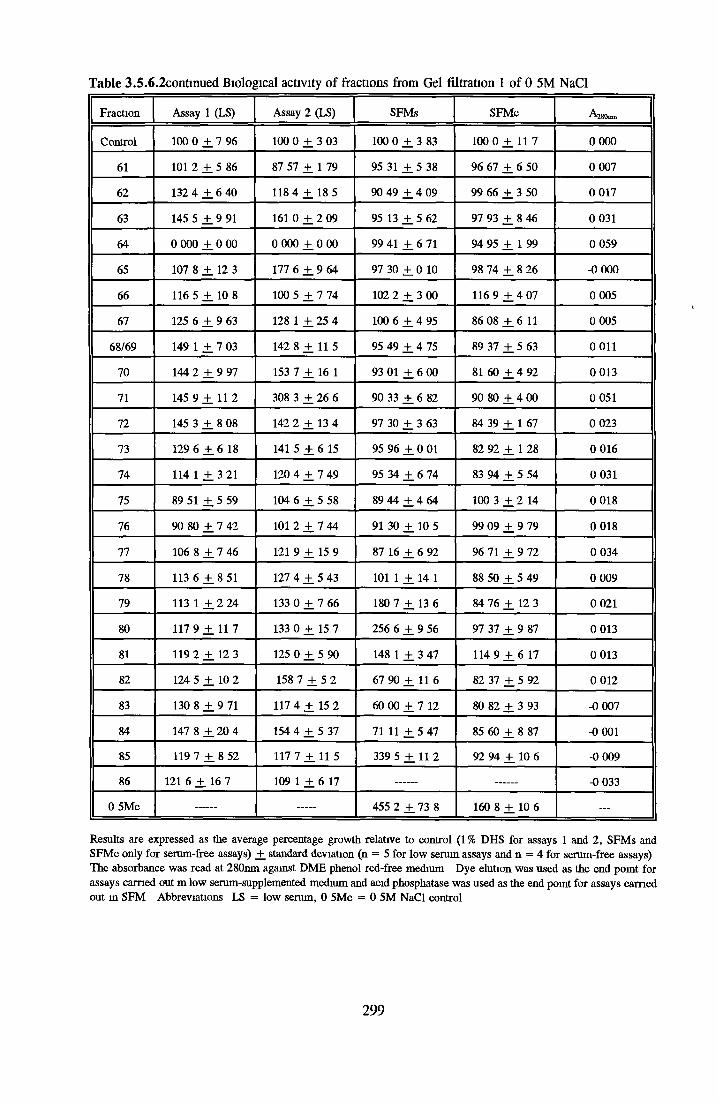
Table 3.5.6.2contmued Biological activity of fractions from Gel filtration 1 of 0 5M NaCl
Fraction Assay 1 (LS) Assay 2 (LS) SFMs SFMc AlKtam
Control 100 0 ± 7 96 100 0 ± 3 03 100 0 ± 3 83 100 0 ± 1 1 7 0000
61 101 2 ± 5 86 87 57 ± 1 79 95 31 ± 5 38 96 67 ± 6 50 0 007
62 132 4 ± 6 40 118 4 + 18 5 90 49 ± 4 09 99 66 ± 3 50 0 017
63 145 5 ± 9 91 161 0 ± 2 09 95 13 ± 5 62 97 93 ± 8 46 0 031
64 0 000 ± 0 0 0 0 000 ± 0 00 99 41 ± 6 71 94 95 ± 1 99 0 059
65 107 8 ± 12 3 177 6 ± 9 64 97 30 ± 0 10 98 74 ± 8 26 -0 000
66 116 5 ± 1 0 8 100 5 ± 7 74 102 2 ± 3 00 116 9 ± 4 07 0 005
67 125 6 ± 9 63 128 1 ± 25 4 100 6 ± 4 95 86 08 ± 6 11 0 005
68/69 149 1 ± 7 03 142 8 ± 11 5 95 49 ± 4 75 89 37 ± 5 63 0 011
70 144 2 ± 9 97 153 7 ± 16 1 93 01 ± 6 00 81 60 ± 4 92 0 013
71 145 9 ± 11 2 308 3 ± 26 6 90 33 ± 6 82 90 80 ± 4 00 0 051
72 145 3 ± 8 08 142 2 ± 13 4 97 30 ± 3 63 84 39 ± 1 67 0 023
73 129 6 ± 6 18 141 5 ± 6 15 95 96 ± 0 01 82 92 ± 1 28 0 016
74 114 1 ± 3 21 120 4 ± 7 49 95 34 ± 6 74 83 94 ± 5 54 0 031
75 89 51 ± 5 59 104 6 ± 5 58 89 44 ± 4 64 100 3 ± 2 14 0 018
76 90 80 ± 7 42 101 2 ± 7 44 91 30 ± 10 5 99 09 ± 9 79 0 018
77 106 8 ± 7 46 121 9 ± 15 9 87 16 ± 6 92 96 71 ± 9 72 0 034
78 113 6 ± 8 51 127 4 ± 5 43 101 1 ± 14 1 88 50 ± 5 49 0 009
79 113 1 ± 2 24 133 0 ± 7 66 180 7 ± 1 3 6 84 76 ± 12 3 0 021
80 117 9 ± 1 1 7 133 0 ± 15 7 256 6 ± 9 56 97 37 ± 9 87 0 013
81 119 2 ± 12 3 125 0 ± 5 90 148 1 ± 3 47 114 9 ± 6 17 0 013
82 124 5 ± 10 2 158 7 ± 5 2 67 90 ± 11 6 82 37 ± 5 92 0 012
83 130 8 ± 9 71 117 4 ± 15 2 60 00 ± 7 12 80 82 ± 3 93 -0 007
84 147 8 ± 20 4 154 4 ± 5 37 71 11 ± 5 47 85 60 ± 8 87 -0 001
85 119 7 ± 8 52 117 7 ± 11 5 339 5 ± 11 2 92 94 ± 10 6 -0 009
86 121 6 ± 16 7 109 1 ± 6 17 -0 033
0 5Mc 455 2 ± 73 8 160 8 ± 10 6 —
Results are expressed as the average percentage growth relative to control (1 % DHS for assays 1 and 2, SFMs and SFMc only for serum-free assays) ± standard deviation (n = 5 for low serum assays and n = 4 for serum-free assays) The absorbance was read at 280nm against DME phenol red-free medium Dye elution was used as the end point for assays earned out m low serum-supplemented medium and acid phosphatase was used as the end point for assays earned out m SFM Abbreviations LS = low serum, 0 5Mc = 0 5M NaCl control
299
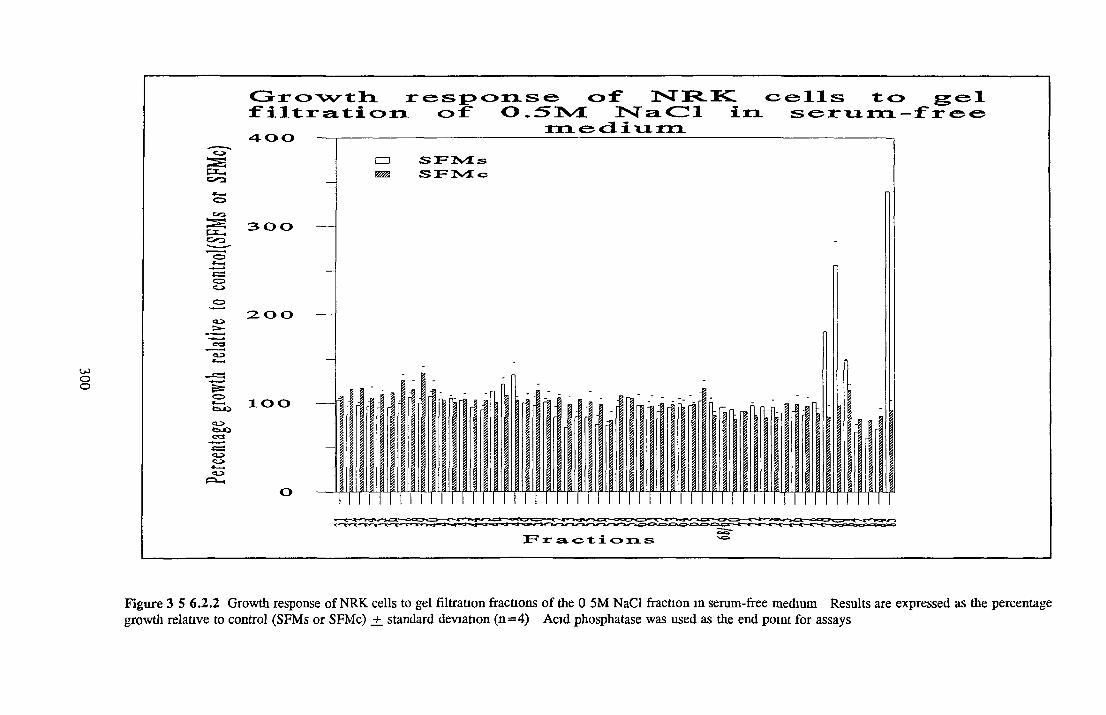
PX-i orao>oa
CO
Growth, f iltratio400
3 0 0
2. O O
lOO
<L>toJOed
esponse of" NRK cells to g of 0,5M N a d in serum-fr
medium
el
F r a c t io n s
Figure 3 5 6.2.2 Growth response of NRK cells to gel filtration fractions of the 0 5M NaCl fraction in serum-free medium Results are expressed as the percentage growth relative to control (SFMs or SFMc) _+ standard deviation (n=4) Acid phosphatase was used as the end point for assays
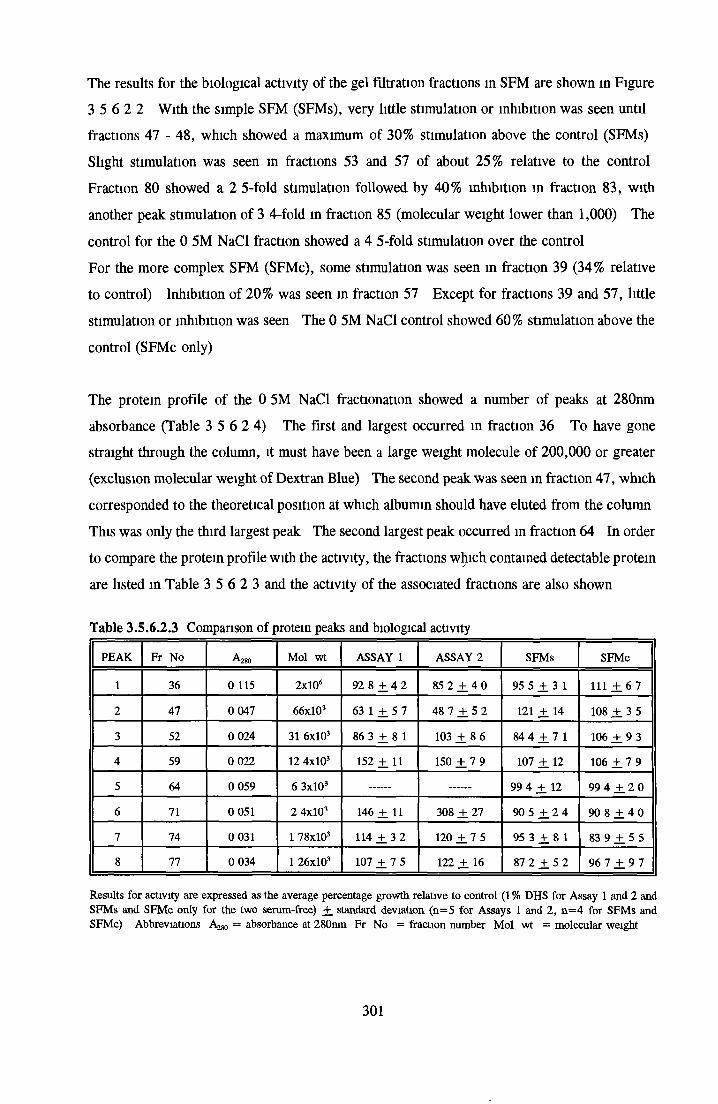
The results for the biological activity of the gel filtration fractions m SFM are shown in Figure
3 5 6 2 2 With the simple SFM (SFMs), very little stimulation or inhibition was seen until
fractions 47 - 48, which showed a maximum of 30% stimulation above the control (SFMs)
Slight stimulation was seen m fractions 53 and 57 of about 25% relative to the control
Fraction 80 showed a 2 5-fold stimulation followed by 40% inhibition in fraction 83, with
another peak stimulation of 3 4-fold m fraction 85 (molecular weight lower than 1,000) The
control for the 0 5M NaCl fraction showed a 4 5-fold stimulation over the control
For the more complex SFM (SFMc), some stimulation was seen in fraction 39 (34% relative
to control) Inhibition of 20% was seen in fraction 57 Except for fractions 39 and 57, little
stimulation or inhibition was seen The 0 5M NaCl control showed 60% stimulation above the
control (SFMc only)
The protein profile of the 0 5M NaCl fractionation showed a number of peaks at 280nm
absorbance (Table 3 5 6 2 4) The first and largest occurred in fraction 36 To have gone
straight through the column, it must have been a large weight molecule of 200,000 or greater
(exclusion molecular weight of Dextran Blue) The second peak was seen in fraction 47, which
corresponded to the theoretical position at which albumin should have eluted from the column
This was only the third largest peak The second largest peak occurred in fraction 64 In order
to compare the protein profile with the activity, the fractions which contained detectable protein
are listed m Table 3 5 6 2 3 and the activity of the associated fractions are also shown
Table 3.5.6.2.3 Comparison of protein peaks and biological activity
PEAK Fr No • 280 Mol wt ASSAY 1 ASSAY 2 SFMs SFMc
1 36 0 115 2x10* 92 8 ± 4 2 85 2 ± 4 0 95 5 ± 3 1 111 ± 6 7
2 47 0 047 66xl03 63 1 ± 5 7 48 7 ± 5 2 121 ± 14 108 ± 3 5
3 52 0 024 31 6xl03 86 3 ± 8 1 103 ± 8 6 84 4 ± 7 1 106 ± 9 3
4 59 0 022 12 4xl03 152 ± 1 1 150 ± 7 9 107 ± 12 106 ± 7 9
5 64 0 059 6 3xl03 99 4 ± 12 99 4 ± 2 0
6 71 0 051 2 4xl03 146 ± 11 308 ± 27 90 5 ± 2 4 90 8 ± 4 0
7 74 0 031 1 78xl03 114 ± 3 2 120 ± 7 5 95 3 ± 8 1 83 9 ± 5 5
8 77 0 034 1 26xl03 107 ± 7 5 122 ± 16 87 2 ± 5 2 96 7 ± 9 7
Results for activity are expressed as the average percentage growth relative to control (1 % DHS for Assay 1 and 2 and SFMs and SFMc only for the two serum-free) ± standard deviation (n=5 for Assays 1 and 2, n=4 for SFMs and SFMc) Abbreviations A280 = absorbance at 280nm Fr No = fraction number Mol wt = molecular weight
301
The results show that where most of the protein eluted off the column (fraction 36), no
significant activity either stimulatory or inhibitory was seen for any of the assay systems In
fraction 47, where albumin was expected to elute off, inhibition seen in the two low serum
assays, and only slight stimulation occurred in the serum-free assays The fact that no activity
was obtained for fraction 64 in the low serum assay as this fraction had the second highest
absorbance Fraction 71 contained the third largest amount of protein and coincided with
activity in the low serum assay, but no activity was seen in the serum-free assays
As a result of one gel filtration experiment some activity was seen in two assays carried out in
low serum medium Some stimulation was seen in the serum-free assays but this did not
coincide with the stimulation in the low serum assays The simpler of the SFM showed better
stimulation than the more complex SFM even though the 0 5M NaCl fraction had shown
inhibition m SFM in section 3 5 4 18
It was necessary to repeat the procedure to see if the same trend was obtained A fresh column
was set up and re-calibrated The void volume was found to be fraction 38
302
3.5.6.3 Repeat of Gel Filtration
The results of a second gel filtration with the 0 5M NaCl fraction are shown m Figure 3 5 6 3 1
and 3 5 6 3 2 and Table 3 5 6 3 The activity for the control 0 5M NaCl fraction was low,
with 14% and 37 5% stimulation above the control (1% DHS) for the two low serum-
supplemented assays Activity was seen in fractions 73 - 79 with maximum stimulation of about
2-fold stimulation over the control occurring in fraction 76 (a molecular weight of less than
2,000 by extrapolation from Figure 3 5 6 2 4) Inhibition was seen in fractions 34 - 40, with
no inhibition appearing at fractions 47 to 49 where the albumin should be eluting off The
protein profile showed that most of the protein eluted off the column in fraction 47 No activity
was seen in fraction 47, but 46 showed 60% stimulation above the control (1 % DHS) in the low
serum assays
As the simpler of the two SFM showed the best results in 3 5 6 2, the SFMs was used to assay
fractions for this filtration (Figure 3 5 6 3 2) Unlike the first filtration, little or no stimulation
was seen in the control, only 12-31% stimulation above control (SFMs) Together with the
results obtained in section 3 5 4 18, it would appear that the stimulation seen m the first
experiment may have been due to an artifact
In the first gel filtration, no activity was seen in fraction 46 Both filtrations showed no
stimulation occurring m fraction 47 where the albumin should have eluted off the column
Activity was seen m fractions 58 - 60 (mol wt 18,200 - 13,800) for the first but not the second
gel filtration using low serum-supplemented assays The best activity seen in fractions from the
second gel filtration occurred in fractions 76 - 79 (mol wt less than 2,000)
By extrapolating from the calibration curve, the molecular weight of any of the fractions higher
than 71 had molecular weights of about 2000 or less However, when the 0 5M NaCl fraction
was diafiltered in ATCC during initial preparation, diafiltration occurred using a YM3
(molecular cut off of 3,000) So anything smaller than 3,000 which was not tightly bound to
albumin would have been lost Unless gel filtration caused some tightly bound factor to become
unbound during passage through the column, the stimulation here would appear to be due to
artifacts as there was little activity in the 0 5M NaCl control Both gel filtrations showed some
stimulation associated with a factor of less than 2,000 molecular weight
303

Table 3.5.6.3 Biological activity of fractions from Gel filtration 1 of 0 5M NaCl
Fraction Assay 1 (LS) Assay 2 (LS) Assay 1 (SF) Assay 2 (SF) A280mu
Control 100 0 ± 1 82 100 0 ± 8 72 100 0 ± 2 70 100 0 ± 6 42 0 000
31 106 2 ± 1 1 0 111 7 ± 11 5 102 7 ± 3 90 102 9 ± 4 85 0 015
32 96 59 ± 6 56 110 9 ± 6 74 0 004
33 88 64 ± 12 1 115 2 ± 10 8 101 6 ± 3 96 101 6 ± 3 47 0 014
34 69 09 ± 5 70 82 70 ± 7 21 0 033
35 66 36 ± 1 02 57 30 ± 5 01 103 5 ± 2 03 100 6 ± 4 95 0 064
36 66 82 ± 6 93 50 46 ± 10 5 0 091
37 60 91 ± 1 90 48 85 ± 2 65 102 3 ± 2 73 101 3 ± 4 83 0 074
38 62 30 ± 4 13 50 11 ± 1 49 0 084
39 60 45 ± 3 45 54 50 ± 2 66 103 5 ± 4 70 99 67 ± 4 90 0 078
40 61 14 ± 3 60 59 90 ± 1 99 105 1 ± 4 52 99 01 ± 10 1 0 051
42 103 3 ± 5 71 106 4 ± 7 14 102 3 ± 4 64 102 3 ± 2 83 0 035
43 105 3 ± 5 17 113 5 ± 5 36 103 5 ± 3 25 104 6 ± 7 44 0 049
44 102 3 ± 7 14 113 2 ± 3 57 96 85 ± 3 01 102 3 ± 5 56 0 041
45 98 68 ± 3 01 109 6 ± 3 57 102 3 ± 4 82 95 30 ± 6 23 0 036
46 142 9 ± 1 1 1 150 0 ± 9 82 98 09 ± 4 56 94 70 ± 7 40 0 043
47 90 91 ± 8 11 96 40 ± 12 5 99 20 ± 6 36 97 83 ± 4 63 0 021
48 92 98 ± 6 85 97 50 ± 1 07 95 80 ± 2 60 95 36 ± 3 92 0 004
49 98 56 ± 4 97 101 7 ± 8 93 97 30 ± 2 61 94 70 ± 5 94 0 000
50 100 9 ± 5 71 116 0 ± 8 93 95 04 ± 0 76 95 97 ± 5 00 -0 004
51 73 93 ± 8 04 90 50 ± 4 95 95 40 ± 3 81 98 76 ± 6 58 -0 009
52 92 13 ± 12 7 106 9 ± 9 30 95 80 ± 3 15 97 53 ± 6 09 -0 003
53 102 8 ± 6 63 103 8 ± 3 93 101 4 ± 6 28 95 37 ± 6 26 -0 010
54 97 31 ± 2 19 93 02 ± 7 48 103 8 ± 4 31 105 7 ± 4 41 -0 015
55 106 9 ± 15 1 100 0 ± 12 8 101 1 ± 3 91 102 8 ± 8 57 -0 002
56 96 21 ± 12 1 101 0 ± 4 82 100 0 ± 5 58 98 93 ± 5 87 -0 017
57 105 5 + 4 38 86 20 ± 4 19 97 60 ± 5 97 104 9 ± 6 51 -0 013
58 104 3 ± 11 3 101 2 ± 8 63 96 39 ± 1 81 102 8 ± 3 74 0 037
59 88 72 ± 7 75 100 3 ± 3 84 100 4 ± 1 86 111 0 ± 5 33 -0 003
60 90 24 ± 9 81 98 84 ± 9 36 99 64 ± 2 36 108 9 ± 3 77 -0 011
0 5M c 1 1 4 2 ± 5 30 137 5 ± 10 7 104 6 ± 5 36 100 0 ± 10 6
Results are expressed as the average percentage growth relative to control (1% DHS for assays 1 and 2(LS), serum-free medium for Assays 1 and 2(SF)) ± standard deviation (n = 5 for low serum assays (DE as end point) and n = 4 for serum-free assays (AP as end point)) The absorbance was read at 28Qnm against DM E phenol red-free medium Abbreviations LS = low serum, SF = serum-free, 0 5M c = control 0 5M NaCl fraction
304
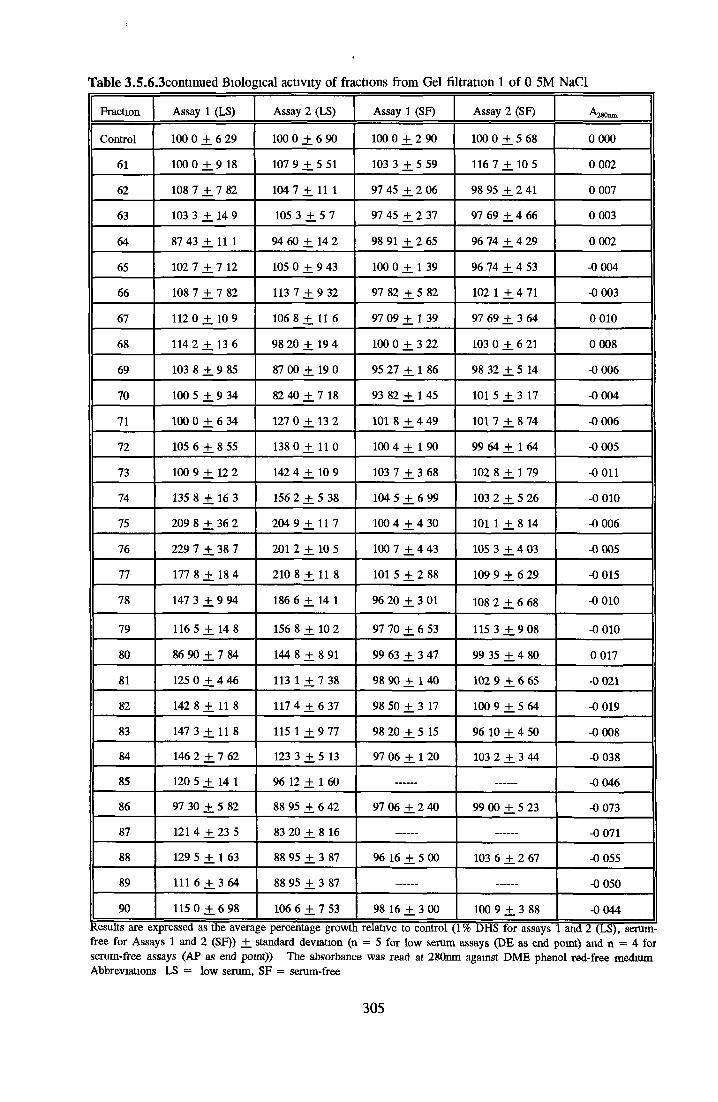
Table 3.5.6.3contmued Biological activity of fractions from Gel filtration 1 of 0 5M NaCl
Fraction Assay 1 (LS) Assay 2 (LS) Assay 1 (SF) Assay 2 (SF) 280mn
Control 100 0 ± 6 29 100 0 + 6 90 100 0 ± 2 90 100 0 ± 5 68 0 000
61 100 0 ± 9 18 107 9 ± 5 51 103 3 ± 5 59 116 7 ± 10 5 0 002
62 108 7 ± 7 82 104 7 +. 11 1 97 45 ± 2 06 98 95 ± 2 41 0 007
63 103 3 +. 14 9 105 3 + 5 7 97 45 + 2 37 97 69 ± 4 66 0 003
64 87 43 ± 11 1 94 60 + 14 2 98 91 ± 2 65 96 74 ± 4 29 0 002
65 102 7 ± 7 12 105 0 + 9 43 100 0 ± 1 39 96 74 ± 4 53 -0 004
66 108 7 ± 7 82 113 7 + 9 32 97 82 ± 5 82 102 1 ± 4 71 -0 003
67 112 0 ± 10 9 106 8 + 11 6 97 09 ± 1 39 97 69 + 3 64 0 010
68 114 2 ± 13 6 98 20 ± 19 4 100 0 ± 3 22 103 0 ± 6 21 0 008
69 103 8 + . 9 85 87 00 ± 19 0 95 27 ± 1 86 98 32 ± 5 14 -0 006
70 100 5 ± 9 34 82 40 ± 7 18 93 82 ± 1 45 101 5 ± 3 17 -0 004
71 100 0 ± 6 34 127 0 + 13 2 101 8 ± 4 49 101 7 ± 8 74 -0 006
72 105 6 ± 8 55 138 0 + 11 0 100 4 ± 1 90 99 64 ± 1 64 -0 005
73 100 9 ± 12 2 142 4 + 10 9 103 7 ± 3 68 102 8 ± 1 79 -0 011
74 135 8 + 16 3 156 2 + 5 38 104 5 ± 6 99 103 2 +. 5 26 -0 010
75 209 8 +. 36 2 204 9 + 11 7 100 4 ± 4 30 101 1 ± 8 14 -0 006
76 229 7 ± 38 7 201 2 ± 10 5 100 7 ± 4 43 105 3 ± 4 03 -0 005
77 177 8 ± 18 4 210 8 + 11 8 101 5 ± 2 88 109 9 ± 6 29 -0 015
78 147 3 ± 9 94 186 6 + 14 1 96 20 ± 3 01 108 2 ± 6 68 -0 010
79 116 5 ± 1 4 8 156 8 + 10 2 97 70 ± 6 53 115 3 ± 9 08 -0 010
80 86 90 ± 7 84 144 8 + 8 91 99 63 ± 3 47 99 35 ± 4 80 0 017
81 125 0 ± 4 46 113 1 + 7 38 98 90 + 1 40 102 9 ± 6 65 -0 021
82 142 8 ± 11 8 117 4 + 6 37 98 50 ± 3 17 100 9 ± 5 64 -0 019
83 147 3 +. 11 8 115 1 + 9 77 98 20 ± 5 15 96 10 ± 4 50 -0 008
84 146 2 ± 7 62 123 3 + 5 13 97 06 ± 1 20 103 2 ± 3 44 -0 038
85 120 5 ± 14 1 96 12 + 1 60 -0 046
86 97 30 +. 5 82 88 95 + 6 42 97 06 ± 2 40 99 00 ± 5 23 -0 073
87 121 4 ± 23 5 83 20 ± 8 16 -0 071
88 129 5 ± 1 63 88 95 + 3 87 96 16 ± 5 00 103 6 ± 2 67 -0 055
89 111 6 ± 3 64 88 95 + 3 87 -0 050
90 115 0 ± 6 98 106 6 + 7 53 98 16 ± 3 00 100 9 ± 3 88 -0 044
free for Assays 1 and 2 (SF)) +_ standard deviation (n = 5 for low serum assays (DE as end point) and n = 4 for serum-free assays (AP as end point)) The absorbance was read at 280nm against DM E phenol red-free medium Abbreviations LS — low serum, SF = serum-free
305
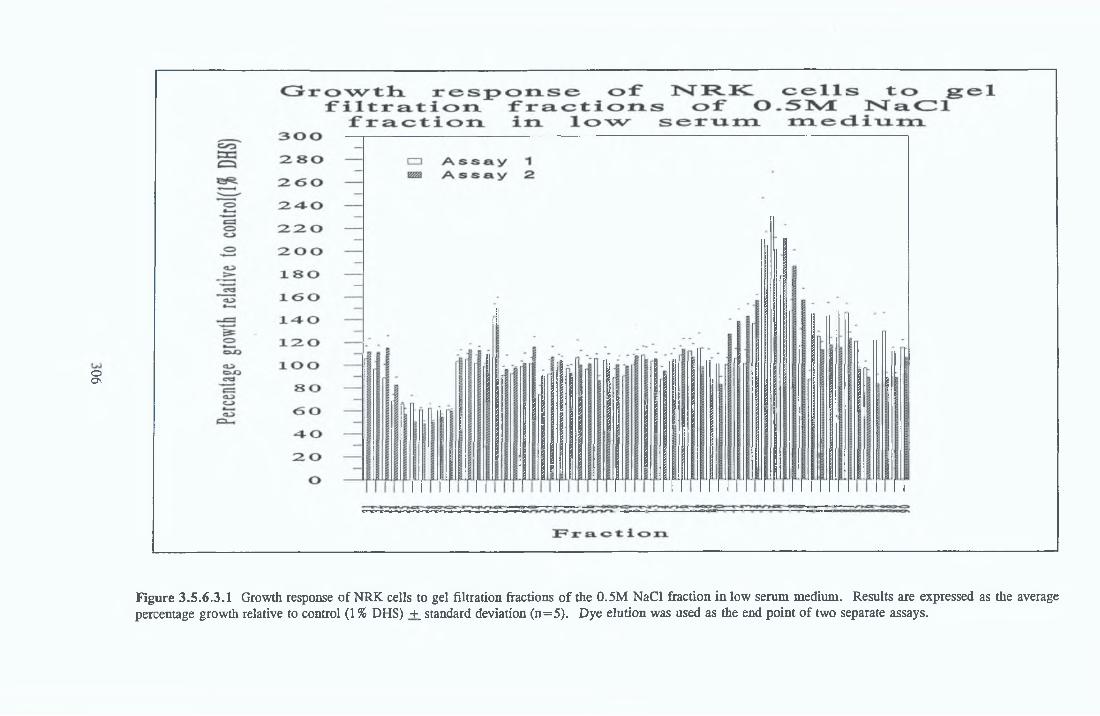
oo \
Figure 3.5.6.3.1 Growth response of NRK cells to gel filtration fractions of the 0.5M NaCl fraction in low serum medium. Results are expressed as the averagepercentage growth relative to control (1 % DHS) +_ standard deviation (n=5). Dye elution was used as the end point of two separate assays.
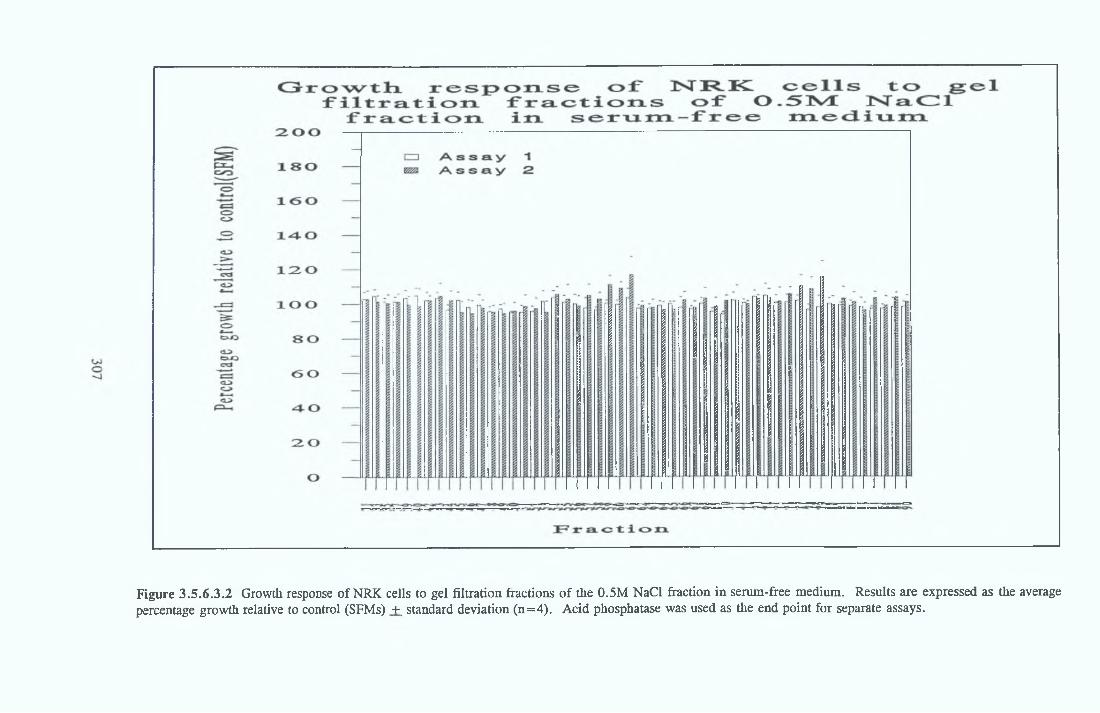
Figure 3.5.6.3.2 Growth response of NRK cells to gel filtration fractions of the 0.5M NaCl fraction in serum-free medium. Results are expressed as the averagepercentage growth relative to control (SFMs) +. standard deviation (n=4). Acid phosphatase was used as the end point for separate assays.

3.5.6.4 Gel filtration of BSA
With the low activity obtained with the 0 5M NaCl control and no consistent activity being
observed after gel filtration except less than 2,000 molecular weight, it was decided to subject
BSA to gel filtration to see where (if any) activity was eluting from the column
In low serum-supplemented assays, slight stimulation was seen but no significant peak of
activity was observed (Figure 3 5 6 4 1) In fraction 47, BSA was growth inhibitory relative
to the control (1% DHS) by about 10 - 20%
Good stimulation was seen in assay 2 where the control albumin showed a 2 2-fold stimulation
over the control (1 % DHS) In assay 1, the control BSA was only 58% stimulatory above the
control There appeared to be less stimulation overall in assay 1 Although there was
stimulation in several fractions (62-63, 85-87 and 88-100), none individually were as good as
the control BSA
When the fractions were tested m the serum-free medium (SFMs), variable responses to the
fractions were seen depending on the assay (Figure 3 5 6 4 2) No stimulation was seen m
fraction 47 or in the BSA control (No activity for BSA at 0 lmg/ml was also seen in section
3 5 4 18)
According to the protein profile of the BSA, one major protein peak occurred in fraction 47
(Figure 3 5 6 4 2) A small spike occurred in fraction 42, probably due to aggregation of
albumin No stimulation and about 20% inhibition was seen in fractions 42 and 47 for low
serum assays respectively and no effect was observed in serum-free assays
308
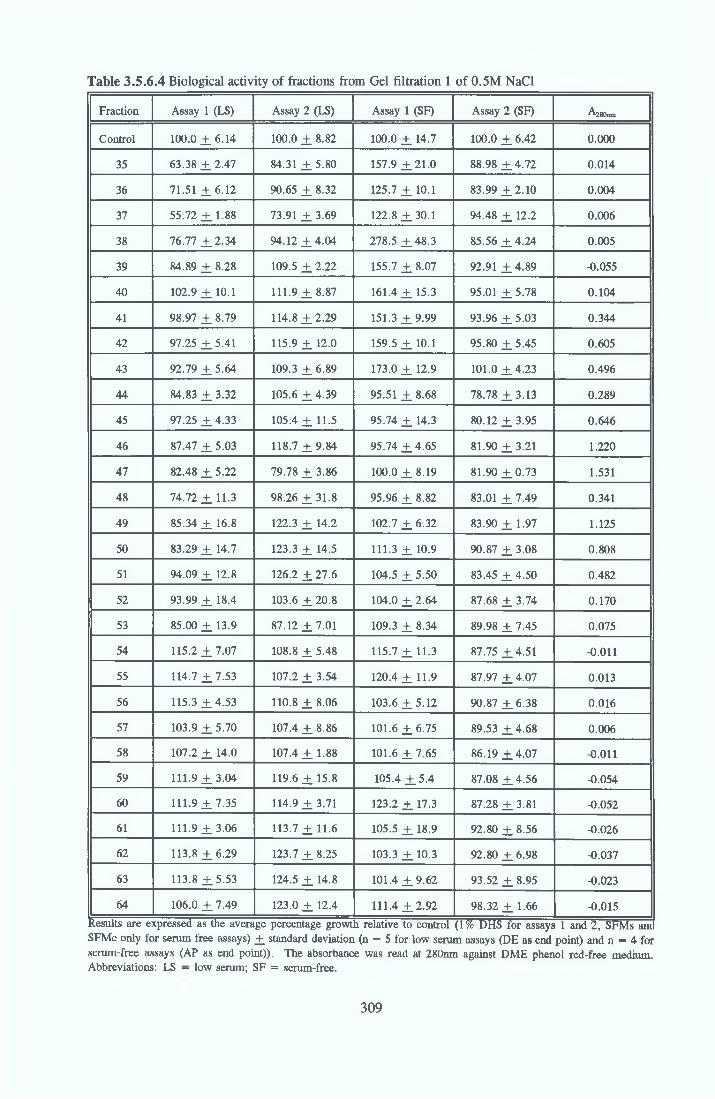
Table 3.5.6.4 Biological activity of fractions from Gel filtration 1 of 0.5M NaCl
Fraction Assay 1 (LS) Assay 2 (LS) Assay 1 (SF) Assay 2 (SF) A280nm
Control 100.0 ± 6 . 1 4 100.0 ± 8.82 100.0 ± 14.7 100.0 ± 6.42 0.000
35 63.38 ± 2 . 4 7 84.31 ± 5 . 8 0 157.9 ± 2 1 . 0 88.98 ± 4 .72 0.014
36 71.51 ± 6 . 1 2 90.65 ± 8.32 125.7 ± 10.1 83.99 ± 2 . 1 0 0.004
37 55.72 ± 1 . 8 8 73.91 ± 3.69 122.8 ± 3 0 . 1 94.48 ± 12.2 0.006
38 76.77 ± 2 . 3 4 94.12 ± 4 . 0 4 278.5 ± 4 8 . 3 85.56 ± 4 . 2 4 0.005
39 84.89 ± 8.28 109.5 ± 2 .22 155.7 ± 8 . 0 7 92.91 ± 4 . 8 9 -0.055
40 102.9 ± 10.1 111.9 ± 8 . 8 7 161.4 ± 15.3 95.01 ± 5 . 7 8 0.104
41 98.97 ± 8.79 114.8 ± 2 . 2 9 151.3 ± 9 . 9 9 93.96 ± 5 . 0 3 0.344
42 97.25 ± 5.41 115.9 ± 12.0 159.5 ± 10.1 95.80 ± 5 . 4 5 0.605
43 92.79 ± 5 . 6 4 109.3 ± 6.89 173.0 ± 12.9 101.0 ± 4 . 2 3 0.496
44 84.83 ± 3 . 3 2 105.6 ± 4 . 3 9 95.51 ± 8.68 78.78 ± 3 . 1 3 0.289
45 97.25 ± 4.33 105.4 ± 11.5 95.74 ± 14.3 80.12 ± 3 . 9 5 0.646
46 87.47 ± 5 . 0 3 118.7 ± 9 . 8 4 95.74 ± 4 . 6 5 81.90 ± 3 . 2 1 1.220
47 82.48 ± 5.22 79.78 ± 3.86 100.0 ± 8 . 1 9 81.90 ± 0 . 7 3 1.531
48 74.72 ± 1 1 . 3 98.26 ± 3 1 . 8 95.96 ± 8.82 83.01 ± 7 . 4 9 0.341
49 85.34 ± 16.8 122.3 ± 14.2 102.7 ± 6 . 3 2 83.90 ± 1 . 9 7 1.125
50 83.29 ± 14.7 123.3 ± 14.5 111.3 ± 10.9 90.87 ± 3.08 0.808
51 94.09 ± 12.8 126.2 ± 2 7 . 6 104.5 ± 5 . 5 0 83.45 ± 4 . 5 0 0.482
52 93.99 ± 18.4 103.6 ± 20.8 104.0 ± 2 . 6 4 87.68 ± 3.74 0.170
53 85.00 ± 13.9 87.12 ± 7 . 0 1 109.3 ± 8.34 89.98 ± 7.45 0.075
54 115.2 ± 7 . 0 7 108.8 ± 5.48 115.7 ± 1 1 . 3 87.75 ± 4 . 5 1 -0.011
55 114.7 ± 7 . 5 3 107.2 ± 3.54 120.4 ± 1 1 . 9 87.97 ± 4 . 0 7 0.013
56 115.3 ± 4 . 5 3 110.8 ± 8.06 103.6 ± 5 . 1 2 90.87 ± 6 . 3 8 0.016
57 103.9 ± 5 . 7 0 107.4 ± 8.86 101.6 ± 6 . 7 5 89.53 ± 4 . 6 8 0.006
58 107.2 ± 14.0 107.4 ± 1.88 101.6 ± 7 . 6 5 86.19 ± 4 . 0 7 -0.011
59 111.9 ± 3 . 0 4 119.6 ± 15.8 105.4 ± 5 . 4 87.08 ± 4 . 5 6 -0.054
60 111.9 ± 7 . 3 5 114.9 ± 3 . 7 1 123.2 ± 17.3 87.28 ± 3.81 -0.052
61 111.9 ± 3 . 0 6 113.7 ± 11.6 105.5 ± 18.9 92.80 ± 8 . 5 6 -0.026
62 113.8 ± 6 . 2 9 123.7 ± 8.25 103.3 ± 10.3 92.80 ± 6 . 9 8 -0.037
63 113.8 ± 5 . 5 3 124.5 ± 14.8 101.4 ± 9 . 6 2 93.52 ± 8.95 -0.023
64 106.0 ± 7.49 123.0 ± 12.4 111.4 ± 2 . 9 2 98.32 ± 1.66 -0.015
Results are expressed as the average percentage growth relative to control (1 % DHS for assays 1 and 2 , SFM s ancSFM c only for serum-free assays) ± standard deviation (n = 5 for low serum assays (DE as end point) and n = 4 for scrum-free assays (AP as end point)). The absorbance was read at 280nm against DM E phenol red-free medium. Abbreviations: LS — low serum; SF = serum-free.
309

Table 3.5.6.4continued Biological activity of fractions from Gel filtration 1 of 0 5M NaCl
Fraction Assay 1 (LS) Assay 2 (LS) Assay 1 (SF) Assay 2 (SF) 280nm
Control 100 0 ± 9 94 100 0 ± 12 4 100 0 ± 2 92 100 0 ± 9 04 0 000
65 1 1 2 0 + 8 92 138 8 ± 9 79 94 44 + 12 6 74 82 ± 4 07 -0 048
66 119 3 ± 8 2 4 142 5 ± 23 1 96 11 ± 9 14 79 86 ± 2 52 -0 027
67 112 6 ± 6 70 132 5 ± 6 41 110 8 ± 16 5 83 93 ± 1 84 -0 020
68 120 3 ± 10 6 132 2 ± 10 8 94 72 ± 8 72 79 86 ± 2 52 -0 019
69 98 88 ± 1 14 125 8 ± 13 4 101 4 ± 4 29 77 94 ± 6 13 -0 032
70 96 63 ± 10 6 11 1 ± 12 0 91 10 ± 1 20 88 70 ± 4 33 -0 041
71 101 7 ± 6 06 118 5 ± 8 20 93 92 ± 11 7 89 90 ± 5 94 -0 017
72 88 49 ± 13 1 120 3 ± 7 41 101 2 ± 13 8 85 28 ± 7 22 -0 015
73 85 55 ± 16 4 120 7 ± 9 19 100 0 ± 10 5 87 90 ± 9 00 -0 029
74 100 0 ± 8 44 111 3 ± 9 63 91 82 ± 5 93 82 46 ± 6 46 -0 008
75 100 4 ± 12 0 127 8 ± 10 7 106 3 ± 14 3 84 30 ± 6 76 -0 016
76 102 4 ± 4 94 123 9 ± 9 77 113 5 ± 14 2 83 30 ± 4 02 -0 026
77 86 47 ± 5 76 111 3 ± 5 15 120 6 ± 13 2 90 50 ± 8 99 -0 023
78 110 7 ± 5 72 102 6 ± 7 92 127 6 ± 3 45 90 90 ± 3 63 -0 053
79 108 4 ± 7 23 108 2 ± 12 9 95 79 ± 6 39 92 39 ± 13 2 -0 024
80 101 7 ± 10 1 119 6 ± 12 1 96 00 ± 3 92 94 62 ± 4 48 -0 034
82 98 42 ± 6 85 113 2 ± 10 4 92 90 ± 2 60 86 96 ± 8 74 -0 020
83 104 3 ± 9 83 112 8 ± 1 0 7 99 78 ± 7 13 94 56 ± 13 2 -0 023
84 78 85 ± 6 96 95 12 ± 7 89 90 93 ± 8 59 101 6 ± 5 06 -0 034
85 107 3 ± 8 68 137 8 ± 12 2 88 94 ± 8 83 104 0 ± 6 72 -0 015
86 118 4 ± 6 09 133 9 ± 14 4 93 58 ± 7 41 103 8 ± 5 14 -0 022
87 116 1 ± 8 49 138 8 ± 2 1 3 98 67 ± 5 28 100 8 ± 7 28 -0 003
88 111 5 ± 9 71 107 8 ± 11 3 101 3 ± 4 12 102 7 ± 7 86 -0 015
89 115 9 ± 11 5 153 4 ± 11 6 102 8 ± 3 54 101 9 ± 1 05 -0 020
90 113 3 ± 11 1 147 8 ± 6 21 98 00 ± 9 09 103 0 ± 10 1 -0 032
92 115 3 ± 14 4 142 4 ± 6 99 100 3 ± 2 82 97 81 ± 10 2 -0 003
96 113 6 ± 8 69 152 0 ± 16 7 140 3 ± 28 3 94 53 ± 8 01 -0 040
98 114 8 ± 6 23 151 2 ± 15 7 99 78 ± 5 18 1 1 2 0 ± 3 15 -0 011
100 99 64 ± 12 2 141 5 ± 21 7 95 20 ± 7 86 112 3 ± 5 81 -0 007
BSAc 158 0 ± 14 1 224 5 ± 13 7 102 6 ± 2 95 96 50 ± 9 89 -0 007
Results are expressed as the average percentage growth relative to control (1 % DHS for assays 1 and 2 , SFM s and SFM c only for serum-free assays) ± standard deviation (n = 5 for low serum assays (DE as end point) and n = 4 for serum-free assays (AP as end point)) The absorbance was read at 280nm against DM E phenol red-free medium Abbreviations LS = low serum, SF — serum-free
310
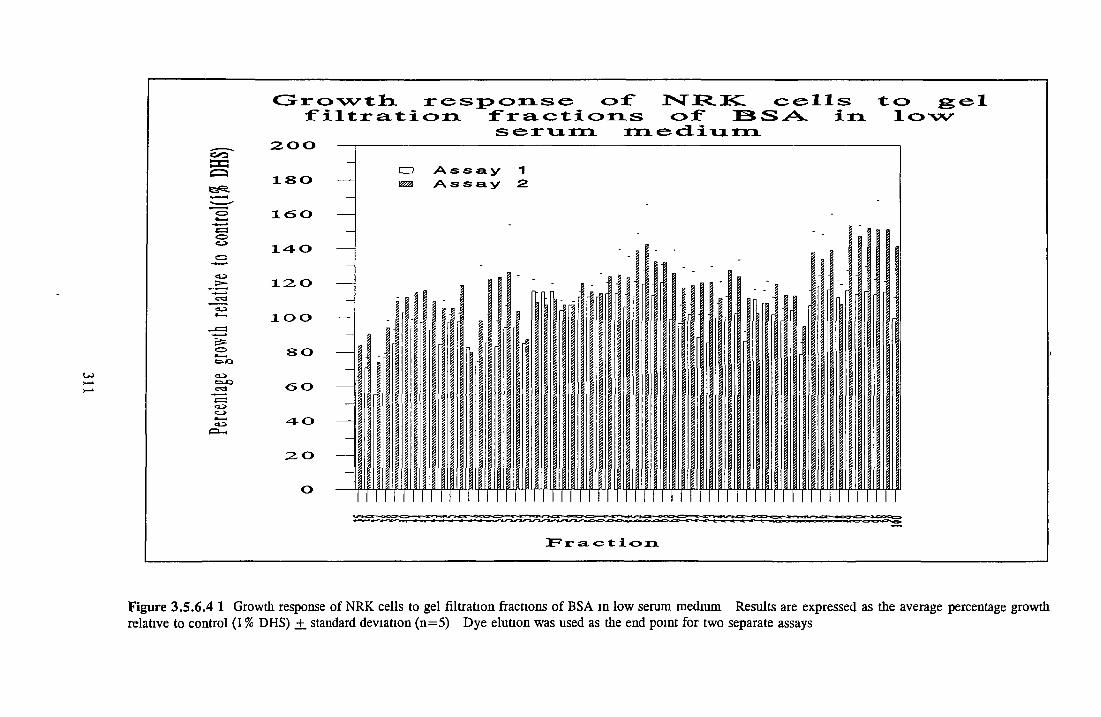
Figure 3.S.6.4 1 Growth response of NRK cells to gel filtration fractions of BSA in low serum medium Results are expressed as the average percentage growthrelative to control (1 % DHS) _+ standard deviation (n=5) Dye elution was used as the end point for two separate assays
These experiments showed that for the 0 5M NaCl fraction, two separate gel filtration runs
showed stimulating activity at low molecular weights of less than 2,000 A protein peak
corresponded with the activity in one experiment but not in the other
The low activity may have been due to the activity being spread out over several fractions as
a result may have lowered the individual activity of a fraction The active factor may also have
required the presence of the BSA molecule to elicit its activity However, the control for the
0 5M NaCl fraction was low
When the untreated BSA was run on the column, there was a spread of activity over the
fractions This activity was low and did not correspond to one mam peak suggesting that a
variety of factors may be required to impart the activity to BSA There was no activity at the
position at which the albumin was eluted from the column In addition, no peak activity was
seen at low molecular weights of less than 2,000 to correspond to the peaks found with the
0 5M NaCl fraction
A 9,000 molecular weight protein such as erythrotropin-like factor would be eluted from the
column around fraction 61 For the 0 5M NaCl fraction, there was little or no activity seen in
fraction 61, with some stimulation in fractions 62 and 63 in one experiment and no activity in
the second experiment No significant activity was seen in these fractions with the BSA control
These results indicate that if erythrotropin-like factor was present on the albumin, it did not
account for the activity associated with the BSA or the 0 5M NaCl fraction, unless its activity
required the presence of the BSA molecule
312

3.5.6.5 DIAFILTRATION OF BSA
In order to investigate the possibility that recombination of factors/components of different
molecular weight were necessary to restore activity, BSA was sequentially diafiltered through
a series of membranes with decreasing molecular weight cut offs (100,000, 30,000, 10,000 and
3,000) The filtrates (F100, F30, F10 and F3) and retentates (R100, R-^oo, R10.30 and R3.10) were
tested alone and in combination for their growth stimulatory activity on NRK cells in low serum
conditions In two separate diafiltration experiments, a 20mg/ml BSA solution was diafiltered
A second solution with just ATCC was diafiltrated as a control for factors in the ATCC which
may have been isolated in any of the retentates
The results for two separate diafiltrations (two assays per diafiltration) are shown in Tables
3 5 6 5 la and b In the first diafiltration, variable activity was retained in the R100 (only 10%
in assay 1 and 58 3% in assay 2 of the activity seen with the 1% DHS control) 83-91%
stimulation above the control (1% DHS) was seen in the filtrate (F100) This corresponded to
66% of the activity obtained with the BSA control Recombination of the retentate and filtrate
was slightly more stimulatory than the filtrate alone, resulting in 76 - 82% of the activity
obtained by the BSA control In the second diafiltration, 53 - 67 6 % of the activity obtained
by the control BSA was retained in the R100 The filtrate showed the same stimulation as the
BSA control (100 - 121% of the activity found in the control BSA) The combination of the
filtrate and retentate was again as stimulatory as the BSA control (116 9 - 81%)
For first diafiltration, the R ioo showed 47 -55% of the growth achieved by the BSA control
In the first assay, only 21 % activity was retained m the F^+ R^«, In the second diafiltration,
activity was seen in the retentate but little or no stimulation in the filtrate The amount of
activity in the R30-100 was variable between the two assays, 35 - 73% of that obtained with the
BSA control Recombination of the R30-100 and F30 increased the activity to 48 6 - 82 7 % of that
obtained with the BSA control For the R10_M and F10 little or no stimulation was seen in either
diafiltration (no F10 was kept for assaying in diafiltration 2) Some slight inhibition was seen
in the R3.10 and F3 in the first diafiltration but not in the second
The diafiltered ATCC controls from the first diafiltration were assayed to ensure that
components from the medium were not responsible for the observed results Little or no
stimulation was seen when the standard deviations were taken into account (Table 3 5 6 5 2)
Slight inhibition by R3_10 was seen in one of the two assays
313

Table 3.5.6.5.1a Biological activity of retentâtes and filtrâtes of BSA (Diafiltration 1)
VARIABLE ASSAY 1 ASSAY 2 VARIABLE ASSAY 1 ASSAY 2
1%DHS 100 0 ± 5 39 100 0 ± 10 6 1% DHS 100 0 ± 5 95 100 0 ± 10 6
+ BSA 237 6 ± 32 0 223 9 ± 14 2 + BSA 209 1 ± 13 9 223 9 ± 14 2
+ RiOO 112 9 ± 4 99 158 3 ± 14 0 "*■ R lO 30 118 8 ± 2 75 96 36 ± 8 50
+ F ioo 190 6 + 21 5 182 6 ± 2 0 8 + F 10 100 0 ± 18 4 78 54 ± 9 50
+ RlOO + F 100 204 7 + 40 0 158 7 ± 17 0 + R + F 10 81 90 ± 10 3 73 68 ± 8 50
+ R 30 100 174 1 ± 20 1 158 7 ± 1 1 3 + R 3 10 70 13 ± 5 50 100 6 ± 8 06
+ F 30 101 2 ± 4 03 70 99 ± 10 9 + F3 89 61 ± 10 3 101 6 ± 6 52
+ R 30 100 + F 30 129 4 ± 12 4 105 5 ± 14 7 + r + f 3 75 97 ± 2 75 97 70 ± 4 06
Table 3.5.6.5.1b Biological activity of retentâtes and filtrâtes of BSA (Diafiltration 2)
VARIABLE ASSAY 1 ASSAY 2 VARIABLE ASSAY 1 ASSAY 2
1%DHS 100 0 + 10 6 100 0 ± 1 59 1% DHS 100 0 ± 10 6 100 0 ± 8 00
+ BSA 233 8 + 16 7 233 0 +. 22 2 + BSA 233 8 ± 16 7 233 0 + . 22 2
+ R -100 190 4 + 14 5 170 6 +. 14 1 + R i o 30 154 5 ± 13 9 113 7 ± 5 88
F ™ 262 1 + 27 7 233 0 ± 12 0 1% DHS 100 0 ± 1 86 100 0 ± 9 20
+ R + F 100 256 4 + 25 8 207 8 + .2 1 1 + BSA 246 0 ± 17 9 223 0 ± 8 00
®-30 100 198 3 + 10 0 147 0 ± 13 8 R 3 10 102 6 ± 1 86 97 67 ± 9 30
+ F 30 137 6 + 19 6 109 8 ± 9 60 + f 3 100 0 ± 7 86 83 72 ± 6 97
+ R + F 30 210 7 + 25 3 164 7 ± 9 19 + r + f 3 92 30 ± 10 2 86 00 ± 9 30
Table 3.5.6 5.2 Biological acüvity of retentâtes and filtrâtes of ATCC
VARIABLE ASSAY 1 ASSAY 2
1%DHS 100 0 ± 28 0 100 0 ± 19 3
+ BSA 294 1 ± 2 0 4 244 0 ± 27 0
RlOO 104 4 ± 15 5 102 0 ± 25 4
+ F 100 91 20 ± 6 74 126 0 ± 2 7 5
"*■ R30100 91 20 ± 15 5 102 0 ± 2 0 8
F^ 99 99 ± 9 18 122 2 ± 15 1
+ R i o 30 101 4 ± 7 64 108 1 ± 1 06
+ F 10 94 1 ± 14 2 63 00 ± 0 42
+ R 3 10 74 65 ± 4 88 93 30 ± 8 31
+ f 3 108 4 ± 12 9 93 30 ± 15 4
314

The results for the combinations of the retentates are shown in Table 3 5 6 5 3 The retentates
from the ATCC diafiltrations were also recombined These were referred to as for example
Ra-u+RiooATCC, while the BSA solutions were referred to R3.10+R100BSA
While the control R10_30+R31()ATCC showed no stimulation, R10-30+ R3-10BSA showed between
28 1 and 42 2% stimulation above the control (1% DHS) m both diafiltrations ( except assay
2 in Diafiltration 1 ,2 2%) The amount of stimulation was low varying between 20 6 - 25 4%
of the activity of the BSA control (Again very low activity was seen in Assay 2 from
Diafiltration 1)
The combination R3o_10o+R3.ioBSA was not as stimulatory as the control BSA The ATCC
control was inhibitory in the first diafiltration but had no effect in the second diafiltration
For the combination of R100+R3.10BSA, improved growth in the first diafiltration but not in the
second was seen The addition of R3.10 did not improve growth obtained with the R100 alone
T able 3 .5 .6 .5 .3 a Biological activity combinations o f retentates o f BSA (Diafiltration 1)
VARIABLE ASSAY 1 ASSAY 2
1%DHS 100 0 ± 5 39 100 0 ± 4 90
+ BSA 304 2 ± 27 7 243 2 + 15 9
+ R i o 30 R -3 |qBS A 142 2 +. 12 2 102 2 ± 11 3
+ R i o 30 R 3 .oATCC 97 18 ± 26 4 106 6 ± 11 8
+ R 100 "f" R 3 10BSA 181 1 ± 1 2 1 168 2 ± 13 6
R 100 R 3 i q A T C C 94 37 ± 19 0 96 30 ± 6 79
1% DHS 100 0 ± 7 89 100 0 + 4 90
+ BSA 168 7 ± 0 15 243 2 + 15 9
+ R 30 100 R 3 10BSA 156 2 ± 9 44 175 0 ± 6 82
R 3 0 100 R 3 10ATCC 86 25 ± 1 1 2 76 00 ± 2 17 '
Results are expressed as the percentage growth relative to control (1% DHS) _+ standard deviation (n=3)
315
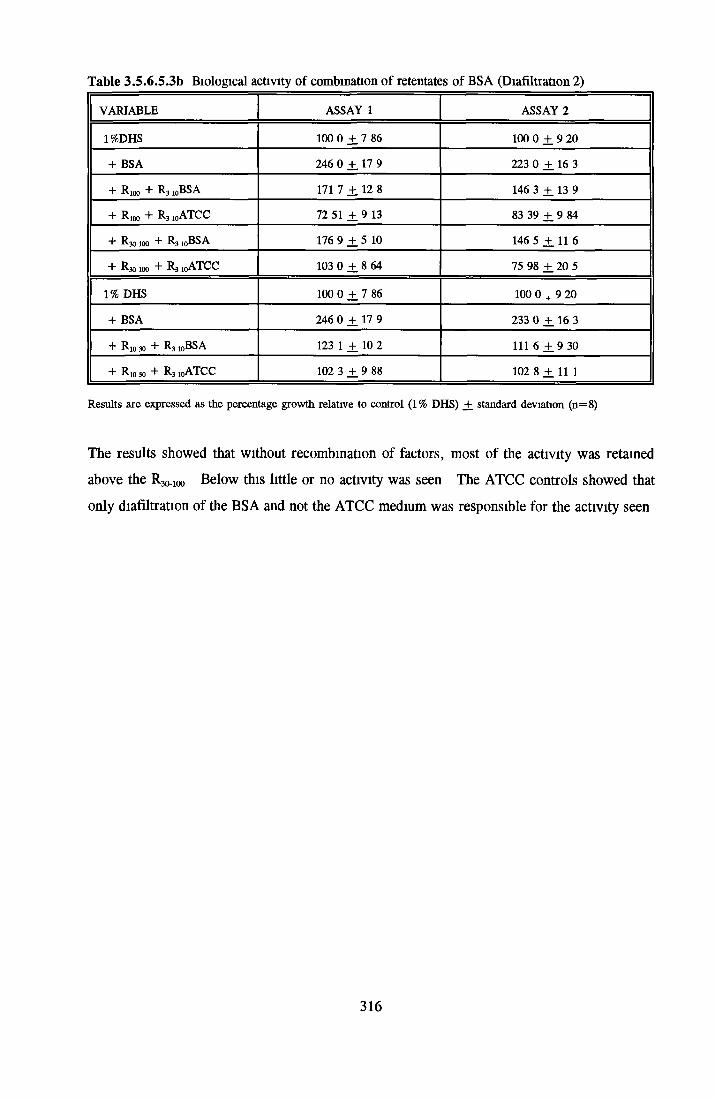
Table 3.5.6.5.3b Biological activity of combination of retentates of BSA (Diafiltration 2)
VARIABLE ASSAY 1 ASSAY 2
1 %DHS 100 0 ± 7 86 100 0 ± 9 20
+ BSA 246 0 +. 17 9 223 0 ± 16 3
+ R i(x) + R3 iqB S A 171 7 ± 12 8 146 3 ± 13 9
+ R 100 R310ATCC 72 51 ± 9 13 83 39 ± 9 84
R30100 "I” R310BSA 176 9 ± 5 10 146 5 ± 11 6
+ R30100 "I" R310ATCC 103 0 +. 8 64 75 98 ± 20 5
1% DHS 100 0 + 7 86 100 0 + 9 20
+ BSA 246 0 ± 17 9 233 0 ± 16 3
Rio 30 R310BSA 123 1 ± 10 2 111 6 ± 9 30
+ Rio 30 R310ATCC 102 3 ± 9 88 102 8 ± 1 1 1
Results are expressed as the percentage growth relative to control (1% DHS) _+ standard deviation (n = 8)
The results showed that without recombination of factors, most of the activity was retained
above the R30-100 Below this little or no activity was seen The ATCC controls showed that
only diafiltration of the BSA and not the ATCC medium was responsible for the activity seen
316
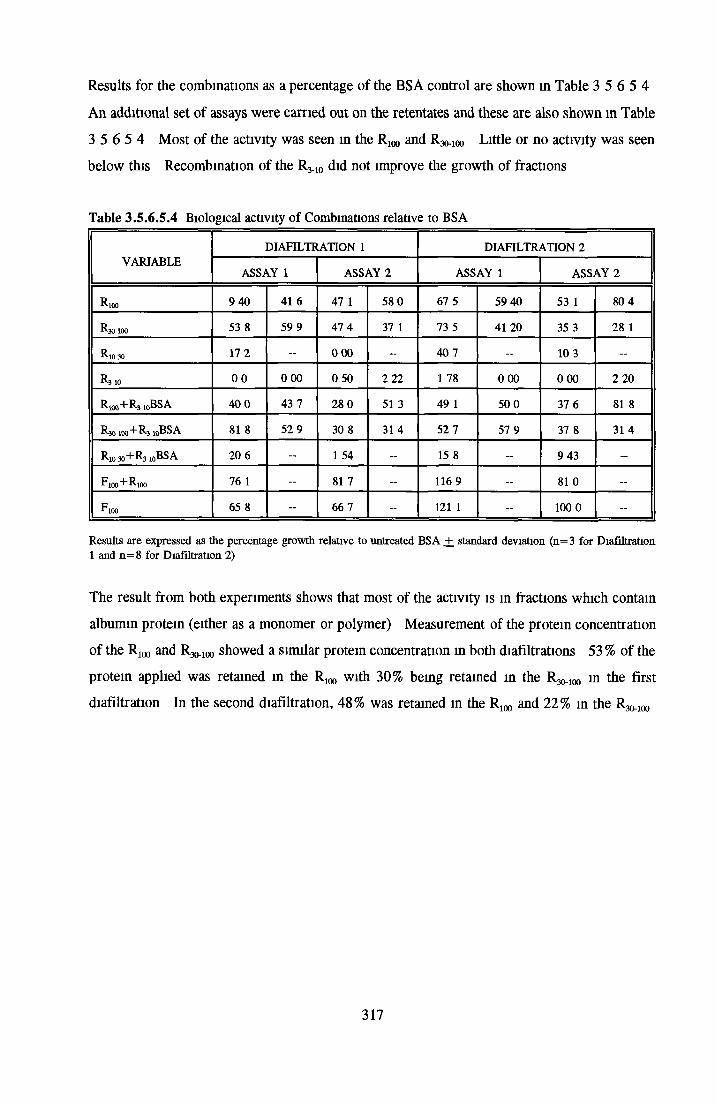
Results for the combinations as a percentage of the BSA control are shown in Table 3 5 6 5 4
An additional set of assays were carried out on the retentates and these are also shown in Table 3 5 6 5 4 Most of the activity was seen in the R100 and R30.100 Little or no activity was seen below this Recombination of the R3.10 did not improve the growth of fractions
T able 3 .5 .6 .5 .4 Biological activity o f Combinations relative to BSA
VARIABLEDIAFILTRATION 1 DIAFILTRATION 2
ASSAY 1 ASSAY 2 ASSAY 1 ASSAY 2
RlOO 9 4 0 41 6 47 1 58 0 67 5 59 40 53 1 8 0 4
R 30 100 53 8 59 9 47 4 37 1 73 5 41 20 35 3 28 1
R-10 30 17 2 - 0 0 0 - 40 7 - 10 3 -
R-3 10 0 0 0 0 0 0 50 2 22 1 78 0 0 0 0 0 0 2 20
R 100+ R 3 »BSA 4 0 0 43 7 28 0 51 3 49 1 50 0 37 6 81 8
R 30 100 + R -3 10BSA 81 8 52 9 30 8 31 4 52 7 57 9 37 8 31 4
R i o 30+ R 3 10BSA 20 6 - 1 54 - 15 8 - 9 43 -
F,00 + RlOO 76 1 - 81 7 - 116 9 - 81 0 -
F 100 65 8 - - 66 7 - 121 1 - - 100 0 -
Results are expressed as the percentage growth relative to untreated BSA +_ standard deviation (n = 3 for Diafiltration 1 and n = 8 for Diafiltration 2)
The result from both experiments shows that most of the activity is in fractions which contain albumin protein (either as a monomer or polymer) Measurement of the protein concentration
of the R100 and R3(Moo showed a similar protein concentration in both diafiltrations 53% of the
protein applied was retained in the R100 with 30% being retained in the R ^ ^ in the first diafiltration In the second diafiltration, 48% was retained in the R100 and 22% in the R^o,,
317

3.5.6.6 Diafiltration of 0.5M NaCl Fraction
Diafiltration was carried out using the 0 5M NaCl fraction as described for BSA in section 3 5 6 5 The results for the retentâtes only are shown m Tables 3 5 6 6 1 and 2
T able 3 .5 .6 .6 .1 Biological activity o f retentâtes o f the 0 5M NaCl fraction
VARIABLE ASSAY 1 ASSAY 2
1%DHS 100 0 ± 7 08 100 0 ± 6 20
+ 0 5M NaCl 205 1 ± 15 0 222 2 ± 18 5
+ R -100 101 6 ± 3 76 96 82 ± 8 67
+ R 3 0 100 99 73 ± 5 64 109 2 ± 10 7
+ R lO 30 95 03 ± 5 29 76 54 ± 8 34
+ R 3 10 94 09 ± 7 53 59 88 ± 11 3
+ R 100 + R 3 10 105 1 ± 10 0 82 09 + 18 6
+ R 30 100 + R 3 10 98 39 ± 1 1 6 83 95 ± 22 0
+ R i o 30 + R 3 10 97 85 ± 7 52 62 96 ± 16 1
1% DHS 100 0 ± 6 60 100 0 ± 7 20
+ 0 5M NaCl 275 8 ± 17 2 169 9 ± 2 0 9
+ R io o + R 3 0 100 155 2 ± 13 8 112 6 ± 1 1 5
+ R io o + R lO 30 168 9 ± 6 89 115 7 ± 1 3 0
+ R 30 100 "1" R lO 30 210 3 ± 13 8 157 4 ± 8 50
Results are expressed as the percentage growth relative to control (1% DHS) ± standard deviation (n = 8 )
The results show that no apparent activity was visible in any of the retentates This was unlikely to be due to a loss of the active factor on diafiltration, as diafiltration of the 0 5M
NaCl fraction did not result in a loss of activity as seen in section 3 5 4 20 The loss of activity may also have been due to a requirement for some albumin to be present for the active factor to elicit a response Recombination of any of the factors with the R3.10 did not result in a
recovery of activity However, recombination of the R30.100 + Rioo and the R100 +R10_30 showed 20 to 30% of the activity observed with the 0 5M NaCl fraction alone (Table 3 5 6 6 2) When
the R30-100 an<i R10-30 were recombined, 60 to 80% of the activity associated with the 0 5M NaCl fraction was restored
318

Table 3.5 6.6 1 Biological activity of retentates of the 0 5M NaCl fraction
VARIABLE ASSAY 1 ASSAY 2
+ 0 5M NaCl 100 0 100 0
+ R io o 1 5 0 0 0
+ R 3 0 100 0 0 0 7 38
+ R-10 30 0 0 0 0 0 0
+ R 3 10 0 0 0 0 00*
+ R io o + R 3 10 4 70 0 00*
+ R 30 100 R 3 10 0 0 0 0 00*
+ R i o 30 + R 3 10 0 0 0 0 00*
"t" RlOO "I" RlO 30 31 4 18 0
+ R io o + R 3 0 100 39 2 22 5
+ R jO 30 + R 3O 100 62 7 82 2
Results are expressed as the percentage growth relative to 0 5M NaCl fraction
The results for the diafiltration of the 0 5M NaCl fraction suggest that the activity of the 0 5M
NaCl fraction was not due to a subpopulation of albumin as no activity was seen in the R30.ioo
Moreover, the activity appeared on recombination of the R30.100 and the R ^ Activity was also seen in the combination of the R100 with either the R10_30 or R3(Moo These results show a trend different to that observed with the native albumin on diafiltration
319

CHAPTER FOUR
DISCUSSION
i
4.0 DISCUSSION
Serum is a requirement of virtually all types of cells grown in culture, its function being to
provide the additional nutrients and protective factors not present in the basal medium Fetal
bovine / calf sera are most commonly used to support growth However, problems in the use of serum include cost, batch variability, supply limitations and the potential of biological contamination (viruses and mycoplasma) The undefined nature of serum makes interpretation of results difficult and hampers the elucidation of biochemical pathways On an industrial scale, additional problems exist The variability in serum batches results in variable production runs The high levels of protein present in serum make downstream processing more difficult and
increases purification costs Also, regulations governing the production of pharmaceuticals are
critical of the excessive use of serum in industrial production
To overcome many of the above problems, serum-free media (SFM) were developed
However, as the nutritional requirements varied considerably between cell lines and culture
conditions, not to mention the complexity of serum itself, it has not been possible to develop
a universal SFM which would support the growth of all cell lines
In order to encourage cell growth, many growth factors and hormones normally present m
serum were added Two of the most commonly used supplements in SFM are bovine insulin and human transferrin While growth in SFM has overcome many of the problems mentioned above, the use of animal-derived proteins still present the possibility of biological c o ntam ination
in addition to a loss of media definition For these reasons and to satisfy industrial regulations, development of protein free / defined media has become important Production of proteins from such a medium would, theoretically, be free from immunoglobulins and other protein contaminants associated with serum-derived components such as albumin and transferrin
The development of protein-free media is usually based on supplementing the basal medium with a wide variety of low molecular weight components to such an extent that cells do not require large molecular weight proteins Most success has been achieved for anchorage- independent cells which are m general more tolerant and have less demanding nutritional requirements (Agy et a l , 1981, Darfler, 1990, Shinmoto et a l , 1988) than anchorage-
dependent cells Important growth stimulatory factors may not be required for some cell lines
which exhibit an autocrine production system (Rikimaru et al 1990) Where a dependence on
320

exogenously added growth factors or hormones is required, recombinant or synthetic analogues
(e g a-cyclodextrin and cholesterol for albumin, fernc-gluconate for transferrin) have been employed Recombinant growth factors are sometimes used it is claimed that they are purer
than serum-derived proteins
It was the aim of this project to investigate the serum-derived proteins and in serum-free medium so as to replace them with non animal-derived components which may take the form
of recombinant proteins / synthetic analogues or simple chemical compounds (e g recombinant
insulin or IGF-I and ferric complexes in the case of insulin and transferrin respectively)
In order to do this, it was necessary to be able to screen a wide range of variables with
minimum effort For this reason miniaturized assay systems using 96-well plate assays were used Miniaturized assay systems are semiautomated with the use of automatic multi-well
pipetters and ELISA plate readers to detect end points In addition to being able to handle a wide selection of variables, methods were simple to perform, involved no use of radioactive material and were sensitive as well as cost effective Acid phosphatase and crystal violet dye
elution were both used as end points for miniaturized assay systems Angela Martin (Ph D
thesis, 1992) compared the suitability of various end points used m miniaturized assay systems Acid phosphatase was presented as a suitable candidate for cytotoxicity and growth stimulatory
assays (Martin and Clynes, 1991) For NRK cells, a linear relationship was found to exist
between cell number and AP activity and the sensitivity was very good, it being possible to detect as few as 500 cells (Angela Martin, Ph D , 1992) However there was a loss of linearity
at above 8xl04 cells per well, so it was important to ensure that cell growth did not exceed this upper limit
The other cell lines used in these investigations, MDCK and CHOK1 cells were analyzed for
their ability to produce acid phosphatase A linear response for both cell lines was obtained when acid phosphatase production was compared to cell number
Acid phosphatase activity was however, merely a rapid screening method It was necessary to support the findings by looking at cell number to confirm the effects of specific variables This necessity was most evident from the results obtained in section 3 5 4 8 when investigating the
growth promoting effects of the 0 5M NaCl fraction from heparm sepharose chromatography
of BSA on NRK cells in low serum-supplemented medium Acid phosphatase production was found not to represent increased cell number in 96-well plates As crystal violet dye elution
321

was found to reflect changes in cell number, this was used as the end point for subsequent
screening studies involving the 0 5M NaCl fraction
4.1 Development of low serum and serum-free medium for NRK cells
A number of SFM existed for NRK cells or NRK subclones, but attempts to grow the parental
NRK cells in these SFM failed In order to develop a SFM, it was decided to investigate some
of the more common serum-free additives in low serum conditions By using low serum concentrations, it was hoped to see what factors may be required in a SFM
Insulin, transferrin and albumin were studied and the optimum concentrations were found to be in the range used in most SFM (section 3 11) A lipid source has also been recommended for
use in SFM (Glassy et a l , 1988) A lipoprotein complex called Ex-cyte (Pentex product) was
used as a lipid source Ex-cyte is a water soluble mixture of cholesterol and phospholipids which has been shown to support the growth of many lymphoid and hybridoma cells as well as
fibroblasts such as CHOK1 and BHK21 cells (Hewlett et a l , 1989) This was found to be most
stimulatory at 20 - 30/ig/ml The combination of BSA, insulin, transferrin and Ex-cyte was referred to as ’BITE’ Many combinations like this appear in the literature e g HITES where
H = hydrocortisone and S = selenium (Carney et a l , 1984) BITE addition to 2% DHS was
not as stimulatory as 5 % FCS so a number of additional factors were tested
Without adding growth factors or hormones, it is possible to enhance biological activity by
improving the basal media to provide additional nutrients usually supplied by serum In a series
of experiments the effects of different basal media were investigated As cells were normally grown in DME, this was used as the basis for comparing all the basal media tested Where growth occurred, the addition of BITE improved the growth achieved by each basal medium The best growth was obtained using McCoys 5a basal media even though ATCC was the basal medium chosen for the SFM of NRK cells (Rizzino, 1984, Nugent et a l , 1989, Newman et a l , 1986)
The low growth response which occurred in Leibovitz-15 may have been due to the replacement of g lu co se as the energy source by L-galactose When g lu co se was present the level of ammo
acids correlated with the growth stimulatory ability McCoys 5a has a greater variety and m
322
general a higher concentration of amino acids than DME or Ham’s F12 Further addition of
non-essential ammo acids to McCoys 5a medium did not result m improved growth as seen in section 3 16 Mitaka et a l , (1991) when comparing the ability of basal media to support the
growth of rat hepatocytes found that addition of ammo acids, both essential and non-essential enhanced the growth in Leibovitz L-15 in comparison to ATCC
Of the inorganic salts and vitamins, the levels in ATCC were comparable to McCoys 5a, except that McCoys had more folic acid, myo-inositol, calcium and magnesium salts In addition
McCoys 5a had vitamins not present in ATCC (nicotinic acid, ascorbic acid and aminobenzoic
acid) ATCC had more inorganic salts (CuS04, FeN03, Fe2S04, MgCl2 and ZnS04) McCoys 5a is a very rich basal medium which has been used to support the growth of many primary
cultured cells from normal bone marrow, skin, gingiva, testes, mouse, kidneys and lung and rat embryos (Hsu and Kellog, 1960) In looking at the growth of ovine satellite cells, Dodson et al (1990) compared several basal media (CRCM-30, low and high glucose DME, MCDB-
104, McCoys 5a, Ham’s F10 and M199) They found that use of McCoys 5a resulted in the
best growth At 15% horse serum, McCoys 5a stimulated the best proliferation with up to 8
times the growth achieved by DME (high glucose)
However, McCoys 5a is not as defined as ATCC medium as it contains bactopeptone at a concentration of 0 6mg/ml Bactopeptone is a heat-stable enzymatic digest of animal tissues which is autoclavable and therefore not subject to possible viral or mycoplasma contamination
More importantly, its precise composition is not known However, the fact that the cells
remained viable in this basal medium was the basis for choosing it
At the same time as the ability of different basal media to support growth was investigated, a variety of growth factors and hormones were also tested as a means of improving the growth seen in 2% DHS and BITE (ATCC as basal medium) Two end points were used for analysis, acid phosphatase production and cell counts A combination of EGF, dexamethazone and BITE showed the best stimulation overall when AP (but not CC) was used as the end point (2 25 _+ 0 61-fold stimulation above the control (2% DHS + BITE) for the three assays with CC as end point, 1 73 _+ 0 72-fold stimulation for the three assays with AP as end point)
Dexamethazone alone showed increasing inhibition at increasing concentrations (more inhibitory with CC than AP) The combination of EGF and Dexamethazone was better than their additive
323

effects for AP and less than EGF alone for CC Dexamethazone has been reported to modulate the activity of EGF (by modifying EGF cell surface receptors qualitatively (Baker et a l , 1978, Conover et a l , 1989) At the same time, Dexamethazone has been found to be toxic for some
cell types (Chilton et a l , 1990)
With cell counts as the end point, best stimulation was seen with EGF, fl-Estradiol and BITE
(2 04 Hi 0 49-fold stimulation) B-Estradiol showed no growth stimulation when used alone
IL-lfl showed variable stimulation while IL-la was inhibitory IL-lfl, together with TNF-a,
has recently been reported to stimulate the production of mainly cytokine-induced neutrophil chemoattractant, equivalent to human gro/melanoma growth stimulatory activity in NRK-49F
cells (Watanabe and Miyai, 1993)
Both a-FGF, heparin -I- BITE and fl-FGF + BITE were almost equally stimulatory at 10/xg/ml
FGF a-FGF and heparin were not stimulatory at lng/ml while fl-FGF was stimulatory at both
concentrations Shipley et a l , (1989) studied the effects of a- and fl-FGF on the growth of
normal human keratinocytes and fibroblasts They found that for the fibroblasts, heparin (10/xg/ml) improved the activity of a-FGF and the combination was almost as stimulatory as fl-FGF For the keratinocytes, a was better than fl and heparin slightly inhibited the action of
a-FGF but dramatically inhibited fl-FGF activity
IGF-I did not show any stimulation alone or in combination with EGF This may be due to the
presence of msulm which, for many cell lines, has been shown to exert its stimulatory activity
by acting at the IGF-I receptors (MaGoffin and Erickson, 1988, Neely et a l , 1991, McMorris et a l , 1986) Insulin and EGF have been reported to act synergistically for NRK-49F cells
(van Zoelen et al, 1985) As insulin activity in SFM often occurs through the IGF receptor, it was possible that the synergistic effect seen in section 3 1 3 was similar to that reported by van Zoelen However, if insulin and EGF were synergistic together, the stimulation caused by EGF and BITE would be expected to be higher
The combination of EGF and BITE was further studied in a lower serum concentration, 1 % DHS In this situation, maximum stimulation for 3 assays together was 4 12 Hi 0 24-fold stimulation over the growth achieved by BITE alone (EGF = lng/ml), while m an earlier experiment (Table 3 13 4) little growth was seen at 10 and 50ng/ml This combination of EGF and BITE was found to give better growth than that seen with 5% FCS using AP as the end
324

point (microscopic observation confirmed the extent of stimulatory activity with EGF)
With the extent of activity seen for EGF+BITE and for McCoys 5a+BITE basal medium, it
was decided to combine these results and eliminate the background serum Ex-cyte V was used
originally and this was found to contain BSA fraction V As BSA was already in the combination, Ex-cyte III was chosen to replace Ex-cyte V However, Ex-cyte III was inhibitory
so EGF (lng/ml) replaced Ex-cyte as the ’E’ in BITE
As no serum was being incorporated in the assay, an attachment factor called laminin was included (section 3 16) Again ATCC was found not to be as effective as McCoys 5a Addition of lammin did not improve growth However, Rizzino (1984) had found no requirement for fibronectin or laminin on plastic The most surprising result was that the BSA appeared inhibitory The BSA could be inhibitory due to interfering with the attachment of the cells or it may be that the concentration used, which was not toxic in serum-supplemented
medium, had now become toxic
As MDCK and CHOK1 cells had been grown successfully m SFM it was decided to try the
components of these SFM on the growth of NRK cells Variables were compared in ATCC (basal medium for MDCK SFM), Ham’s F12 (basal medium for CHOK1 SFM) and McCoys
5a From the components m the MDCK SFM, insulin was most important From the components in the CHOK1 SFM, insulin and Fe^C^ were most important Similar work was
undertaken by Bradshaw and Dubes in 1983 They compared factors required by NRK-49F cells to those required by other kidney cell lines epithelial cells MDCK and LLC-PKj (pig
kidney) and fibroblasts BHK-21 They found that the response of kidney cells varied The variations could have been due to species differences, origin of the cells (mesodermal as opposed to ectodermal) or even to the age or state of health of the animal when the cells were
obtained Thus, finding that the SFM designed for the MDCK cells would not support the growth of NRK cells was not surprising
The extent of growth for the SFM over the basal medium was low This may have been due to some residual trypsin acting on the cells or the presence of some toxic compound which the cells could not deactivate or indeed to one of the components of the SFM So, trypsin inhibitor
and EDTA were added to the SFM Trypsin inhibitor was added to inhibit the possible action
of residual trypsin However, the omission of trypsin inhibitor did not affect the cells EDTA,
which has been reported to act as a chelator of toxic factors (Bertheussen, 1993), showed
325

variable effects in three separate assays EDTA can have variable results depending on the
metal to which it is complexed e g Hugenschmidt et al (1993), suggested that the tetrasodium or Cu-EDTA were found to be toxic to NRK-52E, while the Zn or Fe-EDTA were not)
Very surprising was the observation that omission of EGF resulted in a significant increase of
growth, between 1 6-fold and 2-fold stimulation over the control (Figure 3 17 1) In low serum-supplemented medium EGF was perhaps the most stimulatory factor present EGF has
been reported in the literature to be stimulatory to NRK clones in SFM (Nugent et a l , 1989,
Newman et a l , 1986, Assoian et a l , 1984) In combination with retmoic acid, anchorage- independent growth in soft agar was induced, but in monolayer growth was stimulatory (Jetten
and Goldfarb, 1983)In sections 3 1 5 and 3 1 6 in SFM with either ATCC or McCoys 5a, EGF showed only slight stimulation while in sections 3 17 1 and 3 17 3, EGF appeared to be inhibitory As the components in the SFM changed between the different sections and the original stock of EGF remained the same, it may have been possible for one of the components of the SFM to be modulating the activity of EGF In section 3 15, only insulin and transferrin were present in addition to EGF In sections 3 17 1 and 3 17 3, EDTA was additionally common to both
It was possible that EDTA had in some way modulated the role of EGF, perhaps by binding divalent ions such as extracellular Ca2+ Many growth factors exert their mitogemc activity
through a cascade of secondary messengers like 1,4,5 inositol tri-phosphate (IP3) and
diacylglycerol (Berridge, 1987) One of the results is the mobilization of Ca2+ which is largely
due to Ca2+ release from intracellular stores but also from extracellular Ca2+ (Pandiella et a l , 1987, 1988) While Ca2+-channel blockers were reported to inhibit the action of recombinant
PDGF on vascular smooth muscle cells (Block et a l , 1989), EGTA only resulted in a
reduction of mitogemc activity (Pandiella et a l , 1987) The presence of EDTA may not account for the whole loss of activity associated with EGF
EGF has been reported to induce growth inhibition of A431 cells at concentrations greater than
InM (6ng/ml), while being stimulatory at concentrations up to 0 InM (0 6ng/ml) (Kawamoto et a l , 1983b) This alternative effect was related to the presence of high and low affinity EGF- receptors It may be that EGF in our system was stimulatory m low serum-supplemented
medium due to the up-regulation of EGF-receptors or alternatively, that growth in SFM resulted in a down regulation of high affinity EGF-receptors, which coupled to the presence or absence of EDTA may explain the variable loss of activity
326 f
The EGF receptor density is one of the major controlling parameters in density-dependent
growth inhibition and phenotypic transformation of NRK cells. Up-regulation of the EGF
receptor has been associated with the expression of the transformed phenotype in these cells
when induced by TGF-fi, retinoic acid or PDGF (van Zoelen et al., 1988). The level of EGF
receptor expression in exponentially growing NRK cells was reported to be low (Rizzino et al.,
1990) and the level of binding decreased even further at high cell densities. So the activity seen in low serum-supplemented medium, may have been due to an up-regulation of the EGF
receptor induced by some serum component (most likely TGF-fi or PDGF). However,
anchorage-independent growth which occurs as part of the phenotypic transformation would
have to have been inhibited in low serum-supplemented medium.
It is also possible that the loss of stimulation in SFM is due to the absence of an additional
competence factor. For example, Olsen et al. (1988) found that EGF alone could not stimulate
DNA synthesis in Swiss 3T3 mouse cells without the presence of brandykinin or prostaglandins.
Nugent et al.(1989) found that EGF did not stimulate NRK cells alone but required TGF-fi for
anchorage-independent growth, and that EGF was inhibitory to anchorage-dependent growth. Massague, (1985) had earlier suggested that TGF-fi induced a specific decline in the number
of high affinity EGF-receptors in sparse monolayer cultures, thus reducing possible activity by
EGF. As seen with the SFM for CHOK1 and MDCK, exclusion of insulin or Fe^O,*
separately, resulted in lower growth than that seen with the complete SFM.
So, using McCoys 5a supplemented with insulin, Fe2S0 4 and EDTA as the basis, a variety of
factors were screened for growth promoting activity (section 3.1.7). These included the trace
elements used by Mendiaz et al. (1986), interleukins (IL-1, IL-4 and IL-6), phosphatidic and lysophosphatidic acid (van Corvan et al., 1992; Bashir et al., 1992), BSA and the 0.5M NaCl
fraction from Heparin Sepharose chromatography of BSA, HDL (Rizzino, 1984) and growth factors (EGF, fl-FGF and PDGF) and Briclone. Of these factors the most stimulatory were found to be fi-FGF and PDGF. Variations in results were seen with IL-6, phosphatidic acid and the trace elements. Taub et al. (1979) noted different responses from the same component depending on the assay system used. The different activities of the factors could be explained by the variations made within the basic SFM for different assays. While serum-free Briclone was very stimulatory in one of the two assays, the entire composition of serum-free Briclone
was unknown. As a result no further work was carried out using Briclone. Further analysis of serum-free Briclone components by fractionating may yield interesting results.
327
All these assays had been carried out using acid phosphatase as the end point The combination
of B-FGF and PDGF was then tested in comparison to the basal medium alone, and basal medium supplemented with 1 % DHS and 5% DHS The results showed that while growth was
significantly (20-fold) greater in the SFM than in the basal medium, the combination of B-FGF
and PDGF was 3 times less stimulatory than 1% DHS and 10-times less stimulatory than 5%
DHS This showed that there were still factors to be found which would improve the growth
in SFM
To confirm that the growth observed was due to the SFM and not to residual serum factors, it
was necessary to subculture NRK cells in SFM (section 3 1 9) Results show that there was
an initial lag phase, after which better growth was observed When after subculture 7, cells
were no longer fed on day 4 of an 8 day incubation, much better growth was observed with the
SFM containing B-FGF + PDGF but not with the SFM containing J3-FGF (both SFM containing
insulin and FejSOJ This could have been due to the cells taking time to adapt to the medium
after passaging or it may be that the NRK cells were producing an autocrine factor which was
only becoming active after a certain concentration had been reached It was also noted that in
the presence of B-FGF and PDGF, much fewer cells appeared to be floating in the suspension than when only B-FGF was present
Comparing the SFM developed here with those reported for NRK cells and their subclones,
small variations between SFM were seen Bradshaw and Dubes (1983) found FGF (50ng/ml)
and PDGF (05-1 OU/ml) not to have any effect on NRK 49F cells, while insulin and retinoic
acid did The SFM designed by Rizzmo (1984) contained insulin, transferrin, FGF, lammin and HDL Lammin was found to have no effect on cell attachment m plastic which was used
here Transferrin was not necessary as the SFM appeared to be better when Fe SC was used (section 3 16 2 1) The level of FGF used by Rizzmo (1984) was much higher (lng/ml as opposed to 150ng/ml) HDL had been found to be very slightly stimulatory at low concentrations and increasingly inhibitory at higher concentrations HDL was found to be inhibitory at 0 5/tg/ml (as based on cholesterol concentration) while Rizzmo used 300/xg/ml HDL The basis of determining the concentration may account for some of the difference between the levels used but could not account for such a big difference The HDL used m these
studies was bovine-derived and contained 10/xg/ml cholesterol and between 10 - 35/ig/ml protein Cholesterol measurement was used as the basis for testing as the protein content was
not known exactly. Rizzmo had found the HDL not to be stimulatory alone but to show a
328
synergistic effect with the other factors In the present study, HDL was not tested with the other factors except insulin, ferrous sulphate and EDTA (section 3 17 4) In addition, the
presence of bactopeptone in the medium may have reduced the requirements for lipoproteins
Production of autocrine activity
Bradshaw and Dubes found that growth of NRK-49F cells in SFM at low cell density was
markedly increased by adding SFM that had been conditioned by NRK-49F cells at higher cell
densities Without this conditioned medium, the cell growth rate at low densities was high through the first and second passages but subsequently decreased In the subculture described
in section 3 19, cell growth decreased in passages 2 and 3 but appeared to be reaching a steady
rate at passages 4 -6 and again at passage 9 and onwards
Cells grown at high cell densities showed a similar rate of growth to that achieved with 10%
FBS (Bradshaw and Dubes, 1983) At low cell densities (3,100 cells/cm2), after 4 days with
conditioned medium (CM obtained from high cell densities after 4 days growth), cell number
was 4-times greater than that achieved without CM (Bradshaw and Dubes, 1983) The cells,
in the SFM developed here, grew very slowly at first with very little observable growth after
4 days Thereafter the growth improved rapidly when the cells were not fed with fresh medium Rizzino also found that CM prepared from high density serum-free NRK-49F cells did stimulate
the growth of NRK cells at low densities
In section 3 1 9, it is shown that leaving the medium on the cells for 8 days resulted in a doubling of the cell number for the SFM incorporating FGF and PDGF but not for the SFM
with FGF The cell density was 3xl04 cells/cm2 In comparison to Bradshaw and Dubes (1983) this is a low cell initial cell density A comparison of the initial cell density and the cell yield for the SFM is shown
329
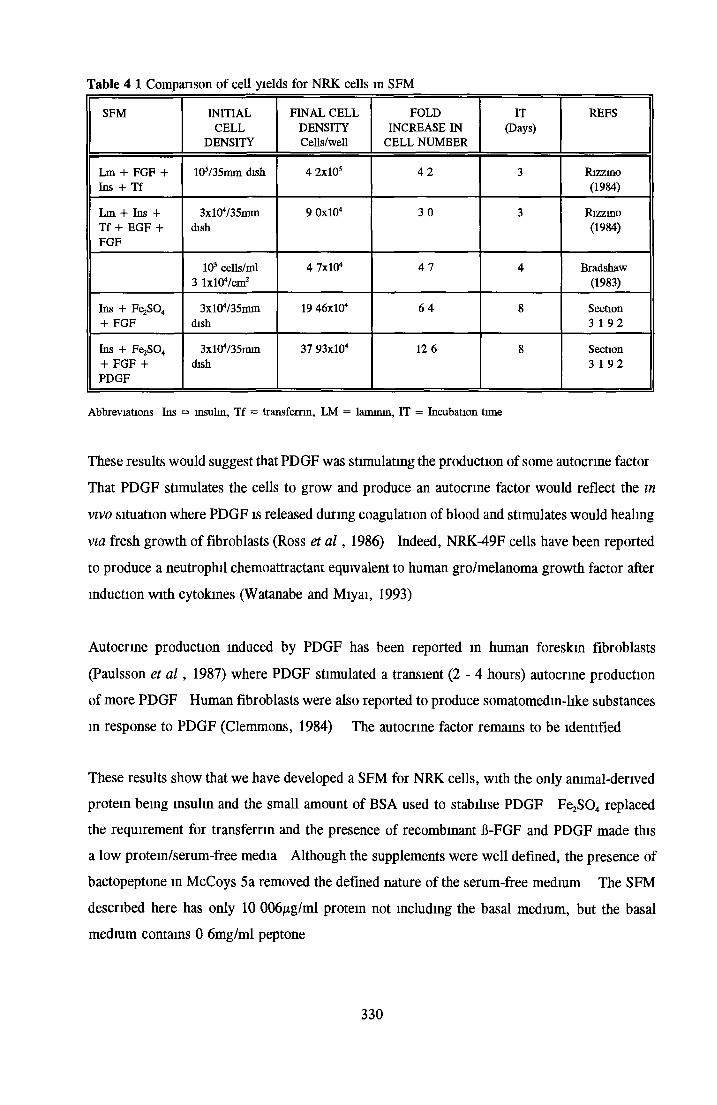
Table 4 1 Comparison of cell yields for NRK cells m SFM
SFM INITIALCELL
DENSITY
FINAL CELL DENSITY Cells/well
FOLD INCREASE IN
CELL NUM BER
IT(Days)
REFS
Lm + FGF + Ins + Tf
105/35m m dish 4 2x10s 4 2 3 Rizzino(1984)
Lm + Ins + T f + EGF + FGF
3 x l0 4/35m mdish
9 OxlO4 3 0 3 Rizzino(1984)
103 cells/m l 3 lx l0 4/cm2
4 7 x l0 4 4 7 4 Bradshaw(1983)
Ins + FejSO,, + FGF
3 x l0 4/35mmdish
19 4 6 x l0 4 6 4 8 Section 3 1 9 2
Ins + FejSO,, + FGF + PDGF
3 x l0 4/35mmdish
37 93 x l0 4 12 6 8 Section 3 1 9 2
Abbreviations Ins = insulin, T f = transferrin, LM = laminin, IT = Incubation time
These results would suggest that PDGF was stimulating the production of some autocrine factor
That PDGF stimulates the cells to grow and produce an autocrine factor would reflect the in
vivo situation where PDGF is released during coagulation of blood and stimulates would healing
via fresh growth of fibroblasts (Ross et a l , 1986) Indeed, NRK-49F cells have been reported
to produce a neutrophil chemoattractant equivalent to human gro/melanoma growth factor after
induction with cytokines (Watanabe and Miyai, 1993)
Autocrine production induced by PDGF has been reported in human foreskin fibroblasts
(Paulsson et a l , 1987) where PDGF stimulated a transient ( 2 -4 hours) autocrine production of more PDGF Human fibroblasts were also reported to produce somatomedin-like substances in response to PDGF (Clemmons, 1984) The autocrine factor remains to be identified
These results show that we have developed a SFM for NRK cells, with the only animal-derived protein being insulin and the small amount of BSA used to stabilise PDGF Fe^C^ replaced the requirement for transferrin and the presence of recombinant fl-FGF and PDGF made this a low protein/serum-free media Although the supplements were well defined, the presence of bactopeptone in McCoys 5a removed the defined nature of the serum-free medium The SFM described here has only 10 006^g/ml protein not including the basal medium, but the basal medium contains 0 6mg/ml peptone
330
To obtain a truly defined medium, it would be necessary to replace the peptone with a
combination of amino acids and/or peptides Alternatively, as Glasgows minimal essential medium (GME) was the next best basal medium to McCoys 5a, it may be possible to replace
McCoys 5a with this as it is a defined basal medium In comparison to McCoys 5a, GME has a lower concentration of many vitamins and contains no ascorbic acid, biotin, nicotinic acid or vitamin B12 Supplementation with these vitamins together with additional essential and non
essential amino acids may allow growth of NRK cells in GME as the basal medium for a SFM
similar to that seen in McCoys 5a
4.2 Replacement of transferrin by inorganic/organic iron sources using MDCK cells in
SFM
To investigate the replacement of insulin and transferrin, perhaps the two most universal
components in SFM, two cell lines for which SFM already existed were chosen These were Chinese Hamster Ovary (CHOK1) and Madin-Darby Canine Kidney (MDCK) cells For
MDCK cells, a SFM initially described by Taub in 1979 has remained essentially unchanged MDCK cells showed a requirement for prostaglandin Ex (PGE,) and transferrin Where a SFM
for CHOK1 cells is concerned, Ham’s F12 was originally designed for these cells, but changes
and additions have been made frequently CHOK1 cells showed little requirement for transferrin (Appendix E) even though it was still included in the SFM designed by Mendiaz (1986) They did however, have a requirement for insulin These two cell lines offered suitable
environments in which to look at the replacement of insulin and transferrin, with a view to
developing a SFM devoid of animal-derived products
In order to investigate the replacement of transferrin, it was necessary to establish whether MDCK cells grew in the SFM and how well they responded to both insulin and transferrin When a growth curve was used to compare the response of MDCK cells in SFM and in serum- supplemented medium (SSM), a longer lag phase was observed m the SFM (Figure 3 2 11) On day 5, for 2 of the 3 assays, the cell yield in the SSM was 4 to 5-times that achieved in SFM By day 8, the cell numbers were almost the same, however at this stage, cells in the SSM would already have peaked and be in the decline phase of the growth cycle In later assays and subcultures, the MDCK cells appeared to grow almost as well as cells in SSM In
the subculture experiments, initial assays were set up in closed systems i e in non-vented 25cm? flasks Within hours of inoculating the cells into the SFM or basal medium alone (ATCC), the
331
f
medium became very basic and the cells did not attach This was also observed by Edel Murphy who worked with MDCK cells in this laboratory (Edel Murphy, M Sc , 1986) The fact that this happened only in non-vented flasks and occurred with the BM and SFM only in
the presence of MDCK cells indicated that the MDCK cells somehow may have caused an increase in the pH in the absence of C02 The buffers may also have had a deleterious effect
on these cell lines in the absence of C02 and serum (HEPES has been found to inhibit some cell
types in SFM by increasing superoxide dismutase and catalase mhibitable activities (Bowman
et a l , 1985, Bell and Quinton, 1991)) This problem was circumvented by using vented 25cm2
flasksWhen subcultured over a period of 40 days and 9 passages, slight adaption was apparent No direct comparison was made at this stage with SSM, but cells in SFM appeared to reach confluency around the same time as cells in SSM However, Jefferson et al (1985) subcultured
MDCK cells for 10 passages in SFM and compared the protein synthesis patterns in passages
1 and 10 They found that MDCK cells grown m a hormonally-defined medium exhibited
significant changes in both the specific activity of proteins and the labelling of specific proteins associated with the cell membrane The changes increased with increased cell passage in SFM
An increased methionine uptake was suggested to be due to increased protein synthesis So although the cells would appear not to require significant adaption to SFM when analysing cell
number, protein synthesis patterns show otherwise indicating the limitations of looking only at
one variable as the end point of experiments
Comparing the results to those obtained by Taub et al (1979), growth rates of 1 5 doublings a day for SFM and SSM were seen In the first growth curve, the values for the SFM were much lower with doublings of 0 97 per day (assays 1 and 3) but m the subcultures an average of 1 1 doublings per day were obtained This average was obtained from all the subculture data but did not include subcultures that had grown over 5 day periods For the basal medium and SSM, doublings/day of 0 284 and 1 80 were obtained respectively The growth seen here m SFM was only 60% that obtained by Taub et al (1979) in SFM This variation in growth may have been due to a number of reasons, use of bovine instead of human transferrin, purity of some components of SFM, purity of ultrapure H20
MDCK cells were shown to be responsive to insulin and transferrin in SFM (Figure 3 2 1 3 and 4) Stimulation by insulin started at 0 5/xg/ml (little or no activity at 0 1/ig/ml), reaching a
maximum growth of 1 9-fold to 2 5-fold stimulation over the control (no insulin) at 5 -
332
10/ig/ml Transferrin showed stimulation with a maximum stimulation of 1 37-fold to 4 08-fold
over the control (no transferrin) at 5 - 20/xg/ml Cells showed very little stimulation by either BSA fraction V or BSA fatty acid free in SFM at low concentrations (0 1 and 0 5mg/ml) and
became increasingly inhibited at higher concentrations (Figure 3 2 15) BSA fraction V was more inhibitory than BSA fatty acid free
Taub et al (1979) looked at the concentration profile of all the factors in SFM For insulin,
our results compare very well, maximum stimulation was similar, occurring at 5 - 10/xg/ml
while Taub found maximum stimulation at 2 5 - 7 5/xg/ml For transferrin, the extent of
stimulation obtained in our experiments was variable (1 38-fold to 4 08-fold stimulation over
the control), with maximum stimulation at 5 - 20/xg/ml, presumably affected by the iron content
of the SFM and the oxidation state of the iron For Taub, stimulation of up to 6 5-fold was reported at 5 - 10/xg/ml No mention was made as to the extent of iron saturation of the
transferrin i e whether it was apo-, partially- or fully-saturated ’Highly purified’ bovine and
human transferrin were compared to the insulin and transferrin normally used by Taub and were
found to give similar results
In a hormone deletion study (Figure 3, Taub et a l , 1979), omission of PGEX or transferrin was
found to have the most serious effects on growth Omission of transferrin resulted in only 11 % of the growth achieved by the complete SFM Omission of PGE, resulted in 50% growth while
leaving out insulin only resulted in a 20% reduction in growth as compared to the complete
SFM When omission studies were carried out while subculturing the cells, it was found that
over a 5 week period, loss of any one component did not drastically affect growth except for
transferrin and PGE (Taub et a l , 1979) The fact that MDCK cell growth was significantly
stimulated by transferrin meant that MDCK cells could be used to investigate the replacement of transferrin by inorganic and organic iron sources
Human transferrin is a glycoprotein of about 79kDa with two binding sites for a single trivalent atom of iron (referred to as N and C termini) In vivo, transferrin is the mam carrier of iron Transferrin carries out two functions in SFM It acts as a source and transporter of iron into the cell and it also acts as a detoxifying agent by binding other metals present in the medium The addition of iron could not equal the growth stimulating effect of transferrin, suggesting that
transferrin had a growth promoting effect independent of its transport activity, probably as a progression factor (Mather and Sato, 1979)
333

Transferrin interaction with the transferrin receptor is the main method of iron transfer across
the cell membrane Other methods with and without transferrin have been reported (Basset et
a l , 1986, Inman and Wessling-Resmck 1993, Wright et a l , 1986, Sibille et a l , 1982, Crowe
and Morgan, 1992 and Thorstensen, 1988) If methods other than transferrin receptor mediated
endocytosis were operating in MDCK cells, a variety of iron containing compounds might replace transferrin Such compounds have already been used to successfully replace transferrin
for a number of other cell lines These include simple soluble iron salts like Fe2S04 (Mendiaz et a l , 1986), ferric citrate and ferric ammonium citrate (Amouric et a l , 1984) Simpler iron salts are liable to become oxidized in the SFM Thus, more complex chelators like ferric
salicylaldehyde isonicotmoyl hydrazone (Fe-SIH) and ferric pyridoxal isonicotmoyl hydrazone
(Fe-PIH) (Laskey et a l , 1988, Sanders and Cheung, 1988, Brock and Stevenson, 1987) are often required However, it should be noted that iron is not always stimulatory Iron was
found to inhibit the hormone responsiveness of pituitary cells (Sato et a l , 1991, Eby et a l ,
1993)
We set out initially to see how important the level of iron loading on the transferrin was for its
biological effect Transferrin can be referred to as apo- (iron poor), partially-saturated (1
molecule of iron bound per molecule of transferrin) or fully-saturated/holo (fully-saturated carries 2 molecules of iron per molecule) transferrin If all iron saturation levels of transferrin
acted equally well, it would indicate the importance of transferrin as a transporter of iron rather than just as a sourceYoung et al (1979) found no difference between apo- and holo transferrin for SV3T3
fibroblasts Mather and Sato (1979) reported that less iron was required in medium where transferrin was incorporated Eby et al (1992) found that MDCK cells had a dependence for
transferrin While di-fernc was able to support growth at concentrations up to 50 - 100j^g/ml, the apo- (iron poor) was inactive at concentrations of 0 05 to 100/xg/ml in iron poor medium
When apo-, partially- and fully-saturated transferrins were compared in SFM (section 3 3 1), all showed equally good stimulation at concentrations of 5 - 10/xg/ml At higher concentrations, the apo- and partially-saturated transferrins became less stimulatory or inhibitory while the fully- saturated transferrin continued to be stimulatory This would coincide with the apo- and
partially-saturated transferrins being at such high concentrations that they were scavenging the iron in the medium and making it less available to the cells in a transferrin-independent delivery
system The fact that no inhibition was seen by Eby et al (1992) would make sense as the
334
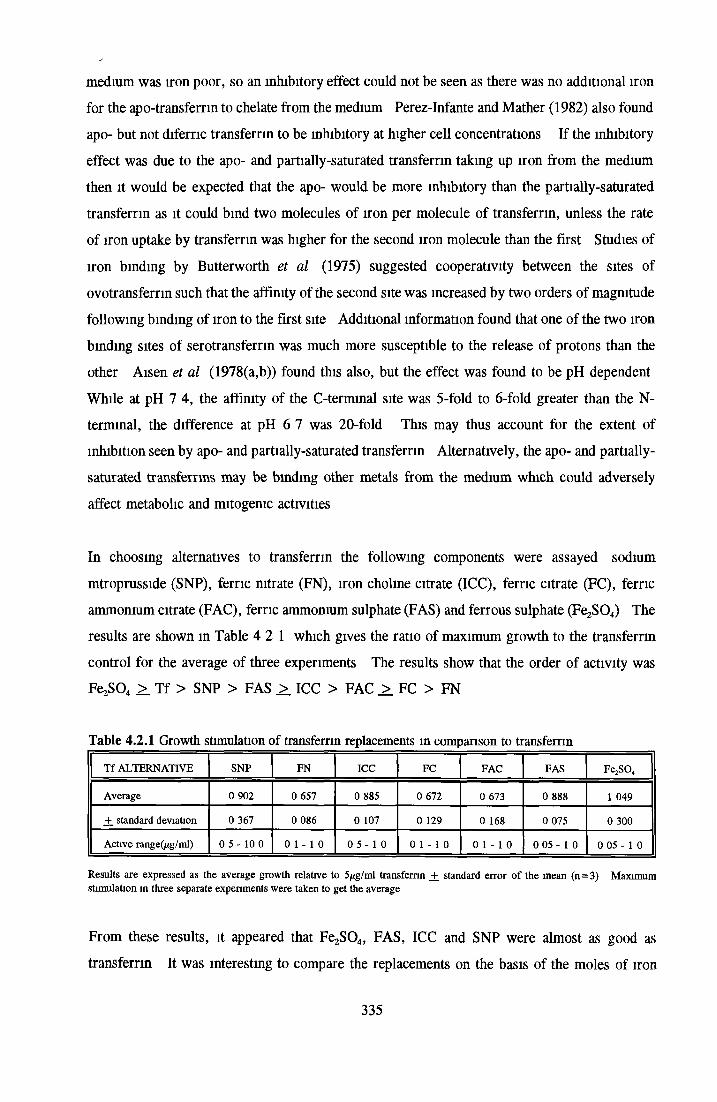
medium was iron poor, so an inhibitory effect could not be seen as there was no additional iron for the apo-transferrin to chelate from the medium Perez-Infante and Mather (1982) also found apo- but not difernc transferrin to be inhibitory at higher cell concentrations If the inhibitory
effect was due to the apo- and partially-saturated transferrin taking up iron from the medium then it would be expected that the apo- would be more inhibitory than the partially-saturated
transferrin as it could bind two molecules of iron per molecule of transferrin, unless the rate of iron uptake by transferrin was higher for the second iron molecule than the first Studies of
iron binding by Butterworth et al (1975) suggested cooperativity between the sites of
ovotransferrin such that the affinity of the second site was increased by two orders of magnitude
following binding of iron to the first site Additional information found that one of the two iron
binding sites of serotransferrin was much more susceptible to the release of protons than the other Aisen et al (1978(a,b)) found this also, but the effect was found to be pH dependent
While at pH 7 4, the affinity of the C-terminal site was 5-fold to 6-fold greater than the N- terminal, the difference at pH 6 7 was 20-fold This may thus account for the extent of inhibition seen by apo- and partially-saturated transferrin Alternatively, the apo- and partially-
saturated transferrins may be binding other metals from the medium which could adversely
affect metabolic and mitogemc activities
In choosing alternatives to transferrin the following components were assayed sodium
mtroprusside (SNP), ferric nitrate (FN), iron choline citrate (ICC), ferric citrate (FC), ferric ammonium citrate (FAC), ferric ammonium sulphate (FAS) and ferrous sulphate (Fe2S04) The
results are shown in Table 4 2 1 which gives the ratio of maximum growth to the transferrin
control for the average of three experiments The results show that the order of activity was Fe^SO, >_ Tf > SNP > FAS >. ICC > FAC >. FC > FN
Table 4.2.1 Growth stimulation of transferrin replacements in comparison to transferrin
Tf ALTERNATIVE SNP FN ICC FC FAC FAS Fe2S 0 4
Average 0 902 0 657 0 885 0 672 0 673 0 888 1 049
_+ standard deviation 0 367 0 086 0 107 0 129 0 168 0 075 0 300
Active range(/ig/ml) 0 5 - 10 0 0 1 - 1 0 0 5 - 1 0 0 1 - 1 0 0 1 - 1 0 0 05 - 1 0 0 05 - 1 0
Results are expressed as the average growth relative to 5/ug/ml transferrin _+ standard error o f the mean (n=3) Maximum stimulation in three separate experiments were taken to get the average
From these results, it appeared that Fe2S04, FAS, ICC and SNP were almost as good as transferrin It was interesting to compare the replacements on the basis of the moles of iron
335
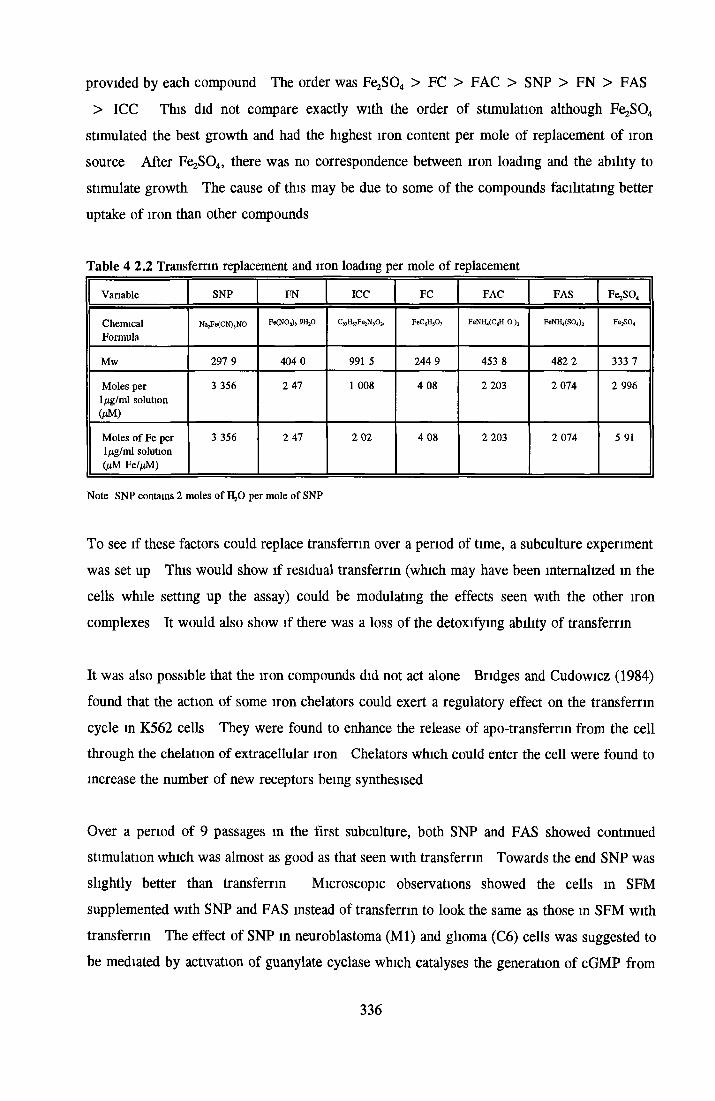
provided by each compound The order was Fe SC > FC > FAC > SNP > FN > FAS
> ICC This did not compare exactly with the order of stimulation although FejSC stimulated the best growth and had the highest iron content per mole of replacement of iron
source After Fe^O,,, there was no correspondence between iron loading and the ability to stimulate growth The cause of this may be due to some of the compounds facilitating better
uptake of iron than other compounds
Table 4 2.2 Transferrin replacement and iron loading per mole of replacement
Variable SNP FN ICC FC FAC FAS Fe^SO*
ChemicalFormula
Na2Fe(CN)jNO Fe(NO,), 9HjO FeCgHjO; FeNEKCJI O )2 FeNH,(SO,)2 FejSO,
Mw 297 9 404 0 991 5 244 9 453 8 482 2 333 7
Moles per 1/ig/ml solution 0*M)
3 356 2 47 1 008 4 08 2 203 2 074 2 996
Moles o f Fe per 1 Mg/ml solution Q M Fe/ftM)
3 356 2 47 2 02 4 08 2 203 2 074 5 91
Note SNP contains 2 moles o f H ,0 per mole o f SNP
To see if these factors could replace transferrin over a period of time, a subculture experiment was set up This would show if residual transferrin (which may have been internalized in the cells while setting up the assay) could be modulating the effects seen with the other iron
complexes It would also show if there was a loss of the detoxifying ability of transferrin
It was also possible that the iron compounds did not act alone Bridges and Cudowicz (1984)
found that the action of some iron chelators could exert a regulatory effect on the transferrin cycle in K562 cells They were found to enhance the release of apo-transferrin from the cell through the chelation of extracellular iron Chelators which could enter the cell were found to increase the number of new receptors being synthesised
Over a period of 9 passages m the first subculture, both SNP and FAS showed continued stimulation which was almost as good as that seen with transferrin Towards the end SNP was
slightly better than transferrin Microscopic observations showed the cells in SFM supplemented with SNP and FAS instead of transferrin to look the same as those m SFM with transferrin The effect of SNP in neuroblastoma (Ml) and glioma (C6) cells was suggested to be mediated by activation of guanylate cyclase which catalyses the generation of cGMP from
336
GTP (Zwiller et a l , 1982) So SNP activity could be due to more than acting as a source of
iron
ICC and Fe2S0 4 did not maintain a high level of stimulation The cell yield was getting lower
with each passage until at passage 8, there was not enough cells to continue on The cells in
either of these SFM were ragged and the cytoplasm were spread out (m comparison to the Tf controls) So as seen with Fe2S04 and ICC in the first experiment, good stimulation was not
carried through to the subculture This may indicate that internalized transferrin (as transferrin bound to the transferrin receptor) may have been responsible for the transport of FezSC into the cells in the cell growth assay The dilution of remaining transferrin through several passages would result in less transport or iron and slower growth It was also possible that the state of oxidation of the iron complexes may have affected results as fresh samples had not been made up between growth assays and setting up the subculture experiment
Fresh samples of all iron compounds were prepared and a second subculture experiment was carried out Again, ICC was unable to support growth but FejSC was as stimulatory as
transferrin (Table 3 3 3 2) However the experiment became contaminated after only the third
passage The subculture was repeated (Table 3 3 3 3) The results supported the findings in the second subculture experiment ICC was unable to support growth It would appear that
ICC had used residual transferrin m the growth stimulatory assays to facilitate transport of iron
to the cells After only one passage, the growth was low, indicating the lack of a carrier molecule to effect growth Some cell lines have been reported to produce transferrin as an
autocrine factor These include Reuber H-35 cells (Shapiro and Wagner, 1989), rat Rhodamine fibrosarcoma (Nagao and Nashikawa, 1989) and mammary epithelial cells (Lee et a l , 1987) If autocrine production of transferrin were occurring for MDCK cells, subculture of MDCK cells in SFM without transferrin would not have died out within 5 passages as reported by Taub et a l , (1979) In addition, the subculture in medium containing ICC would not have shown growth as low as was evident after several passages
It would appear that the oxidation state of Fe2S04 affects its ability to stimulate growth The importance of the oxidation state of Fe2S04 would necessitate making up fresh solutions on a regular basis
These results showed that transferrin could be successfully replaced in SFM with either FAS, Fe2S04 or SNP FAS did not appear to suffer from a loss of growth stimulatory ability, while
337
SNP was not as consistently stimulatory FAS was not always the most stimulatory factor
during the subculture experiments but it was found most consistently to give good growth and therefore, a reliable alternative to transferrin Growth rates similar to transferrin were
maintained As PGEi can be replaced by Di-butyryl cAMP (Taub et a l , 1984), the only source of ammal-derived protein present in the SFM was bovine insulin Growth assays (Taub et a l ,
1979) showed that loss of insulin did not impede the cells from being subcultured in SFM IGF-I and recombinant insulin were tried as alternatives to bovine insulin but neither could
support growth as well as bovine insulin However, the extent of stimulation by bovine insulin
after 1 passage in SFM was minimal (Appendix D) So theoretically, MDCK cells could be
grown in SFM devoid of any ammal-derived proteins
4.3 CHOK1 growth in SFM and the role of Insulin
CHOK1 cells have great industrial importance due to their ease of transfection, rapid growth in suspension or on microcarriers and their biosafety status They have been used to produce many recombinant proteins Many SFM have been cited for the growth of CHO cells Ham’s F12 was originally designed to support the clonal growth of such cells in a defined medium
(Ham, 1965) However, without the presence of contaminating selenium, the medium was
found not to support growth (Hamilton and Ham, 1977) Some of the SFM media designed for
the growth of CHO cells include Hamilton and Ham, 1977, Mendiaz et a l , 1986, and Darfler,
1990 MCDB was based on Ham’s F12, but contains higher L-glutamine, CaC^ and lower cysteine In addition it contains 20 trace elements, including all the ones incorporated by
Mendiaz et al (1986) The medium designed by Darfler is a complex combination of factors based on Ham’s F12 containing in addition high concentrations of trace elements and a protem- free lipid emulsion
For these studies, the SFM developed by Mendiaz was used The growth response of CHOK1 cells in this medium was in the presence of fibronectin found to be much lower than that achieved with 5% FCS (Figure 3 2 2 1) Removal of fibronectin resulted in a dramatic improvement (Mendiaz found fibronectin failed to elicit a positive response) The growth in
serum-supplemented medium (SSM) peaked at day 5 and then went into rapid decline while in
SFM and basal medium, growth continued The decline in growth in SSM was probably due
a combination of contact inhibition of the cells, accumulation of toxic waste compounds and a
338
lack of fresh nutrients Comparing SFM with and without fibronectin, on day 7, growth
without fibronectin was 38 9 - 42x104 cells/well while in the presence of fibronectin only 6 - 11 4xl04 cells/well was countedResults obtained by Mendiaz showed growth in SFM to be 75 % of that achieved in medium
supplemented with 4% FCS after 4 days incubation The inoculation density used by Mendiaz
was much higher than that used here (1 27X104 cells/cm2 as opposed to 0 2xl04 cells/cm2), which may explain the low stimulation in these studies In the assay system, growth in SFM with and without fibronectin on day 3 (no day 4 for SFM without fibronectin) of 2-3% and 18- 19% (in 2 assays) growth of the SSM was obtained respectively In a later experiment (section 3 2 2 6), this went up to 32% growth m SFM as compared with the SSM The differences in
stimulation in these experiments were probably due to a combination of factors including the
later incorporation of trace elements, improved user serum-free techniques, the purity of the components in the SFM and the ultrapure H20 used to make up the basal medium
Calibration of cell number against acid phosphatase (AP) production showed a linear relationship in the range tested This end point was then used as a basis to investigate the response of CHOK1 cells m SFM to insulin, transferrin and albumin Insulin showed variable
stimulation Two early experiments showed a maximum of 3-fold to 5-fold stimulation over
the control (no insulin) while in two later experiments, 7-fold to 9-fold stimulation was seen Moreover, in assays 1 and 2, the growth response to insulin was high even at the initial concentration (0 1/xg/ml) while in assays 3 and 4 at 0 1/xg/ml, growth was only 20% above the
control (no insulin) At 0 5/xg/ml, the stimulation had dramatically increased to almost maximum levels
As the exact same pretreatment procedure was used in all assays, the question was asked whether the low extent of stimulation could be related to the possibility of msulin-independent mutants becoming expressed in assays 1 and T> This could support the results observed the reduced stimulation seen by insulin as well as the almost steady state stimulation across the concentration range tested In assays 3 and 4, the greater response to insulin and the concentration-dependent increase in stimulation at low levels of insulin would indicate the absence of insulin-independent mutants Extrapolating from Figure 2 m Mendiaz’s paper (1986), growth stimulation at 0 l^g/ml and 10 - 20/xg/ml were 3-fold and 4-fold over the
control (no insulin) respectively The results obtained from assays 1 and 2 compare favourably with these (but not with the results in assays 3 and 4) Other causes could be due to changes
in the levels of components in the SFM, deactivation of water soluble vitamin components on
339
storage, changes in the levels of trace elements, loss of biological activities of insulin on storage at -20°C with time The variation in growth response of CHOK1 cells is further discussed on
page 340
In CHOK1 cells, transferrin was found to have no significant effect in the presence of FejSC
(Figure 3 2 2 4) If either transferrin or Fe SC was omitted, little change m stimulation was
observed, but when both were removed there was a significant loss in growth of about 50%
(Mendiaz et a l , 1986)
Albumin, BSA fraction V and fatty acid free were both tested for their growth stimulatory
activity on CHOK1 cells (Figure 3 2 2 5) While both showed little stimulation at 0 1 and 0 5mg/ml, higher concentrations resulted in increased inhibition (so much so that negative
values were obtained with AP as the end point)
As mentioned before, the real test of a SFM is its ability to support growth through serial passages This becomes very important on an industrial level where growth over an extended
period in SFM can result in a greater product yield The results of the initial subculture (Figure
3 2 2 6 1) showed the SFM to only support growth for 3 subcultures and to fall off during the
fourth passage It was thought that this may have been due to omission of the trace elements used by Mendiaz to maintain batch to batch consistency
In a growth curve (Figure 3 2 2 6 2), addition of the trace elements (TE) showed better growth than SFM without TE So this was used as a basis for an additional subculture With TE m
the SFM, the CHOK1 cells were subcultured for up to 6 passages (Figure 3 2 2 6 3) In the fifth passage, a large increase in cell number occurred In the sixth passage no cells attached The same observation was made for a later subculture in which CHOK1 cells were subcultured for 9 passages (big increase in cell number in passage 8 and no attachment in passage 9) Mendiaz made no mention of subculturmg
The SFM described by Gasser et al (1985) allowed CHO cells to be grown for up to 40 passages in 10 months This SFM consisted of MEMs/Ham’s F12 supplemented with 10/xg/ml
transferrin, 80mIU/ml (2/xg/ml) insulin, 1&7M selenite and 5xl0'6M Fe2S04 For these cells,
transferrin was found to be the principal growth promoting factor He also found the growth promoting effects of insulin to be very variable When active, insulin reached maximum
340
mitogemc activity at 2/ig/ml (superphysiological concentrations) However, a different subclone
of CHO cells was used by Gasser et a l , (1985)
Aside from a lack of essential components which may be missing in a SFM, another possible
reason for the inability of CHOK1 cells to grow in SFM over extended periods could be related to the development of insulin-independent mutants as mentioned by Mendiaz Mendiaz found that msulin-mdependent mutants grew faster than parental cells and while they were stimulated by insulin during the first 48 hours, insulin became inhibitory at high concentrations
(500ng/ml) In the subcultures carried out in these investigations, the second last subculture
resulted in a larger cell yield than previously seen If these were insulin-independent mutants which had just formed, subculturing them into SFM containing insulin would inhibit their
growth To determine if this is the case, CHOK1 cells could be grown m SFM with insulin until a huge increase m cell number is obtained The cells would then be split into two flasks (one with and one without insulin) If the observations were due to the formation of msulin-
mdependent mutants, only the cells in the SFM without insulin would grow Other factors may have affected the long-term growth of CHOK1 cells in SFM Recently Bridges et al (1993),
found that the extracellular matrix was important for the long-term anchorage-dependent growth of CHOK1 cells It was found that, after 5 passages of cells grown m SFM with lng/ml insulin, cells lost their ability to attach to tissue culture flasks but if coated with fibronectin,
cells would attach In addition, the authors found that increasing concentrations of 10, 100 and 1 ,000ng/ml of insulin resulted in the cells becoming less flattened and rounded up and lost their ability to attach If fibronectin was added, attachment would again improve
These results would suggest that after a certain number of passages and/or the concentration of insulin can affect the ability of CHOK1 cells to lay down an extracellular matrix
The dependence of the CHOK1 cells on insulin made it a suitable system to study the replacement of bovme msulm with either a recombinant IGF or recombinant insulin
Insulin is, in general one of the major components of SFM, however the use of msulm at microgram/ml levels which are superphysiological, has led to many investigations into the biological activity of msulm For many cell types, insulin was found only to exert a mitogemc effect at high concentrations because it was cross reacting with the IGF-I receptor For some
closely related cell lines like Chinese hamster lung cell lines CC139 and V79, msulm was found to act via the IGF-I receptor (Van Obberghen and Pouyssegur (1983), Leckett et a l , 1993)
341
For a small number of cell lines, the insulin was found to be active at nanogram levels, via its own receptor (Nagarajan and Anderson, 1982)
Mendiaz et al (1986), found that CHOK1 cells showed a significant increase in growth rate at
insulin concentrations of 1 to 5ng/ml Thereafter, the growth rate was more gradual and
reached a saturation point at 10/xg/ml In support of this, Mamounas et al (1989), found that insulin acted at its own receptor with a half maximum stimulation of 14ng/ml In addition, it
was found that IGF-I had little or no effect on DNA synthesis until concentrations of 225ng/ml, while IGF-II showed some stimulation of DNA synthesis with a half maximum activity at 75ng/ml However, this occurred with cells that had been starved for 72 hours in SFM
without insulin Cells starved for 10 days showed the same profile
From the results it was shown that IGF-I was not an effective mitogen for CHOK1 cells at the concentrations tested IGF-II could stimulate growth but not as significantly as the bovine insulin Due to the low activity of the IGFs, it did not appear that insulin was acting to exert such a mitogemc effect through the IGF receptor The maximum activity of insulin occurred
at slightly higher than normal physiological concentrations (50 - lOOng/ml)
Recombinant human insulin is a another possible alternative to bovine insulin Bovme insulin was found to be active at 0 01IU - 0 02IU/ml (0 389 to 0 77/xg/ml) When comparing other
sources of insulin it was found that the order of activity was bovine > ovine > recombinant human > porcme > equine insulin So recombinant human insulin could be used as an alternative to bovme insulin even though it was not quite as stimulatory
Some unexpected results occurred during this investigation the shift in activity and the variability in growth stimulation, the presence of inhibition at higher concentrations, the fact that 10/xg/ml bovme insulin control was not inhibitory and all other insulins tested at this concentration were (fresh recombinant insulin was tested later and found not to be inhibitory at this concentration), there was also a distinct difference in the morphological observations made by Mendiaz et a l , (1986) The shift in the maximum active range may possibly be
explained by the increased sensitivity of the cells to insulin after subculturing in SFM before assaying
342

Of primary concern was the conflicting results showing bovme and the other insulins to be
inhibitory at higher concentrations while the insulin control (10/xg/ml) showed good stimulation in section 3 4 1 and 3 4 2 As seen in section 3 4 2, the higher concentrations of insulin showed decreased stimulation and eventually inhibition However, the control bovme insulin
used as a control on each plate showed 3-fold stimulation over the control at 10jtg/ml The
control bovine insulin had the same maximum (or there abouts) stimulation as that for the insulin being tested All the other insulins were either not stimulatory or inhibitory at this
concentration, possibly due to the following reasons
1 This discrepancy was not due to a pH effect For all insulins (except ovine insulin), initial
reconstitution involved the use of IN HC1 (IN NaOH for ovine insulin) which may have
affected the pH and so the growth of the cells Using the highest concentration of each insulin, the pH was measured and all were in the range pH 7 35 to 7 44 That all insulins showed this
trend at high concentrations could suggest that some inhibitory factor got into the medium when
the insulins were being reconstituted
2 From earlier results it could not have been the insulins themselves, unless some inhibitory
factor was present when the insulins were reconstituted However, later experiments with the bovme and recombinant insulins showed significant activity (up to 10-fold stimulation over the control) at all concentrations tested (no inhibition)
3 Initial dilutions could have incorporated an inhibitory factor into the 10X insulin stocks that
were used to make up all further dilutions However, similar experiments were carried out using the same msuhn stocks with MDCK cells in SFM and no dilution of an inhibitory factor
I
was observed i e if some component other than msuhn was so inhibitory to CHOK1 cells, it
was likely that some inhibition at higher concentrations of insulin would be seen on the MDCK cells in SFM which had been exposed to the same samples of insulin However, it could also be argued that the inhibitory effect may have been cancelled out by the growth stimulatory effect of the insulin for MDCK cells, resulting m no significant effect, as was seen
4 Mendiaz also presented information on the existence of msulin-independent mutants, which could become predominant in the serum-free medium cited without the presence of insulin If
insulin-independent mutants had formed, these would be present in the control without insulin and the extent of growth stimulation over the control would be very low This could have
343
occurred in section 3 2 2 3 and 3 4 2 The inhibition in section 3 4 2 may possibly then be
explained by the insulin-independent mutants being inhibited by high concentrations of insulin
5 The stock of insulin could have been inhibitory Later studies with old and new batches
showed this not to be the case
6 Error in dilution If there was an error in the dilution when reconstituting the insulin from which the control was obtained, this would explain the fact that growth was seen at 10/xg/ml
provided the dilutional error made the insulin solution 10-fold less than it actually was However, using the same insulin stock and a new insulin stock (section 3 4 3) similar growth stimulation was seen at 10^g/ml for both stocks
It may be that this problem is linked with the variations m the extent of activity Could this be
due to insulin-independent mutants? As mentioned in 4 above, this is a possibility The same batch of insulin showed different growth stimulatory responses, so the variation cannot be
ascribed to the batch The passage number of the cells was investigated Passages 11 to 13 were used m section 3 2 2 and passages 4 to 7 were used section 3 4 However, even withm
each section, differing extents of stimulation were seen Passage number 4 and 14 were assayed and while some slight difference in stimulation was evident, it was not sufficient to account for the large differences in stimulation observed
The fact that the ratio of maximum stimulation by the insulins relative to the bovme insulin
control remained the same regardless of the extent of activity, suggested that the variation in activity may occur in the basal medium If the insulin control (10/xg/ml bovine insulin) were
used as the control, the extent of stimulation between assays would be similar, the only problem would be the inhibition seen in section 3 4 2 It may be that the presence of some additional factor is required for cell growth in the absence of insulin and the concentration of this factor may vary from one batch of basal medium to another e g trace element levels or deactivation of water soluble vitamins on storage This would make sense as different batches of Ham’s F12 were used in sections 3 4 1-2 and 3 4 3-4
The variation was not due to the pretreatment as all cell cultures m section 3 4 were grown in SFM before assaying In section 3 2 2 3, cells were not grown in SFM before assaying and still this variation in activity was seen Gasser also reported variability m the growth response of his CHO cell line (1985)
344
Variations m the morphological observations were conflicting with those of Mendiaz (Appendix K) When CHOK1 cells were grown in these experiments, in serum-free medium with or without insulin, they appeared fibroblastic in nature Mendiaz also observed that the CHOK1 cells that they used were only fibroblastic like m the absence of insulin in serum-free medium
Morphologically, they looked like the CHOK1 cells that Mendiaz grew in SFM without insulin When Mendiaz incorporated insulin into the medium the cells became round to cuboid in shape
This only happened with the CHOK1 cells used m these studies when the cells were 90 to
100% Migration of cells and formation of ’balls of cells’ occurred for these CHOK1 cells in
a similar way to that described by Mendiaz This was only seen when the cells were grown for
a long period of time (2 weeks) in SFM without feeding and which had been set up at an initially low cell density In serum-supplemented medium (5% FCS), cells grew similar that
described by Mendiaz (1986) Again only when fully confluent did the cells round up In addition, they seemed to form into balls of cells
In conclusion, CHOK1 cells were found to grow in the SFM described by Mendiaz et al (1986)
over a number of passages However continuous growth in the SFM was not seen These cells were shown to be responsive to insulin In attempting to replace insulin, IGFs were tried For
many cell lines the mitogemc action of insulin has been reported to be due to the insulin acting
at superphysiological concentrations at the IGF-I receptor The IGFs failed to elicit a significant
response This indicated that perhaps insulin was acting through its own receptor
Recombinant human insulin was found to stimulate growth of these cells but was not quite as
stimulatory as bovine insulin However, it can be used to replace bovme insulin in SFM As transferrin was found to have no effect, this meant that transferrin was the only animal-derived protein in this SFM and could be potentially removed due to the little dependence of CHOK1 cells on transferrin
4.4.1 Growth stimulatory effect of BSA on NRK cells
While investigating the optimization of a low serum-supplemented medium for NRK cells, it was found that addition of BSA resulted in increased growth (section 3 11) As it was hoped
to use reduced serum supplementation with increased numbers of growth stimulatory factors as a basis for developing a SFM, the possible use of BSA as a growth stimulatory factor would
345
present problems BSA is such a ’sticky’ protein that it could be carrying factors other than the desired product, also of course, it is an animal-derived protein with the consequence of possible
biological contamination
Since it was possible that the activity associated with BSA could be isolated from the protein
(Melsert et a l , 1989, Kan and Yamane, 1982, Tigyi and Miledi, 1992), it was possible that the
active factor could be replaced by a synthetic analogue, thereby maintaining the defined nature of the SFM Alternatively, if the BSA was found to be required as a carrier to facilitate activity, synthetic carriers which contain hydrophobic pockets like BSA could be used, for
example fl-cyclodextrins for lipids
As this work was initiated before a SFM had been developed for NRK cells, many of the
investigations to identify the source of the activity were carried out in low serum-supplemented
medium (1% DHS) When a SFM was finally developed, the results were surprising The BSA stimulated the uptake of exogenous thymidine into the cells in SFM, but in a growth assay
over 4 days, increasing concentrations of BSA resulted in increased inhibition Why this should be so was unclear That factors may be stimulatory in the presence of serum and inhibitory in the absence of serum (as seen m section 3 1 with EGF) indicate the extreme mter-dependence of factors in a complex medium These results call into question the use of low and very low
serum-supplemented media as a means of identifying possible factors required for growth in SFM
Not only were NRK cells inhibited by BSA in serum-free growth assays, but the 0 5M NaCl fraction (isolated by heparin sepharose chromatography), which showed as much stimulation as
the unfractionated BSA in low serum-supplemented assays, was just as inhibitory in SFM
CHOK1 cells also exhibited a similar trend (section 3 5 4 3) These results for CHOK1 cells did not agree with the slight stimulation that BSA provoked in SFM m section 3 2 The reason for this may lie in the fact that the BSA was diafiltered m the experiment described in section 3 5 4 While Nilausen (1978) found diafiltration to improve stimulation by BSA for Chinese hamster (CHEF) cells in SFM by the removal of inhibitory compounds, in this case diafiltration appeared to remove the stimulatory activity For MDCK cells, lack of stimulation was seen
with both the 0 5M NaCl fraction and with the BSA, but no significant inhibition was observed (section 3 5 4 3)
346

The assay conditions under which NRK cells were set up to look at exogenous thymidine uptake and cell growth were similar In the thymidine uptake assay (section 3 5 4 13), cells were allowed to attach m the SFM for 18 hours, before addition of the BSA or 0 5M NaCl fraction
Addition of the 0 5M NaCl fraction was based on the original concentration of BSA i e if BSA
were at lmg/ml, then the active component of the 0 5M NaCl fraction would be at the
concentration that would be present in lmg/ml of the original BSA sample and was referred to
as lmg/ml When cell growth was being measured, the same procedure was used, except that after addition of the 0 5M NaCl fraction or BSA, the assay was incubated for a further 4 days m order to allow cell growth to occur (section 3 5 4 14)
Uptake of thymidine was measured from 4 to 24 hours after the initial addition of BSA or 0 5M
NaCl fraction, whereas the growth assay was terminated at 4 days after BSA addition Why
uptake of exogenous thymidine was stimulated but cell growth inhibited is not known If the
presence of BSA resulted in steric hindrance to physical attachment of the cells after an initial
round of cell division, the original BSA would be expected to be significantly more inhibitory than the 0 5M NaCl fraction as the 0 5M NaCl fraction contained only 3 % of the protein m the
untreated BSA So sometime between 24 hours and 4 days at the end of the growth assay, the
BSA and 0 5M NaCl fraction became apparently inhibitory
That the 0 5M NaCl fraction was inhibitory to NRK and CHOK1 cells m SFM was surprising
BSA has been found to be stimulatory to a wide variety of cells in SFM and was incorporated into the SFM designed for NRK-49F cells (Newman et a l , 1986, Nugent et a l , 1989)
However, various batches or fractions of BSA have been reported to be inhibitory for some cell lines in SFM (McKiernan and Bavister, 1992, Barlian and Bols, 1991) In the experiments presented here, the 0 5M NaCl fraction was as inhibitory as the untreated BSA It was possible that the 0 5M NaCl fraction stimulated entry of cells into the S phase of the cell cycle, but that other factors needed for completion of the cycle were absent in the SFM In a low serum- supplemented medium, all the factors for growth would be present in the medium but in a SFM, components normally supplied by the serum would need to be synthesized by the cells themselves or supplied exogenously The lack of these components may have had a deleterious effect on continued cell growth These results meant that neither the BSA nor the 0 5M NaCl
fraction would be incorporated into the SFM designed in section 3 1 for the growth of NRK cells
347
I
In order to identify the putative ’active’ factor, various methods used to isolate the activity from
BSA which have been reported in the literature were investigated As this work was initiated before a SFM had been developed for NRK cells, much of the investigations were carried out
in low serum-supplemented medium
A comparison of the different end points used to assay the growth stimulatory effect of BSA on
NRK cells yielded some interesting results relating not only to the types of albumin tested but
to the end points used BSA fraction V was shown to be stimulatory using all end points, with a 2-fold stimulation over the control (2% DHS) for acid phosphatase (AP) and cell number
(CN) as end points With image analysis (IA) as the end point, 6-fold to 10-fold stimulation
over the control was obtained, yet when the dye was eluted off the same plate (dye elution
DE), only a 2-fold stimulation was obtained The fact that IA used colony area as a means of
detection would suggest that BSA promoted both cell growth (as seen with other end points) and
cell spreading (as seen with image analysis) For HSA fraction V, all end points showed a 2- fold stimulation, including IA This would indicate that while BSA fraction V promotes growth
and spreading of NRK cells in low serum-supplemented medium, HSA fraction V promotes
growth but has no additional effect on cell spreading
In later studies while investigating the activity of the 0 5M NaCl fraction, variability was again
seen in the results (section 3 5 4 4) However, the variability could not be attributed to cell
spreading only Acid phosphatase was originally used while screening fractions from HS chromatography In Run 6 , low activity was obtained using AP When the samples were re
screened using IA and dye elution, the stimulation obtained by both IA and DE was greater than
that obtained with AP That IA showed greater stimulation may, as has been said above, be
due to detecting a spreading effect in addition to growth stimulation However, that DE showed
greater stimulation suggested that in some way, AP was not properly representing changes in cell growth When AP, DE and cell number were used as end points for a BSA growth assay in 24-well plates, the extent of stimulation measured by AP was not much different to that measured by cell number or DE This would have suggested that perhaps the seeding density of the cells in the 96-well plate assays was not suitable, yet when the growth stimulatory effect of BSA was compared on the basis of initial cell density, DE was found to be consistently better than AP The reason for this is unknown
348
Due to the variations in growth stimulation exhibited by HSA and BSA fraction V and fatty acid
free albumins, it was possible that fatty acids or lipids may have been responsible for the
activity
Initially a commercially available lipid-protein mixture called Ex-cyte (supplied by Pentex) was
tested in combination with HSA-faf Ex-cyte products encompass a range of water-soluble cell
culture nutrient supplements derived from the lipid fraction of adult bovine or human sera All
Ex-cyte products consist of a mixture of lipoproteins, cholesterol, phospholipids and fatty acids A typical batch of Ex-cyte III (bovme-derived) solution contains 9 9mg/ml cholesterol, 0 07mg/ml triglycerides, 8 04mg/ml phospholipids, 9 6mg/ml fatty acids and 19 5mg/ml protein
(Pentext, Growth Enhancement Media Supplement) It has been shown to support the growth
and monoclonal antibody production of AHT-107 cells in SFM (Hewlett, 1991) and the growth
of BHK-21 cells in reduced serum conditions (Smith et a l , 1990) The Ex-cyte when tested
on NRK cells alone was inhibitory (Appendix B) Although some slight stimulation was seen
when combined with HSA-faf, the extent of stimulation could not overcome the inhibitory effect
of the albumin alone High density lipoprotein (HDL) was found to have little or no effect on
the growth of NRK cells in SFM (section 3 17 4) even though it was present in many of the
SF media described for NRK-49F cells (Rizzino, 1984, Newman et a l , 1986 and Nugent et a l ,
1989)
Lipid content was found to be responsible for the growth promoting effects of BSA on Yoshida
sarcoma (Yamane et a l , 1975), SY40 transformed cells (Rockwell et a l , 1980), HeLa Cells
(Gerschenson et a l , 1967) and Chinese Hamster cells (Ham, 1963, Nilausen, 1978) On the basis of these reports, a variety of lipids were loaded onto the albumin (oleic acid, cholesterol, phosphatidylserine and phosphatidylcholine) (section 3 5 14) No stimulation by the lipids without albumin on their own was found, and when loaded onto albumin no significant increase in stimulation was seen This may be because the lipids were not actually stimulatory to the NRK cells without a carrier However, both Nilausen (1978) and Jager et al (1988) suggested that oleic acid was just as good alone as it was when loaded onto albumin
These results indicated that if fatty acids or lipids were responsible for the difference in activity
between BSA and HSA fraction V and fatty acid free, then the type of lipid or the concentration
may not have been suitable for NRK cells The levels of oleic acid and cholesterol used were not excessive with levels of 1 - 25/ig/ml reported in serum-free medium for several myelomas
349

and hybridomas, Chinese Hamster fibroblasts and adult rat hepatocytes (Jager, 1988, Nilausen
1978, Miyazaki et a l , 1991) This would suggest that either the wrong fatty acids were tested or the fatty acids did not complex properly with the albumin and as a result not delivered to the
cell The results seen with oleic acid and HSA-faf suggest, however, that loading took place (section 3 5 1 4 3) Also the affinities of fatty acids for albumin (especially delipidated
albumin) are so strong, having association constants m the order of 107 to 109 (Spector and
Fletcher, 1978) for long-chain fatty acids, that it was unlikely that loading did not take place
Use of HSA-faf instead of BSA-faf may also have affected the results as BSA binds fatty acids more tightly, but both exhibit a strong affinity for fatty acid binding
It is of course possible that fatty acids other than those tested may have been responsible for the activity Gerschensen et al (1967) found 20 4 (arachidomc acid) and 18 2 (linoleic acid) to be
the most important fatty acids for the growth of HeLa cells However, different nutritional
requirements appeared to exist for different cell types Jager et al (1988) found that oleic acid could replace linoleic acid for X63-Ag8 653 myeloma cell line While Nilausen (1978) also found oleic acid to be as active as linoleic acid on the growth of Chinese hamster cells CHEF,
oleic acid could not replace linoleic acid for another Chinese hamster cell line, CHD-3 (Ham,
1963) Keratmocytes took up linoleic acid from solution in preference to oleic acid (Schurer
et a l , 1994) Linoleic acid was found not to have any significant effect on the growth of NRK
cells in SFM (section 3 1 6) although the lipids may have had other activities not detected by the end points used here, for example contributing to the structural integrity of cell membranes
(Smith et a l , 1982)
Gerschensen et al (1967) and Miyazaki et al (1991) also looked at stimulation by fatty acids
and phospholipids without albumin The extent of activity observed with phosphatidylethanolamine, phosphatidylcholine and cholesterol was low, reaching a maximum of only 30% stimulation above the control (Miyazaki et a l , 1991) From the results obtained in section 3 5 15, little or no activity was seen with acid phosphatase (AP) but some slight stimulation was seen with image analysis (IA) as the end point The fact that the activity was low may indicate that combinations of lipids were required or that the stimulatory activity was due to some other factor lost or deactivated during removal of lipids
A number of other possibilities to explain the difference m growth between fraction V and fatty
acid free albumins exist The charcoal treatment itself may have been responsible for the loss of stimulation between fraction V and fatty acid free albumins of both species As dehpidation
350

using charcoal at low pH is a harsh method, the treatment may have destroyed the activity of
some component other than fatty acids Chen (1967) found that charcoal treatment did not
drastically affect the albumin molecule itself as determined by analytical ultrafiltration, optical
rotary dispersion and the ability to bind fatty acids However, a recent report (Sen et a l , 1991)
suggests that a change in the intrinsic optical activity of albumin was due to a change in the secondary structure of the protein, which may m turn have affected the binding sites and thus
the biological activity of BSA
Another cell line, SCC-9 (human squamous carcinoma of the tongue) had shown responsiveness to albumin (section 3 5 12) For SCC-9 cells, no clear differentiation was seen m stimulation
between fraction V and fatty acid free albumins, regardless of the source of albumin, human
or bovine (order of stimulation was BSA-faf > HSA fraction V = HSA-faf > BSA fraction
V) That both human fraction V and fatty acid free induced similar stimulation suggested that
lipids were not important for the SCC-9 stimulating activity
Batch to batch variation may have affected the results (i e the BSA fraction V may have been
from a ’good’ batch whrie the fatty acid free may have been from a ’bad’ batch; where both
’good’ and ’bad’ refer to the ability of the albumin to stimulate growth of NRK cells) Inter
batch variability has been reported with BSA (McKiernan and Bavister, 1992, Tomooka et a l ,
1985) To find out if the differences in activity of the fraction V and fatty acid free albumins could be due differences in the batches from which they were derived, both human and bovine albumins for which a commercially available fatty acid free component was available were obtained and tested on NRK cells (section 3 5 2 1) As the serum in which the assays were being carried out was equine, equine serum albumin (ESA) fraction V and fatty acid free were also tested For both BSA and HSA, fatty acid free albumins showed lower growth stimulation
than the fraction V from which they were derived For ESA, fraction V and the fatty acid free showed little stimulation For rat tracheal epithelial cells, Thomassen (1989) found s imilar
results when comparing BSA fraction V (A4503) and BSA-faf (A6003), albumin of the type used here However, no mention was made of the batch number
The initial isolation procedure may also interfere with the interpretation of results as the BSA- faf and the fraction V used in section 3 5 11 were isolated by different means The three most
common initial fractionation steps by which albumins are fractionated are cold alcohol precipitation, salt fractionation and heat-shock treatment The results showed that the salt
351

fractionated albumin had almost no activity The heat-shock fractionated BSA was twice as
stimulatory as the cold alcohol precipitated BSA Thus while the BSA fraction Vs prepared by cold alcohol precipitation showed roughly the same stimulation, no claim can be made that heat-
shock fractionated BSA will always be better at stimulating growth of NRK cells as only one sample of salt fractionated and heat-shock fractionated BSA were tested Barlian and Bols
(1991) looked at the effect of the initial fractionation and the effect on the growth of salmon embryo and trout gonadal cells 3 of the 5 BSAs prepared by cold alcohol precipitation were
stimulatory while no fraction V prepared by heat-shock or salt fractionation supported growth
In summary, the results from sections 3 5 1 and 2 showed the growth promoting activity of
BSA on NRK cells in low serum medium to depend on the source, the batch, charcoal treatment and probably the initial isolation step Comparison of BSA and HSA fraction V and fatty acid free albumins showed that charcoal treatment resulted in a reduction or total loss of activity
respectively Attempts to replace the possible factors lost in the charcoal treatment with a
commercially available lipoprotein mixture or individual lipids failed to restore activity To
determine if the activity lost during charcoal treatment was due to a loss of fatty acids or to inactivation of some other factor, it would be necessary to carry out the charcoal extraction on
the BSA, identify the fatty acids and lipids removed, and combine the identified fatty acids with the charcoal treated albumin to see if activity would be restored
4.4.2 Extraction of activity from albumin with organic solvents
Organic solvent treatment of albumin has been used to extract active components such as fatty acids and other lipids like lysophosphatides (Tigyi and Miledi, (1991 and 1992)) Lysophosphatidic acid has been shown to stimulate 3H thymidine incorporation into a number
of cell lines including Rat-1 fibroblasts (van Corven et al ,1989), Human foreskin fibroblasts (Jalink et al ,1990) and other fibroblasts (Bell et a l , 1979) Much evidence to date suggested that lysophosphatidic acid could be an intracellular messenger with a role in cell growth and motility, possibly acting through a G protein-coupled receptor (Durieux and Lynch, 1993) In trying to isolate the activity associated with albumin which activated chloride oscillatory currents in Xenopus Oocytes, Tigyi and Miledi (1992) carried out sequential extractions with
a variety of organic solvents Lysophosphatides were found to be present on serum albumin but not plasma albumin, suggesting that these were factors picked up by albumin during the
clotting process The activity of the isolated lysophosphatide was tested on neunte retraction
352

m PC pheochromocytoma cells in SFM and also on 3H thymidme incorporation into Sp2-0-
Agl4 myeloma cells in SFM, where it was inhibitory
In an effort to determine if the lysophosphatidates were responsible for the activity seen with BSA on NRK cells, the extraction procedure of Tigyi and Miledi (1991,1992) was used (section 3 5 3) As solvent extraction has also been reported to extract fatty acids, it was of interest to
see if the recombination could restore activity to the albumin The organic solvents used were methanol, ethanol, acetone, chloroform and di-ethyl-ether (assays carried out in low serum
medium)
In two or three separate extraction processes (depending on the organic solvent), most of the activity remained with the protem phase for each of the solvents Very little or no activity was
isolated with the organic phase Only when acetone was used as the extracting solvent was
increased activity seen with recombination of the organic and protein phase, whrie only one of
the two extractions with chloroform showed increased activity on recombination
The inability of recombination of the organic and protem phase to effect a recovery in activity would indicate that the active factor was not due to phosphatidic or lysophosphatidic acid The variable loss in activity in the protem phase may have been partially as a result of the process Extraction with organic solvents is a harsh treatment and may have resulted in the inactivation
of some of the factors associated with the albumin It is also possible that some protem was
lost during extraction process for example, as a result of protem residues sticking to gilson tips
The results obtained by Tigyi and Miledi (1992) for the extraction of activity with the organic
solvents did show some reduction m activity for DEE, chloroform and acetone for the protem
phase, with no significant activity in the organic phase alone Only for methanol and to a lesser extent, ethanol was activity seen in the organic phase (Tigyi and Miledi, 1992)
To see if the vigorous mixing affected the activity of BSA, a control BSA dissolved into ATCC medium was exposed to 3 x 1 hour mixing at room temperature In three of the four assays no growth at all occurred Very few cells attached, most were suspended in the medium, with no increase in cell number Why BSA which had been stirred vigorously caused such a response from the cells is unknown the albumin samples exposed to various solvents did not
elicit this response It may be that the excessive stirring denatured the BSA and exposed it to some component in the basal medium which hindered proper refolding of the albumin molecule
353
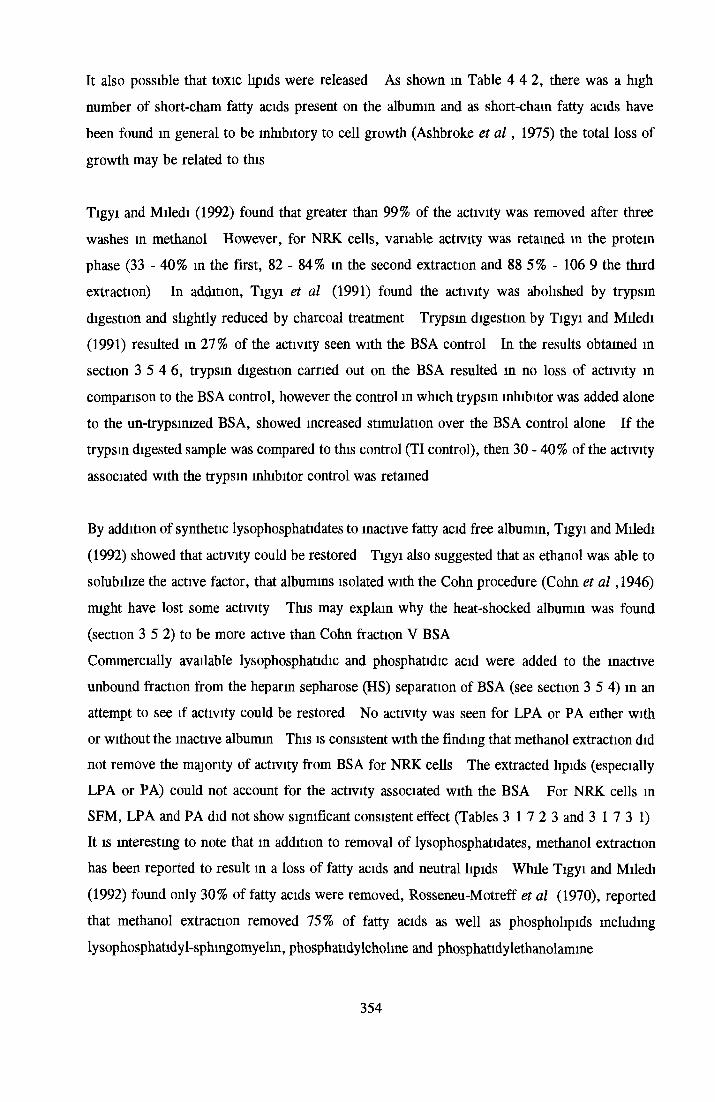
It also possible that toxic lipids were released As shown in Table 4 4 2, there was a high number of short-cham fatty acids present on the albumin and as short-chain fatty acids have
been found in general to be inhibitory to cell growth (Ashbroke et a l , 1975) the total loss of
growth may be related to this
Tigyi and Miledi (1992) found that greater than 99% of the activity was removed after three
washes in methanol However, for NRK cells, variable activity was retained in the protein phase (33 - 40% in the first, 82 - 84% in the second extraction and 88 5% - 106 9 the third extraction) In addition, Tigyi et al (1991) found the activity was abolished by trypsin
digestion and slightly reduced by charcoal treatment Trypsin digestion by Tigyi and Miledi(1991) resulted in 27% of the activity seen with the BSA control In the results obtained in section 3 5 4 6, trypsin digestion carried out on the BSA resulted in no loss of activity in
comparison to the BSA control, however the control in which trypsin inhibitor was added alone
to the un-trypsimzed BSA, showed increased stimulation over the BSA control alone If the trypsin digested sample was compared to this control (TI control), then 30-40% of the activity
associated with the trypsin inhibitor control was retained
By addition of synthetic lysophosphatidates to inactive fatty acid free albumin, Tigyi and Miledi
(1992) showed that activity could be restored Tigyi also suggested that as ethanol was able to solubilize the active factor, that albumins isolated with the Cohn procedure (Cohn et al ,1946)
might have lost some activity This may explain why the heat-shocked albumin was found (section 3 5 2) to be more active than Cohn fraction V BSA
Commercially available lysophosphatidic and phosphatidic acid were added to the inactive unbound fraction from the heparin sepharose (HS) separation of BSA (see section 3 5 4) in an attempt to see if activity could be restored No activity was seen for LPA or PA either with or without the inactive albumin This is consistent with the finding that methanol extraction did not remove the majority of activity from BSA for NRK cells The extracted lipids (especially LPA or PA) could not account for the activity associated with the BSA For NRK cells in SFM, LPA and PA did not show significant consistent effect (Tables 3 1 7 2 3 and 3 17 3 1) It is interesting to note that m addition to removal of lysophosphatidates, methanol extraction has been reported to result in a loss of fatty acids and neutral lipids While Tigyi and Miledi
(1992) found only 30% of fatty acids were removed, Rosseneu-Motreff et al (1970), reported
that methanol extraction removed 75% of fatty acids as well as phospholipids including
lysophosphatidyl-sphmgomyelm, phosphatidylcholine and phosphatidylethanolamme
354
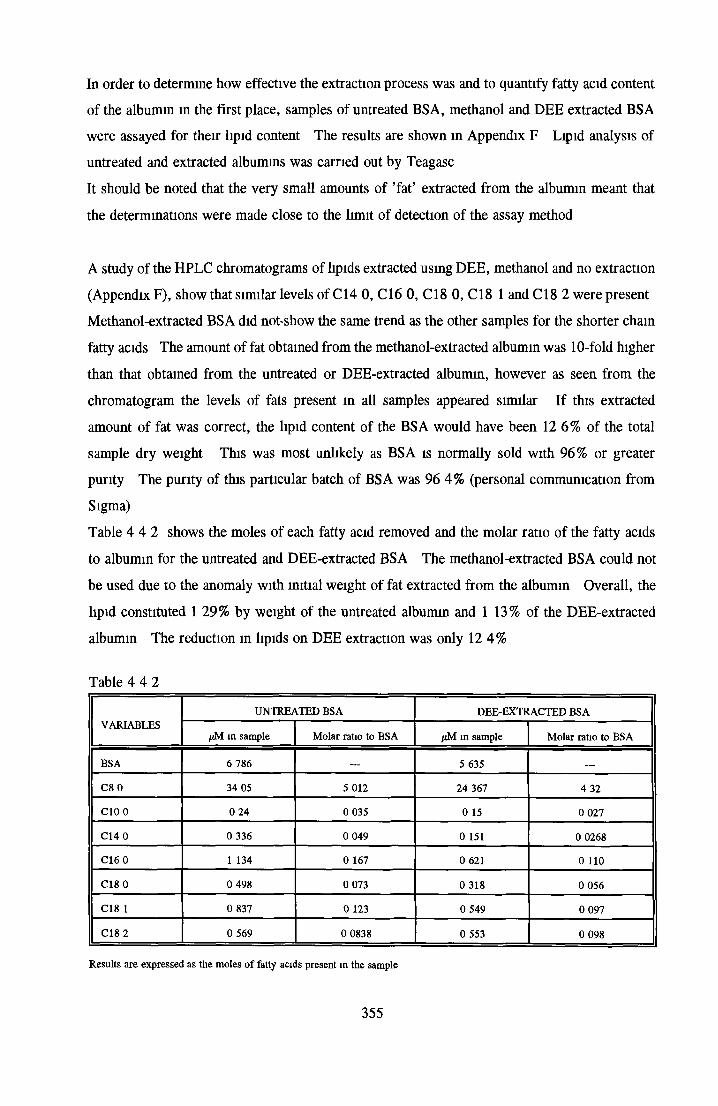
In order to determine how effective the extraction process was and to quantify fatty acid content of the albumin in the first place, samples of untreated BSA, methanol and DEE extracted BSA were assayed for their lipid content The results are shown in Appendix F Lipid analysis of
untreated and extracted albumins was carried out by Teagasc
It should be noted that the very small amounts of ’fat’ extracted from the albumin meant that
the determinations were made close to the limit of detection of the assay method
A study of the HPLC chromatograms of lipids extracted using DEE, methanol and no extraction
(Appendix F), show that similar levels of C14 0, C16 0, C18 0, C18 1 and C18 2 were present Methanol-extracted BSA did not-show the same trend as the other samples for the shorter chain
fatty acids The amount of fat obtained from the methanol-extracted albumin was 10-fold higher
than that obtained from the untreated or DEE-extracted albumin, however as seen from the
chromatogram the levels of fats present in all samples appeared similar If this extracted
amount of fat was correct, the lipid content of the BSA would have been 12 6 % of the total sample dry weight This was most unlikely as BSA is normally sold with 96% or greater purity The purity of this particular batch of BSA was 96 4% (personal communication from
Sigma)
Table 4 4 2 shows the moles of each fatty acid removed and the molar ratio of the fatty acids
to albumin for the untreated and DEE-extracted BSA The methanol-extracted BSA could not
be used due to the anomaly with initial weight of fat extracted from the albumin Overall, the
lipid constituted 1 29% by weight of the untreated albumin and 1 13% of the DEE-extracted albumin The reduction in lipids on DEE extraction was only 12 4%
Table 4 4 2
VARIABLESUNTREATED BSA DEE-EXTRACTED BSA
/¿M in sample Molar ratio to BSA /¿M in sample Molar ratio to BSA
BSA 6 786 — 5 635 —
C8 0 34 05 5 012 24 367 4 32
C10 0 0 24 0 035 0 15 0 027
C14 0 0 336 0 049 0 151 0 0268
C16 0 1 134 0 167 0 621 0 110
C18 0 0 498 0 073 0 318 0 056
C18 1 0 837 0 123 0 549 0 097
C18 2 0 569 0 0838 0 553 0 098
Results are expressed as the moles o f fatty acids present in the sample
355
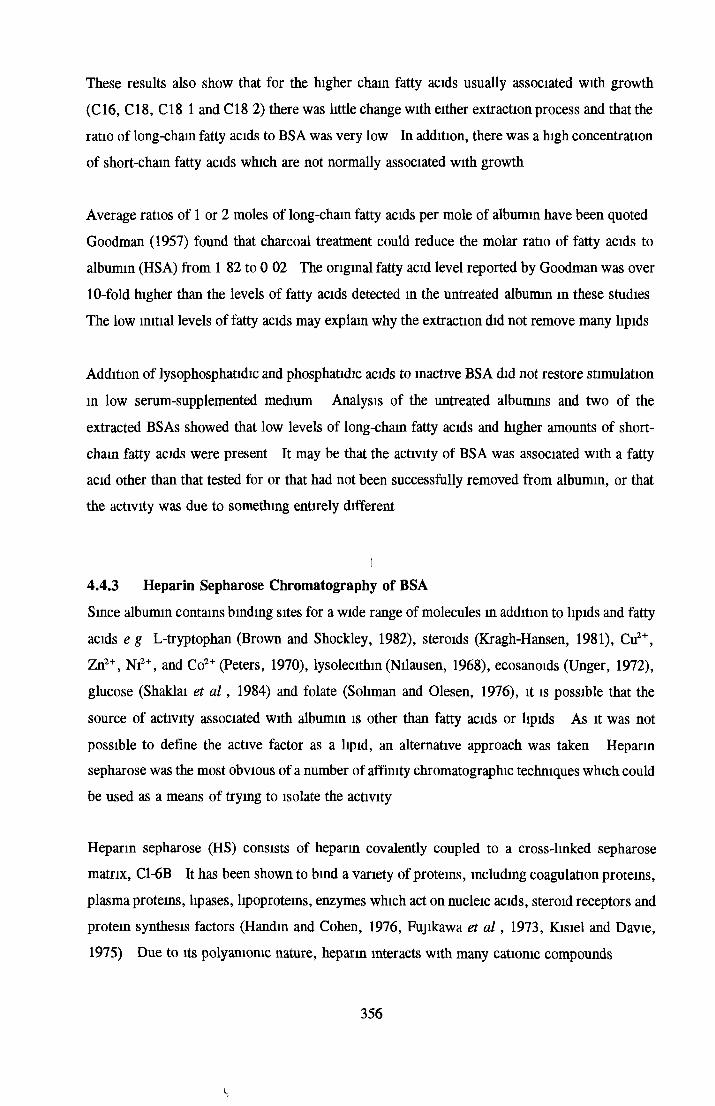
These results also show that for the higher chain fatty acids usually associated with growth
(C16, C18, C18 1 and C18 2) there was little change with either extraction process and that the ratio of long-chain fatty acids to BSA was very low In addition, there was a high concentration
of short-chain fatty acids which are not normally associated with growth
Average ratios of 1 or 2 moles of long-cham fatty acids per mole of albumin have been quoted
Goodman (1957) found that charcoal treatment could reduce the molar ratio of fatty acids to albumin (HSA) from 1 82 to 0 02 The original fatty acid level reported by Goodman was over
10-fold higher than the levels of fatty acids detected in the untreated albumin m these studies
The low initial levels of fatty acids may explain why the extraction did not remove many lipids
Addition of lysophosphatidic and phosphatidic acids to inactive BSA did not restore stimulation
in low serum-supplemented medium Analysis of the untreated albumins and two of the
extracted BSAs showed that low levels of long-cham fatty acids and higher amounts of short-
cham fatty acids were present It may be that the activity of BSA was associated with a fatty acid other than that tested for or that had not been successfully removed from albumin, or that the activity was due to something entirely different
[4.4.3 Heparin Sepharose Chromatography of BSA
Since albumin contains binding sites for a wide range of molecules in addition to lipids and fatty
acids e g L-tryptophan (Brown and Shockley, 1982), steroids (Kragh-Hansen, 1981), Cu2+, Zn2+, Ni2+, and Co2+ (Peters, 1970), lysolecithin (Nilausen, 1968), ecosanoids (Unger, 1972),
glucose (Shaklai et a l , 1984) and folate (Soliman and Olesen, 1976), it is possible that the
source of activity associated with albumin is other than fatty acids or lipids As it was not possible to define the active factor as a lipid, an alternative approach was taken Heparin sepharose was the most obvious of a number of affinity chromatographic techniques which could be used as a means of trying to isolate the activity
Heparin sepharose (HS) consists of heparin covalently coupled to a cross-linked sepharose matrix, C1-6B It has been shown to bind a variety of proteins, including coagulation proteins,
plasma proteins, lipases, lipoproteins, enzymes which act on nucleic acids, steroid receptors and protein synthesis factors (Handin and Cohen, 1976, Fujikawa et a l , 1973, Kisiel and Davie,
1975) Due to its polyanionic nature, heparin interacts with many cationic compounds
356
s
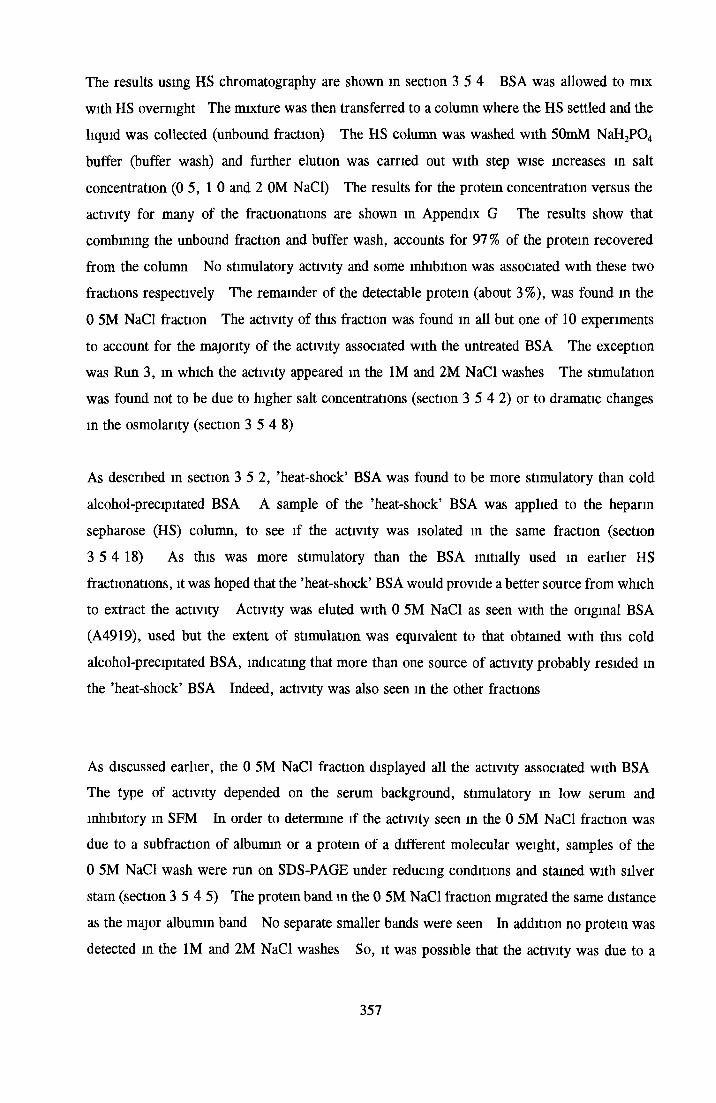
The results using HS chromatography are shown in section 3 5 4 BSA was allowed to mix
with HS overnight The mixture was then transferred to a column where the HS settled and the
liquid was collected (unbound fraction) The HS column was washed with 50mM NaH2P04
buffer (buffer wash) and farther elution was carried out with step wise increases in salt
concentration (0 5, 1 0 and 2 0M NaCl) The results for the protein concentration versus the activity for many of the fractionations are shown in Appendix G The results show that combining the unbound fraction and buffer wash, accounts for 97 % of the protein recovered
from the column No stimulatory activity and some inhibition was associated with these two
fractions respectively The remainder of the detectable protein (about 3%), was found in the
0 5M NaCl fraction The activity of this fraction was found in all but one of 10 experiments
to account for the majority of the activity associated with the untreated BSA The exception was Run 3, in which the activity appeared in the 1M and 2M NaCl washes The stimulation was found not to be due to higher salt concentrations (section 3 5 4 2) or to dramatic changes in the osmolarity (section 3 5 4 8)
As described in section 3 5 2, ’heat-shock’ BSA was found to be more stimulatory than cold
alcohol-precipitated BSA A sample of the ’heat-shock’ BSA was applied to the heparin
sepharose (HS) column, to see if the activity was isolated in the same fraction (section
3 5 4 18) As this was more stimulatory than the BSA initially used in ear her HS
fractionations, it was hoped that the ’heat-shock’ BSA would provide a better source from which to extract the activity Activity was eluted with 0 5M NaCl as seen with the original BSA
(A4919), used but the extent of stimulation was equivalent to that obtained with this cold
alcohol-precipitated BSA, indicating that more than one source of activity probably resided m the ’heat-shock’ BSA Indeed, activity was also seen in the other fractions
As discussed earlier, the 0 5M NaCl fraction displayed all the activity associated with BSA The type of activity depended on the serum background, stimulatory m low serum and inhibitory in SFM In order to determine if the activity seen in the 0 5M NaCl fraction was due to a subfraction of albumin or a protein of a different molecular weight, samples of the 0 5M NaCl wash were run on SDS-PAGE under reducing conditions and stained with silver stam (section 3 5 4 5) The protein band in the 0 5M NaCl fraction migrated the same distance
as the major albumin band No separate smaller bands were seen In addition no protein was
detected in the 1M and 2M NaCl washes So, it was possible that the activity was due to a
357
subtraction of the albumin which specifically bound HS or the active component may have been
bound very closely to albumin
If the activity was due to a protein, then digestion with either trypsin or pepsin could have
resulted in loss of activity It was also possible that the protein present in the 0 5M NaCl wash was due to residual albumin which under more extensive washing with the buffer may have
eluted off Trypsin digestion as monitored by SDS-PAGE (Figure 3 4 4 6) showed partial degradation in the first experiment and on extended exposure (18 hours), full degradation of the
0 5M NaCl band Biological activity of the 0 5M NaCl control was low m the first experiment after exposure to trypsin for 2 hours In the second experiment under the same conditions,
addition of trypsm to the 0 5M NaCl fraction, either before or after addition of trypsm inhibitor
resulted in a loss of stimulation whrie with the 0 5M NaCl fraction and trypsm inhibitor (TI) alone, growth stimulation above that caused by the 0 5M NaCl fraction was observed The activity of BSA did not appear to be affected by trypsm and it too showed increased stimulation when incubated with TI alone That the TI caused stimulation on its own presented problems
in determining the extent of activity lost from the 0 5M NaCl fraction However, using either
the TI control (0 5M NaCl fraction and TI) or the untreated 0 5M NaCl fraction as a control,
the 0 5M NaCl fraction appeared to be partially sensitive to trypsm (varying between 23 4 -
44% and 44-69% activity retained depending on the control respectively)
Due to the problems with trypsm inhibitor, pepsin digestion was carried out in order to get a clearer picture (section 3 5 4 7) Again, no significant effect on BSA stimulatory activity was
observed (about 20% lost) With the 0 5M NaCl fraction, only 10 - 22% of the activity was retained upon digestion with pepsm However, the pH control for this experiment, also showed
low stimulation (15 7, 34 4 and 58 9% of the activity obtained for the 0 5M NaCl control for three separate assays respectively) Thus the total loss seen with pepsin was not due to pepsm alone but also to the pH The reduction in activity between the low pH and the low pH with pepsm varied between 35 and 68% in the three assays In a second pepsm digestion experiment, no difference in loss of stimulation was seen between the pH 2 6 sample with or without pepsm Later experiments which looked at the stability of BSA and the 0 5M NaCl fraction over a variety of pH (section 3 5 4 15), showed that BSA was relatively insensitive to
extremes of pH For the 0 5M NaCl fraction, exposed to pH 2 6 , variable activity was seen
with 38 to 63 % of the activity of the 0 5M NaCl fraction retained These results would indicate that exposure of the 0 5M NaCl fraction to pH 2 6 resulted in variable loss (as seen m two
358
separate experiments) in activity and that addition of pepsin could cause further inactivation in
some cases This partial loss of activity due to exposure pH may have been caused, in part,
to inadequate although vigorous mixing
Various analytical determinations were made (fatty acids, citrate and phospholipids) on the
untreated BSA and 0 5M NaCl fraction (sections 3 5 4 9 - 11) However, the determinations
were made at the detection limits of the diagnostic kits used As mentioned earlier, the
biological activity associated with BSA is often attributed to fatty acids or lipids Kane, (1990) found that the activity associated with BSA that stimulated the growth of pre-implantation
embryos was due to citrate The effect of citrate was examined on the growth of NRK cells
A wide range of citrate concentrations, both with and without the unbound fraction were looked at, to see if activity could be generated However, no activity was seen
Following 24-hour dialysis against ATCC, 67 7 - 90 8% of the activity was retained (section
3 5 4 16) When compared using the ATCC dialysed control, only 35 - 57 6% of the activity was retained, which meant that some component of the basal medium (ATCC) was being lost
resulting in lower growth in the ATCC alone Polet and Speiker-Polet (1975) found dialysis of BSA did not affect activity while Nilausen (1978) found increased activity after dialysis probably due to removal of inhibitory factors such as citrate, lactate, pyruvate and ferric ions (Hansen and Ballard, 1968)
The 0 5M NaCl fraction was reapplied to the column (section 3 5 4 17) The reapplication
experiment showed that most of the detectable protein could be removed on reapplication of the
0 5M NaCl fraction The remaining protein migrated on an SDS-PAGE gel similarly to BSA
It would be necessary to ascertain if the remaining albumin is part of the active component or a residual contamination from the separation process The 0 5M NaCl fraction was further studied using HPLC, gel filtration and diafiltration (discussed below)
4.4.4 HPLC of BSA and 0.5M NaCl fraction
An erythrotropin-like factor has been reported to be the active component associated with BSA for erythroid cells from fetal bovme liver (Congote, 1987) A C18 /¿Bondapak column was
used as the initial fractionation step in isolating erythrotropm-like factor from BSA by reverse
phase HPLC The active factor had the same elution profile as fetal bovine serum erythrotropm
359
and elicited the same biological effect In order to determine if the activity associated with BSA for NRK cells could be due to an erythrotropin-like factor, BSA was fractionated using the procedure described by Congote As the column used in these studies was not a semi- preparative column, a larger number of runs were required to obtain sufficient volumes for
assaying the bioactivity of the fractions on NRK cells
The protein elution profiles of BSA consistently showed 1 major peak at 50% Acetomtrile
(ACN)) and three smaller peaks at the end of gradient at 75 - 80% ACN The major peak
corresponded to the bulk of the albumin as seen in the lyophilized fractions, and bioassays showed this to be inhibitory Two areas of slight stimulation occurred, fraction 6 (before the main protein peak with no apparent protein peak (at 280nm) associated with the activity) and
fraction 12 (corresponding to the first of the three smaller peaks) The activity m these fractions was low in comparison to the control BSA, being less than 20% and 37% of the
control BSA, when dye elution and cell number were used as the end points respectively The
0 5M NaCl fraction was not very stable during lyophilization, which might indicate that the
’active factor’ for NRK cells was not erythrotropin-hke factor The protein elution profile showed the 0 5M NaCl fraction to elute off the column in the same place as albumin The
three peaks at the end were found to exist as interference as they were present when no albumin was applied to the column
Coproporphynn was used as a reference peak by Congote (1987) to determine the position of
erythrotropm-like factor Samples of coproporphyrin were run to see if the small amount of activity had a similar retention time A sample containing BSA and coproporphynn was applied to the column (Table 3 5 5 3 1) Over 5 runs, two peaks appeared consistently in the same positions The first of these peaks (peak 2) was at 31 5 - 32mm and the second peak occurred at 68 - 73mm and corresponded to the position of the mam protein peak in these studies From these results, it was possible that the activity observed in fraction 6 could be related to erythrotropin-hke factor However, Congote recovered 100% of the activity from the untreated albumin, while the activity here was very low The low activity may have been due to a separation of the erythrotropm-like factor and erythropoietin, with which it is very synergistic It may also have been that only a small amount of the activity was due to erythrotropm-like factor
360
The elution profiles obtained in these experiments were different to those obtained by Congote Congote’s main protein peak eluted off very early at about 24 - 28% ACN while the mam
protein peak here eluted off about 50% ACN The second peak obtained by Congote (1987) corresponded to our first peak (50% ACN) Only a small peak was seen at 24 -28% ACN When the albumin used by Congote (A8022) was run on the column, an elution profile similar
to that seen with BSA (A4919) was obtained (Figures 3 5 5 5 1 and 2) The size of the column necessitated some changes in the running programme, however, as the separation was based on hydrophobic interactions it was very unlikely that the dimensions of the column would affect
the acetomtrile concentration at which the albumin eluted off the column
The fact that Congote’s first protein peak came off the column after such a short retention time suggested that the column may have been overloaded, which may have explained the differences
m the protein elution profiles 2ml of a 40mg/ml solution was applied to Congotes’ column at a time As the column used here was one quarter of the size of the column used by Congote, one quarter of the albumin should have been applied (20mg in total) in accordance with Congotes procedure (1987) However, the injection loop on the HPLC delivered a maximum volume of only 20pil With a maximum concentration of 200mg/ml albumin, only 4mg could
be applied at a time Without a larger injection loop, it was not possible to prove whether overloading of Congote’s column had taken place
A repeat experiment with the BSA and 0 5M NaCl fraction on the rp-HPLC resulted in variable
growth inhibition in low serum assays Whatever the reason for the inhibition, further experiments involving studies on bioactivity were not to be depended upon However, the elution profiles of the protein, had not changed drastically during these experiments The
elution profile of BSA-faf (A6003), BSA fraction V (A4919), BSA fraction V (A8022) and the 0 5M NaCl fraction were compared No significant changes in the elution position of the different albumins were observed (0 5M NaCl fraction contained a lot less protein in the mam peak)
It cannot be ruled out that erythrotropin-like factor is not present on the BSA used m these studies, however it did not appear to be the major active factor associated with BSA for NRK cells Congote, (1985) mentioned that fetal kidney cells were activated to a lesser extent than
liver erythroid cells by erythrotropin Not only were differences observed in the response of different cell types but species variation in growth response to erythrotropin-like factor was also found between bovine and rat liver erythroid cells (Congote, 1987)
361
In order to further confirm that erythrotropin was not the major active factor, it was necessary
to look at the molecular weight of the active factor in the 0 5M NaCl fraction The apparent
molecular weight of erythrotropin-like factor is 9000 (Congote, 1987) If the molecular weight
of the active fraction was not simriar, then the factor being looked at was most unlikely to be
erythrotropin-like factor To do this, the active fraction from the heparm sepharose fractionation was subjected to gel filtration
4.4.5 Gel filtration and Diafiltration of BSA and 0.5M NaCl fraction
Gel filtration was carried out to determine if any of the activity of the 0 5M NaCl fraction could
be related to erythrotropin-like factor which has an apparent molecular weight of 9,000 When the 0 5M NaCl fraction was run on the column, three major protein peaks appeared
(200,000, 130,000 and 66,000) in fractions that corresponded albumin polymers and monomers
A number of other protein peaks were obtained (Table 3 5 6 2 3) Biological activity of the fractions were tested under low serum and serum-free conditions Samples were tested on the
equivalent amount (mg/ml) that would be present in the untreated albumin
For low serum-supplemented media, activity was seen in fractions, 33 - 35, 54 - 60, 68 - 74
and 84 None of the fractions showed all the activity that would have been expected from the 0 5M NaCl control itself Activity reached about 50% stimulation over the control (1 % DHS) This may have been due to the activity being eluted off over a number of fractions as seen m the bell-shaped curve of activity for some fractions It may also be due to the active factor requiring the BSA molecule to be present for activity
Comparing the position of activity with the protein profiles, the fractions 33 - 35 would have
a molecular weight of 200,000 or greater which could indicate large polymers of BSA A protein peak in fraction 71 would correspond to the activity seen in fractions 68 - 74, which would indicate a molecular weight of about 2,400 If this were the major source of the activity associated with BSA, it would have to be tightly bound to albumin as diafiltration using a 3,000 molecular weight cut-off membrane could not remove it, yet for some reason it must have dissociated from albumin under the conditions used for gel filtration (this however, is unlikely)
For NRK cells in SFM, fractions exhibited no stimulation with the more complex SFM (insulin, Fe2S0 4, fi-FGF and PDGF), while with the simpler SFM (insulin and Fe2S0 4) some stimulation
362
was observed in fractions 79-81 and again m 84, which would indicate a molecular weight of
1,000 or less The extent of stimulation was very low
Gel filtration of the 0 5M NaCl fraction was repeated using low serum-supplemented assay
system (section 3 5 6 3) However, the 0 5M NaCl control showed low stimulation (lower than
had been seen previously with this same sample) The only major band of activity was isolated in fractions 74 - 79 which had a molecular weight of 2,000 or less This almost corresponded
to the activity seen in the first gel filtration experiment No activity was seen in the fractions
where the albumin eluted off the column
BSA was subjected to gel filtration in order to compare the results with the 0 5M NaCl fraction
(section 3 5 6 4) In low serum-supplemented media, slight biological activity was seen with
one of the BSA controls (which could invalidate one of the two assays) Activity was present in several fractions, 62 - 63, 85 - 87 and 88 - 100, but none of them were individually as good as the control BSA or as high as the stimulation seen with the 0 5M NaCl fraction As no
activity was found at the point where the albumin eluted off the column, it would indicate that
the albumin itself was not responsible for the activity, unless in some way the gel filtration procedure irreversibly destroyed the activity However, this is unlikely In addition, the spread
of stimulation across a wide molecular weight band would suggest that a variety of factors were
responsible for the activity Again, the possibility also existed that the active factor required BSA to exert its stimulatory effect
To investigate the possibility that recombination of factors with different molecular masses was necessary for activity, samples of BSA and the 0 5M NaCl fraction were diafiltered through membranes with molecular weight cut offs of 100,000, 30,000, 10,000 and 3,000
The results showed that for BSA virtually all of the activity was retained m 2 fractions (R100 and the R30-100), suggesting that the activity was due to monomers and polymers of albumin or to some factor bound to the albumin Following from the gel filtration, it would appear that the activity was due to some factor bound to albumin which although not removed during diafiltration, could become separated from the albumin molecule during gel filtration
No stimulation was caused by the R310, the fraction which would contain erythrotropm-hke factor, provided the factor was dissociated from the BSA during diafiltration Recombination
363
/
of the R3.10 with the R30-100 or R100 resulted in a small increase in activity m one experiment but
not m the second, suggesting that some small activity may be found in the R3.10 However, as
Congote (1987) used hydrophobic interactions to separate BSA and erythrotropin-like factor,
it is possible that erythrotropin-like factor remained bound to the BSA during diafiltration
Diafiltration of the 0 5M NaCl fraction resulted m a different trend to that seen with the BSA
None of the retentates showed growth stimulation individually Only on recombination of R100
+ R10-30> R30-100 + R10-30 and R100 + R10-30 was activity seen Of these, 60-80% of the activity
of the 0 5M NaCl fraction was restored in the R1(wo + R3(M00, suggesting that the active factor
had a molecular weight of between 10,000 and 30,000 daltons and required the presence of a
small amount of albumin for activity However, this diafiltration was carried out only once
4.4.6 Summary on the activity associated with BSA on NRK cellsThe results show that all of the growth stimulatory activity associated with BSA fraction V can
be isolated in 3 % or less of the original protein by means of chromatography using heparin
sepharose The 0 5M NaCl fraction elicits all the stimulatory activity shown by BSA in low
serum-supplemented medium and also the inhibition shown by BSA in SFM
Samples of the active fraction showed a band similar to that of BSA when run on SDS-PAGE
gels This would suggest the presence of either a subpopulation of BSA or of BSA as a
contaminant Reapplication of the 0 5M NaCl fraction to the heparin sepharose column,
resulted in retained activity in the 0 5M NaCl fraction with a significant loss of protein The
remaining protein showed the same migration as BSA on SDS-PAGE gels It is possible that
the activity was due to a subpopulation of albumin Microheterogeneity of BSA has been
widely reported (Kaplan and Foster, 1971, Janatova, 1974) Most commonly, fluctuations in
the disulphide pairing on the albumin molecule, or the presence of bound impurities can result
in heterogeneity The results obtained with HPLC and gel filtration would indicate that the
activity was not due to the subfraction of the albumin molecule itself but rather to some
impurity as the activity did not remain with the albumin, although of course, the putative active
ligand may have been destroyed especially under the conditions used for rp-HPLC However,
the possibility that this impurity binds to only a small amount of the albumin may indicate the
presence of a subpopulation of albumin to which the impurity can bind
364
From lipid loading experiments and extraction of lipids from BSA, the activity would not appear
to be due to fatty acids/lipids Reverse phase HPLC, gel filtration and diafiltration of BSA
results would indicate that erythrotropin-hke factor was not the major source of the activity
The activity of the 0 5M NaCl fraction was found to be partially susceptible to proteolytic
degradation by trypsin or pepsin Diafiltration of the 0 5M NaCl fraction indicated that the
activity was isolated in the R10_30 retentate and depended on the presence of a small amount of
albumin for activity Further analysis of the more purified component (as isolated in the
reapplication experiment), would yield more useful information as to the identity of the active
component
In addition it was possible that the activity was not due to a growth stimulatory factor but rather
the removal of some specific growth inhibitor from the basal medium or from the serum
That the activity could be isolated using heparin sepharose would suggest a cationic nature for
the active component Many factors have been isolated or purified using heparin sepharose
chromatography including human platelet IV (Handin and Cohen, 1976), brain and pituitary
fibroblast growth factor (Gospodarowicz et a l , 1984), bovine factors VII (Kisiel and Davie,
1975) and IX (Fuykawa et a l , 1973), apolipoprotein-H-hke protein (Li et a l , 1990) In
addition to these factors, other impurities present on albumin include insulin inhibitors (Bajaj
and Vallance-Owen, 1971), proteases (Zurawski e t a l , 1975) and nucleases (Anai e t a l , 1972)
That albumin can carry such a broad variety of factors confirms how important it is for the
source of the activity to isolated and defined for use in serum-free media
365
4.5 Implications of results for industrial applications
Although the investigations carried out in this thesis were based on the use of anchorage-
dependent cells grown in monolayer cultures on a small scale, the results have implications
which may apply to industrial situations
4.5.1 Development of defined mediaThe use of defined media offers potential advantages with respect to satisfying regulatory
requirements and facilitating product purification (t e by reducing the amount of total protein
in the culture system, purification of the desired protein can be made easier) To this end, the
use of recombinant proteins and/or synthetic compounds provides an opportunity to replace
animal-derived proteins normally used in SFM Three of the most commonly used factors used
for small-scale and large-scale applications are the animal-derived proteins, bovine insulin,
transferrin and albumin
From an industrial point of view, the CHOK1 cell line is probably the most important cell type
of the three cell lines studied in these investigations These cells showed a high level of
dependence on the presence of bovine insulin for growth stimulation monolayer SF cultures
The possible use of recombinant IGF or recombinant insulin instead of bovine-derived insulin
would remove an animal-derived protein from the formulation and in the case of recombinant
IGF, reduce in the amount of protein present in the medium It was possible to replace bovine-
denved insulin with recombinant human insulin, thereby providing a means by which CHOK1
cells could be grown m monolayer cultures in a SFM devoid of ammal-derived proteins (the
only other ammal-derived protein in the SFM being bovine transferrin, which was found not
to be necessary m the presence of Fe2S0 4)
That recombinant human insulin could replace bovme-derived insulin for the growth of CHOK1
cells in monolayer, does not mean that all recombinant proteins or synthetic analogues can
replace the ammal-derived components Indeed, it would be necessary to determine if the
recombinant human insulin was a suitable replacement for large-scale applications of CHOK1
cells, grown either in free suspensions or on microcarriers Most importantly the productivity
of the cells would have to be compared to ensure that the development of a more defined
medium did not result m a drop of productivity or in alterations of the activity of the desired
product Thomas and Fung (1994) found that a recombinant modified IGF-I (modified by
truncation of part of the N-termmal which stopped the IGF from binding to IGF-bindmg
366
proteins) could replace bovine insulin for CHODXB11 cells without affecting the production
of mterleukin-I or tumour necrosis factor receptors m a 2L serum-free fermentation
BSA is widely used as an additive in mdustrial-scale cell culture In this thesis, it was
demonstrated that all of the growth stimulatory activity associated with BSA for NRK cells in
low serum-supplemented medium was confined to about 3 % of the BSA (i e the portion bound
to heparin sepharose and removed by 0 5M NaCl) This confirms the necessity for assessing
the role of BSA on growth and production As discussed earlier, m different systems BSA may
act as just a carrier of the active factor (e g fatty acids, lipids or lysophosphatidic acid) which
may replace albumin In situations where a carrier molecule is required, cyclodextrins and
polyethylene glycol have been used Indeed, Blasey and Winzer (1989) were able to replace
albumin with polyethylene glycol to allow growth of hybridomas in a low protein SFM where
mAb production constituted a major part of the total protem
As the MDCK cell line is industrially important in the production of canine vaccines, the use
of a SFM devoid of animal-derived proteins offers the same potential advantages as described
for CHOK1 cells Bovine transferrin was successfully replaced by iron salts or iron complexes
for MDCK cells grown in SFM On an industrial scale, the ability of iron complexes to replace
transferrin (either human- or bovine-derived) will be affected by additional considerations
Kovar (1990) suggested that the ability of insoluble iron complexes to replace transferrin for
a number of hybridomas was due to physical contact when the complexes precipitate out of
solution On scaling up, this form of contact would be less frequent and may reduce the
effectiveness of the replacing factor Indeed, Metcalf (1994) reported that some iron complexes
which could replace transferrin in monolayer culture were unable to replace transferrin in
suspension cultures However Darfler (1990) found that soluble sodium mtroprusside could
replace transferrin to allow protein-free culture of hybridoma cells with mAb production often
exceeding 80% of the total protein while Cole et al (1987) could grow human-human
hybridomas m a SFM but the viability and maximum cell densities were reduced m comparison
to the albumin and transferrin containing controls
An alternative approach to that used in this thesis, would involve getting the cells themselves
to produce the additional factors required to stimulate growth and obviate the requirement of
adding animal-derived or recombinant proteins Kitano (1994) found that recombinant human
367
FGF could improve the growth of a human-human hybridoma, HBW-416 at low cell densities
By introducing a plasmid containing the recombinant human FGF gene, a stable transformant
was obtained which could be used to scale up to a 200L fermenter via two-steps from the master
cell bank while the original cell line required 4 - 5 steps The transformant was able to produce
good yields of the active antibody
It must be stressed that the use of one parameter i e growth (as used in this thesis), may not
be a sufficient basis for deciding on the appropriate components or the concentration of
components of a specific SFM, particularly when the aim is the large-scale culturing of cells
to produce some factor other than biomass
4.5.2 Suspension versus anchorage-dependent growth and productionAs mentioned above, differences may exist in the growth response and production rate of cells
when grown in suspension cultures as opposed to anchorage-dependent growth Many
anchorage-dependent cultures have been scaled up (by use of microcarriers and encapsulation
for example) without a significant loss in productivity Reports by Kitano (1994) and Brand
et a l (1994), suggest that differences in growth and production may indeed be a problem, but
one which is overcome by adapting the cells to grow in suspension and then reselecting for
highly expressing clones Brand et al (1994) collated evidence to suggest that the specific
production rate of recombinant CHO cell lines measured in static cultures in the presence of
serum was a poor indicator of the subsequent performance of the cell line in SF suspension
culture In this situation, the development of a high producing cell line was first obtained It
was only after a high producer was isolated that it was subsequently exposed to serum-ftee
conditions and suspension cultures simultaneously In this thesis, it was found that while
albumin and EGF were stimulatory in low serum-supplemented media they had no effect or
were inhibitory under serum-free conditions (depending on the concentration) As different sets
of conditions result in differences in growth patterns, it may be necessary to optimise one
parameter at a time i e selection of a high producing cell line in SFM and then adaption to
suspension culture (Satoh et a l , 1991)
Gawlitzek et al (1994) observed differences in the glycosylation of recombinant glycoproteins
when comparing anchorage-dependent to anchorage-independent growth and serum-
supplemented medium to SFM The results showed that BHK-21 cells grown in suspension
cultures, secreted a higher proportion of N-glycosylated protein forms than cells grown on
microcarriers However the effect of these alterations on the activity of the glycoprotein were
not discussed
368
4.5.2 Prospects for use of SFM on industrial scaleProspects for the use of SFM or protein-free media on an industrial scale will depend on the
ability to overcome problems which result in the loss of serum including increased sensitivity
to shearing effects, increased susceptibility to pH, increased susceptibility to proteolytic
enzymes, reduction in productivity or alterations in the final product Many of these problems
have been overcome by strict control of pH (Smiley et a l , 1989, Gurhan and Ozdural, 1990),
aeration and agitation (Marquis et a l , 1989), addition of shear protective agents e g Pluromc
F68 or methylcellulose (Papoutsakis, 1991, Marquis et a l , 1989), reactor design e g perfusion
cultures which control the growth of hybridomas to maintain a high viability while lengthening
the phase of specific mAb production (Fazekas de St Groth, 1983) For some systems, the use
of a SFM resulted in a higher productivity than in SSM (Satoh et a l , 1991)
Problems relating to productivity on scaling up have in some cases been solved by the cloning
and selection of more resilient cells In fact, the future use of SFM for large-scale applications
may not so much depend on the development of a specific SFM tailored to a cell line but
isolating a clonal cell line which is suitable to grow under pre-specified serum-free conditions
and at the same time retain a high degree of productivity An example of this was shown by
Kitano (1994) who adapted a human-human hybridoma (HBW-4 16) to a protein-free medium
by use of repetitive cloning and selection The resulting cell line produced as much mAb as
the original cell line By further exposing the cells to high shear stress m a spinner flask (by
increasing agitation speeds), an improved cell line AGC-1 was developed which could produce
10 times as much IgG as the original cell line The AGC-1 cell line could easily be scaled up
to 200L fermenter without loss of productivity
Other methods of increasing the productivity include increasing the gene copy number of the
selected protein This selection of a highly-expressing system is carried out by the use of
selective pressure, most commonly dhfr-MTX (Miyaji et a l , 1990b, Satoh et a l , 1991) or
glutamine synthetase (Brand et a l , 1994) Further improvements can be made by altering the
gene product, e g Hosoi et al (1991) removed an AT-rich sequence in the 3’ non-coding
region of the fi-IFN gene This resulted in a more stable mRNA, which allowed for increased
productivity Satoh et al (1991) removed a membrane binding region of M-CSF which
increased the rate at which M-CSF was secreted
369
Alterations in the control of the growth cycle can also improve productivity Oh et a l (1994)
used high salt concentrations and the presence of butyrate to lengthen the stationary phase and
enhance mAb production 2 3-fold over the hybridoma in the control medium Kessler et al
(1994) found that growth in ’Ultraculture’, a commercially available SFM could increase the
stability of mouse hybridoma clonal cell lines by suppressing the rapid multiplication of non-
secreting variants Growth in this medium resulted in increased chromosomal abnormalities,
specifically in an increase in double minutes It was suggested that the stability of the clones
also related to evolution of a hypertriploid-hypotetraploid karyotype
These trends indicate that the use of defined media conditions (low-protein and protein-free
medium) are part of a concerted effort to make mammalian cell fermentations as economical
and production as possible
370

C H A P T E R F I V E
C O N C L U S I O N A N D F U R T H E R R E S E A R C H
5.0 CONCLUSIONS AND FURTHER RESEARCH
The aims of this thesis were to investigate alternatives to fetal bovine/calf serum in animal cell
culture With respect to the three cell lines used in this project, SFM were already reported
The efficiency of the SFM were to be investigated with special emphasis on the role of BSA,
bovine insulin and bovine transferrin in the hope of replacing the ammal-derived proteins with
synthetic analogues, recombinant proteins or simple inorganic/organic salts This would result
in upgraded SFM which would be devoid of animal-derived products and possibly low-protein
or protem-free media
1 The investigations into the roles of BSA, insulin and transferrin for NRK cells were
hampered due to the fact that NRK parental cells would not grow in the SFM designed by
Rizzino (1984) for the subclone, NRK-49F It was therefore necessary to develop an alternative
SFM As the cells would not remain viable in the basal medium (ATCC), a low serum-
supplemented medium consisting of 1 % DHS supplemented with 0 5mg/ml BSA, 5/zg/ml
insulin, 5/ig/ml transferrin and 5ng/ml EGF was developed McCoys 5a was found to support
greater cell growth than ATCC medium A SFM was subsequently developed using this basal
medium supplemented with 10/xg/ml insulin, 1 39/xg/ml Fe^SO,,, 5ng/ml PDGF and lng/ml B-
FGF This was found to support long-term (at least 10 passages) growth of NRK cells in a
SFM
The apparently logical approach of examining the growth stimulatory effects of factors m the
presence of low background of serum turned out to have serious limitations in that both EGF
and BSA were stimulatory in the presence of serum and had no effect or were inhibitory
(depending on the concentration) in SFM
While it was possible to get NRK cells to grow without serum supplementation, the SFM was
not totally defined as it contained bactopeptone, bovine-derived insulin and BSA (to stabilize
recombinant PDGF) To develop a completely defined medium, the following should be
attempted
(a) Replacement of McCoys 5a with GME This was found to be the next best basal
medium to McCoys 5a (section 3 14 ) As bactopeptone is a protein digest from meat extract,
it may be possible to improve the growth m GME by further addition of ammo acids, both
essential and non-essential
(b) Use of recombinant IGF-I or human insulin to replace bovine-derived insulin
(c) Use of cyclodextrins as a carrier for recombinant PDGF m place of BSA
371
2 As BSA fraction V was very stimulatory to NRK cells in low serum-supplemented
assays, it was hoped to isolate the source of the activity, so that the BSA could be replaced by
synthetic factors (i e specific factors e g fatty acids or analogues to albumin e g
cyclodextrins), which could be used m SFM BSA fraction V strongly stimulated growth of
NRK cells in low serum (2% and 1 % DHS) supplemented medium, while BSA fatty acid free
was not as stimulatory HSA fraction V was found to be growth stimulatory while HSA fatty
acid free was mildly inhibitory To determine if the presence of lipids or fatty acids on the
fraction V albumins was responsible for activity, a variety of lipids (oleic acid, cholesterol,
phosphatidylserine and phosphatidylcholine) were loaded onto HSA fatty acid free Alone or
in combination, the lipids failed to improve the ability of HSA fatty acid free to stimulate
growth of NRK cells Also extraction of lipids from BSA fraction V with organic solvents
failed to extract the majority of activity associated with BSA fraction V
Further investigations using heparin sepharose chromatography of BSA fraction V revealed that
the activity associated with BSA was confined to less than 3% of the original protein and was
consistently eluted with 0 5M NaCl The active factor stimulated growth to the same extent
as the untreated BSA fraction V in low serum-supplemented medium However, m the SFM
designed for NRK cells (section 3 1), the active factor was as inhibitory as the untreated BSA
fraction V Further, the active factor and the untreated BSA fraction V were also found to be
inhibitory with CHOK1 cells in SFM
Reverse phase-HPLC was employed to further identify the active factor However, a
combination of exposure to acetomtrile, trifluoroacetic acid and lyophilization resulted in a loss
of biological activity Further fractionation by gel filtration to determine the molecular mass
of the active component, resulted m a loss of activity for the active factor and for BSA fraction
V The loss of activity after rp-HPLC and gel filtration would suggest that the activity
associated with BSA and the 0 5M NaCl fraction was not associated with an erythrotropin-like
factor
Using diafiltration to find out if recombination of fractions were necessary to restore activity,
diafiltration was carried out against a series of molecular weight membranes For BSA fraction
V, all of the activity appeared to remain with the albumin protein (either as monomers or
polymers) Thus, further work is required to the identify the component(s) of the active factor
isolated in the 0 5M NaCl fraction obtained by heparin sepharose chromatography of BSA
This may involve reapplication of the 0 5M NaCl fraction to heparin sepharose in order to
produce a more purified active factor
372
3 For CHOK1 cells, which are industrially important, the aim was to upgrade the existing
SFM to a defined medium free from any animal-derived proteins So the effects of bovine-
derived insulin and transferrin were investigated The cells were found to be dependent on
insulin but not on transferrin and as such was an ideal system to study the replacement of
bovine-insuhn It was found that bovine insulin could not be replaced by recombinant IGFs but
could be replaced by recombinant human insulm It remains to be shown if the recombinant
insulin can continue to replace bovine insulm over several passages m SFM Transferrin had
little or no effect on growth and so could be removed from the medium By removal of
transferrin and replacement of bovine with recombinant human insulin, a SFM devoid of
ammal-derived proteins could be prepared, the only protein present being recombinant human
insulin In addition, as CHOK1 cells are industrially important, it would be necessary to look
at their growth in SFM m large-scale systems, either in suspension or on microcarriers This
would show if the replacement of bovine-derived insulin and transferrin were successful on
scale-up As the yield of recombinant product is of prime importance on an industrial scale,
it would be necessary to determine the effectiveness of the replacements on the yield of a
desired product
4 For MDCK cells, the SFM designed for their growth contained bovine-derived insulin
and transferrin As MDCK cells have been shown to be dependent on the presence of
transferrin, and not very dependent on insulin, this was a suitable cell line for investigation of
the replacement of transferrin in SFM with inorganic and organic complexes Of the factors
which supported growth in the absence of transferrin, only some (ferric ammonium sulphate,
ferrous sulphate and sodium mtroprusside) were able to support prolonged growth m serum-
free, transferrm-free medium As insulin was the only remaining serum-derived protein (insulin
was found not to exert a strong effect on MDCK cells) it may be possible to either remove
insulin totally from the medium or replace it with recombinant insulm, thereby creating a SFM
devoid of ammal-derived proteins It is yet to be shown that the cells can continue to grow in
a SFM totally devoid of ammal-derived products over a period of time (several passages)
These investigations show that factors traditionally used in designing a SFM can be replaced by
defined components which are not ammal-derived There is as a result, great potential for
developing totally defined low protein or protein-free media for a wide variety of cell lines
373

B I B L I O G R A P H Y
Adams P A and Berman M C (1980) Kinetics and mechanisms of the interactions between HSA and monomeric haemm Biochem J 191, 95-102
Agy P C , Shipley G D and Ham R G (1981) Protein-free medium for C-1300 mouse neuroblastoma cells In Vitro 17, (8), 671-680
Aheam G S , Daehler C C and Majumdar S K (1992) Serum-free media for murine erythroleukemia cells still not as good as serum-supplemented media In Vitro 28a, 227-229
Aisen P , Leibman A and Zweier J (1978a) Stoichiometric and site characteristics of the binding of iron to human transferrin J Biol Chem 253, 1930-1937
AisenP and Leibman A (1978b) In Transport by Proteins (Blauer G and Sund H eds), pp 277-294 W de Gruyten and Co Berlin, NY
Alexandndes T and Smith R J (1989) A novel fetal msulin-like growth factor (IGF) I receptor J Biol Chem 264, (22), 12922-12930
Alkhalof N , Propper A and Adessi G (1991) Proliferation of guinea-pig uterine epithelial cells in serum-free cutlure conditions effect of 17 B-estradiol, EGF and insulin J Ster Biochem Molec Biol 38, (3), 340-350
Allen J C , Smith C J , Thomas J M , Hussain S and Gaugas J M (1979) Inhibition of lymphocyte proliferation by polyammes requires ruminant-plasma polyamine oxidase Eur J Biochem 102, 153- 158
Allen R E , Dodson M V , Luiten L S and Boxhom L K (1985) A serum-free medium that supports the growth of cultured skeletal muscle satellite cells In Vitro 21, (11), 636-640
Allen R E and Boxhom L K (1989) Regulation of skeletal muscle satellite cell proliferation and differentiation by transforming growth factor-B, insulin-like growth factor I and fibroblast growth factor J Cell Physiol 138, 311-315
Altalo K , Kusimanen E , Myllyla R , Knstala U , Asko-Seljavaara S and Vahen A (1982) Extracellular matrix proteins of human epidermal keratinocytes and feeder 3T3 cells J Cell Biol 94, 497-505
Anai M , Haraguchi H and Takazi Y (1972) An endonuclease associated with bovme plasma factor II The ongm and activation mechanism of the enzyme J Biol Chem 247. 199-203
Anderson W L , Chase C G and Tomasi T B Jr (1982) Transferrin support of stimulated lymphocytes In Vitro 18 (9), 766-774
Anderson S N , Ruben Z and Fuller G C (1990) Cell-mediated contraction of collagen lattices in SFM effect of serum and non serum factors In Vitro 26, 61-66
Amounc M J , Marvaldi J , Pichon J , Bellot F and Figarella C (1984) Effect of lactofemn on the growth of a human colon adenocarcinoma cell line comparison with transferrin In Vitro 20, (7), 543- 548
Anver E D , Ellis D , Temple T and Jaffe R (1982) Metanephnc development m serum-free organ culture In Vitro 18, (8), 675-682
Ashbrook J D , Spector A A and Santos EC (1975) Long-chain fatty acid binding to human plasma albumin J Biol Chem 250, 2333-38
374
Asselbergs F A M , Rahuel J , Cumin F and Leist C (1994) Scaled-Up production of recombinant human remn in CHO cells for enzymatic and x-ray structure analysis J Biotechnology 32, (2), 191-202
Assoian R K , Frolik C A , Roberts A B , Miller D M and Spom M B (1984) Transforming growth factor-fl controls receptor levels for epidermal growth factor in NRK fibroblasts Cell 36, 35-41
Baeza-Squiban A , Boisvieuz-Ulnch E , Guilanelh C , Houcine 0 , Geraud G , Guennou C and Marano F (1994) Extracellular matrix-dependent differentiation of rabbit tracheal epithelial primary culture In Vitro 30A. (1), 56-67
Bajaj J S and Vallance-Owen J (1971) Insulin antagonism of normal and diabetic albumin after liver perfusion Lancet i, 16-17
Baker J B , Barsh G S , Carney D H and Cunningham D D (1978) Dexamethazone modulates binding and action of epidermal growth factor in serum-free cell culture Proc Natl Acad Sci USA 75, 4, 1882-1886
Ballotti R , Lammers R , Scimeca J-C , Dull T , Schlessmger J , Ullrich A and Van Obberghen E (1989) Intermolecular transphosphorylation between insulin receptors and EGF-insulin receptor chimeras EMBO Journal 8, (11), 3303-3309
Barano J L S and Hammond J M (1984) Comparative effects of insulin and IGFs on DNA synthesis and differentiation of porcine granulosa cells Biochem Biophys Res Comm 124. (2), 484-490
Barlian A and Bols N (1991) Identification of bovine serum albumins that support salmonoid cellproliferation in the absence of serum In Vitro 27a. (6), 439-441
Barlian, A , Ganassm R C , Tom D and Bols N C (1993) A comparison of bovine serum albumin and chicken ovalbumin as supplements for the serum-free growth of Chinook Salmon Embryo cells, CHSE- 214 Cell Biology Intemat Reports 17, (7), 677-684
Barnes D and Sato G (1980a) Serum-free cell culture a unifying approach Cell 22, 649-655
Barnes D and Sato G (1980b) Methods for growth of cultured cells in serum-free medium Anal Biochem 102, 255-270
Barnes D W , Silnutzer J , See C and Shaffer M (1983) Characterization of serum spreading factorwith monoclonal antibody Proc Natl Acad Sci USA 80, 1362-1366
Barnes D (1984) Attachment factors in cell culture In Mammalian Cell Culture, The use of serum-free hormone-supplemented media Mather J P (Ed ) Chapter 9, 195-237
Barnes D W (1987) Serum-free animal cell culture Biotechniques, 5, 534-541
Basset P , Quesneau Y and Zwiller J (1986) Iron-induced L1210 cell growth evidence of a transfemn-independent iron transport Cancer Res 46, 1644-1647
Bashir N , Kuhen K and Taub M (1992) Phospholipids regulate growth and function of MDCK cells in hormonally-defined serum-free medium In Vitro 28a, 663-668
Beattie G M , Lappi D A , Baird A and Hayek A (1990) Selective elimination of fibroblasts from pancreatic islet monolayers by basic fibroblast growth factor-Saponn mitotoxin Diabetes 39,1002-1005
Belisle B W , Anderson K F , DeGiovanm A , Godwin G , Kohler J and Montalto J G (1990) Large- scale production of monoclonal antibody produced in serum-free culture medium containing Ex-Cyte VLE growth enhancement media supplement Miles Communication, Form PP042 4/90
375
Bell E , Ivansson B and Memll C (1979) Production of a tissue-like structure by contraction of collagen lattices by human fibroblasts of different proliferative potential in vitro Proc Natl Acad Sci USA 76, 1274-1278
Bell C L and Quinton PM (1991) Effects of media buffer systems on growth and electrophysiologic characteristics of cultured sweat duct cells In Vitro 27a, 47-54
Bemdge M J (1987) Inositol tn-phosphate and diacylglycerol two interacting second messengers Ann Rev Biochem 56, 159-193
Bertheussen K (1993) Growth of cells in a new defined protein-free medium Cytotechnology H , 219- 231
Berthier R , Valiron O , Schweitzer A and Marguene G (1993) Serum-free medium allows the optimal growth of human megakaryocyte progemtors compared with human plasma-supplemented cultures role of TGF-B Stem Cells H , (2), 120-129
Bertolero F , Kaighn M E , Gonda M and Saffiotti U (1984) Mouse Epidermal Keratmocytes clonal proliferation and response to hormones and growth factors in serum-free medium Exp Cell Res 155.64-80
Bertolero F , Kaighn M E , Camalier R F and Suffiotti U (1986) Effects of serum and serum-denved factors on the growth and differentiation of mouse keratmocytes In Vitro 22, (7), 423-428
Beuhmck T and Cassio J (1983) Angiotensinogen production by rat hepatoma cells in culture and analysis of its regulation by somatic cell genetics J Cell Biol 97, 544-555
Birkenfeld A , Ezra Y , Navot R D , Granovshy S , Schenker J G , Levy I S and Vlodavsky I (1988) Indication of selective growth of human endometrial epithelial cells on extracellular matrix In Vitro 24, (12), 1188-1191
Bjare U (1992) Serum-free cell culture Pharmac Ther 53, 355-374
Bjorkerud S and Bjorkerud B (1994) Lipoproteins are major and primary mitogens and growth promoters for human arterial smooth muscle cells and lung fibroblasts in vitro Arteriosclerosis and Thrombosis 14, (2), 288-298
Blasey H D andWmzerU (1989) Low protein serum-free medium for antibody production in stirred bioreactors Biotech Letts i i , (7), 248-253
Bliem R , Oakley R , Matsuoka K , Varecka R andTaianolV (1990) Antibody production in packed bed reactors using serum-free and protein-free medium Cytotechnology 4, 279-283
Block L H , Emmons L R , Vogt E , Sahimdis A , Vetter W and Hoppe J (1989) Ca2+-channel blockers inhibit the action of recombinant platelet-denved growth factor in vascular smooth muscle cells Proc Natl Acad Sci USA 86,2388-2392
Bowman C M , Berger E M , Butler E N , Toth K M and Repme J E (1985) HEPES may stimulate cultured endothelial cells to make growth-retarding oxygen metabolites In Vitro 21, (3), part 1, 140- 142
Bottenstein J and Sato G H (1978) Growth of a rat neurobastoma cell line in serum-free supplemented medium Proc Natl Acad Sci USA 16, 514-517
376
Bradbury M W B , Raja K and Ueda F (1994) Contrasting uptakes of Fe-59 into spleen, liver, kidney and some other soft tissues in normal and hypotransfemnaemic mice - Influence of an antibody against the transfemn receptor Biochem Pharmacol 47, (6), 969 - 974
Bradshaw G L and Dubes G R (1983) Supplementary factors required for serum-free culture of Rat Kidney cells of line NRK-49F In Vitro 19, (10), 735-742
Branchaud C L , Goodyear C G , Guy da H J and Lefebvre Y (1990) A serum-free system for culturing human placental trophoblasts In Vitro 26, 865-870
Brand H N , Froud S J , Metcalfe H K , Onadipe A O , Shaw A and Westlake A J (1994) Selection strategies for highly productive recombinant cell lines In Animal Cell Technology products of today, prospects for tomorrow (Eds Spier R E , Griffiths J B and Berthold W) 55-60
Bnand P , Petersen 0 W and Van Deure B (1987) A new diploid non-tumongemc human breast epithelial cell line isolated and propagated in chemically-defined medium In Vitro 23, 181-188
Bridges K R and Cudkowicz A (1984) Effect of iron chelators on the transfemn receptor m K562 cells J Biol Chem 259, (21), 12970-12977
Bridges M , Gebert C and Gray P (1993) Importance of extracellular matrix in the long-term, anchorage-dependent growth of cell line CHOK1 In Animal Cell Technology products of today, prospects for tomorrow (Eds Spier R E , Griffiths J B and Berthold W) 115-118
Brock, J H and Stevenson J (1987) Replacement of transferrin in serum-free cultures of mitogen- stimulated mouse lymphocytes by a lipophilic iron chelator Immunol Lett 15, 23-25
Brower M , Carney D N , Oie H K , Gazdar A F and Minna J D (1986) Growth of cell lines and clinical specimens of human non-small cell lung cancer in serum-free defined medium Cancer Res 46, 798-806
Brown K D and Holley R W (1979) Epidermal growth factor and the control of proliferation of Balb/c 3T3 and Benzo[a]pyrene - transformed Balb/c 3T3 cells J Cell Physiol 100, 139-
Brown J R and Shockley P (1977) Serum albumin structure and characterization of its ligand binding sites Methods in Enzymology 72, Lipids part D, 25-68
Brown J R and Shockley P (1982) In ’Lipid-Protein Interactions’ (P Jost and O H Griffith eds ,) Vol 1, 25-68, New York
Buntemeyer H , Burg M and Lehmann J (1993) Cholesterol an important additive for serum-free media'? In Animal Cell Technology products of today, prospects for tomorrow (Eds Spier R E , Griffiths J B and Berthold W) 124-126
Buml, P H , Bemerdim I , Klemman H K and Kretchman N (1981) Effect of serum fibronectin and lamimn on adhesion of rabbit intestinal epithelial cells in culture J Supramol Struct Cell Biochem 16, 385-392
Butler M (1986) In Thilly W G (Ed ) Mammalian Cell Technology, Butterworths, New York, 91- 108
Butterworth R M , Gibson J F and Williams J (1975) Electron-paramagnetic-resonance spectroscopy of iron-binding fragments of hen ovotransfemn Biochem J 149, 559-563
Carney D , Bunn P Jr , Gazdar A , Pagan J and Minna J (1984) Selective growth in serum-free hormone-supplemented medium of tumour cells obtained by biopsy from patients with small cell
377
carcinoma of the lung Proc Natl Acad Sci USA 78, 3185-3189
Carlsson R , Engvall E , Freeman A and Ruoslahti E (1981) Lamimn and fibronectm m cell adhesion Enhanced adhesion of cells from regenerating liver to lamimn Proc Natl Acad Sci USA 78, 2403- 2406
Carpenter G and Cohen S (1979) Epidermal growth factor Annu Rev Biochem 48, 193-216
Casella S , Han V K , D’Ercole A J , Svoboda M E and Van Wyk J J (1986) Insulin-like growth factor 11 binding to the type I somatomedin receptor J Biol Chem 261, (20), 9268-9273
Chan R Y Y , Ponka P and Schulman H M (1992) Transfemn-reporter-independent but iron- dependent proliferation of variant Chinese Hamster Ovary cells Exp Cell Res 202. 326-336
Chang T , Steplewski Z and Koprowski H (1980) Production of monoclonal antibodies in serum-free medium J Immunol Methods 39, 369-375
ChenRF (1967) Removal of fatty acids from serum albumin by charcoal treatment J Biol Chem 242. (2), 173-181
Chen H W and Kandutsch A A (1983) Cholesterol requirements for cell growth endogenous synthesis versus exogenous sources In The growth requirements of vertebrate cells in vitro, Eds Waymouth, Ham and Chappie, Cambridge Umversity Press, p327
Cheresh D A , Smith J W , Cooper H M andQuarantaV (1989) A novel vitronectin receptor integnn (avftx) is responsible for distinct adhesive properties of carcinoma cells Cell 57, 59-69
Chenngton P U and Purdee A B (1980) Synergistic effects of EGF and thrombin on the growth stimulation of diploid chínese hamster fibroblasts J Cell Physiol 105, 25-35
Chemajovsky Y , Mory Y , Chen L , Marks Z , Novick D , Rubinstein M and Revel M (1984) Efficient constitutive production of human fibroblast interferon by hamster cells transformed with the IFN-B 1 gene fused to an SV40 early promoter DNA 3, 297-308
Chiang M C , Strong J A and Asem E K (1993) BSA enhances Ca2+ currents in chicken granulosa cells Molecular and Cell Endocrinology 94, (1), 27-36
Chiang L C , Silnutser J , Pipas J M and Barnes D W (1985) Selection of transformed cells in serum- free media In Vitro 21, (12), 707-712
Chilton D G , Johnson B H , Danel-Moore L , Kawa S and Thompson E B (1990) Increased glucocorticoid responsiveness of CD4 + T-cell clonal lines grown in serum-free media In Vitro 26, 561- 570
Chio S-T and Chang W-C (1992) Insulin-like growth factor I stimulates transcription of the c-jun proto-oncogene in Balb/c 3T3 cells Biochem Biophys Res Comm 183. (2). 524-531
Chitambar C R and Zivkovic Z (1987) Uptake of Gallium-67 by Human Leukaemic cells demonstration of transferrin receptor-dependent and transferrin-independent mechanisms Cancer Res 47, 3929-3934
Chitambar C R and Zivkovic Z (1989) Release of soluble transfemn receptor from the surface of human leukaemic HL-60 cells Blood 24, 602-608
Chitambar C R and Zivkovic Z (1990) Influence of cellular iron status on the release of soluble transfemn receptor from human pro-myelocitic leukaemic HL60 cells J Lab Clm Med , 116, 345-
378
353
Christman J K , Gerber M , Pnce P M , Flordellis C , Edelman J and Acs G (1982) Amplification of expression of Hepatitus B surface antigen in 3T3 cells co-transfected with a dominant-acting gene and cloned viral DNA Proc Natl Acad Sci USA 79, (6), 1815-1819
Chua F , Oh S K W , Yap M and Teo W K (1994) Enhanced IgG production in eRDF media with and without serum a comparative study J Immunol Methods 167, (1-2), 109-119
Chung C K and Antomades H N (1992) Expression of c-Mi/platelet-denved growth factor B, ínsulin-like growth factor I, and transforming growth factor-a messenger RNAs and their respective receptor messenger RNAs in primary human gastnc carcinomas In Vivo studies with in situ hybridization and immunocytochemistry Cancer Res 52, 3453-3459
Clark G D , Stoker M G P , Ludlow A and Thornton M (1970) Requirement of serum for DNA synthesis m BHK-21 cells, effects of density, suspension and viral transformation Nature 227. 798-801
Clemmons D (1984) Multiple hormones stimulate the production of somatomedin by cultured human fibroblasts J Clin Endo Met 58, 850-856
Clemmons D (1993) IGF binding proteins and their function Molec Reproduct and Develop 35,(4),368-375
Cleveland W L , Wood I and Erlanger B (1983) Routine large-scale production of monoclonal antibodies m a protein-free culture medium I Immunol Methods 56, 221-234
Coezy E , Bouhmk J , Clauser E , Pinet F , Philippe M , Menard J and Lorvol P (1984) Effect of glucocorticoids and anti-glucocorticoids on angiotensinogen production by rat hepatoma cells in culture In Vitro 20, (7) 528-534
Cohn E J , Strong L E and Hughes W L Jr (1946) Preparation and properties of serum and plasma protein IV A system for the separation into fractions of the protein and lipoprotein components of biological tissues and fluids J Am Chem Soc 68, 459-475
Condorelli G , Formisano P , Villone G , Smith R J and Beguinot F (1989) Insulin and insulin-like growth factor I (IGF I) stimulate phosphorylation of a Mw 175,000 cytoskeleton-associated protein in intact FRTL5 cells J Biol Chem 264, (21), 12633-12638
Condorelli G , Bueno R and Smith R J (1994) Two alternatively spliced forms of the human insulin- like growth factor I receptor have distinct biological activities and internalization kinetics J Biol Chem 269. (11), 8510-8516
Congote L F (1984) Extraction from fetal bovine serum of erythrotropm, an erythroid cell-stimulating factor Anal Biochem 140, 428-433
Congote L F (1985) Similarities m structure and function of bovine serum erythrotropm and human insulin-like growth factor-II two fetal erythroid cell stimulating factors Biochem Biophys Res Commun 126, (2), 653-659
Congote L F (1987) Extraction of an erythrotropin-like factor from bovine serum albumin (Cohn fraction V) In Vitro 23, (5), 361-366
Congote L F and Esch F (1987) The erythrotropm of bovine Cohn fraction V has the N-terminal sequence of IGF-II with isoleucine at position 35 Biochem Biophys Res Comm 149. (3). 1026-1032
379
Connolly D T , Knight M B , Harakas N K , Wittwer A J and Deder J (1985) Determination of the number of endothelial cells m culture versus an acid phosphatase assay Anal Biochem 152.136-140
Conover C A , Dollar L A , Hmtz R and Rosenfeld R G (1983) IGF-I and glucocorticoids synergistically regulate mitosis m competent human fibroblasts J Cell Physiol 116, 191-197
Conover C A , Hmtz R L and Rosenfeld R G (1985) Comparative effects of somatomedin C and insulin on the metabolism and growth of cultured human fibroblasts J Cell Physiol JL22, 133-141
Conover C A , Rosenfeld R G and Hmtz R L (1989) Serum glucocorticoids have persistent and controlling effects on insulin-like growth factor I action under serum-free assay conditions in cultured human fibroblasts In Vitro, 25, (6), pp 521-527
Conrad M E , Umbreit J N , Moore E G , Uzel C and Berry M R (1994) Alternate iron transport pathway mobilfemn and integnn in K562 cells J Biol Chem 269. (10'). 7169-7173
Conradt H S , Ausmeier M , Dittmar K E J , Hauser H and Lindenmaier P (1986) Secretion of glycosylated human IL-2 by recombinant mammalian cell lines Carbohydrate Res 149, 443-450
Crichton R R and Charloteaux-Wauters M (1987) Iron transport and storage Eur J Biochem 164. 485-506
Crowe A and Morgan E H (1992) Iron and transferrin uptake by brain and cerebrospinal fluid in the rat Brain Research 592. 8-16
Czech M P (1982) Structural and functional homologies m the receptors for insulin and the IGFs Cell 31, Nov , 8-10
Czech M P (1988) Insulin receptor signalling J Biol Chem 263. (23). 11017-11020
Czech M P (1989) Signal transmission by IGFs Cell 59, Oct , 235-238
Dahms N M , Wick D A and Brzycki-Wessell M A (1994) The bovine mannose 6-phosphate/insulin- like Growth factor II receptor J Biol Chem 269, (5), 3802-3809
Darfler F J and Insel P A (1984) Methods for serum-free culture of neuronal and lymphoid cells (Bnes D W , Sirbasku D A and Sato G H eds), pp 187-196 Alan R Liss
Darfler F J (1990a) Preparation and use of lipid microemulsions as nutritional supplements forculturing mammalian cells In Vitro 26, 779-783
Darfler F J (1990b) A protein-free medium for the growth of hybndomas and other cells of the immune system In Vitro 26, Aug , 769-778
Darlington G J , Kelly J H and Buffone G J (1987) Growth and hepatospecific gene expression of human hepatocyte cells in defined medium In Vitro 23, (5), 349-354
David L , Nesland J M , Holm R and Sobnnhosimoes M (1994) Expression of laminin, collagen IV, fibronectin, and type IV collagenase in gastnc carcinoma - An immunohistochemical study of 87 patients Cancer 73, (3), 518-527
De Boer M , Ossendorp F , Van Duijn G , Ten Voorde G and Tager J (1989) Optimal conditions for the generation of monoclonal antibodies using primary immunization of mouse splenocytes in vitro under serum-free conditions J Immunol Methods 121, 253-260
De Miranda J F R , Eikelboom T D and van Os G A J (1976) The extent of hydrophobic binding area
380
Dicher P , Pohjanpelto P , Pettican P and Rozengurt E (1981) Similarities between FGF and PDGF Exp Cell Res 135. 221-227
Dickson R B , Huff K K , Spencer E M and Lippman M E (1986) Induction of EGF-related polypeptide by 17 B-Estradiol in MCF-7 human breast cancer cells Endocrinology 118. 138-142
Dicohleto P E and Bowen-Pope D F (1983) Endothelial cell-denved proteins that binds to PDGF receptor Proc Natl Acad Sci USA 80, 1919-1923
Dodson M V , Mathison B A and Mathison B D (1990) Effects of medium and substratum on ovine satellite cell attachment, proliferation and differentiation in vitro Cell Differentiation and Development 29, 59-66
Dufresne M , Jane D , Theriault A and Adeli K (1993) Expression of cathepsin B and aryl hydrocarbon hydroxylase activities and of apolipoprotein B m Human hepatoma cells maintained longterm in a serum-free medium In Vitro 29a, 873-878
Dulbecco R (1970) Topoinhibition and serum requirements of transformed and untransformed cells Nature 227, 802-806
Durant S , Duval D , Hassid J and Homo-Delarche F (1989) Mouse embryo fibroblast proliferation and prostaglandin production in medium supplemented with FBS or serum substitutes (Ultroser SF and G) role of Glucocorticoids J Steroid Biochem 33, (6), 1103-1110
Duneux M E and Lynch K R (1993) Signalling properties of lysophosphatidic acid TIPS, 14, 249- 253
Eagle H (1955) Nutritional needs of mammalian cells in tissue culture Science 122. 501-504
Eagle H and Piez K (1962) The population-dependent requirement by cultured mammalian cells for metabolites which they can synthesize J Exp Med 116, 29-43
Eby J E , Sato H and Sirbasku D A (1992) Preparation of iron-deficient tissue culture medium by Deferoxamine-sepharose treatment and application to differential actions of apotransfemn and difemc transferrin Anal Biochem 203, 317-325
Eby J E , Sato H and Sirbasku D A (1993) Apotransfemn stimulation of thyroid hormone dependent rat pituitary tumour cell growth in serum-free chemically defined medium Role of Fe(III) chelation J Cell Physiol 156, (3), 588-600
Edelson J D , Chan S , Jassal D , Post M and Tanswell A K (1994) Vitamin D stimulates DNA synthesis in alveolar type-II cells Biochem Biophys Acta - Molecular cell research 1221. (2), 159-166
Eisman J A , Sutherland R L , McMenemy M L , Fragonas J C , Musgrove E A and Pang G Y N (1989) Effect of 1,25-Dihydroxyvitamin D3 on cell cycle kinetics of T47D human breast cancer cells J Cell Physiol 138, 611-618
El-Bradry O M , Meyers M , Spengler B , Chang T , Ross R and Biere J (1991) Medium conditioned by human neuroblastoma BE(2)-C-cells contains an autocnne/paracnne acting growth factor with properties similar to IGF-II Advances in Neuroblastoma Res 3, 257-266
Elliot W M and Auersperg N (1993) Growth of normal human ovanan surface epithelial cells in reduced-serum and serum-free medium In Vitro 29a, 9-18.
studied by fatty acid binding to albumin Mol Pharmacol 12, 454-462
381
Htnerman J , Fiedler E , Tolcher A and Rebbeck P (1987) Effects of defined medium, fetal bovine serum, and human serum on growth and chemosensitivities of human breast cancer cells in primary culture inference for in vitro assays In Vitro 23, (2), 134-140
Evans R W and Williams J (1988) Studies of the binding of different iron donors to human serum transferrin and isolation of iron-bindmg fragments from the N and C-terminal regions of the protein Biochem J 173. 543-552
Fahmy M and Young S P (1993) Modulation of iron metabolism in monocyte cell line U937 by inflammatory cytokines changes in transferrin uptake, iron handling and femtin mRNA Biochem J 296, 175-181
Favom R E , Decupis A , Ravera F , Cantom C , Piram P , Ardizzom A , Noonan D and Biassom R (1994) Expression and function of the msulm-like growth factor I system in human non-small-cell lung cancer and normal lung cell lines Intemat J Cancer 56, (6), 858-866
Fazekas de St Groth S (1983) Automated production of monoclonal antibodies in a cytostat J Immunol Method 57, 121-136
Feinstein R , Kanety H , Papa M Z , Lunenfeld B and Karasik A (1993) Tumour necrosis factor-a suppresses insulin-induced tyrosine phosphorylation of insulin receptor and its substrates J Biol Chem 268. (35), 26055-26058
Ferguson M W J , Sharpe P M , Thomas B L and Beck F (1992) Differential expression of insulin- like growth factors-I and factors-II (IGF-I and IGF-II), mRNA, peptide and binding protein I during mouse palate development a comparison with TGF-B peptide distribution J Anatomy 181, (2), 219- 238
Flier J F , Usker P and Moses A C (1986) Monoclonal antibody to IGF-I receptor blocks IGF-I receptor-mediated DNA synthesis clarification of the mitogemc mechanism of IGF-I and insulin in human skin fibroblasts Proc Natl Acad Sci USA 83, 664-668
Flonm J R , Magn K A , Ewton D Z , James P L , Gnndstaff K and Rotwein P S (1991) "Spontaneous" differentiation of skeletal myoblasts is dependent upon autocrine secretion of insulin-like growth factor-II J Biol Chem 266, (24), 15917-15923
Freund J E (1979) Modem elementary statistics Fifth Edn Prentice-Hall, p45
Fujn D K and Gospodarowicz D (1983) Chicken egg yolk-supplemented medium and the serum-free growth of normal mammalian cells In Vitro 19, 811-817
Fujikawa K , Thompson A R , Legaz M E , Meyer R G and Davie E W (1973) Isolation and characterization of Bovine factor IX (Christmas factor) Biochemistry 12, (24), 4938-4945
Ganther H E , Hafeman D G , Lawrence R A , Serfass R E and Hoekstra W G (1976) Selenium and glutathione peroxidase m health and disease a review In Prasa A S (ed), Trace Elements in Human Heath and Disease, New York, Academic Press Inc pp 165-234
Gasser F , Mulsant P and Gillois M (1985) Long-term multiplication of the Chinese hamster ovary (CHO) cell line in serum-free medium In Vitro, 21, (10), 588-592
Gawlitzek M , Villers C , Verbert A , Wagner R and Conradt H S (1994) Changes m the glycosylation pattern of recombinant proteins effected by defined culture conditions of BHK-21 cells In Animal Cell Technology products of today, prospects for tomorrow (Eds Spier R E , Griffiths J B and Berthold W) 649-651
382
Gazdar A F and Oie H K (1986) Correspondence re, Martin Brower et al Growth of cell lines and clinical specimens of human non-small cell lung cancer in a serum-free defined medium Cancer Res 46, 6011-6012
Geaugey V , Duval D , Geahel I , Marc A and Engasser J M (1989) Influence of amino acids on hybndoma cell viability and antibody secretion Cytotechnology 2, 119
Gerschenson L E , Mead J F , Harary I and Haggerty D F Jr (1967) Studies on the effects of essential fatty acids on growth rate, fatty acid composition, oxidative phosphorylation and respiratory control of HeLa cells m culture Biochem Biophys Acta 131, 42-49
Gilbert S F and Migeon B R (1975) D-valine as a selective agent for normal human and rodent epithelial cells in culture Cell 5, 11-17
Gilchrest B A , Calchoun J K and MaCiag T (1982) Attachment and growth of human keratinocytes in a serum-free environment J Cell Physiol 112, 197-206
Gilmour R S , Prosser C G , Fleet I R , Cocco L , Saunders J C , Brown K D and Corps A N (1988) From animal to molecule aspects of the biology of insulin-like growth factors Br J Cancer 58, Suppl IX, 23-30
Glassy C M , Tharakan J P and Chau P C (1988) Serum-free media in hybndoma culture and monoclonal antibody production Biotech and Bioeng 32, 1015 - 1028
Goldblum S E , Ding X D , Funk S E and Sage E H (1994) SPARC (Secreted protein acidic and rich in cysteine) regulates endothelial cell shape and bamer function Proc Natl Acad Soc USA 91, (8), 3448-3452
Golombick T , Dansey R , Bezwoda W R and Rosendorff J (1990) Establishment and characterization of two new human ovarian cancer cell lines UWOV1 and UWOV2 and a subline UWOV2 (Sf) growing in serum-free conditions growth characteristics, biochemical and cytogenetic studies In Vitro 26, 447- 454
Goodman D S (1957) Preparation of HSA free of long-chain fatty acids Science 125, 1296-1297
Gordon P R , Gelman K L and Gilchrest B A (1988) Demonstration of a choline requirement for optimal keratmocyte growth in a defined culture medium J Nutr U8, 1487-1494
Gospodarowicz D , Hirabayashi K , Giguere L and Tauber J P (1981a) Factors controlling the proliferative rate, final cell density and life span of bovine vascular smooth muscle cells m culture J Cell Biol 89, 568-578
Gospodarowicz D , Vlodavshy I , Greenburg G and Birdwell G R (1981b) The effect of EGF and FGF upon cell proliferation and differentiation using vascular and comeal endothelial cells as a model In Waymouth C , Ham R G , Chappie P J (Eds) The growth requirement of vertebrate cells in vitro New York, Cambridge University Press, Chapter 36, 492-542
Gospodarowicz D , Cheng J , Lui G M , Baird A and Bohlent P (1984) Isolation of brain fibroblast growth factor by hepann-sepharose affinity chromatography identity with pituitary fibroblast growth factor Proc Natl Acad Sci USA 81, 6963-6967
Gospodarowicz D and Cheng J (1987) Growth of myoblasts in lipoprotein-supplemented, serum-free medium regulation of proliferation by acidic and basic fibroblast growth factor In Vitro 23, (7), 507- 514
383
Goto M , Akai K , Murakami A , Hashimoto C , Tsuda E , Ueda M , Kawamshi G , Takahashi N , Ishimoto A , Chiba H and Sasaki R (1988) Production of recombinant human erythropoietin in mammalian cells host-cell dependency of the biological activity of the cloned glycoprotein Bio/Technology 6, 67-71
Griffiths J B , Thornton B and McEntee I (1982) The development and use of microcamers and glass sphere culture techniques for the production of Herpes simplex virus Dev Biol Stand 50,103-119
Griffiths B (1986) Can cell culture medium costs be reduced? Strategies and possibilities TibTech October, 268-272
Griffiths B (1990) Animal cells - the breakthrough to a dominant technology Cytotechnology 3, 109- 116
Griffiths B (1992) Scaling-up of animal cell culture Chapter 3 In Animal Cell Culture a practical approach Second edition (Freshney R I Ed), 47-93
Gnnnell F (1978) Cellular adhesiveness and extracellular substrata, in International Review of Cytology, Volume 53 (Bourne G H , Damelli J F and Jean K W eds ), Academic Press, New York,65-144
Guhe C and Follmann W (1994) Growth and characterization of porcine urinary bladder epithelial cells in vitro Am J Physiol 266, (2), F298-F308
GuilbertLJ andlscoveNN (1976) Partial replacement of serum by selemte, transfemn, albumin and lecithin in haemopoietic cell cultures Nature 263, October 14, 594-595
Gurhan S I and Ozdural N (1990) Serial cultivation of suspended BHK 21/13 cells in serum-reduced and serum-free medium supplemented with various membrane protective agents Cytotechnology 3, 89- 93
Guttendge J M C , Paterson S K , Segal A W and Halliwell B (1981) Inhibition of lipid peroxidation by the iron-binding protein lactofemn Biochem J 199, 259-261
Habemcht, A (Ed ) (1990) Growth factors, differentiation factors and cytokines Spnnger-Verlag, Berlin
Hahm H A , Ip M M , Darcy K , Black J D , Shea W K , Forczek S , Yoshimura M Oka T (1990) Primary culture of normal rat mammary epithelial cells within a basement matrix II Functional differentiation under serum-free conditions In Vitro 26, 803-814
Halter S A , Winmer A R and Arteaga C L (1993) Pretreatment with vitamin A inhibits transforming growth factor alpha stimulation of human mammary carcinoma cells J Cell Physiol 156, 80-87
Ham R G (1963) Albumin replacement by fatty acids in clonal growth of mammalian cells Science 140. 802-803
Ham R G (1965) Clonal growth of mammalian cells in a chemically-defined, synthetic medium Proc Natl Acad Sci USA 53, 288-293
Ham R G (1981) In Tissue Growth Factors (eds R Basergu) Handbook of experimentalPharmacology, pl3
Ham R G , St Clair J A , Webster C and Blau H M (1988) Improved media for normal humanmuscle satellite cells serum-free clonal growth and enhanced growth in low serum In Vitro 24, 833-844
384

Hamilton W.G. and Ham R.G. (1977). Clonal growth of Chinese hamster cell lines in protein-free media. In Vitro 13, (9), 537-547.
Hanson R. and Ballard F.J. (1968). Citrate, pyruvate and lactate contaminants of commercial serum albumin. J. Lip. Res. 9, 667-668.
Handin R.I. and Cohen H.J. (1976). Purification and binding properties of human platelet factor IV. J. Biol. Chem. 251, (14), 4273-4282.
Harford J.B., Casey J.L., Koeller D.M. and Klausner R.D. (1990). Structure, function and regulation of the transferrin receptor: insights from molecular biology. In Intracellular Trafficking of proteins (Steer G.J. and Hanover J.A. eds.) Cambridge University Press, 302-324.
Hartmann H., Meyer-Alber A. and Braulke T. (1992). Metabolic actions of insulin-like growth factor II in cultured adult rat hepatocytes are not mediated through insulin-like growth factor II receptor. Diabetologia 35, 216-223. '
Harvey M.B. and Kaye P.L. (1992). Mediation of the actions of insulin and insulin-like growth factor-I on pre-implantation mouse embryos in vitro. Molecular Reproduction and Development 33, 270-275.
Hashizume S., Kuroda K. and Murakami H. (1983). Identification of lactoferrin as an essential growth factor for human lymphocytic cell lines in SFM. Biochem. Biophys. Acta 263, 377-382.
Hatfield D., Lee B.J., Hampton L. and Diamond A.M. (1991). Selenium induces changes in the selenocysteine tRNA[Ser]Sec population in mammalian cells. Nucleic Acid Res. 19, (4), 939-943.
Hayashi I. and Sato G. (1979). Replacement of serum by hormones, permits growth of cells in a defined medium. Nature (London) 259, 132-134.
Heldin C.H., Westermark B. and Wateson A. (1980). Chemical and biological properties of a growth factor from human osteosarcoma cells: resemblance with PDGF. J. Cell. Physiol. 105, 235-246.
Hennig B., Boissonneault G.A. and Wang Y. (1989). Protective effects of vitamin E in age-related endothelial cell injury. Intemat. J. Vit. Nutr. Res. 59, 273-279.
Hewitt A.T., Varner H.H., Silver M.H., Dessau W., Wilkes C.M. and Martin G.R. (1982). The isolation and partial characterization of chondronectin, an attachment factor for chrondrocytes. J. Biol. Chem. 252, 2330-2334.
Hewlett, G., DuvinskiM.S. and Montalto J.G. (1989). PENTEX EX-CYTE growth enhancement media supplement as a lipoprotein additive for mammalian cell culture. Miles Science J. (Elkhart, IN) H (1),9- 14.
Hewlett G. (1991). Strategies for optimizing serum-free media. Cytotechnology 5, 3-14.
Hink W.F. (1991). A serum-free medium for the culture of insect cells and production of recombinant proteins. In Vitro 27A. 397-401.
Hirayama M., Kohgo Y., Kondo H., Shintani N ., Fujikawa K., Sasaki K., Kato J. and Niitsu Y. (1993). Regulation of iron metabolism in HepG2 cells: a possible role for cytokines in the hepatic deposition of iron. Hepatology 18, (4), 874-880.
Hirling H., Henderson B.R. and Kuhn L.C. (1994). Mutational analysis of the [4Fe-4S]-cluster converting iron regulatory factor from its RNA-binding form to cytoplasmic aconitase. EMBO Journal 13, (2), 453-461.
385
Hodgson J (1990) BSE scares up a host of sourcing worries Bio/technology 8,990
Hodgson L L , Quail E A and Morgan E H (1994) Receptor-independent uptake of transfemn-bound iron by reticulocytes Archives Biochem Biophys 308, (1), 318-326
Hoffmann C , Goldfines I D and Whittaker J (1989) The metabolic and mitogemc effects of both insulin and insulin-like growth factor are enhanced by transfection of insulin receptors into NIH3T3 fibroblasts J Biol Chem 264. (15), 8606-8611
Holinka C , Anzui Y , Hata H , Kimmel N , Kuramoto H and Gurpide E (1989) Proliferation and responsiveness to estrogen of human endometrial cancer cells under serum-free culture conditions Cancer Res 49, 3297-3301
Hosoi S , Miyaji H , Satoh M , Kunmoto T , Mihara A , Fujiyoshi N , Itoh S and Sato S (1991) Optimization of cell culture conditions for production of biologically active proteins Cytotechnology 5, S17-34
Hsu T C and Kellogg D S (1960) Primary cultivation and continuous propagation in vitro of tissues from small biopsy specimens J N C I 25, 221-231
Humbel R (1990) IGFs I and II Eur J Biochem 190, 445-462
Huff K K, Kaufman D , Gabbay K H , Spencer E M , Lippman M E and Dickson R B (1986)Secretion of an IGF-I-related protein by human breast cancer cells Cancer Res 46, 4613-4619
Hugenschmidt S , Planasbohne F and Taylor D M (1993) On the toxicity of low doses of tetrasodium- ethylenediamine-tetraacetate(Na-EDTA) in normal rat kidney (NRK) cells in culture Archives Toxicol 67, (1), 76-78
Hutchings S and Sato G (1978) Growth and maintenance of HeLa cells in serum-free mediumsupplemented with hormones Pro Natl Acad Sci USA 75, (2), 901-904
Hynes R (1987) Integnns a family of cell surface receptors Cell 57, 59-69
Iguchi T , Uchuna FD A and Bern H A (1987) Growth of mouse vaginal epithelial cells in culture effect of sera and supplemented SFM In Vitro 23, (8), 535-540
111 C , Brehm T , Lydersen B , Hernandez R and Burnett K (1988) Species specificity of iron delivery in hybndomas In Vitro 24, (5), 412-419
Inman R S and Wessling-Resmck M (1993) Characterization of transfemn-independent iron transport in K562 cells J Biol Chem 268, (12), 8521-8528
Iscove N N (1984) Culture of lymphocytes and hemopoietic cells in serum-free medium In Barnes D W , Sirbasku D A and Sato G H (eds ), Methods for serum-free culture of neuronal and lymphoid cells Liss, New York, 169-185
Iscove N and Melchers F (1978) Complete replacement of serum by albumin, transferrin and soybean lipid m cultures of lipopolysacchande reactive B lymphocytes J Exp Med 147, 923-933
Ito F , Takii Y , Suzuki J and Masamune Y (1982) Reversible inhibition by human serum lipoprotein of cell proliferation J Cell Physiol 113, 1-3
Jager V , Lehmann J and Fnedl P (1988) Serum-ffee growth medium for the cultivation of a wide spectrum of mammalian cells in stirred bioreactors Cytotechnology 1, 319-329
386

Jalink K , van Corvan E J and Moolenaar W H (1990) Lysophosphatidic acid but not phosphatidic acid, is a potent Ca2+-mobilizing stimulus for fibroblasts J Biol Chem 265, 12232-12239
Janatova J (1974) On the heterogeneity of serum albumin J Med 5, 149-216
Jayme D W (1991) Nutrient optimization for high-density biological production applications Cytotechnology 5, 15-30
Jassal D , Han R , Camggia I , Post M and Tanswell A (1991) Growth of distal fetal rat lung epithelial cells in a defined serum-free medium In Vitro 27a, 625-632
Jefferson D M , Yang C-P H , Cobb M H and Scott W N (1985) A comparison of protein synthetic patterns of MDCK cells grown in serum and hormonally-defined serum-free medium J Cell Physiol 123. 126-131
Jetten A M and Goldfarb R H (1983) Action of epidermal growth factor and retinoids on anchorage- dependent and -independent growth of nontransformed rat kidney cells Cancer Res 43, 2094-2099
Jhun B H , Memkoth J L , Leitner J W , Drazmn B and Olefsky J M (1994) Insulin and insulm-hke growth factor-I signal transduction requires p21rat J Biol Chem 269, (8), 5699-5704
Jmg N , Shmrba R , Kitam H , Kawakatsu H , Tomooka Y and Sakakura T (1991) Secretion of polypeptides related to EGF and IGF-I by a human teratocarcinoma cell line In Vitro 27a, 864-872
Johnson E W , Meumer S F , Roy C J and Parenteau N L (1992) Senal cultivation of normal human keratinocytes a defined system for studying the regulation of growth and differentiation In Vitro 28a. 429-435
Jonas H A and Hamson L C (1985) The human placenta contains two distinct binding and immunoreactive species of insulin-like growth factor-I receptors J Biol Chem 260, (4), 2288-2294
Jozan S , Roche H , Cheutin F , Carton M and Salles B (1992) New human ovanan cell line OVCCRl/sf in serum-free medium In Vitro 28a, 687-689
Kaighn M E , Camalier R F , Bertolero F and Saffiotti U (1988) Spontaneous establishment and characterization of mouse keratinocyte cell lines in serum-free medium In Vitro 24, (8), 845-854
KanM andYamanel (1982) In vitro proliferation and lifespan of human diploid fibroblasts in serum- free BSA-contaimng medium J Cell Physiol 111, 155-162
Kane M (1990) Control of growth in pre-implantation embryos I J M S January, 17-21
Kang C Y , Bishop D H L , Seo J-S , Matsuura Y and Choe M (1987) Secretion of particles of hepatitis B surface antigen from insect cells using a baculovirus vector J Gen Virol 68, 2607-2613
Kaplan J , Jordan I and Sturrock A (1991) Regulation of the transfemn-independent iron transport system in cultured cells J Biol Chem 266, (5), 2997-3004
Kaplan LJ and Foster JF (1971) Isoelectric focusing behaviour of bovine plasma albumin, mercaptalbumin, and B-lactoglobumins A and B Biochemistry 10, (4), 630-636
Kaufman R J , Wasley L C , Spiliotes A J , Gossels S D , Latt S A , Larsen G A and Kay R M (1983) Coamplification and coexpression of human tissue-type plasminogen activator and munne dihydrofolate reductase sequences in Chinese hamster ovary cells Mol Cell Biol 5, 1750-1759
387
Kawamoto T , Sato J D , Le A , McClure D B and Sato G H (1983a) Development of a serum-free medium for growth of NS-1 mouse myeloma cells and its application to the isolation of NS-1 hybndomas Anal Biochem 130, 445-453
Kawamoto T , Sato J D , Le A , Polikoff J , Sato G H and Mendelsohn J (1983b) Growth stimulation of A431 cells by epidermal growth factor identification of high-affimty receptors for epidermal growth factor by an anti-receptor monoclonal antibody Proc Natl Acad Sci USA 80, 1337-1341
Kessler N , Bertrand S , Thomas G and Aymard M (1994) Serum-free UltraCULTURE™ medium an alternative to the unstability generated by long-term cultivation of mouse hybndomas In Animal Cell Technology products of today, prospects for tomorrow (Eds Spier R E , Gnffiths J B and Berthold W) 127-129
Kidwell W R , Salomon D S , Liotta L A , Zweibel J A and Bano M (1982) Effects of growth factors on mammary epithelial cell proliferation and basement membrane synthesis In Growth of cells in hormonally-defined media (Sato G H , Pardee A B and Sirbasku D A eds) Cold Spnng Harbour Laboratory, Cold Spnng Harbour New York, pp 807-818
Kidwell W R , Salomon D S , Liotta L A et al (1984) The growth of normal mammary epithelium on collagen in serum-free medium In Cell culture methods for molecular and cell biology(D Barnes, D Sirbasku and G Sato Eds ) A R Liss Inc , NY pp 807-818
Kirk D , Kagawa S , Vener G , Narayan K S , Ohnuki Y and Jones L W (1985) Selective growth of normal adult human urothelial cells in serum-free medium In Vitro 21, (3), part 1, 165-171
Kisiel W and Davie E W (1975) Isolation and characterization of Bovine Factor VII Biochemistry 14, (22), 4928-4934
Kitano K , Ichimon Y , Sawada H , Iwasa S , Sasai S and Tsukamoto K (1991) Effective production of anti-tetanus toxoid and anti-HBsAg human monoclonal antibodies by serum-free culture of hybndomas Cytotechnology 5, S53-74
Kitano K (1994) Improvement of cell lines for large-scale mammalian cell cultunng In Animal Cell Technology products of today, prospects for tomonow (Eds Spier R E , Gnffiths J B and Berthold W) 35-42
■- Klausner R , Ashwell G , Renswoude J , Harford J and Bndges K (1983) Binding of apotransfemn to K562 cells explanation of the transfemn cycle Proc Nad Acad Sci USA 80, 2263- 2266
Klausner R D , Rouault T A , Harford J B (1993) Regulating the fate of mRNA the control of cellular iron metabolism Cell 72. 19-28
Kobayashi T , Hashimoto K and Yoshikawa K (1993) Growth inhibition of human keratinocytes by 1,25-dihydroxyvitamm D3 is linked to dephosphorylation of retinoblastoma gene product Biochem Biophys Res Comm 196, (1), 487-493
KoherN andLiptonA (1974) Platelet as a source of fibroblast growth promoting activity Exp Cell Res 87,297-301
Kovar J and Franek F (1984) Serum-free medium for hybndoma and parental myeloma cell growth cultivation a novel composition of growth supporting substances Immunol Lett 7, 339-345
Kovar J and Franek F (1987) Iron compounds at high concentrations enable hybndoma growth in a protein-free medium Biotechnol Lett 9, (4), 259-264
388
Kovar J (1989) Various cell lines grow m protein-free hybndoma medium In Vitro 25 (2), May, 395- 396
Kovar J (1990) Insoluble iron compound is able to stimulate growth of cultured cells In Vitro 26, (11), 1026-1027
Kragh-Hansen U (1981) Molecular Aspects of ligand binding to serum albumin Pharmacological Reviews 33, (1), 17-53
Knegerbeckova K , Kovar J and Neumannova V (1993) Production of transferrin in human cell lines in a defined protein-free system detection by ELISA Immunol Cell Biol 21» (4), 303-309
Kuneko H and Goshina A (1982) Selective killing of fibroblast-like cells in culture of mouse heart cells by treatment with Ca2+Ionophore, A23187 Exp Cell Res 142. 407-416
Kurano S , Kurano N , Leist C and Fiechter A (1990) Utilization and stability of vitamins in serum- contaimng and serum-free media m CHO cell culture Cytotechnology 4, 243-250
Laemmli E and Favre M (1973) Mutation of the head of Bacteriophage T4 J Mol Biol 80, 575- 599
Lambert K J and Birch J R (1985) In Spier R E and Griffiths J B (Eds ), Animal Cell Biotechnology, Vol 1, Academic Press, London, 86-122
Lammers R , Gray A , Schlessinger J andUllnchA (1989) Differential signalling potential of insulin and IGF-I receptor cytoplasmic domains EMBO J 8, (5), 1369-1375
Landschulz W , Thesleff I and Ekblom P (1984) A lipophilic iron chelator can replace transferrin as a stimulator of cell proliferation and differentiation J Cell Biol 98, 596-601
Larsson B and Litwm J (1987) The growth of Polio virus in human diploid fibroblasts grown with cellulose microcamers in suspension Dev Biol Standard 66, 385-390
Laskey J , Webb I , Schulman H and Ponka P (1988) Evidence that transferrin supports cell proliferation by supplying iron for DNA synthesis Exp Cell Res J76, 87-95
Leckett B , Spurmams A , Allen C and Germinano R J (1993) Mutant Cell line demonstrating a block in insulin and msulm-like growth factor type 1 (IGF-I) induced mitogenesis J Cell Physiol 155. 179- 184
Lee E Y H , Barcellos-Hoff M H , Chen L-H , Parry G and Bisseil M J (1987) Transferrin is a major mouse milk protein and is synthesized by mammary epithelial cells In Vitro 23, (3), 221-226
Lee G M andPalssonBO (1993) Stability of antibody productivity is improved when hybndoma cells are entrapped in calcium alginate beads Biotech Bioeng 42,1131-1135
Leiderman L J , Tucker J A and Dennis V W (1989) Characterization of proliferation and differentiation of opossum kidney cells in serum-free defined medium In Vitro 25, (10), 881-886
Li Q , Blacher R , Esch F and Congote L F (1990) Isolation from fetal bovine serum of an apolipoprotein-H-like protein which inhibits thymidine incorporation in fetal calf erythroid cells Biochem J 267, 261-264
Li X S , Chen J C , Sheikh M S , Shao Z M and Fontana J A (1994) Retinoic acid inhibition of insulin-like growth factor I stimulation of c-fos mRNA levels in a breast carcinoma cell line Exp Cell Res 211, (1), 68-73)
389
Li J L , Li Y J , Chao S , Ouyang M H and Peng Y B (1993) Serum-free medium for long-term growth, freezing, clomng and fusion of myelomas and hybndomas In Vitro 29a, 87-88
Lin C Q and Bissell MJ (1993) Mutli-faceted regulation of cell differentiation by extracellular matrix FASEB Journal 7, (9), 737-743
Liotha, Nageswara RC and Wewer U M (1986) Biochemical interactions of tumour cells with the basement membrane Ann Rev Biochem 55, 1037-57
Liu J J , Chen B S , Tsai T F , Wu Y J , Pang V F , Hsieh A , Hsieh J H and Chang T H (1991) Long-term and large-scale cultivation of human hepatoma Hep G2 cells m hollow fiber bioreactor Cytotechnology 5, 129-139
Liu S Q , Ito Y and Imamshi Y (1993) Cell growth on immobilized growth factor 7 Protein-free cell culture by using growth-factor-immobilized polymer membrane Enzyme Microb Technol .15, 167- 172
Loo D , Rawson C , Schmitt M , Lindburg K and Barnes D (1990) Glucocorticoid and thyroid hormones inhibit proliferation of SF mouse embryo cells J Cell Physiol 142. 210-217
Luan Y T , Mutharasan R and Magee W E (1987a) Effect of various glucose/glutamine ratios on hybndoma growth, viability and monoclonal antibody formation Biotech Lett 9, 535-538
Luan Y T , Mutharasan R and Magee W E (1987b) Strategies to extend longevity of hybndomas in culture and promote yield of monoclonal antibodies Biotech Lett 9, (10), 691-696
Lum J B , Infante A J , Makker D M , Yang F and Bowman B H (1986) Transfemn synthesis by inducer T lymphocytes J Clin Invest 77, 841-849
Lund P K , Moats-Staats B , Hynes M , Simmons J , Jansen M , D’Ercole A and Van Wyk J (1986) Somatomedin-C/IGF-I and IGF-II mRNAs in rat fetal and adult tissues J Biol Chem 261, (31), 14539-14544
Maciag T (1981) An endocnne approach to the control of epidermal growth serum-free cultivation of human keratinocytes Science 211, 27 March, 1452-1454
Maclndoe J H , and Eitre L A (1980) Androgens inhibit oestrogen action in MCF-7 human breast cancer cells Life Sci 27, 1643-1648
Maeda S , Kawai T , Obinata M , Fujiwara H , Honuchi T , Saeki Y , Sato Y and Furusawa M (1985) Production of human a-interferon m silkworm using a baculovirus vector system Nature 315. 592-594
Maegawa H , McClain D A , Freidenberg G , Olefsky J M , Napier M , Lipan T , Dull T J , Lee J and Ullnch A (1988) Properties of a human insulin receptor with a COOH-terminal truncation J Biol Chem 263, (18), 8912-8917
MaGoffin D A and Enckson G F (1988) An improved method for primary culture of ovanan androgen-producing cells in serum-free medium effects of lipoproteins, insulin and IGF-I In Vitro 24, (9), 862-870
Maiorella B , Inlow D , Shauger A and Harano D (1988) Large-scale insect cell-culture for recombinant protein production Bio/technology 6, 1406-1410
Malan-Shibley L and Iype P T (1983) A serum-free medium for clonal growth and serial subcultivation of diploid rat liver epithelial cells In Vitro 19, (10), 749-758
390

Mamounas M , Gervm D and Englesberg E (1989) The insulin receptor as a transmitter of a mitogemc signal in Chinese hamster ovary CHOK1 cells Proc Natl Acad Sci USA 86, 9294-9298
Maroudas N G (1975) Adhesion and spreading of cells on charged surfaces J Theor Biol 49, 417- 424
Marquis C P , Kow K S , Barford J P and Harbour C (1989) Agitation and aeration effects in suspension mammalian cell cultures Cytotechnology 2, 163-170
Marrow J S , Wemtraub B C and Rosen S W (1981) Ectopic production in serum-free media of the common alpha subumt of the glycoprotein hormones In Vitro 17, (5), 421-425
Martin A and Clynes M (1991) Acid phosphatase endpoint for in vitro toxicity tests In Vitro 27A. 183-184
Martin A J (1992) Cytotoxicity testing in vitro Investigation of 5 miniaturized colonmetnc assays Ph D Dublin City Umversity Section 4 1 5, 221-222
Massague J (1985) Transforming growth factor-B modulates the high-affimty receptors for epidermal growth factor and transforming growth factor-B J Cell Biol 100, 1508-1514
Masson E A , Atkin S L and white M C (1993) D-valine selective medium does not inhibit human fibroblast growth in vitro In Vitro 29a, 912-913
Mather J P and Sato G H (1979) The use of hormone-supplemented serum-free medium in primary cultures Exp Cell Res 124. 215-221
Mather JP (1984) Mammalian cell culture the use of serum-free supplemented media Plenum Press, New York
Matsuda H , Matsumoto M , Haraguchi S and Kanai K (1989) Partial purification of a growth factor synthesised by rat hepatoma cell line established in SFM Cancer Res 49, 2118-2122
Matsuura Y , Possee R D and Bishop D H L (1987) Expression of the s-coded genes of lymphocytic choriomeningitis adenovirus using a baculovirus vector J Gen Vir 67, 1515-1529
MatsuyaY andYamanel (1986) Population-dependent requirements of vitamin B12 and metabolically related substances of several mouse cell types in serum-free, albumin fortified medium Cell Struct Funct H , 9-19
McClain D A , Maegawa H , Thies R S and Olefsky J M (1990) Dissection of the growth versus metabolic effects of insulin and insulin-like growth factor-I in transfected cells expressing kinase-defective human insulin receptors J Biol Chem 265. (3). 1678-1682
McKeehan W and Ham R (1976) Stimulation of clonal growth of normal fibroblasts with substrata coated with basic polymers J Cell Biol 71, 727-734
McKeehan W , Adams P and Rosser M (1982) Modified nutrient medium MCDB 151, defined growth factors, cholera toxin, pituitary factors, and horse serum support epithelial cell and suppress fibroblast proliferation in primary cultures of rat ventral prostate cells In Vitro 18, (2), Feb 87-91
McKeehan W , Barnes D , Reid L , Stanbndge E , Murakami H and Sato G H (1990) Frontiers in mammalian cell culture In Vitro 26, 9-23
McKieman S and Bavister B (1992) Different lots of bovine serum albumin inhibit or stimulate in vitro development of hamster embryos In Vitro 28a, (3), 154-156
391
McMoms F A , Smith T , DeSalvo S and Furlanetto R (1986) IGF-I/Somatomedin C a potential inducer of oligodendrocyte development Proc Natl Acad Sci USA 85, 822-826
Medema R H , de Vnes-Smits A , van der Zon G , Maassen J A and Bos J (1993) Ras activation byinsulin and epidermal growth factor through enhanced exchange of guanine nucleotide on p21ras Mol Cell Biol Jan, 155-162
Megham M A , Martin D M , Singleton J R and Feldman E L (1993) Effects of serum and lnsulm- like growth factors on human neuroblastoma cell growth Regulatory Peptides 48, (1-2), 217-224
Melsert R , Hoogerbrugge J W and Rommerts F F G (1989) Albumin, a biologically active protein acting on Leydig cells Mol Cell Endocrinol 64, 35-44
Mendiaz E , Mamounas M Moffett J and Englesberg E (1986) A defined medium for the effect ofinsulin on the growth, amino acid transport and morphology of Chinese hamster ovary cells, CHOK1 (CCI 61) and the isolation of insulin ’independent’ mutants In Vitro, 22, (2), 66-74
Metcalfe H , Field R P and Froud S J (1994) The use of 2-hydroxy-2,4,5-cyclohepatnn-l-one (Tropolone) as a replacement for transferrin In Animal cell technology products of today Prospects for tomorrow (Eds Spier R E , Griffiths J B and Berthold W ) 88-90
Michel M L , Sobczak E , Malpiece Y , Tiollais P and Streeck R E (1985) Expression of amplified hepatitus B virus surface antigen genes in Chinese hamster ovary cells Bio/technology 3, (6), 561-566
Mignot G , Faure T , Ganne V , Arbeille B , Paviram A and Romet-Lemonne J L (1990) Production of recombinant Von Willebrand factor by CHO cells cultured in macroporous microcamers Cy totechnology 4, 163-171
Mmamoto Y and Mitsugi K (1984) Growth Differ cell defined environ Proc Int Symp (Ed Murakami H ) Kodansha, Toyko 1985, 127
Minamoto Y , Ogawa K , Abe H , Iochi Y and Mitsugi K (1991) Development of a serum-free and heat-stenlizable medium and continuous high-density cell culture Cytotechnology 5, s35-51
Mitaka T , Sattler G L and Pitot H C (1991) Amino acid-nch medium (Leibovitz L-15) enhances and prolongs proliferation of primary cultured rat hepatocytes in the absence of serum J Cell Physiol 147, 495-504
Mitaka T , Nonoka K and Mochizuki Y (1993) Redifferentiation of proliferated rat hepatocytes cultured in L-15 medium supplemented with EGF and DMSO In Vitro 29a, 714-722
Mitram-Rosenbaum, S , Maroteaux L , Mory Y , Revel M and Howley P M (1983) Inducible expression of the human interferon fi 1 gene lined to a bovine papilloma virus DNA vector and maintained extracellularly m mouse cells Mol Cell Biol 3, 233-240
Miyaji H , Mizukami T , Hosoi S , Sato S , Fujiyoshi N and Itoh S (1990a) Expression of human beta-interferon in Namalwa KJM-1 which was adapted to serum-free medium Cytotechnology 3, 133- MO
Miyaji H , Harada N , Mizukami T , Sato S , Fujiyoshi N and Itoh S (1990b) Efficient expression of human beta-interferon in Namalwa KJM-1 cells adapted to serum-free medium by a dhff gene co- amplification method Cytotechnology 4, 173-180
Miyaji H , Harada N , Mizukami T , Sato S , Fujiyoshi N and Itoh S (1990c) Expression of human lymphotoxin in Namalwa KJM-1 cells adapted to serum-free medium Cytotechnology 4, 39-43
392
Miyazaki K., Masui H. and Sato G. (1984). Growth and differentiation of human bronchogenic carcinoma cells in serum-free medium. In: Cell culture methods for molecular and cell biology (Barnes D.W., Sirbasku D.A. and Sato G.H. eds), chapter 3, 83-94. Alan R. Liss, Inc., New York.
Miyazaki K. and Horio T. (1989). Growth inhibitors: molecular diversity and roles in cell proliferation. In Vitro 25, (10), 866-872.
Miyazaki M., Bai L. and Namba M. (1991). Extending effect of phospholipids, cholesterol, and ethanolamines on survival of adult rat hepatocytes in serum-free primary culture. Res. Exp. Med. 191. 77-83.
Moellering B.J., Tedesco J.L., Townsend R.R., Hardy M.R., Scott R.W. and Prior C.P. (1990). Electrophoretic differences in a monoclonal antibody expressed in three media. BioPharm. Feb., 30-38.
Monette F.C., Hartwell R., Wu D. and Sigounas G. (1990). Erythroid stem cell culture in serum- depleted medium. J. Tissue Culture Methods 13, (2), 69-75.
Moolenaar W.H., Kruijer W., B.C. Tilly, Verlaan I., Bierman A.J. and de Laat S.W. (1986). Growth factor-like action of phosphatidic acid. Nature 323, 171-173.
Morita H., Yasumitsu H., Watanabe Y., Miyazaki K. and Umeda M. (1993). Characterization of cell- adhesive proteins secreted by cell lines in protein-free and lipid-free synthetic medium - Mouse L.P3 Cells secrete a procollagen molecule with potent cell-attachment activity. Cell Structure and Function 18, (1), 61-72.
Morley C.G.D. and Bezkorovainy A. (1985). Cellular iron uptake from transferrin: is endocytosis the only mechanism. Int. J. Biochem. 17, 553-564.
Morrison R.S and DeVellis J. (1981). Growth of purified astrocytes in a chemically-defined medium. Proc. Natl. Acad. Soc. USA 78, (11), 7205-7209.
Morrow J.S., Weintraub B.C. and Rosen S.W. (1981). Ectopic production in serum-free media of the common alpha subunit of the glycoprotein hormones. In Vitro 17, (5), 421-425.
Moss A.M. and Livingston J.N. (1993). Distinct fl-subunits are present in hybrid insulin-like growth factor-I receptors in the central nervous system. Biochem. Journal 294, (3), 685-692.
Moxham C.P., Duronia V. and Jacobs S. (1989). Insulin-like growth factor I receptor B-subunit heterogeneity: evidence for hybrid tetramers composed of insulin-like growth factor I and insulin receptor heterodimers. J. Biol. Chem. 264, (22), 13238-13244.
Murakami H., Masui H., Sato G.H., Sueoka N., Chow T.P. and Kano-Sueoka T. (1982) Growth of hybridoma cells in serum-free medium: ethanolamine is an essential component. Proc. Natl. Acad. Sci. USA 79, 1158-1162.
Murakami H., Yamada K., Shirahata S., Enomoto A. and Kaminogawa S. (1991). Physiological enhancement of immunoglobulin production of hybridomas in serum-free media. Cytotechnology 5, 83- 94.
Murayama Y., Okamoto T., Ogata E., Asano T., Iiri T., Katada T., Ui M., Grubb J.H., Sly W.S. and Nishimoto I. (1990). Distinctive regulation of the functional linkage between the human cation- independent mannose-6-phosphate (M6P) receptor and GTP-binding proteins by insulin-like growth factor II and mannose-6-phosphate. J. Biol. Chem. 265, (29), 17456-17462.
Murhammer D.W. and Goochee C.F. (1988). Scale-up of insect cell cultures: protective effects of Pluronic F-68. Bio/technology 6, 1411-1415.
393
Murphy E (1986) Investigation of substitutes for foetal calf serum m animal cell culture media M Sc Dublin City Umversity Section 3 2, 41
Mydlo J H , Zajac J and Macchia R J (1993) Conditioned media from a renal cell carcinoma cell line demonstrates the presence of basic fibroblastic growth factor J Urol 150. (3). 997-1001
Nagao Y and Nishikawa K (1989) B-FGF, albumin and transferrin purified from rat Rhodamine fibrosarcoma tissue are all essential for growth of primary tumour cells from the same tissue in serum- free medium In Vitro 25, (10), 873-880
NagarajanL and Anderson W B (1982) Insulin promotes the growth of F9 embryonal carcinoma cells apparently by acting through its own receptor Biochem Biophys Res Comm 106. (3). 974-980
Nagano N , Aoyagi M and Hirakawa K (1993) Extracellular matrix modulates the proliferation of rat astrocytes in serum-free medium Glia 8, (2), 71-76
Najar H M , Bru-Capdeville A , Gieseler R and Peters J (1990) Differentiation of human monocytes into accessory cells at serum-free conditions Eur J Cell Biol 51, 339-346
Najjar S M , Accili D , Phillippe N , Jemberg J , Margolis R and Taylor S I (1993) ppl20/Ecto- ATPase, an endogenous substrate of the insulin receptor tyrosine kinase, is expressed as two variable spliced isoforms J Biol Chem 268, (2), 1201-1206
Neely E K , Morhenn V B , Hintz R L , Wilson D M and Rosenfeld R G (1991) Insulin-like growth factors are mitogemc for human keratinocytes and a squamous cell carcinoma J Invest Dermatol 96, (1), 104-110
Newman M J , Lane E A , Nugent M A and Racker E (1986) Induction of anchorage-independent growth by EGF and altered sensitivity to type B TGF in partially transformed rat kidney cells Cancer Res 46, 5842-5850
NilausenK (1968) Growth promoting effect of lysolecithin on Chinese hamster cells in vitro Nature 217. 268-269
Nilausen K (1978) Role of fatty acids in growth-promoting effect of serum albumin on hamster cells in vitro J Cell Physiol 96, 1-14
Nishizawa Y , Sato R , Nishn K , Kishimoto S and Matsumoto K (1989) Effect of androgen on proliferation of estrogen responsive tranformed mouse Leydig cells in serum-free culture Cancer Res 49, 1377-1382
Nishikawa T , Matsubara T andMaedaS (1993) Production of basic fibroblast growth factor (B-FGF) by human osteosarcoma cell lines autocnne-like regulation of their growth and chemotaxis by B-FGF Cancer Journal 6, (3), 130-135
Noguchi S , Nishizawa Y , Uchida N , Yamaguchi K , Sato B , Kitamura Y and Matsumoto K (1985) Stimulative effect of physiological doses of androgens and pharmacological doses of estrogen on growth of Shiongi carcinoma 115 in mice Cancer Res 45, 5746-5750
Norkm S A , Czemobilsky B , Griffith E and Dubin I N (1965) Effect of albumin and fatty acids on cellular growth in vitro Arch Path 80, 273-277
Nugent M A , Lane E A , Keski-Oja J , Moses H L and Newman M J (1989) Growth stimulation, altered regulation of epidermal growth factor receptors, and autocrine transformation of spontaneously transformed normal rat kidney cells by transforming growth factor B Cancer Res 49, 3884-3890
394

Nugent M A and Newman M J (1989) Inhibition of normal rat kidney cell growth by transforming growth factor-6 is mediated by collagen J Biol Chem 264. (30), 18060-18067
Oakley B R , Kirsch D R and Moms N R (1980) A simplified ultrasensitive stain for detecting proteins in polyacrylamide gels Anal Biochem 105. 361-363
OcclestonNL and Walker C (1993) Production of multiple growth factors by a human non-small cell lung cancer cell line Cancer Lett 21. 1-3
Oda D and Watson E (1990) Human oral epithelial cell culture 1 Improved growth conditions for reproducible culture in serum-free medium In Vitro 26, 589-595
Ogasawara M , Karey K P , Marquardt H and Sirbasku D A (1989) Identification and purification of truncated insulin-like growth factor I from porcine uterus evidence for high biological potency Biochemisty, 28, 2710-2721
Ogato M , Wakita K , Kimura K , Marumoto Y , Oh-i K and Shimizu S (1993) High-level expression of recombinant human soluble thrombomodulin in serum-free medium by CHO-K1 cells App Microbiol Biotechnol 38, 520-525
Oh S K W , Vig P , Chua F , Teo W K and Miranda G S Y (1994) Overproduction of monoclonal antibodies in high salt medium in the presence of butryate In Animal cell technology products of today, prospects for tomorrow (Eds Spier R E , Griffiths J B and Berthold W ) 460-464
Ohmon H (1988) Development of a serum-free medium for in vitro immune responses by using B- cyclodextnn J Immunol Method 112. 227-233
Ohmura E , Okada M , Onoda N , Kamiya Y , Murakami H , Tsushima T and Shizume K (1990) Insulin-like growth factor I and transforming growth factor-a as autocrine growth factors m human pancreatic cancer cell growth Cancer Res 50, 103-107
Okasaki R , Riggs B L and Conover C A (1994) Glucocorticoid regulation of insulin-like growth factor-binding protein expression m normal human osteoblast-like cells Endocrinology 134, (1), 126- 132
Olsen R , Santone K , Melder D , Oakes S G , Abraham R and Powis G (1988) An increase in intracellular free Ca2+ associated with serum-free growth stimulation of Swiss 3T3 fibroblasts by epidermal growth factor m the presence of brandykimn J Biol Chem 263, (34), 18030-18035
Ong J , Yamashita S and Melmed S (1987) Insulin-like growth factor I induces c-fos messenger ribonucleic acid in L6 rat skeletal muscle cells Endocrinology 120, 353-357
Oonk R B , Jansen R and Grootegoed J A (1989) Differential effects of follicle-stimulating hormone, insulin and insulin-like growth factor I on hexose uptake and lactate production by rat Sertoli cells J Cell Physiol 139, 210-218
Orly J , Sato G H and Enckson G F (1980) Serum suppresses the expression of hormonally-induced functions in cultured granulosa cells Cell 20, 817-827
Oshiro S , Nakajima H , Markello T , Krasnewich D , Bemardim I and Galh W A (1993) Redox, transfemn-independent, and receptor-mediated endocytosis iron uptake systems m cultured human fibroblasts J Biol Chem 268, (29), 21586-21591
Ozturk S S and Polsson B O (1990) Loss of antibody productivity during long-term cultivation of a hybndoma cell line in low serum and serum-free medium Hybndoma 9, 167-175
395
Pakkanen R , Kanttmen A , Santama L and Aalto J (1992) Bovine colostrum fraction as a serum substitute for the cultivation of mouse hybndomas Appl Microbiol Biotechnol 37,451-456
Palm S and Furcht L (1982) The interaction of schwannoma cell line with lamimn and fibronectin in vitro J Cell Biol 95, 133
Pande G andKhurA (1988) Differential expression of fibronectin in a rat histiocytoma possible role of fibronectin in tumour cell adhesion Exp Cell Res 174, 41-48
Pandiella A , Malgaroli A Meldolesi J and Vicentmi L M (1987) EGF raises cytosolic Ca2+ in A431 and Swiss 3T3 cells by dual mechanism Exp Cell Res 170. 175-185
Pandiella A , Beguinot L , Velu T J and Meldolesi J (1988) Transmembrane signalling at epidermal growth factor receptors over-expressed in NIH 3T3 cells Biochem J 254. 223-228
Papoutsakis E T (1991) Media additives for protecting freely suspended animal cells against agitation and aeration damage TibTech 9,316-324
Paterson T , Innes J and MooreS (1994) Approaches to maximizing stable expression of alpha-1-antitrypsin m transformed CHO cells Appl Microb Biotech 40, (5), 691-698
Paulsson Y , Hammacher A , Heldin C H and Werstermark B (1987) Possible positive autocrine feedback in the pre-replicative phase of human fibroblasts Nature 32, 715-717
Pavlakis G N and Hamer D (1983) Regulation of metallothionein-growth hormone hybrid gene in bovine papilloma virus Proc Nad Acad Sci USA 80, 397-401
Peehl D and Ham R (1979) Clonal growth of human keratinocytes with small amounts of dialysed serum In Vitro 26, 526-540
Peehl D M and Stamey T S (1986) Serum-free growth of adult human prostatic epithelial cells In Vitro 22, (2), 82-90
Perez-Infante V and Mather J P (1982) The role of transferrin in the growth of testicular cell lines in serum-free medium Exp Cell Res 142, 325-332
Peters T (1970) In (Bodansky O and Steward C P Eds) Adv Clin Chem J_3, 37-111 Academic Press
Peters T (1985) Serum Albumin Advances in protein chemistry 37,161-245
PhillpotsRJ (1989) Bovine spongiform encephalopathy a hazard to cell culture and biologically based medicines Cytotechnology 2, 161-162
Pillai S , Bikle D , Mancianti M , Cline P and Hincenbergs M (1990) Calcium regulation of growth and differentiation of normal human keratinocytes modulation of differentiation competence by stages of growth and extracellular calcium J Cell Physiol 143, 294-302
Pledger W J , Stiles C D , Antomodes H N , and Scher C D (1978) An ordered sequence of events is required before Balb/c 3T3 cells become committed to DNA synthesis Proc Natl Acad Soc USA 75, 2839-2843
PoletH and Speiker-Polet H (1975) Serum albumin is essential for in vitro growth of activated human lymphocytes J Exp Medicine 142, 949-959
396
Powellbraxton L , Hollmgshead P , Warburton C , Dowd M , Pittsmeek S , Dalton D , Gillett N and Stewart T A (1993) IGF-I is required for normal embryonic growth in mice Genes and Devel 7, (12b), 2609-2617
Praeger F and Cnstofalo V J (1986) The growth of WI-38 cells in a serum-free, growth factor-free, medium with elevated calcium concentrations In Vitro 22, (6), 355-359
Price P J and Gregory E A (1982) Relationship between in vitro growth promotion and biophysical and biochemical properties of the serum supplement In Vitro 18, 576-584
Pytela R , Pierschbacher M D , Ginsberg M H , Plow E F and Ruoslahti E (1986) Platelet membrane glycoprotein IIb/IIIa member of a family of Asp-Gly-Asp specific adhesion receptors Science 231,1559- 1562
Rahenchilla F , Moover C and Wille J (1989) Biosynthesis of proteoglycans by proliferating and differentiating normal human keratinocytes cultured in serum-free medium J Cell Physiol 140, 98- 106
Ramirez W , Hertl W , NowlanE D and BinkowskiN J (1984) Surface treatment and cell attachment In Vitro 20, (10), 802-808
Reddel R , Ke Y , Gerwin B , McMenamin M , Lecher J , Su R , Brash D , Park J B , Rhim J and Hams C (1988) Transformation of human bronchial epithelial cells by infection with SV40 on Adenovirus-12 SV40 hybrid virus or transfection via strontium phosphate co-precipitation with a plasmid containing SV40 early region genes Cancer Res 48, 1904-1909
Reitma P H , Astnn S M , Tread J , Bar-short Z , Hall A , Teitelbaum S L and Kahn A J (1983) Regulation of myc gene expression in HL-60 leukaemia cells by a vitamin D metabolite Nature 306. 492-494
Renner U , Mojto J , Arzt E , Lange M , Stalla J , Muller O A and Stalla G K (1993) Secretion of polypeptide growth factors by human non-functioning pituitary adenoma cells m culture Neuroendocnnology 57, (5), 825-834
Reyne Y , Nougues J and Dulor J P (1989) Differentiation of rabbit adipocyte precursor cells in a serum-free medium In Vitro 25, August, (8), 747-751
Richardson D and Baker E (1992) Two mechanisms of iron uptake from transferrin by melanoma cells J Biol Chem 267, (20), 13972-13979
Richien G V , Anel A and Kleinfeld A M (1993) Interactions of long-chain fatty acids and albumin determination of free fatty acid levels using the fluorescent probe ADIFAB Biochemistry 32,7574-7580
Rikimaru K , Toda H , Tachikawa N , Kamata N and Enomoto S (1990) Growth of the malignant and nonmalignant human squamous cells in a protein-free defined medium In Vitro 26, 849-856
Rizzmo A (1984) Behaviour of transforming growth factors in serum-free medium an improved assay system for transforming growth factors In Vitro 20, (10), 815-822
Rizzino A , Kazakoff P and Nebelsick J (1990) Density-induced down regulation of epidermal growth factor receptors In Vitro 26, 537-542
Robinson C B and Wu R (1991) Culture of conducting airway epithelial cells m serum-free medium J Tiss Cult Meth 13, 95-102
397
Rockwell G A , Sato G H and McLure D B (1980) Growth requirements of SV40 virus transformed Balb/c 3T3 cells in serum-free monolayer culture J Cell Physiol 103. 323-331
Rose D W , Saltiel A R , Majumdar M and Decker SJ (1994) Insulm receptor substrate I is required for insulm-mediated mitogemc signal transduction Proc Natl Acad Sci USA 91, 797-801
Rosenfeld R G , Conover C , Hodges D , Lee P D K , Misra P , Hmtz R and Li C H (1982) Heterogemty of IGF-I affinity for IGF-II Receptor comparison of natural, synthetic and recombinant DNA-denved IGF-I Biochem Biophys Res Comm 143. (1), 199-205
Ross R , Raines E W and Bowen-Pope D F (1986) The biology of platelet-denved growth factorCell 46, 155-169
Rosseneu-Motreff M , Blaton V , Declercq B , Vandemme D and Peeters H (1970) Size and shape determination of native and defatted bovine serum albumin monomers chemical characterization of lipids bound to native and defatted bovine serum monomers J Biochem (Toyko) 68, 369-377
Roth R A , Morgan D O , Beaudoin J and Sara V (1986) Purification and characterization of thehuman brain insulin receptor J Biol Chem 261, (8), 3753-3757
Ruoslahti E and Pierschbacher M (1987) New perspectives in cell adhesion RGDs and integnns Science 238, 491-497
Ruoslahti E (1988) Fibronectin and its receptor Ann Rev Biochem 57, 375-413
RutzkyLP (1981) Peptone growth factors for senal cell proliferation in the absence of serum In ’The growth requirements of vertebrate cells in vitro' (Waymouth C , Ham R G and Chappie P J eds ), 277- 292 Cambridge University Press, London and New York
Saad B , Schawalder H and Maier P (1993) Crude liver membrane fractions as substrate preserve liver-specific functions in long-term, serum-free rat hepatocyte cultures In Vitro 29a, (1), 32-40
Sage H , Johnson C and Bomstein P (1984) Characterization of a novel serum albumin-bmding glycoprotein secreted by endothelial cells in culture J Biol Chem 259. (61. 3993-4007
Saier M H Jr (1984) Hormonally defined, serum-free medium for a proximal tubular kidney epithelial cell line, LLC-PK1 In Barnes D W , Sirbasku D A and Sato G H (eds ) Cell culture methods for molecular and cellular biology, 3, 25-31 Alan R Liss, Inc, New York
Salas-Prato M (1982) Growth of fetal mouse liver cells m hormone-supplemented serum-free medium In Sato G H , Purdee A B , Sirbasku DA(Eds ) Growth of cells in hormonally defined media Cold Spring Harbour, NY Book A, 615-624
Salomon D S , Liotta L A and Kidwell W R (1981) Differential response to growth factor by rat mammary epithelium plated on different collagen substrata in serum-free medium Proc Natl Acad Soc USA 28, 382-386
Sanders E J and Cheung E (1988) Transferrin and iron requirements of embryonic mesoderm cells cultured in hydrated collagen matrices In Vitro 24, (6), 581-587
Sandstrom C E , Miller W M and Papoutsakis E T (1994) Serum-free media for cultures of primitive and mature haematopoietic cells Biotech Bioeng 43, 706-733
Sarubbi D J , Narayanan R , Telang N T and Newman M J (1990) Evaluation of the role of extracellular matrix proteins, polyunsaturated fatty acids and c-myc expression in the inhibition of the serum-free growth of epithelial cells by TGF-B1 In Vitro 26, 1195-1201
398
Sasaki T , Shintani M and Kihara K (1984) Inhibition of growth of mammalian cell cultures by extracts of arginine-utilizing mycoplasmas In Vitro 20, 369-375Sato J , Kawamoto T and Okawto T (1987) Cholesterol requirement of NS-1 mouse myeloma cells for growth in serum-free medium J Exp Med 165, 1761-1766
Sato H , Eby J E and Sirbasku D A (1991) Iron is deleterious to hormone-responsive pituitary cell growth in serum-free defined medium In Vitro 27A. (8), 599-602
Satoh S , Kobayashi J , Mizoguchi J , Nogawa M and Otam M (1991) Serum-free cultivation of anchorage-dependent cells on microcamer effective production of human macrophage colony-stimulating factor Cytotechnology 5, S95-144
Schaffer L , Kjeldsen T , Anderson A S , Wiberg F C , Larsen U D , Cara J F , Mirmira R G , Nakagawa S H and Howard S T (1993) Interactions of a hybnd lnsulin/insulin-like growth factor-I analog with chimeric insulin/type I insulin-like growth factor receptors J Biol Chem 268, (5), 3044- 3047
Schlaeger D E , Klier T and Christensen K (1993) Investigations of the TSH antibody producing mouse hybndoma cell line under serum-free conditions In Animal cell technology products of today, prospects for tomorrow (Eds Spier R E , Griffiths J B and Berthold W ) 130-133
Schmtzer J E , Carley W W and Palade G E (1988) Albumin interacts specifically with a 60-kDa microvascular endothelial glycoprotein Proc Natl Acad Sci USA 85, 6773-6777
Schmtzer J , Sung A , Horvat R and Bravo J (1992) Preferential interaction of albumm-binding proteins, gp30 and gpl8, with conformationally modified albumins J Biol Chem 267, (34), 24544- 24553
Schmtzer J and Bravo J (1993) High affinity binding, endocytosis, and degradation of conformationally modified albumins J Biol Chem 268, (10), 7562-7570
Schmtzer JE and Oh P (1994) Albondin-mediated capillary permeability to albumin J Biol Chem 269, (8), 6072-6082
Schurer N Y , Stremmel W , Grundmann J U , Schliep V , Kleinert H , Bass N M and Williams M L (1994) Evidence for a novel keratinocyte fatty acid uptake mechanism with preference for linoleic acid comparison of oleic and linoleic acid uptake by cultured keratinocytes, fibroblasts and a human hepatoma cell Biochem Biophys Acta - Lipids and Lipid metabolism 1211. (1). 51-60
Sen A C , Matsuyana K , Wanwimolrak S and Pemn J H (1991) Observations of the conformational changes in HS A following removal of fatty acids by charcoal J Pharmaceutical and Biomedical Analysis 9, 9, 781-784
Shaffer M C , Foley T P and Barnes D W (1984) Quantification of spreading factor in humanbiological fluids J Lab Clin Med 103, 783-790
Shaklai, N , Garlick, R L and Bunn H F (1984) Non-enzymatic glycosylation of human serum albumin alters its conformation and function J Biol Chem 259, 3812-3817
Shapiro L E and Wagner N (1989) Transferrin is an autocrine growth factor secreted by Reuber H-35 cells m serum-free medium In Vitro 25, (7), 650-654
Shinmoto H , Dosako S and Taneya S (1988) Long-term culture of mouse hybndoma HB8852 cells in a protein-free medium Biotechnol Lett 10, (10), 683-689
399
Shmtam N , Kohgo Y , Kato J , Kondo H , Fujikawa K , Miyazaki E and Nutsu Y (1994) Expression and extracellular release of transferrin receptors during peripheral erythroid progenitor cell differentiation m liquid culture Blood 83, (5), 1209-1215
Shmtam Y , Inamoto K and Kitano K (1988) Carboxymethyl cellulose as an albumin substitute Appl Microbiol Biotechnol 27, 533-537
Shipley G and Ham R (1981) Improved medium and culture conditions for clonal growth with minimal serum protein and for enhanced serum-free survival of Swiss 3T3 cells In Vitro 17, (8), 656-670
Shipley G , Keeble W , Hendrickson J , Coffey R and Pittlekow M (1989) Growth of normal human keratinocytes and fibroblasts in serum-free medium is stimulated by acidic and basic fibroblastic growth factors J Cell Physiol 138. 511-518
Shirai Y , Hashimoto K , Ine S (1989) Formation of effective channels m alginate gel for immobilization of anchorage-dependent animal cells Appl Microbiol Biotechnol H , 342-345
Sibille J C , Octave J N , Schneider Y I , Troue T and Crichton R R (1982) Transfemn protein and iron uptake by cultured hepatocytes Febs Lett 150, 365-369
Simms E , Gazdar A F , Abrams P G and Minna J D (1980) Growth of human small cell (Oat cell) carcinoma of the lung in serum-free growth factor-supplemented medium Cancer Res 40, 4356-4363
Simoman M H , White M L and Gill G N (1982) Growth and function of cultured bovine adrenocortical cells in a serum-free defined medium Endo H I, 919-927
Simmons J G , Vanwyk J J , Hoyt E C and Lund P K (1993) Multiple transcription start sites in the rat insulin-like growth factor-I gene give rise to IGF-I messenger RNAs that encode different IGF-I precursors and are processed differently in vitro Growth Factors 9, (3), 205-221
Smiley A L , Hu W-S and Wang D I C (1989) Production of human immune interferon by recombinant mammalian cells cultivated on microcamers Biotech Bioeng 33,1182-1190
Smith F B , Kikkawa Y , Diglio C A and Dalen R C (1982) Increased saturated phospholipids in cultured cells grown with linoleic acid In Vitro 18, 331-338
Smith G E , Summers M D and Fraser M I (1983) Production of human B-interferon in insect cells infected with a baculovirus expression vector Mol Cell Biol 3, 2156-2165
Smith G E , Ju G , Encson B L , Moschera J , Lahm H W , Chizzomte R and Summers M D (1985) Modification and secretion of human interleukin 2 produced in insect cells by baculovirus expression vector Proc Natl Acad Sci USA 82, 8404-8408
Smith S M , Draper, M E and Houghton, R G (1990) Growth of BHK21 Cl 13 suspension cells in low serum medium supplemented with PENTEX EX-CYTE III European Society for Animal Cell Technology meeting, Avignon France, May 11
Soliman H A and Olesen H (1976) Folic acid binding by human plasma albumin Scand J Clin Lab Invest 36, 299-304
Soma Y and Grotendorst G R (1989) TGF-B stimulates primary human skin fibroblast DNA synthesis via an autocrine production of PDGF-related peptides J Cell Physiol 140, 246-253
Spector A A and Fletcher J E (1978) In ’Disturbances m lipid and lipoprotein metabolism’ pp 229- 248 Amer Physiol Soc , Rockville, Maryland
400
Speiker-Polet H and Polet H (1976) Identification of albumin as the serum factor essential for the growth of activated human lymphocytes J Biol Chem 251, 987-992
Speiker-Polet H and Polet H (1981) Requirement of a combination of saturated and unsaturated free fatty acid earner protein for in vitro growth of lymphocytes J Immunol 126. 949-954
Spier R E and Gnffiths J B (1988) Animal cell biotechnology Vol 3, Academic Press, London
Snvastava M D , Deluca H , Ambrus J L (1994) Inhibition of IL-6 and IL-8 production in human fibroblast cell lines by 1,25 (OH) (2) Vitamin D-3 and two of its analogues with lower calcemic activity Res Commun Chem Path and Pharm 83, (2), 145-150
Stampfer M R and Bartley J C (1985) Induction of transformation and continuous cell lines from normal mammary epithelial cells after exposure to benzo[a]pyrene Proc Natl Acad Sci USA 82, 2394-2398
Stiles C D (1983) The molecular biology of platelet-denved growth factor Cell 33, 653-655
Stoll K E , Ottino P and Duncan J R (1994) Interrelationship of ascorbate, arachidomc acid and prostaglandin Ej in B16 melanoma cells Prostaglandins, Leukotnenes and Essential fatty acids 50, (3), 123-131
Straford-May W and Cuatrecasas P (1985) Transfemn receptor its biological significance J Membrane Biol 88, 205-215
Stoltz J F , Rivat C , Geschier C , Colosetti P and Sertillanges (1989) Chromatographic punfication of human albumin technical and economic aspects Colloque Inserm 175. 191-200
Suzuki T , Ohta M and Hoshi H (1989) Serum-free chemically defined medium to evaluate the direct effects of growth factors and inhibitors on proliferation and function of neonatal rat cardiac muscle cells in culture In Vitro 25, 601-606
Szejtli J (1986) Cyclodextnns in biotechnology Starke 38, (11), 388-390
Takata Y , Webster N J G and Olefsky J M (1992) Intracellular signalling by a mutant human insulin receptor lacking the carboxyl-terminal tyrosine autophosphorylation sites J Biol Chem 267, (13), 9065-9070
Tamm I and Kikuchi T (1990) Insulin like growth factor-I, insulin and epidermal growth factor are survival factors for density-inhibited, quiescent Balb/c-3T3 munne fibroblasts J Cell Physiol 143,494 - 500
Tartare S , Mothe I , Kowalskichauvel A , Breittmayer J P , Ballotti R and Van Obberghen E (1994) Signal transduction by a chimenc insulin-like growth factor-I (IGF-I) receptor having the carboxyl- terminal domain of the insulin receptor J Biol Chem 269, (15), 11449-11455
Taub M , Chuman L , Saier M H Jr and Sato G (1979) Growth of MDCK epithelial cell line m hormone supplemented serum-free medium Proc Natl Acad Sci USA 76 (7), July, 3338-3342
Taub M , Saier M H Jr , Chuman L and Hiller S (1983) Loss of the PGE, requirement for MDCK cell growth associated with a defect in cyclic AMP phosphodiesterase J Cell Physiol 114. 153-161
Taub M , Devis P E and Hiller-Grohol S (1984) PGE,-independent MDCK cells have elevated intracellular cAMP but retain the growth stimulatory effects of glucagon and epidermal growth factor m serum-free medium J Cell Physiol 120. 19-28
401

Tauber J P , Cheng J , Massoglia S and Gospodarowicz D (1981) High density lipoprotein and the growth of vascular endothelial cells in serum-free medium In Vitro 17, (5), 519-530
Terranova V P , Rohrhack D H and Martin G R (1980) Role of lamimn in the attachment of PAM 212 (epithelial) cells to basement membrane collagen Cell 22, 719-726
Testa U , Pelosi E and Peschle C (1993) The transferrin receptor Critical Reviews in Oncogenesis 4, (3), 241-276
Tharakan J P , Lucas A and Chan P C (1986) Hybndoma growth and antibody secretion in serum- supplemented and low protein serum-free medium J Immunol Methods 94, 225-235
Thiele C J , Deutsch L A and Israel M A (1988) The expression of multiple proto-oncogenes is differentially regulated during retinoic acid induced maturation of human neuroblastoma cell lines Oncogene 3, 281-288
Thies R S , Ullnch A and McClain D (1989) Augmented mitogenesis and impaired metabolic signalling mediated by a truncated insulin receptor J Biol Chem 264. (5). 12825-12825
Thomas J N and Fung V (1994) Comparison of long R3IGF-I with insulin in the support of cell growth and recombinant protein expression in CHO cells In Animal cell technology products of today, prospects for tomorrow (Eds Spier R E , Griffiths J B and Berthold W ) 91-95
Thomassen D (1989) Variable responsiveness of rat tracheal epithelial (RTE) cells to bovine serum albumin in serum-free culture In Vitro 25, (11), 1046-1050
Thorstensen K and Romslo I (1988) Uptake of iron from transferrin by isolated rat hepatocytes J Biol Chem 263, (18), 8844-8850
Thorstensen K and Romslo I (1990) The role of transferrin m the mechanism of cellular iron uptake Biochem J 271. 1-10
Tigyi G Dyer D , Matute C and Miledi R (1990) A serum factor that activates thephosphatidylmositol phosphate signalling system in Xenopus oocytes Proc Natl Acad Sci USA 87,1521-1525
Tigyi G , Henschen A and Miledi R (1991) A factor that activates oscillatory chloride currents in Xenopus Oocytes co-punfies with a subfraction of serum albumin J Biol Chem 266, (31), 20602- 20609
Tigyi G and Miledi R (1992) Lysophosphatidates bound to serum albumin activate membrane currents in Xenopus Oocytes and Neunte Retraction in PC 12 Pheochromocytoma cells J Biol Chem 267. 21360-21367
Timpl R , Rohde H , Robey G P , Rennard S I , Foidart J M and Martin G R (1979) Lamimn aglycoprotein from basement membranes J Biol Chem 254, 9933-9937
Togami M , Blazka D and Hayashi J (1988) Control of angiotensinogen production by H4 rathepatoma cells in SF culture In Vitro 24, (7), 699-704
Tokiwa T , Miyagiwa M , Kusaka Y , Muraoka A and Sato J (1988) Effects of various substrates on human hepatoblastoma and hepatoma cell culture Cell Biol Intemat Reports 12, (2), 131-142
Tomooka Y M , Hams S E and McLachlan J. A (1985) Growth of seminal vesicle epithelial cells inserum-free collagen gel culture In Vitro 21, 4, 237-245
402

Treadway J L , Momson B D , Goldfme I D and Pessin J E (1989) Assembly of lnsulin/insulin-like growth factor-I hybrid receptors in vitro J Biol Chem 264, (36), 21450-21453
Tsao M , Sanders G H S and Gnsham J W (1987) Regulation of cultured hepatic epithelial cells by transfemn Exp Cell Res 171, 52-62
Tseng S C G, Savion N , Gospodarowicz D and Stem R (1981) Characterisation of collagens synthesised by cultured bovme comeal endothelial cells J Biol Chem 256. 3361-3365
Tsukada J , Misago M , Kikuchi M , Sato T , Ogawa R , Ota T , Oda S , Monmoto I , Chiba S and Eto S (1992) Interactions between recombinant erythropoietin and serum factor(s) on murine megakaryocyte colony formation Blood 80, 37-45
Tumbow M A , Keller S R , Rice K M and Gamer C W (1994) Dexamethasone down-regulation of insulin receptor substrate-1 in 3T3-L1 adipocytes J Biol Chem 269. (4). 2516-2520
Ueno T , Suita S , Zaizen Y (1993) Retinoic acid induces insulin-like growth factor-II expression m a neuroblastoma cell line Cancer Lett 71, 1-3, 177-182
Ullnch A , Bell J , Chen E , Herrera R , Petruzzelh L , Dull T , Gray A , Coussens L , Liao Y , Tsubokawa M , Mason A , Seeburg P , Grunfeld C , Rosen 0 and Ramachandran J (1985) Human insulin receptor and its’ relationship to the tyrosine kinase family of oncogenes Nature 313, (28), 756- 761
Unger W G (1972) Binding of prostaglandin to human serum albumin J Pharm Pharmacol 24,470- 477
Van Corven E M , Groemnk A , Jalink K , Eicholtz T and Moolenaar W H (1989) Lysophosphatidate-induced cell proliferation identificationand dissection of signalling pathways mediated by G proteins Cell 59, 45-54
Van Corven E J , van Ryswyk A , Jalink K , van der Bend R L , van Blitterswyk W J and Moolenaar W H (1992) Mitogemc action of lysophosphatidic acid and phosphatidic acid on fibroblasts Dependence on acyl-chain lenght and inhibition by sumann Biochem J 281. 163-169
Van Der Basch J (1984) Primary tissue cultures of human colon carcinomas in serum-free medium an in vitro system for tumour analysis and therapy experiments In D W Barnes, D A Sirbasku and G H Sato (eds ) Cell culture methods for molecular and cellular biology, vol 3, 73-82 Alan R Liss Inc , New York
Van Der Burg B , Rutteman G , Blankenstein M , DeLaat S and van Zoelen E (1988) Mitogemc stimulation of human breast cancer cells in growth factor-defined medium synergistic action of insulin and estrogen J Cell Physiol 134. 101-108
Van Der Haegen B A , Ham R G and Kano-Sueoka T (1989) Growth of rat mammary tumour line 64-24 in liposome-supplemented defined medium 1 Effect of liposome B components on colony growth In Vitro 24, (2), 151-157
Van Obberghen-Schilling E and Pouyssegur J (1983) Mitogen-potentiating action and binding characteristics of insulin and insulin-like growth factors in Chinese hamster fibroblasts Exp Cell Res 147. 369-378
Van Zoelen E , van Oostwaard T M J , van der Saag P T and de Laat S (1985) Phenotypic transformation of normal rat kidney (NRK) cells in a growth-factor-defined medium induction by a neuroblastoma-denved transforming growth factor independendy of the EGF receptor J Cell Physiol 123. 151-160
403
Van Zoelen E , van Oostwaard T M J and de Laat S (1988) The role of polypeptide growth factors in phenotypic transformation of normal rat kidney cells J Biol Chem 263. (1), 64-68
Van Zoelen E , Peters P H J , Afink G B , Vangenesen S , Deroos A D G , Vanrotterdam W and Theuvenet A P R (1994) Brandykinin-induced growth inhibition of normal rat kidney (NRK) cells is paralleled by a decrease in epidermal growth factor receptor expression Biochem J 298, (2), 335-340
Varam J , Dixit U M , FligielS E G , McKeever P E and Carey T E (1986) Thrombospondm-induced attachment and spreading of human squamous carcinoma cells Exp Cell Res 167, 376-390
Vaughn JL and Fan F (1989) Use of commercial serum replacements for the cultures of insect cells In Vitro 25, (2), 143-145
Verspohl E J , Maddux B A and Goldfine I D (1988) Insulin and insulin-like growth factor I regulate the same biological functions in HEP-G2 cells via their own specific receptors J Clin Endocrinol Metab 67, 169-174
Watanabe K andMiyaiH (1993) Production of an Interleukin-8 like chemokine by cytokine stimulated rat NRK-49F fibroblasts and its suppression by anti-inflammatory steroids Biochem Pharmacol 45, (7), 1425-1430
Waters S B , Yamauchi K and Pessin J E (1993) Functional expression of insulin receptor substrate-I is required for insulin-stimulatedmitogemc signalling J Biol Chem 268. (30). 22231-22234
Watt S M and Davis J M (1989) Flow sorting for isolating CFU-E Chapter 29 In Methods in Mol Biol No 5 Animal cell culture, Eds Pollard J W and Walker J M Humana Press Clifton, New Jersey, 347-359
Wille J J Jr , Pittelkow M R , Shipley G D and Scott R E (1984) Integrated control of growth and differentiation of normal human prokeratinocytes cultured m serum-free medium clonal analysis, growth kinetics and cell cycle studies J Cell Physiol 121. 31-44
Wilson W D and Foster J F (1971) Conformation-dependent limited proteolysis of bovine plasmaalbumin by an enzyme present in commercial albumin preparations Biochemistry 10, (10), 1772-1780
Wnght T L , Bnssot P , Ma W L and Weisiger R (1986) Characterization of non-transfemn-bound iron clearance by rat liver J Biol Chem 261, (23), 10909-10914
Wu R and Sato G H (1978) Replacement of serum m cell culture by hormones a study of hormonal regulation of cell growth and specific gene expression J Toxicol Environ Health 4, 427-448
Yabe N , Matsuga Y , Yamane I and Takada M (1986) Enhanced formation of mouse hybndomas without HAT treatment in a SFM In Vitro 22, (7), 363-368
Yabe N , Kato M , Matuko Y , Yamane I , Iizuka M , Takayoshi H and Susuki K (1987) Role of iron chelators in growth promoting effect on mouse hybndoma cells in a chemically-defined medium In Vitro 23, (12), 815-820
Yamada K , Ikeda I , Sughara T , Hashizume S , Shirahata S and Murakami H (1990) Stimulation of proliferation and immunoglobulin M production by lactofemn in human-human and mouse-mouse hybndomas cultures m serum-free conditions Cytotechnology 3, 123-131
Yamane I , Murakami O and Kato M (1975) Role of bovine albumin in a serum-free suspension cellculture medium Proc Soc Exp Biol Med 147, 439-442
404
Yang J , Larson L , Flynn D , Elias J and Nandi S (1982) Serum-free primary culture of human normal epithelial cells in collagen gel matrix Cell Biol Intemat Reports 6, (10), 969-975
Yang C M and Chou S P (1993) Primary culture of canine tracheal smooth muscle cells in serum-free medium effects of msulm-like growth factor-I and insulin J Receptor Res 13, (6),943-960
Yano H , Konro M and Nakashima T (1986) A new human hepatocellular carcinoma cell line (KYN-1) with a transformation to adenocarcinoma In Vitro 22, (11), 637-646
Yoshida T and Takeuchi M (1991) Primary culture and cryopreservation of mouse astrocytes under serum-free conditions Cytotechnology 5, 99-106
Young D , Cox III F , Chipman S and Hartman S (1979) The growth stimulation of SV3T3 cells by transferrin and its dependence on biotin Exp Cell Res 118, 410-414
Zhu S , Gray T E and Nettesheim P (1992) The effect of sodium selemte on cell proliferation and transformation of primary rat tracheal epithelial cells Carcinogenesis 13, (10), 1725-1729
Zirvi K A , Chee D O and Hill G H (1986) Continuous growth of human tumour cell lines m SFM In Vitro 22, (7), 369-374
Zurawski V R Jr , Kohr W J and Foster J F (1975) Conformational properties of bovine plasma albumin with a cleaved internal peptide bond Biochemistry 14, 5579-5586
Zwiller J , Basset P Ulnch G and Mandel P (1982) Guanylate cyclase activators hemin and sodium mtroprusside stimulate cell growth in serum-free medium Exp Cell Res 141, 445-449
405

APPENDICES
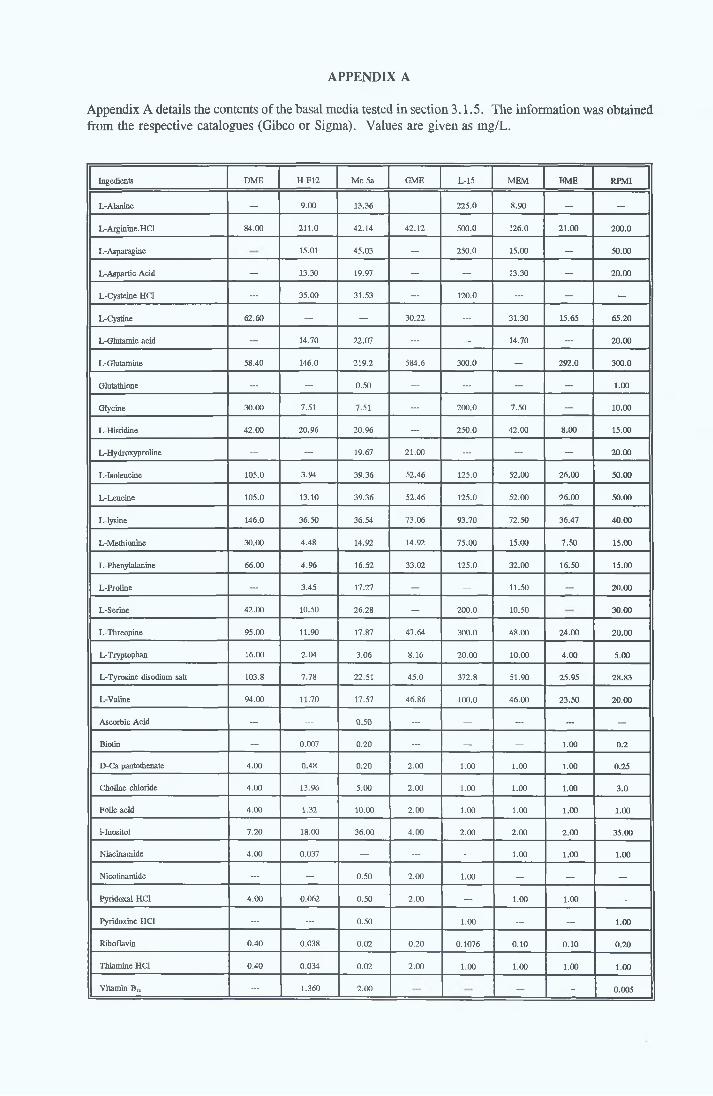
APPENDIX A
Appendix A details the contents of the basal media tested in section 3.1.5. The information was obtained from the respective catalogues (Gibco or Sigma). Values are given as mg/L.
Ingedients DME HF12 Me 5a GME L-15 MEM BME RPMI
L-Alanine — 9.00 13.36 — 225.0 8.90 — —
L-Arginine. HC1 84.00 211.0 42.14 42.12 500.0 126.0 21.00 200.0
L-Asparagine 15.01 45.03 — 250.0 15.00 — 50.00
L-Aspartic Acid — 13.30 19.97 — . . . 13.30 — 20.00
L-Cysteine HC1 — 35.00 31.53 . . . 120.0 — _ —
L-Cystine 62.60 . . . _ 30.22 — 31.30 15.65 65.20
L-Glutamic acid — 14.70 22.07 — . . . 14.70 — 20.00
L-Glutamine 58.40 146.0 219.2 584.6 300.0 — 292.0 3 0 0 . 0
Glutathione . . . — 0.50 — — . . . — 1.00
Glycine 30.00 7.51 7.51 — 200.0 7.50 — 10.00
L-Histidine 42.00 20.96 20.96 — 250.0 42.00 8.00 1 5 .0 0
L-Hydroxyproline . . . — 19.67 21.00 . . . — — 2 0 . 0 0
L-Isoleucine 105.0 3.94 39.36 52.46 125.0 52.00 26.00 5 0 . 0 0
L-Leucine 105.0 13.10 39.36 52.46 125.0 52.00 26.00 5 0 .0 0
L-lysine 146.0 36.50 36.54 73.06 93.70 72.50 36.47 4 0 . 0 0
L-Methionine 30.00 4.48 14.92 14.92 75.00 15.00 7.50 1 5 .0 0
L-Phenylalanine 66.00 4.96 16.52 33.02 125.0 32.00 16.50 1 5 .0 0
L-Proline — 3.45 17.27 — — 11.50 — 2 0 . 0 0
L-Serine 42.00 10.50 26.28 — 200.0 10.50 3 0 .0 0
L-Threonine 95.00 11.90 17.87 47.64 300.0 48.00 2 4 . 0 0 2 0 . 0 0
L-Tiyptophan 16.00 2.04 3.06 8.16 20.00 10.00 4 . 0 0 5 .0 0
L-Tyrosine disodium salt 103.8 7.78 22.51 45.0 372.8 51.90 25.95 2 8 . 8 3
L-Valine 94.00 11.70 17.57 46.86 100.0 46.00 23.50 2 0 . 0 0
Ascorbic Acid . . . . . . 0.50 . . . . . . _ — —
Biotin . . . 0.007 0.20 — . . . . . . 1 .0 0 0 . 2
D-Ca pantothenate 4.00 0.48 0 .2 0 2 . 0 0 1 .0 0 1 .0 0 1 .0 0 0 . 2 5
Choline chloride 4 . 0 0 13.96 5 .0 0 2 . 0 0 1 .0 0 1 .0 0 1 .0 0 3 . 0
Folic acid 4 . 0 0 1 .3 2 1 0 .0 0 2 . 0 0 1 .0 0 1 .0 0 1 .0 0 1 .0 0
i-Inositol 7 . 2 0 1 8 .0 0 36.00 4 . 0 0 2 . 0 0 2 . 0 0 2 . 0 0 35.00
Niacinamide 4 . 0 0 0 .0 3 7 . . . . . . — 1 .0 0 1 .0 0 1 .0 0
Nicotinamide . . . — 0 .5 0 2 . 0 0 1 .0 0 — — —
Pyridoxal HC1 4 .0 0 0 .0 6 2 0 . 5 0 2 . 0 0 . . . 1 .0 0 1 .0 0 . . .
Pyridoxine HC1 . . . . . . 0 . 5 0 . . . 1 .0 0 . . . - - - 1 .0 0
Riboflavin 0 .4 0 0.038 0 . 0 2 0 .2 0 0.1076 0 . 1 0 0 . 1 0 0 . 2 0
Thiamine HC1 0 . 4 0 0.034 0 .0 2 2 . 0 0 1 .0 0 1 .0 0 1 .0 0 1 .0 0
Vitamin B,2 . . . 1.360 2 . 0 0 - - 0 .0 0 5
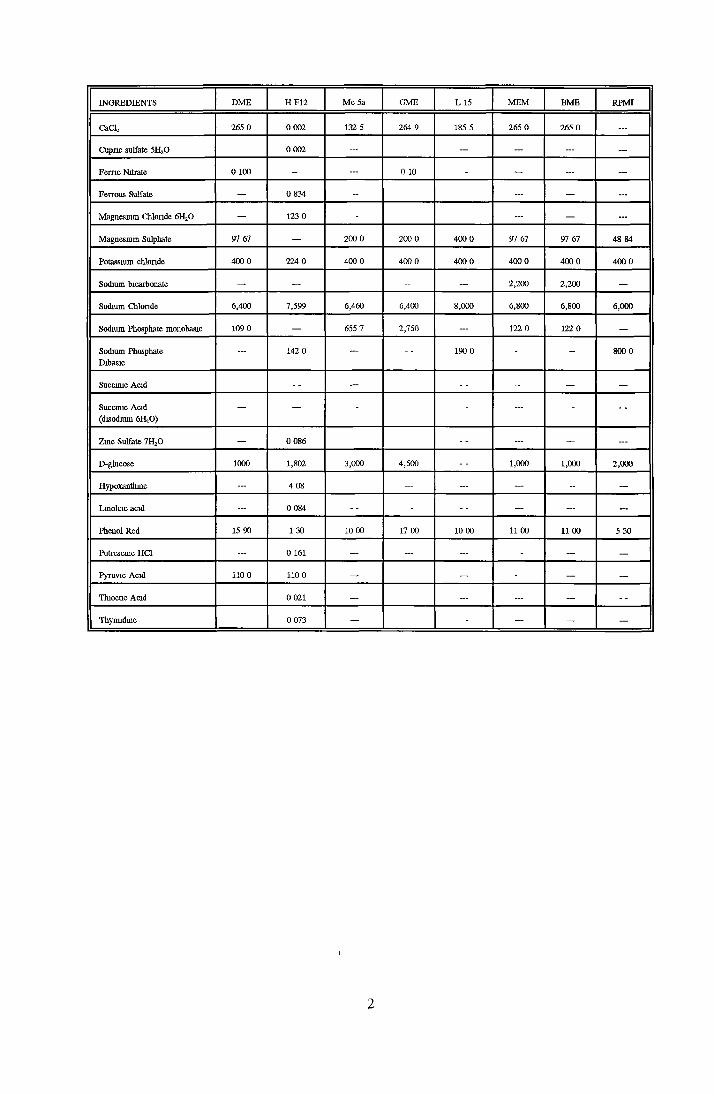
INGREDIENTS DME HF12 Me 5a GME L 15 MEM BME RPMI
CaCl2 265 0 0 002 132 5 264 9 185 5 265 0 265 0 __
Cupnc sulfate 5H20 0 002 . . . . . . . . . . . .
Feme Nitrate 0 100 - . . . 0 10 - . . . . . . . . .
Ferrous Sulfate . . . 0 834 - . . . . . . . . .
Magnesium Chloride 6H20 . . . 123 0 - . . . . . . —
Magnesium Sulphate 97 67 . . . 200 0 200 0 400 0 97 67 97 67 48 84
Potassium chlonde 400 0 224 0 400 0 400 0 400 0 400 0 400 0 400 0
Sodium bicarbonate — - . . . 2,200 2,200 . . .
Sodium Chlonde 6,400 7,599 6,460 6,400 8,000 6,800 6,800 6,000
Sodium Phosphate monobasic 109 0 . . . 655 7 2,750 . . . 122 0 122 0
Sodium Phosphate Dibasic
. . . 142 0 - - 190 0 - - - 800 0
Succinic Acid . . . - . . . . . .
Succinic Acid (disodium 6H20)
. . . . . . - - . . . - . . .
Zmc Sulfate 7H20 . . . 0 086 . . . — . . .
D-glucose 1000 1,802 3,000 4,500 1,000 1,000 2,000
Hypoxanthine . . . 4 08 ___ . . . — - . . .
Lmoleic acid . . . 0 084 - . . . . . . . . .
Phenol Red 15 90 1 30 10 00 17 00 1 0 0 0 1 1 0 0 1 1 0 0 5 3 0
Putrescine HC1 . . . 0 161 . . . . . . - . . . . . .
Pyruvic Acid 1 1 0 0 1 1 0 0 — - . . . . . .
Thioctic Acid 0 0 2 1 . . . . . . . . .
Thymidine 0 0 7 3 . . . - . . . - . . .
\
2
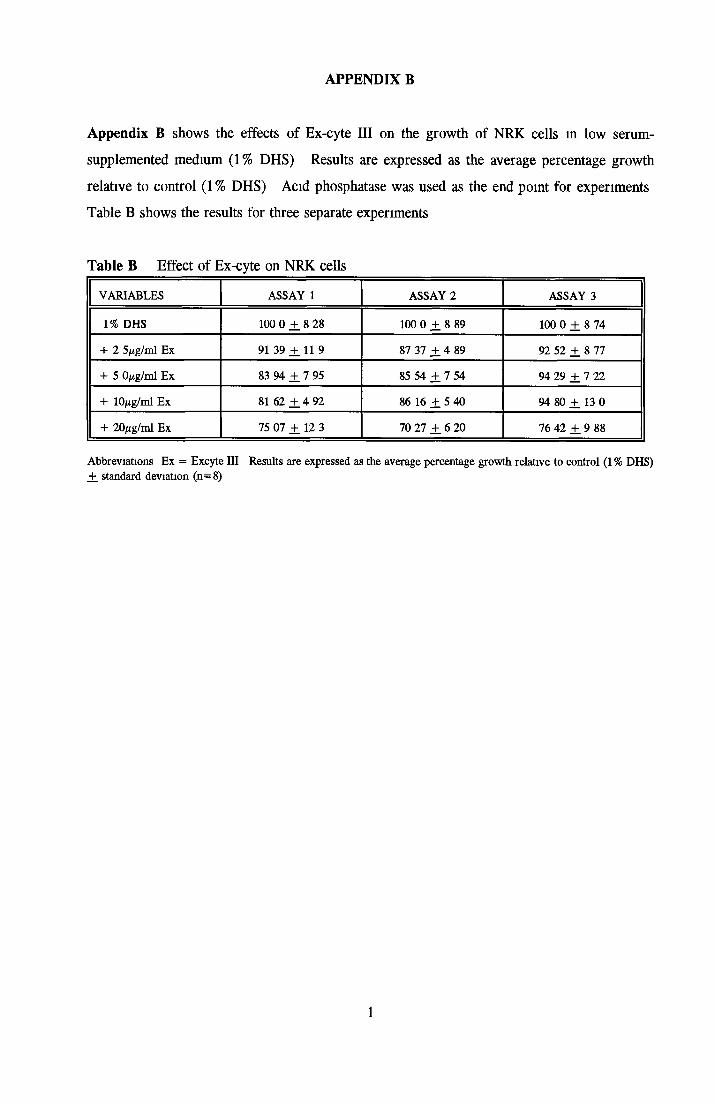
APPENDIX B
Appendix B shows the effects of Ex-cyte III on the growth of NRK cells in low serum-
supplemented medium (1% DHS) Results are expressed as the average percentage growth
relative to control (1% DHS) Acid phosphatase was used as the end point for experiments Table B shows the results for three separate experiments
Table B Effect of Ex-cyte on NRK cells
VARIABLES ASSAY 1 ASSAY 2 ASSAY 3
1% DHS 100 0 ± 8 28 100 0 ± 8 89 100 0 + 8 74
+ 2 5/ig/m l Ex 91 39 ± 11 9 87 37 + 4 89 92 52 + 8 77
+ 5 0/ig/m l E x 83 94 ± 1 95 85 54 + 7 54 94 29 + 7 22
+ 10/ig/m l E x 81 62 ± 4 92 86 16 + 5 40 94 80 ± 13 0
+ 20/ig/m l E x 75 07 ± 12 3 70 27 + 6 20 76 42 ± 9 88
Abbreviations E x = Excyte III Results are expressed as the average percentage grow th relative to control (1 % DHS) +. standard deviation ( n = 8)
1
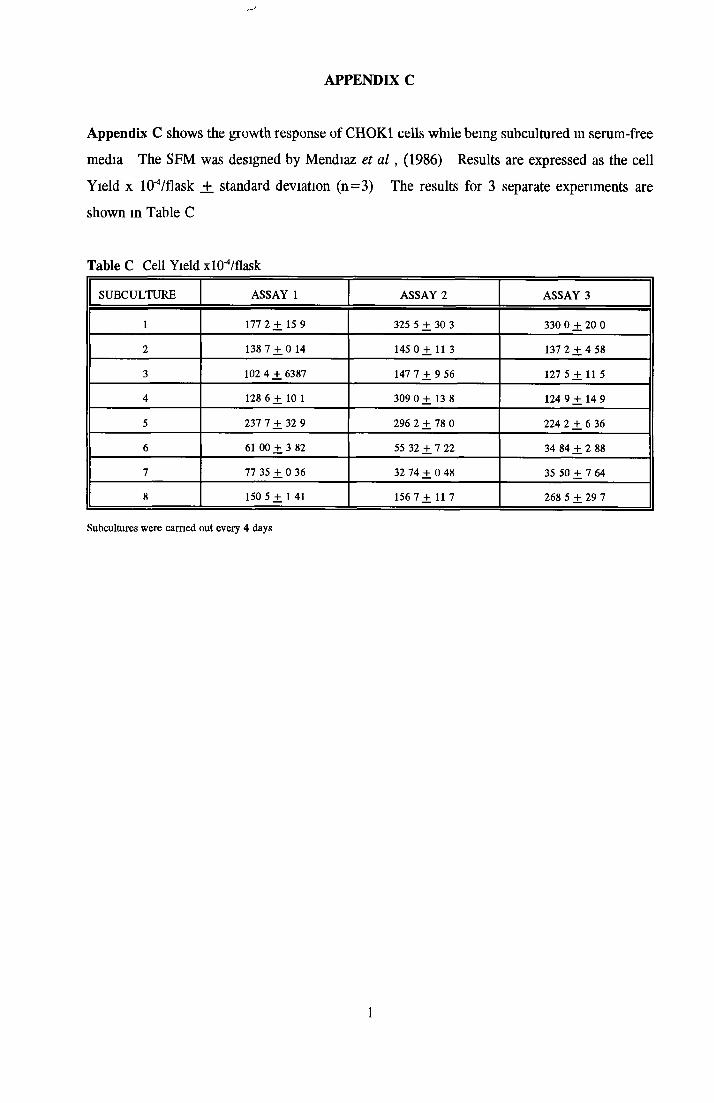
APPENDIX C
Appendix C shows the growth response of CHOK1 cells while being subcultured in serum-free
media The SFM was designed by Mendiaz et a l , (1986) Results are expressed as the cell
Yield x 1 O'4/flask ±_ standard deviation (n=3) The results for 3 separate experiments are
shown in Table C
Table C Cell Yield xlCTVflask
SU BCULTU RE ASSAY 1 ASSAY 2 ASSAY 3
1 177 2 + 15 9 325 5 + 30 3 330 0 + 20 0
2 1387 + 0 14 145 0 + 11 3 1372 + 4 58
3 102 4 ± 6387 147 7 ± 9 56 127 5 + 11 5
4 128 6 ± 10 1 309 0 + 13 8 124 9 + 14 9
5 237 7 + 32 9 296 2 + 78 0 224 2 + 6 36
6 61 00 + 3 82 55 32 + 7 22 34 84 ± 2 88
7 77 35 + 0 36 32 74 ± 0 48 35 50 + 7 64
8 150 5 + 1 41 156 7 + 11 7 268 5 + 29 7
Subcultures were earned out every 4 days
1

APPENDIX D
Appendix D shows the growth response of MDCK cells to IGF-I and recombinant human
insulin under serum-free conditions The results are expressed as the average percentage growth
relative to control (no insulin) _+ standard deviation (n=8) Acid phosphatase was used as the
end point and the results for 3 separate experiments are shown in Tables Da and Db
Table Da IGF-I
VARIABLES ASSAY 1 ASSAY 2 ASSAY 3
0 OnM IGF-I 100 0 + 2 99 100 0 ± 6 59 100 0 + 7 57
SFM con 109 5 ± 4 19 167 5 + 3 88 1087 + 9 11
0 InM IGF-I 86 73 + 4 12 74 04 + 3 14 102 0 ± 9 83
0 5 iM IGF-I 86 31 + 3 39 70 72 + 3 69 94 77 + 9 15
1 OnM IGF-I 86 99 + 6 56 75 15 + 2 58 92 28 + 9 90
5 OnM IGF-I 75 33 + 4 43 77 88 + 4 85
10 OnM IGF-I 72 81 + 7 24 95 46 + 8 08 69 92 + 5 71
20 OnM IGF-I 79 11 + 4 49 104 1 ± 9 72 88 70 + 3 45
50 OnM IGF-I 70 60 + 0 02 99 34 + 8 86 108 7 + 9 87
SFM con refers to the SFM designed by Taub el al , (1979) containing 5/ag/ml bovine insulin
Table Db Recombinant human insulin
VARIABLES ASSAY 1 ASSAY 2 ASSAY 3
0 0IU/ml 100 0 + 1 74 100 0 + 3 55 100 0 + 8 48
SFM con 111 6 + 2 6 9 106 0 + 6 22 100 9 + 4 63
0 0002IU/ml 87 87 ± 3 06 82 80 + 4 76 86 36 + 6 26
0 001IU/ml 87 32 ± 3 15 75 60 ± 3 71 90 83 ± 5 43
0 002IU/ml 87 32 + 4 29 75 00 + 4 79 82 81 ± 4 38
0 01IU/ml 76 53 + 3 86 77 77 + 5 03 92 89 +. 7 85
0 02IU/ml 89 52 + 2 22 79 49.+ 2 79 91 39 ± 8 97
0 10IU/ml 95 40 + 3 67 88 88 + 4 49 103 3 +. 7 18
0 20IU/ml 95 71 + 4 47 79 63 ± 4 44 87 60 + 5 63
SFM con refers to the SFM designed by Taub el a l , (1979) containing 5/ig/ml bovine insulin
1
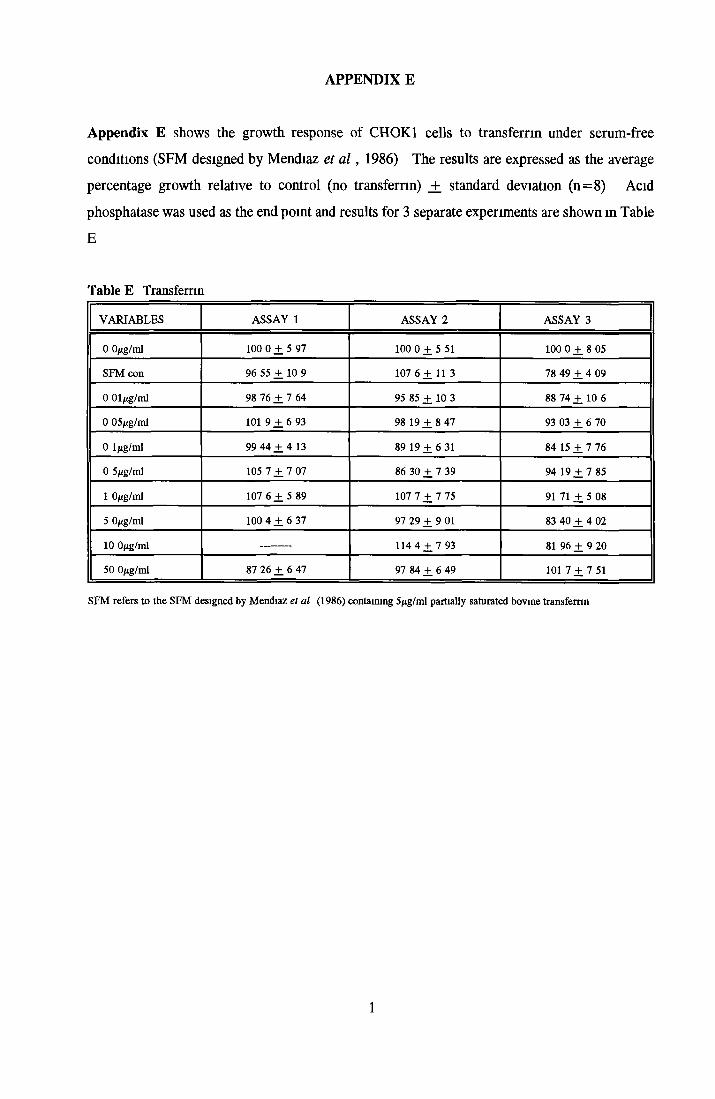
APPENDIX E
Appendix E shows the growth response of CHOK1 cells to transferrin under serum-free
conditions (SFM designed by Mendiaz et a l , 1986) The results are expressed as the average
percentage growth relative to control (no transferrin) _+ standard deviation (n=8) Acid phosphatase was used as the end point and results for 3 separate experiments are shown in Table
E
Table E Transferrin
VARIABLES ASSAY 1 ASSAY 2 ASSAY 3
0 0/ig/ml 100 0 + 5 97 1000 + 5 51 100 0 + 8 05
SFM con 96 55 + 10 9 107 6 + 11 3 78 49 + 4 09
0 01/ig/ml 98 76 ± 1 64 95 85 ± 10 3 88 74 + 10 6
0 05/ug/ml 101 9 + 6 93 98 19 + 8 47 93 03 + 6 70
0 1 jug/ml 99 44 + 4 13 89 19 + 6 31 84 15 + 7 76
0 5fig/ml 105 7 +. 7 07 86 30 + 7 39 94 19 + 7 85
1 0/ug/ml 107 6 + 5 89 m i ± 1 75 91 71 + 5 08
5 0/ug/ml 100 4 + 6 37 97 29 + 9 01 83 40 + 4 02
10 0fig/ml 1144 + 7 93 81 96 + 9 20
50 Oftg/ml 87 26 + 6 47 97 84 + 6 49 101 7 + 7 51
SFM refers to the SEM designed by Mendiaz el al (1986) containing 5^g/ml partially saturated bovine transferrin
1

APPENDIX F
Appendix F shows a report on the analysis of albumin samples for fatty acid content Due to
the very small amount of fat extracted from samples, determinations were made close to limits of the method The analysis was carried out by Teagasc, The National Food Centre,
Agriculture and Food Department Authority
Three samples were analyzed Samples A and C were samples of albumin exposed to the extraction process described by Tiygi and Miledi (1991) with methanol and di-ethy 1-ether as the
organic solvents respectively Sample B was a control albumin sample, not exposed to any extraction process BSA fraction V (Sigma, A4919 lot 110H04635) was used here
Positive identification of C14 0, C16 0, C18 0, C18 1 and C18 2 was made in all samples CIO 0 was identified at low levels in samples B and C but a split peak was found at the
appropriate retention time for sample A A peak close to the retention time for C8 0 was found m all samples but positive identification was not possible
1

M s Joanne K eenanN ational C ell x T issu e C u ltu re C en treD ublin C ity U niversityG lasnevinD ublin 9
The National Food CentreD u n s i n e a C a s ll e k n o c k D u b li n 1 5 Ire la n d
T e l e p h o n e + 3 5 3 I 8 3 8 3 2 2 2 r a x 1 3 5 3 I 8 3 8 3 6 8 4
R E P O R T N O . R 0 3 /9 4 D A T E 28 F eb ru ary 1994
R E P O R T O N A N A L Y S IS O F P R O T E IN S A M P L E S
F O R F A T T Y A C ID C O N T E N T
Samples
T h ree (3) sam ples o f isolated p ro te in w ere received from M s Jo an n e K eenan, D ublin
C ity U n iversity on 17 Jan u ary 1994 T h e sam ples w ere sto red re frig e ra ted until
analysed
Methods
T h e sam ples w ere ex tracted w ith m ethanol (20 ml m ethanol p e r g p ro tein ) by shaking
fo r 1 h o u r T h e ex trac ts w e re cen trifuged (3500 rp m , 10 m m ) and the supernatan t
rem oved T h e ex traction w as repeated and the supernatan ts com bined and evapora ted
at 45°C un d er a stream o f nitrogen
M ethyl este rs o f the fatty acids in the sam ples w ere p rep ared by sapon ification with
alkali and reflux ing w ith boron trifluoride-m ethanol T h e m ethyl este rs o f the fatty
acids w ere ex tracted in to hep tane, the ex trac t concen tra ted and the fatly acids
de term ined by gas ch rom atography w ith a flam e ionization d e tec to r (FA D M 111)
P a g e 1 o f 2
C o n d itio n s
1 This Report relates only lo the samples as received by the Laboratory2 This Report may be reproduced only in its entirely
2
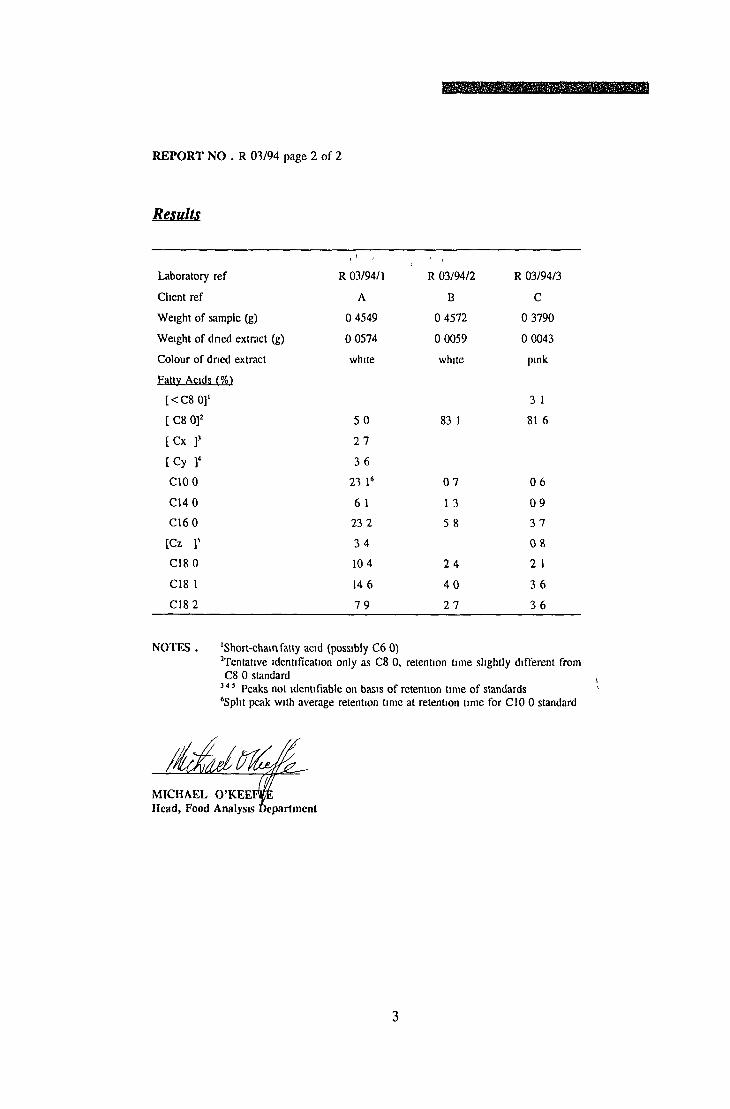
REPORT NO . R 03/94 page 2 of 2
Results
Laboratory ref R 03/94/1 R 03/94/2 R 03/94/3
Client ref A B C
W eight o f sample (g) 0 4549 0 4572 0 3790
W eight o f dried extract (g) 0 0574 0 0059 0 0043
C olour o f dried extract white white pink
Fattv Acids (%)
[ < C 8 0]1 3 1
[ C8 0]2 5 0 83 1 81 6
[ C x f 2 7
[ C y f 3 6
C10 0 23 l 6 0 7 0 6
C14 0 6 1 1 3 0 9
C16 0 23 2 5 8 3 7
[Cz r 3 4 0 8
C18 0 10 4 2 4 2 1
C18 1 14 6 4 0 3 6
C18 2 7 9 2 7 3 6
N O TES . ‘Short-chairifatty acid (possibly C6 0)’Tentative identification only as C8 0, retention time slightly different from C8 0 standard
3 4 5 Peaks not identifiable on basis o f retention time o f standards‘Split peak with average retention time at retention time for CIO 0 standard
MICHAEL O’KEEFKE Head, Food Analysis Department
3
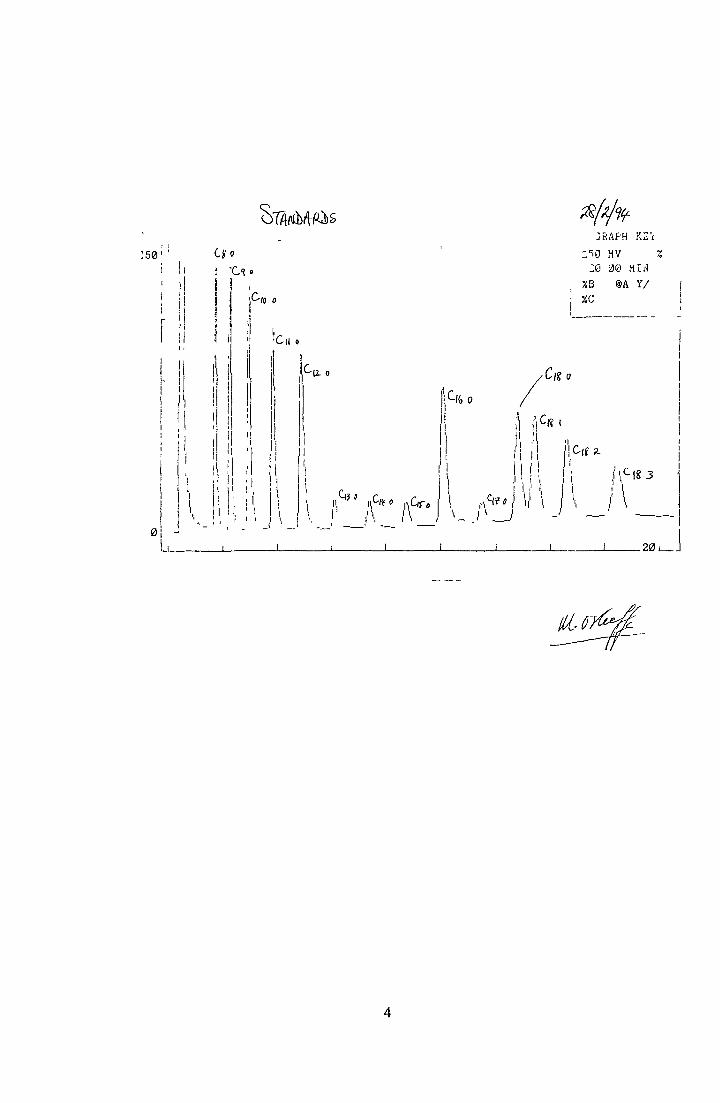
SlfaiMÄbs

' 50 '
/ - f t
. GRAPH KEY
:50 mv a 20 00 MIN
%B @A Y/7.C
K t_20i_
501 GRAPH K E Y _
50 MV % 20 00 MIN
%B @A Y/%C
20
tfffîà e Æ .
5
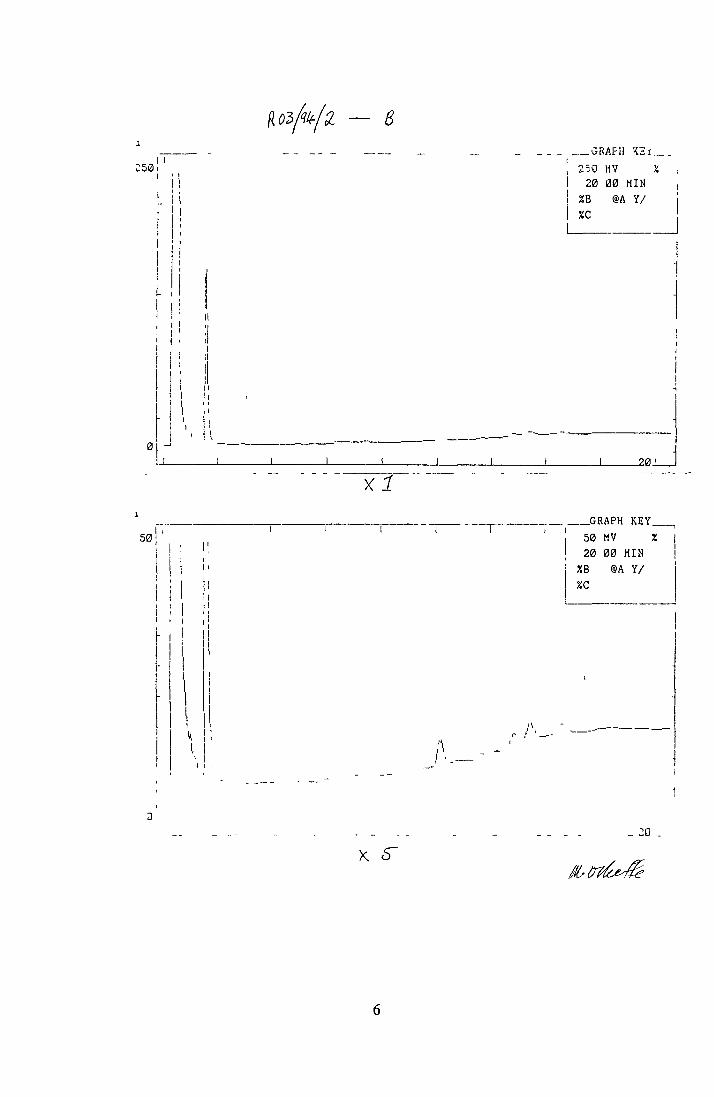
I ì
— ß
GRAPH KE i.
250 HV ;20 00 MIN
ZB @A Y/ %C
i i
! i
_201_X 1
I ! Ii i ! ! ......................
GRAPH K E Y _50 MV Z 20 00 MIN
ZB @A Y/ZC
X 5"20 _
6
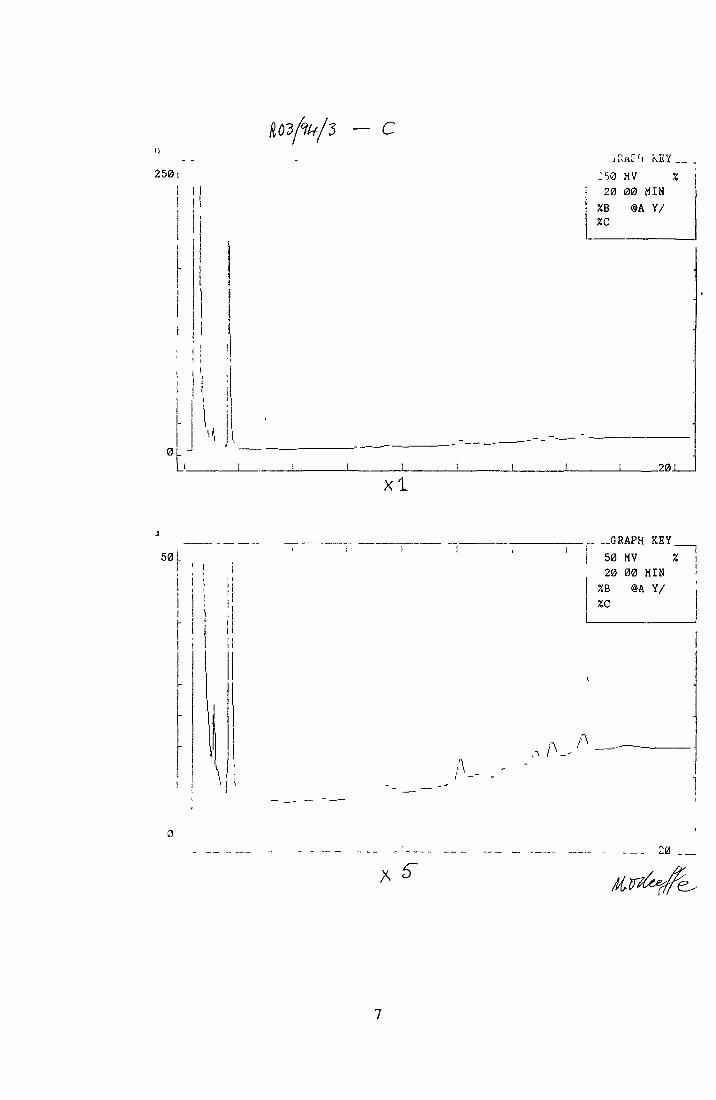
ÄÖ3/W/3 — C
X l
,r:rtfh KEY
:c,0 mv % 20 00 MIN
%B @A Y/%C
_20i
GRAPH K E Y _j 50 MV %
20 00 MIN %B @A Y/%C
A 5"e -
7

Appendix G shows a comparison of the growth stimulatory activity of heparin sepharose fractions and the protein profiles for Runs 1 to 10
APPENDIX G
1
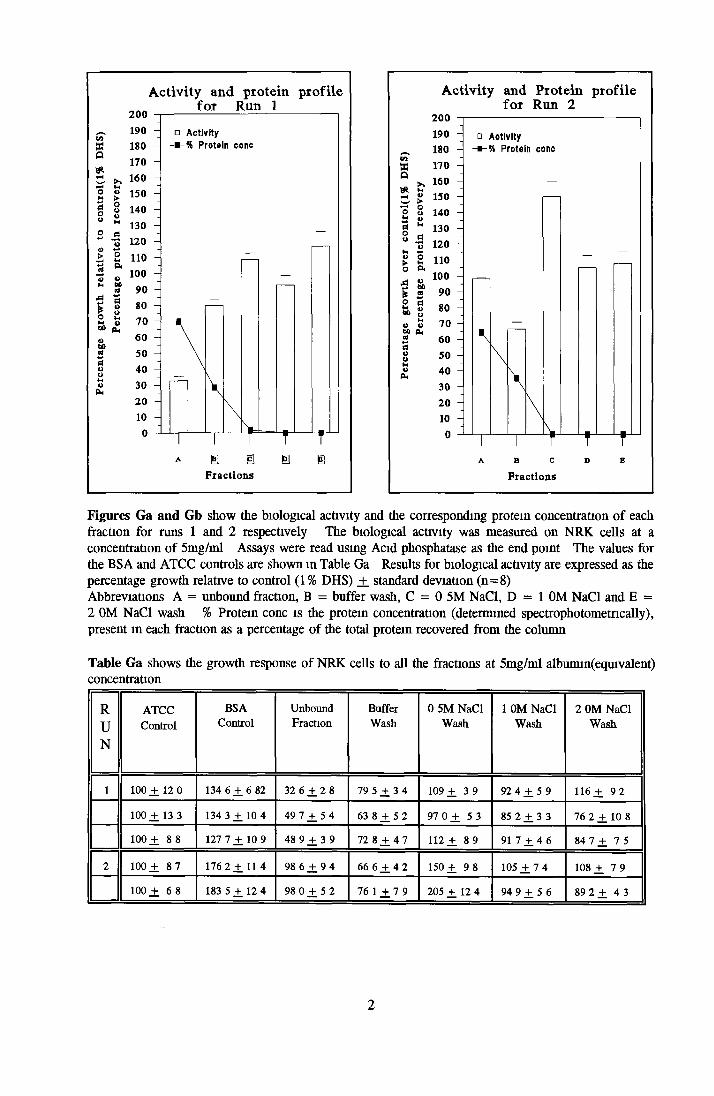
Activity and protein profile
xAxa
a*
Fractions
Activity and Protein profilefor Run 2
mHa5 I“’S o 2 ° H «>3 NO - O ^ 4>N *-O o o ft
t3 60 * 2 2 dInto o
U4) O 60 0k
Fractions
Figures Ga and Gb show the biological activity and the corresponding protein concentration of each fraction for runs 1 and 2 respectively The biological activity was measured on NRK cells at a concentration of 5mg/ml Assays were read using Acid phosphatase as the end point The values for the BSA and ATCC controls are shown in Table Ga Results for biological activity are expressed as the percentage growth relative to control (1 % DHS) ±_ standard deviation (n=8)Abbreviations A = unbound fraction, B = buffer wash, C = 0 5M NaCl, D = 1 0M NaCl and E = 2 0M NaCl wash % Protein conc is the protein concentration (determined spectrophotometncally), present m each fraction as a percentage of the total protein recovered from the column
Table Ga shows the growth response of NRK cells to all the fractions at 5mg/ml albumin(equivalent) concentration
RUN
ATCCControl
BSAControl
UnboundFraction
BufferW ash
0 5M N aC l W ash
1 0M NaCl W ash
2 0M N aC l W ash
1 100 +. 12 0 134 6 + 6 82 32 6 +. 2 8 79 5 +. 3 4 109 + 3 9 92 4 + 5 9 1 1 6 + 9 2
100 +. 13 3 134 3 + 10 4 49 7 ± 5 4 63 8 + 5 2 97 0 + 5 3 85 2 + 3 3 76 2 + 10 8
100 ± 8 8 127 7 ± 10 9 48 9 ± 3 9 72 8 ± 4 7 1 1 2 ± 8 9 91 7 + 4 6 84 7 + 7 5
2 100 j f 8 7 176 2 + 11 4 98 6 ± 9 4 66 6 +, 4 2 1 5 0 + 9 8 105 + 7 4 108 ±_ 7 9
100 ± 6 8 183 5 + 12 4 98 0 ± 5 2 76 1 ± 1 9 205 + 12 4 94 9 + 5 6 89 2 + 4 3
2

coXQ
«>oA*o
00 Oh
A ctivity and Protein profile for Run 3
200190 - 180 170 160 150 140 130 120
110 100
90 80 70 60 50 40 30 20 10
□ Activity -■ -% Protein cone
\
\
B C
Fractions
A ctivity and Protein profile for Run 4200
coXGw >’S © £ o¿J ü3 * o h
4)♦h «-*« Oo ft*2 bo£ ««2 * m a lto O uo o M PL,
«CL,
190 180 170 160 150 140 130 - 120 -
110 100
90 80 7060 H 50 40 30 20 10 0
□ Activity -■-51 Protein conc
\V
B C
Fractions
Figures Gc and Gd show the biological activity and the corresponding protein concentration of each fraction for runs 3 and 4 respectively (Assay 1) The biological activity was measured on NRK cells at a concentration of 5mg/ml Assays were read nsing Acid phosphatase as the end point The values for the BSA and ATCC controls are shown in Table Gc Results for biological activity are expressed as the percentage growth relative to control (1% DHS) _+_ standard deviation (n=8) Abbreviations A = unbound fraction, B = buffer wash, C = 0 5M NaCl, D = 1 OM NaCl and E = 2 OM NaCl wash % Protein conc is the protein concentration (determined spectrophotometncally), present m each fraction as a percentage of the total protein recovered from the column
Table Gc shows the growth response of NRK cells to all the fractions at 5mg/ml albumin(equivalent) concentration
RUN
ATCCControl
BSAControl
UnboundFraction
BufferW ash
0 5M NaCl W ash
1 0M N aC l W ash
2 0M N aC l W ash
3 100 ± 3 01 170 3 ± 13 2 73 7 ± 2 9 73 8 ± 3 4 101 ± 1 1 0 164 .+ 7 9 138 ± 9 9
100 ± 1 46 157 4 + 11 9 67 3 ± 5 4 111 ± 5 2 101 ± 6 53 150 + 9 3 138 ± 11 8
100 _+ 4 50 1 387 + 7 82 57 5 ± 3 8 63 1 ± 4 1 105 ± 1 68 141 + 10 136 + 11 8
4 100 ± 6 58 148 5 + 9 70 94 7 + 12 105 + 4 2 169 + 14 4 1 1 3 + 7 3 1 0 9 + 1 0 2
100 ± 5 58 129 6 ± 4 43 94 6 ± 6 3 100 ± 1 9 160 ± 10 3 117 + 5 7 130 ± 3 0
100 + 4 46 110 6 + 5 72 74 4 + 5 7 125 + 6 9 161 ± 12 4 1 1 9 + 5 9 126 ± 9 6
3
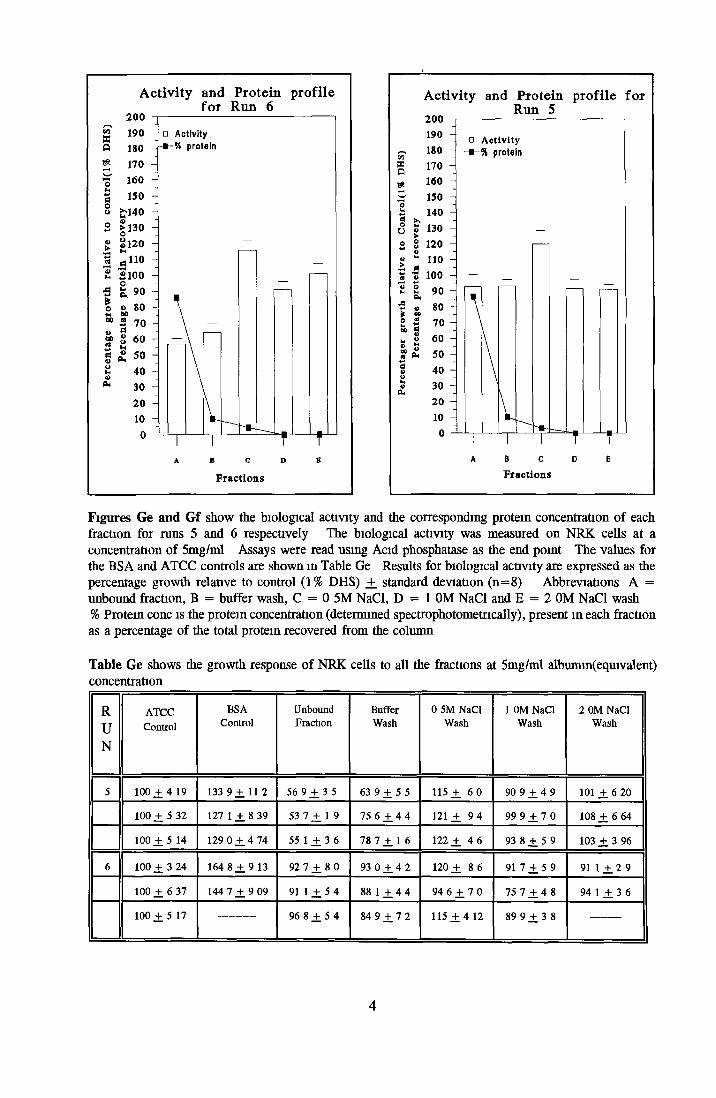
200S 190a iso2 170? wo3 150 ° £140 2 >130 " 21201 >2 £100_ o■3 e . 900 « 80M 60“ 2 70
2 ° 60 s £ 508 4001 30
20 10
0
Activity and Protein profilefor Run 6
Fractions
200Activity and Protein profile for
Run 5
»Q
0uÖoUo
« o* £ Cm-a
£ 2»> 9
190180170160150140130120110100
9080706050403020100
o Activity -■ -% protein
\
VFractions
Figures Ge and Gf show the biological activity and the corresponding protein concentration of each fraction for runs 5 and 6 respectively The biological activity was measured on NRK cells at a concentration of 5mg/ml Assays were read using Acid phosphatase as the end point The values for the BSA and ATCC controls are shown in Table Ge Results for biological activity are expressed as the percentage growth relative to control (1% DHS) +. standard deviation (n=8) Abbreviations A = unbound fraction, B = buffer wash, C = 0 5M NaCl, D = 1 0M NaCl and E = 2 0M NaCl wash % Protein conc is the protein concentration (determined spectrophotometncally), present in each fraction as a percentage of the total protein recovered from the column
Table Ge shows the growth response of NRK cells to all the fractions at 5mg/ml albumm(equivalent) concentration
RUN
ATCCControl
BSAControl
UnboundFraction
BufferWash
0 5M NaCl Wash
1 0M NaCl Wash
2 0M NaCl Wash
5 100 + 4 19 133 9 ± 11 2 56 9 + 3 5 63 9 + 5 5 1 1 5 + 6 0 90 9 + 4 9 101 +. 6 20
100 + 5 32 127 1 ± 8 39 53 7 +. 1 9 75 6 + 4 4 121 + 9 4 99 9 ± 7 0 108 ± 6 64
100 + 5 14 129 0 +. 4 74 55 1 ± 3 6 78 7 ± 1 6 122 ± 4 6 93 8 _+ 5 9 103 ± 3 96
6 100 + 3 24 164 8 ± 9 13 92 7 ± 8 0 93 0 + 4 2 120 _+ 8 6 91 7 + 5 9 91 1 + 2 9
100 + 6 37 144 7 ± 9 09 91 1 _+ 5 4 88 1 + 4 4 94 6 + 7 0 75 7 + 4 8 94 1 + 3 6
100 + 5 17 96 8 _+ 5 4 84 9 + 7 2 1 1 5 + 4 12 89 9 + 3 8
4

Activity and Protein profile forRun 7
390 -
~ 360 -
* 330 -I
S' 300Oug & 270 ü £0 8 240
5 .5 210 a o8 2 180 &«
1 I 150w öH 8 120D h“ CL,
90
60 -
30 -
□ Activity -■-% protein —
Fractions
Activity and Protein profile Run 8
for
aa
0OU
oa,
* 2? o cdK **oo Ö
Fractions
Figures Gg and Gh show the biological activity and the corresponding protein concentration of each fraction for runs 7 and 8 respectively The biological activity was measured on NRK cells at a concentration of 5mg/ml Assays were taken down using Dye elution as the end point The values for the BSA and ATCC controls are shown in Table Gg Results for biological activity are expressed as the average percentage growth relative to control (1 % DHS) _+ standard deviation (n=8) Abbreviations A = unbound fraction, B = buffer wash, C = 0 5M NaCl, D = 1 0M NaCl and E = 2 0M NaCl wash % Protein conc is the protein concentration (determined spectrophotometncally), present in each fraction as a percentage of the total protein recovered from the column
Table Gg shows the growth response of NRK cells to all the fractions at 5mg/ml albumin(equivalent) concentration
RUN
ATCCControl
BSAControl
UnboundFraction
BufferWash
0 5M NaCl Wash
1 0M NaCl Wash
2 0M NaCl Wash
7 100 ± 13 6 205 3 ± 1 1 9 103 + 18 1 123 ± 9 6 321 ± 35 2 91 9 ± 12 109 ± 9 67
100 + 9 67 201 5 +. 28 0 94 9 + 16 86 2 ± 10 316 ± 24 7 65 8 ± 4 6 97 6 ± 4 35
100 + 9 15 273 7 +. 16 9 76 3 ± 6 4 105 ± 11 318 ± 2 9 9 116 ± 8 07 249 ± 18 1
8 100 + 13 5 286 9 ± 28 3 97 0 ± 8 4 109 ± 6 4 177 ± 7 21 100 ± 12 8 106 ± 6 12
100 + 7 95 201 9 ± 17 0 106 ± 8 6 105 ± 10 170 ± 22 6 137 ± 1 6 9 121 ± 4 11
100 + 1 0 6 247 8 + 26 8 102 ± 18 92 9 ± 22 210 ± 23 4 97 4 ± 6 6 98 8 ± 17 3
5
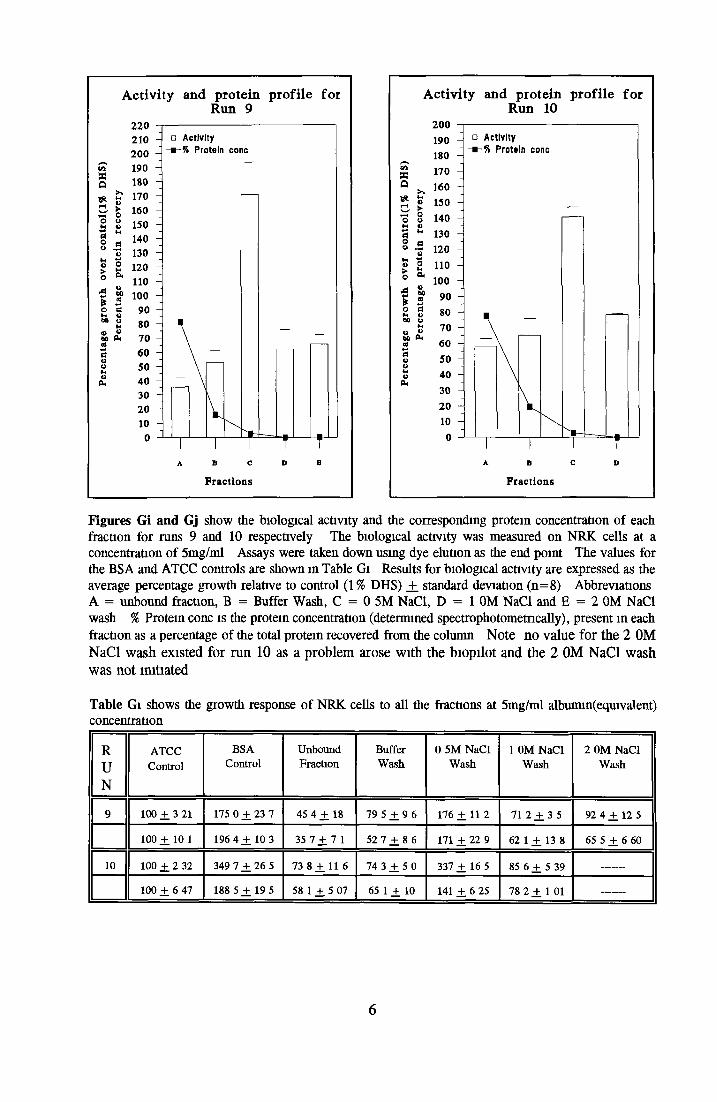
Activity and protein profile forRun 9
XflHQ
►o
*
oua*
dao*HOOh
Fractions
Activity and protein profile forRun 10
CO8Q
2 8^ I*.
oPk
otHa,
4)>O
so
60 0*ett
Fractions
Figures Gi and Gj show the biological activity and the corresponding protein concentration of each fraction for runs 9 and 10 respectively The biological activity was measured on NRK cells at a concentration of 5mg/ml Assays were taken down using dye elution as the end point The values for the BSA and ATCC controls are shown m Table Gi Results for biological activity are expressed as the average percentage growth relative to control (1 % DHS) ±_ standard deviation (n=8) Abbreviations A = unbound fraction, B = Buffer Wash, C = 0 5M NaCl, D = 1 0M NaCl and E = 2 0M NaCl wash % Protein conc is the protein concentration (determined spectrophotometncally), present in each fraction as a percentage of the total protein recovered from the column Note no value for the 2 0M NaCl wash existed for run 10 as a problem arose with the biopilot and the 2 0M NaCl wash was not initiated
Table Gi shows the growth response of NRK cells to all the fractions at 5mg/ml albumin(equivalent) concentration
RUN
ATCCControl
BSAControl
UnboundFraction
BufferWash
0 5M NaCl Wash
1 0M NaCl Wash
2 0M NaCl Wash
9 100 + 3 21 175 0 + 23 7 45 4 ± 18 79 5 ± 9 6 176 ± 1 1 2 71 2 ± 3 5 92 4 ± 12 5
100 ± 10 1 196 4 ± 1 0 3 35 7 ± 7 1 52 7 ± 8 6 171 ± 22 9 62 1 ± 13 8 65 5 ± 6 60
10 100 ± 2 32 349 7 ± 26 5 73 8 ± 11 6 74 3 ± 5 0 337 ± 1 6 5 85 6 ± 5 39
100 + 6 47 188 5 + 19 5 58 1 + 5 07 65 1 + 10 141 + 6 25 78 2 + 1 01
6

APPENDIX H
Appendix H shows the growth response of NRK cells to a dilution curve of each fraction
obtained from Run 5 on the HS column (Assay 1) Results are expressed as the average
percentage growth relative to control (1 % DHS) _+ standard deviation (n=8) Acid phosphatase
was used as the end point The results for three independent assays are shown in Tables Ha
to c Abbreviations A l, A2 and A3 refer to assays 1, 2 and 3 respectively
Bioactivity of fractions from Run 5
COXQ
0O
o>*4fido»4
A*o
V6Qfifl*eo
Dm
Albutnia(c4uivalent) concentration(mg/ ml)
Figure H Growth response of NRK cells in low serum-supplemented medium (1 % DHS) to all fractions at albumin (equivalent) concentrations
1
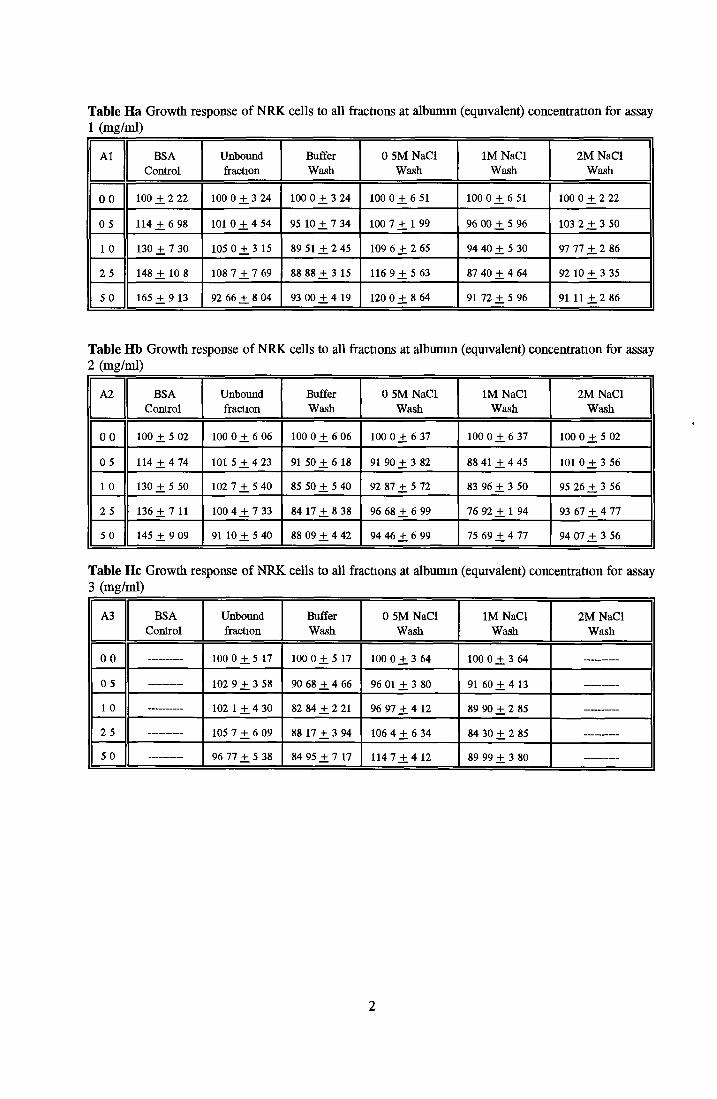
Table Ha Growth response of NRK cells to all fractions at albumin (equivalent) concentration for assay1 (mg/ml)
A1 BSA Unbound Buffer 0 5M NaCl 1M NaCl 2M NaClControl fraction Wash Wash Wash Wash
0 0 100 + 2 22 100 0 +. 3 24 100 0 + 3 24 100 0 + 6 51 1000 + 6 51 100 0 ± 2 22
0 5 114 + 6 98 101 0 + 4 54 95 10 + 7 34 100 7 + 1 99 96 00 + 5 96 103 2 ± 3 50
1 0 130 + 7 30 105 0 + 3 15 89 51 ± 2 45 109 6 + 2 65 94 40 + 5 30 9111 ± 1 86
2 5 148 + 10 8 108 7 +. 7 69 88 88 + 3 15 116 9 + 5 63 87 40 ± 4 64 92 10 + 3 35
5 0 165 + 9 13 92 66 +_ 8 04 93 00 + 4 19 120 0 + 8 64 91 72 _+ 5 96 91 11 ± 2 86
Table Hb Growth response of NRK cells to all fractions at albumin (equivalent) concentration for assay2 (mg/ml)
A2 BSA Unbound Buffer 0 5M NaCl 1M NaCl 2M NaClControl fraction Wash Wash Wash Wash
0 0 100 + 5 02 100 0 +. 6 06 100 0 +. 6 06 100 0 + 6 37 100 0 + 6 37 100 0 + 5 02
0 5 114 + 4 74 101 5 +. 4 23 91 5 0 + 6 18 91 90 + 3 82 88 41 ± 4 45 101 0 + . 3 56
1 0 130 +. 5 50 102 7 ± 5 40 85 50 + 5 40 92 87 + 5 72 83 96 + 3 50 95 26 ± 3 56
2 5 136 + 7 11 100 4 ± 1 33 84 17 + 8 38 96 68 + 6 99 76 92 + 1 94 93 67 ± 4 77
5 0 145 + 9 09 91 10 ± 5 40 88 09 ± 4 42 94 46 + 6 99 75 69 + 4 77 94 07 ± 3 56
Table He Growth response of NRK cells to all fractions at albumin (equivalent) concentration for assay3 (mg/ml)
A3 BSA Unbound Buffer 0 5M NaCl 1M NaCl 2M NaClControl fraction Wash Wash Wash Wash
0 0 100 0 +. 5 17 100 0 + 5 17 100 0 + 3 64 100 0 ± 3 64
0 5 102 9 +. 3 58 90 68 + 4 66 96 01 + 3 80 91 60 + 4 13
1 0 102 1 ± 4 30 82 84 + 2 21 96 97 + 4 12 89 90 + 2 85
2 5 105 7 + 6 09 88 17 + 3 94 106 4 + 6 34 84 30 + 2 85
5 0 96 77 ± 5 38 84 95 + 7 17 114 1 ± 4 12 89 99 + 3 80
2
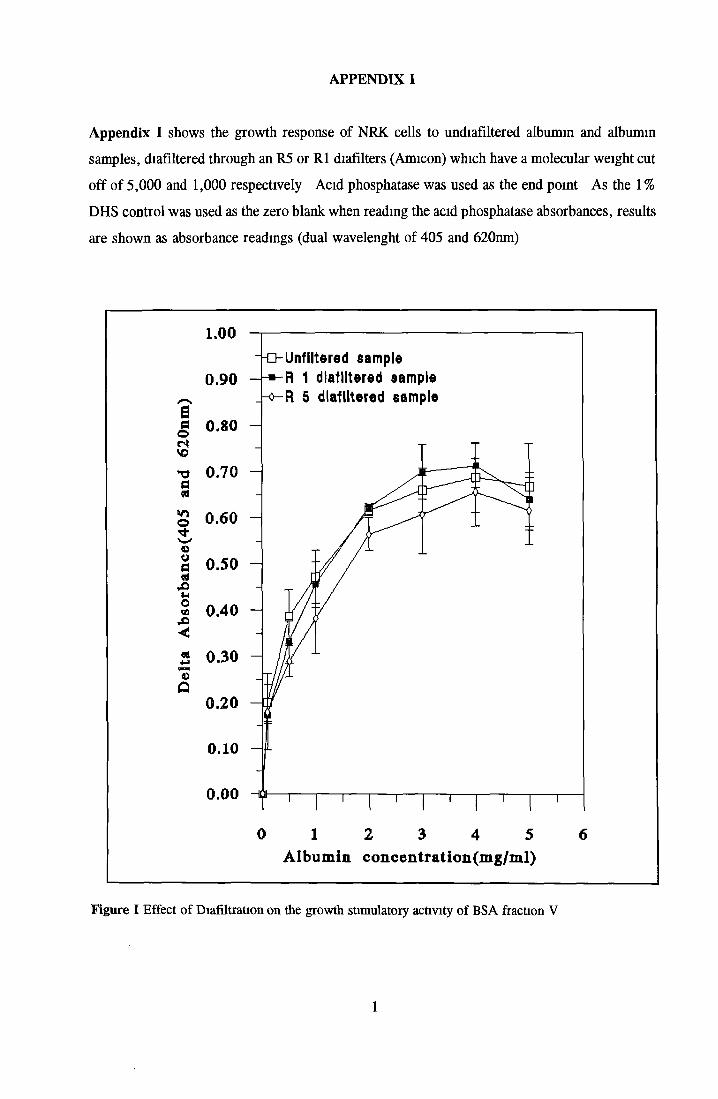
APPENDIX I
Appendix I shows the growth response of NRK cells to undiafiltered albumin and albumin
samples, diafiltered through an R5 or R1 diafilters (Amicon) which have a molecular weight cut
off of 5,000 and 1,000 respectively Acid phosphatase was used as the end point As the 1 %
DHS control was used as the zero blank when reading the acid phosphatase absorbances, results
are shown as absorbance readings (dual wavelenght of 405 and 620nm)
0 1 2 3 4 5 6Albumin concentration(m g/m l)
Figure I Effect of Diafiltration on the growth stimulatory activity of BSA fraction V
1
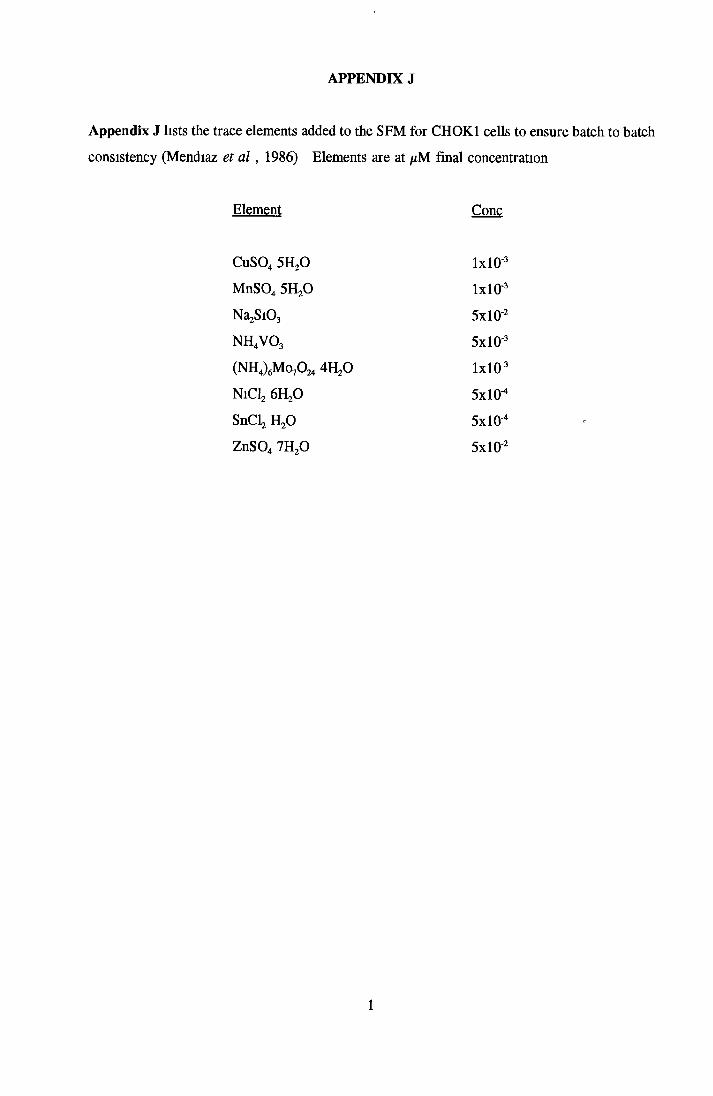
Appendix J lists the trace elements added to the SFM for CHOK1 cells to ensure batch to batch
consistency (Mendiaz et a l , 1986) Elements are at /zM final concentration
APPENDIX J
Element Cone
CuS04 5H20 1x10'
MnS04 5H20 1x10'
Na^iOj 5x10'
n h 4v o 3 5x10'
(NH4)6Mo70 24 4H20 1x10
NiCla 6H20 5x10"
SnClj H20 5x10"
ZnS04 7H20 5x10'
1

A P P E N D IX K
A ppendix K show s the typical m orphology o f CHOK1 cells in serum-free and serum
supplemented medium.
Figure A: Confluent CHOK1 cells in SSM. Magnification lOOx.
Figure C: CHOK1 cells in SFM without insulin. Magnification 200x.
Figure B: CHOK1 cells in SFM (including insulin). Magnification lOOx.
Figure D: CHOK1 cells showing ’ball formation’ over extended growth in SFM with insulin Magnification lOOx.