Embed Size (px)
Citation preview
0
Investigating the treatment of deferred tax in the debt-to-equity ratio
OS Fourie
23446080
Mini-dissertation submitted in partial fulfilment of the requirements for the degree Magister Commercii in
Management Accountancy at the Potchefstroom Campus of the North-West University
Supervisor: Prof S van Rooyen
November 2016

i
CERTIFICATE OF LANGUAGE EDITOR

ii
ACKNOWLEDGEMENTS
I would like to express my outmost appreciation to the following individuals who
made an enormous contribution to this study:
Firstly I would like to thank my God and Saviour, Jesus Christ, for his never
ending grace and love and for walking alongside me every single day of my
life and always picking me up when I stumble and fall;
Professor Surika Van Rooyen for being an incredible study leader and person,
without whom this study would never have been possible. Thank you for
always listening and never being too busy to help me, even if it is only to
answer a single question. Without your exceptional guidance and motivation I
would never have been able to make such a success of this study;
To my loving fiancé Magdelie, I cannot put into words how much you mean to
me. Without your never-ending love, support and encouragement I would not
have been able to accomplish what I have up until this point. Thank you for
always standing by me no matter how big or small the challenge;
To the language editor Hanta Henning, for her professional assistance and
valuable support;
To my parents, Attie and Marieta Fourie, who gave me this unbelievable
opportunity to study and make my dreams become a reality. Your love and
encouragement has always helped me to never give up and make a success
of every journey I embark on;
My brothers, Henry and Walter Fourie, who have always been there to
support me. Your love and support have helped me to overcome some of the
toughest challenges in my life;
To JP Coertzen, you are more than just my best friend, you are my brother.
Thank you for your support and always being there to provide a helping hand
in times of need;
Gerhard Grobbelaar, for your wise words, love and encouragement; and
To the participants of the study, for their willingness to be a part of the project.
iii
ABSTRACT
The current business environment is filled with challenges and companies face a
constant struggle to remain competitive and an attractive investment that can
guarantee investors long-term growth. One of the most useful tools to determine
financial performance is the financial statements published by a company. These
statements are a summary of the business performance of the entity and can be
used by shareholders to take a closer look at how the entity performed during a
specific financial period.
The figures reported in said financial statements contain a wealth of information.
However, these financial statements need to be analysed and interpreted using
certain techniques in order to obtain this information. The main objective of this study
is to gain a better understanding regarding the treatment of deferred tax in the debt-
to-equity ratio and to determine how this differs between theory and practice.
The study firstly focuses on the literature of financial statement analysis, ratio
analysis, and specifically the debt-to-equity ratio. Ratio analysis is a critical analysis
tool as this technique is one of the most commonly used financial statement analysis
tools. Debt and equity are the forms of financing available to an entity and serves as
the platform to embark on future projects that will contribute to growth and
sustainability of the firm, and in these two forms of financing we can find the capital
structure. This is where debt management comes in along with the role the debt-to-
equity ratio plays in ensuring that correct decisions are made.
The calculation of ratios and the inputs used to calculate these ratios are often open
to high levels of subjectivity. This leads to the question of how certain items should
be treated in the calculation of ratios. Deferred tax is one of those inputs that is
subject to uncertainty when it comes to the proposed treatment of this item in the
calculation of the debt-to-equity ratio.
The second part of the study employs a qualitative method approach to collect
empirical data, using semi-structured research interviews which consist of a pre-
arranged set of questions (which are based on the literature review). It is found that
the debt-to-equity ratio is very important and that valuable information can be
extracted from this ratio based on the responses from participants in academia and
practice. Even though there are a multitude of ways in which deferred tax can be
iv
treated in the calculation of the debt-to-equity ratio, participants from academia and
practice overwhelmingly respond that they would rather include deferred tax as part
of debt. In so doing the item is not merely excluded, and this ensures that no
unnecessary loss of information occurs.
The practical implications of the study is that the research can be used as starting
point by financial statement users to investigate the effect that deferred tax can have
on other ratios based on the figures reported in the financial statements. This will
facilitate discussion regarding ratios and show that the items included in calculations
are not set in stone and have a variety of implications.
The limitations of the study are that only stockbrokers and portfolio managers are
used as the representatives of professionals in practice. The only input investigated
in the calculation of the debt-to-equity ratio is deferred taxes. The participants in
academia only consist of lecturers from one of South Africa’s major universities.
Areas for further research include using participants from more than one university
and also including banks as part of the professionals in practice. Other inputs that
have an impact on the debt-to-equity ratio can be examined and more focus can be
placed on equity, which is also a very important input in the calculation of this ratio.
The study recommends that, when calculating the debt-to-equity ratio, deferred tax
should be included in the calculation to ensure that the ratio remains comparable
and as simple as possible. By doing so this item is not simply excluded this ensures
that no unnecessary loss of information will take place. Furthermore, it is also
recommended that the debt-to-equity ratio should be calculated including and
excluding deferred tax and that both these ratios should be disclosed. By computing
both ratios the user has the freedom to select the ratio that best suits their needs and
thus the impact of deferred tax will not be ignored.
Keywords: Accounting standards, Debt, Debt-to-equity ratio, Deferred taxes, Equity,
Financial statement analysis, Gearing, Ratio analysis.
v
OPSOMMING
Die huidige sake-omgewing is uiters uitdagend en maatskappye is gewikkel in 'n
konstante stryd om beide mededingend te bly en 'n aantreklike belegging te wees
wat langtermyn groei vir beleggers kan waarborg. Een van die mees bruikbare
instrumente om finansiële prestasie te bepaal is die finansiële state wat deur ʼn
maatskappy gepubliseer word. Hierdie state dien as 'n opsomming van die
maatskappy se besigheidprestasie en kan gebruik word deur belanghebbendes om
ʼn beter begrip te verkry van hoe die entiteit presteer het tydens 'n spesifieke
finansiële tydperk.
Die syfers gerapporteer in die finansiële state bevat 'n rykdom van inligting. Die
finansiële state moet wel ontleed en geïnterpreteer word deur gebruik te maak van
sekere tegnieke om hierdie inligting te bekom. Die hoofdoel van hierdie studie is om
'n beter begrip ten opsigte van die hantering van uitgestelde belasting in die skuld-
tot-ekwiteit-verhouding te verkry en ook om vas te stel hoe hierdie aspek in teorie en
in die praktyk verskil.
Dié studie fokus eerstens op die literatuur van finansiële staatontleding,
verhoudingsanalise en spesifiek die skuld-tot-ekwiteit-verhouding.
Verhoudingsanalise is 'n kritiese analise instrument omdat hierdie tegniek as een
van die mees algemeen gebruikte finansiële staatanalise instrumente beskou word.
Skuld en ekwiteit is die vorme van finansiering wat vir 'n entiteit is en dien as die
platform vir die voortsetting van toekomstige projekte. Dit sal ook bydra tot die groei
en volhoubaarheid van die firma, en in hierdie twee vorme van finansiering vind ons
die kapitaalstruktuur. Dit is hier waar skuldbestuur voorkom en ook waar die rol van
skuld-tot-ekwiteit-verhouding speel om te verseker dat korrekte besluite gemaak kan
word duidelik word.
Die berekening van verhoudinge en die insette wat gebruik word om hierdie
verhoudinge te bereken is dikwels hoogs subjektief. Dit lei tot die vraag hoe sekere
items in die berekening van verhoudings hanteer moet word. Uitgestelde belasting is
een van die insette wat onderhewig is aan onsekerheid wanneer dit kom by die
voorgestelde hantering van hierdie item in die berekening van die skuld-tot-ekwiteit-
verhouding.
vi
Die tweede deel van die studie maak gebruik van 'n kwalitatiewe benadering vir die
insameling van empiriese data met behulp van semi-gestruktureerde
navorsingsonderhoude wat bestaan uit 'n voorafbepaalde stel vrae (gebaseer is op
die literatuuroorsig). Daar is bevind dat die skuld-tot-ekwiteit-verhouding baie
belangrik is. Gebaseer op die antwoorde van die deelnemers in die akademie en
praktyk is bepaal dat waardevolle inligting vanuit hierdie verhouding verkry kan word.
Alhoewel daar baie verskillende maniere is hoe uitgestelde belasting in die
berekening van die verhouding hanteer kan word, noem deelnemers vanuit die
akademie en praktyk met ʼn geweldige meerderheid dat hul eerder uitgestelde
belasting sal insluit as deel van skuld in die berekening van die skuld-tot-ekwiteit
verhouding. So word dit verseker dat die item nie bloot uitgesluit word nie en dat
geen onnodige verlies van inligting sal plaasvind nie.
Die praktiese implikasies van die studie is dat die navorsing gebruik kan word as
vertrekpunt deur finansiële staat gebruikers om die effek wat uitgestelde belasting op
ander verhoudings kan hê te ondersoek gebaseer is op die syfers wat in die
finansiële state gerapporteer is. Dit sal help om besprekings rakende verhoudings te
fasiliteer en ook om te toon dat die items wat in berekeninge ingesluit kan word nie
vasgestel is nie en 'n verskeidenheid van implikasies kan hê.
Die beperkinge van die studie is dat slegs aandelemakelaars en
portefeuljebestuurders as verteenwoordigers van die professionele praktyk optree.
Die enigste inset waarna gekyk word rakende die berekening van die skuld-tot-
ekwiteit-verhouding is uitgestelde belasting. Akademiese deelnemers bestaan slegs
uit dosente van een van Suid-Afrika se groot universiteite. Gebiede vir verdere
navorsing sluit in die gebruik van deelnemers van meer as een universiteit en om
banke in te sluit as deel van die professionele mense in die praktyk. Ander insette
wat 'n impak op die skuld-tot-ekwiteit-verhouding het kan ondersoek word en meer
klem kan op ekwiteit geplaas word, wat ook 'n baie belangrike inset in die berekening
van hierdie verhouding lewer.
Die studie beveel aan dat uitgestelde belasting in die berekening van die skuld-tot-
ekwiteit-verhouding ingesluit moet word om te verseker dat die verhouding
vergelykbaar en so eenvoudig as moontlik bly. Sodoende word die item nie bloot
uitgesluit nie en word verseker dat geen onnodige verlies van inligting sal plaasvind

vii
nie. Verder word dit ook aanbeveel dat die skuld-tot-ekwiteit-verhouding bereken
moet word insluitende en uitsluitende uitgestelde belasting, en albei hierdie
verhoudings moet openbaar word. Deur die berekening van beide hierdie
verhoudings het die gebruikers die vryheid om die verhouding wat die beste by hul
behoeftes pas te kies en die impak van uitgestelde belasting sal nie bloot geïgnoreer
word nie.
Sleutelwoorde: Ekwiteit, Finansiële staatontleding, Hefboom, Rekeningkundige
standaarde, Skuld, Skuld-tot-ekwiteit-verhouding, Uitgestelde belasting,
Verhoudingsanalise.
viii
TABLE OF CONTENTS
CERTIFICATE OF LANGUAGE EDITOR ................................................................... i
ACKNOWLEDGEMENTS .......................................................................................... ii
ABSTRACT .............................................................................................................. iii
OPSOMMING ............................................................................................................ v
CHAPTER 1 ............................................................................................................... 1
1.1. PURPOSE, SCOPE AND PROGRESS OF STUDY ........................................... 1
1.1.1. Background ................................................................................................... 1
1.1.2. Motivation of topic actuality ........................................................................... 3
1.2. PROBLEM STATEMENT ................................................................................... 4
1.3. OBJECTIVES...................................................................................................... 5
1.4. RESEARCH DESIGN/METHOD ......................................................................... 6
1.4.1. Literature review ........................................................................................... 6
1.4.2. Empirical research ........................................................................................ 7
1.5. OVERVIEW ......................................................................................................... 8
CHAPTER 2 ............................................................................................................. 11
PURPOSE AND IMPLICATIONS OF THE DEBT-TO-EQUITY RATIO ................... 11
2.1. INTRODUCTION ............................................................................................... 11
2.2. FINANCIAL STATEMENTS .............................................................................. 12
2.2.1. The role of financial statements .................................................................. 14
2.2.2. Uses and users of financial statements....................................................... 15
2.3. BUSINESS ANALYSIS ..................................................................................... 17
2.4. FINANCIAL STATEMENT ANALYSIS ............................................................. 17
2.4.2. The purpose of financial statement analysis ............................................... 18
2.4.3. Financial statement analysis techniques ..................................................... 21
2.5. THE FINANCIAL ANALYST ............................................................................. 25
2.5.1. What does the financial analyst need to know? .......................................... 25
ix
2.5.2. The role of the financial analyst .................................................................. 26
2.5.3. The investment analyst ............................................................................... 27
2.5.4. The inside and the outside analyst .............................................................. 27
2.6. RATIO ANALYSIS ............................................................................................ 28
2.6.2. The purpose of ratio analysis ...................................................................... 31
2.6.3. How to ensure ratio analysis achieves its stated goals ............................... 33
2.6.4. Challenges regarding the application of ratio analysis ................................ 33
2.6.5. Limitations, pitfalls and risks of ratio analysis .............................................. 37
2.7. DEBT-TO-EQUITY RATIO ................................................................................ 38
2.7.1. Debt ............................................................................................................ 39
2.7.2. Equity .......................................................................................................... 40
2.7.3. Debt management ratios ............................................................................. 40
2.7.4. Background to the debt-to-equity ratio ........................................................ 41
2.7.5. Implications of the debt-to-equity ratio ........................................................ 42
2.8. SUMMARY ........................................................................................................ 44
CHAPTER 3 ............................................................................................................. 48
TREATMENT OF DEFERRED TAX IN THE DEBT-TO-EQUITY RATIO ................ 48
3.1. BACKGROUND ................................................................................................ 48
3.2. DEFERRED TAX .............................................................................................. 49
3.2.1. Background to deferred tax and income taxes ............................................ 49
3.2.2. Deferred tax assets and liabilities ............................................................... 53
3.2.3. Implications of deferred tax ......................................................................... 55
3.2.4. Treatment of deferred tax in the debt-to-equity ratio ................................... 56
3.3. SUMMARY ........................................................................................................ 60
CHAPTER 4 ............................................................................................................. 62
RESEARCH METHODOLOGY ................................................................................ 62
4.1. INTRODUCTION ............................................................................................... 62
x
4.2. THE RESEARCH OBJECTIVES OF STUDY ................................................... 63
4.3. PARADIGMATIC ASSUMPTIONS ................................................................... 63
4.3.1. Philosophical worldviews ............................................................................ 67
4.3.2. The philosophical perspective of this study ................................................. 69
4.4. RESEARCH APPROACH ................................................................................. 70
4.4.1. Frame of reference ..................................................................................... 70
4.4.2. Research design ......................................................................................... 71
4.5. QUANTITATIVE, QUALITATIVE AND MIXED METHOD OF RESEARCH ..... 77
4.6. THE STUDY POPULATION.............................................................................. 79
4.7. THE RESEARCH INSTRUMENT ...................................................................... 80
4.7.1. The qualitative research interview ............................................................... 81
4.7.1.1. Description ............................................................................................ 81
4.7.1.2. Objective of the research interview ....................................................... 82
4.7.1.3. Reliability and validity of the research interview .................................... 82
4.7.1.4. Conducting a research interview ........................................................... 84
4.7.1.5. Study sample of the interview ............................................................... 87
4.7.1.6. Administration of the interview .............................................................. 87
4.7.1.7. Analysis of the interview ....................................................................... 88
4.8. SUMMARY ........................................................................................................ 88
CHAPTER 5 ............................................................................................................. 90
ANALYSIS OF EMPIRICAL RESULTS ................................................................... 90
5.1. INTRODUCTION ............................................................................................... 90
5.2. THE RESEARCH INTERVIEW ......................................................................... 90
5.2.1. Theme 1: Factors other than deferred tax taken into consideration when
calculating the debt-to-equity ratio ........................................................................ 91
5.2.1.1. Value placed on the calculation of the debt-to-equity ratio and
information that can be extracted from this ratio ................................................ 91
xi
5.2.1.2. Should information reported in terms of IFRS be adjusted when
calculating certain ratios for more accurate information? ................................... 95
5.2.1.3. Will the type of analyst and their background influence inputs used in the
calculation of the debt-to-equity ratio ................................................................. 98
5.2.2. Theme 2: Current treatment of deferred tax as a liability in the debt-to-equity
ratio and the impact thereof ................................................................................ 101
5.2.2.1. Does the industry in which the entity operates affect the treatment of
deferred tax in the debt-to-equity ratio? ........................................................... 102
5.2.2.2. Can deferred tax be regarded as a form of debt financing in terms of the
debt-to-equity ratio? ......................................................................................... 105
5.2.2.3. Will the inclusion or exclusion of deferred tax from debt affect decisions
made based on the debt-to-equity ratio? ......................................................... 107
5.2.2.4. Is a deferred tax liability an influential item in the calculation of the debt-
to-equity ratio? ................................................................................................. 110
5.2.3. Theme 3: The different proposed treatments of deferred tax in the
calculation of the debt-to-equity ratio .................................................................. 113
5.2.3.1. How will the participant treat deferred tax in the calculation of the debt-
to-equity ratio? ................................................................................................. 113
5.2.3.2. Can a deferred tax liability be recognised as equity in the calculation of
the debt-to-equity ratio and why?..................................................................... 115
5.2.3.3. Should the deferred tax liability rather be offset against the cost price of
the asset in the calculation of the debt-to-equity ratio and why? ..................... 118
5.2.3.4. Would it be more accurate to exclude the deferred tax liability completely
from the calculation of the debt-to-equity ratio? ............................................... 120
5.3. SUMMARY ...................................................................................................... 122
CHAPTER 6 ........................................................................................................... 123
CONCLUSIONS AND RECOMMENDATIONS ...................................................... 123
6.1. INTRODUCTION ............................................................................................. 123
6.2. OBJECTIVES OF THE STUDY ...................................................................... 123
xii
6.3. OVERVIEW OF THE LITERATURE ............................................................... 124
6.3.1. Different aspects of the debt-to-equity ratio and the purpose and implications
of this ratio .......................................................................................................... 124
6.3.2. Determining what the appropriate treatment of deferred tax is in the
calculation of the debt-to-equity ratio .................................................................. 125
6.4. EMPIRICAL STUDY ....................................................................................... 127
6.4.1. Participants’ views regarding the debt-to-equity ratio and the proposed
treatment of deferred tax in the calculation of this ratio ....................................... 127
6.4.2. Factors other than deferred tax taken into consideration when calculating the
debt-to-equity ratio .............................................................................................. 128
6.4.3. Current treatment of deferred tax as a liability in the debt-to-equity ratio and
the impact thereof ............................................................................................... 130
6.4.4. The different proposed treatments of deferred tax in the calculation of the
debt-to-equity ratio .............................................................................................. 132
6.5. OVERVIEW AND RECOMMENDATIONS ...................................................... 134
6.6. LIMITATIONS AND RECOMMENDATIONS FOR FURTHER RESEARCH ... 137
6.7. SUMMARY ...................................................................................................... 138
BIBLIOGRAPHY .................................................................................................... 140
ANNEXURES ......................................................................................................... 149
7.1 APPENDIX A: Semi-structured research interviews ..................................... 149
xiii
LIST OF TABLES
Table 4-1: Representative sampling of each component ......................................... 66
Table 4-2: Four worldviews ...................................................................................... 68
Table 4-3: A classification framework of design types .............................................. 76
Table 4-4: Quantitative, mixed and qualitative methods ........................................... 79
Table 5-1: Participants’ responses regarding the value that can be placed on the
calculation of the debt-to-equity ratio........................................................................ 92
Table 5-2: Participants’ responses regarding whether information reported in terms
of IFRS should be adjusted when calculating certain ratios ..................................... 96
Table 5-3: Participants’ responses regarding whether the analyst and their
background will influence inputs used to calculate the debt-to-equity ratio .............. 99
Table 5-4: Participants’ responses regarding the type of industry in which an entity
functions and whether this will affect the treatment of deferred tax in the debt-to-
equity ratio .............................................................................................................. 102
Table 5-5: Participants’ responses regarding deferred tax being viewed as a form of
debt financing ......................................................................................................... 105
Table 5-6: Participants’ responses regarding if decisions will be influenced by
including or excluding the deferred tax liability when calculating the debt-to-equity
ratio ........................................................................................................................ 108
Table 5-7: Participants’ responses regarding deferred tax being an influential item in
the calculation of the debt-to-equity ratio ................................................................ 110
Table 5-8: Participants’ responses to how they would treat the deferred tax liability
when calculating the debt-to-equity ratio ................................................................ 114
Table 5-9: Participants’ responses regarding a deferred tax liability being treated as
equity in the calculation of the debt-to-equity ratio ................................................. 116
Table 5-10: Participants’ responses regarding a deferred tax liability being offset
against the cost price of the asset that created the liability in the calculation of the
debt-to-equity ratio ................................................................................................. 118
Table 5-11: Participants’ responses regarding a more accurate debt-to-equity ratio
being calculated by completely excluding the deferred tax liability from the
calculation .............................................................................................................. 121
xiv
LIST OF FIGURES
Figure 2-1: Summary of the financial statements, business allocation context and
various analysis tools ............................................................................................... 13
Figure 2-2: Parties benefiting from financial statement analysis .............................. 21
Figure 2-3: Five most commonly used financial analysis techniques ....................... 24
Figure 2-4: Ratio analysis categories ....................................................................... 30
Figure 2-5: Process of choices in the application of ratio analysis ........................... 36
Figure 3-1: Description of temporary differences……………………………………… 52
Figure 4-1: The research process ............................................................................ 65
Figure 4-2: A metaphor of research design .............................................................. 72
Figure 4-3: Mapping designs .................................................................................... 74
Figure 4-4: Mapping designs (Level 2) ..................................................................... 75
1
CHAPTER 1
1.1. PURPOSE, SCOPE AND PROGRESS OF STUDY
1.1.1. Background
Current economic conditions play a big role in the survival of new and upcoming
entities as well as long standing corporations. The economic environment and
business strategy of a firm influences its business activities (Palepu & Healy, 2008:1-
2). The above-mentioned highlights the importance of financial performance and
management. One of these performance aspects lies in evaluating financial
statements to gain a clearer insight regarding how the entity performed on a financial
level during the previous financial years to ensure continuous improvement on a
performance level. Gibson (2013:628) states that financial statements include the
balance sheet, income statement, and statement of cash flow. The new heading for
balance sheet has changed to the statement of financial position, the name change
is recognised, but for the purpose of the literature review and study reference will be
made to the balance sheet. The balance sheet and income statement provide the
information required by most of the stakeholders of a business required for decision
making (Singla, 2014:17). Financial statements play a very important role in gaining
a better understanding of how an entity functions. These statements are a primary
source of evaluating their investment in an entity for any investor. Penman (2010:2)
maintains that the primary source of information regarding a firm is the financial
statements they publish. Financial statements help investors to decide whether to
invest in a firm. Investors use these financial statements to ensure that the firm has
the ability to keep adding value to their investment (Penman, 2010:2). According to
Singla (2014:17) some of the most valuable information of past performance and
present position of an entity are stored in financial statements. Financial statements
are the lens that provides insight on the business and it is important to gain a better
understanding of how the entities’ operations are presented through the financial
statements (Penman, 2010:232).
The comparative and relative importance of data presented can be emphasised
through various financial data analysis techniques which can be used to evaluate the
2
position of a firm (Gibson, 2013:199). Financial analysis is the process of
synthesizing and summarizing financial and operative data with a view of gaining
insight into the operative activities of a business. It is a technique used to X-ray the
financial position as well as the progress of a company (Singla, 2014:18).
Financial analysis is used to assess the performance of a firm based on its stated
goals and strategies (Palepu & Healy, 2008:5-1). According to Jeter and Chaney
(1988:42) the usual goal of conducting a financial statement analysis is to predict
future conditions and performance based on the evaluation of past and current
financial positions. Singla (2014:18) summarises the purpose of financial statement
analysis as diagnosing the profitability and financial soundness of a business
through treatment of the information contained in the financial statements. The
importance of financial statement analysis and the role it plays in an entity’s future
success can’t be overstated. Long-term sustainability and improved management of
businesses by owners can be gained through better interpretations and proper use
of financial statements (Van Auken & Yang, 2014:2).
Damjibhai (2016:30) states that a very powerful measurement tool that can be used
to measure organisation performance is ratio analysis. Ratio analysis also serves as
a prediction tool that can be used to prevent financial distress and fraudulent
financial reporting (Arshad, Iqbal & Omar, 2015:35-36). Ratio analysis is when
different account balance relationships are compared (Gibson, 2013:638). The
definition of ratio analysis is the systematic use of ratios to interpret statements to
determine where an entity’s strengths and weaknesses lie as well as to determine
current financial conditions and historic performance (Damjibhai, 2016:31). Ratio
analysis is very open ended, especially when it comes to certain inputs to calculate a
ratio. Gibson (2013:200) states that different computations of the same ratio can be
derived from each author or source on financial analysis.
Debt management and financial leverage play an important role in financial
management and have a number of implications (Correia, Flynn, Uliana, & Wormald,
2013:5-15). The debt-to-equity ratio is one of the key ratios in terms of risk and debt
management for an entity. According to Correia et al. (2013:5-16) the debt-to-equity
ratio indicates to what extent shareholders’ funds cover debt and is an indication of
medium financial risk. The debt-to-equity ratio is used as an indicator of risk (Skae,
3
2014:297). The debt-to-equity ratio is commonly used to measure financial leverage,
and is also useful for credit analysis (Penman, 2010:371). This ratio is a useful
assessment tool to analyse an entity’s debt paying ability. Long-term debt-paying
ability can be determined by computing the debt-to-equity ratio. Creditors can also
use this ratio to determine if they are well protected in case of insolvency (Gibson,
2013:285). Thus this ratio can be used to determine a company’s debt position,
especially from the perspective of future investors and creditors. The lower this ratio,
the better a company’s debt position is in terms of long-term debt-paying ability
(Gibson, 2013:285). The ratio indicates how well a company is capitalised, and a
higher ratio indicates that a company is dependent on future profits for the payment
of debt.
1.1.2. Motivation of topic actuality
Two problems often encountered with ratio analysis are, firstly, the inclusion or
exclusion of certain items in a specific ratio and, secondly, ensuring consistency. A
lack of uniformity is one of the problems that arises when calculating certain ratios
(Gibson, 2013:286). Financial statement analysis has no standard setters, is not
codified, and has no framework. It therefore lacks structure in contrast to financial
accounting (Entwistle, 2015:555). There are certain aspects of the debt-to-equity
ratio that can be problematic for an analyst, specifically the appropriate treatment of
deferred taxes. IAS 12 is the international accounting standard that regulates the
proposed treatment of deferred taxes purely from a financial accounting perspective.
Correia et al. (2013:5-16) maintain that the appropriate treatment of deferred tax is
an issue that arises from the debt-to-equity ratio. The classification of deferred taxes
in this ratio lies in the hands of the analyst (Lasman & Weil, 1978:49). Deferred tax
can be treated as equity or as a liability (Huss & Zhao, 1991:71), and this leads to an
area where further study can be done to determine how this item is classified.
Deferred tax is frequently regarded as equity based on the premise that there will
always be a new tax allowance to replace those that are reversing; therefore it is
unlikely that a liability will arise (Huss & Zhao, 1991:71). Should there be an
expectation that a liability will arise, it is suggested that it is appropriate to treat the
item as debt. Gibson (2013:626) states that deferred tax can be classified as an
asset or a liability based on the nature of the timing differences. These differences
are the result of revenue and expenses recognised in different time periods for the
4
purpose of tax and financial statements. Deferred tax will never really reverse in a
growing company; thus the deferred tax liability should be added to equity when
calculating debt ratios (Bartlett, 2014:693). Jeter and Chaney (1988:42) concur that
the treatment of deferred taxes lies in the consistent growth of the account and the
likelihood of future reversal.
The treatment of deferred tax in the calculation of the debt-to-equity ratio can lead to
information being reported in a manner that does not reflect the economic substance
of the item. When anticipating that the total amount of deferred taxes will not reverse
in the future, the reported liability will be higher than the economic substance of the
event (Jeter & Chaney, 1988:42). The reason for treating deferred tax as a liability is
based on the user’s assumption that the tax will be paid in the near future (Huss &
Zhao, 1991:71). Equity treatment is motivated by the fact that increases in deferred
taxes are de facto earnings (Huss & Zhao, 1991:71). In practice the treatment comes
down to the fact that deferred taxes are treated as equity and added back to net
income (Jeter & Chaney, 1988:42). Deferred tax treatment can also be affected by
factors that affect a rating decision, for example future profitability judgements (Huss
& Zhao, 1991:71). The question that needs to be answered is how the theory differs
from practice regarding the treatment of deferred tax and what the reasons are, if
any, for these differences.
1.2. PROBLEM STATEMENT
Financial statements can be used as an indicator of future growth and soundness of
a company, but in itself is silent (Singla, 2014:17). The owners’ perception of the
financial statements can influence the way in which financial statements are used
and interpreted (Van Auken & Yang, 2014:2). The personal judgement and
competence of the accountant can affect the financial statements of an entity
(Singla, 2014:17). Taking this into account, financial statements and the analysis
thereof relies greatly on the judgement of certain people. This begs the question how
certain items should be treated in the financial statements to ensure that the correct
decisions can be made based on this information.
Debt-to-equity is one of the most commonly used debt management ratios (Bartlett,
2014:693). The debt-to-equity ratio provides crucial information to creditors, analysts,
5
shareholders, and potential investors regarding the financial strength or weakness of
a company, for example long-term survival and the probability of future dividend
payments (Axson, 2010; Matthew, Fada, Ukonu & Adejoh, 2016:6). The debt-to-
equity ratio can be used to calculate the share price of an entity with greater
precision (Safania, Nagaraju & Roohi, 2011:278). The importance of the debt-to-
equity ratio and the role it plays in financial statement analysis can’t be understated,
emphasising the importance of the correct calculation of this formula. Lasman and
Weil (1978:49) point out that the number of analysts who calculate the debt-to-equity
ratio is almost the same as the number of definitions for this ratio indicating the level
of subjectivity involved. The appropriate treatment of deferred tax is one of the
subjective items in the calculation of this ratio.
The question could therefore be asked: what is the appropriate treatment of deferred
tax when calculating the debt-to-equity ratio? The inclusion or exclusion of this
amount can have a significant influence on the debt-to-equity ratio, which is viewed
as one of the key risk formulas for any entity.
1.3. OBJECTIVES
The main objective of this study is to gain a better understanding regarding the
treatment of deferred tax in the debt-to-equity ratio and to determine how this differs
in theory and in practice.
The main objective will be achieved by the following secondary objectives:
Conceptualising the debt-to-equity ratio from the literature by performing an in
depth theoretical study regarding the ratio to gain a better understanding of
the purpose and implications of this ratio (research objective 1);
Conceptualising from the literature what the appropriate treatment of deferred
tax in the debt-to-equity ratio is (research objective 2);
Determining from an academic perspective how deferred tax should be
treated in the calculation of the debt-to-equity ratio by gaining the opinion of
specific academic practitioners who specialise in the field of financial
management and financial accounting (research objective 3);
6
Determining how stockbrokers and portfolio managers take deferred tax into
account when calculating the debt-to-equity ratio by performing interviews
with certain professionals in practice (research objective 4); and
Based on research conducted, formulate a conclusion and recommendations
regarding the treatment of deferred tax in the debt-to-equity ratio (research
objective 5).
1.4. RESEARCH DESIGN/METHOD
To achieve the above objectives, a thorough literature study with an empirical study
will be conducted.
1.4.1. Literature review
The literature study will follow a two-pronged approach. Firstly, the work of theorists
regarding this specific ratio will be carefully reviewed and considered. Consideration
will also be given to locally (nationally) and internationally published academic
research on this matter. This will be performed to gain a thorough understanding of
the current and proposed treatment of deferred tax in the debt-to-equity ratio.
Different opinions of theorists will be analysed and compared. This will be done to
gain a better insight regarding the inner workings of the debt-to-equity ratio and to
identify to what extent the literature agrees or disagrees regarding certain aspects of
this ratio.
The literature study will aim to achieve the following:
To obtain a sound foundation of widely accepted theory and detailed
reasoning behind the acceptance of this theory for the calculation of the debt-
to-equity ratio;
To gain a better understanding regarding deferred tax and what the proposed
treatment of this amount is based on theory;
To determine how stockbrokers and portfolio managers calculate the debt-to-
equity ratio and if there are any differences between theory and practice;
7
To determine whether previous studies, both nationally and internationally,
have posited any conclusions or recommendations regarding the proposed
treatment of deferred tax; and
To determine how deferred tax should be treated in ratio analysis by
examining the following proposed treatments as stated by Huss and Zhao
(1991:70):
Liability treatment: The deferred income tax credit will be
included as part of the company’s long-term liabilities;
Equity treatment: The deferred income tax credit is added to
shareholder equity; and/or
Excluded from the ratio: The deferred income tax credit will not
be used in the calculation of the debt-to-equity ratio.
1.4.2. Empirical research
This study will adapt the constructivism paradigm, as subjective meaning based on
interpretation will be developed to answer the research questions in the best
possible manner. Social constructivists adhere to the belief that individuals seek
understanding of the world in which they live and function. This understanding is
gained by developing subjective meaning from their own life experiences (Creswell,
2014:8). The research method used in this study is a qualitative research method.
Qualitative research is one of the best methods to use when studying a subject in
depth (Myers, 2013:9). Qualitative research places more concern on words rather
than numbers and provides a primary view of the connection between theory and
research (Bryman & Bell, 2011:386). Pellissier (2007:23) states that when qualitative
research is conducted, a wide assortment of data-collection methods and the
application of varied conceptual frameworks are used to solve problems. The design
is chosen to meet the objectives of this study.
The empirical research will be conducted by performing interviews regarding the
proposed treatment of deferred taxes in the debt-to-equity ratio and investigating the
specific views regarding this aspect. The representatives of this proposed empirical
study includes stockbrokers and portfolio managers to gain insight regarding the
views in practice; further interviews will be conducted with academics at the North-
8
West University who specialise in the fields of financial accounting and financial
management for a more theoretical background. For the purpose of this study
stockbrokers and portfolio managers are defined as professionals who focus on
investing and selling shares in firms. The reason for the selection of the above-
mentioned professionals is that they view ratios as a primary focus area when it
comes to evaluating and making decisions regarding a specific share. Thus financial
statement analysis plays an important role in gaining a more comprehensive insight
regarding a specific company to ensure appropriate and informed decisions can be
made. Interviews with academics are done to gain specific insight regarding IAS 12
(deferred taxes), which is an accounting term, and to ascertain the different views
regarding this item from a financial management perspective. Interviews are seen as
social interactions with specific norms, expectations, and social roles. The explicit
purpose of an interview is to gain specific information through a structured
conversation (Babbie & Mouton, 2012:249). The content of the interviews will be
developed to include questions regarding the current treatment of deferred taxes in
practice and the rationale behind the treatment. It is purely based on theory and an
academic view how this item should be handled in the debt-to-equity ratio.
For the purpose of this study, trustworthiness will be illustrated by recording,
transcribing, and coding the interviews conducted. The results of these interviews
will be interpreted and the results obtained from professionals in practice will be
compared and analysed to determine whether any differences or similarities exist in
the participants’ treatment of deferred taxes. The results of interviews with
academics will also be interpreted to determine what the specific views are from an
academic perspective, and based on this information a comparison between theory
and practice will be made. The results of the interviews and the literature study will
be used to draw a conclusion regarding the proposed treatment of deferred tax in the
debt-to-equity ratio.
1.5. OVERVIEW
The study will be conducted in six chapters, as follows:
Chapter 1: Purpose, scope and progress of study
9
The first chapter of this study provides a summary of the background on the
research. The background of ratio analysis and the debt-to-equity ratio is discussed
and the research objectives are provided together with the methodology used as well
as the outline of the study.
Chapter 2: Purpose and implications of the debt-to-equity ratio
Chapter two consists of a literature study that focuses on what the accepted theory is
regarding financial statement analysis, the debt-to-equity ratio, and the proposed
inputs when calculating this ratio. This is done to gain a better understanding
regarding this ratio and which inputs have a significant influence when it comes to
calculations. Previous literature studies, text books, and locally as well as
internationally published academic research are studied to gain further insight
regarding this issue from a purely theoretical viewpoint.
Chapter 3: Treatment of deferred tax in the debt-to-equity ratio
The treatment of deferred taxes is the main input where further theoretical study will
be required to gain a better understanding regarding the proposed classification of
this item and how the classification of this item will influence the debt-to-equity ratio.
This chapter focuses on gaining further insight regarding the proposed treatment of
deferred taxes in the debt-to-equity ratio by reviewing previous studies, textbooks,
and articles that address this matter. These resources are used to gain better insight
regarding the treatment of deferred taxes from a theoretical and research viewpoint.
Chapter 4: Research design and method
In Chapter 4 the research methodology of this study is described. The development
of questions used for the interviews as well as the rationale for selecting certain
people for interviews are discussed and explained. The reasons for certain questions
are more thoroughly discussed to ensure the required information is gained from
interviews.
Chapter 5: Analysis of empirical results
In this chapter the results of the interviews conducted are assessed, specifically
regarding the proposed treatment of deferred taxes based on theory and the views of

10
academics that specialise in their respective fields. The feedback from stockbrokers
and portfolio managers is assessed and compared to theory.
Chapter 6: Conclusion and recommendations
Conclusions are drawn based on the results of the literature review and the
interviews conducted are discussed based on the objectives set out in sections 1-3.
Recommendations are then made based on the study.
11
CHAPTER 2
PURPOSE AND IMPLICATIONS OF THE DEBT-TO-EQUITY RATIO
2.1. INTRODUCTION
This chapter consists of a literature study of the accepted theory of ratio analysis and
specifically the debt-to-equity ratio to address the first secondary objective set in
section 1.3 in Chapter 1. The purpose of this chapter is to obtain sufficient
information from the literature regarding the debt-to-equity ratio and to gauge what
the specific functions behind this formula are. This aids in creating a bigger picture of
the subject under discussion and provides a good indication of what the content of
the interviews developed for the empirical study should consist of.
To fully understand the theory behind ratio analysis, the importance of financial
statements must first be understood. A better understanding of the role of financial
statements enhances the understanding of the importance thereof. Ratio analysis
serves as one of the principal analysis tools used in the analysis of financial
statements (Palepu & Healy, 2008:5-1). The financial analyst is just as important as
the techniques he uses to analyse the financial statements, because without proper
interpretation and analysis of figures accurate projections and decisions will not be
achievable (Correia et al., 2013:5-15). With regard to the previous statement, deeper
insight regarding the role and the importance of the analyst will also be required.
A sound foundation of widely accepted theory is established and the reasoning
behind the acceptance thereof is discussed. This is done to obtain a better insight
into the calculation of the debt-to-equity ratio and the extent to which the literature
agrees and disagrees on different aspects regarding this topic.
Consideration is then given to published local and international academic research
performed in order to determine whether previous studies indicate any variation
between how theory suggests the inputs in the debt-to-equity ratio should be treated
and how it is done in practice. The different aspects of debt and equity are analysed
to determine the role these items play in the above-mentioned ratio.
12
2.2. FINANCIAL STATEMENTS
The economic consequences of the business activities of a firm are summarised in
its financial statements (Palepu & Healy, 2008:1-3). The end product of an
organisation’s accounting cycle is the financial statements that are delivered from
this process, which provide a representation of the company’s financial position and
periodic performance (Albrecht, Holland, Malagueño, Dolan & Tzafrir, 2015:803-
804). Financial statements are derived from financial reporting processes which are
governed by accounting rules and standards, management incentives, and the
enforcement and monitoring of mechanisms (Subramanyam & Wild, 2009:67).
Accounting numbers are translated from the economic factors and financial
statements report these numbers (Penman, 2010:17).
Financial statements form the lens through which the business is viewed and it is
important to gain a better understanding of how entities’ operations are presented
through the financial statements (Penman, 2010:232). Financial statements play a
central part in analysing and understanding a firm (Stickney, Brown & Wahlen,
2007:2). The financing and investment activities of a company are, at a point in time,
reported in its financial statements, and these statements are used to summarise the
operating activities for the preceding period (Subramanyam & Wild, 2009:27).
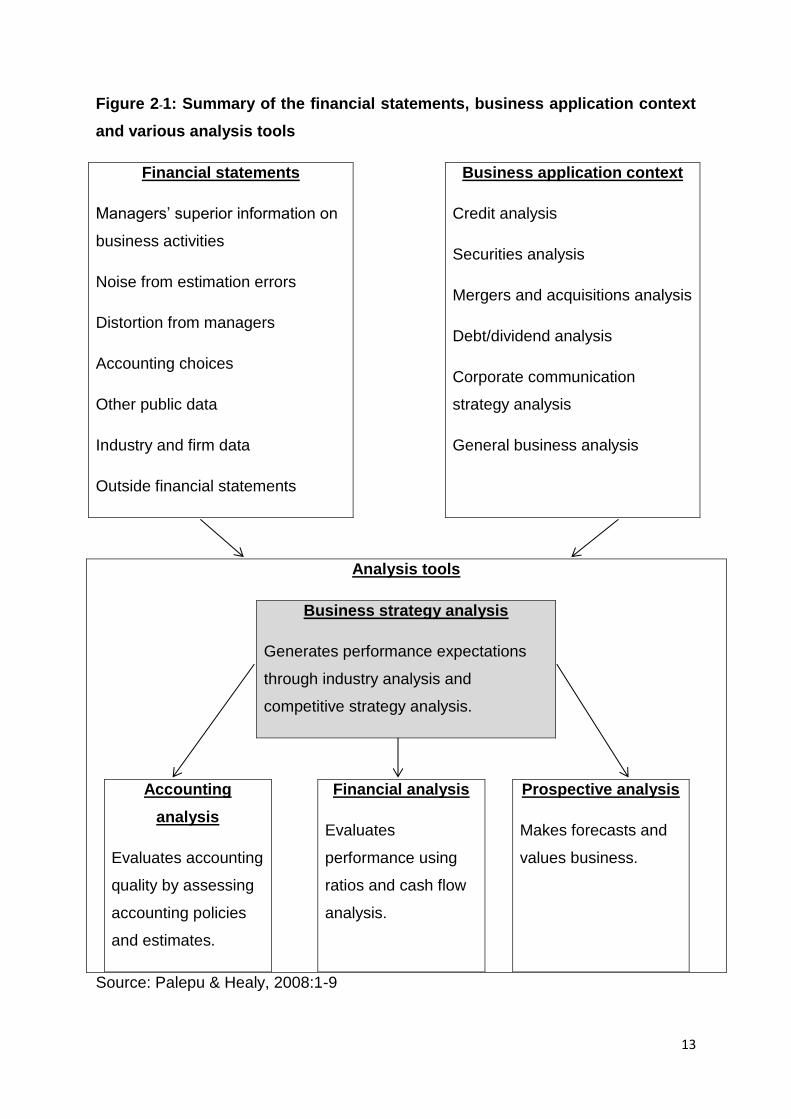
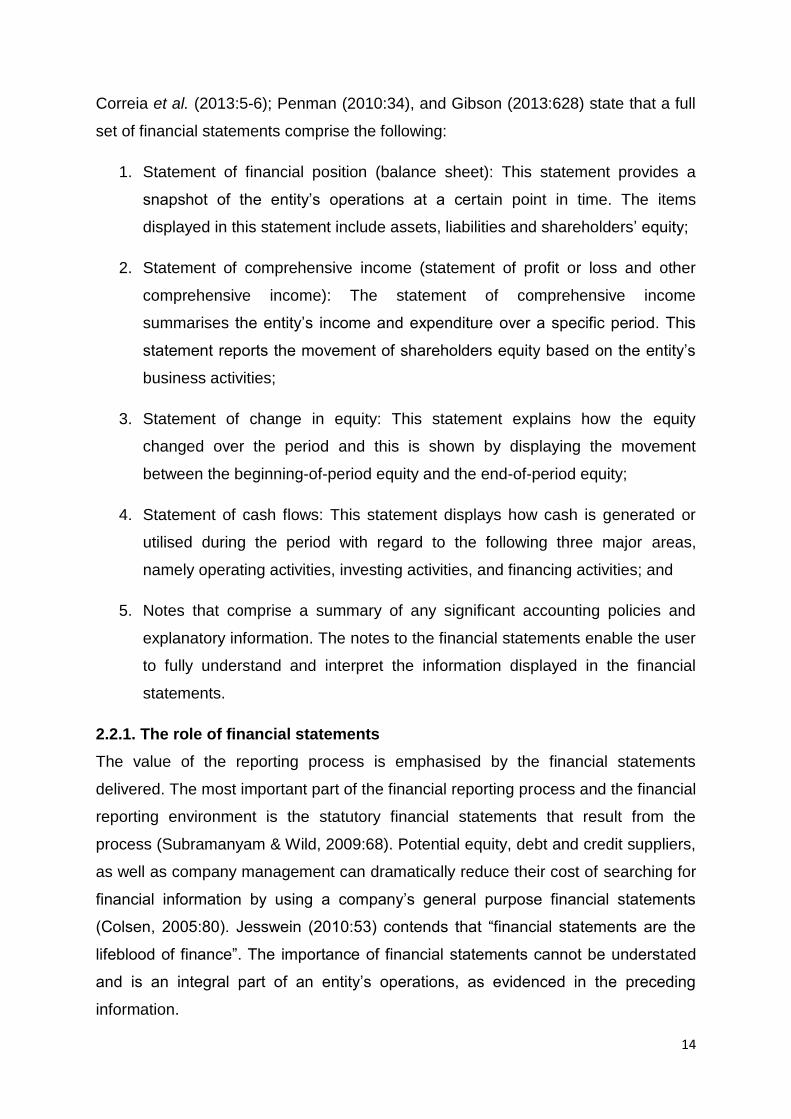
Figure 2-1 summarises the information that can be obtained from financial
statements, what business application context is, and the types of tools that exist to
analyse the aforementioned.
13
Figure 2-1: Summary of the financial statements, business application context
and various analysis tools
Financial statements
Managers’ superior information on
business activities
Noise from estimation errors
Distortion from managers
Accounting choices
Other public data
Industry and firm data
Outside financial statements
Business application context
Credit analysis
Securities analysis
Mergers and acquisitions analysis
Debt/dividend analysis
Corporate communication
strategy analysis
General business analysis
Analysis tools
Business strategy analysis
Generates performance expectations
through industry analysis and
competitive strategy analysis.
Accounting
analysis
Evaluates accounting
quality by assessing
accounting policies
and estimates.
Financial analysis
Evaluates
performance using
ratios and cash flow
analysis.
Prospective analysis
Makes forecasts and
values business.
Source: Palepu & Healy, 2008:1-9
14
Correia et al. (2013:5-6); Penman (2010:34), and Gibson (2013:628) state that a full
set of financial statements comprise the following:
1. Statement of financial position (balance sheet): This statement provides a
snapshot of the entity’s operations at a certain point in time. The items
displayed in this statement include assets, liabilities and shareholders’ equity;
2. Statement of comprehensive income (statement of profit or loss and other
comprehensive income): The statement of comprehensive income
summarises the entity’s income and expenditure over a specific period. This
statement reports the movement of shareholders equity based on the entity’s
business activities;
3. Statement of change in equity: This statement explains how the equity
changed over the period and this is shown by displaying the movement
between the beginning-of-period equity and the end-of-period equity;
4. Statement of cash flows: This statement displays how cash is generated or
utilised during the period with regard to the following three major areas,
namely operating activities, investing activities, and financing activities; and
5. Notes that comprise a summary of any significant accounting policies and
explanatory information. The notes to the financial statements enable the user
to fully understand and interpret the information displayed in the financial
statements.
2.2.1. The role of financial statements
The value of the reporting process is emphasised by the financial statements
delivered. The most important part of the financial reporting process and the financial
reporting environment is the statutory financial statements that result from the
process (Subramanyam & Wild, 2009:68). Potential equity, debt and credit suppliers,
as well as company management can dramatically reduce their cost of searching for
financial information by using a company’s general purpose financial statements
(Colsen, 2005:80). Jesswein (2010:53) contends that “financial statements are the
lifeblood of finance”. The importance of financial statements cannot be understated
and is an integral part of an entity’s operations, as evidenced in the preceding
information.
15
A financial statement presents a picture of the economic performance of an entity
and is the primary source of information regarding the company (Alexander, Britton &
Jorisson, 2003:548; Penman, 2010:2). Correia et al. (2013:5-6) confirm that the
entire year’s performance of an entity is summarised in its financial statements. The
financial statements of a company serve as a representation of its management, who
carry the prime responsibility for the fairness of presentation and the information
presented (Subramanyam & Wild, 2009:113).
The performance of a firm and its financial position at the end of the year can be
displayed through its collective financial statements. According to Singla (2014:17)
some of the most valuable information of past performance and present position of
an entity are stored in financial statements. Financial statements provide important
information to stakeholders and are a legitimate part of good management (Albrecht
et al., 2015:804). Dobrin (2010:25) states that the owners can follow the company’s
financial position by using reports and financial statements. Thus it can be concluded
that financial statements are more than a mere list of figures; it plays a much bigger
role in gaining a better understanding regarding an entity’s performance. The value
of financial statements therefore lies in the fact that current and historic financial
performance can be derived from this information and can be used to make
important decisions.
2.2.2. Uses and users of financial statements
Financial statements are prepared for a group of diverse users, and each one of
these users have certain objectives that they want to achieve through analysis
(Gibson, 2013:215). According to Bartlett (2014:693) and Correia et al. (2013:5-9)
the main stakeholders who use financial statements are a company’s shareholders,
credit providers, government bodies, employees, auditors, and investment analysts.
Financial statements provide the information used by most of the stakeholders of a
business to make decisions regarding the entity (Singla, 2014:17).
The following section addresses how stakeholders can use financial statements. By
comparing the views of White, Sondhi and Fried (2003:2) with that of Burke
(2011:138), one could posit that financial statements are used by investors and
creditors to make better economic decisions and guide them regarding where to
place their scarce investment resources. Financial statements help investors decide
16
whether to invest in a firm. Investors use these financial statements to ensure the
firm has the ability to keep adding value to their investment (Penman, 2010:2).
Equity analysts and credit analysts are interested in formulating expectations about
future earnings and cash flows, about the financial position and possible changes in
the financial position; therefore the information these two parties require is very
similar and financial statements have evolved to serve these needs (Comiskey &
Mulford, 2000:9). Shareholders use the financial statements of the firm to measure
actual performance compared to expectations (Albrecht et al., 2015:804).
The financial statements of an entity are used as a tool to communicate to external
stakeholders; thus these annual accounts can be used to convey a certain message
to the outside world (Alexander et al., 2003:548). Financial statements portray the
role of supporting external users in evaluating current and projected performance of
the company and are one of the least expensive and most widespread methods of
communication management (Dobrin, 2010:29). The financial statements provided
by an entity are not only used to ensure compliance is reached, but also to deliver
valuable information to their stakeholders regarding an entity’s business activities.
The information contained in financial statements can be used and helps the analyst
to infer fundamental value (Penman, 2010:32). The analyst therefore also depends
on these statements, because without this information proper analysis would not be
possible and it would be hard to create value. The financial statements the company
publishes is one of the sources that can be used to gain insight into the performance
of the company (Vergoossen, 1993:156). Financial statements are used to gain
external financing, and the rapid communication thereof can be an incentive to gain
loans at a lower cost (Achek & Gallali, 2015:147). White et al. (2003:2) maintains
that, because of the selective reporting of economic events by the accounting
system, compounded by alternative accounting methods and estimates, financial
statements are at best a resemblance of the economic reality. Hence financial
statements are, at best, only a resemblance of the economic reality, but without
these figures there would be no resemblance whatsoever, which would place a great
deal of strain on the decision making process.
17
2.3. BUSINESS ANALYSIS
Business analysis is the action of evaluating a company’s economic expectations
and risks and is useful for making a wide range of business decisions. This analysis
aids in making informed decisions by giving structure to the decision making task
through an evaluation of the company’s strategies, business environment, financial
position, and performance (Subramanyam & Wild, 2009:3-4). As reported by the
International Institute of Business Analysis (IIBA), an entity’s weaknesses can be
identified through the use of business analysis. The goal of this analysis is to achieve
changes that will provide added value to shareholders (Bradea, Sabău-Popa & Boloş
Marcel, 2014:851).
Business analysis assists the company in defining its strategy, goals, the
requirements for projects, and the improvement of technology and processes
(Bradea et al., 2014:851). Business intermediaries try to achieve successful
business analysis through the following four key steps: business strategy analysis,
accounting analysis, financial statement analysis, and prospective analysis (Palepu
& Healy, 2008:1-8). Combining accounting analysis with several techniques of
financial analysis should enable external parties to judge the performance and the
financial position of a company in a proper perspective (Alexander et al., 2003:632).
The technique of analysing financial statements is viewed and should be seen as an
important and integral part of business analysis. An important part of this analysis
lies in analysing an entity’s business environment and strategy (Subramanyam &
Wild, 2009:14).
2.4. FINANCIAL STATEMENT ANALYSIS
According to Subramanyam and Wild (2009:3) the analysis of financial statements is
integral and an important part of the broader field of business analysis. Financial
analysis is defined as the process of studying a company’s financial reports (Gibson,
2013:216). The analysis of financial statements consists of quantitative and
qualitative conditions which are taken into consideration when measuring the relative
financial position among firms and industries (Gibson, 2013:628). Financial analysis
becomes a very interesting activity, especially when it comes to determining whether
the market is fairly pricing an entity’s shares (Stickney et al., 2007:2). Another
important aspect of financial statement analysis is to determine what a company’s
18
financing and investing activities consist of and to analyse the summarised operating
activities for the preceding period (Subramanyam & Wild, 2009:27).
The analysis of financial statements has traditionally been seen as part of the central
analysis that is required for the valuation of equity (Nissim & Penman, 2001:109). By
analysing financial statements it provides users with meaningful information and
enables them to interpret the financial and non-financial information they receive in
order to make informed decisions (Skae, 2014:280). The analysis of financial
information can be done in different ways, depending on the nature of the firm or
industry and what the specific needs of the user are (Gibson, 2013:216). Financial
analysis is a technique used to X-ray the financial position as well as the progress of
a company. It can be defined as the process of synthesizing and summarizing
financial and operative data with a view of getting an insight into the operational
activities of a business enterprise (Singla, 2014:18).
Financial analysis focuses the lens on the company’s statements to create a clearer
picture regarding its operations. Through this analysis the durability of competitive
advantage from sequences of accounting numbers are organised to highlight these
features of the entity (Penman, 2010:17). Financial analysis aims to use financial
data to evaluate the current and past performance of a firm and, in so doing, assess
the company’s sustainability (Palepu & Healy, 2008:1-9).
2.4.2. The purpose of financial statement analysis
The overall objective of analysing financial statements is to examine the financial
position and returns in relation to the risk of the firm, with the view of forecasting the
firm’s future prospects (Correia et al., 2013:5-9). Financial analysis serves the
purpose of evaluating the performance of the firm based on the strategy, economic-,
and industrial environment in which the company is competitive and the accounting
strategy that the company has applied (Alexander et al., 2003:586). The standard
analysis of financial statements distinguishes shareholders’ probability from the risks
that arises from operations which emerge from the companies’ borrowings to finance
operations (Nissim & Penman, 2003:532). The analysis of financial statements leads
to the identification of certain aspects that are relevant to make investment
decisions. The goal of this analysis is to assess the firm’s value based on the
financial statements (Ou & Penman, 1989:295).
19
The analysis of financial information is a valuable activity when managers have
detailed information on an entity’s strategies and performance that will not likely be
fully disclosed due to a variety of institutional factors (Palepu & Healy, 2008:1-1, 1-
8). Therefore financial analysis intends to obtain managers’ inside-information from
public financial statement data (Palepu & Healy, 2008:1-1, 1-8). Based on the
aforementioned it may be postulated that financial statement analysis is not only
important for external stakeholders, but also plays a very important role for
managers inside the company.
The analysis of financial statements is a method that is used to analyse the entire
business (Penman, 2010:17). The goal of financial statement analysis is to
determine entity performance, future prospects, and the company’s financial
structure (Skae, 2014:280). According to Konchitchki and Patatoukas (2013:682) the
financial analysis of a firm’s probability drivers applied at the aggregated level
delivers a timely insight regarding its future real economic activity. Long-term
sustainability and improved management of businesses by owners can be gained
through better interpretations and proper use of financial statements (Van Auken &
Yang, 2014:2). The objectives of financial and non-financial analysis are interrelated
with the needs of financial statement users (Skae, 2014:280).
Financial analysis is used to assess the performance of a firm based on its stated
goals and strategy (Palepu & Healy, 2008:5-1). Financial statement analysis is not a
source of every single answer required regarding the specific firm, but enables the
appropriate questions to be posed regarding the firm’s performance (Duhovnik,
2008:134). The aim of this analytical process is to establish trends for the particular
enterprises over a certain period and to compare the results and trends with those of
competitors to identify appropriate measures to improve current strengths and
weaknesses (Skae, 2014:280). Singla (2014:18) summarises the purpose of
financial statement analysis as diagnosing the profitability and financial soundness of
a business through treatment of the information contained in the financial
statements. Based on the results of empirical analysis performed by Nissim and
Penman (2003:531) the conclusion is made that financial statement analysis
explains cross-sectional differences in current and future rates of return including
price-to-book ratios, which are established on expected rates of return on equity.
20
When the results of financial analysis are compared with industry averages and with
competitors’ results more meaningful information will be gained. It is important to
take note that caution must be exercised when using industry averages and
competitors’ results, because these results are not a complete determination of how
competitors function, but rather an indication of where the firm is currently standing
in the market (Gibson, 2013:216). The analysis of accounting data serves as an
important precondition for effective financial analysis, as the quality of the financial
analysis and conclusions drawn therefrom depends heavily on the quality of the
underlying accounting data (Subramanyam & Wild, 2009:106).
According to Singla (2014:18-19) there are a wide range of parties that benefit from
financial analysis, as illustrated below:
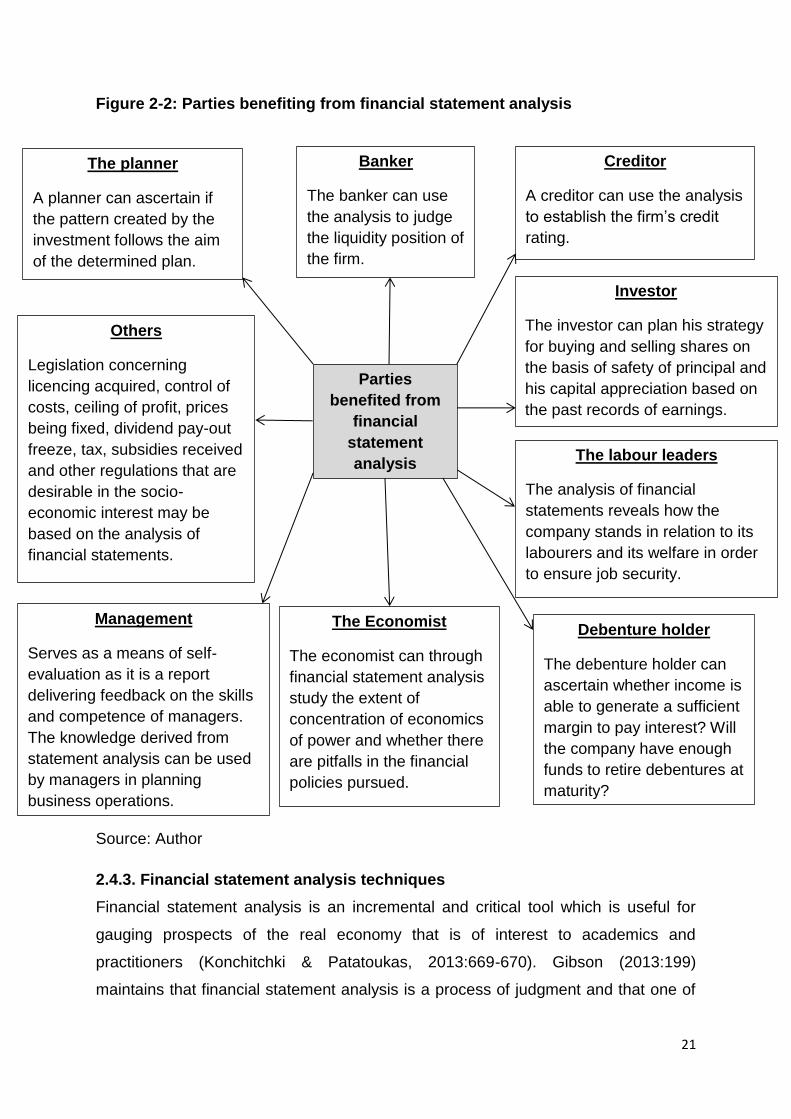
21
Figure 2-2: Parties benefiting from financial statement analysis
Source: Author
2.4.3. Financial statement analysis techniques
Financial statement analysis is an incremental and critical tool which is useful for
gauging prospects of the real economy that is of interest to academics and
practitioners (Konchitchki & Patatoukas, 2013:669-670). Gibson (2013:199)
maintains that financial statement analysis is a process of judgment and that one of
Parties
benefited from
financial
statement
analysis
Creditor
A creditor can use the analysis
to establish the firm’s credit
rating.
Debenture holder
The debenture holder can
ascertain whether income is
able to generate a sufficient
margin to pay interest? Will
the company have enough
funds to retire debentures at
maturity?
Banker
The banker can use
the analysis to judge
the liquidity position of
the firm.
Management
Serves as a means of self-
evaluation as it is a report
delivering feedback on the skills
and competence of managers.
The knowledge derived from
statement analysis can be used
by managers in planning
business operations.
Others
Legislation concerning
licencing acquired, control of
costs, ceiling of profit, prices
being fixed, dividend pay-out
freeze, tax, subsidies received
and other regulations that are
desirable in the socio-
economic interest may be
based on the analysis of
financial statements.
The planner
A planner can ascertain if
the pattern created by the
investment follows the aim
of the determined plan.
The labour leaders
The analysis of financial
statements reveals how the
company stands in relation to its
labourers and its welfare in order
to ensure job security.
The Economist
The economist can through
financial statement analysis
study the extent of
concentration of economics
of power and whether there
are pitfalls in the financial
policies pursued.
Investor
The investor can plan his strategy
for buying and selling shares on
the basis of safety of principal and
his capital appreciation based on
the past records of earnings.
22
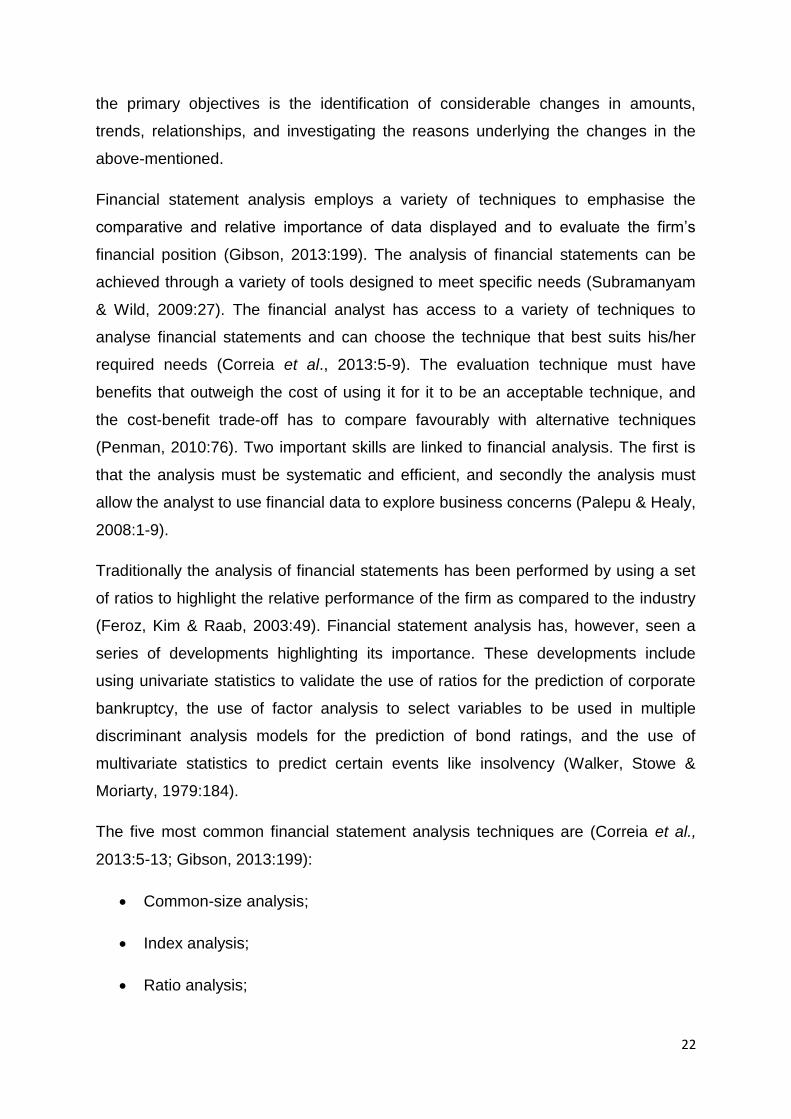
the primary objectives is the identification of considerable changes in amounts,
trends, relationships, and investigating the reasons underlying the changes in the
above-mentioned.
Financial statement analysis employs a variety of techniques to emphasise the
comparative and relative importance of data displayed and to evaluate the firm’s
financial position (Gibson, 2013:199). The analysis of financial statements can be
achieved through a variety of tools designed to meet specific needs (Subramanyam
& Wild, 2009:27). The financial analyst has access to a variety of techniques to
analyse financial statements and can choose the technique that best suits his/her
required needs (Correia et al., 2013:5-9). The evaluation technique must have
benefits that outweigh the cost of using it for it to be an acceptable technique, and
the cost-benefit trade-off has to compare favourably with alternative techniques
(Penman, 2010:76). Two important skills are linked to financial analysis. The first is
that the analysis must be systematic and efficient, and secondly the analysis must
allow the analyst to use financial data to explore business concerns (Palepu & Healy,
2008:1-9).
Traditionally the analysis of financial statements has been performed by using a set
of ratios to highlight the relative performance of the firm as compared to the industry
(Feroz, Kim & Raab, 2003:49). Financial statement analysis has, however, seen a
series of developments highlighting its importance. These developments include
using univariate statistics to validate the use of ratios for the prediction of corporate
bankruptcy, the use of factor analysis to select variables to be used in multiple
discriminant analysis models for the prediction of bond ratings, and the use of
multivariate statistics to predict certain events like insolvency (Walker, Stowe &
Moriarty, 1979:184).
The five most common financial statement analysis techniques are (Correia et al.,
2013:5-13; Gibson, 2013:199):
Common-size analysis;
Index analysis;
Ratio analysis;

23
Reviewing descriptive material; and
The study of differences in the components of financial statements between
industries.
These techniques are presented in figure 2.3 below.
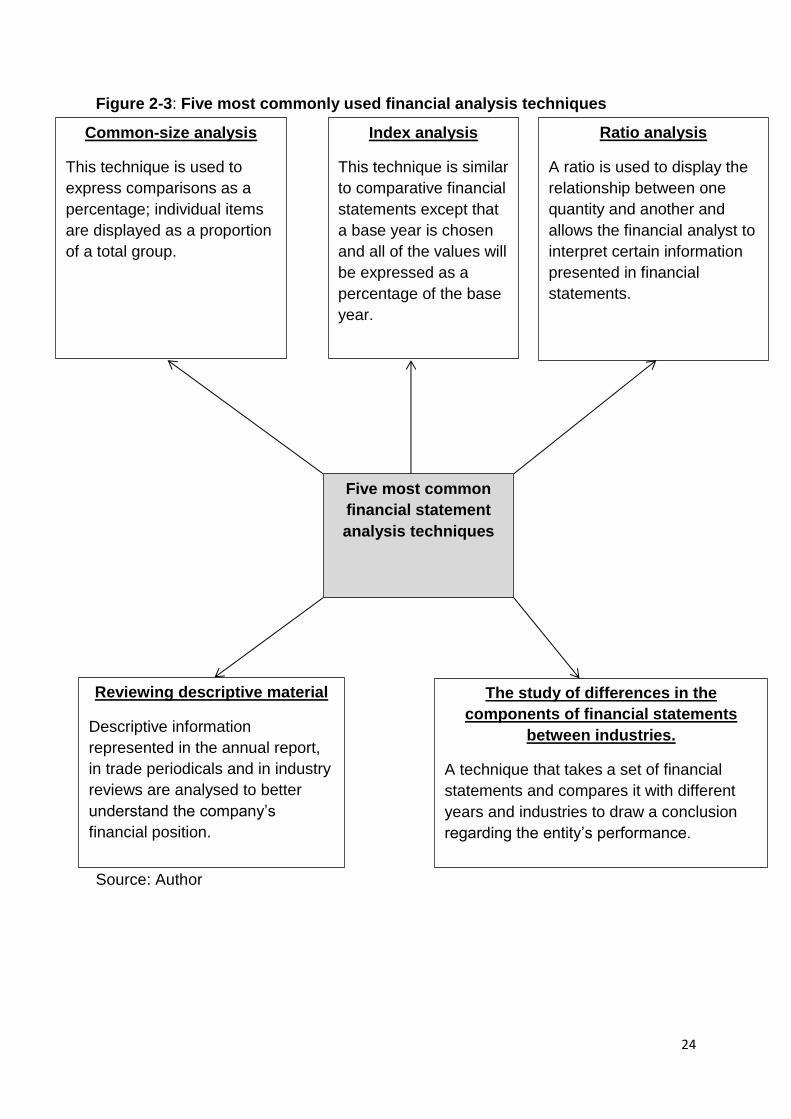
24
Figure 2-3: Five most commonly used financial analysis techniques
Source: Author
Ratio analysis
A ratio is used to display the
relationship between one
quantity and another and
allows the financial analyst to
interpret certain information
presented in financial
statements.
Common-size analysis
This technique is used to
express comparisons as a
percentage; individual items
are displayed as a proportion
of a total group.
The study of differences in the
components of financial statements
between industries.
A technique that takes a set of financial
statements and compares it with different
years and industries to draw a conclusion
regarding the entity’s performance.
Reviewing descriptive material
Descriptive information
represented in the annual report,
in trade periodicals and in industry
reviews are analysed to better
understand the company’s
financial position.
Index analysis
This technique is similar
to comparative financial
statements except that
a base year is chosen
and all of the values will
be expressed as a
percentage of the base
year.
Five most common
financial statement
analysis techniques
25
2.5. THE FINANCIAL ANALYST
2.5.1. What does the financial analyst need to know?
Analysts use ratios to make projections about the future; this means that it is
important that the analyst should understand the factors that could affect such ratios
in the future and how past events can affect the ratio (Correia et al., 2013:5-15). The
analyst has to provide insightful comments and, in order to do so, this basic
knowledge of the local and global economic and political environment within which
the entity operates is required (Skae, 2014:282). Modern general financial
statements serve the purpose of backing the analyst’s valuation of a company’s
equity as articulated in the Financial Accounting Standards Board’s (FASB)
conceptual framework, and has led to fair value measurement and accounting
treatment of asset-and-liability recognition, which are both appropriately orientated
toward the future rather than the past (Colsen, 2005:80).
According to Penman (2010:2, 14, 17) an accomplished analyst knows the business
he/she is analysing through knowledge of the following:
An understanding of the industry in which the company operates and the
firm’s position in it;
A good understanding of the business and the entity’s competitive
advantage;
An understanding of how the financial statements measure the success of
the business;
The firm’s strategy to build networks, how to meet challenges of their
competitors, and how to adapt to technological change;
The type of products that the company sells;
The company’s consumer demand anticipation;
Whether there is excess capacity in the firm’s industry;
An understanding of the ever evolving technology path, how data, voice and
multimedia might be delivered in the future; and
26
An understanding of government regulations.
2.5.2. The role of the financial analyst
Analysis corrects where accounting measurement is defective and the analyst
supplements the financial statements with other information when the picture is not
complete, but to do this the analyst must know what the statements are truly saying
(Penman, 2010:17). The company’s published annual report is a key source of
information for the analyst; however, these financial reports have certain drawbacks
which the financial analyst need to understand and take into consideration when
performing certain tasks (Bartlett, 2014:717). The financial analyst who understands
management’s disclosure strategies has the opportunity to create inside information
from public data. The analyst plays an important role in enabling outside parties to
evaluate the firm’s current and prospective performance (Palepu & Healy, 2008:1-
10). The financial analyst can proceed to value the business through the use of
financial statements and good knowledge of the entity’s operations (Penman,
2010:17).
The financial analyst has the task of analysing a firm’s profit potential. In order for the
analyst to be able to do this they first have to assess the profit potential of each of
the industries in which the firm is competing (Palepu & Healy, 2008:2-1). The analyst
collects information on one or more shares, forms opinions, and writes
recommendations when shares are being appraised. This association usually
stretches from investment banks to brokerage houses that provide recommendations
to profitable customers (Bildstein-Hagberg, 2003:439). The primary focus of the
financial analyst should be on the accounting estimates and methods that the firm
uses to determine critical success factors and risks (Palepu & Healy, 2008:1-10).
The financial analyst can be viewed as a critic in terms of a dramatic context and
portrays the role of a silent messenger between the stage and audience that
assesses the quality of the plot (financial statements) and the performance of the
main actors (management) (Bildstein-Hagberg, 2003:435). According to Givoly
(2003:620) the role that the financial analyst plays in code law countries, which are
countries that have a legal code that purports to exhaustively cover a complete
system of law, is less important, because companies rely more on private debt-
financing. Thus the outside analyst only has limited access to corporate information,
27
regardless of search efforts to gather specific information. The financial analyst
forces the market to act and becomes an active creator of trade, by upsetting the
structure that separates the reckonable and controllable from the unknown and
ambiguous (Bildstein-Hagberg, 2003:435).
2.5.3. The investment analyst
The investment analyst plays a critical role in the capital market as information
mediator between companies and investors. There are three main types of
investment analysts, namely investment advisors, portfolio managers, and
directors/heads of departments (Vergoossen, 1994:156). The investment analyst
makes decisions that are often followed by both institutional and individual investors
in making final investment decisions. These decisions can also affect the market
value of the firm, consequently emphasising its importance (Putri & Arofah, 2013:90,
91). Investment analysts are often investors in their own right, e.g. portfolio
managers. They gather, analyse and interpret accounting numbers and disseminate
the results due to their function as information intermediaries between the company
and parties interested in the company’s performance (Vergoossen, 1993:156).
2.5.4. The inside and the outside analyst
Outside analysts are the professionals who are outside of the business looking in
(Penman, 2010:12). The outside analyst tries to create “inside information” through
the analysis of financial statement data, which leads to the analyst gaining valuable
insight about the firm’s current performance and future prospects (Palepu & Healy,
2008:1-1). According to Penman (2010:12) there are two main types of outside
analysts, namely credit analysts, for example bond rating agencies, and equity
analysts, which are seen as the prime amongst business analysts (Palepu & Healy,
2008:1-1).
The outside analyst might have a disadvantage in terms of information relative to the
company’s managers, but is more objective in evaluating the economic
consequences of the entity’s investment and operational decisions (Palepu & Healy,
2008:1-1). The outside analyst has the objective of understanding an entity’s
strategies and aims to answer the question regarding the durability of the entity’s
competitive advantage (Penman, 2010:17).
28
The inside analyst is responsible for designing strategies that help the company
maintain its competitive advantage (Penman, 2010:17). The inside analyst plays the
role of having to decide what idea to buy or what strategy to invest in based on the
cost of implementation. To make this decision the investors turns to analysis
(Penman, 2010:17). The inside and outside analyst differ from each other based on
one aspect, which is that the inside analyst has more information to work with and
has access to more information than the outside analyst (Penman, 2010:13).
2.6. RATIO ANALYSIS
A multitude of figures are presented in a company’s financial statements. These
figures do not mean a great deal to the user in isolation; hence it needs to be
compared with something else. This is where ratio analysis can be used (Alexander
et al., 2003:605). Ratio analysis is when different account balance relationships are
compared (Gibson, 2013:638). Ratios simply express the mathematical relationship
between one variable and another and allows the user to analyse the financial
information on which the ratio is based (Bartlett, 2014:680; Damijibhai, 2016:31). The
computation of these ratios might be a simple arithmetic process, but the true
challenge lies in the interpretation of the ratio which can be more complex
(Subramanyam & Wild, 2009:33). Ratios are used to interpret statements to
determine where an entity’s strengths and weaknesses lie as well as to determine
current financial conditions and historic performance (Damjibhai, 2016:31).
Ratio analysis is seen as one of the principal tools of financial analysis and includes
an assessment of how various line items in the company’s financial statements
relate to each other (Palepu & Healy, 2008:5-1). It is important to highlight the fact
that ratios are tools that provide insight into the underlying conditions and should not
be viewed as a complete and final financial analysis, but should rather be seen as a
starting point for further analysis (Subramanyam & Wild, 2009:35; White et al.,
2003:114).
Numerous ratios can be computed from the figures reported in a company’s financial
statements; some of these ratios might have general application in financial analysis,
while others are exclusive to specific circumstances or industries (Subramanyam &
29
Wild, 2009:36). Financial statements can be standardised across firms and over time
by means of ratio analysis, facilitating comparative analysis (White et al., 2003:154).
By comparing the views of Alexander et al. (2003:548) with that of Subramanyam
and Wild (2009:33) it can be determined that ratio analysis is one of the most well-
known and widely used tools of financial analysis. According to Stickney et al.
(2007:35) one of the most useful analytical tools for analysing profitability and risk is
financial statement ratios. Damjibhai (2016:30) states that ratio analysis is a very
powerful measurement tool that can be used to measure organisational
performance. Forecasts of future performance can be made when a company’s
present performance is compared to its past performance and/or the performance of
its peers. This may be achieved through ratio analysis, which provides the
foundation to make these forecasts, and through calculating and benchmarking
these ratios against past performance, management objectives, or other
organisations’ ratios. This ultimately contributes to making meaningful forecasts
(Palepu & Healy, 2008:5-1; Klumpp & Cole, 2016:23). Financial ratios can be used
to help equity investors and creditors make intelligent investment and credit
decisions through the comparison of risk and return of different firms (White et al.,
2003:111). Ratio analysis creates a comparison of individual firm’s ratios against the
benchmarks of similar firms both in the past and the present, to get a sense of what
is normal and abnormal (Nissim & Penman, 2001:109). Ratio analysis consists of the
analysis of current financial statements, but is also an analysis of future residual
earnings. Combining this analysis tool with valuation analysis will provide substance
to fundamental analysis (Nissim & Penman, 2001:109).
Ratio analysis is used to assess the firm’s income statement and balance sheet data
and is used as a tool by the financial analyst to examine the firm’s performance and
financial condition given its strategy and goals (Palepu & Healy, 2008:5-31). Ratio
analysis is a simple financial analysis technique and serves as a quick method of
comparison; evidence suggests that financial ratios contain predictive value even if it
only finds application in times of financial distress (Le Roux & Lowies, 2009:3). Ratio
analysis enables the user to focus on specific questions concerning the current
financial position of the entity (Alexander et al., 2003:605). The primary advantage of
ratios is that the risk and return relationship of firms of different sizes can be
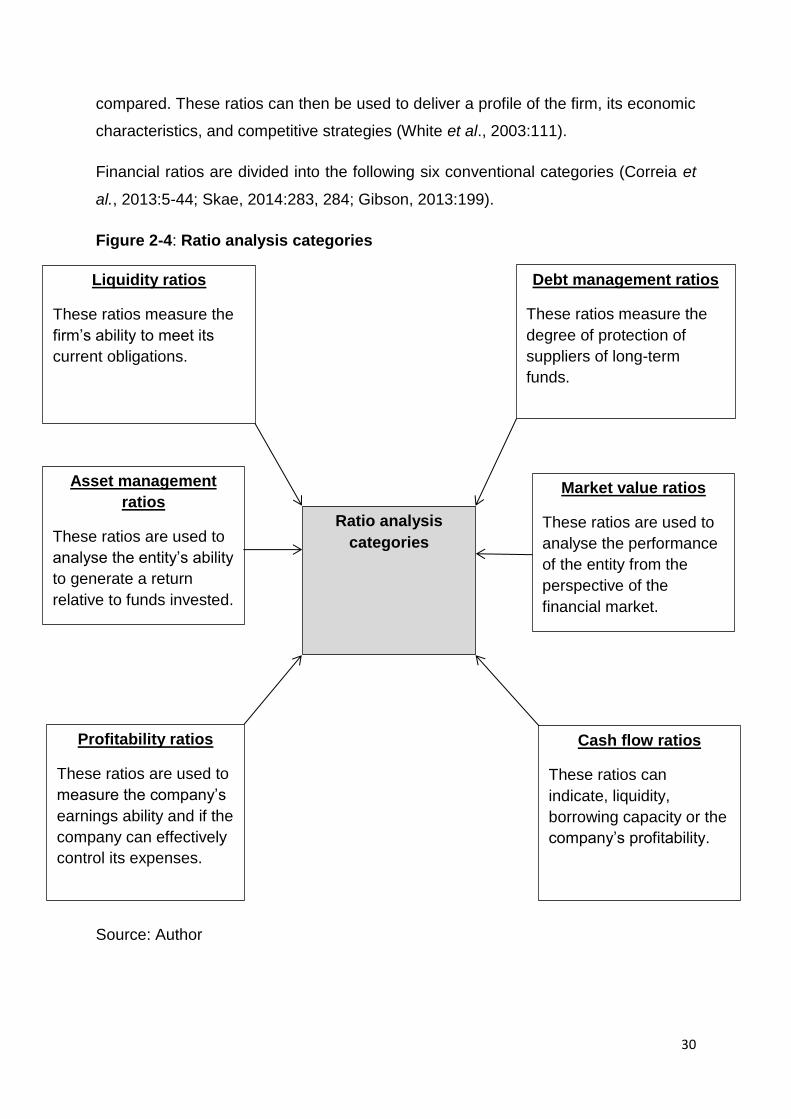
30
compared. These ratios can then be used to deliver a profile of the firm, its economic
characteristics, and competitive strategies (White et al., 2003:111).
Financial ratios are divided into the following six conventional categories (Correia et
al., 2013:5-44; Skae, 2014:283, 284; Gibson, 2013:199).
Figure 2-4: Ratio analysis categories
Source: Author
Ratio analysis
categories
Liquidity ratios
These ratios measure the
firm’s ability to meet its
current obligations.
Asset management
ratios
These ratios are used to
analyse the entity’s ability
to generate a return
relative to funds invested.
Debt management ratios
These ratios measure the
degree of protection of
suppliers of long-term
funds.
Profitability ratios
These ratios are used to
measure the company’s
earnings ability and if the
company can effectively
control its expenses.
Cash flow ratios
These ratios can
indicate, liquidity,
borrowing capacity or the
company’s profitability.
Market value ratios
These ratios are used to
analyse the performance
of the entity from the
perspective of the
financial market.
31
2.6.2. The purpose of ratio analysis
Comparing the views of Alexander et al. (2003:606) and Mesarić (2014:127) it can
be determined that analysing the financial statements by means of financial ratios is
helpful in answering specific questions regarding the entity. These questions include
how successful the business is (for example whether it makes a profit), whether
assets are utilised to the fullest, questions regarding sustainability, the entity’s ability
to fulfil commitments, and whether the entity is in fact profitable and efficient. The
analysis of a specific ratio can lead to important relations and bases of comparison
being revealed, which can in turn be used to uncover conditions and trends which
are difficult to detect by inspecting the individual components that constitute the ratio
(Subramanyam & Wild, 2009:35). Different analysts stress different attributes
regarding the same ratio, meaning that ratios are diverse and have a multitude of
application possibilities in more than one specific ratio analysis category (Duhovnik,
2008:134). Ratio analysis, like any other analysis tool, is often more useful when
future oriented, which means that the factors affecting the ratio is usually adjusted to
represent the probable future trend and magnitude (Subramanyam & Wild, 2009:35).
Researchers and practitioners find that ratios which express relationships between
various items from the three financial statements serve as effective indicators of
various dimensions of probability and risk (Stickney et al., 2007:35). The analysis of
financial information is a very important and commonly used tool that determines the
financial health of a company (De, Bandyopadhyay, & Chakraborty, 2010:535;
Klumpp & Cole, 2016:23). Ratios calculated from financial information have long
been considered to be accurate predictors of business failure and have proven to
make accurate distinction between failed and non-failed companies several years
prior to failure (Maricica & Georgeta, 2012:728).
Financial ratios are very valuable tools for company managers. They allow the user
to summarise the data received, and, through the analysis of this data, provide
meaningful information that can be used to make decisions (Singh & Schmidgall,
2002:201). Ratios deliver further insight into the entity’s performance and economic
relationships when assessed through an integrated analysis. This technique does
not aim to provide all the answers about a firm, but rather to point to the relevant
questions (White et al., 2003:154). Financial ratios have multi-dimensional purposes
in finance, because these ratios can be used for judging the financial health or
32
performance of the company over a period of time; furthermore, the ratios are also a
useful tool that can be used to compare the firm’s financial position and performance
with respect to others who are operating in the same or different industry, to pinpoint
areas of concern, or to identify areas for further improvement (De et al., 2010:535).
The ratio itself is important, but the financial analyst draws more value from the
relationship between the variables used to calculate the ratio and how these
variables change over time and compare to suitable benchmarks (Bartlett,
2014:680).
Even though the analyst might not get all the answers regarding the performance of
the firm when using ratio analysis, this analysis technique will still help the analyst to
frame certain questions for further probing (Palepu & Healy, 2008:5-1). Ratio
analysis helps the user to understand the firm’s liquidity and provide valuable insight
into the financial future of the company. Through the use of this technique
appropriate action can be taken to improve the firm’s liquidity (Klumpp & Cole,
2016:23). Based on the information found in the three major financial statements, a
variety of ratios can be calculated and these ratios can assist financial managers to
summarise and analyse the financial and operating data included in the statements
(Singh & Schmidgall, 2002:201). Many of the ratios that can be calculated have
important variables in common with other ratios; accordingly, it is not necessary to
calculate every possible ratio in order to analyse a situation (Subramanyam & Wild,
2009:35).
Financial ratios are a useful measurement tool that provide a snapshot of the firm’s
financial position at a particular point of time and have the ability to provide a
comprehensive idea about the financial performance of the company over a period of
time (De et al., 2010:535). The interpretation and studying of how a ratio changes
over time and the comparison of a company’s specific ratio with suitable benchmarks
that enables the analyst to draw certain comparisons and conclusions is one of the
instrumental goals of ratio analysis (Bartlett, 2014:680). Ratio analysis is an essential
part of comprehensive financial analysis, and this specific analysis tool is designed
to facilitate comparisons by eliminating differences of size across firms and over time
(White et al., 2003:112). Ratio analysis also serves as a prediction tool that can be
used to prevent financial distress and fraudulent financial reporting (Arshad et al.,
2015:35-36).
33
2.6.3. How to ensure ratio analysis achieves its stated goals
Like most other techniques in financial analysis a ratio is not relevant in isolation.
Ratios are useful when interpreted in comparison with prior ratios, predetermined
standards, and the ratios of competitors (Subramanyam & Wild, 2009:35; Bartlett,
2014:680). To ensure the analyst gains the most out of ratio analysis the primary
focus should be the relationships indicated by the ratios, not the detail of the
calculations (White et al., 2003:119).
To achieve success through analysis consistency is both required and is important;
even more important is the interpretation of the ratios calculated to determine what
the ratio means to ensure value adding comments can be provided once the analysis
has been performed (Skae, 2014:282). Ratio analysis has different indicators which
reveal a variety of aspects of the business and are used for different purposes. This
means that the focus should be on the correct aspect during analysis to ensure
success of decisions (Mesarić, 2014:128). Ratio analysis has a substantial amount
of advantages, but has one big disadvantage, namely that every single ratio must be
compared to a benchmark ratio one at a time. Simultaneously, the assumption is
made that all other factors remain fixed and that the selected benchmarks are
appropriate for comparison. To overcome this problem, ratios can be calculated and
combined to create a meaningful picture of a firm’s financial structure (Yeh,
1996:980).
The calculation of a financial ratio on its own contains little meaningful information.
To ensure effective interpretation of these ratios they either have to be compared to
historic ratios to identify trends, industry ratios or management goals and standards,
and they need to be evaluated in the context of associated ratios. The trend and
variability of these ratios also need to be taken into consideration (Correia et al.,
2013:5-15; Gibson, 2013:200). To effectively implement ratio analysis the financial
numbers of the underlying business factors need to be related in as much detail as
possible (Palepu & Healy, 2008:5-1).
2.6.4. Challenges regarding the application of ratio analysis
The most challenging aspects of ratio analysis lie in the skilful application and
interpretation of the ratios, and therein lies the success of this analysis technique
(Subramanyam & Wild, 2009:35). Financial managers often encounter one specific
34
challenge created by ratio analysis, namely the inconsistency in utilisation of ratios in
different texts and how they are used by different entities (Skae, 2014:282). The lack
of benchmarks that indicate optimal levels is often a problem when it comes to ratio
analysis and the evaluation of a ratio often depends on the view and skill of the
analyst (White et al., 2003:112).
Computing financial ratios is the easy part of ratio analysis; the challenge lies in the
interpretation of these ratios (Correia et al., 2013:5-15). The interpretation of ratios
needs to be done with care, because factors affecting the numerator can correlate
with those affecting the denominator, thus emphasising the level of skill required for
proper analysis (Subramanyam & Wild, 2009:35). Results gathered from ratio
analysis should be interpreted in the proper context keeping in mind the purpose and
priorities of the analysis, considering that there are many other factors and indicators
involved in assessing performance, and that ratios alone should not be the sole
source for decision making purposes (Mesarić, 2014:128). The calculation of a set of
ratios is not a complicated task; the aggregation of those ratios is where the analysis
process starts becoming complicated and requiring imagination and experienced
judgement (Yeh, 1996:980).
There is no standard definition of ratios; however, there is a certain consensus about
the importance and significance of certain ratios, but no agreement on how the ratios
should be calculated (Duhovnik, 2008:134). Gibson (2013:200) states that different
computations of the same ratio can be derived from each author or source on
financial analysis. A standard list of ratios or standard calculations of these ratios
does not exist. Each financial analysis author and source makes use of a different
list of ratios and even different calculations. This is one of the challenges of ratio
analysis (Gibson, 2013:200). The importance and the possible classification of ratios
in different groups are reasons which make this analysis technique complicated and
challenging (Duhovnik, 2008:134).
Based on the information stated above it can be noted that ratio analysis and the
application thereof poses some definite challenges. It is a complicated process for
users and analysts who are still deciding whether or not to utilise ratio analysis. It is
very important for the two parties mentioned to understand the importance of

35
decisions and choices that can be made based on ratios. Figure 2-5 serves as a
starting point to help these users in undertaking this process.
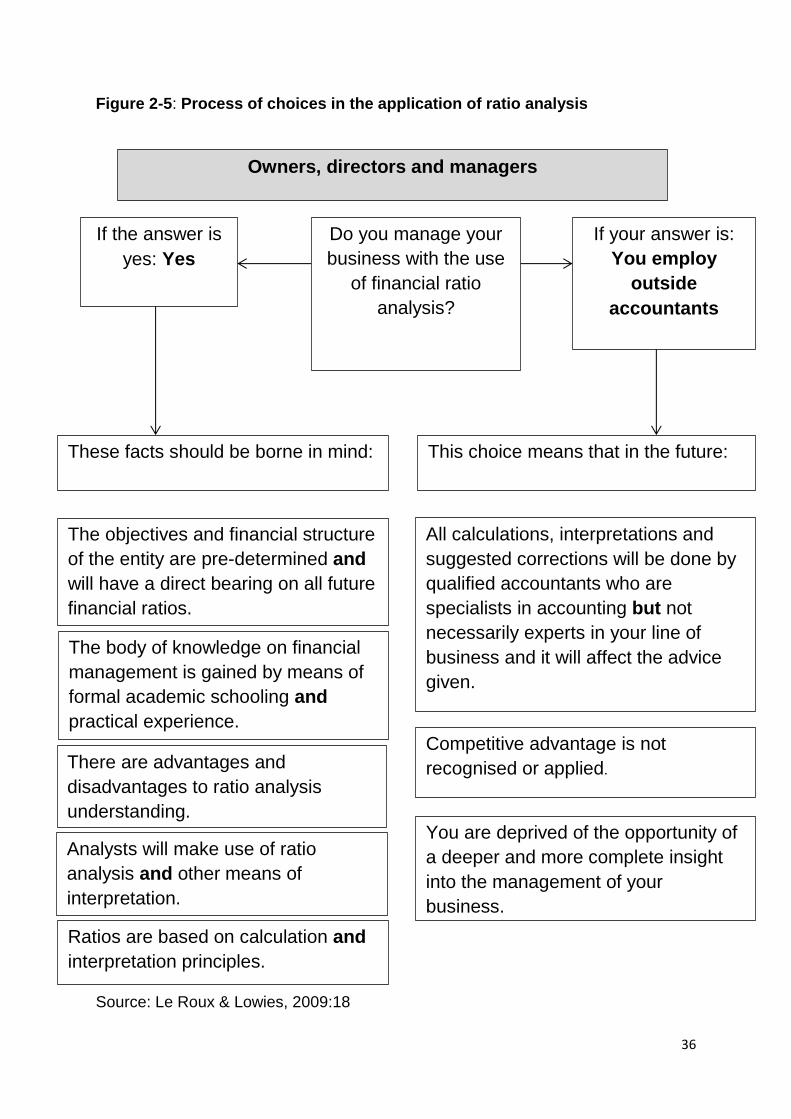
36
Figure 2-5: Process of choices in the application of ratio analysis
Source: Le Roux & Lowies, 2009:18
Owners, directors and managers
If the answer is
yes: Yes
Do you manage your
business with the use
of financial ratio
analysis?
If your answer is:
You employ
outside
accountants
These facts should be borne in mind: This choice means that in the future:
The objectives and financial structure
of the entity are pre-determined and
will have a direct bearing on all future
financial ratios.
The body of knowledge on financial
management is gained by means of
formal academic schooling and
practical experience.
There are advantages and
disadvantages to ratio analysis
understanding.
Analysts will make use of ratio
analysis and other means of
interpretation.
All calculations, interpretations and
suggested corrections will be done by
qualified accountants who are
specialists in accounting but not
necessarily experts in your line of
business and it will affect the advice
given.
Competitive advantage is not
recognised or applied.
You are deprived of the opportunity of
a deeper and more complete insight
into the management of your
business.
Ratios are based on calculation and
interpretation principles.
37
2.6.5. Limitations, pitfalls and risks of ratio analysis
Ratio analysis in itself is not a complete and all-inclusive analysis technique; ratios
deliver a wide variety of information, but have limitations and problem areas which
include (Correia et al., 2013:5-30; Le Roux & Lowies, 2009:1,3,18; Mesarić,
2014:129; Skae, 2014:316):
The diversification of firms in different industries can be misleading when
comparing such a firm against one set of industry averages and this can
lead to inaccurate decisions being made;
Management could strive to be up to the sector leaders; as such averages
would not be the correct comparison base and industry leaders should
rather be used for comparisons;
Different accounting policies play a role when making inter-firm
comparisons and this can cause limitations in terms of comparison
accuracy;
Company’s year-ends should be taken into consideration and can cause
distortion in ratios, because of factors like seasonality which lead to
inaccurate comparisons being made;
When performing ratio analysis the focus should be on small focused
entities rather than large entities that operate in a variety of industries. The
limitation arises because it is not always possible to make comparisons
with small focused entities;
The manipulation of financial statements poses a problem area,
specifically when it comes to making accurate conclusions from ratios
based on these statements;
The financial statements of the company do not include inflationary effects;
because these statements are prepared on the historic cost basis and with
the exclusion of this element it can lead to financial ratios being distorted;
38
Ratio analysis includes making a conclusion regarding whether the ratio is
good or bad, but because of the amount of subjectivity that is required the
task of making this conclusion becomes very complicated;
Some ratios might have preference in a particular industry but not in
another. Some ratios require minimal values and have strong importance
compared to others of minor importance. All of these factors contribute to
the difficulty level of ratio analysis;
Ratio analysis on its own is not a complete method of financial analysis,
because this analysis technique is only directed at the measurement of
financial objectives;
Ratio analysis lacks an explicit theoretical structure and the authority of the
analysts’ experience is what the user of a ratio has to rely on to make
decisions;
Using ratios in isolation could lead to incomplete conclusions being drawn
from financial information; and
Internal ratios can be influenced by external factors and can cause
difficulty in the measurement and explanation of substantial ratio changes.
The above-mentioned limitations do not negate the efficacy nor the importance of
ratio analysis. The important part of these limitations is that the financial analyst take
note of them and makes the necessary adjustments to ensure effectiveness (Correia
et al., 2013:5-31). The use of a blindly implemented procedural approach can be
dangerous as the efficacy of the entire exercise depends on the interpretation of the
ratios. The skill of the analyst becomes more important, but perceptive analysis of
the ratios will ensure accurate insight into the entity’s operations (Correia et al.,
2013:5-31).
2.7. DEBT-TO-EQUITY RATIO
There are two main sources of financing available to a company, namely debt and
equity. Both these sources differ and have well-known characteristics (Alexander et
al., 2003:617). Debt financing and equity financing do not need to be interrelated,
39
meaning that an increase in equity doesn’t need to be reflected by an equivalent
decrease in long-term debt (Cheng & Yun, 2006:135). Leverage is when relatively
more debt financing is used in the capital structure. Leverage aims to increase the
returns on equity investors’ funds in exchange for the acceptance of higher financial
risk (Correia et al., 2013:14-3). The ideal mix of debt to equity would be a mix that
ensures the maximum return on equity. This will ensure that the firm magnifies
returns to ordinary shareholders and that the inherent risks are controllable (Madan,
2007:400).
2.7.1. Debt
Debt forms part of a company’s liabilities which represents an obligation to make
payments of cash, goods, or service at an amount that is determinable on a
reasonably predictable future date as compensation for benefits or services received
in the past (Stickney et al., 2007:19). According to Correia et al. (2013:14-3) there
are different forms of debt financing which include long-term or short term debt and
secured or unsecured debt.
Debt financing includes several potential benefits that make it an attractive form of
financing. These advantages include that, if debt financing is used instead of equity
financing, the current shareholders will not lose any control over the firm (Correia et
al., 2013:5-20; Palepu & Healy, 2008:5-19). Debt is a cheaper form of financing
compared to equity due to lower risk, lower expected return, and tax advantages
(Skae, 2014:97). Debt might be a cheaper form of finance, but the implication of this
is that the financial risk of the company will keep increasing as more debt is incurred.
Interest and capital payments must still be made even in times of economic
downturn, regardless if the entity has sufficient income to cover these payments
(Correia et al., 2013:14-3; Skae, 2014:93). The greater the weight of debt in a firm’s
capital structure, the more likely it is that shareholders will either lose everything or
strike it rich. Thus meaning the higher the firm’s leverage, the more volatile returns
will be (Arditti, 1967:22).
Debt financing differs from equity financing because an agreement or contract is
usually drawn up, which leads to the receiver of credit having to perform by making
loan repayments with interest on specific dates (Subramanyam & Wild, 2009:17).
There was a time when it was regarded appropriate to only include long-term debt in
40
leverage calculations as short-term debt was generally only used for seasonality
purposes. Current practice, however, dictates that short-term debt which either is not
repaid on an interim basis, or is gained or funded (replaced with long-term debt),
should be included in the calculation of leverage (Fridson & Alvarez, 2002:271-272).
2.7.2. Equity
Shareholder equity refers to the amount that remains after a company’s liabilities
have been deducted from its assets. It is referred to as residual interest, because
these shareholders are exposed to the maximum amount of risk associated with the
company. This entitles them to the residual interest (Gibson, 2013:628;
Subramanyam & Wild, 2009:137). Equity is seen as the main summary number on
the balance sheet when it is viewed from a share price valuation perspective
(Penman, 2010:34). Dividends received by shareholders and the capital growth in
the value of the shares are two of the rewards equity investors receive (Correia et
al., 2013:14-3). Shareholder equity can be divided into two basic categories, namely
paid-in capital and retained earnings. Other accounts, disclosed separately from
these two categories, may also appear (Gibson, 2013:117). The implication of
shareholder equity is that the owners of this interest have a claim on all assets not
required to meet the claims of creditors, and valuing the assets and liabilities in the
balance sheet in turn leads to the valuation of equity (Stickney et al., 2007:19).
2.7.3. Debt management ratios
Debt management and financial leverage play an important role in financial
management and have a number of implications. By using these ratios the analyst
will attempt to assess the impact of financial leverage on risk (Correia et al., 2013:5-
15). Debt-to-equity is one of the most commonly used debt management ratios
(Bartlett, 2014:693). Debt management ratios are also known as solvency ratios
(Bartlett, 2014:693). The solvency or long-term sustainability of the company can be
evaluated when using the debt management ratios.
Debt management ratios are used to determine the company’s adherence to its
stated financing policies, their target capital structures, and agreed upon debt-to-
equity proportions (Bartlett, 2014:693). The analysis of a firm’s capital structure is
essential and plays a pivotal role in evaluating long-term risk and return prospects,
indicating the important role debt plays as well as the risk that comes with it (White et
41
al., 2003:130). Analysts use debt ratios as a measurement tool to analyse a
company’s solvency and measure the amount of liabilities, particularly the amount of
long-term debt in a firm’s capital structure. The higher the proportion of debt relative
to equity, the higher the solvency risk for the firm (Stickney et al., 2007:2; White et
al., 2003:130). Debt management ratios attract the interest of certain stakeholders,
such as banks and credit providers in particular, because these ratios provide some
indication of the future prospects and current financial well-being of the company
(Bartlett, 2014:693).
2.7.4. Background to the debt-to-equity ratio
The debt-to-equity ratio serves the purpose of displaying the proportion of debt
financing used by the company compared to equity funds invested (Madan,
2007:400; Palepu & Healy, 2008:5-20). The debt-to-equity ratio provides crucial and
important information to creditors, analysts, shareholders, and potential investors
regarding the financial strength or weakness of a company, for example the
probability of long-term survival and the expectation of future dividend payments
taking place (Axson, 2010; Matthew et al., 2016:6).
The investment structure and operational activities of the company are two elements
which contribute to the debt-to-equity ratio (Cheng & Yun, 2006:135). The debt-to-
equity ratio is used as a measurement tool and is an appropriate ratio when it comes
to measuring the financial risk or financial strength of the company (Alexander et al.,
2003:617). Skae (2014:297) agrees that the debt-to-equity ratio is used as an
indicator of risk. The debt-to-equity ratio is another computation used to analyse the
long-term debt-paying ability of a company and also indicates to what extent
creditors are protected in case of insolvency.
The debt-to-equity ratio indicates to what extent shareholders’ funds cover debt and
is an indication of medium financial risk (Correia et al., 2013:5-16). The debt-to-
equity ratio has many positives and is a common measurement tool, because the
ratio highlights the effect of different accounting treatments without over-complicating
the issues. In its simplest form the calculation of this ratio will be debt divided by
equity (Lasman & Weil, 1978:49). According to Taub (1975:412), the expectation of a
direct relationship between the size of the firm and the debt-to-equity ratio of said
firm exists. The necessary adjustments to leases, pensions, and unconsolidated
42
subsidiaries may lead to the debt-to-equity ratio increasing and in turn a more
accurate reflection of this ratio (Lasman & Weil, 1978:49).
Comparing the views of Feldstein, Green, and Sheshinski (1983:45) with Taub
(1975:412) one could postulate that the desired debt-to-equity ratio of a firm is
influenced by the difference between the respective costs of debt and equity. The
greater the difference between these costs, the greater the influence on the desired
ratio. The firm can therefore choose an optimal debt-to-equity ratio in order to
minimise the total cost of capital. The numerator compromises of both secured and
unsecured loans, and the denominator consists of ordinary and preference share
capital, reserves, and surpluses (Madan, 2007:400). The numerator of the debt-to-
equity ratio will be debt. The debt used in the calculation of this ratio can include all
liabilities; all liabilities excluding current liabilities or only long-term interest bearing
debt can be used, and debt held on behalf of other company’s and the government
will be excluded from debt (Lasman & Weil, 1978:49).
A problem area of ratio analysis is the lack of uniformity in the way certain ratios are
calculated. This becomes especially pertinent when the debt-to-equity ratio is
calculated. To make comparison possible the debt-to-equity ratio of the firm should
be calculated in a similar manner as industry ratios (Gibson, 2013:285).
2.7.5. Implications of the debt-to-equity ratio
Many borrowings may include a covenant that protects the issuer (Subramanyam &
Wild, 2009:35). One of these covenants can include the maintenance of a constant
debt-to-equity ratio, and if this covenant is not upheld it could lead to the immediate
repayment of the outstanding amount (Subramanyam & Wild, 2009:35). The long-
term debt-to-equity ratio can be used to calculate the share price of an entity and
helps to ensure that the calculation is done with greater precision (Safania et al.,
2011:278). The debt-to-equity ratio is the most commonly used ratio worldwide when
it comes to measuring financial risk. The higher the ratio, the higher the financial risk
of the company, since a higher ratio implies higher interest charges and an
increased exposure to possible interest changes (Alexander et al., 2003:617).
Factors such as national or institutional differences can influence certain aspects of
the debt-to-equity ratio. In countries more oriented to shareholders the debt-to-equity
ratio will be lower than in countries more credit oriented that (Alexander et al.,
43
2003:618). High corporate debt-to-equity ratios are detrimental to macroeconomic
stability, and the size of this ratio significantly influences and affects the interest rate
policy on savings and investments. If the debt-to-equity ratio exceeds a critical limit it
will lead to changes in financing policies, and stabilisation policies will involve high
costs of growth forgone (Sundararajan, 1985:431).
When the financial analyst is assessing the solvency of the company, different
coverage ratios and the debt-to-equity ratio will be analysed (Lasman & Weil,
1978:49). The debt-to-equity ratio can show what the current debt position of a
company is by interpreting the long-term debt paying ability of the company
(Gibson, 2013:285). It can be determined with certainty that the efficacy of
bankruptcy as a source of discipline for management will be affected by the financial
structure of the firm, specifically its debt-to-equity ratio (Grossman & Hart, 1982:108).
If a firm’s share price falls, the market value of the firm’s share price has the
tendency to fall at a more rapid pace than the market value of its debt. This will
cause the debt-to-equity ratio to rise, which leads to an increase in share risk
(Beckers, 1980:662). Movement in a firm’s debt-to-equity ratio has certain
implications. For example, a reduction in the ratio can lead to a decrease in the
probability of bankruptcy of the firm, and a reduction in financial leverage could lead
to an increase in the value of existing risky debt, because bondholders now receive
greater protection on their claims (Agrawal & Mandelker, 1987:826).
Debt bears with it an inherent risk in the form of increased variances regarding
returns, and the debt-to-equity ratio of a firm is used as a measure of this risk.
Consequently, as this ratio increases, the risk borne by shareholders and the
expected utility of their investment will decrease and lose its appeal (Arditti,
1967:22). Madan (2007:409) states that neither a high nor a low debt-to-equity ratio
is desirable for any firm, and although financing is a very subjective decision and a
function of multiple factors it is important that a firm which operates above the break-
even point with assured profits should always introduce more debt into the capital
structure to increase the debt-to-equity ratio to an optimal point.
Therefore, one can confidently posit that analysing and interpreting financial
statements and financial information is a very important tool to gain deeper insight
and a clearer picture of an entity’s operations and functions. Debt and equity are the
44
forms of financing available to an entity and serve as the platform for embarking on
future projects that will contribute to growth and sustainability of the firm. In these
two forms of financing we can find the capital structure. Proper management and
planning of the capital structure plays a big role in the success of fund management
and ensuring profitable projects can be embarked upon. This is where debt
management comes in, and the role the debt-to-equity ratio plays in ensuring correct
decisions can be made especially when it comes to financing and proper financial
leverage of the firm.
2.8. SUMMARY
The importance of financial statements to a diverse group of users who require this
information to determine what the figures really say about the inner workings and
performance of the business is evidenced in the stated research. A complete set of
statements serves a deeper purpose than merely representing information. It is a
lens which enables one to focus on the economic performance of the entity and
which displays the entity’s true performance during a specific financial period.
Financial statements are the life blood of finance and are a representation of
management, who perform a critical task in ensuring business success. The true
value of statements is that it provides past and current information regarding
financial performance. Stakeholders can use this information to make predictions
regarding the future of the business.
Financial statements paint a picture of the entity’s ability to create value for
shareholders and whether the entity will be able to do this indefinitely. Financial
statements is a very important instrument a firm can use to communicate to the
outside world regarding their operations. The financial analyst also draws invaluable
information from statements, because without it the financial analyst would not be
able to clearly analyse the puzzle to determine the true meaning behind the figures.
The figures in financial statements of a firm is only a representation of the events
that took place during the year; to truly extract true value the information and figures
should be analysed and interpreted.
In doing so the business as a whole can be analysed, after which the financial
analyst can work his/her way toward the financial statements, a specific component
45
of business analysis, to gain an overall picture of how the entity functioned and
performed. The financial analyst will include quantitative and qualitative conditions in
his overall procedure of financial analysis, and if proper financial analysis is
performed it will be a gateway to determine future prospects, measure risk,
determine a fair price for the shares and the efficacy of financing, and determine how
investment activities are managed. This information can then be compared to that of
similar entities and industry standards. Financial analysis is the process of
synthesising and summarising financial and operative data. Through this process
true value can be extracted in the form of meaningful information that possesses
value to those who need to make informed decisions. This will further enable them to
take the appropriate steps.
Financial analysis measures firms’ performance based on the strategy as well as the
economic and industrial environment in which the firm operates and determines how
successful and effectively the firm is being managed. Financial analysis results can
be used to determine certain key areas and identify trends. By comparing these
results with benchmarks and competitors the analyst can identify strengths,
weaknesses, and areas where improvement is required to ensure sustainability.
Financial analysts have certain analytical tools which can help them achieve their
stated goals and ensure efficacy. One of the most commonly used analytical
techniques is ratio analysis, which takes the figures represented in financial
statements and expresses them in certain specific ratios. These ratios take a figure
that does not mean much in isolation and changes it into something that provides
valuable information.
The financial analyst requires certain skills to ensure a successful analysis. These
skills are that the analyst must be systematic and efficient, and must have the ability
to properly analyse financial data and then interpret the results to draw a proper
conclusion regarding areas analysed. The financial analyst can use all of his
analytical tools to draw accurate conclusions. Ratio analysis is one of the tools which
the analyst uses to make insightful comments and deliver proper results to those
who require it. An accomplished analyst knows the business he is analysing and with
a wide spread knowledge and proper background the analyst can analyse
statements and make concrete interpretations of information analysed. Financial
statements in truth deliver a blurred and incomplete picture, and the financial analyst
46
can, through his analysis, sketch a complete and clear picture of what these
statements entail.
The annual report published by a company is a key source of information, but still
has certain drawbacks, and if the analyst understands and takes this into
consideration it will ensure an accurate analysis. The financial analyst can be seen
as a critic who portrays the role of a silent messenger between the crowd and the
performance of the actors who are the managers and assesses the quality of the plot
(statements). The research also reveals that there is a variety of analysts, for
example investment analysts as well as inside and outside analysts, and each one of
the analysts has their own goals and objectives. Each analyst structures the analysis
to ensure they achieve what they set out to do.
Financial statements represent a multitude of figures which do not contain much
meaning in isolation, unless it can be compared to something else. Here a specific
financial analysis technique, namely ratio analysis, is encountered. Ratios are used
to disclose mathematical relations between two figures and thus the figures
represented in the statements start to make sense and help the user to understand
what is actually being presented. Ratio analysis is regarded as one of the principal
tools of financial analysis. Its true value lies in the correlation and reaction between
different line items and how they react to each other. The challenge lies in correctly
interpreting a ratio and properly assessing and extracting the information required.
It is important to note, however, that ratios are not an end unto themselves or a
complete analytical tool; it has its gaps and shortcomings. By combining this
technique with other analytical tools, however, and with the required skill and
knowledge a complete and overall assessment can be done. Ratio analysis should
be viewed as a starting point for further analysis. If done correctly it can open doors
to perform analyses on a specific area of the business. The value of this information
can be instrumental to investors who need to make smart investment decisions.
Ratio analysis is an analytical tool that can be used to analyse profitability and risk,
which provides a solid foundation to make forecasts of future performance and
whether the firm is on route to achieving their stated goals and strategies. The
computation of ratios has the benefit that it is a quick method of comparison which
utilises past information as well as the environment of the industry in which the entity
47
functions. Risk and return relationships can be computed and compared to firms of
different sizes, and thus a profile of the firm can be delivered.
Debt-to-equity is one of the more specific debt management ratios and the results of
this ratio displays the proportion of debt funds to equity. The information provided
through this ratio is crucial to creditors, analysts, shareholders, and potential
investors. The debt-to-equity ratio provides an indication of the level of debt financing
included in the capital structure of the firm, which can be a signal to future investors
regarding the riskiness of the firm and can thus be used determine how investors will
approach and perceive the firm within its industry. The debt-to-equity ratio is also a
determinant of long-term debt paying ability and to what extent shareholders’ funds
cover the firm’s debt. The ratio is also used by the financial analyst to determine the
solvency of the firm and whether the firm is currently in a financial position that can
ensure future sustainability.
The aim of this chapter is to address the first secondary research objective as
defined in section 1.3 of Chapter 1, namely conceptualising from the literature what
the debt-to-equity ratio entails and how this ratio should be calculated. A thorough
literature overview on ratio analysis and the debt-to-equity ratio is presented in this
chapter. The magnitude of the debt-to-equity ratio for certain stakeholders and how
this ratio can portray a specific message regarding the debt and equity function of
the firm is made evident in the review.
The importance of financial statements and the analysis of the figures contained
therein are discussed in the literature overview. Ratio analysis as a financial analysis
tool is investigated and the value of the debt-to-equity ratio and information extracted
from this ratio is also determined. The main objective of this study is to investigate
the proposed treatment of deferred taxes in the debt-to-equity ratio and through this
chapter it is clear how the debt-to-equity ratio functions and how it can be used to
better understand how deferred tax can be treated in the calculation of the debt-to-
equity ratio. Chapter 3 focuses on deferred tax and how this item can be treated in
the calculation of the debt-to-equity ratio.
48
CHAPTER 3
TREATMENT OF DEFERRED TAX IN THE DEBT-TO-EQUITY RATIO
3.1. BACKGROUND
This chapter consists of a literature study of the accepted theory on deferred taxes
and specifically how this item should be treated in the calculation of the debt-to-
equity ratio to address the second secondary objective set in section 1.3 in Chapter
1. The purpose of this chapter is to obtain sufficient information from the literature
regarding deferred tax to gain a better understanding of this item and how it
functions to determine how the proposed treatments will affect the results drawn
from the debt-to-equity ratio. This will help to create a bigger picture of the subject
under discussion and will provide a good indication of the content to be included in
the interviews used in the qualitative part of this study.
A sound foundation of widely accepted theory is established and the reasoning
behind the acceptance thereof obtained. This is done in order to acquire better
insight into the calculation of the debt-to-equity ratio and what the appropriate
treatment of deferred tax in this ratio is, as well as the extent to which the literature
agrees and disagrees on different aspects regarding this topic.
Deferred tax is regarded as an obligation or asset that the company will recover or
pay at a future date due to differences between information reported in terms of
international financial reporting standards and the income tax act (Koppeschaar,
Gaie-Booysen, Rossouw, Papageorgiou, Van Wyk, Smith, Sturdy, Van der Merwe,
Deysel, & Schmulian, 2015:152). Deferred tax assets (liabilities) provide progressive
information regarding future tax benefits (payments) that will realise upon reversal of
the account. The benefits (payments) associated with deferred tax assets (liabilities)
are substantial items for many firms (Laux, 2013:1358). Hence deferred tax is a
substantial and important item in the financial statements of an entity and further
study into this item will aid in gaining a better understanding of this item.
Consideration is given to local and international published academic research to
determine whether previous studies found any variation between how theory
suggests deferred tax should be treated in the calculation of the debt-to-equity ratio.
49
The different aspects of deferred tax, including deferred tax assets and liabilities, are
analysed to determine the role this item plays and the different ways this item can be
treated in this ratio.
3.2. DEFERRED TAX
3.2.1. Background to deferred tax and income taxes
Income tax represents one of the more challenging aspects of financial reporting and
analysis; whereas some accounting topics are more narrowly scoped, income taxes
have a pervasive impact on an entity’s business decisions, financial statements, and
associated disclosures (Comiskey & Mulford, 2000:177). Income tax is usually a
material item in the balance sheet and, in spite of the pervasiveness and importance
of taxes; it is an item that is not well understood by important users of financial
statements (Comiskey & Mulford, 2000:177). The amount of tax that is charged
against the profit in a given period is an important determinant of earnings per share
as well as the price earnings ratio, which obviously affects all other ratios calculated
on after tax figures (Alexander et al., 2003:333). The amount of income taxes
recognised in the income statement for the current period includes the movement in
deferred tax from the opening to the closing of the balance sheet amounts
(Alexander et al., 2003:349).
Differences between the carrying amounts of assets and liabilities presented in the
balance sheet, which are determined in terms of international financial standards,
and the carrying amounts recognised in terms of the income tax act lead, to deferred
taxes being recognised (Koppeschaar et al., 2015:152). Deferred taxes can be found
in the balance sheet and is the estimated amount in need for the upcoming period
that exists as a result of temporary differences between financial accounting
standards and tax regulations (Ifanda & Wulandari, 2015:159). Deferred tax
represents the cumulative difference between taxes that have been calculated using
the statutory rate and the amount that has actually been paid (Fridson & Alvarez,
2002:276).
Deferred tax is viewed as an obligation or asset that will be payable or recoverable at
a date in the future (Koppeschaar et al., 2015:152). In many countries the amount
that is payable by a business for tax purposes for a specific period often bears little
50
relationship to the profit as reported by the accountants in the income statement. The
accountant’s report is often used by the tax authorities as their starting point, but a
great deal of adjustments are made to it (Alexander et al., 2003:334). IAS 12 sets the
following requirement: that deferred tax be measured by reference to tax rates and
laws, as enacted or substantively enacted by the balance sheet date, that are
predicted to apply in the periods in which the assets and liabilities to which the
deferred tax relates are realised or settled (Alexander et al., 2003:348).
The difference between the statutory rate and taxes actually paid is a reflection of
the tax consequences, for future periods of the differences between the assets or
liabilities tax base, and their carrying amounts for financial reporting purposes
(Fridson & Alvarez, 2002:276). When taking into consideration the temporary
differences, it is important to take note that these mainly result from differences in
the timing of the recognition of revenue, gains and expenses or losses in the books
of the shareholders versus the tax return in determination of pre-tax financial and
taxable income respectively (Comiskey & Mulford, 2000:184). Financial statements
use specific accounting principles which are not necessarily the same principles
used to complete the firm’s tax return. Whenever an item enters the financial
accounting income statement in one year and the tax return in another, it will lead to
the creation of a timing difference (Lasman & Weil, 1978:52).
According to Koppeschaar et al. (2015:154) for an entity to calculate and recognise
deferred tax the following needs to be determined:
The assets or liabilities carrying amount;
The tax base of the asset or liability;
What the difference is between the carrying amount and the tax base of the
item and whether this temporary difference will be taxable, deductible, or
exempt;
The suitable measurement of the deferred tax balance; and
The movement between the newly calculated deferred tax balance and the
balance that was recorded at the end of the previous period.
51
Deferred tax is reflected as a line item in the balance sheet of a firm and displays the
amount of deferred tax assets and liabilities. The income tax note show which items
in the balance sheet include deferred taxes. These amounts influence the
assessment of a firm’s financial position such as the current ratio and debt ratios
(Stickney et al., 2007:587). The deferred tax line item can be classified as an asset
or a liability based on the nature of the timing differences. These differences arise
due to revenue and expenses being recognised in different time periods for the
purpose of tax and financial statements (Gibson, 2013:626). By granting the use of
accelerated depreciation methods or instalment accounting, tax law has in effect
granted an interest free loan to going concerns that make use of these methods. But
the statements of firms that employ these methods that defer taxes contain the same
income tax expense they would have had had they not used these methods (Lasman
& Weil, 1978:52). Deferred taxes is an item that adds value, because the item
represents tax payments that are deferred, so the value of deferred taxes is the net
present value of the tax benefits (Amir, Kirschenheiter, & Willard, 2001:275).
Temporary differences can be divided into two categories, i.e. deductible temporary
differences and taxable temporary differences. The differences between the two
categories can be displayed as follows.
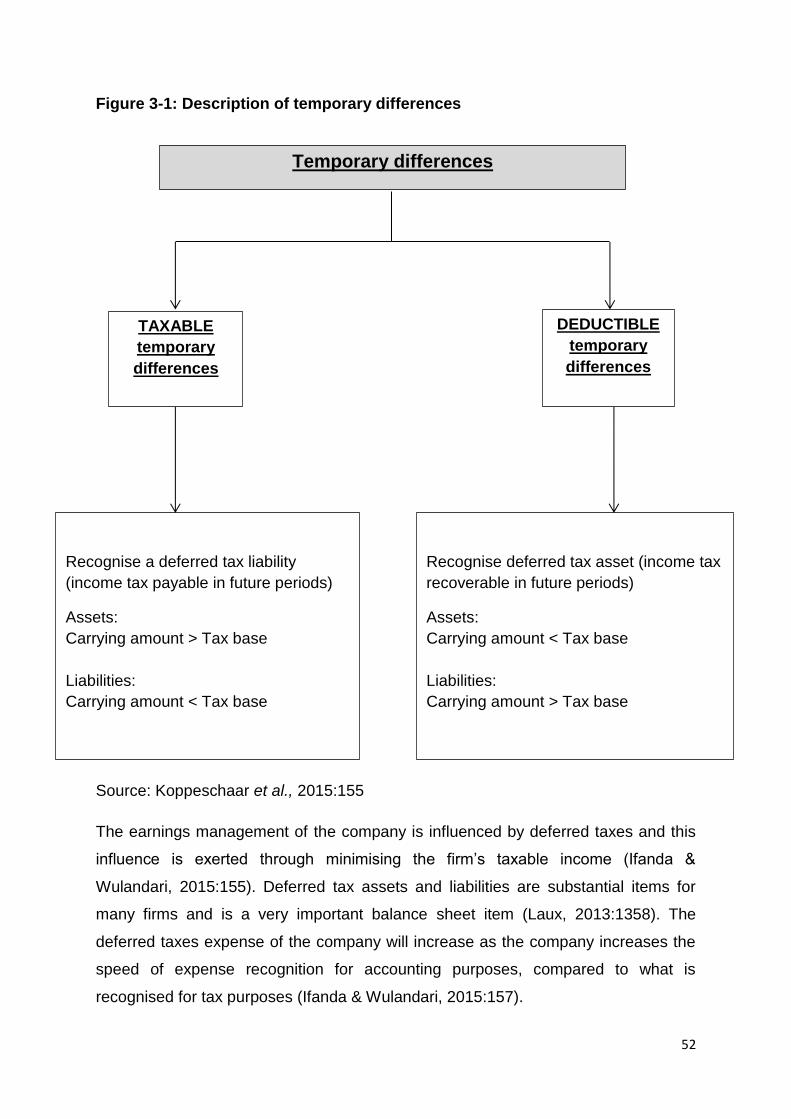
52
Figure 3-1: Description of temporary differences
Source author Koppeschaar et al
Source: Koppeschaar et al., 2015:155
The earnings management of the company is influenced by deferred taxes and this
influence is exerted through minimising the firm’s taxable income (Ifanda &
Wulandari, 2015:155). Deferred tax assets and liabilities are substantial items for
many firms and is a very important balance sheet item (Laux, 2013:1358). The
deferred taxes expense of the company will increase as the company increases the
speed of expense recognition for accounting purposes, compared to what is
recognised for tax purposes (Ifanda & Wulandari, 2015:157).
TAXABLE
temporary
differences
DEDUCTIBLE
temporary
differences
Recognise a deferred tax liability
(income tax payable in future periods)
Assets:
Carrying amount > Tax base
Liabilities:
Carrying amount < Tax base
Recognise deferred tax asset (income tax
recoverable in future periods)
Assets:
Carrying amount < Tax base
Liabilities:
Carrying amount > Tax base
Temporary differences
53
Deductible temporary differences is a temporary difference that upon origination
leads to the reduction of pre-tax financial income to below the level of taxable
income, and the creation of deductible temporary differences will give rise to a
deferred tax asset (Comiskey & Mulford, 2000:232). Taxable temporary differences
are differences that upon its reversal will lead to the taxable income increasing
above the level of pre-tax financial income, and upon the origination the taxable
temporary difference will lead to deferred tax liability being created (Comiskey &
Mulford, 2000:235).
3.2.2. Deferred tax assets and liabilities
A deferred tax asset (liability) provides forward-looking information about future tax
benefits (payments) that are a result of the deferred tax account reversing in the
future (Laux, 2013:1358). Generally accepted accounting principles require that
deferred taxes be reported in a manner that reflects temporary differences between
tax and book income (Sansing, 1998:359). Recognising deferred taxes either as a
deferred tax liability or as a deferred tax asset is due to temporary differences arising
due to differences between the tax base and carrying amount of an asset or liability.
The difference between a book basis and tax basis recognition of items in the
balance sheet multiplied by the tax rate leads to the creation of deferred taxes. In
other words the deferred tax asset or liability is equal to the tax amount that would
need to be settled if all the assets and liabilities were sold for their book values today
(Koppeschaar et al., 2015:154; Sansing, 1998:359).
A deferred tax liability can be viewed as a future tax obligation that is the result of the
origination of taxable temporary differences, and upon origination these temporary
differences cause pre-tax financial income to exceed taxable income (Comiskey &
Mulford, 2000:233). A deferred tax liability is defined as the amount of income tax
that will be payable in future periods in respect of a taxable temporary difference,
and a deferred tax asset is the amount of income tax that will be recovered in a
future period (Koppeschaar et al., 2015:153). Most of the listed deferred tax assets
emerge as a result of the recognition of expenses or losses in the determination of
pre-tax financial income before they can form part of the determination of taxable
income (Comiskey & Mulford, 2000:185). The disclosure of deferred taxes form a
very important part of an entity’s financial statements, and a change in the deferred
54
tax asset and deferred tax liability each year is a reflection of the deferred income tax
expense for the year (Stickney et al., 2007:587).
During times of crisis, only the net deferred tax liabilities of a firm experiencing
losses will be significant, indicating that in crisis periods investors do not appreciate
the recording of deferred tax liabilities, which are in total higher than the deferred tax
assets. This is likely because these liabilities lead to additional tax payments in
future periods, which delay the reversal of the effects that the crisis exerted on the
firm (Samara, 2014:143). Investors have the perception that net deferred tax
liabilities contain negative information content that becomes even more negative for
firms who record losses during financial crises, and when net deferred tax liability is
recorded it will deliver a negative signal to investors because it implies future
payments of taxes (Samara, 2014:144).
Tax base is defined as the amount that is attributable to a specific asset or liability for
tax purposes. IAS 12 has specific guidelines that serve the purpose of determining
the tax base of assets and liabilities (Koppeschaar et al., 2015:155). The tax base of
a deferred tax asset relies on whether the future economic benefits arising from the
carrying amount of the asset will be recovered and whether it will be taxable or not. If
the future economic benefits are taxable, the amount deductible for tax purposes will
be the tax base of the asset (Koppeschaar et al., 2015:155). A deferred tax liability
can be created from two different items, which are liabilities and revenue received in
advance, and both items have specific criteria that should be used to determine the
tax base (Koppeschaar et al., 2015:157).
A deferred tax asset should only be created to the extent that it will be utilised in the
future by means of taxable temporary differences, or when appropriate evidence
exists to indicate that ample taxable income will be available against which the
deductible temporary differences can be utilised (Koppeschaar et al., 2015:168).
Alexander et al. (2003:334) maintain that, based on the principles of IAS 12, a
deferred tax asset is recognised for all deductible temporary differences to the extent
that there will be taxable profit against which these deductible temporary differences
can be utilised. Samara (2014:144) determines that the recording of deferred tax
assets becomes a source of information content for share prices under specific
circumstances, in particular during a financial crisis. Deferred tax assets which are
55
recognised by loss making firms is seen in a positive light by investors, because
recording the deferred tax is a signal of future profitability (Samara, 2014:144).
Expenses (revenues) included in the net income of the company after taxes, for
example accelerated depreciation, lead to the deferred tax liability (asset) being
recognised after the tax related cash-flows are realised in the financial statements.
Hence the deferred tax liability (asset) is not associated with future tax payments and
the timing of reversal does not influence the timing of future tax payments (Laux,
2013:1358). Most significant deferred tax liability positions are represented in the
disclosures of firms in capital-intensive industries (Comiskey & Mulford, 2000:210).
Deferred tax liabilities expected to realise later do not have a lower value than
deferred tax liabilities expected to realise sooner. The same concept applies to
deferred tax assets regarding the value being higher for a deferred tax asset with a
quicker realisation period, and firms that avoids the reversal of deferred tax liabilities
which originate from differences between book and tax depreciation by reinvesting in
new assets which do not increase firm value (Guenther & Sansing, 2000:2).
3.2.3. Implications of deferred tax
In principle, deferred taxes are the tax impact of future income which exists due to
differences between the tax and accounting treatment of tax losses, which can still
be used in the future and set off against taxable income (Ifanda & Wulandari,
2015:160). Deferred taxes provide incremental information about future tax
payments of the firm, but the magnitude of the information provided is still very small
(Laux, 2013:1357). Deferred tax has certain inherent weaknesses that come with the
premise of this item. One of these weaknesses is that a going concern using
accelerated depreciation on the tax return will probably be able to suspend payment
of the so-called liability indefinitely (Lasman & Weil, 1978:52). Current earnings are
influenced by deferred taxes and also act as a source of information that help predict
future earnings; current and future earnings clearly have implications for the overall
value of the firm (Guenther & Sansing, 2000:3).
The deferred tax amount displayed on the balance sheet is not a legal obligation to
the government or anyone else. The government levies taxes on a firm’s taxable
income displayed on the tax return and only as it is earned. It does not automatically
levy a tax because the deductions for depreciation decline. Taxes are levied in a
56
given year only if there is taxable income available in that period (Lasman & Weil,
1978:53). Laux (2013:1359) indicates that, based on his findings, investors seem to
value only the information content of certain items of deferred tax; he therefore
questions the information’s ability to offset the cost of delivering and utilising it. One
way to view the deferred tax balance is to see it as an interest-free loan which the
government provides to the firm and that needs to be repaid in the future; therefore
the item is a liability. By using this framework the presence of deferred taxes
effectively increases the financial gearing and consequently creates ordinary share
systematic risk (Chandra & Ro, 1997:314).
Deferred tax items are value relevant under specific circumstances. Moreover, it is
likely that the chances of a loss during a financial crisis lead to incremental negative
coefficients of net deferred tax liabilities. This implies that recognising net deferred
tax liabilities makes the reversal from losses to profits less likely because it is an
indication of future tax payments. This is perceived as a negative signal from the firm
to investors (Samara, 2014:139). Deferred tax has many implications for a firm, but
delaying the repayment of a deferred tax liability will not increase firm value as, is in
order to delay reversal of the liability arising from depreciation differences, a firm will
need to purchase new assets which generate new accelerated tax depreciation.
However, the present value of the tax saving would have already been reflected in
the price of the new asset and therefore a firm that allows the deferred tax liability to
reverse has the same value as a firm that keeps its deferred tax liability from
reversing (Guenther & Sansing, 2000:2-3).
3.2.4. Treatment of deferred tax in the debt-to-equity ratio
Both the traditional and the Modigliani-Miller view is that the debt-to-equity ratio of
the firm is in direct relation to the current tax rate of the firm as well as the current
inflation rate (Feldstein et al., 1983:45; Taub, 1975:412). Correia et al. (2013:5-16)
state that the appropriate treatment of deferred tax is an issue that arises from the
calculation of the debt-to-equity ratio. Given the history of the diversity of accounting
policies regarding deferred taxes as well as the variety of different prevailing views
on the nature and cash flow implications, it becomes important to determine and
understand how the market perceives deferred taxes (Chandra & Ro, 1997:314).
57
In a growing company deferred tax will never really reverse, and therefore the
deferred tax liability should be added to equity when calculating the debt-to-equity
ratio (Bartlett, 2014:693). Many analysts are of the opinion that the net worth of the
firm is understated by the amount of the deferred tax liability, since this item will in all
likelihood never become due and it is therefore not really a liability at all (Fridson &
Alvarez, 2002:276). Jeter and Chaney (1988:42) concur that the appropriate
treatment of deferred taxes lies in the consistent growth of the account and how
likely future reversal might be. The reasoning behind deferred tax liability forming
part of equity is based on the fact that, as long as the company continues to pay
taxes at less than the statutory rate, the deferred tax account will continue to grow
(Fridson & Alvarez, 2002:276).
Intuitively, even though the deferred tax liability might never reverse, the difference
between the tax and economic depreciation will decrease over time, because the tax
base of the assets will gradually diverge from the cost of replacing the asset.
However, the tax-favoured investment might have a lower pre-tax rate of return and
it will be invariant. So the firm will continue to bear implicit taxes, but no longer
receive tax benefits in the form of tax allowances in excess of economic
depreciation, which will create a gap between the market value of the firm and the
cost of replacement (Sansing, 1998:360-361). Reserves for deferred tax usually
include differences between the income reported and taxable income that will never
reverse; this can lead to the debt-to-equity ratio being distorted and not being an
accurate reflection (Lasman & Weil, 1978:49). Deferred tax treatment can also be
influenced by factors that affect a rating decision, for example future profitability
judgements (Huss & Zhao, 1991:71).
The financial analyst has to determine whether deferred tax will be included or
excluded when the debt-to-equity ratio is calculated (Lasman & Weil, 1978:49). The
treatment of deferred taxes can lead to information being reported in a manner that
does not reflect the economic substance of the item. When anticipating that the total
amount of deferred taxes will not reverse in the future, the reported liability will be
higher than the economic substance of the event (Jeter & Chaney, 1988:42).
The reason for treating deferred tax as a liability is based on the assumption that the
tax will be paid and redeemed in the near future by the person who bears the tax
58
responsibility (Huss & Zhao, 1991:71). The deferred income tax line item reported on
the balance sheet clearly does not have all the attributes of a liability, as there is a
lack of legal obligation as well as relative certainty of the amount and relative
certainty of the date the obligation will be settled. Moreover, unlike a true long-term
liability, the amount displayed in the statement is not a present value calculated
using a historical market interest rate. All these factors add to the item not being a
true liability (Lasman & Weil, 1978:53). Huss and Zhao (1991:70) posit that one of
the ways to calculate the debt-to-equity ratio is to completely exclude deferred tax
from the calculation in order to minimise the influence of this item.
Equity treatment is motivated through the fact that increases in deferred taxes are de
facto earnings (Huss & Zhao, 1991:71). Relative to current standards, when deferred
taxes are accounted for in terms of international accounting standards, it leads to the
liability being overstated. The overstatement should be accounted for as equity.
Further, the effect of this overstatement will depend on whether or not the tax
benefits are capitalised into the original cost of the asset that lead to the deferred tax
liability being recognised. If so, the tax liability should be reduced to net present
value; if not, the entire balance should be reported as equity (Amir et al., 2001:276).
The view of recording the deferred tax liability as shareholders’ equity will have
certain implications, one of which is that this treatment will be negatively related to
ordinary share risk (Chandra & Ro, 1997:314).
Deferred taxes modelled in the form of equity and the contribution of the
aforementioned deferred taxes to the debt-to-equity ratio will then also be negatively
related to the financial risk of the firm. The view of the market regarding deferred
taxes leads to the item being treated as equity or as a proxy for factors which
inversely relate to ordinary share risk (Chandra & Ro, 1997:313).
The high persistence and strength of the observable negative correlation between
deferred tax and risk is an indication that the market does not regard deferred taxes
as a liability, but might instead view it as a form of equity. Deferred taxes are not
redeemable as long as the firm is experiencing increasing amounts of originating
temporary differences each year (Chandra & Ro, 1997:326). Amir et al. (2001:275)
state that, through analysis performed, the results show that the deferred tax liability,
as currently recorded in accordance with financial accounting standards, overstates
59
the firm’s liabilities. According to Chandra and Ro (1997:329) when the debt-to-
equity ratio is being calculated and an adjustment is made for deferred taxes as a
liability, the deferred taxes account will relate in a negative manner to the market
beta and the standard deviation of ordinary share returns. This negative relation will
persist when the accounting beta, financial gearing, and the variability of operating
returns are controlled, and this negative relation will be prevalent over subsamples of
firms where the selected characteristics differ.
Tax benefits included in the cost of an asset lead to classical accounting relations
being preserved by expensing only a portion of the deferred tax expense. If the
deferred tax liability is not expensed against the price of the asset, and the benefits
are not reflected in the price of the operating assets, proper accounting determines
and requires the deferred taxes to be valued as equity, increasing the value of the
firm on a dollar to dollar basis (Amir et al., 2001:288-289). Deferred taxes become
repayable and in effect reverse temporary differences when the reported temporary
differences exceed the originating differences during the year when such a firm
reduces the size of its depreciable assets while earning increased taxable income,
which is rare. Thus the view of the market might be that deferred taxes is a
permanent tax saving or a transfer of the government’s share of firm value to
shareholders, thereby increasing shareholder equity (Chandra & Ro, 1997:326).
Tax deductibility and the taxability regarding the deferred tax liability is something
that can be taken into account when the value of an asset is being determined (Huss
& Zhao, 1991:70). Huss and Zhao (1991:70) maintain that asset reduction treatment
is one of the ways in which deferred tax can be treated when calculating the debt-to-
equity ratio. This proposed treatment suggests that the deferred tax liability should
be treated as a reduction in the value of the firm’s assets.
Firm value serves a meaningful purpose for investors, but it is not meaningful to ask
whether deferred taxes should be recognised as a liability or shareholder equity from
the standpoint of firm value. Any differences between these two proposed treatments
of deferred taxes merely shift value between the book value of equity and future
abnormal earnings, without affecting the total firm value (Amir et al., 2001:285). The
debt-to-equity ratio can be calculated in a wide variety of ways, and when this ratio is
adjusted for deferred taxes to include the tax liability in equity, the change in the
60
debt-to-equity as a result of deferred taxes is negatively related to the ordinary share
risk and financial risk measures of a company (Chandra & Ro, 1997:329).
Investors regard deferred taxes as a real liability and they discount the amount to its
present value according to the likelihood and timing of settlement. Users of financial
statements will have the view that a portion of the deferred tax liability should form
part of equity, and this will be a more appropriate treatment of the item. For
accounting rule-making bodies it can be determined that deferred taxes that arise
from inter-period tax allocation is transformed into value that is consistent with the
allocation between equity and liabilities by investors (Givoly & Hayn, 1992:406).
When an assessment of ordinary share risk is done, the market regards deferred
taxes not as a tax burden, but as an indicator of favourable future cash flows or
perhaps as a permanent transfer of the government’s stake in the overall value of
the firm to shareholders. It would seem that the market rewards firms’ efforts to defer
or minimise taxes by viewing such firms as a lower risk investment. Many doubts and
questions are raised regarding the treatment of deferred taxes as a liability and
whether this treatment is an appropriate basis for formulating accounting rules for
deferred taxes (Chandra & Ro, 1997:329).
3.3. SUMMARY
Income taxes, and with it deferred taxes, pose one of the more challenging areas of
financial accounting and is an area which may be truly challenging to the financial
analyst. Deferred tax is usually a material amount in the balance sheet of a firm and
thus has a direct implication when it comes to the calculation of certain ratios. If the
deferred tax amount is substantial it has a material effect on the ratios calculated.
Consequently the interpretations and results of these ratios will also be affected.
Deferred taxes can be separated into a deferred tax asset or liability, and the liability
treatment is where the questions lie, especially in terms of how this item should be
treated in the calculation of the debt-to-equity ratio. The research shows that
deferred tax can either be included as a liability, equity, or be partially offset against
the price of the asset. Each one of these proposed treatments will have a different
outcome when calculating the debt-to-equity ratio and this ratio can substantially be
affected, which can lead to different decisions being made on a ratio affected by one
substantial item.
61
The aim of this chapter is to address the second secondary research objective (cf.
Section 1.3, Chapter 1) which seeks to conceptualise from the theory what deferred
taxes are and what role it plays in the financial statements of an entity. Further, a
deeper understanding regarding the difference between a deferred tax asset and
liability and the different factors that lead to these items being created is gained.
Deferred taxes are thoroughly discussed in order to truly understand this item. This
will aid in creating a better understanding of how this item can be treated when
calculating the debt-to-equity ratio.
The different proposed treatments of the deferred tax liability in the debt-to-equity
ratio is thus established and a reason for each one of these proposed treatments
determined. The main objective of this study is to investigate the proposed treatment
of deferred taxes in the debt-to-equity ratio and in this chapter it is determined how
this aspect is viewed from a literature perspective. Chapter 4 focuses on the
research methodology followed in this study.
62
CHAPTER 4
RESEARCH METHODOLOGY
4.1. INTRODUCTION
This chapter is aimed at and focuses on the relevant information regarding the
research paradigm, research design, and the methods used to conduct this study.
The method and paradigm proposed for this project are therefore discussed (cf.
Sections 3.3 to 3.5), and the research design described, which details the scientific
procedures followed to investigate the problem stated (cf. Section 1.2). In other
words, the framework of the plan to perform the study is set out (research design),
and specifics of how to achieve this plan discussed.
The main purpose of conducting research is to obtain new insight into a specific
phenomenon and in this way formulate answers and solutions about previously
identified research questions (Kumar, 2008:6). The research methodology is
described as one of the most important aspects of the research paper as it provides
information by which the quality and the validity of the study can be judged (Fox &
Jennings, 2014:140; Kallet, 2004:1229). The manner in which the research is
conducted, e.g. the research design, data-sets, and analysis techniques will directly
affect the validity of the study results. The research methodology is aimed at
providing a detailed explanation of how the study was conducted in order to enable
other researchers and reviewers to replicate the study themselves and asses the
merit of the research (Fox & Jennings, 2014:138). Hannabuss (1996:23) states that
the research methodology should be determined fairly early in the research process
as it plays an essential part in determining whether the study is feasible.
Chapters 2 and 3, respectively, focuses on providing a literature review that provides
an overview of previous research conducted on ratio analysis, debt-to-equity ratio,
and the impact of deferred tax in this specific ratio. The literature review is used to
develop the questionnaires used during interviews with academic practitioners and
professionals in practice. The primary reason for conducting a literature review is to
determine what is already known about the specific area the study focuses on
(Bryman & Bell, 2011:91), and to determine how this topic is viewed by others (Berg,
63
2007:25). This review is performed to contextualise the study in order to debate and
justify a case as well as synthesise the literature on the topic in order to engage and
analyse it (Henning, 2009:27). This chapter will focus on all the relevant information
regarding the research paradigm, research design, and the methods used to conduct
this study.
4.2. THE RESEARCH OBJECTIVES OF STUDY
As stated in Section 1.3, the main objective of this study is to gain a better
understanding regarding the treatment of deferred tax in the debt-to-equity ratio and
to determine how this differs in theory and practice. The secondary research
objectives applicable to the empirical research are formulated in Section 1.3 and are
described as follows:
Conceptualising the debt-to-equity ratio from the literature by performing an in
depth theoretical study regarding the ratio to gain a better understanding of
the purpose and implications of this ratio (research objective 1);
Conceptualising from the literature what the appropriate treatment of deferred
tax in the debt-to-equity ratio is (research objective 2);
Determining from an academic perspective how deferred tax should be
treated in the calculation of the debt-to-equity ratio by gaining the opinion of
specific academic practitioners who specialise in the field of financial
management and financial accounting (research objective 3);
Determining how stockbrokers and portfolio managers take deferred tax into
account when calculating the debt-to-equity ratio by performing interviews
with certain professionals in practice (research objective 4); and
Based on research conducted, formulate a conclusion and recommendations
regarding the treatment of deferred tax in the debt-to-equity ratio (research
objective 5).
4.3. PARADIGMATIC ASSUMPTIONS
During the process of research the scientist will always interpret the research from a
specific paradigm. Certain philosophical assumptions will therefore be used when
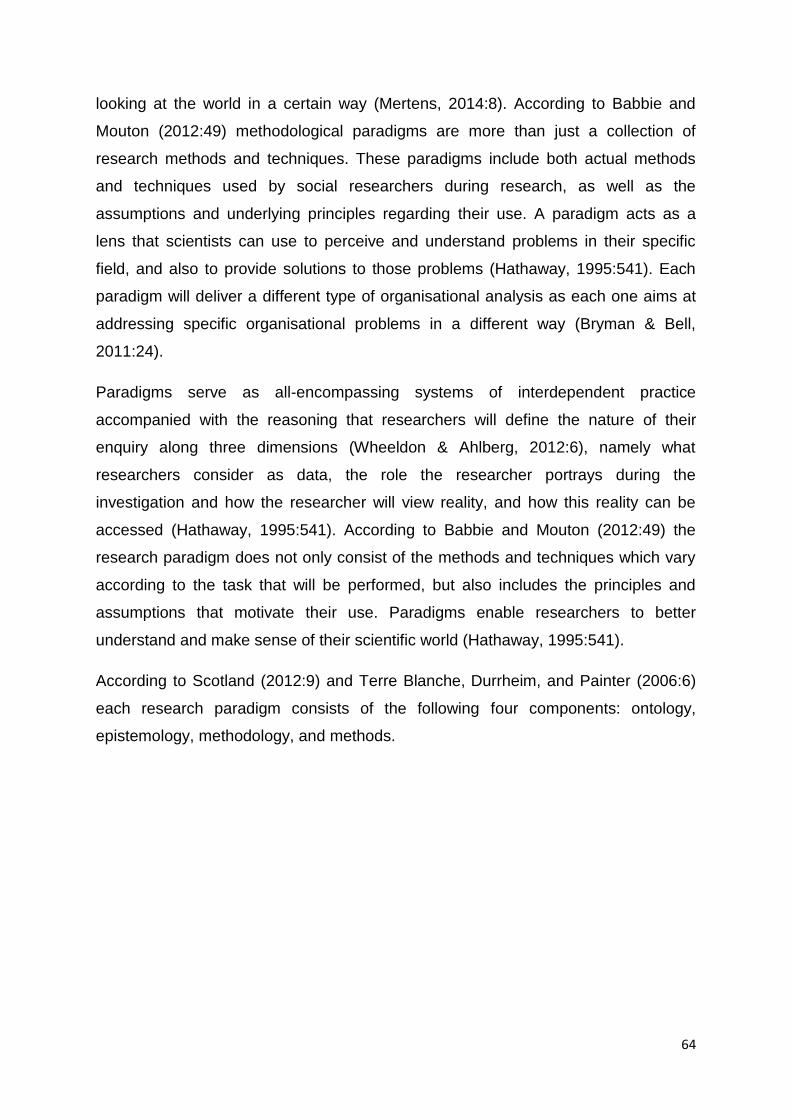
64
looking at the world in a certain way (Mertens, 2014:8). According to Babbie and
Mouton (2012:49) methodological paradigms are more than just a collection of
research methods and techniques. These paradigms include both actual methods
and techniques used by social researchers during research, as well as the
assumptions and underlying principles regarding their use. A paradigm acts as a
lens that scientists can use to perceive and understand problems in their specific
field, and also to provide solutions to those problems (Hathaway, 1995:541). Each
paradigm will deliver a different type of organisational analysis as each one aims at
addressing specific organisational problems in a different way (Bryman & Bell,
2011:24).
Paradigms serve as all-encompassing systems of interdependent practice
accompanied with the reasoning that researchers will define the nature of their
enquiry along three dimensions (Wheeldon & Ahlberg, 2012:6), namely what
researchers consider as data, the role the researcher portrays during the
investigation and how the researcher will view reality, and how this reality can be
accessed (Hathaway, 1995:541). According to Babbie and Mouton (2012:49) the
research paradigm does not only consist of the methods and techniques which vary
according to the task that will be performed, but also includes the principles and
assumptions that motivate their use. Paradigms enable researchers to better
understand and make sense of their scientific world (Hathaway, 1995:541).
According to Scotland (2012:9) and Terre Blanche, Durrheim, and Painter (2006:6)
each research paradigm consists of the following four components: ontology,
epistemology, methodology, and methods.
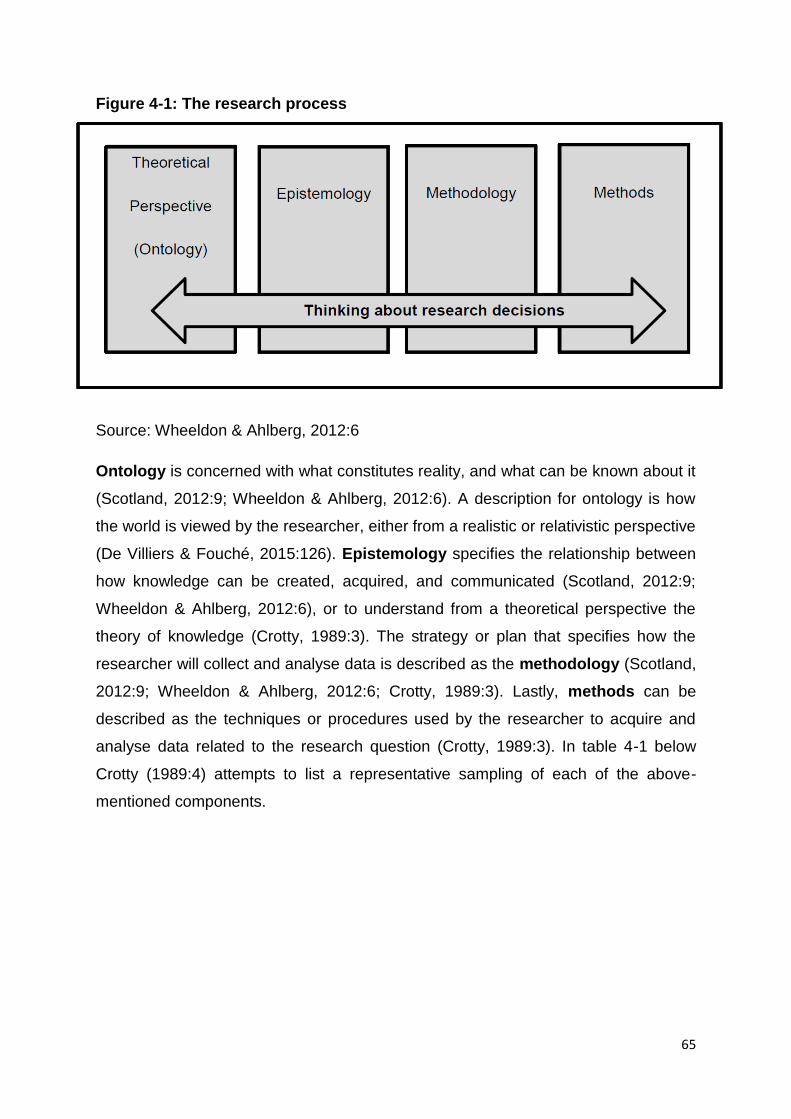
65
Figure 4-1: The research process
Source: Adapted from Wheeldon and Ahlberg (2012:6)
Source: Wheeldon & Ahlberg, 2012:6
Ontology is concerned with what constitutes reality, and what can be known about it
(Scotland, 2012:9; Wheeldon & Ahlberg, 2012:6). A description for ontology is how
the world is viewed by the researcher, either from a realistic or relativistic perspective
(De Villiers & Fouché, 2015:126). Epistemology specifies the relationship between
how knowledge can be created, acquired, and communicated (Scotland, 2012:9;
Wheeldon & Ahlberg, 2012:6), or to understand from a theoretical perspective the
theory of knowledge (Crotty, 1989:3). The strategy or plan that specifies how the
researcher will collect and analyse data is described as the methodology (Scotland,
2012:9; Wheeldon & Ahlberg, 2012:6; Crotty, 1989:3). Lastly, methods can be
described as the techniques or procedures used by the researcher to acquire and
analyse data related to the research question (Crotty, 1989:3). In table 4-1 below
Crotty (1989:4) attempts to list a representative sampling of each of the above-
mentioned components.
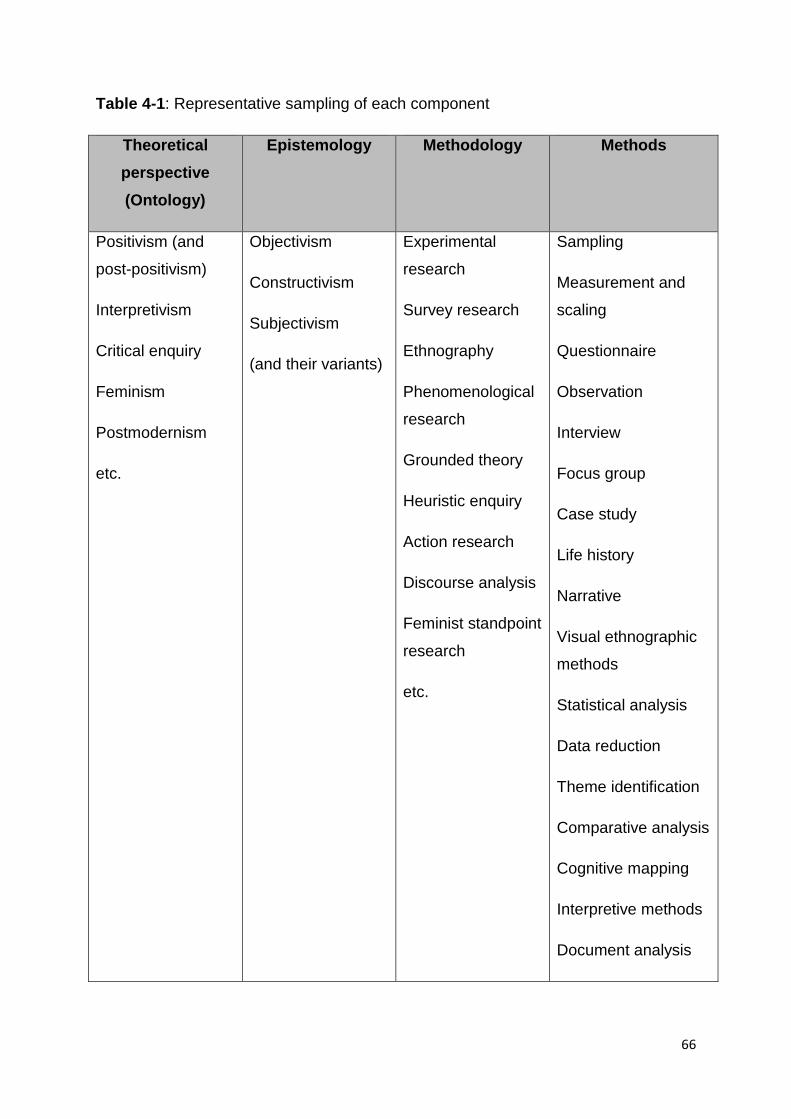
66
Table 4-1: Representative sampling of each component
Theoretical
perspective
(Ontology)
Epistemology Methodology Methods
Positivism (and
post-positivism)
Interpretivism
Critical enquiry
Feminism
Postmodernism
etc.
Objectivism
Constructivism
Subjectivism
(and their variants)
Experimental
research
Survey research
Ethnography
Phenomenological
research
Grounded theory
Heuristic enquiry
Action research
Discourse analysis
Feminist standpoint
research
etc.
Sampling
Measurement and
scaling
Questionnaire
Observation
Interview
Focus group
Case study
Life history
Narrative
Visual ethnographic
methods
Statistical analysis
Data reduction
Theme identification
Comparative analysis
Cognitive mapping
Interpretive methods
Document analysis

67
Content analysis
Conversation
analysis
etc.
Source: Crotty, 1989:5
The purpose served by these four components is to ensure the soundness of the
research performed and to present convincing results (Crotty, 1989:6). The three
dimensions of ontology, epistemology, and methodology constrain each other
(Wheeldon & Ahlberg, 2012:7). Scotland (2012:10) maintains that the research
methods used to conduct a research study could be traced back, through the
methodology and epistemology, to the ontological position of the researcher.
4.3.1. Philosophical worldviews
All researchers have certain beliefs and philosophical assumptions, and by gaining
appropriate knowledge regarding research philosophies will influence the research
design and how research will be performed (Blumberg, Cooper & Schindler,
2008:17; Creswell, 2012:15). Creswell (2013:6) distinguishes between four
philosophical worldviews, namely post-positivism, constructivism, transformative
view, and pragmatism. The major elements of each one of these worldviews are
represented in table 4-2 below:
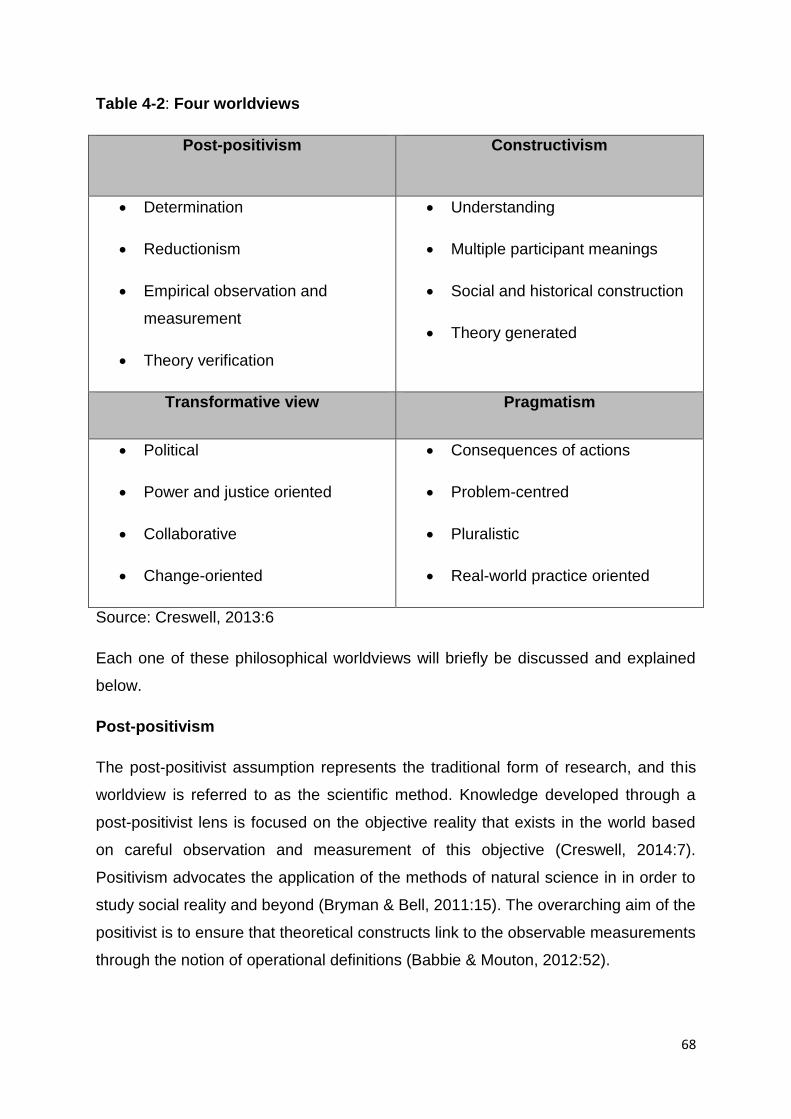
68
Table 4-2: Four worldviews
Post-positivism Constructivism
Determination
Reductionism
Empirical observation and
measurement
Theory verification
Understanding
Multiple participant meanings
Social and historical construction
Theory generated
Transformative view Pragmatism
Political
Power and justice oriented
Collaborative
Change-oriented
Consequences of actions
Problem-centred
Pluralistic
Real-world practice oriented
Source: Creswell, 2013:6
Each one of these philosophical worldviews will briefly be discussed and explained
below.
Post-positivism
The post-positivist assumption represents the traditional form of research, and this
worldview is referred to as the scientific method. Knowledge developed through a
post-positivist lens is focused on the objective reality that exists in the world based
on careful observation and measurement of this objective (Creswell, 2014:7).
Positivism advocates the application of the methods of natural science in in order to
study social reality and beyond (Bryman & Bell, 2011:15). The overarching aim of the
positivist is to ensure that theoretical constructs link to the observable measurements
through the notion of operational definitions (Babbie & Mouton, 2012:52).

69
Constructivism
Constructivism is regarded as an approach to qualitative research and can be
described as interpretivism. Social constructivists follow the belief that individuals
seek understanding of the world in which they live and function. This understanding
is gained by developing subjective meaning from their own life experiences
(Creswell, 2014:8). Constructivism is an ontological position which states that social
phenomena and their meanings are achieved by social actors on a continuous basis
(Bryman & Bell, 2011:22).
Transformative view
The transformative worldview determines that the research performed contains an
action agenda for reform that might lead to a change in the lives of participants, the
institution where the participants work or live, and lastly the researcher’s life. The
researcher acts as a voice and messenger for the participants in the situation
(Creswell, 2014:9).
Pragmatism
This worldview is a result of actions, situations, and consequences rather than
antecedent conditions; this worldview is more focused on the research problem than
the methods used to perform the research (Creswell, 2014:10-11). The researcher
selects techniques and methods that ensure the research objective is reached in the
best possible way (Creswell, 2012:28). Philosophers who adopt the pragmatic
paradigm reject the notion that answers to research problems can be found by using
a single scientific method (Mertens, 2014:35).
4.3.2. The philosophical perspective of this study
For the purpose of this study the researcher adopts the constructivist paradigm. The
qualitative research approach is usually linked to phenomenology or interpretivism
(Babbie & Mouton, 2012:49). Constructivism implies that social interaction does not
only produce social phenomena and categories, but that these are also in a constant
state of revision (Bryman & Bell, 2011:22). The interpretivist researcher cannot be
separated from the subject being studied (De Villiers & Fouché, 2015:128).
Interpretivism is predicated upon the view that a strategy is required that respects
differences between people and the objects linked to the natural sciences, and
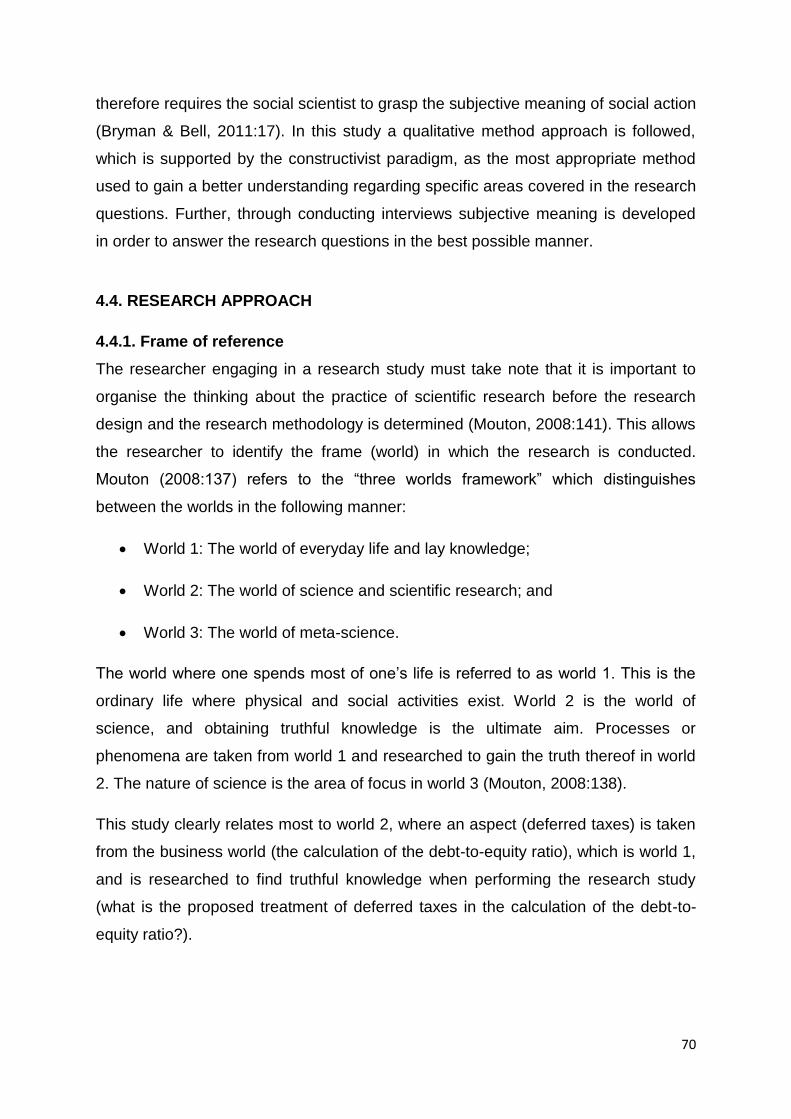
70
therefore requires the social scientist to grasp the subjective meaning of social action
(Bryman & Bell, 2011:17). In this study a qualitative method approach is followed,
which is supported by the constructivist paradigm, as the most appropriate method
used to gain a better understanding regarding specific areas covered in the research
questions. Further, through conducting interviews subjective meaning is developed
in order to answer the research questions in the best possible manner.
4.4. RESEARCH APPROACH
4.4.1. Frame of reference
The researcher engaging in a research study must take note that it is important to
organise the thinking about the practice of scientific research before the research
design and the research methodology is determined (Mouton, 2008:141). This allows
the researcher to identify the frame (world) in which the research is conducted.
Mouton (2008:137) refers to the “three worlds framework” which distinguishes
between the worlds in the following manner:
World 1: The world of everyday life and lay knowledge;
World 2: The world of science and scientific research; and
World 3: The world of meta-science.
The world where one spends most of one’s life is referred to as world 1. This is the
ordinary life where physical and social activities exist. World 2 is the world of
science, and obtaining truthful knowledge is the ultimate aim. Processes or
phenomena are taken from world 1 and researched to gain the truth thereof in world
2. The nature of science is the area of focus in world 3 (Mouton, 2008:138).
This study clearly relates most to world 2, where an aspect (deferred taxes) is taken
from the business world (the calculation of the debt-to-equity ratio), which is world 1,
and is researched to find truthful knowledge when performing the research study
(what is the proposed treatment of deferred taxes in the calculation of the debt-to-
equity ratio?).

71
4.4.2. Research design
The research design is used to specify certain aspects that contribute towards
answering the research question; these aspects include determining the participants,
data collection, variable measures, and data-analysis methods (Lussier, 2011:97).
The research design allows the researcher to select a suitable research method that
will justify the research objectives and constructivist research paradigm of this study.
The study must be attentively planned to answer the research question, as the
research question is the starting point of the entire research process (Lussier,
2011:97).
Babbie and Mouton (2012:74) make a clear distinction between the research design
and the research methodology by referring to the analogy of building a house. When
a couple decides to build a house there are many different ideas that arise regarding
the style, size, shape, etc. The architect will then be consulted to try and visualise
their ideas and then use these ideas to draw a plan for the house. The architect will
then discuss the plan with the couple in order to make the changes necessary to
satisfy their needs. When the design plan is finalised the architect will start building
the house through the execution of the design. The building contractor will make use
of different tools and methods (here, the research methodology) to perform the
different tasks of building the house. The building inspector will, after the house is
completed, certify the house to ensure the house was built in accordance with the
original plan. These steps constitute the research design.
The analogy of building a house discussed above can be put into context by referring
to Figure 4-2 below that displays a metaphor for the research design:
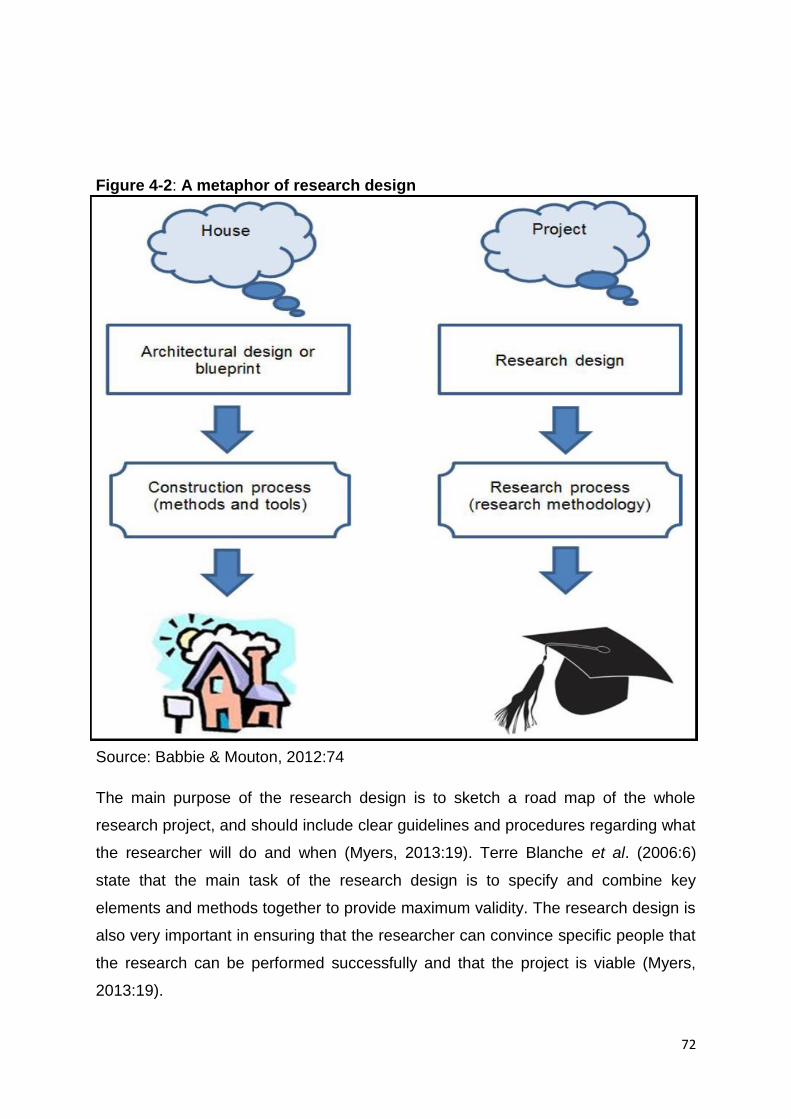
72
Figure 4-2: A metaphor of research design
Source: Babbie & Mouton, 2012:74
The main purpose of the research design is to sketch a road map of the whole
research project, and should include clear guidelines and procedures regarding what
the researcher will do and when (Myers, 2013:19). Terre Blanche et al. (2006:6)
state that the main task of the research design is to specify and combine key
elements and methods together to provide maximum validity. The research design is
also very important in ensuring that the researcher can convince specific people that
the research can be performed successfully and that the project is viable (Myers,
2013:19).
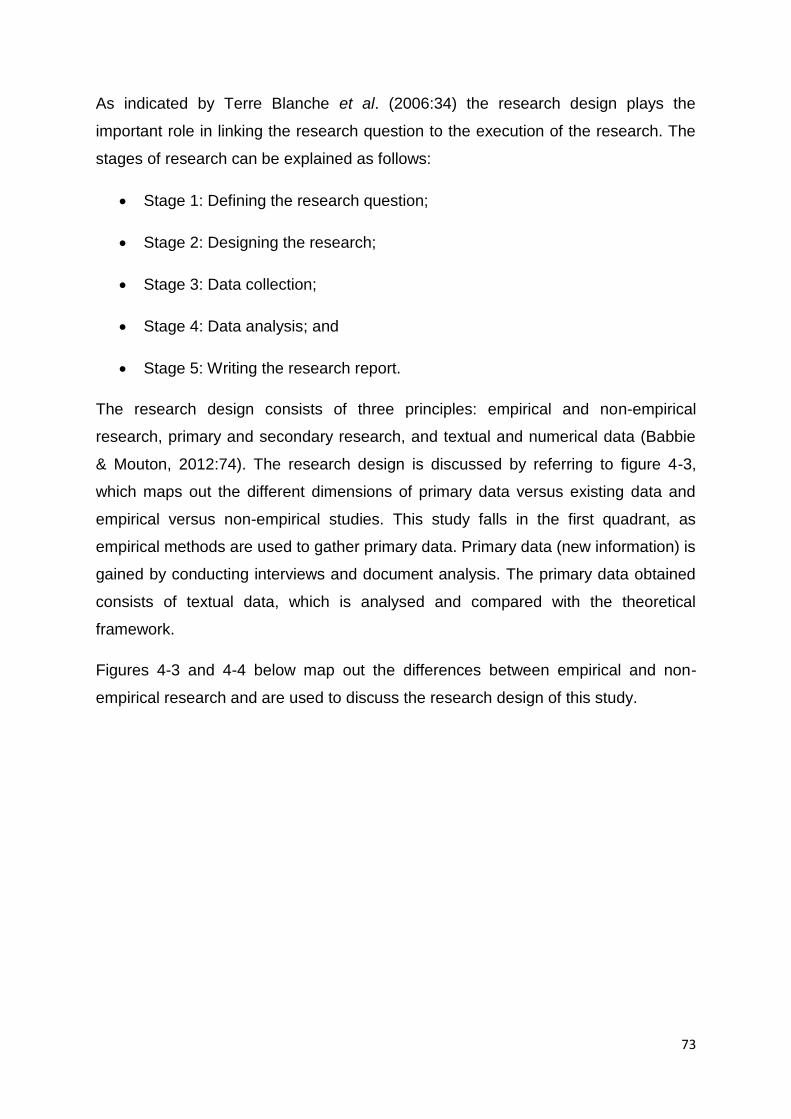
73
As indicated by Terre Blanche et al. (2006:34) the research design plays the
important role in linking the research question to the execution of the research. The
stages of research can be explained as follows:
Stage 1: Defining the research question;
Stage 2: Designing the research;
Stage 3: Data collection;
Stage 4: Data analysis; and
Stage 5: Writing the research report.
The research design consists of three principles: empirical and non-empirical
research, primary and secondary research, and textual and numerical data (Babbie
& Mouton, 2012:74). The research design is discussed by referring to figure 4-3,
which maps out the different dimensions of primary data versus existing data and
empirical versus non-empirical studies. This study falls in the first quadrant, as
empirical methods are used to gather primary data. Primary data (new information) is
gained by conducting interviews and document analysis. The primary data obtained
consists of textual data, which is analysed and compared with the theoretical
framework.
Figures 4-3 and 4-4 below map out the differences between empirical and non-
empirical research and are used to discuss the research design of this study.
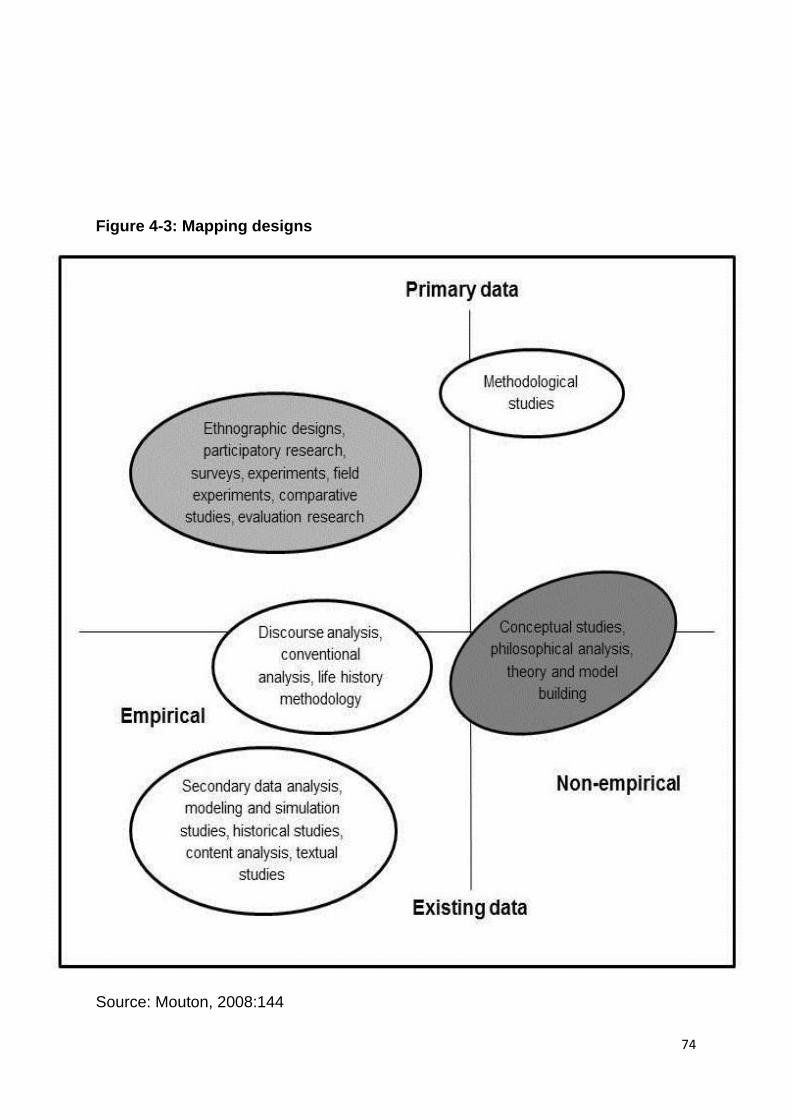
74
Figure 4-3: Mapping designs
Source: Mouton, 2008:144
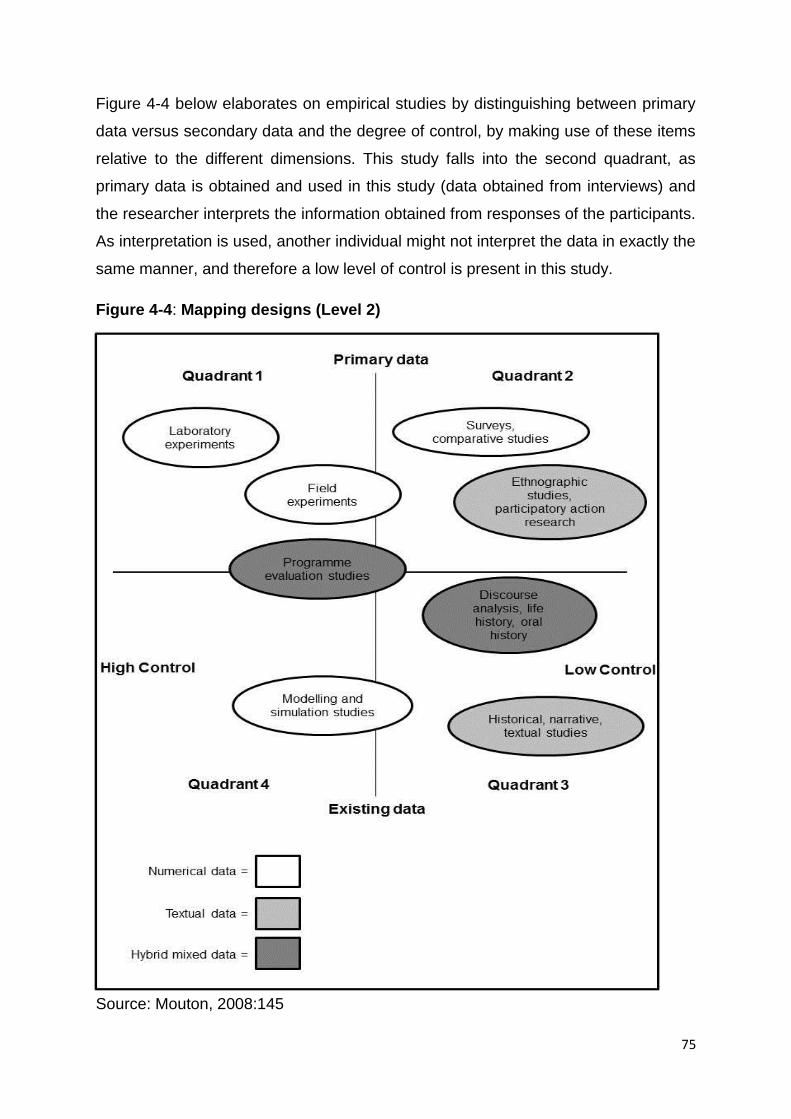
75
Figure 4-4 below elaborates on empirical studies by distinguishing between primary
data versus secondary data and the degree of control, by making use of these items
relative to the different dimensions. This study falls into the second quadrant, as
primary data is obtained and used in this study (data obtained from interviews) and
the researcher interprets the information obtained from responses of the participants.
As interpretation is used, another individual might not interpret the data in exactly the
same manner, and therefore a low level of control is present in this study.
Figure 4-4: Mapping designs (Level 2)
Source: Mouton, 2008:145
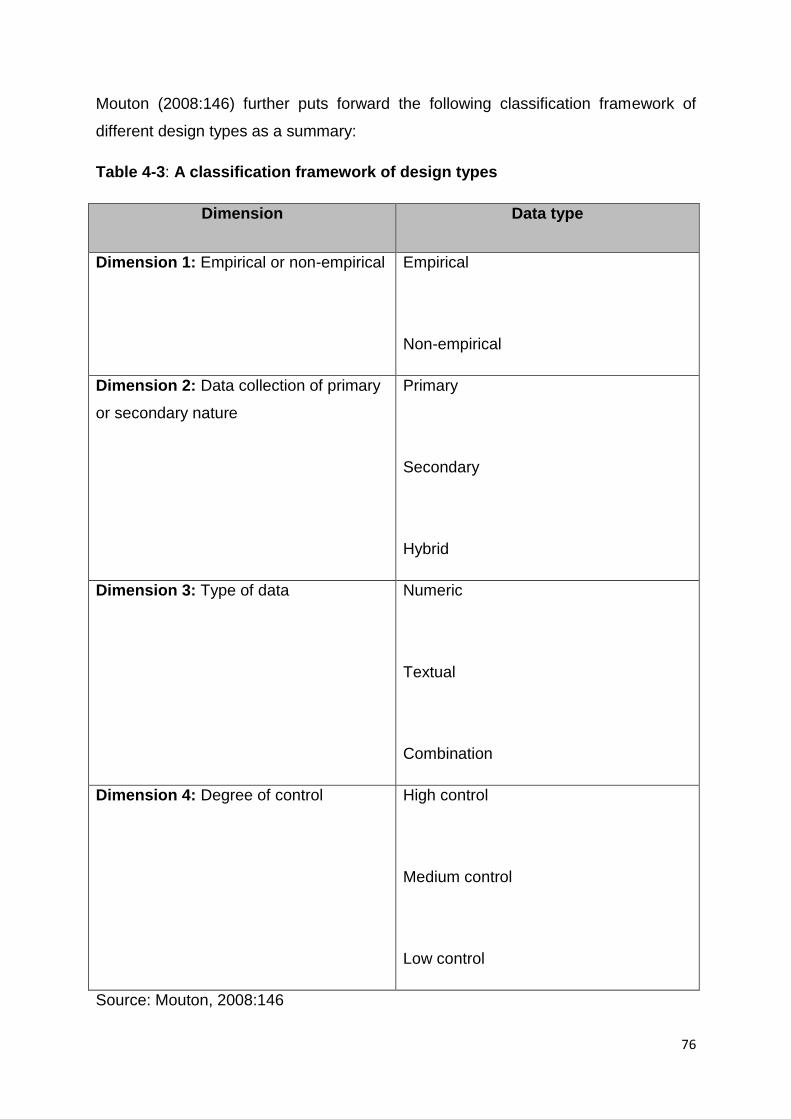
76
Mouton (2008:146) further puts forward the following classification framework of
different design types as a summary:
Table 4-3: A classification framework of design types
Dimension Data type
Dimension 1: Empirical or non-empirical Empirical
Non-empirical
Dimension 2: Data collection of primary
or secondary nature
Primary
Secondary
Hybrid
Dimension 3: Type of data Numeric
Textual
Combination
Dimension 4: Degree of control High control
Medium control
Low control
Source: Mouton, 2008:146
77
By using the classification provided in table 4-4 above, the appropriate classification
of this study is as empirical, collecting primary textual data, with a low level of
control.
To conclude, the study is therefore classified as empirical, as interviews is the
selected technique utilised to gather information from the selected participants. New
data collected from the participants through the above-mentioned method and data
collection is therefore classified as of primary nature. The type of data gathered and
used in this study is textual data, as the responses of the interview questions
regarding descriptive questions are interpreted as textual results. As the researcher
is responsible for interpreting the results and responses of interviews, it leads to a
low level of control being present; the reason is based on the fact that interpretation
might be different when done by another individual.
4.5. QUANTITATIVE, QUALITATIVE AND MIXED METHOD OF RESEARCH
Distinctions between qualitative and quantitative research methods are one of the
most common distinctions used to classify and characterise different types of
research (Myers, 2013:7). The quantitative research method stems from a strong
academic tradition and there is considerable dependence on numbers that represent
concepts and opinions (Amaratunga, Baldry, Sarshar & Newton, 2002:19).
Quantitative research methods within the natural sciences were originally developed
with the aim of studying natural phenomena (Myers, 2013:7). The process of
undertaking quantitative research is purely empirical in nature, based on this method
being defined as drawing conclusions based upon evidence extracted from data and
statistical analysis by means of deductive reasoning (De Villiers & Fouché,
2015:129).
Qualitative research in general consists of a small sample size and does not report
statistical results (Terre Blanche et al., 2006:9). The qualitative method is more
focused on words and observations (Amaratunga et al., 2002:19) and can
sometimes be a very helpful method to gain an understanding of the local meaning
of certain phenomena (Bartunek & Seo, 2002:238). The qualitative research
methodology is defined as a research method that yields evocative data gained
through the researcher’s experiences and perceptions put in writing (De Villiers &
78
Fouché, 2015:133). It is a method that makes use of observational methods such as
conducting interviews or observing participants to gather data (Babbie & Mouton,
2012:53).
Qualitative and quantitative research is often seen as complimentary within the
context of research literature, hence the existence of the mixed method. The mixed
method approach consists of both qualitative and quantitative methods of research
to gather data (De Villiers & Fouché, 2015:137). The mixed method can also be
described as triangulation, and within the research context the strengths and
weaknesses of one method is balanced with those of the other method. Triangulation
stems from the idea that the researcher should do more than just one thing in the
study, this means that during the research project more than one research method
must be utilised to gather data (Myers, 2013:9). Amaratunga et al. (2002:19) and
Grafton, Lillis and Mahaama (2011:12) describe mixed methods as research
strategies that consist of both quantitative and qualitative research methods used to
study the same phenomenon.
The researcher using a combination of qualitative and quantitative research methods
will gain the advantage of better insight into results being gathered (Amaratunga et
al., 2002:30). By combining the qualitative and quantitative research methods the
researcher is provided with the opportunity to incorporate divergent views into their
study, which results in gaining a deeper understanding of the research problem
(Grafton et al., 2011:12). The use of mixed methodologies has many advantages,
but one of the main challenges arising from this approach is choice of data collection
techniques to achieve a triangulation of results to improve their validity (De Villiers &
Fouché, 2015:137). Each research method has its merits and one method is not
inherently better than the other, but the researcher must choose a method that
ensures the research objectives are achieved (Amaratunga et al., 2002:30). Creswell
(2013:17) provides a summary of the three methods which can be seen in table 4-5:
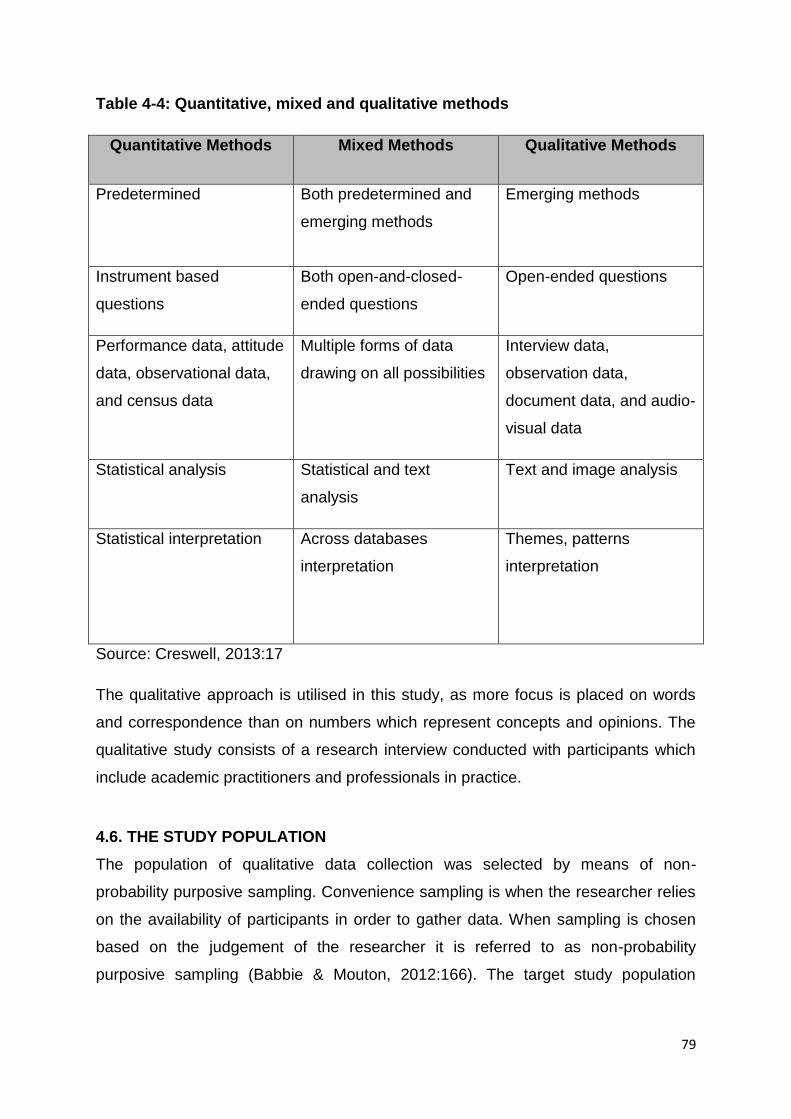
79
Table 4-4: Quantitative, mixed and qualitative methods
Quantitative Methods Mixed Methods Qualitative Methods
Predetermined
Both predetermined and
emerging methods
Emerging methods
Instrument based
questions
Both open-and-closed-
ended questions
Open-ended questions
Performance data, attitude
data, observational data,
and census data
Multiple forms of data
drawing on all possibilities
Interview data,
observation data,
document data, and audio-
visual data
Statistical analysis Statistical and text
analysis
Text and image analysis
Statistical interpretation Across databases
interpretation
Themes, patterns
interpretation
Source: Creswell, 2013:17
The qualitative approach is utilised in this study, as more focus is placed on words
and correspondence than on numbers which represent concepts and opinions. The
qualitative study consists of a research interview conducted with participants which
include academic practitioners and professionals in practice.
4.6. THE STUDY POPULATION
The population of qualitative data collection was selected by means of non-
probability purposive sampling. Convenience sampling is when the researcher relies
on the availability of participants in order to gather data. When sampling is chosen
based on the judgement of the researcher it is referred to as non-probability
purposive sampling (Babbie & Mouton, 2012:166). The target study population
80
chosen to perform the qualitative research interview is academic practitioners and
professionals in practice.
The academic practitioners selected consist of a sample that reflects both the
financial accounting and financial management fields in order to represent a fair
reflection of both sides of the theory. Accounting academics are specifically chosen
because of their focused knowledge of deferred taxes, a specific accounting term
based on International Financial Reporting Standards (IFRS), to better understand
their views regarding this item and the treatment thereof. Financial management
academics are chosen because of their focussed knowledge regarding financial
statement analysis, specifically the calculation of the debt-to-equity ratio, to gain data
regarding what the proposed treatment of deferred taxes is when calculating this
ratio.
The professionals in practice chosen consist of stockbrokers and portfolio managers
who focus on investing and selling shares in firms. The reason for the selection is
based on the fact that these professionals calculate specific ratios based on a
company’s statements and use these ratios in their decision making process to
determine if shares should be bought or sold (refer to section 2.5). The stockbrokers
specifically are equity traders who, on a daily basis, make use of financial
information to make decisions. The debt-to-equity ratio is one of the ratios a
stockbroker and portfolio manager can use to determine the financial leverage of a
company and thus determine the enclosed financial risk, which influences decisions
regarding the company’s shares (cf. Section 2.7.4).
4.7. THE RESEARCH INSTRUMENT
Babbie and Mouton (2012:100) state that the social scientist has a variety of
research instruments at his/her disposal and that each instrument has its strengths
and weaknesses which allow certain concepts to be appropriately studied. The
research instrument significantly influences the reliability and validity of the research
being performed (Richardson, 2004:349). The research instrument best suited to
address the research question must be selected to ensure the research objectives
are achieved.
During this study the following data collection instruments are used:
81
Interviews with academic practitioners; and
Interviews with professionals in practice.
Richardson (2004:349) concludes that a reliable research instrument is one that
yields results which are consistent when used repeatedly under similar conditions
and with similar participants over a period of time. The research instrument should
be valid, meaning that the instrument measures what it purports to measure; it is one
of the fundamental requirements of the research instrument (Richardson, 2004:350).
To demonstrate the validity, reliability, and scope of the research instrument used to
gather data in the study, a discussion further describing the instrument follows
below:
4.7.1. The qualitative research interview
Interviews are viewed as one of the most important data gathering techniques for
qualitative researchers and is the most widely used qualitative research method.
Interviews allow the researcher to gather valuable data from people who find
themselves in various roles and situations (Myers, 2013:119). The natural basis of
an interview is based on human conversation, where the researcher has the choice
of setting the pace and style of questions to gain required results (Hannabuss,
1996:22). In this study the research interview is employed as a qualitative research
method.
4.7.1.1. Description
The research interview is described as a method of obtaining qualitative information
through the process of interacting with participants who are exposed to the
phenomenon being studied (De Villiers & Fouché, 2015:135). When using
questionnaires the participants are expected to read the enclosed questions.
Interviews consist of face-to-face encounters between the researcher and the
participant (Babbie & Mouton, 2012:249). The essential characteristic that
distinguishes a questionnaire from an interview is the fact that a research
questionnaire does not require direct interaction, whereas the interview requires
direct interaction between the researcher and the participant (Rowley, 2014:308).
82
4.7.1.2. Objective of the research interview
The type of interview technique selected by the researcher is very important to
ensure that the desired quality of data is obtained through the interviews conducted
(De Villiers & Fouché, 2015:135). The main objective of conducting a research
interview is to make use of a prearranged set of questions that allows the researcher
to obtain data from the participants (Babbie & Mouton, 2012:249). The objective of
the research interview is to help the researcher focus on the subjects of the world,
and to use the language of the participant instead of imposing one’s own views
(Myers, 2013:119).
4.7.1.3. Reliability and validity of the research interview
Reliability
Reliability can be defined as a concept that is achieved when the results derived
from a study are repeatable (Bryman & Bell, 2011:41). The researcher responsible
for conducting the interview must be able to build a relationship with the participants
involved in the research interview, and possess suitable skills to ensure reliability
(De Villiers & Fouché, 2015:135). The level of comfort-ability brought to the interview
by the interviewer and their preparedness to talk directly affects the disclosure
received from participants (Myers, 2013:119). One of the major challenges of
conducting research interviews is that the researcher must ensure that the interview
is free of research bias and subjectivity. By using research interviews the researcher
always runs the risk of putting certain ideas or answers in the heads of participants
by influencing them on an interpersonal level (Hannabuss, 1996:24). Reliability can
crop up in different forms when performing social research, and when a single
observer is the sole source responsible for deriving data reliability concerns are
raised, especially because of the lack of safeguards against the subjectivity of the
researcher (Babbie & Mouton, 2012:120).
The attitude of the researcher who performs the interview directly influences the
responses of the participants (Babbie & Mouton, 2012:120). To ensure reliability of
the research interview it is critical that the interviewer be prepared and understands
each question that needs to be answered (Babbie & Mouton, 2012:120). The
researcher’s preparedness and knowledge of the research questions will allow the
interviewer to correctly apply the questions to each participant’s specific
83
circumstances. This will ensure that the questions are asked and answered in the
manner intended (Babbie & Mouton, 2012:120).
During the process of conducting the research interview the researcher specifically
focuses on the above-mentioned factors combined with pervasive objectivity
throughout the entire discussion, ensuring that all of the above-mentioned factors are
addressed. The researcher also tested the questionnaire by performing a test
interview in order to establish that all of the questions are clear and understandable.
All of the interviews were recorded and the responses carefully transcribed.
Validity
Validity is described as a concept that is mainly concerned with the integrity of the
conclusions developed from a piece of research (Bryman & Bell, 2011:42). The
research questionnaire and a copy of the transcribed script was sent to each one of
the participants. This was done in order to confirm the validity and accuracy of their
responses. The selection of participants plays a very important role in determining
the validity of the research interview. Purposive non-probability sampling was the
method used to select the participants for the interview. Participants from both
specific academic fields covered in this study were included as well as professionals
in practice who specifically make use of the debt-to-equity ratio.
The validity of the research interview is increased when similar answers are
delivered from participants based on questions that differ from each other in a very
small manner (Griffee, 2005:37). Triangulation of data increases the validity of data
obtained from the research interview. Triangulation is when at least two sources of
data are compared to each other (Griffee, 2005:37). Triangulation increases validity
when interviews are performed with multiple participants delivering similar answers
with the assumption that at least a couple of duplicate questions exist (Griffee,
2005:37).
Validity was ensured by making use of an independent person to transcribe the
results of the research interview to ensure objectivity and accuracy in transcribing.
Face validity was ensured by consulting the literature review (thus other researchers
and experts on the subject) when the questionnaire was developed.
84
4.7.1.4. Conducting a research interview
Based on how important the research interview is, and how valuable data extracted
from this process can be, indicates that performing this qualitative data collection
method is no trivial enterprise (Qu & Dumay, 2011:238). Each interview performed is
seen as a small work of art, and each piece of art is created at a different pace in
relation to its specific ebb and flow (Trochim & Donnelly, 2007:115). Performing a
successful research interview requires that the interviewer makes use of various
skills, for example extensive listening, note taking, and carefully and sufficiently
planning the interview (Qu & Dumay, 2011:239). Every interview has certain similar
components; there is the opening part that allows the interviewer to set the tone and
pace, the middle, described as the heart of the interview, and lastly the end part
viewed as the wrap-up of the interview (Trochim & Donnelly, 2007:115).
The researcher can choose between three basic interview techniques, namely
structured, semi-structured, and unstructured interviews. The selection of the
appropriate interview technique helps the interviewer to obtain the desired quality of
data (De Villiers & Fouché, 2015:135). The different types of interviews each pose its
own set of strengths and weaknesses, and each technique might be more or less
suitable to achieve the goals of certain areas of research (Hannabuss, 1996:24).
Each one of the above-mentioned interview techniques is discussed in further detail
below.
Structured interviews
Structured interviews consist of pre-formulated questions that are usually asked and
answered in a specific order, within a certain pre-determined time frame (Myers,
2013:122). Further exploration of the topic is very limited as the answers of
respondents are predefined by the researcher (Blumberg et al., 2008:265). The
structured interview, also referred to as the standardised interview, aims to give each
respondent the same interview stimulus by using the same frame of questioning
(Bryman & Bell, 2011:202). Responses on questions asked in a structured interview
are limited to a set amount of categories, and there is little to no room for deviation
when it comes to the pre-determined questions used for the interview (Qu & Dumay,
2011:244). The role of the interviewer is minimised when the structured interview is
85
used due to the lack of improvisation required when the interview is conducted
(Myers, 2013:122).
Unstructured interviews
The unstructured interview is a very useful technique if the interview is conducted
with regard to a wide-ranging problem area and the researcher has to identify the
issues that will help better understand the situation (Blumberg et al., 2008:265). The
unstructured interview is on the exact opposite side of the spectrum as structured
interviews as this form of interview consists of little pre-formulated questions and
placing a time limit on the interview is not mandatory (Myers, 2013:122). This type of
interview is very useful to gain information in contrast to using fixed-choice
alternatives asked in a closed question as with structured interviews (Bryman & Bell,
2011:204). Consistency between unstructured interviews is not all-important,
meaning that maintaining consistency between unstructured interviews is not a
primary focus or objective for the interviewer (Myers, 2013:122).
Semi-structured interviews
The semi-structured interview finds its place somewhere between a structured and
unstructured interview. Pre-formulated questions are used when performing the
interview, but the interviewer is not required to strictly adhere to these questions
(Myers, 2013:122). The list of questions used in the semi-structured interview is
usually pre-determined, but the interviewer can still ask additional questions to gain
further clarification on responses (Griffee, 2005:36). The focus of the interview is
using the established interview guide, which includes a broad range of themes that
need to be addressed. The interviewer uses this guide to direct the questions in such
a manner that it ensures all the topics and issues of the study are covered (Qu &
Dumay, 2011:246). The semi-structured interview starts out with more specific
questions to ensure that the necessary areas are covered, and these questions are
asked in a similar manner between interviews (Blumberg et al., 2008:265).
Consistency is maintained during semi-structured interviews given the fact that each
interview will start with similar types of questions each time (Myers, 2013:122).
Questions asked in semi-structured interviews are usually more general in their
frame of reference, and the interviewer has a higher level of freedom to ask further

86
questions in response to replies that are viewed as significant (Bryman & Bell,
2011:205).
The participants taking part in the interview need to be informed regarding the
purpose of the study. Furthermore, the reason for selecting the participant and how
their responses will be treated should be communicated (Hannabuss, 1996:25). The
research interview can be a difficult data collection technique which requires a
sophisticated skill set. Dilley (2000:134) states that the following five foci need to be
considered throughout the entire interview:
Listen to what the interviewee is saying;
Compare the interviewee’s responses to what is currently known;
Compare the interviewee’s responses with other questions asked;
Always keep track of time; and
Offer information to initiate responses, clarification or further explanation.
Based on the above descriptions it was determined that the appropriate type of
interview to use in this study would be a semi-structured interview making use of a
pre-arranged set of questions. The semi-structured interview allows the researcher
to obtain answers to questions that are not limited while also allowing the interview to
flow without steering it in a pre-determined direction.
Difficulties of an interview
The prime risk associated with performing a research interview is that the possibility
always exists that the conversation might derail and move off topic, thus affecting the
data collected (De Villiers & Fouché, 2015:135). The research interview can be very
expensive and time consuming and is often very intensive; consequently, the risk of
covering a small sample of the population, which is not representative of the
population as a whole, increases (Hannabuss, 1996:23). The risk of selecting an
incorrect interview technique is ever present, due to the fact that the technique
selected has such a prominent effect on the quality of data gained from the interview
(De Villiers & Fouché, 2015:135). The results and data gathered from the interview
can also be corrupted or unreliable as a result of various factors, emphasising that
87
the research interview is not a risk free data gathering method (Hannabuss,
1996:24).
4.7.1.5. Study sample of the interview
The population of the interview consists of academic practitioners specialising in the
fields of financial accounting and financial management. The professionals in
practice consist of stockbrokers and portfolio managers. The study sample was
selected based on purposive non-probability sampling, which is a sampling method
used to select participants based on the judgement of the researcher. Four academic
practitioners were selected of which two specialise in accounting and two in financial
management. All of the academic participants are qualified charted accountants and
one of the participants also has a doctoral degree in accounting sciences and is an
accredited professor at the North-West University.
The professionals in practice reflect a wide range regarding specific qualifications,
age, background, and types of portfolios managed. The sample of four participants
consist of traders, fund managers, quantitative-, and equity analysts. Each one of
these participants obtained specific qualifications which they use in their respective
fields and their experience range from four years up to 26 years. The qualifications
held by the professionals in practice include a B.com economics honours, B.com
honours in risk management, charted financial analyst and charted accountant
degree.
4.7.1.6. Administration of the interview
In order to conduct the interviews each one of the participants were contacted and
the research was briefly explained to them. Permission was obtained to conduct
interviews and then appointments were scheduled. It was clearly communicated to
each participant that the interview was voluntary and anonymous. Permission was
also obtained from each participant to record the interview.
The type of interview used was a semi-structured interview making use of a pre-
arranged set of questions. The questionnaire was followed carefully in order to
ensure reliability. The participants were, however, allowed to provide additional
comments, and if the participants had any further questions the researcher answered
it. The lists of questions used in the interviews are documented in Appendix A.
88
4.7.1.7. Analysis of the interview
The interviews performed were recorded and the data carefully extracted and
transcribed from the recordings by an independent person to ensure objectivity. This
was done to ensure that the data remains objective and free from any form of bias.
One of the crucial stages in the process of doing a content analysis is the coding of
data (Bryman & Bell, 2011:299). Data was then sorted into categories based on the
research objectives. Coding was used to sort the data in different themes and
categories (Section 1.3).
Qualitative data was analysed by means of thematic content analysis by searching
for patterns and themes in the data. The researcher familiarised himself with the data
by reading through it several times. After the data was read several times different
items were placed in different themes and categories and Atlas.ti was used to code
the data to determine the specific applicable themes. This was done by searching for
important themes and similar ideas between different interviews. Themes were
further separated into sub-themes. By making use of sub-categories coding and
interpretation of data was made possible.
4.8. SUMMARY
The objective of this chapter is to provide an overview of the philosophical paradigm
applicable in this study, as well as the research design and methods that will be
implemented to achieve secondary research objectives 3, 4, and 5 (see Section 1.3).
The constructivist paradigm is the most applicable paradigm to address the research
objective. This study makes use of the qualitative research method approach. This
approach is thoroughly discussed; the reason for implementing this specific method
in the study was explained in Section 4.5.
One research instrument used in this study is the qualitative research interview (see
Section 4.7.1). The specified instrument is discussed in detail and the reliability and
validity thereof are accounted for. The study sample and population for the research
interview and the reason for selection is justified and determined. In conclusion, this
chapter aims to address different aspects of the research design and methods used
in the study. By addressing these aspects the purpose behind each technique and

89
method is discussed. In the next chapter results and analysis of the empirical data
are provided.
90
CHAPTER 5
ANALYSIS OF EMPIRICAL RESULTS
5.1. INTRODUCTION
The main objective of this study is to gain a better understanding regarding the
treatment of deferred tax in the debt-to-equity ratio and to determine how this differs
in theory and in practice. In order to achieve this objective, further secondary
objectives are set. A thorough literature study regarding ratio analysis and the debt-
to-equity ratio is done in Chapter 2 in order to gain more insight into the calculation
of this ratio and to determine how this ratio fits into the bigger picture of financial
statement analysis. The literature study performed in Chapter 3 is used to better
understand deferred taxes and how this item should be treated in the calculation of
the debt-to-equity ratio. The most suitable research method to achieve the remaining
objectives is established and discussed in Chapter 4. The results from the research
interviews performed will now be analysed and discussed in order to achieve
secondary research objectives 3 and 4 as set out in Section 1.3.
5.2. THE RESEARCH INTERVIEW
Semi-structured interviews were conducted in order to investigate what the proposed
treatment of deferred tax in the calculation of the debt-to-equity ratio is as based on
the views of academic practitioners and professionals in practice. The questions
were based on a questionnaire consisting of open-ended questions (cf. Appendix A).
The participants were asked for their permission to record all the interviews for
transcription and analysis. Based on the transcribed texts three different themes
could be identified and analysed. These themes are the factors outside deferred tax
taken into consideration regarding the debt-to-equity ratio, current treatment of
deferred tax as a liability in this ratio and the impact thereof, and the proposed
treatment of deferred tax in the calculation of the debt-to-equity ratio. The results of
the interviews will now be discussed. Direct words from professionals in academia
will be indicated with an (A) while those of professionals in practice will be indicated
with a (P).
91
5.2.1. Theme 1: Factors other than deferred tax taken into consideration when
calculating the debt-to-equity ratio
The first theme emerging from the interviews regards factors other than deferred tax
which can be taken into consideration regarding the debt-to-equity ratio. It consists of
three sub-themes, namely:
What value can be placed on the calculation of the debt-to-equity ratio and the
information that can be extracted from this ratio?
Should information reported in terms of International Finance Reporting
Standards (IFRS) be adjusted when calculating certain ratios?
Will the type of analyst influence the inputs used to calculate the debt-to-
equity ratio?
5.2.1.1. Value placed on the calculation of the debt-to-equity ratio and
information that can be extracted from this ratio
Firstly, the participants were asked whether they believed that the calculation of the
debt-to-equity ratio had certain value to it and what importance can be placed on
information that can be extracted from this ratio (Question 1, Appendix A, page 148).
Table 5-1 contains the direct words of the participants regarding the value that can
be placed on the calculation of the debt-to-equity ratio. Although some of the
participants were hesitant in their answers, the majority of professionals in academia
and practice felt that the debt-to-equity ratio is a very valuable ratio that contains
very important information (1). Most of the participants could elaborate as to why this
ratio is very valuable based on the specific purpose that it serves, and it was
determined that, both in theory and practice, the ratio is regarded as one that plays a
very important role regarding some key areas - solvency, leverage, share price, and
summarising the entire balance sheet (2). There is, however, a recurring theme in
terms of questioning the value of the ratio. The problem that most of the participants
have, especially in practice, is that the ratio is not the most important ratio to
consider, but that it is more of a check ratio. The true importance usually comes from
the size of the ratio, which can be a flag for further investigation (3). Furthermore, the
academic participants also named certain cases in which the ratio has a great deal
more meaning and value. For example, for external purposes the ratio would be
much more important compared to looking at it internally (4).
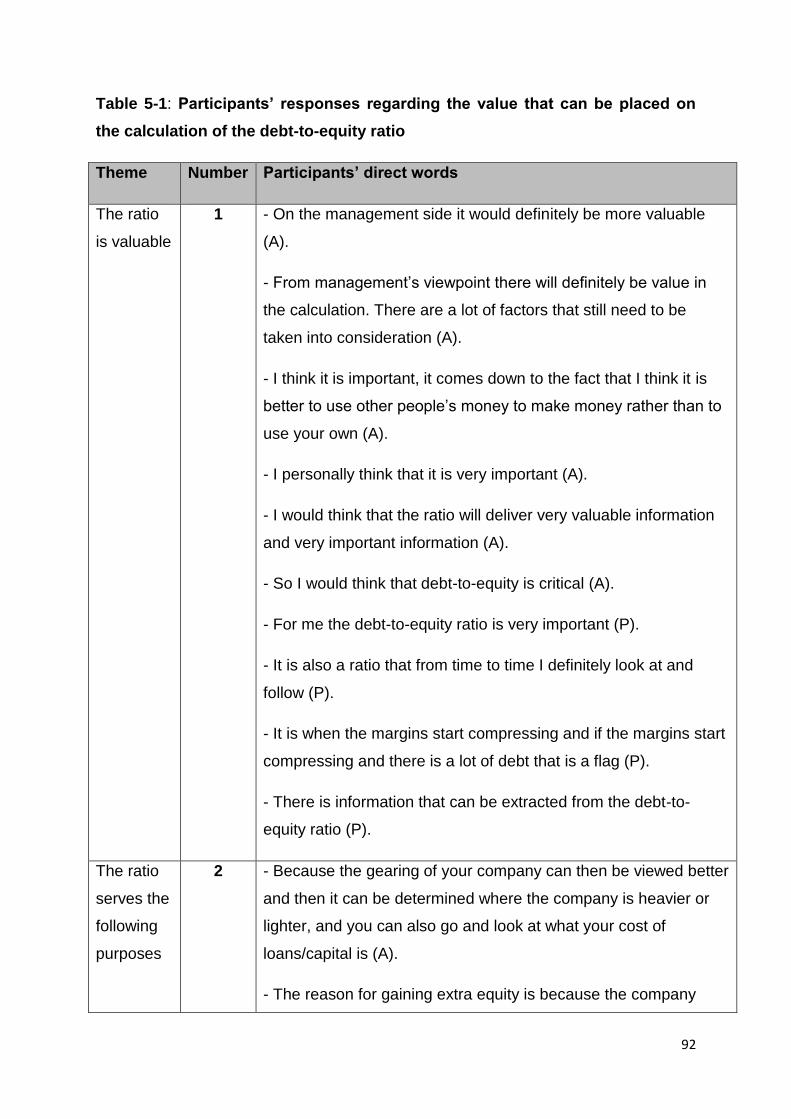
92
Table 5-1: Participants’ responses regarding the value that can be placed on
the calculation of the debt-to-equity ratio
Theme Number Participants’ direct words
The ratio
is valuable
1 - On the management side it would definitely be more valuable
(A).
- From management’s viewpoint there will definitely be value in
the calculation. There are a lot of factors that still need to be
taken into consideration (A).
- I think it is important, it comes down to the fact that I think it is
better to use other people’s money to make money rather than to
use your own (A).
- I personally think that it is very important (A).
- I would think that the ratio will deliver very valuable information
and very important information (A).
- So I would think that debt-to-equity is critical (A).
- For me the debt-to-equity ratio is very important (P).
- It is also a ratio that from time to time I definitely look at and
follow (P).
- It is when the margins start compressing and if the margins start
compressing and there is a lot of debt that is a flag (P).
- There is information that can be extracted from the debt-to-
equity ratio (P).
The ratio
serves the
following
purposes
2 - Because the gearing of your company can then be viewed better
and then it can be determined where the company is heavier or
lighter, and you can also go and look at what your cost of
loans/capital is (A).
- The reason for gaining extra equity is because the company
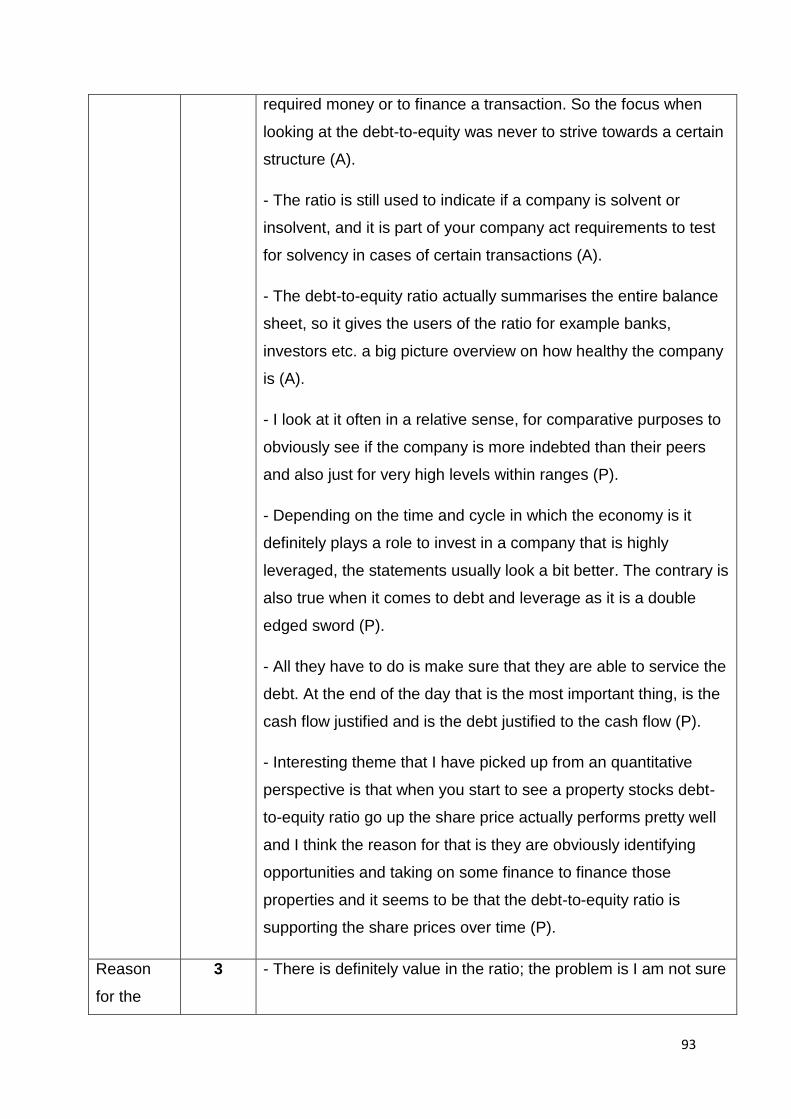
93
required money or to finance a transaction. So the focus when
looking at the debt-to-equity was never to strive towards a certain
structure (A).
- The ratio is still used to indicate if a company is solvent or
insolvent, and it is part of your company act requirements to test
for solvency in cases of certain transactions (A).
- The debt-to-equity ratio actually summarises the entire balance
sheet, so it gives the users of the ratio for example banks,
investors etc. a big picture overview on how healthy the company
is (A).
- I look at it often in a relative sense, for comparative purposes to
obviously see if the company is more indebted than their peers
and also just for very high levels within ranges (P).
- Depending on the time and cycle in which the economy is it
definitely plays a role to invest in a company that is highly
leveraged, the statements usually look a bit better. The contrary is
also true when it comes to debt and leverage as it is a double
edged sword (P).
- All they have to do is make sure that they are able to service the
debt. At the end of the day that is the most important thing, is the
cash flow justified and is the debt justified to the cash flow (P).
- Interesting theme that I have picked up from an quantitative
perspective is that when you start to see a property stocks debt-
to-equity ratio go up the share price actually performs pretty well
and I think the reason for that is they are obviously identifying
opportunities and taking on some finance to finance those
properties and it seems to be that the debt-to-equity ratio is
supporting the share prices over time (P).
Reason
for the
3 - There is definitely value in the ratio; the problem is I am not sure
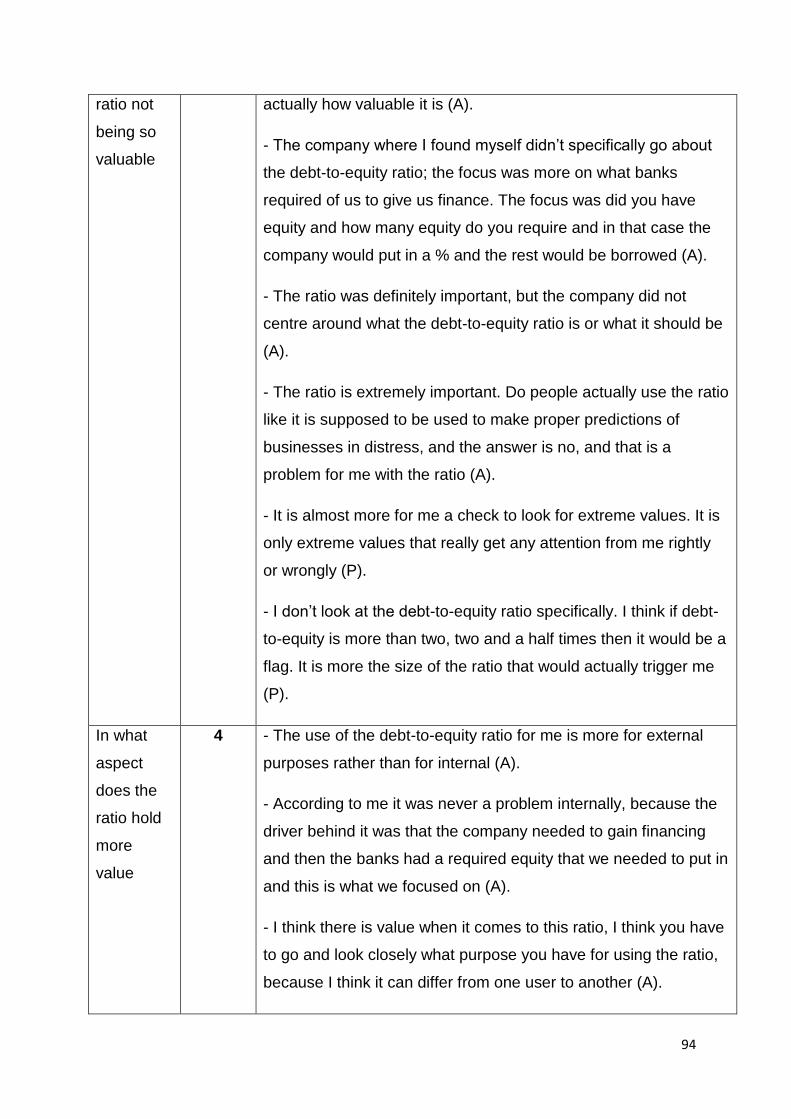
94
ratio not
being so
valuable
actually how valuable it is (A).
- The company where I found myself didn’t specifically go about
the debt-to-equity ratio; the focus was more on what banks
required of us to give us finance. The focus was did you have
equity and how many equity do you require and in that case the
company would put in a % and the rest would be borrowed (A).
- The ratio was definitely important, but the company did not
centre around what the debt-to-equity ratio is or what it should be
(A).
- The ratio is extremely important. Do people actually use the ratio
like it is supposed to be used to make proper predictions of
businesses in distress, and the answer is no, and that is a
problem for me with the ratio (A).
- It is almost more for me a check to look for extreme values. It is
only extreme values that really get any attention from me rightly
or wrongly (P).
- I don’t look at the debt-to-equity ratio specifically. I think if debt-
to-equity is more than two, two and a half times then it would be a
flag. It is more the size of the ratio that would actually trigger me
(P).
In what
aspect
does the
ratio hold
more
value
4 - The use of the debt-to-equity ratio for me is more for external
purposes rather than for internal (A).
- According to me it was never a problem internally, because the
driver behind it was that the company needed to gain financing
and then the banks had a required equity that we needed to put in
and this is what we focused on (A).
- I think there is value when it comes to this ratio, I think you have
to go and look closely what purpose you have for using the ratio,
because I think it can differ from one user to another (A).
95
The responses from participants correlate with the findings of Axson (2010) and
Matthew et al. (2016:6) who find that the debt-to-equity ratio provides crucial and
important information regarding the company to a wide variety of stakeholders. It
could also be determined that the ratio delivers important information regarding
some key areas, for example financial risk, solvency, leverage, and share price, and
is a ratio that summarises the entire balance sheet. This correlates with the findings
of Alexander et al. (2003:617), Axson (2010), Matthew et al. (2016:6) and Palepu
and Healy (2008:5-20) who propose that the debt-to-equity ratio is a tool that delivers
very important information regarding long-term survival, financial risk, and the level
of debt financing being used by a company.
Most of the participants in practice opine that the ratio is not the most important ratio
to calculate or use and that the ratio is likely used more often as a check ratio. The
true importance of this ratio actually comes through when the ratio is quite sizeable,
which could then be a flag for further investigation. Mesarić (2014:129) makes a
similar finding regarding ratio analysis, that some ratios have stronger importance
compared to other ratios, and that a certain ratio might have a higher preference in
one industry compared to another.
5.2.1.2. Should information reported in terms of IFRS be adjusted when
calculating certain ratios for more accurate information?
The purpose of this question was to determine whether the figures and information
that the company reports in terms of IFRS need to be adjusted for the calculation of
certain ratios and whether these adjustments would deliver more accurate results
(refer to Question 2, Appendix A). Table 5-2 provides the responses of participants
regarding the adjustment of information reported in terms of IFRS. The participants
in practice emphasise the fact that there is a large time constraint on them that
makes it very hard to actually adjust figures and that adjustment is not always an
option. This question elicited many divergent results. A couple of the participants feel
that the information should not be adjusted; this is emphasised mostly from those in
the accounting field who feel that the information reported in terms of IFRS already
serves a very all-round purpose and that there is no requirement to adjust. The
professionals in practice are also of the opinion that the time constraint largely
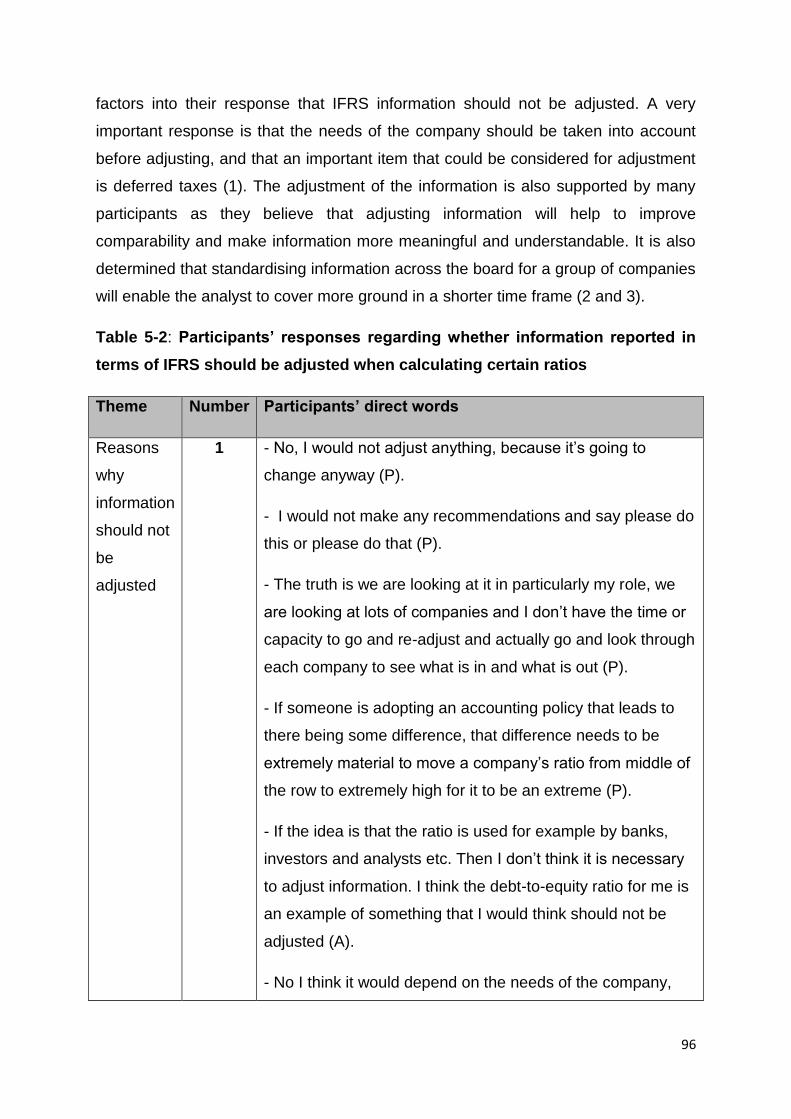
96
factors into their response that IFRS information should not be adjusted. A very
important response is that the needs of the company should be taken into account
before adjusting, and that an important item that could be considered for adjustment
is deferred taxes (1). The adjustment of the information is also supported by many
participants as they believe that adjusting information will help to improve
comparability and make information more meaningful and understandable. It is also
determined that standardising information across the board for a group of companies
will enable the analyst to cover more ground in a shorter time frame (2 and 3).
Table 5-2: Participants’ responses regarding whether information reported in
terms of IFRS should be adjusted when calculating certain ratios
Theme Number Participants’ direct words
Reasons
why
information
should not
be
adjusted
1 - No, I would not adjust anything, because it’s going to
change anyway (P).
- I would not make any recommendations and say please do
this or please do that (P).
- The truth is we are looking at it in particularly my role, we
are looking at lots of companies and I don’t have the time or
capacity to go and re-adjust and actually go and look through
each company to see what is in and what is out (P).
- If someone is adopting an accounting policy that leads to
there being some difference, that difference needs to be
extremely material to move a company’s ratio from middle of
the row to extremely high for it to be an extreme (P).
- If the idea is that the ratio is used for example by banks,
investors and analysts etc. Then I don’t think it is necessary
to adjust information. I think the debt-to-equity ratio for me is
an example of something that I would think should not be
adjusted (A).
- No I think it would depend on the needs of the company,
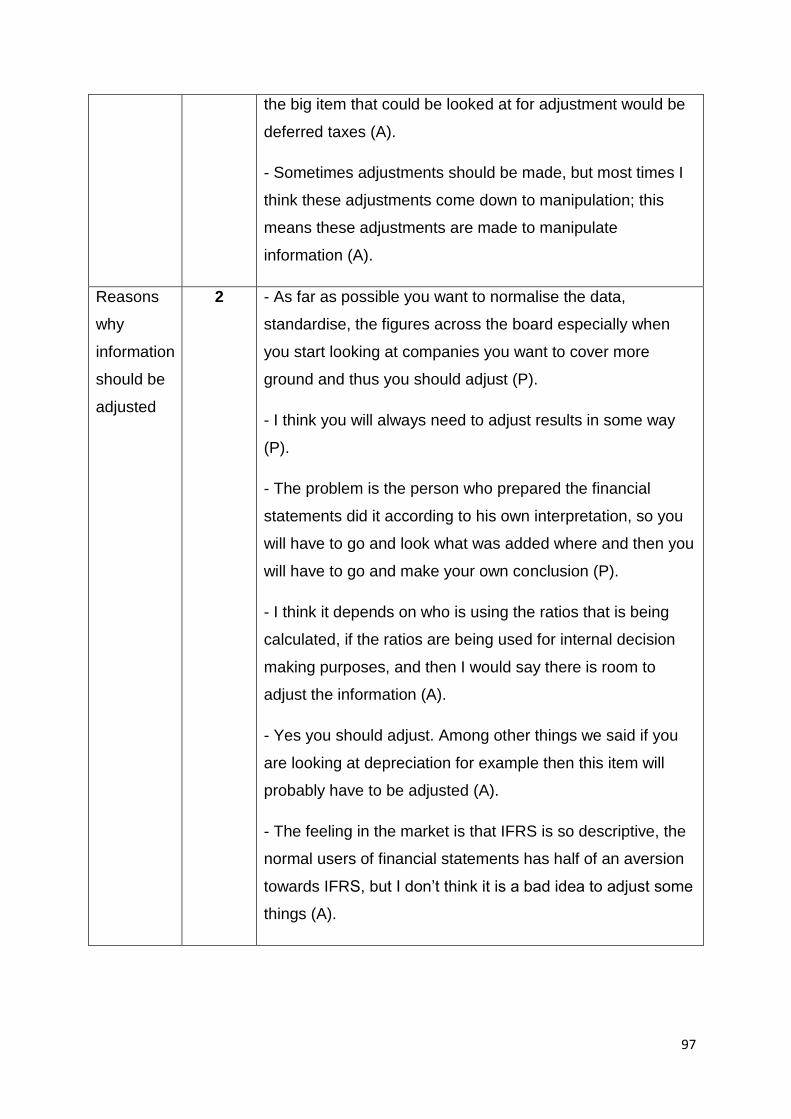
97
the big item that could be looked at for adjustment would be
deferred taxes (A).
- Sometimes adjustments should be made, but most times I
think these adjustments come down to manipulation; this
means these adjustments are made to manipulate
information (A).
Reasons
why
information
should be
adjusted
2 - As far as possible you want to normalise the data,
standardise, the figures across the board especially when
you start looking at companies you want to cover more
ground and thus you should adjust (P).
- I think you will always need to adjust results in some way
(P).
- The problem is the person who prepared the financial
statements did it according to his own interpretation, so you
will have to go and look what was added where and then you
will have to go and make your own conclusion (P).
- I think it depends on who is using the ratios that is being
calculated, if the ratios are being used for internal decision
making purposes, and then I would say there is room to
adjust the information (A).
- Yes you should adjust. Among other things we said if you
are looking at depreciation for example then this item will
probably have to be adjusted (A).
- The feeling in the market is that IFRS is so descriptive, the
normal users of financial statements has half of an aversion
towards IFRS, but I don’t think it is a bad idea to adjust some
things (A).
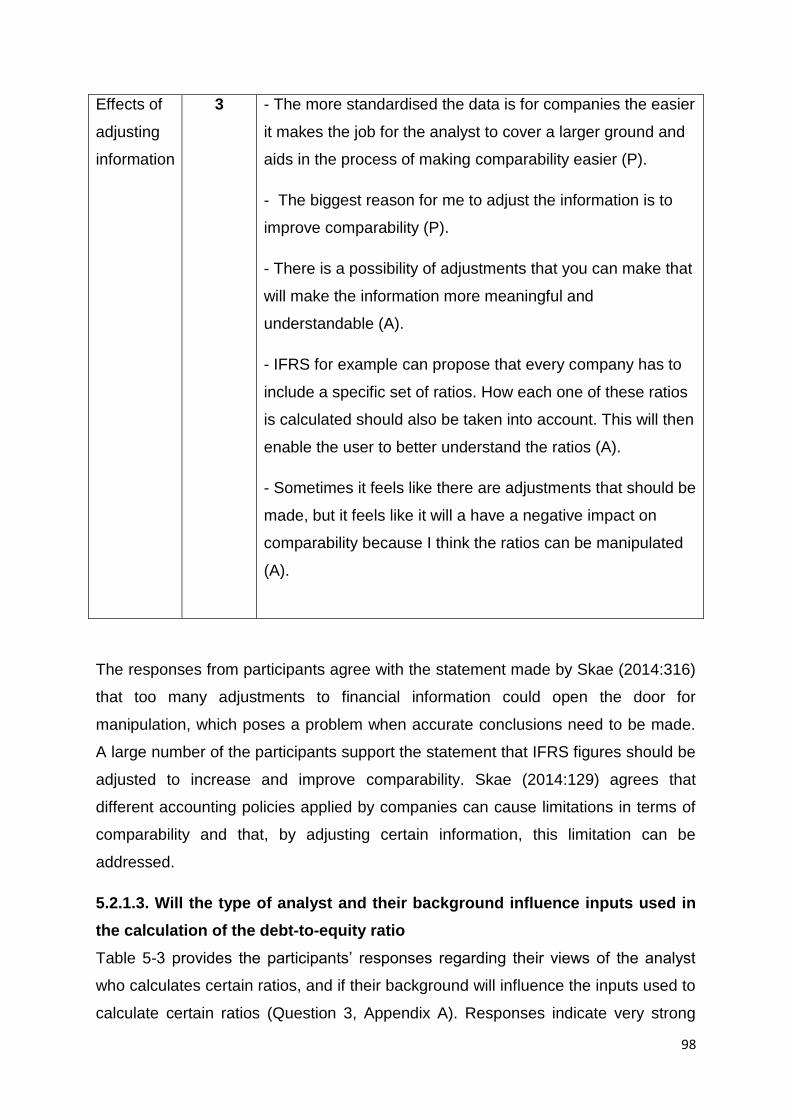
98
Effects of
adjusting
information
3 - The more standardised the data is for companies the easier
it makes the job for the analyst to cover a larger ground and
aids in the process of making comparability easier (P).
- The biggest reason for me to adjust the information is to
improve comparability (P).
- There is a possibility of adjustments that you can make that
will make the information more meaningful and
understandable (A).
- IFRS for example can propose that every company has to
include a specific set of ratios. How each one of these ratios
is calculated should also be taken into account. This will then
enable the user to better understand the ratios (A).
- Sometimes it feels like there are adjustments that should be
made, but it feels like it will a have a negative impact on
comparability because I think the ratios can be manipulated
(A).
The responses from participants agree with the statement made by Skae (2014:316)
that too many adjustments to financial information could open the door for
manipulation, which poses a problem when accurate conclusions need to be made.
A large number of the participants support the statement that IFRS figures should be
adjusted to increase and improve comparability. Skae (2014:129) agrees that
different accounting policies applied by companies can cause limitations in terms of
comparability and that, by adjusting certain information, this limitation can be
addressed.
5.2.1.3. Will the type of analyst and their background influence inputs used in
the calculation of the debt-to-equity ratio
Table 5-3 provides the participants’ responses regarding their views of the analyst
who calculates certain ratios, and if their background will influence the inputs used to
calculate certain ratios (Question 3, Appendix A). Responses indicate very strong
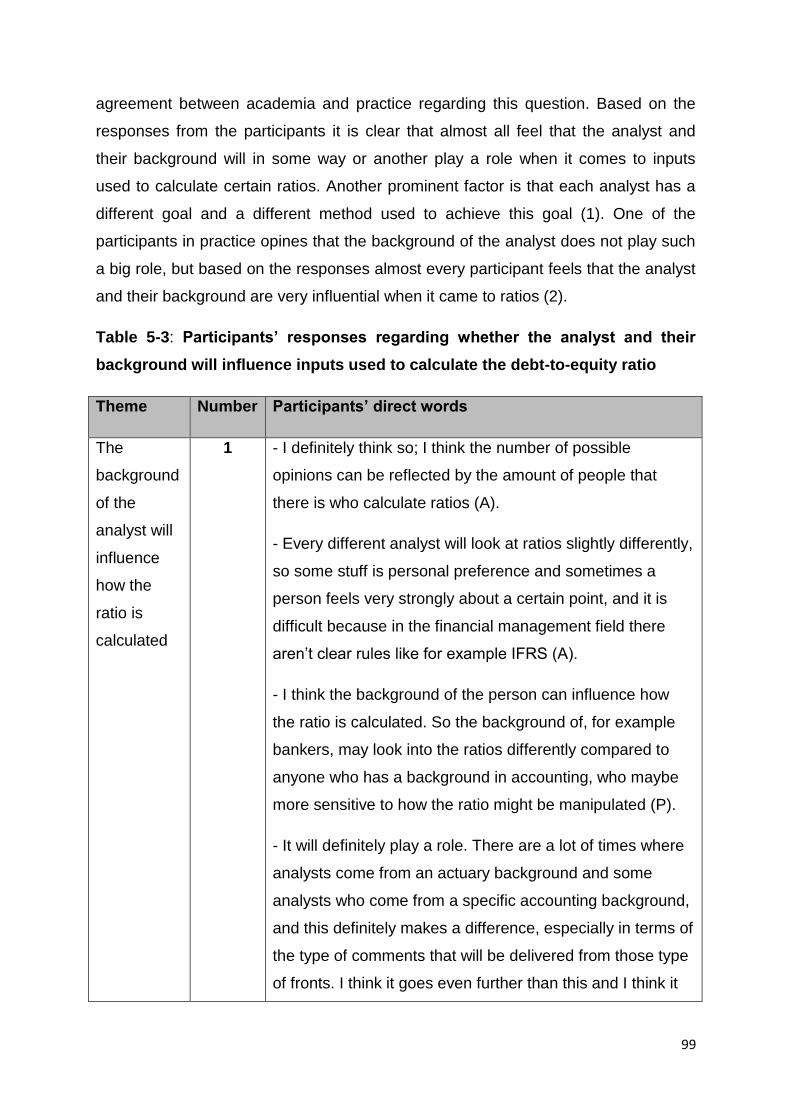
99
agreement between academia and practice regarding this question. Based on the
responses from the participants it is clear that almost all feel that the analyst and
their background will in some way or another play a role when it comes to inputs
used to calculate certain ratios. Another prominent factor is that each analyst has a
different goal and a different method used to achieve this goal (1). One of the
participants in practice opines that the background of the analyst does not play such
a big role, but based on the responses almost every participant feels that the analyst
and their background are very influential when it came to ratios (2).
Table 5-3: Participants’ responses regarding whether the analyst and their
background will influence inputs used to calculate the debt-to-equity ratio
Theme Number Participants’ direct words
The
background
of the
analyst will
influence
how the
ratio is
calculated
1 - I definitely think so; I think the number of possible
opinions can be reflected by the amount of people that
there is who calculate ratios (A).
- Every different analyst will look at ratios slightly differently,
so some stuff is personal preference and sometimes a
person feels very strongly about a certain point, and it is
difficult because in the financial management field there
aren’t clear rules like for example IFRS (A).
- I think the background of the person can influence how
the ratio is calculated. So the background of, for example
bankers, may look into the ratios differently compared to
anyone who has a background in accounting, who maybe
more sensitive to how the ratio might be manipulated (P).
- It will definitely play a role. There are a lot of times where
analysts come from an actuary background and some
analysts who come from a specific accounting background,
and this definitely makes a difference, especially in terms of
the type of comments that will be delivered from those type
of fronts. I think it goes even further than this and I think it
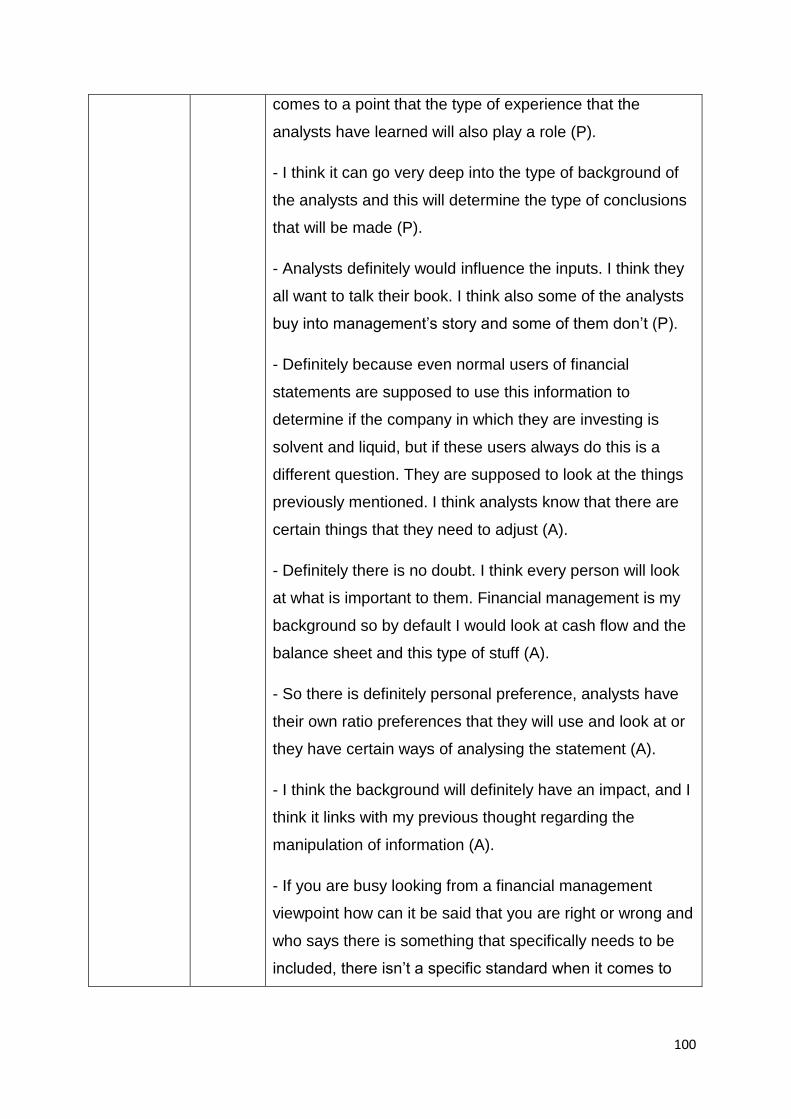
100
comes to a point that the type of experience that the
analysts have learned will also play a role (P).
- I think it can go very deep into the type of background of
the analysts and this will determine the type of conclusions
that will be made (P).
- Analysts definitely would influence the inputs. I think they
all want to talk their book. I think also some of the analysts
buy into management’s story and some of them don’t (P).
- Definitely because even normal users of financial
statements are supposed to use this information to
determine if the company in which they are investing is
solvent and liquid, but if these users always do this is a
different question. They are supposed to look at the things
previously mentioned. I think analysts know that there are
certain things that they need to adjust (A).
- Definitely there is no doubt. I think every person will look
at what is important to them. Financial management is my
background so by default I would look at cash flow and the
balance sheet and this type of stuff (A).
- So there is definitely personal preference, analysts have
their own ratio preferences that they will use and look at or
they have certain ways of analysing the statement (A).
- I think the background will definitely have an impact, and I
think it links with my previous thought regarding the
manipulation of information (A).
- If you are busy looking from a financial management
viewpoint how can it be said that you are right or wrong and
who says there is something that specifically needs to be
included, there isn’t a specific standard when it comes to
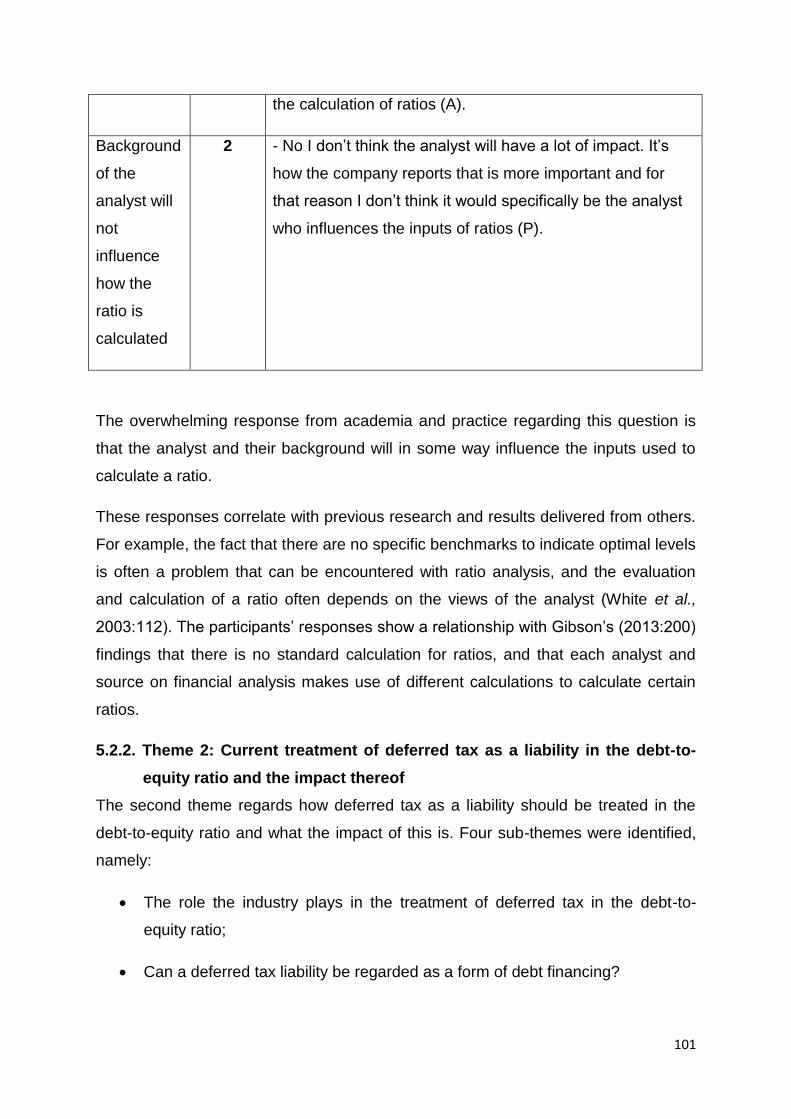
101
the calculation of ratios (A).
Background
of the
analyst will
not
influence
how the
ratio is
calculated
2 - No I don’t think the analyst will have a lot of impact. It’s
how the company reports that is more important and for
that reason I don’t think it would specifically be the analyst
who influences the inputs of ratios (P).
The overwhelming response from academia and practice regarding this question is
that the analyst and their background will in some way influence the inputs used to
calculate a ratio.
These responses correlate with previous research and results delivered from others.
For example, the fact that there are no specific benchmarks to indicate optimal levels
is often a problem that can be encountered with ratio analysis, and the evaluation
and calculation of a ratio often depends on the views of the analyst (White et al.,
2003:112). The participants’ responses show a relationship with Gibson’s (2013:200)
findings that there is no standard calculation for ratios, and that each analyst and
source on financial analysis makes use of different calculations to calculate certain
ratios.
5.2.2. Theme 2: Current treatment of deferred tax as a liability in the debt-to-
equity ratio and the impact thereof
The second theme regards how deferred tax as a liability should be treated in the
debt-to-equity ratio and what the impact of this is. Four sub-themes were identified,
namely:
The role the industry plays in the treatment of deferred tax in the debt-to-
equity ratio;
Can a deferred tax liability be regarded as a form of debt financing?
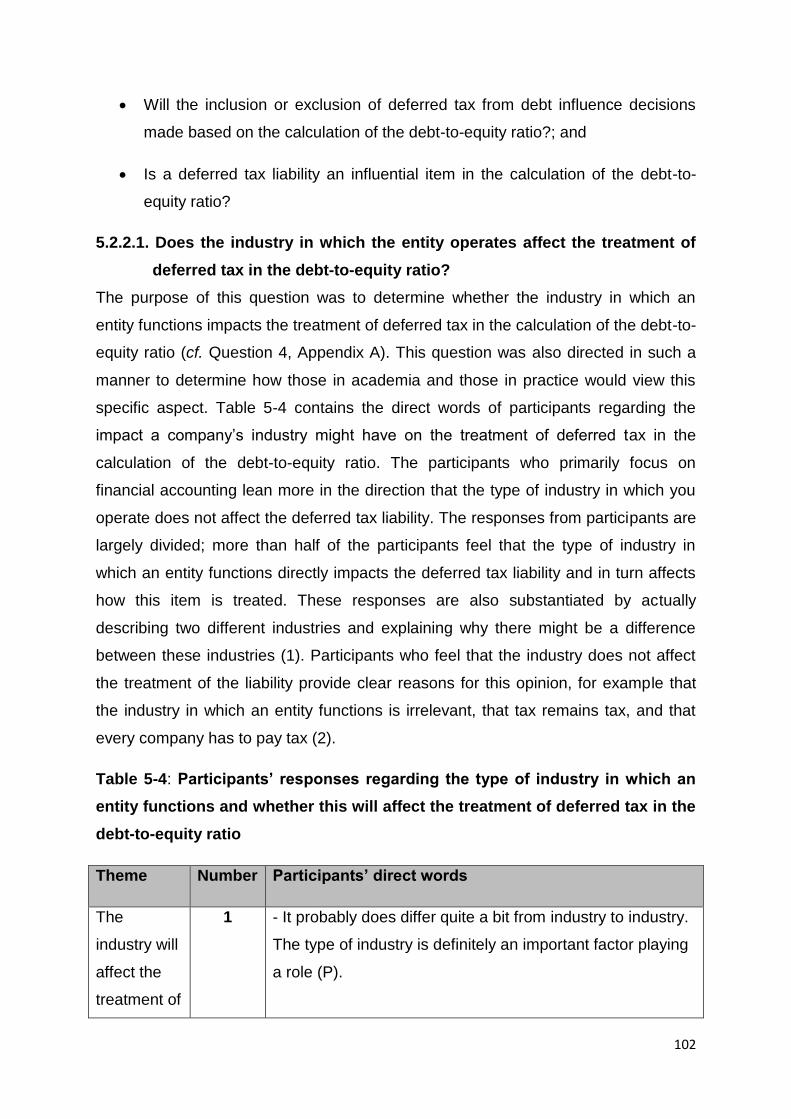
102
Will the inclusion or exclusion of deferred tax from debt influence decisions
made based on the calculation of the debt-to-equity ratio?; and
Is a deferred tax liability an influential item in the calculation of the debt-to-
equity ratio?
5.2.2.1. Does the industry in which the entity operates affect the treatment of
deferred tax in the debt-to-equity ratio?
The purpose of this question was to determine whether the industry in which an
entity functions impacts the treatment of deferred tax in the calculation of the debt-to-
equity ratio (cf. Question 4, Appendix A). This question was also directed in such a
manner to determine how those in academia and those in practice would view this
specific aspect. Table 5-4 contains the direct words of participants regarding the
impact a company’s industry might have on the treatment of deferred tax in the
calculation of the debt-to-equity ratio. The participants who primarily focus on
financial accounting lean more in the direction that the type of industry in which you
operate does not affect the deferred tax liability. The responses from participants are
largely divided; more than half of the participants feel that the type of industry in
which an entity functions directly impacts the deferred tax liability and in turn affects
how this item is treated. These responses are also substantiated by actually
describing two different industries and explaining why there might be a difference
between these industries (1). Participants who feel that the industry does not affect
the treatment of the liability provide clear reasons for this opinion, for example that
the industry in which an entity functions is irrelevant, that tax remains tax, and that
every company has to pay tax (2).
Table 5-4: Participants’ responses regarding the type of industry in which an
entity functions and whether this will affect the treatment of deferred tax in the
debt-to-equity ratio
Theme Number Participants’ direct words
The
industry will
affect the
treatment of
1 - It probably does differ quite a bit from industry to industry.
The type of industry is definitely an important factor playing
a role (P).
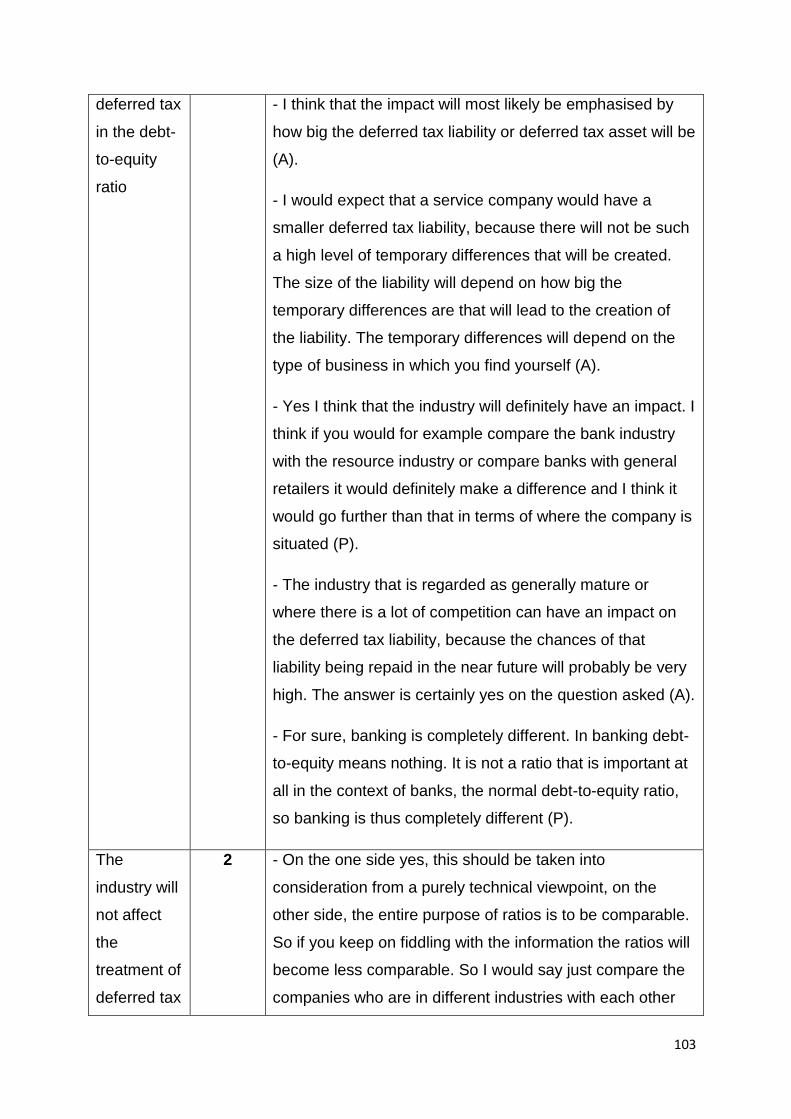
103
deferred tax
in the debt-
to-equity
ratio
- I think that the impact will most likely be emphasised by
how big the deferred tax liability or deferred tax asset will be
(A).
- I would expect that a service company would have a
smaller deferred tax liability, because there will not be such
a high level of temporary differences that will be created.
The size of the liability will depend on how big the
temporary differences are that will lead to the creation of
the liability. The temporary differences will depend on the
type of business in which you find yourself (A).
- Yes I think that the industry will definitely have an impact. I
think if you would for example compare the bank industry
with the resource industry or compare banks with general
retailers it would definitely make a difference and I think it
would go further than that in terms of where the company is
situated (P).
- The industry that is regarded as generally mature or
where there is a lot of competition can have an impact on
the deferred tax liability, because the chances of that
liability being repaid in the near future will probably be very
high. The answer is certainly yes on the question asked (A).
- For sure, banking is completely different. In banking debt-
to-equity means nothing. It is not a ratio that is important at
all in the context of banks, the normal debt-to-equity ratio,
so banking is thus completely different (P).
The
industry will
not affect
the
treatment of
deferred tax
2 - On the one side yes, this should be taken into
consideration from a purely technical viewpoint, on the
other side, the entire purpose of ratios is to be comparable.
So if you keep on fiddling with the information the ratios will
become less comparable. So I would say just compare the
companies who are in different industries with each other
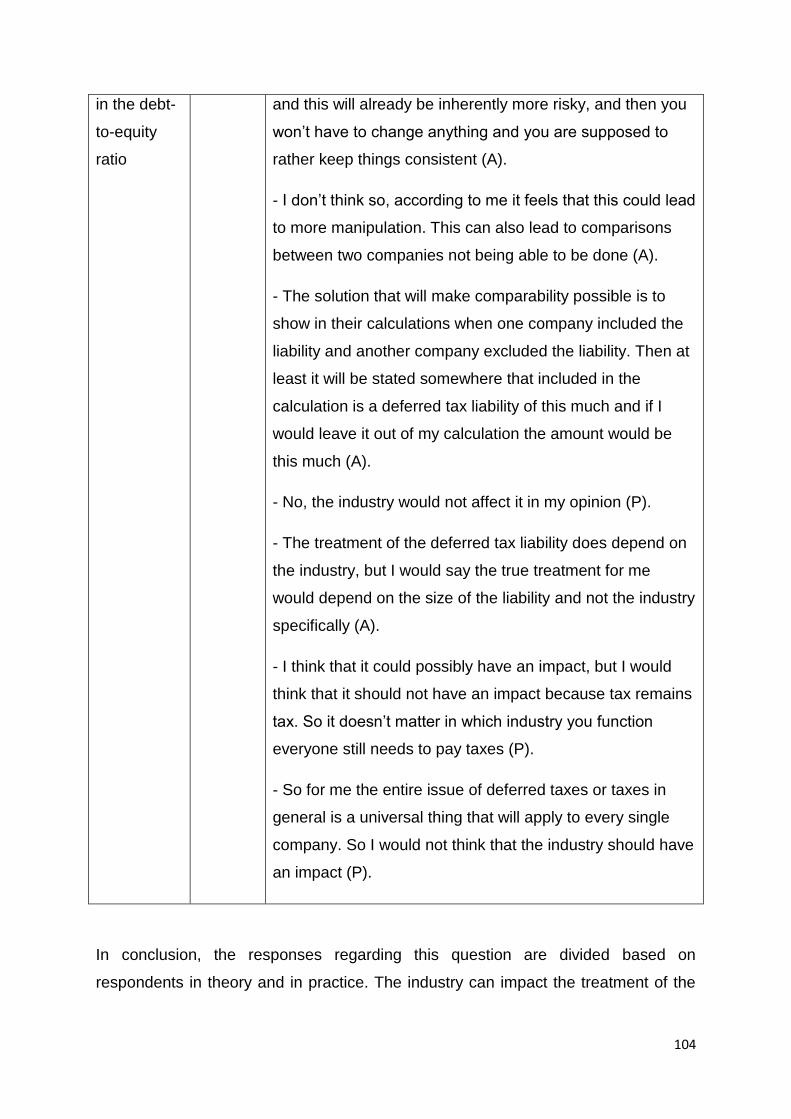
104
in the debt-
to-equity
ratio
and this will already be inherently more risky, and then you
won’t have to change anything and you are supposed to
rather keep things consistent (A).
- I don’t think so, according to me it feels that this could lead
to more manipulation. This can also lead to comparisons
between two companies not being able to be done (A).
- The solution that will make comparability possible is to
show in their calculations when one company included the
liability and another company excluded the liability. Then at
least it will be stated somewhere that included in the
calculation is a deferred tax liability of this much and if I
would leave it out of my calculation the amount would be
this much (A).
- No, the industry would not affect it in my opinion (P).
- The treatment of the deferred tax liability does depend on
the industry, but I would say the true treatment for me
would depend on the size of the liability and not the industry
specifically (A).
- I think that it could possibly have an impact, but I would
think that it should not have an impact because tax remains
tax. So it doesn’t matter in which industry you function
everyone still needs to pay taxes (P).
- So for me the entire issue of deferred taxes or taxes in
general is a universal thing that will apply to every single
company. So I would not think that the industry should have
an impact (P).
In conclusion, the responses regarding this question are divided based on
respondents in theory and in practice. The industry can impact the treatment of the
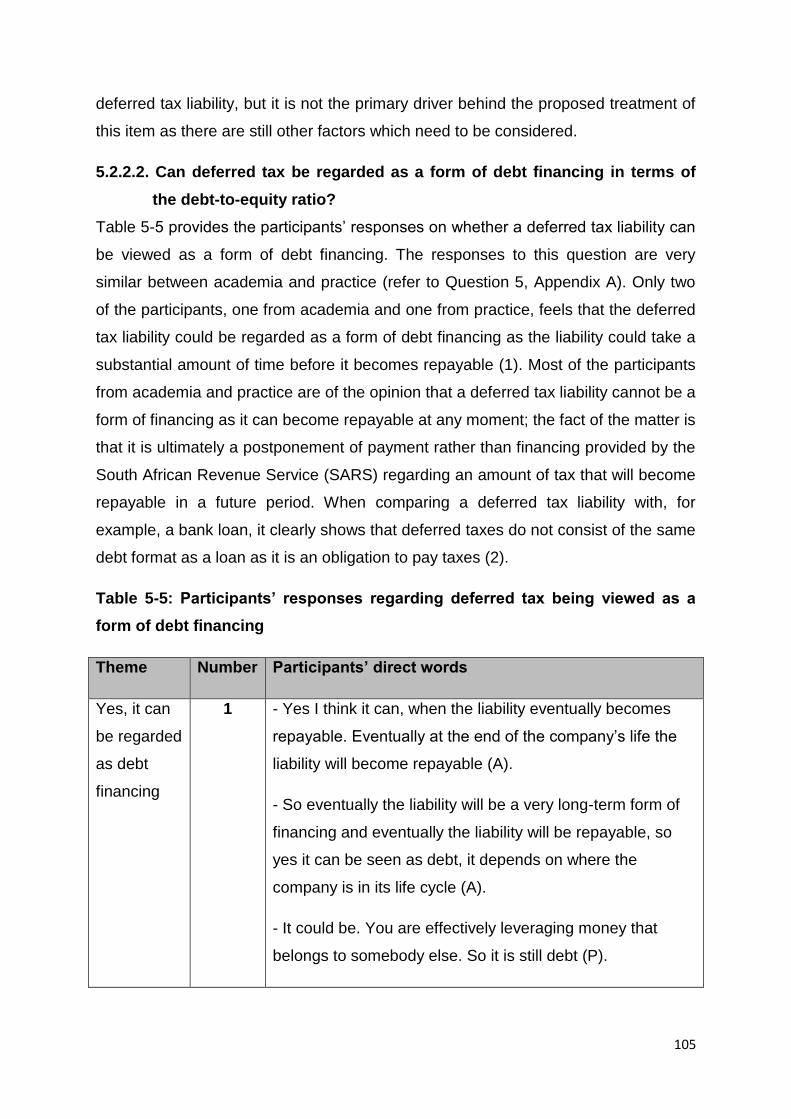
105
deferred tax liability, but it is not the primary driver behind the proposed treatment of
this item as there are still other factors which need to be considered.
5.2.2.2. Can deferred tax be regarded as a form of debt financing in terms of
the debt-to-equity ratio?
Table 5-5 provides the participants’ responses on whether a deferred tax liability can
be viewed as a form of debt financing. The responses to this question are very
similar between academia and practice (refer to Question 5, Appendix A). Only two
of the participants, one from academia and one from practice, feels that the deferred
tax liability could be regarded as a form of debt financing as the liability could take a
substantial amount of time before it becomes repayable (1). Most of the participants
from academia and practice are of the opinion that a deferred tax liability cannot be a
form of financing as it can become repayable at any moment; the fact of the matter is
that it is ultimately a postponement of payment rather than financing provided by the
South African Revenue Service (SARS) regarding an amount of tax that will become
repayable in a future period. When comparing a deferred tax liability with, for
example, a bank loan, it clearly shows that deferred taxes do not consist of the same
debt format as a loan as it is an obligation to pay taxes (2).
Table 5-5: Participants’ responses regarding deferred tax being viewed as a
form of debt financing
Theme Number Participants’ direct words
Yes, it can
be regarded
as debt
financing
1 - Yes I think it can, when the liability eventually becomes
repayable. Eventually at the end of the company’s life the
liability will become repayable (A).
- So eventually the liability will be a very long-term form of
financing and eventually the liability will be repayable, so
yes it can be seen as debt, it depends on where the
company is in its life cycle (A).
- It could be. You are effectively leveraging money that
belongs to somebody else. So it is still debt (P).
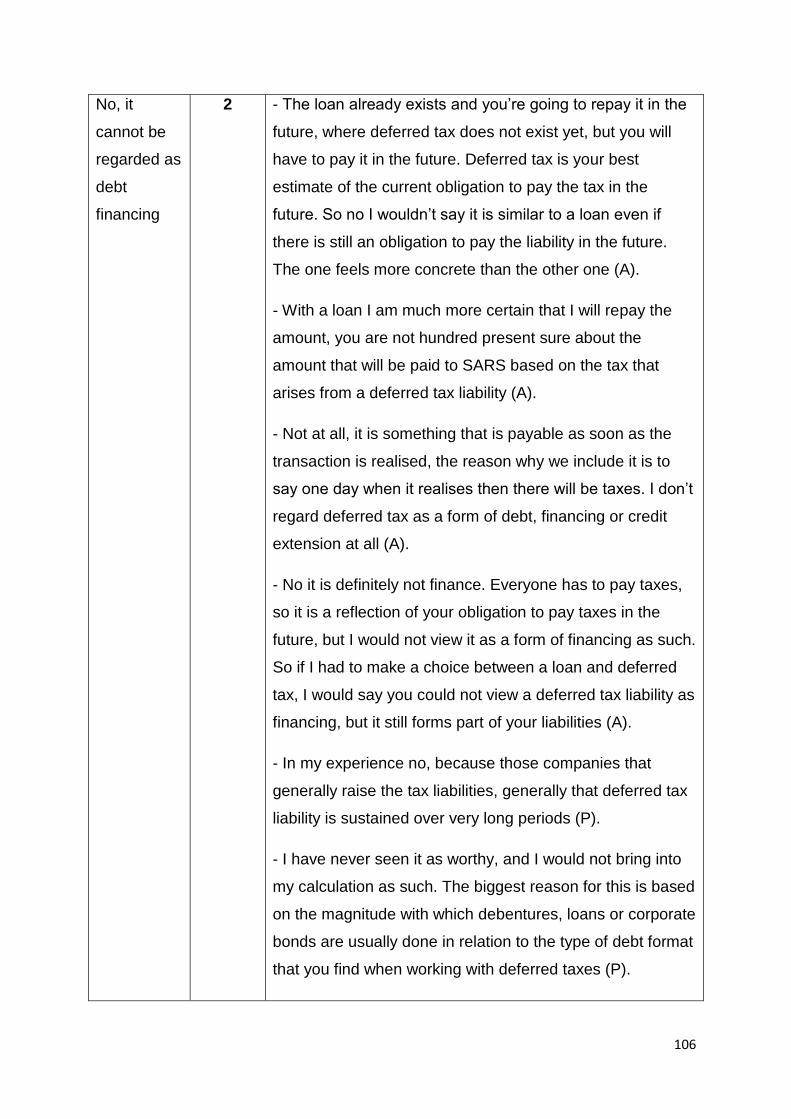
106
No, it
cannot be
regarded as
debt
financing
2 - The loan already exists and you’re going to repay it in the
future, where deferred tax does not exist yet, but you will
have to pay it in the future. Deferred tax is your best
estimate of the current obligation to pay the tax in the
future. So no I wouldn’t say it is similar to a loan even if
there is still an obligation to pay the liability in the future.
The one feels more concrete than the other one (A).
- With a loan I am much more certain that I will repay the
amount, you are not hundred present sure about the
amount that will be paid to SARS based on the tax that
arises from a deferred tax liability (A).
- Not at all, it is something that is payable as soon as the
transaction is realised, the reason why we include it is to
say one day when it realises then there will be taxes. I don’t
regard deferred tax as a form of debt, financing or credit
extension at all (A).
- No it is definitely not finance. Everyone has to pay taxes,
so it is a reflection of your obligation to pay taxes in the
future, but I would not view it as a form of financing as such.
So if I had to make a choice between a loan and deferred
tax, I would say you could not view a deferred tax liability as
financing, but it still forms part of your liabilities (A).
- In my experience no, because those companies that
generally raise the tax liabilities, generally that deferred tax
liability is sustained over very long periods (P).
- I have never seen it as worthy, and I would not bring into
my calculation as such. The biggest reason for this is based
on the magnitude with which debentures, loans or corporate
bonds are usually done in relation to the type of debt format
that you find when working with deferred taxes (P).
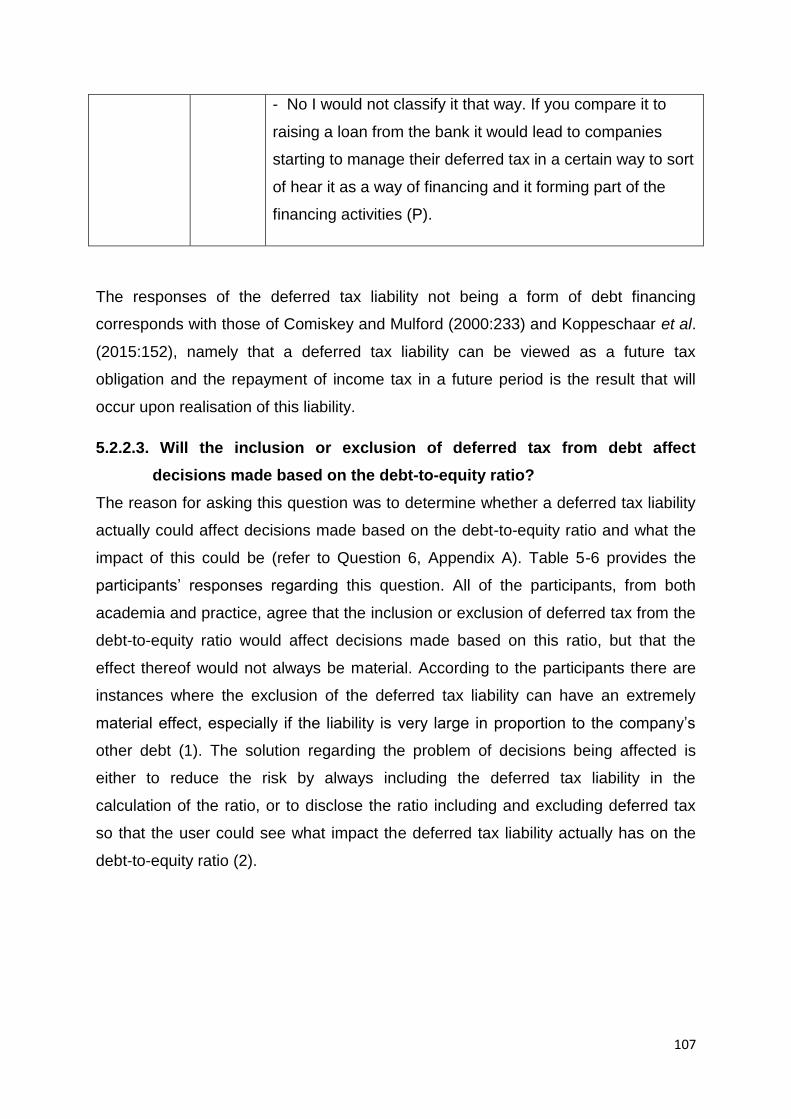
107
- No I would not classify it that way. If you compare it to
raising a loan from the bank it would lead to companies
starting to manage their deferred tax in a certain way to sort
of hear it as a way of financing and it forming part of the
financing activities (P).
The responses of the deferred tax liability not being a form of debt financing
corresponds with those of Comiskey and Mulford (2000:233) and Koppeschaar et al.
(2015:152), namely that a deferred tax liability can be viewed as a future tax
obligation and the repayment of income tax in a future period is the result that will
occur upon realisation of this liability.
5.2.2.3. Will the inclusion or exclusion of deferred tax from debt affect
decisions made based on the debt-to-equity ratio?
The reason for asking this question was to determine whether a deferred tax liability
actually could affect decisions made based on the debt-to-equity ratio and what the
impact of this could be (refer to Question 6, Appendix A). Table 5-6 provides the
participants’ responses regarding this question. All of the participants, from both
academia and practice, agree that the inclusion or exclusion of deferred tax from the
debt-to-equity ratio would affect decisions made based on this ratio, but that the
effect thereof would not always be material. According to the participants there are
instances where the exclusion of the deferred tax liability can have an extremely
material effect, especially if the liability is very large in proportion to the company’s
other debt (1). The solution regarding the problem of decisions being affected is
either to reduce the risk by always including the deferred tax liability in the
calculation of the ratio, or to disclose the ratio including and excluding deferred tax
so that the user could see what impact the deferred tax liability actually has on the
debt-to-equity ratio (2).
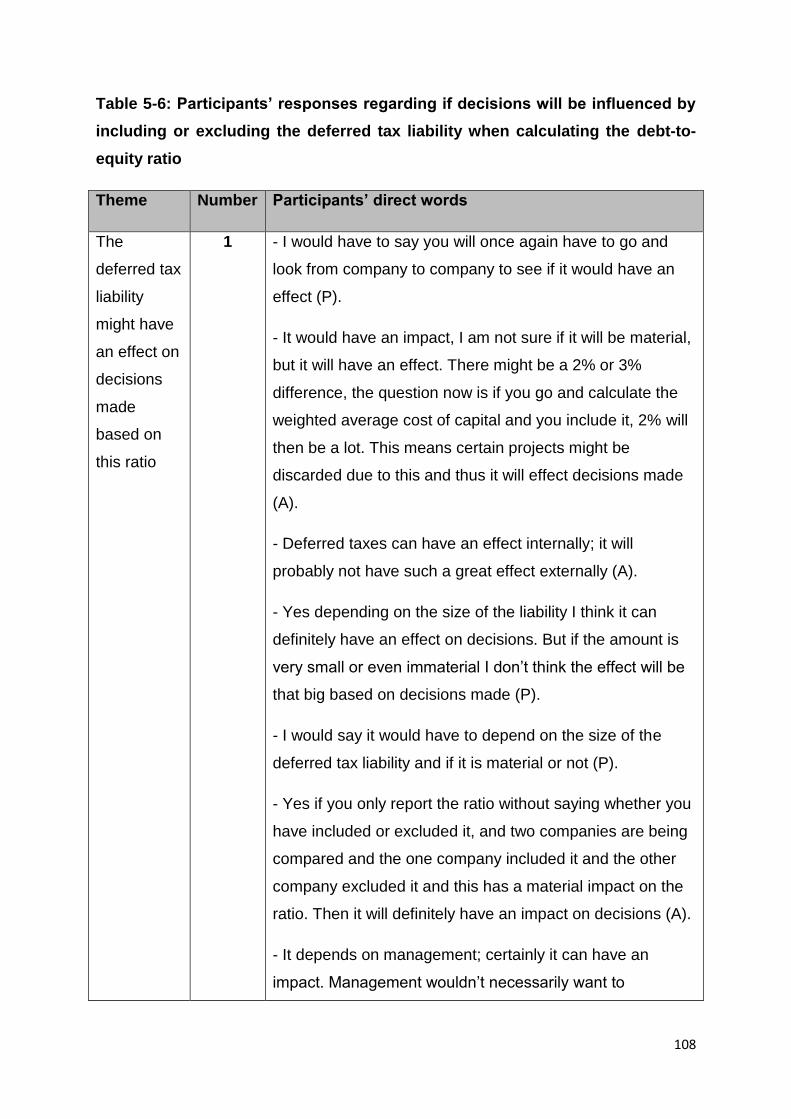
108
Table 5-6: Participants’ responses regarding if decisions will be influenced by
including or excluding the deferred tax liability when calculating the debt-to-
equity ratio
Theme Number Participants’ direct words
The
deferred tax
liability
might have
an effect on
decisions
made
based on
this ratio
1 - I would have to say you will once again have to go and
look from company to company to see if it would have an
effect (P).
- It would have an impact, I am not sure if it will be material,
but it will have an effect. There might be a 2% or 3%
difference, the question now is if you go and calculate the
weighted average cost of capital and you include it, 2% will
then be a lot. This means certain projects might be
discarded due to this and thus it will effect decisions made
(A).
- Deferred taxes can have an effect internally; it will
probably not have such a great effect externally (A).
- Yes depending on the size of the liability I think it can
definitely have an effect on decisions. But if the amount is
very small or even immaterial I don’t think the effect will be
that big based on decisions made (P).
- I would say it would have to depend on the size of the
deferred tax liability and if it is material or not (P).
- Yes if you only report the ratio without saying whether you
have included or excluded it, and two companies are being
compared and the one company included it and the other
company excluded it and this has a material impact on the
ratio. Then it will definitely have an impact on decisions (A).
- It depends on management; certainly it can have an
impact. Management wouldn’t necessarily want to
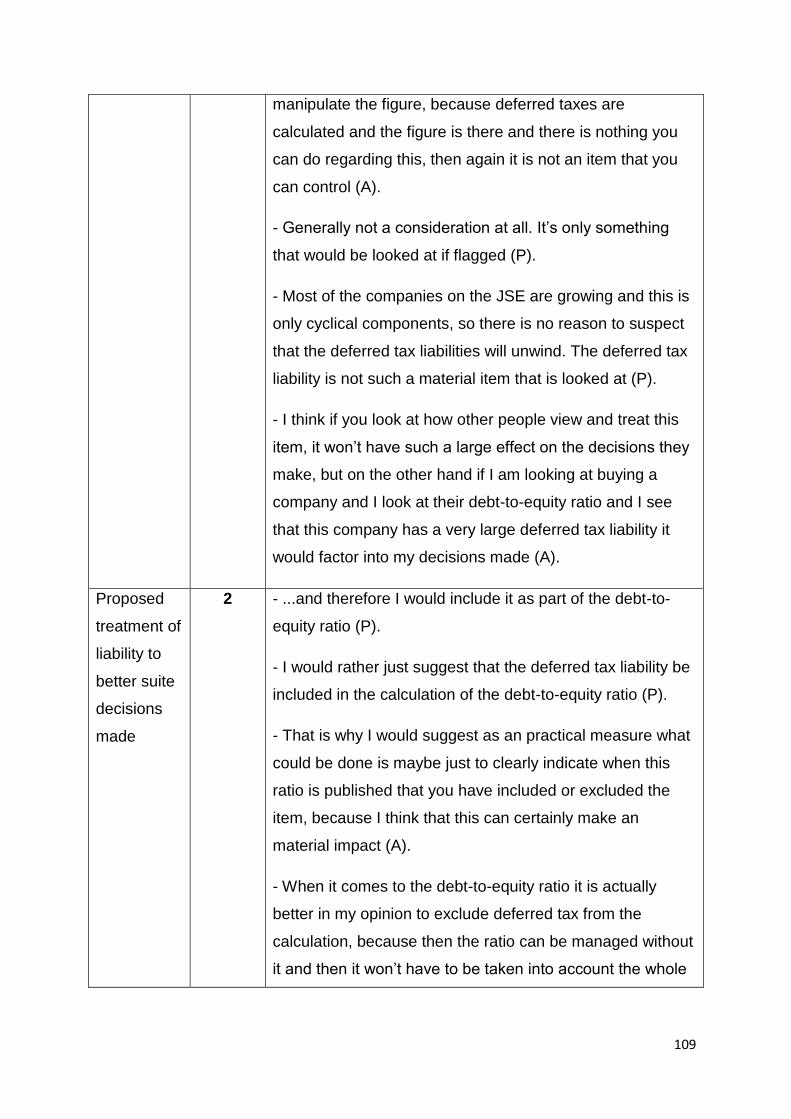
109
manipulate the figure, because deferred taxes are
calculated and the figure is there and there is nothing you
can do regarding this, then again it is not an item that you
can control (A).
- Generally not a consideration at all. It’s only something
that would be looked at if flagged (P).
- Most of the companies on the JSE are growing and this is
only cyclical components, so there is no reason to suspect
that the deferred tax liabilities will unwind. The deferred tax
liability is not such a material item that is looked at (P).
- I think if you look at how other people view and treat this
item, it won’t have such a large effect on the decisions they
make, but on the other hand if I am looking at buying a
company and I look at their debt-to-equity ratio and I see
that this company has a very large deferred tax liability it
would factor into my decisions made (A).
Proposed
treatment of
liability to
better suite
decisions
made
2 - ...and therefore I would include it as part of the debt-to-
equity ratio (P).
- I would rather just suggest that the deferred tax liability be
included in the calculation of the debt-to-equity ratio (P).
- That is why I would suggest as an practical measure what
could be done is maybe just to clearly indicate when this
ratio is published that you have included or excluded the
item, because I think that this can certainly make an
material impact (A).
- When it comes to the debt-to-equity ratio it is actually
better in my opinion to exclude deferred tax from the
calculation, because then the ratio can be managed without
it and then it won’t have to be taken into account the whole
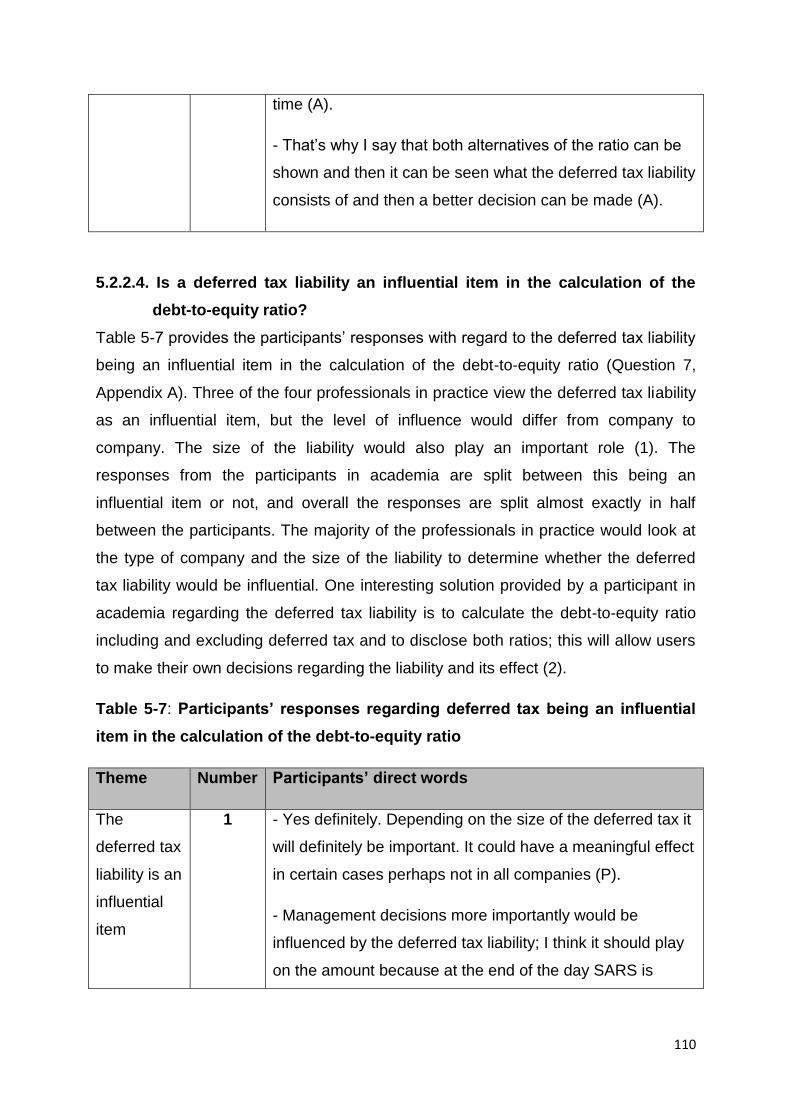
110
time (A).
- That’s why I say that both alternatives of the ratio can be
shown and then it can be seen what the deferred tax liability
consists of and then a better decision can be made (A).
5.2.2.4. Is a deferred tax liability an influential item in the calculation of the
debt-to-equity ratio?
Table 5-7 provides the participants’ responses with regard to the deferred tax liability
being an influential item in the calculation of the debt-to-equity ratio (Question 7,
Appendix A). Three of the four professionals in practice view the deferred tax liability
as an influential item, but the level of influence would differ from company to
company. The size of the liability would also play an important role (1). The
responses from the participants in academia are split between this being an
influential item or not, and overall the responses are split almost exactly in half
between the participants. The majority of the professionals in practice would look at
the type of company and the size of the liability to determine whether the deferred
tax liability would be influential. One interesting solution provided by a participant in
academia regarding the deferred tax liability is to calculate the debt-to-equity ratio
including and excluding deferred tax and to disclose both ratios; this will allow users
to make their own decisions regarding the liability and its effect (2).
Table 5-7: Participants’ responses regarding deferred tax being an influential
item in the calculation of the debt-to-equity ratio
Theme Number Participants’ direct words
The
deferred tax
liability is an
influential
item
1 - Yes definitely. Depending on the size of the deferred tax it
will definitely be important. It could have a meaningful effect
in certain cases perhaps not in all companies (P).
- Management decisions more importantly would be
influenced by the deferred tax liability; I think it should play
on the amount because at the end of the day SARS is
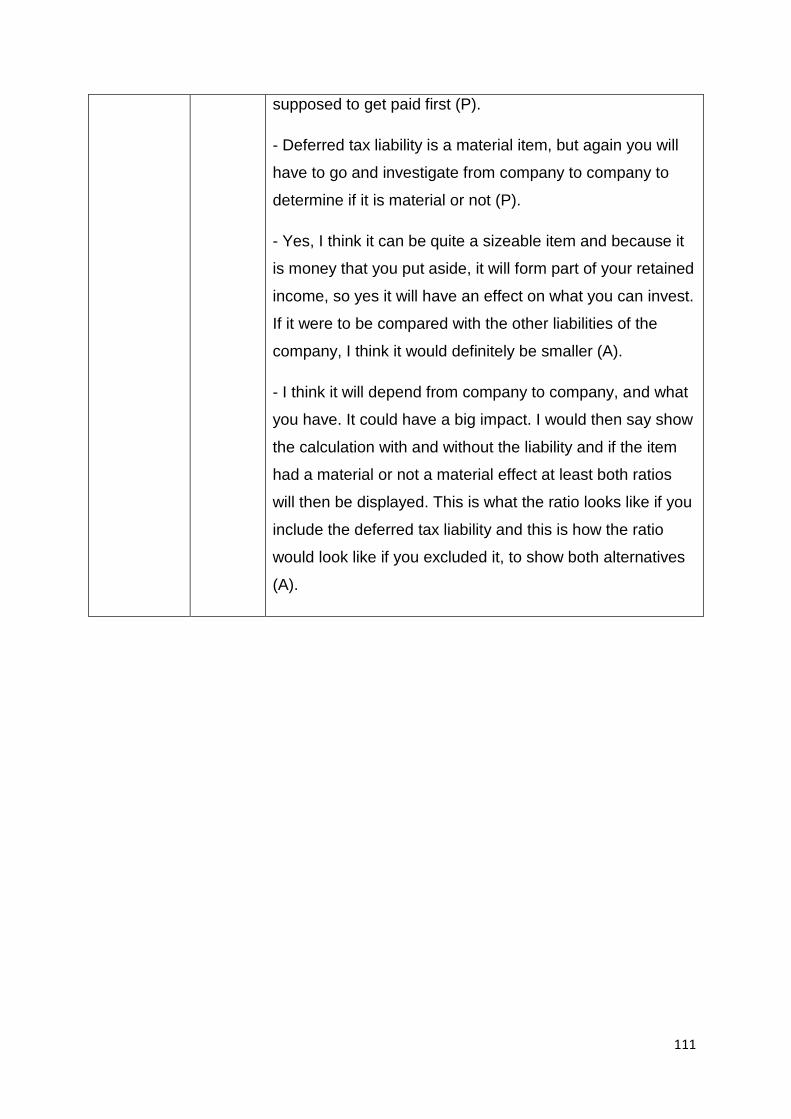
111
supposed to get paid first (P).
- Deferred tax liability is a material item, but again you will
have to go and investigate from company to company to
determine if it is material or not (P).
- Yes, I think it can be quite a sizeable item and because it
is money that you put aside, it will form part of your retained
income, so yes it will have an effect on what you can invest.
If it were to be compared with the other liabilities of the
company, I think it would definitely be smaller (A).
- I think it will depend from company to company, and what
you have. It could have a big impact. I would then say show
the calculation with and without the liability and if the item
had a material or not a material effect at least both ratios
will then be displayed. This is what the ratio looks like if you
include the deferred tax liability and this is how the ratio
would look like if you excluded it, to show both alternatives
(A).
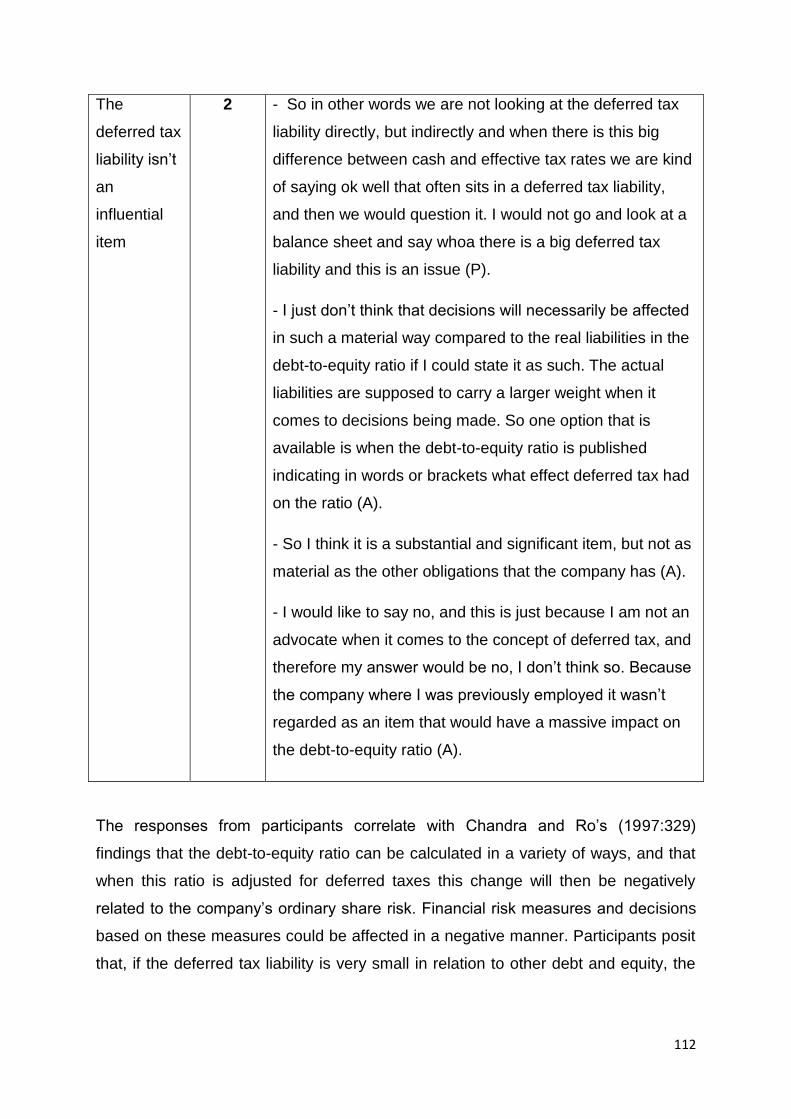
112
The
deferred tax
liability isn’t
an
influential
item
2 - So in other words we are not looking at the deferred tax
liability directly, but indirectly and when there is this big
difference between cash and effective tax rates we are kind
of saying ok well that often sits in a deferred tax liability,
and then we would question it. I would not go and look at a
balance sheet and say whoa there is a big deferred tax
liability and this is an issue (P).
- I just don’t think that decisions will necessarily be affected
in such a material way compared to the real liabilities in the
debt-to-equity ratio if I could state it as such. The actual
liabilities are supposed to carry a larger weight when it
comes to decisions being made. So one option that is
available is when the debt-to-equity ratio is published
indicating in words or brackets what effect deferred tax had
on the ratio (A).
- So I think it is a substantial and significant item, but not as
material as the other obligations that the company has (A).
- I would like to say no, and this is just because I am not an
advocate when it comes to the concept of deferred tax, and
therefore my answer would be no, I don’t think so. Because
the company where I was previously employed it wasn’t
regarded as an item that would have a massive impact on
the debt-to-equity ratio (A).
The responses from participants correlate with Chandra and Ro’s (1997:329)
findings that the debt-to-equity ratio can be calculated in a variety of ways, and that
when this ratio is adjusted for deferred taxes this change will then be negatively
related to the company’s ordinary share risk. Financial risk measures and decisions
based on these measures could be affected in a negative manner. Participants posit
that, if the deferred tax liability is very small in relation to other debt and equity, the
113
inclusion or exclusion of this item will not have a big impact on decisions made by
the company.
5.2.3. Theme 3: The different proposed treatments of deferred tax in the
calculation of the debt-to-equity ratio
The third theme regards the different proposed treatments of deferred tax in the
calculation of the debt-to-equity ratio. It is divided into four sub-themes namely:
How will the participant treat the deferred tax liability in the calculation of the
debt-to-equity ratio?
Can a deferred tax liability be treated as equity in the calculation of the debt-
to-equity ratio?
Can a deferred tax liability be offset against the cost price of an asset when
calculating the debt-to-equity ratio? and
Would the exclusion of the deferred tax liability deliver a more accurate debt-
to-equity ratio?
5.2.3.1. How will the participant treat deferred tax in the calculation of the debt-
to-equity ratio?
The purpose of this question was to determine how the participants from both
academia and practice would actually treat a deferred tax liability in the calculation of
the debt-to-equity ratio and to better understand their views (refer to Question 8,
Appendix A). The results can be seen in table 5-8. The overwhelming response to
this question from participants in academia and practice move towards treating the
deferred tax liability as part of debt in the calculation of the debt-to-equity ratio. This
is due to the fact that it is still an obligation to repay an amount in the future. Based
on the fact that the users of financial statements and ratios are the same, and
because IFRS attempts to take everything into account for decision making
purposes, six of the participants, three from academia and three from practice, feel
that the current treatment of the item as a liability is correct (1). The participants who
state that the item should be included as part of debt are in agreement with the views
of Huss & Zhao (1991:71) that the treatment of deferred tax as a liability is based on
the assumption that the tax will be paid and redeemed in the near future.
114
Only one participant from academia feels that the deferred tax liability should not
form part of debt. The reason for excluding the liability from debt is based on the fact
that, if the assets of a company are continuously replaced, the liability will not be
repayable for quite some time. Should this happen it would be more appropriate to
exclude the item from debt (2). This correlates with Bartlett’s (2014:693) view that in
a constantly growing company the deferred tax liability will never really reverse due
to assets continuously being replaced. Thus the deferred tax liability should rather be
excluded from debt.
Table 5-8: Participants’ responses to how they would treat the deferred tax
liability when calculating the debt-to-equity ratio
Theme Number Participants’ direct words
Include the
deferred tax
liability as
part of debt
in
calculation
1 - In my opinion I have always seen deferred tax as the tax
for the future. If it is pulled through to accounting it can be
determined that we have a current liability in our books, and
it is a present obligation to do something. I would say
consider it in your ratios depending on what your goals are.
It seems to me you still have a present obligation to pay
that tax. I would say you need to include it as part of debt,
but I can see the arguments of the people who do not want
to include it as part of debt (A).
- It depends on whether you consider it to be a liability. It
becomes a liability when the amount is repayable. It will
only become repayable once the company stops growing.
So when the company starts to decline and moves into a
declining phase or the company is liquidated, then the
deferred tax liability normally becomes repayable (A).
- There are many thoughts that went into the development
of IFRS. The International Accounting Standards Board
does a lot of research regarding what is important for
decision making and what isn’t important and according to
me because the user of the debt-to-equity ratio is the same
115
as the user of the financial statements. Based on this I think
you should treat it the same as IFRS and therefore it should
be treated as part of debt (A).
- Normally I don’t adjust the ratio; I accept it at face value. I
don’t adjust the ratio for deferred tax liabilities (P).
- It depends on the size. If it is a large amount, it would
affect me. So the biggest thing that would influence my
decision here is the materiality and the size of the deferred
tax liability (P).
- I think it should still be viewed as a liability. As it forms
more part of the liability. I think it is a bit more conservative
to look at deferred tax as a liability because at some point
we are going to have to pay that cash out (P).
Exclude the
liability from
debt when
doing the
calculation
2 - I think we excluded it from debt and ignored it; we
emphasised it in the company where I worked and sanitised
it. We therefore just excluded it from the calculation. We put
the item in the balance sheet and that was it, and it always
just lay there (A).
- As long as you keep on replacing your assets and if the
assets keep on being renewed and as long as the assets
are renewed the liability will actually be a reserve, and then
I would consider it to be capital and not include it as part of
debt (A).
5.2.3.2. Can a deferred tax liability be recognised as equity in the calculation of
the debt-to-equity ratio and why?
Table 5-9 provides the participants’ direct words with regard to whether they would
classify the deferred tax liability as equity when calculating the debt-to-equity ratio
(Question 9, Appendix A). The responses regarding this question go both ways;
there is a strong argument that the deferred tax liability is closer to equity rather than
116
a liability because of its permanence and the fact that it is a long-term source of
funding. Three of the four participants in practice state that they would rather treat
the deferred tax liability as equity due to the permanence of the item in a growing
company (1). According to Fridson and Alvarez (2002:276) the reason why the
deferred tax liability should form part of equity rather than debt is based on the fact
that, as long as the company continues to pay taxes at less than the statutory rate
due to assets continuously being replaced, the account will not reverse. The
responses from participants agree with research performed regarding this question.
The fact that the deferred tax liability is an obligation to repay an amount to SARS
makes it more of a liability than equity, and the fact that the equity holders have no
share in this amount can be contradictory towards the decision to recognise it as
equity. Three of the participants from academia state that the deferred tax liability still
represents an obligation to pay an outstanding amount and, as such, the item cannot
be treated as equity (2).
Table 5-9: Participants’ responses regarding a deferred tax liability being
treated as equity in the calculation of the debt-to-equity ratio
Theme Number Participants’ direct words
The
deferred tax
liability can
be treated
as equity
1 - Yes, closer to equity than debt. Because of its
permanence and it is a permanent source of funding, so
that would be the rational (P).
- The only thing that I maybe can think of is if it’s coming off
the back end of a big tax loss and you have the deferred tax
loss and you don’t pay the tax for the next couple of years
than in a sense it could be regarded as equity (P).
- If you look at the fact that a growing company which keeps
on expanding and buying large new assets will have a
deferred tax liability and the probability of reversal does not
seem imminent based on the fact that the company
reaching maturity is far off and then from that viewpoint it
might be regarded as equity (P).
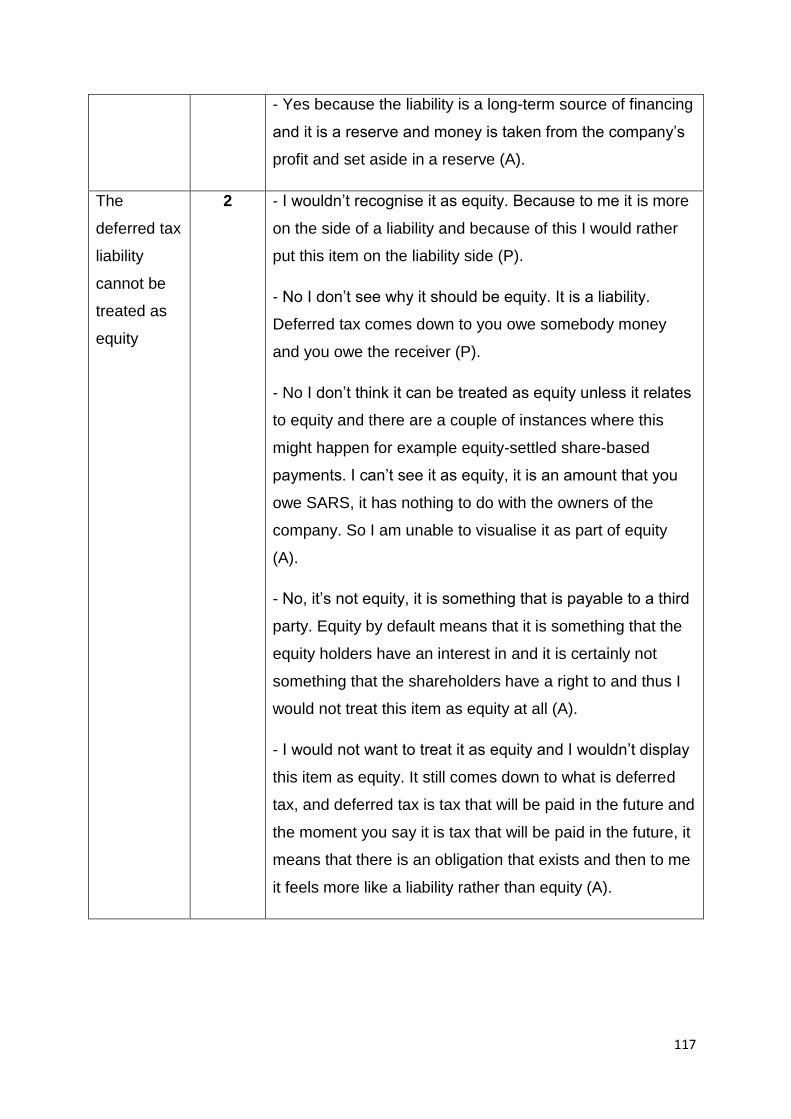
117
- Yes because the liability is a long-term source of financing
and it is a reserve and money is taken from the company’s
profit and set aside in a reserve (A).
The
deferred tax
liability
cannot be
treated as
equity
2 - I wouldn’t recognise it as equity. Because to me it is more
on the side of a liability and because of this I would rather
put this item on the liability side (P).
- No I don’t see why it should be equity. It is a liability.
Deferred tax comes down to you owe somebody money
and you owe the receiver (P).
- No I don’t think it can be treated as equity unless it relates
to equity and there are a couple of instances where this
might happen for example equity-settled share-based
payments. I can’t see it as equity, it is an amount that you
owe SARS, it has nothing to do with the owners of the
company. So I am unable to visualise it as part of equity
(A).
- No, it’s not equity, it is something that is payable to a third
party. Equity by default means that it is something that the
equity holders have an interest in and it is certainly not
something that the shareholders have a right to and thus I
would not treat this item as equity at all (A).
- I would not want to treat it as equity and I wouldn’t display
this item as equity. It still comes down to what is deferred
tax, and deferred tax is tax that will be paid in the future and
the moment you say it is tax that will be paid in the future, it
means that there is an obligation that exists and then to me
it feels more like a liability rather than equity (A).
118
5.2.3.3. Should the deferred tax liability rather be offset against the cost price
of the asset in the calculation of the debt-to-equity ratio and why?
Table 5-10 provides the participants’ responses with regards to whether they think
the deferred tax liability that exists due to temporary differences created by a specific
asset should be offset against the cost price of this asset when calculating the debt-
to-equity ratio (Question 10, Appendix A). Three professionals in practice and one in
academia feel that the deferred tax liability could be offset against the cost price of
the asset that created the temporary differences. But the problem with this proposed
treatment is that the liability is kept out of sight and the company might forget about
it, which could lead to other ratios being negatively influenced by this treatment (1).
The responses correlate with the findings of Amir et al. (2001:276) that the deferred
tax liability is the result of a certain tax obligation that can be taken into account
when the cost price of the asset is being determined or it can be treated as equity.
The other half of the participants, consisting of three professionals in academia and
one in practice, are of the opinion that this course of action would overcomplicate
things, and that there would be too many unnecessary consequences resulting from
treating the deferred tax liability like this (2). This proposed treatment would lead to
other information regarding the company being affected and this could lead to
incorrect decisions being made that are based on this information.
Table 5-10: Participants’ responses regarding a deferred tax liability being
offset against the cost price of the asset that created the liability in the
calculation of the debt-to-equity ratio
Theme Number Participants’ direct words
The
deferred tax
liability can
be offset
against the
cost price of
the asset
1 - I think you can set it off against the cost price of the asset.
Absolutely other decisions can definitely be influenced if the
deferred tax liability is treated as such (P).
- I think you should be able to offset it. I think it would
muddy the waters and it would leave the doors open for too
much fin nicking if it is done and this can be a problem (P).
- You might be able to treat the liability as such, the
119
problem with this is it then comes back to the previous
question of regarding a liability as equity and then you’re
technically going to make it part of the asset (P).
- It’s not a bad idea, but the problem then arises regarding
the liability, out of sight out of mind. So if you do not know
about it and you put it off against the cost price of the asset
and one day when the asset eventually realises you need to
remember that there is a deferred tax liability that is parked
inside the cost price of the asset and this could influence
the figures and the calculations. I don’t think it necessarily
needs to be disclosed like this on the statements, but I think
if you calculate a certain ratio the liability can certainly be
treated like this (A).
The
deferred tax
liability
should not
be offset
against the
cost price of
the asset
2 - No. From my point of view, and others might disagree I
always want the accounting to be as simple as possible. I
would rather have it be wrong but simple. For there to be
add backs and more complications that you have to keep in
mind. By doing the proposed treatment it would lead to the
over complication of the analysis process (P).
- No I don’t think so. I think that this might be a solution for
the debt-to-equity dilemma, should the liability be included
or not, but I think that it will cause other problems. It will
lead to information regarding assets being reflected
incorrectly, so it will lead to a different area of your decision
making process being adversely affected (A).
- No, for the simple reason the more information you have
the better your decisions will be. As soon as you start off
setting items against each other it will cause your
information to dampen and then you will have less
information available. I don’t think these two items should
be offset against each other, because it will make the
120
information less understandable (A).
- To me it feels like if you go and offset the liability against
the cost price of the asset, I think that information will be
lost, because a person who wants to see what assets you
have will now see that your assets are worth less. The
reason for this is because I went and included future
liabilities in the cost price of my asset (A).
- If I, for example went and bought property, plant and
equipment and I financed this transaction with a loan, why
don’t I net the finance lease against the asset, because
then my answer would be zero when these two items are
subtracted from each other. Why wouldn’t we do this with a
finance lease, but now we want to go and do this with a
deferred tax liability and it would be incorrect (A).
5.2.3.4. Would it be more accurate to exclude the deferred tax liability
completely from the calculation of the debt-to-equity ratio?
Lastly, the participants were asked whether a more accurate debt-to-equity ratio
would be delivered if the deferred tax liability was completely excluded from the
calculation (refer to Question 11, Appendix A). Table 5-11 provides the participants’
direct words regarding a more accurate debt-to-equity ratio being presented when
deferred tax is excluded from the calculation. Two of the participants, one from
practice and one from academia, state that they would exclude the deferred tax
liability from the calculation of the debt-to-equity ratio to improve comparability
between companies (1). The majority of the participants state that they would include
the liability in the calculation of the debt-to-equity ratio, because the deferred tax
liability is still an obligation to pay an amount to SARS. The inclusion of the liability
as part of debt is a better reflection of the item compared to excluding it from the
ratio (2).
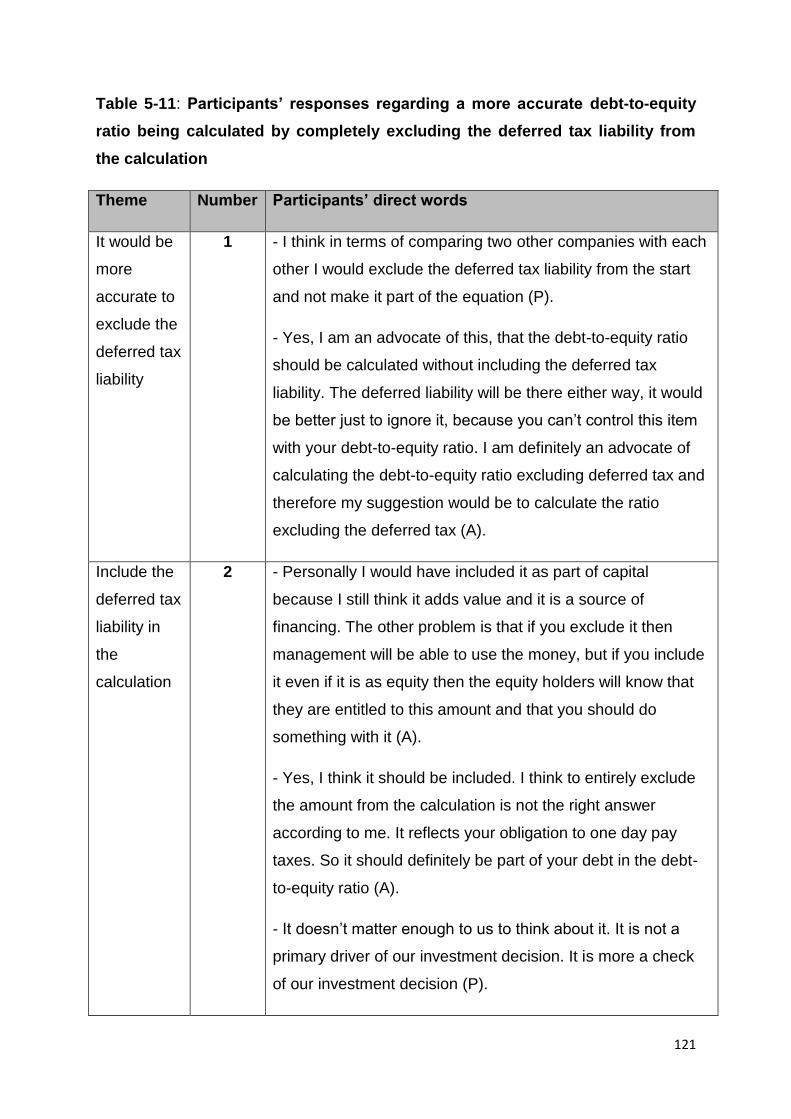
121
Table 5-11: Participants’ responses regarding a more accurate debt-to-equity
ratio being calculated by completely excluding the deferred tax liability from
the calculation
Theme Number Participants’ direct words
It would be
more
accurate to
exclude the
deferred tax
liability
1 - I think in terms of comparing two other companies with each
other I would exclude the deferred tax liability from the start
and not make it part of the equation (P).
- Yes, I am an advocate of this, that the debt-to-equity ratio
should be calculated without including the deferred tax
liability. The deferred liability will be there either way, it would
be better just to ignore it, because you can’t control this item
with your debt-to-equity ratio. I am definitely an advocate of
calculating the debt-to-equity ratio excluding deferred tax and
therefore my suggestion would be to calculate the ratio
excluding the deferred tax (A).
Include the
deferred tax
liability in
the
calculation
2 - Personally I would have included it as part of capital
because I still think it adds value and it is a source of
financing. The other problem is that if you exclude it then
management will be able to use the money, but if you include
it even if it is as equity then the equity holders will know that
they are entitled to this amount and that you should do
something with it (A).
- Yes, I think it should be included. I think to entirely exclude
the amount from the calculation is not the right answer
according to me. It reflects your obligation to one day pay
taxes. So it should definitely be part of your debt in the debt-
to-equity ratio (A).
- It doesn’t matter enough to us to think about it. It is not a
primary driver of our investment decision. It is more a check
of our investment decision (P).
122
- I think it should be included. That for me is a more
appropriate treatment of the item and will deliver a more clear
reflection of the debt-to-equity ratio (P).
- I would still keep it in the debt-to-equity ratio (P).
- I think we should rather go and calculate two formulas,
where deferred tax is included and excluded. I think it will
accommodate both users who are out there. People who feel
strongly about the one side and people who feel more
strongly about the other side will be able to gain value and
benefit from both formulas, and therefore I would suggest
calculating two formulas, one including and one excluding
deferred tax (A).
5.3. SUMMARY
This chapter serves to provide an overview of the data analysis of the empirical
research done in this study. The results of the qualitative research interviews are
thoroughly discussed. The data from the research interviews was independently
transcribed and coded by making use of Atlas.ti in order to identify different themes.
From this data three main themes could be identified under which the research
interviews could be classified. The main themes identified include the following:
factors other than deferred tax taken into consideration when calculating the debt-to-
equity ratio, current treatment of deferred tax as a liability in this ratio and the impact
thereof, and the different proposed treatments of deferred tax in the calculation of the
debt-to-equity ratio. The main themes were then split into sub-themes to help better
sort and categorise the responses made by participants. These themes and sub-
themes were tabulated and thoroughly discussed in section 5.2. The participants’
direct words were included in the tables in order to support the identified themes.
With this chapter secondary research objectives 3 and 4 (Section 1.3) are reached.
Chapter 6 provides the major findings, conclusions, recommendations, limitations,
and recommendations for future research.
123
CHAPTER 6
CONCLUSIONS AND RECOMMENDATIONS
6.1. INTRODUCTION
In this concluding chapter, a general overview of the study is provided in order to
indicate that the research objectives, as stated in section 1.3, have been addressed.
Conclusions are drawn, the limitations pertaining to this study are discussed, and
recommendations for further research opportunities are provided in order to
conclude this chapter. This chapter aims to achieve secondary research objective 5
(Section 1.3).
6.2. OBJECTIVES OF THE STUDY
As discussed in Section 1.3, the main goal of this study is to gain a better
understanding regarding the treatment of deferred tax in the debt-to-equity ratio and
to determine how this differs between theory and practice.
The main objective was achieved by the following secondary objectives:
Conceptualising the debt-to-equity ratio from the literature by performing an in
depth theoretical study regarding the ratio to gain a better understanding of
the purpose and implications of this ratio (research objective 1);
Conceptualising from the literature what the appropriate treatment of deferred
tax in the debt-to-equity ratio is (research objective 2);
Determining from an academic perspective how deferred tax should be
treated in the calculation of the debt-to-equity ratio by gaining the opinion of
specific academic practitioners who specialise in the field of financial
management and financial accounting (research objective 3);
Determining how stockbrokers and portfolio managers take deferred tax into
account when calculating the debt-to-equity ratio by performing interviews
with certain professionals in practice (research objective 4); and
124
Based on research conducted, formulate a conclusion and recommendations
regarding the treatment of deferred tax in the debt-to-equity ratio (research
objective 5).
In this chapter conclusions are drawn for each one of these objectives. These
conclusions are based on the findings in Chapters 2 to 5.
6.3. OVERVIEW OF THE LITERATURE
The literature study was done in order to obtain information to reach secondary
research objectives 1 and 2 and will be discussed below:
6.3.1. Different aspects of the debt-to-equity ratio and the purpose and
implications of this ratio
The first research objective achieved in Chapter 2 focused on gaining a better
understanding of the debt-to-equity ratio. The literature study undertakes a thorough
discussion regarding financial statements and how important it is for stakeholders to
better understand what the figures in financial statements really mean. Financial
statements are used to sketch a picture of the economic performance of an entity
and are the primary source of information regarding the company (Section 2.2.1).
Financial statement analysis is a method that can be used to analyse the business
as a whole (Section 2.4.2). Financial statement analysis is a method used to
thoroughly investigate the financial position as well as the progress of the company,
and allows insight into the operative activities to be gained (Section 2.4.1). It is
established that financial statements deliver very important information, and through
proper analysis of these statements valuable information can be extracted.
Ratio analysis is one of the most well-known and widely used financial statement
analysis tools (Section 2.6.1). Ratio analysis can be defined as the systematic use of
ratios to analyse and interpret statements in order to determine where an entity’s
strengths and weaknesses lie (Section 2.6.1). The debt-to-equity ratio is one of the
ratios used when the focus of the analysis is directed towards debt management.
The debt-to-equity ratio is used to indicate how much debt financing is currently
being used by an entity in relation to equity funds invested (Section 2.7.4).
125
The importance and value of the debt-to-equity ratio lies in the fact that the result of
this ratio conveys an important message regarding the investment structure and
operational activities of the entity (Section 2.7.3). The debt-to-equity ratio is the most
commonly used ratio worldwide when it comes to measuring financial risk or financial
strength of an entity, and is used by creditors to determine to what extent they will be
protected in case of insolvency (Section 2.7.4). The debt-to-equity ratio is used to
determine the solvency of a company, and based on debt paying ability of the
company allows stakeholders to determine what the current debt position of the
entity is (Section 2.7.5).
In conclusion it can be determined that the debt-to-equity is a very important ratio
which can be used to obtain very valuable information regarding the debt
management of an entity. The lack of uniformity in the calculation of ratios is a
problem, especially when it comes to comparability between industries and
benchmarks (section 2.7.4, page 43). This is especially true when it comes to the
calculation of the debt-to-equity ratio, because of the fact that there are different
views regarding what should be included as part of debt and equity in the calculation
of this ratio.
6.3.2. Determining what the appropriate treatment of deferred tax is in the
calculation of the debt-to-equity ratio
The second research objective that was achieved in Chapter 3 focuses on gaining a
better understanding of deferred tax and how this item should be treated in the
calculation of the debt-to-equity ratio. The literature study tends toward the problem
identified at the beginning of the study in the thorough study regarding deferred tax.
The main research objective is to gain a better understanding regarding the
treatment of deferred tax in the calculation of the debt-to-equity ratio. An issue that
arises from the calculation of the debt-to-equity ratio is the appropriate treatment of
deferred taxes (Section 3.2.4). Chapter 3 focuses on what deferred taxes are in
order to gain insight into how a deferred tax liability should be treated in the debt-to-
equity ratio.
Income taxes present one of the more challenging aspects of the financial reporting
process and have a pervasive impact on the company’s business decisions. Income
taxes are usually a material item compared to other items in the balance sheet
126
(Section 3.2.1). The differences between the carrying amount of an asset or liability
presented in the financial statements which are determined according to accounting
standards, and the carrying amount recorded according to the tax act, leads to
deferred taxes being recognised (Section 3.2.1). Deferred taxes represent the
cumulative differences between the amount of taxes that was actually paid and taxes
calculated according to the statutory rate (Section 3.2.1).
Deferred tax assets and liabilities are very important balance sheet items and both
these items are substantial for many firms (Section 3.2.2). The difference between a
deferred tax asset and a deferred tax liability is a very important distinction that
needs to be made, especially because the one is an asset that is the result of
deductible temporary differences that will lead to less tax being paid in the future.
The deferred tax liability is the result of taxable temporary differences that will lead to
the company paying more tax in a future period. Deferred tax assets provide
information regarding the future tax benefits that will be received upon reversal of
this account (Section 3.2.2). A deferred tax liability can be viewed as a future tax
obligation that is the result of an item created due to taxable temporary differences
which cause the pre-tax financial income to exceed the taxable income (Section
3.2.2).
The concept of deferred taxes has certain weaknesses that come with the premise of
this item, and one of these weaknesses is that a going concern will probably be able
to indefinably suspend the repayment of the so-called liability by making use of
effective and clever tax management (Section 3.2.1). The deferred tax liability should
be included as part of equity when calculating the debt-to-equity ratio based on the
following: in a constantly growing company the deferred tax liability will never really
reverse, and as long as the company keeps paying taxes at less than the statutory
rate the deferred tax account will continue to grow (Section 3.2.4). The liability
treatment of deferred taxes and including it as debt is based on the assumption that
the tax will be paid in the near future (Section 3.2.4). When deferred taxes are
accounted for in terms of current international accounting standards it leads to the
liability being overstated. The effect of this overstatement can be treated by
capitalising the tax benefit into the original cost of the asset (Section 3.2.4). Tax
deductibility and taxability regarding the deferred tax liability are factors that can be
taken into account when the value of an asset is determined (Section 3.2.4).
127
In conclusion, deferred taxes is usually a material amount in the balance sheet of a
company, and when it comes to the calculation of the debt-to-equity ratio the
appropriate treatment of deferred tax liabilities can become a problem. Based on the
literature review performed, the deferred tax liability can be treated as debt, as
equity, or it can be offset against the cost price of the asset that is responsible for
this liability. Each one of these proposed treatments will have a different effect on the
calculation of the debt-to-equity ratio and this can lead to different decisions being
made based on a ratio affected by one substantial item.
6.4. EMPIRICAL STUDY
An empirical study was performed in order to meet secondary research objectives 3
and 4 (Section 1.3). A qualitative method approach was followed in order to evaluate
the requirements as per the literature and compare them to the outcome of the
empirical results. Reference is made to the literature studied in Chapters 2 and 3 as
well as the empirical results in Chapter 5. In this way the objectives set out in Section
1.3 are put into context.
6.4.1. Participants’ views regarding the debt-to-equity ratio and the proposed
treatment of deferred tax in the calculation of this ratio
Qualitative research interviews were performed to address research objectives 3 and
4 (Section 1.3). These objectives include determining from an academic and practice
viewpoint how participants from both these fields would account for deferred tax
when calculating the debt-to-equity ratio. The last research objective is to formulate a
conclusion and recommendations based on research performed regarding the
treatment of deferred tax in the debt-to-equity ratio. To achieve these objectives
interviews were performed with professionals in academia and professionals in
practice. The results of these interviews can be seen in Section 5.2. Through the
coding of data three main themes were identified in the responses, namely:
Factors other than deferred tax taken into consideration when calculating the
debt-to-equity ratio;
Current treatment of deferred tax as a liability in the debt-to-equity ratio and
the impact thereof; and
128
The different proposed treatments of deferred tax in the calculation of the
debt-to-equity ratio.
The conclusions drawn from each of these themes are now discussed.
6.4.2. Factors other than deferred tax taken into consideration when
calculating the debt-to-equity ratio
Value placed on the calculation of the debt-to-equity ratio and information that can
be extracted from this ratio
The participants were asked what value they would place on the calculation of the
debt-to-equity ratio and information that can be extracted from this ratio. Most of the
participants from both academia and practice posit that the debt-to-equity ratio is a
very valuable ratio that contains valuable information. These responses correlate
with the findings of the literature study (Section 2.7.4). Most of the participants state
their reasons why the debt-to-equity ratio is important to them and why they would
place value on the information extracted from this ratio. It is determined that, from
both theory and practice viewpoints, the ratio is regarded as one that plays a very
important role and delivers important information regarding some key areas, for
example financial risk, solvency, leverage, share price, and a ratio that summarises
the entire balance sheet.
Even though the debt-to-equity ratio is very valuable and delivers important
information, one recurring theme became evident from the participants’ responses.
Most of the participants in practice state that the ratio is not the most important ratio
to calculate or use, and that the ratio is used like a check ratio. This correlates with
the findings made in the literature study (Section 2.6.5). The true importance of this
ratio actually comes through when the ratio is quite sizeable, and this could then be
a flag for further investigation. The participants also state that the debt-to-equity ratio
would have more meaning and be more valuable if this ratio is investigated at and
used for external purposes compared to looking at the ratio internally. This statement
is important as it shows that the ratio is important, but more value can be extracted
from this ratio if it is used for external purposes.
Should information reported in terms of IFRS be adjusted when calculating certain
ratios for more accurate information?
129
The second question was asked to determine if participants would adjust certain
figures reported in terms of IFRS when calculating certain ratios. The participants in
practice emphasise the fact that they deal with very large time constraints which
makes it very hard to make adjustments to figures. The question elicited various split
results between the participants. The participants in the field of accounting note that
information reported in terms of IFRS already takes into account what management
requires to make decisions and that there is no requirement to adjust these figures.
The responses from participants agree with the findings of the literature study and
the statements made by other authors regarding this aspect (Section 2.6.5). A large
number of the participants support the statement that IFRS figures should be
adjusted to increase and improve comparability; if the adjustments are correctly
applied it makes the information more understandable and accurate. The
professionals in practice also state that, if information could be standardised across
companies, it would allow them to cover more ground over a shorter period, a
sentiment echoed in the literature (Section 2.6.5).
Will the type of analyst and their background influence inputs used in the calculation
of the debt-to-equity ratio
Thirdly, the participants were asked if the analyst and their background would
influence the inputs used to calculate the debt-to-equity ratio. The participants from
academia and practice strongly agree on this point as almost every participant states
that the background of the analyst would in some way affect and play a role when it
comes to what inputs would be used to calculate the debt-to-equity ratio. Each
analyst has their own goals when they calculate and look at different ratios, which
definitely affects the way a ratio is calculated. Analysts also employ individual
methods and techniques to calculate a certain ratio to ensure the correct information
can be extracted from the ratio. In conclusion the overwhelming response from
academia and practice regarding this question is that the analyst and their
background will in some way influence the inputs used to calculate a ratio. The
participants’ responses agree with the findings of the literature study (Sections 2.5.2
and 2.6.4).
These results and the participants’ direct words are found in Section 5.2.1.
130
6.4.3. Current treatment of deferred tax as a liability in the debt-to-equity ratio
and the impact thereof
Does the industry in which the entity operates affect the treatment of deferred tax in
the debt-to-equity ratio?
The participants were then asked if they think the industry in which an entity
functions would affect the treatment of deferred tax in the calculation of the debt-to-
equity ratio. The participants who primarily focus on financial accounting state that
the type of industry in which an entity operates would not have an impact on the
deferred tax liability and its treatment in the debt-to-equity ratio, because every
single company has to pay taxes regardless of their industry. If the deferred tax
liability is treated differently between industries, comparability would be directly
affected and be less effective. Participants also provide a possible solution, to rather
disclose the ratio including and excluding deferred taxes so that the user of the ratio
can see both ratios and use the one that best suits their needs. More than half of the
participants responded that they believe the type of industry would definitely affect
the treatment of deferred taxes. The responses are substantiated by providing
examples from two different industries, like banking and mining, and explaining why
differences between these two industries exist. Thus the responses regarding this
question are divided between theory and practice. The industry can impact the
treatment of the deferred tax liability, but it is not the primary driver behind the
proposed treatment of this item as there are still other factors that need to be
considered.
Can deferred tax be regarded as a form of debt financing in terms of the debt-to-
equity ratio
The second question was asked to determine whether the participants regarded
deferred tax as a form of debt financing in terms of the debt-to-equity ratio. Only two
participants, one from academia and one from practice, feel that deferred taxes
could be regarded as debt financing, because the company is effectively leveraging
money that belongs to somebody else. The repayment of a deferred tax liability
could sometimes take a substantial amount of time leading to it being regarded as a
long-term source of financing. Three of the participants in practice and three in
academia state that deferred taxes cannot be regarded as debt financing, because it
131
comes down to an outstanding amount which reflects an entity’s future obligation to
repay an outstanding amount related to taxes. The deferred tax liability is ultimately a
postponement of payment provided by SARS rather than a form of financing. The
responses on the deferred tax liability not being a form of debt financing agrees with
the findings of the literature study (refer to Section 3.2.1).
Will the inclusion or exclusion of deferred tax from debt affect decisions made based
on the debt-to-equity ratio?
The third question asked was if the participants think the inclusion or exclusion of
deferred taxes from the debt-to-equity ratio would affect decisions made based on
this ratio. All of the participants, from both academia and practice, are in agreement
that the inclusion or exclusion of deferred tax from the debt-to-equity ratio could have
an impact on decisions made based on this, but they also opine that the impact of
this might not always be material. Some participants feel that the impact on
decisions would directly be affected by the size of the deferred tax liability; this would
also differ from company to company. The type of decisions that the debt-to-equity
ratio is used for would also be affected by how substantial the treatment of deferred
tax is when calculating this ratio. Conclusions drawn from participants’ responses
agree with the results obtained from the literature study (Section 3.2.4). Participants
respond by saying that, if the deferred tax liability is very small in relation to other
debt and equity, the inclusion or exclusion of this item will not have a big impact on
decisions made by the company. It is also suggested that the ratio should be
calculated including and excluding deferred taxes.
Is a deferred tax liability an influential item in the calculation of the debt-to-equity
ratio
Lastly, the participants were asked if the deferred tax liability is an influential item in
the calculation of the debt-to-equity ratio. Two professionals in practice and two
professionals in academia view the deferred tax liability as an influential item; the
level of influence, however, is directly related to the size of the liability. The reason
for the item being influential is that the item will definitely have an impact on the
management decision making process, and with most companies the deferred tax
liability can be quite sizeable and due to this it will have a material impact on
decisions made by management. Two professionals in practice and two
132
professionals in academia note that the deferred tax liability would not be an
influential item as it is not an item that receives a large amount of focus when it
comes to calculating ratios. Decisions might be affected in some way, but the effect
of how the deferred tax liability is treated might not be that material. The solutions
that can be implemented is to calculate the debt-to-equity ratio including, excluding
deferred taxes, and to disclose both ratios. This will reduce the risk of the item
materially affecting decisions as both alternatives of the ratio can be viewed.
These results and the participants’ direct words are found in Section 5.2.2.
6.4.4. The different proposed treatments of deferred tax in the calculation of
the debt-to-equity ratio
How will the participant treat deferred tax in the calculation of the debt-to-equity
ratio?
The first question was asked to determine how each one of the professionals in
practice and professionals in academia would treat deferred tax when calculating the
debt-to-equity ratio. The overwhelming response regarding this question comes
down to the fact that six participants, consisting of three people from academia and
three from practice, would treat the deferred tax liability as debt in the debt-to-equity
ratio as this item is still debt. The reason why the participants would treat it as debt is
based on the fact that the deferred tax liability still remains an obligation to repay
taxes in a future period, and the most appropriate treatment would be to include the
item as part of debt. This correlates with the findings of the literature study (Section
3.2.4).
Two participants from academia say that they would completely exclude the liability
from debt as the results would be more accurate; if one looks at a company that is
continuously growing and replacing their assets, the chances that the deferred tax
liability will reverse in the near future is very slim. Thus the item should not form part
of debt. This agrees with the findings of the literature study (Section 3.2.4).
Can a deferred tax liability be recognised as equity in the calculation of the debt-to-
equity ratio and why?
The second question was asked to determine whether the participants would treat
the deferred tax liability as equity in the calculation of the debt-to-equity ratio. The
133
responses regarding this question lean both ways as half of the participants feel that
the deferred tax liability could be treated as equity while the other half feels that this
treatment would be inappropriate. Three of the four participants in practice state that
they would rather treat the deferred tax liability as equity. This is due to that the item
can almost be permanent and that the liability can be regarded as a permanent
source of funding. The likelihood of the account reversing in a company that is
currently in a period of high growth is highly unlikely and, based on this, the item is
closer to equity than debt. The statements made by participants agree with the
findings made in the literature study (Section 3.2.4).
Three of the participants from academia state that the deferred tax liability still
represents an obligation and thus the item cannot be treated as equity. The liability
represents an obligation to repay an amount of outstanding taxes to SARS in the
future. Therefore the item is not equity, because equity is something that the equity
holders have a right to share in. The equity holders have no claim towards the
deferred tax liability as this amount has to be paid to SARS in the future and the
company cannot use these funds put aside as investments in long-term projects as it
is still an obligation that can become repayable at any moment.
Should the deferred tax liability rather be offset against the cost price of the asset in
the calculation of the debt-to-equity ratio and why?
The third question regards one of the alternative treatments of deferred tax in the
calculation of the debt-to-equity ratio. The participants were asked whether the
deferred tax liability could be offset against the cost price of the asset that was
responsible for creating the taxable temporary differences. Three professionals in
practice and one in academia posit that one could offset the deferred tax liability
against the cost price of the asset that created the temporary differences and that
this could be a solution for the whole debt-to-equity dilemma and what should be
done with deferred taxes. The problem with this proposed treatment is an “out of
sight, out of mind” problem as the company might completely forget about the
liability. Furthermore, other ratios could also be negatively impacted by treating the
liability like this. The conclusion drawn from the interviews correlate with the findings
of the literature study (Section 3.2.4).
134
The other half of the participants, consisting of three professionals in academia and
one in practice, state that offsetting the deferred tax liability against the cost price of
the asset would unnecessarily overcomplicate matters and the treatment of deferred
tax like this could have large consequences for other aspects of the company.
Treating the liability in this manner will also lead to information being lost as well as
information regarding assets being displayed incorrectly, thus negatively impacting
the company in the long run. The responses are equally divided between participants
as half of the participants in academia say you could do this while the other half
disagrees and says it should not be offset. Participants in practice responded the
same way.
Will it be more accurate to exclude the deferred tax liability completely from the
calculation of the debt-to-equity ratio?
Lastly, the participants were asked whether they thought that a more accurate debt-
to-equity ratio could be calculated if the deferred tax liability was completely
excluded from this calculation. Two participants, one from practice and one from
academia, respond that they would completely exclude the deferred tax liability from
their calculations, as comparability will be improved and better decisions made
based on this ratio. The other six participants, consisting of people in practice and
academia, state that they would still include the deferred tax liability in the calculation
of the debt-to-equity ratio as this item still reflects a future obligation of the entity, and
the amount will have to be repaid in a future period. The inclusion of the liability as
part of debt is a better reflection of the debt-to-equity ratio as opposed to completely
excluding it from the calculation. It is also proposed that two formulas, one including
and the other excluding deferred tax, be calculated.
These results and the participants’ direct words are found in Section 5.2.3.
6.5. OVERVIEW AND RECOMMENDATIONS
To achieve secondary objective 5, recommendations are made based on the
research done and conclusions drawn from this study. The main objective of this
study is to gain a better understanding regarding the treatment of deferred tax in the
debt-to-equity ratio and to determine how this differs between theory and practice.
135
With regards to gaining a better understanding about the purpose and implications of
the debt-to-equity ratio it can be posited through reviewing the literature that this ratio
conveys a very important message regarding the investment structure and
operational activities of the company. The debt-to-equity ratio is also one of the most
commonly used ratios when it comes to measuring a firm’s financial risk. Thus it
could be determined that the debt-to-equity ratio is a very important ratio that can
deliver very valuable information regarding the debt management of a company. By
examining and comparing the information gathered through the literature study and
interviews the conclusion can be drawn that the debt-to-equity ratio is certainly a
very important ratio from both academic and practice viewpoints. However, the debt-
to-equity ratio is not the most important ratio especially when compared to other
ratios that deliver more valuable information. The viewpoint regarding the debt-to-
equity ratio is that the ratio should rather be used as a check ratio. Due to the large
time constraint imposed on them, professionals in practice do not have time to adjust
figures reported in terms of IFRS when calculating certain ratios. The proposed
treatment of deferred tax in the calculation of the debt-to-equity ratio is one of the
focus areas of this study and determining the different ways this item could be
treated is an area investigated in detail. Based on the literature study and interviews
it can be determined that there are many different ways of treating deferred tax when
it comes to the calculation of the debt-to-equity ratio. Each one of these proposed
treatments is supported in some manner by participants in academia and practice.
The different treatments of deferred tax has many positive aspects, and some of
these alternative treatments help to solve the whole debt-to-equity dilemma
regarding the deferred tax liability, but each one of these alternatives can also have
negative implications.
As a result of these findings the following recommendations can be made:
Adjustments regarding figures reported in terms of IFRS should not be
overemphasised as much time is devoted to the development of reporting
standards to ensure that accurate management decisions can be made; thus
making adjustments should not be a focus area when calculating ratios;
The debt-to-equity ratio should not be calculated and used on its own. The
ratio can deliver valuable information, but it is not the only ratio that analysts
136
in practice take into account. Using this ratio in combination with, for example
debt-to-EBITDA, will increase the value of information extracted from this
ratio. EBITDA stands for earnings before interest, tax, depreciation and
amortisation.
Focus must also be placed on the analyst who calculates and discloses a
certain ratio, because the background of the analyst and their views will
definitely affect how inputs like deferred taxes are treated in the calculation.
This can have a large impact on decisions made;
The information used to calculate ratios across industries could be
standardised as far as possible - if all of the debt-to-equity ratios in one
industry includes deferred taxes while another industry’s exclude it from the
ratio, comparability will be heavily affected which could lead to incorrect
decisions being made;
When calculating the debt-to-equity ratio it should be properly disclosed that
the deferred tax liability is not a form of debt financing and that this item
should not be taken into consideration when looking at the company’s long-
term capital structure;
The views regarding the treatment of deferred tax in the calculation of the
debt-to-equity ratio are very similar between academia and practice as the
overwhelming responses regarding this item are exactly the same. The main
issue faced by professionals in practice is a lack of time to calculate the debt-
to-equity ratio in several different ways. Based purely on the responses from
the interviews and the literature study performed it is recommended that the
deferred tax liability should be included in the calculation of the debt-to-equity
ratio as this treatment ensures that the item is taken into account;
The deferred tax liability could be treated as equity in the debt-to-equity ratio.
It is, however, recommended that a disclosure or note should be made
indicating that the deferred tax liability forms part of equity. The reason for
treating the liability as such should also be stated. The equity holders of the
company must also be informed in some way that they have no claim towards
137
the deferred tax liability and this is still an obligation to pay tax in a future
period;
Financial information should be kept as simple as possible. It is therefore not
recommended that the deferred tax liability be offset against the cost price of
the asset responsible for the taxable temporary difference. This could
complicate matters unnecessarily and could lead to information being lost in
the process; and
It is suggested that the debt-to-equity ratio always be calculated in two ways:
one ratio should be calculated by including deferred tax in the calculation of
the debt-to-equity ratio and another ratio should then be calculated excluding
deferred tax from the calculation. By disclosing both of these ratios the user of
the ratios will be able to see what impact deferred tax actually has on the
calculation of the debt-to-equity ratio, which will reduce the risk of decisions
being significantly influenced by the incorrect treatment of deferred taxes. The
person who makes use of the ratios can then select the ratio that best suits
their needs without completely ignoring the deferred tax liability.
6.6. LIMITATIONS AND RECOMMENDATIONS FOR FURTHER RESEARCH
As with every study this study is subject to certain limitations which are now
discussed.
The study only focused on stockbrokers and portfolio managers who are
professionals in practice, and these are not the only people who calculate and
use the debt-to-equity ratio;
Only one input was considered regarding the debt-to-equity ratio, and many
other inputs could have an impact on the calculation of this ratio;
The professionals in academia only comprised two subject fields; other fields
could also be taken into consideration when looking at this aspect, for
example taxation; and
The participants in academia are lecturers from only one university, and
academics from other universities might have different views regarding the
138
treatment of deferred tax in the calculation of the debt-to-equity ratio. This
also means that the results cannot be generalised for all other universities in
South Africa.
Future research opportunities may include the following:
The study includes only interviews with academics from one of the universities
in South Africa. As a future research opportunity academics from other
universities could be included;
The study only focuses on portfolio managers and stockbrokers. In future,
research professionals from, for example, banks, could be employed, as the
ratio is often used by banks and considered in terms of debt covenants;
The research only focuses on the treatment of deferred tax in the calculation
of the debt-to-equity ratio. Future research could explore other inputs that
factor into the calculation of this ratio which can also have a significant impact
on the results obtained from this ratio;
The study only focuses on the debt-to-equity ratio and how deferred tax could
impact this ratio. Future studies could include other ratios impacted by
deferred taxes and what impact deferred tax could have on decisions made
based on these ratios;
This study focuses solely on the debt-to-equity ratio from a South African
company’s perspective. Future studies could be performed to investigate how
deferred tax could influence a company in other countries across the globe;
and
The study primarily focuses on the liability input of the calculation of the debt-
to-equity ratio. In future, more focus could be placed on equity and what
should be included as part of this item, because equity is a very important
component in the calculation of the debt-to-equity ratio.
6.7. SUMMARY
Chapter 6 serves to provide an overview of the research study. The secondary
research objectives are used as a guideline to summarise the findings presented in
139
the previous chapters. Objectives 1 and 2 are addressed in chapter 2 and 3, while
objectives 3 and 4 are accomplished in chapter 5.
After careful consideration of the results, recommendations are formulated in order
to address the shortcomings detected through the study. The limitations of this study
are presented and recommendations for possible future study opportunities made.
The research question focuses on obtaining a better understanding regarding the
treatment of deferred tax in the debt-to-equity ratio and to determine how this item is
treated in practice and what the theory suggests. This objective was achieved by
performing a literature review and qualitative research interviews with professionals
in practice and professionals in academia.
The final conclusion of this research study is that the debt-to-equity ratio is definitely
a very valuable ratio. In order to ensure that the ratio remains comparable and as
simple as possible the ratio should be calculated by including the deferred tax liability
as part of debt. By doing this the item is not merely excluded, which ensures that no
unnecessary loss of information takes place.
It is also recommended that the debt-to-equity ratio always be calculated in two
ways: one ratio should be calculated by including deferred tax in the calculation of
the debt-to-equity ratio and another ratio should then be calculated excluding
deferred tax from the calculation. Both these ratios should be disclosed. By
computing both these ratios the user has the freedom to select the ratio that best
suits their needs, and the impact of deferred tax will not simply be ignored.
140
BIBLIOGRAPHY
Achek, I. & Gallali, M.I. 2015. Financial statements' credibility, discretionary
accruals and the cost of debt: Tunisian evidence. African Journal of Business &
Economic Research, 10(1):137-159.
Agrawal, A. & Mandelker, G.N. 1987. Managerial incentives and corporate
investment and financing decisions. The Journal of Finance, 42(4):823-837.
Albrecht, C., Holland, D., Malagueño, R., Dolan, S. & Tzafrir, S. 2015. The role of
power in financial statement fraud schemes. Journal of Business Ethics, 131(4):803-
813.
Alexander, A., Britton, A. & Jorisson, A. 2003. International financial reporting and
analysis. 1st ed. London: Thomson.
Amaratunga, D., Baldry, D., Sarshar, M. & Newton, R. 2002. Quantitative and
qualitative research in the built environment. Work Study, 51(1):17-31.
Amir, E., Kirschenheiter, M. & Willard, K. 2001. The aggregation and valuation of
deferred taxes. Review of Accounting Studies, 6(2-3):275-297.
Arditti, F.D. 1967. Risk and the required return on equity. The Journal of Finance,
22(1):19-36.
Arshad, R., Iqbal, S.M. & Omar, N. 2015. Prediction of business failure and
fraudulent financial reporting: Evidence from Malaysia. Indian Journal of Corporate
Governance, 8(1):34-53.
Axson, D. 2010. Best practices in planning and performance management:
Radically rethinking management for a volatile world. 3rd ed. Hoboken, NJ: John
Wiley & Sons.
Babbie, E. & Mouton, J. 2012. The practice of social research. 14th ed. Cape
Town: Oxford University Press.
141
Bartlett, G. 2014. Business strategy. (In Fouché, J. & Barnard, J., eds. Financial
management: turning theory into practice. 1st ed. Cape Town, SA: Oxford
University Press Southern Africa.
Bartunek, J.M. & Seo, M. 2002. Qualitative research can add new meanings to
quantitative research. Journal of Organizational Behaviour, 23(2):237-242.
Beckers, S. 1980. The constant elasticity of variance model and its implications for
option pricing. The Journal of Finance, 35(3):661-673.
Berg, B.L. 2007. Qualitative research methods for the social sciences. 6th ed.
Boston: Pearson.
Bildstein-Hagberg, S. 2003. Staging information-financial analysis and the (up)
setting of market scenes. International Review of Financial Analysis, 12(4):435-451.
Blumberg, B., Cooper, D.R. & Schindler, S. 2008. Business research methods.
Berkshire: McGraw-Hill.
Bradea, L., Sabău-Popa, D.C. & Boloş Marcel, L. 2014. Using dashboards in
business analysis. Annals of the University of Oradea, Economic Science Series,
23(1):851-856.
Bryman, A. & Bell, E. 2011. Business research methods. 3rd ed. Oxford: Oxford
University Press.
Burke, J.J. 2011. Auditor liability to external users for misleading financial
statements of publicly listed companies: Two normative propositions. Syracuse
Journal of International Law and Commerce, 39(1):137-188.
Chandra, U. & Ro, B.T. 1997. The association between deferred taxes and
common stock risk. Journal of Accounting and Public Policy, 16(3):311-333.
Cheng, M.T. & Yun, C. 2006. The application of a quantile regression to the
relationship between debt financing and equity financing by dual-issue cases. The
Journal of American Academy of Business, Cambridge, 8(2):134-137.
Colsen, R.H. 2005. General purpose financial statements. CPA Journal, 75(4):80.
142
Comiskey, E.E. & Mulford, C.W. 2000. Guide to financial reporting and analysis.
1st ed. New York: John Wiley & Sons.
Correia, C., Flynn, D., Uliana, E. & Wormald, M. 2013. Financial management. 7th
ed. Cape Town: Juta & Company.
Creswell, J.W. 2014. Research design: Qualitative, quantitative and mixed method
approaches. California: SAGE Publications, Inc.
Creswell, J.W. 2013. Research design: Qualitative, quantitative and mixed method
approaches. California: SAGE Publications, Inc.
Creswell, J.W. 2012. Qualitative inquiry and research design: Choosing among five
approaches. California: SAGE Publications, Inc.
Crotty, M. 1989. The foundation of social research. Londen: Sage.
Damjibhai, S.D. 2016. Performance measurement through ratio analysis: the case
of Indian Hotel Company Ltd. IUP Journal of Management Research, 15(1):30.
De. A., Bandyopadhyay, G. & Chakraborty, B.N. 2010. Application of factor analysis
on the financial ratios of Indian cement industry and validation of the results by
cluster analysis. In international conference on modeling, optimization, and
computing (ICMOS 20110). AIP Publishing, 1298(1):535-540.
De Villiers, R.R. & Fouché, J.P. 2015. Philosophical paradigms and other
underpinnings of the qualitative and quantitative research methods: An accounting
education perspective. Journal of Social Sciences, 43(2):125-142.
Dilley, P. 2000. Conducting successful interviews: Tips for intrepid research.
Theory Into Practice, 39(3):131-137.
Dobrin, M. 2010. Role of financial statements as management tools to companies
that use and exploit natural resources. Revista Minelor/Mining Revue, 16(5):25-29.
Duhovnik, M. 2008. Improvements of the Cash Flow Statement control function in
Financial Reporting. In Proceedings of Rijeka Faculty of Economics, Journal of
Economics and Business, 26(1):123-150.
143
Entwistle, G. 2015. Reflections on teaching financial statement analysis.
Accounting Education, 24(6):555-558.
Feldstein, M., Green, J. & Sheshinski, E. 1983. Inflation and taxes in a growing
economy with debt and equity finance. In Inflation, Tax Rules, and Capital
Formation, 1(1):44-60.
Feroz, E.H., Kim, S. & Raab, R.L. 2003. Financial statement analysis: A data
envelopment analysis approach. Journal of the Operational Research Society,
54(1):48-58.
Fox, B.H. & Jennings, W.G. 2014. How to write a methodology and results section
for empirical research. Journal of Criminal Justice Education, 25(2):333-344.
Fridson, M. & Alvarez, F. 2002. Financial statement analysis: a practitioner’s guide.
3rd ed. New York: Wiley and Sons.
Gibson, C.H. 2013. Financial statement analysis. 13th ed. Connecticut: South-
Western Cengage Learning.
Givoly, D. 2003. Discussion-the influence of culture and corporate governance on
the characteristics that distinguish superior analysts. Journal of Accounting, Auditing
& Finance, 18(4):619-624.
Givoly, D. & Hayn, C. 1992. The valuation of the deferred tax liability: Evidence
from the stock market. Accounting Review, 67(2):394-410.
Grafton, J., Lillis, A.M. & Mahaama, H. 2011. Mixed methods research in
accounting. Qualitative Research in Accounting and Management, 8(1):5-21.
Griffee, D.T. 2005. Research tips: Interview data collection. Journal of
Developmental Education, 28(3):36-37.
Grossman, S.J. & Hart, O.D. 1982. Corporate financial structure and managerial
incentives. In the economics of information and uncertainty, 82(1):107-140.
Guenther, D.A. & Sansing, R.C. 2000. Valuation of the firm in the presence of
temporary book-tax differences: The role of deferred tax assets and liabilities. The
Accounting Review, 75(1):1-12.
144
Hannabuss, S. 1996. Research interviews. New Library World, 97(5):22-30.
Hathaway, R.S. 1995. Assumptions underlying quantitative and qualitative
research: Implications for institutional research. Research in Higher Education,
36(5):535-562.
Henning, E. 2009. Finding your way in qualitative research. Pretoria: Van Schaik
Publishers.
Huss, H.F. & Zhao, J. 1991. An investigation of alternative treatments of deferred
taxes in bond rates' judgments. Journal of Accounting, Auditing & Finance, 6(1):69-
73.
Ifanda, L.M. and Wulandari, N. 2015. The effect of deferred tax and tax planning
toward earnings management practice: An empirical study on non-manufacturing
companies listed in Indonesia stock exchange in the period of 2008-2012.
International Journal of Organizational Innovation (Online), 8(1):155.
Jesswein, K.R. 2010. The changing LIFO-FIFO dilemma and its importance to the
analysis of financial statements. Academy of Accounting and Financial Studies
Journal, 14(1):53-62.
Jeter, D.C. & Chaney, P.K. 1988. A financial statement analysis approach to
deferred taxes. Accounting Horizons, 2(4):41-49.
Kallet, R.H. 2004. How to write the methods section of a research paper.
Respiratory Care, 49(10):574-1232.
Klumpp, L. & Cole, A. 2016. Are you telling the right story about your liquidity?
Nonprofit world, 34(2):22-24.
Konchitchki, Y. & Patatoukas, P.N. 2013. Taking the pulse of the real economy
using financial statement analysis: Implications for macro forecasting and stock
valuation. The Accounting Review, 89(2):669-694.
Koppeschaar, Z.R., Gaie-Booysen, F.F., Rossouw, J., Papageorgiou, K., Van Wyk,
H.A., Smith, C., Sturdy, J., Van der Merwe, C.M., Deysel, D.J. & Schmulian, A.
2015. Descriptive accounting IFRS focus. 19th ed. Durban: Lexis Nexis.
145
Kumar, C.R. 2008. Research methodology. India, New-Delhi: APH Publishers
Corporation.
Lasman, D.A. & Weil, R.L. 1978. Adjusting the debt-equity ratio. Financial Analysts
Journal, 34(5):49-58.
Laux, R.C. 2013. The association between deferred tax assets and liabilities and
future tax payments. The Accounting Review, 88(4):1357-1383.
Le Roux, F. & Lowies, G.A. 2009. Residential property development and financial
ratio analysis: A South African perspective. Acta Structilia, 16(1):1-31.
Lussier, R.N. 2011. Research methods and statistics for business. Illinois:
Waveland Press, Inc.
Madan, K. 2007. An analysis of the debt-equity structure of leading hotel chains in
India. International Journal of Contemporary Hospitality Management, 19(5):397-
414.
Maricica, M. & Georgeta, V. 2012. Business failure risk analysis using financial
ratios. Procedia-Social and Behavioral Sciences, 62:728-732.
Matthew, A.A., Fada, A.A., Ukonu, I.C. & Adejoh, A.L. 2016. Role of financial ratio
analysis in assessing business performance in the hospitality and tourism
operations. Paper presented at the Academic Conference of Mediterranean
Research and Publications International on Sustainable Development at Abubakar
Tafawa Balewa University Bauchi, Bauchi, Bauchi State, Nigeria, West-Africa, 10
March.
Mertens, D.M. 2014. Research and evaluation in education and psychology:
integrating diversity with quantitative, qualitative and mixed methods. California:
SAGE Publications, Inc.
Mesarić, M. 2014. Ratio analysis and Piotroski scoring system in the automobile
industry in Croatia. Ekonomski Vjesnik/Econviews: Review of Contemporary
Business, Entrepreneurship and Economic issues, 27(1):127-141.
Mouton, J. 2008. How to succeed in your master’s and doctoral studies: A South
African guide and resource book. Pretoria: Van Schaik Publishers.
146
Myers, M.D. 2013. Qualitative research in business & management. 2nd ed.
London: Sage Publications Ltd.
Nissim, D. & Penman, S.H. 2003. Financial statement analysis of leverage and how
it informs about profitability and price-to-book ratios. Review of Accounting Studies,
8(4):531-560.
Nissim, D. & Penman, S.H. 2001. Ratio analysis and equity valuation: From
research to practice. Review of Accounting Studies, 6(1):109-154.
Ou, J.A. & Penman, S.H. 1989. Financial statement analysis and the prediction of
stock returns. Journal of Accounting and Economics, 11(4):295-329.
Palepu, K.G. & Healy, P.M. 2008. Business analysis & valuation: using financial
statements. 4th ed. Mason: Thomson South-Western.
Pellissier, R. 2007. Business research made easy. Cape Town: Juta.
Penman, S.H. 2010. Financial statement analysis and security valuation. 4th ed.
New York: Mc Graw Hill.
Putri, N.K. & Arofah, T. 2013. The impact of risk report formats on investment
analysis decisions: an experimental case from Indonesia. Asian Academy of
Management Journal of Accounting and Finance, 9(1):89-112.
Qu, S.Q. & Dumay, J. 2011. The qualitative research interview. Qualitative
Research in Accounting & Management, 8(3):238-264.
Richardson, J.T.E. 2004. Methodological issues in questionnaire-based research
on student learning in higher education. Educational Psychology Review, 16(4):347-
358.
Rowley, J. 2014. Designing and using research questionnaires. Management
Research Review, 37(3):308-330.
Safania, S., Nagaraju, B. & Roohi, M. 2011. Relationship between long-term debt-
to-equity ratio and share price a study on NSE, INDIA (2007-2010). International
Journal of Business Management & Economic Research, 2(4):278-283.
147
Sansing, R. 1998. Valuing the deferred tax liability. Journal of Accounting
Research, 36(2):357-363.
Samara, A.D. 2014. Assessing the relevance of deferred tax items: Evidence from
loss firms during the financial crisis. The Journal of Economic Asymmetries,
11(1):138-145.
Scotland, J. 2012. Exploring the philosophical underpinnings of research: Relating
ontology and epistemology to the methodology and methods of the scientific,
interpretive, and critical research paradigms. English Language Teaching, 5(9):9-16.
Singh, A.J. & Schmidgall, R.S. 2002. Analysis of financial ratios commonly used by
US lodging financial executives. Journal of Retail & Leisure Property, 2(3):201-213.
Singla, A. 2014. Financial analysis-basis for decision. International Journal of
Computer Science & Management Studies, 14(1):17-19.
Skae, F.O., ed. 2014. Analysis of financial and non-financial information. 7th ed.
Managerial finance. Pietermaritzburg, SA: Interpak books.
Stickney, C.P., Brown, P.R. & Wahlen, J.M. 2007. Financial reporting, financial
statement analysis, and valuation. 7th ed. Mason: Thomson South-Western.
Subramanyam, K.R. & Wild, J.J. 2009. Financial statement analysis. 10th ed. New
York: Mc Graw Hill.
Sundararajan, V. 1985. Debt-Equity ratios of firms and interest rate policy:
Macroeconomic effects of high leverage in developing countries. Staff Papers,
32(3):430-474.
Taub, A.J. 1975. Determinants of the firm's capital structure. The Review of
Economics and Statistics, 57(4):410-416.
Terre Blanche, M., Durrheim, K. & Painter, D. 2006. Research in practice. 2nd ed.
Cape Town: UCT Press.
Trochim, W.M.K. & Donnelly, J.P. 2007. Research methods knowledge base. 3rd
ed. New York: AICPA.
148
Van Auken, H. & Yang, K. 2014. Chinese smes' uses of financial statements in
decision making. Journal of Developmental Entrepreneurship, 19(04):1-16.
Vergoossen, R.G.A. 1994. Accounting changes and the use of financial statements:
A study among investment analysts. European Accounting Review, 5(1):156-159.
Vergoossen, R.G. 1993. The use and perceived importance of annual reports by
investment analysts in the Netherlands. European Accounting Review, 2(2):219-
244.
Walker, M.C., Stowe, J.D. & Moriarity, S. 1979. Decomposition analysis of financial
statements. Journal of Business Finance & Accounting, 6(2):173-186.
Wheeldon, J. & Ahlberg, M. 2012. Visualising social science research: Maps,
methods, and meaning. Thousand Oaks, CA: Sage Publications.
White, G.I., Sondhi, A.C. & Fried, D. 2003. The analysis and use of financial
statements. 3rd ed. New Jersey: Wiley.
Yeh, Q.J. 1996. The application of data envelopment analysis in conjunction with
financial ratios for bank performance evaluation. Journal of the Operational
Research Society, 47(8):980-988.
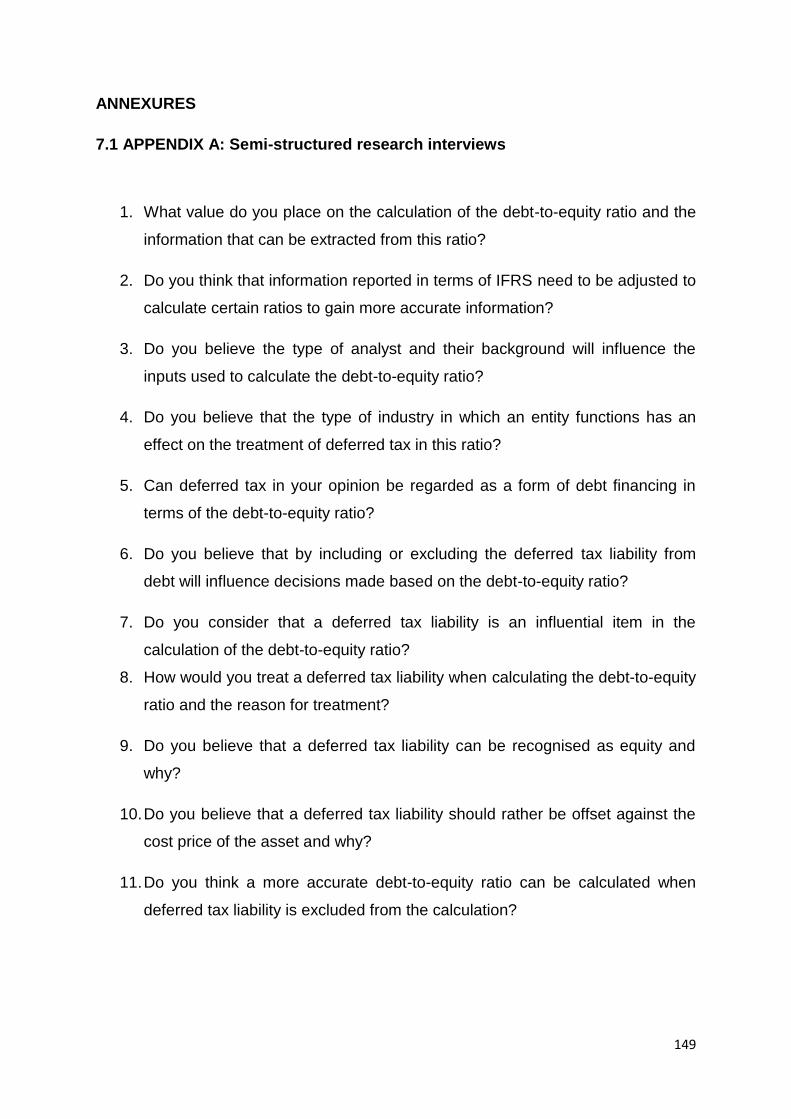
149
ANNEXURES
7.1 APPENDIX A: Semi-structured research interviews
1. What value do you place on the calculation of the debt-to-equity ratio and the
information that can be extracted from this ratio?
2. Do you think that information reported in terms of IFRS need to be adjusted to
calculate certain ratios to gain more accurate information?
3. Do you believe the type of analyst and their background will influence the
inputs used to calculate the debt-to-equity ratio?
4. Do you believe that the type of industry in which an entity functions has an
effect on the treatment of deferred tax in this ratio?
5. Can deferred tax in your opinion be regarded as a form of debt financing in
terms of the debt-to-equity ratio?
6. Do you believe that by including or excluding the deferred tax liability from
debt will influence decisions made based on the debt-to-equity ratio?
7. Do you consider that a deferred tax liability is an influential item in the
calculation of the debt-to-equity ratio?
8. How would you treat a deferred tax liability when calculating the debt-to-equity
ratio and the reason for treatment?
9. Do you believe that a deferred tax liability can be recognised as equity and
why?
10. Do you believe that a deferred tax liability should rather be offset against the
cost price of the asset and why?
11. Do you think a more accurate debt-to-equity ratio can be calculated when
deferred tax liability is excluded from the calculation?