Embed Size (px)
Citation preview
Intrusive large igneous provinces below sedimentary basins:An example from the Exmouth Plateau (NW Australia)
Max Rohrman1,2
Received 13 January 2013; revised 15 July 2013; accepted 16 July 2013.
[1] Large igneous provinces (LIPs) are commonly characterized by extrusion of hugeoutpourings of flood basalts. However, some LIPs associated with thick sedimentary basinsdisplay mainly intrusive sill and dike complexes and a relative absence of extrusives asevidenced on the Exmouth Plateau. Here a breakup-related 150 km × 400 km sill compleximaged on seismic reflection data intruded mainly Triassic sedimentary rocks between theLate Jurassic and the Early Cretaceous. The sill complex is most likely sourced by a mafic oran ultramafic magma chamber, seismically imaged as a high-velocity body (HVB) andcovering ~16 × 104 km2. This magma chamber is located at the base of the crust and did notgenerate extrusives. Simple hydrostatic calculations suggest that melt became verticallyarrested in the basin sediments, primarily owing to a reduction in the magmatic overpressuregradient as a result of the differences between fracture and melt gradients controlled byupward decreasing densities of the basin fill. Furthermore, magma overpressures at thesource between 5 and 20 MPa are required to explain the presence of sill complexes at 4–11km depth, indicating that the HVB is the source of the sill/dike complex on the ExmouthPlateau. The extent and outline of the HVB places constraints on the origin of magmatismand LIP formation. In combination with published data, the results suggest a thermalanomaly (upwelling or plume) source for the observed magmatism.
Citation: Rohrman, M. (2013), Intrusive large igneous provinces below sedimentary basins: An example from theExmouth Plateau (NW Australia), J. Geophys. Res. Solid Earth, 118, doi:10.1002/jgrb.50298.
1. Introduction
[2] Sill complexes consisting of sills and dikes form thenetwork that brings flood basalts to the surface [Ernst et al.,2005], forming part of many large igneous provinces (LIPs)such as volcanic rifted margins, oceanic plateaus, ocean basinflood basalt, and continental flood basalt provinces [Coffinet al., 2006]. However, in sedimentary basins associated withLIPs like volcanic rifted margins, extrusives are sometimeslacking as displayed on seismic reflection data acquired bythe hydrocarbon industry [e.g., Rohrman, 2007].[3] While a majority of research has focused on theories for
the generation of flood basalts, relatively little attention isdedicated to the crustal-scale plumbing network feeding floodbasalts [Cartwright and Hansen, 2006]. Most research studiesaddressing the intrusive network tend to focus on individualintrusions, such as smaller outcrop-scale and laboratory-basedstudies [Polteau et al., 2008; Kavanagh et al., 2006; Galerneet al., 2008], assumed to be representative for larger intruded
regions. The igneous sheet system is of crucial importance,providing constraints on magma chamber dynamics, theamount of magmatic products generated, and, ultimately, theorigin of LIPs.[4] This article targets a 400 km × 150 km NE-SW trending
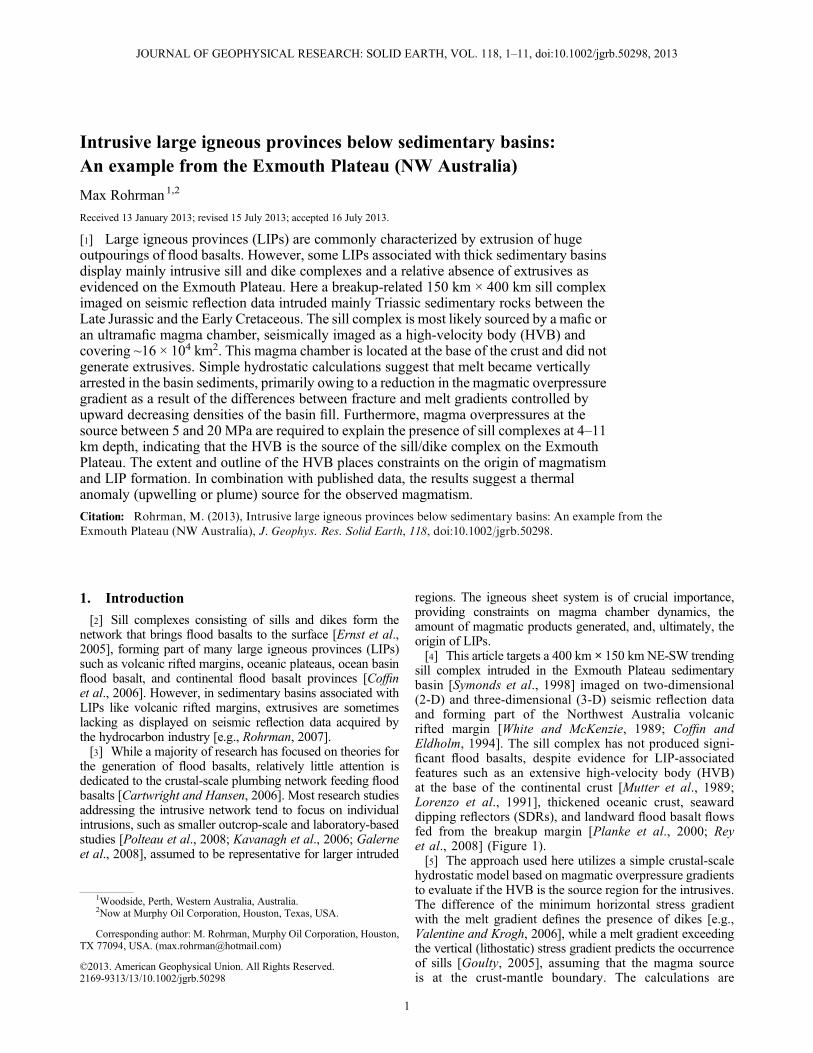
sill complex intruded in the Exmouth Plateau sedimentarybasin [Symonds et al., 1998] imaged on two-dimensional(2-D) and three-dimensional (3-D) seismic reflection dataand forming part of the Northwest Australia volcanicrifted margin [White and McKenzie, 1989; Coffin andEldholm, 1994]. The sill complex has not produced signi-ficant flood basalts, despite evidence for LIP-associatedfeatures such as an extensive high-velocity body (HVB)at the base of the continental crust [Mutter et al., 1989;Lorenzo et al., 1991], thickened oceanic crust, seawarddipping reflectors (SDRs), and landward flood basalt flowsfed from the breakup margin [Planke et al., 2000; Reyet al., 2008] (Figure 1).[5] The approach used here utilizes a simple crustal-scale
hydrostatic model based on magmatic overpressure gradientsto evaluate if the HVB is the source region for the intrusives.The difference of the minimum horizontal stress gradientwith the melt gradient defines the presence of dikes [e.g.,Valentine and Krogh, 2006], while a melt gradient exceedingthe vertical (lithostatic) stress gradient predicts the occurrenceof sills [Goulty, 2005], assuming that the magma sourceis at the crust-mantle boundary. The calculations are
1Woodside, Perth, Western Australia, Australia.2Now at Murphy Oil Corporation, Houston, Texas, USA.
Corresponding author: M. Rohrman, Murphy Oil Corporation, Houston,TX 77094, USA. ([email protected])
©2013. American Geophysical Union. All Rights Reserved.2169-9313/13/10.1002/jgrb.50298
1
JOURNAL OF GEOPHYSICAL RESEARCH: SOLID EARTH, VOL. 118, 1–11, doi:10.1002/jgrb.50298, 2013
constrained by observations of intruding sills and dikes onseismic reflection data over a crustal-scale vertical sectionon the Exmouth Plateau.
2. Geologic Setting
[6] The Exmouth Plateau (Figure 1) off the northwest coastof Australia is a prolific gas-prone sedimentary basin formedas a response to several extension episodes. The earliest ofthese is a poorly defined Late Permian event, to accommo-date deposition of the Triassic Locker Shale Formation andsubsequent thick Mungaroo Formation deltaics consisting
of sand-rich fluvial and/or tidal channels cutting througha matrix of fine-grained silt, shale, and coal-rich deposits(Figure 2). The Mungaroo is Rhaetian to Norian (LateTriassic) in age and reaches a thickness of up to 7 km.Renewed extension took place at the end of the Triassicand the Middle Jurassic, resulting in block faulting ofthe Triassic Mungaroo Formation and deeper section(Figure 2) [Driscoll and Karner, 1998; Frey et al., 1998],followed by limited deposition toward the Late Jurassic.Extension continued in the Exmouth Sub-basin (ESB),where a graben developed in the Early Jurassic [Mihut andMüller, 1998]. During the Callovian, a major unconformitysignaled the end of a major extension and the onset of athermal sag phase on the Exmouth Plateau, with sedimenta-tion continuing in mini basins derived from eroding tiltedfault blocks. Most models prefer an Early Cretaceous timingof breakup [Hopper et al., 1992; Frey et al., 1998; Mihutand Müller, 1998; Robb et al., 2005; Hall, 2012; Gibbonset al., 2012], although a Late Jurassic breakup [Heine andMüller, 2005] has been suggested. Prior to the magmaticevent, the region experienced anomalously low subsidencefollowed by an increase of subsidence and depositionof the deltaic Barrow Group during the Berriasianand the Valanginian [Driscoll and Karner, 1998]. In theValanginian, a major breakup unconformity was generatedthat is more pronounced toward the shelf in the east, gene-rating significant erosion in the south and the east.[7] Breakup was largely contemporaneous with magmatic
sills and dikes intruding the Mungaroo and younger forma-tions between the Late Jurassic and the Early Cretaceous[Symonds et al., 1998] and extrusion of SDRs and flood basaltsfrom the Gascoyne margin rift axis [Rey et al., 2008](Figure 2). Evidence from the Yardie East 1 well (Figure 1)on the Exmouth Peninsula classifies the sills as doleritesintruding Middle Jurassic and older sediments, whereas theflood basalts have not been sampled directly and areinterpreted from seismic characteristics [Rey et al., 2008].Many sills are eroded by the Valanginian unconformity asevidenced by seismic data in the ESB [Mihut and Müller,1998], placing an upper limit on the age of the intrusives.Mutter et al. [1989] identified a high-velocity body (HVB)from wide-angle ESP (expanding spread profile) velocities,
B
100 km COB
Gascoyne Abyssal
plain
N
YE1 22
20
18
Cuviermargin
112 115
?
E5
OBS2
OBS7
Ju
A
?
flood basalt
SDR
sill complex
selected wells
HVB
3D cube
ESP locations
Jupiter-1 well
OBS locations
COBbathymetryseismic line
EPC
D
WP
JR
CAP
Figure 1. Map of the Exmouth Plateau, modified from Reyet al. [2008] and Mihut and Müller [1998]. EP: ExmouthPlateau, ESB: Exmouth Sub-basin, JR: Joey Rise, WP:Wallaby Plateau, CAP: Cuvier Abyssal Plain, SDR:Seaward Dipping Reflector series, HVB: High-VelocityBody, COB: Continent Ocean Boundary, YE1: Yardie East1 well. Bathymetry is denoted in kilometers. CRFZ: CapeRange Fault Zone. ESP locations from Mutter et al. [1989].OBS locations from Fomin et al. [2000].
10
15
20
kmapp. paleo seabed
HVBmantle
lower crust
NW SE
Mungaroo Fm
sill/dike 40 km
Isolated sill
?
5
basalt/SDRs
COB
Interconnected sills
Ju
Barrow Gp
Figure 4,6
Figure 3, 8
Figure 5
Locker Fm (?)
Isolated sill Sills ?
A B
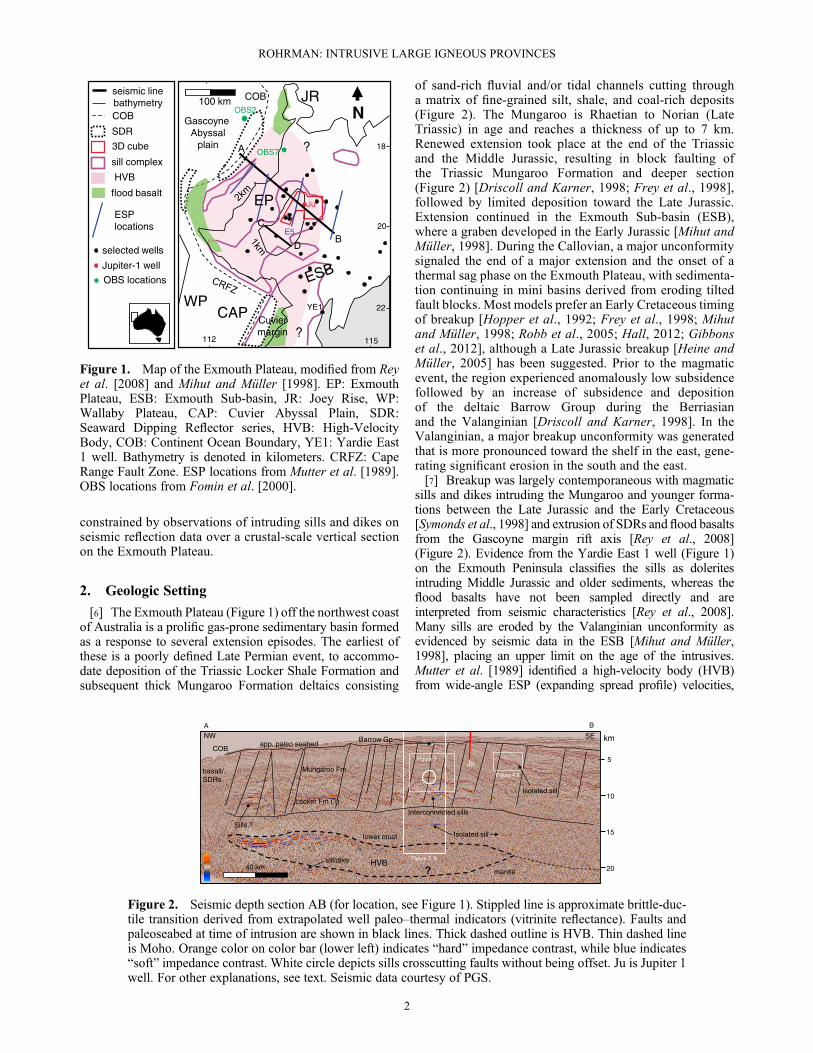
Figure 2. Seismic depth section AB (for location, see Figure 1). Stippled line is approximate brittle-duc-tile transition derived from extrapolated well paleo–thermal indicators (vitrinite reflectance). Faults andpaleoseabed at time of intrusion are shown in black lines. Thick dashed outline is HVB. Thin dashed lineis Moho. Orange color on color bar (lower left) indicates “hard” impedance contrast, while blue indicates“soft” impedance contrast. White circle depicts sills crosscutting faults without being offset. Ju is Jupiter 1well. For other explanations, see text. Seismic data courtesy of PGS.
ROHRMAN: INTRUSIVE LARGE IGNEOUS PROVINCES
2
interpreted as underplated magmatic material at the base of thecrust [Hopper et al., 1992] at 15–18 km depth [Frey et al.,1998], presumed to be of similar age as sill/dike intrusion.[8] Finally, the area experienced postrift sedimentation
and subsidence throughout the Cretaceous and the Tertiarywhile affected by a major Campanian inversion event andNeogene compression as a result of plate reorganization[Longley et al., 2002].
3. Seismic Interpretation
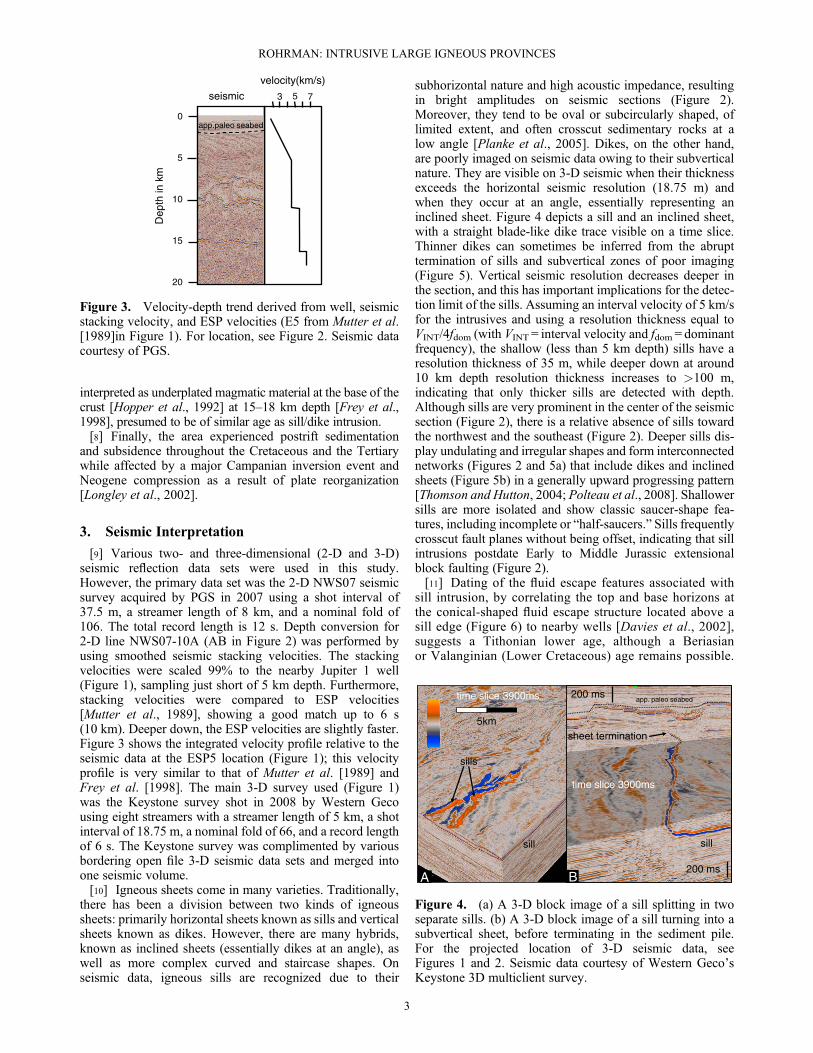
[9] Various two- and three-dimensional (2-D and 3-D)seismic reflection data sets were used in this study.However, the primary data set was the 2-D NWS07 seismicsurvey acquired by PGS in 2007 using a shot interval of37.5 m, a streamer length of 8 km, and a nominal fold of106. The total record length is 12 s. Depth conversion for2-D line NWS07-10A (AB in Figure 2) was performed byusing smoothed seismic stacking velocities. The stackingvelocities were scaled 99% to the nearby Jupiter 1 well(Figure 1), sampling just short of 5 km depth. Furthermore,stacking velocities were compared to ESP velocities[Mutter et al., 1989], showing a good match up to 6 s(10 km). Deeper down, the ESP velocities are slightly faster.Figure 3 shows the integrated velocity profile relative to theseismic data at the ESP5 location (Figure 1); this velocityprofile is very similar to that of Mutter et al. [1989] andFrey et al. [1998]. The main 3-D survey used (Figure 1)was the Keystone survey shot in 2008 by Western Gecousing eight streamers with a streamer length of 5 km, a shotinterval of 18.75 m, a nominal fold of 66, and a record lengthof 6 s. The Keystone survey was complimented by variousbordering open file 3-D seismic data sets and merged intoone seismic volume.[10] Igneous sheets come in many varieties. Traditionally,
there has been a division between two kinds of igneoussheets: primarily horizontal sheets known as sills and verticalsheets known as dikes. However, there are many hybrids,known as inclined sheets (essentially dikes at an angle), aswell as more complex curved and staircase shapes. Onseismic data, igneous sills are recognized due to their
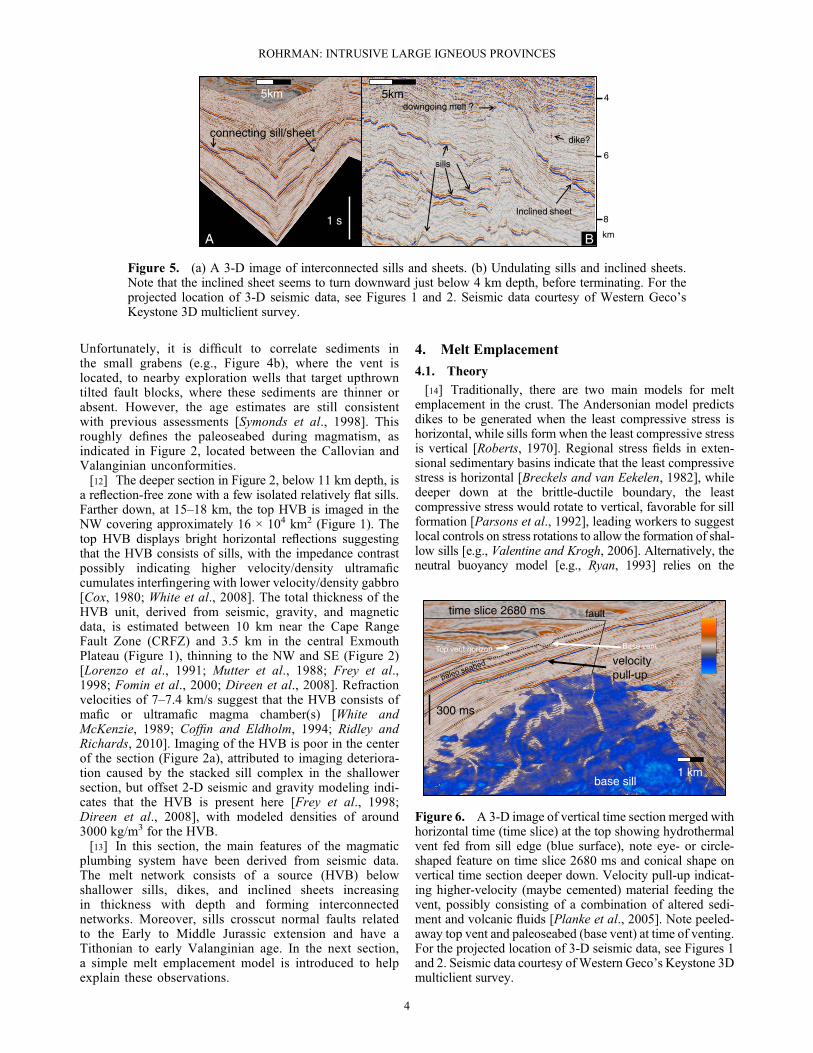
subhorizontal nature and high acoustic impedance, resultingin bright amplitudes on seismic sections (Figure 2).Moreover, they tend to be oval or subcircularly shaped, oflimited extent, and often crosscut sedimentary rocks at alow angle [Planke et al., 2005]. Dikes, on the other hand,are poorly imaged on seismic data owing to their subverticalnature. They are visible on 3-D seismic when their thicknessexceeds the horizontal seismic resolution (18.75 m) andwhen they occur at an angle, essentially representing aninclined sheet. Figure 4 depicts a sill and an inclined sheet,with a straight blade-like dike trace visible on a time slice.Thinner dikes can sometimes be inferred from the abrupttermination of sills and subvertical zones of poor imaging(Figure 5). Vertical seismic resolution decreases deeper inthe section, and this has important implications for the detec-tion limit of the sills. Assuming an interval velocity of 5 km/sfor the intrusives and using a resolution thickness equal toVINT/4fdom (with VINT = interval velocity and fdom = dominantfrequency), the shallow (less than 5 km depth) sills have aresolution thickness of 35 m, while deeper down at around10 km depth resolution thickness increases to >100 m,indicating that only thicker sills are detected with depth.Although sills are very prominent in the center of the seismicsection (Figure 2), there is a relative absence of sills towardthe northwest and the southeast (Figure 2). Deeper sills dis-play undulating and irregular shapes and form interconnectednetworks (Figures 2 and 5a) that include dikes and inclinedsheets (Figure 5b) in a generally upward progressing pattern[Thomson and Hutton, 2004; Polteau et al., 2008]. Shallowersills are more isolated and show classic saucer-shape fea-tures, including incomplete or “half-saucers.” Sills frequentlycrosscut fault planes without being offset, indicating that sillintrusions postdate Early to Middle Jurassic extensionalblock faulting (Figure 2).[11] Dating of the fluid escape features associated with
sill intrusion, by correlating the top and base horizons atthe conical-shaped fluid escape structure located above asill edge (Figure 6) to nearby wells [Davies et al., 2002],suggests a Tithonian lower age, although a Beriasianor Valanginian (Lower Cretaceous) age remains possible.
Dep
th in
km
5
10
15
20
0app.paleo seabed
seismic
velocity(km/s)
53 7
Figure 3. Velocity-depth trend derived from well, seismicstacking velocity, and ESP velocities (E5 from Mutter et al.[1989]in Figure 1). For location, see Figure 2. Seismic datacourtesy of PGS.
5km
sills
sill
time slice 3900ms
A200 ms
sheet termination
time slice 3900ms
B
200 ms
sill
app. paleo seabed
Figure 4. (a) A 3-D block image of a sill splitting in twoseparate sills. (b) A 3-D block image of a sill turning into asubvertical sheet, before terminating in the sediment pile.For the projected location of 3-D seismic data, seeFigures 1 and 2. Seismic data courtesy of Western Geco’sKeystone 3D multiclient survey.
ROHRMAN: INTRUSIVE LARGE IGNEOUS PROVINCES
3
Unfortunately, it is difficult to correlate sediments inthe small grabens (e.g., Figure 4b), where the vent islocated, to nearby exploration wells that target upthrowntilted fault blocks, where these sediments are thinner orabsent. However, the age estimates are still consistentwith previous assessments [Symonds et al., 1998]. Thisroughly defines the paleoseabed during magmatism, asindicated in Figure 2, located between the Callovian andValanginian unconformities.[12] The deeper section in Figure 2, below 11 km depth, is
a reflection-free zone with a few isolated relatively flat sills.Farther down, at 15–18 km, the top HVB is imaged in theNW covering approximately 16 × 104 km2 (Figure 1). Thetop HVB displays bright horizontal reflections suggestingthat the HVB consists of sills, with the impedance contrastpossibly indicating higher velocity/density ultramaficcumulates interfingering with lower velocity/density gabbro[Cox, 1980; White et al., 2008]. The total thickness of theHVB unit, derived from seismic, gravity, and magneticdata, is estimated between 10 km near the Cape RangeFault Zone (CRFZ) and 3.5 km in the central ExmouthPlateau (Figure 1), thinning to the NW and SE (Figure 2)[Lorenzo et al., 1991; Mutter et al., 1988; Frey et al.,1998; Fomin et al., 2000; Direen et al., 2008]. Refractionvelocities of 7–7.4 km/s suggest that the HVB consists ofmafic or ultramafic magma chamber(s) [White andMcKenzie, 1989; Coffin and Eldholm, 1994; Ridley andRichards, 2010]. Imaging of the HVB is poor in the centerof the section (Figure 2a), attributed to imaging deteriora-tion caused by the stacked sill complex in the shallowersection, but offset 2-D seismic and gravity modeling indi-cates that the HVB is present here [Frey et al., 1998;Direen et al., 2008], with modeled densities of around3000 kg/m3 for the HVB.[13] In this section, the main features of the magmatic
plumbing system have been derived from seismic data.The melt network consists of a source (HVB) belowshallower sills, dikes, and inclined sheets increasingin thickness with depth and forming interconnectednetworks. Moreover, sills crosscut normal faults relatedto the Early to Middle Jurassic extension and have aTithonian to early Valanginian age. In the next section,a simple melt emplacement model is introduced to helpexplain these observations.
4. Melt Emplacement
4.1. Theory
[14] Traditionally, there are two main models for meltemplacement in the crust. The Andersonian model predictsdikes to be generated when the least compressive stress ishorizontal, while sills form when the least compressive stressis vertical [Roberts, 1970]. Regional stress fields in exten-sional sedimentary basins indicate that the least compressivestress is horizontal [Breckels and van Eekelen, 1982], whiledeeper down at the brittle-ductile boundary, the leastcompressive stress would rotate to vertical, favorable for sillformation [Parsons et al., 1992], leading workers to suggestlocal controls on stress rotations to allow the formation of shal-low sills [e.g., Valentine and Krogh, 2006]. Alternatively, theneutral buoyancy model [e.g., Ryan, 1993] relies on the
1 s
5kmdowngoing melt ?
BA
Inclined sheet
sills
connecting sill/sheetdike?
5km 4
6
8
km
Figure 5. (a) A 3-D image of interconnected sills and sheets. (b) Undulating sills and inclined sheets.Note that the inclined sheet seems to turn downward just below 4 km depth, before terminating. For theprojected location of 3-D seismic data, see Figures 1 and 2. Seismic data courtesy of Western Geco’sKeystone 3D multiclient survey.
300 ms
1 km
Base vent
velocity pull-up
base sill
time slice 2680 ms fault
Top vent horizon
Figure 6. A 3-D image of vertical time section merged withhorizontal time (time slice) at the top showing hydrothermalvent fed from sill edge (blue surface), note eye- or circle-shaped feature on time slice 2680 ms and conical shape onvertical time section deeper down. Velocity pull-up indicat-ing higher-velocity (maybe cemented) material feeding thevent, possibly consisting of a combination of altered sedi-ment and volcanic fluids [Planke et al., 2005]. Note peeled-away top vent and paleoseabed (base vent) at time of venting.For the projected location of 3-D seismic data, see Figures 1and 2. Seismic data courtesy ofWestern Geco’s Keystone 3Dmulticlient survey.
ROHRMAN: INTRUSIVE LARGE IGNEOUS PROVINCES
4
density differences of host rock and intruding dikes, formingsills and stalling melt where the density of the host rocks equalsthe melt. The latter model seems hard to justify where higherdensity melts clearly intrude lower density sediments asobserved on 3-D seismic data [e.g., Thomson and Hutton,2004; Thomson, 2007; Rohrman, 2007] and outcrop [e.g.,Francis, 1982]. During the last decade, alternatives to the twotraditional models have been proposed, focusing on the quanti-tative formation of saucer-shaped sills [Malthe-Sørensen et al.,2004], experimental studies assessing rigidity contrasts of thehost rock [Kavanagh et al., 2006], as well as more qualitativestudies, addressing the influence of water-rich, high-porosityhost rock sediments on intruding magma [Thomson, 2007;Schofield et al., 2012].[15] It is important to keep in mind that the division of
dikes and sills is an artificial one, based on the limited extentsof outcrops and the discussion in the previous section. Theapproach used here is that dikes and sills are part of the samemelt system migrating upward from a source, trying to reachthe free surface, as depicted in Figure 2. I will use a simplecrustal-scale hydrostatic model for dikes [Lister and Kerr,1991; Rubin, 1995; Smallwood and Maresh, 2002] to eval-uate why ascending melt becomes arrested in a sedimentarybasin while incorporating the presence of sills in the model.Moreover, melt supply is taken as continuous for flood basaltprovinces [Menand and Tait, 2002], as evidenced by recog-nition of multiple magma batches in sills [e.g., Puffer et al.,2009], crystallization times of <1000 years for dolerites[Holness et al., 2012], and the geologically short durationof LIPs [e.g., Coffin and Eldholm, 1994].[16] The present model depends on the differences
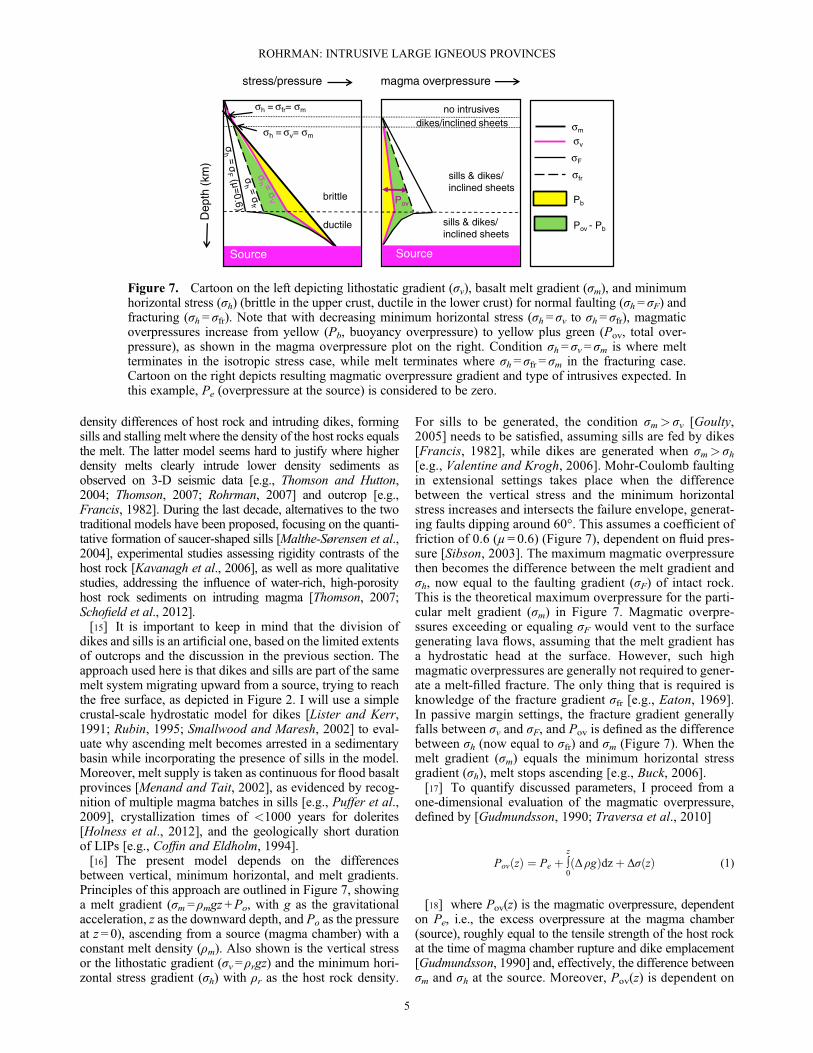
between vertical, minimum horizontal, and melt gradients.Principles of this approach are outlined in Figure 7, showinga melt gradient (σm = ρmgz +Po, with g as the gravitationalacceleration, z as the downward depth, and Po as the pressureat z = 0), ascending from a source (magma chamber) with aconstant melt density (ρm). Also shown is the vertical stressor the lithostatic gradient (σv = ρrgz) and the minimum hori-zontal stress gradient (σh) with ρr as the host rock density.
For sills to be generated, the condition σm> σv [Goulty,2005] needs to be satisfied, assuming sills are fed by dikes[Francis, 1982], while dikes are generated when σm> σh[e.g., Valentine and Krogh, 2006]. Mohr-Coulomb faultingin extensional settings takes place when the differencebetween the vertical stress and the minimum horizontalstress increases and intersects the failure envelope, generat-ing faults dipping around 60°. This assumes a coefficient offriction of 0.6 (μ= 0.6) (Figure 7), dependent on fluid pres-sure [Sibson, 2003]. The maximum magmatic overpressurethen becomes the difference between the melt gradient andσh, now equal to the faulting gradient (σF) of intact rock.This is the theoretical maximum overpressure for the parti-cular melt gradient (σm) in Figure 7. Magmatic overpre-ssures exceeding or equaling σF would vent to the surfacegenerating lava flows, assuming that the melt gradient hasa hydrostatic head at the surface. However, such highmagmatic overpressures are generally not required to gener-ate a melt-filled fracture. The only thing that is required isknowledge of the fracture gradient σfr [e.g., Eaton, 1969].In passive margin settings, the fracture gradient generallyfalls between σv and σF, and Pov is defined as the differencebetween σh (now equal to σfr) and σm (Figure 7). When themelt gradient (σm) equals the minimum horizontal stressgradient (σh), melt stops ascending [e.g., Buck, 2006].[17] To quantify discussed parameters, I proceed from a
one-dimensional evaluation of the magmatic overpressure,defined by [Gudmundsson, 1990; Traversa et al., 2010]
Pov zð Þ ¼ Pe þ ∫z
0Δ ρgð Þdzþ Δσ zð Þ (1)
[18] where Pov(z) is the magmatic overpressure, dependenton Pe, i.e., the excess overpressure at the magma chamber(source), roughly equal to the tensile strength of the host rockat the time of magma chamber rupture and dike emplacement[Gudmundsson, 1990] and, effectively, the difference betweenσm and σh at the source. Moreover, Pov(z) is dependent on
Dep
th (
km)
stress/pressure
brittle
ductile
σh = σfr= σm
SourceSource
P
sills & dikes/inclined sheets
dikes/inclined sheetsno intrusives
magma overpressure
sills & dikes/inclined sheets
σh = σv= σmσm
σv
Pb
Pov - Pb
σF
Source
σfr
Figure 7. Cartoon on the left depicting lithostatic gradient (σv), basalt melt gradient (σm), and minimumhorizontal stress (σh) (brittle in the upper crust, ductile in the lower crust) for normal faulting (σh = σF) andfracturing (σh = σfr). Note that with decreasing minimum horizontal stress (σh = σv to σh = σfr), magmaticoverpressures increase from yellow (Pb, buoyancy overpressure) to yellow plus green (Pov, total over-pressure), as shown in the magma overpressure plot on the right. Condition σh = σv = σm is where meltterminates in the isotropic stress case, while melt terminates where σh = σfr = σm in the fracturing case.Cartoon on the right depicts resulting magmatic overpressure gradient and type of intrusives expected. Inthis example, Pe (overpressure at the source) is considered to be zero.
ROHRMAN: INTRUSIVE LARGE IGNEOUS PROVINCES
5
the buoyancy pressure Pb (Figure 7) integrated upwardover depth z with z = 0 at the source, Δρ= ρr – ρm, and gis the gravitational acceleration. Finally, Pov(z) is alsodependent on stress changes (Δσ(z)). This is taken as thedifference between the principal stresses σ1 and σ3 at thecrustal depth where the dike is measured [Gudmundsson,2002] and generally translates in the difference betweenthe vertical stress (σv) and the minimum horizontal stress(σh). Laboratory studies stress the importance of viscouspressure drop [e.g., Lister and Kerr, 1991; Traversaet al., 2010] in equation (1). However, viscous pressuredrop is poorly defined in nature and is assumed to benegligible in this study.[19] Seismic dike thickness measurements in the brittle
domain are used to constrain the model, modified fromPhilpotts [1990] as follows:
Pov zð Þs ≈WmρrV
2p
2:25L≈
WmEd
2 1� ν2ð ÞL (2)
withW as the dike thickness, Vp as the P wave velocity of thehost rock, and L as the horizontal length of the dike. Equation(2) uses a Poisson ratio (ν) of 0.25 and a Vp/Vs ratio between1.5 and 2. The term ρrVp
2 is roughly equal to the dynamicYoung’s modulus (Ed), depending on the Vp/Vs ratio, whilefor dike and sill emplacement, the static Young’s modulus(Es=mEd) should be used, with a conversion factor m. Ed isgenerally 2–3 times Es, but it can be up to a factor of 10[Gudmundsson, 1990].[20] Deeper in the crust, ductile fracturing is the dominant
process [Weinberg and Regenauer-Lieb, 2010], and powerlaw creep takes over from brittle deformation, effectivelychanging the minimum horizontal stress (σh) closer or equalto the vertical stress (σv) [Rubin, 1995] (Figure 7). Equation
(1) should be substituted by equation (3) at the brittle-ductileboundary (BD) and can be rewritten as
Pov zð Þ ¼ σm � ΔσBD zð Þ (3)
where ΔσBD(z) is the minimum horizontal stress at and belowthe brittle-ductile transition modified from Turcotte andSchubert [2002] and Qin and Buck [2008] as follows:
ΔσBD zð Þ ¼ ρ1gBDþ ρ2g z� BDð Þ
� ρ1gz� σhð Þ z¼BDj ·εAp
� �1=n
expEp
nR T zð Þ � T tð Þð Þ� �
(4)
with z ≥BD; ρ1 and ρ2 are the host rock densities above andbelow the brittle-ductile boundary, respectively; ε is thestrain rate; Ap is the lithology-dependent constant; n is thelithology-dependent power; Ep is the lithology-dependent ac-tivation energy; R is the gas constant; and T(t) is the referencetemperature at the brittle-ductile boundary with T(z) ≥ T(t).Temperature is assumed to increase linearly with depth. Pe
in equation (3) is the difference between σm and ΔσBD(z) atthe source. In the next section, aforementioned theory isapplied to the Exmouth Plateau intrusive system.
4.2. Application to the Exmouth Plateau
[21] The sediment density log from the Jupiter 1 well is usedto build a one-dimensional model on the Exmouth Plateau atthe time of magmatism. The densities define an almost lineartrend from seabed to about 4.7 km depth, independent fromthe age of the formations. Therefore, a simple density relation-ship with depth, defined as ρr=0.15z+1900, was used tobackstrip [e.g., van Hinte, 1978] the sedimentary section tothe time of magmatism, with z=0 at the water bottom. Thebackstripped (depth-stretched) seismic section and the
Dep
th in
km
Magma overpressure (MPa)
15 30
5
10
15
20
0 paleo seabed
45seismic
density(kg/m3)
2600
3000
200060 75
increasing ε
brittle/ductile transition (higher ε)
main sill zone
isotropic σh=σV
brittle: σh=0.8σV
ductile
ductile (higher ε)
brittle/ductile transition
data box
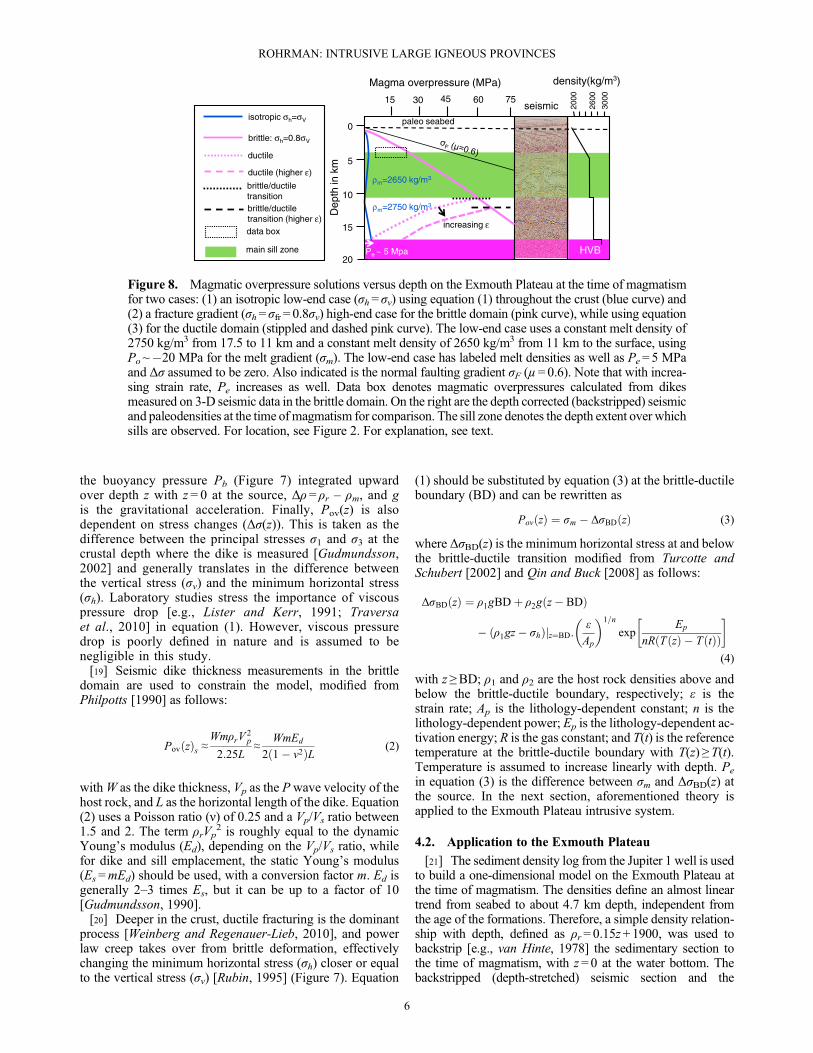
Figure 8. Magmatic overpressure solutions versus depth on the Exmouth Plateau at the time of magmatismfor two cases: (1) an isotropic low-end case (σh= σv) using equation (1) throughout the crust (blue curve) and(2) a fracture gradient (σh= σfr = 0.8σv) high-end case for the brittle domain (pink curve), while using equation(3) for the ductile domain (stippled and dashed pink curve). The low-end case uses a constant melt density of2750 kg/m3 from 17.5 to 11 km and a constant melt density of 2650 kg/m3 from 11 km to the surface, usingPo~�20 MPa for the melt gradient (σm). The low-end case has labeled melt densities as well as Pe=5 MPaand Δσ assumed to be zero. Also indicated is the normal faulting gradient σF (μ =0.6). Note that with increa-sing strain rate, Pe increases as well. Data box denotes magmatic overpressures calculated from dikesmeasured on 3-D seismic data in the brittle domain. On the right are the depth corrected (backstripped) seismicand paleodensities at the time of magmatism for comparison. The sill zone denotes the depth extent over whichsills are observed. For location, see Figure 2. For explanation, see text.
ROHRMAN: INTRUSIVE LARGE IGNEOUS PROVINCES
6
density-depth relationship are displayed in Figure 8. Using thisapproach, the effect of porosity in sediments on melt ascent isincorporated since density decreases proportionally withincreasing porosity in the Jupiter 1 well. Note that this relation-ship is only valid for the upper 4.7 km of the section. Below4.7 km depth, the velocity-depth function in Figure 3 wasconverted to density using the relationship of Brocher[2005]. Backstripping thickens sediments [e.g., van Hinte,1978], and in the case of the Exmouth Plateau, the shallow sed-iments at the time of magmatism expanded by about 400 m,thereby decreasing water depth. This means that paleo–waterdepth at the time of magmatism must have been around400 m less than the current water depth of around 900 m andassumes that tectonic and flexural subsidence are negligible.The density-depth relationship was therefore downshifted500 m, consistent with paleobathymetry derived frombiostratigraphy.[22] Visual inspection on the location of the sills in
Figure 2 indicates that most sills are between 5 and 11 kmdepth at the level where the paleo–host rock density is around2600 kg/m3 (Figure 8, green level).[23] To evaluate melt ascent on the Exmouth Plateau, we
first need some boundary conditions. From Figure 2, weknow that the minimum horizontal stress (σh) must have beenin a NW-SE direction from the orientation of the faults at thetime of breakup. Moreover, Figure 2 also indicates that thedifferential stress was large enough to initiate normalfaulting, and therefore, σh was close to the normal faultinggradient as evidenced by Jurassic block faulting. However,the relative lack of normal faulting after the Jurassic blockfaulting event indicates that the minimum horizontal stresssignificantly increased over the Exmouth Plateau in theLate Jurassic and the Early Cretaceous. A maximum stresscondition at magmatism is given by an absence of reversefaulting (Figure 2), when the minimum horizontal stress ishigher than the vertical stress (σh> σv). In extensionalsedimentary basins, the regional minimum horizontal stressis always lower than the vertical stress (σh< σv) [Breckelsand van Eekelen, 1982]. Therefore, minimum horizontalstress conditions at the time of intrusion must have beensomewhere between isotropic (σh = σv) and normal faulting(μ = 0.6) (Figure 8) to facilitate hydraulic fracturing.Overpressures above the normal faulting gradient (Figure 8)are unlikely as they would lead to extrusion [Valentine andKrogh, 2006], not observed on seismic data.[24] Two end-member scenarios were run. The first one
(blue curve in Figure 8) is essentially a buoyancy-case isotro-pic (σh= σv) scenario using equation (1) throughout the crust,assuming that basalt melt densities in the crust vary between2600 and 2800 kg/m3 [Ryan, 1993]. Melt density quite likelychanges with depth, becoming more buoyant on ascent as aresult of compressibility of the melt and exsolution of volatilephases [e.g., Karlstrom and Richards, 2011]. The key obser-vation in the modeling is that σm> σv in the sill zone(Figure 8) with melt densities and gradients matched to cal-culate the sill configuration in Figure 8. Results indicate thatmelts with a constant density of 2600 kg/m3 do not generatethe right depth extent over which sills are observed on seis-mic (Figures 2 and 3). By increasing source overpressures(Pe), these melts vent to the surface, again in contrastwith the observations. However, when a melt density of2650 kg/m3 is used for the upper section (12 km seabed), a
good fit with the upper sill zone (4–11 km) is obtained.Deeper down at 11–12 km depth, the brittle-ductile boundaryis encountered, characterized by an apparent reduction in theamount of sills observed on seismic (Figure 8), althoughthere is one prominent sill deeper down at 15 km. Themagmatic overpressures required to generate sills are verysubtle and are limited to less than 5 MPa throughout theupper crust. However, higher melt densities in the lower crust[Hogan et al., 1998] are required to prevent melt fromstalling deeper in the section. In the isotropic case, equation(1) is used in the lower crust with a melt density of2750 kg/m3 and a Pe in excess of ~5 MPa to match the sillat 15 km. Higher melt densities are theoretically possiblebut would require a higher Pe. The isotropic case (σh= σv)assumes little strength of rocks and therefore represents aminimum case (Figure 8). However, it is more likely thatrocks do have some strength and can be approximated by ahigh-end case fracture gradient equal to σh = 0.8σv (pinkcurve in Figure 8) in the brittle domain using equation (1).Deeper down at the brittle-ductile transition, ductile behaviorwill take over as indicated by pink stippled and dashed curvesin Figure 8. This brittle-ductile hybrid curve defines thesecond case scenario.[25] Extrapolated well-derived paleotemperature (vitrinite
reflectance) data suggest that the brittle-ductile transition,estimated at ~300°C, was at a similar depth at breakup timecompared to present. This indicates that the brittle-ductileboundary depth has remained relatively unchanged overtime since the magmatic event and that the maximumoverpressures at the brittle ductile boundary would be around60 MPa for the σh= 0.8σv fracture gradient.[26] Extension models for the Exmouth Plateau assume
depth-dependent stretching, with stretching factors beingabout twice as high in the lower crust [Driscoll and Karner,1998; Frey et al., 1998] to match the current structural con-figuration, while crustal deformation strain rates remain at10�14–10�15 s�1. Moreover, the Jurassic extension phasespredate magmatism by 20–50 Ma, with most control on thebrittle-ductile boundary at the time of magmatism comingfrom the underplating process. Underplating will increasethe temperature and move the brittle-ductile boundaryshallower, but is dependent on the thickness of the underplate[e.g., McKenzie and Jackson, 2002] and the mode of em-placement, being either instantaneous or noninstantaneous(batched) [Annen, 2011]. This is counteracted by an increasein strain rate up to 10�8 s�1 as a result of intrusion of melt[Fournier, 1999], moving the brittle-ductile transition todeeper depths (Figure 8). Hence, magmatic overpressures atthe source (Pe) are now dependent on the melt gradient, thechoice of lithology (including dry or wet) assumed for thelower crust, the temperature at the brittle-ductile boundary,the temperature gradient, and the strain rate.[27] Higher temperature gradients will generally reduce
the overpressures, while increasing strain rates increaseoverpressures. However, using the constraint (σm> σv) topredict the presence of the sill at 15 km depth implies thatPe> 0 and is most likely between 5 and 20 MPa dependingon stress/strain conditions. These estimates conform withlaboratory tensile strength measurements of basement rocks[Etheridge, 1983] and field studies [Handy and Streit, 1999].[28] It is important to stress that magmatism is very fast
relative to extension-related crustal deformation. This
ROHRMAN: INTRUSIVE LARGE IGNEOUS PROVINCES
7
implies that the magmatic overpressure conditions forintruding melt, as depicted in Figure 8, must have fairlyshort geological timescales.[29] Both end-member scenarios depicted in Figure 8 sug-
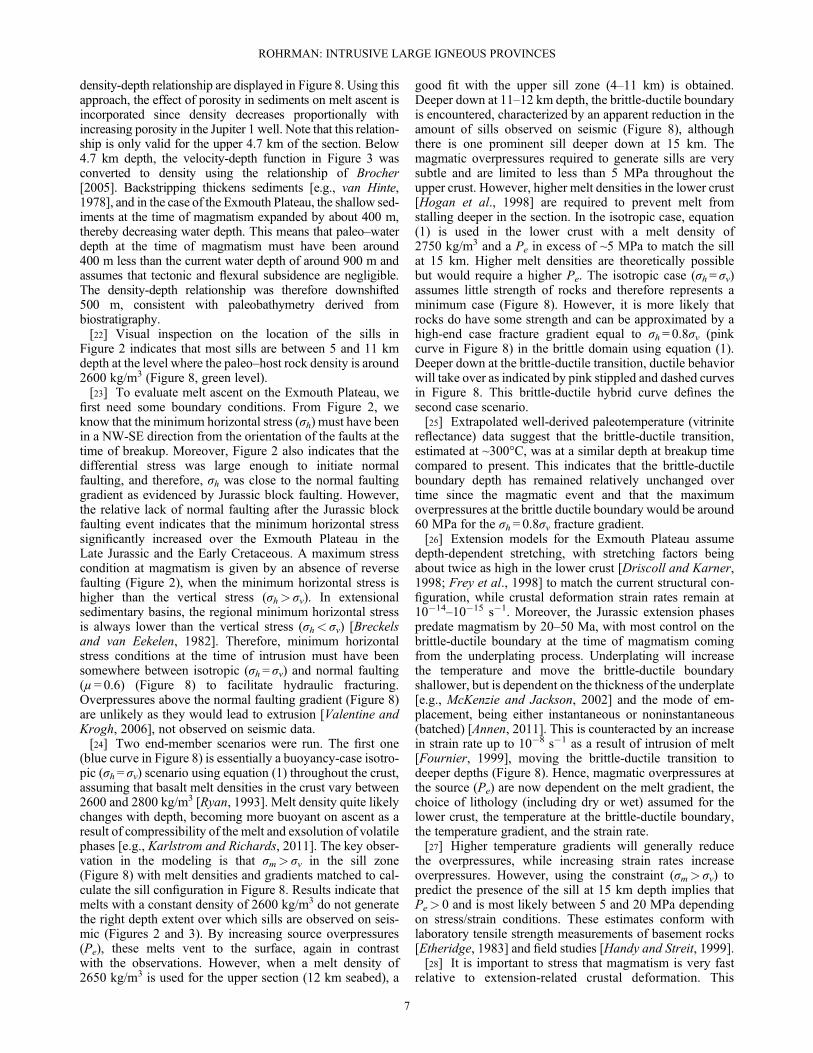
gest that melt can reach quite close to the normal faulting gra-dient at shallow depths (upper 2 km). This is observed inFigure 9, where the Callovian unconformity and overlyingsediments show evidence of late-stage faulting. Deeper downin the brittle domain, magma-tectonism is not expected sincethe faulting gradient is not exceeded and the melt follows afracture gradient.[30] Several dikes were measured between 3 and 6 km depth
on 3-D seismic data, although some might represent inclinedsheets. Visible dike thicknesses are estimated at 20–40 m,while horizontal dike lengths vary from 13 to 18 km. The dataare depicted in Figure 8 in the data box, using equation (2) withan average Vp=4000 m/s from Figure 3 and an Ed/Es ratio of2 (m=0.5). Seismic resolution can only resolve dikes ofaround 20 m and up. Information from outcrop studiesindicates that dike thicknesses at rift zones are generallyaround 1–7 m, with thicker dikes anticipated to be sourcedby deeper magma chambers [Klausen, 2006; Ray et al.,2007]. Unfortunately, dike measurement data plot roughly be-tween isotropic and the σh=0.8σv fracture gradient (Figure 8),yielding no particular information on the exact overpressurevalues at the time of intrusion, with additional uncertainty onthe Ed/Es ratio. Moreover, dikes with thicknesses >30 m arequite likely affected by other mechanisms than elastic defor-mation, such as thermal erosion [Fialko and Rubin, 1999].However, the data do suggest that modeled scenarios capturethe range of possible magmatic overpressure solutions.
5. Results and Discussion
[31] This study proposes that sedimentary basin fill is themost important control on predicting if flood basalts make
it to the surface. A key assumption in this analysis is that sillsare fed by dikes as proposed for structured basins like theCarboniferous Midland Valley (UK) [Francis, 1982], whilein unstructured basins like the Karoo, both sills and dikesfeed sills [Galerne et al., 2008]. Evidence exists for sillsbeing fed by dikes on the Exmouth Plateau, but there is alsoevidence for sills sourced by central feeders and inclinedsheets. Upward decreasing sediment densities decrease themagma overpressure gradient and, if the sediment pile isthick enough, lead to termination of magma ascent. This isobserved in sill and dike complexes on the ExmouthPlateau. However, sills and dikes seem to be stalled deeperin the section (around 4–5 km) than calculated (~2 km)(Figure 8), suggesting that other mechanisms could beimportant. There is evidence for sediment overpressures inthe Mungaroo Formation at 4–5 km depth from offset wells,generated by rapid burial of the Mungaroo deltaics in theTriassic. Since overpressured sediments are mechanicallyweaker and have higher porosities and, as a result, lower den-sity than normally pressured sediments, this could generate adecrease of melt ascent. Alternatively, the reaction betweenlower density, water-saturated sediments, and hot magmacould be generating rapid cooling of magma and subsequentmelt arrest. Other mechanisms that could influence meltdistribution are lithology type and orientation, such as thepreference for basalt melt to intrude horizontally layered sed-iments [e.g., Francis, 1982] and horizontally oriented meta-morphic foliations forming sills [Handy and Streit, 1999].[32] Thus, the Exmouth Plateau is the first of a “hidden”
class of intrusive LIPs, sourced by a mafic or an ultramaficmagma chamber, displaying mainly intrusive magmatismand general absence of extrusives. Intrusive LIPs are generatedwhere sedimentary basin fill is relatively thick, while extendedcrystalline crustal thicknesses are thin, generating lowermagma overpressures and causing arrest of ascending basalticmelt in the basin. Results indicate that thick crystalline crust
2
4
6
8
10
km3 km
C D
approximate paleo seabed ?
sill
inclined sheets
Valanginian unconformity
Callovian unconformity
saucer shaped sill
inclined sheet
sills
NW SE
F1
Figure 9. Seismic depth section showing inclined sheet feeding a saucer-shaped sill. Note that the saucer-shaped sill generates subtle faulting at and just above the Callovian unconformity. The faulting (and sill in-trusion) observed was most likely generated between the Valanginian and Callovian unconformities, andthe timing is estimated by the approximate paleoseabed. Note that the approximate paleoseabed is theboundary between subtle faulted (e.g., F1 faults) and unfaulted sediments. The observations are consistentwith Figure 8, indicating that at this depth, sill intrusion was near the normal faulting gradient and magma-tectonism did occur. For location, see the CD section in Figure 1. Seismic data courtesy of PGS.
ROHRMAN: INTRUSIVE LARGE IGNEOUS PROVINCES
8
must have higher maximum magmatic overpressures at thebrittle-ductile boundary, making eruptions at the surface morelikely if there is no significant basin fill arresting melt ascent. Ifmaximum magmatic overpressures scale with crystallinecrustal thicknesses, the latter could be used as a proxy formagma eruptability. This has important implications forPaleozoic and Proterozoic LIPs that are either highly erodedor deeply buried at present. Some or part of these could be cat-egorized as intrusive LIPs with consequences for originalmagma volumes.[33] Other mechanisms for termination of melt ascent in
flood basalt provinces have been proposed. The simplest ofthese is that at one point, the heat source generatingmagmatism was exhausted and melt ascent terminated [e.g.,Buck, 2006]. However, the occurrence of doleritic intrusionswithout the presence of extrusives in sedimentary basins isquite common on magmatic rifted margins, as documentedby Cartwright and Hansen [2006] on the NorwegianAtlantic margin, as well as basins offshore southern Australia[Holford et al., 2012] and offshore Senegal [Rocchi et al.,2007]. Suggesting that the relationship between thinnedextended crystalline crust in combination with relatively thickbasin fill sediments must play a crucial role in melt arrest.Another mechanism for melt termination is owing to heataddition to the lower crust by means of mafic or ultramaficmagma chamber emplacement, leading to strong horizontalstress generation and possible flow of the lower crust[McKenzie and Jackson, 2002; Karlstrom and Richards,2011]. This would terminate melt ascent and switch off theintrusive system. The process could operate in all LIPs anddoes not explain the general noneruptive nature of sills anddikes in volcanic margin basins such as the Exmouth Plateau.[34] It has to be kept in mind that the proposed model is a
simplification of processes associated with intrusion, andvarious processes in the shallow subsurface such as thelowering of densities in ascending melt as a result ofdevolitizaton of the melt close to the surface [Pinel andJaupart, 2004] and inelastic deformation associated withshallow sediments [Goulty, 2005] have not been taken intoaccount. Results suggest that it is likely that original meltdensity reduces on ascent as a result of volatile exsolution[Karlstrom and Richards, 2011]. However, most of the meltfractionation must take place at the HVB magma chamberdue to the relatively similar chemical composition of doleriteintrusives and flood basalt in LIPs [e.g., Galerne et al., 2008;Fleming and Elliot, 2008]. Additional evidence is providedby basalt geochemistry studies, indicating that basalt is nota primary melt generated from partial melting of mantlematerial. Instead, basalts are fractionation products generatedat depths less than 30 km [O’Hara and Herzberg, 2002],consistent with what is proposed here.[35] There are several implications of the results presented
here that could be used as constraints for LIP formationmodels [e.g., Sleep, 1997; Silver et al., 2006]. First, the sillsand dike distribution could be used to pinpoint flood basaltmagma chambers at depth. Subsequently, the locationof the Moho level magma chambers could be used to con-strain the fetch area of the basalts, constraining deepersublithospheric or intralithospheric mantle-melt fetch areas.It is interesting to note that the seismic section in Figure 2shows bright amplitudes below the HVB that could beinterpreted as a sill or a dike feeder to the HVB, suggesting
that fetch areas for melt at lithospheric level are even larger.Second, the top, thickness, and extent of HVBs from seismicreflection and refraction data should be mapped, if possible.Synthetic reflection seismic modeling on one of the few out-cropping analogs for a HVB, i.e., the Mafic Complex in theIvrea zone of the Alps, indicates that the lateral (horizontal)resolution is poor compared with the vertical resolution[Rutter et al., 1999]. This could indicate that the HVB con-sists of many closely spaced magma chambers, instead ofone large magma chamber layer [e.g., White et al., 2008].[36] Finally, this takes us to the origin of the HVB and sill/
dike/sheet complexes on the Exmouth Plateau (Figure 1).Previous models proposed decompression melting aidedby small-scale convection or a mantle plume origin formagmatism [e.g., White and McKenzie, 1989; Hopper et al.,1992; Mihut and Müller, 1998]. Crucial observations to beexplained are the normal thickness oceanic crust at theCuvier margin from 130 Ma onward [e.g., Robb et al.,2005], while anomalously thick oceanic crust is observed overthe Gascoyne Plain [Rey et al., 2008], as well as the absence ofan apparent hot spot trail [Hopper et al., 1992]. Recent recog-nition of a sliver of Jurassic ocean crust within Cretaceous oce-anic crust in the Wharton Basin, to the west of the GascoyneAbyssal Plain, has important implications for plate tectonicmodels of the region [Gibbons et al., 2012]. The new recon-structions suggest the presence of a Gascoyne block that riftedaway from the Gascoyne margin around 136 Ma [Gibbonset al., 2012]. I argue that the outline and thickness of theHVB, thinning toward the Gascoyne rift margin and thicken-ing toward the CRFZ, could suggest the presence of a thermalanomaly (mantle plume or upwelling) centered around theeastern part of the CRFZ, with a radius of ~200–300 km, at~136 Ma, thus generating intrusives and underplating belowthe EP and thickened oceanic crust in the Gascoyne AbyssalPlain. Seismic data from the Wallaby Plateau (WP) [Sayerset al., 2002] (Figure 1), a continental fragment that rifted awayfrom the Cuvier margin at ~133 Ma [Robb et al., 2005;Gibbons, et al., 2012], suggest the presence of sills akin tothose found on the EP. This implies that the Exmouth sillsystem originally continued to the WP. Therefore, it could bepossible that the anomaly present before breakup below theWP, the EP, and the Cuvier margin at ~136 Ma or earlierwould have migrated to the Greater India plate, moving awayfrom the Cuvier margin at ~130 Ma, before ocean spreadingcommenced in the Cuvier Abyssal Plain (CAP) [Gibbonset al., 2012]. However, it remains problematic what wouldhave happened to the hot spot trail in the Middle/LateCretaceous and the Tertiary, considering the complex platetectonic history of the region, as well as lack of knowledgeon the duration of the upwelling. Another criterion for thepresence of an upwelling/plume is generation of uplift overthe upwelling region. Unfortunately, the Exmouth Plateaurecords neither subsidence nor uplift in the Late Jurassic.However, it does record deposition of the Early CretaceousBarrow Group delta, sourced from the middle to the easternCRFZ margin region, where the HVB is thicker [Lorenzoet al., 1991] and magmatism seems more intense [e.g., Mihutand Müller, 1998]. If there was any thermal anomaly or plumecausing magmatism in the greater Exmouth region, this up-welling was most likely less energetic than plumes/upwellings,generating highmagmatismLIPs such as the Parana-Etendeka,Deccan Traps, and the North Atlantic.
ROHRMAN: INTRUSIVE LARGE IGNEOUS PROVINCES
9
6. Conclusions
[37] This paper provides an integrated study of magmaticascent on the Exmouth Plateau from the Moho to the uppercrust, as visualized by the presence of an igneous sheet sys-tem on high-resolution 2-D and 3-D seismic reflection data.The igneous sheet complex has not produced extrusives,and these constraints are used to calculate melt gradientsand, ultimately, excess magma overpressures at the sourcemagma chamber(s) near the Moho. Magmatic overpressuresat the HVB source are estimated at 5–20 MPa, although largeuncertainties remain concerning temperatures, rheology, andstrain rates at the HVB source. Moreover, the results indicatethat the difference between horizontal stress and melt gradi-ents as a function of depth-integrated density provides themain control on magma ascent. Furthermore, the differencebetween vertical stress gradient and melt gradient providesimportant controls on the depth extent over which sills areobserved on seismic data. This implies that relatively thin crys-talline crust in combination with thick sedimentary basin fill,commonly found in extensional basins, generated melt arrestof the igneous system and explains the absence of extrusives.Additionally, it could be argued that the brittle-ductile transi-tion acts as a magma trap on the Exmouth Plateau, with thickersills occurring in the region of the highest overpressure, con-trolling conditions for preferred sill emplacement at this level.[38] Timing of formation of the igneous sheet complex,
estimated to be Tithonian to Valanginian in age, is derivedfrom indirect dating of one hydrothermal vent andstratigraphic relationships of the sills. These estimates areconsistent with previous work and suggest that magmatismwas contemporaneous to slightly preceding the main riftingevent in the Valanginian.[39] The source of the igneous sheet complex is a magma
chamber at the Moho, identified as a HVB in earlier studies,consisting of sills that can be mapped with some confidencebelow large parts of the Exmouth Plateau and neighbouringregions. The extent and outline of the HVB places constraintson the origin of magmatism and LIP formation. In combina-tion with published data, including plate reconstructions,magnetic data, oceanic thickness estimations, and Barrowdelta deposition pattern, the results suggest an upwelling orplume source for the observed magmatism.
[40] Acknowledgments. I would like to thank PGS for permission touse seismic images from the New Dawn 2D seismic survey and WesternGeco for permission to use seismic images from the Keystone 3D multiclientsurvey. Joe Cartwright and Agust Gudmundsson provided constructivecomments on earlier versions of the manuscript. I thank Sverre Planke forthorough reviews that improved the quality of the paper. The interpretationsand ideas expressed here are the author’s and not those ofaffiliated companies.
ReferencesAnnen, C. (2011), Implications of incremental emplacement of magmabodies for magma differentiation, thermal aureole dimensionsand plutonism-volcanism relationships, Tectonophysics, 500, 2–10,doi:10.1016/j.tecto.2009.04.010.
Breckels, I. M., and H. A. M. van Eekelen (1982), Relationship between hor-izontal stress and depth in sedimentary basins, J. Pet. Technol., 34,2191–2199.
Brocher, T. M. (2005), Empirical relations between elastic wavespeeds anddensity in the Earth’s crust, Bull. Seismol. Soc. Am., 95, 2081–2092,doi:10.1785/0120050077.
Buck, W. R. (2006), The role of magma in the development of theAfro-Arabian rift system, in The Afar Volcanic Province Within the
East African Rift System, Geol. Soc. London, Spec. Publ., vol. 259,edited by G. Yirgu, C. Ebinger, and P. R. H. Maguire, pp. 43–54,Geol. Soc., London.
Cartwright, J., and D. M. Hansen (2006), Magma transport through the crustvia interconnected sill complexes, Geology, 34, 929–932, doi:10.1130/G22758A.
Coffin, M. F., R. A. Duncan, O. Eldholm, J. G. Fitton, F. A. Frey,H. C. Larsen, J. J. Mahoney, A. D. Saunders, R. Schlich, andP. J.Wallace (2006), Large igneous provinces and scientific ocean drilling:Status quo and a look ahead, Oceanography, 19, 150–160.
Coffin, M. F., and O. Eldholm (1994), Large igneous provinces: Crustalstructure, dimensions, and external consequences, Rev. Geophys., 32,1–36.
Cox, K. G. (1980), A model for flood basalt volcanism, J. Petrol., 21,629–650.
Davies, R., B. R. Bell, J. A. Cartwright, and S. Shoulders (2002), Three-dimensional seismic imaging of Paleogene dike-fed submarine volcanoesfrom the Northeast Atlantic margin, Geology, 30, 223–226.
Direen, N. G., H. M. J. Stagg, P. A. Symonds, and J. B. Colwell (2008),Architecture of volcanic rifted margins: New insights from the Exmouth-Gascoyne margin, Western Australia, Aust. J. Earth Sci., 55, 341–363,doi:10.1080/08120090701769472.
Driscoll, N. W., and G. D. Karner (1998), Lower crustal extension across thenorthern Carnarvon basin, Australia: Evidence for an eastward dipping de-tachment, J. Geophys. Res., 103, 4975–4991.
Eaton, B. E. (1969), Fracture gradient prediction and its application inoilfield operations, J. Pet. Technol., 21, 1353–1360.
Ernst, R. E., K. L. Buchan, and I. H. Campbell (2005), Frontiers in large igneousprovince research, Lithos, 79, 271–297, doi:10.1016/j.lithos.2004.09.004.
Etheridge, M. A. (1983), Differential stress magnitudes during regional de-formation and metamorphism: Upper bound imposed by tensile fracturing,Geology, 11, 231–234, doi:10.1130/0091-7613.
Fialko, Y. A., and A. M. Rubin (1999), Thermal and mechanical aspects ofmagma emplacement in giant dike swarms, J. Geophys. Res., 104,23,033–23,049, doi:10.1029/1999JB900213.
Fleming, D. H., and T. H. Elliot (2008), Physical volcanology and geologicalrelationships of the Jurassic Ferrar large igneous province, J. Volcanol.Geotherm. Res., 172, 20–37, doi:10.1016/j.jvolgeores2006.02.016.
Fomin, T., A. Goncharev, P. Symonds, and C. Collins (2000), Acousticstructure and seismic velocities in the Carnarvon Basin, Australian NorthWest Shelf: Towards an integrated study, Explor. Geophys., 31,579–583.
Fournier, R. O. (1999), Hydrothermal processes related to movement of fluidfrom plastic into brittle rock in the magmatic-epithermal environment,Econ. Geol., 94, 1193–1211.
Francis, E. H. (1982), Magma and sediment - I. Emplacement mechanism oflate Carboniferous tholeiite sills in northern Britain, J. Geol. Soc. London,139, 1–20.
Frey, Ø., S. Planke, P. A. Symonds, and M. Heeremans (1998), Deep crustalstructure and rheology of the Gascoyne volcanic margin, WesternAustralia, Mar. Geophys. Res., 20, 293–312.
Galerne, C. Y., E. R. Neumann, and S. Planke (2008), Emplacement mech-anisms of sill complexes: Information from the geochemical architectureof the Golden Valley sill complex, South Africa, J. Volcanol. Geotherm.Res., 177, 425–440.
Gibbons, A. D., U. Barckhausen, P. van den Bogaard, K. Hoernle, R.Werner, J. M. Whittaker, and R. D. Müller (2012), Constraining the Jurassic ex-tent of Greater India: Tectonic evolution of the West Australian margin,Geochem. Geophys. Geosyst., 13, Q05W13, doi:10.1029/2011GC003919.
Goulty, N. R. (2005), Emplacement mechanism of the Great Whin andMidland Valley dolerite sills, J. Geol. Soc. London, 162, 1047–1056.
Gudmundsson, A. (1990), Emplacement of dikes, sills and crustalmagma chambers at divergent plate boundaries, Tectonophysics, 176,257–275.
Gudmundsson, A. (2002), Emplacement and arrest of sheets and dikes incentral volcanoes, J. Volcanol. Geotherm. Res., 116, 279–298.
Hall, R. (2012), Late Jurassic-Cenozoic reconstructions of the Indonesian re-gion and the Indian Ocean, Tectonophysics, 570–571, 1–41, doi:10.1016/j.tecto.2012.04.021.
Handy, M. R., and J. E. Streit (1999), Mechanics and mechanisms of mag-matic underplating: Inferences from mafic veins in deep crustal mylonite,Earth Planet. Sci. Lett., 165, 271–286.
Heine, C., and R. D. Müller (2005), Late Jurassic rifting along the AustralianNorth West Shelf: Margin geometry and spreading ridge configuration,Aust. J. Earth Sci., 52, 27–39, doi:10.1080/08120090500100077.
Hogan, J. P., J. D. Price, and M. C. Gilbert (1998), Magma traps and drivingpressure: Consequences for pluton shape and emplacement in an exten-sional regime, J. Struct. Geol., 20, 1155–1168.
Holford, S., N. Schofield, J. D. MacDonald, I. R. Duddy, and P. F. Green(2012), Seismic analysis of igneous systems in sedimentary basins and
ROHRMAN: INTRUSIVE LARGE IGNEOUS PROVINCES
10
their impacts on hydrocarbon prospectivity: Examples from the southernAustralian margin, APPEA J., 2012, 229–252.
Holness, M. B., C. Richardson, and R. T. Helz (2012), Disequilibrium dihe-dral angles in dolerite sills: A new proxy for cooling rate, Geology, 40,795–798, doi:10.1130/G33119.1.
Hopper, J. R., J. C. Mutter, R. L. Larson, C. Z. Mutter, and NorthwestAustralia study group (1992), Magmatism and rift margin evolution:Evidence from Northwest Australia, Geology, 20, 853–857.
Karlstrom, L., and M. Richards (2011), On the evolution of large ultramaficmagma chambers and timescales for flood basalt eruptions, J. Geophys.Res., 116, B08216, doi:10.1029/2010jb008159.
Kavanagh, J. L., T. Menand, and R. S. J. Sparks (2006), An experimental in-vestigation of sill formation and propagation in layered elastic media,Earth Planet. Sci. Lett., 245, 799–813.
Klausen, M. B. (2006), Similar dyke thickness variation across three volca-nic rifts in the North Atlantic region: Implications for intrusion mecha-nisms, Lithos, 92, 137–153.
Lister, J. R., and R. C. Kerr (1991), Fluid-mechanical models of crack prop-agation and their application to magma transport in dykes, J. Geophys.Res., 96, 10,049–10,077.
Longley, I. M., et al. (2002), The North West Shelf of Australia—AWoodside perspective, in The Sedimentary Basins of Western Australia3: Proceedings of Petroleum Exploration Society of AustraliaSymposium, edited by M. Keep and S. J. Moss, pp. 27–88, PESA, Perth.
Lorenzo, J. M., J. C. Mutter, R. L. Larson, and Northwest Australia studygroup (1991), Development of the continent-ocean transform boundaryof the southern Exmouth Plateau, Geology, 19, 843–846.
Malthe-Sørensen, A., S. Planke, H. Svensen, and B. Jamtveit (2004),Formation of saucer shaped sills, in Physical Geology of High LevelMagmatic Systems, Geol. Soc. London, Spec. Publ., vol. 234, edited byC. Breitkreuz and N. Petford, pp. 215–227, Geol. Soc., London.
McKenzie, D., and J. Jackson (2002), Conditions for flow in the continentalcrust, Tectonics, 21(6), 1055, doi:10.1029/22002TC001394.
Menand, T., and S. R. Tait (2002), The propagation of a buoyant liquid-filledfissure from a source under constant pressure: An experimental approach,J. Geophys. Res., 107(B11), 2306, doi:10.1029/2001JB000589.
Mihut, D., and R. D. Müller (1998), Volcanic margin formation andMesozoic rift propagators in the Cuvier abysal plain off westernAustralia, J. Geophys. Res., 103, 27,135–27,149.
Mutter, J. C., R. L. Larson, and Northwest Australia Study Group (1989),Extension of the Exmouth Plateau, offshore northwestern Australia:Deep seismic reflection/refraction evidence for simple and pure shearmechanisms, Geology, 17, 15–18.
O’Hara, M. J., and C. Herzberg (2002), Interpretation of trace element andisotope features of basalts: Relevance of field relations, petrology, majorelement data, phase equilibria and magma chamber modeling in basalt pet-rogenesis, Geochim. Cosmochim. Acta, 66, 2167–2154.
Parsons, T., N. H. Sleep, and G. A. Thompson (1992), Host rock rheologycontrols on the emplacement of tabular intrusions: Implications forunderplating of extending crust, Tectonics, 11, 1348–1356.
Philpotts, A. (1990), Principles of Igneous and Metamorphic Petrology,Prentice Hall, N.J.
Pinel, V., and C. Jaupart (2004), Likelihood of basaltic eruptions as a func-tion of volatile content and volcanic edifice size, J. Volcanol. Geotherm.Res., 137, 201–217, doi:10.1016/j.volgeores.2004.05.010.
Planke, S., P. A. Symonds, E. Alvestad, and J. Skogseid (2000), Seismicvolcanostratigraphy of large volume basaltic extrusive complexes on riftedmargins, J. Geophys. Res., 105, 19,335–19,351.
Planke, S., T. Rassmussen, S. S. Rey, and R. Myklebust (2005), Seismiccharacteristics and distribution of volcanic intrusions and hydrothermalvent complexes in the Vøring and Møre basins, in Petroleum Geology:North-West Europe and Global Perspectives—Proceedings of the 6thPetroleum Geology Conference, edited by A. G. Doré and B. A. Vining,pp. 833–844, Geol. Soc., London.
Polteau, S., E. C. Ferré, S. Planke, E. R. Neumann, and L. Chevallier (2008),How are saucer shaped sills emplaced? Constraints from the GoldenValley sill, South Africa, J. Geophys. Res., 113, B12104, doi:10.1029/2008JB005620.
Puffer, J. H., K. A. Block, and J. C. Steiner (2009), Transmission of flood ba-salt through a shallow crustal sill and the correlation of sill layers with ex-trusive flows; The Palisades intrusive system and the basalts of the Newarkbasin, New Jersey, USA, J. Geol., 117, 139–155.
Qin, R., andW. R. Buck (2008),Why meter-wide thick dikes at spreading cen-ters?, Earth Planet. Sci. Lett., 265, 466–474, doi:10.1016/j.epsl.2007.10.044.
Ray, R., H. C. Sheth, and J. Mallik (2007), Structure and emplacement ofthe Nandurbar-Dhule mafic dyke swarm, Deccan Traps, and thetectonomagmatic evolution of flood basalts, Bull. Volcanol., 69,537–551, doi:10.1007/s00445-006-0089-y.
Rey, S. S., S. Planke, P. A. Symonds, and J. I. Faleide (2008), Seismicvolcanostratigraphy of the Gascoyne margin, Western Australia, J. Volcanol.Geotherm. Res., 172, 112–131, doi:10.1016/j.jvolgeores.2006.11.013.
Ridley, V. A., and M. Richards (2010), Deep crustal structure beneath largeigneous provinces and petrologic evolution of flood basalts, Geochem.Geophys. Geosyst., 11, doi:10.1029/2009GC002935.
Robb, M. S., B. Taylor, and A. M. Goodliffe (2005), Re-examination of themagnetic lineations of the Gascoyne and Cuvier Abyssal Plains, off NWAustralia, Geophys. J. Int., 163, 42–55.
Roberts, J. R. (1970), The intrusion of magma into brittle rocks, inMechanism of Igneous Intrusion, edited by G. Newall and H. Rast,Geol. J. Special issue, 2, 278–338, Gallery Press, Liverpool.
Rocchi, S., A. Mazzotti, M. Maronni, L. Pandolfi, P. Constantini,G. Bertozzi, D. Di Biase, F. Frederici, and P. Goumbo Lô (2007),Detection of Miocene saucer shaped sills (offshore Senegal) via integratedinterpretation of seismic, magnetic and gravity data, Terra Nova, 19,232–239.
Rohrman, M. (2007), Prospectivity of volcanic basins: Trap delineation andacreage de-risking, AAPG Bull., 91, 915–939, doi:10.1306/12150606017.
Rubin, A. M. (1995), Propagation of magma filled cracks, Annu. Rev. EarthPlanet. Sci., 23, 287–336.
Rutter, E. H., J. Khazanehdari, K. H. Brodie, D. J. Blundell, andD. A. Waltham (1999), Synthetic seismic profile through the Ivrea zone-Serie dei Laghi continental crustal section, northwestern Italy, Geology,27, 79–82.
Ryan, M. P. (1993), Neutral buoyancy and the structure of mid-ocean ridgemagma reservoirs, J. Geophys. Res., 98, 22,321–22,338.
Sayers, J., I. Borissova, D. Ramsay, and P. A. Symonds (2002), Geologicalframework of the Wallaby Plateau and adjacent areas, GeoscienceAustralia Record 2002/21, 85 pp.
Schofield, N. J., D. Brown, C. Magee, and C. T. Stevenson (2012), Sillmorphology and comparison of brittle and non-brittle emplacementmechanisms, J. Geol. Soc. London, 169, 127–141, doi:10.1144/0016-76492011-078.
Sibson, R. H. (2003), Brittle-failure controls on maximum sustainable over-pressure in different tectonic regimes, AAPG Bull., 87, 901–908.
Silver, P. G., M. D. Behn, K. Kelly, M. Schmitz, and B. Savage (2006),Understanding cratonic flood basalts, Earth Planet. Sci. Lett., 245,190–201, doi:10.1016/j.epsl2006.01.050.
Sleep, N. H. (1997), Lateral flow and ponding of starting plume material,J. Geophys. Res., 102(B5), 10,001–10,012.
Smallwood, J. R., and J. Maresh (2002), The properties, morphology anddistribution of igneous sills: Modeling, borehole data and 3D seismic fromthe Faroe-Shetland area, in The North Atlantic Igneous Province:Stratigraphy, Tectonic, Volcanic and Magmatic Processes, Geol. Soc.London Spec. Publ., vol. 197, edited by D. Jolley and B. R. Bell,pp. 271–306, Geol. Soc., London.
Symonds, J., S. Planke, Ø. Frey, and J. Skogseid (1998), Volcanicevolution of the Western Australian continental margin and its implica-tions for basin development, in The Sedimentary Basins of WesternAustralia 2. Proceedings of Petroleum Exploration Society ofAustralia Symposium, edited by P. G. Purcell and R. R. Purcell,pp. 33–54, PESA, Perth.
Thomson, K. (2007), Determining magma flow in sills, dikes and laccolithsand their implications for sill emplacement mechanisms, Bull. Volcanol.,70, 183–201, doi:10.1007/s00445-007-0131-8.
Thomson, K., and D. Hutton (2004), Geometry and growth of sill com-plexes: Insights using 3D seismic from the North Rockall, Bull.Volcanol., 66, 364–375.
Traversa, P., V. Pinel, and J. R. Grasso (2010), A constant influx model fordyke propagation: Implications for magma reservoir dynamics,J. Geophys. Res., 115, B01201, doi:10.1029/2009/JB006559.
Turcotte, D. L., and G. Schubert (2002), Geodynamics, 2nd ed., CambridgeUniv. Press, Cambridge.
Valentine, G. A., and K. E. C. Krogh (2006), Emplacement of shallow dikesand sills beneath a small basic volcanic center: The role of pre-existingstructure (Paiute Ridge, southern Nevada, USA), Earth Planet. Sci. Lett.,246, 217–230, doi:10.1016/j.epsl.2006.04.031.
van Hinte, J. E. (1978), Geohistory analysis—Application of micropaleon-tology in exploration geology, AAPG Bull., 62, 201–222.
Weinberg, R. F., and K. Regenauer-Lieb (2010), Ductile fractures andmagma migration, Geology, 38, 363–366, doi:10.1130/G30482.1.
White, R., and D. McKenzie (1989), Magmatism at Rift zones: The genera-tion of continental flood basalts at rift margins, J. Geophys. Res., 94,7685–7729.
White, R. S., L. K. Smith, A.W. Roberts, P. A. F. Christie, N. J. Kusznir, andthe rest of the iSIMM team (2008), Lower crustal intrusion on the NorthAtlantic continental margin, Nature, 452, 460–464.
ROHRMAN: INTRUSIVE LARGE IGNEOUS PROVINCES
11


