Embed Size (px)
Citation preview
Interaction of nitrogen nutrition and salinity in Grey poplar(Populus tremula ¥ alba)
B. EHLTING1, P. DLUZNIEWSKA1, H. DIETRICH1, A. SELLE5, M. TEUBER6, R. HÄNSCH4, U. NEHLS5, A. POLLE2,J.-P. SCHNITZLER6, H. RENNENBERG1 & A. GESSLER3
1Institut für Forstbotanik und Baumphysiologie, Professur für Baumphysiologie, Albert-Ludwigs-Universität Freiburg,Georges-Koehler-Allee 053/054, 79110 Freiburg, Germany, 2Forstbotanisches Institut, Georg-August-Universität Göttingen,Büsgenweg 2, 37077 Göttingen, Germany, 3Institut National de la Recherche Agronomique (INRA), Centre de Recherche deNancy, 54280 Champenoux, France, 4Institut für Pflanzenbiologie, Technische Universität Braunschweig, Humboldtstr. 1,38023 Braunschweig, Germany, 5Physiologische Ökologie der Pflanzen, Eberhard-Karls-Universität, Auf der Morgenstelle 1,72076 Tübingen, Germany and 6Forschungszentrum Karlsruhe GmbH, Institut für Meteorologie und Klimaforschung,Atmosphärische Umweltforschung (IMK-IFU), Kreuzeckbahnstr. 19, 82467 Garmisch-Partenkirchen, Germany
ABSTRACT
Salinity represents an increasing environmental problem inmanaged ecosystems. Populus spp. is widely used for woodproduction by short-rotation forestry in fertilized planta-tions and can be grown on saline soil. Because N fertiliza-tion plays an important role in salt tolerance, we analysedGrey poplar (Populus tremula ¥ alba, syn. Populus cane-scens) grown with either 1 mM nitrate or ammonium sub-jected to moderate 75 mM NaCl. The impact of N nutritionon amelioration of salt tolerance was analysed on differentlevels of N metabolism such as N uptake, assimilation and N(total N, proteins and amino compounds) accumulation. Naconcentration increased in all tissues over time of salt expo-sure. The N nutrition-dependent effects of salt exposurewere more intensive in roots than in leaves. Application ofsalt reduced root increment as well as stem height increaseand, at the same time, increased the concentration of totalamino compounds more intensively in roots of ammonium-fed plants. In leaves, salt treatment increased concentra-tions of total N more intensively in nitrate-fed plants andconcentrations of amino compounds independently of Nnutrition. The major changes in N metabolism of Greypoplar exposed to moderate salt concentrations weredetected in the significant increase of amino acid concen-trations. The present results indicate that N metabolism ofGrey poplar exposed to salt performed better when theplants were fed with nitrate instead of ammonium as sole Nsource. Therefore, nitrate fertilization of poplar plantationsgrown on saline soil should be preferred.
Key-words: amino acids; ammonium; ammonium trans-porter; nitrate; nitrate reductase; nitrate transporter; photo-respiration; salt stress.
INTRODUCTION
Although soil salinity has existed long before humans havecultivated land for agriculture, this detrimental factor ofplant growth and development has been aggravated by irri-gation.According to the Land and Plant Nutrition Manage-ment Service, the total area of saline soils amounts to 397million ha, c. 19.5% of irrigated land and 2.1% of dryland agriculture proceed on salt-affected soils (http://www.fao.org/ag/agl/agll/spush/topic2.htm). Thus, salt stressconstitutes an agricultural and environmental problemworldwide, and salinity is expected to cause serious salin-ization problems for more than 50% of all arable lands until2050 (Ashraf 1994).
Salinity is a major abiotic stress that is visible on thephysiological, biochemical and molecular level (Hasegawaet al. 2000; Parida & Das 2005). Unlike many toxins andherbicides, excess NaCl has no single cellular target, and thedeleterious effects of NaCl stress result from either osmoticinhibition of water uptake by roots, similar to droughtstress, or by disarrangement of ion homeostasis (Garciaet al. 1997; Munns 2005). As a consequence of primary salteffects, secondary stresses, such as oxidative damage andthe generation of reactive oxygen species (ROS), are oftenobserved (Zhu 2001).
N fertilization plays an important role in the ameliorationof salt stress tolerance. The impact of N nutrition on ame-lioration of salt tolerance has been analysed on differentlevels of N metabolism such as N uptake, assimilation and N(total N, proteins and amino acids) accumulation. It isthought that sufficient N supply helps to compensate andcorrect nutritional imbalances in salt-stressed plants(Gomez et al. 1996), because salt stress decreases theuptake of nutrients such as NO3
- in many plant species(Aslam, Huffaker & Rains 1984; Botella et al. 1997). Nitrateand ammonium are actively absorbed into root cells viahigh-affinity transport systems (HATS) for NO3
- and NH4+
(Glass et al. 2002). Gene expression analyses indicate thatsalt can stimulate the expression of nitrate transporters(Popova, Dietz & Golldack 2003). Nitrate reductase (NR)
Correspondence: B. Ehlting. Fax: +49 7612038302; e-mail:[email protected]
Plant, Cell and Environment (2007) doi: 10.1111/j.1365-3040.2007.01668.x
© 2007 The AuthorsJournal compilation © 2007 Blackwell Publishing Ltd 1

activity, the first enzyme in the NO3- reduction and assimi-
lation pathway, has shown contradictory effects in differentplant species in response to salt stress (Bourgeais-Chaillou,Perez-Alfocea & Guerrier 1992; Cramer & Lips 1995). Theamino acid proline and other amino acids have beendescribed as osmoprotectants or ‘compatible solutes’, mol-ecules accumulating during water shortage, which do notinhibit normal metabolic reactions (Brown & Simpson1972; Yancey et al. 1982), but protect cells from furtherdamage. The osmotic potential of Na stored in vacuolesneeds to be counterbalanced, for example, via compatiblesolutes increasing the osmotic potential in the cytosol, andapparently, osmotic adjustment is a key issue to tolerate saltstress. Whether plants with increased concentrations ofproline display increased salt tolerance is still a matter ofdebate (Kishor et al. 1995; Blum et al. 1996). Secondaryeffects of salt stress are also counteracted by compatiblesolutes protecting membranes as well as proteins andmetabolites scavenging ROS, which arise to higher amountsduring stress.
Limited information is available on plant performance independence of different nitrogen sources, for example,nitrate or ammonium, during salt stress. Growth and yieldof salt-stressed sweet pepper are enhanced by increasednitrate supply (Gomez et al. 1996). Lewis, Leidi & Lips(1989), analysing growth rates and gas exchange, suggestedthat ammonium-fed plants are more susceptible to salt. Indifferent herbaceous species (Pisum sativum, Helianthusanuus, Glycine max), nitrate-supplied plants are less sensi-tive to salt stress compared with ammonium-supplied indi-viduals with regard to mineral composition, growth andphysiological parameters (Bourgeais-Chaillou et al. 1992;Ashraf & Sultana 2000; Frechilla et al. 2001). When ammo-nium is the only N source for pea plants under salt stress,root growth and belowground total N concentration arereduced, and amino acid concentration increases at theexpense of protein contents (Speer, Brune & Kaiser 1994).Biomass, N uptake and N content of Populus tremula ¥ albasaplings grown in aqueous solution are more severelyreduced upon salt treatment when ammonium is fed(Dluzniewska et al. 2007).
Populus species can be grown on saline soil in order toprevent erosion and to possibly ameliorate soil (Singh1998). Because Populus spp. is widely used for wood pro-duction by short-rotation forestry in fertilized plantations,the type of N supply may play an important role in tolerat-ing salt stress. The aim of this study was to characterize theimpact of different nitrogen nutrition (nitrate or ammo-nium) on plant growth and N metabolism during moderatelong-term salt treatment on Grey poplar P. tremula ¥ alba(Bolu & Polle 2004) grown as hydroponics on clay granules.Based on previous observations for non-woody species, weassume that the N metabolism of NH4
+-grown poplars ismore susceptible towards salt treatment as compared withNO3
--fed plants.The analysis of N metabolism is focused onN uptake via molecular analyses of selected genes encodingnitrate and ammonium transporters, on N assimilation viaexpression and enzyme assays of the key enzyme NR and
on the accumulation of the main N assimilation products,for example, amino acids and proteins.We intend to identifyprocesses of N metabolism most affected by moderate salttreatment in dependence of N nutrition.
MATERIAL AND METHODS
Plant growth conditions and treatments
Grey poplar saplings [Populus tremula ¥ alba syn.Populus ¥ canescens, Institut National de la RechercheAgronomique (INRA) clone 717 1B4] about 5 cmtall were purchased from Picoplant Pflanzenvertrieb und –verkauf (Oldenburg, Germany) and cultivated as hydro-ponics on clay granules watered with Hoagland solution(Hoagland & Arnon 1950) in the greenhouse in Freiburg.Because plants might react differently when grown on dif-ferent substrates, our experiments were performed on clayin order to work close to natural soil conditions. Four-week-old plants were transferred to Long Ashton solution(Hewitt 1966) with CaNO3 substituted with CaCl2, andN supply was provided by 0.5 mM KNO3 and 0.5 mMNH4Cl [0.5 mM KNO3, 0.5 mM NH4Cl, 0.9 mM CaCl2,0.3 mM MgSO4, 0.6 mM KH2PO4, 42 mM K2HPO4, 10 mMFe–ethylenediaminetetraacetic acid (EDTA), 2.0 mMMnSO4, 10.0 mM H3BO3, 7.0 mM Na2MoO4, 0.05 mM CoSO4,0.2 mM ZnSO4, 0.2 mM CuSO4, pH 5.5]. After 2 weeks, thepopulation of poplars was split in two groups, one suppliedwith 1 mM KNO3, while the other group was supplied with1 mM NH4Cl 6 and 8 weeks prior experiment I and II,respectively. After another 4 (experiment I) and 6 weeks(experiment II), the plants were transported to Garmisch-Partenkirchen. They were cultivated for another week inthe greenhouse before they were transferred to the solardomes at the Mt. Wank research station (for details of thesolar domes, see Brüggemann & Schnitzler 2002).
The experiments were performed in the solar domesunder close-to-natural irradiation conditions.For each plant,1.7 L pots were used, and the plants were arranged in groupsof six in one large bowl.The nutrient solution was exchangedevery second day in order to avoid nutrient depletion, and atthe same time, the bowls were moved within the solar domesto avoid position effects. Experiment I was performed inAugust 2004, and the mean daily photosynthetical activeradiation (PAR) averaged over the 2 weeks from 06.00 to18.00 h was 360 mmol m-2 s-1 (lowest value at noon,102 mmol m-2 s-1; highest value at noon, 1046 mmol m-2 s-1);the mean temperature during the day was 23 °C (minimumat noon, 14 °C; maximum at noon, 35 °C) and the meanrelative humidity 58% (minimum at noon, 30%; maximumat noon, 77%). Experiment II was performed inSeptember 2004, and the mean daily PAR averaged overthe whole experimental period was 310 mmol m-2 s-1
(minimum at noon, 83 mmol m-2 s-1; maximum at noon,1139 mmol m-2 s-1), the mean temperature 21 °C (minimumat noon, 16 °C; maximum at noon, 34 °C) and the meanrelative humidity 54% (minimum at noon,25%;maximum atnoon, 76%). During experiments I and II, there were 12 and
2 B. Ehlting et al.
© 2007 The AuthorsJournal compilation © 2007 Blackwell Publishing Ltd, Plant, Cell and Environment
9 d with mean PAR above 250 mmol m-2 s-1, respectively.Because of different climatic conditions, the data for experi-ments I and II were analysed separately.
Before the experiment started, the plants were accli-mated to the solar domes up to 9 d. Salt treatment wasapplied by slowly increasing the NaCl concentration(25 mM NaCl on the first day, 50 mM on the third day and75 mM on the fifth day). The nutrient solution was replacedevery second day. For each time point and treatment (NO3
-/NH4
+, with and without salt), six plants were cultivated. Theplants were harvested at 13.00 h Central European Time(CET) at three time points (time point 0 before salt appli-cation, 1 and 2 weeks after start of salt treatment) and planttissues (leaves, roots and stems) were frozen in liquid nitro-gen and stored at -80 °C until further analyses. The ratio offresh weight (FW) to dry weight (DW) of coarse roots andselected leaves did not change because of different N nutri-tion and/or salt treatment (data not shown).
Determination of NR activity
Frozen plant material was ground to a fine powder in a smallmortar with liquid nitrogen. NR activity was determined asdescribed earlier (Scheible et al. 1997) using EDTA in theextraction and reaction buffers (Kaiser & Spill 1991). Avolume of 400 mL extraction buffer [100 mM 4-(2-hydroxyethyl)-1-piperazineethanesulfonic acid (HEPES)–KOH,pH 7.5,5 mM Mg-acetate,5 mM dithiothreitol (DTT),1 mM EDTA, 0.5 mM phenylmethanesulphonylfluoride(PMSF), 25 mM leupeptine (only for leaf material), 25 mMchymostatine (only for root material), 20 mM flavin adenindinucleotide (FAD), 5 mM Na2MoO4, 10% (v/v) glycerin,1% (w/v) polyvinyl polypyrrolidone (PVPP), 0.5% bovineserum albumin (BSA) and 0.1% (v/v) TritonX-100] wasadded to 100 mg tissue powder. NR activity was measuredimmediately in this crude extract without any centrifugationstep by transferring 165 mL crude extract into a reaction tubefilled with 825 mL reaction mixture. The reaction mixtureconsisted of 100 mM HEPES–KOH buffer (pH 7.5) supple-mented with 6.0 mM KNO3, 6.0 mM EDTA, 0.6 mMNADH, 12 mM FAD, 6 mM Na2MoO4, 3 mM DTT and either25 mM leupeptine (leaf material) or 25 mM chymostatine(root material). Assays were run at 25 °C. The reaction wasterminated after 6, 12 and 18 min by mixing of 300 mL assaymixture with 25 mL 0.6 M Zn-acetate and 75 mL 0.25 mMphenazinemethosulfate. Nitrite formation was quantified bythe addition of 1% sulfanilamide and 0.02% N-(1-naphtyl)-ethylene-diamine dihydrochloride (in 3.0 M HCl), and theA540 was measured. Absorption was converted into nitriteconcentrations using an external standard.
Gene expression analysis
Gene expression analysis of nitrate and the ammoniumtransporters in fine roots were performed by real-time PCR.Root RNA was isolated by a CsCl gradient as described byGrunze, Willmann & Nehls (2004). Aliquots of 1 mg totalRNA were treated with DNAse I (Invitrogen, Groningen,
the Netherlands) and were used for first-strand cDNA syn-thesis in a total volume of 20 mL, containing 50 pmol oligo-d(T)18–primer (GE Healthcare Europe GmbH, Munich,Germany) and 200 U Superscript II RNase H reverse tran-scriptase (Invitrogen) according to the manufacturer’sinstructions. After synthesis, 30 mL of 5 mM 2-amino-2-(hydroxymethyl)propane-1,3-diol (Tris)/HCl, pH 8.0 wereadded, and aliquots were stored at -80 °C. Real-time PCRwas performed using 10 mL Q-PCR-Mastermix (containingSYBR green and fluorescein;ABgene,Hamburg,Germany),0.5 mL cDNA, and 10 pmol of each primer (PttNRT2.1:GAACAGCCGATCTGAAC and GCGTTGGCCAT-GCTTCTATAG;PttAMT1.2: see Selle et al. 2005) in a MyiQreal-time PCR system (Bio-Rad, Hercules, CA, USA). Spe-cific primers for 18S rRNA (Selle et al. 2005), actin primers(Langer et al. 2004) and the constitutively expressed poplargene PttJIP1 (Grunze et al. 2004) were used as references.PCR was performed in triplicate together with dilutionseries of the reference genes.Three different cDNA synthe-sis reactions of four different plants were used for analysis.
Expression analysis of root PcNR gene was performed vianorthern hybridization. Total RNA of roots was extractedfrom powdered plant material using the Plant RNeasy kit,according to the manufacturer’s instruction (Qiagen,Hilden, Germany) with minor modifications. For one RNAextraction, three samples of 70 mg root tissue each wereused. 900 ml RLT buffer (Qiagen), supplemented with 1%b-mercaptoethanol, 1% polyvinylpyrrolidone (PVP) and7 mM ethylxanthogenate was added to 70 mg of homog-enized leaf tissue and incubated for 10–30 min at 58 °C.Aftercentrifugation,the samples were transferred on a QIAshred-der spin column (Qiagen).The samples were centrifuged for1 h at 4 °C at 14 000 ¥ g and treated according to the manu-facturer’s instructions. After washing the first sample with500 mL RPE buffer (Qiagen), the second sample was pipet-ted on the RNeasy mini column (Qiagen) and washedaccordingly. Finally, the third sample was applied.The RNAwas eluted with 50 mL RNAse-free water.
For northern blot analysis, 7 mg RNA per sample wasseparated on denaturing formaldehyde–agarose gels andwas subsequently transferred overnight onto a Hybond-XLnylon membrane (GE Healthcare Europe GmbH). TheDNA probe was synthesized from linearized partial NRcDNA (Gene bank accession number DQ855565, NRforward primer TCNWCNCCNTTYATGAACAC andNR reverse primer CCNCCRTTRGGRAAYTNGG) by32P labelling, using the Strip-EZ DNA kit (Ambion, Austin,TX, USA), as described in the manufacturer’s protocol.RNA was hybridized and washed according to standardprotocols (Sambrook & Russel 2001). The membrane wasexposed to a phosphorimage screen (Molecular Imager FX,Imaging Screen K; Bio-Rad, Munich, Germany) and analy-sed by PhosphorImager Molecular Imager FX (Bio-Rad).
Analysis of amino compounds and ammonium
Soluble N compounds were extracted and analysed asdescribed previously (Gessler et al. 1998). Aliquots of
Nitrogen metabolism in salt-treated poplar 3
© 2007 The AuthorsJournal compilation © 2007 Blackwell Publishing Ltd, Plant, Cell and Environment

100 mg of homogenized tissues (fine roots, leaves) weretransferred in a mixture of 1 mL methanol:chloroform (7:3,v/v) and 0.2 mL HEPES buffer [5 mM ethylene glycol tet-raacetic acid (EGTA), 20 mM HEPES, 10 mM NaF, pH 7.0].Homogenates were incubated on ice for 30 min. Water-soluble amino compounds were extracted twice with 0.6 mLdistilled water. The aqueous phases were combined andfreeze dried (Alpha 2-4; Christ, Osterode, Germany). Thedried material was dissolved in 1 mL of 0.2 M lithiumcitrate buffer (pH 2.2) directly before analyses.Amino com-pounds were separated and detected by an automatedamino acid analyser (Biochrom; Pharmacia LKB, Freiburg,Germany) as described by Gessler et al. (1998).
Elemental analysis
For elemental analysis, the plant material was completelydried at 65 °C for 10 d and digested with HNO3 (100 mgtissue + 1 mL of 65% HNO3 suprapur for 10 h at 160–170 °C, 10 bar) in a pressure ashing device (Seif, Unter-schleißheim, Germany). Samples (10 mL), diluted withultrapure H2O, were analysed by inductively coupledplasma-optical emission spectroscopy (ICP-OES; JY 70Plus, Devision d’Instruments S.A., J1obin Yvon, France).Quantification was performed by external standards. Nitro-gen in the plant tissue was determined by oxidative com-bustion of 5–10 mg of homogenized, pulverized dry samplesin a CHN-analyser (CHN-O-RAPID, Elementar, Hanau,Germany). Because of the origin of a common experiment,element data of Fig. 1 are presented and discussed inanother context (Ache, personal communication).
Extraction and detection of water-solubleprotein (WSP)
For protein analysis, 50 mg of plant tissue homogenized inliquid nitrogen was extracted in four volumes of extractionbuffer (120 mM HEPES pH 7.5, 6 mM Mg-acetate, 1.2 mMEDTA and 3 mM Na2MoO4) by two strokes (5 s each) soni-fication (Sonopuls HD60; Bandelin, Berlin, Germany) onice. The samples were centrifuged for 10 min at 4 °C and17 500 ¥ g in a Beckman-Microfuge R (Beckman Instru-ments, Palto Alto, CA, USA). Five microliters of the proteinextract was incubated with 995 mL protein-assay solution(Bio-Rad) according to the manufacturer’s instructions, andthe absorbance was measured at 595 nm. BSA was used asstandard.
Statistical analyses
Data derived from experiments I and II were analysedseparately. For each time point, the impact of N nutrition,salt stress and the interaction of N nutrition and salt stresswere analysed by a general linear model (GLM) (SPSSversion 13.0, SPSS GmbH Software, Munich, Germany). Incase of heterogeneous variances, P-values were evaluatedby the Tamhane-T2 test for non-equal variances (SPSS
version 13.0) wherever possible. P-values with P � 0.05were considered as significant differences.
RESULTS
Na accumulation in fine roots, stemsand leaves
Young Grey poplar plants were fed either nitrate or ammo-nium while the plants were subjected to moderate salt con-centrations in the hydroponic solution up to 75 mM NaCl.The focus was on the long-term effects on N metabolism ofsalt-adapted poplars so that time points analysed were after1 and 2 weeks of salt exposure. The microclimatic condi-tions varied in two independent experiments with respectto air temperature and irradiation (see Materials andMethods). Because this affected transpiration (data notshown) and thus probably transport of mineral elementswith the xylem sap, the results of both experiments wereanalysed separately.
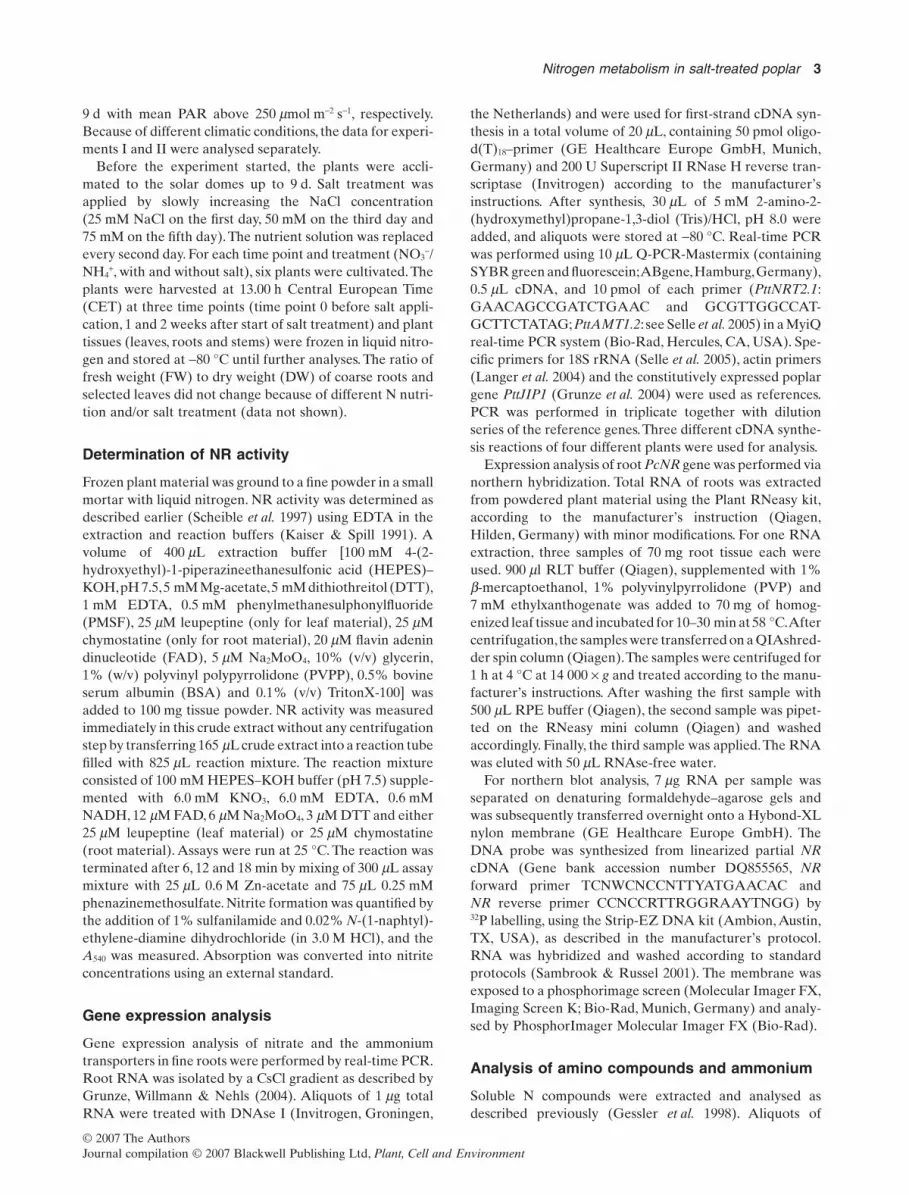
In order to evaluate the actual in vivo impact of themoderate salt exposure of 75 mM NaCl on poplar fed withdifferent N sources, the distribution of Na was analysed inroots, stems and leaves. The concentration of Na increasedsignificantly in roots, stem and leaves after 1 and 2 weeks ofsalt application (Fig. 1). In roots, the Na concentration wasalready very high after the first week of salt application andreached almost 10 mg g-1 DW after the second week. Instems and leaves, the Na concentration increased moreslowly over the 2 weeks of salt exposure. In leaves, Naconcentrations increased from the first to the second weekmore than fourfold in experiment I and 9.5- to 20.0-fold inexperiment II with nitrate and ammonium fertilization,respectively. The accumulation of Na was slowest in leaves,but after 2 weeks of salt exposure, similar concentrations asin stems had accumulated (up to 8.1 mg Na g-1 DW-1). Thisindicates that Na was taken up by, and distributed withinthe entire plant, thereby causing salt exposure to all plantorgans. The N nutrition had no consistent impact on the Naaccumulation.
Growth analysis
Economical interest on poplar in plantations is focusedon high yields. Because N fertilization has, in general,a substantial impact on growth, we analysed growth insalt-treated poplar saplings in dependence of N nutrition.Root dry mass of plants fed nitrate was significantlyhigher than of plants grown with ammonium before expo-sure to salt treatment (Fig. 2). Root biomass was signifi-cantly reduced by the salt treatment at the end ofboth experiments, but there was no N nutrition-relatedeffect. Root growth rates were also affected by salt as thediameter increment was significantly reduced when calcu-lated over the whole experimental period (from T0until T2 in Table 1). This reduction was more stronglyaffected by the salt treatment in ammonium-fed plantsthan in nitrate-fed plants (Table 1). Similarly, the stem
4 B. Ehlting et al.
© 2007 The AuthorsJournal compilation © 2007 Blackwell Publishing Ltd, Plant, Cell and Environment
Experiment I Experiment II
LeavesS
tems
Roots
Na
(mg
g–1
DW
)
0
2
4
6
8
10
12
0
2
4
6
8
10
02468
10
N – – – – * 1 –S *** *** * 1 ***N*S – – * –
N – – * 1 ** *** 1 2 –S *** *** *** ***N*S – * *** –
N * – – – *** 1 2 ** 1 2
S *** *** *** ***N*S – – *** ***
Time of salt exposure (weeks)0 1 20 1 2
12
12
Figure 1. Na contents in differentorgans of poplar trees upon salttreatment. Presented are the amountsof Na in roots, stems and leaves ofexperiment I and II. White boxes indicatenitrate with salt; grey boxes indicatenitrate only; striped boxes indicateammonium with salt, and black boxesindicate feeding with ammonium only.Columns represent means of independentmeasurements of 6 individual plants pertreatment and SD. Significant differencesare indicated by * (P � 0.05),** (P � 0.01) and *** (P � 0.001).1 indicates that the significance identifiedwith the general linear model (GLM) wasrecalculated because of heterogeneousvariances and could not be re-identified.2 indicates that the significance identifiedwith the GLM was recalculated becauseof heterogeneous variances and could bere-identified only in the salt-treatedgroup, but not in the non-salt-treatedgroup. -, not significant; N, N nutrition;S, salt treatment; N*S, interaction of Nnutrition and salt treatment; DW, dryweight.
0
1
2
3
4
5
0 1 2
Experiment I Experiment II
Le ave s
Roo ts
0 1 2
0
1
2
3
4
D ry
wei
ght(
g)
N *** – – *** – –S – ** 1 – ***N*S – – – **
NS – – – –N*S – – ** –
Time of salt exposure (weeks)
– – – – – –
Figure 2. Dry weight (DW) of roots andleaves upon salt treatment. White boxesindicate nitrate with salt; grey boxesindicate nitrate only; striped boxesindicate ammonium with salt, and blackboxes indicate feeding with ammoniumonly. Columns represent means ofindependent measurements of 6individual plants per treatment and SD.Significant differences are indicated by** (P � 0.01) and *** (P � 0.001).1 indicates significant difference only inammonium-fed plants. -, not significant;N, N nutrition; S, salt treatment; N*S,interaction of N nutrition and salttreatment.
Nitrogen metabolism in salt-treated poplar 5
© 2007 The AuthorsJournal compilation © 2007 Blackwell Publishing Ltd, Plant, Cell and Environment

height growth was more reduced because of salt inammonium-fed plants after 2 weeks (experiment I). Leafgrowth was not significantly affected by salt exposure.
Gene expression analysis of nitrate andammonium transporters in fine roots
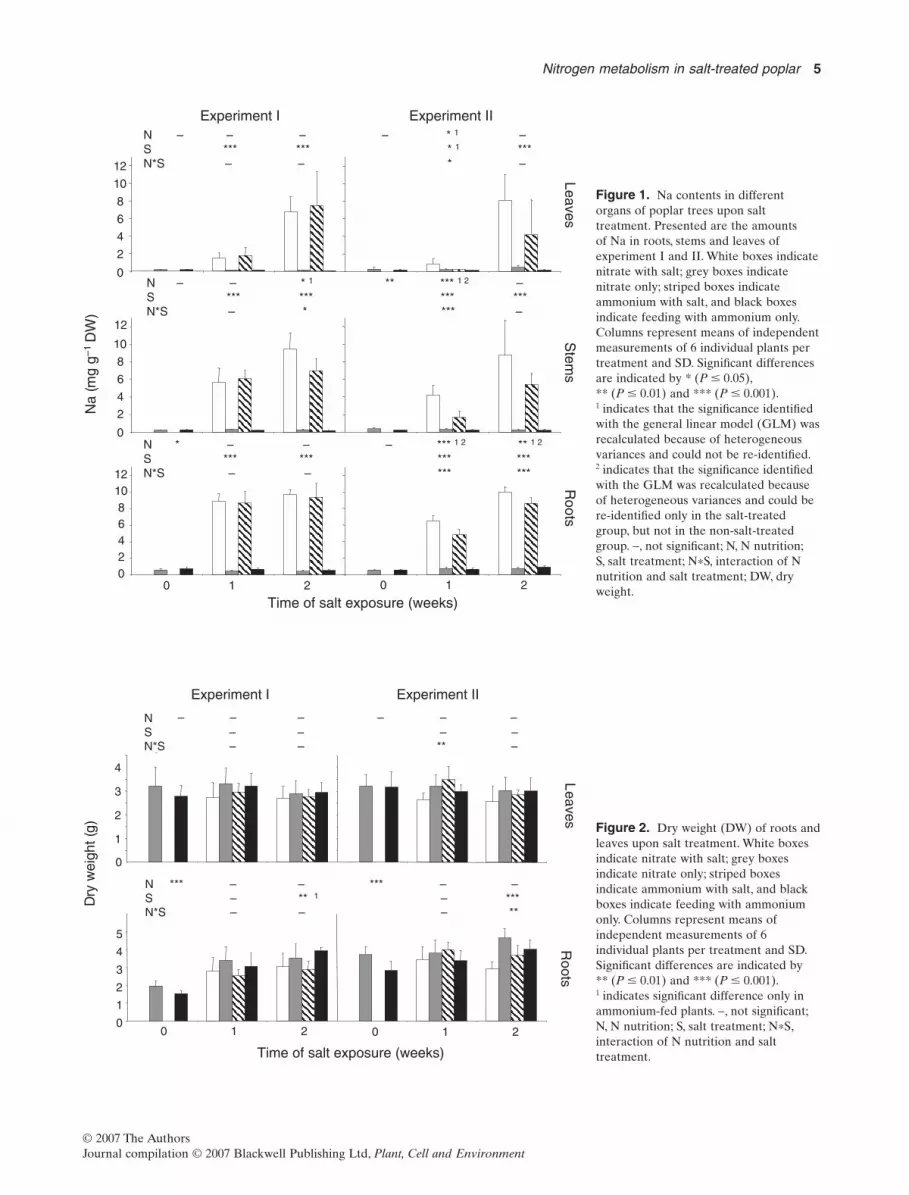
Growth was affected as a result of salt treatment, especiallywhen the plants were fed with ammonium. The different Nsource obviously had an impact on plant performance. Weanalysed stepwise the N metabolism beginning with Nuptake via gene expression analysis of nitrate and ammo-nium transporters in fine roots after both 1 and 2 weeks ofsalt application.Two high-affinity transporters were selectedfor the analysis, namely, the high-affinity nitrate transporterNRT2.1 and the high-affinity ammonium transporterAMT1.2. Both transporters belong to gene families, but onlythe chosen isoforms were specifically root expressed andwere thus presumably the most important N transporters(Selle, unpublished results; Selle et al. 2005). The transcriptlevels of both transporters were higher in nitrate-fed plantsthan in ammonium-fed plants independent of the salt treat-ment during the 2 weeks of analysis in each experiment(Fig. 3, except AMT1 at T = 0 in both experiments).
In nitrate-supplied plants, NRT2.1 transcripts accumu-lated more under salt exposure compared with controls notexposed to salt after 1 week, but after 2 weeks, transcriptaccumulation was less in the presence of salt compared tocontrols. NRT2.1 transcript levels did not change as a resultof salt treatment when ammonium was supplied as N source.
In nitrate-fed plants, AMT1.2 transcripts accumulatedduring the 2 weeks of experiment in both salt-treated andcontrol plants. However, this accumulation was significantlylower in salt-treated poplar. In ammonium-fed plants, theAMT1.2 transcript level did not change as a consequence ofsalt treatment. Thus, the response of the AMT1.2 transcriptlevel differed significantly depending on both N nutritionand salt-stress treatment (P-values for N*S 0.011 and 0.044for experiments I and II, respectively).
N uptake of poplar was measured in experimentsperformed under comparable meteorological conditions(light, temperature, salinity levels) as described in thisstudy, but with plants in aerated aqueous solution(Dluzniewska et al. 2007) and not on clay granulate. Nuptake was significantly reduced because of salt exposureonly in ammonium-fed plants, whereas in nitrate-fedplants, N net uptake was not affected by salt. This wasconsistent with our results indicating that plants fed withnitrate were less affected by salt treatment than plants fedwith ammonium.
NR gene expression and NR enzyme activity inroots and leaves
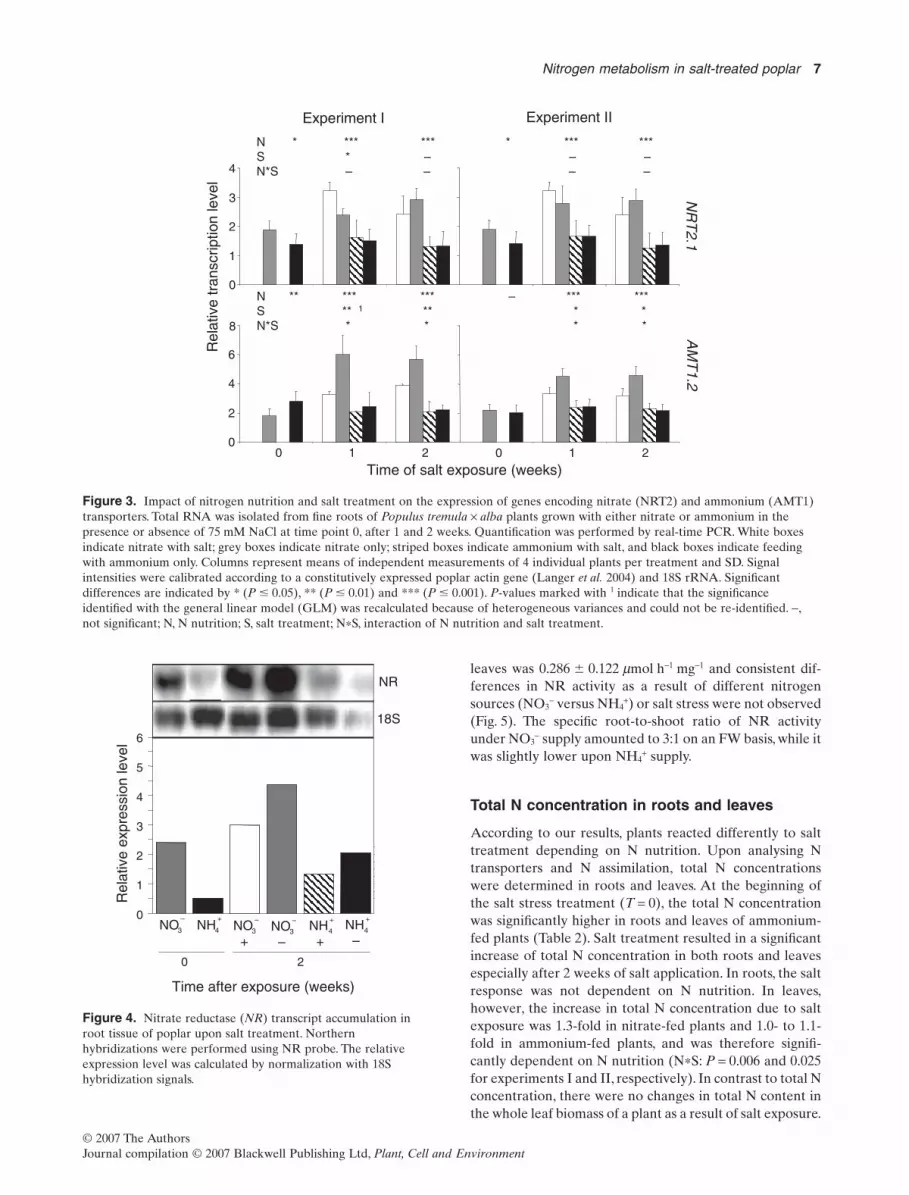
Subsequent to its uptake, nitrate has to be reduced beforebeing further assimilated. This key step in N assimilation iscatalysed by the NR producing nitrite, which is furtherreduced to ammonium. Both NR gene expression and NRenzyme activity were analysed, because nitrate reductionis highly regulated by environmental and internal factorson the transcriptional level as well as on the post-transcriptional level for fine tuning (Kaiser & Huber1994). Substantially higher NR transcript levels weredetected in roots of plants fed with nitrate than in rootsof plants fed with ammonium (Fig. 4). Application ofsalt stress resulted only in a minor decrease of NR tran-script levels in both nitrate- and ammonium-fed plants(Fig. 4).
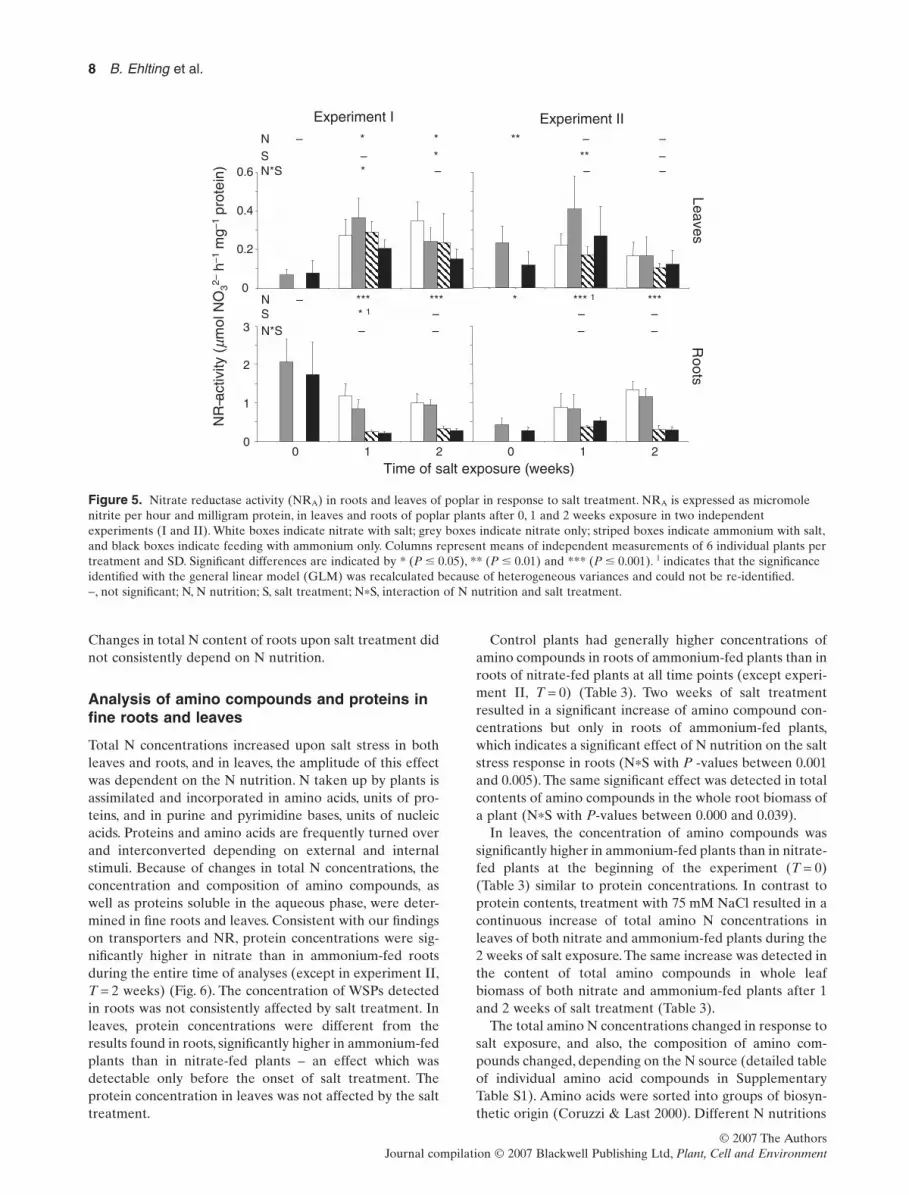
Accordingly, a significant higher NR activity was detectedin roots of nitrate-fed plants than in roots of plantsfed with ammonium at all time points analysed (Fig. 5).The average NR activity in control roots amountedto 1.5 � 0.7 mmol h-1 mg-1 (experiment I) and 0.7 �
0.4 mmol h-1 mg-1 (experiment II) for nitrate-fed plants,and to 1.0 � 1.0 mmol h-1 mg-1 (experiment I) and 0.3 �
0.2 mmol h-1 mg-1 (experiment II) for ammonium-fedplants. Salt treatment had no clear-cut impact on NR activ-ity observed in roots (Fig. 5). The average NR activity in
Table 1. Growth rates of different tissues after 2 weeks of salt treatment
Treatment from T0 until T2
Root diameterincrement(mm week-1) Significance
Stem height growth(mm week-1) Significance
Leaf growth(numbers week-1) Significance
Experiment INO3
- with salt 0.3 � 0.0 N ns 48.8 � 9.7 N ns 1.8 � 0.3 N *without salt 0.4 � 0.3 S ***+ 55.8 � 6.3 S *** 1.9 � 0.2 S ns
NH4+ with salt 0.2 � 0.2 N*S ns 46.7 � 10.2 N*S ns 2.0 � 0.4 N*S ns
without salt 0.7 � 0.1 68.8 � 10.7 2.3 � 0.3
Experiment IINO3
- with salt 0.4 � 0.1 N ns 29.2 � 8.3 N ns 1.3 � 0.6 N nswithout salt 0.5 � 0.1 S ***+ 54.2 � 9.4 S *** 2.3 � 0.5 S **
NH4+ with salt 0.2 � 0.2 N*S ** 35.0 � 11.5 N*S ns 1.7 � 0.6 N*S ns
without salt 0.6 � 0.1 53.3 � 9.2 1.9 � 0.2
Presented are means and SD (n = 6). Significant differences are indicated by * (P � 0.05), ** (P � 0.01) and *** (P � 0.001). + indicates thatP-values were recalculated because of heterologous variances, and significant differences due to salt were detected only in plants fed withammonium. N, N nutrition; S, salt stress; N*S, interaction of N nutrition and salt treatment; ns, not significant.
6 B. Ehlting et al.
© 2007 The AuthorsJournal compilation © 2007 Blackwell Publishing Ltd, Plant, Cell and Environment
leaves was 0.286 � 0.122 mmol h-1 mg-1 and consistent dif-ferences in NR activity as a result of different nitrogensources (NO3
- versus NH4+) or salt stress were not observed
(Fig. 5). The specific root-to-shoot ratio of NR activityunder NO3
- supply amounted to 3:1 on an FW basis, while itwas slightly lower upon NH4
+ supply.
Total N concentration in roots and leaves
According to our results, plants reacted differently to salttreatment depending on N nutrition. Upon analysing Ntransporters and N assimilation, total N concentrationswere determined in roots and leaves. At the beginning ofthe salt stress treatment (T = 0), the total N concentrationwas significantly higher in roots and leaves of ammonium-fed plants (Table 2). Salt treatment resulted in a significantincrease of total N concentration in both roots and leavesespecially after 2 weeks of salt application. In roots, the saltresponse was not dependent on N nutrition. In leaves,however, the increase in total N concentration due to saltexposure was 1.3-fold in nitrate-fed plants and 1.0- to 1.1-fold in ammonium-fed plants, and was therefore signifi-cantly dependent on N nutrition (N*S: P = 0.006 and 0.025for experiments I and II, respectively). In contrast to total Nconcentration, there were no changes in total N content inthe whole leaf biomass of a plant as a result of salt exposure.
NR
T2 .1
0
1
2
3
4
Experiment I Experiment II
0
2
4
6
0 1 2 0 1 2
Time of salt exposure (weeks)
Rel
ativ
et r
ansc
riptio
nle
vel
N * *** *** * *** ***S * – – –N*S – – – –
N ** *** *** – *** ***S ** 1 ** * *N*S * * * *
AM
T1. 2
8
Figure 3. Impact of nitrogen nutrition and salt treatment on the expression of genes encoding nitrate (NRT2) and ammonium (AMT1)transporters. Total RNA was isolated from fine roots of Populus tremula ¥ alba plants grown with either nitrate or ammonium in thepresence or absence of 75 mM NaCl at time point 0, after 1 and 2 weeks. Quantification was performed by real-time PCR. White boxesindicate nitrate with salt; grey boxes indicate nitrate only; striped boxes indicate ammonium with salt, and black boxes indicate feedingwith ammonium only. Columns represent means of independent measurements of 4 individual plants per treatment and SD. Signalintensities were calibrated according to a constitutively expressed poplar actin gene (Langer et al. 2004) and 18S rRNA. Significantdifferences are indicated by * (P � 0.05), ** (P � 0.01) and *** (P � 0.001). P-values marked with 1 indicate that the significanceidentified with the general linear model (GLM) was recalculated because of heterogeneous variances and could not be re-identified. -,not significant; N, N nutrition; S, salt treatment; N*S, interaction of N nutrition and salt treatment.
0
1
2
3
4
5
6
NH4
+
–NO3
–
–NH4
+
+NO3
–
+NH4
+NO3
–
18S
NR
Rel
ativ
eex
pres
sion
leve
l
0 2
Time after exposure (weeks)
Figure 4. Nitrate reductase (NR) transcript accumulation inroot tissue of poplar upon salt treatment. Northernhybridizations were performed using NR probe. The relativeexpression level was calculated by normalization with 18Shybridization signals.
Nitrogen metabolism in salt-treated poplar 7
© 2007 The AuthorsJournal compilation © 2007 Blackwell Publishing Ltd, Plant, Cell and Environment
Changes in total N content of roots upon salt treatment didnot consistently depend on N nutrition.
Analysis of amino compounds and proteins infine roots and leaves
Total N concentrations increased upon salt stress in bothleaves and roots, and in leaves, the amplitude of this effectwas dependent on the N nutrition. N taken up by plants isassimilated and incorporated in amino acids, units of pro-teins, and in purine and pyrimidine bases, units of nucleicacids. Proteins and amino acids are frequently turned overand interconverted depending on external and internalstimuli. Because of changes in total N concentrations, theconcentration and composition of amino compounds, aswell as proteins soluble in the aqueous phase, were deter-mined in fine roots and leaves. Consistent with our findingson transporters and NR, protein concentrations were sig-nificantly higher in nitrate than in ammonium-fed rootsduring the entire time of analyses (except in experiment II,T = 2 weeks) (Fig. 6). The concentration of WSPs detectedin roots was not consistently affected by salt treatment. Inleaves, protein concentrations were different from theresults found in roots, significantly higher in ammonium-fedplants than in nitrate-fed plants – an effect which wasdetectable only before the onset of salt treatment. Theprotein concentration in leaves was not affected by the salttreatment.
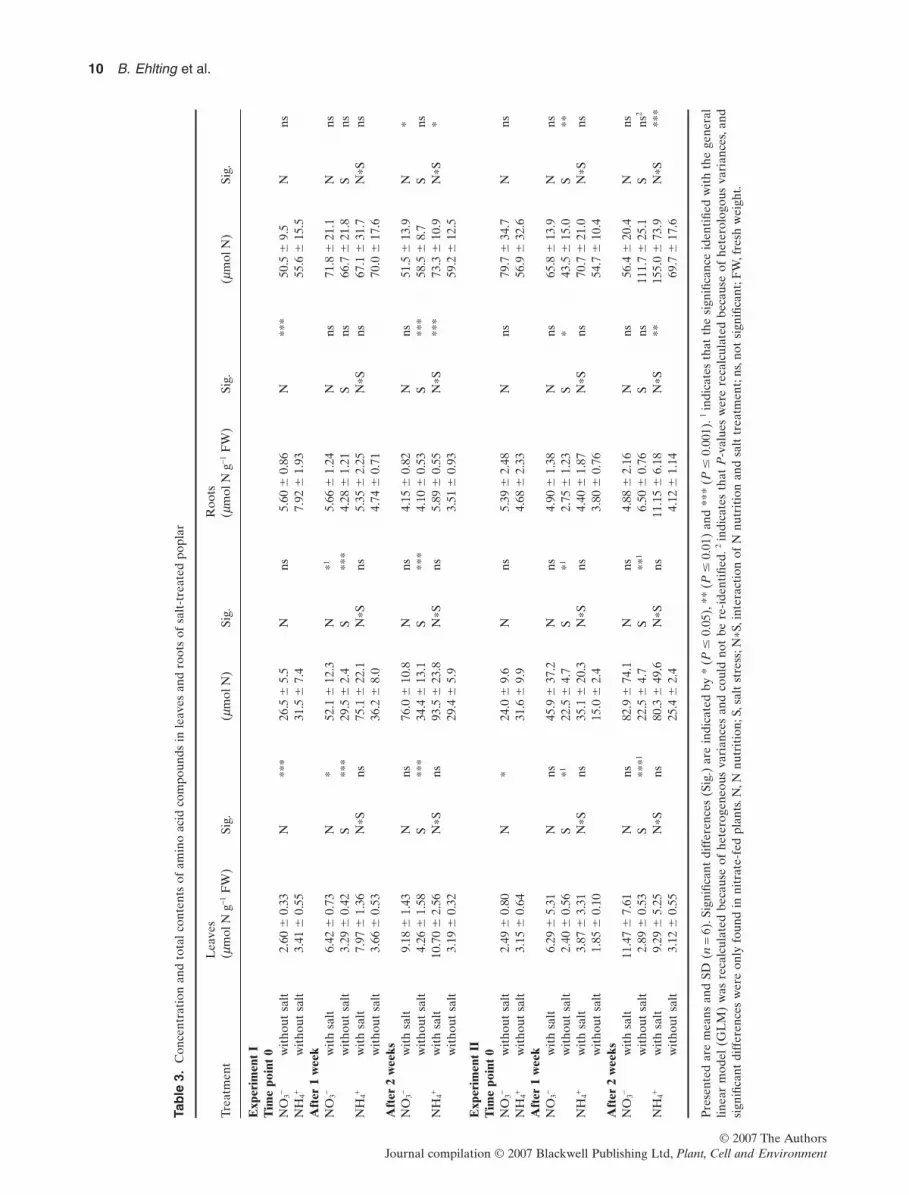
Control plants had generally higher concentrations ofamino compounds in roots of ammonium-fed plants than inroots of nitrate-fed plants at all time points (except experi-ment II, T = 0) (Table 3). Two weeks of salt treatmentresulted in a significant increase of amino compound con-centrations but only in roots of ammonium-fed plants,which indicates a significant effect of N nutrition on the saltstress response in roots (N*S with P -values between 0.001and 0.005). The same significant effect was detected in totalcontents of amino compounds in the whole root biomass ofa plant (N*S with P-values between 0.000 and 0.039).
In leaves, the concentration of amino compounds wassignificantly higher in ammonium-fed plants than in nitrate-fed plants at the beginning of the experiment (T = 0)(Table 3) similar to protein concentrations. In contrast toprotein contents, treatment with 75 mM NaCl resulted in acontinuous increase of total amino N concentrations inleaves of both nitrate and ammonium-fed plants during the2 weeks of salt exposure.The same increase was detected inthe content of total amino compounds in whole leafbiomass of both nitrate and ammonium-fed plants after 1and 2 weeks of salt treatment (Table 3).
The total amino N concentrations changed in response tosalt exposure, and also, the composition of amino com-pounds changed, depending on the N source (detailed tableof individual amino acid compounds in SupplementaryTable S1). Amino acids were sorted into groups of biosyn-thetic origin (Coruzzi & Last 2000). Different N nutritions
Roo ts
0
1
2
0 1 2
Experiment I Experiment II
0 1 2
Time of salt exposure (weeks)
NR
–act
ivity
(mm
olN
O32–
h–1m
g–1pr
otei
n)
0
0.2
0.4
0.6
Leav es
N – * * ** – –S – * ** –N*S * – – –
N – *** *** * *** 1 ***S * 1 – – –N*S – – – –3
Figure 5. Nitrate reductase activity (NRA) in roots and leaves of poplar in response to salt treatment. NRA is expressed as micromolenitrite per hour and milligram protein, in leaves and roots of poplar plants after 0, 1 and 2 weeks exposure in two independentexperiments (I and II). White boxes indicate nitrate with salt; grey boxes indicate nitrate only; striped boxes indicate ammonium with salt,and black boxes indicate feeding with ammonium only. Columns represent means of independent measurements of 6 individual plants pertreatment and SD. Significant differences are indicated by * (P � 0.05), ** (P � 0.01) and *** (P � 0.001). 1 indicates that the significanceidentified with the general linear model (GLM) was recalculated because of heterogeneous variances and could not be re-identified.-, not significant; N, N nutrition; S, salt treatment; N*S, interaction of N nutrition and salt treatment.
8 B. Ehlting et al.
© 2007 The AuthorsJournal compilation © 2007 Blackwell Publishing Ltd, Plant, Cell and Environment

Table 2. Total N concentrations and absolute contents in poplar leaves and roots as affected by different N nutritions and salt treatment
TreatmentLeaves(g N g-1 DW) Sig. (g N) Sig.
Roots(g N g-1 DW) Sig. (g N) Sig.
Experiment ITime point 0NO3
- without salt 1.8 � 0.1 N *** 5.7 � 1.3 N ns 0.8 � 0.1 N *** 1.6 � 0.3 N nsNH4
+ without salt 2.2 � 0.2 6.1 � 0.9 1.0 � 0.1 1.5 � 0.1After 1 weekNO3
- with salt 2.0 � 0.2 N *** 5.4 � 1.1 N * 0.9 � 0.1 N ns 2.4 � 0.5 N nswithout salt 1.7 � 0.1 S *** 5.5 � 1.0 S ns 0.9 � 0.1 S ns 2.9 � 0.6 S *
NH4+ with salt 2.2 � 0.1 N*S ns 6.5 � 1.0 N*S ns 0.9 � 0.1 N*S ns 2.3 � 0.3 N*S ns
without salt 2.0 � 0.1 6.3 � 1.0 0.9 � 0.1 2.8 � 0.7After 2 weeksNO3
- with salt 2.1 � 0.1 N *** 5.7 � 1.1 N *** 0.9 � 0.1 N ns 2.6 � 0.6 N nswithout salt 1.6 � 0.1 S *** 4.7 � 0.7 S ns 0.8 � 0.1 S * 2.9 � 0.4 S *
NH4+ with salt 2.4 � 0.3 N*S ** 6.6 � 0.9 N*S ns 1.0 � 0.1 N*S ns 2.8 � 0.4 N*S ns
without salt 2.4 � 0.2 6.9 � 1.3 0.9 � 0.1 3.4 � 0.2
Experiment IITime point 0NO3
- without salt 1.7 � 0.1 N *** 5.4 � 0.9 N * 0.7 � 0.1 N ** 2.7 � 0.3 N *NH4
+ without salt 2.0 � 0.1 6.5 � 1.3 0.8 � 0.1 2.3 � 0.5After 1 weekNO3
- with salt 1.9 � 0.2 N ns 4.9 � 0.6 N ns 0.9 � 0.1 N ns 3.1 � 0.5 N nswithout salt 1.9 � 0.3 S ns 6.0 � 1.3 S ns 0.9 � 0.1 S ns 3.3 � 0.7 S ns
NH4+ with salt 1.9 � 0.1 N*S ns 6.8 � 1.0 N*S ** 0.9 � 0.1 N*S ns 3.5 � 0.2 N*S *
without salt 1.9 � 0.1 5.6 � 0.4 0.8 � 0.1 2.7 � 0.4After 2 weeksNO3
- with salt 2.3 � 0.1 N ** 5.9 � 1.7 N ns 0.9 � 0.0 N ns 2.6 � 0.4 N nswithout salt 1.7 � 0.2 S *** 5.3 � 1.3 S ns 0.8 � 0.1 S ** 3.7 � 0.6 S *
NH4+ with salt 2.3 � 0.2 N*S * 6.7 � 0.6 N*S ns 0.9 � 0.1 N*S ns 3.2 � 0.7 N*S *
without salt 2.1 � 0.1 6.3 � 1.1 0.8 � 0.1 3.2 � 0.3
Presented are means and SD (n = 6). Significant differences (Sig.) are indicated by * (P � 0.05), ** (P � 0.01) and *** (P � 0.001). ns, notsignificant; N, N nutrition; S, salt stress; N*S, interaction of N nutrition and salt treatment; DW, dry weight.
Experiment I Experiment II
LeavesR
oots
Pro
tein
(mg
g–1F
W)
0
2
4
6
8
10
12
0
0.5
1.0
1.5
2.0
0 1 2 0 1 2Time of salt exposure (weeks)
N * – – *** – –S – – – –N*S – – – –
N *** *** *** * *** –S – * – –N*S – * – –
2.5
Figure 6. Water-soluble protein (WSP)contents of poplar leaves and roots asaffected by salt treatment. Proteincontents were analysed in leaves androots in experiment I and II. White boxesindicate nitrate with salt; grey boxesindicate nitrate only; striped boxesindicate ammonium with salt, and blackboxes indicate feeding with ammoniumonly. Columns represent means ofindependent measurements of 6individual plants per treatment and SD.Significant differences are indicated by* (P � 0.05) and *** (P � 0.001); -: notsignificant. N, N nutrition; S, salttreatment; N*S, interaction of N nutritionand salt treatment. FW, fresh weight.
Nitrogen metabolism in salt-treated poplar 9
© 2007 The AuthorsJournal compilation © 2007 Blackwell Publishing Ltd, Plant, Cell and Environment
Tab
le3.
Con
cent
rati
onan
dto
talc
onte
nts
ofam
ino
acid
com
poun
dsin
leav
esan
dro
ots
ofsa
lt-t
reat
edpo
plar
Trea
tmen
tL
eave
s(m
mol
Ng-1
FW
)Si
g.(m
mol
N)
Sig.
Roo
ts(m
mol
Ng-1
FW
)Si
g.(m
mol
N)
Sig.
Exp
erim
ent
IT
ime
poin
t0
NO
3-w
itho
utsa
lt2.
60�
0.33
N**
*26
.5�
5.5
Nns
5.60
�0.
86N
***
50.5
�9.
5N
nsN
H4+
wit
hout
salt
3.41
�0.
5531
.5�
7.4
7.92
�1.
9355
.6�
15.5
Aft
er1
wee
kN
O3-
wit
hsa
lt6.
42�
0.73
N*
52.1
�12
.3N
*15.
66�
1.24
Nns
71.8
�21
.1N
nsw
itho
utsa
lt3.
29�
0.42
S**
*29
.5�
2.4
S**
*4.
28�
1.21
Sns
66.7
�21
.8S
nsN
H4+
wit
hsa
lt7.
97�
1.36
N*S
ns75
.1�
22.1
N*S
ns5.
35�
2.25
N*S
ns67
.1�
31.7
N*S
nsw
itho
utsa
lt3.
66�
0.53
36.2
�8.
04.
74�
0.71
70.0
�17
.6A
fter
2w
eeks
NO
3-w
ith
salt
9.18
�1.
43N
ns76
.0�
10.8
Nns
4.15
�0.
82N
ns51
.5�
13.9
N*
wit
hout
salt
4.26
�1.
58S
***
34.4
�13
.1S
***
4.10
�0.
53S
***
58.5
�8.
7S
nsN
H4+
wit
hsa
lt10
.70
�2.
56N
*Sns
93.5
�23
.8N
*Sns
5.89
�0.
55N
*S**
*73
.3�
10.9
N*S
*w
itho
utsa
lt3.
19�
0.32
29.4
�5.
93.
51�
0.93
59.2
�12
.5
Exp
erim
ent
IIT
ime
poin
t0
NO
3-w
itho
utsa
lt2.
49�
0.80
N*
24.0
�9.
6N
ns5.
39�
2.48
Nns
79.7
�34
.7N
nsN
H4+
wit
hout
salt
3.15
�0.
6431
.6�
9.9
4.68
�2.
3356
.9�
32.6
Aft
er1
wee
kN
O3-
wit
hsa
lt6.
29�
5.31
Nns
45.9
�37
.2N
ns4.
90�
1.38
Nns
65.8
�13
.9N
nsw
itho
utsa
lt2.
40�
0.56
S*1
22.5
�4.
7S
*12.
75�
1.23
S*
43.5
�15
.0S
**N
H4+
wit
hsa
lt3.
87�
3.31
N*S
ns35
.1�
20.3
N*S
ns4.
40�
1.87
N*S
ns70
.7�
21.0
N*S
nsw
itho
utsa
lt1.
85�
0.10
15.0
�2.
43.
80�
0.76
54.7
�10
.4A
fter
2w
eeks
NO
3-w
ith
salt
11.4
7�
7.61
Nns
82.9
�74
.1N
ns4.
88�
2.16
Nns
56.4
�20
.4N
nsw
itho
utsa
lt2.
89�
0.53
S**
*122
.5�
4.7
S**
16.
50�
0.76
Sns
111.
7�
25.1
Sns
2
NH
4+w
ith
salt
9.29
�5.
25N
*Sns
80.3
�49
.6N
*Sns
11.1
5�
6.18
N*S
**15
5.0
�73
.9N
*S**
*w
itho
utsa
lt3.
12�
0.55
25.4
�2.
44.
12�
1.14
69.7
�17
.6
Pre
sent
edar
em
eans
and
SD(n
=6)
.Sig
nific
ant
diff
eren
ces
(Sig
.)ar
ein
dica
ted
by*
(P�
0.05
),**
(P�
0.01
)an
d**
*(P
�0.
001)
.1in
dica
tes
that
the
sign
ifica
nce
iden
tifie
dw
ith
the
gene
ral
linea
rm
odel
(GL
M)
was
reca
lcul
ated
beca
use
ofhe
tero
gene
ous
vari
ance
san
dco
uld
not
bere
-ide
ntifi
ed.2
indi
cate
sth
atP
-val
ues
wer
ere
calc
ulat
edbe
caus
eof
hete
rolo
gous
vari
ance
s,an
dsi
gnifi
cant
diff
eren
ces
wer
eon
lyfo
und
inni
trat
e-fe
dpl
ants
.N,N
nutr
itio
n;S,
salt
stre
ss;N
*S,i
nter
acti
onof
Nnu
trit
ion
and
salt
trea
tmen
t;ns
,not
sign
ifica
nt;F
W,f
resh
wei
ght.
10 B. Ehlting et al.
© 2007 The AuthorsJournal compilation © 2007 Blackwell Publishing Ltd, Plant, Cell and Environment
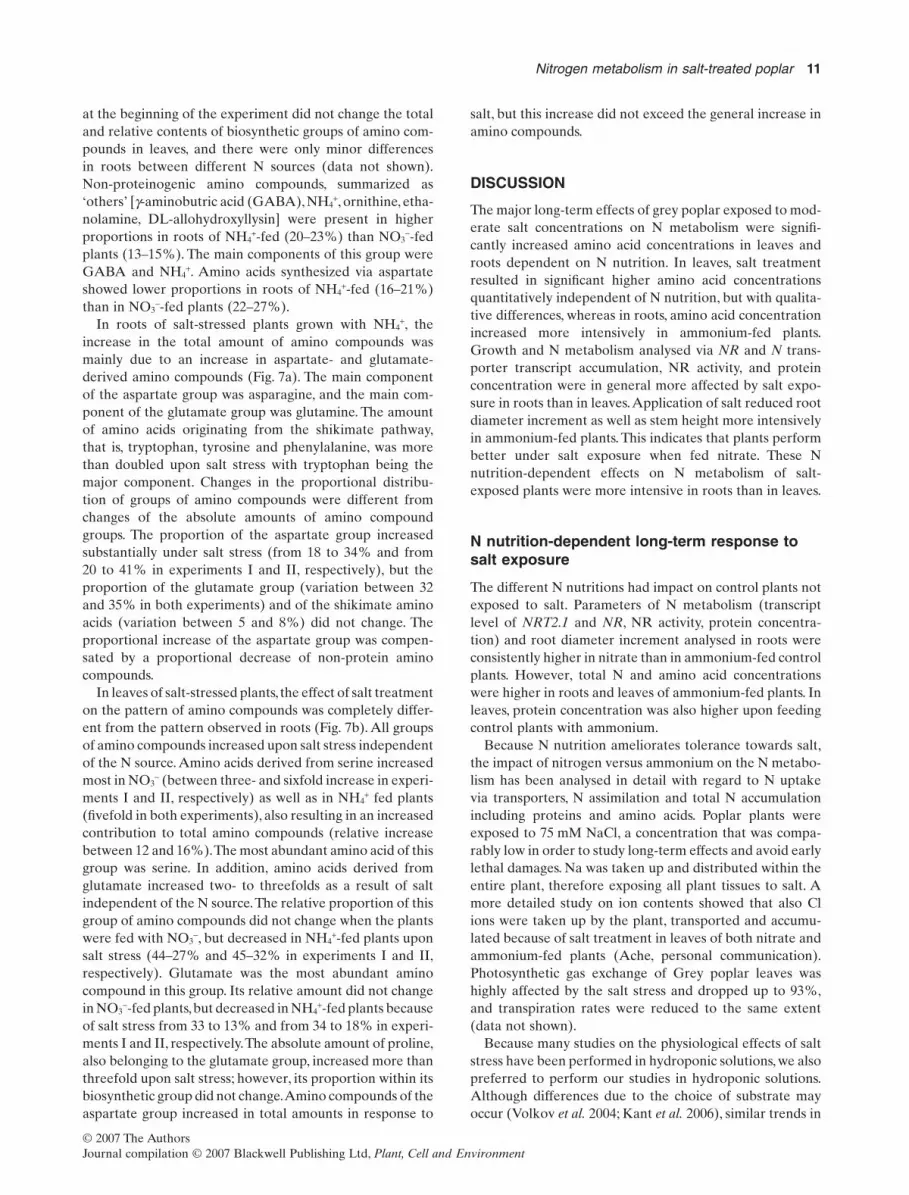
at the beginning of the experiment did not change the totaland relative contents of biosynthetic groups of amino com-pounds in leaves, and there were only minor differencesin roots between different N sources (data not shown).Non-proteinogenic amino compounds, summarized as‘others’ [g-aminobutric acid (GABA), NH4
+, ornithine, etha-nolamine, DL-allohydroxyllysin] were present in higherproportions in roots of NH4
+-fed (20–23%) than NO3--fed
plants (13–15%). The main components of this group wereGABA and NH4
+. Amino acids synthesized via aspartateshowed lower proportions in roots of NH4
+-fed (16–21%)than in NO3
--fed plants (22–27%).In roots of salt-stressed plants grown with NH4
+, theincrease in the total amount of amino compounds wasmainly due to an increase in aspartate- and glutamate-derived amino compounds (Fig. 7a). The main componentof the aspartate group was asparagine, and the main com-ponent of the glutamate group was glutamine. The amountof amino acids originating from the shikimate pathway,that is, tryptophan, tyrosine and phenylalanine, was morethan doubled upon salt stress with tryptophan being themajor component. Changes in the proportional distribu-tion of groups of amino compounds were different fromchanges of the absolute amounts of amino compoundgroups. The proportion of the aspartate group increasedsubstantially under salt stress (from 18 to 34% and from20 to 41% in experiments I and II, respectively), but theproportion of the glutamate group (variation between 32and 35% in both experiments) and of the shikimate aminoacids (variation between 5 and 8%) did not change. Theproportional increase of the aspartate group was compen-sated by a proportional decrease of non-protein aminocompounds.
In leaves of salt-stressed plants, the effect of salt treatmenton the pattern of amino compounds was completely differ-ent from the pattern observed in roots (Fig. 7b). All groupsof amino compounds increased upon salt stress independentof the N source. Amino acids derived from serine increasedmost in NO3
- (between three- and sixfold increase in experi-ments I and II, respectively) as well as in NH4
+ fed plants(fivefold in both experiments), also resulting in an increasedcontribution to total amino compounds (relative increasebetween 12 and 16%).The most abundant amino acid of thisgroup was serine. In addition, amino acids derived fromglutamate increased two- to threefolds as a result of saltindependent of the N source.The relative proportion of thisgroup of amino compounds did not change when the plantswere fed with NO3
-, but decreased in NH4+-fed plants upon
salt stress (44–27% and 45–32% in experiments I and II,respectively). Glutamate was the most abundant aminocompound in this group. Its relative amount did not changein NO3
--fed plants,but decreased in NH4+-fed plants because
of salt stress from 33 to 13% and from 34 to 18% in experi-ments I and II, respectively.The absolute amount of proline,also belonging to the glutamate group, increased more thanthreefold upon salt stress; however, its proportion within itsbiosynthetic group did not change.Amino compounds of theaspartate group increased in total amounts in response to
salt, but this increase did not exceed the general increase inamino compounds.
DISCUSSION
The major long-term effects of grey poplar exposed to mod-erate salt concentrations on N metabolism were signifi-cantly increased amino acid concentrations in leaves androots dependent on N nutrition. In leaves, salt treatmentresulted in significant higher amino acid concentrationsquantitatively independent of N nutrition, but with qualita-tive differences, whereas in roots, amino acid concentrationincreased more intensively in ammonium-fed plants.Growth and N metabolism analysed via NR and N trans-porter transcript accumulation, NR activity, and proteinconcentration were in general more affected by salt expo-sure in roots than in leaves.Application of salt reduced rootdiameter increment as well as stem height more intensivelyin ammonium-fed plants. This indicates that plants performbetter under salt exposure when fed nitrate. These Nnutrition-dependent effects on N metabolism of salt-exposed plants were more intensive in roots than in leaves.
N nutrition-dependent long-term response tosalt exposure
The different N nutritions had impact on control plants notexposed to salt. Parameters of N metabolism (transcriptlevel of NRT2.1 and NR, NR activity, protein concentra-tion) and root diameter increment analysed in roots wereconsistently higher in nitrate than in ammonium-fed controlplants. However, total N and amino acid concentrationswere higher in roots and leaves of ammonium-fed plants. Inleaves, protein concentration was also higher upon feedingcontrol plants with ammonium.
Because N nutrition ameliorates tolerance towards salt,the impact of nitrogen versus ammonium on the N metabo-lism has been analysed in detail with regard to N uptakevia transporters, N assimilation and total N accumulationincluding proteins and amino acids. Poplar plants wereexposed to 75 mM NaCl, a concentration that was compa-rably low in order to study long-term effects and avoid earlylethal damages. Na was taken up and distributed within theentire plant, therefore exposing all plant tissues to salt. Amore detailed study on ion contents showed that also Clions were taken up by the plant, transported and accumu-lated because of salt treatment in leaves of both nitrate andammonium-fed plants (Ache, personal communication).Photosynthetic gas exchange of Grey poplar leaves washighly affected by the salt stress and dropped up to 93%,and transpiration rates were reduced to the same extent(data not shown).
Because many studies on the physiological effects of saltstress have been performed in hydroponic solutions, we alsopreferred to perform our studies in hydroponic solutions.Although differences due to the choice of substrate mayoccur (Volkov et al. 2004; Kant et al. 2006), similar trends in
Nitrogen metabolism in salt-treated poplar 11
© 2007 The AuthorsJournal compilation © 2007 Blackwell Publishing Ltd, Plant, Cell and Environment
0
1
2
3
4
5
Roots
32%
10%35%
2%6%
15%23%
10%43%
2%7%
15%18%
11%
35%2%
8%
26%34%
9%32%
3%7%
15%
31%
10%36%
2%8%
13%28%
14%
38%
2%7%
11%
41%
8%
34%
2%5%
10%20%
12%
35%2%7%
24%
Experim
entIE
xpe ri mentII
0
1
2
3
4
5
6
6
(a)
Tot
alam
ino
com
poun
dsin
root
s(m
mol
Ng–1
FW
)
with salt without salt with salt without saltNO3– NH4
+NO3– NH4
+
Experim
entI
Leaves
with salt without salt with salt without salt
0
1
2
3
4
5
6
7
8
Tot
a la m
ino
com
poun
dsin
leav
es(m
mol
Ng–1
FW
)
18%
25%44%
4%2%
7%16%
35%35%
4%3%7%
(b)
15%
39%27%
7%5% 7%
Experim
entII
26%
23%38%
3%2% 8%
18%
21%47%
2%
2%10%4%
16%
38%32%
4% 6%16%
22%45%
3%3%
11%15%
33%36%
4%5%7%
NO3– NH4
+
1
2
3
4
5
6
7
0
8
NO3– NH4
+
Figure 7. Amino compounds in roots(a) and leaves (b) of poplar plantstreated with salt for 2 weeks at nitrate orammonium nutrition. Amino acids aregrouped together deriving from the samepathway. Presented are the percentualdistributions of these biosynthetic groups,and mean values of sums of aminocompounds of each group of six plantsand SD. Black: cysteine, serine, glycine;black-dotted: proline, glutamate,glutamine, histidine, arginine; light grey:tryptophane, tyrosine, phenylalanine;dark grey: alanine, leucine, valine; white:GABA, ammonium, ornithine,ethnolamine, DL-allohydroxyllysin;white-dotted: asparagine, aspartate, lysine,methionine, isoleucine, threonine. FW,fresh weight.
12 B. Ehlting et al.
© 2007 The AuthorsJournal compilation © 2007 Blackwell Publishing Ltd, Plant, Cell and Environment
overall reactions can be expected. Salt stress experimentswith other poplar species grown in sand cultures presentsimilar results than we observed with respect to growthrates (Sixto et al. 2005; Chang et al. 2006). For comparisonof different data sets, not only the substrate but also thevariability between clones of the same species has to beconsidered (Sixto et al. 2005).
As an indicator for the N uptake, transcript levels ofnitrate and ammonium transporters have been analysed.The NO3
- and NH4+ transporters analysed in this study as
well as NR were mainly induced by NO3-. Mineral N nutri-
tion is strongly dependent on water availability (Gessleret al. 2005), and because salinity reduces osmotic waterpotential and therefore the water availability, we suggestthat nitrogen uptake via NO3
- and NH4+ transporters is
affected by salt stress. However, mRNA levels of both trans-porters of NH4
+ supplied plants were not affected by salttreatment at all. This was consistent with the NH4
+ concen-tration in roots, which was also not affected by the salttreatment (Supplementary Table S1). Although in nitrate-fed plants NO3
- and NH4+ transporter transcripts were
lower in the presence of salt than in controls, levels oftransporter transcripts were still higher than in ammonium-fed plants (with or without salt). It may be possible thatother members of the nitrate or ammonium transportergene families respond more pronouncedly. However, com-pared to the two further genes of the NRT2 gene family,only NRT2.1 is root specific and expressed at least at atenfold higher level than any other members of the NRT2gene family (Selle, unpublished results), and is thus presum-ably the most important nitrate importer in fine roots. Fur-thermore, among three members of the AMT1 gene familythat are expressed in fine roots to a comparable extent,AMT1.2 is the only root specifically expressed gene (Selleet al. 2005) and was thus chosen for analysis.
Upon N uptake, nitrate was subjected to reduction. Pro-viding NO3
- as the sole nitrogen source resulted in substan-tially higher NR transcript accumulation and NR activity inroots. Salt had only minor impact on NR transcript accumu-lation and NR activity. NR is the key enzyme in N assimi-lation and is therefore highly regulated in its transcriptionaland post-transcriptional regulation. From the presentexperiment, it seems that moderate salt exposure does notnegatively affect NR transcript accumulation and NR activ-ity on the long term, and the plants were already adaptedafter 1 week of salt treatment. Effects of salinity on NRactivity in other species are reported contradictory. NRactivity was slightly inhibited by salt in tomato roots(Cramer & Lips 1995), in maize leaves (Abd el Baki et al.2000) and in leaves of Bruguira parviflora (Parida & Das2004), whereas in soybean, NR activity was stimulated(Bourgeais-Chaillou et al. 1992).
The total N concentration and the amino acid concen-tration increased in roots and leaves because of salt. Inroots, the increase of total N concentration was indepen-dent of the N source, whereas the increase of amino acidsoccurred only in ammonium-fed roots. In leaves, theincrease of total N was favoured in nitrate-supplied plants,
while the total concentration of amino compoundsincreased significantly in leaves of both nitrate- andammonium-fed plants. This suggests that changes in totalN concentrations due to salt are only partially reflected bychanges in amino acid concentrations. Accumulation offree amino acids under water stress has been shown inmany plant species with different amino acids increasingin different species (summarized by Rai 2002). In addition,poplars grown in aerated aqueous solutions increased theconcentration of amino compounds in leaves independentof N nutrition (Dluzniewska et al. 2007). Accumulation offree amino acids in stressed plants could be a consequenceof several processes (Mansour 2000), for example, proteindegradation (Becker & Fock 1986) and/or growth inhibi-tion (Davies & van Volkenburgh 1983). In the presentexperiment, the increase of amino compounds was not dueto degradation of WSP in leaves or roots (Fig. 6).However, non-soluble proteins could be decomposed andcould account for the increase in amino acids(Dluzniewska et al. 2007). There was no growth inhibitionof leaves (Table 1 & Fig. 2), but root DW and root diam-eter increment was smaller upon salt exposure when theplants were fed with ammonium. In parallel, the increasein the concentration of amino compounds in roots onlyoccurred in ammonium-fed plants. It might be possiblethat the increase of amino compounds correlates withinhibited growth in roots. Other explanations for the accu-mulation of free amino compounds such as inhibition ofprotein synthesis (Dhindsa & Cleland 1975) and/ordecreases in amino acid export (Tully, Hanson & Nelson1979) were not investigated in this study. In addition,mobilization of storage proteins in bark and wood (Cooke& Weih 2005) and transport of the constituent amino com-pounds to the leaves and/or roots cannot be excludedfrom the present results.
Accumulation of amino compounds in roots and leaves inresponse to salt stress is thought to be connected to thecompensation of salt stress by compatible solutes (Mansour2000). Proline is 300 times more soluble in water than otheramino acids and thus can act as a non-toxic osmoprotectant(Palfi et al. 1974). It is accumulating because of salt stress inmany plants (Lee & Liu 1999; Khatkar & Kuhad 2000;Muthukumarasamy, Gupta & Panneerselvam 2000; Singhet al. 2000; Jain et al. 2001; Popova et al. 2003). In this study,proline was not detected in Grey poplar roots, but in leaves,proline increased more than three to four times (experi-ments I and II, respectively) upon salt stress. However, thisincrease was not specific, because a general increase of thesoluble amino acid content was observed in the same orderof magnitude, and other amino compounds, such as serine,increased more than 10-fold. In Populus euphratica, prolinealso appears to play only a minor role in cell pressureadjustment because its overall concentration is too small tocompensate salt stress considerably (Ottow et al. 2005).
When amino compounds are sorted into groups of biosyn-thetic origin, proline belongs to the glutamate group. Themajor components of the glutamate biosynthetic group areglutamate and glutamine. Although proline and glutamate
Nitrogen metabolism in salt-treated poplar 13
© 2007 The AuthorsJournal compilation © 2007 Blackwell Publishing Ltd, Plant, Cell and Environment
accumulated in response to salt stress, the relative abun-dance of the glutamate biosynthetic group decreased.Accu-mulation of glutamine upon salt stress was also detected inother plant species (Amonkar & Karmarkar 1995). Both theprimary route of NH4
+ assimilation as well as reassimilationof photorespiratory NH4
+ produce glutamine. Changes inphotorespiration may have caused the increase of glutaminein the present study, because other products of photorespi-ration, that is, serine, also increased substantially as a resultof salt treatment independent of the N source. Serine is theprecursor for cysteine. Cysteine, glutamate and glycine areimportant for synthesis of glutathione (GSH), which hasbeen significantly increased because of moderate salt treat-ment analysed after 1 and 2 weeks (Herschbach, personnalcommunication). GSH synthesis is linked to photorespira-tion, probably because photorespiratory glycine is requiredfor GSH synthesis (Noctor et al. 1999). In further experi-ments, photorespiration needs to be analysed in order toevaluate its actual impact.
In roots, the relative and absolute amounts of aminocompounds changed differently upon salt treatment com-pared to leaves. There were no major effects of salt treat-ment on total amino compounds in NO3
--fed roots. In NH4+-
fed roots, amino acids synthesized from aspartate, withasparagine being the main component, were increasedbecause of salt. Asparagine, synthesized via amidation ofaspartate, represents an inert amino acid used as storageand/or transport of N from source to sink tissue. In parallel,amino acids of the glutamate group increased as a result ofsalt stress with glutamine being the major component.Glutamine is also used for long-distance N transport andmay indicate more intensive allocation of amino N from theroots to the shoots.
The accumulation of specific amino acids indicates anactive process of adaptation and protection in response tosalinity, such as the production of osmoprotectants andcompounds reactive against oxidative stress, as well as themobilization and transformation into transport forms.However, there may be more than one function for oneparticular osmoprotectant, and different osmoprotectantscan have different functions (Hasegawa et al. 2000).
ACKNOWLEDGMENTS
We gratefully acknowledge M. Kay and T. Meyer for tech-nical assistance, as well as U. Neef and M. Brinker forproviding RNA for the present analysis. This study wasfinancially supported by the Deutsche Forschungsgemein-schaft (DFG) under the contracts Hänsch HA3107/32, Ren-nenberg RE515/20, Schnitzler SCHN653/4, Nehls, NE332/9-1 and Polle PO362/13.
REFERENCES
Abd el Baki G.K., Siefritz F., Man H.M., Welner H., Kaldenhoff R.& Kaiser W.M. (2000) Nitrate reductase in Zea mays L. undersalinity. Plant, Cell & Environment 23, 515–521.
Amonkar D.V. & Karmarkar S.M. (1995) Nitrogen uptake andassimilation in halophytes. In Nitrogen Nutrition in Higher Plants(eds H.S. Srivastava & R.P. Singh), pp. 431–445. AssociatedPublisher Co., New Delhi, India.
Ashraf M. (1994) Breeding for salinity tolerance in plants. Criticalreviews in Plant Science 13, 17–42.
Ashraf M. & Sultana R. (2000) Combination effect of NaCl salinityand nitrogen form on mineral composition of sunflower plants.Biologia Plantarum 43, 615–619.
Aslam M., Huffaker R.C. & Rains D.W. (1984) Early effects ofsalinity on nitrate assimilation in barley seedlings. Plant Physi-ology 76, 321–325.
Becker T.W. & Fock H.P. (1986) The activity of nitrate reductaseand the pool size of some amino acids and some sugars in water-stressed maize leaves. Photosynthesis Research 8, 267–274.
Blum A., Munns R., Passioura J.B., Turner N.C., Sharp R.E., BoyerJ.S., Nguyen H.T., Hsiao T.C., Verma D.P.S. & Hong Z. (1996)Genetically engineered plants resistant to soil drying and saltstress: how to interpret osmotic relations? Plant Physiology 110,1051–1053.
Bolu W.H. & Polle A. (2004) Growth and stress reactions inroots and shoots of a salt-sensitive poplar species(Populus ¥ canescens). Tropical Ecology 45, 161–171.
Botella M.A., Martinez V., Nieves M. & Cerdá A. (1997) Effect ofsalinity on the growth and nitrogen uptake by wheat seedlings.Journal of Plant Nutrition 20, 793–804.
Bourgeais-Chaillou P., Perez-Alfocea F. & Guerrier G. (1992)Comparative effect of N sources on growth and physiologicalresponses of soybean exposed to NaCl-stress. Journal ofExperimental Botany 43, 1225–1233.
Brown A.D. & Simpson J.R. (1972) Water relations of sugar-tolerant yeast: the role of intracellular polyols. Journal ofGenetical Microbiology 72, 589–591.
Brüggemann N. & Schnitzler J.P. (2002) Comparison of isopreneemission, intercellular isoprene concentration and photosyn-thetic performance in water-limited oak (Quercus pubescensWilld. and Quercus robur L.) saplings. Plant Biology 4, 456–463.
Chang Y., Chen S.-L., Yin W.-L., Wang R.-G., Liu Y.-F., Shi Y.,Shen Y.-Y., Li Y., Jiang J. & Liu Y. (2006) Growth, gasexchange, abscisic acid, and calmodulin response to salt stressin three poplars. Journal of Integrative Plant Biology 48, 286–293.
Cooke J.E.K. & Weih M. (2005) Nitrogen storage and seasonalnitrogen cycling in Populus: bridging molecular physiology andecophysiology. New Phytologist 167, 19–30.
Coruzzi G. & Last R. (2000) Amino acids. In Biochemistry andMolecular Biology of Plants. (eds B.B. Buchanan, W. Gruissem &R.L. Jones), pp. 358–410. American Society of Plant Physiolo-gists, Rockville, MD, USA.
Cramer M.D. & Lips S.H. (1995) Enriched rhizosphere CO2 con-centration can ameliorate the influence of salinity on hydroponi-cally grown tomato plants. Physiologia Plantarum 94, 425–433.
Davies W.J. & van Volkenburgh E. (1983) The influence of waterdeficit on the factors controlling the daily pattern of growth ofPhaseolus trifoliates. Journal of Experimental Botany 34, 987–999.
Dhindsa R.S. & Cleland R.B. (1975) Water stress and protein syn-thesis. Plant Physiology 55, 781–788.
Dluzniewska P.,Gessler A.,Dietrich H.,Schnitzler J.-P.,Teuber M. &Rennenberg H. (2007) N uptake and its metabolism in Populuscanescens upon salinity. New Phytologist 173, 279–293.
Frechilla S., Lasa B., Ibarretxe L., Lamsfus C. & Aparicio-Tejo P.(2001) Pea responses to saline stress is affected by the source ofnitrogen nutrition (ammonium or nitrate). Plant GrowthRegulation 35, 171–179.
14 B. Ehlting et al.
© 2007 The AuthorsJournal compilation © 2007 Blackwell Publishing Ltd, Plant, Cell and Environment
Garcia A.B., Engler J.D.A., Iyer S., Gerats T., Van Montagu M. &Caplan A.B. (1997) Effects of osmoprotectants upon NaCl stressin rice. Plant Physiology 115, 159–169.
Gessler A., Schneider S., Weber P., Hanemann U. & Rennenberg H.(1998) Soluble N compounds in trees exposed to high loads of N:a comparison between the roots of Norway spruce (Picea abies)and beech (Fagus sylvatica) trees grown under field conditions.New Phytologist 138, 385–399.
Gessler A., Jung K., Gasche R., Papen H., Heidenfelder A., MetzlerB.B.M., Augustin S., Hildebrand E. & Rennenberg H. (2005)Climate and forest management influence nitrogen balance ofEuropean beech forests: microbial N transformations and inor-ganic N net uptake capacity of mycorrhizal roots. EuropeanJournal of Forest Research 124, 95–111.
Glass A.D.M., Britto D.T., Kaiser B.N., et al. (2002) The regulationof nitrate and ammonium transport systems in plants. Journal ofExperimental Botany 53, 855–864.
Gomez I., Pedreno J.N., Moral R., Iborra M.R., Palacios G. &Mataix J. (1996) Salinity and nitrogen fertilization affecting themacronutrient content and yield of sweet pepper plants. Journalof Plant Nutrition 19, 353–359.
Grunze N., Willmann M. & Nehls U. (2004) The impact of ectomy-corrhiza formation on monosaccharide transporter gene expres-sion in poplar roots. New Phytologist 164, 147–155.
Hasegawa P.M., Bressan R.A., Zhu J.K. & Bohnert H.J. (2000)Plant cellular and molecular responses to high salinity. AnnualReview of Plant Physiology and Plant Molecular Biology 51,463–499.
Hewitt E.J. (1966) Sand and water culture methods used in thestudy of plant nutrition. In: 2nd Revised Edition, CommonwealthBureau of Horticulture and Plantation Crops, East Malling,Technical Communication No. 22, pp. 430–439. CommonwealthAgriculture Bureau, Farnham Royal, England.
Hoagland D.R. & Arnon D.I. (1950) The water-culture method forgrowing plants without soil. California Agricultural ExperimentStation Circular 347, 1–32.
Jain M., Mathur G., Koul S. & Sarin N.B. (2001) Ameliorativeeffects of proline on salt stress-induced lipid peroxidation in celllines of groundnut (Arachis hypogaea L.). Plant Cell Reporter 20,463–468.
Kaiser W.M. & Spill D. (1991) Rapid modulation of spinach leafnitrate reductase by photosynthesis. 2. In vitro modulation byATP and AMP. Plant Physiology 96, 368–375.
Kaiser W.M. & Huber S.C. (1994) Posttranscriptional regulation ofnitrate reductase in higher plants. Plant Physiology 106, 817–821.
Kant S., Kant P., Raveh E. & Barak S. (2006) Evidence that differ-ential gene expression between the halophyte, Thellungiellahalophila, and Arabidopsis thaliana is responsible for higherlevels of the compatible osmolyte proline and tight control ofNa+ uptake in T. halophila. Plant, Cell & Environment 29, 1220–1234.
Khatkar D. & Kuhad M.S. (2000) Short-term salinity inducedchanges in two wheat cultivars at different growth stages. Biolo-gia Plantarum 43, 629–632.
Kishor P.B.K., Hong Z., Miao G.H., Hu C.A.A. & Verma D.P.S.(1995) Overexpression of D-pyrroline-5-carboxylate synthetaseincreases proline production and confers osmotolerance intransgenic plants. Plant Physiology 108, 1387–1394.
Langer K., Levchenko V., Fromm J., Geiger D., Steinmeyer R.,Lautner S., Ache P. & Hedrich R. (2004) The poplar K+ channelKPT1 is associated with K+ uptake during stomatal opening andbud development. Plant Journal 37, 828–838.
Lee T. & Liu C. (1999) Correlation of decreases in calcium contentswith proline accumulation in the marine green macroalga Ulvafasciata exposed to elevated NaCl contents in seawater. Journalof Experimental Botany 50, 1855–1862.
Lewis O.A.M., Leidi E.O. & Lips S.H. (1989) Effect of nitrogensource on growth response to salinity stress in maize and wheat.New Phytologist 111, 155–160.
Mansour M.M.F. (2000) Nitrogen containing compounds andadaptation of plants to salinity stress. Biologia Plantarum 43,491–500.
Munns R. (2005) Genes and salt tolerance: bringing them together.New Phytologist 167, 645–663.
Muthukumarasamy M., Gupta S.D. & Panneerselvam R. (2000)Enhancement of peroxidase, polyphenol oxidase and superoxidedismutase activities by triadimefon in NaCl stressed Raphanussativus L. Biologia Plantarum 43, 317–320.
Noctor G., Arisi A., Jouanin L. & Foyer C. (1999) Photorespiratoryglycine enhances glutathione accumulation in both the chloro-plastic and cytosolic compartments. Journal of ExperimentalBotany 50, 1157–1167.
Ottow E.A., Brinker M., Teichmann T., Fritz E., Kaiser W., BroschéM., Kangasjärvi J., Jiang X. & Polle A. (2005) Populus euphraticadisplays apoplastic sodium accumulation, osmotic adjustment bydecreases in calcium and soluble carbohydrates,and develops leafsucculence under salt stress. Plant Physiology 139, 1762–1772.
Palfi G., Koves F., Bito M. & Sebestyen R. (1974) The role of aminoacids during water stress in species accumulating proline. Phyton32, 121–127.
Parida A.K. & Das A.B. (2004) Effects of NaCl stress on nitrogenand phosphorous metabolism in a true mangrove Bruguieraparviflora grown under hydroponic culture. Journal of PlantPhysiology 161, 921–928.
Parida A.K. & Das A.B. (2005) Salt tolerance and salinity effectson plants: a review. Ecotoxicology and Environmental Safety 60,324–349.
Popova O.V., Dietz K.J. & Golldack D. (2003) Salt-dependentexpression of a nitrate transporter and two amino acid trans-porter genes in Mesembryanthemum crystallinum. Plant Molecu-lar Biology 52, 569–578.
Rai V.K. (2002) Role of amino acids in plant response to stresses.Biologia Plantarum 45, 481–487.
Sambrook J. & Russel D.W. (2001) Molecular cloning: a laboratorymanual, 3rd edn, Cold Spring Harbor Laboratory Press, ColdSpring Harbor, NY, USA.
Scheible W.R., Gonzalez Fontes A., Morcuende R., Lauerer M.,Geiger M., Glaab J., Gojon A., Schulze E.D. & Stitt M. (1997)Tobacco mutants with a decreased number of functional niagenes compensate by modifying the diurnal regulation of tran-scription, post-translational modification and turnover of nitratereductase. Planta 203, 304–319.
Selle A., Willmann M., Grunze N., Kopriva S. & Nehls U. (2005)The high affinity poplar ammonium importer PttAMT1.2 and itsrole in ectomycorrhizal symbiosis. New Phytologist 168, 697–706.
Singh B. (1998) Biomass production and nutrient dynamics in threeclones of Populus deltoides planted on Indogangetic plains. Plantand Soil 203, 15–26.
Singh S.K., Sharma H.C., Goswami A.M., Datta S.P. & Singh S.P.(2000) In vitro growth and leaf composition of grapevine culti-vars as affected by sodium chloride. Biologia Plantarum 43,283–286.
Sixto H., Grau J.M., Alba N. & Alia R. (2005) Response to sodiumchloride in different species and clones of genus Populus L.Forestry 78, 93–104.
Speer M., Brune A. & Kaiser W.M. (1994) Replacement of nitrateby ammonium as the nitrogen source increases the salt sensitiv-ity of pea plants. 1. Ion concentrations in roots and leaves. Plant,Cell & Environment 17, 1215–1221.
Tully R.E., Hanson A.D. & Nelson C.E. (1979) Proline accumu-lation in water stressed barley leaves in relation to transloca-tion and the nitrogen budget. Plant Physiology 63, 518–523.
Nitrogen metabolism in salt-treated poplar 15
© 2007 The AuthorsJournal compilation © 2007 Blackwell Publishing Ltd, Plant, Cell and Environment
Volkov V., Wang B., Dominy P.J., Fricke W. & Amtmann A. (2004)Thellungiella halophila, a salt-tolerant relative of Arabidopsisthaliana, possesses effective mechanisms to discriminatebetween potassium and sodium. Plant, Cell & Environment 27, 1.
Yancey P.H., Clark M.E., Hand S.C., Bowlus R.D. & Somero G.N.(1982) Living with water stress: evolution of osmolyte system.Science 217, 1214–1222.
Zhu J.K. (2001) Plant salt tolerance. Trends in Plant Science 6,66–71.
Received 7 January 2007; received in revised form 20 March 2007;accepted for publication 23 March 2007
SUPPLEMENTARY MATERIAL
The following supplementary material is available for thisarticle:
Table S1. Amino compounds in nmol N g-1 FW in differentorgans of poplar trees with salt stress (+NaCl) or withoutsalt stress (-NaCl) after 1 (T1) and 2 (T2) weeks.
This material is available as part of the online articlefrom: http://www.blackwell-synergy.com/doi/abs/10.1111/j.1365-3040.2006.01668.x(This link will take you to the article abstract)
Please note: Blackwell Publishing is not responsible for thecontent or functionality of any supplementary materialssupplied by the authors. Any queries (other than missingmaterial) should be directed to the corresponding authorfor the article.
16 B. Ehlting et al.
© 2007 The AuthorsJournal compilation © 2007 Blackwell Publishing Ltd, Plant, Cell and Environment


