Embed Size (px)
Citation preview
0
Integrating Agency and Resource Dependence Theory:
Firm Profitability, Industry Regulation, and Board Tasks Performance
Amedeo Pugliese † a
Alessandro Minichilli b
Alessandro Zattoni c d
Journal of Business Research (2014) volume 67: 1189-1200
† Corresponding Author.
a † Queensland University of Technology School of Accountancy, 2 George St, 4001 Brisbane,
Australia. Tel: +61 (7) 3138 1022; email: [email protected]
b Bocconi University, Department of Management and Technology, Milan, Italy.
c Parthenope University, Department of Business Economics, Naples, Italy.
d SDA Bocconi School of Management, Strategic and Entrepreneurial Management
Department, Milan, Italy.
Acknowledgments: The authors express their gratitude to Pieter-Jan Bezemer, Sherrena
Buckby, Graeme Dean, Gavin Nicholson, Riccardo Vigano’, Sue Taylor and all workshop
participants at QUT for their valuable feedbacks on earlier versions of the manuscript. We
acknowledge the financial support from the Italian Ministry of University Innovation and
Research (MIUR - Project 2008LLE9J3 – 2008), and the Regione Campania (P.O.R.
Campania FSE 2007-2013, Axis IV – Project INNOSYSTEM). All errors remain our own.
0
Integrating Agency and Resource Dependence Theory:
Firm Profitability, Industry Regulation, and Board Tasks Performance
ABSTRACT
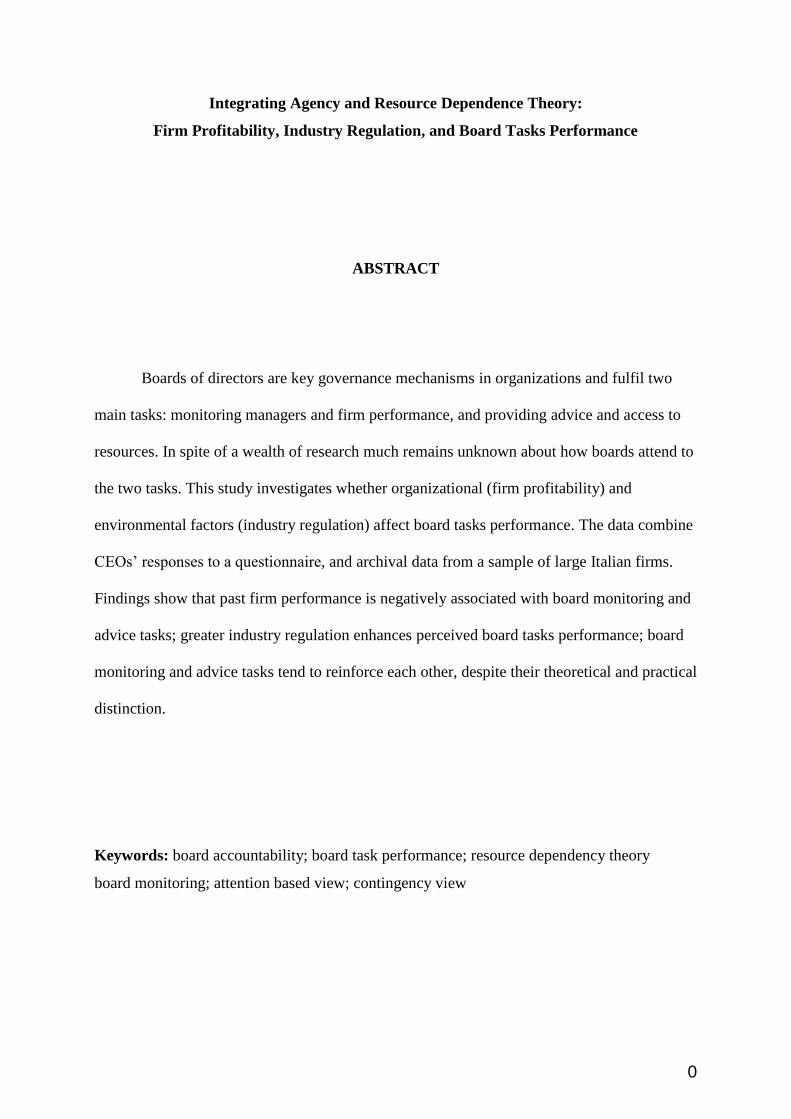
Boards of directors are key governance mechanisms in organizations and fulfil two
main tasks: monitoring managers and firm performance, and providing advice and access to
resources. In spite of a wealth of research much remains unknown about how boards attend to
the two tasks. This study investigates whether organizational (firm profitability) and
environmental factors (industry regulation) affect board tasks performance. The data combine
CEOs’ responses to a questionnaire, and archival data from a sample of large Italian firms.
Findings show that past firm performance is negatively associated with board monitoring and
advice tasks; greater industry regulation enhances perceived board tasks performance; board
monitoring and advice tasks tend to reinforce each other, despite their theoretical and practical
distinction.
Keywords: board accountability; board task performance; resource dependency theory
board monitoring; attention based view; contingency view
1
Integrating Agency and Resource Dependence Theory:
Firm Profitability, Industry Regulation, and Board Tasks Performance
1. Introduction
The roaring collapses of highly profitable firms like Enron and Parmalat in the early
2000s sounded as corporate governance paradoxes: their boards were composed of prominent
and knowledgeable managers, academics and professional, and ticked all the boxes of the best
governance practices. Nonetheless, they filed for bankruptcy with multi-billionaire losses for
their shareholders, bondholders, workers and the society at large (Coffee, 2005). These cases
cast doubts on the collective understanding of what boards do, prompting numerous calls to
move beyond the demographics and provide a systematic analysis of board behaviour (Dalton,
Hitt, Certo & Dalton, 2007).
Despite the wealth of research on boards of directors, there is still a quest for a deeper
understanding of what drives board task performance (Huse, 2007). Boards are expected to
perform two tasks: monitoring managers and firm performance, and providing advice and
access to resources (Hillman & Dalziel, 2003). Prior studies explaining board monitoring or
advice tasks rely upon board composition (Le, Walters & Kroll, 2006), or micro-level
determinants - as board processes and cognitive conflicts - (Forbes & Milliken, 1999), and
macro-level factors (Minichilli, Zattoni, Nielsen & Huse, 2012). In almost all instances,
researchers analyse monitoring and advice tasks separately. More recently the literature
highlights the need to move beyond this “static view”, integrating the two perspectives
underlying board monitoring (Agency theory) and advice (Resource Dependence theory)
tasks (Hillman & Dalziel, 2003). This is further reinforced by Ocasio’ s attention-based view
(ABV), suggesting that decision-making bodies as the board of directors do not constantly
engage in all activities, “but place different emphasis on their tasks according to the various
2
issues and answers they focus on” (1997: 188). Ocasio indicates that boards’ engagement into
the different tasks depends on the contextual conditions boards and organizations are
embedded into (Ocasio & Joseph, 2005), thus sparking a number of studies using a
contingency approach to boards (Filatotchev & Nakajima, 2010).
Building on these perspectives, this study seeks to empirically assess whether past
firm performance and industry regulation affect board monitoring and advice tasks. The data
are drawn from a sample of Italian largest companies, whose CEOs responded to a detailed
questionnaire. Findings are in line with prior works indicating that board demography does
not affect board monitoring and advice tasks (Finkelstein & Mooney, 2003), and in addition
show that past performance is negatively associated with board monitoring and advice,
whereas greater industry regulation enhances both tasks.
This study enhances understanding of how boards operate: first, by providing evidence
of the effects of past firm performance on board monitoring and advice tasks, whereas most of
the existing literature is concerned with the effects of board behaviour on the subsequent
performance. Second, by showing that greater industry regulation increases a board’s
attention towards monitoring and advice tasks. Third, by suggesting that despite the different
theoretical underpinnings, and distinct measurement construct, board monitoring and advice
tasks are strongly correlated (boards that are perceived to monitor tend to be considered active
in their advice task as well).
These findings have implications for practice: the literature does not posit the
dichotomous view of the board as monitor versus advisor; rather, researchers posit boards to
be either active in the two tasks or less engaged overall. A more general concern arises with
boards in high performing firms: according to the findings these are reluctant to perform the
expected tasks; ultimately, there is a potential threat for high performing firms that board hold
back, thus imposing higher vigilance on boards’ engagement.

3
The remainder of the paper is structured as follows. Section two illustrates the
theoretical background and derives hypotheses. Section three follows a description of the
sampling procedure and the method. Section four reports the findings before discussing
implications for theory and practice. Section five concludes with the limitations and possible
avenues for future research.
2. Board Tasks Performance
Board tasks performance is defined as the “board’s ability to perform its control and
service tasks effectively” (Forbes & Milliken, 1999: 493). These tasks refer to the activities a
board performs to comply with regulation and shareholders’ expectations. The two tasks are
theoretically distinct and are made up of different activities. Board monitoring is rooted into
agency theory (AT) (Fama & Jensen, 1983): boards are expected to monitor activities and
decisions in order to ensure shareholders’ interests are met. The watchdog function is
amplified in the case of separation between ownership and control, that is, when managers do
not bear a major stake of wealth effects of their decisions (Coffee, 2005). However, the legal
nature of the board imposes monitoring as a primary task for the board regardless the
organizational forms (Bainbridge, 2002): directors are required to oversee a firm’s activities
as a part of their “duty of care” towards the company and all key stakeholders (Blair, 2012).
Beside the monitoring task, resource dependence theory (RDT) proposes that boards
provide access to resources that are not otherwise available (Pfeffer & Salancick, 1978); RDT
sees boards as asset of the firm contributing to sustained value creation (Hillman, Withers &
Collins, 2009). The advice or resource provision task includes advice on strategic initiatives,
an active involvement in decision-making, and follow-up on strategic choices.
The two tasks stem from different theoretical traditions, suggesting a stylized model of
what boards (should) do, and how to enhance monitoring and advice respectively. The
4
distinction affects both researchers’ understanding of boards, and a firm’ search for good
directors: board monitoring emphasize directors’ independence and ability to challenge
managers who are not acting in the best interests of stakeholders; board advice envisions that
board capital is a key factor in enhancing advice and resource provision (Sundaramurthy &
Lewis, 2003).
The theoretical distinction underlying the two tasks and its implications in terms of
regulatory provisions and expected board behaviour shapes the development of research.
Traditionally governance scholars explored how board composition impacts on firm or board
tasks performance (Daily, Dalton & Cannella, 2003). The so-called “usual suspects” (board
independence and size, CEO duality, board ownership) account for a limited part in
explaining board tasks performance (Forbes & Milliken, 1999), whilst board processes,
cognitive conflicts and effort norms are better predictors of engagement (Minichilli, et al.,
2012). Studies on boards of directors downplay the role of firm or context specific conditions
on board behaviour (Bamberger, 2008), and the numerous calls for additional research
overcoming these limitations have only received partial fulfilment (Dalton & Dalton, 2011).
Ocasio (1997) offers an alternative view and challenges the idea of boards being
constantly involved into their tasks: the ABV proposes that boards, as all decision making
bodies, selectively choose where to address their efforts. Such selectivity is due to time
constraint and prioritization, board members’ bounded rationality and limitation in
information gathering, thus impairing boards’ ability to perform their tasks. The work of
Hillman, and Dalziel (2003) and Sundaramurthy, and Lewis (2003) further develops this view,
highlighting the paradox of control and collaboration within board of directors, and proposes
an integration of the two views. The application of ABV to the understanding of decision–
making bodies is yet more profound: Ocasio identifies patterns to ascertain how boards
distribute and regulate their attention to their tasks (focus of attention) through the
5
development of the concept of situated attention. What tasks boards focus on, and what they
do, depends on the specific context or situation they find themselves in (1997:188). Barnett
(2008) provides additional theoretical backing to this stream of research, indicating that board
configurations and actions are highly dependent on the set of internal and external conditions
that firms face.
Recent empirical works support these intuitions: Tuggle, and colleagues (2010) find
significant variation in how boards prioritize board monitoring according to changing
profitability. Zhang (2010) explores the board transitioning between information seeking and
strategic actions, when process-based conditions vary. Yu, Engelman, and Van den Ven
(2005) build on ABV and observe how organizational structure influences aspects of the
merger integration process managers attended to over time.
2.1 Firm profitability and board tasks performance
This study investigates the effects of firm and industry characteristics on board
monitoring and advice tasks. With respect to boards’ allocation of attention to monitoring and
advice tasks, firm performance and industry regulation are considered as relevant factors
(Boyd, Haynes, Hitt, Bergh & Ketchen, 2012): first, past and current firm performance matter
because of the use by directors as a means to assess managerial effectiveness (Walsh &
Seward, 1990). Second, industry regulation matters to boards because of the emphasis on
interactions, compliance to norms and resource provisions required, conditional on the
different levels of regulation (Cho & Hambrick, 2006).
Past firm performance influences boards’ engagement into monitoring and advice
tasks. This is consistent with evidence of a bi-directional relationship of firm performance and
governance structures (Platt & Platt, 2012): the board and CEO affect firm performance, but
profitability also affects them. However, while boards’ effects on subsequent firm

6
performance have received wide attention (Pugliese, Bezemer, Zattoni, Huse, van Den Bosch
& Volberda, 2009), the impact of past and current performance on board tasks is not fully
exploited.
Firm profitability is generally employed to assess how well (or poorly) executives
operate. A few studies subvert this logic by exploring how firm profitability affects board
composition and structure (Gales & Kesner, 1994; Mueller & Barker, 1997). These examine
extreme cases of bankruptcy, showing that negative returns often lead to changes in board and
leadership structures (Daily, 1995). This study takes a different stand and posits that boards in
high (low) performing firms behave differently in relation to their focus on monitoring and
advice tasks. To our knowledge, no study has investigated whether past and current
profitability affects boards’ monitoring or advice tasks.
In poorly performing firms, boards are supposed to be active monitors. This role is
fully consistent with predictions of AT indicating that the substitution of poorly performing
managers is one of the mechanisms in place to ensure shareholders’ interests are met (Walsh
& Seward, 1990). Poor performing firms require a more vigilant approach from their boards:
managers who caused the poor performance should be evaluated, and fired, if necessary. This
is also backed by a legal perspective: directors of distressed firms are more likely to engage in
monitoring activities, reducing the threat of litigation due to a breach in their duty of care
towards shareholders (Bainbridge, 2002).
The resource dependence theory (RDT) suggests that boards act primarily as providers
of resources that are lacking internally, adjusting their behaviour to organizational and
environmental contingencies (Hillman & Dalziel, 2003). Limited empirical evidence shows
that past performance affects board’s advice task (Boyd, 1995). When firms experience
impaired performance, the board will search for organizationally relevant gains from
operating both inside and outside the board and revisit the firm strategic direction

7
(Geletkanycz & Boyd, 2011). In addition, boards are required to securing access to valuable
resources (Boeker & Goodstein, 1991): as part of the advice task, boards support the CEO and
the executive team in making informed choices about future directions and subvert current
conditions (Carpenter & Westphal, 2001).
HP1a: Poor firm performance associates positively with board monitoring and advice
tasks.
Whereas both a theoretical rationale and early empirical evidence show that poor
performance triggers board monitoring and advice, little is known about board behaviour in
high performing firms (Daily, et al., 2003). The dearth of studies is due in part to the nature of
governance theories calling for a board’s action only when things go bad (Coffee, 2005). A
commonly assumed assumption is that boards of directors in profitable firms are discharged
from tight monitoring responsibilities: “if there is nothing broken, there is no need for fixing
it” (Leblanc & Gilles, 2005:175). Wesphal, and Zajac (1995, 1998, 2001) attribute this to a
great degree of symbolism in the Board-TMT relationship: CEOs of well performing firms are
less subject to monitoring and scrutiny and their choices find generally large consensus.
Tuggle, et al, (2010) find that negative deviation from prior performance increases a board’s
attention to monitoring, while positive deviation reduces it.
At a more general level, this perspective is consistent with the evidence that the
probability of disciplinary actions of the boards is more pronounced in the case of poor
performance (Baghat & Bolton, 2008). This suggests that (independent) boards are more
prone to refrain from monitoring if they consider firm performance to be satisfactorily.
Turning attention to board advice in high-performing firms, Ocasio (1997) describes how
decision-makers’ cognition of the current status of a corporation fosters a transition between
tasks. Profitable firms require more attention towards new investments and opportunities and

8
the main challenge posed on directors is shifting into expansion and increasing productivity;
directors reduce their emphasis on financial control and monitoring activities, focusing their
attention towards the achievement of a company’ s growth objectives (Hillman, 2005). Boards
in successful companies tend to emphasize the pursuit of new strategic initiatives and
ventures thus reducing the control function (Lynall, Golden & Hillman, 2003).
HP1b: High firm performance associates negatively with board monitoring task and
positively with board advice task.
2.2 Industry regulation and board tasks performance
Government policy, regulation and enforcement are major forces in the business
environment. Firms deal with environmental features such as industry regulation and
uncertainty that shape boards’ search for external legitimacy and resource provision (Boyd,
1990). Pfeffer (1972) asserts that a board reflects the firm’s external dependencies.
Governance scholars extensively rely upon his view and suggest that boards develop as
efficient responses to the firm’s environment (Abebe, Angriawan & Liu, 2011). Industry
characteristics are among the major forces shaping companies’ structures, top-management
teams and boards of directors (Dess & Beard, 1984). Research shows that uncertainty, level of
competition and regulation affect board size, outsider ratio, and interlocks (Boyd, 1995). Also,
shifts in the regulatory or technological environment cause important changes in board
composition and leadership structure (Hillman, Cannella & Paetzold, 2000).
Nevertheless, extant studies do not explore the effects of industry regulation on board
monitoring and advice tasks. Firms operating in regulated industries are subject to compliance
to strict norms and rules affecting various areas of a corporation’s life (e.g. production,
accountability and reporting, pricing and level of employment). Regulators view board
oversight as complementary to supervision, and boards become the mechanism through which
9
compliance and accountability are ensured (Adams & Ferreira, 2008). This is consistent with
the “regulatory pressure hypothesis” suggesting that board monitoring is heightened in highly
regulated industries (Becher & Frye, 2011). Hagendorff, Collins, and Keasey (2010) find that
such complementarity exists in the banking sector in a sample of 13 countries. Also, Becher,
and Frye (2011)’s study of IPOs documents lower board monitoring after industry
deregulation in multiple sectors. In addition a firm’s ability to compete in the market is related
to the fulfilment of what is required of regulators and legislation imposing the supervision of
a company’s operations in order to avoid incurring in sanctions and litigation costs (Millstein
& MacAvoy, 1998): this is witnessed by Pfeffer’s findings that boards tend to appoint
directors with legal expertise in regulated industries in order to reduce threats of litigation
(1972).
Also, regulation restricts some of the strategic options available and most of the
decision-making and planning functions are shifted away from a firm’s managers and boards
to public officials that choose profitability levels and intensity of competition (Lang &
Lockhart, 1990). Strategic alternatives are only partially left to the managers: if not entirely,
major strategic initiatives require negotiation or approval of the regulatory body. HP2a:
Greater industry regulation associates positively with board monitoring task, and negatively
with board advice task.
On the other hand, firms operating in less regulated and open to competition industries
face different types of challenges: the lack of regulation reduces the attention towards
monitoring, thus alleviating the board from the monitoring function (Boyd, 1995). At the
same time they experience a more direct control over key factors affecting performance. In
such industries the level of competition, the difficulty to foresee the future of the sector, and
the threat of newcomers enhance uncertainty (Lang & Lockhart, 1990): firms struggle to
adapt to the continuous and sudden changes within the industry that might be outside of their
10
control, and directors are required to act as providers of resources that are lacking internally
(Hillman, 2005). In order to increase their proximity to key resources, firms tend to empower
directors to bring in valuable resources, and to guarantee a company’ success and growth. A
board needs to fill in the gap with subjects whose choices are likely to affect firm’s
positioning and competitive advantage (Hillman, et al., 2000). RDT posits that this role is
enhanced through directors with superior knowledge of the rules, being able to advise
managers in taking decisions and build sustained competitive advantage.
The shift from monitoring towards more of an entrepreneurial orientation is shown by
Cho, and Hambrick (2006) in the context of a deregulation in the US airline industry in the
1980s, when directors (and managers) switched their attention from meeting regulators’
requirements toward the search for new profitable niches.
HP2b: Lower industry regulation associates negatively with board monitoring task,
and positively with board advice task.
3. Methods
3.1 Sample selection and data collection
The data were gathered through a questionnaire addressed to the CEOs of the top
2,000 Italian companies, ranked by turnover, at the end of 2004. Previous research on boards
of directors shows that a low response rate (below 20%) is still acceptable: board members
are busy professionals and are reluctant to reveal private information despite confidentiality
and secrecy agreements in place. In order to increase the response rate, we followed three
steps in designing of the survey: a pre-test with 12 executives fine-tuned the language and
content of questions. The questionnaire included a presentation letter detailing the main
purpose of the study. A reminder was sent out to the non-responding firms three months after
the first round. At the end of the data collection process we received 264 valid responses, with
11
a 13% overall response rate, which is consistent with previous studies (Finkelstein, Hambrick
& Cannella, 2009).
While the cover letter ensured confidentiality and anonymity in revealing the data only
in aggregate form (Posdakoff, MacKenzie, Lee & Posdakoff, 2003), companies needed to be
identifiable to allow researchers matching primary data with archival, accounting-based
information. Financial data from 2001-2004 were collected through ORBIS, a widely used
database providing a wealth of financial and governance information about the companies.
OLS regressions are employed to test hypotheses. The joint use of archival and survey
data with temporal lags minimizes effects of common method variance (Payne, Benson &
Finegold, 2009). The Kolmogorov-Smirnov two-sample test is employed to check for
selection bias, and compared responding to non-responding firms. Results suggest that the
two sub-samples of responding and non-responding companies are not significantly different
across several dimensions: industry representation, company size, profitability and age,
family ownership.
The only difference refers to the “listing status”: 25% of firms included in the final
sample are listed entities, while they account for 13% of the initial population. This is not
likely to affect the results as a considerable portion of non-listed firms is in the final sample,
and a control for the listing status is included in the models. Lastly, to ensure rigor and
increase significance of the analyses, observations with missing data on dependent variables
were handled by listwise deletion: “missing data were identified if respondents had omitted to
answer on any single items referring to the construct of monitoring and advice tasks”.
The Italian setting
Italy is an appropriate setting to conduct research on boards of directors: first, since a
decade the Italian regulators engaged into a great debate that resulted into increasing pressure
12
on board scrutiny (Enriques & Volpin, 2007). Second, the Italian corporate governance
system resembles other systems (i.e. France, Spain, Portugal) in Europe as well as in Asia that
are characterized by a weak disciplining role of capital markets and a stronger reliance upon
internal governance mechanisms (De Jong, 1997). Italian corporations are legally required to
have a board of directors who is appointed by the general shareholders’ assembly. All
companies have a statutory board and in the vast majority of the cases, companies would rely
upon an external auditor to verify compliance of financial statements to accounting standards.
Listed companies are subjected to oversight by the market regulator (CONSOB, the
equivalent of US SEC) who issued in 1999 and 2002 a version of the “code of best practice”.
The code is widely adopted and represents a benchmark also among large non-listed
companies; this increased homogeneity in governance practices, including higher
transparency in the appointment of directors, larger proportion of independent, and the
adoption of board committees aligns Italian corporate law to the majority of regulation in
developed countries (Zattoni & Cuomo, 2008).
Dependent Variables: measures of board monitoring and advice tasks
The two dependent variables are computed through multiple items measured in the
questionnaire survey on a 5-point Likert scale. CEOs were asked to rate multiple items that
relate to the two main concepts (latent constructs). The dependent variables are perceptual
measures of board monitoring and advice tasks (Knockaert & Ucbasaran, 2013). Perceptual
measures are often used to measure board roles (Nicholson & Newton, 2010; Stevenson &
Radin, 2009; van Den Heuvel, van Gils & Voordeckers, 2006) and more generally in the
entrepreneurial domain.
Further, Lyon, Lumpkin, and Dess suggest that “one potential advantage of perceptual
approaches is a relatively high level of validity because researchers can pose questions that

13
address directly the underlying nature of a construct” (2000: 1058). Also, they highlight the
relevance of the data-source: these measures come from the most knowledgeable individual in
the organization, and enhance their fit with the investigated concepts. Nevertheless, given the
difficulty in capturing multi-dimensional concepts as in the form of monitoring and advice
tasks, an exploratory factor analysis (EFA) is employed to reduce multi-items variables into
single and clearly identifiable factors (Hair, Black, Babin & Anderson, 2010: 99). This
technique is extensively used in corporate governance research because of the specific
features of the field, where hardly any single item or measure is an exhaustive proxy for the
underlying concept to be measured (Larcker & Rusticus, 2010).
The questionnaire includes nine items referring to various activities in which a board
engages; in order to minimize the risk of “serial answers” and “social desirability bias”, the
items are inserted at different places in the questionnaire. The EFA confirms the existence of
two main factors (eigenvalue > 1), and that the questionnaire items and latent constructs are
consistent with existing theories and measures in different contexts (van Ees, van Der Laan &
Postma, 2008).
The two main constructs resulting from EFA are identifiable as CEOs’ perception of
board monitoring and advice tasks. All factors have acceptable loading scores on each
component of the latent construct, indicating a high association with the latent construct itself
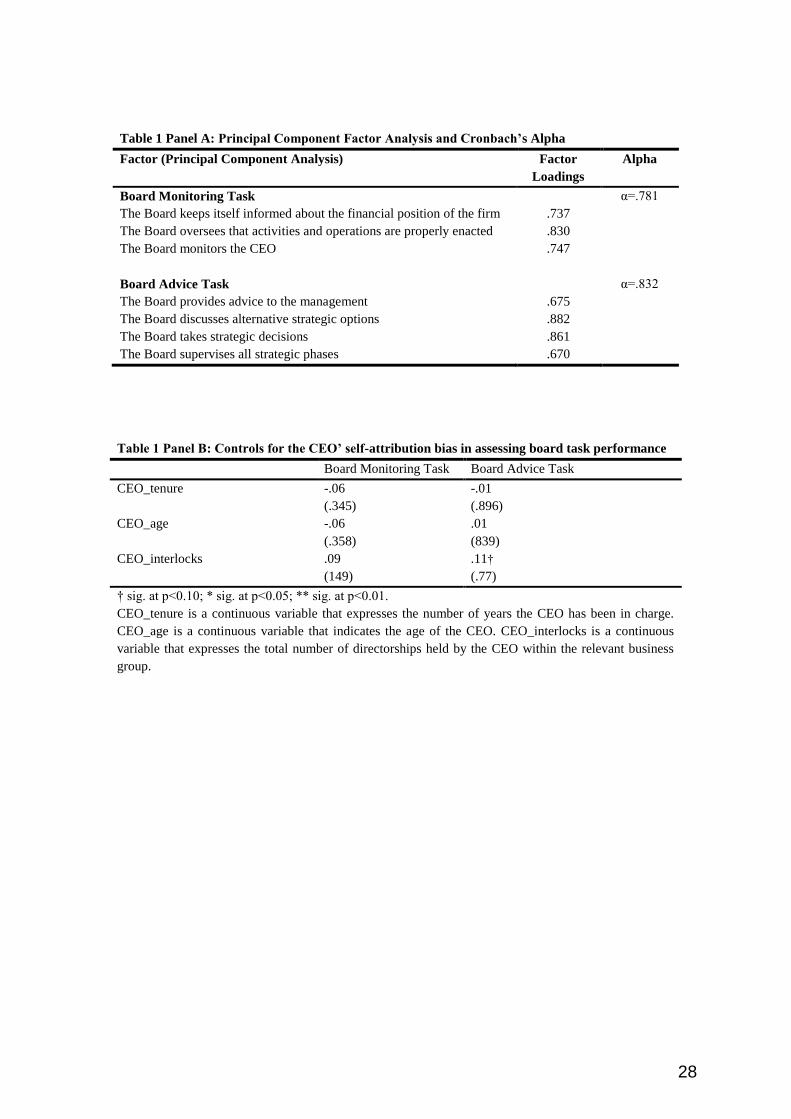
(Zhang, 2010): the variable “monitoring task” is the mean of three items. CEOs rated the
extent to which the board: keeps itself informed about financial position of the firm; oversees
that the operations are properly enacted; and monitors the CEO (Cronbach’ α = .781). The
variable “advice” is the mean of four items about the different aspects a board is expected to
contribute to. CEOs rated the extent to which the board: provides advice to the management;
discusses alternative options; takes strategic decisions; and supervises all strategic phases
(Cronbach’ α = .832). Measuring CEOs’ perception of board monitoring and advice, rather

14
than actual task performance, raises potential concerns related to the self-attribution bias (i.e.
the CEOs could downplay board’s contribution because of their status and power, or even
unintentionally).
In the attempt to minimize these concerns, we test whether CEOs’ perception of board
monitoring and advice is affected by potential proxies for CEO power and influence: CEO
tenure and age, or by the overall number of interlocks within the business group. Correlation
analysis (Table 1 Panel B) shows that there are no significant patterns in the data: CEO age,
tenure and interlocks do not correlate with CEOs’ perception of monitoring or advice tasks.
Hence, we rule out the risk that CEOs’ assessment of board task performance is affected by
power or self-attribution.
-------------------------------------------
INSERT TABLE 1 ABOUT HERE
-------------------------------------------
Independent and Control Variables
The two main predictors of board tasks performance are firm past performance and
industry regulation. The data for the two variables were drawn from archives and the survey.
“Past firm performance” (profit) is the average Return on Equity (ROE) in the three years
preceding the administration of the questionnaire (2001 to 2003). ROE is the most relevant
figure from the equity-holders’ perspective, whom boards pay attention to, and it is used as an
overall profitability measure for corporations capturing both operating and financial results
(Shen & Lin, 2009; Brick & Chidambaran, 2010). This study primarily relies on data from
financial statements: first, for the sake of comparability, accounting measures are employed to
assess firm performance because the sample includes both listed and unlisted companies;
15
second, stock market based performance are susceptible of investors’ anticipation and the risk
of suffering a downward bias due to the observation period (Baghat & Bolton, 2008). In order
to test the effects of performance on board monitoring or advice tasks, the sample is
partitioned into quintiles (Ramdani & van Witteloostuijn, 2010), and identified firms whose
profitability falls within the first (h_prof) or the last quintile (l_prof). An industry-adjusted
measure of ROE is also employed: this is computed as the average ROE (2001-2003) of the
relevant Firmi minus the average ROE of its industry (identified through the ATECO codes).
The analyses – untabulated in the paper – confirm our results
“Industry regulation” (ind_reg) indicates whether a firm operates within a sector that
is subject to government regulation. This is measured by asking CEOs whether the firm is
subjected to a highly regulated environment (5 on a 5-point scale) or not (1 on a 5-point scale).
Three main reasons justify the use of this metric over a dummy variable at industry level
(regulated versus non-regulated): first, industries cannot be classified as regulated or not
regulated with a clear-cut criterion (King & Lenox, 2000). There are different levels of
regulation between the two extremes (e.g. free competition and regulation); some industries
might be only partially regulated: the food industry is subject to health regulation and quality
checks on the products, while in the construction and manufacturing health and safety are a
primary concern. Others instead, like public utilities are regulated even in terms of fares,
employment levels, dividend policies and strategic choices. Another reason is the superior
knowledge of the CEO in assessing whether the main industry in which a company operates is
more or less regulated: this is particularly relevant in a sample that includes conglomerates
operating in different industries with varying levels of regulation. A third reason is strictly
related to the research design of this study: using a scaled measure for industry regulation,
allows discriminating between firms operating in highly regulated or non-regulated industries
and benchmark them with the rest of the population.
16
In order to check whether CEOs’ indications are reliable, CEOs’ responses are
matched to the traditional classification of regulated versus non-regulated industries. The
study employs the ATECO codes and classification from 2002 to cluster firms in their
respective industries. We found 13 main industries at a two-digit code level. Spearman’ index
shows a high overlap between the two (.28 at 0.01 level) suggesting that the measure is a
reliable proxy. In addition, we checked that firms operating in regulated (or non-regulated)
industries had lower (higher) Return on Asset (ROA) and Return on Sales (ROS) standard
deviation in the years from 2001 until 2003. Results show that firms operating in highly
regulated industries have lower variance in operating profits, thus suggesting they are more
predictable, which is a feature of regulated environments. Lastly, to perform our analyses, a
series of dummies identify firms operating in highly regulated industries (h_ind_reg) or in
low regulated ones (l_ind_reg).
A number of control variables are employed in this study: they refer to firm and board
features. Four different firm-level attributes are taken into account: Firm Size (size) is
computed as the logarithmic transformation of the average turnover in 2001-2003. Family
ownership (fam) is a dummy variable indicating whether one family holds at least 30% of
shares (1), or not (0). The listing status (listed) of corporations is a dummy variable indicating
whether the company has been consistently listed during the three years prior to the study (1),
or not (0). The institutional ownership (inst_own) is also included because of the potential
disciplining function on the board of directors’ monitoring or advice tasks: the variable sums
up the total percentage of shares held by the banks, mutual funds and venture capitalists.
A number of board-level controls are included: CEO duality (CEO_dual) indicates
whether the CEO is also the Chairperson of the board (1), or not (0). This is an important
feature and alters the dynamics between the top management team and outside directors
(Boyd, 1995). The size of the board (bd_size) is a continuous variable winsorized at 95%

17
value to reduce the impact of extreme values: three firms have more than 25 board members
and three less than 2; in order to keep the observations within the sample, these are attributed
to the top (bottom) values of the distribution at 5 and 95 percentage. Board independence
(bd_outs) is calculated as the ratio of independent, unaffiliated and non-executive directors
sitting on the board over the total number of directors. Directors’ ownership (bd_own)
indicates the ratio of directors with shares in the company over the total number of directors.
Board regulation (bd_reg) is a dummy variable based on the CEO’s indication about whether
the board has formal regulation in place suggesting how it must operate (1), or not (0). This is
a relevant feature in board research (Brick & Chidambaran, 2010) as it is likely to put
restrictions or enable a board’ s ability in performing its key tasks. Board meeting (bd_meet)
is the number of meetings held by the board during the year prior to the survey. This variable
is winsorized at 95% because two firms had more than 20 meetings in a year and five only
one: to keep the observations within the sample, these were attributed to the top (bottom)
values of the distribution at 5 and 95 percentage.
-------------------------------------------
INSERT TABLE 2 ABOUT HERE
-------------------------------------------
4. Results
Descriptive statistics and univariate analyses
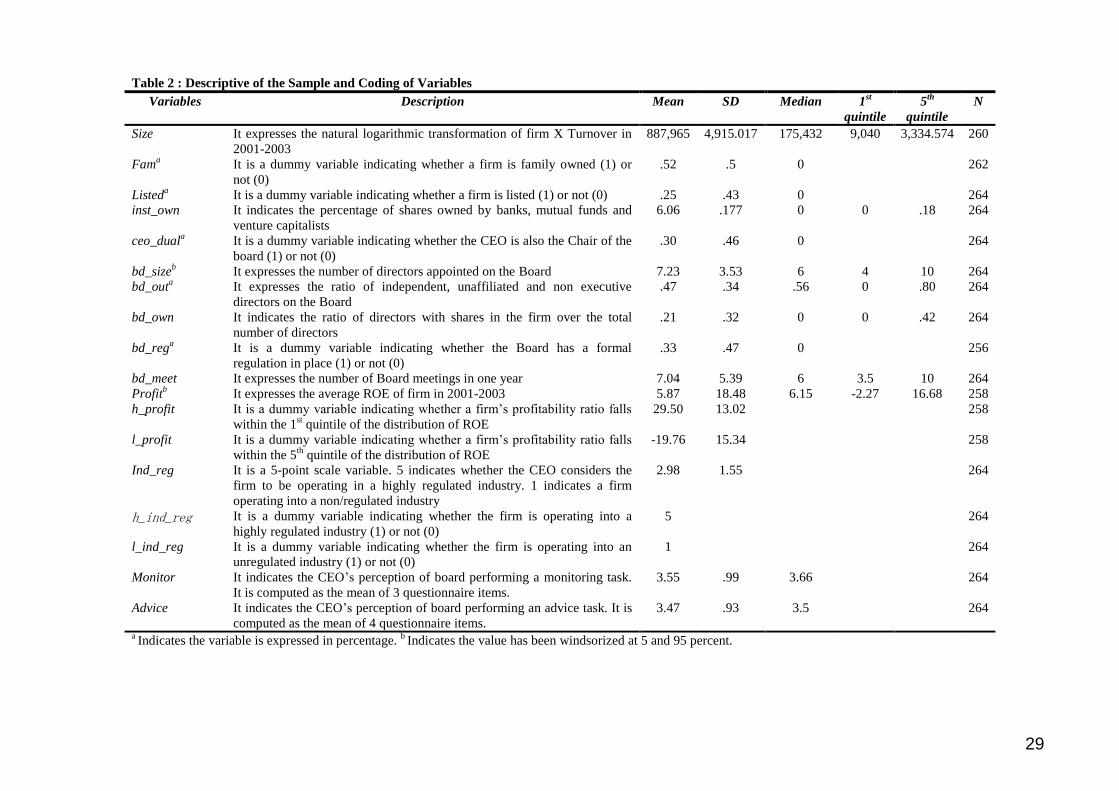
The descriptive statistics in Table 2 indicate that boards have on average 7 members,
CEO duality is not a common practice (30.7%), and seldom boards regulate the way they
operate (33.3%). A number of tests are performed to check for potential differences between
listed versus non-listed firms and between family-firms versus non-family firms across a
18
series of dimensions. Results from independent sample t-test confirm some differences
between listed and non-listed companies: listed companies tend to have larger boards (9.36)
with more outsiders (66%). The t-test shows significant differences between family and non-
family firms: FFs have smaller boards, spend less time in formal board meetings than non-
family peers, and tend to operate in non-regulated industries.
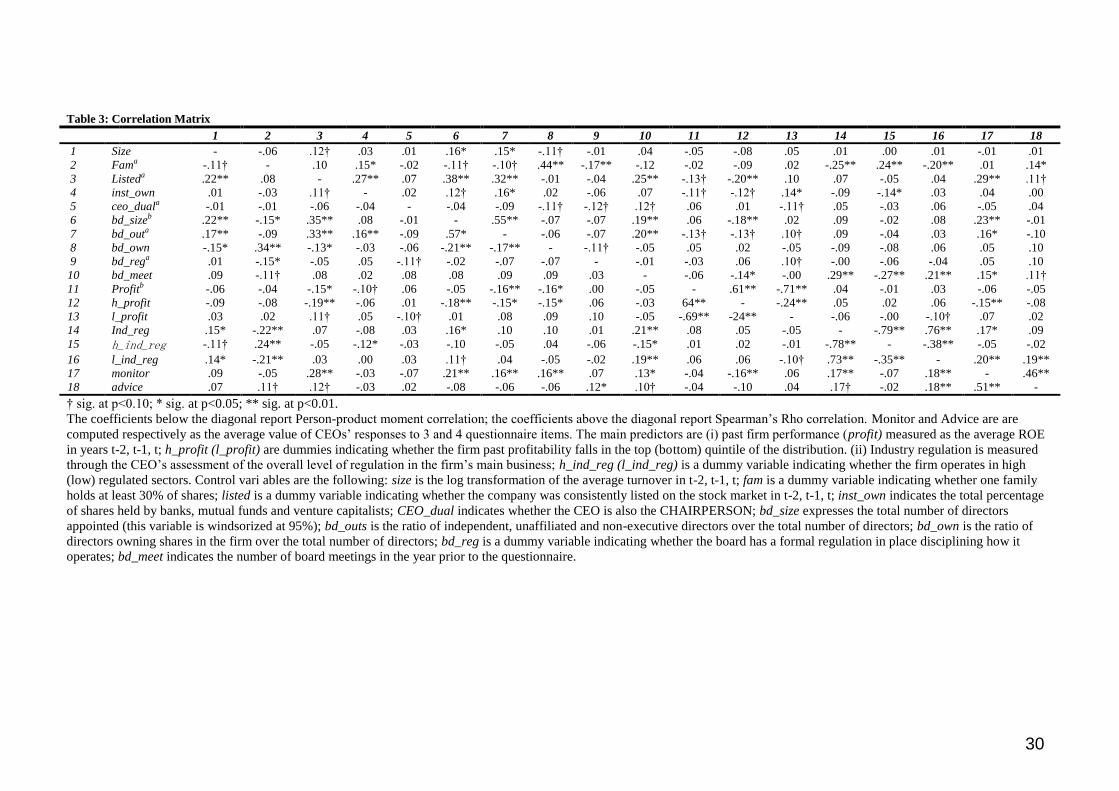
Table 3 displays correlations coefficients for all variables employed. Both Spearman
and Pearson coefficients are reported due to the presence of several dummy variables (Hair, et
al., 2010). The correlation analysis shows mostly expected results. Larger boards tend to have
higher number of outsiders, and meet more frequently. CEOs’ perception of board monitoring
is enhanced in listed corporations, and correlates positively to board size and outsider ratio.
Results also suggest that monitoring is negatively correlated with higher firm performance,
whilst it is positively associated with industry regulation. CEOs’ perception of board advice
increases in listed and family firms, whilst it is not correlated to any of the structural
dimensions of the board. The number of board meetings positively correlates to both tasks.
Furthermore, the correlation among monitoring and resource provision tasks is particularly
high (0.51; p<0.01), suggesting that boards are active in the two tasks at the same time (van
Den Heuvel, et al., 2006). These results are in line with findings from previous studies, thus
increasing confidence in the suitability of the sample for the purpose of this study.
-------------------------------------------
INSERT TABLE 3 ABOUT HERE
-------------------------------------------
Multivariate Analyses

19
Tables 4 & 5 present the results of multivariate analyses. A three-step regression is
employed for each of the two dependent variables. This is consistent with other studies on
boards of directors (Machold, Huse, Minichilli & Nordqvist, 2011; Payne, et al., 2009), and
enables capturing the additional variance explained when adding a new group of variables to
the previous model. In both cases, Model 1 in Tables 4 & 5 reports the results for control
variables only. Model 2 and 3 present respectively the effects of firm performance and
industry regulation on board monitoring and advice. Model 4 reports the full model with
controls, industry regulation and past firm performance. Variance inflation factors (VIFs) and
linear dependency tests are performed in order to check for multicollinearity. None of the
VIFs approach the critical threshold of 10, with the highest score approaching 2.
Model 1 in Table 4 indicates that firm and board level characteristics are not
significantly associated with board monitoring. The only notable exception is the listing status
of the corporation (0.57, p<0.01). This result is in line with existing theory and empirical
findings (Payne, et al., 2009): boards in listed companies face higher pressure in performing
their monitoring activities than their non-listed peers. Model 1 in Table 5 reports similar
results: listing status (0.31, p<0.05), family ownership (.31, p<05) and board regulation (0.28,
p<0.05) enhance CEO’s perception of board advice. Models 2, 3 and 4 are relevant to our
hypotheses.
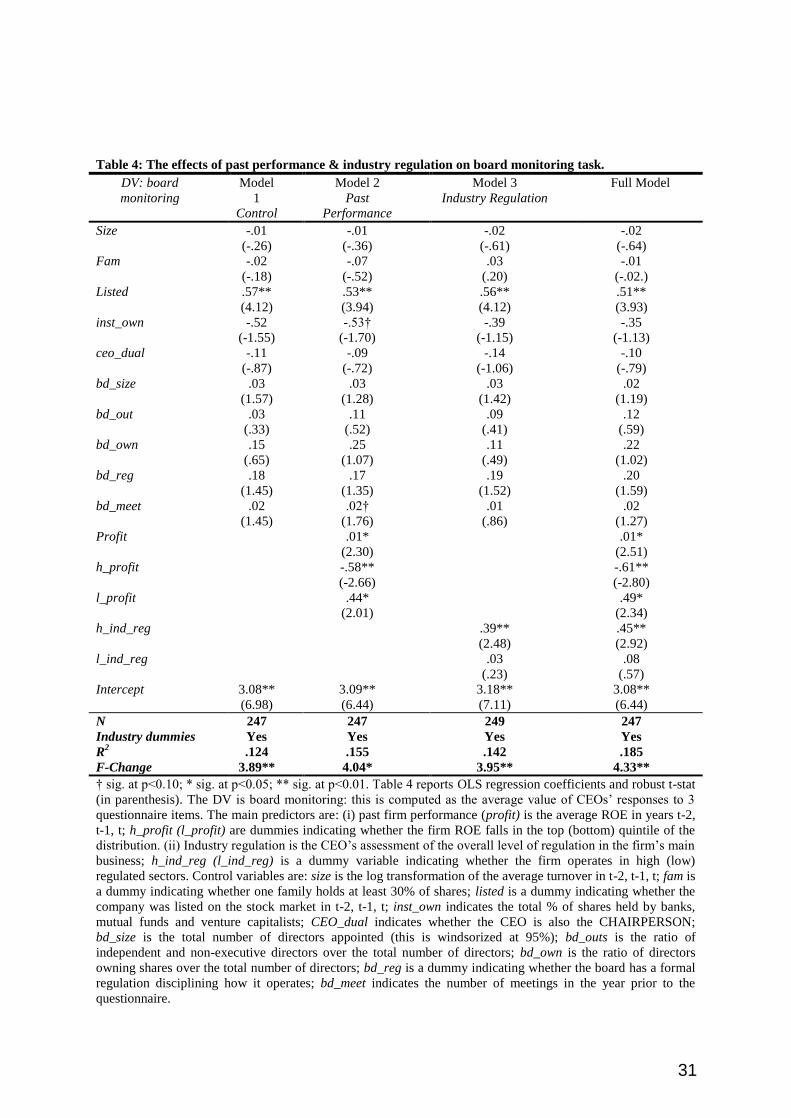
Model 2 (Table 4) tests the effect of past firm performance on the board monitoring,
and focus on the most and least profitable firms (the top and bottom quintiles respectively).
Past firm performance is significantly associated with board monitoring: when running a
piecewise regression with dummies for high (low) performance, results show that CEOs
perceive board monitoring to be higher in poorly performing firms (.44, p<0.05), while it is
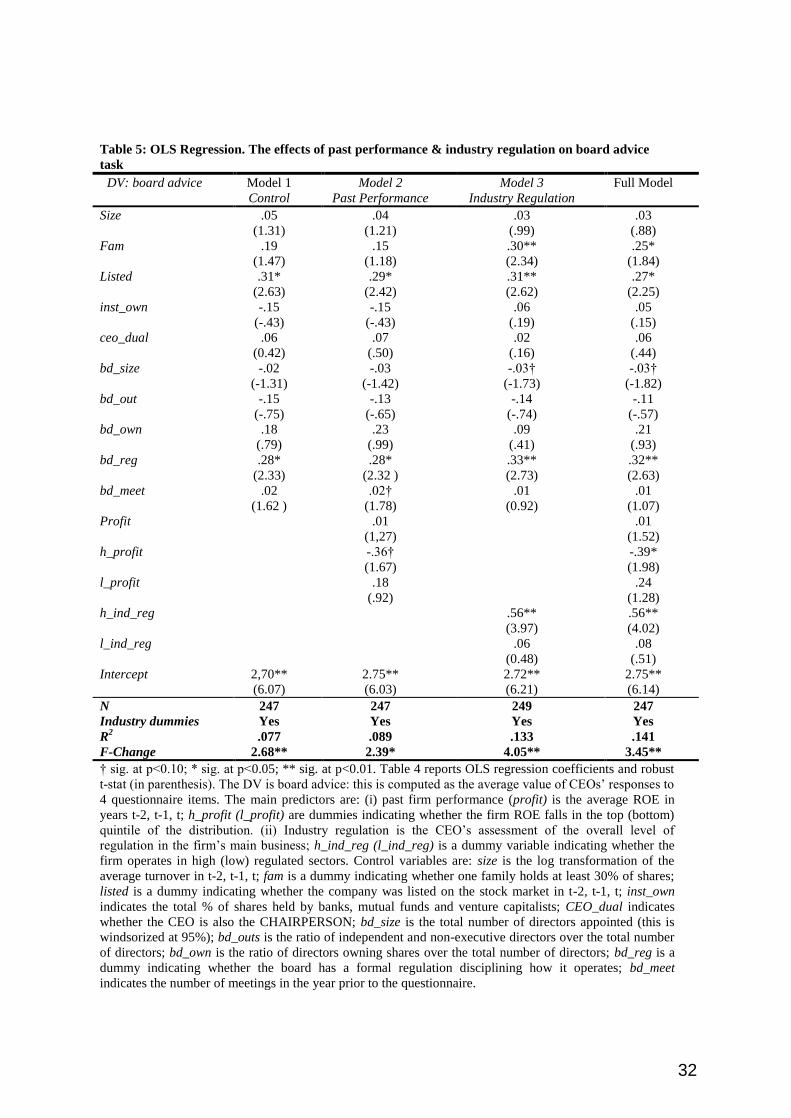
lower in high performing firms (-.58, p< 0.01). When examining the effects of past firm
performance on the board advice, Model 2 (Table 5) shows somewhat similar and less
20
pronounced results. Past firm performance affects board advice: results show that in highly
performing firms boards tend to reduce their advice task (-0.36, p<0.10), while there is a
positive, yet not statistically significant association with for poorly performing companies
(.18, p>.10).
These results substantially support Hp1a suggesting that poorly performing firms are
positively associated with board monitoring and advice task. Results provide only partial
support to Hp1b and show that higher (past) firm performance significantly reduces board
monitoring as well as board advice.
Model 3 in Table 4 illustrates the impact of industry regulation on the CEOs’
perception of board monitoring. Two dummies are employed to capturing whether the firm
operates into a highly or non-regulated industry. Results reveal that boards of companies
operating in highly regulated industries are perceived to perform a monitoring task (0.39,
p<0.01), while in non-regulated sectors, the result is not statistically significant (.03, p>.10).
When turning attention to the impact of industry regulation on the CEOs’ perception of board
advice, Model 3 (Table 5) shows that greater industry regulation will also enhance board
advice (0.56, p<0.01). These results provide partial support to Hp2a. When looking at firms
operating in non-regulated industries, results are not significant with regard to both tasks:
hence, we reject Hp2b positing a positive relation between low industry regulation and board
advice (.06, p>.10), and a negative relationship with board monitoring (.03, p>.10).
Model 4 (Table 4 & 5) supports our hypothesis: when testing the full model for
monitoring and advice tasks, both industry regulation and past firm performance are
associated with CEOs’ perception of board monitoring and advice. The full model shows in
both cases a higher explanatory power in terms of monitoring (R2
=0.185) and advice (R2
=0.141) tasks.

21
---------------------------------------------------
INSERT TABLES 4 & 5 ABOUT HERE
---------------------------------------------------
Robustness Checks
In order to assess the sensitivity of the main results to the use of alternative
specifications and analyses, a series of additional tests are performed. All tests employ the full
model (Model 4) as a benchmark.
The first concern is the potential for endogeneity or reverse causality in the model.
This issue is quite common in governance studies (Baghat & Bolton, 2008), and we tried to
address it in a number of ways. First, the study employs lagged performance measures (up to
three years prior to the administration of the survey) as predictors of board monitoring and
advice tasks. This attenuates the risk that board activism in 2004 might have “caused” firm
performance in 2001, 2002 and 2003. Second, the possibility of endogeneity being caused by
omitted variables is ruled out by including a number of control variables that are likely to
affect both CEO’s perception of board monitoring and advice and firm performance (Chenhall
& Moers, 2007): CEO duality, board size, outsider ratio, directors’ ownership, board
regulation and number of meetings. Hence, the risk of having biased and inconsistent
coefficient estimates is minimized (Wooldridge, 2000). Furthermore, a formal test for the
presence of omitted variables is performed by re-running the two full models with monitoring
and advice tasks as dependent variables, and employing the post-estimation commands “estat
ovtest” and “linktest” in STATA (Cameron & Trivedi, 2010: 92): in all cases we fail to reject
the null hypothesis “H0: the model has no omitted variables” as the |Prob>F| is always non
significant with the minimum value approaching .687. Third, the potential threat of
simultaneity is checked by running OLS regressions where the main predictor in our model
22
(past firm performance) becomes the dependent variables while CEOs’ perception of board
monitoring and advice become the predictors (Booth, Cornett & Tehranian, 2002). The
regression coefficients show that both monitoring (β= .031, p=.980) and advice (β= -.405,
p=.755) tasks do not affect firm performance.
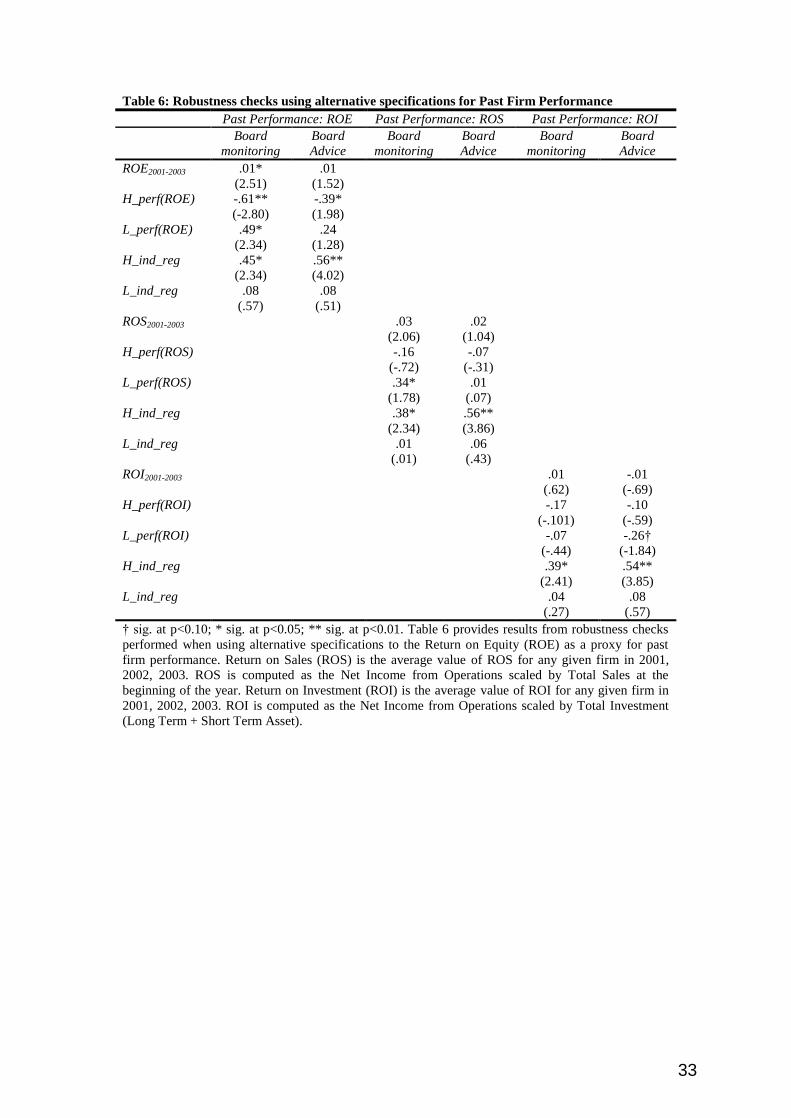
A second concern relates to the choice of return on equity (ROE) as a proxy for past
firm performance; ROE captures the overall profitability of the firm and picks up firm
leverage. In order to control for the potential effects of the capital structure, two alternative
measures of past firm performance are employed: average return on sales (ROS) in 2001-
2003 and average return on investment (ROI) in 2001-2003. Results show that changing the
proxy for past firm performance (either using ROS or ROI) does not substantially alter the
findings. Table 6 displays similarity across different measures of firm performance with only
one minor difference: the coefficient estimates on high performing firms lose their statistical
significance but keep their economic meaning (negative sign).
-------------------------------------------
INSERT TABLE 6 ABOUT HERE
-------------------------------------------
A third concern arises with regard to the composition of the sample as listed and
unlisted companies might differ in terms of board behaviour because of more (less) stringent
regulatory requirements. Therefore separate analyses on the sub-samples of listed firms only
and compare results with the full sample are performed. For the sake of parsimony only
results of OLS regressions on the full models (Model 4) are presented, employing board
monitoring and advice tasks as the dependent variables. The results show that in the sub-
sample of listed firms only (64 observations) the main effects are even more pronounced and

23
regression coefficients confirm that in high performing firms boards do not execute
monitoring task (-1.18, p<0.01), while the effect on advice task is still negative but not
statistically significant (-.07, p>0.10). On the other hand, boards in poorly performing firms
enhance monitoring (.94, p<0.01). Likewise, when turning to the effects of industry regulation,
results confirm that in highly regulated industries boards tend to be involved in monitoring
(.46, p<0.10) and advice (.47, p<0.10).
-------------------------------------------
INSERT TABLE 7 ABOUT HERE
-------------------------------------------
5. Discussion
Agency and resource-dependence theories suggest that boards are involved into
monitoring and advice tasks (Hillman & Dalziel, 2003). The two tasks constitute the core
activities in which boards engage (Geletakanycz & Boyd, 2011). Ocasio’s “attention-based
view” (1997) provides an appealing and theoretically sound approach to explore what boards
do, proposing that boards emphasize board monitoring and advice tasks according to the
contingencies they face. This study employs past performance and industry regulation as
“contextual factors” and shows that boards change their engagement under varying
circumstances.
The study contributes to both theory and practice: first, it provides support to the
“attention-based view”. Recent works by Zhang (2010), Tuggle, et al, (2010), Cho, and
Hambrick (2006) found that boards selectively direct their attention to strategic, monitoring or
entrepreneurial activities. We extend this line of enquiry and indicate that boards do not
constantly engage into monitoring or advice tasks: more specifically, when turning attention
24
to the effects of past performance and industry regulation on boards’ monitoring and advice,
changes in the contingencies above also change the way boards shift their attention to the
tasks. The most intriguing contribution comes from an in-depth examination of the
relationship between past profitability and board tasks performance: past firm performance
affects boards’ involvement into monitoring and advice tasks, indicating the likelihood of
contingencies in place. In high-performing firms, boards seem to be less engaged in both
monitoring and advice tasks, while in poorly performing firms we find higher involvement in
monitoring and advice tasks. This is a novel result in governance and board studies. Literature
and previous works analyse what boards do in the case of firms facing crisis or turnaround
situations (Daily, 1995), but very limited attention to boards in high-performing firms (Daily,
et al., 2003). The present investigation suggests that boards pay less attention to their tasks
when the company is performing well, thus explaining unexpected declines of very profitable
organizations. Furthermore, results show that board monitoring and advice tasks are
correlated and are similarly affected by firm and industry level contingencies. This is coherent
with the idea of a paradox of control and collaboration suggested by Sundaramurthy, and
Lewis (2003), and provides empirical support to the intuition behind Hillman, and Dalziel’s
work (2003) proposing an integration of agency and resource-based theory.
Industry regulation also has an effect on board tasks performance: greater industry
regulation enhances board monitoring and advice tasks. Regulation imposes a higher degree
of compliance to rules, standards and requirements demanded by authorities or ruling bodies,
and boards act as complements rather than substitutes in this endeavour. The results support
the “complementarity hypothesis” (Becher & Frye, 2011) by showing that higher regulation
enhances board monitoring. Firms need to conform to requirements and bylaws imposed by
regulators. The breach of regulation and failure to conform to existing rules could eventually
result in high litigation costs and disruption in the business activities. Therefore boards are
25
required to exert higher monitoring and more closely follow-up of all initiatives run by the
management (O’Donoghue, 2004). Regulation requires boards to be active in advice and
counselling, as well as in networking activities, due to the importance of links with regulators,
and enhancing the legitimacy and strengthening links with key players. Prior literature shows
the importance of having boards acting as advisors and trying to influence the key actors,
gaining access to superior information (Hillman, 2005): ultimately, these activities have
positive outcomes in terms of performance. This opens up new perspectives in interpreting
board dynamics and effectiveness, given that boards with similar structural features might
present different level of engagement in the two tasks.
The findings from this study also have practical implications. It is often questioned
why corporations with increasing profitability may experience sudden and unexpected
downturns (Leblanc & Gilles, 2005). Based on the evidence provided, one possible
explanation is the lack of boards’ engagement in the expected tasks, thus reducing
management accountability. Given the potential harm to the corporation and its shareholders,
one main implication is to increase scrutiny and request of activism also in the case of high-
performing companies. This is somehow contrary to the expectation that boards do not engage
much in the two tasks when the corporation is performing well: ultimately, this could turn to
be very detrimental and disproportionately increase the power of managerial team without
adequate control. It is well-established in the literature about symbolism (Zajac & Westphal,
2001) that CEOs gain power over the board if the company is well-performing; however, this
is creating a threat for the firm as boards become reluctant in carrying on their tasks.
These results open up paths for further investigation: growing anecdotal evidence
shows that profitable firms turn into financial distress and disgrace at an unexpected speed. It
seems that boards are more reluctant in challenging CEOs and the top management team in
case the latter would guarantee high levels of profits; however, albeit this is in line with an
26
agency rationale, it is also very risky. Profits might mask excessive risk-taking or short-term
choices (cutting maintenance costs or R&D expenditures) that might be harmful in the long-
term. There are also consequences in terms of our approach to boards and governance issues:
mainstream theories often call for increased board’s activism to protect shareholders in the
case value maximization is at a risk (Fama & Jensen, 1983). Nevertheless, managers might
possibly mask bad choices by artificially increasing profits, thus limiting boards’ willingness
to oversight them. In poor performing firms we find a positive but non-significant association
to monitoring and no relationship with resource provision task.
6. Conclusions and Limitations
Several studies have examined structural characteristics and board processes as drivers
of board monitoring and advice (e.g. Kiel & Nicholson, 2004; Payne, et al., 2009), also in
different institutional contexts (Minichilli, et al., 2012). However, the literature overlooked
the role of potential contingencies (Filatotchev & Nakajima, 2010). This study explores the
effect of past firm profitability and industry regulation on boards’ monitoring and advice tasks.
It moves away from the idea that board activism is a function of structural features or working
style, and hypothesizes that boards’ engagement into different tasks varies according to firm-
level and industry specific conditions. Findings show that greater industry regulation is
positively associated with monitoring and advice, while firm profitability is negatively
associated to both tasks. This study contributes to theory and practice. First, boards do not
always engage in board monitoring and advice tasks, but internal (performance) and external
(industry regulation) factors affect their behaviour. This is consistent with the predictions of
Ocasio’s attention-based view of the firm (1997). Second, boards in a highly performing firm
are perceived as rather passive both in monitoring and advice. Overall, boards seem reluctant
to challenge CEOs and managers when firms are operating profitably. It would be interesting
27
investigating the reasons behind the lack of engagement and there is potential for future
research.
This study has a number of limitations. The study assesses board monitoring and
advice tasks as the CEOs’ perception of board task performance, through a survey instrument.
Despite the care in crafting the survey, wording and distribution of the items, and the number
of tests to minimize the common method variance, there is an inherent risk of measuring
CEOs’ perceptions of the underlying phenomena, rather than what boards actually do. Data
triangulation and the use of multiple responses from directors on the same board would
significantly increase the validity of the constructs. Survey data are cross-sectional, thus
changes in board tasks performance over time as firm profitability and industry regulation
vary cannot be tracked.
The study draws data from a single country, Italy. Despite the similarities and
congruence of codes and regulation with other European and Asian contexts, results might be
context specific. Cross-country studies offer a more nuanced investigation of why this is
likely to happen and whether boards’ responses to past firm profitability and industry
regulation are invariant or country-specific (Minichilli, et al., 2012). The analyses span over
post-crisis period (2001 quarters 1 to 3, according to the NBER bulletin), thus potentially
altering firms’ and regulators’ attention towards governance issues.
28
Table 1 Panel A: Principal Component Factor Analysis and Cronbach’s Alpha
Factor (Principal Component Analysis) Factor
Loadings
Alpha
Board Monitoring Task α=.781
The Board keeps itself informed about the financial position of the firm .737
The Board oversees that activities and operations are properly enacted .830
The Board monitors the CEO .747
Board Advice Task α=.832
The Board provides advice to the management .675
The Board discusses alternative strategic options .882
The Board takes strategic decisions .861
The Board supervises all strategic phases .670
Table 1 Panel B: Controls for the CEO’ self-attribution bias in assessing board task performance
Board Monitoring Task Board Advice Task
CEO_tenure -.06
(.345)
-.01
(.896)
CEO_age -.06
(.358)
.01
(839)
CEO_interlocks .09
(149)
.11†
(.77)
† sig. at p<0.10; * sig. at p<0.05; ** sig. at p<0.01.
CEO_tenure is a continuous variable that expresses the number of years the CEO has been in charge.
CEO_age is a continuous variable that indicates the age of the CEO. CEO_interlocks is a continuous
variable that expresses the total number of directorships held by the CEO within the relevant business
group.
29
Table 2 : Descriptive of the Sample and Coding of Variables
Variables Description Mean SD Median 1st
quintile
5th
quintile
N
Size It expresses the natural logarithmic transformation of firm X Turnover in
2001-2003
887,965 4,915.017 175,432 9,040 3,334.574 260
Fama It is a dummy variable indicating whether a firm is family owned (1) or
not (0)
.52 .5 0 262
Listeda It is a dummy variable indicating whether a firm is listed (1) or not (0) .25 .43 0 264
inst_own It indicates the percentage of shares owned by banks, mutual funds and
venture capitalists
6.06 .177 0 0 .18 264
ceo_duala It is a dummy variable indicating whether the CEO is also the Chair of the
board (1) or not (0)
.30 .46 0 264
bd_sizeb It expresses the number of directors appointed on the Board 7.23 3.53 6 4 10 264
bd_outa It expresses the ratio of independent, unaffiliated and non executive
directors on the Board
.47 .34 .56 0 .80 264
bd_own It indicates the ratio of directors with shares in the firm over the total
number of directors
.21 .32 0 0 .42 264
bd_rega
It is a dummy variable indicating whether the Board has a formal
regulation in place (1) or not (0)
.33 .47 0 256
bd_meet It expresses the number of Board meetings in one year 7.04 5.39 6 3.5 10 264
Profitb
It expresses the average ROE of firm in 2001-2003 5.87 18.48 6.15 -2.27 16.68 258
h_profit It is a dummy variable indicating whether a firm’s profitability ratio falls
within the 1st quintile of the distribution of ROE
29.50 13.02 258
l_profit It is a dummy variable indicating whether a firm’s profitability ratio falls
within the 5th
quintile of the distribution of ROE
-19.76 15.34 258
Ind_reg It is a 5-point scale variable. 5 indicates whether the CEO considers the
firm to be operating in a highly regulated industry. 1 indicates a firm
operating into a non/regulated industry
2.98 1.55 264
h_ind_reg It is a dummy variable indicating whether the firm is operating into a
highly regulated industry (1) or not (0)
5 264
l_ind_reg It is a dummy variable indicating whether the firm is operating into an
unregulated industry (1) or not (0)
1 264
Monitor It indicates the CEO’s perception of board performing a monitoring task.
It is computed as the mean of 3 questionnaire items.
3.55 .99 3.66 264
Advice It indicates the CEO’s perception of board performing an advice task. It is
computed as the mean of 4 questionnaire items.
3.47 .93 3.5 264
a Indicates the variable is expressed in percentage.
b Indicates the value has been windsorized at 5 and 95 percent.
30
Table 3: Correlation Matrix
1 2 3 4 5 6 7 8 9 10 11 12 13 14 15 16 17 18
1 Size - -.06 .12† .03 .01 .16* .15* -.11† -.01 .04 -.05 -.08 .05 .01 .00 .01 -.01 .01
2 Fama -.11† - .10 .15* -.02 -.11† -.10† .44** -.17** -.12 -.02 -.09 .02 -.25** .24** -.20** .01 .14*
3 Listeda .22** .08 - .27** .07 .38** .32** -.01 -.04 .25** -.13† -.20** .10 .07 -.05 .04 .29** .11†
4 inst_own .01 -.03 .11† - .02 .12† .16* .02 -.06 .07 -.11† -.12† .14* -.09 -.14* .03 .04 .00
5 ceo_duala -.01 -.01 -.06 -.04 - -.04 -.09 -.11† -.12† .12† .06 .01 -.11† .05 -.03 .06 -.05 .04
6 bd_sizeb .22** -.15* .35** .08 -.01 - .55** -.07 -.07 .19** .06 -.18** .02 .09 -.02 .08 .23** -.01
7 bd_outa .17** -.09 .33** .16** -.09 .57* - -.06 -.07 .20** -.13† -.13† .10† .09 -.04 .03 .16* -.10
8 bd_own -.15* .34** -.13* -.03 -.06 -.21** -.17** - -.11† -.05 .05 .02 -.05 -.09 -.08 .06 .05 .10
9 bd_rega .01 -.15* -.05 .05 -.11† -.02 -.07 -.07 - -.01 -.03 .06 .10† -.00 -.06 -.04 .05 .10
10 bd_meet .09 -.11† .08 .02 .08 .08 .09 .09 .03 - -.06 -.14* -.00 .29** -.27** .21** .15* .11†
11 Profitb -.06 -.04 -.15* -.10† .06 -.05 -.16** -.16* .00 -.05 - .61** -.71** .04 -.01 .03 -.06 -.05
12 h_profit -.09 -.08 -.19** -.06 .01 -.18** -.15* -.15* .06 -.03 64** - -.24** .05 .02 .06 -.15** -.08
13 l_profit .03 .02 .11† .05 -.10† .01 .08 .09 .10 -.05 -.69** -24** - -.06 -.00 -.10† .07 .02
14 Ind_reg .15* -.22** .07 -.08 .03 .16* .10 .10 .01 .21** .08 .05 -.05 - -.79** .76** .17* .09
15 h_ind_reg -.11† .24** -.05 -.12* -.03 -.10 -.05 .04 -.06 -.15* .01 .02 -.01 -.78** - -.38** -.05 -.02
16 l_ind_reg .14* -.21** .03 .00 .03 .11† .04 -.05 -.02 .19** .06 .06 -.10† .73** -.35** - .20** .19**
17 monitor .09 -.05 .28** -.03 -.07 .21** .16** .16** .07 .13* -.04 -.16** .06 .17** -.07 .18** - .46**
18 advice .07 .11† .12† -.03 .02 -.08 -.06 -.06 .12* .10† -.04 -.10 .04 .17† -.02 .18** .51** -
† sig. at p<0.10; * sig. at p<0.05; ** sig. at p<0.01.
The coefficients below the diagonal report Person-product moment correlation; the coefficients above the diagonal report Spearman’s Rho correlation. Monitor and Advice are are
computed respectively as the average value of CEOs’ responses to 3 and 4 questionnaire items. The main predictors are (i) past firm performance (profit) measured as the average ROE
in years t-2, t-1, t; h_profit (l_profit) are dummies indicating whether the firm past profitability falls in the top (bottom) quintile of the distribution. (ii) Industry regulation is measured
through the CEO’s assessment of the overall level of regulation in the firm’s main business; h_ind_reg (l_ind_reg) is a dummy variable indicating whether the firm operates in high
(low) regulated sectors. Control vari ables are the following: size is the log transformation of the average turnover in t-2, t-1, t; fam is a dummy variable indicating whether one family
holds at least 30% of shares; listed is a dummy variable indicating whether the company was consistently listed on the stock market in t-2, t-1, t; inst_own indicates the total percentage
of shares held by banks, mutual funds and venture capitalists; CEO_dual indicates whether the CEO is also the CHAIRPERSON; bd_size expresses the total number of directors
appointed (this variable is windsorized at 95%); bd_outs is the ratio of independent, unaffiliated and non-executive directors over the total number of directors; bd_own is the ratio of
directors owning shares in the firm over the total number of directors; bd_reg is a dummy variable indicating whether the board has a formal regulation in place disciplining how it
operates; bd_meet indicates the number of board meetings in the year prior to the questionnaire.
31
Table 4: The effects of past performance & industry regulation on board monitoring task.
DV: board
monitoring
Model
1
Control
Model 2
Past
Performance
Model 3
Industry Regulation
Full Model
Size -.01
(-.26)
-.01
(-.36)
-.02
(-.61)
-.02
(-.64)
Fam -.02
(-.18)
-.07
(-.52)
.03
(.20)
-.01
(-.02.)
Listed .57**
(4.12)
.53**
(3.94)
.56**
(4.12)
.51**
(3.93)
inst_own -.52
(-1.55)
-.53†
(-1.70)
-.39
(-1.15)
-.35
(-1.13)
ceo_dual -.11
(-.87)
-.09
(-.72)
-.14
(-1.06)
-.10
(-.79)
bd_size .03
(1.57)
.03
(1.28)
.03
(1.42)
.02
(1.19)
bd_out .03
(.33)
.11
(.52)
.09
(.41)
.12
(.59)
bd_own .15
(.65)
.25
(1.07)
.11
(.49)
.22
(1.02)
bd_reg .18
(1.45)
.17
(1.35)
.19
(1.52)
.20
(1.59)
bd_meet .02
(1.45)
.02†
(1.76)
.01
(.86)
.02
(1.27)
Profit .01*
(2.30)
.01*
(2.51)
h_profit -.58**
(-2.66)
-.61**
(-2.80)
l_profit .44*
(2.01)
.49*
(2.34)
h_ind_reg .39**
(2.48)
.45**
(2.92)
l_ind_reg .03
(.23)
.08
(.57)
Intercept 3.08**
(6.98)
3.09**
(6.44)
3.18**
(7.11)
3.08**
(6.44)
N 247 247 249 247
Industry dummies Yes Yes Yes Yes
R2 .124 .155 .142 .185
F-Change 3.89** 4.04* 3.95** 4.33**
† sig. at p<0.10; * sig. at p<0.05; ** sig. at p<0.01. Table 4 reports OLS regression coefficients and robust t-stat
(in parenthesis). The DV is board monitoring: this is computed as the average value of CEOs’ responses to 3
questionnaire items. The main predictors are: (i) past firm performance (profit) is the average ROE in years t-2,
t-1, t; h_profit (l_profit) are dummies indicating whether the firm ROE falls in the top (bottom) quintile of the
distribution. (ii) Industry regulation is the CEO’s assessment of the overall level of regulation in the firm’s main
business; h_ind_reg (l_ind_reg) is a dummy variable indicating whether the firm operates in high (low)
regulated sectors. Control variables are: size is the log transformation of the average turnover in t-2, t-1, t; fam is
a dummy indicating whether one family holds at least 30% of shares; listed is a dummy indicating whether the
company was listed on the stock market in t-2, t-1, t; inst_own indicates the total % of shares held by banks,
mutual funds and venture capitalists; CEO_dual indicates whether the CEO is also the CHAIRPERSON;
bd_size is the total number of directors appointed (this is windsorized at 95%); bd_outs is the ratio of
independent and non-executive directors over the total number of directors; bd_own is the ratio of directors
owning shares over the total number of directors; bd_reg is a dummy indicating whether the board has a formal
regulation disciplining how it operates; bd_meet indicates the number of meetings in the year prior to the
questionnaire.
32
Table 5: OLS Regression. The effects of past performance & industry regulation on board advice
task
DV: board advice Model 1
Control
Model 2
Past Performance
Model 3
Industry Regulation
Full Model
Size .05
(1.31)
.04
(1.21)
.03
(.99)
.03
(.88)
Fam .19
(1.47)
.15
(1.18)
.30**
(2.34)
.25*
(1.84)
Listed .31*
(2.63)
.29*
(2.42)
.31**
(2.62)
.27*
(2.25)
inst_own -.15
(-.43)
-.15
(-.43)
.06
(.19)
.05
(.15)
ceo_dual .06
(0.42)
.07
(.50)
.02
(.16)
.06
(.44)
bd_size -.02
(-1.31)
-.03
(-1.42)
-.03†
(-1.73)
-.03†
(-1.82)
bd_out -.15
(-.75)
-.13
(-.65)
-.14
(-.74)
-.11
(-.57)
bd_own .18
(.79)
.23
(.99)
.09
(.41)
.21
(.93)
bd_reg .28*
(2.33)
.28*
(2.32 )
.33**
(2.73)
.32**
(2.63)
bd_meet .02
(1.62 )
.02†
(1.78)
.01
(0.92)
.01
(1.07)
Profit .01
(1,27)
.01
(1.52)
h_profit -.36†
(1.67)
-.39*
(1.98)
l_profit .18
(.92)
.24
(1.28)
h_ind_reg .56**
(3.97)
.56**
(4.02)
l_ind_reg .06
(0.48)
.08
(.51)
Intercept 2,70**
(6.07)
2.75**
(6.03)
2.72**
(6.21)
2.75**
(6.14)
N 247 247 249 247
Industry dummies Yes Yes Yes Yes
R2 .077 .089 .133 .141
F-Change 2.68** 2.39* 4.05** 3.45**
† sig. at p<0.10; * sig. at p<0.05; ** sig. at p<0.01. Table 4 reports OLS regression coefficients and robust
t-stat (in parenthesis). The DV is board advice: this is computed as the average value of CEOs’ responses to
4 questionnaire items. The main predictors are: (i) past firm performance (profit) is the average ROE in
years t-2, t-1, t; h_profit (l_profit) are dummies indicating whether the firm ROE falls in the top (bottom)
quintile of the distribution. (ii) Industry regulation is the CEO’s assessment of the overall level of
regulation in the firm’s main business; h_ind_reg (l_ind_reg) is a dummy variable indicating whether the
firm operates in high (low) regulated sectors. Control variables are: size is the log transformation of the
average turnover in t-2, t-1, t; fam is a dummy indicating whether one family holds at least 30% of shares;
listed is a dummy indicating whether the company was listed on the stock market in t-2, t-1, t; inst_own
indicates the total % of shares held by banks, mutual funds and venture capitalists; CEO_dual indicates
whether the CEO is also the CHAIRPERSON; bd_size is the total number of directors appointed (this is
windsorized at 95%); bd_outs is the ratio of independent and non-executive directors over the total number
of directors; bd_own is the ratio of directors owning shares over the total number of directors; bd_reg is a
dummy indicating whether the board has a formal regulation disciplining how it operates; bd_meet
indicates the number of meetings in the year prior to the questionnaire.
33
Table 6: Robustness checks using alternative specifications for Past Firm Performance
Past Performance: ROE Past Performance: ROS Past Performance: ROI
Board
monitoring
Board
Advice
Board
monitoring
Board
Advice
Board
monitoring
Board
Advice
ROE2001-2003 .01*
(2.51)
.01
(1.52)
H_perf(ROE) -.61**
(-2.80)
-.39*
(1.98)
L_perf(ROE) .49*
(2.34)
.24
(1.28)
H_ind_reg .45*
(2.34)
.56**
(4.02)
L_ind_reg .08
(.57)
.08
(.51)
ROS2001-2003 .03
(2.06)
.02
(1.04)
H_perf(ROS) -.16
(-.72)
-.07
(-.31)
L_perf(ROS) .34*
(1.78)
.01
(.07)
H_ind_reg .38*
(2.34)
.56**
(3.86)
L_ind_reg .01
(.01)
.06
(.43)
ROI2001-2003 .01
(.62)
-.01
(-.69)
H_perf(ROI) -.17
(-.101)
-.10
(-.59)
L_perf(ROI) -.07
(-.44)
-.26†
(-1.84)
H_ind_reg .39*
(2.41)
.54**
(3.85)
L_ind_reg .04
(.27)
.08
(.57)
† sig. at p<0.10; * sig. at p<0.05; ** sig. at p<0.01. Table 6 provides results from robustness checks
performed when using alternative specifications to the Return on Equity (ROE) as a proxy for past
firm performance. Return on Sales (ROS) is the average value of ROS for any given firm in 2001,
2002, 2003. ROS is computed as the Net Income from Operations scaled by Total Sales at the
beginning of the year. Return on Investment (ROI) is the average value of ROI for any given firm in
2001, 2002, 2003. ROI is computed as the Net Income from Operations scaled by Total Investment
(Long Term + Short Term Asset).

34
Table 7: OLS Regression (‘full model’ only) on a subsample of Listed Firms
Listed Firms (N=65) Full Sample (N=264)
Board
Monitoring
Board
Advice
Board
Monitoring
Board
Advice
Size .12*
(2.44)
.09
(1.65)
-.02
(-.64) .03
(.88)
Fam .24
(1.11)
.48*
(2.52)
-.01
(-.02.) .25*
(1.84)
Listed .51**
(3.93) .27*
(2.25)
inst_own -.83*
(2.15)
-.64†
(-1.69)
-.35
(-1.13) .05
(.15)
ceo_dual .07
(.40)
.10
(.52)
-.10
(-.79) .06
(.44)
bd_size -.02
(-.96)
-.05
(-1.33)
.02
(1.19) -.03†
(-1.82)
bd_out .26
(.63)
-.36
(-.89)
.12
(.59) -.11
(-.57)
bd_own 1.27**
(2.69)
.12
(.21)
.22
(1.02) .21
(.93)
bd_reg -.06
(-.36)
.31†
(1.70)
.20
(1.59) .32**
(2.63)
bd_meet .35
(-1.19)
-.01
(-.36)
.02
(1.27) .01
(1.07)
Profit .02**
(3.29)
.01
(.58)
.01*
(2.51) .01
(1.52)
h_profit -1.18**
(-2.70)
-.07
(-.18)
-.61**
(-2.80) -.39*
(1.98)
l_profit .94**
(4.11)
.05
(.15)
.49*
(2.34) .24
(1.28)
h_ind_reg .46†
(1.66)
.44†
(1.73)
.45**
(2.92) .56**
(4.02)
l_ind_reg .51**
(2.74)
.22
(1.22)
.08
(.57) .08
(.51)
Intercept 1.56*
(2.68)
2.65**
(3.83)
3.08**
(6.44) 2.75**
(6.14)
N 65 65 247 247
Industry Dummies Yes Yes Yes Yes
R2 .456 .277 .185 .141
F-Change 7.15** 1.74** 4.33** 3.45**
† sig. at p<0.10; * sig. at p<0.05; ** sig. at p<0.01. Table 7 provides OLS regression results for the subsample of
listed firms only. Table 4 reports OLS regression coefficients and robust t-stat (in parenthesis). The DVs are board
monitoring (advice) computed as the average value of CEOs’ responses to 3 (4) questionnaire items. The main
predictors are: (i) past firm performance (profit) is the average ROE in years t-2, t-1, t; h_profit (l_profit) are
dummies indicating whether the firm ROE falls in the top (bottom) quintile of the distribution. (ii) Industry
regulation is the CEO’s assessment of the overall level of regulation in the firm’s main business; h_ind_reg
(l_ind_reg) is a dummy variable indicating whether the firm operates in high (low) regulated sectors. Control
variables are: size is the log transformation of the average turnover in t-2, t-1, t; fam is a dummy indicating whether
one family holds at least 30% of shares; listed is a dummy indicating whether the company was listed on the stock
market in t-2, t-1, t; inst_own indicates the total % of shares held by banks, mutual funds and venture capitalists;
CEO_dual indicates whether the CEO is also the CHAIRPERSON; bd_size is the total number of directors
appointed (this is windsorized at 95%); bd_outs is the ratio of independent and non-executive directors over the total
number of directors; bd_own is the ratio of directors owning shares over the total number of directors; bd_reg is a
dummy indicating whether the board has a formal regulation disciplining how it operates; bd_meet indicates the
number of meetings in the year prior to the questionnaire.
35
REFERENCES
Adams R, Ferreira D. Regulatory pressure and Bank’s directors’ incentives to attend board
meetings. Working Paper, European Corporate Governance Institute 2008.
Abebe MA, Angriawan A, Liu X. CEO power and organizational turnaround in declining
firms: does environment play a role? Journal of Leadership and Organizational Studies
2011; 18: 260-273.
Baghat S, Bolton B. Corporate Governance and Firm Performance. Journal of Corporate
Finance 2008; 14: 257-273.
Bainbridge SM. Director primacy: the means and ends of corporate governance. Northwestern
University Law Review 2002; 97: 547-591.
Bamberger P. Beyond contextualization: using context theories to narrow the micro-macro
gap in management research. Academy of Management Journal 2008; 51: 839-846.
Barnett ML. An attention-based view of real option reasoning. Academy of Management
Review 2008; 33: 606-628.
Becher DA, Frye MB. Does regulation substitute or complement governance? Journal of
Banking and Finance 2011; 35:736-751.
Blair MM. In the best interest of the Corporation: Directors’ Duties in the Wake of the Global
Financial Crisis. In T. Clarke, & D. Branson, editors, The Sage Handbook of Corporate
Governance. Thousands Oaks, California: Sage; 2012. p. 62-93
Boeker W, Goodstein J. Organizational performance and adaption: effects of environment and
performance on changes in board composition. Academy of Management Journal 1991;
34: 805-826.
Booth JR, Cornett MM, Theranian H. Boards of directors, ownership and regulation. Journal
of Banking and Finance 2002; 26: 1973-1996.
36
Boyd BK. Corporate linkages and Organizational Environment: A test of the Resource
Dependence Model. Strategic Management Journal 1990; 11: 419-430.
Boyd BK. CEO duality and firm performance: a contingency model. Strategic Management
Journal 1995; 16: 301-312.
Boyd BK, Haynes KT, Hitt MA, Bergh DD, Ketchen DJ. Contingency hypotheses in strategic
management research: use, disuse or misuse? Journal of Management 2012; 38: 278-
313.
Brick IE, Chidambaran NK. Board Meetings, committee structure, and firm value. Journal of
Corporate Finance 2010; 16: 533-553.
Cameron CA, Trivedi PK. Microeconometrics using Stata (2nd
ed). Texas: Stata Press; 2010.
Carpenter MA, Westphal JD. The Strategic Context of External Network Ties: Examining the
Impact of Director Appointments on Board Involvement in Strategic Decision Making.
Academy of Management Journal 2001; 4: 639-660.
Chenhall RA, Moers F. The issue of endogeneity within theory-based, quantitative
management accounting research. European Accounting Review 2007; 16: 173-195.
Cho TS, Hambrick DC. Attention as the mediator between Top Management Team
characteristics and Strategic change: the case of airline deregulation. Organization
Science 2008; 17: 453-469.
Coffee JC. Gatekeepers: the Profession and Corporate Governance. Oxford: Oxford
University Press; 2005.
Daily CM. The Relationship between Board Composition and Leadership Structure and
Bankruptcy Reorganization Outcomes. Journal of Management 1995; 21(6): 1041-1056.
Daily CM, Dalton DR, Cannella AA. Corporate governance: Decades of dialogue and data.
Academy of Management Review 2003; 28: 371-382.
37
Dalton DR, Dalton CM. Integration of micro and macro studies in governance research: CEO
duality, board composition, and financial performance. Journal of Management 2011;
37: 404-411.
Dalton DR, Hitt MA, Certo TS, Dalton CM. The fundamental agency problem and its
mitigation. The Academy of Management Annals 2007; 1: 1-64.
Dess GG, Beard DW. Dimensions of organizational task environments. Administrative
Science Quarterly 1984; 29: 52-73.
DeJong HW. The Governance Structure and Performance of Large European Corporations,
Journal of Management and Governance 1997; 1: 5-27.
van Ees H, van Der Laan G, Postma TJBM. Effective behaviour in the Netherlands. European
Journal of Management 2006; 26: 84-93.
Enriques L, Volpin P. Corporate governance reforms in continental Europe. Journal of
Economic Perspectives 2007; 21: 117-140.
Fama E, Jensen MC. Separation of Ownership and Control. Journal of Law and Economics
1983; 26: 301-325.
Filatotchev I, Nakajima C. Internal and external corporate governance: an interface between
an organization and its environment. British Journal of Management 2010; 21: 591-606.
Finkelstein S, Hambrick D, Cannella Jr AA. Strategic Leadership. New York: Oxford
University Press; 2009.
Finkelstein S, Mooney AC. Not the usual suspects: how to use board process to make boards
better. Academy of Management Executive 2003; 17: 101-113.
Forbes DP, Milliken FJ. Cognition and corporate governance: Understanding boards of
directors as strategic decision-making groups. Academy of Management Review 1999;
24: 489-505.
38
Gales LM, Kesner IF. An analysis of board of director size and composition in bankrupt
organizations. Journal of Business Research 1994; 30(3): 271-282. (July).
Geletkanycz MA, Boyd BK. CEO Outside Directorships and firm performance: a
reconciliation of agency and embeddedness views. Academy of Management Journal
2011; 54: 335-352.
Hair W, Black B, Babin J, Anderson RE. Multivariate data analysis. New Jersey: Pearson
Prentice; 2010.
Hagendorff J, Collins M, Keasey K. Board monitoring, regulation and performance in the
banking industry: evidence from the market for corporate control. Corporate
governance: an International Review 2010; 5:381-395.
Hendry KP, Kiel GC, Nicholson GJ. How boards strategise: a strategy as practice view. Long
Range Planning 201; 43(1): 33-56.
van den Heuvel J, Van Gils A, Voordeckers W. Board roles in small and medium-sized
family businesses: performance and importance. Corporate Governance: an
international Review 2006; 14: 467-486.
Hillman AJ. Politicians on the Board of Directors: Do Connections affect the Bottom Line?
Journal of Management 2005; 31: 464-481.
Hillman AJ, Cannella Jr AA, Paetzold RL. The Resource Dependence Role of Corporate
Directors: Strategic Adaption of Board Composition in Response to Environmental
Change. Journal of Management Studies 2000; 37: 235-256.
Hillman AJ, Dalziel T. Boards of directors and firm performance: Integrating agency and
resource dependence perspectives. Academy of Management Review 2003; 28: 383-396.
Hillman AJ, Withers MC, Collins BJ. Resource Dependence Theory: A Review. Journal of
Management 2009; 35: 1404-1427.

39
Huse M. Boards, governance and value creation. Cambridge: Cambridge University Press;
2007.
King AA, Lenox MJ. Industry Self-Regulation: The Chemical Industry’s Responsible Care
Program. Academy of Management Journal 2000; 43: 698-716.
Knockaert M, Ucbasaran D. The service role of outside boards in high-tech start-ups: A
Resource dependency perspective. British Journal of Management 2013; 24: 69-84.
Lang JR, Lockhart DE. Increased Environmental Uncertainty and Changes in Board Linkages
Patterns. Academy of Management Journal 1990; 33: 106-128.
Larcker DF, Rusticus TO. On the use of instrumental variables in accounting research.
Journal of Accounting and Economics 2010; 49: 186-205.
Le SA, Walters B, Kroll M. The moderating effects of external monitors on the relationship
between R&D spending and firm performance. Journal of Business Research 2006;
59(2): 278-287.
Leblanc R. Gillies J. Inside the boardroom. Toronto: Wiley and Sons; 2005.
Lynall M, Golden BR, Hillman AJ. Board Composition from Adolescence to Maturity: A
Multi-theoretical View. Academy of Management Review 2003; 28: 416-431.
Lyon DW, Lumpkin GT, Dess GG. Enhancing entrepreneurial orientation research:
operationalizing and measuring a key strategic decision making process. Journal of
Management 2000; 26: 1055-1085.
Machold S, Huse M, Minichilli A, Nordqvist M. Board leadership and strategy involvement
in small firms: A team production approach. Corporate Governance: An International
Review 2011; 19: 368-383.
Millstein IM, MacAvoy PW. The Active Board of Directors and Performance of the Large
Publicly Traded Corporation. Columbia Law Review 1998; 98: 1283-1322.

40
Minichilli A, Zattoni A, Nielsen S, Huse M. Board task performance: an exploration of micro
and macro level determinants of board effectiveness. Journal of Organizational
Behaviour 2012; 33(2): 193-215.
Mueller GC, Barker III VL. Upper echelons and board characteristics of turnaround and non
turnaround declining firms. Journal of Business Research 1997; 39(2): 119-34.
Nicholson GJ, Newton CJ. The role of the board of directors: perceptions of managerial elites.
Journal of Management and Organization 2010; 16(2): 201-218.
O’Donoghue EJ. The Construction of a Firm’s Governance Structure in a Setting of
Uncertainty. Managerial and Decision Economics 2004; 25: 221-229.
Ocasio W. Towards an attention-based view of the firm. Strategic Management Journal 1997;
18: 187-206.
Ocasio W, Joseph J. An attention-based theory of strategy formulation: linking micro and
macro perspectives in strategy processes. Advances in Strategic Management 2005; 22:
39-61.
Payne GT, Benson GB, Finegold DL. Corporate Board Attributes, Team Effectiveness and
Financial Performance. Journal of Management Studies 2009; 46: 704-731.
Pfeffer J. Size and composition of corporate boards of directors: the organization and its
environment. Administrative Science Quarterly 1972; 17: 218-228.
Pfeffer J, Salancik GR. The External Control of Organizations: A Resource Dependency
Perspective. New York: Harper and Row; 1978.
Platt H. Platt M. Corporate board attributes and bankruptcy. Journal of Business Research
2012; 65:1139-1143.
Podsakoff PM, MacKenzie SB, Lee JY, Podsakoff PM. Common method biases in behavioral
research: A critical review of the literature and recommended remedies. Journal of
Applied Psychology 2003; 88: 879-903.
41
Pugliese A, Bezemer P, Zattoni A, Huse M, Van den Bosch AJ, Volberda HW. Boards of
Directors’ contribution to strategy: a literature review and research agenda. Corporate
Governance: an International Review 2009; 17(3): 292-306.
Ramdani D, van Witteloostuijn A. The impact of board independence and CEO duality on
firm performance: a quantile regression analysis for Indonesia, Malysia, South Korea
and Thailand. British Journal of Management 2010; 21: 607-626.
Shen W, Lin C. Firm profitability, state ownership, and top management turnover at the listed
firms in China: a behavioural perspective. Corporate Governance: an International
Review 2009; 17: 443-456.
Stevenson WB, Radin RF. Social capital and Social influence on the Board of Directors.
Journal of Management Studies 2009; 46: 14-44.
Sundaramurthy C. Lewis M. Control and collaboration: paradoxes of governance. Academy
of Management Review 2003; 28: 397-415.
Tuggle CS, Schnatterly K, Johnson RA. Attention patterns in the boardroom: how board
composition and processes affect discussion of entrepreneurial issues. Academy of
Management Journal 2010; 53: 550-571.
Walsh JP, Seward JK. On the efficiency of internal and external corporate control
mechanisms. Academy of Management Review 1990; 15: 421-458.
Westphal JD, Zajac EJ. The symbolic management of stockholders: corporate governance
reforms and shareholder reactions. Administrative Science Quarterly 1998; 43:127-153.
Westphal JD, Zajac EJ. Decoupling policy from practice: the case of stock repurchase
programs. Administrative Science Quarterly 2001; 46: 202-228.
Wooldridge J, Introductory Econometrics. A Modern approach. Ohio: South Western
Thomson Learning; 2000.

42
Yu J, Engelman RM, Van de Ven AH. The integration journey: an attention based view of the
merger and acquisition integration process. Organization Studies 2005; 26: 1501-1528.
Zajac EJ, Westphal JD. Accounting for the explanations of CEO compensation: substance and
symbolism. Administrative Science Quarterly 1995; 40: 283-308.
Zattoni A, Cuomo F. Why adopt codes of good governance? A comparison of institutional
and efficiency perspectives. Corporate Governance: an International Review 2008; 6(1):
1-15.
Zhang P. Board information and strategic task performance. Corporate Governance: an
International Review 2010; 18(5): 473-487.