Embed Size (px)
Citation preview

Integrated Thinking and Tax Transparency
Abstract
The purpose of our study is to link two global corporate developments, namely integrated
thinking and tax transparency. These two reporting initiatives have developed independently,
but thus far there has been no serious consideration of how they may be related. We argue that
there is a natural relationship between these two developments. We use PWC‟s (2014)
framework for measuring tax transparency, and apply the framework to the corporate reports of
a sample of 45 large firms. We use regression analysis to test our prediction that integrated
thinking is positively associated with tax transparency and find results consistent with this
prediction. Our findings suggest that if the regulators want to increase tax transparency, one
possible strategy is to see tax transparency as part of a broader corporate culture of integrated
thinking.
Keywords: integrated reporting, integrated thinking, tax transparency

1
Integrated Thinking and Tax Transparency
1. Introduction
The purpose of our study is to link two global corporate developments, namely integrated
thinking and tax transparency.1 These two reporting initiatives have developed independently,
but thus far there has been no serious consideration of how they may be related. We argue that
there is a natural relationship between these two developments, so we formally predict an
association, and test whether such an association is indeed present.
Tax revenue is essential to governments – it is vital to the development and maintenance
of infrastructure, and to the provision of a justice and law-enforcement system that can support
liberty and a market economy. The revelation that some multinational firms, including
Amazon, Starbucks and Google, in fact pay little tax has sparked considerable public debate.
These firms‟ tax conduct may be legal, but the tax behaviour of these firms has resulted in what
has been dubbed “tax shaming”, public outrage, and even brand boycotts (Barford & Holt,
2013).
KPMG (2013) claims that increased media focus on specific taxpayers means that paying
(or not paying) tax has become a source of reputational risk. Nearly three quarters of CEOs
globally agree with this, because, in their view, firms have both a social and a commercial
responsibility, and this requires firms to satisfy societal needs beyond those of investors,
customers and employees (PWC, 2014). The European Union (EU, 2013) also holds that firms
have a corporate social responsibility towards both the firms‟ immediate stakeholders and
society at large. The EU (2013) regards tax transparency as essential to managing reputational
risk and (re)gaining the trust of society. The Australian Taxation Office (ATO, 2013:1) also
argues that public demand for tax transparency will discourage large corporate tax entities from
1 The International Integrated Reporting Council‟s (IIRC) vision is to embed integrated thinking in mainstream business
practices, and it believes that this kind of thinking is facilitated by integrated reporting as the corporate reporting norm (IIRC,
2013).

2
engaging in aggressive tax avoidance practices, and it will force such entities to manage the
reputational risk associated with their tax behaviour.
David Cameron (2014) goes further, since he advocates greater tax transparency as one
of the most important requirements to prevent corruption and solve tax evasion. Global
initiatives that promote or mandate tax transparency, such as the Extractive Industries
Transparency Initiative (EITI), the Dodd-Frank Wall Street Reform and Customer Protection
Act2 (the Dodd-Frank Act) and the European Union Directives on Accounting and
Transparency3 put pressure on firms to be increasingly transparent about their tax affairs. In the
context of the global focus on tax transparency, the reputational risk associated with not being
tax compliant, and the fact that tax is a significant expense item for most firms, it is advisable
for firms to signal their tax transparency by disclosing tax-related items in their corporate
reports.
Globally integrated reporting has emerged as possible way to solve the problem of
deficient corporate reporting. According to the International Integrated Reporting Council
(IIRC), an integrated report is “a concise communication about how an organization‟s strategy,
governance, performance and prospects, in the context of its external environment, lead to the
creation of value over the short, medium and long term” (IIRC, 2013: 7). Integrated thinking is
the basis of integrated reporting, because it requires “senior executives and Board members to
think (long term) about their business model, how they create value and to whom, material
issues, risks and strategy together which gives integrated reporting the potential to effect
change” (Adams, 2015: 23). Tax presents a significant expense for most firms, coupled with
the reputational risk and cost of non-compliance, so it affects firms‟ ability to create value over
the long term. Hence, we expect that managers who are successful at implementing integrated
thinking are also likely to be more transparent about their firms‟ tax affairs.
2 The Dodd-Frank Wall Street Reform and Consumer Protection Act, Pub. L. No. 111-203, 124 Stat. 1367, H.R. 4173, was
signed into United States law by President Barack Obama during July 2010. 3 Directive 2013/50/EU

3
In this study, we use PWC‟s (2014) framework for measuring tax transparency, and
apply the framework to the corporate reports of a sample of 45 large firms listed on the
Johannesburg Stock Exchange (JSE)4 in South Africa. We use regression analysis to test our
prediction that integrated thinking is positively associated with tax transparency.
We focus on South Africa for two reasons. Firstly, the JSE is the only stock exchange in
the world to mandate integrated reporting (on an apply-or-explain basis)5. Secondly, as
mentioned above, there have been a few global tax transparency reporting initiatives, but there
has not been any such initiative in South Africa. We believe that the South African
combination of a mandated integrated reporting environment, with a lack of country-specific
tax transparency reporting requirements provides a useful setting to evaluate firms‟ tax
transparency disclosure. The corporate reports of firms in countries with mandatory tax
transparency initiatives may display limited cross-sectional variation in disclosure practices,
because firms may engage in boilerplate disclosure to “tick the boxes”. By contrast, because
there are no specific disclosure requirements for an integrated report (IIRC, 2013), the South
African setting is richer, as the integrated reporting framework requires firms to think about
how tax relates to or affects the firms‟ ability to create or destroy value across the six forms of
capital without being prescriptive about disclosure requirements.6
Our findings suggest that integrated thinking is positively associated with tax
transparency, if the effect(s) of the variables corporate governance, firm size, extractive
industry membership and foreign cross-listing are held constant. Additional analysis shows that
our proxy for integrated thinking is positively correlated with both environmental and social
performance. This evidence supports the robustness of our proxy, as managers who think in an
4 The JSE Limited is South Africa‟s only full service securities exchange, providing services in the trading of equities, equity
derivatives, commodity derivatives, and interest rate products (see www.jse.co.za for more information). The Main Board of
the JSE Limited, on which the firms in our sample are listed, is known as the Johannesburg Stock Exchange. 5 Section 3 of the JSE Limited Listings Requirements read together with the King Code for Governance of South Africa 2009
(commonly referred to as King III). 6 An integrated report is intended to extend the traditional focus on financial capital in the annual report and financial
statements; it also requires reporting on various other kinds of capital: manufactured capital, intellectual capital, human capital,
social and relationship capital, and natural capital. There are no specific disclosure requirements for an integrated report –
instead, the preparation of an integrated report is governed by fundamental concepts and guiding principles (IIRC, 2013).

4
integrated manner might be expected also to consider a firm‟s environmental and social impact.
Our evidence shows that these two measures are positively associated with tax transparency,
after taking into account our control variables, but the evidence for environmental performance
is weaker than for social performance. We test whether our main findings are driven by
integrated thinking or by environmental and social performance. In multivariate analysis, we
show that our integrated thinking proxy subsumes the effects of environmental and social
performance.
Our study makes two contributions. Firstly, we show that tax transparency is positively
associated with integrated thinking. Hence, our results suggest that managers who are good at
thinking in an integrated manner are also able to produce transparent tax disclosures. This
finding is relevant to regulators when they consider separately how to improve corporate tax
transparency and address the shortcomings of corporate reporting. Our evidence indicates that
regulators can address tax transparency by requiring firms to produce integrated reports (which
requires the application of integrated thinking), without dictating separate tax transparency
disclosure requirements. Secondly, our study is one of the first empirical studies to investigate
integrated thinking – an exception is a prior study by Serafeim (2014), which, unlike our
investigation of integrated thinking and tax transparency, focuses on the argument that
integrated thinking is positively associated with a long-term oriented investor base.
The remainder of this study is organised as follows: Section 2 reviews the relevant
literature and presents the hypothesis development; Section 3 explains the research design and
method; Section 4 sets out the results; and Section 5 concludes the study.
2. Literature review
2.1 Background
Increasing international trade and the spread of a digital economy has led to tax base erosion
and profit shifting (BEPS) among large multi-national firms. The Organisation for Economic

5
Co-operation and Development (OECD) has developed an action plan to address BEPS issues
in a co-ordinated and comprehensive manner (OECD, 2013). This action plan includes plans to
enhance tax transparency between OECD and non-OECD member countries. The plan also
emphasises the importance of tax transparency at different levels, and it requires corporate
taxpayers to disclose more targeted information about their tax planning strategies (OECD,
2013).
A focus on increased tax transparency is also critical for firms that operate in the
extractive industries. The Extractive Industries Transparency Initiative (EITI) is anchored in
the principle that a country‟s natural resources belong to its citizens, so the EITI Standard is an
international standard that promotes transparency around a country‟s natural resources. The
EITI report requires firms to publish what taxes and royalties they pay, and governments to
publish what they receive from these firms. The information from these two stakeholders is
then independently verified and reconciled (EITI, 2014).
Consistent with the EITI standard, the United States of America (USA) launched its own
initiative regarding tax transparency disclosure, by enacting the Dodd-Frank Wall Street
Reform and Customer Protection Act (Dodd-Frank Act). Comparable amendments were
proposed to the European Union Accounting and Transparency Directives (EU Directives). In
Canada, there is also a commitment to ensure greater tax transparency in reporting for
Canadian extractive industries firms, such as the disclosure of profit taxes, royalties and license
fees paid (Canada, 2014).
The practice of disclosing the total tax contribution (TTC), which consists of taxes borne
and collected, has been adopted by the World Bank; it is also the current practice of FTSE 100
firms, and is promoted by PWC as a practice that assists firms to communicate their social
impact to their stakeholders (EY, 2013; World Bank, 2013; PWC, 2014).
Tax transparency disclosure is high on the agenda of many countries and of international
organisations. Because there have been no mandatory tax transparency disclosure initiatives in

6
South Africa, tax transparency disclosure is not compulsory for firms listed on the JSE at
present, but it represents good practice in reporting which any firm can adopt voluntarily.
However, compliance with the King Code is a JSE listing requirement. The release of
King III requires listed firms to issue an integrated report for all periods on or after 1 March
2010, or explain why they do not wish to apply this principle of the King Code. The “apply-or-
explain” regulation is an intermediate position between voluntary and mandatory disclosure. In
May 2010, the Integrated Reporting Committee of South Africa (IRC) was established to
develop guidelines on good integrated reporting practices. The IRC‟s discussion paper,
released on 25 January 2011, provides a framework for integrated reports. It is the first national
initiative on integrated reporting on South Africa. Since March 2014, the IRC endorses the
Framework of the IIRC for South African firms, and the IRC no longer provides guidance
itself.
South Africa is leading the way in the implementation of integrated reporting, but the
interest in such reporting is global. Most notably, in April 2014, the European Commission
(EC) released its directive on environmental, social and governance (ESG) information. The
EC recognizes that integrated reporting is “a step ahead” of the EC‟s disclosure requirements
and has indicated that the EC is “monitoring with great interest the evolution of the integrated
reporting concept, and, in particular, the work of the IIRC” (EC, 2014:3). In June 2014, the
B20 released a report on “unlocking investment in infrastructure” (B20, 2014:2). One of its key
recommendations to G20 finance ministers is that corporate reporting should provide investors
with a “longer-term and broader perspective on shareholder value creation” (B20, 2014:2); it
refers specifically to integrated reporting as an example of such reporting.7 Some individual
countries that are showing interest in integrated reporting are Australia, Brazil, Japan,
Singapore and India (Cheng et al., 2014). While the uptake on integrated reporting in the USA
is slow, arguably due to a litigious environment, large firms in the USA, such as Prudential and
7 The B20 is a group of business leaders from large companies who try to influence the governments of the G20 countries.

7
Microsoft, are participating in the IIRC‟s Pilot Programme. This pilot programme involves
approximately 100 firms across the globe that have contributed to the development of the IIRC
Framework, and that are among the first to implement the principles of integrated reporting.8
The IIRC Framework provides broad principles, rather than specific reporting standards,
for the preparation of an integrated report. Such a report is supposed to communicate to
stakeholders how organizations have created value over time. In essence, the IIRC Framework
consists of seven guiding principles and eight content elements.9
2.2 Hypothesis development
Our study fits into the broader context of corporate governance and disclosure, because
integrated thinking (and reporting) originated from a corporate governance initiative (King
Code III). Corporate governance refers to the rules, practices and systems whereby firms are
directed and managed; integrated thinking focuses on the decision-making processes in well-
governed firms. Hence, the IIRC‟s (2013:9) Framework requires “those charged with
governance” to acknowledge their responsibility to ensure the integrity of integrated reports. In
this section, we show how we use the prior corporate governance and disclosure literature as a
basis for our hypothesis on integrated thinking and tax transparency.
Generally the literature shows that good corporate governance practices are positively
associated with disclosure quality. For example, Byard et al. (2006) demonstrate that the
quality of financial analysts‟ information regarding upcoming earnings increases when the
quality of corporate governance improves, while Kanagaretnam et al.‟s (2007) findings suggest
that there is less information asymmetry around quarterly earnings announcements where
corporate governance quality is higher. Song et al. (2010) report that corporate governance
8 More detail on the IIRC‟s pilot programme is available online at www.theiirc.org. 9 The seven guiding principles are (1) strategic focus and future orientation, (2) connectivity of information, (3) stakeholder
relationships, (4) materiality, (5) conciseness, (6) reliability and completeness, and (7) consistency and comparability (IIRC,
2013). The eight content elements are (1) organizational overview and external environment, (2) governance, (3) business
model, (4) risks and opportunities, (5) strategy and resource allocation, (6) performance, (7) outlook, and (8) basis of
preparation (IIRC, 2013).
8
improves the value relevance of Level 3 financial instruments disclosure. Wang and Hussainey
(2013) show that good corporate governance improves reporting practices on voluntary
forward-looking statements in annual reports. Kent and Stewart (2008) focus not on the quality
but indicate that the quantity of disclosure relating to the transition to IFRSs is positively
associated with corporate governance.
The studies cited above relates to the disclosure of financial information, but the
literature also shows that good corporate governance practices are associated with corporate
social responsibility (CSR) performance and disclosure (Jo and Harjoto, 2012; Chan et al.,
2014; Jizi et al., 2014). In summary, the literature provides evidence that good corporate
governance improves the quantity and quality of firm disclosure.
The prior literature uses attributes of the board or its directors as proxies for corporate
governance quality. These attributes include CEO and board chairman duality, board size,
percentage of independent directors on the board and the audit committee, the number of board
and audit committee meetings during the year, the existence of board sub-committees, personal
or business relationships of outside directors, the retirement age of directors, and the financial
and accounting expertise of directors (Byard et al., 2006; Kanagaretnam et al., 2007; Kent and
Stewart, 2008; Wang and Hussainey, 2013; Jizi et al., 2014). In addition, Song et al. (2010) and
Jo and Harjoto (2012) use the percentage of institutional investors as an additional proxy for
corporate governance, because institutional owners serve as an additional monitoring
mechanism of managers.
In this study, we consider a component of corporate governance, namely integrated
thinking, which has not been captured by the board function and board structure proxies used
in the prior literature. The IIRC defines integrated thinking as “the active consideration by an
organization of the relationship between its various operating and functional units and the
capitals that the organization uses or affects”. Integrated thinking enables organizations to
understand the relationship between measuring, managing and disclosing information to

9
improve communication of their value creation processes (IIRC, 2013). The IIRC (2013:18)
asserts that “the more integrated thinking is embedded in the business, the more likely it is that
a fuller consideration of key stakeholders‟ legitimate needs and interests is incorporated as an
ordinary part of conducting business”. Integrated thinking “leads to integrated decision-making
and actions that consider the creation of value over the short, medium and long term” (IIRC,
2013:33).
Integrated thinking is the foundation of integrated reporting, which involves providing
concise information that demonstrates an organization‟s ability to create value in the short,
medium and long term (IIRC, 2013). The concept of “tax payments” is listed as an outcome of
integrated reporting, but “taxation” per se is not specifically referred to elsewhere in the
Framework. Tax reporting thus has to be evaluated in the context of the seven guiding
principles and eight content elements that underpin integrated reports (IIRC, 2013).
Tax transparency disclosure can result from the outcomes of integrated thinking, namely
improvement in internal decision-making focused on value creation over time; more cohesive
management reporting, which includes financial (economic) and non-financial (social and
environmental) factors such as sustainability reporting; and better quality communication
between an organization‟s management and its stakeholders (IIRC, 2013). Arguably, managers
who think in an integrated way understand that tax is a key corporate contribution towards
society, that revenue authorities are important stakeholders of firms, and that tax avoidance or
evasion poses a reputational risk that can damage a firm‟s legitimacy within society. Our
hypothesis, stated in the alternative form, is therefore the following:
H1: Integrated thinking is positively associated with tax transparency.
3 Research Design
3.1 Sample

10
Our original sample was the top 50 JSE-listed firms, based on market capitalization, on
31 December 2013. However, of the original 50 firms, we had to exclude five because of
missing data for our integrated thinking proxy. Our final sample thus consists of 45 firms with
a market capitalisation varying from ZAR 30.2 billion to ZAR 1.1 trillion, across 14 industries.
This sample represented 85 per cent of the total market capitalisation of all JSE-listed firms at
that time.
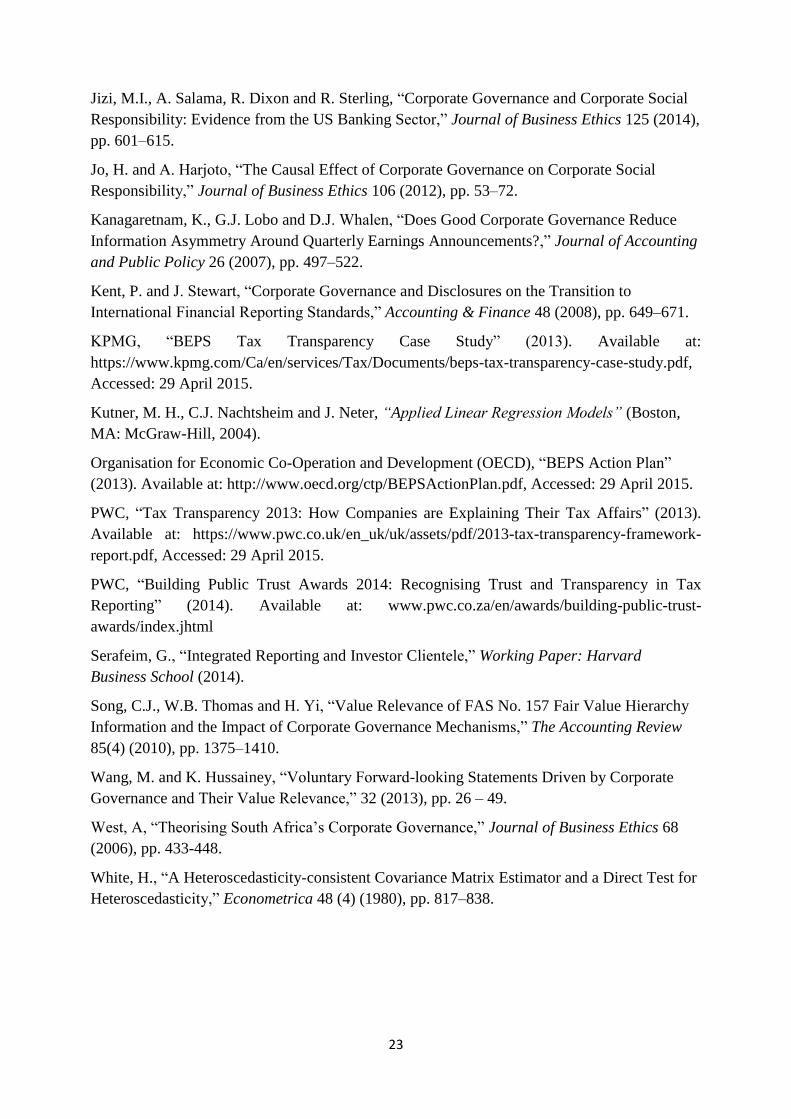
Table 1 gives a detailed industry classification of the sample. Firms from the mining
(extractive) sector are the most strongly represented in our sample, at 11 firms (24 per cent of
the sample), representing 27 per cent of the market capitalisation of the sample. The personal
and household goods sector is represented by only three firms (7 per cent of the sample), but
the market capitalisation of this sector is the second highest, at 21 per cent. If we combine the
finance, insurance and real estate industries in line with the Standard Industry Classification
(SIC) codes, the 14 firms in this sector (31 per cent of the sample) represent 15 per cent of the
market capitalisation of the sample firms.
3.2 Tax Transparency Proxy
We evaluate the tax disclosures in firms‟ annual reports, corporate social responsibility reports,
annual financial statements and integrated reports. We sourced these reports from the
McGregor BFA Database and firms‟ websites for the 2013 financial period. We also refer to
other relevant reports from firms‟ websites, based on a tax-related key word search.
PWC (2013) developed a tax transparency framework to evaluate the tax transparency
reporting of firms listed in the United Kingdom. In addition to mandatory disclosures, the
framework includes international tax transparency disclosure practices which PWC has
accumulated over a number of years. In 2014, PWC (2014) updated the framework for
evaluating the tax transparency of firms listed on the JSE. The PWC (2014) tax transparency
framework provides the basis for our tax transparency proxy. This framework is divided into

11
four categories: (1) tax strategy and risk management, (2) tax numbers and performance, (3)
total tax contribution and wider economic impact, and (4) other disclosures. The specific
disclosure items included in each of the four categories of the tax transparency framework are
set out in our Appendix.
The tax strategy and risk management category requires a clear and accessible discussion
of tax strategy and risk management, including disclosure policies in key areas of the business,
responsibilities for governance, and oversight and material risks. Firms are expected to disclose
information on changes in tax legislation and the impact of such changes on the firms‟ results.
The tax numbers and performance category includes transparent disclosure on tax
numbers and performance, such as clear reconciliations of the tax charge to the statutory rate
and forward-looking measures.
The third category relates to the total tax contribution and its wider economic impact,
showing how tax influences a firm‟s business strategy, results and shareholder value.
Reporting on the economic value added of a firm is also included in this category.
The final category relates to disclosures not covered in the other three categories. This
includes disclosures covering aspects such as value-added tax, capital gains tax, carbon tax and
other voluntary disclosures.
The framework consists of 57 disclosure items across the four categories. Apart from
compliance with IFRS disclosure requirements (Item 1 of Category 2), a firm scores one point
for each of the specific criteria in the framework if the disclosure item is addressed as part of
the firm‟s reporting.
For the purposes of evaluating the IFRS tax disclosure compliance (Item 1 of Category
2), every firm is evaluated against a separate IFRS tax disclosure checklist. As the primary
focus of the study is tax transparency disclosure, and not compliance with mandatory
disclosure requirements, the extent of compliance with the IFRSs is given a lower weight,
because allocating a point to each IFRS disclosure requirement would distort the findings and

12
would not serve our objective. We allocate three points if a firm complies fully with the IFRS
requirements, two points if it complies with the IFRS requirements by at least 85 per cent, and
one point if the firm‟s compliance is below 85 per cent.
A firm‟s final score which we use as our tax transparency proxy is the sum of the 57
disclosure items. The maximum score is 59. Each report of each firm was scored independently
by two members of the research team. The two members compared their separate evaluations
and then reached consensus on the final evaluation of a specific firm.
3.3 Integrated Thinking Proxy
We follow Serafeim (2014) in using the “corporate governance: vision and strategy” (CGVS)
data item of ASSET4 as our integrated thinking proxy.10
ASSET4 defines CGVS as measuring
a firm‟s management commitment to and effectiveness in creating an overarching vision and
strategy on integrating financial and extra-financial aspects.11
ASSET4 argues that CGVS
reflects a firm‟s capacity to show and communicate convincingly its integration of the
economic (financial), social and environmental dimensions into day-to-day decision-making
processes.
The CGVS measure is a composite index ranging from 0 to 100. It incorporates different
aspects, such as whether firms “have a policy for maintaining an overarching vision and
strategy that integrates financial and extra-financial aspects of its business”, “have a policy to
integrate ESG issues into its strategy and day-to-day decision making”, “describe the
implementation of its integrated strategy through a public commitment from a senior
management or board member”, “describe the implementation of its integrated strategy through
the establishment of a CSR committee or team”, “monitor its integrated strategy through
belonging to a specific sustainability index”, “set specific objectives to be achieved on the
10 ASSET4 is a division of Thomson Reuters which collects environmental, social and corporate governance data for over
6 000 firms globally. ASSET4 groups more than 750 individual data items into 18 categories in four pillars, namely economic,
environmental, social and corporate governance performance. 11 The ASSET4 database glossary is available online at http://extranet.datastream.com/data/ASSET4%20ESG/Index.htm.

13
integrated strategy”, “report about the challenges or opportunities linked to the integration of
financial and extra-financial issues”, “integrate financial and extra-financial factors in the
management discussion and analysis section of the annual report”, and “explain how it engages
with its stakeholders”. We believe that this proxy relates to the IIRC‟s (2013) concept of
integrated thinking, because it captures non-financial aspects of the business, reporting on these
aspects and day-to-day decision-making.
3.4 Control Variables
In our model, we control for corporate governance (excluding integrated thinking), size,
extractive industry membership and cross-listing. We aim to show the association between
integrated thinking and tax transparency incremental to accepted corporate governance
practices related to attributes of the board and its directors. Our corporate governance variable
is the “corporate governance board function” (CGBF) data item from the ASSET4 database.
ASSET4 describes this variable as measuring a firm‟s “management commitment and
effectiveness towards following best practice corporate governance principles related to board
activities and functions. It reflects a firm‟s capacity to have an effective board by setting up the
essential board committees with allocated tasks and responsibilities”.
We also control for size, because larger firms are subject to greater public and regulatory
scrutiny, and may therefore attempt to be more transparent. We include an indicator variable to
capture membership of the extractive industries, because recent global tax transparency
initiatives such as the EITI have focused primarily on the extractive industries.
Our sample includes a number of firms with primary listings on the London Stock
Exchange and secondary listings on the JSE, such as Anglo American, Lonmin, BHP Billiton
and British American Tobacco. These firms may be subject to additional regulatory
requirements, aside from those that apply to firms whose primary listing is on the JSE. To

14
control for this effect, we include an indicator variable to capture primary listings on foreign
stock exchanges.
3.5 Model
To test our hypothesis, we estimate the following model (firm-subscripts omitted):
TRANSt = β0 + β1ITHINKt + β2GOVt + β3SIZEt + β4EXTRACTt +β5CROSSt + ε (1)
where
TRANS is the proxy for tax transparency and represents the score obtained from the
framework developed to measure tax transparency in corporate reporting;
ITHINK is the proxy for integrated thinking and measures a firm‟s management‟s
commitment to and effectiveness in convincingly showing and communicating that it
integrates both financial (economic) and non-financial (social and environmental)
dimensions into its day-to-day decision-making processes;
GOV measures a firm‟s management commitment to and effectiveness in following best
practice corporate governance principles related to board activities and functions;
SIZE represents the natural log of market capitalisation;
EXTRACT is an indicator variable coded 1 for firms in the extractive industries and 0
otherwise; and
CROSS is an indicator variable which is coded 1 for firms with a cross-listing on an
exchange other than the JSE and 0 otherwise.
All variables except for EXTRACT and CROSS are winsorised to the 5th
and 95th
percentiles.
T-statistics are estimated based on White‟s (1980) standard errors.
4. Results
4.1 Descriptive Statistics

15
Table 2 contains descriptive statistics for the variables included in Equation (1). The maximum
score a firm can achieve on the tax transparency framework is 59. The highest raw score on the
descriptive statistics is 32. The lowest score is seven, with a mean (median) of 16.69 (16).
The ITHINK variable is expressed as a percentage. The mean (median) integrated
thinking percentage is 83.21 (89.09), and the value at the 25th
percentile is 81.22. In other
words, 75 per cent of the sample firms score 81.22 or higher for integrated thinking. These
high scores match our expectations, given the emphasis placed on integrated reporting in the
South African business environment, and that the sample includes 45 of the largest firms listed
on the JSE. Despite these high percentages, the sample exhibits variation in terms of integrated
thinking, with a minimum score of 44.99 and a standard deviation of 13.35.
The GOV variable is expressed as a percentage. The mean (median) governance
percentage is 64.68 (70.77), with a standard deviation of 19.42. Given that the sample includes
the largest firms listed on the JSE, it is not surprising that there is not much variation in the
SIZE variable – the mean (median) size is 25.38 (25.20) and the standard deviation of SIZE is
0.95. Of the total sample, 24 per cent of the firms are in the extractive industries and have a
cross-listing.
Table 3 sets out the correlations for the variables included in the regression. All the
independent variables are significantly and positively correlated with transparency. There is a
strong positive correlation between integrated thinking and corporate governance. Integrated
reporting is considered a corporate governance initiative – in South Africa, the requirement that
firms must prepare an integrated report is contained in the King Code III of Governance for
South Africa. Hence, we expected this strong correlation between integrated thinking and
corporate governance. There is also a strong positive correlation between governance and size,
which suggests that larger firms have better governance practices. Cross-listing is positively
correlated with integrated thinking, using both Pearson and Spearman correlations. Despite
these strong correlations, the highest variation inflation factor in our regression is 1.60, which

16
is below the accepted level of 10 (Kutner et al., 2004). This finding suggests that
multicollinearity is not a major concern in our results.
4.2 Main Results
Table 4 contains the coefficient estimates and associated t-statistics for Equation (1). Contrary
to our expectation, the coefficient of GOV is insignificant. This finding suggests that there is no
significant association between corporate governance and tax transparency. This result is
insensitive to using alternative measures of corporate governance in the ASSET4 database.12
The coefficient of SIZE is positive and significant. This result suggests that larger firms
are more transparent in their tax disclosures. This evidence supports the argument that larger
firms are subject to greater public and political scrutiny, and may perceive themselves to face
greater reputational risk than smaller firms. Larger firms respond to this scrutiny and risk by
being more transparent in their disclosures. In addition, tax transparency costs are likely to be
regressive and as a result more affordable to larger firms relative to smaller firms.
The coefficient of EXTRACT is positive and significant, which suggests that firms in the
extractive industries are more transparent in their tax disclosures than firms in other industries.
This finding is not surprising, because many global tax transparency initiatives focus on the
extractive industries. In addition, the nature of the business of firms in this industry requires a
greater focus on social responsibility as these firms extract non-renewable resources. These
firms could justify their wider social impact through their tax transparency and their monetary
contribution towards revenue authorities.
The coefficient of CROSS is insignificant, suggesting that cross-listing has no
incremental explanatory power for transparency over other variables in the model.
12 Specifically, we also individually re-estimate Equation (1) using the board structure (CGBS), compensation policy (CGCP)
and shareholder rights (CGSR) variables from ASSET4. In the regression in which we substitute board functions for
compensation policy, the coefficient of ITHINK remains significant at a 10 per cent level, using a one-tailed test. Other than
this, our inferences remain unaffected by these alternative design choices.

17
Most importantly, the coefficient of our variable of interest, ITHINK, is positive and
significant. This finding suggests that firms that apply a higher level of integrated thinking, on
average, are more transparent in their tax disclosures than firms with lower levels of integrated
thinking. This implies that tax transparency is part of an overarching vision and strategy to
integrate financial and non-financial aspects in corporate decision-making processes.
Our results have implications for regulators, as they suggest that linking tax transparency
initiatives to integrated reporting initiatives which promotes integrated thinking may be an
effective strategy to improve tax transparency.
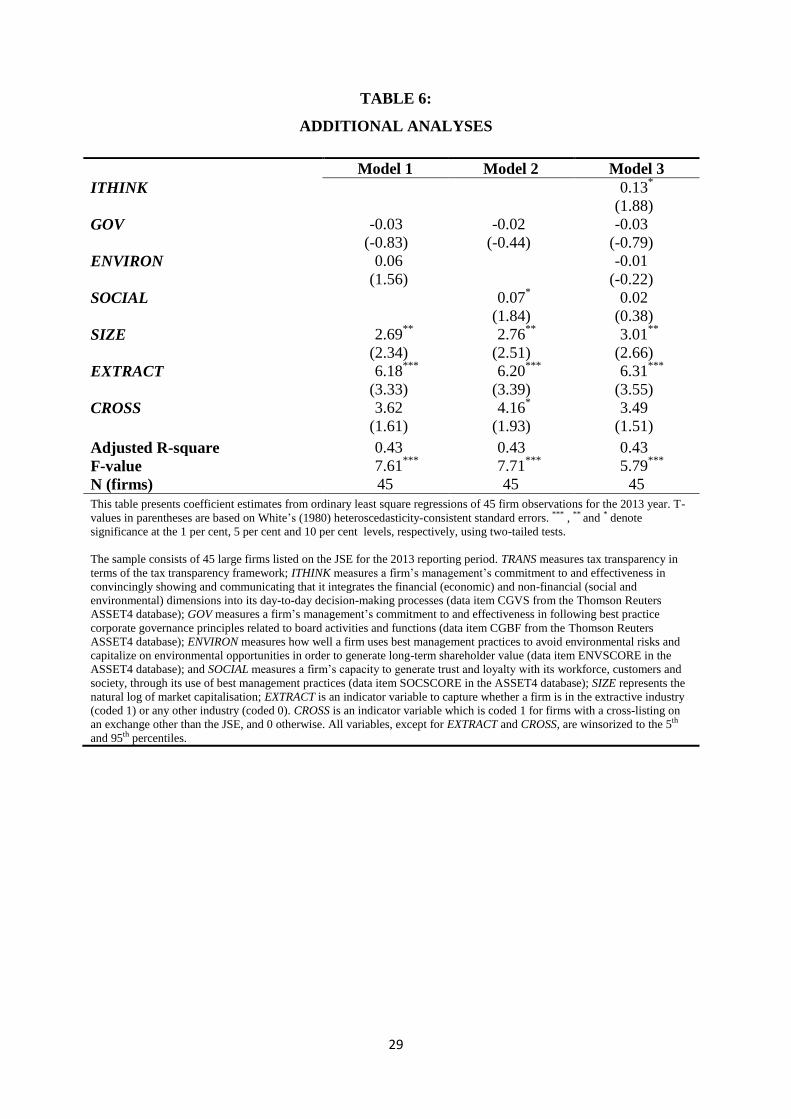
4.3 Additional Analyses
In addition to corporate governance data, ASSET4 contains data on firms‟ economic,
environmental and social performance. If our integrated thinking proxy (ITHINK) does indeed
capture integrated thinking, as intended by the IIRC‟s Framework, we would expect it to be
positively correlated with ASSET4‟s environmental and social performance scores.13
If this
assumption holds, we would also expect firms with higher levels of environmental and social
performance to be more transparent in their tax disclosures. We test this idea by means of
univariate correlation analysis.
Table 5 contains the relevant correlation coefficients. The results show strong positive
correlations between our integrated thinking proxy and ASSET4‟s environmental and social
scores. This evidence suggests that higher levels of integrated thinking are indeed associated
with higher levels of environmental and social performance. As we have shown in Tables 3 and
4, higher levels of integrated thinking are also associated, on average, with higher levels of tax
transparency. This finding suggests that our integrated thinking proxy captures the integrated
13 ASSET4 describes its environmental score (“ENVSCORE”) as a firm‟s impact on “living and non-living natural systems,
including the air, land and water, as well as complete ecosystems. It reflects how well a firm uses best management practices to
avoid environmental risks and capitalize on environmental opportunities in order to generate long-term shareholder value”. Its
social score (“SOCSCORE”) is defined as a firm‟s “capacity to generate trust and loyalty with its workforce, customers and
society, through its use of best management practices. It is a reflection of the firm‟s reputation and the health of its license to
operate, which are key factors in determining its ability to generate long-term shareholder value”.

18
level of managements‟ thinking, because it is positively associated with three different areas of
business. In addition, both environmental and social scores are positively associated with tax
transparency. In other words, firms with strong environmental and social performance are also,
on average, more transparent in their tax disclosures than firms with weak environmental and
social performance.
The results set out in Table 5 suggest that environmental and social performance may be
correlated omitted variables in Equation (1). We investigate the effect of these variables on our
inferences, as set out in Table 6. In the first model in Table 6, we regress TRANS on the
ASSET4 environmental score (ENVIRON) and our control variables from Equation (1). The
inferences for the control variables are similar to those in Table 4. The coefficient of ENVIRON
is positive, as expected, but it is insignificant when we use a two-tailed test.14
This finding
suggests that firms‟ environmental performance, on average, is not incrementally associated
with tax transparency, if the effect of the control variables remains constant.
In Model 2 in Table 6, we regress TRANS on the ASSET4 social score (SOCIAL) and our
control variables from Equation (1). The inferences for the control variables are similar to
those contained in Table 4, except for the cross-listing, which is significant at a 10 per cent
level. The social performance of firms is also positively associated with tax transparency. This
finding suggests that firms‟ reputation with employees, customers and society is associated
with tax transparency. It therefore suggests that firms that score high in our tax transparency
framework do not do so as a result of a mere tick-box compliance exercise, but because their
commitment to a sound reputation is also reflected in their dealings with society.
Finally, Model 3 in Table 6 addresses the potential correlated omitted variables problem
by including the ASSET4 environmental and social scores in the model, as well as our
integrated thinking proxy, ITHINK. These variables are highly correlated. The highest variance
inflation factor of the regression (4.22) is below the threshold of 10, which suggests that
14 The coefficient is significant at the 10 per cent level, using a one-tailed test (p-value = 0.06).

19
multicollinearity is not a major concern, but that the results nevertheless need to be interpreted
with caution. Again, the inferences with regard to the control variables are similar to those in
Table 4. More importantly, when integrated thinking, environmental and social performance
are included in the same model, the coefficients of environmental and social performance are
insignificant. By contrast, the coefficient of integrated thinking remains significant at a 10 per
cent level of significance. This evidence suggests that it is the overall integrated thinking of
management, as opposed to environmental or social performance, which drives our results.
5. Conclusion
In this study, we investigate two global corporate reporting initiatives, namely integrated
thinking and tax transparency, which have developed independently from each other.
Integrated thinking (and thus reporting) addresses the shortcomings of corporate reporting,
particularly a short-term focus on financial capital. It requires firms to report on how they
create or destroy value over the short, medium, and long term, by focusing on six forms of
capital: financial capital, manufactured capital, intellectual capital, human capital, social and
relationship capital, and natural capital. There are no set of definitive disclosure requirements
for integrated reporting – the IIRC (2013) Framework merely requires firms to tell their value
creation story by applying guiding principles and certain content elements. The key to
integrated reporting is integrated thinking – it is argued that firms cannot produce high quality
integrated reports if thinking about the six forms of capital in an integrated manner is not part
of the firms‟ very fabric.
The integrated reporting initiative emerged concurrently with an increased global focus
on corporate tax transparency through disclosure. The tax transparency initiative follows in the
wake of the OECD‟s BEPS project and allegations of tax avoidance by large corporates such as
Starbucks, Google and Amazon. Some global tax transparency disclosure initiatives include the
EITI Standard, the Dodd-Frank Act, and the EU‟s Capital Requirement Directive (CRD IV).

20
We argue that, although these two global corporate reporting initiatives have arisen
independently, they are in fact related. Tax is an important consideration for most firms,
because of the magnitude of tax expenses, and the reputational risk and cost associated with
non-compliance. The IIRC (2013) argues that integrated thinking, the foundation of integrated
reporting, should result in integrated decision-making. We posit that if managers are able to
think in an integrated manner, as envisaged by the IIRC (2013) Framework, managers will also
provide high quality tax transparency disclosure.
We investigate this issue in the South African context, where integrated reporting has
been mandated through the stock exchange regulations of the JSE (on an “apply-or-explain”
basis), although no separate tax transparency disclosure is mandated in South Africa. This
unique setting allows us to test whether integrated thinking is associated with tax transparency
disclosure. In other words, we examine, in the absence of mandated tax transparency disclosure
requirements, whether firms that are able to think in an integrated manner also voluntarily
provide transparent tax disclosure.
Our findings suggest that integrated thinking is positively associated with tax
transparency, after controlling for the effect of corporate governance, firm size, extractive
industry membership and foreign cross-listing. Additional analyses show that our proxy for
integrated thinking is positively associated with both environmental and social performance.
This implies that managers of firms that think in an integrated manner tend to consider
managing and reporting on tax, environmental and social aspects to be part of their day-to-day
decision-making. This finding provides reassurance that our proxy does measure integrated
thinking, as intended by the IIRC. However, if we include all these variables in a single model,
neither environmental nor social performance contributes significantly or incrementally to any
explanation of variations in tax transparency. This finding suggests that it is integrated
thinking, rather than environmental or social performance, that drives our main results.

21
Our findings suggest that if the regulators want to increase tax transparency, one possible
strategy is to see tax transparency as part of a broader corporate culture of integrated thinking.
As firms across the globe struggle to cope with the increasing number of disclosure
requirements, it seems sensible for regulators to join forces to formulate fewer requirements,
but ones that address more areas of concern. This is the aim of the Corporate Reporting
Dialogue (CRD) introduced by the IIRC. Its purpose is to bring together organizations with
international influence in the corporate reporting landscape. The IIRC hopes that CRD
members will collaborate towards a common goal, and will respond to market calls for better
alignment and a reduction in the corporate reporting burden. Some CRD members are the
Climate Disclosure Standards Board (CDSB), the Financial Accounting Standards Board
(FASB), the Global Reporting Initiative (GRI), the International Accounting Standards Board
(IASB), the IIRC, the International Public Sector Accounting Standards Board (IPSASB), the
International Organization for Standardization (ISO), and the Sustainability Accounting
Standards Board (SASB). This list does not include key bodies calling for transparent tax
disclosures. Our findings suggest that integrated thinking is already contributing towards
increased tax transparency, and that it would be sensible for these two groups of bodies to join
forces.
Our study is not without its limitations. Firstly, our sample only covers 45 large firms.
This small sample may limit the generalisability of our findings. Despite this, these firms
represent 85 percent of the market capitalisation of the JSE and we believe our sample is not
inconsequential. Secondly, our setting is unique as South Africa‟s corporate structures are akin
to the shareholder model (also referred to as the Anglo-American model), yet its corporate
governance practices are based on a wider inclusive stakeholder approach (also referred to the
European model) (West, 2006). Therefore we cannot conclude that our findings will translate
to settings with different features.

22
REFERENCES
Adams, C., “The International Integrated Reporting Council: A call to action,” Critical
Perspectives on Accounting 27 (2015), pp. 23−28.
Australian Taxation Office (ATO), “Improving the Transparency of Australia‟s Corporate Tax
System” (2013). Available at: https://www.ato.gov.au/Business/Large-business/In-
detail/Large-business-bulletin/2013/Large-business-bulletin--September-2013/?page=5.
B20, Unlocking Investment in Infrastructure: Is current accounting and Reporting a Barrier
(2014). Available at:
http://www.kpmg.com/Global/en/IssuesAndInsights/ArticlesPublications/Press-
releases/Documents/unlocking-investment-in-infrastructure.pdf, Accessed: 29 April 2015.
Barford, V. and G. Holt, “Google, Amazon, Starbucks: The Rise of „Tax Shaming‟” (2013).
Available at: http://www.bbc.com/news/magazine-20560359, Accessed: 29 April 2015.
Byard, D., Y. Li and J. Weintrop, “Corporate Governance and the Quality of Financial
Analysts‟ Information,”Journal of Accounting and Public Policy 25 (2006), pp. 609–625.
Cameron, D., “The Corruption Cure: Transparency, Taxes, Trade,” The Wall Street Journal
June 4 (2014). Available at: http://www.wsj.com/articles/david-cameron-the-corruption-
curetransparency-taxes-trade-1401913005, Accessed: 29 April 2015.
Canada, “Budget 2014” (2014). Available at: http://www.budget.gc.ca/2014/docs/plan/ch3-2-
eng.html.
Chan, M.C., J. Watson and D. Woodliff, “Corporate Governance Quality and CSR
Disclosures,” Journal of Business Ethics 125 (2014), pp. 59–73.
Cheng, M., W. Green, P. Conradie, N. Konishi and A. Romi, “The International Integrated
Reporting Framework: Key Issues and Future Research Opportunities,” Journal of
International Financial Management & Accounting 25(1) (2014), pp. 90–119.
European Commission (EC), Disclosure of non-financial and diversity information by large
companies and groups - Frequently asked questions (2014). Available at:
http://europa.eu/rapid/press-release_MEMO-14-301_en.htm, Accessed: 29 April 2015.
EITI, EITI Factsheet (2014). Available at: http://eiti.org/files/document/2014-08-
14_EITI_Factsheet_English.pdf, Accessed: 29 April 2015.
European Union (EU), New disclosure requirements for the extractive industry and loggers of
primary forests in the Accounting (and Transparency) Directives (Country by Country
Reporting) – frequently asked questions (2013). Available at:
file:///C:/Users/User/Downloads/MEMO-13-541_EN.pdf, Accessed: 29 April 2015.
EY, “EY‟s Excellence in Integrated Reporting Awards 2013,” (2013). Available at:
http://www.ey.com/Publication/vwLUAssets/EYs_Excellence_in_Integrated_Reporting_Awar
ds_2013/$FILE/EY%20Excellence%20in%20Integrated%20Reporting.pdf, Accessed: 29 April
2015.
International Integrated Reporting Council (IIRC), The International Integrated Reporting
Framework (2013).
23
Jizi, M.I., A. Salama, R. Dixon and R. Sterling, “Corporate Governance and Corporate Social
Responsibility: Evidence from the US Banking Sector,” Journal of Business Ethics 125 (2014),
pp. 601–615.
Jo, H. and A. Harjoto, “The Causal Effect of Corporate Governance on Corporate Social
Responsibility,” Journal of Business Ethics 106 (2012), pp. 53–72.
Kanagaretnam, K., G.J. Lobo and D.J. Whalen, “Does Good Corporate Governance Reduce
Information Asymmetry Around Quarterly Earnings Announcements?,” Journal of Accounting
and Public Policy 26 (2007), pp. 497–522.
Kent, P. and J. Stewart, “Corporate Governance and Disclosures on the Transition to
International Financial Reporting Standards,” Accounting & Finance 48 (2008), pp. 649–671.
KPMG, “BEPS Tax Transparency Case Study” (2013). Available at:
https://www.kpmg.com/Ca/en/services/Tax/Documents/beps-tax-transparency-case-study.pdf,
Accessed: 29 April 2015.
Kutner, M. H., C.J. Nachtsheim and J. Neter, “Applied Linear Regression Models” (Boston,
MA: McGraw-Hill, 2004).
Organisation for Economic Co-Operation and Development (OECD), “BEPS Action Plan”
(2013). Available at: http://www.oecd.org/ctp/BEPSActionPlan.pdf, Accessed: 29 April 2015.
PWC, “Tax Transparency 2013: How Companies are Explaining Their Tax Affairs” (2013).
Available at: https://www.pwc.co.uk/en_uk/uk/assets/pdf/2013-tax-transparency-framework-
report.pdf, Accessed: 29 April 2015.
PWC, “Building Public Trust Awards 2014: Recognising Trust and Transparency in Tax
Reporting” (2014). Available at: www.pwc.co.za/en/awards/building-public-trust-
awards/index.jhtml
Serafeim, G., “Integrated Reporting and Investor Clientele,” Working Paper: Harvard
Business School (2014).
Song, C.J., W.B. Thomas and H. Yi, “Value Relevance of FAS No. 157 Fair Value Hierarchy
Information and the Impact of Corporate Governance Mechanisms,” The Accounting Review
85(4) (2010), pp. 1375–1410.
Wang, M. and K. Hussainey, “Voluntary Forward-looking Statements Driven by Corporate
Governance and Their Value Relevance,” 32 (2013), pp. 26 – 49.
West, A, “Theorising South Africa‟s Corporate Governance,” Journal of Business Ethics 68
(2006), pp. 433-448.
White, H., “A Heteroscedasticity-consistent Covariance Matrix Estimator and a Direct Test for
Heteroscedasticity,” Econometrica 48 (4) (1980), pp. 817–838.
24
TABLE 1:
SAMPLE COMPOSITION
Industry No of firms % of
sample
Market
Cap
31/12/2013
ZAR billion
Market
Cap %
Financial
- Financial Services 7 15.56 784 836 9.29
- Real Estate 3 6.67 142 950 1.69
- Insurance 4 8.89 362 106 4.29
Food & Beverage 2 4.44 941 397 11.14
Forestry & Paper 1 2.22 66 540 0.79
Health Care 3 6.67 229 070 2.71
Industrial Goods & Services 3 6.67 230 530 2.73
Media 1 2.22 455 876 5.40
Mining 11 24.44 2 289 045 27.10
Oil & Gas 1 2.22 334 338 3.96
Personal & Household Goods 3 6.67 1 772 778 20.99
Retail 4 8.89 233 627 2.77
Telecommunications 2 4.44 604 437 7.16
Total 45 100.00 8 447 530 100.00

25
TABLE 2:
DESCRIPTIVE STATISTICS
Mean Std dev Min 25th
Median 75th
Max
TRANS 16.69 7.05 7.00 11.00 16.00 21.00 32.00
ITHINK 83.21 13.35 44.99 81.22 89.09 91.12 93.17
GOV 64.68 19.42 21.47 53.13 70.77 78.87 86.87
SIZE 25.38 0.95 24.40 24.59 25.20 26.01 27.31
EXTRACT 0.24 0.44 0.00 0.00 0.00 0.00 1.00
CROSS 0.24 0.44 0.00 0.00 0.00 0.00 1.00
The sample consists of 45 large firms listed on the JSE for the 2013 reporting period. TRANS measures tax transparency in terms
of the tax transparency framework; ITHINK measures a firm‟s management commitment to and effectiveness in convincingly
showing and communicating that it integrates the financial (economic) and non-financial (social and environmental) dimensions
into its day-to-day decision-making processes (data item CGVS from the Thomson Reuters ASSET4 database); GOV measures a
firm‟s management‟s commitment to and effectiveness in following best practice corporate governance principles related to
board activities and functions (data item CGBF from the Thomson Reuters ASSET4 database ); SIZE represents the natural log
of market capitalisation; EXTRACT is an indicator variable that captures whether a firm is in the extractive industry (coded 1) or
any other industry (coded 0). CROSS is an indicator variable which is coded 1 for firms with a cross-listing on an exchange other
than the JSE, and 0 otherwise. All variables, except for EXTRACT and CROSS, are winsorized to the 5th and 95th percentiles.

26
TABLE 3:
CORRELATION MATRIX
TRANS ITHINK GOV SIZE EXTRACT CROSS
TRANS 1.00 0.38 0.33 0.48 0.44 0.43
ITHINK 0.33 1.00 0.45 0.19 0.06 0.30
GOV 0.30 0.45 1.00 0.47 0.14 0.32
SIZE 0.39 0.27 0.46 1.00 0.04 0.29
EXTRACT 0.42 0.10 0.17 -0.00 1.00 0.16
CROSS 0.32 0.49 0.27 0.19 0.16 1.00
This table reports Pearson (Spearman) correlations above (below) the diagonal line. Correlations indicated in Bold are
significant at a 5 per cent level of significance.
The sample consists of 45 large firms listed on the JSE for the 2013 reporting period. TRANS measures tax transparency in
terms of the tax transparency framework; ITHINK measures a firm‟s management commitment to and effectiveness in
convincingly showing and communicating that it integrates the financial (economic) and non-financial (social and
environmental) dimensions into its day-to-day decision-making processes (data item CGVS from the Thomson Reuters
ASSET4 database); GOV measures a firm‟s management‟s commitment to and effectiveness in following best practice
corporate governance principles related to board activities and functions (data item CGBF from the Thomson Reuters
ASSET4 database); SIZE represents the natural log of market capitalisation; EXTRACT is an indicator variable that captures
whether a firm is in the extractive industry (coded 1) or any other industry (coded 0). CROSS is an indicator variable which is
coded 1 for firms with a cross-listing on an exchange other than the JSE, and 0 otherwise. All variables, except for EXTRACT
and CROSS, are winsorized to the 5th and 95th percentiles.

27
TABLE 4:
MAIN RESULTS
Predicted
Sign
Coefficients
ITHINK + 0.14**
(2.63)
GOV + -0.03
(-0.95)
SIZE + 3.02***
(2.83)
EXTRACT + 6.31***
(3.54)
CROSS + 3.35
(1.48)
Adjusted R-square 0.46
F-value 8.50***
N (firms) 45
This table presents coefficient estimates from ordinary least square regressions of 45 firm observations for the 2013 year. T-
values in parentheses are based on White (1980) heteroscedasticity-consistent standard errors. *** and ** denotes significance
at the 1% and 5% levels, respectively, using two-tailed test.
The sample consists of 45 large firms listed on the JSE for the 2013 reporting period. TRANS measures tax transparency in
terms of the tax transparency framework; ITHINK measures a firm‟s management commitment to and effectiveness in
convincingly showing and communicating that it integrates the financial (economic) and non-financial (social and
environmental) dimensions into its day-to-day decision-making processes (data item CGVS from the Thomson Reuters
ASSET4 database); GOV measures a firm‟s management‟s commitment to and effectiveness in following best practice
corporate governance principles related to board activities and functions (data item CGBF from the Thomson Reuters
ASSET4 database); SIZE represents the natural log of market capitalisation; EXTRACT is an indicator variable that captures
whether a firm is in the extractive industry (coded 1) or any other industry (coded 0). CROSS is an indicator variable which is
coded 1 for firms with a cross-listing on an exchange other than the JSE, and 0 otherwise. All variables, except for EXTRACT
and CROSS, are winsorized to the 5th and 95th percentiles.

28
TABLE 5
CORRELATIONS: ENVIRONMENTAL AND SOCIAL
TRANS ITHINK GOV ENVIRON SOCIAL
TRANS 1.00 0.38 0.33 0.42 0.31
ITHINK 0.33 1.00 0.45 0.76 0.66
GOV 0.30 0.45 1.00 0.64 0.38
ENVIRON 0.35 0.69 0.59 1.00 0.71
SOCIAL 0.40 0.34 0.32 0.69 1.00
This table reports Pearson (Spearman) correlations above (below) the diagonal line. Correlations indicated in Bold are
significant at a 5 per cent level of significance.
The sample consists of 45 large firms listed on the JSE for the 2013 reporting period. TRANS measures tax transparency in
terms of the tax transparency framework; ITHINK measures a firm‟s management commitment to and effectiveness in
convincingly showing and communicating that it integrates the financial (economic) and non-financial (social and
environmental) dimensions into its day-to-day decision-making processes (data item CGVS from the Thomson Reuters
ASSET4 database); GOV measures a firm‟s management‟s commitment to and effectiveness in following best practice
corporate governance principles related to board activities and functions (data item CGBF from the Thomson Reuters
ASSET4 database); ENVIRON measures how well a firm uses best management practices to avoid environmental risks and
capitalize on environmental opportunities in order to generate long-term shareholder value (data item ENVSCORE in the
ASSET4 database); and SOCIAL measures a firm‟s capacity to generate trust and loyalty with its workforce, customers and
society, through its use of best management practices (data item SOCSCORE in the ASSET4 database). All variables are
winsorized to the 5th and 95th percentiles.
29
TABLE 6:
ADDITIONAL ANALYSES
Model 1 Model 2 Model 3
ITHINK 0.13*
(1.88)
GOV -0.03
(-0.83)
-0.02
(-0.44)
-0.03
(-0.79)
ENVIRON 0.06
(1.56)
-0.01
(-0.22)
SOCIAL 0.07*
(1.84)
0.02
(0.38)
SIZE 2.69**
(2.34)
2.76**
(2.51)
3.01**
(2.66)
EXTRACT 6.18***
(3.33)
6.20***
(3.39)
6.31***
(3.55)
CROSS 3.62
(1.61)
4.16*
(1.93)
3.49
(1.51)
Adjusted R-square 0.43 0.43 0.43
F-value 7.61***
7.71***
5.79***
N (firms) 45 45 45
This table presents coefficient estimates from ordinary least square regressions of 45 firm observations for the 2013 year. T-
values in parentheses are based on White‟s (1980) heteroscedasticity-consistent standard errors. *** , ** and * denote
significance at the 1 per cent, 5 per cent and 10 per cent levels, respectively, using two-tailed tests.
The sample consists of 45 large firms listed on the JSE for the 2013 reporting period. TRANS measures tax transparency in
terms of the tax transparency framework; ITHINK measures a firm‟s management‟s commitment to and effectiveness in
convincingly showing and communicating that it integrates the financial (economic) and non-financial (social and
environmental) dimensions into its day-to-day decision-making processes (data item CGVS from the Thomson Reuters
ASSET4 database); GOV measures a firm‟s management‟s commitment to and effectiveness in following best practice
corporate governance principles related to board activities and functions (data item CGBF from the Thomson Reuters
ASSET4 database); ENVIRON measures how well a firm uses best management practices to avoid environmental risks and
capitalize on environmental opportunities in order to generate long-term shareholder value (data item ENVSCORE in the
ASSET4 database); and SOCIAL measures a firm‟s capacity to generate trust and loyalty with its workforce, customers and
society, through its use of best management practices (data item SOCSCORE in the ASSET4 database); SIZE represents the
natural log of market capitalisation; EXTRACT is an indicator variable to capture whether a firm is in the extractive industry
(coded 1) or any other industry (coded 0). CROSS is an indicator variable which is coded 1 for firms with a cross-listing on
an exchange other than the JSE, and 0 otherwise. All variables, except for EXTRACT and CROSS, are winsorized to the 5th
and 95th percentiles.

30
APPENDIX:
TAX TRANSPARENCY CRITERIA
Category 1: Tax Strategy and risk management
Is tax identified as a business risk?
Is there a clear discussion of how the firm approaches its tax affairs (may be called tax strategy,
policy on tax, and approach to tax)?
Does the firm mention its approach to tax planning/minimising tax liabilities?
Does the firm mention its approach/policy on transfer pricing?
Does the firm discuss its relationship/interaction with tax authorities, including tax compliance
aspects?
Is there any discussion of tax risk management; and who is responsible for governance and tax
oversight?
Is it apparent that the Board or audit committee has discussed tax during the year?
Is there any disclosure of any amount set aside for uncertain tax positions?
Is there any disclosure of the circumstances that led to an uncertain tax position?
Is there any discussion of any important changes in tax legislation and the impact of these changes
on the firm‟s results?
Is there any disclosure of policies on the use of jurisdictions commonly regarded as “tax havens” or
“low tax jurisdictions”?
Are the disclosures above illustrated with helpful charts and graphics?
Category 2: Tax numbers and performance
To what extent does the firm comply with the IFRS tax-related disclosure requirements?
Would a layperson understand all the headings in the tax reconciliation; and know what these
headings refer to?
Is the amount under any general or “other” heading in the tax reconciliation less than 10% of the
total of the reconciling items?
Does the firm show an “adjusted” tax rate as well as (and/or) the ETR (effective tax rate), perhaps
removing non-recurring items?
Does the firm show a weighted average statutory rate of corporate income tax?
Is the deferred tax note consistent with the tax note and the income statement?

31
Is there any discussion of cash tax payments and how these relate to the tax charge?
Is there any discussion about the main drivers for the tax rate?
Is there any discussion of how the effective tax rate is likely to perform in future?
Is there a forecast ETR (i.e. a figure or range of figures)?
Is there a forecast cash tax rate?
Are the disclosures illustrated with helpful charts and graphics?
Is the impact of tax on the future results of the business stated?
Category 3: Total tax contribution and wider economic impact
Is there any discussion of how tax impacts the business strategy or results?
Is there any discussion of advocacy or lobbying activity on tax?
Is there any discussion of any country-by-country reporting initiatives and their impact on the firm‟s
operations?
Does the firm show taxes paid by country/geographic region/ project?
Is there any mention of paying taxes in the developing world?
Is there any mention of the impact of tax on shareholder value?
Is there any mention of the importance of tax transparency or stakeholder interest in what tax is
paid?
Is there any mention of tax in a discussion about the firm‟s economic value add?
Does the discussion above mention taxes other than corporation tax?
Is there any reconciliation of other taxes paid to other taxes charged/borne in P&L/Income
Statement?
Does the firm disclose its total tax contribution (TTC)?
Does the firm disclose a split between taxes borne and taxes collected?
Are the disclosures above illustrated with helpful charts and graphics?
Category 4: Other disclosures
Does the firm refer to other, more detailed, documents on tax, e.g. on the web site?
Does the firm mention any tax transparency competition?

32
Are the disclosures illustrated with helpful charts and graphics?
Does the firm assist with tax advice or tax return preparation for employees‟ personal tax?
Does the firm disclose information relevant to employees‟ tax position on remuneration, e.g. tax
equalisation payments and tax grossing-up practices?
Is there disclosure of the tax consequences of buying and/or selling or impairment of specific assets?
Does the firm define different/additional effective tax rate calculations?
Does the firm disclose additional information beyond IAS 12 requirements regarding the expiry
dates of tax credits/losses or deferred tax?
Does the firm mention any disputes with the tax authorities and their effect on the firm‟s tax liability
for the current/ past years?
Does the firm disclose how it defines taxation?
Does the firm disclose its policy regarding Value-Added Tax or Capital Gains Tax valuations?
Does the firm disclose any possible changes in taxation legislation that will affect the industry that
the firm operates in?
Does the firm disclose its tax reference number?
Does the firm disclose any government tax subsidies it has received?
Does the firm disclose its withholding tax exposure?
Does the firm mention any interest receivable or payable to the tax authority under finance income
or expense?
Does the firm disclose when its tax return was submitted?
Does the firm mention that it is regarded as the best taxpayer by its revenue authority?
Does the firm mention the effect of carbon taxes?