Embed Size (px)
Citation preview

Journal of Public Economics 206 (2022) 104587
Contents lists available at ScienceDirect
Journal of Public Economics
journal homepage: www.elsevier .com/ locate / jpube
Tax evasion and tax avoidanceq
https://doi.org/10.1016/j.jpubeco.2021.1045870047-2727/� 2022 Elsevier B.V. All rights reserved.
q Part of the material in this study appeared in the working paper version of thepaper: ‘‘Tax Evasion and Inequality”, NBER working paper #23772, September 2017.We thank the Norwegian Tax Administration for their goodwill and cooperation,and we are grateful for financial support from the Research Council of Norway,grant 262522/F10. Further, Zucman gratefully acknowledges financial support fromthe Laura and John Arnold Foundation. The activities of CEBI are financed by theDanish National Research Foundation, Grant DNRF134.⇑ Corresponding author.
E-mail addresses: [email protected] (A. Alstadsæter), [email protected] (N. Johannesen), [email protected] (S. Le Guern Herry),[email protected] (G. Zucman).
Annette Alstadsæter a, Niels Johannesen b,⇑, Ségal Le Guern Herry c, Gabriel Zucman d
aNorwegian University of Life Sciences, NorwaybUniversity of Copenhagen, CEBI and CEPR, Denmarkc Sciences Po Paris, FrancedUC Berkeley and NBER, United States
a r t i c l e i n f o
Article history:Received 11 September 2020Revised 7 November 2021Accepted 28 December 2021
Keywords:Tax evasionTax avoidanceTax enforcementHidden wealth
a b s t r a c t
Exploiting rich administrative data and salient policy variation, we study the substitution between illegaltax evasion and legal tax avoidance. By increasing its enforcement effort, the Norwegian governmentpushed many wealthy individuals to disclose assets previously hidden abroad. We find that the taxes paidby these individuals rise 30% at the time of disclosure and that the rise is sustained over time. After stop-ping to evade, taxpayers do not start avoiding more. Our results suggest that cracking down on evasion bythe wealthy can be an effective way to raise tax revenue, increase tax progressivity, and ultimately reduceinequality.
� 2022 Elsevier B.V. All rights reserved.
1. Introduction
In recent years, governments in many rich countries have takenambitious steps to crack down on tax evasion by the wealthy, nota-bly by limiting the opportunities for evasion through undeclaredoffshore accounts (Johannesen and Zucman, 2014; Johannesenet al., 2020). Enhancing tax enforcement at the top of the wealthdistribution may be desirable for at least three reasons. First, ithas the potential to raise government revenue significantly as thewealthiest taxpayers account for a large fraction of total taxes. Sec-ond, it may help restore the progressivity of the tax system, whichis currently being eroded by very high evasion rates at the top(Alstadsæter et al., 2019b). Third, it may mitigate the secular risein inequality as top income and wealth shares continue to increasein many countries (Alvaredo et al., 2018).
Fighting the illegal tax evasion of the wealthy, however, onlycontributes to these policy goals to the extent that it effectively
raises their tax payments. This is not given even if enforcementis successful in the sense that it curbs tax evasion. As the wealthyare widely viewed to have ample opportunities for legal tax avoid-ance (Landier and Plantin, 2017), one may be concerned that theysimply start avoiding more whenever enhanced enforcement com-pels them to evade less. This implies that the degree of substitutionbetween evasion and avoidance at the top is a key parameter forguiding these enforcement policies. If substitution is low, crackingdown on the evasion technologies used by the wealthy may be anattractive way to boost tax collection, increase the effective pro-gressivity of the tax system, and reduce inequality. If substitutionis high, the net benefits are likely to be small - or even negativeif there are real resource costs of enforcement.
From a theoretical perspective, it is certainly possible that eva-sion and avoidance are substitutes because of the way their mar-ginal costs and benefits interact (Slemrod and Yitzhaki, 2002).For instance, reducing evasion could render avoidance more attrac-tive by moving taxpayers into an income bracket with a highermarginal tax rate or by lowering the marginal cost of time andother inputs shared between evasion and avoidance technologies.However, it is also theoretically possible that evasion and avoid-ance are not substitutes: Wealthy taxpayers may be in the topincome bracket regardless of their evasion choices and evasionand avoidance could rely on entirely different inputs. This theoret-ical ambiguity calls for careful empirical analysis. While we are notaware of empirical papers speaking directly to this question, thepuzzling finding that higher audit rates cause a decrease in tax pay-

1 This conceptualization of tax avoidance is similar to Stiglitz (1985) who discussesvarious forms of arbitrage, including postponement of taxes and investment in taxfavored assets such as housing and pension accounts. It is somewhat broader thanSlemrod and Yitzhaki (2002) who only consider strategies that reduce tax liabilitieswithout altering the consumption basket.
A. Alstadsæter, N. Johannesen, Ségal Le Guern Herry et al. Journal of Public Economics 206 (2022) 104587
ments for high-income taxpayers (Slemrod et al., 2001) is sugges-tive of strong substitution between evasion and avoidance.
In this paper, we provide new empirical evidence on substitu-tion between tax evasion and tax avoidance at the top of thewealth distribution by exploiting salient policy variation anddetailed administrative data from Norway. The Norwegian taxadministration operates a tax amnesty program, under which tax-payers who voluntarily disclose assets hidden abroad pay nopenalties and suffer no criminal sanctions. The amnesty was rarelyused until the Norwegian government launched a series of policyinitiatives, most prominently the conclusion of informationexchange agreements with a large number of tax havens, to reduceoffshore tax evasion in 2008. This effort led around 1,500 taxpayersto disclose previously unreported foreign assets and income overthe period 2008–2016. This represents a large sample of wealthytaxpayers who started to evade less at a well-defined point in time;the question we address in this paper is whether they also startedto avoid more.
The Norwegian context is attractive to study the interplaybetween tax avoidance and tax evasion for several reasons. First,the enforcement policy represents an exogenous shock to tax eva-sion: it increased the risk of detection for offshore tax evaders andpushed many of them to use the amnesty. This alleviates concernsthat the drop in tax evasion may be endogenous to changes in taxavoidance. Second, we can draw on administrative wealth data forthe entire Norwegian population as well as a unique dataset withcomprehensive transaction-level information on cross-border banktransfers. The richness of the data allows us to measure the behav-ioral adjustments accompanying participation in the amnesty:adoption of tax avoidance techniques and cross-border capitalmovements. The coverage of the data makes it possible to analyzealso the very top of the wealth distribution: households with doz-ens of millions of dollars in net wealth whose evasion and avoid-ance are of particular interest to policy makers, but difficult tostudy with the smaller datasets obtained from, for instance, ran-domized tax audits.
In the main analysis, we estimate the behavioral adjustmentsof tax evaders at the time they disclose hidden assets under theamnesty in an event-study framework with a control group ofother taxpayers. Our main results have the flavor of dynamicdifference-in-difference estimates that express the change inbehavior of disclosers over and above the change for other tax-payers with similar ex ante characteristics. We are particularlyinterested in the change in reported wealth, income, and taxespaid around the disclosures as well as changes in the use of arange of tax avoidance techniques. The results allow for a testof the substitutability between evasion and avoidance. Withperfect substitution, each dollar decrease in evasion should bemirrored by a dollar increase in avoidance; hence, we shouldsee no change in tax bases and tax liabilities, but a largeincrease in the use of avoidance techniques. With no substitu-tion, by contrast, we should see substantial increases in taxbases and tax liabilities, but no change in the use of avoidancetechniques.
The first set of results provides clear evidence against perfectsubstitution between evasion and avoidance. We find a sharpincrease in reported net wealth (of around 60%) and income (ofaround 25%) at the time of disclosure as well as a correspondingincrease in taxes paid (of around 30%). These behavioral changesare persistent: Disclosers report higher net wealth, income, andtax liabilities throughout the four-year period we follow them afterthey participate in the amnesty, with no clear decline over time.While this set of results does not rule some increase in avoidancearound disclosure, it clearly rejects that the increase is largeenough to offset the decrease in evasion, as implied by perfectsubstitution.
2
The next set of results suggests low or even zero substitutionbetween evasion and avoidance. We consider a range of outcomescapturing avoidance techniques available to wealthy Norwegians:Legal ways to reduce effective taxation that exploit differences intax rates across ownership structures, asset types and jurisdic-tions.1 First, taxpayers can defer personal taxes on capital incomeby holding assets through separate legal entities. Second, they canreduce their wealth tax liability by investing in unlisted shares andreal estate, which in Norway are taxed at only a fraction of marketvalue. Third, they can avoid Norwegian taxes by moving their taxresidence to a foreign country. Except for a small increase in newlyfounded holding companies prior to amnesty participation, we findno evidence that tax evaders increase tax avoidance when they dis-close foreign assets and income. While we do not cover all possibleavoidance margins and therefore cannot exclude that unobservedmargins change at the time of disclosure, the low responsivenesson all the margins we do observe suggests that the overall increasein avoidance is small if not zero.
We corroborate the conclusions from the event-study analysisin a simple cross-sectional framework that compares tax paymentsin levels across taxpayers. While disclosers, before using theamnesty, paid much less taxes than other taxpayers with the samewealth and labor income (�20%), they paid the same, or slightlymore, after using the amnesty (+5%). The latter result suggests thatdisclosers avoid less than other taxpayers after they have stoppedevading, which is difficult to reconcile with high substitutionbetween evasion and avoidance.
We explore three possible mechanisms underlying the appar-ently low substitution between tax evasion and tax avoidance.First, tax avoidance could be associated with fixed costs so thatevaders with limited offshore wealth optimally choose not toadjust the avoidance margin upon disclosure. We re-estimate themodel while allowing the results to vary with disclosure size, butfind no clear signs of substitution to avoidance even for the sub-sample with the largest disclosures. Second, tax evaders could haveexhausted all avoidance opportunities already before entering theamnesty – starting from such a corner solution, changes in themarginal costs and benefits of avoidance need not induce behav-ioral changes. We document that although the probability to adoptthe various avoidance techniques rises strongly with wealth, thereis scope for more avoidance even at the very top of the wealth dis-tribution. Moreover, we find no substitution to avoidance even forthe subsample who were pursuing avoidance least aggressivelybefore disclosing. Third, tax avoidance opportunities could be con-centrated among the very wealthiest. However, when we allow theestimates to vary with ex ante wealth, we find no substitution toavoidance even for the wealthiest disclosers. Overall, these resultssuggest that evasion and avoidance are largely independent deci-sions with limited substitution.
Finally, we ask to what extent the asset disclosures wereaccompanied by asset repatriation. This is important from the per-spective of future tax compliance: Assets in Norwegian banks aresubject to third-party reporting to the tax authorities and thusmuch more difficult to misreport than assets in foreign banks. Itis also important for discussions about capital flight (Johannesenand Pirttilä, 2016): If tax evasion opportunities in offshore havensdrive capital abroad, to what extent can increased enforcementthen reverse the flow? The results document that amnesty partic-ipants gradually repatriated the majority of the offshore assetsafter disclosure. Using transaction data, we estimate that they

A. Alstadsæter, N. Johannesen, Ségal Le Guern Herry et al. Journal of Public Economics 206 (2022) 104587
transfer funds equivalent to around 60% of the disclosed assets totheir domestic accounts over the disclosure over a five-year period.Using tax return data, we see an even starker picture with almost75% of the estimated increase in taxable wealth and 90% of the esti-mated increase in taxable income belonging to domestic categoriesafter five years. As Norwegian taxpayers are not required to takeassets home to benefit from the tax amnesty, the strong repatria-tion responses suggest that holding assets is largely undesirablein the absence of evasion-related gains.
The results are robust to a range of modifications of the empir-ical framework. While the baseline model effectively compares thetrajectories of disclosers and non-disclosers with similar ex antecharacteristics in terms of wealth, income and age, our estimatesdo not change much when we reduce the number of controls(e.g. keeping only wealth), including more controls (e.g. addingcontrols for equity investments) or change how the ex ante con-trols are measured (e.g. exclude hidden assets from wealth mea-sure). The results also remain similar when we re-weight theobservations to make the discloser sample match the observablecharacteristics of an arguably randomly selected sample of offshoretax evaders whose secret accounts were exposed in the context ofthe Swiss Leaks (Alstadsæter et al., 2019b). The latter result sug-gests that selection into the amnesty is not an important concern,although we are unable to account for selection on unobservables.
Overall, our results suggest that cracking down on tax evasionby the wealthy can be a potent way to improve tax collection,increase the effective progressivity of the tax system, and ulti-mately reduce inequality. By increasing the detection risk associ-ated with offshore tax evasion, the Norwegian authorities wereable to significantly increase taxes paid by a large number ofwealthy taxpayers.2 The estimated increase in annual tax paymentscorresponds to around 2% of the disclosers’ total net wealth (includ-ing increases in both wealth and income taxes), much more than thewealth tax at around 1% of reported net wealth. This suggests thatstricter enforcement can potentially raise more revenue than evenlarge increases in nominal rates when evasion is high. Given thatthe estimates are roughly uniform across the ex ante wealth distri-bution, including for the very wealthiest disclosers, the revenue gainis significant in dollar terms.
Our paper contributes to a broad literature on the effects of gov-ernment policies aimed at reducing tax evasion (see Slemrod, 2018for a survey). Recent initiatives studied in the literature include theintroduction of electronic filing (Okunogbe and Pouliquen, 2018);new forms of third-party information reporting to improve thetax compliance of small firms (Slemrod et al., 2017;Naritomi,2019); withholding taxes on credit card sales to limit evasion ofsales taxes (Brockmeyer and Hernandez, 2018); and crackdownson offshore tax evasion (Johannesen and Zucman, 2014;Johannesen, 2014). Moreover, our paper contributes to the largeliterature on tax avoidance behavior among high earners, such ascorporate executives (Goolsbee, 2000), professional footballers(Kleven et al. (2013), and inventors (Akcigit et al., 2016). Finally,our analysis relates closely to a small set of papers studying disclo-sures of offshore wealth under tax amnesties without consideringthe interplay between evasion and avoidance (Johannesen et al.,2020; Londoño-Vélez and Ávila-Mahecha, 2021).3
The rest of the paper proceeds as follows. Section 2 describesthe data. Section 3 develops the empirical strategy. Section 4 pre-sents the results. Section 5 concludes.
2 We only observe compliance responses that occur through the amnesty. Evidencefrom the U.S. suggests that there may have been additional gains through silentdisclosures: repatriation of undeclared offshore assets outside of the amnesty(Johannesen et al., 2020).
3 An earlier literature analyzes U.S. state amnesties (e.g. Mikesell, 1986;Fisher et al.,1989; Crane and Nourzad, 1990).
3
2. Background and data
2.1. Tax and bank transfer data
For the purposes of our analysis, we combine data for the entirepopulation of Norway from a number of different administrativesources.
We obtain de-identified data on taxable wealth, taxable incomeand tax liabilities from the Norwegian tax authorities. Since Nor-way levies a tax on net wealth, the wealth information is compre-hensive and includes a detailed decomposition on asset classessuch as deposits, housing, bonds, equities, and mutual fund shares.For most income and asset categories, tax authorities receive infor-mation from third parties, such as employers and banks. Otheritems, such as foreign and unlisted securities, are self-reportedby the taxpayers. For key income and asset categories, our datasetincludes information about both the amount originally claimed bythe taxpayer and the amount on the most recent tax return afterany corrections made by tax authorities.
In the data at our disposal, wealth is recorded at tax value. Foritems such as loans and deposits, the tax value is equivalent to themarket value, but for other items the tax value is systematicallybelow the market value (housing) or zero (tax-favored pensionaccounts). Investments in asset types with a low tax value is ofindependent interest to us because they represent an importanttax avoidance strategy as explained below. However, when weseek to control for ex ante characteristics in our regressions, weprefer to measure wealth at market value. Following Alstadsæterel al., (2019a), we construct a measure of market wealth that isconsistent with the household wealth recorded in nationalaccounts and thus comparable to wealth for the United States com-puted by Saez and Zucman (2016).4 For disclosers, the measure ofex ante net wealth also includes the value of the hidden assets, basedon the corrections to pre-disclosure tax returns made by the taxauthorities for the purposes of computing back taxes.
We match income, wealth and tax data to comprehensive infor-mation about cross-border bank transfers collected by the Norwe-gian customs authorities. For each transfer involving a personalaccount in a Norwegian bank, we observe the transferred amount,the owner of the Norwegian account, and the country of the foreignbank account. Last, we add information from the corporate share-holder register to study the use of holding corporations to avoidtaxes, and information from the population register to studymigration.
2.2. The amnesty
To capture changes in offshore tax evasion empirically, we addinformation on the voluntary disclosure scheme (the ”amnesty”) tothe dataset. In Norway, tax evaders can generally escape penaltytaxes and criminal sanctions if they voluntarily provide informa-tion about unreported income and wealth sufficient for the taxadministration to assess the correct amount of taxes owed up toten years back in time. The two main conditions for using thisamnesty is, firstly, that the declared income and wealth do notcome from criminal activity and, secondly, that disclosure is fullyvoluntary and not prompted by ongoing investigations by the taxadministration. Under these two conditions, no penalty taxes
4 We construct market values consistent with national accounts for each compo-nent of net wealth separately, as detailed in Alstadsæter el al., (2019a). For housingassets, we multiply the tax value of each unit with the ratio of the value of thehousing stock in national accounts to the aggregate tax value summed over allhousing in Norway. For tax-favored pension accounts, we assign a share of theaggregate value observed in national accounts to each individual based on age andsalary level.

9 We measure disclosures within an asset class as the difference between the assetvalue on the final tax return (i.e. after corrections made by the tax authorities in thecontext of the amnesty) and the asset value initially claimed by the taxpayer (i.e.before these corrections). It is not possible to assign all disclosures to asset classes, astax auditors in some cases correct the total taxable wealth on the tax return withoutcorrecting the relevant wealth components. This is not consequential for the tax
A. Alstadsæter, N. Johannesen, Ségal Le Guern Herry et al. Journal of Public Economics 206 (2022) 104587
apply, but the taxpayer has to pay taxes due on the disclosedincome and wealth up to ten years back. There is no requirementthat offshore assets be repatriated to benefit from the amnesty.By contrast, taxpayers caught evading have to pay back taxes dueplus an additional penalty tax that can reach 60% of the evadedtaxes. Prison sentences up to six years are applicable in the mostserious evasion cases. In international comparisons, the absenceof penalty taxes makes Norway’s disclosure scheme one of themost generous ones, providing strong incentives for taxpayers todisclose offshore assets and income (OECD, 2015).
As shown in Fig. 1, participation in the amnesty correlatesstrongly with the enforcement efforts of the tax authority.5 Onlyfew taxpayers used the amnesty before 2008 when the authoritieshad virtually no way of detecting offshore tax evasion. The first waveof disclosures began when the Norwegian government stepped upits enforcement efforts by concluding a number of bilateral tax trea-ties with tax havens such as Jersey (October 2008), the CaymanIslands (April 2009), Luxembourg (July 2009), and Switzerland(August 2009). The treaties were signed in the context of a coordi-nated crackdown on tax havens by G20 countries (Johannesen andZucman, 2014) and allowed tax authorities to request bank informa-tion from cooperating tax havens on a case-by-case basis. The secondwave occurred after the signature in November 2013 of a multilat-eral convention providing for an automatic exchange of bank infor-mation between a large number of countries, including key taxhavens (see Zucman, 2015, for a global analysis of these policydevelopments).
Between 2008 and 2016, around 1,500 individuals participatedin the amnesty (excluding a small number of participants whosecases were dropped because no tax evasion was actually commit-ted). This group of primarily wealthy individuals who acknowl-edged hiding assets abroad is large relative to the size of theNorwegian population. To fix ideas, there were 3.8 million adultsin Norway in 2007 (the year before amnesty participation pickedup), of which 38,000 in the top 1% of the wealth distribution. Oursample of 1,500 tax evaders is also large relative to the numberof wealthy people typically sampled and found evading taxes inrandom audits or randomized controlled trials—two of the keysources used to study tax evasion (e.g., Slemrod et al., 2001;Slemrod, 2018). Total back taxes collected under the amnesty inthe period 2007–2016 amounted to approximately $250 million.6
We document a number of additional insights from theamnesty data in the Online Appendix. First, the distribution of dis-closures is heavily skewed: while the median amnesty participantdisclosed around $0.5 million, the largest 10% of the disclosureseach exceeded $5 million and the largest 1% each exceeded $50million (Figure A1).7 Second, Switzerland accounts for the largestfraction of the disclosed assets, and its significance increases mono-
5 A theoretical literature shows that amnesties have more participants if combinedwith enhanced enforcement (Stella, 1991;Baer and Le Borgne, 2008). Another reasonfor the increased use of the amnesty from 2008–2009 may be the series of data leaksfrom tax havens, such as Swiss Leaks and Panama Papers, which may have increasedthe perceived risk of both criminal investigation and public exposure for offshore taxevaders (Johannesen and Stolper, 2017). Moreover, a scandal in 2007, widely coveredin Norwegian media, where the Mayor of Oslo was accused of hiding money on Swissbank accounts by his ex-son-in-law and ultimately had to resign may also havecontributed to the surge in amnesty in participants in 2008–2009.
6 By comparison, the U.S. disclosure program collected around $6.5 billion fromaround 45,000 disclosers over the period 2009–2012, including both back taxes andpenalties (Johannesen et al., 2020). Measured per capita, the Norwegian program hadaround three times more participants and collected around three times more revenuethan the U.S. program (albeit over a somewhat longer period).
7 Throughout the paper, values in NOK are converted into USD using the fixedexchange rate 5.86 NOK/USD, the average exchange rate in 2007.
8 The prominence of Switzerland in facilitating offshore evasion is consistent withearlier work based on macro data (Alstadsæter et al., 2018) and with more recentevidence from the disclosure program of the Netherlands (Leenders et al., 2020).
4
tonically through the wealth distribution, reaching 67% for the top0.1% (Figure A2).8 Third, the composition of the offshore portfoliovaries considerably across wealth groups: housing assets dominatesfor disclosers belonging to the bottom 50% of the wealth distributionwhereas financial assets in the form of deposits and bonds dominateat higher wealth levels (Figure A3).9 Finally, the asset compositionvaries across locations: bonds and deposits are relatively moreimportant in Switzerland, Luxembourg and Jersey while equityinvestments and housing assets are relatively more important inthe U.S. and Spain respectively (Figure A4).
2.3. Avoidance techniques
Further, we use the micro-data to capture empirically several ofthe main ways in which Norwegian taxpayers avoid taxes.
First, a well-known tax planning technique in Norway involvesinvesting in unlisted shares: since no market price is available forsuch securities, they enter the wealth tax base at the tax value ofthe underlying business assets, which typically implies a signifi-cant rebate.10 Similarly, the tax value of housing assets is only a rel-atively small fraction of the market value.11 We use the tax value ofunlisted shares and housing assets as an outcome in the analysis tocapture these forms of tax avoidance.
Second, equity dividends and capital gains are taxable whendistributed to individual shareholders, but tax free when dis-tributed to corporate shareholders. This provides an incentive forindividuals to own shares through a holding company, as it allowsfor deferral, in principle indefinitely, of taxes on the dividendsreceived on the shares (Alstadsæter el al., 2019a). We create anindicator for founding a holding company based on the administra-tive corporate shareholder register and use it as an outcome in theanalysis to capture avoidance through deferral of dividend taxes.12
Third, a number of countries offer low tax rates to wealthy res-idents, which makes it possible for wealthy Norwegians to avoidthe high local taxes by moving their residence. Such responseswould be in line with existing evidence that taxation shapes migra-tion decisions at the top (Kleven et al., 2013a,b; Akcigit et al.,2016). Based on the administrative population register, we thusconstruct an indicator for moving away from Norway to captureavoidance through migration.
assessment, as total taxable wealth is computed correctly, nor for our main analysis,but it implies that our attempt to break down disclosures by asset class remainsincomplete.10 Gobel and Hestdal (2015) estimate that the tax rebate to the most liquid unlistedequities is around 70% and exceeds 90% for a set of unlisted equities that wereeventually listed. In principle, it is possible that the wealth tax rebate is partlycapitalized into prices of unlisted shares. However, many investors are not wealth taxpayers: individuals with net wealth below the threshold where the wealth tax tick in,pension funds, corporations and foreigners.11 On average, primary housing was taxed 20% of their assessed market value in2007 with considerable variation across units (Statistics Norway, 2009). Starting in2010, a new assessment system aimed to tax primary housing at a uniform 25% oftheir estimated market value and secondary housing at 40% while leisure housesremained under the favorable old assessment system. With the new assessmentsystem, the tax rebate was thus slightly larger for primary than for secondaryhousing. However, it remained possible to reduce the effective exposure to the wealthtax considerably by investing in housing assets without changing the primaryresidence.12 We define a holding company as a corporation with only financial income. Inprinciple, other limited liability companies can generate the same tax advantages as aholding company. As shown in Table 1, around 17% of disclosers owned closely-heldcorporations of any kind as compared to around 1.5% in the general population.

Fig. 1. Disclosures by year. The figure shows the number of participants in the Norwegian amnesty by year of first contact with the tax authorities. The dashed vertical linesindicate major tax enforcement initiaties during the sample period: a series of bilateral treaties with tax havens about information exchange on request starting in 2009 andthe multilateral convention adopting the automatic information exchange in 2013.
A. Alstadsæter, N. Johannesen, Ségal Le Guern Herry et al. Journal of Public Economics 206 (2022) 104587
Fourth, until 2009, there was a wealth tax rebate for taxpayerswhose combined wealth and income tax liabilities exceeded 80% oftheir taxable income (Melby and Halvorsen, 2009).13 The rule cre-ated a significant tax avoidance opportunity for wealthy taxpayerswho could reduce tax payments by structuring their assets in sucha way that they generated little taxable income (e.g., by investingin securities that do not pay dividends). We capture this avoidancebehavior empirically by constructing an indicator for benefiting fromthe 80% rule in 2007 (the last year where the rule was fullyapplicable).
Fifth, dividends paid out to individual shareholders were taxexempt until 2005, but then became taxable following a tax reformin 2006. The reform created an incentive for owners of closely heldbusinesses to pay out dividends in 2005 (Alstadsæter and Fjærli,2009). We construct an indicator for taking advantage of this taxavoidance opportunity.14
We note that while the former four tax avoidance outcomes aredynamic – we observe them in every year and we can trackwhether they change systematically around the time tax evadersenter the amnesty – the latter two are static – we observe themonly once, in 2007 and 2006 respectively.
2.4. Summary statistics
Table 1 reports summary statistics for the population ofamnesty participants in Column (1) and all other Norwegians inColumn (2) for the year 2007. The individuals described in thetable correspond exactly to the individuals in the estimatingsample.
13 A similar system applies in other countries that have wealth taxes (see Jakobsenet al., 2020 for details on a similar rule in Denmark).14 To be precise, the indicator takes the value one when dividends distributed out ofa closely held firm in 2005 exceeds after-tax profits in the accounting year 2004(which is the base for the 2005 dividend payout).
5
As shown in Panel A, disclosers are older and more likely to bemale, married and foreign born than other taxpayers. As shown inPanel B, disclosers tend to be very wealthy: the average discloserreported more than $3 million of taxable net wealth on their taxreturn in 2007, which is around 150 times more than the averagenon-discloser. The differences in reported income and tax liabili-ties are smaller, mainly because many disclosers are retired andearn no labor income. As shown in Panel C, disclosers owned alot more housing wealth and unlisted shares than non-disclosersin 2007 and were much likely to found a holding company; by con-trast, they were less likely to migrate. Moreover, disclosers were10–20 times more likely to benefit from the 80% rule and to max-imize dividends from closely held firms in preparation for the 2006tax reform. As shown in Panel D, cross-border bank transfers werearound $13,000 from foreign accounts and $16,000 to foreignaccounts for disclosers in 2007 and 10–20 times smaller for non-disclosers. Tax havens accounted for around 25% of both incomingand outgoing bank transfers within the group of disclosers and aconsiderably smaller fraction for others.15
Disclosers are thus markedly different from the rest of the Nor-wegian population: they are much richer, and before using theamnesty they engaged much more in tax avoidance. In Column(3) of Table 1, we explore how much of the differences can beexplained by demographic characteristics. Specifically, for eachdiscloser, we identify all the non-disclosers with the exact samedemographic characteristics (age, number of children, etc.) andtake the average of their covariates. This procedure creates onesynthetic non-discloser for each discloser with identical demo-graphics, and we compute the average covariates for this syntheticsample. The differences between discloser and non-disclosersdecrease somewhat when balancing the demographic characteris-tics, but remain large.
15 We define the set of tax havens in the same way as Johannesen and Zucman(2014).

Table 1Descriptive Statistics. The table shows descriptive statistics as of 2007 for the 1,447individuals who disclosed offshore assets under the Norwegian tax amnesty (Column1); for the rest of the population (Column 2); and for a weighted subsample of non-disclosers with the same demographics as disclosers (Column 3). Panel A showsaverage values for demographic variables: age, number of children, marital status,gender and an indicator for being born outside of Norway. Panel B shows the taxablenet wealth and income reported on the tax return and the resulting tax liabilities (inUSD converted from NOK at the exchange rate 5.86); Panel C shows tax avoidanceindicators: the tax value of housing assets and unlisted shares (in USD), an indicatorfor founding a holding company, an indicator for moving the residence out ofNorway; and indicator for benefitting from using the 80% rule to obtain a wealth taxdiscount and an indicator for paying out all retained earnings of a closely held firmprior to the 2006 tax reform. Column D shows cross-border bank transfers (in USD):from all foreign countries, from tax havens, to all foreign countries and to tax havenswhere tax havens are countries not complying with the OECD principles oftransparency and cross-border information exchange (Johannesen and Zucman,2014).
(1) (2) (3)Disclosers Non-disclosers
(Individuals disclosingassets under the
amnesty)
(Individuals notdisclosing assets
under the amnesty)All Balanced
Number of individuals 1,447 3,714,572 -Panel A: DemographicsAge 58 46 58Number of children 2.3 2.3 2.3Married 60% 44% 60%Male 66% 50% 66%Foreign born 22% 11% 22%Panel B: Wealth, income
and tax liabilitiesNet wealth (USD
reported tax value)3,076,394 19,487 67,981
Net wealth (USDestimated marketvalue)
5,680,021 202,980 327,795
Income (USD reportedtax value)
184,988 56,414 65,929
Tax liabilites (USDreported tax value)
80,948 13,927 16,229
Panel C: AvoidanceHousing wealth (USD tax
value)284,002 26,130 34,948
Unlisted shares (USD taxvalue)
2,162,212 16,245 25,315
Founds holding company 0.69% 0.05% 0.05%Emigrates 0.00% 0.02% 0.02%Benefits from 80% rule 6.08% 0.24% 0.28%Maximizes dividends
from closely held firm(2005)
7.12% 0.70% 1.08%
Owner of a firm (100% ofshares)
16.86% 1.51% 1.99%
Panel D: Bank transfersFrom foreign countries
(USD)13,039 605 1,175
- of which from taxhavens (USD)
3,100 67 96
To foreign countries(USD)
15,908 1,232 1,851
- of which to tax havens(USD)
4,089 69 104 17 The panel is not fully balanced as individuals enter the sample when they turn18 years old or move to Norway, and exit the sample when they die or move awayfrom Norway. We have information about amnesty participation until 2016 andindividuals who participated after 2013 generally remain in the sample, but onlycontribute to identification of the pre-trend. However, as we cannot compute the sizeof the disclosure for individuals disclosing after 2013, such individuals fall out of thesample when the estimates are conditioned on the size of the disclosure (Fig. 6).18 Including non-disclosers in the analysis allows us to employ both individual fixedeffects and a full set of time dummies, which is not possible in empirical designs that
A. Alstadsæter, N. Johannesen, Ségal Le Guern Herry et al. Journal of Public Economics 206 (2022) 104587
Finally, Fig. 2 illustrates how ex ante tax avoidance varies withthe position in the wealth distribution and whether the differencesin avoidance across disclosers and non-disclosers can be explained
16 Each figure is constructed by, first, taking averages within narrow wealth groups,each containing 0.01% of the population and, then, taking averages of those within thenine broader wealth groups shown in the figure. The figure in the top-left panel servesas a check that the other figures effectively compare disclosers and non-discloserswith equal net wealth.
6
by differences in wealth.16 For all of the avoidance outcomes, thereis a pronounced wealth gradient – richer people avoid more – butcontrolling for wealth, avoidance is similar across disclosers andnon-disclosers. Moreover, tax avoidance is far from systematic evenat the very top of the wealth distribution, suggesting that discloserswere generally not, prior to making the disclosure, in a corner solu-tion where all avoidance opportunities were exhausted. Rather, dis-closers appear to be in an interior solution where a change to themarginal costs and benefits of avoidance, e.g. through a shock to eva-sion, could induce changes in the optimal choice of avoidance.
3. Empirical model
We study the behavioral adjustments of tax evaders around thetime they disclose hidden income and assets under the amnesty inan event-study framework. The outcomes capture overall tax com-pliance (i.e. taxable wealth, taxable income and tax liabilitiesclaimed by the tax payers), the use of various tax avoidance tech-niques (i.e. holding companies, unlisted shares, migration, housingassets) and capital flows (i.e. ingoing and outgoing cross-borderbank transfers). Our estimating sample spans the period 2002–2013 and covers the entire adult population of Norway as of2007, around 3.8 million adults, including the 1,447 amnesty par-ticipants.17 Indexing individuals by i and years by t, we estimate thefollowing empirical model:18
logðYitÞ ¼ ai þ ct � Xi þX
bkDkit þ uit
where aidenotes individual fixed effects, ctdenotes calendar yeardummies, Xi is a vector of dummies capturing individual character-
istics (defined in 2007 before the first wave of disclosures) and Dkit
denotes event time dummies, indicating year k relative to the yearof the disclosure of individual i. Standard errors are clustered at theindividual level to allow for auto-correlation in the error term.
The event time dummies are the main variables of interest asthey measure the change in the outcome for disclosers since thereference year, over and above the change observed for non-disclosers with similar ex ante characteristics in the same period.Since evaders disclosing offshore wealth in the beginning of year0 can incorporate the disclosed wealth into the tax return for year�1, we let year �2, the last year for which the tax return has def-initely been submitted at disclosure in year 0, be the referenceyear.
The interaction terms ct � Xi ensure that the dynamic adjust-ments of disclosers are measured relative to a counterfactual tra-jectory described by non-disclosers with similar ex antecharacteristics. Accounting for the counterfactual trajectory isimportant given that many factors, entirely unrelated to amnestyparticipation, affected the economic outcomes of disclosers duringthe sample period, e.g. net wealth increased due to the boom in the
identify event-time dummies exclusively from differences in the timing of the event(Borusyak and Jaravel, 2017).19 There is likely to be some undisclosed offshore evasion among taxpayers in thecontrol group. This suggests that we are partly identifying off a comparison between,for instance, the reported net wealth of disclosers and the reported net wealth ofevading non-disclosers with similar obseved ex ante characteristics. This comparisonis still likely to address the potential confounders discussed above and pre-trendsremain a good diagnostic of confounding shocks.

Fig. 2. Tax avoidance by wealth group. The figure shows, by location in the net wealth distribution, the average of the following outcomes: net wealth at market value(upper left), an indicator for owning a holding company (upper right), the tax value of housing assets (middle left), the tax value of unlisted shares (middle right), an indicatorfor paying out all retained earnings from a closely held firm just before tax reform in 2006 (bottom left) and an indicator for using the 80% rule to obtain a wealth tax discount(bottom right). To account for differences across disclosers and non-disclosers in the distribution of wealth within the nine wealth groups, the figures are constructed by, first,taking averages within much narrower wealth groups, each containing 0.01% of the population and then averages of those within the nine broader wealth groups shown inthe figure.
A. Alstadsæter, N. Johannesen, Ségal Le Guern Herry et al. Journal of Public Economics 206 (2022) 104587
housing market, labor income fluctuated due to life-cycle factorsand tax liabilities changed mechanically due to tax reforms. Allof these effects are likely to be heterogeneous and our model there-fore allows the counterfactual trajectory to vary by ex ante charac-teristics (captured by Xi).19
In the baseline specification, the ex ante characteristics are cap-tured with 10 dummies for net wealth, 10 dummies for income and6 dummies for age (a total of 26 dummies). To construct the dum-mies for net wealth, we divide the sample of disclosers into tenequally sized groups based on their net wealth in 2007 (including
19 There is likely to be some undisclosed offshore evasion among taxpayers in thecontrol group. This suggests that we are partly identifying off a comparison between,for instance, the reported net wealth of disclosers and the reported net wealth ofevading non-disclosers with similar obseved ex ante characteristics. This comparisonis still likely to address the potential confounders discussed above and pre-trendsremain a good diagnostic of confounding shocks.
7
assets disclosed in later years), assign non-disclosers to thesewealth groups, and create dummies corresponding to the groups.We construct the dummies for income following an analogous pro-cedure while the dummies for age express uniform intervals (e.g.20–29, 30–39, . . ., and 70+).
In robustness tests, we modify the vector of ex ante character-istics in a number of ways. First, we consider versions of the modelthat control both more and less exhaustively for ex ante character-istics. For instance, we add controls for ex ante equity investmentsto allow for systematic differences in the portfolio compositionacross disclosers and non-disclosers with the same net wealth,income and age. Second, we re-define the characteristics so theyare measured in 2005 rather than in 2007. This addresses the con-cern that a very small group of taxpayers made disclosures alreadyin 2006–2007, but adds noise by increasing the time between mea-surement of the characteristics and observation of the relevant
A. Alstadsæter, N. Johannesen, Ségal Le Guern Herry et al. Journal of Public Economics 206 (2022) 104587
outcomes. Third, we re-define ex ante variables to exclude disclo-sures made under the amnesty. In the baseline model, we includedisclosures in the wealth and income controls; however, it is notclear which of the two models delivers the most accurate counter-factual for disclosers.
Occasionally, we employ a more compact version of the base-line model where the omitted event time categories are �4, �3and�2 and the categories 0, 1 and 2 are replaced by a simple postdummy. In this model, post is the key variable of interest. Itexpresses the change in the outcome from the years before the dis-closure to the years after relative to the change over the same per-iod for non-disclosers who are similar in terms of wealth, incomeand age.20
Across all specifications, the key identifying assumption is thatdisclosers would have followed the same trajectory as non-disclosers with the same ex ante characteristics if they had notmade a disclosure under the amnesty. A key concern is reversecausality: Taxpayers may have chosen to participate in the amnestybecause of changes in the economic outcomes of interest. Forinstance, the decision to legally repatriate hidden assets may beinduced by losses on the stock market or by investment opportuni-ties in a start-up company, in which case we would underestimatethe increase in compliance (measured by net wealth) and overesti-mate the increase in avoidance (measured by unlisted shares). Thefact that the waves of disclosures followed salient enforcementefforts attenuates this concern: It seems plausible that the vastmajority of disclosers chose to use the amnesty in response tothe increased risk of detection for offshore tax evaders rather thanbecause of idiosyncratic shocks to their balance sheets. Moreover,our empirical design allows us to detect some forms of reversecausality by comparing trends in the outcomes across disclosersand non-disclosers in the years prior to disclosure: To the extentthat confounding shocks occur in an earlier year than the disclo-sure, they will appear as a differential trend for the disclosers inthe pre-disclosure period. Finally, we also consider a major incomecomponent, wage income, which is notmechanically related to dis-closures and therefore offers another diagnostic: If wage dynamicsdiffers systematically across disclosers and non-disclosers, it raisesconcerns about endogeneity and suggests that differential dynam-ics in total income and tax payments cannot be attributed entirelyto disclosures.
Another issue that is important for the interpretation of theestimates is selection into the amnesty: While our estimates cap-ture substitution between evasion and avoidance in the subsampleof offshore evaders who choose to disclose under the amnesty, theestimates are, in principle, local to this subsample and may notnecessarily extend to the full sample of offshore evaders.21 It fol-lows that we may overestimate substitution if there is selection intothe amnesty on characteristics correlating with high substitutabilityand vice versa. In robustness tests, we go some way toward address-ing this issue using information about individuals whose undeclaredoffshore wealth was detected through a data leak and who thereforearguable constitute a randomly selected sample of offshore tax eva-ders (Alstadsæter et al., 2019b).22 We exploit this data source byre-estimating the baseline model while re-weighting the observa-
20 However, when the outcome is the opening of a holding company, we estimatethe full model and report the coefficient on year �1 in event time. We take thisslightly different approach because the opening of a holding company is a flowvariable and because the fully dynamic results discussed in Section 4.2 clearlyindicate a sharp response in year �1 and no response in other years.21 This is reminiscent of IV estimates being local to the group of compliers (Angristet al., 1996).22 We use customer data leaked from the Swiss bank HSBC Switzerland in 2006 inthe so-called Swiss Leaks and later matched to tax data by the Norwegian taxauthorities and used to crack down on undeclared accounts. We refer to earlier workfor a detailed account of this data source (Alstadsæter el al., 2019).
8
tions in the sample of disclosers so that they match the leaked sam-ple in terms of the wealth distribution.23 This method corrects forselection on wealth, which is important if wealthy individuals havemore scope for substitution to avoidance; however, it does not cor-rect for selection on other observables nor unobservables.
4. Results
4.1. Tax compliance
The first set of results describes the dynamics of overall taxcompliance around the time taxpayers make disclosures underthe amnesty. We consider three main outcomes: taxable netwealth, taxable income, and total tax liabilities. In all three cases,we capture compliance by using the values claimed by the taxpay-ers on the tax return before any corrections are made by the taxauthorities. The estimated coefficients on the event time dummiesand 95% confidence bounds are plotted in Fig. 3.
As shown in Fig. 3A, disclosures under the amnesty are associ-ated with large and persistent increases in reported net wealth.Specifically, the net wealth of disclosers follows the same trajec-tory as that of non-disclosers in the years �5 to �2 and thenincreases sharply by 0.5 log-points (around 65%) relative to non-disclosers between years �2 and 0. The effect of the amnestyshows up as soon as year �1 because tax evaders using theamnesty in the beginning of year 0 can report the disclosed assetson the tax return for year �1. The differential shift in the netwealth of disclosers persists through the remainder of the eventwindow.
It is instructive to compare the magnitude of the increase in netwealth around disclosure to recent evidence that Scandinavianswho evaded taxes through accounts at HSBC Switzerland held onaverage 40% of their true net wealth on the undeclared Swissaccounts (Alstadsæter el al., 2019b). The estimated wealthincrease of 65% implies an offshore wealth share of almost exactly40% under the assumption that amnesty participants disclosed allof their offshore assets (65%=165 � 40%). This suggests that off-shore tax evasion not only decreases, but literally ends at the timeof participation in the amnesty.
As shown in Fig. 3B, the results for reported income are similarto those for reported wealth. From year �5 to �2, the incomes ofdisclosers and non-disclosers evolve in parallel; there is then a dif-ferential increase of almost 20% from year �2 to0 for disclosers. Itis not surprising that income increases less than wealth in relativeterms since many disclosers have labor or pension income that isunaffected by the disclosure.
As shown in Fig. 3C, tax liabilities follow the same qualitativepattern as wealth and income with a differential jump of almost30% from year �2 to 0. The magnitude of the jump correspondsto what one would mechanically expect given the differentialincrease of 20% in taxable income and 65% in taxable wealth, andthe marginal tax rates that apply to income and wealth.
To get a sense of the implications for effective taxation ofwealth, we re-estimate the model using as an outcome the tax lia-bilities claimed by the taxpayer scaled by net wealth (measured atmarket value and including subsequent disclosures).24 As shown inFig. 3D, this ratio follows the same trend for disclosers and non-disclosers between year �5 and �2 and then shifts up differentiallyfor disclosers by around two percentage points between year �2 and0. Importantly, the increase reflects changes in wealth taxes as wellas in capital income taxes.
23 We compare the wealth distribution of amnesty participants and HSBC customersin Table A1 in the Appendix.24 To limit the impact of extreme values, we winsorize this outcome at the 95% level.

Fig. 3. Tax compliance. The figure shows point estimates for event time dummies (with 95% confidence bands) obtained from a model with individual fixed effects, calendartime dummies interacted with indicators for wealth, income and age and a full set of event time dummies (disclosure is year 0 and year �2 is the omitted category). Theoutcomes are net wealth (in logs), income (in logs), tax liabilities (in logs) and tax liabilities (scaled by the market value of net wealth including disclosures) as claimed by thetaxpayer. The confidence bands are based on standard errors clustered at the individual level.
A. Alstadsæter, N. Johannesen, Ségal Le Guern Herry et al. Journal of Public Economics 206 (2022) 104587
While the pre-trends in reported net wealth, income and taxesare consistent with the identifying assumption, we conduct a fur-ther test for endogeneity by estimating the baseline model forwage income. As shown in Fig. 3E, wage income evolves in parallelfor disclosers and non-disclosers throughout the entire event win-dow. This is consistent with our interpretation that the increase intaxable income and tax liabilities around amnesty participation isexplained by the disclosures and not by confounding shocks towages.
In brief, the results presented in this section consistently showthat amnesty participation is associated with a significant and sus-tained increase in overall tax compliance: the taxable wealth andincome reported by taxpayers increase as do the resulting tax lia-bilities. This is clearly inconsistent with tax evasion and tax avoid-ance being perfect substitutes. Under this hypothesis, we shouldsee no change in overall tax compliance around disclosure, as eachdollar decrease in evasion should be offset by a dollar increase inavoidance thus leaving all tax bases unchanged. By contrast, the
9
result is consistent with imperfect or no substitution betweentax evasion and tax avoidance. Under this hypothesis, ending off-shore evasion is accompanied by a modest or no increase in avoid-ance and, thus, a sizeable increase in tax bases.
4.2. Tax avoidance
The next set of results describes the use of four well-defined taxavoidance techniques around the time taxpayers make disclosuresunder the amnesty. The avoidance techniques are: emigration outof Norway, the founding of a holding company and investments intwo distinct tax-favored asset classes. The results are illustrated inFig. 4.
As shown in Fig. 4A, emigration rates decline slightly amongnon-disclosers relative to disclosers in the years after disclosure,a small decrease in this dimension of tax avoidance. However,the estimated coefficients are very small (at most 0.01%) and statis-tically insignificant. As shown in Fig. 4B, there is a clear and statis-

Fig. 4. Tax avoidance. The figure shows point estimates for event time dummies (with 95% confidence bands) obtained from a model with individual fixed effects, calendartime dummies interacted with indicators for wealth, income and age (in 2007) and a full set of event time dummies (disclosure is year 0 and year �2 is the omitted category).The outcomes are an indicator for emigration, an indicator for founding a holding company; the taxable value of housing assets (in logs) and the taxable value of unlistedshares (in logs). The confidence bands are based on standard errors clustered at the individual level.
A. Alstadsæter, N. Johannesen, Ségal Le Guern Herry et al. Journal of Public Economics 206 (2022) 104587
tically significant increase in incorporations of Norwegian holdingcompanies by disclosers in year �1. Some amnesty participants doseem to prepare for a tax-efficient repatriation of assets; however,the size of the estimated coefficient (around 1%) suggests that thisis a very small minority.25 As shown in Figs. 4C and 4D, there a slightdifferential decrease in investments in housing and unlisted sharesaround disclosure, but the estimates are statistically insignificant.26
These results indicate that amnesty participation is associatedwith small or no increases in the use of the four tax avoidance
25 As shown in Table 1, more than 80% of the disclosers did not have a closely heldcorporation of any kind and thus needed to found a new corporation to be able todefer taxes on capital income in this way.26 The two remaining avoidance techniques described above cannot be studied inthe present framework, because they were not available in the years that tax evadersused the amnesty. The tax saving from having closely held firms pay out dividendsexisted only in 2005, and the possibility to obtain a wealth tax rebate when totaltaxes owed exceeded 80% of income ended in 2009.27 To be precise, we estimate the following equation:
logðTaxesitÞ ¼ ct � netwealthit þ /t � incomeit þ Xit þX
bkDkit þ �it
where Taxesit denotes the tax liabilities claimed by individual i inyear t; ct and /t are calendar time dummies; netwealthit represents199 indicators for net wealth (one for each percentile of the distri-bution and one for each percentile of the top one percent); incomeitrepresents 199 indicators for non-wealth income (one for each per-centile of the distribution and one for each percentile of the top onepercent); Xit is a vector of demographic controls (age, gender, mar-ital status, county and number of children); and Dk
it indicates year krelative to the year of the disclosure of individual i. The controlscapture the non-linear and time-variant mapping of wealth andincome into tax liabilities conditional on taxpayer choices aboutevasion and avoidance.
10
techniques. While we cannot exclude responses on avoidance mar-gins that we are unable to measure, the results are suggestive thatsubstitution between evasion and avoidance is low or zero. This isremarkable given that the sample of disclosers consists mostly ofvery wealthy individuals.Finally, we address the avoidanceresponses in a different empirical framework that compares levelsof tax liabilities across disclosers and non-disclosers with the samemarket wealth and the same income from non-wealth sources.Specifically, we regress the tax liabilities (in logs) claimed by indi-vidual i in year t on a large set of non-parametric controls for themarket value of net wealth and income from non-wealth sources,rich demographic controls and a vector of event-time dummies.27The event-time dummies measure whether disclosers are able toachieve lower tax liabilities than non-disclosers with the samewealth and the same income from non-wealth sources, either by ille-gally hiding assets offshore (evasion) or by legally structuring theirwealth in a tax efficient way (avoidance). A shown in Fig. 5, dis-closers claim significantly less taxes (-20%) than equally wealthynon-disclosers before disclosure. This is consistent with substantialevasion through offshore accounts prior to amnesty participation.When they enter the amnesty, their tax liabilities increase sharplyand they claim slightly more taxes (+5%) than equally wealthynon-disclosers after disclosure. This is suggestive that the level ofavoidance remains modest after disclosure, lower than for similarnon-disclosers, which is difficult to reconcile with strong substitu-tion from evasion to avoidance.
4.3. Robustness
In the first series of robustness tests, we explore how sensitivethe results are to the specific set of ex ante characteristics that isincluded in the model. We present the results from the compact

Fig. 5. The tax compliance gap. The figure shows the gap in tax payments between disclosers and non-disclosers with similar net wealth and non-wealth income. The gap isestimated in a regression of claimed tax liabilities (in logs) on a large set of non-parametric controls for the market value of net wealth and income from non-wealth sources,rich demographic controls and a vector of event-time dummies. The figure shows the point estimates for the event-time dummies (with 95% confidence bands). Theconfidence bands are based on standard errors clustered at the individual level.
A. Alstadsæter, N. Johannesen, Ségal Le Guern Herry et al. Journal of Public Economics 206 (2022) 104587
model in Table 2 whereas the fully dynamic results are reported inFigure A5-A6 in the Online Appendix. We start from the most par-simonious model where the calendar time dummies enter alonewithout any interactions (Column 1) and sequentially add interac-tions with ex ante wealth (Column 2), income (Column 3) and age(Column 4). We further add interactions with ex ante equityinvestments to allow for systematic differences in the portfoliocomposition (Column 5); address a small number of early disclo-sures by defining controls already in 2005 (Column 6); correctfor selection on wealth by re-weighting the observations so thatthe effective wealth distribution among disclosers corresponds tothe one observed in the HSBC leak (Column 7); and apply an alter-native definition of ex ante net wealth that does not include subse-quent disclosures (Column 8). Some of the estimated coefficientsare quite different from the baseline when the model includes nocontrols (e.g. the estimate for reported income changes signs).Otherwise, the qualitative patterns are highly stable as we varythe features of the model. Across all specifications, there is a size-able and statistically significant increase in reported net wealth,income and tax liabilities at the time of disclosure while the onlystatistically significant increase in tax avoidance is the foundationof new holding companies immediately before disclosure.28
Next, as some of our outcomes are in logs, observations withzeroes are discarded in the main regressions.29 This means thatour baseline results capture behavioral adjustments on the intensivemargin, but not on the extensive margin. We address this challengeby re-estimating the baseline model while using as an outcome adummy indicating a strictly positive value of the variable of interest.
28 In some specifications, the estimated change in unlisted shares and housingassets is significantly negative, which is the opposite of what should be expected ifdisclosers were substituting from evasion to avoidance.29 Negative values of net wealth are also discarded.
11
The results, reported in Figure A7 in the Online Appendix, indicate astrong and statistically significant adjustment of tax liabilities on theextensive margin: a differential increase of around 5 percentagepoints in the probability of claiming a positive tax liability aroundthe time of disclosures. We also find small and statistically insignif-icant increases in net wealth and housing assets on the extensivemargin.
Finally, the earlier results indicated that a small number of dis-closers founded a holding company in anticipation of the disclo-sure. This raises the question if disclosers used existing holdingcompanies as vehicles of tax avoidance, e.g. increasing investmentsin unlisted shares and housing assets held through the companies,which may explain why we see none of these behavioral adjust-ments at the individual level. While we do not observe the balancesheets of holding companies and therefore cannot test this hypoth-esis directly, we split the sample of disclosers into two groups —those who owned a holding company in year t � 2 and thosewho did not — and estimate the baseline model separately forthe two groups. The results, reported in Figure A8 in the OnlineAppendix, show that the increase in tax liabilities around disclo-sure is similar for the two groups, suggesting that disclosers arenot able to use existing holding companies to significantly reducethe tax cost of disclosure.
4.4. Mechanisms
The apparent absence of substitution between avoidance andevasion is somewhat surprising. In this subsection, we explore anumber of possible mechanisms.
Fixed costs of avoidanceWe first consider whether the lack of substitution toward
avoidance can be explained by high fixed costs of adjusting the

Table 2Robustness. The table shows the results from a range of robustness tests conducted by varying the compact model. Column (1) shows the results from the most parsimoniousspecification that only includes individual FE and year FE and no further controls. Column (2) adds interactions between year FE and ten indicators of net wealth; Column (3)further adds interactions between year FE and ten indicators of income; Column (4) further adds interactions between year FE and six indicators of age and is thus equivalent tothe baseline model; Column (5) further adds interactions between year FE and six indicators of equity investments; Column (6) measures the controls for net wealth, income andage controls in 2005 rather than in 2007 as in the baseline; Column (7) re-weights the observations so that the wealth distribution matches the one observed in the leaked sampleof customers at HSBC; Column (8) only measures the controls for net wealth and income with the values claimed by the tax payer, rather than with values including subsequentdisclosures as in the baseline. The estimates generally indicate the change from years �4, �3 and �2 to the years 0, 1 and 2 (relative to the control group) except when theoutcome is founding a holding company where estimates are the change from year �2 to year �1 (relative to the control group).
(1) (2) (3) (4) (5) (6) (7) (8)Only yearcontrols
Add wealthcontrols
Add incomecontrols
Add age controls(Baseline)
Add equitycontrols
Use 2005 asbaseline
Reweight withHSBC data
Use pre-disclosurewealth as control
ComplianceNet wealth 0.277 0.417 0.401 0.425 0.510 0.441 0.437 0.359
(0.044) (0.043) (0.043) (0.043) (0.043) (0.047) (0.043) (0.041)Taxable
income�0.134 0.142 0.152 0.180 0.181 0.123 0.185 0.152
(0.036) (0.036) (0.035) (0.034) (0.033) (0.032) (0.035) (0.034)Tax liabilities 0.069 0.163 0.168 0.212 0.226 0.196 0.221 0.233
(0.032) (0.032) (0.032) (0.032) (0.032) (0.035) (0.032) (0.032)AvoidanceEmigration �0.0001 �0.0001 �0.0001 �0.0001 0.0000 0.0000 �0.0001 0.0000
(0.000) (0.000) (0.000) (0.000) (0.000) (0.000) (0.000) (0.000)Holding
company0.010 0.011 0.011 0.011 0.011 0.011 0.008 0.011
(0.004) (0.004) (0.004) (0.004) (0.004) (0.004) (0.003) (0.004)Housing
assets�0.234 �0.098 �0.121 �0.115 �0.085 �0.035 �0.105 �0.184
(0.056) (0.056) (0.056) (0.056) (0.057) (0.062) (0.056) (0.058)Unlisted
shares�0.226 �0.171 �0.200 �0.132 �0.027 �0.193 �0.133 �0.156
(0.113) (0.113) (0.113) (0.112) (0.112) (0.111) (0.112) (0.113)RepatriationMoney
transfersin
0.091 0.093 0.093 0.093 0.092 0.098 0.093 0.093
(0.014) (0.014) (0.014) (0.014) (0.013) (0.017) (0.014) (0.014)Money
transfersout
�0.017 �0.011 �0.010 �0.010 �0.011 �0.017 �0.010 �0.011
(0.008) (0.008) (0.008) (0.008) (0.008) (0.013) (0.009) (0.008)Individual FE Yes Yes Yes Yes Yes Yes Yes YesYear FE Yes Yes Yes Yes Yes Yes Yes YesYear x Wealth
FE- Yes Yes Yes Yes Yes Yes Yes
Year x IncomeFE
- - Yes Yes Yes Yes Yes Yes
Year x Age FE - - - Yes Yes Yes Yes YesYear x Equity
FE- - - - Yes - - -
2005 baseline - - - - - Yes - -HSBC weights - - - - - - Yes -Predisclosed
wealth- - - - - - - Yes
30 Note that the sample is slightly different than in the other regressions: As wecannot compute the size of the disclosure for individuals disclosing after 2013, suchindividuals fall out of the sample when the estimates are conditioned on the size ofthe disclosure.
A. Alstadsæter, N. Johannesen, Ségal Le Guern Herry et al. Journal of Public Economics 206 (2022) 104587
avoidance margin. For instance, an important way to avoid capitaltaxes is to invest in housing assets; however, houses are lumpyinvestment objects and transactions are associated with consider-able costs. Similarly, setting up a holding company is a discretedecision that involves operating costs and creates frictions forowners to access their assets. At the extreme, moving to a foreigncountry is a choice with important consequences for economic andprivate life. For individuals who reduce evasion by disclosing a rel-atively small offshore account, we should not expect a detectableincrease on these avoidance margins.
To shed light on the role of fixed costs, we rank the populationof disclosers by the size of their disclosures, divide them into fivegroups corresponding to the quintiles of the distribution, and esti-mate the compact model while allowing the estimates to varyacross group. If high fixed costs of avoidance explain the lack ofsubstitution toward avoidance in the full sample, we should expectmuch more substitution when focusing on a subsample with par-ticularly large disclosures for whom the potential gains fromavoidance are significant.
12
The results, illustrated in Fig. 6, do not support an importantrole for fixed avoidance costs. In line with intuition, changes inoverall tax compliance are (roughly) monotonic in the size of thedisclosures. However, there is no clear gradient in adjustmentson the avoidance margins. While the propensity to found a holdingcompany appears to be slightly increasing in the size of the disclo-sure, it remains a very rare outcome for all groups. Moreover, indi-viduals with the largest disclosures appear to reduce investment inboth housing and unlisted shares.30
Avoidance opportunities only at the topNext, we investigate whether the lack of adjustment on the
avoidance margin may owe itself to the fact that the most attrac-tive tax avoidance opportunities are only available to the verywealthiest taxpayers.

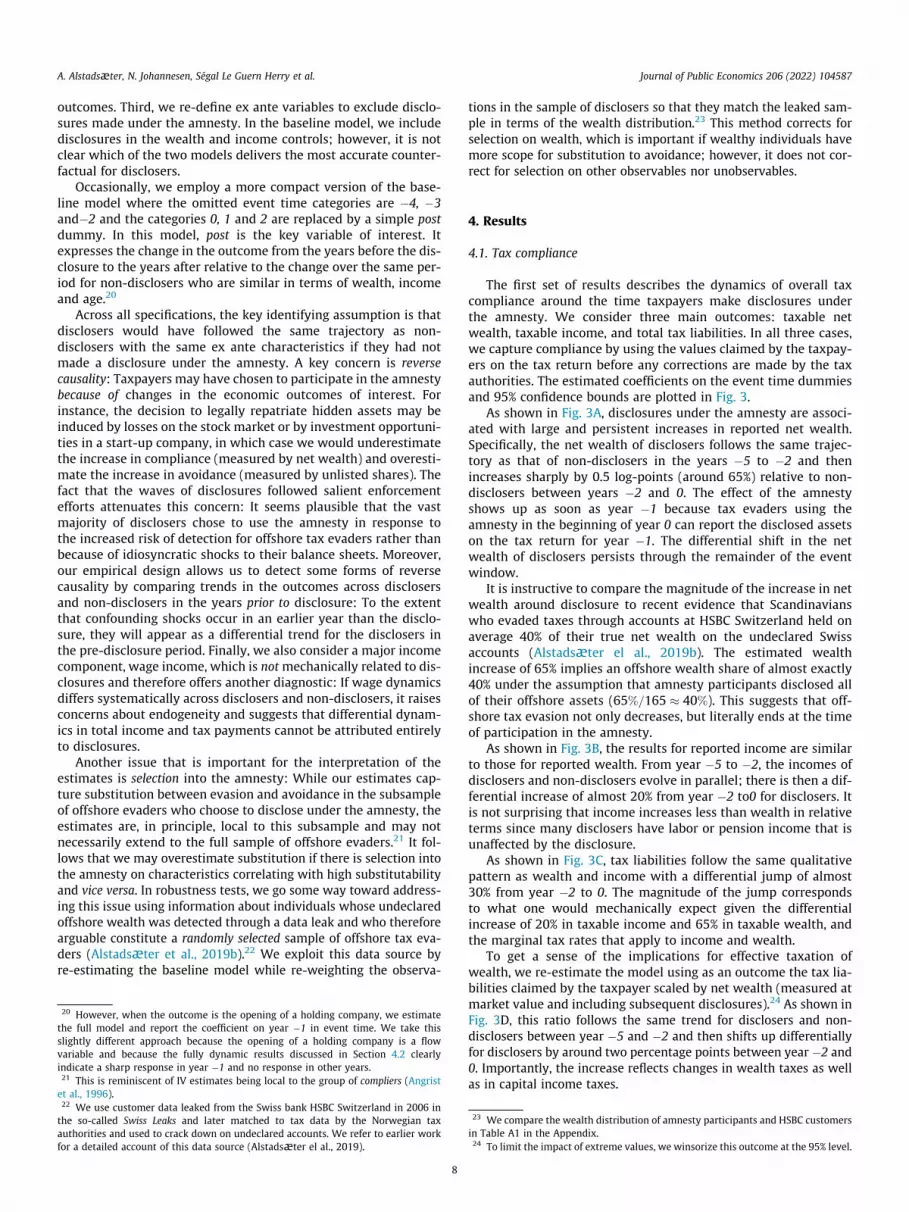
Fig. 6. Heterogeneity by disclosure size. The figure shows point estimates from the compact model by the size of disclosures. To form the groups, we rank disclosers by theirdisclosure and divide them into five groups corresponding to the quintiles of the distribution. Darker shades of blue indicate groups with larger disclosures. There are nineoutcomes: Wealth is reported taxable wealth (in logs); Income is reported taxable income (in logs); Tax is the tax liabilities (in logs); Migration is an indicator for moving themain residence to a foreign country; Holding is an indicator for setting up a holding company; Housing is the tax value of housing assets (in logs); Unlisted is the tax value ofunlisted shares (in logs); In-transfer is incoming transfers from foreign bank accounts (scaled by net wealth in 2007); Out-transfer is outgoing transfers to foreign bankaccounts (scaled by net wealth in 2007). Note that while the bars generally indicate the change from years �4, �3 and �2 to the years 0, 1 and 2 (in event time) relative to thecontrol group and conditional on controls, the bars indicate the change from year �2 to year �1 for the holding company outcome because the fully dynamic results indicatethat the entire response takes place in period �1.
A. Alstadsæter, N. Johannesen, Ségal Le Guern Herry et al. Journal of Public Economics 206 (2022) 104587
To study this mechanism, we rank the population of disclosersby their net wealth in 2007 (measured at market value and includ-ing subsequent disclosures), divide them into five groups corre-sponding to the quintiles of the distribution, and apply thecompact model to each group separately. If tax avoidance opportu-nities are increasing strongly in wealth, even within our sample ofrelatively wealthy disclosers, we should expect to see a clearwealth gradient in the avoidance responses and particularly largeadjustments in the wealthiest subsample.
The results, illustrated in Fig. 7, do not provide evidence in favorof this hypothesis. There is no clear gradient in the complianceestimates. For instance, the increase in tax payments is relativelyuniform across wealth groups except for the least wealthy groupwhere the increase is smaller; possibly because this group earnslow returns (Fagereng et al., 2020) and are below the thresholdfor being liable to wealth taxes. Further, there is little signs ofincreases in avoidance for any of the wealth groups. The wealthiestare slightly more likely to open a holding company, but at the sametime reduce holdings of both housing assets and unlisted shares.
Only tax aggressive individuals avoidFinally, it is possible that only a small fraction of particularly tax
aggressive disclosers are able and willing to engage in taxavoidance.
To investigate this possibility, we use as an ex ante measure oftax aggressiveness the ratio of net wealth at tax value to net wealthat market value. This measure captures both evasion, because off-shore assets disclosed under the amnesty enter the denominatorbut not the numerator, and avoidance, because tax favored assetsgenerally enter the denominator at market value but the numera-tor at a lower tax value. We rank the population of disclosers bythis measure of tax aggressiveness in 2007, divide them into five
13
groups corresponding to the quintiles of the distribution, and applythe compact model to each group separately.
The results, presented in Fig. 8, provide some evidence of sub-stitution toward avoidance for the most tax aggressive subsample(darkest shade of blue). While this group increased reported netwealth roughly as much as other groups, they barely reportedmore income. Moreover, they exhibited a sizeable, albeit statisti-cally insignificant, increase in unlisted shares as well as an increasein housing assets. This is all suggestive that substitution from eva-sion to avoidance did occur within a small group of highly taxaggressive individuals. However, the evidence is weak becausethe sample is small and tax aggressiveness is observed with con-siderable noise.
4.5. Repatriation
In the final part of the analysis, we study whether disclosures ofoffshore assets were accompanied by repatriation. While this is notimmediately relevant for the main question about substitutionbetween evasion and avoidance, it has important implications forfuture tax compliance: Assets in Norwegian banks are subject tothird-party reporting to the tax authorities and thus much moredifficult to misreport than assets in foreign banks.
Bank transfersThe first outcome is the value of bank transfers from foreign
accounts, a direct measure of asset repatriation. To relate theresults to the analysis of wealth dynamics, we scale bank transfersby ex ante net wealth (measured in 2007 at market value andincluding any assets subsequently disclosed). This implies thatthe main estimates capture the share of total net wealth trans-
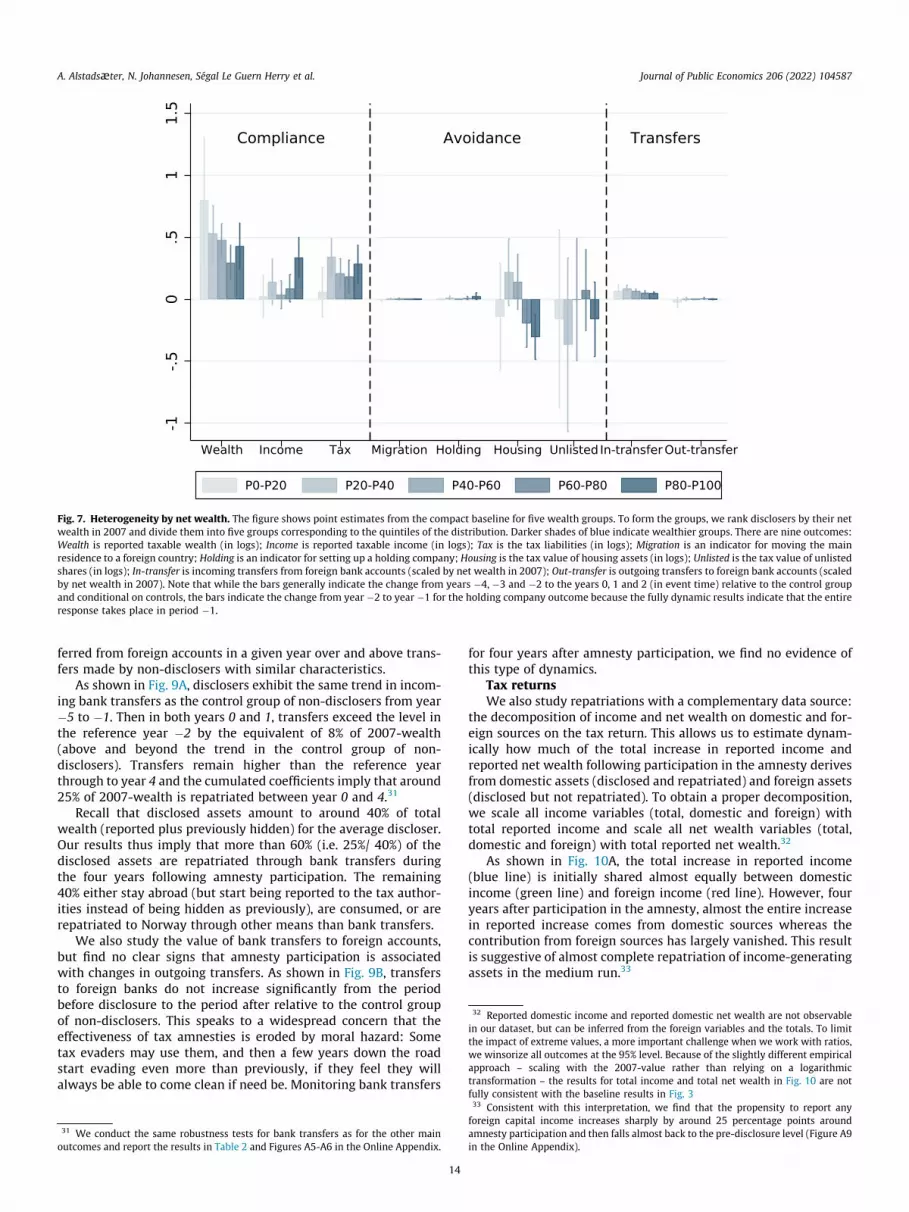
Fig. 7. Heterogeneity by net wealth. The figure shows point estimates from the compact baseline for five wealth groups. To form the groups, we rank disclosers by their netwealth in 2007 and divide them into five groups corresponding to the quintiles of the distribution. Darker shades of blue indicate wealthier groups. There are nine outcomes:Wealth is reported taxable wealth (in logs); Income is reported taxable income (in logs); Tax is the tax liabilities (in logs); Migration is an indicator for moving the mainresidence to a foreign country; Holding is an indicator for setting up a holding company; Housing is the tax value of housing assets (in logs); Unlisted is the tax value of unlistedshares (in logs); In-transfer is incoming transfers from foreign bank accounts (scaled by net wealth in 2007); Out-transfer is outgoing transfers to foreign bank accounts (scaledby net wealth in 2007). Note that while the bars generally indicate the change from years �4, �3 and �2 to the years 0, 1 and 2 (in event time) relative to the control groupand conditional on controls, the bars indicate the change from year �2 to year �1 for the holding company outcome because the fully dynamic results indicate that the entireresponse takes place in period �1.
32 Reported domestic income and reported domestic net wealth are not observablein our dataset, but can be inferred from the foreign variables and the totals. To limitthe impact of extreme values, a more important challenge when we work with ratios,we winsorize all outcomes at the 95% level. Because of the slightly different empiricalapproach – scaling with the 2007-value rather than relying on a logarithmictransformation – the results for total income and total net wealth in Fig. 10 are not
A. Alstadsæter, N. Johannesen, Ségal Le Guern Herry et al. Journal of Public Economics 206 (2022) 104587
ferred from foreign accounts in a given year over and above trans-fers made by non-disclosers with similar characteristics.
As shown in Fig. 9A, disclosers exhibit the same trend in incom-ing bank transfers as the control group of non-disclosers from year�5 to �1. Then in both years 0 and 1, transfers exceed the level inthe reference year �2 by the equivalent of 8% of 2007-wealth(above and beyond the trend in the control group of non-disclosers). Transfers remain higher than the reference yearthrough to year 4 and the cumulated coefficients imply that around25% of 2007-wealth is repatriated between year 0 and 4.31
Recall that disclosed assets amount to around 40% of totalwealth (reported plus previously hidden) for the average discloser.Our results thus imply that more than 60% (i.e. 25%/ 40%) of thedisclosed assets are repatriated through bank transfers duringthe four years following amnesty participation. The remaining40% either stay abroad (but start being reported to the tax author-ities instead of being hidden as previously), are consumed, or arerepatriated to Norway through other means than bank transfers.
We also study the value of bank transfers to foreign accounts,but find no clear signs that amnesty participation is associatedwith changes in outgoing transfers. As shown in Fig. 9B, transfersto foreign banks do not increase significantly from the periodbefore disclosure to the period after relative to the control groupof non-disclosers. This speaks to a widespread concern that theeffectiveness of tax amnesties is eroded by moral hazard: Sometax evaders may use them, and then a few years down the roadstart evading even more than previously, if they feel they willalways be able to come clean if need be. Monitoring bank transfers
31 We conduct the same robustness tests for bank transfers as for the other mainoutcomes and report the results in Table 2 and Figures A5-A6 in the Online Appendix.
14
for four years after amnesty participation, we find no evidence ofthis type of dynamics.
Tax returnsWe also study repatriations with a complementary data source:
the decomposition of income and net wealth on domestic and for-eign sources on the tax return. This allows us to estimate dynam-ically how much of the total increase in reported income andreported net wealth following participation in the amnesty derivesfrom domestic assets (disclosed and repatriated) and foreign assets(disclosed but not repatriated). To obtain a proper decomposition,we scale all income variables (total, domestic and foreign) withtotal reported income and scale all net wealth variables (total,domestic and foreign) with total reported net wealth.32
As shown in Fig. 10A, the total increase in reported income(blue line) is initially shared almost equally between domesticincome (green line) and foreign income (red line). However, fouryears after participation in the amnesty, almost the entire increasein reported increase comes from domestic sources whereas thecontribution from foreign sources has largely vanished. This resultis suggestive of almost complete repatriation of income-generatingassets in the medium run.33
fully consistent with the baseline results in Fig. 333 Consistent with this interpretation, we find that the propensity to report anyforeign capital income increases sharply by around 25 percentage points aroundamnesty participation and then falls almost back to the pre-disclosure level (Figure A9in the Online Appendix).
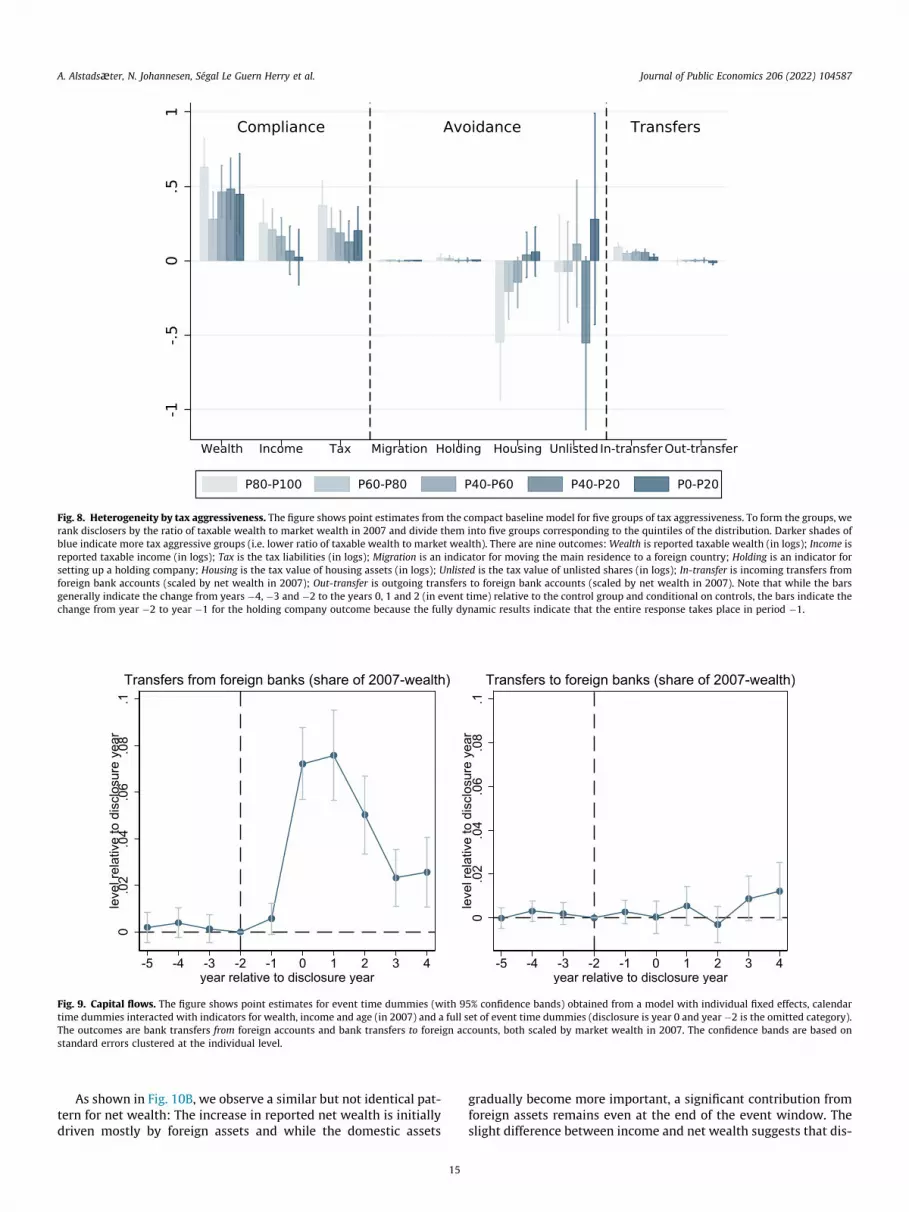
Fig. 8. Heterogeneity by tax aggressiveness. The figure shows point estimates from the compact baseline model for five groups of tax aggressiveness. To form the groups, werank disclosers by the ratio of taxable wealth to market wealth in 2007 and divide them into five groups corresponding to the quintiles of the distribution. Darker shades ofblue indicate more tax aggressive groups (i.e. lower ratio of taxable wealth to market wealth). There are nine outcomes: Wealth is reported taxable wealth (in logs); Income isreported taxable income (in logs); Tax is the tax liabilities (in logs); Migration is an indicator for moving the main residence to a foreign country; Holding is an indicator forsetting up a holding company; Housing is the tax value of housing assets (in logs); Unlisted is the tax value of unlisted shares (in logs); In-transfer is incoming transfers fromforeign bank accounts (scaled by net wealth in 2007); Out-transfer is outgoing transfers to foreign bank accounts (scaled by net wealth in 2007). Note that while the barsgenerally indicate the change from years �4, �3 and �2 to the years 0, 1 and 2 (in event time) relative to the control group and conditional on controls, the bars indicate thechange from year �2 to year �1 for the holding company outcome because the fully dynamic results indicate that the entire response takes place in period �1.
Fig. 9. Capital flows. The figure shows point estimates for event time dummies (with 95% confidence bands) obtained from a model with individual fixed effects, calendartime dummies interacted with indicators for wealth, income and age (in 2007) and a full set of event time dummies (disclosure is year 0 and year �2 is the omitted category).The outcomes are bank transfers from foreign accounts and bank transfers to foreign accounts, both scaled by market wealth in 2007. The confidence bands are based onstandard errors clustered at the individual level.
A. Alstadsæter, N. Johannesen, Ségal Le Guern Herry et al. Journal of Public Economics 206 (2022) 104587
As shown in Fig. 10B, we observe a similar but not identical pat-tern for net wealth: The increase in reported net wealth is initiallydriven mostly by foreign assets and while the domestic assets
15
gradually become more important, a significant contribution fromforeign assets remains even at the end of the event window. Theslight difference between income and net wealth suggests that dis-

Fig. 10. Foreign and domestic income and assets. The figure shows point estimates for event time dummies (with 95% confidence bands) obtained from a model withindividual fixed effects, calendar time dummies interacted with indicators for wealth, income and age (in 2007) and a full set of event time dummies (disclosure is year 0 andyear �2 is the omitted category). The outcomes are reported income decomposed into a foreign and a domestic part (all scaled by reported income in 2007) and reported netwealth decomposed into a foreign and a domestic part (all scaled by reported net wealth in 2007). The confidence bands are based on standard errors clustered at theindividual level.
A. Alstadsæter, N. Johannesen, Ségal Le Guern Herry et al. Journal of Public Economics 206 (2022) 104587
closers are more likely to keep assets with a low taxable return inforeign accounts.34
5. Conclusion
The main lesson emerging from the paper is that fighting taxevasion can be an effective way to collect more tax revenue fromthe wealthy, increase the progressivity of the tax system—and ulti-mately reduce inequality.
This result was far from obvious. In a field experiment in Min-nesota where randomly selected taxpayers were informed thatthe returns they were about to file would be ‘‘closely examined”,Slemrod et al. (2001) find that high-income treated taxpayers paidless tax relative to the control group—suggesting substitution awayfrom evasion toward legal avoidance. In our setting where we canobserve a large sample of very wealthy tax evaders with ampleaccess to tax avoidance opportunities, several high-quality mea-sures of avoidance, and follow taxpayers over time, we can ruleout that such substitution is significant.
Our research design and data deliver clear, compelling, and con-sistent results. By boosting its enforcement effort, the Norwegiangovernment induced a large sample of wealthy individuals to dis-close previously hidden assets. The taxes paid by these amnestyparticipants jump by a striking 30% at the time they use theamnesty. The increase in wealth, income and taxes is sustainedover time. The decrease in evasion is not accompanied by anincrease in the key forms of tax avoidance documented in the Nor-wegian context, such as emigration and investment in tax-favoredasset classes. And these results cannot be explained by a lack ofavoidance opportunities among amnesty participants.
Our results inform the global policy debate about the potentialbenefits of fighting offshore tax evasion. By combining enforce-ment measures that raised the probability of detecting undeclaredforeign accounts with an amnesty that made it relatively attractive
34 Consistent with this interpretation, we find that, within the class of foreign assets,the largest contribution to the total increase in reported net wealth comes fromdeposits, which generally have a lower return than other financial assets (Figure A10in the Online Appendix).
16
for evaders to come into compliance, the Norwegian governmentwas able to significantly increase revenue collection from mostlywealthy offshore evaders. Our findings suggest that this combina-tion of policies has an important role to play for the sustainabilityof progressive taxation in a globalized world.
Declaration of Competing Interest
The authors declare that they have no known competing finan-cial interests or personal relationships that could have appearedto influence the work reported in this paper.
Appendix A. Supplementary material
Supplementary data associated with this article can be found, inthe online version, at https://doi.org/10.1016/j.jpubeco.2021.104587.
References
Akcigit, U., Baslandze, S., Stantcheva, S., 2016. Taxation and the InternationalMobility of Inventors. Am. Econ. Rev. 106 (10), 2930–2981.
Alstadsæter, A., Fjærli, E., 2009. Neutral taxation of shareholder income? Corporateresponses to an announced dividend tax. Inter. Tax Public Fin. 16 (4), 571–604.
Alstadsæter, A., Johannesen, N., Zucman, G., 2019a. Tax Evasion and Inequality. Am.Econ. Rev. 109 (6), 2073–2103.
Alstadsæter, A., Kopczuk, W., Telle, K., 2019b. Social networks and tax avoidance:Evidence from a well-defined Norwegian tax shelter. Int. Tax Public Finance 26,1291–1328.
Angrist, J.D., Imbens, G.W., Rubin, D.B., 1996. Identification of causal effects usinginstrumental variables. J. Am. Stat. Assoc. 91 (434), 444–455.
Alvaredo, Facundo, Chancel, Lucas, Piketty, Thomas, Saez, Emmanuel, Zucman,Gabriel, 2018. The World Inequality Report 2018. Harvard University Press.http://wir2018.wid.world.
Baer, K., Le Borgne, E., 2008. Tax Amnesties: Theory, Trends, and Some Alternatives.International Monetary Fund.
Borusyak, K., Jaravel, X., 2017. ‘‘Revisiting Event Study Designs, with an Applicationto the Estimation of the Marginal Propensity to Consume, Working Paper.
Brockmeyer, A., Hernandez, M., 2018. Taxation, Information And Withholding:Evidence From Costa Rica. Working Paper.
Crane, Steven E., Nourzad, Farrokh, 1990. Tax Rates and Tax Evasion: Evidence fromCalifornia Amnesty Data. Natl. Tax J. 43 (2), 189–199.
Fagereng, A., Guiso, L., Malacrino, D., Pistaferri, L., 2020. Heterogeneity andpersistence in returns to wealth. Econometrica 88 (1), 115–170.

A. Alstadsæter, N. Johannesen, Ségal Le Guern Herry et al. Journal of Public Economics 206 (2022) 104587
Fisher, Ronald C., Goddeeris, John H., Young, James C., 1989. Participation in TaxAmnesties: The Individual Income Tax. Nat. Tax J. 42 (1), 15–27.
Gobel, M., Hestdal, T., 2015. ‘‘Formuesskatt på unoterte aksjer: en analyse avulikheter i verdsettelsesgrunnlaget til børsnoterte og unoterte aksjer, mimeo,Norwegian School of Economics.
Goolsbee, Austan, 2000. What Happens When You Tax the Rich? Evidence fromExecut. Compens. J. Polit. Econ. 108 (2), 352–378.
Jakobsen, K., Jakobsen, K., Kleven, H., Zucman, G., 2020. Wealth Taxation andWealthAccumulation: Theory and Evidence from Denmark. Quart. J. Econ., 329–388
Johannesen, N., 2014. Tax evasion and Swiss bank deposits. J. Public Econ. 111, 46–62.
Johannesen, N., Pirttilä, J., 2016. ‘‘Capital flight and development: An overview ofconcepts, methods, and data sources. UNU-WIDER Working Paper
Johannesen, N., Stolper, T., 2017. ‘‘The deterrence effect of whistleblowing: an eventstudy of leaked customer information from banks in tax havens. Working Paper(forthcoming in the Journal of Law and Economics).
Johannesen, N., Langetieg, P., Reck, D., Risch, M., Slemrod, J., 2020. Taxing hiddenwealth: the consequences of US enforcement initiatives on evasive foreignaccounts. Am. Econ. J.: Econ. Policy 12 (3), 312–346.
Johannesen, N., Zucman, G., 2014. The end of bank secrecy? An evaluation of theG20 tax haven crackdown. Am. Econ. J.: Econ. Policy 6 (1), 65–91.
Kleven, H., Landais, C., Saez, E., 2013a. Taxation and International Migration ofSuperstars: Evidence from the European Football Market. Am. Econ. Rev., 1892–1924
Kleven, H., Landais, C., Saez, E., Schultz, E., 2013b. Migration and Wage Effects ofTaxing Top Earners: Evidence from the Foreigners’ Tax Scheme in Denmark.Quart. J. Econ. 129, 333–378.
Landier, A., Plantin, G., 2017. Taxing the Rich. Rev. Econ. Stud. 84 (3), 1186–1209.Londoño-Vélez, J., Ávila-Mahecha, J., 2021. Enforcing wealth taxes in the developing
world: Quasi-experimental evidence from Colombia. Am. Econ. Rev.: Insights 3(2), 131–148.
17
Melby, I., Halvorsen, E., 2009. ‘‘Skattebegrensning gjennom ‘80-prosentsregelen’.Økonomiske analyser 2/2009.
Mikesell, John L., 1986. Amnesties for State Tax Evaders: The Nature of andResponse to Recent Programs. Natl. Tax J. 39 (4), 507–525.
Naritomi, J., 2019. Consumers as Auditors. Am. Econ. Rev. 109 (9), 3031–3072.OECD, 2015. ‘‘Update on Voluntary Disclosure Programmes: A pathway to tax
compliance. August 2015.Okunogbe, O., Pouliquen, V., 2018. ‘‘Technology, Taxation, and Corruption: Evidence
from the Introduction of Electronic Tax Filing. World Bank Policy ResearchWorking Paper 8452.
Saez, E., Zucman, G., 2016. Wealth Inequality in the United States since 1913:Evidence from Capitalized Income Tax Data. Quart. J. Econ. 131 (2), 519–578.
Slemrod, J., 2018. Tax Compliance and Enforcement. J. Econ. Literature. forthcoming.Slemrod, J., Collins, B., Hoopes, J., Reck, D., Sebastiani, M., 2017. Does Credit-Card
Information Reporting Improve Small-Business Tax Compliance? J. Public Econ.149, 1–19.
Slemrod, J., Yitzhaki, S., 2002. Tax avoidance, evasion, and administration.Handbook of public economics, Vol. 3. Elsevier, pp. 1423–1470.
Slemrod, J., Blumenthal, M., Christian, C., 2001. Taxpayer response to an increasedprobability of audit: evidence from a controlled experiment in Minnesota. J.Public Econ. 79, 455–483.
Statistics Norway, 2009. ‘‘Selveide boliger, forholdet mellom ligningsverdi ogsalgssum. Available online at https://www.ssb.no/a/kortnavn/sbolig/tab-2009-04-01-03.html.
Stella, P., 1991. An Economic Analysis of Tax Amnesties. J. Public Econ. 46, 383–400.Stiglitz, J.E., 1985. The general theory of tax avoidance. Natl. Tax J. 38 (3), 325–337.Zucman, G., 2015. The Hidden Wealth of Nations: The Scourge of Tax Havens.
University of Chicago Press.


