Embed Size (px)
Citation preview

35
Geological Survey of Finland, Special Paper 48
Integrated geological interpretation of remotely sensed data to support geological mapping in Mozambique
GTK Consortium Geological Surveys in Mozambique 2002–2007,
edited by Yrjö Pekkala, Tapio Lehto & Hannu Mäkitie
Geological Survey of Finland, Special Paper 48,35–63, 2008
INTEGRATED GEOLOGICAL INTERPRETATION OF
REMOTELY SENSED DATA TO SUPPORT
GEOLOGICAL MAPPING IN MOZAMBIQUE
by
Ernst M. Schetselaar1*, Markku Tiainen2 & Tsehaie Woldai3
Schetselaar, E. Tiainen, M. & Woldai, T. 2008. Integrated geological interpretation
of remotely sensed data to support geological mapping in Mozambique. Geological
Survey of Finland Special Paper 48, 35–63, 24 figures.
This paper presents the applied methodology and results of geological remote sensing
interpretation in preparation of 1:250 000 and 1:50 000 scale geological field mapping
of the LOT 2 / LOT 3 project areas and their extensions for the Mineral Resourc-
es Capacity Building Project (Republic of Mozambique) funded by the World Bank
(IDA, AfDB, NDF). The data pre-processing, geometric registration, enhancement and
integrated interpretation of remotely sensed and airborne geophysical data together
with existing geological maps resulted in seamless provisional geological map cover-
age of the project areas that guided field mapping and complemented geological map
compilation in areas where field data were sparse or lacking. The approach is knowl-
edge-driven, since available geological map data from Mozambique and neighbouring
countries were used, whenever possible, to establish relationships between image and
geological map patterns that allowed calibration of the interpretation of contacts and
units with respect to the previously known geological lithostratigraphy. Once these re-
lationships were established, geologically significant discrepancies between map and
image patterns highlighted features that provided follow-up targets to be tested in the
subsequent field mapping campaigns.
Key words (GeoRef Thesaurus, AGI): interpretation, Landsat TM, ASTER,
SRTM, airborne gamma-ray spectrometry, magnetic survey, geological mapping,
Mozambique.
1 International Institute for Geo-Information Science and Earth Observation (ITC), Hengelosestraat 99, Enschede, the Netherlands.*2 Geological Survey of Finland (GTK),P.O.Box 96, FI-02151 Espoo, Finland3 International Institute for Geo-Information Science and Earth Observation (ITC), Hengelosestraat 99, Enschede, the Netherlands.
E-mail: [email protected]
* Present address: Geological Survey of Canada 245A-615 Booth Street, Ottawa, Ontario, Canada K1A-0E9, email: [email protected]

36
Geological Survey of Finland, Special Paper 48
Ernst M. Schetselaar, Markku Tiainen & Tsehaie Woldai
Due to their underexploited mineral and energy
potential, African countries like Mozambique need
efficient methods for upgrading their geoscience
knowledge base. An important part of this endeav-
our involves updating geological map coverage.
Whereas in the past the coverage and publication of
traditional geological maps of a limited region de-
manded multiple years of fieldwork, more time-ef-
ficient approaches of mapping larger regions within
shorter time spans are required. An integrated geo-
logical mapping approach, in which existing geo-
logical map data are re-compiled on the basis of the
interpretation of aerial photographs, satellite image-
ry and airborne geophysical data before and during
progressing fieldwork provides solutions that meet
this requirement, since it facilitates the time-efficient
production of consistent up-to-date digital geologi-
cal map databases covering large regions that can be
easily upgraded in future mapping campaigns.
Integrated approaches to geological mapping
are not entirely new. Geologists have long assem-
bled diverse layers of geoscience data to study the
relationships between the spatial patterns in each
for resource exploration and mapping endeavours.
In the past this has been accomplished using an
'analog' approach, forcing maps printed on mylar
to be portrayed on a uniform map scale on a light
table. However, with the increasing availability of
digital datasets and the routine use of geographic
information systems (GIS), the task of studying re-
INTRODUCTION
lationships between data and producing provisional
geological maps to assist field mapping has become
easier and more versatile. Contrary to the “light ta-
ble” approach, GIS allows maps and image data to
be combined, overlaid and manipulated at any scale
with any combination of layers and subject to any
integrated enhancement. The compilation and inter-
pretation of a variety of geoscience data produces
predictive maps, containing structural, lithological,
geophysical and surficial information for the geol-
ogist before he or she actually begins field work.
These provisional geological maps may be iterative-
ly revised and upgraded to publishable geological
maps on the basis of evolving insight by repeatedly
integrating newly acquired field and laboratory data
in the interpretation process. They can also serve
as first-order geological maps in areas where field
mapping is not feasible. The fundamental difference
with respect to traditional ground-based mapping is
that in the latter the compilation of units away from
field control (current and legacy field observations)
is largely based on geological inference, while in
the integrated approach this geological inference is
repeatedly tested and calibrated against the interpre-
tation of remote sensing imagery. In this paper we
report on how we applied this methodology to the
compilation of provisional geological map coverage
of LOT 2 and LOT 3 in Mozambique in the prepa-
ration of 1:250 000 and 1:50 000 scale geological
field mapping campaigns.
Digitizing and compilation of previously published geological maps
A seamless coverage of 1:250 000 scale provi-
sional geological maps was prepared during the pre-
liminary phase of the regional geological mapping
of the LOT 2 and LOT 3 areas and their extensions in
Mozambique with the objective to produce the most
up-to-date geological map coverage over the project
areas before fieldwork commenced. The prepara-
tory compilation work comprised the recovery of
old airborne geophysical surveys, digitizing of pre-
viously published maps, geometric co-registration
of the spatial data layers, various image processing
and enhancement techniques and knowledge-driven
geological image interpretation. In addition to de-
scribing the methodology, we present examples of
image processing and interpretation results to illus-
trate how significant geological information was ex-
tracted from the multi-source image data sets. The
data processing and interpretation tasks, described
in more detail in the subsequent sections, were con-
ducted in phase with fieldwork progress.
WORKING METHODOLOGY FOR THE PRODUCTION OF
PROVISIONAL GEOLOGICAL MAPS
A digital compilation of geological map data
was prepared from the raster-scanned and digi-
tized (double degree) 1:250 000 scale geological
map sheets published by Hunting Ltd (1984) and
1:250 000 scale geological maps provided by the
National Directorate of Geology (DNG). A feature

37
Geological Survey of Finland, Special Paper 48
Integrated geological interpretation of remotely sensed data to support geological mapping in Mozambique
class list was prepared to encode the various litho-
logical, structural and topographic features repre-
sented on the geological maps. Faults that also de-
fine lithological contacts were separately encoded
and selectively copied to the coverage of geological
structures. The arc-node topology for generating the
coverage of geological units was generated by the
selective extraction of those polyline codes that de-
fine the boundaries of lithological units. Dykes were
digitized as polylines and were not included in the
set of polylines that form the arc-node topology of
the lithological units. Structural elements, such as
foliation, and bedding elements were also extracted
from the Hunting geological maps.
Merging and back calibration of airborne geo-
physical surveys
New airborne geophysical survey data were ac-
quired by Fugro Airborne Surveys in 2003, to the
south and west of the older airborne surveys ac-
quired by Hunting Ltd in 1983. Inspection of grids
from the airborne geophysical 1983 survey data
revealed that its geological interpretation was seri-
ously hampered by the effects of prominent flight-
based level shifts and micro-levelling errors. Hence,
the line data from the Hunting geophysical survey
were recovered from the GEODESA archives at
ITC to reduce levelling errors, since this allowed the
production of grids that better suited the needs for
geological interpretation. The recovery and process-
ing of the line data proved to be effective in reduc-
ing significant level shifts in the eTh and K channels
in the northern block of the survey and in reduc-
ing micro-levelling errors in the aeromagnetic data.
The U channel, however, could not be improved, as
the flight-based level shifts appeared to be 'smeared
out' over adjacent flight lines. This was apparently
induced by previous attempts to correct for level
shifts in the U channel by filtering the data.
Merging of the magnetic grids was based on 20
metre downward continuation of the 1983 survey
to the nominal flying height of the 2003 survey and
levelling the data to the 2000 IRGF before comput-
ing the residual magnetic field. The K, eTh, eU and
total count grid values (18 000) in the overlap area
of the two surveys were used to generate regression
equations for back-calibration of each channel of
the 1983 gamma-ray spectrometry data. Areas with
extreme topography and hence excessive flying alti-
tude were omitted from the regression analysis. The
line data of K, eTh, eU, TC and the total magnetic
field channels were registered on the MOZNET da-
tum and gridded on 250-metre cells using a mini-
mum curvature gridding algorithm. Reduction to
the pole was carried out and 1st vertical derivative
grids were derived from the IRGF subtracted mag-
netic field. This further facilitated the interpretation
of regional geological units and structures.
Geometric transformation of LANDSAT 7 ETM
and ASTER scenes
All LANDSAT ETM scenes provided to the
project were georeferenced on UTM projection,
zone 36S, Clarke 1866 Ellipsoid, Tete Datum. Over-
lays of GPS track logs collected during a reconnais-
sance mission in November 2002 revealed that the
mis-registration between the GPS track logs collect-
ed by a handheld unit (Garmin 12XL) amounted to
systematic shifts of 200–300 metres, predominantly
in northings. Given that both the track log and ETM
scenes were registered on the same projection and
ellipsoid, it appeared that the systematic displace-
ments were due to missing translation parameters
between the older provincial datum and new na-
tional MOZNET datum (equivalent to WGS84). In
December 2002 the required datum transformations
(Bursa-Wolf transformation parameters) became
available through a technical report on the adjust-
ment of the old geodetic network of Mozambique,
conducted for an urban-environmental management
project by Norconsult International (1998).
Thirty-five LANDSAT ETM scenes covering the
LOT 2 and LOT 3 areas and their extensions were
re-sampled to fit the MOZNET datum using bicu-
bic re-sampling (Fig. 1). The re-registration of the
LANDSAT scenes to the MOZNET datum facilitat-
ed the registration of GPS stations collected during
fieldwork without having to apply datum transfor-
mations to the GPS measurements afterwards.
The ASTER 1A and 1B scenes are by standard
registered on UTM projection with WGS84 datum
(equivalent to the MOZNET datum) to a nominal
accuracy of 100 metres. They were interactively
registered to 1 to 2 pixel accuracy by shifting the
scenes until they fitted the GPS track logs within a
tolerance of one to two pixels (15–30 metres).

38
Geological Survey of Finland, Special Paper 48
Ernst M. Schetselaar, Markku Tiainen & Tsehaie Woldai
Image enhancement
Several enhanced products were derived from
the LANDSAT 7 ETM scenes to support geologi-
cal image interpretation. The enhancement methods
that were employed included: linear and interactive
contrast stretching of single bands and colour com-
posite images and principal component analysis.
In generating colour composite images from the
twenty possible combinations of the six 30-me-
tre bands, the discrimination of rocks (or related
soil cover) was considered an important factor in
selecting an optimal triplet for discrimination of
Fig. 1 Layout of the LANDSAT 7 ETM scenes over LOT 2, LOT 3 and LOT 2/3 extension areas.
lithological units. Another less important factor for
consideration was the possibility to detect lithologi-
cal variations indirectly expressed as broad-scale
geobotanic relationships in natural and semi-natu-
ral vegetation communities. The band combina-
tions RGB (red, green, blue) 731 and RGB 732 pro-
vided attractive colour composites, particularly for
LANDSAT scenes acquired over relatively dry areas
or during dry periods. Both band triplets exploit the
strong and broad absorption features of carbonate
and hydroxyl-bearing minerals between about 2.2–
2.4 microns, a range overlapping with the wave-
length position of ETM band 7. The 731 and 732

39
Geological Survey of Finland, Special Paper 48
Integrated geological interpretation of remotely sensed data to support geological mapping in Mozambique
band combinations also provide information on the
spectral slope between 0.4 and 0.7 microns (the vis-
ible range comprising band 1, band 2 and band 3),
which is diagnostic for the presence of iron-oxide
minerals (Goetz et al. 1983). Good exposures of
carbonate and mica rich rocks typically appear in
shades of blue on such colour composites, whereas
rocks with red alteration, due to high contents of
iron-oxides, appear in yellow to reddish tones. The
use of these diagnostic spectral properties of rocks
and derived soil material is obviously hampered in
areas with moderate to dense vegetation cover. In
these areas, however, subtle geobotanic relation-
ships between natural vegetation communities and
their substrate may be exploited by using band com-
binations that include the prominent and steep slope
between the visible red and near infra-red range of
the green vegetation spectrum. Hence, RGB 473
was used as an additional combination to maximize
spectral discrimination of lithological units in areas
with higher green biomass densities. Examples of
colour composite images generated from the above
mentioned band combinations are presented in Fi-
gure 2.
Principal component analysis was used to exploit
the sun illumination of the LANDSAT scenes. PCA
generates a new orthogonal set of bands along the
lines of maximum variance among the original bands
(Curran 1985). This effectively minimizes redun-
dant information, particularly because the original
bands tend to be highly correlated. The new bands,
called principal components, are ordered according
to the percentage of variance they explain. The first
principal component contains the information that
is common among the multispectral bands, which
is usually strongly related to the scene illumination.
As a result, PC1 provides optimal enhancement of
relief features, which may be exploited for outlining
lithological units on their variable geomorphologic
expression. PC1 images, for example, appeared to
enhance the differences between granites and intru-
sive rocks of mafic composition and the differences
among different felsic suites themselves, as well as
the more subtle small-scale linear patterns reflecting
Fig. 2 Subscenes of LANDSAT ETM colour composite images for different band combinations. A) RGB 732;
B) RGB 731; C) RGB 432.
40
Geological Survey of Finland, Special Paper 48
Ernst M. Schetselaar, Markku Tiainen & Tsehaie Woldai
differences in the degree of penetrative foliation/
bedding fabric in various plutonic, metamorphic
and sedimentary rock units.
The ASTER VNIR scenes were enhanced and
displayed as false colour composite images (rgb
321). The stretching intervals of the three bands
where interactively adapted to background bright-
ness variations. Although the visible-near infrared
(VNIR) spectral response of the ASTER scenes is
highly sensitive to vegetation cover, their higher
spatial resolution (15 metres in comparison to the
30-metre pixels for LANDSAT) provided advantag-
es in the image interpretation of lithological units.
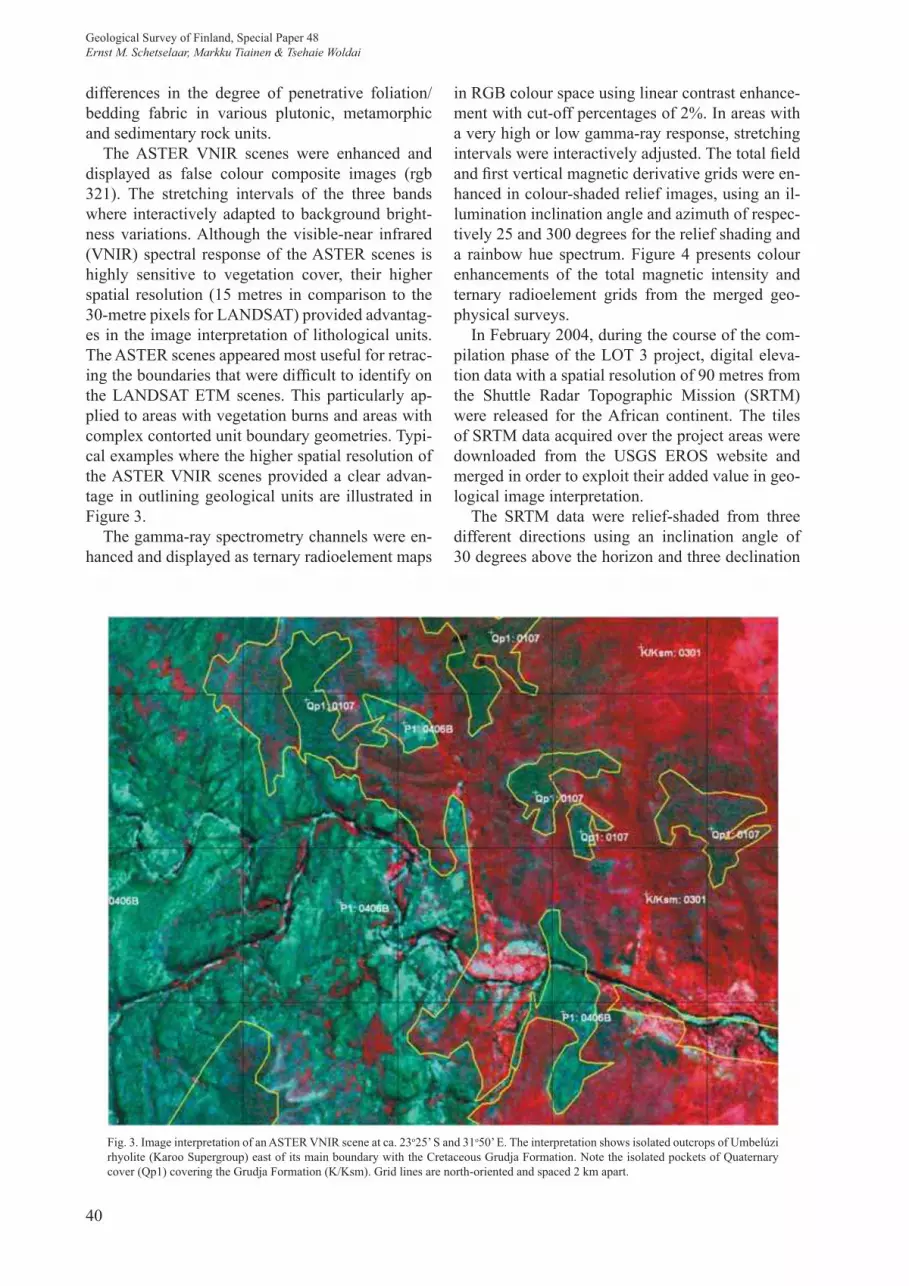
The ASTER scenes appeared most useful for retrac-
ing the boundaries that were difficult to identify on
the LANDSAT ETM scenes. This particularly ap-
plied to areas with vegetation burns and areas with
complex contorted unit boundary geometries. Typi-
cal examples where the higher spatial resolution of
the ASTER VNIR scenes provided a clear advan-
tage in outlining geological units are illustrated in
Figure 3.
The gamma-ray spectrometry channels were en-
hanced and displayed as ternary radioelement maps
in RGB colour space using linear contrast enhance-
ment with cut-off percentages of 2%. In areas with
a very high or low gamma-ray response, stretching
intervals were interactively adjusted. The total field
and first vertical magnetic derivative grids were en-
hanced in colour-shaded relief images, using an il-
lumination inclination angle and azimuth of respec-
tively 25 and 300 degrees for the relief shading and
a rainbow hue spectrum. Figure 4 presents colour
enhancements of the total magnetic intensity and
ternary radioelement grids from the merged geo-
physical surveys.
In February 2004, during the course of the com-
pilation phase of the LOT 3 project, digital eleva-
tion data with a spatial resolution of 90 metres from
the Shuttle Radar Topographic Mission (SRTM)
were released for the African continent. The tiles
of SRTM data acquired over the project areas were
downloaded from the USGS EROS website and
merged in order to exploit their added value in geo-
logical image interpretation.
The SRTM data were relief-shaded from three
different directions using an inclination angle of
30 degrees above the horizon and three declination
Fig. 3. Image interpretation of an ASTER VNIR scene at ca. 23o25’ S and 31o50’ E. The interpretation shows isolated outcrops of Umbelúzi
rhyolite (Karoo Supergroup) east of its main boundary with the Cretaceous Grudja Formation. Note the isolated pockets of Quaternary
cover (Qp1) covering the Grudja Formation (K/Ksm). Grid lines are north-oriented and spaced 2 km apart.

41
Geological Survey of Finland, Special Paper 48
Integrated geological interpretation of remotely sensed data to support geological mapping in Mozambique
Fig. 4. Colour enhancements of airborne geophysical grids with a grid resolution of 250 metres. A) Colour-shaded relief image of the residual total
magnetic field; B) Ternary radioelement grid, rgb KThU.
angles of 270, 315 and 360 degrees. The individ-
ual shaded-relief enhancements were combined in
a colour composite image, such that topographic
features were rendered in different colours. Figure
5 presents a subscene of the SRTM colour shaded-
relief image that was enhanced interactively during
image interpretation through linear contrast stretch-
ing to adapt the enhancement to the local prevail-
ing topographic relief characteristics. The resultant
relief-shaded colour composite image appeared to
be particularly useful in tracing the boundaries be-
tween Quaternary units.

42
Geological Survey of Finland, Special Paper 48
Ernst M. Schetselaar, Markku Tiainen & Tsehaie Woldai
Twenty-eight LANDSAT TM scenes were com-
bined in four image map mosaics that cover the
LOT 2 and LOT 3 project areas. The band com-
bination 7-3-1 in RGB was selected, as this pro-
vides optimal spectral information for geological
interpretation. The mosaic was compiled in several
steps, from small to large areas, to keep the colour
balance in hand and to avoid boundary effects. His-
togram matching and/or feathering in the overlap
was sometimes needed. Finally, four blocks were
combined into one image (Fig. 6). The mosaic has a
spatial resolution of 30 metres and is 3 GB in size.
The geometry has been compared with the GPS
field measurements, where tracks were logged. The
track logs fitted within one pixel to the correspond-
ing roads on the mosaic.
Integrated image enhancement
Many geological remote sensing studies have
demonstrated that the integrated enhancement of
remotely sensed and airborne geophysical data sets
may yield significant geological information that is
not obvious in the enhanced products of the individ-
ual data sets (Harris et al. 1994). The integration of
gamma-ray spectrometry grids and satellite imagery
of higher spatial resolution, in particular, has proven
useful to enhance geological information, because
it allows the interpretation of geochemical infor-
mation contained in the gamma-ray spectrometry
Fig. 5. Ternary shaded-relief image of shuttle radar topographic mission (SRTM) data (90 metre spatial resolu-
tion). The SRTM data are relief shaded using three illumination directions (inclination angle is 30º and decli-
nation angles are 270º, 315º and 360º) and combined in a colour composite image. Topographic features are
displayed in different colours dependent on their orientation.
channels in the context of structural features, such
as lithological contacts, faults and foliation trends.
(Wilford et al. 1997, Schetselaar 2000).
The digital processing methods used to gener-
ate integrated enhancements are all based on the
principle of mapping co-registered grids/images on
distinct perceptual attributes of human colour vi-
sion using image algebraic operations. In practice,
the geoscience data sets are first co-registered on a
common pixel/grid cell size, after which they are
‘fused’ in colour composite images by the applica-
tion of an algebraic algorithm to the pixels.
The HPF transform, a method proposed by
Chavez et al. (1991), was used to merge K, eTh and
eU grids with a mosaic of LANDSAT TM5 scenes,
both registered on 30-metre pixels. The red, green
and blue channels of the colour composite are com-
puted as follows:
The factors a, b and c were selected to weigh
chromatic contrast (hue and saturation) with the
intensity contrast from LANDSAT ETM5. For this

43
Geological Survey of Finland, Special Paper 48
Integrated geological interpretation of remotely sensed data to support geological mapping in Mozambique
Fig. 6. The combined mosaic of the LANDSAT 7 ETM scenes covering the LOT 2, LOT 3 and their extensions.

44
Geological Survey of Finland, Special Paper 48
Ernst M. Schetselaar, Markku Tiainen & Tsehaie Woldai
study, a = 1 and b = 3 provided an optimal result for
geological interpretation. This method is effective
in enhancing structural details from the LANDSAT
scenes while minimizing spectral distortions among
the gamma-ray spectrometry channels. Image en-
hancement before and after processing and interpre-
tation examples are illustrated in Figures 7 and 8,
respectively.
In addition to employing LANDSAT ETM image
data as an intensity substitute, relief-shaded SRTM
Fig. 8. IHS composite image of gamma-ray spectrometry data, rgb KThU. Intensity is modulated by LANDSAT
TM5. Yellow lines show the Hunting compilation, blue lines the LANDSAT interpretation prepared by the GTK
Consortium. Lake Cahora Bassa is shown as black.
Fig. 7. Image clips to illustrate the effects on integrated enhancement of LANDSAT TM and gamma-ray spectrometry channels. A) Original ternary
radioelement map; B) Ternary radioelement map ‘sharpened’ with LANDSAT ETM band 7.
data were used for image fusion purposes. Figure
9 shows an example from the NW corner of LOT
3 (Upper Save river basin). Note that the relative
stratigraphic positions of units, due to rendering
topographic relief, have become obvious. Creta-
ceous units, such as the Sena Formation in red, pink
and yellow-green hues, are clearly seen to underlie
the Quaternary cover because they correspond to
denudational slopes in areas of (badland) erosion.

45
Geological Survey of Finland, Special Paper 48
Integrated geological interpretation of remotely sensed data to support geological mapping in Mozambique
The integrated rendering or image fusion methods
that integrated ternary mapping of the radioelement
concentrations with structural information from
LANDSAT images and shaded-relief SRTM proved
to be the most successful enhancement strategy to
support geological image interpretation and map-
ping. Compositional geological information (min-
eralogy and K, eTh, eU geochemistry) appeared to
Fig. 9. Image fusion of relief-shaded SRTM and gamma-ray spectrometry grids (grid size is 50x50 km)). A) A ternary radioelement map; B) The
ternary radioelement map ‘sharpened’ with relief-shaded SRTM data.
be less affected by weathering and vegetation cover
when compared to the spectral information of the
optical remote sensing data. Regionally consist-
ent compositional patterns were readily apparent
on these image enhancements and could be easily
placed in the context of topographic and structural
information rendered on shaded-relief SRTM and
enhanced LANDSAT images.
At the end of February 2003 the digital compi-
lation of the remotely sensed, airborne geophysical
and geologic map data that cover the LOT 2 area
was completed and properly registered on UTM pro-
jections and the MOZNET (WGS84) datum. Once
this digital compilation was available, it became
possible to implement interactive geological inter-
pretation techniques in a digital (GIS) environment.
The interpretation was conducted interactively in a
GIS environment exploiting spatial query, overlay
and image enhancement functions. This facilitated
interactive enhancement of the various remotely
sensed and airborne geophysical data and made it
possible to compare the digital compilation of the
geology maps published by Hunting.
The main objectives of the geological image in-
terpretation were to:
Resolve mismatches between adjacent sheets
of the Hunting geological maps;
Trace geological structures and lithological
units from geological maps covering neigh-
•
•
Geological interpretation of compiled and processed data sets
bouring countries, particularly Zimbabwe,
where the maps appear to be superior in show-
ing lithological and structural details;
Identify discrepancies between the Hunting
geological maps and geological features in-
ferred from the enhanced image products;
Resolve intersecting boundary conflicts be-
tween image-inferred and map digitized geo-
logical features.
During the interpretation it appeared that in are-
as with no or a low density of field observations,
many additional geological features could be identi-
fied from the remote sensing and airborne geophysi-
cal data sets. This was particularly true for the area
south of the 16o S latitude, where virtually no field-
work had been conducted. On the other hand, for
some areas north of Lake Cahora Bassa the Hunting
compilation contained geological details that could
not be identified on any of the compiled data sets.
Of the six lithological units of the Fíngoè Group
•
•

46
Geological Survey of Finland, Special Paper 48
Ernst M. Schetselaar, Markku Tiainen & Tsehaie Woldai
recognized in detailed field studies, for example,
only four units (marble, quartzite, mica schist and
metaconglomerate) could be extracted from the
image data.
The interactive overlay of the digitized legacy
geological maps on enhanced image data proved
useful for matching the lithostratigraphic map units
with subtle contrasts in tonal and textural image di-
agnostics, on which basis many more lithological
units could be recognized. It should be noted, how-
ever, that the relationships between lithostratigraph-
ic units and contrasting image diagnostic elements,
such as tone, texture, shape and pattern, rarely yield
straightforward one-to-one relationships. Several
units on the map may match with only one identifi-
able unit on the enhanced imagery, or vice versa. As
a result, in places with good field control and a lack
of image diagnostic features, generalization of field-
established lithological details into less differenti-
ated units was unavoidable. The relationships be-
tween mapped lithological units, igneous, structural
or stratigraphic patterns and image diagnostics were
established by overlaying the digital geological
maps on the image enhancements. Where gamma-
ray spectrometry data complemented the geologi-
cal information content of satellite imagery, it was
helpful to first digitize boundaries on the basis of
contrasting hues on the ternary radioelement image.
Thereafter, boundaries could be further refined by
interpreting ASTER and LANDSAT scenes.
All newly recognized units that were added to the
compilation during the interpretation were assigned
provisional numerical codes ranging from 0100 for
Quaternary units to 2200 for Archaean units (Fig.
10). The last two digits of the numerical codes (i.e.
0107, 0106) have only been chrono-stratigraphi-
cally ordered where this was possible. The provi-
sional legend was used for the image interpretation
of LOT 2 and LOT 3 in the preliminary map pro-
duction phase and was replaced by new codes on
the final map products.
The geological units and structures extracted by
image interpretation were integrated with digitized
information from the published geological maps.
This was motivated by the need to provide the
most up-to-date geological knowledge base for the
project areas. For the LOT 3 area two interpretation
products were provided. The first is a 'pure' image
interpretation exclusively showing only those geo-
logical features that could be reliably recognized on
the various image enhancements. The second is an
integrated compilation, where features of geological
maps that could not be identified via image inter-
pretation are blended in with the image-interpreted
features. Hence, the second product represented the
most complete geological knowledge base, since
our image interpretation significantly improved the
geometry of previously mapped features while it
also highlighted discrepancies with respect to exist-
ing geological maps, some of which evolved into
new geological information after their significance
had been established in the field.
A database was prepared that allows the transfer of
codes from the Hunting geological map to the lithos-
tratigraphic codes, respecting as much as possible the
lithostratigraphic standards of Mozambique defined
in the project documentation. Additional fields in the
table allowed the generalization of lithological units
and members into formations and groups. A 'com-
ment' field contains remarks on lithostratigraphic
interpretation problems and/or brief interpretation
statements on which the allocation of the unit was
based. A sample listing of a few records from this
attribute table is provided in Table 1.
Table 1. Sample of attribute table used to transcribe lithostratigraphic codes of the Hunting geological map compilation (column HC) to the number
codes used in this project (NEW-P).

47
Geological Survey of Finland, Special Paper 48
Integrated geological interpretation of remotely sensed data to support geological mapping in Mozambique
Fig. 10. Provisional legend distilled from previously published geological maps (Hunting Ltd. 1984) and unpublished DNG reports
used for image interpretation.

48
Geological Survey of Finland, Special Paper 48
Ernst M. Schetselaar, Markku Tiainen & Tsehaie Woldai
Areas of high outcrop density and secondary
roads were interpreted from the 15-metre TM band 8
and colour composite images of bands 7, 3 and 1 for
the entire project area. Most areas of good bedrock
exposure can be recognized as positive features in
the topographic relief with a rough and 'dotty' image
texture. It was difficult to identify the primary and
secondary roads, such that only segments of many
could be identified. Some roads or paths do not ap-
pear to be connected to the paved road network and
instead appear to originate from minor settlements
in remote areas. Additional roads were identified
from colour composites of geometrically corrected
ASTER scenes, now available. A digital interpre-
tation guide map was prepared to document areas
considered of specific interest for follow-up work
before the start of the first field season. The interpre-
tation guide shows areas of specific interest as num-
bered polygons on the interpretation. The polygons
are linked to an attribute table with a memo field
for details on the reasoning followed during the in-
terpretation, including preliminary geological ideas
and hypothesis to be verified during fieldwork. The
targets overlap with areas defined in the fieldwork
activity plan, previously submitted. The interpreta-
tion guide also contains a number of traverse sug-
gestions with concise description of follow-up tar-
gets along the traverse (Fig. 11).
Geological image interpretation results
This section provides a generalized summary of
the geological image interpretation conducted for
Fieldwork planning
LOT 2 and LOT 3. The geological interpretation of
lithostratigraphic units and structures is based on
qualitative descriptions of diagnostic interpretation
elements derived from the LANDSAT 7 enhanced
thematic mapper (ETM), magnetic, gamma-ray spec-
trometry, shuttle radar topographic mission (SRTM)
data and the derived image fusion products. Table 2
lists the most frequently used image enhancements.
Image sub-scenes with labelled overlays illustrate
how the lithostratigraphic units and structures were
outlined on the various enhancements generated
from LANDSAT 7 ETM, airborne geophysical and
shuttle radar terrain mapping (SRTM) data. The
description of the image diagnostics for the lithos-
tratigraphical units are grossly ordered from old to
young into nine groups ranging in age from Archae-
an to Quaternary (Fig. 12). The internal order within
each group, however, was highly provisional and
accommodates, in addition to stratigraphic order,
lateral variations in the lithostratigraphic encoding
of rock units. This is because the stratigraphic and
geochronology information was at this preliminary
stage of geological mapping still based on a variety
of older geological map publications. These were
the most up-to-date sources of information before
the fieldwork and associated U/Pb zircon dating
sample campaigns were undertaken. The unit num-
bers on the interpretation examples correspond with
those of the legends of the provisional geological
maps of LOT 2 and LOT 3.
Table 2. Image enhancements commonly employed for the geological image interpretation of the LOT 2 and LOT 3 project areas.
Image enhancement Spatial resolution
Enhancement procedure
Landsat 7 ETM731 colour composite
30 m Colour composite image with standard deviation stretch 2 sigma for each band, red= band 7, green = band 3 and blue = band 1
Total field magnetic intensity grid
250 m Histogram equalization combined with relief shading, declination 330o, inclination 25o in rainbow colour spectrum and in grey scale
1st. vertical derivative magnetic grid
250 m Standard deviation stretch of 1st. vertical derivative magnetic grid in grey scale
Ternary relief-shaded SRTM 90 m Colour composite image with standard deviation stretch for each band. Bands are relief shaded SRTM data with illumination azimuths at 120o angles with each other.
IHS [K-eTh-eU]-TMB7 composite image
30 m Intensity-Hue-Saturation composite image where hue and saturation are modulated by radioelement grids (K = red, eTh = green, eU = blue) and intensity is modulated by high-pass filtered Landsat ETM band 7.
IHS [K-eTh-eU]-relief-shaded-SRTM composite image
90 m Intensity-Hue-Saturation composite image where hue and saturation are modulated by radioelement grids (K = red, eTh = green, eU =blue) and intensity is modulated by relief-shaded SRTM data.

49
Geological Survey of Finland, Special Paper 48
Integrated geological interpretation of remotely sensed data to support geological mapping in Mozambique
Fig. 11. Example of a digital fieldwork traverse plan (red-orange stippled lines) for the south of LOT 2 compiled on the basis of the interpretation of
roads providing access to the target areas from ASTER VNIR scenes. Clicking on the traverse 27 (blue stippled line) opens the attributes associated
to the traverse. The attributes include a concise description of the image interpretation together with a number of suggestions for verification in the
field. The background shows an IHS [K-eTh-eU]-ETM7 composite image of the Barue Complex with an overlay of the provisional geological map
compilation for the sedimentary cover and the Serra de Gorongosa intrusive ring complex with its satellite dykes.
Archaean granite-gneiss terrains and
greenstone belts
Rocks that belong to the eastern margin of the
Archaean Zimbabwe craton are exposed for ca.
300 km along the border between Mozambique and
Zimbabwe (Fig. 12). These rocks are mainly com-
posed of granitoid, banded TTG gneiss and include
the eastern portions of the E-W trending Udzi-Mu-
tare-Manica and Cronley-Munhinga greenstone
belts that extend from Zimbabwe. Both greenstone
belts are characterized by prominent E-W trending
linear magnetic anomalies (Fig. 13A), probably due
to magnetic susceptibility contrasts between the
metabasalt and metasedimentary units within them.
The airborne radioelement concentrations of the Ar-

50
Geological Survey of Finland, Special Paper 48
Ernst M. Schetselaar, Markku Tiainen & Tsehaie Woldai
Fig. 12. Distribution of interpreted provisional lithological units (generalized in groups) from Archaean to Quaternary.

51
Geological Survey of Finland, Special Paper 48
Integrated geological interpretation of remotely sensed data to support geological mapping in Mozambique
Fig. 13. Image interpretation examples of Archaean units. A) Total field magnetic intensity image displaying prominent E-W trending linear anoma-
lies associated with the Manica and Cronley greenstone belts; B) LANDSAT ETM 731 colour composite image with outline of the Manica and
Cronley greenstone belts (yellow lines); C) Detail of B showing interpreted units of the Manica greenstone belt 2201: Mica schist, graphite schist
and metagraywacke, 2202: quartzite and metasandstone, 2204: calc-silicate rocks. 2221: metabasalt, 2222: peridotite, serpentinite; D) Detail of B
showing interpreted units of the Cronley greenstone belt; E) Inliers and circular domes of Archaean granitoids to the North of Manica, correspond-
ing to circular magnetic lows with smooth magnetic relief; F) Detail of image E interpreted Archaean domes.
chaean units are generally low with the exception of
some granitoid units. The greenstone belts generally
display dark green hues and smooth image texture
on the LANDSAT ETM colour composite images
and form linear positive features that outline folia-
tion form lines within the greenstone belts. Metaba-
salts have the darkest tone while schist and psam-
mite are slightly lighter in tone (Figs. 13B, D).
On a LANDSAT ETM731 colour composite im-
age, the granitoids and gneisses exhibit light pink,
white-yellow tones and display moderate to coarse
image textures. Isolated Archaean granite-gneiss
domes forming circular basement inliers beneath
supracrustals of the Rushinga and Gairezi Groups
have been outlined on the magnetic data (Fig. 13E)
and LANDSAT ETM colour composite images
52
Geological Survey of Finland, Special Paper 48
Ernst M. Schetselaar, Markku Tiainen & Tsehaie Woldai
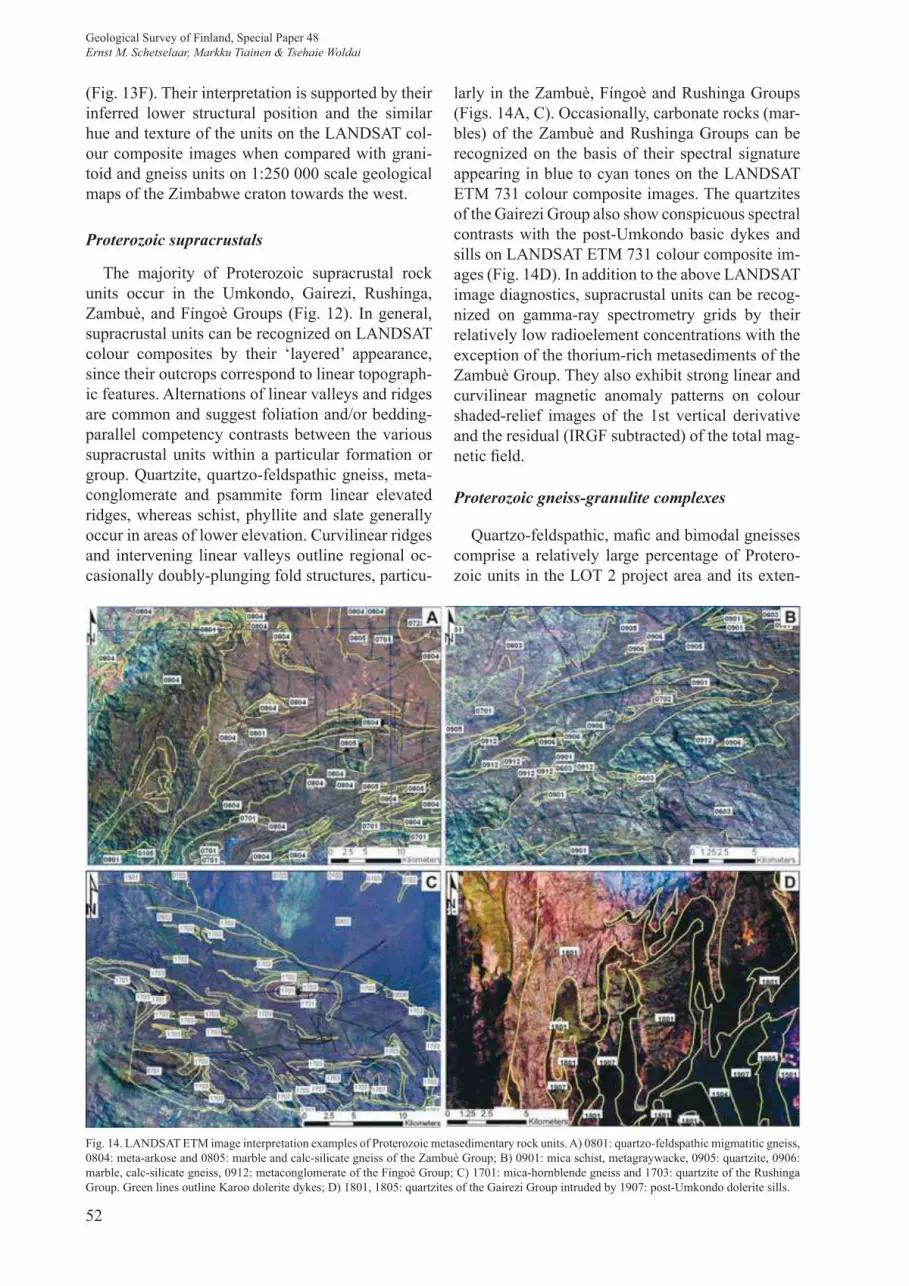
Fig. 14. LANDSAT ETM image interpretation examples of Proterozoic metasedimentary rock units. A) 0801: quartzo-feldspathic migmatitic gneiss,
0804: meta-arkose and 0805: marble and calc-silicate gneiss of the Zambuè Group; B) 0901: mica schist, metagraywacke, 0905: quartzite, 0906:
marble, calc-silicate gneiss, 0912: metaconglomerate of the Fíngoè Group; C) 1701: mica-hornblende gneiss and 1703: quartzite of the Rushinga
Group. Green lines outline Karoo dolerite dykes; D) 1801, 1805: quartzites of the Gairezi Group intruded by 1907: post-Umkondo dolerite sills.
(Fig. 13F). Their interpretation is supported by their
inferred lower structural position and the similar
hue and texture of the units on the LANDSAT col-
our composite images when compared with grani-
toid and gneiss units on 1:250 000 scale geological
maps of the Zimbabwe craton towards the west.
Proterozoic supracrustals
The majority of Proterozoic supracrustal rock
units occur in the Umkondo, Gairezi, Rushinga,
Zambuè, and Fíngoè Groups (Fig. 12). In general,
supracrustal units can be recognized on LANDSAT
colour composites by their ‘layered’ appearance,
since their outcrops correspond to linear topograph-
ic features. Alternations of linear valleys and ridges
are common and suggest foliation and/or bedding-
parallel competency contrasts between the various
supracrustal units within a particular formation or
group. Quartzite, quartzo-feldspathic gneiss, meta-
conglomerate and psammite form linear elevated
ridges, whereas schist, phyllite and slate generally
occur in areas of lower elevation. Curvilinear ridges
and intervening linear valleys outline regional oc-
casionally doubly-plunging fold structures, particu-
larly in the Zambuè, Fíngoè and Rushinga Groups
(Figs. 14A, C). Occasionally, carbonate rocks (mar-
bles) of the Zambuè and Rushinga Groups can be
recognized on the basis of their spectral signature
appearing in blue to cyan tones on the LANDSAT
ETM 731 colour composite images. The quartzites
of the Gairezi Group also show conspicuous spectral
contrasts with the post-Umkondo basic dykes and
sills on LANDSAT ETM 731 colour composite im-
ages (Fig. 14D). In addition to the above LANDSAT
image diagnostics, supracrustal units can be recog-
nized on gamma-ray spectrometry grids by their
relatively low radioelement concentrations with the
exception of the thorium-rich metasediments of the
Zambuè Group. They also exhibit strong linear and
curvilinear magnetic anomaly patterns on colour
shaded-relief images of the 1st vertical derivative
and the residual (IRGF subtracted) of the total mag-
netic field.
Proterozoic gneiss-granulite complexes
Quartzo-feldspathic, mafic and bimodal gneisses
comprise a relatively large percentage of Protero-
zoic units in the LOT 2 project area and its exten-
53
Geological Survey of Finland, Special Paper 48
Integrated geological interpretation of remotely sensed data to support geological mapping in Mozambique
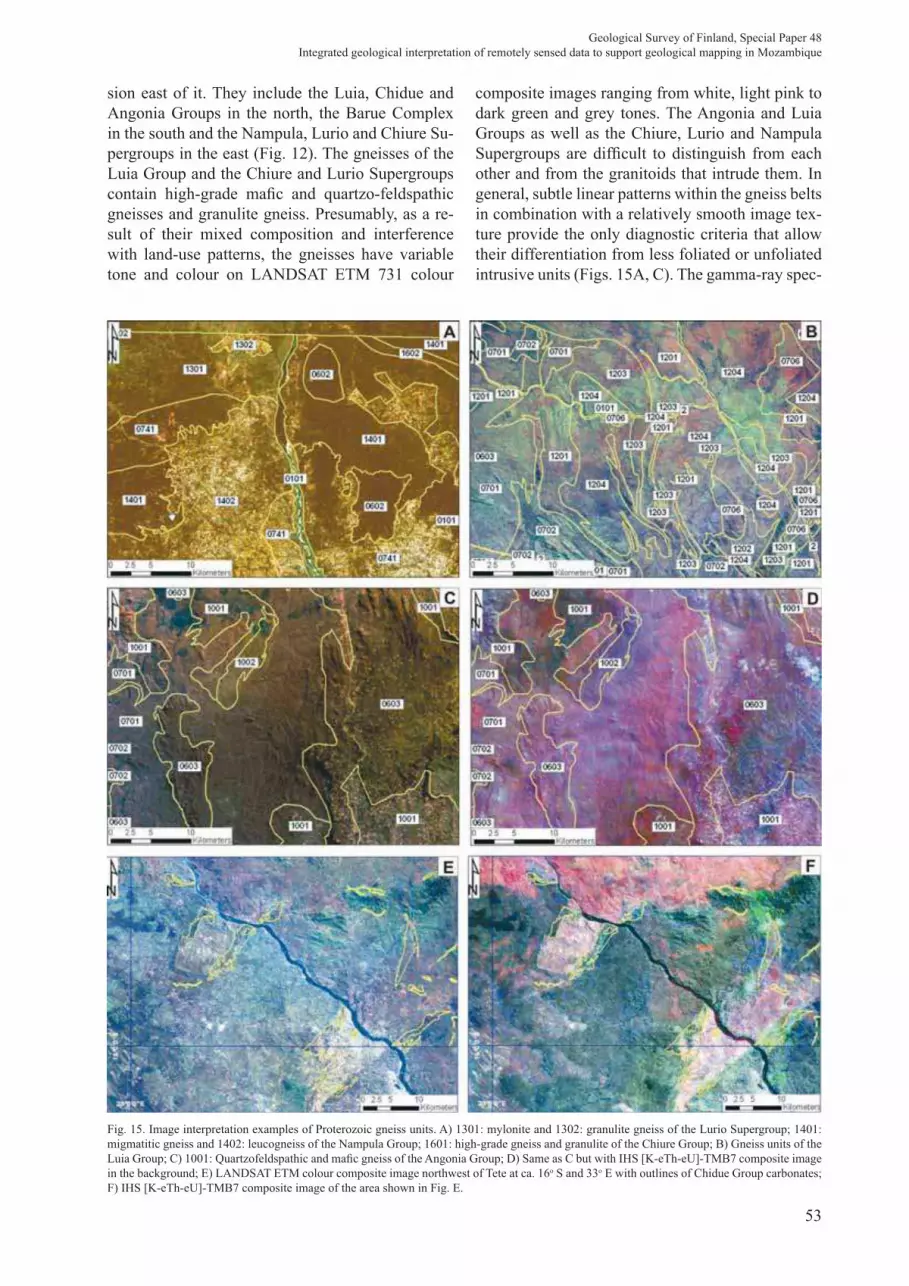
Fig. 15. Image interpretation examples of Proterozoic gneiss units. A) 1301: mylonite and 1302: granulite gneiss of the Lurio Supergroup; 1401:
migmatitic gneiss and 1402: leucogneiss of the Nampula Group; 1601: high-grade gneiss and granulite of the Chiure Group; B) Gneiss units of the
Luia Group; C) 1001: Quartzofeldspathic and mafic gneiss of the Angonia Group; D) Same as C but with IHS [K-eTh-eU]-TMB7 composite image
in the background; E) LANDSAT ETM colour composite image northwest of Tete at ca. 16o S and 33o E with outlines of Chidue Group carbonates;
F) IHS [K-eTh-eU]-TMB7 composite image of the area shown in Fig. E.
sion east of it. They include the Luia, Chidue and
Angonia Groups in the north, the Barue Complex
in the south and the Nampula, Lurio and Chiure Su-
pergroups in the east (Fig. 12). The gneisses of the
Luia Group and the Chiure and Lurio Supergroups
contain high-grade mafic and quartzo-feldspathic
gneisses and granulite gneiss. Presumably, as a re-
sult of their mixed composition and interference
with land-use patterns, the gneisses have variable
tone and colour on LANDSAT ETM 731 colour
composite images ranging from white, light pink to
dark green and grey tones. The Angonia and Luia
Groups as well as the Chiure, Lurio and Nampula
Supergroups are difficult to distinguish from each
other and from the granitoids that intrude them. In
general, subtle linear patterns within the gneiss belts
in combination with a relatively smooth image tex-
ture provide the only diagnostic criteria that allow
their differentiation from less foliated or unfoliated
intrusive units (Figs. 15A, C). The gamma-ray spec-

54
Geological Survey of Finland, Special Paper 48
Ernst M. Schetselaar, Markku Tiainen & Tsehaie Woldai
Fig. 16. Image interpretation examples of the gneissic units of the Barue Complex. A) LANDSAT ETM 731 colour composite with interpretation
superimposed (in yellow); units: 1502: Intermediate to felsic gneiss 1502B: quartzo-feldspathic gneiss; 1503: mafic gneiss and 1503B: ultramafic
to mafic gneiss; B) IHS composite image [K-eTh-eU]-TMB7 with interpretation superimposed; C) Total field magnetic data with interpretation
superimposed. Note magnetic lows corresponding to unit 1502B; D) Relief-shaded SRTM data with interpretation superimposed.
trometry grids provided slightly better diagnostics,
since many of the gneiss units have low to moderate
radioelement signatures that contrast with the high-
er radioelement concentrations of the surrounding
granitoid units (Fig. 15D).
Internal differentiation of the Angonia, Luia
Groups and Nampula Supergroups into units of dif-
ferent metamorphic grade and bulk mineralogical
composition can only be locally established on ba-
sis of the linear topographic expression of granulite
and calc-silicate gneiss of the Chidue Group (Fig.
15E), which also exhibit anomalously high thorium
concentrations (Fig. 15F). This suggests that some
of the Chidue Group carbonates were not of su-
pracrustal origin but rather represent deformed and
metamorphosed carbonatites. In general, however,
diagnostic image characteristics needed to differ-
entiate quartzo-feldspathic gneiss, mafic gneiss and
granulite within any of these groups are lacking.
The Barue Complex displays conspicuous folia-
tion trajectories involved in spectacular kilometric-
scale basin and dome interference fold structures
that can be outlined on LANDSAT ETM, gamma-
ray spectrometry, shaded-relief total magnetic field
data and to some extent on shaded-relief SRTM data
(Figs. 16A, D). Variation in bulk rock composition
parallel to the gneissic banding is suggested by al-
ternating bands of light-orange and dark-green hues
on the LANDSAT ETM731 colour composite im-
ages (Fig. 16A), which correspond to zones with
high total count values and thorium concentrations,
respectively, low total count values and low thori-
um concentrations on the gamma-ray spectrometry
grids (Fig. 16B). The most felsic units (1502B) cor-
respond to negative magnetic anomalies (Fig. 16C).
Proterozoic to Early Palaeozoic plutonic rocks
Voluminous Mesoproterozoic and minor occur-
rences of early Palaeozoic plutonic rocks are ex-
posed in the Tete province in the north of the LOT
2 area, whereas lesser amounts are exposed among
the gneissic units of the Barue complex (Fig. 12).

55
Geological Survey of Finland, Special Paper 48
Integrated geological interpretation of remotely sensed data to support geological mapping in Mozambique
Fig. 17. Image interpretation examples of Proterozoic mafic and ultramafic plutonic units exposed in Tete Province. A) Regional view of mafic and
ultramafic units of Tete Province (yellow outlines). The largest are 1: Atchiza Suite, 2: Chipera Suite and 3: Tete Suite; B) LANDSAT ETM colour
composite of the Chipera mafic Suite (0702: gabbro); C) IHS [K-eTh-eU]-TMB7 composite image of Chipera mafic Suite. The low radioelement
concentrations yield a dark grey tone on the IHS composite image that contrasts with the K-rich signature of adjacent gneissic and granitoid units;
D) Total magnetic intensity image with outline of the Tete Suite.
They can be subdivided into two major suits: (1)
ultramafic-mafic intrusions and (2) synkinematic
to post-kinematic granitoids. The ultramafic-ma-
fic rocks include three intrusive suites: the Atchiza
Suite at the northwestern shore of Lake Cahorra
Bassa, the Chipera Suite at the northeastern shore of
Lake Cahora Bassa and the Tete Suite to the north
east of the town of Tete, which is by far the largest
of the three (Fig. 17A). The mafic-ultramafic suits
have a slightly darker image tone on the LANDSAT
colour composite images and a relatively smooth
texture in comparison to adjacent gneiss-granitoid
terrains (Fig. 17B), low to very low radioelement
concentrations (Fig. 17C) and a high total field
magnetic background with rough magnetic textures
(Fig. 17D). The granitoid suites have been classified
based on local field relationships into three groups:
pre-Fíngoè, post-Fíngoè and late tectonic granites.
Although this classification has been maintained in
our image interpretation, it was noted that the re-
gional configuration of airborne radioelement sig-
natures provided scope for alternative classifications
of the various granitoid plutonic suites. The classi-
fication of granitoids was amended after fieldwork
and U/Pb zircon age dating, since granitoids previ-
ously believed to be older than the Fíngoè Group
appeared to postdate it (Mänttäri this volume).
Mesoproterozoic granitoids in the LOT 2 area
have high total count signatures and elevated K or
eTh airborne concentrations that stand out against
those of supracrustal belts and mafic igneous rocks
and gneiss belts (Fig. 18A). Relative bright im-
age tones and coarse image textures on LAND-
SAT colour composite images, in addition, allow
the differentiation of Mesoproterozoic granitoid
units from gneiss and supracrustal belts, although
this does not consistently apply throughout LOT 2.
Charnokitic granites, such as the 'Castanho Granite',
underlie rugged mountainous terrains displaying a
highly dissected topographic relief. This allows
their differentiation from the supracrustal belts and
mafic igneous units with which they are in contact

56
Geological Survey of Finland, Special Paper 48
Ernst M. Schetselaar, Markku Tiainen & Tsehaie Woldai
Fig. 18. Regional view and image interpretation examples of Meso- and Neoproterozoic granitoid intrusions in Tete Province. A) IHS [K-eTh-eU]-
TMB7 composite image showing distinct radioelement signatures of granitoids (units 0701, 0602 and 0603) in the Fíngoè area; B) LANDSAT ETM
731 colour composite image showing contrasting image texture on the basis of which unit 0701 (pre-Fíngoè granite) can be differentiated from
younger granites 0602 and 0603; C) Rugged terrain underlain by unit 0706: Charnokitic granite yields a distinct rough image texture in addition to a
brown tone on the LANDSAT ETM 731 colour composite image; D) IHS [K-eTh-eU]-TMB7 composite image showing distinct high radioelement
concentrations of a regional cluster of post-kinematic Neoproterozoic granite plutons in northern Tete Province.
(Figs. 18B, C). Pan-African Early Paleozoic granite
plutons (unit 0602) stand out as conspicuous high
total count anomalies with elevated airborne eU
concentrations (Fig. 18D).
Karoo Supergroup
(Upper Carboniferous - Jurassic)
Sedimentary and volcanic rocks of the Karoo Su-
pergroup were deposited in E-W and NW-SE trend-
ing rift basins that formed during the predecessor
and subsequent stages of Gondwana breakup (Man-
ninen et al. this volume). Sedimentary rocks of the
Karoo Supergroup are dominantly exposed along
the Zambezi River and its tributaries and along the
shores of Lake Cahorra Bassa, whereas volcanic
rocks (mainly basalt and rhyolite) are exposed at
the margins of the Precambrian basement through-
out the LOT 2 and LOT 3 areas as far south as the
border of Mozambique with Swaziland. Figure 12
shows the distribution of Karoo and superimposed
post-Karoo basins in the LOT 2 and LOT 3 areas.
Sedimentary and volcanic units of the Karoo Su-
pergroup display characteristic linear image patterns
related to sedimentary bedding, igneous jointing or
internal drainage. This rendered differentiation with
the underlying Precambrian units straightforward.
Volcanic rocks of the Karoo Supergroup are domi-
nated by basalt, with diagnostically low radioele-
ment concentrations that contrast with the relatively
high radioelement concentrations of the rhyolite
flows.
Sedimentary units of the Karoo Supergroup ex-
posed around Lake Cahora Bassa and the Zambezi
River can be easily differentiated based on the con-
trasting image tone, topographic relief, drainage
and fracture patterns on LANDSAT ETM colour
composite images (Fig. 19A), whereas the basaltic
units can be easily distinguished from the sedimen-

57
Geological Survey of Finland, Special Paper 48
Integrated geological interpretation of remotely sensed data to support geological mapping in Mozambique
Fig. 19. Image interpretation examples of sedimentary and volcanic units of the Karoo Supergroup. A) LANDSAT ETM 731 colour composite
west of Tete showing sedimentary and volcanic rock units: 0401: Lower Karoo, undifferentiated, 0405: Upper basalts, 0407: Lower basalts, 0408:
tholeitic basalts, 0411: Upper Karoo, undifferentiated, 0413: basalt, sandstone (Stormberg member), 0414: Dolerite; B) IHS [K-eTh-eU]-TMB7
composite image of the same area as shown in Fig. A; C) LANDSAT ETM 731 colour composite image of the shores of Lake Cahora Bassa showing
sedimentary units of the Karoo Supergroup, 0401: Lower Karoo clastic sedimentary rocks (undifferentiated) 0411: Upper Karoo clastic sedimentary
rocks (undifferentiated) 0412: conglomeratic sandstone, 0413 Stormberg member; D) LANDSAT ETM 731 colour composite image northwest of
Lake Cahorra Bassa showing Upper Karoo sedimentary rocks (0411).
tary units based on their low gamma-ray spectrom-
etry signatures (Fig. 19B). The coarser clastic units
(sandstone and conglomerate) often stand out due
to their bright image tone against the units consist-
ing of finer grained clastics (Fig. 19C). The lower,
slightly dissected relief renders their distinction
from the strongly dissected Precambrian basement
and peneplains underlain by Quaternary cover (Fig.
19D).
Further towards the south, exposures of volcanic
units, mainly basalt and rhyolite of the Karoo Su-
pergroup, exclusively exist. The basalts have a dark
grey-blue image tone on LANDSAT ETM731 col-
our composite images with characteristic rectangu-
lar drainage patterns (Fig. 20A). The intensive dyke
swarms that occur within the basalt units are read-
ily apparent on grey-scale images of the 1st vertical
derivative magnetic field (Fig. 20B). The rhyolites
that are interlayered with the basalts in the southern
half of the LOT 3 area have a prominent positive
topographic expression with highly dissected relief
on shaded-relief SRTM data (Fig. 20C), and exhibit
light cream to orange hues and internal linear fac-
ture patterns on LANDSAT ETM 731 colour com-
posite images (Fig. 20D).
Cretaceous intrusions
Younger intrusions include alkaline ring com-
plexes, carbonatites and alkaligranite dikes and
are all inferred to be Cretaceous in age (Hunting,
1984). The most prominent of these intrusions are
Cone Negoso on the north shore of Lake Cahorra
Bassa consisting of carbonatite with satellite trach-
yte cones to the south of it, the Salambidua com-
plex on the border with Malawi and the large Serra
de Gorongosa ring complex (now dated to 181 Ma,

58
Geological Survey of Finland, Special Paper 48
Ernst M. Schetselaar, Markku Tiainen & Tsehaie Woldai
Fig. 20. Image interpretation examples of volcanic units of the Karoo Supergroup. A) LANDSAT ETM 731 colour composite at 20o S and 34o E
showing tholeitic basalt of the Karoo Supergroup; B) First vertical derivative magnetic field of the area shown in Fig. A illustrating straight linear
anomaly patterns associated with a dyke swarm within unit 0408. The continuation of the linear anomaly pattern east of unit 0408 suggests the
presence of unit 0408 in the subsurface beneath Cretaceous-Tertiary sedimentary cover; C) Relief-shaded SRTM data showing a strong contrast in
topographic expressions between rhyolite (units 0406B/0406C) and tholeitic basalt (unit 0408); D) LANDSAT ETM 731 colour composite of the
areas shown in Fig. C.
Lower Jurasic, see Mänttäri (this volume) consisting
of alkali granite, gabbro, syenite, monzonite as well
as a contact skarn consisting of calc-silicate rocks
in the hosting gneisses of the Barue Complex (Fig.
12). All of these intrusions have a prominent topo-
graphic expression that can be easily recognized
from relief-shaded SRTM data (Figs. 21A, B). The
carbonatites, in addition, yield some of the highest
total count, thorium and uranium anomalies on the
gamma-ray spectrometry grids (Figs. 21C, D). The
associated satellite cones and dykes are too small
to yield anomalies in the geophysical data but can
be easily identified from the LANDSAT ETM 731
colour composite images (Figs. 21E, F).
Cretaceous sedimentary units
Cretaceous sedimentary units are exposed within
the NNW, NNE, and E-W trending rift basins where
they unconformably overlie the older sedimentary
units or tholeitic basalt of the Karoo Supergroup.
Locally, however, Cretaceous sedimentary rocks
overstep the Karoo and directly rest unconform-
ably on the Precambrian basement (Fig. 12). The
sedimentary rocks are predominantly composed
of coarse-grained continental and marine clastics,
mainly sandstone and conglomeratic sandstone.
The oldest Cretaceous formations, however, consist
of silty marl that exhibits a characteristic dark tone
and dendritic drainage pattern on the LANDSAT
ETM 731 colour composite images (Fig. 22A). The
coarse-grained sedimentary rocks generally display
light image tones and also exhibit spectacular den-
dritic drainage patterns in steeply dissected terrain
(badland morphology), the Mágoè Formation in
particular (Fig. 22B). The sandstones of the Sena
Formation have bimodal potassium and thorium-
rich radioelement signatures which may suggest
that the gneissic units of the Barue Complex, with
a similar bimodal radioelement composition of its
gneissic units, are its main provenance (Fig. 22C).

59
Geological Survey of Finland, Special Paper 48
Integrated geological interpretation of remotely sensed data to support geological mapping in Mozambique
Towards the south in the LOT 3 area, several new
inliers of the Sena Formation were discovered by
our remote sensing interpretation. This was based
on their contrasting K-rich gamma-ray spectrom-
etry signature and dissected relief expression in ero-
sional windows through Quaternary cover along the
Fig. 21. Image interpretation examples of Cretaceous intrusions. A) SRTM ternary relief shaded image showing topographic expression of the Serra
de Gorongosa ring complex; B) Topographic expression of carbonatite and alkaline ring complexes in Tete Province; C) Cone Negose carbonatite
with satellite trachyte cones on a LANDSAT ETM 731 colour composite image; D) as C on an IHS [K-eTh-eU]-TMB7 composite image. Note
the prominent thorium and uranium anomalies associated to the main intrusion; E) Serra Salambidue carbonatite and syenite-monzonite stocks
(outlined in yellow lines) on an IHS [K-eTh-eU]-TMB7 composite image. Note the high total count and uranium anomalies corresponding to the
carbonatite intrusion; F) Detailed image interpretation of the Serra de Gorongosa ring complex. 0502: Alkali granite, 0503: syenite, monzonite;
0513: skarn within hosting gneisses of the Barue Complex.
deepest levels of dendritic drainage systems (Fig.
22D). Thin slivers of the Grudja and Maputo For-
mations are also found along river valleys in south-
ern Mozambique, where their distinction from the
overlying Tertiary Jofane and Cheringoma Forma-
tions is difficult.

60
Geological Survey of Finland, Special Paper 48
Ernst M. Schetselaar, Markku Tiainen & Tsehaie Woldai
Fig. 22. Image interpretation examples of Cretaceous sedimentary rock units (Grudja, Mágoè and Maputo Formations). A) LANDSAT ETM 731
colour composite image of the Massingir area (ca. 24o S and 32o E). Unit 0301 corresponding to Cretaceous rocks of the Grudja Formation is
outlined on the basis of the dark-grey image tone and dendritic drainage patterns; B) LANDSAT ETM 731 colour composite image west of Tete
(16o S) showing spectacular dendritic drainage patterns associated to the Mágoè Formation (unit 0302); C) IHS [K-eTh-eU]-TMB7 composite im-
age of Sena Formation. Note that units 0304, 0304B and 0304C can be differentiated on the basis of their distinct radioelement signatures, which
may either represent a lateral facies or a stratigraphic differentiation; D) IHS [K-eTh-eU]-relief-shaded SRTM composite image of unit 0304 (Sena
Formation) at ca. 21o S and 33o E) Note the potassium-rich signature of unit 0304 that strongly contrasts with the thorium-rich signatures of units
0201, 0204 and 0107. The isolated inlier of unit 0304 does not appear on the previously published geological map of this area.
Tertiary sedimentary rock units
Tertiary (Paleogene to Neogene) sedimentary
rocks are predominantly exposed in the LOT 3 area
along the Save and Limpopo river valleys, along
the north-south trending coast and the Sabe basin
east of the Barue Complex (Fig. 12). The Tertiary
sequence is composed of sandstone, silty marl and
carbonates including the numulitic limestone of the
Jofane Formation (unit 0202) and reef limestone of
the Cheringoma Formation (unit 0204). These units
exhibit widely spaced dendritic drainage patterns
in steeply sloping terrain along river valleys but
generally lack internal drainage patterns on gently
sloping and flat terrains. They display, dependent
on land cover, variable generally light image tones
(green, orange or yellow) and a smooth image tex-
ture on LANDSAT ETM 731 colour composite im-
ages (Figs. 23A, B). The Inhaminga sandstone (unit
0203) and Mikindani Formation (unit 0201) that
is also dominantly composed of sandstone display
darker image tones and moderately rough image
textures (Figs. 23A, B). Along the Save river, within
LOT 3, the Jofane Formation exhibits dark image
tone when exposed by erosion along the Save River
(Fig. 23C). In the extreme south of Mozambique,
thin layers of Jofane Formation are recognized from
their relatively bright tones (Fig. 23D).
Quaternary to recent units
Quaternary and recent sediments cover approxi-
mately 50 percent of the LOT 2 and LOT 3 areas.
They form the extensive floodplains of the on-shore
part of the Mozambique basin of Southern and East-
ern Mozambique and the infill of the more localized

61
Geological Survey of Finland, Special Paper 48
Integrated geological interpretation of remotely sensed data to support geological mapping in Mozambique
rift basins to the north of it (Fig. 12). The Quater-
nary cover is largely composed of unconsolidated
or semi-consolidated argillic and sandy alluvial, flu-
vial, Aeolian and marine sediments. Their stratifica-
tion is usually sub-horizontal in the east but towards
the west along the border with South Africa, they
have been tilted by neotectonic faulting. South of
22o S, large tracts of the flood plain are covered by
sands that were formed by Aeolian reworking into
inland dunes. In many areas the various Quaternary
deposits can be elucidated by careful interpretation
of the age relationships between inland and coastal
land forms (Figs. 24A, B). Recent alluvial and ma-
rine sediments (unit 0101) can be recognized on the
basis of their dark image tone and low topographic
elevation in association to rivers, lakes and man-
groves along the coast (Fig. 24B).
Interpretation of shaded-relief SRTM images is
helpful in mapping the relative stratigraphic position
of the Quaternary units and elucidating their con-
tacts in both denudational and aggradational land-
forms. Sandy deposits generally form positive relief
features, namely ridges and plateaus that display a
light orange or brown image tone and rough image
texture, whereas the argillic sediments are confined
to topographic depressions that display a dark im-
age tone and smooth image texture on LANDSAT
7 ETM 731 colour composite images (Fig. 24C).
The break of the slope between the floors and rims
of circular depressions, known as ‘dambos’, can
be recognized on the satellite imagery and relief-
shaded SRTM data and coincides with the contacts
between the argillic alluvial deposits and overlying
cover sands (Fig. 24D). Furthermore, the argillic
(unit 0106) and overlying cover sand deposits (unit
0107) have a subtle but consistent contrast in radi-
oelement signature that can be used, in addition to
the satellite imagery and relief-shaded SRTM data,
in mapping their distribution (Figs. 24E, F).
Fig. 23. Image interpretation examples of Tertiary sedimentary rock units (Mikindani, Jofane, Inhaminga and Cheringoma Formations). A) LAND-
SAT ETM 731 colour composite image at ca. 18o30’ S and 35o E, displaying a stratigraphic sequence of Tertiary units. From top to bottom: Mi-
kandini Formation (unit 0201), Inhaminga sandstone (unit 0203) and Cheringoma Formation (unit 0204); B) Characteristic pink-orange hue and
smooth image texture of the Cheringoma Formation on a LANDSAT ETM 731 colour composite image at ca. 20o S and 34o E; C) Exposures of
the Jofane Formation (unit 0202) in the River Save valley; D) Thin slivers of the Jofane Formation can be identified based on their light tone in
southern Mozambique.

62
Geological Survey of Finland, Special Paper 48
Ernst M. Schetselaar, Markku Tiainen & Tsehaie Woldai
Fig. 24. Image interpreted units of Quaternary to recent cover. A) LANDSAT ETM 731 colour composite image at 25o30’ S/35o E showing Quater-
nary units: 0101 recent alluvial deposits, 0102: interior dunes, 0104: coastal dunes and 0107: aeolian reworked fluvial sands; B) LANDSAT ETM
731 colour composite image at ca. 20o S/34o E showing Quaternary units: 0101 recent alluvial deposits (in mangroves), 0104: coastal dunes, 0106:
argillic deposits and 0107: aeolian reworked fluvial sands; C) Units 0106 and 0107 on the LANDSAT ETM 731 colour composite image at ca. 23o S,
32o30’ E; D) IHS [K-eTh-eU]-relief-shaded SRTM composite image of the area shown in Fig. C; E) Differentiation of units 0106 and 0107 on the
LANDSAT ETM 731 colour composite image at ca. 22o S/33o30’ E; F) Ternary relief-shaded SRTM image showing linear and circular topographic
expressions of the subhorizontal contacts between units 0106 and 0107.
Characteristic linear patterns (presumable linear
dunes and blow-outs) indicate the wind transport di-
rection and allow the differentiation of coastal and
inland dune deposits from each other and the cover
sands of the flood plains. The gamma-ray spectrom-
etry grids are sometimes useful for determining the
provenance of the Quaternary sediments. Terraces
along the Limpopo River, for example, are com-
posed of thorium-rich sediments suggesting that
thorium-rich Cretaceous sedimentary rocks of the
Sena formation upstream of the river terraces pro-
vided the source of these sediments.

63
Geological Survey of Finland, Special Paper 48
Integrated geological interpretation of remotely sensed data to support geological mapping in Mozambique
In this paper we have presented the data process-
ing and integration methodology and a summary
of geological image interpretation results that sup-
ported the regional geological field mapping com-
ponent of LOT 2, LOT 3 and their extensions. We
have shown that the integrated enhancement and
digital interpretation of airborne geophysical, opti-
cal remote sensing and SRTM data lend themselves
to extract a large number of lithological and struc-
tural patterns. These patterns appeared to be re-
gionally consistent and supported geological map
compilation in combination with insights obtained
from geological field mapping. Integrated image
enhancement, in which image data of higher spatial
resolution (e.g. LANDSAT ETM and shaded-relief
CONCLUSION
ACKNOWLEDGEMENTS
SRTM data) substituted the intensity of the ternary
radioelement colour composite, proved to be very
effective for geological mapping. It was by far the
most useful enhancement technique for outlining
bedrock units in the Precambrian basement and
helped in analyzing relationships between the Phan-
erozoic sedimentary cover, landscape morphology
and topography. A systematic comparison of the
newly published geological map coverage and the
image database will highlight a number of geologi-
cally significant discrepancies that justify field fol-
low-ups in a variety of terrains and for a variety of
purposes (e.g. geological mapping, earth resource
exploration as well as land use and hazard studies).
We thank Sally Barrit for airborne geophysi-
cal data processing that allowed us to merge the
older Hunting survey with the more recent Fugro
airborne geophysical surveys. Gerard Reinink is
acknowledged for his contribution to the various
image processing tasks, including geometric cor-
rection, preparing the LANDSAT ETM mosaic of
the project areas and the enhancement and delivery
of the individual LANDSAT and ASTER VNIR
scenes. Many thanks to Ruben Vargas and Koert Si-
jmons for their contribution in compiling the legacy
geological maps and map production of the pro-
visional geological maps compiled from the geo-
logical image interpretation presented in this paper.
Thanks to Eira Kuosmanen for preparing a general-
ized geological map of the project area. Finally we
want to thank Hilkka Arkimaa for critical reading
of the manuscript and for comments that improved
this paper.
Chavez, P. S., Sides, S. C. & Anderson, J. A. 1991. Com-
parison of three different methods to merge multi-resolution
and multi-spectral data: LANDSAT TM and SPOT Panchro-
matic. Photogrammetic Engineering and Remote Sensing
57, 295–303.
Curran, P. J. 1985. Principles of Remote Sensing, Longman
Group UK Limited. Essex, England, 282 p.
Goetz, A. F. H., Barrett, N. R. & Rowan, L. C. 1983. Remote
sensing for exploration an overview, Economic Geology,
special issue on techniques and results of remote sensing,
pp. 573–590.
Harris, J. R., Bowie, C., Rencz A. N. & Graham, D. 1994.
Computer enhancement techniques for the integration of
remotely sensed, geophysical and thematic data for the
geosciences. Canadian Journal of Remote Sensing, 20,
210–221.
Hunting Geology & Geophysics 1984. Mineral inventory
project, minésterio dos recursos minerais, dirrecção nacion-
al de geologia, Mozambique, final report 329 p.
Norconsult International 1998. The Mozambique national
geodetic network, local government reform and engineering
project urban/environmental management, technical report
on adjustment old network.
Schetselaar, E. M. 2000. On preserving spectral balance in im-
age fusion and its advantages for geological image interpre-
tation. Photogrammetic Engineering and Remote Sensing,
67, 925–934.
Wilford, J. R., Bierwith, P. N., & Craig, M. A. 1997. Ap-
plication of airborne gamma-ray spectrometry in soil/rego-
lith mapping and applied geomorphology. AGSO Journal of
Australian Geology & Geophysisics, 17, 201–216.
REFERENCES


