Embed Size (px)
Citation preview
5
METHODS FOR ASSESSING THE POSITIONAL AND THEMATIC ACCURACY OFREMOTELY SENSED PRODUCTS
Carlos Antonio Oliveira Vieira1, Paul M. Mather2, Antônio Simões Silva3,Dalto Domingos Rodrigues4, Joel Gripp Júnior5, Antônio Santana Ferraz6 and
Julio Cesar de Oliveira7.
Universidade Federal de Viçosa, Departamento de Engenharia Civil, Brasil.School of Geography, University of Nottingham, UK
Recibido: julio 2005 Aceptado: diciembre 2005
AbstractThe aim of this paper is to review standard methods for assessing the quality control ofcartographic products in the context of remote sensing. A further aim is to present amethodology to assess the positional accuracy of spatial databases using generic features(and their spatial distribution) within the image in the validation phase, and also to describea methodology that specifically takes into account spatial pattern of errors of omission andcommission, in order to present the user with an indication of the reliability of the pixel labelassignments. Results show that a considerable amount of research and development needsto be accomplished before the spatial characterisation of positional and thematic accuracyassociated with remote sensing can be adequately reported in standardised format andlegends. Several techniques for the quality control of spatial databases using genericfeatures are adapted to the context of remote sensing. However, one drawback of someof these approaches is the difficulty in obtaining homologous points in both representations.Alternative techniques to overcome such limitations are discussed.
Keywords: Standard Methods, Remote Sensing, Spatial Databases, Image, PositionalAccuracy
MÉTODOS PARA EVALUAR LA PRECISIÓN POSICIONAL Y TEMÁTICA DEPRODUCTOS GENERADOS POR SENSOMETRÍA REMOTA
ResumenEl objetivo de este artículo es revisar los métodos estándares aplicados para evaluar elcontrol de calidad de productos cartográficos en el contexto de los sensores remotos.Adicionalmente se persigue presentar una metodología que permita evaluar la precisión
Artíc
ulos
1Ing , Msc en , PhD en Geografia,Universidade Federal de Viçosa, Departamento de Engenharia Civil CCE,Viçosa – MG, 36571-000, Brazil. Email: [email protected] Professor, School of Geography, University of Nottingham, University Park, Nottingham NG7 2RD, UK.Email: [email protected]‘3 Universidade Federal de Viçosa, Departamento de Engenharia Civil CCE, Viçosa – MG, 36571-000, Brazil4 Universidade Federal de Viçosa, Departamento de Engenharia Civil CCE, Viçosa – MG, 36571-000, Brazil5 Universidade Federal de Viçosa, Departamento de Engenharia Civil CCE, Viçosa – MG, 36571-000, Brazil6 Universidade Federal de Viçosa, Departamento de Engenharia Civil CCE, Viçosa – MG, 36571-000, Brazil7 Universidade Federal de Viçosa, Departamento de Engenharia Civil CCE, Viçosa – MG, 36571-000, Brazil
GEOENSEÑANZA. Vol.11-2006 (1). Enero - junio. p.5- 15. ISSN 1316-60-77
Carlos A. Oliveira Vieira, Paul M. Mather, Antônio Simões Silva, Dalto Domingos Rodrigues,Joel Gripp Júnior, Antônio Santana Ferraz and Julio Cesar de Oliveira.
6
posicional de bases de datos espaciales utilizando características genéricas (y su espacialdistribución) dentro de la imagen durante la fase de validación; así como describir unametodología que tome en consideración patrones espaciales por errores de omisión ycomisión, para darle al usuario un nivel de la confiabilidad del pixel etiquetado. Losresultados obtenidos demuestran que hay una necesidad de desarrollar mucho másinvestigación, aún antes que la caracterización espacial y la exactitud temática asociadoal uso de los sensores remotos pueda ser llevado a formatos estándares y leyendasconocidos. Un considerable número de técnicas de control de calidad de base de datosespaciales, utilizando características genéricas, son adaptadas al contexto de los sensoresremotos. Sin embargo, una de las desventajas de estas técnicas radica en la dificultad deobtener puntos homogéneos en ambas presentaciones. Las técnicas alternativas parasolventar tales limitaciones son aquí discutidas.
Palabras Claves: Métodos Estándares, Sensores Remotos, Base de Datos Espaciales,Imagen, Precisión Posicional
1. IntroductionIt is widely acknowledged that classification of remotely sensed imagery has variable, andoften poor, quality. The cause and nature of these errors have been subjects of extensiveresearch in order to improve the accuracy of remotely sensed products. Error in this contextcan be defined as a discrepancy between the situation depicted on the generated image(map) and reality (Arbia, Griffith, and Haining, 1998). Performing spatial data analysisoperations on data of unknown accuracy will result in a product with low reliability andlimited use in the decision-making process. This can be compounded by errors derivingfrom one source propagating through the database via derived products (Lunetta, Congalton,Fenstermaker, Jessen and McGwire, 1991). The quality of data is a function both of theinherent properties of those data and the use to which they are to be put. Hence, knowledgeof error levels is necessary if data quality is to be estimated.
There are two different components of accuracy in the context of remote sensing:positional and thematic accuracy (Janssen and Van der Wel, 1994). Positional accuracydetermines how closely the position of discrete objects shown on a rectified image (map)or in a spatial database agree with the true position on the ground, while thematic accuracyrefers to the non-positional characteristic of a spatial data entity, the so-called attributes(which are derived from radiometric information).
Quality control of cartographic products is usually accomplished by computing thediscrepancy between each member of a set of well defined points present in one cartographicdocument with the corresponding points observed in the field, using a technique thatguarantees sufficient accuracy for the analysis. In spatial databases generated from remotelysensed data, it is equally necessary to have knowledge of the discrepancies (errors).However, in some imagery where the number of control points is not sufficient, or wheretheir spatial distribution is not adequate, the use of generic features (such as roads, edges,polygons, etc) to provide a means of relating two spatial data sets is an important alternative.
The aim of this paper is to review standard methods for assessing the quality ofcartographic products in the context of remote sensing. A further aim is to present a
GEOENSEÑANZA. Vol.11-2006 (1). Enero - junio. p.5- 15. ISSN 1316-60-77
7
methodology to assess the positional accuracy of spatial databases using generic features(and their spatial distribution) within the image in the validation phase, and also to presentthe user with an indication of the thematic reliability of the remote sensing products.
2. Study Area and DataTwo different datasets were used in order to assess the positional and thematic accuracyof remote sensing products.
2.1 Positional AccuracyThe study area is located near the town of Uberaba-MG, in south-eastern Brazil. This areais located at approximately 700m above sea level, and possesses an undulating topography.The economic activities of the region are based on the milk and derived products as mostof the area is covered by grassland.
Two remotely sensed multi-band images were used in this study, one acquiredby the Landsat Thematic Mapper (at 30m of resolution) and the other by the High ResolutionCCD Camera (HRCCC) carried by the China-Brazil Earth Resources Satellite (CBERS).This camera has a spatial resolution of 20 m. For the purposes of this study, a singlewaveband of each of the two multi-band images (TM and HRCCC), were used. A 1:25,000scale map of the study region was used to provide ground reference data.
The two single-band images were geometrically registered to the UTM referencesystem (zone -23 S) using the Córrego Alegre horizontal datum (Brazil). Image to mapregistration used 14 and 12 ground control points respectively for the Landsat TM andCBERS HRCCC images, with nearest neighbour resampling, since this technique maintainsthe original pixel values (Jensen, 1986). In each case, the root-mean-square (RMS) errorassociated with registration was less than 0.5 pixels (i.e., the RMSLandsat = 0.4721 and theRMSCBERS = 0.479). Atmospheric correction was not performed since comparisons are notbeing made directly between images.
2.2. Thematic AccuracyA SPOT High Resolution Visible (HRV) multispectral (XS) image (14 June 1994) of a regionof flat agricultural land located near the village of Littleport (E. England) was used in thesecond case study, together with Field Data Printouts for the summer 1994. These printoutswere derived from survey data supplied by individual farms, and provide details of the cropor crops growing in each field in the study area. On the basis of examination of the areascovered by each crop, the geographical scale of the study, and the spectral separabilityof the crops, seven crop categories were selected: potatoes, sugar beet, wheat, fallow,onions, peas and bulbs.
Image processing operations were performed using ERDAS Imagine (version 8.0)and the IDRISI GIS. Neural network application used the SNNS software. Some in-houseprograms were written to carry out specific procedures. Registration of the image to theOrdnance Survey (GB) 1:25,000 map was performed using 17 ground control points andnearest neighbour interpolation. The RMS error was 0.462 pixels.
GEOENSEÑANZA. Vol.11-2006 (1). Enero - junio. p.5- 15. ISSN 1316-60-77
Methods for assessing the positional and thematic accuracy ofremotely sensed products
8
3. Techniques for Estimating Positional and Thematic Accuracy3.1 Positional AccuracyA standard method of assessing the positional accuracy of cartographic products is basedon comparison of deviations between homologous control points that can be accuratelylocated on both the reference map and the geometrically corrected image. Statisticscomputed from the deviations at these homologous points are used to perform specifictests to evaluate the accuracy of the geometric corrected image.
An alternative approach to assess the positional accuracy of cartographic productsis based on the use of geometric features (Galo, Poz, and Ferreira, 2001). Examples ofgeometric features are roads, edges, and other boundaries. They should be easily locatedand represented as a set of sequential coordinates in both documents (i.e., the image tobe corrected and the reference map). Three feature-based methods have been used byVieira, Mather, and Borges (2002) to measure the correspondence between features shownon a reference map and a remotely sensed image. These are the Generated Point Method,the Areal Method and the Equivalent Rectangle Method. As these alternative methodswork with the relative distances between homologous points, there is no need to applytrend analysis to check for the presence of systematic errors in the E and N directions (Eand N are the directions X and Y respectively on the Universal Transverse Mercatorcoordinate system). One of these methods is presented in the following sections.
3.1.1 Map Accuracy Standards (MAS) DeterminationAn important method for cartographic evaluation of generated maps is the use of MapAccuracy Standards – MAS (Galo et al., 2001), which is based on the comparison ofdeviations between homologous control points easily located on the reference map (Xm,Ym) and the image (Xi, Yi). Statistics computed from the deviations at these homologouspoints (ÆE = Xm - Xi, ÆN = Ym - Yi) are used to perform specific tests to evaluate the trendand the accuracy of the geometrically corrected image. In this analysis it was consideredthat the reference map was sufficiently accurate for our purposes, i.e. to assess thegeometric quality of the images.
According to Merchant (1982), the aim of trend analysis is to check for the presenceof systematic errors. This check uses the sample mean of the deviations (ÆE, ÆN). A statisticaltest is applied, using the null hypothesis that the sample mean is estimating a true (population)mean of zero. If the null hypothesis can be accepted at some significance level then theconclusion to be drawn is that there is no trend or systematic error in the directions X andY respectively.
The Student’s t Test is normally used to carry out this statistical test. The criticalvalueτ n-1α/2, is obtained from statistical tables (where n is the total number of controlpoints and α is the confidence level, for example 0.1). If the calculated value of tfor the deviations along the north-south dimension |tN| is less than τn-1α/2 and the calculatedvalue of t for deviations in the east–west dimension |tE| is less than the tabled valueτn-1α/2 then the generated product (e.g., image) is free from systematic errors on thedirections N and E respectively. The estimated values of tN and tE can be estimated usingthe following equations:
GEOENSEÑANZA. Vol.11-2006 (1). Enero - junio. p.5- 15. ISSN 1316-60-77
Carlos A. Oliveira Vieira, Paul M. Mather, Antônio Simões Silva, Dalto Domingos Rodrigues,Joel Gripp Júnior, Antônio Santana Ferraz and Julio Cesar de Oliveira.
9
tN = (1/σN).ÆN.n1/2 (1)tE = (1/σE).ÆE.n1/2 (2)where σE and σN are the standard deviations of the discrepancies ÆE and ÆN in the directionsE and N respectively.
Accuracy analysis uses comparison of the variance of sample deviations ( var(Æχ,var Æγ) to their respective pre-defined (tabled) values. The test is performed using ahypothesis about the mean and standard deviation of the sample for each of the geometriccoordinates. The statistical procedure employed is the Chi-square (χ 2) test.. The accuracyof the geometrically corrected image can be estimated separately for the directions N andE, using standard statistical methodology involving the comparison of a sample value ofχ2 (χ2N,n-1) and the tabled value (χ2n-1, α), or (χ2E,n-1) and (χ2n-1, α) respectively. The valuesof χ2N,n-1 and χ2E,n-1 are estimated using the following equations:
χ2N,n-1 = (n-1) . (σN2/θ N2) (3)χ2E,n-1 = (n-1) . (σE2/θ E2) (4)
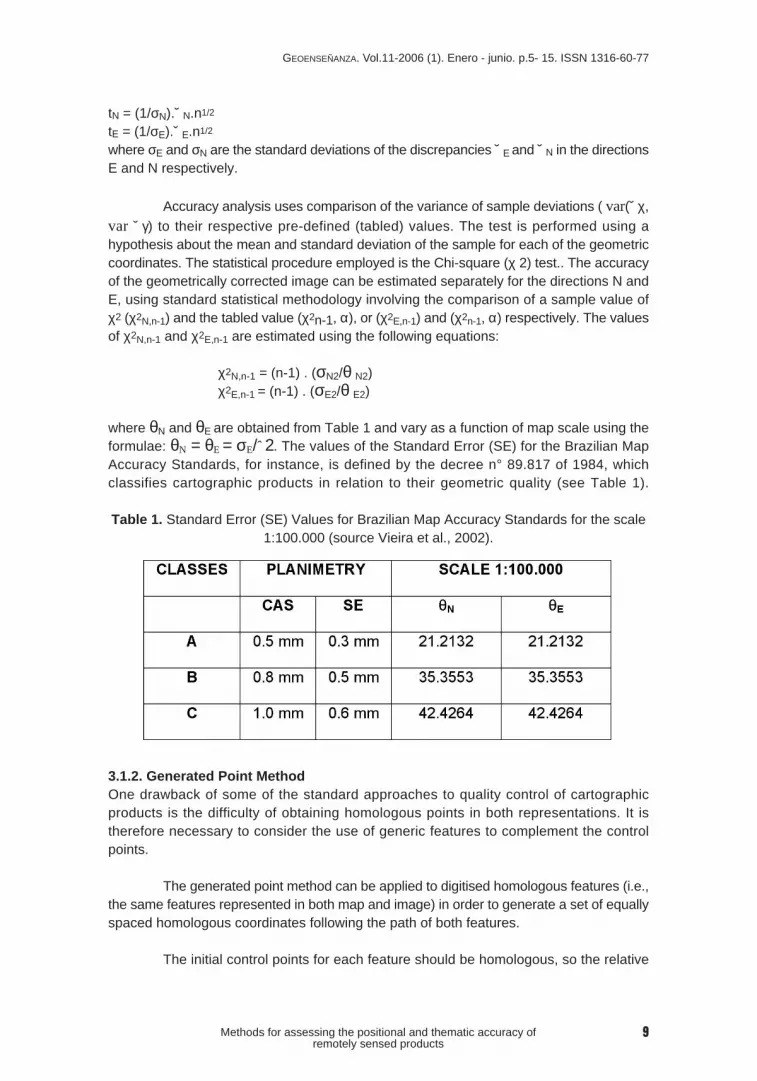
where θN and θE are obtained from Table 1 and vary as a function of map scale using theformulae: θN = θE = σE/Ã2. The values of the Standard Error (SE) for the Brazilian MapAccuracy Standards, for instance, is defined by the decree n° 89.817 of 1984, whichclassifies cartographic products in relation to their geometric quality (see Table 1).
Table 1. Standard Error (SE) Values for Brazilian Map Accuracy Standards for the scale1:100.000 (source Vieira et al., 2002).
3.1.2. Generated Point MethodOne drawback of some of the standard approaches to quality control of cartographicproducts is the difficulty of obtaining homologous points in both representations. It istherefore necessary to consider the use of generic features to complement the controlpoints.
The generated point method can be applied to digitised homologous features (i.e.,the same features represented in both map and image) in order to generate a set of equallyspaced homologous coordinates following the path of both features.
The initial control points for each feature should be homologous, so the relative
GEOENSEÑANZA. Vol.11-2006 (1). Enero - junio. p.5- 15. ISSN 1316-60-77
Methods for assessing the positional and thematic accuracy ofremotely sensed products
10
distances (or deviations D) between the generated homologous points are used to performthe comparison. It is evident that if there is no deviation between the generated homologouspoints, the image is well corrected with reference to the map; otherwise, it is necessaryto apply statistical analysis to in order to check the positional accuracy.
A comparison between the median and standard deviation of these deviationsand published Map Accuracy Standards (MAS) are carried out considering a specific scale.The accuracy test uses a Chi-square (χ2) test based on the specified Standard Error (SE).The geometrically corrected image will be accepted as accurate if χ2D,n-1 < χ2n-1, α. Thesample value of χ2D,n-1 can be estimated using equation (5):
χ2D,n-1 = (n-1) . (σD2/θD2) (5)
where, as before, θD is obtained from the Table 1. However, it is not directional, andseparate tests are not carried out for the N and E dimensions separately. The value θDis computed from the formula θD = SE/Ã2
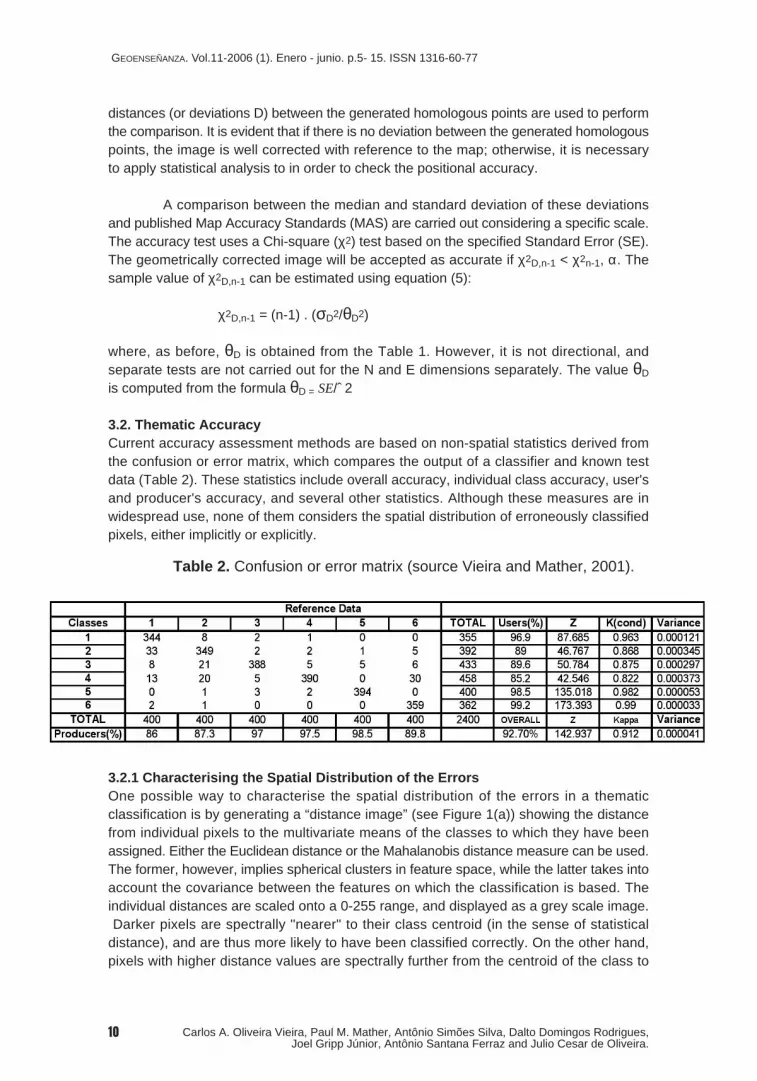
3.2. Thematic AccuracyCurrent accuracy assessment methods are based on non-spatial statistics derived fromthe confusion or error matrix, which compares the output of a classifier and known testdata (Table 2). These statistics include overall accuracy, individual class accuracy, user'sand producer's accuracy, and several other statistics. Although these measures are inwidespread use, none of them considers the spatial distribution of erroneously classifiedpixels, either implicitly or explicitly.
Table 2. Confusion or error matrix (source Vieira and Mather, 2001).
3.2.1 Characterising the Spatial Distribution of the ErrorsOne possible way to characterise the spatial distribution of the errors in a thematicclassification is by generating a “distance image” (see Figure 1(a)) showing the distancefrom individual pixels to the multivariate means of the classes to which they have beenassigned. Either the Euclidean distance or the Mahalanobis distance measure can be used.The former, however, implies spherical clusters in feature space, while the latter takes intoaccount the covariance between the features on which the classification is based. Theindividual distances are scaled onto a 0-255 range, and displayed as a grey scale image. Darker pixels are spectrally "nearer" to their class centroid (in the sense of statisticaldistance), and are thus more likely to have been classified correctly. On the other hand,pixels with higher distance values are spectrally further from the centroid of the class to
GEOENSEÑANZA. Vol.11-2006 (1). Enero - junio. p.5- 15. ISSN 1316-60-77
Carlos A. Oliveira Vieira, Paul M. Mather, Antônio Simões Silva, Dalto Domingos Rodrigues,Joel Gripp Júnior, Antônio Santana Ferraz and Julio Cesar de Oliveira.
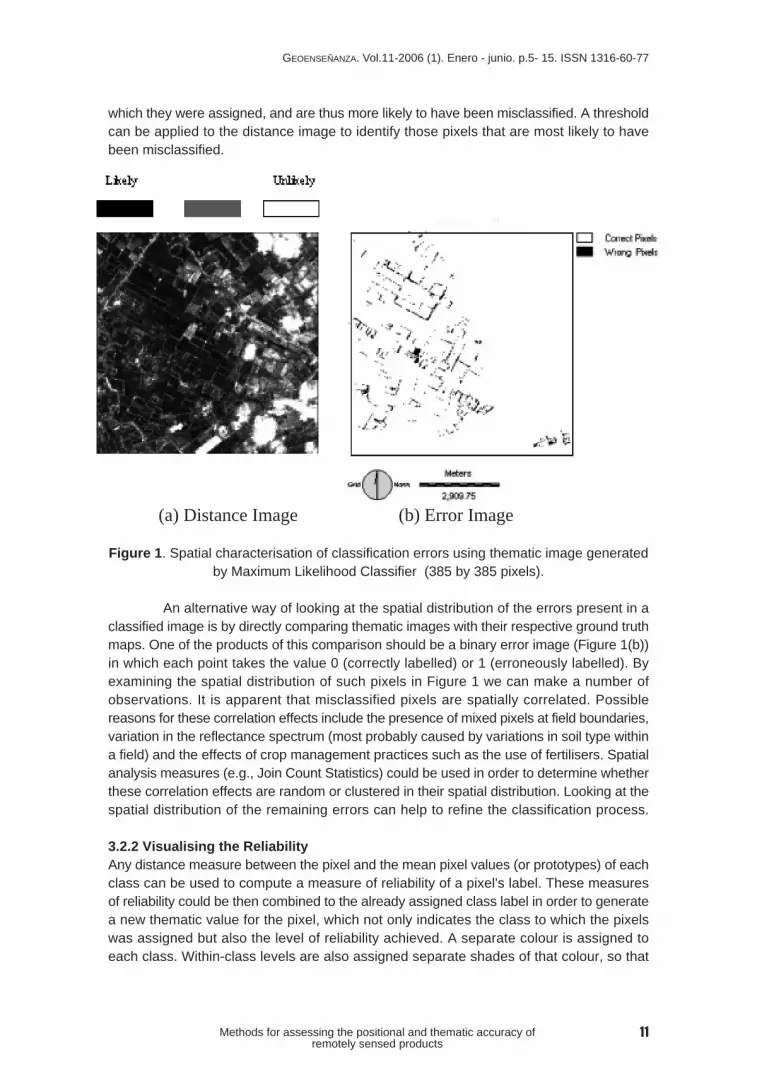
which they were assigned, and are thus more likely to have been misclassified. A thresholdcan be applied to the distance image to identify those pixels that are most likely to havebeen misclassified.
(a) Distance Image (b) Error Image
Figure 1. Spatial characterisation of classification errors using thematic image generatedby Maximum Likelihood Classifier (385 by 385 pixels).
An alternative way of looking at the spatial distribution of the errors present in aclassified image is by directly comparing thematic images with their respective ground truthmaps. One of the products of this comparison should be a binary error image (Figure 1(b))in which each point takes the value 0 (correctly labelled) or 1 (erroneously labelled). Byexamining the spatial distribution of such pixels in Figure 1 we can make a number ofobservations. It is apparent that misclassified pixels are spatially correlated. Possiblereasons for these correlation effects include the presence of mixed pixels at field boundaries,variation in the reflectance spectrum (most probably caused by variations in soil type withina field) and the effects of crop management practices such as the use of fertilisers. Spatialanalysis measures (e.g., Join Count Statistics) could be used in order to determine whetherthese correlation effects are random or clustered in their spatial distribution. Looking at thespatial distribution of the remaining errors can help to refine the classification process.
3.2.2 Visualising the ReliabilityAny distance measure between the pixel and the mean pixel values (or prototypes) of eachclass can be used to compute a measure of reliability of a pixel's label. These measuresof reliability could be then combined to the already assigned class label in order to generatea new thematic value for the pixel, which not only indicates the class to which the pixelswas assigned but also the level of reliability achieved. A separate colour is assigned toeach class. Within-class levels are also assigned separate shades of that colour, so that
11
GEOENSEÑANZA. Vol.11-2006 (1). Enero - junio. p.5- 15. ISSN 1316-60-77
Methods for assessing the positional and thematic accuracy ofremotely sensed products
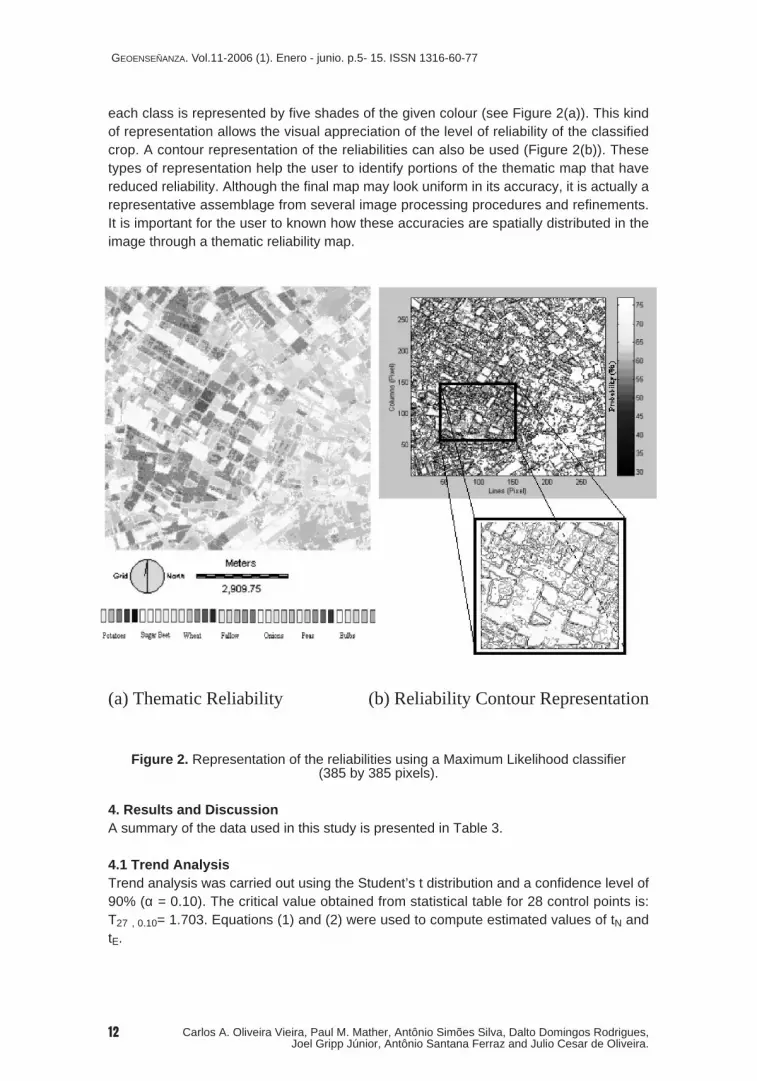
each class is represented by five shades of the given colour (see Figure 2(a)). This kindof representation allows the visual appreciation of the level of reliability of the classifiedcrop. A contour representation of the reliabilities can also be used (Figure 2(b)). Thesetypes of representation help the user to identify portions of the thematic map that havereduced reliability. Although the final map may look uniform in its accuracy, it is actually arepresentative assemblage from several image processing procedures and refinements.It is important for the user to known how these accuracies are spatially distributed in theimage through a thematic reliability map.
(a) Thematic Reliability (b) Reliability Contour Representation
Figure 2. Representation of the reliabilities using a Maximum Likelihood classifier(385 by 385 pixels).
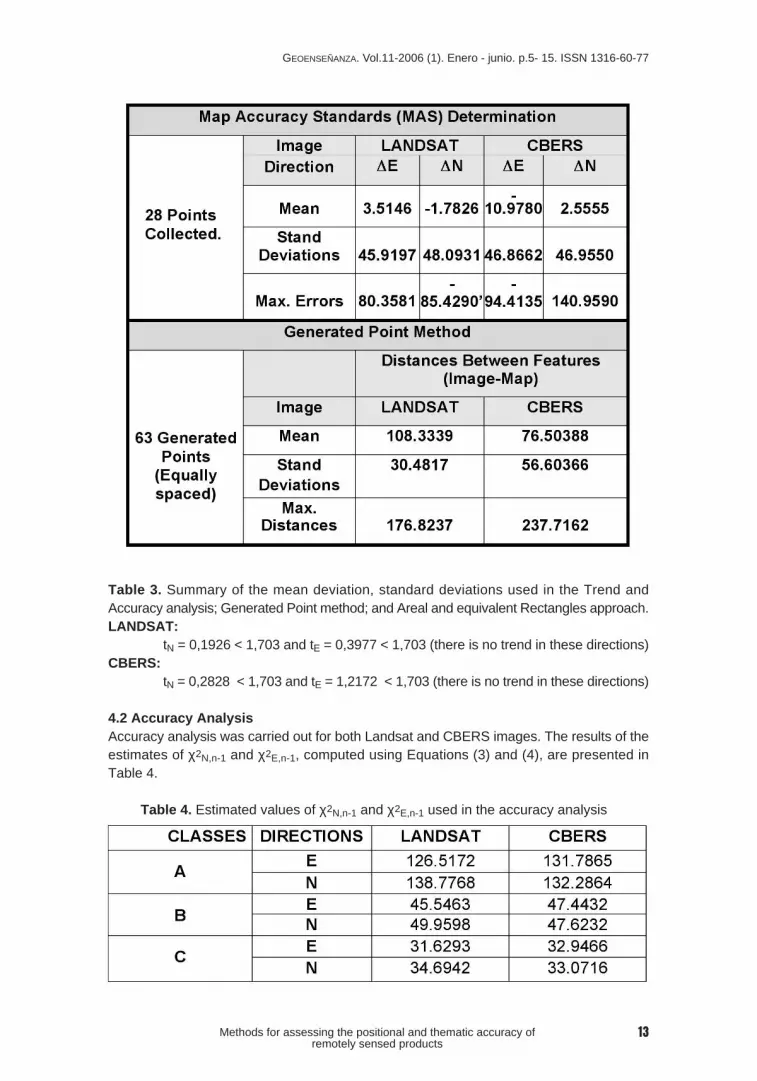
4. Results and DiscussionA summary of the data used in this study is presented in Table 3.
4.1 Trend AnalysisTrend analysis was carried out using the Student’s t distribution and a confidence level of90% (α = 0.10). The critical value obtained from statistical table for 28 control points is:T27 , 0.10= 1.703. Equations (1) and (2) were used to compute estimated values of tN andtE.
12
GEOENSEÑANZA. Vol.11-2006 (1). Enero - junio. p.5- 15. ISSN 1316-60-77
Carlos A. Oliveira Vieira, Paul M. Mather, Antônio Simões Silva, Dalto Domingos Rodrigues,Joel Gripp Júnior, Antônio Santana Ferraz and Julio Cesar de Oliveira.
13
Table 3. Summary of the mean deviation, standard deviations used in the Trend andAccuracy analysis; Generated Point method; and Areal and equivalent Rectangles approach.LANDSAT:
tN = 0,1926 < 1,703 and tE = 0,3977 < 1,703 (there is no trend in these directions)CBERS:
tN = 0,2828 < 1,703 and tE = 1,2172 < 1,703 (there is no trend in these directions)
4.2 Accuracy AnalysisAccuracy analysis was carried out for both Landsat and CBERS images. The results of theestimates of χ2N,n-1 and χ2E,n-1, computed using Equations (3) and (4), are presented inTable 4.
Table 4. Estimated values of χ2N,n-1 and χ2E,n-1 used in the accuracy analysis
GEOENSEÑANZA. Vol.11-2006 (1). Enero - junio. p.5- 15. ISSN 1316-60-77
Methods for assessing the positional and thematic accuracy ofremotely sensed products
14
Adopting the critical value of χ2 = 36,7412 and considering the limit values for the classesA, B, and C as shown in Table 1 for the Brazilian Map Accuracy Standards (scale 1:100.000),these two images have accuracy equivalent to the class C.
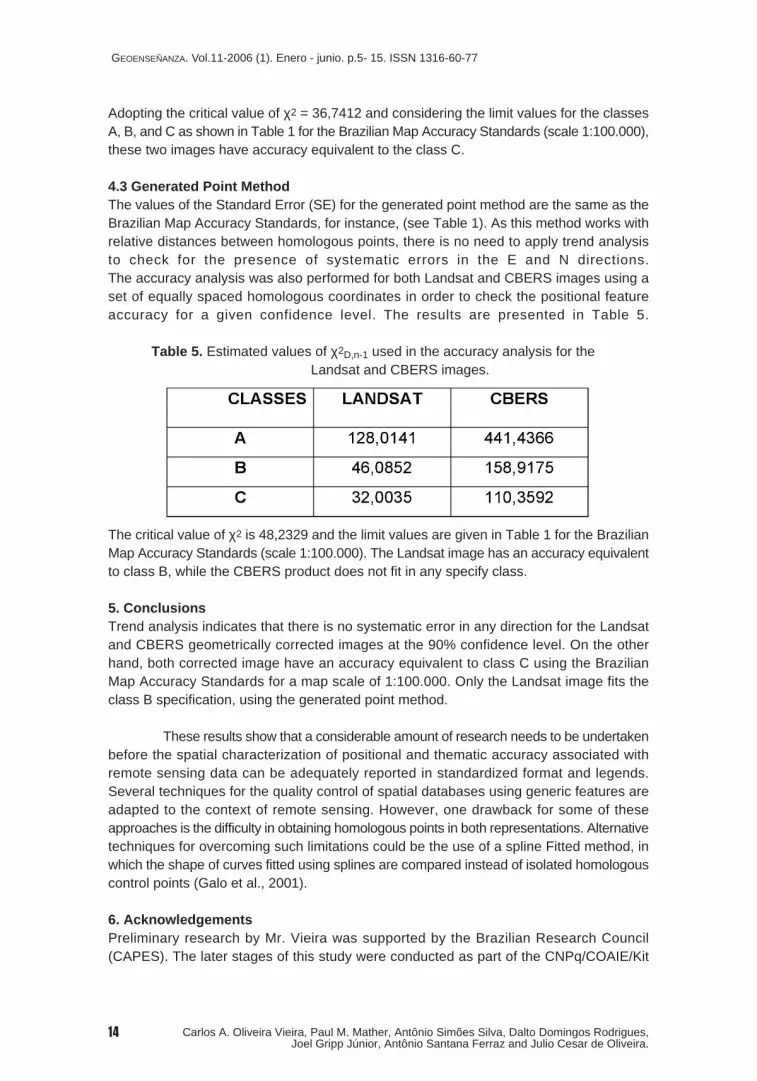
4.3 Generated Point MethodThe values of the Standard Error (SE) for the generated point method are the same as theBrazilian Map Accuracy Standards, for instance, (see Table 1). As this method works withrelative distances between homologous points, there is no need to apply trend analysisto check for the presence of systematic errors in the E and N directions.The accuracy analysis was also performed for both Landsat and CBERS images using aset of equally spaced homologous coordinates in order to check the positional featureaccuracy for a given confidence level. The results are presented in Table 5.
Table 5. Estimated values of χ2D,n-1 used in the accuracy analysis for theLandsat and CBERS images.
The critical value of χ2 is 48,2329 and the limit values are given in Table 1 for the BrazilianMap Accuracy Standards (scale 1:100.000). The Landsat image has an accuracy equivalentto class B, while the CBERS product does not fit in any specify class.
5. ConclusionsTrend analysis indicates that there is no systematic error in any direction for the Landsatand CBERS geometrically corrected images at the 90% confidence level. On the otherhand, both corrected image have an accuracy equivalent to class C using the BrazilianMap Accuracy Standards for a map scale of 1:100.000. Only the Landsat image fits theclass B specification, using the generated point method.
These results show that a considerable amount of research needs to be undertakenbefore the spatial characterization of positional and thematic accuracy associated withremote sensing data can be adequately reported in standardized format and legends.Several techniques for the quality control of spatial databases using generic features areadapted to the context of remote sensing. However, one drawback for some of theseapproaches is the difficulty in obtaining homologous points in both representations. Alternativetechniques for overcoming such limitations could be the use of a spline Fitted method, inwhich the shape of curves fitted using splines are compared instead of isolated homologouscontrol points (Galo et al., 2001).
6. AcknowledgementsPreliminary research by Mr. Vieira was supported by the Brazilian Research Council(CAPES). The later stages of this study were conducted as part of the CNPq/COAIE/Kit
GEOENSEÑANZA. Vol.11-2006 (1). Enero - junio. p.5- 15. ISSN 1316-60-77
Carlos A. Oliveira Vieira, Paul M. Mather, Antônio Simões Silva, Dalto Domingos Rodrigues,Joel Gripp Júnior, Antônio Santana Ferraz and Julio Cesar de Oliveira.
15
Enxoval (Project Number 68.0045/01-5) performed in collaboration with The University ofNottingham. We are grateful to Logica PLC, INPE and SPOT Image for permission to usetheir images.
Bibliography referencesARBIA, G., GRIFFITH, D., and HAINING, R., 1998, Error propagation modelling in raster GIS: overlay
operations. International Journal of Geographical Information Science, 12, pp. 145-167.
CONGALTON, R. G., and GREEN, K., 1999, Assessing the Accuracy of Remotely Sensed Data:Principles and Practices (New York: Lewis Publishers).
FERREIRA, L. F., and CINTRA, J. P., 1999, Quantificação de Discrepâncias entre Feições Linearespor Retângulo Equivalente. Brazilian Magazine of Cartography, 51, pp. 1-8.
GALO, M., dal POZ, A. P., and FERREIRA, F. M., 2001, Uso de Feições no Controle de Qualidadeem Cartografia. In Proceedings of the XX CBC - Cartography Brazilian Congress,Porto Alegre, 7-12 October 2001,http://www.cartografia.org.br/2001/english/index.html.
JASSEN L. L. F., and VAN der WEL, F. J. M., 1994, “Accuracy assessment of satellite derived land-cover data: a review. Photogrammetric Engineering and Remote Sensing, 48, pp.595-604.
JENSEN, J. R., 1986, Introductory Digital Image Processing – A Remote Sensing Perspective. Prentice-Hall, Englewood Cliffs, NJ.
LUNETTA, R. S., CONGALTON, R.G., FENSTERMAKER, L. K., JESSEN, J. H., and MCGWIRE, K.C., 1991, Remote sensing and geographic information system data integration: errorsources and research issues. Photogrammetric Engineering and Remote Sensing,57, pp. 677-687.
MERCHANT, D. C., 1982, Spatial Accuracy Standards for Large Scale Line Maps. In Proceedingsof the Technical Congress on Surveying and Mapping, 1, 222-231.
VIEIRA, C. A. O. and MATHER, P. M., 2001, On Assessment of the Spatial Reliability of ThematicImages. Ed. Peter J. Halls, Innovations in GIS 8: Spatial Information and the Environment.Taylor and Francis, London, pp. 88-101.
VIEIRA, C. A. O.; MATHER, P. M. , 2000, Visualization of Measures of Classifier Reliability and Errorin Remote Sensing In. ICG ACCURACY 2000, 4th International Symposium on SpatialAccuracy Assessment and Environmental Sciences, Delft University Press, Amsterdam,2000, p. 701-708.
VIEIRA, C. A. O.; MATHER, P. M.; BORGES, P. A. F., 2002, Assessing the Positional Accuracy ofRemotely Sensed Products In. 5th International Symposium on Spatial AccuracyAssessment in Natural Resources and Environmental Sciences, Melbourne, Australia,2002.
GEOENSEÑANZA. Vol.11-2006 (1). Enero - junio. p.5- 15. ISSN 1316-60-77
Methods for assessing the positional and thematic accuracy ofremotely sensed products