Embed Size (px)
Citation preview
Instructor Meteorologist Handbook
i^rieaainm^ tfowmgA Q/\Moioledae
Kir We,
te
. wrac QUALITY
"ySSSfSSßfSSSCWß^wkt X
REVIEW AND APPROVAL STATEMENT
AWS/UH—96/001, Instructor Meteorologist Handbook, October 1996, has been reviewed and is approved for public release. Their is no objection to unlimited distribution of this document to the public at large, or by the Defense Technical Information Center (DTIC) to the National Technical Information Service (NTIS).
O^öL-^CL; ARTHUR C. MEADE, Lt Col, USAF Deputy Director of Plans & Operations
^>RJk JAMES S. PERKINS AWS Scientific and Technical Information Program Manager 23 October 1996
DHC QUALITY INSPECTED 3
BM% m
REPORT DOCUMENTATION PAGE
1. Report Date: 23 Oct 1996
2. Report Type: Users Handbook
3. Title: Instructor Meteorologist Handbook
4. Author.: HQAWS/XON
5. Performing Organization Name and Address: Headquarters Air Weather Service, 102 W Losey St, Room 125, Scott AFB IL 62225-5206
6. Performing Organization Report Number: AWS/UH—96/001
7. Distribution/Availability Statement: Approved for public release; distribution unlimited.
8. Abstract: This handbook serves as a framework for Air Force instructor meteorologists (IM) to develop a program aimed at strengthening their unit's technical approach to forecasting. The handbook is broken into sections that introduce the IMs to their primary reponsibilities and objectives, gives them background information, and provides a starting point for developing a tailored IM program. The handbook also contains previously printed, but pertinent technical documents, which provide time- tested procedures for conducting Air Force weather operations.
9. Subject Terms: METEOROLOGICAL SATELLITE, AUTOMATED WEATHER DISTRIBUTION SYSTEM, NEXT GENERATION RADAR, METEOROLOGICAL DATA, TERMINAL AERODROME FORECASTS, WEATHER WARNING, WEATHER WATCH, WEATHER ADVISORY, QUALITY CONTROL, METRICS, TERMINAL FORECAST REFERENCE
NOTEBOOK, LOCAL AREA FORECAST PLAN
10. Number of Pages: 95
11. Security Classification of Report: Unclassified
12. Security Classification of this Page: Unclassified
13. Security Classification of Abstract: Unclassified
14. Limitation of Abstract: UL
Standard Form 298
THIS DOCUMENT IS BEST
QUALITY AVAILABLE. THE
COPY FURNISHED TO DTIC
CONTAINED A SIGNIFICANT
NUMBER OF PAGES WHICH DO
NOT REPRODUCE LEGIBLY.
INTRODUCTION
As an instructor meteorologist (M) (or the person performing IM duties), you are the technical leader of your weather station. It is your responsibility to take advantage of new technology involving the science of meteorology and to insert improved techniques into your weather operations. Your principal duties include:
• managing daily meteorological requirements • applying the science of meteorology to garrison and deployed weather station operations • directing/performing technical evaluations • maintaining your unit Local Area Forecast Program (LAFP) • management and exploitation of meteorological processing systems at your unit • technical training and instruction of unit weather forecasters—you must be able to determine, request, supervise,
and conduct training at the unit level
As you may notice, there's very little in this list that isn't already being done in a weather station. The difference now is that the Air Force Weather Back To Basics program realigns some responsibilities in order to take advantage of the strengths of the officer's degree in meteorology. Weather station enlisted leadership will continue to play a vital role in weather station operations, but the burden of technical leadership has been taken from the chief of weather station operations (CWSO) and placed on your shoulders.
Not all officer technical leaders have extensive weather station experience. This handbook will serve as a valuable starting point for these officers, as well as for more seasoned officer meteorologists, to use in strengthening the unit's technical approach to forecasting. This handbook will introduce you to each of the primary IM duties, give you background information, and provide a starting point for developing your IM program. You should refer to this information whenever possible and use available training resources. Feel free to add local references/ resources to this binder; cross-feed good ideas to your major command aerospace sciences officer or HQ AWS/
XON.
The first 11 tabs of the binder contain background information and guidance for key primary IM responsibilities; the 12th tab is a shopping list of technical and scientific resources and references. You'll notice that many of the materials we've included are from "the good old days." Don't worry—the concepts are just as valid today as in the "COMEDs" days. Note: several of the technical references point you to rescinded AWS and AF publications. In the event of conflicting guidance, always follow directive procedures contained in current AF publications.
As you develop and apply your IM approach, seek out and employ the experience of the command meteorologist (CM), NCOIC, and unit training manager; other IMs and National Weather Service science operations officers (SOOs). As always, your major command aerospace sciences point-of-contact (POC) or HQ AWS/XON can assist you with specific questions or problems. If you have any questions about this handbook, call Maj. Jeff Kapolka, AWS/XON, DSN 576-4721, extension 430; ore-mail him at [email protected].
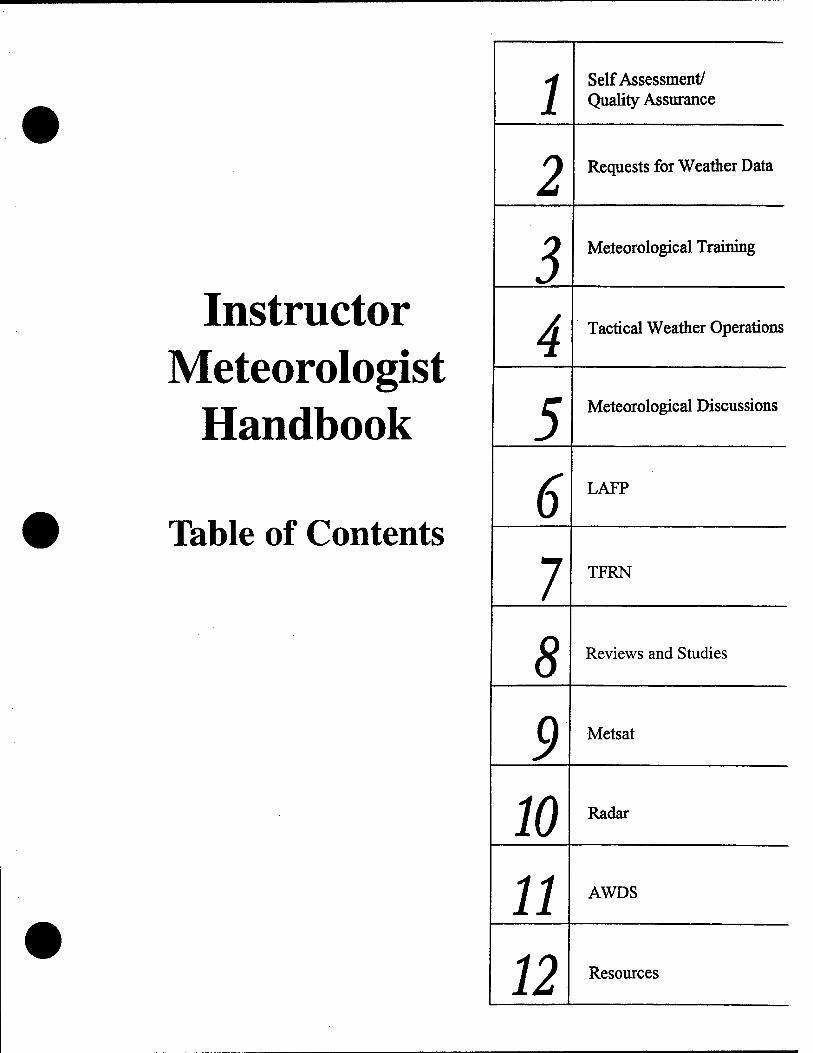
Instructor Meteorologist
Handbook
Table of Contents
1 Self Assessment/ Quality Assurance
2 Requests for Weather Data
3 Meteorological Training
4 Tactical Weather Operations
5 Meteorological Discussions
6 LAFP
7 TFRN
8 Reviews and Studies
9 Metsat
10 Radar
11 AWDS
12 Resources
SELF ASSESSMENT
The best way to gauge the overall health of your unit is by conducting a thorough self-assessment. You can accomplish this by running various checklists (e.g., Quality Air Force Assessment (QAFA), MAJCOM Air Traffic System Analysis, Operational Support Squadron). HQ AWS/CVV, Standardization and Evaluation Divi- sion, has made your job easier through a standardized assessment program.
With the new AFI 15-180, Air Force Weather Proficiency and Upgrade Program (AFWPUP), checkrides are used to ensure personnel are proficient at their job. Checkrides are now also required for all skill-level upgrades. HQ AWS/CVV has checkride forms available for you to use and evaluate your personnel. They are attached to this document.
The following references will help you develop or improve your self-assessment program:
• AFI 15-180 Air Force Weather Standardization and Evaluation Program • Contains guidance on the assessment program
• HQ AWS/CW Technical Standardization and Evaluation Checklists - Be sure to check the AWS Bulletin Board for updates and changes
• HQ AWS/CW Checkride Lists
Your MAJCOM aerospace science POC, HQ AWS/CVV or HQ AWS/XON can assist you with specific questions or problems.
QUALITY ASSURANCE
A forecast product quality assurance program is vital to evaluating the quality of your forecast products. The program consists of three equally important subprograms: (1) a quality control (QC) program, (2) a technical performance program, and (3) an operational effectiveness program. In addition, there must be a quality assurance program for the observing products; however, this is the responsibility of the weather NCOIC.
QUALITY CONTROL (QC)
QC is how you make sure your unit's products meet established standards (e.g., AFMs, AFIs, local Weather Support Plan or Weather Support Instruction). You do this by tracking errors and taking corrective action if you discover problems. QC itself can be divided into two types: (1) on-the-spot QC and (2) after-the-fact QC.
ON-THE-SPOT QC
Because on-the-spot QC corrects errors before the product reaches the user, it should receive the most attention. It's everyone's responsibility, not just the IM's. Some examples of on-the-spot QC include: checking for consistency between observation, terminal aerodrome forecast (TAF), and weather warning and advisory products (i.e., horizontal QC); checking the automated weather dissemination system (AWDS) to make certain that forecast products are accurately transmitted to the user; and verifying that forecast products are properly encoded (e.g., TAFs) or completed (e.g., pilot briefing forms, weather flimsies). Whenever you or any forecaster finds a problem, bring it to the attention of the person responsible and provide the necessary guidance for on-the-spot correction. The key is to correct the error before the user ever sees it. Even though the AWDS performs basic QC for products like TAFs and observations, on-the-spot QC is still important to catch all errors. It's the only way some products, such as briefings, may be checked before being given to the user.
AFTER-THE-FACT QC
After-the-fact QC involves checking samples of selected forecast products for items that, in the eyes of the customer, would detract from the products' usefulness. While errors are the most prominent of these items, after-the-fact QC is more than just looking for things that "slipped through" the on-the-spot QC.
What products should you check? As a minimum, include all forecast products given to a user (including other AFW units) such as TAFs; weather warnings, watches, and advisories; and briefings. In addition to these products, you need to check "input products." These input products are items forecasters complete while developing their forecasts, such as forecast worksheets and locally performed analyses.

What should you check for? On forecast products, check the same things you checked during on-the-spot QC (e.g., horizontal QC, errors). You'll also want to check the timeliness of the product. In other words, was it disseminated or given to the user on schedule or was it late? When you check the input products, see if they are completed or analyzed in accordance with your local guidance. More importantly, you also need to check that they were completed using sound meteorological reasoning.
What type of sample size should you use? Sample sizes for each product checked may vary from month to month, based on factors such as unit workload, experience, number of errors found previously, and importance toward achieving needed quality in the end product. You may want to check more forecast worksheets and local analyses if forecast performance is poor. When there are no indications that a problem exists, you can reduce the sample size to a minimum that will still allow for detection of significant trends. However, you should never make the minimum sample less than 10 percent of the total available. Place your emphasis on poor weather events and high workload days or shifts. These are times when forecasters are most likely to make errors.
What do you do with the after-the-fact QC results? Use the data to find particular problem areas where guidance or training is necessary.
TECHNICAL PERFORMANCE
Technical Performance is the program to monitor, evaluate, and improve the technical quality of the forecast products. Unlike QC, technical performance occurs after the fact. It involves computing metrics, or technical health indices, using data collected during verification of your unit's forecast products. You use these metrics to measure your unit's forecast skill. Two types of technical performance are (1) TAF verification (TAFVER), and (2) weather warning/weather advisory verification.
TAF VERIFICATION (TAFVER)
TAFVER is used to measure the accuracy of your TAFs. All AFW units with TAF responsibility are required to have a TAFVER program. Current requirements are described in Attachment 1. You will have to compute and track the AFW TAFVER metric for each forecaster in your unit and for your unit as a whole. The current AFW TAFVER metric is specified in Attachment 1. You may (or your MAJCOM may direct you to) also compute performance measures in addition to the AFW TAFVER metric.
Each month, you will send your unit's AFW TAFVER metric data to your parent MAJCOM. They will compile the data for all their weather units and send the data on to AWS/XONA. AWS/XONA will then compute the AFW TAFVER metric for all of AFW units and forward it to AF/XOW.
You and your unit's leadership need to use the TAFVER program to assess individual and unit technical health. Look for trends in the data; hopefully, the trend shows improvement. If it doesn't, you'll need to take a closer look at what may have caused the downturn. Don't forget that a downturn, especially among individual forecasters, may be attributed to a small sample size. Also, when you are comparing your unit against persistence, remember that it's more difficult to beat persistence when there are few opportunities to do so. Consequently, your AFW TAFVER metric may have a seasonal bias. For example, your unit may do better in winter than it does in summer. Compare your long-term trends to other stations in your climatological region, your MAJCOM, and AFW to determine overall forecasting health.
You also need to use the metric as a baseline to design and tailor follow-on technical training. Take a look at weather conditions that contributed unfavorably to your unit's AFW TAFVER metric. If forecasters are having problems forecasting certain weather phenomena (e.g., poor visibility due to radiation fog), then additional training in that area would be advisable.
WEATHER WARNING/WEATHER ADVISORY VERIFICATION
Weather warning/advisory verification is used to measure how well your unit was able to provide weather warning and weather advisory support. All AFW units that issue weather warnings and/or weather advisories will have a weather warning/weather advisory verification program.
You have to verify all of your warnings and advisories for tornadoes, winds 25 knots or greater, hail, and freezing precipitation. You can verify other warnings or advisories you think are necessary. As a rule, it's a good idea to verify all of them except observed advisories.
Each month, you will have to complete AF Form 3810, Weather Warning and Weather Advisory Data, or a computer-generated equivalent. Attachment 2 provides instructions on completing the AF Form 3810. Then you will send your unit's AF Form 3810 data to your parent MAJCOM. They will forward the data for all their weather units and send the data on to AWS/XONA.
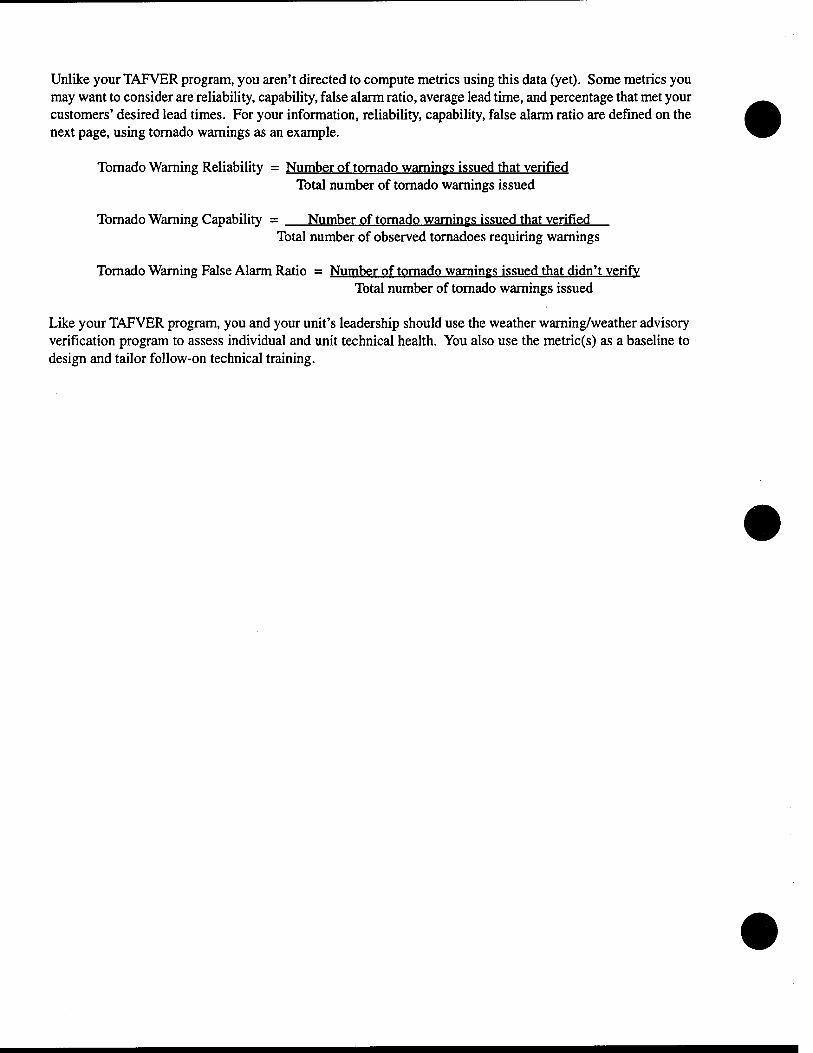
Unlike your TAFVER program, you aren't directed to compute metrics using this data (yet). Some metrics you may want to consider are reliability, capability, false alarm ratio, average lead time, and percentage that met your customers' desired lead times. For your information, reliability, capability, false alarm ratio are defined on the next page, using tornado warnings as an example.
Tornado Warning Reliability = Number of tornado warnings issued that verified Total number of tornado warnings issued
Tornado Warning Capability = Number of tornado warnings issued that verified Total number of observed tornadoes requiring warnings
Tornado Warning False Alarm Ratio = Number of tornado warnings issued that didn't verify Total number of tornado warnings issued
Like your TAFVER program, you and your unit's leadership should use the weather warning/weather advisory verification program to assess individual and unit technical health. You also use the metric(s) as a baseline to design and tailor follow-on technical training.
OPERATIONAL EFFECTIVENESS
Operational effectiveness should be a very high goal of your weather unit. This is where you gauge how well you forecast your customer's critical operational weather thresholds. You do this through your operational verification (OPVER) program.
OPERATIONAL VERIFICATION (OPVER)
All AFW units with forecast responsibilities (including forecast units and weather support units) will have an OPVER program.
You and your customer should establish operational verification criteria. The criteria must be based on go/no-go thresholds that are critical to operations. If a go/no-go threshold cannot be defined, use the element value at which operational decision making begins to be influenced. Observations used to verify these forecasts must be accurate and virtually always available. Sources of observations include, but are not limited to, certified weather observers, weather radar, radiosonde data, satellite data, and aircrew observations.
When your unit issues TAFs covering operationally significant periods, you need to verify at least one operational criterion within theTAF. That is, the verfication hours should be based upon operational requirements. Verification of TAFs used as part of a your OPVER program may involve any appropriate data or verification source. In other words, you're not limited to surface observations as the only verification tool.
You will also need to verify at least one additional forecast element not in the TAF. Selection of this element should be from elements and thresholds that have the greatest impact on your supported agency's mission. For example, this element could be selected from a range forecast, a low-altitude training route forecast, an air- refueling forecast, a drop-zone forecast, an electrooptics forecast, a mission-planning forecast, or a mission- control forecast. You will want to verify this element for at least 1 year to establish seasonal capability. Specify and document the forecast lengths for this element. You may want to verify more than one verification hour since many operations are conducted over a time period of several hours. After 1 year, you may substitute a new element. However, do not extract verification results that are required by your TAFVER and weather warning/ weather advisory programs to satisfy your OPVER requirements.
For each forecast, you need to record whether the element is predicted to be above (FAVORABLE) or below (UNFAVORABLE) the threshold, verify FAVORABLE or UNFAVORABLE for the selected element in every forecast, record the verification, and compare it against persistence. Measures of performance may include forecast capability, reliability, or percent correct, and should be compared to persistence.
If you provide direct operational support, you should inform the supported agencies of the effectiveness of your forecast support. At a minimum, provide OPVER information at least quarterly and include a comparison of weather service to persistence (i.e., no weather service). Attachment 3 shows an example OPVER report that you could prepare for your command meteorologist's signature. You're encouraged to brief your supported agencies on the effectiveness of all key services provided (e.g., weather warnings/weather advisories, TAFs).
Remember, your OPVER program is for the benefit of you and your customers. You need to monitor OPVER statistics, evaluate the results to identify problem areas, adjust procedures, and provide training as required. If performance data shows that you don't have the capability to satisfy the operational requirement, you need to document this shortfall and forward it to the next higher headquarters.
Your MAJCOM aerospace sciences POC or HQ AWS/XON can assist you with specific questions or problems.
INSTRUCTIONS FOR COMPUTING THE AFW TAFVER METRIC
Verification Criteria. The verification criteria for the AFW TAFVER metric consists of two categories: instru- ment meteorological conditions (IMC), and visual meteorological conditions (VMC). For the purposes of the
AFW TAFVER metric, the two conditions are defined as follows:
a. MC: When either the ceiling is less than 1,500 feet or the visibility is less than 3 statute miles (4,800
meters).
b. VMC: When both the ceiling is equal to or greater than 1,500 feet and the visibility is equal to or greater
than 3 statute miles (4,800 meters).
Verification Hours. AFW TAFVER metric verification data will be collected 3, 6, and 12 hours after the TAF
was first issued.
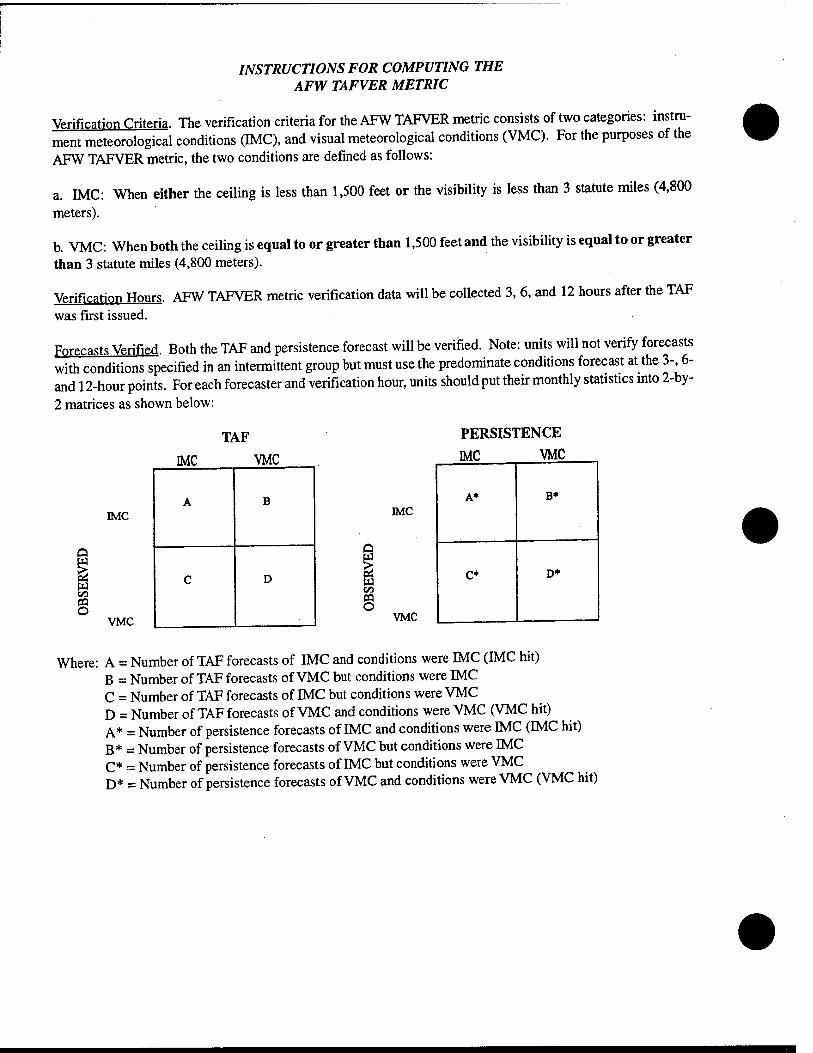
Forecasts Verified. Both the TAF and persistence forecast will be verified. Note: units will not verify forecasts with conditions specified in an intermittent group but must use the predominate conditions forecast at the 3-, 6- and 12-hour points. For each forecaster and verification hour, units should put their monthly statistics into 2-by-
2 matrices as shown below:
w
8
TAF
IMC VMC
IMC
VMC
A B
C D w
PERSISTENCE
IMC VMC
IMC
VMC
A* B*
C* D*
Where: A = Number of TAF forecasts of IMC and conditions were IMC (IMC hit) B = Number of TAF forecasts of VMC but conditions were IMC C = Number of TAF forecasts of IMC but conditions were VMC D = Number of TAF forecasts of VMC and conditions were VMC (VMC hit) A* = Number of persistence forecasts of EMC and conditions were EMC (EMC hit) B* = Number of persistence forecasts of VMC but conditions were EMC C* = Number of persistence forecasts of IMC but conditions were VMC D* = Number of persistence forecasts of VMC and conditions were VMC (VMC hit)

Performance Measure. The AFW TAFVER metric will use the AWS Skill Score (SS). Units will compute the SS for each forecaster and the unit as a whole. Units will use the formula below to calculate SS:
SS = (F-P)/(l-P)
Where: F = Forecast Accuracy = (A+D)/(A+B+C+D) P = Persistence Accuracy = (A*+D*)/(A*+B*+C*+D*)
a. In those cases when P equals 1 and F equals 1 (i.e., the persistence and forecast accuracy are 100 percent), units will report the SS as "NC" (not computable).
b. In those cases when P equals 1 and F is less than 1, units will report the SS as -999.
c. As conditions below 1,500 feet/3 miles can be a rare event, the SS score should be used with caution under regimes that offer few opportunities below 1,500 feet/3 miles, and/or for small sample sizes (individual fore- caster, unit, or even MAJCOMs).
Reporting Requirements. Units will send these matrices for the 3-, 6-, and 12-hour points for their original (not amended) TAFs to their MAJCOM each month.
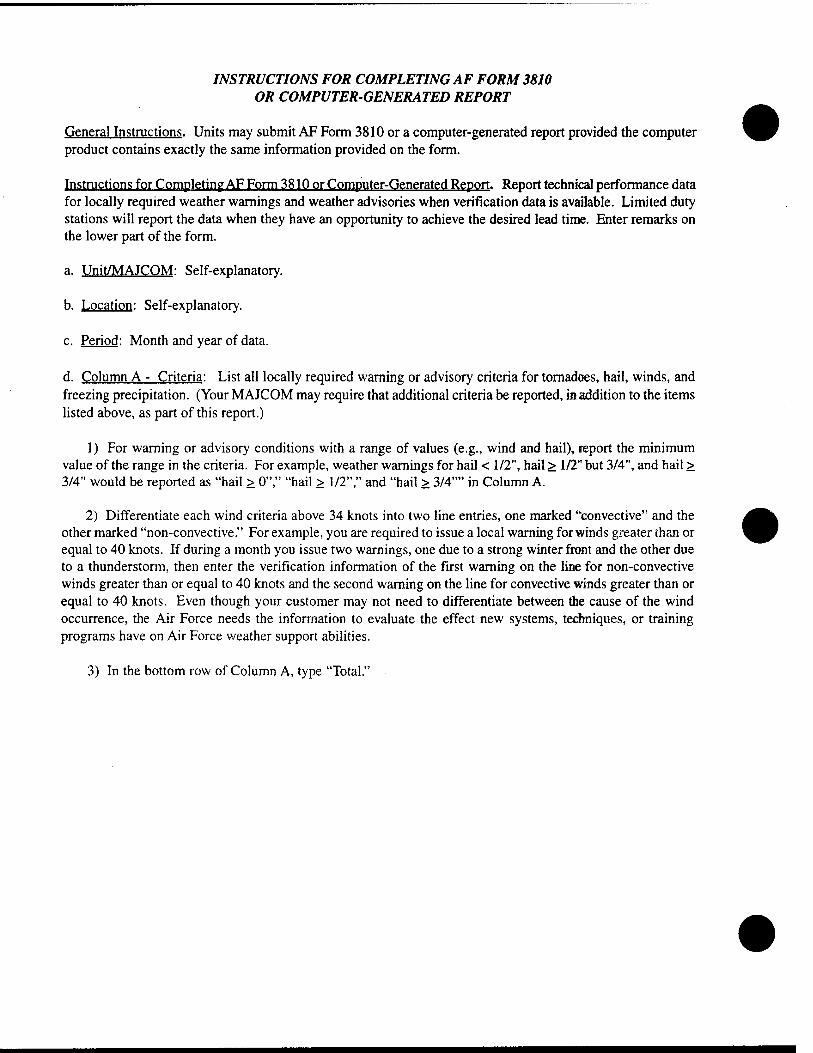
INSTRUCTIONS FOR COMPLETING AF FORM 3810 OR COMPUTER-GENERATED REPORT
General Instructions. Units may submit AF Form 3810 or a computer-generated report provided the computer product contains exactly the same information provided on the form.
Instructions for Completing AF Form 3810 or Computer-Generated Report. Report technical performance data for locally required weather warnings and weather advisories when verification data is available. Limited duty stations will report the data when they have an opportunity to achieve the desired lead time. Enter remarks on the lower part of the form.
a. Unit/MAJCOM: Self-explanatory.
b. Location: Self-explanatory.
c. Period; Month and year of data.
d. Column A - Criteria: List all locally required warning or advisory criteria for tornadoes, hail, winds, and freezing precipitation. (Your MAJCOM may require that additional criteria be reported, in addition to the items listed above, as part of this report.)
1) For warning or advisory conditions with a range of values (e.g., wind and hail), report the minimum value of the range in the criteria. For example, weather warnings for hail < 1/2", hail > 1/2" but 3/4", and hail > 3/4" would be reported as "hail > 0"," "hail > 1/2"," and "hail > 3/4"" in Column A.
2) Differentiate each wind criteria above 34 knots into two line entries, one marked "convective" and the other marked "non-convective." For example, you are required to issue a local warning for winds greater than or equal to 40 knots. If during a month you issue two warnings, one due to a strong winter front and the other due to a thunderstorm, then enter the verification information of the first warning on the line for non-convective winds greater than or equal to 40 knots and the second warning on the line for convective winds greater than or equal to 40 knots. Even though your customer may not need to differentiate between the cause of the wind occurrence, the Air Force needs the information to evaluate the effect new systems, techniques, or training programs have on Air Force weather support abilities.
3) In the bottom row of Column A, type "Total."
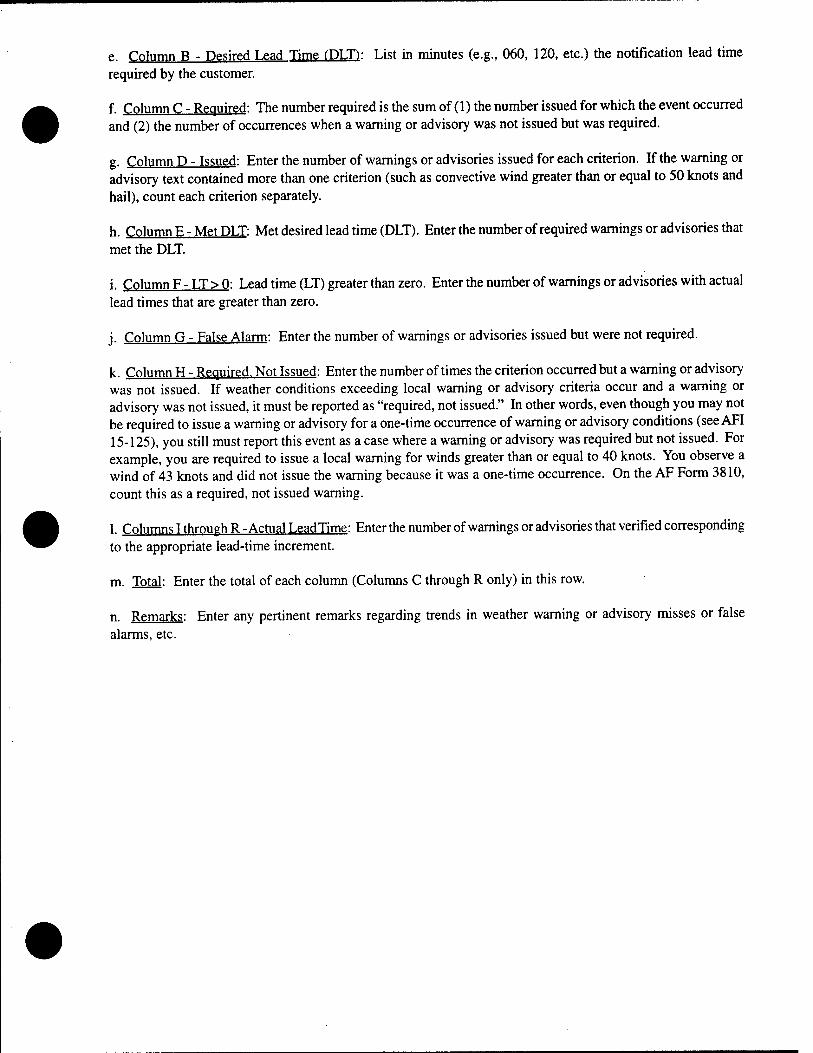
e. Column B - Desired Lead Time (DLT): List in minutes (e.g., 060, 120, etc.) the notification lead time required by the customer.
f. Column C - Required: The number required is the sum of (1) the number issued for which the event occurred and (2) the number of occurrences when a warning or advisory was not issued but was required.
g. Column D - Issued: Enter the number of warnings or advisories issued for each criterion. If the warning or advisory text contained more than one criterion (such as convective wind greater than or equal to 50 knots and hail), count each criterion separately.
h. Column E - Met DLT: Met desired lead time (DLT). Enter the number of required warnings or advisories that met the DLT.
i. Column F-LT>0: Lead time (LT) greater than zero. Enter the number of warnings or advisories with actual lead times that are greater than zero.
j. Column G - False Alarm: Enter the number of warnings or advisories issued but were not required.
k. Column H - Required. Not Issued: Enter the number of times the criterion occurred but a warning or advisory was not issued. If weather conditions exceeding local warning or advisory criteria occur and a warning or advisory was not issued, it must be reported as "required, not issued." In other words, even though you may not be required to issue a warning or advisory for a one-time occurrence of warning or advisory conditions (see AFI 15-125), you still must report this event as a case where a warning or advisory was required but not issued. For example, you are required to issue a local warning for winds greater than or equal to 40 knots. You observe a wind of 43 knots and did not issue the warning because it was a one-time occurrence. On the AF Form 3810, count this as a required, not issued warning.
1. Columns I through R -Actual LeadTime: Enter the number of warnings or advisories that verified corresponding to the appropriate lead-time increment.
m. Total: Enter the total of each column (Columns C through R only) in this row.
n. Remarks: Enter any pertinent remarks regarding trends in weather warning or advisory misses or false alarms, etc.
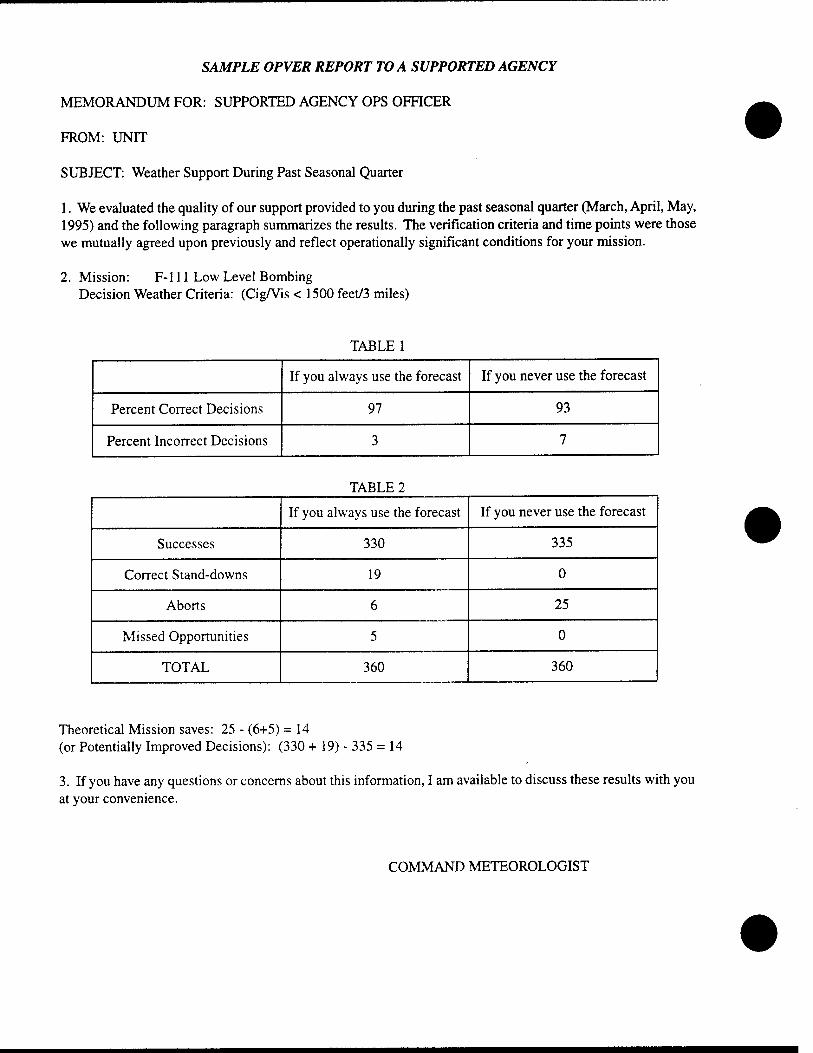
SAMPLE OPVER REPORT TO A SUPPORTED AGENCY
MEMORANDUM FOR: SUPPORTED AGENCY OPS OFFICER
FROM: UNIT
SUBJECT: Weather Support During Past Seasonal Quarter
1. We evaluated the quality of our support provided to you during the past seasonal quarter (March, April, May, 1995) and the following paragraph summarizes the results. The verification criteria and time points were those we mutually agreed upon previously and reflect operationally significant conditions for your mission.
2. Mission: F-l 11 Low Level Bombing Decision Weather Criteria: (Cig/Vis < 1500 feet/3 miles)
TABLE 1
If you always use the forecast If you never use the forecast
Percent Correct Decisions 97 93
Percent Incorrect Decisions 3 7
TABLE 2
If you always use the forecast If you never use the forecast
Successes 330 335
Correct Stand-downs 19 0
Aborts 6 25
Missed Opportunities 5 0
TOTAL 360 360
Theoretical Mission saves: 25 - (6+5) = 14 (or Potentially Improved Decisions): (330 + 19) - 335 = 14
3. If you have any questions or concerns about this information, I am available to discuss these results with you at your convenience.
COMMAND METEOROLOGIST
REQUESTS FOR WEATHER DATA
The meteorological products received at your base weather station (BWS) are the building blocks for your entire forecast process. These products are received in a variety of forms and through a number of different mediums. For simplicity, the weather data can be broken down into the following categories:
1) Routine Data Requirements: data normally required frequently in the day-to-day station opera- tions.
2) Special Event Data Requirements: data required on-demand to meet special support requirements, but not normally required for routine mission support.
Routine data requirements include such items as meteorological satellite (METSAT), alphanumeric (A/N) and graphic data received via your AWDS, weather facsimile products via the Air Force Digital Graphics System (AFDIGS), A/N and notice to airman (NOTAM) information via the Air Force Meteorological Dissemination System (AFMEDS), and METSAT imagery available through the National Environmental Satellite Data and Information Service (NESDIS).
Special event data requirements include such products as special data packages needed to support specific exercises or contingency operations plans. These requirements may come in the form of site-specific weather information such as observations, forecasts or warnings out of Air Force Global Weather Center (AFGWC); METSAT data provided by the National Oceanic and Atmospheric Administration (NOAA), or climatology requests from the Air Force Combat Climatology Center (AFCCC).
/■
The following references will aid you in your requests for weather data:
AFM 15-125 Weather Station Operations - Chapter 6 discusses the complete weather communications network, including the description of how products are disseminated and their various sources. Also included are complete instructions on all aspects of BWS data manipulation, to include service preparation, establishing weather data requirements on various types of weather equipment, and requesting weather communications services.
AFCAT 15-152, Vol I Facsimile and Graphics Products Catalog - Contains brief descriptions of facsimile and graphics products available on the AFDIGS and AWDS.
AFCAT 15-152, Vol II Weather Station Index - Contains a worldwide index of weather station identifiers and related information.
AFCAT 15-152, Vol III Weather Message Catalog - Provides a description of all non-decodable weather bulletins.
T-TWOS #16 Adding Maritime Observations to AWDS - Describes how to maximize your AWDS formatted binary data (FBD) products by including maritime observations.
AFI15-118 Requesting Specialized Weather Support • Describes specialized atmospheric and space environmental support, collectively termed specialized support, and provides guidance and procedures for requesting it.
AFCCC/TN—95/005 Capabilities, Products, and Services oftheAFCCC - Describes the capabilities, purpose, and organization of the Air Weather Service unit charged with building, maintaining, and applying the USAF climatic database.
AFI 33-103 Requirements Development and Processing - Details the process to streamline the development of and response to C4 systems requirements.
Your MAJCOM aerospace sciences POC or HQ AWS/XON can assist you with specific questions or concerns.
AFCCC/TN-95/005
Capabilities, Products, and Services of the
AFCCC Air Force
Combat Climatology Center
DECEMBER 1995
APPROVED FOR PUBLIC RELEASE; DISTRIBUTION IS UNLIMITED.
Air Force Combat Climatology Center 859 Buchanan Street
Scott Air Force Base, Illinois 62225-5116
REPORT DOCUMENTATION PAGE
2. Report Date: December 1995
3. Report Type: Technical Note
4. Title: Capabilities, Products, and Services of the Air Force Combat Climatology Center (AFCCC)
7. Performing Organization Name and Address: Air Force Combat Climatology Center (AFCCC), 859 Buchanan St, Scott AFB IL 62225-5116
8. Performing Organization Report Number: AFCCC/TN—95/005
11. Supplementary Notes: Supersedes AD-A275654
12. Distribution/Availability Statement: Approved for public release; distribution is unlimited
13. Abstract: Describes the capabilities of the Air Force Combat Climatology Center (AFCCC), an agency that creates, maintains, and applies the Air Force's climatological database. Describes AFCCC products and services and tells how to request them. Describes the climatological database and AFCCC computer assets. Discusses AFCCC mission and organization. Appendices provide request formats, Dial-In applications, and a history of AFCCC and military
climatology.
14 Subject terms: CLIMATOLOGY, WEATHER, WEATHER OBSERVATIONS, METEOROLOGY, DATABASE, APPLICATIONS, COMPUTER APPLICATIONS, COMPUTERS, COMPUTERIZED SIMULATION, MILITARY ORGANIZATIONS, AIR FORCE FACILITIES, NUMERICAL ANALYSIS, PRODUCTS, SERVICES, AIR FORCE COMBAT CLIMATOLOGY CENTER
15. Number of Pages: 40
17. Security Classification of Report: Unclassified
18. Security Classification of This Page: Unclassified
19. Security Classification of Abstract: Unclassified
20. Limitation of Abstract: UL
Standard Form 298
in
PREFACE
This technical note describes the capabilities, purpose, and organization of the Air Force Combat f^k \ Climatology Center, formerly the United States Air Force Environmental Technical Applications Center ^^ -■ (USAFETAC), the Air Weather Service unit charged with building, maintaining, and applying the United States Air Force's climatic database.
AFCCC is located at Scott Air Force Base, Illinois. Its Operating Location A (OL-A), collocated with the National Climatic Data Center at Asheville, North Carolina, maintains the Air Force's climatic computer database as part of the Federal Climate Complex.
AFCCC analysts apply the contents of the total database to satisfy specific customer needs upon request. The computer database maintained by OL-A, AFCCC at Asheville is in the same building as a civilian version maintained by the National Climatic Data Center. Both databases were built from weather observations collected, in some cases, over periods of more than 100 years. The databases are continuously updated through electronic input of environmental information from worldwide sources.
The purpose of this document is to familiarize potential AFCCC customers throughout the Department of Defense with AFCCC and its capabilities. It begins by describing some of AFCCC's products and services and telling potential customers how to obtain them. Most AFCCC services are requested in accordance with AFI 15-118, Requesting Specialized Weather Support; AR 115-12, U.S. Army Requirements for Weather and Climatological Support; and NAVOCEANCOMINST 3140.1. After describing the contents of the climatic database, AFCCC's computer assets and organization are discussed briefly. Appendices provide request formats, "Online" applications, and a history of AFCCC and military climatology.
Because weather affects virtually every military operation, all levels of planners and operational specialists should find something of interest here. Those familiar with past AFCCC services should take a careful look at the new capabilities listed. Recent technological advancements have resulted in a number of new climatological data applications.
IV
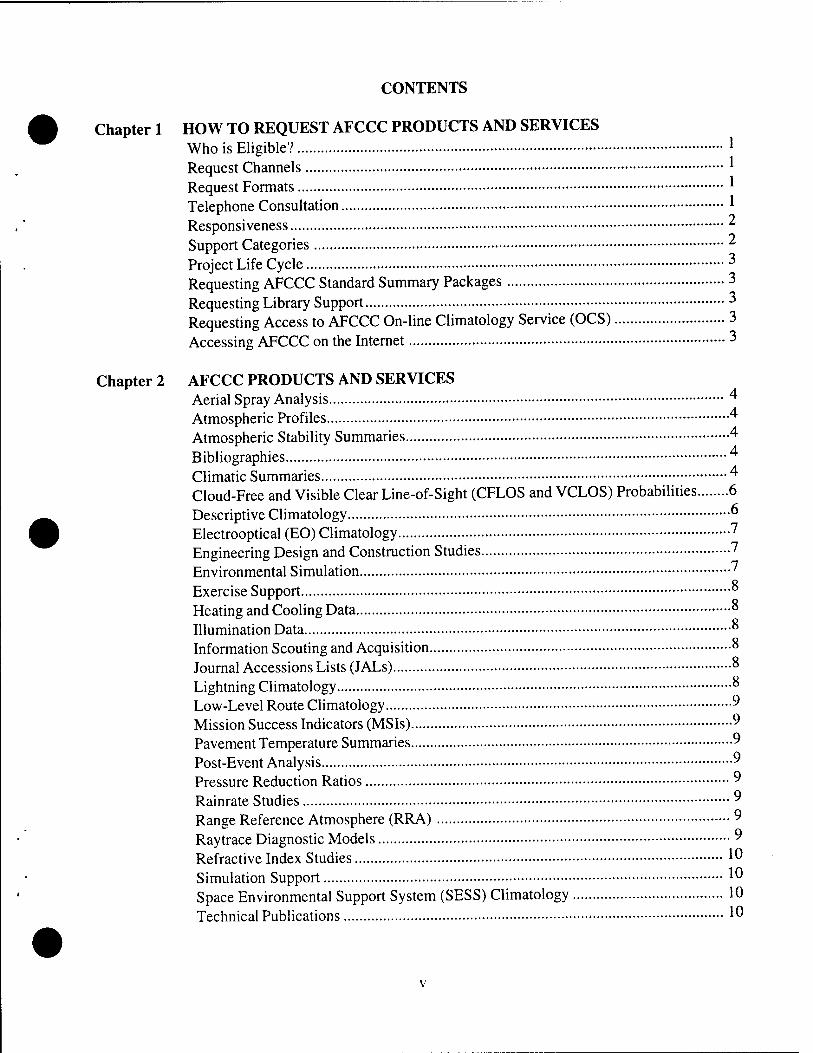
CONTENTS
Chapter 1 HOW TO REQUEST AFCCC PRODUCTS AND SERVICES Who is Eligible? * Request Channels *■ Request Formats * Telephone Consultation 1 Responsiveness 2
Support Categories 2 Project Life Cycle •* Requesting AFCCC Standard Summary Packages 3 Requesting Library Support 3 Requesting Access to AFCCC On-line Climatology Service (OCS) 3 Accessing AFCCC on the Internet 3
Chapter 2 AFCCC PRODUCTS AND SERVICES Aerial Spray Analysis 4 Atmospheric Profiles 4
Atmospheric Stability Summaries 4
Bibliographies 4
Climatic Summaries 4 Cloud-Free and Visible Clear Line-of-Sight (CFLOS and VCLOS) Probabilities 6 Descriptive Climatology 6
Electrooptical (EO) Climatology 7
Engineering Design and Construction Studies 7
Environmental Simulation 7
Exercise Support ° Heating and Cooling Data 8 Illumination Data ° Information Scouting and Acquisition 8 Journal Accessions Lists (JALs) ° Lightning Climatology 8 Low-Level Route Climatology 9 Mission Success Indicators (MSIs) 9 Pavement Temperature Summaries 9 Post-Event Analysis " Pressure Reduction Ratios " Rainrate Studies " Range Reference Atmosphere (RRA) 9 Raytrace Diagnostic Models " Refractive Index Studies 10 Simulation Support 10 Space Environmental Support System (SESS) Climatology 10 Technical Publications > 10
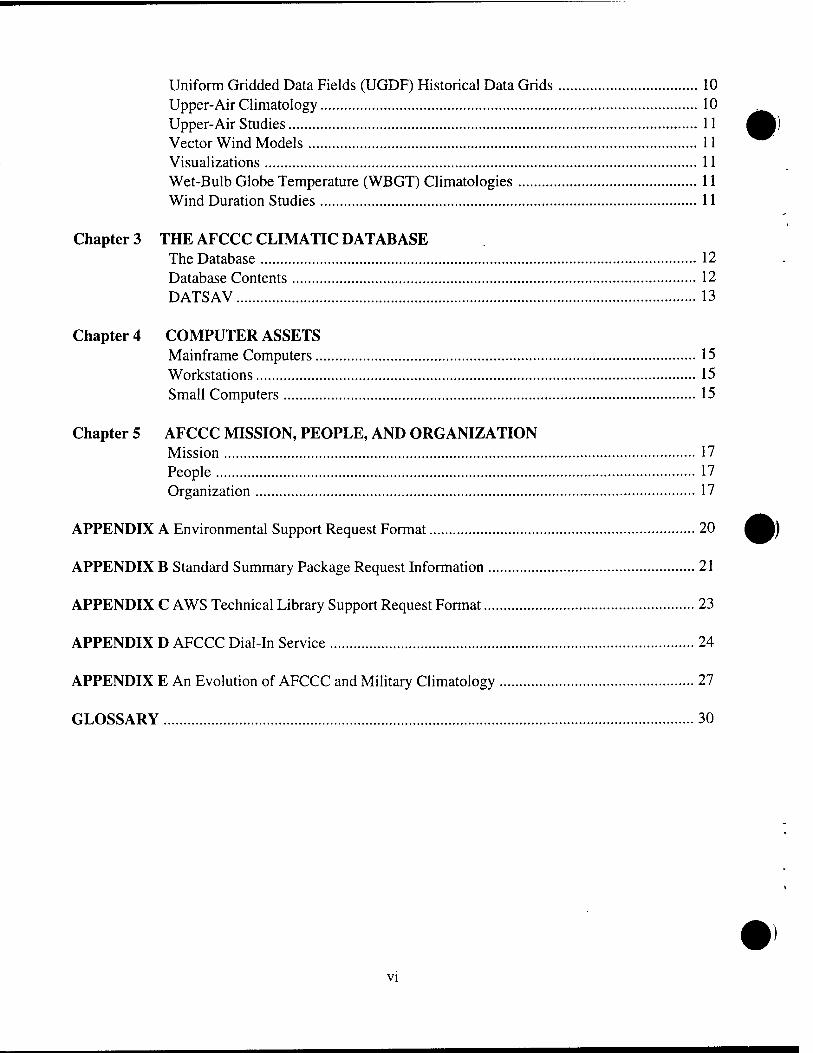
Uniform Gridded Data Fields (UGDF) Historical Data Grids 10 Upper-Air Climatology 10 Upper-Air Studies 11 Vector Wind Models 11 Visualizations 11 Wet-Bulb Globe Temperature (WBGT) Climatologies 11 Wind Duration Studies 11
Chapter 3 THE AFCCC CLIMATIC DATABASE The Database 12 Database Contents 12 DATSAV 13
Chapter 4 COMPUTER ASSETS Mainframe Computers 15 Workstations 15 Small Computers 15
Chapter 5 AFCCC MISSION, PEOPLE, AND ORGANIZATION Mission 17 People 17 Organization 17
APPENDIX A Environmental Support Request Format 20
APPENDIX B Standard Summary Package Request Information 21
APPENDIX C AWS Technical Library Support Request Format 23
APPENDIX D AFCCC Dial-In Service 24
APPENDIX E An Evolution of AFCCC and Military Climatology 27
GLOSSARY 30
vi
FIGURES
Figure 1. AFCCC Organization as of November 1995 16
TABLES
Table 1. AFCCC Crisis/Contingency Support Products 2
Table 2. Standard Ceiling and Visibility Categories 21
Vll
CAPABILITIES, PRODUCTS, AND SERVICES OF THE AIR FORCE COMBAT CLIMATOLOGY CENTER (AFCCC)
Chapter 1 HOW TO REQUEST AFCCC PRODUCTS AND SERVICES
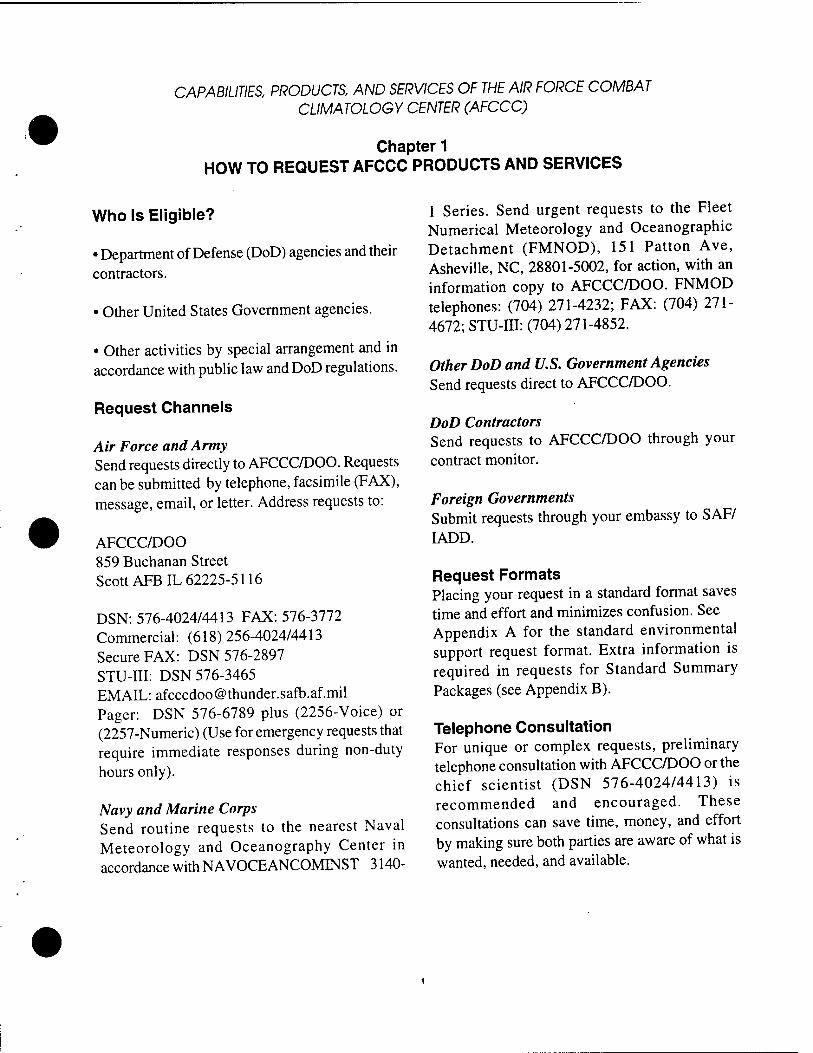
Who Is Eligible?
• Department of Defense (DoD) agencies and their contractors.
• Other United States Government agencies.
• Other activities by special arrangement and in accordance with public law and DoD regulations.
Request Channels
Air Force and Army Send requests directly to AFCCC/DOO. Requests can be submitted by telephone, facsimile (FAX), message, email, or letter. Address requests to:
AFCCC/DOO 859 Buchanan Street Scott AFBIL 62225-5116
DSN: 576-4024/4413 FAX: 576-3772 Commercial: (618)256-4024/4413 Secure FAX: DSN 576-2897 STU-III: DSN 576-3465 EMAIL: [email protected] Pager: DSN 576-6789 plus (2256-Voice) or (2257-Numeric) (Use for emergency requests that require immediate responses during non-duty hours only).
Navy and Marine Corps Send routine requests to the nearest Naval Meteorology and Oceanography Center in accordance with NAVOCEANCOMINST 3140-
1 Series. Send urgent requests to the Fleet Numerical Meteorology and Oceanographic Detachment (FMNOD), 151 Patton Ave, Asheville, NC, 28801-5002, for action, with an information copy to AFCCC/DOO. FNMOD telephones: (704) 271-4232; FAX: (704) 271- 4672; STU-ffl: (704) 271-4852.
Other DoD and U.S. Government Agencies Send requests direct to AFCCC/DOO.
DoD Contractors Send requests to AFCCC/DOO through your contract monitor.
Foreign Governments Submit requests through your embassy to SAF/ IADD.
Request Formats Placing your request in a standard format saves time and effort and minimizes confusion. See Appendix A for the standard environmental support request format. Extra information is required in requests for Standard Summary Packages (see Appendix B).
Telephone Consultation For unique or complex requests, preliminary telephone consultation with AFCCC/DOO or the chief scientist (DSN 576-4024/4413) is recommended and encouraged. These consultations can save time, money, and effort by making sure both parties are aware of what is wanted, needed, and available.
CHAPTER 1
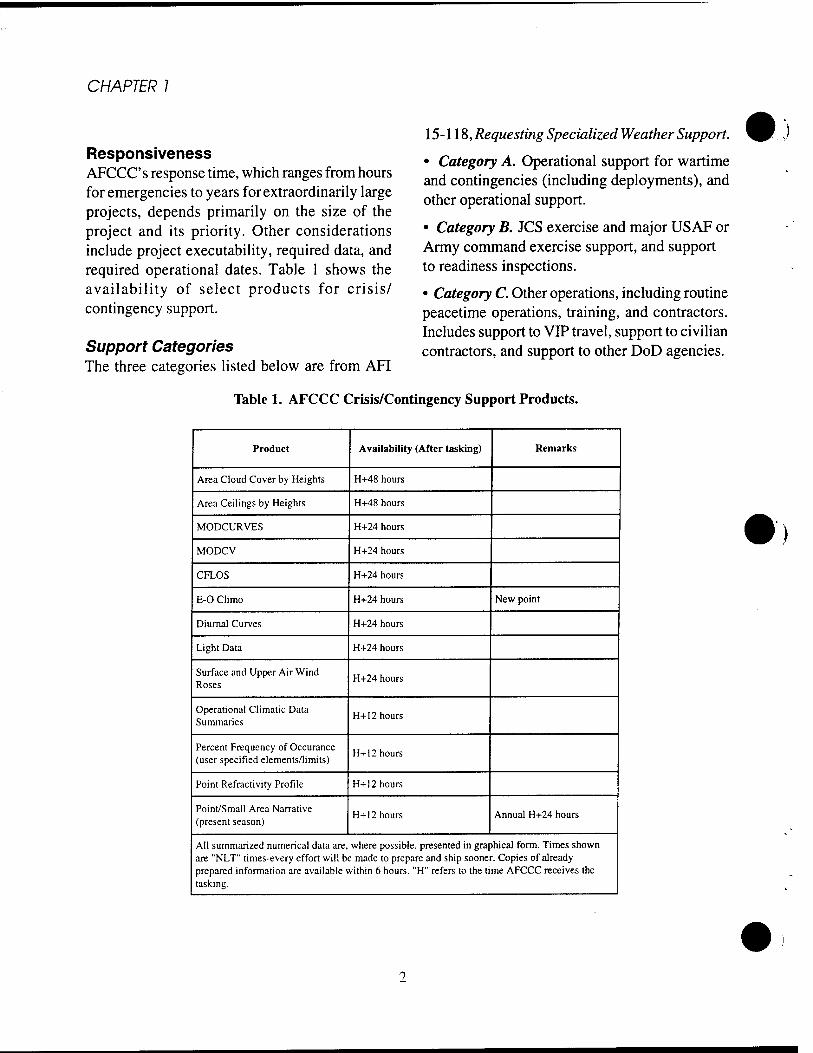
Responsiveness AFCCC's response time, which ranges from hours for emergencies to years for extraordinarily large projects, depends primarily on the size of the project and its priority. Other considerations include project executability, required data, and required operational dates. Table 1 shows the availability of select products for crisis/ contingency support.
Support Categories The three categories listed below are from AFI
15-118, Requesting Specialized Weather Support.
• Category A. Operational support for wartime and contingencies (including deployments), and other operational support.
• Category B. JCS exercise and major USAF or Army command exercise support, and support to readiness inspections.
• Category C. Other operations, including routine peacetime operations, training, and contractors. Includes support to VIP travel, support to civilian contractors, and support to other DoD agencies.
Table 1. AFCCC Crisis/Contingency Support Products.
Product Availability (After tasking) Remarks
Area Cloud Cover by Heights H+48 hours
Area Ceilings by Heights H+48 hours
MODCURVES H+24 hours
MODCV H+24 hours
CFLOS H+24 hours
E-0 Climo H+24 hours New point
Diurnal Curves H+24 hours
Light Data H+24 hours
Surface and Upper Air Wind Roses
H+24 hours
Operational Climatic Data Summaries
H+12 hours
Percent Frequency of Occurance (user specified elements/limits)
H+12 hours
Point Refractivity Profile H+12 hours
Point/Small Area Narrative (present season)
H+12 hours Annual H+24 hours
All summarized numerical data are, where possible, presented in graphical form. Times shown are "NLT" times-every effort will be made to prepare and ship sooner. Copies of already prepared information are available within 6 hours. "H" refers to the time AFCCC receives the tasking.
AFCCC PRODUCTS AND SERVICES
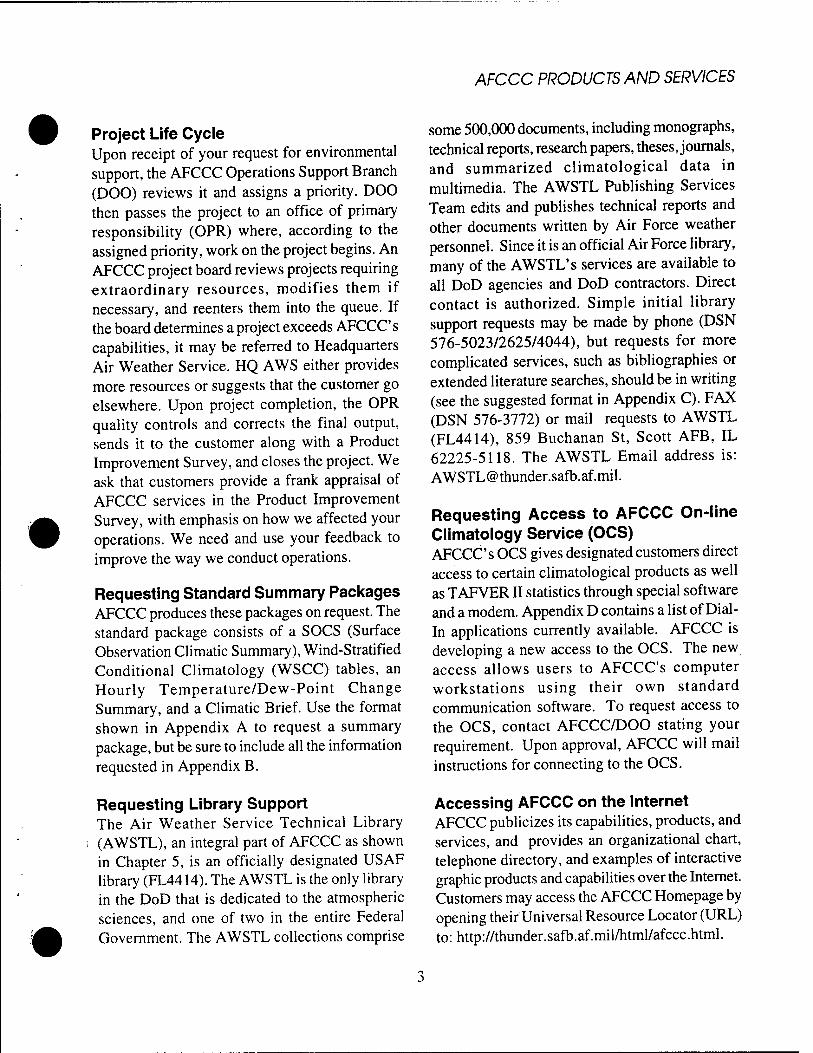
Project Life Cycle Upon receipt of your request for environmental support, the AFCCC Operations Support Branch (DOO) reviews it and assigns a priority. DOO then passes the project to an office of primary responsibility (OPR) where, according to the assigned priority, work on the project begins. An AFCCC project board reviews projects requiring extraordinary resources, modifies them if necessary, and reenters them into the queue. If the board determines a project exceeds AFCCCs capabilities, it may be referred to Headquarters Air Weather Service. HQ AWS either provides more resources or suggests that the customer go elsewhere. Upon project completion, the OPR quality controls and corrects the final output, sends it to the customer along with a Product Improvement Survey, and closes the project. We ask that customers provide a frank appraisal of AFCCC services in the Product Improvement Survey, with emphasis on how we affected your operations. We need and use your feedback to improve the way we conduct operations.
Requesting Standard Summary Packages AFCCC produces these packages on request. The standard package consists of a SOCS (Surface Observation Climatic Summary), Wind-Stratified Conditional Climatology (WSCC) tables, an Hourly Temperature/Dew-Point Change Summary, and a Climatic Brief. Use the format shown in Appendix A to request a summary package, but be sure to include all the information requested in Appendix B.
Requesting Library Support The Air Weather Service Technical Library
. (AWSTL), an integral part of AFCCC as shown in Chapter 5, is an officially designated USAF library (FL4414). The AWSTL is the only library in the DoD that is dedicated to the atmospheric sciences, and one of two in the entire Federal Government. The AWSTL collections comprise
some 500,000 documents, including monographs, technical reports, research papers, theses, journals, and summarized climatological data in multimedia. The AWSTL Publishing Services Team edits and publishes technical reports and other documents written by Air Force weather personnel. Since it is an official Air Force library, many of the AWSTL's services are available to all DoD agencies and DoD contractors. Direct contact is authorized. Simple initial library support requests may be made by phone (DSN 576-5023/2625/4044), but requests for more complicated services, such as bibliographies or extended literature searches, should be in writing (see the suggested format in Appendix C). FAX (DSN 576-3772) or mail requests to AWSTL (FL4414), 859 Buchanan St, Scott AFB, IL 62225-5118. The AWSTL Email address is: [email protected].
Requesting Access to AFCCC On-line Climatology Service (OCS) AFCCC s OCS gives designated customers direct access to certain climatological products as well as TAFVERII statistics through special software and a modem. Appendix D contains a list of Dial- In applications currently available. AFCCC is developing a new access to the OCS. The new access allows users to AFCCCs computer workstations using their own standard communication software. To request access to the OCS, contact AFCCC/DOO stating your requirement. Upon approval, AFCCC will mail instructions for connecting to the OCS.
Accessing AFCCC on the Internet AFCCC publicizes its capabilities, products, and services, and provides an organizational chart, telephone directory, and examples of interactive graphic products and capabilities over the Internet. Customers may access the AFCCC Homepage by opening their Universal Resource Locator (URL) to: http://thunder.safb.af.mil/html/afccc.html.
CAPABILITIES, PRODUCTS, AND SERVICES OF THE AIR FORCE COMBAT CLIMATOLOGY CENTER (AFCCC)
Chapter 2 AFCCC PRODUCTS AND SERVICES
The following partial alphabetical listing of AFCCC s products and services should give potential customers an idea of our nearly limitless capabilities. Most of the products and services listed here can be modified or tailored to meet unique or specialized requirements. To discuss your requirements, call AFCCC/DOO, DSN 576- 4024/4413.
Aerial Spray Analysis This PC version of the Forest Service (Cramer- Barry-Grim) Aerial Spray Computer Model is used to predict aircraft spray dispersion and deposition over a given area. Some applications include design optimization of spray concentrations, optimum flight and meteorological conditions for spraying, and assessment of potential environmental impacts.
Atmospheric Profiles Our analysts can prepare a detailed atmospheric analysis for any predefined atmospheric segment of the world, for a specified time in the recorded past, from the surface to 400,000 feet. These analyses include vertical or slant-range profiles of wind, temperature, absolute humidity, density, pressure, and precipitable water. Profiles also provide gridded cloud depictions, site weather pseudo-surface observations, 24-hour weather history, and aerosol variables. These vertical profiles are produced by the AWS Atmospheric Slant-Path Analysis Model (ASPAM).
Atmospheric Stability Summaries This empirical program uses surface observations to calculate the Pasquill classes (A-F) by hour and month, where A indicates strong convection,
D represents purely mechanical turbulence, and F implies stable air in which mechanical turbulence is strongly damped by stratification.
Bibliographies With access to more than 400 online computer databases, AFCCC can provide requesters with bibliographies that cite currently available references on any given subject in the atmospheric sciences and related disciplines. Database vendors include DIALOG, CIRC II, and the Defense Technical Information Center (DTIC). We also have a secure terminal on the Defense Research Development Test and Evaluation (RDT&E) Online System (DROLS), which contains more than 1 million citations on DoD scientific and technical documents. "Subject" bibliographies (SBs) are prepared ad hoc on one subject, for one requester. "Current awareness" bibliographies (CABs) are prepared periodically to provide one or more requesters with recent additions to the literature on a specific subject or discipline.
Climatic Summaries AFCCC routinely produces a number of standard climatic summaries, including the following:
• Ceiling and Visibility (MODCV). We've modeled ceiling and visibility climatology for more than 600 stations worldwide. MODCV is available in DOS or Windows versions. MODCV displays conditional and unconditional climatological probabilities of selected ceiling and visibility thresholds out to 72 hours and is similar to wind-stratified conditional climatology tables. The latest MODCV version includes better graphics and data for limited duty stations.
CHAPTER 2
• Modeled Diurnal Curves (MODCURVES). These products provide monthly summarized temperature, dew point, altimeter setting, relative humidity, and pressure altitude changes by hour for stations from which surface observations are available. The product provides data in monthly increments, and includes four wind sectors and two sky cover categories. Values are displayed in graphic and tabular form. The product is used primarily as a forecaster aid and in systems development when variation of any of the weather elements listed is important. These summaries resemble temperature/dewpoint summaries, but are menu driven in a Windows environment.
• Surface Observation Climatic Summaries (SOCS). The SOCS replaced the Revised Uniform Summary of Surface Weather Observations (RUSSWO) in July 1988. Each SOCS summarizes hourly observations (and "summary of day" data) for a given weather station. Five years of record are required to create a SOCS. AFCCC updates existing SOCS whenever 10 additional years are added to the database, or more frequently on request. SOCS summarize observed data in eight categories: atmospheric phenomena, precipitation, wind, ceiling/visibility/sky cover, pressure, crosswinds, degree days, temperature, and humidity. Each SOCS includes a Climatic Brief, described below. AFCCC publishes SOCS as AFCCC data summaries and provides the information in diskette or microfiche format.
• Climatic Brief. AFCCC publishes climatic briefs, two-page summaries of monthly and annual climatic data for any station with a SOCS, as part of a larger publication entitled Station Climatic Summaries. This product consists of a seven-part series that comprises North America; Latin America; Europe; Africa; Asia; Antarctica, Australia, and Oceania; and USSR, Mongolia, and China. The publications also include collections of the Operational Climatic Data Summaries (OCDS).
• Operational Climatic Data Summary (OCDS). This product is a summary of monthly and annual climatic data prepared manually when the creation of a standard computerized "climatic brief is impractical due to lack of data, or to answer a short-notice request. The most recent 10-year period of record is used unless more data is available. Data is supplemented from other sources such as earlier periods of record, data from contemporary and/or earlier stations, and published data from other sources.
• Temperature/Dew-Point Summaries. These summaries provide monthly summarized temperature and dew point changes by hour, stratified by ceiling and wind, for stations from which surface weather observations are available. Data is provided in monthly increments. Up to six wind sectors, three wind-speed classifications, and up to five ceiling categories may be stipulated by the customer. Values are displayed in tabular and graphic form. The product is used primarily as a forecaster aid in systems development when temperature and/or humidity variation is important. These summaries are available in diskette or microfiche format.
• Wind-Stratified Conditional Climatology Tables. These monthly tables give percent occurrence frequencies of past hourly weather observations for specified weather categories of ceiling or visibility stratified by surface wind direction and valid for 1 to 48 hours from the initial weather condition. These summaries are available in diskette or microfiche format.
• Crosswind summaries. These summaries give percent occurrence frequencies for specified crosswind components based on hourly observations. Categorical ceiling/visibility constraints are included. The content and basis for each summary is clearly described in each product. Crosswind summaries have been a part of each SOCS since July 1988.
AFCCC PRODUCTS AND SERVICES
• Heating and Cooling Degree-Day Summaries. These monthly tables are computed by determining the difference between daily mean temperatures and 65° F (or another base temperature determined by the customer), then summing these differences for each individual month. For calculating degree-days, the daily mean temperature is normally defined as the sum of the daily maximum and minimum temperatures divided by two. The use of other mean temperature definitions is identified in individual summaries. A modified version of these summaries has been a part of each SOCS since July 1988.
• Temperature Duration Summaries. These can be for high or low temperatures. They have been used in applications such as the determination of battery life.
• Precipitation Summaries. These provide climatological precipitation amounts for every week of the year. They can be used in combination with temperature to determine the best times to use heavy equipment with the least damage to roads and grounds.
• Daily Temperature/Precipitation Summaries. These give maximum/minimum and mean maximum/minimum temperatures, degree-days, two maximum and mean precipitation, and maximum and mean snowfall for every day of the year during a specified period of record. Mean precipitation and snowfall are based only on days in which precipitation and snowfall actually occurred; the number of years of precipitation or snowfall for each date is given.
• Cloud Data Summaries. These include cloud amount distributions of total cloud, cloud cover (low, middle, or high) within various layer combinations, frequency of occurrence of clear
skies, and frequency of less than a specified cloud amount above or below various heights. Distributions of total cloud cover versus maximum cloud tops and frequency of occurrence of consecutive grid points along a specified great circle route having specified cloud cover are also included. Monthly summaries for available analysis hours can be prepared for any point, anywhere in the world.
Cloud-Free and Visible Clear Line-of- Sight (CFLOS and VCLOS) Probabilities Static CFLOS probabilities of various look-angles can be produced for specified locations by using cloud cover distributions from surface observations or Air Force Global Weather Central (AFGWC) cloud analyses using the Standard Research Institute (SRI) CFLOS Model. AFCCC also has a visible clear-line-of-sight (VCLOS) model that estimates environmental effects on sensors at visible light frequencies, such as those in the TV Maverick and TV GBU 15. Input data consists of surface weather observations, nephanalysis cloud fields, date, time, locations, attack geometry, and targe^ackground albedos. Data can be processed for single case and climatological studies and used to evaluate the effectiveness of electrooptical systems (see also our CFLOS simulation capabilities described under environmental simulation).
Descriptive Climatology These narrative studies (prepared on request for regions, areas, or points) are written to the customer's order. Studies include descriptions and effects of synoptic climatology on the point or region studied. The emphasis is on typical daily weather scenarios and their causes. Studies can be prepared to cover events that, while rare, may still affect mission success drastically. A typical study, for example, might discuss the occurrence of dust storms that restrict visibility to less than
CHAPTER 2
1/2 mile in a region or at a point during a specific time period. Narrative studies are typically produced in one of three packages according to the needs of the customer:
• Point/Small Area Climatologies are site- specific, for areas smaller than Connecticut and for operations below 5,000 feet above ground level (AGL). They can be prepared for specific time periods. They usually take from a week to three months to complete, but high-priority projects covering time periods of a month or less can be turned out in less than 72 hours.
• Large/Intermediate Area Climatologies describe areas larger than the point/small area products—the Persian Gulf is an example. They place more emphasis on mean low-, middle-, and upper-level features. They may be seasonal or annual. These studies generally take from 3 to 12 months.
• Regional Climatologies cover portions of one or more continents, typically for periods of an entire year. These studies provide detailed discussions of major meteorological and climatological regimes, with emphasis on the interaction of semipermanent climatic controls responsible for seasonal weather patterns. Regional studies may take from 12 months to 2 years.
Electrooptical (EO) Climatology We have adapted the LOWTRAN7 model to use conventional data bases in generating electrooptical transmittance climatologies in selected wavelength intervals, such as the 8-12 micron band for infrared systems. A "driver" program was developed to read conventional surface data for input into LOWTRAN7 and selection of the aerosol model to be used. We've also developed a program that reads conventional upper-air data and creates input for FASCOD2, the model used to compute
transmittance for laser-guided munitions. Our EOCLIMO microcomputer program provides three station-specific transmittance climatology in an interactive format. The current version provides monthly transmittance climatology for individual stations at 3-hour intervals. For some regions of the world, a brief descriptive narrative accompanies the statistical data for each station. The program also generates a map of available stations, along with joint probabilities of user-defined transmittance and ceiling thresholds. The EOCLIMO CD-ROM is now available providing a climatology for selected stations worldwide. The EO Tactical Decision Aid (EOTDA) allows us to simulate performance of air- to-ground weapons systems based on environmental information.
Engineering Design and Construction Studies Standard engineering design data packages include temperature, precipitation, icing, and extreme wind analyses. Crosswind studies for runway orientation, along with meteorological data and climatological narratives for inclusion in base master or comprehensive plans are also available. We also provide design freezing index and other data, to include pavement temperature information for pavement evaluation studies. We provide engineering design and meteorological data for the USAF Base Master Plan, Tabs A and D, as well as the data for Engineering Weather Data, the Tri- Service manual.
Environmental Simulation When weather data is inadequate or not available for use in operational simulations, war-gaming, or weapons systems effectiveness studies, simulated weather observations may be the answer. AFCCC has developed a number of sophisticated techniques that provide simulations for single stations or for large arrays of statistically correlated points. These techniques include:
AFCCC PRODUCTS AND SERVICES
• Ceiling and Visibility Observations and Forecasts (CVOF). The CVOF model is a state- of-the-art simulation model that generates ceiling and visibility observations and forecasts. The observations have the proper spatial and temporal correlation. The forecasts are designed to show the same skill as the Air Force average for ceiling and visibility forecasts.
• Cloud-Free Line-of-Sight (CFLOS). We've developed several CFLOS simulation models. One tabulates a climatology of CFLOS statistics based on a ground-based view of orbiting or geostationary satellites. It is capable of handling several sites simultaneously to produce joint-site CFLOS probabilities. Another simulator (CLDGEN) creates cloud scenes as if they were observed by someone on the ground. It can be used to estimate the probability of a cloud-free arc for a specified duration. Another model (C_Cloud_S) provides cloud-cover distribution statistics and CFLOS probabilities for any point on Earth. Output applies to space- or earth-based viewing.
Exercise Support We provide tailored climatological support with products that range from weather impact indicators to en route winds for all DoD exercises, major or minor.
Heating and Cooling Data AFCCC offers a wide range of heating and cooling data, which includes:
• Heating and air conditioning design and criteria data (AFM 88-29, Engineering Weather Data).
• Heating and cooling degree-day statistics.
• Computerized Energy Analysis Reference Year (CEARY) data for use in building-load analysis. CEARY data is from 12 months of specially selected surface observations for each location.
Direct, diffuse, reflected, and total solar irradiance are calculated from weather elements and added to each observation.
Illumination Data The NITELITE Windows-based microcomputer program has been upgraded to include all the information contained in the various LIGHT programs. Units should switch to NITELITE since this is now the standard and it is the only one we plan to improve in the future.
Information Scouting and Acquisition AFCCC continually improves and enlarges its library collections by actively identifying and acquiring new scientific and technical documents (particularly those from sources outside the United States).
Journal Accessions Lists (JALs) JALs are lists of articles in recent journals (magazines) received by the AWS Technical Library. They are published and distributed monthly to make recipients aware of recent scientific and technical articles and make it possible to order copies. JALs are produced on topics that include atmospheric physics, space, atmospheric sciences, meteorology, statistics and mathematics, climatology and forecasting, and general topics.
Lightning Climatology We provide cloud-to-ground lightning-strike climatology on diskette for anywhere in the CONUS. Data format options include graphs and tables of monthly and diurnal variations of average lightning strikes and isopleth analyses of average strikes for each of eight regions, or for the entire CONUS. Tailored regional lightning climatologies stratified by upper-level wind direction are also available. A microcomputer graphics program lets users display lightning- strike climatology for any of the eight regions or for the entire CONUS.
CHAPTER 2
Low-Level Route Climatology Our interactive microcomputer programs provide worst-case route climatology for low-level refueling or training routes. Users enter entry, turn, and exit points.
Mission Success Indicators (MSIs) Our program computes percent occurrence frequencies with respect to time, the number of days a specific weather event occurred, or the start-stop date-time groups with duration in hours of any weather or combination of weather elements in the DATSAV surface weather observation database.
Pavement Temperature Summaries Using a model provided by the Air Force Civil Engineering Support Agency, we provide runway pavement temperature data for varying depths and types of runway surface.
Post-Event Analysis We provide observational data, AFGWC analyses, and other published information for specific locations (from days to years in duration) to answer questions related to specific events.
Pressure Reduction Ratios We provide pressure reduction ratios ("r" factors) on request for DoD weather observing facilities.
Rainrate Studies These studies provide statistics on the effects of rain/atmospheric moisture on attenuation of radio wave propagation. This product contains estimates of rain-event duration and rainrate frequency of occurrence for instantaneous rainrate thresholds using a dataset that includes both instantaneous and clockhour rainrates. This product uses rainfall statistics, cloud moisture, and freezing level data along with state-of-the-art attenuation models to estimate the related attenuation of electromagnetic radiation.
Range Reference Atmosphere (RRA) A "reference atmosphere" is a statistical model of the atmosphere derived from upper-air observations over a specific location. The five atmospheric models developed for the Range Commander's Council/Meteorology Group (RCC/MG) are called "range reference atmospheres," or RRAs. The RRA is the authoritative source for upper-atmosphere climatology over the launch/recovery site for which it has been prepared. RRAs are used to plan, evaluate, and establish environmental launch constraints for aerospace vehicles launched from a particular location. RRAs contain tabulations of monthly and annual means, standard deviations, and skewness coefficients for wind speed, pressure, temperature, density, water vapor pressure, virtual temperature, and dew point temperature. They also provide means and standard deviations for zonal and meridional wind components and the linear (product moment) correlation coefficient between wind components. Statistical values are tabulated at 1-km intervals from mean sea level (MSL) to 30 km and at 2-km intervals from 30 to 70 km. Wind statistics begin at about 10 meters above station elevation and continue upward with respect to MSL thereafter. For ranges without rocketsonde measurements, RRAs terminate at 30 km, but they may be extended upward when rocketsonde data from a nearby location is available.
Raytrace Diagnostic Models The RAYTRAC (formerly CLIMORAY) model uses AFCCC's upper-air database to produce a series of historical raytraces that can be used to generate height-error climatologies and other refractive statistics. For example, an easy to use program derived from RAYTRAC is now available to compute optimum transmitter heights for balloon-borne radars.
REQUESTING PRODUCTS AND SERVICES
Refractive Index Studies These studies provide refractive index values and refractive gradients through the atmosphere. We can provide refractive climatologies for individual radiosonde stations as well as post-analysis of meteorological data to investigate anomalous radiowave propagation. We offer a PC program that displays different types of refractivity climatology for any upper-air station with a statistically significant number of observations. Several raytrace models are available for use in post-analysis studies. They have various capabilities that include graphic output, altitude error, laterally heterogeneous atmosphere (multiple soundings) and elevation angle errors. The Variable Terrain Radio Parabolic Equation (VTRPE) model handles microwave propagation over land and water, and includes'terrain effects and multiple soundings. A climatological raytrace program produces a climatology of height error (see Raytrace Diagnostic Models).
Simulation Support Surface observations, cloud analyses, and various analyzed weather charts for selected scenarios are available for use in simulation studies.
Space Environmental Support System (SESS) Climatology AFCCC has developed techniques for providing statistical studies of the space environment. These studies include those that provide climatological distributions of data. Results are displayed in graphic or tabular format. Using SESS models with historical inputs, we can analyze past events. The Ionospheric Conductivity and Electron Density (ICED) model provides state-of-the-art specifications of the mid-latitude ionosphere. The International Reference Ionosphere (IR1 90) model provides climatology of the ionosphere for nonauroral latitudes. Together, these models provide a means for performing ionospheric point analysis. The Wide-Band Scintillation Model
(WBMOD) is available for analyzing trans- ionospheric communication anomalies. The Magnetospheric Specification Model (MSM) specifies fluxes of particles up to 100 KeV from 2 to 10 earth radii. The Vector Spheric Harmonic (VSH) and Mass Spectrometer and Incoherent Scatter (MSIS) models provide atmospheric conditions up to 1500 KM.
Technical Publications AFCCC writes, edits, publishes, distributes, and maintains AWS, AFCCC, and AFGWC technical reports, technical notes, forecaster memos, catalogs, project reports, users handbooks, and data summaries in a variety of media, including conventional paper, microfiche, diskette, and CD- ROM. We also maintain copies of former AWS wing technical publications.
Uniform Gridded Data Fields (UGDF) Historical Data Grids We can provide (from our archives, in UGDF format) weather-event scenarios for a given date or for a series of dates. The data consists of surface variables; low, middle, and high cloud type, amount, bases, and tops; and wind, temperature, dew point temperature, and D-value for mandatory upper-air levels.
Upper-Air Climatologies Statistical summaries of means, extremes, etc., for user-selected atmospheric variables are available, along with estimates of "worst case" scenarios. The current menu now contains about 40 measured or derived meteorological elements from upper-air observations. These include various thermodynamic variables of pressure, temperature, moisture, and stability, along with wind speed, direction, wind shear values, and refractive coefficients. Users can specify starting and stopping elevations, as well as the increment, to study any layer of the atmosphere for which data is available. Graphics depicting the vertical
10
CHAPTER 2
profiles of statistical values can be generated for any of the available meteorological elements versus height. Wind roses (graphic or tabular) can also be produced from user-specified upper- atmospheric levels.
Upper-Air Studies We can provide specialized studies of such weather variables as upper-level winds, temperature, moisture, density, standard height levels, D-values, and wind shear (to include extreme values), on request. We can also provide probability ellipses for debris fallout and inter- or intra-level correlations of winds.
Vector Wind Models Although these models were originally designed to derive additional information for RRAs, they can be used independently. The software, based on the work of O. E. Smith of NASA, calculates a number of wind statistics based on an assumed bivariate normal distribution of the wind. Input consists of five variables: two means, two standard deviations, and correlation between the u- and v-wind components. The interactive program can answer a number of questions, such as "What's the probability of a wind speed greater
than 50 knots?" or "What's the probability wind rose for a selected location at 10-km altitude?" A limited amount of graphics can be produced.
Visualizations AFCCC has numerous graphics and data visualization capabilities through the use of McIDAS, PV-Wave, and ARC/INFO. We provide high quality maps and charts depicting customer-specified atmospheric variables, terrain, and geographic boundaries. Graphical products can be provided on color or black/white hard copy, or in standard graphic file formats such as GIF and TIFF. Using ARC/INFO, we can perform Geographic Information System (GIS) functions and create GIS datasets.
Wet-Bulb Globe Temperature (WBGT) Climatologies WGBT studies, most frequently used to determine the effects of heat stress on troops, are available on request.
Wind Duration Studies Studies of wind duration and other wind variables, often useful for evaluating the feasibility and sizing of wind-powered generators, are available.
11
CAPABILITIES, PRODUCTS, AND SERVICES OF THE AIR FORCE COMBAT CLIMATOLOGY CENTER (AFCCC)
Chapter 3 AFCCC CLIMATIC DATABASE
The Database The AFCCC climatic database, created and maintained by OL-A, AFCCC at Asheville, is subject to continuous monitoring and quality control. The data it contains is as comprehensive and accurate request. As we can make it. Because the application and use of this data (mostly "raw" or unprocessed) requires considerable meteorological skill and experience; we generally discourage its unconditional release to agencies outside AFCCC. Even AFCCC analysts who use the data routinely (almost all of whom are meteorologists) occasionally confer with the dataset specialists at OL-A, AFCCC before attempting to use it in a specific application. AFCCC also has access to the National Climatic Data Center (NCDC) climatic database, the civil counterpart to the collocated Air Force version.
Database Contents The AFCCC climatic database contains more than 40 subsets of related data. Some of the best known of these are listed below. Most are described in detail in USAFETACATN—86/003, Directory of Climatic Databases . In addition to the commonly used databases (or datasets) listed here, AFCCC has produced hundreds of others to fulfill special customer needs; although these remain available, they are not advertised for general use. Customers with unique requirements need only describe those requirements in their initial request for AFCCC services. In consultation with the customer, we will determine the best way to satisfy these requirements by developing a new customized dataset or by modifying an existing one. The following are examples of frequently used databases/datasets; periods of record vary and are subject to change.
• AWS Master Station Catalog This is a dataset which lists weather stations worldwide (with location, elevation, and current reporting status) that now transmit (or have transmitted since January 1977) surface and upper-air observations, radar observations, and/ or forecasts.
• Summary of Day Daily weather element summaries for about 1,800 stations, mostly U.S. periods of record vary, but some go back to 1890. Elements included are maximum, minimum, and mean temperature; precipitation, snowfall, snow depth, peak wind, and the number of days on which specified atmospheric phenomena, such as fog, dust, and haze occurred.
• Station File Weather station datasets consisting of surface observations from the mid-1930s to the present. They include elements such as wind, pressure, temperature, cloud, visibility, and weather. These files have undergone the most rigorous quality control available.
• Real-Time Nephanalysis (RTNEPH) Global analyses (on an eighth-mesh polar stereographic grid) of cloud and weather data from conventional surface and satellite observations since January 1984. Data includes present weather, visibility, and total cloud coverage, along with cloud type, base, top, and coverage for each of four floating layers. RTNEPH replaced 3DNEPH in 1983.
CHAPTER 3
DATSAV In five parts, these datasets contain worldwide weather observations collected through the Automated Weather Network (AWN). Daily observations are decoded at AFGWC and transmitted to OL-A, AFCCC for electronic storage. OL-A, AFCCC creates monthly and yearly datasets from the following:
DATSAV2 Surface. Surface observational data (synoptic, airways, MET AR, synoptic ship) from January 1973 to the present include such elements as wind, pressure, temperature, cloud cover, visibility, weather, and precipitation.
DATSAV2 Upper-Air. Radiosonde, rawinsonde, pibal, and dropsonde observations from January 1973 to the present. Data includes wind, pressure, temperature, height, cloud, stability, thickness, and precipitable water.
DATSAV Aircraft. Aircraft observations from October 1975 to the present include wind, temperature, altitude, turbulence, cloud, icing, visibility, and radar data.
DATSAV Rocketsonde. Rocketsonde observations from October 1975 to the present include height, temperature, pressure, wind, and density data.
DATSAV Satellite. Satellite observations from October 1975 to the present include height, temperature, and wind data from geostationary and polar-orbiting satellites.
• High-Resolution Analysis System (HIRAS) HIRAS replaced the Coarse-Mesh Upper-Air Analysis (below) in 1985. HIRAS is a global analysis of surface and upper-air data (on a 2.5-
by 2.5-degree grid) compiled from conventional surface observations, upper-air soundings, and satellite data from January 1985 to the present. HIRAS includes wind, pressure, height, temperature, D-value, precipitable water, vorticity, and vertical velocity data for 16 levels from the surface to 10 millibars.
• Snow Depth Climatology This contains global mean monthly snow depth values on a polar stenographic eighth-mesh grid (approximately 25 nm spacing).
• Surface Temperature Analysis A global analysis (on an eighth-mesh grid) of surface temperatures compiled since April 1979. To produce this analysis, AFGWC uses surface observations of ambient temperatures over land and sea-surface temperatures over water.
• Terrain-Geography File A global analysis (on an eighth-mesh grid) of geographical and terrain height data. It includes a geography indicator (water, ice, land, or coast), time zone indicator, and elevation. AFCCC now has a version of the Terrain-Geography file that gives probable aerosol type (rural, industrial, or maritime).
• Post-1985 Vandenberg Tower Database Weather Information Network Display System data from Vandenberg AFB's micrometeor- ological network of more than 20 tower-mounted sensors. Data includes 5-minute averages of wind direction, speed, temperature, pressure, and vertical temperature differential at elevations of 6, 12, 50, 100, 200, and 300 feet.
• Lightning Database Consists of cloud-to-ground lightning-flash data across the CONUS from 1986 to 1994. Data includes flash location, time, polarity, and peak current of the first return stroke. Although the
13
AFCCC CLIMATIC DATABASE
lightning dataset is proprietary and not therefore releasable outside AFCCC, we can provide summaries that give temporal or spatial variations of lightning flashes as they affect aircraft operations, space vehicle launches, and resource protection.
• Upper-Air Climatology This consists of monthly statistical information for gridded upper air parameters based upon the European Center for Mid-Range Weather Forecasts (ECMWF) analysis product. These analyses were summarized over the years 1980- 1991 for each grid point, pressure level, and month of the year.
• Agricultural Meteorological Database This is a gridded dataset (approximately 25nm spacing) covering the worlds major crop raising regions composed of meteorological parameters such as temperature, precipitation, radiation, and evapotranspiration. The analysis is produced once per day and is available since 1993. Only DoD customers have access to this data.
• Patrick Tower Database Weather Information Network Display System data from Patrick AFB's micrometeorological network of more than 60 tower-mounted sensors. Data includes 5-minute averages of wind direction, speed, temperature, pressure, and vertical temperature differential at various elevations from 6 to 492 feet.
14
CAPABILITIES, PRODUCTS, AND SERVICES OF THE AIR FORCE COMBAT CLIMATOLOGY CENTER (AFCCC)
Chapter 4 COMPUTER ASSETS
Mainframe Computers AFCCC operates two mainframe computers at Scott AFB: an IBM 3090 for unclassified and collateral secret work, and an IBM ES9000 for classified and SCI work. Both are in the Scott Consolidated Computer Facility, Bldg. 1575. OL- A, AFCCC operates a UNISYS mainframe computer for unclassified work only.
• IBM 3090 Mainframe (Scott AFB) The IBM 3090 mainframe is capable of high- speed processing of data and is supported by 228 gigabytes of on-line storage. It contains two Central Processing Units (CPU). Data is fed into the computer by 9-track reel tape units, 36-track cartridge tape units, and two communication channels from remote locations. The main feature of the mainframe is its relational database management system (IBM's DB2) that can search millions of pieces of data in seconds. Current print capabilities include a graphics plotter, four remote printers, two high-speed printers, and a photographic quality Postscript color printer. The mainframe is accessible using IBM dumb terminals, or by IBM terminal emulation packages on the local area network (LAN) file server, and on the UNIX workstations. This LAN is connected to the Scott AFB backbone, allowing connection to the AFIN and the global internet using TCP/IP protocol. This allows connection between the 3090 mainframe and the UNIX workstations.
• IBM ES9000 Mainframe (Scott AFB) The IBM ES9000 mainframe is a powerful system supported by 240 gigabytes of on-line storage capability. Installed in February 1993, it was the first system in DoD to incorporate relational DBMS with IBM's read/write optical disk, Symmetrix EMC Disk Array, and traditional Direct Access Storage Device (DASD) storage. The ES9000 also uses 9-track and 36-track tape storage.
• UNISYS 2200 Mainframe (OL-A) The AFCCC climatic database is stored and manipulated on a UNISYS 2200 mainframe with 233 gigabytes of on-line storage. OL-A, AFCCC is collocated with the National Climatic Data Center (NCDC) at Asheville, NC.
Workstations AFCCC is modernizing its hardware architecture. RISC workstations have been purchased and are being used for prototyping. The new architecture will be on a Unix operating system and will provide enhanced graphical support capabilities.
Small Computers Access to the mainframe and the UNIX workstations is provided by a Novell-based LAN of small computers, along with a comprehensive collection of software that can meet virtually any customer requirement
15
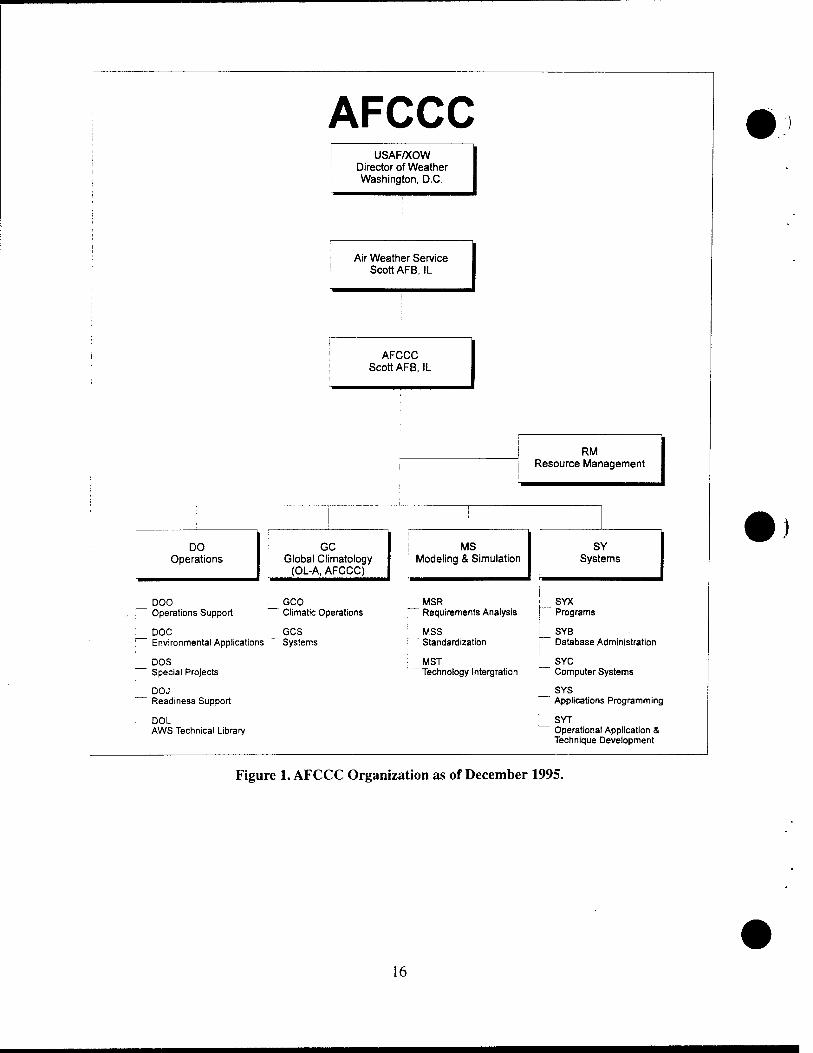
AFCCC j USAF/XOW
Director of Weather I Washington, D.C.
Air Weather Service Scott AFB, IL
AFCCC Scott AFB, IL
1 RM Resource Management i 1
i
DO Operations
GC Global Climatology
(OL-A, AFCCC)
j MS Modeling & Simulation
SY Systems
DOO . . Operations Support
^GCO Climatic Operations
L_MSR Requirements Analysis
^__ SYX ] Programs
DOC Environmental Application
GCS s Systems
MSS Standardization
j_ SYB | Database Administration
DOS Special Projects
MST Technology Integration
i SYC Computer Systems
DOJ Readiness Support
L_ SYS Applications Programming
DOL AWS Technical Library
SYT Operational Application & Technique Development
Figure 1. AFCCC Organization as of December 1995.
16
CAPABILITIES, PRODUCTS, AND SERVICES OF THE AIR FORCE COMBAT CLIMATOLOGY CENTER (AFCCC)
Chapter 5 MISSION, PEOPLE, AND ORGANIZATION
Mission AFCCC is an Air-Force controlled, named organization assigned to the Air Weather Service, a field operating agency. After collecting and storing worldwide environmental observations in its climatic database, AFCCC develops and produces special weather impact information used in planning and executing worldwide military operations of the Air Force, Army, Navy, Marine Corps, unified commands, and allied nations. AFCCC also provides information to support engineering design and employment of weapons systems, and to support weather sensitive, multi- millon dollar National Programs controlled by the Secretary of the Air Force. AFCCC is the DoD lead for air and space weather modeling and simulation. Figure 1, opposite page, shows AFCCC organization as of November 1995.
• At Asheville (OL-A, AFCCC) civilian technicians create and maintain the Air Force's computerized climatic database from environmental information received from observing stations around the world primarily through AFGWC at Offutt AFB. After quality- controlling these observations, OL-A, AFCCC summarizes and preserves the data as a permanent climatological record that it uses to produce standard summaries and other data to requesters.
• At Scott AFB, a mixed force of military and civilian scientists and computer specialists use the climatic database (the second largest relational database in the Air Force), along with the vast information resources of the Air Weather Service Technical Library (AWSTL), to prepare weather and space environmental studies and analyses for DoD and other clients upon request. Tailored application of information in the database ranges
from answers to simple requests for climatological probabilities to the very latest in weather and space environmental simulation studies.
People AFCCC s manning authorizations include about 150 positions at Scott AFB and 64 at OL-A. About 110 civilian positions are distributed for the most part among weather technicians or meteorologists (at least 20 with advanced degrees) and computer specialists. Officer authorizations include about 30 for meteorologists with advanced degrees. The 70 enlisted positions are distributed primarily among the weather and computer specialties.
Organization AFCCC comprises five divisions. The first, Resource Management (RM), provides the commander and staff with support services in the areas of personnel, manpower, organization, supply, budget, training, mobility, facilities, intelligence/security, and information management. The other three (Operations, Systems, and Operating Location A) interact with AFCCC customers. Each division is further organized into branches and teams of specialists that work together to satisfy customer requests.
Operations Division (DO) The central point of contact for all AFCCC support services. Supervises production of studies and analyses performed in response to customer requests. The following branches are under DO.
• DOO—Operations Support Branch Receives, processes, prioritizes, and assigns taskings to satisfy customer support requests. Manages AFCCC production. Maintains AFCCC capabilities and requirements baselines; develops
17
CHAPTER 5
strategies to ensure that AFCCC meets present and future weather operations requirements.
• DOC—Environmental Applications Branch Uses AFCCC's climatic database and data from other sources to analyze, simulate, and determine probabilities of environmental conditions and their effects on customer activities such as military operations, weapons system research and development, a variety of simulation activities, military construction projects, and planning for any environmentally dependent event.
• DOS—Special Projects Branch Uses the AFCCC climatic database and data from other sources to analyze, simulate, and determine probabilities of environmental conditions and their effects on classified programs and projects.
• DOJ—Readiness Support Branch Researches existing literature and data to prepare regional, area, and point descriptive climatologies to meet specific customer-defined operational requirements. Manages the contingency response capability.
• DOL—AWS Technical Library Provides specialized environmental library support products and services to DoD agencies that include AFCCC, AWS, and AF weather units worldwide.
Systems Division (SY) Plans and develops AFCCC s scientific and technical capabilities; manages AFCCC's computer systems and operations.
• SYB—Database Administration Branch Administers and maintains specialized computer databases; coordinates data interface requirements with outside agencies.
• SYC—Mainframe Computer Branch Operates AFCCC's mainframe computers and maintains the local area network.
• SYS—Applications Programming Branch Designs, develops, evaluates, produces, and maintains mainframe and small computer software.
• SYT—Operational Application and Technique Development Branch Monitors the results of research in the environmental sciences; adapts promising scientific and technical modeling developments to meet identified DoD climatic support requirements.
• SYX—Programs Branch Manages AFCCC computer systems. Maintains computer configuration baseline; develops strategies to meet present and future computer requirements. Initiates and processes baseline changes. Monitors contracts.
Global Climatology Division (OL-A, AFCCC) Manages the Air Force's climatological database. As a participating member of the Federal Climate Complex at Asheville NC, maintains reciprocal agreements that make climatic databases available to other agencies. Organizes and maintains environmental datasets. Summarizes clima- tological data.
• GCO—Climatic Operations Branch Creates and manages the climatological database; processes data into discrete datasets for specialized applications. Prepares standard and specialized climatic summaries. Arranges for Air Force access to the National Climatic Data Center (NCDC) climatic database.
• GCS—Systems Branch Manages and operates OL-A computers. Designs and produces software used for processing climatology. Develops strategies to meet present and future computer requirements.
MISSION, PEOPLE, AND ORGANIZATION
Modeling and Simulation Division (M&S) AFCCC recently formed a new division, manned by representatives of all services, to support the commander of AFCCC in his role as the DoD Executive Agent for Air and Space Natural Environment Modeling and Simulation. Over a dozen meteorologists, oceanographers, and computer scientists will coordinate technical support to all DoD M&S activities that use weather or weather effects data, and ensure the seamless inclusion of natural environment representations into these M&S activities.
• Requirements Analysis Branch Identifies and documents DoD M&S weather capabilities and requirements, and documents shortfalls.
• Standardization Branch Develops and coordinates standards for weather products and services ensuring interoperability with DoD systems and activities. Guides and oversees DoD verification and validation of weather models, modules, subroutines, algorithms, etc., and data used for joint M&S applications.
• Technology Integration Branch Identifies technologies for solving shortfalls and guide (and influence through indorsement and funding recommendations) DoD short-term and long-term efforts for technology development and implementation. Coordinates M&S weather technical support to DoD M&S activities.

APPENDIX A Support Assistance Request (SAR) Format
• Request AFCCC services by letter, message, or fax using the format in AFI15-118 or the format below.
1. Support name: Give exercise, operation nickname, or project title.
2. Unit supported. The unit that the requester supports; for example, "175 Composite Wing, Elmendorf AFB."
3. Mission category/impact: Category A, B, or C, and provide an impact if support is unavailable.
4. Point of contact. Give name, complete address, and phone number of your point of contact for this project.
Specify an alternate, please.
5. Medium/number of copies. Specify paper, microfiche, floppy disk, facsimile, email, etc. How many copies?
6. Delivery/address for response: To whom do you want the data sent? Give complete address. Specify ordinary mail, express mail, message, fax, email, etc.
7. Security classification. Specify classification/precedence for response.
8. Type of support. Tell us exactly what you need; for example, "Elmendorf AFB percent occurrence frequency of: (1) ceilings less than 300 feet, (2) visibilities less than 1 statute mile, and (3) crosswinds greater than 30 knots for each month (all hours) and for all months." Include any other information (including environmental factors) we may need to fill the request. Note the special information requirements for requesting standard summary packages—see Appendix B.
9. Suspense date. Tell us when you need it. Describe the effect(s) on your mission (and on your customer's mission, if applicable) if we can't meet your suspense.
10. Justification. Tell us why you need it. Describe the effect(s) on your mission (and on your customer's mission, if applicable) if AFCCC were unable to provide the requested services. If support is for a contractor, tell us (a) whether or not DoD has a contract obligation to provide the support and (b) what the penalties are if the support cannot be provided or if the suspense cannot be met.
11. Telephone consultations. If you have discussed this request with us previously, please describe those contacts here. Include dates, subject, and participants.
20
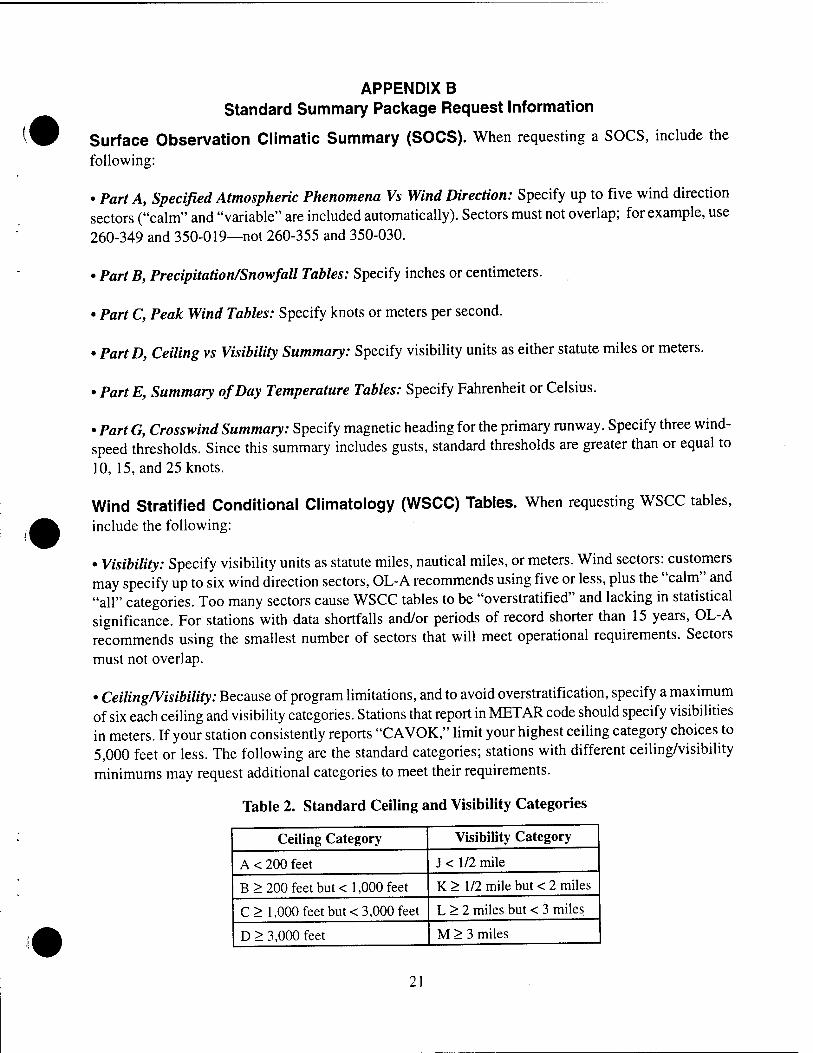
APPENDIX B Standard Summary Package Request Information
Surface Observation Climatic Summary (SOCS). When requesting a SOCS, include the
following:
• Part A, Specified Atmospheric Phenomena Vs Wind Direction: Specify up to five wind direction sectors ("calm" and "variable" are included automatically). Sectors must not overlap; for example, use 260-349 and 350-019—not 260-355 and 350-030.
• Part B, Precipitation/Snowfall Tables: Specify inches or centimeters.
• Part C, Peak Wind Tables: Specify knots or meters per second.
• Part D, Ceiling vs Visibility Summary: Specify visibility units as either statute miles or meters.
• Part E, Summary of Day Temperature Tables: Specify Fahrenheit or Celsius.
• Part G, Crosswind Summary: Specify magnetic heading for the primary runway. Specify three wind- speed thresholds. Since this summary includes gusts, standard thresholds are greater than or equal to 10, 15, and 25 knots.
Wind Stratified Conditional Climatology (WSCC) Tables. When requesting WSCC tables, include the following:
• Visibility: Specify visibility units as statute miles, nautical miles, or meters. Wind sectors: customers may specify up to six wind direction sectors, OL-A recommends using five or less, plus the "calm" and "all" categories. Too many sectors cause WSCC tables to be "overstratified" and lacking in statistical significance. For stations with data shortfalls and/or periods of record shorter than 15 years, OL-A recommends using the smallest number of sectors that will meet operational requirements. Sectors must not overlap.
• Ceiling/Visibility: Because of program limitations, and to avoid overstratification, specify a maximum of six each ceiling and visibility categories. Stations that report in MET AR code should specify visibilities in meters. If your station consistently reports "CAVOK," limit your highest ceiling category choices to 5,000 feet or less. The following are the standard categories; stations with different ceiling/visibility minimums may request additional categories to meet their requirements.
Table 2. Standard Ceiling and Visibility Categories
Ceiling Category Visibility Category
A < 200 feet J < 1/2 mile
B > 200 feet but < 1,000 feet K > 1/2 mile but < 2 miles
C > 1,000 feet but < 3,000 feet L > 2 miles but < 3 miles
D > 3,000 feet M > 3 miles
21
Hourly Temperature/Dew-Point Change Summaries. In requests for Hourly Temperature/Dew- Point Change Summaries:
• Specify up to five ceiling categories: standard categories are:
< 1,000 feet > 1,000 feet but < 3,000 feet > 3,000 feet but < 12,000 feet > 12,000 feet but <20,000 feet > 20,000 feet
• Specify up to six wind direction sectors; note, however, that more than four sectors can decrease a summary's usefulness due to overstratification. The four standard sectors are:
330-059 North 060-149 East 150-239 South 240-329 West
• Specify up to three wind-speed categories; the lowest includes "calm." Standard categories are:
Calm to < 5 knots >5 knots but < 12 knots >12 knots
NOTES: 1. Although each of the components of a standard summary package is normally prepared at the same time, data shortfalls may occasionally make it necessary for OL-A to truncate or even eliminate one or more of those components. For example, there are some full-time stations for which "extremes" are not available and are not provided.
2. Whenever OL-A begins a routine update of a standard summary package, they send a criteria worksheet to the affected station. For those stations with serious data shortfalls and/or short periods of record, OL-A will suggest that category choices be limited to avoid overstratification and loss of statistical significance.
3. Ceiling categories for the WSCC and the Hourly Temperature/Dew-Point Change Summary should not normally be the same. When they are, the latter is seriously overstratified in the lower ceiling categories where, in most cases, fewer observations fall. This can also cause overstratification in the higher categories. For example, 3,000-foot ceilings should not be grouped with clear skies; the result would be underestimation of the maximum temperature. For the best definition of temperature change from insolation, clear skies and high ceilings should not be included with middle or lower ceilings. To request AWSTL services, send a letter, message, or Email to the AWSTL with the following information (you may use the Support Assistance Request format in AFI 15-118):
22
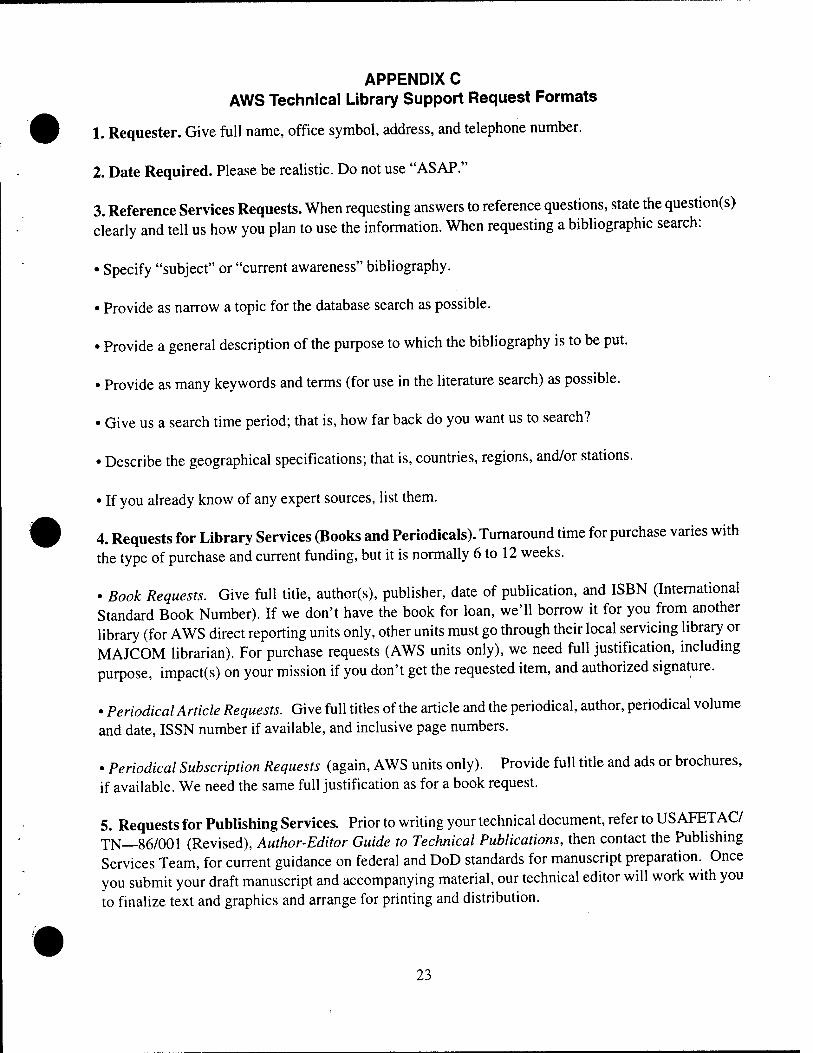
APPENDIX C AWS Technical Library Support Request Formats
1. Requester. Give full name, office symbol, address, and telephone number.
2. Date Required. Please be realistic. Do not use "ASAP."
3. Reference Services Requests. When requesting answers to reference questions, state the question(s) clearly and tell us how you plan to use the information. When requesting a bibliographic search:
• Specify "subject" or "current awareness" bibliography.
• Provide as narrow a topic for the database search as possible.
• Provide a general description of the purpose to which the bibliography is to be put.
• Provide as many keywords and terms (for use in the literature search) as possible.
• Give us a search time period; that is, how far back do you want us to search?
• Describe the geographical specifications; that is, countries, regions, and/or stations.
• If you already know of any expert sources, list them.
4. Requests for Library Services (Books and Periodicals). Turnaround time for purchase varies with the type of purchase and current funding, but it is normally 6 to 12 weeks.
• Book Requests. Give full title, author(s), publisher, date of publication, and ISBN (International Standard Book Number). If we don't have the book for loan, we'll borrow it for you from another library (for AWS direct reporting units only, other units must go through their local servicing library or MAJCOM librarian). For purchase requests (AWS units only), we need full justification, including purpose, impact(s) on your mission if you don't get the requested item, and authorized signature.
• Periodical Article Requests. Give full titles of the article and the periodical, author, periodical volume and date, ISSN number if available, and inclusive page numbers.
• Periodical Subscription Requests (again, AWS units only). Provide full title and ads or brochures, if available. We need the same full justification as for a book request.
5. Requests for Publishing Services. Prior to writing your technical document, refer to US AFETAC/ TN—86/001 (Revised), Author-Editor Guide to Technical Publications, then contact the Publishing Services Team, for current guidance on federal and DoD standards for manuscript preparation. Once you submit your draft manuscript and accompanying material, our technical editor will work with you to finalize text and graphics and arrange for printing and distribution.
23
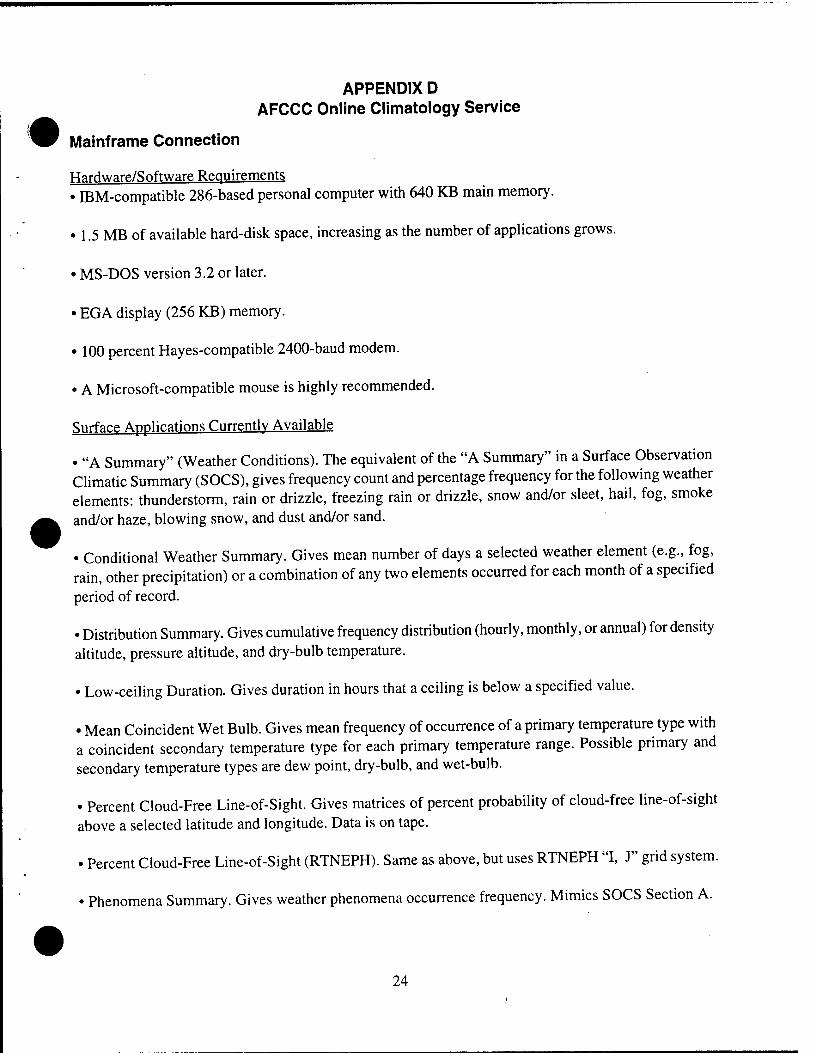
APPENDIX D AFCCC Online Climatology Service
Mainframe Connection
Hardware/Software Requirements • IBM-compatible 286-based personal computer with 640 KB main memory.
• 1.5 MB of available hard-disk space, increasing as the number of applications grows.
• MS-DOS version 3.2 or later.
• EGA display (256 KB) memory.
• 100 percent Hayes-compatible 2400-baud modem.
• A Microsoft-compatible mouse is highly recommended.
Surface Applications Currently Available
• "A Summary" (Weather Conditions). The equivalent of the "A Summary" in a Surface Observation Climatic Summary (SOCS), gives frequency count and percentage frequency for the following weather elements: thunderstorm, rain or drizzle, freezing rain or drizzle, snow and/or sleet, hail, fog, smoke and/or haze, blowing snow, and dust and/or sand.
• Conditional Weather Summary. Gives mean number of days a selected weather element (e.g., fog, rain, other precipitation) or a combination of any two elements occurred for each month of a specified
period of record.
• Distribution Summary. Gives cumulative frequency distribution (hourly, monthly, or annual) for density altitude, pressure altitude, and dry-bulb temperature.
• Low-ceiling Duration. Gives duration in hours that a ceiling is below a specified value.
• Mean Coincident Wet Bulb. Gives mean frequency of occurrence of a primary temperature type with a coincident secondary temperature type for each primary temperature range. Possible primary and secondary temperature types are dew point, dry-bulb, and wet-bulb.
• Percent Cloud-Free Line-of-Sight. Gives matrices of percent probability of cloud-free line-of-sight above a selected latitude and longitude. Data is on tape.
. Percent Cloud-Free Line-of-Sight (RTNEPH). Same as above, but uses RTNEPH "I, J" grid system.
• Phenomena Summary. Gives weather phenomena occurrence frequency. Mimics SOCS Section A.
24
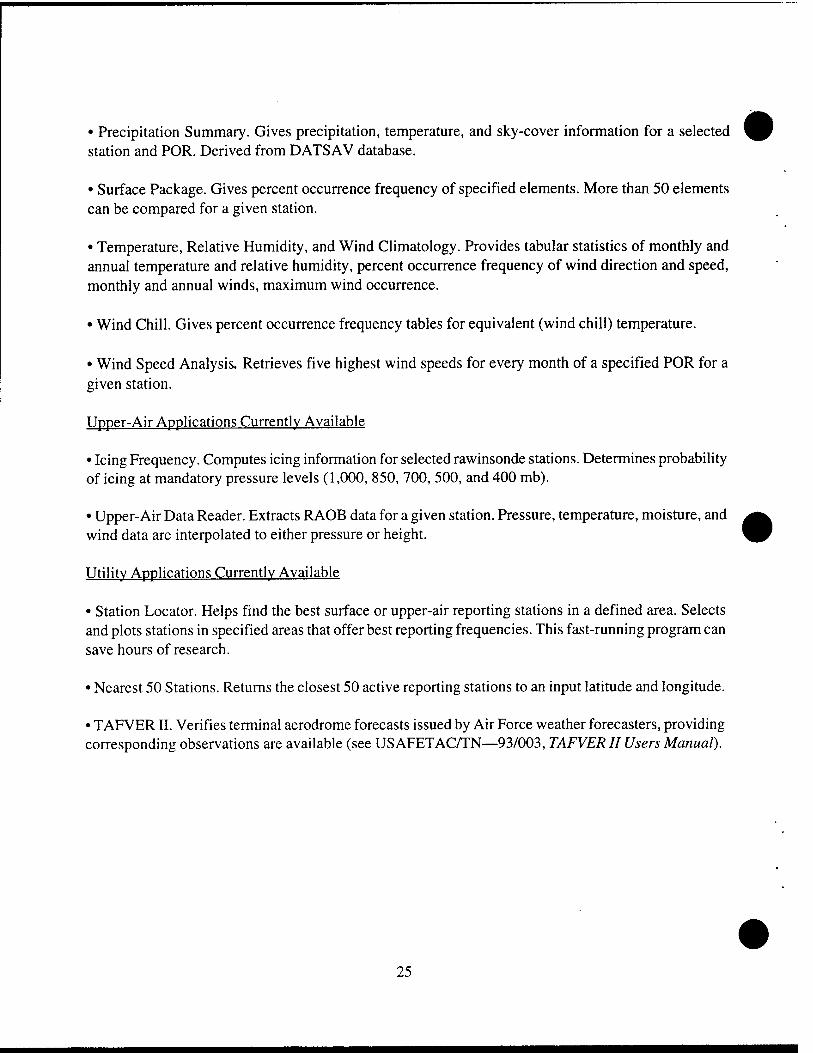
• Precipitation Summary. Gives precipitation, temperature, and sky-cover information for a selected station and POR. Derived from DATSAV database.
• Surface Package. Gives percent occurrence frequency of specified elements. More than 50 elements can be compared for a given station.
• Temperature, Relative Humidity, and Wind Climatology. Provides tabular statistics of monthly and annual temperature and relative humidity, percent occurrence frequency of wind direction and speed, monthly and annual winds, maximum wind occurrence.
• Wind Chill. Gives percent occurrence frequency tables for equivalent (wind chill) temperature.
• Wind Speed Analysis. Retrieves five highest wind speeds for every month of a specified POR for a given station.
Upper-Air Applications Currently Available
• Icing Frequency. Computes icing information for selected rawinsonde stations. Determines probability of icing at mandatory pressure levels (1,000, 850, 700, 500, and 400 mb).
• Upper-Air Data Reader. Extracts RAOB data for a given station. Pressure, temperature, moisture, and wind data are interpolated to either pressure or height.
Utility Applications Currently Available
• Station Locator. Helps find the best surface or upper-air reporting stations in a defined area. Selects and plots stations in specified areas that offer best reporting frequencies. This fast-running program can save hours of research.
• Nearest 50 Stations. Returns the closest 50 active reporting stations to an input latitude and longitude.
• TAFVERII. Verifies terminal aerodrome forecasts issued by Air Force weather forecasters, providing corresponding observations are available (see USAFETAC/TN—93/003, TAFVER II Users Manual).
25
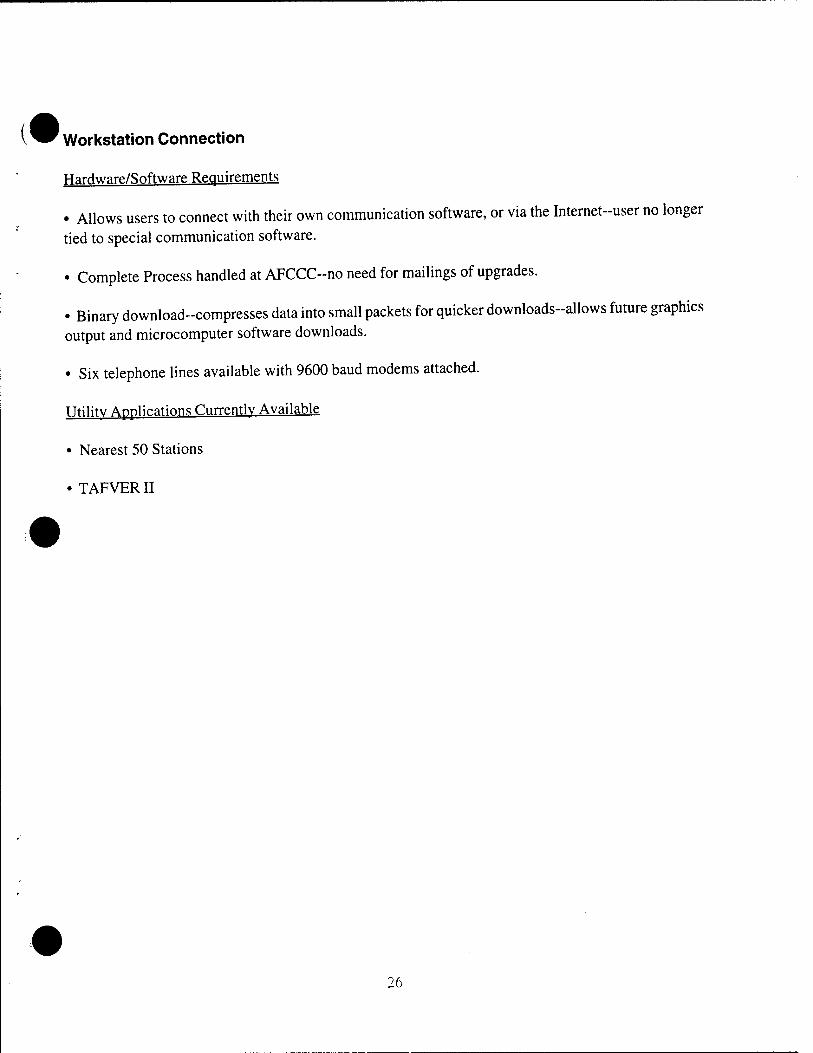
V^P Workstation Connection
Hardware/Software Requirements
• Allows users to connect with their own communication software, or via the Internet-user no longer
tied to special communication software.
• Complete Process handled at AFCCC--no need for mailings of upgrades.
• Binary download-compresses data into small packets for quicker downloads-allows future graphics output and microcomputer software downloads.
• Six telephone lines available with 9600 baud modems attached.
Utility Applications Currently Available
• Nearest 50 Stations
• TAPVERII
26
APPENDIX E An Evolution of AFCCC and Military Climatology
Military Climatology Origins The paper punched card, developed by Herman Hollerith for use in the 1890 U.S. Census, made the use of historical weather records a practical means for determining the probability of future weather events and patterns. The British used punched cards successfully in about 1920 to extract wind data from ships' logs and produce wind roses for ocean areas. The Dutch Meteorological Institute borrowed some of the British cards in 1922 and began their own weather analyses. Norway, France, and Germany followed. In 1927, the Czech meteorologist L.W. Pollak placed small and cheap punch machines of his own design in every Czech weather station; as each observation was taken, it was punched on a card that was sent to a central tabulating unit for summary and analysis. Although the equipment for gathering and tabulating weather data has changed since then, the basic process has not.
The United States, where the punched card originated, was late to join the Europeans in collecting and tabulating weather observations. Fortunately, one of the "make-work" projects of the mid-thirties resulted in a sizeable punched card climatic database. A 1934 Works Progress Administration (WPA) project resulted in an atlas of ocean climates, prepared by punching 2 million observations (taken from 1880 to 1933) onto cards and summarizing the results. Another 3 1/2 million observations were processed manually, a task that took 90 percent of the labor devoted to the entire project.
In 1936, the WPA also funded a project that resulted in the compilation and analysis of millions of surface and upper-air-observations taken from 1928 to 1941. From this project came a number of climatological publications vital to the Nation's preparation for World War II.
WWII The Army Air Forces Weather Research Center's Climatological Section was born at Boiling Field September 10, 1941. This was just a week after the U.S. Destroyer Greer was attacked by a German submarine off the coast of Iceland. The attack provoked President Franklin Roosevelt to announce that "From now on, if German or Italian vessels of war enter these waters, they do so at their own risk." An unofficial state of war with Germany and Italy existed from that day forward. Although there was strong pressure for neutrality, military visionaries had seen the need to prepare for war as early as 1937, when the Air Weather Service itself was founded.
By 1941, the U.S. Weather Bureau had already turned over most of its climatological records and facilities to the military. Most of the Weather Bureau's climatology had been produced by the depression-induced WPA projects mentioned earlier. Even so, military climatology had a long way to go, especially since the meteorological offices of every major country in Europe had been analyzing the world's weather on punched cards long before World War II began in 1939.
The December 7, 1941 attack on Pearl Harbor moved the collection and application of weather statistics to a top-drawer priority overnight. With current weather and forecasts blacked-out in hostile areas, planners turned to the climatologists with their questions. Where should air bases be located? How should the runways be oriented? What areas should heavy armor avoid? What should specifications for fuels and lubricants be? How about specifications for landing mats, wires, buildings? What times, dates, and locations are best for amphibious landings? How about bombing weather? Prevailing winds aloft? With the limited information at their disposal, military
27
climatologists produced climatological summaries to help provide answers to planners' questions. The Army Air Forces climatological effort continued to expand. In 1943, the USAAF Statistical Services Division (now AFCCC's Operating Location A) was created at Winston- Salem, NC, to begin the routine storage and processing of military weather observations. There was probably no WWII operation, major or minor, that did not include a climatological input. The planning for every landing, mission, and offensive, including the D-Day invasion in 1944 and the atomic bombing of Japan, required extensive climatological preparation.
Postwar Although demobilization cut deeply into the Air Weather Service's wartime strength of nearly 19,000, the importance of climatology and its applications continued to be recognized. In early 1946, the military established a Climatology Unit (the AFCCC of its time) at Gravelly Point, VA. The USAAF Statistical Services Division gained responsibility for processing and storage of military weather data in 1943, and moved to New Orleans in 1946. There, about 300 people punched weather observations onto cards and summarized them. A major postwar project was processing the "Kopenhagener Schlüssel" deck of 7 million captured German punched cards containing weather observations taken during WWII in Europe and the Middle East. In 1948, the Military Climatology Unit (now a division) moved to Andrews AFB, with the well-known climatologist Dr Woodrow C. Jacobs as its Chief.
During the '50s A Climatic Center at Andrews AFB continued to provide climatological data applications under various designations throughout the decade, with particular emphasis on the war in Korea and the strategic buildup necessitated by the Cold War. In 1952, the Statistical Services Division moved
from New Orleans to Asheville, N.C., where it is today. In 1956, the first electronic computer (an IBM 705) became operational at Asheville, signalling the end for the high-speed electronic accounting machines (mostly IBM) used since WWII to process climatology. In 1959, IBM electronic accounting equipment installed at the Climatic Center allowed data processing directly from punched card to tape.
During the '60s In July 1960, the Data Processing Division at Asheville began reporting to the Climatic Center. In 1964, a IBM 7040 computer was installed at the Climatic Center, now in Washington, DC, at the Navy Yard Annex. In December 1964, the Climatic Center was officially designated the "Environmental Technical Applications Center, USAF." Computer upgrades continued. OL-A bought a new IBM 705-UJ. from the Department of Agriculture in 1965 and an IBM 7044 replaced the 7040 in 1966. In 1968, twin RCA Spectra 70/ 45 computer systems were commissioned at Asheville for joint use by OL-A (then the Data Processing Division) and the National Climatic Data Center (then the National Weather Records Center).
During the '70s By 1972, OL-A's card-punching function had been all but eliminated, resulting in a manpower drop from about 200 to 122. A further RIF (reduction-in-force) brought OL-A's authorized civilian strength to 83. In 1975, USAFETAC's move to Scott AFB, Illinois was finally completed after the Air Force won a long legal battle against opponents who wanted to keep the unit in Washington. The move, which took 13 months and put USAFETAC's project commitments about 2 years behind schedule, was declared complete on October 31 when the new PDP 1 1/ 45 and IBM 360/45 computers became operational in Building 859. In 1976, the AWS
■)
28
Library (a branch of AFCCC that now maintains the largest atmospheric physics collection in the DoD, if not the world) was officially designated Air Force Library #4414, and named the "AWS Technical Library." In 1979, the twin RCA computers at OL-A/NCDC were replaced by UNIVAC 1100/lOs. By the end of 1979, USAFETAC strength stood at 232, with 149 at Scott and 83 at Asheville. Demand for climatological service still exceeded capabilities; the decade-end project backlog stood at 49,799 man-hours.
During the '80s and '90s USAFETAC continued to exploit computer and electronic technology as its computer power expanded exponentially through the eighties and nineties. To better reflect the changing mission of the unit, USAFETAC was officially renamed the Air Force Combat Climatology Center (AFCCC) effective October 1, 1995. Today's climatologists and analysts continue to fulfill the
same kinds of customer requirements that their predecessors handled 50 years ago, but with much-improved techniques and equipment. From a few microcomputers shared by eager analysts in 1980, AFCCC now offers choices from among workstations linked to a mainframe computer and from a variety of stand-alone and networked microcomputers, all equipped with the latest software. After several variations, AFCCCs unclassified mainframe computer is now an IBM 3090 with 195 gigabytes (195 billion bytes) of storage—the first AFCCC computer, an IBM 705, had only 300 megabytes (300 million bytes) of storage. At Asheville, the OL-A computer was upgraded to a UNISYS 2200 with 23.3 gigabytes of storage. Increased storage capacity and compute strength had been complemented by improved communications, most by direct satellite link. For the future, AFCCC is moving toward a networked workstation environment. This will allow exploitation of data visualization techniques and other new technologies.
29
GLOSSARY
^^^ Climatic. In general use, of or referring to climatology.
Climatological. Synonymous with climatic.
Climatological Forecast. A weather forecast based on the climate of a region rather than the dynamic implications of current weather; in essence, a statistical forecast.
Climatology. The scientific study of climate. Includes the presentation of climatic data (climatography), the analysis of the causes of differences in climate (physical climatology), and the application of climatic data to the solution of specific design or operational problems (applied climatology).
Climate. The long-term manifestations of weather, however they may be expressed.
Database. A collection of data fundamental to an enterprise. Data organized for rapid search and retrieval. An example is the all-inclusive climatological database maintained by ACCC's OL-A. Many of the larger subsets of the AFCCC database are also referred to as "databases."
Dataset. A collection of similar and related data records recorded for use by a computer. Unique combinations or aggregations of data elements; subsets of a database. Many subsets of the AFCCC climatological database maintained by OL-A, especially those created for a specific requirement, are referred to as "datasets."
Gigabyte. An amount of computer storage equal to one billion bytes or 1,000 megabytes.
Megabyte. An amount of computer storage equal to one million bytes.
30
METEOROLOGICAL TRAINING
An effective training program is the key to success in the Base Weather Station.
The Career Field Education and Training Plan (CFETP) is a comprehensive education and training document that identifies life-cycle education/training requirements, training support resources, and nünimum core task requirements for the weather specialty. Both an enlisted and officer CFETP should be maintained in your unit. The CFETP will help you understand the overall training requirements as well as provide a list of support material to use within the unit for additional training. The current CFETP is listed in AFIND 8, Section E, and can be ordered by your publications monitor.
You must be able to analyze and determine the training and needs of individuals within the unit, request training materials and assistance, and supervise and conduct various types of training in your unit. AFMAN 15-125 breaks the training into four areas:
Upgrade Training (UT) - The CFETP identifies mandatory requirements, sources of training and documentation requirements for upgrade to the next skill level.
Qualification Training (QT) - Task-specific knowledge and performance training designed to qualify an individual for a specific duty position. The CFETP identifies the requirements and may list a Qualification Training Package (QTP) specifically designed to guide QT for a specific position. Unit- unique qualification requirements identified should be addressed by additional training.
Formal Training - Normally conducted in-residence in a formal classroom setting. Some QT and UT can only be accomplished by attendance at the appropriate formal course.
On-the-Job Training (OJT) - The training received to acquire the skills and knowledge to do the job. OJT can be either initial training or continuation training. Realistically, it includes a number of different training options, including: hands-on instruction, unit seminars, meteorological discussions, review of technical publications, computer-based training modules, or video.
Meteorological training is a unique challenge. You must be able to effectively teach others to apply the science of meteorology to operational forecast decisions. To do this you must not only know the forecaster's requirements to do their job, but also your customer's requirements for forecast support. Once you know these then the challenge begins. You must have a basic understanding of the learning process. You'll need to know how to communicate, teach, test and lastly, guide and motivate your personnel to insure that your weather station is training effectively.
The following references will help you to develop or improve your meteorological training program:
FYI #34 Continuation Training - Provides a shell, or infrastructure to help arrange training activities and training material into a logical format.
2WW/FM—85/002 Technical Training (A Management Guide) -Assists you in administering a tech- nical training program. (Note: The reference list is no longer valid; however, the purpose was to give you an example of a program.)
Fundamentals of Teaching Handout - Provides basic teaching and training techniques.
It's also up to you to be aware of the available training tools—a list is included at the end of this section. The references are listed in the functional area for which they are most representative (e.g. Weather Radar, Satellite, Numerical Weather, Tropical, Forecasting, Severe Weather, and Miscellaneous), and is in various formats: COMET modules (IVD/CD ROM), Air Training Command Interactive Video Device (IVD), computer-based instructions (CBIs), and various pamphlet publications from HQ AWS/XON (FYIs, TTWOS, ECHOES, and Check-It- Outs). Your weather station should also have copies of USAFETAC/TC—95/001, Air Force Weather Technical Publications 1992-1995 and AWS/TC—91/001, Catalog ofAWS Technical Documents 1941-1991.
Take full advantage of other agencies' training materials, seminars, conferences, and expertise. Some sources are: HQ AWS/XON-sponsored conferences, MetTIPs, Meteorological Process Reviews (MPRs), etc.; MAJCOM aerospace scientists, and NWS science and operations officers (SOOs), other IM's, weather stations within your region or MAJCOM, universities, Cooperative Program for Operational Meteorology, Education, and Training (COMET), Air Force Institute of Technology (AFIT), etc.
Your MAJCOM aerospace sciences POC or HQ AWS/XON can answer your specific questions or concerns.
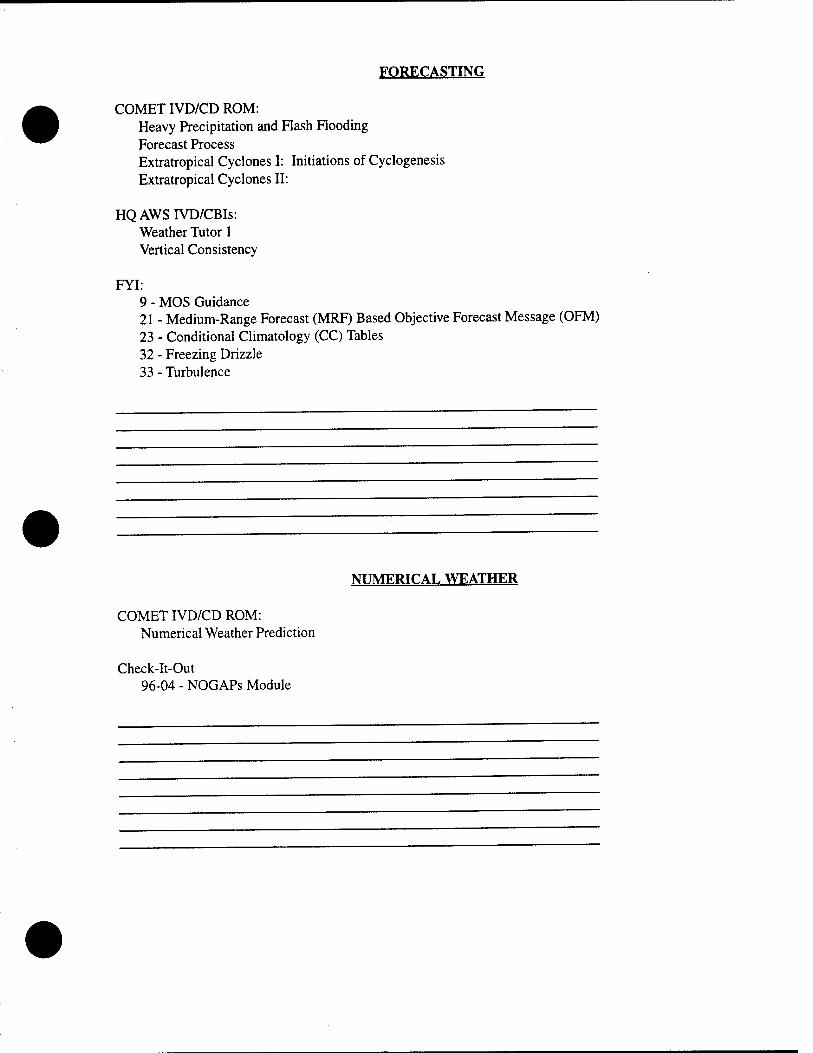
FORECASTING
COMET IVD/CD ROM: Heavy Precipitation and Rash Flooding Forecast Process Extratropical Cyclones I: Initiations of Cyclogenesis Extratropical Cyclones II:
HQ AWS IVD/CBIs: Weather Tutor 1 Vertical Consistency
FYI: 9 - MOS Guidance 21 - Medium-Range Forecast (MRF) Based Objective Forecast Message (OFM) 23 - Conditional Climatology (CC) Tables 32 - Freezing Drizzle 33 - Turbulence
NUMERICAL WEATHER
COMET IVD/CD ROM: Numerical Weather Prediction
Check-It-Out 96-04 - NOGAPs Module
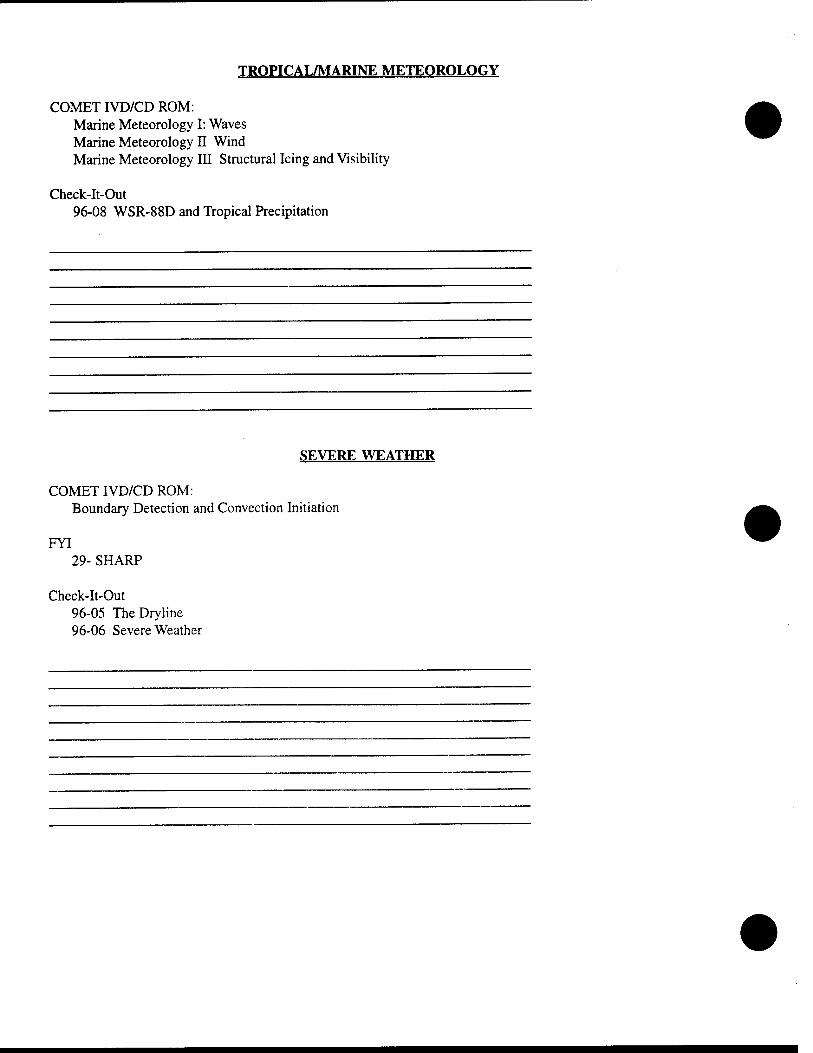
TROPICAL/MARINE METEOROLOGY
COMET IVD/CD ROM: Marine Meteorology I: Waves Marine Meteorology II Wind Marine Meteorology III Structural Icing and Visibility
Check-It-Out 96-08 WSR-88D and Tropical Precipitation
SEVERE WEATHER
COMET IVD/CD ROM: Boundary Detection and Convection Initiation
FYI 29- SHARP
Check-It-Out 96-05 TheDryline 96-06 Severe Weather
WEATHER RADAR
COMET IVD/CD ROM: Workshop on Doppler Radar Interpretation Workshop on Doppler Radar Interpretation (Reference Section)
ATC IVDs: History of NEXRAD System Concepts WSR-88D Products Doppler Theory Review Basic Velocity Interpretation Vertical Variations Distinct Patterns Horizontal Variations
CBIs: WSR-88D Algorithm Tutor WSR-88D Non Convective WSR-88D UCP
ECHOES 1 - Basic WSR-88D Operating Procedures 2 - WSR-88D Reflectivity and Related Products 3 - Storm Structure User Functions 4 - WSR-88D Dial-Up Capabilities 5 - WSR-88D Velocity and Related Products 6 - WSR-88D Routine Product Set (RPS) Lists 7 - WSR-88D Severe Weather Analysis User Functions 8 - Mesocyclone/Tornadic Vortex Signature 9 - Color Schemes on the Principal User Processor (PUP) 10 - Sea Breezes Fronts 11 - NEXnotes 12 - WSR-88D Unit Training Guide 14 - NEXnotes 15 - Clutter Suppression 16 - Operational Uses of VDL,
Check-It-Out 96-01 WSR-88D Operations 96-08 WSR-88D and Tropical Precipitation
AWDS
T-TWOS 1 - Q-Vectors on AWDS 2 - Advection on AWDS 3 - Cloud Free Line of Sight Users Manual 4 - Wind Profiler Data Network 5 - AWDS Stability Indices 6 - More AWDS Stability Indices 7 - AWDS Pressure /Height Changes 8 - AWDS Streamlines 9 - Ceiling Forecasting 10 - SHARP 11 - Forecasting Winter Precipitation 12 - AWDS Aircraft Icing Forecasts 13 - GSM Forecast Package 14 - Isallobaric Wind 15 - Thunderstorm Decision Tree 16 - Adding Maritime Observations to AWDS 17 - Isentropic Analysis 18 - Analysis, Initialization, and Model (AIM) Run 19 - AWDS Plotting Options 20 - Jet Streaks 21 - Isallobaric Analysis 22 - Cold Air Damming and Coastal Fronts 23 - Divergence on AWDS 24 - European Stability Indices 25 - Delta Vorticity 26 - AWDS System Manager Continuity Binder 27 - AWDS Command Sequence Editing 28 - AWDS SOPs 29 - The Fog Stability Index 30 - Barnes Objective Analysis
SATELLITE
COMET IVD/CD-ROM: Satellite Meteorology: Remote Sensing Using the New GOES Imager Det 5 Basic METSAT
Check-It-Out 96-07 Satellite Meteorology
XON Satellite Exploitation Modules Module 1: General Information and Usage Module 2: Enhancement Curves Module 3: Harris 1000
MISCELLANEOUS
FYI 10 - Technical Improvement 11 - Commanders WX Info Pamphlet 12 - TAFVER 14 - Fixed Meteorological Equipment 16 - RVR-2 17 - Lightning Detection System 22 - TAFVER II Statistical Output 24 - A Layman's Guide to Developing A Forecast Study 27 - Weather Staff Officer's Guide to Climatology 30 - Air Force Weather Bulletin Board 34 - Continuation Training
Check-It-Out 96-02 Weather Regimes 96-03 MetTIPs 96-04 NOG APS 3.4
U1DÄMENTALS OF TEACHING
AIR FORCE l/EATHER

INTRODUCTION
As an instructor meteorologist, you must have a basic understanding of the learning process. In addition, you'll need to know about various methods of instruction including associated questioning techniques, how to make tests, and the basics of the communicative process.
We realize this is a lot to learn. To help streamline the process, we borrowed some study material from Air Education and Training Command (AETC) that introduces you to the trainer business. This material occasionally refers to Air Force Manual (AFMAN) 36-2236, Guidebook for Air Force Trainers. AFMAN 36-2236 contains useful information beyond what is referenced in this guide. Through all of your studies keep in mind—your students will appreciate your efforts.

TRAINER'S ROLE
OBJECTIVES
Analyze the trainer's role and responsibilities in instructional situations.
Analyze instructional situations to determine effective feedback provided by the trainer.
INTRODUCTION
As an trainer you will be fulfilling an important position. This unit is designed to provide knowledge necessary in fulfilling your role as an trainer. The role trainers play is a varied one in the sense that they must not only know what to teach and how to teach, but they must be aware of their own behavior and attitudes as well as those of the students to ensure objectives are accomplished.
1. TRADITIONAL CLASSROOM TRAINER
Traditional classroom instruction is trainer-led instruction. In a traditional classroom you will have at least six roles to fulfill. You will be a planner, an trainer, a leader, a counselor, an evaluator, and a manager. While you study these roles separately, keep in mind that the effective trainer plays all of these roles in the course of a single day. Together, these roles make up the ideal trainer.
PLANNER. As a planner, plan the for various instructional tasks to be accomplished by the students. Find out what the student-centered objectives are for the lesson to be taught. This will aid you when you prepare questions and activities to guide the students' learning. Pay particular attention to the level of learning required of the students. If students are to attain a knowledge level, a simple explanation may be in order. If, however, students are expected to learn and perform a skill, a demonstration followed by hands-on practice may be required.
Consider your students' abilities and experiences when you plan their instruction. Try to foresee problems that might arise due to a student's lack of experience and plan to provide that student with extra help. If you know that a student is knowledgeable in an area you are about to teach, try to make use of the student's expertise.
Personalize the training by focusing on your station's or region's forecast areas of interest, relevant anecdotes, and questions to spark student interest and to encourage participation.
TRAINER. As an trainer you are responsible for your students' learning.
Know your subject well. In addition to being familiar with relevant manuals, regulations, and student instructional materials, you may wish to read the latest journals and pamphlets in order to keep yourself current with changes in your field.
Training can take several forms—seminars, demonstrating, discussing, leading small groups, and one-on-one on the forecast counter to assist learning. Question your forecasters in order to determine how well they understood your instruction. Through carefully planned questions, you will involve your students and encourage them to think about the subject. Respond directly to students' questions, either in class or in private. In your role as an trainer, you are constantly interacting with your students.

LEADER. The leader role entails three important responsibilities. First, be a role model for your students. Many will consider your words and actions as examples to follow. As a role model, you should always maintain a high standard of professional integrity in all of your undertakings.
Second, guide the training your students receive by managing discussions, providing demonstrations of techniques or of equipment use, and showing students how to accomplish a task efficiently.
And third, provide a positive atmosphere in which your students will learn. Your effective leadership will do much to produce in your students a positive attitude toward your instruction.
COUNSELOR. As a counselor, help the students in making adjustments to the learning environment, advise students, and refer them to appropriate agencies as necessary. In order to be an effective counselor, observe your students' attitudes and behavior. You need to understand your students as well as they need to understand you.
EVALUATOR. In your role as an evaluator, you are responsible for determining whether your students have successfully achieved the objectives. Provide feedback to your students to keep them informed on their progress throughout the course. Areas of difficulty should be of particular concern to you as an evaluator. Assist your students in correcting areas where they are having difficulty and compliment them on the things done well. Always encourage them.
You may be required to write test items. These should be constructed so that they duplicate the conditions, behavior and standards called for by the objectives. When you administer tests; explain the testing procedures and make sure that all students have an equal opportunity to complete the test within an optimal testing environment. When you score tests, watch for high miss items and try to determine why they were high miss items. Once the tests have been scored and analyzed, inform the students of their grades as soon as possible and critique appropriate items. In your role as evaluator, you will both assess and inform your students as to their progress in the course.
MANAGER. Record progress checks, tests, and any counseling interviews. You must also manage the time to keep the instruction moving properly.
2. NON-TRADITIONAL TRAINING
Non-traditional classroom instruction is instruction in which the trainer is not the primary source of information. These are usually self-paced courses and the primary source of information may be reading materials, audiovisual materials such as the Multimedia Training System (MTS), computers, etc., or any combination of these training materials. The role of the trainer is significantly modified in the self-paced classroom as more emphasis is placed on the roles of manager, counselor, tutor, and evaluator than that of information-giver. The responsibilities are interrelated.
MANAGER. As in any classroom, the manager of a self-paced class must ensure that the physical facilities are adequate, that materials are adequately maintained, that equipment is operable, and that records and reports are up-to-date. The manager has a challenging task to keep track of the progress of the students and assign them appropriate tasks or materials. The manager makes it all happen. As a manager, you must focus your attention on the needs and progress of the individual student as well as on the "big picture" of the training environment as a whole.
EVALUATOR. The individualization that makes self-paced instruction work depends on you. By knowing each student's needs and progress, you ensure efficient progression and thorough learning. In order to keep abreast of where your students are, you need to evaluate their progress. Most self-paced courses include the lesson appraisals and/or progress checks which will help you. Many courses include pretests to let you see important strengths or weaknesses before the students begin their course work.
TUTOR. Since the curriculum materials provide the information in self-paced courses, you might think that the trainer could be removed from that role entirely. However, individual differences among students' learning abilities may still require tutoring to get all of the message across. You must understand each student's strengths and weaknesses and provide the help necessary to achieve success. Help them understand difficult concepts and the connections between various things they have studied. You must be an active part of each student's learning experience. If a student asks you a question, don't simply send that student back to restudy the material. Show some interest! Explain the material, point out the answer or connection, and show that you really care. Then prescribe further readings or whatever is necessary to achieve full understanding.
COUNSELOR. Self-paced instruction works best with self-motivated students. Those who do not bring their own drive with them must be encouraged. Many bright students work best independently. Some with lesser ability depend more on group identity and external motivation for achievement. Since they do not have the environment of a definite class of other students doing the same tasks at the same time, they can get bogged down and feel isolated.
Show them the importance of the material they're studying. Point out how their success in training will lead to success on the job. Instill pride in their career field and its part in the total mission. Challenge them to succeed. Above all, show them that you care about them. Motivation in the self-paced course is doubly important, since students will miss the interpersonal challenge of a class progressing together.
3. EFFECTIVE FEEDBACK—read AFMAN 36-2236, Chapter 26.
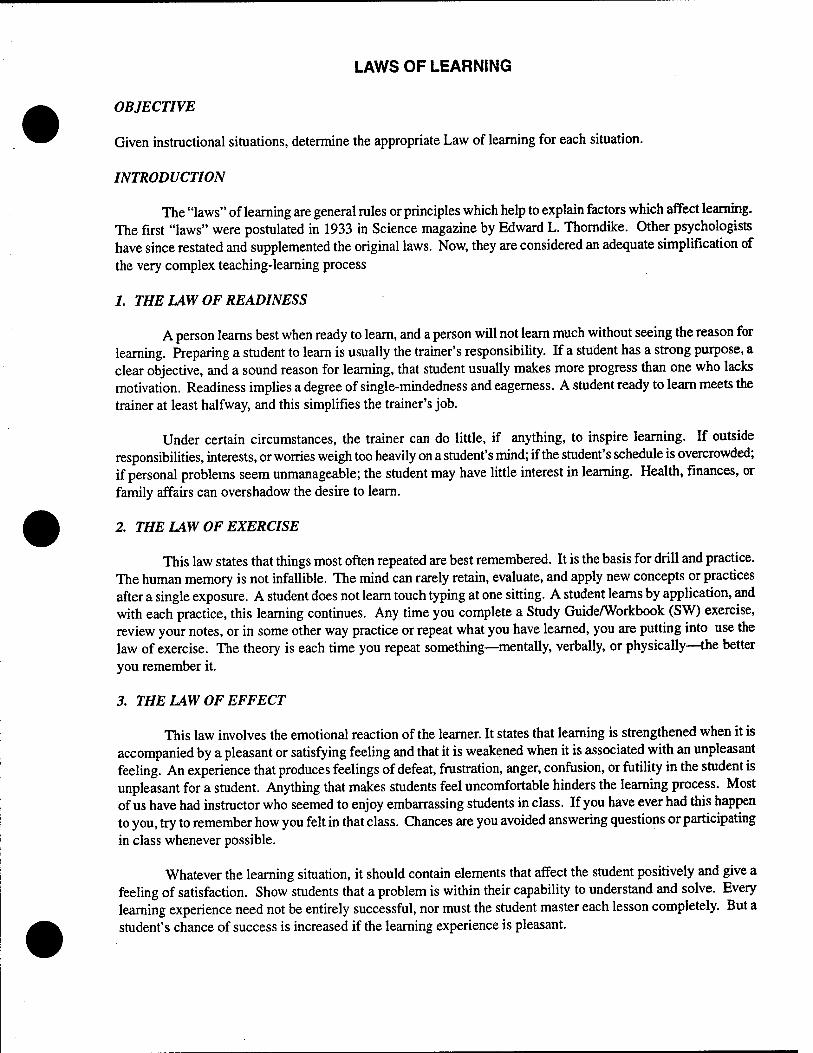
LAWS OF LEARNING
OBJECTIVE
Given instructional situations, determine the appropriate Law of learning for each situation.
INTRODUCTION
The "laws" of learning are general rules or principles which help to explain factors which affect learning. The first "laws" were postulated in 1933 in Science magazine by Edward L. Thorndike. Other psychologists have since restated and supplemented the original laws. Now, they are considered an adequate simplification of the very complex teaching-learning process
1. THE LAW OF READINESS
A person learns best when ready to learn, and a person will not leam much without seeing the reason for learning. Preparing a student to learn is usually the trainer's responsibility. If a student has a strong purpose, a clear objective, and a sound reason for learning, that student usually makes more progress than one who lacks motivation. Readiness implies a degree of single-mindedness and eagerness. A student ready to learn meets the trainer at least halfway, and this simplifies the trainer's job.
Under certain circumstances, the trainer can do little, if anything, to inspire learning. If outside responsibilities, interests, or worries weigh too heavily on a student's mind; if the student's schedule is overcrowded; if personal problems seem unmanageable; the student may have little interest in learning. Health, finances, or family affairs can overshadow the desire to learn.
2. THE LAW OF EXERCISE
This law states that things most often repeated are best remembered. It is the basis for drill and practice. The human memory is not infallible. The mind can rarely retain, evaluate, and apply new concepts or practices after a single exposure. A student does not learn touch typing at one sitting. A student learns by application, and with each practice, this learning continues. Any time you complete a Study Guide/Workbook (SW) exercise, review your notes, or in some other way practice or repeat what you have learned, you are putting into use the law of exercise. The theory is each time you repeat something—mentally, verbally, or physically—the better you remember it.
3. THE LAW OF EFFECT
This law involves the emotional reaction of the learner. It states that learning is strengthened when it is accompanied by a pleasant or satisfying feeling and that it is weakened when it is associated with an unpleasant feeling. An experience that produces feelings of defeat, frustration, anger, confusion, or futility in the student is unpleasant for a student. Anything that makes students feel uncomfortable hinders the learning process. Most of us have had instructor who seemed to enjoy embarrassing students in class. If you have ever had this happen to you, try to remember how you felt in that class. Chances are you avoided answering questions or participating in class whenever possible.
Whatever the learning situation, it should contain elements that affect the student positively and give a feeling of satisfaction. Show students that a problem is within their capability to understand and solve. Every learning experience need not be entirely successful, nor must the student master each lesson completely. But a student's chance of success is increased if the learning experience is pleasant.
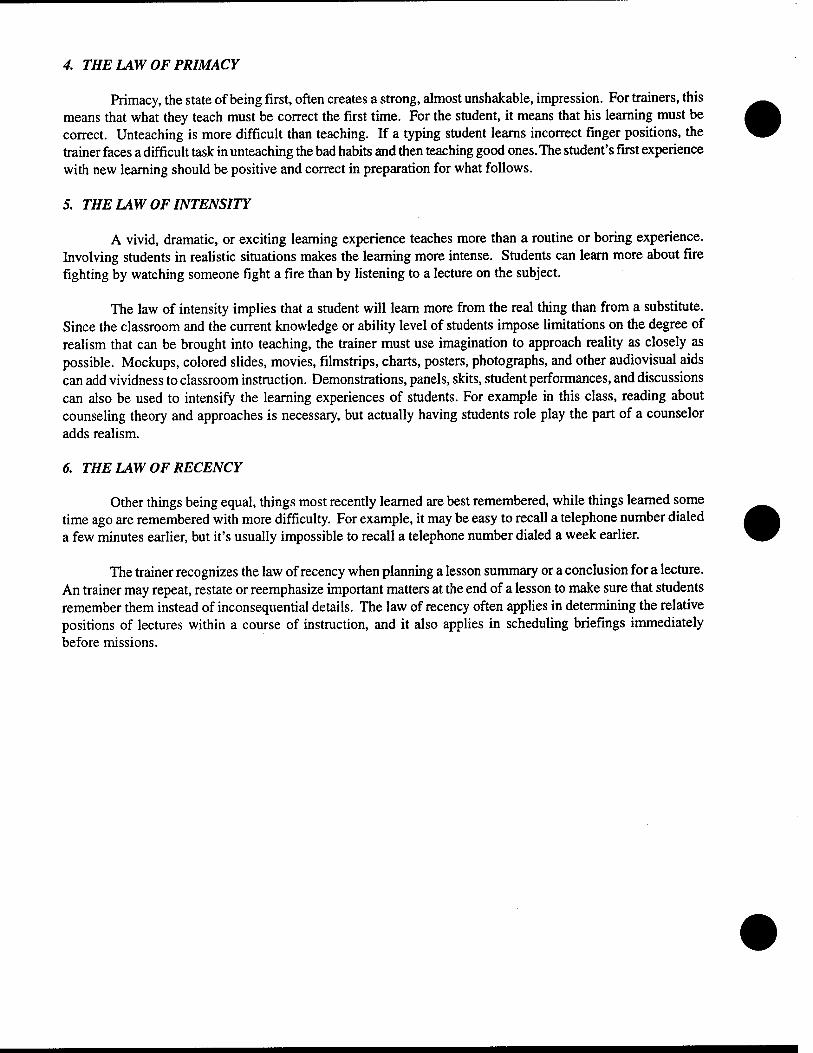
4. THE LAW OF PRIMACY
Primacy, the state of being first, often creates a strong, almost unshakable, impression. For trainers, this means that what they teach must be correct the first time. For the student, it means that his learning must be correct. Unteaching is more difficult than teaching. If a typing student learns incorrect finger positions, the trainer faces a difficult task in unteaching the bad habits and then teaching good ones. The student's first experience with new learning should be positive and correct in preparation for what follows.
5. THE LAW OF INTENSITY
A vivid, dramatic, or exciting learning experience teaches more than a routine or boring experience. Involving students in realistic situations makes the learning more intense. Students can learn more about fire fighting by watching someone fight a fire than by listening to a lecture on the subject.
The law of intensity implies that a student will learn more from the real thing than from a substitute. Since the classroom and the current knowledge or ability level of students impose limitations on the degree of realism that can be brought into teaching, the trainer must use imagination to approach reality as closely as possible. Mockups, colored slides, movies, filmstrips, charts, posters, photographs, and other audiovisual aids can add vividness to classroom instruction. Demonstrations, panels, skits, student performances, and discussions can also be used to intensify the learning experiences of students. For example in this class, reading about counseling theory and approaches is necessary, but actually having students role play the part of a counselor adds realism.
6. THE LAW OF RECENCY
Other things being equal, things most recently learned are best remembered, while things learned some time ago are remembered with more difficulty. For example, it may be easy to recall a telephone number dialed a few minutes earlier, but it's usually impossible to recall a telephone number dialed a week earlier.
The trainer recognizes the law of recency when planning a lesson summary or a conclusion for a lecture. An trainer may repeat, restate or reemphasize important matters at the end of a lesson to make sure that students remember them instead of inconsequential details. The law of recency often applies in determining the relative positions of lectures within a course of instruction, and it also applies in scheduling briefings immediately before missions.
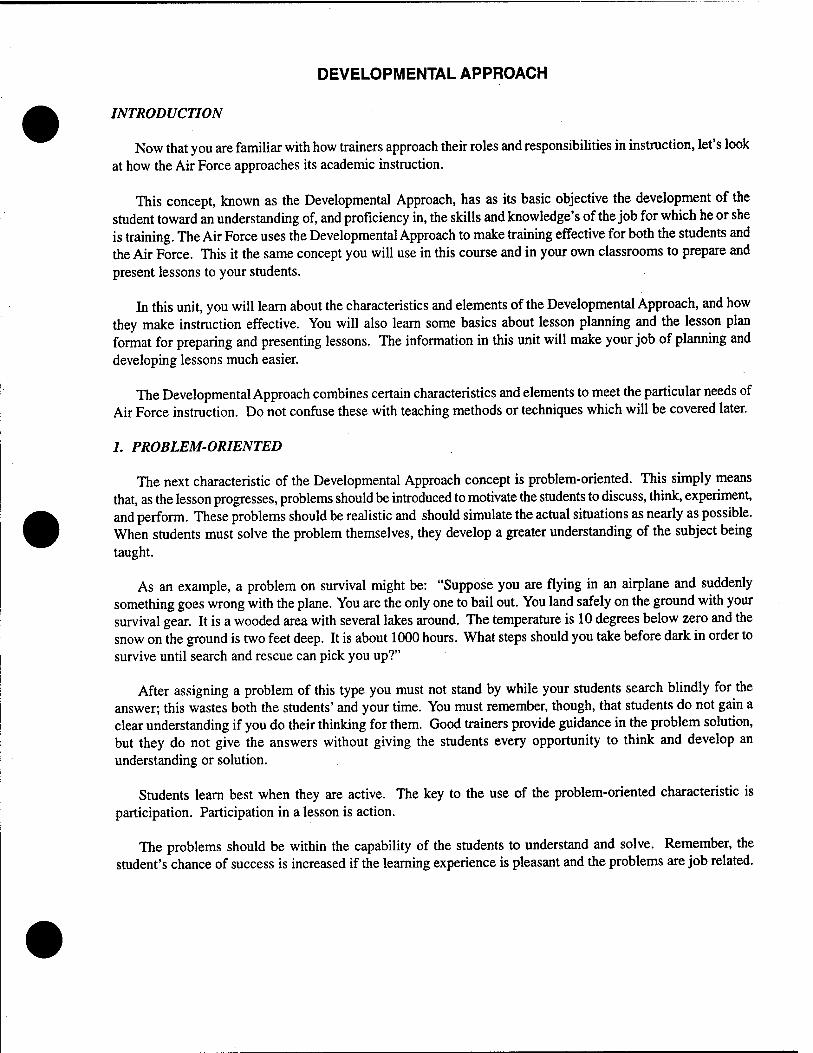
DEVELOPMENTAL APPROACH
INTRODUCTION
Now that you are familiar with how trainers approach their roles and responsibilities in instruction, let's look at how the Air Force approaches its academic instruction.
This concept, known as the Developmental Approach, has as its basic objective the development of the student toward an understanding of, and proficiency in, the skills and knowledge's of the job for which he or she is training. The Air Force uses the Developmental Approach to make training effective for both the students and the Air Force. This it the same concept you will use in this course and in your own classrooms to prepare and present lessons to your students.
In this unit, you will learn about the characteristics and elements of the Developmental Approach, and how they make instruction effective. You will also learn some basics about lesson planning and the lesson plan format for preparing and presenting lessons. The information in this unit will make your job of planning and developing lessons much easier.
The Developmental Approach combines certain characteristics and elements to meet the particular needs of Air Force instruction. Do not confuse these with teaching methods or techniques which will be covered later.
1. PROBLEM-ORIENTED
The next characteristic of the Developmental Approach concept is problem-oriented. This simply means that, as the lesson progresses, problems should be introduced to motivate the students to discuss, think, experiment, and perform. These problems should be realistic and should simulate the actual situations as nearly as possible. When students must solve the problem themselves, they develop a greater understanding of the subject being taught.
As an example, a problem on survival might be: "Suppose you are flying in an airplane and suddenly something goes wrong with the plane. You are the only one to bail out. You land safely on the ground with your survival gear. It is a wooded area with several lakes around. The temperature is 10 degrees below zero and the snow on the ground is two feet deep. It is about 1000 hours. What steps should you take before dark in order to survive until search and rescue can pick you up?"
After assigning a problem of this type you must not stand by while your students search blindly for the answer; this wastes both the students' and your time. You must remember, though, that students do not gain a clear understanding if you do their thinking for them. Good trainers provide guidance in the problem solution, but they do not give the answers without giving the students every opportunity to think and develop an understanding or solution.
Students learn best when they are active. The key to the use of the problem-oriented characteristic is participation. Participation in a lesson is action.
The problems should be within the capability of the students to understand and solve. Remember, the student's chance of success is increased if the learning experience is pleasant and the problems are job related.
The problem-oriented characteristic is applicable to all methods of instruction. All problems need not be lengthy or sophisticated. Good thought-provoking questions (how and why) used during the development of the lesson, during a discussion, or during a workbook exercise make a lesson problem-oriented.
2. ELEMENTS
The elements of the Developmental Approach help establish the trainer's role in developing the lesson. Just as with the characteristics, all the elements apply to any type of lesson. Each element is discussed in the following sections.
MOTIVATION. One element of the Developmental Approach is motivation. In a previous lesson motivation was described as making changes in the frequency and vigor of a person's activities, creating a personal drive to act. Thus motivation can be seen as the driving force which causes a person to spring into action and move toward a definite goal or objective. If students are to possess a desire to achieve the objectives set out for them a particular course, they must want to learn.
The trainer's role, then, is to continually create a desire to learn. This may be accomplished by paying attention to several factors: student's needs, aspirations, interests, attitudes, values, and their incentive to learn.
EXPLANATION. Explanation (presentation) is a means to initiate and sustain the learning process by explaining how something works or by clarifying ideas. It is included in the trainer activities in the presentation of a developmental lesson. Explanation is necessary in guiding student learning.
Certainly, a very important part of the trainer activity is giving the student clear, definite explanations and directions on the best way to perform the job. Effective explanations should be based on the whole-part-whole characteristic. Before students can fully understand parts of a job or activity, they should have a picture of the whole activity. Once this has been done, they can begin to fit the parts into the overall picture. As these parts are understood, one by one a complete picture is drawn or developed and the job is seen in its complete form.
In your explanation, be sure to present the goals completely and clearly, and be certain that the students perceive these goals. Clarifying the goals prepares the students for learning. Each new idea should relate to a previous idea and logically lead the student to the next idea (known to unknown).
Clear explanation gives students the opportunity to understand and relate the needs individually so that each one will be prepared to do the job. The fact that students do not learn at the same rate will influence how much explanation is used and at what rate.
INSTRUCTIONAL METHODS
INTRODUCTION
You learned that trainers perform many roles in the performance of their duty. As a subject matter expert (SME), you are more concerned with what to teach. As a curriculum developer you might be concerned with how the material is going to be taught. A strong case can be made for either point of view. However, we are going to discuss the many ways to present instruction.
Once you have determined the objectives of the training session, you should choose the most economical and efficient method of instruction. A primary concern in choosing a method should be the activities the student will have to perform in attainment of the objective. Five methods have been selected because of their applicability to the classroom.
TEACHING METHODS
LECTURE METHOD. The teaching lecture is a formal or informal delivery of concepts, information, or principles by an trainer. The group size and the amount of required student interaction, if any, will aid in determining the type of lecture you will be present.
DEMONSTRATION-PERFORMANCE METHOD. The demonstration-performance is the presentation of a sequence of events to show a procedure, technique, or operation. It's commonly used with small groups in a classroom or laboratory environment and it combines oral explanation with the operation or handling of equipment, or materials.
GUIDED DISCUSSION METHOD. The guided discussion is an trainer controlled, interactive process of sharing information and experiences related to achieving an educational objective. The ability of the trainer and the common core of experience of the students will determine the success or failure of the guided discussion.
SELF PACED METHOD. Self paced instruction is a learning program which is organized so that students are allowed to move through at their own pace under the guidance of an trainer.
CASE STUDY METHOD. The case study is a learning experience in which students encounter real-life situations in order to achieve some objective. Students develop insight into the solution of specific problems by studying realistic case studies.
SUMMARY
This section has provided you with a sampling of the teaching methods that can be used or considered for use in the classroom or other locations available to you. Those that you have read about are the methods that are most commonly used in instruction. You can read AFMAN 36-2236, for a more detailed explanation of instructional methods.

INTRODUCTION TO EVALUATION/MEASUREMENT
INTRODUCTION
Tests should measure how well students meet our instructional objectives. From true/false tests to simulated war games, we gather measurement data to compare student performance to what we intended to teach. A test which measures carefully written objectives is said to be a criterion-referenced test (CRT). You may find yourself writing tests from time to time in order to measure your students' understanding of the material as well as your effectiveness as an trainer.
1. CHARACTERISTICS OF EVALUATION
Information pertaining to this topic is found in AFMAN 36-2236, Chapter 24, Criterion- Referenced Evaluation, paragraph 24.5
2. WRITTEN TEST ITEMS
Information pertaining to this topic is found in AFMAN 36-2236 Chapter 21.
3. EFFECTIVE QUESTIONING TECHNIQUES
The entire purpose of questioning is often defeated by the trainer who has not learned how to question effectively. Questions that are improperly used can be harmful to the learning process. Successful questioning depends on the trainer's questioning techniques. The following techniques are based on trainer research and experience. They are not ironclad rules to be used regardless of the consequences. There may be occasions when the trainer, if conditions warrant, may violate some of the techniques. These techniques, if properly used, should enable inexperienced trainers to carry on their instructional effort effectively.
USE EFFECTIVE QUESTIONS. You have probably determined by now that an trainer must use a variety of questions. What type of question to use depends on the particular situation. In fact, a good question in one situation may not be a good question for another situation. Knowledge of the various types of effective questions will help you in planning and asking questions.
RHETORICAL. Trainers often ask questions without expecting an answer. These are rhetorical questions. They are either answered by the trainer or left unanswered. An example of a rhetorical question would be "Have you ever wondered why ...?" or "What would you do if you ever found yourself...?" Rhetorical questions can be used early in a lesson to get the students' attention. They also may be used during a lesson to maintain interest, or near the end of a lesson to summarize or close.
OVERHEAD. An overhead question is a question directed to the entire group and is one to which you expect an answer. Overhead questions may be used to initiate and stimulate discussion of the topic. These questions keep everyone in the class alert and following the development of the subject. They are often used as lead-off questions but also may be used during the lesson.
DIRECT. As the name indicates, this type of question is directed to a particular student to answer. A very effective method is to begin as if you are asking an overhead question, then pause to give each student an opportunity to think, and then call on a particular student by name to answer. Using the ask, pause, call (APC) technique in asking direct questions is effective because it requires every student in the class to think and reason. If you direct the question to one particular student too early, the other students will know they can relax and think about something else. Direct questions are one of the most important teaching-learning tools you have in the classroom. They are useful in getting students involved, developing the subject, obtaining participation, and/or evaluating the effectiveness of your instruction.
REVERSE. A reverse question occurs when a student asks the trainer a question which the trainer returns to the student who asked it, for the answer. For example, 1st Lt Michaels might ask you, "I really can't see your point. Why is it necessary to have authoritarian leaders?" You, as the trainer, could reverse the question by saying, "Think about it for a minute, 1st Lt Michaels. Why do you think it would be necessary to have an authoritarian leader, say, in a combat situation?" You can see here that slightly rephrasing the question to make it clearer or more specific may be helpful to the student in answering. Reverse questions stimulate thinking, provide clarification and student participation, and develop the subject.
RELAY. This is a question which a student has asked the trainer, but rather than the trainer answering, the trainer directs or relays the question to another student. For example, Sgt White asks the trainer a question. The trainer pauses and then asks, "That's a good point. How do you feel about that, SSgt Dennis?" Relay questions can also stimulate thinking, provide clarification and student participation, and develop the subject.
AVOID INEFFECTIVE QUESTIONS. Your questions can have a negative as well as a positive effect on your students. When questions are poorly planned or phrased, they may confuse, mislead or belittle students. In any of these situations, students become frustrated and learning is inhibited. Try to avoid asking ineffective questions.
DEAD-END. A dead-end question requires only a simple, categorical answer, or a yes or no for an answer. This kind of question does not promote discussion. Quite the contrary, it encourages guessing and can be a waste of time. If you find that you must ask a yes or no question, follow it up with a "how" or "why" question for further explanation.
FOGGY. As the name implies, foggy questions are unclear or vague. They usually occur when the trainer has not thought through the desired answer. The ambiguous question, "What happened in Cleveland in 1873?" is unclear because students will not understand what is wanted. Students may have differing interpretations of an ambiguous question. The indefinite question, "What is the meaning of life?" is also unclear because it does not provide any focus or limits for the students. To avoid foggy questions, plan and properly phrase your questions to ensure they are definite and specific.
MULTIPLE. Multiple questions occur when several questions are asked as one. For example, "What are the purposes of feedback, and how and why do you give feedback?" This question would leave students confused as to what information the trainer wants answered first. The trainer should rephrase the example as three different questions and allow three different students to answer. This would reduce confusion and increase student participation.
CATCH. Catch questions are questions which attempt to trick or trap students. This category includes some leading questions in which the answer is implied or suggested in the question and requires only agreement on the part of the student. For example, "Now this is the first step, isn't it?" implies the expected answer. It prevents the students from really having to think. Another type of catch question is the loaded question. "Have you quit pressuring your subordinates?" is loaded, because no matter what the student says, it could be wrong. Catch questions can also include presenting jokes, riddles, and brain teasers as serious instruction. Any of these questions will cause the students to doubt your credibility and sincerity.
AVOID STIFLING THE DISCUSSION. You may find that, although you adequately plan and effectively phrase your questions, your students are still not participating as you would like. You may be stifling the discussion. The key here is to be patient.
ALLOW TIME FOR STUDENTS. Be sure you are allowing enough time for students to think and respond. Waiting for an answer can be difficult, especially for an inexperienced trainer. However, too many rapid fire questions do not allow students to think. This may encourage short responses and result in little discussion. Allow enough time for students to respond, especially to lead-off and overhead questions. Also try to allow for more than one student response per question. This encourages student participation.
DON'T ANSWER YOUR OWN QUESTIONS. Rather than wait for students to respond, impatient trainers may feel tempted to answer their questions themselves. This can become a very annoying habit. It increases the amount of teacher talk and decreases the amount of student participation. Students will quickly learn that it is not necessary to prepare for class, because "the teacher answers all the questions anyhow." You may try prompting the students to encourage participation.
BE CLEAR AND CONCISE. Don't make students spend their time and energy trying to answer questions that are vague and meaningless. How often have you sat in class and listened to the trainer ask a question to which your response was "Huh?" The wording of your question is very important, especially to avoid smart-aleck answers. If you ask, "When do you use Boyle's law?" the answer might be "Never. I don't even know the man." Think through what you are teaching, and then plan clear and concise questions. If you have to rephrase or ask your questions several times, students may become more and more confused.
SHOW CONCERN FOR INDIVIDUAL DEFERENCES. This technique pertains to your attitude toward your students. If students are not participating, perhaps it is because they feel you do not care about them. Your attitude toward your students is conveyed through your tone of voice, body language, and facial expressions.
ENCOURAGE PARTICD7ATION. Rather than allowing one or two aggressive students to dominate the discussion while other class members sit quietly, encourage all students to participate. Ask challenging questions, but keep them within the students' ability. Often, simple eye contact and a smile will encourage response. By randomly calling on non-volunteers, you can convey the idea that everyone is responsible for participating.
BE TACTFUL. Since you may not know the reason for their non participation, be tactful with your students. Embarrassing them will destroy their confidence in you and greatly reduce their willingness to try and answer any future questions.
BE ACCEPTING OF STUDENT RESPONSES. Give credit for good answers, and always interpret a sincere response to the advantage of the student. Artfully accepting a student's response, even though the answer may not be totally correct, is much better than completely rejecting the student's response. Let them know you appreciate their efforts. Praising the work of an earnest student encourages further effort. A good rule to follow is "treat others as you would like to be treated."
HANDLING STUDENT'S QUESTIONS. As an trainer you should encourage students to ask questions, assuming they are sincere and relevant.
TREAT SINCERE QUESTIONS EQUALLY. You should treat all sincere questions with interest and equal consideration regardless of who asks them. Evaluate the importance of each question and gauge the amount of time that can be given to it depending upon the particular circumstances. If the material is difficult and the whole class can profit, a question may warrant a lengthy explanation. However, if the material is not considered to be difficult and affects only one or two students, you may choose to shorten your answer or to confer privately after class with the affected students. If students have questions that are not directly related to the lesson, it is usually best to answer their questions outside of class.
BE HONEST. Students may occasionally ask you questions which you cannot answer. The best procedure is to be honest and admit that you do not know. If relevant to the lesson, try to look up the answer immediately or make a note to look it up. If you do promise to return with an answer at a later time, be sure and do so. There is nothing wrong with keeping a pen and paper with you to jot down such notes to make sure you do not forget them. Never bluff students with a guess. You are sure to get caught and lose your credibility.

COMMUNICATIVE PROCESS
INTRODUCTION
Every time you communicate you send a message to someone. The sender transmits the message. The message is the content. The person who listens to or reads the message is the receiver.
In a typical classroom setting, the trainer is the sender, the knowledge or skill being taught is the message, and the students are the receivers. This is a simplified example of the basic elements of the communicative process.
/. EFFECTIVENESS OF THE COMMUNICATIVE PROCESS
PREPARATION. Adequate preparation for any lesson includes determining your objectives, developing your outline, and planning your audiovisual support.
NERVOUSNESS. Most of us become uncomfortable or nervous when we are to speak to a group. This nervousness may take many forms, such as the queasy feeling of "butterflies in the stomach", a choked feeling in the throat, and/or fidgeting. Some nervousness is both natural and desirable. However, when the trainer suffers from stage fright, students may also become uneasy or anxious. The secret is to get the butterflies "flying in formation."
POSITPVE ATTITUDE. Have a positive attitude toward your students. They are the same people you enjoy visiting with in a less structured atmosphere. Most students are warm human beings who are interested in what their trainer has to say.
ENTHUSIASM. Enthusiasm is the key when practice is over and you are ready to deliver the presentation. Some subjects may seem dull, but if we get involved the subject becomes more interesting. There is no such thing as a dull subject, only dull teachers. Use enthusiasm to replace fear, and your students will be more involved with both you and what you are saying.
TAKE-YOUR-TIME. Don't rash yourself. As you begin to speak, take your time. Make sure that all your notes are arranged properly. When you are ready, look at the class, take a deep breath, and begin.
SINCERITY. To be really effective, you must also be sincere. Audiences will be amazingly tolerant of weaknesses in preparation and delivery as long as they feel you are sincere. Sincerity may be defined as being honest and truthful in everything you do. If students ever doubt your sincerity, you lose effectiveness. Once lost, sincerity is nearly impossible to regain. Sincerity is reflected in your interest and enthusiasm toward the subject, your eye contact with your students, your concern toward your students, and your self-confidence. You may use many of the communicative skills to demonstrate your sincerity.
2. EFFECTIVE COMMUNICATIVE SKILLS
EFFECTIVE NONVERBAL SKILLS. Communication experts tell us that over half our meaning may be communicated through physical, or nonverbal, behavior. This includes eye contact, body movement and gestures.
Eye contact is one of the most important factors of nonverbal communication. It is important because it lets your students know you are interested in them. Look directly at your students and include everyone equally. This creates a more natural, direct feeling of conversation. You must maintain eye contact to determine your students' reactions to your presentation.
EFFECTIVE VERBAL SKILLS. A good speaking voice has three important characteristics. It has a reasonably pleasant quality, it is easily understood or intelligible, and it expresses variety.
ARTICULATION. This or enunciation, refers to the precision and clarity with which sounds of speech are made. Most articulation problems result from laziness of the tongue and lips or failing to open the mouth wide enough. Striving to "over-articulate" will produce clear, understandable words.
VARIETY. Variety is the spice of speaking. Students will tire rapidly listening to a lesson in which everything sounds the same. Some factors you can vary in speaking include rate, volume, force, pitch, and emphasis.
MESSAGE. The message is the information or content being communicated. In a typical classroom this will include all the knowledge and skills you teach your students.
CONTENT. To be effective, a message should be well planned. The message should gain and hold the students' attention. It must motivate the students to learn by creating a desire within them. The information in every message should be accurate and up-to-date. Otherwise it has no meaning for the students.
MEDIUM. The content of a message may be delivered or transmitted in different ways. The method of delivery is called the medium. In the classroom the medium is often a lecture. Other media include reading material, discussion, demonstrations, computers, and audiovisual aids. More than one medium may be used for a presentation. For example you may present a lesson using both a lecture and transparencies.
USING FEEDBACK IN THE CLASSROOM Chapter 26 (of AFMAN 36-2236, Sep 94)
INTRODUCTION.
We are familiar with courses which consist of readings, lectures, an assigned paper or project, and tests. In traditional courses like these, individualized comments from trainers to students are limited to grades on papers, quizzes, exams, and the final grade. But comments of this sort come well after students have been evaluated on their course work. If there is any impact on learning, it will come during the next phase or in another course or in some follow-on activity on the job.
GIVING FEEDBACK TO STUDENTS.
The purpose of feedback is to improve student performance. In its most effective form, it provides constructive advice, direction, and guidance to students in their efforts to raise their performance levels. It is a communication medium in the sense that the trainer can review course standards with the students and provide feedback on their performance in relation to these standards. Students must understand the purpose and role of feedback in the learning process. Otherwise, as we have seen, they may reject the feedback and make little or no effort to improve.
CHARACTERISTICS OF EFFECTIVE FEEDBACK
OBJECTIVITY. Effective feedback focuses on the student and student performance; it should not reflect the trainer's personal opinions, likes, dislikes, or biases. For example, if a student demonstrates a complicated test construction sequence, it would be unfair to give feedback on personality traits unless they interfere with performance. If a student makes a speech and expresses views that conflict with the trainer's beliefs, the trainer should give feedback on the merits of the speech, not on the basis of agreement or disagreement with the student's views.
CONSTRUCTIVENESS. Feedback is pointless unless a student profits from it. Praise just for the sake of praise has no value unless the only goal is to motivate or improve self-concept. The trainer should identify a fault or a weakness and also provide positive guidance for the student to improve. Negative criticism that does not point toward improvement or a higher level of performance should be omitted from feedback.
FLEXIBILITY. As effective trainers, we should remain flexible in giving feedback. We should avoid mechanical, predetermined techniques and preconceived opinions regarding content, subject matter, and student capability. We should consider the actual content of a student effort or what actually happens during a student activity. We then give feedback on those observed factors that affected performance. Sometimes a good student will do poorly, and a poor student will do well. A friendly student may suddenly become hostile, or a hostile student may suddenly become friendly and cooperative. We should be honest enough to evaluate each effort on its own merits.
ORGANIZATION. Unless feedback follows some pattern of organization, a series of otherwise valid comments may lose their impact. Almost any pattern is acceptable if it is logical and understandable to the student and to the trainer. Therefore, the trainer should tell the student what the pattern will be in order to improve the student's comprehension of the feedback. For example, an effective organizational pattern might be the sequence of the student activity itself. In certain instances, feedback can begin at the point of failure and work backward through the steps that led to the failure. A successful performance can be analyzed in a similar fashion.

COMPREHENSIVENESS. Comprehensive feedback need not be extremely long nor must it treat every detail of a student's performance. As trainers, we must decide whether we can achieve the best results by discussing a few major points or a number of minor points. We should base our feedback either on areas which need improvement or on areas that we can reasonably expect a student to improve.
METHODS OF GIVING FEEDBACK. The critique of a student's performance is always the trainer's responsibility, and we can never delegate it in its entirety. However, we can add interest and variety to our feedback if we exercise our imagination and draw on the talents, ideas, and opinions of others. The following methods for giving feedback may be used individually or in combination.
TRAINER FEEDBACK. Most critiquing results from the direct leadership and guidance of the trainer. We conduct workshop sessions to refine skills; we hold individual conferences or critique in front of a group; we examine outlines and drafts; we coach and conduct practice sessions.
Group Critiques. Sometimes we give feedback in a one-to-one student-to-teacher setting, but a more efficient way is often within a general class session. Students may make identical mistakes as they perform an exercise or explore new experiences; giving feedback to a group of students means that more aspects of the subject can be covered.
Written Feedback. When we write down feedback we can devote more time and more thought to preparing it than we can when giving immediate oral feedback in the classroom. What we lose in spontaneity we often make up for in more complete, carefully considered comments. Written feedback also gives students a permanent record they can refer to as necessary. Rating scales, a form of written feedback, often provide for standardization among trainers which students appreciate.
STUDENT FEEDBACK. Other methods of feedback focus on student leadership under the supervision of the trainer. We often involve students in the feedback session because they learn as they help teach others. Many civilian schools use a system of teachers' aides or graduate assistants to help with the feedback because direct involvement with students can be extremely valuable; more experienced students can give more effective student-centered feedback.
Self-evaluation. One goal of education is to give students enough confidence to be self-critical; allowing them to evaluate their own performances can help with this process. Beginning writing students, for instance, can often spot elementary errors in their own work if they participate in a supervised proofreading exercise. When television facilities are available, an effective way to critique public speaking is for students to see themselves on TV. Giving students a checklist or a scale of some sort often aids them in self-evaluation. When students evaluate their own work, the trainer usually needs to follow up and make sure the feedback is complete and accurate.
Student-led Evaluation. Students can give feedback in a variety of different ways, but they must never be put in a position of substituting fully for the trainer. Sometimes a student may lead the discussion in a group feedback session, but the trainer should set the ground rules. The efficiency of this type of feedback may be limited by inexperienced participants, but it may also generate a high level of student interest, participation, and learning. In student-led evaluation, the trainer invites members of the class to comment on student activity or singles out one student to present all the feedback. Still another technique is to divide the class into small groups and assign each group a specific area on which to comment. Using basic criteria and guidelines issued by the trainer, these groups then present their findings to the class. Their combined reports provide comprehensive feedback of individual and class performance.
SUMMARY
Since, by the nature of their job, trainers are evaluators, they should have the ability to give feedback in the classroom. Feedback is not part of the grading process but a step in the learning process. The purpose of feedback is to improve future performances of the students and, when possible, to reinforce learning. Effective feedback stresses student strengths as well as suggestions for improvement. Feedback should be acceptable, constructive, flexible, organized, and comprehensive. Classroom feedback may be varied for interest, and it may be both written and oral. Student participation in feedback should be carefully supervised and trainers should reserve time for themselves to ensure adequate coverage.
Ground Rules To Aid The Trainer
1. Establish and maintain rapport with the students. 2. Tell the students the organizational pattern to be used in the feedback. 3. Cover the major strengths and weaknesses. Try to be specific and give examples if possible. 4. Avoid trying to cover everything. A few well made points may be more beneficial than numerous but inadequately developed points. 5. Do not extend feedback beyond its scheduled time. A point of diminishing returns can be reached quickly. 6. Allow time for a summary of the feedback to reemphasize the most important things that a student should remember. 7. Try to avoid comments with "never" or "always;" most rules have exceptions. Your feedback may be wrong. 8. Do not criticize something that cannot be corrected. 9. Do not criticize when you cannot suggest an improvement. 10. Avoid controversies with the class, and try not to take sides with group factions. Stop the discussion before arguments get started. 11. Avoid being maneuvered into the unpleasant position of defending feedback. If the feedback is honest, objective, constructive, and supported, no defense should be necessary. 12. If part of the feedback is written, it should be consistent with the oral feedback.
2WW/FM-85/002
2d ww forecaster
memo
TECHNICAL TRAINING
A MANAGEMENT GUIDE
fi PUBLISHED BY 2WW/DNS
I*
REVIEW AND APPROVAL STATEMENT
'"is Forecaster Memo has been reviewed and is approved for publication. #
MICHAEL J. A^ÜM,"l/t Lt, USAF ruolic Af^Mrs Officer
' X'.'ALD L. BEST, Lt Col, US. USAF C*ief, Aerospace Sciences Division
(-- ^^^^^gC- GA*?' S. C:-zander
, Colonel, USAF
$
%
OVERVIEW
1. This forecaster memo (FM) is designed to assist management,and supervisory personnel in administering those technical training requirements applicable to their unit. The aim is to tie these requirements together into one, manageable package. Thus, allowing more time for training rather than administration.
2. A strong technical training program is essential; because forecasting experience at detachment level has been decreasing over the past 10 years. It's gone from near 13 years to less than 3 years per forecaster, with some units averaging even less. As our experience levels decreased, our manning levels decreased, while workloads either stayed the same or, in most cases, increased. The result is less time available to complete the numerous training requirements. By themselves, these are reasons to consolidate the technical training requirements, to plan who will train the new forecasters, and to plan well in advance who needs formal training through the Chanute supplementary course.
3. Independent recurring training programs do not lend themselves to a smoothly run program. Such independent approaches are hindered by inexperience. For example, in many cases the METSAT Specialist (MSS) or radar coordinator is an inexperienced junior officer or mid-level NCO who has only a couple of years forecasting experience. One way to overcome these problems.is to develop a consolidated training schedule. All detachment people involved • with training - the Detachment Commander/Chief, Station Chief, Radar Coordinator, MSS, OJT Manager, Mobility Officer/NCO and FOT monitor - should sit down at least twice a year and prepare a 12 month training schedule. After six months, a review of the, past six months should be made to determine , if the.schedule was met. • . • ' .
4. Those training requirements which were not accomplished due to exercises, TDYs, etc., should be considered when revising the remaining six months of the schedule and extending the schedule an additional six months. This meeting should also serve'as a review of the training documentation. Have appropriate entries been made on AF Forms 3130, 1098, 971 and in the OJT records? The requirements in AFR 50-23 have not been mentioned yet. Guidance on administering the OJT program already exists and should be followed. The OJT administrator should be an active member in these meetings so everyone knows how upgrade training is progressing.
4
TRAINING REQUIREMENTS
1. Each unit must determine its own training requirements. The following • list covers the technical training areas (and references) applicable to most units:
a. Radar Training, FHH-7C
D. METSAT Training, AWSR 105-20
c. Tactical Readiness Training, AWSR 55-2
d. Monthly Forecaster Seminars, AWSR 105-22
e. Follow-On-Training (FOT) Program, AWSR 50-5
f. Certification of Weather Personnel, AWSR 52-3/AWSR 50-3/AWSR 50-12
g. Forecaster Preparatory Program (FPP), AWSR 52-6/AWSP 51-1 .
h. Supplementary Courses, AWSR 52-6
i. Electro-Optics, AWSR 105-7
l. Technical training requirements can be broken down into four parts:
a. initial training requirements, (includes remedial training).-
b. Recurring training requirements.
c. Supplementary courses. .
d. Trainers.
3. Once you have identified your training requirements and broken them into the above groups, you can begin setting up your technical training program.
#
^
%
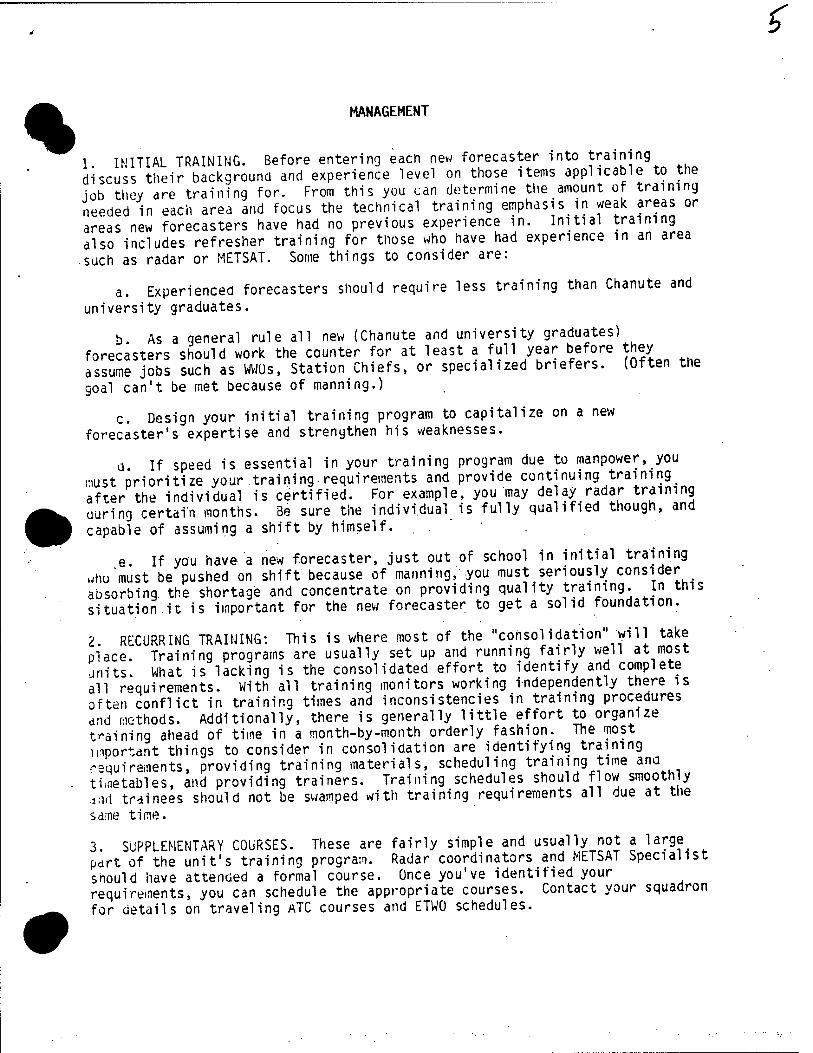
r
%
MANAGEMENT
1 INITIAL TRAINING. Before entering each new forecaster into training discuss their background and experience level on those items applicable to the job they are training for. From this you can determine the amount ot training needed in each area and focus the technical training emphasis in weak areas or areas new forecasters have had no previous experience in. Initial training also includes refresher training for those who have had experience in an area such as radar or METSAT. Some things to consider are:
a. Experienced forecasters should require less training than Chanute and
university graduates.
b As a general rule all new (Chanute and university graduates) forecasters should work the counter for at least a full year before they assume jobs such as WWüs, Station Chiefs, or specialized briefers. (Often the
goal can't be met because of manning.)
c. Design your initial training program to capitalize on a new forecaster's expertise and strengthen his weaknesses.
d. If speed is essential in your training program due to manpower, you nust prioritize your training.requirements and provide continuing training after the individual is certified. For example, you may delay radar training uuring certain months. Be sure the individual is fully qualified though, and capable of assuming a shift by himself.
e. If you have a new forecaster, just out of school in initial training who'must be pushed on shift because of manning, you must seriously consider absorbing the shortage and concentrate on providing quality training. In tms situation it is important for the new forecaster to get a solid foundation.
2 RECURRING TRAINING: This is where most of the "consolidation" will take place. Training programs are usually set up and running fairly well at most units. What is lacking is the consolidated effort to identify and complete all requirements. With all traininq monitors working independently there is often conflict in training times and inconsistencies in training procedures and methods. Additionally, there is generally little effort to organize training ahead of time in a month-by-month orderly fashion. The most important things to consider in consolidation are identifying training -oquirements, providing training materials, scheduling training time ana timetables, and providing trainers. Training schedules should flow smooth y i:id trainees should not be swamped with training requirements all due at the
same time.
3 SUPPLEMENTARY COURSES. These are fairly simple and usually not a large part of the unit's training program. Radar coordinators and METSAT Specialist should have attended a formal course. Once you've identified your requirements, you can schedule the appropriate courses. Contact your squadron for details on traveling ATC courses and ETWO schedules.
4. TRAINERS. Like recurring training, the selection and utilization of 4m7> trainers often suffers from poor planning and last minute decisions. Planning Mm to replace the radar coordinator, mobility officer or MSS should be considered flV -drly so any qualification training - especially fornal supplementary ^^ courses - can be scheduled early. Determining who will train new forecasters and assist observers in the Forecaster Preparatory Program (FPP) should also ;>e an integral part of the technical training program.
5. Tu assist you in a technical training program, we have provided some examples. Attachment 1 is a sample DO I, attachment 2 is a sample 12 month . schedule, and attachment 3 is a list of available training materials and ways to best use some of then.
•
?
*
SAMPLE DO I
Training
TECHNICAL TRAINING PROGRAMS
This operating instruction organizes all recurring technical training requirements into one program.
1. Responsibilities.
a. The (Detachment Commander/Detachment Chief/WSU Chief) is responsible for the overall training.
b Individuals designated in writing to monitor individual programs are responsible for ensuring that all required individuals complete necessary training requirements and that changes are made in training programs as required.
c All individuals are responsible for completing assigned training In a timely manner and for assisting the training monitors in improving training methods.
c. Scope.
a This operating instruction is designed as a single document to assist in managing the overall recurring technical training requirements of this unit. Upgrade training and proficiency training (AFR 50-23 requirements) are covered in a separate 001. Individual program requirements, and specific procedures are contained in separate 0Is,S0Ps, and training program binders, as noted:
(1) Radar Training (FMH-7C).
(2) METSAT Training (AWSR 105-20).
(3) Technical Readiness Training (AWSR 55-2).
(4) Monthly Forecaster Seminars (AWSR 105-22).
(5) F0T Program (AWSR 50-5).
(6) Certification of Weather Personnel (AWSR 52-3/AWSR 50-12).
(7) Forecaster Preparatory Program (FPP) (AWSR 52-6/AWSP 52-1).
(8) Supplementary Course (AWSR 52-6).
(9) Electro-Optics (AWSR 105-7)
3. Procedures.
Atch 1
3
a To ensure the training requirements are met in a timely and organized ^j^- manner, the following individuals will meet every six months (Jun and Dec) to MM ?reyar<i a training schedule for the next twelve months. ^^
(1) Detachment Commander (Detachment Chief, WSU/OIC).
(2) Station Chief.
(3) UJT Manager.
(4) Radar Coordinator.
(5) METSAT Specialist (METSAT Coordinator).
(6) Mobility Üfficer/NCO...
(7) FOT Monitor
b The above individuals will review the training accomplished -1n the last six months, revise the next six month training schedule to meet needs, and extend the training schedule out another six months.
c. In addition to the recurring training schedule, the following itans will be discussed and added to the schedule as necessary:
(1) Need to replace monitors due to projected gains or losses.
(2) Need for supplementary course attendance.
(3) Appointment of forecasters- to train new forecasters.
(4) Appointment of forecasters to assist observers entering the FPP
• (5), Initial training requirements due to projected gains.
ü. Documentation of training, including OJT records, will also be reviewed at this meeting.
%
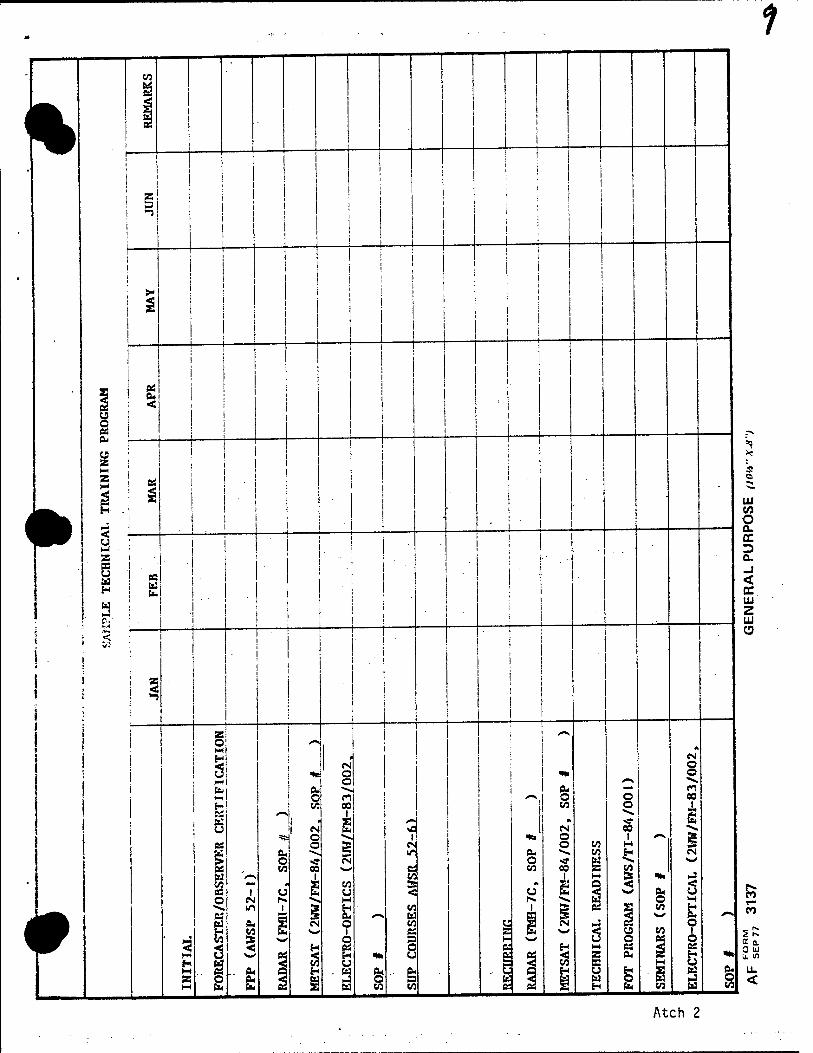
1
< %
i i
co
l i 1
I 1 t
1
<r i
j i i i i
]
i i i
>*
! I
1 i
1
i i
i f
\ i i i
i
i j
1
i -^
i i !
1
| !
1
i i I
| i
1 i
| 1 i
i
i i
i ^
«5
1
*a 04
PS <
C at 1 ft U 1
i Z ; HI
RA
IN
1 ■ i
(fe 5 ' 1 ,
'
i i M • ! ' 1 Z {
S3 a H
S3
ft ' i i
■ ! 1
Cd 1 i 1 !■•• Ci
\ ' ; -i ——
■ ' M
! !
! ' \ i a '
i
i i 1 1 i ;
2 i
r>
O l •■*• • H i
I ! i 1 s «•»
i
o 1
| "Hi
CM O o
i i M c >"\ ^. i I ft 1 ft "*. I ft ^ CO r W ' O n '-» o O 00
| |
CE
RT
! *-» I
M
1 1 <N
CO
<£
CO
CM
o 's.
1
I O ^•*. 1 "to O 1 *■■* 1? ! W a 5 PN c co H k5
! £ ft, U" ft *»» CO H es O «a <\ o sr a *■*««. «a/
i « M « \*s a CO 00 S3 w /*s i V 1 M Sc ■Ha -J to 85 1 1 U s 3 < u s 1 <
*-> ft 3 o CN (*• *«. »- f>» -V. o M
— m 1 ►■■» g £ *~*
c ft
1 § 5 CO H ft ^■N | l B eu
CO o C
E S-i CM 3 u CO
O 1
CO A W c i- W u o fid 9 ^H ^v
a o
3i H ft! 2 & ^ M Ö ^ as v^ 5 a B «Hi c_ e S3 <
CO tn ft
M & ■Ht
.. «Li ft* 1 H
£ •a ft o - & .
ft H u
§ ■a § $ M ft. ft w 173 c K- H fti CO w CO
CO O CL cc 3 ft
< CC LU z LU U
CO
co
a Q. 0 ui 1L 1/1
u. <
Atch 2
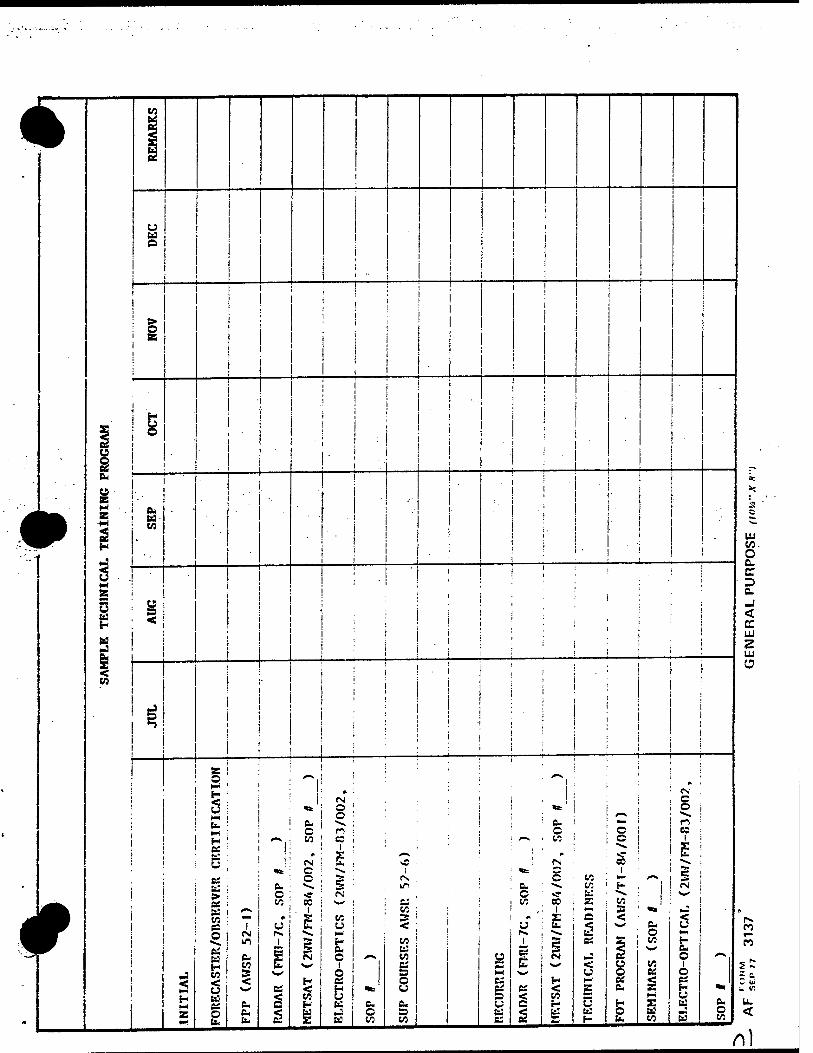
I
#
u § Pu
g H B
2
&3
<
u bJ O
z
6 o
a« w
8 <
* v
UJ w. O c c => a
< UJ 2 UJ a
! M
SS O i—'
<
H
2
H K t; u e: > s; to e o -I Bl to ! < u a es o
o o
! fc I ^ O <">
»■V i CO ! CC
6. c to
i 5 ! C
I
1ft
C 10
ft.
ft. o to
es
c o
cc I
s
5 CO H
to I CJ p—i
H CH o *->
i o es H CJ
w C to
Ift
to
to tu CO
o
C 3 10
u t-l
«Ml u
C to
(N ■ CC c : i c ■ to . »- •*. to i f- <r • K ■ "■»■ ec i z ■. to
K ! §
ftS H < to H
< t:
<
u Ed
'1 OS CM
b.
O to
to es
s to
, O i o
I n
i ? i •»»
■ 5 »> CM
< ^. fr- eu o
i o a H o w 5
a. o to
CO
n
£ i+ - L. Z bi - V!
u. <
n)
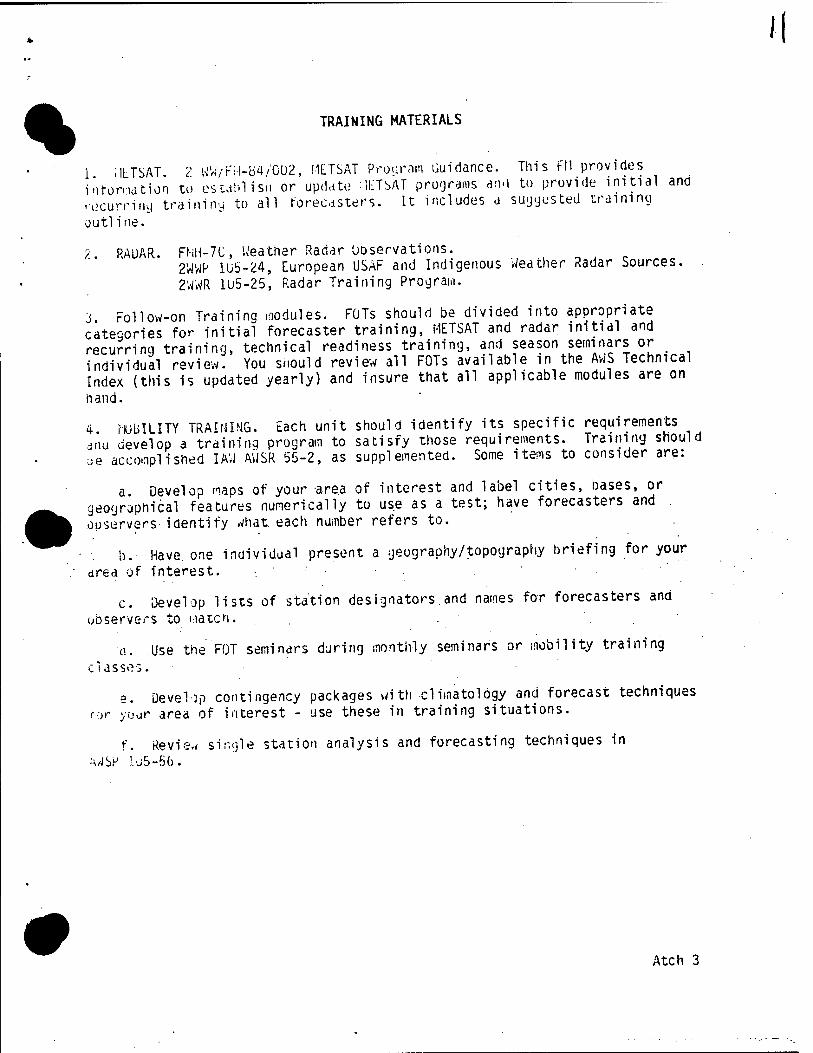
%
TRAINING MATERIALS
1 .1LTSAT ? WW/Fii-B4/GU2, METSAT Program Guidance. This Ffl provides information to ostaMis.i or update :JETbAT programs and to provide initial ana .-DCurrirK) training to all forecasters. It includes a suggested training
outline.
7 RADAR. FMH-7C, Weather Radar Observations. 2WWP 1U5-24, European USAF and Indigenous Weather Radar Sources. 2WWR 1U5-25, Radar Training Program.
3 Follow-on Training modules. FOTs should be divided into appropriate categories for initial forecaster training, METSAT and radar initial and recurring training, technical readiness training, and season seminars or _ individual review. You should review all FOTs available in the Aw'S Technical Index (this is updated yearly) and insure that all applicable modules are on
hand.
4 MUUILITY TRAINING. Each unit should identify its specific requirements -nu develop a training program to satisfy those requirements. Training should ^e accomplished IAW AÜSR 55-2, as supplemented. Some items to consider are:
a Develop maps of your area of interest and label cities, bases, or geographical features numerically to use as a test; have forecasters and ouservers identify what, each number refers to.
b. Have, one individual present a geography/topography briefing for your
area of interest.
c. Develop lists of station designators.and names for forecasters and
observers to match.
o. Use the FOT seminars during monthly seminars or mobility training
classes.
e. Develop contingency packages with climatology and forecast techniques for your area of interest - use these in training situations.
f. Review single station analysis and forecasting techniques in
-A/JSH l-j5-5b.
Atch 3
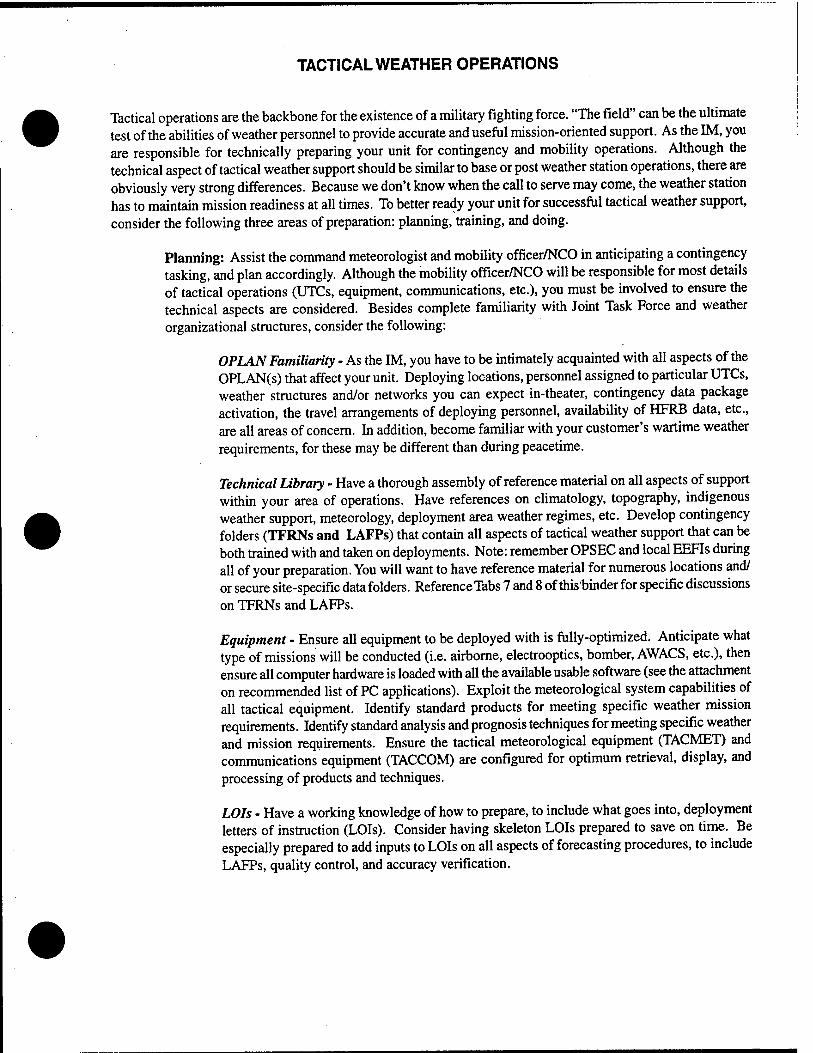
TACTICAL WEATHER OPERATIONS
Tactical operations are the backbone for the existence of a military fighting force. "The field" can be the ultimate test of the abilities of weather personnel to provide accurate and useful mission-oriented support. As the IM, you are responsible for technically preparing your unit for contingency and mobility operations. Although the technical aspect of tactical weather support should be similar to base or post weather station operations, there are obviously very strong differences. Because we don't know when the call to serve may come, the weather station has to maintain mission readiness at all times. To better ready your unit for successful tactical weather support, consider the following three areas of preparation: planning, training, and doing.
Planning: Assist the command meteorologist and mobility officer/NCO in anticipating a contingency tasking, and plan accordingly. Although the mobility officer/NCO will be responsible for most details of tactical operations (UTCs, equipment, communications, etc.), you must be involved to ensure the technical aspects are considered. Besides complete familiarity with Joint Task Force and weather organizational structures, consider the following:
OPLAN Familiarity - As the IM, you have to be intimately acquainted with all aspects of the OPLAN(s) that affect your unit. Deploying locations, personnel assigned to particular UTCs, weather structures and/or networks you can expect in-theater, contingency data package activation, the travel arrangements of deploying personnel, availability of HFRB data, etc., are all areas of concern. In addition, become familiar with your customer's wartime weather requirements, for these may be different than during peacetime.
Technical Library - Have a thorough assembly of reference material on all aspects of support within your area of operations. Have references on climatology, topography, indigenous weather support, meteorology, deployment area weather regimes, etc. Develop contingency folders (TFRNs and LAFPs) that contain all aspects of tactical weather support that can be both trained with and taken on deployments. Note: remember OPSEC and local EEFIs during all of your preparation. You will want to have reference material for numerous locations and/ or secure site-specific data folders. ReferenceTabs 7 and 8 of this binder for specific discussions on TFRNs and LAFPs.
Equipment- Ensure all equipment to be deployed with is fully-optimized. Anticipate what type of missions will be conducted (i.e. airborne, electrooptics, bomber, AWACS, etc.), then ensure all computer hardware is loaded with all the available usable software (see the attachment on recommended list of PC applications). Exploit the meteorological system capabilities of all tactical equipment. Identify standard products for meeting specific weather mission requirements. Identify standard analysis and prognosis techniques for meeting specific weather and mission requirements. Ensure the tactical meteorological equipment (TACMET) and communications equipment (TACCOM) are configured for optimum retrieval, display, and processing of products and techniques.
LOIs - Have a working knowledge of how to prepare, to include what goes into, deployment letters of instruction (LOIs). Consider having skeleton LOIs prepared to save on time. Be especially prepared to add inputs to LOIs on all aspects of forecasting procedures, to include LAFPs, quality control, and accuracy verification.
Training: You are responsible to prepare your unit for deployed forecasting. Work with the mobility officer/NCO to develop a comprehensive training plan that meets the forecast training needs for your unit. Tailor the training to OPLAN taskings. Refer to Tab 4 for further guidance on training.
Theater-Specific - Research and prepare appropriate theater-specific (site-specific, if possible) weather products for familiarization by unit members. Prior familiarity with local topography, climatology, theater forecast challenges, indigenous weather sources, etc, should be accomplished. Develop and conduct seminars on area of responsibility (AOR) weather (i.e. weather regimes, synoptic influences, mesoscale influences). Develop training and familiarization packages for the AOR.
Manual Procedures -You must always be prepared for the inoperability (or unavailability) of both TACMET and TACCOM. To prepare for this, personnel must stay proficient in manual analysis procedures to include proficiency in limited-data forecast techniques (single-station forecasting) and manual Skew-T analyses. Use actual AOR data for training material whenever possible.
Doing: Just as in-garrison, you are responsible for the forecast program. We have discussed preparation (planning) and training, now put it all together and successfully apply it during deployed operations. While deployed, continually search for means to improve forecast operations. Use forecast aids as much as possible. Develop and implement a metric to assist in analyzing accuracy. Continually train forecasters on AOR-specific subjects as required. Implement deployed forecast reviews when necessary (see Tab 9).
The following partial listing of references should assist you in the area of tactical weather operations:
AFI15-103 Weather Support For The US Army
AFI15-118 Requesting Specialized Weather Support - Describes specialized atmospheric and space environmental support, collectively termed specialized support, and provide guidance and procedures for requesting it.
AFM 15-125 Weather Station Operations - Chapter 14 discusses subjects on tactical operations.
AFM 105-4 Weather Support For Army Tactical Operations
AFCCC/TN—95/005 Capabilities, Products, and Services oftheAFCCC - Describes the capabilities, purpose, and organization of the Air Weather Service unit charged with building, maintaining, and applying the USAF climatic database.
USAFETAC/TC—95/001 - Lists unclassified technical publications produced by HQ AWS and its two centers from 1992-1995.
AWS/TC—91/001 - Lists technical documents produced by AWS and its subordinates from 1941-1991.
FYI Publications - Cover a variety of weather-related topics, providing general information to the Air Force Weather Support System.
*#2 Pallet Configurations *#4 Battlefield WX Equipment SOPs *#7 Ceilometer *#19 Marwin Rawinsonde Improvements (Antennas) *#20 Integrated Meteorological System (IMETS) #23 Conditional Climatology Tables
*#25 The Air Force Global Weather Central Dial-In System *#26 Deployed LAFP Development #27 Weather Staff Officer's Guide to Climatology #29 SHARP #30 Air Force Weather Bulletin Board
*#31 Manual Observing System (MOS)
* Maintained by the Air Force Combat Weather Center (AFCWC)
Air Force Weather Bulletin Board - Serving as a focal point for weather-related issues for the Air Force weather community, the bulletin board has a library on just about everything weather related. Accessed via dial in or via AWS Homepage (see FYI #30 for information on accessing the AFW Bulletin Board).
Air Weather Service Homepage - A one-stop shopping location for weather-related information. Provides links to both the AFCCC and AFGWC's AFWIN. Accessed via the internet, this Homepage can also access the AFW Bulletin Board.
Theater Specific:
PACAF CATALOG 15-1 High Frequency Regional Broadcast Teletype Data Packages OPLANS and Levels Catalog
PACAFI15-105 High Frequency Regional Broadcast System Operations
PACAFI15-106 Weather Specialty Wartime Proficiency Training
617 WS (USAFE) R16-3 Exercise/Contingency Weather Support
617 WS (USAFE) 116-5 Tactical Weather Communications
Your MAJCOM aerospace sciences POC, the Air Force Combat Weather Center, or HQ AWS/XON can assist you with specific questions or concerns.
RECOMMENDED LIST OF PC APPLICATIONS
FROM AFCCC/AWS TECHNICAL LIBRARY
Diskettes
*MODCV for Windows *MODCURVES for Windows *MRCAT AFTOX *INSOL Mark El EO TDA NGM Plot ♦Nitelite for Windows Upper Air Climo for Windows SHARP + SHED
* Also available on Theater Climatic Files CD
CD-ROMS
ISMCS EO-Climo Cloud Ceiling Climatology Atlas Theater Climatic Files
OTHER RESOURCES
MetTIPS (AWS/XON) AFDIS (AFGWC) NODDS w/OASIS (Navy)

METEOROLOGICAL DISCUSSIONS
You can ensure the "science of meteorology" is considered in daily operations through a sound program of meteorological discussions or conferences. Meteorological discussions are conducted for three purposes:
1) Exchange information regarding the forecast
2) Provide a consensus forecast
3) Training
Meteorological Discussions include both shift change briefings and formal "full-blown" forecast discussions when you meet with all available forecasters to discuss forecast reasoning. These formal discussions could either coincide with a routine shift change briefing or be scheduled to occur 1 to 2 hours before terminal forecasts are issued. Formal scheduled meteorological discussions may not be feasible 7 days a week, but the knowledge gained from these discussions will carry over into those situations when you may not be readily available.
The following three references will help you develop or improve your meteorological discussion program:
AFM15-125 Weather Station Operations -Attachment 6 contains a sample shift change briefing format (see Sample Shift Change Briefing Format at end of chapter).
7WW/FM—90/005 Forecast Discussions - Contains some excellent philosophy on forecast discussions.
MetTIPs - More checklists on shift change briefings and forecast discussions.
Your MAJCOM aerospace sciences POC or HQ AWS/XON can assist you with specific questions or concerns.
SAMPLE SHIFT CHANGE BRIEFING FORMAT (Forecast Funnel Approach)
(Forecast Funnel: Hemispheric Scale >» Synoptic Scale »> Mesoscale Scale >» Local Scale)
The Weather Apprentice:
- Past and current weather and trends. - Equipment status, outages, and current trends.
The Weather Journeyman/Craftsman:
Hemispheric Scale (broad brush) - guides the synoptic scale
- Purpose: --Get the overall impression of the "big picture."
- Some questions to ask: -Where are the long wave troughs and ridges? Past and present. -How are they moving? —Are there any splits or blocks? -Is the pattern in transition? Retrogression or progression? Breakdown of the split or block?
- Some tools to use: —Looped series of 500 mb geopotential height analysis and prognostic charts —Looped satellite imagery —Water vapor satellite imagery —500 mb geopotential height change analysis —Discussion bulletins
Synoptic Scale (Conventional METCON, continental size-focus) - drives the mesoscale
- Purpose: —Identify regime —Begin to develop forecast problem of the day
- Some questions to ask: —What is causing the current weather? —How does the initial analysis compare to the current satellite? —Are there any transitory short wave troughs and ridges? -Where are the surface frontal boundaries? —Are there any low-level jet streaks? -What are the characteristics of my air mass? Will it undergo modification?
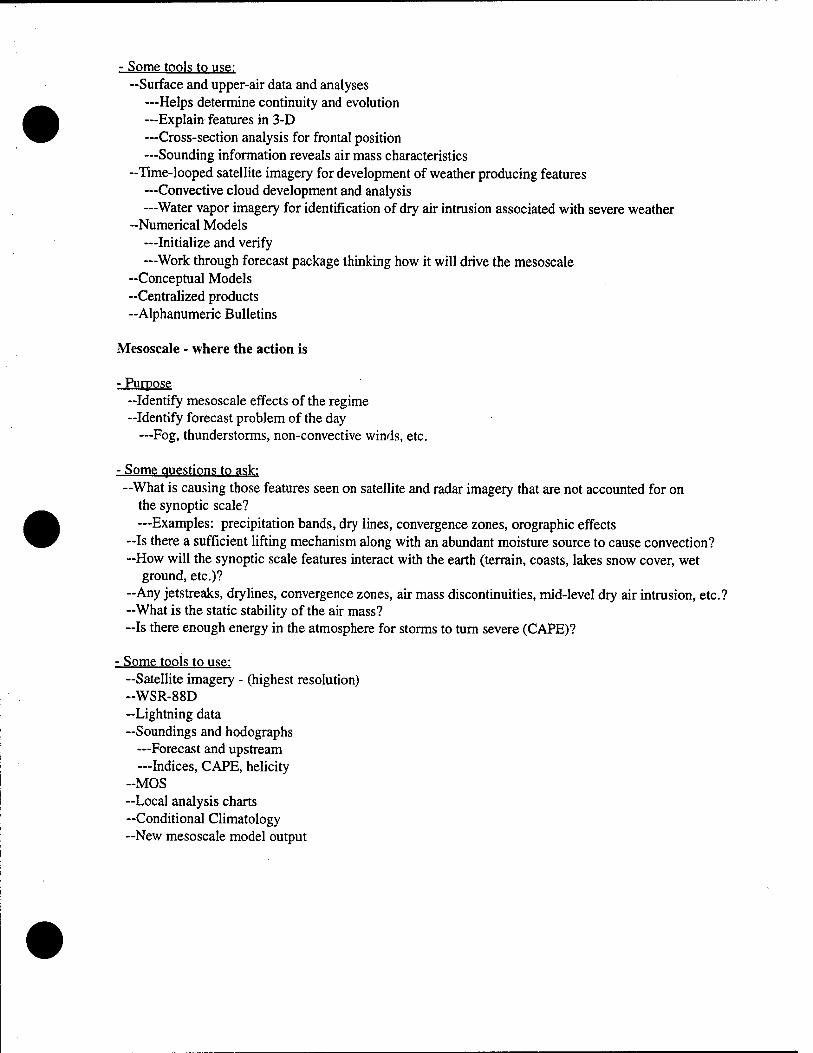
- Some tools to use: —Surface and upper-air data and analyses
—Helps determine continuity and evolution —Explain features in 3-D —Cross-section analysis for frontal position —Sounding information reveals air mass characteristics
-Time-looped satellite imagery for development of weather producing features —Convective cloud development and analysis —Water vapor imagery for identification of dry air intrusion associated with severe weather
-Numerical Models —Initialize and verify —Work through forecast package thinking how it will drive the mesoscale
-Conceptual Models -Centralized products -Alphanumeric Bulletins
Mesoscale - where the action is
- Purpose —Identify mesoscale effects of the regime —Identify forecast problem of the day
—Fog, thunderstorms, non-convective winds, etc.
- Some questions to ask: —What is causing those features seen on satellite and radar imagery that are not accounted for on
the synoptic scale? —Examples: precipitation bands, dry lines, convergence zones, orographic effects
-Is there a sufficient lifting mechanism along with an abundant moisture source to cause convection? -How will the synoptic scale features interact with the earth (terrain, coasts, lakes snow cover, wet
ground, etc.)? -Any jetstreaks, drylines, convergence zones, air mass discontinuities, mid-level dry air intrusion, etc.? —What is the static stability of the air mass? --Is there enough energy in the atmosphere for storms to turn severe (CAPE)?
- Some tools to use: —Satellite imagery - (highest resolution) -WSR-88D —Lightning data -Soundings and hodographs
—Forecast and upstream —Indices, CAPE, helicity
-MOS —Local analysis charts —Conditional Climatology —New mesoscale model output
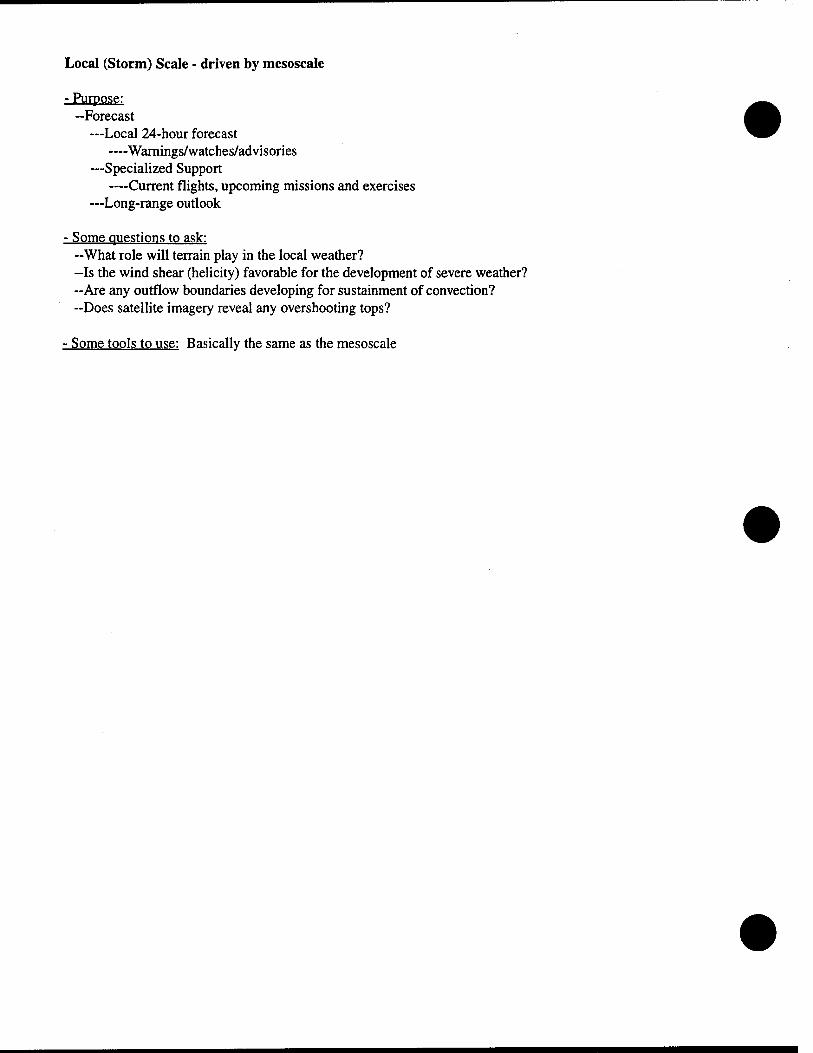
Local (Storm) Scale - driven by mesoscale
- Purpose: —Forecast
—Local 24-hour forecast —Warnings/watches/advisories
—Specialized Support —Current flights, upcoming missions and exercises
—Long-range outlook
- Some questions to ask: —What role will terrain play in the local weather? —Is the wind shear (helicity) favorable for the development of severe weather? —Are any outflow boundaries developing for sustainment of convection? --Does satellite imagery reveal any overshooting tops?
- Some tools to use: Basically the same as the mesoscale
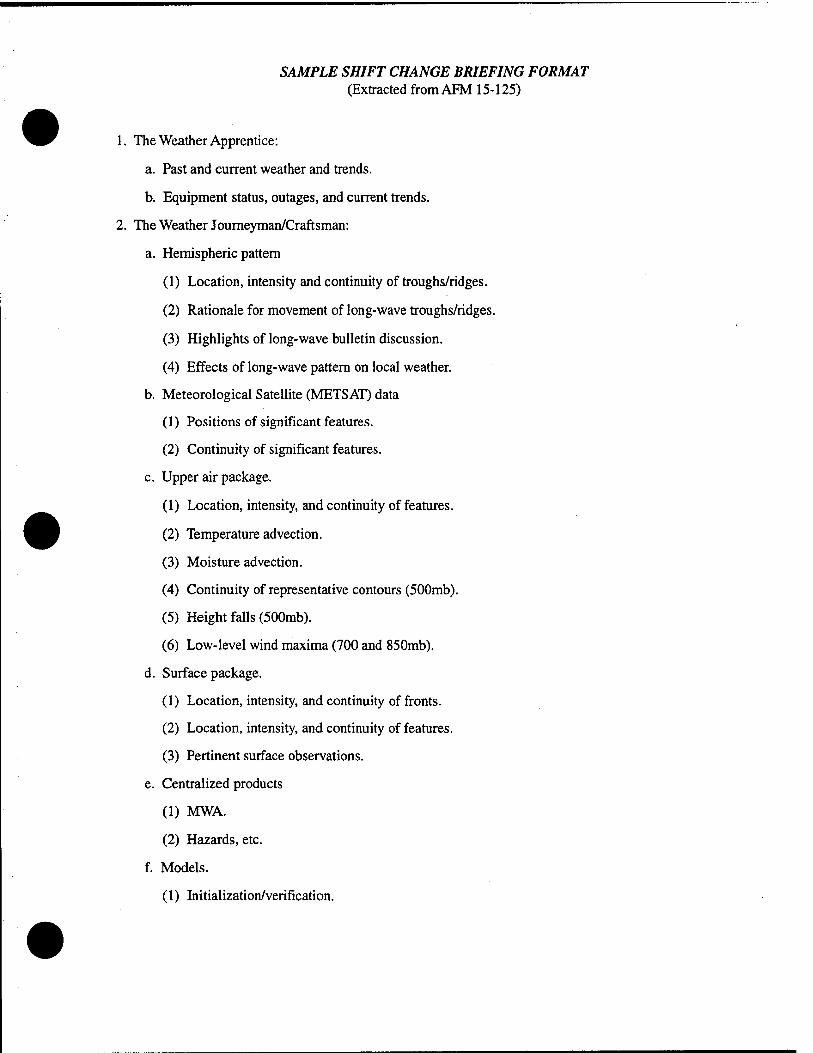
SAMPLE SHIFT CHANGE BRIEFING FORMAT (Extracted from AFM 15-125)
1. The Weather Apprentice:
a. Past and current weather and trends.
b. Equipment status, outages, and current trends.
2. The Weather Journeyman/Craftsman:
a. Hemispheric pattern
(1) Location, intensity and continuity of troughs/ridges.
(2) Rationale for movement of long-wave troughs/ridges.
(3) Highlights of long-wave bulletin discussion.
(4) Effects of long-wave pattern on local weather.
b. Meteorological Satellite (METSAT) data
(1) Positions of significant features.
(2) Continuity of significant features.
c. Upper air package.
(1) Location, intensity, and continuity of features.
(2) Temperature advection.
(3) Moisture advection.
(4) Continuity of representative contours (500mb).
(5) Height falls (500mb).
(6) Low-level wind maxima (700 and 850mb).
d. Surface package.
(1) Location, intensity, and continuity of fronts.
(2) Location, intensity, and continuity of features.
(3) Pertinent surface observations.
e. Centralized products
(1) MWA.
(2) Hazards, etc.
f. Models.
(1) Initialization/verification.
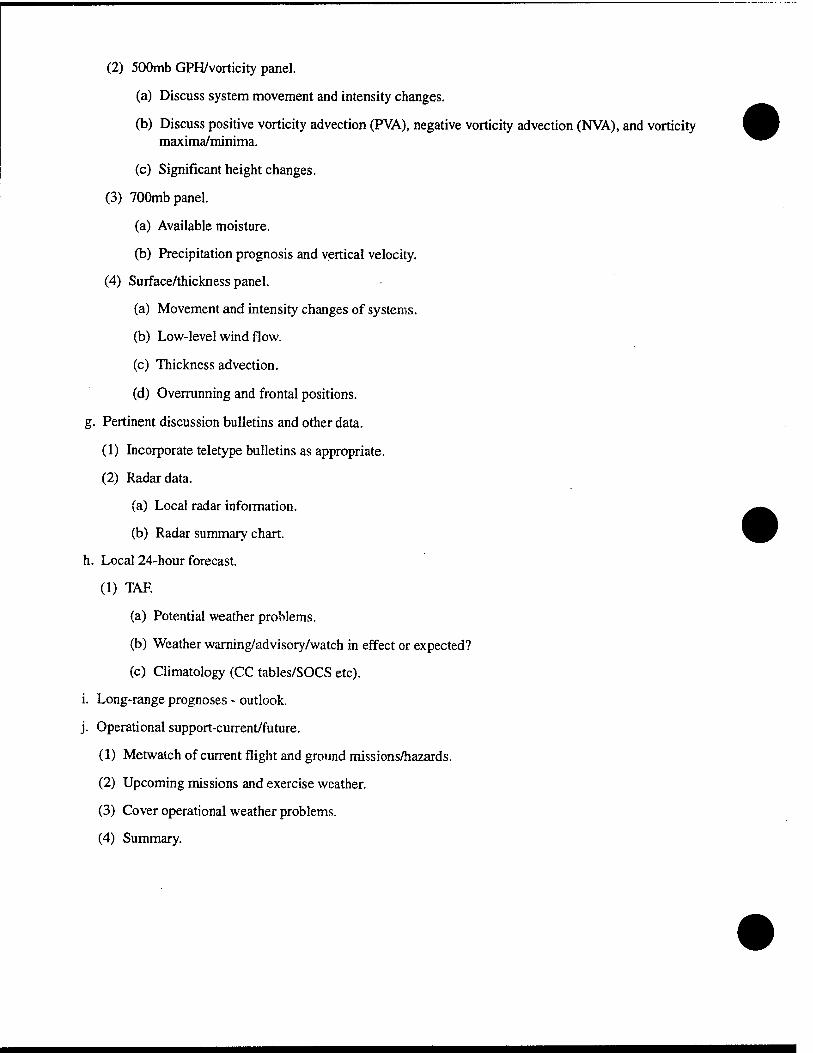
(2) 500mb GPH/vorticity panel.
(a) Discuss system movement and intensity changes.
(b) Discuss positive vorticity advection (PVA), negative vorticity advection (NVA), and vorticity maxima/minima.
(c) Significant height changes.
(3) 700mb panel.
(a) Available moisture.
(b) Precipitation prognosis and vertical velocity.
(4) Surface/thickness panel.
(a) Movement and intensity changes of systems.
(b) Low-level wind flow.
(c) Thickness advection.
(d) Overrunning and frontal positions,
g. Pertinent discussion bulletins and other data.
(1) Incorporate teletype bulletins as appropriate.
(2) Radar data.
(a) Local radar information.
(b) Radar summary chart,
h. Local 24-hour forecast.
(1) TAF.
(a) Potential weather problems.
(b) Weather warning/advisory/watch in effect or expected?
(c) Climatology (CC tables/SOCS etc),
i. Long-range prognoses - outlook.
j. Operational support-current/future.
(1) Metwatch of current flight and ground missions/hazards.
(2) Upcoming missions and exercise weather.
(3) Cover operational weather problems.
(4) Summary.
•
7TH WEATHER WING FORECASTER MEMO
7 WW/FM>-90/005
13 JULY 1990
FORECAST DISCUSSIONS
1. INTRODUCTION. People who have had the opportunity to visit or inspect a number of weather units are of the same opinion. Generally, you can judge the overall technical health of a unit just by observing a few forecast discussions. A strong forecast section will almost always have good, sound meteorological discussions. Likewise, it is usually the case that you can't develop a top-notch forecasting section without insisting on quality forecast discussions. Developing a program of thorough, meteorologically-sound forecast discussions and exercising this program religiously on a day-to-day basis are two of the most important steps a unit can take to improve its technical health. Ultimately, improved technical capabilities result in better weather support to the operational community. Therefore, a strong forecast discussion program is a sound investment that will pay dividends both technically and operationally, as well. This forecaster memo (FM) provides some guidance on how to establish a program of sound forecast discussions.
2. PURPOSE. The primary purpose of any forecast discussion is simply to provide and exchange information regarding the forecast in a meteorologically-organized manner. However, there are several secondary purposes which can be equally important. One of these secondary purposes is to provide for "consensus forecasting." Consensus forecasting is based on the time-proven principle that two or more heads are better than one when it comes to problem solving. This makes tremendous sense when it comes to the problem of forecasting the weather. Two or more people are going to have more knowledge and experience collectively, are less likely to miss key information, and are, therefore, more likely to develop an accurate forecast. Yet another purpose for conducting forecast discussions—perhaps the most important one—is training. Forecast discussions are probably the best mechanism available for the experienced "old heads" in a unit to pass their valuable experience on to those that have arrived more recently. A unit forecast program cannot afford to let such experience go untapped. When conducted on a routine basis, forecast discussions will tend to maximize the knowledge and effective experience of the entire unit.
Approved For Public Release; Distribution Is Unlimited
Distribution: 1 WW/DK 2 7 WW/WSU 1 Det 1, 7 WW 1 2 WW/DN 2 6 WS/DON 4 9 WS 1 3 WW/DN 2 15 WS/DON 14 Det 1fi, 9 WS 1 4 WW/DN 2 17 WS/DON 14 AWS/DOOF 1 5 WW/DN 2 USAFFTAC 5 AWS/DCTM 1 5 WW/DOR 45 AFGWC 2 33 50TCHTNG/TTMV 1 7 WW/DN 12 CL-G, 7 WW 1
OPR: 7 WW/DN (Lt Col Danielson) Typist: Ms Michele Tanner
3. TIMING. AWSR 105-22 prescribes the content of forecast discussions and shift change briefings, but does not distinguish between the two. Cther than timing, there is no difference. Obviously, the timing of shift change briefings is determined by the shift schedule. Most successful forecast sections will either expand one of these shift change briefings or conduct a totally separate forecast discussion during the day to include all available station personnel, forecaster and observer alike, in a "full-blown" forecast discussion. In the case of these "full-blown" forecast discussions, timing is everything. Several things need to be considered. First and foremost, select a time that is an houi or two prior to the local terminal area forecast (TAF) file time. Once a TAF has already been disseminated, it is almost pointless to conduct a "full-blown" discussion. Second, try to select a time that facilitates discussion; avoid the more hectic portions of the day. In addition, time selection should consider data availability. Many units schedule their forecast discussions based on the local receipt time of key forecast model outputs. Finally, depending on the supported unit's operations, forecasts at certain times of the day have more impact than the others. For example, the forecast that is prepared prior to the wing standup briefing is probably a key forecast. Holding the unit's "full-blown" forecast discussion just prior to the key forecast will maximize the benefits of consensus forecasting. It may be very difficult to select a time that meets all of these criteria; however, keep in mind that there is some flexibility since units can change TAF file times to suit their local requirements.
4. PARTICIPATION. The bottom line when it comes to participation in forecast discussions is really quite simple: To obtain the maximum benefit of these discussions, insist on maximum participation on a routine basis. Maximum participation is not always possible at every shift change briefing; however, for the key, "full-blown" briefings, all available forecasters and the station leadership should attend. Active participation in forecast discussions is one of the primary ways the commander or detachment chief and the station chief have for exercising their technical leadership. Finally, forecast discussion participation by the duty observer is required by AWSR 105-22. This participation is a key portion of their training to become briefers and forecasters. Again, ensure that all available observers attend and participate in the entire forecast discussion, not just the observer portion.
5. TECHNICAL LEADERSHIP. As previously mentioned, forecast discussions are an excellent opportunity for station management to exercise their technical leadership. Unfortunately, many officers, in particular, find themselves assigned to a detachment for the first time, or at least for the first time in a long time, as the commander. Therefore, there is a natural tendency for these new commanders to feel a bit uncomfortable in the role of technical leader. However, the commander or detachment chief is ultimately responsible for the technical quality of all unit products. By definition, they are the technical leaders, and this role cannot be delegated. While there will be a learning curve, any officer with one or two degrees on the wall should, given time, be able to stand toe-to-toe in forecast discussions with any counter forecaster. The key to technical leadership is recognizing what it is. The emphasis here is on the word "leadership;" the word "technical" is merely an adjective. Too many people confuse this issue believing that the technical leader must be the technical expert. While this would be ideal, it is seldom the case. Leadership is that intangible skill that motivates, molds units, and accomplishes the mission. Technical skill is another skill altogether.
A commander demonstrates technical leadership by participating in and directing daily forecast discussions. This doesi not mean that the commander must lead all forecast discussions. Quite the contrary, that is more the role of -the technical expert. But it is the commander, as the technical leader, who ensures that all the "i"s are dotted and the "t"s are crossed when it comes to the forecast discussions. He or she makes sure everyone is present and that discussions are thorough and in accordance with established procedures. The commander ensures that adequate attention is given to each aspect of the forecast with special emphasis on operational or other customer requirements. As the technical leader, the commander ensures that all appropriate studies are run or considered and that a reasonable consensus is attained. His responsibility is to ensure that forecast discussions are just that—discussions and not inquisitions. Openness and a free exchange of ideas are essential, not only to arrive at the best possible forecast, but also to ensure maximum participation and learning for everyone. Over a period of time, a commander that was weak technically will acquire strong forecasting skills by conducting routine, thorough forecast discussions.
6. ORGANIZATION. Organize discussions so they flow from the macroscale hemispheric patterns to the micrcscale local effects and from the top of the atmosphere down to the surface. A suggested forecast discussion outline is contained below. Note that the points listed need not be briefed in a rigid, inflexible order. However, all points listed should be integrated into the discussion as it progresses.
7. FORECAST DISCUSSION GUIDE.
a. Observer Briefing.
(1) Briefs past and current weather and trends.
(2) Briefs equipment outages and current status.
b. Forecaster Briefing.
(1) Hemispheric Pattern (Spectral 0-5 Wave 500mb Analysis and 108-Hour 0-5 Wave 500mb Prog).
(a) Location, intensity, continuity, and expected movement of longwave troughs and ridges.
(b) Highlights of the FXUS03 KWBC teletype bulletin (discusses longwave features).
(c) Discuss how longwave pattern will affect the local weather.
(d) Discuss what the numerical models should be doing based on the longwave pattern.
(2) Latest Synoptic Timii Satellite Photo (0000Z or 1200Z).
(a) Positions of significant features.
(b) Continuity of significant features.
(3) Upper Air Package. Note the 3-dimensional relationships.
(a) 200-300mb.
_1_ Location, intensity, continuity of pressure features.
2_ Location, strength, continuity of jet.
3_ Relate jet position to satellite data.
(b) 500mb.
2_ Location, intensity, continuity of pressure features.
_2 Continuity of representative contour(s).
3_ Temperature ädvection.
4 Height falls.
5_ Moisture advection.
6_ Any reanalysis?
(c) 700mb.
J_ Location, intensity, continuity of pressure features.
2_ Temperature advection.
_3 Moisture advection.
£ Any reanalysis?
(d) 850mb.
2 Location, intensity, and continuity of fronts and pressure features.
2^ Temperature advection.
3_ Moisture advection.
4_ Low-level wind maxima.
_5 Any reanalysis?
(4) Surface Package.
(a) Location, intensity, continuity of pressure features.
(b) Sensible weather.
_1_ HWD.
2 SXUS bulletins.
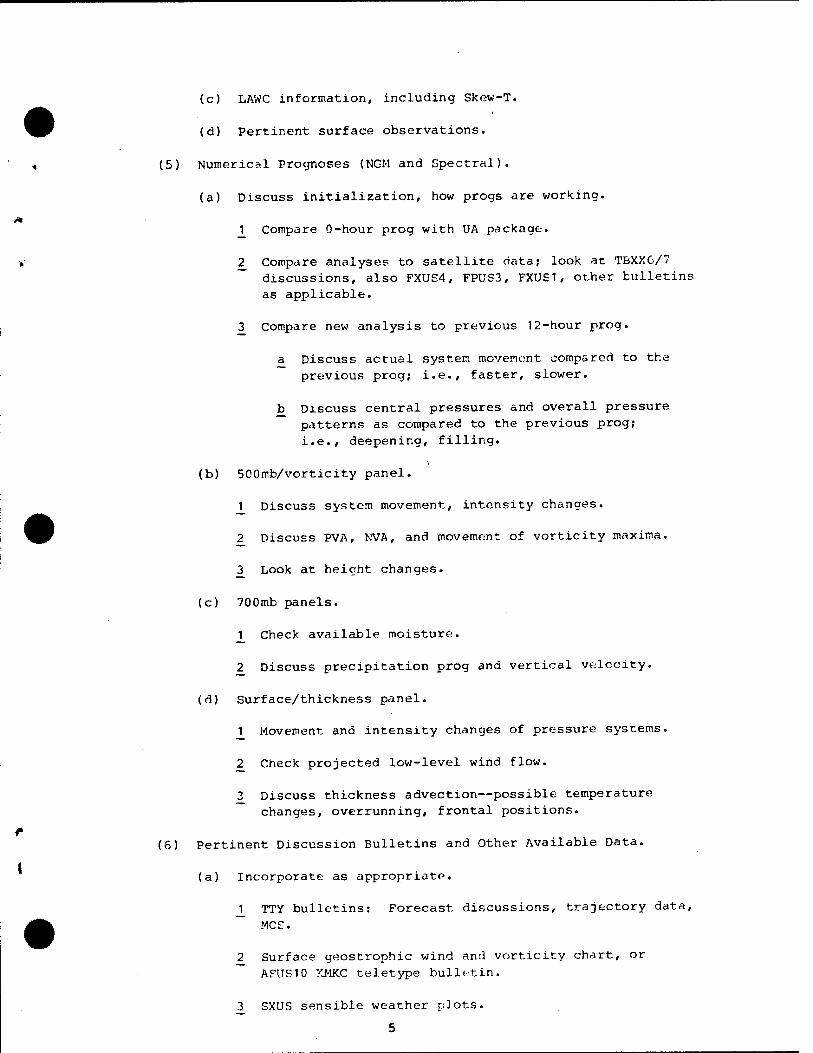
(c) LAWC information, including Skew-T.
(d) Pertinent surface observations.
(5) Numerical Prognoses (NGM and Spectral).
(a) Discuss initialization, how progs are working.
1 Compare 0-hour prog with UA package.
2 Compare analyses to satellite data; look at TBXX6/7 discussions, also FXUS4, FPUS3, FXUS1, other bulletins as applicable.
3 Compare new analysis to previous 12-hour prog.
a Discuss actual system movement compared to the previous prog; i.e., faster, slower.
b Discuss central pressures and overall pressure patterns as compared to the previous prog; i.e., deepening, filling.
(b) 500mb/vorticity panel.
1 Discuss system movement, intensity changes.
2 Discuss PVA, NVA, and movement of vorticity maxima.
3 Look at height changes.
(c) 700mb panels.
1 Check available moisture.
2 Discuss precipitation prog and vertical velocity.
(d) Surface/thickness panel.
1 Movement and intensity changes of pressure systems.
2 Check projected low-level wind flow.
3 Discuss thickness advection—possible temperature changes, overrunning, frontal positions.
(6) Pertinent Discussion Bulletins and Other Available Data,
(a) Incorporate as appropriate.
1 ^y bulletins: Forecast discussions, trajectory data,
MCS.
2 Surface geostrophic wind and vorticity chart, or ~ AFUS10 KMKC teletype bulletin.
3 SXUS sensible weather plots.
5
(b) Satellite data; incorporate into the discussion.
1 Show system movement; jets, ridges, troughs, vort maxima.
2 Compare to analyses and progs.
(c) Radar data.
1 Discuss local radar.
2 Discuss RAREPS, MDR bulletins (SDUS 21-26 KWBC), radar summary chart.
(7) Local 24-Hour Forecast.
(8) Long-Range Progs — Outlook.
(a) Discuss 72- and 84-hour spectral progs.
(b) Discuss 3-5 day prog charts.
(9) Operational Eriefing.
(a) Discuss upcoming missions and exercise weather.
(b) Cover operational weather problems.
8. SUMMARY. The value of good forecast discussions cannot be overemphasized. When it comes to improving the level of knowledge and experience of unit forecasters and raising overall unit technical performance, nothing can compare to the results obtained by simply following a program of good, sound forecast discussions conducted on a routine basis.
TECHNICAL NOTE 7WW/TN- 80/001
s^
FORECAST WORKSHEET A NEW APPROACH
Thomas L. Rish,Lt Col, USAF Ronald G. Shaw, MSgt, USAF
1 MAY 1980
Approved for Public Release; Distribution Unlimited
7TH WEATHER WING (MAC)
SCOTT AFB, ILLINOIS 62225
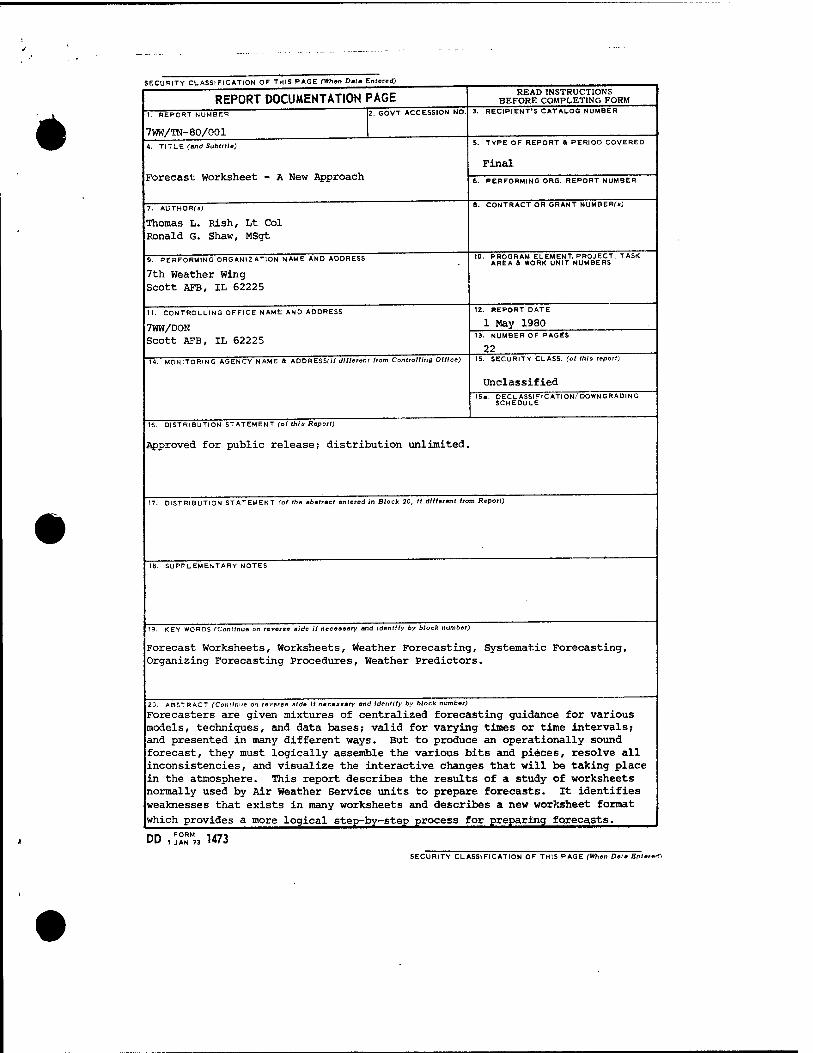
*
SECURITY CLASSIFICATION OF THIS PAGE (When Data Entered)
REPORT DOCUMENTATION PAGE I. REPORT NUMBER
7WW/TN-80/001
2. GOVT ACCESSION NO
READ INSTRUCTIONS BEFORE COMPLETING FORM
3. RECIPIENT'S CATALOG NUMBER
4. TITLE (and Subtitle)
Forecast Worksheet - A New Approach
7. AUTHORf«;
Thomas L. Rish, Lt Col Ronald G. Shaw, MSgt
9. PERFORMING ORGANIZATION NAME AND ADDRESS
7th Weather Wing Scott AFB, IL 62225
I I. CONTROLLING OFFICE NAME AND AODRESS
7WW/DON Scott AFB, IL 62225
I«. MONITORING AGENCY NAME 4 ADDRESSCif dltlerent from Controlling Otlice)
5. TYPE OF REPORT 1 PERIOD COVERED
Final 6. PERFORMING ORG. REPORT NUMBER
8. CONTRACT OR GRANT NUMBERf»)
10. PROGRAM ELEMENT. PROJECT, TASK AREA & WORK UNIT NUMBERS
12. REPORT DATE
1 May 1980 13. NUMBER OF PAGES
22 15. SECURITY CLASS, (ot this report)
Unclassified 15«. DECLASSIFIC ATI ON/DOWN GRADING
SCHEDULE
16. DISTRIBUTION ST ATEMEN T (otthia Report)
Approved for public release; distribution unlimited.
17. DISTRIBUTION STATEMENT (of the abstract entered in Block 20, 11 dltlerent from Report)
18. SUPPLEMENTARY NOTES
19. KEY WORDS (Continue on reverse side it necessary and identify by block number)
Forecast Worksheets, Worksheets, Weather Forecasting, Systematic Forecasting, Organizing Forecasting Procedures, Weather Predictors.
20. ABSTRACT (Continue en reverse side If necessary and Identity by block number)
Forecasters are given mixtures of centralized forecasting guidance for various models, techniques, and data bases; valid for varying times or time intervals; and presented in many different ways. But to produce an operationally sound forecast, they must logically assemble the various bits and pieces, resolve all inconsistencies, and visualize the interactive changes that will be taking place in the atmosphere. This report describes the results of a study of worksheets normally used by Air Weather Service units to prepare forecasts. It identifies weaknesses that exists in many worksheets and describes a new worksheet format
which provides a more logical step-by-step process for preparing forecasts.
DD,, FORM 1i|7, AN 73 1473
SECURITY CLASSIFICATION OF THIS PAGE (When Data Entered)
TABLE OF CONTENTS
PARAGRAPH
1. 1.1 1.1.1 1.1.2 1.2
2. 2.1 2.2 2.3 2.4
3. 3.1 3.2 3.3
4.
5. 5.1 5.2 5.2.1 5.2.2 5.2.3 5.3 5.4 5.5 5.6 5.7
6. 6.1 6.2 6.3 6.4 6.5 6.6
TITLE PAGE
INTRODUCTION 1 Common Weaknesses in Worksheets 1
Insufficient Detail 1 Poor Organization 1
Guidelines for Designing Worksheets 1
DESCRIPTION 2 Selection of Times 2 Selection of Predictors 2 Symbol Definitions 2 Data Sources 4
EXAMPLES 4 Worksheet Entries 4 Forecasting from the Worksheet 11 Alternate Format 11
APPLICATIONS 11
DESIGN TIPS 14 Forecast Schedules and Prog. Sequences 14 Choosing Predictors 14
Synoptic Scale Predictors 14 Local Predictors 15 Guidance Forecasts 15
Data Sources 15 Overprinting Maps 15 Record of Forecast and Amendments 16 Forecast Reviews 16 Supervisor Comments 16
CONCLUSIONS 16 Operational Use 16 Overseas Applications 16 Workload 16 Formal Training 16 Need for Improved Centralized Guidance 16 Future Automation 16
•
LIST OF ILLUSTRATIONS
FIGURE LEGEND PAGE
1 2 3a 3b 4a 4b 4c 5a 5b 6a 6b 6c 7a 7b 8a 8b 8c 9a 9b
10 11
Basic Worksheet for Scott AFB, IL 3 Dew Point - Relative Humidity Conversion Chart 5 Completed Worksheet (03/0600Z Oct 79) 6 Completed Worksheet (03/1800Z Oct 79) 7 500mb Analysis (03/0000Z Oct -79) 8 Surface Analysis (03/0000Z Oct 79) 8 Satellite Photo (03/0000Z Oct 79) 8 Surface Analysis (03/0600Z Oct 79) 8 Satellite Photo (03/0600Z Oct 79) 8 500mb Analysis (03/1200Z Oct 79) 9 Surface Analysis (03/1200Z Oct 79) 9 Satellite Photo (03/1200Z Oct 79) 9 Surface Analysis (03/1800Z Oct 79) 9 Satellite Photo (03/1800Z Oct 79) 9 500mb Analysis (04/0000Z Oct 79) 10 Surface Analysis (04/0000Z Oct 79) 10 Satellite Photo (04/0000Z Oct 79) 10 Surface Analysis (04/0600Z Oct 79) 10 Satellite Photo (04/0600Z Oct 79) 10 Basic Worksheet Post Analysis (02/2300Z - 04/0600Z Oct 79) 12 Alternate Worksheet Post Analysis (02/2300Z - 04/0600Z Oct 79) 13
•
FORECAST WORKSHEETS - A NEW APPROACH
1. INTRODUCTION. One of the most perplexing problems forecasters face today is how to effectively use the myriad of available information in preparing forecasts. Even if time was abundant, the task would be difficult because forecasting aids are mixtures of products from different models, tech- niques, and data bases; valid for different times or time intervals; and presented in many different ways. Simply put, forecasters are given numerous bits and pieces of data that never fit together perfectly; yet, they must assemble all the various parts, interpret implications of each bit of information, resolve all inconsistencies, and put everything together as an operationally sound
forecast.
Through years of experience, forecasters generally learn to do most of these things in their head and still derive a fairly clear picture of what's happening. However, new forecasters usually don't have that ability and frequently develop the bad habit of relying too heavily on only a few central- ized aids and ignoring the rest. This has become a critical problem in many units because there is no real "pro" around to teach good habits or procedures, and it's getting worse as the experience
level declines.
In an attempt to resolve this problem, we conducted a study which focused primarily on methods for improving use of centralized guidance. The study began with an evaluation of worksheets used by 7WW units and guidance available for developing them. Our search lead to a thorough review of work- sheets, and their effectiveness. This technical note describes our findings and recommendations.
1.1. Common Weaknesses in Worksheets. Several different publications furnish guidelines for de- signing worksheets, but the primary source available to all units is AWS TR 218, Pieparation of Terminal Forecast Worksheets. It contains an excellent description of the objective of worksheets and features they should contain. This guidance also promotes two serious deficiencies which thwart the objective: Insufficient detail and poor organization.
1.1.1. insufficient Detail. This deficiency refers to inadequate information concerning when major changes in key predictors will take place and how significant those changes will be. Substantial changes in predictors such as temperature, stability, moisture, vorticity, etc., frequently occur during a 24-hour period, but very few worksheets require more than one entry for each element. Furthermore, the significance or magnitude of change is usually missing because oversimplified entries, such as "increasing/decreasing" or "yes/no", are used. Many aids available to forecasters give predictions of various elements in 6 or 12-hour intervals, but such detail is rarely recorded on worksheets. Omission of this essential guidance encourages forecasters to overlook a detailed analysis of timing and significance of major changes that should be considered.
1.1.2. Poor Organization- The other major deficiency arises because little thought is given to arranging the data in a format that helps digest the information recorded. Entries are usually scattered all over the page, different types of entries are made for the same element (e.g. moisture indicated by dewpoint, temperature/dewpoint, dewpoint spread, or relative humidity), and when valid times are recorded, they often vary. This lack of organization makes most worksheets distasteful to use and of limited value in deriving conclusions.
1.2. Guidelines for Designing Worksheets. The following features were used as guidelines for designing a better format for worksheets. The objective was to eliminate the two problems cited above and to improve use of available information. These features include the best of those listed in AWSTR 218 plus others believed necessary to achieve the objective:
a. Provide a logical step-by-step process for preparing forecasts.
b. Aid review and collating essential information.
c. Promote evaluation of data as it is received rather than just prior to forecast deadlines.
d. Depict data in a format that is easily derived, rapidly entered, and quickly digested.
e. Minimize rechecks of data evaluated earlier.
f. Minimize oversight by focusing attention on key predictors.
g. Provide continuity and consistency in time and space.
h. Provide detailed information on timing and significance of expected changes in predictors.
i. Flag times for intensifying local met watch or use of local forecast studies.
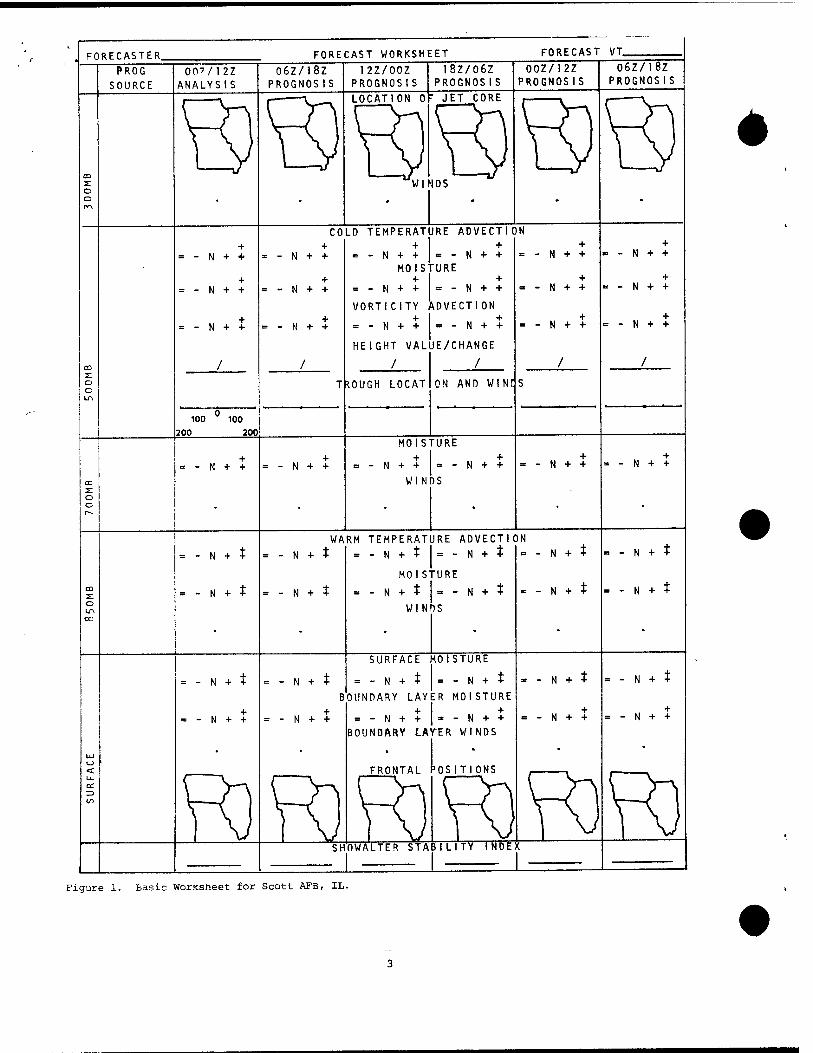
FfiRFr.ASTER FORECAST WORKSHEET FORECAST «T
PROG
SOURCE 007/12Z
ANALYSIS
06Z/18Z PROGNOSIS
12Z/00Z PROGNOSIS
18Z/06Z PROGNOSIS
00Z/12Z PROGNOSIS
06Z/18Z PROGNOSIS
Hi H) LOCATION 0 - JET CORE
Hi Hi CO
2: 0 0
Ly LV WINDS
LV LV COLD TEMPERATURE ADVECTION
+ = - N + *
+ = - N + +
+ = - N + +
+ = - N + +
+ + = -N + + - - N + +
MOISTURE + +
= -N + + =-N + +
+ = - N + +
+ = - N + +
+ ■ - N + +
+ = - N + +
= - N + + +
= - N + +
VORTICITY
= - N + +
IVDVECTION
- - N + + +
= - N + + +
= - N + +
HEIGHT VALUE/CHANGE
CD
2T O O LA
/ / / / / /
T *OUGH LOCAT ON AND WINt S
100 100 200 200
MOISTURE
= - N + + +
= - N + + +
= - N + + +
= - N + + +
= - N + + +
= - N + +
CD
2: 0 0 1—
• •
WIN )S
• •
= - N + t WA
= - N + t RM TEMPERATURE ADVECTK
«-N + tN-N + t
MOISTURE
)N
= - N + t = - N + t
CO 2: = - N + t = - N + t = -N + :t|=-N + t = - N + $ = - N + t 0 LA CO
• -
WIN IS
• •
SURFACE MOISTURE
= - N + t = - N + X = - N + $ = - N + t - - N + t = - N + t BOUNDARY LAYER MOISTURE
+ = - N + +
+ = - N + +
+ + = -N + +=-N + +
+ = - N + +
+ = - N + +
BOUNDARY LA YER WINDS
CJ
< CC
CO
i
H H FRONTAL
Hi >OSITIONS
H^ V^ Hi — I V I V SH OWALTER STA
I I V
SILITY INDE X
I I V
•
Figure 1. Basic WorKsheet for Scott AFB, IL.
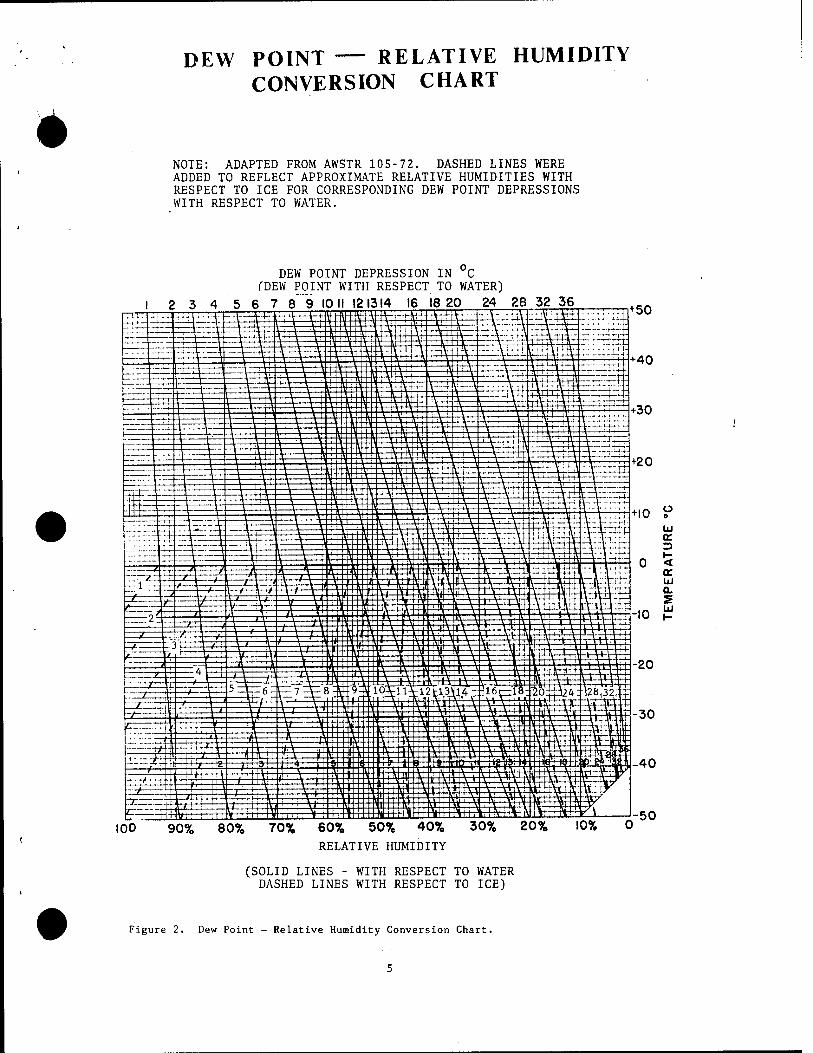
•
DEW POINT — RELATIVE HUMIDITY CONVERSION CHART
NOTE: ADAPTED FROM AWSTR 105-72. DASHED LINES WERE ADDED TO REFLECT APPROXIMATE RELATIVE HUMIDITIES WITH RESPECT TO ICE FOR CORRESPONDING DEW POINT DEPRESSIONS WITH RESPECT TO WATER.
2 3 4
DEW POINT DEPRESSION IN UC TDEW POINT WITH RESPECT TO WATER)
5 6 7 8 9 10II 121314 16 18 20 24 28 32 36
100 90% 80% 70% 60% 50% 40%
RELATIVE HUMIDITY
30% 20% 10%
(SOLID LINES - WITH RESPECT TO WATER DASHED LINES WITH RESPECT TO ICE)
Figure 2. Dew Point - Relative Humidity Conversion Chart.
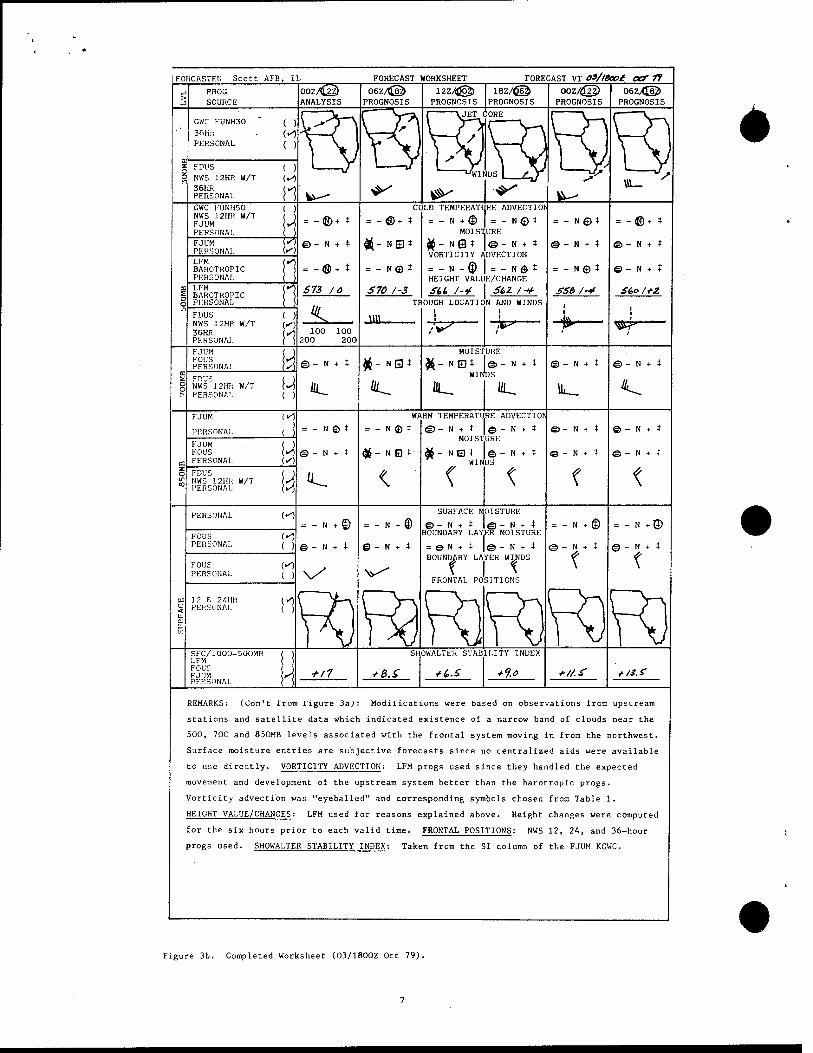
REMARKS: (Con't from figure 3aJ: Modifications were based on observations from upstream
stations and satellite data which indicated existence of a narrow band of clouds near the
500, 700 and 850MB levels associated with the frontal system moving in from the northwest.
Surface moisture entries are subjective forecasts since no centralized aids were available
to use directly. VORTICITY ADVECTION: LFM progs used since they handled the expected
movement and development of the upstream system better than the barotropic progs.
Vorticity advection was "eyeballed" and corresponding symbols chosen from Table 1.
HEIGHT VALUE/CHANGES: LFM used for reasons explained above. Height changes were computed
for the six hours prior to each valid time. FRONTAL POSITIONS: NWS 12, 24, and 36-hour
progs used. SHOWALTER STABILITY INDEX: Taken from the SI column of the FJUM KGWC.
•
Figure 3b. Completed Worksheet (03/18O0Z Oct 79).
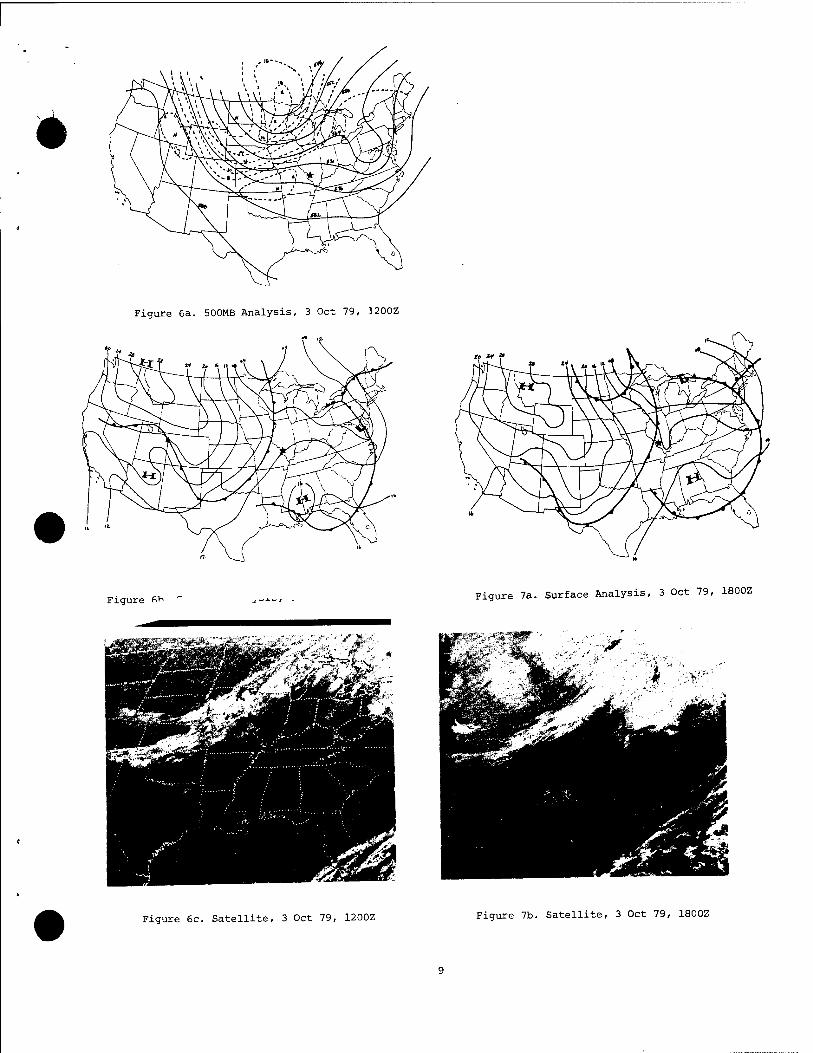
•
Figure 6a. 500MB Analysis, 3 Oct 79, 3200Z
Figure ft* Figure 7a. Surface Analysis, 3 Oct 79, 1800Z
Figure 6c. Satellite, 3 Oct 79, 1200Z Figure 7b. Satellite, 3 Oct 79, 1800Z
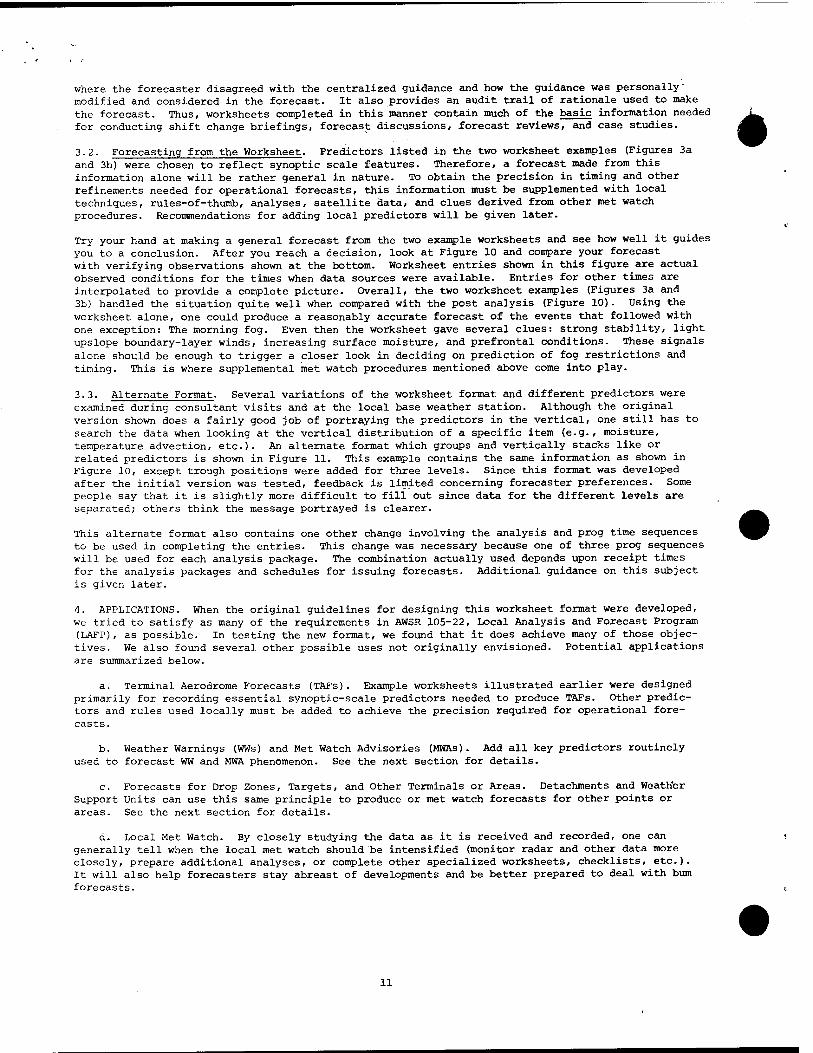
where the forecaster disagreed with the centralized guidance and how the guidance was personally modified and considered in the forecast. It also provides an audit trail of rationale used to make the forecast. Thus, worksheets completed in this manner contain much of the basic information needed for conducting shift change briefings, forecast discussions, forecast reviews, and case studies.
3.2. Forecasting from the Worksheet. Predictors listed in the two worksheet examples (Figures 3a and 3b) were chosen to reflect synoptic scale features. Therefore, a forecast made from this information alone will be rather general in nature. To obtain the precision in timing and other refinements needed for operational forecasts, this information must be supplemented with local techniques, rules-of-thumb, analyses, satellite data, and clues derived from other met watch procedures. Recommendations for adding local predictors will be given later.
Try your hand at making a general forecast from the two example worksheets and see how well it guides you to a conclusion. After you reach a Decision, look at Figure 10 and compare your forecast with verifying observations shown at the bottom. Worksheet entries shown in this figure are actual observed conditions for the times when data sources were available. Entries for other times are interpolated to provide a complete picture. Overall, the two worksheet examples (Figures 3a and 3b) handled the situation quite well when compared with the post analysis (Figure 10). Using the worksheet alone, one could produce a reasonably accurate forecast of the events that followed with one exception: The morning fog. Even then the worksheet gave several clues: strong stability, light upslope boundary-layer winds, increasing surface moisture, and prefrontal conditions. These signals alone should be enough to trigger a closer look in deciding on prediction of fog restrictions and timing. This is where supplemental met watch procedures mentioned above come into play.
3.3. Alternate Format. Several variations of the worksheet format and different predictors were examined during consultant visits and at the local base weather station. Although the original version shown does a fairly good job of portraying the predictors in the vertical, one still has to search the data when looking at the vertical distribution of a specific item (e.g., moisture, temperature advection, etc.). An alternate format which groups and vertically stacks like or related predictors is shown in Figure 11. This example contains the same information as shown in Figure 10, except trough positions were added for three levels. Since this format was developed after the initial version was tested, feedback is limited concerning forecaster preferences. Some people say that it is slightly more difficult to fill out since data for the different levels are separated; others think the message portrayed is clearer.
This alternate format also contains one other change involving the analysis and prog time sequences to be used in completing the entries. This change was necessary because one of three prog sequences will be used for each analysis package. The combination actually used depends upon receipt times for the analysis packages and schedules for issuing forecasts. Additional guidance on this subject is given later.
4. APPLICATIONS. When the original guidelines for designing this worksheet format were developed, we tried to satisfy as many of the requirements in AWSR 105-22, Local Analysis and Forecast Program (LAFP), as possible. In testing the new format, we found that it does achieve many of those objec- tives. We also found several other possible uses not originally envisioned. Potential applications are summarized below.
a. Terminal Aerodrome Forecasts (TAFs). Example worksheets illustrated earlier were designed primarily for recording essential synoptic-scale predictors needed to produce TAFs. Other predic- tors and rules used locally must be added to achieve the precision required for operational fore- casts.
b. Weather Warnings (WWs) and Met Watch Advisories (MWAs). Add all key predictors routinely used to forecast WW and MWA phenomenon. See the next section for details.
c. Forecasts for Drop Zones, Targets, and Other Terminals or Areas. Detachments and Weath'er Support Units can use this same principle to produce or met watch forecasts for other points or areas. See the next section for details.
d. Local Met Watch. By closely studying the data as it is received and recorded, one can generally tell when the local met watch should be intensified (monitor radar and other data more closely, prepare additional analyses, or complete other specialized worksheets, checklists, etc.). It will also help forecasters stay abreast of developments and be better prepared to deal with bum forecasts.
*
11
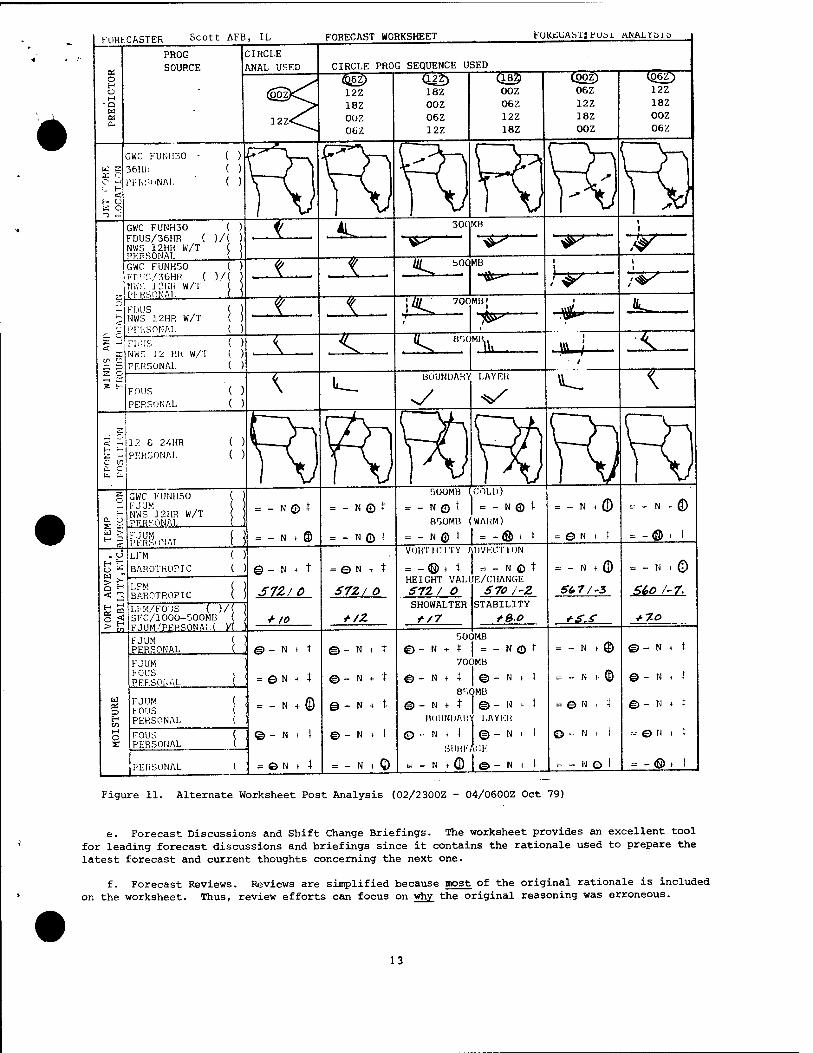
FORECAST WORKSHEET FOKüUAbTJ fÜbl ANALXbia
•
Figure 11. Alternate Worksheet Post Analysis (02/2300Z - 04/0600Z Oct 79)
e. Forecast Discussions and Shift Change Briefings. The worksheet provides an excellent tool for leading forecast discussions and briefings since it contains the rationale used to prepare the latest forecast and current thoughts concerning the next one.
f. Forecast Reviews. Reviews are simplified because most of the original rationale is included on the worksheet. Thus, review efforts can focus on why the original reasoning was erroneous.
13
c. Frontal Position: Recommended all seasons.
d. Temperature Advection: Recommended all seasons.
e. Vorticity Advection: Recommended all seasons.
f. Height Value/Change (500mb): Recommended fall, winter, and spring seasons. Optional summer.
g. Stability: Recommend at least one stability index be evaluated routinely. Choose indexes for which progs are available or which can be computed and which give the best indication of im- pending significant weather for your area.
h. Moisture (All levels shown): Recommend all seasons.
5.2.2. Local Predictors. In addition to the general predictors mentioned earlier, worksheets should also contain other predictors used locally on a routine basis. They would consist of trigger pre- dictors discussed above plus others geared to local forecasting techniques, studies, and rules-of- thumb. When the latter are not used on a daily basis and space on the basic worksheet is limited, these special predictors could be included on supplemental worksheets. Blank spaces, rather than symbols, should be provided for entries when specific values are needed for a particular forecasting technique. Some examples of special predictors frequently used in forecasting fog, stratus, thunder- storms, snow, freezing precipitation, etc. are given below:
Low Level Jet Freezing Level Inversion Height Thickness Values Tropopause Height Sea Sfc Temperature Temperature (Sfc/Aloft) Dewpoint/Depression (Sfc/Aloft)
5.2.3. Guidance Forecasts. Guidance forecasts such as model output statistics (MOS), conditional climatology (CC), etc. can also be recorded on the worksheet. Comparisons with predictors are much easier when these forecasts are displayed in original form for the same valid time. Entries for the "analysis" column should be omitted since they will be of little value.
5.3. Data Sources. This is a list of major data sources available to most CONUS units:
a. Winds (Aloft): 00/12Z Analyses, Skew-T 00/12Z Observed Winds, NWS 12hr Upper Wind Prog, AFGWC 109 Progs, and FDUS KWBC.
b. Winds (Boundary Layer): FOUS KWBC, Skew-T.
c. Temperature Advection (All levels): 00/12Z Analyses, 00/12Z Observed Winds/Temps, AFGWC 109 Progs, and FJUM KGWC.
d. Moisture (All levels): 00/12Z Analyses, FJUM KGWC, FOUS KWBC, New Composite Chart, LFM Anal/Progs, Mean RH/Vertical Velocity Prog.
e. Vorticity: LFM, Barotropic, and Anal/Progs.
f. Height Value/Change (500mb): Same as vorticity.
g. Stability: NWS Composite Chart, LFM Anal/Prog, FOUS KWBC, Lifted Index, and Mean RH/ Vertical Velocity.
h. Thickness: SFC/1000-500mb Anal, 30hr Prog, LFM Anal/Progs, and FOUS KWBC.
i. Frontal Positions: SFC Anal, SFC/1000-500 Thickness Anal/Prog, Weather Depiction, Satellite, and SFC Weather Progs (12, 24, 36).
j. Misc TTY Bulletins: FAUS KWBC/KGWC (Area fcsts), FPUS KWBC (Public fcsts), and TBXX6 (Satellite discussion).
5.4. Overprinting Maps. Worksheets should be tailored to the terminal or area by overprinting small maps to depict positions of frontal systems, jet cores, etc. An excellent source for maps of the size needed is the Defense Mapping Agency Catalog of Maps, Charts, and Related Products, Part I - Aerospace Products, Vol II Weather Plotting Charts. The map chosen can then be traced on to the master for printing.
For more flexible worksheets such as those needed to produce or met watch forecasts for several different terminals or areas, "bulls-eyes" can be substitued for the maps to show relative positions
15
•
Technical Report 218
PREPARATION OF
TERMINAL FORECAST WORKSHEETS
By Bryan G. Falzgraf HO, 7th WEATHER WING
THIS DOCUMENT HAS BEEN APPROVED FOR PUBLIC R ELEASE AND SALE;
ITS DISTRIBUTION IS UNLIMITED.
PUBLISHED BY
AIR WEATHER SERVICE (MAC) UNITED STATES AIR FORCE
OCTOBER 1969
October 1969 Technical Report 218
PREFACE
Forecast worksheets are recommended for all AWS units with terminal-
forecast responsibility. This report, prepared by Mr. Bryan G. Falzgraf,
Aerospace Sciences Division, 7 Weather Wing, describes the characteristics of
a good worksheet and outlines the steps for designing an effective product.
It was originally issued as 7WW TN No. 2 (1966) and later revised as
7WWP 105-8 (1969).
E. 0. JESS Colonel, USAF Director of Aerospace Sciences 23 September 1969
DISTRIBUTION: "F" Plus Special
This document has been approved for public release and sale; its distribution is unlimited.
October 1969 Technical Report 218
PREPARATION OF TERMINAL FORECAST WORKSHEETS
*
Introduction
One of the most significant duties in our base weather stations is the
preparation of the local terminal forecast (TAF). In fact, it is probably the
only really creative effort still left to our detachments. Most of the other
types of forecasts issued, such as icing, turbulence, route winds, or severe
weather areas, are extracted primarily from one or another of the various
centralized products received, generally via the facsimile circuits. Although
many of these FAX products (analyses and progs) play a vital part in the fore-
caster's thinking and formulation of the TAF, how he weighs and relates them
is pretty much left up to his good judgement. Therefore, some means to assist
him in reviewing and Judiciously collating all the information at his disposal
is highly desirable.
For two principal reasons the terminal forecast is perhaps one of the most
complex and difficult forecasts to make, if done conscientiously. First of
all, it is a forecast which incorporates scales of motion from the microscale
up to Rossby waves, or perhaps larger. And secondly, it covers a continuous
time spectrum from valid time up to 24 hours, and in some cases longer. The
prognostic charts currently available to the forecaster over the facsimile
networks provide him with forecast data in time steps of 6 and 12 hours. This
means that the local forecaster must fill in the gaps by means of locally pre-
pared aids and charts.
The local forecaster has considerable raw data at his disposal to use in
making his forecast. The big question is how does he go about putting it into
a form which will portray the essential features of the synoptic conditions
and allow him to make the best possible forecast. The answer to this is not
easy but one thing is fairly obvious, it is impossible for any one man to keep
all this information in his head with any satisfactory degree of organization,
even though he may be an "old hand." The only way this problem can be ap-
proached is to organize the data into a simple, usable form such as a check-
list or worksheet so that the forecaster can see at a glance the more perti-
nent synoptic parameters.
Many individuals tend to quail at the suggestion that they complete some
type of a checksheet prior to the writing of the TAF. However, the Importance
of such a check is recognized in many other fields of man's endeavor. In the
first place, it provides a standardized and systematic approach to the prepa-
ration of the terminal forecast. Most of us will agree that an organized
Technical Report 218 October 1969
attack on a problem, limited as it may be, is better than a helter-skelter,
catch-as-catch-can approach. Secondly, such a worksheet can embody in an ab-
breviated form all or most of the more important parameters which have a bear-
ing on the forecast for the local base. Conscientious use, therefore, of a
worksheet helps to ensure that the forecaster does not inadvertently neglect
or blithely overlook one or more significant factors affecting the forecast.
All of us, members of the Air Force, are familiar with the checklist proce-
dures followed by pilots before takeoff, regardless of whether they have flown
a particular aircraft one month or 20 years. Such a routine is another step
toward achieving 100$ certainty that no contingency has been overlooked. This
can easily happen in a base weather station particularly on a "bad" weather
day when the forecaster's duties seem to snowball. A third virtue of such a
worksheet is that it allows the forecaster to do much of the "dog" work at odd
moments he can catch between the press of other duties, and yet he has avail-
able a documented summation of his findings for collation and evaluation when
it comes down to converting his generalized forecast to specific values and
times. A fourth merit of such a worksheet is retention of continuity. If the
worksheets for the past 24 hours, for example, are kept on the TAF preparation
clipboard, the present forecaster has a handy and quick reference to those
critical elements affecting his station's forecast, plus a record of the Judg-
ment made on them by forecasters on previous shifts. Lastly, but probably
most important of all is the significance to the new forecaster such a work-
sheet will have. When we use the term "new" forecaster here, we have refer-
ence to the man who has been in the station less than two years, regardless of
how long he has been forecasting. To really understand the weather at a given
locale, one should spend a minimum of two of each season in the same weather
station.
Field visits to weather detachments have turned up a wide variety of check-
lists and procedures for making terminal forecasts. These range from none at
all to very detailed and unwieldly documents which are more of a menace than a
help. Several cases have been noticed where the forecaster has prepared his
TAF and then later gone back and filled out the checklist or worksheets.
There are probably as many checklists as there are stations, some good and
some bad. Some checklists are nothing more than a list of charts, bulletins,
etc., which the forecaster indicates he has studied by placing a check mark by
each item to show he has "checked" it. This type of checklist is considered
poor and does nothing more than verify that the forecaster has done his Job, a
procedure which should be accomplished by other management means. If you are
using this type of checklist at your detachment, we strongly suggest you dis-
card it and design one using some of the guidelines outlined in this report.
Hereafter in this discussion we will use the term "worksheet" since the term
*
October 1969 Technical Report 218
"checklist" seems to imply the type of approach described above. The purpose
of this discussion then is to establish some general guidelines for prepara-
tion of worksheets based on features of those currently in use.
Characteristics of a Good Worksheet.
Obviously, it is impossible to design a worksheet which could be used by
every detachment. However, there are some general characteristics which are
common to all good worksheets. The characteristics which are most important
are outlined below and may be used as a guide in constructing a worksheet for
your detachment:
a. Purpose; Each entry on the worksheet should have a specific purpose
in the ultimate preparation of the forecast.
b. Simplicity: The worksheet should not be so detailed that the user
gets more involved in completing the form than putting it to practical use.
Detailed instructions for interpretation and use of the data should be main-
tained separately from the worksheet. As the word "checklist" so aptly de-
scribes, each item should be answerable by a short entry, such as a wind direc-
tion or a temperature value. The user must be capable not only of completing
all entries with a minimum of writing, but he should be able to observe and
assimilate at a glance all the information. One method of reducing the number
of parameters is to have separate worksheets for different seasons of the year.
For example, an item related to freezing precipitation is useless for most
U.S. bases during the summer months; likewise, many stations need not be con-
cerned with thunderstorm or hail forecasting during the winter half of the
year. In the main, of course, the winter worksheet will contain several more
items than the one for summer.
c. Content: The worksheet should include a diagnosis of present weather
conditions and embody procedures which lead to a logical, step-by-step arrival
at the final terminal forecast. It should contain significant parameters and
procedures derived from local forecast studies, rules of thumb, and experience.
d. Flexibility: The worksheet should be designed to serve as an evalua-
tion tool as well as a forecast tool. Evaluation of procedures as to their
value in preparing forecasts needs to be constantly reviewed. The worksheet
can be of considerable value in determining how well a given study or rule of
thumb is performing.
e. Functional: The worksheet should be designed to get the Job done as
quickly and easily as possible, with a minimum of rechecking of data, taking
another look at the charts, etc. It should embody all the necessary basic in-
formation needed to write the final forecast.
Technical Report 218 October 1969
There are perhaps others which could be added, but in general, these char- acteristics embody most of the desirable features.
Designing a VJorksheet.
The design of a good effective worksheet is not an easy task. It requires
considerable time and thought by the Detachment Commander and his people. A
standard type of worksheet for every detachment is neither feasible nor de-
sirable, as every detachment has its own local problems and weather peculiari-
ties. The worksheet must be keyed to the individual detachment and somewhat
to the caliber of people assigned. The following step outline may be useful
in preparing a worksheet for your detachment:
a. Thoroughly review the Terminal Forecast Reference Pile for the detach-
ment and extract all significant parameters from climatology, local forecast
studies, rules of thumb, etc. To begin with, don't be too selective. Extract
everything pertinent; do your "weeding" out later.
b. Identify especially those weather situations which constitute your
major operational problems. Break these down further by season if appropriate.
c. Study carefully the file times for your TAF preparation in the light of data and charts available to make each forecast.
d. Evaluate each element, e.g., wind direction and speed, clouds, etc.,
in the TAF for which you are required to make a forecast and consider the
studies, rules of thumb, etc., applicable to each. At this point you may be-
gin to start "weeding" out some of the less useful parameters. Since the
relative importance of travelling disturbances, diurnal and seasonal influences,
and the effect of local geography varies from station to station, worksheets
must be specialized tools to fit the needs of individual stations. *
e. The next step is to design your format. Again, there are many varia-
tions on this and we will only attempt to provide some general ideas. The
details can be worked out only by each individual detachment. One approach is
to divide your worksheet into sections. We suggest also that you use only one
sheet of paper if practical to ease handling and filing problems. Both sides
can be utilized. Some detachments print a space on the front or back of the
worksheet to encode their TAF. The sectioning of your worksheet may be done,
for example, as shown in Figure 1.
(l) Each of these sections should contain blank spaces for the fore-
caster to make an entry of the information needed, e.g., "yes" or "no" to a
specific question, a specific value of some parameter, say thickness. As an
example, under climatology you should provide a space for entering persistence-
probability values appropriate for the current weather situation. Also, under
October 1969 Technical Report 218
Forecast Studies and Objective Aids, you may want to provide entries for cer-
tain parameters, such as, height of inversion and low level wind direction,
these in turn being keyed to a station study for stratus at the terminal.
(2) Space should be provided for the forecaster to state what he be-
lieves to be his major forecast problems for the valid TAP period.
(3) Finally, there should be a place for the forecaster to evaluate
his forecast which in turn will serve to monitor the effectiveness of the
various techniques, forecast studies, etc., being used by the station. At a
minimum, this space should contain a "bust review" if one is appropriate.
Summary.
It is hoped that some of the guidelines contained in this report will
assist the detachment in designing a good, effective worksheet. It is not an
easy task and several revisions may be needed before you can come up with one
which will suit your needs. If some entries on the worksheet prove to be of
little value in the forecast, discard them by all means. The whole idea is to
assist the forecaster in arriving at the best possible forecast for his termi-
nal with a minimum of work duplication and reliance on an oftentimes faulty
memory. The little extra effort required to complete a TAF worksheet pays a
handsome bonus in improved forecasts.
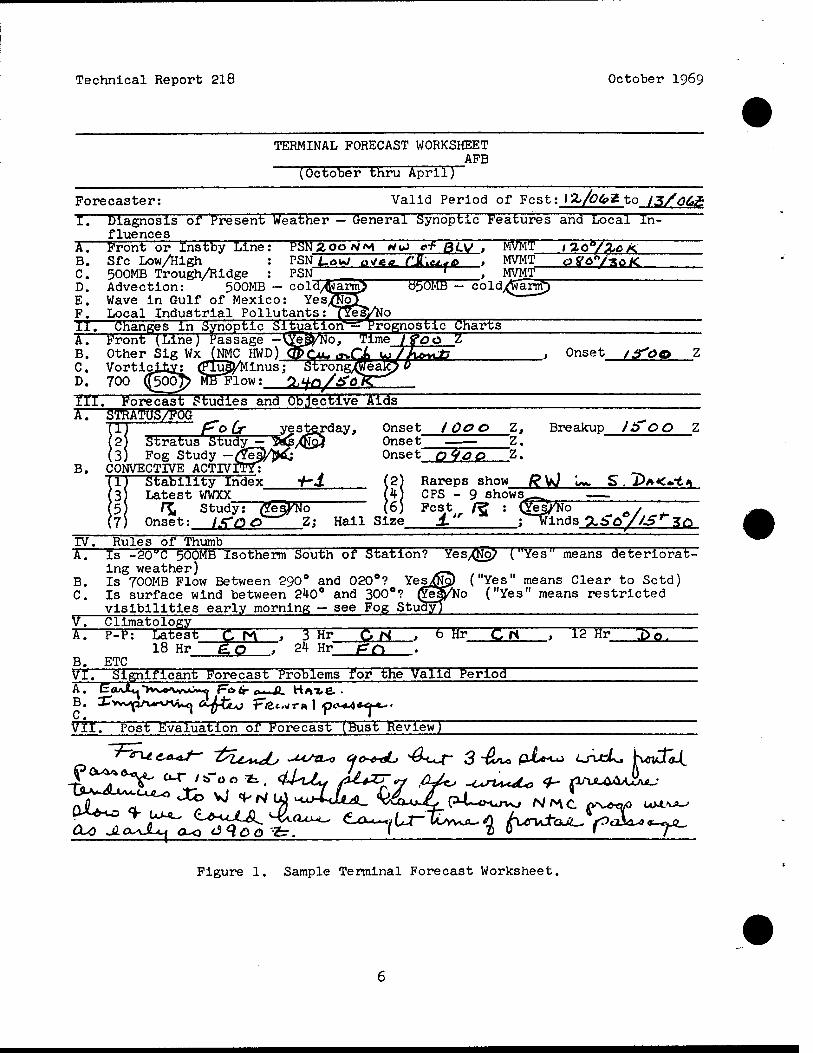
Technical Report 218 October 1969
TERMINAL FORECAST WORKSHEET AFB
(October thru April)
Forecaster: Valid Period of Fest: Il/0b2 to 13/062: "T". Diagnosis of Present Weather — General Synoptic Features and Local In-
fluences PSN20QNM WoJ c-f ßLV , MVMT l?.Oa/Zcj<
PSN _ ~ ~ "~J , MVMT D. Advectlon:" ' 5Ö0MB — cold/(foarnL$ Ö50MB — cold,(Jwarj£) E. Wave in Gulf of Mexico: Yes^Nof F. Local Industrial Pollutants
~K~. Front or Instby Line B. Sfc Low/High C. 500MB Trough/Ridge
II. Changes in Synoptic Sltuatlori'^Prognostic Charts T~. Front (Line) Passage -Vjeg^No, Time If00 Z
' Slg Wx (NMC " "' * .city: <PlW
D. 700 ((500^ MB~Flow: 1,ifn/i
-tfe^No, _^___ B. Other Slg Wx (NMC HWD) OPC^ ITG6 W7'b**dD , Onset f 3*00 Z C. Vorticjjfcy: (Flug/Minus; Stroni
III. Forecast Studies and Objective Aids T~. STRATUS/FOG _
TTT P~o Or yesterday, Onset I OOP Z, Breakup /i> OO Z (2) Stratus Study - &&/§$) Onset _■— Z. (3) Fog Study -rfeal/)& Onset o9ao Z.
B. CONVECTIVE ACTIVITY: TTT Stability Index ^-.1 (2) Rareps show RW U* S.T>A<»t*
3} Latest WWXX (4) CPS - 9 shows^ [5) f£ Study: pej^Nö (6) Fest fä : QTeJ/'No ~7 ~
iset: L<aa— Z; Hail Size A " ;Winds a.S"a //S^ZC*
IV. Rules of Thumb _-.... T~. Is -20"C 500MB Isotherm South of Station? Yes/Ng? ("Yes" means deteriorat-
ing weather) __ B. Is 700MB Flow Between 290° and 020°? Yes^Ng) ("Yes" means Clear to Sctd) C. Is surface wind between 240° and 300°? (?e|yNo ("Yes" means restricted
visibilities early morning — see Fog Study) V. Climatology "" ^~= Lates _
18 Hr do ~ , 24 Hr P C\ P-P: Latest C r*\ , 3 Hr G N , b Hr C rH 12 Hr TDo~
B. ETC VI. Significant Forecast Problems for the Valid Period'
VII. Post Evaluation of Forecast (Bust Review)
r-7ru <£.***/- '£?u^dLf U4JZL*} cto-^b *öt*4~ 3 -£L* pL*-^ LSVCL» KcvCfo-C
Figure 1. Sample Terminal Forecast Worksheet.
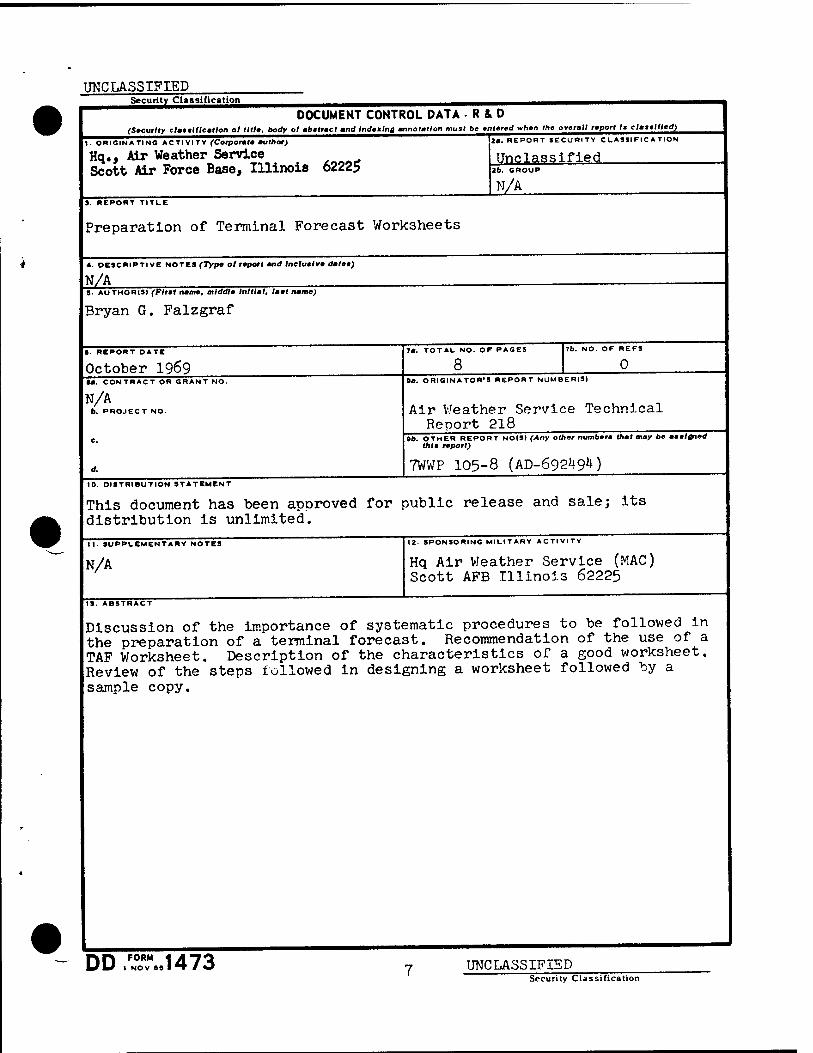
UNCLASSIFIED Security Classification
DOCUMENT CONTROL DATA R&D (S*eurlly claeellleatlon ol title, body ol abetract and Indenlnj annotation must be entered when the overall report It clatellled)
I. ORIGINATING ACTIVITY (Corporate author)
Hq., Air Weather Service Scott Air Force Base, Illinois 62225
2«. REPORT SECURITY C L ASH Fl C A TION
Unclassified 2b. GROUP
N/A 3. REPORT TITLE
Preparation of Terminal Forecast Worksheets
4. DESCRIPTIVE NOTES (Type ol report and Inclutive datee)
N/A S- AUTHOR(S) (Flret name, middle Initial, laat name)
Bryan G. Falzgraf
S. REPORT DATE
October 1969 M. CONTRACT OR GRANT NO.
N/A 6. PROJECT NO.
7a. TOTAL NO. OF PAGES
8 7b. NO. OF REFS
0 »a. ORIGINATOR'S REPORT NUMBERIS)
Air Weather Service Technical Report 218
9b. OTHER REPORT NO(3) (Any other number* that may be mamigned thlm report)
7WWP 105-8 (AD-692491*) 10. DISTRIBUTION STATEMENT
This document has been approved for public release and sale; its distribution is unlimited.
11. SUPPLEMENTARY NOTES
N/A
12. SPONSORING MILITARY ACTIVITY
Hq Air Weather Service (MAC) Scott AFB Illinois 62225
IS. ABSTRACT
Discussion of the importance of systematic procedures to be followed in the preparation of a terminal forecast. Recommendation of the use of a TAF Worksheet. Description of the characteristics of a good worksheet. Review of the steps followed in designing a worksheet followed by a sample copy.
L DD,FN°ORVM..1473 7 UNCLASSIFIED
Security Classification
IlNflTASSIFIED Security Classification
KEY WORD! KOll WT
LINKS
ROH WT KOLC WT
Terminal Forecast
8 UNCLASSIFIED Security Classification
LOCAL ANALYSIS AND FORECASTING PROGRAM
A well-developed Local Analysis and Forecasting Program (LAFP) is essential to the good workings of every weather station providing weather forecasts. A strong LAFP will help ensure a systematic and organized approach to analysis and forecasting. As the instructor meteorologist you are charged with integrating the analysis and forecasting function of the weather station into the LAFP. AFM 15-125 defines the LAFP as follows:
Local Analysis and Forecast Program—A systematic and consistent approach to weather forecasting. The LAFP identifies techniques and tools used to forecast individual weather elements, describes requirements for locally prepared work charts/composites, and describes refinements and application of centralized products.
The LAFP encompasses numerous subjects. At a minimum, it should address the following:
Mctwatch Metwatch procedures tailored by regime Radar procedures METSAT procedures AWDS procedures
Analysis and Forecast Development Usage and analysis procedures of centralized products by regime Usage and analysis procedures of locally prepared products by regime Procedures for model initialization and verification TFRN (Tab 8) Forecast worksheets Forecast discussions (Tab 6) Forecast seminars Forecast reviews (Tab 9)
EOTDA Support (If your unit supports EO weapon systems)
One of the best systematic approaches to weather forecasting is the forecast funnel. The funnel helps you apply physical reasoning to the data to organize and best utilize the available data. It lets you sort out the contributions from different atmospheric scales of motion. (A discussion of the forecast funnel is attached)
Another way to apply a systematic approach to weather forecasting is through a well thought out and organized forecast worksheet. AFM 15-125 defines the forecast worksheet as follows:
Forecast Worksheet—Tool used to document, track, and evaluate past and future weather events. It may contain forecast rules-of-thumb, question and answer discriminators, decision-logic trees, etc., to help develop a forecast.
A good worksheet can help you organize thought processes and guide you through an examination of the atmosphere as you prepare your forecast. We've included some references to get you started; however, the older references do not address regime based worksheets. Keep this point in mind as you review them. We've also included an example of the Tinker AFB Forecast Worksheet (with attachments). In the regime spirit they've developed separate worksheets based upon gusty winds, severe thunderstorms, fog/stratus, and winter weather.
The following five references will help you develop or improve your LAPP program:
AFM 15-125 Weather Station Operations - Chapter 4 contains definitive guidance on content and responsibility.
2WW/FM—86/009 The Local Analysis and Forecast Program - An in-depth discussion of the LAFP with sample SOPs and worksheets.
7WW/TN—80/001 Forecast Worksheet: A New Approach - A new approach in 1980, but contains valid information.
AWS/TR—218 Preparation of Terminal Forecast Worksheets -This one was probably written before you were bom, but the concepts are still sound.
MetTEPs - Contains information about what features to analyze on specific products and what products to use to forecast specific weather elements.
Your MAJCOM aerospace sciences POC or HQ AWS/XON can assist you with specific questions or concerns.
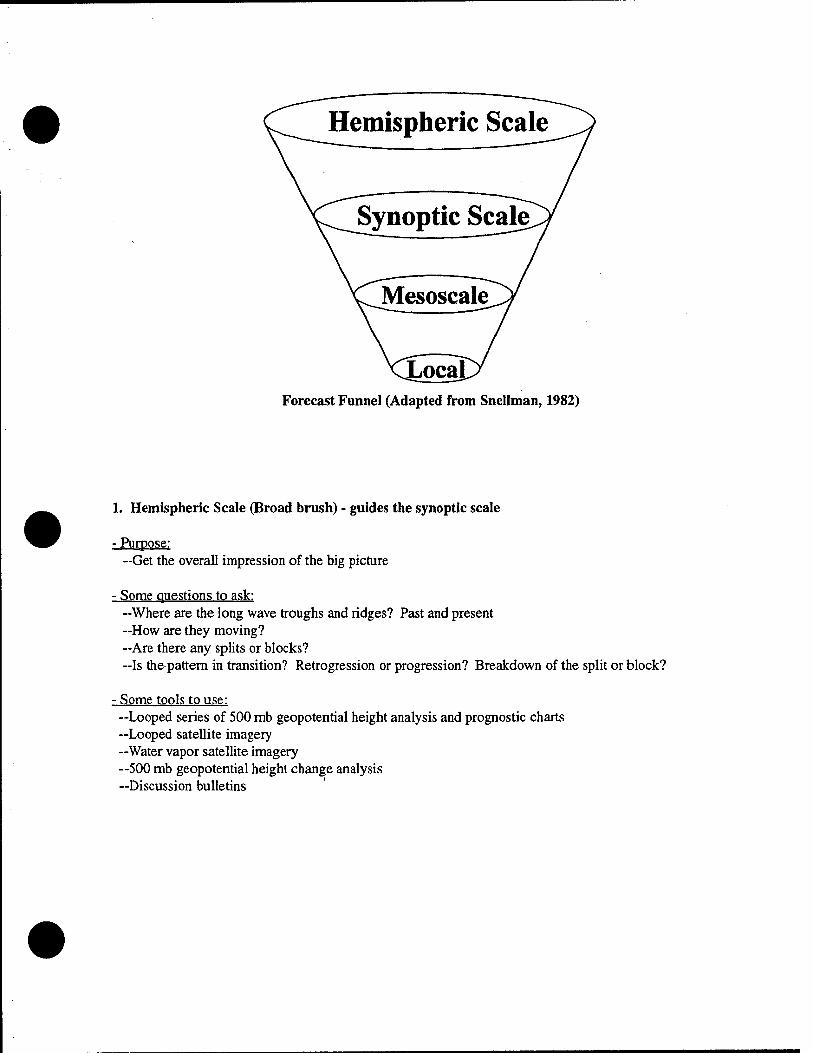
Forecast Funnel (Adapted from Snellman, 1982)
1. Hemispheric Scale (Broad brush) - guides the synoptic scale
- Purpose: -Get the overall impression of the big picture
• Some questions to ask: -Where are the long wave troughs and ridges? Past and present —How are they moving? -Are there any splits or blocks? -Is the pattern in transition? Retrogression or progression? Breakdown of the split or block?
• Some tools to use: —Looped series of 500 mb geopotential height analysis and prognostic charts —Looped satellite imagery —Water vapor satellite imagery —500 mb geopotential height change analysis —Discussion bulletins
2. Synoptic Scale (Conventional METCON, continental size-focus) - drives the mesoscale
- Purpose: —Identify regime —Begin to develop forecast problem of the day
- Some questions to ask: —What is causing the current weather? —How does the initial analysis compare to the current satellite? —Are there any transitory short wave troughs and ridges? —Where are the surface frontal boundaries? —Are there any low-level jet streaks? —What are the characteristics of my air mass? Will it undergo modification?
- Some tools to use: —Surface and upper air data and analyses
—Helps determine continuity and evolution —Explain features in 3-D —Cross-section analysis for frontal position —Sounding information reveals air mass characteristics
-Time-looped satellite imagery for development of weather producing features —Convective cloud development and analysis —Water vapor imagery for identification of dry air intrusion associated with severe
weather —Numerical Models
—Initialize and verify —Work through forecast package thinking how it will drive the mesoscale
—Conceptual Models —Centralized products -Alphanumeric Bulletins
3. Mesoscale • where the action is
- Purpose —Identify mesoscale effects of the regime —Identify forecast problem of the day
—Fog, thunderstorms, non-convective winds, etc.
- Some questions to ask: —What is causing those features seen on satellite and radar imagery that are not accounted for on the synoptic
scale? —Examples: precipitation bands, dry lines, convergence zones, orographic effects
-Is there a sufficient lifting mechanism along with an abundant moisture source to cause convection?
—How will the synoptic scale features interact with the earth (terrain, coasts, lakes snow cover, wet ground, etc.)?
—Any jetstreaks, drylines, convergence zones, air mass discontinuities, mid-level dry air intrusion, etc.? —What is the static stability of the air mass? —Is there enough energy in the atmosphere for storms to turn severe (CAPE)?
- Some tools to use: -Satellite imagery - (highest resolution) --WSR-88D —Lightning data -Soundings and hodographs
—Forecast and upstream —Indices, cape, helicity
-MOS -Local analysis charts —Conditional Climatology —New mesoscale model output
4. Local (Storm) Scale - driven by mesoscale
- Purpose: -Forecast
—Local 24-hour forecast —Warnings/watches/advisories
—Specialized Support —Current flights, upcoming missions and exercises
—Long-range outlook
- Some questions to ask: -What role will terrain play in the local weather? -Is the wind shear favorable for the development of severe weather? -Are any outflow boundaries developing for sustainment of convection? -Does satellite imagery reveal any overshooting tops?
- Some tools to use: Basically the same as the mesoscale
5. Conclusion
The forecast funnel is one approach to the forecast process. The forecast funnel is a thought process to investigate the physical nature of what's going on in the atmosphere.
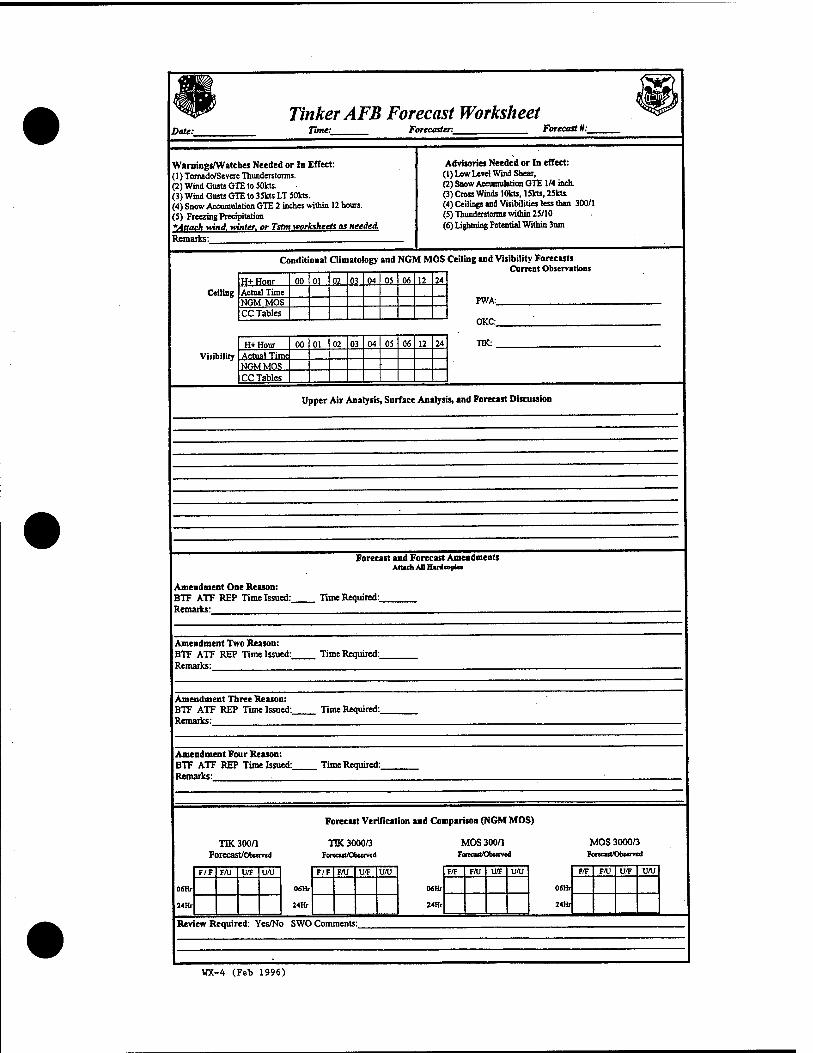
Date:
Tinker AFB Forecast Worksheet Time: Forecaster: Forecast H:
Warnings/Watches Needed or In Effect: (1) Tornado/Severe Thunderstonns. (2) Wind Gusts GTE to 50kts. (3) Wind Gusts GTE to 35kts LT 50kts. (4) Snow Accumulation GTE 2 inches within 12 hours. (5) Freezing Precipitation *Attach wind, winter, or Tstm worksheets as needed. Remarks:
Advisories Needed or In effect: (1) Low Level Wind Shear, (2) Snow Accumulation GTE 1/4 inch. (3) Cross Winds lOkts, lSlcts, 25kts. (4) Ceilings and Visibilities less than 300/1 (5) Thunderstorms within 25/10 (6) Lightning Potential Within 3nm
Conditional Climatology and NGM MOS Ceiling and Visibility Forecasts Current Observation]
Ceiling
Viability
H+Hour 00 01 02 0? 04 05 06 12 ?* Actual Time NGM MOS CC Tables
PWA:
OKC:
H+Hour 00 01 02 03 04 05 06 12 24 Actual Time NGM MOS CC Tables
TK:
Upper Air Analysis, Surface Analysis, and Forecast Discussion
Forecast and Forecast Amendments Attach AD Hirtcopia
Amendment One Reason: BTF ATF REP Time Issued:_ Remarks:
Time Required:.
Amendment Two Reason: BTF ATF REP Time Issued:. Remarks:
Time Required:.
Amendment Three Reason: BTF ATF REP Time Issued:. Remarks:
Time Required:.
Amendment Four Reason: BTF ATF REP Time Issued:. Remarks: ■
Time Required:.
Forecast Verification and Comparison (NGM MOS)
TK 300/1 Forecast/Observed
TK 3000/3 Forecut/OUcrvcd
MOS 300/1 Ferecm/Observed
MOS 3000/3 Forecast/Observed
0«Hr
24Hr
F/F F/U U/F U/U
06Hr
24Hr
F/F F/U U/F U/U
OSHr
24Hr
F/F F/U U/F U/U
06Hr
2«Hi
Review Required: Yes/No SWO Comments:.
WX-4 (Feb 1996)
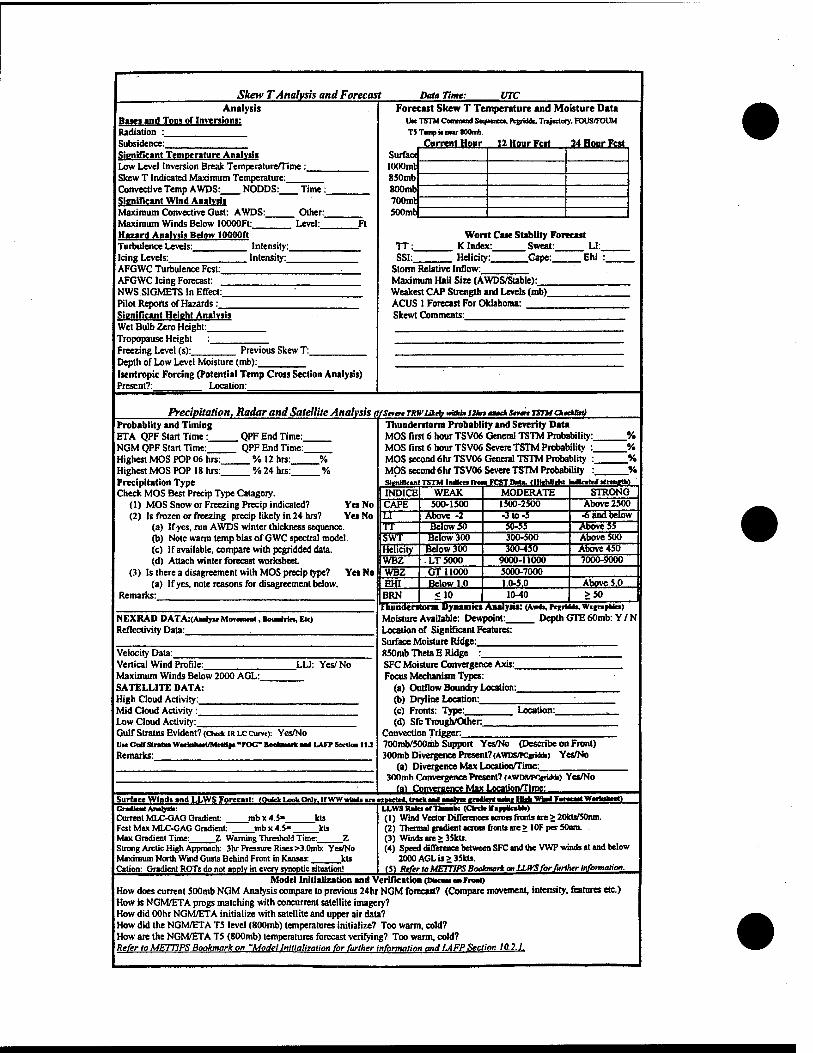
Skew T Analysis and Forecast Data Time: VTC
Level:
Analysis Bases and TOD» of Inversions: Radiation : Subsidence: Significant Temperature Analysis Low Level Inversion Break Temperature/rime : Skew T Indicated Maximum Temperature: Convective Temp AWDS: NODDS: Time :_ Significant Wind Analysis Maximum Convective Gust: AWDS: Other:_ Maximum Winds Below lOOOOFt:. Hazard Analysis Below 10000ft Turbulence Levels: Intensity:, Icing Levels: lntensity:_ AFGWC Turbulence Fest: AFGWC Icing Forecast: NWS SIGMETS In Effect: Pilot Reports of Hazards: Significant Height Analysis Wet Bulb Zero Height: Tropopause Height Freezing Level (s):_
Ft
Previous Skew T: Depth of Low Level Moisture (mb): Isentropic Forcing (Potential Temp Cross Section Analysis) Present?: Location:
Forecast Skew T Temperature and Moisture Data Ute TSTM Command Sequence«, ftgridde. Trajectory. FOUS/FOUM T5 Temp n near SOOrnb.
Current Hour 12 Hour Pert 14 Hour Fest Surface 1000ml 850mb 8O0mb 700mt SOOmb
Worst Case Stablity Forecast TT: K Index: Sweat: LI:. SSI: Helicity: Gape: Ehi
Storm Relative Inflow: Maximum Hail Size (AWDS/Stable): Weakest CAP Strength and Levels (mb)_ ACUS 1 Forecast For Oklahoma: Skewt Comments:
Precipitation, Radar and Satellite Analysis grsntn nwiikeh> »an» mm —ck s*m TSTM a*cUa4
.QPF End Time:, QPF End Time: %12hrs:
% 24 his: % %
Probablity and Timing ETA QPF Start Time: NGM QPF Start Time: Highest MOS POP 06 hrs:_ Highest MOS POP 18 hrs:_ Precipitation Type Check MOS Best Precip Type Catagory.
(1) MOS Snow or Freezing Precip indicated? Yes No (2) Is frozen or freezing precip likely in 24 hrs? Yes No
(a) If yes, run AWDS winter thickness sequence. (b) Note warm temp bias of GWC spectral model. (c) If available, compare with pegridded data. (d) Attach winter forecast worksheet
(3) Is there a disagreement with MOS precip type? Yes No (a) If yes, note reasons for disagreement below.
Remarks:
NEXRAD DATA:(Aualyic Movement, BoiaWria, Etc) Reflectivity Data:
Velocity Data: Vertical Wind Profile: Maximum Winds Below 2000 AGL: SATELLITE DATA: High Cloud Activity: Mid Cloud Activity : Low Cloud Activity:,
LLJ: Yes/No
Gulf Stratus Evident? (Check IRLC Curve): Yes/No UM Gotr Strata Worfafceel/Mettle« -FOC" ] Remarks:
LAFP Section 1IJ
Thunderstorm Probablity and Severity Data MOS first 6 hour TSV06 General TSTM Probability:, MOS first 6 hour TSV06 Severe TSTM Probability :_ MOS second 6hrTSV06 General TSTM Probablity :_ MÖS second 6hrTSV06 Severe TSTM Probability :. SnmHItanl TSTM ln«tcea fro» FC3T D.U. flltiMliht Mlcaicd atrentUi)
INDICE WEAK CAPE rr rr SWT Helicity WBZ WBZ EHI
500-1500 Above -2
Below SO Below 300
Below 300 LT5000 GT 11000 Below 1.0
MODERATE 1500-2500 TtaT- -353T
300-500 300-450
9000-11000 5000-7000 1.0-5.0
BRN | <10 | 10-40 | >50 Thunderstorm Dynamics Analysis: (AwaXPcirrtiu,Wiiro*k>)
STRONG Above 2500 -6 and below
Above 5 i Above 500 Above 450 7000-9000
Above 5.0
Moisture Available: Dewpoint:. Location of Significant Features: Surface Moisture Ridge: 850mb Theta E Ridge :
DepUiGTE60mb:Y/N
SFC Moisture Convergence Axis: Focus Mechanism Types:
(a) Outflow Boundry Location: (b) Dryline Location: (c) Fronts: Type: Location:. (d) Sfc Trough/Other.
Convection Trigger, 700mb/500mb Support Yes/No (Describe on Front) 300mb Divergence Present? (AWDsyrciridde) Yes/No
(a) Divergence Max Location/Time:_ 300mh Convergence Present? (Awns/pcgricVfc) Yes/No
lai Convergence Max Localionnime: Surface Wlndnad LLWS Forecast: (OiMkVLookOnlT.lrvVVVwliMl1aj«wii«cleCtr«ck«n4»naliii tntintm+uVtpvn'**'»ffW*MkM*)
kts kts
Genauen* Analyaia: Current MLC-OAG Gradient mbx4.5- Fcst Max MLC-GAG Gradient: mbx4.5= Max Gradient Time: Z Warning Threshold Time: Z Strong Arctic High Approach: 3hr Pressure Rises >3.0mb: Yes/No Maximum North Wind Gusts Behind Front in Kansas: kts Cation: Gradient ROTs do not apply in every synoptic situation!
LLWS Rake «fTaanufc: (Clrde If «npHraHi) (1) WimlVecux Differences across fronts are > 20kts/50nm. (2) Thermal gradient across fronts are > 10F per SOnm. (3) Winds are >35kts. (4) Speed difference between SFC and the VWP winds at and below
2000AGLis>35kts. (5) Refer to METTIP5 Bookmark on LLWS for further information.
Model Initialization and Verifkatioa (Obcanaaei Front) How does current 500mb NGM Analysis compare to previous 24hr NGM forecast? (Compare movement, intensity, features etc.) How is NGM/ETA progs matching with concurrent satellite imagery? How did OOhr NGM/ETA initialize with satellite and upper air data? How did the NGM/ETA T5 level (800mb) temperatures initialize? Too warm, cold? How are the NGM/ETA T5 (800mb) temperatures forecast verifying? Too warm, cold? Refer to METT1PS Bookmark on "Model Initialization for further information and LAFP Section 10.2.1.

LOCAL GENERATED FORECAST WORKSHEETS
1. Gusty Wind/Low Level Jet Worksheet. This worksheet was designed to assist personnel in forecasting strong, gusty, surface winds. It is a good tool to use when weather warning winds of 35 knots (non-convective) or greater are expected. In addition, it also aids the forecaster on the timing of low-level jet.
2. Severe Thunderstorm Forecast Worksheet. Forecasters will use this worksheet when severe weather potential exists for central Oklahoma. It may be used in conjunction with the SHARP program or the AWDS SKEW-T. It should be updated with each new sounding during severe weather seasons.
3. Fog/Stratus Forecast Worksheet. Gulf stratus/fog formation develops when central Oklahoma is open to the Gulf of Mexico. Normally this is when the high pressure system begins to move off the east coast, and we are on the backside of the high. This worksheet is an excellent tool to be used during this synoptic situation.
4. Winter Weather Worksheet. There are two winter weather worksheets available to forecasters. The first worksheet is on the reverse side of the Gulf Stratus Worksheet. It is a quick and dirty method of forecasting snow, freezing rain, or rain. In addition, there is a checklist to use for forecasting icing events. The second worksheet is used in conjunction with the SKEW-T, NGM Numerical Output, UGDF data, and using the AWDS command sequence Winter Weather. On the reverse side of this worksheet are rules of thumb for forecasting icing.
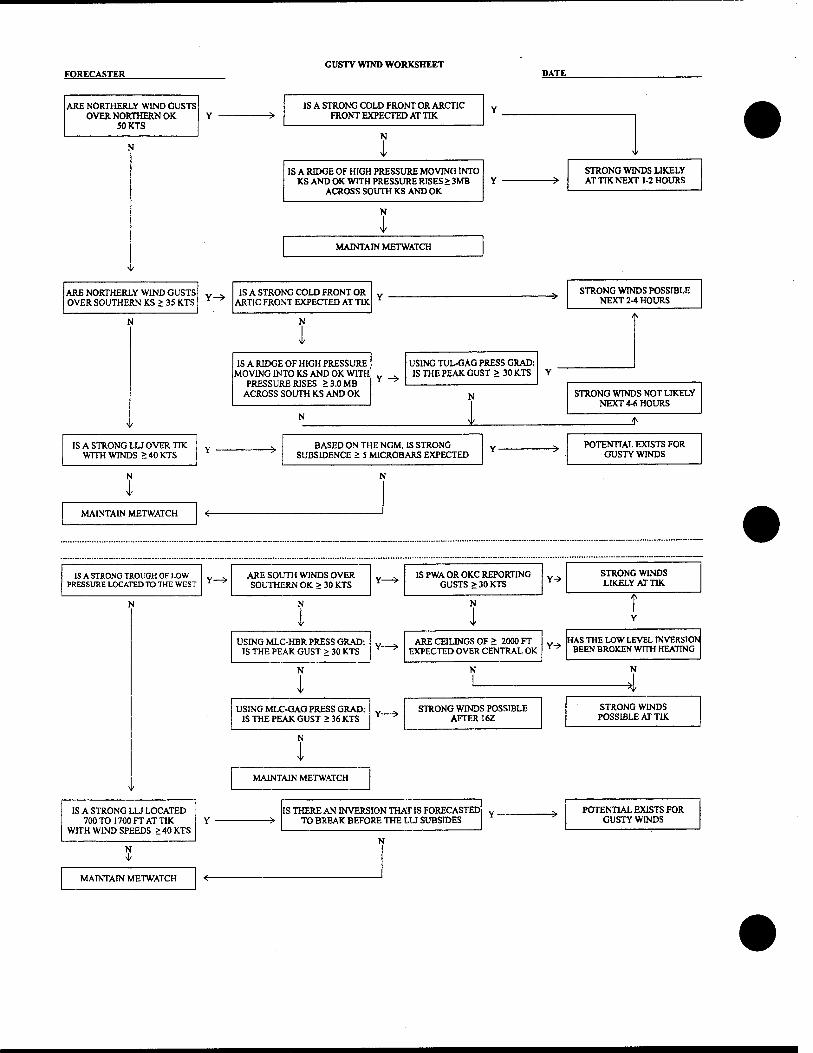
GUSTY WIND WORKSHEET FORECASTER DATE
ARE NORTHERLY WIND GUSTS OVER NORTHERN OK
50KTS
IS A STRONG COLD FRONT OR ARCTIC FRONT EXPECTED AT TIK
N N
i IS A RIDGE OF HIGH PRESSURE MOVING INTO
KS AND OK WITH PRESSURE RISES > 3MB ACROSS SOUTH KS AND OK
STRONG WINDS LIKELY AT TIK NEXT 1-2 HOURS
N
MAINTAIN METWATCH
ARE NORTHERLY WIND GUSTS OVER SOUTHERN KS > 35 KTS
Y-=> IS A STRONG COLD FRONT OR ARTIC FRONT EXPECTED AT TIK
STRONG WINDS POSSIBLE NEXT 2-4 HOURS
IS A RIDGE OF HIGH PRESSURE MOVING INTO KS AND OK WITH
PRESSURE RISES > 3.0 MB ACROSS SOUTH KS AND OK
Y -=>
USING TUL-GAG PRESS GRAD: IS THE PEAK GUST > 30 KTS
STRONG WINDS NOT LIKELY NEXT 4-« HOURS
IS A STRONG LU OVER TIK WITH WINDS > 40 KTS
BASED ON THE NGM, IS STRONG SUBSIDENCE > 5 MICROBARS EXPECTED
POTENTIAL EXISTS FOR GUSTY WINDS
MAINTAIN METWATCH
IS A STRONG TROUGH OF LOW PRESSURE LOCATED TO THE WEST Y—> ARE SOUTH WINDS OVER
SOUTHERN OK > 30 KTS IS PWA OR OKC REPORTING
GUSTS > 30 KTS Y->
STRONG WINDS LIKELY AT TIK
USING MLC-HBR PRESS GRAD: IS THE PEAK GUST > 30 KTS
ARE CHUNGS OF > 2000 FT EXPECTED OVER CENTRAL OK
Y-> HAS THE LOW LEVEL INVERSION
BEEN BROKEN WITH HEATING
4 USING MLC-GAG PRESS GRAD:
IS THE PEAK GUST > 36 KTS Y—> STRONG WINDS POSSIBLE
AFTER 16Z STRONG WINDS
POSSIBLE AT TIK
MAINTAIN METWATCH
IS A STRONG LU LOCATED 700 TO 1700 FT AT TIK
WITH WIND SPEEDS > 40 KTS
IS THERE AN INVERSION THAT IS FORECASTED TO BREAK BEFORE THE LU SUBSIDES
POTENTIAL EXISTS FOR GUSTY WINDS
N
MAINTAIN METWATCH
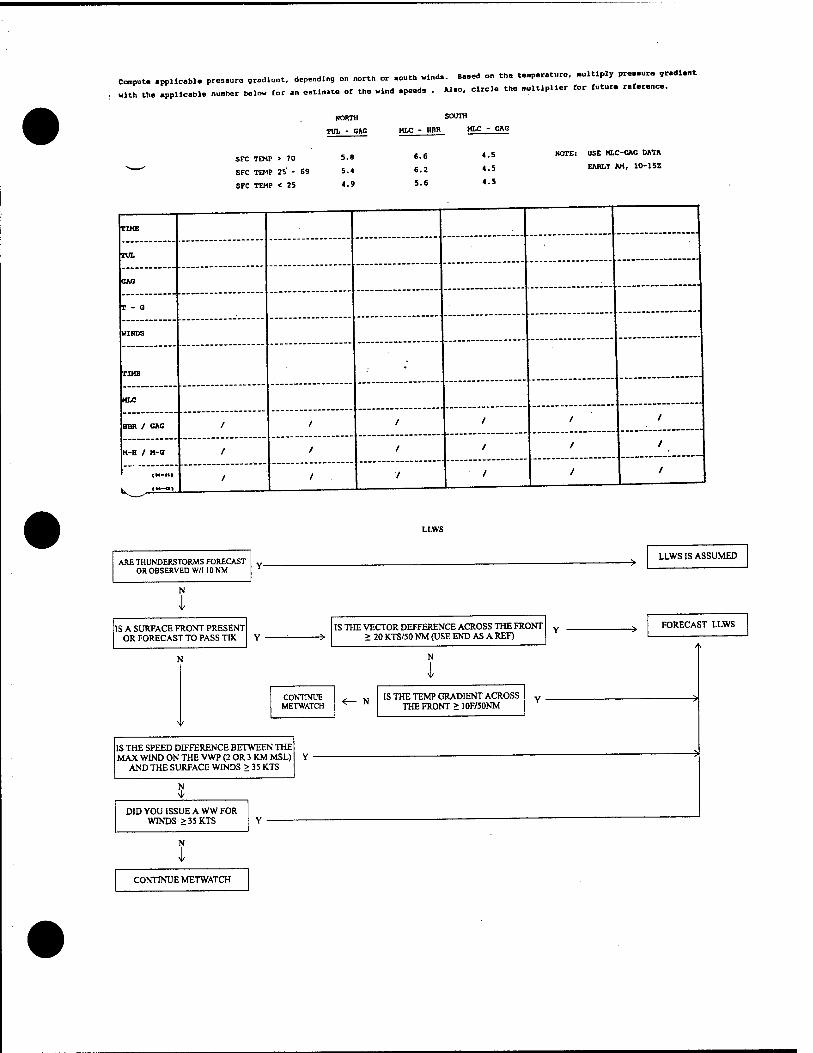
Compute appUc.b,. pressure aradlent. dependln, on north or eouth winds. Based on th. temperature, »ultlply pressure or.di.nt
with the wllcbl. number below for an estimate of the wind speed, . Also, clrde the multiplier (or tutur. reference.
SFC TEMP > 70
SFC TEMP 25' - 69
SFC TEMP < 25
NORTH
TUX - GAG
5.8
5.4
4.9
SOUTH
HLC - HBR KLC - GAG
6.6
6.2 5.6
4.5
4.5
4.5
NOTE: USE HLC-GAG DATA
EARLY AH, 10-15Z
TIME
TUL
CAG
T - G
HINDS
TIKE
HLC
HUB / CAG / / 1 1 1 1
M-H / M-G / / 1 1 1 1
' <M-111 / / 1 '
1 1
k .. '** *"
ARE THUNDERSTORMS FORECAST OR OBSERVED W/I 10 NM
IS A SURFACE FRONT PRESENT OR FORECAST TO PASS TIK
LLWS
IS THE VECTOR DEFFERENCE ACROSS THE FRONT > 20 KTS/50 NM (USE END AS A REF)
CONTINUE METWATCH
IS THE SPEED DIFFERENCE BETWEEN THE MAX WIND ON THE VWP (2 OR 3 KM MSL)
AND THE SURFACE WINDS > 35 KTS
N
DID YOU ISSUE A WW FOR WINDS > 35 KTS
IS THE TEMP GRADIENT ACROSS THE FRONT > 10F/50NM
LLWS IS ASSUMED
FORECAST LLWS
CONTINUE METWATCH
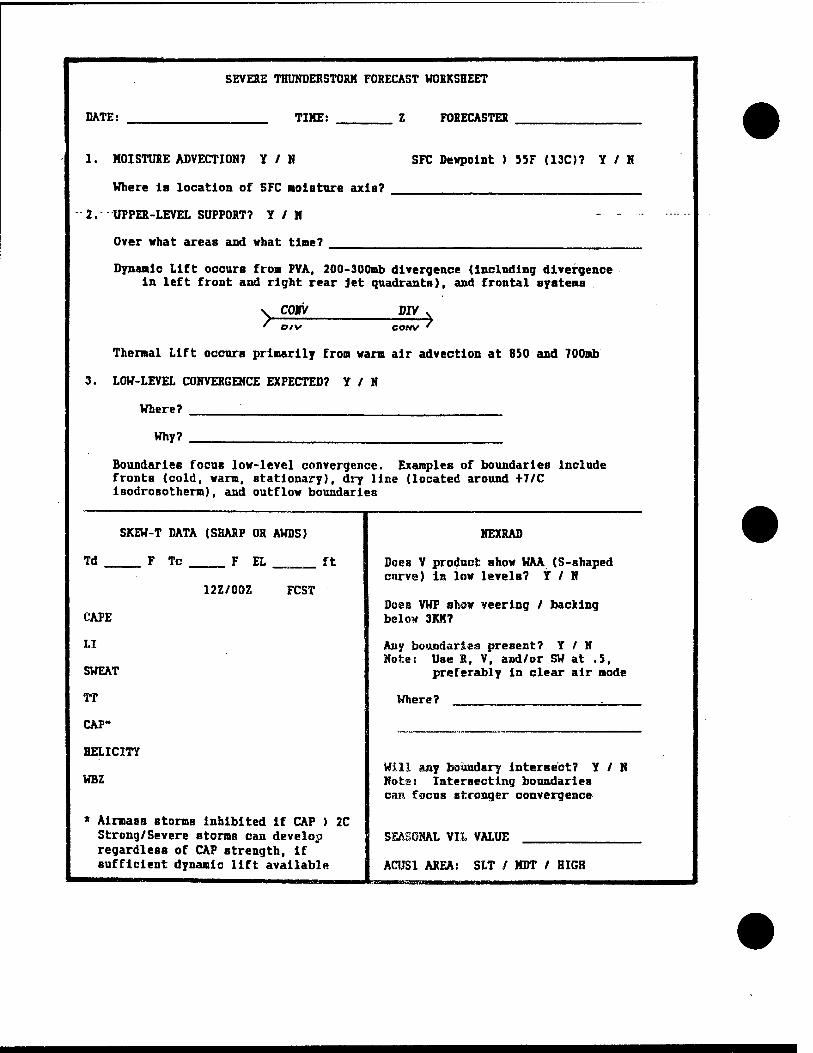
SEVERE THUNDERSTORM FORECAST WORKSHEET
DATE: TIKE: FORECASTER
1. MOISTURE ADVECTIOH? Y / H SFC Dewpoint > 55F (13C)? Y / K
Where is location of SFC Moisture axiB?
2. UPPER^LEVEL SUPPORT? Y/N - . .
Over what areaa and what time?
Dynamic Lift occurs from FVA, 200-300mb divergence (including divergence in left front and right rear Jet quadrantB), and frontal systems
> COW DIV OtV CONV '
Thermal Lift OCCUTB primarily from warm air advection at 850 and 700mb
3. LOW-LEVEL COHVERGEHCE EXPECTED? Y / M
Where?
Why7
Boundaries focus low-level convergence. Examples of boundaries include fronts (cold, warm, stationary}, dry line (located around +7/C isodrosotherm), and outflow boundaries
SKEW-T DATA (SHARP OR AWDS)
Td F Tc F EL ft
12Z/00Z FCST
CAPE
LI
SWEAT
TT
CAP"
HELICITY
WBZ
* AirmaBB stormB inhibited if CAP > 2C Strong/Severe storms can develop regardless of CAP strength, if sufficient dynamic lift available
KEXRAD
Does V product show WAA (S-shaped curve) in low levels? Y / M
Does VWP show veering / backing below 3KM?
Any boundaries present? Y/N Note: Use R, V, and/or SW at .5,
preferably in clear air mode
Where? .
Will any boundary intersect? Y/N Note: Intersecting boundaries can focus stronger convergence
SEASONAL VIL VALUE
ACUS1 AREA: SLT / MDT / HIGH
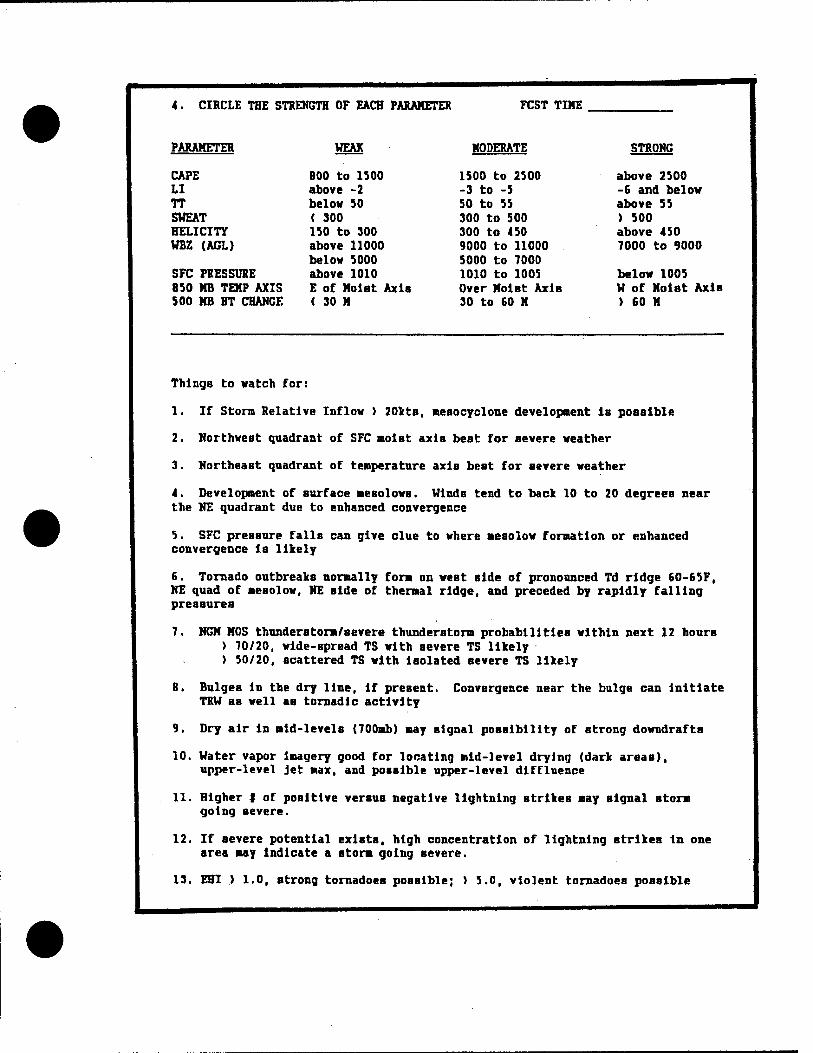
CIRCLE THE STRENGTH OF EACH PARAMETER FCST TIME
PARAMETER WEAK
CAPE BOO to 1500 LI above -2 TT below 50 SWEAT < 300 HELICITY 150 to 300 WBZ (AGL) above 11000
below 5000 SFC PRESSURE above 1010 850 MB TEMP AXIS E of Molat Axle 500 MB HT CHANGE < 30 M
MODERATE
1500 to 2500 -3 to -5 50 to 55 300 to 500 300 to 450 9000 to 11000 5000 to 7000 1010 to 1005 Over Moist Axis 30 to 60 M
STRONG
above 2500 -6 and below above 55 ) 500 above 450 7000 to 9000
below 1005 W of Moist Axis > 60 M
Things to watch for:
1. If Storm Relative Inflow ) 20kts, mesocyclone development la possible
2. Northwest quadrant of SFC moist axis beat for severe weather
3. Northeast quadrant of temperature axis best for severe weather
4. Development of surface mesolows. Winds tend to back 10 to 20 degrees near the NE quadrant due to enhanced convergence
5. SFC pressure falls can give clue to where mesolow formation or enhanced convergence Is likely
6. Tornado outbreaks normally form on west side of pronounced Td ridge 60-65F, HE quad of mesolow, NE side of thermal ridge, and preceded by rapidly falling pressures
7. NGM M0S thunderstorm/severe thunderstorm probabilities within next 12 hours > 70/20, wide-spread TS with severe TS likely ) 50/20, scattered TS with Isolated severe TS likely
8. Bulges in the dry line, if present. Convergence near the bulge can initiate TRW as well as toraadlc activity
9. Dry air in mid-levels (700mb) may signal possibility of strong downdrafta
10. Water vapor Imagery good for locating mid-level drying (dark areas), upper-level jet max, and possible upper-level diffluence
11. Higher # of positive versus negative lightning strikes may signal storm going severe.
12. If severe potential exlstB, high concentration of lightning strikea in one area may indicate a storm going severe.
13. EHI > 1.0, strong tornadoes possible; ) 5.0, violent tornadoes poBBible
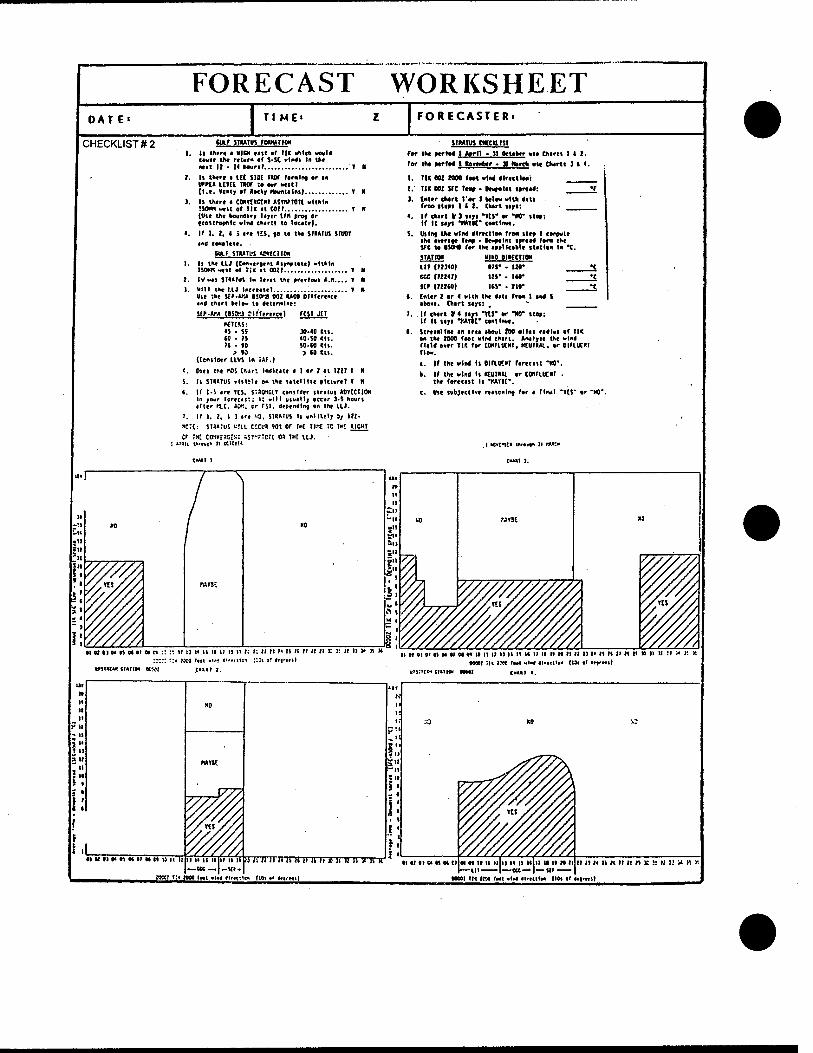
FORECAST WORKSHEET OAT E< TIME' FORECASTER!
CHECKLIST #2 cu.r stmus fawn» I. It thtrt ■ KICK cut of riK which wowld
«wit Iht rttwrn of S-SC wlndl fn the wl II - 14 howrll I n
i. ii mere ■ itc siac nor tonine or an urn« ICHL nor u or «ml (i.t. »e»i» of «ect» iiMmuiiit) » «
). II there a C0mt»C£»T AJYHMOtt «Ithln 150WI «til or III at COIT t It (Ute Ute boundary lartr IFH proo or oeoltroeMc wind eharti to locate).
'. ir I. I, I S art HS, to to the JIUIUS SIUOT
ine Cotelttt. • CH.r STAATfS IftlCllW
I. II the ILJ (Convtroenl Alrnptott) «tlhln is»« tit «i ;:« at ooii T a
I. IVMI Jllalirl l> tt-ai the »rcrtewl A.K.... I «
1. will the IU tncrealel t II lilt We 5t»-«K» I50T3 001 DAM Dltfcrcnce •nd chart bele* to dtttrntnt:
iir-nr-A (isw Mtfiniictl rest Jtl «ttJS: as ■ st x-ao m. U ■ IS 40-50 (tl. Ii • «0 50-« «It.
> tO > «0 (tl. (Cenlldtr UVS In iAf.)
<. Ootl IM COS Cr.irt Indicate III'! I'. Uli t K
5. II SIHAIUS vltlMe on Iht latellltt liclvrtl I n
I. II IS art Its. STWCU conilder llralwl ADrtCIIW In jrewr fc-recilt: It »III «twalljr occur 3-5 hovri liter lit. W. er rsi, depending on tut LLJ.
>. II I. I. I I art tt). SIHAIUS Ii »lltil, >y III.
w:t: snarus viti Ktia tot or IHt tl« :c mc »ICHI
cr ;HC coivmc-v: :<T-"ct! OS 1»[ tu. : «in. i*»!««» it KT:I!(
IWII i
SHAWS cwtnisi ror tht RrM I April . 11 October wit Hull I I I.
ror the MfM I «ottubtr ■ « Htrcli ait »ertt 114.
ois- . no* H us* - no- •c us- . no- •t
Int data fro* t and 1
III 001 MM loot wind direction':
IU 001 JfC In» - ttwrottl «oread:
tnttr chart Tor S below with dtta Iroo Iteo« 111. Chart towi: ■ ir ckart V) tarl *ttS* or "HO* lief; II It lajl ■Mttir (Mtlnwt.
Utlnf the wind dlrtctlon fro« tlco I cotewle the avtrt*» lew» - oewpolnt sprtad ror« Iht srt U iSOHO ror tl» aoollcablc nation I« *C. SIATIO» WHO omeno» III (II1I0) CCC (»147)
it» i;»u) tnttr Z or 4 abovt. Chart tajfi:
. U thirl »« lljl -Its- or -HO- ttoa; ir It tayi -KATIC contlnvt.
StrtrallM an ana abowt {00 «litt radlwt of IK On tnt 1000 foot wind chart. Analjrlt Iht wind now o»tr II< ror umniKnt. MUIIAL. or oinutm flow.
i. if iht wind ii oinotm rtrttait -M-. b. If tht wind ll htUIttl or COHFLUCIIT .
tht forecait ll "KAtlt".
c. Ute tubjtcllvt rtaienlno for a final "TtS" or "HO"
.1 -CT-ltl l*r»^n Jt r*»>
IIUDICHNDINil :- '.: u ii t« it ii i» n if t: 1 U M I* It II :.*:: ::* ixa fm -•»* *i»*.ns-» ::,if «fin»»»
IrflllCM IHriON OfrMI .tM.lt !.
rr it II K j* )i n *• » M it er si oi « M «i M tt II II ir u H it ic \t II it « n « « HIIKJINHJUIHI . oooei :u JMC r»*i -w II»*TH»W (tai ■» «fr«»!
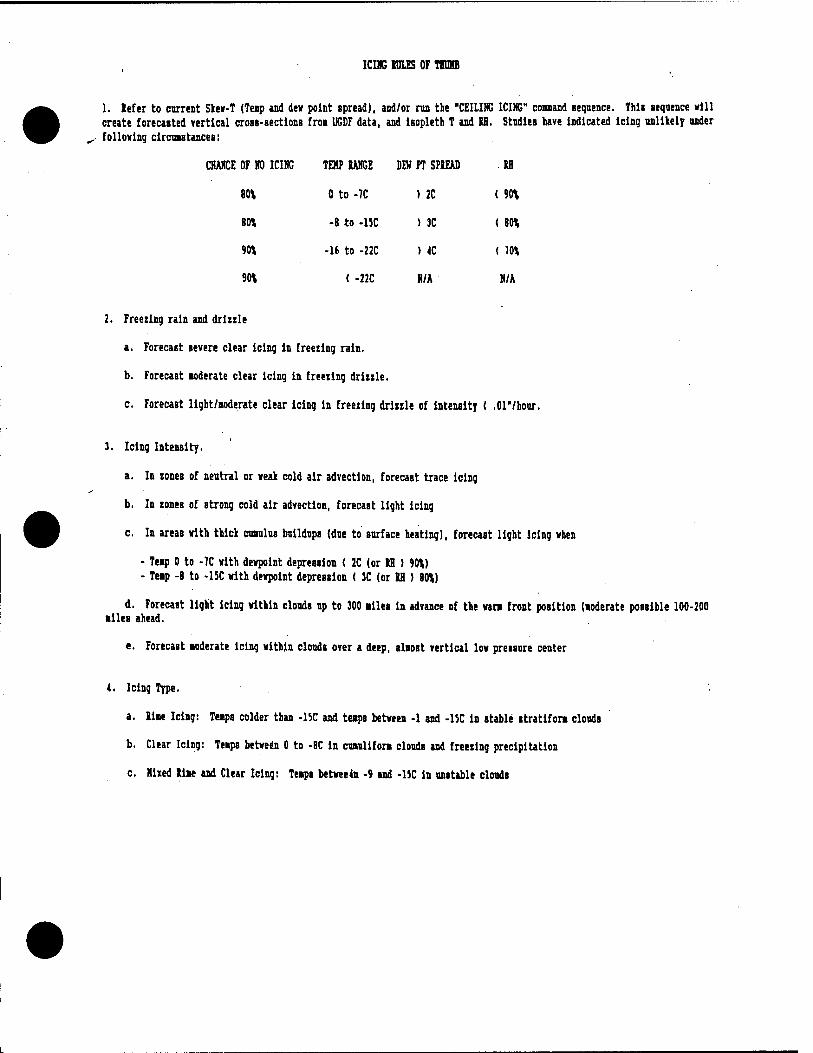
ICDC IDLES OF THUMB
1. Refer to current Skew-T (Tenp and dev point spread), and/or run the "CEILING ICING" connand sequence. This sequence will create forecasted vertical cross-sections fro« UGDF data, and isopleth T and SB. Studies have indicated icing unlikely under following clrcuistances:
CHAHCE OF HO ICING TEMP RANGE DEW FT SPREAD .RH
80% 0 to -7C 1 2C < m 80% -8 to -15C ) 3C ( 80%
90X -16 to -22C > 4C ( m 90\ < -22C H/A »/A
2. Freezing rain and drizzle
a. Forecast severe clear icing in freezing rain.
b. Forecast »derate clear icing in freezing drizzle.
c. Forecast light/aoderate clear icing in freezing drizzle of intensity ( .or/hour,
3. Icing Intensity.
a. In zones of neutral or weak cold air advectlon, forecast trace icing
b. In zones of strong cold air advectlon, forecast light icing
c. In areaB with thick cumins buildups (due to Burface heating), forecast light icing when
- Teip 0 to -7C with dewpoint depression < 2C (or RH > 90\) - Temp -B to -15C with dewpoint depression < JC (or RH ) 80%)
d. Forecast light icing within clouds up to 300 alles in advance of the wan front position (»derate possible 100-200 ■lies ahead.
e. Forecast »derate icing within clouds over a deep, alaoat vertical low pressure center
4. Icing Type.
a. line Icing: Tens colder than -ISC and tups between -1 and -15C in stable stratifora clouds
b. Clear Icing: Teiips between 0 to -8C in cuaulifori clouds and freezing precipitation
c. Mixed RIM and Clear Icing: Teips betwee4n -9 and -15C in unstable clouds
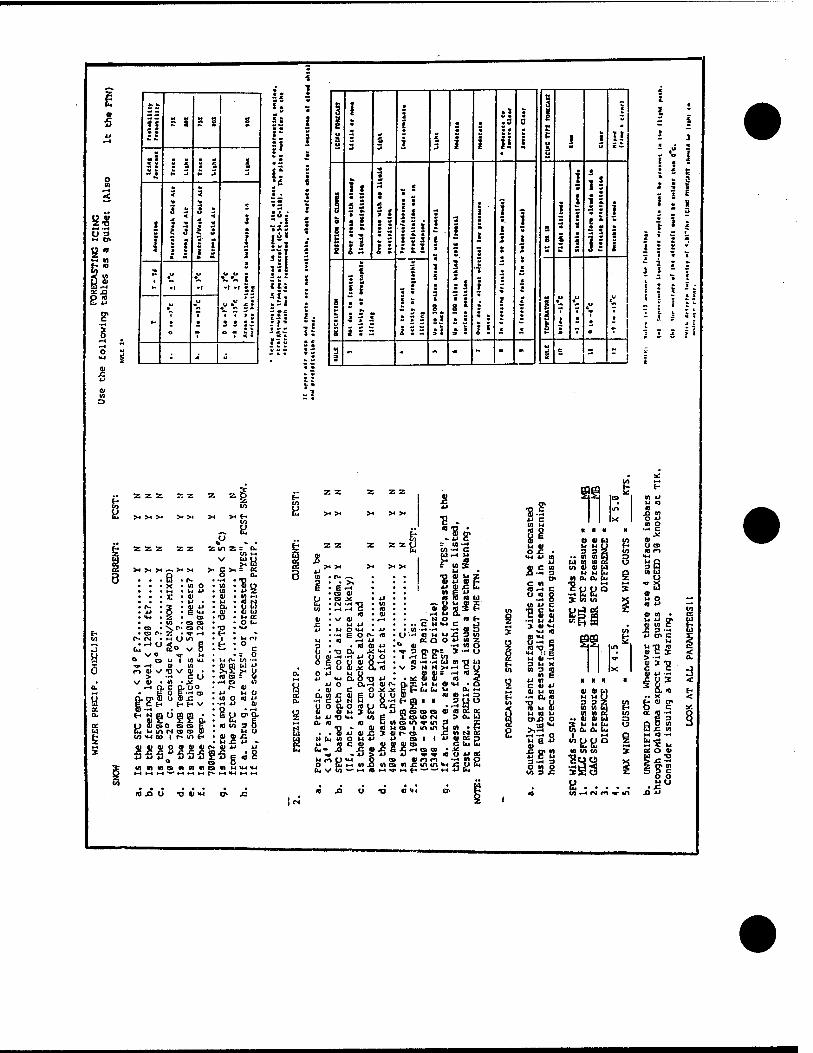
2« fr* —i
° 2.
a: JO
01
m m <n a 5 s
1 ^
c w
•* • *• 3
W X <
I
•• <
<
4 ! i 3 5 t
3
? *•
M * m «
£ s *• • m ••
3
j i *
-i »t • «
v"= r- «It* • • • ■
*• • 1
.«
*• V <
•
; J
il -
I: s :. i • ^ i: |
!*i "■
in
»Si •
JI-: i!
s ? . m 1 J
9 c * E ™
P ■ e • • M « o
ZJ | c
m
I 1 Ü i c u i
U 5 ■£
a i • I f -• c « ■ V
K 2 • • - e i s 3 - £ » * : i - 2 2 - s 5 • s ! e
u • * • 3 s • • «#, ! 5 ^ c * «• ft • *■ S £ ■ • ** • i i ^ • *• s £
• •• t. ■
15 1 i |H| e s
*
• 1
•1 • « •
s J?
5 M Jf I
M i -• K
I ? • . . f I " c
8 • • : s ■ 8 T* >' ? c «X
e • £ u c
c
S Z I |
• -• c
I s 2 • « 3 •
• • 1 I c c 1
t • • e
s
M - - - - - - » | e = =
- 1*
- x
- ? - I : s;
; i -:
y 5
u
X >4 >4 >t X X > t*
„ Ü »U - .
Z22 2Z Zin2: C en v-*
>4 u c >. = «
• ••£)•!*. O 0.
• • -X »WO V) as • . . M • u U u • • • £ • 01 01 « »-t
01 bl • *J - 6 ■ e *M a 01
• <M • 2 • O ■o • • W • O «B O CM • ts <\r>o(N •o «*-> • o r« 7- - -Q* <-t €-
r« IN • *-* XJ tn 1 w r* b:^0^» vg H c
V O -<r fri s o O O U | Ul 4-4 n o to ■-* TT -* 0» tf) oi m ui «J
>i£ >. y 10 c» = o
CO OIVOV Cl • > -^ CO
v a> • « • M •-* O V) •-H n« c a uo r- a
£ o E •*< o n* CT» ffl o 3) £ E C (- £- H v
cj at so so E (U !-• IA IN CB (S O
*J MO
mois
PC to
g. a
mple
t
«1 u> 3 p u u
co «w oo t r* ■/> C^ si oi x: U JC *> »
ajoioiooioioio- 01 *i iJ
.£„.'8 wwwtsmmwc «1 MUU t-t *-**-*-*+■**-* Mf> •-« •-<
2 Z Z Z 2
■E n •
. >* >*
o ai « M -^ *n
•o v/ Of
U 4J M O ««J
■»Eoi
JJ o 01
« o
• <a a ■-< w
S" a 9
cu jq a G *i N u Q. o n
oi *J
o §.•:
■ <u u oi 4 w o u
(J IM EuM Ifl W — t-«
H «IN Q 0 J^ -v e u g u D
w» E £ u vto
01 10 u ts
J5 M a> M
U
1» SB . H O
- -- - M «M >-^ ffl u u
a a o 01
r P a» g»= i *H c c w
fl-H-HW • > M N >*
• «88" J.3C W M 01
3SOB Cl
m vin 3 I m in H
ts M f es HCBQ •
« *n *n jc ui in *M t- •-<
w*5 •^ c r-l M
B*. 01 u z U 01 {-.
Is n a CJ u S x
-• oi 5 5 3 CO
IA Z -rf «1 O » — U
in -g (■) r-( c u -1 n 2, a < w • a
CU t* HMD 3 U O
to os cc > a. u
« .E V) M 0£ 01 OS p Club .K _ U4itt
5£a
•8.5 JJ C 10 u
2?
Ü.S C «I a -i ü a
■ES
5i 8
8-B u oi -^ 3 u X man
. « E
i-t 01 u to H ■< a« VI T3 U < m u ai 0 M n u a o>jo o 5 s("" 9 ^^ « 6 --* -^ o
u e ■" o» jc g< •) u c u 3~« 3 OHO in 3 jc
io JO o -a oi »J
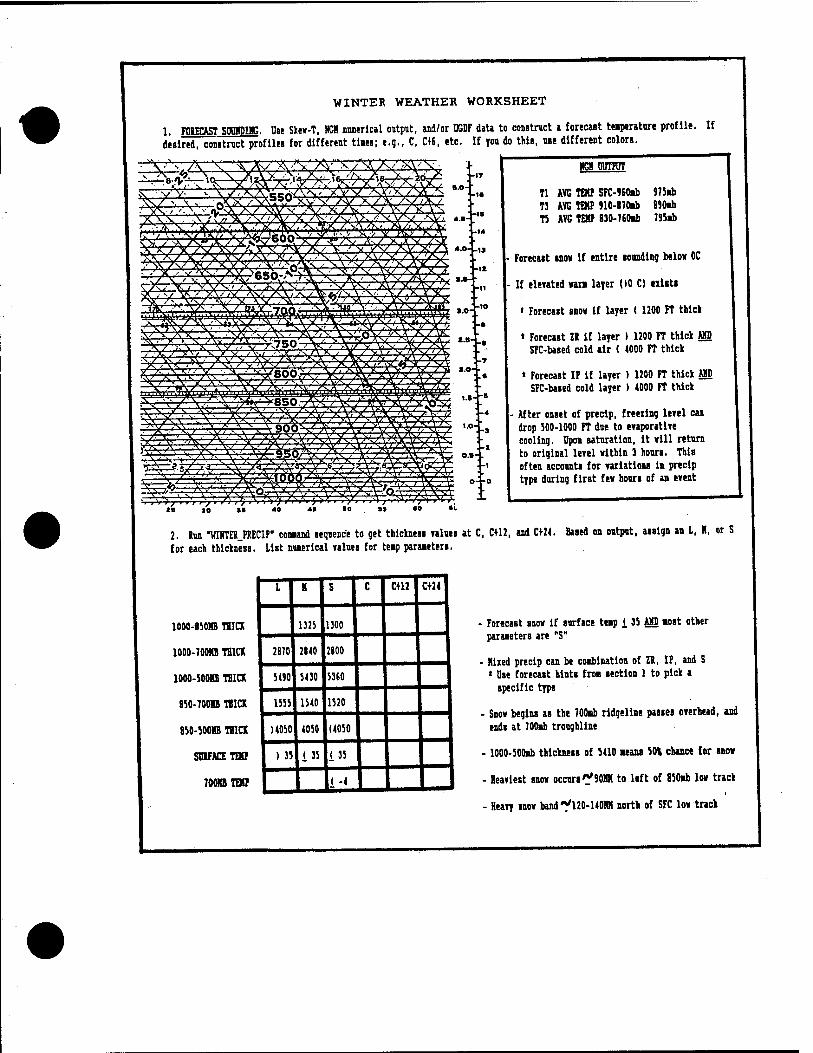
WINTER WEATHER WORKSHEET
1. FOKCAST SOUKDHC-. Use Skev-T, »CM numerical output, aid/or UGDF data to construct a forecast temperature profile. If desired, construct profile« for different times; e.g., C, C+6. etc. If yon do this, use different colors.
KGH OUTPUT
Tl AVG ?E» SFC-960mb 975mb T3 AVG TOP 910-870mb B90mb T5 AVG TEH 830-760mb 795mb
Forecast snov if entire sounding belov OC
If elevated van layer ()0 C) exists
• Forecast snov if layer < 1200 FT thick
» Forecast Zi if layer > 1200 FT thick AMD SFC-based cold air ( 4000 FT thick
* Forecast IF if layer ) 1200 FT thick AJD SFC-based cold layer ) 4000 FT thick
- After onset of precip, freexing level can drop 500-1000 FT dne to evaporative cooling. Upon saturation, it vill return to original level vithin 3 hours. This often accounts for variations in precip type during first fev hours of an event
2. Hun "WIMTES.PRECIP" cowand sequence to get thickness values at C, C+12. and C+24. Based on output, assign an I, M, or S for each thickness. List numerical values for temp parameters.
- Forecast snov if surface temp i 35 AM most other parameters are "S"
- Nixed precip can be combination of U, IF, and S < Use forecast hints from section 1 to pick a
specific type
- Snov begins as the 700mb ridgeline passes overhead, and ends at 700ib troughline
- 1000-500mb thickness of 5410 means SO\ chance for snov
- Heaviest snov occurs ?901W to left of 850mb lov track
- Heavy snov band •^120-140101 north of SFC lov track
LIM S C C«2 C+24
1000-150HB THICK 1325 1300
1000-700MB THICK 2870 2840 2800
1000-500HB THICK 54)0 5430 5380
B50-700H THICK 1555 1540 1520
850-500HB THICK J4050 4050 (4050
S01FACETEO ) 35 135 135
700MB TOO i- 1 ,. U
2WW/FM-86/009
THE LOCAL ANALYSIS AND FORECAST PROGRAM (LAFP)
by
SMSgt D.G. McGrew
DECEMBER 1986 OPR: 2WW/DNS
APPROVED FOR PUBLIC RELEASE DISTRIBUTION UNLIMITED
%
REVIEW AND APPROVAL STATEMENT
2WW/R1-86/009, The Local Analysis and Forecast Program, December 1986, is approved for public release. There is no objection to the unlimited distribution of this document to the public at large, or by the Defense Technical Information Center (DTIC) to the National Technical Information Center (NTIS).
DONALD L. BEST, Lt Col, USAF Chief, Aerospace Sciences Division
>PZETG] Commander
ii #
FOREWORD
1. One of the most challenging problems facing forecasters today is effectively integrating the'myriad of available information into the forecast process. The task is a difficult one since forecasting aids are a mixture of products from different models, techniques, and data bases each valid for different times or time intervals and presented in many different formats. Yet each forecaster must understand the state of the atmosphere before the forecast generation process begins. This means that there must be a system to unravel this myriad of data into a logical, systematic scheme to guide the forecast process.
2. The solution to this challenge within the Air Weather Service (AWS) is the LAFP. AWS policy is stated in AWSR 105-22, Section A, para 2. It says that AWS units will use an LAFP to ensure a systematic and organized approach to forecasting is followed. The quality of your forecasts is directly related to a thorough, systematic, flexible, and well documented LAFP.
3. Two problems that are prevalent in existing LAFPs are poor organization and insufficient detail. The need for a sound, workable program and relevant, easy-to-use worksheets is more evident with the decline in our experience level and the gradual disappearance of our "old pros" in the base weather station. Most forecasters will generally learn over the years to put all the pieces of the puzzle together in their head and still arrive at a fairly clear picture of the atmosphere. Unfortunately, we don't have time to wait for our forecasters to acquire that ability. We must train them now and give them the best posssible guidance while they are learning. Thus, the LAFP becomes a teaching tool as well as a functional daily guide. This dual role underscores the need to focus on improving our LAFPs.
4. The ultimate purpose of this forecaster memo, therefore, is to provide guidance you can use to eliminate the problems of poor organization and lack of sufficient detail in your LAFP.
%
i n
TABLE OF CONTENTS
Page
Foreword i i i
Chapter 1. What is An LAFP? 1
Chapter 2. Developing the Written Guidance 2
Chapter 3. Organizing the Written Guidance 4
Chapter 4. Developing a TAF Worksheet 8
Chapter 5. Organizing the TAF Worksheet 10
Chapter 6. Terminal Forecast Reference File (TFRF) 19
Chapter 7. Getting the Most From Your LAFP 20
Conclusion 21
APPENDICES
A. Sample DOI With Attachments 22
B. Sample DOI With SOP 33
C. Sample DOI and Supporting SOPs 55
TV
#
CHAPTER 1
WHAT IS AN LAFP?
1. To answer the question, "what is an LAFP?", lets quote the governing directive, AWSR 105-22. "A systematic and consistent approach to weather forecasting. The program specifies techniques and tools used to forecast individual weather elements; describes requirements for locally prepared work charts and refinement of centralized products. This program applies to the geographical areas of forecast responsibility defined in the unit mission directives."
2. Now let's simplify that. The LAFP is a locally developed set of instructions, information, and guidance that tells the forecaster what products to use, how to analyze or prepare them, and the preferred sequence of events. It also provides guidance on interpreting the data and determining the goodness of the products (initialization).
3. The LAFP is not just written guidance. It consist of the LAFP written guidance, TAF Worksheet, forecast discussions, and terminal forecast reference file (TFRF). All of these fit together and should function together in the forecast generation process. This is what I will refer to as the LAFP in this forecaster memo.
%
CHAPTER 2
DEVELOPING THE WRITTEN GUIDANCE
1 The first step is to select the products you will be using. Make sure you have taken into consideration all of the products available. Review AWSR 105 52, AFGWCP 105-2, VolTTl and III, and 2 WWP 105-2. Some minimum considerations in your selection of products should be:
a. Facsimile products.
(1) Select a representative sampling of the atmosphere (300mb, 500mb, 700mb, 850mb, gradient level, surface).
(2) Select critical parameters (vorticity, thickness, etc.). (3) Select charts from DWD/GMGO/UKMO and AFGWC so you will have
something for comparison and for backup.
b. Teletype products.
(1) Observations and TAFs (remember; upstream can be any direction). (2) Upper air data (remember; upstream can be any direction). (3) Trajectory bulletins. These are best used for trends. (4) AXEW and AXEE KGWC. For metwatch and to track weather/cloud
areas. (5) Discussion bulletins
(a) FSEU EDZX, (CTF supplement). (b) FOXX 20 EDKG (c) ASXX EGRR (d) FSXX EGRR (e) PDEU KGWC (f) PDME LERT (g) Others as desired
(6) Other data you feel will enhance your forecast program. (7) New data as it becomes available.
2 The second step is to design a TAF worksheet. The reason you need to do this s so your ultimate written guidance (e.g., DOIs and SOPs) is compatible with the TAF worksheet. Also, this approach will ensure that you have the same products and parameters included in both If you lock in the DOI/SOP first you may theS unknowingly limit yourself in what you can put on the worksheet, or you might create a worksheet contrary to your guidance (i.e.,
bait).
3 Chapters 4 and 5 will deal with constructing the TAF worksheet. After you have a draft of the worksheet you can proceed with written guidance. Use the draft as a guide in organizing the DOI/SOP.
4. Your written guidance should:
a. Provide guidance on which charts to analyze. b.' Provide guidance on which parameters to analyze.
#
c. Provide specific details on how to analyze (colors, intervals, highlighting, etc.).
d. Incorporate these considerations:
(1) Start from 300mb and work down to the surface. (2) Start with synoptic scale and work down to TAF scale (your
terminal area). (3) Always consider continuity. (4) Ensure initialization of products. (5) Should lead forecasters through the TAF preparation logically and
step-by-step.
e. Provide guidance on how to use the TAF worksheet. f. Provide guidance on forecast discussions.
5. Now you have the ingredients of your written guidance and we can move on to organizing and finalizing it.
%
CHAPTER 3
ORGANIZING THE WRITTEN GUIDANCE
1. There are two formats you can use. One uses only a DOI with attachments (see Appendix A). The other uses a DOI to implement the LAFP and designates responsibilities and procedures. It refers to SOPs for guidance in specific areas such as Processing Centrally Prepared Products, Forecast Discussions, Local Area Work Charts (LAWCs), TAF Preparation, etc., (see Appendix B and C). What is important is that you create logical and useable guidance.
2. We recommend you use a DOI to implement the LAFP and SOPs for specific guidance. This allows you to keep your SOPs--the working guidance for the forecaster--!'n the work area. When your guidance is in the form of a DOI it should be kept with the rest of your DO Is and will not be available to the forecasters.
3. Now that we have an implementing DOI, let's look at the attachments or SOPS.
a. Shift Duties and Responsibilities. This SOP is important for training purposes and to designate specific tasks or responsibilities. One of the more important responsibilities is the METWATCH assumption. It was stated so well in 3 WW Pamphlet 105-8 that we will quote it here:
"The METWATCH Assumption. The first requirement of any LAFP is to ensure forecasters are prepared to assume METWATCH responsibility at the start of the duty shift. To effectively accomplish this, the oncoming duty forecaster must understand where and why the weather is occurring and how it is expected to change. A review of the METSAT imagery, centralized analyses and forecast packages, and observational data is essential to any understanding of weather affecting the terminal or forecast area. The time required to accomplish this review varies from situation to situation and individual to individual. We recommend a 30-minute overlap between forecasters to ensure adequate preparation, but the oncoming forecaster has the responsibility to expand or reduce the overlap as dictated by the circumstances. Some suggested techniques and procedures for the review are:
a. Review the last few terminal forecast worksheets and pay close attention to forecast reasoning and any remarks concerning unforecast weather. Terminal Airdrome Forecast (TAF) amendments can provide valuable insight into centralized models accuracy, particularly timing errors.
b. Next, quickly review all pertinent observational data. This includes Meteorological Satellite (METSAT) imagery. Compare the imagery and the centralized forecast package to determine areas of agreement or inconsistence in initializing the prog series. Locate areas of developing weather and then determine the cause of the development. A word of caution: do not ignore or exclude downstream weather as insignificant. Reviewing the sequence of the previous day's weather (surface observations, METSAT, and so forth) can assist the forecaster in locating these developing areas. In addition, this review can help establish diurnal tendencies for development or dissipation of convective weather, low ceilings, and poor visibilities. Use current data, that is, temperature, dew point, winds, and/or surface pressure/altimeter, to project diurnal effects or influence.
#
c. A verbal exchange of ideas between forecasters is next. The forecaster being relieved discusses significant meteorological and operational events. Include the current weather (a representative sequence), meteorological reasoning of the existing terminal forecast, and of course the forecast. When reviewing the forecast, comment on the goodness of the centralized products, emphasizing any adjustments needed or made. Limited duty station forecasters assuming the first duty shift of the day or when recalled for severe weather, may wish to call a nearby full-time station or Weather Support Unit (WL) to assist in assessing the meteorological situation. If this procedure is used--we strongly recommend it—document the requirement in operating instructions or a letter of agreement, etc."
b. Processing Centralized Products. This consists of enhancement and reanalysis of selected products. The objective is to aid the forecast process by highlighting certain items and thereby establishing a common reference point for analysis. Your SOP should include these items:
(1) Enhancement of Analysis/Progs. There is a difference between chart enhancement and meteorological analysis. Enhancement is merely processing charts for display—highl ighting features already on the charts such as isopleths of temperature and vorticity and moisture fields. As a minimum, enhance the following:
(a) Outline your country and put an asterick (*) by your station location.
(b) Color high and low center symbols, fronts and troughs, and other significant features on all designated charts.
(c) 300mb enhancement.
1. Highlight areas of 60 kts or greater during the summer and RO kts or greater in the winter.
2. Indicate jet maxima with a red arrow.
(d) 500mb enhancement.
-Or
%
1. Shade positive vorticity advection (PVA) in red. 7. Place a black "X" on significant vorticity centers. 3_. Highlight areas of moisture (dew point depression _< 5UC)
with a scalloped green line. 4. Select a height contoi'** (one appropriate to, your area
and the time of year) and color it brown. Trace and label with DTG at least one 12-hour past position of that contour in black.
(e) 700mb enhancement.
1. Highlight 0°C isotherm in red. 7. Highlight areas of moisture (dew point depression _< 4 C)
with a scalloped green line.
(f) 850mb enhancement.
1. Highlight 0°C isotherm in red.
2. Highlight areas of moisture (dew point depressions <_ 3°C) with a scalToped green line.
(2) Reanalysis of Centralized Products. A review of METSAT imagery from the last 3-6 hours is a good place to start. Focus your attention on the existing weather, not the forecast weather. Look for indications of movement of significant features, new development or dissipation, and convective signatures. Try to establish a relationship between the centralized prog package and the existing weather. Make the analysis fit the atmospheric conditions and not vice versa.
(a) Centralized analysis is synoptic scale and often misses minor troughs or perturbations in the initial analysis. This is particularly true with weakening and/or dissipating frontal boundaries.
(b) Determine past positions, movements, and intensities of currently analyzed pressure centers, troughs, and ridges. Tie the temperature and moisture advection fields together with the low level wind flow to obtain a "first guess" on the 12-24 hour positions and intensities.
(c) An area of enhanced cloudiness or weather occurring independently of synoptic features should indicate the need for a reanalysis.
(d) Examine upper air analyses and reanalyze as necessary. Computer smoothing often causes some features to go undetected.
(e) Determine if interaction with a moisture source or terrain feature will affect the analyses.
c. Forecast Development. As you accomplish your enhancement and reanalyses of the centralized products, you have already done a good portion of your forecast development. Once all of the data is in, you can put everything together and think seriously about your forecast. Some additional steps you need to consider are:
(1) Initialize. (2) Establish continuity and trends. (3) Check vertical consistency. (4) Locate frontal boundaries using thickness, isotherms or
vorticity. Any one or all are good. (5) Track thermal/moisture advection moving into your area.
Remember that when you enhance the centralized progs you are not analyzing them. You must go back and perform the above steps—and anything else you feel is important—in order to complete the analysis process. If the centralized prog package initializes well, it can handle most synoptic scale features. Still, to accurately use these progs you must interpret them. For example, just because the 500mb height/vorticity analysis shows an absolute vorticity value of 10 over the forecast area and the 24 hour prog has a 14, that is no guarantee of deteriorating weather conditions. Simply looking at vorticity numbers over the forecast area should not be your sole basis of the forecast. While PVA does reflect increasing values with time, the strength of the advection must be part of the forecast. With PVA the wind flow must be from higher to lower values and the advection is strongest when the wind flow is perpendicular to the vorticity isopleths. Of course, both the speed of the wind and the vorticity gradient are factors as well, so the strength of advection and its affect must be assessed. Also, knowing the strengths and weaknesses of the particular model used to produce the centralized products #
will help you interpret the forecast process. Some study of model strengths and weaknesses is obviously beneficial.
This SUP should be your guide through the forecast development process. It can give you the general outline and refer to forecast aids for specific details or provide some specific guidance on what to look for and/or how to analyze for specific phenomena/parameters. One important step that needs to be included is to complete the appropriate section(s) of the TAF worksheet as you complete each analysis step. This eliminates after-the-fact completion, enhances the analysis thought process, and provides documentation of what you have completed in the event someone has to take over your shift or comes in to help out.
d. TAF worksheet. This can be a separate SOP or combined with forecast development. Provide the forecasters with some guidance on how to get the most out of the form. What are you looking for, etc.
e. Forecast Reviews. This is a valuable part of the quality control and training aspect of the LAFP. It is dealt with in 2 WW/FM-86/003.
f. Forecast Discussions. The forecast discussions and shift change briefings should cover the following:
(1) Past weather and what caused it. (2) Present weather and what is causing it. (3) Expected changes and why—tomorrow's weather and what will cause
it. . (4) Discuss UA and surface—tie them together, i.e., discuss vertical
consistency. (5) Initialization and comparison of different models. (6) Most important weather feature for the day (biggest challenge). (7) Use consensus forecasting techniques to aid in forecast
development. (8) Discuss satellite and radar.
4. The last step is to compare your written guidance with the draft of your TAF worksheet and make sure they are compatible. Make any necessary changes and go final.
%
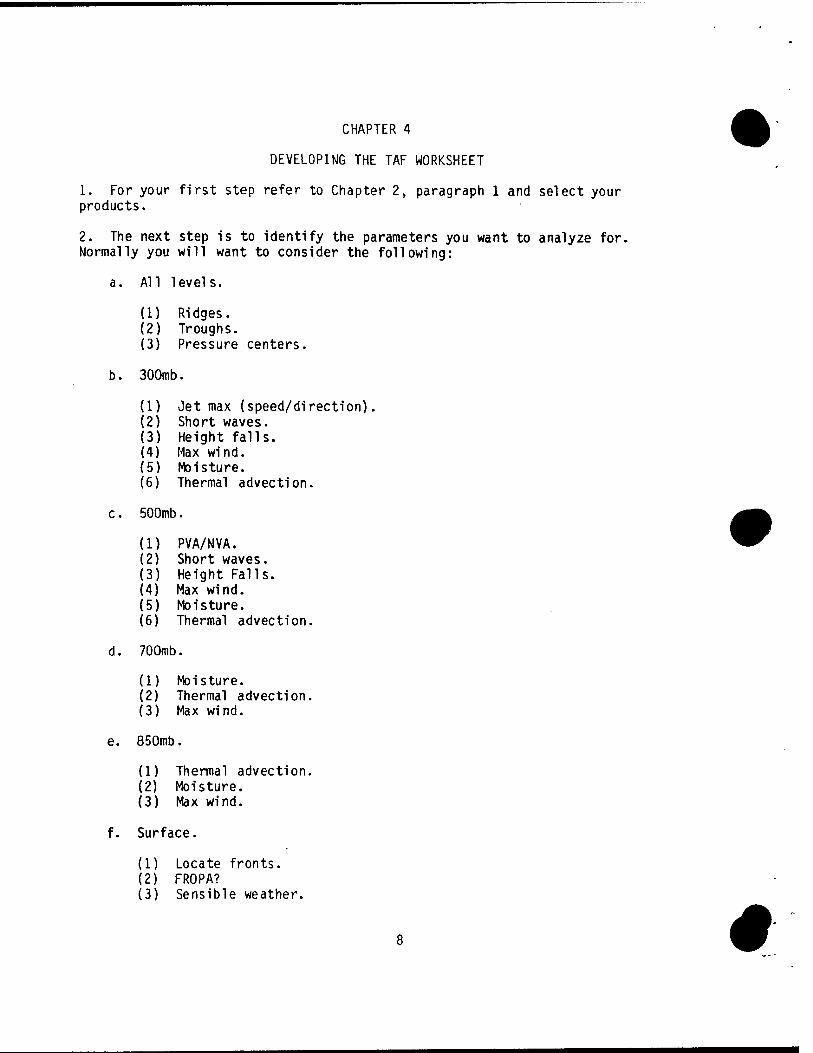
CHAPTER 4
DEVELOPING THE TAF WORKSHEET
1. For your first step refer to Chapter 2, paragraph 1 and select your products.
2. The next step is to identify the parameters you want to analyze for. Normally you will want to consider the following:
a. All levels.
(1) Ridges. (2) Troughs. (3) Pressure centers.
b. 300mb.
(1) Jet max (speed/direction). (2) Short waves. (3) Height falls. (4) Max wind. (5) Moisture. (6) Thermal advection.
c. 500mb.
(1) PVA/NVA. (2) Short waves. (3) Height Falls. (4) Max wind. (5) Moisture. (6) Thermal advection.
d. 700mb.
(1) Moisture. (2) Thermal advection. (3) Max wind.
e. 850mb.
(1) Thermal advection. (2) Moisture. (3) Max wind.
f. Surface.
(1) Locate fronts. (2) FROPA? (3) Sensible weather.
#
g. Miscellaneous.
(1) Vertical consistency. (2) Initialization. (3) Continuity. (4) Upstream stations. (5) Local effects. (6) Approved forecast studies and rules of thumb (ROT).
3. Once you have finalized your selection of parameters and other considerations, you can organize it all into a logical, easy to use format.
%
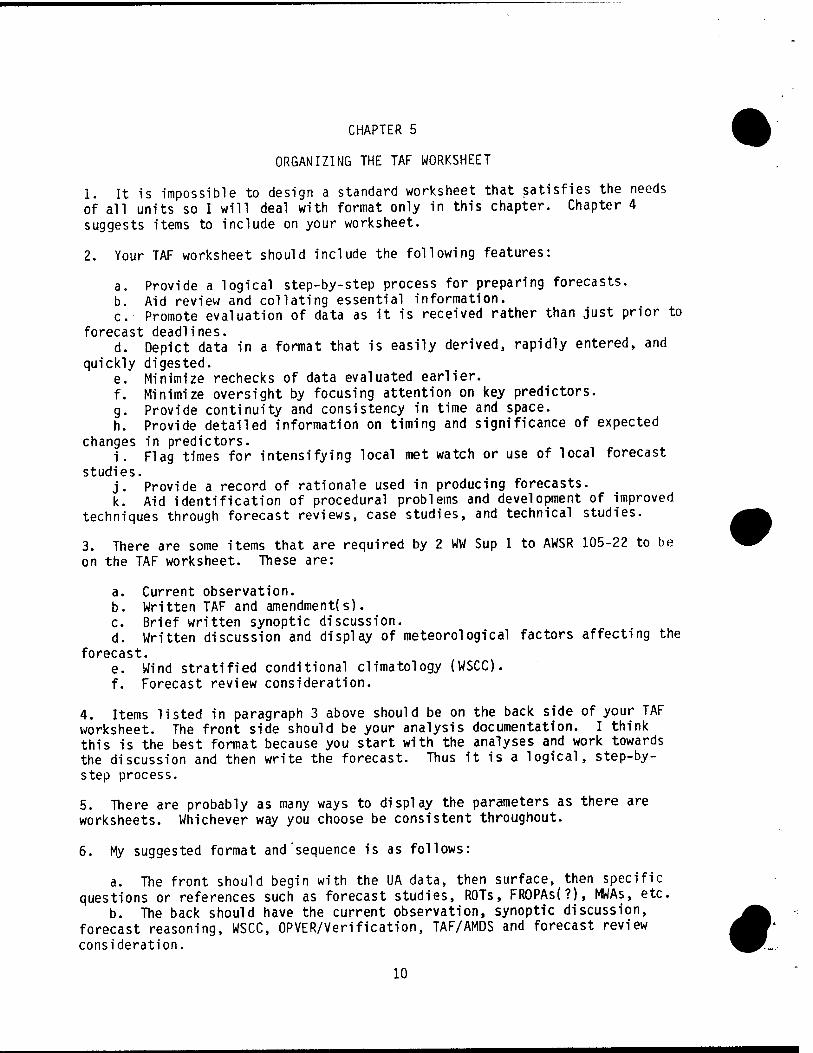
CHAPTER 5
ORGANIZING THE TAF WORKSHEET
1. It is impossible to design a standard worksheet that satisfies the needs of all units so I will deal with format only in this chapter. Chapter 4 suggests items to include on your worksheet.
2. Your TAF worksheet should include the following features:
a. Provide a logical step-by-step process for preparing forecasts. b. Aid review and collating essential information. c. Promote evaluation of data as it is received rather than just prior to
forecast deadlines. d. Depict data in a format that is easily derived, rapidly entered, and
quickly digested. e. Minimize rechecks of data evaluated earlier. f. Minimize oversight by focusing attention on key predictors. g. Provide continuity and consistency in time and space. h. Provide detailed information on timing and significance of expected
changes in predictors. i. Flag times for intensifying local met watch or use of local forecast
studies. j. Provide a record of rationale used in producing forecasts. k. Aid identification of procedural problems and development of improved
techniques through forecast reviews, case studies, and technical studies.
3. There are some items that are required by 2 WW Sup 1 to AWSR 105-22 to be on the TAF worksheet. These are:
a. Current observation. b. Written TAF and amendments). c. Brief written synoptic discussion. d. Written discussion and display of meteorological factors affecting the
forecast. e. Wind stratified conditional climatology (WSCC). f. Forecast review consideration.
4. Items listed in paragraph 3 above should be on the back side of your TAF worksheet. The front side should be your analysis documentation. I think this is the best format because you start with the analyses and work towards the discussion and then write the forecast. Thus it is a logical, step-by- step process.
5. There are probably as many ways to display the parameters as there are worksheets. Whichever way you choose be consistent throughout.
6. My suggested format and sequence is as follows:
a. The front should begin with the UA data, then surface, then specific questions or references such as forecast studies, ROTs, FR0PAs(?), MWAs, etc.
b. The back should have the current observation, synoptic discussion, forecast reasoning, WSCC, OPVER/Verification, TAF/AMDS and forecast review consideration.
10
*

See Fig 1 for a sample of this format. Figs 2-5 are samples of TAF worksheets that are all different but have the essential ingredients.
% 11
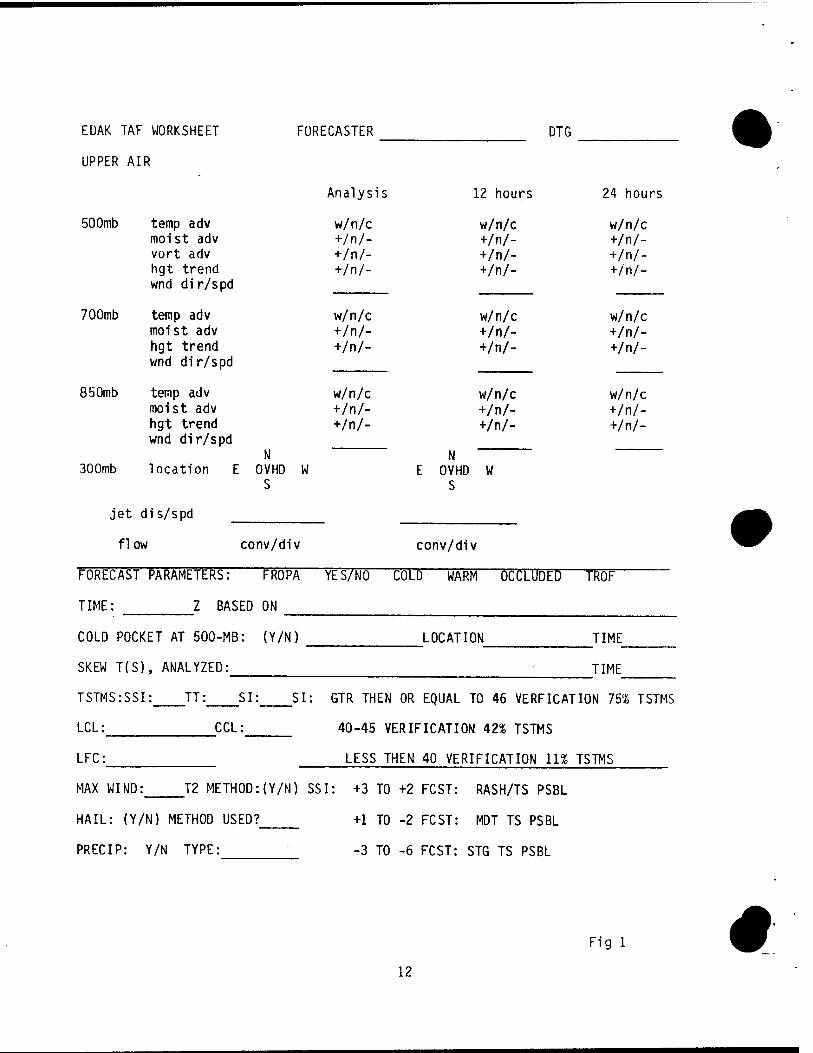
EÜAK TAF WORKSHEET FORECASTER DTG
UPPER AIR
Analysis 12 hours 24 hours
500mb temp adv moist adv vort adv hgt trend wnd dir/spd
temp adv moist adv hgt trend wnd dir/spd
temp adv moist adv hgt trend wnd dir/spd
location E N
OVHD W S
w/n/c +/n/- +/n/- +/n/-
w/n/c +/n/- +/n/- +/n/-
w/n/c +/n/- +/n/- +/n/-
700mb w/n/c +/n/- +/n/-
w/n/c +/n/- +/n/-
w/n/c +/n/- +/n/-
850mb w/n/c +/n/- +/n/-
w/n/c +/n/- +/n/-
w/n/c +/n/- +/n/-
300mb N
E OVHD W S
jet c iis/spd
flow conv/div conv/div
FORECAST PARAMETERS: FRO PA YES/NO COLD WARM OCCLUDED TROF
TIME: Z BASED
>ET AT 500-MB:
, ANALYZED:
ON
COLD POCK (Y/N) LOCATION TIME
SKEW T(S) TIME
TSTMS:SS1 : TT: SI : SI: GTR THEN OR EQUAL TO 46 VERFICATION 75% TSTMS
LCL: CCL: 40-45 VERIFICATION 42% TSTMS
LFC:
T2 METHOD
LESS THEN 40 VERIFICATION 11% TSTMS
MAX WIND: :(Y/N) SSI: +3 TO +2 FCST: RASH/TS PSBL
HAIL: (Y/N) METHOD USED' ? +1 TO -2 FCST: MDT TS PSBL
PRECIP: Y/N TYPE: -3 TO -6 FCST: STG TS PSBL
Fig 1
12
#
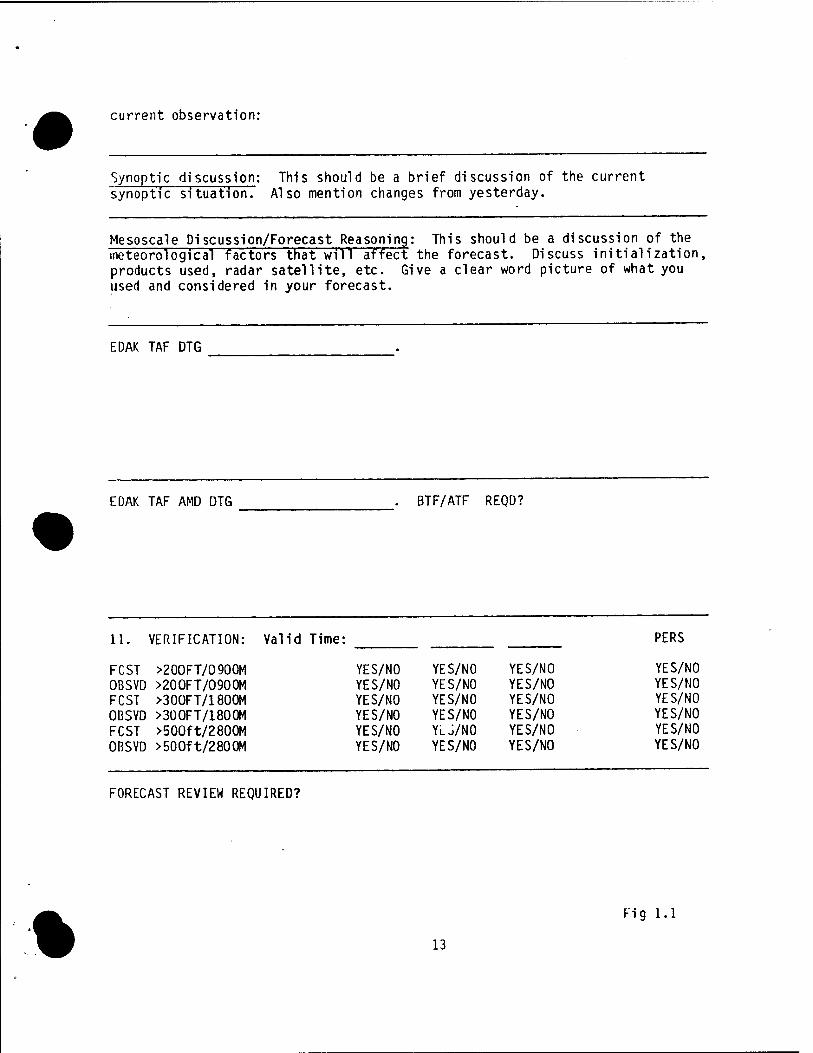
current observation:
Synoptic discussion: This should be a brief discussion of the current synoptic situation. Also mention changes from yesterday.
Mesoscale Discussion/Forecast Reasoning: This should be a discussion of the meteorological factors that will affect the forecast. Discuss initialization, products used, radar satellite, etc. Give a clear word picture of what you used and considered in your forecast.
EDAK TAF DTG
EDAK TAF AMD DTG BTF/ATF REQD?
11. VERIFICATION: Valid Time: PERS
FCST >20OFT/O900M YES/NO YES/NO YES/NO YES/NO OBSVD >20OFT/O900M YES/NO YES/NO YES/NO YES/NO FCST >30OFT/18O0M YES/NO YES/NO YES/NO YES/NO OBSVD >30OFT/1800M YES/NO YES/NO YES/NO YES/NO FCST >500ft/2800M YES/NO YLJ/NO YES/NO YES/NO OBSVD >500ft/2800M YES/NO YES/NO YES/NO YES/NO
FORECAST REVIEW REQUIRED?
% 13
Fig 1.1
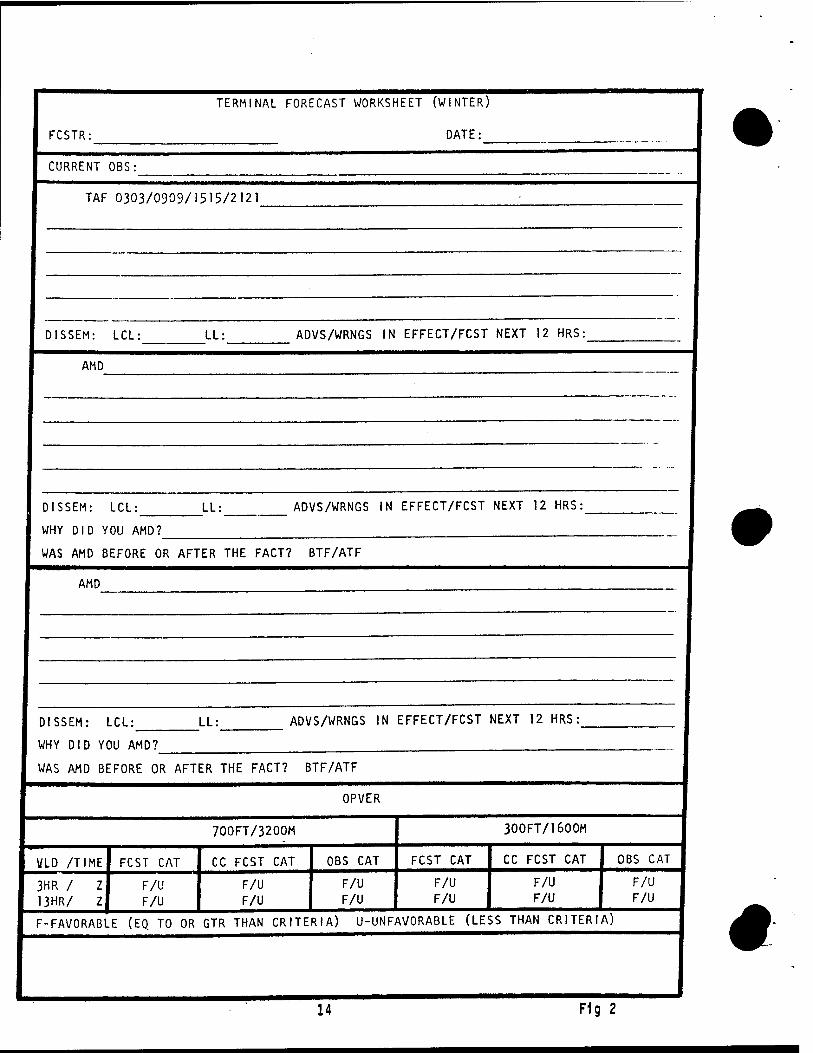
FCSTR:
TERMINAL FORECAST WORKSHEET (WINTER)
DATE:
CURRENT OBS:
TAF 0303/0909/1515/2121
DISSEM: LCL: LL: ADVS/WRNGS IN EFFECT/FCST NEXT 12 HRS:
AMD
DISSEM: LCL: LL: ADVS/WRNGS IN EFFECT/FCST NEXT 12 HRS:
WHY DID YOU AMD?
WAS AMD BEFORE OR AFTER THE FACT? BTF/ATF
AMD
DISSEM: LCL:
WHY DID YOU AMD?
LL: ADVS/WRNGS IN EFFECT/FCST NEXT 12 HRS:
WAS AMD BEFORE OR AFTER THE FACT? BTF/ATF
OPVER
700FT/3200M 300FT/1600M
VLD /TIME FCST CAT CC FCST CAT OBS CAT FCST CAT CC FCST CAT OBS CAT
3HR / Z 13HR/ Z
F/U F/U
F/U F/U
F/U F/U
F/U F/U
F/U F/U
F/U F/U
F-FAVORABLE (EQ TO OR GTR THAN CRITERIA) U-UNF; WORABLE (LESS THAN CRITERIA)
*
14 Fig 2
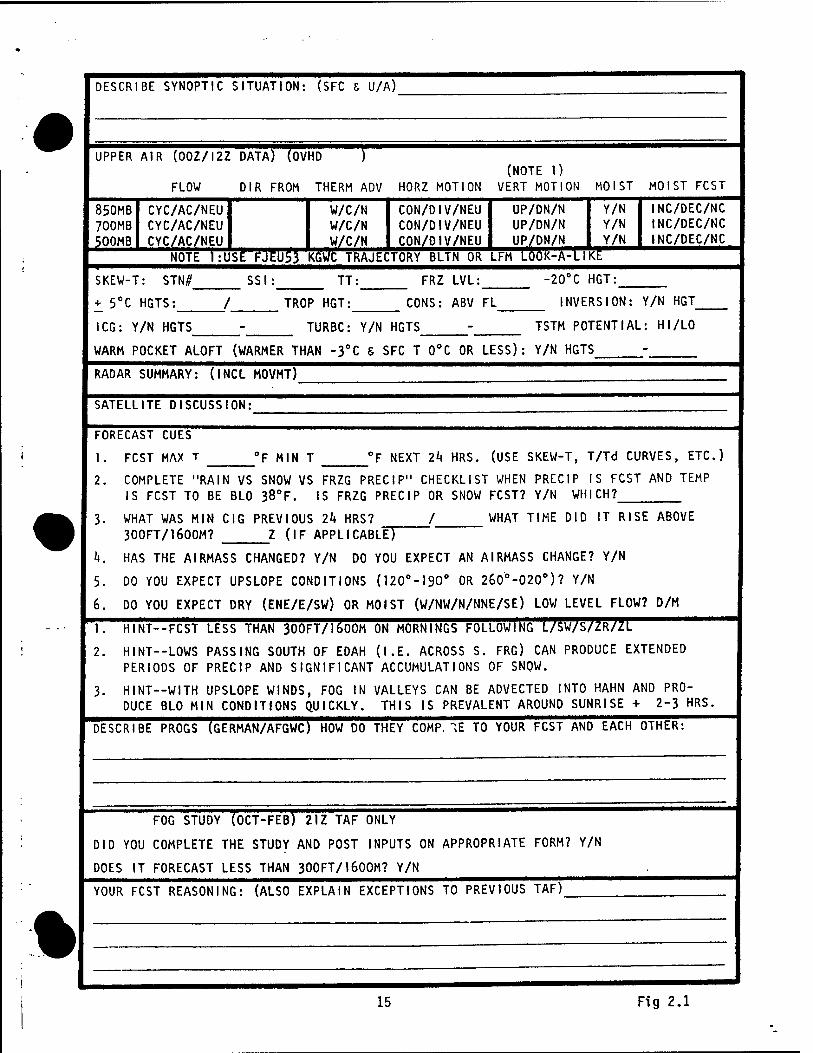
DESCRIBE SYNOPTIC SITUATION: (SFC 6 U/A)
UPPER AIR (00Z/I2Z DATA) (OVHD ) (NOTE 1)
FLOW DIR FROM THERM ADV HORZ MOTION VERT MOTION MOIST MOIST FCST
850MB 700MB 5O0MB
CYC/AC/NEU CYC/AC/NEU CYC/AC/NEU
W/C/N W/C/N W/C/N
CON/DIV/NEU CON/DIV/NEU CON/DIV/NEU
ÜP/DN/N UP/DN/N UP/DN/N
NOTE 1:USE FJEU53 KGWC TRAJECTORY BLTN OR LFM LOOK-A-LIKt
Y/N Y/N Y/N
INC/DEC/NC INC/DEC/NC INC/DEC/NC
SKEW-T: STN#_
+ 5°C HGTS:
SSI TT: FRZ LVL: -20°C HGT:
TROP HGT: CONS: ABV FL INVERSION: Y/N HGT
ICG: Y/N HGTS TURBC: Y/N HGTS TSTM POTENTIAL: HI/LO
WARM POCKET ALOFT (WARMER THAN -3°C S SFC T 0°C OR LESS): Y/N HGTS
RADAR SUMMARY: (INCL MOVMT)
SATELLITE DISCUSSION:
FORECAST CUES
1. FCST MAX T 'F MIN T 'F NEXT Zk HRS. (USE SKEW-T, T/Td CURVES, ETC.)
2. COMPLETE "RAIN VS SNOW VS FRZG PRECIP" CHECKLIST WHEN PRECIP IS FCST AND TEMP IS FCST TO BE BLO 38°F. IS FRZG PRECIP OR SNOW FCST? Y/N WHICH?
3. WHAT WAS MIN CIG PREVIOUS 2k HRS? / WHAT TIME DID IT RISE ABOVE 300FT/1600M? Z (IF APPLICABLE)
k. HAS THE AIRMASS CHANGED? Y/N DO YOU EXPECT AN AIRMASS CHANGE? Y/N
5. DO YOU EXPECT UPSLOPE CONDITIONS (120°-190° OR 260°-02O°)? Y/N
6. DO YOU EXPECT DRY (ENE/E/SW) OR MOIST (W/NW/N/NNE/SE) LOW LEVEL FLOW? D/M
1. HINT--FCST LESS THAN 300FT/160OM ON MORNINGS FOLLOWING L/SW/S/ZR/ZL
2. HINT--LOWS PASSING SOUTH OF EDAH (I.E. ACROSS S. FRG) CAN PRODUCE EXTENDED PERIODS OF PRECIP AND SIGNIFICANT ACCUMULATIONS OF SNOW.
3. HINT—WITH UPSLOPE WINDS, FOG IN VALLEYS CAN BE ADVECTED INTO HAHN AND PRO- DUCE BLO MIN CONDITIONS QUICKLY. THIS IS PREVALENT AROUND SUNRISE + 2-3 HRS.
DESCRIBE PROGS (GERMAN/AFGWC) HOW DO THEY COMP. M TO YOUR FCST AND EACH OTHER:
FOG STUDY (OCT-FEB) 21Z TAF ONLY
DID YOU COMPLETE THE STUDY AND POST INPUTS ON APPROPRIATE FORM? Y/N
DOES IT FORECAST LESS THAN 300FT/160OM? Y/N
YOUR FCST REASONING: (ALSO EXPLAIN EXCEPTIONS TO PREVIOUS TAF)
%
15 Fig 2.1
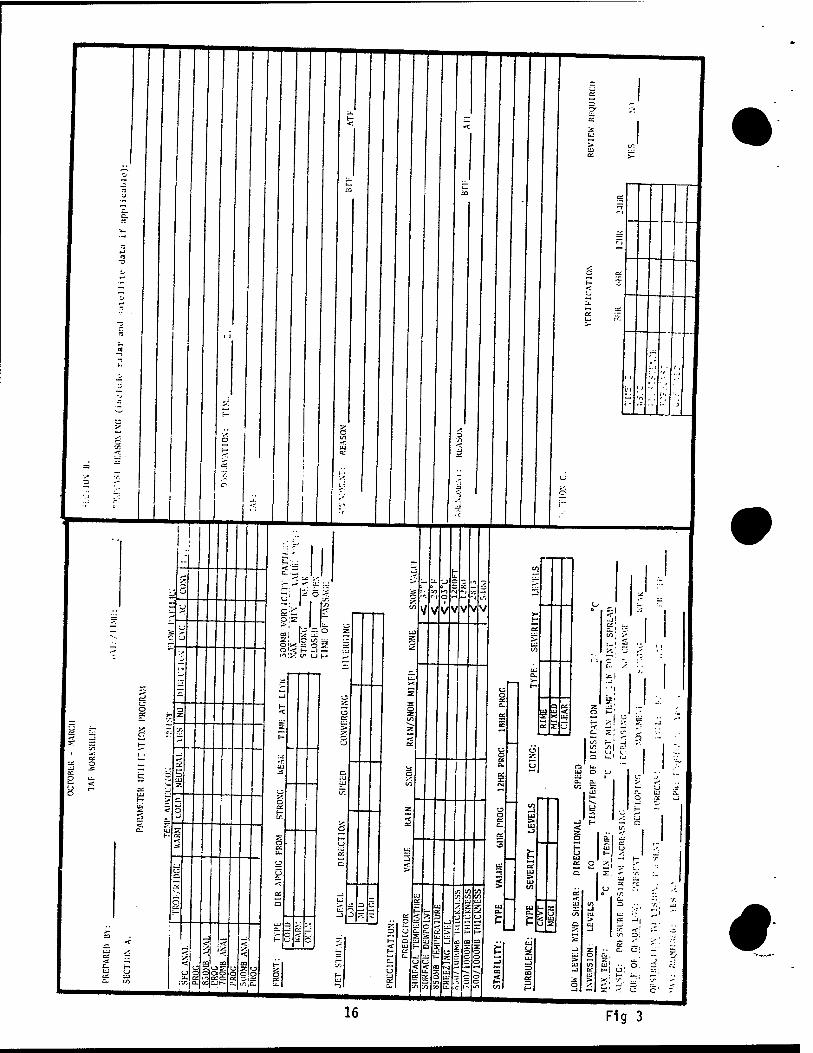
5
o
b u. f- < 6 H
z. Ic co ^ _
">:;-, i/i u (-- :-
egl oa
<
fii
o
Ö - cc u. o G
oc c
OJ -
-j
5*
UJ
u:
5
" ^ o 0 J — :£ :z
LT:
1 1
i
I'l
(■ o
-i.
•/ 1
3
Q U3 X
5
< Ul
I/> y^|
a; X
u
""*
o > UJ
i=
t «O
cc
ä > Ul
UJ a. Ul fc X
e C u tu
-1
PI
«
16 Fig 3
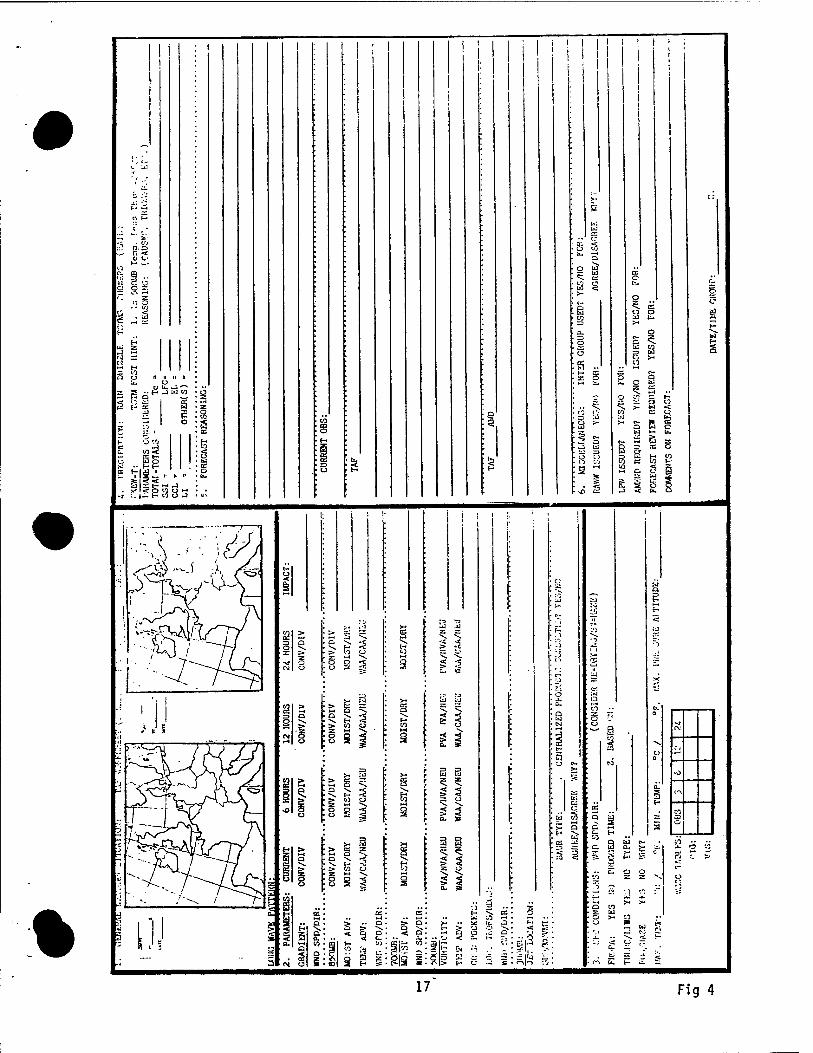
%
l\ -t.
o =r. •z.
LI O
i- a
o u w to 3 toJ o t- e- g _; j. It !■
_] 2 o to i- t- to o
! ! ! i i
g 3
a
CO
s
s 5 a, *
3 ?3 W
5 Z
| 3
3
..§1 IN n Sis s
..5 § 2
E-« v. as ■*■ -*3 1i
Ö K C O =K
5 <- 13 r}
>o c£
es o r« =e S a &J c fcj •-. fcu
5 B B = oe o o SI H B e to i-
- a
P
rv
^
•0
(*\
n a
£ c- e g
1 >H >* ■ o to
• O >• O —. UJ 1-,
t-\ U. i~ ■r 5
17 Fig 4
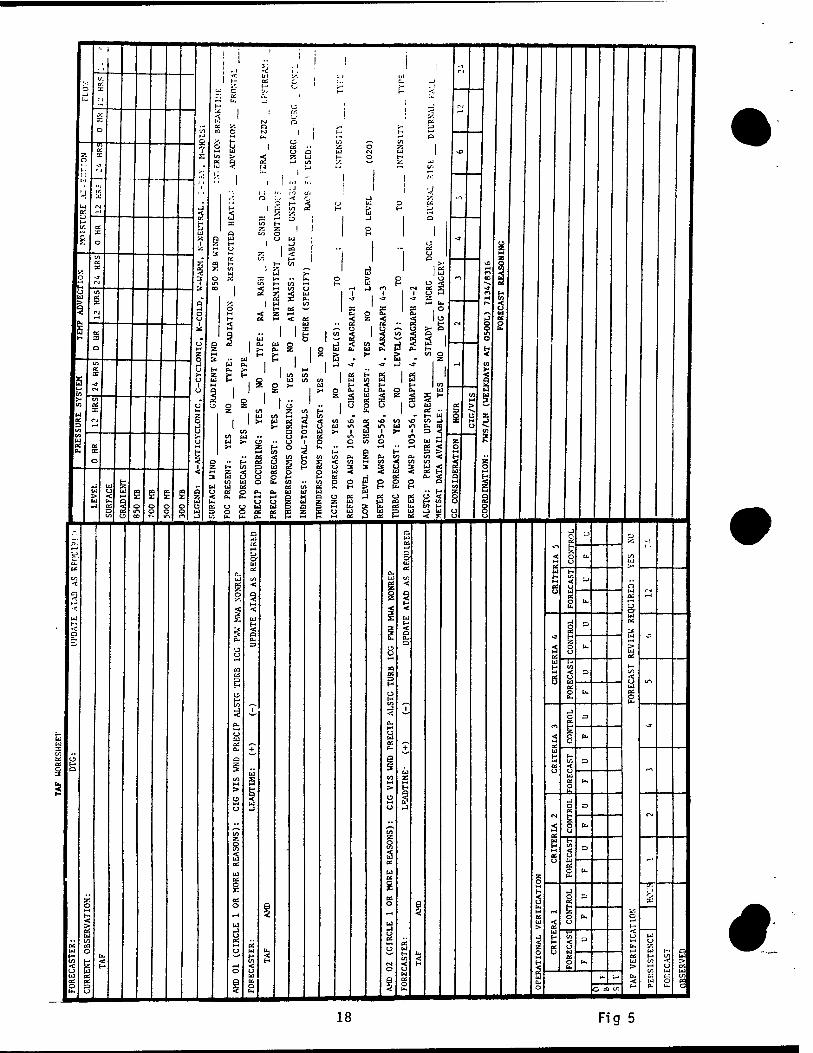
' y
i K ~
en H tft HH
1 w V) H
ä 1 1 >- w >- a w w w >■ o u i >*
»-4 H o
3" F- a n in
S H O
VI S3 w H»
#
18 Fig 5
CHAPTER 6
TERMINAL FORECAST REFERENCE FILE (TFRF)
1. The TFRF should consist of the following:
a. Required publications for turbulence and icing. b. Pertinent publications listed in 2WW/FM-84/002. c. Unit Terminal Forecast Reference Notebook (TFRN). d. Forecast Aids Notebooks.
2. Your TFRF should be a set of publications and forecast aids that enhance the forecast program. It should be comprehensive and kept available to the forecaster--near the forecast work area.
3. Uhen assembling your forecast aids, keep in mind the following and provide guidance accordingly:
a. Parameters analyzed for on TAF worksheet. b. Your units forecast problems. c. Local effects.
% 19
CHAPTER 7
GETTING THE MOST OUT OF YOUR LAFP
1. To ensure an effective LAFP you should first follow the guidelines in AWSR 105-22 and this forecaster memo. Next ask yourself and others the following questions:
a. Is it logically constructed and does it lead us step-by-step through the analysis and forecast development process?
b. Does it address our needs?
(1) Local forecast problems. (2) Pertinent parameters analyzed for. (3) Sufficient detail to ensure a quality forecast. (4) Is it easy to understand. (5) Is it easy to use (apply).
If necessary, make some changes. Once you have completed assembling, your LAFP is not set in stone. You should use it on a test basis and work out the bugs. Get a consensus of opinions to fine-tune it before you finalize it.
2. One area that needs special attention is providing sufficient guidance in the analysis and forecast development process. It is not enough to tell the forecaster what to do, you must tell them how to do it as well. I don't mean you have to spoon feed them. There is a lot of good information available that needs to be part of your written guidance either in the SOPs or referenced by them. Forecasting in Europe is difficult and every bit of help we can get is needed. To this end, it is important that you make information contained in the many publications available to the forecasters. Some of this information can be part of the SOP and TAF worksheet or included in the TFRF.
3. Another method of enhancing your LAFP is by using seasonal checklists with your TAF worksheet. You can develop them for fog, snow, freezing rain, thunderstorms, or whatever your most significant seasonal problem(s) might be.
4. Use 2 WW Form 16, Synoptic Display, with the TAF worksheet to provide a picture to go with your words.
5. The LAFP is designed so that you progress through the analysis phase accomplishing predetermined steps. As you progress through each step you need to document the information gained. Information that is derived during the analysis process is usually lost or diluted if not communicated or documented. To ensure effective use of the analysis, document the information on the TAF worksheet as it becomes available.
20 #

CONCLUSION
Forecasters are given numerous bits and pieces of data that are like pieces of a ouzzle they never fit together perfectly. The challenge TS to piece toShe^the puzzle, assemble all the pieces, interpret the Implications of each piece of data, resolve inconsistencies, correlate simi1iar pieces of data, and put everything together as an operationally sound forecast. The answer to this challenge is an effective LAFP.
%
21
APPENDIX A SAMPLE DOI WITH ATTACHMENTS
rnnrc DETACHMENT OPERATING INSTRUCTION 105-1 DEPARTMENT OF THE AIR FORCE ,„A?i Date
Detachment 1, 99th Weather Squadron (MAC)
WEATHER ; Local Analysis and Forecast Program (LAFP)
This operating instruction outlines unitJfP°;/jb^^f ^^1^^). It
&h ^^^^^" Äment*the requiremen of AWSR 105-22.
! PURPOSE: To ensure a systematic «"d og«|nl2^«»^^t1h?u?5 be used orecast?ng is followed.This progr»id "nes ^^^a which affect the area
to forecast weather conditions and/or specif«: p ^ tQ , de
of concern. It encourages aggressive step D>S V ^ services. The
2. customer regents and speclflc weather ««^«Ä * Terminal Forecast Reference Notebook TFRNI ant„roug„ Initial and
preparing local forecast products.
3. Centrally Prepared Products
.. Forecasters »11! develop %^^^'£XXl£- limitations In the usefulness of centr ^ ^ /of products, review of
Zl^^^^^™^^™ facility *essa9es, Snars, and study of technical publications,
b Processing of centrally prepared products.
(1, oispuyed facile charts used specifically^ ;l ,9ht weather bHemr2)
Wi'olher Srill, prepafeo facsimile charts will be processed MM Attachment 1.
„SJUSS 3 üssr.-asasaÄ1« -'
%
OPR: CC DISTRIBUTION:
Reviewed
22
DOI 105-1 Date
encouraged. The additional analyses will enhance the possibility of having each forecast begin on a positive note. They will also help you develop an awareness of the reliability of weather progs.
b. Analysis and plotting of LAWCs will be mission tailored to elements requiring special attention, e.g., thunderstorms, winds, etc. Chart content, deviations from standards, and elements to be analyzed are listed in Attachment 2. Sensible weather plots, radar observation reports, and other special charts can be used in lieu of a plotted LAWC when the element or synoptic feature of interest is clearly depicted. Analysis and plotting requirements of miscellaneous charts can be used in lieu of plotted LAWC when the element or synoptic feature of interest is clearly depicted. Analysis and plotting requirements of miscellaneous charts not listed in the appropriate attachment will be placed in the station log until the DOI is updated.
c. Forecast Worksheet. Use a worksheet to ensure a systematic and well organized approach when formulating forecast products. The worksheet will establish techniques for forecasting specific conditions and/or phenomena. The worksheet and/or checklist will be completed prior to the issuance of a forecast. However, forecast reasoning is a continuing process. Each time the forecaster receives updated information, the forecast should be evaluated for strengths and weaknesses; amend it as required. Further guidance is provided in AWSRs 105-22 and 27.
5 Forecast Discussions. Forecast discussions will normally cover the subjects listed in AWSR 105-22 and AWSP 105-56, pages 1-2-1 and 2. A guide checklist is provided in Attachment 3 to ensure completeness of discussion. Discussions will be held at shift changes, prior to issuance of terminal forecasts, and as needed for command briefings, exercises, etc. All available forecasters will participate (observer attendance is encouraged). Discussions should ensure sound meteorological reasoning is used in preparation of the local forecast and that there is consistency between forecasts. Telephone discussions with weather units are encouraged.
6. Forecast Reviews. Forecast reviews are primarily aimed towards product improvement. They are not a punitive action but a learning tool. The Station Chief is responsible for routinely checking forecasts to determine when a review is required. If the missed forecast was not of meteorological significance (e.g., visibility is forecasted to lower by 1000Z, but actually drops at 1015Z), then a formal review or reanalysis is not worthwhile. When the forecast miss is operationally or meteorologically significant, the forecaster should review the forecast reasoning and the development of the phenomenon. The thrust of the labor should be towards developing a technique to make the review within 10 days of receipt. Completed forecast reviews (reanalysis) will be maintained in a Forecast Review Binder(s). Before the onset of the coming season; each forecaster will review the appropriate reviews. Significant findings will be discussed at station meetings. Reviews which no longer serve any value will be discarded.
23 #
DOI 105-1 Date
Specific criteria and general format guidance are provided in Attachment 4.
4 Atch Commander 1- Processing Centrally Prepared
Products 2. Local Area Work Charts (LAWCs) and
Skew T-Log Ps 3. Forecast Discussion Checklist 4. Forecast Review
% 24
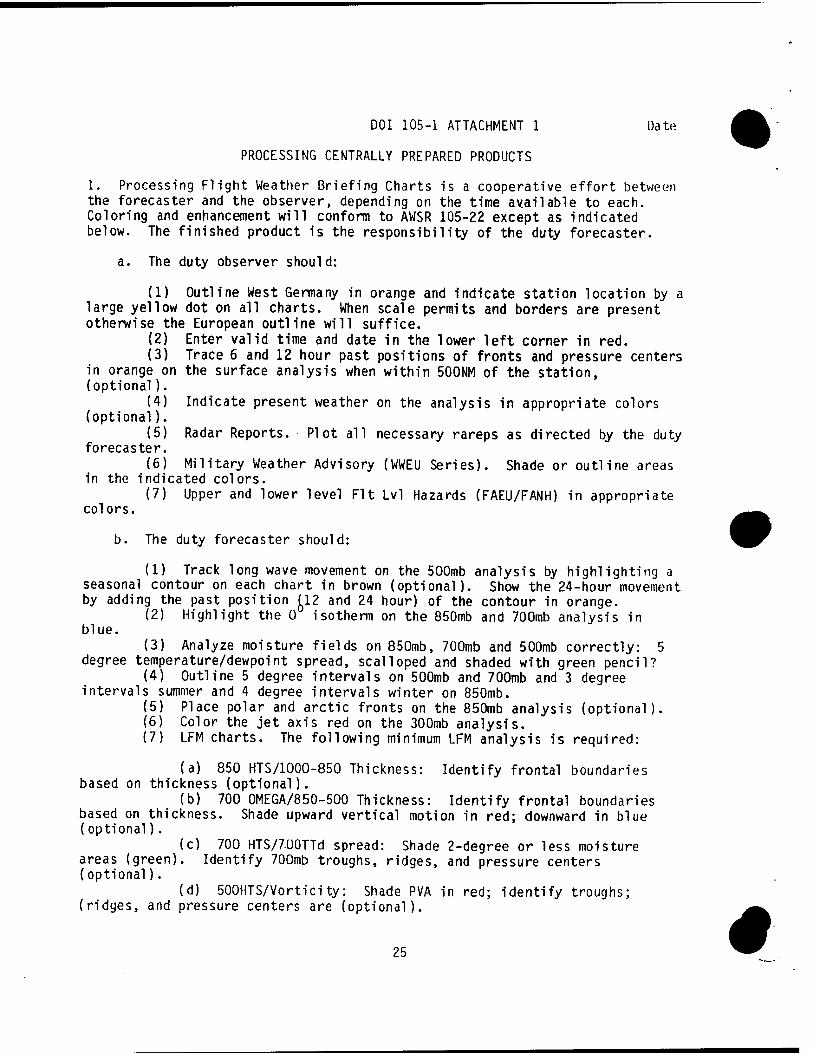
DOI 105-1 ATTACHMENT 1 Date
PROCESSING CENTRALLY PREPARED PRODUCTS
1. Processing Flight Weather Briefing Charts is a cooperative effort between the forecaster and the observer, depending on the time available to each. Coloring and enhancement will conform to AWSR 105-22 except as indicated below. The finished product is the responsibility of the duty forecaster.
a. The duty observer should:
(1) Outline West Germany in orange and indicate station location by a large yellow dot on all charts. When scale permits and borders are present otherwise the European outline will suffice.
(2) Enter valid time and date in the lower left corner in red. (3) Trace 6 and 12 hour past positions of fronts and pressure centers
in orange on the surface analysis when within 500NM of the station, (optional).
(4) Indicate present weather on the analysis in appropriate colors (optional).
(5) Radar Reports. Plot all necessary rareps as directed by the duty forecaster.
(6) Military Weather Advisory (WWEU Series). Shade or outline areas in the indicated colors.
(7) Upper and lower level Fit Lvl Hazards (FAEU/FANH) in appropriate colors.
b. The duty forecaster should:
(1) Track long wave movement on the 500mb analysis by highlighting a seasonal contour on each chart in brown (optional). Show the 24-hour movement by adding the past position (12 and 24 hour) of the contour in orange.
(2) Highlight the 0 isotherm on the 850mb and 700mb analysis in blue.
(3) Analyze moisture fields on 850mb, 700mb and 500mb correctly: 5 degree temperature/dewpoint spread, scalloped and shaded with green pencil?
(4) Outline 5 degree intervals on 500mb and 700mb and 3 degree intervals summer and 4 degree intervals winter on 850mb.
(5) Place polar and arctic fronts on the 850mb analysis (optional). (6) Color the jet axis red on the 300mb analysis. (7) LFM charts. The following minimum LFM analysis is required:
(a) 850 HTS/1000-850 Thickness: Identify frontal boundaries based on thickness (optional).
(b) 700 OMEGA/850-500 Thickness: Identify frontal boundaries based on thickness. Shade upward vertical motion in red; downward in blue (optional).
(c) 700 HTS/7-ÜOTTd spread: Shade 2-degree or less moisture areas (green). Identify 700mb troughs, ridges, and pressure centers (optional).
(d) 500HTS/Vorticity: Shade PVA in red; identify troughs; (ridges, and pressure centers are (optional).
25 «
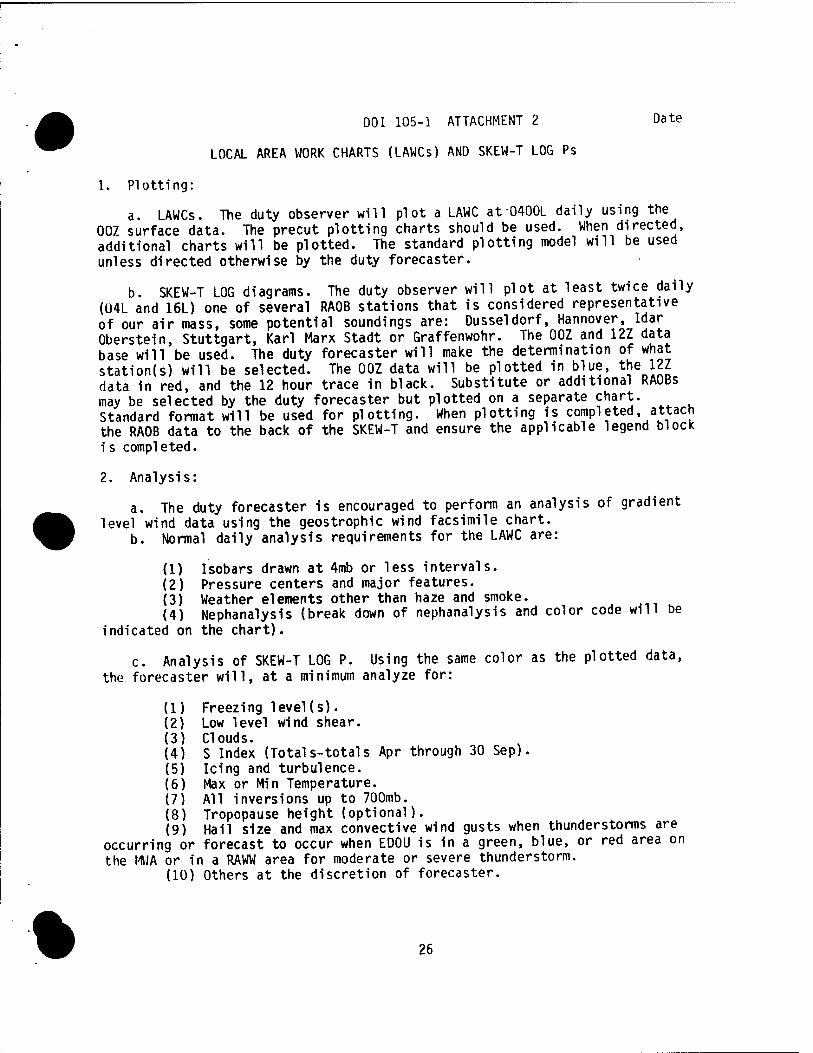
%
DOI 105-1 ATTACHMENT 2 Date
LOCAL AREA WORK CHARTS (LAWCs) AND SKEW-T LOG Ps
1. Plotting:
a. LAWCs. The duty observer will plot a LAWC at0400L daily using the 007 surface data. The precut plotting charts should be used. When directed, additional charts will be plotted. The standard plotting model will be used unless directed otherwise by the duty forecaster.
b. SKEW-T LOG diagrams. The duty observer will plot at least twice daily (04L and 16L) one of several RAOB stations that is considered representative of our air mass, some potential soundings are: Düsseldorf, Hannover, Idar Oberstein, Stuttgart, Karl Marx Stadt or Graffenwohr. The 00Z and 12Z data base will be used. The duty forecaster will make the determination of what station(s) will be selected. The 00Z data will be plotted in blue, the 12Z data in red, and the 12 hour trace in black. Substitute or additional RAOBs may be selected by the duty forecaster but plotted on a separate chart. Standard format will be used for plotting. When plotting is completed, attach the RAOB data to the back of the SKEW-T and ensure the applicable legend block i s completed.
2. Analysis:
a. The duty forecaster is encouraged to perform an analysis of gradient level wind data using the geostrophic wind facsimile chart.
b. Normal daily analysis requirements for the LAWC are:
(1) Isobars drawn at 4mb or less intervals. (2) Pressure centers and major features. (3) Weather elements other than haze and smoke. (4) Nephanalysis (break down of nephanalysis and color code will be
indicated on the chart).
c. Analysis of SKEW-T LOG P. Using the same color as the plotted data, the forecaster will, at a minimum analyze for:
(1) Freezing level(s). (2) Low level wind shear. (3) Clouds. (4) S Index (Totals-totals Apr through 30 Sep). (5) Icing and turbulence. (6) Max or Min Temperature. (7) All inversions up to 700mb. (8) Tropopause height (optional). (9) Hail size and max convective wind gusts when thunderstorms are
occurring or forecast to occur when EDOU is in a green, blue, or red area on the MMA or in a RAWW area for moderate or severe thunderstorm.
(10) Others at the discretion of forecaster.
26
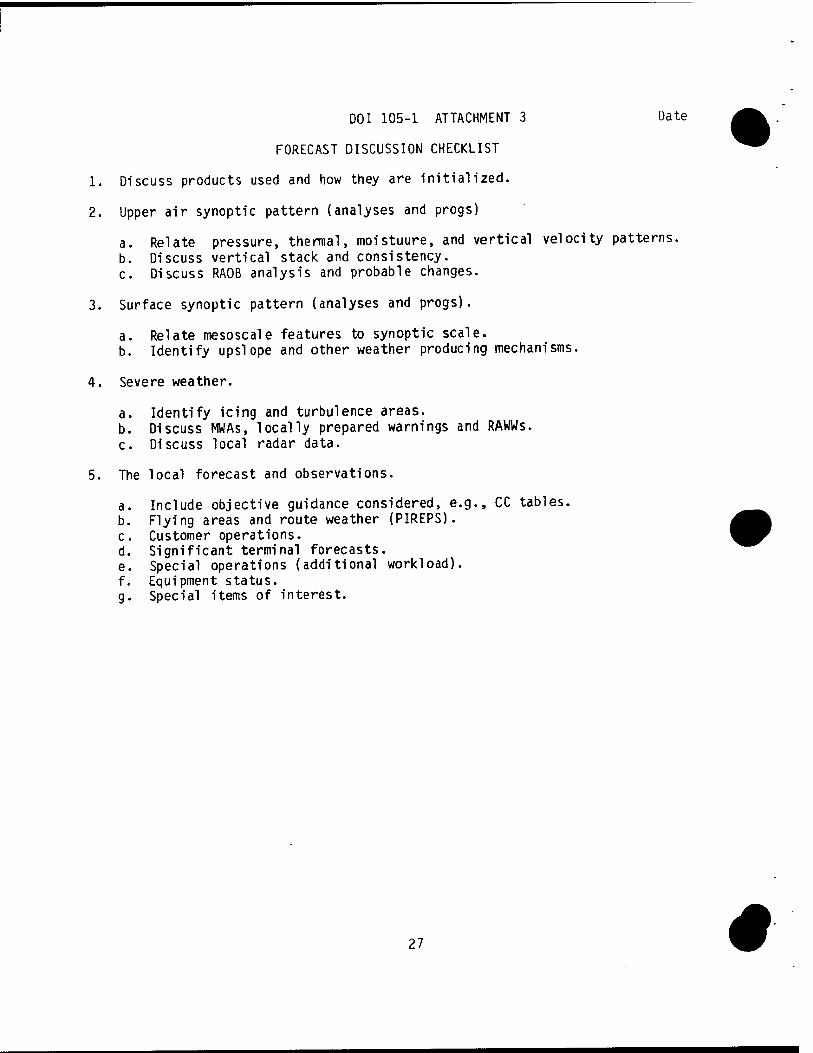
DO I 105-1 ATTACHMENT 3 Date
FORECAST DISCUSSION CHECKLIST
1. Discuss products used and how they are initialized.
2. Upper air synoptic pattern (analyses and progs)
a. Relate pressure, thermal, moistuure, and vertical velocity patterns. b. Discuss vertical stack and consistency. c. Discuss RAOB analysis and probable changes.
3. Surface synoptic pattern (analyses and progs).
a. Relate mesoscale features to synoptic scale. b. Identify upslope and other weather producing mechanisms.
4. Severe weather.
a. Identify icing and turbulence areas. b. Discuss MWAs, locally prepared warnings and RAWWs. c. Discuss local radar data.
5. The local forecast and observations.
a. Include objective guidance considered, e.g., CC tables. b. Flying areas and route weather (PIREPS). c. Customer operations. d. Significant terminal forecasts. e. Special operations (additional workload). f. Equipment status. g. Special items of interest.
27 #
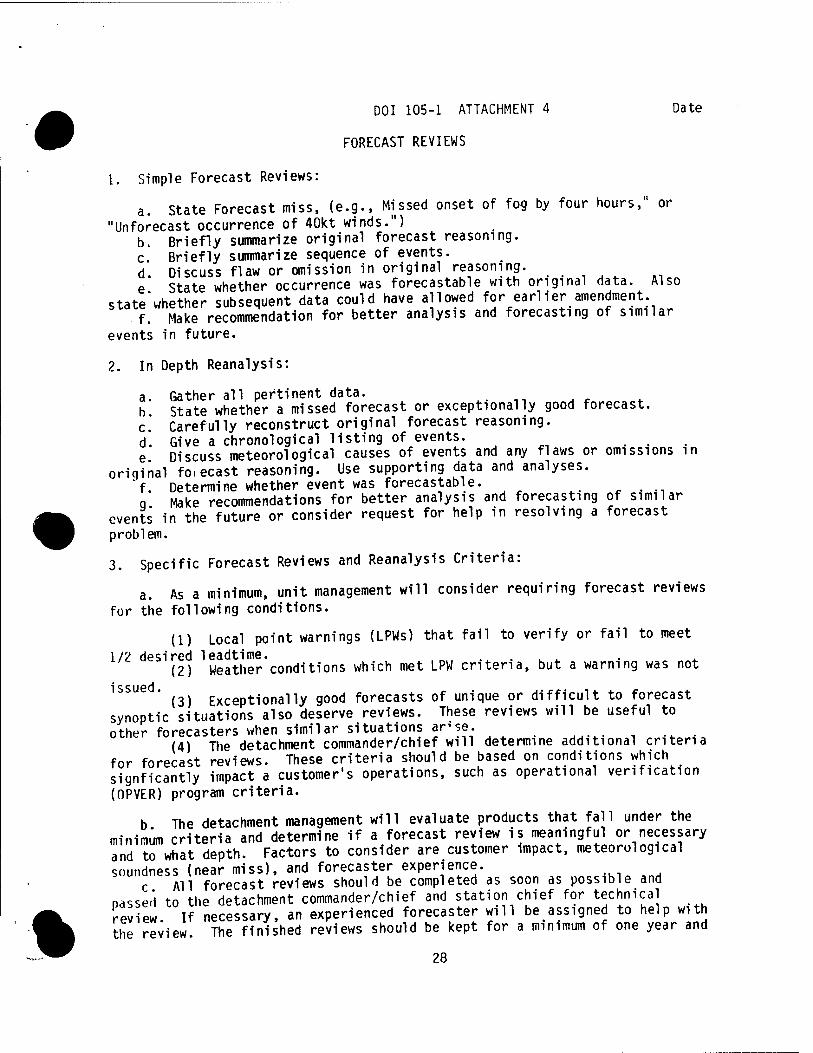
%
DOI 105-1 ATTACHMENT 4 Date
FORECAST REVIEWS
t. Simple Forecast Reviews:
a. State Forecast miss, (e.g., Missed onset of fog by four hours," or "Unforecast occurrence of 40kt winds.")
b. Briefly summarize original forecast reasoning. c. Briefly summarize sequence of events. d. Discuss flaw or omission in original reasoning. . e State whether occurrence was forecastable with original data. Also
state'whether subsequent data could have allowed for earlier amendment. f. Make recommendation for better analysis and forecasting of similar
events in future.
2. In Depth Reanalysis:
a. Gather all pertinent data. b State whether a missed forecast or exceptionally good forecast. c. Carefully reconstruct original forecast reasoning. d. Give a chronological listing of events. e Discuss meteorological causes of events and any flaws or omissions in
oriqinal fo. ecast reasoning. Use supporting data and analyses. "f. Determine whether event was forecastable. - . .,
q Make recommendations for better analysis and forecasting of similar events in the future or consider request for help in resolving a forecast problem.
3. Specific Forecast Reviews and Reanalysis Criteria:
a. As a minimum, unit management will consider requiring forecast reviews for the following conditions.
(1) Local point warnings (LPWs) that fail to verify or fail to meet 1/2 desired leadtime. ......
(2) Weather conditions which met LPW criteria, but a warning was not
1SSUe ' (3) Exceptionally good forecasts of unique or difficult to forecast synoptic situations also deserve reviews. These reviews will be useful to other forecasters when similar situations anse.
(4) The detachment commander/chief will determine additional criteria for forecast reviews. These criteria should be based on conditions which signficantly impact a customer's operations, such as operational verification (OPVER) program criteria.
b The detachment management will evaluate products that fall under the minimum criteria and determine if a forecast review is meaningful or necessary and to what depth. Factors to consider are customer impact, meteorological soundness (near miss), and forecaster experience.
c All forecast reviews should be completed as soon as possible and passe«! to the detachment commander/chief and station chief for technical review If necessary, an experienced forecaster will be assigned to help with the review. The finished reviews should be kept for a minimum of one year and
28

then evaluated. Those that do no contribute to a better understanding of the forecasting problan may be discarded.
29 4
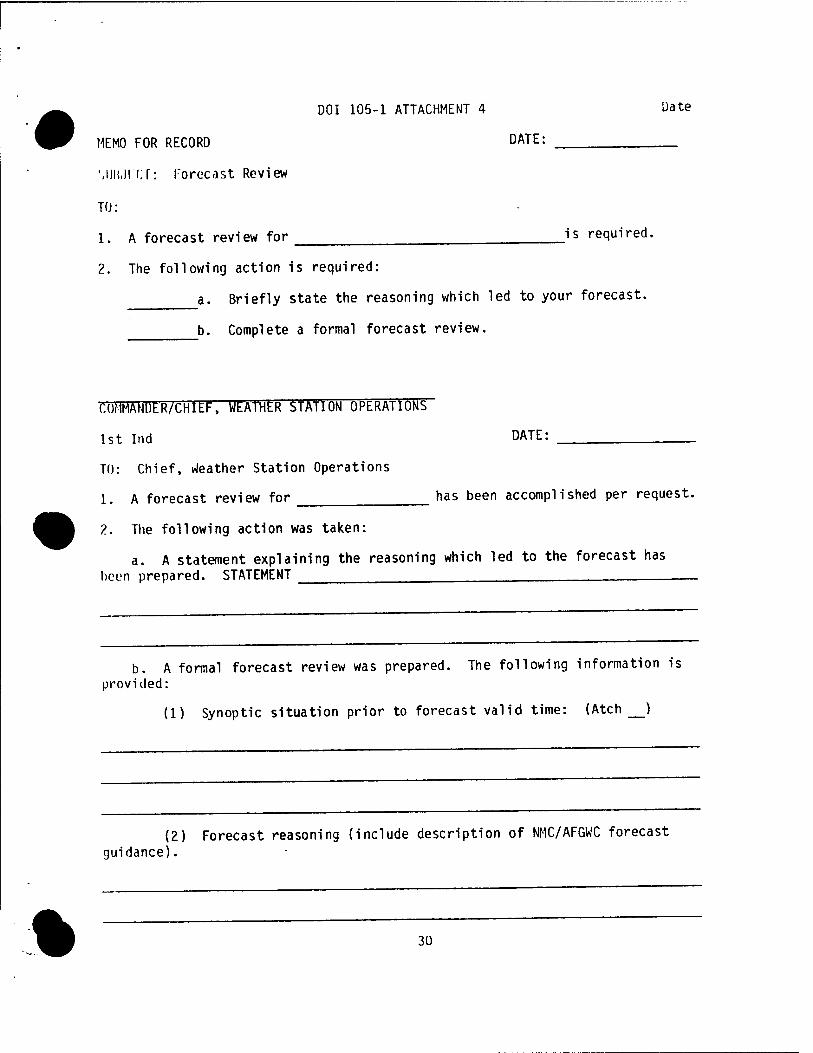
DOI 105-1 ATTACHMENT 4 Date
MEMO FOR RECORD DATE:
Mllt.ll'Cr: Forecast Review
TO:
1. A forecast review for is required.
2. The following action is required:
a. Briefly state the reasoning which led to your forecast.
b. Complete a formal forecast review.
COMMAHüER/CHIEF, WEATHER STATION OPERATIONS
1st Ind DATE:
TO: Chief, leather Station Operations
1. A forecast review for has been accomplished per request.
?.. The following action was taken:
a. A statement explaining the reasoning which led to the forecast has been prepared. STATEMENT —
b. A formal forecast review was prepared. The following information is provided:
(1) Synoptic situation prior to forecast valid time: (Atch )
(2) Forecast reasoning (include description of NMC/AFGWC forecast guidance).
% 30
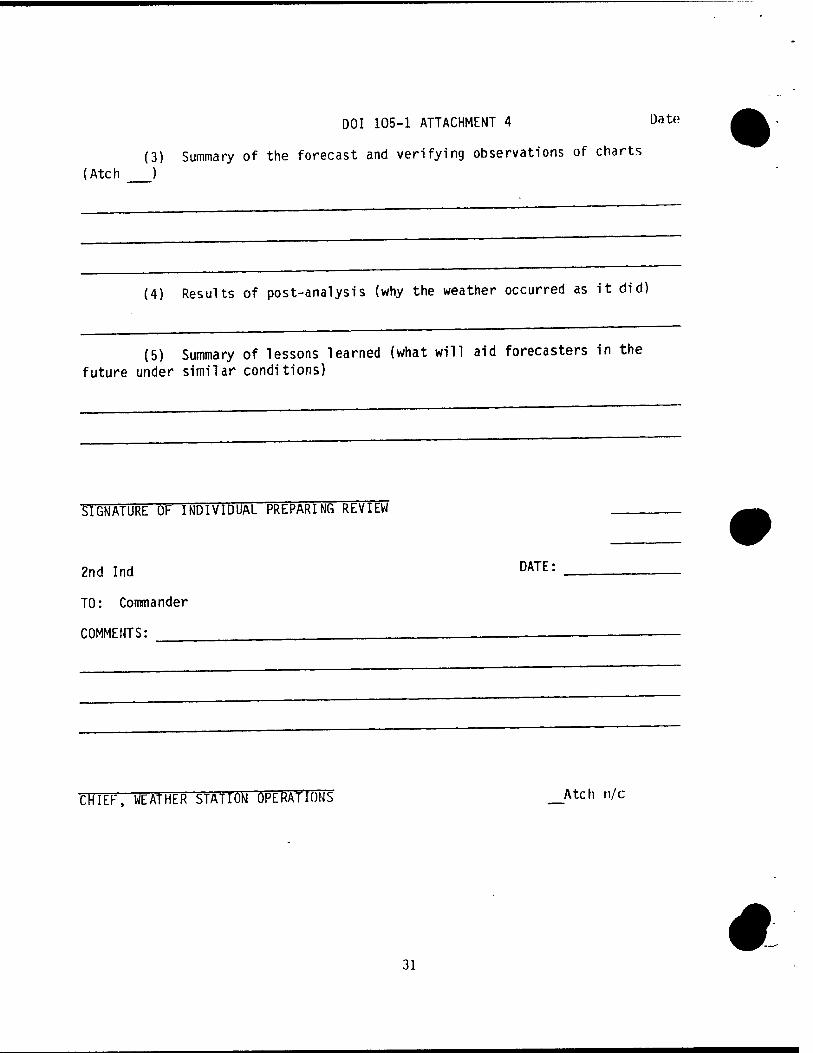
DOI 105-1 ATTACHMENT 4 Date
(3) Summary of the forecast and verifying observations of charts (Atch )
(4) Results of post-analysis (why the weather occurred as it did)
(5) Summary of lessons learned (what will aid forecasters in the future under similar conditions)
SIGNATURE OF INDIVIDUAL PREPARING RtVitW
2nd Ind DATE;
TO: Commander
COMMENTS:
CHIEF, LEATHER STATION OPERATIONS __Atch n/c
« 31
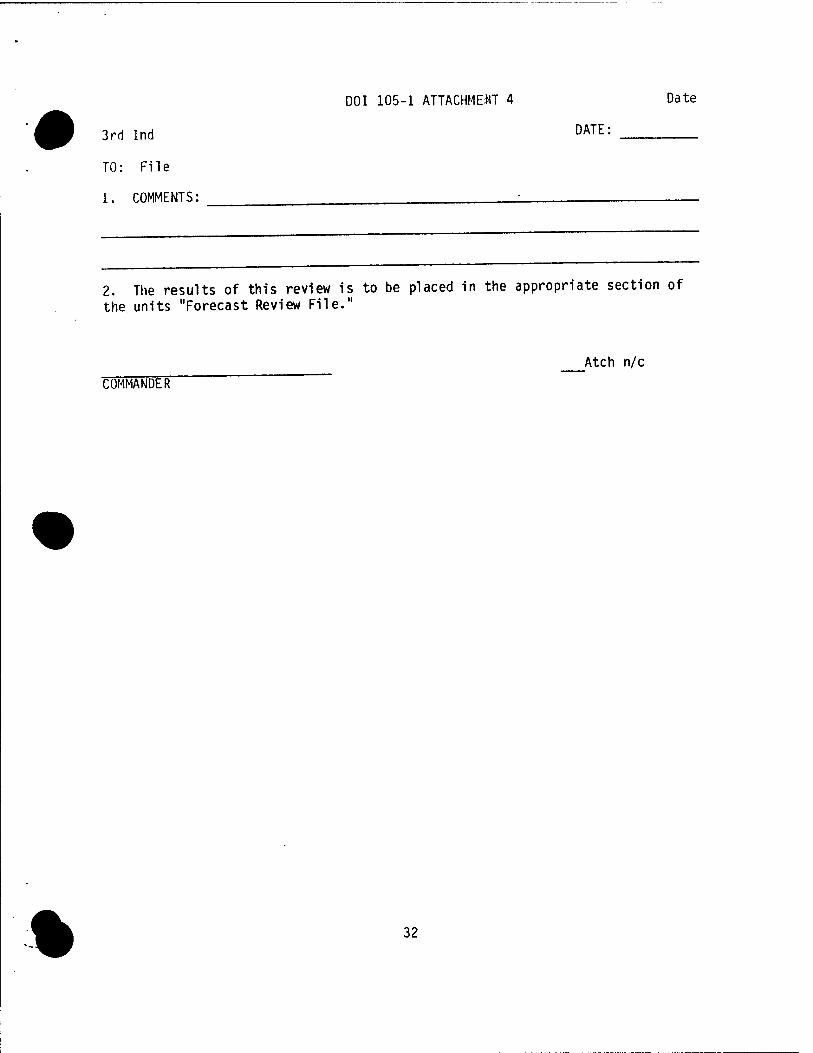
DO I 105-1 ATTACHMENT 4 Date
3rd Ind DATE:
TO: File
1. COMMENTS: ■
2. The results of this review is to be placed in the appropriate section of the units "Forecast Review File."
Atch n/c
COMMANDER
% 32
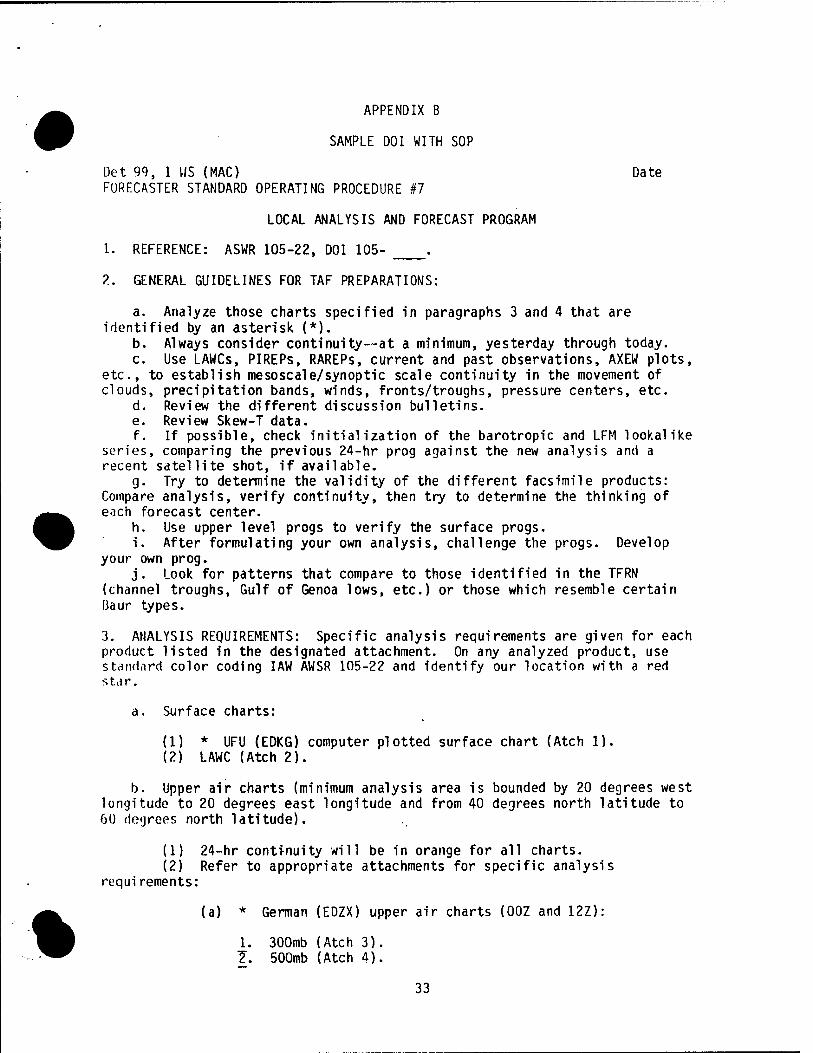
APPENDIX B
SAMPLE DOI WITH SOP
Det 99, 1 US (MAC) Date FORECASTER STANDARD OPERATING PROCEDURE #7
LOCAL ANALYSIS AND FORECAST PROGRAM
1. REFERENCE: ASWR 105-22, DOI 105- .
?.. GENERAL GUIDELINES FOR TAF PREPARATIONS:
a. Analyze those charts specified in paragraphs 3 and 4 that are identified by an asterisk (*).
b. Always consider continuity—at a minimum, yesterday through today. c. Use LAWCs, PIREPs, RAREPs, current and past observations, AXEW plots,
etc., to establish me soscale/synoptic scale continuity in the movement of clouds, precipitation bands, winds, fronts/troughs, pressure centers, etc.
d. Review the different discussion bulletins. e. Review Skew-T data. f. If possible, check initialization of the barotropic and LFM lookalike
series, comparing the previous 24-hr prog against the new analysis and a recent satellite shot, if available.
g. Try to determine the validity of the different facsimile products: Compare analysis, verify continuity, then try to determine the thinking of each forecast center.
h. Use upper level progs to verify the surface progs. i. After formulating your own analysis, challenge the progs. Develop
your own prog. j. Look for patterns that compare to those identified in the TFRN
(channel troughs, Gulf of Genoa lows, etc.) or those which resemble certain Naur types.
3. ANALYSIS REQUIREMENTS: Specific analysis requirements are given for each product listed in the designated attachment. On any analyzed product, use standard color coding IAW AWSR 105-22 and identify our location with a red star.
a. Surface charts:
(1) * UFU (EDKG) computer plotted surface chart (Atch 1). (2) LAWC (Atch 2).
b. Upper air charts (minimum analysis area is bounded by 20 degrees west longitude to 20 degrees east longitude and from 40 degrees north latitude to 60 degrees north latitude).
(1) 24-hr continuity will be in orange for all charts. (2) Refer to appropriate attachments for specific analysis
requi rements:
%
(a) * German (EDZX) upper air charts (00Z and 12Z):
1. 300mb (Atch 3). 7. 500mb (Atch 4).
33
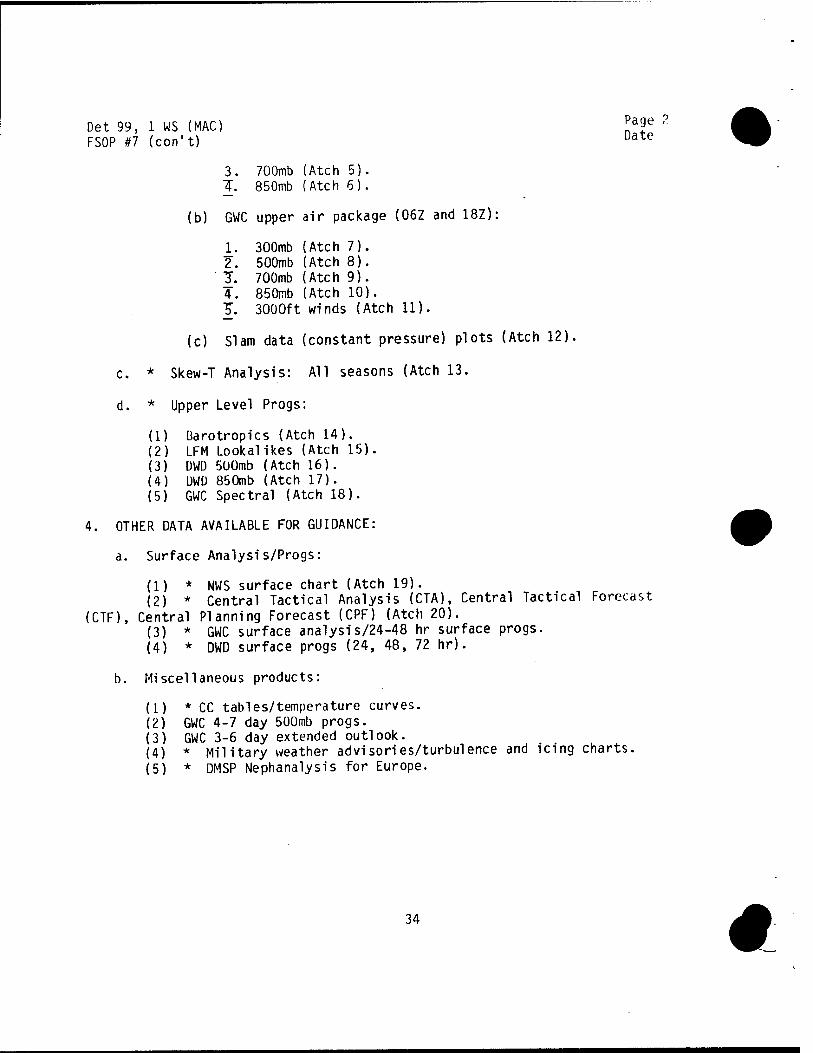
Det 99, 1 WS (MAC) !^e 2
FSOP #7 (con't) Date
3. 7O0mb (Atch 5). T. 850mb (Atch 6).
(b) GWC upper air package (06Z and 18Z):
1. 3O0mb (Atch 7). 2. 5O0mb (Atch 8). 7. 7O0mb (Atch 9). 4. 850mb (Atch 10). ^. 3000ft winds (Atch 11).
(c) Slam data (constant pressure) plots (Atch 12).
c. * Skew-T Analysis: All seasons (Atch 13.
d. * Upper Level Progs:
(1) Barotropics (Atch 14). (2) LFM Lookalikes (Atch 15). (3) ÜWD 500mb (Atch 16). (4) UWÜ 850mb (Atch 17). (5) GWC Spectral (Atch 18).
4. OTHER DATA AVAILABLE FOR GUIDANCE:
a. Surface Analysis/Progs:
(1) * NWS surface chart (Atch 19). (2) * Central Tactical Analysis (CTA), Central Tactical Forecast
(CTF), Central Planning Forecast (CPF) (Atch 20). (3) * GWC surface analysis/24-48 hr surface progs. (4) * DWD surface progs (24, 48, 72 hr).
b. Miscellaneous products:
(1) * CC tables/temperature curves. (2) GWC 4-7 day 500mb progs. (3) GWC 3-6 day extended outlook. (4) * Military weather advisories/turbulence and icing charts. (5) * DMSP Nephanalysis for Europe.
34
#
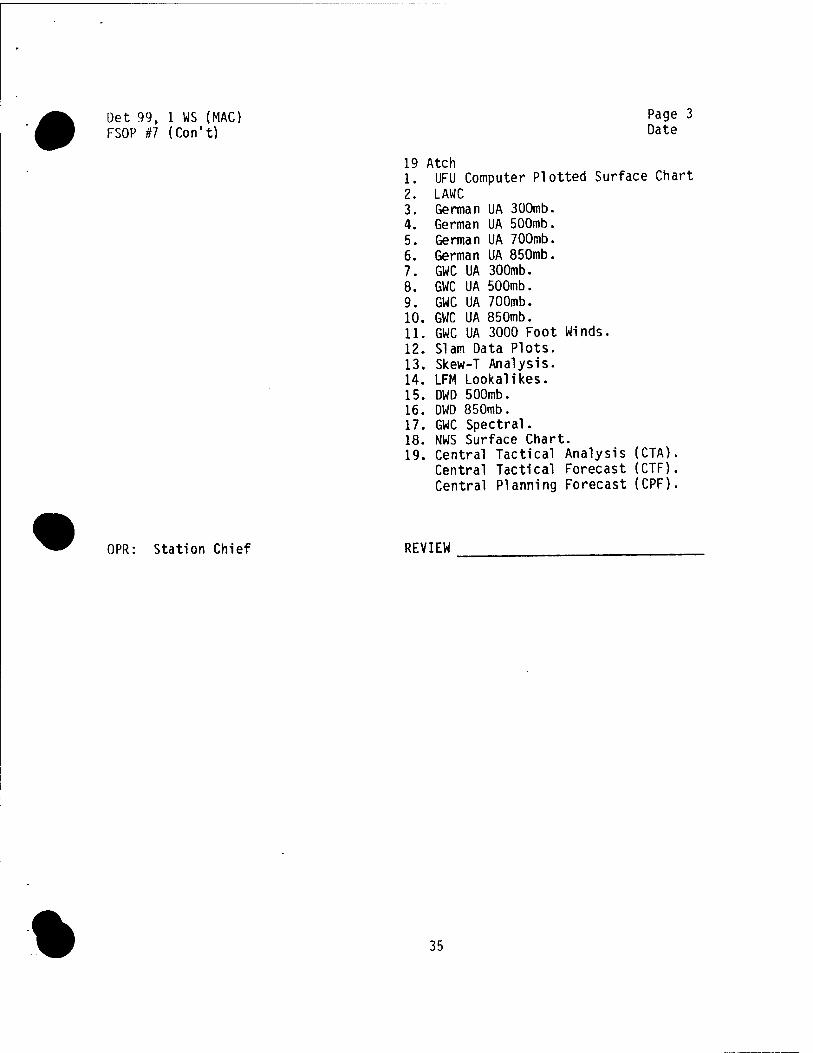
üet 99, 1 WS (MAC) FSOP #7 (Con't)
Page 3 Date
19 Atch 1. UFU Computer Plotted Surface Chart
LAWC German UA 3ÜOmb. German UA 500mb. German UA 700mb. German UA 850mb. GWC UA 300mb.
2. 3. 4. 5. 6. 7. 8. 9. 10. 11. 12. 13. 14. 15. 16. 17. 18. 19.
GWC UA 500mb. GWC UA 700mb. GWC UA 850mb. GWC UA 3000 Foot Winds. Slam Data Plots. Skew-T Analysis. LFM Lookalikes. DWD 500mb. DWD 850mb. GWC Spectral. NWS Surface Chart. Central Tactical Analysis (CTA). Central Tactical Forecast (CTF). Central Planning Forecast (CPF).
OPR: Station Chief REVIEW
% 35
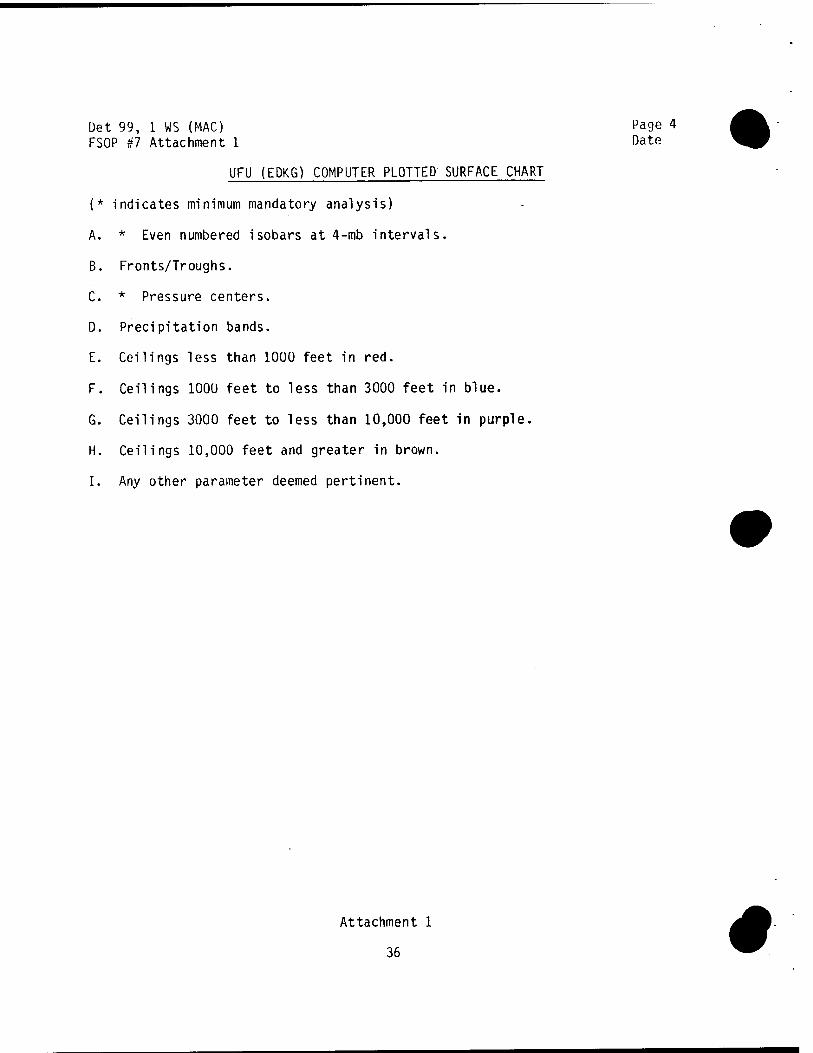
Det 99, 1 WS (MAC) Page 4 FSOP #7 Attachment 1 Date
UFU (EDKG) COMPUTER PLOTTED SURFACE CHART
{* indicates minimum mandatory analysis)
A. * Even numbered isobars at 4-mb intervals.
B. Fronts/Troughs.
C. * Pressure centers.
D. Precipitation bands.
E. Ceilings less than 1000 feet in red.
F. Ceilings 1000 feet to less than 3000 feet in blue.
G. Ceilings 3000 feet to less than 10,000 feet in purple.
H. Ceilings 10,000 feet and greater in brown.
I. Any other parameter deemed pertinent.
Attachment 1
36 #
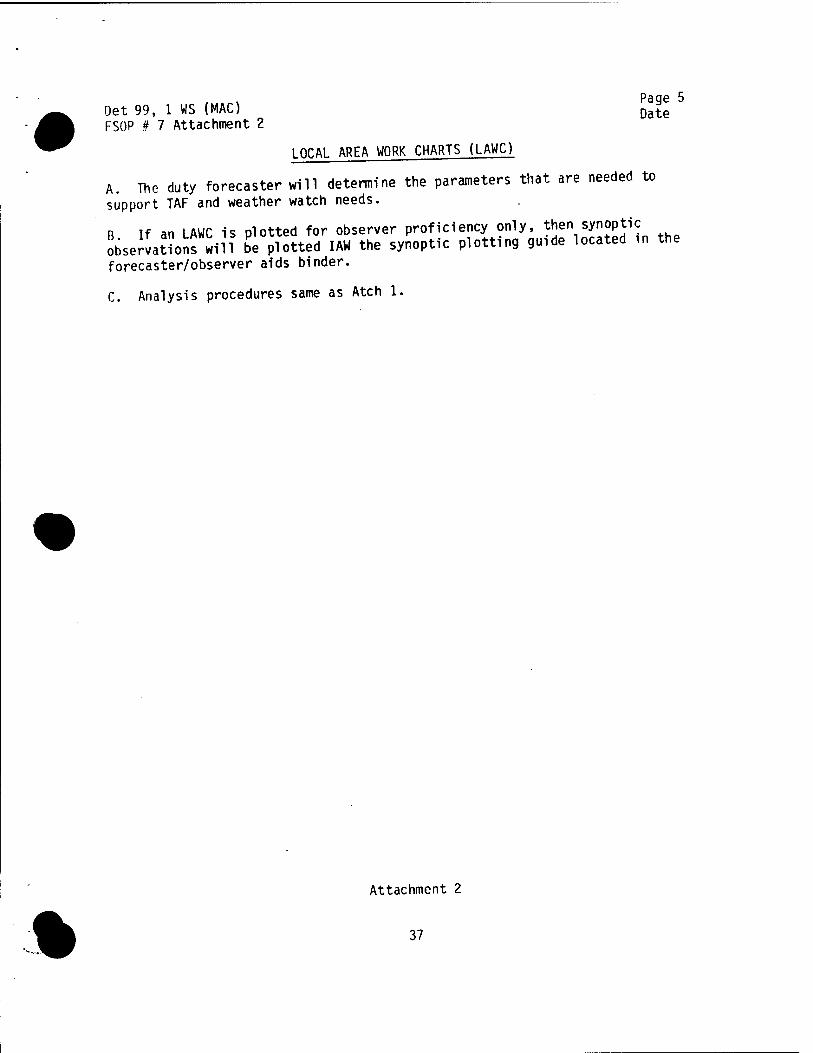
%
, „v Page 5 Oet 99, 1 WS (MAC) DaJe FSOP # 7 Attachment 2
LOCAL AREA WORK CHARTS (LAWC)
A. The duty forecaster will determine the parameters that are needed to
support TAF and weather watch needs.
n If an LAWC is plotted for observer proficiency only, then synoptic observations will be plotted IAW the synoptic plotting guide located ,n the forecaster/observer aids binder.
C. Analysis procedures same as Atch 1.
Attachment 2
37
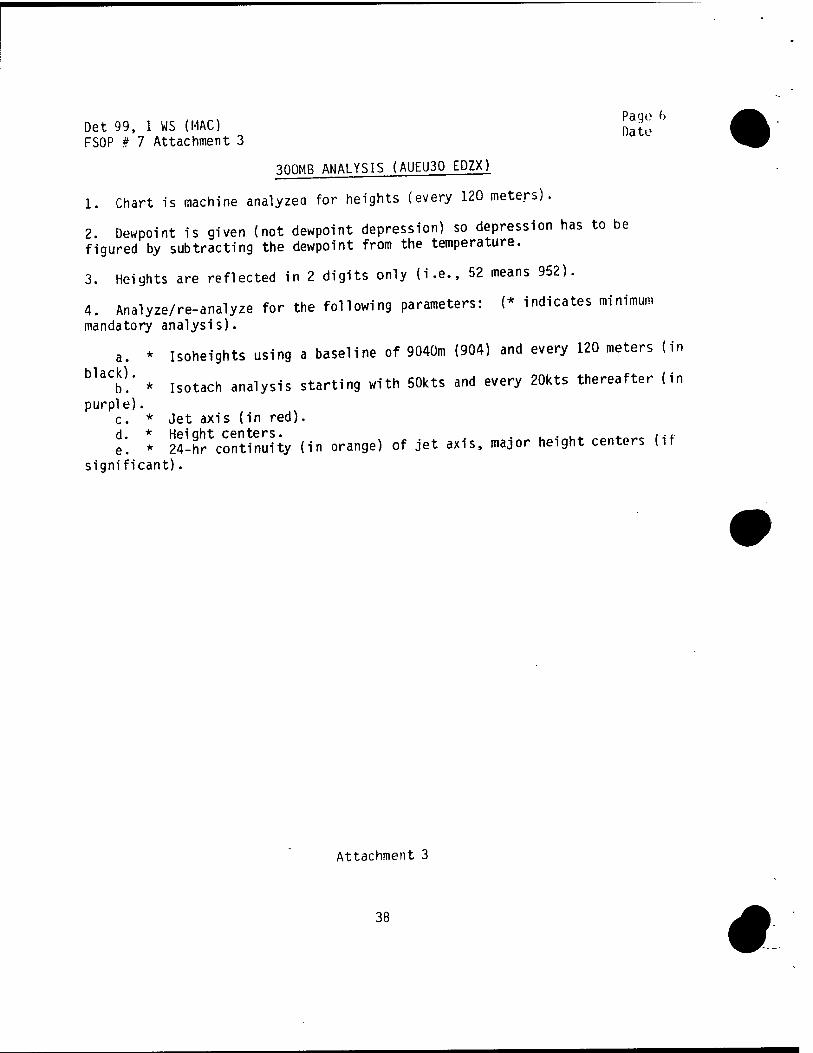
Det 99, 1 WS (MAC) [^ FSOP # 7 Attachment 3
300MB ANALYSIS (AUEU30 EDZX)
1. Chart is machine analyzed for heights (every 120 meters).
2. Dewpoint is given (not dewpoint depression) so depression has to be figured by subtracting the dewpoint from the temperature.
3. Heights are reflected in 2 digits only (i.e., 52 means 952).
4. Analyze/re-analyze for the following parameters: (* indicates minimum mandatory analysis).
a. * Isoheights using a baseline of 9040m (904) and every 120 meters (in
b1aCbk)." * Isotach analysis starting with 50kts and every 20kts thereafter (in purple).
c. * Jet axis (in red).
e'. * S'-h^continuity (in orange) of jet axis, major height centers (if significant).
Attachment 3
38
#
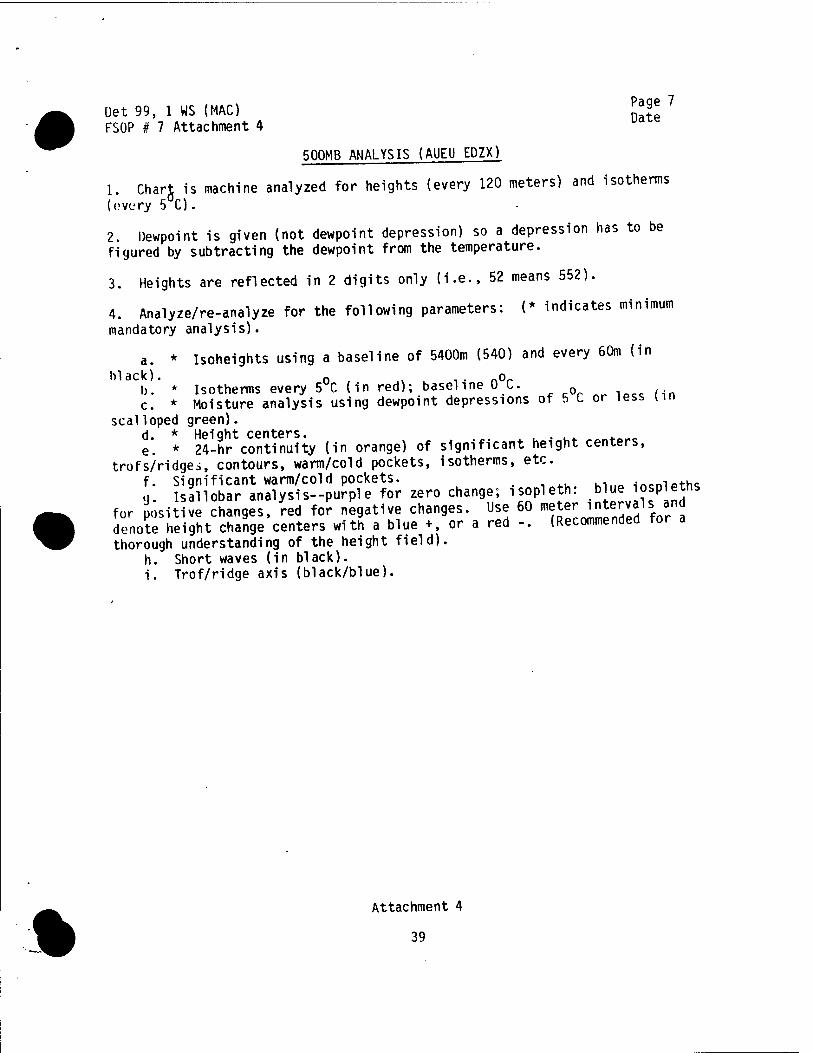
üet 99, 1 WS (MAC) ^ 7
FSOP # 7 Attachment 4
500MB ANALYSIS (AIP EDZX)
1. CharJ is machine analyzed for heights (every 120 meters) and isotherms (overy 5 0.
2. Dewpoint is given (not dewpoint depression) so a depression has to be figured by subtracting the dewpoint from the temperature.
3. Heights are reflected in 2 digits only (i.e., 52 means 552).
4. Analyze/re-analyze for the following parameters: (* indicates minimum mandatory analysis).
a. * Isoheights using a baseline of 5400m (540) and every 60m (in black). 0 . or
I). * Isotherms every 5UC (in red); baseline 0 C. c. * Moisture analysis using dewpoint depressions of 5 C or less im
scalloped green). d. * Height centers. . „»„«.,,,.<. e. * 24-hr continuity (in orange) of significant height centers,
trofs/ridges, contours, warm/cold pockets, isotherms, etc. f. Significant warm/cold pockets. ««enipth« g. Isallobar analysis-purple for zero change; isopleth: blue lospleths
for ositive changes, red fof negative changes. Use 60 ™ter intervals and denote height change centers with a blue +, or a red -. (Recommended for a thorough understanding of the height field).
h. Short waves (in black). i. Trof/ridge axis (black/blue).
%
Attachment 4
39
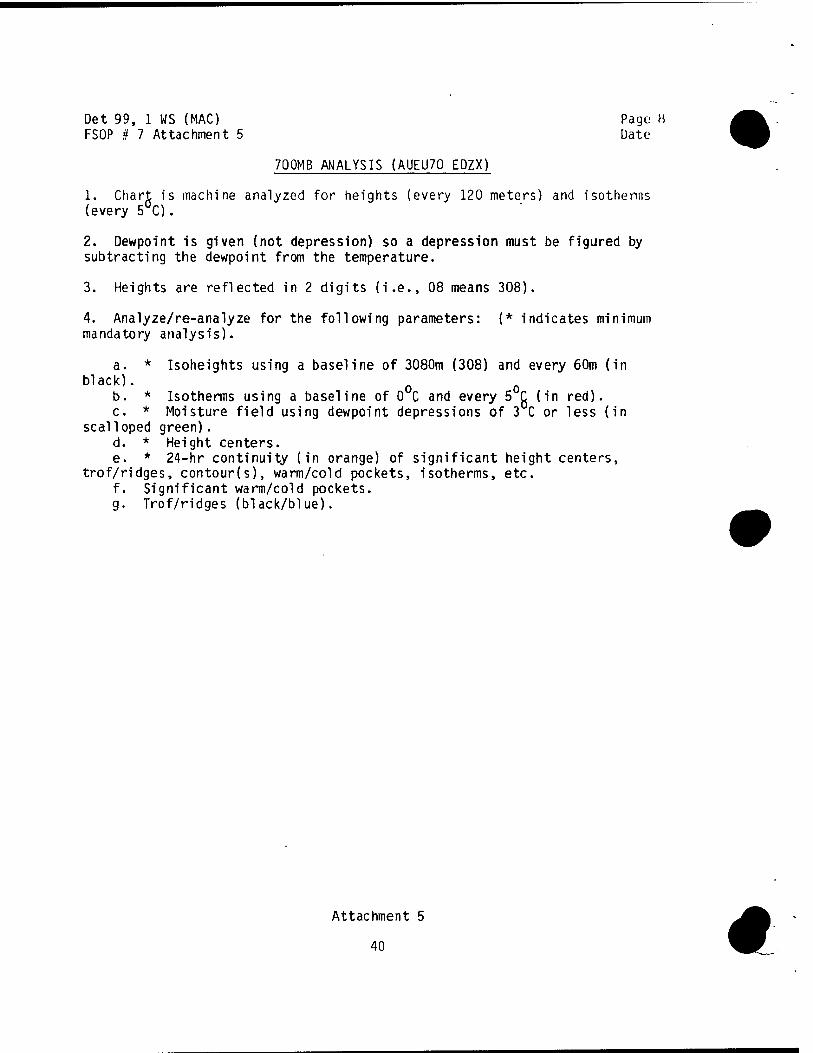
Det 99, 1 WS (MAC) Page H FSOP # 7 Attachment 5 Date
700MB ANALYSIS (AUEU70 EDZX)
1. Chart is machine analyzed for heights (every 120 meters) and isotherms (every 5°C).
2. Dewpoint is given (not depression) so a depression must be figured by subtracting the dewpoint from the temperature.
3. Heights are reflected in 2 digits (i.e., 08 means 308).
4. Analyze/re-analyze for the following parameters: (* indicates minimum mandatory analysis).
a. * Isoheights using a baseline of 3080m (308) and e\/ery 60m (in black).
b. * Isotherms using a baseline of 0 C and every 5 C (in red). c. * Moisture field using dewpoint depressions of 3 C or less (in
scalloped green). d. * Height centers. e. * 24-hr continuity (in orange) of significant height centers,
trof/ridges, contour(s), warm/cold pockets, isotherms, etc. f. Significant warm/cold pockets. g. Trof/ridges (black/blue).
Attachment 5
40 #
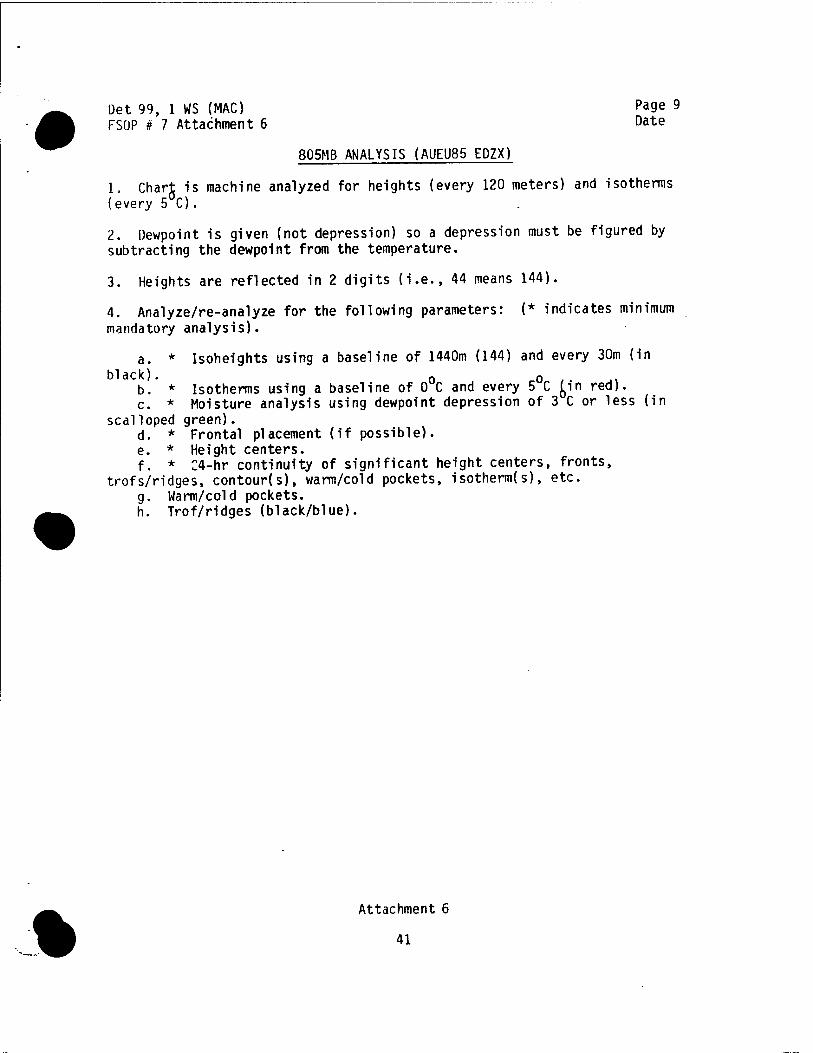
Det 99, 1 WS (MAC) Pa9e 9 FSOP # 7 Attachment 6 bate
805MB ANALYSIS (AUEU85 EDZX)
1. Chart is machine analyzed for heights (every 120 meters) and isotherms (every 5 C).
2. »ewpoint is given (not depression) so a depression must be figured by subtracting the dewpoint from the temperature.
3. Heights are reflected in 2 digits (i.e., 44 means 144).
4. Analyze/re-analyze for the following parameters: (* indicates minimum mandatory analysis).
a. * Isoheights using a baseline of 1440m (144) and every 30m (in black). 0 0
b. * Isotherms using a baseline of 0 C and every 5 C ^in red). c. * Moisture analysis using dewpoint depression of 3 C or less (in
scalloped green). d. * Frontal placement (if possible). e. * Height centers. f. * C4-hr continuity of significant height centers, fronts,
trofs/ridges, contour(s), warm/cold pockets, isotherm(s), etc. g. Warm/cold pockets. h. Trof/ridges (black/blue).
%
Attachment 6
41
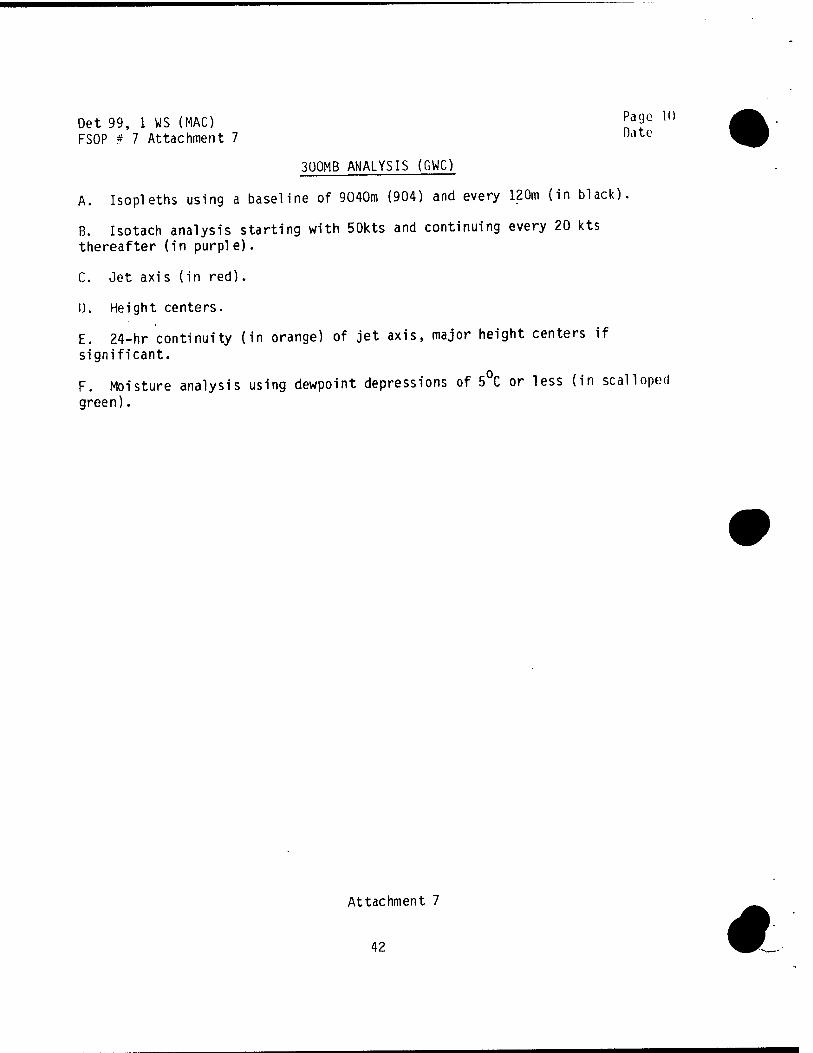
Det 99, 1 WS (MAC) Pä(}c l()
FSOP # 7 Attachment 7 n,,te
300MB ANALYSIS (GWC)
A. Isopleths using a baseline of 9040m (904) and every 120m (in black).
B. Isotach analysis starting with 50kts and continuing every 20 kts thereafter (in purple).
C. Jet axis (in red).
0. Height centers.
E. 24-hr continuity (in orange) of jet axis, major height centers if significant.
F. Moisture analysis using dewpoint depressions of 5°C or less (in scalloped green).
Attachment 7
42 #
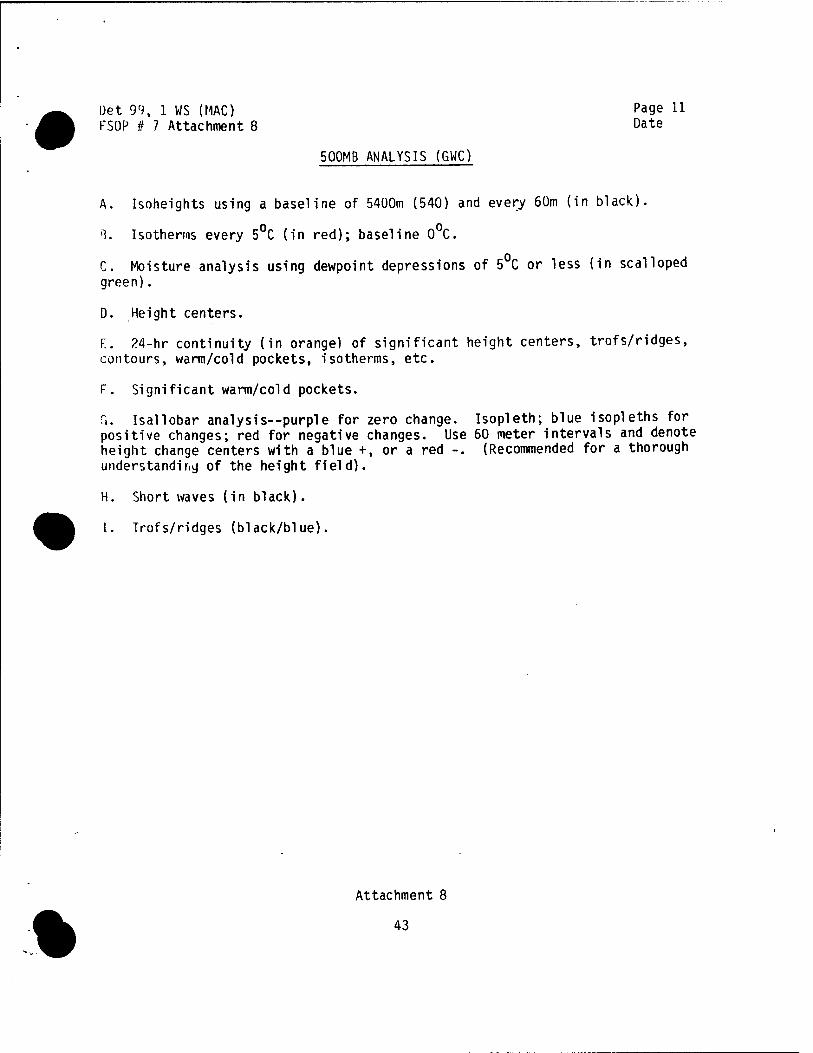
Det 9'i, 1 WS (MAC) Page 11 FSOP # 7 Attachment 8 Date
500MB ANALYSIS (GWC)
A. Isoheights using a baseline of 5400m (540) and every 60m (in black).
'1. Isotherms every 5°C (in red); baseline 0 C.
C. Moisture analysis using dewpoint depressions of 5 C or less (in scalloped green).
D. Height centers.
F.. 24-hr continuity (in orange) of significant height centers, trofs/ridges, contours, warm/cold pockets, isotherms, etc.
F. Significant warm/cold pockets.
G. Isallobar analysis—purple for zero change. Isopleth; blue isopleths for positive changes; red for negative changes. Use 60 meter intervals and denote height change centers with a blue +, or a red -. (Recommended for a thorough understanding of the height field).
H. Short waves (in black).
I. Trofs/ridges (black/blue).
%
Attachment 8
43
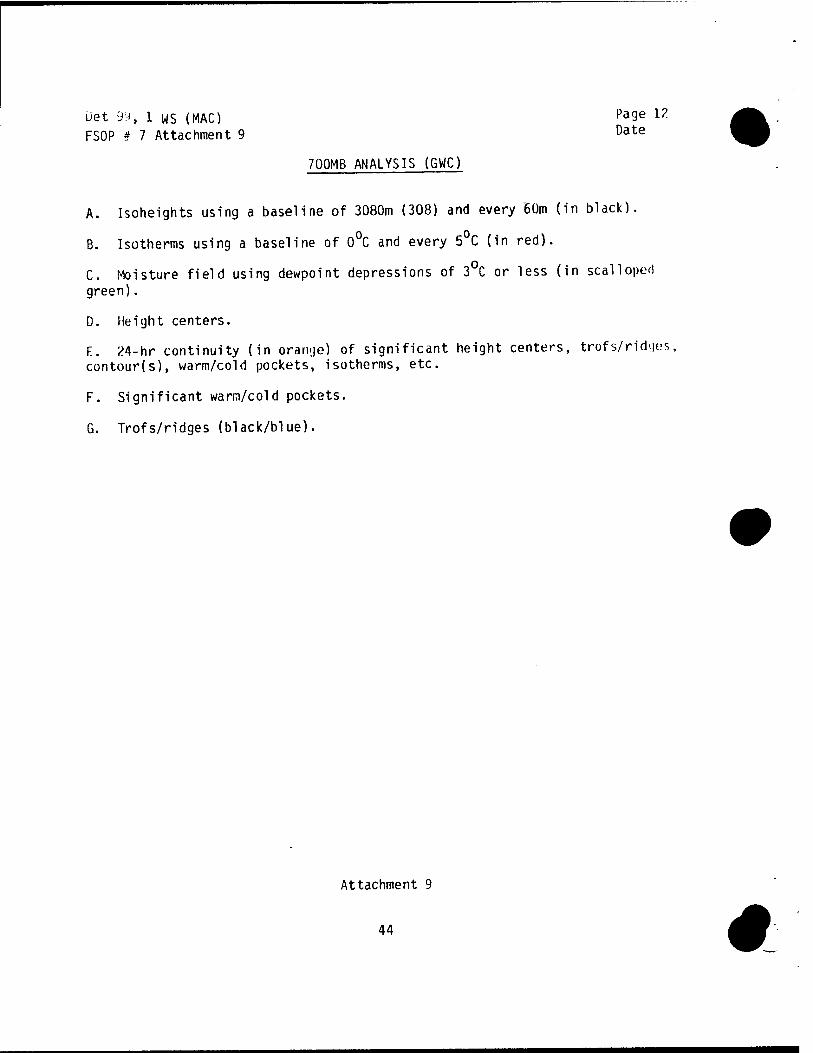
üet £>:-i, 1 WS (MAC) Pa9e l?- FSOP # 7 Attachment 9 Date
700MB ANALYSIS (GWC)
A. Isoheights using a baseline of 3080m (308) and every 60m (in black).
B. Isotherms using a baseline of 0°C and every 5 C (in red).
C. Moisture field using dewpoint depressions of 3 C or less (in scalloped green).
D. Height centers.
F.. ^4-hr continuity (in orange) of significant height centers, trofs/rid«|os, contour(s), warm/cold pockets, isotherms, etc.
F. Significant warm/cold pockets.
G. Trofs/ridges (black/blue).
Attachment 9
44 #
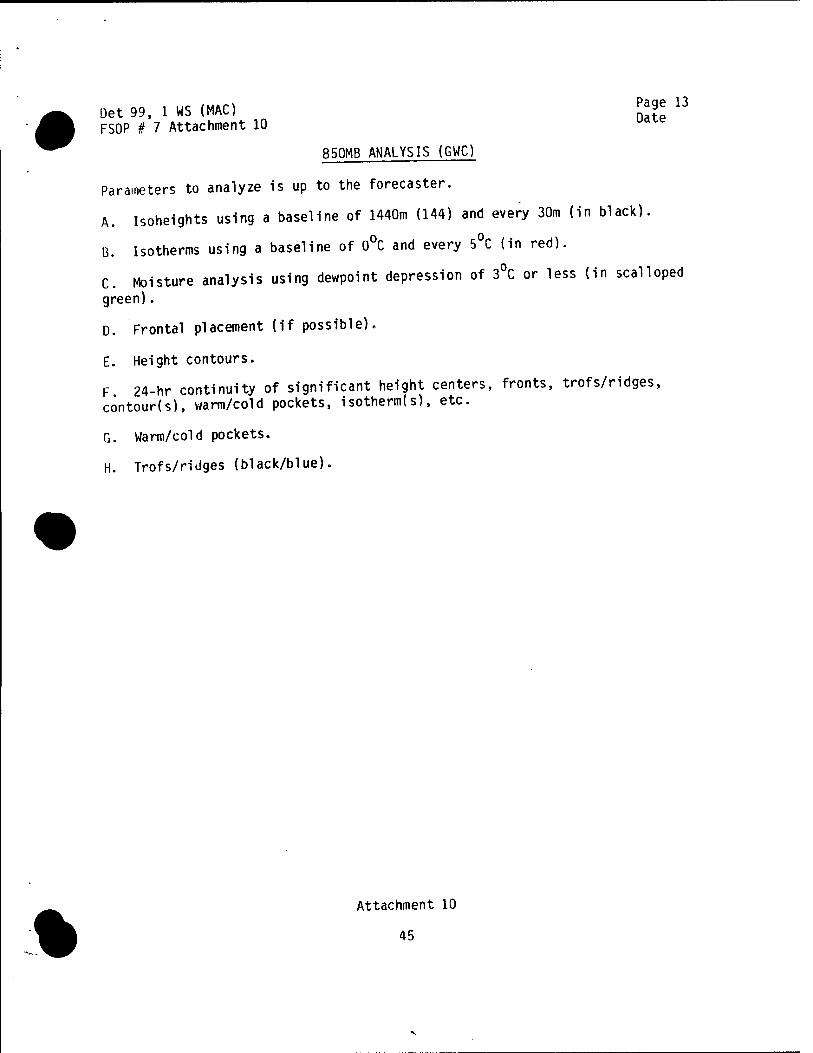
Det 99, 1 WS (MAC) {*g 13
FSOP # 7 Attachment 10
850MB ANALYSIS (GWC)
Parameters to analyze is up to the forecaster.
A. Isoheights using a baseline of 1440m (144) and every 30m (in black).
13. Isotherms using a baseline of 0°C and every 5°C (in red).
C. Moisture analysis using dewpoint depression of 3°C or less (in scalloped
green).
D. Frontal placement (if possible).
E. Height contours.
F 24-hr continuity of significant height centers, fronts, trofs/ridges, contour(s), warm/cold pockets, isotherm(s), etc.
G. Warm/cold pockets.
H. Trofs/ridges (black/blue).
%
Attachment 10
45
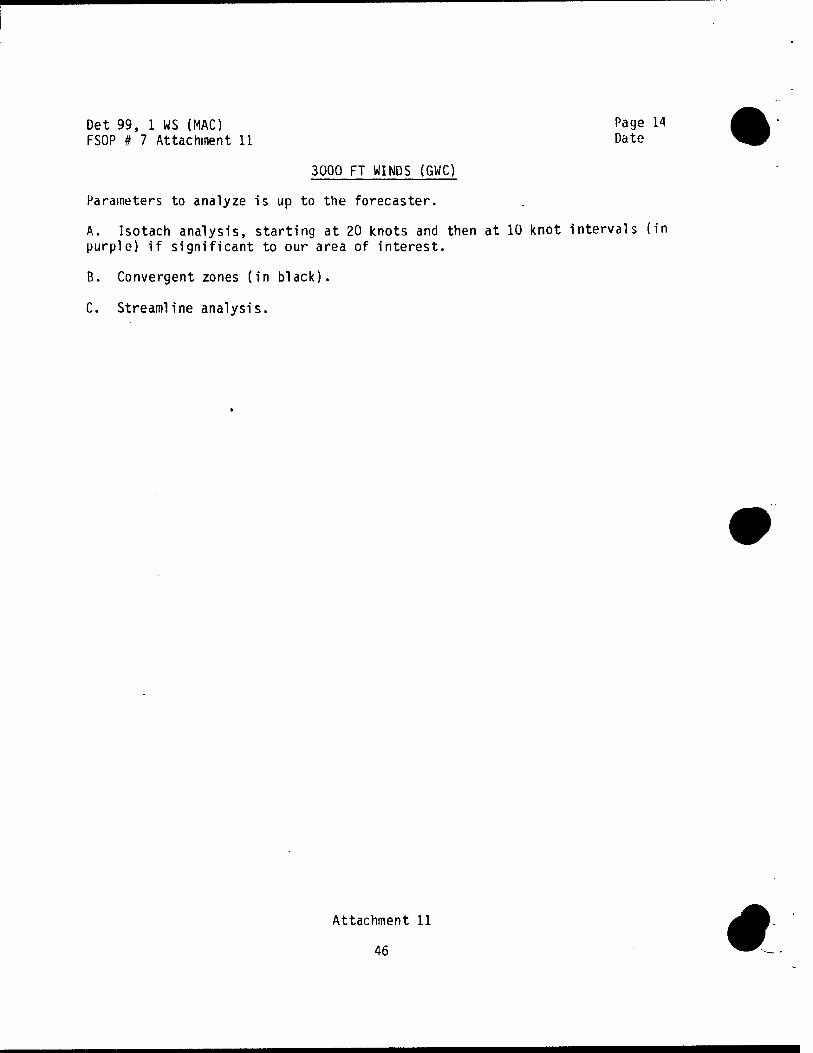
Det 99, 1 WS (MAC) Page 14 FSOP # 7 Attachment 11 Date
3000 FT WINDS (GWC)
Parameters to analyze is up to the forecaster.
A. Isotach analysis, starting at 20 knots and then at 10 knot intervals (in purple) if significant to our area of interest.
B. Convergent zones (in black).
C. Streamline analysis.
Attachment 11
46 #
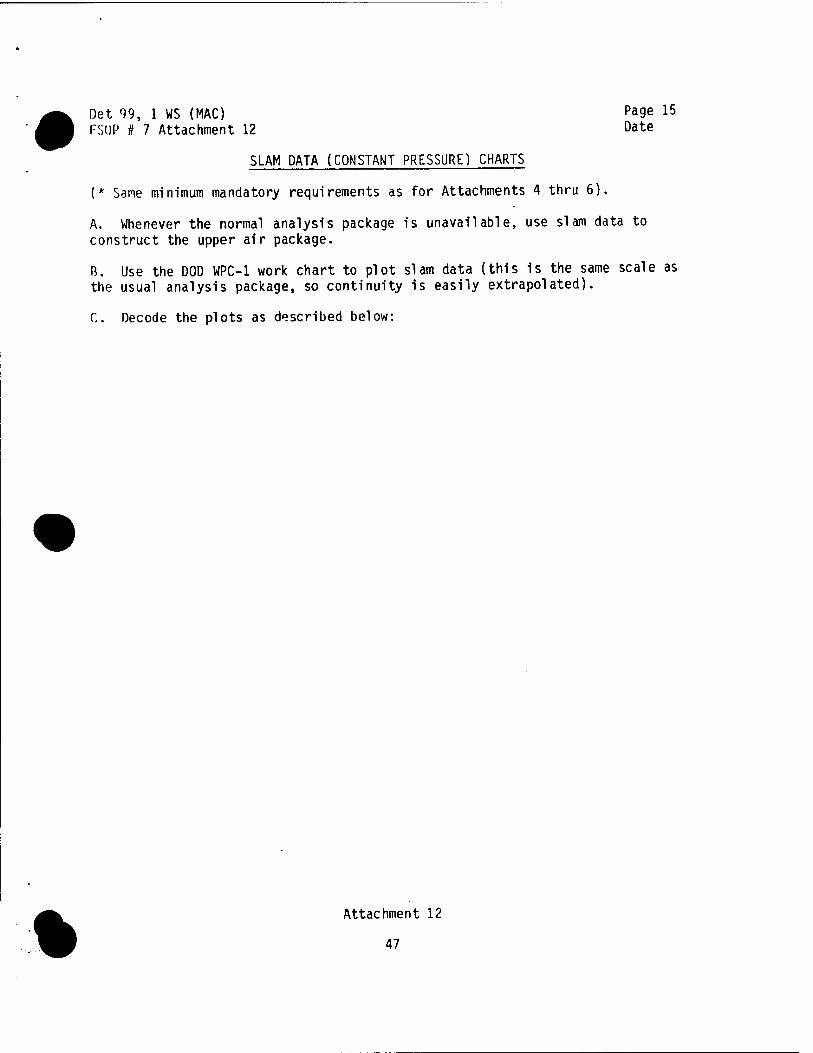
Det 99, 1 WS (MAC) Page 15 FSDP # 7 Attachment 12 Date
SLAM DATA (CONSTANT PRESSURE) CHARTS
(* Sane minimum mandatory requirements as for Attachments 4 thru 6).
A. Whenever the normal analysis package is unavailable, use slam data to construct the upper air package.
B. Use the DOD WPC-1 work chart to plot slam data (this is the same scale as the usual analysis package, so continuity is easily extrapolated).
C. Decode the plots as described below:
%
Attachment 12
47
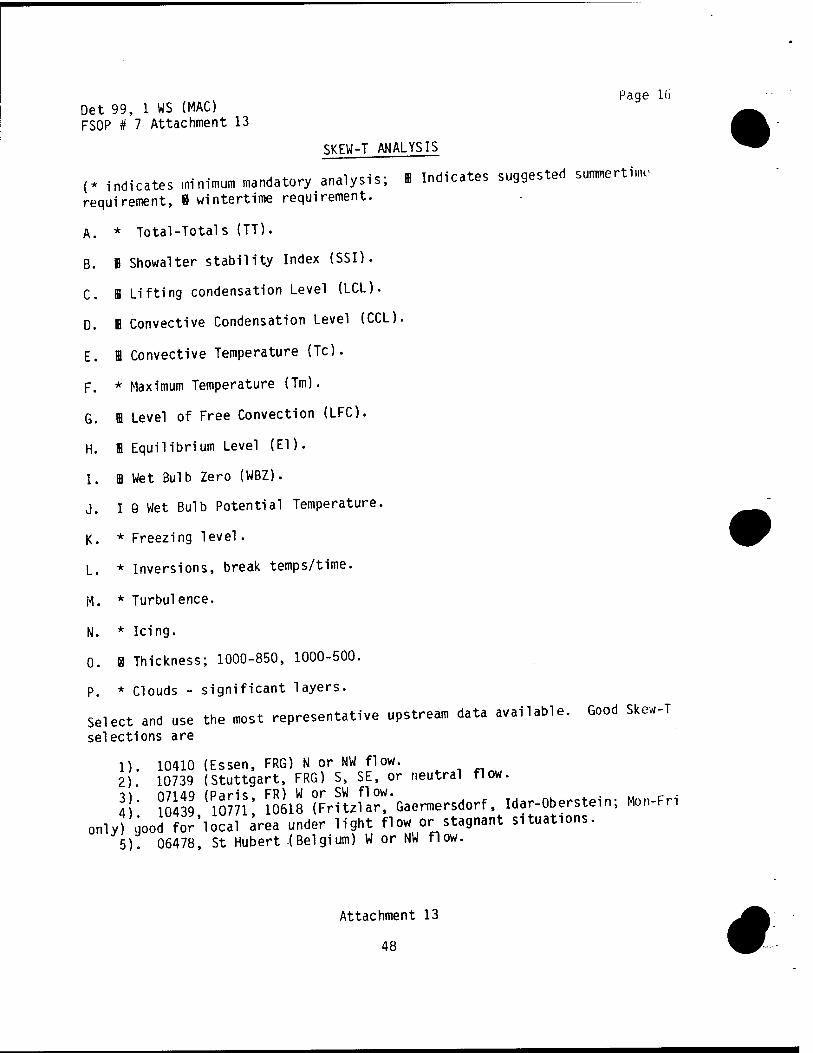
Page 1(> Det 99, 1 WS (MAC) FSOP # 7 Attachment 13
SKEW-T ANALYSIS
(* indicates minimum mandatory analysis; I Indicates suggested summertime requirement, B wintertime requirement.
A. * Total-Totals (TT).
B. 1 Showalter stability Index (SSI).
C. ffl Lifting condensation Level (LCL).
D. 1 Convective Condensation Level (CCL).
E. I Convective Temperature (Tc).
F. * Maximum Temperature (Tm).
G. ffl Level of Free Convection (LFC).
H. B Equilibrium Level (El).
I. I Wet Bulb Zero (WBZ).
J. I 9 Wet Bulb Potential Temperature.
K. * Freezing level.
L. * Inversions, break temps/time.
M. * Turbulence.
N. * Icing.
0. 8 Thickness; 1000-850, 1000-500.
p. * Clouds - significant layers.
Select and use the most representative upstream data available. Good Skew-T selections are
1). 10410 (Essen, FRG) N or NW flow. 2) 10739 (Stuttgart, FRG) S, SE, or neutral flow.
l\' ?0439 (1077l' Sis (Frnz^'Gaen^rsdorf. Idar-Oberstein; Mon-Fri only) good for'local area under light flow or stagnant situations.
5). 06478, St Hubert -(Belgium) W or NW flow.
Attachment 13
48 #
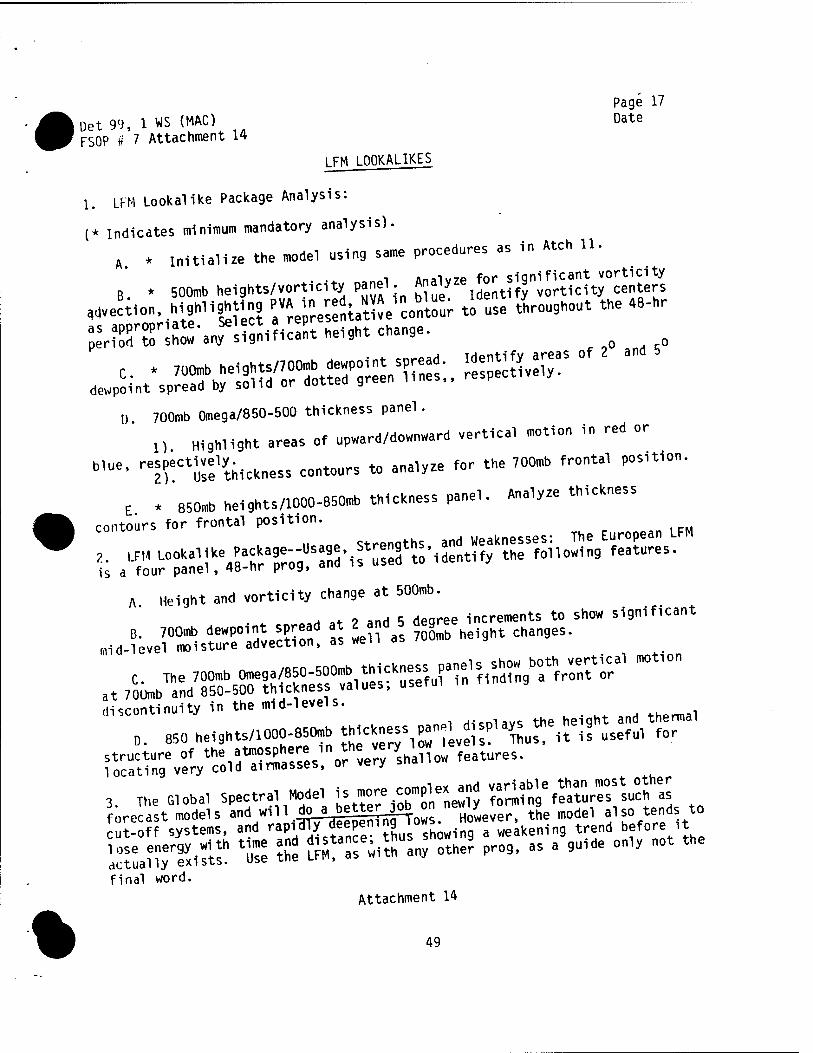
Page 17
Det 99, 1 WS (MAC) Date F50P # 7 Attachment 14
I.FM LOOKALIKES
1. LFM Lookalike Package Analysis:
(* indicates minimum mandatory analysis).
A * initialize the model using same procedures as in Atch 11.
i AnAivyp for significant vorticity B * 500mb heights/vorticUy panel. An^ze
ld°ntifJ vorticity centers
„ 700mb Onega/850-500 thickness panel.
U Highlight areas of upward/downward vertical .notion In red or
blue. «ptJJlVb,.,, contours to analyze for the 700mb front* position.
E . wo* heights/1000-850* thickness panel. Ana!yze thickness
contours for frontal position. ^
H Height and vorticity change at 500mb.
;t^d^^^^ Continuity 1, the .Id-levels.
0. 850 heightsAOOO-85« thickness pane 1 P^J« { ,« useful ,„,
3. The Oioba, Spec-, «ode, is .none co^nd '«^Ä« Ä
ITuanyÄ K the SSMVtfU "tne? Prog, as a guide oniy not the
%
final word. Attachment 14
49
Det 99, 1 WS (MAC) Page 18 FSOP # 7 Attachment 15 Date
DWD 50OMB 4 PANEL PROG
A. To effectively use this prog, identify and place the upstream frontal system on your 850mb analysis or surface chart. Try to associate the surface front with a particular isotherm at 500mb. Follow this isotherm relationship through the entire 72-hr time frame of the prog, moving the front(s) and create a useful surface prog.
B. This model uses a baseline height value of 5520m (552) with additional contours at 80 meter intervals. Isotherms are given in standard 5 C increments.
C. This model has proven to be very useful in locating and tracking frontal systems through a 72-hr forecast cycle. It usually does not work well under a summertime regime, when fronts are rather weak and diffuse. However, in winter the prog is highly effective.
Attachment 15
50 #
, „i Pa9e 19
üet 99, 1 WS (MAC) Date
FSOP # 7 Attachment 16
DUD 850MB 4 PANEL PROG
A. Like the BOOmb 4 panel prog, the DUD 850mb prog displays heights and temperature fields through the 72-hr forecast cycle ™e0model use a baseline height value of the 1440m (144) and a standard 5 C interval on isotherms.
B. As on the BOOmb prog, attempt to place the surface Jironltal system in association with a particular isotherm, and continue this through the entire 72 hr forecast cycle. This should yield a relatively accurate 72-hr surface
prog.
C. The same seasonal considerations for the DUD 500mb prog should be applied
to the BBOmb prog.
%
Attachment 16
61
Det99, 1 WS (MAC) ^ 2° FSOP # 7 Attachment 17
GLOBAL WEATHER CENTRAL SPECTRAL
A. Attempt to place frontal systems using the thickness isopleths. Identify any major pressure systems, and look for any trofs/ndgesr which may be significant.
B These progs have proven useful in locating frontal positions at the 24-36 hour time frame. Displayed are 1000-500mb thickness nsopleths, overlaid on lOOOmb (surface) contours.
Attachment 17
52 #
Det 99, 1 WS (MAC) Page 21 FSÜP # 7 Attachment 18 Date
NWS SURFACE CHART
Upon receipt of the 00Z surface chart, ensure that 24-hr continuity (if available) is placed on the chart to include pressure.centers, fronts, trofs, and any other feature deemed significant by the duty forecaster.
%
Attachment 18
53
Det 99, 1 WS (MAC) Page 22 FSOP # 7 Attachment 19 Date
CENTRAL TACTICAL ANALYSIS (CTA) CENTRAL TACTICAL FORECAST (CTF) CENTRAL PLANNING FORECAST (CPF)
A. These analyses/progs are generated by DWD (Deutches Wetterdienst) and gives a broad overview of weather conditions within the Federal Republic of Germany. The CTA is somewhat vague as to exact conditions within an area, while the progs are consistently pessimistic. However, good information can be obtained on weak surface features in some situations.
B. For greater detail, see the accompanying teletype narrative headed: FXEU51 EDZX.
Attachment 19
54 4
%
APPENDIX C SAMPLE DOI AND SUPPORTING SOPs
Det , WS DOI 105-
Weather
LOCAL ANALYSIS AND FORECAST PROGRAM (LAFP)
This DOI establishes policy and procedures for the Detachment Local Analysis and Forecast Program (LAFP). The overall objective fo the LAFP is to better meet local customer weather requirements by provding a systematic approach to weather forecasting. This DOI implements and compliments the requirements of AWSR 105-22 as supplemented by 2 WW.
1. General. The systematic approach of the LAFP minimizes overlooking key predictors by emphasizing a thorough analysis phase to increase precast accuracy. The LAFP analysis and forecast procedures are outlined in the referenced SOPs, while the DOI procedures are for the major components of the
LAFP.
2. Responsibilities. Forecasters and observers will follow the LAFP procedures as outlined by the appropriate directives. All personnel equally share the responsibility to assist in maintaining or improving the LAFP as a viable program. The station chief is responsible for the overall management of the LAFP and shares with the commander, the technical leader of the unit, the responsibility to ensure the LAFP is oriented toward the stated objectives.
3. Procedures. The LAFP procedures consist of the following:
a. Forecast discussions.
(1) At each shift change, the duty forecaster will brief the oncoming forecaster. Forecast SOP (FSOP) # (Forecaster Discussions) provide guidance and lists items to be coveredT The intent of the FSOP is not to structure the content rigidly but to ensure a logical progression to a clear understanding of the meteorological situation. The oncoming forecaster ^ controls the shift change briefing because understanding where and why the weather is occurring and how it is expected to change is the primary purpose of the shift change briefing:
(2) At Z (M-F) all available forecasters will attend the daily station briefing. This discussion will be an expanded shift change briefing focusing on synoptic weather and the impact on local weather.
(3) Forecast discussions will also be held for special weather situations. All available forecasters will attend these special weather situations to focus on consensus forecasting derived from LAFP analyses. At the duty forecasters' discretion, when no other forecasters are available in the base weather station, contact the station chief or commander.
b. Processing Facsimile Products.
(1) Enhancement. Color all charts posted as aids for briefing as outlined in FSOP # (Facsimile Chart Processing). Observers share
55
equally in these duties, however, it remains the responsibility of the duty forecasters to ensure that this is accomplished.
(2) Centralized product reanalysis. Reanalyze the centralized facsimile products as outlined in FSOP # (Centralized Product Reanalysis). Incorporate as much METSAT imagery into the.reanalysis as possible. Reanalysis differs from enhancement and is strictly a forecaster responsibility.
c. METSAT Imagery. Use the imagery to initialize the centralized products, to maintain continuity and make adjustments to the progs, and as a short range forecasting tool. FSOP # (METSAT Imagery) provides additional guidance.
d. Local Analysis and Forecast Development. Better forecast reasoning is the main objective of local analyses; local analysis, therefore, is necessary for small or mesoscale features that are not resolved on the synoptic (centralized) scale. Each analysis/reanalysis builds and refines the forecast reasoning and forecast development data bases. The forecast development process is not limited to the 30 minutes prior to the scheduled TAF issue time, nor to few minutes prior to significant meteorological change. Preparation and timely amendment of the TAF and associated products (warnings, advisories, etc.) should be viewed as continuing process. FSOP # (Forecast Development) outlines steps to be taken in forecast development.
e. Forecast Review. The forecast review process is intended to be a learning experience rather than a method of punishment for a missed forecast. The unit program includes both "good" and "missed" forecasts. The commander or station chief evaluates all forecasts and then subjectively assigns reviews on a case-by-case basis. Forecasts having a signficant impact on a customer's operation will be given first priority. The preparation of reviews should be the first step in solving operationally significant forecast problems by improving forecast performance through technical development reviews, but these should be coordinated with the station chief. The format and content for both "informal" and "in-depth" reviews are outlined in FSOP # . (Forecast Review).
(Signature). (Rank), USAF Commander ~~
56 4
%
rSUP /.< FORECAST DISCUSSIONS
1. Focus the forecast discussion on the items listed below. Expand the discussion to the synoptic scale as appropriate.
a. Past weather and causes. b. Present weather and causes. c. Forecast weather and causes.
2. Discussions will be held routinely for shift change briefings and special weather situations.
a. Shift change briefings should cover the following subjects:
(1) Surface analysis.
(a) Continuity of movement, pressure centers, frontal systems, and other significant features.
(b) Associated cloud and sensible weather patterns.
(2) Significant upper air features.
(a) Position of troughs and ridges. (b) Continuity of movement of key features (contours, height
fall centers, etc.).
(3) METSAT imagery.
(a) Position and characteristics of cloud formations. (b) Identification of significant upper air and surface
features. (c) Dissipation/formation and movement of cloud patterns.
(4) Initialization of numerical progs/forecast model and adjustments.
(a) "Goodness" of progs and supporting analyses. (b) Current customer operations and potential problems.
b. Special weather situation briefings should focus on a particular problem.
c. A daily (M-F) station briefing, attended by all available forecasters will be conducted at Z. This briefing will be an expanded shift change briefing using these guidelines:
(1) Focus on synoptic weather and impact on local weather. (2) Use consensus forecasting techniques to aid development of
forecast reasoning. (3) The station chief or commander may on occasion lead the
discussion.
DATE REVIEWED
57
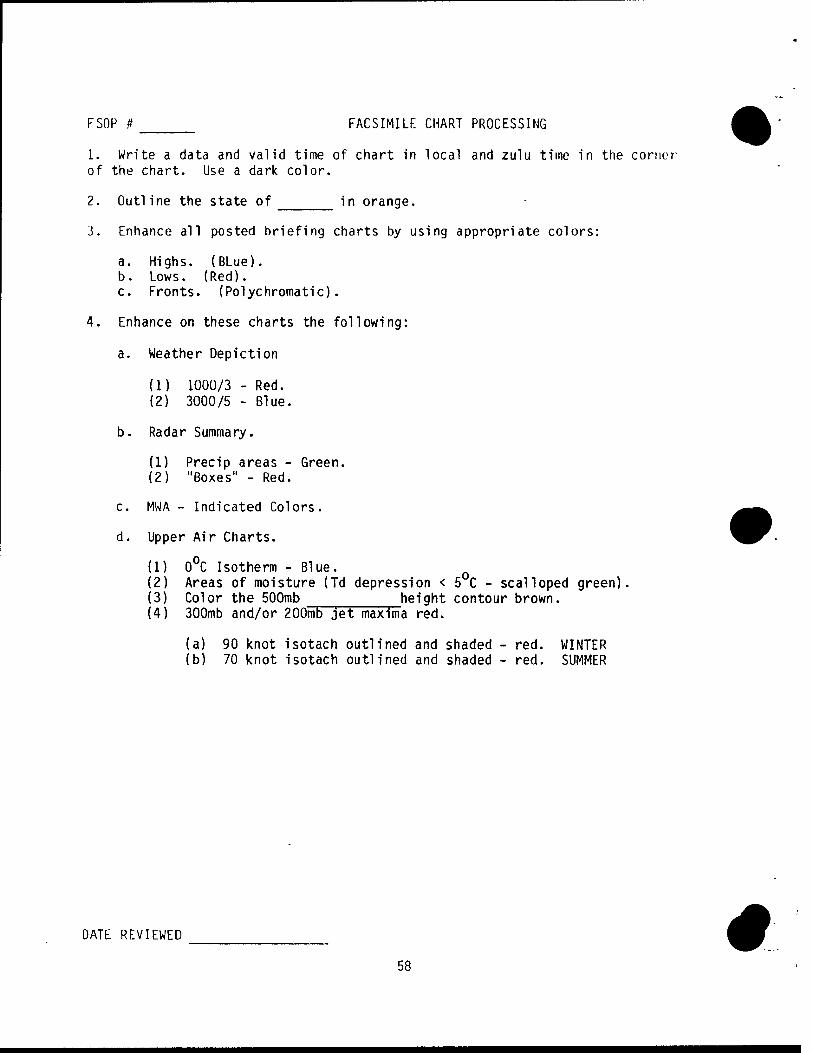
FSOF # FACSIMILE CHART PROCESSING
1. Write a data and valid time of chart in local and zulu time in the corner of the chart. Use a dark color.
2. Outline the state of in orange.
3. Enhance all posted briefing charts by using appropriate colors:
a. Highs. (BLue). b. Lows. (Red). c. Fronts. (Polychromatic).
4. Enhance on these charts the following:
a. Weather Depiction
(1) 1000/3 - Red. (2) 3000/5 - Blue.
b. Radar Summary.
(1) Precip areas - Green. (2) "Boxes" - Red.
c. MWA - Indicated Colors.
d. Upper Air Charts.
(1) 0°C Isotherm - Blue. (2) Areas of moisture (Td depression < 5 C - scalloped green). (3) Color the 500mb _^ height contour brown. (4) 300mb and/or 200mb jet maxima red.
(a) 90 knot isotach outlined and shaded - red. WINTER (b) 70 knot isotach outlined and shaded - red. SUMMER
DATE REVIEWED
58
#
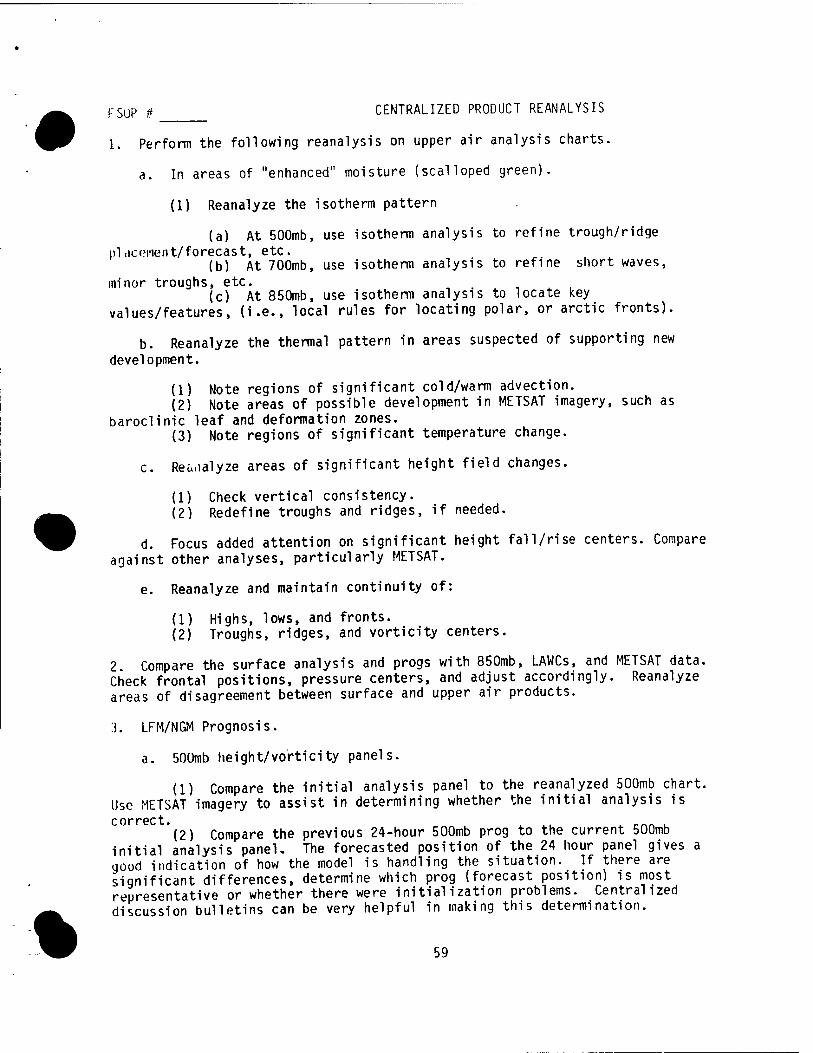
%
FSUP T4 CENTRALIZED PRODUCT REANALYSIS
1. Perform the following reanalysis on upper air analysis charts.
a. In areas of "enhanced" moisture (scalloped green).
(1) Reanalyze the isotherm pattern
(a) At 500mb, use isotherm analysis to refine trough/ridge pi dcoi'ient/forecast, etc.
(b) At 700mb, use isotherm analysis to refine short waves,
minor troughs, etc. ,.,,., (c) At 850mb, use isotherm analysis to locate key
values/features, (i.e., local rules for locating polar, or arctic fronts).
b. Reanalyze the thermal pattern in areas suspected of supporting new development.
(1) Note regions of significant cold/warm advection. (2) Note areas of possible development in METSAT imagery, such as
baroclinic leaf and deformation zones. (3) Note regions of significant temperature change.
c. Reanalyze areas of significant height field changes.
(1) Check vertical consistency. (2) Redefine troughs and ridges, if needed.
d. Focus added attention on significant height fall/rise centers. Compare against other analyses, particularly METSAT.
e. Reanalyze and maintain continuity of:
(1) Highs, lows, and fronts. (2) Troughs, ridges, and vorticity centers.
2. Compare the surface analysis and progs with 850mb, LAWCs, and METSAT data. Check frontal positions, pressure centers, and adjust accordingly. Reanalyze areas of disagreement between surface and upper air products.
3. LFM/NGM Prognosis.
a. 500mb height/vorticity panels.
(1) Compare the initial analysis panel to the reanalyzed 500mb chart. Use METSAT imagery to assist in determining whether the initial analysis is correct.
(2) Compare the previous 24-hour 500mb prog to the current 500mb initial analysis paneU The forecasted position of the 24 hour panel gives a good indication of how the model is handling the situation. If there are significant differences, determine which prog (forecast position) is most representative or whether there were initialization problems. Centralized discussion bulletins can be very helpful in making this determination.
59
b. MSL Pressure/1000/500mb thickness panels. Analyze frontal position/features using the 1000-500mb thickness field.
DATE REVIEWED
60 «
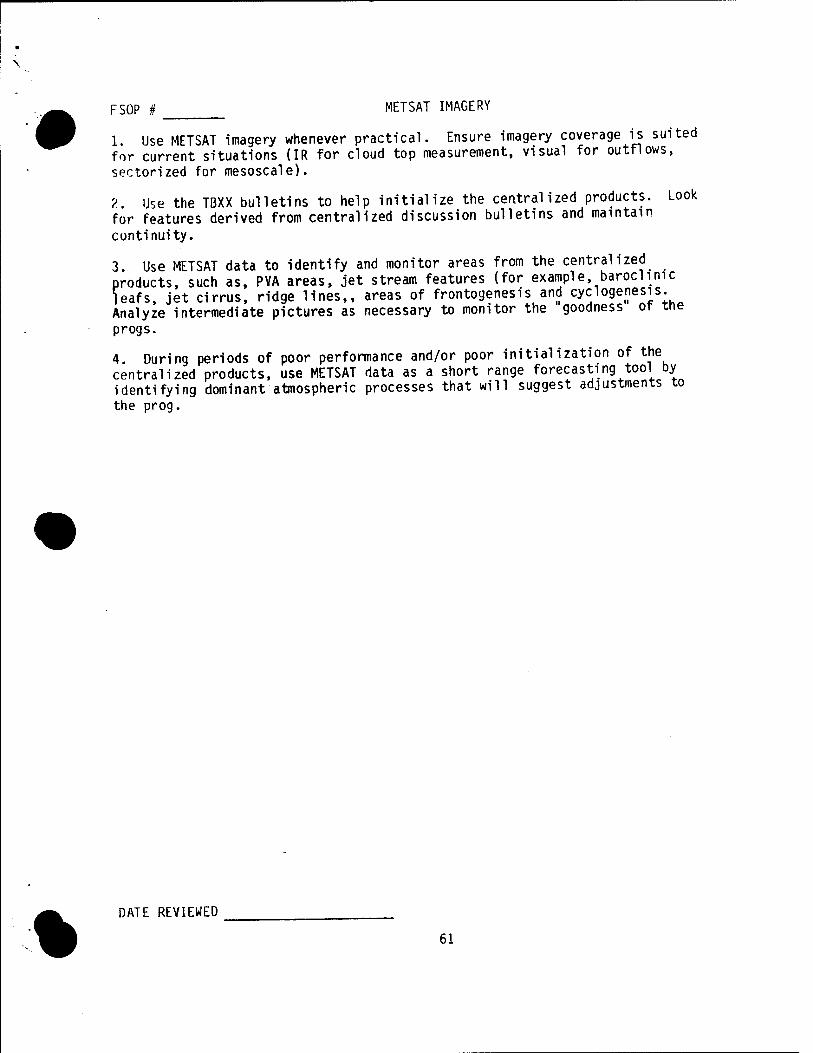
FSOP # METSAT IMAGERY
1. Use METSAT imagery whenever practical. Ensure imagery coverage is suited for current situations (IR for cloud top measurement, visual for outflows, sectorized for mesoscale).
?. Use the TBXX bulletins to help initialize the centralized products. Look for features derived from centralized discussion bulletins and maintain
continuity.
3. Use METSAT data to identify and monitor areas from the centralized products, such as, PVA areas, jet stream features (for example, baroclimc leafs, jet cirrus, ridge lines,, areas of frontogenesis and cyclogenesis. Analyze intermediate pictures as necessary to monitor the goodness or we progs.
4. During periods of poor performance and/or poor initialization of the centralized products, use METSAT data as a short range forecasting tool by identifying dominant atmospheric processes that will suggest adjustments to
the prog.
%
DATE REVIEWED
61
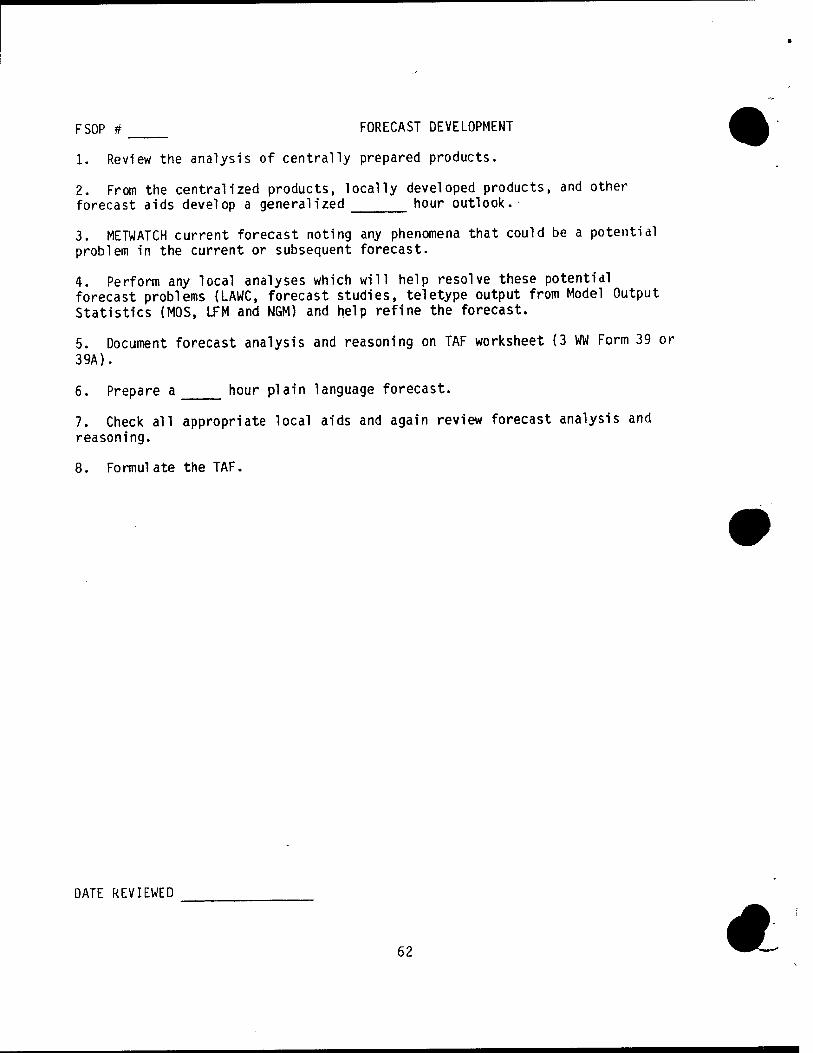
FSOP # FORECAST DEVELOPMENT
1. Review the analysis of centrally prepared products.
2. From the centralized products, locally developed products, and other forecast aids develop a generalized hour outlook.-
3. METWATCH current forecast noting any phenomena that could be a potential problem in the current or subsequent forecast.
4. Perform any local analyses which will help resolve these potential forecast problems (LAWC, forecast studies, teletype output from Model Output Statistics (MOS, LFM and NGM) and help refine the forecast.
5. Document forecast analysis and reasoning on TAF worksheet (3 WW Form 39 or 39A).
6. Prepare a hour plain language forecast.
7. Check all appropriate local aids and again review forecast analysis and reasoning.
8. Formul ate the TAF.
DATE REVIEWED
62 4L
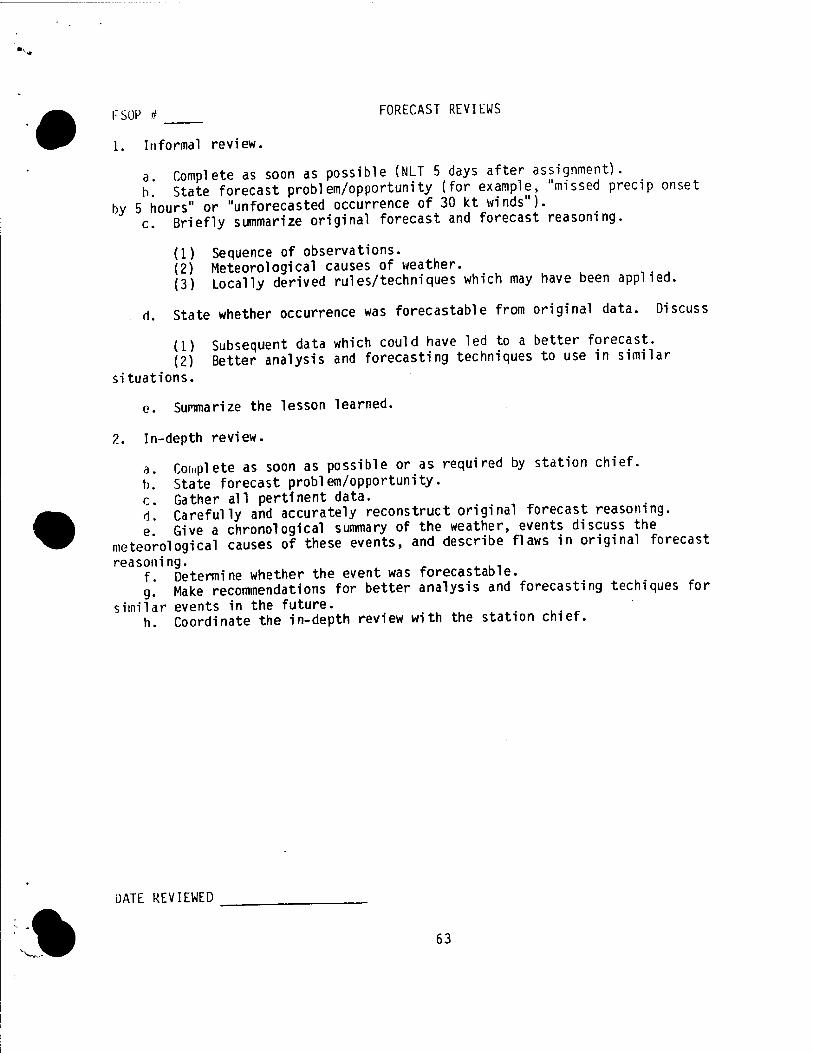
FSÜP ^ FORECAST REVIEWS
1. Informal review.
a Complete as soon as possible (NLT 5 days after assignment). b. State forecast problem/opportunity (for example, "missed precip onset
by 5 hours" or "unforecasted occurrence of 30 kt winds"). c. Briefly summarize original forecast and forecast reasoning.
(1) Sequence of observations. (2) Meteorological causes of weather. (3) Locally derived rules/techniques which may have been applied.
d. State whether occurrence was forecastable from original data. Discuss
(1) Subsequent data which could have led to a better forecast. (2) Better analysis and forecasting techniques to use in similar
situations.
e. Summarize the lesson learned.
2. In-depth review.
a. Coh.plete as soon as possible or as required by station chief. b. State forecast problem/opportunity. c. Gather all pertinent data. d Carefully and accurately reconstruct original forecast reasoning, e' Give a chronological summary of the weather, events discuss the
meteorological causes of these events, and describe flaws in original forecast
reasoning. . . . . f Determine whether the event was forecastable. g." Make recommendations for better analysis and forecasting techiques for
similar events in the future. h. Coordinate the in-depth review with the station chief.
;%
UATE REVIEWED ,
63
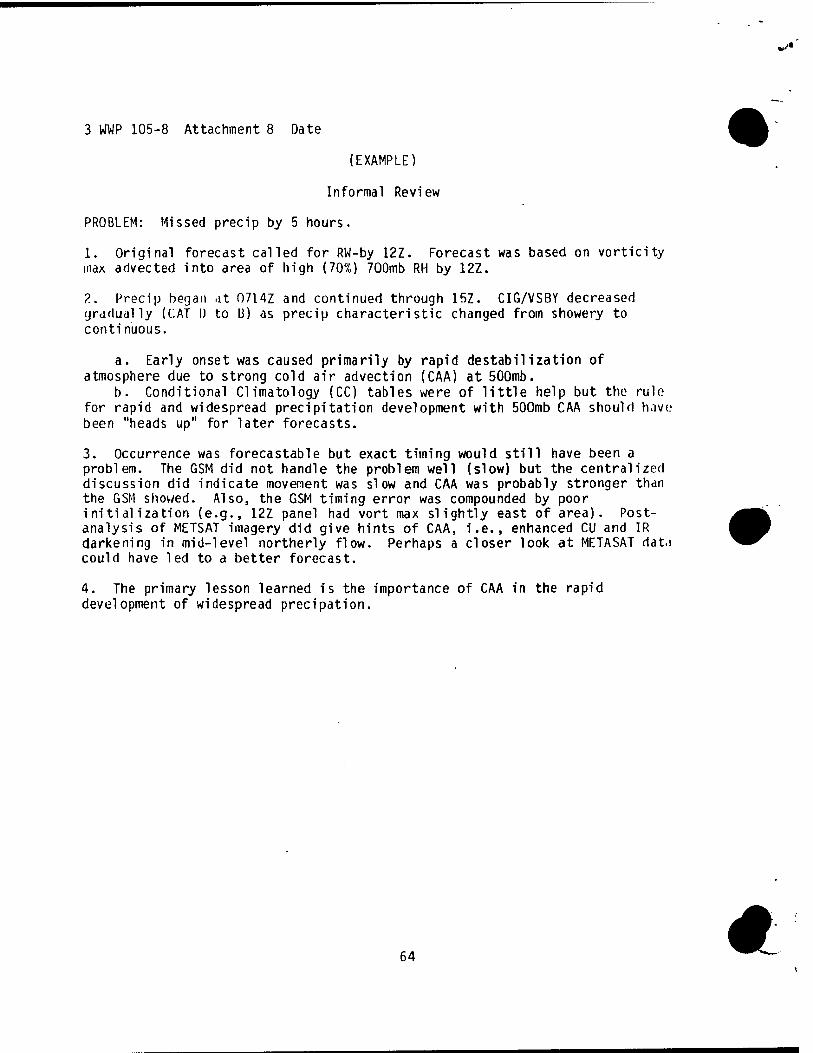
3 WWP 105-8 Attachment 8 Date
(EXAMPLE)
Informal Review
PROBLEM: Missed precip by 5 hours.
1. Original forecast called for RW-by 12Z. Forecast was based on vorticity max advected into area of high (70%) 7O0mb RH by 12Z.
2. Precip began -it 0714Z and continued through 15Z. CIG/VSBY decreased gradually (CAT I) to 13) as precip characteristic changed from showery to continuous.
a. Early onset was caused primarily by rapid destabilization of atmosphere due to strong cold air advection (CAA) at 500mb.
b. Conditional Climatology (CC) tables were of little help but the rule for rapid and widespread precipitation development with 500mb CAA should have been "heads up" for later forecasts.
3. Occurrence was forecastable but exact timing would still have been a problem. The GSM did not handle the problem well (slow) but the centralized discussion did indicate movement was slow and CAA was probably stronger than the GSM showed. Also, the GSM timing error was compounded by poor initialization (e.g., 12Z panel had vort max slightly east of area). Post- analysis of METSAT imagery did give hints of CAA, i.e., enhanced CU and IR darkening in mid-level northerly flow. Perhaps a closer look at METASAT dat.i could have led to a better forecast.
4. The primary lesson learned is the importance of CAA in the rapid development of widespread precipation.
64 #
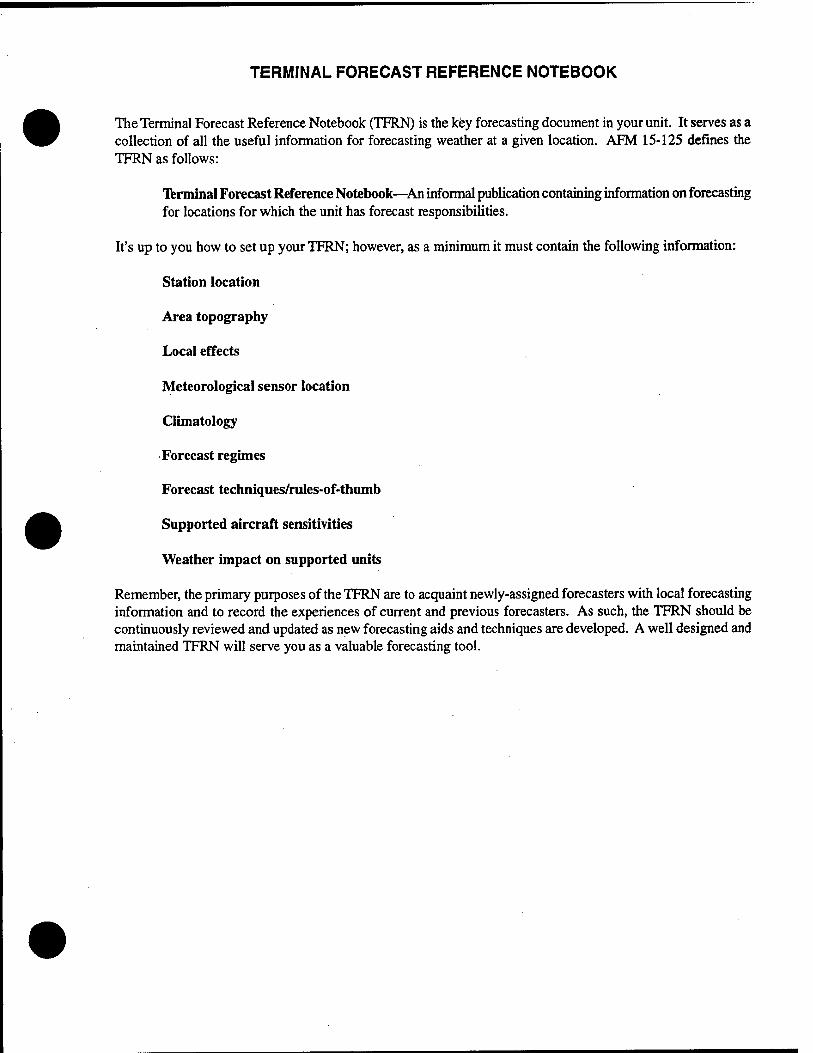
TERMINAL FORECAST REFERENCE NOTEBOOK
The Terminal Forecast Reference Notebook (TFRN) is the key forecasting document in your unit. It serves as a collection of all the useful information for forecasting weather at a given location. AFM 15-125 defines the TFRN as follows:
Terminal Forecast Reference Notebook—An informal publication containing information on forecasting for locations for which the unit has forecast responsibilities.
It's up to you how to set up your TFRN; however, as a minimum it must contain the following information:
Station location
Area topography
Local effects
Meteorological sensor location
Climatology
Forecast regimes
Forecast techniques/rules-of-thumb
Supported aircraft sensitivities
Weather impact on supported units
Remember, the primary purposes of the TFRN are to acquaint newly-assigned forecasters with local forecasting information and to record the experiences of current and previous forecasters. As such, the TFRN should be continuously reviewed and updated as new forecasting aids and techniques are developed. A well designed and maintained TFRN will serve you as a valuable forecasting tool.
The following four references will help you develop or improve your TFRN program:
AFM 15-125 Weather Station Operations - Contains guidance on content and review responsibility.
Check it Out 96-02 Weather Regimes - Gives an overview of the weather regime concept and how to incorporate it into the forecast process.
7WW/FM—90/003 Terminal Forecast Reference Notebook - An excellent but brief discussion of the purpose and content of the TFRN.
2WW/FM—86/001 Terminal Forecast Reference Notebooks - A more in-depth discussion than the 7WW memo, also contains examples.
Although the older references do not mention weather or forecast regimes specifically, they do discuss topics such as "local terminal weather with typical synoptic situations" and "atmospheric features that produce operationally significant weather at your terminal." Phrases such as those can be used interchangeable with forecast regime.
In addition to the references listed above, copies of old TFRNs are available from the Air Weather Service Technical Library (AWSTL). If your current TFRN seems unusually "thin" or if it's newer than 1990, there's a good chance some useful information was "weeded out." If this is the case, you should strongly consider requesting a copy of your old TFRN. Also, if you do have a large revision of your TFRN, send a complete copy to the AWSTL.
Your MAJCOM aerospace sciences POC or HQ AWS/XON can assist you with specific questions or concerns.
2WW/FM-86/001
2d ww forecaster
memo
\
SMSgt D.G. McGrew £ s
Terminal
Forecast
Reference
Notebooks
»UBLISHED BY:
!WW/DNS
MAY 1986 mSBBB
APPROVED FOR PUBLIC RELEASE
DISTRIBUTION UNLIMITED T:>
PART I: OVERVIEW
A. REQUIREMENTS: Units with forecast (terminal, point warning, METWATCH ) responsibilities will maintain a TFRN. Forecast units will maintain a TFRN for each unit for which it has forecast responsibility. Additionally, an unofficial TFRN, or forecaster handbook, may be developed by units not required to maintain a TFRN.
B. PURPOSE: The TFRN is designed primarily to acquaint newly assigned forecasters with local topography, climatology, forecasting problems and techniques, and serve to record the experience of current and previous forecasters. It is also a valuable forecasting aid for units or agencies with forecast and/or briefing responsibility. Forecast centers are required to maintain a TFRN for each location that they have a forecast responsibility for. The TFRN must be continuously reviewed and updated as forecasting aids and techniques are developed and evaluated and as new climo data becomes available. Those stations that develop an unofficial TFRN or forecaster handbook should use the same general format as TFRNs. We do receive many requests for TFRNs from such places as Bad Toelz and Soesterberg.
C. PROCEDURES: The TFRN is developed by each forecasting unit IAW AWSR 105-22, 2 WW Sup 1. However, there are some things you can do to make sure that you do not have your TFRN returned to you to reaccomplish.
a. Send the original document. Make a copy to keep for your use, but send the original forward for review and approval. Your original document will copy much better than most copies will.
b. Do not use color codes, or any kind of color that will detract from the meaning if it reproduces black. Our copier will not reproduce colors. Also, some colors will obscure the data they are~hTghTTght1ng by reproducing in a dark "grey" shade or black. The bottom line 1s-don't use colors! If you want to use colors to make it easier to Interpret the data, color code your station work copy.
c. Do not use copies as part of your "original". Have them retyped, redrawn or whatever is necessary. We have received some copies that were legible but not reproduceable. Do yourself a favor and take the time to make a useful, legible and reproduceable document, preferably on your office word processor or computer. Also, do not use your original as a work copy. Keep it filed to use for updates, revisions, etc. This will allow you to color code your work copy, or enhance it in any way you wish.
d. Make sure that you have complied with AWSR 105-22, 2 WW Sup 1 and include all of the required information.
wing If you are not sure what data to include in your TFRN, ask squadron or . Don't just send it in and hope. Do it right the first time.
%
Revisions or updates may be submitted as pen and ink or page changes if the changes are not too extensive. Use your judgement. If the update/revision is extensive, we will publish a new TFRN. See Paragraph F for examples of pen and ink or page changes. All changes will be submitted through your squadron to 2 WW/DNS. This is not just for approval - we know who all needs copies of your changes.
D. FORMAT AND CONTENT: Part II shows examples of what we are looking for in the TFRNs. There is no perfect format, and content will vary fron unit to unit. However, all TFRNs should be reasonably alike in both format and content. All TFRNs will have a table of contents and all pages will be numbered.
E. TFRN CHECKLIST
1. Assign one or more forecasters to assist in developing or revising your TFRN. Perhaps one per each section of the TFRN.
2. Each individual involved in compiling the TFRN should review AWSR 105-22 and 2WW Sup 1 as well as this forecaster memo.
3. Locate good maps of the local area. Make sure they are reproduceable. If you have difficulty with this, ask squadron or wing for help in locating some.
4. Locate a good diagram of the runway complex to use in identifying the location of your met equipment.
5. Review all climo data for currency. If you are due a new RUSSWO in the next few months (less than six) then you might want to wait for the new data before completing section II. Include the period of record for all data used.
6. Make sure your operationally critical weather elements in Section II is in the right format and has supporting climo data.
7. Review all forecast studies and ROTs to see if (1) they are approved, and (2) they have been evaluated recently (within the last five years). All studies and ROTs should be periodically (or continuously) evaluated to insure they continue to be valid.
8. Make arrangements for typing support to insure legible and reproduceable copies.
9. Insure that all graphs are legible and do not use color codes.
10. Review the finished product before forwarding it to squadron. If you follow the directions provided in this forecaster memo and AWSR 105-22, you should not have your TFRN returned.
•
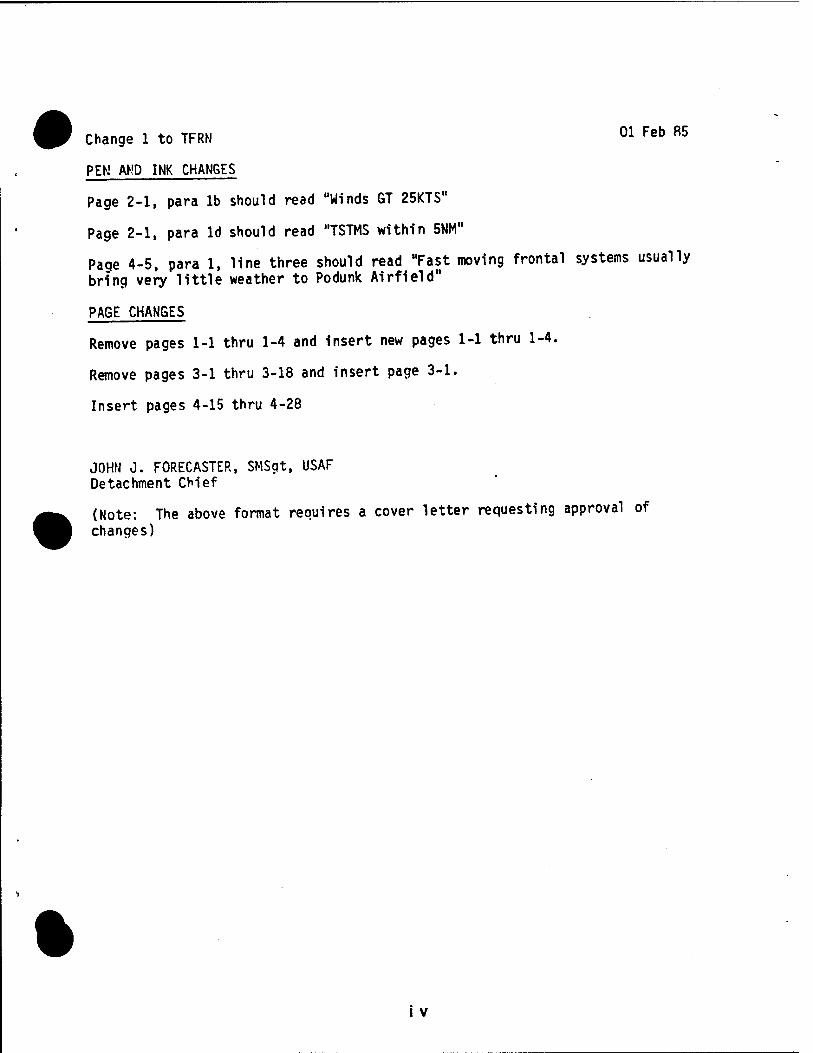
Change 1 to TFRN 01 Feb fi5
PEN AMD INK CHANGES
Page 2-1, para lb should read "Winds 6T 25KTS"
Page 2-1, para Id should read "TSTMS within 5NM"
Page 4-5, para 1, line three should read "Fast moving frontal systems usually bring very little weather to Podunk Airfield"
PAGE CHANGES
Remove pages 1-1 thru 1-4 and insert new pages 1-1 thru 1-4.
Remove pages 3-1 thru 3-18 and insert page 3-1.
Insert pages 4-15 thru 4-28
JOHN J. FORECASTER, SMSgt, USAF Detachment Chief
(Note: The above format requires a cover letter requesting approval of changes)
•
i v
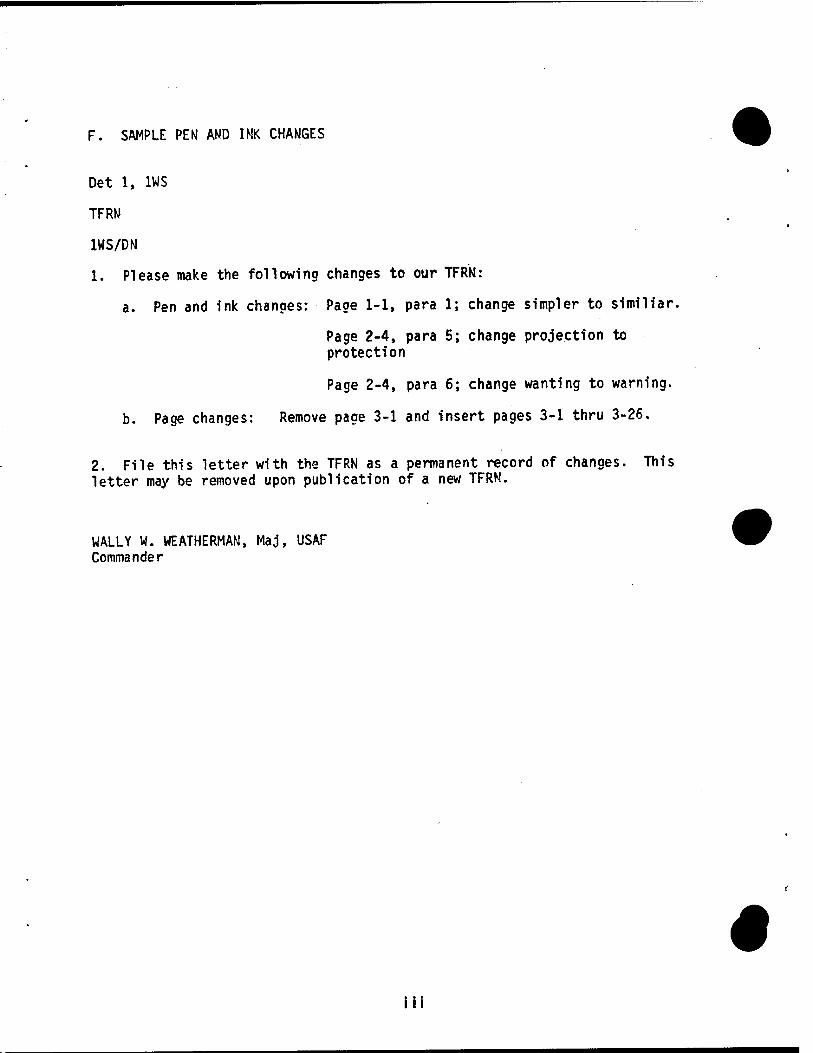
F. SAMPLE PEN AND INK CHANGES
Det 1, 1WS
TFRN
1WS/DN
1. Please make the following changes to our TFRN:
a. Pen and ink changes: Page 1-1, para 1; change simpler to similiar.
Page 2-4, para 5; change projection to protection
Page 2-4, para 6; change wanting to warning.
b. Page changes: Remove page 3-1 and insert pages 3-1 thru 3-26.
2. File this letter with the TFRN as a permanent record of changes. This letter may be removed upon publication of a new TFRN.
WALLY W. WEATHERMAN, Maj, USAF Commander
•
M
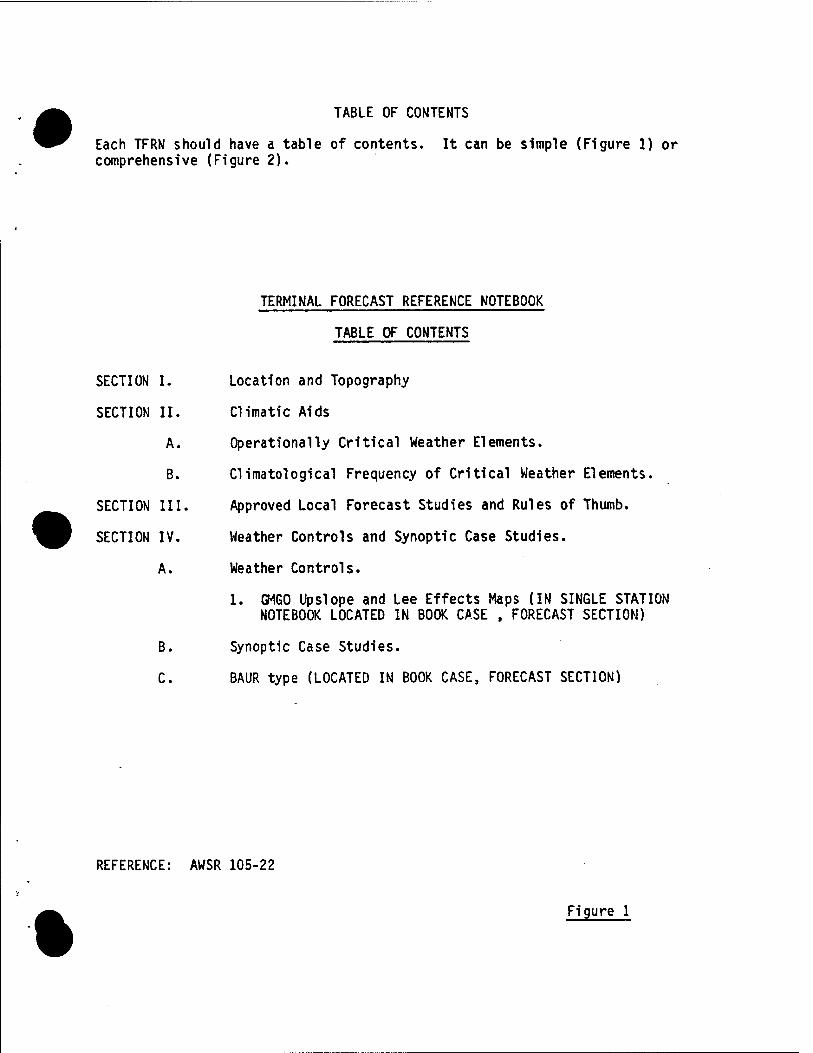
TABLE OF CONTENTS
Each TFRN should have a table of contents. It can be simple (Figure 1) or comprehensive (Figure 2).
TERMINAL FORECAST REFERENCE NOTEBOOK
TABLE OF CONTENTS
SECTION I.
SECTION II.
A.
B.
SECTION III.
SECTION IV.
A.
B.
C.
Location and Topography
Climatic Aids
Operationally Critical Weather Elements.
Climatological Frequency of Critical Weather Elements.
Approved Local Forecast Studies and Rules of Thumb.
Weather Controls and Synoptic Case Studies.
Weather Controls.
1. GMGO Upslope and Lee Effects Maps (IN SINGLE STATION NOTEBOOK LOCATED IN BOOK CASE , FORECAST SECTION)
Synoptic Case Studies.
BAUR type (LOCATED IN BOOK CASE, FORECAST SECTION)
REFERENCE: AWSR 105-22
•
Figure 1
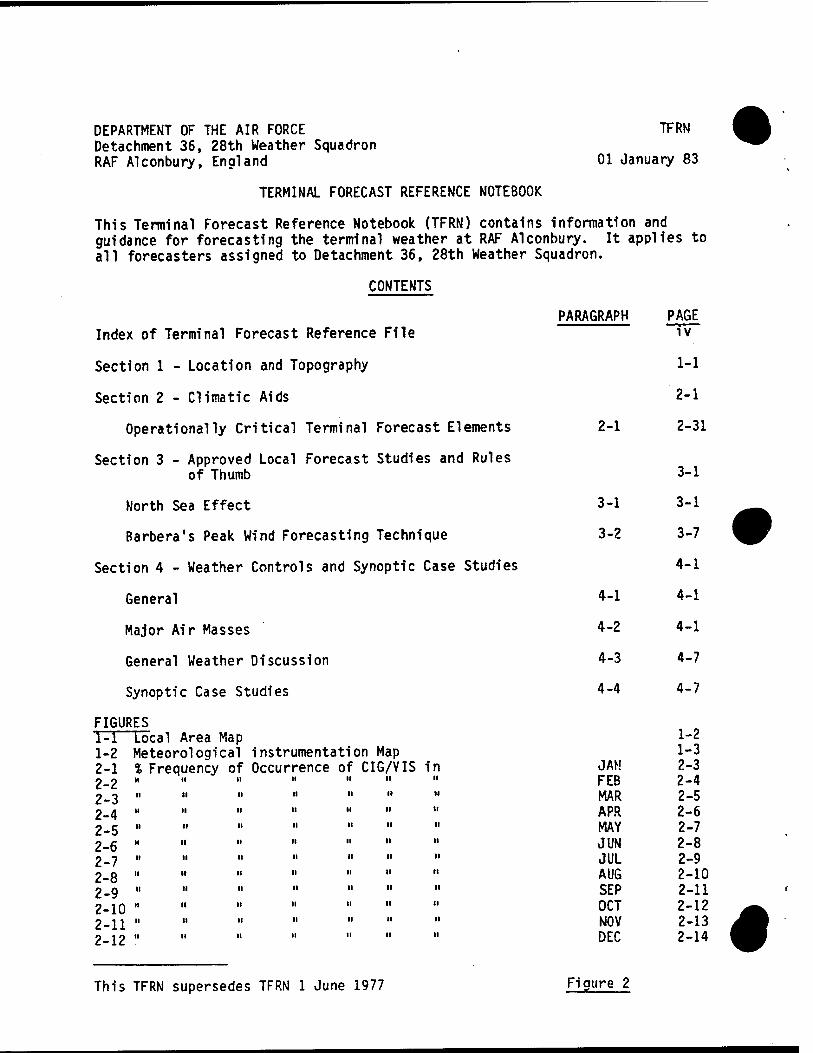
DEPARTMENT OF THE AIR FORCE Detachment 36, 28th Weather Squadron RAF Alconbury, England
TFRN
01 January 83
TERMINAL FORECAST REFERENCE NOTEBOOK
This Terminal Forecast Reference Notebook (TFRN) contains information and guidance for forecasting the terminal weather at RAF Alconbury. It applies to all forecasters assigned to Detachment 36, 28th Weather Squadron.
CONTENTS
Index of Terminal Forecast Reference File
Section 1 - Location and Topography
Section 2 - Climatic Aids
Operationally Critical Terminal Forecast Elements
Section 3 - Approved Local Forecast Studies and Rules of Thumb
North Sea Effect
Barbera's Peak Wind Forecasting Technique
Section 4 - Weather Controls and Synoptic Case Studies
General
Major Air Masses
General Weather Discussion
Synoptic Case Studies
FIGURES 1-1 Local Area Map 1-2 Meteorologi cal instrumentation Map 2-1 % Frequency of Occurrence of CIG/VIS in 2-2 H II ■I ii it ■i ■I
2-3 ii H II H II II n
2-4 ■I n H n H n II
2-5 II ■I H H ■1 H ■i
2-6 II ■I II ii ■I ■1 ■I
2-7 ■1 II ■I ■I II ■I II
2-8 II H ti II II II it
2-9 II II H ■1 II n H
2-10 H II H H n H n
2-11 n II ii ■I ■I n II
2-12 ■I it H II ■1 II
This TFRN supersedes TFRN 1 June 1977
PARAGRAPH PAGE IV
1-1
2-1
2-1 2-31
3-1
3-1 3-1
3-2 3-7
4-1
4-1 4-1
4-2 4-1
4-3 4-7
4-4 4-7
1-2 1-3
JAN 2-3 FEB 2-4 MAR 2-5 APR 2-6 MAY 2-7 JUN 2-8 JUL 2-9 AUG 2-10 SEP 2-11 OCT 2-12 NOV 2-13 DEC 2-14
Figure 2
•
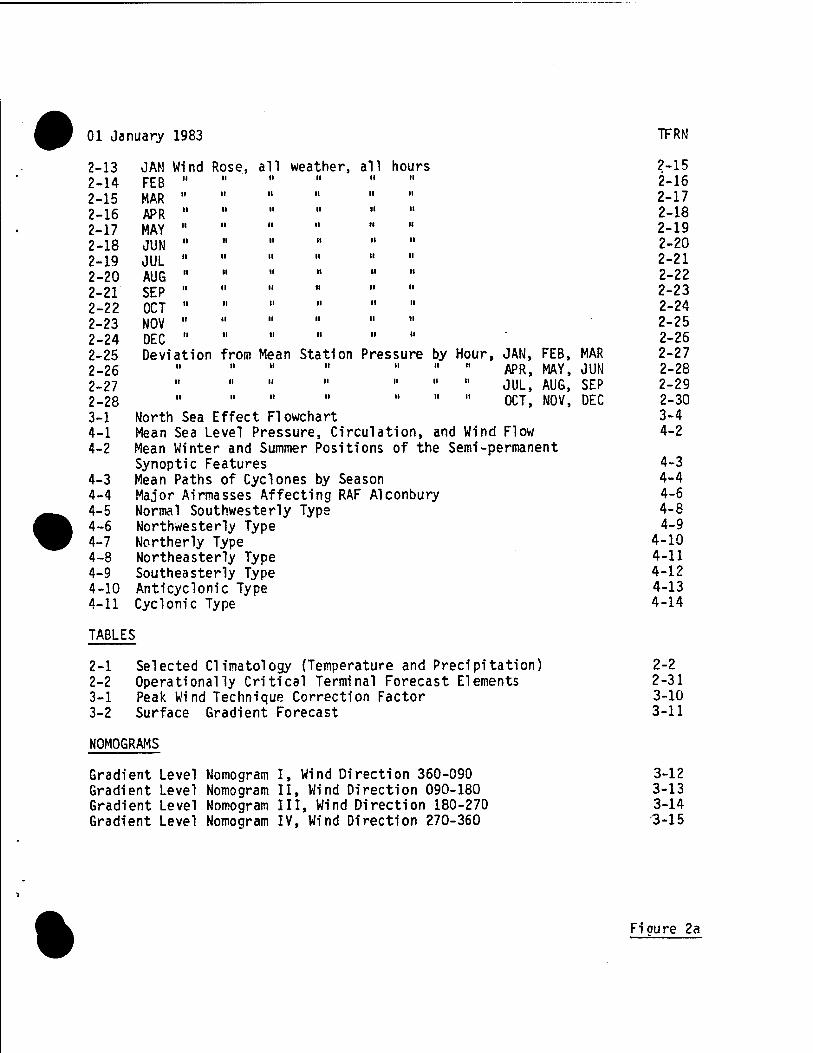
01 January 1983
2-13 2-14 2-15 2-16 2-17 2-18 2-19 2-20 2-21 2-22 2-23 2-24 2-25 2-26 2-27 2-28 3-1 4-1 4-2
4-3 4-4 4-5 4-6 4-7 4-8 4-9 4-10 4-11
JAN Wind Rose, all weather, all hours FEB M II II n ■1 n
MAR H ■1 ■I H II n
APR H II n M ■1 ■I
MAY ii n M ■I ■i ■I
JUN ii ■i n H H n
JUL II H II M ■I H
AUG H II ■I H ■i H
SEP ■I II II ■I II H
OCT H II II II n H
NOV it II II ■1 n II
DEC n II II H n II
Devi ation from Mean Station Pressure b. II II H II n II
H II II II H II
II H n II N H
our, JAN, FEB, MAR APR, MAY, JUN JUL, AUG, SEP OCT, NOV, DEC
North Sea Effect Flowchart Mean Sea Level Pressure, Circulation, and Wind Flow Mean Winter and Summer Positions of the Semi-permanent Synoptic Features Mean Paths of Cyclones by Season Major Airmasses Affecting RAF Alconbury Normal Southwesterly Type Northwesterly Type Northerly Type Northeasterly Type Southeasterly Type Anticyclonic Type Cyclonic Type
TABLES
2-1 Selected Climatology (Temperature and Precipitation) 2-2 Operationally Critical Terminal Forecast Elements 3-1 Peak Wind Technique Correction Factor 3-2 Surface Gradient Forecast
TFRN
2-15 2-16 2-17 2-18 2-19 2-20 2-21 2-22 2-23 2-24 2-25 2-26 2-27 2-28 2-29 2-30 3-4 4-2
4-3 4-4 4-6 4-8 4-9
4-10 4-11 4-12 4-13 4-14
2-2 2-31 3-10 3-11
NOMOGRAMS
Gradient Gradient Gradient Gradient
Level Nomogram I, Wind Direction 360-090 Level Nomogram II, Wind Direction 090-180 Level Nomogram III, Wind Direction 180-270 Level Nomogram IV, Wind Direction 270-360
3-12 3-13 3-14
<3-15
•
Fioure 2a
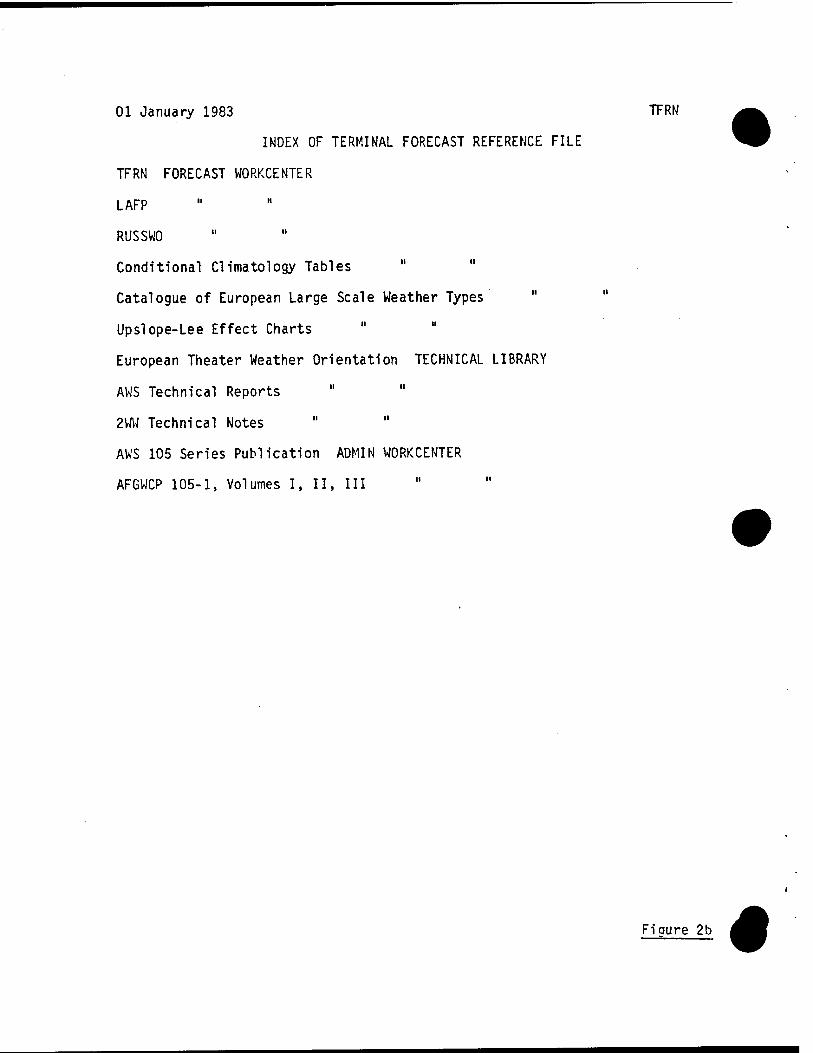
01 January 1983 TFRN
INDEX OF TERMINAL FORECAST REFERENCE FILE
TFRN FORECAST WORKCENTER
LAFP
RUSSWO
Conditional Climatology Tables " "
Catalogue of European Large Scale Weather Types " "
Upslope-Lee Effect Charts
European Theater Weather Orientation TECHNICAL LIBRARY
AWS Technical Reports
2WW Technical Notes
AWS 105 Series Publication ADMIN WORKCENTER
AFGWCP 105-1, Volumes I, II, III
Fiaure 2b •
SECTION 1
LOCATION
AND TOPOGRAPHY
%
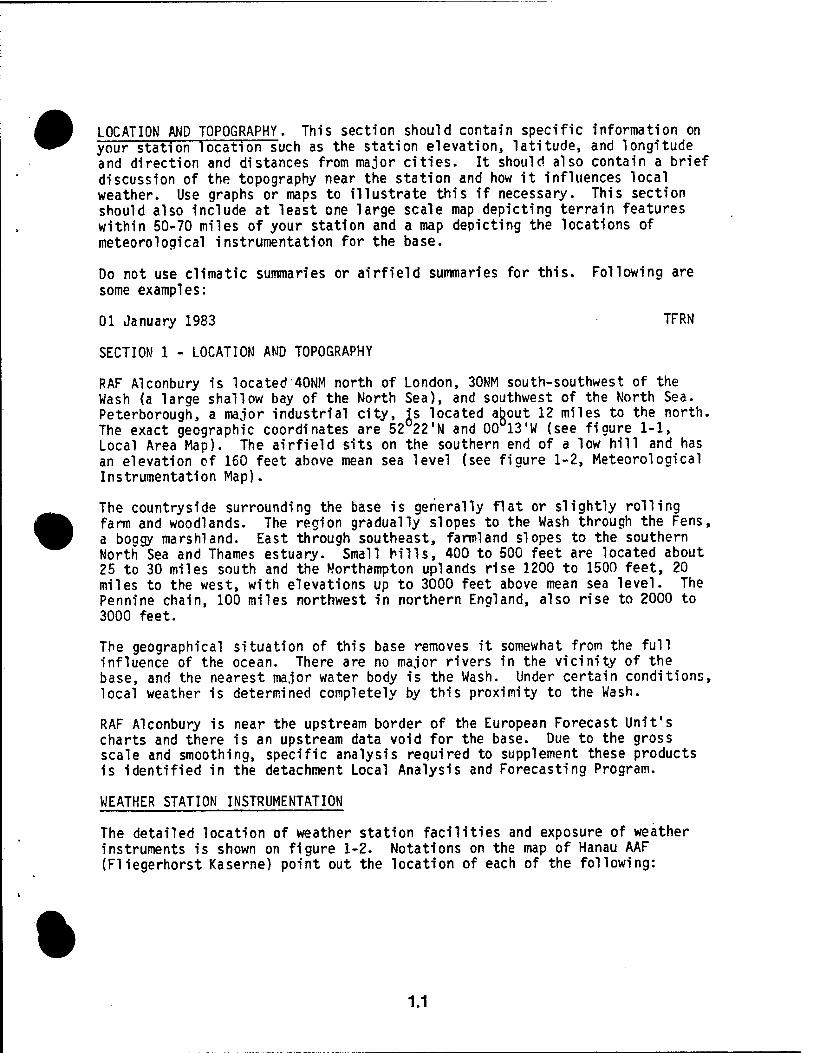
LOCATION AND TOPOGRAPHY. This section should contain specific information on your station location such as the station elevation, latitude, and longitude and direction and distances from major cities. It should also contain a brief discussion of the topography near the station and how it influences local weather. Use graphs or maps to illustrate this if necessary. This section should also include at least one large scale map depicting terrain features within 50-70 miles of your station and a map depicting the locations of meteorological instrumentation for the base.
Do not use climatic summaries or airfield summaries for this. Following are some examples:
01 January 1983 TFRN
SECTION 1 - LOCATION AND TOPOGRAPHY
RAF Alconbury is located 40NM north of London, 30NM south-southwest of the Wash (a large shallow bay of the North Sea), and southwest of the North Sea. Peterborough, a major industrial city, is located about 12 miles to the north. The exact geographic coordinates are 52°22'N and 00°13'W (see figure 1-1, Local Area Map). The airfield sits on the southern end of a low hill and has an elevation of 160 feet above mean sea level (see figure 1-2, Meteorological Instrumentation Map).
The countryside surrounding the base is generally flat or slightly rolling farm and woodlands. The region gradually slopes to the Wash through the Fens, a boagy marshland. East through southeast, farmland slopes to the southern North Sea and Thames estuary. "Small hills, 400 to 500 feet are located about 25 to 30 miles south and the Northampton uplands rise 1200 to 1500 feet, 20 miles to the west, with elevations up to 3000 feet above mean sea level. The Pennine chain, 100 miles northwest in northern England, also rise to 2000 to 3000 feet.
The geographical situation of this base removes it somewhat from the full influence of the ocean. There are no major rivers in the vicinity of the base, and the nearest major water body is the Wash. Under certain conditions, local weather is determined completely by this proximity to the Wash.
RAF Alconbury is near the upstream border of the European Forecast Unit's charts and there is an upstream data void for the base. Due to the gross scale and smoothing, specific analysis required to supplement these products is identified in the detachment Local Analysis and Forecasting Program.
WEATHER STATION INSTRUMENTATION
The detailed location of weather station facilities and exposure of weather instruments is shown on figure 1-2. Notations on the map of Hanau AAF (Fliegerhorst Kaserne) point out the location of each of the following:
%
1.1
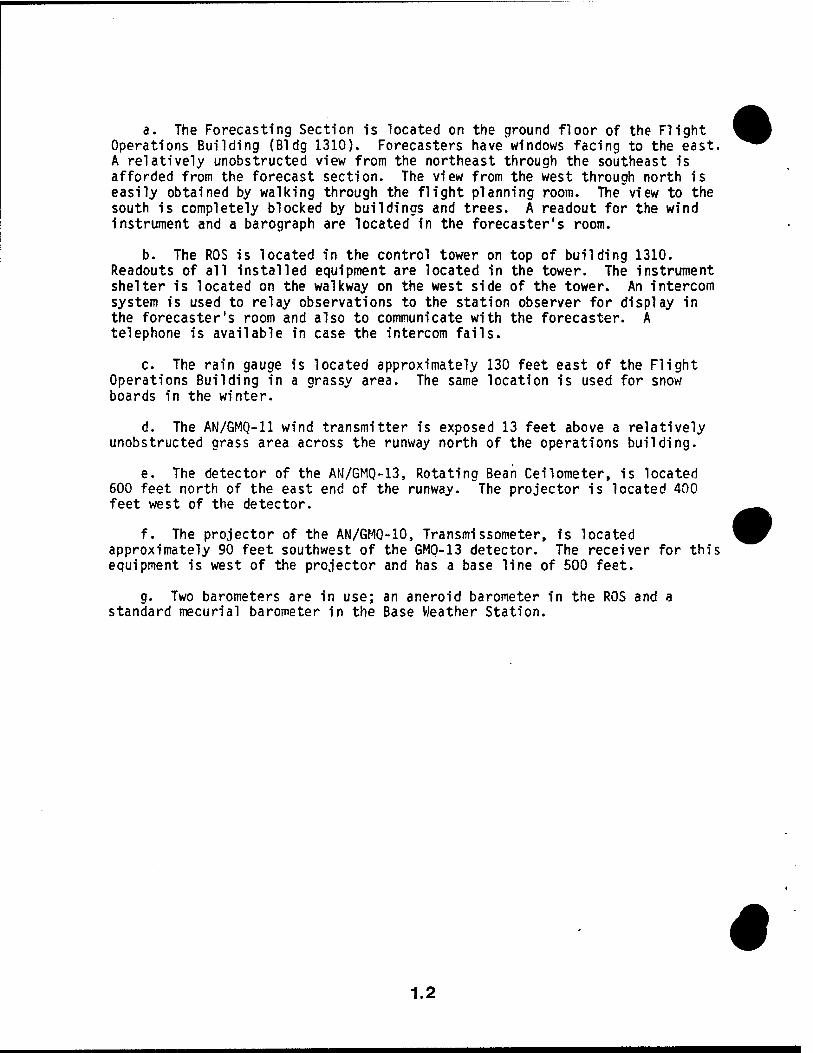
a. The Forecasting Section is located on the ground floor of the Flight Operations Building (Bldg 1310). Forecasters have windows facing to the east. A relatively unobstructed view from the northeast through the southeast is afforded from the forecast section. The view from the west through north is easily obtained by walking through the flight planning room. The view to the south is completely blocked by buildings and trees. A readout for the wind instrument and a barograph are located in the forecaster's room.
b. The ROS is located in the control tower on top of building 1310. Readouts of all installed equipment are located in the tower. The instrument shelter is located on the walkway on the west side of the tower. An intercom system is used to relay observations to the station observer for display in the forecaster's room and also to communicate with the forecaster. A telephone is available in case the intercom fails.
c. The rain gauge is located approximately 130 feet east of the Flight Operations Building in a grassy area. The same location is used for snow boards in the winter.
d. The AN/GMQ-11 wind transmitter is exposed 13 feet above a relatively unobstructed grass area across the runway north of the operations building.
e. The detector of the AM/GMQ-13, Rotating Bean Ceilometer, is located 600 feet north of the east end of the runway. The projector is located 400 feet west of the detector.
f. The projector of the AN/GMQ-10, Transmissometer, is located approximately 90 feet southwest of the GMO-13 detector. The receiver for this equipment is west of the projector and has a base line of 500 feet.
g. Two barometers are in use; an aneroid barometer in the ROS and a standard mecurial barometer in the Base Weather Station.
•
1.2
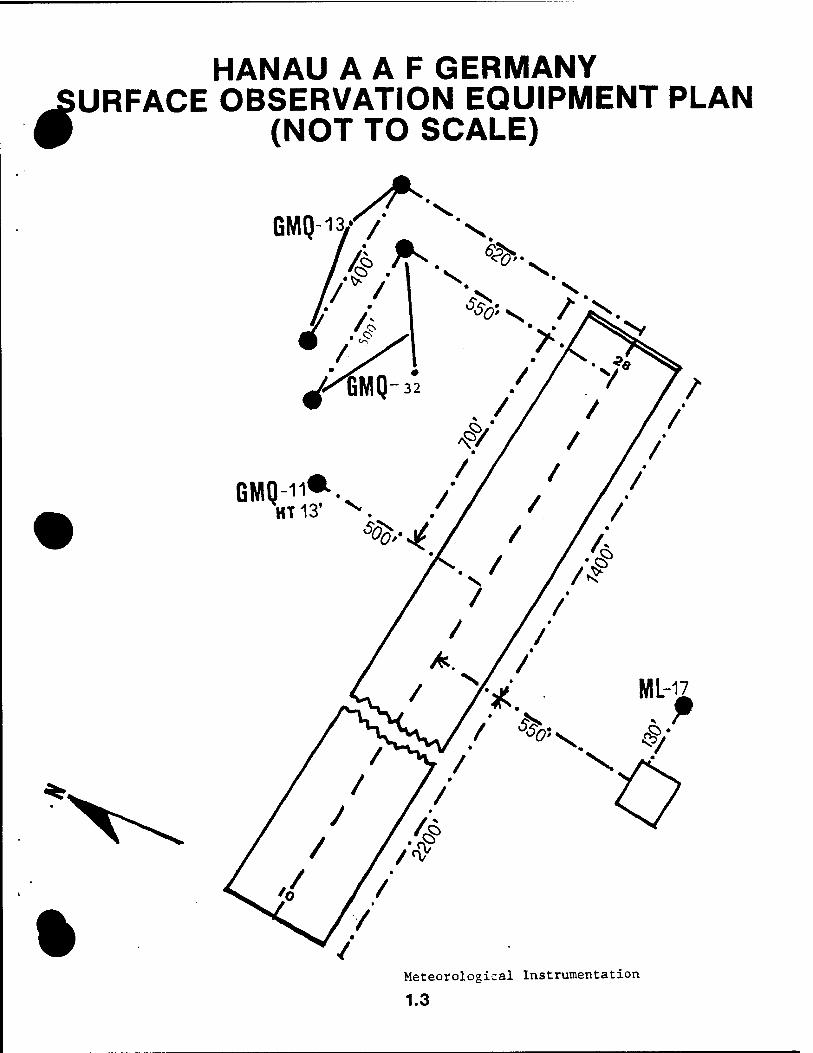
•
HANAU A A F GERMANY URFACE OBSERVATION EQUIPMENT PLAN
(NOT TO SCALE)
BMQ-1VV X
%
GMQ-11*-.
/' %-,
ML-" r
#
Meteorological Instrumentation
1.3
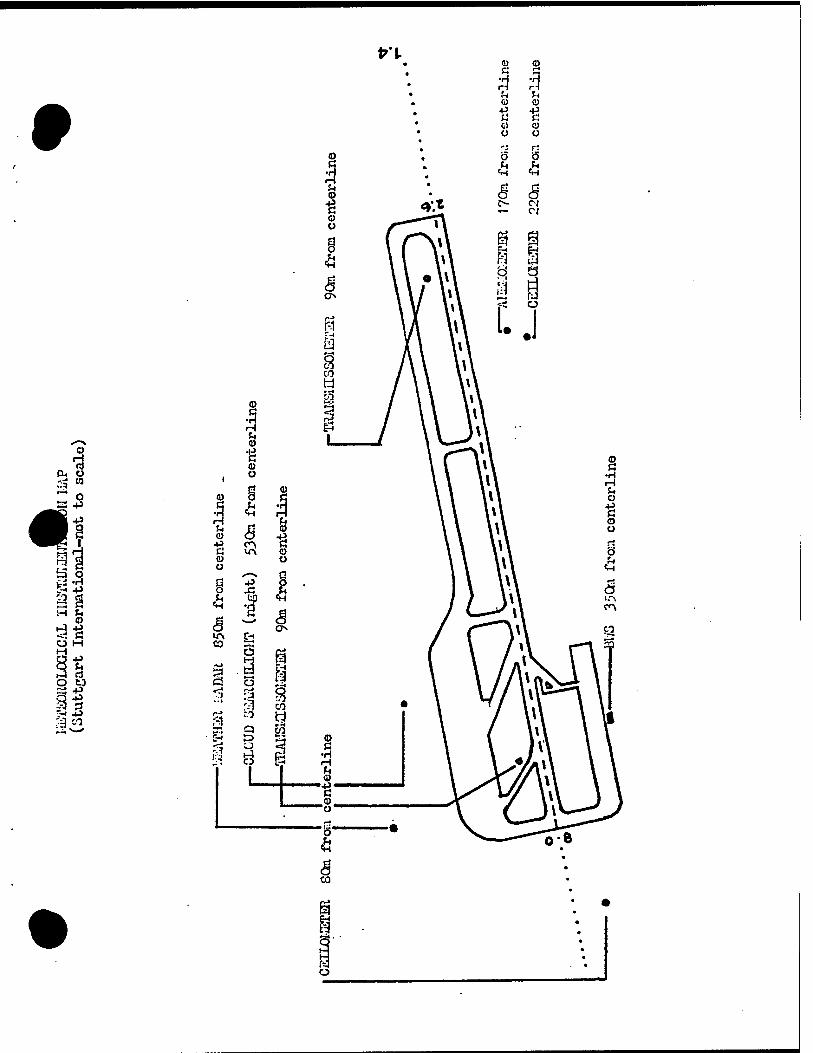
frl- • a> <i> • C
3 3 • U r. ^^^ * 0)
p ■p ^R ^A G n ^J • 0) 0) fl ^p • o o ^^^ \ .M rt
<D 9 Ö s f a t. u
3 • «H «H
u a> • 8 5
■g <** c- 4 o ^^^^^^^
o *~ \ i ß i /*""\i\ 0 a o \ I v\ 8 B £ o
\\ •V\ \\/ Vv 3 i
8 \ v v\ \A v\ i: .1 a A \ V\ S /\ \ v\ CO
Ö / \ \ v\ <D
to / \ \ v\ G 3 / \ \ \l\
dt Ü
«1 i3 g ÖS
•=: G
o to "^ .P 35 >« -P a«
G •H H fn 0)
•P. G <u
1 o d <o
1 1 3 5 &
-p <r\ G G irv O G> o U
'-> a n •P 5 o -C fc
a 3 a U\ Ö to -3 a a
1 S •3 8 51 a
3 n « Q 53
1 3 2j d 3
L G
•H
Ü
o Ü
p
8
M o
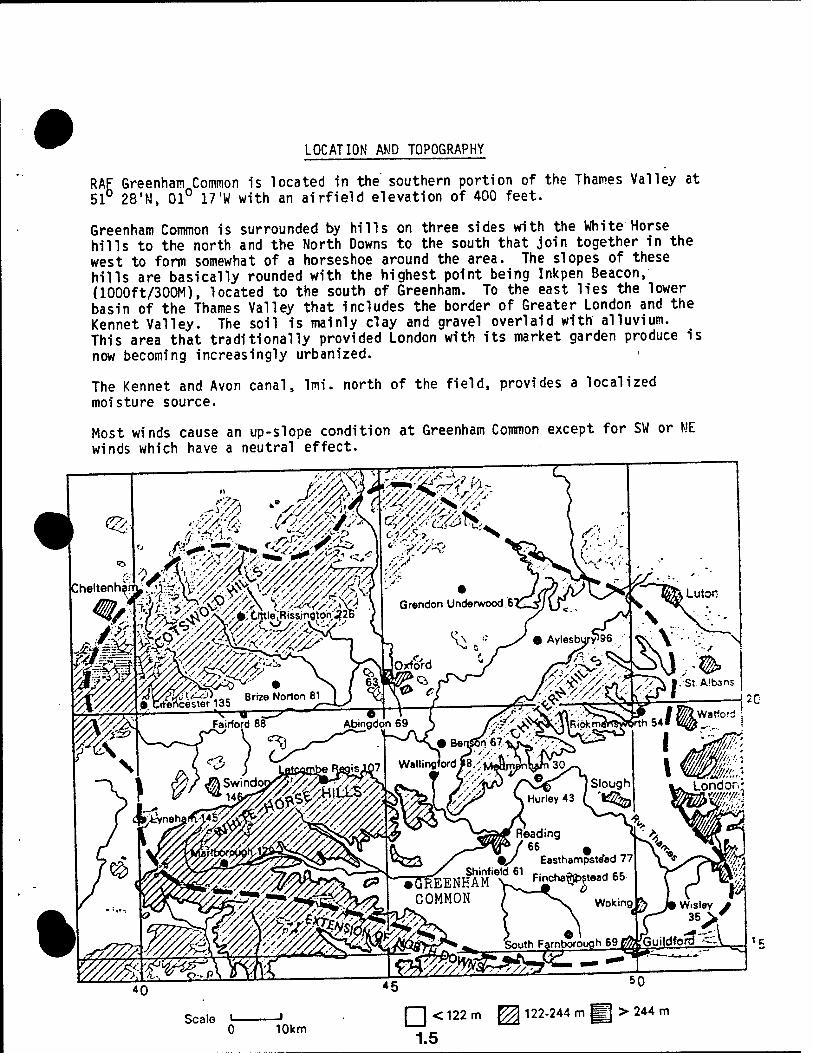
LOCATION AMD TOPOGRAPHY
RAF Greenham Common is located in the southern portion of the Thames Valley at 51° 28'N, 01° 17'W with an airfield elevation of 400 feet.
Greenham Common is surrounded by hills on three sides with the White Horse hills to the north and the North Downs to the south that join together in the west to form somewhat of a horseshoe around the area. The slopes of these hills are basically rounded with the highest point being Inkpen Beacon, (1000ft/300M), located to the south of Greenham. To the east lies the lower basin of the Thames Valley that includes the border of Greater London and the Kennet Valley. The soil is mainly clay and gravel overlaid with alluvium. This area that traditionally provided London with its market garden produce is now becoming increasingly urbanized.
The Kennet and Avon canal, lmi. north of the field, provides a localized moisture source.
Most winds cause an up-slope condition at Greenham Common except for SW or ME winds which have a neutral effect.
Luton
10km
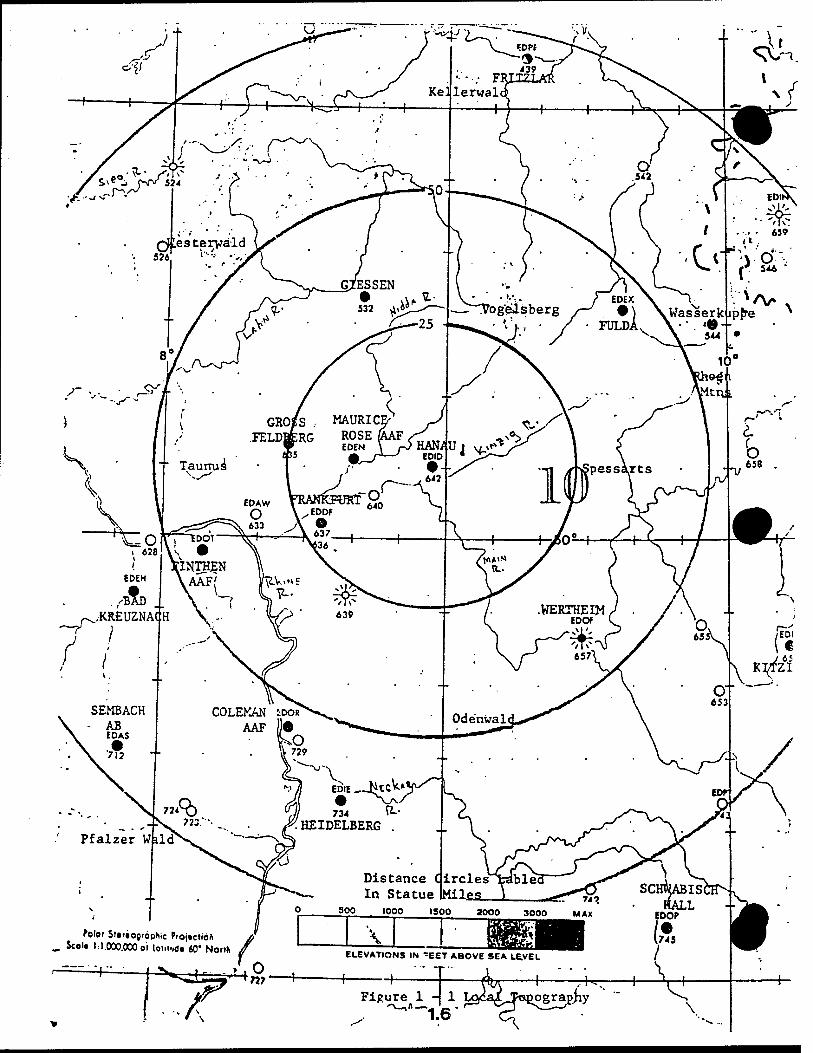
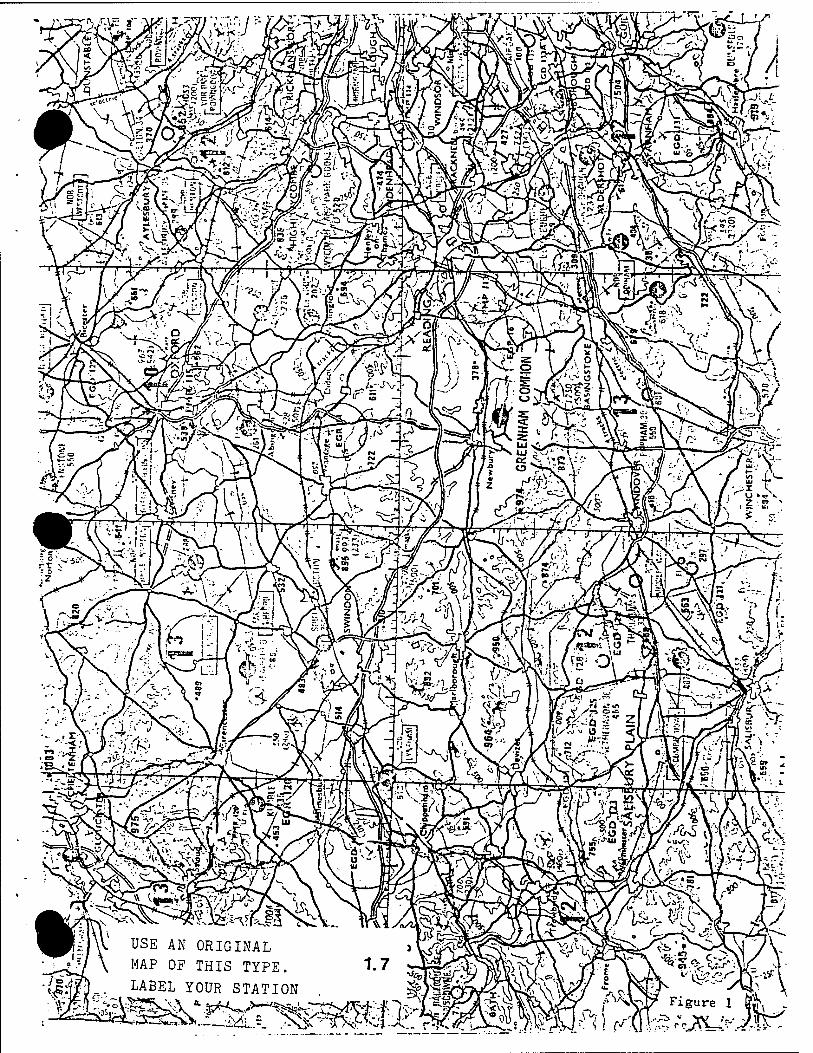
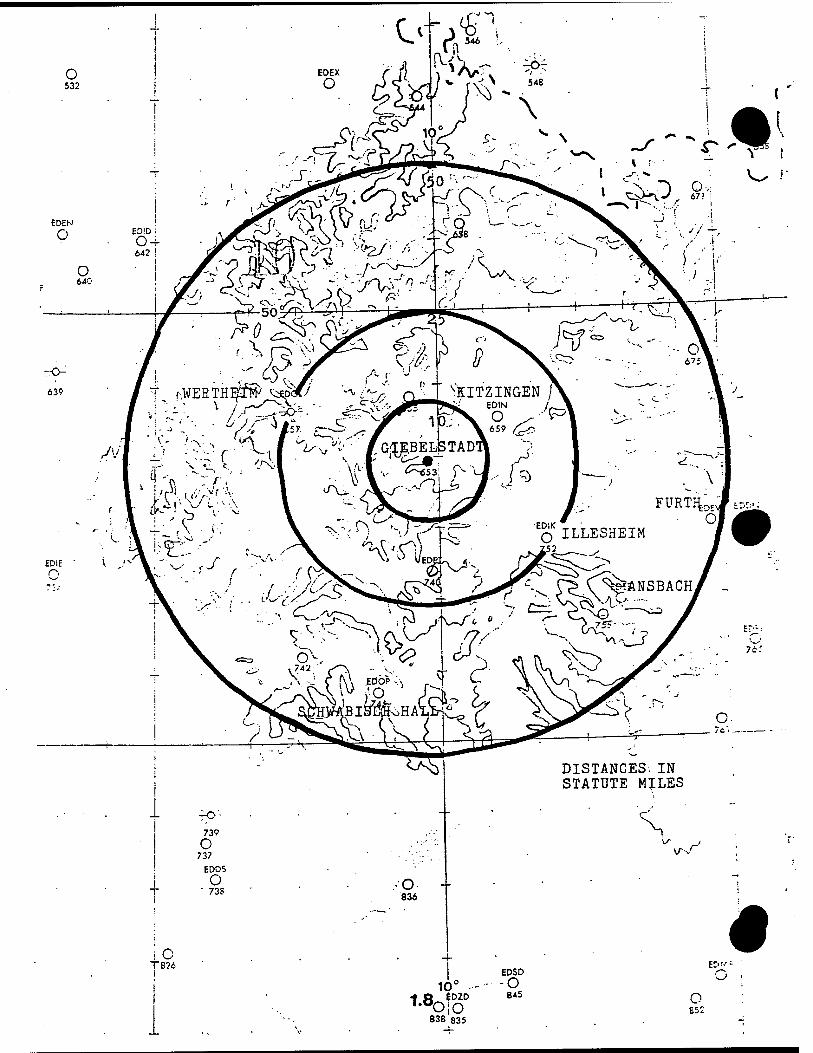
c< EDEX
°. ^M:/^x ^ *■
^t^>: r. m
AJ
Til
DISTANCES.IN STATUTE MILES
TO-
y- r>
\ C T826
10c
838 835
• ED'"
o o es:
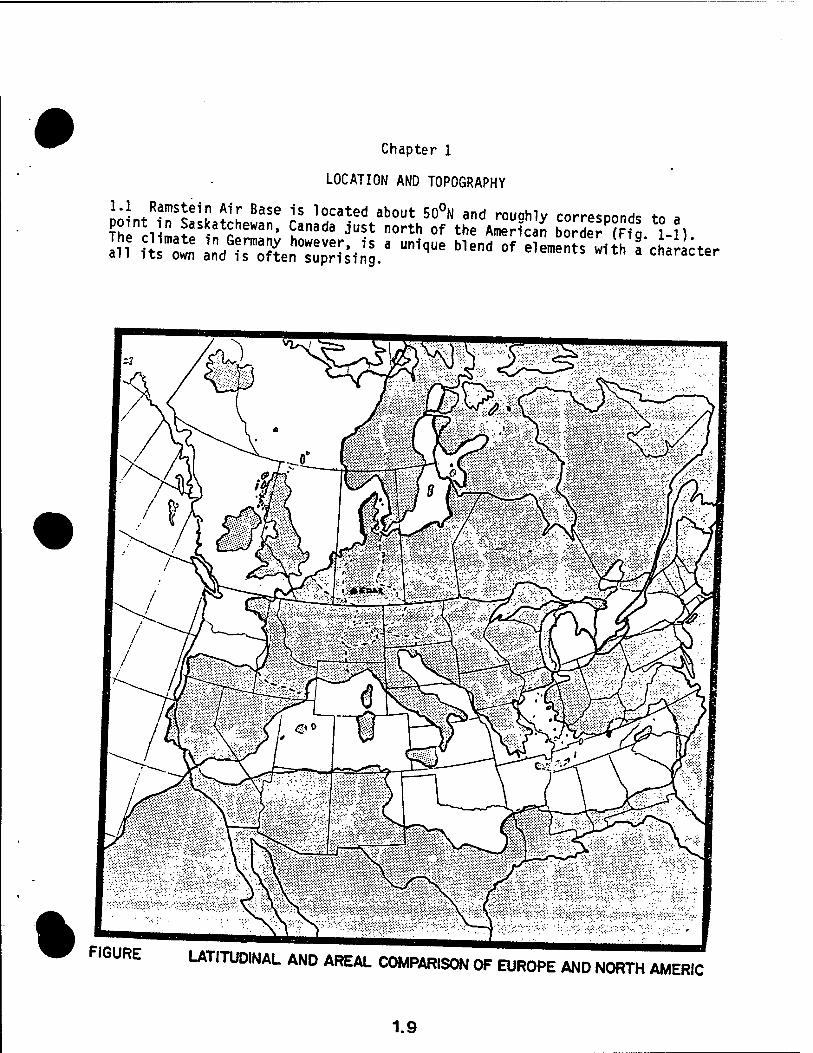
Chapter 1
LOCATION AND TOPOGRAPHY
IST %"% Ä&irsrun,que blend of "-^S's-e^t^
% FIGURE LATITUDINAL AND AREAL COMPARISON OF EUROPE AND NORTH AMERIC
1.9
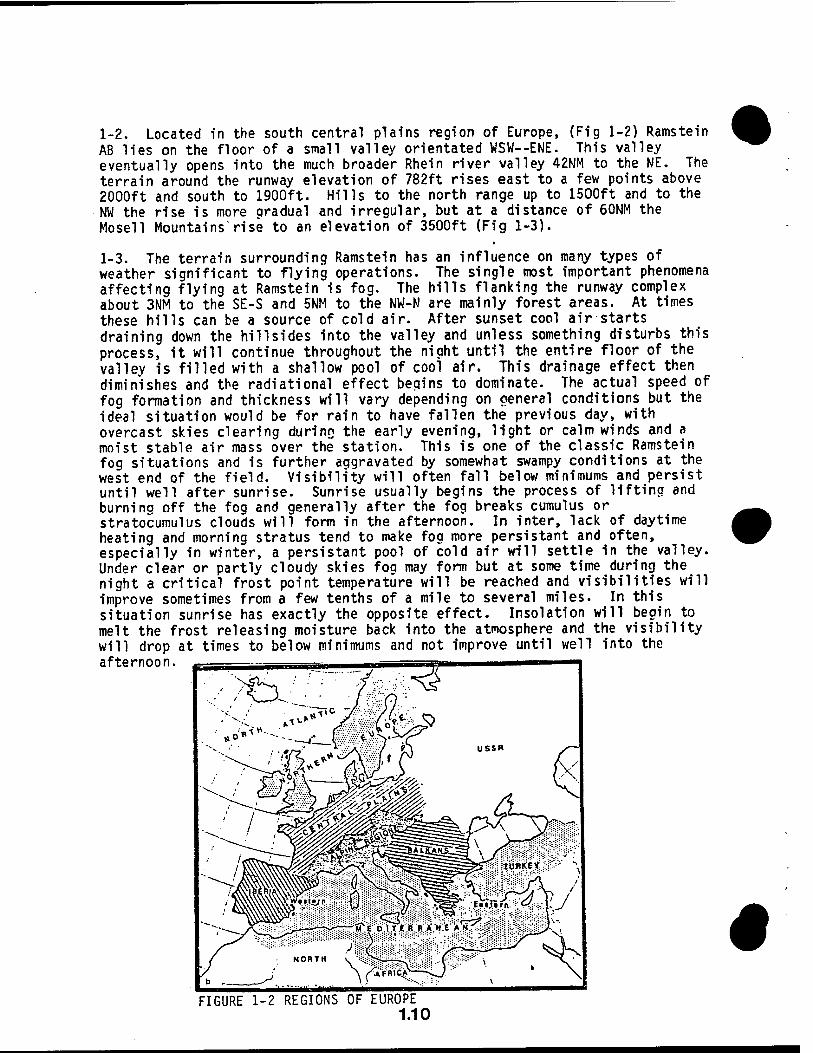
1-2. Located in the south central plains region of Europe, (Fig 1-2) Ramstein AB lies on the floor of a small valley orientated WSW--ENE. This valley eventually opens into the much broader Rhein river valley 42NM to the NE. The terrain around the runway elevation of 782ft rises east to a few points above 2000ft and south to 1900ft. Hills to the north range up to 1500ft and to the NW the rise is more gradual and irregular, but at a distance of 60NM the Mosel! MountainsVise to an elevation of 3500ft (Fig 1-3).
an influence on many types of The single most important phenomena
hills flanking the runway complex are mainly forest areas. At times After sunset cool air starts
1-3. The terrain surrounding Ramstein has weather significant to flying operations, affecting flying at Ramstein is fog. The about 3NM to the SE-S and 5NM to the NW-N these hills can be a source of cold air. draining down the hillsides into the valley and unless something disturbs this process, it will continue throughout the night until the entire floor of the valley is filled with a shallow pool of cool air. This drainage effect then diminishes and the radiational effect begins to dominate. The actual speed of fog formation and thickness will vary depending on general conditions but the ideal situation would be for rain to have fallen the previous day, with overcast skies clearing during the early evening, light or calm winds and a moist stable air mass over the station. This is one of the classic Ramstein fog situations and is further aggravated by somewhat swampy conditions at the west end of the field. Visibility will often fall below minimums and persist until well after sunrise. Sunrise usually begins the process of lifting and burning off the fog and generally after the fog breaks cumulus or stratocumulus clouds will form in the afternoon. In inter, lack of daytime heating and morning stratus tend to make fog more persistant and often, especially in winter, a persistant pool of cold air will settle in the valley. Under clear or partly cloudy skies fog may form but at some time during the night a critical frost point temperature will be reached and visibilities will improve sometimes from a few tenths of a mile to several miles. In this situation sunrise has exactly the opposite effect. Insolation will begin to melt the frost releasing moisture back into the atmosphere and the visibility will drop at times to below minimums and not improve until well into the afternoon.
•
FIGURE 1-2 REGIONS OF EUROPE 1.10
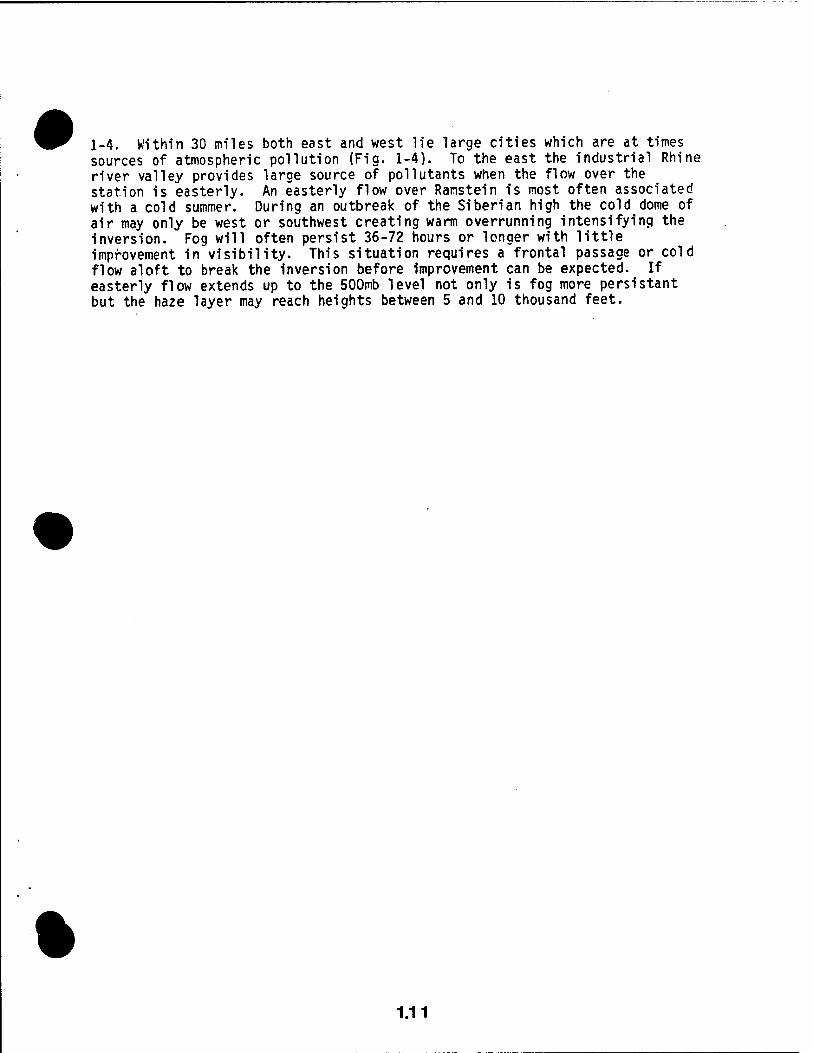
1-4. Within 30 miles both east and west lie large cities which are at times sources of atmospheric pollution (Fig. 1-4). To the east the industrial Rhine river valley provides large source of pollutants when the flow over the station is easterly. An easterly flow over Ranstein is most often associated with a cold summer. During an outbreak of the Siberian high the cold dome of air may only be west or southwest creating warm overrunning intensifying the inversion. Fog will often persist 36-72 hours or longer with little improvement in visibility. This situation requires a frontal passage or cold flow aloft to break the inversion before improvement can be expected. If easterly flow extends up to the 500mb level not only is fog more persistant but the haze layer may reach heights between 5 and 10 thousand feet.
%
1.11
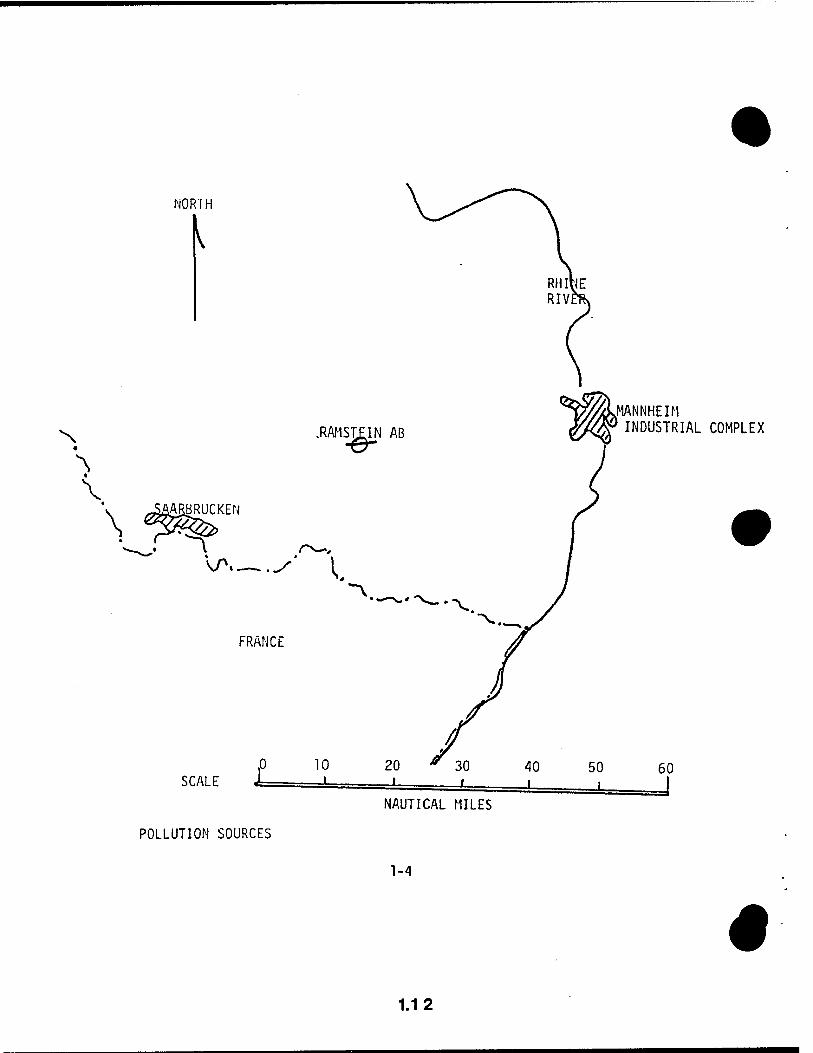
N
\
NOR IH
ARBRUCKEN
^T \A
SCALE
POLLUTION SOURCES
FRANCE
MANNHEIM INDUSTRIAL COMPLEX
NAUTICAL MILES
1-4
•
1.12
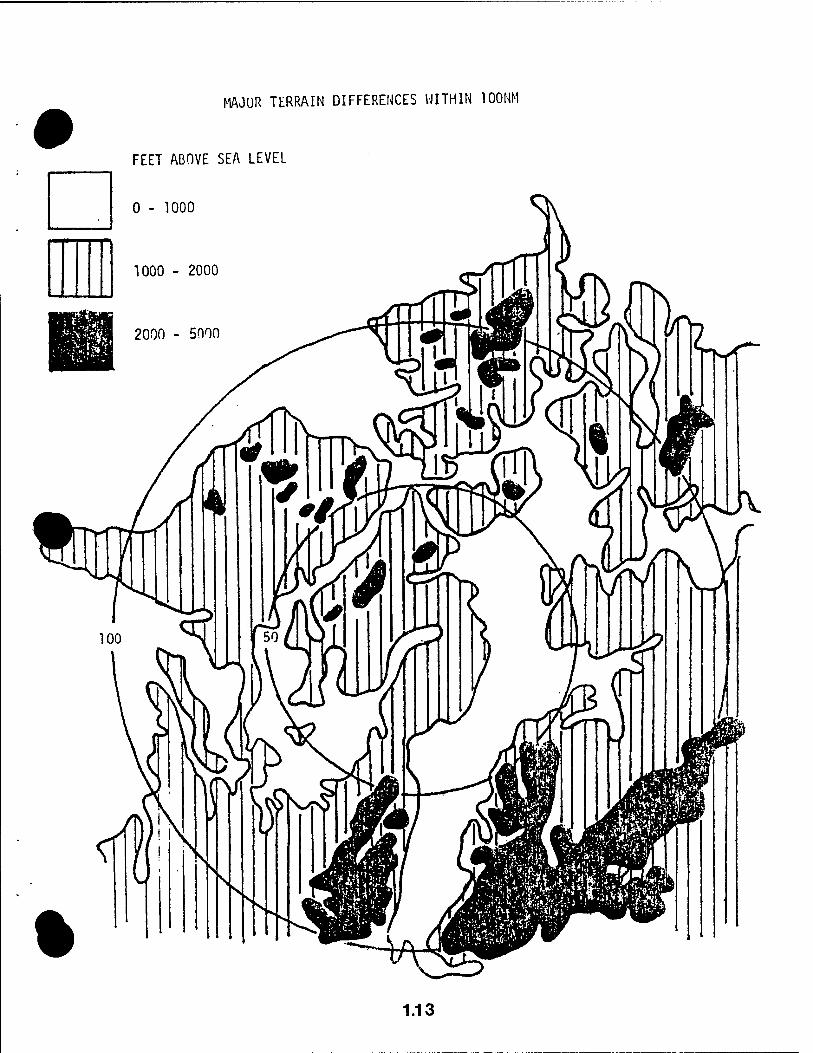
MAJOR TERRAIN DIFFERENCES WITHIN 100NM
FEET ABOVE SEA LEVEL
1.13
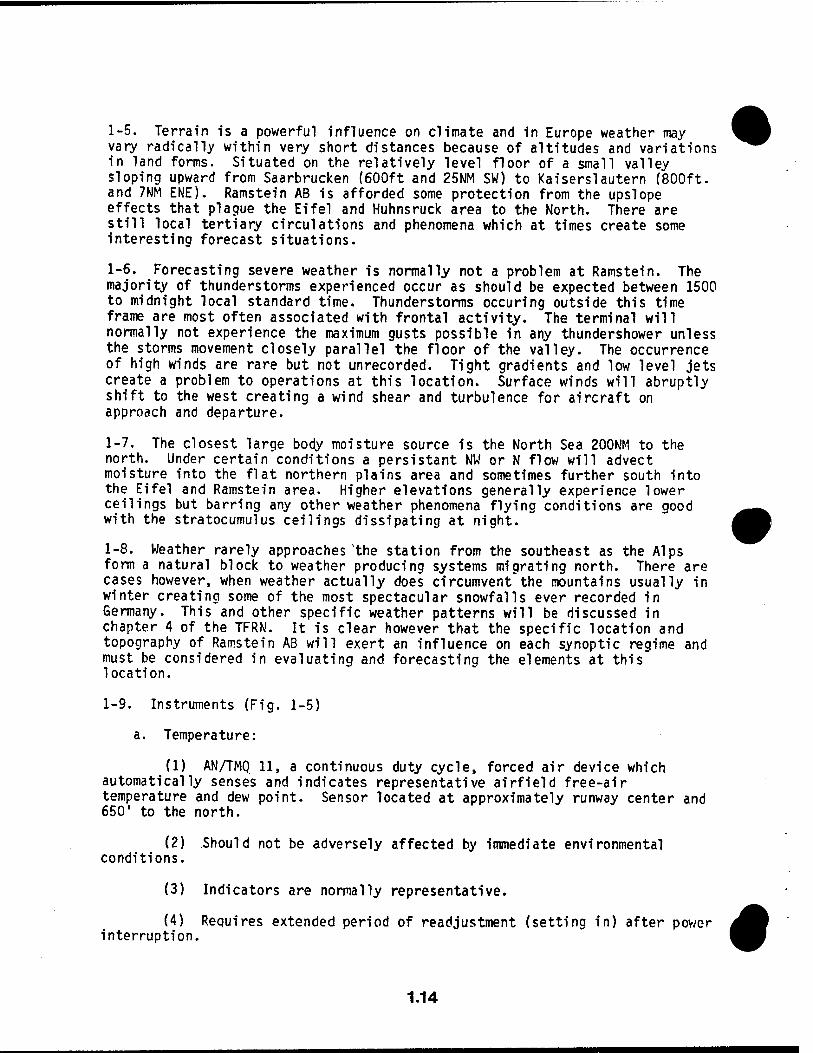
1-5. Terrain is a powerful influence on climate and in Europe weather may vary radically within very short distances because of altitudes and variations in land forms. Situated on the relatively level floor of a small valley sloping upward from Saarbrücken (600ft and 25NM SW) to Kaiserslautern (800ft. and 7NM ENE). Ramstein AB is afforded some protection from the upslope effects that plague the Eifel and Huhnsruck area to the North. There are still local tertiary circulations and phenomena which at times create some interesting forecast situations.
1-6. Forecasting severe weather is normally not a problem at Ramstein. The majority of thunderstorms experienced occur as should be expected between 1500 to midnight local standard time. Thunderstorms occuring outside this time frame are most often associated with frontal activity. The terminal will normally not experience the maximum gusts possible in any thundershower unless the storms movement closely parallel the floor of the valley. The occurrence of high winds are rare but not unrecorded. Tight gradients and low level jets create a problem to operations at this location. Surface winds will abruptly shift to the west creating a wind shear and turbulence for aircraft on approach and departure.
1-7. The closest large body moisture source is the North Sea 200NM to the north. Under certain conditions a persistant NW or N flow will advect moisture into the flat northern plains area and sometimes further south into the Eifel and Ramstein area. Higher elevations generally experience lower ceilings but barring any other weather phenomena flying conditions are good with the stratocumulus ceilings dissipating at night.
1-8. Weather rarely approaches the station from the southeast as the Alps form a natural block to weather producing systems migrating north. There are cases however, when weather actually does circumvent'the mountains usually in winter creating some of the most spectacular snowfalls ever recorded in Germany. This and other specific weather patterns will be discussed in chapter 4 of the TFRM. It is clear however that the specific location and topography of Ramstein AB will exert an influence on each synoptic regime and must be considered in evaluating and forecasting the elements at this" location.
1-9. Instruments (Fig. 1-5)
a. Temperature:
(1) AN/TMQ 11, a continuous duty cycle, forced air device which automatically senses and indicates representative airfield free-air temperature and dew point. Sensor located at approximately runway center and 650' to the north.
(2) Should not be adversely affected by immediate environmental conditions.
(3) Indicators are normally representative.
(4) Requires extended period of readjustment (setting in) after power A\w interruption. mm
1.14
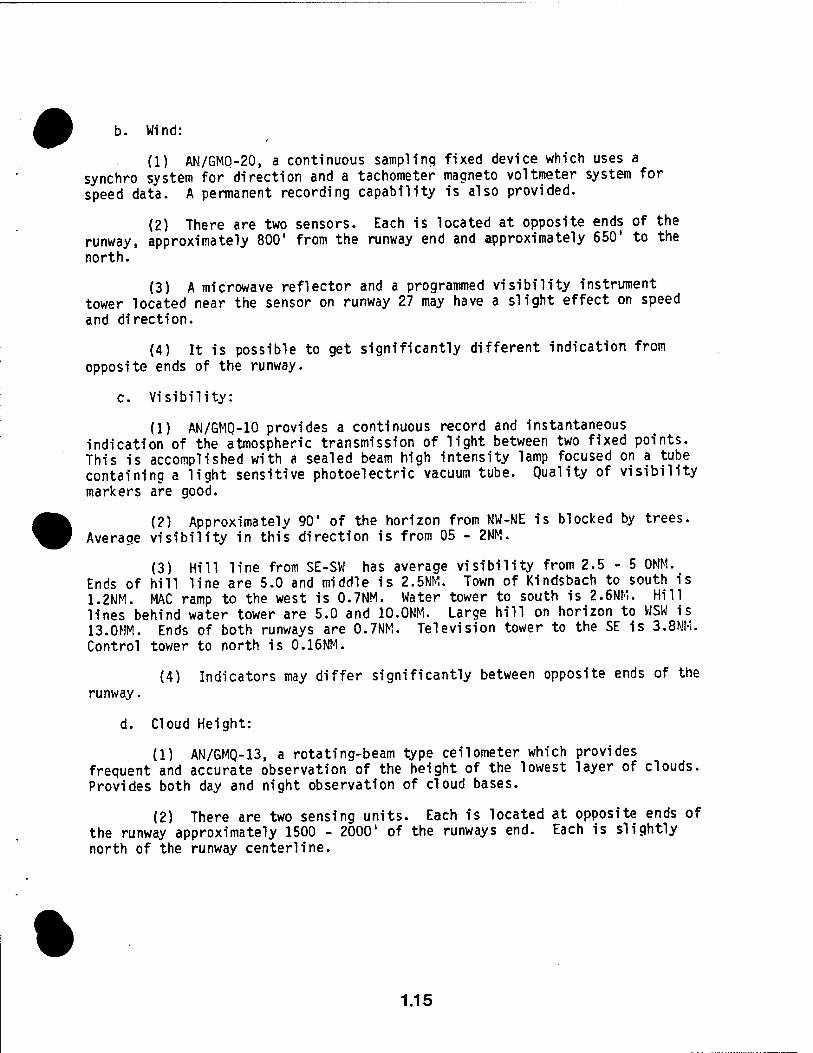
b. Wind:
(1) AN/GMO-20, a continuous sampling fixed device which uses a synchro system for direction and a tachometer magneto voltmeter system for speed data. A permanent recording capability is also provided.
(2) There are two sensors. Each is located at opposite ends of the runway, approximately 800' from the runway end and approximately 650* to the north.
(3) A microwave reflector and a programmed visibility instrument tower located near the sensor on runway 27 may have a slight effect on speed and direction.
(4) It is possible to get significantly different indication from opposite ends of the runway.
c. Visibility:
(1) AN/GMQ-10 provides a continuous record and instantaneous indication of the atmospheric transmission of light between two fixed points. This is accomplished with a sealed beam high intensity lamp focused on a tube containing a light sensitive photoelectric vacuum tube. Quality of visibility markers are good.
(?) Approximately 90' of the horizon from NW-NE is blocked by trees. Average visibility in this direction is from 05 - 2NM.
(3) Hill line from SE-SW has average visibility from 2.5-5 OMM. Ends of hill line are 5.0 and middle is 2.5NM. Town of Kindsbach to south is 1.2NM. MAC ramp to the west is 0.7NM. Water tower to south is 2.6NK. Hill lines behind water tower are 5.0 and 10.0NM. Large hill on horizon to WSW is 13.0NM. Ends of both runways are 0.7NM. Television tower to the SE is 3.8NK. Control tower to north is 0.16NM.
(4) Indicators may differ significantly between opposite ends of the runway.
d. Cloud Height:
(1) AN/GMQ-13, a rotating-beam type ceilometer which provides frequent and accurate observation of the height of the lowest layer of clouds. Provides both day and night observation of cloud bases.
(2) There are two sensing units. Each is located at opposite ends of the runway approximately 1500 - 2000' of the runways end. Each is slightly north of the runway center!ine.
%
1.15
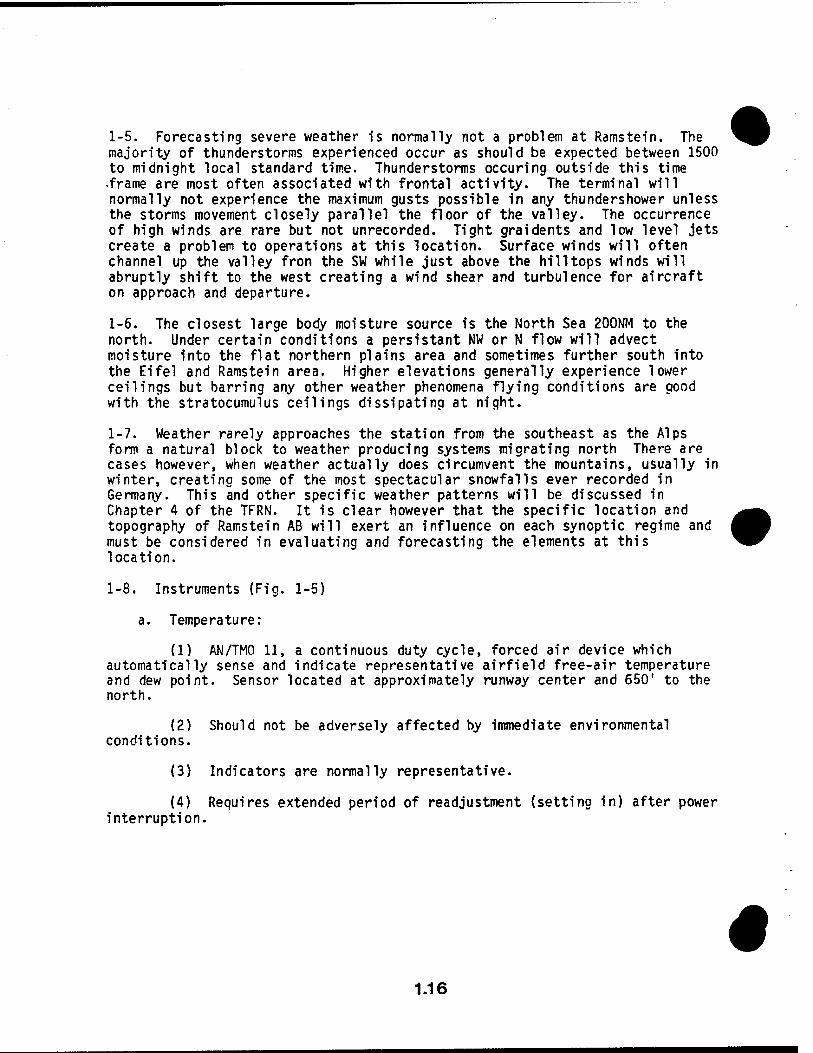
1-5. Forecasting severe weather is normally not a problem at Ramstein. The majority of thunderstorms experienced occur as should be expected between 1500 to midnight local standard time. Thunderstorms occuring outside this time frame are most often associated with frontal activity. The terminal will normally not experience the maximum gusts possible in any thundershower unless the storms movement closely parallel the floor of the valley. The occurrence of high winds are rare but not unrecorded. Tight graidents and low level jets create a problem to operations at this location. Surface winds will often channel up the valley fron the SW while just above the hilltops winds will abruptly shift to the west creating a wind shear and turbulence for aircraft on approach and departure.
1-6. The closest large body moisture source is the North Sea 200NM to the north. Under certain conditions a persistant NW or N flow will advect moisture into the flat northern plains area and sometimes further south into the Eifel and Ramstein area. Higher elevations generally experience lower ceilings but barring any other weather phenomena flying conditions are good with the stratocumulus ceilings dissipating at night.
1-7. Weather rarely approaches the station from the southeast as the Alps form a natural block to weather producing systems migrating north There are cases however, when weather actually does circumvent the mountains, usually in winter, creating some of the most spectacular snowfalls ever recorded in Germany. This and other specific weather patterns will be discussed in Chapter 4 of the TFRN. It is clear however that the specific location and topography of Ramstein AB will exert an influence on each synoptic regime and must be considered in evaluating and forecasting the elements at this location.
1-8. Instruments (Fig. 1-5)
a. Temperature:
(1) AK'/TMO 11, a continuous duty cycle, forced air device which automatically sense and indicate representative airfield free-air temperature and dew point. Sensor located at approximately runway center and 650' to the north.
(2) Should not be adversely affected by immediate environmental conditions.
(3) Indicators are normally representative.
(4) Requires extended period of readjustment (setting in) after power interruption.
•
1.16
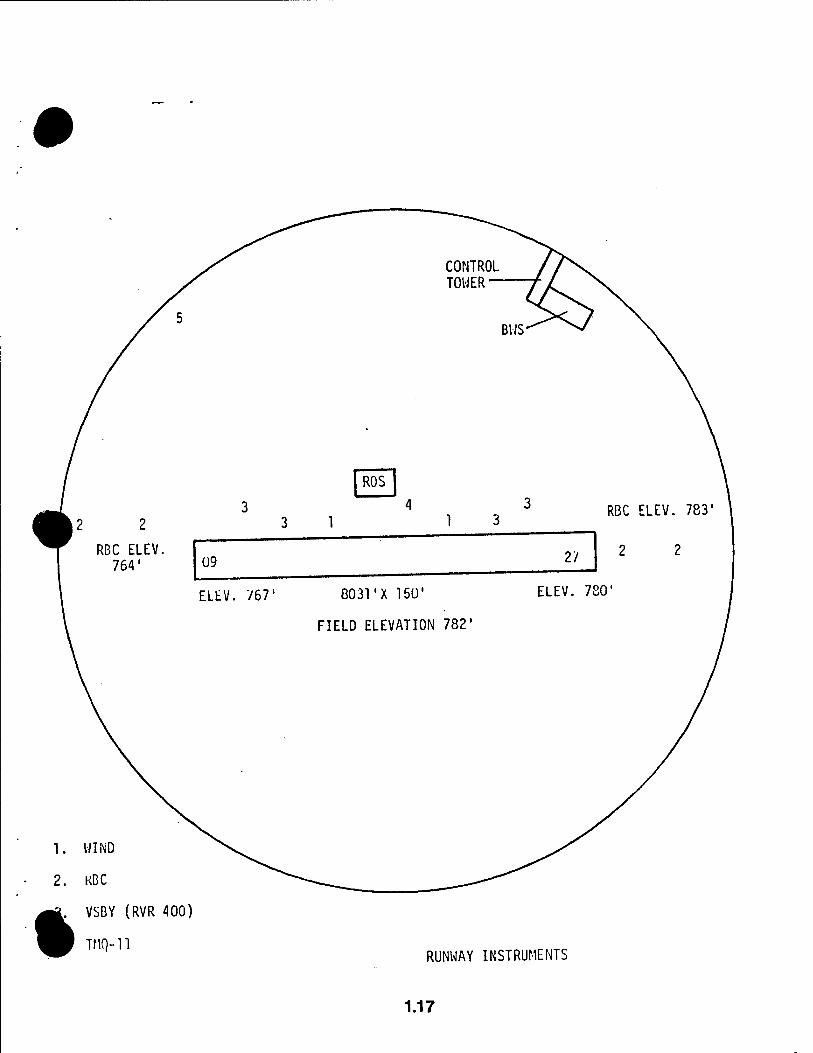
RUNWAY INSTRUMENTS
1.17
SECTION 2
CLIMATIC AIDS
%
CLIMATIC AIDS. Tailor this section to support operations requirements. Information should be current and easy to understand. The period of record should be included for all data used. The contents of this section are listed in 2 WW Sup 1 to AWSR 105-22. The first is a list of operationally critical weather elements and their threshold values. The sup specifically states that you will include a clear statement of impact and actions taken by the customer v/hen a threshold is exceeded. This should be easy to do since the format is almost dictated by the requirement (critical weather element, impact, customer actions), and your point warnings and MWAs are generally critical weather elements. The second is a graphic or tabular presentation of the climatological frequency of your critical weather elements. This should be in the form of wind roses, bar graphs, percent frequency of occurrency by season, etc. You may use a word summary in addition. The following pages are some examples of how other units have depicted their climatology:
•
2.1
01 January 1983 TRFN
SECTION 2 - CLIMATIC AIDS
This section contains climatic aids tailored to support operational requirements. The data was extracted from the 30 Nov 77 Revised Uniform Summary of Surface Weather Observations (RUSSWO), and daily climatology logs (temperature, precipitation, and wind gust data), January 1973 throuah December 1982.
%
2.2
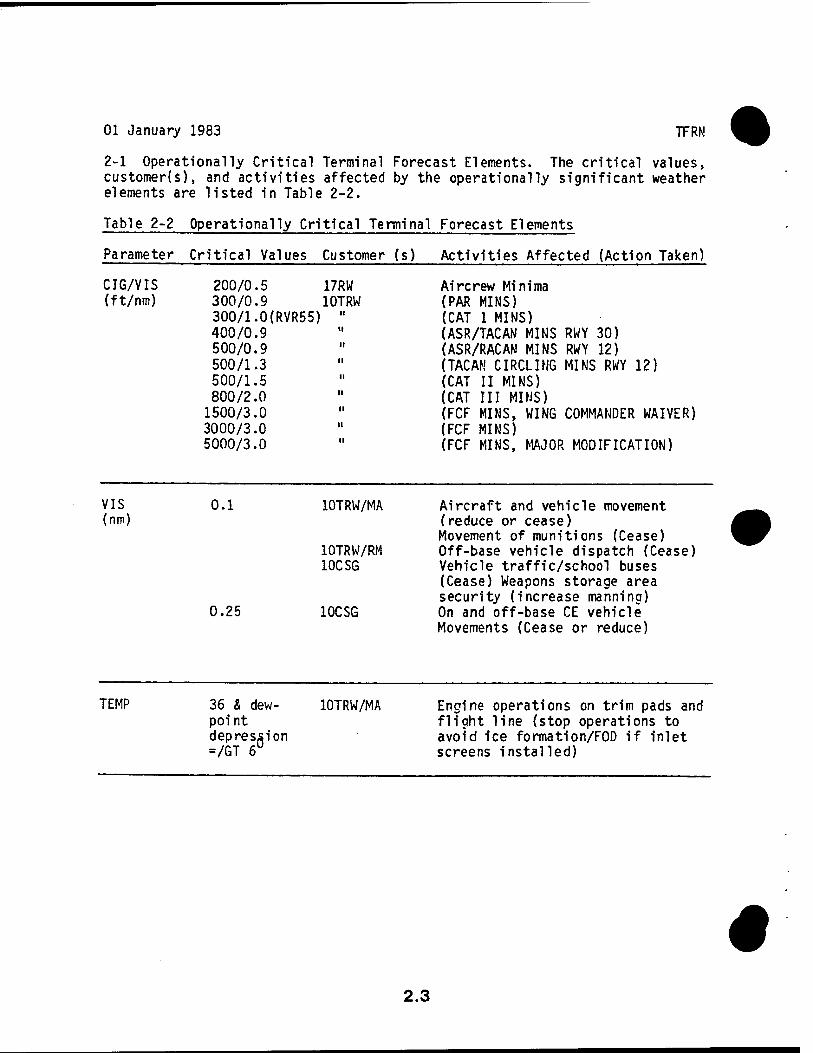
01 January 1983 TFRM
2-1 Operationally Critical Terminal Forecast Elements. The critical values, customer(s), and activities affected by the operationally significant weather elements are listed in Table 2-2.
Table 2-2 Operationally Critical Terminal Forecast Elements
Parameter Critical Values Customer (s) Activities Affected (Action Taken)
Aircrew Minima (PAR MINS) (CAT 1 MINS) (ASR/TACAN MINS RWY 30) (ASR/RACAN MINS RWY 12) (TACAN CIRCLING MINS RWY 12) (CAT II MINS) (CAT III MINS) (FCF MINS, WING COMMANDER WAIVER) (FCF MINS) (FCF MINS, MAJOR MODIFICATION)
CIG/VIS 200/0.5 17RW (ft/nm) 300/0.9 10TRW
300/1.0(RVR55) " 400/0.9 500/0.9 500/1.3 500/1.5 800/2.0 1500/3.0 3000/3.0 5000/3.0
VIS (nm)
0.1
0.25
10TRW/MA
10TRW/RM 10CSG
10CSG
Aircraft and vehicle movement (reduce or cease) Movement of munitions (Cease) Off-base vehicle dispatch (Cease) Vehicle traffic/school buses (Cease) Weapons storage area security (increase manning) On and off-base CE vehicle Movements (Cease or reduce)
TEMP 36 & dew- poi nt depression =/GT 6U
10TRW/MA Engine operations on trim pads and flight line (stop operations to avoid ice formation/FOD if inlet screens installed)
«
2.3
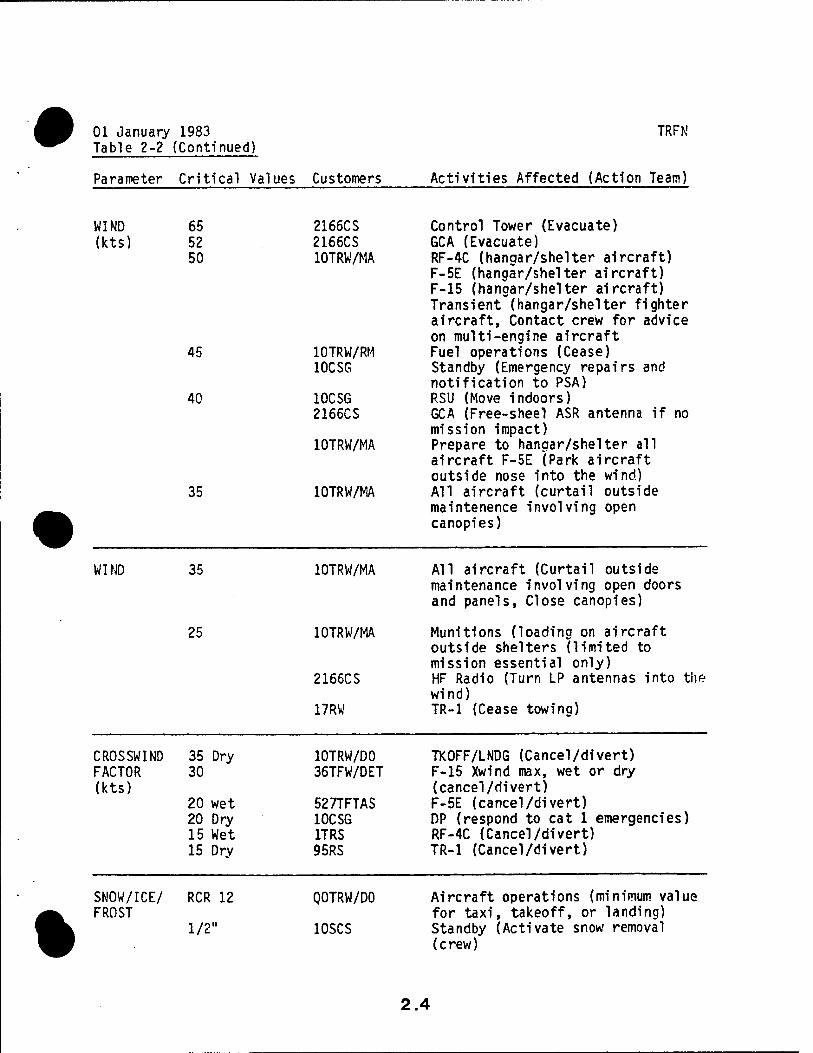
01 January 1983 Table 2-2 (Continued)
Parameter Critical Values Customers
TRFN
Activities Affected (Action Team)
WIND (kts)
65 52 50
2166CS 2166CS 10TRW/MA
45 10TRW/RM 10CSG
40 10CSG 2166CS
10TRW/MA
35 10TRW/MA
Control Tower (Evacuate) GCA (Evacuate) RF-4C (hangar/shelter aircraft) F-5E (hangar/shelter aircraft) F-15 (hangar/shelter aircraft) Transient (hangar/shelter fighter aircraft, Contact crew for advice on multi-engine aircraft Fuel operations (Cease) Standby (Emergency repairs and notification to PSA) RSU (Move indoors) GCA (Free-sheel ASR antenna if no mission impact) Prepare to hangar/shelter all aircraft F-5E (Park aircraft outside nose into the wind) All aircraft (curtail outside maintenence involving open canopies)
WI NO 35
25
10TRW/MA All aircraft (Curtail outside maintenance involving open doors and panels, Close canopies)
10TRW/MA Munitions (loading on aircraft outside shelters (limited to mission essential only)
2166CS HF Radio (Turn LP antennas into the wind)
17RW TR-1 (Cease towing)
CROSSWIND FACTOR (kts)
35 Dry 30
20 wet 20 Dry 15 Wet 15 Dry
10TRW/D0 TKOFF/LNDG (Cancel/divert) 36TFW/DET F-15 Xwind max, wet or dry
(cancel/divert) 527TFTAS F-5E (cancel/divert) 10CSG DP (respond to cat 1 emergencies) 1TRS RF-4C (Cancel/divert) 95RS TR-1 (Cancel/divert)
%
SNOW/ICE/ FROST
RCR 12
1/2"
QOTRW/DO Aircraft operations (minimum value for taxi, takeoff, or landing)
10SCS Standby (Activate snow removal (crew)
2.4
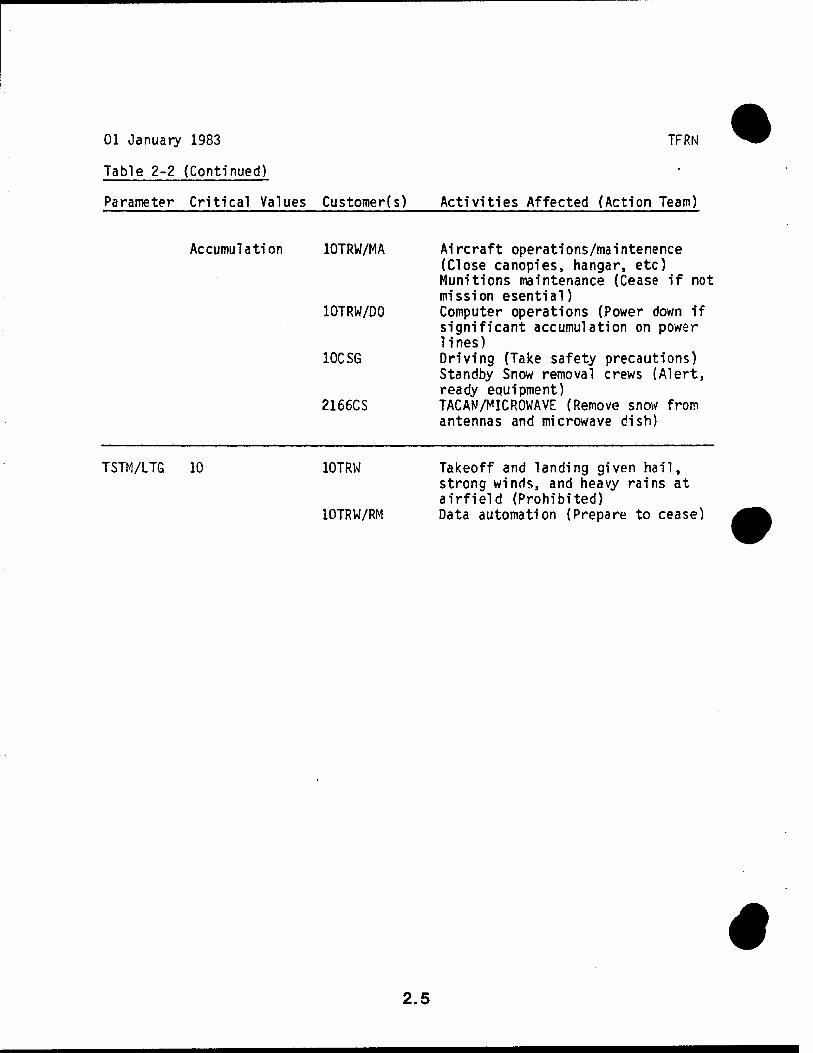
01 January 1983
Table 2-2 (Continued)
TFRN
Parameter Critical Values Customer(s) Activities Affected (Action Team)
Accumulation 10TRW/MA Aircraft operations/maintenence (Close canopies, hangar, etc) Munitions maintenance (Cease if not mission esential)
10TRW/DO Computer operations (Power down if significant accumulation on power lines)
10CSG Driving (Take safety precautions) Standby Snow removal crews (Alert, ready equipment)
2166CS TACAN/MICROWAVE (Remove snow from antennas and microwave dish)
TSTM/LTG 10 10TRW Takeoff and landing given hail, strong winds, and heavy rains at airfield (Prohibited)
10TRW/RM Data automation (Prepare to cease)
•
2.5
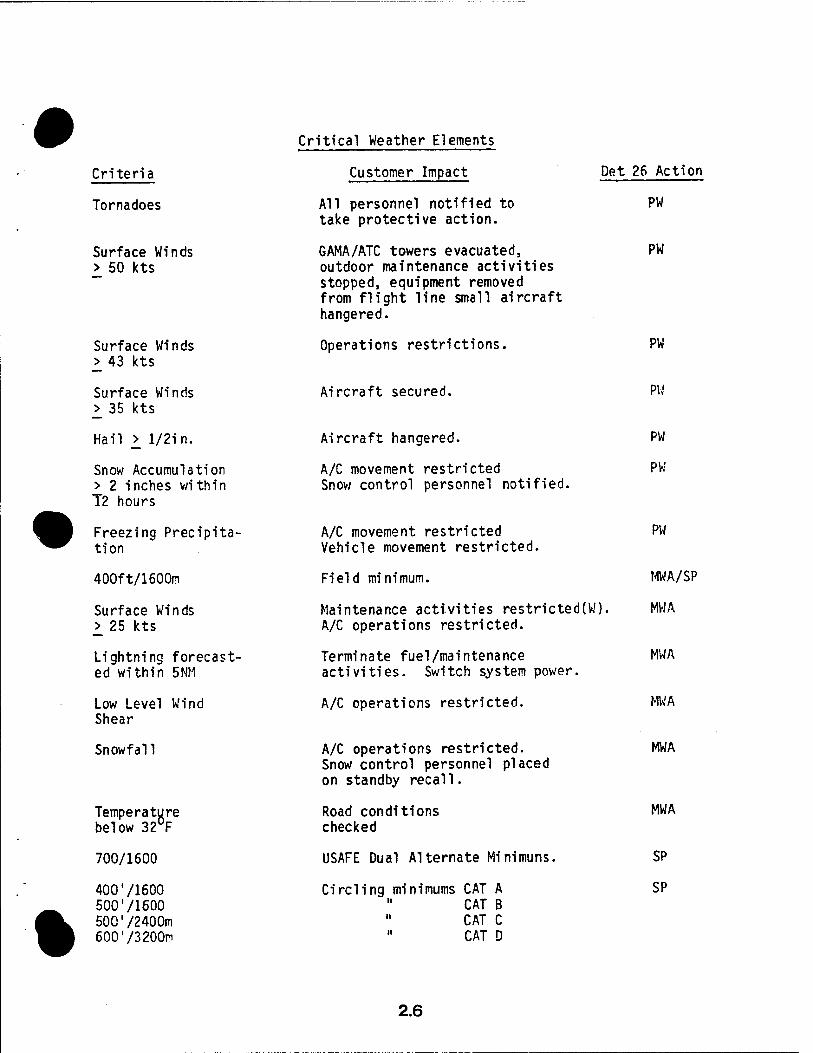
%
Criteria
Tornadoes
Surface Winds > 50 kts
Surface Winds _> 43 kts
Surface Winds _> 35 kts
Hail _> l/2in.
Snow Accumulation > 2 inches within T2 hours
Freezing Precipita- ti on
400ft/1600m
Surface Winds _> 25 kts
Lightning forecast- ed within 5MM
Low Level Wind Shear
Snowfall
Temperature below 32°F
700/1600
400'/1600 500 71600 50072400m 60073200m
Pet 26 Action
PW
PW
Critical Weather Elements
Customer Impact
All personnel notified to take protective action.
GAMA/ATC towers evacuated, outdoor maintenance activities stopped, equipment removed from flight line small aircraft hangered.
Operations restrictions. PW
Aircraft secured. PW
Aircraft hangered. PW
A/C movement restricted PW Snow control personnel notified.
A/C movement restricted PW Vehicle movement restricted.
Field minimum. MWA/SP
Maintenance activities restricted(W). MWA A/C operations restricted.
Terminate fuel/maintenance MWA activities. Switch system power.
A/C operations restricted. MWA
A/C operations restricted. MWA Snow control personnel placed on standby recall.
Road conditions MWA checked
USAFE Dual Alternate Minimuns. SP
Circling minimums CAT A SP CAT B CAT C CAT D
2.6
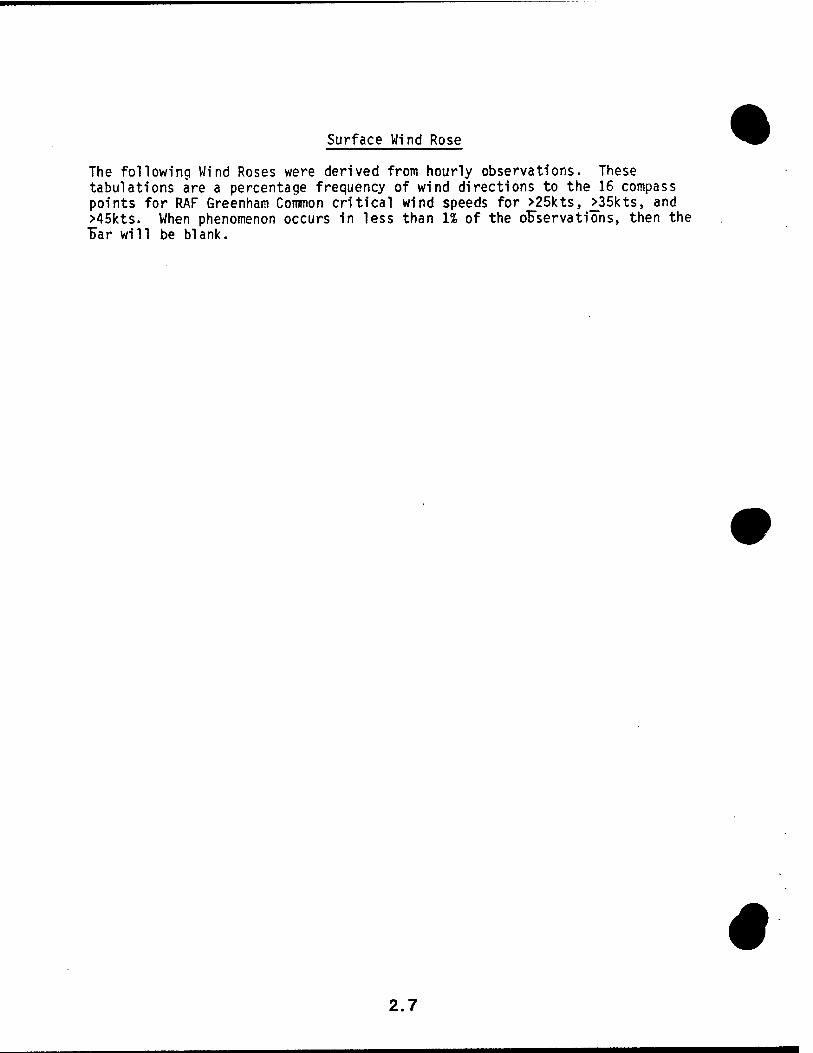
Surface Wind Rose
The following Wind Roses were derived from hourly observations. These tabulations are a percentage frequency of wind directions to the 16 compass points for RAF Greenham Common critical wind speeds for >25kts, ^35kts, and >45kts. When phenomenon occurs in less than 1% of the oFservations, then the Far will be blank.
•
2.7
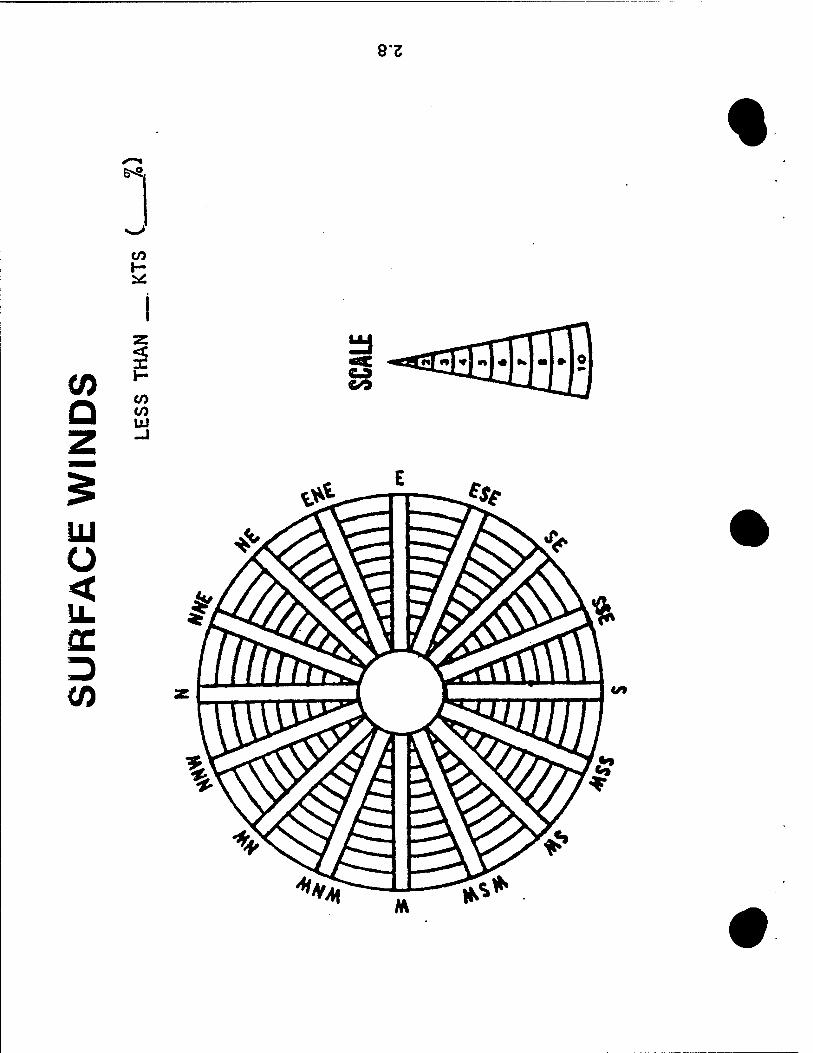
e>s
QmZ
%
CO
C/) Q Z
UJ Ü <
cc D
to to UJ
a CO -«33333333
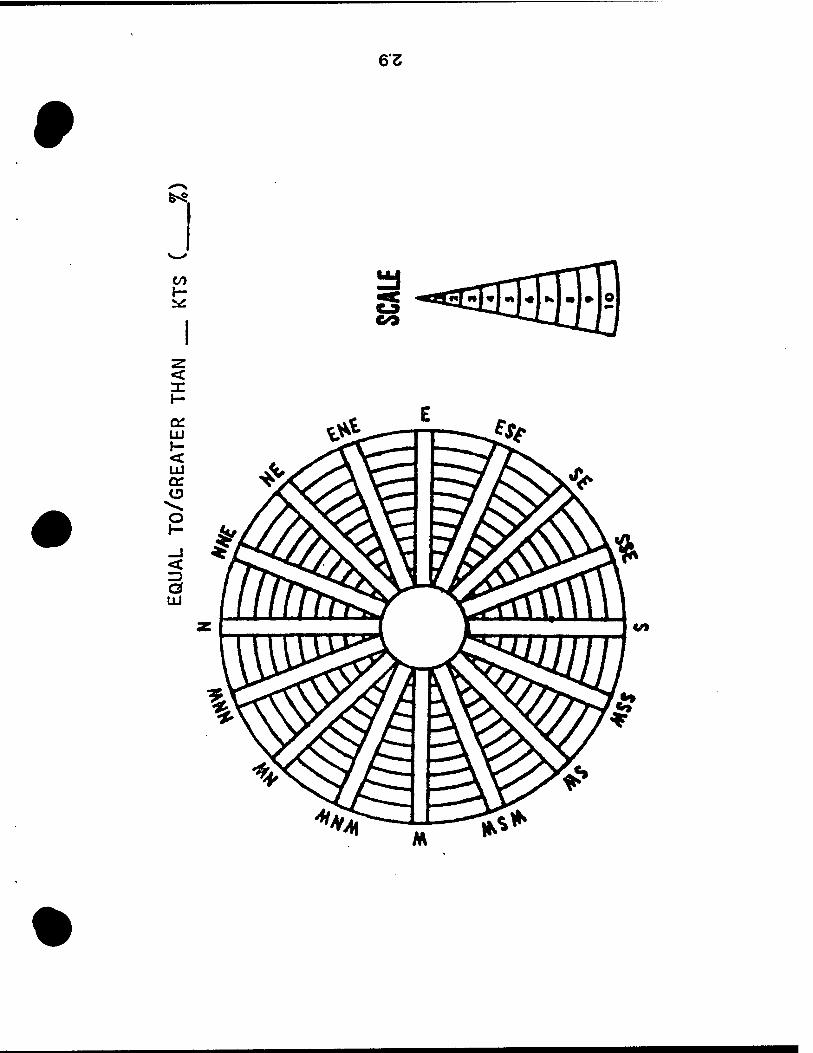
t 63
6>S
in
< x
Ul
< Ul
<
Ö tu
a CO
^EEHjffl
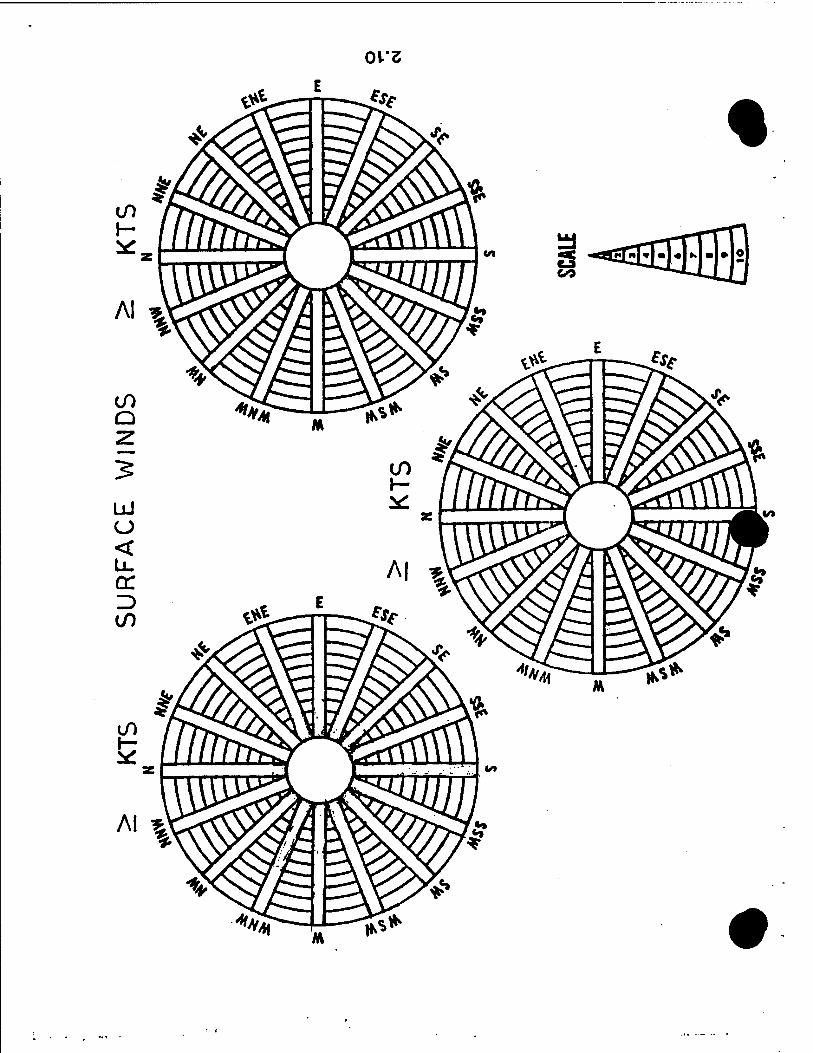
<H'3
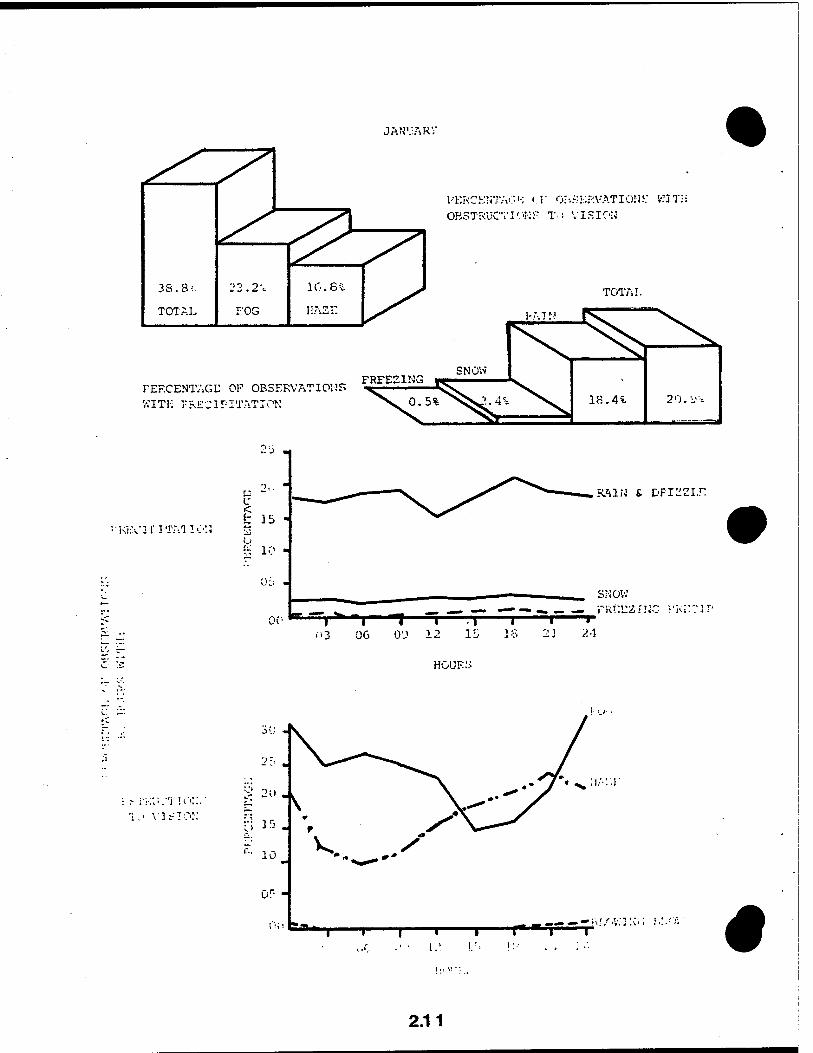
JAN'JAR;
PEKCKNTAO1-; <!' OI^KRVATIOÜJ: WIT!; OBSTRUC'VI'.'!■:■■ T>; VISION
PERCENTAGE OF OBSERVATIONS WITH PRECIPITATION
■KhViri TAT IC-tJ
< fc 15
r, 1(
OG
RAIN & DPi^zi.r:
09 1L. 24
sr;ow
HOURS
..• vi-io
.^;i,v.r
«
2.11
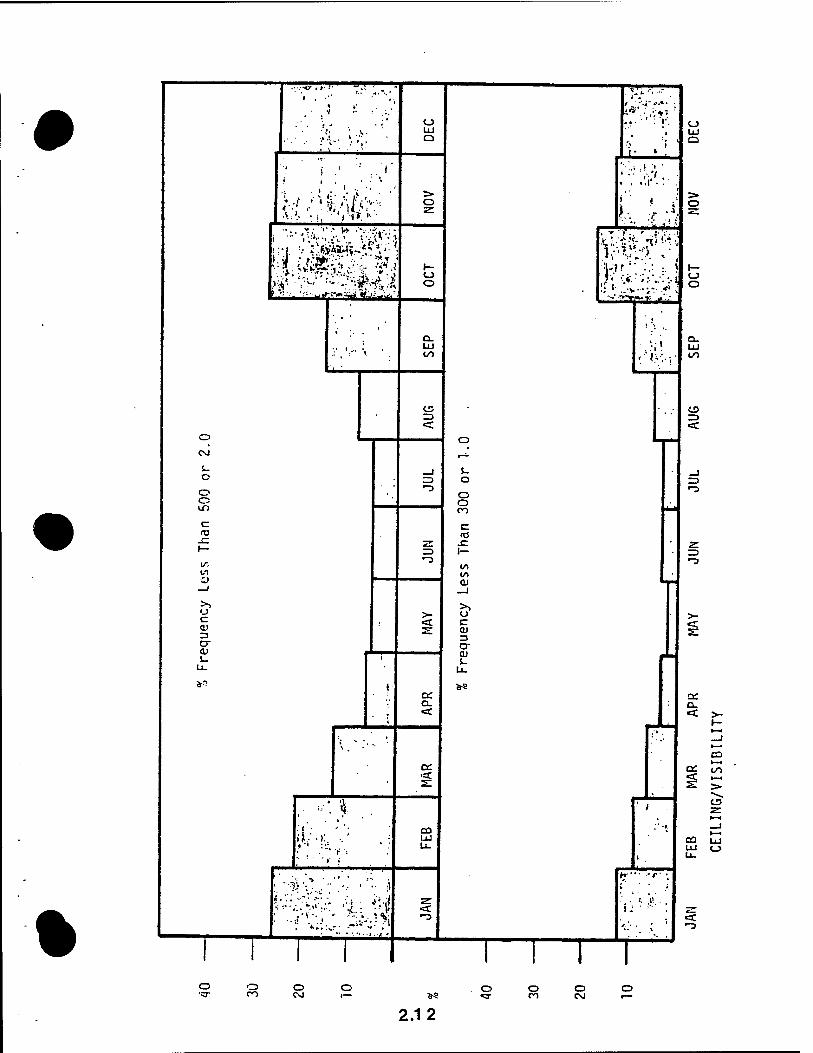
%
o CM
L. O o o en
c: T3
I/-. </) i)
U c (LI
CT
»s
w-
!3 ?•*•
•. i
*.%>'..'■"
o UJ Q
O
o o
Q. LU l/>
>-
CL
CO UJ u.
•a: ■-a
o o o ro c <o
JC I— (/) I« (LI
o c 3 o- 1-
&9
i: 1 ■ ■ ',■■'(,
i. it A
!:«•...•>■■■• jr-.fJ
o UJ Q
t— o o
UJ l/>
«=c
•-3
'S
>■
»»'■-• •<••
I J
ac D- < >-
H- K-1 _l •—• CO •—*
Q: 1/1
CD
co tu UJ o u.
«a:
I I I I o •vT
o ro O
CVJ 5«
2.12
o o n o CVJ
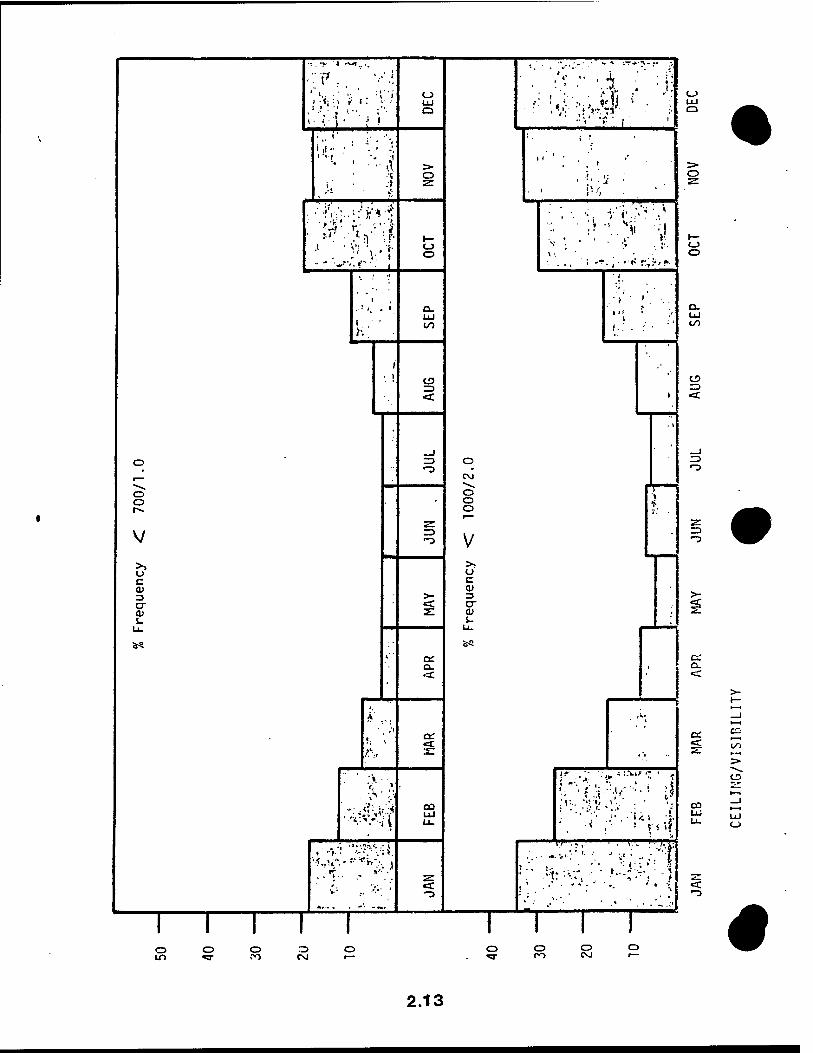
o o
V
o c 3
01 i-
"V . i -1; :■, ;: i: ■.■
ill i i ■
»ii —
1 . :<vr
i •■>■! ■-•.•■.;>
' ••:■•.)
1 I I I I
o ÜJ o
CJ o
a. UJ
co
>-
a: o.
or
CO
-3
o evj o o O
u c 01 3 o- OJ 5-
, « ' •. , «I»
UJ O
O O
a. UJ CO
CD
13 •"3
>- ca:
5
V/" .-', v.. '■ J.
•t:
o to
o o o o CSJ r—
o «3-
i—i—r o o o CO OJ i—
en «a:
CO
< •"3
C2
1/0
CO
UJ
•
2.13
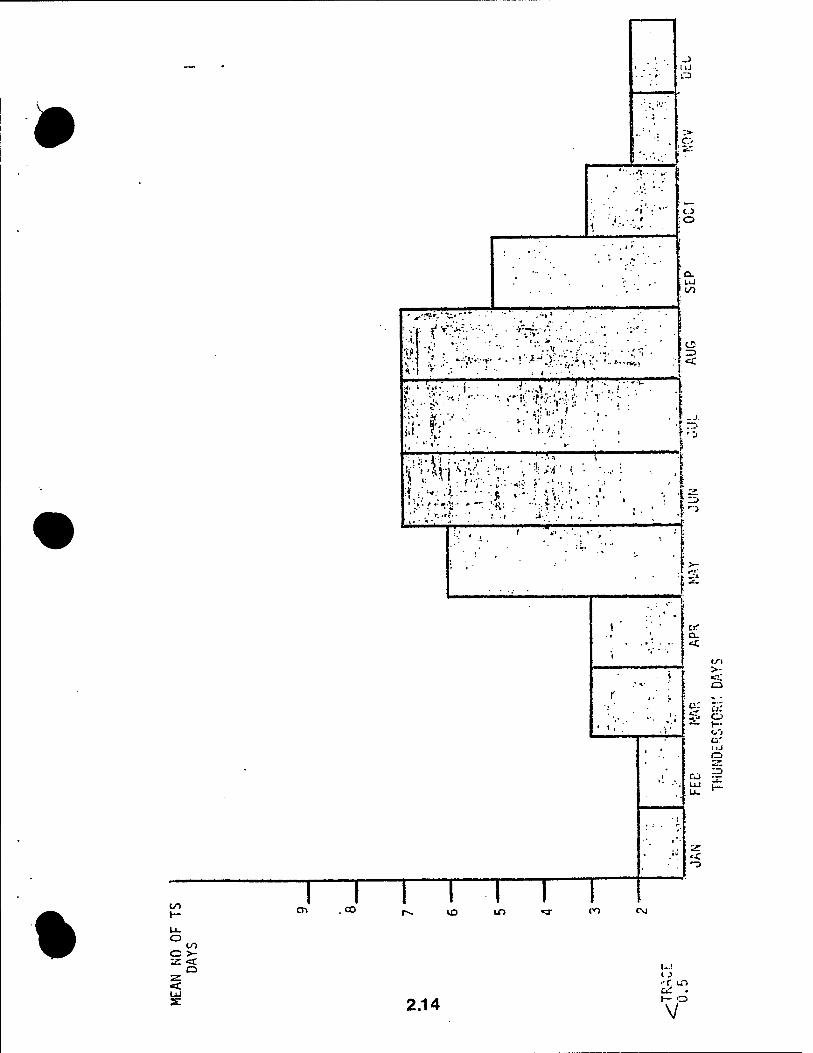
•
o o
a.
%
I/)
o c >-
o
en .co
UJ
' *•-:*'-
"..v ... -;■
'■:•=.-£.■
I. ' *■ * • .
*: 'I' ■)■ - •. !->.■■ '. • ' • .
!i" >**«*'>"■■■ :'v ■ -;'A" '■ '
:* . w ' 1 .. . • . » ;. . > ; ■ 1 • 1
!.:.- • '" .. :* ' •' i«:, ... • •• .■,.,.-.1;. ►— -^: -::»■;■,• , ' • •'
V£> in
2.14
I I I I I I I ro
i
• r —. r ''•> J i
• 1 ■ I
1
p:
Clf a.
>■
a' O
«■C
U! I J -f LO
V"
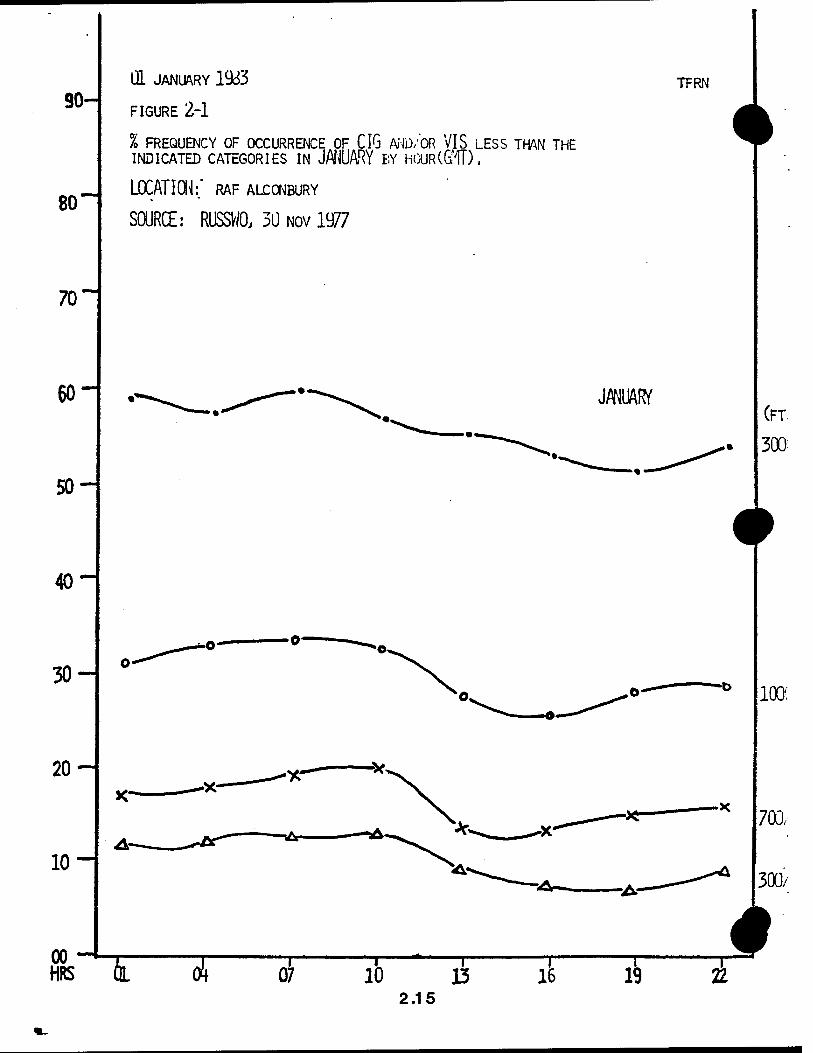
90-
80
HL JANUARY 19&>
FIGURE 2-1
% FREQUENCY OF OCCURRENCE OF CIG AND/OR VIS LESS TMN THE INDICATED CATEGORIES IN JANUARY BY HIXJRCG'IT) ,
LOCATION:' RAF ALCONBURY
SOURCE: RUSSWO, 30 NOV 1977
TFRN
70
60-
50-
40-
30-
20-
10-
00 ' HRS ¥ of J —T-
10 —r 13
2.15 J T
19
(FT.
300
lOOi
703/
300/
4 n
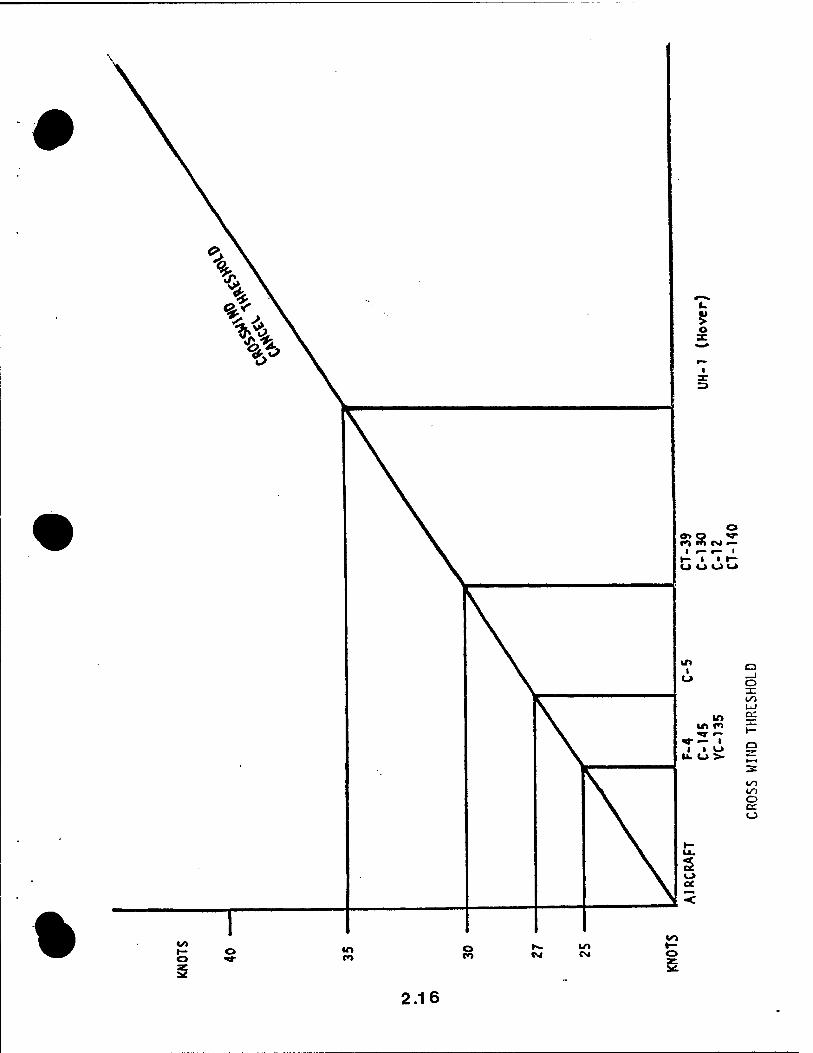
o
I
% «/> m
2.16
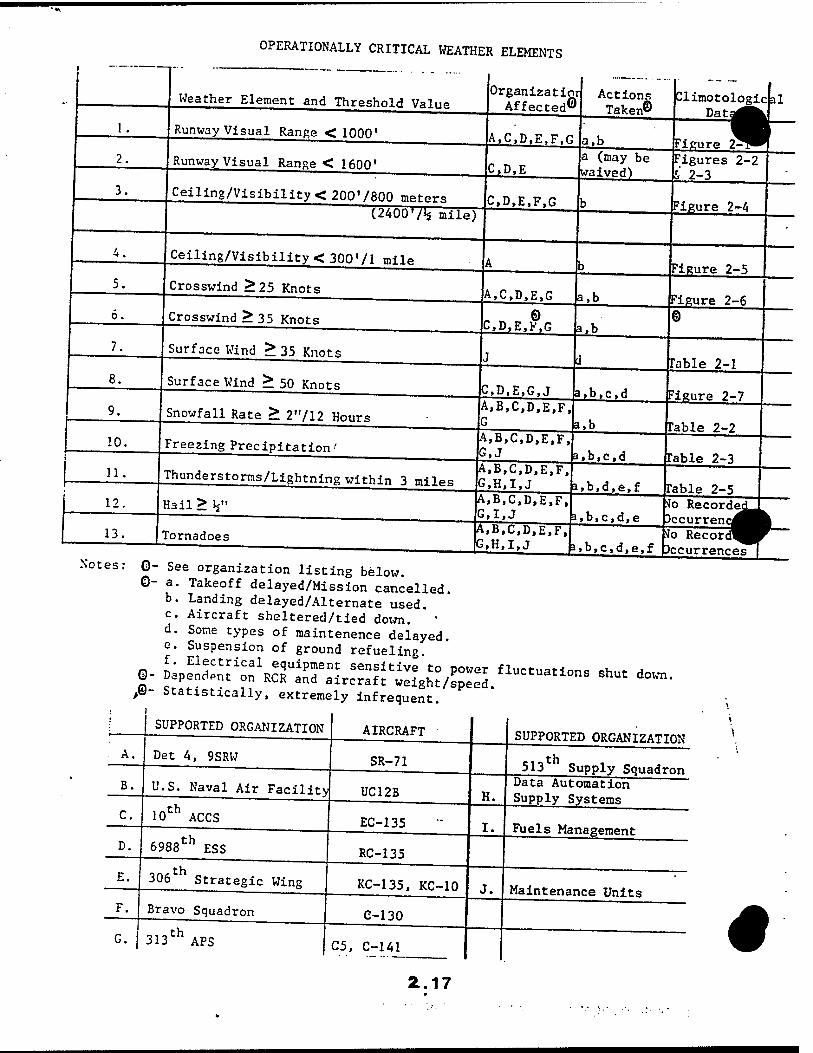
1 OPERATIONALLY CRITICAL WEATHER ELEMENTS
1.
Weather Element and Threshold Value
Runway Visual Range < IQQQ'
3.
Runway Visual Range < 1600'
Ceiling/Visibility < 20O'/800 meters ~ (2400» jk. mile)
Organizatior Affected0
A.C.D.E.F.G
C,D,E
Ceiling/Visibility < 30071 mile
Crosswind >25 Knots
Crosswind > 35 Knots
C,D,E,F,G
Actions Taken©
Climotolqgicjal DatJ
a,b a (may be waived)
Figures 2-2 Figure 2^^
Surface Wind > 35 Knots
i: Surface Wind > 50 Knots
10.
Snowfall Rate > 2"/12 Hours
A,C,D,E,G a.b
Figure 2-4
Figure 2-5
© C,D,E,F.G a,b
C.D.E.G.J
Figure 2-6
Freezing Precipitation-'
11.
12.
13.
Thunderstorms/Lightning within 3 miles
A,B,C,D,E,F, G
a>b,c,d Figure 2-7
A,B,C,D,E,F, G,J
a,b
A,B,C,D,E,F, G,H,I,J
Hail > V
Tornadoes
A,B,C,D,E,F, G.I.J
Table 2-1
Table 2-2
a.b.cd Table 2-3
a,b,d,e,f Table 2-5
>B,C,D,E,F, G,H,I,J
3»b,c,d,e ■Jo Recorded Jccurrenc Jlo Recorc ^
»ibiC^ie.f Jccurrences" Notes: 0- See organization listing below.
©- a. Takeoff delayed/Mission cancelled. b. Landing delayed/Alternate used. c. Aircraft sheltered/tied down. d. Some types of maintenence delayed. e. Suspension of ground refueling
e- Ä^ÄT.^rSS'Xl/SS nuctuations 6hut d°- >©- Statistically, extremely infrequent.
B.
SUPPORTED ORGANIZATION
Det 4, 9SRW
U.S. Naval Air Facility
C.
D.
E.
10th ACCS
AIRCRAFT
SR-71
UC12B
6988th ESS
.th 306 Strategic Wing
EC-135
RC-135
H.
SUPPORTED ORGANIZATION
,th 513 Supply Squadron
Data Automation Supply Systems
I. Fuels Management
Bravo Squadron
313th APS
KC-135, KC-10
C-130
I C5, C-141_
Maintenance Units
«
2.17
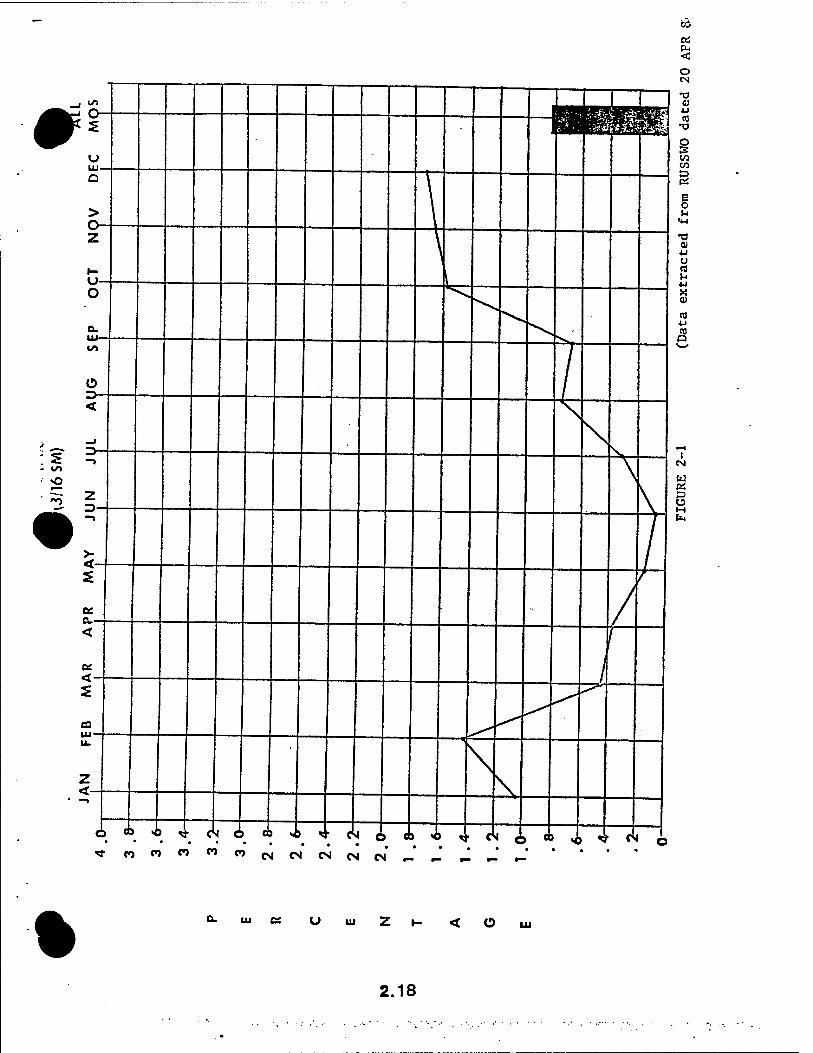
CO
< o CM
4J
u LU-
CO T3
O CO CO
CS
> o- \
es
B o u
z
u-
\ U eg u
o
Q. tu—
Q)
CO 4J CO p
Ü 3—
\~*
<
\ \ t—1
•§ in \
\
1 CM
w D Ü
• >• <— /
fe
2
C—- /
7-
<
Of <-- /
f
CO
u.
Z <—
\
\ * —i
o to
n
1
n el o to
CS cs 4-
• • es
es o
es
OS i
<0 • <
4- •
X 6 ob • s
» e\
• c I
%
Ul O
2.18
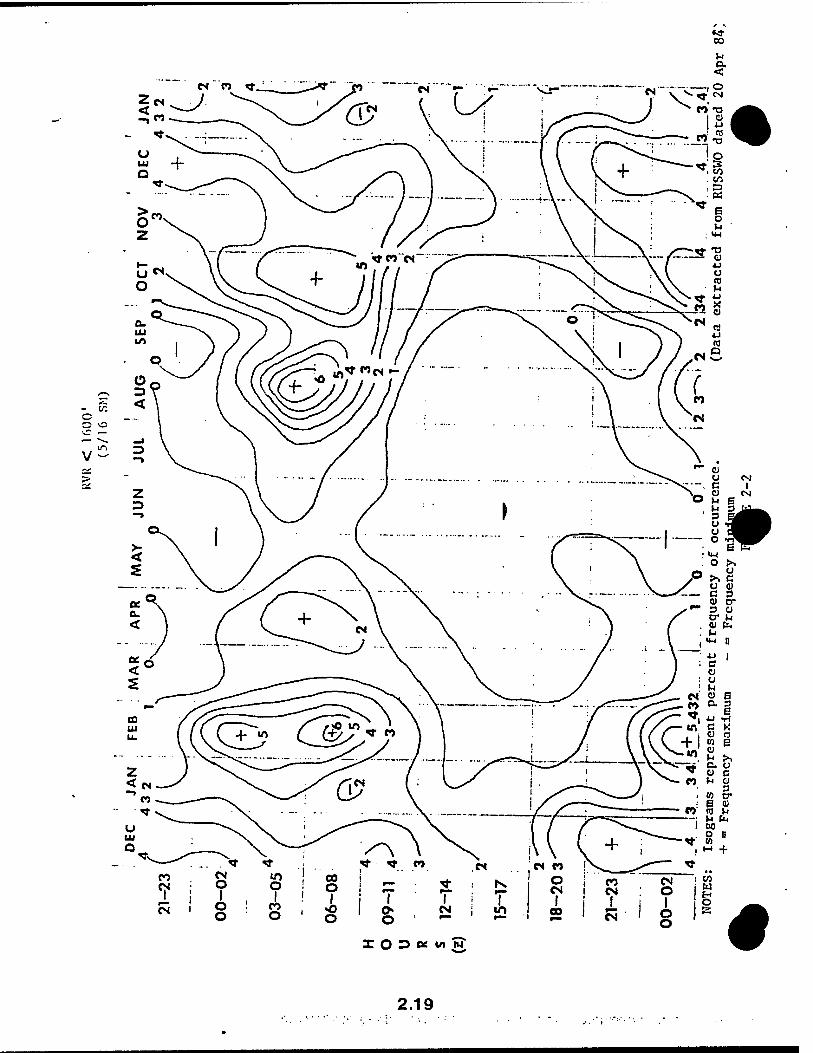
co
- v. o o o
V >
X03KVIN
2.19
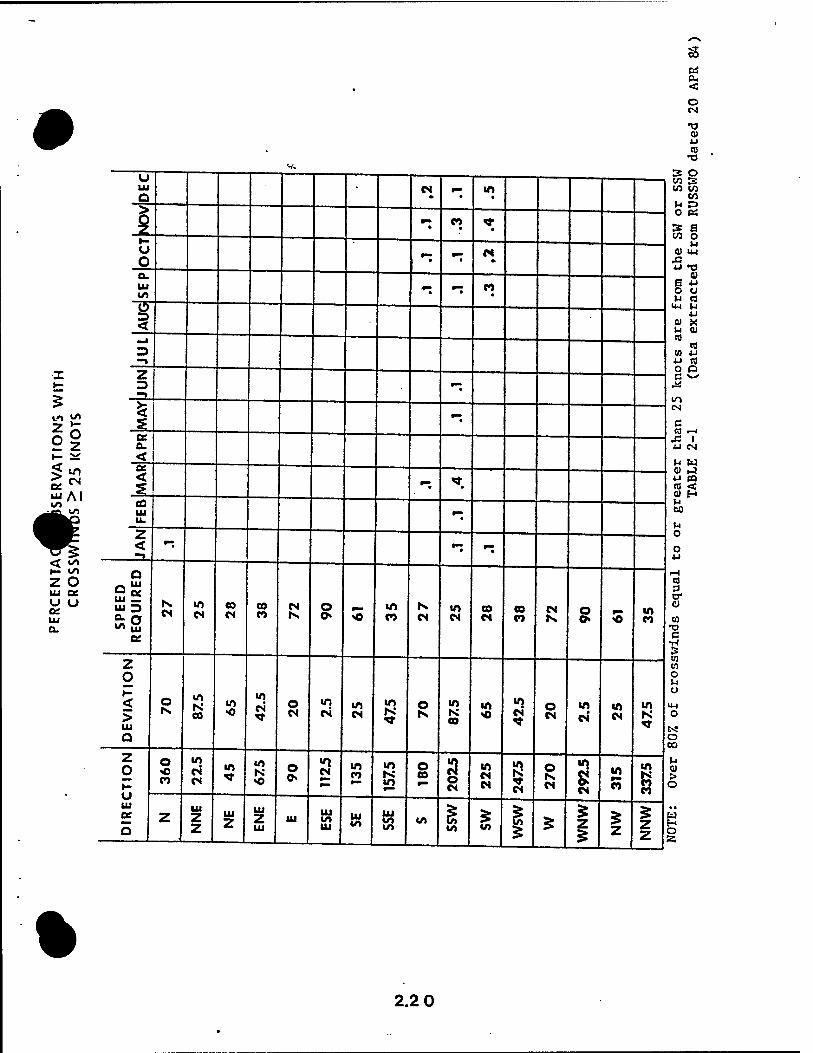
s
»
V.
< o CM
•o
« •o s o u
LU o es • - m • W 3 W t/3
i u o
• • • O (S
» e W O
• • • M
dl «w
4J tJ o. UI CD
~7K"
.»■ • •
ire
fro
m
extr
acte
<
5 knots
£ (D
ata
■J
SE
RV
AT
ION
S W
ITH
TOS > 2
5 K
NO
TS
z -> -.
»■» CN
C C0 •—4 es
a. .C 1 *J CM
n u < • * W PO
n <c 0) H
CQ UI u. • es
u
m <J 1/1
z o tu tu u u ߣ UI Q.
z < fMft
• • o o
SP
EE
D
RE
QU
IRE
D
K CS
m es
co es
eo n
es o S3
m o es
m es
00 es
to CO
es »s o
o ff"» S)
m
a 3
O CO
n
z O »- < > UI Q
O «n K 00
«n o
in es o
es m es m
es m o
Is •n K 00
m SS
in es' O
es m • es
in es
m K
w w o o
IM o
o 03
DIR
EC
TIO
N
O «0 cn
in es es
m in N o
0» «0 es in m
»n o CO 3 o es
es es
o es
es o es
<n n
in K n eo
U a > o
Z UI
UI
2
UI
5 -
UI m UI I
UI to
UI in
«n i/>
5 -
£ § S 5
i Z 5 Z Z
H O
%
2.2 0
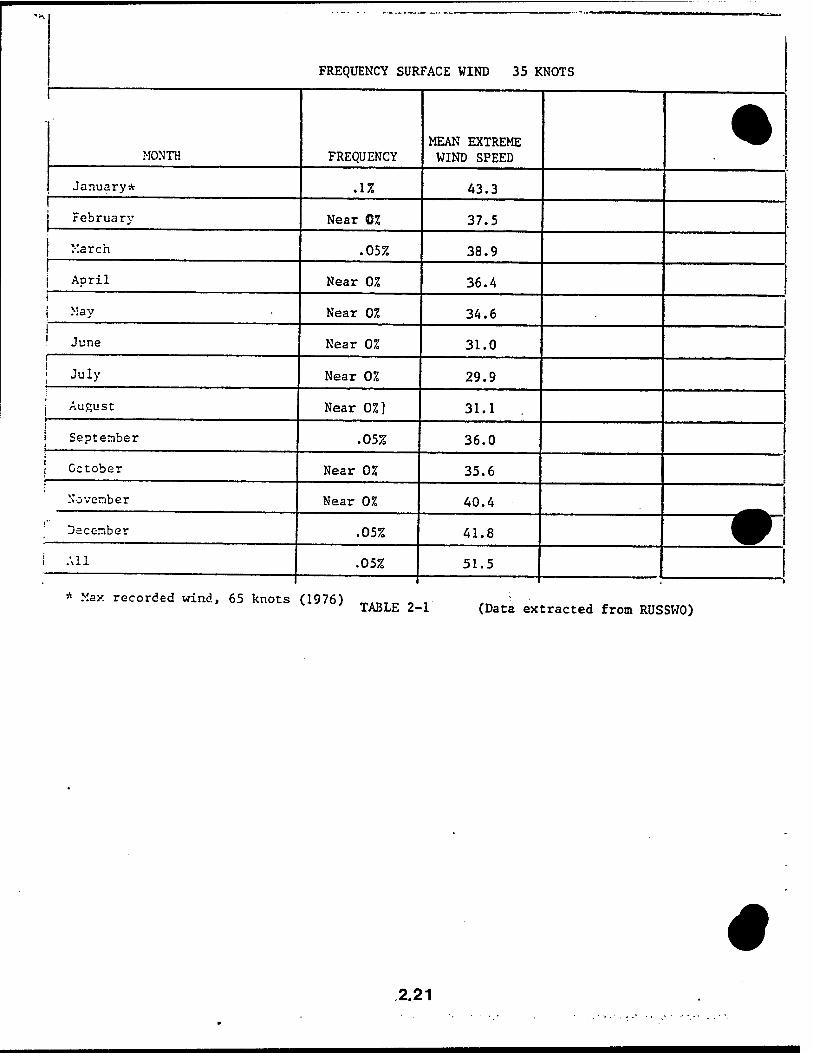
^
FREQUENCY SURFACE WIND 35 KNOTS
MONTH FREQUENCY MEAN EXTREME WIND SPEED
•
January* .1% A3.3 1 j February Near Q% 37.5
1 March .05% 38.9 j | April Near 0% 36.4 i
i -ay Near 0% 34.6 I ! June Near 07. 31.0
j July Near 01 29.9
j August Near 02] 31.1
i September .05% 36.0 i
i October Near 0% 35.6
November Near 0% 40.4
December .05% 41.8 ^
All .05% 3,3
* Max recorded wind, 65 knots (1976) „,.„.„ „ , TABLE 2-1 (Data extracted from RUSSWO)
4 2.21
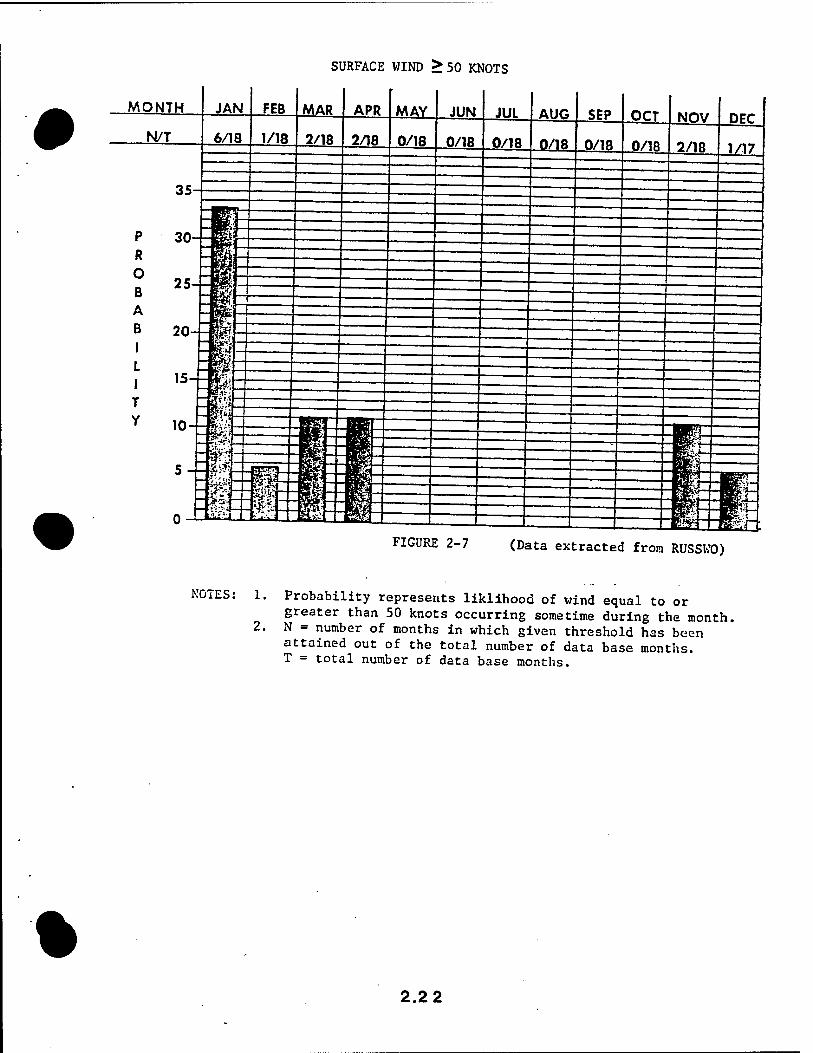
SURFACE WIND > 50 KNOTS
FIGURE 2-7 (Data extracted from RUSSUO)
%
NOTES: 1.
2.
Probability represents liklihood of wind equal to or greater than 50 knots occurring sometime during the month, N = number of months in which given threshold has been attained out of the total number of data base months. T = total number of data base months.
2.2 2
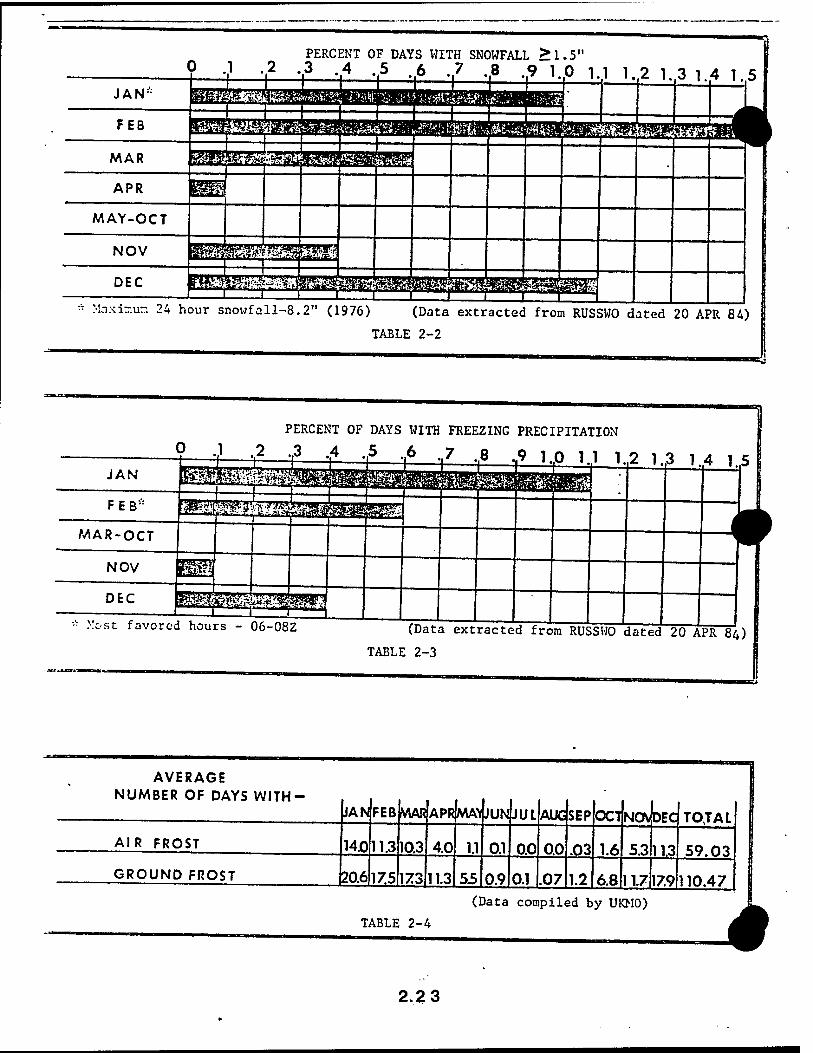
PERCENT OF DAYS WITH SNOWFALL >1.5" 2 -3 .4 ..5 .6 .7 ,f8 .,9 1.0 1.1 1,2 1. 3 1.4 1
* Maxisur. 24 hour snoufall-8.2" (1976) (Data extracted from RUSSWO dated 20 APR 84)
TABLE 2-2
:': Most favored hours - 06-08Z (Data extracted from RUSSWO dated 20 APR 84)
TABLE 2-3
2.2 3
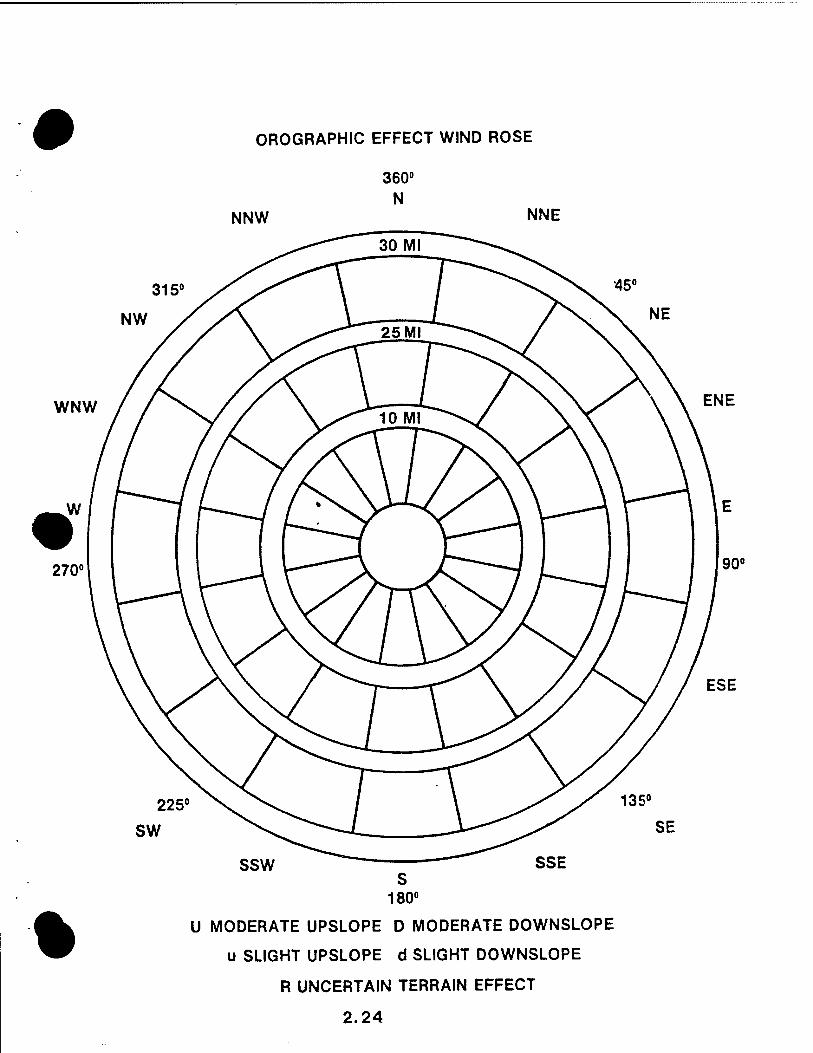
WNW
OROGRAPHIC EFFECT WIND ROSE
NNW
%
SSW
360° N
S 180°
NNE
SSE
U MODERATE UPSLOPE D MODERATE DOWNSLOPE
u SLIGHT UPSLOPE d SLIGHT DOWNSLOPE
R UNCERTAIN TERRAIN EFFECT
2.24
SECTION 3
APPROVED LOCAL
FORECAST STUDIES
AND
RULES OF THUMB
#
APPROVED LOCAL FORECAST STUDIES AND RULES OF THUMB (ROT). Only approved studies and ROTs go in this section. If you have none, say so in this section. Approved studies and ROTs kept in this section will have a summary of the verification data with it. These should be reviewed and verified periodically, perhaps every three years for a two year period. A summary of the review and verification data will be filed in this section.
Forecaster hints and techniques should be in section 4.
%
3.1
SECTION 4
WEATHER
CONTROLS
%
WEATHER CONTROLS. Here we are looking for those atmospheric and geographic features which produce operationally significant weather at your terminal. This should be a seasonal discussion which includes such topics as the stations relation to storm tracks, frequency and effects of frontal/trof passages, stratus/fog and severe weather (icing, turbulence, freezing precip thunderstorms, etc.), effects of local terrain, water bodies on weather, etc. Don't scimp here! This is for your benefit. This section can be a valuable tool in your forecast program. The following pages are some examples.
%
4.1
A DISCUSSION BY SEASON OF WEATHER ASSOCIATED WITH
VARIOUS SYNOPTIC PATTERNS AT
STUTTGART AIRFIELD, GERMANY
13 DECEMBER 1979
%
4.2

WINTER
DECEMBER-JANUARY-FEBRUARY
#
4.3

SPRING
MARCH-APRIL-MAY
ft
4.4

SUMMER
JUNE-JULY-AUGUST
«
4.5

FALL
SEPTEMBER-OCTOBER-NOVEMBER
%
4.6
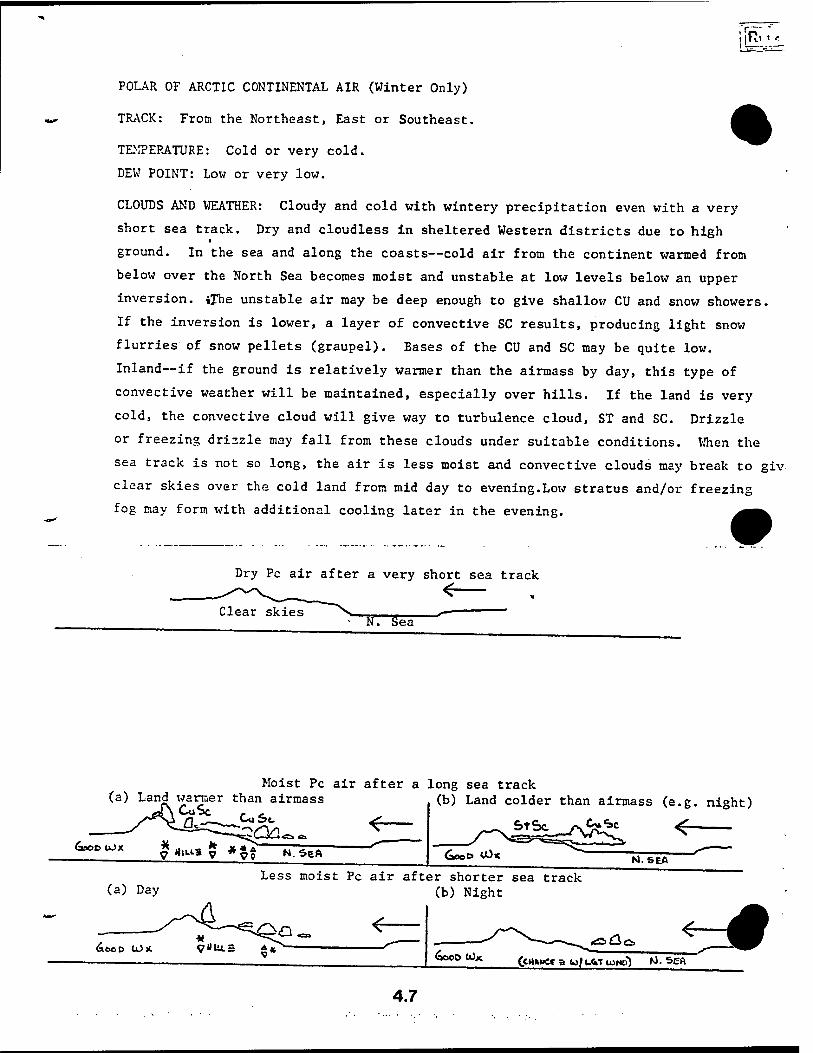
iifo ' <•
POLAR OF ARCTIC CONTINENTAL AIR (Winter Only)
TRACK: From the Northeast, East or Southeast.
TEMPERATURE: Cold or very cold.
DEW POINT: Low or very low.
CLOUDS AND WEATHER: Cloudy and cold with wintery precipitation even with a very
short sea track. Dry and cloudless in sheltered Western districts due to high
ground. In the sea and along the coasts—cold air from the continent warmed from
below over the North Sea becomes moist and unstable at low levels below an upper
inversion. iThe unstable air may be deep enough to give shallow CU and snow showers.
If the inversion is lower, a layer of convective SC results, producing light snow
flurries of snow pellets (graupel). Bases of the CU and SC may be quite low.
Inland—if the ground is relatively warmer than the airmass by day, this type of
convective weather will be maintained, especially over hills. If the land is very
cold, the convective cloud will give way to turbulence cloud, ST and SC. Drizzle
or freezing drizzle may fall from these clouds under suitable conditions. When the
sea track is not so long, the air is less moist and convective clouds may break to giv
clear skies over the cold land from mid day to evening.Low stratus and/or freezing
fog may form with additional cooling later in the evening.
Dry Pc air after a very short sea track
< Clear skies
N. Sea
Moist Pc air after a long sea track (a) Land warmer than airmass (b) Land colder than airmass (e.g. night)
CuSc , t
<r 5tSc==o^Sv <~ GooO (OK N. SEA
(a) Day Less moist Pc air after shorter sea track
(b) Night
Da, <r IAMB U)K .<=>&<
6000 t0x Cm»** a to/ IAT tW) M. Sgft
4.7
%
01 January 1983 TFRN
SECTION 4 - Weather Controls And Synoptic Case Studies
4-1 General: The climate of the United Kingdom (UK) is milder than that of comparable latitudes in other parts of the world due to the North Atlantic Ocean and the prevailing westerlies. The proximity of warm water, even as far north as the Arctic Circle, prevents long periods of cold weather as observed in Russia and Asia.
4-4.1 Our weather is similar to that found along the west coast of North America, although there are no significant north-south mountain ranges to block the flow of westerly winds from the North Atlantic as in the case of North America. Very little protection is afforded the base from the southwest to west. The downslope motion is also not enouth to create a pronounced drying effect. Moist air from the southwest to the west is advected over the base with negligible modification. Therefore, we experience a maritime climate with very mild winters, cool summers, frequent cloudiness and fog, and fairly evenly distributed precipitation.
4-1.2 The main air flow over England during the winter is southwesterly. The predominant system is a northeastward extension of the deep semi-permanent low centered south of Iceland. The principle variation from winter to summer circulation is the intensification and northward displacement of the Atlantic High. Figure 4-1 illustrates the mean pressure, circulation, and wind flow by season while figure 4-2 shows the mean winter and summer postions of the semi- permanent synoptic features. Figure 4-3 shows the primary and secondary mean cyclone paths by season.
4-1.3 The Gulf Stream dominates the circulation of the North Atlantic with the result that warm water is transported northeastward from the southwestern Atlantic toward northwestern Europe. Throughout the major portion of the year, maritime airmasses dominate. The winters are generally mild with moderately high humidities. Summers are relatively cool with high humidities.
4-2 Major Airmasses. The major airmasses that affect the UK are as follows:
4-2.1 Maritime Arctic (mA). This air moves southward from the Arctic on the rear of a deep depression over Scandanavia. The clouds are chiefly cumulus and cumulonimbus and showers are fequent in winter and early spring (snow showers). The north wind is generally cold and visibility good.
4-2.2 Maritime Polar (mP). The air moves into the British Isles from the western North Atlantic. This is the most common air mass over the UK. It occurs in the rear of cold occluded fronts which are associated with depressions to the north and northwest. Cumulus and cumulonimbus are the most frequent cloud types and showers are common in spring and autumn. Thunderstorm activity is likely in the summer.
4-2.3 Continental Arctic (cA). This air brings frost into the eastern and southeastern UK. The visibility is usually lowered by haze. The clouds are generally stratocumulus of fair weather cumulus
4.8
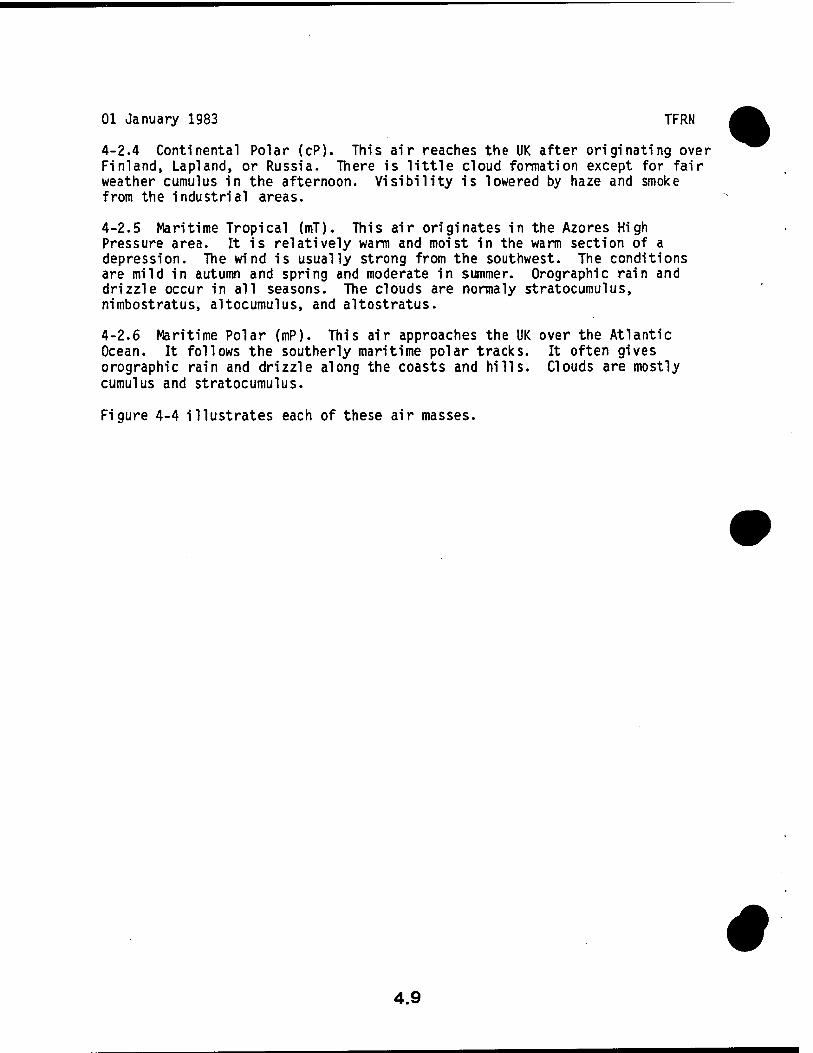
01 January 1983 TFRN
4-2.4 Continental Polar (cP). This air reaches the UK after originating over Finland, Lapland, or Russia. There is little cloud formation except for fair weather cumulus in the afternoon. Visibility is lowered by haze and smoke from the industrial areas.
4-2.5 Maritime Tropical (mT). This air originates in the Azores High Pressure area. It is relatively warm and moist in the warm section of a depression. The wind is usually strong from the southwest. The conditions are mild in autumn and spring and moderate in summer. Orographic rain and drizzle occur in all seasons. The clouds are normaly stratocumulus, nimbostratus, altocumulus, and altostratus.
4-2.6 Maritime Polar (mP). This air approaches the UK over the Atlantic Ocean. It follows the southerly maritime polar tracks. It often gives orographic rain and drizzle along the coasts and hills. Clouds are mostly cumulus and stratocumulus.
Figure 4-4 illustrates each of these air masses.
#
4.9
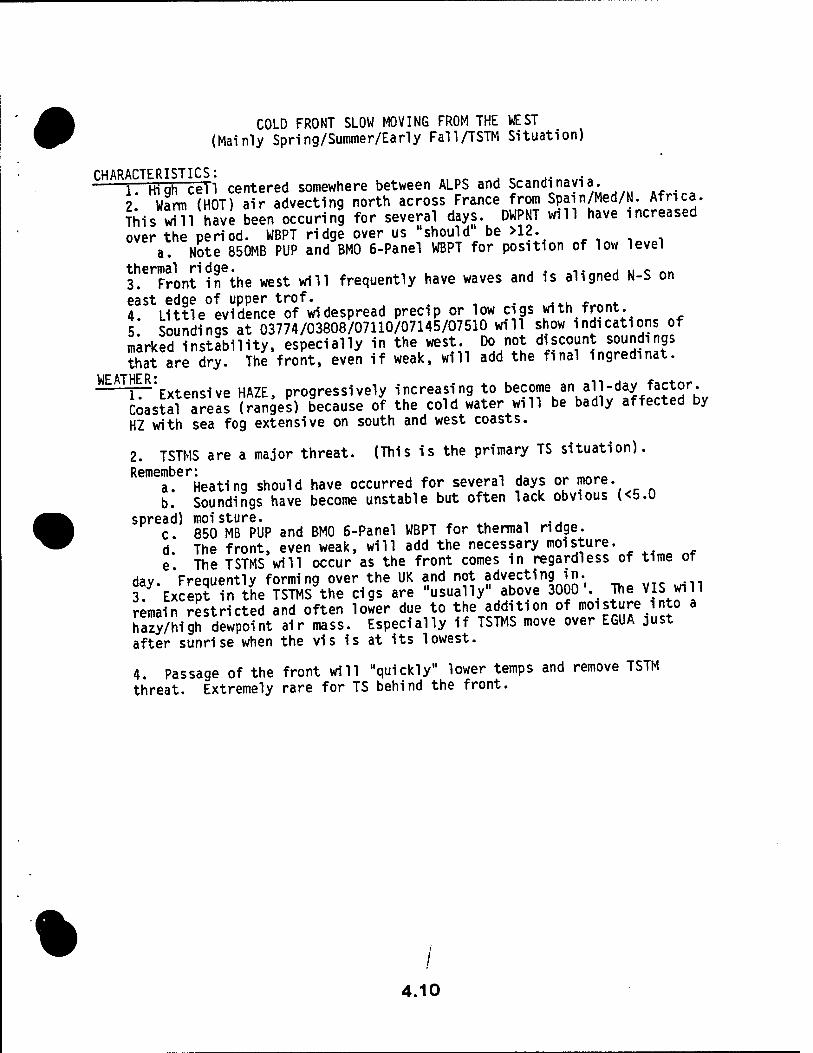
COLD FRONT SLOW MOVING FROM THE WEST (Mainly Spring/Summer/Early Fall/TSTM Situation)
1. High cell centered somewhere between ALPS and Scandinavia. 2 Warm (HOT) air adverting north across France from Spain/Med/N. Africa. This wHl have been occuring for several days. DWPNT will have increased over the period. WBPT ridge over us "should be >12.
a. Note 850MB PUP and BMO 6-Panel WBPT for position of low level
3*!erFron"inethe west will frequently have waves and is aligned N-S on east edge of upper trof. . 4. Little evidence of widespread precip or low cigs with front. 5 Soundings at 03774/03808/07110/07145/07510 will show indications of marked instability, especially in the west. Do not discount soundings "rt are dry. The front, even if weak, will add the final ingredinat.
i—Extensive HAZE Droqressively increasing to become an all-day factor. Coasta? arels (rfnges) because of the cold water will be badly affected by HZ with sea fog extensive on south and west coasts.
2. TSTMS are a major threat. (This is the primary TS situation).
Remember* a. Heating should have occurred for several days or more. b. Soundings have become unstable but often lack obvious (<5.0
spread) moisture. ,. L , . . c. 850 MB PUP and BMO 6-Panel WBPT for thermal ridge. d. The front, even weak, will add the necessary moisture. e. The TSTMS will occur as the front comes in regardless of time of
day. Frequently forming over the UK and not adverting in. 3 Except in the TSTMS the cigs are "usually" above 3000'. The VIS will remain restricted and often lower due to the addition of moisture into a hazy/high dewpoint air mass. Especially if TSTMS move over EGUA just after sunrise when the vis is at its lowest.
4. Passage of the front will "quickly" lower temps and remove TSTM threat. Extremely rare for TS behind the front.
»
4.10
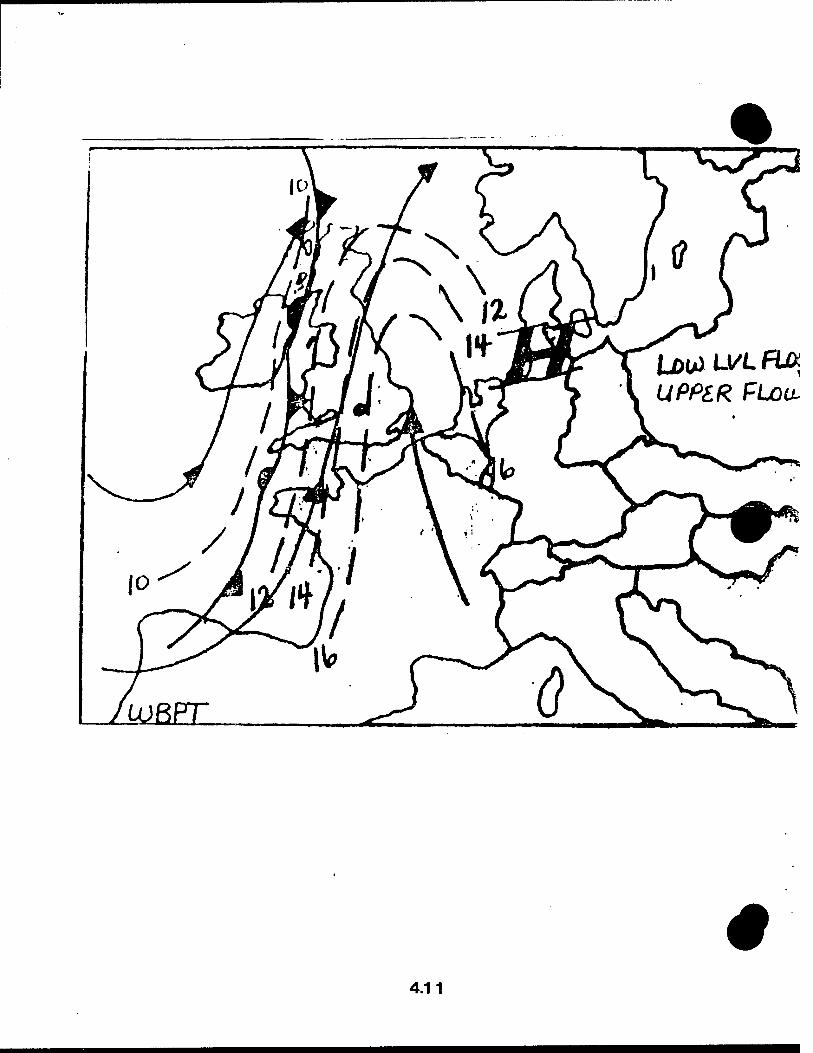
#
4.11

APPENDIX
%

In this section you may list additional references to be used in conjunction with the TFRN. Some examples would be Baur Catalog, Upslope/Lee Charts, and METSAT/RADAR reference files. List the names and locations.
The following pages are used to show examples of poor quality "originals" that were sent to 2WW/DNS for approval. These are included to reemphasize the need for reproducible originals. Some of these were legible when received.
%
A1
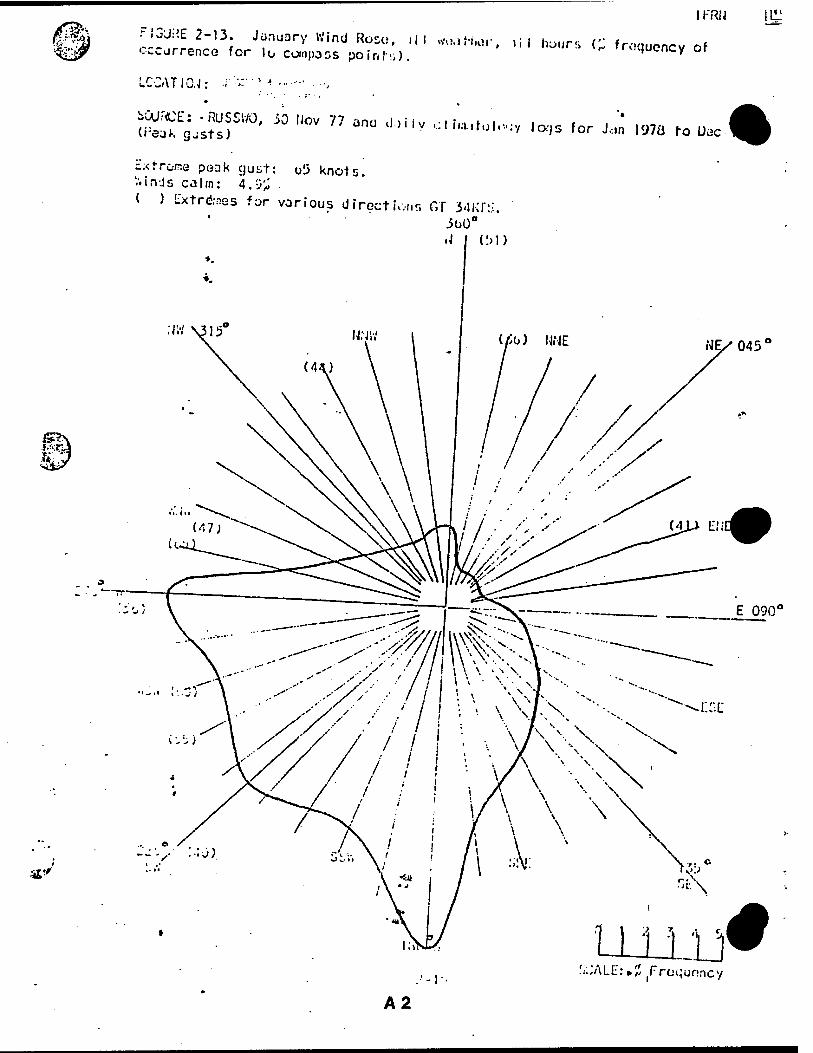
IKRIJ 1115 Kim
:&*
rlsj-AE 2-13. January Wind Roso, ij I «v.»}-»..»!- HI h.i.r. f *^ occurrence for lo compass polnhl). ' " froc>uencY of
LCCATI0.J: .f'--"1* - ....
bCUr<CE: -RUSSWO, 30 Nov 77 ano d)i (rejj-, qjsts) iy ol ii.i-1Utl.-:y lorjs for J,m 1978 fo Uac
txfrome peak gust: o!5 knots. '.".inJs cairn: 4 . v'^ .
< ) Lxtr&nes for various direct lour, GT 3<1KP;
300°
'.:.ALb:»% Fro^unncy
A2
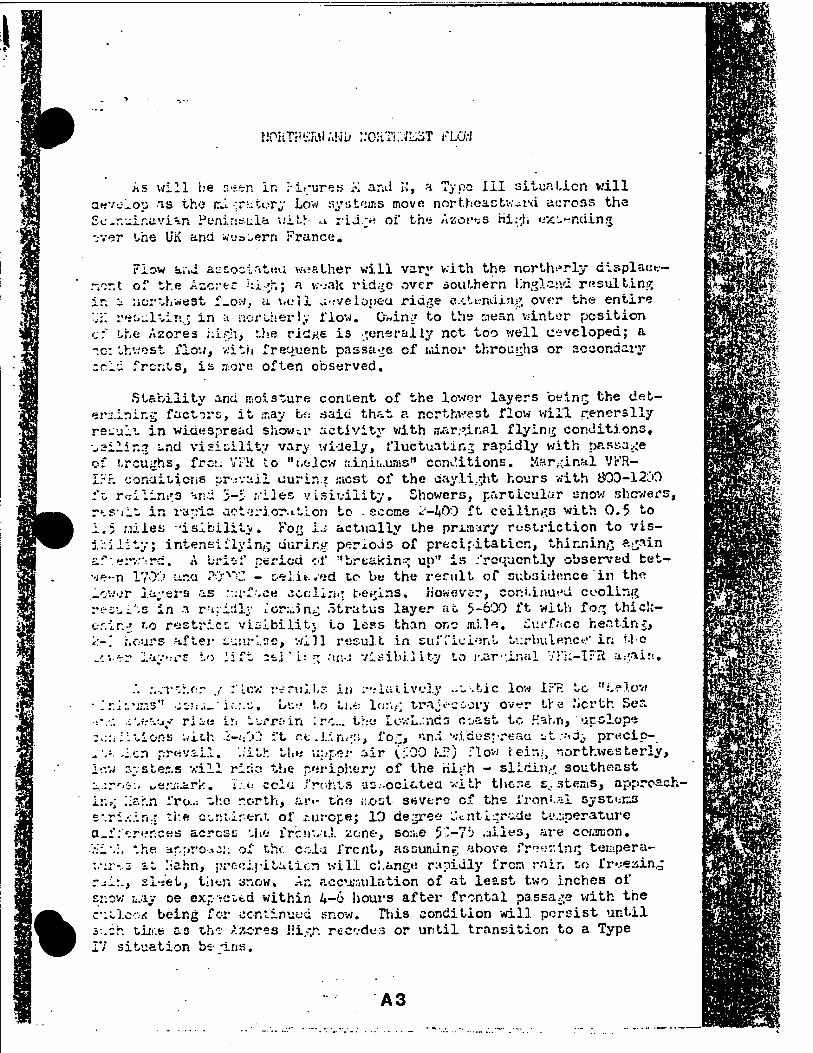
IJOKTilSIW.'iNi; ::o.'i7i:wuöT FLOVJ
As will he seen in M.;ures i\ and I.', a Typo III situation will aevolop is the ird :r--tory Low systems move northeastward across the Sc-r.-ir:uvivn Peninsula with ..i rid.;« oi" the Azores Hi:;h extending -,-ver the UK and wj^ern France.
Flow and a-j£:oii'it«i'.i weather will vary with the northerly displace- ment of the Azores -:i.-+.j a w.-ak ridfjo over southern hnglcr.d rnsultins in a northwest f_ow, a i.eli u-:veloneu rid.je e.tU-ndinjj over the entire ■JK ret-ultin.; in •:•. northerly flow. G»im' to the siean winter position ••.:" the Azores hirii, -he rictK« is generally net too well developed; a 10: thv.-est flow, with frequent passage of minor throurh3 or sccondai'y cold fronts, is sore often observed.
Stability and moisture content of the lower layers being the det- ermining factors, it ;r.ay be said that a northvrest flew will r:enerslly result in widespread shower activity with i-r.ar.^inal flying conditions, „silin.^ and visibility vary widely, fluctuating rapidly with passage of troughs, fro:.; \"i)i to "i.elcw fs.ini!..ums" conditions. Marginal V'r'R- IFr. conditions prevail uurin.j -acst of the daylight hours with 80D-12CO ft r<,-ilint'3 and 3-i .viles v.Lsieiiity. Showers, particular snow showers, r'.siit in rapio GOterioration to .eccme i'-l»00 ft ceilings with 0.5 to 1.5 niles visibility. Fo/j is actually the primary restriction to vis- ibility; intensiflying during periods of precipitation, thinning a-;ain af • erv.-:rc. A brisf period of "breaking up" is frequently observed tet- ••ie-n 1700 ana PO'VC. - telin.ed to be the remit of subsidence in the »ewer layers as :-.:rf-vce ccr;lln<r begins. However, continued cooling resui'vs in a ra-dtily ■.'or;..i n^ Stratus layer at 5-600 ft with for; thiclc- er.Lr.-i to restricr. visibility to less than one .idle, Surface hentinj, '<:-'. hours after i-unrlse, will result in sufficient turbulence' in the ..'.'..«-;• lay*.-re to lift 2ti'i:^ an-j visibility to r:ar-.ir.al Vr'h-IFIi a:;:air!.
A n.;rr.r.er ./ Mow rvruit?. in r-riatLvely ..-.tic low IF?, to "telovi • :r.J:.u:.-;3'' .;-•.• :.i_- U:.u, bue t.o ti.e la:;r trajectory ov?r tre hcrth Sea -.•.■:. .i'.er-.uy rii« ir. t^rrrän ::••'.... the Lov.-L.-ncs oast to Kahn, upslope ■;.;:; iitions -..ith .i-i;'.C ft r.t .J.-.n.••;:;, for, an.» widospreau Lt .■Ady precip-
%
:■-■ den prevail. With Ihn upper air fcoO i-J:) flow lein/, northwesterly, CM rr.sterr.s will ricia the rerioherv of the Hi;rh - sliding southeast :.rr'i:. ^e.'-ji^rk. :';.<: cola fronts as.-ocicteci with these systems, apprcacn- ::.-; iia'r.n fro..: ~J.'.c north, an- öhe iuost severe of the frontal systems •.ri.-:.:.n.r the eminent of r.urope; 10 decree JcntiiTrade U'.-.iperature _f;'.rer.ces acresü the fronvil aone, sorue 5--7t% .niies, are coi.ar.on, i".:. the approA.::. of thf cola frcnt, assuming above freer.inr; teiapera- •:r-..2 at iiahn, j.'rceijdtaticn will change rapidly from rain to frveain., J!:., si-set, tij'-n snow. An accumulation of at least two inches of :;ov; u.ay oe expected within 4-6 hours after frontal passage with the •:t'l.e--.<< being for continued snow. This condition will persist until :.zh tirr.e as ihi Azores l!i.-,r. recedes or until transition to a Type 7 situation b€-;ins.
fjff,A,:'
&$■
m
i^v
m
A3
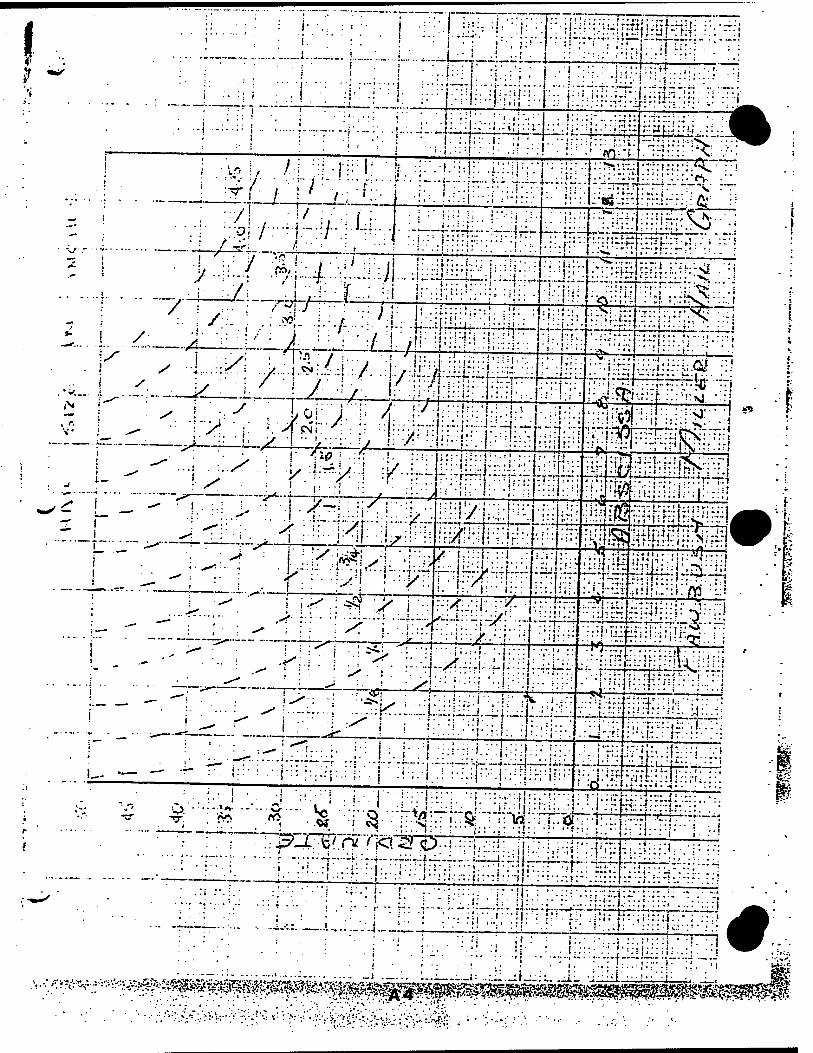
I ?
.. J ■.:—■•. :. .!....; Mi;.,''^;':,iü'",Jl •'•*• ■ •• •■
I- '■'i:'.-.' .:r;-
:*t.... :■!:::•
:;ir..:; :":' .::'i
:T,'
^l.ffi ■!■:.:; :::f: T^i-nM^"7?
.Li:. /-i-.._
7 "7
^.;J4::::.,.J::.J.
/■'
7-=?b^
!/
/
y
• • I - /- /.:
A- ILL^lLiUJ
, . . i'M:-<i :':! ^ •.:.; _;{.:.:.:.: •■'*• <' -'' : *N -!
... hi: l:.^ :fi :r..| ..:u. "V::.-;
. / i,.—h—r
;!:.::; rrntr i , ;:.
... .•: : '. ! . /v
* /* j. ;. >f P ^
x r • • • i • • .
./ y .,.-. :i/..
x* ~^T-^Y ±-M±
.S- ■.::..:'/..,
y ...... ... .... .
:/::-::
• (::;
:.. I
::.:.:i:i.::i.;.o^ •:;
m/mm\ 1 r»—=—5—
*T • —*
y::
I.:::
K-
::l ->.— ■ » • •
i:::
;v^i t^_;
.^:.
-<Pi—
i
■\:
irr:
7j?tn..
,.i-*fl... ij n■ • i ' ■*••■>•!
ti;lS.-,::K.ffl :.:i
iSP nm^i kj.
u- — . .i ...
• ■ i
I
I
•1;=:: :ri-i"i-H' il:'
;^>. "T
• -■»«■ w .... l^ «? ::i"a-
• ■;:. ■•■:; :l i
i::§'~T:Tfli ='li^
-*>^^r
J£L
:• :-):••::
:-H:.: J: .•-.i!l.::;
.r;.r:-^; •i.".::
•; ; • i .... •■ ... : j .; : •: i;:•• ■;;;; 11; •. •;; -i J; •.} _• r-
f :::,-* -H—r——,.
n-tnc:
^^:^^^^m^^m^^^^^^^^^^^^^^
. * f:
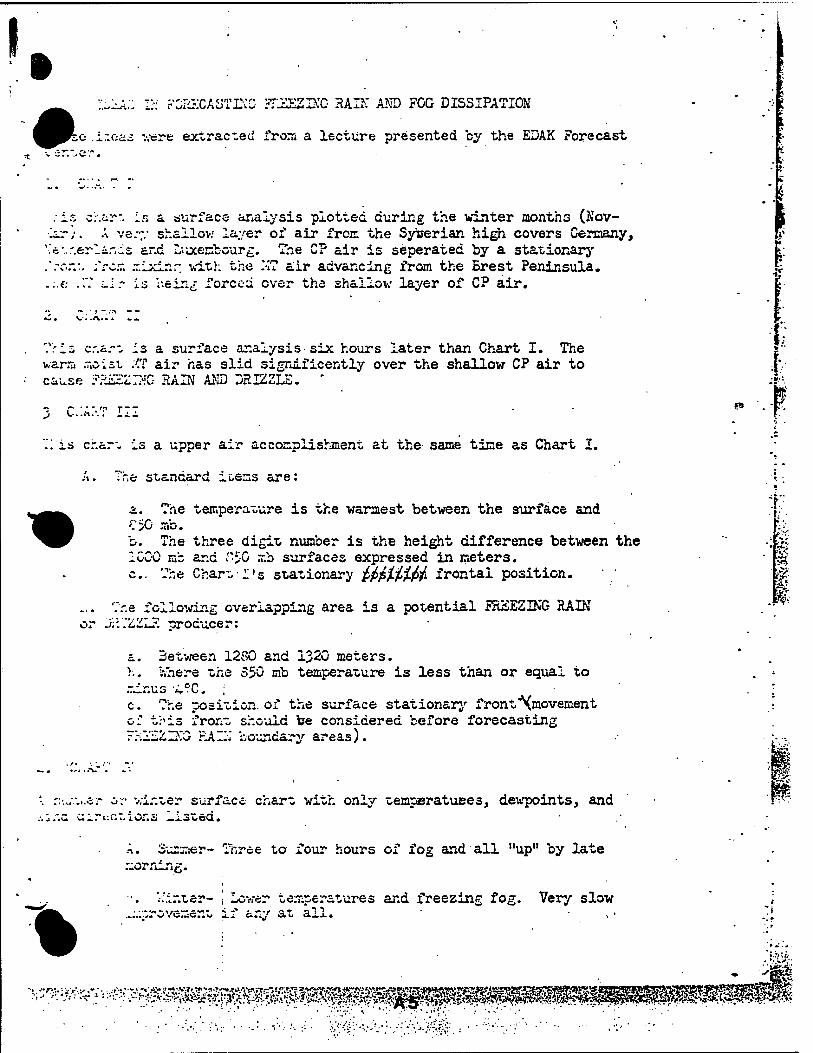
I »
IJILA;; Ih FuiECASTEG TIJLZZIXC HAIN AND FOG DISSIPATION
o incas -.vere extracted from a lecture presented by the EDAK Forecast
.is c;-.«ir:. is a surf ace analysis plotted during the winter months (Nov- •lar;. A very shailov.' layer of air from the Sycerian high covers Germany,
■•^•..'.erlir.is and Luxembourg. The CP air is seperated by a stationary ir»" «jr?t.V r.ixinr wi.tr. tne .-ü a ;ir advancing from the Brest Peninsula.
.-..€: .".V Lir is being forced over the shailov layer of C? air.
14
i
Vris cr.a.-; is a surface analysis-six hours later than Chart I. The warm moist XT air has slid significently over the shallow CP air to cause .'FUZZING RAIN AND DRIZZLE. '
3 c.:.;:-.? m
".'. is char- is a upper air accomplishment at the- same time as Chart I.
A. The standard icems arei
a. The temperature is the warmest between the surface and '. JIKJ mo.
b. The three digit number is the height difference between the IGOO mb and "£G mb surfaces expressed in meters. c The Chart I's stationary fypjLfäptf. frontal position.
... '"r.e following overlapping area is a potential FREEZING RAIN or iHIZZLH producer:
a. Between 1280 and 1320 meters. h. V.here the 35Ö mb temperature is less than or equal to mir.us A.'r'C. ; c. The position, of the surface stationary front"\movement o:' this front should be considered before forecasting FI-iZSZIXC- RAIIJ boundary areas).
, si.
'-. ::u.v...er or winter surface chart with only temperatuEes, devpoints, and .•.j.'.o CH.TV.OT. i or. s —..xsteo.
A. Summer- Three to four hours of fog and all "up" by late morning.
"%
inucsr- i —o wer temperatures and freezing fog. Very slow .^.'.provement xi any at ai.x.
WA!-
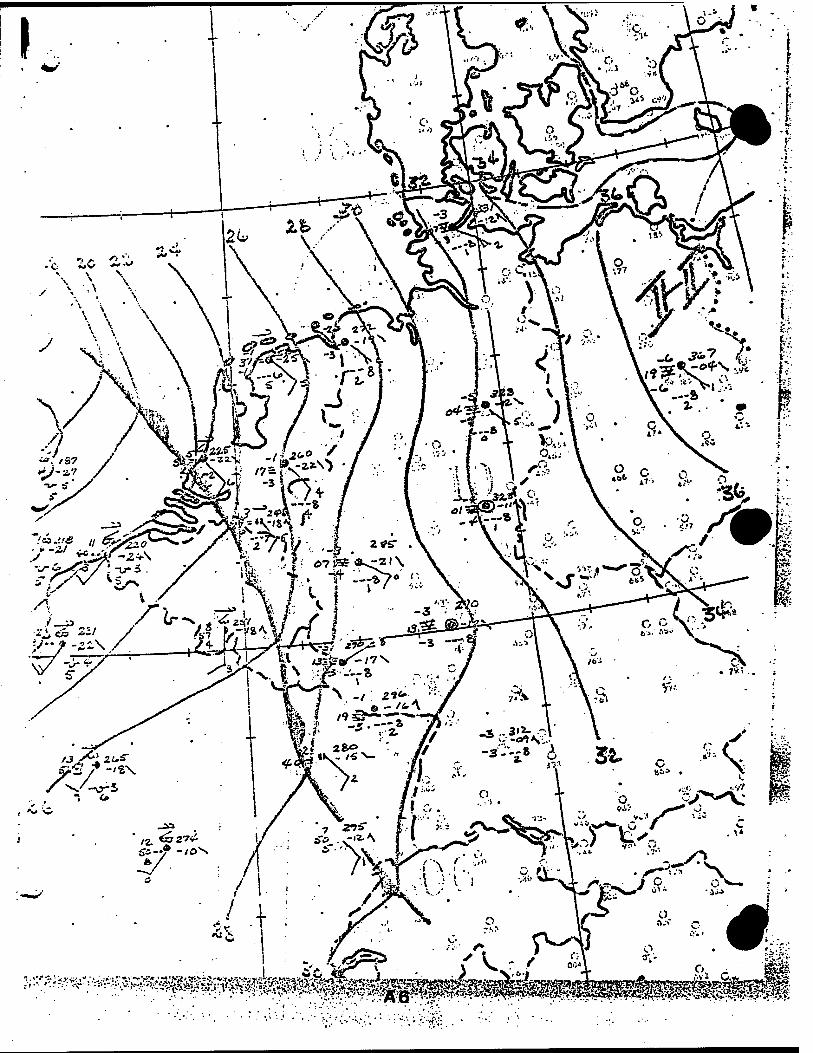
■^^im^»^m^^^^^^^^m^^^^^^M
7TH WEATHER WING FORECASTER MEMO
7 WW/EM-90/003
16 MAY 1990
TERMINAL FORECAST REFERENCE NOTEBOOK
INTRODUCTION
1. BACKGROUND.
According to AWSR 105-22, THE LOCAL ANALYSIS AND FORECAST PROGRAM, a Terminal Forecast Reference Notebook (TFRN) is an informal publication containing information on forecasting for locations for which units have a forecast responsibility (TAF, watch/warning, advisory). It is up to the wings or squadrons to specify the organization and format of unit TFRNs, approve changes, and maintain copies of all subordinate unit TFRNs. Procedures for making changes and responsibilities for approving and maintaining TFRNs are outlined in the 7 WW supplement to AWSR 105-22. The organization and format of TFRNs is contained in this Forecaster Memo.
2. PURPOSE.
The TFRN is the key forecasting document in the unit. It serves as the repository of all the useful information for forecasting weather at a given location. It is important for all forecasters to be thoroughly familiar with the unit TFRN and for newly assigned forecasters to review the TFRN upon assignment and periodically thereafter. While the TFRN should not be subject to frequent change, departing forecasters who have developed local expertise should be asked to review the TFRN and update it based on their knowledge and experience. This transference of experience from the departing forecaster corps to the newly assigned replacements is one of the key functions of the TFRN.
Approved For Public Release; Distribution Is Unlimited
Distribution: 1 WW/DN 2 7 WW/WSU 1 Det 1, 7 WW 1
2 WW/DN 2 6 WS/DON 4 9 WS 1 3 WW/DN 2 15 WS/DON 14 Det 16, 9 WS 1
4 WW/DN 2 17 WS/DON 14 AWS/DOOF 1
5 WW/DN 2 USAFETAC 5 AWS/DOTM 1
5 WW/DOR 45 AFGWC 2 33 50TCHTNG/TTMV 1
7 WW/DN 12 OL-G, 7 WW 1
OPR: 7 WW/DNS (Mr Quast/SMSgt Jimenez)
TFRN FORMAT AND ORGANIZATION
1. FOBMAT. Use the editorial guidelines given in USAFETAC Technical Note 72-1, except as noted below.
a. Cover sheet. Disregard paragraphs 2.1 and 2.2 in TN 72-1. Prepare a cover sheet containing the heading — TERMINAL FORECAST REFERENCE NOTEBOOK — and the unit designation and location, date of publication, superseded document statement (if applicable), and a Distribution Statement A (ref AFR 80-45, Atch 1), "Approved for public release; distribution is unlimited." On the inside of the cover, include a distribution list.
b. Changes. Procedures for issuing changes are contained in the 7 WW Supplement 1 to AWSR 105-22. Page changes preserve the neatness of the document and are encouraged. Publish formal changes using the format prescribed in AFR 5-1. Distribute changes to all those offices who maintain the TFRN.
2* CONTENT
a. Chapter 1, LOCATION, TOPOGRAPHY, AND LOCAL EFFECTS. This chapter will contain:
(1) A general discussion of the physical location of the station with respect to surrounding landmarks. Include field elevation, latitude and longitude, and significant topographic features which influence local weather; e.g., vegetation, orography, inland waterways, proximity to large bodies of water, etc.
(2) A discussion relating the above features to characteristic local weather conditions; e.g., upslope and downslope phenomena, land and sea breezes, wind eddies, etc.
(3) A discussion of the physical location and exposure of the weather station and ROS, if applicable, and any observation limitations; a list of fixed meteorological sensors and their location; and a description of the runway orientation(s) and length(s).
(4) A discussion of the sources of pollution (dust, smoke, etc.) that affect the local weather.
(5) Maps or charts in appropriate sections to help amplify discussions. Occasionally, a cutout from a portion of an aeronautical chart will suffice, but they are frequently too cluttered with irrelevant data. In the latter case, a pen-and-ink tracing of significant features should be substituted. Avoid fold-out maps or charts if possible. Recommended maps or charts include:
(a) A large-scale topographic map (1:1,000,000) covering a radius of approximately 50 statute miles from the station. Mileage circles concentric with the station add perspective to the map. Highlight significant geographic features which affect the local weather, such as lakes, swamps, deserts, pollution sources, etc.
(b) A detailed map of the runway complex identifying the runway orientation(s), and length(s) and meteorological sensor locations.
(c) Other maps or diagrams, such as terrain cross sections, to illustrate upslope and downslope trajectories.
b. Chapter 2, SYNOPTIC CLIMATOLOGY. Describe controlling features and local terminal weather associated with typical synoptic situations. Illustrations of typical examples should be used freely to amplify the discussions and portray sequential movements and life cycles of weather systems and synoptic patterns. A few statistics may be included in the discussions, however, numerous climatic data should not be included. Examples of items that could be discussed in this chapter are given below. Adapt your own format for the discussion.
(1) Major controlling features. Describe the major synoptic features which control the local weather each season.
(2) Synoptic weather.
(a) Winter air masses.
(b) Winter weather.
(c) Summer air masses.
(d) Summer weather.
(e) Transition periods.
(f) Cyclogenesis.
(3) Frontal Influences
(a) Cold fronts.
(b) Warm fronts
(c) Occluded fronts.
(d) Sea or land breeze fronts (if, applicable).
c. Chapter 3, MISCELLANEOUS. Include any current information the unit considers useful in teaching or helping forecasters to make better local forecasts. Brevity will contribute to effectiveness—keep it short, with only concise, meaningful information. The following areas should be addressed:
(1) Information on sensitivities of supported aircraft. This information need not be included in the TFRN if documented elsewhere, such as in a weather support plan, Forecasting Aids Notebook (FAN), or technical skills handbook.
(2) Climatological information which highlights local flying weather, addresses operationally significant forecast problems, and assists in answering frequently asked questions. It should not duplicate the RUSSWO/SOCS data unless a pictorial presentation would be helpful. Include source of data and period of record. USAFETAC considers a period of record of ten years to be climatologically adequate.
(3) Summaries of synoptic case studies of typical weather situations or unusual occurrences. Any forecasting techniques developed from these case studies which can help identify those situations should be included in the Forecasting Techniques Notebook (FTN).
(4) Discussions of unit operationally significant forecast problems. If available, include proven or time-tested rules or techniques which are useful, plus a brief summary describing their accuracy. Lengthy studies should be placed in an appendix and described in an operational mode in the FTN.
d. APPENDICES. Additional information which more fully details portions of the TFRN or which is lengthy should be included as an appendix. Each appendix should be referenced somewhere in the text.
SUMMARY
A complete, well organized TFRN is a key part of the unit's Local Analysis and Forecast Program (LAFP). As a repository of unit forecast knowledge, it is the key document in the transference of expertise from the experienced forecaster corps to the newcomers. Therefore, it is important to keep the unit TFRN up-to-date and to use it, particularly in the training of all newly assigned forecasters.
2WU FORECASTER
MEMO
2WW/FM-86/003
FORECAST REVIEWS
BY
CAPT FRANCIS 6. TOWER
CAPT DAVID W. RUST
SMSGT DANfJY G. MCGREW
This Forecaster Memo provides guidance on preparing Forecast Reviews
APPROVED FOR PUBLIC RELEASE DISTRIBUTION UNLIMITED OPR: 2 WW/DNS AUGUST 1986
REVIEW AND APPROVAL STATEMENT
This Forecaster Memo has been reviewed and is approved for publication. »
DONALD L. BEST, Lt Col, USAF Chief, Aerospace Sciences Division
Ws&Tlllty&r, Colonel, USAF Commander
INTRODUCTION
1. Whenever someone has to do something he/she doesn't like/want to, on his own time, it is perceived as punishment regardless of the reasons or benefits. It's true that learning does occur during reviews and equally true, is that growth often involves pain. Therefore, I ask the question "Why are we dishing out pain and punishment to our people? What are the gains to be realized from forecast reviews and how do we maximize our return on investment?
2. We deal out the anguish because forecast reviews aid personal, professional and unit growth. However, the scope of reviews has changed drastically. We no longer have degree holders writing Indepth reviews. Instead, the reviews of today concentrate on understanding the basic causes of the weather and forecast generation process. The maximum training effect can best be realized by using a simple review formula, applied to just a sufficient depth, and aimed at specific forecast/OPVER problems. In this light forecast reviews aid technical health. Still, there's no way to make reviews painless.
3. Once assigned, forecasters will avoid doing reviews. Usually it's because the review threatens their self-esteem. They may think they can t write, or that they don't know enough and this review will prove to everyone how incompetent they really are (here is the real pain). Forecasters must take that extra step to learn, and leaders must help forecasters to write well written reviews. These young forecasters will someday have to teach others to write reviews.
4. Why do some stations lack a dynamic review program? Just as with forecasters, inexperience, and the threat to manager's self-esteem are major factors. If management is not experienced with forecast reviews they are less likely to be involved.
5. The purpose of this forecaster memo is to guide managers and forecasters through the forecast review process. By leading you through the review, we aim to relieve the perceived threat. However, there is always some pain involved with growth, and the purpose of forecast reviews is growth.
FORECAST REVIEWS: WHY
1^ If you've never done or lead a review before, the attached checklist and example give you the shell of your review. This will help with the purely mechanical aspects of reviews but the first question to be asked is, "Why is this review necessary?"
2. Will the review add to understanding of local weather forecasting, the use of products or forecaster competence? If not, then why spend the manpower? Ideally, you should concentrate on. WA/WW, OPVER criteria or other areas that impact the customer's operations. Good forecasts are just as needy of reviews as bad ones.
3. Two instances which are almost always Ignored. The first is where there' is a significant difference between a forecast and the actual conditions but it doesn't significantly affect your customer. An example is a forecast for 20 SCT 40 OVC but the observation is SKC. Conversely, a forecast of mostly clear skies which, verified with 40 OVC, is not usually forecast review material, but the forecast was wrong. Consider assigning a review. It may head off problems in the future. The second instance often ignored is when a forecaster "hits" a good forecast, especially if it involved forecasting significant and difficult to forecast parameters when at forecast time it was A-OK. It seems so seldom that we really make those "hero" forecasts so, how was it done? A review here would not only help others but would reinforce meteorological techniques. Hopefully, it wasn't luck, but even that still needs to be shared.
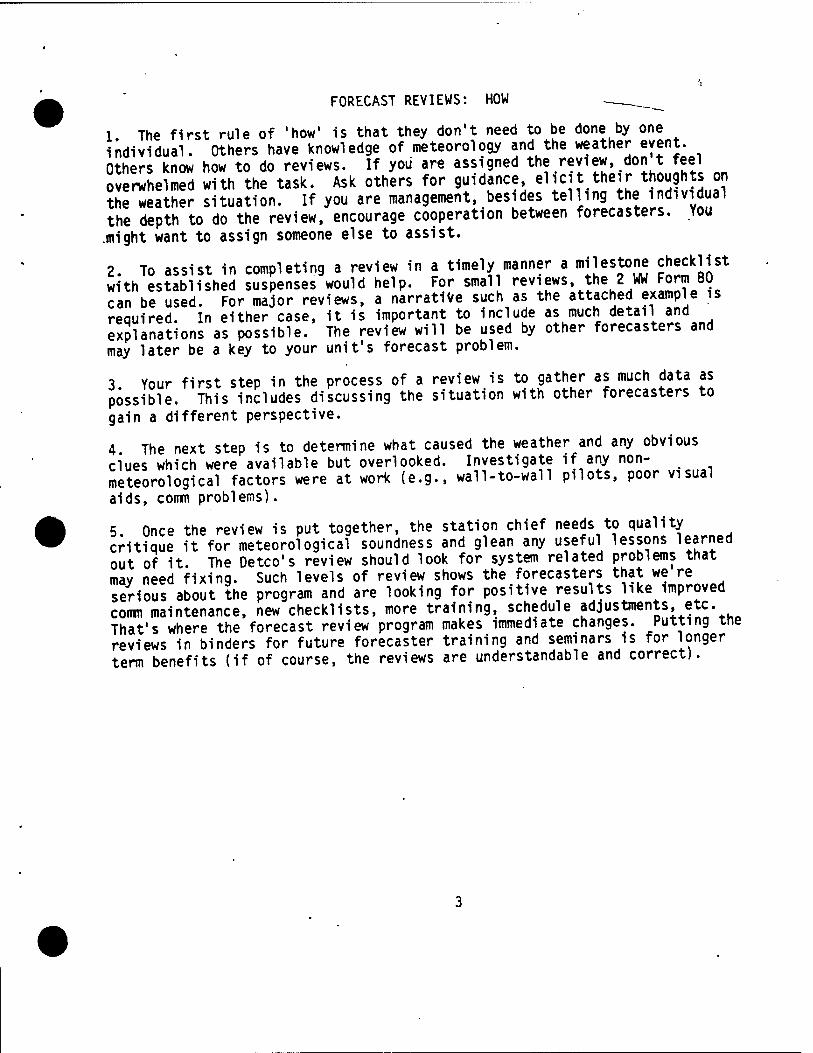
FORECAST REVIEWS: HOW ___
1 The first rule of 'how' is that they don't need to be done by one individual. Others have knowledge of meteorology and the weather event. Others know how to do reviews. If you are assigned the review don t feel overwhelmed with the task. Ask others for guidance elicit their thoughts on the weather situation. If you are management, besides telling the individual the depth to do the review, encourage cooperation between forecasters. You .might want to assign someone else to assist.
2. To assist in completing a review in a timely manner a milestone checklist with established suspenses would help. For small reviews, the 2 WW Form 80 can be used. For major reviews, a narrative such as the attached example is required. In either case, it is important to include as much detail and explanations as possible. The review will be used by other forecasters and may later be a key to your unit's forecast problem.
3 Your first step in the process of a review is to gather as much data as possible. This includes discussing the situation with other forecasters to gain a different perspective.
4 The next step is to determine what caused the weather and any obvious clues which were available but overlooked. Investigate if any non- meteorological factors were at work (e.g., wall-to-wall pilots, poor visual aids, comm problems).
5. Once the review is put together, the station chief needs to quality critique it for meteorological soundness and glean any useful lessons learned out of it. The Detco's review should look for system related problems that may need fixing. Such levels of review shows the forecasters that we re serious about the program and are looking for positive results like improved comm maintenance, new checklists, more training, schedule adjustments, etc That's where the forecast review program makes immediate changes. Putting tne reviews in binders for future forecaster training and seminars is for longer term benefits (if of course, the reviews are understandable and correct).
CONCLUSION
1. Forecast reviews should be done when the situation warrants it and the review will be productive. There are no absolute rules of when one is required. It's up to unit management to assign reviews and specify their depth.
2. The most important thing to remember is that you are doing the forecast review to understand why the event did not happen.the way you forecast it. In the case of a "hit" on a tough situation for which you are doing a review, you want to be able to pass along the key factors that made your forecast a success. In both cases your aim is to provide meaningful and useful information to your fellow forecasters.
3. Forecast reviews are learning tools and learning, whether meteorology or boxing, always involves personal risk and a little pain. You may doubt your own ability to understand and accurately describe the synoptic weather and write a good forecast review. Yet in doing one, you will learn and gain confidence. You and others will benefit from the reviews. Forecast reviews, with significant lessons learned, should be crossfed to squadron and wing. 2WW/DN will publish the good reviews in the form of Tech Notes and give you the credit. It is'a very nice feeling to see your work in print.
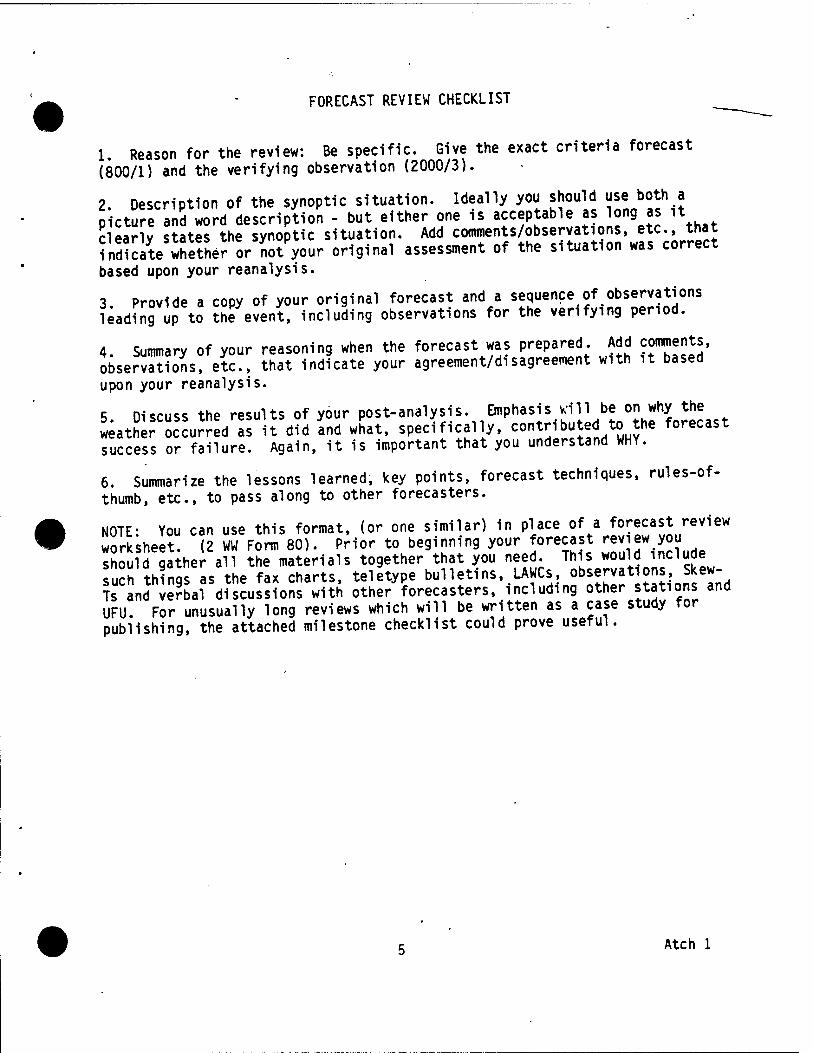
FORECAST REVIEW CHECKLIST
1. Reason for the review: Be specific. Give the exact criteria forecast (800/1) and the verifying observation (2000/3).
2. Description of the synoptic situation. Ideally you should use> both a Dicture and word description - but either one is acceptable as long as it Nearly states the synoptic situation. Add c0«™Je^s/
t^seJ^^^s'w^correct indicate whether or not your original assessment of the situation was correct
based upon your reanalysis.
3 Provide a copy of your original forecast and a sequence of observations leading up to the event, including observations for the verifying period.
4 Summary of your reasoning when the forecast was prepared. Add comments, obsermlJXs? etc., that indicate your agreement/disagreement with it based upon your reanalysis.
5 Discuss the results of your post-analysis. Emphasis will be on why the weather occurredls it did and what, specifically, contributed to the forecast success or failure. Again, it is important that you understand WHY.
6. Summarize the lessons learned, key points, forecast techniques, rules-of- thumb, etc., to pass along to other forecasters.
NOTE: You can use this format, (or one similar) in place of a Precast review worksheet. (2 WW Form 80). Prior to beginning your forecast rev ew you should gather all the materials together that you need. This would include such things as the fax charts, teletype bulletins, LAWCs, observations Skew- Ts and verbal discussions with other forecasters, including other stations and UFU. For unusually long reviews which will be written as a case study for publishing, the attached milestone checklist could prove useful.
Atch 1
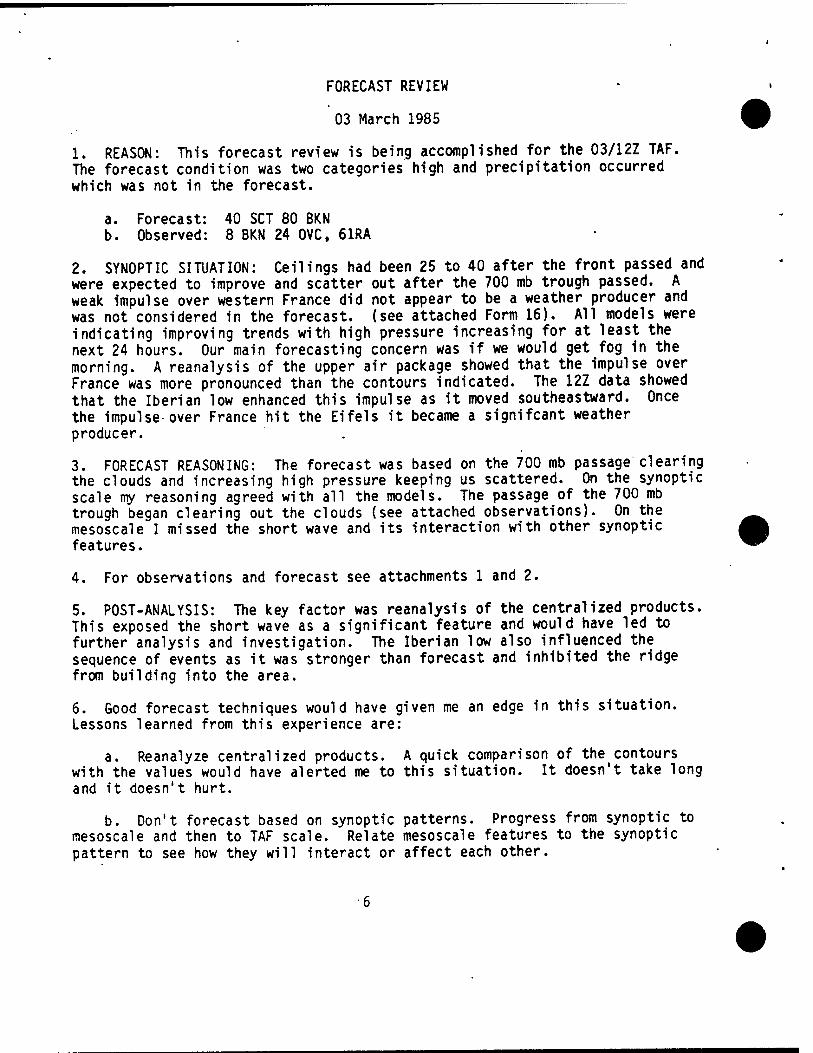
FORECAST REVIEW
03 March 1985
1. REASON: This forecast review is being accomplished for the 03/12Z TAF. The forecast condition was two categories high and precipitation occurred which was not in the forecast.
a. Forecast: 40 SCT 80 BKN b. Observed: 8 BKN 24 OVC, 61RA
2. SYNOPTIC SITUATION: Ceilings had been 25 to 40 after the front passed and were expected to improve and scatter out after the 700 mb trough passed. A weak impulse over western France did not appear to be a weather producer and was not considered in the forecast, (see attached Form 16). All models were indicating improving trends with high pressure increasing for at least the next 24 hours. Our main forecasting concern was if we would get fog in the morning. A reanalysis of the upper air package showed that the impulse over France was more pronounced than the contours indicated. The 12Z data showed that the Iberian low enhanced this impulse as it moved southeastward. Once the impulse over France hit the Eifels it became a signifcant weather producer.
3. FORECAST REASONING: The forecast was based on the 700 mb passage clearing the clouds and increasing high pressure keeping us scattered. On the synoptic scale my reasoning agreed with all the models. The passage of the 700 mb trough began clearing out the clouds (see attached observations). On the mesoscale I missed the short wave and its interaction with other synoptic features.
4. For observations and forecast see attachments 1 and 2.
5. POST-ANALYSIS: The key factor was reanalysis of the centralized products. This exposed the short wave as a significant feature and would have led to further analysis and investigation. The Iberian low also influenced the sequence of events as it was stronger than forecast and inhibited the ridge from building into the area.
6. Good forecast techniques would have given me an edge in this situation. Lessons learned from this experience are:
a. Reanalyze centralized products. A quick comparison of the contours with the values would have alerted me to this situation. It doesn't take long and it doesn't hurt.
b. Don't forecast based on synoptic patterns. Progress from synoptic to mesoscale and then to TAF scale. Relate mesoscale features to the synoptic pattern to see how they will interact or affect each other.
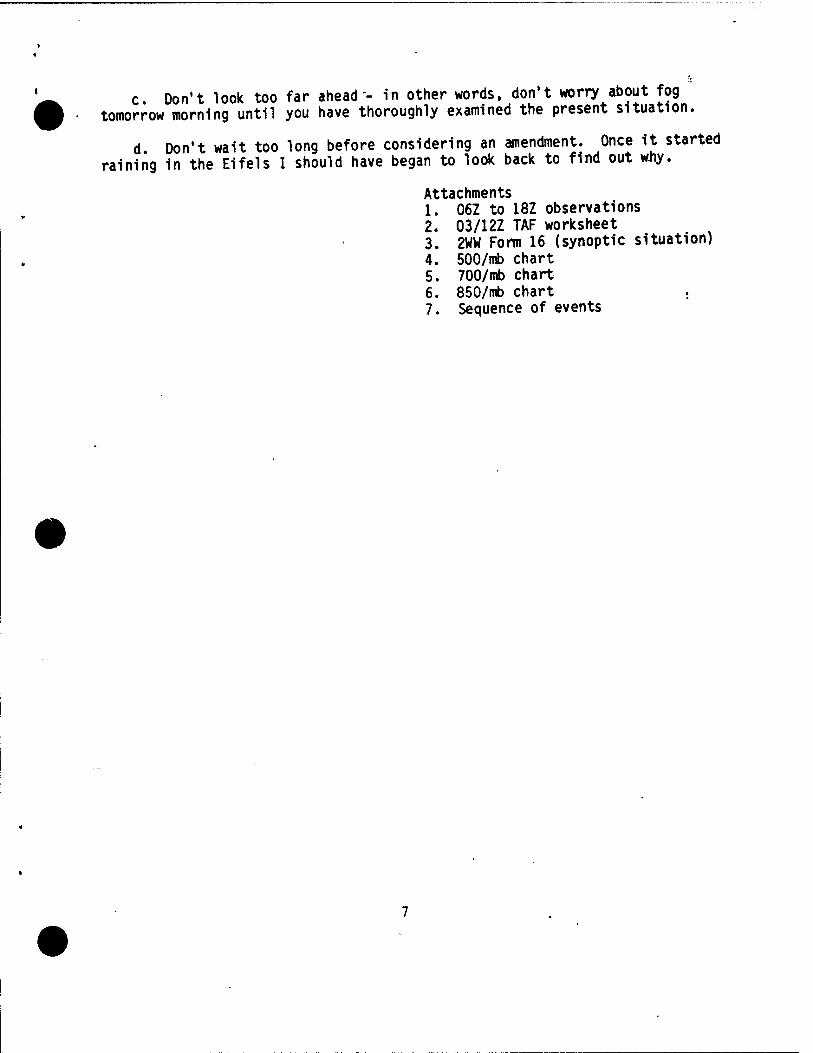
c. Don't look too far ahead-- in other words, don't worry about fog tomorrow morning until you have thoroughly examined the present situation.
d Don't wait too long before considering an amendment. Once it started raining in the Eifels I should have began to look back to find out why.
Attachments 1. 06Z to 18Z observations 2. 03/12Z TAF worksheet 3. 2WW Form 16 (synoptic situation) 4. 500/mb chart 5. 700/mb chart 6. 850/mb chart . 7. Sequence of events
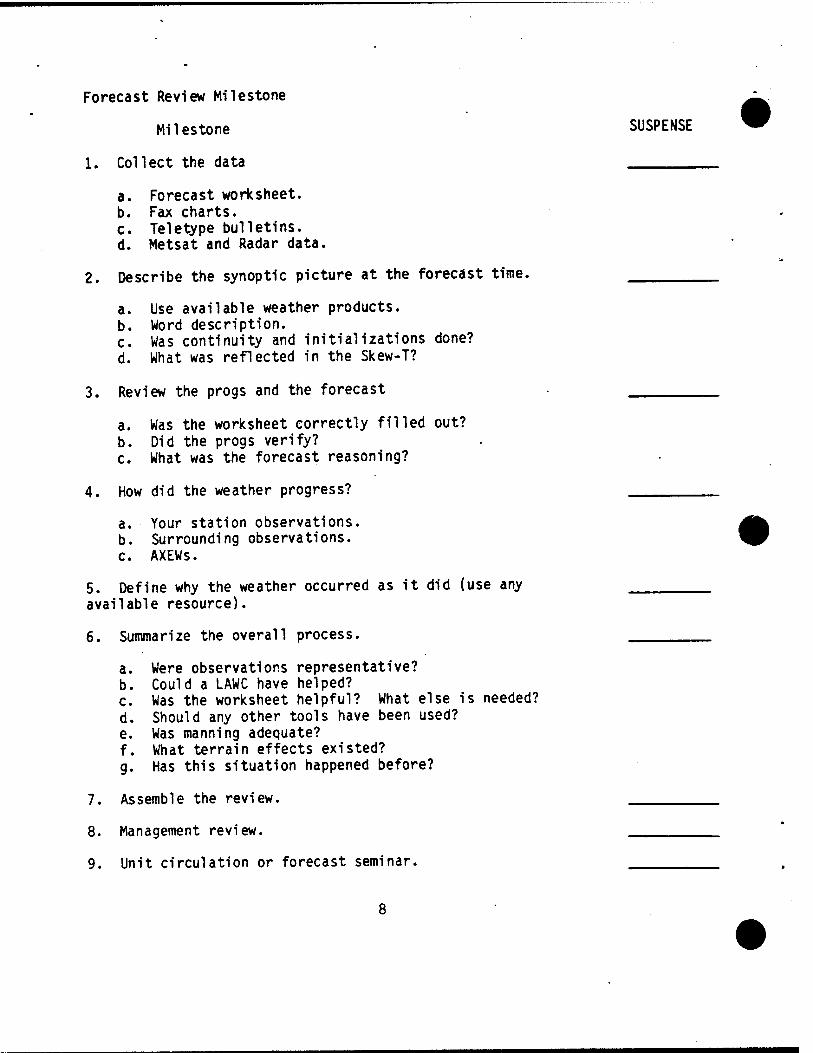
Forecast Review Milestone
Milestone SUSPENSE
1. Collect the data
a. Forecast worksheet. b. Fax charts. c. Teletype bulletins. d. Metsat and Radar data.
2. Describe the synoptic picture at the forecast time.
a. Use available weather products. b. Word description. c. Was continuity and initializations done? d. What was reflected in the Skew-T?
3. Review the progs and the forecast
a. Was the worksheet correctly filled out? b. Did the progs verify? c. What was the forecast reasoning?
4. How did the weather progress?
a. Your station observations. b. Surrounding observations. c. AXEWs.
5. Define why the weather occurred as it did (use any available resource).
6. Summarize the overall process.
a. Were observations representative? b. Could a LAWC have helped? c. Was the worksheet helpful? What else is needed? d. Should any other tools have been used? e. Was manning adequate? f. What terrain effects existed? g. Has this situation happened before?
7. Assemble the review.
8. Management review.
9. Unit circulation or forecast seminar.
8
AWS/TN-79/002
FORECAST REVIEWS AND CASE STUDIES
Kenneth E. German, Col, USAF
May 1979
Approved For Public Roloaso; Distribution Unlimited
AIR WEATHER SERVICE (MAC) Scott AFB, Illinois 62225
REVIEW AND APPROVAL STATEMENT
This publication approved for public release. There is no objection to unlimited distribution of this document to the public at large, or by the Defense Documentation Center (DDC) to the National Technical Information Service (NTIS).
This technical publication has been reviewed and is approved for publication.
JCHI Asst Ch^/Forecasting^Svc Div Directorate of Aerospace Services Reviewing Officer
FOR THE COMMANDER
ROBERT M. GOTTUSO, Col, USAF DCS/Aerospace Sciences Air Weather Service
SECURITY CLASSIFICATION OF THIS PAGE W* P"« Entered)
REPORT DOCUMENTATION PAGE T. REPORT NUMBER
AWS/TN-79/002
READ INSTRUCTIONS BEFORE COMPLETING FORM
2. GOVT ACCESSION NO.
4. TITLE (and Subtitle)
Forecast Reviews and Case Studies
3. RECIPIENT'S CATALOG NUMBER
5. TYPE ÖT REPORT & PERIOD COVERED
Final 6. PERFORMING ORG. REPORT NUMBER
"8. CONTRACT OR GRANT NUMBhRf»;
7. AUTHORf«;
Kenneth E. German
9. PERFORMING ORGANIZATION NAME AND ADDRESS
Air Weather Service/DNT Scott AFB IL 62225
II. CONTROLLING OFFICE NAME AND ADDRESS
AWS/DNT Scott AFB IL 62225
"10. PROGRAM ELEMENT, PROJECT, TASK AREA 4 WORK UNIT NUMBERS
U. MONITORING AGENCY NAME * AOORESSf» dllleren, Irom Contro.Mn, »„.*)
12. REPORT DATE
.1979 13. NUMBER OF PAGES
39 15. SECURITY CLASS, (ol thl. nport)
Unclassified 15. DECLASSIFICATION/DOWNGRADING
SCHEDULE
16. DISTRIBUTION STATEMENT (ol thl. Report)
Approved for public release; distribution unlimited.
17. DISTRIBUTE STATEMENT (ol tn. .b.tr.ct entered in Block 20, U dlll.rent Iron, Report)
18. SUPPLEMENTARY NOTES
19 KEY WORDS (Conttnu. on r.v.r.. .Id. II n.c....ry mnd Id.ntlly by nock number)
Weather Forecast Reviews, Forecast Evaluations, Worksheets Weather Case Studies Bust Reviews
20 ABSTRACT (Conrlnu. on „v.r.. .Id. II nece.eery end Id.ntlly by block number) *nw.0_ One of the most effective ways of improving forecasting performance is the fore- cast review (sometimes called bust review). The fo«<=«* «vl^1^°!!S
0SSrs effectiveness of the forecaster who does the review and it is he P™ to «hers who forecast for the station. Even though the benefits are nearly universally acclaimed, staff visits often find that the forecast review P^ograra fall tar short of this ideal. One of the reasons often given is that there is ^^quaie guidance available concerning the content of a good forecast review and how to judge its effectiveness. This technical note is written to help meet this neea..
DD , ^73 1473 SECURITY CLASSIFICATION OF THIS PAGE (When U.,a Entered)
SECURITY CLASSIFICATION OF THIS PAGEfWon Datm Bnfrmd)
20. ABSTRACT.
This technical note discusses forecast reviews and provides several examples that can be used by forecasters who want ideas to use in documenting their forecast reviews.
May 1979
PURPOSE
This technical note discusses forecast reviews and provides several examples that can be used by forecasters who want ideas to use in documenting their forecast
reviews
DISTRIBUTION
Wings, squadrons, and detachments (except SESS and STAFFMET units). 3350 TTCHG Chanute AFB IL 61868 MAC/IGIS
May 1979 PREFACE
One of the most effective ways of improving forecasting performance is the fore- cast review (sometimes called bust review). The forecast review improves the effec- tiveness of the forecaster who does the review and it is helpful to others who fore- cast for the station. Even thouqh the benefits are nearly universally acclaimed, staff visitors often find that the forecast review programs fall far short ot tnis ideal. One of the reasons often given is that there is inadequate guidance available concerning the content of a good forecast review and how to judge its effectiveness. This technical note is written to help meet this need.
Approved for public release; distribution unlimited.
May 19 79
TABLE OF CONTENTS
„•^-, Page Chapter Title
1 INTRODUCTION * 1.1 Definitions , 1.1.1 Bust Analysis . 1.1.2 Forecast Evaluation 1.1.3 Forecast Review l 1.1.4 Case Study 2 1.2 Procedures 2 1.2.1 Selecting Thresholds 1.2.2 Operational Procedures/Instructions (01)
2 THE REVIEW • * 2.1 Synoptic Description 2.2 Reasoning Used 2.3 Verification 2.4 Results 5 2.5 Lessons Learned
AFTER THE REVIEW | Technical Evaluation Commander's Evaluation Use of Forecast Reviews
THE CASE STUDY j? Rationale for Doing Case Studies ° Examples of Published Case Studies
EXAMPLES OF FORECAST REVIEWS j* Example 1. Forecast Review Worksheet ^ Example 2. Another Forecast Review Worksheet j-j- Example 3. Forecast Reviews on a Forecast Worksheet lJ Example 4. Building a Data Base ]■* Example 5. Persistent Stratus *■" Example 6. Non-occurrence of Low Ceilings *' Example 7. Review of Warning Using AWS Form 39 j° Example 8. Review of a Correct Forecast ^ Example 9. Station Chief's Evaluation zo
6 EXAMPLES OF CASE STUDIES ^1 6.1 Example 1. Synoptic Study for Germany j- 6.2 Example 2. Ice Storm i^ 6.3 Example 3. Strong Wind ~* 6.4 Example 4. Low Level Jet 6.5 Example 5. Snowstorm
3 3. 3. 3.
4 4. 4.
5 5. 5. 5. 5, 5.5 5.6 5.7 5.8 5.9
May 1979
Chapter 1
INTRODUCTION
The purpose of a forecast review is to improve forecasting. Generally, this pur- pose is achieved if a forecaster carefully reanalyzes data for a given situation so that he and others better understand what happened. A forecast review should be initiated whenever the forecaster does not thoroughly understand the sequence of events. Station workload usually makes such an idealistic approach impractical; so reviews usually are done for those events most likely to increase forecasting capa- bility The beginning forecaster should seek advice from more experienced forecasters concerning causes of events and selection of events to review. This chapter will provide a few definitions and discuss unit forecast review program procedures.
1.1. Definitions.
Definitions of terms such as bust review, bust analysis, forecast review, and case study have been attempted by many without achieving universal clarity or accep- tance On the basis of these experiences, it appears that a continuum exists and precise definitions are neither possible nor required. The definitions that will be used in this publication will be arbitrary, primarily relying on the amount of time required to do the job. We begin with two terms associated with unit daily quality control activities so that the forecast review is easier to define.
1.1.1. Bust Analysis. Whenever a forecast is no longer representative, it must be amended. In this process, normal procedures require a reason be given for the amend- ment The activities involved in reassessing the situation before writing the amend- ment' comprise a bust analysis. There usually is little time for this function; so the bust analyses tend to be short. Some possible examples are given below:
The front was delayed by development of a wave.
The front accelerated.
A warm front intensified.
The stratus occurred early.
Precipitation began six hours early.
A squall line developed unexpectedly ahead of the front.
Thunderstorm dissipated.
These examples really do not say much, but they are better than a statement that the forecast was amended because ceilinq was out of category. Of course, additional information can be written if desired. Every amended forecast provides an oppor- tunity to improve forecasting capability, and each forecaster should do as much investigation as workload permits.
1.1.2. Forecast Evaluation. One of the daily duties of the station chief should be to review the forecasts issued. Part of this task is to evaluate the forecasts, the bust analyses, look for trends, and determine what actions (e.q., forecast review, case study, nothing) are required. This process is called forecast evaluation.
1.1.3. Forecast Review. A forecast review (sometimes called bust review or a fore- cast reanalysis) is an after-the-fact review of the observations, analyses, and forecast aids which were available to the forecaster to determine whether existing station procedures were adequate, and to identify the ways to prepare a correct forecast. The time required for this process normally should be less than one hour. Chapter 5 contains examples of forecast reviews prepared by AWS units. We have typed the comments, but in actual practice the forecast reviews often are handwritten.
1.1.4. Case Study. A case study is sometimes called an in-depth reanalysis. The basic purpose of it is the same as the forecast review, but usually considerable effort is used to collect and present the data and analyses thoroughly in a clear and readable form. The effort usually requires several hours'concentrated work and some rewrites over a period of several weeks or months. Chapter 6 contains examples of case studies.
May 1979
1.2. Procedures.
* „„„f^tic effective, forecast review program provides tremendous potential
elements described in the following paragraphs.
1 2 1 Selecting Thresholds. In general, workload places practical "»J^ions on ihe'amounfof effort thatcan be applied to a .Jj-^^^SSS -A-SSS«- that is too stringent or is ill-conceived generally 5S^SSS±5Sd^hen establishing tive or punitive work. Therefore, careful planning is requirea wnen es * the program, and periodic reassessment of the program is required to make sure continues to work effectively.
The station managers must ensure that the forecast «view program is not ijjter- pretea aslunLhment? The sole intent must be to Jg*™ ^efSSSS w^s? Fore- Performance; the forecast review simply is ?«* «f *^ ™!*/J*JC£Srprofessional casters who willingly do forecast reviews should be P«ised f°^.™ir
N^teworthy attitude toward their unit and for their leadership and initiative^ Notewortny reviews should always receive public praise. A forecaster wno Knows t effort will be recognized is more likely to produce.
Some events are so important to the station operation that «£J Jj^* £™ special consideration for a forecast review. Examples used by various units are
An unforecast event had significant adverse customer impact.
Weather warning criteria met but no warning issued.
Weather warning issued but event does not occur.
Weather conditions below 1000/2 occur without being forecast or are fore- cast and fail to occur.
Selected events.
The particular thresholds ^^/^^J^^^^^^^STS^^ of specifically identified aspects of a station's operation. Tnese goax clearly stated and explained to all forecaster personnel. In mostcases, tnen, duty forecaster should initiate the required review. Only in a few ^P^™* cases should it be necessary for a station .^pervisor to ^^^^Jtlon Obviously, when such direction is needed, it should be done witnout
Thresholds that are beyond the state-of-the-art normally should not be e|tjb- lished. If a customer requires such accuracies, the Staff Weatnerurric^ obligated to advise what the capabilities -^' ^a^improvements are possible^n^^ are beinq worked, and what is impossible. In AWS units, tne Q«"«-" £ belntriedby many, and it is unlikely that these problems will be solved by inexperienced forecasters.
Sometimes an outstanding forecast merits a forecast review to document how a 5
meSüatch of upstream stations to produce an absolutely superb wind warning.
The station chief or DetCo should always be prepared to require a fewforecast reviews £'££ improve unit or individual deficiencies identified through on the^ spot OJT or the verification program. In addition, a J°™cast review vehicle for providing training for the less experienced forecasters.
Occasionally an event will be so interesting or illustrative of typical gather at a locaUon that a case study is desirable A case study "»^JJ^KaiEe.. forecast review that contains copies of the basic facsimile or °PJ«tJ°n;^™ *nt supplemental reanalyses, data and other charts that could ^ hjlpful in subsequ reviews. Although forecasters may initiate case studies, the station manay assign several every year.
May 1979
The first step in establishing effective forecast "view Procedures is to write down specific unit goals (e.g., improve wind warning Performance by 20 P^cent, improve visibility forecasting by 10 percent) for the forecast review Pg^ranu These may be different for each unit. Once the ?oal* *"J^^f^ie^ng the possible to write specific thresholds to assist the f°"car^t^ve!
elSpSti0n of cases or events for which forecast reviews would be most Productive. ^ this step enables the station manager to take the next logical step.
1.2.2. Operational Procedures/Instructions (01). An 01 should be written to specify the purpose or goals, the thresholds, and the procedures to ^ followed The goa and thresholds have been discussed. The procedures ^o be followedjan be £££*£ in the 01 or described on a forecast review form (see examples 1 and l) . mese v cedures normally will include:
Review of forecast aids used in making the forecast to determine if all pertinent available information was used, and if it was used properly,
Verification of the forecast aids to determine whether the guidance was adequate, incorrect or misleading;
Reanalysis to determine what actually happened. This step may require iteration with the previous step;
Identification of potential forecast hints and any other lessons learned;
instructions for format such as local ^standard form letter or memo (See examples at Chapter 5, Examples 2, ?, 4 and 5, respectively); and
Review by station managers, feedback to forecasters, filing, and a system for periodic (seasonal) review.
When writing operational instructions, care must be taken to avoid ^necessary or fruitless activity. The best way to do this i. to >a ^ °rec*^ers understa ^ the purpose of the program and then to give them the authority ana « v * make it work. Forecasts that indicate correct trends but miss the timing by a few minutes or the ceiling or visibility by small amounts, ^J^0*™fc
dJgU^e.
reviews. These subjective determinations can be made quite well by a auty io caster who has been trained to know the customers' requirements and sensitivities. The review is discussed in Chapter 2.
May 1979
Chapter 2
THE REVIEW
There are 8everal ways of doing forecast reviews; differences ?" £fc£f J^" and length of investigation. The purpose of the review will largely dxctate the approach used. For example, a review of severe convective activity^caster?« 'basic different approach than a review of a radiation fog episode. The forecaster s basic Meteorological training provides sufficient background in ^^nfanc^s
f?he results tion of a suitable approach. The details of approach are variable. It s tne resu that count. Different forecasters get there in different ways, but generally all reviews should include the following:
2.1. Synoptic Description. This should briefly describe the ^^ic situation prior to the valid time of the forecast. Key charts should be attached and "»£™ in this portion of the review. The written description should complement the charts. It is not necessary to describe the location of each feature, when it can be readily seen on a map. For example:
-A high pressure area with center located over southeast Indiana was domi- nating the Scott AFB area." This sentence, alone, is an adequate ^f^^ion. A Sid front extended from eastern Montana to central Nevada. Weak so"therly "°w
«isted throughout the Mississippi Valley." The last two sentences are «°t n|ce8sary because they contain information readily apparent from the attached maps and are not relevant to the fog forecast.
The purpose of the description is to provide an introduction and rough guide to synoptl/classification. Most forecasters need or at 1""\•?^ulfSS JSmSts whether the synoptic situation is frontal or air mass and what tYPe- Such comments provide a frame of reference which makes it easier for weather personnel to unaer stand the subsequent comments and discussion.
2.2. Reasoning Used. This should provide a summary of the reasoning used when the forecast was prepared. Be sure to briefly mention key forecast guidance used. Examples include:
LFM indicated strong PVA in next 12 hours;
NWS discussion indicated low would move east; and,
PDÜS indicated front would slow down.
In each case the referenced product should be attached to the review.
This step is important because it can indicate better ways to do the job as well as define any misinterpretations of existing guidance. Care must be taken to pre elude ridicule or other adverse feedback to the forecaster It is essential that this step be done frankly so that any problems can be solved. Irrational or emotional reaction by supervisors to these commentswill quicklyprevent any useful information from being obtained. In some cases, this information might have to be treated as privileged.
This mentally retained information is perishable and must be written as soon as possible after the event occurs. Whether the event was correctly " ^co"^^f he forecast, it is this step that illuminates the effectiveness and understanding or tne existing procedures.
2.3. Verification. In general, a summary of the forecast and ^e verifying observa- tions or charts is required. The summary quickly describes the e1?^forecast and whether it verified or not. Copies of the actual forecast and verifying observations should always be attached for subsequent reference Incase, wh^e the subject is timing of a synoptic control, such as a front (wind shift) or »trough aloft (cessation of precipitation) , charts showing the extrapolated (forecast) Positions of the feature(s) and the verifying analyses (adjusted if necessary) should be attached.
May 19 79
5 A Results This discussion contains the results of the post-analysis, with emphasis on why the weather occurred as it did, and the factors responsible for the forecast's success or failure. This step is one in which payoff often occurs.
It will not always be possible to identify the real causes or to specify fool- proof ways to" preven? recurrence. Nevertheless, a painstaking effort is required CLSriate charts should be examined closely, and whenever continuity or struc- ture inspect, o?her analysis solutions should be considered In addition, the ohvsical mechanismrcausing the event are not always easy to identify. For example SvecUon rog migh? be identified as radiation fog and strong gusty winds associated wiS a Ttronl surface pressure gradient could be attributed to local effect(s). When thfcauses of the weather that occurred are imperfectly known, the purpose of the forecast reviewis to help build a data base (several different descriptions of a sZTllr evenO tnat can be used to improve knowledge and understanding of the event.
5 s Lessons Learned. No review is complete without a summary of lessons learned, as well as suggesSons which would aid forecasters in the future under similar ccndi- n„ These are the conclusions and recommendations resulting from the work. As
suc^'thS deserve carerul consideration and should be proposed with that expectation. The station supervisor should carefully evaluate each conclusion and recommendation.
In all the above steps, include pertinent information from other forecast reviews done ror similar events ana situations. Frequently, the observation or expression of an^the?pirson assists in providing greater understanding of ^Physical processes involved in the event. Using the forecast review is described in Chapter 3.
May 1979
Chapter 3
AFTER THE REVIEW
The act of completing a forecast review is^™^£?£d^^££Uä individual and station performance. The completed forecast review mus to ensure the work has been done «refully and completely. *nd that «e and recommendations follow logically from the inf?™atf°^ P"8^!?^1^ station pro- review. Some possible subsequent actions to consider «^^JJh^gSToJ cedure, further evaluation, refer to parent unit, and ^»^"""rt™.0 capabilities. The following paragraphs explore these possible actions.
3.1. Technical Evaluation. Ideally the unit commande' -hould^Jorm this Junction,
o^cr^n'mA^ ^ «- « approach to arrive at a correct forecast.
A few thoughts illustrating common technical weaknesses, written by 2WW/DNs on some forecast reviews are given below.
-A forecast review was accomplished because the ceiling and visibility J" not
^e%ore1a^^^
bÄKraÄ s^gÄ^^ becoml worse. The person accomplishing the review aimed most of his criticism^or th. huBt at the traiectory bulletin. Some important details were xerc out HI "'<= review A trough "is forecast to pass the station, yet there was no mention of coStnuity, aSSno indication of any attempt to use the latest «urfa« ^°^C
after
SSormaiion to note changing ceiling and visibility ^f^Jo'what oSer Kforma- trough passage at upstream stations. No mention was made as to what other iniorma "on? besidel the trajectory bulletin, might have been looked at to catch the fact that weak ridging and warming occurred behind the trough.
"Another review looked at a situation where visibility failed to improve as fore- cast F^g dissipation was forecast to coincide with the breaking of a low level ?nversion9due ^surface heating. The forecast breaking temperature was hit on^the
Heating Curves performed.
' "A third review discussed a missed forecast where low ceiling, low visibility and rain caused by overrunning from the south was expected to continue, but, ^tead, conSitKnfimproved. The'forecast was based on a low pressure center remaining stationary west of the station and maintaining overrunning conditions, msteaa, tne low movedYealfor the station and conditions improved significantly. Jo« gportant a?eas were not discussed. There was no mention of surface or upper air continuity "changes, such a the movement, deepening or filling of the low center One set of conditions might cause the low to remain west of the station, while another might cause the low to move east rapidly."
Finally, Example 10 (Chapter 5) illustrates a good forecast evaluation. We collected many samples of forecast reviews, but few showed such constructive comments.
May 19 79
3 2 Commander's Evaluation. The unit commander must personally evaluate the re- view In a large measure, the success of a forecast review program depends on the interest shown by the unit commander in the forecast reviews. The unit commander should make public comments about the positive points or characteristics of each review. For credibility, it must be clear that the unit commander has indeed read the review.
3 3 Use of Forecast Reviews. One possible outcome of the review is identification of any errors of omission or commission made in the stress of real time. This infor- mation can be used by the individual, but also can indicate a need for changes in station procedures, e.g., relieving the forecaster for a few minutes before TAF time, or arranging to have local flying weather information posted in squadron operations to reduce the number of phone calls. When the problem is readily defined, corrective action can be taken immediately. Subsequently, the review should be used for seasonal or orientation reading.
In many cases a single forecast review is not sufficient to identify effective, lasting solutions. These insufficiencies will be minimized if the review makes full use of all resources available. In-station resources include other shift forecasters, the station chief, wing weather officers, and the DetCo. Out-of-station assistance may be available from a nearby National Weather Service (NWS) or commercial weather service office. In addition, the parent unit technical consultant is available. Asking for assistance has the added benefit of ensuring that the parent unit is aware of unit problems and efforts to find solutions. With this knowledge, the technical consultant may be able to provide beneficial crossfeed from other units.
A unit might not want to do this much with a single forecast review, but, at the very least, the review should be held for consolidation with other forecast reviews of similar events. A collection of reviews provides deeper insights into forecast- ing than does a single review.
In those few cases when several forecast reviews fail to bring out practical solutions, the problem should be identified as a unit limitation, and forwarded through channels for long term solution. Some problems are beyond the state-of-the- art and should be labeled as such so that a research requirement can be written, in the interim, the unit should brief customers of the limitation, but strive to perform as well as possible.
The finished review should then be circulated among all forecasters, and any significant findings discussed at the next forecasters' meeting. Completed reviews should be filed by type and season. Part of the preparation for approaching seasons should include review of the appropriate forecast reviews by each unit forecaster. Because of the limited time usually available for such activity, it is important that each review retained for this purpose is easy to read, complete, and minimally redundant to other reviews in the collection.
Following each season, forecast reviews should be reexamined and common elements summarized by type. After several seasons, solutions to forecast problems often become evident; therefore, end-of-season reviews should be maintained for at least five years. Forecast reviews which no longer contribute to better understanding of the forecast problem may be discarded. Solutions to forecast problems should be included in the unit TFRN. Case studies are described in Chapter 4.
May 1979
Chapter 4
THE CASE STUDY
A8 explained in Chapter Inhere is no W^tt* J^^*^ "in* and case studies. Administratively, aS2rJE do case studies should be more than a few hours a case study. .f"c^e^Chnical publication, or in one of the encouraged to publish their efforts in an AWS tecnnic v professional journals whenever others would benefit.
4.1. Rationale for Doing Case Studies•,.££-»*•& £ r*ad ÄgressTas* . building block in advancing the ^ate-of-the art Ofte ^^ ^ fche empiri- been smoothed through ««f«!1*^ **;!**„£ hints and rules (theory) are devised cal evidence (observations) from w^^nd «vere thunderstorm forecasting rules in An example is the development of^^^^LaTsnowfall as described in AWS TR 200 (Rev) . Another Wie « «orecasting n vy ^ ^^ af 3WW TO 76-2. These advanf^of?"f ^/"Jameters became evident. Other branches study, until important relationships and P^^f ^^ervations to establish a behavior
a'w.y iin^lV%^llf&^^^l^l^i.e understands - meteorologica! processes.
_ 4.»,^ fnrorast review to work toward The case study is used in thesame way as the «orjc.^ ^ & phen j nt
solution of forecast Problems. The first tew c 8 should review these «A'and sÄnfseasonal'Stations so that the, are aware of the kinds of situations in which the event can occur.
When doi», a case study the «'» »^„* ™Äs Sfitl.!"^.-.
c.se°srudiera„Ä^^ SUinrr-atronXranr^e&s^teroeooirevident.
The forecaster should not * «^££ >^^t^r\££.\^n£"" The keys are patience and persistence. These are essentlar ror always reward the investigator who uses them faithfully.
The format of an effective case study can ^^^sinsl^tatio"*.^ "\
fta„d.rrforrtnmake.acbc«P™i- S STS/:**?.^« -* — """^ - effective.
4 2 Examples of Published Case Studies.
of a7ufy li-l-^^^^^JS^^^^ Ä^LestÄ
AWS T. 200 <Eev, . »ores on Analysis and ^",'^J^S'^SJSS^'.^. the Air Force Global Weather Central. Case studies or ■ illustrate thorough
Ssif andTfcriPtio» Ärllation^of all levels and types of «».
„SkrETAC TH 73-2, The Ocheltree Tornado, <a «se study,.^«»^^„^ JS" study of a meso-scale development in Kansas and Missouri, woo graphs.
Other examples may be found in the various wing publications an^in ^pro^^
grp^Lh^^This^xJr/worrL^rSuLef for S.lly Produced case studies, as iS illustrated by the case studies in Chapter 6.
May 1979
Chapter 5
EXAMPLES OF FORECAST REVIEWS
The forecast reviews in this chapter were selected from those submitted by the wings. The examples show several different approaches to doing forecast reviews. They are printed here as examples to illustrate portions of the discussions in the first three chapters. In addition, a forecaster may want to refer to them when ideas are needed about format or content. Each unit, of course, should have a number of forecast review samples on hand.
The reviews printed here have been modified to enhance their usefulness for this document. At the same time, we retained as much of the original review as possible.
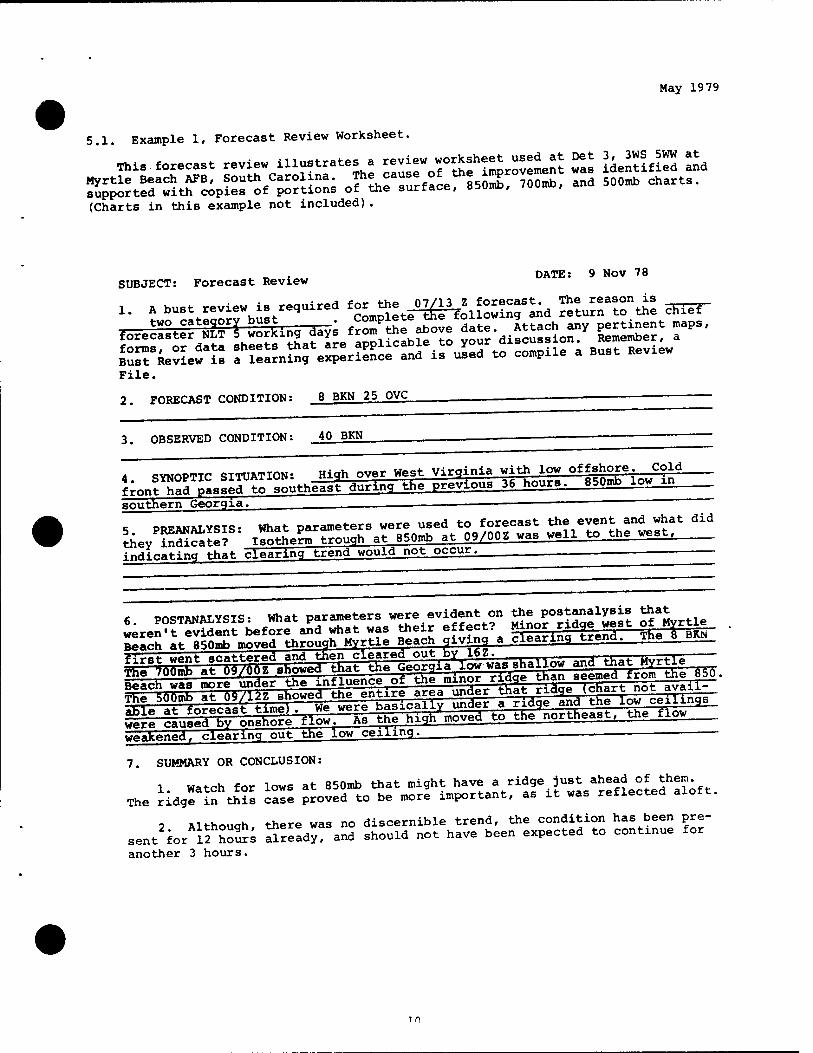
May 1979
5.1. Example 1, Forecast Review Worksheet.
This forecast review illustrate, a review worksh«"££.£ »J iAenfifS end
(Charts in this example not included).
^ _ DATE: 9 Nov 78 SUBJECT: Forecast Review
1. » bust review is requited '^^J^J^^ SoutHo"*: cTOT
forms, or data sheets that are appucaoie to y^ ,, B t Review Bust Review is a learning experience and is used to compile a Bust Review
File.
2. FORECAST CONDITION: 8 BKN 25 OVC _ ___ —
3. OBSERVED CONDITION: 40 BKN
southern Georgia. - ~ , —^s, ty Pesters we~ used^orecast ^event^what did
indicating that clearing trend wnnia not occur. ~~~~~~ZZHIZI
6. POSTM.M.YSIS, What parameters were evident on the po.tan.lysi. ^
"» ra„HBd by onshore tiow As the high movea to the northeast, tue tiow weakened, clearing out the low ceiling. __
7. SUMMARY OR CONCLUSION:
1 watch for lows at 850mb that might have a ridge just ahead of then. The ridge in this case proved to be more important, as it was reflected aloft.
Although, there was no discernible trend, the condition has been pre- fer 12 hours already, and should not have been expected to continue for 2.
sent another 3 hours.
in
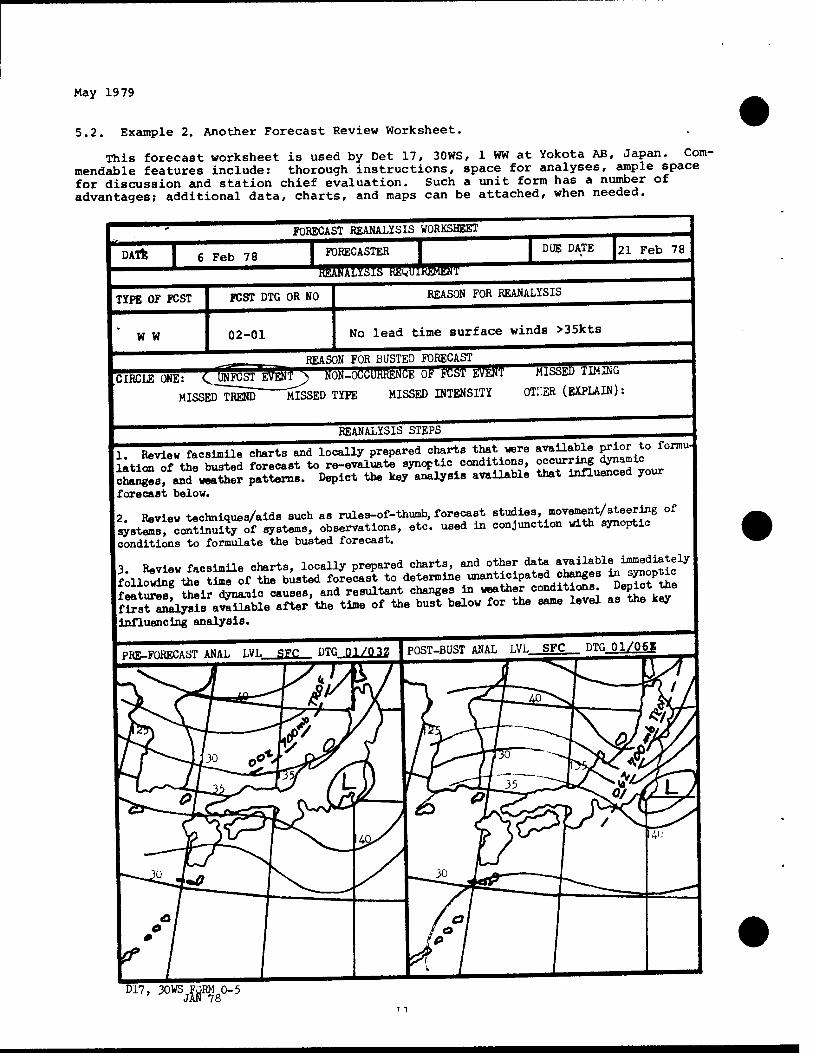
May 1979
5.2. Example 2. Another Forecast Review Worksheet.
This forecast worksheet is used by Det 17, 30WS, 1 WW at Yokota AB, Japan. Com- mendable features include: thorough instructions, space for analyses, ample space for discussion and station chief evaluation. Such a unit form has a number of advantages; additional data, charts, and maps can be attached, when needed.
FORECAST REANALYSIS WORKSHEET
DATE 6 Feb 78 FORECASTER
mmmrmitmmr mm DUE DATE 21 Feb 78
TYPE OF FCST
W W
FCST DTG OR NO
02-01
REASON FOR REANALYSIS
No lead time surface winds >35kts
REASON FOR BUSTED FORECAST
ICIRCLE OWE: <L "NFCST'^K"'^-*oflflUkkEtife OF flit»1 dMI'l' MISSED TIM1MÜ MISSHTTREND MISSED TYPE MISSED INTENSITY OTI-ER (EXPLAIN):
REANALYSIS STEPS
1. Review facsimile charts and locally prepared charts that were available P^to form» lationof the busted forecast to re-evaluate synoptic conditions ^[^ <^f° changes, and weather patterns. Depict the key analysis available that influenced your forecast below.
2 Review techniques/aids such as rules-of-thumb, forecast studies, movement/steering of systems; continuSy^of systems, observations, etc. used in conjunction with synoptic conditions to formulate the busted forecast.
3 Review facsimile charts, locally prepared charts, and other data available immediately f ollSthe time of the busted forecast to determine unanticipated changes in synoptic features th^ir dynamic causes, and resultant changes in weather conditions. Depict the JSsHnalysls aSble after'the time of the bust below for the same level as the key influencing analysis.
D17, »WS^O-5
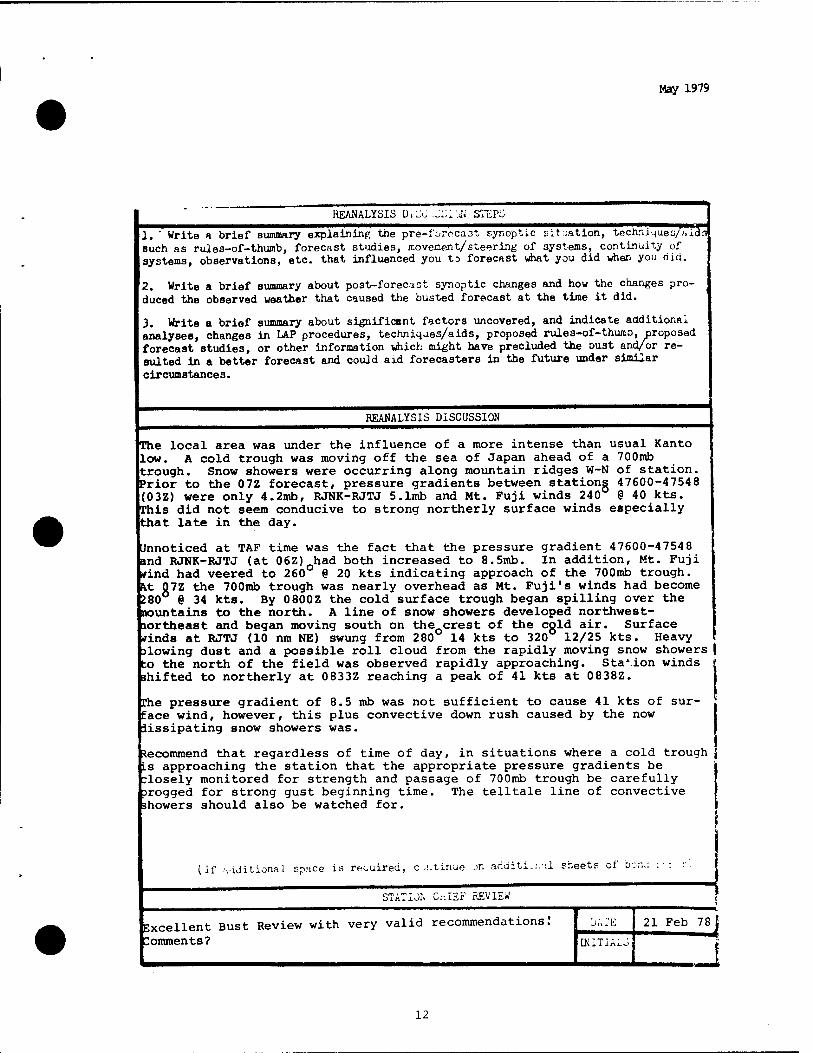
May 1979
REANALYSIS D, ^ ._:;: ii STEPS
^^Trlte a brief summary explaining the pre-i'orecast synoptic situation, techni4ueü/;'i.dn such as rules-of-thumb, forecast studies, movement/steering of systems, continuity of systems, observations, etc. that influenced you to forecast what you did when you did.
2. Write a brief summary about post-forecast synoptic changes and how the changes pro- duced the observed weather that caused the busted forecast at the time it did.
3. Write a brief summary about significant factors uncovered, and indicate additional analyses, changes in LAP procedures, techniques/aids, proposed rules-of-thuita, proposed forecast Btudies, or other information which might have precluded the Dust and/or re- sulted in a better forecast and could aid forecasters in the future under similar circumstance s.
REANALYSIS DISCUSSION
The local area was »ander the influence of a more intense than usual Kanto low. A cold trough was moving off the sea of Japan ahead of a 700mb trough. Snow showers were occurring along mountain ridges W-N of station. Prior to the 07Z forecast, pressure gradients between stations 47600-47548 (03Z) were only 4.2mb, RJNK-RJTJ 5.1mb and Mt. Fuji winds 240 @ 40 Jets. This did not seem conducive to strong northerly surface winds especially that late in the day.
Unnoticed at TAF time was the fact that the pressure gradient 47600-47548 and RJNK-RJTJ (at 06Z) had both increased to 8.5mb. In addition, Mt. Fuji »rind had veered to 260 @ 20 kts indicating approach of the 700mb trough. \t 07Z the 700mb trough was nearly overhead as Mt. Fuji's winds had become 280 § 34 kts. By 0800Z the cold surface trough began spilling over the nountains to the north. A line of snow showers developed northwest- lortheast and began moving south on the crest of the cold air. Surface »rinds at RJTJ (10 nm NE) swung from 280 14 kts to 320 12/25 kts. Heavy slowing dust and a possible roll cloud from the rapidly moving snow showers to the north of the field was observed rapidly approaching. Station winds ähifted to northerly at 0833Z reaching a peak of 41 kts at 0838Z.
The pressure gradient of 8.5 mb was not sufficient to cause 41 kts of sur- face wind, however, this plus convective down rush caused by the now dissipating snow showers was.
Recommend that regardless of time of day, in situations where a cold trough Is approaching the station that the appropriate pressure gradients be ;losely monitored for strength and passage of 700mb trough be carefully arogged for strong gust beginning time. The telltale line of convective showers should also be watched for.
{
Uf -ruiitional sp^ce is required, c^tinue jn arfditi.:.•:! sheets of o~:\.: ::• •■■.
STATION Cr.ISF REVIEW
Excellent Bust Review with very valid recommendations.' Comments?
'j/'il'E
[KITIA1.J
21 Feb 78J
12
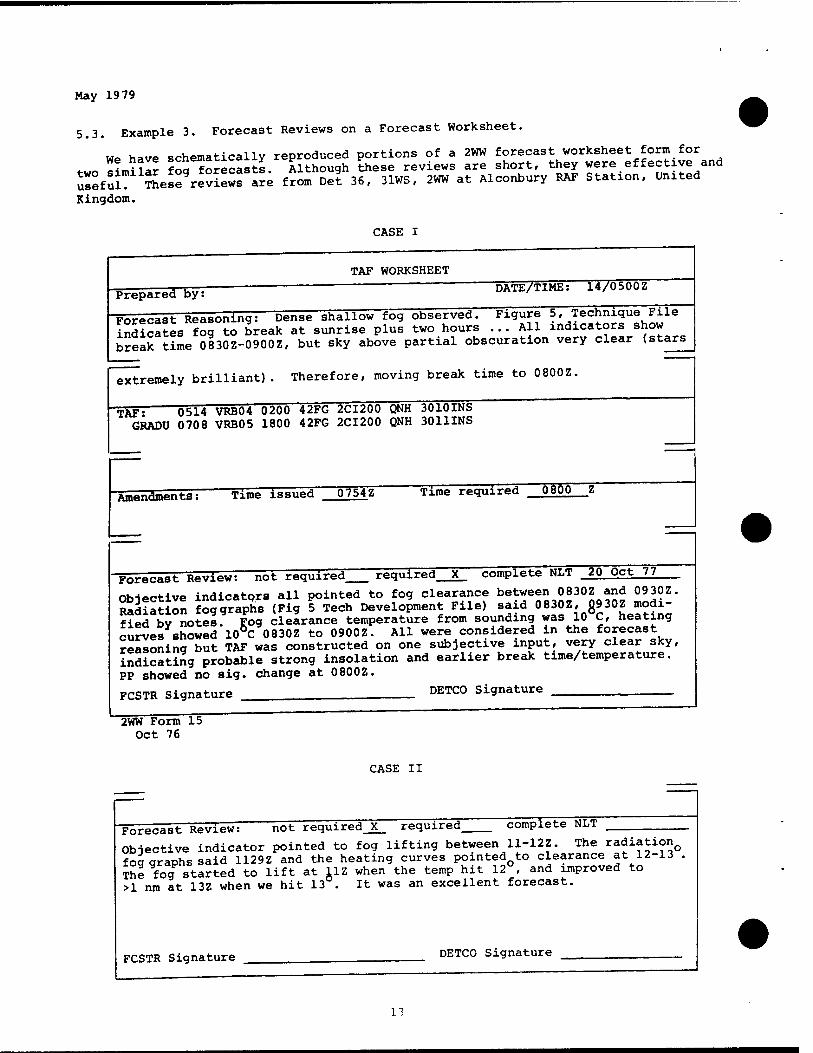
May 1979
5.3. Example 3. Forecast Reviews on a Forecast Worksheet.
We have schematically reproduced portions of a 2WW forecast worksheet form for t -J^ fn« forecasts Although these reviews are short, they were effective and SSfSmil£e2grefvtews"tie from De? 36, 31WS, 2WW at Alconbury RAF Station, United
Kingdom.
CASE I
TAF WORKSHEET
Prepared by: DATE/TIME: 14/u.uus
Forecast Reasoning: Dense shallow fog observed. Figure 5, Technique File indicates fog to break at sunrise plus two hours ... All indicators show break time 0830Z-0900Z, but sky above partial obscuration very clear (stars
"extremely brilliant). Therefore, moving break time to 0800Z.
TÄf": 0514 VRB04 0200 42FG 2CI200 QNH 3010INS GRADU 0708 VRB05 1800 42FG 2CI200 QNH 3011INS
■Amendments: Time issued 0/S4Z Time required 0800 Z
Forecast Review:—not required required__X_ complete NLT 20 Oct 77 \
Obiective indicators all pointed to fog clearance between 0830Z and 0930Z. Station foggraphs (Fig 5 Tech Development File) said 0830Z, 0930Z modi- fied bv notes. Eog clearance temperature from sounding was 10 C, heating curves showed 106C 0830Z to 0900Z. All were considered in the forecast reasoning but TAF was constructed on one subjective input, very clear sky, indicating probable strong insolation and earlier break time/temperature.
PP showed no sig. change at 0800Z.
FCSTR Signature DETCO Signature
2WW Form 15 Oct 76
CASE II
Forecast Review! not required_X_ required complete NLT
Objective indicator pointed to fog lifting between 11-12Z. The radiation fog graphs said 1129Z and the heating curves pointed to clearance at 12-13 . The fog started to lift at 11Z when the temp hit 12 , and improved to >1 nm at 13Z when we hit 13°. It was an excellent forecast.
FCSTR Signature DETCO Signature
13
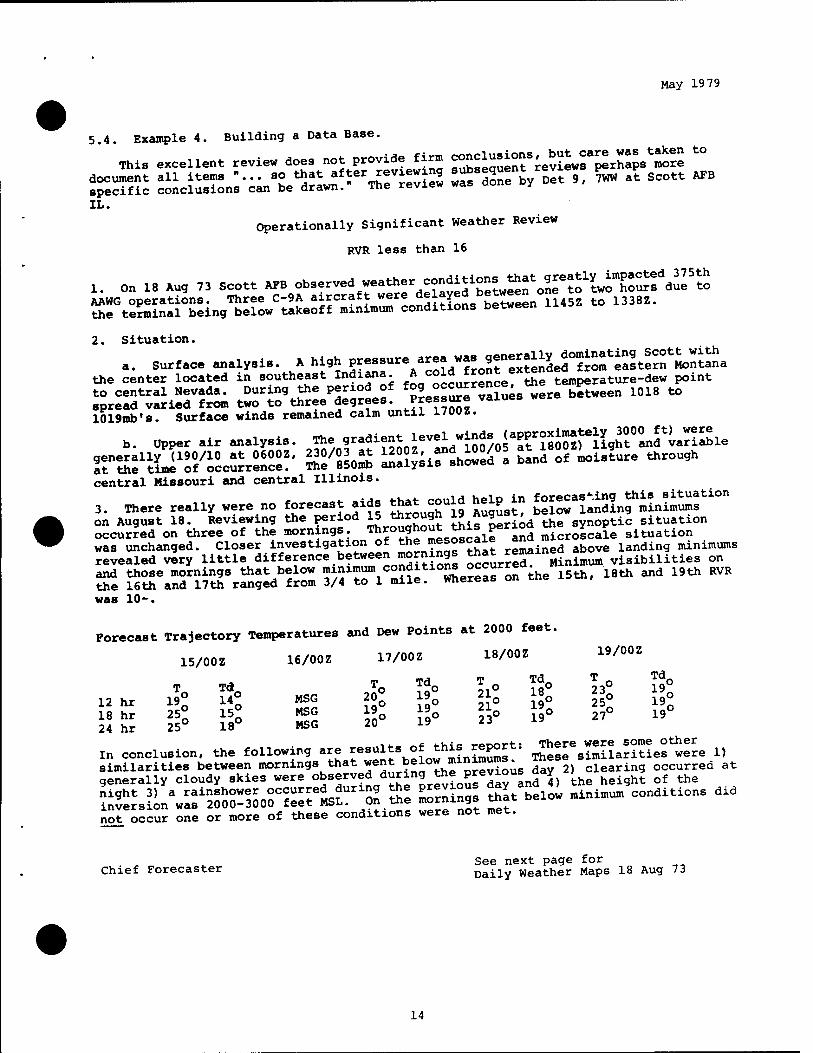
May 1979
5.4. Example 4. Building a Data Base.
This excellent review does not provide fir, «JSSSS'^S-^rSi'ÄS ** document all items «... so that after "viewing ^»g^J/„.,. 9, ^w at Scott AFB specific conclusions can be drawn. The review was cone y IL.
Operationally Significant Weather Review
RVR less than 16
1. O» 18 Au, 73 SCO« ». O.arved v.ath.r -dition^thatJ^^Ä."«
&3S£r^^°2£?2&?iJSSSSZ*- 11.5« to 133... 2. Situation.
a. Surface analysis. A high ^•-^^/^fSSifSSl^tSS'^S. the center located in southeast Indiana fJ
cold front extenae^
£trÄÄ EZ£L'S%Z '£~gr^~ *—1018 tt 1019mb'8. Surface winds remained calm until 1700z.
ÄtU^cSrenc.?' S'.iÄ Ä."»a Sana ot -U*~ »~* central Missouri and central Illinois.
3. There really were no forecast aids that could help in «SJ-^^iÄ"" on August 18. Reviewing the period 15 through 19 August, ^ svnoptic situation occurred on three of the mornings -Throughout this period £^£2. situation was unchanged. Closer investigation of the ^oscale ™ & landinq ndnimums revealed very little difference between minings that remai visibilities on and those mornings that below -"".«Sjj^^JS^S the 15th, 18th and 19th RVR the 16th and 17th ranged from 3/4 to 1 mile, wnereas on was 10-.
Forecast Trajectory Temperatures and Dew Points at 2000 feet.
15/00Z 16/00Z 17/00Z 18/00Z 19/00Z
12 hr llj Hi MSC $ SS 21° l£ jg »%
i!£ $ if0 E 29o° S° & »° 27° 19
in conclusion, the following are "suits of this report: ^«.J™^" «~ "
^ver^L^aslSriSoS^t^-Sn Se morning Klow minimum conditions did St%ccur one or more of these conditions were not met.
See next page for Chief Forecaster Daily Weather Maps 18 Aug 73
14
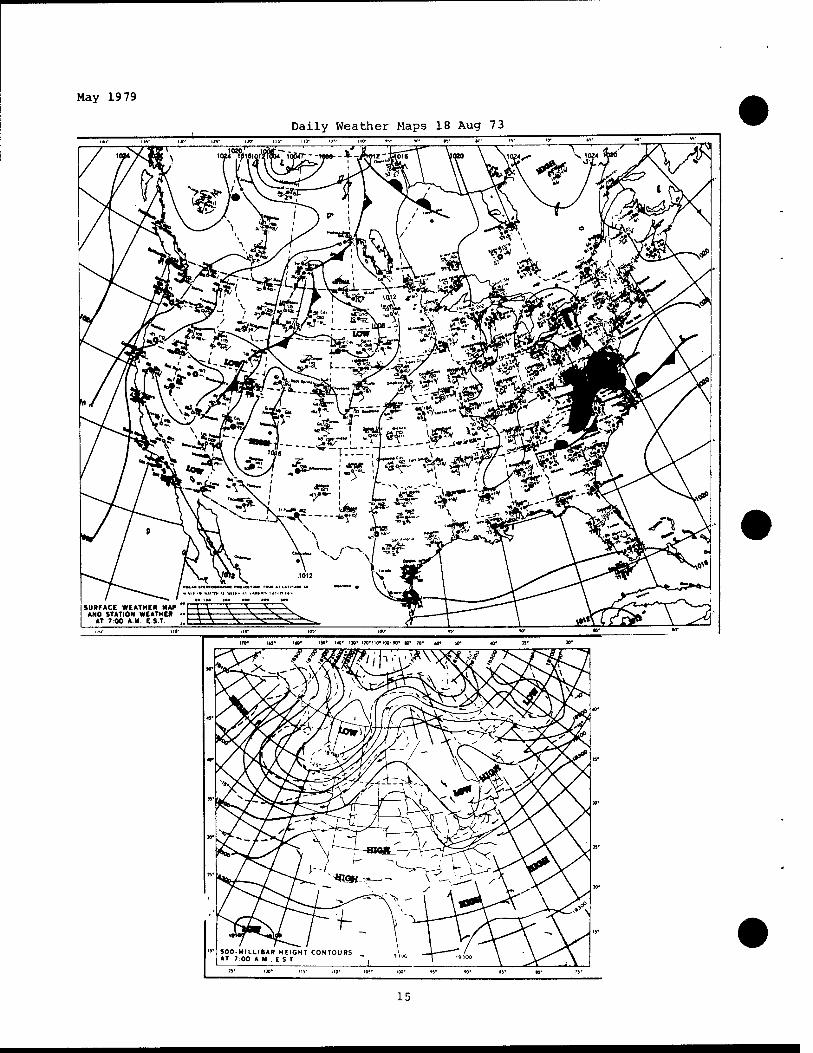
May 1979
Daily Weather Maps 18 Aug 73
w in* i*o* iJo* no* ijo* iM*no«ioo-w w n- w w
"' 500-MILUBAfl HEIGHT CONTOURS »T 7:00 A M.. ES T
15
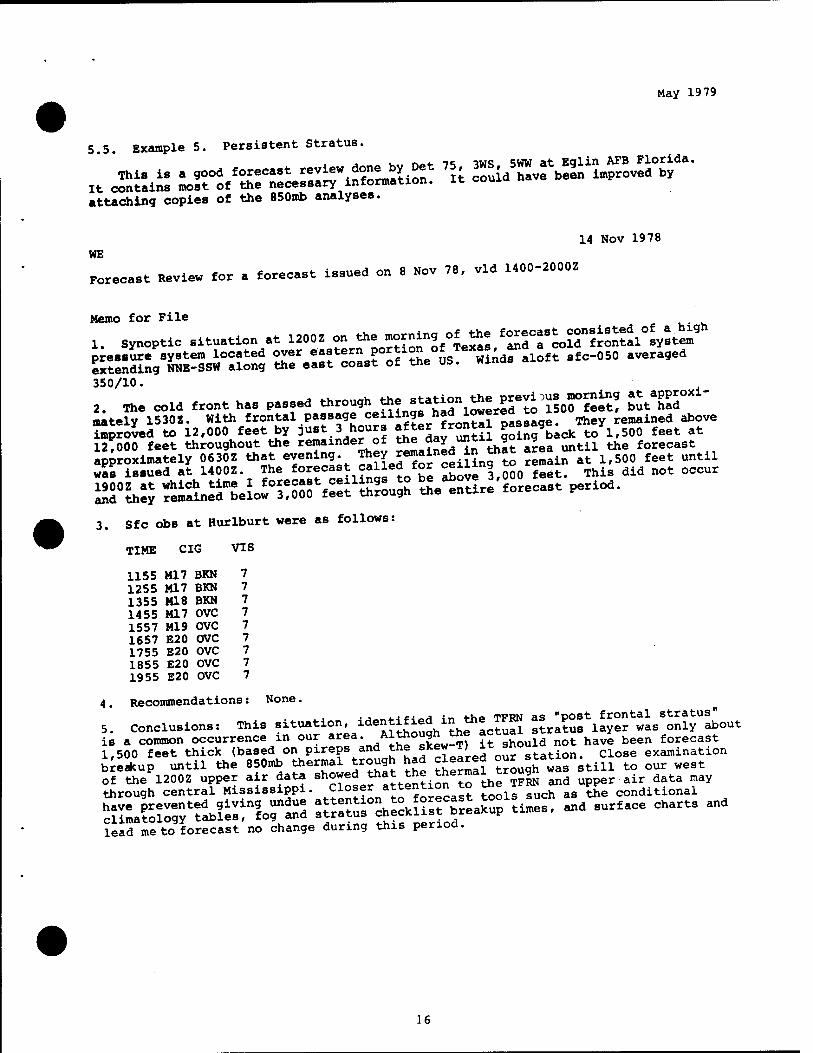
May 1979
5.5. Example 5. Persistent Stratus.
attaching copies of the 850mb analyses.
14 Nov 1978 HE
Forecast Review for a forecast issued on 8 Nov 78, vld 1400-2000Z
Memo for File
1. synoptic situation .t 1200Z on the »ornin, of the ^«^to»^^ h
e=o'ÄÄ S;r.t.ttco,.ro(lthe0uS!
e^af ,io,t .«OH,» ««*- 350/10.
2. The cold front has passed through th<j station ^reviou,, morning ^approxi- mately 15302. With frontal passage ceilings had lowerect remained above improved to 12,000 feet by Dust 3 hours after frontal p g ^ Q feet at 12?000 feet throughout the remainder of the day until go area until the forecast
AT.! aai.*s.-5SÄt sa. rs ^ s u* «^«s* s
3. Sfc obs at Hurlburt were as follows:
TIME CIG VIS
1155 Ml 7 BKN 7 1255 M17 BKN 7 1355 M18 BKN 7 1455 M17 OVC 7 1557 M19 OVC 7 1657 E20 OVC 7 1755 B20 OVC 7 1855 E20 OVC 7 1955 E20 OVC 7
4. Recommendations: None.
3. Conclusions: This situation, identified in the TFRN ^^iSS«."^"^ i. a common occurrence in our area • /i^g^* Should not have been forecast 1,500 feet thick (based on pireps and the skew T) it J£° £ examination breakup until the 850mb thermal trough had cleared our stat ^ west of the 12002 upper air data showed that the thermal trough wa ir data may through central Mississippi. Closer attention to the TFW«n ppe conditional
^ss^srso?1» :ssrsÄS? yi*^ t^s, and ^^ *»*. ^ lead me to forecast no change during this period.
16
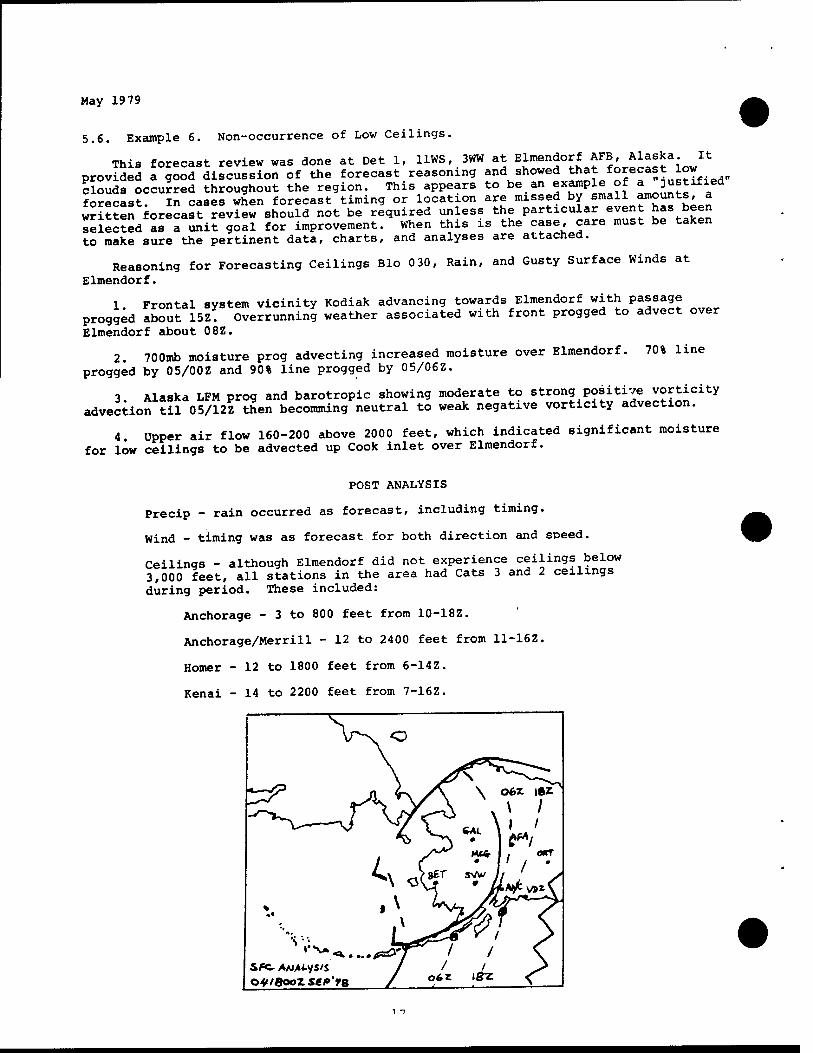
May 1979
at Elmendorf AFB, Alaska. It and showed that forecast low to be an example of a "justified" are missed by small amounts, a the particular event has been
s the case, care must be taken are attached.
and Gusty Surface Winds at
5.6. Example 6. Non-occurrence of Low Ceilings.
This forecast review was done at Det 1, 11WS, 3WW provided a good discussion of the forecast reasoning clouds occurred throughout the region. This appears forecast. In cases when forecast timing or location written forecast review should not be required unless selected as a unit goal for improvement. When this l to make sure the pertinent data, charts, and analyses
Reasoning for Forecasting Ceilings Bio 0 30, Rain, Elmendorf.
1 Frontal system vicinity Kodiak advancing towards Elmendorf with passage progged about 15Z. Overrunning weather associated with front progged to advect over Elmendorf about 08Z.
2. 700mb moisture prog advecting increased moisture over Elmendorf. 70% line progged by 05/00Z and 90% line progged by 0 5/06Z.
3. Alaska LFM prog and barotropic showing moderate to strong positive vorticity advection til 05/12Z then becomming neutral to weak negative vorticity advection.
4. Upper air flow 160-200 above 2000 feet, which indicated significant moisture for low ceilings to be advected up Cook inlet over Elmendorf.
POST ANALYSIS
Precip - rain occurred as forecast, including timing.
Wind - timing was as forecast for both direction and speed.
Ceilings - although Elmendorf did not experience ceilings below 3,000 feet, all stations in the area had Cats 3 and 2 ceilings during period. These included:
Anchorage - 3 to 800 feet from 10-18Z.
Anchorage/Merrill - 12 to 2400 feet from 11-16Z.
Homer - 12 to 1800 feet from 6-14Z.
Kenai - 14 to 2200 feet from 7-16Z.
"\ ° *\ ^N~
-Z? \ o6X |«r . \ /
• \ 1
M£fr , OKT
^J >t£T •
SVW , * IA
* ,\ \ my
s^.. ,..fJrj '" / 1 \ SfC- A/UyUyS'S / 1 y Ol/6ooZS£J»'T8 o6Z igz. ^
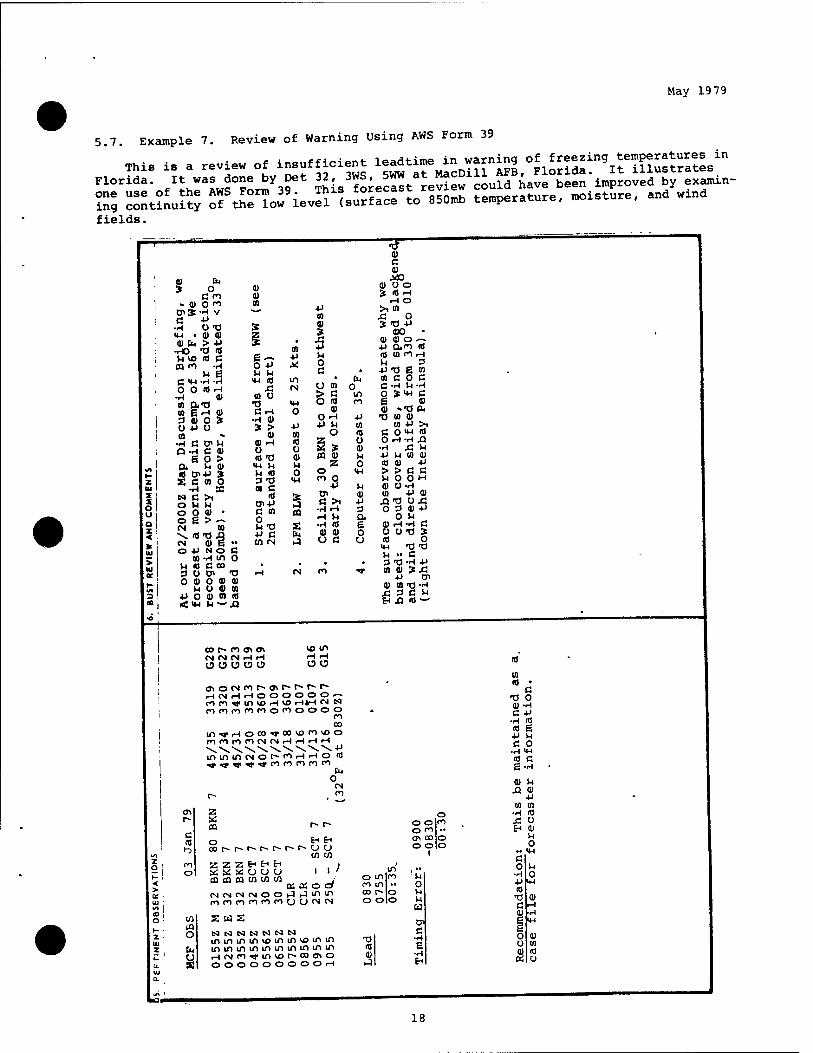
May 19 79
5.7, Example 7. Review of Warning Using AWS Form 39
This is a review of insufficient leadtime in warning oJ^S^I^StSU."1
Plorida It was done^y oet 32 3WS WW a Ma ^JoufdBha^^" improved by examin-
°ng continuity of^ToJ'ie^1 (surface to 850mb temperature, moisture, and wxnd
fields.
fa o
c d 01 0 f*>
0) n
a)
0>2 -H v *^ C -P •H O TJ S >M • 111 0) Z 01 fa > P 5
•HO "O «a : M VD «0 C 6- n M -H 0 -P
i M 6 M M C >W -H -iH <M id
: O 0 « iH Xi •H 01 CO O
1 0) cwo »0 w e <H o) C r-l 3 01 0 > •H 0) Ü -P O * ? «1 - 01
•H C Di u 01 i-4 Q-H C 0) O
e o > Id -0 CU w 0> <M M
y| id D»-P > M id
Z X G m O 3 T3 u •H 5G a c X N C >i id
o OhM Oi-P O 0 0» • C (0 o e > — 0 _
z < *
CM tn M -0
CM 0) B „ P ti OT CM
o +> N O c M-Hin 0
hdcoo • 3 U CT> -o r-l 0 01 O 0» 01
MOO) 01 D +J 0 0) w «
P CO 01
co P M
in CM
<M O
o 01 u O
>M
5 £ fa
0 c •
• fa U oi o > c in O id n
0) OH P P M (A
O •d 55 O £2 > 0) 0) 0) M
Z o o <M P) 0
■p u D> 0) a >i 4J •H f-1 3 r-l M 04 •H id R 01 01 O O ß U
0) c 0) M3 O O id r-t
r-l O >i w x! O S -0 P
00 • 0) 0) o --~ 4j cuo id Id CO O r-l M 3 P -a e w a c o c
•H M -H S IM C
01 -T3 Qt
to oi 01 P >i O IM Id
•H X>
c •
i 0) -a
CO <u •P
c c O H
üJIMH-fl
c O . •H p id > to 0) 01 xi-a O 3
O 0) r-l • o o>o id
IM t3 "O M •• C 3 >a -H P oi oi U .e
P D< 0) CO -O -H Ä 3 Ö M H XI « —
00 (•"■ co CT* o\ <M CM CN r-l r-l o o o o u
10 in r-l r-l
fjl z r~
A ti id o r? 00
z o ci z
i o « ■<
CQ > orr CN UJ n kO
ID O ! W S r- A
O N IU I in z ! fe in u. y iH ti. s o
cfiocMnr-oAr»i^«"~f~ rHCNr-lr-lOOOOOO^ ro n <w m vo r-l vo I-H*H CM N nnconrooMOOOO
n oo
invriocoo'fflionioo rOPinnCNCNr-lr-li-lrH
ininincMor~-nrHr-io id
fa O
CM
r- . ^
ir-r—r~r»r~r~-r~ocj cfl 01
ZZHHtn ; « « u u u ii
icMCMCMOOiJiJinin iroromnnutJcMCM
/
w s J N CS1 N N N N iininmixjininvoinin iinininininmininin icMfi^m^or^ooofio POOOOOOOOr-l
o in ro in oo r- o o
o o o o ON 00 o o
I
u o u u a oi c
•H e
•■H
0) id •
c »O 0
CU -H C -P
■H id id e •P M c 0
•H IM id c e-H 0) u ja ai
p CO 01
■•4 id x: o tri 0)
M 0
>• IM ti 0 M
•H o ■P >M id TJ 0) C r-l 01 •r< ß IM
o 0) c> CO 0) id 05 o
18
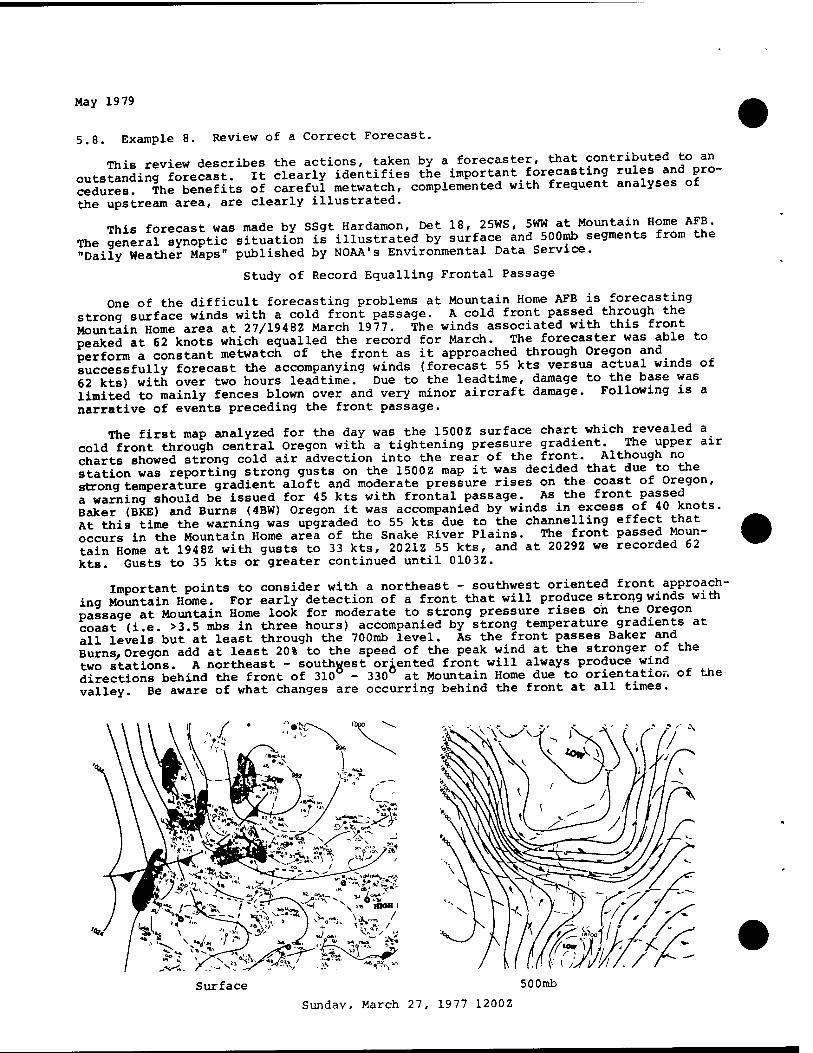
May 1979
5.8. Example 8. Review of a Correct Forecast.
This review describes the actions, taken by a forecaster, that^?ontri^efn^° *" outstanding forecast. It clearly identifies the important forecasting rules and pro- cedures The benefits of careful metwatch, complemented with frequent analyses of the upstream area, are clearly illustrated.
This forecast was made by SSgt Hardamon, Det 18, 25WS, 5WW at Mountain Home AFB. The general synoptic situation is illustrated by surface and 500mb segments from the "Daily Weather Maps" published by NOAA's Environmental Data Service.
Study of Record Equalling Frontal Passage
One of the difficult forecasting problems at Mountain Home AFB is forecasting strong surface winds with a cold front passage. A cold front passed through the Mountain Home area at 27/1948Z March 1977. The winds associated with this front peaked at 62 knots which equalled the record for March. The forecaster was able to perform a constant metwatch of the front as it approached through Oregon and successfully forecast the accompanying winds (forecast 55 kts versus actual winds of 62 kts) with over two hours leadtime. Due to the leadtime, damage to the base was limited to mainly fences blown over and very minor aircraft damage. Following is a narrative of events preceding the front passage.
The first map analyzed for the day was the 1500Z surface chart which revealed a cold front through central Oregon with a tightening pressure gradient. The upper air charts showed strong cold air advection into the rear of the front. Although no station was reporting strong gusts on the 1500Z map it was decided that due to the strong temperature gradient aloft and moderate pressure rises on the coast of Oregon, a warning should be issued for 45 kts with frontal passage. As the front Passed Baker (BKE) and Burns (4BW) Oregon it was accompanied by winds in excess of 40 knots. At this time the warning was upgraded to 55 kts due to the channelling effect that occurs in the Mountain Home area of the Snake River Plains. The front passed Moun- tain Home at 1948Z with gusts to 33 kts, 2021Z 55 kts, and at 2029Z we recorded 62 kts. Gusts to 35 kts or greater continued until 0103Z.
Important points to consider with a northeast - southwest oriented front approach- ing Mountain Home. For early detection of a front that will produce strong winds with passage at Mountain Home look for moderate to strong pressure rises on tne Oregon coast (i.e. >3.5 mbs in three hours) accompanied by strong temperature gradients at all levels but at least through the 700mb level. As the front passes Baker and Burns. Oregon add at least 20% to the speed of the peak wind at the stronger of the two stations. A northeast - southwest oriented front will always produce wind directions behind the front of 310 - 330 at Mountain Home due to orientation of the valley. Be aware of what changes are occurring behind the front at all times.
Surface 500mb
Sunday, March 27, 1977 1200Z
May 1979
5 9 Example 9. Station Chiefs Evaluation.
' .„ i. . review of »forecast «^ «^^ST^'XA'^"
The »it «hat provided £l'™£ »^^Ä^oSS'U^ti^ tZ." 2r.?"^r*eriS.Psn*Ushed1oy
U»0^dE„viroh»eotal cata Service.
UNFORECAST STRATUS
9 Mar 1978 Situation:
The . Mar 73 forecast was for existin, scattered ^^-^fÄ»
SSJSTSScSd'SS'lÄ. S-ÄE-til ut. i» the afternoon.
Forecaster's thinking and support:
The Key to the situation seemed to be the 850mb analysisj With the -ailahle^^ data at 08/04L, forecast conditions and trend showed stratutoj*^ & lQW in cast was based on the 850mb analysis, ^analysis at«''£ citv-Mineral Wells-Del louth central Oklahoma with an associated trough from »JjJ^^gi panhandle. Rio, moving eastward. An 850mb «othera ^°ugh reached i Nebraska and another to
«„dT£ss E^ÄÄr.S air advecticn to its east, and with stratus occurring in the cold air advection.
Actual: „ ^w ocn„K =,* nn/127 there was shown an additional develop- ing hindsight and the 850mb at 08/12Z, there was continued to move east-
ment of a cold pocket in the ^xas panhandle^ The^lowna Therefore cold air ward to Blytheville and trough from Little Rock Lake Char ^ ^ ^^ £or
Artuse &V^*^tt£*»™ wL a NW drying wind. Problem solving:
tional upper air sounding at Amanllo for 08/00Z.
UNFORECAST STRATUS REVIEW
9 March 1978
One tool that could have been used at forecastle: 850mb 24-hour Prog, ^on
KÄstra^^^ Timing fog the stratus: 5 degree spread or less as a good guess,
occurred at 4 spread.
Stratus
No further analysis required.
Signed, Station Chief
20
May 1979
Chapter 6
EXAMPLES OF CASE STUDIES
The case studies in this chapter were selected from case studies submitted by the The case swai« r printed here to provide a few examples a
fScafter can rerer^o when ?d1as Tr?neläl about format or content. We made some mod!"catLns to äe case studies, but we retained as much of the original work as possible.
21
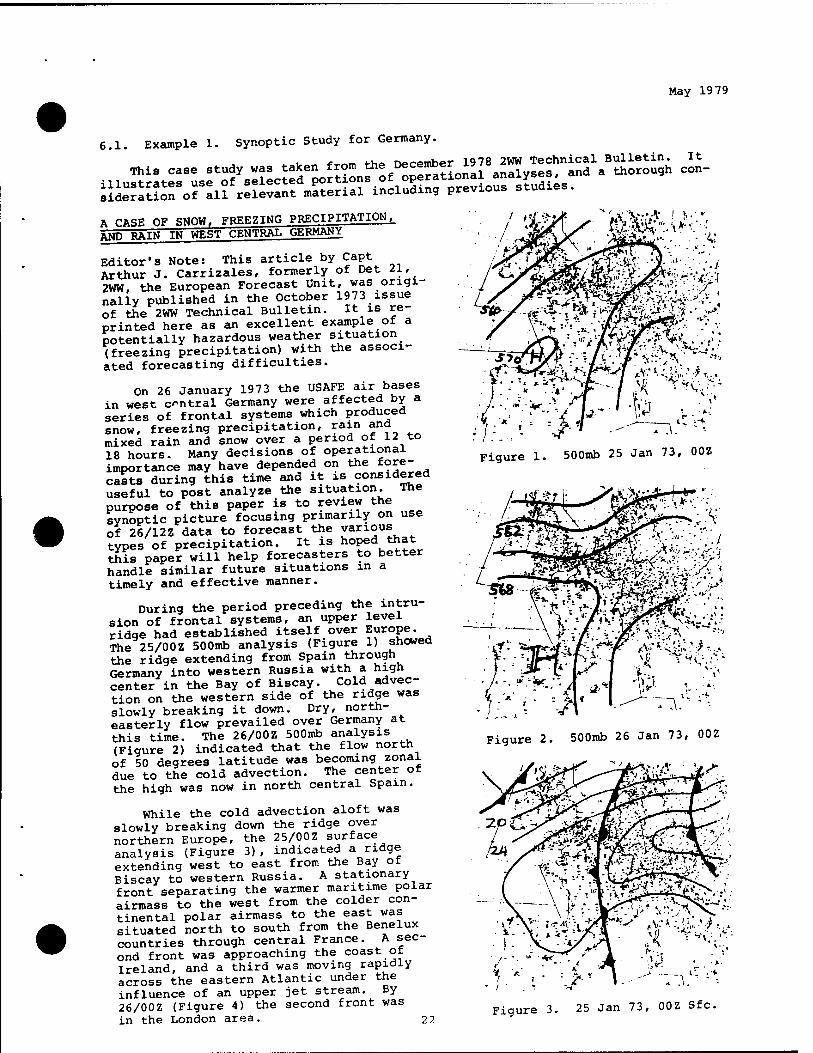
May 1979
j.o- ;> Figure 1. 500mb 25 Jan 73, OOZ
6.1. Example 1. Synoptic Study for Germany.
A CASE OF SNOW, FREEZING PRECIPITATION, AND RAIN IN WEST CENTRAL GERMANY
Editor's Note: This article by Capt Arthur J. Carrizales, formerly of Det 21, 2WW, the European Forecast Unit, was origi- nally published in the October 1973 issue of the 2WW Technical Bulletin. It is re- printed here as an excellent example of a potentially hazardous weather situation (freezing precipitation) with the associ- ated forecasting difficulties.
On 26 January 1973 the USAFE air bases in west central Germany were affected by a series of frontal systems which produced snow, freezing precipitation, rain and mixed rain and snow over a period of 1-2 to 18 hours. Many decisions of operational importance may have depended on the fore- casts during this time and it is considered useful to post analyze the situation. The purpose of this paper is to review the synoptic picture focusing primarily on use of 26/12Z data to forecast the various types of precipitation. It is hoped that this paper will help forecasters to better handle similar future situations in a timely and effective manner.
During the period preceding the intru- sion of frontal systems, an upper level ridge had established itself over Europe. The 25/00Z 500mb analysis (Figure 1) showed the ridge extending from Spain through Germany into western Russia with a high center in the Bay of Biscay. Cold advec- tion on the western side of the ridge was slowly breaking it down. Dry, north- easterly flow prevailed over Germany at this time. The 26/00Z 500mb analysis (Figure 2) indicated that the flow north of 50 degrees latitude was becoming zonal due to the cold advection. The center of the high was now in north central Spain.
While the cold advection aloft was slowly breaking down the ridge over northern Europe, the 25/00Z surface analysis (Figure 3), indicated a ridge extending west to east from the Bay of Biscay to western Russia. A stationary front separating the warmer maritime polar airmass to the west from the colder con- tinental polar airmass to the east was situated north to south from the Benelux countries through central France. A sec- ond front was approaching the coast ot Ireland, and a third was moving rapidly across the eastern Atlantic under the influence of an upper jet stream. By 26/00Z (Figure 4) the second front was in the London area. 2 2
Figure 2. 500mb 26 Jan 73, 00Z
Figure 3. 25 Jan 73, 00Z Sfc.
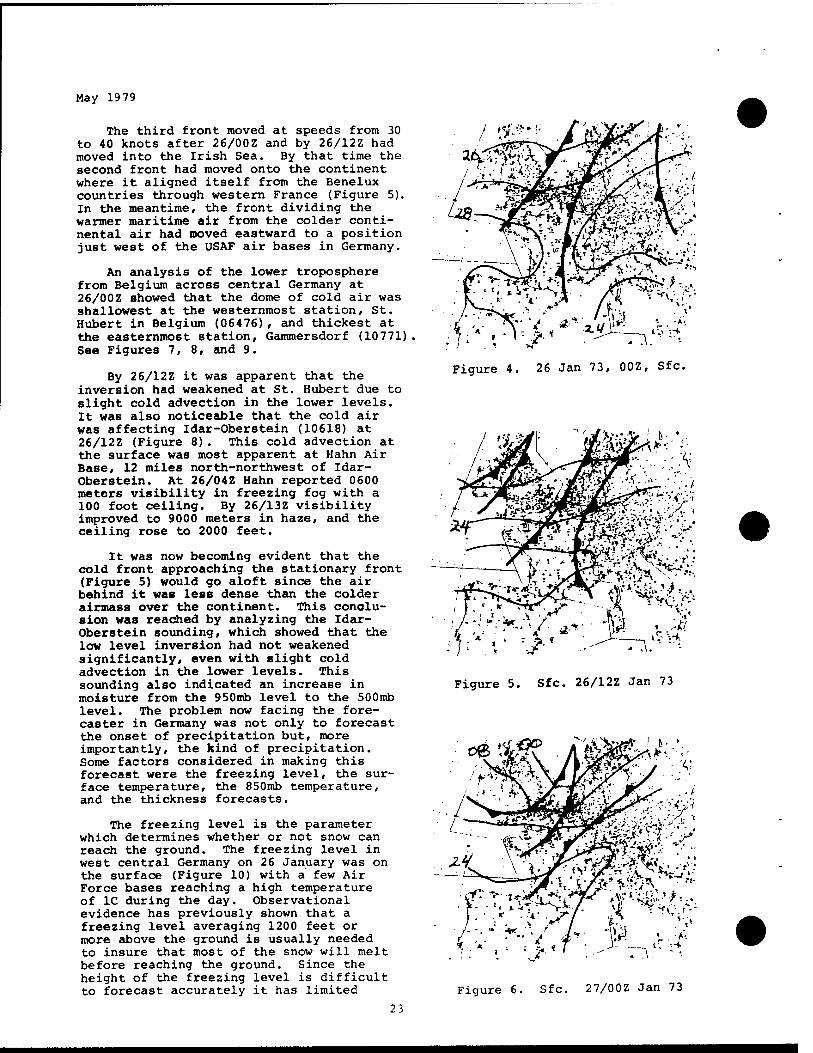
May 19 79
The third front moved at speeds from 30 to 40 knots after 26/00Z and by 26/12Z had moved into the Irish Sea. By that time the second front had moved onto the continent where it aligned itself from the Benelux countries through western France (Figure 5). In the meantime, the front dividing the warmer maritime air from the colder conti- nental air had moved eastward to a position just west of the USAF air bases in Germany.
An analysis of the lower troposphere from Belgium across central Germany at 26/00Z showed that the dome of cold air was shallowest at the westernmost station, St. Hubert in Belgium (06476), and thickest at the easternmost station, Gammersdorf (10771) See Figures 7, 8, and 9.
By 26/12Z it was apparent that the inversion had weakened at St. Hubert due to slight cold advection in the lower levels. It was also noticeable that the cold air was affecting Idar-Oberstein (10618) at 26/12Z (Figure 8). This cold advection at the surface was most apparent at Hahn Air Base, 12 miles north-northwest of Idar- Oberstein. At 26/04Z Hahn reported 0600 meters visibility in freezing fog with a 100 foot ceiling. By 26/13Z visibility improved to 9000 meters in haze, and the ceiling rose to 2000 feet.
It was now becoming evident that the cold front approaching the stationary front (Figure 5) would go aloft since the air behind it was less dense than the colder airmass over the continent. This conclu- sion was reached by analyzing the Idar- Oberstein sounding, which showed that the low level inversion had not weakened significantly, even with slight cold advection in the lower levels. This sounding also indicated an increase in moisture from the 950mb level to the 500mb level. The problem now facing the fore- caster in Germany was not only to forecast the onset of precipitation but, more importantly, the kind of precipitation. Some factors considered in making this forecast were the freezing level, the sur- face temperature, the 850mb temperature, and the thickness forecasts.
The freezing level is the parameter which determines whether or not snow can reach the ground. The freezing level in west central Germany on 26 January was on the surface (Figure 10) with a few Air Force bases reaching a high temperature of 1C during the day. Observational evidence has previously shown that a freezing level averaging 1200 feet or more above the ground is usually needed to insure that most of the snow will melt before reaching the ground. Since the height of the freezing level is difficult to forecast accurately it has limited
23
Figure 4. 26 Jan 73, 00Z, Sfc.
*:■;■ ■>
Figure 5. Sfc. 26/12Z Jan 73
v. ■*■■
Figure 6. Sfc. 27/00Z Jan 73
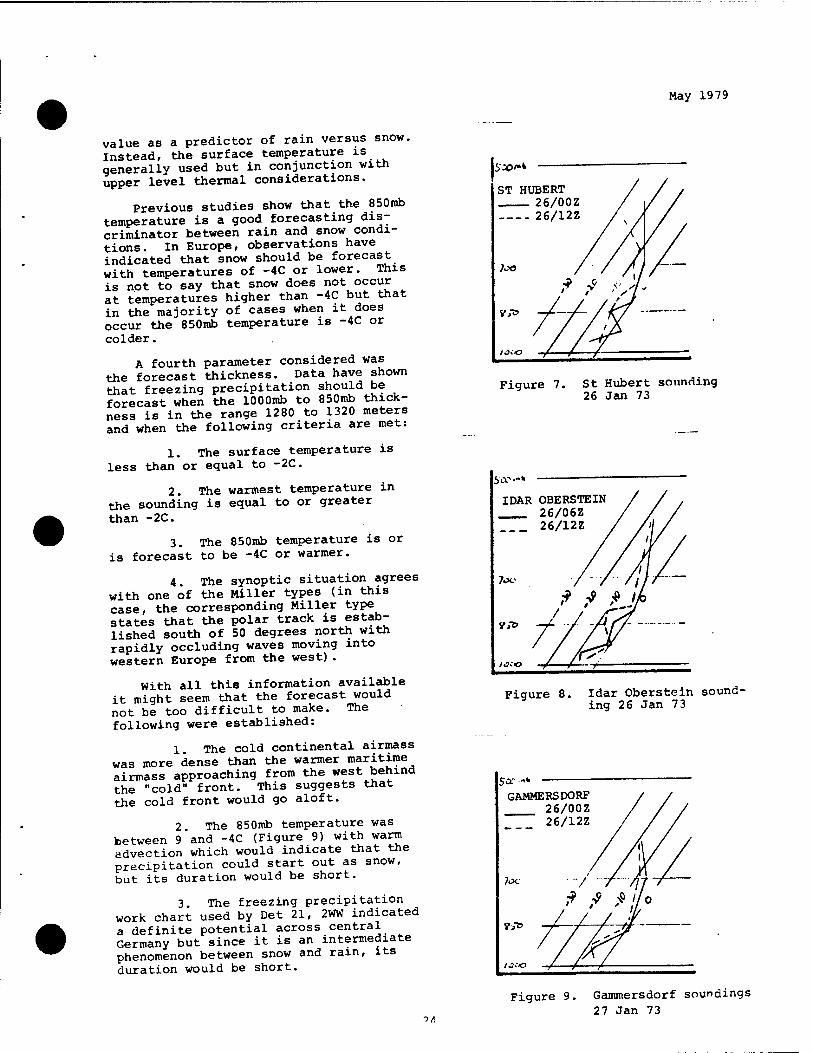
May 1979
value as a predictor of rain versus snow. Instead, the surface temperature is generally used but in conjunction with upper level thermal considerations.
Previous studies show that the 850mb temperature is a good forecasting dis- criminator between rain and snow condi- tions. In Europe, observations have indicated that snow should be forecast with temperatures of -4C or lower. This is not to say that snow does not occur at temperatures higher than -4C but that in the majority of cases when it does occur the 850mb temperature is -4C or colder.
A fourth parameter considered was the forecast thickness. Data have shown that freezing precipitation should be forecast when the lOOOmb to 850mb thick- ness is in the range 1280 to 1320 meters and when the following criteria are met:
1. The surface temperature is less than or equal to -2C.
2. The warmest temperature in the sounding is equal to or greater than -2C.
3. The 850mb temperature is or is forecast to be -4C or warmer.
4. The synoptic situation agrees with one of the Miller types (in this case, the corresponding Miller type states that the polar track is estab- lished south of 50 degrees north with rapidly occluding waves moving into western Europe from the west).
With all this information available it might seem that the forecast would not be too difficult to make. The following were established:
1 The cold continental airmass was more dense than the warmer maritime airmass approaching from the west behind the "cold" front. This suggests that the cold front would go aloft.
2 The 850mb temperature was between 9"and -4C (Figure 9) with warm advection which would indicate that the precipitation could start out as snow, but its duration would be short.
3. The freezing precipitation work chart used by Det 21, 2WW indicated a definite potential across central Germany but since it is an intermediate phenomenon between snow and rain, its duration would be short.
Sce><«k
ST HUBERT 26/00 26/12
Figure 7. St Hubert sounding 26 Jan 73
5or.-»
IDAR OBERSTEIN 26/06Z
_ 26/12Z
Figure 8. Idar Oberstein sound- ing 26 Jan 73
5a-.»» GAMMERSDORF 26/00Z
26/12Z
7ij>c
SS-Ö
■>/[
Figure 9. Gammersdorf soundings 27 Jan 73
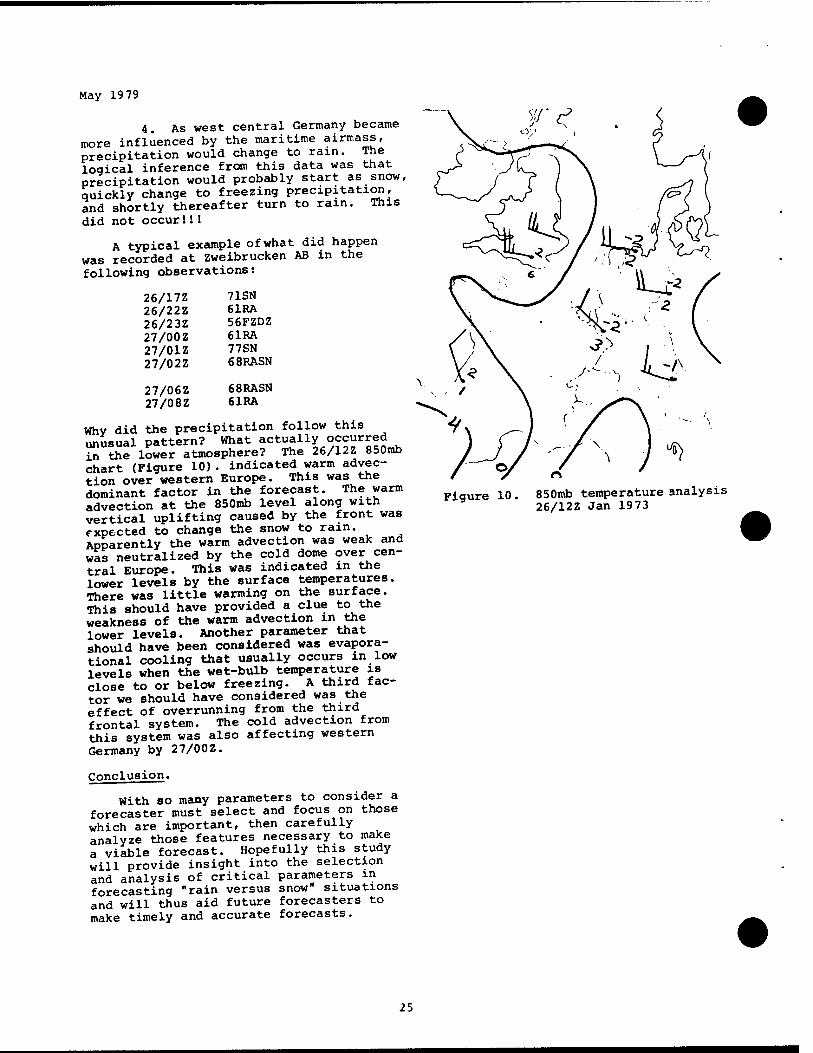
May 1979
4. As west central Germany became more influenced by the maritime airmass, precipitation would change to rain. The logical inference from this data was that precipitation would probably start as snow, quickly change to freezing precipitation, and shortly thereafter turn to rain. This did not occur!I!
A typical example ofwhat did happen was recorded at Zweibrucken AB in the following observations:
26/17Z 26/22Z 26/23Z 27/00Z 27/01Z 27/02Z
27/06Z 27/08Z
71SN 61RA 56FZDZ 61RA 77SN 68RASN
68RASN 61RA
Why did the precipitation follow this unusual pattern? What actually occurred Sthe lower atmosphere? The 26/12Z 850mb chart (Figure 10). indicated warm advec- tion over western Europe. This was the dominant factor in the forecast. The warm advection at the 850mb level along with vertical uplifting caused by the front was expected to change the snow to ram. Apparently the warm advection was weak and was neutralized by the cold dome over cen- tral Europe. This was indicated in the lower levels by the surface temperatures. There was little warming on the surface. This should have provided a clue to the weakness of the warm advection in the lower levels. Another parameter that should have been considered was evapora- tional cooling that usually occurs in low levels when the wet-bulb temperature is close to or below freezing. A third fac- tor we should have considered was the effect of overrunning from the third frontal system. The cold advection from this system was also affecting western Germany by 27/00Z.
Conclusion.
With so many parameters to consider a forecaster must select and focus on those which are important, then carefully analyze those features necessary to make a viable forecast. Hopefully this study will provide insight into the selection and analysis of critical parameters in forecasting "rain versus snow" situations and will thus aid future forecasters to make timely and accurate forecasts.
Figure 10. 850mb temperature analysis 26/12Z Jan 1973
25
May 1979
6.2. Example 2. Ice Storm.
This study is similar to Example 1. It iUuitrat.. a different format. It was prepared by Det 2, 3WS, 5WW at Seymour Johnson AFB, NC.
ICE STORM OF THE 8th AND 9th OF JANUARY 1971
SEYMOUR JOHNSON AFB, N. C.
The major problem facing the duty forecasters on the 7th and 8th of Jan was what type of precipitation will occur - rain, snow or freezing ram.
If rain or snow were to occur, the amounts would not be excessive and would present little problem.
But freezing rein or any amount over 25 inoh would present ^«S^^cfon
ÄrrcrertÄ^
becomes a threat to the health and comfort of personnel.
Large scale synoptic features prior to the onset of the ice storm:
2 Jan - First evidence of a major upper trough at SOOmbs in the western United States. High index existed from the Rockies to the East Coast. Weak front extended from Great Lakes region to West Texas.
3 Jan - 500mb trough intensified rapidly over the ^^^«^^"^gjfj^rapidly under high index. Front in the Mid-United States became better ^^fj^ast. deepening low in NE Oklahoma. Weak surface high pressure ridge over East Coast.
4 Jan - 500mb trough now dominates western 2/3 of ^ted ftat«.. 992mb ^oves from Oklahoma to central Wisconsin. Front extends *"* «"co"°in,f .JJJaS Sgn Orleans area. SW flow up to 500mb over East Coast. Weak ridge of furrace nig extends from NE down over the Carolinas.
5 Jan - 500mb trough now dominates most of the united States. SW flow at 500mb extends from Texas to New England. Cold front passes GSB. High pressure moves Canada to central United States and is building rapidly.
6 Jan - 500mb trough shows little change. Upper flow now very strong and is oriented SW to NE from Texas to New England. Width of the band is ^^fl^nLal Sessure over southern Minnesota to Florida. Surface high is now at 1036 mb central pressure and located over eastern Kansas. Front extends from central Gulf of Mexico to central Florida then NE into the Atlantic.
7 Jan - 500mb trough extends from Great Lakes ^ion to ^e |winto ^^evidencf band of strong SW to NE flow continues over eastern United States, f1"* **x?f^nois or low development in central Gulf of Mexico. Arctic high now over southern Illinois and moving slowly east.
8 Jan - 500mb trough shows evidence of filling and moving slowly to the east. Sur- face high now In southern Pennsylvania. Weak »cold "^er- extends down over Virginil and the Carolinas. The wave on the front is now ^11 defined in the Gulf or Mexico and moving NE. Very light ice pellets were observed at GSB at 0500E and nfinnp Ät. 074QE a mixture of light rain and light ice pellets was oDservea. «t T22ll\ery lignt snow'and ice pellets were observed. The surf-e temperature has remained at around 35°F during this period. At 1^7E a mixture o 1 & rain and light freezing rain was observed and the temperature had dropped to 3*J^. fV™^ the light rain was dropped and only freezing rain, was carr led - th "continued until 09/0800E and the surface temperature remained 32 F during this 14 hour period.
9 Jan - Cut-off low at 500mb over Baja, California. The 500mb trough overcentral United States is weaker and SW flow over eastern United States is.^11 present but is now weaker. Surface low has moved across Florida and " now a^*™™^* °f ILM and moving ENE. Surface high over New England with weak cold finger moving
26
May 1979
slowly out of the South Atlantic States. Low ceilings and restricted visibility continued throughout the day, but the temperature remained at 34 F and no further accumulation of freezing precipitation occurred.
CLUES TO THE ICE STORM THREAT
1. Location of the cold high pressure system.
a. Center of the high located to the north (111, Ind, Ohio, Pa.). Moving east or east by northeast very slowly.
b. Tongue of cold air extends down the Atlantic Seaboard - a form of the "cold
finger".
2. Surface front will be to the south and/or southeast and will be quasi-stationary.
a. Wave will form on the front in Southern States (Laf Miss, Ala, Ga) or in the
Gulf of Mexico.
b Wave will develop into a closed low and move rapidly to the east-northeast passing into the Atlantic Ocean after crossing the Florida, Georgia or South Carolina
coast.
c. Low may slow down and deepen off the North Carolina coast - most serious
threat.
d. Low may continue to E or ENE into the Atlantic Ocean and shorten the duration of the threat to the GSB area.
3 Upper air flow will be from the SW at least up to the 500mb level and be strong and in a broadband covering most of the east coast of the United States.
4 Surface to 3000 ft winds have a NE direction as a result of the pressure ridge extendinq from the high cell to the north. The cold flow from the north has a short over water trajectory and has been slightly modified. Surface temperatures are in ?he low thirties - usually between 306F and 348F. Thus, light or very light ram or drizzle falling into this cold layer will freeze on contact. When this condition persists for several hours a heavy layer of ice will accrue.
5 If the surface low slows down and de epens off the North Carolina coast and the low level winds increase to 15 knots or more the potential for extensive damage to power lines and trees is very great.
SUGGESTED ACTIONS WHEN THE ICE STORM THREAT IS PRESENT.
1. LAWC's every three hours, more frequently if workload permits and manpower is available.
2. Plot GSO, CHS and AHN soundings:
a. Check layer thickness.
b. Look for inversions.
c. Look for warm layers.
3. Keep continuous metwatch:
a. Look for bright band(s) on the FPS-77.
b. Look for possible convective activity - TSW has been carried at GSB when the low on the front moved close to our area.
4. Keep snow vs rain worksheet and check the probability of occurrence of snow/rain.
5 if the low moves NNE and the front does not move well out of our area, be alert for a second open wave or low development that might cause the freezing rain to start aqain.
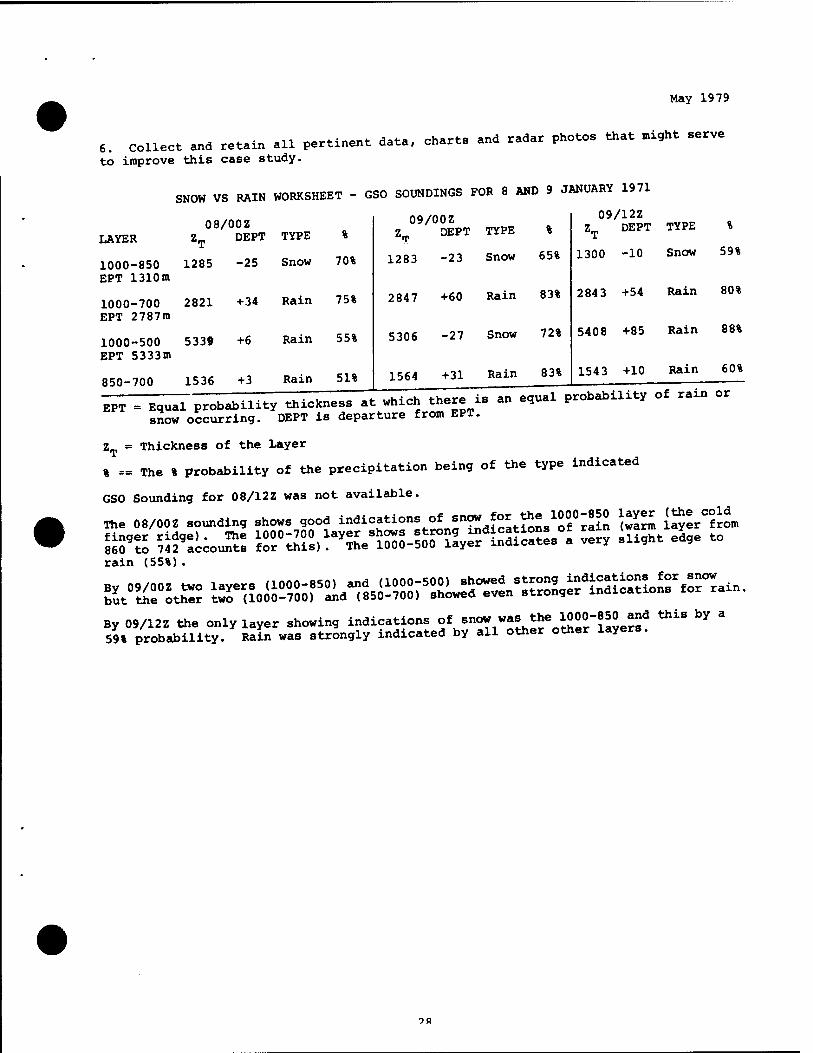
May 1979
6. Collect and retain all pertinent data, charts and radar photos that might serve
to improve this case study.
SNOW VS RAIN WORKSHEET - GSO SOUNDINGS FOR 8 AND 9 JANUARY 1971
LAYER
1000-850 EPT 1310m
1000-700 EPT 2787m
1000-500 EPT 5333m
850-700
08/00Z Z„ DEPT TYPE "T
1285
2821
5339
1536
-25
+34
+6
+3
Snow
Rain
Rain
Rain
%
70%
75%
55%
51%
09/00Z
1283
2847
5306
1564
DEPT TYPE
-23 Snow
+60
-27
+31
Rain
Snow
Rain
%
65%
83%
72%
83%
09/12Z Z„ DEPT TYPE % T
1300 -10 Snow 59%
284 3 +54 Rain 80%
5408 +85 Rain 88%
1543 +10 Rain 60%
CTT^Tprob.Mlit, thickness «which there i. an .,u.l proonhiU« of ..in or snow occurring. DEPT is departure from EPT.
Z = Thickness of the layer
% == The % probability of the precipitation being of the type indicated
GSO Sounding for 08/12Z was not available.
«,e 08/003 .oundi», .hows cooo i»<««"°"%l™£ *°!t^Tf°r.!n (w.m iSerlro*
rain (55%) .
SÄotSr iÄ0°?00r.Ä
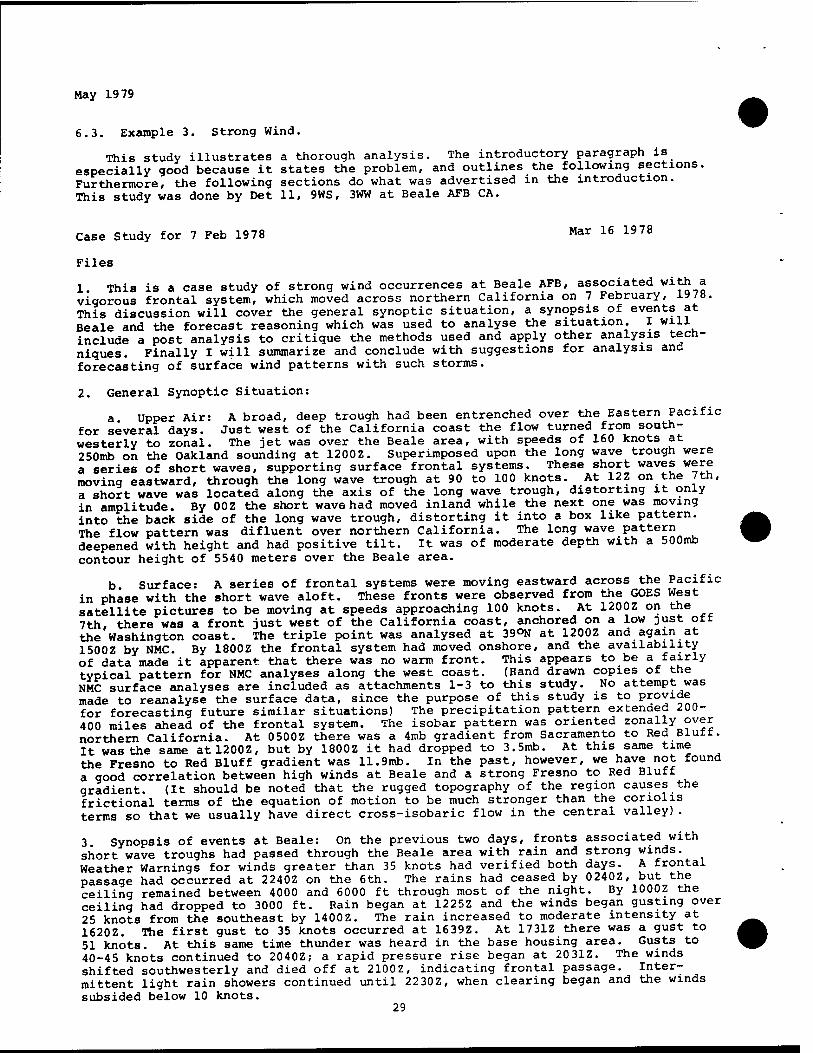
May 1979
6.3. Example 3. Strong Wind.
This study illustrates a thorough analysis. The introductory paragraph is especially good because it states the problem, and outlines the following sections. Furthermore, the following sections do what was advertised in the introduction. This study was done by Det 11, 9WS, 3WW at Beale AFB CA.
Case Study for 7 Feb 1978 Mar 16 1978
Files
1. This is a case study of strong wind occurrences at Beale AFB, associated with a vigorous frontal system, which moved across northern California on 7 February, 19 78. This discussion will cover the general synoptic situation, a synopsis of events at Beale and the forecast reasoning which was used to analyse the situation. I wl11
include a post analysis to critique the methods used and apply other analysis tech- niques. Finally I will summarize and conclude with suggestions for analysis and forecasting of surface wind patterns with such storms.
2. General Synoptic Situation:
a Upper Air: A broad, deep trough had been entrenched over the Eastern Pacific for several days. Just west of the California coast the flow turned from south- westerly to zonal. The jet was over the Beale area, with speeds of 160 knots at 250mb on the Oakland sounding at 1200Z. Superimposed upon the long wave trough were a series of short waves, supporting surface frontal systems. These short waves were moving eastward, through the long wave trough at 90 to 100 knots. At 12Z on the 7th, a short wave was located along the axis of the long wave trough, distorting it only in amplitude. By 00Z the short wave had moved inland while the next one was moving into the back side of the long wave trough, distorting it into a box like pattern. The flow pattern was difluent over northern California. The long wave pattern deepened with height and had positive tilt. It was of moderate depth with a 500mb contour height of 5540 meters over the Beale area.
b. Surface: A series of frontal systems were moving eastward across the Pacific in phase with the short wave aloft. These fronts were observed from the GOES West satellite pictures to be moving at speeds approaching 100 knots. At 1200Z on the 7th, there was a front just west of the California coast, anchored on a low just oft the Washington coast. The triple point was analysed at 39°N at 1200Z and again at 1500Z by NMC. By 1800Z the frontal system had moved onshore, and the availability of data made it apparent that there was no warm front. This appears to be a fairly typical pattern for NMC analyses along the west coast. (Hand drawn copies of the NMC surface analyses are included as attachments 1-3 to this study. No attempt was made to reanalyse the surface data, since the purpose of this study is to provide for forecasting future similar situations) The precipitation pattern extended 200- 400 miles ahead of the frontal system. The isobar pattern was oriented zonally over northern California. At 0500Z there was a 4mb gradient from Sacramento to Red Bluff. It was the same atl200Z, but by 1800Z it had dropped to 3.5mb. At this same time the Fresno to Red Bluff gradient was 11.9mb. In the past, however, we have not found a good correlation between high winds at Beale and a strong Fresno to Red Bluff gradient. (It should be noted that the rugged topography of the region causes the frictional terms of the equation of motion to be much stronger than the coriolis terms so that we usually have direct cross-isobaric flow in the central valley).
3. Synopsis of events at Beale: On the previous two days, fronts associated with short wave troughs had passed through the Beale area with rain and strong winds. Weather Warnings for winds greater than 35 knots had verified both days. A frontal passage had occurred at 2240Z on the 6th. The rains had ceased by 0240Z, but the ceiling remained between 4000 and 6000 ft through most of the night. By 1000Z the ceiling had dropped to 3000 ft. Rain began at 1225Z and the winds began gustmg over 25 knots from the southeast by 1400Z. The rain increased to moderate intensity at 1620Z. The first gust to 35 knots occurred at 1639Z. At 1731Z there was a gust to 51 knots. At this same time thunder was heard in the base housing area. Gusts to 40-45 knots continued to 2040Z; a rapid pressure rise began at 2031Z. The winds shifted southwesterly and died off at 2100Z, indicating frontal passage. Inter- mittent light rain showers continued until 22 30Z, when clearing began and the winds subsided below 10 knots.
29
May 1979
4. Forecast Reasoning: The frontal system •PP™«*^ *J „SSeric" pSSf oooU
past 40 knots, the warning was amended to 45 knots. An atter tne issued at 1730, for winds gusting past 50 knots.
5. Post Analysis:
a. Standard analysis techniques had identified the strength of the| nonconve^tive winds in this system 15 hours before they °?cur"?: ™f * wa^aJ£;r warnings. There to forecast winds above 35 knots until the issue time of the ^JS^J Lot winds was also a tendency to wait until anotter station in*L£lt likely due to *<™™sh
before issuing the weather warning. The 51 knot gust was «»•%££•£0£fwas not gusts from the thunderstorm, heard in the base housing a"a« v™.JtJa^ account for detected on the 1730Z SAC RAREP. Precipitation attenuation may partially account Sis Maximum reported tops over the Beale Area at that time were 11,000 ft.
K AWS TR 200 (REV) May 1972, Chapter 10 discusses methods of f°recasting maxi- mum gustffr™ 'tnunafrsL^cells! A. method discussed in Section B par was applied to the 1200Z OAK sounding, which ?'•££•*• "JJ1"« »£. for Sveral rea- techniques discussed in this chapter have ^"le benefit for Beale^or sons. Thunderstorms at Beale are nearly exclusively associated wit» r™ associ- The thunderstorms themselves are seldom severe ** ■™«Wg£ Se thunderstorms ated with the synoptic scale pressure ^eld' ^/ust fronts from tnern are usually in the 10-15 knot range. The methods described in cnapter J^| gustS for the peak intensity of the life c*cle °f a stom-^is « unlesTyou Ire in forecasting peak gusts at an arbitrary point, like an »J™™^™^ / The certain that the storm will be at peak "»tensity when it P^JJJJJJl *£" within the
adding 5-10 knots to gust speeds when thunderstorms are expectea witn «ie strong surface winds.
6. Conclusions. With vigorous, fast moving ^t^^^^riS^
SoSd^^/Sed^ 35 knots in the Sacramento area or until they approach 35 ^^^"11 warnings provide the desired leadtime of 1 hour. This will result in «" "™ which do not verify. However, weather warning coverage and ^continuity ol reason- important than a high rate of verification. To insu« that tteoontinu^y ing is maintained, prior to each forecast, the previous ZOourso sheets should be read and the forecast reasonings considered. The low levei wi SfoerecSas8ts°included in Model Output Statistics bulletins should £•£ .J^"1* watched in considering strong winds in the 12 - 36 hour perioa aown»
o At eh* Chief Forecaster 1. SFC Anl 1200Z
2. SFC Anl 1500Z 3. SFC Anl 1800Z
6
* Attachments withdrawn.
30
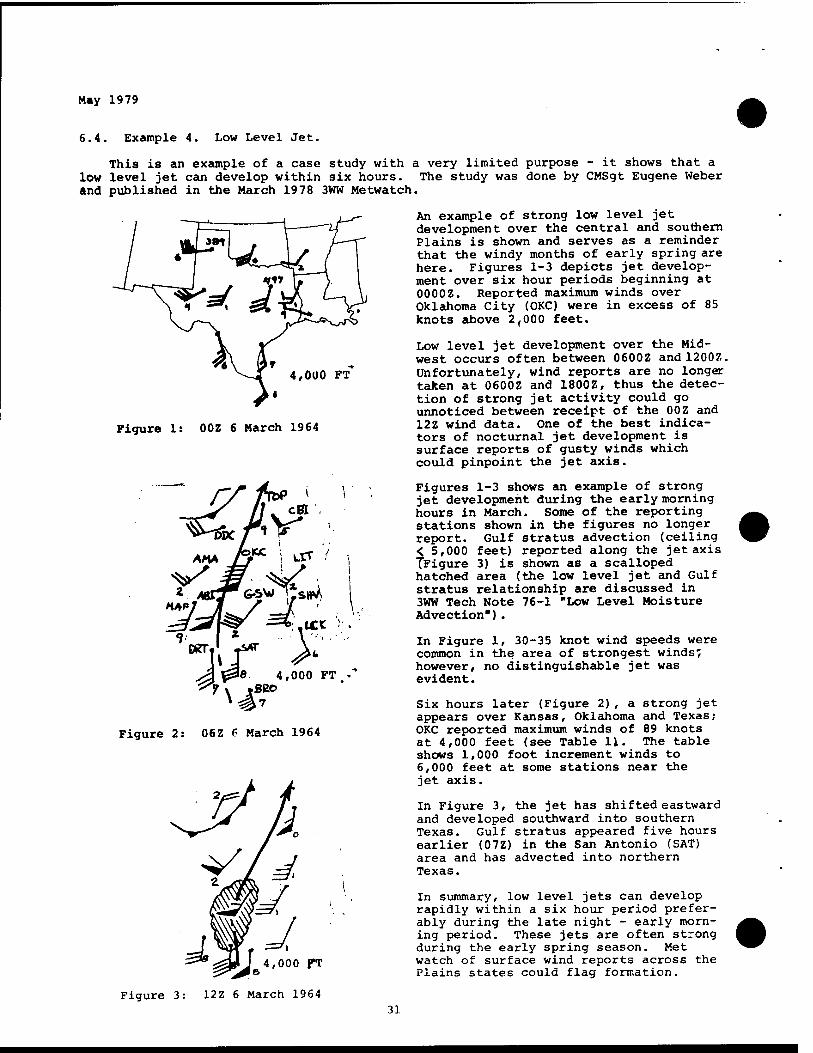
4,000 FT
Figure 1: 00Z 6 March 1964
~^^r^Y i T"
May 1979
6.4. Example 4. Low Level Jet.
This is an example of a case study with a very limited purpose - it shows that a low level jet can develop within six hours. The study was done by CMSgt Eugene Weber and published in the March 1978 3WW Metwatch.
An example of strong low level jet development over the central and southern Plains is shown and serves as a reminder that the windy months of early spring are here. Figures 1-3 depicts jet develop- ment over six hour periods beginning at 0000Z. Reported maximum winds over Oklahoma City (OKC) were in excess of 85 knots above 2,000 feet.
Low level jet development over the Mid- west occurs often between 0600Z andl200Z. unfortunately, wind reports are no longer taken at 0600Z and 1800Z, thus the detec- tion of strong jet activity could go unnoticed between receipt of the 00Z and 12Z wind data. One of the best indica- tors of nocturnal jet development is surface reports of gusty winds Which could pinpoint the jet axis.
Figures 1-3 shows an example of strong jet development during the early morning hours in March. Some of the reporting stations shown in the figures no longer report. Gulf stratus advection (ceiling < 5,000 feet) reported along the jet axis TFigure 3) is shown as a scalloped hatched area (the low level jet and Gulf stratus relationship are discussed in 3WW Tech Note 76-1 "Low Level Moisture Advection").
In Figure 1, 30-35 knot wind speeds were common in the area of strongest winds* however, no distinguishable jet was evident.
Six hours later (Figure 2), a strong jet appears over Kansas, Oklahoma and Texas; OKC reported maximum winds of 89 knots at 4,000 feet (see Table 11. The table shows 1,000 foot increment winds to 6,000 feet at some stations near the jet axis.
In Figure 3, the jet has shifted eastward and developed southward into southern Texas. Gulf stratus appeared five hours earlier (07Z) in the San Antonio (SAT) area and has advected into northern Texas.
In summary, low level jets can develop rapidly within a six hour period prefer- ably during the late night - early morn- ing period. These jets are often strong during the early spring season. Met watch of surface wind reports across the Plains states could flag formation.
31
z MOT &!**> xts**
any T5"*"
>• 000 FT •
Figure 2: 06Z P March 1964
4,000 pT
Figure 3: 12Z 6 March 1964
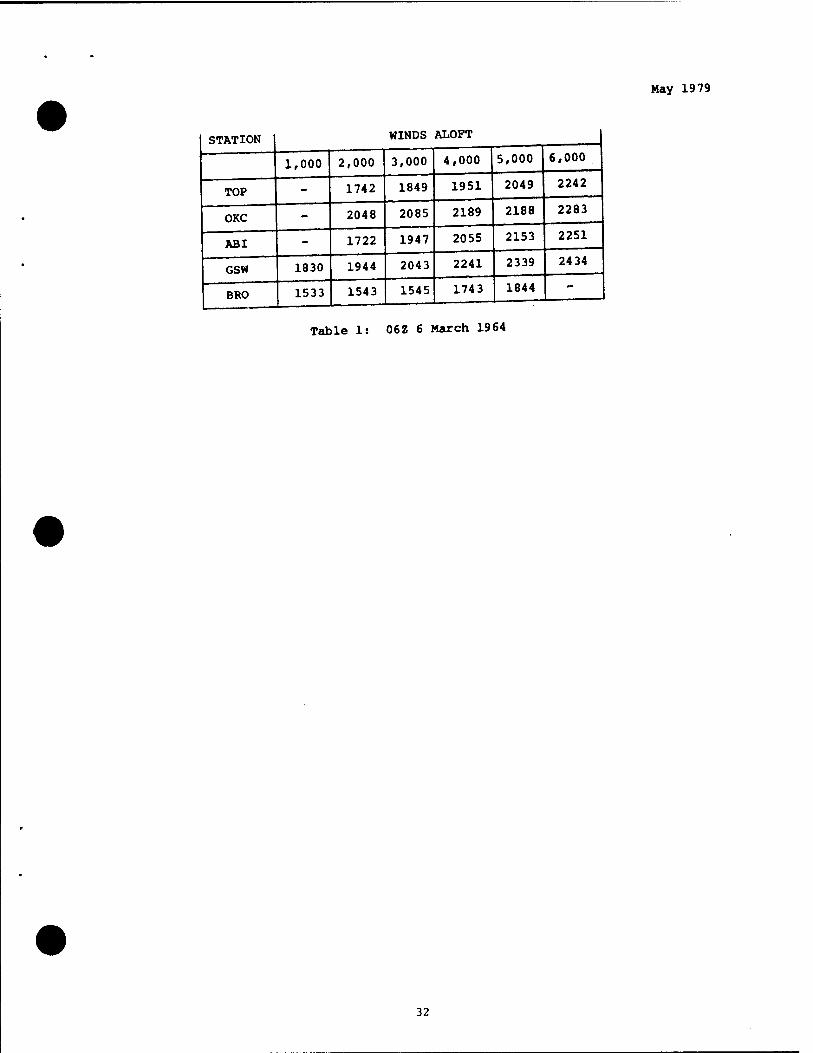
May 1979
STATION 1 WINDS ALOFT
1,000 2,000 3,000 4,000 5,000 6,000
TOP - 1742 1849 1951 2049 2242
OKC - 2048 2085 2189 2188 2283
ABI - 1722 1947 2055 2153 2251
GSW 1830 1944 2043 2241 2339 24 34
BRO 1533 1543 1545 1743 1844 "~
Table 1: 06Z 6 March 1964
32
May 1979
6.5. Example 5. Snowstorm.
This study was done by Det 5, 5WS, 5WW at Fort Knox, KY. The record snowfall was correctly forecast primarily using centrally prepared facsimile and teletype products. Copies of N^Dail? Weather Maps and selected teletype bulletins (MOS, LFM Output,
and trajectory) were attached to the original.
29 September 1978 5WS, Det 5 TFRN (C8)
CASE STUDY
of the
16-17 JANUARY 1978, MIDWEST SNOWSTORM by MSgt John Slaby, Chief Forecaster
1 It seemed like an avalanche fell on the Ohio River Valley on 16 and 17 January 1978. It was the heaviest snowfall ever recorded in this area, nearly two feet had fallen at some nearby locations in just 24 hours. Fort Knox got 11 inches which broke tne previous 24-hour January record by 4 inches. The snowstorm resulted from a typical "Texas Wave". This wave was a culmination of a series that had developed that 77-78 winter under a very unusual and persistent long wave pattern.
2 A cut off blocking ridge aloft over the Gulf of Alaska shunted vigorous short waves south of the high on a west-east track from California across the United Spates This block anchored a long wave trough over the eastern half of the country that fed arctic air over the Midwest. As the minor waves moved eastward underneath Se Jetstream a!ong the southern border, they pumped warm moist Gulf air over these Sid persistent domes. (See the accompanying NWS Daily Maps - Atch 1.) The short wave that moved inland Sunday morning, January the 15th, produced the snowstorm addressed in this study. There were 70 to 90 knot winds around the trough at 500mbs. ifmovea from coast to coast in just 72 hours. The surface "Texas Wave" had formed Dv 0700EST, 16 January. Although it was not an intense appearing cyclone on the sur face, the atmospheric dynamics aloft for a storm were more than amply present.
3 Heavy snow had begun at Fort Knox by sunrise on the 16th. The first point warn- ing for 7 inches, which had been issued before accumulation occurred, was up- graded to a foot of snow at 1200EST (after only 3 inches had fallen based on the latest progs and RAOBs. All total, 10.8 inches of new snow was officially recorded afthe Etfield from the 16th at 0700EST to the 17th at 0700EST. At the NWS Regional Forecast Office in Louisville, KY, 17 inches were recorded.
4. The detachment forecasters did a magnificent job forecasting this storm. Our customers were warned as early as Sunday morning, the 15th by the standby forecaster that heaw snow was coming the next day. We were consistently ahead of the local NWS weathermen and TV weather casters (who unanimously underestimated the strength of this system) in our predictions of the onset and intensity.
5. But the main purpose of this study is to praise the centralized products that helped us make these accurate predictions. Much of the credit should go to the centralizeSguidance, it was the first alert of the storm, the guidance element fore- casts met the commonly accepted rules for heavy snow, and the timing was excellent. Z evaluation of the individual guidance products follows. Forecasters m the future should continue to rely on these products in combination with local analyses. They are, in my opinion, the best tools we have for winter weather forecasting.
a. The Limited Fine Mesh (LFM) facsimile charts based on the 16/0000GMT observed
data was nearly a perfect prog.
(1) The forecast 1000-500mb thickness at 16/1200GMT was 5330 feet; the optimum for heavy snow is considered to be 5330 feet.
(2) Heaviest snowfalls usually occur under the thickness ridge? it too was forecast over Kentucky by 17/0000GMT.
(3) The trough amplitude at 500mbs deepened from the 16th to 17th over the local area. This is a very good indicator of strong upward vertical motion.
May 1979
(4) Optimum track for the vorticity maximum center is 2% degrees south of
your location; the actual track was 3 degrees of latitude.
(5) A strong influx of moisture was exhibited. The RAOBs at "/"OOGMT^ received^ l$OuGMT?and ^eprecipitable water chart verj, led this PJ^J; £0
5000 foot over Little Rock the observed winds were 5 knots rrom From
degrees), in other words, the jet was pointed d^e^e^fSe moist tongue lay
inches.
(6) The actual track of the surface low center tracked further north than the LFM proggS but since there was no well-developed center this *£•«&£* affect the forecast. LFM progs did correctly precast splitting tendencies center. A Local Area Work Chart was analyzed at "/^fJ^uS positive vorticity
south of Fort Knox.
b. FOUS 65 KWBC, which is a LFM-derived, product, forecast:
(1) very strong vertical velocity upward through°«t the period. The maxi- mum was +3.6 microbars/sec (at the 700mb level) valid at 16/1800GMT.
(2) Total precipitation to be .82 inch - water equivalent - in the 24
hours after 16/1200GMT, the start of the storm.
(3) All precipitation to be in the form ^^/a^S^1 whicf are the element forecasts for thickness andJP^bounda^ l*Jer The "recast thermal plotted on the locally derived precipitation type "^ram. The tore the conditions were in the high range of snow on the noaogram which also ^
air mass was capable of containing ^^ ™°™^/£0*S3* after midnight from missed the changeover to freezing rain that occurred shortly ar ^ into 17/0500 to 0900GMT. Temperatures approached but did not cross we freezing rain from the forecast plots on the nomogram.
(4) Timing was perfect. Large moisture increases began at 16/1200GMT when heavy snow started and significant drying was forecast when it ended.
(5) Almost the same conditions were present on the ne£J^"^^^f
based «n'lhe daS run valid at 16/1200GMT. The ^JP^Xrt SSSy little higher - .99 inch - hitting the actual snowfall almost exactly.
c. The Model Output Statistics-bulletins - FOUS 7 and YAXX 9 - also were very
good forecasts.
(1) Both products forecast a 40 per cent probability of 2 inches or more
of precipitation (water equivalent).
previous 12 hours.) The categorical snowfall forecast missed, less x.
was forecast.
(3) POPs (probability of any precipitation) averaged 90 to a 100 per cent.
d. GWC's trajectory model backed up the NWS products.
(1) Constant pressure level trajectories at the 500 and ^Omb levels indicated extreme upward vertical velocity - as much as a lOOmbs after 16/l^uu
(2) Large increases in moisture to total saturation at all levels were
progged
models didn't
(3) GWC's trajectory picked up the low level warming J^^^^f5
idn't. The 850mb temperature was forecast to rise to u ueyj-c
May 1979
17/0600GMT and the 2000 foot temperature to +4 degrees C, indicating a changeover from snow to rain. It was discounted because the 2000 foot temperature forecast was thought to be too warm. Which it was, but the GWC trajectory still gave the best indications of a possible change to freezing rain which, subsequently, occurred.
e. NWS's trajectory model was not as accurate as GWC's this time. FOUS 52 KWBC was much too dry below 700mbs with a spread of 5 Celsius degrees at the 850mb level valid for 17/0000GMT. This was at the height of the storm, and the surface spread was an even greater 12 degrees. On the next run forecast temperatures and dew points were more reasonable. The NWS model had two good forecasts, though.
(1) Extreme positive vertical motion was indicated after 16/1200GMT - 100 millibars in 12 hours at the 700mb level.
(2) The forecast 850mb temperature was forecast to be in the optimum range of -3 to -5 degrees Celsius at -4.5 degrees C.
6. Analyses the next day as the storm was ending also verified two rules. Fort Knox experienced the last heavy snow at 17/1400GMT as the 850mb low center passed. The center was pinpointed from 1200GMT RAOB data. Light snow ended at the same time when our extrapolation showed the 700mb trough should have moved through, at 17/ 1900GMT. We had to amend one rule based on this storm and others last winter. It had been an accepted rule that the 850mb 0 degree Celsius isotherm does not move northward when the air is saturated due to the cooling effect of the evaporation of precipitation. The 0 degree isotherm is a key determinant of precipitation type. Since at the beginning of the 16 January storm, the 0 degree line was across northern Alabama, MissiBBippi, and Arkansas, and the air was totally saturated, and we still had a change in type, we had to adjust this guideline. The 850mb 0 degree C isotherm should move at 20 per cent of the 5000 foot wind normal to the isotherm in saturated air.
35
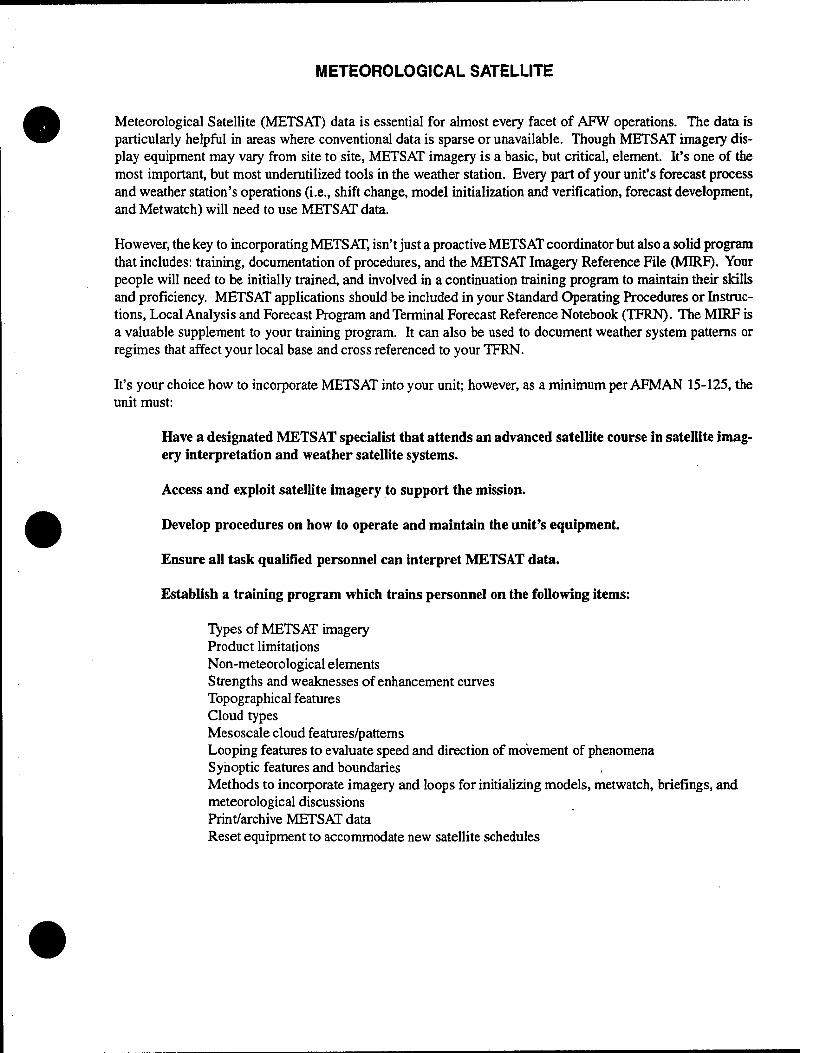
METEOROLOGICAL SATELLITE
Meteorological Satellite (METSAT) data is essential for almost every facet of AFW operations. The data is particularly helpful in areas where conventional data is sparse or unavailable. Though METSAT imagery dis- play equipment may vary from site to site, METSAT imagery is a basic, but critical, element. It's one of the most important, but most underutilized tools in the weather station. Every part of your unit's forecast process and weather station's operations (i.e., shift change, model initialization and verification, forecast development, and Metwatch) will need to use METSAT data.
However, the key to incorporating METSAT, isn't just a proactive METSAT coordinator but also a solid program that includes: training, documentation of procedures, and the METSAT Imagery Reference File (MIRF). Your people will need to be initially trained, and involved in a continuation training program to maintain their skills and proficiency. METSAT applications should be included in your Standard Operating Procedures or Instruc- tions, Local Analysis and Forecast Program and Terminal Forecast Reference Notebook (TFRN). The MIRF is a valuable supplement to your training program. It can also be used to document weather system patterns or regimes that affect your local base and cross referenced to your TFRN.
It's your choice how to incorporate METSAT into your unit; however, as a minimum per AFMAN 15-125, the unit must:
Have a designated METSAT specialist that attends an advanced satellite course in satellite imag- ery interpretation and weather satellite systems.
Access and exploit satellite imagery to support the mission.
Develop procedures on how to operate and maintain the unit's equipment.
Ensure all task qualified personnel can interpret METSAT data.
Establish a training program which trains personnel on the following items:
Types of METSAT imagery Product limitations Non-meteorological elements Strengths and weaknesses of enhancement curves Topographical features Cloud types Mesoscale cloud features/patterns Looping features to evaluate speed and direction of movement of phenomena Synoptic features and boundaries Methods to incorporate imagery and loops for initializing models, metwatch, briefings, and meteorological discussions Print/archive METSAT data Reset equipment to accommodate new satellite schedules
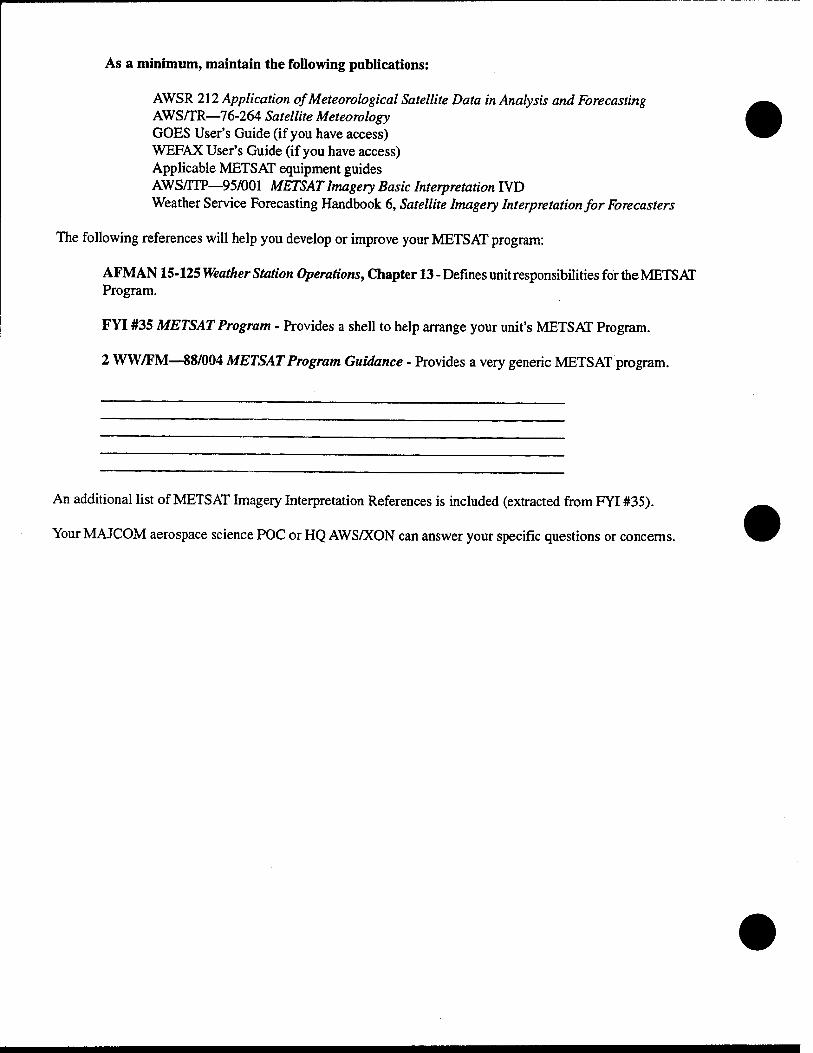
As a minimum, maintain the following publications:
AWSR 212 Application of Meteorological Satellite Data in Analysis and Forecasting AWS/TR—76-264 Satellite Meteorology GOES User's Guide (if you have access) WEFAX User's Guide (if you have access) Applicable METSAT equipment guides AWS/TTP—95/001 METSAT Imagery Basic Interpretation IVD Weather Service Forecasting Handbook 6, Satellite Imagery Interpretation for Forecasters
The following references will help you develop or improve your METSAT program:
AFMAN15-125 Weather Station Operations, Chapter 13 - Defines unit responsibilities for the METSAT Program.
FYI #35 METSAT Program - Provides a shell to help arrange your unit's METSAT Program.
2 WW/FM—88/004 METSAT Program Guidance - Provides a very generic METSAT program.
An additional list of METSAT Imagery Interpretation References is included (extracted from FYI #35).
Your MAJCOM aerospace science POC or HQ AWS/XON can answer your specific questions or concerns.
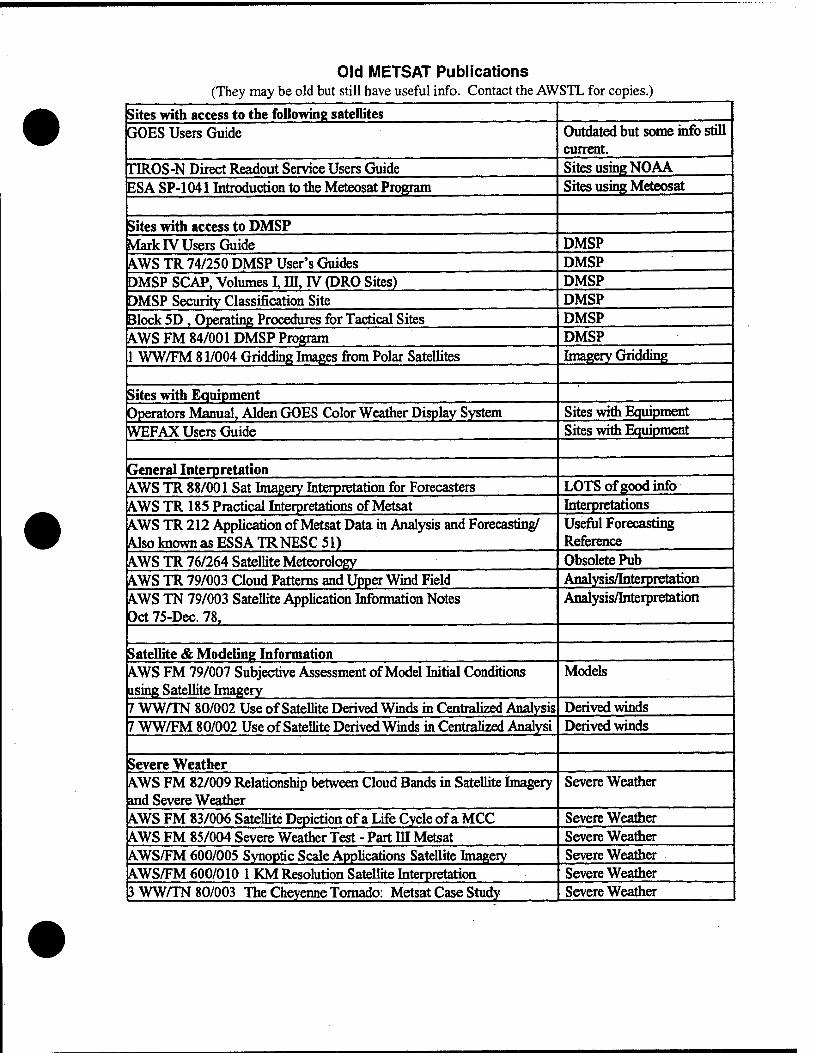
Old METSAT Publications (They may be old but still have useful info. Contact the AWSTL for copies.)
Sites with access to the following satellites GOES Users Guide
11ROS-N Direct Readout Service Users Guide ESA SP-1041 Introduction to the Meteosat Program
Sites with access to DMSP Mark IV Users Guide AWS TR 74/250 DMSP User's Guides DMSP SCAP, Volumes I, HI, IV (PRO Sites) DMSP Security Classification Site Block 5D , Operating Procedures for Tactical Sites AWS FM 84/001 DMSP Program
Sites with Equipment Operators Manual, Alden GOES Color Weather Display System WEFAX Users Guide
General Interpretation AWS TR 88/001 Sat Imagery Interpretation for Forecasters
1 WW/FM 81/004 Gridding Images from Polar Satellites
AWS TR 185 Practical Interpretations of Metsat AWS TR 212 Application of Metsat Data in Analysis and Forecasting/ Also known as ESSATRNESC 51) AWS TR 76/264 Satellite Meteorology AWS TR 79/003 Cloud Patterns and Upper Wind Field AWS TN 79/003 Satellite Application Information Notes Oct 75-Dec. 78,
Satellite & Modeling Information AWS FM 79/007 Subjective Assessment of Model Initial Conditions using Satellite Imagery 7 WW/TN 80/002 Use of Satellite Derived Winds in Centralized Analysis 7 WW/FM 80/002 Use of Satellite Derived Winds in Centralized Analysi
Severe Weather AWS FM 82/009 Relationship between Cloud Bands in Satellite Imagery and Severe Weather AWS FM 83/006 Satellite Depiction of a Life Cycle of a MCC AWS FM 85/004 Severe Weather Test - Part m Metsat AWS/FM 600/005 Synoptic Scale Applications Satellite Imagery AWS/FM 600/010 1 KM Resolution Satellite Interpretation 3 WW/TN 80/003 The Cheyenne Tornado: Metsat Case Study
Outdated but some info still current. Sites using NOAA Sites using Meteosat
DMSP DMSP DMSP DMSP DMSP DMSP Imagery Gridding
Sites with Equipment Sites with Equipment
LOTS of good info Interpretations Useful Forecasting Reference Obsolete Pub Analysis/Interpretation Analysis/Interpretation
Models
Derived winds Derived winds
Severe Weather
Severe Weather Severe Weather Severe Weather Severe Weather Severe Weather
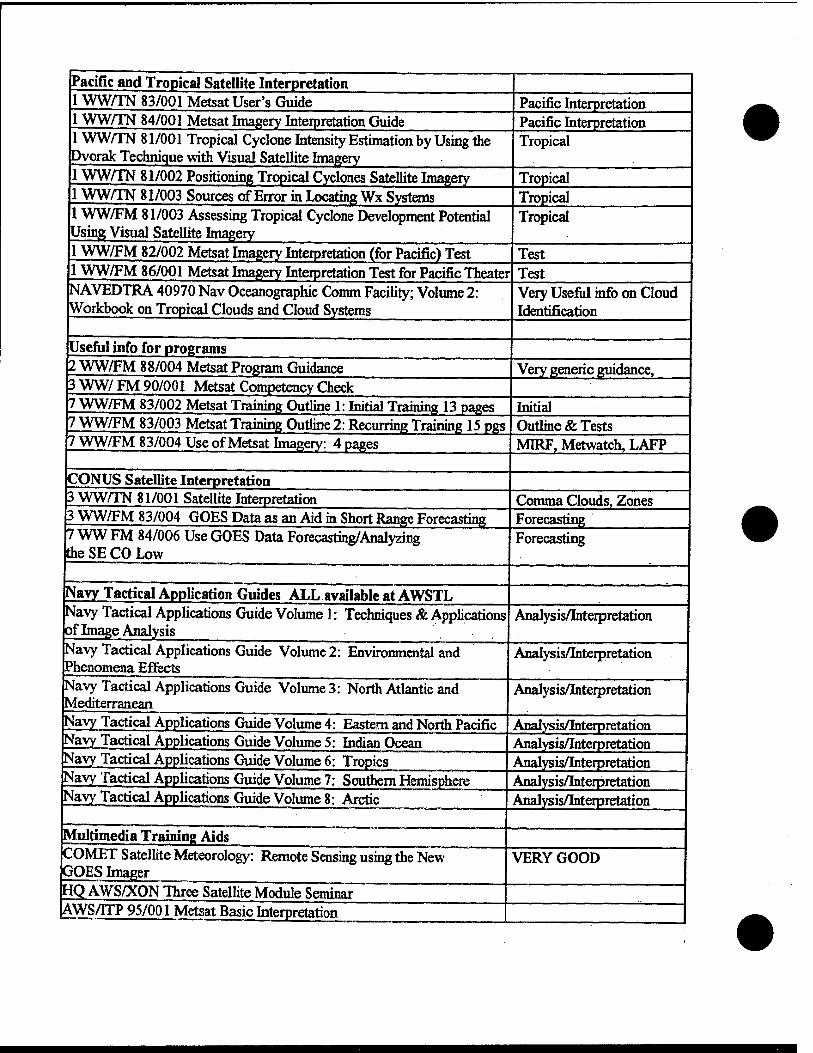
Pacific and Tropical Satellite Interpretation
1WW/TN 81/001 Tropical Cyclone Intensity Estimation by Using the Dvorak Technique with Visual Satellite Imagery
1 WW/TN 83/001 Metsat User's Guide 1 WW/TN 84/001 Metsat Imagery Interpretation Guide
1 WW/TN 81/002 Positioning Tropical Cyclones Satellite Imagery 1 WW/TN 81/003 Sources of Error in Locating Wx Systems 1WW/FM 81/003 Assessing Tropical Cyclone Development Potential Using Visual Satellite Imagery 1 WW/FM 82/002 Metsat Imagery Interpretation (for Pacific) Test 1 WW/FM 86/001 Metsat Imagery Interpretation Test for Pacific Theater NAVEDTRA 40970 Nav Oceanographic Comm Facility; Volume 2: Workbook on Tropical Clouds and Cloud Systems
Pacific Interpretation Pacific Interpretation Tropical
Tropical Tropical Tropical
Test Test
Useful info for programs 2 WW/FM 88/004 Metsat Program Guidance 3 WW/ FM 90/001 Metsat Competency Check 7 WW/FM 83/002 Metsat Training Outline 1: Initial Training 13 pages 7 WW/FM 83/003 Metsat Training Outline 2: Recurring Training 15 pgs 7 WW/FM 83/004 Use of Metsat Imagery: 4 pages
CONUS Satellite Interpretation 3 WW/TN 81/001 Satellite Interpretation 3 WW/FM 83/004 GOES Data as an Aid in Short Range Forecasting 7 WW FM 84/006 Use GOES Data Forecasting/Analyzing the SE CO Low
Very Useful info on Cloud Identification
Very generic guidance,
Initial Outline & Tests MIRF, Metwatch, LAFP
Comma Clouds, Zones Forecasting
Navy Tactical Application Guides ALL available at AWSTL Navy Tactical Applications Guide Volume 1: Techniques & Applications of Image Analysis Navy Tactical Applications Guide Volume 2: Environmental and Phenomena Effects Navy Tactical Applications Guide Volume 3: North Atlantic and Mediterranean Navy Tactical Applications Guide Volume 4: Eastern and North Pacific Navy Tactical Applications Guide Volume 5: Indian Ocean
Forecasting
Analysis/Interpretation
Analysis/Interpretation
Analysis/Interpretation
Navy Tactical Applications Guide Volume 6: Tropics Navy Tactical Applications Guide Volume 7: Southern Hemisphere Navy Tactical Applications Guide Volume 8: Arctic
Multimedia Training Aids COMET Satellite Meteorology: Remote Sensing using the New GOES Imager HQ AWS/XON Three Satellite Module Seminar AWS/ITP 95/001 Metsat Basic Interpretation
Analysis/Interpretation Analysis/Interpretation Analysis/Interpretation Analysis/Interpretation Analysis/Interpretation
VERY GOOD
2WW/FM-88/004
2d ww forecaster
memo
METSAT Program Guidance
by Capt Jeffrey E. Malan 2 WW METSAT Coordinator
Approved for public release;' distribution is unlimited 1
m pril 1988 2d Weather Wing
Kapaun Air Station, Germany APO New York 09094-5000
*\
REVIEW AND APPROVAL STATEMENT
2 UW/FM-88/004, METSAT Program Guidance, April 1988, is approved for public release. There is no objection to the unlimited distribution<0f this document to the public at large, or by the Defense Technical Distribution Center (DTIL) to the National Technical Information Service (NTIS). This forecaster memo rescinds 2 WW/FM-84/002.
DONALD L. BEST, Lt Col, USAF Chief, Aerospace Sciences Division
Colonel, USAF Commander
4
OVERVIEW
Provides information to establish or maintain a unit METSAT data acquisition and application program.
n
TABLE OF CONTENTS
PAGE
I. INTRODUCTION IV
II. PROGRAM MANAGEMENT 1
III. BASIC METSAT PROGRAM 2
A. TECHNICAL LIBRARY 2
B. USE OF SATELLITE IMAGERY 2
Ci METSAT IMAGERY REFERENCE FILE (MIRF) 3
*
m #
4 INTRODUCTION
1. Air Weather Service (AWS) METSAT Policy. Satellites have proven to be a vital source of data for AWS support to national defense. The AWS objective is to provide every AWS unit having forecasting or briefing responsibilities access to satellite data applicable to its mission. The Defense Meteorological Satellite Program (DMSP) and other Department of Defense (DOD)- controlled systems are AWS's primary sources of satellite data. Non-DOD- controlled United States systems are AWS's secondary sources of satellite data. Foreign systems are tertiary sources. The non-DOD-controlled systems will be used to complement and supplement the DMSP.
2. 2 WW METSAT Policy. 2 WW endorses subordinate unit efforts to acquire sufficient METSAT imagery display systems to satisfy customer-stated requirements. Units will promote METSAT imagery as an operational decision aid to support force readiness and daily mission effectiveness.
• IV
* PROGRAM MANAGEMENT
Proqram management is outlined in AWSR 105-20. Training requirements are delineated in AWSP 50-8. AWS/TN-88/001, Satellite Imagery Interpretation for Forecaster^ is also necessary to running the program.
BASIC METSAT PROGRAM
A. TECHNICAL LIBRARY
1. Required publications are listed in AWSR 105-20 and its 2 WW supplement.
2. Applicable equipment user's instructions should be on hand for training and guidance.
B. USE OF SATELLITE IMAGERY
1. LAFP: Written procedures should contain ways to integrate METSAT data with conventional data. Some suggestions for doing this are listed below. Make sure your data are of the best quality possible. The Satellite Imagery Dissemination System (SIDS) quality control flow chart will help you keep SIDS data good. (Atch 1)
a. METSAT data and local analyses comparisons: often the nephanalysis is very subjective as to where the clouds are or where various layers end. This comparison can also be used to adjust features (fronts, lows, etc.) on surface and upper air charts. Use of METSAT data in conjunction with the conventional data can aid in interpreting the photo as well as "fine tuning" local analyses. Each data source has advantages and disadvantages—put together, the data can answer many questions that could not be answered by considering each data source separately.
b. Initialization of analysis and prognosis packages: on the forecaster worksheet, indicate agreement or disagreement between the METSAT data and the analyses, and what modifications need be made to the progs. This kind of documentation of forecaster reasoning will help maintain continuity between forecasters and between successive products.
c. METWATCH program (terminal, route, and area): the METWATCH is a product of the LAFP, so METSAT data can assist in forecasting your METWATCH criteria. Gridding on the satellite imagery is valuable for tracking weather phenomena or systems.
d. Forecast discussions: the quality of the analyses compared to the METSAT data will enhance these discussions. The METSAT data aid verification and provide continuity that also can enhance discussions.
e. Forecast reviews and case studies: METSAT data should be included with conventional data. METSAT data's frequency makes it a useful tool for the shorter-lived phenomena, and for following the movements of larger-scale systems. Reviews and case studies can be documented in either your TFRN, MIRF, or review/case studies files, with cross references as necessary.
4
2. METSAT imagery also is an excellent briefing aid for both stand-ups and over-the-counter aircrew briefings. Select the best imagery possible for briefings, and provide overlays of specific areas of interest, if available.
3. METSAT data can enhance forecasting for other than the local area. It fills the data-void areas and provides a real-time look at weather systems and phenomena. Incorporate satellite imagery with old ROTs, forecast studies and hints to enhance their usefulness.
C. METSAT IMAGERY REFERENCE FILE (MIRF)
1. The MIRF should be used in two ways to increase your knowledge about METSAT data. First, as you develop your file, you will be actively looking for features on the photos and, hence, learning as you go. This should be a continuing process that involves all_ forecasters. Second, once the file has been started, new forecasters can use it to learn about the local area phenomena, and how systems affect terminal forecasting.
2. One important thing to remember is that the METSAT data is just that-- data. You must learn to process the imagery, through interpretation and comparisons to conventional data, to make this data most useful in your forecast generation process and overall customer support. A breakout of the DMSP Mark IV data label identification is given in Atch 2.
3. Some suggested subjects for inclusion in your MIRF follow:
a. Geographical features in visual and IR.
b. Cloud features in visual and IR.
(1) Examples of familiar or recurring synoptic patterns. (2) Examples of good and poor analysis initialization. (3) Cyclones and anticyclones (4) Comma clouds (5) Frontal systems (6) Thunderstorms (7) Turbulence (8) Jet streams (9) Cloud types (10) Sea breeze/land breeze clouds
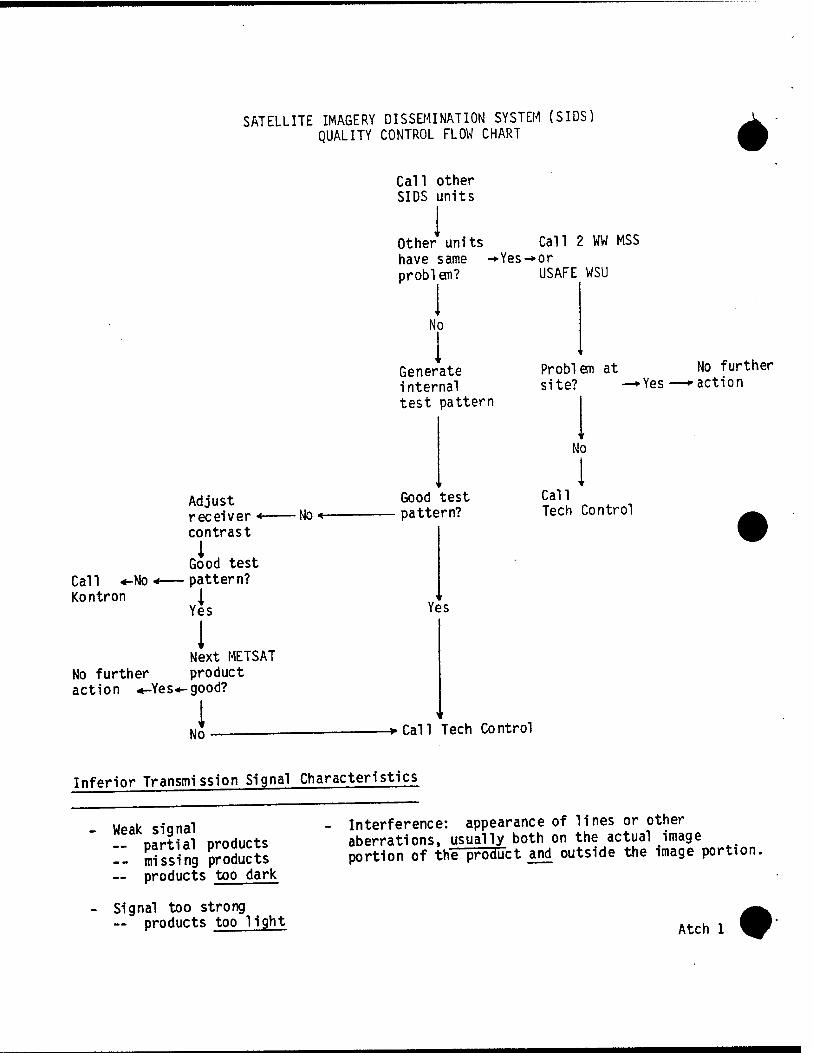
SATELLITE IMAGERY DISSEMINATION SYSTEM QUALITY CONTROL FLOW CHART
(SIDS)
*
Call other SIDS units
Call ««-No Kontron
No further action «-Yes«-good?
Adjust receiver +- contrast i
Good test pattern?
ri.
Next METSAT product
No<-
Other units Call 2 WW MSS have same -►Yes-»or problem?
No
Generate internal test pattern
Good test pattern?
Yes
USAFE WSU
Problem at site?
No
Call Tech Control
■Yes No further action
No Call Tech Control
Inferior Transmission Signal Characteristics
Weak signal — partial products -- missing products — products too dark
Signal too strong -- products too light
Interference: appearance of lines or other aberrations, usually both on the actual image portion of the product and outside the image portion.
Atch 1
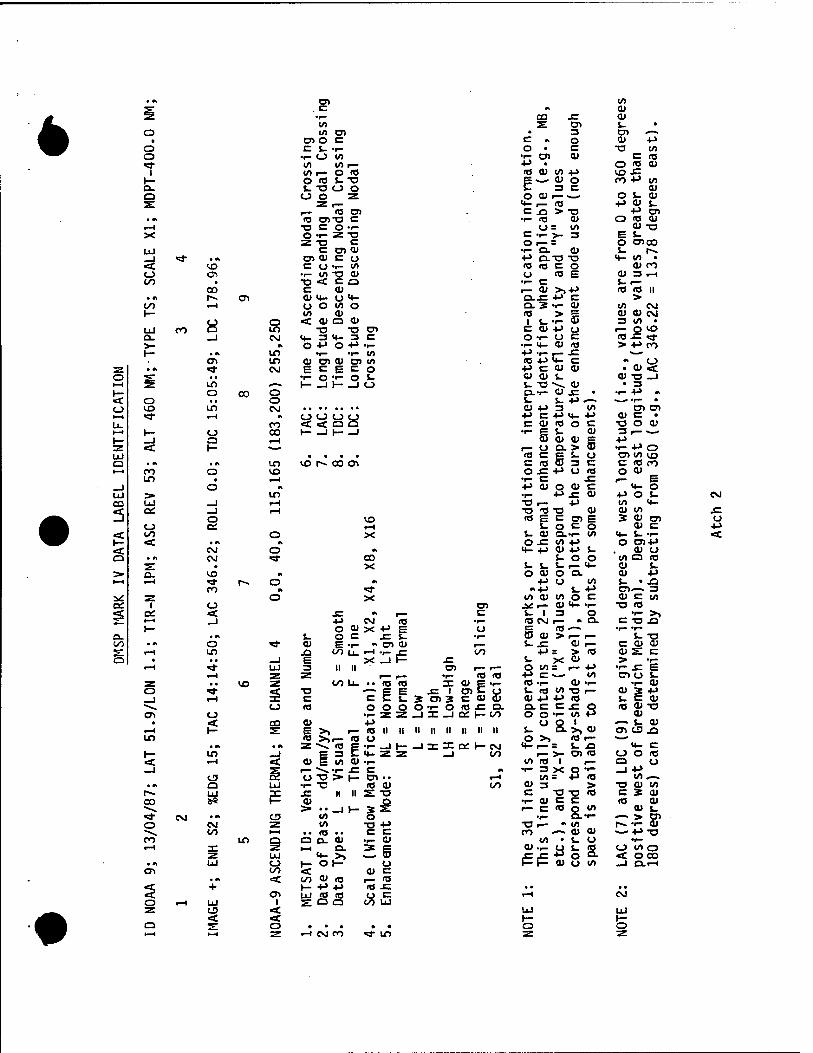
*
• A co c
•r~ CO
O 10 CO • COO c o c S- T- o •1— O 10 «a- to
(/) r- O «0 h- o fl fO Q- i- -o o o O o o z s Z i—
US CO • A UJ o>-o c
T—1 ■o C O •r— X o •r*» 2! ■o
z -o c UJ c co cu _l «* ••> CO a> c o «a: IO c O -r- 10 o <n •r— co 73 aj to
00 ■D c
< c CO
a * A r- en CD M- O <+- 00 H O O CO o 1—
o O to < CJ
a) a CO Ul CO O If) T3 -o co Cv _1 CM 4- 2 4- 3 c >• M o P O +J •r- 1- • A If) •^ ■r" 10
o If) 0) co a> CO CO z • A «* CM e c E c O o S • • O -r- o s- t—1 Z in «—s h-lh JO 1— O 00 o < o
VO «d-
IT) O CM * o
1—■ o o o 8 LL. CO < < Q t—I H- o 00 H- —1 t- _l 1— —1 a 1—1
2 < I- «*--■
UJ • • • 9
o ■ M ■ n If) CO NC0O1 H-1 co
in o 1X5
i-H _J o « Ul >• If) CD Ul _1 1-4
3 O
_l o
1—4
CO i-H
< to o X i- < • •* «t
«c CM o <K
Q •z. CM • «a- CO
X 5» o. CO A
►—I .—I <* r-» o M
co M «a- ii z O X a: 1 o CO < C£ < JZ - r— c y H-* _! P CM <B •^
1— o a; X ■»-» E o o. • n S- o c x: C •^ 00 • A o «d- CJ E •^ •> co o> r««
E: .—4 m X) oo U. —I •!- J= oo Q • • • _i E X_lh J=
r—1 «* UJ 3 ll II CO r— r— 1-4 z Z p- g^m. •r- re <o
z «3 Z 00 u. " <a «o X O E-i- o "* rf ■o — E E x: t co C o —1 «H X C c C j_ X CO 3 C <U (U
o 10 o o o o •>- O «j x: Q. en o •i-zz_i:i:_ia;K-oo • < CO CO 4-> i-H \- s E >» ^~ n II II II II II II II II ir> A3 Sr- rtj u
• A • A z ■*■* <a c ■rJh-JI-taHN t— If) _1 E 3 sz vzz _J 00 < .-I < 0) E to a* •^ —J Tg* ^— ^•» M— j= c M
CD ss o -o S» 1- co •• 1-4 • M Q Ul •1" -a (0 Cv> oo
r-~ Ui x JC ii II s -a 00 a* 1— a» *2 ~>. > • • _i K- «* CM CJJ (0 o O CM Z to -o +J
CO t—i • • (O .. c c CO If) O a Q. 0) ..- CJ 1—4 X z t—t Q. Si z UJ «*- >> • A UJ o \— Op o o oo < CJ c
• A < oo 01 <Q r- «a ■s + ►- +> ■»-> ITS -C «* O) UJ (O ro
(^ UJ O .-4 Ul 1 s: o a z
< < < O «E o • • • • •
to * cu CO x: cu s co 5_ • 3 co —
c « O CJ 4-> o • c T3 CO •r- CO cu C fO +J . o IO CJ (0 OJ to +J VO J= E *^ CU O co -P to c 3 C CJ o <u 1— •*-• o J- a> <*- ,_ f0 p cu s- C X) > -o P co •i- «3 a> o <o cu <_> = CO CU -o C -f- >- 3 E 5- O i— O COCO •i- o. CU s- r>. 4-> Q.T3 TS <*- to • <0 (O c o CU CO O (T3 E CU 3 i-4 •i- C S- I— i— cu >?+* (0 IO II Q-x: 4-> C > a. 2 •r- CU CO CM IO > E CU CU CM
1 s- •r- 55 3 C0 • c cu ■P o r— O CO O •!- o c flX^f •t- 14- CU «3 > P co +J -r- cf ^«» <0 ■»-> « o
■«-> C cu cu • cu < CJ CU S- CJ T3 _l j- -o --^ cu • 3 OLT- cu x: • •i- P « s- s- +■> *—« •^^ »r— • tt) +J 3 to co co 4J C 4-> 4- ■»-> a c • C CJ «3 O c •o o cu •i- E S- CJ 3 i— ~—
a> CJ cu s P . i— o ex > •r- P O R3 C S3 u co to io C It3 c c io co o x: 4-> O f0 o cu
•r- c x: r- E 4-> cu O CJ c <4- O •r- •4->x: CJ P o s_ T3 i— ■P C0 C!_ TJ t» -a cu CU CO <o E C CO E 34) cn
s_ o c o CU £= J- cu Q.-1- CO M- S_ •■— o x: tO 4-> O COP
ci- +J CU 4-> j- cu o s- o o to o io
5- J- S- i— ci- CJ s. o a> O Q- CU -P
4J U to i- • XJ «•!-> i- •p C1^-~ 3
to CU to o c cu c to J* i— cu ««- •r- ■o <o t- 1 3 O ••- >» IO CM ^— * a. COJ3 C 03*-* •p— *r~ Ö CU > i— r— S- T3 s- x: CU P— C CJ CU
■»-> = > 10 CJ S c s_ X CJ > T- O tO S r— 4-> •r- x: E
■»-> c - - CO nut «a T- CU •r" •i- CJ s- «a to -a ^— cu 3 P CU +J +J B3 s. c a> a. c c x: s IO CU X3 o o •i- to CU
s-u aj, cu ■~* j- a» CJ^ CD XJ
o >> «3 r— ^—* «•- r— = $- n cc- C
fmm >- co «a O O « to re r— Q o •i- 3 X o •r— _J 4-»
CO = +J «3 CO ,— CU 3 > •o CU CO c ■o -o « c 3 at •r- CU c c (O CU r- C wa CO a» J_
•i— •r— ~- > CO T3 ■— «. (/) l>» •»- cu CO —. CJ CU — P-O
CO • I- U •r- CU.^
tfcS at o
IO O CO o
|S|E D. CO
«C o oo —I Q.i-1
1—4 CM
Ul UJ 1— 1— o O
CM
o
•-I CM CO «J- If)
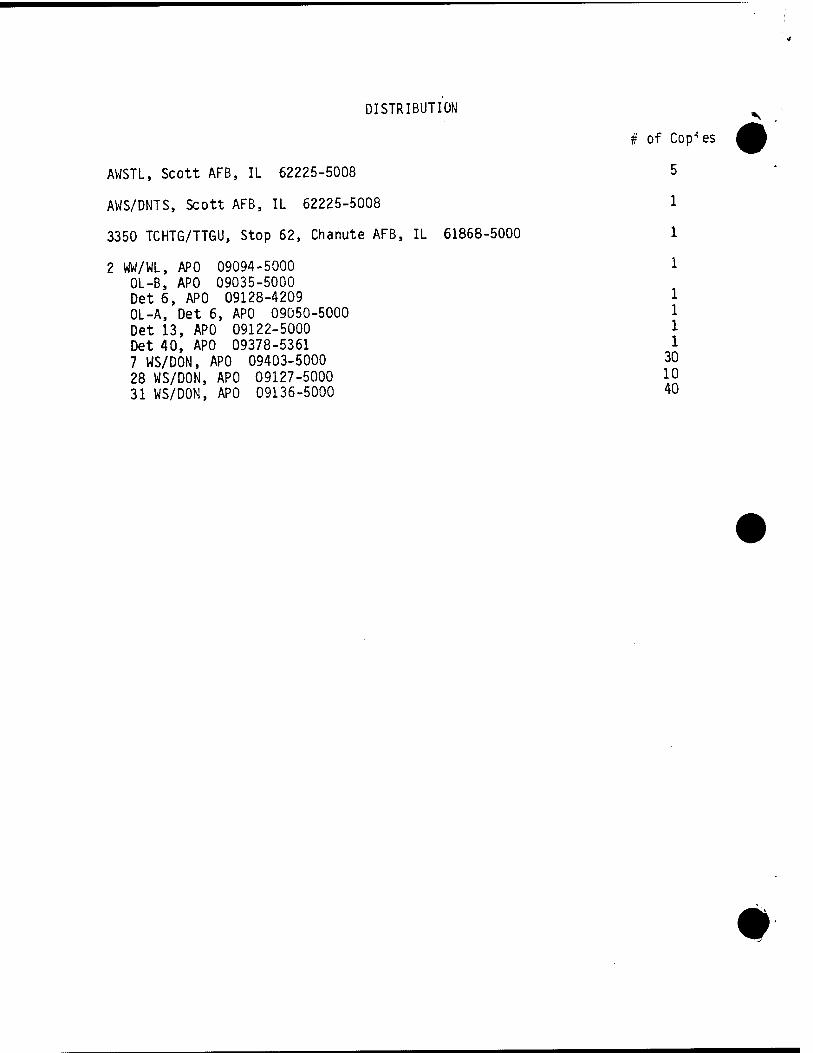
DISTRIBUTION
# of Copies
AWSTL, Scott AFB, IL 62225-5008 5
AWS/DNTS, Scott AFB, IL 62225-5008 1
3350 TCHTG/TTGU, Stop 62, Chanute AFB, IL 61868-5000 1
2 WW/WL, APO 09094-5000 1 OL-B, APO 09035-5000 Det 6, APO 09128-4209 1 OL-A, Det 6, APO 09050-5000 1 Det 13, APO 09122-5000 1 Det 40, APO 09378-5361 1 7 WS/DON, APO 09403-5000 30 28 WS/DON, APO 09127-5000 10 31 WS/DON, APO 09136-5000 40
s
RADAR
Weather radar is essential for your day-to-day forecasting and metwatch program. Though weather radar equipment may vary from the new WSR-88D Doppler radar to the FPS-77 and FPQ-21 radars (Europe), radar data is a basic, but critical, element in the Metwatch and forecast process. The data is particularly helpful in making weather warning decisions. Often radar data is the first indicator of severe weather. Weather radar data applications should be included in your Standard Operating Procedures or Instructions, Local Analysis and Forecast Program, and Terminal Forecast Reference Notebook. It's up to you how you want to incorporate radar into your unit; however, per AFM 15-125, as a minimum the unit must:
Have a designated Weather Radar System Manager that attends a WSR-88D system managers course and the WSR-88D Unit Control Position (UCP) Managers course. (If the unit has a Doppler radar. The UCP course is only needed if the unit has control of the RDA.)
Access and exploit radar data to support the mission.
Develop procedures on how to operate and maintain the unit's equipment.
Ensure all task qualified personnel can interpret radar data
Establish a training program that trains personnel on the following items:
Determining the radar status.
Troubleshooting problems according to local guidance (including graphics restarts, PUPUP/ PUPDOWN procedures, recovering from a PUP software malfunction (software lockup) and shutdown and start-up procedures.
Acquiring (via the graphics tablet and applications terminal) and interpreting graphic and alphanumeric data.
As a minimum, maintain the following publications:
FMH-11, Doppler Radar Meteorological Observations, Parts A through D, and Air Force Supplement 1, to Parts A and D. Memorandum of Agreement for Interagency Operations of the WSR-88D. Operator Handbook Set, Volumes 1 through 3 including: (At UCP sites) Operator handbook UCP, Job Sheets 25 Oct 93, to include changes 1 and 2. (At UCP sites) UCP on-site training program, 2 Apr 92. Radar Product Generation UCP on-the-job proficiency checklist, Version 2, 24 Mar 94. AF TO 31P1-4-108-78-1, PUP User's Guide (WSR-88D Doppler Radar) AF TO 31P1-4-108-61, Operator's Manual - PUP Workstation (WSR-88D Doppler Radar) (At UCP sites) AFTO 31P1-4-108-58-1, User's Guide - Unit Control Position. (At UCP sites) AFTO 31P1-4-108-51, Operator's Manual - Unit Control Position WSR-88D Radar.
As the IM in your weather station, you will rely heavily on the radar during severe weather. You will use the radar to develop tools and aids to assist the forecaster in issuing weather warnings. In addition, you will train forecasters in new techniques using the radar to identify severe weather signatures. Being familiar with the following areas will aid you performing IM duties.
1) Standard Products. There are two types of products received from the RDA; base products and derived products. There are three base products and the rest are derived products. The three base products are base reflectivity, base velocity, and spectrum width. Examples of the products can be found in the Radar Continuity/Continuation Training Binder and in The WSR-88D Operator's Guide to Mesocyclone Recognition and Diagnosis. Descriptions and limitations of the products can be found in the WSR-88D system managers course study guide, KWXR-2001.
2) Standard Analysis And Prognosis Techniques. Analysis and prognosis techniques are part of the radar training and continuation training programs. New methods and techniques are always being developed. These methods and techniques are published in scientific papers, given in seminars, and published in ECHOES. Therefore, keep the training and continuation training programs up to date. The study guide from the WSR-88D system managers course also provides some basic analysis techniques.
3) System Configuration. System configuration will very between weather stations. The Radar Continuity/Continuation Training Binder contains the configuration for each unit.
4) New Products And Techniques. See the Standard Products and Standard Analysis and Prognosis Techniques section.
5) Local Forecast Problems. Radar data may be helpful in forecasting problem areas. You need to be proactive incorporating radar data into the forecast process. Radar data can be used in identifying inversion heights, low level jets, and clear air boundaries; just to name a few. Techniques developed to identify hard to forecast phenomenon should be kept in the Radar Continuity/Continuation Training Binder.
The following references will help you develop or improve your radar program:
AFMAN 15-125 Weather Station Operations, Chapter 8 - Defines unit responsibilities for the radar program
ECHOES # (to be determined) Radar Program - Provides a shell to help arrange your unit's radar program. (To be published Fall 1996)
XON HOMEPAGE - The latest information on military weather radar applications
Your MAJCOM Aerospace Science POC or HQ AWS/XON can answer your specific questions or concerns.
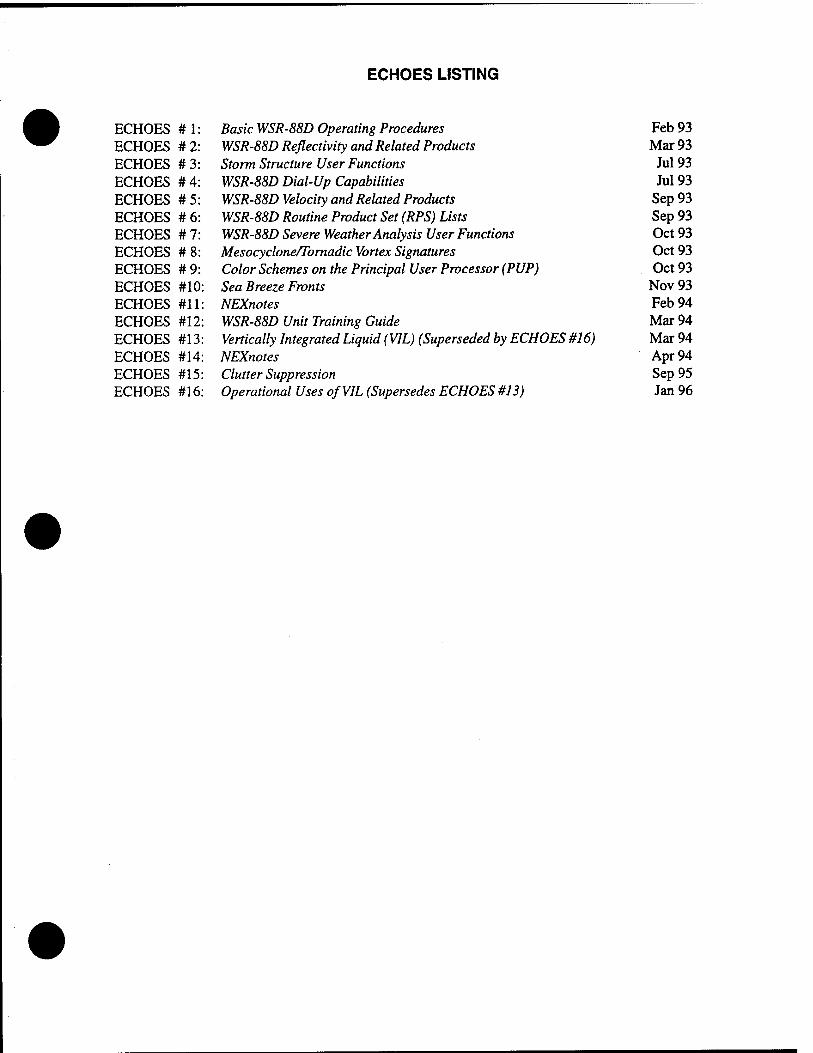
ECHOES LISTING
ECHOES #1 ECHOES #2 ECHOES #3 ECHOES #4 ECHOES #5 ECHOES #6 ECHOES #7 ECHOES #8 ECHOES #9 ECHOES #10 ECHOES #11 ECHOES #12 ECHOES #13 ECHOES #14 ECHOES #15 ECHOES #16
Basic WSR-88D Operating Procedures Feb 93 WSR-88D Reflectivity and Related Products Mar 93 Storm Structure User Functions Jul 93 WSR-88D Dial-Up Capabilities Jul 93 WSR-88D Velocity and Related Products Sep 93 WSR-88D Routine Product Set (RPS) Lists Sep 93 WSR-88D Severe Weather Analysis User Functions Oct 93 Mesocyclone/Tornadic Vortex Signatures Oct 93 Color Schemes on the Principal User Processor (PUP) Oct 93 Sea Breeze Fronts Nov 93 NEXnotes Feb 94 WSR-88D Unit Training Guide Mar 94 Vertically Integrated Liquid (VIL) (Superseded by ECHOES #16) Mar 94 NEXnotes Apr 94 Clutter Suppression Sep 95 Operational Uses of VIL (Supersedes ECHOES #13) Jan 96
AWDS
As the IM within your weather station, you will rely heavily upon the products received and developed by means of your AWDS. Although your duties may or may not extend to being the AWDS System Manager (ASM) (see Attachment 1 for a listing of ASM tasks), you will be responsible for developing mission-specific meteorological applications in order to optimize your local forecast program. In any case, to aid your role as the IM this section on AWDS has been broken down into the following areas: standard products, standard analysis and prognosis techniques, system configuration, new products and techniques, and local forecast products.
1) Standard Products: There are five types of data available over AWDS (alphanumeric (A/N), vector graphic, formatted binary data (FBD), uniform gridded data fields (UGDF), and raster scan). Tab 2 of this handbook provides guidance on how to ensure that your unit is receiving all the products you require. Before you can develop local forecast techniques, you have to be sure that you are receiving all the necessary building blocks of meteorological data. Review your data requirements on occasion to see if any additions/deletions need to be made.
2) Standard analysis and Prognosis Techniques: Obtaining the raw materials (in this case the standard products) is only the first step in utilizing your AWDS to the greatest extent possible. The next step is in the development of the standard techniques used in the daily applications of meteorological reasoning. Most often found within a station's forecaster Standard Operating Procedures (SOPs), these techniques include the actions to analyze data, develop forecasts, forecast severe weather, etc. Being written as SOPs, the techniques are consistent, allowing continuity to prevail. As new techniques are developed, ensure they are properly documented in order to ensure this continuity.
3) System Configuration: Ensure your system is setup in such a fashion to maximize the effectiveness of the forecast process. Route products to appropriate locations. Have your command sequences default to logical windows. View appropriate graphic products adjacent to one another. Allow yourself some window space in order to work on application processes, command sequences, etc.
4) New Products and Techniques: This is really where the IM earns their pay. After you receive those basic products required, have finalized your standard forecasting techniques, it's time to apply science to your AWDS in order to fine-tune your forecast processes. There are many AWDS forecasting applications already developed that require research to acquire, and possibly additional research and reasoning to apply them to local conditions. In addition, AWDS has numerous capabilities which may be exploited, but may require research and experimentation in order to implement. Examples of AWDS tools and techniques are LGGs, various Barnes analysis techniques, using previously generated grids as first guess grids, severe weather algorithms, modified Skew-Ts, vertical cross-sections, PPC links, metwatch alerting tools, command sequences, etc. Quality sources of new information and/or new applications and techniques can be found from a variety of sources. The Air Force Weather Bulletin Board, T-TWOS and AWDS conferences are just a few of examples of such sources.
5) Local Forecast Problems: At nearly every weather station, there are particular forecast problems which continually baffle logical forecasting thought processes. As the IM, attempt to use your AWDS in conjunction with other tools, information sources and applied scientific meteorology in order to solve these mysteries. If assistance is required, contact the Aerospace Sciences Division at HQ AWS (AWS/ XON). That organization is designed to assist IMs with forecast problems, and there is a dedicated AWDS team located there to aid in your forecast-related requests.
The following references will aid you in your AWDS operations:
AFM15-125 Weather Station Operations - Chapter 6 covers data and product-related topics. Chapter 7 explains the technical foundation of the AWDS, and details system management procedures.
AFCAT15-152, Vol I - Facsimile and Graphics Products Catalog contains brief descriptions of facsimile and graphics products available on the AFDIGS and AWDS.
AFCAT 15-152, Vol II - Weather Station Index contains a worldwide index of weather station identifiers and related information.
AFCAT 15-152, Vol III - Weather Message Catalog provides a description of all non-decodable weather bulletins.
AFI 33-103 Requirements Development and Processing - Details the process to streamline the development of and response to C4 systems requirements.
AWDS Functional Handbooks - A complete guide to system operations.
T-TWOs - Available as both hard and soft copies, T-TWOs are intended to provide AWDS information to Air Force Weather (A list of T-TWOs is included later in this section.).
FYI #30 Air Force Weather Bulletin Board - Explains procedures for linking into the Weather Bulletin Board. Serving as a focal point for weather-related issues for the Air Force weather community, the bulletin board has a library dedicated to AWDS. A variety of information can be obtained using this electronic medium. New capabilities, future plans, training aids, T-TWO publications, etc., can be quickly and easily downloaded directly to your location. Many of these topics can be tailored to optimize your local forecast process.
AFGWC Software Technical Applications Facility - (DSN 271-7770) This service is available 24 hours a day, 7 days a week and is designed to handle all trouble calls concerning the operations of your AWDS.
Your MAJCOM aerospace sciences POC or HQ AWS/XON can assist you with specific questions or concerns.
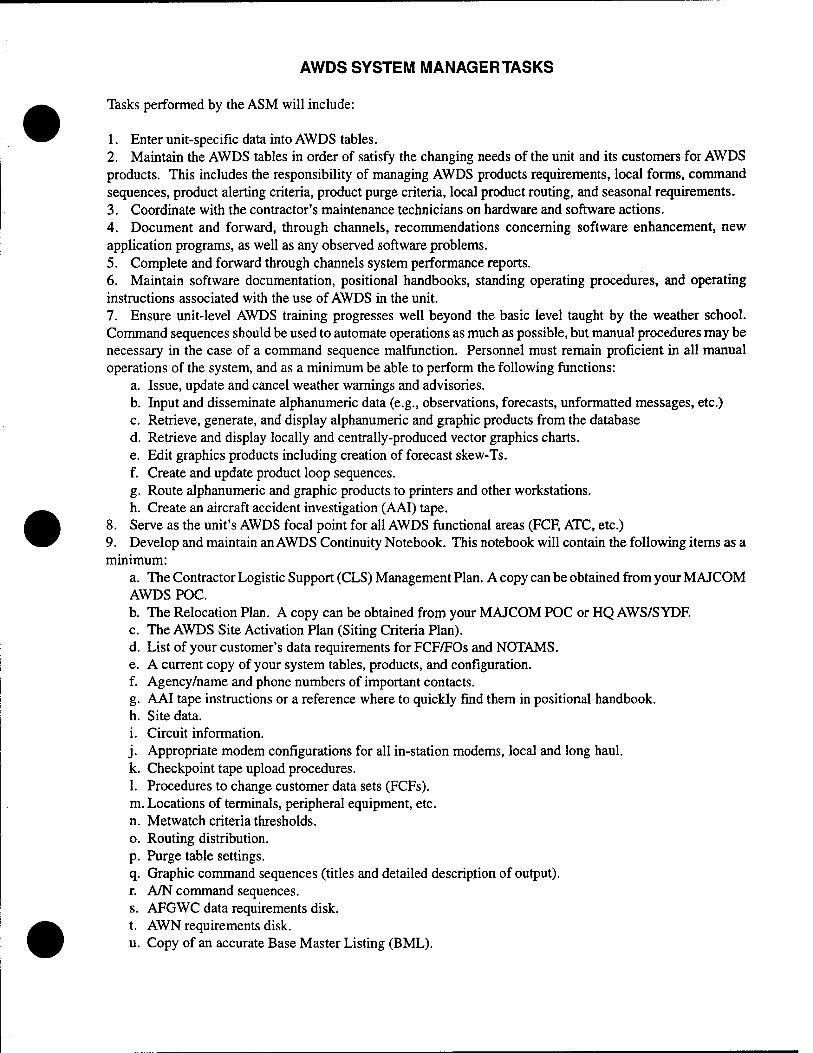
AWDS SYSTEM MANAGER TASKS
Tasks performed by the ASM will include:
1. Enter unit-specific data into AWDS tables. 2. Maintain the AWDS tables in order of satisfy the changing needs of the unit and its customers for AWDS products. This includes the responsibility of managing AWDS products requirements, local forms, command sequences, product alerting criteria, product purge criteria, local product routing, and seasonal requirements. 3. Coordinate with the contractor's maintenance technicians on hardware and software actions. 4. Document and forward, through channels, recommendations concerning software enhancement, new application programs, as well as any observed software problems. 5. Complete and forward through channels system performance reports. 6. Maintain software documentation, positional handbooks, standing operating procedures, and operating instructions associated with the use of AWDS in the unit. 7. Ensure unit-level AWDS training progresses well beyond the basic level taught by the weather school. Command sequences should be used to automate operations as much as possible, but manual procedures may be necessary in the case of a command sequence malfunction. Personnel must remain proficient in all manual operations of the system, and as a minimum be able to perform the following functions:
a. Issue, update and cancel weather warnings and advisories. b. Input and disseminate alphanumeric data (e.g., observations, forecasts, unformatted messages, etc.) c. Retrieve, generate, and display alphanumeric and graphic products from the database d. Retrieve and display locally and centrally-produced vector graphics charts. e. Edit graphics products including creation of forecast skew-Ts. f. Create and update product loop sequences. g. Route alphanumeric and graphic products to printers and other workstations, h. Create an aircraft accident investigation (AAI) tape.
8. Serve as the unit's AWDS focal point for all AWDS functional areas (FCF, ATC, etc.) 9. Develop and maintain an AWDS Continuity Notebook. This notebook will contain the following items as a minimum:
a. The Contractor Logistic Support (CLS) Management Plan. A copy can be obtained from your MAJCOM AWDS POC. b. The Relocation Plan. A copy can be obtained from your MAJCOM POC or HQ AWS/SYDF. c. The AWDS Site Activation Plan (Siting Criteria Plan). d. List of your customer's data requirements for FCF/FOs and NOTAMS. e. A current copy of your system tables, products, and configuration. f. Agency/name and phone numbers of important contacts. g. AAI tape instructions or a reference where to quickly find them in positional handbook, h. Site data. i. Circuit information. j. Appropriate modem configurations for all in-station modems, local and long haul. k. Checkpoint tape upload procedures. 1. Procedures to change customer data sets (FCFs). m. Locations of terminals, peripheral equipment, etc. n. Metwatch criteria thresholds. o. Routing distribution. p. Purge table settings. q. Graphic command sequences (titles and detailed description of output). r. A/N command sequences. s. AFGWC data requirements disk. t. AWN requirements disk. u. Copy of an accurate Base Master Listing (BML).
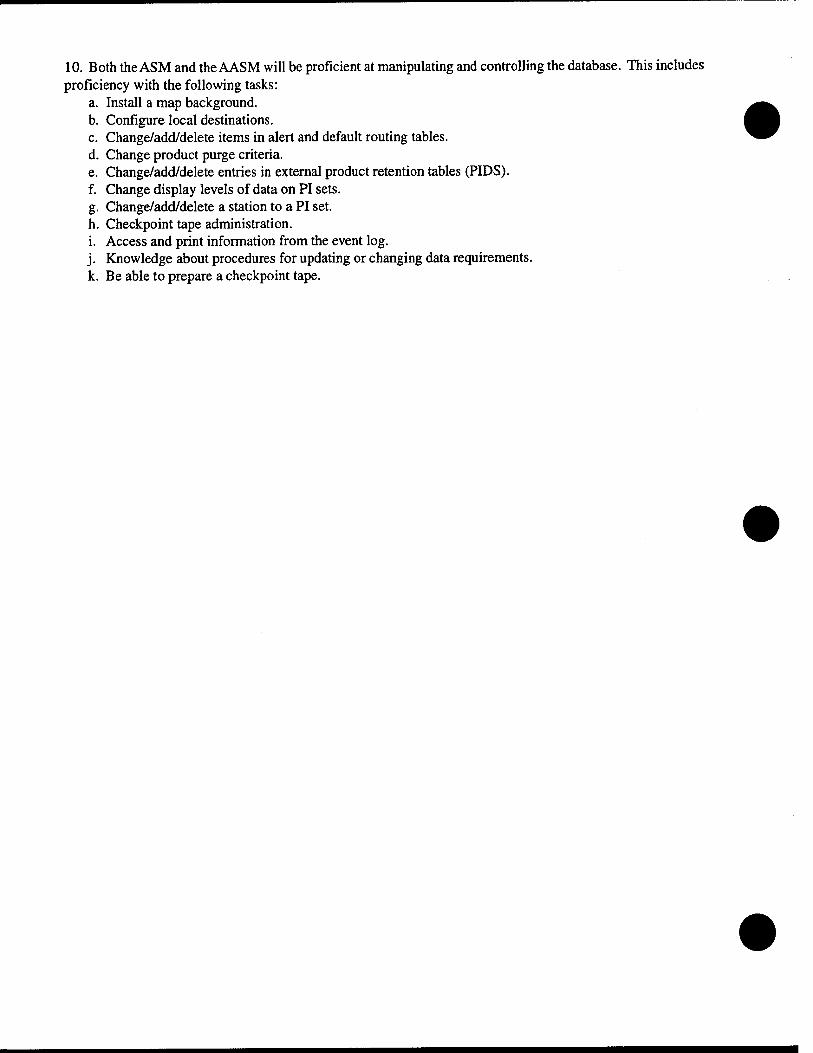
10. Both the ASM and the AASM will be proficient at manipulating and controlling the database. This includes proficiency with the following tasks:
a. Install a map background. b. Configure local destinations. c. Change/add/delete items in alert and default routing tables. d. Change product purge criteria. e. Change/add/delete entries in external product retention tables (PIDS). f. Change display levels of data on PI sets. g. Change/add/delete a station to a PI set. h. Checkpoint tape administration. i. Access and print information from the event log. j. Knowledge about procedures for updating or changing data requirements. k. Be able to prepare a checkpoint tape.
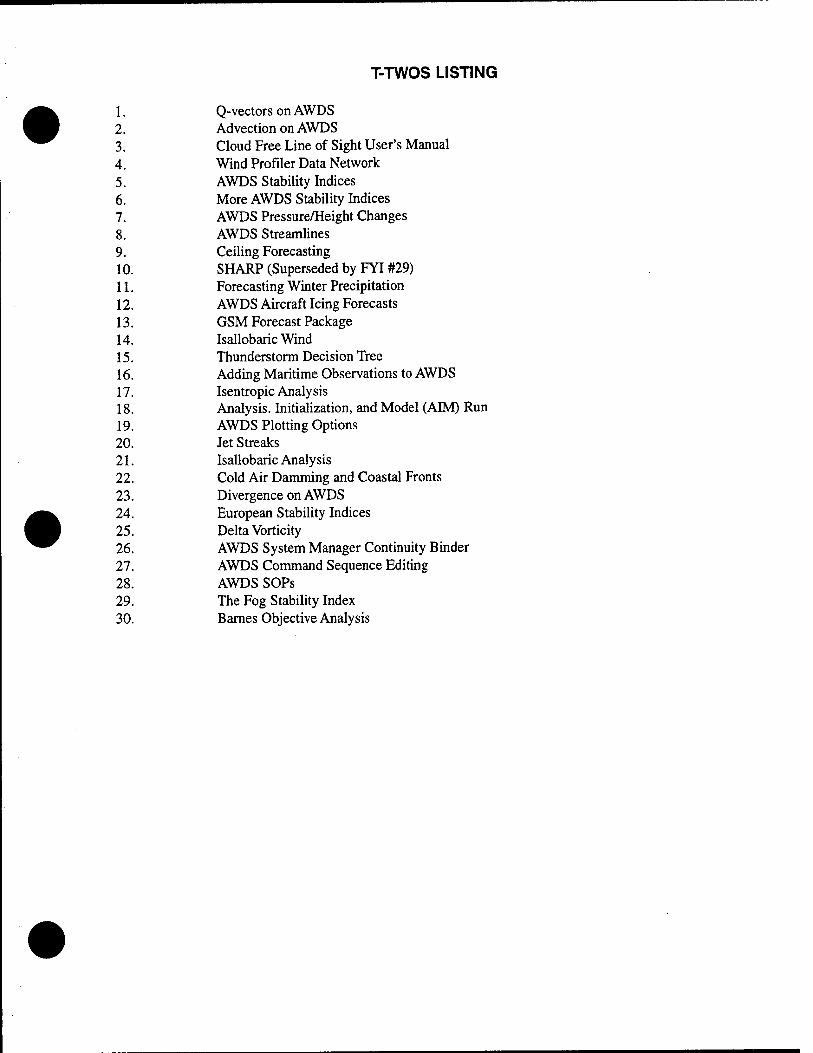
T-TWOS LISTING
1. Q-vectorsonAWDS 2. Advection on AWDS 3. Cloud Free Line of Sight User's Manual 4. Wind Profiler Data Network 5. AWDS Stability Indices 6. More AWDS Stability Indices 7. AWDS Pressure/Height Changes 8. AWDS Streamlines 9. Ceiling Forecasting 10. SHARP (Superseded by FYI #29) 11. Forecasting Winter Precipitation 12. AWDS Aircraft Icing Forecasts 13. GSM Forecast Package 14. Isallobaric Wind 15. Thunderstorm Decision Tree 16. Adding Maritime Observations to AWDS 17. Isentropic Analysis 18. Analysis. Initialization, and Model (AIM) Run 19. AWDS Plotting Options 20. Jet Streaks 21. Isallobaric Analysis 22. Cold Air Damming and Coastal Fronts 23. Divergence on AWDS 24. European Stability Indices 25. Delta Vorticity 26. AWDS System Manager Continuity Binder 27. AWDS Command Sequence Editing 28. AWDS SOPs 29. The Fog Stability Index 30. Barnes Objective Analysis
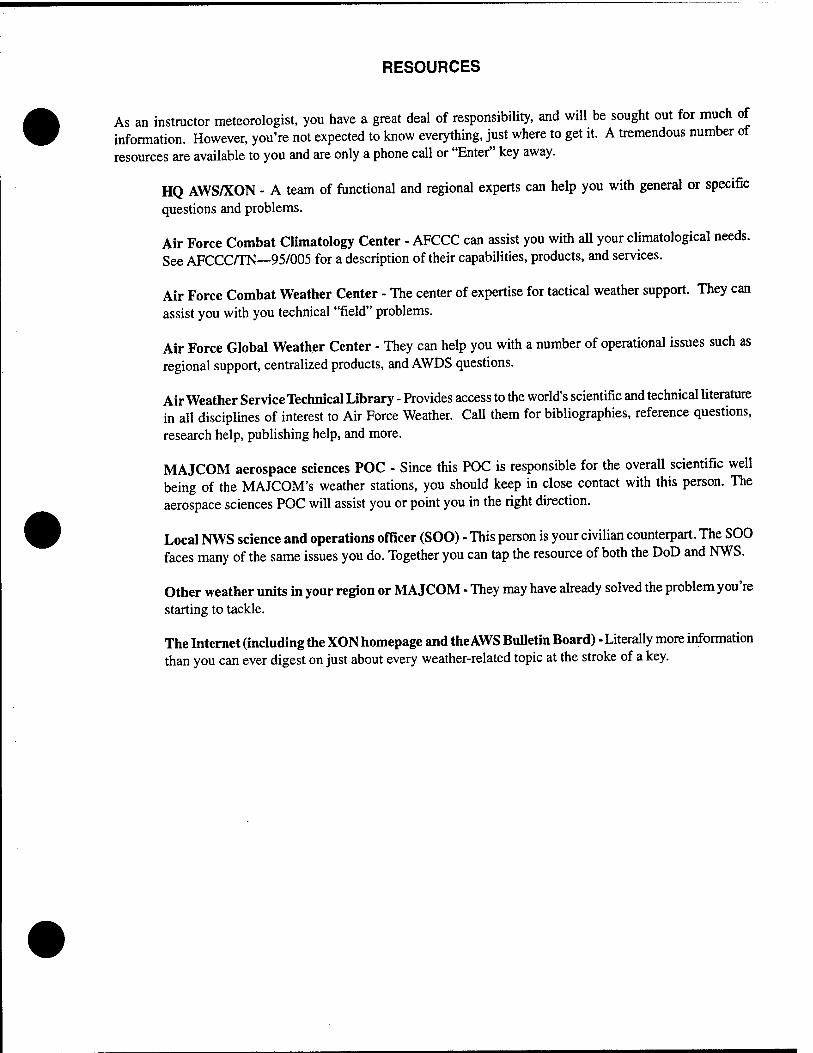
RESOURCES
As an instructor meteorologist, you have a great deal of responsibility, and will be sought out for much of information. However, you're not expected to know everything, just where to get it. A tremendous number of resources are available to you and are only a phone call or "Enter" key away.
HQ AWS/XON - A team of functional and regional experts can help you with general or specific
questions and problems.
Air Force Combat Climatology Center - AFCCC can assist you with all your climatological needs. See AFCCC/TN—95/005 for a description of their capabilities, products, and services.
Air Force Combat Weather Center - The center of expertise for tactical weather support. They can assist you with you technical "field" problems.
Air Force Global Weather Center - They can help you with a number of operational issues such as regional support, centralized products, and AWDS questions.
Air Weather Service Technical Library - Provides access to the world's scientific and technical literature in all disciplines of interest to Air Force Weather. Call them for bibliographies, reference questions, research help, publishing help, and more.
MAJCOM aerospace sciences POC - Since this POC is responsible for the overall scientific well being of the MAJCOM's weather stations, you should keep in close contact with this person. The aerospace sciences POC will assist you or point you in the right direction.
Local NWS science and operations officer (SOO) - This person is your civilian counterpart. The SOO faces many of the same issues you do. Together you can tap the resource of both the DoD and NWS.
Other weather units in your region or MAJCOM - They may have already solved the problem you're starting to tackle.
The Internet (including the XON homepage and the AWS Bulletin Board) ■ Literally more information than you can ever digest on just about every weather-related topic at the stroke of a key.
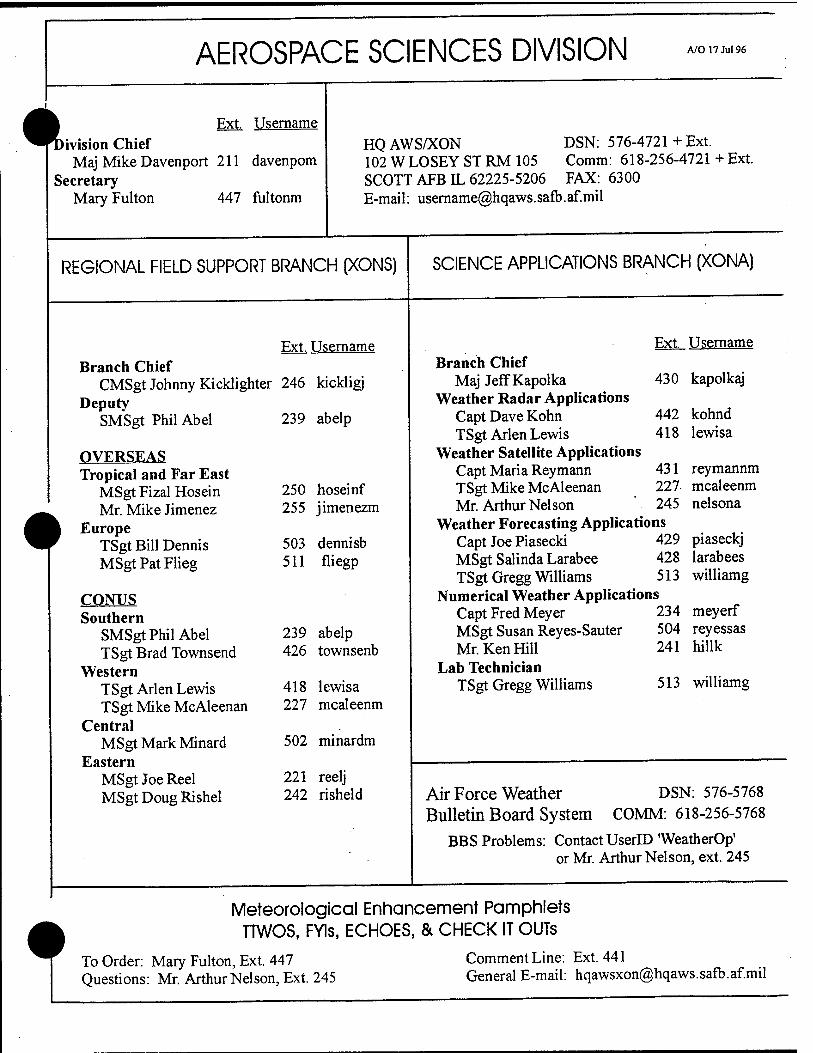
AEROSPACE SCIENCES DIVISION A/O 17 Jul 96
*
Ext. Username ivision Chief
Maj Mike Davenport 211 davenpom Secretary
Mary Fulton 447 fultonm
HQAWS/XON DSN: 576-4721+Ext. 102 WLOSEY ST RM 105 Comm: 618-256-4721 + Ext. SCOTT AFBIL 62225-5206 FAX: 6300 E-mail: [email protected]
REGIONAL FIELD SUPPORT BRANCH (XONS)
Ext. Username Branch Chief
CMSgt Johnny Kicklighter 246 kickligj Deputy
SMSgt Phil Abel 239 abelp
OVERSEAS Tropical and Far East
MSgt Fizal Hosein Mr. Mike Jimenez
Europe TSgt Bill Dennis MSgt Pat Flieg
CONUS Southern
SMSgt Phil Abel TSgt Brad Townsend
Western TSgt Arlen Lewis TSgt Mike McAleenan
Central MSgt Mark Minard
Eastern MSgt Joe Reel MSgt Doug Rishel
250 hoseinf 255 jimenezm
503 dennisb 511 fliegp
239 abelp 426 townsenb
418 lewisa 227 mcaleenm
502 minardm
221 reelj 242 risheld
SCIENCE APPLICATIONS BRANCH (XONA)
Ext. Username Branch Chief
Maj Jeff Kapolka Weather Radar Applications
Capt Dave Kohn TSgt Arlen Lewis
Weather Satellite Applications Capt Maria Reymann TSgt Mike McAleenan Mr. Arthur Nelson
Weather Forecasting Applications Capt Joe Piasecki 429 MSgt Salinda Larabee 428 TSgt Gregg Williams 513
Numerical Weather Applications
430 kapolkaj
442 418
431 227- 245
Capt Fred Meyer MSgt Susan Reyes-Sauter Mr. Ken Hill
Lab Technician TSgt Gregg Williams
234 504 241
kohnd lewisa
reymannm mcaleenm nelsona
piaseckj larabees williamg
meyerf reyessas hillk
513 williamg
Air Force Weather DSN: 576-5768 Bulletin Board System COMM: 618-256-5768
BBS Problems: Contact UserBD WeatherOp' or Mr. Arthur Nelson, ext. 245
Meteorological Enhancement Pamphlets TTWOS, FYls, ECHOES, & CHECK IT OUTs
To Order: Mary Fulton, Ext. 447 Questions: Mr. Arthur Nelson, Ext. 245
Comment Line: Ext. 441 General E-mail: [email protected]
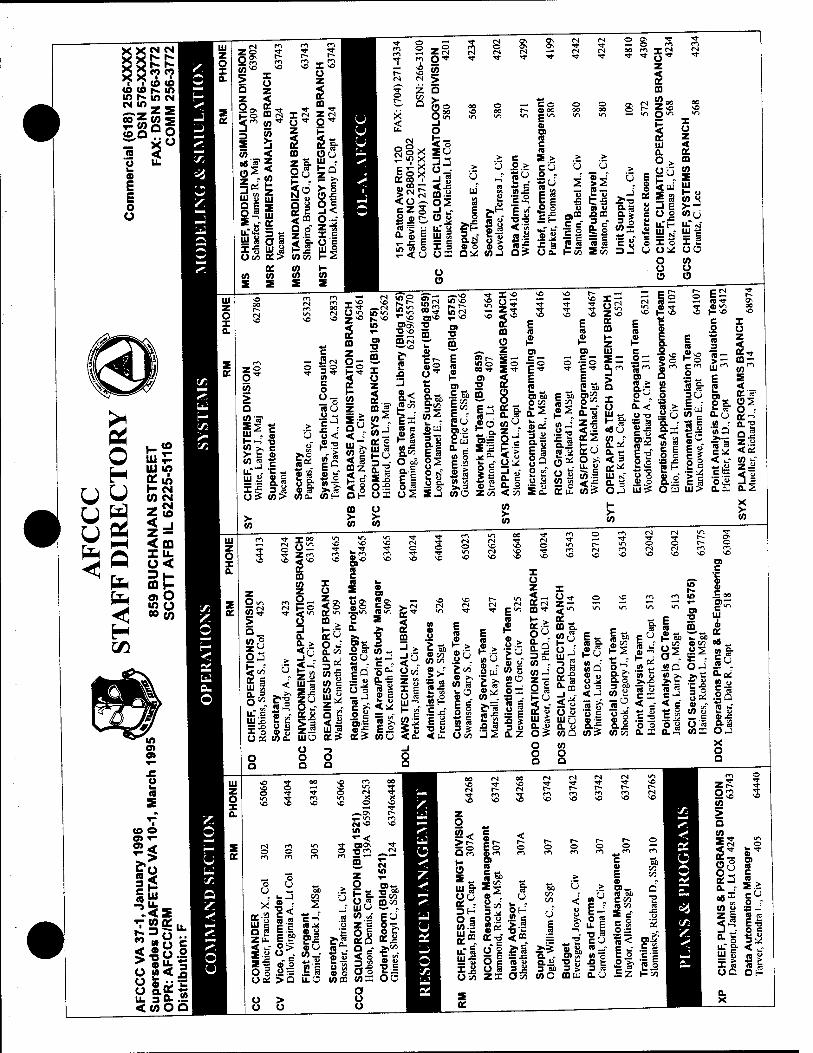
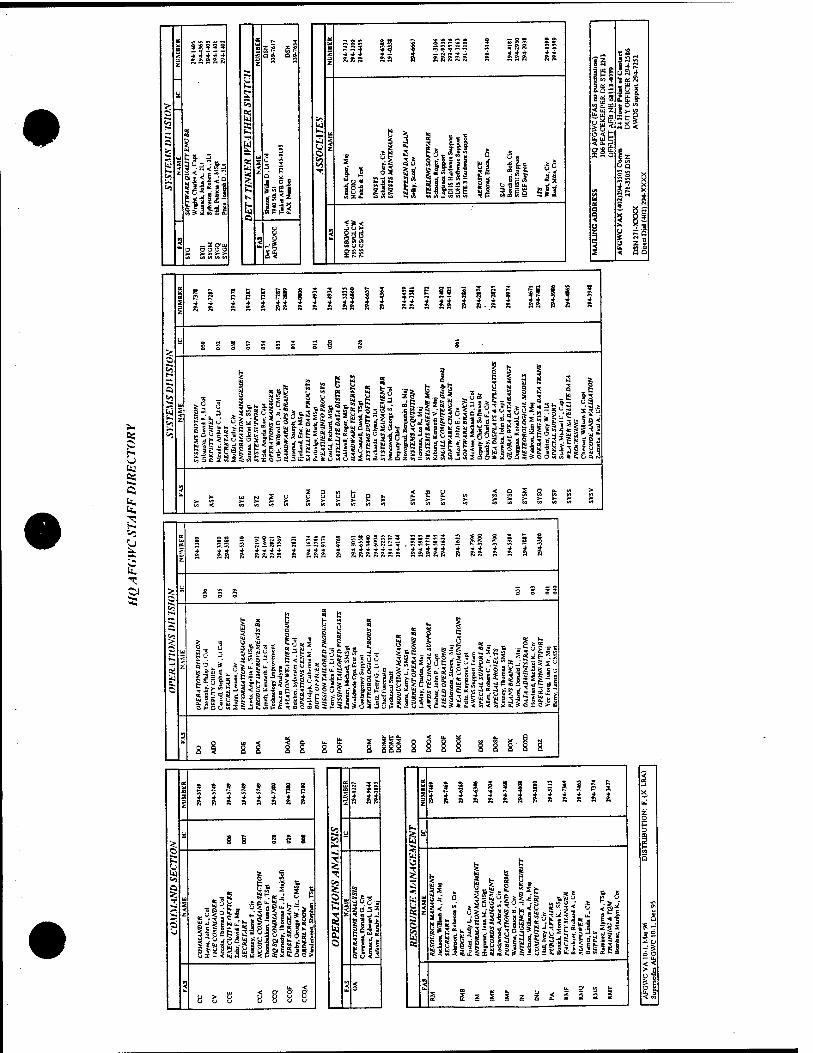
•
OS
£ OS
ki
ex
B U 1
7
L
1 5
1 >1
4 3 4 4 4
J
a: «a
8 t i < j E *
llil-li
o ooi3o
a u c
2
s 5
1
% ft !~
n a SS gs
! u i
lllS u
a*
!3! aaa 32
S5J5
pi go!
gsg
ass rjR4
"ui e BOS
!5S
v. S
PR R K p PS I « S K! i ± i ± ± it 1 1 i ti
SI |5 E S5 ä u 2 | §5 I i
B S S y e B
go, S >
1 * a f g l
O >■ Q U n 3
II ill
S S
Is- C i
i o: S
O EO t
isifiriiigti rliiflpll
i o 3 8 i iss
353334-ti aaaaaaaa
1 i § S
3
5333353335353 aaaaaaaaaaaas
i ä
8-
2 u - ä
<$ > 3 o 'S * E o s
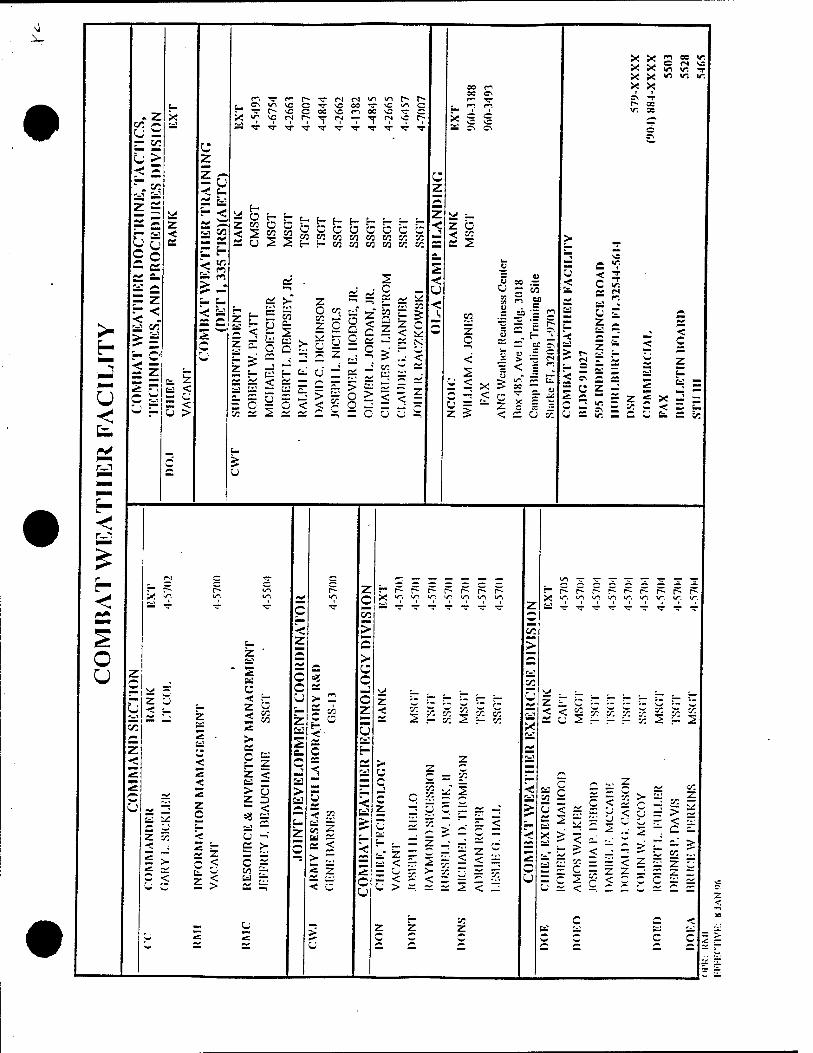
\
#
>■
<
r--i
r
<
o u
r- or:
c/:
- cs
= z
Si c 5
z
Is 2S Es! £- < ** is
E H
> -
rCNiz-ivcorrvCOO-^NC^C
es! <
z < CJ >
E- Ü co o
E- C
CO CO
E- C c c
2 2 WKtOKCOKKK PS-MMOICOKK
t= tu C Z OT co
S ^ t» H O c £ £i £ . "^ ^
^ ->• o £ £ F«
ö a Z
CO C Z
CO Si
0 = S > ^ O < < > ?*s t*s r*
o Z -: ^ - M r, -
£ :.• u - £ _
£ o > < £ O I: z i; z o o
z z < -
so n so o r-, rr
j^ m m X = C r: o *i S Cv C\
z b < so S 2
X X rt 00
X X «■) VI X X m <n X X £^ *T t- a:
u -
CO
z C
<
<
CO ~ Z CO
— J 2 » ,*-- C\
1 < I " --> u-T ^ EZ 12 S T ü C * s ■£ Z c = = < S CJ CO
x «?
Z CJ
O
10
>• <
z
<
z c
esi CJ
^b
> CS
2. <
> Z
* g
K 2 C <
=- K >-
c r- c/i r-
1$ SE
2
■< •
c
CO
Z
<
s~ c- r- X ^ -0
< v: ss A v: 5: — 2 r K 2 r
C CO CO
C 7. * ?!
Z „
> t>- a ;- "* N ~ ~
c a.
< 9
C ^ 5 =
z -
111 S=! Z
*s ><■ _..: ■_
< ■M k. Ü t. X y:
X v, un w^ vn v, i/*. v-1, v", i/~.
z
SP = i„ , iO =. <
- Z 5 - C
ssliill ~ > 10 —. =i - < z 2 z -. =s ü ^ <
= < C >
V5 z
c c
c CO
2 CO 10 — CO
Ü < r: £ ii -
c <
- 2
, - -3 > < - Z ^ i3 co .T. 5E-C-S = <Z^zr-
— 'w *; <~ ^ CJ ^ <• k -
?■ «^ rr 10
M JO
Z
< CJ ~ J» ^J r- < ii.' •— *£ — ^ > — >
** CO -.^ < z Z
A. w w c Ü < c z
cd ti
c c


![Conversation Coursebook: [First Stage] Instructor: [Hawran](https://img.dokumen.tips/doc/110x75/63509b9b150c1228c7082a56/conversation-coursebook-first-stage-instructor-hawran-.jpg)


