Embed Size (px)
Citation preview
1
Information Effect on Voter Turnout: How Campaign Spending Mobilises
Voters
Siim Trumm
Laura Sudulich
Joshua Townsley
Abstract
We explore the impact of campaign effort on constituency-level turnout variation in
Britain, under the premise that higher levels of campaign visibility stimulate electoral
participation. We focus on the relationship between the competitiveness of the race and
campaign effort as a provider of electoral information on the one hand, and voter
turnout on the other hand. In doing so, we address the role of campaign effort and
competitiveness in shaping turnout both independently as well as jointly. Further to
this, we seek to add nuance to our understanding of how electoral campaigns mobilise
voters by evaluating the comparative ability of different parties – based on whether or
not they are ‘viable’ contenders in a particular constituency – to stimulate turnout. We
find evidence that campaign effort mobilises voters and has a significant positive effect
on voter turnout; this effect is independent from, and unconditioned by, the
competitiveness of the race. However, we do find that this effect is mostly driven by
the campaign effort of the ‘viable’ contenders in the constituency.
Keywords
Electoral participation, competitiveness, campaign information, Great Britain
This is the post-print version of the following article:
Trumm, S., Sudulich, L. & Townsley, J. Information Effect on Voter Turnout: How
Campaign Spending Mobilises Voters. Acta Politica, Forthcoming.
2
Introduction
For much of the early post-war period in Britain, local electoral campaigns were often
dismissed as being largely ineffective in terms of shaping electoral outcomes. Over the
last three decades, however, extensive research has challenged and successfully shifted
this consensus. As a result, there is now very little room for doubt left: local campaigns
matter. Efforts put in place by candidates and parties in the run up to the polling day
clearly have an impact upon voters’ choices. Next to that, campaign effort has also a
discernible positive effect on turnout (Geys 2006). The more intense, visible, and
informative an electoral campaign is, the higher the likelihood of citizens casting a vote.
While a myriad of other factors also contribute to explaining turnout and electoral
results, the positive effects of local campaign effort on both of these phenomena are
rather uncontested.
Campaign effort is the combination of activities aimed at maximising electoral gains.
It serves the purpose of mobilising the electorate: from the core supporter to the
electorally undecided voter. It does so by enhancing the wider salience of the election
as well as promoting the specific partisan message. In fact, campaign efforts put in
place by political parties and candidates, together with intensive media coverage, are
the two key sources of information available to voters in the run up to the election.
Here, we focus on the former; specifically, we explore the impact of campaign effort
on constituency-level turnout variation under the premise that more visible campaigns
encourage electoral participation. Experimental studies have shown that citizens are
more likely to vote when they are stimulated by exposure to campaign information
(Green and Gerber 2008). In a similar vein, observational studies have shown that
campaign mobilisation effort is a very powerful predictor of turnout not just in the US
(Hillygus 2005), but across various electoral institutions (Karp and Banducci 2007;
Karp et al. 2008).
We explore the extent to which local-level campaign effort actually affects turnout in
the context of the 2010 British general election. Our analysis focuses on campaigning
during the short campaign; i.e., from the dissolution of the Parliament to the polling
day. We then turn to uncover whether the effects of campaign effort are moderated by
the competitiveness of the race. While this is not an uncharted territory, little attention
has to date been paid to the potential interaction between the competitiveness of a
3
constituency race and campaign effort put in place by parties in the constituency. We
add nuance and provide a more complete account of these effects by including the so-
called minor parties, which are often neglected, also to our analysis. While they often
struggle to secure large numbers of MPs under the first-past-the-post system, they
represent an undeniably substantial electoral presence in British politics. Parties like
the UK Independence Party and the Green Party are not just fielding increasing number
of candidates at general elections, but they are also enjoying growing vote shares.
Moreover, regional parties like the Scottish National Party and Plaid Cymru are
expanding their presence beyond the devolved institutions. There are more and more
constituencies at Westminster elections where electorally relevant information is
coming also from parties other than the Labour Party, the Conservative Party, and the
Liberal Democrats. As such, their effects should be taken into consideration. Our aim,
therefore, is to take into account that the ‘traditional’ main parties are no longer the
only salient providers of electoral information for voters in today’s British political
landscape.
We find strong evidence that both the aggregate constituency-level campaign effort put
in place by all local candidates and the marginality of the seat affect turnout – i.e., the
proportion of people choosing to cast their ballot is notably higher in marginal
constituencies as well as in constituencies where parties spend more on their electoral
campaigns. When disentangling this effect, we find, however, that the campaign effort
put in place by the ‘viable’ contenders in the constituency has a far greater impact upon
turnout than the effort of ‘other’ parties. Further to this, and against our theoretical
expectations, we find no evidence that the competitiveness of the race conditions the
positive effect of campaign effort, neither for the viable contenders in the constituency
nor for the others. In other words, the local level effort to get out the vote by parties and
candidates is equally important in marginal and safe seats.
The article is organised as follows. We first discuss the developments regarding voter
turnout in Britain and survey the existing literature on campaign effort and electoral
participation. This is done to draw our theoretical expectations and methodological
approach. Then, we outline the rationale for our approach to assessing the effect of
aggregate and disaggregate campaign effort on turnout. After this, we describe our data
4
and measures. In the final section, we present and examine the findings, to then
conclude with a discussion of their implications.
Constituency-Level Electoral Dynamics
We begin with a discussion of the dependent variable in the study; i.e., constituency-
level turnout.1 UK-wide turnout at the election to the House of Commons was 65% in
2010, but just like campaign effort, it varied greatly across different constituencies. The
electoral system used for general elections in Britain accentuates the role of the local
level in relation to both the competitiveness of the race as well as campaign intensity.
One may reasonably assume that the campaign dynamics were different in a
constituency like Aberavon – where the difference in the vote share of the winner and
the runner up in 2005 was 46% – from those in places such as Ceredigion where the
difference was 0.6% and the winner decided by only a handful of votes. In the former,
voters may feel that turning out to vote is a rather pointless exercise, while in the latter
each extra vote is more likely to be felt as potentially pivotal.
Over the recent decades, the view that national arena is the only meaningful level of
competition (Kavanagh 1970) has been replaced. The conventional wisdom held that
local-level campaigns in Britain, possibly more than in other contexts, were largely
unimportant in shaping electoral outcomes. The potential impact of local campaigns
was first raised in the 1970s by Denver and Hands (1974). They explored the role of
local campaigns in mobilising the electorate and suggested that campaign spending
(which they used as a proxy for campaign effort) might actually have a bigger impact
on getting people out to vote than constituency marginality. Nowadays, the field of
electoral politics in Britain has firmly focused on the sub-national level, following a
considerable amount of research being produced on the effects of local campaigns on
both voting behaviour (Fieldhouse and Cutts 2009; Fisher et al. 2011; Johnston et al.
2011; Johnston and Pattie 2006, 2008; Pattie et al. 1995) and turnout patterns (Fisher
and Denver 2009; Denver et al. 2004). From studies of campaign effects on vote choice
we know that, at general elections, British political parties have proved their capacity
1 This is often referred to as the local level in the spending literature, while the literature on turnout
generally labels it as the aggregate level to distinguish it from studies that address the determinants of
individual-level turnout.
5
to strategically target campaign efforts and, by and large, to make gains (or contain
losses) where needed.
The case of the 2010 general election is of particular interest as the televised leaders
debates are considered essential in explaining how it unfolded (Pattie and Johnston
2011; Stevens et al. 2011). If the information provided at the national level by the mass
media saturates the demand for it, then electoral information produced by local
campaign effort should in fact not be a significant predictor of turnout any longer. As
such, digging deeper into the determinants of constituency-level turnout contributes to
the debate on whether there is a shift towards ‘TV elections’ (Wring and Ward 2010)
or whether the local level still continues to play a crucial role in mobilising electoral
participation. A first piece of evidence supporting the latter scenario comes from a
recent study by Fisher et al. (2016). They found that despite moves towards micro-
targeting voters, campaigning by the three largest parties in Britain increases turnout.
However, this approach excludes the potential role of the so-called ‘minor’ parties as
meaningful providers of electoral information, and also leaves aside the increasingly
diverse combinations of parties that are serious contenders in many constituencies up
and down Britain. Our contribution breaks from the ‘traditional’ three party frame and
accounts for the role played by relative newcomers on the British electoral scene.
Campaign Effort, Competitiveness and Electoral Participation
When parties and their candidates actively engage with the electorate on the ground by
intensifying the amount of activities aimed at winning votes in the run-up to the
election, they simultaneously increase the amount of information on the election in
general. While pursuing of course a partisan agenda, their campaign effort increases the
salience of the election by intensifying the public debate surrounding it, as well as
voters’ exposure to it. Studies of negative campaigning show that the more intense
campaign effort that is put in by parties and candidates (regardless of its content), the
higher the likelihood of citizens casting a vote.2 Moreover, the general increase in late
deciders (Hayes and McAllister 1996) suggests that ‘late’ campaign dynamics are likely
to play an important role in determining variation in turnout. Therefore, we limit our
2 See, for example, Lau et al. (2007) for a comprehensive review of this literature.
6
analysis to the so-called short campaign, covering the campaign effort that took place
in the immediate run up to the polling day.
In addition to the effects associated with campaign effort, the likelihood of casting a
ballot should be particularly high when the election is expected to be a close race as the
perceived utility of voting is greater in a marginal constituency than a safe one.
Therefore, it is unsurprising that previous studies have found two constituency-level
characteristics to be highly influential at determining how many people do choose to
vote: marginality, as a measure of how competitive a particular constituency is, and
campaign effort (Geys 2006). With regard to constituency marginality, it is widely
accepted that when an election is a close contest, the probability that one vote might
determine the outcome goes up. This, in turn, increases the perceived utility of voting
and acts as an additional motivation to go to the polls. Matsusaka and Palda (1993) refer
to it as the Downsian closeness hypothesis. Voters acknowledge that the benefits of
casting their ballot are not just limited to merely fulfilling their sense of civic duty,
which voting in very safe seats is arguably restricted to, but that they might have a
chance of determining the result as well.
With regard to campaign effort, the more candidates invest in their campaigns in a given
constituency, the greater their collective capacity to engage with the electorate and
expose potential voters to electorally relevant information. As voters are exposed to
more electioneering – defined by Bowler and Farrell (2011: 683) as the kinds of
activities that get people out to vote – in their daily lives, the amount of information
they have on candidates and their policy-positions is naturally increased as a result.
Consequently, voters in constituencies with more intense campaign activity have to
bear lower costs of information acquisition (Dawson and Zinser 1976; Chapman and
Palda 1983), in turn, increasing their probability of casting a vote. We build on these
two elements by exploring both their separate and joint effects.
Combined and Separate Effort
While studies addressing the effects of campaigning and competitiveness on electoral
participation are not in short supply, our approach significantly departs from previous
research in response to long-term changes in the British political landscape. Despite the
high level of disproportionality that is typical of the first-past-the-post electoral system,
7
‘minor’ parties do contest elections and lately they have been doing so with significant
success. The UK Independence Party gained nearly 1 million votes in 2010 and fielded
572 candidates, while the British National Party gained over half a million of votes,
both notable increases from the previous general election in 2005. These two parties
are of course not the only ones either. The Green Party stood 310 candidates in 2010
and secured its first ever seat in the House of Commons when Caroline Lucas was
elected as MP for Brighton Pavilion. While the major traditional contenders are still
receiving greater media attention, smaller parties are becoming increasingly effective
players in the local context.
A second major change in recent years is the rise of regional parties – the Scottish
National Party and Plaid Cymru in particular. These parties have been growing in size
and popularity not only in the context of the devolved and local elections, but also with
substantial success at the recent general elections. For instance, SNP won 6 seats in
2010, including Moray, with a 14% majority, and came second in 27 other seats. At the
same time, Plaid Cymru won 3 Westminster seats in Wales, including Dwyfor
Meirionnydd with a 22% majority. Therefore, the campaign efforts put in place by the
so-called minor and regional parties are no longer negligible when studying activities
that stimulate turnout. Yet, the scholarly tradition on the matter tends to focus merely
on the activities of the three (traditionally) largest parties: Labour, Conservatives, and
Liberal Democrats (Denver and Hands 1997; Denver et al. 2004; Fieldhouse and Cutts
2009; Fisher 1999; Fisher et al. 2014). Given the changing landscape of who is and who
is not a relevant actor in the context of British elections, limiting the analysis to the
campaign efforts put in place by Labour, Conservatives, and Liberal Democrats may
omit potentially crucial information needed to explain the effects of campaign effort on
turnout.
As such, we depart from the traditional approach by exploring the effects of campaign
effort put in place by all parties that are contesting a constituency. In doing so, we
explore whether the aggregate effort of all parties in play is responsible for variation in
constituency-level turnout. Next to that, we still account for the fact that certain parties
might be more influential than others in mobilising the electorate as shown, for
example, by Fisher et al. (2016). However, we avoid imposing a fixed constraint that
treats certain parties – generally Labour, Conservatives, and Liberal Democrats – as the
8
most relevant ones irrespective of the constituency in question. Instead, we allow for
the possibility that in different seats, different sets of parties are the most relevant
players. For example, the three viable contenders in the marginal seat of Watford in
2010 were the usual suspects: Labour, Conservatives, and Liberal Democrats. They
secured 94% of all votes cast between them. Meanwhile, in the Na h-Eileanan an Iar
constituency in Scotland the viable contenders were the SNP, the Scottish Labour Party,
and an Independent candidate Murdo Murray, receiving a combined vote share of 88%.
The latter is also by no means a stand-alone example. In fact, it illustrates a broader
trend whereby the power of the traditional ‘big three’ is being eroded in more and more
Westminster constituencies. Therefore, our approach accounts for different
combinations of parties in a constituency by setting apart the campaign efforts of (a)
‘viable contenders’ – those that have a realistic chance of winning the seat regardless
of what party they represent – from (b) ‘other contenders’ who are not realistically in
with a chance of winning the seat.
Empirically, this choice results in two parallel sets of models: the first set accounts for
the combined campaign effort of all parties contesting the election in a constituency.
The second set then disentangles campaign effort on the basis of previous party
performance in the constituency by focusing on the campaign effect associated with the
parties of a particular standing in the given constituency. On the one hand, it is sensible
to expect that the higher the aggregate campaign effort of all parties contesting the
election in a constituency, the higher the turnout. On the other hand, past studies have
proven the differential capacity across parties, leading us to expect that the positive
effect of campaign effort on turnout is stronger for viable contenders than other
contenders. While our specification of ‘main’ parties differs from previous studies by
looking at the specific dynamics of party competition in each seat, there is no reason to
expect invariance.
In addition to testing the above, we also explore the interplay between the campaign
effort put in place in a constituency (aggregate as well as disaggregate) and electoral
competitiveness of the constituency. Although previous studies have shown that both
are useful predictors of turnout on their own, the extent to which the competitiveness
of the race might moderate the positive effect of campaign effort remains unexplored.
As electorally relevant information serves the purpose of enhancing the visibility of the
9
election, its positive effect on voters’ likelihood of casting a ballot should be stronger
in a constituency where the likelihood of this vote making a difference is higher. As
such, we expect the effects of campaign effort to be conditioned by the marginality
status of the race and we empirically test for the potential interaction effect between
marginality and campaign effort.
Data and Measures
Parliamentary candidates in Britain are obliged by law to disclose their campaign
expenditure. This allows us to use official electoral returns data provided by the UK
Electoral Commission (2016) to account for constituency-level campaign effort in the
run up to the 2010 general election. Relying on official campaign spending data has
several unique advantages: it covers all candidates and parties – i.e., it is not subject to
missing observations in a manner that self-reported spending measures in election
surveys are – and, crucially, is more reliable than the survey-based and self-reported
measures of campaign spending. Our analysis encompasses the short campaign when
parties and candidates intensify their campaign efforts in order to secure the votes of
the undecided voters and those who might otherwise be inclined not to vote at all. We
then integrate this information with constituency-level turnout data and various socio-
economic indicators from the most recent 2011 Census.
Dependent Variable and Core Explanatory Variables
The dependent variable in our study – turnout – is operationalised as the percentage of
registered voters in the given constituency who cast a valid vote at the 2010 general
election.
The first core explanatory variable – marginality – is measured as the difference
between the winner’s and runner up’s vote share at the previous election in percentage
points.3 It describes the expected competitiveness of the race in a given constituency.4
As such, this difference effectively characterises the lead that the winner had in 2005
3 As a result of the Fifth Periodic Review of Westminster, the actual 2005 results could not be used to
gauge the marginality of some constituencies. We rely on estimates of the 2005 results as if the election
had been conducted under the new boundaries for those constituencies (Rallings and Thrasher 2007). 4 For further discussion on the appropriateness of relying on the expectations about the closeness of the
race to count for the expected vote see, for example, Bonneau (2007).
10
over her/his runner up. Being an inverse measure of competitiveness, higher values
indicate that the seat is safer and lower values indicate that the seat is more marginal.
We also operationalise marginality in terms of marginality status. This is measured as
a categorical variable, distinguishing between safe seats, two-way marginal seats, and
three-way marginal seats. Constituency is coded safe if the difference in vote share
between the winner and runner-up was more than 10% in 2005, two-way marginal if
this difference was below 10% (but the third-placed party was more than 10% off the
winner), and three-way marginal if the vote shares of the three most popular parties in
the constituency were within 10% in 2005.
The second core explanatory variable is campaign spending in a given constituency
during the short campaign. In line with a large tradition of studies in Britain (Fisher
2015; Johnston et al. 1989; Johnston and Pattie 1994; Pattie et al. 1995; Whiteley and
Seyd 1994) and elsewhere (Benoit and Marsh 2003, 2008, 2010; Maddens et al. 2006;
Sudulich and Wall 2011; Wauters et al. 2010) we use a proxy measure for campaign
effort in the shape of electoral expenditure. In a comprehensive meta-analysis, Geys
(2006) shows that electoral spending data are consistently one of the most significant
predictors of turnout, and we have no reason to expect anything different. In addition
to the fact that the use of campaign spending as an indicator of campaign effort is
common practice, Fisher et al. (2016) have recently provided further evidence
demonstrating that official electoral returns produce robust estimates to those based on
survey measures of campaign activity. Gauging campaign effort is renowned for being
difficult (Cutts and Fieldhouse 2009), with every measure presenting advantages and
disadvantages. While spending data are limited in their capacity to capture nuances,
they have higher reliability than survey-based measures and do not suffer from non-
response given the abovementioned legal requirement to report spending returns.
We aggregate candidates’ electoral expenditures at constituency level – representing
the overall amount spent in each constituency – and divide it by the legal spending limit
in the given constituency. Candidate spending in Britain is limited by law and varies
by both the electorate size and the geography of the constituency. Therefore, a relative
measure of campaign spending is more appropriate for comparing campaign intensity
across constituencies. In addition to total campaign spending, and to assess the
11
mobilisation effects associated with the campaign efforts put in place by different
parties in each constituency, we also build separate variables for the relative spending
of the viable contenders in each constituency, i.e., those with a realistic chance of
winning the seat (Campaign Spending – Viable Contenders), and the other parties in
each constituency (Campaign Spending – Other Contenders).
We distinguished between viable and other contenders in each constituency according
to its marginality status as follows. First, we separated constituencies that are safe, two-
way marginal (i.e., have two close contenders), and three-way marginal (i.e., have three
close contenders). We counted as ‘viable contenders’ those parties that are in with a
realistic chance of winning in each type of seat based on their performance at the
previous election. For instance, in a safe seat, the only ‘viable contender’ is the party
that finished first at the previous election. This would, for example, be the case of the
above-mentioned Aberavon. Alternatively, in two-way and three-way marginal
constituencies, the ‘viable contenders’ are the top two and three parties, respectively.
For example, the Ochil and South Perthshire constituency was a three-way marginal
following the 2005 general election with Labour on 31.4%, SNP on 29.9%, and the
Conservatives on 21.5%. In this instance, the viable contenders were Labour, SNP, and
the Conservatives, each representing a significant campaigning presence in this
constituency. Whereas the conventional approach would only capture the campaign
effort of Labour and the Conservatives, our approach allows us to take into account the
specific dynamics of each seat’s competitiveness when capturing the effect of the
‘viable’ contenders’ campaign efforts compared to those of the other parties.
Finally, we run a robustness check of Models 1 and 2 – reported in the Appendix – by
controlling only for previous turnout under the assumption that it would account for
marginality and the other controls. Results are in line with what is presented here.
Other Explanatory Variables and Controls
Constituency-level turnout is of course not just a function of campaign spending and
marginality. Therefore, we control for the social dimension of electoral participation as
well as the economic composition of the electorate in the constituency by including
several constituency-specific demographics in the analysis. We account for the former
by controlling for single occupancy households on the premise that people who do not
12
share their residency are likely to receive fewer social cues associated with voting.
Household dynamics have been shown to significantly influence voter participation
(Cutts and Fieldhouse 2009). For example, individuals residing in single occupancy
households are less likely to be stimulated to vote through talking to others about the
upcoming election at home. It is operationalised as the percentage of people in the
constituency who live in a single-person household and we expect it to have a negative
effect on turnout. We account for the latter by controlling for economic factors in the
shape of social class. It is a widely used demographic classification, indicating socio-
economic position based mainly on one’s occupation. The measure is operationalised
as the percentage of working-age people in the constituency who are, according to
Census 2011, in the top two analytical classes of the National Statistics Socio-
Economic classification. We expect to see a positive effect on turnout as the more
affluent voters are likely to have more time and resources that they can invest in being
politically active (Schlozman et al. 2012).
We also include two control variables in the analysis. We explore the effect that the
size of the electorate has on turnout, operationalised as the number of eligible voters in
the district in thousands. As the size of the electorate increases, the probability that a
single vote might influence the election outcome decreases. Therefore, following
Downs’ (1957) ‘calculus-of-voting’ model in which voters are instrumentally rational,
we expect larger constituencies in terms of the electorate size to experience weaker
turnout. Finally, we control for constituency type by setting apart those that are rural
(county) from those that are urban (borough/burgh).
Empirical Strategy
Given that our dependent variable – turnout – is normally distributed, we implement
OLS models with robust standard errors. Our analysis includes all 2010 Westminster
constituencies in Britain5 for which the Electoral Commission received full spending
returns, with the exception of the Speaker’s constituency as it is traditionally not
contested by major parties. The final sample includes 615 constituencies.
5 The 17 constituencies in Northern Ireland are, therefore, excluded.
13
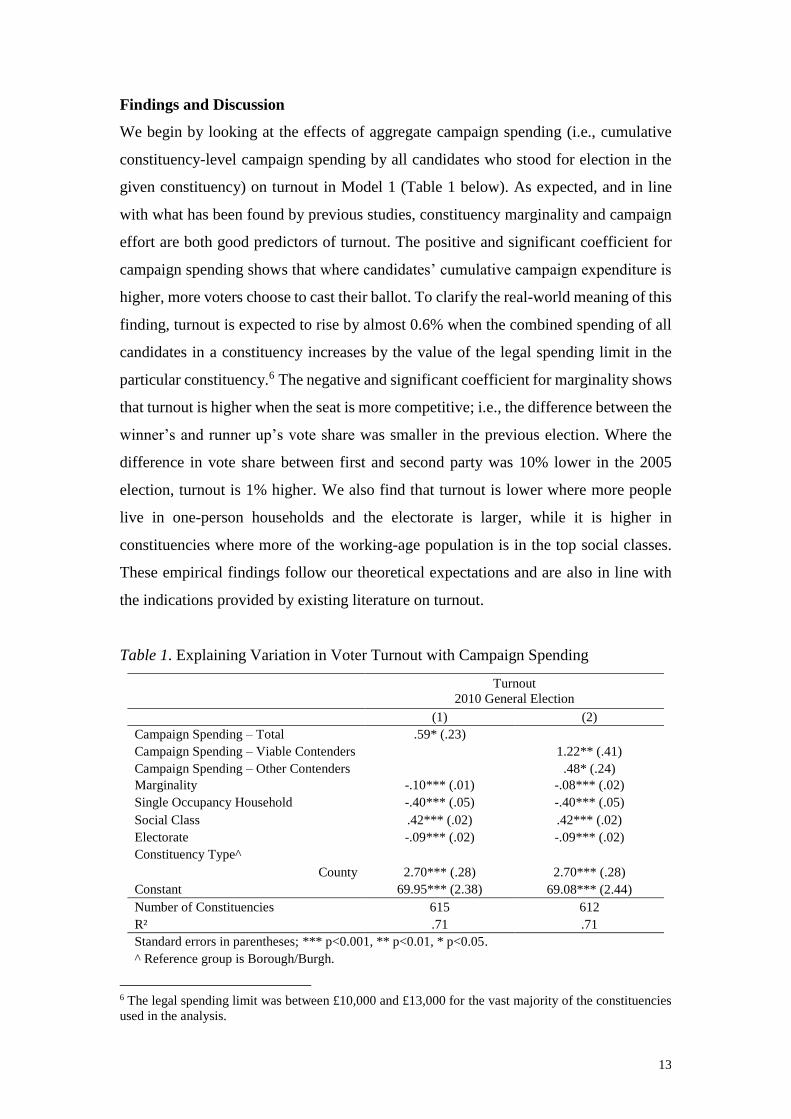
Findings and Discussion
We begin by looking at the effects of aggregate campaign spending (i.e., cumulative
constituency-level campaign spending by all candidates who stood for election in the
given constituency) on turnout in Model 1 (Table 1 below). As expected, and in line
with what has been found by previous studies, constituency marginality and campaign
effort are both good predictors of turnout. The positive and significant coefficient for
campaign spending shows that where candidates’ cumulative campaign expenditure is
higher, more voters choose to cast their ballot. To clarify the real-world meaning of this
finding, turnout is expected to rise by almost 0.6% when the combined spending of all
candidates in a constituency increases by the value of the legal spending limit in the
particular constituency.6 The negative and significant coefficient for marginality shows
that turnout is higher when the seat is more competitive; i.e., the difference between the
winner’s and runner up’s vote share was smaller in the previous election. Where the
difference in vote share between first and second party was 10% lower in the 2005
election, turnout is 1% higher. We also find that turnout is lower where more people
live in one-person households and the electorate is larger, while it is higher in
constituencies where more of the working-age population is in the top social classes.
These empirical findings follow our theoretical expectations and are also in line with
the indications provided by existing literature on turnout.
Table 1. Explaining Variation in Voter Turnout with Campaign Spending
Turnout
2010 General Election
(1) (2)
Campaign Spending – Total .59* (.23)
Campaign Spending – Viable Contenders 1.22** (.41)
Campaign Spending – Other Contenders .48* (.24)
Marginality -.10*** (.01) -.08*** (.02)
Single Occupancy Household -.40*** (.05) -.40*** (.05)
Social Class .42*** (.02) .42*** (.02)
Electorate -.09*** (.02) -.09*** (.02)
Constituency Type^
County 2.70*** (.28) 2.70*** (.28)
Constant 69.95*** (2.38) 69.08*** (2.44)
Number of Constituencies 615 612
R² .71 .71
Standard errors in parentheses; *** p<0.001, ** p<0.01, * p<0.05.
^ Reference group is Borough/Burgh.
6 The legal spending limit was between £10,000 and £13,000 for the vast majority of the constituencies
used in the analysis.
14
In Model 2 we explore the extent to which campaign mobilisation effects vary across
parties. We do so by distinguishing between the campaign efforts put in place by viable
contenders in the constituency (based on the seat’s marginality status) and other
contenders. The disaggregated analysis indicates that there are several crucial
differences in the extent to which more intense campaign efforts put in place by
different parties stimulate electoral participation. The effects we observed in Model 1
are clearly driven first and foremost by the campaign efforts of viable contenders. The
comparison of coefficients for viable and other contenders indicates that campaign
spending by the former has over two times the effect on turnout than that of the latter.
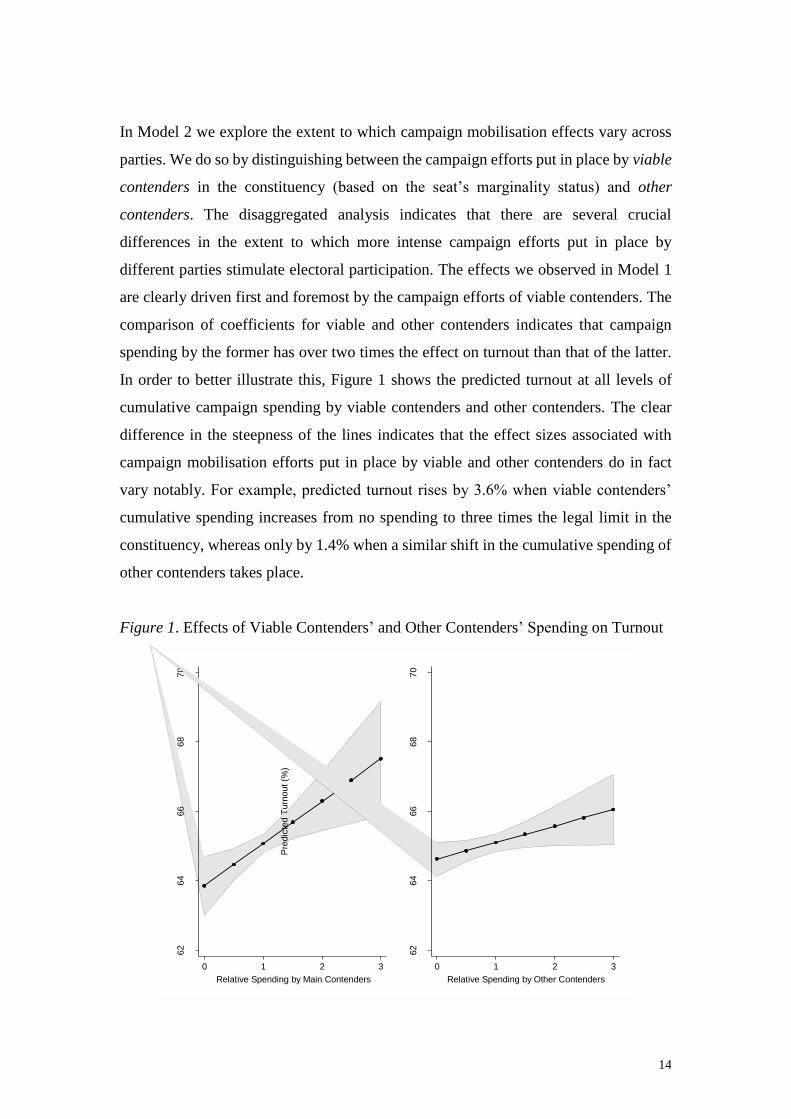
In order to better illustrate this, Figure 1 shows the predicted turnout at all levels of
cumulative campaign spending by viable contenders and other contenders. The clear
difference in the steepness of the lines indicates that the effect sizes associated with
campaign mobilisation efforts put in place by viable and other contenders do in fact
vary notably. For example, predicted turnout rises by 3.6% when viable contenders’
cumulative spending increases from no spending to three times the legal limit in the
constituency, whereas only by 1.4% when a similar shift in the cumulative spending of
other contenders takes place.
Figure 1. Effects of Viable Contenders’ and Other Contenders’ Spending on Turnout
62
64
66
68
70
Pre
dic
ted T
urn
out (%
)
0 1 2 3
Relative Spending by Main Contenders
62
64
66
68
70
Pre
dic
ted T
urn
out (%
)
0 1 2 3
Relative Spending by Other Contenders
15
Figure 1 does confirm our expectation that parties differ in their capacity to mobilise
voters in line with their prominence in the constituency. The higher the local standing
of the party is, the stronger its ability to mobilise voters. This builds on the findings by
Fisher et al. (2016), but indicates also that a party’s ability to bring voters to the polls
is not necessarily determined by its national size and/or presence. Rather, its local status
has a meaningful impact on its ability to mobilise voters.
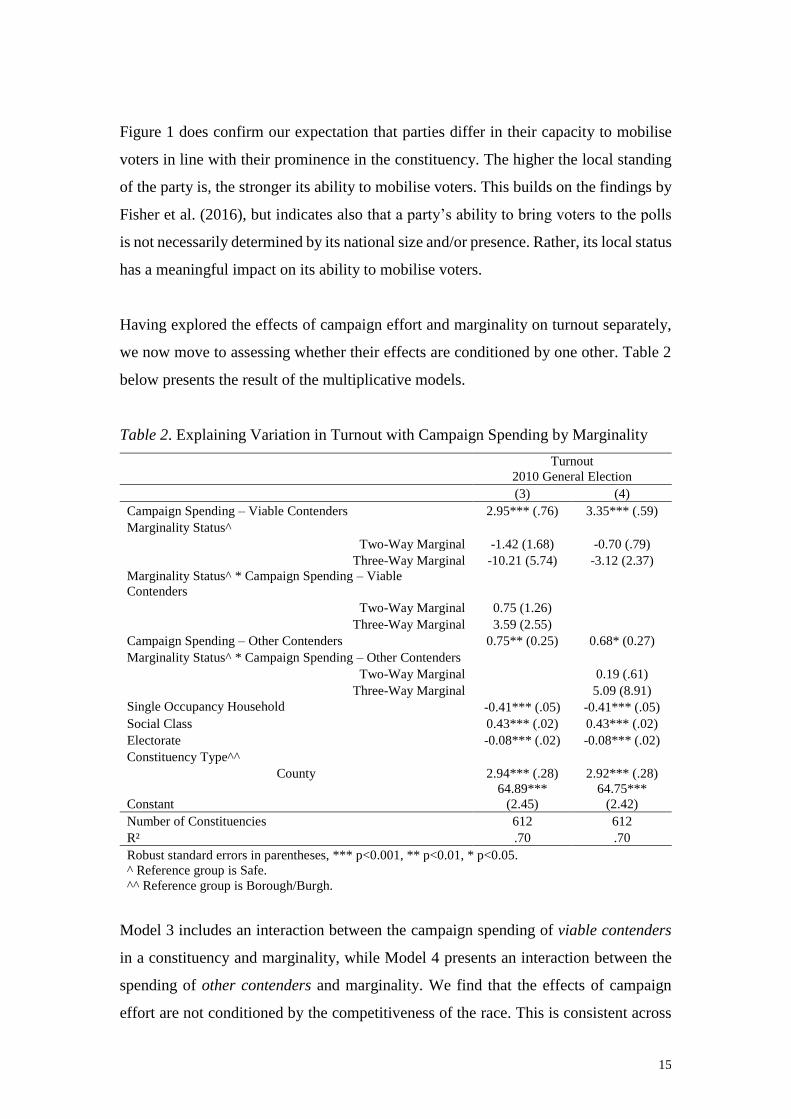
Having explored the effects of campaign effort and marginality on turnout separately,
we now move to assessing whether their effects are conditioned by one other. Table 2
below presents the result of the multiplicative models.
Table 2. Explaining Variation in Turnout with Campaign Spending by Marginality
Turnout
2010 General Election
(3) (4)
Campaign Spending – Viable Contenders 2.95*** (.76) 3.35*** (.59)
Marginality Status^
Two-Way Marginal -1.42 (1.68) -0.70 (.79)
Three-Way Marginal -10.21 (5.74) -3.12 (2.37)
Marginality Status^ * Campaign Spending – Viable
Contenders
Two-Way Marginal 0.75 (1.26)
Three-Way Marginal 3.59 (2.55)
Campaign Spending – Other Contenders 0.75** (0.25) 0.68* (0.27)
Marginality Status^ * Campaign Spending – Other Contenders
Two-Way Marginal 0.19 (.61)
Three-Way Marginal 5.09 (8.91)
Single Occupancy Household -0.41*** (.05) -0.41*** (.05)
Social Class 0.43*** (.02) 0.43*** (.02)
Electorate -0.08*** (.02) -0.08*** (.02)
Constituency Type^^
County 2.94*** (.28) 2.92*** (.28)
Constant
64.89***
(2.45)
64.75***
(2.42)
Number of Constituencies 612 612
R² .70 .70
Robust standard errors in parentheses, *** p<0.001, ** p<0.01, * p<0.05.
^ Reference group is Safe.
^^ Reference group is Borough/Burgh.
Model 3 includes an interaction between the campaign spending of viable contenders
in a constituency and marginality, while Model 4 presents an interaction between the
spending of other contenders and marginality. We find that the effects of campaign
effort are not conditioned by the competitiveness of the race. This is consistent across
16
both models. Although the direction of the interaction is generally in line with our
theoretical expectations, there is no substantial evidence of moderating effects.
The insignificant interaction terms suggest that higher levels of electoral information
drive voters to the polls in constituencies where the race is open (between two or three
viable competitors) as much as they do in safe constituencies (with only one viable
candidate). While this goes against our initial expectations, it has an important real-
world meaning: campaign efforts aimed at enhancing the visibility of the election
contribute to electoral participation irrespective of electoral competitiveness.
Conclusions
In this study, we explored the impact of campaign intensity on turnout by looking at
the aggregate constituency-level campaign effort to get out the vote by all parties. We
did so under the premise that restricting the analysis to the traditional main parties in
Britain – Labour, Conservatives, and Liberal Democrats – limits our understanding of
how electioneering stimulates turnout. This is the first attempt to account for a rapidly
changing political landscape in Britain, where several other parties are experiencing
significant growth in membership and electoral support and, in turn, are choosing to
deploy more and more campaign resources in their bids to win seats in the House of
Commons. We find that greater campaign effort, providing higher amount of electoral
information, does lead to greater electoral participation, ceteris paribus. The greater
availability of information results in reduced costs of voting and, in turn, increases the
likelihood of citizens casting a ballot.
Next to quantifying the impact of aggregate campaign effort, we also disaggregate its
effects by party – setting them apart on the basis of whether or not they were ‘viable
contenders’ in the constituency. Our approach allows for different combinations of
parties to be treated as the ‘viable’ ones in a particular constituency, accounting for the
increasingly varied dynamics of British politics on the local level. Our findings from
the disaggregate analysis show that the effects of campaign effort on turnout are nearly
three times stronger when carried out by parties that are viable contenders in the
constituency than those who are not. This applies regardless of which exact parties
count as ‘viable’ contenders in the constituency.
17
We then expand on how competitiveness of the race influences electoral participation.
While marginality has a discernible impact on turnout in line with our expectations, it
does not condition the effectiveness of campaign effort (aggregate or disaggregate). In
other words, no matter how competitive the race is expected to be in the constituency,
making more electorally relevant information available to voters has a positive effect
on turnout.
There are three key points arising from this study. First, given the changing dynamics
of British politics, future research should look beyond the ‘traditional’ major players in
the shape of the Labour Party, the Conservative Party, and the Liberal Democrats. It is
important to account for the considerable, and increasingly successful, campaign efforts
made by other parties contesting Westminster elections. For example, around 12% of
all votes cast at the 2010 general election went to parties other than Labour,
Conservatives, and Liberal Democrats. At the 2015 general election, this increased to
approximately 25%. In Scotland, a former Labour heartland, SNP won all but 3 seats
in the House of Commons in 2015, while UK Independence Party actually supplanted
the Liberal Democrats as the third most popular party in Britain in terms of vote share
by receiving 3.9 million votes to the Liberal Democrats’ 2.4 million. Accounting for
these changes in the British electoral landscape is, therefore, unavoidable.
Second, the lack of significant interaction effects between campaign effort on the one
hand and marginality on the other hand suggests that providing information to voters is
equally helpful in getting out the vote in safe and marginal constituencies. This has
significant implications on how one should think about campaigning in these electoral
contexts. Under the first-past-the-post system, the incentives to vote in safe seats are
limited, particularly for those who do not support the incumbent party. This can, in turn,
understandably be perceived by parties and candidates as a disincentive to spend
resources in such constituencies. Our findings, however, indicate that even under such
more unfavorable conditions for engaging with the electorate, parties unlikely to win
should still campaign intensively as the information it communicates to voters does act
as a trigger for greater electoral participation.
Finally, our findings testify for the relevance of local electoral campaigns by showing
that constituency-level dynamics have not been completely overshadowed by the TV

18
debates. This brings into question the notion that the 2010 general election was the ‘TV
election’ (Johnston and Pattie 2011), by showing that parties at local level also
continued to play a pivotal role in providing information to voters in the run up to the
polling day.
19
Bibliography
Benoit, K. and Marsh, M. 2003. For a Few Euros More: Campaign Spending Effects in
the Irish Local Elections of 1999. Party Politics 9(5): 561-582.
Benoit, K. and Marsh, M. 2008. The Campaign Value of Incumbency: A New Solution
to the Puzzle of Less Effective Incumbent Spending. American Journal of
Political Science 52(4): 874-890.
Benoit, K. and Marsh, M. 2010. Incumbent and Challenger Campaign Spending Effects
in Proportional Electoral Systems: The Irish Elections of 2002. Political
Research Quarterly 63(1): 159-173.
Bonneau, C.W. 2007. The Effects of Campaign Spending in State Supreme Court
Elections. Political Research Quarterly 60(3): 489-499.
Bowler, S. and Farrell, D.M. 2011. Electoral Institutions and Campaigning in
Comparative Perspective: Electioneering in European Parliament Elections.
European Journal of Political Research 50(5): 668-688.
Chapman, R. G. and Palda, K, S. 1983. Electoral Turnout in Rational Voting and
Consumption Perspectives. Journal of Consumer Research 9: 337-346.
Cutts, D. and Fieldhouse, E. 2009. What Small Spatial Scales Are Relevant as Electoral
Contexts for Individual Voters? The Importance of the Household on Turnout
at the 2001 General Election. American Journal of Political Science 53(3): 726-
739.
Dawson, P. and Zinser, J. 1976. Political Finance and Participation in Congressional
Elections. Annals of the American Academy of Political and Social Science
425159-73.
Denver, D.T. and Hands, H.T.G. 1974. Marginality and Turnout in British General
Elections. British Journal of Political Science 4(1): 17-35.
Denver, D.T. and Hands, H.T.G. 1977. Challengers, Incumbents, and the Impact of
Constituency Campaigning in Britain. Electoral Studies 16(2): 175-193.
Denver, D., Hands, H.T.G. and MacAllister, I. 2004. The Electoral Impact of
Constituency Campaigning in Britain, 1992–2001. Political Studies 52(2): 289-
306.
Downs, A. 1957. An Economic Theory of Democracy. New York: Harper and Row.
Electoral Commission. 2016. Previous UK General Elections. Available at:
http://www.electoralcommission.org.uk/find-information-by-subject/elections-

20
and-referendums/past-elections-and-referendums/uk-general-elections
[Accessed on 23/03/2016].
Farrell, D.M. and Schmitt-Beck, R. 2004. Do Political Campaigns Matter? Campaign
Effects in Elections and Referendums. London: Routledge.
Fieldhouse, E. and Cutts, D. 2009. The Effectiveness of Local Party Campaigns in
2005: Combining Evidence from Campaign Spending and Agent Survey Data.
British Journal of Political Science 39(2): 367-388.
Fisher, J. 1999. Party Expenditure and Electoral Prospects: a National Level Analysis
of Britain. Electoral Studies 18: 519-532.
Fisher, J. 2015. Party Finance: The Death of the National Campaign? Parliamentary
Affairs 68(1): 133-153.
Fisher, J., Cutts, D. and Fieldhouse, E. 2011. The Electoral Effectiveness of
Constituency Campaigning in the 2010 British General Election: The ‘Triumph’
of Labour? Electoral Studies 30(4): 816-828.
Fisher, J. and Denver, D. 2009. Evaluating the Electoral Effects of Traditional and
Modern Modes of Constituency Campaigning in Britain 1992-2005.
Parliamentary Affairs 62(2): 196-210.
Fisher, J., Johnston, R., Cutts, D., Pattie, C. and Fieldhouse, E. 2014. You Get What
You (Don’t) Pay For: The Impact of Volunteer Labour and Candidate Spending
at the 2010 British General Election. Parliamentary Affairs 67(4): 804-824.
Fisher, J., Fieldhouse, E., Johnston, R., Pattie, C. and Cutts, D. 2016. Is All
Campaigning Equally Positive? The Impact of District Level Campaigning on
Voter Turnout at the 2010 British General Election. Party Politics 22(2): 215-
226.
Geys, B. 2006. Explaining Voter Turnout: A Review of Aggregate-level Research.
Electoral Studies 25(4): 637-663.
Green, D.P. and Gerber, A.S. 2008. Get Out the Vote: How to Increase Voter Turnout.
Washington: Brookings Institution Press.
Hayes, B. C. and McAllister, I. 1996. Marketing Politics to Voters: Late Deciders in
the 1992 British Election. European Journal of Marketing 30(10/11): 127-139.
Hillygus, D.S. 2005. Campaign Effects and the Dynamics of Turnout Intention in
Election 2000. Journal of Politics 67(1): 50-68.
21
Johnston, R.J., Pattie, C. and Johnston, L.C. 1989. The Impact of Constituency
Spending on the Result of the 1987 British General Election. Electoral Studies
8(2): 143-155.
Johnston, R.J. and Pattie, C. 1994. The Impact of Party Spending on Party Constituency
Campaigns at Recent British General Elections. Party Politics 1(2): 261-273.
Johnston, R.J. and Pattie, C. 2008. How Much Does a Vote Cost? Incumbency and the
Impact of Campaign Spending at English General Elections. Journal of
Elections, Public Opinion and Parties 18(2): 129-152.
Johnston, R.J., Rossiter, D. and Pattie, C. 2008. Far Too Elaborate About So Little:
New Parliamentary Constituencies for England. Parliamentary Affairs 6(1): 4-
30.
Johnston, R.J. and Pattie, C. 2011. Electoral Systems, Geography, and Political
Behaviour: United Kingdom Examples. In B.Warf and J.Leib (eds.) Revitalizing
Electoral Geography. Burlington: Ashgate Publishing Company, pp. 31-58.
Johnston, R.J., Pattie, C., Cutts, D., Fieldhouse, E. and Fisher, J. 2011. Local Campaign
Spending at the 2010 General Election and Its Impact: Exploring What Wider
Regulation Has Revealed. The Political Quarterly 82(2): 169-192.
Johnston, R.J. and Pattie, C. 2006. Putting Voters in Their Place: Geography and
Elections in Great Britain. Oxford: Oxford University Press.
Karp, J.A. and Banducci, S.A. 2007. Party Mobilization and Political Participation in
New and Old Democracies. Party Politics 13(2): 217-234.
Karp, J.A., Banducci, S.A. and Bowler, S. 2008. Getting Out the Vote: Party
Mobilization in a Comparative Perspective. British Journal of Political Science
38(1): 91-112.
Kavanagh, D. 1970. Constituency Electioneering in Britain. London: Longmans.
Lau, R.R., Sigelman, L. and Brown Rovner, I. 2007. The Effects of Negative Political
Campaigns: A Meta-Analytic Reassessment. Journal of Politics 69(4): 1176-
1209.
Maddens, B., Wauters, B., Noppe, J. and Fiers, S. 2006. Effects of Campaign Spending
in an Open List PR System: The 2003 Legislative Elections in
Flanders/Belgium. West European Politics 29(1): 161-168.
Matsusaka, J.G. and Palda, F. 1993. The Downsian Voter Meets the Ecological Fallacy.
Public Choice 77(4): 855-878.
22
Pattie, C., Johnston, R.J. and Fieldhouse, E. 1995. Winning the Local Vote: The
Effectiveness of Constituency Campaign Spending in Great Britain, 1983-1992.
American Political Science Review 89(4): 969-983.
Pattie, C. and Johnston, R. 2011. A Tale of Sound and Fury, Significant Something?
The Impact of the Leaders’ Debates in the 2010 UK General Election. Journal
of Elections, Public Opinion and Parties 21(2): 147-177.
Rallings, C. and Thrasher, M. 2007. The Media Guide to the New Parliamentary
Constituencies. Plymouth: LGC Elections Centre.
Schlozman, K.L., Verba, S. and Brady, H.E. 2012. The Unheavenly Chorus: Unequal
Political Voice and the Broken Promise of American Democracy. Princeton:
Princeton University Press.
Stevens, D., Karp, J.A. and Hodgson, R. 2011. Party Leaders as Movers and Shakers
in British Campaigns? Results from the 2010 Election. Journal of Elections,
Public Opinion and Parties 21(2): 125-145.
Sudulich, L. and Wall, M. 2011. How Do Candidates Spend Their Money? Objects of
Campaign Spending and the Effectiveness of Diversification. Electoral Studies,
30(2): 91-111.
Wauters, B., Weekers, K. and Maddens, B. 2010. Explaining the Number of
Preferential Votes for Women in an Open-List PR System: An Investigation of
the 2003 Federal Elections in Flanders (Belgium). Acta Politica 45(4): 468-490.
Whiteley, P. and Seyd, P. 1994. Local Party Campaigning and Voting Behaviour in
Britain. Journal of Politics 56(1): 242-151.
Wring, D. and Ward, S. 2010. The Media and the 2010 Campaign: The Television
Election? Parliamentary Affairs 63(4): 802-817.

23
Appendix A. Robustness Check
Table A1 displays findings from models where previous turnout in the constituency is
used to control for the profile of the constituency instead of marginality and socio-
economic characteristics. It is operationalised as the percentage of voters who cast a
valid vote at the 2005 general election in the constituency. The findings reported in
Table A1 are in line with those presented in the main text. Campaign spending –
aggregate and disaggregate – consistently has positive effects on turnout, while the
effect sizes associated with campaign spending by viable and other contenders are
comparable and remain within a rough 2:1 ratio.
Table A1. Previous Turnout and Campaign spending as predictors of Turnout
Turnout
2010 General Election
(A1.1) (A1.2)
Campaign Spending – Total 0.91*** (.18)
Campaign Spending – Viable Contenders 1.13*** (.24)
Campaign Spending – Other Contenders 0.70** (.23)
Previous Turnout 0.77*** (.03) 0.76*** (.03)
Constant 16.65*** (1.68) 16.89*** (1.74)
Number of Constituencies 615 615
R² .74 .75
Standard errors in parentheses; *** p<0.001, ** p<0.01, * p<0.05.


