Embed Size (px)
Citation preview

Seediscussions,stats,andauthorprofilesforthispublicationat:https://www.researchgate.net/publication/228195725
AfricanAmericanTurnoutinMajority-MinorityDistricts
ARTICLE·JANUARY2011
CITATIONS
2
READS
23
2AUTHORS,INCLUDING:
LukeJohnKeele
PennsylvaniaStateUniversity
50PUBLICATIONS1,610CITATIONS
SEEPROFILE
Allin-textreferencesunderlinedinbluearelinkedtopublicationsonResearchGate,
lettingyouaccessandreadthemimmediately.
Availablefrom:LukeJohnKeele
Retrievedon:08February2016

African American Turnout in Majority-MinorityDistricts∗
Luke Keele† Ismail White‡
First draft: February 17, 2011
This draft: August 22, 2011
Abstract
The 1965 Voting Rights Act has been a central part of Federal efforts to increaseminority participation in the U.S. The latest phase of enforcement under the VotingRights Act has been the creation of majority-minority Congressional districts. To fightvote dilution, these districts are drawn so that a majority of the voting age populationare minorities. One open question about minority-majority districts is whether theyincrease citizen participation in the form of turnout. While much of the empirical lit-erature on this question has produced inconclusive answers, recent studies suggest thatresiding in one of these districts can significantly increase minority turnout. We arguethat much of the variability in these findings can be attributed to the different designchoices of previous researchers. In this study we address the weakness of previousresearch designs and offer a new design that exploits the redistricting process to gainadditional leverage on this question. Unlike previous research, our design accounts forpossible variation in treatment specification by ensuring that voters who were movedinto minority-majority districts through the redistricting process are comparable tovoters that remained in existing districts. Our use of the redistricting process alsoallows us to correctly model the selection process that leads voters to be moved intominority-majority districts. We find little evidence that minority voter turnout in-creases when minority voters are moved into these districts.
∗We thank Jas Sekhon, Rocıo Titiunik, Don Green, Walter Mebane, Jonathan Nagler, and seminarparticipants at New York University, the University of Wisconsin, Yale University and Ohio State Universityfor helpful comments and discussion.†Associate Professor, Department of Political Science, 211 Pond Lab, Penn State University, University
Park, PA 16802 Phone: 814-863-1592, Email: [email protected]‡Assistant Professor, Department of Political Science, 2008 Derby Hall, Ohio State University, Columbus,
OH 43210 Phone: 614-292-4478, Email: [email protected]
Since its passage, the 1964 Voting Rights Act has outlawed discriminatory practices re-
sponsible for disenfranchising African Americans and language minorities (Latino Americans
in particular) in many parts of the country (mostly in the South but not entirely). Not only
has the Act effectively done away with blatantly discriminatory restrictions on minority
voting such as literacy tests and poll taxes but provisions of the Act have also resulted in
the creation of majority-minority congressional districts that many have suggested are vital
to the continued protection of African American and Latino electoral participation. While,
advocates of majority-minority districts as well as many members of the courts view the
creation of such districts as effective tools for increasing minority electoral participation, the
exact impact of these districts on registration and turnout rates among minorities remains
unclear. Efforts by social scientists to assess the effects of living in majority-minority dis-
tricts on minority electoral participation have produced somewhat mixed results, with the
bulk of these studies observing only slightly higher rates of voter turnout among those blacks
and Latinos who reside in these districts compared to those who do not.
In this paper we will revisit the question of, “do majority-minority districts increase mi-
nority electoral participation,” and offer a new research design that leverages the redistricting
process in a way that accounts for many of the analytical challenges (i.e., problems with se-
lection effects, variation in treatment specification and treatment effect heterogeneity) that
have plagued previous researcher’s efforts. By focusing on the effects of majority-minority
districts on those minorities who were moved, through the redistricting process, from a non-
majority-minority district to a majority-minority district we are able to offer a more precise
test of how these districts affect individual level electoral behavior. We find strong evidence
to suggest that residing in a majority-minority district has little or no effect on African
American voter turnout. In fact, in some cases moving from a non-majority-minority dis-
trict to a majority-minority district results in a decrease in African American voter turnout.
We also examine turnout rates for white voters that are also moved and find similar patterns.
We conclude that while the creation of majority-minority districts has significantly increased
2
representation of minorities in Congress, these special electoral districts appear less effective
at inspiring continued minority involvement in the electoral process - at least for African
American voters.
1 The Voting Rights Act and Minority Participation
The question of does the creation of majority-minority districts increase minority electoral
participation is an important one given the early successes of the 1965 Voting Rights Act
(VRA) at removing the barriers to the electoral participation of racial minorities. Only three
years after the passage of the VRA, black voter registration rates in the South increased by
over 30% and black voter turnout in the South increased by about 18% (Bullock and Gaddie
2009). These increases in turnout were then followed by significant increases in the number of
black elected officials in the South. At the time of the VRA’s passage in 1964, it is estimated
that there were only a few hundred black elected officials in the entire southern United
States, in the eight years following the enforcement of the VRA, however, that number had
increased to nearly 2000 and by the 1990’s the number of black elected officials in the South
had grown to well over 3000 (Bullock and Gaddie 2009).
While the VRA’s initial focus on removing legal and physical barriers to registration
and voting resulted in a significant increase in black electoral participation and descriptive
representation, by the 1980’s, enforcement of anti-discrimination laws under the VRA had
stalled due to the Supreme Court’s ruling in Mobile v. Boldin which established that claims
of racial discrimination under the VRA must prove intent to discriminate on the basis of
race (Issacharoff, Karlan and Pildes 2007). This proved particularly frustrating for many
members of the Civil Rights community who noted that despite significant gains in black
voter registration and an increase in black elected officials, blacks in the South still lagged
significantly behind southern whites in turnout, registration rates, and the proportion of
descriptively similar elected officials.
3
In 1982, however, Congress amended section 2 of the VRA, which removed intent to dis-
criminate as a criterion for proving voting-related discrimination. With the newly amended
VRA and the Supreme Court’s ruling in Thornberg v Gingles in 1986, enforcement of the
VRA began to shift away from a strict focus on legal and physical barriers that suppressed
minority electoral participation to challenges aimed at state and local institutions that di-
luted minority voting strength (Issacharoff, Karlan and Pildes 2007). As a result of this
change to the VRA, many states were required to create majority-minority U.S. Congres-
sional districts in order to achieve preclearance from the Justice Department. The creation
of these districts, following the 1990 census, resulted in a second wave of blacks elected to
the U.S. Congress. From the late 1980’s to the mid-1990’s the percentage of blacks elected
to Congress increased by roughly 80%, with the bulk of the new additions coming from
Southern states.
Despite increasing minority representation in Congress critics have questioned whether
or not majority-minority districts are the most efficient means of providing minority voters
the opportunity to elect candidates of their choice. While many, including the courts, have
interpreted the VRA as justifying proactive steps on the part of the government to increase
minority political participation, others note that majority-minority districts tend to be rather
uncompetitive and might actually have the effect of reducing minority incentives to turnout.
2 Minority Turnout and Majority-Minority Districts
Following the 1990’s redistricting, a significant amount of research has sought to understand
the effects of majority-minority districts on minority voter turnout. Building on research
that seeks to understand how minority empowerment affects minority participation, these
researchers have generally theorized that racial minorities living in majority-minority dis-
tricts will exhibit higher levels of turnout than those who do not. These researchers attribute
this effect to a heightened sense of political empowerment possessed by minorities living in
4
places where they witness higher levels of political power held by members of their racial
in-group, particularly but not exclusively in the form of office holding (Barreto, Segura
and Woods 2004; Bobo and Gilliam 1990; Browning, Marshall and Tabb 1984; Gilliam and
Kaufman 1998; Leighley 2001). The theory goes on to argue that minorities who live in
majority-minority districts are more likely to participate because feelings of racial empower-
ment increase feelings of efficacy, trust in government, and attention to politics. Others have
suggested that mobilization might also play an important role in increasing minority partic-
ipation in majority-minority districts. These authors argue that we might expect minority
participation to increase, since minority candidates may use targeted mobilization efforts
aimed specifically at minority voters (Toure and Hamilton 1992).
While current theory has been devoted to understanding why we might expect an increase
in minority participation, we would argue that there are plausible counter-arguments as
well. Many elections may not be visible enough for minority voters to feel empowered. For
example, the VRA has primarily focused on increasing representation in the U.S. House and
state legislatures. Public ignorance of politics is well documented, and these offices may
not be visible enough to engage citizens’ interest. Moreover, the seats created for Justice
Department preclearance tend to very safe. The lack of competition may work to undermine
voter interest, but also candidates will have little need to expend efforts on mobilization or
voter outreach.
Despite expectations that majority-minority districts increase minority turnout, the em-
pirical evidence has been mixed. One of the earliest attempts at testing the effects of
majority-minority districts was done by Brace et al. (1995) who found little support for
the empowerment hypotheses using both overtime and cross-sectional analysis of precinct
level turnout data from majority-minority precincts that were moved, because of redistrict-
ing, from majority-white districts into majority-minority districts. Similarly, Gay (2001),
who also examines precinct level data finds that residing in a majority-black Congressional
district rarely bolsters black electoral participation. Barreto, Segura and Woods (2004) re-
5

visited the effects of majority-minority districts on turnout question by examining individual
level turnout data collected from Latinos in California. By comparing the voting behavior
of Latinos who live in majority-Latino districts with those Latinos who do not, Barreto,
Segura and Woods (2004) find rather strong support for the idea that majority-minority dis-
tricts have a positive net effect on minority turnout - in their case Latino turnout. Similarly
Washington (2006) aggregates individual level data from across 20 years and hundreds of
elections and also finds modest increases in turnout among African Americans when there
is an African American candidate.
What accounts for the mixed results observed in the extant literature? The literature
itself has already identified one possible reason. Early studies relied on aggregate data, and
aggregate data may mislead due to the well known ecological inference problem. Differences
in voter turnout at aggregate levels are not generalizable to the behavior of actual voters
without running afoul of the ecological inference fallacy. That is we must be careful not
to assume that individual members of a group have the same average characteristics of
the group at large. Inferences about individuals based on aggregates can lead to wildly
incorrect inferences (Goodman 1959; Achen and Shively 1995). Moreover, statistical fixes
for ecological inference errors have limited ability to solve the bias that often results from
aggregation (Tam Cho 1998).
There are, however, more basic reasons for the differences in the existing results. One
is that different researchers have defined the quantity of interest in subtly different ways.
For the sake of brevity we refer to the quantity of interest or the statistical quantity being
estimated as an intervention or the treatment. Primarily researchers have defined the treat-
ment either in terms of majority-minority districts or minority candidates. For example,
Brace et al. (1995) and Barreto, Segura and Woods (2004) define the treatment as residing
in a majority-minority district with one or more minority candidate on the ballot. On the
other hand, Gay (2001) defines the treatment as an African American candidate for the U.S.
House. She pools both candidates from districts created by the VRA and candidates from
6
areas with large black populations. Washington (2006) further pools the treatment to be a
black candidate for the U.S. House, Senate or governor. While Barreto (2007) defines the
treatment as a Hispanic mayoral candidate. Thus some treatments may be stronger than
others and thus easier to detect.
Another reason for differences in the existing empirical results is that none of the existing
work has accounted for selection, the process by which voters are selected for treatment. As
we explore below, there are systematic reasons why we should expect that voters in these
districts differ from voters outside of these districts. Unless we account for such selection
effects, estimates from standard regression models will be biased (Heckman 1979).
Finally, we must account for heterogenous responses to the treatment. That is, when
voters are treated, they must respond in the same way for a statistical model to produce
consistent parameter estimates. One existing study, for example, pools all House, Senate,
and gubernatorial races from 1982 to 2000 (Washington 2006). Here, we have to assume
that response to a House candidate is the same as the response to a Senate candidate. Even
in Barreto, Segura and Woods (2004), where the type of office is constant it is possible
that responses differ across congressional districts. Why does this matter? Least squares
parameter estimates of the treatment effect are directly affected by such heterogeneity. When
there is response heterogeneity, least squares estimates of the treatment effect converge to
a consistently estimated parameter, but this parameter does not represent a meaningful
treatment effect (Angrist and Pischke 2009). With plausible theoretical arguments for and
against the participatory effects of these districts and a number of design issues at stake
considerable attention needs to be paid to the research design, so that a sharp test of the
theory can distinguish between these competing claims. We turn to research design issues
next.
7

3 Research Design
Our basic research question is fairly simple but developing an answer to this question raises
thorny statistical issues. These issues require a carefully developed research design before
we can have much confidence in any answers that we might provide. To understand the
issues that we face, we start with some basic notation.1 Let Di ∈ {0, 1} be an indicator of
treatment that is 1 if the individual is in a majority-minority district and 0 otherwise and
Yi ∈ {0, 1} records whether an individual votes or not. We define the average causal effect as
E[Yi|D = 1]−E[Y|D = 0]. Of course for E[Yi|D = 1]−E[Yi|D = 0] to be a valid estimate of
the causal effect of the treatment Di, we need to be confident that E[Yi|D = 1] = E[Yi|D = 0]
before D = 1 goes in to effect. In our context, we need this to be true before the creation of
a majority-minority district. In other words, we need to identify a good counterfactual for
African American voters in the majority-minority districts, since we know that voters are not
randomly selected to be included in these districts and those selected to be in these districts
may differ systematically from those not included in these districts. Next, we explore why it
is that those moved into these districts may differ from those who are not moved into these
districts.
We know that voters are not assigned to congressional districts at random, and it might
be the case that state legislators draw boundaries to perhaps include African American
subpopulations that are more or less likely to vote. For example, assume state legislators
believe that the creation of a majority-minority district creates a safe Democratic seat while
perhaps making other districts more competitive for Republican candidates. Let’s further
assume that legislators must select one of two counties both of which are 40% black for
inclusion into the majority-minority district. In county 1, African American turnout averages
1Our outline here is based on the potential outcomes framework from the treatment effects literature(Holland 1986; Rubin 1974, 1990). Here, we imagine that for each individual i, there exists a pair ofpotential outcomes: Yi(1) for what would occur if the individual were exposed to the treatment and Yi(0) ifnot exposed. In this framework, we define the causal effect of the treatment as the difference: Yi(1)− Yi(0).The fundamental problem is that we cannot observe both Yi(1) and Yi(0). Instead we must estimate averageeffects of treatments over populations: E[Yi(1)− Yi(0)] or E[Yi|D = 1]− E[Y|D = 0].
8
60% while in county 2 African American turnout averages 40%. If legislators are trying to
create a safe Democratic seat, county 1 is much more likely to be included in the district
rather than county 2 since this will further aid in the creation of the safe Democratic seat.
Selection of this type makes it unlikely that E[Yi|D = 1] = E[Yi|D = 0] holds and thus
invalidates E[Y |D = 1]− E[Y |D = 0] as an estimator of the causal effect.
If we assume that selection has occurred in the process of drawing majority-minority
districts what can we do? First, we must rule out any design that does not have a longitudinal
component. With a longitudinal design, we can at least compare turnout behavior before
the creation of any majority-minority districts in question. This will serve an an important
validity check on our counterfactual. If we find that turnout differed before the treatment
goes into effect, we will need some further adjustment strategy.
One possibility is to collect data on (pre-treatment) variables that potentially confound
treatment status and the outcome. One might use this data with either matching estimators
or regression models to adjust for these confounders. Once the observed differences (in these
confounders) between the treatment and control groups have been taken into account, we
can estimate causal effects. For this strategy to work, requires an additional assumption
that is sometimes referred to as “selection on observables” (Barnow, Cain and Goldberger
1980).2 Under this assumption, the researcher asserts that all relevant variables that predict
treatment are observed by the researcher. In statistical terms, we must assume that we have
perfectly specified models for both turnout and selection into the treatment. Undoubtedly,
this is a very strong assumption that we wouldn’t expect to be true in general. We exploit
the redistricting process after the 2000 Census as strategy for satisfying this assumption.
3.1 Redistricting
By exploiting the redistricting process, we can build a more credible research design. That
is our research design will be based on a simple comparison created by redistricting: we will
2Other names for this assumption include “conditional ignorability” and “ignorable treatment assign-ment.”
9
compare African American voters that after the 2000 Census are moved into a majority-
minority district to African American voters that remain with a white Member of Congress.
Redistricting provides us with a number of advantages. First, when analysts believe that
selection has occurred and wish to account for it, they must ask themselves who are the
decision makers in charge of selection and what criteria did they use in the selection process
(Rubin 2008)? In the redistricting process, we are able to identify the decision makers in
the selection process as state legislators. Moreover, we can know the criteria by which state
legislators select geographic areas into Congressional districts. That is state legislators have
access to census data on measures like race, education and income as well as voter and
election data like registration levels, turnout rates, and vote returns. As such, we have good
reason to believe that the specification of our statistical models will be nearly correct since
we can simply model the selection process that occurs when states redistrict. Moreover,
as Sekhon and Titiunik (2010) note another strength of designs that use redistricting is
that district boundaries are drawn by public officials, not voters. Thus, redistricting shares
an important aspect of experiments: the individuals in charge of assigning treatment are
separate from the population that receives the treatment. As such, while state legislators
rely on observable measures such as as voting shares, past registration figures, and census
variables, they do not consider any individual-level characteristics of voters are not available
to us. Importantly, this implies that unobservables should not play a serious role in the
selection process. In short, redistricting increases the credibility of our design since it gives
us confidence that once we condition or control for observable characteristics, units may be
comparable in terms of their unobservable characteristics as well.
Second, under redistricting we can exactly pinpoint the timing of the process. This
allows us to compare turnout levels between those moved into a majority-minority district
and those left behind before voters are moved. This will allow us to exploit something called
a placebo test to assess the quality of our counterfactual and understand the role of statistical
adjustment in the creation of our counterfactuals. Causal theories do more than predict the
10

presence of an effect; they also predict the absence of an effect in the absence of treatment.
For example, if we compare turnout before redistricting and find that turnout levels differ,
any post-redistricting effects are suspect. Thus, for any statistical model we develop, we
apply it before redistricting occurred to ensure there is no difference between those who
are later moved into the majority-minority district and those that remained behind after
redistricting.
3.2 The Estimand and Other Design Issues
We now address a number of issues that arise both from the use of redistricting and the study
of turnout in majority-minority districts. First, we consider the estimand: the quantity being
estimated in our research design. The estimand depends directly on how we define Di. As we
noted above, definitions of Di have varied significantly in the extant literature. While it may
be possible to separate the effect of African American candidates and whether the district is
majority-minority or nearly majority-minority, we assume the two are fused and impossible to
separate. For our study, the treatment is being moved into a majority-minority district with
a African American candidate for the U.S. House.3 Specifically, we study voters being moved
to a candidate in a district created by the VRA. Formally, Di = 1 for voters that are moved
from a white incumbent to a African American Democrat in a majority-minority district.
The definition of Di is partially motivated by Sekhon and Titiunik (2010) who demonstrate
that research designs based on redistricting require some care. They demonstrate that the
correct comparison is that of those moved by redistricting to those left behind. Under this
design selection on observables will identifying the causal effect. Comparing those already in
an existing district to those moved into the district requires additional assumptions. Thus,
Di = 0 for voters who remain in a district with a white incumbent. Our estimand is somewhat
narrow, but it is also well defined. While we cannot separate the effect of candidate race
3Our treatment is quite similar to that in Barreto, Segura and Woods (2004) except that they also makecomparisons at the level of the state legislature. We only focus on the U.S. House and hold state officesconstant by making sure they match across treated and control.
11
and the racial composition of the district, there is little to be done since the two rarely occur
separately.
One thing we cannot control in our design is the electoral environment that occurs in
the two districts after redistricting. Clearly, the treated voters have been moved to a new
Congressional district while the control voters remain in a different district. We would prefer
the campaigns in the two districts to be identically competitive in terms of mobilization and
political interest. The key worry is that a competitive election in the control district may
cause African American voters to turnout at unusually high rates which would then obscure
any increase in turnout by voters that have moved to the uncompetitive district with an
African American candidate. Of course, this problem is endemic to the research question. In
any design, a counterfactual comparison has to be made across two different Congressional
districts where different elections occur simultaneously. In general, we seek to account for
this concern by using areas where voters are moved from one uncompetitive environment to
another. That is, we specifically look for areas where voters move from a district with a white
Republican candidate who wins easily and has done so for sometime. Thus we can contrast
voters facing a white Republican candidate who is expected to win easily with voters who
now have a chance to vote for an African American candidate in an equally uncompetitive
election. Below we provide summaries of the ex-post electoral environment for each area
that we study.
In some cases we will compare voters from entire counties that are moved into a majority-
minority district to voters in counties that were not moved. In other instances, we will focus
on a single county where some precincts from that county are moved from a district with
a white candidate to a majority-minority district with a African American candidate. We
designate this second design as a within-county design since county is held constant. Where
possible, we attempt to use within-county designs. That is we attempt to hold county
constant if possible. The reason we prefer the within-county design is that in many states,
including the two we examine, election administration is done by county governments. Thus
12

some county governments may make it more difficult or easier to vote depending on the
number of polling locations used or the number of voting machines at each polling location.
In the within-county design, factors of this type will be held constant.
Finally, we must account for heterogenous treatment effects. That is it might be the
case that the effect of African American representation in majority-minority districts differs
from district to district. For example, it may be the case that in urban areas with higher
levels of socio-economic status, African American voters are more likely to be empowered
by this new form of representation. We account for heterogeneity by looking at districts in
separate analyses. We are unable to examine every district, but we select a representative
set of districts for our study. We now turn to the states and districts that we selected for
our investigation.
3.3 Redistricting Case Selection
Data availability for the majority-minority districts created after the 1990 census is poor. To
that end, we focus on voters that are moved into these existing districts after the 2000 census.
While we cannot, then, directly examine behavior after the creation of these districts, if the
empowerment theory holds that should not matter. Table 1 contains a list of the districts
that were created after the 1990 census along with descriptive measures from the 2000 census.
As we outline below, we focus on districts in Georgia and North Carolina. We found data
availability and reliability to be highest in these two states. These states also allowed us to
examine districts that range from rural and suburban to urban.
3.3.1 North Carolina
North Carolina is somewhat famous or perhaps infamous for its redistricting in the 1990’s. In
that decade, North Carolina created two majority-minority districts: the 1st and 12th. The
creation of these districts set off a series of lawsuits that took years to litigate (Issacharoff,
Karlan and Pildes 2007; Bullock and Gaddie 2009). The redistricting process in 2000 created
13
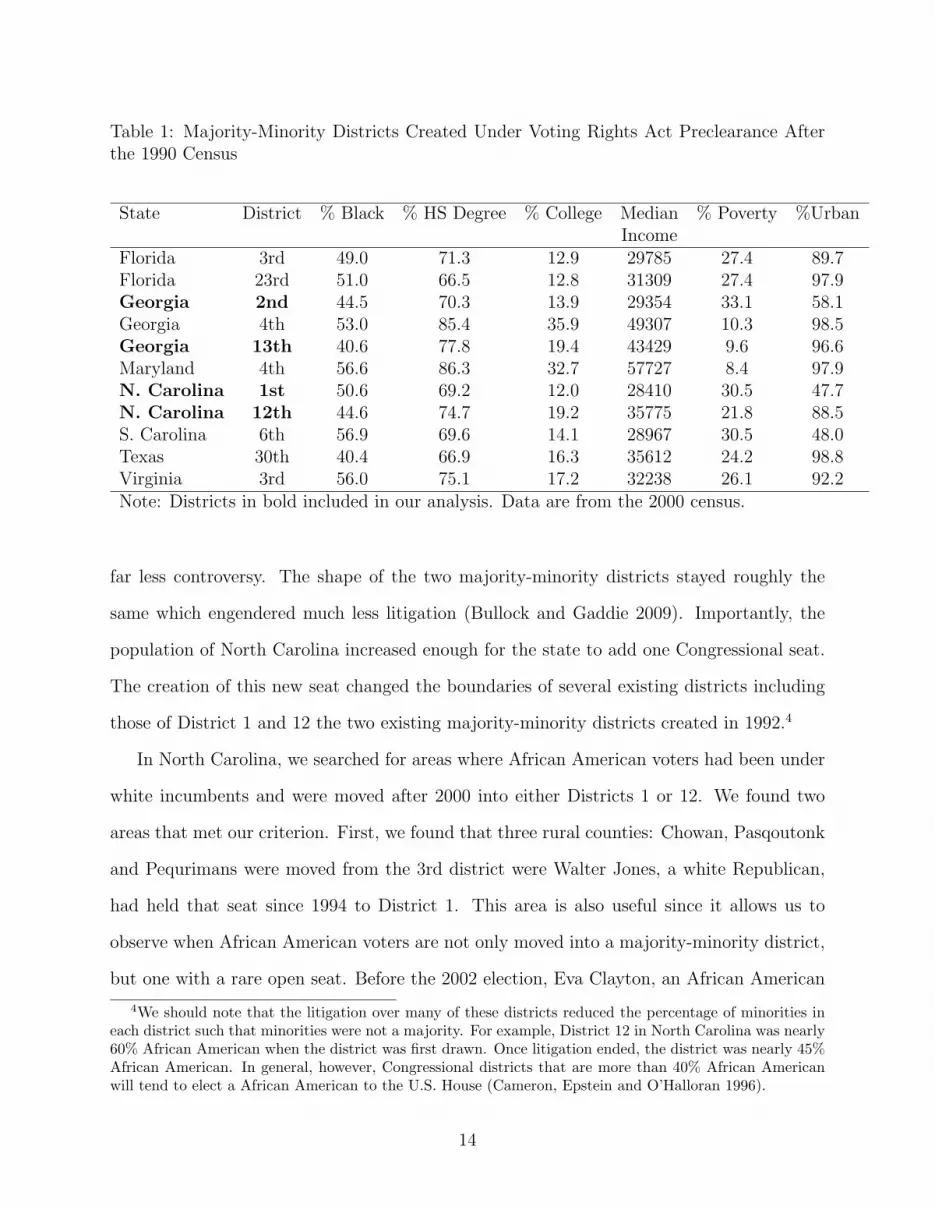
Table 1: Majority-Minority Districts Created Under Voting Rights Act Preclearance Afterthe 1990 Census
State District % Black % HS Degree % College Median % Poverty %UrbanIncome
Florida 3rd 49.0 71.3 12.9 29785 27.4 89.7Florida 23rd 51.0 66.5 12.8 31309 27.4 97.9Georgia 2nd 44.5 70.3 13.9 29354 33.1 58.1Georgia 4th 53.0 85.4 35.9 49307 10.3 98.5Georgia 13th 40.6 77.8 19.4 43429 9.6 96.6Maryland 4th 56.6 86.3 32.7 57727 8.4 97.9N. Carolina 1st 50.6 69.2 12.0 28410 30.5 47.7N. Carolina 12th 44.6 74.7 19.2 35775 21.8 88.5S. Carolina 6th 56.9 69.6 14.1 28967 30.5 48.0Texas 30th 40.4 66.9 16.3 35612 24.2 98.8Virginia 3rd 56.0 75.1 17.2 32238 26.1 92.2Note: Districts in bold included in our analysis. Data are from the 2000 census.
far less controversy. The shape of the two majority-minority districts stayed roughly the
same which engendered much less litigation (Bullock and Gaddie 2009). Importantly, the
population of North Carolina increased enough for the state to add one Congressional seat.
The creation of this new seat changed the boundaries of several existing districts including
those of District 1 and 12 the two existing majority-minority districts created in 1992.4
In North Carolina, we searched for areas where African American voters had been under
white incumbents and were moved after 2000 into either Districts 1 or 12. We found two
areas that met our criterion. First, we found that three rural counties: Chowan, Pasqoutonk
and Pequrimans were moved from the 3rd district were Walter Jones, a white Republican,
had held that seat since 1994 to District 1. This area is also useful since it allows us to
observe when African American voters are not only moved into a majority-minority district,
but one with a rare open seat. Before the 2002 election, Eva Clayton, an African American
4We should note that the litigation over many of these districts reduced the percentage of minorities ineach district such that minorities were not a majority. For example, District 12 in North Carolina was nearly60% African American when the district was first drawn. Once litigation ended, the district was nearly 45%African American. In general, however, Congressional districts that are more than 40% African Americanwill tend to elect a African American to the U.S. House (Cameron, Epstein and O’Halloran 1996).
14

woman, held the seat in District 1 since 1992 announced her retirement. Four different
candidates competed in the Democratic primary in the Spring of 2002. The winner of that
primary, Frank Balance, went on to easily win the seat in the Fall of 2002.5 For this district,
we also include results from the 2002 primary. The second area that we study is around
the city of Winston-Salem. The center of Winston-Salem has been apart of District 12 since
its creation in 1992. Under the 2002 redistricting plan, a number of precincts around the
Winston-Salem urban core were moved from the 5th district to the 12th. The 5th district
seat was held by Richard Burr a white Republican. For this analysis, we are able to restrict
the analysis to Forsyth County and thus it is our preferred within-county design where all
county level variation is held fixed. Note that Winston-Salem has never had an African
American mayor.
Table 2 contains details on the electoral environment in the post-treatment (post-redistricting)
elections in North Carolina for the four districts we use in our analysis. We have nearly ideal
conditions in 2002, the first election after redistricting. In both cases, the African Ameri-
can voters that do not move to the majority-minority district experience an election where
the Republican incumbent in unopposed. The only instance where the control voters face a
competitive environment are in 2004 and 2006 when the seat is open in the 5th District. The
Republican wins but not by huge margins–nine and seven points respectively. Interestingly,
however, the Democratic challenger in these elections spends very little, which suggests that
large scale mobilization probably did not occur. Moreover, the African American candidate,
Mel Watt, spends more than half a million dollars despite vote margins of more than fifteen
points. Thus mobilization may have occurred in that district.
3.3.2 Georgia
Georgia already had a majority-minority district before 1992. Redistricting after 1990 added
the 2nd and 4th as majority-minority districts. Georgia gained 2 Congressional seats after
5Frank Balance, an African American man, later resigned due to criminal charges. His seat was filled ina special election by G. K. Butterfield who has held the seat ever since
15

Table 2: NC Districts Post-Redistricting Profile and Environment
Case 1 Case 2Treated Control Treated Control
Moved To Remained In Moved To Remained InDistrict 1 3 12 5Party Dem Rep Dem RepFirst Election in New District 2002 2002 2002 20022002 Vote Share 64% 100% 65% 100%2004 Vote Share 65% 71% 67% 59%2006 Vote Share 100% 69% 57% 57%2002 Campaign Spending .626 .462 .358 .4202002 Opponent Campaign Spending .012 0 .003 .0122004 Campaign Spending .422 .639 .579 1.12004 Opponent Campaign Spending .039 .012 .105 .3832006 Campaign Spending .387 .553 .503 1.42006 Opponent Campaign Spending 0 .065 .442 .139
Note: Spending in millions of dollars. Spending data from Center for Responsive Politics. Openseat in District 1 in 2002. Open seat in District 5 in 2004.
the 2000 census, and one of these newly created districts, the 13th, was drawn to be nearly
majority-minority. The seat in the 13th district was won by David Scott a black candidate
in 2002. This district was largely created from parts of the three existing majority-minority
districts. Georgia, like Texas, redistricted twice after the 2000 census. The first redistrict-
ing plan was drawn by a Democratically controlled state legislature. In 2002, however, the
Republican party gained control of the state senate and governorship. Then in 2004, the
Republican party captured the state house as well. With both the governorship and legisla-
ture under GOP control, state legislators proceeded to redraw the Democratic map created
in 2002. On May 6, 2005, Governor Perdue signed into law the second redistricting plan
since the 2000 census (Barone, Grant and Ujifusa 2005). This double redistricting received
far less fanfare than the process led by Tom Delay in Texas. Later, we only study voters
that were moved between 2004 and 2006. We do this since we have better data for 2002
than 1998 thus giving us a better placebo test.
We study two of the four majority-minority districts in the state. Again we looked for
16
geographic areas with substantial black populations that were moved from white incumbents
to black incumbents. The large number of existing majority-minority districts made such
areas somewhat rare. That is many of the black voters that make up the newly drawn 13th
district had an African American member of Congress before the 2002 redistricting. In the
end, we examine two different areas. We first study when black voters were moved from
District 8, where Jim Marshall a white Democratic incumbent was targeted by Republicans
and black voters were moved to District 2 a seat held by Sanford Bishop, a black Democrat,
who has held that seat since it was drawn to be a majority-minority district in 1992. We
found only two counties, Peach and Dooley, where African American voters were moved from
areas which had never had a black representative into the 2nd District. Most of the changes
to this district consisted of counties that were moved out of the district in 2002 and then
were moved back in 2006. This was primarily a function of Democrats attempting to make
the 8th District more competitive in their favor and Republicans moving African Americans
back into the 2nd District to shift the map back in their favor for the 2006 election.
We next examine voters who are moved into District 13 represented by David Scott an
African American Democrat in Cobb County after the redistricting in 2005. Cobb County
after the 1990 redistricting process was split between the 6th and 7th Districts and was
represented by Newt Gingrich until a special election in 1999 and Bob Barr another white
Republican. In 2002, state legislators drew the map such that part of Cobb County remained
in the 6th while the rest of the county was split between the 11th represented by longtime
white Republican incumbent Phil Gingrey and the 5th represented by John Lewis an African
American incumbent. The new plan drawn in 2005 left parts of Cobb County split between
the 6th and the 11th districts but added a substantial portion of the county to the 13th
District while the 5th District no longer covered part of the county. In our analysis, we
compare voters in Cobb County who were moved into District 13 but before were part of
either the 6th or 11th before 2005. We exclude any voters that were part of the 5th for
the two elections where the county was included in that district. Using the changes to
17
Cobb County has several advantages. First, it allows us to maintain a within-county design.
The area also represents a place where a suburban county shifted from a primarily white,
conservative area to one with a growing African American population. Finally, we also found
a unique opportunity to control confounding factors via design in Cobb County.
State legislators split a number of precincts in Cobb County when they completed the
redistricting plan in 2005. That is, they split precincts across two of the three Congressional
districts that make up the county. Of these split precincts, we found two precincts that
were split across District 11 where Phil Gingrey the white Republican was the incumbent
and District 13 where David Scott an African American Democrat was the incumbent.6
Thus within these two precincts, some of the voters were in a House district with a white
incumbent and some voters were able to vote for a black candidate for the first time in 2006.
Thus we can compare black voters who were voting at the same location, but some were
given ballots for a white candidate and some for a black candidate. This design allows us to
hold all precinct level covariates constant and as such is even superior to the within county
design as a large number of factors are held constant by the design of the study. For voters
in these precincts, we will simply adjust for the individual level covariates in the voter file.
Table 3 contains details on the electoral environment in the post-treatment (post-redistricting)
elections in Georgia for the four districts we use in our analysis. Here, we are unable to only
compare uncompetitive districts. In one case, voters who were moved to District 2 from Dis-
trict 8 were moved to hurt the electoral prospects of the Democratic incumbent in the 8th.
Thus, in the 8th we might expect mobilization to occur among the African American voters
who were not moved to the African American incumbent. Since the Democratic candidate
was in an extremely competitive election, we must expect some mobilization effort among
African Americans. As such, it is here that we might least expect turnout to be higher
among those moved to the African American candidate. Interestingly in District 13, despite
6Two other precincts were split across these districts as well, but these were precincts that before werepart of the 5th District. Therefore 2006 would not be the first time African American voters had a chanceto vote for an African American candidate.
18

the challenger losing handily, spending by the challenger exceeded spending by the African
American incumbent. For the African American voters who do not move to the 13th, the
challenger there spends a mere $3,000 dollars in 2006 and nothing in 2008. Thus we can be
confident voters in the control district were not mobilized by the challenger there.
Table 3: GA Districts Post-Redistricting Profile and Environment
Case 1 Case 2Treated Control Treated Control
Moved To Remained In Moved To Remained InDistrict 2 8 13 11Party Dem Dem Dem RepFirst Election in New District 2006 2006 2006 20062006 Vote Share 68% 51% 69% 71%2008 Vote Share 69% 57% 69% 68%2006 Campaign Spending .818 1.9 1.2 1.32006 Opponent Campaign Spending .028 2.0 1.3 .0032008 Campaign Spending 1.0 1.8 1.4 1.62008 Opponent Campaign Spending .008 1.2 5.2 0Note: Spending in millions of dollars. Spending data from Center for Responsive Politics.
In sum, we examine four different majority-minority districts each with different overall
profiles. Both District 1 in North Carolina and District 2 in Georgia contain no large
metropolitan areas and are by and large rural districts. The counties in these districts tend to
be poorer and less well-educated than average. The part of District 12 in North Carolina that
we examine mainly encompasses the Winston-Salem metro area, a longstanding Southern
urban area with a core that is predominantly African American. The part of District 13
in Georgia that we examine, Cobb County, is predominantly suburban and has grown more
recently with the rise of Atlanta. Here, the residents are largely well educated with high
incomes. We think these four areas provide a reasonable representation of areas in the South
with African American voting blocs. Table 1 contains a profile of the districts created in
1992 along with the 13th district in Georgia. The data there underscore that the districts
in our study are broadly representative of these districts more generally.
19
In both Georgia and North Carolina precincts, which represent a single polling place, are
the geographic units that are typically shifted in the creation of districts. While many of
the Congressional districts in North Carolina and Georgia comprise entire counties, counties
are often split in the drawing of Congressional districts. When counties are split, they are
almost always split along precinct lines. In both states, we verified that precinct boundaries
did not change as voter were moved from white to black candidates. In many cases, the
precinct identifier in both states is the name of the polling location. This allows us to know
with a high degree of certainty whether polling places remained the same before and after
redistricting thus holding voting costs constant. We also verified precinct boundaries using
maps and GIS software. In Cobb County, we removed a few precincts from the study that
were altered for the 2006 election.
3.4 Mechanisms
Our design is tailored to answer a specific question: does moving African American voters in
the redistricting process into a majority-minority district with an African American candi-
date increase turnout. This design cannot directly shed light on mechanistic questions about
why turnout may or may not increase when these voters are moved. That is, it cannot tell
us whether empowerment or mobilization is at work. In general, we don’t think this is a
flaw, since the estimation of causal effects is hard enough. Moreover, any statistical evidence
about mechanisms would require a new set of stronger assumptions (Imai et al. 2011).
We do believe, however, that with an additional analysis we might be able to provide
some indirect evidence on mechanisms. We would argue a key element in this study is public
awareness. That is, empowerment is unlikely to play a role if African American voters do
not know that they can vote for a representative of the same race. Mobilization might
be the vehicle to raise public awareness, but may not occur since the races are generally
uncompetitive. Thus a basic part of understanding the mechanism is knowing whether
African Americans are either aware of the fact that they live in a district or have been moved
20
to a district with an African American representative. Data from the Black Election Study
in 1996 provides some evidence. In that survey, 78% of respondents were able to correctly
identify the race of their representative when that representative was African American.
When the representative was white, however, 62% are able to correctly identify the race of
the representative. This suggests that generally, African Americans know when they are
represented by another African American. Of course, this survey data tells us nothing about
the voters in our study.
For more direct evidence, we leverage white voters. While we are focusing on how turnout
among African Americans changes after redistricting, of course, a number of white voters
are also moved by redistricting into these majority-minority districts. We expect that whites
moved into a district with a African American representative will feel little empowerment
and may even react negatively due to racial resentment. Thus, for whites, we expect turnout
to either stay constant or decline. If we find that turnout among whites uniformly declines
this suggests that whites are turning out at lower rates given a negative reaction to being
represented by an African American. If we find evidence of a decline in turnout for whites
that would be consistent with past studies (Gay 2001). A decline in turnout among whites
also suggests that whites are aware that they have been moved to a district with an African
American representative. If political awareness is roughly constant across white and African
American voters, this suggests that African American voters should also be aware of the move
to a representative that is African American. In short, if whites appear to react negatively to
being moved to a majority-minority district, we can probably assume that African Americans
are also aware of being moved. If turnout does not increase under this scenario, we can rule
out the empowerment mechanism which also suggests that a lack of mobilization may be to
blame.
21
4 Data
Another advantage of relying on redistricting after 2000 instead of after 1990 when many
majority-minority districts were created is data availability. For the period before and after
2000, we can obtain individual level data on turnout. To avoid an analysis with aggregate
data, we use the voter files from both North Carolina and Georgia. The voter files contain
whether registered voters voted in each election. There are a few other important covariates
in the voter file as well including gender, age, race, and party registration. In all the analyses
that follow, we focus only on citizens in the voter file that are African American and are
registered Democrats as compared to white voters that are registered as either Democrats
or Republicans. Restricting the analysis to Democrats among African Americans reduces
the sample by less than 3%. Use of the voter file, of course, limits our analysis to registered
voters. While this limits our inference somewhat, we think the tradeoff is worth it to avoid
running afoul of the ecological inference problem.
For our analysis, we combined the individual level data in the voter file with two other
data sources at the precinct level. The first data source is Census data from 2000. While
the Census obviously contains many different covariates, we used the following Census mea-
sures: percentage of African Americans, percentage of African Americans that are of voting
age, percentage with a college degree, percentage with a high school degree, percent unem-
ployed, percentage below the poverty level, percentage of housing that is renter occupied,
and median age.7 We also collected precinct level data from both state election boards.
Specifically, precinct level election data allowed us to measure partisan support for Federal
offices, turnout, and the percentage of African Americans that are registered to vote. These
are all measures that we expect state legislators to use when redistricting, thus we seek to
ensure that these measures are comparable across our treated and control groups.
7Census data in 2000 was collected at either the block or blockgroup level. We hired a GIS analyst toeither aggregate the block level data to the precinct geography or estimate precinct level measures fromthe blockgroup since in North Carolina and Georgia precincts typically differ by less than 1% in terms ofpopulation. Thus all census measures were used as precinct level covariates.
22

5 Analysis
We conduct two related but different analyses. We believe that the internal validity of our
estimates increases with each step. In our first analysis, we begin by estimating a precinct
level propensity score. Here, we estimate a logistic regression with Pr(Di = 1) as the outcome
variable and the precinct level Census, election, and turnout measures as predictors. The
voter file provides us with three individual level covariates for adjustment. These covariates
are gender, age, and whether respondents voted in the last two national elections. As we
noted above, race and party identification are held constant by stratification. While we
may not have measures for education or income at the individual level, we argue they are
unnecessary since these measures are simply proxies for past voting behavior.
In this first analysis, we adjust for these measures using a matching estimator. In the
matching analysis, we pay special attention to voter history by matching on it exactly. This
means that people who didn’t vote in last election are exactly matched to citizens who didn’t
vote and vice versa. Since we have voting history for two elections, voters are matched
exactly in a four level combination. Exact matching on past outcomes implies that our
analysis is equivalent to a nonparametric (DID) estimator (Athey and Imbens 2006). We also
stratify the precinct level propensity score and exactly match within these propensity score
categories. This is equivalent to a matching analysis with propensity subclassification (Rubin
2008). That is we compare people within propensity score categories. We use ten propensity
score subclasses, we tend to lose observations as overlap decreases but the bias adjustment
should be greater.8 Here, we rely on genetic matching to form our matched samples (Sekhon
and Diamond 2005; Sekhon 2011). With the matched data, we then estimate the turnout rate
with a regression model adjusting for age and gender with clustering on precincts to account
for within precinct correlations. We implement this analysis, before and after redistricting
occurred. We expect it to return no effect in the election before redistricting. If we fail
8We also used five propensity score subclasses but generally found betters results in terms of the placebotest with ten subclasses.
23
this placebo test, we have decreased confidence in the estimates after redistricting since the
groups were not comparable before the treatment occurred.
Our second analysis is built around the placebo test and has the highest level of internal
validity. Here, we start with a placebo test matching analysis. That is we perform a simple
matching analysis on the last midterm election before voters are moved by redistricting.
Here, we hope to find that the treatment and control groups have identical levels of turnout.
If true we have increased confidence that selection on observables holds since the analysis
passes the placebo test. Because we are using data from the voter file, we can then track the
voters that satisfy the placebo test in the post-treatment elections that is after voters are
moved by redistricting. In this analysis, we limit our inferences to those voters that satisfy
the placebo test and presumably the selection on observables assumption. This also implies
that we have to exclude any voters who registered to vote between these two elections.
For this analysis, we use a simpler matching estimator. Here, we match on age, gender,
voting history and the precinct level propensity score. Again, we exactly match on past
turnout behavior. Often we find that the analysis with all the registered voters does not
satisfy the placebo test; that is pretreatment levels of turnout differed even with our ad-
justments via matching. When this occurs, we search for a subset of voters for whom the
placebo test holds. We accomplish this by enforcing a caliper on the precinct level propensity
score. A caliper is a matching rule that stipulates that two matched pairs must be some
minimum distance or they will not be matched. Application of a caliper invariably discards
some treated observations. This makes the inference more local but reduces bias in the es-
timated treatment effect if it allows us to pass the placebo test. We enforce the caliper on
the precinct level propensity score, since we know that assignment to treatment is based on
these covariates. We started with a caliper distance of .2 times the standard deviation of the
propensity score; this caliper distance serves as a useful starting point (Rosenbaum 2010).
If we observe no differences in turnout under this caliper distance, we increased the caliper
distance to observe whether we could increase the number of observations used while still
24
maintaing a zero order treatment effect. We iterated this process until we found a caliper
distance that produced a point estimate that passes the placebo test but drops the smallest
number of observations. If a smaller caliper was necessary, we repeated the process until we
found a subset of voters that satisfied the placebo test. Once we have a subset of voters with
identical voting rates before redistricting, we simply track the turnout among this subset of
voters in future elections using χ2 tests to measure statistical significance.
In the appendix, we report unadjusted voter turnout rates for those that were moved
into a majority-minority district by redistricting and those who remained in the existing
district. It is this comparison that represents the correct counterfactual quantity, but it does
not correct for any selection. Conducting this analysis before redistricting occurs forms a
simple placebo test that allows us to understand whether we need to correct for selection.
6 Results
6.1 North Carolina
Table 4 contains estimates in two columns by racial category. We first examine the results
from the placebo test to understand whether our statistical adjustments are successful. For
the placebo test, we wish to do more than simply find an estimate that is not statistically
significant, the closer the estimated difference in turnout is to zero the greater confidence we
have in our adjustments. As we can see in the first row of Table 4, the placebo test results
are better for African Americans than whites. For African Americans, the estimate is less
than a single percentage point, while for whites the difference is one and half percentage
points.
As we mentioned before we might expect this primary to be singularly competitive since
the seat is open and might energize African American voters who have been newly shifted
into District 1. However, we find a large decline in turnout for both racial categories. That
is for African Americans who were moved into District 1, the majority-minority district,
25

turnout was around 13 points lower in both the primary and general election. In the 2004
general, turnout is basically the same for both sets of voters. In 2006, however, African
American turnout in District 1 was again lower by more than five percentage points.
Next, we turn to the longitudinal analysis in Table 5. While this analysis excludes citizens
that registered to vote between 1998 and 2002, it allows us to exactly track voters who voted
at similar rates before redistricting. The general pattern from the previous analysis repeats
itself. In 1998, we observe a difference of around one percentage point that is not statistically
significant for African Americans and less than a half a percentage point for whites. When
we recalculate the turnout rate for this same subset of voters in 2002, where the treated
voters are now in a majority-minority district with an African American candidate in an
open race, we find that turnout is lower by nearly 12 points and 20 points. Turnout for the
treated voters remains lower in both 2004 and 2006. Thus all the evidence, we have seen so
far indicates that political participation by African American moved to a majority-minority
district actually declines, and the behavior of whites mirrors that of minorities. We next
turn to our second area of analysis in North Carolina.
We repeat the same two analyses for voters in Forsyth county, who were moved from a
Republican in the 5th House District to a African American incumbent in District 12. The
analysis, here, has the advantage of being a within-county design, so all county level factors
related to election administration are held constant. The other key difference between here
and District 1 is that we are now studying an urban area instead of a largely rural area.
Table 6 contains our estimates after we matched on individual level covariates and used
subclassification on the precinct level propensity score. Here, we find our corrections work
better than in District 1. For African Americans, the placebo difference is a tenth of a
percentage point, and for whites the placebo difference is less than a percentage point.
The results do differ between racial categories. For African Americans, we find very little
difference between the controls who stayed with a white candidate and the treated units
that moved to an African American candidate. In each election between 2002 and 2006,
26
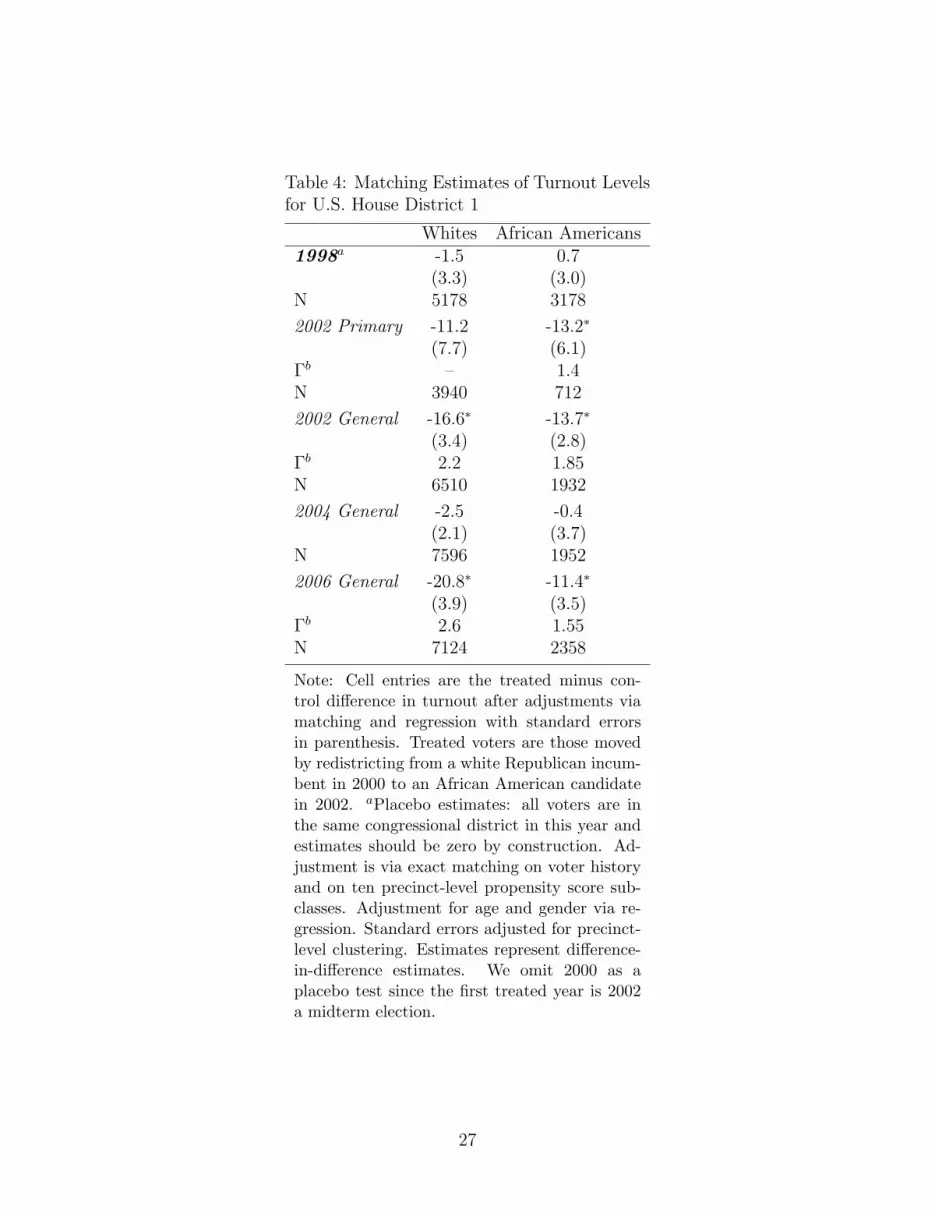
Table 4: Matching Estimates of Turnout Levelsfor U.S. House District 1
Whites African Americans1998a -1.5 0.7
(3.3) (3.0)N 5178 3178
2002 Primary -11.2 -13.2∗
(7.7) (6.1)Γb – 1.4N 3940 712
2002 General -16.6∗ -13.7∗
(3.4) (2.8)Γb 2.2 1.85N 6510 1932
2004 General -2.5 -0.4(2.1) (3.7)
N 7596 1952
2006 General -20.8∗ -11.4∗
(3.9) (3.5)Γb 2.6 1.55N 7124 2358
Note: Cell entries are the treated minus con-trol difference in turnout after adjustments viamatching and regression with standard errorsin parenthesis. Treated voters are those movedby redistricting from a white Republican incum-bent in 2000 to an African American candidatein 2002. aPlacebo estimates: all voters are inthe same congressional district in this year andestimates should be zero by construction. Ad-justment is via exact matching on voter historyand on ten precinct-level propensity score sub-classes. Adjustment for age and gender via re-gression. Standard errors adjusted for precinct-level clustering. Estimates represent difference-in-difference estimates. We omit 2000 as aplacebo test since the first treated year is 2002a midterm election.
27

Table 5: Turnout for Elections in U.S. House District 1 Among Voters With Identical Voting Ratesin 1998
African American Voters1998a 2002 Primary 2002 General 2004 2006
Control Treated Control Treated Control Treated Control Treated Control Treated63.6 62.5 48.2 36.7 68.5 54.6 80.0 74.6 57.0 46.7
Difference Difference Difference Difference Difference-1.1 -11.5 -13.9 -5.4 -10.3
χ2 0.34 21.59∗ 50.29∗ 10.42∗ 25.89∗
White Voters1998a 2002 Primary 2002 General 2004 2006
Control Treated Control Treated Control Treated Control Treated Control Treated64.7 64.9 66.4 46.4 72.2 64.2 81.3 82.4 62.2 48.3
Difference Difference Difference Difference Difference0.2 -20.0 -8.0 1.1 -13.9
χ2 0.023 117.7∗ 34.73∗ 0.97 25.89∗
Note: Cell entries are the estimated turnout percentage in treatment and control groups. Treated votersare those moved by redistricting from a white Republican incumbent in 2000 to an African Americancandidate in 2002. aPlacebo estimates: all voters are in the same congressional district in this year andestimates should be zero by construction. Adjustment in 1998 analysis is via exact matching on voterhistory, age, gender, and precinct-level propensity score with caliper applied. We then track the sameset of voters from 1998 through subsequent elections. That is, we track the turnout rates for voters withidentical voting rates in 1998* p-value < 0.01
28

Table 6: The Effect of House Candidate Raceand Redistricting in U.S. House District 12
Whites African Americans1998a -0.8 -0.1
(2.6) (2.3)N 1174 1024
2002 General -3.4 0.1(22.3) (3.3)
N 1276 1074
2004 General -2.9 -0.4(3.1) (4.3)
N 2232 1370
2006 General -8.6 0.06(5.7) (2.3)
N 2386 1592
Note: Cell entries are the treated minus con-trol difference in turnout after adjustments viamatching and regression with standard errorsin parenthesis. Treated voters are those movedby redistricting from a white Republican incum-bent in 2000 to an African American incumbentin 2002. aPlacebo estimates: all precincts are inthe same congressional district in this year andestimates should be zero by construction. Ad-justment is via exact matching on voter historyand on ten precinct-level propensity score sub-classes. Adjustment for age and gender via re-gression. Standard errors adjusted for precinct-level clustering. Estimates represent difference-in-difference estimates. We omit 2000 as aplacebo test since the first treated year is 2002a midterm election.
29
the estimated difference never exceeds half of a percentage point. For whites, however,
the differences are clearly negative in the post-treatment period, though these do not reach
statistical significant once we adjust for clustering.
Table 7 contains estimates for the voters that we tracked from 1998 to subsequent elec-
tions. First, we review results for African American voters. In 2002, the placebo difference
is mere tenth of a percentage point. In 2004 and 2006, we observe minor differences that are
not statistically significant. Thus the pattern for voters moved to District 12 differs from
that of voters moved into District 1. Here, we find that when African American voters are
moved into a majority-minority district with an African American candidate little changes in
terms of turnout behavior. Once we adjust for selection, turnout levels stay constant despite
being moved into a majority-minority district. The difference in the results suggest that our
concerns about treatment heterogeneity were justified. That is the effect may differ from
place to place. For white voters, there is little evidence of any change since subsequent esti-
mates are quite close to the estimate placebo difference. These results suggest little change
occurred among white voters. We now turn to Georgia to further understand this process.
6.2 Georgia
We begin with the results from the 2nd House District in Georgia. Like District 1 in North
Carolina, this congressional district is either rural or made up of small towns. As we men-
tioned earlier, we rely on the second redistricting in Georgia. Thus, we use results from 2002
as our placebo estimates. That is we compare voters who were moved to an African American
candidate in 2006 and had been able to vote for an African American House representative
at anytime before then. We were careful to not include any areas that were moved to an
African American member of Congress in 2002, but were then moved out of that district in
2005. Here, we examine voters that were moved from a white Democratic incumbent to an
African American incumbent.
Table 8 contains estimates for voters in both racial categories. Readers should note that
30
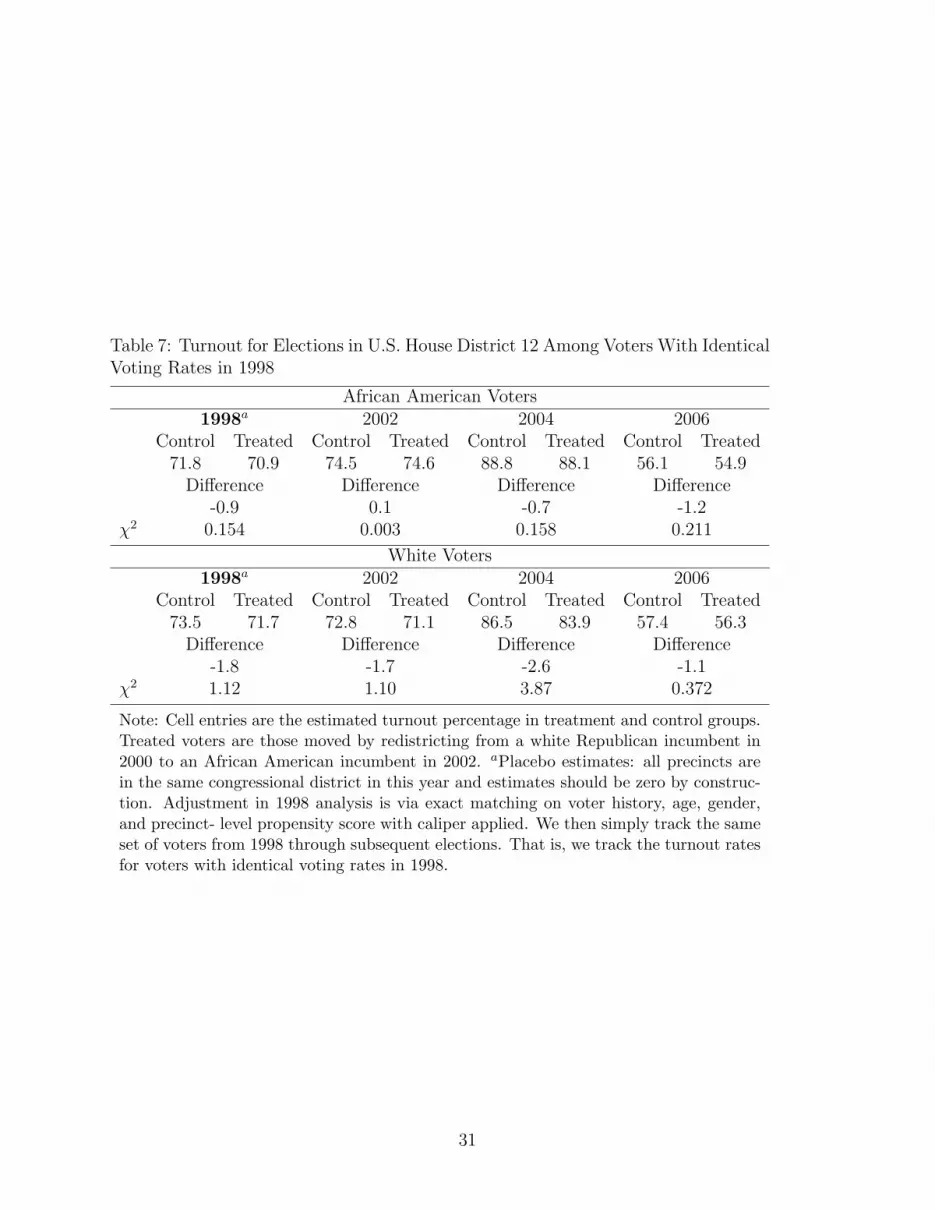
Table 7: Turnout for Elections in U.S. House District 12 Among Voters With IdenticalVoting Rates in 1998
African American Voters1998a 2002 2004 2006
Control Treated Control Treated Control Treated Control Treated71.8 70.9 74.5 74.6 88.8 88.1 56.1 54.9
Difference Difference Difference Difference-0.9 0.1 -0.7 -1.2
χ2 0.154 0.003 0.158 0.211
White Voters1998a 2002 2004 2006
Control Treated Control Treated Control Treated Control Treated73.5 71.7 72.8 71.1 86.5 83.9 57.4 56.3
Difference Difference Difference Difference-1.8 -1.7 -2.6 -1.1
χ2 1.12 1.10 3.87 0.372
Note: Cell entries are the estimated turnout percentage in treatment and control groups.Treated voters are those moved by redistricting from a white Republican incumbent in2000 to an African American incumbent in 2002. aPlacebo estimates: all precincts arein the same congressional district in this year and estimates should be zero by construc-tion. Adjustment in 1998 analysis is via exact matching on voter history, age, gender,and precinct- level propensity score with caliper applied. We then simply track the sameset of voters from 1998 through subsequent elections. That is, we track the turnout ratesfor voters with identical voting rates in 1998.
31

turnout in 2008 was very high among African Americans undoubtedly due to the presence
of Obama on the ballot. We find this is true in all the results we present. Given that
the presence of Obama was constant across all states this should not bias our estimates.
First, we review results for African Americans. Strictly speaking, we pass the placebo test
in 2002 since the estimates are not statistically significant, but the point estimate is fairly
large at 3.8 percent. Given this poor result, we also estimated a placebo test for 2004.
In 2004, the placebo results are much better with estimated differences of less than one
percent. This implies that we should have greater faith in the estimates for 2008 than 2006.
Here, we do observe a small increase in turnout in 2006; it is over three percentage points.
In both cases, we cannot rule out that zero is contained within a 95% confidence interval.
In 2008, we observe that turnout for those moved is lower relative to those that were not
moved. Thus we see some weak evidence for an increase in turnout due to voters moving
to a majority-minority district. Whatever increase we observe, however, it appears to be
temporary. Moreover, in 2008 when the estimates pass a placebo test, we observe a decline
in turnout among the treated. For whites, the placebo difference again is rather large at
just under two percentage points. The estimates in 2006 and 2008 are negative but small in
magnitude and are small relative to their estimated standard errors.
Table 9 contains the results from our longitudinal analysis. The pattern here is nearly
identical to that in Table 8. For African Americans, the results from the placebo test are
improved but not perfect as we observed a difference of 1.2 percentage points. In 2006,
however, turnout increases just over seven percentage points. Importantly, this is the first
evidence we have found of an increase in turnout for voters moved to an African American
candidate. In 2008, however, turnout in the treatment group is lower by one percentage
point. Thus, the increase we observed in 2006 appears to be temporary. For white voters,
the placebo difference is improved at half a percentage point. We find no evidence of change
in post-treatment elections as both differences are small and not statistically significant.
Finally, we present the results from Cobb County. Cobb County forms a fourth type
32
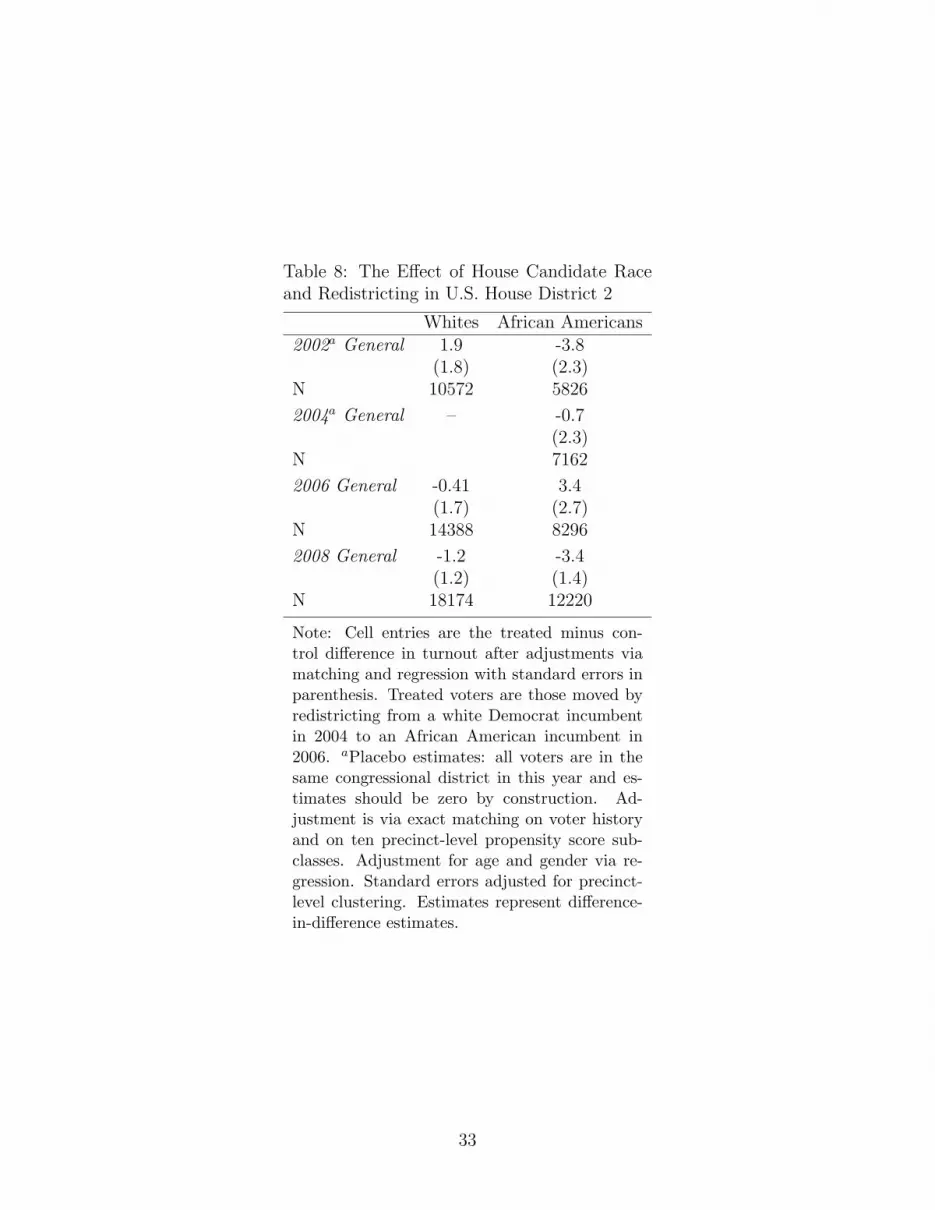
Table 8: The Effect of House Candidate Raceand Redistricting in U.S. House District 2
Whites African Americans2002a General 1.9 -3.8
(1.8) (2.3)N 10572 5826
2004a General – -0.7(2.3)
N 7162
2006 General -0.41 3.4(1.7) (2.7)
N 14388 8296
2008 General -1.2 -3.4(1.2) (1.4)
N 18174 12220
Note: Cell entries are the treated minus con-trol difference in turnout after adjustments viamatching and regression with standard errors inparenthesis. Treated voters are those moved byredistricting from a white Democrat incumbentin 2004 to an African American incumbent in2006. aPlacebo estimates: all voters are in thesame congressional district in this year and es-timates should be zero by construction. Ad-justment is via exact matching on voter historyand on ten precinct-level propensity score sub-classes. Adjustment for age and gender via re-gression. Standard errors adjusted for precinct-level clustering. Estimates represent difference-in-difference estimates.
33
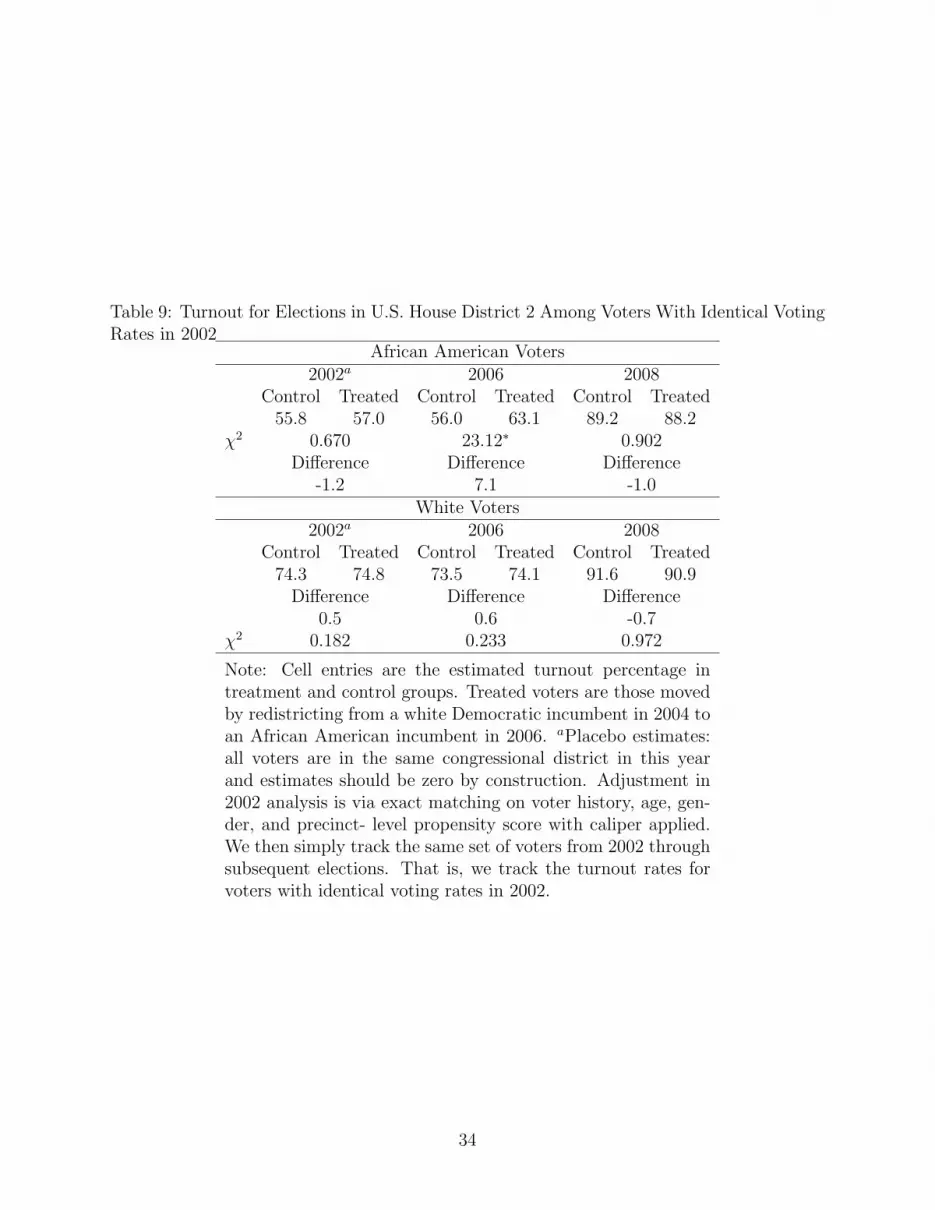
Table 9: Turnout for Elections in U.S. House District 2 Among Voters With Identical VotingRates in 2002
African American Voters2002a 2006 2008
Control Treated Control Treated Control Treated55.8 57.0 56.0 63.1 89.2 88.2
χ2 0.670 23.12∗ 0.902Difference Difference Difference
-1.2 7.1 -1.0White Voters
2002a 2006 2008Control Treated Control Treated Control Treated
74.3 74.8 73.5 74.1 91.6 90.9Difference Difference Difference
0.5 0.6 -0.7χ2 0.182 0.233 0.972
Note: Cell entries are the estimated turnout percentage intreatment and control groups. Treated voters are those movedby redistricting from a white Democratic incumbent in 2004 toan African American incumbent in 2006. aPlacebo estimates:all voters are in the same congressional district in this yearand estimates should be zero by construction. Adjustment in2002 analysis is via exact matching on voter history, age, gen-der, and precinct- level propensity score with caliper applied.We then simply track the same set of voters from 2002 throughsubsequent elections. That is, we track the turnout rates forvoters with identical voting rates in 2002.
34

of geographic area. It is a fast-growing suburb of Atlanta with high levels of education
and income. In the 2000 Census median family income in the county exceeded $67,000
and 28% of residents above the age of 25 had a college degree. Compare that to Dooley
County one of the counties in our District 2 analysis. In Dooley County median income was
just over $35,000 and less than six percent had a college degree. We might expect African
Americans with high levels of SES, as in Cobb County, to respond to the opportunity to
vote for a African American candidate. The analysis, here, again represents our preferred
within-county design. We report two sets of results. First, we report results for the county
as a whole. Second, we report results for the two split precincts, where voters in the same
precinct were in different Congressional districts.
Table 10 contains estimates from our matching estimator for African American voters
in Cobb County. In Cobb County, the placebo results for both racial groups are poor. In
both cases, the pretreatment differences are more than two percent and are statistically
significant for whites. However, given what we observe in 2006 and 2008, we would argue
that we can still reasonably conclude that the move to a majority-minority district did not
increase turnout. That is in 2006, for whites we see a small decline in turnout and for African
Americans a slight increase. In 2008, we observe statistically significant declines of around
three percent for both racial groups. Readers should keep in mind that these matching
estimates are equivalent to difference-in-difference estimates. Thus the point estimates for
2006 and 2008 account for overtime change among the two groups. Thus in 2006 one might
conclude there was a minor uptick in turnout that increase is gone by 2008.
Table 11 contains the results from our longitudinal analysis where the estimates are
generally consistent with those in Table 10. The placebo estimates are slightly improved
from the matched analysis. However, we treat the placebo estimate as a baseline difference
and look for deviations from this baseline. For white voters, we observe a decline in turnout
in 2006 and for African Americans a possible increase, but not one that is statistically
distinguishable from zero. In 2008, we observe a return to the baseline estimate in 2002.
35

Table 10: Matching Estimates ofTurnout Levels for Cobb County
Whites African Americans2002a -2.1∗ -2.7
(0.8) (2.1)N 36568 8124
2006 -1.6 0.9(5.4) (2.1)
N 44086 14334
2008 -2.8∗ -3.3∗
(0.8) (1.3)Γ 1.1 1.2N 56098 22774
Note: Cell entries are the treated mi-nus control difference in turnout afteradjustments via matching and regres-sion with standard errors in parenthe-sis. Treated voters are those moved byredistricting from a white Republicanincumbent in 2004 to an African Amer-ican incumbent in 2006. aPlacebo esti-mates: all voters are in the same con-gressional district in this year and esti-mates should be zero by construction.Adjustment is via exact matching onvoter history and on ten precinct-levelpropensity score subclasses. Adjust-ment for age and gender via regression.Standard errors adjusted for precinct-level clustering. Estimates representdifference-in-difference estimates.
36
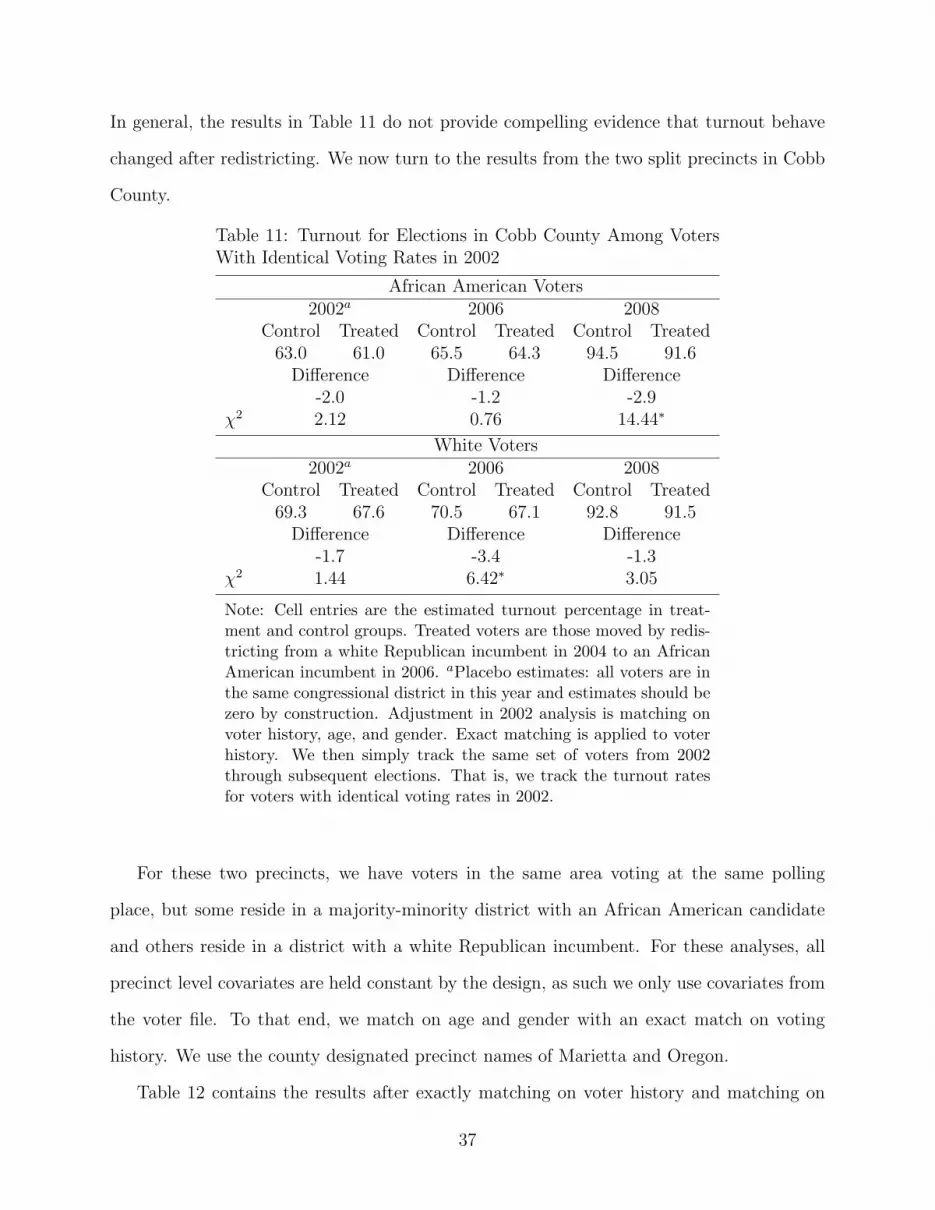
In general, the results in Table 11 do not provide compelling evidence that turnout behave
changed after redistricting. We now turn to the results from the two split precincts in Cobb
County.
Table 11: Turnout for Elections in Cobb County Among VotersWith Identical Voting Rates in 2002
African American Voters2002a 2006 2008
Control Treated Control Treated Control Treated63.0 61.0 65.5 64.3 94.5 91.6
Difference Difference Difference-2.0 -1.2 -2.9
χ2 2.12 0.76 14.44∗
White Voters2002a 2006 2008
Control Treated Control Treated Control Treated69.3 67.6 70.5 67.1 92.8 91.5
Difference Difference Difference-1.7 -3.4 -1.3
χ2 1.44 6.42∗ 3.05
Note: Cell entries are the estimated turnout percentage in treat-ment and control groups. Treated voters are those moved by redis-tricting from a white Republican incumbent in 2004 to an AfricanAmerican incumbent in 2006. aPlacebo estimates: all voters are inthe same congressional district in this year and estimates should bezero by construction. Adjustment in 2002 analysis is matching onvoter history, age, and gender. Exact matching is applied to voterhistory. We then simply track the same set of voters from 2002through subsequent elections. That is, we track the turnout ratesfor voters with identical voting rates in 2002.
For these two precincts, we have voters in the same area voting at the same polling
place, but some reside in a majority-minority district with an African American candidate
and others reside in a district with a white Republican incumbent. For these analyses, all
precinct level covariates are held constant by the design, as such we only use covariates from
the voter file. To that end, we match on age and gender with an exact match on voting
history. We use the county designated precinct names of Marietta and Oregon.
Table 12 contains the results after exactly matching on voter history and matching on
37
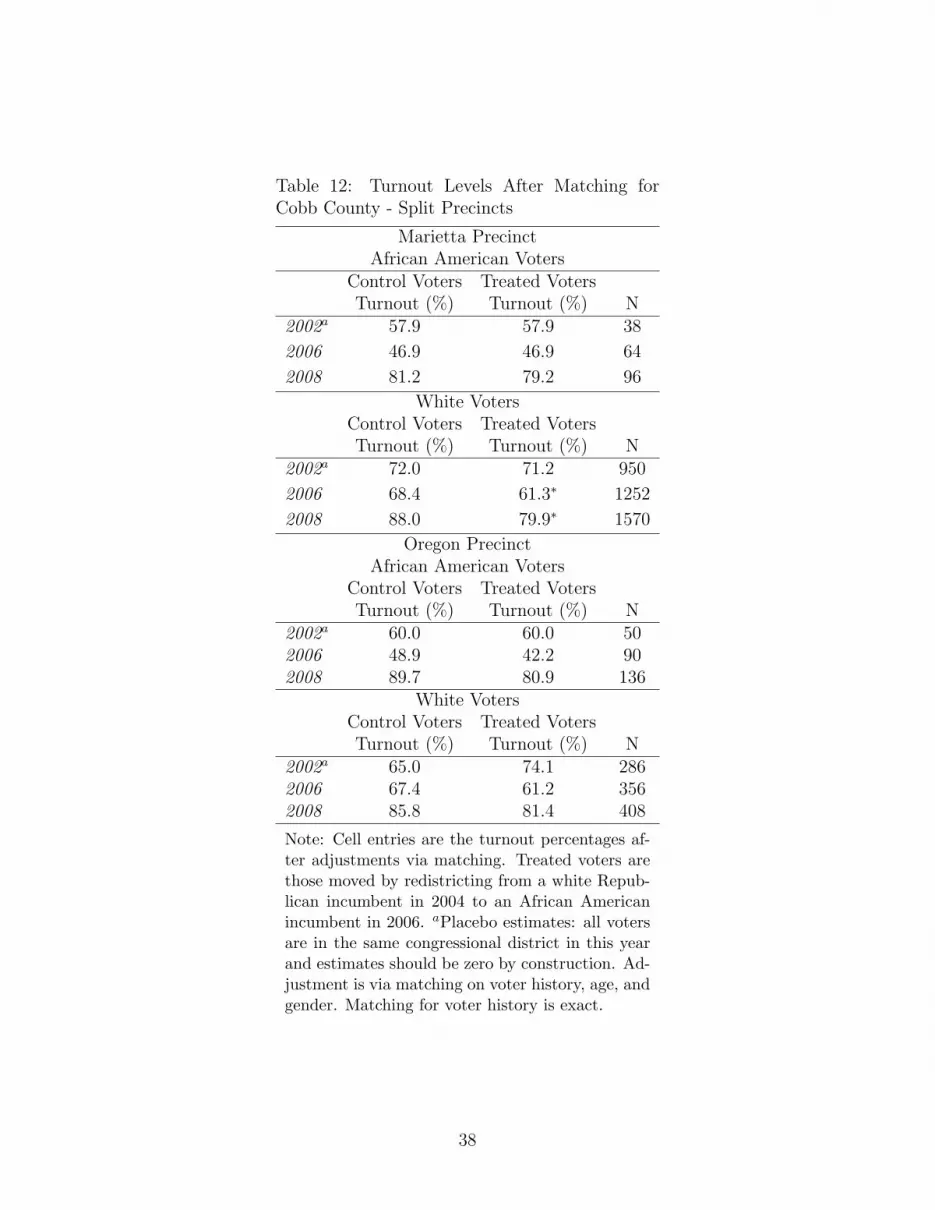
Table 12: Turnout Levels After Matching forCobb County - Split Precincts
Marietta PrecinctAfrican American Voters
Control Voters Treated VotersTurnout (%) Turnout (%) N
2002a 57.9 57.9 38
2006 46.9 46.9 64
2008 81.2 79.2 96
White VotersControl Voters Treated VotersTurnout (%) Turnout (%) N
2002a 72.0 71.2 950
2006 68.4 61.3∗ 1252
2008 88.0 79.9∗ 1570
Oregon PrecinctAfrican American Voters
Control Voters Treated VotersTurnout (%) Turnout (%) N
2002a 60.0 60.0 502006 48.9 42.2 902008 89.7 80.9 136
White VotersControl Voters Treated VotersTurnout (%) Turnout (%) N
2002a 65.0 74.1 2862006 67.4 61.2 3562008 85.8 81.4 408
Note: Cell entries are the turnout percentages af-ter adjustments via matching. Treated voters arethose moved by redistricting from a white Repub-lican incumbent in 2004 to an African Americanincumbent in 2006. aPlacebo estimates: all votersare in the same congressional district in this yearand estimates should be zero by construction. Ad-justment is via matching on voter history, age, andgender. Matching for voter history is exact.
38

age, age-squared, and gender. For African Americans, in both of the split precincts, the
empirical pattern is similar. First, we are able to produce perfect placebo outcomes. That
is voting rates before redistricting were identical. In the Marietta precinct, we observe no
change in 2006 and a slight decline in 2008. In the Oregon precinct, turnout declines in
both subsequent elections. For white voters, the results are quite different in that for both
precincts there is some evidence of a decline in turnout. In the Marietta precinct, the placebo
difference is satisfactory at less than a percentage point. In the Oregon precinct, however,
the placebo difference is quite large, but in both districts we observe large declines in turnout
for both 2006 and 2008. In the Oregon precinct, we see a large reversal as the difference in
2002 is 9.1 points but is -6.2 points in 2006, a substantial reversal, though there isn’t enough
power to rule out the possibility that zero is contained with the confidence interval.
Table 13 contains results from our longitudinal analysis. The pattern, here, is quite clear.
In three of the four analyses, the placebo results are good to excellent with two of them being
exactly zero. In all cases, however, we observe declines of four percentage points or more
in 2006. In 2008, the estimates are split evenly between negative and positive without any
clear pattern. In general, we observe good placebo estimates followed by either a one or two
election decline in turnout rates. There is, however, no evidence of turnout increasing.
7 Omnibus Test
We conduct one final analysis, which serves two purposes. First, we have presented a large
number of estimates and tests across four geographic areas, when we have a general hypothe-
sis that we would like to test. Therefore, it is useful at this point to conduct an omnibus test
that summarizes our results. Second, we have conducted our analyses at the individual level.
The treatment however generally occurs at the precinct level. Though insofar as precincts
are split, the treatment is at the individual level. That said, generally, one could say that
our inferences should occur at a more aggregate level. Here, we perform an omnibus test
39
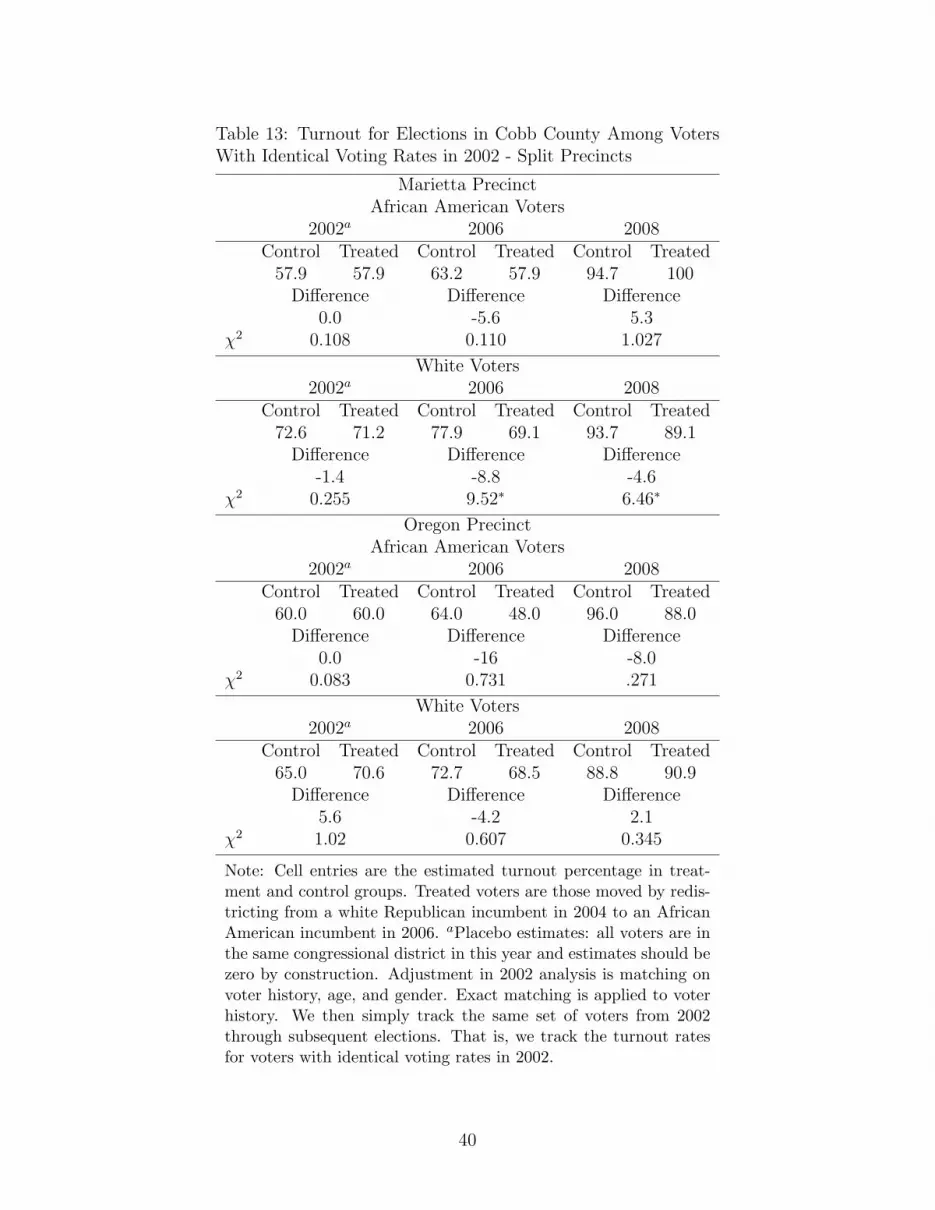
Table 13: Turnout for Elections in Cobb County Among VotersWith Identical Voting Rates in 2002 - Split Precincts
Marietta PrecinctAfrican American Voters
2002a 2006 2008Control Treated Control Treated Control Treated
57.9 57.9 63.2 57.9 94.7 100Difference Difference Difference
0.0 -5.6 5.3χ2 0.108 0.110 1.027
White Voters2002a 2006 2008
Control Treated Control Treated Control Treated72.6 71.2 77.9 69.1 93.7 89.1
Difference Difference Difference-1.4 -8.8 -4.6
χ2 0.255 9.52∗ 6.46∗
Oregon PrecinctAfrican American Voters
2002a 2006 2008Control Treated Control Treated Control Treated
60.0 60.0 64.0 48.0 96.0 88.0Difference Difference Difference
0.0 -16 -8.0χ2 0.083 0.731 .271
White Voters2002a 2006 2008
Control Treated Control Treated Control Treated65.0 70.6 72.7 68.5 88.8 90.9
Difference Difference Difference5.6 -4.2 2.1
χ2 1.02 0.607 0.345
Note: Cell entries are the estimated turnout percentage in treat-ment and control groups. Treated voters are those moved by redis-tricting from a white Republican incumbent in 2004 to an AfricanAmerican incumbent in 2006. aPlacebo estimates: all voters are inthe same congressional district in this year and estimates should bezero by construction. Adjustment in 2002 analysis is matching onvoter history, age, and gender. Exact matching is applied to voterhistory. We then simply track the same set of voters from 2002through subsequent elections. That is, we track the turnout ratesfor voters with identical voting rates in 2002.
40

and account for aggregation with the sign test.9
How does the sign test work? Let us say that the status quo hypothesis is that African
American candidates from VRA created districts increase turnout. To make an inference
about this hypothesis, we can treat each test in our analysis as a trial, and we might infer
that each positive treated minus control difference serves as evidence for the status quo
hypothesis. Under the null hypothesis, however, positive and negative estimated turnout
differences as equally likely. For our total set of tests, we can: ask how likely is it that we
observe this number of positive differences if the null hypothesis is true? Thus we formulate
the following hypotheses about p, the probability of a positive difference for each trial:
H0 : p =1
2vs Ha : p >
1
2
In our analyses, we conducted 15 different tests based on the stratified matching estimator
and 15 different tests based on the longitudinal matching estimator. We count the number
of times, for each estimator, that the difference in turnout percentages is positive. We don’t
record the magnitude of the difference, just whether the difference was positive. Of course,
this feature of the test disadvantages the alternative hypothesis, since any positive difference
no matter how small counts as evidence against the null hypothesis.
We now report what we find starting with results for African Americans. For the strati-
fied matching estimator, we count four positive differences and one that is exactly zero and
is dropped. For the longitudinal matching estimator, we count three positive differences. As-
suming each trial is from a binomial distribution with probability of success equal to 0.5, the
p-value for the two sign tests are .971 and .996, respectively. Thus there is little evidence to
would allow us to reject the null hypothesis. Notably, if we change the alternative hypothesis
to be one where African American candidates from VRA created districts decreases turnout,
9Readers should note that sign test is a special case of the exact binomial test where the probability isfixed at 0.5. This sign test can also be used to test for differences in medians as an alternative to a rankbased test. The trials here are not strictly independent, but we think this still serves as a useful summaryof the overall results.
41
the p-values are 0.089 and 0.018 for the stratified and longitudinal estimators respectively.
Thus we are able to reject the null under this alternative hypothesis in one case and narrowly
avoid rejecting it in another. For whites, the results are even more stark. For the stratified
matching estimator, we count zero positive difference out of 15 tests. For the longitudinal
data, there were 3 positive tests out of 15 tests. Using the sign test, that implies p-values of
1 and 0.99 respectively. If we were to test for a negative effect, our p-values would be 0.000
and 0.018. In sum, the sign test provides little evidence of an increase in turnout and better
evidence for a decrease in turnout.
8 Discussion
We think our study offers both substantive and methodological insights. One methodolog-
ical insight to be drawn from our study is the clear evidence of treatment heterogeneity.
While we generally find no effects, we find a large negative effect in one instance and a small
positive effect in another. As we noted earlier, one existing study pools over 4,000 elections
(Washington 2006). Pooling such a large number of diverse districts and races almost surely
leads to inconsistent estimates. Also it is clear that selection needs to be accounted for when
modeling turnout. Districts are clearly drawn to suit greater political purposes. Thus we
must expect that state legislators will draw districts strategically. If our empirical estimates
do not account for this, we may be misled. While our research here says nothing about how
Hispanics might respond in majority-minority districts, other work using a nearly identi-
cal research design in Hispanic districts finds results consistent with what we present here
(Sekhon, Titiunik and Henderson 2010).
Substantively, we find there is little evidence that the districts created under the VRA
increase turnout. That is, while turnout may have increased when these districts were
created, we, however, find little evidence that turnout increases when African American
voters are moved into the district. What we do observe is that turnout generally declines
42
when white voters are moved into these districts, reflecting perhaps a racial backlash. Why
might African American voters not respond when moved to a majority-minority district
with an African American representative? One reason may be that voters are unaware that
they have been moved into a district that is represented by an African American district.
We would argue that since turnout almost always declines among whites this is unlikely.
That is, unless we think awareness is lower among African Americans than whites there
is little reason to think that whites should respond negatively to being redistricted but
African Americans would be unaware. Moreover, as we noted earlier, in the Black Election
Study a large percentage of respondents can correctly identify the race of their Congressional
representative especially when that representative is African American.
One could perhaps argue that the redistricting process itself depresses turnout. While
that is a possibility, other research has found that turnout does not decline when voters are
moved from one district to another after redistricting (Keele and White N.d.). Our conjecture
is that the lack of competition is the key factor. Without competition, there is no need for
mobilization of voters and little reason for newly imported voters to express themselves
at the polls. While our study cannot distinguish between these different mechanisms, we
believe it does provide strong evidence against the hypothesis that these districts increase
participation. While it is clear these districts help minorities gain office, they do not appear
to increase participation or at least not anymore.
43

References
Achen, Christopher and W. Phillips Shively. 1995. Cross-Level Inference. Chicago: Univer-
sity of Chicago Press.
Angrist, Joshua D. and Jorn-Steffen Pischke. 2009. Mostly Harmless Econometrics. Prince-
ton, NJ: Princeton University Press.
Athey, Susan and Guido W. Imbens. 2006. “Indentification and Inference in Nonlinear
Difference-In-Difference Models.” Econometrica 74(2):431–497.
Barnow, B.S., G.G. Cain and A.S. Goldberger. 1980. Issues in the Analysis of Selectivity
Bias. In Evaluation Studies, ed. E. Stromsdorfer and G. Farkas. Vol. 5 San Francisco, CA:
Sage.
Barone, Michael, Richard Grant and Grant Ujifusa. 2005. The Almanac of American Politics
2006. Washington, D.C.: National Journal.
Barreto, Matt A. 2007. “Si Se Puede! Latino Candidates and the Mobilization of Latino
Voters.” American Political Science Review 101(3):425–441.
Barreto, Matt A., Gary Segura and Nathan Woods. 2004. “The Effects of Overlap-
ping Majority-Minority Districts on Latino Turnout.” American Political Science Review
98(1):65–75.
Bobo, Lawrence and Franklin D. Gilliam. 1990. “Race, Sociopolitical Participation, and
Black Empowerment.” American Political Science Review 84(2):377–393.
Brace, Kimball, Lisa Handley, Richard G. Niemi and Harold W. Stanley. 1995. “Minority
Turnout and the Creation of Majority-Minority Districts.” American Politics Quarterly
23(2):190–203.
44

Browning, R. P., D.R. Marshall and D. H. Tabb. 1984. Protest Is Not Enough: The Strug-
gle for Black and Hispanics for Equality in Urban Politics. Berkeley, CA: University of
California Press.
Bullock, Charles S. and Ronald Keith Gaddie. 2009. The Triumph of Voting Rights in the
South. Norman, OK: University of Oklahoma Press.
Cameron, Charles, David Epstein and Sharyn O’Halloran. 1996. “Do Majority-Minority
Districts Maximize Substantive Black Representation in Congress?” American Political
Science Review 90(4):794–812.
Gay, Claudine. 2001. “The Effect of Black Congressional Representation on Political Partic-
ipation.” American Political Science Review 95(3):589–602.
Gilliam, Franklin D. Jr and Karen M. Kaufman. 1998. “Is There An Empowerment Lifecy-
cle? Long-Term Black Empowerment and Its Influence on Voter Participation in Atlanta,
Cleveland, and Los Angeles.” Urban Affairs Review 33(6):741–766.
Goodman, Leo. 1959. “Some Alternatives to Ecological Correlation.” American Journal of
Sociology 64(6):610–625.
Heckman, James A. 1979. “Sample Selection Bias as a Specification Error.” Econometrica
47:153–161.
Holland, Paul W. 1986. “Statistics and Causal Inference.” Journal of the American Statistical
Association 81:945–960.
Imai, Kosuke, Luke Keele, Dustin Tingley and Teppei Yamamoto. 2011. “Unpacking the
Black Box of Causality.” American Political Science Review Forthcoming.
Issacharoff, Samuel, Pamela S Karlan and Richard H. Pildes. 2007. The Law of Democracy:
Legal Structure of the Political Process. 3rd ed. New York, NY: Foundation Press.
45
Keele, Luke and Ismail White. N.d. “The Role of Information Costs in Voter Turnout.”
Unpublished Manuscript.
Leighley, Jan E. 2001. Strength in Numbers? The Political Mobilization of Racial and Ethnic
Minorities. Princeton, N.J.: Princeton University Press.
Rosenbaum, Paul R. 2010. Design of Observational Studies. New York: Springer-Verlag.
Rubin, Donald B. 1974. “Estimating Causal Effects of Treatments in Randomized and
Nonrandomized Studies.” Journal of Educational Psychology 6:688–701.
Rubin, Donald B. 1990. “Formal Modes of Statistical Inference For Causal Effects.” Journal
of Statistical Planning 25(1):279–292.
Rubin, Donald B. 2008. “For Objective Causal Inference, Design Trumps Analysis.” The
Annals of Applied Statistics 2(3):808–840.
Sekhon, Jasjeet S. 2011. “Multivariate and Propensity Score Matching Software with Au-
tomated Balance Optimization: The Matching Package For R.” Journal of Statistical
Software 42(7):1–52.
Sekhon, Jasjeet S. and Alexis Diamond. 2005. “Genetic Matching for Estimating Causal Ef-
fects.” Unpublished Manuscript. Presented at the Annual Meeting of the Political Method-
ology, Tallahassee, FL.
Sekhon, Jasjeet S. and Rocio Titiunik. 2010. “When Natural Experiments are Neither
Natural Nor Experiments: Lessons from the Use of Redistricting to Estimate the Personal
Vote.” American Political Science Review Forthcoming.
Sekhon, Jasjeet S., Rocio Titiunik and John Henderson. 2010. “Cause or Effect? Turnout
in Majority-Minority Districts.” Unpublished Manuscript.
Tam Cho, Wendy K. 1998. “Iff the Assumption Fits...: A Comment on the King Ecological
Inference Solution.” Political Analysis 7:143–163.
46
Toure, Kwame and Charles Hamilton. 1992. Black Power: The Politics of Liberation in
America. Vintage Books.
Washington, Ebonya. 2006. “How Black Candidates Affect Voter Turnout.” Quarterly Jour-
nal of Economics 121(3):973–998.
47
A Appendix
A.1 Voter Registration Rates
Here, we present one additional analysis. We might also expect that when state legislators
move African American citizens into majority-minority districts that this will attract new
voters. This should be reflected in voter registration rates that is we might expect an influx
of new voters. Of course, a flood of newly registered voters should also be reflected in
turnout rates, which, as we have shown, did not appear to increase. As one final empirical
analysis, we explore whether registration rates might also have been affected by the move
into a majority-minority district. As we outlined earlier, our analysis is based on the so-
called voter file a database which contains records on all citizens that are registered to vote.
The voter file contains data on the date each citizen registered to vote. We calculated the
percentage of registered voters that registered in the year of the election before the closing
date in each state. In North Carolina, the closing date is 25 days before the election. In
Georgia, the closing date is the fifth Monday before the election. As a rule of thumb, we
counted all the voters that registered before October 1st of the election year. Thus we can
observe whether a higher percentage of voters registered right before the first chance to vote
for an African American as compared to areas that were not moved to a majority-minority
district. We present unadjusted estimates, since we have almost no covariates to use for
statistical adjustment. Table 14 contains the results from our analysis. Table reftab:registr
also contains placebo estimates for each area in both states. The placebo estimates are
reasonable close particularly for District 13 in Georgia. In North Carolina, we observe
either a modest increase in registration in 2002, the first year of treatment. In Georgia we
see minor increases, but these increases are also found among control voters. Noticeably,
in 2008 in Georgia, registration rates were higher in majority-minority districts. Perhaps
House candidates led registration drives in concert with the Obama campaign.
48

Table 14: Percentage of Registered Voters Registering in Year of Election
North CarolinaDistrict 1
1998a 2002 2004 2006Control 5.0% 4.1% 4.9% 2.6%Treated 4.2% 4.5% 8.8% 3.1%
District 121998a 2002 2004 2006
Control 5.1% 3.8% 7.9% 4.2%Treated 4.4% 4.1% 6.8% 3.1%
GeorgiaDistrict 2
2002a 2006 2008Control 3.8% 4.9% 17.9%Treated 2.8% 4.9% 23.5%
District 132002a 2006 2008
Control 7.5% 10.2% 18.5%Treated 7.8% 10.3% 21.0%
Note: aPlacebo estimates.
49

B Unadjusted Estimates
Here, we present simply unadjusted turnout rates for the areas in our study. Comparison
between these estimates and our other estimates gives some sense of the magnitude of se-
lection effects. Table 15 contains unadjusted turnout levels for House District 1 in North
Carolina. The control units are voters that remained in District 3 with a white Republican
incumbent. The treated units are voters that were moved from District 3 to the open race
with a African American candidate in District 1. Importantly, Table 15 contains estimates
from before the treated voters were shifted to District 1 by redistricting. These estimates
clearly reveal that the treated voters had substantially lower levels of turnout out before
being moved.
Table 15: Unadjusted Turnout Levels for U.S. House District 1
African American Voters White VotersControl Counties Treated Counties Control Counties Treated Counties
Turnout (%) Turnout (%) Turnout (%) Turnout (%)1998a General 59.8 50.3∗∗ 59.8 61.6∗∗
2000a General 73.4 65.2∗∗ 80.3 77.6∗∗
2002 Primary 43.4 27.5∗∗ 36.0 29.4∗∗
2002 General 61.1 42.4∗∗ 68.1 58.4∗∗
2004 General 73.1 67.6∗∗ 80.0 76.6∗∗
2006 General 45.8 30.6∗∗ 57.1 40.9∗∗
Note: Voters in treated counties were moved by redistricting from white incumbent to open race wonby African American Democrat. Voters in control counties remain with white incumbent. aPlaceboestimates. All counties in same congressional district with white incumbent for these years. Firstelection for which redistricting was effect was 2002.** p-value < 0.01* p-value < 0.05
Table 16 contains the unadjusted estimates before and after redistricting for District 12
in North Carolina. We see that the precincts that were moved into District 12 tended to
vote at lower rates before being moved to the majority-minority district. The difference is
not as large as in District 1 but the differences remain substantial.
Table 17 contains the unadjusted results for House District 2. Surprisingly, the unad-
justed estimates pass the placebo test in 2002. That is the unadjusted difference in voting
50

Table 16: Unadjusted Turnout Levels for U.S. House District 12
African American Voters White VotersControl Precincts Treated Precincts Control Precincts Treated Precincts
Turnout (%) Turnout (%) Turnout (%) Turnout (%)1998a 63.8 56.2∗ 66.9 69.8∗
2000a 77.1 71.3∗ 81.7 81.0
2002 65.7 56.7∗ 67.6 67.7
2004 84.8 74.5∗ 84.5 80.1∗
2006 38.4 28.6∗ 50.8 48.8∗
Note: Voters in treated counties were moved by redistricting from white incumbent to openrace won by African American Democrat. Voters in control counties remain with white in-cumbent. aPlacebo estimates. All voters in same congressional district with white incumbentfor these years. First election for which redistricting was effect was 2002. ** p-value < 0.01* p-value < 0.05
rates was a mere 0.6 of a percent. We next observe that in 2006 turnout did actually increase
for those moved to the majority-minority district. This increase did not last long, however,
as turnout in the control group was actually higher in 2008. The full analysis largely match
the pattern in the unadjusted estimates.
Table 17: Unadjusted Turnout Levels for U.S. House District 2
African American Voters White VotersControl Voters Treated Voters Control Voters Treated VotersTurnout (%) Turnout (%) Turnout (%) Turnout (%)
2002a 58.1 58.7 71.7 75.7∗
2004a 77.6 79.6∗ 87.1 88.3∗
2006 48.9 54.0∗ 64.1 67.5∗
2008 80.9 78.7∗ 83.1 82.6
Note: Voters in treated counties were moved by redistricting from white in-cumbent to open race won by African American Democrat. Voters in controlcounties remain with white incumbent. aPlacebo estimates. All voters in samecongressional district with white incumbent for these years. First election forwhich redistricting was effect was 2002. ** p-value < 0.01* p-value < 0.05
Table 18 contains the unadjusted results for Cobb County. Here, we find that turnout
was lower among treated voters in both 2002 and 2004. While the differences are not large
at three and a half percentage points in 2002 and one and a half percentage points in 2004,
51
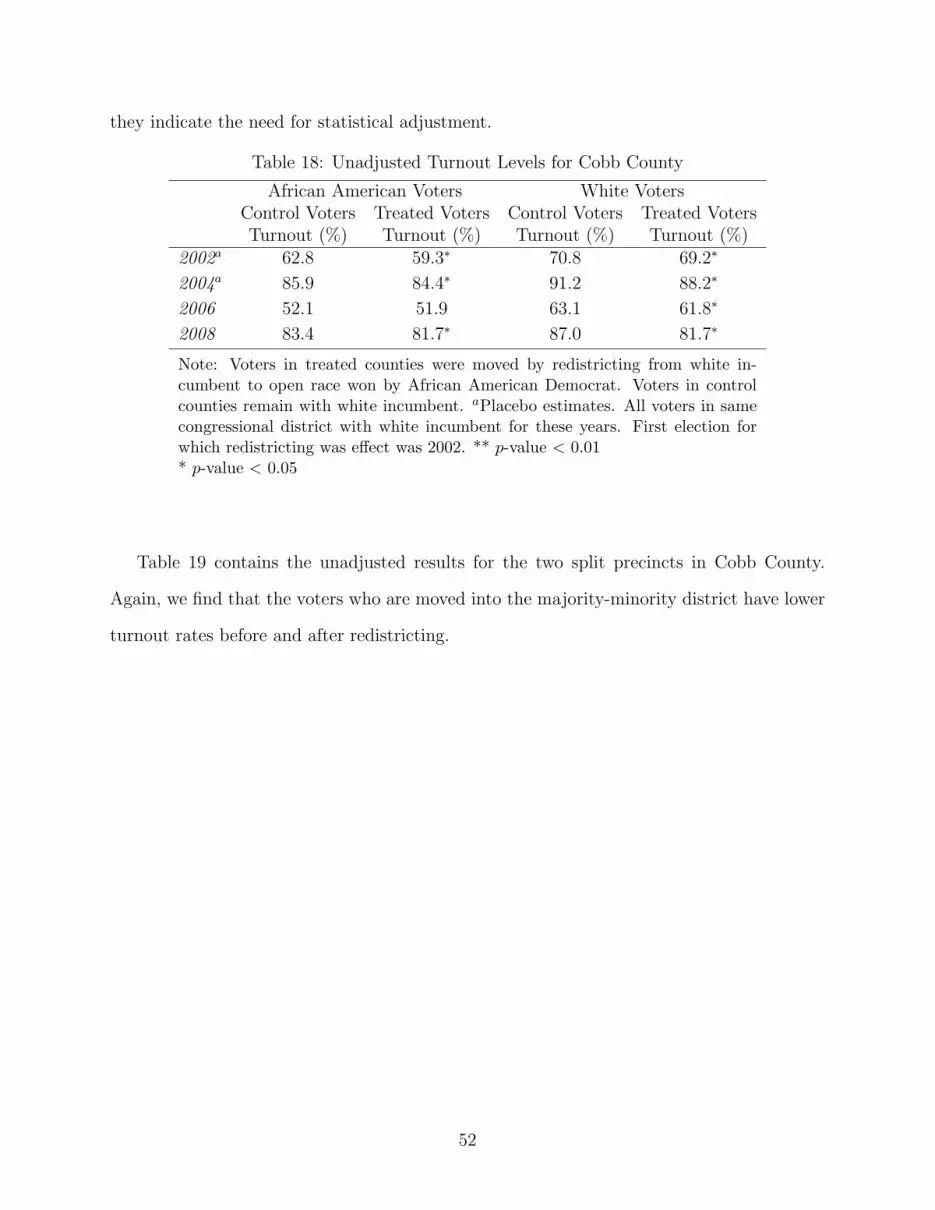
they indicate the need for statistical adjustment.
Table 18: Unadjusted Turnout Levels for Cobb County
African American Voters White VotersControl Voters Treated Voters Control Voters Treated VotersTurnout (%) Turnout (%) Turnout (%) Turnout (%)
2002a 62.8 59.3∗ 70.8 69.2∗
2004a 85.9 84.4∗ 91.2 88.2∗
2006 52.1 51.9 63.1 61.8∗
2008 83.4 81.7∗ 87.0 81.7∗
Note: Voters in treated counties were moved by redistricting from white in-cumbent to open race won by African American Democrat. Voters in controlcounties remain with white incumbent. aPlacebo estimates. All voters in samecongressional district with white incumbent for these years. First election forwhich redistricting was effect was 2002. ** p-value < 0.01* p-value < 0.05
Table 19 contains the unadjusted results for the two split precincts in Cobb County.
Again, we find that the voters who are moved into the majority-minority district have lower
turnout rates before and after redistricting.
52
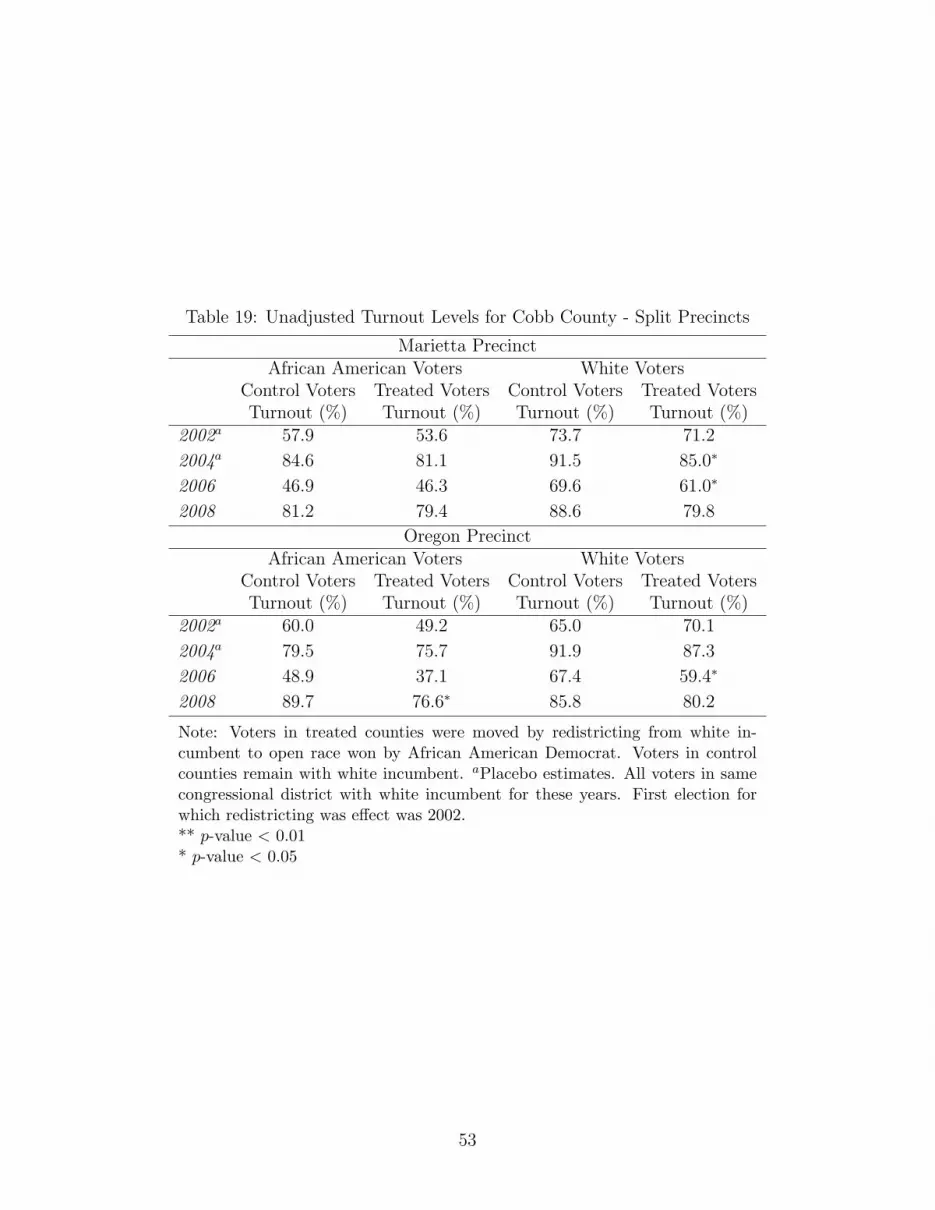
Table 19: Unadjusted Turnout Levels for Cobb County - Split Precincts
Marietta PrecinctAfrican American Voters White Voters
Control Voters Treated Voters Control Voters Treated VotersTurnout (%) Turnout (%) Turnout (%) Turnout (%)
2002a 57.9 53.6 73.7 71.2
2004a 84.6 81.1 91.5 85.0∗
2006 46.9 46.3 69.6 61.0∗
2008 81.2 79.4 88.6 79.8
Oregon PrecinctAfrican American Voters White Voters
Control Voters Treated Voters Control Voters Treated VotersTurnout (%) Turnout (%) Turnout (%) Turnout (%)
2002a 60.0 49.2 65.0 70.1
2004a 79.5 75.7 91.9 87.3
2006 48.9 37.1 67.4 59.4∗
2008 89.7 76.6∗ 85.8 80.2
Note: Voters in treated counties were moved by redistricting from white in-cumbent to open race won by African American Democrat. Voters in controlcounties remain with white incumbent. aPlacebo estimates. All voters in samecongressional district with white incumbent for these years. First election forwhich redistricting was effect was 2002.** p-value < 0.01* p-value < 0.05
53
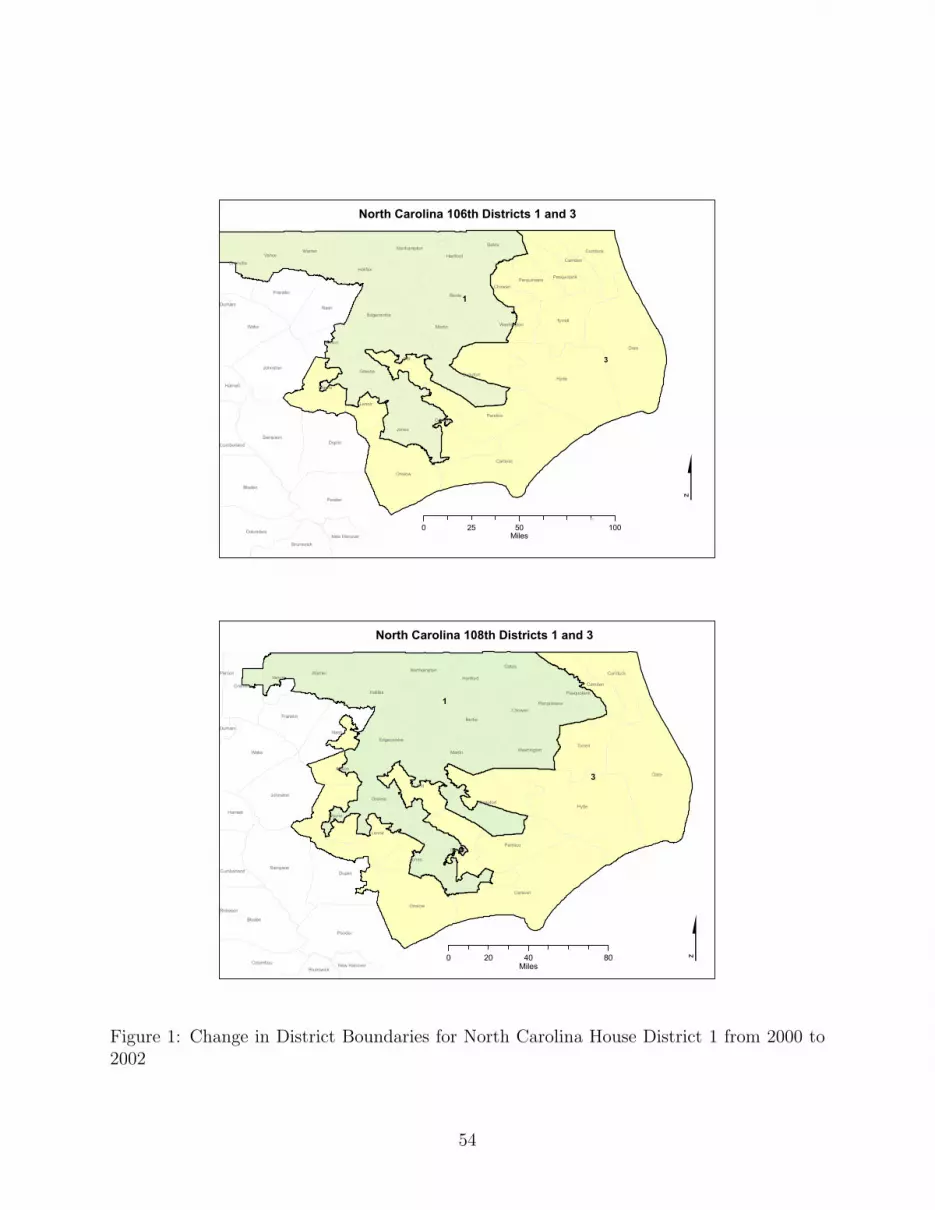
Dare
Hyde
Pitt
Carteret
Duplin
Pender
Bertie
Onslow
Wake
Beaufort
Bladen
Halifax
Craven
Nash
Sampson
Tyrrell
Johnston
Wayne
Jones
Martin
Pamlico
Lenoir
Franklin
Warren
Columbus
CurrituckGates
Granville
Wilson
HertfordVanceNorthampton
Edgecombe
Brunswick
Camden
Washington
Greene
ChowanPerquimans
Harnett
Pasquotank
Cumberland
New Hanover
Durham 1
3
$0 50 10025
Miles
North Carolina 106th Districts 1 and 3
Dare
Hyde
Pitt
Carteret
Duplin
Pender
Bertie
Wake
Onslow
Bladen
Beaufort
Halifax
Craven
Nash
Sampson
Tyrrell
Johnston
Wayne
Jones
Martin
Pamlico
Lenoir
Franklin
Warren
Granville
CurrituckGates
Wilson
Columbus
HertfordVanceNorthampton
Edgecombe
Camden
Washington
Greene
Harnett
ChowanPerquimans
Cumberland
Pasquotank
Brunswick New Hanover
Durham
Person
Robeson
North Carolina 108th Districts 1 and 3
$0 40 8020Miles
1
3
Figure 1: Change in District Boundaries for North Carolina House District 1 from 2000 to2002
54

021111091
073
112
133Forbush
012
092
132
East Bend
122
043
Shoals
031
082
032
063
Midway
Wallburg
042
015
Farmington
081
072
Freeman
131
033
Arcadia
034
709
507
066
Germanton
014
053
013
West Arcadia
055
011
401
083
Smith Grove
075
Mizpah
Gumtree
068
708
051
101
Abbotts Creek
054
065
074
061
071
King West
602505
207
King East
123
605
705
062
908
906
Shady Grove West
201
Walnut Cove West
809
Thomasville 08
304
Oak Ridge 1
206
Shady Grove East
501
506
Pinnacle
052
903
Huntsville
Hillsdale
067
306
204
904
905
Stokesdale
604
806
907
HP 01
Liberty South
808 405
603
Reedy Creek
403
Walnut Cove East
805
305
503
909
302
607
Chestnut Grove
802
North Davidson
064
606
502
801
707807
HP 23
504
404901803
HP 24
601701
804
HP 02
402
HP 15
706 702
HP 22
HP 13
704
205
HP 16
902
203
HP 14
301
703
Deep River South
Deep River North
Mocksville North County
303
HP 25
HP 03
Siloam
HP 21
HP 25
Thomasville 07
Fall Creek North
Pine Hall
HP 12
HP 20A
Oak Ridge 2
Wilson St.
Thomasville 01
Forsyth County
12th District
North Carolina 106th 12th District and Forsyth County
0 5 10Miles
$
5th District
021111091
073
112
133Forbush
012
092
132
East Bend
122
043
Shoals
031
082
032
063
Midway
Wallburg
042
015
Farmington
081
072
Freeman
131
033
Arcadia
034
709
507
066
Germanton
014
053
013
West Arcadia
055
011
401
083
Smith Grove
075
Mizpah
Gumtree
068
708
051
101
Abbotts Creek
054
065
074
061
071
King West
602505
207
King East
123
605
705
062
908
906
Shady Grove West
201
Walnut Cove West
809
Thomasville 08
304
Oak Ridge 1
206
Shady Grove East
501
506
Pinnacle
052
903
Huntsville
Hillsdale
067
306
204
904
905
Stokesdale
604
806
907
HP 01
Liberty South
808 405
603
Reedy Creek
403
Walnut Cove East
805
305
503
909
302
607
Chestnut Grove
802
North Davidson
064
606
502
801
707807
HP 23
504
404901803
HP 24
601701
804
HP 02
402
HP 15
706 702
HP 22
HP 13
704
205
HP 16
902
203
HP 14
301
703
Deep River South
Deep River North
Mocksville North County
303
HP 25
HP 03
Siloam
HP 21
HP 25
Thomasville 07
Fall Creek North
Pine Hall
HP 12
HP 20A
Oak Ridge 2
Wilson St.
Thomasville 01
Forsyth County
12th District
North Carolina 108th 12th District and Forsyth County
0 5 10Miles
$
5th District
55

Laurens
Lee
Dodge
Telfair
Dooly
Sumter
Jones
Talbot
Taylor
Macon
Wilcox
Bibb
Terrell
Marion
Crisp
Monroe
Twiggs
Upson
Pike
Stewart
Harris
Wilkinson
WashingtonMeriwether
Houston
RandolphTurner
Irwin
Crawford
Pulaski
Worth
Baldwin
Ben Hill
Lamar
Hancock
Coffee
Bleckley
Webster
Schley
Wheeler
Peach
Troup
JasperButts
Muscogee
Chattahoochee
Johnson
PutnamSpalding
Jeff Davis
Coweta
DoughertyCalhounClay
Quitman
Glascock
Treutlen
Fayette WarrenHeard
Georgia 108th Districts 2 and 3
$0 25 50
Miles
CD 3
CD 2
Laurens
Lee
Dodge
Telfair
Dooly
Sumter
Jones
Talbot
Taylor
Macon
Washington
Wilcox
Bibb
Marion
Crisp
Monroe
Twiggs
Upson
Terrell
Pike
Wilkinson
Houston
Hancock
Crawford Johnson
Wheeler
Turner
Pulaski
Baldwin
Ben HillJeff Davis
MeriwetherLamar
JasperButts
Bleckley
Worth
Webster
Schley
Peach
Putnam
Treutlen
Spalding
Irwin
Randolph
Jefferson
Montgomery
Coffee
Stewart
GlascockCoweta
Emanuel
WarrenFayette
Harris
Appling
Bacon
Muscogee
Henry Warren
Toombs
Georgia 110th Districts 2 and 3
$0 25 50
Miles
CD 3
CD 2
Figure 2: Change in District Boundaries for House District 2 from 2002 to 2006
56

$
0 7 14Miles
CD 6
CD 11
CD 5
Cobb County
Cobb County Congressional Districts 108th Congress
CD 11
CD 13
CD 6
CD 5
Cobb County Congressional Districts 110th Congress
$
0 7 143.5 Miles
Cobb County
Figure 3: Change in District Boundaries for Cobb County from 2002 to 2006
57


