Embed Size (px)
Citation preview
International Journal of Recent Technology and Engineering (IJRTE)
ISSN: 2277-3878, Volume-8 Issue-4, November 2019
11596
Published By:
Blue Eyes Intelligence Engineering & Sciences Publication
Retrieval Number: D8933118419/2019©BEIESP
DOI:10.35940/ijrte.D8933.118419
Indian Banking Sector a Major Contributor to
Economy: Constancy Major Concern
Namita Rajput, Anil Kumar Goyal
Abstract: Due to an intermediary role of banks in the
economy, they hold a unique locus across all sectors with prudent
lending policies, environmental impact analysis, and efficient
credit approval systems. The banks play a vital role in the lending
process which is dispatched along with the credit risk, that is,
when the borrower fails to repay the money borrowed and fails to
satisfy the obligations, then the asset is said to be bad or Non-
performing. A poor financial performance in an economy creates
a distress in the economic stability leading to an economic crisis.
The banking stability has a direct impact on the real output and
employability which revolves around the financial stability of an
economy. With the global initiatives undertaken, the Reserve
Bank of India (RBI) developed Banking Stability Map and
published the Financial Stability Report in 2010. It is measured
using five dimensions of Stability Map, which are, Soundness(s),
Asset Quality (Q), Profitability (P), Liquidity (L) and Efficiency
(E).With the upsurge in the deteriorating asset quality and the
financial health of banking institutions, lack of adequate fund
and pressure of capital regulation makes the balance of stability
in the Indian banking sector a challenge. The main objective of
the study is to conduct a comprehensive review of all the possible
dimensions of financial stability in the country across the Public
Sector, Private Sector and Foreign Banks through Statistical
tools from a time period of 13 years from 2005-2018. The
statistical data and figures will be beneficial for the upcoming
researchers and policymakers, as it displays an overview of the
banking stability across the three main tiers of the banking world.
Keywords: NPA, Public sector banks, Private Sector Banks,
Foreign Banks, Financial Stability Map
I. INTRODUCTION
Every country‟s main objective is to attain a stable economic
growth which revolves around the financial stability of an
economy. The financial crisis left a strong imprint over the
economy, there were diverse views over the analysis for the
causes and polices to recover, which included the monetary
policy , shadow banking , subprime mortgage market crisis
and Global imbalances. But the main culprit was the banking
sector which contributed to the financial crisis hence banking
sector plays a central role in an economy. International
organizations like World Bank, IMF, BIS and central banks
of many countries took an active participation towards
resolving the global crisis.Historical evidence clarifies that
banking stability affects the financial stability, and has a
strong influence on the real economy in terms of real output
and labor market. So, in order to increase the monitoring and
regulatory norms, banking stability map and indicators were
presented as a yardstick to determine the capacity of an
economy to fight the internal and external shocks. The
Financial stability is achieved through the ambulation of
banking stability, real economy and financial market, where
Revised Manuscript Received on November 15, 2019
Dr Namita Rajput, Principal (OSD), Sri Aurobindo College (E),
University of Delhi, India, Anil Kumar Goyal*, Professor, Rukmini Devi Institute of Advanced
Studies, New Delhi, India,
the banking sector plays a major role. The stability of banks
is depended on the positive and negative externalities from
the financial market and real economy.The Banking stability
is designed and predicted through Banking Stability Map and
Banking stability Indicator. Banking stability shares a
positive correlation with financial stability; therefore, it has a
direct impact over the financial stability. Indian Banking
stability is constructed using the five dimensions of banking
stability indices. The impact of the banking stability can be
studied using CAR framework. The movements in financial
stability can be inferred due to the deterioration of asset
quality.
II. HISTORICAL OUTLOOK
The Financial Crisis that originated in the United States
reached out as a global crisis affecting the economic and
financial performances, after which the policymakers and
experts have developed and are still looking into various
models to identity any early warnings. IMF presented the
Global Financial Stability Map (GFSM) in the Global
Financial Stability Report April 2007 and published the
paper titled “Can you map global financial stability?” in
2010.The report was introduced to foresee the risks and
factors affecting the financial stability in a graphical
manner. The entire monitoring system was enhanced with
GFSM and other financial surveillance in a systematic
way. For the global financial stability assessment there
were two pre requisites to analyze, that is, Judgment and
technical adjustments. The numerical limitation of a
model is taken care by the technical adjustments while
the judgment is related to surveillance and to predict the
location of the risk factors in the map.IMF also developed
EWE (Early Warning Exercise) in collaboration with the
Financial Stability Board. Early Warning List to detect
the associated risks by the EWE rounds. Other Central
Banks are also working towards finding better measures
to maintain banking stability by mitigating risks. Bank of
Canada attempted to develop a tool named “An Index of
Financial Stress for Canada” to determine the
macroeconomic factors causing stress in the form of an
index. But, the financial stability remains in the distress
of the combined from the banking, Forex market and debt
and equity markets. The behavior of these four Markets
reflects the stress in the household sector and non-
financial business sector in Canada.India developed the
Banking Stability Map and Indicators where the first copy
as published in 2010 as Financial Stability Report (FSR)
released by the Reserve Bank of India, which was
enhanced in every subsequent years.
III. REVIEW OF LITERATURE
Indian Banking Sector a Major Contributor to Economy: Constancy Major Concern
11597
Published By:
Blue Eyes Intelligence Engineering & Sciences Publication
Retrieval Number: D8933118419/2019©BEIESP DOI:10.35940/ijrte.D8933.118419
A. Global Context
Salas and Saurina (2002) talk about the bank level
variables which could explain the loan problem in Spain
during 1985- 1997, even after regulating the economic
factors like GDP growth, indebt of family and firm using
the Panel data.
Pain (2003) examined that, the loan problems led to a crisis
in the UK banks during 1978-2000. Using Panel data
regression analysis, it was found that both macroeconomic
factors and Bank specific factors were responsible for the
catastrophe. Macroeconomic factors like real GDP growth
real interest rates and lagged aggregate lending growth and
Bank specific factors like the loan portfolio to be the
determinants.
Shu chang (2002) examines the determinants of the banks
in Hong Kong and the impact of macroeconomic factors.
The paper concluded that the current year increase in equity
prices were found to bring down the NPA level in banks.
Salas and Saurina (2002) investigates the determinants for
bank loan using Panel data across the Spanish Commercial
banks from 1985-97.The paper concluded that if the interest
income falls it gives an incentive for the managers to shift
towards a rescue credit policy which might lead to non-
performing assets in future.
Quagliariello M (2006) highlights that Exim Bank intent to
impose higher credit interest rates which could be charged
for the customers who have low creditworthiness, poses a
shift towards NPLs. A higher lagged ROA can be associated
with higher future non- performing assets.
Alper and Anbar (2011) talked about the determinants of
bank‟s profitability in Turkey for the time period of 2002-
2010. The paper talks about the positive and negative
impacts on the bank profitability via Return on Assets
(ROA) and Return on Equity (ROE). The size of assets and
interest rates had a positive impact on the profitability of
banks whereas the size of loan had a negative impact.
Roman and Danuletiu (2013) studied the factors affecting
profitability of Romanian Commercial Banks from 2003-
2011. The study reveals that the bank specific variables and
external factors affect the profitability, like the assets
quality, liquidity and management in the banks have a
significant impact.
Islam (2014) examined the financial performance of
National Bank Limited Bangladesh for the period 2008-
2013 and divided the study into two sub-periods ranging
from 2008- 2010 and 2011-2013.The study concluded that
management and proper implementation of strategies could
improve the profitability of banks.
Menicucci and Paolucci (2016) studied the relationship
between bank specific factors and profitability from 2009-
2013 for 28 European banks. The study revealed that the
CAR ratio, higher deposit ratio and the bank size are
positively related to the profitability. Mehta and Bhavani
(2017) studied the impact of variables in profitability in 19
banks of UAE from 2006-2013.The results declare that the
Capital Adequacy Ratio and improved asset quality has a
huge impact on profitability of banks. The authors
recommended a profitability enhancing model for better
performance in banks.
Islam and Hasan (2017) studied the performance and
determinants of profitability for commercial banks in
Kosovo. They used ROAE (return on Average Equity),
ROAA (Return on Average Assets and NIM (Net Interest
Margin). It concluded that the internal factors like the asset
quality, Capital adequacy and Management Efficiency
affect the profitability.
Mohamed and Soliman (2017) studied the impact of Basel
III reforms for Egyptian banks. It has been found that there
is a negative impact over the smaller or financially weaker
banks and find it challenging to maintain their pace with
lack of funds.
B. Indian Context
Cowley and Cummins (2005) explained the prominence of
the SARFASI act enacted in 2002.The result unveils the
importance of Securitization on the trajectory of the modern
finance. It is a process which eases the process of liquidity
of illiquid assets. Hence, facilitates risk management and
reduces the liquidity risk.
Gerlach, S., Peng, W.&Shu, C. (2005) concluded that the
NPA ratio surge with bankruptcies and nominal interest rate
but declines with economic growth and the inflation rate.
Mario Castelino (2005) pronounced that the NPAs of the
corporate sector have descended drastically, though there is
a hype of NPAs in the retail sector and also the issue related
to frauds in the mortgage loans.
Chaitalia, RishabBengani and OnkarRedkar (2006)
explained the need for asset reconstruction companies and
analysis of the regulatory framework and various issues
plaguing the system.
Hernando De Soto (2007) states the advantages of
Securitization using SARFASI Act 2002 and compares with
the measures that prevailed before securitization. The
process is preferred to improve capital return, raise finance,
lower risk and manage the mortgage assets, etc.
Jain (2007) explained the reasons for the increasing level of
NPAs and the prudential measures available for the same.
He also stated that the problem for rising NPA is more acute
in PSBs in comparison to Private sector banks.
Sahoo,P. and Nayak (2007) The study gives a conceptual
review of green banking initiatives. The paper concludes by
stating that the firms could attain higher return on
environment friendly projects and banks should go green to
ensure the flow of investment toward greener projects.
Vallabh, Bhatia and Mishra (2007) explored an empirical
graft and study the analysis of NPAs across public, private,
and foreign sector banks in India. The results reveal the
transition of NPAs over the years which can be explained
via macroeconomic factors and bank-specific factors. The
linear relationship among the independent variables was
processed using a test named “Durbin-Watson test” and VIF
characteristic and concluded that public sector banks face
more NPAs than private sector banks.
Karunakar (2008) highlights the concern of lower
profitability due to NPAs and the liability discrepancy
among the banks and the financial sector, which is
dependent upon the risk associated with the management.
The study concludes by advising proper credit assessment
and risk management.
Karunakar and Mrs. K. Vasuki (2008) emphasis on
various theoretical aspects oscillating from the factors
causing NPA, magnitude of NPA and their impact on the
Indian banking system and finally the measures to control
the rise of NPAs.
Rajesham and Rajender (2008) described the causes and
consequences of NPAs in Public Sector Banks. The result of
study showed the efforts
required at the headquarters of
International Journal of Recent Technology and Engineering (IJRTE)
ISSN: 2277-3878, Volume-8 Issue-4, November 2019
11598
Published By:
Blue Eyes Intelligence Engineering & Sciences Publication
Retrieval Number: D8933118419/2019©BEIESP
DOI:10.35940/ijrte.D8933.118419
ministry of finance, RBI and Banks‟s to control the issue. It
also parleys about the opportunity cost between profitability
and social welfare.
Vadrale Kavita (2008) A case study on the green banking
initiatives undertaken by three private and three public
sector banks from 2010-2015. Green Banking Initiatives by
Indian Public and Private sector banks.
Akhan (2009) highlighted the present level of NPAs of
NBFCs and measures to control the same. NBFCs are found
to be performing better in comparison to the Scheduled
Commercial Banks in NPA management.
Dhanda and Rani (2009) presented the status of NPAs in
different segments of public sector banks in India and to
ascertain the relative importance of different causes of
NPAs as per opinion of bank employees.
Uppal (2009) examined the priority sector lending and
targets achieved by various bank groups in 2006 and 2007
of the Indian banking industry. The study resulted that the
public sector banks did not achieve the target due to priority
sector lending process in comparison to the Private and
Foreign Banks.
Bahl S (2012) The Green banking practices via internal and
external process can have a positive impact on the
effectiveness. The results obtained from the primary data
analysis conclude that the level of awareness among the
respondents is quite low.
Rajput, Gupta and Chauhan (2012) studied the
magnitude of NPA in in the Indian banking sector and used
empirical analysis to investigate the relationship between
profitability and NPA. The paper depicts an inverse
relationship of NPA and the profitability of banks.
Selvarajan and Vadivalagan (2012) analyzed the cost and
factors causing non- performing assets in Indian Banks.
And, concluded that the banks have given more loans to the
borrowers and takes appropriate steps to recover the loan
through proper follow up with the borrower.
Asha Singh (2013) observed that the NPA in the public
sector is mounting every year. In contrary to this, the non-
performing assets of private sector banks is plunging
.Generally, the reduction in NPAs shows that banks have
strengthened their credit evaluation process and the
increased NPAs shows the necessity of provisions, which
brings down the overall profitability of banks.
Kumar (2013) in his paper stated that the Non-performing
Assets (NPAs) is a rising problem for the Indian banking
sector for the past years. The major issue in the late 90s
after the economic reforms was the challenging
performance of the Indian banks due to the accretion of
rising NPAs.
Samir and Karma (2013) highlighted the position of NPAs
in selected banks and the policies used by the banks to face
the problem of NPAs particularly in State Bank of India
(SBI), Punjab National Bank (PNB) and Central Bank of
India (CBI). It studied the policies brought in to resolve the
rising issue of NPA from the year 2003 to 2012.
Singh (2013) analyzed the recovery performance of the
Indian banks through various recovery channels. He studied
the factors affected by NPAs like the profitability, capital
adequacy ratio, and employment generation, living standard
of people and income level of the banks.
Devi and Reddy (2014) analyzed the classification of loan
assets in Public Sector Banks to examine the causes and
remedial measures. The study concluded that the amount of
standard assets have shown increasing trend during the
stated time period from 2004 to 2013.
Joseph and Prakash (2014) studied the trend in NPAs
from the year 2008-2013. The study reveals that there are
many internal and external factors found, which affect the
NPAs of the bank. They concluded that NPAs was higher in
the public sector Banks.
Deka G (2015) The study emphasizes on the positive
effects of green banking practices and portrays a complete
analysis of SBI and the level of awareness among customers
in Assam. The study concludes that there is a strong need
for diversification for the green banking initiatives and
guidelines.
Narang D (2015) The study provides detailed analysis of
the green banking initiatives by SBI, PNB, HDFC and
ICICI bank. Banks have paved their way towards a digital
economy by paperless banking.
Barhate, G.H and Tambol M.A. (2016) Green banking is
beneficial for the economy as a whole. Green banking will
guarantee an improvement in asset quality by green
projects. Government should formulate green policy
guidelines by proving financial incentives for going green.
Kumar and Kavita (2017) state that financially strong
banks can cope up with the new international regulations
while weaker banks will pose to face challenges for
maintaining the capital requirements. The study concluded
that a sound banking system is a major concern for
shareholders and bankers else might end up with
bankruptcy.
Laila M (2017) studied about the factors or determinants
responsible for the non- performing loans and how these
factors vary across private, public and foreign banks. He
used the fixed effects model and random effects model to
analyze the difference. He concluded that the average level
of NPA is higher in the public sector banks followed by
private and foreign banks.
Roy and Samanta (2017) find the substantial difference
among the gross Non- performing asset and the Net Non-
Performing Asset position of Public Sector Banks in India.
The paper also endeavors the impact on the net profit of the
selected banks due to GNPA from 2011 to 2016.The study
discloses the declining trend of GNPA of all the banks.
Makkar and Hardeep (2018) measured the profitability of
banks and identified the factors that influence the
profitability of 46 Indian commercial banks from 2001-
2016. The study used various indicators like ROA, liquid
assets to total assets, CAR and Non- performing assets to
total assets for profitability of banks.
Gayathri and Vikram (2018) in their research paper study
the comparative analysis between public and private sector
banks from 2010-2017.The paper concludes from the
analysis that the NPA trend is greater in public sector in
comparison to the Private sector.
C. Gaps in the Literature
After an extensive review of literature, we conclude that no
research has presented extensive wider constraints as far as
the time period is concerned, as well as the number of
banks. This piece of study will give a snapshot of all the
above points and will be a unique study with extensive time
period across all the scheduled commercial banks. Along
with this, it will also highlight the stability indices across all
scheduled commercial banks
with graphical explanation and
extensive comparative analysis
Indian Banking Sector a Major Contributor to Economy: Constancy Major Concern
11599
Published By:
Blue Eyes Intelligence Engineering & Sciences Publication
Retrieval Number: D8933118419/2019©BEIESP DOI:10.35940/ijrte.D8933.118419
under each dimension, which is a road not travelled.
IV. METHODOLOGY
Construction of Banking Stability Map (BSM) and
Indicator
The stability Map and Indicator is constructed using five
stability indices which are named as follows:
Soundness
Asset quality
Profitability
Liquidity and
Efficiency
CAMELS are renowned international rating system to rate
the banking institutions. Points greater than 3 are
considered to be good financial institutes.
Weighted average of each of the ratios for each dimension
given in the following table is used in the assessment. The
weights are based on the CAMELS rating, where each
index lies in range of 0 to 1. The following ratios are used
for the construction of each index. Standardized Ratios are
calculated for Banking Stability Map and Indicator for each
dimension where the weights are based on the CAMEL
rating, which is:
Table: 1 CAMEL Ratings
Standardized Value of particular
Ratio
CAMELS Ratings
1 0-0.2
2 0.2-0.4
3 0.4-0.6
4 0.6-0.8
5 0.8-1.0
The banking stability Indicator is the average of
composite to of all these five dimensions and the banking
stability map is the graphical representation of all the
ratios dimension wise. A strong financial stability will
improve the stability of the bank hence, improving the
capacity to absorb shocks in the economy. In this study,
following dimensions are analysed to calculate the
Financial Stability Indicator of the Indian Scheduled
Commercial banks which is inclusive of the public, sector
Banks, Private Sector Banks and Foreign Banks from
2005-2018.
Table 2 Financial Stability Ratios
DIMENSIO
NS
RATIOS
Soundness CRAR Tier
1Capital/
Tier 2
Capital
Leverage
Ratio
Asset
Quality
Net
NPA/Tot
al
Advances
Gross
NPA/Tot
al
Advances
Sub-
standard
advances/
Gross
NPA
Profitability Return
on
Assets
Net
Interest
Margin
Profit
Liquidity Credit-
Deposit
Ratio
Efficiency Cost/Incom Business Staff
e per
employee
expense/
Total
Expenses
Therefore, the following ratios are healthy for the banks
which are positively correlated and negatively correlated.
The ratios which are positively correlated contribute
towards a healthy banking system, that is, higher the value
better it is.
Table 3 Positive and Negative Correlation of the
Indicators
Positive Correlation Negative Correlation
CAR
Tier I/Tier II Capital
Sub-standard
Advances/Gross NPA
ROA
NIM
Profit
Business per
employee
Credit-Deposit Ratio
Net NPA/Total
Advances
Gross NPA/Total
Advances
Cost to income ratio
Staff expense/Total
expense
V. ANALYSIS AND INTERPRETATION OF THE
DIMENSIONS OF THE STABILITY
INDICES
A. Soundness: The capital adequacy is above the required
regulatory requirements. The CRAR ratios have shown an
edge up after the phased implementation of Basel III
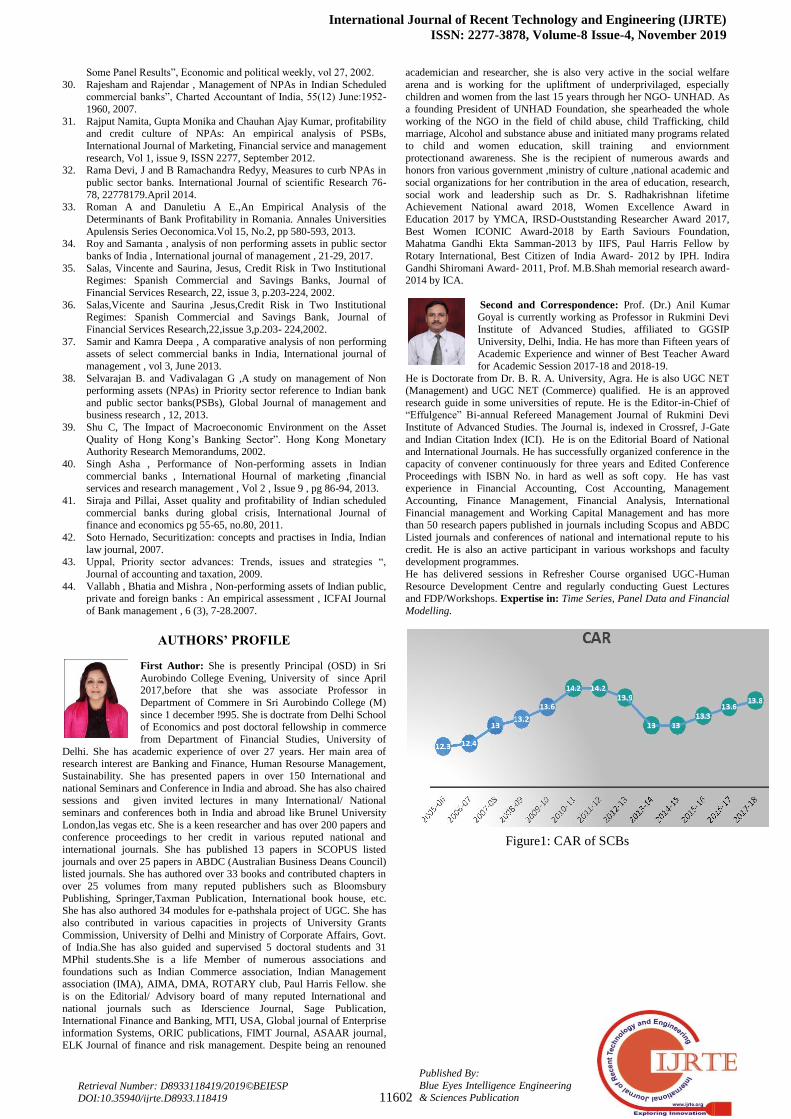
1. Capital Adequacy Ratio (CAR): It reflects the ability
of a bank to meet the future capital requirements. It is
calculated by the following formula:
Tier1+Tier 2+Tier 3 Capital/ Total Risk weighted Assets
(RWA)
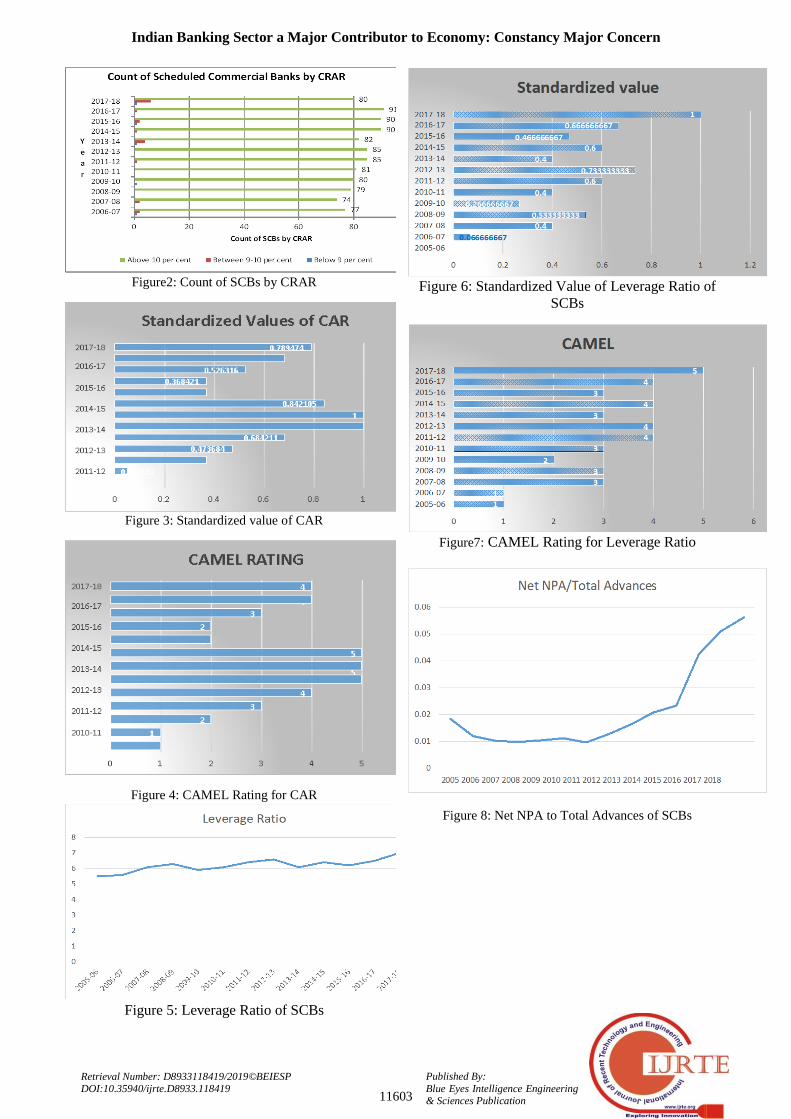
The following is the Data is compiled from RBI data
base, which depicts the CRAR ratios of the Scheduled
Commercial Banks.
Insert Figure1: CAR of SCBs
Insert Figure2: Count of SCBs by CRAR
Insert Figure 3: Standardized value of CAR
Insert Figure 4: CAMEL Rating for CAR
Implication: It can be observed that the Capital Adequacy
Ratio has fallen down drastically after the implementation of
the Capital requirements of the Basel III norms which
requires higher provisioning requirements, but it has shown
an improvement from the preceding year.
2. Leverage Ratio: It depicts the degree up to which
it can leverage its capital base. It is represented as a measure
for bank‟s core capital divided by the total assets.
Tier I Capital (Equity + Reserves)/ Total risk-weighted
assets
The tier 1 assets are the assets that can be liquidated when
the banks need capital.
The following graph depicts the Leverage ratios of the
Scheduled Commercial Banks:
Insert Figure 5: Leverage Ratio of SCBs
Insert Figure 6: Standardized Value of Leverage Ratio of
SCBs
InsertFigure7: CAMEL Rating for Leverage Ratio
Implication: Higher Leverage
ratio means more capital to
International Journal of Recent Technology and Engineering (IJRTE)
ISSN: 2277-3878, Volume-8 Issue-4, November 2019
11600
Published By:
Blue Eyes Intelligence Engineering & Sciences Publication
Retrieval Number: D8933118419/2019©BEIESP
DOI:10.35940/ijrte.D8933.118419
withstand any negative economic shocks. Under the
implementation of Basel III requirements, Tier 1 and Tier 2
assets must maintain 10.5% of its risk weighted assets. The
Tier 1 Capital depicts the bank‟s core capital and Tier 2
capital is known as the „supplementary Capital‟. The Ratio
has shown a positive growth, but a sudden dip is observed
from 2016-17 due to the implementation of Demonetization.
By end of March 2018, the leverage ratio was 6.7 % for the
SCBs, which is above 3 % as recommended by the Pillar 1
capital requirement by the Basel Committee. The Public
sector banks represented a poor ratio, followed by the
foreign banks in comparison to the private sector banks.
The Annual Economic report by the Bank for international
settlements stated that the Basel III requirement will help the
banks fight against the risk factors. It also stated that, Tier 1
capital ratio and the leverage ratio share a complementary
relationship.
B. Asset Quality: is a vital constituent to measure the
financial health of a bank.
The deterioration of the asset quality is major ongoing
concern in the Indian economy, which took its origination
from the credit boom in 2006-11.
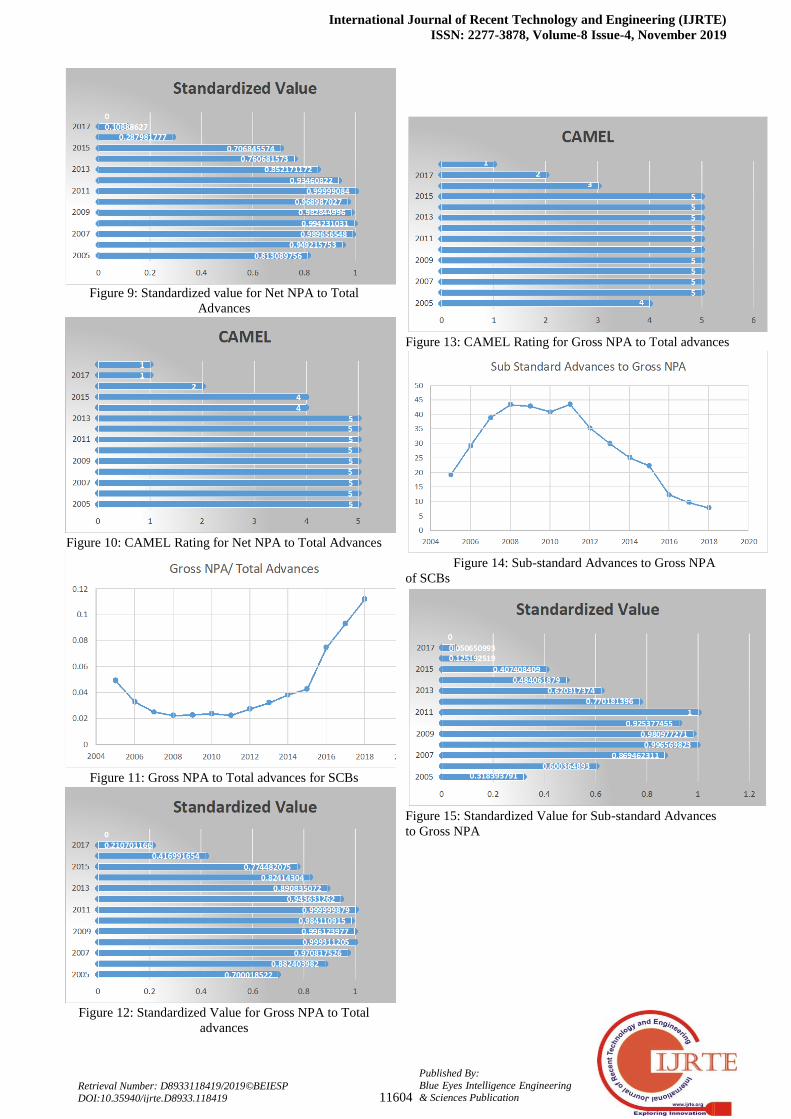
1. Net NPA/Total Advances
Insert Figure 8: Net NPA to Total Advances of SCBs
Insert Figure 9: Standardized value for Net NPA to Total
Advances
Insert Figure 10: CAMEL Rating for Net NPA to Total
Advances
Implication: Higher Net NPA/ Total loan given depicts fall
in the quality of assets. The ratio has shown a sudden rise in
the year 2016-2018, which is not a good signal.
2. Gross NPA/ Total Advances
Insert Figure 11: Gross NPA to Total advances for SCBs
Insert Figure 12: Standardized Value for Gross NPA to
Total Advances
Insert Figure 13: CAMEL Rating for Gross NPA to Total
Advances
Implication: The ratio has shown a sudden surge from
2016-18. Higher the ratio of Gross NPA to Total Advances,
higher is the risk associated with it.
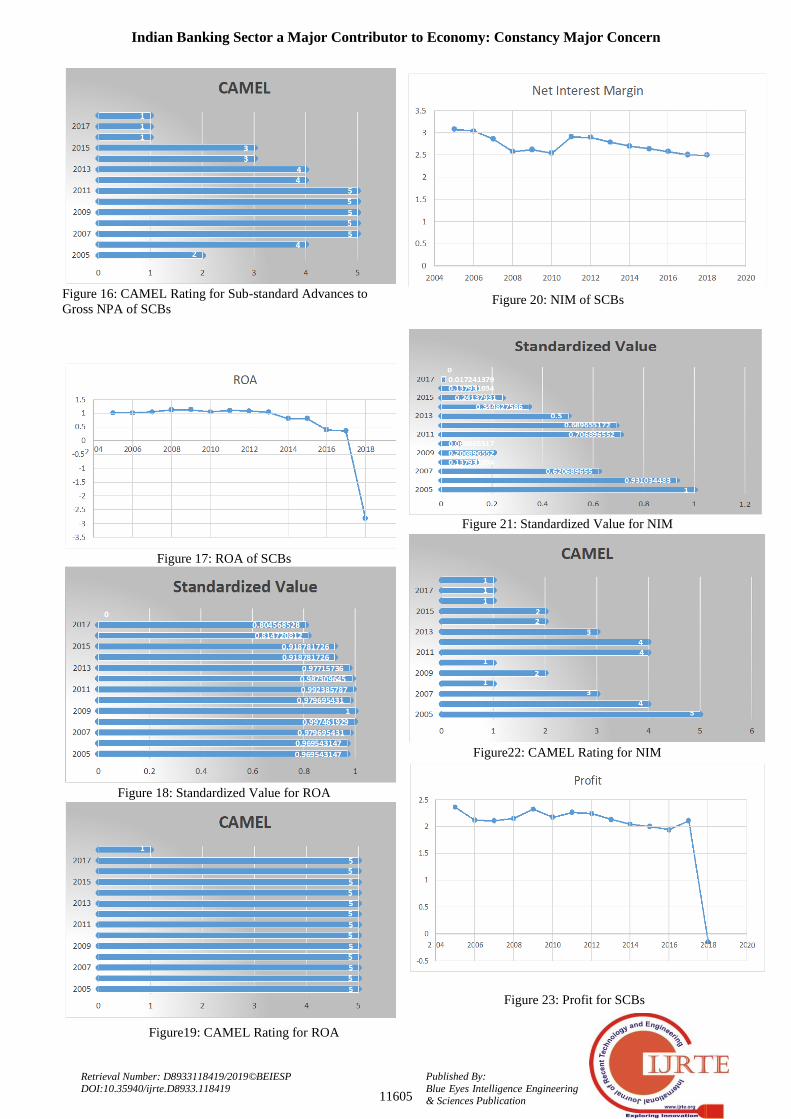
3. Sub-standard Advances/ Gross NPA: This ratio gives
a measure for the amount of loan categorized into the sub-
standard assets. Therefore, a higher ratio means that there is
increase in Doubtful or loss assets.
Insert Figure 14: Sub-standard Advances to Gross NPA
of SCBs
Insert Figure 15: Standardized Value for Sub-standard
Advances to Gross NPA
Insert Figure 16: CAMEL Rating for Sub-standard
Advances to Gross NPA of SCBs
Implication: Sub-standard/ Gross NPA have deteriorated. It
means that more assets are falling into doubtful or loss
assets and have pared the possibility of recovery.
C. Profitability: The weak profitability of the scheduled
commercial banks is a very big concern in the Indian
economy, as does it make the economy vulnerable to
economic shocks.
1. ROA (Return on Assets): The Return on Asset
also declined in the scheduled commercial banks, which
resulted in the profitability of Scheduled commercial bank
due to the loan loss provisioning, increasing cost and the
declining revenue.
Insert Figure 17: ROA of SCBs
Insert Figure 18: Standardized Value for ROA
Insert Figure19: CAMEL Rating for ROA
Implication: The Bank‟s Profitability has plunged
drastically.
2. Net Interest Margin: It is difference between the
amount of income generated by the bank (or interest
received) and the interest paid to the lenders. Higher the
NIM, higher is the Bank‟s profitability.
Insert Figure 20: NIM of SCBs
Insert Figure 21: Standardized Value for NIM
Insert Figure22: CAMEL Rating for NIM
Implication: The NIM has declined in the current years due
to the fall in Deposit growth. Therefore, demand for savings
increased and the demand for loans decreased.
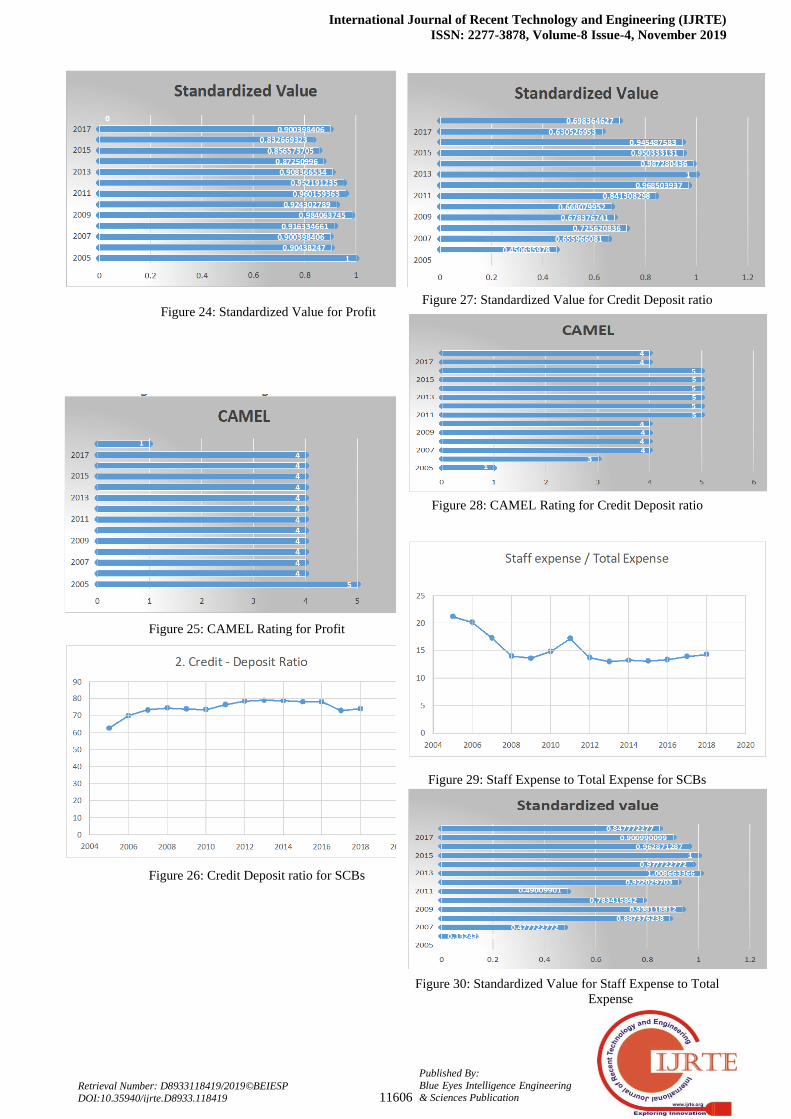
3. Profit
Insert Figure 23: Profit for SCBs
Insert Figure 24: Standardized Value for Profit
Insert Figure 25: CAMEL Rating for Profit
Implication: The Bank‟s Profitability declined drastically in
2017-18 due to the increase in NPA, fall in ROA and other
profitability indices.
D. Liquidity: Credit-Deposit Ratio It depicts the
amount of funds used for lending; a higher ratio shows that
there is more dependence on the deposits for lending. An
ideal credit Deposit ratio is considered to be around 65-75%.
Insert Figure 26: Credit Deposit ratio for SCBs
Insert Figure 27: Standardized Value for Credit Deposit
ratio
Insert Figure 28: CAMEL Rating for Credit Deposit
ratio
Implication: The C-D ratio declined due to the
Demonetization in 2016, but it has shown as improvement
from the preceding year.
E. Efficiency: Management of the Banking Sector
with efficiency is a crucial measure. Better the Management
lower will be the NPA.
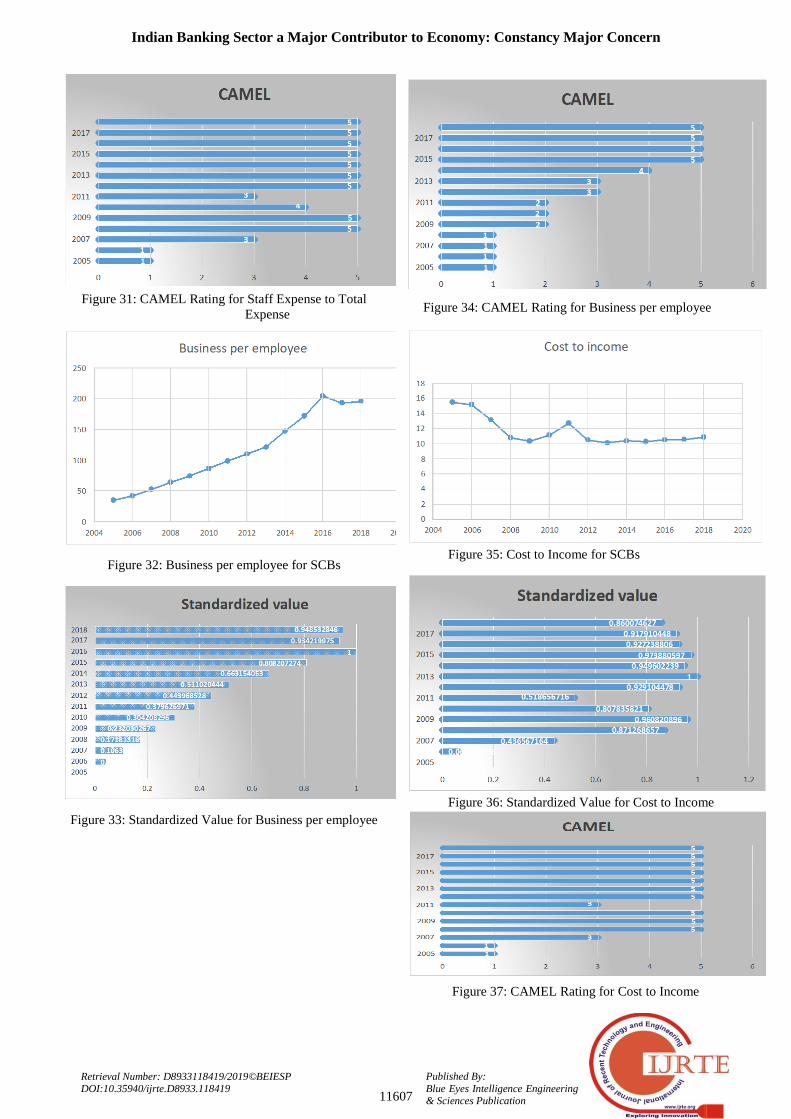
1. Staff Expense to Total Expense: It gives the measure
for the proportion of staff expenses from Total expense.
Insert Figure 29: Staff Expense to Total Expense for
SCBs
Insert Figure 30: Standardized Value for Staff Expense
to Total Expense
Insert Figure 31: CAMEL Rating for Staff Expense to
Total Expense
Implication: The Staff expenses have decreased in the
subsequent years, thereby, contributing in the reduction of
the operational cost.
2. Business per employee: gives a measure of productivity
and efficiency of the banks. It means Revenue per
employee and higher value is a positive sign.
Insert Figure 32: Business per employee for SCBs
Insert Figure 33: Standardized Value for Business per
employee
Insert Figure 34: CAMEL Rating for Business per
employee
Implication: The Business per employee has increased in
the subsequent periods.
3. Cost to Income: It gives a
measure for cost of running
Indian Banking Sector a Major Contributor to Economy: Constancy Major Concern
11601
Published By:
Blue Eyes Intelligence Engineering & Sciences Publication
Retrieval Number: D8933118419/2019©BEIESP DOI:10.35940/ijrte.D8933.118419
the system. Lower the cost better is the efficiency.
Insert Figure 35: Cost to Income for SCBs
Insert Figure 36: Standardized Value for Cost to
Income
Insert Figure 37: CAMEL Rating for Cost to Income
Implication: The cost of running has decreased which is a
positive indication.
VI. BANKING STABILITY ANALYSIS
USING CAMEL
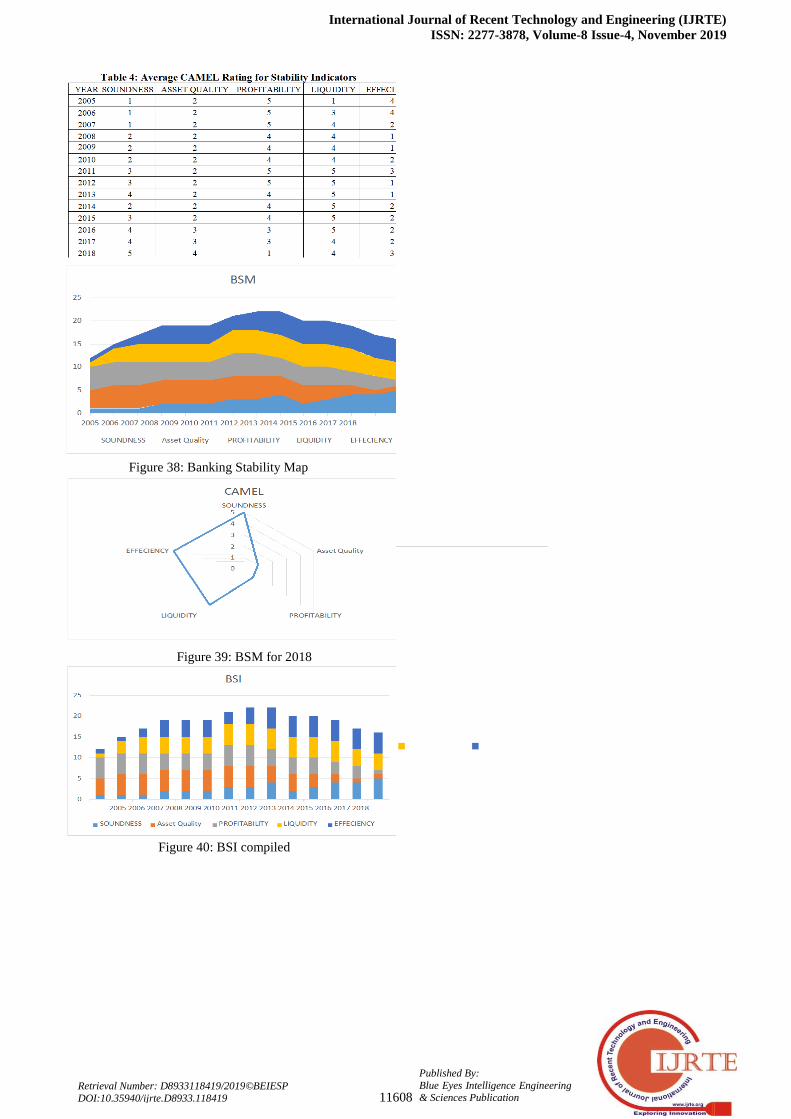
The following table gives the compilation of all
standardized values of each indicator from 2005- 2018,
which has been later converted into the CAMEL rating.
Insert Table 4: Average CAMEL Rating for Stability
Indicators
The following Chart Depicts the Indian Banking Stability
Map.
Insert Figure 38: Banking Stability Map
VII. OBSERVATION
From the above figure 38, it can be observed that soundness
of the banking system has shown a positive surge, asset
quality has deteriorated, profitability of the banking sector is
a major concern, as it has taken a sudden dip in the financial
year 2017-18. Liquidity of the banking sector is mediocre; it
declined after the implementation of demonetization.
Efficiency of the banking system is good and has
improvised.
Insert Figure 39: BSM for 2018
Insert Figure 40: BSI compiled
VIII. CONCLUSION
The financial Stability of the banking sector plays a
significant role in the policy making and identifying the key
factors to resolve in case of any discrepancy. Financial
stability is a phase or situation, where the banking system
attains maximum efficiency and develops the capacity to
absorb any economic shocks. The current banking
developmental policies are paving their ways to strengthen
and broaden the pathway for a more transparent system. As
far as soundness, measured by capital adequacy ratio and
leverage ratio, the mount improved from the year 2015-2018
due to the implementation of capital conservation buffer,
which reduced the credit growth. The asset quality,
measured by different ratios, has deteriorated over period of
time during the study period. Profitability is the third
measure of stability in banking system. There is a drastic
decline in the profitability of scheduled commercial banks in
the later stage of study period because of increase in NPAs
and fall in return on assets. The fourth parameter of stability
is liquidity which is satisfactory except the minor change in
2016 due to demonetization. The last pillar of checking
stability is efficiency which is measured by various means
like staff expenses, business per employee and cost to
income. Overall efficiency is satisfactory but needs
improvement to perform better.
REFERENCES
1. Akhan J, Non-performing asset management of non-banking financial
companies: An introspection, the management accountant, February
2009. 2. Anbar,Adem and Alper,deger ,Bank Specific and Macroeconomic
Determinants of Commercial Bank Profitability: Empirical Evidence
from Turkey, Business and Economics Research Journal, Vol2, No.2,pp.139-152,2011.
3. Bhasin, “Creative Accounting Scam at satyam Computer Limited: How the fraud Story unfolded? “Open Journal of accounting, 57-81,
Sept 2016.
4. Castelino Mario, managing non-performing assets- An uphill task-
Charted Financial analyst, Oct 2006. 5. Chaitalia, Bengani and Redkar, “Setting up and working of asset
reconstruction companies in India-A perspective on the impediment”.
Symbiosis Institute of Management, Pune, Nov 2006. 6. Cowley and Cummins, J.D, Securitization of life insurance assets and
liabilities, the wharton school, University of Pennsylvania,
Philadelphia.2005 7. Dhanda and Rani, An empirical study on the position, causes and
remedial measures for the non performing assets in public sector
banks, KAIM Journal of management and research, pg33-40.2009. 8. Gayathri and Vaishtha, “Non-performing Loans of PSU Banks-Some
Panel Results”, International Journal of Pure and applied
mathematics, Vol118, 2018. 9. Islam Ariful and Hasan Rana Rezwanul, Determinants of bank
Profitability for the selected Private Commercial banks in
Bangladesh: A Panel data Analysis. Banks and Bank Systems, Vol 12, No.3, pp.179-192, 2017.
10. Islam M A.,An Analysis of the Financial Performance of National
Bank Limited using Financial Ratios, Journal of Behavioral Economics, Finance, Entrepreneurship, Accounting and Transport,
Vol 2,No.5,pp121-129,2014.
11. Jain V , Non performing assets in commercial banks , 2007 , Regal publications, New Delhi.
12. Joseph and Prakash , A study on analysing the trend of nap level in
private and public sector banks “ International journal of scientific and research Publications , Vol 4 , 2014.
13. Karunakar, Are non-performing asset Gloomy or greedy from Indian Perceptive? Research journal of Social Science, Vol 3, INSI net
publictions.2008.
14. Kumar Krishnan and Kavita (2017). An Analysis of the Financial Performance of Indian Commercial Banks. The IUP Journal of Bank
Management, VolXVII, No1, pp 1-20.
15. Kumar Krishnan and Kavita (2017). An Analysis of the Financial Performance of Indian Commercial Banks. The IUP Journal of Bank
Management, VolXVII, No1, pp 1-20.
16. Kumar Pradhan, A comparative study of NPA of Old Private sector banks and foreign banks, Research journal of Management science,
Col 2, 38-40, July 2013.
17. Kumar, “A comparative study of NPA of Old Private sector bank and
Foreign banks”, Research Journal of management sciences, Issue
2319-1171 Vol.2, 38-40, 2013.
18. Maiti A and Jana S K (2017).Determinants of profitability of Banks in India: A Panel Data Analysis. Scholars Journal of Economics,
Business and Management, Vol4, No.7, pp436-445.
19. Maiti A and Jana S K (2017).Determinants of profitability of Banks in India: A Panel Data Analysis. Scholars Journal of Economics,
Business and Management, Vol4, No.7, pp436-445.
20. Makkar A and Hardeep (2018).Key Factors Influencing Profitability of Indian Commercial Banks. International Journal of academic
Research and Development, Vol 3, No.1, pp 373-378.
21. Makkar A and Hardeep (2018).Key Factors Influencing Profitability of Indian Commercial Banks. International Journal of academic
Research and Development, Vol 3, No.1, pp 373-378.
22. Mario Castelino, managing non-performing asset, charted financial analyst, Mumbai, 2005.
23. Mehta A and Bhavani What Determines banks‟ Profitability?
Evidence from emerging Markets: The case of the UAE Banking
Sector. Accounting and Finance research. Vol6, No.1, pp 77-88,
2017.
24. Memdani Laila, Macroeconomic and bank specific determinants of non-performing loans in the Indian banking sector, Studies in
business and economics, Lucian Blaga University o Sibiu, Faculty of
economic science , vol 12(2), pg125-135, August. 25. Menicucci E and Paolucci G, Factors Affecting Bank Profitability in
Europe: An empirical Investigation. African Journal of Business
Management. Vol 10, No.17.pp 410- 420, 2016. 26. Mittal and Deeksha, “the problem of rising Non performing Assets in
Banking Sector in India: Comparative Analysis of Public and private
sector banks”, International Journal Of management, IT and Enginering.2017.
27. Mohamed Zaky A H and Soliman M M .The Impact of
Announcement of Basel III on the Banking System Performance: An empirical Research on Egyptian Banking Sector. The business and
management review, Vol9, No.2, pp.165-175, 2017
28. Pain,Darren , The provisioning experience of the major UK Banks: a small panel investigation, Bank of England working papers, Bank of
England,2003. 29. Rajaraman and Vaishta, “Non-
performing Loans of PSU banks –
International Journal of Recent Technology and Engineering (IJRTE)
ISSN: 2277-3878, Volume-8 Issue-4, November 2019
11602
Published By:
Blue Eyes Intelligence Engineering & Sciences Publication
Retrieval Number: D8933118419/2019©BEIESP
DOI:10.35940/ijrte.D8933.118419
Some Panel Results”, Economic and political weekly, vol 27, 2002.
30. Rajesham and Rajendar , Management of NPAs in Indian Scheduled commercial banks”, Charted Accountant of India, 55(12) June:1952-
1960, 2007.
31. Rajput Namita, Gupta Monika and Chauhan Ajay Kumar, profitability and credit culture of NPAs: An empirical analysis of PSBs,
International Journal of Marketing, Financial service and management
research, Vol 1, issue 9, ISSN 2277, September 2012. 32. Rama Devi, J and B Ramachandra Redyy, Measures to curb NPAs in
public sector banks. International Journal of scientific Research 76-
78, 22778179.April 2014. 33. Roman A and Danuletiu A E.,An Empirical Analysis of the
Determinants of Bank Profitability in Romania. Annales Universities
Apulensis Series Oeconomica.Vol 15, No.2, pp 580-593, 2013. 34. Roy and Samanta , analysis of non performing assets in public sector
banks of India , International journal of management , 21-29, 2017.
35. Salas, Vincente and Saurina, Jesus, Credit Risk in Two Institutional Regimes: Spanish Commercial and Savings Banks, Journal of
Financial Services Research, 22, issue 3, p.203-224, 2002.
36. Salas,Vicente and Saurina ,Jesus,Credit Risk in Two Institutional Regimes: Spanish Commercial and Savings Bank, Journal of
Financial Services Research,22,issue 3,p.203- 224,2002.
37. Samir and Kamra Deepa , A comparative analysis of non performing assets of select commercial banks in India, International journal of
management , vol 3, June 2013.
38. Selvarajan B. and Vadivalagan G ,A study on management of Non performing assets (NPAs) in Priority sector reference to Indian bank
and public sector banks(PSBs), Global Journal of management and business research , 12, 2013.
39. Shu C, The Impact of Macroeconomic Environment on the Asset
Quality of Hong Kong‟s Banking Sector”. Hong Kong Monetary Authority Research Memorandums, 2002.
40. Singh Asha , Performance of Non-performing assets in Indian
commercial banks , International Hournal of marketing ,financial services and research management , Vol 2 , Issue 9 , pg 86-94, 2013.
41. Siraja and Pillai, Asset quality and profitability of Indian scheduled
commercial banks during global crisis, International Journal of finance and economics pg 55-65, no.80, 2011.
42. Soto Hernado, Securitization: concepts and practises in India, Indian
law journal, 2007.
43. Uppal, Priority sector advances: Trends, issues and strategies “,
Journal of accounting and taxation, 2009.
44. Vallabh , Bhatia and Mishra , Non-performing assets of Indian public, private and foreign banks : An empirical assessment , ICFAI Journal
of Bank management , 6 (3), 7-28.2007.
AUTHORS’ PROFILE
First Author: She is presently Principal (OSD) in Sri
Aurobindo College Evening, University of since April 2017,before that she was associate Professor in
Department of Commere in Sri Aurobindo College (M)
since 1 december !995. She is doctrate from Delhi School of Economics and post doctoral fellowship in commerce
from Department of Financial Studies, University of
Delhi. She has academic experience of over 27 years. Her main area of research interest are Banking and Finance, Human Resourse Management,
Sustainability. She has presented papers in over 150 International and
national Seminars and Conference in India and abroad. She has also chaired sessions and given invited lectures in many International/ National
seminars and conferences both in India and abroad like Brunel University
London,las vegas etc. She is a keen researcher and has over 200 papers and conference proceedings to her credit in various reputed national and
international journals. She has published 13 papers in SCOPUS listed
journals and over 25 papers in ABDC (Australian Business Deans Council) listed journals. She has authored over 33 books and contributed chapters in
over 25 volumes from many reputed publishers such as Bloomsbury
Publishing, Springer,Taxman Publication, International book house, etc. She has also authored 34 modules for e-pathshala project of UGC. She has
also contributed in various capacities in projects of University Grants
Commission, University of Delhi and Ministry of Corporate Affairs, Govt. of India.She has also guided and supervised 5 doctoral students and 31
MPhil students.She is a life Member of numerous associations and
foundations such as Indian Commerce association, Indian Management association (IMA), AIMA, DMA, ROTARY club, Paul Harris Fellow. she
is on the Editorial/ Advisory board of many reputed International and
national journals such as Iderscience Journal, Sage Publication, International Finance and Banking, MTI, USA, Global journal of Enterprise
information Systems, ORIC publications, FIMT Journal, ASAAR journal, ELK Journal of finance and risk management. Despite being an renouned
academician and researcher, she is also very active in the social welfare
arena and is working for the upliftment of underprivilaged, especially children and women from the last 15 years through her NGO- UNHAD. As
a founding President of UNHAD Foundation, she spearheaded the whole
working of the NGO in the field of child abuse, child Trafficking, child marriage, Alcohol and substance abuse and initiated many programs related
to child and women education, skill training and enviornment
protectionand awareness. She is the recipient of numerous awards and honors fron various government ,ministry of culture ,national academic and
social organizations for her contribution in the area of education, research,
social work and leadership such as Dr. S. Radhakrishnan lifetime Achievement National award 2018, Women Excellence Award in
Education 2017 by YMCA, IRSD-Ouststanding Researcher Award 2017,
Best Women ICONIC Award-2018 by Earth Saviours Foundation, Mahatma Gandhi Ekta Samman-2013 by IIFS, Paul Harris Fellow by
Rotary International, Best Citizen of India Award- 2012 by IPH. Indira
Gandhi Shiromani Award- 2011, Prof. M.B.Shah memorial research award-2014 by ICA.
Second and Correspondence: Prof. (Dr.) Anil Kumar Goyal is currently working as Professor in Rukmini Devi
Institute of Advanced Studies, affiliated to GGSIP
University, Delhi, India. He has more than Fifteen years of Academic Experience and winner of Best Teacher Award
for Academic Session 2017-18 and 2018-19.
He is Doctorate from Dr. B. R. A. University, Agra. He is also UGC NET (Management) and UGC NET (Commerce) qualified. He is an approved
research guide in some universities of repute. He is the Editor-in-Chief of “Effulgence” Bi-annual Refereed Management Journal of Rukmini Devi
Institute of Advanced Studies. The Journal is, indexed in Crossref, J-Gate
and Indian Citation Index (ICI). He is on the Editorial Board of National and International Journals. He has successfully organized conference in the
capacity of convener continuously for three years and Edited Conference
Proceedings with ISBN No. in hard as well as soft copy. He has vast experience in Financial Accounting, Cost Accounting, Management
Accounting, Finance Management, Financial Analysis, International
Financial management and Working Capital Management and has more than 50 research papers published in journals including Scopus and ABDC
Listed journals and conferences of national and international repute to his
credit. He is also an active participant in various workshops and faculty
development programmes.
He has delivered sessions in Refresher Course organised UGC-Human
Resource Development Centre and regularly conducting Guest Lectures and FDP/Workshops. Expertise in: Time Series, Panel Data and Financial
Modelling.
Figure1: CAR of SCBs
Indian Banking Sector a Major Contributor to Economy: Constancy Major Concern
11603
Published By:
Blue Eyes Intelligence Engineering & Sciences Publication
Retrieval Number: D8933118419/2019©BEIESP DOI:10.35940/ijrte.D8933.118419
Figure2: Count of SCBs by CRAR
Figure 3: Standardized value of CAR
Figure 4: CAMEL Rating for CAR
Figure 5: Leverage Ratio of SCBs
Figure 6: Standardized Value of Leverage Ratio of
SCBs
Figure7: CAMEL Rating for Leverage Ratio
Figure 8: Net NPA to Total Advances of SCBs
International Journal of Recent Technology and Engineering (IJRTE)
ISSN: 2277-3878, Volume-8 Issue-4, November 2019
11604
Published By:
Blue Eyes Intelligence Engineering & Sciences Publication
Retrieval Number: D8933118419/2019©BEIESP
DOI:10.35940/ijrte.D8933.118419
Figure 9: Standardized value for Net NPA to Total
Advances
Figure 10: CAMEL Rating for Net NPA to Total Advances
Figure 11: Gross NPA to Total advances for SCBs
Figure 12: Standardized Value for Gross NPA to Total
advances
Figure 13: CAMEL Rating for Gross NPA to Total advances
Figure 14: Sub-standard Advances to Gross NPA
of SCBs
Figure 15: Standardized Value for Sub-standard Advances
to Gross NPA
Indian Banking Sector a Major Contributor to Economy: Constancy Major Concern
11605
Published By:
Blue Eyes Intelligence Engineering & Sciences Publication
Retrieval Number: D8933118419/2019©BEIESP DOI:10.35940/ijrte.D8933.118419
Figure 16: CAMEL Rating for Sub-standard Advances to
Gross NPA of SCBs
Figure 17: ROA of SCBs
Figure 18: Standardized Value for ROA
Figure19: CAMEL Rating for ROA
Figure 20: NIM of SCBs
Figure 21: Standardized Value for NIM
Figure22: CAMEL Rating for NIM
Figure 23: Profit for SCBs
International Journal of Recent Technology and Engineering (IJRTE)
ISSN: 2277-3878, Volume-8 Issue-4, November 2019
11606
Published By:
Blue Eyes Intelligence Engineering & Sciences Publication
Retrieval Number: D8933118419/2019©BEIESP
DOI:10.35940/ijrte.D8933.118419
Figure 24: Standardized Value for Profit
Figure 25: CAMEL Rating for Profit
Figure 26: Credit Deposit ratio for SCBs
Figure 27: Standardized Value for Credit Deposit ratio
Figure 28: CAMEL Rating for Credit Deposit ratio
Figure 29: Staff Expense to Total Expense for SCBs
Figure 30: Standardized Value for Staff Expense to Total
Expense
Indian Banking Sector a Major Contributor to Economy: Constancy Major Concern
11607
Published By:
Blue Eyes Intelligence Engineering & Sciences Publication
Retrieval Number: D8933118419/2019©BEIESP DOI:10.35940/ijrte.D8933.118419
Figure 31: CAMEL Rating for Staff Expense to Total
Expense
Figure 32: Business per employee for SCBs
Figure 33: Standardized Value for Business per employee
Figure 34: CAMEL Rating for Business per employee
Figure 35: Cost to Income for SCBs
Figure 36: Standardized Value for Cost to Income
Figure 37: CAMEL Rating for Cost to Income
International Journal of Recent Technology and Engineering (IJRTE)
ISSN: 2277-3878, Volume-8 Issue-4, November 2019
11608
Published By:
Blue Eyes Intelligence Engineering & Sciences Publication
Retrieval Number: D8933118419/2019©BEIESP
DOI:10.35940/ijrte.D8933.118419
Figure 38: Banking Stability Map
Figure 39: BSM for 2018
Figure 40: BSI compiled


