Embed Size (px)
Citation preview

Inclusive growth, human capital developmentand natural resource rent in SSA
Ibrahim D. Raheem1• Kazeem O. Isah2 •
Abdulfatai A. Adedeji3
Received: 8 November 2015 / Accepted: 29 August 2016
� The Author(s) 2016. This article is published with open access at Springerlink.com
Abstract This paper seeks to achieve two objectives. First, we argued for the
increase in government expenditure on education and health to examine the pos-
sibility of achieving inclusive growth. Second, financing gap model was employed
to estimate the potential growth in GDP per capita that is accruable to the economy
if government use natural resource rent to finance increase in expenditure of edu-
cation and health. Relying on dataset for 18 SSA countries, among the results
obtained showed that both government expenditures are found to be significant for
explaining growth in SSA. However, augmenting health expenditure with natural
resource appears to be more significant for making growth process inclusive. Also,
the results of the simulation exercise indicate that increasing government expen-
diture on health would increase GDP per capita growth by over 3.1 %. The policy
implication of this is drawn based upon the results obtained.
Keywords Inclusive growth � Education and health expenditures � Natural resourcerents � Financing gap model and Sub Saharan Africa
1 Introduction
A layman would have an eye-catching and appealing picture of natural resource
abundance. But a closer and scientific investigation of the effects of natural
resources on both the macro- and socio-economic variables would suggest
otherwise. For instance, natural resource abundance has been found to fuel growth
& Ibrahim D. Raheem
1 School of Economics, University of Kent, Canterbury, UK
2 Centre for Econometrics and Allied Research, University of Ibadan, Ibadan, Nigeria
3 Department of Economics, University of Ibadan, Ibadan, Nigeria
123
Econ Change Restruct
DOI 10.1007/s10644-016-9193-y

‘‘exclusiveness’’. The entire supply chain of natural resources from discovery to
sales has features of growth elitism. As an illustration, governments or their
appointees hold property rights to natural resource wealth, in which case, the
immediate effect of the supply chain is self-enrichment of the property rights
holders. Second, in a case where the private sector is allowed to be among the
stakeholders, selfish interest of the government through excessive taxation might
discourage investment required to discover natural resources in the first place.
Another channel is if the political elite or other powerful groups were given
preferential access to the resource wealth, they would use it for their own benefit
without investing the generated wealth for overall growth (Warner 2012).
Also, the exact macroeconomic effect of natural resource abundance is difficult
to unravel. In the short term, there is existence of volatility in the revenue accruable
from the exploitation, exploration and sales of these resources. This makes it
difficult to conduct macroeconomic stabilization policies. The long run challenge
relates to the ample evidences that have shown that resource-endowed countries
tend to have slower economic growth rate as compared with resource-scarce
countries (Frankel 2012; Oyinlola et al. 2015; Arezki and Nabli 2012). This strand
of the literature is referred to as ‘‘Resource Curse Hypothesis’’ (RCH), a coinage
attributed to Sachs and Warner (1995). It should be noted that the RCH debate is
inconclusive, as studies have argued and documented evidences on both sides of the
argument (See Frankel 2012 for a survey).
The problem identified by the studies that have refuted RCH is due to the fact that
they concentrate on aggregate growth. These studies have an implicit assumption
that all the citizens enjoy the rents received from the sales/export of these resources,
which is the hardly the case in reality. In the sub-Saharan African (SSA) case, there
are ample evidences that have proved that a selected proportion of the population,
mostly the political elite and urban dwellers, enjoy these proceeds. Also, a large
chuck of this revenue is spent on recurrent and administrative expenditures, which is
biased against the poor and unemployed. Thus, this being the case is an indication
that these categories of citizenry (i.e. the poor and unemployed) are potentially
being deprived from reaping the benefits of the endowment.1 This among others
might limit the ability of these sets of citizens to contribute their productivity quota
to the national output. Hence, it could then be summarily stated that natural resource
abundance would not lead to inclusive growth,2 as this might be a plausible
1 Caution must be exercised here, in that we are not making a case of total deprivation by these two
categories of citizenry. We are, however, inferring that in cases where government performs its right to
these people (the poor and unemployed), it is either low quality infrastructural facilities are provided, or
project never reached the completion stage-where citizens can have access and use such facilities. This is
just as Arezki et al. (2012) concluded that ‘‘investment’’ in the quality of public investment should be
given utmost importance and priority.2 Ianchovichina and Gable (2012) defined inclusive growth as the one that aims to sustainably and
rapidly reduce poverty and inequality and ensures that all the labour force contribute to and benefit from
economic growth process. This can be achieved through providing a level playing field for investment and
increasing productive employment opportunities. In a similar vein, Warner (2012) also discussed the
concept of growth inclusiveness as the one in which income of lower-income groups grow relatively
faster and that no social group(s) is/are left behind in the economic growth process. This concept would
be further explored in succeeding sections of the study.
Econ Change Restruct
123

candidate in explaining the RCH. The existence of inclusive growth ensures that all
the sections of the country are active in the growth process of the economy. To this
end, there would be increase in the tax-based revenue of the government, through
increase in job creation. Hence, government would have more funds to formulate
and implement developmental policies.
The importance of inclusive growth has been demonstrated on a global, regional
and national levels. A classical example is the tagging of the World Economic
Forum that was held in Nigeria Forging Inclusive Growth, Creating Jobs; in
February 2014, UK’s Department for International Development (DFID) high-
lighted inclusive growth as part of work plans and strategies. Also, in May 2014,
European Commission emphasized the important role of the private sector led
strategy in achieving inclusive growth. Nigeria’s 2013 Federal Government Budget
was coined ‘Fiscal Consolidation with Inclusive Growth’; in November 2013, the
International Monetary Fund (IMF) set inclusive growth as a pivotal part of their
research agenda for 2014.3 To further demonstrate the importance of inclusive
growth, Organization for Economic Cooperation and Development (OECD) and
United Nations Development Programme (UNDP) have actively been engaging in
coming up with policy papers geared towards enhancing inclusive growth.
Examples of such papers include OECD (2012) whose report identified three
problems: poverty,4 unemployment5 and inequality,6 that growth from 1990s to date
had failed to tackle. OECD (2013a, b, c) also emphasizes the importance of
inclusive growth. Goal 8 of the proposed Open Working Group on Sustainable
Development Goal is related to inclusive growth. G20 (2013) have confirmed the
absence of inclusive growth in the region and further argued not only for a strong,
sustainable and balanced growth but also for a more inclusive pattern of growth that
will mobilize the talents of the citizenry. Also, Anand et al. (2013) argued that the
Arab Spring, the growing divide between Main Street and Wall Street in advanced
economies, and the ‘‘three speed’’ world economy have placed inclusive growth at
the forefront of policy debates.
In this study, we make a case for Human Capital Development (HCD) as a likely
and efficient candidate/mechanism to ensure and enhance inclusive growth. HCD is
a broad concept and cannot be measured holistically. However, we postulate that
education and health are key indicators of HCD. This claim has also been backed by
the fact that they (education and health) have retained their prominence by being
3 Even though efforts have been made by IMF to shed light on inclusive growth prior to the November
2013 meeting. Studies such as Arezki and Nabli (2012), Arezki, Dupuy and Gelb (2012), Heuty (2012),
Ianchovichina and Gable (2012) and Warner (2012) have confirmed the believe of IMF in inclusive
growth.4 World Bank (2006) as cited in CAFOD (2014) stated that not all growth are poverty-reducing. Despite
the impressive growth at the turn of the 20th century, over 1.2 billion (24%) of the world’s population live
below $1.25 a day.5 World Bank (2013) stated that excess of 200 million world population are out of job and about 600
million jobs need to be generated in the next 15 years to keep the current level of employment constant.6 The OECD (2013b) has explained that the gap between the rich and poor is widening almost
everywhere and the current level is widest in the last 30 years amongst the OECD member countries.
Oxfam (2014) analyzed that the top 85 richest people in the world own the same amount of wealth as the
bottom half of the world population (i.e. 1.3 billion people)!.
Econ Change Restruct
123

among the nine objectives of Millennium Development Goals (MDGs) and recently,
Sustainable Development Goals (SDG). Also, agencies such as United Nations
Educational, Scientific and Cultural Organization (UNESCO), OECD, UNDP and
World Health Organization (WHO) have advocated for the improvement in the
quality of service delivery as well as increase in government expenditures on these
sectors.
Based on the foregoing, this study seeks to achieve two broad objectives. Firstly,
to empirically examine the possibility of achieving inclusive growth through
increase in government expenditures on health and education. The second objective
is to examine the potential benefit of investing the natural resources rent on HCD
indicators. To this end, the study uses financing gap model and simulation
methodology under certain assumptions to estimate the potential economic growth
accruable by investing natural resource rent on human capital indicators.
The novelty this study brings forth is based on its objective. Most of the existing
papers on inclusive growth are policy papers, which is less empirical, as it is not
driven by econometric or other scientific approaches.7 The scope of this study is
limited to 18 SSA countries for the period 1995–2013. The reasons adduced to
limiting the scope to SSA are because (1) with the exception of very few countries
(Botswana, Namibia and may be South Africa), statistics have shown that resource-
rich countries in SSA are ensnared with RCH; (2) resource rents have been the
major source of revenue for SSA countries; (3) the region is the least in the global
HDI rankings and (4) the region has the highest prevalence of poverty and
inequality. The selected countries are based on data availability.
The rest of the paper is structured as follows: section two dwells on inclusive
growth issues and further argued for the beneficial effects of inclusive growth. In
section three, we discuss the data and provide a detailed trend analysis of the key
variables in the study. Model specification and methodological related issues are
offered in section four. Sections five and six house the empirical result and
conclusion respectively.
2 Expositions on inclusive growth
It is the intention of this section to provide a general overview of inclusive growth,
by examining its definitions/meaning, determinants as well as measurement.
2.1 Concept of inclusive growth
More than ever before, institutions, governments and organizations have been
actively talking about inclusive growth. This is a fall out of the fact that it has been
observed that increase in income (GDP) of countries does not necessarily mean
growth in the first instance, not to talk of sustainable growth. This notion is justified
because in most developing countries, there is high unemployment rate, wide
7 We acknowledge that Warner (2012) was quite empirical, the point of divergence is on the premise that
Warner focused on the labour side of inclusive growth.
Econ Change Restruct
123

income disparity as well as increasing rate of poverty. Despite this, such countries
still record incidence of growth. Hence, the growth recorded is the product of a
section of the population and not the entire population. To ensure justice and equity,
the burgeoning arguments have tilted towards ensuring that all economic agents
contribute their quota to the growth process of their country.
Although, there is no absolute acceptable definition of inclusive growth, a
situation that cut across all branches of economics in agreeing to common
definition(s) of any term, there is however, near unison in terms of what inclusive
growth generally meant.8 As the term ‘‘inclusive’’, which means all; entire; total and
whole, inclusive growth could then be defined as the one that aims to ensure that all
income, social and economic groups/agents contribute their quota in the growth
process of an economy. Based on this concept, it could be inferred that inclusive
growth tends to mainly solve socio-economic/developmental problems such as
poverty, inequality and unemployment. It could also be argued that the economic
growth that solves these problems is inclusive in nature. For instance, a classical
example of inclusive growth could be the one that the wage rate is higher than per
capita income (GDP per capita) and/or economic growth is accompanied by fall in
poverty rate, unemployment and inequality gap. However, it should be noted that
inclusive growth is conditioned upon continuity/sustainability. That is, such growth
must have a steady and relatively stable trend.
In order to have a sound understanding of the concept of inclusive growth, we
limit our review to the two leading advocates of inclusive growth-the OECD and
UNDP. Starting with the OECD, special attention was devoted to the socioeconomic
adversities (unemployment, inequality and poverty) confronting the global econ-
omy. They defined inclusive growth as the one that reduces poverty and inequality
and benefits the most marginalized section of the population. The poverty-
inequality-growth debate has long been contested and this study does not attempt to
delve into it. Rather, it attempts to demonstrate how this debate might lead to
inclusive growth. Inclusive growth is linked to the debate in that it proves to the
governments that growth is just a process and not an end (i.e. it is a mere necessary
but not sufficient condition for long-term development). Growth should be seen as a
tool to achieving wider objectives.9 Emphasis must be placed on the quality of
8 Institutions and organizations such as the World Bank, OECD, Asian Development Bank (ADB) and
UNDP perceive inclusive growth differently, as such, its components differ across these institutions. For
instance, ADB had criticized existing definitions as ‘‘… vague and do not lend themselves to easy
quantitative operationalization, whilst others are quite specific but do not capture the essence of the
concept…’’. Ali and Son (2007) defined growth as inclusive if it increases the social opportunity function,
which depends on two factors: (1) average opportunities available to the population, and (2) how
opportunities are shared among the population. In essence, they define inclusive growth as growth that not
only creates new economic opportunities, but also one that ensures equal access to the opportunities
created for all segments of society, particularly for the poor. The inability to have a clear-cut definition
might be due to the fact that the concept ‘‘inclusive growth’’ does not have a theoretical foundation, and to
a large extent, is country specific (Addison and Nino-Zarazua 2012).9 Ravallion (2009) and World Bank (2012) found that low-income countries (\$700 GDP per capita)
should prioritize growth because the available capital is not sufficient to redistribute or to reduce
incidence of poverty. However, high-income countries should patronize pro-poor policy because
inequality would dampen the growth and as such would not be able to reduce poverty (Chandy and
Penciakova 2013; COFOD 2014).
Econ Change Restruct
123

growth rather than quantity. Also, it helps to erase the notion that growth would
eradicate these socio-economic problems. Hence, concerned stakeholders are put on
their toes to forge policies that would enhance poverty and inequality-resistant
growth.
2.2 Determinants of inclusive growth
Irrespective of the fact that inclusive growth has varying definitions across
organizations, there are however, some common positions as regard its determi-
nants. Using the concept of OECD and UNDP, it could be simply summarized that
HCD indicators as well as other socioeconomic variables serve as valid and strong
determinants of inclusive growth. To this end, variables such as investment in
human capital,10 job creation, structural transformation and broad-based growth,11
good institutions12 and social protection13 have been found to aid the desired
growth. The assumption that achieving growth first, and that the effect would later
trickle down to alleviate poverty and inequality is rather unrealistic.14
Discussions on inclusive growth would be incomplete without a mention of
structural transformation. In the words of Matusyama (2008), ‘‘structural change is a
complex, intertwined phenomenon, not only because economic growth brings about
complementary changes in various aspects of the economy, such as the sector
compositions of output and employment, organization of industry, etc., but also
these changes in turn affect the growth process. The transformation from the rural
agricultural society to the urban industrial society is just one of many aspects of
structural change […]’’. History has shown that structural transformation is critical
to economic development. There are diverse forms of structural transformation: it
could be diversification of the economy from an agrarian-based to manufacturing
10 There are ample evidences that have confirmed the positive linkage in the investment in human capital
(education and health) and economic growth (see Ravallion 2004; Hull 2009).11 Expanding economic activities in an economy would not only create jobs but also diversify the
economy away from existing activities. It would also lead to stability within the economy. However, there
is a long-standing debate on how such transformation can be achieved (Chang and Grabel 2004; Saad-
Filho 2010 ; CAFOD 2014).12 The importance of ‘‘good and functional’’ institutions has been identified by the influential paper of
Acemoglu et al (2003) and tonnes of later studies. Even though in the measurement of institutions, there is
no explicit proxy for inclusive growth, these variables are somewhat related. For instance, voice and
accountability empowers the citizenry to demand for the financial activities of their government. The
control of corruption, which has been identified to be unfavorable to job creation, would improve the
status of the population. Also, a responsible government would not further marginalize the marginalized
population. Such government would factor in the preferences of all sections of the population in
formulating policies and making decisions. Hence, this type of governance could be termed ‘‘government
for all’’.13 Taxation can be used to achieve this. This would invariably lead to direct transfer and redistribution of
income. By taxing multinational companies and high-income earners above small and medium scale
enterprises as well as those considered to be poor, the gap between the rich and poor would be drastically
reduced. Brazil and Libya are exceptional examples of countries that adopted the policies that would see
to the fact that the poor receive financial assistance from the government.14 Statistics have shown that most countries in SSA have been recording growth rate that is not
accompanied by improvement the socioeconomic wellbeing of their populace. A detailed exposition of
this is presented in the third section of this study.
Econ Change Restruct
123

based. This is the first stage of transformation process. It could also be as a result of
industrialization process of countries. This is evidenced considering the antecedents
of China, Japan and South Korea.
Even though, Africa has witnessed major structural transformation as well as
industrialization process, this has not translated to expected growth or growth rate
compatible with other developing regions in the world. This is to say that structural
transformation is not a homogenous process (Osei and Jedwab 2013). Productivity
growth is quite essential to structural change and hence economic development.
Data reveals that the productivity gap in Africa is about 2.5 %. This gap could have
been reduced to 1.5, if Africa had similar productivity rate as that of Asia. This gap
would have also been reduced to 1.7 should Africa had similar employment rate
with Asia. To further drive home the importance of structural transformation,
McMillan and Rodrik (2011) while using dataset for 38 developing countries, it was
found that structural transformation is growth-enhancing for Asian countries while
it is growth-reducing for Africa.15
2.3 Measures of inclusive growth
Having given an overview of the concept of inclusive growth as well as its
determinants, the next area that should be explored is the measurement related
issues. Just as there is no consensus as regards a workable definition, measuring
inclusive growth suffers similar fate. Ali and Son’s (2007) measurement used the
concept of social opportunity function based on two conditions: (1) average
opportunities available to the population, and (2) how opportunities are shared or
distributed among the population. This function gives greater weight to the poor. As
such, opportunities created for the poor are more important than the non-poor. The
increase in these opportunities would lead to inclusive growth. Anand et al. (2013)
built on the Ali and Son (2007) to develop a measure of inclusive growth using a
macro social mobility function, following the micro literature on income
distribution. Their measure provides a framework to study equity and efficiency
together. The measure is equally used to study the dynamics and determinants of
inclusive growth in low-income countries and emerging markets. The model
assumes that inclusive growth depends on income growth and distribution. Using
consumer’s theory, income and substitution effect was decomposed into growth and
distributional components. The underlying social welfare function must satisfy two
properties to capture these features: (1) it is increasing in its argument (to capture
growth dimension) and (2) it satisfies the transfer property—any transfer of income
from a poor person to a richer person reduces the value of the function (to capture
distributional dimension).
15 This study does not intend to be elaborate in structural transformation discussion. For more
information and elucidation, interested readers should see Greenwald and Stiglitz (2013), Lin
(2010, 2012), Rodrik (2010), Stiglitz and Lin (2013), among others. For African based studies, Osei
and Jedwab (2013) for Ghana; Adeyinka et al. (2013) for Nigeria and Resnick and Thurlow (2013) for
Zambia. An interesting study by Herd (2013) shows how the evolution of the Chinese social policies was
able to reduce inequality and hence induce inclusive growth.
Econ Change Restruct
123
The extant literature precludes any attempt to explicate the theoretical association
between HCD measures and inclusive growth. This implies ample vagueness in the
precise mechanisms through which the effects of HCD is transmitted to inclusive
growth. Nonetheless, we lay out a plausible transmission mechanism, which is
presumed to work via the fiscal behavior of the government. Specifically, it hinges
on the effectiveness of both government tax efforts and government expenditures.
On the revenue side, the government has to be able to tax the natural resource rents
and allocate the tax revenue productively into the education and health sectors. For
government spending, government priorities should be set in such a fashion that is
de-linked from the gyration of resource revenues. However, the management of
resource wealth in this manner is more difficult than depicted. Some of the
challenges include, but are not limited to, the well-known volatility of resource
prices; the non-renewable status of some of these natural resources and its
implication on the optimality of expenditures; weak institutional quality and
attendant narrow fiscal space.16 Beyond these, also noteworthy is the time lag
between ‘‘cause’’ and ‘‘effect’’ of natural resource rent on inclusive growth. Once
government increases her expenditure of these HCD indicators, it takes some time
before the effects, if any, on inclusive growth begin to manifest.17
3 Data and trend analysis
The key variables of interest in this paper are inclusive growth, natural resource rent
and government expenditure on human development indicators (education and
health). In addition to economic growth being a prerequisite for the attainment of
inclusive growth, productive employment has also remained one of the key drivers
of inclusive economic growth since employment outcome is an important outcome
of inclusiveness. In this regard therefore, we utilize log of GDP per person
employed as a proxy for inclusive growth to reflect two factors of average
opportunities available to the population and how these opportunities are distributed
in the population. Consequently, the government expenditure variable is defined as
the log of current operating expenditures in education, including wages and salaries
and excluding capital investments in buildings and equipment. The health
expenditure on the other hand is measure as log of per capita public health
expenditure, which covers the provision of health services (preventive and curative),
family planning activities, nutrition activities, and emergency aid designated for
health but does not include provision of water and sanitation. More so, labour force
and physical capital were measured as log of population and log of gross fiscal
capital formation respectively. Control variables included in the analysis are trade
openness measured as sum of export and import to GDP and price level (inflation
rate). A balanced panel annual data set of 18 SSA countries covering the period of
16 Lundgren et al. (2013) in their study adequately dealt with the problem of natural resource wealth in
SSA along the lines of its management, difficulties and solutions.17 We thank an anonymous reviewer for drawing our attention to this very important point.
Econ Change Restruct
123

1995–2014 would be utilized, and all data are sourced from World Development
Indicators (WDI) of World Bank.
Our definition of natural resource rent is akin to that of the World Bank and this
variable is proxied by total natural resource rent. In the World Bank definition,
natural resources are classified under five categories: oil, natural gas, forest and
mineral. The aggregation of these categories yields total natural resource rent, which
is measured in proportion to GDP. Thus, Fig. 1 below partitioned countries in SSA
to include those whose resource rents as a percentage of GDP is\10 % (countries in
black bars), 10–20 % (countries in yellow bars) and 20 % and above are in red bars.
Figures 2 and 3 below provides on a regional basis, a graphically illustration of
average resource rents as percentage of GDP (Fig. 2) and average GDP person
employed (Fig. 3). It is only a common sense argument that natural resource
endowments provide an opportunity to improve economic growth and alleviate
poverty. In this regard one expects that if properly harnessed, natural resource rents
have the potential of making growth more inclusive in the SSA countries. With the
exception of the Arab, Middle East and countries from North Africa (MENA),
natural resource rents, as a percentage of GDP, for SSA is slightly higher than that
of other regions.
After the 2000s energy crisis and recent oil discoveries, natural resource boom
have contributed significantly to increases in government revenue of SSA, and same
is expected to have been used to accelerate economic growth inclusiveness.
Paradoxically, Figs. 2 and 3 appears to be going in an opposite directions. On the
one hand, growth in the less resource endowed regions such as Europe, Latin
America and North America seems to be inclusive on the basis of their impressive
GDP per person employed. On the other hand, the use of resource rents in SSA
Fig. 1 Average natural resource rents in SSA (1991–2013)
Econ Change Restruct
123

countries and other resource endowed regions has been disappointing and growth in
these regions can be said not to be inclusive especially in the sense of the abysmal
level of GDP per person recorded in these resource endowed regions.
Access to health and education and other vital infrastructure such as safe drinking
water and adequate sanitation defines the quality of human capital. In order to make
the working population possess the human capabilities necessary to be productively
employed, investment on human capital development such as spending on health
care and education cannot be ignored. For growth to be inclusive, it needs to
enhance human capabilities. Also, within the analytical framework of inclusive
growth, health and education expenditures can also be utilized as indicators of the
degree of equality of opportunity that a country’s population enjoys. To this end, we
equally demonstrate graphically if available resource rent determines the level of
investment in Haman Capital Development (HCD) on regional basis.
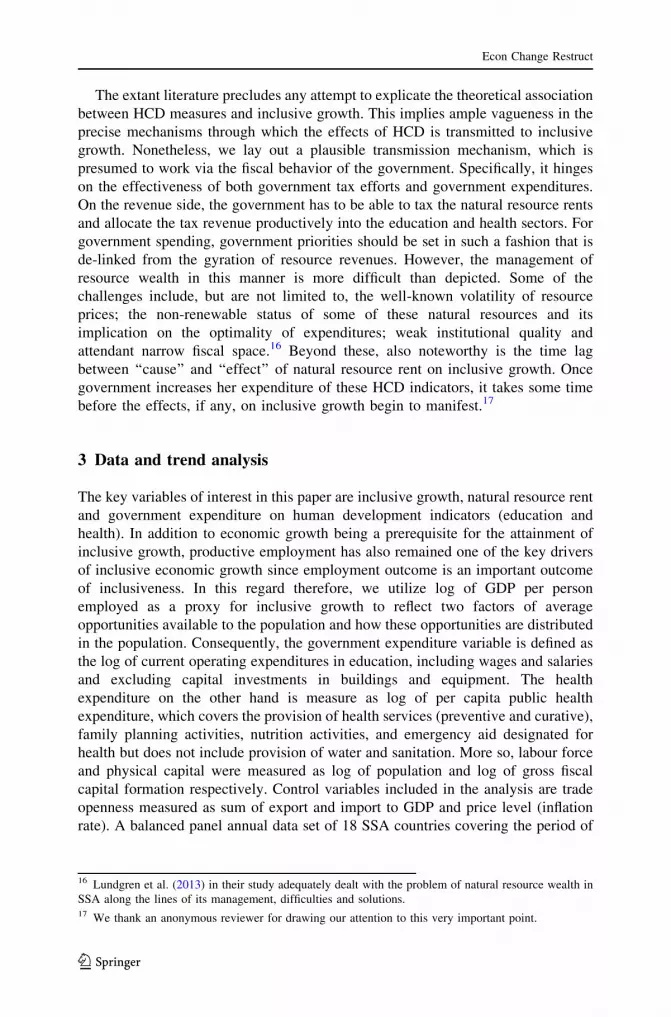
Thus, Fig. 4 represents average health expenditure per capita of both the resource
rich regions and the less resource rich regions. Not too surprising though, Europe
and North America despite being the least resource endowed regions tend to give
priority to HCD on the basis of health expenditure than other regions. Specifically,
their average per capita health expenditures between 1995 and 2013 are well above
East_Asia NorthAmerica Europe Latin
America SSA MENA Arab
Series1 2.183 2.48 2.229 6.638 14.428 26.797 29.363
0
5
10
15
20
25
30
35
(% o
f R
eal G
DP)
Fig. 2 Average natural resource rent (1991–2013). Source plotted by the authors
SSA East_Asia Arab MENA LatinAmerica Europe North
AmericaSeries1 3209.47 10518.77 13362.63 15341.77 15926.52 28175.1 57712.53
0
10000
20000
30000
40000
50000
60000
70000
Con
stan
t US
Dol
lar
($)
Fig. 3 Average GDP per-person employed (1991–2013). Source plotted by the authors
Econ Change Restruct
123
6000 and 11,000 US dollar, respectively. On the contrary, however, health per
capita expenditure in SSA and other resource rich regions such as Arab and MENA
are far much lower than 1000 US dollar.
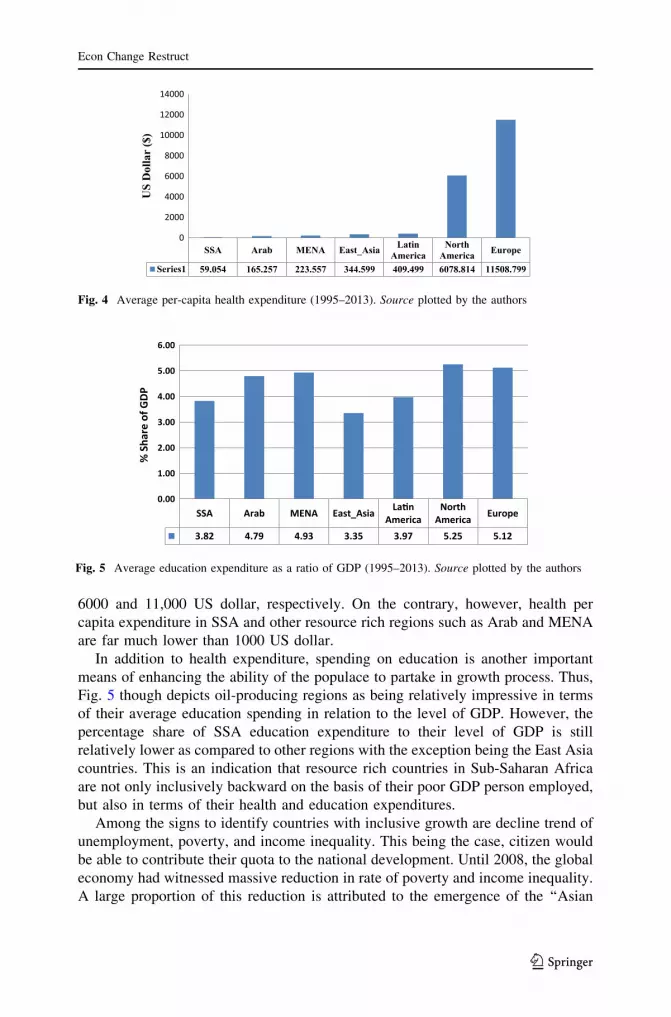
In addition to health expenditure, spending on education is another important
means of enhancing the ability of the populace to partake in growth process. Thus,
Fig. 5 though depicts oil-producing regions as being relatively impressive in terms
of their average education spending in relation to the level of GDP. However, the
percentage share of SSA education expenditure to their level of GDP is still
relatively lower as compared to other regions with the exception being the East Asia
countries. This is an indication that resource rich countries in Sub-Saharan Africa
are not only inclusively backward on the basis of their poor GDP person employed,
but also in terms of their health and education expenditures.
Among the signs to identify countries with inclusive growth are decline trend of
unemployment, poverty, and income inequality. This being the case, citizen would
be able to contribute their quota to the national development. Until 2008, the global
economy had witnessed massive reduction in rate of poverty and income inequality.
A large proportion of this reduction is attributed to the emergence of the ‘‘Asian
SSA Arab MENA East_Asia LatinAmerica
NorthAmerica Europe
Series1 59.054 165.257 223.557 344.599 409.499 6078.814 11508.799
0
2000
4000
6000
8000
10000
12000
14000
US
Dol
lar
($)
Fig. 4 Average per-capita health expenditure (1995–2013). Source plotted by the authors
SSA Arab MENA East_Asia La�nAmerica
NorthAmerica Europe
3.82 4.79 4.93 3.35 3.97 5.25 5.12
0.00
1.00
2.00
3.00
4.00
5.00
6.00
% S
hare
of G
DP
Fig. 5 Average education expenditure as a ratio of GDP (1995–2013). Source plotted by the authors
Econ Change Restruct
123

Tigers’’; notable countries are China, India and East Asian countries. The inverse is
the case for the African story.
Figure 6 below presents a graphical illustration of percentage of population
living in households with consumption or income per person below the poverty line
between 1981 and 2012. The graph shows that SSA recorded highest poverty rate
relative to other regions over the years. This suggests that the largest percentage of
the population living in households is below poverty line relative to other region.
Ironically, the region that is blessed with a lot of natural resource rents could not
cater for its citizens. Europe and central Asia that have the least resource
endowment could cater for its citizens. This clearly show that the resources meant
for the provision of infrastructure and other basic amenities in Sub-Saharan Africa
are either mismanaged or embezzled by so called ‘‘leader’’.
Figure 7 depicts the income disparities at a sub-regional level for the regions.
The disaggregation of income inequality into sub-region further shows the problem
inherent in the African economy. The southern part of Africa recorded the highest
level of income disparities among its citizens with Gini indices ranging from 49 to
52. Also, West, East and Central Africa have recorded an increasing uneven
distribution of income whereas Southern and North Africa have recorded
oscillations resulting in lower Gini Indices from decade of 2000–2009 compared
to 1980–1989.
0
5
10
15
20
25
30
35
40
45
1981 1984 1987 1990 1993 1996 1999 2002 2005 2008 2010 2011 2012
Europe and Central Asia Middle East and North Africa
Latin America and the Caribbean East Asia and Paci�ic
South Asia Sub-Saharan Africa
Fig. 6 % of population living in households with consumption or income per person below the povertyline (1981–2012). Note South Asia, East Asia and Pacific and Sub-Saharan Africa values are rescaled bydividing the series by 2. This is to enable us show the trend clearly because the values of other regions arevery small. Source World Bank website using polvcalnet
Econ Change Restruct
123

3.1 Model specification and methodological framework
Given our desire to account for the contribution of human capital to inclusive
growth in SSA, this study adopts an augmented neoclassical model by Mankiw et al.
(1992) to empirically evaluate if expenditure on education and health makes growth
process inclusive in SSA. To achieve this: (1) we look at the direct effect of
government’s education and health expenditures as well as natural resource rents on
inclusive growth process; and (2) we examine if natural resource rents is important
for augmenting expenditures on education and health to enhance the inclusion of
human capital for inclusive growth process. In view of this, the baseline equation
denoting the inclusive growth model without natural resource rents interaction is
represented as follows:
INGROWTHit ¼ a0 þ a1LABit þ a2CAPit þ a3EDUit þ a4HLTit þ a5NRSit þ Z 0cþ li þ eit
ð1Þ
Equation (1) is the baseline inclusive-growth model where INGROWTHit is the log
of GDP per person. The number of countries i ¼ 1; . . .;N; the number of periods
t ¼ 1; . . .; T , LABit is log of population denoting labour force, CAPit is the log of
gross physical capital formation representing stock of physical capital, EDUit is log
of government expenditure on education, HLTit is log of health expenditure per
capita, NRSit is total natural resource rents as a percentage of GDP, while Z is a
k � 1 vector of control variables. The latter includes inflation rate (INFit) foreign
direct investment (FDIit) and trade openness (TOPit). The regression parameters are
a0; a1; a2; a3; a4; a5 while c denotes a 1� k vector of parameters on the control
variables; li is the country-specific effect while eit is the regression disturbance
term.
Fig. 7 Income inequality. Source Milcent (2014)
Econ Change Restruct
123

Consequently, the extended inclusive-growth specifications allowing for inter-
action between the respective conventional growth drivers such as education and
health expenditures and natural resource rents is represented in Eq. (2) as follows:
INGROWTHit ¼ a0þ a1LABit þ a2CAPit þ a3EDUit þ a4 EDUit �NRSitð Þþ a5HLTitþ a6 HLTit �NRSitð Þþ a7NRSit þZ 0cþliþ eit
ð2Þ
As shown in Eq. (2), in order to verify if natural resource rents enhances the
inclusion of human capital in growth process in SSA, we interact growth
determinant variables namely education and health expenditures with natural
resource rents (NRSit).
To complement this study, we further adopt a simulation methodology based on
the intuition that human capital is a key driver of growth in an economy. Following
this logic, we estimate the potential growth that is accruable by increasing
government expenditure on health and education. We argue that natural resource
rent should fund these expenditures.18 It is assumed that in the process of increasing
government expenditure, more jobs would be created, investment increases, which
thus increase tax-based revenue of the government. This would invariable boost
capital formation, which is part of the key drivers of long-run economic growth. In
an attempt to capture this, we use the incremental capital output ratio (ICOR)
derived from historical values of government expenditures on health and education.
We draw inferences and inspiration from the financing gap model, which is
known to be useful for forecasting and policy simulations. International organiza-
tions such as the World Bank and the United Nations have based their simulation
policies on this model. Despite its laudable advantage, it is not free from criticism.
First, there is no direct relationship in the variables used for simulation or
forecasting (i.e. it is not every dollar spent on education or health would yield extra
growth). Second, the principles of ICOR assume linearity between and/or among
variables of interest. The first problem can be addressed using historical data on
government expenditure on education and health as well as growth. Using historical
data also partly help address the concern that some expenditure might be driven by
bad policies. The second criticism is about the precision of point estimates; this is
less of a concern about estimates of the average impact over a long period.
Nonetheless, the simulation results should be interpreted with caution. That is, they
are only illustrative and useful in providing an order of magnitude rather than
precise estimates of the impact.
Based on the foregoing, the first step is to calculate ICOR that measures the
amount of expenditure needed to produce one extra unit of growth. ICOR is
calculated given the formula below:
ICORit ¼Gov:ExpenditureitGDP Growthit
ð3Þ
18 Since government have different sources of income, channeling resource rent on the two sectors of the
economy would not have adverse effect on the rest of the sectors provided government can diversify their
source of income away from the depending on proceeds from natural resources.
Econ Change Restruct
123

It should be noted that some countries might experience negative growth, which
thus might produce negative values for ICOR, which does not have any empirical
meaning. Hence, we used the absolute value of ICOR. It is a known fact that trend
of economic growth rate of African countries are susceptible to volatility. This
problem is addressed using the median value of ICOR over a period of time as
against the estimated annual values. In specific reference, we used the 5-year non-
overlapping periods, except the last period that has 4 years.
Using Eq. (3) and assuming that natural resource rent would produce the same
output per dollar as historical values of government expenditure, the additional
output resulting from investing the resource in rent is given as follows:
DGDP0it ¼
RESit
ICORi
ð4Þ
The potential GDP, which is the level that would be achieved by increasing
government expenditure, is given as:
GDP�it ¼ DGDP0
it þ GDPit ð5Þ
The last stage is to calculate the potential growth of output per capita by
comparing the potential output growth with actual or historical data. This is
achieved by implanting the formula below:
g�t ¼PT
0
GDP�t
GDPt� 100%
� �,
T ; where T is 5 years: ð6Þ
4 Empirical results
4.1 Panel models regression results
The empirical outcomes resulting from the estimation of the three static panel
models considered however, reveals fixed effect as the preferred model to the
pooled and random effect models. This is as a result of the significance of both the
*F-statistic and the Hausman test prompting the rejection of the null hypothesis on
both instances. To this end, we are statistically constrained to concentrate on
discussing the practical and empirical implications of estimates from the fixed effect
model only.
Thus, the empirical result in Table 1 below shows that inclusive growth in SSA
countries can be positively and significantly enhanced by human capital develop-
ment via spending on education and health cares. The magnitude of this association
seems be more pronounced when the natural resource rent is interacted with health
expenditure, while the interaction between natural resource rent and education
expenditure constitute inclusive growth drag (though this is insignificant).
Hence, the economic implication of the above empirical findings is that, inclusive
growth in SSA countries can be amplified through government spending on
Econ Change Restruct
123

education and health care over the period under consideration. What this implies is
that inclusive growth in SSA requires more than just large size of labour force; but
labour force with quality to be complimented with available capital stocks. More
importantly also, inclusive growth in the region can be attained directly via effective
allocation of resource rents even though using it to augment spending on human
development via health expenditure increases the inclusiveness impacts of resource
rents on growth process in SSA.
In sum, the view that human capital development via spending on education and
health conclusive can aid the attainment of inclusive growth tends to be supported
by the panel evidence reported in this study. Also, the statistical significant of both
the direct and indirect impacts of resource rents on inclusive growth process as
shown in our empirical report is to a meaningful extent, an indication that
development of human capital for the attainment of growth inclusiveness can be
fostered through effective allocation of resource rents in SSA.
4.2 Simulation exercise
The comprehensive report of the simulation exercise, which is meant to complement
the results of the estimated panel model, is presented in Table 2. Precisely, the study
based the simulation results on the assumption that the total natural resource
revenue are spent on health sector. The exclusion of the education is due to its
Table 1 Empirical results of
inclusive growth models
***, ** and * implies significant
at 1, 5 and 10 %
Variable Fixed effect model
Coefficient Standard error T-stat.
Dependent variable: log of GDP per person (inclusive growth)
Constant 6.523*** 0.108 64.02
CAP 0.012 0.019 0.71
LAB -0.203* 0.055 -1.51
EDU 0.082** 0.035 0.52
HLT 0.112** 0.049 2.55
NRS 0.033** 0.005 2.20
FDI 0.293** 0.067 2.49
INF 0.0002** 0.0001 2.02
TOP 0.0004 0.0006 0.63
EDU*NRS 0.045 0.001 1.34
HLT*NRS 0.078** 0.002 2.16
Diagnostic statistic
Countries 18
Observation 342
R-squared 0.476
F-statistic 52.38***
*F-statistic 213.96***
Hausman test 17.55** (0.041)
Econ Change Restruct
123

insignificant coefficients when interacted with natural resource rent. The result of
the simulation exercise show that on the average, the region could have had an
increased GDP per capita on about 3 %. Among the top gainers are Senegal,
Ethiopia and Mozambique. It is puzzling to infer that countries such as Congo, DR
and Cote d’Ivoire would experience growth drag should they embark on increasing
government expenditure in the health sector. On the average, countries like
Madagascar and Kenya have no incentive into improvement government expen-
ditures on the health sector. A plausible reason for these scenarios is difficult to
infer.
5 Conclusion
The study considered empirical analysis of inclusive growth, human capital
development and natural resource rents in SSA. It utilizes all the three classes of
static panel model to examine if, augmenting education and health expenditure with
natural resource rents in SSA would be significant for making growth process
inclusive. In addition, a financing gap model was further employed to estimate the
potential growth in GDP per capita that is accruable to the economy if government
use natural resource rent to finance increase in health expenditure.
Table 2 Simulation exercise.
Source authors’ computation
Ave is Average; Act is Actual,
Pot meant Potential, Addi stands
for Additional, Education
expenditure while Hea is health
expenditure per capita
Country Ave Hea Ave act GDP Pot GDP Addi GDP
Burkina Faso 25.101 399.063 407.198 2.039
Cameroon 43.068 896.216 902.409 0.691
Congo, Dr 9.978 241.142 235.943 -2.156
Cote d’Ivoire 60.828 1024.82 1024.652 -0.016
Ethiopia 9.635 178.803 194.812 8.953
Ghana 40.798 521.253 528.845 1.456
Kenya 25.846 539.316 540.889 0.292
Madagascar 14.861 277.513 277.623 0.039
Malawi 18.305 227.608 229.342 0.762
Mali 30.703 429.247 434.862 1.308
Mozambique 19.321 300.046 310.54 3.497
Niger 17.342 268.478 268.935 0.170
Nigeria 57.942 758.567 772.035 1.775
Senegal 35.553 738.369 972.278 31.679
South Africa 397.819 5366.857 5400.798 0.632
Sudan 55.69 818.504 841.734 2.838
Tanzania 19.846 434.476 441.583 1.636
Uganda 34.136 320.403 327.103 2.091
Zambia 44.772 751.602 761.873 1.367
Average 50.674 762.751 782.813 3.108
Econ Change Restruct
123
Using dataset for 18 SSA countries, it was found that education and health are
good determinants of inclusive growth. This however, appears to be more
significantly pronounced when the interaction is between health expenditure and
natural resource rent. Results of the simulation exercise show that SSA would have
had a potential GDP per capita growth of about 3.1 %. It was also established that
countries with relative higher GDP per capita (for instance, South Africa and Cote
d’Ivoire) tend not to benefit from the additional increase in government expenditure
on health.
The policy relevance of this study suggests that in an attempt to enhance
inclusive growth, it is imperative for government to increase expenditure on
education and health. This being the case, the productivity level of the country
would increase, investment would be on the rise, and employment generation would
soar, which thus increases tax-based revenue of the government. Hence, an attempt
to increase government’s investment in these sectors would further generate
additional revenue for the government. It can be stated that the effect of increase in
government expenditure is a vicious cycle. Hence, it is important for government to
focus on improving her expenditure on health.
This study was unable to provide explanation for the reason why countries with
relative higher GDP per capita tend not to benefit from increasing government
expenditure. Based on this, an interesting area where future research can beam the
search light on is the level of income at which increase in government expenditure
ion education and health would ensure growth and development. By this, it is
implied that future studies should verify the existence of a threshold effect (if any)
between government expenditures and national income level. Lastly, a very
promising area future studies should focus their beam light on is the time lag
between ‘‘cause’’ and ‘‘effect’’ of natural resource rent on inclusive growth.
Open Access This article is distributed under the terms of the Creative Commons Attribution 4.0
International License (http://creativecommons.org/licenses/by/4.0/), which permits unrestricted use, dis-
tribution, and reproduction in anymedium, provided you give appropriate credit to the original author(s) and
the source, provide a link to the Creative Commons license, and indicate if changes were made.
References
Acemoglu D, Johnson S, Robinson JA, Thaicharoen Y (2003) Institutional causes, macroeconomic
symptoms: volatility, crises and growth. J Monet Econ 50(January):49–123
Addison T, Nino-Zarazua M (2012) What is inclusive growth? Nordic-Baltic MDB meeting. UNU-
WIDER, Helsinki
Adeyinka A, Salau S, Vollrath D (2013) Structural change in Nigeria. Unpublished Manuscript,
Department of Economics, University of Houston
Ali I, Son H (2007) Defining and measuring inclusive growth: application to the Philippines, ERD
working paper series no. 98. Asian Development Bank
Anand R, Mishra S, Peris S (2013) Inclusive growth: measurement and determinants, IMF working paper
WP/13/135
Arezki R, Nabli MK (2012) Natural resources, volatility, and inclusive growth: perspectives from the
Middle East and North Africa, International monetary fund working paper WP/12/111
Arezki R, Dupuy A, Gelb A (2012) Resource windfalls, optimal public investment and redistribution: the
role of total factor productivity and administrative capacity. International monetary fund working
paper WP/12/200
Econ Change Restruct
123

CAFOD (2014) What is ‘‘inclusive growth’’? CAFOD discussion paper, August Version, pp 1–17
Chandy L, Penciakova V (2013) The final countdown: prospects for ending extreme poverty by 2030.
Brookings Institute, Washington, DC
Chang HJ, Grabel I (2004) Reclaiming development: an alternative economic policy manual. Zed Books.
In: Arezki R, Pattillo C, Quintyn M, Zhu M (eds) Commodity prices and inclusive growth in low-
income countries. International Monetary Fund, Washington, DC
Frankel JA (2012) The natural resource curse: a survey of diagnoses and some prescriptions, HKS faculty
research working paper series RWP12-014, John F. Kennedy School of Government, Harvard
University
G20 (2013) G20 leaders declaration, St Petersburg, September 2013. http://bit.ly/1nI3Mge growth, NBER
working paper no. 5398. National Bureau of Economic Research, Cambridge. http://papers.nber.org/
papers/w5398
Greenwald B, Stiglitz JE (2013) Industrial policies, the creation of a learning society, and economic
development. In: Stiglitz JE, Lin JY (eds) The industrial policy revolution I: the role of Government
beyond ideology, pp 43–71, Macmillan, Basingstoke
Herd R (2013) The evolution of China’s social policies. Econ Change Reconstr 46:109–141
Heuty A (2012) The role of transparency and civil Society in managing commodities for inclusive growth
and development. In: Arezki R, Pattillo C, Quintyn M, Zhu M (eds) Commodity prices and inclusive
growth in low-income countries, International Monetary Fund. http://bit.ly/1kBamUk
Hull K (2009) Understanding the relationship between economic growth, employment and poverty
reduction. In: Promoting pro-poor growth: employment. OECD, Paris
Ianchovichina E, Gable SL (2012) What is inclusive growth? In: Arezki R, Pattillo C, Quintyn M, Zhu M
(eds) Commodity prices and inclusive growth in low-income countries. International Monetary
Fund, Washington, DC
Lin JY (2010) New structural economics: a framework for rethinking development, Policy research
working paper 5197. World Bank, Washington, DC
Lin JY (2012) The quest for prosperity: how developing economies can take off. Princeton University
Press, Princeton, NJ
Lundgren CJ, Thomas AJ, York RC (2013) Boom, bust, or prosperity? managing Sub-Saharan Africa’s
natural resource wealth, IMF working paper series
Mankiw NG, Romer D, Weil D (1992) A Contribution to the empirics of economic growth. Q J Econ
107(2):407–438
Matusyama K (2008) Structural change. In: Durlauf NS, Blume LE (eds) The New Palgrave dictionary of
economics. Palgrave Macmillan, Basingstoke
McMillan MS, Rodrik D (2011) Globalization, structural change and productivity growth (No. w17143).
NBER, New York
Milcent C (2014) The effect of financial development on income inequality in Africa: looking for a needle
in a haystack?. Jonkoping University, Jonkoping International Business School, Jonkoping
OECD (2012) OECD employment outlook. OECD, Paris
OECD (2013a) Report on addressing base erosion and profit Shifting. OECD, Paris
OECD (2013b) Speech by OECD secretary general angel Gurria, at OECD workshop on inclusive
growth, Together we stand: inclusive growth. Paris, 3 Apr 2013
OECD (2013c) OECD secretary general angel Gurriaopening remarks to OECD Forum 2013: ‘‘people
first!’’ Paris. 28 May 2013
Osei RD, Jedwab R (2013) Is structural change in Sub-Saharan Africa different? New historical evidence
from Ghana in 1960–2010
Oxfam (2014) Working for the few: political capture and economic inequality. Oxfam, Oxford. http://bit.
ly/1bcqZvj
Oyinlola MA, Adeniyi O, Raheem ID (2015) Natural resource abundance, institutions and economic
growth in Africa. Afr J Econ Sustain Dev 4(1):34–48
Ravallion M (2004) Pro-poor growth- a primer. World Bank, Washington, DC
Ravallion M (2009) Do poorer countries have less capacity for redistribution? Policy research working
paper 5046. World Bank, Washington, DC
Resnick D, Thurlow J (2013) The political economy of Zambia’s recovery: structural change without
transformation?
Rodrik D (2010) Globalization, structural change and productivity growth, NBER working paper no.
17143
Econ Change Restruct
123

Saad-Filho A (2010) Growth, poverty and inequality: From Washington consensus to inclusive growth,
DESA working paper no. 100, pp 1–22
Sachs JD, Warner AM (1995) Natural resource abundance and economic growth, NBER working paper
no. 5398. National Bureau of Economic Research, Cambridge. http://papers.nber.org/papers/w5398
Stiglitz JE, JY Lin (eds) (2013) The industrial policy revolution I: the role of government beyond
ideology, Palgrave Macmillan, New Yor, forthcoming
Warner A (2012) Inclusive growth in natural resource intensive countries. In: Arezki R, Pattillo C,
Quintyn M, Zhu M (eds) Commodity prices and inclusive growth in low-income countries.
International Monetary Fund, Washington, DC
World Bank (2006) World development report 2006: equity. World Bank, Washington, DC
World Bank (2012) Inequality in focus, introduction to the inequality in focus series. World Bank,
Washington, DC
World Bank (2013) World development report 2013: Jobs. World Bank, Washington, DC
Econ Change Restruct
123


