Embed Size (px)
Citation preview
journal ofManagmt Studies 31:5 September 1994 0022-2380
IN SEARCH OF EXCELLENT MANAGEMENT
JAMES V. KOCH
Old Dominion Unwmi@
RICHARD J. CEBULA
Georgia InstitUte of Technology
ABSTRACT
Despite important advances in recent years, no agreement exists concerning what constitutes management excellence. Specific knowledge of how managerial beha- viour is perceived and evaluated by others will help to resolve unsettled questions about what is meant by management excellence and improve the actual decisions of managers. This article examines the determinants of managerial excellence as perceived by corporate CEOs, directors, and financial analysts in Fortune magazi- ne’s annual survey of the best-managed American firms in 33 industries. While the firms perceived to be best managed are more profitable and less risky, and grow faster and reward their stockholders more than less well-managed firms, these variables explain only about 30 per cent of the variance in management ratings. The firms perceived to be best managed have more involvement in international markets and research and development, while large firm size and firm diversification reflect negatively upon perceived managerial quality. The relative inability of conventional financial measures of firm performance to explain perceptions of managerial excellence underlines the complex nature both of these perceptions and strategic behaviour. The results support Varadarajan and Ramanujam’s conclusion that excellent management depends upon a diverse set of competencies and values, as well as Chakravarthy’s contention that the most important characteristic of firm performance is management’s ability to transform the firm and adapt to a rapidly changing environment. By contrast, little support is found for the maximization of stockholder wealth criterion of Rappaport.
INTRODUCTION
Quality . . . you know what it is, yet you don’t know what it is. But that’s self- contradictory. But some things are better than others, that is, they have more quality . . . but when you try to say what the quality is . . . it all goes poof. . .
Address for reprints: James V. Koch, 5000 Edgewater Drive, Norfolk, VA 23508-1720, USA.
0 Basil Blackwell Ltd 1994. Published by Blackwell Publishers, 108 Cowley Road, Oxford OX4 IJF, UK and 238 Main Street, Cambridge, MA 02142, USA.
682 JAMES V. KOCH AND RICHARD J. CEBULA
but if you can’t say what quality is, how do you know what it is, or how do you know that it even exists? (Pirsig, 1974, pp. 163-4).
Evaluating management performance is fundamental to strategic management practice and research (Venkatraman and Ramanujam, 1987). Yet, surprisingly little empirical information is available on what is being measured or evaluated when it is asserted that a firm is well managed. Management performance is an illusive notion; as Cameron and Whetton (1983), Chakravarthy (1986), and Var- adarajan and Ramanujam (1 990) have observed, no consensus exists concerning either its attributes or its measurement. For example, Woo and Willard (1983) analysed 14 performance measures in an attempt to isolate factors critical to management success and concluded that rate of return on investment was the most important. Nonetheless, Chakravarthy (1986) and Venkatraman and Rama- nujam (1987, 1990) caution against utilizing a single performance measure to. evaluate management excellence. They reflect the consensus view that multiple criteria must be employed if one wishes to reflect accurately the subtleties of management performance.
The most prestigious and well-known evaluation of management excellence is carried out each year by Fortune magazine. Fortune surveys financial analysts and industry managers concerning the overall management excellence of firms in the industries with which they are connected. The result is a highly publicized summary rating score that reflects the expert opinion of the respondents con- cerning the overall quality of management of the rated firms. The survey provokes questions such as, what do these experts mean when they say a firm is well managed? Do the evaluations of experts reflect current theory and empirical evidence concerning management excellence and strategy? What strategic man- agerial choices are most likely to improve the perception of experts concerning the management excellence of a firm?
This article is directed at answering the above questions. Of course, the fact that one view of the determinants of management excellence may predominate does not demonstrate that this view is correct. However, when management excellence is discussed, perceptions (however inaccurate) can influence reality if the perceptions in question are those of financial analysts who make portfolio recommendations that sway the investors who determine the value of a firm’s stock. Thus, this study constitutes much more than an intellectual exercise. It describes an important link between the recorded performance of firms and how knowledgeable observers evaluate that performance.
A REVIEW OF THE LITERATURE
In recent years, many studies have analysed one strategic aspect of firm beha- viour and its effects upon firm performance. The most attention has been paid to the effects of diversification upon firm performance. Rumelt’s (1974, 1982) important work is the best example of this genre and stimulated a host of additional studies that either extended or quarrelled with his conclusions. These studies, however, have not focused upon questions of overall manage- ment quality, although they have increased vastly the knowledge we have con-
0 Basil Blackwell Ltd 1994
IN SEARCH OF EXCELLENT MANAGEMENT 683
cerning the effects of a strategic variable such as diversification upon firm per- formance.
The most influential early analysis of overall firm performance was carried out by Woo and WiUard (1983), who factor analysed PIMS data and concluded the return on investment (ROI) was the most comprehensive measure of overall firm performance. ROI was culled from a list of 14 performance measures (for example, market share, research and development activity, etc.) that have appeared frequently in discussions of strategic management.
More recently, Chakravarthy (1986) and Venkatraman and Ramanujam (1987, 1990) examined overall firm performance and concluded no single measure of firm performance was capable by itself of assessing firm behaviour and manage- ment excellence. Chakravarthy’s study, based upon a sample of 14 firms within the computer industry, is particularly relevant here, because seven of his firms were cited by Peters and Waterman (1982) as especially well managed. Chakra- varthy analysed factors differentiating the firms perceived to be well managed from the remainder and found ROI and related financial performance measures could not do so. However, the excellently-managed firms generated more of what Cyert and March (1 963) have termed ‘organizational slack’ - discretionary resources in excess of dividend payments required to satisfy stockholders. Research and development activity was the most important use of these slack resources. Chakravarthy concluded that well-managed firms have no longer time horizon than other firms, and they pay attention to other ‘stakeholders’ in the firm (customers, employees, and host communities) in addition to stockholders.
Several authors, in addition to Peters and Waterman, have constructed lists of ‘best-managed‘ American firms. Loomis (1984a,b) focused upon 25 ‘corporate stars’ with high ROIs during the 1973-84 period, while Maidique and Hayes (1984) constructed a list of superior high tech firms. Clifford and Cavanaugh (1985) examined 100 mid-sized companies with strong records of growth between 1975 and 1980. More recently, Varadarajan and Ramanujam (1990) studied 74 companies cited by Business Month magazine as one of the five best-managed companies in one of the years in the period 1972-86. In general, these studies have concluded that the best-managed firms are innovators who spend larger than average amounts on research and development, maintain a strong consumer orientation, have an intense focus upon quality, are cost-conscious, and adapt quickly to change.
Other inquiries into the determinants of overall management excellence have focused upon the stock market performance of firms that have appeared on lists of best-managed firms (Granatelli and Martin, 1984; Johnson et al., 1985). These studies found the firms cited by Peters and Waterman in their well-known In Search of Excelhce (1982) as being especially well managed exhibited no better stock market performance than the market as a whole and, in some cases, much worse.
Previous empirical studies of excellently-managed firms have extended our knowledge of management behaviour. Nonetheless, they have not been definitive because of one or more of the following: (1) use of small sample sizes; (2) focus only upon ‘well-managed’ firms; and (3) dependence upon a discrete ‘yes/no’ variable to identify firms as well managed.
With respect to (1) above, exclusive focus upon a small number of firms in one industry is instructive, but naturally leads to speculations about what is true in
0 Basil Blackwell Ltd 1994
684 JAMES V. KOCH AND RICHARD J. CEBUL4
general. With respect to (2), as Bettis and Mahajan (1985) and others have pointed out, one must also study firms that are not well managed if one wishes to draw inferences about the behaviour of webmanaged firms. With respect to (3), it is an oversimplification to say a firm either is ‘well managed‘ or ‘not well managed’. A continuum exists in management excellence and must be recog- nized.
A CLOSER LOOK AT THE FoR77~3E MANAGEMENT EXCELLENCE SURVEY
In 1987, Fortune magazine surveyed more than 8000 corporate executives, direc- tors, and financial analysts concerning the perched quality of management at 306 large corporations in 33 industries (Schultz, 1988). Of these individuals, 3480 responded to the survey and rated the ten largest firms in their industry (but no others) on eight key attributes, one of which was overall quality of management. The scale for the rating varied between 0 (poor) to 10 (excellent). Over 90 per cent of the ratings were completed prior to the crash of the stock market on 19 October 1987.
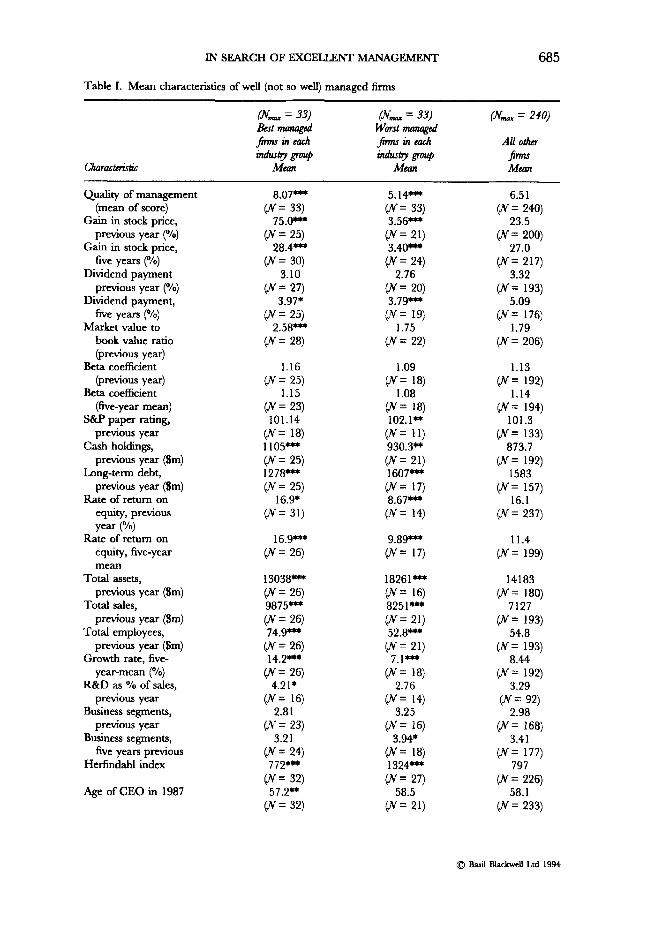
The mean rating assigned to the overall quality of management of the 306 companies evaluated was 6.53. The highest rating (9.34) was earned by Merck and Company, while the lowest rating (2.72) was assigned to BankAmerica. As table I indicates, the mean for the highest-rated firm in each of the 33 industries was 8.07, while the mean for the lowest-rated firms in each industry was 5.14.
Table I contains additional data that describe the 306 evaluated firms in other important ways. The data are largely derived from the Compustat-PC Plus (1988) and Compact Disclosure (1988) data banks. Relative to other firms, those firms viewed as being the best managed were characterized by:
(1) much larger recent gains in the prices of their common stocks; (2) greater stock market price variability; (3) slightly lower mean dividend payments; (4) higher mean ratios of market value to book value; (5) slightly better (lower) rankings on Standard & Poor’s ( S M ’ s ) index that
(6) larger cash holdings; (7) smaller outstanding debt; (8) higher rates of profit earned on stockholders’ equity; (9) smaller firm size as measured by the dollar value of total assets, but larger
firm size as measured by the dollar value of sales or the number of employees;
measures the quality of the short-term paper debt the firms float;
(10) much higher rates of firm growth, (1 1) greater intensity of research and development expenditures per dollar of
(12) slightly less diversification across industry lines (the typical firm, however
(1 3) lower Herfindahl Indexes of stockholder concentration; ( 1 4) slightly younger, though equally experienced, chief executive officers
sales;
managed, became less diversified over the previous five years);
(CEOs);
0 Basil Blackwell Ltd 1994
IN SEARCH OF EXCELLENT MANAGEMENT 685
Table I. Mean characteristics of well (not so well) managed firms
(N- = 33) (N- = 33) (N- = 240) Eat mrmagcd Wwst managed j h s in each Jirmrinuuh All o h
indwly group indurlry fimrr charactnictic Mean Mean
Quality of managcme (mean of score)
Gain in stock price, previous year (“10)
Gain in stock price, five years (“10)
Dividend payment previous year (“10)
Dividend payment, five years (O/O)
Market value to book value ratio (previous year)
Beta coefficient
Beta coefficient (five-year mean)
S&P paper rating, previous year
Cash holdings, previous year (Sm)
Long-term debt, previous year (Sm)
Rate of return on equity, previous year (“10)
Rate of return on equity, five-year mean
Total assets, previous year (Sm)
Total sales, previous year ($m)
Total employees, previous year (Sm)
Growth rate, five- year-mean (“10)
R&D as O h of sales, previous year
Business segments, previous year
Business segments, five yean previous
Herfindahl index
@re.vious year)
Age of CEO in 1987
:nt 8.07- (N= 33)
75.0- ( N = 25)
28.4- ( N = 30)
3.10 (N = 27)
3.97* (N= 25)
2.58- ( N = 28)
1.16 ( N = 25)
1.15 ( N = 23) 101.14
( N = 18) 1105- (N= 25) 1278- ( N = 25)
16.9* ( N = 31)
16.9*** (N = 26)
13038*** ( N = 26) 9875- ( N = 26) 7 4 . F
( N = 26) 14.2-
( N = 26) 4.2 1*
( N = 16) 2.81
(If= 23) 3.2 1
( N = 24) 772-
( N = 32) 57.2**
( N = 32)
5.14-
3.56-
3.40-
2.76
3.79-
1.75
(N= 33)
(N= 21)
( N = 24)
(N= 20)
( N = 19)
( N = 22)
1.09 (N= 18)
1.08 (N= 18) 102.1-
930.3”
1607- (N= 17) 8.67- ( N = 14)
9.89*** ( N = 17)
18261- ( N = 16) 8251*+*
52.8-
7.1- ( N = 18)
2.76 ( N = 14)
3.25 (N= 16)
3.94’ ( N = 18) 1324- ( N = 27)
58.5
( N = 11)
( N = 21)
( N = 21)
(N= 21)
( N = 21)
6.5 1 (N= 240)
23.5
27.0 ( N = 217)
3.32 ( N = 193)
5.09 (N= 176)
1.79 ( N = 206)
1.13 (N= 192)
1.14 (N= 194)
101.3 ( N = 133)
873.7 ( N = 192)
1583 ( N = 157)
16.1 (N= 237)
11.4
( N = 200)
(N = 199)
14183 (N = 180)
7127 (N = 193)
54.8 ( N = 193)
8.44 ( N = 192)
3.29 ( N = 92)
2.98 (N= 168)
3.41 ( N = 177)
797 ( N = 226)
58.1 ( N = 233)
0 Basil Blackwell Ltd 1994
686 JAMES V. KOCH AND RICHARD J. CEBULA
Table I. Conrinued
(N- = 33) (N- = 33) (N- = 240) Best managed Worst maRaged jim in each jim in each All other d u s @ group d u s @ group J;nns
Characterirric Mean Mean Mean
Years CEO has spent with firm as of 1987
Years CEO has been CEO as of 1987
CEO salary plus bonus in 1987 (000)
Stock owned by CEO in 1987 (%)
CEO total compensation in 1987 (000)
26.2 (N= 26)
7.5 (N= 26) 1042*** (N= 26)
1.24* ( N = 26) 1042*** (N= 26)
24.1*** (N= 21)
(N= 21)
( N = 21)
(N= 21)
(N= 21)
6.1 **
831*"
0.25"*
1 133***
26.2 (N= 195)
7.5 (N= 195)
944 (N= 193)
2.01
1538 ( N = 193)
(N = 190)
* 9 , W *** = statistically significant at the 0.10, 0.05, or 0.01 level in a difference of means test in which this mean is compared to the mean of all other h s .
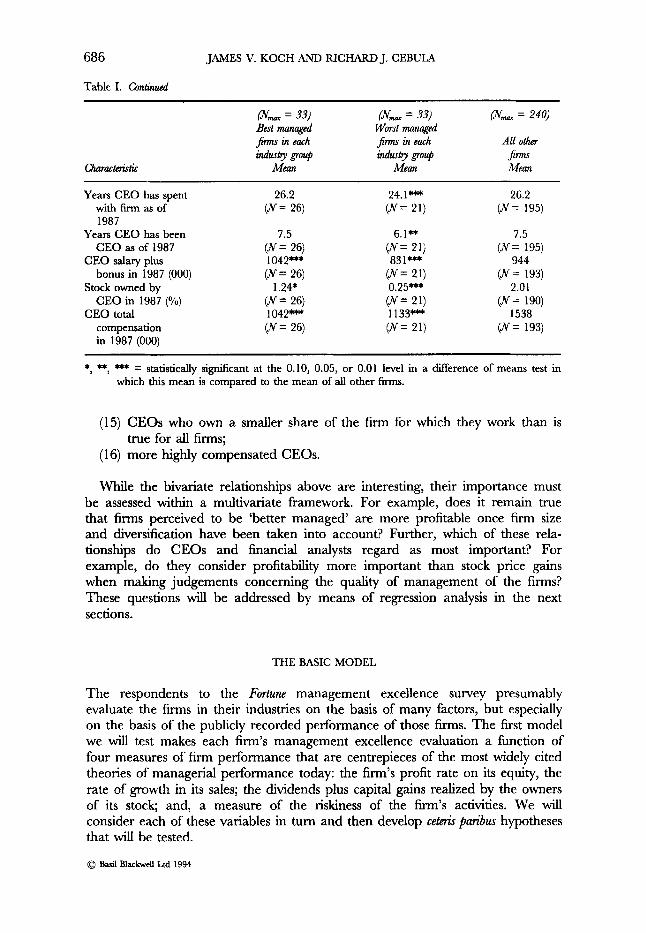
(15) CEOs who own a smaller share of the firm for which they work than is
( I 6) more highly compensated CEOs. true for all firms;
While the bivariate relationships above are interesting, their importance must be assessed within a multivariate framework. For example, does it remain true that firms perceived to be 'better managed' are more profitable once firm size and diversification have been taken into account? Further, which of these rela- tionships do CEOs and financial analysts regard as most important? For example, do they consider profitability more important than stock price gains when making judgements concerning the quality of management of the firms? These questions will be addressed by means of regression analysis in the next sections.
THE BASIC MODEL
The respondents to the Fortune management excellence survey presumably evaluate the firms in their industries on the basis of many factors, but especially on the basis of the publicly recorded performance of those firms. The first model we will test makes each firm's management excellence evaluation a function of four measures of firm performance that are centrepieces of the most widely cited theories of managerial performance today: the firm's profit rate on its equity, the rate of growth in its sales; the dividends plus capital gains realized by the owners of its stock; and, a measure of the riskiness of the firm's activities. We will consider each of these variables in turn and then develop 6eteri.s paribus hypotheses that will be tested.
0 Basil Blackwell Ltd 1994
IN SEARCH OF EXCELLENT MANAGEMENT 68 7
A good manager enables a firm to achieve its objectives. While significant dis- agreement remains concerning whether modern firms should or do maximize profits (Pindyck and Rubinfeld, 1989), there is virtual unanimity that earning profits is an important goal of the firm. It is difficult for a firm to achieve other possible goals such as maximizing stockholder value or generating organization slack without a high profit stream.
HI: A direct relationship exists between perceived management excellence and the firm's profit rate on stockholder equity."][*]
Growth maximization was first suggested by Baumol (1967) as the goal which most large firms, for a variety of reasons, seek to attain. Higher growth probably means higher profits in the long run, greater rewards to stockholders, more avail- able managerial slack, and higher managerial compensation.
H2: A direct relationship exists between perceived management excellence and firm growth.
Managers are the hired agents of the owners of the firm, the stockholders. While disagreement exists over Rappaport's (1 986) contention that the overriding duty of managers is to enhance the value of the stockholders' investment, there is a strong consensus that excellent management will provide stockholders with sig- nificant returns, as measured by dividends plus capital gains.
H3: A direct relationship exists between perceived management excellence and the return to stockholders.
Higher profits, more explosive growth, and a record of large increases in stockholder value perhaps may cause the firm to incur higher levels of risk. Tra- ditional portfolio choice theory expounded by Markowitz (1959) and Copeland and Weston (1979) posits a direct relationship between return and risk. However, it is worth noting that empirical evidence on this issue is mixed, with some studies finding a positive association (Cardozo and Smith, 1983; Fisher and Hall, 1969), some finding no association (Bettis and Mahajan, 1985; Stigler, 1963) or mixed results depending upon the circumstances (Amit and fivnat, 1988; Bettis and Hall, 1982), and some finding a negative association (Armour and Teece, 1978; Bowman, 1980; Shepherd, 1972). Following traditional portfolio theory, we expect evaluators to abhor risk, other factors such as profit held constant.
H4: An inverse relationship exists between perceived management excellence and firm risk.
Our basic model can be summarized as follows:
where: PER = mean management excellence rating ni = profit rate on equity
0 Basil Blackwell Ltd 1994

688 JAMES V. KOCH AND RICHARD J. CEBULA
Gi = growth rate SR, = stockholder return Ri = measure of risk
and: i = 1, 2 , . . . , 306 firms
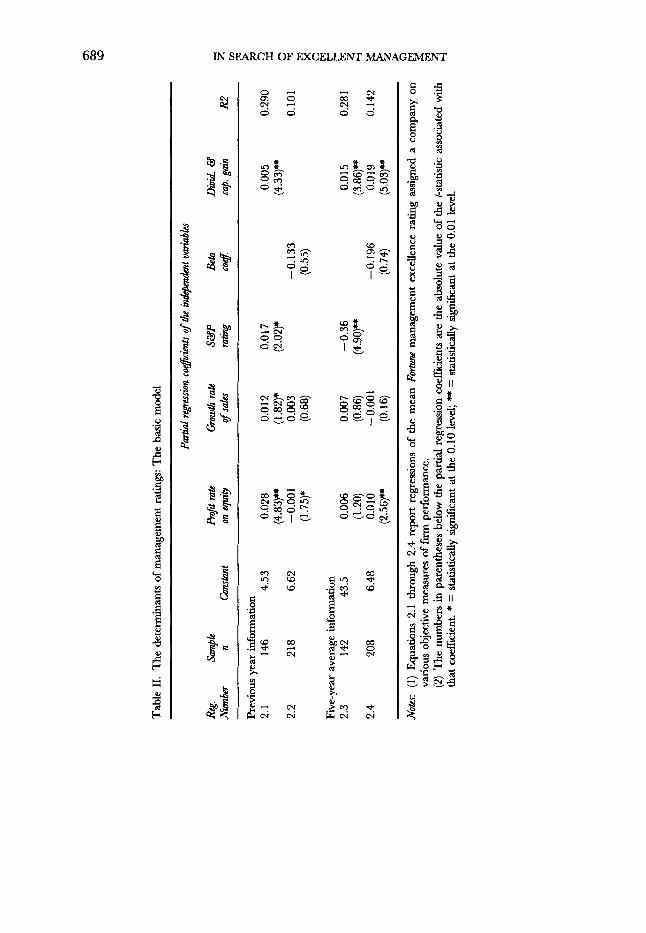
Empirical Anabsis Do evaluators focus upon the most recent values of these variables, or do they take a longer, multiple-year view when they judge whether firms are well managed? Regressions 2.1 and 2.2 in table I1 report results in which the previous year’s values are utilized. Thus, the profit rate on equity is for the year 1986, and the growth rate of the firm’s sales is for a single year (1985 to 1986). (Note that 1987 data were not yet available when the respondents completed the survey.) Regressions 2.3 and 2.4, on the other hand, utilize five-year average data, 1982-1986.[31
Each of the coefficients of the independent variables in regressions 2.1 and 2.2 is statistically significant at the 0.10 level, or better. However, two of the signs are contrary to expectations. The Standard and Poor (S&P) rating is an inverse measure of the quality of a firm’s short-term paper debt; the higher the rating, the more risky S&P believes the firm’s debt to be. We predicted a negative sign on this coefficient rather than the observed positive sign in regression 2.1. When an alternate measure of risk (the firm’s beta coefficient) is utilized in regression 2.2, the sign is negative as predicted, but not statistically significant, and the pro- portion of explained variance falls significantly. Further, it should be noted that market price variability is an inexact reflection of the overall riskiness of a firm’s activities, and that the sign of the coefficient of the profit rate variable is also perverse in regression 2.2. As noted above, Chakravarthy (1986) and others argue that evaluators of
management excellence should consider the performance of a firm over a period of time much longer than a year. Regressions 2.3 and 2.4 rely upon five-year average data in an attempt to reflect this phenomenon. All coefficients assume their expected signs with the coefficients of the S&P paper rating and the sum of the dividends plus capital gains paid by the firm easily being statistically sig- nificant at the 0.01 level. Notably, however, none of the regressions in table I1 explains more than 29 per cent of the variance in the management excellence evaluations. This suggests these individuals focus upon other characteristics in addition to profitability, growth, risk, and returns to stockholders in order to for- mulate their evaluations. These additional characteristics may reflect impres- sionistic judgements on the part of the evaluators of the firm’s future status and perhaps even the personal characteristics of its management. We examine these possibilities in the next sections.
THE EXTENDED MODEL
Regression 3.1 in table I11 extends the basic model developed in the previous section. Following Peters and Waterman (1982), CEOs and financial analysts may form impressions of management excellence only partially based upon firm performance. Equally important, argue Evan (1 976) and Chakravarthy (1 986),
0 Basil Blackwell Ltd 1994
Tabl
e 11
. T
he d
eter
min
ants
of m
anag
emen
t rat
ings
: The
bas
ic m
odel
m Pr
evio
us y
ear i
nfor
mat
ion
%
(1.7
5)*
(0.6
8)
(0.5
5)
E
2.1
146
4.53
0.
028
0.0
12
0.01
7 0.
005
0.29
0 9
2.2
218
6.62
- 0.0
0 1
0.00
3 -0
.133
0.
101
(4.83
)" (1
.82)
* (2
.02)
* (4
.33)"
B Fi
ve-y
ear
aver
age
info
rmat
ion
2.3
142
43.5
0.
006
0.00
7 -0
.36
0.0 1
5 0.
28 I
2.4
208
6.48
0.
010
- 0.0
0 1
-0.1
96
0.01
9 0.
142
(1.2
0)
(0.8
6)
(4.9
0)-
(3.8
6)"
(2.5
6)-
(0.1
6)
(0.7
4)
(5.0
3)-
3, 8 3
Notw:
(1)
Equa
tions
2.1
thro
ugh
2.4
repo
rt re
gres
sions
of
the
mea
n Fo
rtune
man
agem
ent e
xcel
lenc
e ra
ting
assig
ned
a co
mpa
ny o
n
(2)
The
num
bers
in p
aren
thes
es b
elow
the
parti
al re
gres
sion
coef
ficie
nts a
re th
e ab
solu
te v
alue
of
the
t-sta
tistic
ass
ocia
ted
with
th
at c
oeffi
cien
t. * =
stat
istic
ally
sig
nific
ant a
t the
0.1
0 le
vel; " =
statis
tical
ly si
gnifi
cant
at t
he 0
.01
leve
l.
vario
us o
bjec
tive
mea
sure
s of firm
perf
orm
ance
. 5
690 JAMES V. KOCH AND RICHARD J. CEBULA
may be the firm’s perceived ability to adapt to uncertainty and its ability to guarantee its survival by creating viable options for the future (Vancil, 1972).
We will test five hypotheses related to firms’ perceived ability to survive and prosper in a rapidly changing environment. These hypotheses relate to each firm’s size, international activity, extent of diversification, research and develop- ment activity, and degree of stockholder concentration.
The weight of empirical evidence indicates that large firms earn higher rates of profit than small firms (Bradburd and Ross, 1989), and this is that a prion‘ hypothesis we will test. Nonetheless, it is not clear that firm size per se is an advantage in many modern markets (Birch, 1987; Ginzberg and Vojta, 1985). The problems afflicting large firms such as General Motors (Ingrassia and White, 1989) and IBM (Kirkpatrick, 1992) cast doubt upon the notion that large firms uniformly are more efficient and profitable. Further, there is strong evidence that it is possible for small firms to carve out market niches enabling them to survive and prosper in a wide variety of industries (Bradburd and Ross, 1989; Caves and Porter, 1977; Porter, 1979, 1980). Hence, our regressions will provide interesting evidence regarding the views of highly knowledgeable observers on this issue.
H5: A direct relationship exists between perceived management excellence and firm size.
Higher levels of involvement of a firm in international markets usually increase profitability (Grant, 1987; Kim et al., 1989; Leftwich, 1984; Rugman, 1979; Severn and Laurence, 1974; Wolf, 1975) and result in higher returns for inves- tors (Agmon and Lessard, 1977; Buehner, 1987).
H6: A direct relationship exists between perceived management excellence and the degree of firms’ international involvement.
Rumelt’s (1 974, 1982) seminal studies of diversification strategy demonstrated that firms which diversified into ‘related’ markets enabling them to draw upon common skills and resources (for example, research and development) earned higher profit rates than firms that undertook ‘unrelated’ diversification. Since then, this conclusion has been refined and occasionally disputed. As Capon et al. (1 988) have shown, those diversification studies relying upon a ‘business count’ methodology (counting the number of markets in which a firm is involved or uti- lizing a Herfindahl-type index to measure the degree of diversification of a firm) typically have found little relationship between diversification and firm perfor- mance. By contrast, those studies that have utilized a Rumelt-type method of classifjmg diversification activity (for example, related versus unrelated, or consumer goods versus industrial goods) have found that some types of diversifi- cation are related to firm performance. Because of the large sample size involved, this study utilizes a business-count type of measure of diversification (the number of lines of business in which a firm is involved). It is instructive to note (see table I) that the typical firm in the Fortune sample became less diversified and in net terms actually withdrew from markets during the time period, 1982-86, perhaps reflecting the pitfalls associated with increased diversification (Porter, 1987). Taken together, these factors cast some doubt upon the traditionally hypothe-
0 Basil Blackwell Ltd 1994
IN SEARCH OF EXCELLENT MANAGEMENT 69 1
sized positive relationship between management excellence and diversification, and once again we will look with interest at the perceptions of Fortune’s evaluators on this issue.
H7: A direct relationship exists between perceived management excellence and diversification.
Research and development activity is considered to be a strong indicator of progressiveness, new product development, and future firm growth and profits (Chakravarthy, 1986). Strong evidence also exists that research and development expenditures are highly profitable for the typical American manufacturing firm (Pakes, 1985).
H8: A direct relationship exists between perceived management excellence and research and development intensity, as measured by the percentage of firm sales spent on research and development.
Ever since Berle and Means (1932) pointed out the extent to which the American economy is characterized by separation of ownership and manage- ment, there has been much debate over the actual effects of that separation upon management performance and firm behaviour. Over the past 15 years, a litera- ture has developed that posits a firm’s managers can be more effectively mon- itored and controlled when a few, large stockholders exist. The costs of monitoring by stockholders increase significantly when a large number of stock- holders exist, no one of whom owns a significant proportion of the firm’s stock (Demsetz, 1986). In this latter case, the firm’s managers exercise more discretion and make more independent judgements about the firms directions because it is cost-efficient for small stockholders to ‘shirk’ (avoid) management responsibilities. Hill and Snell (1 989) have shown higher stockholder concentration positively relates to firm productivity, as measured by value-added. One mechanism by which this efficiency could be achieved is via managerial compensation decisions. Firms with dominant stockholders pay CEOs less, c e t m i paribus (Dyl, 1988; Santerre and Neun, 1986). Thus, if large stockholders police firm efficiency, then perceived management excellence should be positively associated with stock- holder concentration and negatively associated with managerial discretion,
We utilize a Herfindahl Index to measure the extent the ownership of the firm is concentrated in the hands of a few large st~ckholders.[~] The higher the index, the more concentrated is the firm’s ownership among a few large stockholders. This index can vary between 0 (an infinite number of equally small owners) and 10,000 (a single owner).
H9: A direct relationship exists between perceived management excellence and stockholder concentration.
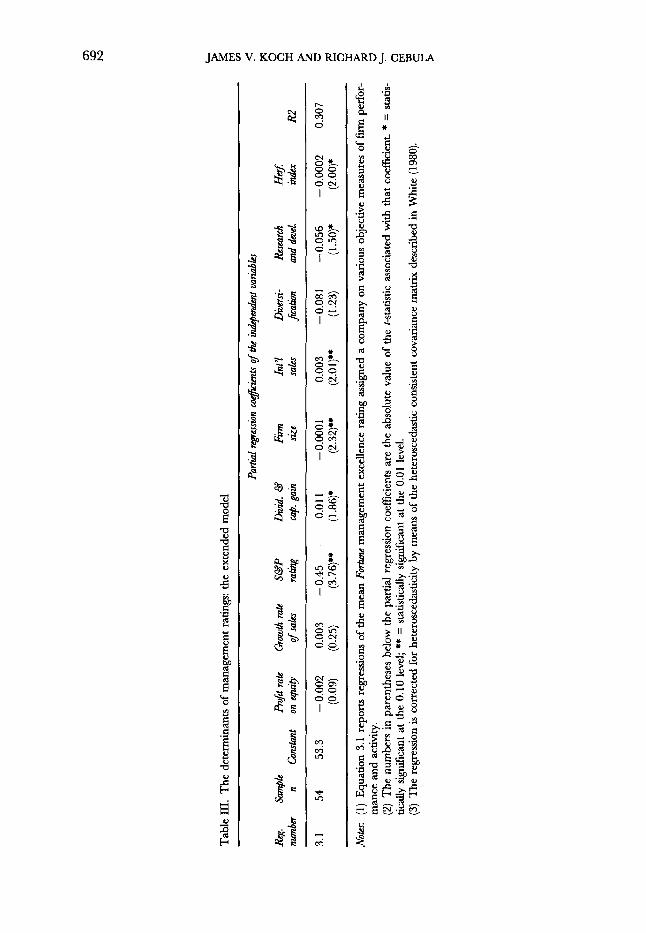
Empirical Ana4.k Regression 3.1 in table I11 examines the influence of these additional variables upon management excellence ratings. Note the coefficient of firm size variable is negative and statistically significant at the 0.01 level. Holding other things
0 Basil Blackwell Ltd 1994
Tab
le III.
The
det
erm
inan
ts of
man
agem
ent r
atin
gs: t
he e
xten
ded
mod
el
3.1
54
53.3
-0
.002
0.
003
-0.4
5 0.
01 1
- 0.
0001
0.
003
-0.0
81
-0.0
56
-0.0
002
0.30
7 (0
.09)
(0
.25)
(3
.76)
” (1
.86)
* (2
.32)
# (2
.01)
**
(1.2
3)
(1.5
0)*
(2.0
0)*
Note
s: (1
) E
quat
ion
3.1
repo
rts r
egre
ssio
ns o
f the
mea
n Fmautc m
anag
emen
t exc
elle
nce
ratin
g as
sign
ed a
com
pany
on
vario
us o
bjec
tive
mea
sure
s of
firm
per
for-
m
ance
and
act
ivity
. (2
) T
he n
umbe
rs in
par
enth
eses
bel
ow t
he p
artia
l reg
ress
ion
coef
ficie
nts
are
the
abso
lute
val
ue o
f th
e t-s
tatis
tic a
ssoc
iate
d w
ith t
hat c
oeff
icie
nt. *
= s
tatis
- tic
ally
sig
nific
ant a
t the
0. I
0 le
vel;
** =
sta
tistic
ally
sign
ifica
nt a
t the
0.0
1 le
vel.
(3) T
he re
gres
sion
is c
orre
cted
for
hete
rosc
edas
ticity
by
mea
ns of
the
hete
rosc
edas
tic c
onsi
sten
t cov
aria
nce m
a&
desc
ribed
in W
hite
(198
0).
c
IN SEARCH OF EXCELLENT MANAGEMENT 693
constant, large firm size is viewed as having a negative impact upon the quality of management, perhaps because excessive firm size may be associated with bureaucratic management styles and diseconomies of scale (Birth, 1987; Ginzberg and Vojta, 1985). This result, however, should be interpreted in the light of the fact that the mean size of the 306 firms in the Fortune sample is almost 10 times larger than that of the approximately 7000 firms for which data are available on the Compustat PC-Plus data base. It does not necessarily follow that this finding applies to firms of all sizes.
The positive and statistically s i m c a n t sign on the coefficient of the interna- tional sales variable strongly suggests that those who assign management excel- lence ratings are favourably impressed by increased international activities. This is not a surprising result in the light of continued evidence that the degree of a firm’s international activities is positively related to its profitability (most recently demonstrated by Kim et al., 1989).
The sign on the coefficient of the diversification variable (a simple count of the number of lines of business in which the firm operates) is negative and just barely fails to achieve statistical significance at the 0.10 level. It is apparent from table I that the firms in the sample have reduced their degree of diversification, at least as it is measured by lines of business. Diversification does not seem to hold favour either with the firms in the sample or with those who evaluate them. This is consistent with previous empirical studies that have utilized ‘business count’ measures of diversification and also with the observation of Hill and Snell (1989) that stockholders typically are unimpressed by diversification, related or other- wise. As predicted, a positive sign appears on the coefficient of the research and
development variable, and the coefficient itself is statistically significant at the 0.10 level. Research and development intensity, per se, seems to imply pro- gressivity and bright prospects in the eyes of Fortune’s evaluators. This finding is consistent with related evidence provided by Chakravarthy (1986), Hill and Snell (1 989), and Pakes (1 985).
Finally, the negative and statistically significant sign on the coefficient of the Herfindahl-type stockholder concentration variable indicates excellent manage- ment is perceived to be associated with firms whose stockholder concentration is small and hence whose managers are able to exercise relatively more discretion. If increased ownership concentration among a firm’s stockholders carries with it increased monitoring and inspection of the firm’s managers (a hypothesis advanced by some agency theorists), then increased monitoring is seen as having a negative influence upon management quality. This perception, however, con- tradicts evidence generated by Hill and Snell (1989) that stockholder concentra- tion increases the valued-added of a firm, but is consistent with the finding of Demsetz and Lehn (1985) that stockholder concentration has no effect on firm profit rates.
INTRAINDUSTRY INFLUENCES
The empirical work presented thus far implicitly has assumed individual firms are compared to all other firms in the sample insofar as profits, growth, dividend
0 Basil Blackwell Ltd 1994
694 JAMES V. KOCH AND RICHARD J. CEBULA
payments, and the like, are concerned. Plausibly, however, it is intraindustry comparisons that are most important. It seems reasonable, for example, that it is IBM’s relationship to DEC or Compaq that is critical in evaluators’ eyes, rather than IBM’s standing relative to Merck or Exxon.
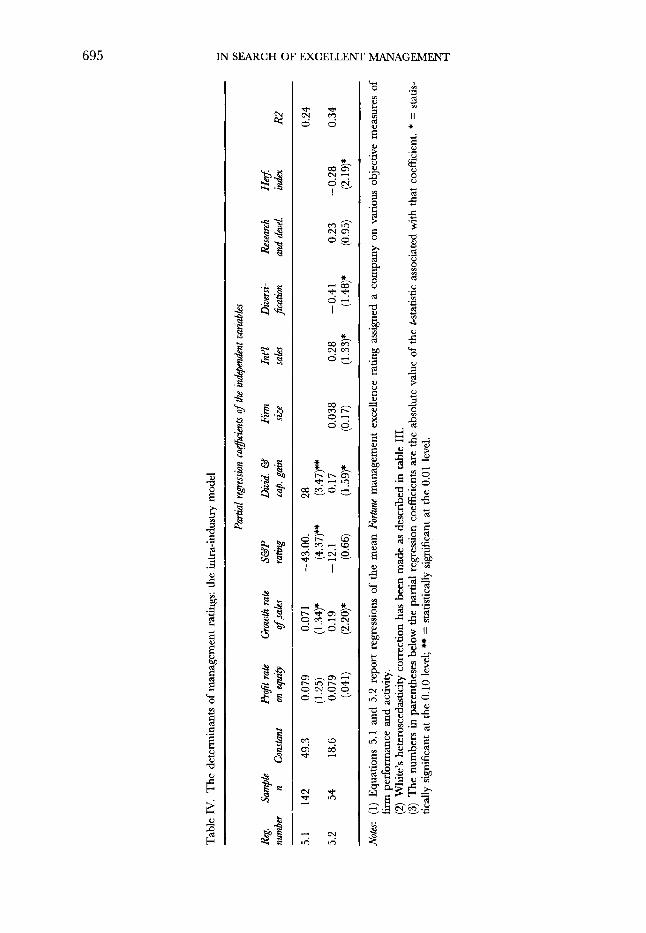
Empirical Anabsis Table IV replicates the basic model and the extended model tested in table 111, but utilizes industry-specific data in every case. Each variable is the ratio of the individual firm’s own value divided by the mean value for that variable within the firm’s industry. For example, Merck‘s mean profit rate on its stockholder equity between 1982 and 1986 was 21.25 per cent, while the pharmaceutical industry mean was 19.46 per cent. Hence, the value used is 21.25/19.46 = 1.092. This normalizing procedure is a substantial step in the direction of con- trolling for industry-specific influences.
Utilization of industry-specific data does little to improve explanatory power. While the signs of the independent variables remain consistent with those reported earlier, the levels of statistical significance of the coefficients generally decline. The major exception to this generalization is the coefficient for the growth rate of sales variable in the extended model tested in regression 4.3. Thus, while CEOs and financial analysts may pay heed to a firm’s growth rate relative to other firms in its industry, there is little evidence that they generally weigh that firm’s managerial success in the same narrow light. Evaluators appear to take a more cosmopolitan view of management excellence - one which compares a firm’s performance and characteristics to firms in many industries, not just the firm’s own industry.
CONCLUSIONS
In the Introduction we asked three questions about the survey of management excellence Fortune magazine publishes each year. First, what do the evaluators mean when they say a firm is well managed? Ceteris paribus, our results provide support for Fortune magazine’s contention that company CEOs and financial analysts perceive that firms which earn higher rates of profit, grow more rapidly, exhibit less financial risk, and reward stockholders more are perceived to be better managed (Reese, 1993). However, these fundamental measures of financial perfor- mance explain only about 30 per cent of the variance in management evaluations.
The evaluators are also influenced by other measures of firm activity that do not directly measure firm performance, but which appear to reflect the perceived adaptability of the firm and its attitudes toward change. Smaller size, heavy research intensiveness, relatively less diversification, and international sales activity are among the firm characteristics that lead evaluators to conclude a firm is better managed. In addition, say the cognoscenti in the Fortune survey, the best- managed firms are not dominated by a few large stockholders.
Second, do the evaluations of experts reflect current theory and empirical evidence concerning management excellence and strategy? Broadly speaking, yes. Conventional quantitative measures of firm performance appear to affect the perceptions of the experts in the fashion that theory and empirical evidence
0 Basil Blackwell Ltd 1994
I
Tab
le IV. T
he d
eter
min
ants
of m
anag
emen
t ra
tings
: the
int
ra-i
ndus
try
mod
el
- v, ;
E E
Partla1
rege
shn
coe@
cmtr
ofth
e in
deph
t va
riub
h
n
31 Re
g. Sa
mpl
e Pr
ofitr
ate
Growth r
ate
Sc3P
Divi
d. c3
Firm
In
t’l
Div
erd-
Re
sear
ch
Her
j nu
mber
n Co
nrta
nt
on e
qu$
of sa
les
ratin
g ca
p. g
ain
sire
sales
fi
atia
n an
d &e
l. in
dex
R.2
5.1
142
49.3
0.
079
0.07
1
- 43
.00.
28
0.
24
5.2
54
18.6
0.
079
0.19
- 12
.1
0.17
0.
038
0.28
-0
.41
0.23
-0
.28
0.34
(1
.25)
(1
.34)
* (4
.37)
- (3
.47)
*
(.041
) (2
.20)
* (0
.66)
(1
.59)
* (0
.17)
(1
.33)
* (1
.48)
* (0
.95)
(2
.19)
*
: No
Notes:
(1)
Equ
atio
ns 5
.1 a
nd 5
.2 r
epor
t re
gres
sion
s of
the
mea
n Fo
rtwze
man
agem
ent
exce
llenc
e ra
ting
assi
gned
a c
ompa
ny o
n va
riou
s ob
ject
ive
mea
sure
s of
firm
perf
orm
ance
and
act
ivity
.
(3)
The
num
bers
in
pare
nthe
ses
belo
w th
e pa
riia
l reg
ress
ion
coef
ficie
nts a
re th
e ab
solu
te v
alue
of
the
tsta
tistic
ass
ocia
ted
with
tha
t co
effic
ient
. * =
sta
tis-
(2)
Whi
te’s
het
eros
ceda
stic
ity c
orre
ctio
n has
been
mad
e as d
escr
ibed
in ta
ble
111.
tical
ly s
igni
fican
t at t
he 0
.10
leve
l; * =
stat
istic
ally
sign
ifica
nt a
t the
0.0
1 le
vel.
9 $ i5 3
696 JAMES V. KOCH AND RICHARD J. CEBUL4
suggest. Nonetheless, Fortune’s experts also appear to incorporate other less quan- tifiable factors in their evaluations. For example, the importance of institutional norms and societal expectations in modifying the behaviour of firms (for example, reducing the drive toward profit maximization) is a respected theme in sociological literature (DiMaggio and Powell, 1983; Meyer and Rowan, 1977). The statements of the evaluators suggest they take such perceptions into account (Fortune, 1988) and the relatively low proportion of variance explained by quanti- fiable explanatory variables is consistent with this view of the world.
Third, what strategic managerial choices are most likely to improve the per- ception of experts concerning the management excellence of a firm? Our study suggests that perceptions of CEOs and financial analysts are more subjective, and less anchored to measured firm performance, than some might either believe or prefer. As a consequence, it would not be easy to outline a specific programme of strategic behaviour by managers that would guarantee a more favourable evaluation in the annual Fortune survey. Too much depends upon the circumstances facing each firm, societal norms, and subjective perceptions of management behaviour (Fligstein, 1990). This is not necessarily a frightening result, but does provide substantial reason for us to reorient our thinking about how strategic evaluations are formulated and on what basis decisions subse- quently are made.
NOTES
[l] Following Chakravarthy (1986) and Venkatraman and Ramanujan (1987, 1990), we view ‘management excellence’ as a complex phenomenon reflecting multiple criteria. For the purposes of our hypotheses, however, it is measured by the pmce/hm.r of respondents of Fortune magazine’s survey to the question, ‘How well managed is Firm X?’
[2] Fisher and McGowan (1983) argue strenuously that accounting rates of return such as the profit rate on equity are totally misleading. Long and Ravenscraft (1984) and others dispute that conclusion. We acknowledge the Fisher-McGowan concerns, but conclude that profit rates on equity usually are reasonably good approximations of a firm’s true economic profit rate.
[3] In a study of this type, questions arise concerning possible multicollinearity of inde- pendent variables. Such problems are largely absent here, since the zero-order corre- lation coefficient between any two independent variables is < 1.71. Also it is of interest to note that the management of excellence evaluations assigned to each firm by the evaluators are highly correlated with each other from year to year, but less than one must surmise. The simple correlation between the 1987 and the 1991 man- agement evaluations is 0.68.
[4] Let X, = the percentage of common stock of a firm owned by a single individual. Then, the Herfindahl Index of concentration of the ownership of the stock of this firm = qx;)?
REFERENCES
AGMON, T. and LIBSARD, D. R. (1977). ‘Investor recognition of corporate international diversification’. Journal ofFinance, 32, September, 1049-55.
0 Basil Blackwell Ltd 1994
IN SEARCH OF EXCELLENT MANAGEMENT 69 7
AMIT, R. and MAT, J. (1988). ‘Diversification and the risk-return tradeoff. Academy of
ARMOUR, H. 0. and TEECE, D. J. (1978). ’Organizational structure and economic perfor-
BAUMOL, W. J. (1967). Busimss Behavior, Value and Gowth. New York Harcourt, Brace. BERJX, A. A. and MEANS, G. C. (1932). l7ze Modenr Corporation and Priuate Prope$. Ncw
York Macmillan. BETTIS, R. A. and HALL, W. K. (1982). ‘Diversification strategy, accounting determined
risk, and accounting determined return’. Acadmy ofManagement Rwim, 25, June, 254-64. BETITS, R. A. and MAHAJAN, V. (1985). ‘Risk/return performance of diversified firms’.
Management Science, 31, July, 785-99. BIRCH, D. (1987). Job Creation in America How Our Smallest Companies Put the Most People to
Work. New York Free Press. BOWMAN, E. H. (1980). ‘A risk/return paradox for strategic management’. Sloan Manage-
mentReviau, 21, Spring, 17-31. BRADBURD, R. M. and ROSS, D. R. (1989). ‘Can small firms find and defend strategic
niches? A test of the Porter hypothesis’. Re&w of Economics and Stahtics, 71, May, 258-62.
BUEHNER, R. (1987). ‘Assessing international diversification of West German corpora- tions’. Strategic Management Journal, 8, January-February, 25-37.
CAMERON, K. S. and WHETTON, D. A. (Eds.) (1983). Organizational Efectiveness: A Comparison ofMultiplG Models. New York: Academic Press.
CAPON, N., HULBERT, J., FARLEY, J. and MARTIN, L. (1988). ‘Corporate diversity and eco- nomic performance: The impact of market specialization’. Strahgic Management Journal, 9, January-February, 61-74.
CARDOZO, R. N. and SMITH, D. K. Jr. (1983). ‘Applying financial portfolio theory to product portfolio decisions: An empirical study’. Journal of Marketing, 47, Spring, 1 lo-- 19.
CAVES, R. E. and PORTER, M. E. (1977). ‘From entry barriers to mobility barriers: Con- jectural decisions and contrived deterrence to new competition’. Qarterb 30~rna l of Eco- nomics, 9 1, May, 42 1 -4 1.
CHAKRAVARTHY, B. S. (1 986). ‘Measuring strategic performance’. Strategic Management JoUrnal, 7, September-October, 437-58.
CLIFFORD, D. K. and CAVANAUGH, R. H. (1985). 7he Winning Pdormance: How America’s High-Gowth Mtiisize Companies Succeed. New York Bantam Books.
COPELAND, T. E. and WESTON, J. F. (1979). Financial 7heoyy and Corporate Policy. Reading, Mass.: Addison-Wesley.
CYERT, R. M. and MARCH, J. G. (1963). A Behavioral 7heoty of the Finn. Englewood Cliffs, NJ.: Prentice-Hall.
DEMSETZ, H. (1986). ‘Corporate control, insider trading, and rates of return’. A m i a n Economu Review, 76, May, 313-16.
DEMSETZ, H. and LEHN, K. (1985). ‘The structure of corporate ownership: Causes and consequences’. Journal of Political Economy, 93, December, 1 155 - 7 7.
DIMAGGIO, P. and POWELL, W. (1 983). ‘Institutional isomorphism’. American Sociological ReuinU, 48, April, 147-60.
DISCLOSURE, INC. (1 988). Compact Ihsclosure. Bethesda, Md.: Disclosure. D n , E. A. (1988). ‘Corporate control and management compensation: Evidence on the
agency problem’. Managerial and Deckion Economics, 9, March, 2 1 --5. EVAN, W. M. (1976). ‘Organization theory and organizational effectiveness: An explora-
tory analysis’. Organ&ation and Adminutrahe Sciences, 7, Spring/Summer, 15-28. FISHER, F. and MCGOWAN, J. J. (1983). ‘On the misuse of accounting rates of return to
infer monopoly profits’. American EEonomic Review, 73, March, 82-97.
Management JOUM~, 31, March, 154-66.
mance’. Bell Journal offionomits, 9, Spring, 106-22.
0 Basil Blackwell Ltd 1994
698 JAMES V. KOCH AND RICHARD J. CEBULA
FISHER, I. N. and HALL, G. R. (1969). ‘Risk and corporate rates of return’. Quartmh Journal of Economics, 83, February, 79-82.
FLIGSTEIN, N. (1990). The Transfornation of Corporate Control. Cambridge, Mass.: Harvard University Press.
GINZBERG, E. and VOJTA, G. (1985). Byond Human Scale: 7 h e Large Corporation at Risk. New York: Basic Books.
GRANATELLI, A. and MARTIN, J. D. (1984). ‘Management quality and investment perfor- mance’. Financial Anahsysts Journal, 40, November/December, 72-4.
G m , R. M. (1 987). ‘Multinationality and performance among British manufacturing companies’. Journal of Intonational Business Studies, Fall, 79-89.
HILL, C. W. L. and SNELL, S. A. (1989). ‘Effects of ownership structure and control on corporate productivity’. Academy of Management Journal, 32, March, 25-46.
INGRASSIA, P. and WHITE, J. B. (1989). ‘Losing the race: With its market share sliding, GM scrambles to avoid a calamity’. Wall StreetJoumal, 120, December 14, A1,8.
JOHNSON, W. B., N A T ~ J A N , A. and RAPPAPORT, A. (1985). ‘Shareholder returns and cor- porate excellence’. Journal ofBusiness Strategy, 6, Fall, 52-62.
KIM, W. C., HWANG, P. and BURGERS, W. P. (1989). ‘Global diversification strategy and corporate profit performance’. Strategic Managment Journal, 10, January-February, 45- 57.
KIRKPATRICK, D. (1992). ‘Breaking up IBM’. Fortune, 126, 27 July, 44-58. KEFIWICH, R. R. (1 984). ‘U.S. multinational companies: Profitability, financial leverage,
LONG, W. F. and RAVENSCRAFT, D. J. (1984). ‘The misuse of accounting rates of return:
LOOMIS, C. J. (1984a). ‘Corporate stars that brightened a decade’. Fortune, 109, 30 April,
LOOMIS, C. J. (1984b). ‘How the service stars managed to sparkle’. Fortune, 109, 1 1 June,
MAIDIQUE, M. A. and HAYES, R. H. (1984). ‘The art of high technology management’.
MARKOWITZ, H. M. (1959). Po$olio Selection. New York Wiley. MEYER, J.W. and ROWAN, B. (1977). ‘Institutionalized Organizations: formal structure as
PAKES, A. (1985). ‘On patents, R&D, and the stock market rate of return’. Journal ofPoli-
PETERS, T. J. and WATERMAN, R. H. Jr. (1982). Zn Search ofExcelhce. New York Harper &
PINDYCK, R. S. and RUBINFELD, D. L. (1 989). Microeconomics. New York Macmillan. PIRSIG, R. M. (1974). Zen and the Art ofMotorcycle Maintenance. New York William Morrow. PORTER, M. E. (1979). ‘The structure within industries and companies’ performance’.
PORTER, M. E. (1980). Cornpetitbe Strategy. New York Free Press. PORTER, M. E. (1987). ‘How to divers@ successfully’. Haruard Business Review, 65, May/
RAPPAPORT, A. (1 986). Creating Shareholder Value. New York Free Press. REES, J. (1993). ‘America’s most admired corporations’. Fortune, 127, February 8, 44-47E RUGMAN, A. M. (1979). Zntmatwnal Diverszjcation and the Multinational Enterprise. Lexington,
RUMELT, R. P. (1974). Stratqy, Structure, and Economic Pe$onnmzce. Cambridge, Mass.: Divi-
RUMELT, R. P. (1 982). ‘Diversification strategy and profitability’. Strategic Manugement
and effective income tax rates’. Survg of Current Buiness, 54, May, 27-36.
Comment’. American Economic Review, 74, June, 494-500.
224-32.
156-66.
Sloan Managemat hhww, 25, Winter, 1-3 1.
myth and ceremony’. A k a n Journal of Socwlogy, 83, September, 340-63.
tical Econmy, 93, April, 390-409.
Row.
Review ofEconomics and Stahtics, 61, May, 214-27.
June, 43-59.
Mass.: Lexington Books.
sion of Research, Graduate School of Business Administration.
Journal, 3, November-December, 359-69.
0 Basil Blackwell Ltd 1994
IN SEARCH OF EXCELLENT MANAGEMENT 699
SANTERRE, R. E. and NEUN, S. P. (1986). ‘Stock dispersion and executive compensation’.
SCHULTZ, E. (1988). ‘America’s most admired corporations’. Fortune, 117, 18 January, 32-
SEVERN, A. K. and LAURENCE, M. M. (1974). ‘Direct investment, research intensity, and
SHEPHERD, W. J. (1972). ‘The elements of market structure’. RevimU ofEconomics and Stad-
STANDARD AND POOR, INC. (1988). Cornpustat PC-Plus. New York Standard & Poor. STIGLER, G. J. (1963). Capital and Rates $Return in Manufacturing Industries. Princeton, N.J.:
Princeton University Press. VANCIL, R. F. (1972). ‘Better management of corporate development’. Haruard Business
Review, 50, 5, 53-62. VARADARAJAN, P. R. and RAMANUJAM, V. (1990). ‘The corporate performance conundrum:
A synthesis of contemporary views and an extension’. Journal o f M a n a g m t Studies, 27, September, 463-83.
VENKATRAMAN, N. and RAMANIJJAM, V. (1987). ‘Measurement of business economic per- formance: An examination of method convergence’. Journal of Management, 13, 1, 109- 22.
WHITE, H. (1980). ‘A heteroskedastic - consistent covariance matrix estimator and a direct test for heteroskedasticity? Economtriccl, 48 May, 817-38.
WOLF, B. M. (1975). ‘Size and profitability among U.S. manufacturing firms: Multi- national versus primarily domestic firms’. Journal $Economics and Business, 28, Fall, 15- 22.
WOO, C. Y. and WILLARD, G. (1983). ‘Performance representation in strategic manage- ment research: discussion and recommendations’. Paper presented to the Academy of Management meetings, Dallas, Texas.
Revia0 $Economics and Statistics, 68, November, 685-7.
52.
profitability’. J o u ~ ~ of Financial and @antitative Anahsir, 29, 18 1-90.
tics, 54, February, 25-37.
0 Basil Blackwell Ltd 1994


