Embed Size (px)
Citation preview

IEA DSM Task 17
Matthias Stifter, René Kamphuis, Matthias Galus, Marijn Renting, Arnoud Rijneveld,
Roman Targosz, Steve Widergren, Lars Nordstrom, Daniel Brodén, Tara Esterl,
Stephen Galsworthy, Pekka Koponen, Suryanarayana Doolla
Edited by Matthias Stifter, René Kamphuis
September, 2016
PV
Heatpump
Home EnergyMgmt System
Market
Building
Meter
El. Storage
Demand FlexibilityDemand Flexibility
DistributionNetwork
Aggregator
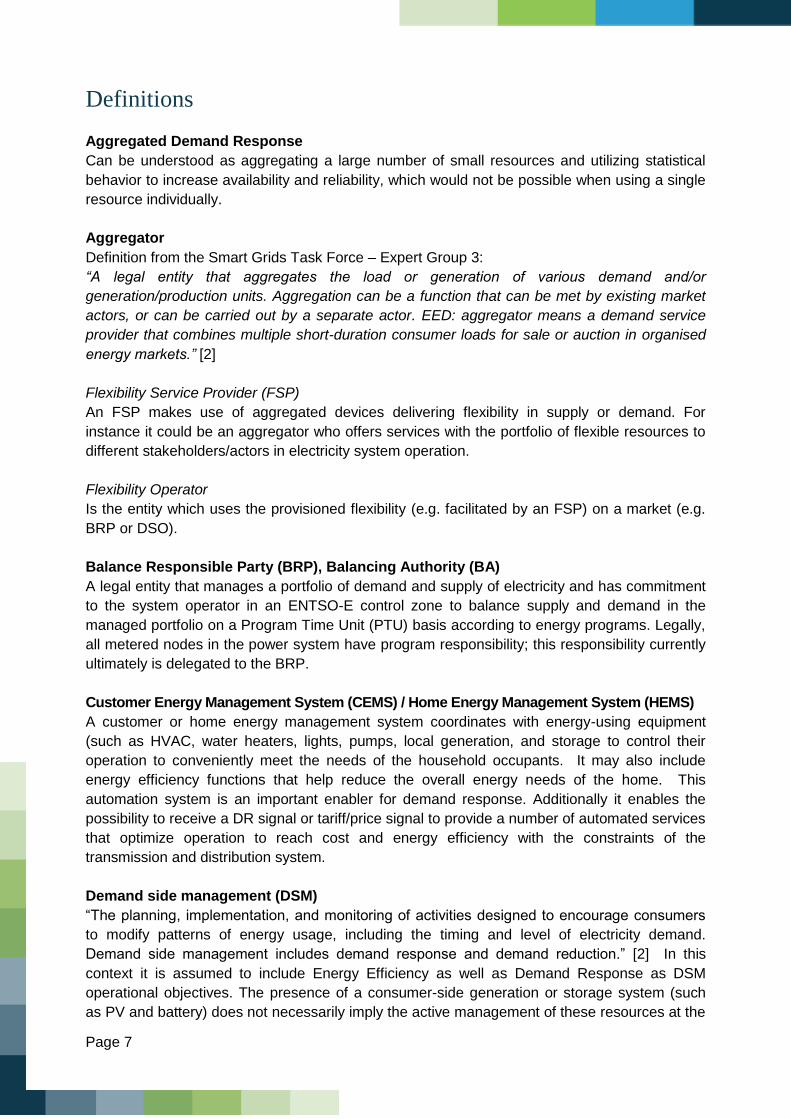
Pilot Studies and Best Practices Demand Flexibility in Households and Buildings

Page 2
1 Contents
1 Contents ............................................................................................................................. 2
Foreword ................................................................................................................................... 4
Context ................................................................................................................................... 4
Aim of the document .............................................................................................................. 4
Structure and methodology .................................................................................................... 4
Executive Summary ................................................................................................................... 5
Abbreviations ............................................................................................................................. 6
Definitions ................................................................................................................................. 7
1 Introduction ........................................................................................................................11
1.1 Background ................................................................................................................11
2 Country context ..................................................................................................................12
2.1 Austria ........................................................................................................................12
2.2 The Netherlands .........................................................................................................13
2.3 Sweden ......................................................................................................................14
2.4 Finland .......................................................................................................................15
2.5 United States of America ............................................................................................15
2.6 Switzerland .................................................................................................................16
3 Experiments and field tests with residential DR Resources ................................................18
3.1 HiT Houses as interactive participants in grids (Salzburg - Austria) ............................18
3.2 PowerMatchingCity (Hoogkerk – The Netherlands) ....................................................20
3.3 Couperus (The Hague – The Netherlands) .................................................................24
3.4 Your Energy Moment (Breda/Zwolle – The Netherlands) ............................................25
3.5 Smart Grid Gotland (Sweden) ....................................................................................28
3.6 Aggregation of Municipal Plants for DR (Switzerland).................................................29
3.7 WarmUp Optimized use of Heat Pumps (Switzerland) ................................................30
3.8 Tiko – Swisscom Energy Solution ..............................................................................32
3.9 AEP Ohio gridSMART (Ohio - USA) ...........................................................................34
3.10 Pacific Northwest Smart Grid Demonstration project (USA) .......................................39
3.11 E-Energy cluster of projects (Germany) ......................................................................42
3.11.1 MOMA (MOdell stadt MAnnheim) ..................................................................................................... 42
3.11.2 eTelligence........................................................................................................................................ 43
3.11.3 Summary of E-Energy projects ......................................................................................................... 44
3.12 Linear project (Belgium) .............................................................................................44
3.13 EcoGrid EU ................................................................................................................46
4 DR characteristics of different types of appliances .............................................................50

Page 3
4.1 Wet appliances ...........................................................................................................50
4.1.1 Netherlands/ Your energy moment ........................................................................................................ 50
4.1.2 Belgium/ Linear ..................................................................................................................................... 50
4.2 Thermostatically controlled loads ...............................................................................51
4.2.1 Austria ................................................................................................................................................... 51
4.2.2 Netherlands ........................................................................................................................................... 51
4.2.3 United States ......................................................................................................................................... 53
4.2.4 Other ..................................................................................................................................................... 53
4.3 Electric vehicle charging .............................................................................................53
4.3.1 Austria ................................................................................................................................................... 54
4.3.2 Netherlands ........................................................................................................................................... 55
4.3.3 Switzerland ............................................................................................................................................ 56
4.3.4 Other ..................................................................................................................................................... 59
4.4 Communicating meter ................................................................................................60
4.4.1 Austria ................................................................................................................................................... 60
4.4.2 Netherlands ........................................................................................................................................... 60
4.4.3 Switzerland ............................................................................................................................................ 60
4.5 Battery storage ...........................................................................................................64
4.5.1 Netherlands ........................................................................................................................................... 64
4.5.2 Switzerland ............................................................................................................................................ 64
4.6 User participation and acceptance .............................................................................68
4.6.1 Switzerland ............................................................................................................................................ 68
5 References ........................................................................................................................70

Page 4
Foreword
Context
Task 17 of the IEA/DSM program is to provide an analysis of the use of demand response,
distributed generation and storage for energy systems operation [1]. The project consists of four
subtasks. The Subtask 10 deliverable describes the context and covers the current role and the
interactions of flexible consumers and producers in the energy system. Subtask 11 covers the
changes and impacts on grid and market operation once optimally using demand flexibility and
includes cost/benefit analyses. This Subtask 12 deliverable collects experiences and describes
best practices in several countries. Subtask 13 ends with the conclusions. Figure 0-1 illustrates
the approach and the project structure.
ST1
2: C
ou
ntr
y sp
ecif
ics
ST1
2: D
emo
nst
rati
on
Pro
ject
s
ST10: Roles and interaction of customers (Micro-level)
ST10: Technical Potentials and capacity
ST10: Requirements and implementation
ST11: Grid/market operation and value creation (Macro-level)
ST13: Conclusions and Recommendations
Figure 0-1 General approach of IEA DSM Task 17
Aim of the document
Based on the collected pilots and case studies from the previous subtasks, the results and
findings of the finished projects in term of successful implementations, barriers and
effectiveness are analyzed. The document presents individual project and technology
experiences on a per country basis. Comparisons and analyses of country specific differences
in the implementation are made. The results are extrapolated to applicability on a large scale.
Structure and methodology
The document starts with discussion of the individual projects and initiatives for the countries
participating and also some comparable countries were some similar, related activities were
done. The discussion points describe the way of invoking demand response, the tariff structure,
the user experiences, and the cost viability. After that, the individual technology types are
evaluated according to their flexibility potential. Finally, parallels and discrepancies between the
experiments are discussed and the lessons learned from the applications are stated.

Page 5
Executive Summary
This document is the third report of the Task 17 deliverables. Real-world implementations are
analyzed and lessons learned are captured. Based on collected information from pilots that
were presented during conferences and workshops organized by the Task 17 team, the results
and findings of these finished projects are further analyzed in terms of effectiveness. The
analysis is in terms of the local context of the participating country and the benefits of
aggregation in real-world living lab environments with different types of individual demand
response technologies. There are a number of lessons learned from these experiences.
Aggregation of DR can be used to implement a large number of use cases in the field of
commercial operation and grid optimization operation. These use cases are possible at the time
scale of seconds to hours. Apart from optimization in the aggregated load and generation,
energy efficiency can be seen to increase due to enlarged awareness of customers.
Direct control of loads by DSOs is seldom encountered. Control mechanisms implemented via
price and tariff schemes that do not give any guaranteed response have been tested as well as
more directive coordination using multi-agent technology. Event driven schemes like CPP
(Critical Peak Pricing) deliver a flexibility response rate of approximately 10-15 %. That can be
nearly doubled if the response is automated. Dynamic tariffing like TOU or RTP leads to 3-5 %
uncovering of load or generation flexibility. Also here, doubling is possible in case of
automation.
Generally, using techniques like HEMS and energy dashboards is highly appreciated by
customers to increase the feedback and control their energy usage. User fatigue appears if the
customer is put in the seat of energy manager and has to deal with details regarding energy
management. Response automation can also help here. Supporting a community aspect for a
group with similar interests to the aggregation leads to an increased appreciation.
From the technology perspective, the roles of tailored, local HEMS are complementary
supported and extended by cloud-based architectures that give advantages as to investment
costs, software maintenance and hardware footprint, while keeping some local decision logic
and maintenance functions. Local area communication technologies used are often standard
wireless connectivity like WiFi and ZigBee. The best equipment types to deliver energy flexibility
are domestic hot water heaters (DHW). Other equipment types like thermostatic controlled
devices, electric vehicles and wet appliances give a non-symmetric flexibility response as to
ramping-up or ramping-down power if they do not necessarily follow a learning-based schedule
optimization strategy. White goods can deliver a sustained response if it is possible to schedule
the whole process cycle.

Page 6
Abbreviations
BRP Balance Responsible Party (EU)
BESS Battery Energy Storage System
B2B Business to Business
BEMS Building Energy Management System
DF Demand Flexibility
DNO Distribution Network Operator
DR Demand Response
DSF Demand Side Flexibility
DSM Demand Side Management
DSO Distribution System Operator
DF Demand flexibility
DER Distributed Energy Resource
DHW Domestic Hot Water
DG Distributed Generation
EE Energy Efficiency
ERGEG Energy Regulators Group for Energy and Gas
FSP Flexibility Service Provider
G2V Grid to Vehicle
HEMS Home Energy Management System
HVAC Heating Ventilation and Air Conditioning
MO Market Operator
PTU Program Time Unit
SCADA Supervisory Control and Data Acquisition
TCL Thermostatically Controlled Load
TNO Transmission Network Operator
TSO Transmission System Operator
VPP Virtual Power Plant
VPN Virtual Private Network
V2G Vehicle to Grid
Page 7
Definitions
Aggregated Demand Response
Can be understood as aggregating a large number of small resources and utilizing statistical
behavior to increase availability and reliability, which would not be possible when using a single
resource individually.
Aggregator
Definition from the Smart Grids Task Force – Expert Group 3:
“A legal entity that aggregates the load or generation of various demand and/or
generation/production units. Aggregation can be a function that can be met by existing market
actors, or can be carried out by a separate actor. EED: aggregator means a demand service
provider that combines multiple short-duration consumer loads for sale or auction in organised
energy markets.” [2]
Flexibility Service Provider (FSP)
An FSP makes use of aggregated devices delivering flexibility in supply or demand. For
instance it could be an aggregator who offers services with the portfolio of flexible resources to
different stakeholders/actors in electricity system operation.
Flexibility Operator
Is the entity which uses the provisioned flexibility (e.g. facilitated by an FSP) on a market (e.g.
BRP or DSO).
Balance Responsible Party (BRP), Balancing Authority (BA)
A legal entity that manages a portfolio of demand and supply of electricity and has commitment
to the system operator in an ENTSO-E control zone to balance supply and demand in the
managed portfolio on a Program Time Unit (PTU) basis according to energy programs. Legally,
all metered nodes in the power system have program responsibility; this responsibility currently
ultimately is delegated to the BRP.
Customer Energy Management System (CEMS) / Home Energy Management System (HEMS)
A customer or home energy management system coordinates with energy-using equipment
(such as HVAC, water heaters, lights, pumps, local generation, and storage to control their
operation to conveniently meet the needs of the household occupants. It may also include
energy efficiency functions that help reduce the overall energy needs of the home. This
automation system is an important enabler for demand response. Additionally it enables the
possibility to receive a DR signal or tariff/price signal to provide a number of automated services
that optimize operation to reach cost and energy efficiency with the constraints of the
transmission and distribution system.
Demand side management (DSM)
“The planning, implementation, and monitoring of activities designed to encourage consumers
to modify patterns of energy usage, including the timing and level of electricity demand.
Demand side management includes demand response and demand reduction.” [2] In this
context it is assumed to include Energy Efficiency as well as Demand Response as DSM
operational objectives. The presence of a consumer-side generation or storage system (such
as PV and battery) does not necessarily imply the active management of these resources at the

Page 8
demand side. Only active participation of these resources by responding to a signal or other
strategy to alter the shape of the load profile is considered as a ‘managed’ demand or an
‘active’ demand side management,
Demand Response (DR)
DR can be defined as a change in the consumption pattern of electricity consumers (e.g. load
shifting, load decrease) in response to a signal (e.g. changes of electricity price) or due to other
incentives or objectives (e.g. increase of the overall system performance, reliability of supply)
[3],[4]. It includes the active response of generation and storage systems at the consumer-side
(‘behind-the-meter’), by changing their ‘original’ generation pattern. Demand response, a term
seen from the utility perspective, thus also includes generation in terms of negative demand.
Distributed Energy Resource (DER)
Subsumes devices on both sides of the electric meter in the distribution network (as opposed to
central generation units) that are able to provide or consume energy (e.g. PV system, storage).
Additionally it is capable of reacting to certain control signals or provides services (e.g. on/off,
power reduction, voltage control) requested from energy management systems or other system
controls. With respect to this definition a DER can be considered as a Demand Response
Resource if it is under control to response to higher control objectives and varies from its static
generation or demand pattern.
Demand (Side) Flexibility (DF, DSF)
Adapted from the definition from the Flexibility Roadmap (Copper Alliance, Ecofys 2015).
“Flexibility is the ability of demand-side power system components to produce or absorb power
at different rates, over various timescales, and under various power system conditions in
response to a signal or triggered by a local event at the residential premises. Demand-side
flexibility options include varying consumption. Opportunities for varying demand exist in many
energy intensive industrial processes, irrigation and municipal water pumping, wastewater
treatment, air and water heating and cooling (HVAC) systems, and electric vehicle charging.
Energy efficiency investments (such as better insulation in buildings) can contribute to flexibility
by freeing up traditional resources (such as HVAC units in this case) to offer greater temporal
variability”
Definition from Eurelectric, Jan 2014:
“On an individual level, flexibility is the modification of generation injection and/or consumption
patterns in reaction to an external signal (price signal or activation) in order to provide a service
within the energy system. The parameters used to characterize flexibility in electricity include:
the amount of power modulation, the duration, the rate of change, the response time, the
location etc. ”
Definition from Rocky Mountain Institute, August, 2015 [5]
“Demand flexibility uses communication and control technology to shift electricity use across
hours of the day while delivering end-use services (e.g., air conditioning, domestic hot water,
electric vehicle charging) at the same or better quality but lower cost. It does this by applying
automatic control to reshape a customer’s demand profile continuously in ways that either are
invisible to or minimally affect the customer, and by leveraging more-granular rate structures
that monetize demand flexibility’s capability to reduce costs for both customers and the grid.

Page 9
Importantly, demand flexibility need not complicate or compromise customer experience.
Technologies and business models exist today to shift load seamlessly while maintaining or
even improving the quality, simplicity, choice, and value of energy services to customers.”
Distributed Generation (DG)
Smaller size generation (as opposed to bulk generation and dispersed) connected to the
distribution network on medium and low voltage levels. Typical nominal powers are ranging
from 1-50MW to 5-100kW in the respective network level. DG can be controlled locally or be
part of central dispatched control operations.
Dispersed Generation
Smallest generation connected to the distribution network on low voltage levels and, opposed to
bulk generation, not connected to a control center. Typical nominal powers are ranging from 1-
5kW in the LV network level. Dispersed generation is best forecasted in an aggregated way; no
mechanisms for direct control generally are implemented into current SCADA-systems so direct
DSO control is not possible. Small, distributed generation systems like residential PV-units are
also coined dispersed generation to emphasize the fact, that they are free-running.
Distribution Network Operator (DNO)
DNO maintains the distribution networks infrastructure in an asset based, investment manner.
The DNO role is completely regulated and no commercial operation is possible.
Distribution System Operator (DSO)
DSO is responsible for the reliable operation of the distribution system.
Energy Efficiency (EE)
Thermodynamically, energy efficiency means the efficiency of a physical or chemical
conversion process. Energy efficiency measures are ranked under demand side management
(DSM), so utility driven. The definition from the Smart Grids Task Force – Expert Group 3 is:
“An actual reduction in the overall energy used, not just a shift from peak periods. Energy
efficiency measures are a way of managing and restraining the growth in energy consumption.
Something is more energy efficient if it delivers more services for the same energy input, or the
same services for less energy input.” [2]
HVAC Loads
These comprise energy usage from electric heaters, electric coolers and electric ventilators in
buildings. The demand response profile characteristics differ for each of these types of loads.
Heaters and coolers additionally may have dedicated storage capabilities like aquifers and ice
storage od inherent storage capabilities like the building’s thermal mass.
Prosumer
A utility customer that produces electricity. Roof top PV installations and energy storage battery
systems are examples of homeowner investments that allow people to do both - consume and
produce energy - for use locally or export during certain parts of the day or the year.
Thermostatically Controlled Loads
These are typically thermal coupled demand processes in relation with Heating, Ventilation and
Air Conditioning, coolers and freezers, electric boilers for warm water.

Page 10
Variable Output Renewable Generation
Generator which uses a primary energy source which is variable in its nature, e.g., photovoltaic
systems, wind power generators, small hydro plants. The variability and predictability of these
generators depends on their type and environmental conditions.
Wet Appliances
Tumble dryers, washing machines and dish washers.

Page 11
1 Introduction
1.1 Background
The EU and the US [6] have jointly done some qualitative inventories on the number, the
distribution and functionality of smart grid projects. They also summed the amount of money
spent on projects in the ascent of smart grids. In the US at that time 99 and in Europe 219
projects were analyzed as to their functional role in the grid. Since then, a new phase of
pioneering work in field tests and living labs at several technology readiness levels has been
continued. The emphasis of roll-out of demand response technology in the last years has been
on increasing the scale and the level of integration of DR technologies in the commercial and
operational electricity system context and the overarching total energy system.
European and US initiatives, but also country-wide programs, have been defined for
encouraging innovation and developing technologies. In the countries contributing to IEA/DSM
Task 17, a number of projects and inventories has been done to uncover DER flexibility. These
are the subject of deeper discussion in this document. Some experiments in closely comparable
settings have been done in neighboring countries. In order to increase the project base, some
of these are also taken up in this document.

Page 12
2 Country context
2.1 Austria
Introduction
In Austria different model regions for smart grids have been established. Among others these
are Smart Grids Model Region Salzburg, Upper Austria and Smart City Aspern. Living lab
projects are running with different objectives to support the integration of renewables and
enable consumer participation.
Besides the already well established direct ripple control, participation of demand to fulfill
system services has increased in recent years. The pooling of smaller units and the role of
aggregators has been established. First players are already providing flexibility as a service for
the secondary balancing market. Costs for the balancing responsible parties are still high and
the share of renewables is increasing. In Figure 2-1 the prices for tertiary reserves markets are
depicted (in Euro per MWh1) over year and respective week number. Different colors are used
for different times of the day, which is separated in 4-hour-periods. On the left side, positive
prices are displayed, on the right side, negative prices. The upper plots show the prices for
weekdays (Monday till Friday), weekend prices are shown in the plots below.
In the recently published Strategic Research Agenda Austria, identified priority topics are
storage and flexibility (demand response) as well as the development and integration of new
business services.
Figure 2-1: Positive and negative balancing capacity prices in the Austrian tertiary control market (in Euro
per MWh)
1 The TSO in Austria reports capacity in MWh, which corresponds to the reservation of 1MW for one hour.

Page 13
Societal costs and benefits of smart grids
In the Austrian Smart Grids Roadmap [7] the benefits for the industry, network operators and
consumers are discussed. From the consumer point of view, introduction of new tariff types and
price models as well as insight into the detailed consumption are named as the main
advantages. From a societal perspective, the environmental and energy efficiency
improvements are dominating the discussions.
While research and demonstration projects on demand-side flexibility are still carried out, some
early adopters and new players (like from telecommunication industry and equipment
manufacturers) are starting to aggregate and participate with demand flexibility in the markets.
2.2 The Netherlands
Introduction
In the Netherlands, a portfolio of so-called IPIN-projects (Integraal Programma Intelligente
Netten [8]) has recently been finished. 12 Living Lab projects were conducted with real
households for approximately three years to get practical experience. In a final evaluation
meeting it was concluded that these projects generally showed the feasibility of Smart Grid
concepts. As an important bottleneck it was felt that on one hand subsidies wrench competition
and DER and DG-RES lack direct market access.
In individual IPIN-projects the largest distribution system operators were represented. Use
cases were implemented for congestion management in a local physical setting and for
optimizing options for local electricity or heat storage. Projects also included the commercial
and industrial area segment. In IPIN also a limited set of retailers and more ICT-service
companies were involved. Prices on the Dutch energy market recently have lowered and the
spread across the day and the year has decreased. Figure 2-2 presents the day-ahead market
price development on the Dutch market in 2003 and 2013 with the time-of-day on the Y-axis,
the day-number on the X-axis and the day-ahead wholesale price on the Y-axis. It can be seen
that the price variability leading to peak prices of 1800 Euro/MWh as in 2013 has decreased
considerably. Overall, the electricity prices have increased during the night due to the import
and export of electricity from interconnections with other systems. Generating companies in the
Netherlands in the past decade have invested heavily in new coal and gas-fired power plants,
which, with the advent and subsidized priority access of renewables like PV and wind, are not
operating at their planned number of hours. Introduction of carbon taxation also leads to
additional challenges for the generation companies.
Figure 2-2 3D price patterns of the APX (Amsterdam Power Exchange) market in 2003 and 2013

Page 14
The lower ‘spark spread’ leads to electricity resale companies focusing on energy efficiency aspects of Demand Side Management and helping customers to introduce renewable energy resources. Societal costs and benefits of smart grids In the Netherlands, in 2012 a study has been performed to determine the overall societal
benefits of intelligent electricity grids [9] from a broad societal perspective also looking at a
longer term covering 2011-2050. Operational and investment costs were considered on this
time span. So the impact is also the result from the energy infrastructure as planned for a
certain period from the high to the low voltage levels. Three gross scenarios were discriminated
for the gross infrastructure: BAU (Business As Usual), Renewable & Gas and Centralized Coal
& Carbon Capture and Storage (CCS) & nuclear. Behavioral changes include several types of
saving and demand and supply profile adaptation in response to incentives. Per customer
segment the potentials used are as defined in Table 2-1. The values assumed closely resemble
the potentials measured in tariff pilots in the US [10].
Table 2-1 Shift potential per customer segment
User group Absolute
saving(TOU)
Daily peak
shift(TOU)
Incidental peak shift
(CPP)
Households 4 % 4 % 16 %
Commercial/SME 4 % 15 % 30 %
Industry 4 15 30
Given these shifting potentials, profiles were constructed with the grid topology belonging to
each of the scenarios. Load distribution curves were calculated and the required newly
necessary capacity at each level of the grid was calculated over the 40 year period. The grid
level, where the efforts are done to keep the grid balanced, plays an important role as to the
cost-benefit ratio. In all three scenarios a positive net result appears for smart grid technology.
For BAU the total benefits are 7.1 b€ and the cost 4.6 b€ with an internal return rate of 13 %.
For the coal and nuclear scenario 14.1 b€ (28 %) appears and for the renewable and gas
scenario 12.5 b€ (31 %). Smart grid technology benefits mostly appear in the MV grids. The
investment costs are lowest in the commercial/SME segment. So the introduction should be
started in this customer sector. The balancing level parameter was chosen as the most
important parameter to be further investigated in the subsequent living lab trials in the
Netherlands. Another outcome of the study was that trade, transport and distribution tariffs
should be made dependent on the physical location and have a time dependent component
related to the connection to the grid. DSOs, now, operating grids mainly rolled out in the 60s
and 70s, are able to invest in their grids in a different way and within other time frames than in
the BAU case. DSOs will only do this if they can trust the demand response of their clients and
the behavior of their clients. That is why priorities exist for novel ways of tariffing. This is
reflected in the practical field test experiments, which are presented in the next sections. 12
projects on SmartGrids and demand response were finalized [8] recently. In the following, some
of the projects will be discussed in more detail.
2.3 Sweden
DSM of industrial loads has been used in some cases for efficient planning and operation of the
Swedish power grid. Some of the recent studies and pilot projects focus on DSM from

Page 15
residential loads. One of the projects is the Smart Grid Gotland project where studies have
been conducted on the potential for congestion management using direct load control of space
heating and domestic hot water appliances in detached houses. Market test and
implementations have also been performed demonstrating some of the challenges with direct
load control of an aggregation of homes. Another project is Klokel where a DSM trial was
conducted by turning off heat pumps of 100 homes during an hour when load peaks were
expected.
2.4 Finland
To enable demand side responses of small customers practically all customers are hourly
interval metered and settled. Aggregation services are available and aggregation is typically
closely connected to balance responsible parties of the competitive energy market. In Finland
aggregated demand side flexible resources have access to the energy markets and most
markets for balancing and reserve capacity, but the volume of demand side participation is still
rather small [11]. Some experimental battery storage system investments are on the way as a
response to increasing need of frequency controlled reserves although many controllable loads
are able to provide equally fast responses with much lower cost and losses. These facts
suggest that there is a need to develop reserve markets and related systems so that the
participation of smaller flexibilities than before can participate without very complex
aggregation. The TSO is gradually developing the ancillary service markets and related
systems, and participating in demand response pilots. About 50% of the power of the ancillary
services comes from resources connected to the distribution grids, such as medium size CHP-
plants. The application of dynamic pricing is slowly increasing in the retail energy markets. The
regulation of distribution grids is strongly biased to favor traditional grid strengthening, such as
new cables, reactors and transformers, to using demand response, batteries and local power
generation.
2.5 United States of America
Two large demonstration projects were supported by industry and the US Department of
Energy as a part of the American Recovery and Reinvestment Act of 2009 (ARRA). One
engaged DER at the distribution feeder level using a market bidding and clearing mechanism.
The other engaged DER and other electric system resources touching on locations that were
spread across several states in the Pacific Northwest. The projects demonstrated what has
become known as “transactive energy” coordination techniques. Other ARRA projects tested
time-of-use, peak time rebate, and critical peak pricing rates to dynamically engage demand-
side resources, but they are not described here.

Page 16
2.6 Switzerland
Different rudimentary forms of DSM are already used in Switzerland for a long time. Distribution
network operators shift larger loads on the consumer level into evening and night hours,
relieving the network from load peaks during the day. This, in effect, reduces the need for load
driven network expansion and allows more efficient planning and operation of distribution
networks. Additionally, since the Swiss tariff regime between different network levels to a large
extent is based on the peak power drawn during a defined period of time, the costs for using the
higher network levels and therefore the final end consumer tariffs are reduced by such
rudimentary schemes. Vice versa, a situation where the peak load of a distribution network is
increased results in higher network costs for this network and its connected end consumers.
The loads, which are shifted to off peak times, are controlled via a ripple control. Besides
offering the benefit of designing and utilizing the network more efficiently, synergies are realized
on markets. Often consumers could benefit when the ripple control is used in the described
manor and one assumes that price advantages shared with consumers, as electricity prices are
usually higher during peak load times as during off peak times. The interest of using the ripple
control with well known strategies lies mainly in the interest of more or less integrated actors as
the synergies are achieved for network and basic supply services together. This leads to
potential barriers for using more advanced demand side management schemes to be used for
self-consumption, or for market relevant use cases by third party actors, as the national Smart
Grid Roadmap highlighted [12] .
Several studies as well as pilot and demonstrations projects were carried out in Switzerland in
the past in order to investigate the potential of more advanced DSM techniques for certain use
cases. The main use cases investigated are the aggregation of demand in order to provide
secondary and tertiary control reserves for the TSO. In order to increase the liquidity of control
reserve markets, guidelines were published in 2014 allowing aggregators of load and
production to participate in control reserve markets. In addition, increasing self-consumption
becomes a main use case in Switzerland. Here, pilot and demonstration projects are aimed at a
load-control which matches production of distributed PV with consumption. Use cases which
explicitly generate a benefit for the network itself are up to date not so much in the focus of
investigations as they are already mainly realized by the ripple control. However, questions on a
coordination scheme that allows the operation and control of loads for the sake of the network
while at the same time leaving enough possibilities to schedule them for market relevant issues
are investigated. Such schemes will without doubts soon increase the flexibility of the entire
system and specifically of consumers in order to handle the fluctuating infeeds much better.

Page 17
Value of flexibility – Switzerland:
In Switzerland there has been some work on the valuation of flexibility for the network or the markets
and different studies have been performed. When focusing on the benefits for network, it was found that
neither battery storage nor load management offer enough savings to compete with conventional network
expansion [13], [14]. Said that, it needs to be considered that batteries are assumed to exclusively be used
to replace power lines and no other market related services are performed [15]. If additional services are
regarded too, batteries become beneficial with larger shares of renewables in Switzerland. As for load
management, it was found that this resource cannot reduce network expansion costs driven by renewable
sources integration, as general availability is too low. Infeed management seems to offer most benefits by
saving substantial network expansion costs. Besides that, benefits of flexibility can be found on markets
such as the intraday market or the ancillary service markets. In order to allow the network and the market
to profit from the flexibility resources, a coordination mechanism is needed with clear guidelines and
rules. Investigations showed that by implementing a coordination scheme, the costs of conventional
network expansion and the coordination scheme become similar, especially when a powerful smart meter
infrastructure is in place. Additionally, the flexibility measure become available in markets which lets the
cost-benefit ratio tend to be positive.
Flexibility has been largely used by integrated utilities to efficiently expand and operate the network and
buy electricity on the market. Typically, flexibility was controlled by a ripple control under the
management of the DSO. Since market signals and network stress drift apart due to the infeed of RES,
the question arises who controls the flexibility for what purposes. Currently, the regulative borders often
are in favor of the DSO, which controls the resources for the sake of the grid but also partly for the
market side of the utility. However, as aggregators arise on the market, they are interested in the control
of flexible resources. Also, the growing momentum of self-consumption push more and more for the
design of a framework that allows a non-discriminatory access to flexibility. As a first step, smart
metering is introduced, in order to create a platform on which measurements can be created to help both,
DSO and market players, to get the measurements they need in a higher resolution. Secondly, rules are
being developed on how a coordination scheme can be designed that allows flexibility to be used by
markets actors and end users, e.g. for maximizing self-consumption, while at the same time giving the
network operator the possibility to keep his network secure. On top of this rather complex question, the
framework should also allow the network operator to contract flexibility for network purposes. In such a
case, a part of the available flexibility or all of it could be contracted to temporarily avoid network
expansion. This relates however to the possibility of contracting the flexibility for market purposes. The
works are conducted in order to revise the electricity supply law. Questions on responsibilities,
compensation, information disclosure and time lapse must be answered.

Page 18
3 Experiments and field tests with residential DR Resources
3.1 HiT Houses as interactive participants in grids (Salzburg - Austria)
The demonstration residential building (Smart Grid Model region Salzburg, Austria [16]) must
be able to contribute to a reduction of peaks in the grids (electricity, district heating, gas). The
HVAC-Systems must as well be able to react to a certain requirement of the grid. The residents
must be able to react to a certain requirement of the grid. To do so, they need:
- Information,
- Devices which make an interaction possible
- Incentives
Energy should be taken from the grid when it can be provided by the grid operator as efficiently
as possible. Comfort of the users must not be harmed in any way.
Configuration and DR mechanism
In this project, demand response was achieved by utilizing HVAC-systems (heating, hot water)
in a residential building in combination with warm water storage. Separate usage of different
energy sources are used for thermal buffering.
Three heat sources feeding into this thermal storage tank (90m³):
- District heating
- Combined heat and power plant (68 kW thermal, 30 kW electric) fired by biogas
- Heat pump (45 kW thermal)
Distributed Energy Resources:
- PV System
- Combined heat and power plant (68 kW thermal, 30 kW electric) fired by biogas
Use cases
The objective is to use energy which is most efficient for the grid: biogas (CHP), PV, electricity
from the grid, district heating to form a grid friendly building, while the comfort must be
preserved.
Tariffs and price schemes
Three network-based tariffs have been introduced, based on daily market price forecast. The
tariff used for the demonstration project was +5 Cents for the high price and -5 Cents from the
normal network tariff in place (see Figure 3-1).

Page 19
Figure 3-1: Tariffs based on daily market price forecast
Technology and information exchange
A local controller was in charge of managing the energy sources. Internet technology based
communication of prices with the customer end devices has been established.
Figure 3-2: Visualization of price forecast and energy feedback
User participation and acceptance
The typical user behavior reflected the so called “toy effect” and visualization and price forecast
did not affect the manual response sustainably. Information about energy usage was not
requested, except there were external stimuli (e.g., interviews or bills). As opposed to manual
DR, automatic DR did turn out to be much more effective. Additionally it has been shown that
information about energy efficiency permanently decreased the total energy consumption
(Figure 3-2).
Current and prospective viability
Automated as well as manual demand response (via visualization) was used as well as an
intelligent optimization strategy for usage of different energy sources.
Table 3-1: Potentials for automated load shifting [16]
Heat source Red Yellow Green
CHP +17 % -11 % -6 %
HP -12 % +9 % +3 %

Page 20
Cost savings show that optimization of usage of energy sources can additionally save operation
costs and perform best when considering the network-based tariff.
Table 3-2: Costs for different operation modes (project HiT) [16]
Operation Full- infeed [€/kWh] Electricity substitution [€/kWh]
normal 0.65 0.5
CO2-optimized 0.68 0.52
Smart Grid cost optimized 0.6 0.45
3.2 PowerMatchingCity (Hoogkerk – The Netherlands)
PowerMatchingCity was operated in Hoogkerk from 2008 to 2014 [17]. Hoogkerk is a suburb of
Groningen in the Northern part of the Netherlands. In the EU-Integral project [18] a living lab
environment with 25 households was set-up. During phase 2 the number of households was
extended to 45 with 20 heat-pump equipped homes in the same street to study congestion
scenarios [19]. In PowerMatchingCity-II, together with the inhabitants, two energy community
services were developed. With ‘smart energy saving’ costs are kept to a minimum. Together
with comfortable renewable the need from the inhabitants to live using renewable energy
resources is key. Three control schemes are used: Automatic (HVAC), semi-automatic
(washing machine) and by-hand (dish-washer/dryer). Solar panels generate electricity. 40
households are involved. An energy monitor helps the inhabitants to fine-tune the energy
services. In one of the streets of PowerMatching City, Thomsonstraat, a residential area
monitor is installed. Analysis of the results indicates a yearly flexibility potential for each micro-
CHP of 21 EUR, for each heat-pump of 28 EUR and for each electric car of 58 EUR.
Configuration and DR mechanism
The heating system of the households was connected to the electricity infrastructure. Either
electricity consuming heat pumps or electricity producing micro-CHPs were installed. Hot water
storage (200 liters) in separate tap-water and home heating water buffers allowed decoupling of
the heat demand from the electricity demand. Scheduling of dish washers and washing
machines as well as charging units for electric transport was also available. PV-installations
allowed optimization of self-consumption scenarios.
Use cases
Use cases studied were:
- Imbalance reduction in portfolios of program responsible parties. Imbalance was caused by
prediction errors of wind and PV generation
- Trade dispatch of the aggregated profile of the 25 households by the BRP’s trade floor and
delivery of ramp-up and ramp-down services.
- Optimizing dispersed energy demand and supply within virtual communities. Two
community types were selected: ‘Together Pleasant Renewable’ in which PV-generation in
one household was coupled to the time the washing machines were operated in another
and ‘Cost Efficient’ optimizing self-consumption in the community at the lowest cost.
- Congestion management for DSO operation. This pertained to the added 20 households in
phase II of the project.

Page 21
Tariffs and prices
During the test, an alternative pricing scheme with emphasis on more real-time prices was
possible for the participants. Also for the communities, a temporary waiver was given by the
government to make net metering within the community possible.
Within the second phase of PowerMatchingCity, work was done on innovative pricing schemes
[20]. ERGEG recommends that smart metering systems should be capable of recording
consumption on a configurable time basis (hourly or 15 minutes). This will optimize the use of
electricity, and stimulates innovative pricing formulas. However in many EU countries, synthetic
profiles are used for the allocation of small consumers. As a consequence,
Domestic consumers have no access to wholesale energy markets.
The energy retailer is not able to create a direct relation between the purchase and
selling of electricity.
The retailer is not able to stimulate or incentive energy consumption during cheap
periods (e.g. with excessive wind energy available).
The customer is not able to take advantage of cheap energy.
Smart meter allocation faces resistance due to volume of data to be transferred. Providing each
day 96x2 values for 7M connections requires excessive data transfer, data processing and data
storage and energy prices for synthetic-based allocated consumers may rise, as non-allocated
consumption is assigned to this group. Finally, energy suppliers and consumers may show no
interest in innovative pricing volumes, as peak/off-peak price spread is limited. One of the
objectives in the PowerMatching City-II also was redesign of wholesale processes, rendering
these future proof by supporting flexible TOU and VPP concepts and to proof the design in
practice: implementation of wholesale processes electricity in a shadow environment.
The findings were that the big data issue can be minimized by aggregating at an early stage in
the measurement data chain. Incomplete metering data is hardly an issue as there is sufficient
data available for a proper extrapolation (based on the standard annual usage). Non allocated
consumption may be assigned to a larger group of consumers. Many energy suppliers are
looking for new products and services.
Technology and information exchange
The homes were equipped with home micro-PCs to act as residential gateway and as a
concentrator. Each device could be measured and metered individually. The home gateways
were connected to dedicated ADSL connections to a central service provider computer. In later
rollouts a complete Microsoft Azure cloud implementation was setup and the wired connectivity
of the home concentrator was replaced by a wireless connection to reduce the cost. For
defining the use case objectives and the operational coordination to satisfy them,
PowerMatcher was used. For analysis purposes, some 100 parameters per household on a 5
minutes data collection scheme were stored in a database. The data periodically were updated
to a data warehouse.

Page 22
User participation and acceptance
A comprehensive energy management dashboard was supplied to the households that gave
feedback on the propositions currently active in the system. User participation was on a regular
basis through meetings and mailing lists. A number of socio-behavioral interventions via
interviews took place to elaborate the feedback from the participants. Most participants were
very eager to continue participation in this trajectory in spite some of the teething troubles in the
beginning. A few withdrew after phase I.
Current and prospective viability
It appeared that the cluster is able to follow a predefined aggregated profile adequately using
the heat storage flexibility. The interaction of the heating system with the thermal buffer will be
discussed later in this document. In Figure 3-3 the profile following capability of the cluster is
shown; the blue line gives the forecasted profile (based on earlier realization and the weather
forecast), the red line the ramp-up/ramp-down requests from the trade floor and the green line
the realization. In most of the cases, the cluster is able to follow the required profile. The
available cluster flexibility as composed from the bids (green) is shown in the right hand part of
Figure 3-3.
Figure 3-3 Profile following and flexibility bandwidth in a cluster of 25 households
In [21] a detailed analysis has been given on the flexibility potential in the PowerMatchingCity
living labs for the second phase of the project. For several device types flexibility bandwidths
were calculated. A sample band width has been reproduced in Figure 3-4.
Figure 3-4 Flexibility bandwidth graph for heat pump operation from [22]

Page 23
Given these bandwidths and comfort constraints, assessments were made as to the financial
picture of flexibility in four different scenarios for the energy supply in the Netherlands [23] to
2030 from the commercial and grid operations perspective. The scenarios describe variants as
shown in Figure 3-5.
Figure 3-5 Scenario variant dimensions from [23]
The results of the scenario calculations are depicted in Figure 3-6 as the net present value of
flexibility in several grid functions as calculated until 2030.
Figure 3-6 Net present value for scenario variants from [21]
Generally the highest benefits of flexibility are avoided investments in grid capacity. Most
benefits can be seen in a central scenario followed by the decentralized renewables scenario.
On an appliance basis the benefits per year for different types of devices are shown in Figure
3-7. The average bill in the Netherlands is in the order of 700 Euro.
Benefits of up to 170 Euro per year can be seen in the BAU scenario for electric vehicles. It has
to be noted, that the needed electric energy per household almost would double with home
charging. On average per device the benefits are 70 Euro/yr per device. This amounts to
approximately 10 % of the electricity bill.

Page 24
Figure 3-7 Benefits per appliance type and scenario from [21]
3.3 Couperus (The Hague – The Netherlands)
The Couperus field test was in an apartment complex with 300 households. The focus was on
using the flexibility of heat pumps in well-insulated buildings, for congestion management and
imbalance reduction.
Configuration and DR mechanism
The substations of the complex, imbalance signal of wind energy and the heat pumps in the
apartments were connected with Powermatcher software. This software technology made sure
the comfort of the consumer was not interfered, there was no congestion and the imbalance
signal was reduced. At first, the aim was to connect all 300 apartments, however some data
communication issues were preventing this. So 150 households served as the control group
and 150 households were connected with the Powermatcher. Flexibility was created by the
latent heat capacity and inertia regarding temperature changes of the well-insulated
apartments. This was achieved by working with a small temperature bandwidth, which was
within the comfort zone of the consumer but offered enough slack to postpone or preheat the
apartments.
Use cases
Real-time wind imbalance reduction
Eneco as a BRP with a portfolio containing wind energy has a considerable financial risk from
imbalance.
Figure 3-8 Imbalance compensation during the Couperus test

Page 25
In Figure 3-8 it can be seen, that the cluster is able to follow the required response from the
imbalance market. During the period September to March, 21 % of the total power (300 kW) of
all the heat pumps appeared to be available as flexible power.
Peak shaving / Congestion Management
For this use case the power at the substation was measured. When the needed power was too
high, runtime of heat pumps in an apartment that were on the high-end of the bandwidth were
postponed to a time there was more room or when runtime was obliged to achieve the
consumers wish. So it appeared that heat pumps can deliver an active real-time response with
minimally inflicting the comfort/temperature.
Tariffs and prices
In this testbed there were no tariffs or prices. The imbalance reduction was based on a price
signal, like high, medium or low. This was the trigger for a heat pump to run or postpone
runtime. So no real financial inventive was giving towards the consumers. In fact they did not
have an active participation in the testbed, and their only prerequisite was that comfort level
was not interfered.
Technology and information exchange
In the apartment building, heat pumps use a common ground-based heat source to generate
water for heating and tap water. The system had a configuration similar to the Hoogkerk field
test. The open-source Powermatcher [24] was used for the implementation the objectives of
the use cases.
Participation and acceptance
In the apartment building the experiment was done in two phases. In the first phase was a
proof-of-concept, which had a technological focus. After the results from that phase, and the
evidence that it worked, it was aimed to incorporate more appliances with a significant energy
usage. However this lies in the influence cycle of the consumer. Consumers’ motivations and
drivers were researched, it appeared they wanted to be in control and obtain a significant
financial incentive. Within the project constraints we decided this would not lead to a viable
value proposition and we did not ask for consumer participation.
Current and prospective viability
Currently (Q2 2016), the project is concluded and the results are public. It shows potential and
can be used as one of the solutions for zero-net metering, congestion management and
imbalance reduction. However it needs to be up-scaled and transformed into a product/service,
where market parties are willing to invest in.
3.4 Your Energy Moment (Breda/Zwolle – The Netherlands)
Configuration and DR mechanism
Your Energy Moment is a pilot that has been conducted in the cities Zwolle and Breda in the
Netherlands. Participants were provided with smart washing machines, a PV-system and a
home energy management system. In 50 houses an additional heat pump was installed to
provide extra flexibility. The goal of the project was to learn if people are willing to change their
energy usage as a result of the incentives they were given and provide flexibility in their energy
usage. Consumers could use their smart washing machines to shift energy use to a moment

Page 26
that was either ‘sustainable’ (when there was PV-generation) or to a ‘financial’ moment, when
energy prices were low. The consumers were provided with an energy computer that was put in
their living room, so it was easy to access. The energy computer gave the consumers
information about the expected energy generation by their PV-system and the energy prices
that were given 24h ahead. Furthermore, the energy computer provided information about real
time energy usage, PV-generation and energy tariffs. Based on this information the consumer
could decide which program they wanted to use for their washing and energy use.
The heat pumps that were installed in 50 houses in Breda were controlled by the energy
management system that could be overruled by the consumers. The temperature in the house
could vary between two set-points defined by the consumer.
Use cases
Consumers could choose between two different profiles:
- The financial profile: the washing machine will start washing when the energy prices are
lowest, making sure that the washing will be done at the lowest price during the day.
- The sustainable profile: the washing machine will start washing when PV-generation is
at a maximum. It will make optimal use of the PV-generation of the house during the
day.
Tariffs and price schemes
Day ahead prices were used and consisted of three tariffs:
1. Low: price per kWh < €0,20
2. Medium: price per kWh €0,20 - €0,30
3. High: price per kWh >€0,30
Included in the prices are taxes, the distribution tariff and the retail price. Taxes were fixed and
both the distribution and retail tariffs were flexible.
Technology and information exchange
The system was installed in Zwolle and most houses in Breda. In 50 houses a heat pump has
been installed that was controlled by the energy management system. The home energy
management systems were given information by the central energy management system (see
Figure 3-9).
User participation and acceptance
The awareness change of the participants with energy production and consumption was a
major target. The change was larger than initially expected by the behavioral scientists. An
import pillar of Your Energy Moment was the acceptance and participation of the consumer in
the project as one of the main goals of the pilot was to learn how consumers can and will
change their energy use patterns. As a result the consumer participation was very high as was
the acceptance. When the participants were asked if they would be willing to participate in a
YEM 2.0 pilot over 80% reacted positive.

Page 27
Figure 3-9 The YEM consumer portal
Current and prospective viability
The pilot Your Energy Moment showed that the smart controlling of heat pumps in combination
with dynamic tariffs (TOU) can result in a 50% peak reduction. The same pilot provided
participants with PV-systems and smart washing machines (next to a dynamic price) and
studied the potential of shifting the energy use of the washing machines to hours where PV-
production was high. The results show that the average energy demand of washing machines
of the participants was 18% higher than the reference group during high PV-production and
31% lower when the energy prices were high. Furthermore, the pilot showed that a 48% peak-
reduction is possible for those who used the automated washing programs [21].
Figure 3-10 Electricity demand of the washing machine during the day for participating
households and for the reference group with the average PV production.
Conclusions
Experiences of pilots in Netherlands show the potential of DR, however it also shows some
barriers that need to be removed. Examples of this are social behavior, tariff structure and

Page 28
technical capabilities of appliances. Consumers need to change the behavior of their energy
use patterns. Are they willing to? Will it be a structural change? On the other hand, what can
the consumers be offered? Which incentives provide the consumer the needed step to live up
to the potential of DR? A third aspect are the legacy devices, which are not yet capable of DR.
Several pilots conducted show interesting results, however upscaling seems difficult. The pilot
Couperus showed a nice paradox: on one hand consumers wanted to be in control (which leads
to a lower incentive), on the other hand, the financial incentive offered was too low. So the
potential exists, yet execution is very difficult.
3.5 Smart Grid Gotland (Sweden)
Configuration and DR mechanism
The smart “customer” Gotland program was initiated through the market test and market
installation subprojects within the Smart Grid Gotland project in late 2013. The program is
planned to end in late 2016 and is ongoing at the time of writing. The aim of the subprojects is
to give consumers the ability to actively participate on the energy market, with the ambition of
having consumer reduce electricity costs and also system costs for the grid. Around 8600
customers were identified, 1600 customers were interested in the project, and finally 260
customers were selected to participate. The type of customers selected were customers with
consumption over 8000 kWh/year with space heating and/or domestic hot water heating
systems. Therefore, most of the customers participating in the program are detached houses.
Control equipment were installed at the customer to enable remote steering of various heating
systems such as hot water boiler, electric heater, electric radiator systems, electric floor
heating, and heat pumps. A mobile application is provided to the customer, with features such
as viewing your real-time electricity consumption, viewing the day-ahead control schedule on
hourly granularity (ON/OFF schedule), possibility of overriding individual hours of the control
schedule, possibility to specify extent of control among different options
(COMFORT/NORMAL/ECONOMY), possibility to specify minimum desired indoor temperature,
and more. A control group consisting of 56 customers was later added as reference with
equipment installed to monitor the real-time electricity consumption.
Use cases
- Electricity bill optimization for end users with wholesale market price
- Supply matching
Tariffs and price schemes
Day-ahead control schedules are sent to the customers, where their consumption is optimized
with the objective of minimizing their cost while maintaining adequate comfort levels. The price
used is a reinforced wholesale market price. The wholesale market price is reinforced by a
time-of-use tariff and a price component related to the wind power production on Gotland.
Technology and information exchange
The customers are remotely steered through the installation of “smart plugs” which are
connected to the WiFi home network.
User participation and acceptance
User interaction with the mobile application is still being analyzed at the time of writing.
However, several surveys have been conducted to measure the perceived satisfaction of the
customers, some of which are shared here: from approximately 200 customers, around 65% of

Page 29
customers rate their satisfaction 7 or above (on a scale of 1-10). From approximately 200
customers, around 50% rate their perceived changes in consumption patterns to be 7 or above
(on a scale of 1-10).
Current and prospective viability
Project is ongoing. Regulatory innovations … Price-setting on the market 100000 customers
3.6 Aggregation of Municipal Plants for DR (Switzerland)
Configuration and DR mechanism
A Swiss study [12] found that the largest electrical consumers in communities have a
substantial potential to be used for demand response. These consumers are sewage treatment
plants, public water suppliers and waste incineration plants, with an installed capacity of 1 GW.
The analysis shows that for waste incineration plants and water treatment plants the potential
for load shifting is considerable, without interfering with their main functionalities and public
service goals.
Use cases
The study identified three different use cases for municipal plants.
Seasonal Shifting: Waste incineration plants might store waste in summer (when energy
demand is low) and burn the waste in winter or when facing high energy prices. This shifting
process suffers from costs for storage and a change in the usual work routine. With higher
energy prices in winter this case might be viable as there is already a small seasonal shifting in
place.
Tertiary control power: Energy consumption of waste incineration plants and water treatment
plants can be adjusted, and could therefore provide positive and negative tertiary control power.
For meeting the requirements for tertiary power control (TPC: ± 5MW for one hour) several
plants must be pooled.
Secondary control power: As only 10% of power provision are effectively requested,
Secondary control reserves can be provided by sewage treatment plants utilizing their thermal
capacity.
Tariffs and price schemes
Prequalified firms can offer their tertiary control reserves on the day ahead market, stating a
price and providing a power product with a minimum of ±5 MW in blocks of 4 hours or for a
week. The Swiss TSO (Swissgrid) than buys the desired quantity for the lowest price. The price
for positive tertiary control reserves varies between 100 CHF/MW/h and 0 CHF with a median
of 10CHF/MW/h.

Page 30
Current and prospective viability
The estimations for the largest 30 to 40 of 3900 infrastructure facilities in Switzerland would
offer 100 MW positive and 200 MW negative regulation services for one hour in the tertiary
reserve control market.
Additionally, the study identified the potential of waste incineration plants for seasonal shifting
and found a load shift of 250 GWh/year if the process of waste incineration would be shifted to
the winter. The benefit of seasonal shifting is likely to gain importance with a higher infeed of
renewable energy preferably producing electricity in summer, e.g. photovoltaics.
The optimized management of a balancing energy pool offers between 6’000 and 12’000 CHF/a
per 100MW installed power without the need for expensive investments. Furthermore, the study
estimates a reduction of energy expenses by 10% - 25%, increasing the viability of the plants.
3.7 WarmUp Optimized use of Heat Pumps (Switzerland)
The objective of the project WARMup [12] was to make an economic assessment of the
versatility of thermal storage facilities. In the project the thermal inertia of boilers and buildings
was used to take advantage of different prices for energy at different times of the day. The
added value potential of optimal management of the thermal storage unit was determined by its
flexibility being assessed on all the prevailing markets through optimal commercial transactions.
All simulations were focused on an operation without limitations of use for the inhabitants. For
this purpose an ex-ante simulation with the aggregated use of 5000 units and 22 flats with real
market data was carried out.
Configuration and DR mechanism
The project WarmUP simulates optimal use of the boiler and trading on the day ahead or
intraday market. All simulated capacity trades were offered at the ancillary service market and a
bid was only counted as accepted if it would have been in the real world.
The energy consumption is adjusted to the projected and real market prices, pre-heating the
heat-pumps when prices are low and using thermal capacity of flats and boilers when prices are
high. Additionally, positive and negative control power was offered on the ancillary market.
Tariffs and prices The prices for tertiary power control are auctioned at the day ahead market in blocs of 4 hours.
A price range of between 0CHF/MW and 100CHF/MW can be usually seen, however, price
spikes of up to 250CHF/MW also appear from time to time. Figure 3-11 shows the price range
between August 2011 and September 2011, an average price of around 75 CHF/MW for tertiary
control (PTRE+) can be seen, this price is significantly larger than the spot market price for
electricity (+PSPOT)

Page 31
Figure 3-11: Price for tertiary power control in 2011
Use cases
Day ahead optimization: Using the forecast on energy consumption taking temperature and
global solar radiation into account, the trading system can use the information and the flexibility
of the pool in order to optimize the schedule of when to buy or sell energy. The flexibility of the
pool of heat pumps can hence help to take advantage of arbitrage opportunities.
Intraday optimization: Within the day a trader can use the flexibility of the virtual power plant to
buy or to sell energy at times when volatile prices occur. The virtual power plant is then used to
take advantage of price peaks.
Balancing services: The flexibility of heat pumps can be used to reduce deviations of the
previously submitted schedules to the balance group responsible. By doing that cost savings
can be realized via reduction of balancing energy. Typically, balancing energy comes at costs a
factor higher than the intraday energy prices.
Redispatching (grid): As load peaks can lead to higher network tariffs or even network
congestions, redispatch of load reduces those peaks and hence the stress on the network.
Furthermore, an intelligent control of load reduces the need for network expansion due to the
integration of renewable energy sources, as load can be shifted to times of major production.
Tertiary control (TRL, TRE): As the thermal inertia of apartments and houses is significant, heat
pumps can be shut down over a longer time. This can help to stabilize the system and provide
negative tertiary control power. While procuring the power offers one value stream to the pool of
heat pumps, a second value stream is realized when the pool is actually scheduled by the TSO
and planned energy consumption is not realized.
All these different use cases were tested in simulations. The biggest gains resulted from day
ahead and intraday trading as Figure 3-10 indicates, tertiary power control contributes also to
the earnings.

Page 32
Figure 3-12: WarmUp cost savings (-) additional costs (+) per month compared to base use
Current and prospective viability
The simulation indicates already a viability of the concept as cost savings are generated. This is
showed by negative values in Figure 3-12. Most of the required monitoring devices are already
in place, so that only a relatively small investment for communication between the buildings and
a pooling operator is required for a market use of WarmUp. Each flat in the buildings faces
savings of up to 40 CHF/a (-5%) depending on conditions.
With an increased infeed of energy from decentralized new renewable resources, WarmUp will
see larger profits as more control power will probably be needed in the system. As the energy-
only-market will be further developed and strengthened, it is quite probable that an increase of
energy price volatility will be seen particularly in intraday markets. Hence, the positive signals
which are indicated in bright green will be more extensive in the future.
The optimization process also aimed to lower the energy consumption by forecasting weather
conditions and the need for hot water and room heating, taking the daily needs of the
inhabitants into account. This resulted in a saving of 1.6-2.3% energy consumption compared to
the normal use.
3.8 Tiko – Swisscom Energy Solution
Tiko [25] is a product already commercially available, that allows consumers to pool their heat
pumps, boiler, or heating system into a virtual power plant to provide secondary control. 8’000
customers are already contributing to the network allowing to provide secondary control to the
TSO. Each participant provides around 1kW of secondary control, depending on weather
conditions and type of use (eco mode/normal mode) and characteristics of the used resource,
e.g. volume of boiler or house.
Configuration and DR mechanism
The backbone of the system is a control unit connected to each heat pump contracted. The
connection with the control server is established via 3G-technology or Ethernet connection
using the local router. The unit not only allows the control of the resources for premises of the
pool operator but also for the customer owning the resource. He has, for example, the
possibility to view the operation mode or the energy consumption of his unit. The pooling
operator bids capacity after being prequalified to the particular ancillary service market of the
TSO. The bids take weather conditions into account as they determine how the heating
systems will operate. If the bids are accepted the pooling operator activates the contracted
devices either for positive or negative control.

Page 33
Tariffs and prices
Each participant pays 49 CHF for three years
of service. The service offers detailed
information on the energy consumption of the
connected devices and additionally the ability
of remote control for both the customer and
the pooling operator. The information and
remote control is accessible by a smartphone
application or via web interface. The remote
control allows to set a desired temperature, an
eco-mode that lowers the energy consumption
by 40%, and provides information about errors
of the heating system. The reward for actually
offering flexibility to the aggregator is implicit.
The control unit, the remote control services
as well as the visualization cost more 449
CHF. However, being able to control the units
for ancillary service markets allows for a
rebate of 400 CHF to the user, hence resulting
in 149 CHF total cost for the customer
including installation.
Use cases
Ancillary / Balancing services: The main use
of the system is the provision of secondary
control to the TSO. Recently, the resources
got also qualified for primary control services.
Therefore a critical amount of users is needed
to reach the 5 MW condition. One main
benefit of tiko is the fast reaction time of the
controlled resources which is below 15 seconds.
Load shifting: As the tiko system is able to alter peak demand locally and temporarily, this
allows load shifting between regions at times of peak energy demand. Hence, the system could
be used to improve the network stability by local network relief.
Integration of new renewables: The system could be beneficial to better integrate new
renewable energy sources such as PV or wind energy into the grid. Redispatching could be a
good option if more customers take part in a widespread tiko network. Also, the product can be
used for optimizing self-consumption measures of (mainly) residential consumers.
Technology and information exchange
The hardware consists of two different components, an “M-Box” that offers 3G communication
and a PLC module. The “M-Box” receives information from the back-end system and directs it
to the K-Box and vice versa. The “K-Box” is a certified meter with a time resolution of 1 second.
It measures the power consumption of the connected device and executes the control signals
send from the central “K-Box”. Households which use tiko products are also offered a separate
switch for the consumers overriding the remote control signals from the operator.
Figure 3-13: Tiko Smartphone App

Page 34
Information from all contracted units is collected in a central backend. If the pool is activated in
order to provide control power from the TSO, an algorithm selects the required units from the
pool. To ensure reliability in providing the contracted products and to ensure customer comfort,
the pool needs to offer redundancy in available units as restrictions may arise at any time
through customers who like to keep their comfort. For this calculation the algorithm takes
several factors into account such as energy price, weather information, type of resource, a
thermic model of the house, the temperature, the operation schedule and current state of the
controlled device.
Participation and acceptance
The main incentive for customers to accept tiko is the possibility to monitor energy
consumption, the operation scheme of their heat pumps and to achieve savings by reducing
their energy cost. The information provided via smartphone application or web interface is
interesting for customers who would like further knowledge on their energy consumption and on
whether the heat pump is working correctly. The remote control function is especially useful
when tiko is used in a holiday home.
Current and prospective viability
The project is already available on the commercial market. The announced goal is to aggregate
connected devices from about 70’000 participants. This will allow for 70MW of controlled
capacity. Other goals include the integration of PV plants into a separate control algorithm,
which should then allow control of consumption in order to increase self-consumption. In
addition, the algorithm will be extended in order to provide frequency control services to the
TSO at the same time as increasing the degree of autarky of buildings with electricity
production. Another benefit is that energy savings are achieved via visualizing the consumption
to the consumers. In total, the users of the tiko products were able to save nearly 1 GWh of
energy since the start of the project.
3.9 AEP Ohio gridSMART (Ohio - USA)
AEP Ohio, partnered with Battelle and the US Department of Energy, demonstrated the flexible
operation of HVAC equipment in approximately 200 homes using a distributed control approach
with the AEP Ohio gridSMART® project’s real-time pricing (RTP) demonstration [26]. The
demonstration was exercised in the late spring to the winter of 2013.
Configuration and DR mechanism
The project implemented a double-auction real-time market that accepted bids and cleared
supply and demand every 5 minutes. The supply was a function of the nodal locational marginal
price (LMP) from the regional wholesale market so the equipment responded to energy and
flow constraints from the bulk power system. They also responded to local distribution feeder
constraints that could be imposed by temporarily setting the feeder capacity limit so that it was
below the actual power flow on the feeder.
Figure 3-14 provides a conceptual overview of the RTP system. At the operations center,
wholesale market prices were received from the PJM 5 minute real-time wholesale energy
market. This was a locational marginal price that was distinct for each of the four distribution

Page 35
circuits. The using a retail tariff approved by the Public Utility Commission of Ohio (PUCO), the
operations center calculated the retail rate to supply electricity from the system.
Figure 3-14: Conceptual Configuration of the gridSMART RTP System
At the residence was a residential energy management system (EMS) that talked with the
operations center’s dispatch system to exchange bids and desired quantity of energy for the
next 5 minute market. In return, the residential EMS received the market clearing price for the 5
minute period. That information was displayed on a consumer display and was used by a local
software agent to control the HVAC equipment.
A smart meter was installed at each residence. The meter collected timestamped, interval
usage data for the residence and sent it back to the operations center as well as to the
residential energy management system. This was used for billing by the service provider and
for decision-making by the local agent. The occupants received a monthly bill and were able to
see a detailed bill through a web-based interface.
The households were able to individually set their comfort sensitivity to price with a smart
thermostat. The greater the comfort, the smaller the temperature dead-band about the desired
setting. The greater the economic incentive, the larger the temperature dead-band. A software
agent in the thermostat bid into the market based on these household preferences. The
occupants were also able to override or change the settings at any time.
At the residence was a residential energy management system (EMS) that communicated with
the operations center’s dispatch system to exchange bids and desired quantity of energy for the
next 5 minute market. In return, the residential EMS received the market clearing price for the 5
minute period. That information was displayed on a consumer display and was used by a local
software agent to control the HVAC equipment.
A smart meter was installed at each residence. The meter collected timestamped, interval
usage data for the residence and sent it back to the operations center as well as to the
residential energy management system. This was used for billing by the service provider and

Page 36
for decision-making by the local agent. The occupants received a monthly bill and were able to
see a detailed bill through a web-based interface.
Figure 3-15 shows the operations display for the system. The top chart indicates the power
flow on the feeder over time. The second chart indicates the state of the population of HVAC
units in each market cycle over time. The third chart shows the market clearing price and the
last chart depicts the observed temperature averaged over all of the participating households.
Figure 3-15. Operations dashboard for AEP Ohio gridSMART demonstration project
The project successfully demonstrated how independent decision-making can work to satisfy
regional and local objectives without direct control. For example, as market prices rise, some
HVAC units did not run because their bids were too low. As market prices rose to the price cap,
all bidding equipment stopped running. Operational behavior such as a deterioration in the
amount of HVAC load to drop out over time were also witnessed as was a small amount of
household fatigue based upon a rise in thermostat overrides if the duration of a feeder capacity
event was too long.
Use cases
The field demonstration investigated the following value stream use cases:
Energy purchase: The retail price of electricity was determined every 5 minutes.
Consumers and their software agents responded to these signals and altered their
behavior with the ability to save money.
Transmission capacity incentive: The RTP was based on the PJM wholesale price of
electricity. This allows demand to respond to transmission-level capacity issues. While
AEP did not have enough DER to affect their bid into the wholesale market and affect its
price, the system benefited from the response of the DER to changes in market prices.

Page 37
Capacity deferral and local energy constraints: When the distribution feeder reached its
supply capacity, market clearing prices rose and demand lowered. The mechanism to
engage the DER by setting a pseudo-capacity constraint also allowed AEP Ohio to have
the resources respond to local critical peak events. In addition, when distribution circuit
sections were switched, this caused overloads on occasion that automatically cause
prices to rise and demand to fall.
Spinning reserve ancillary services: While not implemented in the field, field data was
used to calibrate detailed simulation models that were then used to investigate the
characteristics of high penetrations of the DER reacting like spinning reserves to back
up generation or transmission failures.
Tariffs and prices
Prior to deployment, the project simulated the behavior of the demonstration system using
historical data and detailed residential models. This was used to determine the RTP rate
design. The rate included an energy term that was a function of the 5-minute wholesale price
for energy in the PJM market. This is a locational marginal price (LMP) calculated every 5
minutes for each of the 4 distribution circuits so it includes an incentive to remedy transmission
constraints. The resulting rate design included an investigation of different types of households
and the distribution of benefits in order to come up with a revenue neutral tariff.
The resulting tariff design was presented to the PUCO and a retail rate was resolved for the
four feeders in the demonstration. Besides the energy component, other components included
the costs of the delivery infrastructure, taxes, and other riders. Lastly, an incentive component
was developed that paid back the excess costs that households experienced during a circuit
capacity event and it provided and additional incentive to those households who reduced their
energy consumption during these events.
Technology and information exchange
As shown in Figure 3-14, the household technology included the following:
HEMS: communicated to the smart meter using a Zigbee communications mechanism
to obtain energy usage information. It also communicated to a programmable
thermostat which controlled the HVAC unit using WiFi. The HEM would read the
comfort setting (5 levels of flexibility from full comfort – no flexibility – to full economy –
allowing a relatively large range of temperature excursion from the desired temperature.
Lastly, it communicated back to the operations center dispatch system using a cellular
interface. This relatively expensive piece could be avoided with more common Internet
communications mechanisms in a full scale deployment.
Programmable Thermostat: this device controlled the HVAC unit, provided a display for
the consumer to see the status of their system and the changing price of energy. It also
served as the consumer display for setting household preferences for operation and
sensitive to price (more comfort or more economy). The thermostat also allowed
override capabilities and recorded household temperature these were all reported to the
HEMS.

Page 38
Operations Center: this included the computer hardware to receive the PJM wholesale
price, the power and quality bids from the households, the distribution circuit loading,
and settings for circuit capacity limits. This system ran the retail, double-auction market
and published the resulting market-clearing price according to the tariff. It also
interfaced with the meter management system and the billing system.
Participation and acceptance
The demonstration included a series of 3 consumer satisfaction surveys over about a seven to
nine month period: one at the beginning, one at the end of the summer period, and one at the
end of the year. A summary of the results are shown in Figure 3-16. The surveys indicated
good initial experience with the program as the households chose to enter the program and
were excited about it. The middle period showed a slight decrease in satisfaction, while the
final billing experience was represented in the last survey and it indicated the highest level of
satisfaction.
AEP Ohio also conducted other dynamic pricing programs and this one achieved the highest
satisfaction level. In addition, the household overrides for peak management events (circuit
capacity limit dropped to engage all DER for periods of 2 to 4 hours) were recorded. For 2 hour
events, they indicated an average of 1-2% household overrides over all events with a maximum
less than 5%. For 4 hour events, the average was about 3% with a maximum of less than 10%.
Household perception to monthly bill impacts ranged from 51% savings, 39% about the same,
and 10% felt their bills increased.
Figure 3-16: Overall Consumer Satisfaction with the demonstration
Current and prospective viability
The field data from June to September 2013 was analyzed and described in the report. The
impact to the electric service provider indicated the following,
Wholesale purchase based on energy use for the average household had a cost
reduction of about 5%.

Page 39
System peak shaving resulted in about 6.5% peak load reduction at a 50% simulated
household penetration calibrated to the field data.
Feeder peak management resulted in about 10% peak feeder load reduction at 50%
simulated household penetration.
The analysis of impacts to households indicated,
Average household bill reduction of about 5% (includes the peak management
incentive).
Customer satisfaction and perceived savings are indicated in the section “Participation
and Acceptance” above.
3.10 Pacific Northwest Smart Grid Demonstration project (USA)
The Pacific Northwest Smart Grid Demonstration (PNW SGD) [27], a $179 million project that
was co-funded by the U.S. Department of Energy in late 2009, was one of the largest and most
comprehensive demonstrations of electricity grid modernization ever completed. It included
multiple states and cooperation from multiple electric utilities, including rural electric co-ops,
investor-owned, municipal, and other public utilities. No fewer than 55 unique instantiations of
distinct smart grid systems were demonstrated at the projects' sites. The local objectives for
these systems included improved reliability, energy conservation, improved efficiency, and
demand responsiveness.
Configuration and DR mechanism The demonstration developed and deployed an innovative transactive system that coordinated
many of the project's distributed energy resources and demand-responsive components. With
the transactive system, additional regional objectives were also addressed, including the
mitigation of renewable energy intermittency and the flattening of system load. Using the
transactive system, the project coordinated a regional response across the 11 utilities (see
Figure 3-17). This region-wide connection from the transmission system down to individual
premises equipment was one of the major successes of the project. The project showed that
this can be done and assets at the end points can respond dynamically on a wide scale. In
principle, a transactive system of this type might eventually help coordinate electricity supply,
transmission, distribution, and end uses by distributing mostly automated control responsibilities
among the many distributed smart grid domain members and their smart devices.

Page 40
Figure 3-17: PNWSGD Geographical Region with Project Partners
The project established 14 transactive nodes (transmission zones) to represent large sections
of the power grid’s transmission and generation, and it defined 13 additional transactive nodes
to represent the project’s participating utility and university sites. The algorithmic framework at a
transactive node was intended to be scalable and self-similar, regardless of the device or group
of devices that is being represented by the transactive node.
Figure 3-18 provides a high-level summary of the transactive node approach developed for this
project. Each node represents one or more electrically connected resources. Nodes interact
with electrically connected neighboring nodes to exchange information about the quantity of
energy estimated to be produced or consumed and the cost of that energy. A time series of
information is exchanged so that the nodes negotiate operation not only in the next interval, but
optimize their operation over the time horizon of the time series. Internally, the node manages
the resources under its purview to see that their needs and flexibility are properly reflected in
the negotiation. The system of nodes iterates exchanging information for each operations time
step until the difference in incentive price and energy exchange between each neighbor
converges.
Figure 3-18: PNWSGD transactive node communicating with electrical neighboring nodes

Page 41
Use cases
The project used simulation test scenarios to investigate the system impacts of the deployment
of the transactive approach. The scenarios included the following:
- Distinct seasons of the year (from 2013). This was configured and controlled by feeding the
simulator with different base-load and wind power data corresponding to different seasons
of the year. Three season periods, each lasting 1 week and ending in that season’s
observed peak load for 2013, were defined.
- Penetration level of wind generation. Wind-penetration level is defined by wind peak power
generation capacity divided by total peak base-load power in the region. A calibrated wind
power multiplier was applied to the wind power generation forecast input data, consisting of
recordings of forecasts for the present from each node in the network, to control wind-
penetration level. Three different levels of wind penetration were planned and simulated: no
wind, 10% wind (medium), and 30% wind (high) as a percent of peak total system load.
- Penetration level of transactive control. Three different levels of transactive penetration are
planned and simulated: 0%, 10% (medium), and 30% (high) as percent of peak total
system load.
Tariffs and prices
Simulation was used to formulate the costs of wholesale energy in transmission zones of the
system as a regional wholesale market is not run in this part of the nation. The impacts of
incentives that were not directly proportional to energy supply were also represented by
functions. For example, the project applied an infrastructure cost function at transmission zones
to represent the remainder of wholesale costs beyond what was already represented by the
costs of the generated energy alone.
The transactive system revealed a continuum of incentives to the utilities and asset systems
and engaged assets dynamically according the each asset’s capabilities and the flexibility of the
asset’s owner. In addition, the project used a simulation model of the regional system to assess
the impact of a scaled-up deployment of the transactive system. This simulation showed that
the region’s peak load might be reduced by about 8% if 30% of the region’s loads were
responding to the transactive system.
Technology and information exchange
Transactive neighbors exchanged two paired signals—energy unit cost and energy quantity—
with one another. These signals addressed the present and future exchange of energy between
the two transactive nodes during a set of future time intervals. The unit-cost-like signal was
called the transactive incentive signal (TIS) and the energy signal (actually defined as average
interval power) was called the transactive feedback signal (TFS). This exchange was
bidirectional. Each transactive node was required to send and receive both signal types to and
from each of its transactive neighbors. The project transactive nodes used a common set of 57
sequential future time intervals that ranged in duration from 5 minutes to 1 day.
Participation and acceptance
Assets engaged at implementations of transactive systems sites included residential and
commercial building loads, battery storage, distributed generation, and voltage control. The
actual signals to devices often used pre-existing installed mechanisms, such as direct control of

Page 42
electric water heaters; however, the aggregated asset was coordinated with the transactive
signal at the system level.
General viability
The project achieved several noteworthy results, including the following:
The transactive system was deployed, tested, and validated, providing region-wide
connection from the transmission system down to individual premises equipment,
enabling dynamic response by assets at the end points.
The participating utilities gained valuable experience in the challenges of deploying and
operating smart grid equipment and in the benefits of the equipment in their systems.
This experience is guiding their ongoing smart grid investments.
The basic functionality of the transactive system was confirmed and scale-up analysis
using modeling and simulation showed potential for 8% reduction of regional peak load
with 30% penetration of demand responding to a transactive system.
3.11 E-Energy cluster of projects (Germany)
In Germany an extensive, 6 year ongoing, industry funded program for applying demand
response and dispersed generation now nearly has been completed in 2015. In six large
deployment projects a number of German distribution system archetypes were investigated.
More specifically the results of some projects are contained in the next sections.
3.11.1 MOMA (MOdell stadt MAnnheim)
Load shifting potential of MoMa (E-Energy)
The price elasticity was examined in detail in the project MoMa. MoMa was the only E-Energy
project that introduced random real time prices independent from prices at the energy
exchange, weather or time of the day.
The highest share of the participants (45%) reported to react to the price information for the
current and next day provided by the app / metering portal, whereby 25% reported to react to
price categories and 20% to the precise prices. On average the price elasticity2 is -10.6% for all
participants, but these elasticity results mainly from strong reductions from highly motivated
consumers. It could be shown that the season, weekday and time of the day influence the
flexibility of the participants. During summer the flexibility is higher than during winter time. The
flexibility potential is high during transition periods in case thermal storages like heat pumps are
included.
The elasticity is further analyzed for different groups: manual and automation, manual,
automation and neither of them (see Figure 3-20). The highest price elasticity of -23.6% on
average was reached by the group that shifted the loads manually as well as used the energy
management system to shift loads automatically. During the evening hours the price elasticity
2 In the analysis of moma the own-price elasticity measure is used. The value of the price elasticity is given as a percentage for a
better understanding.

Page 43
went up to -35%, as can be seen in Figure 3-20. The group with only manual shifting had a
relatively high elasticity of -19.5%. In the group with only automation most probably the
participants are less motivated than the ones that use both automation and manual load
shifting. One more reason could be that they are not aware of their ability to influence their
consumption further.
Figure 3-19: Price elasticity per user groups during week days in project moma [28]
3.11.2 eTelligence
Load shifting potential of eTelligence (E-Energy)
In the simple time-of-use tariff (TOU) the participants reduced their load on average by 12%
during the high price time from 8 am to 8 pm. The event tariff in eTelligence was announced
between three and one day ahead of the events. Malus events triggered a reduction of -20% on
average, bonus events triggered an increase of +30%. As a consequence in total more energy
was consumed than saved with event tariffs. With CPP a load shifting of 20% from times with
high prices to low prices could be achieved.
Figure 3-20: Changed load profiles with CPP during day on weekend
(blue=bonus; yellow=no event; grey=malus) in project eTelligence [29]

Page 44
3.11.3 Summary of E-Energy projects
A detailed study of five E-Energy projects within the project EcoGrid-EU was recently published
in report D7-2, (Annex B) [30]. The analysis shows that DR potentials are dependent on the
specific DR tariff scheme. Highest potentials have been achieved by critical peak prices in rare
price events (CPP) in combination with TOU tariffs (20%-30%), as opposed to complex tariff
schemes (3-10%); these figures are comparable to experiences in the US and the Netherlands
presented earlier.
As in other projects, further influencing factors are:
- time interval (weekdays, weekend, and season),
- customer fatigue effect
- lasting motivation of customers (for manual response)
- degree of automation
Figure 3-21 shows an overview of different DR schemes with different characteristics like
motivations and automation mode. Note that the aforementioned factors influence the results as
well as the number of participants.
Figure 3-21: Comparison of reported load shifting potential (in %) - from high to low price periods -
of DSM tariffs with different characteristics in three E-Energy projects [30].
3.12 Linear project (Belgium)
In Belgium, most smart grid research was confined to one project. The Linear project (Demand
response for families, [31]) was started in 2009. The project yielded a large number of results
as to the applicability and to barriers for the introduction of user energy management systems.
Configuration and DR mechanism For automated demand side management, Linear equipped 185 families with a Home Energy
Management System and smart appliances to give demand response, such as a washing
machine, a dishwasher, a tumble dryer with Smart Start capability. Furthermore TCLs like
electric heaters/ heat pumps and/or electrical vehicle chargers were rolled out. 85 families were
equipped with a smart meter. The tool that customers could use was automated scheduling of
devices using the smart start capability.

Page 45
A total of 54 families were also included in the test split into 21 families with a smart meter and
33 families without such a device. By this setting, the effects of automation on demand
response could be studied. Users in this group had a novel TOU tariff to manually invoke
demand response.
Use cases
- Portfolio Management. How can customers be involved to shift their energy consumption
based on the day-ahead market and nominations? The day-ahead prices were made part of
dynamic tariffs.
- Wind forecast error balancing. Can imbalance costs be reduced that are caused by
discrepancies between the wind energy that is predicted and then actually produced?
- Transformer Aging/load distribution curve flattening. Can load spreading over time prevent
the accelerated aging of transformers caused by load peaks?
Tariffs and prices
Two remuneration models were tested in the Linear pilot project. The 185 Linear families with
smart appliances received a capacity fee for the flexibility they offered. The 55 families without
smart appliances participated in a dynamic tariff remuneration scheme. These remunerations
did not replace the original energy contracts of the participants; instead all families still paid
their own energy bills, and the remunerations served as a bonus or cost reduction.
The Linear families without smart appliances participated solely in the portfolio management
business case. They were presented with dynamic prices and were requested to manually shift
their consumption from the more expensive periods to when prices were lower.
For this purpose, they had access on their Linear portal to a webpage that displayed today’s
and tomorrow’s prices. All dynamic tariff participants started the pilot project with a bonus of
100 euros.
Technology and information exchange
White goods, heating systems with TCL, EVs were connected using Wi-Fi and ZigBee based
wireless communication protocols. The Fifthplay home gateway [32] that connects to the
internet and Web-applications was installed. In-house communication errors were found to be
the main cause of malfunctions.
Participation and acceptance
Linear participants received a yearly bonus for participation. A dynamic tariff scheme was
deployed with 6 time zones. Per time zone a commercial part, based on the day-ahead Belpex
market prices and a distribution part was contained. Also a capacity fee was used for delivering
flexibility. Purpose was to see, what amount of flexibility was achievable within the limits of user
comfort and the habits of the residential compared to the average consumer, for which
reference runs were performed as a part of the test earlier.
Manual demand response users found the dynamic prices and responding to them too invasive,
too much effort, and too complex, resulting in response fatigue and only very limited behavioral
changes. The reference curve mechanism also did not perform as expected. Factors such as
changing family composition, electrical equipment install base, etc. reduced the correctness.

Page 46
The Linear pilot project demonstrated that a capacity fee system works well from a user
perspective. Once users have been convinced to start using the system, they keep doing so
without significant response fatigue. No complaints beyond technical malfunctions were
received. Users would like to be able to see what their flexibility is used for.
The Linear capacity fee applied only to those appliances that require interaction from the user,
i.e. the major appliances and electrical vehicles. The smart domestic hot water buffers were not
included. As a simple metric for “amount of flexibility”, the hours of delay configured were used,
i.e., the numbers of hours between configuration of the device and start or departure deadline.
The Linear fee was set at 1 euro per 40 hours of flexibility.
The optimized, automated scheduling of the appliances in households as to the dynamic tariff
performed better in yielding a reliable shift required in the use case. Dishwashers were
outperforming tumble dryers and washing machines in this respect. Also, the financial gains
were of this order (18, 10 and 9 % reduction in cost). Given the composition of the energy use
in households, DHWs in percentage had lower gains (1-9 %), but in total gave higher profits.
Current and prospective viability
For intra-day wind balancing, the benefit potential per household was found to be in the order of
19 Euro per year. Given the cluster composition, increase of consumption appeared to be more
easily realizable than decrease of consumption. The upper control bandwidth per household
was calculated to be 150 W per household. In the realization of the response, the boilers
delivered the largest part, followed by the EVs especially contributing during the night. The DR
evocation did not lead to voltage problems or transformer aging.
Given the consumption patterns, highest loads and transformer ageing mainly takes place
during the evenings. Using DHWs, it was found that 45 buffers in a LV network would lead to a
lifetime increase of 30 months on an age of 62.5 years. DHWs also were also found to be the
main contributor to keep the voltage controlled. For the technique used in Linear, the reading
from the meter was coupled to the operation of the DHW directly.
The acceptance of the smart-start functionality of shiftable appliances, however, was much
better. After 18 months of testing there was still no indication of user fatigue, and the
participants that stopped using the system did so because of technical issues. The Linear field
test demonstrated that automated demand response with household appliances is technically
feasible.
3.13 EcoGrid EU
In EcoGrid EU, the demand response on the isle of Bornholm was analyzed [33]. It is a large
scale demonstration of a real-time market place for distributed energy resources (DER). The
market concept allows regulation of price signals without direct measurement of the individual
DER response
Configuration and DR mechanism
About 2000 consumers have participated in the demonstration. Figure 3-22 shows an overview
of the different groups and their equipment of controllable devices.

Page 47
Figure 3-22: Overview of the different groups.
Use cases
EcoGrid is an example of a real-time market that can be implemented in the context of existing
power markets. EcoGrid supports the need for direct control options on a very short time scale.
Figure 3-23 shows the scope of the project.
Figure 3-23: Scope of the EcoGrid real-time market

Page 48
Tariffs and price schemes
The fundamental concept of this market is a real-time price signal for DERs, i.e., demand
response in this case, on which they should react. The interaction of the DERs and the
electricity grid in turn influences the system power and energy balance. This balance closes the
control loop for the TSO to be able to send out new prices based on the imbalance and
forecasts of wind power and consumption.
Technology and information exchange
The central part here is that the regulation is done without direct measurements of DER
response meaning that DERs are considered some kind of energy cloud, responding in a black
box manner.
User participation and acceptance
In the project the manual group showed no significant response compared to the reference
group.
Figure 3-24: Response of the manual group (blue) in comparison with the reference group (red).
a) normal prices and b) high prices. Note: no significant differences have been measured.
Current and prospective viability
For evaluation, measurement and verification of the demand response a linear model was
created for several reasons. The experimental groups were not controllable due to differences
in the composition in terms of heating systems and usage. Furthermore the existing market
model for system response was mostly nonlinear.
In particular reactions to previous price events are influencing the response behavior. The linear
regression model was therefore based on previous price signals.

Page 49
Figure 3-25: Load response (red) due to real time price (RTP) signal (in green) [33]
The actual responses from the different groups in EcoGrid with automation are shown in Table
3-3. These flexibility potentials show the best and average load shifting for one hour normalized
per customers of the groups. To draw conclusions for longer periods than for the 5 minute
periods, only these periods were considered where prices changed in the same direction for at
least 12 5-minute periods.
Table 3-3: Demand Response results from EcoGrid EU [33]
Decreasing RTP [kW] Increasing RTP [kW]
Groups Best Average Best Average
1a 0.3368 0.0240 -0.3364 -0.0239
1b 0.1497 0.0086 -0.1154 -0.0086
1c 0.0898 0.0051 -0.0947 -0.0051
1a+1b 0.1601 0.0106 -0.1540 -0.0105
1a+1b+1c 0.1413 0.0089 -0.1329 -0.0089
2 0.3177 0.0147 -0.2101 -0.0147
The values in kW are divided by the average load (over the whole evaluation period) of these
groups to get a better feeling for the amount of the load shifting.
Table 3-4: Demand Response as percentage of mean power from EcoGrid EU [33]
Decreasing RTP [%] Increasing RTP [%]
Groups Best Average Best Average
1a 12.1 0,7 -9.4 -0.7
1b 41.7 1.9 -27.6 -1.9
1c 11.6 0.8 -9.5 -0.6
1a+1b 10,1 0.6 -9.4 -0.6
1a+1b+1c 12.1 0.7 -9.4 -0.7
2 6.1 0.3 -6.4 -0.3

Page 50
4 DR characteristics of different types of appliances
The dynamics of demand response and DG-RES generation strongly determines the usability
on the markets and within country specific market settings that have been discussed in the
previous deliverables of this task. Also this dynamics determines the ease with which
appliances can be coordinated looking from the end-customer, the coordination mechanism and
ICT-infrastructure perspective. In the following, some key flexibility parameters of appliances
are discussed.
4.1 Wet appliances
4.1.1 Netherlands/ Your energy moment
One of the important findings was that matching washing loads with PV-generation was
selected by the customers. 66 % of washing was possible with PV-generated electricity
compared to 55 % for the reference situation.
4.1.2 Belgium/ Linear
In the Linear field test dishwashers were found to have an average flexibility window of 8.5 h.
Tumble dryers and washing machines follow at 8.1 and 7.3 h.
Figure 4-1 Flexibility in wet appliances as found in [31]
Figure 4-1 gives the flexibility for the Belgian population wet appliances in MWs. It can be seen,
that maximally 2 GW can be called and that the distribution for delay of operation of appliances
is highly asymmetrical.

Page 51
4.2 Thermostatically controlled loads
4.2.1 Austria
Aggregation for frequency control with electric boilers / heaters
As an example of providing DR services to the secondary control market, the flexibility of
electric water heaters for domestic usage is tapped, preserving comfort without customer
impact. The market has been recently opened to allow pooling of (very) small units. Boilers of a
certain manufacturer are prepared and can be equipped with GPRS connectivity. The status of
storage is permanently communicated and monitored for system control purposes. The new
market player from the telecommunication sector knows to deal with secure data and customer
involvement. Figure 4-2 depicts the concept for providing flexibility with electric water boilers.
New Service Provider
Hot Water Storage
Heating System
Shower
ControlGrid
Control and monitoring
Figure 4-2: Example for providing balancing
reserve with electric water boilers [34]
4.2.2 Netherlands
In Figure 4-3 the heat pump and micro-CHP bandwidths during working days and in the
weekend as determined from the PowerMatching-II experimental data are given. It can be seen
that the bandwidth and thus the flexibility potential is not uniformly distributed. At the early
morning and the end of the afternoon the bandwidth is smaller due to heating up. This means
DR has to be scheduled incorporating comfort preferences of the residential user. Figure 4-4 is
from the day-ahead buffer optimization using next day prices in the Hoogkerk living lab case at
residential customers using the B-Box strategy [35]. Via a stepwise combinatorial approach
filling, the central heating system’s heat-buffering strategy is calculated within the required
comfort constraints of the users. On the X-axis the time of day (0-24) is shown. The cost gain
depends on the price pattern (red). For typical price patterns in the Netherlands the cost benefit
is about one third from prefilling the buffers.

Page 52
Figure 4-3 Heat pump and micro-CHP flexibility in the PMC-II field test
Figure 4-4 Electricity consumption price optimization for HVAC
using heat buffers and forecasted power (Hoogkerk, 2012)
In pilot projects like Couperus and PowerMatchingCity significant amounts of heat pumps were
controlled by PowerMatcher [36] for use cases pertaining to DSO and BRP operation using
scheduling algorithms for buffer optimization. In the pilot Your Energy Moment (Enexis), heat
pumps are utilized to gain experience with consumer behavior within a dynamic tariff setting.
The heat pump in the project Couperus was based on earth / water. Under the building there
was heat/cold source and the building was also well insulated. These factors made sure the
temperature gap between ground temperature and set point was not too big and that the heat
could buffer in the building. These factors made sure that the heat pumps (with the right
settings) could achieve those good results.

Page 53
4.2.3 United States
U.S.A.: gridSMART project
The US has an HVAC DR demonstration using real-time prices in the AEP gridSMART® project.
4.2.4 Other
In the LINEAR-project, an extensive analysis was done as to scheduling the flexibility potential
of DWH’s.
Figure 4-5 Extra and delay flexibility potential of DHW [31]
In Figure 4-5 the additional power that can be mobilized for heating and that can be delayed for
15 DHWs is shown. In this case, it shows, that the potential of pre-emptively storing energy is
much higher than from delaying if the heat demand is not properly scheduled.
4.3 Electric vehicle charging
For Europe in [37] a comprehensive study has been done on the impact and potential of G2V
and V2G in grid and commercial operation. For 45 % of prospective EV owners the benefits of
the V2G-option are too low; impacts on the prospective range as a result of smart charging
including V2G only for 13 % is an issue.

Page 54
Figure 4-6 Unidirectional charging of EVs [37] a) non-optimzed b) optimized charging (unidirectional)
In Figure 4-6 the peak shifting potential of EV charging is illustrated for a number of consecutive
days in the optimized and non-optimized scenario avoiding local congestion is shown. Also
avoiding the wind energy curtailment potential of EVs can be reduced from currently estimated
7 % to via 2 % at 40 % EV penetration to 0.5 % at 100 % penetration. Carbon dioxide emission
reduction from optimized charging is 24 % at 100 % penetration, while cost savings are 9 % at
100 % penetration. Regarding grid management a local automated charging strategy (e.g., at
fixed moments in time) can be disastrous. Interaction with grid management has to be
incorporated.
4.3.1 Austria
A detailed multi-agent based simulation study on real traffic data and including temperature
dependency on the range has been conducted on specific regions (e.g., Upper Austria) and
network segments (e.g., medium voltage, low voltage).
Figure 4-7 shows the differences between uncontrolled and controlled charging with meeting
the objective to charge as much as possible energy from renewables (wind, PV). Detailed
impact studies on the range of the EVs have been conducted [38].

Page 55
Figure 4-7: Uncontrolled and controlled charging of 306 EVs with 11 kW during two summer days.
In the demonstration project SmartLVGrid – model region Köstendorf (Salzburg) real EVs have
been controlled according to PV generation. Figure 4-8 shows a time series of a measurement
of such a controlled charging.
Figure 4-8: Measurements from controlled charging of EV from PV at a household
4.3.2 Netherlands
Figure 4-9 gives the EV flexibility in the PowerMatchingCity-II field test. Largest band width is in
the early evening when home-charging. Weekend flexibility of EV-charging is higher during the
day.
In LomboXnet, a Smart Grid rolled out in Utrecht, recently a new Nissan V2G electricity storage
system has been installed. Purpose is to increase the embedding potential of PV-systems,
massively rolled out in a residential area in Utrecht.
The V2G project aims to increase the use of decentral generated energy locally. By loading the
EV cars with solar, the energy is used locally, however the EV are also a source of energy. It
becomes a two way stream. In the evening when solar energy is not apparent the EV’s are
unloaded to supply energy to the households. This increases the use and value of EV, because
most of the time they are parked in front of the house and not driving.
12.May 00:00 12.May 12:00 13.May 00:00 13.May 12:00 14.May 00:00 14.May 12:00-4
-2
0
2
4
6
BE
A #
40 [
kW
]
PV
Household
E-Car
Total
12.May 00:00 12.May 12:00 13.May 00:00 13.May 12:00 14.May 00:00 14.May 12:00
220
230
240
BE
A #
40 [
Volt]
SmartMeter U L1
SmartMeter U L2
SmartMeter U L3
Charging Station U
12.May 00:00 12.May 12:00 13.May 00:00 13.May 12:00 14.May 00:00 14.May 12:00-4
-2
0
2
4
6
BE
A #
27 [
kW
]
PV
E-Car
12.May 00:00 12.May 12:00 13.May 00:00 13.May 12:00 14.May 00:00 14.May 12:00
220
230
240
BE
A #
27 [
Volt]
SmartMeter U L1
SmartMeter U L2
SmartMeter U L3
Charging Station U

Page 56
Figure 4-9 EV-charging flexibility as determined during the PowerMatchingCity-II field test
4.3.3 Switzerland
Uncontrolled charging can lead to undesired effects in the system, e.g. overloading of the grid.
As electric mobility does play an important role for Switzerland, it is expected that the fraction of
electric vehicles in the vehicle fleet will increase substantially in the future. In order to study the
impacts on the electricity network and develop mitigation techniques for congested situations a
detailed study has been performed for the metropolitan area of Zurich [39]. A simulation of 1
million vehicles using data of the transportation infrastructure, i.e. streets, parking zone and
their capacities, data of the electric distribution grid and a vehicle fleet simulation with different
shares and types of plug-in electric vehicles (PEV) for different years and scenarios is
performed. First, the penetration of different types of electric vehicles in the Swiss automotive
fleet is simulated over time. Then, their actual transport behavior is simulated using a multi
agent micro-simulation model. Vehicles receive a schedule of day trips to fulfil so that the
drivers (agents) can perform activities such as work, leisure shopping or activities at home. The
streets in Switzerland determine the paths, distances and travelling times. Finally, the
distribution grid infrastructure is laid over the transport infrastructure to analyze the effects and
the distribution grid. 2010 is chose to be the base year without any PEVs. The different shares
of PEVs are shown in Table 4-1 for two different scenarios. While scenario A offers a rather low
penetration of PEVs and assumes low charging capacities of 3.5kW (household plug), scenario
C offers a higher penetration of PEV in the vehicle fleet. PEV can be charged with up to 11 kW.
Table 4-1: Share of vehicle types in the scenarios used for the analysis of electric mobility impacts
Scenario A (low penetration) Scenario C (high penetration)
2020 2035 2050 2020 2035 2050
EV 1.5% 13.1% 37.8% 1.2% 7.1% 32.8%
PHEV 8.8% 54.7% 60.7% 5.2% 51.4% 64.7%
P-HEV & ICE 89.7% 32.2% 1.5% 93.6% 51.5% 2.5%
The simulation of uncontrolled charging shows overloading of grid assets during the day.
Especially in specific areas where many cars park for a long time and the grid infrastructure is
rather weak, large load peaks lead to excessively low voltage levels or thermal overloading of
lines and transformers. Options to mitigate these effects are either conventional grid expansion
or an intelligent charging control algorithm. The advantage of an intelligent solution is that costly
and cumbersome construction work is avoided in the city. The intelligent charging scheme
takes advantage of the flexibility offered by the PEV load; a typical use case for demand side
management. Often, cars park longer than the time needed in order to fully recharge their

Page 57
battery. Hence, their charging can be postponed. The controlled charging process does not
take into account a central planning optimization approach. It is a distributed hierarchical and
predictive approach based on local signal reflecting the congestion.
Figure 4-10 shows some simulation results. The congestion level of all electrical nodes at which
PEV charge during the day in the city is shown. The plateaus and spikes indicate congestions
and the local price signals distributed to the PEVs. It is seen that a substantial number of nodes
are overloaded at some time. Especially during day times the congestions occurs which is due
to the base load and the amount of commuters in the city using PEVs. Clearly, this controlled
charging mechanism allows better distribution of loading capacity over the different charging
nodes.
Figure 4-10: Control price signals throughout the day at each node in Zurich in the year 2050
Over time the load of PEV in the city develops in dependence on the time of the day (see
Figure 4-11). The peak load is reached between 8 and 10 AM, when the majority of used cars
are parked at work locations.
Figure 4-11: Uncontrolled PEV load in Scenario C for the years 2020, 2035 and 2050

Page 58
In Figure 4-12 the difference between controlled and uncontrolled loading is shown as the
ability for load shifting. The simulation could show that a controlled charging approach without
any central scheduling with only price based charging process could be beneficial for the grid
stability.
The maximum of load shifting appears around 9 AM, with 12.5 MW compared to 75 MW base
load (~16.5%).
Figure 4-12: Load shifting in the city of Zurich in the year 2050 for scenario C
The use of PHEV and EV for Vehicles to Grid (V2G) services for balancing services.
Additionally to the developed charging algorithm, an approach is developed to use PEV for V2G
services. The algorithm includes multiple states of the vehicles as it considers also if the
vehicles are currently in a controlled charging mode. The simulation assumes 10% of vehicles
to be contracted for V2G services.
The effect of the V2G service on the metropolitan area load curve is shown in Figure 4-13. It
depicts three different load curves. The black, dashed curve shows the city base load in the
year 2010 without PEVs. The blue curve shows the city’s load curve for Scenario C in the year
2050 and controlled charging. Whereas controlled load without V2G services does not affect
the overall load structure strongly as only local load shifts are apparent, providing V2G affects
the overall load more heavily. At times when vehicles feed energy back to the grid as the
system demands it, the load in the V2G case falls below the load seen in the base case. This
means that at lower network levels, substantial amounts of energy are fed back to the grid and
potentially stress the distribution infrastructure. At times of excessive power production in the
system, large load spikes can be seen in the curve, as many vehicles are scheduled to charge
in order to take advantage of the excessive power production. The additional load spikes can
stress the grid. However, as the V2G algorithm is combined with the intelligent control charging
method, the grid is kept always in a secure state. No thermal overloading or voltage instability
occurs.

Page 59
Figure 4-13: Aggregated load of the greater area of Zurich [40]
4.3.4 Other
In the Linear experiment the number of flex-hours for electric vehicles was in the order of 5.6.
Figure 4-14 gives the flexibility of pre-empting or postponing power from EV-chargers as
function of the time-of-day for home-charging. Largest potential is at the beginning of the
evening. In the morning only small flexibility exists.
Figure 4-14 Flexibility potential 32 EVs from [31]

Page 60
4.4 Communicating meter
Communicating meters from the design perspective may facilitate some demand response
mechanism or provide barriers. In the following, this perspective is described.
4.4.1 Austria
From the regulative authorities communication mechanisms for specific demand response
functionalities are not required. Many of existing metering systems provide mechanisms for
switching external loads (via digital signal contacts). Additionally load switching devices are
available to operate load devices (e.g. boilers, heat pumps) at different time intervals with
normally lower tariffs.
4.4.2 Netherlands
The configuration of the Netherlands smart meter requirement specification [41] is depicted in
Figure 4-15. Four ports are defined. Optical port P0 is the most elemental interface to the
metering system and has limited functionality resembling analogous meters in the past. P1
gives with an interval of 10 seconds the values of four power reading registers corresponding to
net production/generation via two tariff classes (e.g. day/night). P1 simply can be interface to
home energy management system or service applications. P2 is reserved for non-electricity
utility products. P3 transmits data on a 15 minute basis in a taxation-compliant way. So the
sample times of the meter fall within to the dynamics of most market and grid operation services
and allow rewarding contributions of end-user customers to grid stability and commercial
applications.
Figure 4-15 Configuration according to DSMR 5.0
4.4.3 Switzerland
Technical requirements for smart metering systems in Switzerland

Page 61
While a regulation for the large scale introduction of smart meters is under its way in
Switzerland, possible minimum technical requirements have been identified beforehand in a
stakeholder process. The working group has been led by the government in order to balance all
interest as far as possible. The minimal technical requirements for smart metering systems in
Switzerland [42] have been published in advance of the regulation in order to point network
operators, who will probably be responsible for the introduction, into the direction of future
regulative requirements. The requirements include quarter hourly measurement of electric
energy consumption or production (kW or kWh) and a bi-directional communication for
automated meter reading (AMR) between the meter and the network operator. Furthermore, the
smart metering system employed must be able to feedback information on energy consumption
to the end user via a specific platform. All measured data must be stored in the meter itself for
at least 30 days to ensure high accessibility of the original data. This ensures a local backup if
data is lost in other processes or if integrity is lost. As for communication standards, some
smart metering systems available use proprietary standards, meaning that neither the interface
nor the data format is easily compatible. This could complicate the communication between a
smart meter and a data concentrator from different manufactures. Hence, the requirements
demand that smart metering systems should be able to integrate meters of different
manufacturers; i. e. a certain degree of interoperability is demanded. The minimum technical
requirements ensure that all relevant benefits, identified in a cost benefit analysis [43], are
effectively realized.
Obviously, particular requirements also need to be laid down for IT-security [44]. Currently,
works are undertaken in order to secure the infrastructure. A risk and protection analysis [45]
has been performed by the Swiss Federal Office of Energy. This offers the basis for further
works on more granular security requirements and schemes for testing and validating them.
The outcome should generate a particular protection profile for the products but also
organisational approaches for ensuring IT-security.
Smart Metering Projects in Switzerland
There are several smart meter projects in Switzerland mostly conducted by local network
operator’s supplier.
The city of St. Gallen carried out a smart metering project to gain technical experiences and
know- how. Within the project the conventional metering systems for electricity, gas, water and
district heating are replaced with smart meter in several buildings. The data is collected by the
local municipal utility company via a fiber connection. Users can access their data via a
webpage to gain insights about their energy and water consumption leading to reduced energy
consumption. The Project was successfully implemented. The data collection and transmission
worked well.
The utility EKZ already installed 50’000 smart meter for their customers. The installation was
carried out if the old meter needed to be replaced at the end of its lifetime cycle. If a critical
density of smart meters is reached within an area the smart meters are then operated in a
“smart mode” allowing full functionalities such as AMR or providing data to customers. The
customers can then access their consumption data via a web interface. The displayed data
includes current and historic consumption, tariffs, and possible malfunctions. The operation of

Page 62
smart meters helps to offer a flexible tariff which is considered important in a future fully
liberalized market.
The utility ewz performed a field study between 2010 and 2013 with 5000 smart meters. The
main goal was to investigate whether efficiency gains can be achieved and consumption can be
reduced. On the other hand it was important to gain experience with the technology in an early
stage of a possible smart metering introduction in Switzerland. The smart meter were
connected via PLC to a tablet within the household. Real time data as well as 15 minute load
data were transmitted to the tablet and visualized. Morevover, automated meter reading was
not implemented as it was too costly for such a small sample. The smart meters were manually
read out and the data was managed in a central database. Customers were able to access the
database and compared their energy consumption with other peer groups or analyze their data.
The project GridBox [46] is conducted by ewz [47] and BKW Energie AG [48], the local utility
company of Zurich and Bern. GridBox aims at providing measurements of the low voltage
electricity network so that a wide area monitoring and state estimation of the network can be
performed. For the field test, a particularly interesting area was chosen in Zurich, it offers a
number of PV plants, a wind power plant and a battery storage system. The battery has a
power rating of 120 kW and a nominal capacity of 720kWh. The goal in the field test is to install
the measurement devices at all network nodes in the area (see Figure 4-15) in order to be able
to test and validate the concept and increase efficiency in the supervision of the network.
Configuration and DR mechanism with smart metering
So far, demand response algorithms are not tested nor at the core of the investigated concepts.
However, using simple time of use tariffs, some pilot projects could achieve load shifting from
times when the network was more heavily loaded to times when it offered more capacity.
Use cases of metering projects
Grid monitoring and real time control: With a widespread collection of data for the network the
state of the distribution network can be calculated. Analysis of the network state allows
detecting operational limits and deriving controls to mitigate congestions. Such controls include
for example setting a set-point voltage of regulated distribution transformers or for line voltage
regulators based on the available data and forecasts. Other examples include the definition of
active and reactive power set-points from grid-connected inverters of generators or storage
devices. Also demand side management can then contribute to relieving the network. Further
benefits include a general loss minimization. Particularly, the project GridBox is focused on this
use case. However, with a widespread availability of smart meters at household level, a
monitoring of the lower network levels becomes possible. With this knowledge, demand
response or demand side management schemes can be implanted on a larger scale.
Tariffs and prices
No specific tariffing or pricing schemes are tested, yet. However, first approaches of time of use
pricing or pricing based on the power actually drawn from the network are being developed.
The data recorded by the devices is then used to develop incentives via specific tariffs for a
desired behavior of the network users.

Page 63
Technology and information exchange
Different project use different technologies based on the use cases, which are realized.
Particularly concepts aiming for control of distributed resources rely on measurements of higher
granularity and a communication infrastructure that offers almost real time data availability. For
example GridBox uses the approach that each measurement device communicates data to a
device that aggregates the data and then sends the aggregated data to the central monitoring
and control server (hierarchical structure). Smart meters could be added into such an
distributed architecture.
Also, several different communication standards are used such as fiber optics, broadband
powerline (BPL), power line (PLC) or GPRS/UMTS. Field tests have shown that mobile
communication is not very suitable due to the high cost and limited bandwidth, especially when
it comes to high granularity. As fiber is not very accessible, BPL seems to be the
communication channel to be favored at the moment for use cases aiming at real time control of
resources.
Figure 4-16: Schematics of GridBox
Participation and acceptance
If the measurement devices are only used in the low voltage network at specific electrical
nodes, consumers or producers are not yet involved and hence no conclusions can be drawn
with regard to acceptance. As for smart meters, on can tentatively say that acceptance is rather
high.
Current and prospective viability
GridBox is currently under deployment of two distribution network companies / utilities. In the
future the GridBox system will include several other projects [49], such as WarmUp (see section

Page 64
3.7) or devices such as battery storage systems. As for smart metering systems, it can be
assumed that a large scale introduction of smart metering will start 2018, if the regulation under
way will be not stopped by a referendum. Then, network operators will start to introduce smart
metering and according to the concept published in 2014 will cover 80% of end consumers by
2025.
4.5 Battery storage
4.5.1 Netherlands
Within Enexis and Stedin two pilots have been conducted. A SmartStorage unit pilot close to a
transformer station has been setup by Enexis to gain experience in using district electricity
storage to support DSO activities. In Hoogdalem, Stedin has rolled out a test with Consumer
electricity storage. Consumers own a PV-system and with a technology system and a battery
they try to optimize the use of solar energy for their own use. Currently the test bed is ongoing
and data is being gathered.
4.5.2 Switzerland
A project focusing on the provision of primary control from a battery energy storage system is
performed from the “Elektrizitätswerke des Kantons Zürich” (EKZ) [50]. The lithium-ion battery
has a nominal power of 1MW and rated power of 1.1 MW and an energy capacity of 580 kWh,
of which 250 kWh are usable. This allows limiting battery degradation.
The battery was integrated on the low and medium voltage level to simulate different types of
grid applications. The low voltage level includes several different loads and generators such as
electric vehicles and office buildings or photovoltaic plants. A second installment allows testing
for island operation qualities.
Figure 4-17 Response to frequency control signal [51]
Configuration and DR mechanism
The ramp rates of the battery are very high and power steps of 2 MW, from -1MW to + 1MW
could be performed within one second. The prequalification test shows, that the battery was
able to perform well for the provision of primary control power which can be seen in Figure
4-17.

Page 65
Use cases
Primary frequency control: The BESS can absorb energy from the grid when the frequency is
above the nominal value and it is able to deliver energy when the system frequency is low. The
main use of the battery is primary frequency control due to its fast reaction time and high
capacity. Batteries can offer control reserves power without producing energy, effectively
decoupling power from energy provision. Compared to generator based frequency control a 1
MW battery offers regulation in both directions whereas a conventional generator reserving a 1
MW band can offer only 0.5 MW of symmetric regulation power reserve.
Furthermore, the reaction time of the battery storage system is fast. It therefore has a high
suitability for fast frequency drops which might occur with a wider deployment of new renewable
energy sources. Such services are not compensated currently by the TSO in Switzerland.
Peak Shaving: offers the opportunity to defer the cost of grid expansions and building additional
power plant capacity. As batteries can be deployed locally within a short time they could
alleviate grid bottlenecks temporarily e.g. until a grid expansion is carried out.
Figure 4-18: Peak shaving measurements from real life system operation using
Figure 4-18 shows the results from one day of peak shaving. The battery charges at night with
small power bursts for a lower depth of discharge which cause less Li-ion battery degradation.
The effect of peak shaving can be seen as the differences between Pbuilding and Pgrid. The
energy consumption of the building peaks between 7:00 and 18:00 with peaks up to 120kW,

Page 66
compared to the grid outtake which is limited by a soft limit of 80kW, the difference is provided
by the battery (PBESS). The state of charge varies between 50% and 15% affecting the soft limit,
which rises at 18:00 to allow recharging, as the battery should operate between an 80% and
20% state of charge level.
Tariffs and prices
The compensation for the provision of primary control varies between 3’000 and 12’000
CHF/MW/week with an average of 6’000 CHF/MW/week. Network charges pose a
disadvantage for both infeed into the grid and charging. This can be an obstacle as the energy
price consists on average of 50% network charges (Figure 4-19).
Figure 4-19 Average price [CHF/MW/week] for the provision of primary control for one week 2011-2012
Technology and information exchange
The battery system is controlled from a dedicated Supervisory Control and Data Acquisition
(SCADA) system which integrates all measurements and alarms from the core system
components (Figure 4-20). Time synchronization of measurements and events is achieved by
an accurate time base from a global positioning system (GPS) clock, distributed via the network
time protocol (NTP). The integrated process control (OPC) interface of the SCADA system
allows connecting additional controllers and devices with a limited time resolution. The
information exchange for primary frequency control is carried out directly through the signal of
the Swiss TSO (Swissgrid).

Page 67
Figure 4-20: Schematic overview of the system
Current and prospective viability
The battery energy storage system already passed its prequalification for the provision of
primary frequency control. In 2015, the battery participated continuously in the Swiss and also
in the European market and was able to offer its capacity for 41 weeks [51]. With an expected
lifespan of 10 years and investment costs of 700’000 CHF for the battery and 2.5 Mio CHF for
the whole system the setup results in capital costs of 15’000 CHF per month. Hence, with
average earnings of 6’000 CHF/MW/week the battery already shows a positive business case
for primary control. If prices for battery storage systems will fall as expected, the provision of
primary power control and even peak shaving might get more profitable. However, one big
uncertainty is the speed of cell degeneration. It largely is affected by the type of operation, this
is especially important if the battery is used for peak shaving.

Page 68
4.6 User participation and acceptance
4.6.1 Switzerland
The Swiss utility conducted a survey of 5000 customers to determine the acceptance of smart
metering [52]. The participants were divided into five groups: control, access to data from their
smart meter with an in-house display, energy consultation, social competition and social
comparison. All meters were replaced by a smart meter a quarter in advance to get results
without an observation bias. The consumption data was collected in a quarter hourly interval,
additionally each interaction with the IHD was recorded, with the information which data was
accessed.
Figure 4-21: Examples of Smart Meter reading visualised on an In-House-Display
The study found a significant lower energy consumption of participants with the access to smart
meter data. A significant effect can be seen with an average of -0.2 kWh per day over the whole
experiment this equals a reduction of 3.2% 3 which is in the upper spectrum of previous
estimations in Switzerland [53]. The other groups had mostly no significant deviation; their
consumption fluctuates over time indicating no clear trend.
Figure 4-22: Impact of Smart Metering data access in kWh/day
3 The average household consumption of the participants was 2‘300 kWh per year

Page 69
In the first week after the installation of the in house display almost every participant had at
least one interaction with it (Figure 4-23). The interest faded quite fast, after a month only 70%
accessed the data and after 10 weeks only half of the participants took weekly interest into their
energy consumption. After one year one third of participants accessed the available
information. The most frequently accessed information was the real time consumption followed
by recent history data and attainment. Figure 5-3 shows how often the household used a
provided tablet in order to analyze their consumption (Y-axis: fraction of households using the
tablet / app at least one time per week; X-axis: weeks). While in the beginning of the field test,
almost every household used the app frequently, the usage went down over time. However, the
saving achieved in electricity consumption were stable over time.
Figure 4-23: Share of households with at least one interaction per week with the smart meter display over
time divided into different types of accessed data; blue: real time data; red: trend; yellow: reach a goal.

Page 70
5 References
[1] Matthias Stifter and René Kamphuis, “IEA DSM Task 17 - Phase 3 - Definition: Integration
of Demand Side Management, Distributed Generation, Renewable Energy Sources and
Energy Storages.” IEA DSM Implementing Agreement, 04-Oct-2013.
[2] Expert Group 3, Smart Grid Task Force, “Regulatory Recommendations for the
Deployment of Flexibility,” Jan. 2015.
[3] European Commission, “Delivering a New Deal for Energy Consumers,” 2015.
[4] Department of Energy, “Benefits of Demand Response in Electricity Markets and
Recommendations for Achieving Them.”
[5] Dyson, Mark, James Mandel, and et al., “The Economics of Demand Flexibility: How
‘flexiwatts’ create quantifiable value for customers and the grid.,” Rocky Mountain Institute,
Aug. 2015.
[6] Vincenzo Giordano and Steven Bossart, “Assessing Smart Grid Benefits and Impacts:
EU and U.S. Initiatives,” Joint Report EC JRC – US DOE, 2012.
[7] “Technologieroadmap Smart Grids Austria,” FEEI, 17-Aug-2015. [Online]. Available:
http://www.feei.at/energie/smart-grids-und-smart-metering/technologieroadmap-smart-
grids-austria. [Accessed: 06-Jun-2016].
[8] “IPIN (integral program intelligent grids).” 2015.
[9] Frans Rooijers, Martijn Blom, and Rob van Gerwen, “Maatschappelijke kosten en baten
van Intelligente Netten.”
[10] A Faruqui, R. Hledik, and J.Palmer, “Time-Varying and Dynamic Rate Design,” RAP, The
Brattle Group, 2012.
[11] “Finland’s DSM structure.” .
[12] BFE, “Smart grids.” [Online]. Available:
http://www.bfe.admin.ch/smartgrids/index.html?lang=de. [Accessed: 06-Sep-2016].
[13] DNV GL, “Kosten-Nutzen-Analyse einer Ampelmodelllösung für den Strommarkt der
Schweiz,” Bundesamt für Energie BFE, Mar. 2015.
[14] BFE, “Kosten und Nutzenaspekte von ausgewählten Technologien für ein Schweizer
Smart Grid,” Bundesamt für Energie, Dec. 2014.
[15] BFE, “Energiespeicher in der Schweiz: Bedarf, Wirtschaftlichkeit und
Rahmenbedingungen im Kontext der Energiestrategie 2050 : Schlussbericht,” Bundesamt
für Energie, 2013.
[16] Georg Siegel, “HiT - Häuser als interaktive Teilnehmer im Smart Grid - Building to Grid,”
AIT Austrian Institute of Technology, 2014.
[17] F.W. Bliek, A. van den Noort, B. Roossien, I.G. Kamphuis, J. de Wit, J. van de Velde, and
M. Eijgelaar, “PowerMatching City, a living lab smart grid demonstration,” Proc IEEE PES
Innov. Smart Grid Technol. Conf Eur., vol. 2010.
[18] “INTEGRAL Integrated ICT-platform based Distributed Control in Electricity Grids,” 2011.
[19] Klaassen, E.A.M., “Assessing the Flexibility Potential in Power Matching City,”
TU/Eindhoven, 2016.
[20] Hans de Heer and Maike van Grootel, “PowerMatchingCity; a market based smart grid
pilot,” presented at the Smart utilities scandinavia 2013, Stockholm, 18-Apr-2013.
[21] C. B. A. Kobus, E. A. M. Klaassen, R. Mugge, and J. P. L. Schoormans, “A real-life
assessment on the effect of smart appliances for shifting households’ electricity demand,”
Appl. Energy, vol. 147, pp. 335–343, Jun. 2015.

Page 71
[22] Elke Klaassen, Rob van Gerwen, Jan Pieter Wijbenga, Arjan Aalberts, “PowerMatching
City Phase-II: What is the value of flexibility?,” presented at the Task 17 symposium:
Demand Flexibility: Dream or Reality, Eindhoven, 30-Jun-2015.
[23] F. Rooijers, B. Schepers, R. van Gerwen, and W. Van der Veen, “Scenario-ontwikkeling
energievoorziening 2030,” netbeheer nederland, 2014.
[24] Powermatcher. Flexiblepower Alliance Network.
[25] “tiko.” [Online]. Available: https://tiko.ch/. [Accessed: 06-Sep-2016].
[26] “AEP Ohio gridSMART® Demonstration Project Final Technical Report,” Jun. 2014.
[27] “Pacific Northwest Smart Grid Demonstration.” .
[28] A. Kießling, “Abschlussbericht E-Energy Modellstadt Mannheim - moma,” Jul. 2013.
[29] D. M. Agsten and et al., “eTelligence Projektabschlussbericht,” Final Report, Nov. 2012.
[30] Suzanne Brunsting, Georgios Giannopoulos, and Tara Esterl, “EcoGrid EU - Framework
conditions across Europe,” ECN, Deliverable D7.2.
[31] “Linear-smartgrid.” [Online]. Available: http://www.linear-smartgrid.be/en/research-smart-
grids. [Accessed: 06-Jun-2016].
[32] “The fifthplay Web Application | fifthplay.” [Online]. Available:
http://www.fifthplay.com/en/smart-homes/the-solution/web-application. [Accessed: 06-Jun-
2016].
[33] Florian Judex, “Resulting Demand Response,” AIT Austrian Institute of Technology, Sep.
2015.
[34] SWECO, “Study on the effective integration of Distributed Energy Resources for providing
flexibility to the electricity system - Final report to The European Commission,” The
European Commission, Apr. 2015.
[35] R. Kamphuis, H. de Heer, B. Roossien, J. van de Velde, M. Eijgelaar, and A. van den
Noort, “Real-time trade dispatch of a commercial VPP with residential customers in the
PowerMatching city SmartGrid living lab,” in 22nd International Conference and Exhibition
on Electricity Distribution (CIRED 2013), 2013, pp. 1–4.
[36] K. Kok, B. Roossien, P. MacDougall, O. van Pruissen, G. Venekamp, R. Kamphuis, J.
Laarakkers, and C. Warmer, “Dynamic pricing by scalable energy management systems
#x2014; Field experiences and simulation results using PowerMatcher,” in 2012 IEEE
Power and Energy Society General Meeting, 2012, pp. 1–8.
[37] “G4V Grid for Vehicles,” FP7, 2011.
[38] M. Stifter, S. Übermasser, and S. Henein, “Agent-Based Impact Analysis of Electric
Vehicles on a Rural Medium Voltage Distribution Network Using Traffic Survey Data,” in
Highlights on Practical Applications of Agents and Multi-Agent Systems, J. M. Corchado,
J. Bajo, J. Kozlak, P. Pawlewski, J. M. Molina, V. Julian, R. A. Silveira, R. Unland, and S.
Giroux, Eds. Springer Berlin Heidelberg, 2013, pp. 405–416.
[39] Galus, Matthias David, “Agent-based modeling and simulation of large scale electric
mobility in power systems,” 2012.
[40] Emanuel Thoma, “Demand Side Management: potential and impact on the swiss
transmission grid,” ETH Zürich, 2015.
[41] “DSMR 5.0 Dutch Smart Meter Requirements.” Netbeheer Nederland, 2016-2007.
[42] BFE, “Grundlagen der Ausgestaltung einer Einführung intelligenter Messsysteme beim
Endverbraucher in der Schweiz.” [Online]. Available:
http://www.bfe.admin.ch/smart%20grids. [Accessed: 11-Apr-2016].
[43] BFE, “Smart Meter Impact assessment.” [Online]. Available:
http://www.bfe.admin.ch/smart%20grids. [Accessed: 11-Apr-2016].

Page 72
[44] BFE, “Ansätze zur Gewährleistung der IKT-Sicherheit von intelligenten Messsystemen bei
Endverbrauchern.” [Online]. Available: http://www.bfe.admin.ch/smart%20grids.
[Accessed: 11-Apr-2016].
[45] “Schutzbedarfsanalyse für Smart Metering in der Schweiz.” [Online]. Available:
http://www.bfe.admin.ch/smartgrids/index.html?lang=de&dossier_id=06636. [Accessed:
06-Sep-2016].
[46] “GridBox - A holistic Smart Grid approach - Gridbox - BKW Energie AG.” [Online].
Available: http://www.gridbox.ch/en-gb/page/GridBox---A-holistic-Smart-Grid-approach-
30107. [Accessed: 05-Aug-2016].
[47] “ewz - wegweisende Energie- und Kommunikationslösungen.” [Online]. Available:
https://www.ewz.ch/de/private.html. [Accessed: 05-Aug-2016].
[48] “BKW.” [Online]. Available: http://www.bkw.ch/privatkunden/. [Accessed: 06-Sep-2016].
[49] Florian Kienzle, “Smart Grid in der Praxisanwendung: Flexible Nutzung von
Wärmespeichern im Projekt WarmUp.” 4. Nationale Photovoltaik - Tagung, 23. Februar
2016 - EWZ.
[50] M. Koller, T. Borsche, A. Ulbig, and G. Andersson, “Review of grid applications with the
Zurich 1 MW battery energy storage system,” Electr. Power Syst. Res., vol. 120, pp. 128–
135, März 2015.
[51] Michael KOLLER, Marina GONZÁLEZ VAYÁ, Aby CHACKO, Theodor BORSCHE, and
Andreas ULBIG, “Primary control reserves provision with battery energy storage systems
in the largest European ancillary services cooperation,” presented at the CIGRE, 2016.