Embed Size (px)
Citation preview
nutrients
Article
Identifying Dietary Strategies to Improve NutrientAdequacy among Ethiopian Infants and YoungChildren Using Linear Modelling
Aregash Samuel 1,2,* , Saskia J. M. Osendarp 2,3 , Elaine Ferguson 4, Karin Borgonjen 2 ,Brenda M. Alvarado 2, Lynnette M. Neufeld 5, Abdulaziz Adish 6, Amha Kebede 1 andInge D. Brouwer 2,*
1 Ethiopian Public Health Institute (EPHI), Gulele Sub City, Addis Ababa, Ethiopia; [email protected] Division of Human Nutrition and Health, Wageningen University and Research, 6700 AA Wageningen,
The Netherlands; [email protected] (S.J.M.O.); [email protected] (K.B.);[email protected] (B.M.A.)
3 Nutrition International (NI), Ottawa, ON K2P2K3, Canada4 London School of Hygiene and Tropical Medicine (LSHTM), London WC1E 7HT, UK;
[email protected] Global Alliance for Improved Nutrition (GAIN), 1202 Geneva, Switzerland; [email protected] Nutrition International (NI), Nifas Silk Lafto Sub City, Kebele 04, Addis Ababa, Ethiopia;
[email protected]* Correspondence: [email protected] (A.S.); [email protected] (I.D.B.); Tel.: +31-613980604 (I.D.B.)
Received: 18 May 2019; Accepted: 19 June 2019; Published: 24 June 2019�����������������
Abstract: Nutrient adequacy of young children’s diet and best possible strategies to improve nutrientadequacy were assessed. Data from the Ethiopian National Food Consumption Survey were analysedusing Optifood (software for linear programming) to identify nutrient gaps in diets for children (6–8,9–11 and 12–23 months), and to formulate feasible Food-Based Dietary Recommendations (FBDRs)in four regions which differ in culture and food practices. Alternative interventions including alocal complementary food, micronutrient powders (MNPs), Small quantity Lipid-based NutrientSupplement (Sq-LNS) and combinations of these were modelled in combination with the formulatedFBDRs to compare their relative contributions. Risk of inadequate and excess nutrient intakes wassimulated using the Estimated Average Requirement cut-point method and the full probabilityapproach. Optimized local diets did not provide adequate zinc in all regions and age groups, iron forinfants <12 months of age in all regions, and calcium, niacin, thiamine, folate, vitamin B12 and B6in some regions and age-groups. The set of regional FBDRs, considerably different for four regions,increased nutrient adequacy but some nutrients remained sub-optimal. Combination of regionalFBDRs with daily MNP supplementation for 6–12 months of age and every other day for 12–23months of age, closed the identified nutrient gaps without leading to a substantial increase in the riskof excess intakes.
Keywords: complementary food; Optifood analysis; nutrient adequacy; food-based dietaryrecommendations; Ethiopia
1. Introduction
Ensuring optimal Infant and Young Child Feeding (IYCF) practices has been identified as one ofthe most effective public health interventions to improve child survival in developing countries [1].The United Nations International Children’s Emergency Fund (UNICEF) and the World HealthOrganization (WHO) recommends that infants are exclusively breastfed during the first six months of
Nutrients 2019, 11, 1416; doi:10.3390/nu11061416 www.mdpi.com/journal/nutrients
Nutrients 2019, 11, 1416 2 of 16
life and are given nutrient-dense semi-solid or solid complementary foods in addition to continuedbreastfeeding from the age of six months until at least two years of age [2]. In its 2003 Global Strategy forIYCF, the WHO emphasizes the use of suitable locally available foods when introducing complementaryfoods [3]. This recommendation is challenging in a country like Ethiopia, where children transitiondirectly to adult diets that are often monotonous, and primarily composed of low nutrient-densecereal-based foods. Further, any infant-specific foods fed to young children tend to be of low nutrientdensity [4–7].
According to Ethiopia’s 2016 Demographic and Health Survey, more than half of children 6–23months of age do not achieve the recommended feeding frequency for their age and just 7% of thesechildren consume a minimum acceptable diet (a combination of minimum dietary diversity which is aconsumption of four or more food groups from the seven food groups and minimum meal frequencywhich is consumption of two or more (at age 6–8 months), three or more (at age 9–23 months) solidor semi-solid feeds for breastfeeding children or four or more solid or semi-solid or milk feeds fornon-breastfeeding children at age 6–23 months) [8,9]. Data from the 2011 Ethiopian National FoodConsumption Survey (NFCS) reported high intakes of iron across all age groups including childrenfrom 1 to 3 years of age [10], whereas intakes of other micronutrients such as zinc and vitamin Awere below recommendations. Although several small-scale and short term Infant and Young ChildNutrition programs combining capacity building and behaviour change communication were able toimprove IYCF practices in Ethiopia [11,12], they are limited by the absence of evidence-based, realisticfood-based dietary recommendations (FBDR) to guide improved practices. One of the few examplesusing realistic guidelines and behaviour change communication (BCC) to improve IYCF and growthis the cluster randomized trial in Ethiopia by Kang et al. (2017), demonstrating the effectivenessof including guideline-based BCC in existing government programmes in improving linear growthamong children living in resource poor settings [13].
Linear programming is a mathematical method that has been used to formulate robustFBDR [14–18]. Linear programming has also been used to develop different FBDRs for differentcontexts, and to objectively identify key nutrient gaps in optimized local diets [17,19–21] and to define“problem nutrients” i.e., nutrients for which it may be difficult to ensure nutrient adequacy withlocal foods alone [18,22]. In Ethiopia, the Alive and Thrive programme used linear programming todetermine whether micronutrient requirements of breastfed infants (6–8 and 9–11 months) could bemet using only unfortified local foods, and illustrated the nutritional needs of infants were difficultto meet when fortified products are not consumed [23]. These analyses, however, were limited to apilot study conducted in one region, using a list of foods available in markets rather than informationon foods that were actually consumed by infants in this region. Additionally, they did not take intoaccount the regional variability in food consumption patterns in Ethiopia.
To address these limitations, in the current study, we used nationally representative individualdietary intake data from the NFCS [10] in linear programming analyses, to identify “problem nutrients”and formulate realistic FBDRs for young children (6–8, 9–11, and 12–23 months of age) from fourregions of Ethiopia. In addition, in combination with the formulated FBDRs we modelled variousnutrition intervention alternatives that could be used to help improve nutrient adequacy: includinga locally produced complementary food (CF),and Micronutrient Powders (MNPs) [24] and Smallquantity Lipid-based Nutrient Supplements (Sq-LNS), both in combination with and without CF [25,26].In addition, we also assessed the risk of inadequate iron and zinc intakes and excess intakes throughthese interventions. Analysis of inadequate and excess intake of iron and zinc was considered due tothe concern of risk for too high iron intake as reported by NFCS [10]. Furthermore, we included zincdue to the high prevalence of stunting [8] and low observed dietary zinc intake in young children [27].Ethical approval for the NFCS was obtained from the Scientific and Ethics Review Committee ofEthiopian Public Health Institute (EPHI), reference number EHNRI 6.13/157.
Nutrients 2019, 11, 1416 3 of 16
2. Methods
2.1. Study Population
In this secondary data analyses, we used anthropometric and 24 h dietary recall data collectedfrom a subgroup of 6–23 months old children in the cross-sectional NFCS [10]. The NFCS data werecollected between June–September 2011. The NFCS is a nationally and regionally representativesample of 6–35-month old children (n = 8079). Our analyses were performed on a subgroup of 31%of these children (n = 2498) by only including children within the age range of 6–23 months andresiding in four regions Tigray, Amhara, Oromia and South Nations, Nationalities and Peoples Region(SNNPR). These four regions were selected to ensure representation of regions included in the pilotcomplementary feeding program of Nutrition International (NI) and UNICEF [28]. Moreover, theseregions are the largest regions in the country and represent different local cultures and child feedinghabits and practices.
2.2. Optifood Analysis
We used linear programming (LP) software (Optifood) to develop Food-Based DietaryRecommendations (FBDR), identify nutrient gaps in local diets and test alternative interventions, asreported elsewhere [16,29,30]. The LP analyses were done by age group and region to theoreticallydetermine whether (1) FBDR could ensure nutrient adequacy (FBDR) and if not, whether including inthe set of FDBRs (2) a locally produced CF consisting of grains and legumes (FBDR + CF), (3) MNP(FBDR + MNP), (4) Sq-LNS (FBDR + Sq-LNS), (5) CF and MNP (FBDR + CF + MNP) or (6) CF andSq-LNS (FBDR + CF + Sq-LNS) would further improve the nutrient adequacy of young children’s diets.
2.2.1. Data Preparation
Data were prepared by region and age group (6–8 months, 9–11 months and 12–23 months). Wedefined model parameters based on the information on food intakes and recipe composition of NFCSdata, using the Optifood data preparation programme in MS Access. Constraints used to ensurerealistic modelled diets were defined by (i) the average energy requirement for the target groups,estimated using the FAO/WHO algorithm for energy requirement and the standard average weight forchildren in each age group as reported by WHO Child Growth Standards: 7.9 kg for 6–8 months, 8.8 kgfor 9–11 months and 10.5 kg for 12–23 months children [31,32]; (ii) foods commonly consumed by thetarget population defined as those consumed by more than 3% of the target population (per regionand age group), excluding water, condiments and salt. Foods with a portion size below 0.5 g/day orconsumed with a weekly frequency below 0.5 servings per week were also excluded. Although moststudies using Optifood analysis use a cut-off point of more than 5%, it was necessary in our studyto use 3% to meet the energy requirements sufficient for Optifood software to model diets; (iii) theestimated average serving size of those foods, calculated as the daily median intake of foods in gramsfor only children consuming that particular food, and (iv) the minimum and maximum consumptionfrequency per week for each food, assigned food group and sub-food group. Foods were assigned tofood groups and subgroups (see Supplemental Table S1). For each (sub) food group these were definedas the 10th and 90th percentiles of weekly frequencies, respectively. For each food, the maximumnumber of servings per week was based on the proportion of children consuming each food, whilethe minimum number of servings/week per food were usually zero except for breast milk intake.The median weekly consumption frequency for food groups defined the food pattern goals used insubsequent steps in Optifood; (v) staple foods were identified as foods belonging to the food groups’grain and grain products or starchy roots. Snacks were defined as foods consumed only in betweenmeals. The type of meal (snack or staple) was determined based on the nature of the food and time ofthe food consumption and (vi) the minimum and the maximum number of daily servings per week ofbreastmilk were set at 6.9 and 7.1 respectively. The portion sizes and the nutrient composition of breastmilk used are explained in Section 2.3.
Nutrients 2019, 11, 1416 4 of 16
The list of nutrients considered in Optifood models were protein, fat, calcium, vitamin C, vitaminB1, vitamin B2, vitamin B6, niacin, vitamin A, folate, vitamin B12, iron and zinc. The content of vitaminA, iron, zinc, calcium, protein, fat, carbohydrate of foods consumed were obtained from the fooddatabases compiled for NFCS 2011, which were primarily from local food composition table (FCT) IIIand IV [33,34] and other regional or international published data [10]. Food composition values forvitamin B6, B12 and folate were derived from the United States Department of Agriculture (USDA) foodcomposition database. The FAO/WHO daily nutrient requirements for protein, thiamine, riboflavin,niacin, vitamin B6, folate, vitamin B12, vitamin C, vitamin A, calcium, iron, and zinc were used [35–37].As the diet is mainly cereal-based with low consumption of animal-derived products and vitamin C,and the dietary diversity of children is extreme low, [38,39] we considered low bioavailability (15%) forzinc [10] and 5% bioavailability for iron [10].
2.2.2. Analysis Using Linear Programming
The linear programming analyses were done by age group (n = 3) and region (n = 4) usingOptifood [15,16], to develop 12 sets of FBDR. The analyses, for each group, were done in Modules II andIII in Optifood. The model parameters, for these analyses, were set-up in Module I. Specifically, after themodel parameters were entered (i.e., food lists, model constraints and goals), 16 linear programmingmodels were run, in Module I (module to set-up model parameters). Each modelled diet had adifferent objective function. An expert who was familiar with local dietary patterns then examinedthe foods selected in these 16 optimized 7-day diets to decide whether at least some individuals fromthe population would consume them. Model parameters were then modified until they resulted inmodelled diets that could be consumed by at least some people in the population. At this point, modelparameters were locked and the analyses began. The first analyses were done in Module II (module toidentify food-based recommendations) which selected the two 7-day optimized diets. Because thesediets are the nutritionally best diets that can be selected given model parameters, they are used to guideselection of food-based recommendations (FBRs) to test in Module III. The objective functions for thesetwo diets either minimized deviations below the RNI or minimized deviations below the RNI andaway from the median food group patterns of the population. We examined the diet patterns of the firstnamed optimized diet to select FBRs to test in Module III (module to test food-based recommendations),which included foods or food sub-groups that contributed ≥5% of at least 13 nutrients in the optimizeddiet and food groups that were higher in the optimized diet than the observed diet (median number ofservings). In module III, two 7-day diets per nutrient were modelled (i.e., total of 26 diets) of which 13minimized (worst-case scenario) and 13 maximized (best-case scenario) the nutrient content of thediet, for one nutrient, by preferentially selecting respectively the lowest and highest nutrient densefoods for that specific nutrient [16]. Module III was first run without testing any FBRs. If a maximized(best-case scenario) modelled diet did not reach 100% of its nutrient’s RNI, the nutrient maximized wasconsidered a “problem” nutrient i.e., it was impossible to select a diet that achieved the RNI for thisnutrient. The FBRs subsequently were tested individually in Module III by including a constraint onthe minimum number of servings per week for that FBR (i.e., a food, food sub-group or food group) andthen examining the minimized (“worst-case” scenario) Module III diets for each nutrient to determinethe percentage RNI achieved in the diet. These “worst-case” scenario levels simulate the lowest valuesin the nutrient’s intake distribution; which if ≥EAR predict a low percentage of the population wouldbe at risk of inadequate intakes. If an individual FBR did not achieve ≥70% RNI for all nutrients, thencombinations of individual FBRs were systematically tested (minimized diets in Module III). Finally,these combinations were examined and the set of FBRs with the highest number of nutrients reachingat least 70% of its RNI in the Module III “worst-case” scenario diets was selected as the baseline FBDR.
2.2.3. Analysis of Alternative Options Using Linear Programming
When the selected baseline FBDR did not ensure a nutrient content of ≥70% in the worst-casescenario, 5 alternative options to FBDR were assessed to see whether nutrient gaps could be filled. In
Nutrients 2019, 11, 1416 5 of 16
combination with the FBDRs, these 5 alternative options were a local CF product, MNP, Sq-LNS, CF +
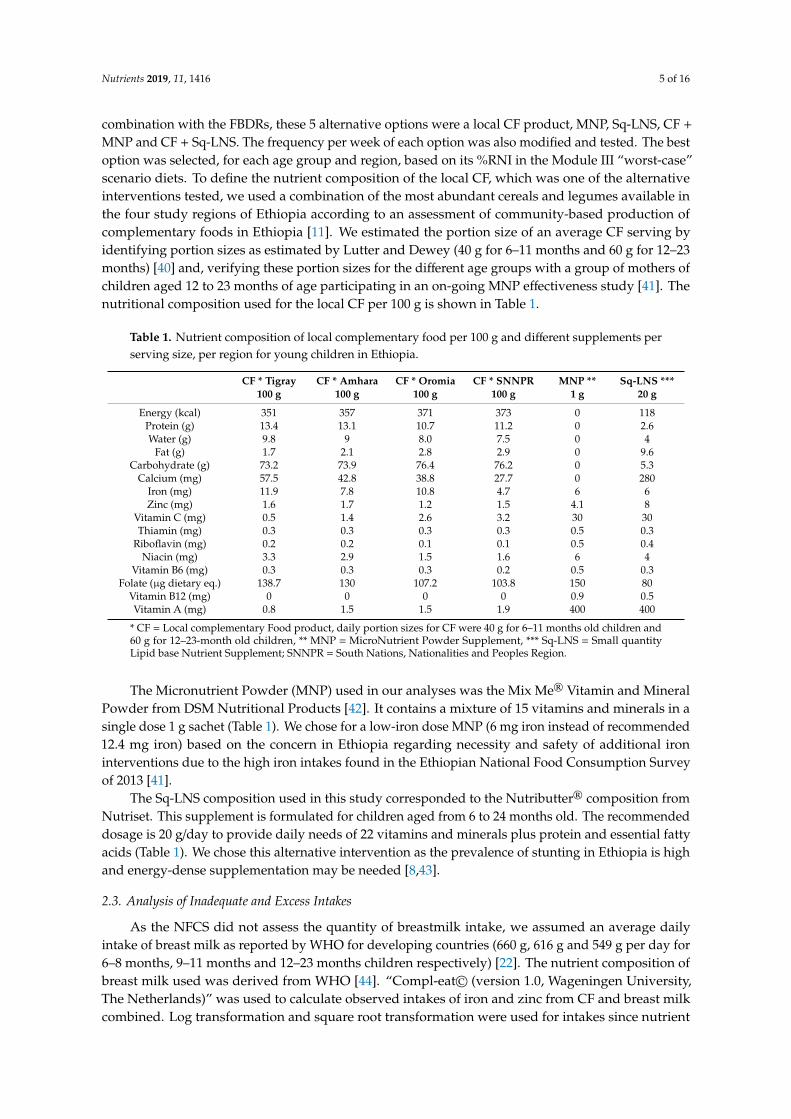
MNP and CF + Sq-LNS. The frequency per week of each option was also modified and tested. The bestoption was selected, for each age group and region, based on its %RNI in the Module III “worst-case”scenario diets. To define the nutrient composition of the local CF, which was one of the alternativeinterventions tested, we used a combination of the most abundant cereals and legumes available inthe four study regions of Ethiopia according to an assessment of community-based production ofcomplementary foods in Ethiopia [11]. We estimated the portion size of an average CF serving byidentifying portion sizes as estimated by Lutter and Dewey (40 g for 6–11 months and 60 g for 12–23months) [40] and, verifying these portion sizes for the different age groups with a group of mothers ofchildren aged 12 to 23 months of age participating in an on-going MNP effectiveness study [41]. Thenutritional composition used for the local CF per 100 g is shown in Table 1.
Table 1. Nutrient composition of local complementary food per 100 g and different supplements perserving size, per region for young children in Ethiopia.
CF * Tigray CF * Amhara CF * Oromia CF * SNNPR MNP ** Sq-LNS ***100 g 100 g 100 g 100 g 1 g 20 g
Energy (kcal) 351 357 371 373 0 118Protein (g) 13.4 13.1 10.7 11.2 0 2.6Water (g) 9.8 9 8.0 7.5 0 4
Fat (g) 1.7 2.1 2.8 2.9 0 9.6Carbohydrate (g) 73.2 73.9 76.4 76.2 0 5.3
Calcium (mg) 57.5 42.8 38.8 27.7 0 280Iron (mg) 11.9 7.8 10.8 4.7 6 6Zinc (mg) 1.6 1.7 1.2 1.5 4.1 8
Vitamin C (mg) 0.5 1.4 2.6 3.2 30 30Thiamin (mg) 0.3 0.3 0.3 0.3 0.5 0.3
Riboflavin (mg) 0.2 0.2 0.1 0.1 0.5 0.4Niacin (mg) 3.3 2.9 1.5 1.6 6 4
Vitamin B6 (mg) 0.3 0.3 0.3 0.2 0.5 0.3Folate (µg dietary eq.) 138.7 130 107.2 103.8 150 80
Vitamin B12 (mg) 0 0 0 0 0.9 0.5Vitamin A (mg) 0.8 1.5 1.5 1.9 400 400
* CF = Local complementary Food product, daily portion sizes for CF were 40 g for 6–11 months old children and60 g for 12–23-month old children, ** MNP = MicroNutrient Powder Supplement, *** Sq-LNS = Small quantityLipid base Nutrient Supplement; SNNPR = South Nations, Nationalities and Peoples Region.
The Micronutrient Powder (MNP) used in our analyses was the Mix Me® Vitamin and MineralPowder from DSM Nutritional Products [42]. It contains a mixture of 15 vitamins and minerals in asingle dose 1 g sachet (Table 1). We chose for a low-iron dose MNP (6 mg iron instead of recommended12.4 mg iron) based on the concern in Ethiopia regarding necessity and safety of additional ironinterventions due to the high iron intakes found in the Ethiopian National Food Consumption Surveyof 2013 [41].
The Sq-LNS composition used in this study corresponded to the Nutributter® composition fromNutriset. This supplement is formulated for children aged from 6 to 24 months old. The recommendeddosage is 20 g/day to provide daily needs of 22 vitamins and minerals plus protein and essential fattyacids (Table 1). We chose this alternative intervention as the prevalence of stunting in Ethiopia is highand energy-dense supplementation may be needed [8,43].
2.3. Analysis of Inadequate and Excess Intakes
As the NFCS did not assess the quantity of breastmilk intake, we assumed an average dailyintake of breast milk as reported by WHO for developing countries (660 g, 616 g and 549 g per day for6–8 months, 9–11 months and 12–23 months children respectively) [22]. The nutrient composition ofbreast milk used was derived from WHO [44]. “Compl-eat© (version 1.0, Wageningen University,The Netherlands)” was used to calculate observed intakes of iron and zinc from CF and breast milkcombined. Log transformation and square root transformation were used for intakes since nutrient
Nutrients 2019, 11, 1416 6 of 16
intakes were not normally distributed. Adjusted observed intakes were then determined with thetransformed data, using the Ugandan estimates for the within-person variation, since these estimateswere not available for Ethiopia [45] and the between-person variation calculated from the NFCS, usingthe National Research Council (NRC) method [46,47], as described elsewhere [48].
The prevalence of inadequate and excess intakes of iron and zinc were calculated in 3 series ofanalyses; (1) the adjusted observed dietary intakes, (2) the adjusted observed intakes plus a daily (7servings/week) or (3) every other day (3.5 servings/week) dosage of MNP. We used the EstimatedAverage Requirement (EAR) cut-point method for zinc (15% and 30% bioavailability) and the fullprobability approach for iron using a bioavailability of 5% and 10% for each age group [48,49], dueto the skewedness of distribution of iron intakes. The EAR and the tolerable upper intake level (UL)from the Institute of Medicine (IOM) [50] were used for iron except for the EAR of 12–23 m which isfrom WHO/FAO [51]. For zinc, we used the EAR set by IOM [50] for 6–11 m and WHO/FAO [51] for12–23 m and, used the UL suggested by WHO [52] as well as the UL suggested by IZiNCG [52], sincethe two UL cut-offs are quite different.
2.4. Other Analyses
The NFCS anthropometric data were analysed using WHO Anthro software version 3.2.2 [53]to estimate Z-scores for height-for-age (HAZ), weight-for-height (WHZ) and weight-for-age (WAZ).Children were classified as stunted, wasted and underweight if their Z-score values for HAZ, WHZand WAZ were below-2 SD, respectively.
3. Results
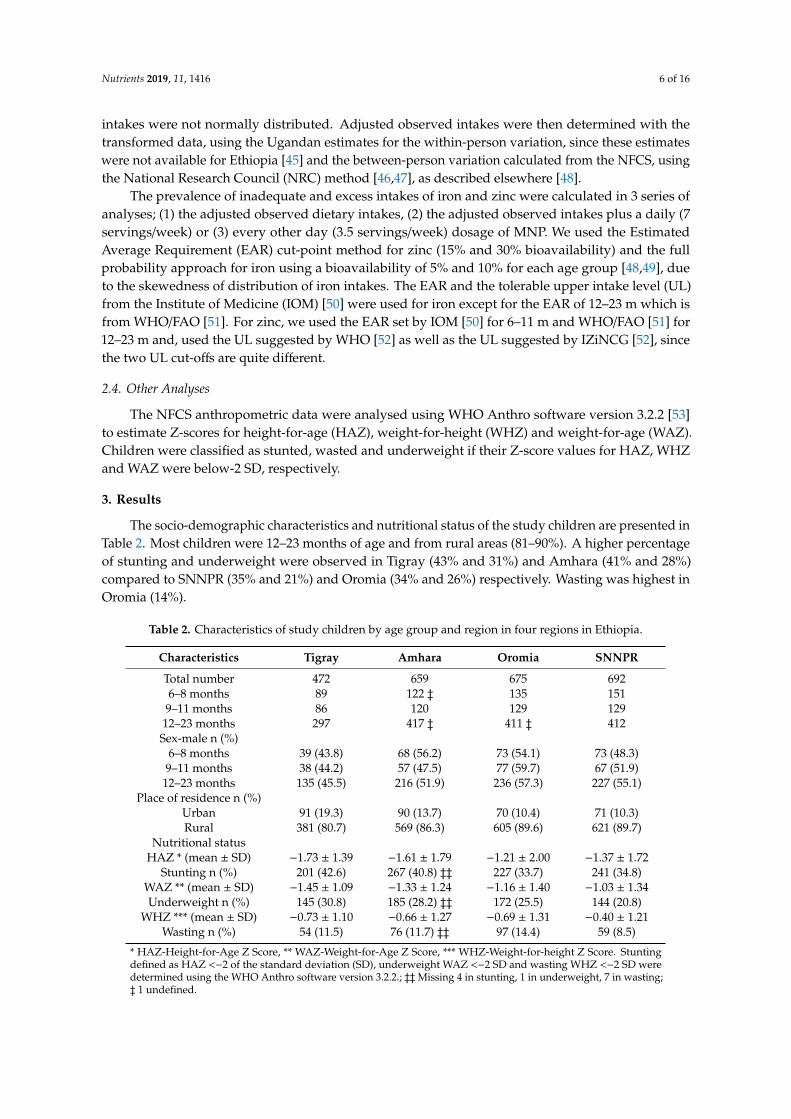
The socio-demographic characteristics and nutritional status of the study children are presented inTable 2. Most children were 12–23 months of age and from rural areas (81–90%). A higher percentageof stunting and underweight were observed in Tigray (43% and 31%) and Amhara (41% and 28%)compared to SNNPR (35% and 21%) and Oromia (34% and 26%) respectively. Wasting was highest inOromia (14%).
Table 2. Characteristics of study children by age group and region in four regions in Ethiopia.
Characteristics Tigray Amhara Oromia SNNPR
Total number 472 659 675 6926–8 months 89 122 ‡ 135 151
9–11 months 86 120 129 12912–23 months 297 417 ‡ 411 ‡ 412
Sex-male n (%)6–8 months 39 (43.8) 68 (56.2) 73 (54.1) 73 (48.3)
9–11 months 38 (44.2) 57 (47.5) 77 (59.7) 67 (51.9)12–23 months 135 (45.5) 216 (51.9) 236 (57.3) 227 (55.1)
Place of residence n (%)Urban 91 (19.3) 90 (13.7) 70 (10.4) 71 (10.3)Rural 381 (80.7) 569 (86.3) 605 (89.6) 621 (89.7)
Nutritional statusHAZ * (mean ± SD) −1.73 ± 1.39 −1.61 ± 1.79 −1.21 ± 2.00 −1.37 ± 1.72
Stunting n (%) 201 (42.6) 267 (40.8) ‡‡ 227 (33.7) 241 (34.8)WAZ ** (mean ± SD) −1.45 ± 1.09 −1.33 ± 1.24 −1.16 ± 1.40 −1.03 ± 1.34Underweight n (%) 145 (30.8) 185 (28.2) ‡‡ 172 (25.5) 144 (20.8)
WHZ *** (mean ± SD) −0.73 ± 1.10 −0.66 ± 1.27 −0.69 ± 1.31 −0.40 ± 1.21Wasting n (%) 54 (11.5) 76 (11.7) ‡‡ 97 (14.4) 59 (8.5)
* HAZ-Height-for-Age Z Score, ** WAZ-Weight-for-Age Z Score, *** WHZ-Weight-for-height Z Score. Stuntingdefined as HAZ <−2 of the standard deviation (SD), underweight WAZ <−2 SD and wasting WHZ <−2 SD weredetermined using the WHO Anthro software version 3.2.2.; ‡‡Missing 4 in stunting, 1 in underweight, 7 in wasting;‡ 1 undefined.
Nutrients 2019, 11, 1416 7 of 16
3.1. Overview of Foods Consumed
The majority of children in all age groups (≥85%) were consuming breastmilk (SupplementalTable S2). In children 6–8 months of age, on average only 28 (out of 80) foods were consumed by >3%of the population. This increased to 38 (out of 93) food items for 9–11 months old children and 52 (outof 172) food items for 12–23 months old children. The total number of foods consumed by the studychildren and number of foods consumed by >3% of children per age group and region is summarizedin Supplemental Table S2.
The list of foods consumed by >3% of the children including the median serving sizes modelled,per age group and region is summarized in Supplemental Table S3. Among the grains, tef, wheat,sorghum and barley were consumed across all age groups and regions. The most commonly consumedlegumes were peas, vetch, chickpeas, broad beans, and kidney beans. Milk was commonly consumedin all regions. It was observed that infants were rarely fed fruits or sweetened snacks, vegetablesand eggs.
Median serving sizes ranged from 1–307 g/day (oil and buttermilk, respectively) for infants 6–8months, 1–267 g/day for infants 9–11 months (oil and milk, respectively) and 1–234 g/day for children12–23 months (oil and milk, respectively) and the actual types and amounts of foods consumed variedby region. For example, milk servings in Tigray were much smaller than those of other regions;biscuits or sweet cookies were only consumed by >3% of children in the Oromia region. Althoughsimilar grains or legumes were consumed across all regions, the serving sizes varied by region, seeSupplemental Table S3. Fortified infant cereals were only included in the models in Tigray and Amhararegions because these food items were not consumed in the other regions. Eggs and starchy roots werenot consumed in Amhara and Tigray regions respectively, while a starchy root like enset was onlyconsumed in SNNPR and some parts of Oromia.
3.2. Problem Nutrients
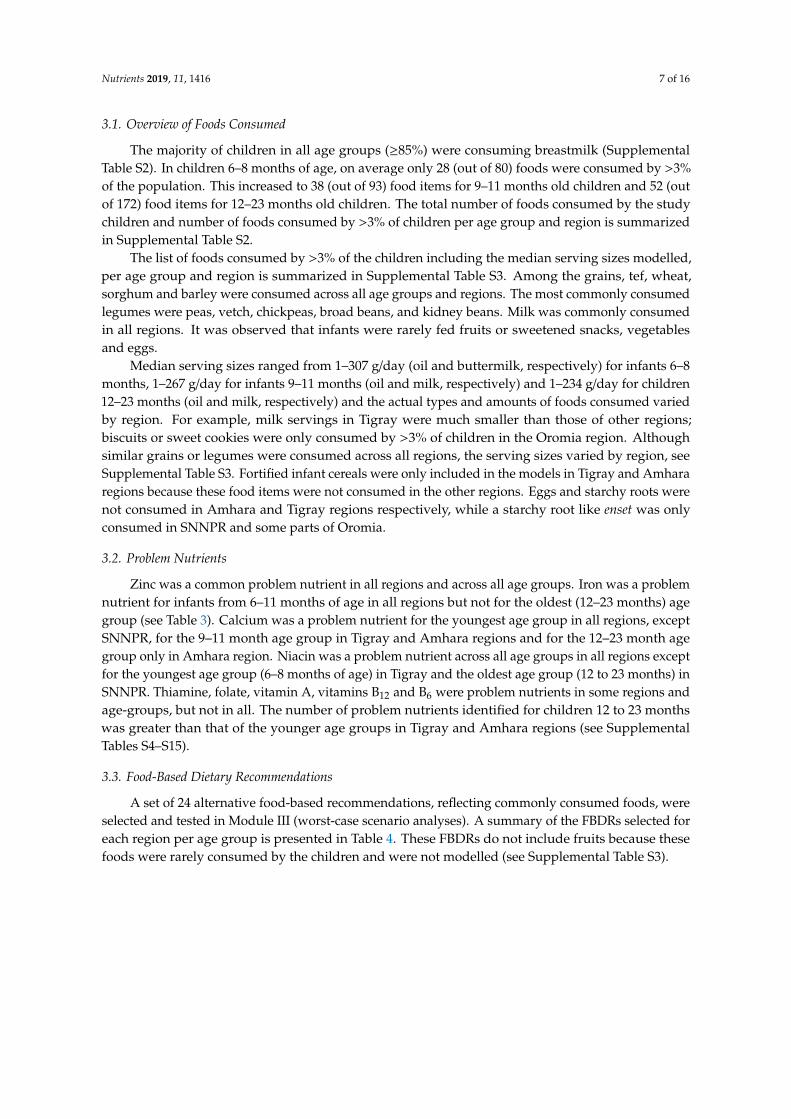
Zinc was a common problem nutrient in all regions and across all age groups. Iron was a problemnutrient for infants from 6–11 months of age in all regions but not for the oldest (12–23 months) agegroup (see Table 3). Calcium was a problem nutrient for the youngest age group in all regions, exceptSNNPR, for the 9–11 month age group in Tigray and Amhara regions and for the 12–23 month agegroup only in Amhara region. Niacin was a problem nutrient across all age groups in all regions exceptfor the youngest age group (6–8 months of age) in Tigray and the oldest age group (12 to 23 months) inSNNPR. Thiamine, folate, vitamin A, vitamins B12 and B6 were problem nutrients in some regions andage-groups, but not in all. The number of problem nutrients identified for children 12 to 23 monthswas greater than that of the younger age groups in Tigray and Amhara regions (see SupplementalTables S4–S15).
3.3. Food-Based Dietary Recommendations
A set of 24 alternative food-based recommendations, reflecting commonly consumed foods, wereselected and tested in Module III (worst-case scenario analyses). A summary of the FBDRs selected foreach region per age group is presented in Table 4. These FBDRs do not include fruits because thesefoods were rarely consumed by the children and were not modelled (see Supplemental Table S3).
Nutrients 2019, 11, 1416 8 of 16
Table 3. Summary of problem nutrients in young children’s diets that can be solved with food-baseddietary recommendations and those persisting, by age group and region.
Calcium Thiamin Niacin Vit.B6 Folate Vit.B12 Vit.A Iron Zinc
Tigray6–8 mo.
9–11 mo.12–23 mo.
Amhara6–8 mo.
9–11 mo.12–23 mo.
Oromia6–8 mo.
9–11 mo.12–23 mo.
SNNPR6–8 mo.
9–11 mo.12–23 mo.
* Nutrient requirements that can be met but require changes consistent with FBDR** Nutrient requirements cannot be met by any combination of local foods
* These are partial problem nutrients being nutrients when the minimized %RNI <70% and the maximized RNI ≥100%. ** These are problem nutrients being nutrients for which it is difficult to ensure nutrient adequacy with localfoods alone (the maximized RNI is <100%).
Table 4. Summary of food-based recommendations (in addition to breastmilk) for young Ethiopianchildren, for different age groups per region.
Food Group Foods 2
Age Group
6 to 8 mo. 1 9 to 11 mo. 1 12 to 23 mo. 1
s/wk. 3 s/wk. 3 s/wk. 3
Tigray
Dairy Milk 7 7 7FICFP 4 7 - -Grains Wheat, teff 4 7 14
Vegetables Vitamin C rich vegetables - 7 3 to 4Legumes Broad beans, vetch, (chick) peas - 14 14
Eggs - - 7
Amhara
Dairy Milk 7 7 7FICFP 7 - -Grains Wheat, teff - 14 14
Vegetables 5 Tomato, onions - - 14Legumes Broad beans, lentils 7 7 21
Starchy Roots Potato - 7 7
Oromia
Dairy Milk 3 to 4 3 to 4 3 to 4Grains Wheat, teff 7 14 14
Vegetables 5 Tomato, onion - 14 14Legumes Broad beans, lentils 7 3 to 4 14
Starchy Roots Potato 7 - -Eggs - - 7
SNNPR
Dairy (butter) milk 3 to 4 3 to 4 7Grains Barley, millet, tef 14 35 21
DGLV 6 Kale - 7 -Legumes Chickpeas, kidney beans 21 14 21
Starchy roots Potato - 3 to 4 -Eggs - - 7
1 Months old; 2 Recommended foods within group; 3 Number of servings per week; 4 Fortified Infant Cereal FoodProduct; 5 Tomatoes and onion 14 servings in total; 6 Dark green leafy vegetables.
3.4. FBDR Combined with Local Complementary Food Products and Supplementation
Supplemental Tables S4–S15 show the worst-case scenario (Module III) of FBDR in combinationwith CF, MNP, Sq-LNS, or CF and MNP for different age groups and different regions. The additionof Sq-LNS to the FBDR was limited because of violation of the energy constraints. For example, in
Nutrients 2019, 11, 1416 9 of 16
SNNPR for 9–11 months old children (Supplemental Table S14), we were able to add Sq-LNS to theFBDR 3.5 times per week (i.e., every other day) but its addition at a frequency of 7 times per weekexceeded the energy constraints. Energy constraints also limited the addition of CF with Sq-LNS to thedeveloped FBDR to just 2 servings/week. Similar results were found for the other regions and agegroups (see Supplemental Table S4–S15).
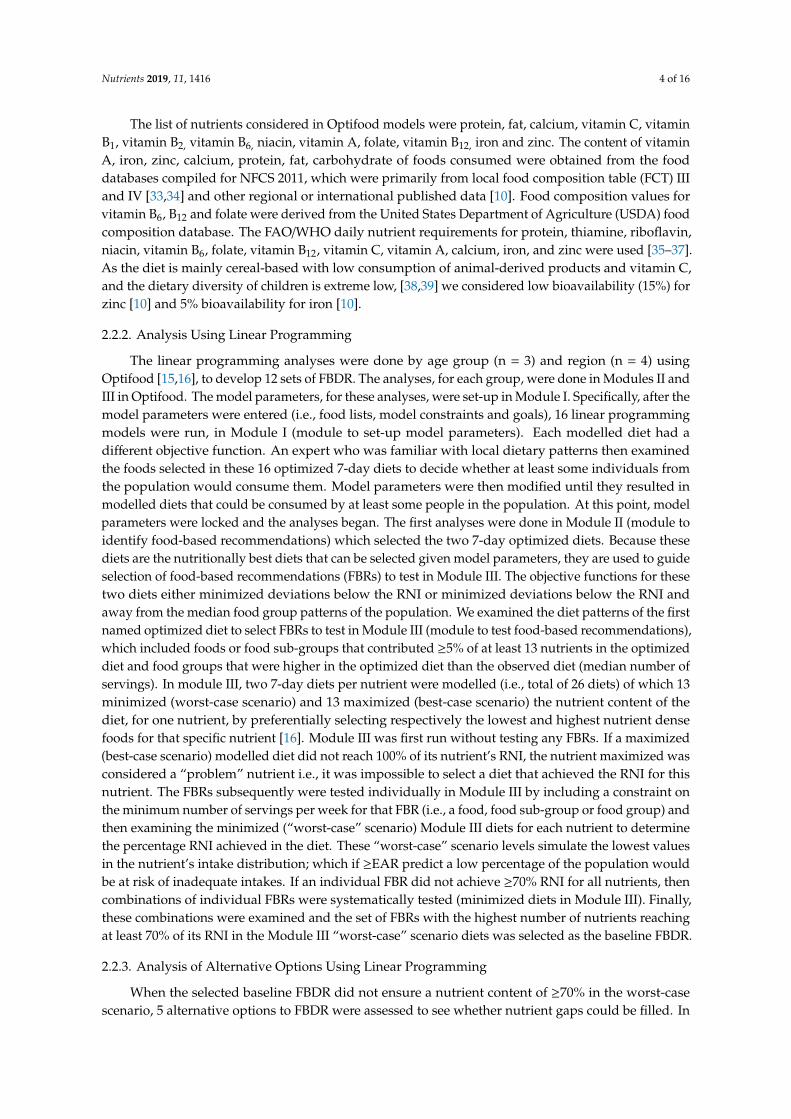
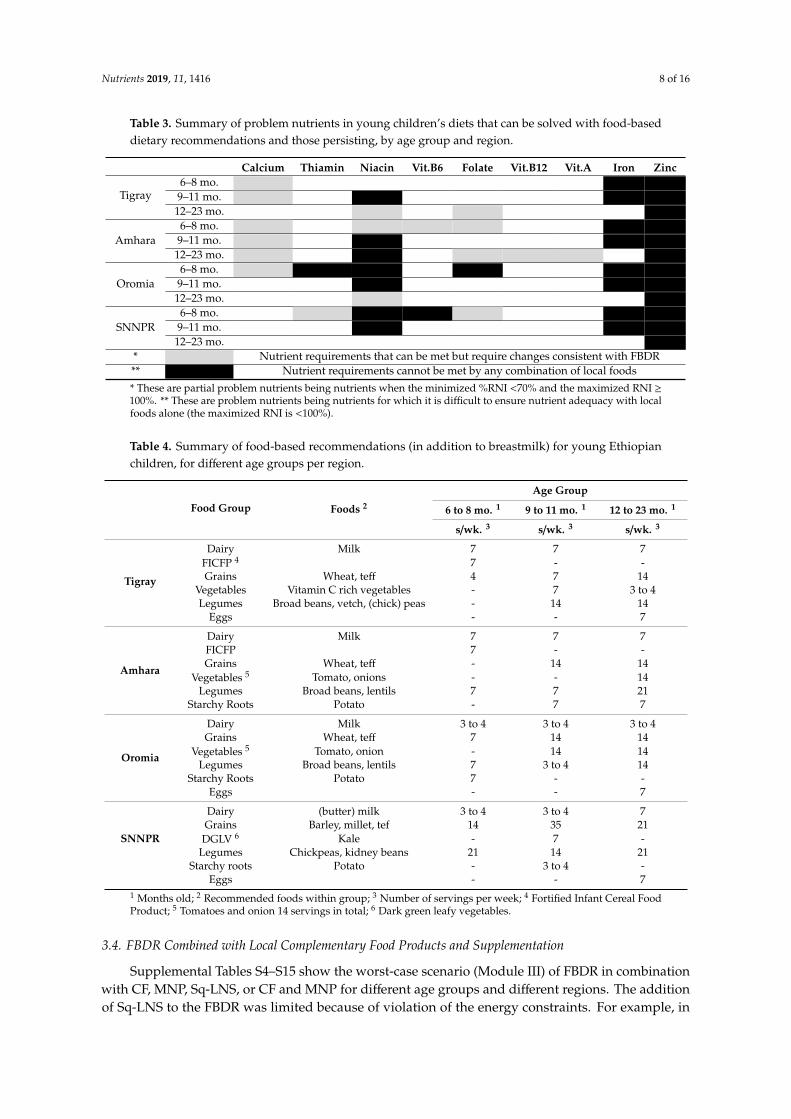
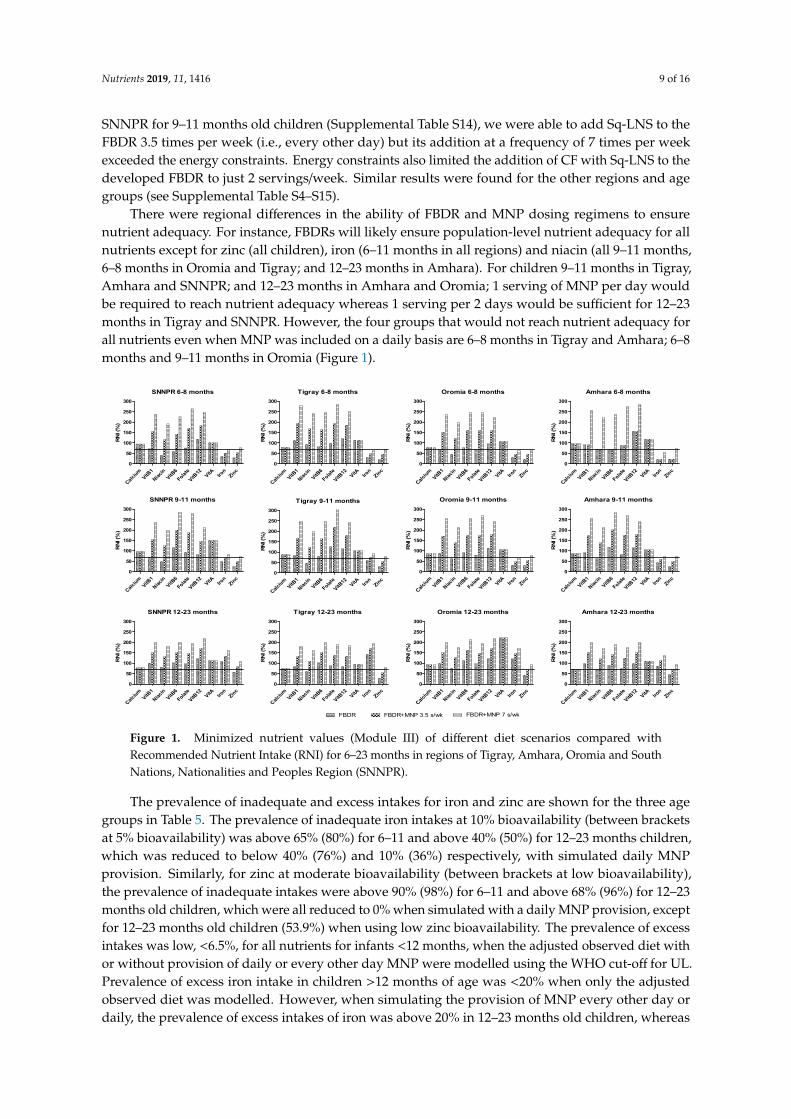
There were regional differences in the ability of FBDR and MNP dosing regimens to ensurenutrient adequacy. For instance, FBDRs will likely ensure population-level nutrient adequacy for allnutrients except for zinc (all children), iron (6–11 months in all regions) and niacin (all 9–11 months,6–8 months in Oromia and Tigray; and 12–23 months in Amhara). For children 9–11 months in Tigray,Amhara and SNNPR; and 12–23 months in Amhara and Oromia; 1 serving of MNP per day wouldbe required to reach nutrient adequacy whereas 1 serving per 2 days would be sufficient for 12–23months in Tigray and SNNPR. However, the four groups that would not reach nutrient adequacy forall nutrients even when MNP was included on a daily basis are 6–8 months in Tigray and Amhara; 6–8months and 9–11 months in Oromia (Figure 1).Nutrients 2019, 11, x FOR PEER REVIEW 10 of 16
Figure 1. Minimized nutrient values (Module III) of different diet scenarios compared with
Recommended Nutrient Intake (RNI) for 6–23 months in regions of Tigray, Amhara, Oromia and
South Nations, Nationalities and Peoples Region (SNNPR).
Table 5. Calculated inadequate and excess intake of selected nutrients at usual intake, addition of 1
MNP every other day (3.5 sachets/week) and daily, among Ethiopian children at different age groups.
Nutrient *(EAR) Age Group 6–8 m (n = 495) Age Group 9–11 m (n = 465) Age Group 12–23 m (n = 1544)
Inadequate% Excess% Inadequate% Excess% Inadequate% Excess%
Iron (10%) **
Usual diet 77.7 4.6 67.1 3.7 40.1 18.7
+1/2MNP/d 67.3 5.3 52.8 4.1 26.2 20.5
+1MNP/d 39.8 6.1 26.6 4.5 10.4 22.2
Iron (5%) **
Usual diet 86.5 4.6 81.6 3.7 52.9 18.7
+1/2MNP/d 82.3 5.3 75.3 4.1 46.4 20.5
+1MNP/d 75.8 6.1 66.5 4.5 35.5 22.2
Zinc (moderate bioavailability) ∞ (WHO cut‐off)
Usual diet 92.7 0 92.3 0 68.6 0.1
+1/2MNP/d 0 0 0 0 8.2 0.1
+1MNP/d 0 0.2 0 0 0 0.1
Zinc (low bioavailability) ∞ (WHO cut‐off)
Usual diet 98.6 0 100 0 96.1 0.1
+1/2MNP/d 96.0 0 97.2 0 87.3 0.1
+1MNP/d 0 0.2 0 0 53.9 0.1
Zinc ≡ (IZiNCG cut‐off)
Usual diet 0.4 0 2.4
+1/2MNP/d 1.6 0.4 6.9
+1MNP/d 21.2 51.0 22.4
* Analysis was made using square root transformation for iron and log10 transformation for zinc and
data was back transformed to assess the inadequate and excess intake; ** EAR for iron: Based on IOM
(10%bioavailability) 6.9 mg/d and IOM (5% bioavailability) 13.8 mg/d for 6–11 months (p. 324) [50]
and based on WHO/FAO (10% of bioavailability) 5.8 mg/d and WHO/FAO (5% bioavailability) 11.6
mg/d for 12–23 months (p 148) [51]; ∞ EAR for Zinc (moderate bioavailability) 2.5 mg/d and (low
bioavailability) 5.0 mg/d for 6–11 months based on IOM (p. 466) [50] and 3.4 mg/d (moderate
bioavailability) and 6.9 mg/d (low bioavailability) for 12–23 months based on WHO/ FAO (p. 148)
SNNPR 6-8 months
RN
I (%
)
Calci
umVitB
1
Niaci
n
VitB6
Fola
te
VitB12
VitA Iron
Zinc
0
50
100
150
200
250
300
Tigray 6-8 months
RN
I (%
)
Calci
umVitB
1
Niaci
n
VitB6
Folate
VitB12
VitA Iron
Zinc
0
50
100
150
200
250
300
Oromia 6-8 months
RN
i (%
)
Calci
umVitB
1
Niaci
n
VitB6
Folate
VitB12
VitA Iron
Zinc
0
50
100
150
200
250
300
Amhara 6-8 months
RN
I (%
)
Calci
umVitB
1
Niaci
n
VitB6
Folate
VitB12
VitA Iron
Zinc
0
50
100
150
200
250
300
SNNPR 9-11 months
RN
I (%
)
Cal
cium
VitB1
Nia
cin
VitB6
Fola
te
VitB12
VitA Iron
Zinc
0
50
100
150
200
250
300
Tigray 9-11 months
RN
I (%
)
Calci
umVitB
1
Nia
cin
VitB6
Folate
VitB12
VitA Iron
Zinc
0
50
100
150
200
250
300
Oromia 9-11 months
RN
I (%
)
Cal
cium
VitB1
Nia
cin
VitB6
Folate
VitB12
VitA Iron
Zinc
0
50
100
150
200
250
300
Amhara 9-11 months
RN
I (%
)
Cal
cium
VitB1
Nia
cin
VitB6
Folate
VitB12
VitA Iron
Zinc
0
50
100
150
200
250
300
SNNPR 12-23 months
RN
I (%
)
Cal
cium
VitB1
Nia
cin
VitB6
Fola
te
VitB12
VitA Iron
Zinc
0
50
100
150
200
250
300
Tigray 12-23 months
RN
I (%
)
Cal
cium
VitB1
Nia
cin
VitB6
Folate
VitB12
VitA Iron
Zinc
0
50
100
150
200
250
300
Oromia 12-23 months
RN
I (%
)
Cal
cium
VitB1
Nia
cin
VitB6
Folate
VitB12
VitA Iron
Zinc
0
50
100
150
200
250
300
Amhara 12-23 months
RN
I (%
)
Cal
cium
VitB1
Nia
cin
VitB6
Folate
VitB12
VitA Iron
Zinc
0
50
100
150
200
250
300
FBDR FBDR+MNP 3.5 s/wk FBDR+MNP 7 s/wk
Figure 1. Minimized nutrient values (Module III) of different diet scenarios compared withRecommended Nutrient Intake (RNI) for 6–23 months in regions of Tigray, Amhara, Oromia and SouthNations, Nationalities and Peoples Region (SNNPR).
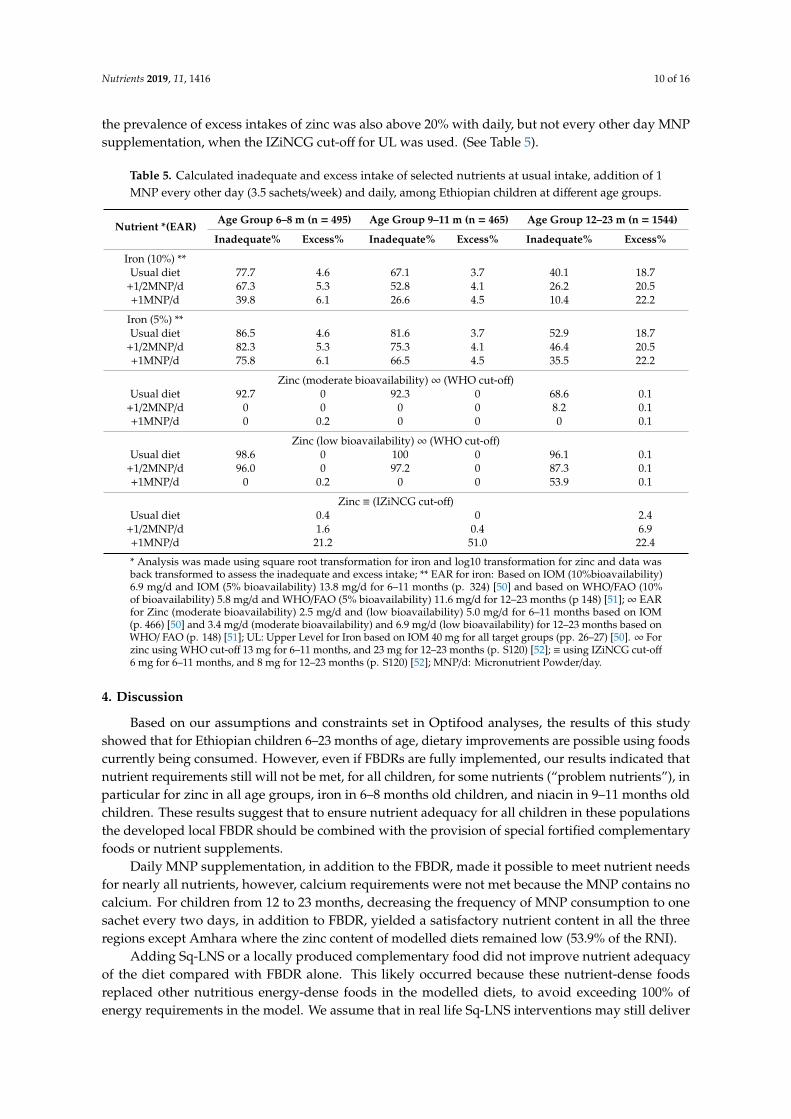
The prevalence of inadequate and excess intakes for iron and zinc are shown for the three agegroups in Table 5. The prevalence of inadequate iron intakes at 10% bioavailability (between bracketsat 5% bioavailability) was above 65% (80%) for 6–11 and above 40% (50%) for 12–23 months children,which was reduced to below 40% (76%) and 10% (36%) respectively, with simulated daily MNPprovision. Similarly, for zinc at moderate bioavailability (between brackets at low bioavailability),the prevalence of inadequate intakes were above 90% (98%) for 6–11 and above 68% (96%) for 12–23months old children, which were all reduced to 0% when simulated with a daily MNP provision, exceptfor 12–23 months old children (53.9%) when using low zinc bioavailability. The prevalence of excessintakes was low, <6.5%, for all nutrients for infants <12 months, when the adjusted observed diet withor without provision of daily or every other day MNP were modelled using the WHO cut-off for UL.Prevalence of excess iron intake in children >12 months of age was <20% when only the adjustedobserved diet was modelled. However, when simulating the provision of MNP every other day ordaily, the prevalence of excess intakes of iron was above 20% in 12–23 months old children, whereas
Nutrients 2019, 11, 1416 10 of 16
the prevalence of excess intakes of zinc was also above 20% with daily, but not every other day MNPsupplementation, when the IZiNCG cut-off for UL was used. (See Table 5).
Table 5. Calculated inadequate and excess intake of selected nutrients at usual intake, addition of 1MNP every other day (3.5 sachets/week) and daily, among Ethiopian children at different age groups.
Nutrient *(EAR)Age Group 6–8 m (n = 495) Age Group 9–11 m (n = 465) Age Group 12–23 m (n = 1544)
Inadequate% Excess% Inadequate% Excess% Inadequate% Excess%
Iron (10%) **Usual diet 77.7 4.6 67.1 3.7 40.1 18.7
+1/2MNP/d 67.3 5.3 52.8 4.1 26.2 20.5+1MNP/d 39.8 6.1 26.6 4.5 10.4 22.2
Iron (5%) **Usual diet 86.5 4.6 81.6 3.7 52.9 18.7
+1/2MNP/d 82.3 5.3 75.3 4.1 46.4 20.5+1MNP/d 75.8 6.1 66.5 4.5 35.5 22.2
Zinc (moderate bioavailability)∞ (WHO cut-off)Usual diet 92.7 0 92.3 0 68.6 0.1
+1/2MNP/d 0 0 0 0 8.2 0.1+1MNP/d 0 0.2 0 0 0 0.1
Zinc (low bioavailability)∞ (WHO cut-off)Usual diet 98.6 0 100 0 96.1 0.1
+1/2MNP/d 96.0 0 97.2 0 87.3 0.1+1MNP/d 0 0.2 0 0 53.9 0.1
Zinc ≡ (IZiNCG cut-off)Usual diet 0.4 0 2.4
+1/2MNP/d 1.6 0.4 6.9+1MNP/d 21.2 51.0 22.4
* Analysis was made using square root transformation for iron and log10 transformation for zinc and data wasback transformed to assess the inadequate and excess intake; ** EAR for iron: Based on IOM (10%bioavailability)6.9 mg/d and IOM (5% bioavailability) 13.8 mg/d for 6–11 months (p. 324) [50] and based on WHO/FAO (10%of bioavailability) 5.8 mg/d and WHO/FAO (5% bioavailability) 11.6 mg/d for 12–23 months (p 148) [51];∞ EARfor Zinc (moderate bioavailability) 2.5 mg/d and (low bioavailability) 5.0 mg/d for 6–11 months based on IOM(p. 466) [50] and 3.4 mg/d (moderate bioavailability) and 6.9 mg/d (low bioavailability) for 12–23 months based onWHO/ FAO (p. 148) [51]; UL: Upper Level for Iron based on IOM 40 mg for all target groups (pp. 26–27) [50]. ∞ Forzinc using WHO cut-off 13 mg for 6–11 months, and 23 mg for 12–23 months (p. S120) [52]; ≡ using IZiNCG cut-off6 mg for 6–11 months, and 8 mg for 12–23 months (p. S120) [52]; MNP/d: Micronutrient Powder/day.
4. Discussion
Based on our assumptions and constraints set in Optifood analyses, the results of this studyshowed that for Ethiopian children 6–23 months of age, dietary improvements are possible using foodscurrently being consumed. However, even if FBDRs are fully implemented, our results indicated thatnutrient requirements still will not be met, for all children, for some nutrients (“problem nutrients”), inparticular for zinc in all age groups, iron in 6–8 months old children, and niacin in 9–11 months oldchildren. These results suggest that to ensure nutrient adequacy for all children in these populationsthe developed local FBDR should be combined with the provision of special fortified complementaryfoods or nutrient supplements.
Daily MNP supplementation, in addition to the FBDR, made it possible to meet nutrient needsfor nearly all nutrients, however, calcium requirements were not met because the MNP contains nocalcium. For children from 12 to 23 months, decreasing the frequency of MNP consumption to onesachet every two days, in addition to FBDR, yielded a satisfactory nutrient content in all the threeregions except Amhara where the zinc content of modelled diets remained low (53.9% of the RNI).
Adding Sq-LNS or a locally produced complementary food did not improve nutrient adequacyof the diet compared with FBDR alone. This likely occurred because these nutrient-dense foodsreplaced other nutritious energy-dense foods in the modelled diets, to avoid exceeding 100% ofenergy requirements in the model. We assume that in real life Sq-LNS interventions may still deliver
Nutrients 2019, 11, 1416 11 of 16
substantial benefits to this population because (1) reported intake data from the NFCS suggestedlower than recommended energy intakes for these age groups [10] and (2) we did not include costconstraints in the model and the best-modelled diets included some expensive food items. Sq-LNSmay be a cheaper alternative for delivering additional energy and nutrients than the replaced fooditems. For instance, in two out of the four regions, fortified commercial infant cereals were reported tobe consumed and were included in the model. When these fortified commercial infant cereals werenot included in the model, the number of problem nutrients increased and only vitamin C, B2 andvitamin A met the criteria for nutrient adequacy in Module III (testing FBDR) (data are not shown).These findings highlight the importance and confirm the need for cost-effective measures, such asfortification or home-fortification, to improve the nutrient adequacy, especially for the youngest agegroup. Future research should investigate whether food fortification is a cost-effective strategy toincrease dietary zinc intakes, and reduce the prevalence of zinc deficiency in this population [54].
We found that adding 3.5 or 7 servings per week of MNPs to the usual diets led to a decrease inthe percentage of inadequate intakes for iron and zinc, without leading to a substantially increasedrisk of excessive intakes for iron. For zinc, daily MNP supplementation increased the risk of excessintakes to 51.0% of the population, which was reduced to <7% when the frequency of MNP use wasreduced to every other day. These findings are in line with other studies confirming that in theory, therequirements of most, but not all, nutrients can be met by optimizing intakes of local foods [18,55].Interventions, such as MNPs can be used to further improve nutrient adequacy [56,57]. However,concerns have been raised about possible side-effects of these interventions, including a possible,iron-induced increased morbidity from diarrhoea and other infectious diseases [58,59]. In addition, ina recent study simulating the effects of home-fortification of complementary foods in West Gojjam,Ethiopia, they observed a substantial increase in the risk of excessive intakes for iron and zinc inchildren 12–23 months of age [60]. These results are in contrast to our observations probably due tointer-study differences reflected in differences in the study population. There is uncertainty abouttolerable upper intakes levels (UL), especially when bioavailability of iron and zinc are low in localdiets [52,61]. Studies showed that bioavailability of iron and zinc depend on the intestinal health of thechildren, not only on the bioavailability from foods [62]. Factors resulting in impaired absorption ofzinc also need to be considered, while addressing the risk of excess intake. Therefore, some caution iswarranted when interpreting these findings [48]. Even so, our findings suggest that, for the older agegroups (12–23 months of age), using the more conservative IZiNCG upper limits, distribution of MNPon every other day may be a safer choice.
The results of our analysis confirm that dietary habits differ across the different geographicalregions in Ethiopia due to differences in cultural practices between regions [63,64]. For instance, eggswere not in the list of foods consumed by children from the Amhara region, most likely because animalsource foods are not consumed during the long fasting season. In the other three regions, eggs could berecommended, at least for children 12–23 months of age. It is therefore advisable to develop separatefood-based dietary recommendations for the different regions, taking into account differences acrossregions in food availability and consumption patterns. Regional differences in food intakes are knownto exist in many countries.
In spite of the fact that the LP approach provides feasible and evidence-based results, this studyhas some limitations. First, in addition to the issue of the energy constraints described before, wecalculated frequencies based on the percentage of the population who consumed each food because wedid not have data on frequencies of food consumption. As the actual consumption frequency per foodis more accurate than an estimated consumption using only one or two 24 h recalls, using estimatedconsumption frequency may affect model input data and lead to bias in nutrient adequacy of somenutrients. The extent of this bias is, however, not known. Second, the feasibility of implementingregional FBDR should be assessed by household trials in order to identify barriers and supportingfactors for the adoption of FBDRs. A translation of these theoretical FBDR into practical guidelinesshould take into account the feasibility of these guidelines, by field-testing the FBDR in practice.
Nutrients 2019, 11, 1416 12 of 16
In addition, increasing access to nutritious foods that are part of a healthy diet, but currently notconsumed frequently enough to feature in the models, continues to be needed. Examples are fruits andvegetables, currently not included in the recommendations for the youngest children because theyare not consumed frequently. Third, Optifood does not take into account all factors that affect foodchoices, such as variation in behaviour, food habits and the influence of social pressure on food choice.To some extent, the program takes this into account by using foods that are being consumed by atleast 3% of the population. However, still, some of these foods may not be feasible options for part ofthe population, for example, fortified infant cereals which may be too costly. In general, it is knownthat the costs of diets based on nutritious local foods could be three to eight times higher than dietsfortified with micronutrient powders (MNPs) [23] and costs were not included as a constraint in ouranalyses. Fourth, the intra-individual variation of the population was not quantifiable from surveydata, to calculate the inadequate and excess intakes hence we used the variance from Uganda survey.However, the large number of survey days included provides a precise estimate of average intake atthe population level which is advantageous for estimating median serving sizes [10,48,51]. Finally, thelinear programming uses only the reported foods to develop the FBDR [65]. This restricts the use offoods that should be included in a healthy diet, such as vegetables and seasonal fruits. The FBDRsdeveloped in this paper were based on food intake data of one season, during the period considered tobe the longest lean season in Ethiopia characterised with low availability of a variety of foods [10]. Thishas affected the foods included in the Optifood modelling and, hence, the foods included in the FBDRs,especially vegetables and fruits. On the other hand, we consider using only consumed food a strengthof the study because the use of consumed food would facilitate the acceptability and adoptability ofthe FBDR by the target groups.
5. Conclusions
Our results show that ensuring nutrient adequacy for 6–23-month-old Ethiopian children isdifficult at least for some nutrients. Nutrient adequacy can be improved, in part, by promoting a dietwith more vegetables (for >12 months children), legumes and animal source food that is currently partof the children’s diets. However, the results suggest that even if the FBDRs are fully adopted, intakesof some nutrients, in particular, zinc, iron and perhaps niacin might remain suboptimal for somechildren in the population and additional interventions are required. The best option to reduce thenutrient gaps is a combination of the regional FBDRs with MNPs (6 mg iron/serving) supplementation;daily (for children <12 months of age) and every other day (for children >12 months of age). Ourfindings confirm that providing MNPs may potentially improve the nutrient adequacy of the dietsof these children, while not leading to substantial excessive intakes. It is important to emphasizethat MNP should not replace the feeding recommendations, but should be promoted in addition tothese FBDRs together with breastfeeding on demand during the first two years of age. Our findingsfurther suggest that region-specific FBDR are required, to account for differences between regions infood availability and dietary habits and to increase the acceptability of the recommendations. Hence,targeted approaches and dosing instructions have to be considered separately for children below 12months of age and children above 12 months of age. The study also confirms the usefulness of LPanalysis in order to explore and evaluate the effect of different options for nutrition interventions so asto inform policymakers.
Supplementary Materials: The following are available online at http://www.mdpi.com/2072-6643/11/6/1416/s1,Table S1. List of food groups and subgroups as defined by Optifood; Table S2. Reported intake and feedingpractice by age group and region; Table S3. List of Foods consumed by >3% of children, median serving sizes(g/d), in Tigray, Amhara, Oromia, SNNP regions in Ethiopia; Tables S4–S15. The optimal, best-case scenario andworst-case scenario of the baseline diet, the worst-case scenario for the food based recommendations and eachalternative combination expressed as a percentage of the recommended nutrient intake by age group and region.
Author Contributions: A.S. was responsible for the design of study, data collection, preparation, analysis andinterpretation, manuscript preparation, and has full responsibility for the final manuscript. S.J.M.O. and I.D.B.were responsible for the conception, design, overview of the study, overview of data analysis and interpretation,
Nutrients 2019, 11, 1416 13 of 16
and contributed to the final manuscript. E.F. contributed to data analysis and interpretation, and the finalmanuscript. K.B. contributed to data analysis and final manuscript. B.M.A. contributed to data analysis. L.M.N.was responsible for the conception of the project. A.A. and A.K. contributed to editing of final paper. All authorshave contributed, read and approved the final manuscript.
Funding: This work was supported by Nutrition International through a grant of Global Affairs Canada(10-1569-ETHNIS-01), and The Netherlands NUFFIC Foundation (CF8768/2013).
Acknowledgments: The authors would like to acknowledge the technical support, for these analyses, of theNutrition International, EPHI, Wageningen University, and especially Sara Wuehler from Nutrition International,Kiflu Tesfaye from Central Statistics Agency and Milan Bloem from Wageningen University.
Conflicts of Interest: The authors report no conflicts of interest associated with this work.
Abbreviations
CF: Complementary Food; EAR: Estimated Average Requirement; EHNRI: Ethiopian Health and NutritionResearch Institute; EPHI: Ethiopian Public Health Institute; FBDR: Food-Based Dietary Recommendations; FAO:Food and Agriculture Organization; FCT: Food Composition Table; HAZ: Height-for-Age Z score; IOM: Instituteof Medicine; IYCF: Infant and Young Child Feeding; IZiNCG: International Zinc Nutrition Consultative Group;LP: Linear Programming; MNP: Micronutrient Powder; NRC: National Research Council; NFCS: National FoodConsumption Survey; RNI: Recommended Nutrient Intake; SD: Standard Deviation; SNNPR: South Nations,Nationalities and Peoples Region; Sq-LNS: Small quantity Lipid-based Nutrient Supplement; UL: Tolerable UpperIntakes Level; UNICEF: United Nation Children’s Fund; WAZ: Weight-for-Age Z score; WHZ: Weight-for-HeightZ score; WHO: World Health Organization.
References
1. Bhutta, Z.A.; Das, J.K.; Rizvi, A.; Gaffey, M.F.; Walker, N.; Horton, S.; Webb, P.; Lartey, A.; Black, R.E.Evidence-based interventions for improvement of maternal and child nutrition: What can be done and atwhat cost? Lancet 2013, 382, 452–477. [CrossRef]
2. WHO. Indicators for Assessing Infant and Young Child Feeding Practices; Part 1 Definitions; World HealthOrganization: Geneva, Switzerland, 2008.
3. WHO. Global Strategy for Infant and Young Child Feeding; World Health Organization: Geneva,Switzerland, 2003.
4. Chastre, C.; Duffield, A.; Kindness, H.; LeJeune, S.; Taylor, A. The Minimum Cost of a Healthy Diet, Findingsfrom Piloting a New Methodology in Four Study Locations; Save the Children: London, UK, 2007; p. 27.
5. FAO. Ethiopia Nutrition Profile. Nutrition and Consumer Protection Division; Food and Agriculture Organization:Rome, Italy, 2008.
6. FMOH. National Nutrition Program I, Program Implementation Manual for NNP; Federal Ministry of Health:Addis Ababa, Ethiopia, 2008.
7. Ijarotimi, O.S. Determinants of childhood malnutrition and consequences in developing countries. Curr.Nutr. Rep. 2013, 2, 129–133. [CrossRef]
8. CSA. Ethiopia Demographic and Health Survey 2016; Central Statistical Agency and ICF International: AddisAbaba, Ethiopia; Rockville, MD, USA, 2016.
9. EHNRI. The National Nutrition Baseline Survey Report; Ethiopian Health and Nutrition Research Institute:Addis Ababa, Ethiopia, 2010.
10. EPHI. Ethiopia National Food Consumption Survey; Ethiopian Public Health Institute: Addis Ababa,Ethiopia, 2013.
11. AAU. Rapid Assessment of Community-Based Production of Complementary Food in Tigray, Amhara, Oromia andSNNP Regions; Addis Ababa University: Addis Ababa, Ethiopia, 2010.
12. USAID. Focusing on Improving Complementary Feeding in Ethiopia: Trials of Improved Practices in an UrbanArea, USAID’s Infant and Young Child Nutrition project; United States Agency for International Development:Washington, DC, USA, 2011.
13. Kang, Y.; Kim, S.; Sinamo, S.; Christian, P. Effectiveness of a community-based nutrition programme toimprove child growth in rural Ethiopia: A cluster randomized trial. Matern. Child Nutr. 2017, 13. [CrossRef][PubMed]
14. Anderson, A.; Earle, M. Diet planning in the third world by linear and goal programming. J. Oper. Res. Soc.1983, 34, 9–16. [CrossRef]
Nutrients 2019, 11, 1416 14 of 16
15. Briend, A.; Darmon, N.; Ferguson, E.; Erhardt, J.G. Linear programming: A mathematical tool for analyzingand optimizing children’s diets during the complementary feeding period. J. Pediatr. Gastroenterol. Nutr.2003, 36, 12–22. [CrossRef] [PubMed]
16. Daelmans, B.; Ferguson, E.; Lutter, C.K.; Singh, N.; Pachon, H.; Creed-Kanashiro, H.; Woldt, M.;Mangasaryan, N.; Cheung, E.; Mir, R.; et al. Designing appropriate complementary feeding recommendations:Tools for programmatic action. Matern. Child Nutr. 2013, 9, 116–130. [CrossRef]
17. Ferguson, E.L.; Darmon, N.; Fahmida, U.; Fitriyanti, S.; Harper, T.B.; Premachandra, I.M. Design of optimalfood-based complementary feeding recommendations and identification of key “problem nutrients” usinggoal programming. J. Nutr. 2006, 136, 2399–2404. [CrossRef]
18. Santika, O.; Fahmida, U.; Ferguson, E. Development of food-based complementary feeding recommendationsfor 9-to 11-month-old peri-urban Indonesian infants using linear programming. J. Nutr. 2009, 139, 135–141.[CrossRef]
19. Darmon, N.; Ferguson, E.; Briend, A. Linear and nonlinear programming to optimize the nutrient density ofa population’s diet: An example based on diets of preschool children in rural Malawi. Am. J. Clin. Nutr.2002, 75, 245–253. [CrossRef]
20. Maillot, M.; Vieux, F.; Amiot, M.J.; Darmon, N. Individual diet modeling translates nutrient recommendationsinto realistic and individual-specific food choices. Am. J. Clin. Nutr. 2010, 91, 421–430. [CrossRef]
21. Vossenaar, M.; Hernandez, L.; Campos, R.; Solomons, N.W. Several ‘problem nutrients’ are identified incomplementary feeding of Guatemalan infants with continued breastfeeding using the concept of ‘criticalnutrient density’. Eur. J. Clin. Nutr. 2013, 67, 108–114. [CrossRef] [PubMed]
22. Dewey, K.G.; Brown, K.H. Update on technical issues concerning complementary feeding of young childrenin developing countries and implications for intervention programs. Food Nutr. Bull. 2003, 24, 5–28.[CrossRef] [PubMed]
23. Vitta, B.; Dewey, K. Identifying Micronutrient Gaps in The Diets of Breastfed 6-11-Month-Old Infants in Bangladesh,Ethiopia and Viet Nam Using Linear Programming; Alive and Thrive: Washington, DC, USA, 2012.
24. Zlotkin, S.; Arthur, P.; Antwi, K.Y.; Yeung, G. Treatment of anemia with microencapsulated ferrous fumarateplus ascorbic acid supplied as sprinkles to complementary (weaning) foods. Am. J. Clin. Nutr. 2001, 74,791–795. [CrossRef] [PubMed]
25. Iannotti, L.L.; Dulience, S.J.L.; Green, J.; Joseph, S.; François, J.; Anténor, M.-L.; Lesorogol, C.; Mounce, J.;Nickerson, N.M. Linear growth increased in young children in an urban slum of Haiti: A randomizedcontrolled trial of a lipid-based nutrient supplement. Am. J. Clin. Nutr. 2014, 99, 198–208. [CrossRef][PubMed]
26. Nestel, P.; Briend, A.; De Benoist, B.; Decker, E.; Ferguson, E.; Fontaine, O.; Micardi, A.; Nalubola, R.Complementary food supplements to achieve micronutrient adequacy for infants and young children. J.Pediatr. Gastroenterol. Nutr. 2003, 36, 316–328. [CrossRef] [PubMed]
27. Ayana, G.; Moges, T.; Samuel, A.; Asefa, T.; Eshetu, S.; Kebede, A. Dietary zinc intake and its determinantsamong Ethiopian children 6–35 months of age. BMC Nutr. 2018, 4, 30. [CrossRef]
28. MI. Formative Research Report for UNICEF Local Complementary Food Production Project; Micronutrient Initiative:Addis Ababa, Ethiopia, 2014.
29. Skau, J.K.; Bunthang, T.; Chamnan, C.; Wieringa, F.T.; Dijkhuizen, M.A.; Roos, N.; Ferguson, E.L. The use oflinear programming to determine whether a formulated complementary food product can ensure adequatenutrients for 6- to 11-month-old Cambodian infants. Am. J. Clin. Nutr. 2013, 99, 130–138. [CrossRef][PubMed]
30. Ferguson, E.; Chege, P.; Kimiywe, J.; Wiesmann, D.; Hotz, C. Zinc, iron and calcium are major limitingnutrients in the complementary diets of rural Kenyan children. Matern. Child Nutr. 2015, 11, 6–20. [CrossRef][PubMed]
31. WHO. Child Growth Standards. Length/height-for-Age, Weight-for-Age, Weight-for-Length, Weight-for-Height andBody Mass Index-for-Age: Methods and Development. (NLM Classification: WS 103); World Health Organization:Geneva, Switzerland, 2006.
32. FAO. Human Energy Requirements, Report of a Joint FAO/WHO/UNU Expert Consultation; FAO/WHO/UNU:Rome, Italy, 2004.
33. EHNRI. Food Composition Table for Use in Ethiopia Part III; Ethiopian Health and Nutrition Research Institute:Addis Ababa, Ethiopia, 1997.
Nutrients 2019, 11, 1416 15 of 16
34. EHNRI. Food Composition Table for Use in Ethiopia Part IV; Ethiopian Health and Nutrition Research Institute:Addis Ababa, Ethiopia, 1998.
35. FAO. Human Vitamin and Mineral Requirements, Report of a Joint FAO/WHO Expert Consultation; WHO/FAO:Bangkok, Thailand, 2004.
36. FAO/WHO/UNU. Protein and Amino Acid Requirements in Human Nutrition, Report of a Joint FAO/WHO/UNUExpert Consultation; WHO: Geneva, Switzerland, 2007.
37. FAO. Fats and Fatty Acids in Human Nutrition, Report of an Expert Consultation; FAO: Rome, Italy, 2010.38. Alive&Thrive. IYCF Practices, Beliefs and Influences in Tigray Region Ethiopia; Alive & Thrive: Addis Ababa,
Ethiopia, 2010.39. Aemro, M.; Mesele, M.; Birhanu, Z.; Atenafu, A. Dietary diversity and meal frequency practices among
infant and young children aged 6–23 months in Ethiopia: A secondary analysis of Ethiopian demographicand health survey 2011. J. Nutr. Metab. 2013, 1–8. [CrossRef] [PubMed]
40. Lutter, C.K.; Dewey, K.G. Proposed nutrient composition for fortified complementary foods. J. Nutr. 2003,133, 3011S–3020S. [CrossRef]
41. Samuel, A.; Brouwer, I.; Feskens, E.; Adish, A.; Kebede, A.; De-Regil, L.; Osendarp, S. Effectiveness of aprogram intervention with reduced-iron multiple micronutrient powders on iron status, morbidity andgrowth in young children in Ethiopia. Nutrients 2018, 10, 1508. [CrossRef] [PubMed]
42. DSM. Mix ME Vitamin Mineral Powder; DSM: Isando, South Africa, 2014. Available online: http://phsl.co/our-products/mix-metm-vitamin-mineral-powder?tmpl=component&print=1&page= (accessed on 15January 2019).
43. Herrador, Z.; Sordo, L.; Gadisa, E.; Moreno, J.; Nieto, J.; Benito, A.; Aseffa, A.; Cañavate, C.; Custodio, E.Cross-sectional study of malnutrition and associated factors among school aged children in rural and urbansettings of Fogera and Libo Kemkem districts, Ethiopia. PLoS ONE 2014, 9, e105880. [CrossRef] [PubMed]
44. WHO/UNICEF. Complementary Feeding of Young Children in Developing Countries: A Review of Current ScientificKnowledge (WHO/NUT/98.1); World Health Organization: Geneva, Switzerland, 1998.
45. EPHI. Ethiopian National Micronutrient Survey Report; Ethiopian Public Health Institute: Addis Ababa,Ethiopia, 2016.
46. Nusser, S.M.; Carriquiry, A.L.; Dodd, K.W.; Fuller, W.A. A semiparametric transformation approach toestimating usual daily intake distributions. J. Am. Stat. Assoc. 1996, 91, 1440–1449. [CrossRef]
47. Dodd, K.W.; Guenther, P.M.; Freedman, L.S.; Subar, A.F.; Kipnis, V.; Midthune, D.; Tooze, J.A.;Krebs-Smith, S.M. Statistical methods for estimating usual intake of nutrients and foods: A review ofthe theory. J. Am. Diet. Assoc. 2006, 106, 1640–1650. [CrossRef] [PubMed]
48. Murphy, S.P.; Vorster, H.H. Methods for using nutrient intake values (NIVs) to assess or plan nutrient intakes.Food Nutr. Bull. 2007, 28, S51–S60. [CrossRef]
49. Gibson, R.S. Principles of Nutritonal Assessment, 2nd ed.; Oxford University Press: New York, NY, USA, 2005.50. IOM. Dietary Reference Intakes for Vitamin A, Vitamin K, Arsenic, Boron, Chromium, Copper, Iodine, Iron,
Manganese, Molybdenum, Nickel, Silicon, Vanadium, and Zinc. Institute of Medicine; The National AcademiesPress: Washington, DC, USA, 2001.
51. WHO/FAO. Guidelines on Food Fortification with Micronutrients. UNSCN Org; World Health Organization/Foodand Agriculture Organization: Geneva, Switzerland, 2006.
52. Hotz, C.; Brown, K.H. Assessment of the risk of zinc deficiency in populations and options for its control.Food Nutr. Bull. 2004, 25, 130–156.
53. WHO. WHO Anthro (Version 3.2. 2 January 2011) and Macros (2011); World Health Organization: Geneva,Switzerland, 2012.
54. Hess, S.Y.; Brown, K.H. Impact of zinc fortification on zinc nutrition. Food Nutr. Bull. 2009, 30, S79–S107.[CrossRef]
55. Vossenaar, M.; Knight, F.A.; Tumilowicz, A.; Hotz, C.; Chege, P.; Ferguson, E.L. Context-specificcomplementary feeding recommendations developed using Optifood could improve the diets of breast-fedinfants and young children from diverse livelihood groups in northern Kenya. In Public Health Nutrition;Cambridge University Press: Cambridge, UK, 2016; pp. 1–13.
56. Rah, J.H.; dePee, S.; Kraemer, K.; Steiger, G.; Bloem, M.W.; Spiegel, P.; Wilkinson, C.; Bilukha, O. Programexperience with micronutrient powders and current evidence. J. Nutr. 2012, 142, 191S–196S. [CrossRef]
Nutrients 2019, 11, 1416 16 of 16
57. Chaparro, C.M.; Dewey, K.G. Use of lipid-based nutrient supplements (LNS) to improve the nutrientadequacy of general food distribution rations for vulnerable sub-groups in emergency settings. Matern.Child Nutr. 2010, 6, 1–69. [CrossRef]
58. Soofi, S.; Ahmed, S.; Fox, M.P.; MacLeod, W.B.; Thea, D.M.; Qazi, S.A.; Bhutta, Z.A. Effectiveness ofcommunity case management of severe pneumonia with oral amoxicillin in children aged 2–59 months inMatiari district, rural Pakistan: A cluster-randomised controlled trial. Lancet 2012, 379, 729–737. [CrossRef]
59. Zimmermann, M.B.; Chassard, C.; Rohner, F.; N’Goran, E.K.; Nindjin, C.; Dostal, A.; Utzinger, J.; Ghattas, H.;Lacroix, C.; Hurrell, R.F. The effects of iron fortification on the gut microbiota in African children: Arandomized controlled trial in Côte d’Ivoire. Am. J. Clin. Nutr. 2010, 92, 1406–1415. [CrossRef] [PubMed]
60. Abebe, Z.; Haki, G.D.; Baye, K. Simulated effects of home fortification of complementary foods withmicronutrient powders on risk of inadequate and excessive intakes in west Gojjam, Ethiopia. Mater. ChildNutr. 2018, 14, e12443. [CrossRef] [PubMed]
61. Hunt, J.R. Bioavailability of iron, zinc, and other trace minerals from vegetarian diets. Am. J. Clin. Nutr.2003, 78, 633S–639S. [CrossRef] [PubMed]
62. Krebs, N.F.; Long, J.; Mondal, P.; Westcott, J.; Miller, L.; Islam, M.; Ahmed, M.; Mahfuz, M.; Ahmed, T. Zinc(Zn) absorption from micronutrient powders (MNP) is low in Bangladeshi toddlers with environmentalenteric dysfunction (EED). FASEB J. 2017, 31, 786.4.
63. Seleshe, S.; Jo, C.; Lee, M. Meat consumption culture in Ethiopia. Korean J. Food Sci. Anim. Res. 2014, 34, 7.[CrossRef] [PubMed]
64. Hirvonen, K.; Hoddinott, J. Agricultural production and children’s diets: Evidence from rural Ethiopia.Agric. Econ. 2016, 48, 469–480. [CrossRef]
65. Wessells, K.; Young, R.; Ferguson, E.; Ouédraogo, C.; Faye, M.; Hess, S. Assessment of Dietary Intake andNutrient Gaps, and Development of Food-Based Recommendations, among Pregnant and Lactating Womenin Zinder, Niger: An Optifood Linear Programming Analysis. Nutrients 2019, 11, 72. [CrossRef]
© 2019 by the authors. Licensee MDPI, Basel, Switzerland. This article is an open accessarticle distributed under the terms and conditions of the Creative Commons Attribution(CC BY) license (http://creativecommons.org/licenses/by/4.0/).


