Embed Size (px)
Citation preview


Contents
Opening Address
Welcome Message
Congratulatory Address
Keynote SpeechⅠⅡⅢ
Overall Schedule
No-Show Policy / Session Preparation
Detailed Session Program
- Oral Presentation
- Poster Presentation
Conference Venues
ICSSC 2017 Conference Committee
03
04
06
08
11
12
13
19
21
22


3
Opening Address
JoonSeub Cha
President, Korean Institute of Smart Media
Welcome to the International Conference on Software & Smart Convergence!
It is my great pleasure to welcome you to the ICSSC 2017, co-hosted by Korean Institute of Smart Media and Far Eastern Fedral university.
First of all, I would like to express endless gratitude to Far Eastern Fedral University and all committee members for ICSSC2017 for all your efforts and contribution to this conference.
This conference will be the most comprehensive conference focused on the various aspects of advances in software applications and smart convergence.
The goal of this conference is to bring researchers from academia and industry as well as practitioners together to share ideas, problems and solutions related to the multifaceted aspects of smart media and applications.
We believe that the conference will provide an opportunity for all participants to update and exchange knowledge of future smart media technology through well-formed presentations and discussions.
We have three cordially invited keynote speakers: Professor Jin Hyung Kim, Kishik Park and Adrey Chusov for special talks with the latest issues in future research for the participants. I believe the three speakers will deliver excellent ideas on the latest topics and trends in smart media technology.
ICSSC 2017 have received lots of high-quality articles from lots of different countries. I am very much sure of that this conference will give you many opportunities for human networking, collaborating each other, and enhancing the academic relationship each other for the future research.
I am also very much glad to see lots of distinguished participants joining this conference at very much charming city, Vladivostok, Russia.
I do hope you enjoy the conference and have wonderful days for good memories in Vladivostok.
Thank you very much,
JoonSeub Cha( President, Korean Institute of Smart Media)

4
Welcome Message
ByoungWan Chang
Honorary President, Korean Institute of Smart Media
Member of the National Assembly
Dear Honorable and distinguished Colleague!
On behalf of the Korean Institute of Smart Media, I want to extend my most sincere and warmest welcome to all honorable researchers to the International Conference on Software & Smart Convergence 2017
Personally, as a honorary president in Korean Institute of Smart Media, it is my great pleasure to be here to welcome you to the ICSSC 2017.
W ith memorable and successful former four international conference in SMA held in Kunming, Danang, KotaKinabalu, and Hobart, I feel much encouraged to have fifth conference again in Vladivostok. I believe that we have chosen a good place that ensures a conference, successfully and I am sure this year’s conference too will be unparalleled and successful in its own way.
I am also delighted that we were able to gather such a diverse cohort of passionate and energetic research leaders from various countries including Korea, USA, Japan and Russia.
ICSSC 2017 aimed to provide a platform that brings together researchers worldwide, innovators and students along with industrial professionals focusing on aspects of advances in software applications and smart convergence. Participants to the conference, besides updating and discuss new trends in smart media technology, have a unique opportunity to generate international research networks.
I also welcome our keynote speaker, : CEO Jin Hyung Kim, Kishik Park and Adrey Chusov I believe the keynote speaker sessions will be great opportunities to share excellent ideas on the latest topics and trends in smart media technology.
I wish all the delegates and the speakers alike the best of learning, interaction and satisfaction of sharing their knowledge.
Finally, I do hope that you have all the opportunities to explore the cultural and historical richness of Vladivostok and other part of the Russia.
Thank you very much,
ByoungWan Chang(Honorary President, Korean Institute of Smart Media)

5
Welcome Message
Chang Hee Han
President, Society for e-Business Studies
Prof. Hanyang University, Korea
Welcome to conference ICSSC 2017 at Vladivostok, Russia.
It is my great pleasure to welcome you at International Conference on Software &
Smart Convergence (ICSSC 2017). ICSSC 2017 is a conference organized by five
institutions (Korean Institute of Smart Media, Far Eastern Federal University, Society
for e-Business Studies, The Convergent Research Among Humanities, Sociology, and
Technology, Korea Bigdata Society). I hope all professionals, students, and industry
leaders from all over the world could have active discussions about their experiences,
creative ideas, and research results.
ICSSC 2017 is an international conference for the presentation of researches in the
field of electronic commerce, Internet businesses, computer science, smart technology,
software, and various information Technology. Especially, many high-quality articles
about software & smart business and technology have been submitted and presented.
I believe the articles will deliver excellent idea on the latest topics and trends in
Information technology.
I am very much sure that ICSSC 2017 will give you many opportunities for human
networking, collaborating with each other, and enhancing the academic relationship
for future research and development. I hope that this conference would give you
another chance to step toward through more active academic exchanges.
I would like to express endless gratitude to all the researchers and participants in
ICSSC 2017. And, I wish you enjoy the ICSSC 2017 and have wonderful days for
great memories in Vladivostok, Russia. I would like to thank all the members of
organizing and program committees for their invaluable contributions for this
conference.
Thank you very much

6
Congratulatory Message
Kirill� S.� Golokhvast
Vice President for Research Far Eastern Federal Univ.
We are happy to welcome you at the Russia’s Far East, in the largest Far Eastern Federal
University!
FEFU is the leader in training experts in the field of computer technology and information
security.
FEFU educates bachelors and masters in “Information Systems and Technologies” and
“Applied Informatics”, “Infocommunication Technologies and Communication Systems”,
“Information Security”, “Computer Security”
The education is aimed at bachelors and masters of information systems and technologies
who possess modern information tools for organizing activities in various fields.
The educational process relies on the study of a whole block of physical, mathematical and
information disciplines, the widespread use of computer technology and software. Students
studying in this area receive fundamental training in various areas of modern electronics (from
the basics of radio engineering, digital and analog circuitry – to the architecture and
command system of microprocessors, microcontrollers); modern computer technology: system
programming, operating systems, computer networks, microprocessor technology, database
management systems, artificial intelligence and computer graphics.
The graduates are fluent in the world's information resources, technical means of
information, they are oriented to work as programmers, electronics engineers, network
administrators, heads of IT departments.
The graduates are focused on solving problems in the development of hardware and
software for computer systems and networks, automated information processing and control
systems. Our graduates are in demand in organizations that use automated control systems,
cloud services, computer and telecommunications systems, networks and systems, etc.
Infocommunication technologies are introduced in all spheres of human activity. Scientific
and engineering activities in the Far East of Russia are closely intertwined with the theoretical
study of information technologies, as well as with the practical application of computing in
scientific and industrial activities. Scientific and educational activities related to the
development and use of tools and methods of information technology and calculators for
various purposes and architectures are actively conducted, and artificial intelligence tools are
being researched and implemented, including when working with big data and in the
implementation of uncertainty problems.
7
Congratulatory Message
Zoonky� Lee
Vice President, Korea BigData Society
Prof. Yonsei University, Korea
On behalf of Korean Bigdata Society, I am here to congratulate Korea Institute of Smart
Media, Far Eastern Federal University at Vladivostok and Society for eBiz Studies in Korea for
successfully hosting ICSSC 2017 in this beautiful city of Vladivostok. My name is Dr. Zoonky
Lee, executive vice president of Korean Bigdata Society.
Around the world nowadays Information technologies are changing the way our society
has been working since the first industrial revolution in 18c. The media used be working as
a few media moguls generated news and broadcast to the public. Most people just listened
to what has been generated and delivered to them. School systems were instituted to
produce mass skilled workers for rapid industrialized societies. Less skilled workers, by the
help of industrialized mass production technologies, could increase their productivity and
generate more revenues. But recent years the rapid development of information technologies
change the knowledge structures, therefore the power structure of our societies. News are
being generated by many small media as well as by individual bloggers. Artificial intelligence
armed with big data and computer generated patterns produce knowledge well over the
power of human experts. Many of our professional jobs including medical doctors, CPAs,
university teachers and lawyers, if we just name a few, are in danger of being replaced by AI.
In fact, it is not just professionals whose jobs are in dangers. One study predicted that more
than 47% of our jobs will disappear in decade.
Whether we call this coming phenomena as the 4th industrial revolution, digital
transformation orindustrial 4.0, it is a very critical moment for scholars in Information and
media area to study how the new technologies are transforming our societies.
In this sense, it is very important for renowned academia in the world get together in this
conference and share their views from many different perspectives. I am pretty sure that
discussions and papers presented in the conference will lead us to a better understanding as
to how new technologies are changing our societies.
I once again congratulate Dr. Cha, JoonSeub, president of Korea Institute of smart media,
D.r Irina Artemyeva, Dean of Far Eastern University at Vladivostok and lastly, not least, Dr.
Han, Chang Hee of president of society of eBiz Studies in Korea for jointly hosting this
conference and I strongly believe that this kind of joint effort has to continue. Thank you.
8
Keynote SpeechⅠ
Jin Hyung Kim
CEO, Artificial Intelligence Research Institute (AIRI)
Professor Emeritus of KAIST Computer Science Department
Chairman, Open Data Strategy Council, Korea
Artificial Intelligence and the 4th Industrial Revolution
The coming technological revolution referred to as the fourth industrial revolution
will fundamentally change the way we live and work. Previous industrial revolutions
are aims to automate physical labor, but current one aims to automate mental labor
and knowledge works. Therefore, its impact is much deeper and wider. This
revolution is driven by digital technology. Many Koreans clearly witnessed the
transformational technology to be Artificial Intelligence(AI) after watching AlphaGo’s
winning over Lee SeDol in Seoul. AI mimics human’s intelligent behavior and is the
major tool for automating mental labor and knowledge works.
There are many ups and downs for 70 years of AI research. Today’s AI success is
based on three factors: powerful computing, Big data from sensors and internet, and
algorithms shared by open source. AI is considered even as a new factor of
production, rather than just a productivity enhancer. AI market is coming much faster
than projected. All the large players such as Google and Apple, as well as startups
are jumping into the market. AI has the potential to double annual growth rates in
most of advanced countries by 2030. Therefore, advanced countries took AI first
strategy to respond the 4th industrial revolution.
All the goodies come with baddies. Many jobs will disappear due to automation
by AI and software. 47% of current jobs in America will disappear within 10 or 20
years. About 70% of Korean workers will affected within 10 years. This means 18
million Korean jobs are under risk. 65% of our children will have completely different
jobs that don’t exist today. Accordingly, our education system should undergo
extensive change, in all aspects of what is taught and how it’s taught.
As other advanced countries, Korea started preparing the transition to the AI era.
Industrial restructuring, education reform, labor and welfare system reform are in the
priority. Adjusting laws and regulations and well as R&D system is required for the
preparation of coming AI society. Are we ready for the new era of the 4th Industrial
Revolution? We need to work hard once again, but much smarter this time.
Keynote SpeechⅡ
Andrey Chusov
Associate Professor @Far-Eastern Federal University
Applying High-Performance Computing in Scientific Analysis of Wave
Physical Fields
Computer-aided simulation of wave phyical fields is usually an implementation of
finding a solution to some differential equation of equilibrium state of a system
“medium-field”, such as the Maxwell’s system of equations or the acoustic wave
equation. In most cases, when it is needed to consider a behavior of a wave field
with respect to its wavelengths the underlying algorithmic implementation requires
computational time and space which are, at best, powers of a used discretization
level and may be exponential if some generalization takes place - for example, to
take into account reflections of waves on boundaries and local inhomogeneties in the
modelled space. Also, a number of those discrette elements of the medium defined
in and delimited by a hypercube is a power of a ratio of the hypercube size to the
minimal considered wavelength. The proportionality coefficient is usually significantly
greater than one. For instance, in architectural acoustics this coefficient should be at
least six which yields for a wavelength 0.34m (which corresponds to a 1kHz sine
wave in normal temperature and pressure) a number of elements approximately
5.5E+3 times the size of the cube in meters. Therefore, most implementations heavily
rely on parallel computing in order to provide accurate results in a reasonable
amount of time.
One of the consequences of this is that strict requirements to the adequacy of the
results as well as special conditions in which simulated field is being studied (such as
detailed behavior of the field components in some small locality in space and time)
necessitate to use a specially developed software and hardware implementation of the
simulation optimized for a given set of problem domain related characteristics.
Some aspects and methods of solving these problems with different kinds of parallel
computers are covered in the report.

10
Keynote SpeechⅢ
Kishik Park, Ph.D.
Member IEEE-SA BOG(Board of Governors)
Prof. University of Science and Technology
President Green ICT Forum Korea
Principal Researcher Electronics & Telecom Research Institute
Ethical Considerations in Artificial Intelligence and Autonomous Systems
To fully benefit from the potential of Artificial Intelligence and Autonomous
Systems (AI/AS), we need to go beyond perception and beyond the search for more
computational power or solving capabilities.
We need to make sure that these technologies are aligned to humans in terms of
our moral values and ethical principles. AI/AS have to behave in a way that is
beneficial to people beyond reaching functional goals and addressing technical
problems. This will allow for an elevated level of trust between humans and our
technology that is needed for a fruitful pervasive use of AI/AS in our daily lives.
Eudaimonia, as elucidated by Aristotle, is a practice that defines human wellbeing
as the highest virtue for a society. Translated roughly as “flourishing,” the benefits of
Eudaimonia begin by conscious contemplation, where ethical considerations help us
define how we wish to live. By aligning the creation of AI/AS with the values of its
users and society we can prioritize the increase of human wellbeing as our metric for
progress in the algorithmic age.
Ethically Aligned Design will provide insights and recommendations from these
peers that provide a key reference for the work of AI/AS technologists in the coming
years. To achieve this goal, in the current version of Ethically Aligned Design (EAD
v1), we identify Issues and Candidate Recommendations in fields comprising Artificial
Intelligence and Autonomous Systems.
The IEEE Global Initiative on this issue is to provide recommendations for IEEE
Standards based on Ethically Aligned Design. IEEE P7000™ – Model Process for
Addressing Ethical Concerns During System Design was the first IEEE Standard Project
inspired by The Initiative. Two further Standards Projects, IEEE P7001TM –
Transparency of Autonomous Systems and IEEE P7002TM – Data Privacy Process, have
been approved, demonstrating The Initiative’s pragmatic influence on issues of AI/AS
ethics.

11
Overall ScheduleJune 27 Contents12:00 - 18:00 Conference Registration15:00 - 17:00 Activity Report by ICSSC Societies17:00 - 17:20 Coffee Break17:20 - 20:00 Welcome Dinner Party
June 28 Contents Remark Chair09:00 - Registration
09:00 - 10:00 Coffee BreakCampus B, 5F
Lobby
10:00 - 10:30 Opening Ceremony
Campus B, 5F
Marine Conf. Hall
KyungJin Cha
10:30 - 11:10 Keynote Speech
-JinHyung Kim
-Andrey Chusov
-KiShik Park
InHo Ra11:10 - 11:40
11:40 - 12:20
12:20 - 13:30 Lunch Campus B, 4F
13:30 - 14:50Oral Presentation
(Session A,B,C,D)
A (Campus E, 319)
B (Campus E, 320)
C (Campus E, 321)
D (Campus E, 322)
YoungChul Kim
Lubov Statsenko
MuCheol Kim
SooHyung Kim
14:50 - 15:10 Coffee Break
15:10 - 16:30Oral Presentation
(Session E,F,G,H)
E (Campus E, 319)
F (Campus E, 320)
G (Campus E, 321)
H (Campus E, 322)
InHo Ra
Alexandr Rodionov
YangHoon Kim
SangMan Moh
16:30 - 16:40 Coffee Break
16:40 - 18:00
Oral Presentation
(Session I, J, K)
I (Campus E, 320)
J (Campus E, 321)
K (Campus E, 322)
Chilwoo Lee
DongSun Park
YongSeok Cho
Poster PresentationCampus E, 3F
Lobby
PanKoo Kim
JinGwang Koh
18:20 - 20:30 BanquetCampus A,
12F Lobby
HangBae Chang
LeeWon Park
June 29 Contents
10:00 - 12:00Special SessionⅠ
Future ICSSC Organization12:00 - 13:00 Lunch
13:00 - 18:00Special SessionⅡ
IT Industries Field Trip
June 30 Contents10:00 - 12:00 Campus Tour - Habarovsk University
12:00 - 13:00 Lunch
13:00 - 17:00 Industry-Academic Cooperation Session(Panel Discussion)
17:00 - 18:00 Organizing Committee Evaluation

12
No-Show Policy
I. "No Show" papers will be excluded from the nomination of the best paper award
of the recommendation for the journal publication.
II. The list of "No Show" papers will be opened to the conference participants unless
the authors report to the program committee before the session in case of
emergencies.
III. Further restrictions or penalty can be applied to the authors of "No Show" papers.
Oral/ Poster Session Preparation
I. A paper presentation should be made by one of authors of paper, during a 20
minute time slot(15 minutes for the presentation itself and 5 minutes for Q&A)
II. All speakers of each session should meet the session chair at its room 10 minutes
before the session.
III. We will prepare laptops running the Adobe Reader and M icrosoft Office for
presentations. Please prepare your presentation files for being read by those
applications.
IV. All poster presenters must prepare presentation material (up to 10 pages A4 size)
at least 10 minutes before the session starts. The presenter should stand by his or
her presentation stand (refer to the poster code below) and answer question
during the session.
V. All session chairs should check the presentations (file, presenter attendance,
microphone etc.) at least 10 minutes before the sessions, and report an evaluation
result for the session to the conference administration center.

13
Oral PresentationⅠ
Session A Information System
13:30 - 14:50, Campus E 319
Session Chair : YoungChul Kim(Chonnam National Univ.)
P.26Policy-based, Cost-Aware Cloud Application Orchestration
Kena Alexander, Choonhwa Lee(Hanyang Univ., Korea)
P.31An Analysis of Information Technology Trends Using Best-selling Books
Mumyoungcho Han, Yujin Lee, Eunhye Kim, Sujin Shim, Choong Kwon Lee(Keimyung Univ., Korea)
P.35Sentiment Analysis Using Reviews from Movie Viewers
Jaehwa Lee, M in Kim, Jin Baek Yi, Choong Kwon Lee(Keimyung Univ., Korea)
Session B Networking & Communications
13:30 - 14:50, Campus E 320
Session Chair : Lubov Statsenko(FEFU)
P.39
System-Level Performance of MAC Protocols in Cognitive Radio Ad Hoc Networks
Kishor Singh, Sangman Moh(Chosun Univ., Korea)
P.45
Design of Smart Greenhouse Sensor Communication System based on LoRa W ireless Sensor Network
Hyeono Choe and Hyun Yeo(Sunchon Nat'l Univ., Korea)
P.50Fake News Detection using Convolutional Neural Networks
Taekeun Hong, Hanil Kim, Pankoo Kim(Chosun Univ., Korea)
P.54
A Novel Clustering Method with Considering Node Connectivity for Centralized Disaster Safety Network with Sensors
A. S. M . Sanwar Hosen(Gunsan Nat'l Univ.), Gi Hwan Cho(Chonbuk Nat'l Univ.), Kishik Park(ETRI, Korea), In-Ho Ra(Gunsan Nat'l Univ.)

14
Oral PresentationⅠ
Session C Smart Information13:30 - 14:50, Campus E 321
Session Chair : M uCheol Kim(Wonkwang Univ.)
P.60
An Empirical Investigation of the Importance of IS Control Mechanisms Compatibility in Achievement of Superior IS Capabilities
Elizaveta Srednik, Kyung Jin Cha(Kangwon Nat'l Univ., Korea)
P.65Detection of Malicious Code using the FP-Growth Algorithm and SVM
Yeongji Ju, Juhyun Shin(Chosun Univ., Korea)
P.69
Adapting Parallel Computer Simulation of Physical Fields to Multiple Problem Domains
Andrey A. Chusov, Lubov G. Statsenko, Alexey P. Lysenko, Sergey N. Kuligin, Nelly A. Klescheva(FEFU, Russia)
Session D Computer V ision, Image Processing & Software Applications
13:30 - 14:50, Campus E 322
Session Chair : SooHyung Kim(Chonnam National Univ.)
P.74
Deep RNN-CNN Based Activity Detection from Video
Yali Nie(Chonbuk Nat'l Univ., Korea), Yong Suk Cho(Hansei Univ., Korea), Yongchae Jeong, Dong Sun Park(Chonbuk Nat'l Univ., Korea)
P.78
A Study of Character Input Interface based on Drag Gesture with a Smart DevicesKitae Bae(SM IT, Korea), Libor Mesicek(J.E. Purkinje Univ., Korea), Hoon Ko(Sungkyunkwan Univ., Korea)
P.82WI-SUN based Cattle Shed Management System
Sooho Jeong, Hyun Yeo(Sunchon Nat'l Univ., Korea)

15
Oral PresentationⅡ
Session E Information System15:10 - 16:30, Campus E 319
Session Chair : Inho Ra(Kunsan National Univ.)
P.87
Multi-level Combination based Topic Detection with Science Data
Mucheol Kim(Wonkwang Univ., Korea), Hosung Kang, Sanghyun Seo, Namyeon Lee(Sungkyul Univ., Korea), Sang Oh Park(Chung-Ang Univ. Korea)
P.91
Diagnostic and Testing Methods to Ensure Security of Protected Distribution SystemsYuri. V. Dobrzhinskii, Tatiana Yu. Dobrzhinskaia, Olesya S. Rogova(FEFU, Russia)
P.94A New Approach to Overcome One-way Data Analytic Process
Hwa Jong Kim(Kangwon Nat'l Univ., Korea)
Session F Networking & Communication
15:10 - 16:30, Campus E 320
Session Chair : Alexandr Rodionov(FEFU)
P.97
The Features of Designing of Underwater Acoustic Sensor Networks for Shelf Zones of North-Western Pacific Regional Seas
A.Yu. Rodionov, P.P. Unru, A.V. Kirianov, L.G. Statsenko and B.A. Salnikov(FEFU, Russia)
P.103PM-10 Forecasting using Separated MLP Neural Networks
S. H. Yu and H. Y. Kwon(Anyang Univ., Korea)
P.106
A Novel Abnormal Behavior Detection Framework to Maximize the Availability in Smart Grid
Jeongshik Hwang and Incheol Shin(Mokpo Nat'l Univ., Korea)
16
Oral PresentationⅡ
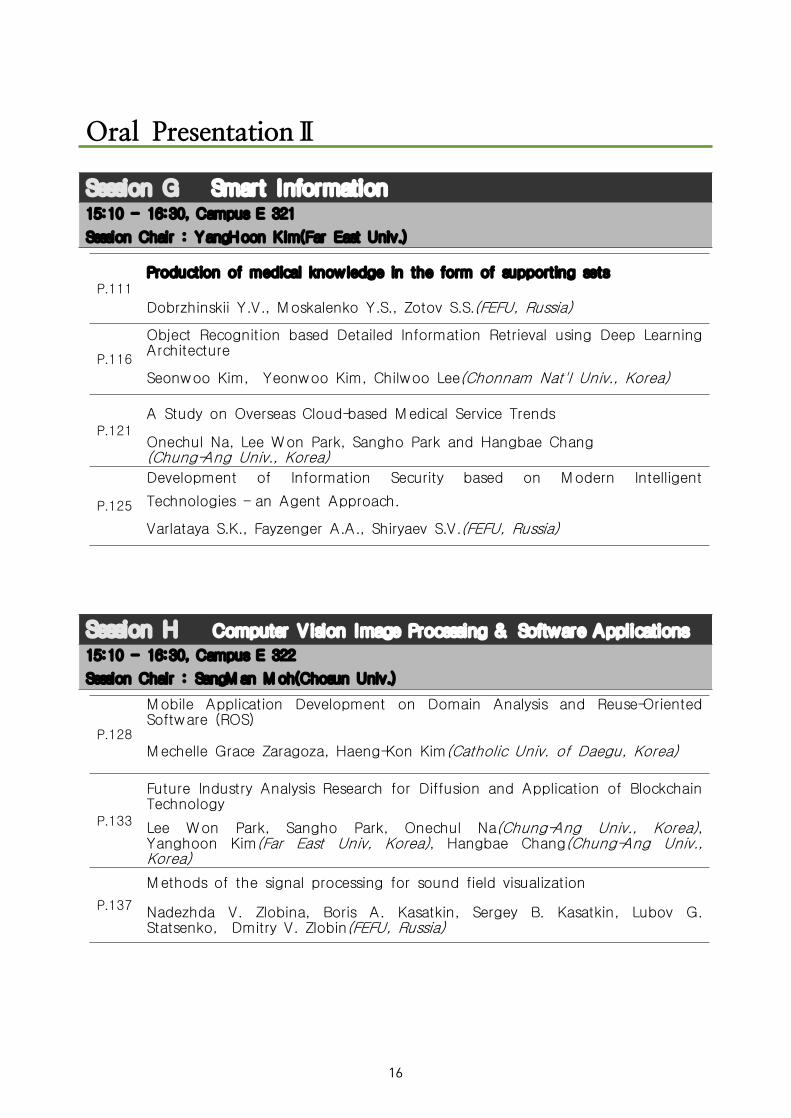
Session G Smart Information15:10 - 16:30, Campus E 321
Session Chair : YangHoon Kim(Far East Univ.)
P.111Production of medical knowledge in the form of supporting sets
Dobrzhinskii Y.V., Moskalenko Y.S., Zotov S.S.(FEFU, Russia)
P.116
Object Recognition based Detailed Information Retrieval using Deep Learning Architecture
Seonwoo Kim, Yeonwoo Kim, Chilwoo Lee(Chonnam Nat'l Univ., Korea)
P.121A Study on Overseas Cloud-based Medical Service Trends
Onechul Na, Lee Won Park, Sangho Park and Hangbae Chang(Chung-Ang Univ., Korea)
P.125
Development of Information Security based on Modern Intelligent
Technologies - an Agent Approach.
Varlataya S.K., Fayzenger A.A., Shiryaev S.V.(FEFU, Russia)
Session H Computer V ision Image Processing & Software Applications
15:10 - 16:30, Campus E 322
Session Chair : SangM an M oh(Chosun Univ.)
P.128
Mobile Application Development on Domain Analysis and Reuse-Oriented Software (ROS)
Mechelle Grace Zaragoza, Haeng-Kon Kim(Catholic Univ. of Daegu, Korea)
P.133
Future Industry Analysis Research for Diffusion and Application of Blockchain Technology
Lee Won Park, Sangho Park, Onechul Na(Chung-Ang Univ., Korea), Yanghoon Kim(Far East Univ, Korea), Hangbae Chang(Chung-Ang Univ., Korea)
P.137
Methods of the signal processing for sound field visualization
Nadezhda V. Zlobina, Boris A. Kasatkin, Sergey B. Kasatkin, Lubov G. Statsenko, Dmitry V. Zlobin(FEFU, Russia)

17
Oral PresentationⅢ
Session I16:40 - 18:00, Campus E 320
Session Chair : ChilWoo Lee(Chonnam National Univ.)
P.144
Analysis of Job Postiongs for Three Software Careers : Developer, Programmer, and Engineer
Hyeongyeong Gim, Soyeon Kim(Keimyung University, Korea)
P.147In Search of Factor Affecting the Ranking of the Songs
Gyubok Lee, Seungyeon Lee, Jihye Choi(Keimyung University, Korea)
P.150Development of News Crawling Systems Using Really Simple Syndication
Jinyoung An, Gyujin Pyo, Myeongjun Jeon(Keimyung University, Korea)
P.153Development of a Portal System for Data Sharing and Utilization
M ingi Jeong, Donghyeok Kim, Eunmin Choi(Keimyung University, Korea)
Session J
16:40 - 18:00, Campus E 321
Session Chair : DongSun Park(Chonbuk National Univ.)
P.156Analysis of Soft Skills Needed for Analytic Jobs in Information Technology
Jae Ik Son, Ye Seul Park(Keimyung University, Korea)
P.160Prediction of Ticket Sales before the Opening of the Movies
Kyoungmin Go, Jungmin Kim, Hyewon Lee(Keimyung University, Korea)
P.164
Automated Classification of Job Advertisements: Causes of Incorrectness and Its Implications
In Hyeok Choi, Myeong Joon Jeon(Keimyung University, Korea)
P.168
A Study on Responsive Web Development for Food Management and Analysis of Customized Refrigerator
Jin Woo Nam, Jae Uk Choi, Kyoung M in Kim(Keimyung University, Korea)

18
Oral PresentationⅢ
Session K16:40 - 18:00, Campus E 322
Session Chair : YongSeok Cho(Hansei Univ.)
P.173Success Factors Affecting Crowdfunding for Game Development Projects
Woochang Lee, Jeonghui Lee, Hwiyeong Gwak, and Suhyeon Moon(Keimyung University, Korea)
P.177Development of Integrated Delivery Systems at Grocery Stores in South Korea
Jungin Lee, Hyunjin Park, Sujin Lee, M inji Kim(Keimyung University, Korea)
P.180Analysis of Knowledge and Skills Needed for Software Architects
Yeongkwang Han, Gyulhee Kim, M ina Kim(Keimyung University, Korea)
P.184
Salary Prediction for Professional Baseball Players in South Korea
Wonseok Lee, Seongkoo Kim, Jaeho Lee, Sangmin Jo(Keimyung University,
Korea)

19
Poster Presentation
Poster SessionCampus E, 3F Lobby
Session Chair : PanKoo Kim(Chosun Univ.)
JinGwang Koh(Sunchon National Univ.)
P.188
Algorithm for the Amount Estimation of a M inor Fish School in a Net
Aleksandr Golov, Yury Morgunov, Byunghyun Lim, Lubov Stasenko,
Kiseon Kim(GIST, Korea)
P.193
Fish Count Estimation of Dense Population in Aquaculturing Nets
Sungjin Park, Yury Morgunov, Aleksandr Golov, Peter Unru, Kiseon Kim
(GIST, Korea)
P.197
Real-time Current Monitoring around a Shallow Coastal Shelf of Korea
Nampyo Hong, Yury Morgunov, Aleksandr Golov, Aleksandr Radionov,
Kiseon Kim(GIST, Korea)
P.201
Design and Implementation of Event Detection System on Hadoop
Van Quan Nguyen, Huyng-Jeong Yang, Young-chul Kim, Soo-hyung Kim,
Guee Sang Lee, M inku Kwon(Chonnam Nat'l Univ., Korea)
P.206
A Study on Next-Generation Bus Information System applied to User’s
Smart Phone ApplicationHwa-Jeong Lee, Dong-Ok Cho, Jin-Gwang Koh(Sunchon Nat'l Univ.,
Korea), Seok-Chul Lee(LTSKorea, Korea), Seung-Jae Oh, Jin-Yong
Jung(Cheongam College, Korea), Gyu-Geun Lim(Songwon Univ., Korea)
P.211
Using Fully Convolutional Network for Text Detection
Son Tung Trieu, Soo-hyung Kim, Huyng-Jeong Yang, Guee Sang
Lee(Chonnam Nat'l Univ., Korea), Dong-Ok Cho, Jin-Gwang Koh(Sunchon
Nat'l Univ., Korea)
P.217
Development of acupuncture simulator for oriental medicine
learner-centered education -Focus on software-
Kang-Jun Lee, Tae-Jin Ha, Seung-Won Cho, Guk-Jeong Kim(BonC, Korea)
P.221Gyroscopes for Text Entry with Mobile Phones
Ashok Choudhary, Jongman Kim(Cleveland State Univ., USA)
P.228
Verification and Validation of Automotive Embedded Software
Subramaniam Ganesan, Kokula Krishna Hari Kunasekaran(Oakland Univ.,
USA)

20
Poster Presentation
Poster SessionCampus E, 3F Lobby
Session Chair : PanKoo Kim(Chosun Univ.)
JinGwang Koh(Sunchon National Univ.)
P.233
Development and Validation of a Parallel System Using a Robot for
Dining philosopher’s problem based on CSP model
Tadaaki Kirishima, Hiroki Sakurai, Masanori Shinozaki, Kazuhito Ohmaki
,Kensei Tsuchida(Toyo Univ. Janpan)
Takaaki Goto(Ryutsu Keizai Univ., Japan)
P.239
Combinational Watermarking for Medical Images
Thrilok Chakravarthy, Ravi Sankar(Univ. of South Florida, USA)
In-Ho Ra(Kunsan Nat'l Univ., Korea)
P.246
Bio Acoustic Signal Feature Extraction and Pattern Recognition Framework
P. Chetlur Adithya, S. R. Pandey, R. Sankar, W. A. Moreno, S. Hart
(Univ. of South Florida, USA), In-Ho Ra(Kunsan Nat'l Univ. Korea)
P.251
Human Face Tracking with Cascaded CNN Face Detector and Enhanced
Active Appearance Model
Hong Tai Tran, M in Ku Kwon, Guee Sang Lee, Hyung Jeong Yang,
Young Chul Kim, In Seop Na, Soo Hyung Kim(Chonnam Nat'l Univ., Korea)
P.256
Development of Context Awareness System for Smart Lab Environments
Prabesh Paudel, Sangkyoon Kim, Soonyoung Park, Kyoungho Choi(Mokpo Nat'l Univ., Korea)
P.261
Distributed MAC Protocols for Cognitive Radio Networks: A Comparative Survey
Subash Luitel, Sangman Moh(Chosun Univ., Korea)
P.267
Design of a Flexible Three-Dimensional Geofence model depending on Context Changes
Rankwon Kim, Hyunmi Ryu, Youngsoo Choi, Gyowoong Hwang, Kyungho Park, Sungguk Cho, Byungkook Jeon(Gangneung-Wonju Nat'l. Univ.,Korea)
21
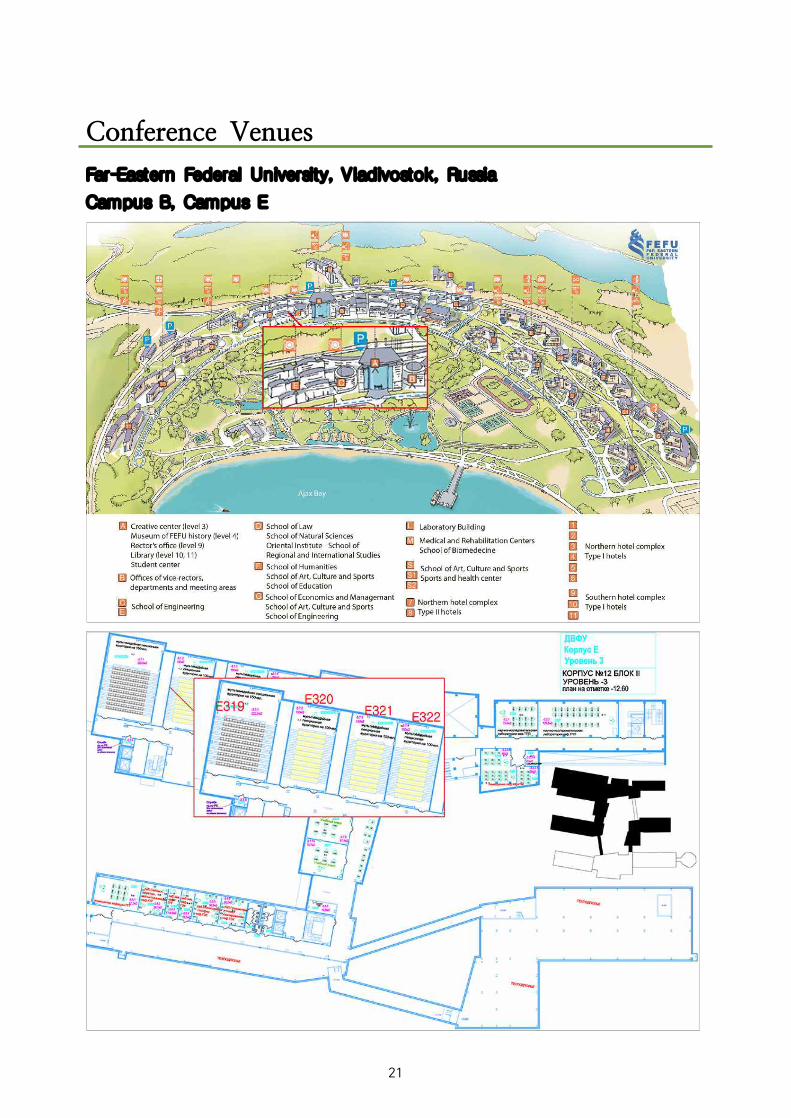
Conference Venues
Far-Eastern Federal University, Vladivostok, Russia
Campus B, Campus E

22
ICSSC 2017 Conference CommitteeGeneral Co-Chairs
- Joon Seub Cha
President of KISM . Korea
- Irina Artemyeva
Dean of FEFU, Russia
- Chang Hee Han
SEBS, Korea
Organizing Committee Co-Chairs
- Kyung Jin Cha
Kangwon National Univ., Korea
- Lubov Statsenko
FEFU, Russia
- Valerii Petukhov
FEFU, Russia
Program Committee Co-Chairs
- In Ho Ra
Kunsan National Univ., Korea
- Alexander Bekker
FEFU, Russia
- Hang Bae Chang
ChungAng Univ., Korea
Web Site Co-Chairs
- WooSung Jang
Hongik Univ., Korea
- DongOk Cho
Sunchon National Univ., Korea
Financial&Registration Co-Chairs
- SooHyung Kim
Chonnam National Univ., Korea
- Aleksei Kholodov
FEFU, Russia
Industrial Chair
- LG CNS, Korea
- DSIC, Korea
- Cyber Tech, Korea
- BonC Innovator, Korea
Advisory & Social Event Committee
- HaengKon Kim
DaeGu Catholic Univ., Korea
- GiSun Kim
GIST, Korea
- KwanHo Song
IPAK, Korea
Local Arrangement Committee
- JeaSung Park
NANURI travel, Russia
Organizing Committee
- ByungKi Kim
Silla Univ., Korea
- SiCheon You
Chosun Univ., Korea
- PanKoo Kim
Chosun Univ., Korea
- HyunHo Yang
Kunsan National Univ., Korea
- Su Ryeol Oh
Mokpo National Univ., Korea
- Chilwoo Lee
Chonnam National Univ., Korea
- JiMan Hong
Soongsil Univ., Korea
- Jingwang Koh
Sunchon National Univ., Korea
- Hansuk Choi
Mokpo National Univ., Korea
- Youngchul Kim
Chonnam National University, Korea
- Kiwhan Cho
Chunbuk National University, Korea
- Yongil Kim
Honam University, Korea

23
ICSSC2017 Conference Committee
- ChangHo Seo
KongJu Univ., Korea
- Suhyung Kim
Chonnam National University, Korea
- Seil Choi
Honam University, Korea
- Sanghyun Bae
Chosun University, Korea
- Gabsang Ryu
Dongshin University, Korea
- ZoonKy Lee
Yonsei University., Korea
- JooSeok Park
Kyunghee University, Korea
Program Committee
- GueeSang Lee
Chonnam National University, Korea
- Yosung Ho
GIST, Korea
- Dong Sun Park
Chonbuk National University, Korea
- ChungKwon Lee
Keimyung Univ., Korea
- YongSeok Cho
Hansei University, Korea
- Hanil Kim
Jeju National University, Korea
- HeeYong Kwon
Anyang University, Korea
- SangMan Moh
Chosun University, Korea
- YongChae Jeong
Chonbuk National Univ., Korea
- GyuGeun Lim
SongWon University, Korea
- HwaJong Kim
Kangwon National Univ., Korea
- YangHoon Kim
FarEast University, Korea
- Mucheol Kim
Wonkwang University, Korea
- SungBeom Pan
Chosun University, Korea

International Conference on Software & Smart Convergence (ICSSC) 2017, June 2017 Copyright ⓒ 2017 ICSSC
This research was supported by Basic Science Research Program through the National Research Foundation of Korea(NRF) funded by the Ministry of Science, ICT & Future Planning (No. 2017R1A2B4010395).
Policy-based, Cost-Aware Cloud Application Orchestration
Kena Alexander1 and Choonhwa Lee2 1 Division of Computer Science and Engineering, Hanyang University
Seoul – South Korea [e-mail: [email protected]]
2 Division of Computer Science and Engineering, Hanyang University Seoul – South Korea
[e-mail: [email protected]]
Abstract
The Orchestration of cloud application components across heterogeneous cloud platforms is an ongoing topic that is steadily receiving traction. Orchestration models and tools allow cloud application managers to automate the distribution of application components based on different factors. However, not much emphasis has been placed on orchestrating application components based on the constraints of Total Cost of Ownership of the application itself. To address this, we present a study that incorporates a Total Cost of Ownership model with a declarative policy model, capable of orchestrating application components. Our study shows that through the combination of these models cost aware cloud application orchestrating across heterogeneous cloud providers can be achieved.
Keywords: Cost Model, Orchestration, Policies, Policy Management
1. Introduction
The well-established concepts of Cloud Computing allow for the provisioning of application resources on Cloud provider platforms with the expressed purpose of reducing the problems of vendor lock in [1]. Vendor lock in, however is just one of the many problems that may be solved through the proliferation of the concepts of Cloud Computing. Prior to this, companies were required to budget the Total Cost of Ownership (TCO) of not only applications that they deploy within their environments but also the infrastructure needed to run such applications [2][3]. However, by outsourcing the infrastructure cost to IaaS, PaaS or even SaaS providers companies were free to concentrate on their applications rather than the
infrastructure required. As cloud computing matured, the number and
quality of cloud providers increased also, giving rise the need for applications to be distributed and orchestrated across homogeneous and eventually heterogeneous cloud platforms [4]. Cloud Application deployment and orchestration standards such as OASIS TOSCA [5] and OASIS CAMP [6] have made significant advancements however, these tools have been unable to provide a means of analyzing cloud application cost as well as allowing for clients to make use of orchestration with regards to the TCO of a cloud application.
In this paper, we therefore aim to propose and present a cloud application orchestration strategy, taking into consideration the Cost of Ownership of a cloud application. In our study we will make use of OASIS CAMP as well as declarative
28 page < ICSSC 2017 Proceeding >26 page International Conference on Software & Smart Convergence ICSSC 2017

policies [7] for deploying managing and interfacing with applications across various cloud platforms.
The rest of this paper is categorized as follows. In section 2 we will works related to our study. In section 3 we will present our TCO model. In sections 4 and 5, we will present our analysis and results after which we will conclude our paper.
2. Related Work
There is a considerable amount of work done recently on estimating the cost of ownership of cloud applications. A mathematical model for determining the Total cost of ownership of cloud applications was demonstrated in [3] which incorporated cost-based factors of cloud providers in order to estimate the TCO of an application. CostHat [8] presented a methodology for modelling and estimating the cost of microservice applications deployed on Amazon AWS and Lambda services. We built our work by also following the TCO approach highlighted by these aforementioned works, however, our focus is on addressing the need for standardized orchestration based on the Cost analysis of cloud-based application components. Our work sees us integrating a cost model with a policy orchestration model based on OASIS CAMP.
3. Cost Model
In this section, we present the cost model used to investigate the cost-aware orchestration of applications across heterogeneous cloud platforms.
3.1 Overall strategy
The overall strategy of our approach focuses on combining the use of a cost model that describes the TCO of a cloud application with a declarative policy model to manage the orchestration of the application and components across multiple cloud providers.
3.2 Cost Model In order to deliver an application to the cloud, cloud-application platforms may supply dedicated virtual machines as is the case with
IaaS or provide a multi-tenant model such as PaaS or SaaS. This choice has different effects on the total cost to deploy and operate an application over a period of time [3]. As cloud applications consists of artifacts owned by a client which are deployed to services allocated on a cloud platform, usage may be specified by the type of service that is allocated and the resources the service utilizes on the platform. Considering this, cloud service providers may then use different models to allocate pricing. For example,
1. usage may be charged at a fixed rateover a period of time regardless of theamount of services deployed or theworkload being experienced.
2. usage may be charged based on thenumber and types of services used. Thisis also accrued over a fixed period oftime.
3. there may be a combination of both,where a fixed maintenance fee ischarged in combination to per-use fee.
If we consider case 1, this option is not well suited for orchestration of application components as there is nothing to be gained by spreading components across providers. The fixed fee will still be applied regardless of there being one (1) service deployed or n services deployed on the provider’s platform. Therefore, with orchestration in mind cases 2 and 3 are more suitable. Using these cases, we can identify the factors that influence operating cost as given in Table 1.
Table 1. Cost factors of the TCO model Cost
factor Description
Ft The fixed cost accrued over time t. Usually maintenance cost
Touti The data transfer cost out of service i.
Tini The data transfer cost into service i.
Sti The unit operating cost of service i accrued over t
3.3 Operating Cost Using these factors, we can deduce that the operating cost of a cloud application over a period of time may be given as the sum of the cost of the services provisioned for the application as seen in equation 1. We may also
< ICSSC 2017 Proceeding > 29 pageICSSC 2017 International Conference on Software & Smart Convergence 27 page
deduce that the operating cost of an application in the cloud may be used to report the current expense of a cloud application and more intuitively, by comparing a “forward lookup” of the expected operating cost and a current “budgeted value”, cloud application managers may use the expected operating cost as a constraint when selecting cloud providers. This consequently can be seen in equations 2 and 3 which respectively minimize or maximize the operating cost.
! = $% + '()% + '*+ + ,% ! = $% + '()%* + '+,* + -%* (1)
!"#$ = "#$['( + *+,(- + *./- + 0(- ] (2)
!"#$ = "#$['( + +,-(. + +#$. + /(. ] (3)
4. Policy Model
Declaratively defined policies have been explored in our previous work [7] as a means of extending the CAMP platform in order to provide orchestration capabilities. In our approach, a declarative policies solution is comprised of declarative policy documents as well as policy management directives written in YAML. Thus, in order to integrate our cost model with our extended CAMP platform it was necessary for us to convert our cost models into policy model constraints.
4.1 Typed Policies and Constraints
Our declarative policies are used to specify the constraint relationship between a property, in this case a CAMP Sensor, and a value. In order to make use of declarative policies it is necessary to identifying the constraints that should be adhered as well as the property and value. For example, an operating cost model may be described as a Management policy that relates the operating cost of a service over a period of time to a budgeted cost for that service.
4.2 Policy management Our approach relies on policy manager directives to define actions that may be taken in case of a policy violation. this is done as policies are considered contracts that should be adhered to by the application and not active objects. For example, a policy manager directive may contain a MOVE action that may be a suitable in case of an operating constraint violation. Our policy manager directives would thus hold the properties affected by such an action as well as the expected transitions if the action is performed.
5. Evaluation
The evaluation of our work was done in two parts. Firstly, we numerically analyzed our cost model using cost information derived from actual cloud providers. Secondly, we illustrated the concepts of our cost model by describing an example application and policies then analyzing the expected behavior using 2 scenarios
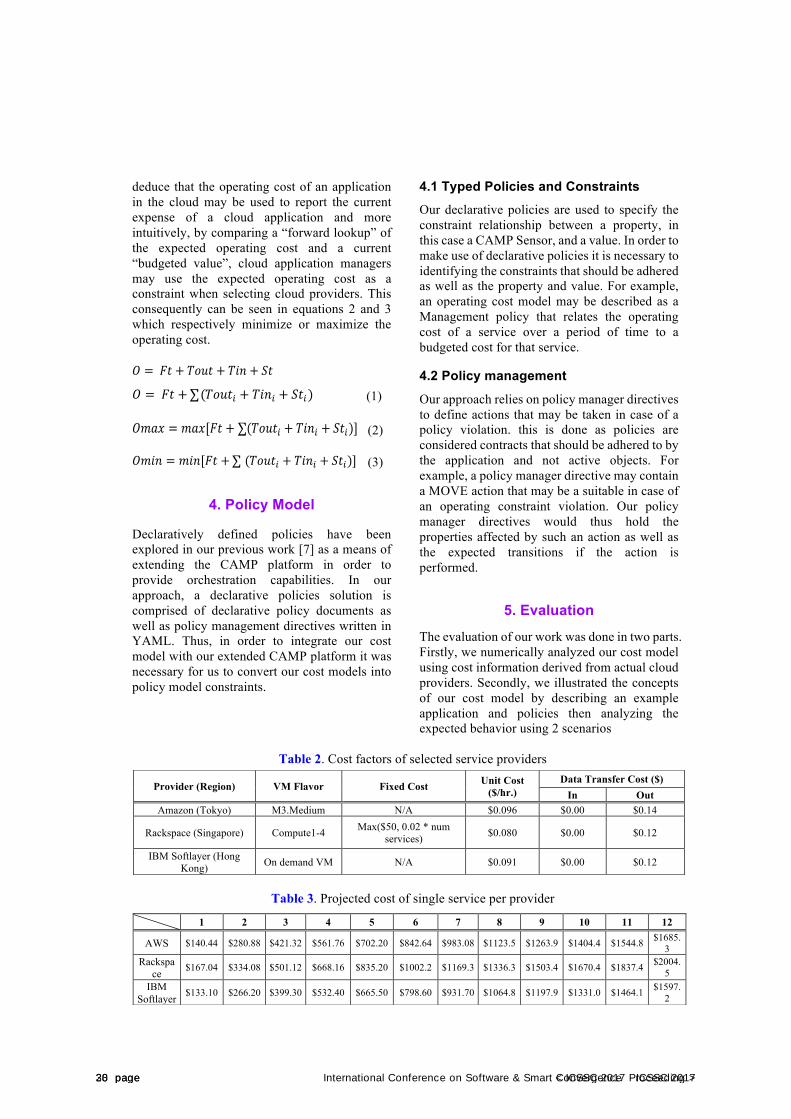
Table 2. Cost factors of selected service providers
Table 3. Projected cost of single service per provider
Provider (Region) VM Flavor Fixed Cost Unit Cost ($/hr.)
Data Transfer Cost ($) In Out
Amazon (Tokyo) M3.Medium N/A $0.096 $0.00 $0.14
Rackspace (Singapore) Compute1-4 Max($50, 0.02 * num services) $0.080 $0.00 $0.12
IBM Softlayer (Hong Kong) On demand VM N/A $0.091 $0.00 $0.12
1 2 3 4 5 6 7 8 9 10 11 12
AWS $140.44 $280.88 $421.32 $561.76 $702.20 $842.64 $983.08 $1123.5 $1263.9 $1404.4 $1544.8 $1685.3
Rackspace $167.04 $334.08 $501.12 $668.16 $835.20 $1002.2 $1169.3 $1336.3 $1503.4 $1670.4 $1837.4 $2004.
5 IBM
Softlayer $133.10 $266.20 $399.30 $532.40 $665.50 $798.60 $931.70 $1064.8 $1197.9 $1331.0 $1464.1 $1597.2
30 page < ICSSC 2017 Proceeding >28 page International Conference on Software & Smart Convergence ICSSC 2017
5.1. Numerical Analysis For our numerical analysis using cloud service providers, we chose to use Amazon EC2, Rackspace and IBM Softlayer clouds. To simplify our experiment, we restricted the flavor of the VM so that the VM’s did not differ performance wise. Table 2 shows the service cost parameters of each VM as given by the provider. We also assumed that each service of the application consumes data symmetrically at 10TB per month. Using the cost model as well as the cost data we derived projected cost data of each provider over a 12-month period for a single service on each provider. This can be seen in Table 3. 5.2. Example application Having obtained cost information using our cost model we then proceeded to analyze the expected behavior of a hypothetical application. Our example application was envisioned as a typical web application comprising a web application artifact delivered as a war file and a database artifact delivered as a database file. The war file must be deployed to a suitable web server and the database file should be deployed onto an SQL server. We convert our constraints of the application into policies that may be used to orchestrate our application. Before converting we identified the following constraints that may be used.
1. The Operating cost per month should be initially be maximized. i.e. !"#$ ≤ &'()*+
2. The Operating cost per month should be minimized. i.e. !"#$ ≤ &'()*+
To test whether our policies were capable of performing orchestration we devised two scenarios.
1. The application must be deployed within a budget of $2000.00. The policy manager must select a provider that maximizes the budget.
2. The application components were deployed on a single provider (AWS) with a budget of $2000.00 for one year. After running for 6 months the budget was reduced to $1650.00. The policy manager was required to suggest a course of action to ensure that the budget is not exceeded.
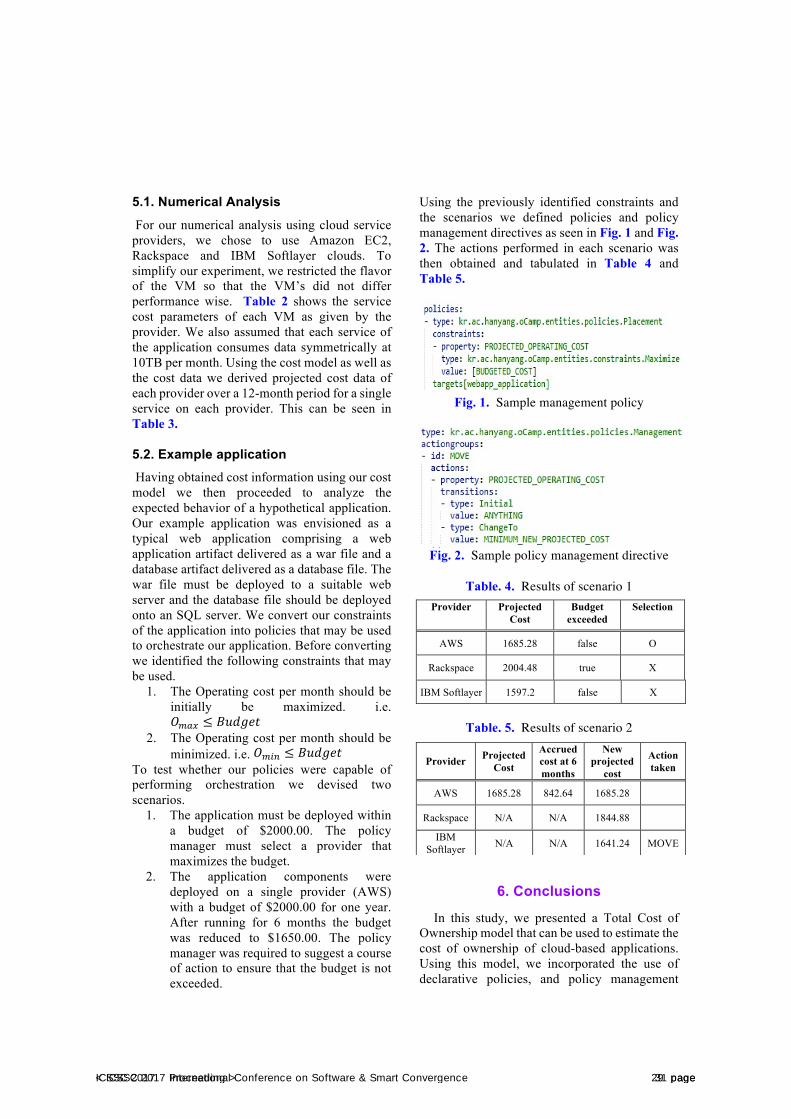
Using the previously identified constraints and the scenarios we defined policies and policy management directives as seen in Fig. 1 and Fig. 2. The actions performed in each scenario was then obtained and tabulated in Table 4 and Table 5.
Fig. 1. Sample management policy
Fig. 2. Sample policy management directive
Table. 4. Results of scenario 1
Table. 5. Results of scenario 2
6. Conclusions
In this study, we presented a Total Cost of Ownership model that can be used to estimate the cost of ownership of cloud-based applications. Using this model, we incorporated the use of declarative policies, and policy management
Provider Projected Cost
Budget exceeded
Selection
AWS 1685.28 false O
Rackspace 2004.48 true X
IBM Softlayer 1597.2 false X
Provider Projected Cost
Accrued cost at 6 months
New projected
cost
Action taken
AWS 1685.28 842.64 1685.28
Rackspace N/A N/A 1844.88
IBM Softlayer N/A N/A 1641.24 MOVE
< ICSSC 2017 Proceeding > 31 pageICSSC 2017 International Conference on Software & Smart Convergence 29 page
directives from a proposed extension of the CAMP standard, in order to validate orchestration of cloud-based applications using cost constraints. We found that the policy models of the proposed extended CAMP specification, when used in collaboration with a suitable cost model, is capable of orchestrating an application and its components across heterogeneous cloud providers.
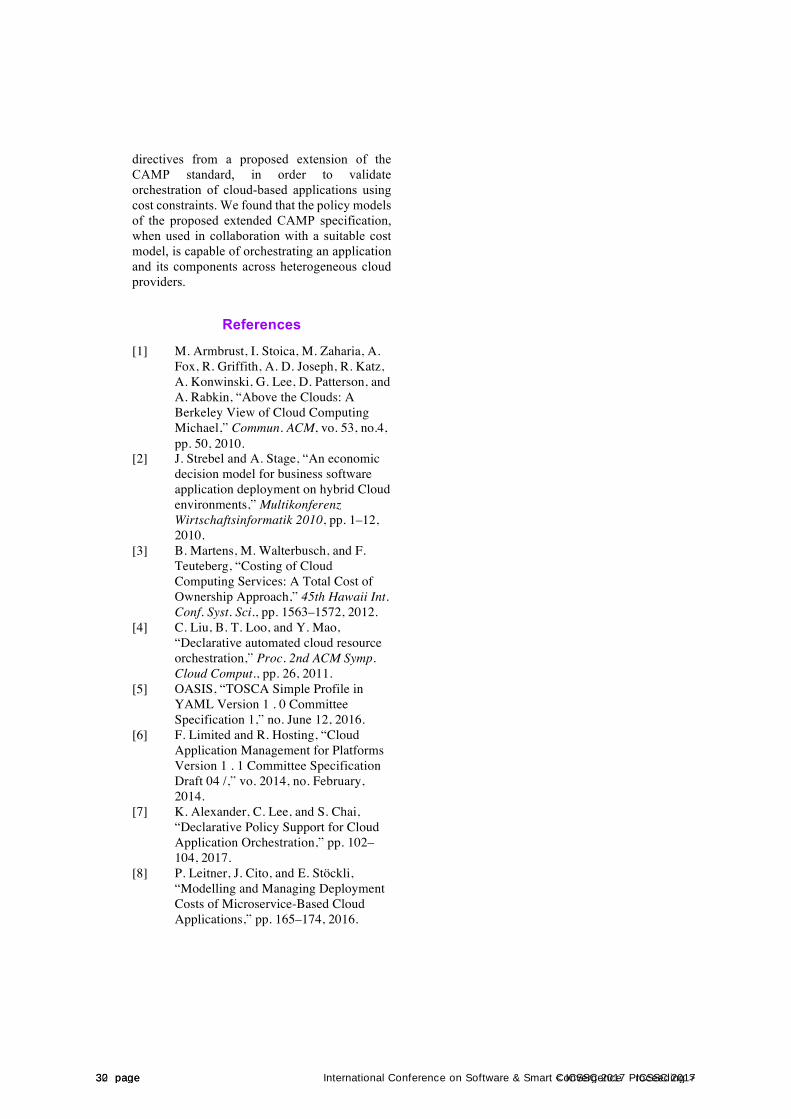
References
[1]
[2]
M. Armbrust, I. Stoica, M. Zaharia, A. Fox, R. Griffith, A. D. Joseph, R. Katz, A. Konwinski, G. Lee, D. Patterson, and A. Rabkin, “Above the Clouds: A Berkeley View of Cloud Computing Michael,” Commun. ACM, vo. 53, no.4, pp. 50, 2010. J. Strebel and A. Stage, “An economic decision model for business software application deployment on hybrid Cloud environments,” Multikonferenz Wirtschaftsinformatik 2010, pp. 1–12,
[3]
[4]
[5]
[6]
2010. B. Martens, M. Walterbusch, and F. Teuteberg, “Costing of Cloud Computing Services: A Total Cost of Ownership Approach,” 45th Hawaii Int. Conf. Syst. Sci., pp. 1563–1572, 2012. C. Liu, B. T. Loo, and Y. Mao, “Declarative automated cloud resource orchestration,” Proc. 2nd ACM Symp. Cloud Comput., pp. 26, 2011. OASIS, “TOSCA Simple Profile in YAML Version 1 . 0 Committee Specification 1,” no. June 12, 2016. F. Limited and R. Hosting, “Cloud Application Management for Platforms Version 1 . 1 Committee Specification Draft 04 /,” vo. 2014, no. February,
[7]
[8]
2014. K. Alexander, C. Lee, and S. Chai, “Declarative Policy Support for Cloud Application Orchestration,” pp. 102–104, 2017. P. Leitner, J. Cito, and E. Stöckli, “Modelling and Managing Deployment Costs of Microservice-Based Cloud Applications,” pp. 165–174, 2016.
32 page < ICSSC 2017 Proceeding >30 page International Conference on Software & Smart Convergence ICSSC 2017
International Conference on Software & Smart Convergence (ICSSC) 2017, June 2017 Copyright ⓒ 2017 ICSSC
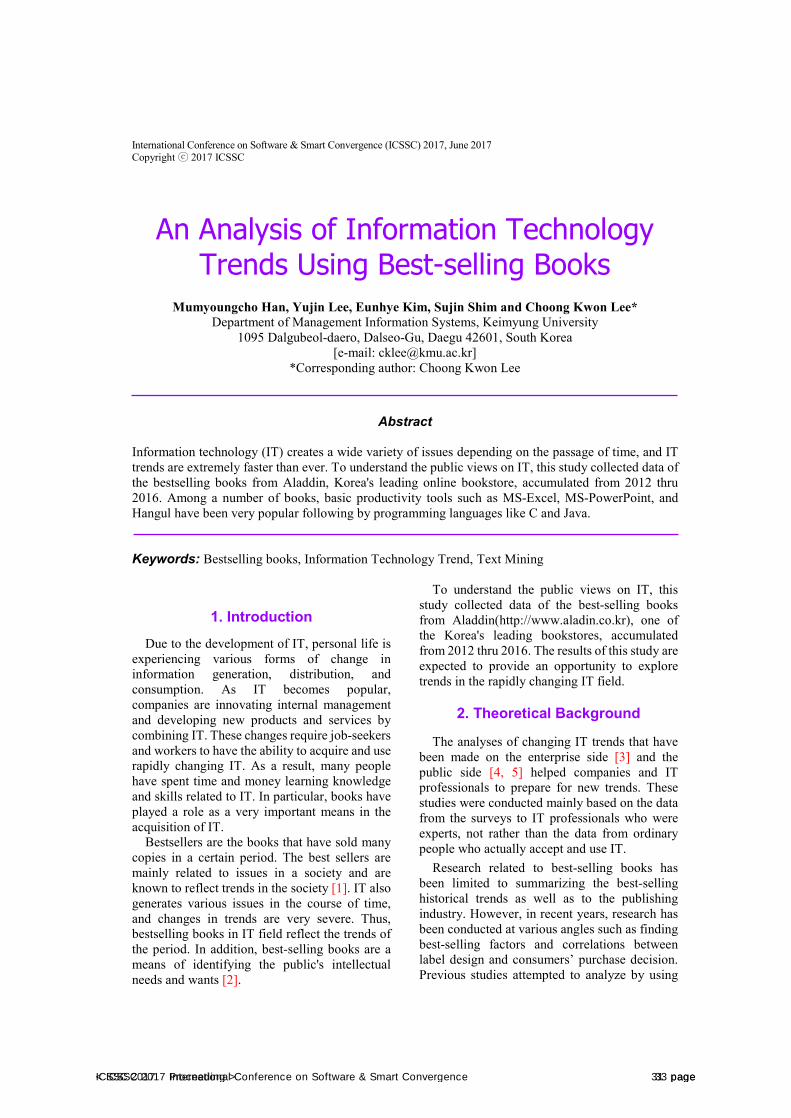
An Analysis of Information Technology Trends Using Best-selling Books
Mumyoungcho Han, Yujin Lee, Eunhye Kim, Sujin Shim and Choong Kwon Lee* Department of Management Information Systems, Keimyung University
1095 Dalgubeol-daero, Dalseo-Gu, Daegu 42601, South Korea [e-mail: [email protected]]
*Corresponding author: Choong Kwon Lee
Abstract
Information technology (IT) creates a wide variety of issues depending on the passage of time, and IT trends are extremely faster than ever. To understand the public views on IT, this study collected data of the bestselling books from Aladdin, Korea's leading online bookstore, accumulated from 2012 thru 2016. Among a number of books, basic productivity tools such as MS-Excel, MS-PowerPoint, and Hangul have been very popular following by programming languages like C and Java.
Keywords: Bestselling books, Information Technology Trend, Text Mining
1. IntroductionDue to the development of IT, personal life is
experiencing various forms of change in information generation, distribution, and consumption. As IT becomes popular, companies are innovating internal management and developing new products and services by combining IT. These changes require job-seekers and workers to have the ability to acquire and use rapidly changing IT. As a result, many people have spent time and money learning knowledge and skills related to IT. In particular, books have played a role as a very important means in the acquisition of IT.
Bestsellers are the books that have sold many copies in a certain period. The best sellers are mainly related to issues in a society and are known to reflect trends in the society [1]. IT also generates various issues in the course of time, and changes in trends are very severe. Thus, bestselling books in IT field reflect the trends of the period. In addition, best-selling books are a means of identifying the public's intellectual needs and wants [2].
To understand the public views on IT, this study collected data of the best-selling books from Aladdin(http://www.aladin.co.kr), one of the Korea's leading bookstores, accumulated from 2012 thru 2016. The results of this study are expected to provide an opportunity to explore trends in the rapidly changing IT field.
2. Theoretical Background
The analyses of changing IT trends that have been made on the enterprise side [3] and the public side [4, 5] helped companies and IT professionals to prepare for new trends. These studies were conducted mainly based on the data from the surveys to IT professionals who were experts, not rather than the data from ordinary people who actually accept and use IT.
Research related to best-selling books has been limited to summarizing the best-selling historical trends as well as to the publishing industry. However, in recent years, research has been conducted at various angles such as finding best-selling factors and correlations between label design and consumers’ purchase decision. Previous studies attempted to analyze by using
< ICSSC 2017 Proceeding > 33 pageICSSC 2017 International Conference on Software & Smart Convergence 31 page
statistical techniques or by relying on intuition of researchers applied to survey data.
Kim [6] analyzed the best-selling factors of Korean literary books. Mullins and Kopelman [7] found that best-sellers are closely related to social issues, and Bounie [8] analyzed best sellers in the e-book market. Park and Park [2] analyzed the books of the top 10 best - sellers in humanities, selected from 2006 to 2015, and tried to understand trends of best sellers in connection with events in the social and cultural field in the period of time.
This study attempts to analyze the best sellers that can be considered to reflect the views of the general public. These attempts are intended to supplement the previous studies that focused on IT managers' views on the IT trends.
3. Research Method
3.1 Data Collection Aladdin opened in 1999 as an online
bookstore and enabled people to make mobile purchases in 2006. Aladdin, who started online, expanded its business successfully by opening off-line bookstores in 2011 [9]. Aladdin, who has grown into a leading company in the Korean book business, developed its own sales index called 'sales point'. Aladdin's bestseller selection does not simply list books based on the quantity sold, but rather depends upon a separate index to list the books. This index provides multi-faceted information by introducing various bestseller concepts, especially focusing on eliminating the impact of large orders in the selection process of the best-selling books.
A tab menu in the website of Aladdin offers bestseller data by week, month, and year. The items of data provided are rank, division, book title, ISBN, publisher/author, author/artist, list price, sale price, discount rate, discount rate, mileage, and publication date. From the sector of computer/mobile sector in Aladdin, we collected a total of 30,000 bestseller data from 2012 to 2016 in the top 100 in the week.
3.2 Analysis Method Rapidminer, an open source data mining
software tool, was used to extract title names from the collected book data and to perform pre-processing such as morphological extraction,
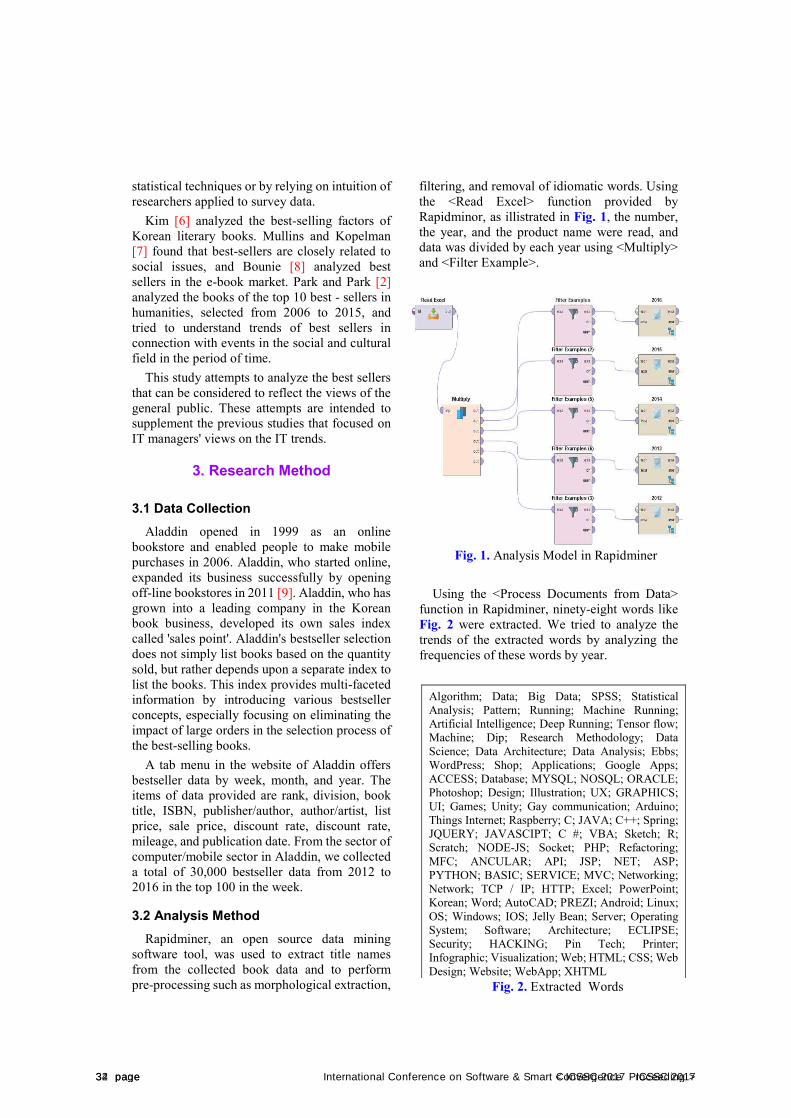
filtering, and removal of idiomatic words. Using the <Read Excel> function provided by Rapidminor, as illistrated in Fig. 1, the number, the year, and the product name were read, and data was divided by each year using <Multiply> and <Filter Example>.
Fig. 1. Analysis Model in Rapidminer
Using the <Process Documents from Data>
function in Rapidminer, ninety-eight words like Fig. 2 were extracted. We tried to analyze the trends of the extracted words by analyzing the frequencies of these words by year.
Fig. 2. Extracted Words
Algorithm; Data; Big Data; SPSS; Statistical Analysis; Pattern; Running; Machine Running; Artificial Intelligence; Deep Running; Tensor flow; Machine; Dip; Research Methodology; Data Science; Data Architecture; Data Analysis; Ebbs; WordPress; Shop; Applications; Google Apps; ACCESS; Database; MYSQL; NOSQL; ORACLE; Photoshop; Design; Illustration; UX; GRAPHICS; UI; Games; Unity; Gay communication; Arduino; Things Internet; Raspberry; C; JAVA; C++; Spring; JQUERY; JAVASCIPT; C #; VBA; Sketch; R; Scratch; NODE-JS; Socket; PHP; Refactoring; MFC; ANCULAR; API; JSP; NET; ASP; PYTHON; BASIC; SERVICE; MVC; Networking; Network; TCP / IP; HTTP; Excel; PowerPoint; Korean; Word; AutoCAD; PREZI; Android; Linux; OS; Windows; IOS; Jelly Bean; Server; Operating System; Software; Architecture; ECLIPSE; Security; HACKING; Pin Tech; Printer; Infographic; Visualization; Web; HTML; CSS; Web Design; Website; WebApp; XHTML
34 page < ICSSC 2017 Proceeding >32 page International Conference on Software & Smart Convergence ICSSC 2017
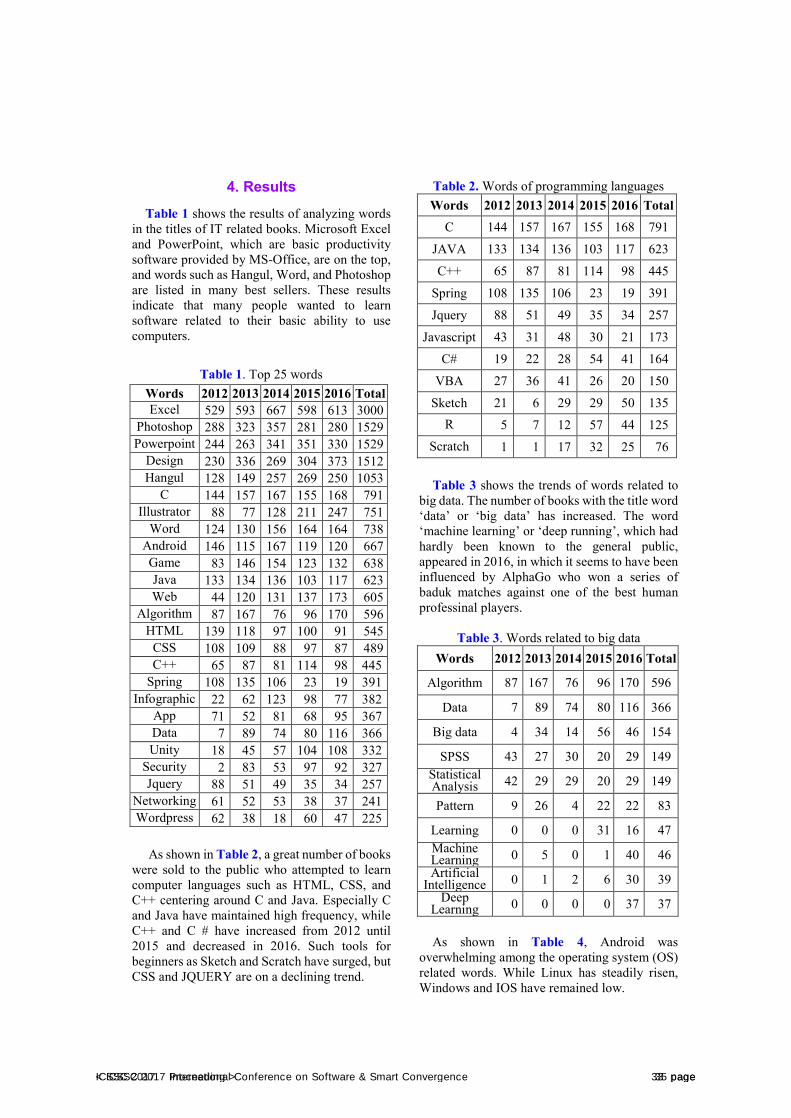
4. Results Table 1 shows the results of analyzing words
in the titles of IT related books. Microsoft Excel and PowerPoint, which are basic productivity software provided by MS-Office, are on the top, and words such as Hangul, Word, and Photoshop are listed in many best sellers. These results indicate that many people wanted to learn software related to their basic ability to use computers.
Table 1. Top 25 words
As shown in Table 2, a great number of books
were sold to the public who attempted to learn computer languages such as HTML, CSS, and C++ centering around C and Java. Especially C and Java have maintained high frequency, while C++ and C # have increased from 2012 until 2015 and decreased in 2016. Such tools for beginners as Sketch and Scratch have surged, but CSS and JQUERY are on a declining trend.
Table 2. Words of programming languages Words 2012 2013 2014 2015 2016 Total
C 144 157 167 155 168 791
JAVA 133 134 136 103 117 623
C++ 65 87 81 114 98 445
Spring 108 135 106 23 19 391
Jquery 88 51 49 35 34 257
Javascript 43 31 48 30 21 173 C# 19 22 28 54 41 164
VBA 27 36 41 26 20 150
Sketch 21 6 29 29 50 135 R 5 7 12 57 44 125
Scratch 1 1 17 32 25 76
Table 3 shows the trends of words related to big data. The number of books with the title word ‘data’ or ‘big data’ has increased. The word ‘machine learning’ or ‘deep running’, which had hardly been known to the general public, appeared in 2016, in which it seems to have been influenced by AlphaGo who won a series of baduk matches against one of the best human professinal players.
Table 3. Words related to big data
Words 2012 2013 2014 2015 2016 Total
Algorithm 87 167 76 96 170 596
Data 7 89 74 80 116 366
Big data 4 34 14 56 46 154
SPSS 43 27 30 20 29 149 Statistical Analysis 42 29 29 20 29 149
Pattern 9 26 4 22 22 83
Learning 0 0 0 31 16 47 Machine Learning 0 5 0 1 40 46 Artificial
Intelligence 0 1 2 6 30 39 Deep
Learning 0 0 0 0 37 37 As shown in Table 4, Android was
overwhelming among the operating system (OS) related words. While Linux has steadily risen, Windows and IOS have remained low.
Words 2012 2013 2014 2015 2016 Total Excel 529 593 667 598 613 3000
Photoshop 288 323 357 281 280 1529 Powerpoint 244 263 341 351 330 1529
Design 230 336 269 304 373 1512 Hangul 128 149 257 269 250 1053
C 144 157 167 155 168 791 Illustrator 88 77 128 211 247 751
Word 124 130 156 164 164 738 Android 146 115 167 119 120 667 Game 83 146 154 123 132 638 Java 133 134 136 103 117 623 Web 44 120 131 137 173 605
Algorithm 87 167 76 96 170 596 HTML 139 118 97 100 91 545
CSS 108 109 88 97 87 489 C++ 65 87 81 114 98 445
Spring 108 135 106 23 19 391 Infographic 22 62 123 98 77 382
App 71 52 81 68 95 367 Data 7 89 74 80 116 366 Unity 18 45 57 104 108 332
Security 2 83 53 97 92 327 Jquery 88 51 49 35 34 257
Networking 61 52 53 38 37 241 Wordpress 62 38 18 60 47 225
< ICSSC 2017 Proceeding > 35 pageICSSC 2017 International Conference on Software & Smart Convergence 33 page
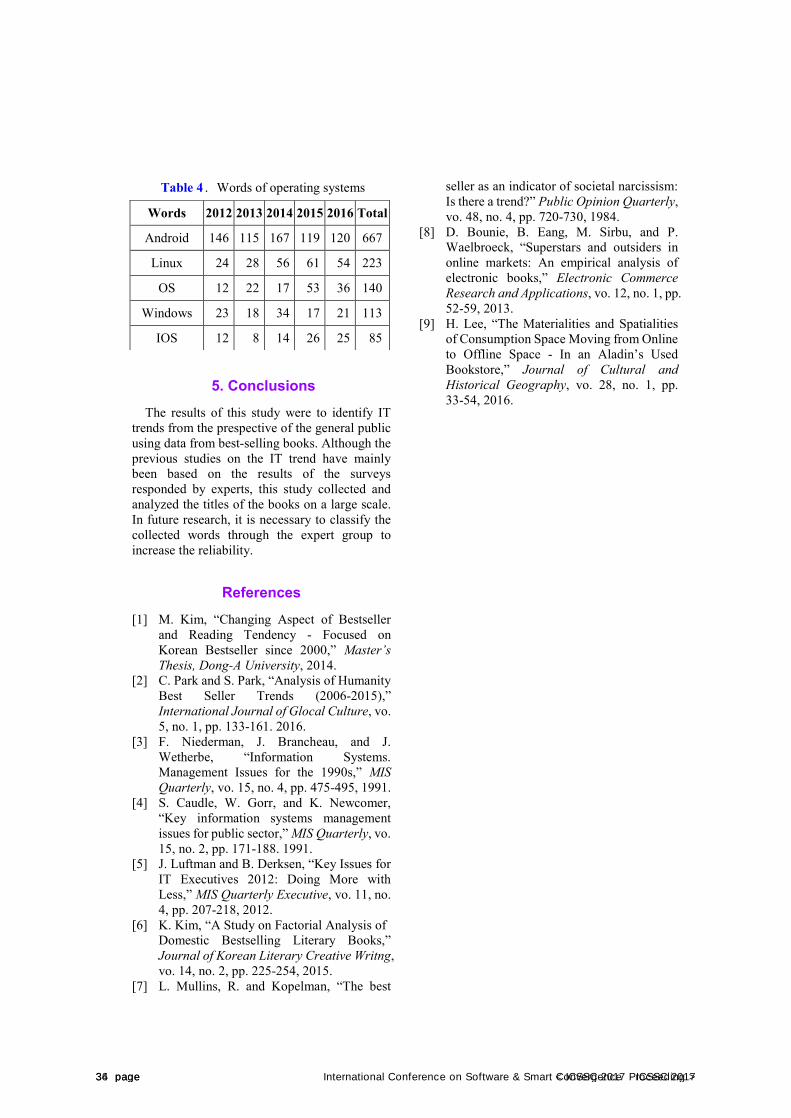
Table 4. Words of operating systems
5. ConclusionsThe results of this study were to identify IT
trends from the prespective of the general public using data from best-selling books. Although the previous studies on the IT trend have mainly been based on the results of the surveys responded by experts, this study collected and analyzed the titles of the books on a large scale. In future research, it is necessary to classify the collected words through the expert group to increase the reliability.
References [1] M. Kim, “Changing Aspect of Bestseller
and Reading Tendency - Focused on Korean Bestseller since 2000,” Master’s Thesis, Dong-A University, 2014.
[2] C. Park and S. Park, “Analysis of Humanity Best Seller Trends (2006-2015),” International Journal of Glocal Culture, vo. 5, no. 1, pp. 133-161. 2016.
[3] F. Niederman, J. Brancheau, and J. Wetherbe, “Information Systems. Management Issues for the 1990s,” MIS Quarterly, vo. 15, no. 4, pp. 475-495, 1991.
[4] S. Caudle, W. Gorr, and K. Newcomer, “Key information systems management issues for public sector,” MIS Quarterly, vo. 15, no. 2, pp. 171-188. 1991.
[5] J. Luftman and B. Derksen, “Key Issues for IT Executives 2012: Doing More with Less,” MIS Quarterly Executive, vo. 11, no. 4, pp. 207-218, 2012.
[6] K. Kim, “A Study on Factorial Analysis of Domestic Bestselling Literary Books,” Journal of Korean Literary Creative Writng, vo. 14, no. 2, pp. 225-254, 2015.
[7] L. Mullins, R. and Kopelman, “The best
seller as an indicator of societal narcissism: Is there a trend?” Public Opinion Quarterly, vo. 48, no. 4, pp. 720-730, 1984.
[8] D. Bounie, B. Eang, M. Sirbu, and P. Waelbroeck, “Superstars and outsiders in online markets: An empirical analysis of electronic books,” Electronic Commerce Research and Applications, vo. 12, no. 1, pp. 52-59, 2013.
[9] H. Lee, “The Materialities and Spatialities of Consumption Space Moving from Online to Offline Space - In an Aladin’s Used Bookstore,” Journal of Cultural and Historical Geography, vo. 28, no. 1, pp. 33-54, 2016.
Words 2012 2013 2014 2015 2016 Total
Android 146 115 167 119 120 667
Linux 24 28 56 61 54 223
OS 12 22 17 53 36 140
Windows 23 18 34 17 21 113
IOS 12 8 14 26 25 85
36 page < ICSSC 2017 Proceeding >34 page International Conference on Software & Smart Convergence ICSSC 2017
International Conference on Software & Smart Convergence (ICSSC) 2017, June 2017 Copyright ⓒ 2017 ICSSC
Sentiment Analysis Using Reviews from Movie Viewers
Jaehwa Lee, Min Kim, Jin Baek Yi, Choong Kwon Lee* Department of Management Information Systems, Keimyung University
1095 Dalgubeol-daero, Dalseo-Gu, Daegu 42601, South Korea [e-mail: [email protected]]
*Corresponding author: Choong Kwon Lee
Abstract
Information and communication technologies, including the Internet, have dramatically improved access to customer-generated contents posted in social media like blogs, boards, and messengers. Potential customers of goods tend to be confident in information, such as comments and reviews generated by previous customers. Because the users' written testimonies can be an important reference material for establishing the business strategy, companies have used sentiment analysis to identify positive or negative feelings or opinions about particular products or services. A feature selection technique was applied to enhance the sentiment analysis of movie reviews by using the machine learning technique. As a result, the mean predictive power of the generated model was 70.9% without including the feature selection process. The predictive power after removing the unnecessary variables through the feature selection process improved to 80.8% on average.
Keywords: Machine learning, Movie reviews, Sentiment analysis, Support vector machine
1. IntroductionRecently, with the rapid development of the ICT including the Internet, there have been explosively increasing media that directly produce comments by users, such as blogs and social nework services, as well as reviews of various products and services. As a result, users are more influenced by word of mouth information produced by the users than with other information in their decision making [1].
Especially in the case of experience goods like movies, opinions of previous buyers are the most important for potential consumer to make decisions. Movie reviews provide information about feelings and rating that previous buyers have written after watching a movie. Therefore, the movie review left by watchers is a very important data that might lead other customers to determine whether or not to watch the movie [2].
Therefore, a variety of text mining studies using movie review data have been performed, mainly using sentiment analysis. As a field of text mining technique, it is a technique to grasp sentimental or opinion information such as positive or negative about a specific product or service [3]. In general, sentiment analysis is based on a dictionary-based method of calculating sentimental score of a document through an sentiment dictionary in which sentimental information is predefined for each word, and a method using a machine learning technique have been widely used. This study aims to enhance the classification performance of machine learning algorithms by using feature selection technique. Therefore, sentiment classification using machine learning technique is performed without using sentiment dictionary.
Text is unstructured data. It has more complicated form than formal data for applying data mining technique, and a number of
< ICSSC 2017 Proceeding > 37 pageICSSC 2017 International Conference on Software & Smart Convergence 35 page
dimensions can be generated because the variable is extracted by the number of words extracted as morpheme. For this reason, if all variables (words) are used in prediction, not only the classification performance is inhibited but also the time and cost required for the analysis are increased. This is a factor that hinders both effectiveness and efficiency in classification, so it is better to eliminate unnecessary variables. Therefore, this study aims to improve the movie review sentiment classification performance of machine learning algorithm by using weighted parameter selection method using SVM (Support Vector Machine).
2. Research Method
2.1 Research Design The purpose of this study is to improve the
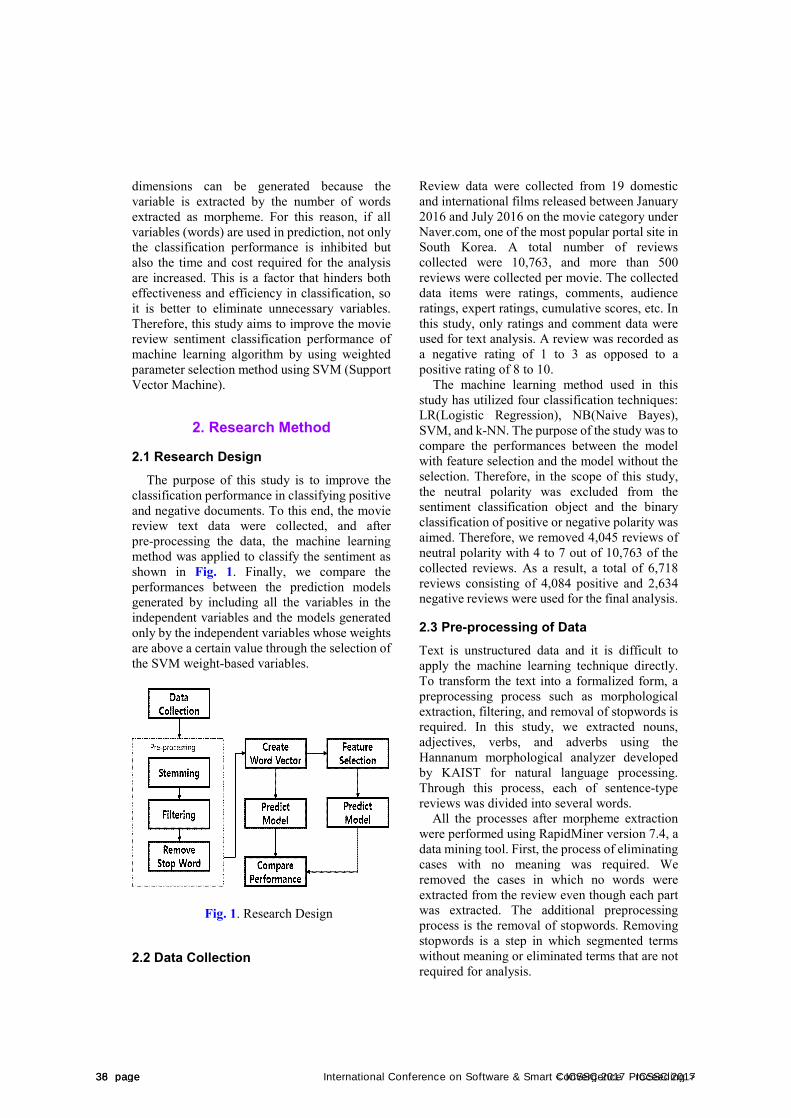
classification performance in classifying positive and negative documents. To this end, the movie review text data were collected, and after pre-processing the data, the machine learning method was applied to classify the sentiment as shown in Fig. 1. Finally, we compare the performances between the prediction models generated by including all the variables in the independent variables and the models generated only by the independent variables whose weights are above a certain value through the selection of the SVM weight-based variables.
Fig. 1. Research Design
2.2 Data Collection
Review data were collected from 19 domestic and international films released between January 2016 and July 2016 on the movie category under Naver.com, one of the most popular portal site in South Korea. A total number of reviews collected were 10,763, and more than 500 reviews were collected per movie. The collected data items were ratings, comments, audience ratings, expert ratings, cumulative scores, etc. In this study, only ratings and comment data were used for text analysis. A review was recorded as a negative rating of 1 to 3 as opposed to a positive rating of 8 to 10. The machine learning method used in this study has utilized four classification techniques: LR(Logistic Regression), NB(Naive Bayes), SVM, and k-NN. The purpose of the study was to compare the performances between the model with feature selection and the model without the selection. Therefore, in the scope of this study, the neutral polarity was excluded from the sentiment classification object and the binary classification of positive or negative polarity was aimed. Therefore, we removed 4,045 reviews of neutral polarity with 4 to 7 out of 10,763 of the collected reviews. As a result, a total of 6,718 reviews consisting of 4,084 positive and 2,634 negative reviews were used for the final analysis.
2.3 Pre-processing of Data Text is unstructured data and it is difficult to apply the machine learning technique directly. To transform the text into a formalized form, a preprocessing process such as morphological extraction, filtering, and removal of stopwords is required. In this study, we extracted nouns, adjectives, verbs, and adverbs using the Hannanum morphological analyzer developed by KAIST for natural language processing. Through this process, each of sentence-type reviews was divided into several words.
All the processes after morpheme extraction were performed using RapidMiner version 7.4, a data mining tool. First, the process of eliminating cases with no meaning was required. We removed the cases in which no words were extracted from the review even though each part was extracted. The additional preprocessing process is the removal of stopwords. Removing stopwords is a step in which segmented terms without meaning or eliminated terms that are not required for analysis.
38 page < ICSSC 2017 Proceeding >36 page International Conference on Software & Smart Convergence ICSSC 2017
Table 1. Stopwords removal No. Word Reason for removal 1 ㅇㅇ consonants only 2 ㄱㅅ consonants only 3 ㅜㅜ vowel only 4 한 one letter Only
As shown in Table 1, reviews written only by consonants or vowels were removed for data reliability. In addition, by running Hannanum morphological analysis, we extracted cases with terms consisting of only one letter. Due to the existence of homonyms and the existence of various parts of speech, it is difficult to grasp meaning with only one letter, and only the words with more than two letters constituting words.
2.4 Word Vector To apply classification prediction models like
SVM, LR, and NB, we constructed a formal data set. Because movie reviews are unstructured text data in the form of sentences, it is necessary to transform the reviews into structured data in a table form. To this end, created a word vector. In the Word Vector, all terms extracted from each case act as variables, and it expresses the vector value when the specific case contains the word.
Table 2. Examples of word vectors Term
1 Term
2 Term
3 Term
n Doc1 1 1 0 0 Doc2 1 0 1 0 Doc3 0 0 0 0 Doc4 0 0 0 0 Doc5 0 0 1 0
As shown in Table 2, the vector value is represented by 0 or 1 depending on whether the document contains a specific word or not, and there is also a method of indicating the number of times a specific word is mentioned in each document. In addition, a method of indicating a TF-IDF (Vector of Inverse Document Frequency) values has widely been used. When a Word Vector Matrix was created, a number of variables were also generated as many as the number of terms extracted from the entire data set. Through this process, if the table is
composed of formal data, the machine learning technique can be applied by using it as training data. In this study, word vectors were generated using TF-IDF vector values.
2.5 Creating a Predictive Model This study was conducted to compare the
performance between the predictive model generated by using all existing variables and the predictive model generated through feature selection when generating the model from the training data. The number of total variables were 1,013 in the Word Vector. Next, SVM weight - based feature selection was performed as a method for extracting variables with a weight greater than a certain reference value. The weight of each variable was normalized with consideration of the convenience and relativeness of feature selection.
Finally, we compared the performances between the models generated by learning the 1,013 terms as variables and the models generated only with variables using SVM weights of 0.05, 0.1, and 0.2, respectively. A number of variables according to each criterion were selected from 734 at the 0.05 level, 485 at the level of 0.1, and 213 for the criterion of 0.2 (see Table 3).
Table 3. Selected variables according to baseline
Weighted Criterion No of Selected Variables
None 1,013 0.05 734 0.1 485 0.2 213
When all prediction models were generated, the ratio of the training data to the test data was divided equally by 70:30 for a conditional analysis. Therefore, 4,702 data out of a total of 6,718 data were used to generate a prediction model, and the data for measuring the generated model performance was measured with 2,016 data, which was 30% of the total data.
3. Results To achieve the purpose of this study, we compared the classification performance of the model without the feature selection and the
< ICSSC 2017 Proceeding > 39 pageICSSC 2017 International Conference on Software & Smart Convergence 37 page
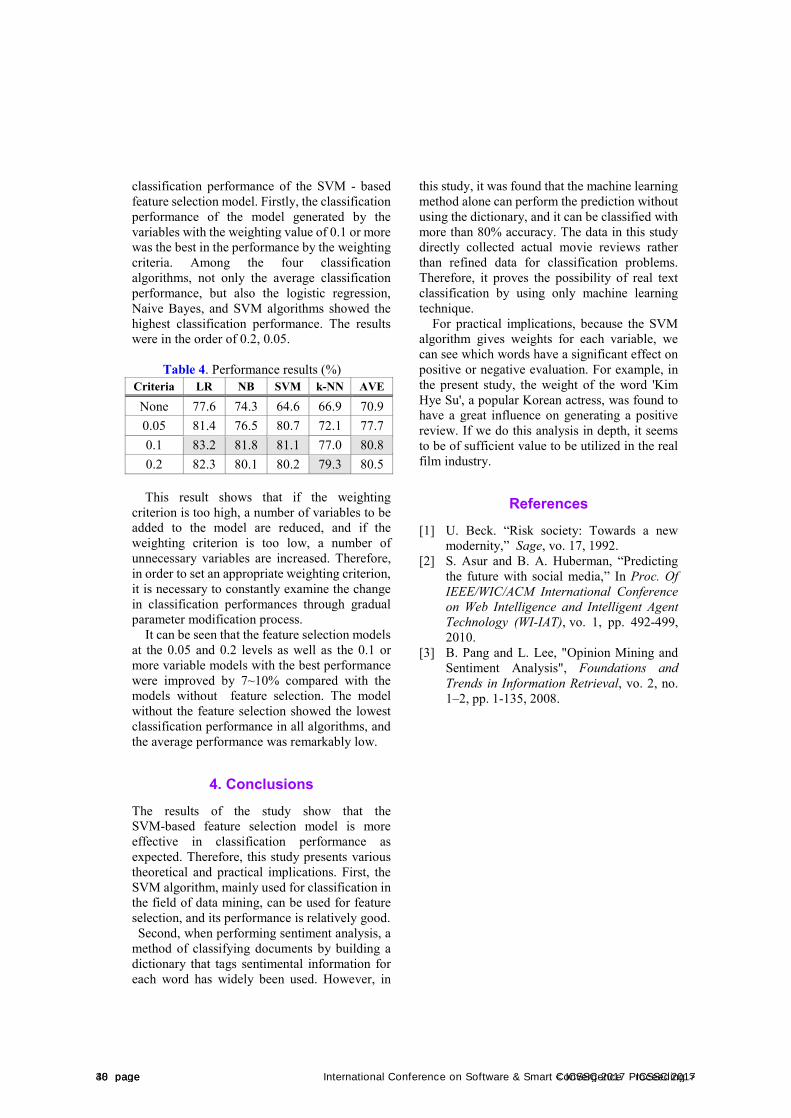
classification performance of the SVM - based feature selection model. Firstly, the classification performance of the model generated by the variables with the weighting value of 0.1 or more was the best in the performance by the weighting criteria. Among the four classification algorithms, not only the average classification performance, but also the logistic regression, Naive Bayes, and SVM algorithms showed the highest classification performance. The results were in the order of 0.2, 0.05.
Table 4. Performance results (%) Criteria LR NB SVM k-NN AVE
None 77.6 74.3 64.6 66.9 70.9 0.05 81.4 76.5 80.7 72.1 77.7 0.1 83.2 81.8 81.1 77.0 80.8 0.2 82.3 80.1 80.2 79.3 80.5
This result shows that if the weighting criterion is too high, a number of variables to be added to the model are reduced, and if the weighting criterion is too low, a number of unnecessary variables are increased. Therefore, in order to set an appropriate weighting criterion, it is necessary to constantly examine the change in classification performances through gradual parameter modification process.
It can be seen that the feature selection models at the 0.05 and 0.2 levels as well as the 0.1 or more variable models with the best performance were improved by 7~10% compared with the models without feature selection. The model without the feature selection showed the lowest classification performance in all algorithms, and the average performance was remarkably low.
4. ConclusionsThe results of the study show that the SVM-based feature selection model is more effective in classification performance as expected. Therefore, this study presents various theoretical and practical implications. First, the SVM algorithm, mainly used for classification in the field of data mining, can be used for feature selection, and its performance is relatively good. Second, when performing sentiment analysis, a
method of classifying documents by building a dictionary that tags sentimental information for each word has widely been used. However, in
this study, it was found that the machine learning method alone can perform the prediction without using the dictionary, and it can be classified with more than 80% accuracy. The data in this study directly collected actual movie reviews rather than refined data for classification problems. Therefore, it proves the possibility of real text classification by using only machine learning technique.
For practical implications, because the SVM algorithm gives weights for each variable, we can see which words have a significant effect on positive or negative evaluation. For example, in the present study, the weight of the word 'Kim Hye Su', a popular Korean actress, was found to have a great influence on generating a positive review. If we do this analysis in depth, it seems to be of sufficient value to be utilized in the real film industry.
References [1] U. Beck. “Risk society: Towards a new
modernity,” Sage, vo. 17, 1992. [2] S. Asur and B. A. Huberman, “Predicting
the future with social media,” In Proc. Of IEEE/WIC/ACM International Conference on Web Intelligence and Intelligent Agent Technology (WI-IAT), vo. 1, pp. 492-499, 2010.
[3] B. Pang and L. Lee, "Opinion Mining and Sentiment Analysis", Foundations and Trends in Information Retrieval, vo. 2, no. 1–2, pp. 1-135, 2008.
40 page < ICSSC 2017 Proceeding >38 page International Conference on Software & Smart Convergence ICSSC 2017
International Conference on Software & Smart Convergence (ICSSC) 2017, June 2017 Copyright ⓒ 2017 ICSSC
This research was supported in part by Basic Science Research Program through the National Research Foundation of Korea (NRF) funded by the Ministry of Education (NRF-2016R1D1A1A09918974).
System-Level Performance of MAC Protocols in Cognitive Radio Ad Hoc
Networks Kishor Singh and Sangman Moh*
Department of Computer Engineering, Chosun University Gwanju, Republic of Korea
[e-mail: [email protected]] *Corresponding author: Sangman Moh
Abstract
Cognitive radio technology allows cognitive secondary users (SUs) to acquire opportunistic access to the underutilized spectrum bands on cellular and ad hoc wireless networks. In this process, SUs scan and identify the vacant channels and then dynamically tune their transceivers to the unoccupied channels and start communication among them without causing unnecessary interference to licensed primary users. Such spectrum utilization not only ensures enhanced connectivity but also increases transmission performance. Along with the opportunistic channel allocation, a number of medium access control (MAC) protocols for cognitive ad hoc networks (CRAHNs) have been developed with different strategies associated with cognitive function and channel selection. In this paper, the system-level performance of the three representative MAC protocols for CRAHNs, which are simple sequential MAC, cognitive MAC, and cognitive 802.11 MAC, are evaluated via simulation and compared to each other. The performance metrics used for our study are average network throughput, end-to-end delay, and packet delivery ratio that are well-known system-level performance metrics in ad hoc networks. According to the performance results, the cognitive 802.11 MAC outperforms the counterpart algorithms significantly.
Keywords: Cognitive radio, cognitive radio ad hoc network, medium access control, channel selection, network throughput, packet delivery ratio, end-to-end delay
1. Introduction
With the enormous growth and development in the field of wireless technologies and the increasing number of relevant devices, frequency spectrum has been one of the most valued resources in wireless communications. The unlicensed bands industrial, scientific and medical (ISM) domains have been overcrowded with the growing technology including Bluetooth, Wi-Fi, and ZigBee and their
applications. In contrast, there are licensed bands such as 400-700 MHz range which is under-utilized quite significantly to aggravate the situation [1]. Furthermore, the regulatory bodies have strictly controlled the radio spectrum allocation through licensing processes. So the licensed bands need to be used more intelligently such that the devices in unlicensed bands could also use the licensed spectrum opportunistically. As a much needed solution, cognitive radio (CR) technology has evolved effectively in the recent decades to address the problem in wireless
< ICSSC 2017 Proceeding > 41 pageICSSC 2017 International Conference on Software & Smart Convergence 39 page
communications resulting from the limited spectrum availability.
The CR technology is blessed with two key characteristics of cognitive capability and reconfigurability to transform their principles into reality [2]. The secondary users (SUs) equipped with CR capability can read their radio environment, scan and identify the vacant channels, and thereon make communication possible on those channels by virtue of their innate ability called cognitive reconfigurality. In other words, reconfigurability allows the secondary users (SUs) to change their transmission parameters (e.g., transmit power, modulation scheme, and operating frequency) based upon the observation and interaction with surrounding environment. The CR parameters are thereby reconfigured depending upon the spectrum characteristics and the information gathered to cope with changing radio environment. The combined features open up the door to what is popularly known as dynamic spectrum access. However, it should be considered that the opportunistic use of the spectrum requires the SUs to sense the channel very accurately and keep track of the primary user (PU) activities before they actually start with their data transmission through the best available channel.
A cognitive radio network (CRN) consists of SUs with a tendency of communicating over the frequency spectrums currently not occupied by the licensed PUs. SUs are supposed to opportunistically use the licensed spectrum unused by PUs. Under the condition, the major responsibility of SUs is to ensure reliable communication among SUs without imposing any kind of interference to PUs. The bottom line is that the unlicensed devices need to vacate the channel being used once the primary user is detected on that channel. And, to make sure that the spectrum resources are optimally used, effective information sharing schemes and efficient dynamic spectrum allocation techniques are required [3]. Nevertheless, the issues such as tolerable interference level for PUs and the effects of irregular activities of PUs and SUs on each other are always arguable.
Cognitive radio ad hoc networks (CRAHNs) are a special kind of CRNs with no centralized network entity. In CRAHNs, SUs need cooperation schemes to carry out the exchange
of network-related information such as PUs’ presence, node configuration, and spectrum holes. The information is basically obtained through local observation and spectrum sensing, and can be used for reconfiguration and routing [4]. Most importantly, each CR user needs to determine the spectrum availability depending on its local observations and promote co-odination among the secondary users. The observed information should be exchanged with its neighbors. That is, reliable neighbor discovery and information exchange processes are so crucial in CRAHNs. CRAHNs are also distinguished by inherent features like dynamic topology, spectrum heterogeneity, multi-hop architecture, self-configuration, and energy constrained power supply. Consequently, a lot of research and development efforts have been put into CRAHNs for supporting a wide range of applications with utmost efficiency.
CRAHNs need some mechanism to select the best spectrum among the available channels according to some policies to achieve quality of service (QoS) requirements. This is primarily achieved through medium access control (MAC) layer. MAC protocols provide access to the network resources including channels, regulates the use of the medium, and thus enable the communication procedure [5].
In CRAHNs, MAC protocols provide multi-channel capability coupled with spectrum heterogeneity. Their prime objective is always to make the best decisions of access channels to ensure the maximum throughput for SUs. Most of the MAC protocols are the modification of IEEE 802.11 with some kind of added features to cope dynamic environment with spectrum heterogeneity and cognitive radio features. As in general CRNs, they enable SUs to make proper use of multiple channels dynamically and opportunistically. The wireless devices can be either single radio or multi-radio.
In general, the cognitive radio MAC (CR-MAC) protocols operate with the three approaches of random access CR-MAC, time-slotted CR-MAC, and probability-based CR-MAC [6]. First, in the random access CR-MAC, after sensing duration, each terminal randomly attempts to access allocated white space starting with a beacon signal. Each of the CR nodes can randomly select the available channel from the pool of channels. This approach
42 page < ICSSC 2017 Proceeding >40 page International Conference on Software & Smart Convergence ICSSC 2017
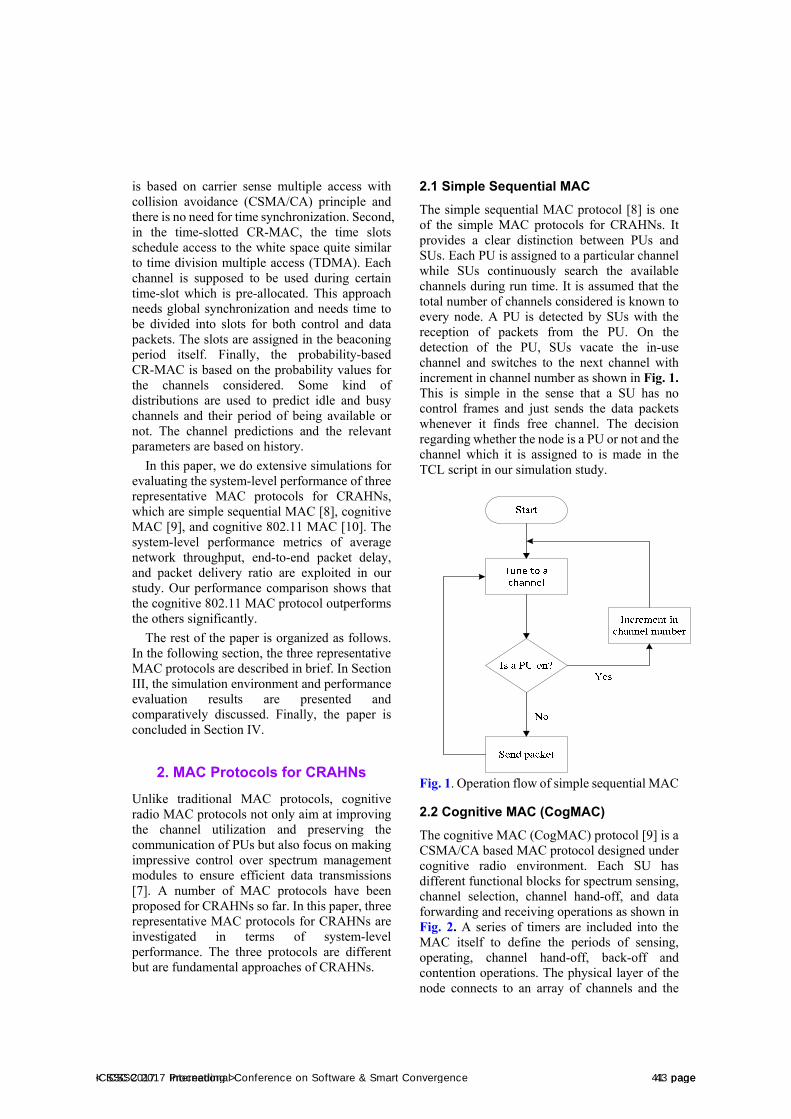
is based on carrier sense multiple access with collision avoidance (CSMA/CA) principle and there is no need for time synchronization. Second, in the time-slotted CR-MAC, the time slots schedule access to the white space quite similar to time division multiple access (TDMA). Each channel is supposed to be used during certain time-slot which is pre-allocated. This approach needs global synchronization and needs time to be divided into slots for both control and data packets. The slots are assigned in the beaconing period itself. Finally, the probability-based CR-MAC is based on the probability values for the channels considered. Some kind of distributions are used to predict idle and busy channels and their period of being available or not. The channel predictions and the relevant parameters are based on history.
In this paper, we do extensive simulations for evaluating the system-level performance of three representative MAC protocols for CRAHNs, which are simple sequential MAC [8], cognitive MAC [9], and cognitive 802.11 MAC [10]. The system-level performance metrics of average network throughput, end-to-end packet delay, and packet delivery ratio are exploited in our study. Our performance comparison shows that the cognitive 802.11 MAC protocol outperforms the others significantly.
The rest of the paper is organized as follows. In the following section, the three representative MAC protocols are described in brief. In Section III, the simulation environment and performance evaluation results are presented and comparatively discussed. Finally, the paper is concluded in Section IV.
2. MAC Protocols for CRAHNs
Unlike traditional MAC protocols, cognitive radio MAC protocols not only aim at improving the channel utilization and preserving the communication of PUs but also focus on making impressive control over spectrum management modules to ensure efficient data transmissions [7]. A number of MAC protocols have been proposed for CRAHNs so far. In this paper, three representative MAC protocols for CRAHNs are investigated in terms of system-level performance. The three protocols are different but are fundamental approaches of CRAHNs.
2.1 Simple Sequential MAC
The simple sequential MAC protocol [8] is one of the simple MAC protocols for CRAHNs. It provides a clear distinction between PUs and SUs. Each PU is assigned to a particular channel while SUs continuously search the available channels during run time. It is assumed that the total number of channels considered is known to every node. A PU is detected by SUs with the reception of packets from the PU. On the detection of the PU, SUs vacate the in-use channel and switches to the next channel with increment in channel number as shown in Fig. 1. This is simple in the sense that a SU has no control frames and just sends the data packets whenever it finds free channel. The decision regarding whether the node is a PU or not and the channel which it is assigned to is made in the TCL script in our simulation study.
Fig. 1. Operation flow of simple sequential MAC
2.2 Cognitive MAC (CogMAC)
The cognitive MAC (CogMAC) protocol [9] is a CSMA/CA based MAC protocol designed under cognitive radio environment. Each SU has different functional blocks for spectrum sensing, channel selection, channel hand-off, and data forwarding and receiving operations as shown in Fig. 2. A series of timers are included into the MAC itself to define the periods of sensing, operating, channel hand-off, back-off and contention operations. The physical layer of the node connects to an array of channels and the
< ICSSC 2017 Proceeding > 43 pageICSSC 2017 International Conference on Software & Smart Convergence 41 page
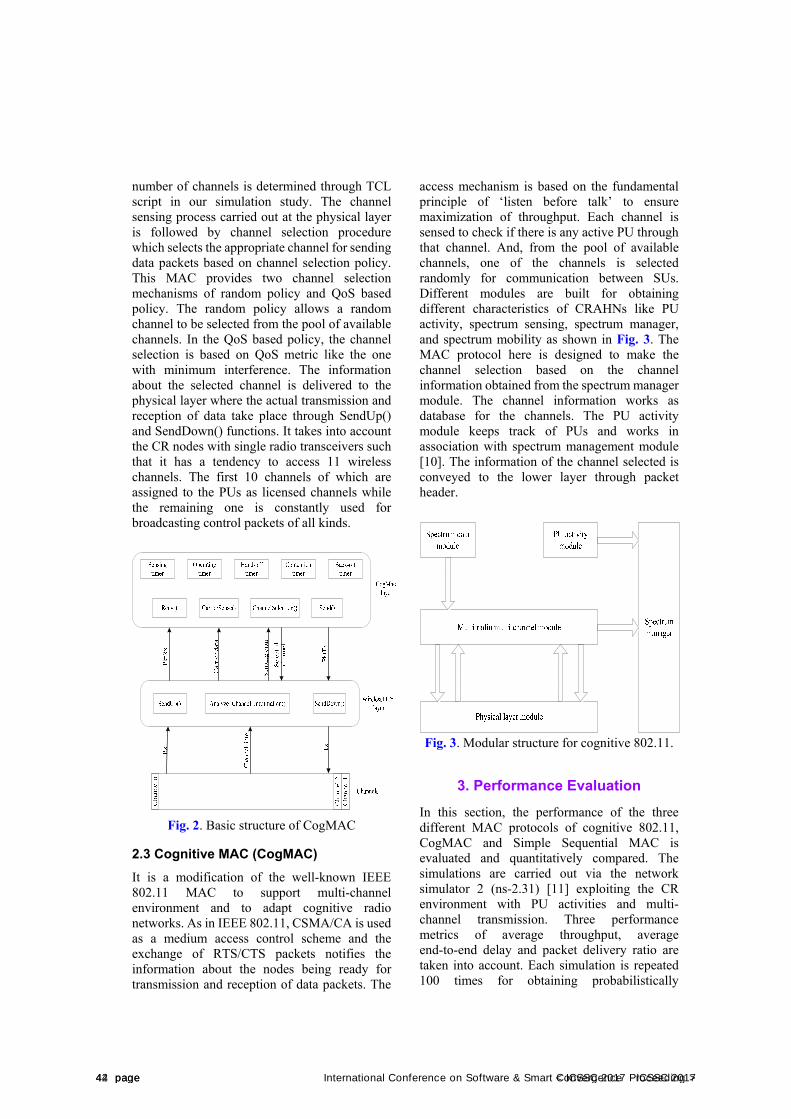
number of channels is determined through TCL script in our simulation study. The channel sensing process carried out at the physical layer is followed by channel selection procedure which selects the appropriate channel for sending data packets based on channel selection policy. This MAC provides two channel selection mechanisms of random policy and QoS based policy. The random policy allows a random channel to be selected from the pool of available channels. In the QoS based policy, the channel selection is based on QoS metric like the one with minimum interference. The information about the selected channel is delivered to the physical layer where the actual transmission and reception of data take place through SendUp() and SendDown() functions. It takes into account the CR nodes with single radio transceivers such that it has a tendency to access 11 wireless channels. The first 10 channels of which are assigned to the PUs as licensed channels while the remaining one is constantly used for broadcasting control packets of all kinds.
Fig. 2. Basic structure of CogMAC
2.3 Cognitive MAC (CogMAC)
It is a modification of the well-known IEEE 802.11 MAC to support multi-channel environment and to adapt cognitive radio networks. As in IEEE 802.11, CSMA/CA is used as a medium access control scheme and the exchange of RTS/CTS packets notifies the information about the nodes being ready for transmission and reception of data packets. The
access mechanism is based on the fundamental principle of ‘listen before talk’ to ensure maximization of throughput. Each channel is sensed to check if there is any active PU through that channel. And, from the pool of available channels, one of the channels is selected randomly for communication between SUs. Different modules are built for obtaining different characteristics of CRAHNs like PU activity, spectrum sensing, spectrum manager, and spectrum mobility as shown in Fig. 3. The MAC protocol here is designed to make the channel selection based on the channel information obtained from the spectrum manager module. The channel information works as database for the channels. The PU activity module keeps track of PUs and works in association with spectrum management module [10]. The information of the channel selected is conveyed to the lower layer through packet header.
Fig. 3. Modular structure for cognitive 802.11.
3. Performance Evaluation
In this section, the performance of the three different MAC protocols of cognitive 802.11, CogMAC and Simple Sequential MAC is evaluated and quantitatively compared. The simulations are carried out via the network simulator 2 (ns-2.31) [11] exploiting the CR environment with PU activities and multi- channel transmission. Three performance metrics of average throughput, average end-to-end delay and packet delivery ratio are taken into account. Each simulation is repeated 100 times for obtaining probabilistically
44 page < ICSSC 2017 Proceeding >42 page International Conference on Software & Smart Convergence ICSSC 2017
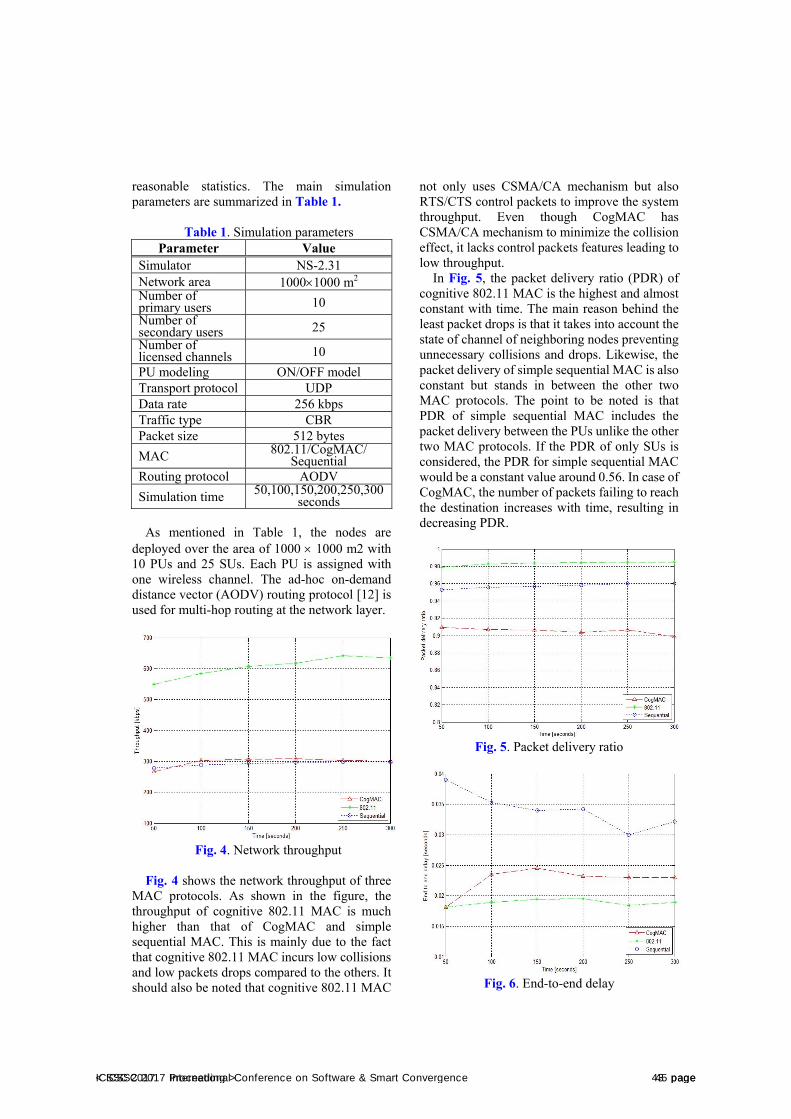
reasonable statistics. The main simulation parameters are summarized in Table 1.
Table 1. Simulation parameters Parameter Value
Simulator NS-2.31 Network area 10001000 m2 Number of primary users 10 Number of secondary users 25 Number of licensed channels 10
PU modeling ON/OFF model Transport protocol UDP Data rate 256 kbps Traffic type CBR Packet size 512 bytes
MAC 802.11/CogMAC/Sequential
Routing protocol AODV
Simulation time 50,100,150,200,250,300 seconds
As mentioned in Table 1, the nodes are deployed over the area of 1000 1000 m2 with 10 PUs and 25 SUs. Each PU is assigned with one wireless channel. The ad-hoc on-demand distance vector (AODV) routing protocol [12] is used for multi-hop routing at the network layer.
Fig. 4. Network throughput
Fig. 4 shows the network throughput of three MAC protocols. As shown in the figure, the throughput of cognitive 802.11 MAC is much higher than that of CogMAC and simple sequential MAC. This is mainly due to the fact that cognitive 802.11 MAC incurs low collisions and low packets drops compared to the others. It should also be noted that cognitive 802.11 MAC
not only uses CSMA/CA mechanism but also RTS/CTS control packets to improve the system throughput. Even though CogMAC has CSMA/CA mechanism to minimize the collision effect, it lacks control packets features leading to low throughput.
In Fig. 5, the packet delivery ratio (PDR) of cognitive 802.11 MAC is the highest and almost constant with time. The main reason behind the least packet drops is that it takes into account the state of channel of neighboring nodes preventing unnecessary collisions and drops. Likewise, the packet delivery of simple sequential MAC is also constant but stands in between the other two MAC protocols. The point to be noted is that PDR of simple sequential MAC includes the packet delivery between the PUs unlike the other two MAC protocols. If the PDR of only SUs is considered, the PDR for simple sequential MAC would be a constant value around 0.56. In case of CogMAC, the number of packets failing to reach the destination increases with time, resulting in decreasing PDR.
Fig. 5. Packet delivery ratio
Fig. 6. End-to-end delay
< ICSSC 2017 Proceeding > 45 pageICSSC 2017 International Conference on Software & Smart Convergence 43 page
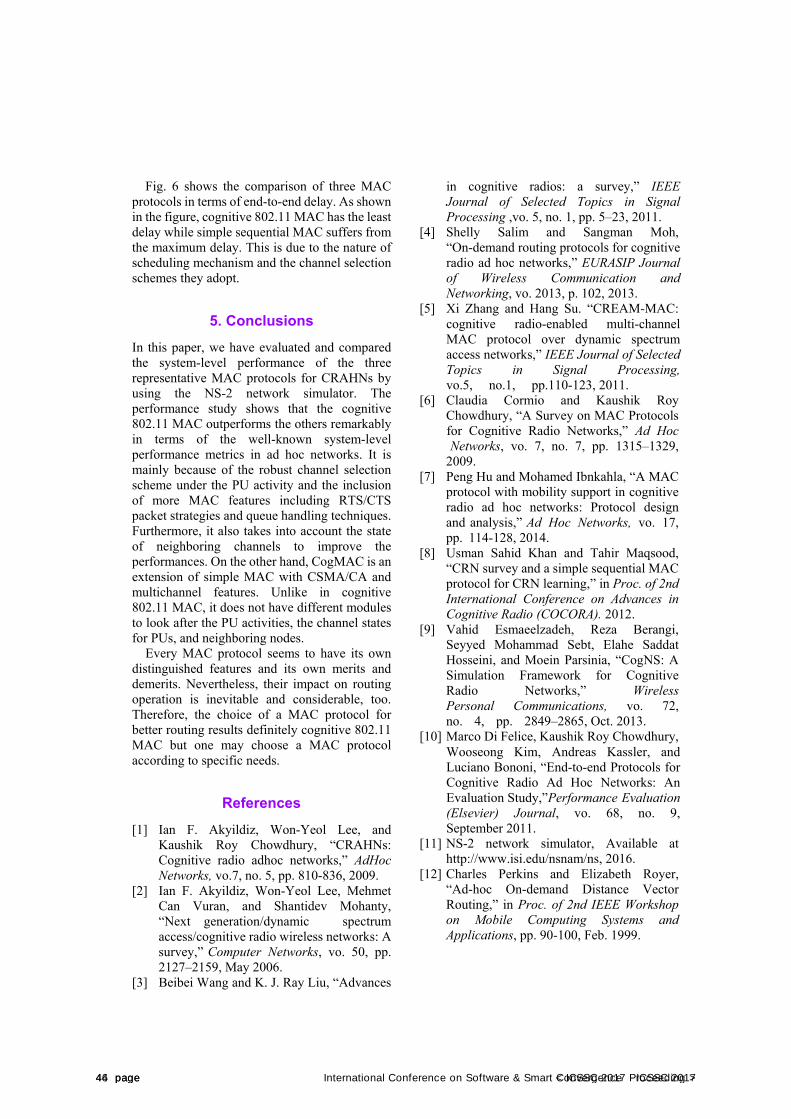
Fig. 6 shows the comparison of three MAC protocols in terms of end-to-end delay. As shown in the figure, cognitive 802.11 MAC has the least delay while simple sequential MAC suffers from the maximum delay. This is due to the nature of scheduling mechanism and the channel selection schemes they adopt.
5. Conclusions
In this paper, we have evaluated and compared the system-level performance of the three representative MAC protocols for CRAHNs by using the NS-2 network simulator. The performance study shows that the cognitive 802.11 MAC outperforms the others remarkably in terms of the well-known system-level performance metrics in ad hoc networks. It is mainly because of the robust channel selection scheme under the PU activity and the inclusion of more MAC features including RTS/CTS packet strategies and queue handling techniques. Furthermore, it also takes into account the state of neighboring channels to improve the performances. On the other hand, CogMAC is an extension of simple MAC with CSMA/CA and multichannel features. Unlike in cognitive 802.11 MAC, it does not have different modules to look after the PU activities, the channel states for PUs, and neighboring nodes.
Every MAC protocol seems to have its own distinguished features and its own merits and demerits. Nevertheless, their impact on routing operation is inevitable and considerable, too. Therefore, the choice of a MAC protocol for better routing results definitely cognitive 802.11 MAC but one may choose a MAC protocol according to specific needs.
References
[1] Ian F. Akyildiz, Won-Yeol Lee, and Kaushik Roy Chowdhury, “CRAHNs: Cognitive radio adhoc networks,” AdHoc Networks, vo.7, no. 5, pp. 810-836, 2009.
[2] Ian F. Akyildiz, Won-Yeol Lee, Mehmet Can Vuran, and Shantidev Mohanty, “Next generation/dynamic spectrum access/cognitive radio wireless networks: A survey,” Computer Networks, vo. 50, pp. 2127–2159, May 2006.
[3] Beibei Wang and K. J. Ray Liu, “Advances
in cognitive radios: a survey,” IEEE Journal of Selected Topics in Signal Processing ,vo. 5, no. 1, pp. 5–23, 2011.
[4] Shelly Salim and Sangman Moh, “On-demand routing protocols for cognitive radio ad hoc networks,” EURASIP Journal of Wireless Communication and Networking, vo. 2013, p. 102, 2013.
[5] Xi Zhang and Hang Su. “CREAM-MAC: cognitive radio-enabled multi-channel MAC protocol over dynamic spectrum access networks,” IEEE Journal of Selected Topics in Signal Processing, vo.5, no.1, pp.110-123, 2011.
[6] Claudia Cormio and Kaushik Roy Chowdhury, “A Survey on MAC Protocols for Cognitive Radio Networks,” Ad Hoc Networks, vo. 7, no. 7, pp. 1315–1329,
2009. [7] Peng Hu and Mohamed Ibnkahla, “A MAC
protocol with mobility support in cognitive radio ad hoc networks: Protocol design and analysis,” Ad Hoc Networks, vo. 17, pp. 114-128, 2014.
[8] Usman Sahid Khan and Tahir Maqsood, “CRN survey and a simple sequential MAC protocol for CRN learning,” in Proc. of 2nd International Conference on Advances in Cognitive Radio (COCORA). 2012.
[9] Vahid Esmaeelzadeh, Reza Berangi, Seyyed Mohammad Sebt, Elahe Saddat Hosseini, and Moein Parsinia, “CogNS: A Simulation Framework for Cognitive Radio Networks,” Wireless Personal Communications, vo. 72, no. 4, pp. 2849–2865, Oct. 2013.
[10] Marco Di Felice, Kaushik Roy Chowdhury, Wooseong Kim, Andreas Kassler, and Luciano Bononi, “End-to-end Protocols for Cognitive Radio Ad Hoc Networks: An Evaluation Study,”Performance Evaluation (Elsevier) Journal, vo. 68, no. 9, September 2011.
[11] NS-2 network simulator, Available at http://www.isi.edu/nsnam/ns, 2016.
[12] Charles Perkins and Elizabeth Royer, “Ad-hoc On-demand Distance Vector Routing,” in Proc. of 2nd IEEE Workshop on Mobile Computing Systems and Applications, pp. 90-100, Feb. 1999.
46 page < ICSSC 2017 Proceeding >44 page International Conference on Software & Smart Convergence ICSSC 2017
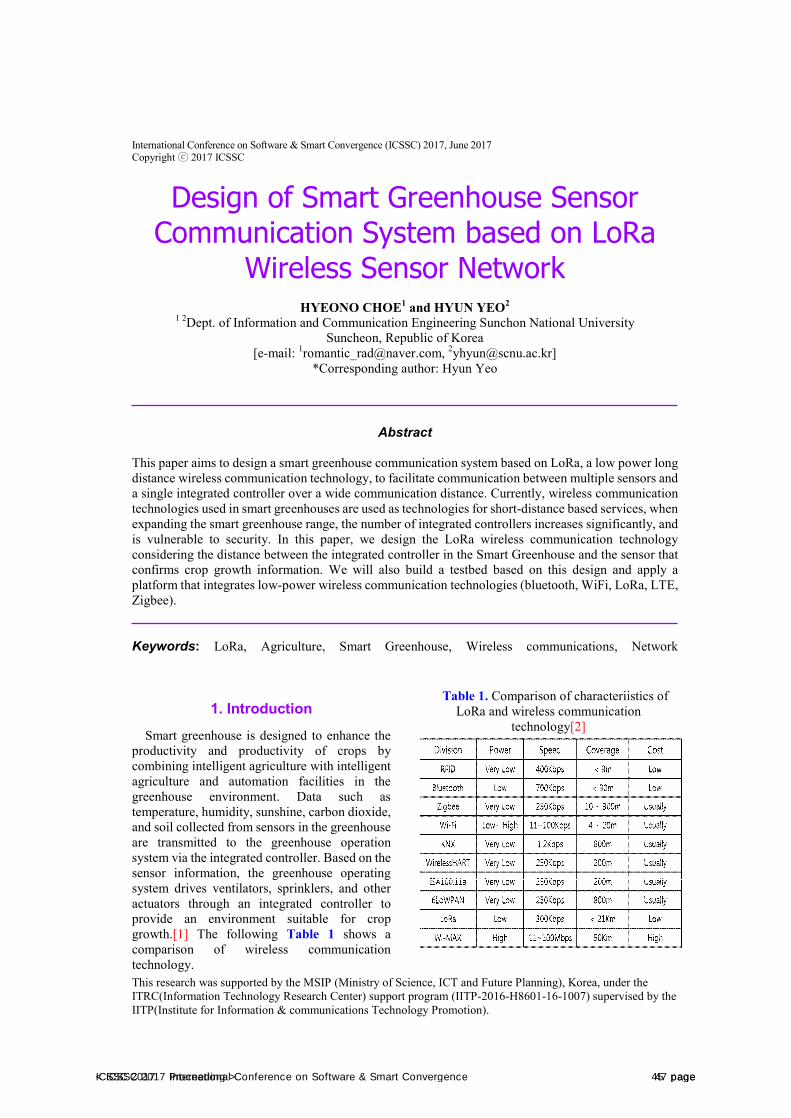
International Conference on Software & Smart Convergence (ICSSC) 2017, June 2017 Copyright ⓒ 2017 ICSSC
This research was supported by the MSIP (Ministry of Science, ICT and Future Planning), Korea, under the ITRC(Information Technology Research Center) support program (IITP-2016-H8601-16-1007) supervised by the IITP(Institute for Information & communications Technology Promotion).
Design of Smart Greenhouse Sensor Communication System based on LoRa
Wireless Sensor NetworkHYEONO CHOE1 and HYUN YEO2
1 2Dept. of Information and Communication Engineering Sunchon National University Suncheon, Republic of Korea
[e-mail: [email protected], [email protected]] *Corresponding author: Hyun Yeo
Abstract
This paper aims to design a smart greenhouse communication system based on LoRa, a low power long distance wireless communication technology, to facilitate communication between multiple sensors and a single integrated controller over a wide communication distance. Currently, wireless communication technologies used in smart greenhouses are used as technologies for short-distance based services, when expanding the smart greenhouse range, the number of integrated controllers increases significantly, and is vulnerable to security. In this paper, we design the LoRa wireless communication technology considering the distance between the integrated controller in the Smart Greenhouse and the sensor that confirms crop growth information. We will also build a testbed based on this design and apply a platform that integrates low-power wireless communication technologies (bluetooth, WiFi, LoRa, LTE, Zigbee).
Keywords: LoRa, Agriculture, Smart Greenhouse, Wireless communications, Network
1. IntroductionSmart greenhouse is designed to enhance the
productivity and productivity of crops by combining intelligent agriculture with intelligent agriculture and automation facilities in the greenhouse environment. Data such as temperature, humidity, sunshine, carbon dioxide, and soil collected from sensors in the greenhouse are transmitted to the greenhouse operation system via the integrated controller. Based on the sensor information, the greenhouse operating system drives ventilators, sprinklers, and other actuators through an integrated controller to provide an environment suitable for crop growth.[1] The following Table 1 shows a comparison of wireless communication technology.
Table 1. Comparison of characteriistics of LoRa and wireless communication
technology[2]
< ICSSC 2017 Proceeding > 47 pageICSSC 2017 International Conference on Software & Smart Convergence 45 page
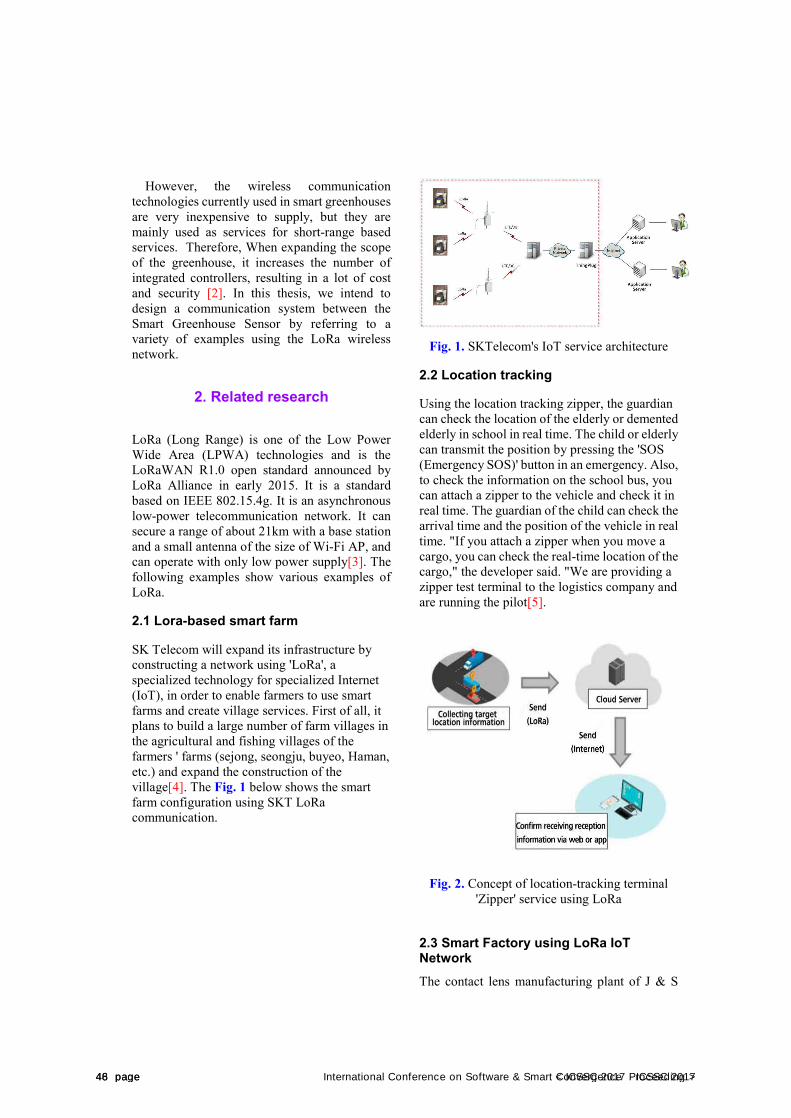
However, the wireless communication technologies currently used in smart greenhouses are very inexpensive to supply, but they are mainly used as services for short-range based services. Therefore, When expanding the scope of the greenhouse, it increases the number of integrated controllers, resulting in a lot of cost and security [2]. In this thesis, we intend to design a communication system between the Smart Greenhouse Sensor by referring to a variety of examples using the LoRa wireless network.
2. Related research
LoRa (Long Range) is one of the Low Power Wide Area (LPWA) technologies and is the LoRaWAN R1.0 open standard announced by LoRa Alliance in early 2015. It is a standard based on IEEE 802.15.4g. It is an asynchronous low-power telecommunication network. It can secure a range of about 21km with a base station and a small antenna of the size of Wi-Fi AP, and can operate with only low power supply[3]. The following examples show various examples of LoRa.
2.1 Lora-based smart farm
SK Telecom will expand its infrastructure by constructing a network using 'LoRa', a specialized technology for specialized Internet (IoT), in order to enable farmers to use smart farms and create village services. First of all, it plans to build a large number of farm villages in the agricultural and fishing villages of the farmers ' farms (sejong, seongju, buyeo, Haman, etc.) and expand the construction of the village[4]. The Fig. 1 below shows the smart farm configuration using SKT LoRa communication.
Fig. 1. SKTelecom's IoT service architecture
2.2 Location tracking
Using the location tracking zipper, the guardian can check the location of the elderly or demented elderly in school in real time. The child or elderly can transmit the position by pressing the 'SOS (Emergency SOS)' button in an emergency. Also, to check the information on the school bus, you can attach a zipper to the vehicle and check it in real time. The guardian of the child can check the arrival time and the position of the vehicle in real time. "If you attach a zipper when you move a cargo, you can check the real-time location of the cargo," the developer said. "We are providing a zipper test terminal to the logistics company and are running the pilot[5].
Fig. 2. Concept of location-tracking terminal 'Zipper' service using LoRa
2.3 Smart Factory using LoRa IoT Network The contact lens manufacturing plant of J & S
48 page < ICSSC 2017 Proceeding >46 page International Conference on Software & Smart Convergence ICSSC 2017
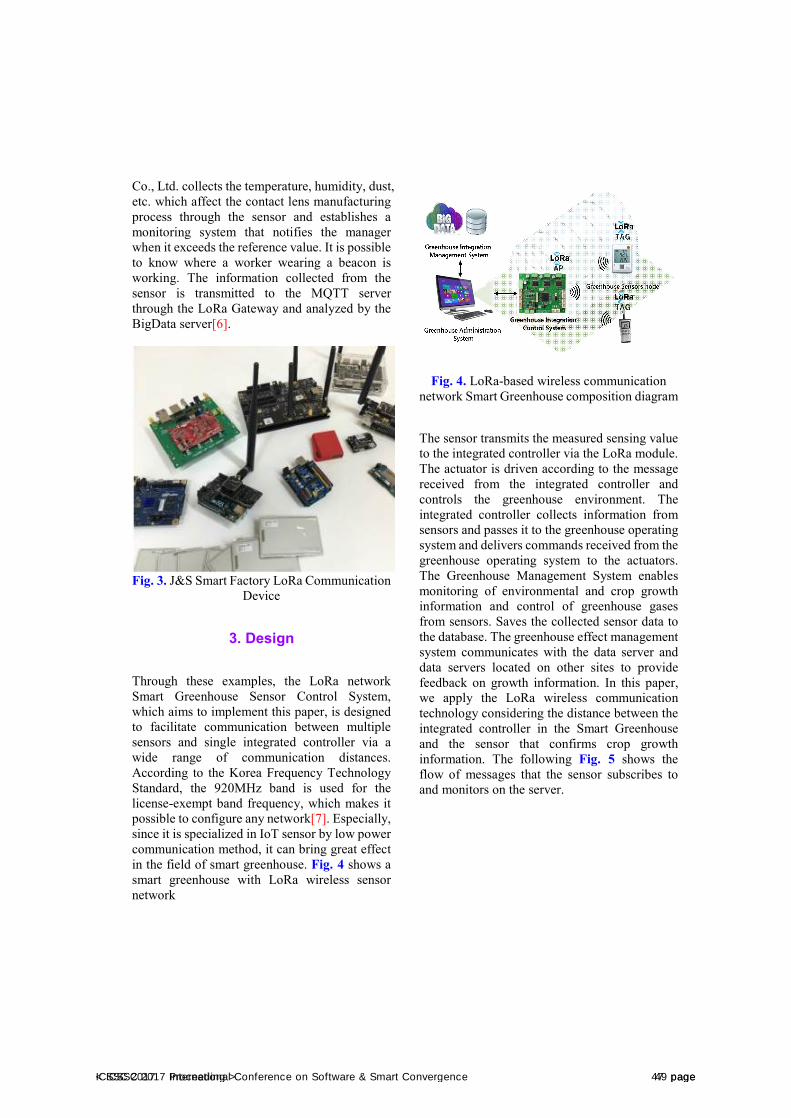
Co., Ltd. collects the temperature, humidity, dust, etc. which affect the contact lens manufacturing process through the sensor and establishes a monitoring system that notifies the manager when it exceeds the reference value. It is possible to know where a worker wearing a beacon is working. The information collected from the sensor is transmitted to the MQTT server through the LoRa Gateway and analyzed by the BigData server[6].
Fig. 3. J&S Smart Factory LoRa Communication Device
3. Design
Through these examples, the LoRa network Smart Greenhouse Sensor Control System, which aims to implement this paper, is designed to facilitate communication between multiple sensors and single integrated controller via a wide range of communication distances. According to the Korea Frequency Technology Standard, the 920MHz band is used for the license-exempt band frequency, which makes it possible to configure any network[7]. Especially, since it is specialized in IoT sensor by low power communication method, it can bring great effect in the field of smart greenhouse. Fig. 4 shows a smart greenhouse with LoRa wireless sensor network
Fig. 4. LoRa-based wireless communication network Smart Greenhouse composition diagram
The sensor transmits the measured sensing value to the integrated controller via the LoRa module. The actuator is driven according to the message received from the integrated controller and controls the greenhouse environment. The integrated controller collects information from sensors and passes it to the greenhouse operating system and delivers commands received from the greenhouse operating system to the actuators. The Greenhouse Management System enables monitoring of environmental and crop growth information and control of greenhouse gases from sensors. Saves the collected sensor data to the database. The greenhouse effect management system communicates with the data server and data servers located on other sites to provide feedback on growth information. In this paper, we apply the LoRa wireless communication technology considering the distance between the integrated controller in the Smart Greenhouse and the sensor that confirms crop growth information. The following Fig. 5 shows the flow of messages that the sensor subscribes to and monitors on the server.
< ICSSC 2017 Proceeding > 49 pageICSSC 2017 International Conference on Software & Smart Convergence 47 page
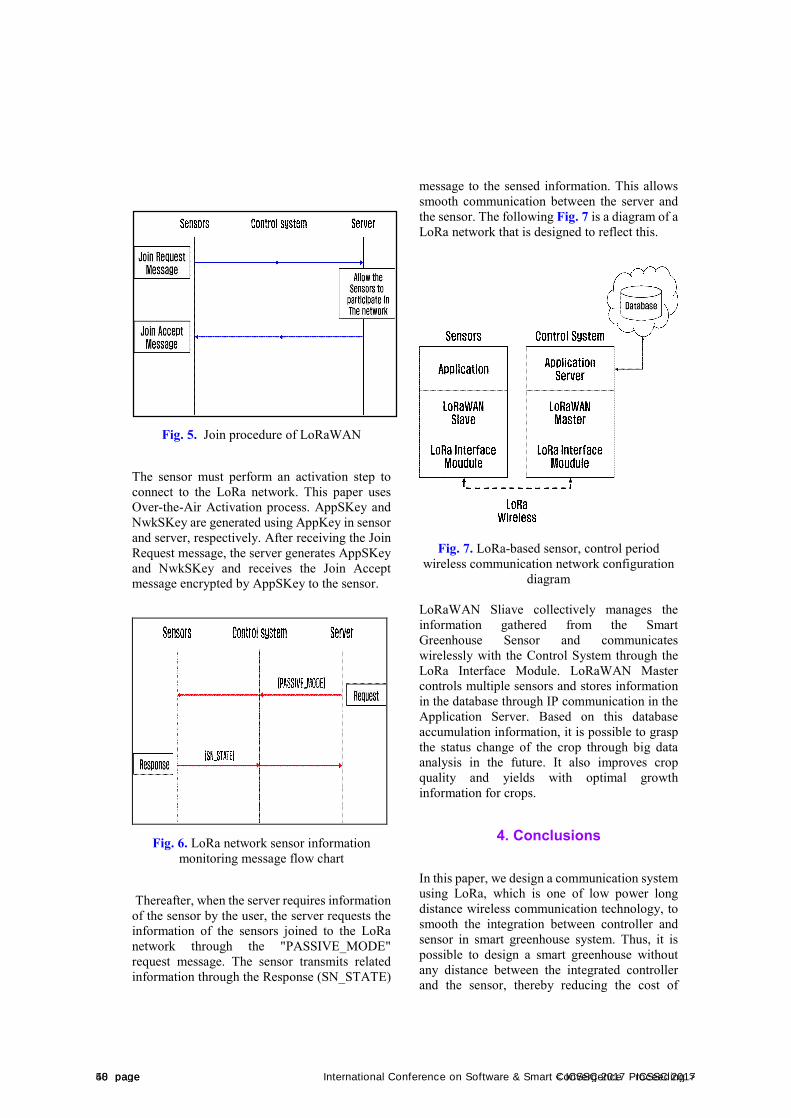
Fig. 5. Join procedure of LoRaWAN
The sensor must perform an activation step to connect to the LoRa network. This paper uses Over-the-Air Activation process. AppSKey and NwkSKey are generated using AppKey in sensor and server, respectively. After receiving the Join Request message, the server generates AppSKey and NwkSKey and receives the Join Accept message encrypted by AppSKey to the sensor.
Fig. 6. LoRa network sensor information monitoring message flow chart
Thereafter, when the server requires information of the sensor by the user, the server requests the information of the sensors joined to the LoRa network through the "PASSIVE_MODE" request message. The sensor transmits related information through the Response (SN_STATE)
message to the sensed information. This allows smooth communication between the server and the sensor. The following Fig. 7 is a diagram of a LoRa network that is designed to reflect this.
Fig. 7. LoRa-based sensor, control period wireless communication network configuration
diagram
LoRaWAN Sliave collectively manages the information gathered from the Smart Greenhouse Sensor and communicates wirelessly with the Control System through the LoRa Interface Module. LoRaWAN Master controls multiple sensors and stores information in the database through IP communication in the Application Server. Based on this database accumulation information, it is possible to grasp the status change of the crop through big data analysis in the future. It also improves crop quality and yields with optimal growth information for crops.
4. Conclusions
In this paper, we design a communication system using LoRa, which is one of low power long distance wireless communication technology, to smooth the integration between controller and sensor in smart greenhouse system. Thus, it is possible to design a smart greenhouse without any distance between the integrated controller and the sensor, thereby reducing the cost of
50 page < ICSSC 2017 Proceeding >48 page International Conference on Software & Smart Convergence ICSSC 2017
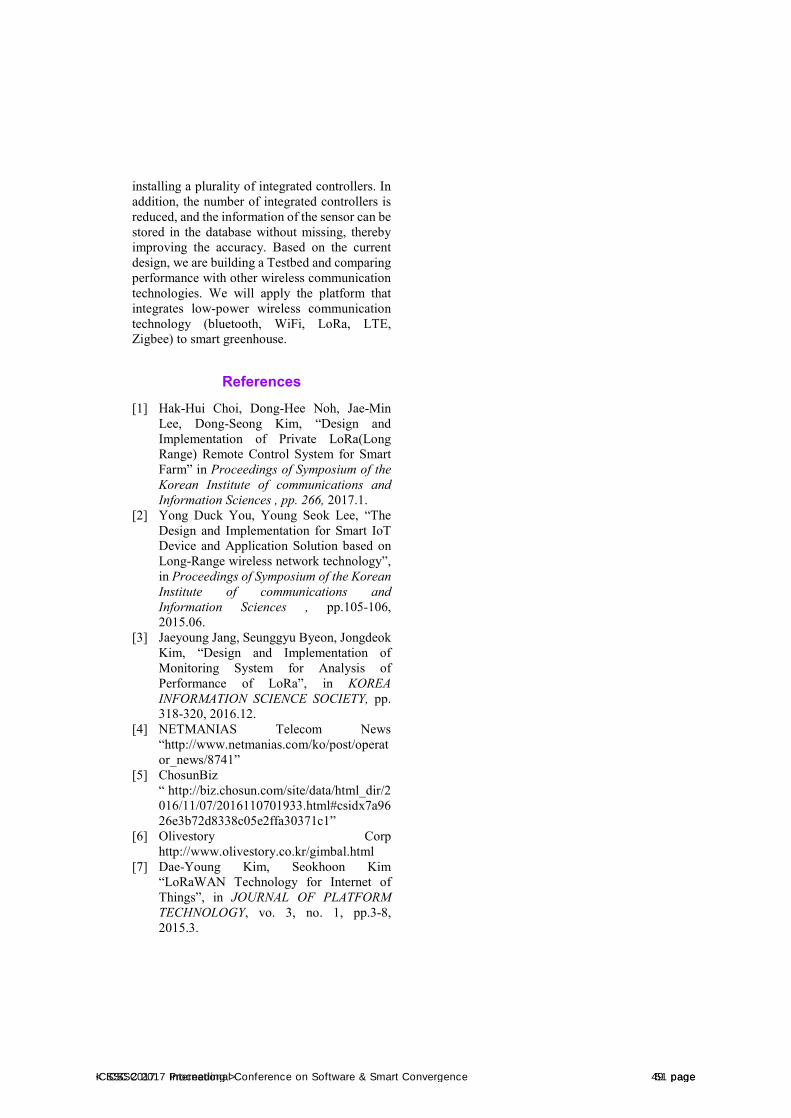
installing a plurality of integrated controllers. In addition, the number of integrated controllers is reduced, and the information of the sensor can be stored in the database without missing, thereby improving the accuracy. Based on the current design, we are building a Testbed and comparing performance with other wireless communication technologies. We will apply the platform that integrates low-power wireless communication technology (bluetooth, WiFi, LoRa, LTE, Zigbee) to smart greenhouse.
References [1] Hak-Hui Choi, Dong-Hee Noh, Jae-Min
Lee, Dong-Seong Kim, “Design and Implementation of Private LoRa(Long Range) Remote Control System for Smart Farm” in Proceedings of Symposium of the Korean Institute of communications and Information Sciences , pp. 266, 2017.1.
[2] Yong Duck You, Young Seok Lee, “The Design and Implementation for Smart IoT Device and Application Solution based on Long-Range wireless network technology”, in Proceedings of Symposium of the Korean Institute of communications and Information Sciences , pp.105-106, 2015.06.
[3] Jaeyoung Jang, Seunggyu Byeon, Jongdeok Kim, “Design and Implementation of Monitoring System for Analysis of Performance of LoRa”, in KOREA INFORMATION SCIENCE SOCIETY, pp. 318-320, 2016.12.
[4] NETMANIAS Telecom News “http://www.netmanias.com/ko/post/operator_news/8741”
[5] ChosunBiz “ http://biz.chosun.com/site/data/html_dir/2016/11/07/2016110701933.html#csidx7a9626e3b72d8338c05e2ffa30371c1”
[6] Olivestory Corp http://www.olivestory.co.kr/gimbal.html
[7] Dae-Young Kim, Seokhoon Kim “LoRaWAN Technology for Internet of Things”, in JOURNAL OF PLATFORM TECHNOLOGY, vo. 3, no. 1, pp.3-8, 2015.3.
< ICSSC 2017 Proceeding > 51 pageICSSC 2017 International Conference on Software & Smart Convergence 49 page
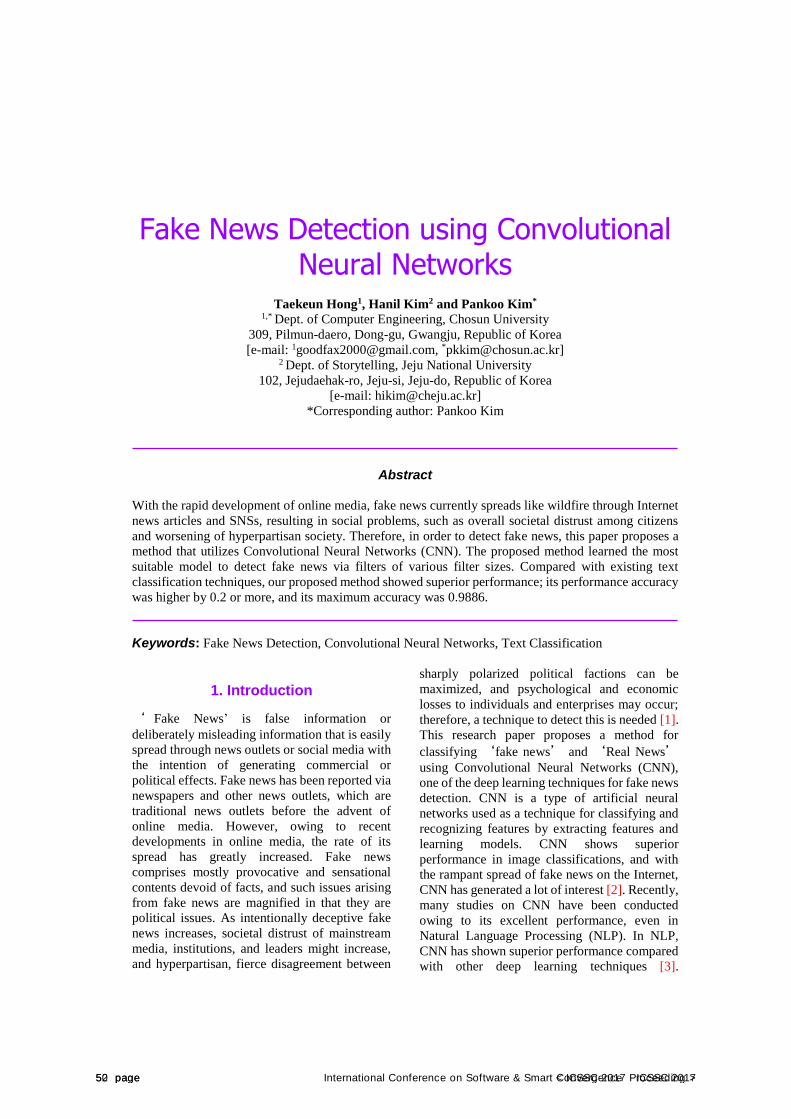
Fake News Detection using Convolutional Neural Networks
Taekeun Hong1, Hanil Kim2 and Pankoo Kim* 1,* Dept. of Computer Engineering, Chosun University
309, Pilmun-daero, Dong-gu, Gwangju, Republic of Korea
[e-mail: [email protected], *[email protected]] 2 Dept. of Storytelling, Jeju National University
102, Jejudaehak-ro, Jeju-si, Jeju-do, Republic of Korea
[e-mail: [email protected]]
*Corresponding author: Pankoo Kim
Abstract
With the rapid development of online media, fake news currently spreads like wildfire through Internet
news articles and SNSs, resulting in social problems, such as overall societal distrust among citizens
and worsening of hyperpartisan society. Therefore, in order to detect fake news, this paper proposes a
method that utilizes Convolutional Neural Networks (CNN). The proposed method learned the most
suitable model to detect fake news via filters of various filter sizes. Compared with existing text
classification techniques, our proposed method showed superior performance; its performance accuracy
was higher by 0.2 or more, and its maximum accuracy was 0.9886.
Keywords: Fake News Detection, Convolutional Neural Networks, Text Classification
1. Introduction
‘ Fake News’ is false information or
deliberately misleading information that is easily
spread through news outlets or social media with
the intention of generating commercial or
political effects. Fake news has been reported via
newspapers and other news outlets, which are
traditional news outlets before the advent of
online media. However, owing to recent
developments in online media, the rate of its
spread has greatly increased. Fake news
comprises mostly provocative and sensational
contents devoid of facts, and such issues arising
from fake news are magnified in that they are
political issues. As intentionally deceptive fake
news increases, societal distrust of mainstream
media, institutions, and leaders might increase,
and hyperpartisan, fierce disagreement between
sharply polarized political factions can be
maximized, and psychological and economic
losses to individuals and enterprises may occur;
therefore, a technique to detect this is needed [1].
This research paper proposes a method for
classifying ‘fake news’ and ‘Real News’
using Convolutional Neural Networks (CNN),
one of the deep learning techniques for fake news
detection. CNN is a type of artificial neural
networks used as a technique for classifying and
recognizing features by extracting features and
learning models. CNN shows superior
performance in image classifications, and with
the rampant spread of fake news on the Internet,
CNN has generated a lot of interest [2]. Recently,
many studies on CNN have been conducted
owing to its excellent performance, even in
Natural Language Processing (NLP). In NLP,
CNN has shown superior performance compared
with other deep learning techniques [3].
52 page < ICSSC 2017 Proceeding >50 page International Conference on Software & Smart Convergence ICSSC 2017
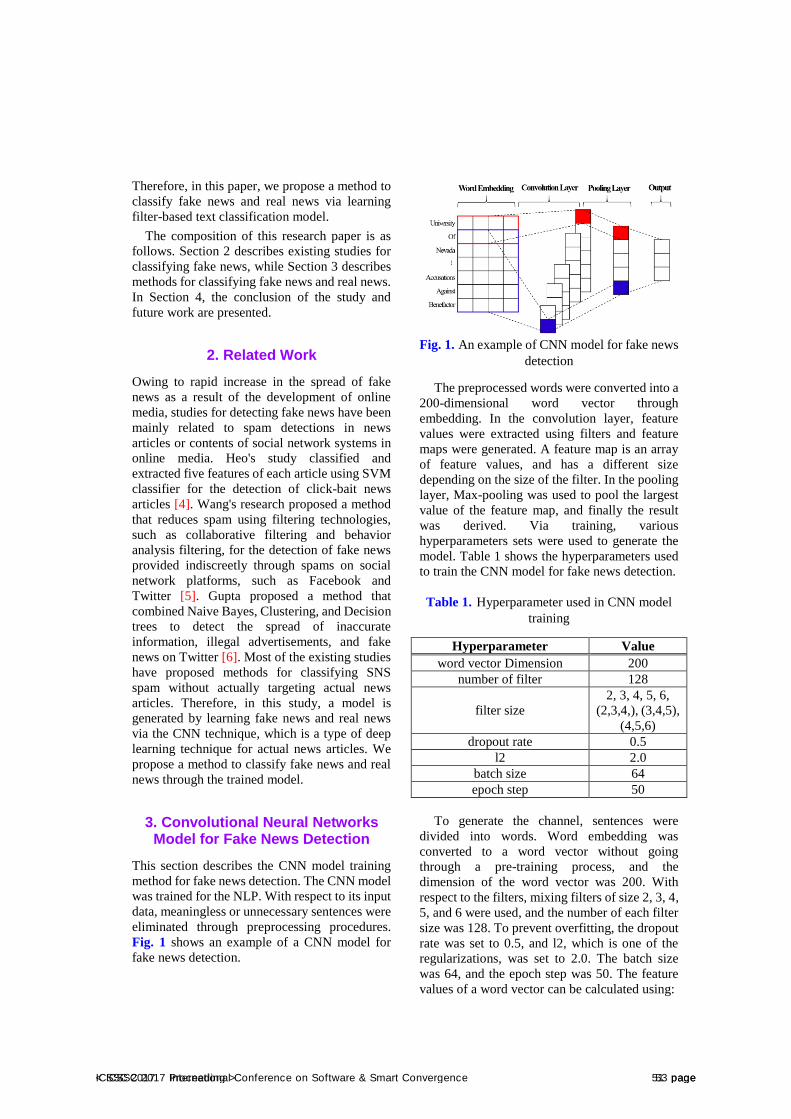
Therefore, in this paper, we propose a method to
classify fake news and real news via learning
filter-based text classification model.
The composition of this research paper is as
follows. Section 2 describes existing studies for
classifying fake news, while Section 3 describes
methods for classifying fake news and real news.
In Section 4, the conclusion of the study and
future work are presented.
2. Related Work
Owing to rapid increase in the spread of fake
news as a result of the development of online
media, studies for detecting fake news have been
mainly related to spam detections in news
articles or contents of social network systems in
online media. Heo's study classified and
extracted five features of each article using SVM
classifier for the detection of click-bait news
articles [4]. Wang's research proposed a method
that reduces spam using filtering technologies,
such as collaborative filtering and behavior
analysis filtering, for the detection of fake news
provided indiscreetly through spams on social
network platforms, such as Facebook and
Twitter [5]. Gupta proposed a method that
combined Naive Bayes, Clustering, and Decision
trees to detect the spread of inaccurate
information, illegal advertisements, and fake
news on Twitter [6]. Most of the existing studies
have proposed methods for classifying SNS
spam without actually targeting actual news
articles. Therefore, in this study, a model is
generated by learning fake news and real news
via the CNN technique, which is a type of deep
learning technique for actual news articles. We
propose a method to classify fake news and real
news through the trained model.
3. Convolutional Neural NetworksModel for Fake News Detection
This section describes the CNN model training
method for fake news detection. The CNN model
was trained for the NLP. With respect to its input
data, meaningless or unnecessary sentences were
eliminated through preprocessing procedures.
Fig. 1 shows an example of a CNN model for
fake news detection.
Fig. 1. An example of CNN model for fake news
detection
The preprocessed words were converted into a
200-dimensional word vector through
embedding. In the convolution layer, feature
values were extracted using filters and feature
maps were generated. A feature map is an array
of feature values, and has a different size
depending on the size of the filter. In the pooling
layer, Max-pooling was used to pool the largest
value of the feature map, and finally the result
was derived. Via training, various
hyperparameters sets were used to generate the
model. Table 1 shows the hyperparameters used
to train the CNN model for fake news detection.
Table 1. Hyperparameter used in CNN model
training
Hyperparameter Value
word vector Dimension 200
number of filter 128
filter size
2, 3, 4, 5, 6,
(2,3,4,), (3,4,5),
(4,5,6)
dropout rate 0.5
l2 2.0
batch size 64
epoch step 50
To generate the channel, sentences were
divided into words. Word embedding was
converted to a word vector without going
through a pre-training process, and the
dimension of the word vector was 200. With
respect to the filters, mixing filters of size 2, 3, 4,
5, and 6 were used, and the number of each filter
size was 128. To prevent overfitting, the dropout
rate was set to 0.5, and l2, which is one of the
regularizations, was set to 2.0. The batch size
was 64, and the epoch step was 50. The feature
values of a word vector can be calculated using:
< ICSSC 2017 Proceeding > 53 pageICSSC 2017 International Conference on Software & Smart Convergence 51 page
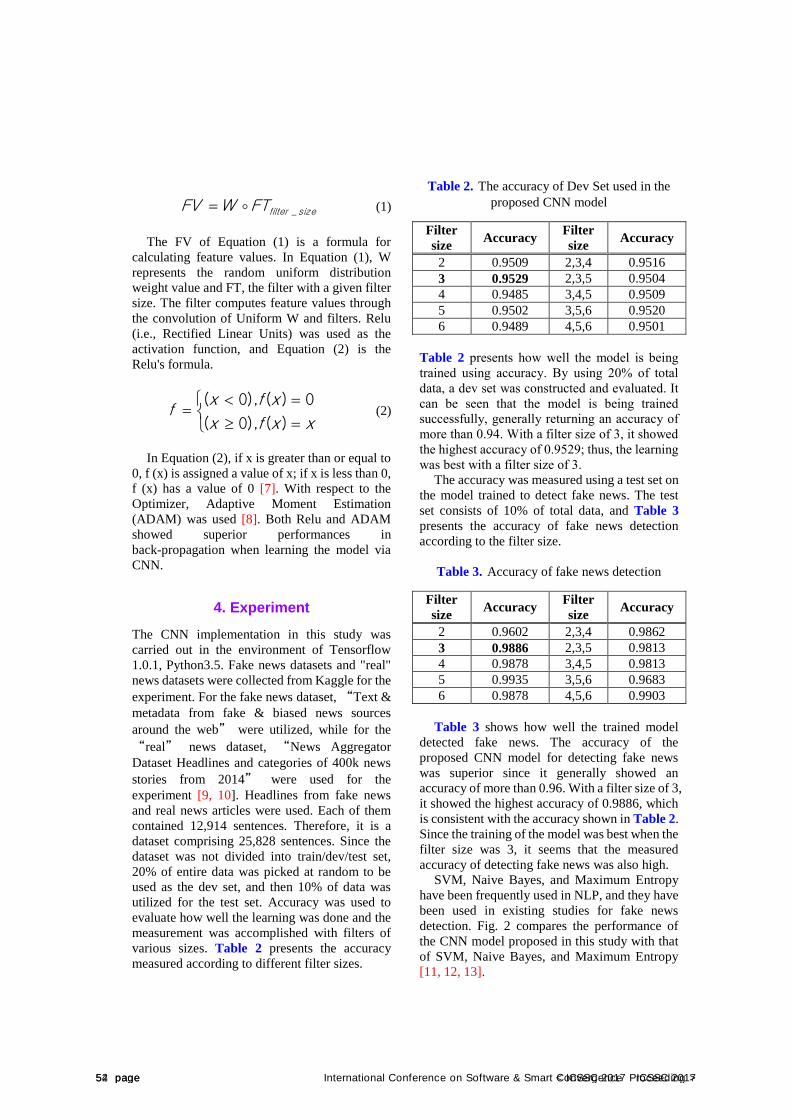
sizefilterFTWFV _ (1)
The FV of Equation (1) is a formula for
calculating feature values. In Equation (1), W
represents the random uniform distribution
weight value and FT, the filter with a given filter
size. The filter computes feature values through
the convolution of Uniform W and filters. Relu
(i.e., Rectified Linear Units) was used as the
activation function, and Equation (2) is the
Relu's formula.
xxfx
xfxf
)(),0(
0)(),0( (2)
In Equation (2), if x is greater than or equal to
0, f (x) is assigned a value of x; if x is less than 0,
f (x) has a value of 0 [7]. With respect to the
Optimizer, Adaptive Moment Estimation
(ADAM) was used [8]. Both Relu and ADAM
showed superior performances in
back-propagation when learning the model via
CNN.
4. Experiment
The CNN implementation in this study was
carried out in the environment of Tensorflow
1.0.1, Python3.5. Fake news datasets and "real"
news datasets were collected from Kaggle for the
experiment. For the fake news dataset, “Text &
metadata from fake & biased news sources
around the web” were utilized, while for the
“real” news dataset, “News Aggregator
Dataset Headlines and categories of 400k news
stories from 2014” were used for the
experiment [9, 10]. Headlines from fake news
and real news articles were used. Each of them
contained 12,914 sentences. Therefore, it is a
dataset comprising 25,828 sentences. Since the
dataset was not divided into train/dev/test set,
20% of entire data was picked at random to be
used as the dev set, and then 10% of data was
utilized for the test set. Accuracy was used to
evaluate how well the learning was done and the
measurement was accomplished with filters of
various sizes. Table 2 presents the accuracy
measured according to different filter sizes.
Table 2. The accuracy of Dev Set used in the
proposed CNN model
Filter
size Accuracy
Filter
size Accuracy
2 0.9509 2,3,4 0.9516
3 0.9529 2,3,5 0.9504
4 0.9485 3,4,5 0.9509
5 0.9502 3,5,6 0.9520
6 0.9489 4,5,6 0.9501
Table 2 presents how well the model is being
trained using accuracy. By using 20% of total
data, a dev set was constructed and evaluated. It
can be seen that the model is being trained
successfully, generally returning an accuracy of
more than 0.94. With a filter size of 3, it showed
the highest accuracy of 0.9529; thus, the learning
was best with a filter size of 3.
The accuracy was measured using a test set on
the model trained to detect fake news. The test
set consists of 10% of total data, and Table 3
presents the accuracy of fake news detection
according to the filter size.
Table 3. Accuracy of fake news detection
Filter
size Accuracy
Filter
size Accuracy
2 0.9602 2,3,4 0.9862
3 0.9886 2,3,5 0.9813
4 0.9878 3,4,5 0.9813
5 0.9935 3,5,6 0.9683
6 0.9878 4,5,6 0.9903
Table 3 shows how well the trained model
detected fake news. The accuracy of the
proposed CNN model for detecting fake news
was superior since it generally showed an
accuracy of more than 0.96. With a filter size of 3,
it showed the highest accuracy of 0.9886, which
is consistent with the accuracy shown in Table 2.
Since the training of the model was best when the
filter size was 3, it seems that the measured
accuracy of detecting fake news was also high.
SVM, Naive Bayes, and Maximum Entropy
have been frequently used in NLP, and they have
been used in existing studies for fake news
detection. Fig. 2 compares the performance of
the CNN model proposed in this study with that
of SVM, Naive Bayes, and Maximum Entropy
[11, 12, 13].
54 page < ICSSC 2017 Proceeding >52 page International Conference on Software & Smart Convergence ICSSC 2017
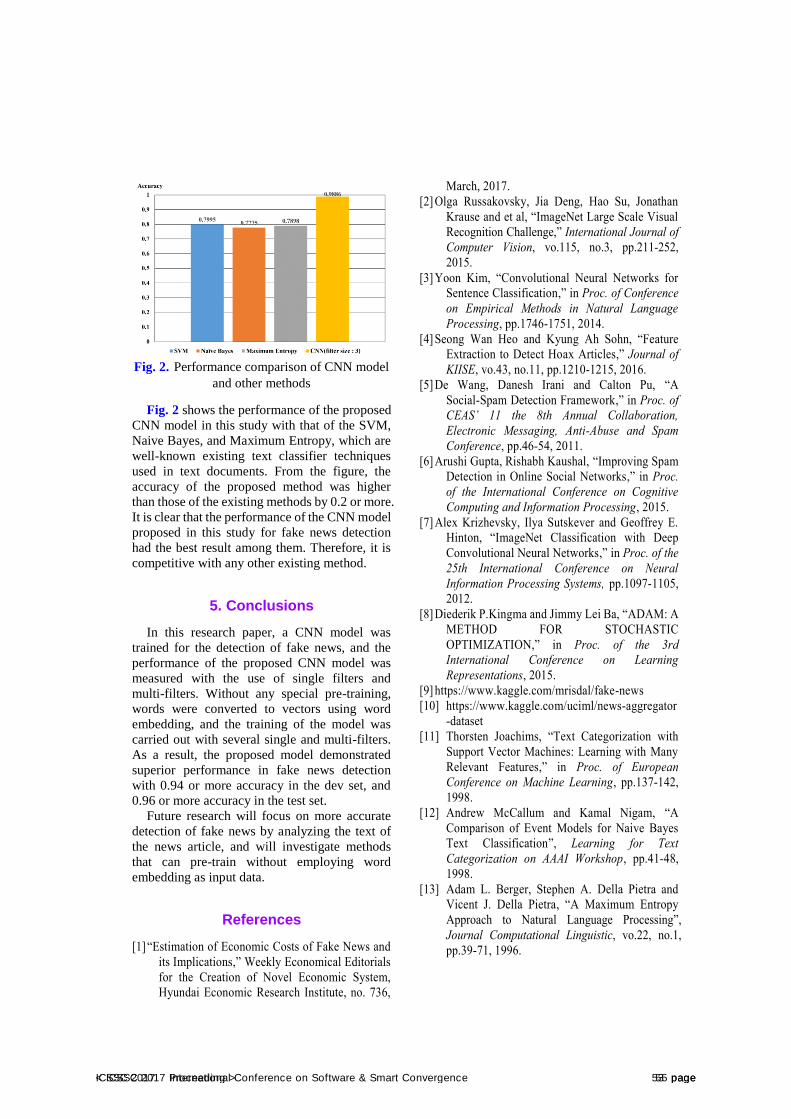
Fig. 2. Performance comparison of CNN model
and other methods
Fig. 2 shows the performance of the proposed
CNN model in this study with that of the SVM,
Naive Bayes, and Maximum Entropy, which are
well-known existing text classifier techniques
used in text documents. From the figure, the
accuracy of the proposed method was higher
than those of the existing methods by 0.2 or more.
It is clear that the performance of the CNN model
proposed in this study for fake news detection
had the best result among them. Therefore, it is
competitive with any other existing method.
5. Conclusions
In this research paper, a CNN model was
trained for the detection of fake news, and the
performance of the proposed CNN model was
measured with the use of single filters and
multi-filters. Without any special pre-training,
words were converted to vectors using word
embedding, and the training of the model was
carried out with several single and multi-filters.
As a result, the proposed model demonstrated
superior performance in fake news detection
with 0.94 or more accuracy in the dev set, and
0.96 or more accuracy in the test set.
Future research will focus on more accurate
detection of fake news by analyzing the text of
the news article, and will investigate methods
that can pre-train without employing word
embedding as input data.
References
[1] “Estimation of Economic Costs of Fake News and
its Implications,” Weekly Economical Editorials
for the Creation of Novel Economic System,
Hyundai Economic Research Institute, no. 736,
March, 2017.
[2] Olga Russakovsky, Jia Deng, Hao Su, Jonathan
Krause and et al, “ImageNet Large Scale Visual
Recognition Challenge,” International Journal of
Computer Vision, vo.115, no.3, pp.211-252, 2015.
[3] Yoon Kim, “Convolutional Neural Networks for
Sentence Classification,” in Proc. of Conference
on Empirical Methods in Natural Language
Processing, pp.1746-1751, 2014.
[4] Seong Wan Heo and Kyung Ah Sohn, “Feature
Extraction to Detect Hoax Articles,” Journal of
KIISE, vo.43, no.11, pp.1210-1215, 2016.
[5] De Wang, Danesh Irani and Calton Pu, “A
Social-Spam Detection Framework,” in Proc. of
CEAS’ 11 the 8th Annual Collaboration,
Electronic Messaging, Anti-Abuse and Spam
Conference, pp.46-54, 2011.
[6] Arushi Gupta, Rishabh Kaushal, “Improving Spam
Detection in Online Social Networks,” in Proc.
of the International Conference on Cognitive
Computing and Information Processing, 2015.
[7] Alex Krizhevsky, Ilya Sutskever and Geoffrey E.
Hinton, “ImageNet Classification with Deep
Convolutional Neural Networks,” in Proc. of the
25th International Conference on Neural
Information Processing Systems, pp.1097-1105,
2012.
[8] Diederik P.Kingma and Jimmy Lei Ba, “ADAM: A
METHOD FOR STOCHASTIC
OPTIMIZATION,” in Proc. of the 3rd
International Conference on Learning
Representations, 2015.
[9] https://www.kaggle.com/mrisdal/fake-news
[10] https://www.kaggle.com/uciml/news-aggregator
-dataset
[11] Thorsten Joachims, “Text Categorization with
Support Vector Machines: Learning with Many
Relevant Features,” in Proc. of European
Conference on Machine Learning, pp.137-142,
1998.
[12] Andrew McCallum and Kamal Nigam, “A
Comparison of Event Models for Naive Bayes
Text Classification”, Learning for Text
Categorization on AAAI Workshop, pp.41-48,
1998.
[13] Adam L. Berger, Stephen A. Della Pietra and
Vicent J. Della Pietra, “A Maximum Entropy
Approach to Natural Language Processing”,
Journal Computational Linguistic, vo.22, no.1,
pp.39-71, 1996.
< ICSSC 2017 Proceeding > 55 pageICSSC 2017 International Conference on Software & Smart Convergence 53 page
International Conference on Software & Smart Convergence (ICSSC) 2017, June 2017 Copyright ⓒ 2017 ICSSC
This research was supported by the National Research Foundation of Korea (NRF) grant funded by the Korea government (No. 2016R1A2B4013002), and by the Ministry of Science and Future Planning, Korea (MSIP), under the Information Technology Research Center (ITRC) support by the IITP (IITP-2015-R0992-15-1026).
A Novel Clustering Method with Considering Node Connectivity for
Centralized Disaster Safety Network with Sensors
A. S. M. Sanwar Hosen1, Gi Hwan Cho2, Kishik Park3 and In-Ho Ra1,* 1School of Computer, Information and Communication Engineering, Kunsan National University
Gunsan, Gunsan-si 54150 - Korea [E-mail: [email protected], [email protected]]
2Division of Computer Science and Engineering, Chonbuk National University Jeonju, Jeollabuk-do 54596 - Korea
[E-mail:[email protected]] 3ETRI(Electronics and Telecommunications Research Institute)
[E-mail:[email protected]] *Corresponding author: In-Ho Ra
Abstract
Natural or manmade disasters are escalating into worldwide, so resulting in a significant impact on our lives. Therefore, a disaster safety network has to be developed where the wireless sensor network (WSN) may play role as a core network. Distributed clustering is known as a common approach for energy efficient routing in WSNs. Most existing clustering methods are based on dividing the network into K-clusters on prior network partitions. This work proposes a K-clustering based candidate cluster header selection method with considering of the nodes’ connectivity information. With this ground, clusters are formed by the giant components a prominent feature of random graphs in which each possible pairs of given set of nodes is present independently with a probability. The simulation results show that through the features selection, the boundary or holes’ nodes can be detected which are excluded out from the candidate cluster headers list to prolong the network lifetime.
Keywords: C-DSN, WSN, Graph metrics, K-clusters, Candidate cluster head nodes
1. IntroductionDisasters are happening almost daily all over the world due to global climate change. These incidents of mass destruction causes a great impact on our global economy, property and lives. Therefore, steps are needed to be taken
towards the prevention of these situations through a centralized or distributed disaster safety network (C-DSN). Recently, wireless sensor network (WSN) has become a mature technology to go beyond being simple fine-grained safety monitoring platforms. Therefore, it can be the enabling technology as a core of the C-DSN [1].
56 page < ICSSC 2017 Proceeding >54 page International Conference on Software & Smart Convergence ICSSC 2017
< ICSSC 2017 Proceeding > 57 pageICSSC 2017 International Conference on Software & Smart Convergence 55 page
58 page < ICSSC 2017 Proceeding >56 page International Conference on Software & Smart Convergence ICSSC 2017
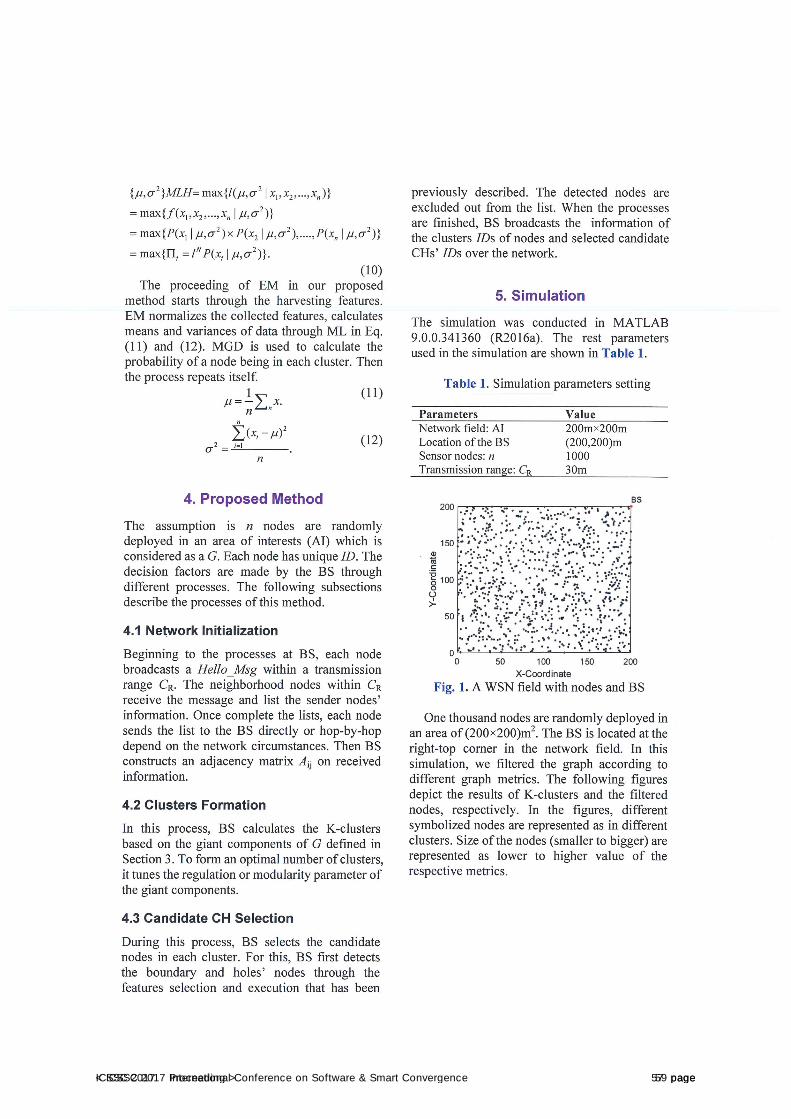
< ICSSC 2017 Proceeding > 59 pageICSSC 2017 International Conference on Software & Smart Convergence 57 page
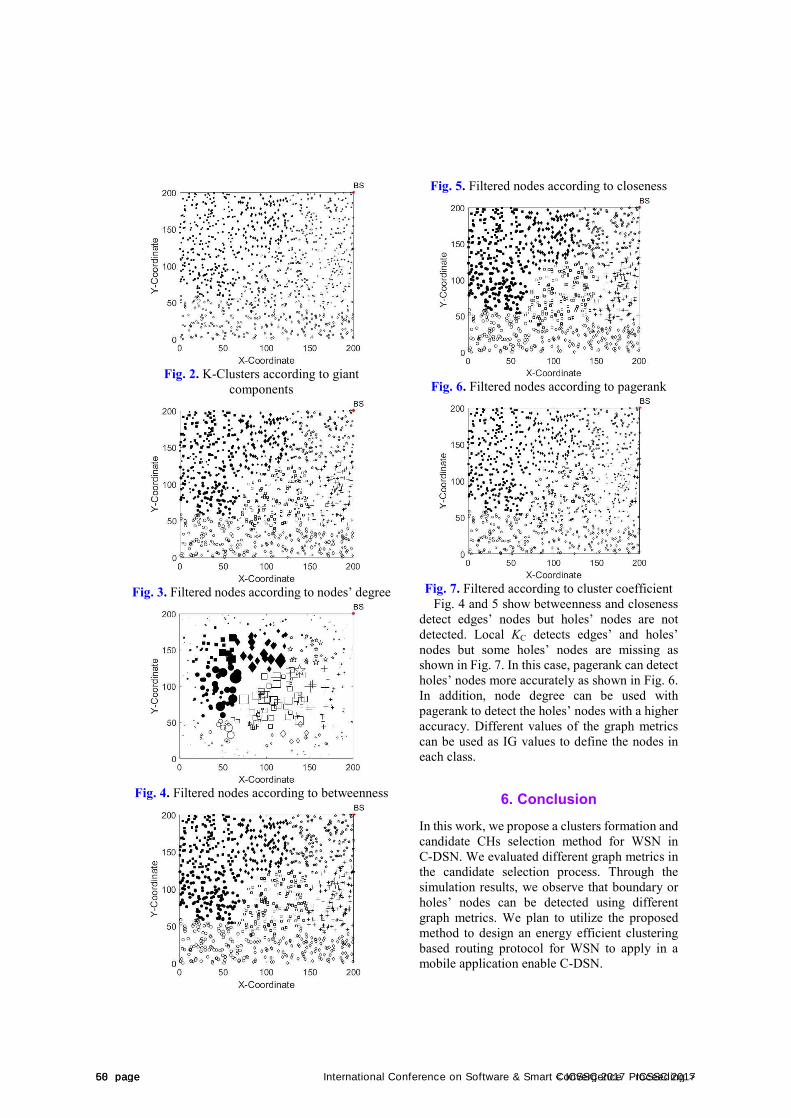
Fig. 2. K-Clusters according to giant components
Fig. 3. Filtered nodes according to nodes’ degree
Fig. 4. Filtered nodes according to betweenness
Fig. 5. Filtered nodes according to closeness
Fig. 6. Filtered nodes according to pagerank
Fig. 7. Filtered according to cluster coefficient Fig. 4 and 5 show betweenness and closeness
detect edges’ nodes but holes’ nodes are not detected. Local KC detects edges’ and holes’ nodes but some holes’ nodes are missing as shown in Fig. 7. In this case, pagerank can detect holes’ nodes more accurately as shown in Fig. 6. In addition, node degree can be used with pagerank to detect the holes’ nodes with a higher accuracy. Different values of the graph metrics can be used as IG values to define the nodes in each class.
6. ConclusionIn this work, we propose a clusters formation and candidate CHs selection method for WSN in C-DSN. We evaluated different graph metrics in the candidate selection process. Through the simulation results, we observe that boundary or holes’ nodes can be detected using different graph metrics. We plan to utilize the proposed method to design an energy efficient clustering based routing protocol for WSN to apply in a mobile application enable C-DSN.
60 page < ICSSC 2017 Proceeding >58 page International Conference on Software & Smart Convergence ICSSC 2017
References [1] D. Chen et al., “Natural disaster monitoring
with WSNs,” Mobile Network and Applications, vo. 18, pp. 651-663, 2013.
[2] S. P. Singh and S. C. Sharma, “A survey on cluster based routing protocol in WSN,” Procedia Computer Science, vo. 45, pp. 687-695, 2015.
[3] W. R Heinzelman et al., “Energy-efficient communication protocol for WSN,” in Proc. of Inter. Conf. on System Science, pp. 1-10, 2000.
[4] J. Yu et al., “A cluster-based routing protocol for WSN with nonuniform node distribution,” Journal of Electronics and Communications, vo. 66, pp. 54-61, 2012.
[5] K. Kira and L. A. Rendell, “A Practical approach to feature selection,” in Proc. of Inter. Workshop on Machine Learning, pp. 249-256, 1992.
[6] W. Peng et al., “An implementation of id3 decision tree learning algorithm,” (available on internet).
[7] A. K. Jain, “Data clustering: 50 years beyond K-means,” Pattern Recognition Letters, vo. 31, pp. 651-666, 2010.
< ICSSC 2017 Proceeding > 61 pageICSSC 2017 International Conference on Software & Smart Convergence 59 page
International Conference on Software & Smart Convergence (ICSSC) 2017, June 2017 Copyright ⓒ 2017 ICSSC
This research was supported by a research grant from the IT R&D program of MKE/IITA, the Korean government [2005-Y-001-04, Development of Next Generation Security Technology]. We express our thanks to Dr. Richard Berke who checked our manuscript.
An Empirical Investigation of the Importance of IS Control Mechanisms
Compatibility in Achievement of Superior IS Capabilities
Elizaveta Srednik1 and Kyung Jin Cha2 1 Department of Business Administration, Kangwon National, Chuncheon, South Korea
[e-mail: [email protected]] 2 Department of Business Administration, Kangwon National, Chuncheon, South Korea
[e-mail: [email protected]] *Corresponding author: Kyung Jin Cha
Abstract
Despite that ICT outsourcing attracts various companies it is prone to information security incidents that occur on the frequent basis and result in various damages to client and vendor companies. Additionally despite that ICT outsourcing environment is acknowledged to be very sensitive to security compromises, not much progress has been made to improve existing issues. Therefore it is critical to reconsider current approach to information security (IS) within ICT outsourcing domain and approach new models and solutions. Thus, by critically considering current state of the IS in this study we propose a unique model that considers compatibility of IS control mechanisms as key factor to the achievement of the IS capabilities, which is facilitated through inter-organizational relationship capital. With the proposed research model we were able to make critical implications that not only expand current theoretical state, but also make practical suggestions for managerial practices. In addition, structural equation modeling analysis supported our approached and proved all hypothesized relations.
Keywords: ICT outsourcing, IS capabilities, control mechanism compatibility, relationship capital
1. IntroductionICT outsourcing emergence enabled organizations to reduce business expenses, improve efficiency and concentrate on their core competences. That led to its wide spread adoption among organization over the last decade. However, ICT outsourcing environment has been analyzed to be very vulnerable due to many risk factors that primarily relate to
information security compromises [1]. Although various frameworks and approaches were proposed to ICT outsourcing security incidents [1], [2] not much progress has been made t solve on-going information security problems. In addition, existing studies constantly address technical issues of information security and disregard criticality of human-related errors that are prone to every organization. For instance, according to [3] 72% of respondents have emphasized that their organizations provide
62 page < ICSSC 2017 Proceeding >60 page International Conference on Software & Smart Convergence ICSSC 2017
employee security awareness training, but at the same time 75% of respondent organizations have suffered employee related security breaches, 50% stated that worst breaches occurred due to the inadvertent human error, and 28% suggested that worst breaches were partly caused by the senior management. Such numbers indicate that it is urgent to reconsider current perceptions of information security and approach it differently. Thus it becomes important to address structural mechanisms that influence employees to comply with organizational information security and as a result facilitate information security capabilities. Therefore, this study investigates IS control mechanisms importance of which have been emphasized have yet been empirically investigated. Moreover, as ICT outsourcing represents an inter-organizational setting it is critical to investigate congruence in regard to client and vendor’s information security control mechanisms. Furthermore, we extend our model to socio-physiological constructs of inter-organizational relationship capital and investigate its influences to information security capabilities within ICT outsourcing environment.
2. Literature Review and Hypothesis(IS) control mechanisms represent an
important area of concern primarily because it addresses all levels of organizational security - from technological assets to human resource management. Nevertheless in most cases information security has been approached as a technical issue only with little attention paid to other structural factors. Based on the work of [4] control can be defined as influence that ensures the respective counterparty performs adequately and process is regulated to yield at positive performance outcomes. Although information security primarily revolves around technology, it is administered by company's employees whose carelessness or lack of awareness can lead to security incidents. Thus, as employees play crucial role in inter-organizational relationship and its outcomes, it becomes critical to give due consideration to IS control mechanisms as structural aspects of each partner company that instrumental for both people and physical processes. As it was mentioned, organizational IS encompasses several security domains. These domains are administered through formal and
management level controls [5], [6] that govern both employees and technology. Although technical control mechanisms (i.e. encryption, decryption, etc) are critical to information security since they are implemented and administered by employees, it is urgent for an organization to implement formal controls in order to achieve and improve organizational information security, such as rule-based structures (e.g. information security policies) that govern how technical controls need to be enforced throughout the organization [6]. But nevertheless, even if technical controls guided through formal-level mechanisms can prevent intentional information security incidents, to a degree they cease their control over unintentional leakage of confidential information since all organizations are prone to human-related errors. Thus, it is important to establish adequate management controls since they primarily deal with employees' behavior, motivate and assist them in implementations and executions of information security initiatives [6], [7]. IS mechanisms of formal and management controls stand out among others primarily because they form a very critical structure for organizational information security on multiple levels. Considering that ICT outsourcing environment is very vulnerable in terms of frequent occurrence of security incidents emerging on the inter-organizational level, compatibility of IS controls between ICT outsourcing partners can strengthen information security capabilities through enhancement of relationship factors like mutual trust, commitment and shared vision [8]. In addition, mutual trust has been emphasized to be prerequisite to establish committed relationship in the significant body of research throughout various domains. It was also analyzed to be one of the most critical predicting factors to superior performance outcomes [9]. In addition as trust is fundamental to positive outcomes of relationships, establishment of mutual trust among partners might contribute to formation of the vision shared among client and vendor companies and form shared vision among partner organizations. Although there is no specialized research that investigates organizational security capabilities and within ICT outsourcing setting, such assessment becomes critical, as they are not only different from commonly approached supply chain or outsourcing capabilities and performance, but
< ICSSC 2017 Proceeding > 63 pageICSSC 2017 International Conference on Software & Smart Convergence 61 page
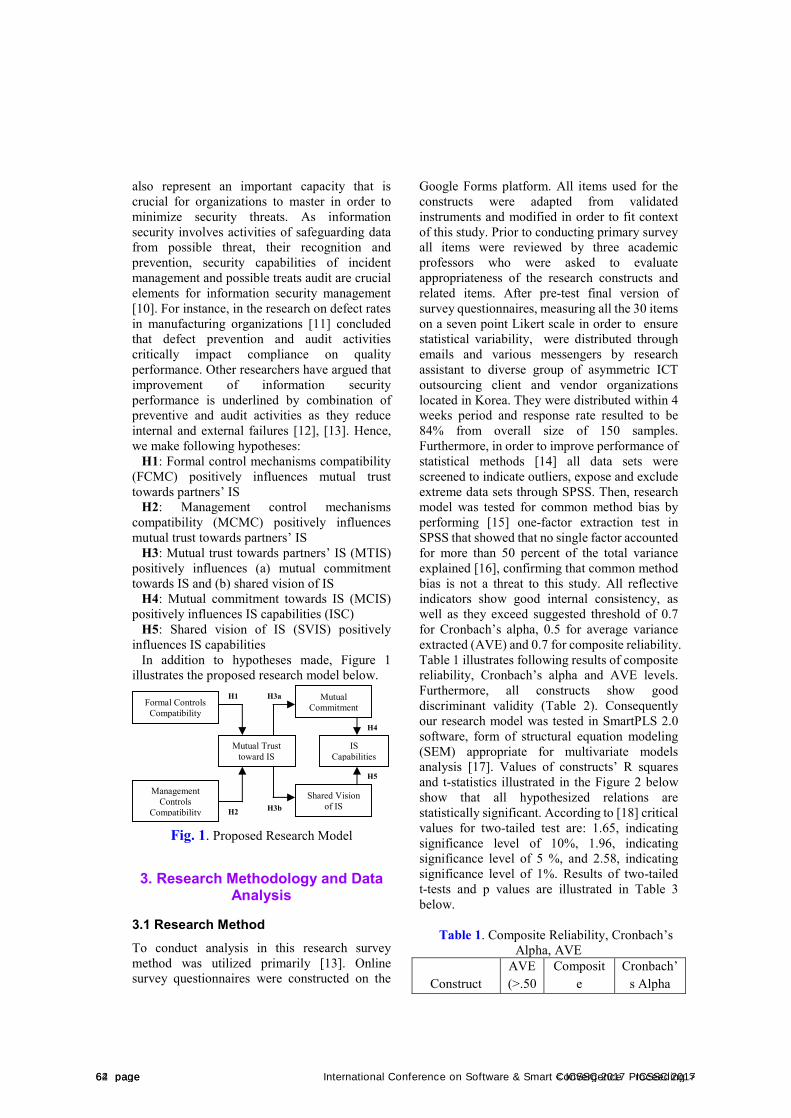
also represent an important capacity that is crucial for organizations to master in order to minimize security threats. As information security involves activities of safeguarding data from possible threat, their recognition and prevention, security capabilities of incident management and possible treats audit are crucial elements for information security management [10]. For instance, in the research on defect rates in manufacturing organizations [11] concluded that defect prevention and audit activities critically impact compliance on quality performance. Other researchers have argued that improvement of information security performance is underlined by combination of preventive and audit activities as they reduce internal and external failures [12], [13]. Hence, we make following hypotheses:
H1: Formal control mechanisms compatibility (FCMC) positively influences mutual trust towards partners’ IS
H2: Management control mechanisms compatibility (MCMC) positively influences mutual trust towards partners’ IS
H3: Mutual trust towards partners’ IS (MTIS) positively influences (a) mutual commitment towards IS and (b) shared vision of IS
H4: Mutual commitment towards IS (MCIS) positively influences IS capabilities (ISC)
H5: Shared vision of IS (SVIS) positively influences IS capabilities
In addition to hypotheses made, Figure 1 illustrates the proposed research model below.
Fig. 1. Proposed Research Model
3. Research Methodology and DataAnalysis
3.1 Research Method To conduct analysis in this research survey method was utilized primarily [13]. Online survey questionnaires were constructed on the
Google Forms platform. All items used for the constructs were adapted from validated instruments and modified in order to fit context of this study. Prior to conducting primary survey all items were reviewed by three academic professors who were asked to evaluate appropriateness of the research constructs and related items. After pre-test final version of survey questionnaires, measuring all the 30 items on a seven point Likert scale in order to ensure statistical variability, were distributed through emails and various messengers by research assistant to diverse group of asymmetric ICT outsourcing client and vendor organizations located in Korea. They were distributed within 4 weeks period and response rate resulted to be 84% from overall size of 150 samples. Furthermore, in order to improve performance of statistical methods [14] all data sets were screened to indicate outliers, expose and exclude extreme data sets through SPSS. Then, research model was tested for common method bias by performing [15] one-factor extraction test in SPSS that showed that no single factor accounted for more than 50 percent of the total variance explained [16], confirming that common method bias is not a threat to this study. All reflective indicators show good internal consistency, as well as they exceed suggested threshold of 0.7 for Cronbach’s alpha, 0.5 for average variance extracted (AVE) and 0.7 for composite reliability. Table 1 illustrates following results of composite reliability, Cronbach’s alpha and AVE levels. Furthermore, all constructs show good discriminant validity (Table 2). Consequently our research model was tested in SmartPLS 2.0 software, form of structural equation modeling (SEM) appropriate for multivariate models analysis [17]. Values of constructs’ R squares and t-statistics illustrated in the Figure 2 below show that all hypothesized relations are statistically significant. According to [18] critical values for two-tailed test are: 1.65, indicating significance level of 10%, 1.96, indicating significance level of 5 %, and 2.58, indicating significance level of 1%. Results of two-tailed t-tests and p values are illustrated in Table 3 below.
Table 1. Composite Reliability, Cronbach’s Alpha, AVE
Construct AVE (>.50
Composite
Cronbach’s Alpha
H5
H4
H3b
H3a
H2
H1
IS Capabilities
Mutual Trust toward IS
Formal Controls Compatibility
Management Controls
Compatibility
Mutual Commitment
Shared Vision of IS
64 page < ICSSC 2017 Proceeding >62 page International Conference on Software & Smart Convergence ICSSC 2017
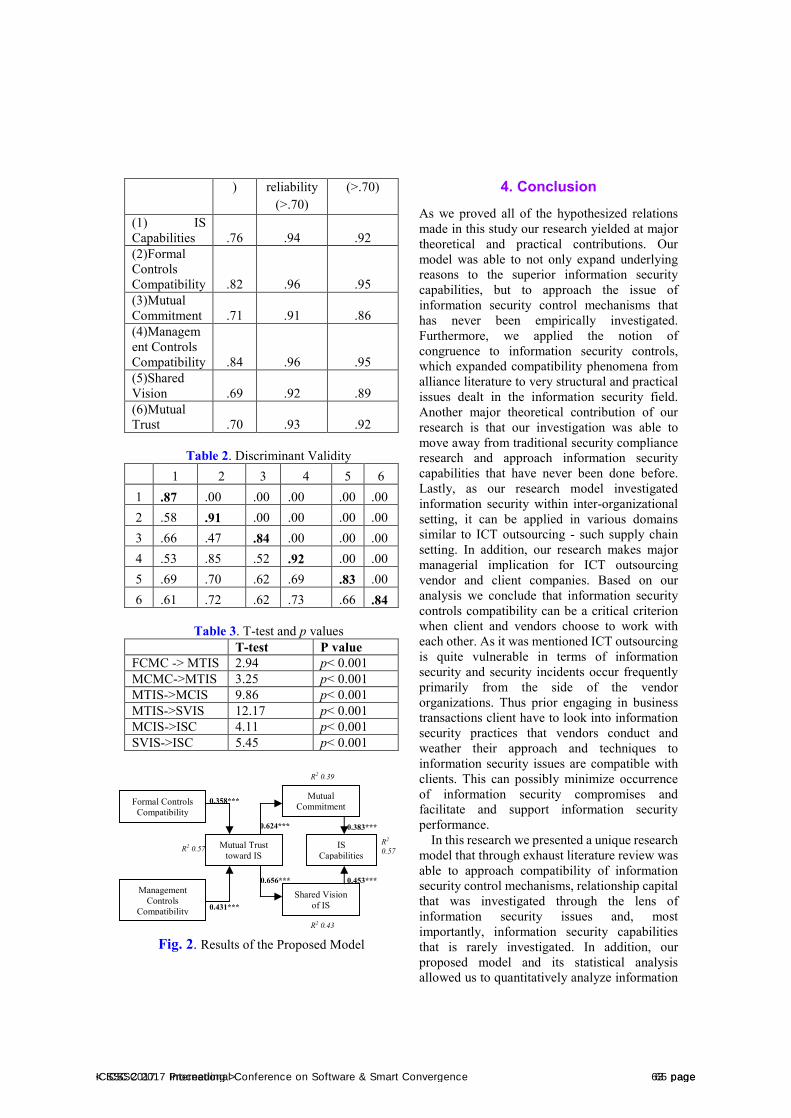
) reliability (>.70)
(>.70)
(1) IS Capabilities .76 .94 .92 (2)Formal Controls Compatibility .82 .96 .95 (3)Mutual Commitment .71 .91 .86 (4)Management Controls Compatibility .84 .96 .95 (5)Shared Vision .69 .92 .89 (6)Mutual Trust .70 .93 .92
Table 2. Discriminant Validity 1 2 3 4 5 6
1 .87 .00 .00 .00 .00 .00 2 .58 .91 .00 .00 .00 .00 3 .66 .47 .84 .00 .00 .00 4 .53 .85 .52 .92 .00 .00 5 .69 .70 .62 .69 .83 .00 6 .61 .72 .62 .73 .66 .84
Table 3. T-test and p values T-test P value
FCMC -> MTIS 2.94 p< 0.001 MCMC->MTIS 3.25 p< 0.001 MTIS->MCIS 9.86 p< 0.001 MTIS->SVIS 12.17 p< 0.001 MCIS->ISC 4.11 p< 0.001 SVIS->ISC 5.45 p< 0.001
Fig. 2. Results of the Proposed Model
4. ConclusionAs we proved all of the hypothesized relations made in this study our research yielded at major theoretical and practical contributions. Our model was able to not only expand underlying reasons to the superior information security capabilities, but to approach the issue of information security control mechanisms that has never been empirically investigated. Furthermore, we applied the notion of congruence to information security controls, which expanded compatibility phenomena from alliance literature to very structural and practical issues dealt in the information security field. Another major theoretical contribution of our research is that our investigation was able to move away from traditional security compliance research and approach information security capabilities that have never been done before. Lastly, as our research model investigated information security within inter-organizational setting, it can be applied in various domains similar to ICT outsourcing - such supply chain setting. In addition, our research makes major managerial implication for ICT outsourcing vendor and client companies. Based on our analysis we conclude that information security controls compatibility can be a critical criterion when client and vendors choose to work with each other. As it was mentioned ICT outsourcing is quite vulnerable in terms of information security and security incidents occur frequently primarily from the side of the vendor organizations. Thus prior engaging in business transactions client have to look into information security practices that vendors conduct and weather their approach and techniques to information security issues are compatible with clients. This can possibly minimize occurrence of information security compromises and facilitate and support information security performance.
In this research we presented a unique research model that through exhaust literature review was able to approach compatibility of information security control mechanisms, relationship capital that was investigated through the lens of information security issues and, most importantly, information security capabilities that is rarely investigated. In addition, our proposed model and its statistical analysis allowed us to quantitatively analyze information
0.383***
R2 0.57
R2 0.39
R2 0.43
R2 0.57
0.431***
0.358***
0.453***0.656***
0.624***
IS Capabilities
Mutual Trust toward IS
Formal Controls Compatibility
Management Controls
Compatibility
Mutual Commitment
Shared Vision of IS
< ICSSC 2017 Proceeding > 65 pageICSSC 2017 International Conference on Software & Smart Convergence 63 page
security control mechanisms and approach information security performance, which is not common in the information security research domain. Considering that information security compromises are prone to every organization, with our research we hope to not only expand views on information security issues and their causing factors, but also contribute to security solutions for practical business environments like ICT outsourcing.
References [1] Khidzir, N. Z., Mohamed, A., Arshad, N. H. “Information Security Risk Factors: Critical Threats Vulnerabilities in ICT Outsourcing”, In Information Retrieval & Knowledge Management, (CAMP), 2010 International Conference on IEEE, pp. 194-199, March 2010. [2] Arshad, N. H., May-Lin, Y., Mohamed, A. “ICT Outsourcing: Inherent Risks, Issues and Challenges”, growth, vo. 25, 2008. [3] Pwc. “Information Security Breaches Survey.” Retrieved from: http://www.pwc.co.uk/assets/pdf/2015-isbs-executive-summary-02.pdf, 2015. [4] Leifer, R., Mills, P. K. “An Information Processing Approach for Deciding upon Control Strategies and Reducing Control Loss in Emerging Organizations”, Journal of Management, vo. 22, no.1, pp. 113-137, 1996. [5] Dhillon, G. “Principles of Information Systems Security: Text and Cases, New York, NY: Wiley. pp. 97-129, 2007. [6] Sindhuja, P. N., Kunnathur, A. S., “Information Security in Supply Chains: A Management Control Perspective,” Information & Computer Security, vo. 23, no. 5, pp. 476-496, 2015. [7] Anthony, R. N., Govindarajan, V. “Management control systems”, McGraw-Hill, New York, NY. 2007. [8] Sarkar, M. B., Echambadi, R., Cavusgil, S. T., Aulakh, P. S. “The Influence of Complementarity, Compatibility, and Relationship Capital on Alliance Performance”, Journal of the Academy of Marketing Science. vo. 29, no. 4, pp. 358-373, 2001. [9] Morgan, R. M., Hunt, S. D. “The Commitment-Trust Theory of Relationship Marketing,” The Journal of Marketing, pp.20-38, 1994. [10] Mao, J. Y., Lee, J. N., Deng, C. P.
“Vendors’ Perspectives on Trust and Control in Offshore Information Systems Outsourcing”, Information & Management. vo. 45, no.7. pp 482-492, 2008. [11] Singh, N. A., Gupta, M. P., Ojha, A. “Identifying Factors of “Organizational Information Security Management”, Journal of Enterprise Information Management, vo. 27, no.5, pp. 644-667, 2014. [12] Ittner, C. D., Nagar, V., Rajan, M. V. “An Empirical Examination of Dynamic Quality- Based Learning Models,” Management Science,” vo. 47, no. 4, pp. 563-578, 2010. [13] Hong, K.S., Chi, Y.P., Chag, L.R., Tang, J.H. “An Integrated System Theory of Information Security Management,” Information Management & Computer Security, vo. 11, no.5, pp. 243-250, 2003. [14] Straub,D. W., Goodman, S. E., Baskerville, R. “Information Security: Policy, Processes, and Practices.” M.E. Sharpe. 2008 [15] Odom, L., and Henson, R. “Data Screening: Essential Techniques for Data Review and Preparation”, Paper presented at the Annual Meeting of the Southwest Educational Research Association, 2002. Harman’s (1967) [16] Schriesheim, C. A. The Similarity of Individual Directed and Group Directed Leader Behavior Descriptions”, Academy of Management Journal, vo. 22, no.2,pp. 345-355, 1979. [17] Chin, W. W. “Issues and Opinion on Structural Equation Modeling”, MIS Quarterly, vo. 22, no. 1, pp. 7-16, 1998. [18] Hair, J.F., Ringle, C.M., and Sarstedt, M. “PLS-SEM: Indeed a Silver Bullet”, Journal of Marketing Theory and Practice, vo. 19, no.2, pp. 139-151, 2011.
66 page < ICSSC 2017 Proceeding >64 page International Conference on Software & Smart Convergence ICSSC 2017
International Conference on Software & Smart Convergence (ICSSC) 2017, June 2017
Copyright ⓒ 2017 ICSSC
This research was supported by the Human Resource Training Program for Regional Innovation and Creativity
through the Ministry of Education and National Research Foundation of Korea (2015H1C1A1035823) and
supported by the MSIP(Ministry of Science, ICT & Future Planning), Korea, under the "Employment Contract
based Master's Degree Program for Information Security" supervised by the KISA(Korea Internet Security
Agency)(H2101-16-1001)
Detection of Malicious Code using the FP-Growth Algorithm and SVM
Yeongji Ju1 and Juhyun Shin2
1Dept. of Software Convergence Engineering, Chosun University
309, Pilmun-daero, Dong-gu, Gwangju, Republic of Korea
[e-mail: [email protected]] 2 Dept. of Control and Measuring Robot Engineering, Chosun University
309, Pilmun-daero, Dong-gu, Gwangju, Republic of Korea
[e-mail: [email protected]]
*Corresponding author: Juhyun Shin
Abstract
Although Open API has been invigorated by advancements in the software industry, diverse types of
malicious code have also increased. Thus, many studies have been carried out to discriminate the
behaviors of malicious code based on API data, and to determine whether malicious code is included in
a specific executable file. Existing methods detect malicious code by analyzing signature data, which
requires a long time to detect mutated malicious code and has a high false detection rate. Accordingly,
in this paper, we propose a method that analyzes and detects malicious code using association rule
mining and an Support Vector Machine (SVM). The proposed method reduces the false detection rate
by mining the rules of malicious and normal code APIs in the PE file and clustering the patterns using
the FP-Growth algorithm, and classifies malicious and normal files using the SVM.
Keywords: Detection of Malicious Code, FP-Growth Algorithm, Support Vector Machine
1. Introduction
Open API was invigorated because of software
advancements; however, malicious code that steals
information and attacks other systems has also
increased[1,2]. Types of malicious code include
viruses, worms, and Trojan horses; the malicious code
calls an API to conduct malicious behaviors. Though
the behaviors of malicious code are distinct and
whether a specific executable file has any malicious
code is grasped through API call information, the
number of reported hacking incidents increased by
46.7% from 10,600 cases in 2013 to 15,545 cases in
2014, and cases of malicious code detection decreased
by 68.4% from 2,415,046 cases in 2013 to 764,025
cases in 2014, which shows that malicious code rapidly
mutates and that new malicious code is generated[3].
Existing methods detect malicious code by analyzing
the defined signature data; detecting mutated
malicious code is time consuming and the false
detection rate is high[4]. Accordingly, in this research,
we detect malicious code using a Support Vector
Machine (SVM) based on the API extracted from the
malicious code. To detect malicious code, the
< ICSSC 2017 Proceeding > 67 pageICSSC 2017 International Conference on Software & Smart Convergence 65 page

malicious code API of a worm form contained in the
PE file is extracted and, after carrying out a
preprocessing step, the pattern rules of malicious and
normal files are extracted using the FP-Growth
algorithm, which can explore the association rule
patterns. We propose to reduce the false detection rate
by classifying malicious and normal files via the SVM
after exploring the association rules and clustering
patterns. This paper is organized as follows: In Section
2, we describe a research of classifying malicious code
and, in Section 3, we describe our proposed method for
detecting malicious code with an SVM. In Section 4,
we present our conclusions and describe future studies.
2. Related Work
In this section, we describe the FP-Growth algorithm
for extracting the API patterns of malicious and normal
files, as well as existing studies on malicious code. The
FP-Growth method is an improvement of the a priori
algorithm, a bottom-up approach that uses a tree and
node links among representative association rule
mining techniques, and is structured such that
instances are inserted twice into the data field and a
tree is made without making a candidate pattern. This
algorithm was proposed to reduce time and memory
use[5,6]. One research quickly explored frequent
patterns from a large-scale pixel and concentrated
frequent data by improving the FP-Growth algorithm
for frequent pattern mining from large-scale spatial
data[7].
Though typical methods of discriminating existing
malicious code detect malicious code based on its
signature, mutated and obfuscated malicious code are
difficult to detecte. To resolve this problem, although
mutated malicious code was analyzed and classified by
generating unique behavior signatures, the result was
similar to the MAL-DNA, which belongs to another
group, showing low reliability[8]. Also, a research that
generated malicious API code ranks and classified
families showed a low behavioral similarity, as it
depends on a dynamic analysis[9].
3. Detection of Malicious Code usingthe FP-Growth Algorithm and SVM
3.1 System Architecture
In this paper, we propose a method to extract
association pattern rules using malicious code API
through the FP-Growth algorithm and to detect
malicious code using an SVM.
Fig. 1. Block Diagram of System for Detecting
Malicious Code
Fig. 1 shows the overall block diagram of the
system that detects malicious code using the APIs of
malicious and normal files. The API of a worm
contained in the existing PE file and the API of normal
code are extracted and a data preprocessing step is
carried out. With the extracted APIs, the attribute data
that satisfies the minimum critical value is built in a
tree form using the FP-Growth algorithm and the
related rules are extracted. The API rule associations
of malicious and normal code are clustered, and then
malicious code is detected by carrying out 10-fold
cross-validation with the SVM.
3.2 Clustering of API Patterns using FP-Growth Algorithm
In this section, we describe the extraction of patterns
using the FP-Growth algorithm after carrying out a
preprocessing step to clustering API patterns. The data
used in this research are the APIs extracted by static
analysis of malicious behavior files of a worm
contained in the PE file and normal behavior files.
Association rule mining is applied to 150 APIs
extracted from malicious and normal files. To classify
the malicious code, the patterns of the APIs are
classified by extracting the association patterns using
the FP-Growth algorithm and carrying out the
clustering after deleting data with abnormal values and
performing a preprocessing step that converts all
letters to lowercase. The association rule is expressed
as R ∶ X → Y , where X and Y are a set of items
containing different elements; it is understood that if a
transaction supports X, then Y will be also supported
with a certain probability. Association rule mining
68 page < ICSSC 2017 Proceeding >66 page International Conference on Software & Smart Convergence ICSSC 2017
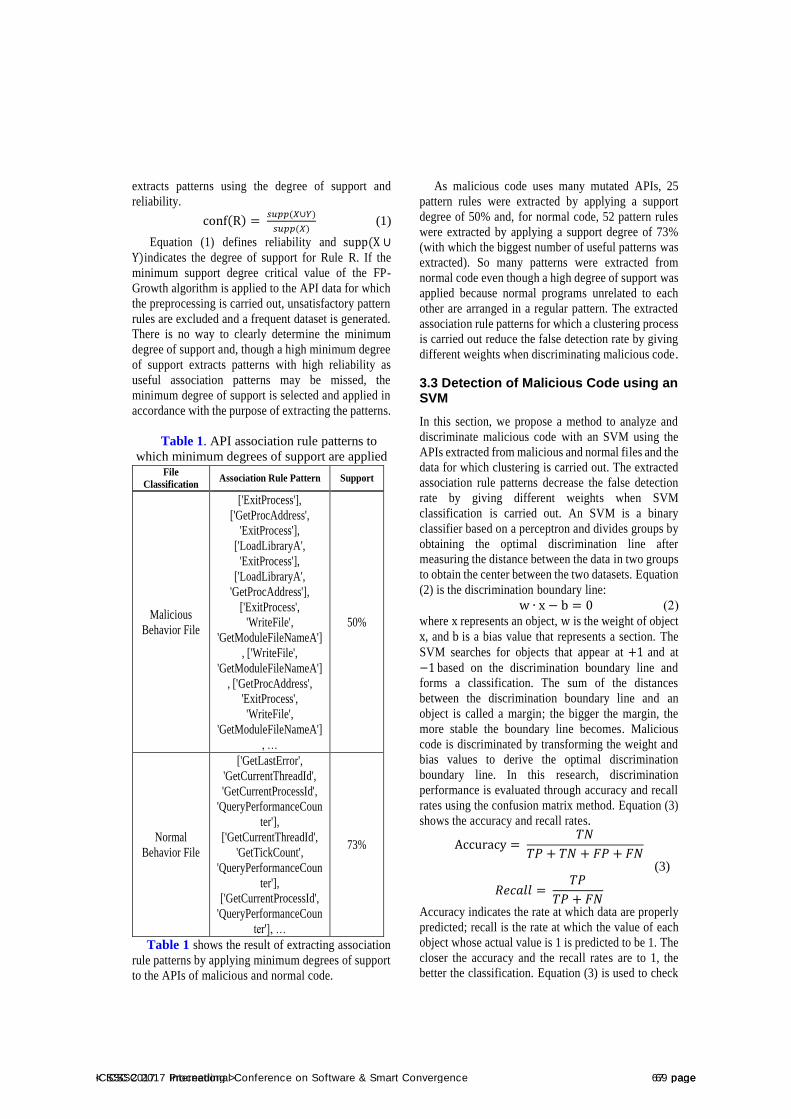
extracts patterns using the degree of support and
reliability.
conf(R) = 𝑠𝑢𝑝𝑝(𝑋∪𝑌)
𝑠𝑢𝑝𝑝(𝑋) (1)
Equation (1) defines reliability and supp(X ∪Y)indicates the degree of support for Rule R. If the
minimum support degree critical value of the FP-
Growth algorithm is applied to the API data for which
the preprocessing is carried out, unsatisfactory pattern
rules are excluded and a frequent dataset is generated.
There is no way to clearly determine the minimum
degree of support and, though a high minimum degree
of support extracts patterns with high reliability as
useful association patterns may be missed, the
minimum degree of support is selected and applied in
accordance with the purpose of extracting the patterns.
Table 1. API association rule patterns to
which minimum degrees of support are applied
Table 1 shows the result of extracting association
rule patterns by applying minimum degrees of support
to the APIs of malicious and normal code.
As malicious code uses many mutated APIs, 25
pattern rules were extracted by applying a support
degree of 50% and, for normal code, 52 pattern rules
were extracted by applying a support degree of 73%
(with which the biggest number of useful patterns was
extracted). So many patterns were extracted from
normal code even though a high degree of support was
applied because normal programs unrelated to each
other are arranged in a regular pattern. The extracted
association rule patterns for which a clustering process
is carried out reduce the false detection rate by giving
different weights when discriminating malicious code.
3.3 Detection of Malicious Code using an SVM
In this section, we propose a method to analyze and
discriminate malicious code with an SVM using the
APIs extracted from malicious and normal files and the
data for which clustering is carried out. The extracted
association rule patterns decrease the false detection
rate by giving different weights when SVM
classification is carried out. An SVM is a binary
classifier based on a perceptron and divides groups by
obtaining the optimal discrimination line after
measuring the distance between the data in two groups
to obtain the center between the two datasets. Equation
(2) is the discrimination boundary line:
w ∙ x − b = 0 (2)
where x represents an object, w is the weight of object
x, and b is a bias value that represents a section. The
SVM searches for objects that appear at +1 and at
−1 based on the discrimination boundary line and
forms a classification. The sum of the distances
between the discrimination boundary line and an
object is called a margin; the bigger the margin, the
more stable the boundary line becomes. Malicious
code is discriminated by transforming the weight and
bias values to derive the optimal discrimination
boundary line. In this research, discrimination
performance is evaluated through accuracy and recall
rates using the confusion matrix method. Equation (3)
shows the accuracy and recall rates.
Accuracy = 𝑇𝑁
𝑇𝑃 + 𝑇𝑁 + 𝐹𝑃 + 𝐹𝑁(3)
𝑅𝑒𝑐𝑎𝑙𝑙 = 𝑇𝑃
𝑇𝑃 + 𝐹𝑁Accuracy indicates the rate at which data are properly
predicted; recall is the rate at which the value of each
object whose actual value is 1 is predicted to be 1. The
closer the accuracy and the recall rates are to 1, the
better the classification. Equation (3) is used to check
File
Classification Association Rule Pattern Support
Malicious
Behavior File
['ExitProcess'],
['GetProcAddress',
'ExitProcess'],
['LoadLibraryA',
'ExitProcess'],
['LoadLibraryA',
'GetProcAddress'],
['ExitProcess',
'WriteFile',
'GetModuleFileNameA']
, ['WriteFile',
'GetModuleFileNameA']
, ['GetProcAddress',
'ExitProcess',
'WriteFile',
'GetModuleFileNameA']
, …
50%
Normal
Behavior File
['GetLastError',
'GetCurrentThreadId',
'GetCurrentProcessId',
'QueryPerformanceCoun
ter'],
['GetCurrentThreadId',
'GetTickCount',
'QueryPerformanceCoun
ter'],
['GetCurrentProcessId',
'QueryPerformanceCoun
ter'], …
73%
< ICSSC 2017 Proceeding > 69 pageICSSC 2017 International Conference on Software & Smart Convergence 67 page
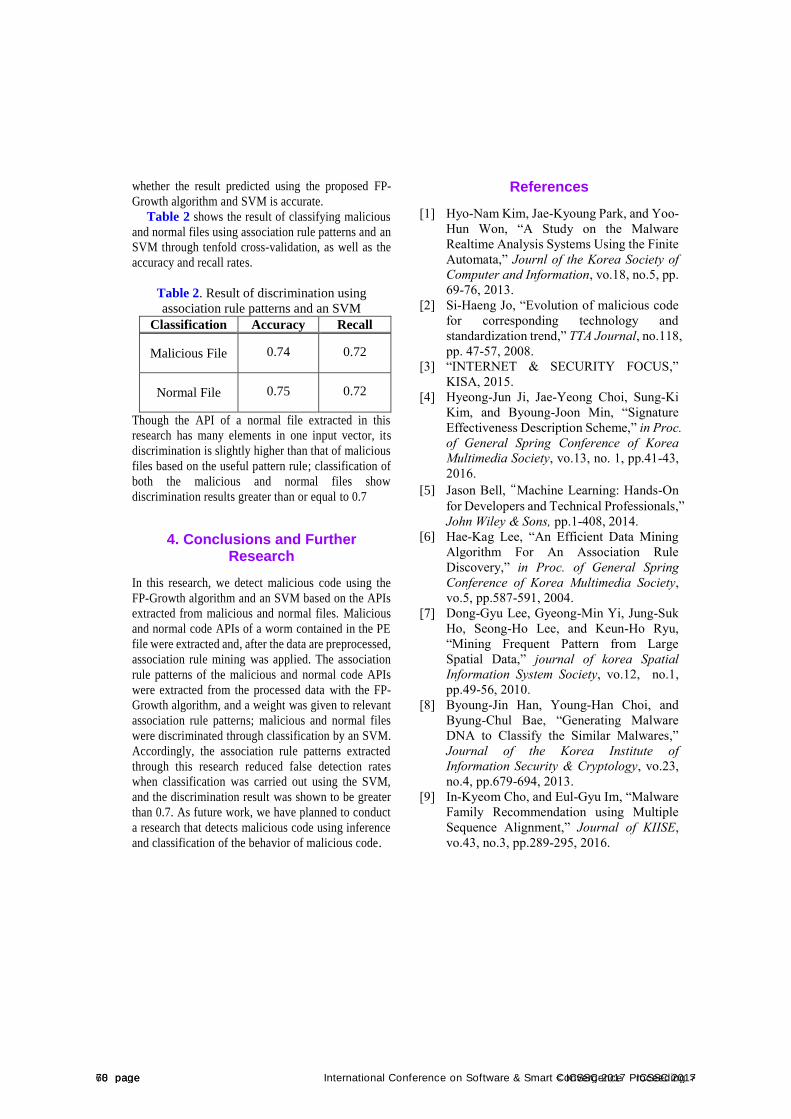
whether the result predicted using the proposed FP-
Growth algorithm and SVM is accurate.
Table 2 shows the result of classifying malicious
and normal files using association rule patterns and an
SVM through tenfold cross-validation, as well as the
accuracy and recall rates.
Table 2. Result of discrimination using
association rule patterns and an SVM
Classification Accuracy Recall
Malicious File 0.74 0.72
Normal File 0.75 0.72
Though the API of a normal file extracted in this
research has many elements in one input vector, its
discrimination is slightly higher than that of malicious
files based on the useful pattern rule; classification of
both the malicious and normal files show
discrimination results greater than or equal to 0.7
4. Conclusions and FurtherResearch
In this research, we detect malicious code using the
FP-Growth algorithm and an SVM based on the APIs
extracted from malicious and normal files. Malicious
and normal code APIs of a worm contained in the PE
file were extracted and, after the data are preprocessed,
association rule mining was applied. The association
rule patterns of the malicious and normal code APIs
were extracted from the processed data with the FP-
Growth algorithm, and a weight was given to relevant
association rule patterns; malicious and normal files
were discriminated through classification by an SVM.
Accordingly, the association rule patterns extracted
through this research reduced false detection rates
when classification was carried out using the SVM,
and the discrimination result was shown to be greater
than 0.7. As future work, we have planned to conduct
a research that detects malicious code using inference
and classification of the behavior of malicious code.
References
[1] Hyo-Nam Kim, Jae-Kyoung Park, and Yoo-
Hun Won, “A Study on the Malware
Realtime Analysis Systems Using the Finite
Automata,” Journl of the Korea Society of
Computer and Information, vo.18, no.5, pp.
69-76, 2013.
[2] Si-Haeng Jo, “Evolution of malicious code
for corresponding technology and
standardization trend,” TTA Journal, no.118,
pp. 47-57, 2008.
[3] “INTERNET & SECURITY FOCUS,”
KISA, 2015.
[4] Hyeong-Jun Ji, Jae-Yeong Choi, Sung-Ki
Kim, and Byoung-Joon Min, “Signature
Effectiveness Description Scheme,” in Proc.
of General Spring Conference of Korea
Multimedia Society, vo.13, no. 1, pp.41-43,
2016.
[5] Jason Bell, “Machine Learning: Hands-On
for Developers and Technical Professionals,”
John Wiley & Sons, pp.1-408, 2014.
[6] Hae-Kag Lee, “An Efficient Data Mining
Algorithm For An Association Rule
Discovery,” in Proc. of General Spring
Conference of Korea Multimedia Society,
vo.5, pp.587-591, 2004.
[7] Dong-Gyu Lee, Gyeong-Min Yi, Jung-Suk
Ho, Seong-Ho Lee, and Keun-Ho Ryu,
“Mining Frequent Pattern from Large
Spatial Data,” journal of korea Spatial
Information System Society, vo.12, no.1,
pp.49-56, 2010.
[8] Byoung-Jin Han, Young-Han Choi, and
Byung-Chul Bae, “Generating Malware
DNA to Classify the Similar Malwares,”
Journal of the Korea Institute of
Information Security & Cryptology, vo.23,
no.4, pp.679-694, 2013.
[9] In-Kyeom Cho, and Eul-Gyu Im, “Malware
Family Recommendation using Multiple
Sequence Alignment,” Journal of KIISE,
vo.43, no.3, pp.289-295, 2016.
70 page < ICSSC 2017 Proceeding >68 page International Conference on Software & Smart Convergence ICSSC 2017
International Conference on Software & Smart Convergence (ICSSC) 2017, June 2017 Copyright ⓒ 2017 ICSSC
Adapting Parallel Computer Simulationof Physical Fields to Multiple Problem
DomainsAndrey A. Chusov, Lubov G. Statsenko, Alexey P. Lysenko, Sergey N. Kuligin and Nelly A.
Klescheva
Far Eastern Federal University
Vladivostok, Russia
[e-mail: [email protected]]
*Corresponding author: Andrey A. Chusov
Abstract
The report presents an approach used by the authors to implement a computer-aided simulation of wave
physical fields providing an adaptability to various problem domains of the simulation assuming high
complexities and heavy computational loads generated by underlying processes of simulation. These
high computational loads cause a typical implementation to require computational capabilities which
can only be provided by a highly parallel platform and to be optimized for a specific efficiency criteria
given for a problem domain. This, in turn, causes a high cost of a development of a simulation system.
The authors have attempted to separate out, structurally, logically and functionally, problem-
independent services required by such a parallel implementation of a simulation system and
implemented a solution to perform simulation of acoustic and electromagnetic fields with a common
set of problem-independent services which are a load balancer between SMP (symmetric
multiprocessors) threads, as well as threads run on computational nodes distributed over a network,
geometry modelling of a medium of a field generation, visualization, data management, node
management (if applicable) and security.
Keywords: high-performance computing, problem-driven development, computer-aided simulation,
wave physical fields
1. Introduction
Computer-aided simulation of wave phyical
fields is usually an implementation of finding a
solution to some differential equation of
equilibrium state of a system “medium-field”,
such as the Maxwell’s system of equations or the
acoustic wave equation. In most cases, when it is
needed to consider a behavior of a wave field
with respect to its wavelengths the underlying
algorithmic implementation requires
computational time and space which are, at best,
powers of a used discretization level and may be
exponential if some generalization takes place -
for example, to take into account reflections of
waves on boundaries and local inhomogeneties
in the modelled space. Also, a number of those
discrette elements of the medium defined in n
and delimited by a hypercube is a power n of a
ratio of the hypercube size to the minimal
considered wavelength. The proportionality
coefficient is usually significantly greater than
one. For instance, in architectural acoustics this
coefficient should be at least six [1] which yields
for a wavelength 0.34m (which corresponds to a
1kHz sine wave in normal temperature and
pressure [2]) a number of elements
< ICSSC 2017 Proceeding > 71 pageICSSC 2017 International Conference on Software & Smart Convergence 69 page
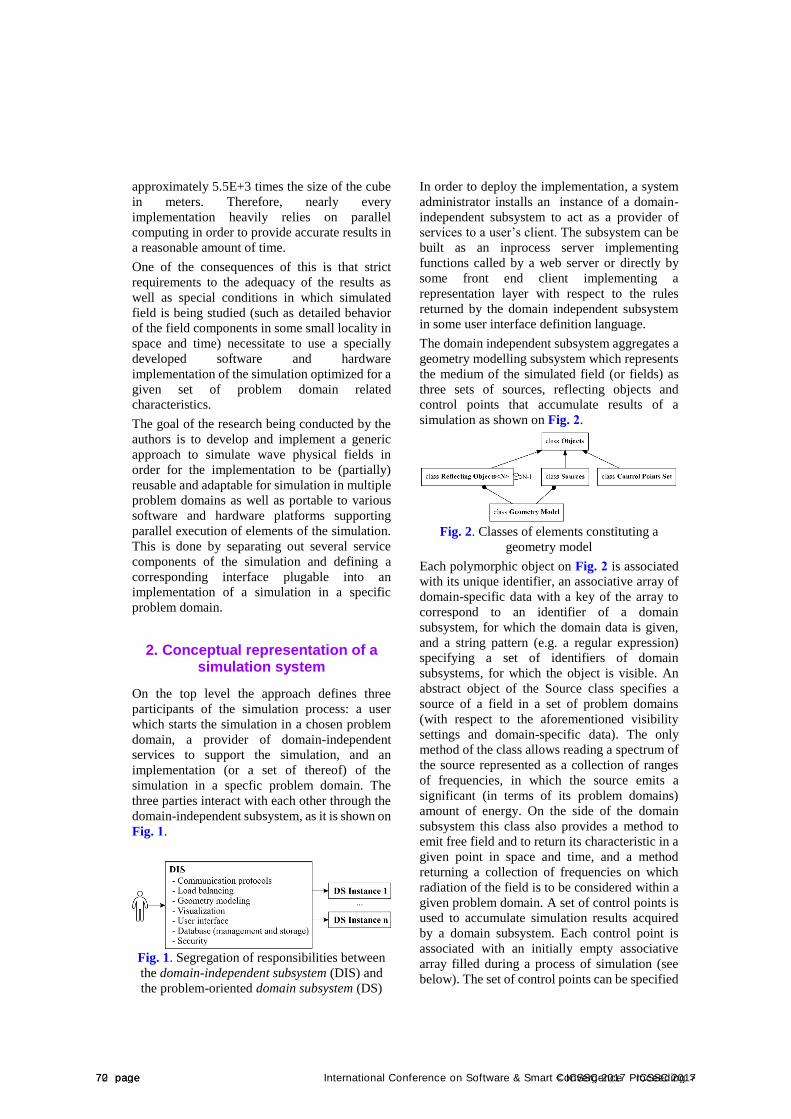
approximately 5.5E+3 times the size of the cube
in meters. Therefore, nearly every
implementation heavily relies on parallel
computing in order to provide accurate results in
a reasonable amount of time.
One of the consequences of this is that strict
requirements to the adequacy of the results as
well as special conditions in which simulated
field is being studied (such as detailed behavior
of the field components in some small locality in
space and time) necessitate to use a specially
developed software and hardware
implementation of the simulation optimized for a
given set of problem domain related
characteristics.
The goal of the research being conducted by the
authors is to develop and implement a generic
approach to simulate wave physical fields in
order for the implementation to be (partially)
reusable and adaptable for simulation in multiple
problem domains as well as portable to various
software and hardware platforms supporting
parallel execution of elements of the simulation.
This is done by separating out several service
components of the simulation and defining a
corresponding interface plugable into an
implementation of a simulation in a specific
problem domain.
2. Conceptual representation of asimulation system
On the top level the approach defines three
participants of the simulation process: a user
which starts the simulation in a chosen problem
domain, a provider of domain-independent
services to support the simulation, and an
implementation (or a set of thereof) of the
simulation in a specfic problem domain. The
three parties interact with each other through the
domain-independent subsystem, as it is shown on
Fig. 1.
Fig. 1. Segregation of responsibilities between
the domain-independent subsystem (DIS) and
the problem-oriented domain subsystem (DS)
In order to deploy the implementation, a system
administrator installs an instance of a domain-
independent subsystem to act as a provider of
services to a user’s client. The subsystem can be
built as an inprocess server implementing
functions called by a web server or directly by
some front end client implementing a
representation layer with respect to the rules
returned by the domain independent subsystem
in some user interface definition language.
The domain independent subsystem aggregates a
geometry modelling subsystem which represents
the medium of the simulated field (or fields) as
three sets of sources, reflecting objects and
control points that accumulate results of a
simulation as shown on Fig. 2.
Fig. 2. Classes of elements constituting a
geometry model
Each polymorphic object on Fig. 2 is associated
with its unique identifier, an associative array of
domain-specific data with a key of the array to
correspond to an identifier of a domain
subsystem, for which the domain data is given,
and a string pattern (e.g. a regular expression)
specifying a set of identifiers of domain
subsystems, for which the object is visible. An
abstract object of the Source class specifies a
source of a field in a set of problem domains
(with respect to the aforementioned visibility
settings and domain-specific data). The only
method of the class allows reading a spectrum of
the source represented as a collection of ranges
of frequencies, in which the source emits a
significant (in terms of its problem domains)
amount of energy. On the side of the domain
subsystem this class also provides a method to
emit free field and to return its characteristic in a
given point in space and time, and a method
returning a collection of frequencies on which
radiation of the field is to be considered within a
given problem domain. A set of control points is
used to accumulate simulation results acquired
by a domain subsystem. Each control point is
associated with an initially empty associative
array filled during a process of simulation (see
below). The set of control points can be specified
72 page < ICSSC 2017 Proceeding >70 page International Conference on Software & Smart Convergence ICSSC 2017
to appertain to a given locus, such as a
hyperplane. Reflecting objects are recurrently
defined in a space of a diminsionality 1N as a
set of reflecting objects of dimentionality 1N .
For 1N the object yields a point specified in N
dimensions.
The load balancer is defined as an associative
array with a key to be an identifier of a domain
subsystem. The value is a pair of a queue of tasks
to execute as parallel elements of a simulation
process, and a queue of threads to provide the
workload to. Depending on a configuration of the
system, the load balancer can assign the load
between distributed nodes of a given instance of
a domain subsystem or between CPU (central
processor unit) cores. In the latter case the queue
of threads can be implemented as a pool of free
threads specified by an atomic integral counter of
free threads. Otherwise, if the simulation system
uses a set of remote nodes to run the simulation
process on, the load balancer is separated onto
two levels. The centralized domain-independent
subsystem aggregates a global load balancer,
acting as a remote a server to which the domain-
independent subsystem provides a socket for
nodes of domain subsystems to connect as
clients. This global load balancer, implementing
the same queue of tasks, also provides a priority
queue of nodes with the latter having a method
returning an integral priority which is based on
the computational capabilities of the node to
execute the parallel elements of the simulation
process. For instance, nodes of the
implementation developed by the authors yield
the priority calculated as follows:
priority(node) = node.cpu_cores() ∙
∙ (1 + (node.gpu_cores() ≠ 0 → 1) 0).
Also, a local load balancer is deployed on each
distributed node together with the
implementation of the parallel element of
simulation. This local load balancer is
implemented similarly to the load balancer in the
inprocess configuration described above. It
provides a local queue of tasks to perform by
SMP worker threads. This queue is accompanied
by a pool of worker threads. When a new task is
generated on a node, the thread that has generated
the task attempts to pop a free worker thread from
the pool (i.e. decrement the integral counter of
the free threads). If there are free threads
available, the newly created thread executes the
task and after the task is complete, the executing
thread registers the event in the load balancer (i.e.
increments the thread counter of the pool). If no
free worker threads available in the pool, the
thread that has generated the task connects to the
global load balancer via the socket, provided by
domain-independent subsystem, and attempts to
register the task in the global load balancer. The
latter checks whether the aforementioned priority
queue of nodes is not empty, and, if it is not
empty, attempts to send the task to a node with
the highest priority. If the transmission of the task
fails, the load balancer attempts to send the task
to another node in the queue. If forwarding the
task to any node of the non-empty queue fails, the
response about the failure is returned to the node
publishing the task to handle it. Otherwise, if the
priority queue of nodes is empty, the global load
balancer attempts to push the task description
into the queue of tasks. The result of the last
operation can exceed a specified memory limit
specified for the domain subsystem of the
publishing node. If that happens, the node stores
the task in the local queue. When a worker thread
of the node successfully completes its execution,
it registers itself in the local pool of threads, and,
if the thread pool is full and there are no tasks in
the local queue, the thread registers its node in
the global load balancer.
As it is shown further, the implementation
provided by the authors shows almost hyperbolic
dependancy of time on a number of total
distributed logical cores involved in the
simulation process (with low number of
synchronization points in the simulation
algorithms themselves), which shows a low
percentage of time, for which the distributed
threads of execution are idle.
During the deployment of the simulation
subsystem the latter is rigestered in the domain-
independent subsystem, that is for an inprocess
server, the registration data includes a a path to
the library implementing the server, and for the
remote server configuration, the domain is
specified with the address (e.g. TCP socket) of its
main node and its public key used for
authentification, if one is used during the
handshake protocol. When the user requests the
domain-independent subsystem to start a
simulation in a given problem domain (i.e. with
a specified domain subsystem) the domain-
independent subsystem delegates the request to
the domain subsystem (to its main node in the
distributed configuration in order to register
< ICSSC 2017 Proceeding > 73 pageICSSC 2017 International Conference on Software & Smart Convergence 71 page
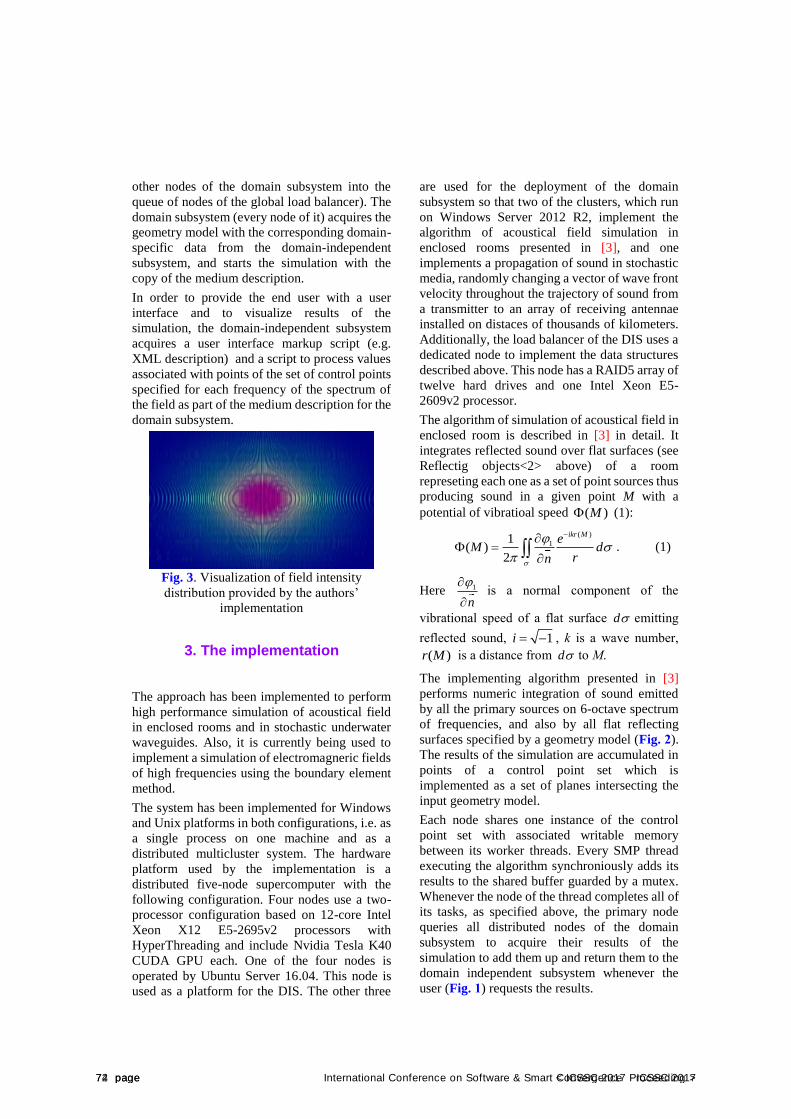
other nodes of the domain subsystem into the
queue of nodes of the global load balancer). The
domain subsystem (every node of it) acquires the
geometry model with the corresponding domain-
specific data from the domain-independent
subsystem, and starts the simulation with the
copy of the medium description.
In order to provide the end user with a user
interface and to visualize results of the
simulation, the domain-independent subsystem
acquires a user interface markup script (e.g.
XML description) and a script to process values
associated with points of the set of control points
specified for each frequency of the spectrum of
the field as part of the medium description for the
domain subsystem.
Fig. 3. Visualization of field intensity
distribution provided by the authors’
implementation
3. The implementation
The approach has been implemented to perform
high performance simulation of acoustical field
in enclosed rooms and in stochastic underwater
waveguides. Also, it is currently being used to
implement a simulation of electromagneric fields
of high frequencies using the boundary element
method.
The system has been implemented for Windows
and Unix platforms in both configurations, i.e. as
a single process on one machine and as a
distributed multicluster system. The hardware
platform used by the implementation is a
distributed five-node supercomputer with the
following configuration. Four nodes use a two-
processor configuration based on 12-core Intel
Xeon X12 E5-2695v2 processors with
HyperThreading and include Nvidia Tesla K40
CUDA GPU each. One of the four nodes is
operated by Ubuntu Server 16.04. This node is
used as a platform for the DIS. The other three
are used for the deployment of the domain
subsystem so that two of the clusters, which run
on Windows Server 2012 R2, implement the
algorithm of acoustical field simulation in
enclosed rooms presented in [3], and one
implements a propagation of sound in stochastic
media, randomly changing a vector of wave front
velocity throughout the trajectory of sound from
a transmitter to an array of receiving antennae
installed on distaces of thousands of kilometers.
Additionally, the load balancer of the DIS uses a
dedicated node to implement the data structures
described above. This node has a RAID5 array of
twelve hard drives and one Intel Xeon E5-
2609v2 processor.
The algorithm of simulation of acoustical field in
enclosed room is described in [3] in detail. It
integrates reflected sound over flat surfaces (see
Reflectig objects<2> above) of a room
represeting each one as a set of point sources thus
producing sound in a given point M with a
potential of vibratioal speed ( )M (1):
( )
11( )
2
ikr Me
M drn
. (1)
Here 1
n
is a normal component of the
vibrational speed of a flat surface d emitting
reflected sound, 1i , k is a wave number,
( )r M is a distance from d to M.
The implementing algorithm presented in [3]
performs numeric integration of sound emitted
by all the primary sources on 6-octave spectrum
of frequencies, and also by all flat reflecting
surfaces specified by a geometry model (Fig. 2).
The results of the simulation are accumulated in
points of a control point set which is
implemented as a set of planes intersecting the
input geometry model.
Each node shares one instance of the control
point set with associated writable memory
between its worker threads. Every SMP thread
executing the algorithm synchroniously adds its
results to the shared buffer guarded by a mutex.
Whenever the node of the thread completes all of
its tasks, as specified above, the primary node
queries all distributed nodes of the domain
subsystem to acquire their results of the
simulation to add them up and return them to the
domain independent subsystem whenever the
user (Fig. 1) requests the results.
74 page < ICSSC 2017 Proceeding >72 page International Conference on Software & Smart Convergence ICSSC 2017
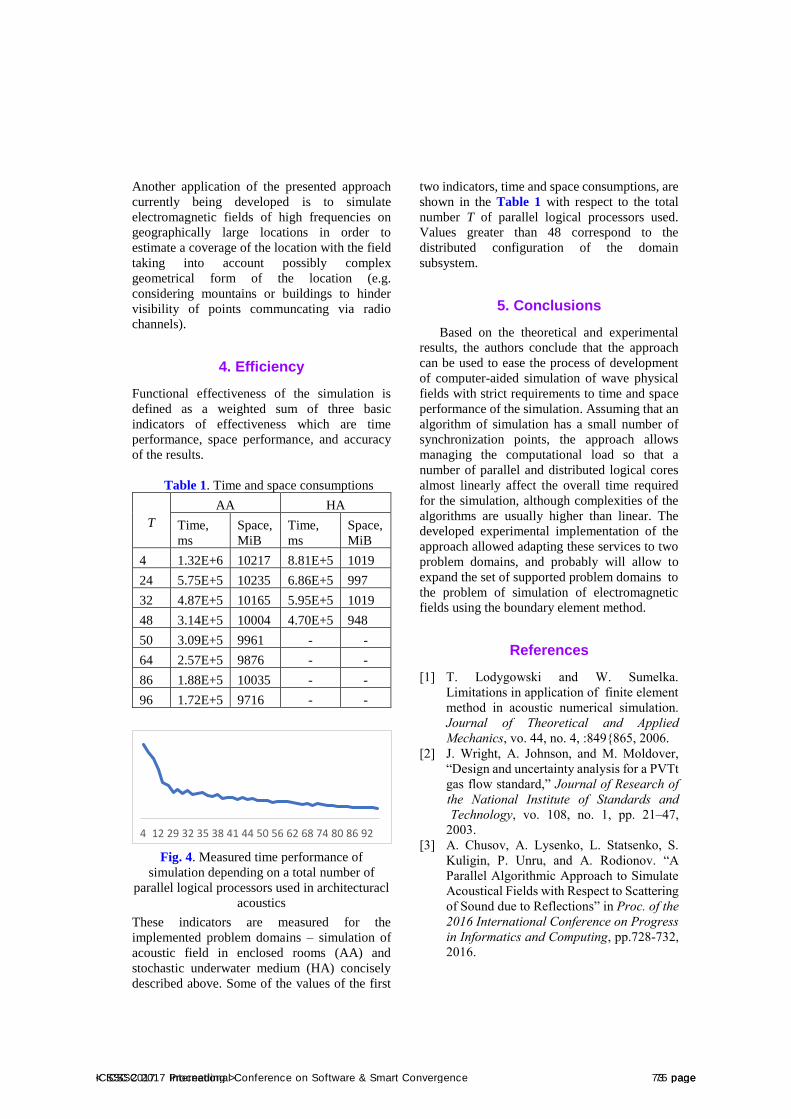
Another application of the presented approach
currently being developed is to simulate
electromagnetic fields of high frequencies on
geographically large locations in order to
estimate a coverage of the location with the field
taking into account possibly complex
geometrical form of the location (e.g.
considering mountains or buildings to hinder
visibility of points communcating via radio
channels).
4. Efficiency
Functional effectiveness of the simulation is
defined as a weighted sum of three basic
indicators of effectiveness which are time
performance, space performance, and accuracy
of the results.
Table 1. Time and space consumptions
T
AA HA
Time,
ms
Space,
MiB
Time,
ms
Space,
MiB
4 1.32E+6 10217 8.81E+5 1019
24 5.75E+5 10235 6.86E+5 997
32 4.87E+5 10165 5.95E+5 1019
48 3.14E+5 10004 4.70E+5 948
50 3.09E+5 9961 - -
64 2.57E+5 9876 - -
86 1.88E+5 10035 - -
96 1.72E+5 9716 - -
Fig. 4. Measured time performance of
simulation depending on a total number of
parallel logical processors used in architecturacl
acoustics
These indicators are measured for the
implemented problem domains – simulation of
acoustic field in enclosed rooms (AA) and
stochastic underwater medium (HA) concisely
described above. Some of the values of the first
two indicators, time and space consumptions, are
shown in the Table 1 with respect to the total
number T of parallel logical processors used.
Values greater than 48 correspond to the
distributed configuration of the domain
subsystem.
5. Conclusions
Based on the theoretical and experimental
results, the authors conclude that the approach
can be used to ease the process of development
of computer-aided simulation of wave physical
fields with strict requirements to time and space
performance of the simulation. Assuming that an
algorithm of simulation has a small number of
synchronization points, the approach allows
managing the computational load so that a
number of parallel and distributed logical cores
almost linearly affect the overall time required
for the simulation, although complexities of the
algorithms are usually higher than linear. The
developed experimental implementation of the
approach allowed adapting these services to two
problem domains, and probably will allow to
expand the set of supported problem domains to
the problem of simulation of electromagnetic
fields using the boundary element method.
References
[1] T. Lodygowski and W. Sumelka.
Limitations in application of finite element
method in acoustic numerical simulation.
Journal of Theoretical and Applied
Mechanics, vo. 44, no. 4, :849{865, 2006.
[2] J. Wright, A. Johnson, and M. Moldover,
“Design and uncertainty analysis for a PVTt
gas flow standard,” Journal of Research of
the National Institute of Standards and
Technology, vo. 108, no. 1, pp. 21–47,
2003.
[3] A. Chusov, A. Lysenko, L. Statsenko, S.
Kuligin, P. Unru, and A. Rodionov. “A
Parallel Algorithmic Approach to Simulate
Acoustical Fields with Respect to Scattering
of Sound due to Reflections” in Proc. of the
2016 International Conference on Progress
in Informatics and Computing, pp.728-732,
2016.
4 12 29 32 35 38 41 44 50 56 62 68 74 80 86 92
< ICSSC 2017 Proceeding > 75 pageICSSC 2017 International Conference on Software & Smart Convergence 73 page
International Conference on Software & Smart Convergence (ICSSC) 2017, June 2017
Copyright ⓒ 2017 ICSSC
This work was supported by the Brain Korea 21 PLUS Project, National Research Foundation of Korea. This
research was supported by Basic Science Research Program through the National Research Foundation of
Korea(NRF) funded by the Ministry of Education(No.NRF-2016R1D1A1B03936269).
Deep RNN-CNN Based Activity Detection from Video
Yali Nie1, Yong Suk Cho
2, Yongchae Jeong
3 and Dong Sun Park
4
1 Department of Electronics Engineering, Chonbuk National University
Jeonju, South Korea
[e-mail: [email protected]] 2 Department of Media and Advertising, Hansei University
Gunpo, South Korea
[e-mail: [email protected]] 3 Division of Electronics and Information Engineering, Chonbuk National University
Jeonju, South Korea
[e-mail: [email protected]] 4 IT Convergence Research Center, Chonbuk National University
Jeonju, South Korea
[e-mail: [email protected]]
*Corresponding author: Dong Sun Park
Abstract
Deep learning has achieved great success for visual recognition or classification in still images.
However, it has not yielded significant gains for classification and detection tasks from video. Our work
proposes a new method to classify multiple activity in a video sequence. We fix the frame as input and
combine Convolutional Neural Network (CNN) and Recurrent Neural Network (RNN) to extract
features and predict the different activities respectively. Pose and action are very similar concepts. A
sequence of pose will comprise of an action in some certain environment, so with a stack of frames, it is
very much possible to get rich source for activity detection from a video. We demonstrate the
effectiveness of the proposed method on two datasets HMDB51 and UCF101.
Keywords: Activity, Convolutional Neural Network, Detection, Recurrent Neural Network
1. Introduction
Recognizing activities from video has become a
popular topic along with deep learning
performing a dramatic change in the field of
computer vision. It is a challenging problem due
to factors such as large pose and scale variations,
fast motions, body part occlusion and varying
number of persons per video. In activity
classification, the performance of a detection
system depends on whether it can extract and
simultaneously classify the activity rightly.
However, there are two crucial obstacles:
appearances and dynamics in action video. We
propose to address the multiple-activity
classification problem by means of a deep
learning model comprised of the convolutional
neural network and the long short-term memory
(LSTM): recurrent neural network. Recently,
ConvNet have witnessed big success in image
classification, object detection [1], pose
estimation [2,3,13,14], and other complex
events. Similarly, LSTM can deal well with
sequential research, such as image caption [16],
speech recognition and tracking [11]. Some
work[4,5,6] also use deep learning to learn
actions from video and get good results, Inspired
76 page < ICSSC 2017 Proceeding >74 page International Conference on Software & Smart Convergence ICSSC 2017
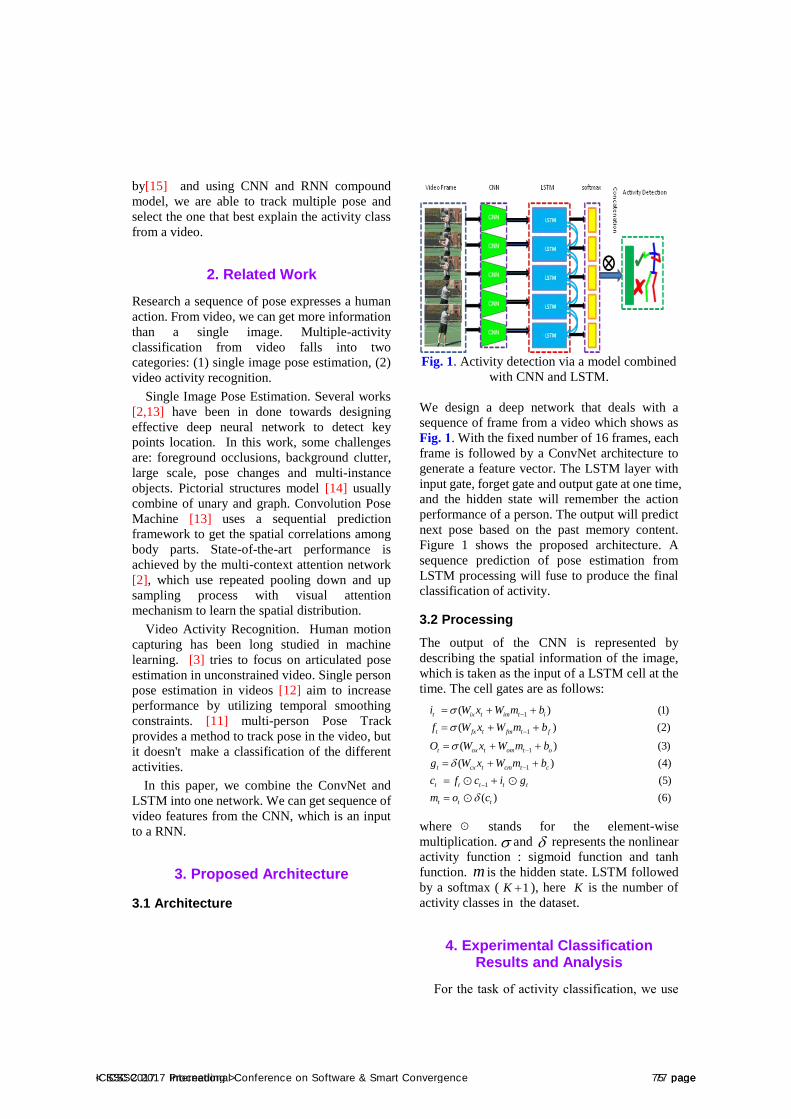
by[15] and using CNN and RNN compound
model, we are able to track multiple pose and
select the one that best explain the activity class
from a video.
2. Related Work
Research a sequence of pose expresses a human
action. From video, we can get more information
than a single image. Multiple-activity
classification from video falls into two
categories: (1) single image pose estimation, (2)
video activity recognition.
Single Image Pose Estimation. Several works
[2,13] have been in done towards designing
effective deep neural network to detect key
points location. In this work, some challenges
are: foreground occlusions, background clutter,
large scale, pose changes and multi-instance
objects. Pictorial structures model [14] usually
combine of unary and graph. Convolution Pose
Machine [13] uses a sequential prediction
framework to get the spatial correlations among
body parts. State-of-the-art performance is
achieved by the multi-context attention network
[2], which use repeated pooling down and up
sampling process with visual attention
mechanism to learn the spatial distribution.
Video Activity Recognition. Human motion
capturing has been long studied in machine
learning. [3] tries to focus on articulated pose
estimation in unconstrained video. Single person
pose estimation in videos [12] aim to increase
performance by utilizing temporal smoothing
constraints. [11] multi-person Pose Track
provides a method to track pose in the video, but
it doesn't make a classification of the different
activities.
In this paper, we combine the ConvNet and
LSTM into one network. We can get sequence of
video features from the CNN, which is an input
to a RNN.
3. Proposed Architecture
3.1 Architecture
Fig. 1. Activity detection via a model combined
with CNN and LSTM.
We design a deep network that deals with a
sequence of frame from a video which shows as
Fig. 1. With the fixed number of 16 frames, each
frame is followed by a ConvNet architecture to
generate a feature vector. The LSTM layer with
input gate, forget gate and output gate at one time,
and the hidden state will remember the action
performance of a person. The output will predict
next pose based on the past memory content.
Figure 1 shows the proposed architecture. A
sequence prediction of pose estimation from
LSTM processing will fuse to produce the final
classification of activity.
3.2 Processing
The output of the CNN is represented by
describing the spatial information of the image,
which is taken as the input of a LSTM cell at the
time. The cell gates are as follows:
where stands for the element-wise
multiplication. and represents the nonlinear
activity function : sigmoid function and tanh
function. is the hidden state. LSTM followed
by a softmax ( ), here is the number of
activity classes in the dataset.
4. Experimental ClassificationResults and Analysis
For the task of activity classification, we use
1
1
1
1
1
( ) (1)
( ) (2)
( ) (3)
( ) (4)
(5)
( ) (6)
t ix t im t i
t fx t fm t f
t ox t om t o
t cx t cm t c
t t t t t
t t t
i W x W m b
f W x W m b
O W x W m b
g W x W m b
c f c i g
m o c
m1K K
< ICSSC 2017 Proceeding > 77 pageICSSC 2017 International Conference on Software & Smart Convergence 75 page
two large action datasets, which are HMDB51
and UCF101. HMDB51 is composed of 6,766
video clips and 51 actions classes, collected from
various realistic videos, including 3,570 trained
and 1,530 test videos. The UCF101 consists of
101 action categories and 13,320 video clips with
9,537 trained and 3,783 test videos.
We train the network with a random 224 × 224
crop from the sequence frame in the video as
input. During training, the batch size of 256 is
used, we train the whole model with RMSprop
for 20k iterations and the learning rate as 10-4.
10 timesteps and 4000 hidden nodes are
consisted of LSTM layer, following a softmax
layer to recognize the activity.
Our method compared with other methods is
as shown in Table 1. The performance of our
method gets an accuracy of 70.6% on the
UCF101 dataset and 41.0% on the HNDB51
dataset respectively. We can see that the activity
detection in video still has a large scope for
improvement, especially on the HMDB51
dataset. Even though deep learning is very
powerful, to use it for the real world, is still a
long way to go.
Table 1. Comparison of our method
performance with other methods on UCF101 and
HMDB51
Method Dataset
UCF101 HMDB51
Model[7] 55.4% 23.6%
Wang[8] 41.5% 16.9%
Two-stream [9] 73.0% 40.5%
HOG[10] 72.4% 40.2%
Ours 70.6% 41.0%
5. Conclusions
In this paper, we have demonstrated that
combining CNN and LSTM together to make an
activity detection from a video can be efficiently
utilized. Our deep structured architecture model
evaluates on the activity dataset which are
UCF101 and HMDB51. The sequence to
sequence method can learn better for more
challenging task in video processing.
References
[1] R. Girshick, J. Donahue, T. Darrell, and J.
Malik, "Rich feature hierarchies for accurate
object detection and semantic
segmentation," in CVPR, 2014.
[2] X. Chu, W. Yang, W. Ouyang, C. Ma, A.
Yuille and X. Wang, "Multi-Context
Attention for Human Pose Estimation," in
CVPR, 2017.
[3] U. Iqbal, M. Garbade, and J. Gall, "Pose for
Action – Action for Pose," arXiv preprint
arXiv:1603.04037, 2016.
[4] B. XiaohanNie, C. Xiong and S. Chunzhu, "
Joint Action Recognition and Pose
Estimation From Video," in CVPR, 2015.
[5] A. Montes, A. Salvador, S. Pascual and X.
Giro-i-Nieto, "Temporal Activity Detection
in Untrimmed Videos with Recurrent Neural
Networks," arXiv preprint
arXiv:1608.08128, 2016.
[6] L. Wang, Y. Xiong, Z. Wang, Y. Qiao, D.
Lin, X. Tang and L. Van, "Temporal
Segment Networks: Towards Good
Practices for Deep Action Recognition,"
arXiv preprint arXiv :1608.00859, 2016.
[7] S. Purushwalkam and A. Gupta, "Pose from
Action: Unsupervised Learning of Pose
Features based on Motion," arXiv preprint
arXiv:1609.05420, 2016.
[8] X. Wang and A. Gupta, "Unsupervised
learning of visual representations using
videos," arXiv preprint arXiv:1505.00687,
2015.
[9] K. Simonyan and A. Zisserman, "Two-stream
convolutional networks for action
recognition in videos," arXiv preprint
arXiv:1406.2199, 2014.
[10] H. Wang and C. Schmid, "Action
recognition with improved trajectories," in
ICCV , 2013.
[11] U. Iqbal, A. Milan and J. Gall, "PoseTrack:
Joint Multi-Person Pose Estimation and
Tracking," in CVPR, 2017.
[12] J. Charles, T. Pfister, D. Magee, D. Hogg,
and A. Zisserman, "Personalizing human
video pose estimation," in CVPR, 2016.
[13] S. Wei, V. Ramakrisma, T. Kanade and Y.
Sheikh, "Convolutional Pose Machines," in
CVPR, 2016.
[14] X. Chen and A. Yuille, "Articulated pose
estimation by a graphical model with image
dependent pairwise relations," in NIPS,
78 page < ICSSC 2017 Proceeding >76 page International Conference on Software & Smart Convergence ICSSC 2017

2014.
[15] M. Ibrahim, S. Muralidharan, Z. Deng, A.
Vahdat, and G. Mori, "A Hierarchical Deep
Temporal Model for Group Activity
Recognition," arXiv preprint
arXiv:1511.06040 , 2016.
[16] A. Karpathy and F.-F. Li, "Deep
visual-semantic alignments for generating
image descriptions," in CVPR, 2015.
< ICSSC 2017 Proceeding > 79 pageICSSC 2017 International Conference on Software & Smart Convergence 77 page
International Conference on Software & Smart Convergence (ICSSC) 2017, June 2017 Copyright ⓒ 2017 ICSSC
This research was supported by a research grant from the IT R&D program of MKE/IITA, the Korean government [2005-Y-001-04, Development of Next Generation Security Technology]. We express our thanks to Dr. Richard Berke who checked our manuscript.
A Study of Character Input Interface based on Drag Gesture with a Smart Devices
Kitae Bae1, Libor Mesicek2 and Hoon Ko3 1 Department of New Media Business, Seoul Media Institute of Technology
99 Hwagok-Ro 61-Gil, Gangseo-Gu, Seoul 07590, Korea [e-mail: [email protected]]
2 Department of Management, Faculty of Social and Economic Studies, J. E. Purkinje University, Moskevska 54, 400-96, Usti nad Labem, Czech Republic
[e-mail: [email protected]] 3 College of Information & Communication Engineering, Sungkyunkwan University,
2066, Seobu-Ro, Jangan-Gu, Suwon-Si, Kyeonggi-Do, S. Korea [e-mail: [email protected]]
*Corresponding author: Kitae Bae
Abstract In this paper, we suggest a way to input characters based on gestures. This way is able to input text three times faster than an existing way based on voice recognition by a person who is a visually impaired. Main issue for these people is that most of smart devices have flat displays without any physical keyboard. The suggested way is a text input method based on gestures and combination of 8 directions moves sequences to input numbers, English/Korean characters and special characters. Initial location and central point of input it is possible to input texts by following drag motion of the users or it controls and processes all applications in the smart devices naturally. This method has been field tested by the visually impaired to prove its efficiency.
Keywords: The Blind People, Drag Gesture, Character input, Voice Input
1. IntroductionA touchscreens has shift an input interface from a button method to a touch method on a flat screen of an electronic device such as appliances, communication devices, or smart devices. Why it became so popular input interface is that the touchscreen looks simple and intuitive, also because it is faster than old cell phones with just 12 keys keyboards and convenient when it inputs. However, the blind feel inconvenience when they use the touchscreen because the touchscreen only offers visible interface to touch. This is major obstacle to blind people or people with major sight problems. It is almost impossible to distinguish the exact area on the flat and small
screen which depends on visual information in comparison with conventional input method like voice or tactile sense [1][2]. It is certainly sure that new technology such as touchscreen would rather be caused reverse discrimination to the visually impaired. Specially, the usability and dependency of the devices such as communication devices and smart devices, which can provide communication with other people, are growing up more and more not only in shopping or banking, general work or office work and in our personal life, but also in society, which is connected to social network systems. In this trend, it has to be studied the usable input interface for the visually impaired, who can be neglected from the smart devices because it has
80 page < ICSSC 2017 Proceeding >78 page International Conference on Software & Smart Convergence ICSSC 2017
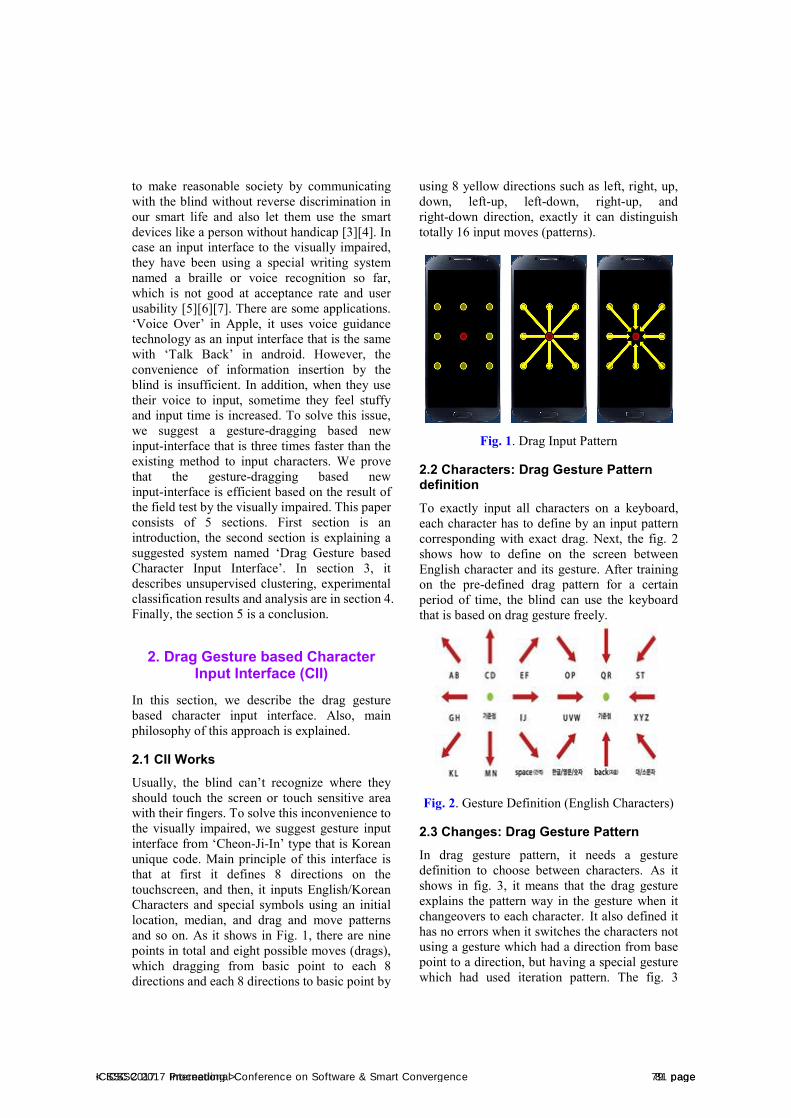
to make reasonable society by communicating with the blind without reverse discrimination in our smart life and also let them use the smart devices like a person without handicap [3][4]. In case an input interface to the visually impaired, they have been using a special writing system named a braille or voice recognition so far, which is not good at acceptance rate and user usability [5][6][7]. There are some applications. ‘Voice Over’ in Apple, it uses voice guidance technology as an input interface that is the same with ‘Talk Back’ in android. However, the convenience of information insertion by the blind is insufficient. In addition, when they use their voice to input, sometime they feel stuffy and input time is increased. To solve this issue, we suggest a gesture-dragging based new input-interface that is three times faster than the existing method to input characters. We prove that the gesture-dragging based new input-interface is efficient based on the result of the field test by the visually impaired. This paper consists of 5 sections. First section is an introduction, the second section is explaining a suggested system named ‘Drag Gesture based Character Input Interface’. In section 3, it describes unsupervised clustering, experimental classification results and analysis are in section 4. Finally, the section 5 is a conclusion.
2. Drag Gesture based Character Input Interface (CII)
In this section, we describe the drag gesture based character input interface. Also, main philosophy of this approach is explained.
2.1 CII Works Usually, the blind can’t recognize where they should touch the screen or touch sensitive area with their fingers. To solve this inconvenience to the visually impaired, we suggest gesture input interface from ‘Cheon-Ji-In’ type that is Korean unique code. Main principle of this interface is that at first it defines 8 directions on the touchscreen, and then, it inputs English/Korean Characters and special symbols using an initial location, median, and drag and move patterns and so on. As it shows in Fig. 1, there are nine points in total and eight possible moves (drags), which dragging from basic point to each 8 directions and each 8 directions to basic point by
using 8 yellow directions such as left, right, up, down, left-up, left-down, right-up, and right-down direction, exactly it can distinguish totally 16 input moves (patterns).
Fig. 1. Drag Input Pattern
2.2 Characters: Drag Gesture Pattern definition To exactly input all characters on a keyboard, each character has to define by an input pattern corresponding with exact drag. Next, the fig. 2 shows how to define on the screen between English character and its gesture. After training on the pre-defined drag pattern for a certain period of time, the blind can use the keyboard that is based on drag gesture freely.
Fig. 2. Gesture Definition (English Characters)
2.3 Changes: Drag Gesture Pattern In drag gesture pattern, it needs a gesture definition to choose between characters. As it shows in fig. 3, it means that the drag gesture explains the pattern way in the gesture when it changeovers to each character. It also defined it has no errors when it switches the characters not using a gesture which had a direction from base point to a direction, but having a special gesture which had used iteration pattern. The fig. 3
< ICSSC 2017 Proceeding > 81 pageICSSC 2017 International Conference on Software & Smart Convergence 79 page
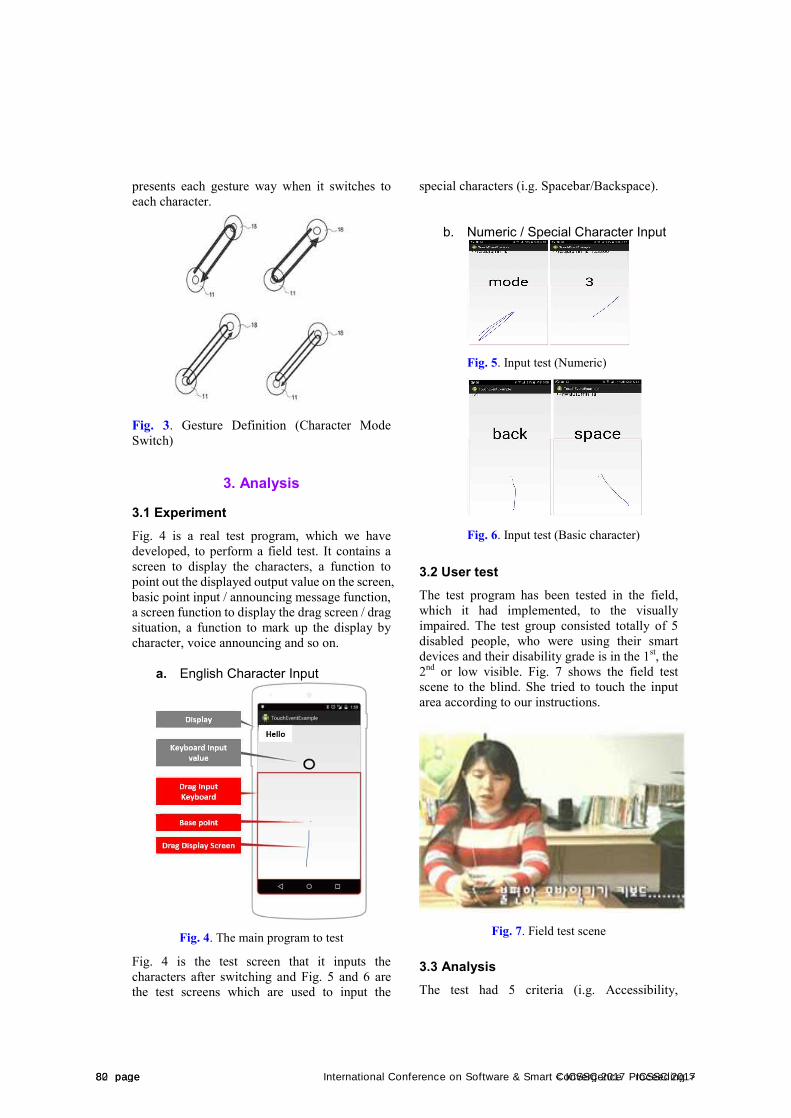
presents each gesture way when it switches to each character.
Fig. 3. Gesture Definition (Character Mode Switch)
3. Analysis
3.1 Experiment Fig. 4 is a real test program, which we have developed, to perform a field test. It contains a screen to display the characters, a function to point out the displayed output value on the screen, basic point input / announcing message function, a screen function to display the drag screen / drag situation, a function to mark up the display by character, voice announcing and so on.
a. English Character Input
Fig. 4. The main program to test
Fig. 4 is the test screen that it inputs the characters after switching and Fig. 5 and 6 are the test screens which are used to input the
special characters (i.g. Spacebar/Backspace).
b. Numeric / Special Character Input
Fig. 5. Input test (Numeric)
Fig. 6. Input test (Basic character)
3.2 User test The test program has been tested in the field, which it had implemented, to the visually impaired. The test group consisted totally of 5 disabled people, who were using their smart devices and their disability grade is in the 1st, the 2nd or low visible. Fig. 7 shows the field test scene to the blind. She tried to touch the input area according to our instructions.
Fig. 7. Field test scene
3.3 Analysis The test had 5 criteria (i.g. Accessibility,
82 page < ICSSC 2017 Proceeding >80 page International Conference on Software & Smart Convergence ICSSC 2017
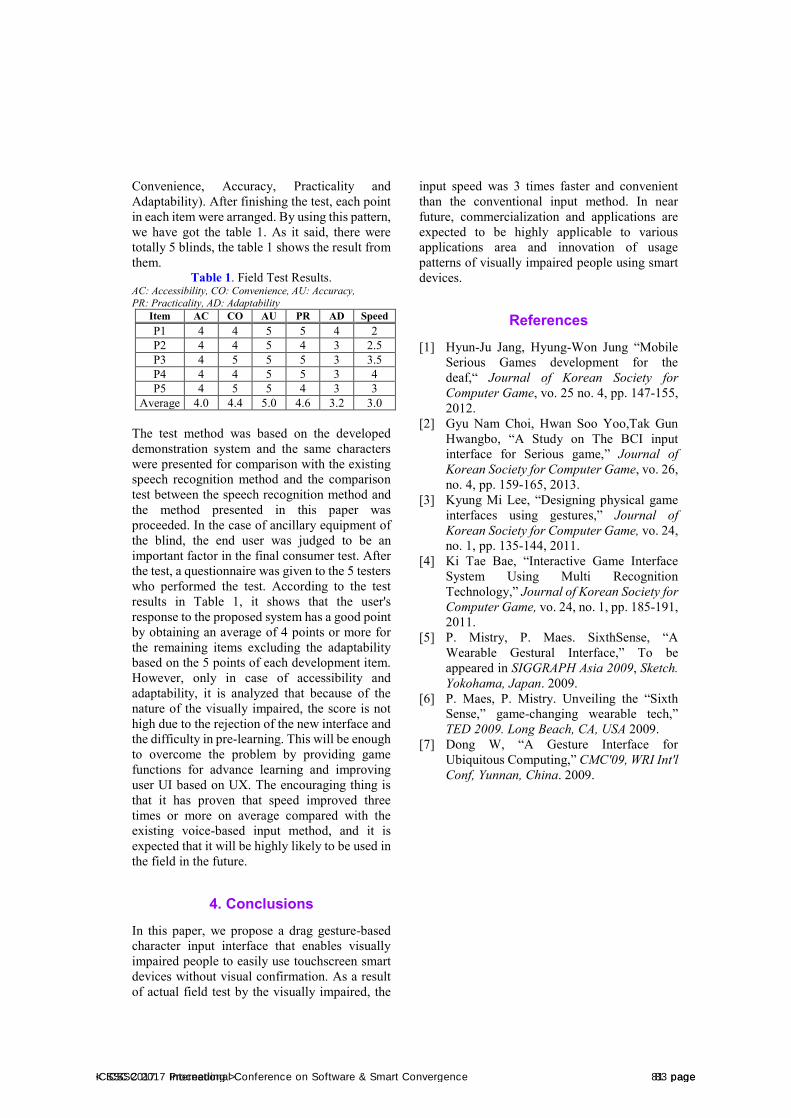
Convenience, Accuracy, Practicality and Adaptability). After finishing the test, each point in each item were arranged. By using this pattern, we have got the table 1. As it said, there were totally 5 blinds, the table 1 shows the result from them.
Table 1. Field Test Results. AC: Accessibility, CO: Convenience, AU: Accuracy, PR: Practicality, AD: Adaptability
Item AC CO AU PR AD Speed P1 4 4 5 5 4 2 P2 4 4 5 4 3 2.5 P3 4 5 5 5 3 3.5 P4 4 4 5 5 3 4 P5 4 5 5 4 3 3
Average 4.0 4.4 5.0 4.6 3.2 3.0
The test method was based on the developed demonstration system and the same characters were presented for comparison with the existing speech recognition method and the comparison test between the speech recognition method and the method presented in this paper was proceeded. In the case of ancillary equipment of the blind, the end user was judged to be an important factor in the final consumer test. After the test, a questionnaire was given to the 5 testers who performed the test. According to the test results in Table 1, it shows that the user's response to the proposed system has a good point by obtaining an average of 4 points or more for the remaining items excluding the adaptability based on the 5 points of each development item. However, only in case of accessibility and adaptability, it is analyzed that because of the nature of the visually impaired, the score is not high due to the rejection of the new interface and the difficulty in pre-learning. This will be enough to overcome the problem by providing game functions for advance learning and improving user UI based on UX. The encouraging thing is that it has proven that speed improved three times or more on average compared with the existing voice-based input method, and it is expected that it will be highly likely to be used in the field in the future.
4. ConclusionsIn this paper, we propose a drag gesture-based character input interface that enables visually impaired people to easily use touchscreen smart devices without visual confirmation. As a result of actual field test by the visually impaired, the
input speed was 3 times faster and convenient than the conventional input method. In near future, commercialization and applications are expected to be highly applicable to various applications area and innovation of usage patterns of visually impaired people using smart devices.
References [1] Hyun-Ju Jang, Hyung-Won Jung “Mobile
Serious Games development for the deaf,“ Journal of Korean Society for Computer Game, vo. 25 no. 4, pp. 147-155, 2012.
[2] Gyu Nam Choi, Hwan Soo Yoo,Tak Gun Hwangbo, “A Study on The BCI input interface for Serious game,” Journal of Korean Society for Computer Game, vo. 26, no. 4, pp. 159-165, 2013.
[3] Kyung Mi Lee, “Designing physical game interfaces using gestures,” Journal of Korean Society for Computer Game, vo. 24, no. 1, pp. 135-144, 2011.
[4] Ki Tae Bae, “Interactive Game Interface System Using Multi Recognition Technology,” Journal of Korean Society for Computer Game, vo. 24, no. 1, pp. 185-191, 2011.
[5] P. Mistry, P. Maes. SixthSense, “A Wearable Gestural Interface,” To be appeared in SIGGRAPH Asia 2009, Sketch. Yokohama, Japan. 2009.
[6] P. Maes, P. Mistry. Unveiling the “Sixth Sense,” game-changing wearable tech,” TED 2009. Long Beach, CA, USA 2009.
[7] Dong W, “A Gesture Interface for Ubiquitous Computing,” CMC'09, WRI Int'l Conf, Yunnan, China. 2009.
< ICSSC 2017 Proceeding > 83 pageICSSC 2017 International Conference on Software & Smart Convergence 81 page
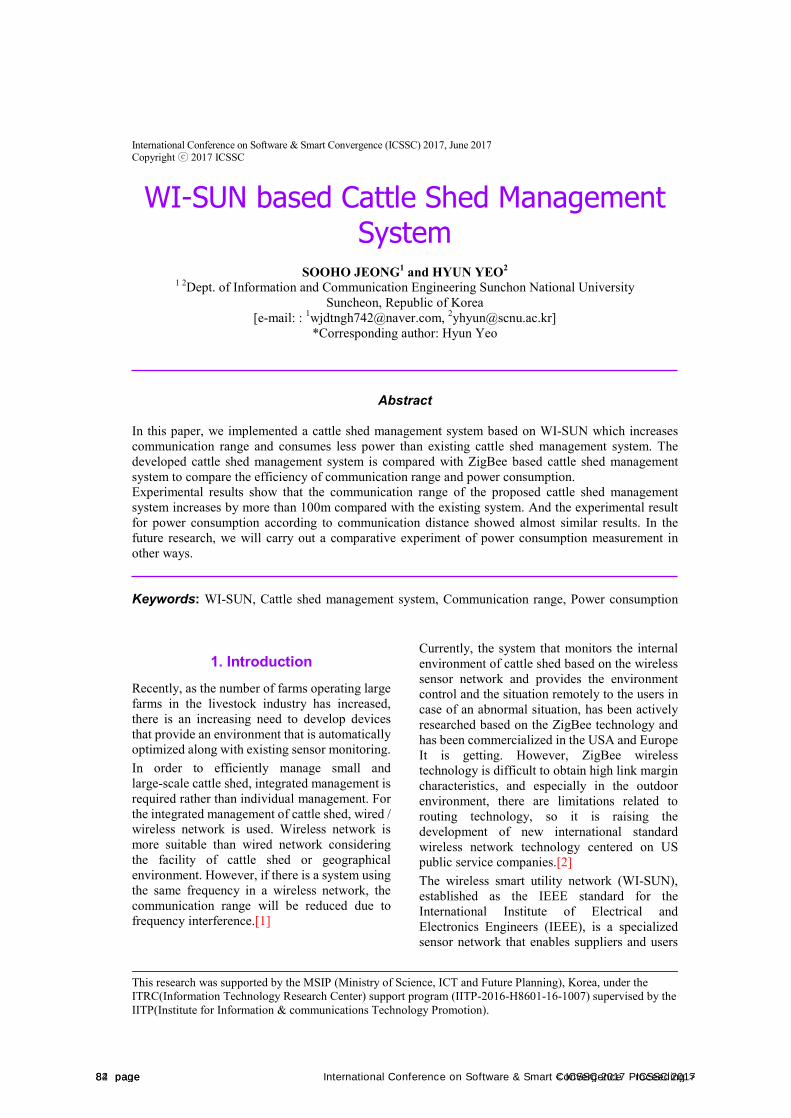
International Conference on Software & Smart Convergence (ICSSC) 2017, June 2017 Copyright ⓒ 2017 ICSSC
This research was supported by the MSIP (Ministry of Science, ICT and Future Planning), Korea, under the ITRC(Information Technology Research Center) support program (IITP-2016-H8601-16-1007) supervised by the IITP(Institute for Information & communications Technology Promotion).
WI-SUN based Cattle Shed Management System
SOOHO JEONG1 and HYUN YEO2 1 2Dept. of Information and Communication Engineering Sunchon National University
Suncheon, Republic of Korea [e-mail: : [email protected], [email protected]]
*Corresponding author: Hyun Yeo
Abstract
In this paper, we implemented a cattle shed management system based on WI-SUN which increases communication range and consumes less power than existing cattle shed management system. The developed cattle shed management system is compared with ZigBee based cattle shed management system to compare the efficiency of communication range and power consumption. Experimental results show that the communication range of the proposed cattle shed management system increases by more than 100m compared with the existing system. And the experimental result for power consumption according to communication distance showed almost similar results. In the future research, we will carry out a comparative experiment of power consumption measurement in other ways.
Keywords: WI-SUN, Cattle shed management system, Communication range, Power consumption
1. IntroductionRecently, as the number of farms operating large farms in the livestock industry has increased, there is an increasing need to develop devices that provide an environment that is automatically optimized along with existing sensor monitoring. In order to efficiently manage small and large-scale cattle shed, integrated management is required rather than individual management. For the integrated management of cattle shed, wired / wireless network is used. Wireless network is more suitable than wired network considering the facility of cattle shed or geographical environment. However, if there is a system using the same frequency in a wireless network, the communication range will be reduced due to frequency interference.[1]
Currently, the system that monitors the internal environment of cattle shed based on the wireless sensor network and provides the environment control and the situation remotely to the users in case of an abnormal situation, has been actively researched based on the ZigBee technology and has been commercialized in the USA and Europe It is getting. However, ZigBee wireless technology is difficult to obtain high link margin characteristics, and especially in the outdoor environment, there are limitations related to routing technology, so it is raising the development of new international standard wireless network technology centered on US public service companies.[2] The wireless smart utility network (WI-SUN), established as the IEEE standard for the International Institute of Electrical and Electronics Engineers (IEEE), is a specialized sensor network that enables suppliers and users
84 page < ICSSC 2017 Proceeding >82 page International Conference on Software & Smart Convergence ICSSC 2017
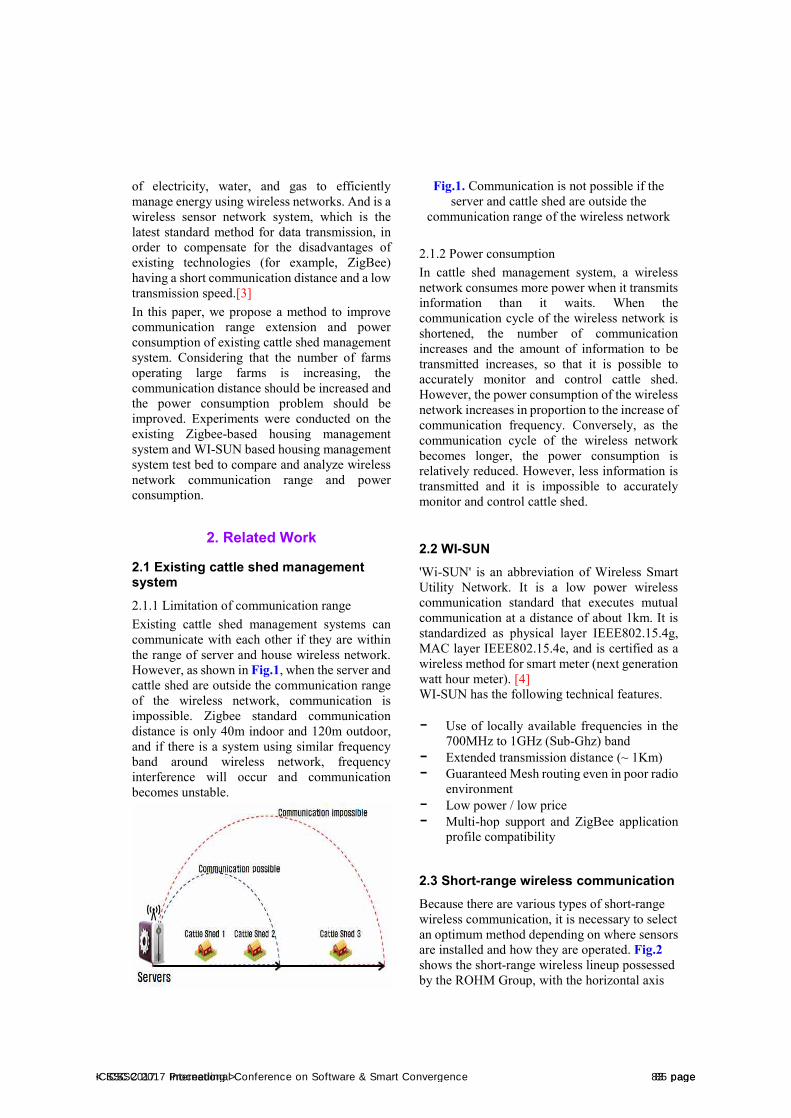
of electricity, water, and gas to efficiently manage energy using wireless networks. And is a wireless sensor network system, which is the latest standard method for data transmission, in order to compensate for the disadvantages of existing technologies (for example, ZigBee) having a short communication distance and a low transmission speed.[3] In this paper, we propose a method to improve communication range extension and power consumption of existing cattle shed management system. Considering that the number of farms operating large farms is increasing, the communication distance should be increased and the power consumption problem should be improved. Experiments were conducted on the existing Zigbee-based housing management system and WI-SUN based housing management system test bed to compare and analyze wireless network communication range and power consumption.
2. Related Work
2.1 Existing cattle shed management system 2.1.1 Limitation of communication range Existing cattle shed management systems can communicate with each other if they are within the range of server and house wireless network. However, as shown in Fig.1, when the server and cattle shed are outside the communication range of the wireless network, communication is impossible. Zigbee standard communication distance is only 40m indoor and 120m outdoor, and if there is a system using similar frequency band around wireless network, frequency interference will occur and communication becomes unstable.
Fig.1. Communication is not possible if the server and cattle shed are outside the
communication range of the wireless network
2.1.2 Power consumption In cattle shed management system, a wireless network consumes more power when it transmits information than it waits. When the communication cycle of the wireless network is shortened, the number of communication increases and the amount of information to be transmitted increases, so that it is possible to accurately monitor and control cattle shed. However, the power consumption of the wireless network increases in proportion to the increase of communication frequency. Conversely, as the communication cycle of the wireless network becomes longer, the power consumption is relatively reduced. However, less information is transmitted and it is impossible to accurately monitor and control cattle shed.
2.2 WI-SUN 'Wi-SUN' is an abbreviation of Wireless Smart Utility Network. It is a low power wireless communication standard that executes mutual communication at a distance of about 1km. It is standardized as physical layer IEEE802.15.4g, MAC layer IEEE802.15.4e, and is certified as a wireless method for smart meter (next generation watt hour meter). [4] WI-SUN has the following technical features.
- Use of locally available frequencies in the 700MHz to 1GHz (Sub-Ghz) band
- Extended transmission distance (~ 1Km) - Guaranteed Mesh routing even in poor radio
environment - Low power / low price - Multi-hop support and ZigBee application
profile compatibility
2.3 Short-range wireless communication Because there are various types of short-range wireless communication, it is necessary to select an optimum method depending on where sensors are installed and how they are operated. Fig.2 shows the short-range wireless lineup possessed by the ROHM Group, with the horizontal axis
< ICSSC 2017 Proceeding > 85 pageICSSC 2017 International Conference on Software & Smart Convergence 83 page
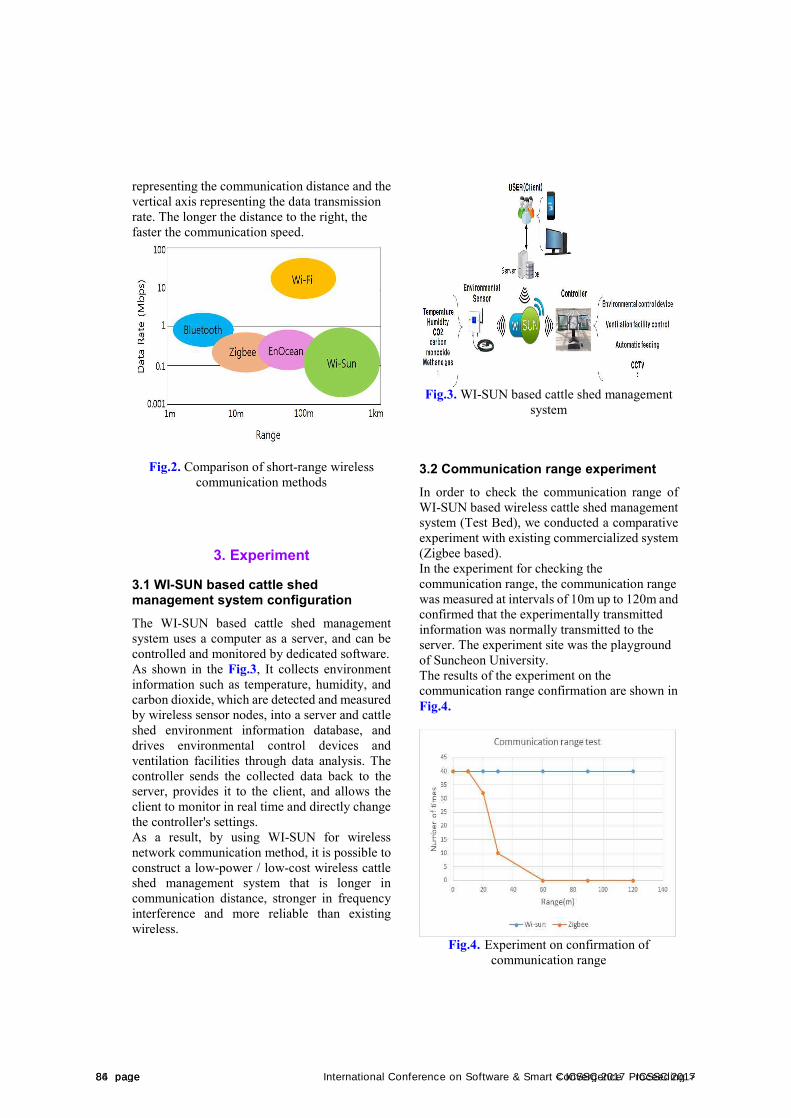
representing the communication distance and the vertical axis representing the data transmission rate. The longer the distance to the right, the faster the communication speed.
Fig.2. Comparison of short-range wireless communication methods
3. Experiment
3.1 WI-SUN based cattle shed management system configuration The WI-SUN based cattle shed management system uses a computer as a server, and can be controlled and monitored by dedicated software. As shown in the Fig.3, It collects environment information such as temperature, humidity, and carbon dioxide, which are detected and measured by wireless sensor nodes, into a server and cattle shed environment information database, and drives environmental control devices and ventilation facilities through data analysis. The controller sends the collected data back to the server, provides it to the client, and allows the client to monitor in real time and directly change the controller's settings. As a result, by using WI-SUN for wireless network communication method, it is possible to construct a low-power / low-cost wireless cattle shed management system that is longer in communication distance, stronger in frequency interference and more reliable than existing wireless.
Fig.3. WI-SUN based cattle shed management system
3.2 Communication range experiment In order to check the communication range of WI-SUN based wireless cattle shed management system (Test Bed), we conducted a comparative experiment with existing commercialized system (Zigbee based). In the experiment for checking the communication range, the communication range was measured at intervals of 10m up to 120m and confirmed that the experimentally transmitted information was normally transmitted to the server. The experiment site was the playground of Suncheon University. The results of the experiment on the communication range confirmation are shown in Fig.4.
Fig.4. Experiment on confirmation of communication range
86 page < ICSSC 2017 Proceeding >84 page International Conference on Software & Smart Convergence ICSSC 2017
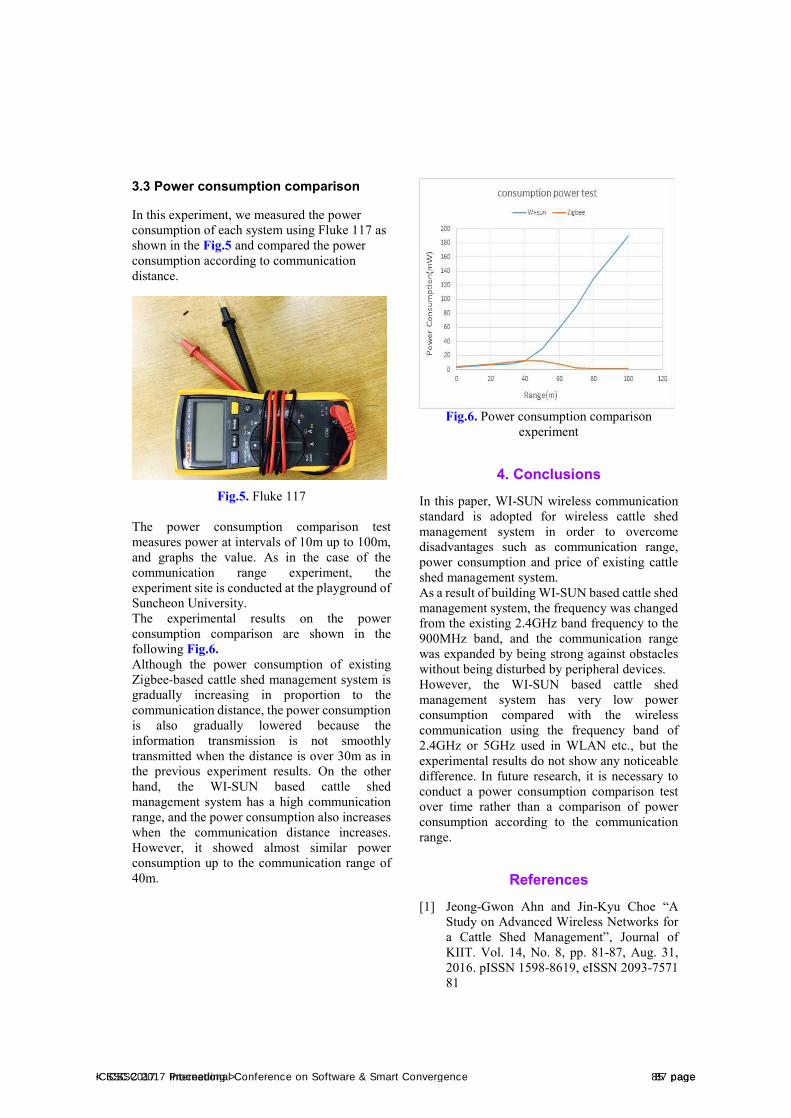
3.3 Power consumption comparison
In this experiment, we measured the power consumption of each system using Fluke 117 as shown in the Fig.5 and compared the power consumption according to communication distance.
Fig.5. Fluke 117
The power consumption comparison test measures power at intervals of 10m up to 100m, and graphs the value. As in the case of the communication range experiment, the experiment site is conducted at the playground of Suncheon University. The experimental results on the power consumption comparison are shown in the following Fig.6. Although the power consumption of existing Zigbee-based cattle shed management system is gradually increasing in proportion to the communication distance, the power consumption is also gradually lowered because the information transmission is not smoothly transmitted when the distance is over 30m as in the previous experiment results. On the other hand, the WI-SUN based cattle shed management system has a high communication range, and the power consumption also increases when the communication distance increases. However, it showed almost similar power consumption up to the communication range of 40m.
Fig.6. Power consumption comparison
experiment
4. Conclusions In this paper, WI-SUN wireless communication standard is adopted for wireless cattle shed management system in order to overcome disadvantages such as communication range, power consumption and price of existing cattle shed management system. As a result of building WI-SUN based cattle shed management system, the frequency was changed from the existing 2.4GHz band frequency to the 900MHz band, and the communication range was expanded by being strong against obstacles without being disturbed by peripheral devices. However, the WI-SUN based cattle shed management system has very low power consumption compared with the wireless communication using the frequency band of 2.4GHz or 5GHz used in WLAN etc., but the experimental results do not show any noticeable difference. In future research, it is necessary to conduct a power consumption comparison test over time rather than a comparison of power consumption according to the communication range.
References [1] Jeong-Gwon Ahn and Jin-Kyu Choe “A
Study on Advanced Wireless Networks for a Cattle Shed Management”, Journal of KIIT. Vol. 14, No. 8, pp. 81-87, Aug. 31, 2016. pISSN 1598-8619, eISSN 2093-7571 81
< ICSSC 2017 Proceeding > 87 pageICSSC 2017 International Conference on Software & Smart Convergence 85 page

[2] Phil Beecher, “TG4g-SUN Opening Report for Montreal”, 15-09-0370-00-004g-tg4g, May. 2009.
[3] Standardization trend of wireless transmission technology for smart utility network”, TTA Journal, vo.133, 2011
[4] “IEEE802.15.4g Smart Utility Networks (SUN) Technology Introduction”, A2U ICT, 2014.12
88 page < ICSSC 2017 Proceeding >86 page International Conference on Software & Smart Convergence ICSSC 2017

International Conference on Software & Smart Convergence (ICSSC) 2017, June 2017 Copyright ⓒ 2017 ICSSC
This research was supported by a research grant from the IT R&D program of MKE/IITA, the Korean government [2005-Y-001-04, Development of Next Generation Security Technology]. We express our thanks to Dr. Richard Berke who checked our manuscript.
Multi-level Combination based Topic Detection with Science
Mucheol Kim1, Hosung Kang2, Sanghyun Seo2, Namyeon Lee3, Sang Oh Park4
1 Department of Computer & Software Engineering, Wonkwang University, Republic Of Korea [e-mail: [email protected]]
2 Division of Media Software, Sungkyul University, Republic Of Korea [e-mail: [email protected],[email protected]]
3 Division of paideia, Sungkyul University, Republic Of Korea [e-mail: [email protected]]
4 School of Computer Science & Engineering, Chung-Ang University, Republic Of Korea [e-mail: [email protected]]
*Corresponding author: Sang Oh Park
Abstract
In recent, various data are available when many research examples utilizing, we extract key keywords related to social issues using existing research reports, extract papers and news key words based on report data to provide research methods and social flows In this paper, we propose a method to extract the keywords and related keywords in the field of medical security. Keywords: Topic Analysis, Decision Support System, Information Retrieval, Science Data
1. Introduction Recently, with the development of networks,
information systems are being expanded around the next generation web. In the existing web, if the flow of production and consumption of information is separated and operated as information providers and information consumers, many people participate in the process of information generation, sharing and consumption in the recent web 2.0 era [1]. As a result, the amount of data increases not only at a very high speed, but also in the form of information. This huge and diverse data is called big data, and people are interested in effective processing and analysis of big data [2].
However, this big data is too much data to be accepted by an individual, so most of the data has
a one-time nature and it often fails to be used properly. As such, there is a lot of information that can be of value if it is already meaningful information or processing. In particular, as users participate in the creation, distribution, and consumption of information through the Web, the amount of information is increasing rapidly, and there is a need for a proper management model [3].
In addition, due to the recognition of the reality of limited science and technology applied only in laboratories, the need for science and technology capable of solving social problems is emerging recently. Although information technologies that are far removed from social problems can not overcome limitations applied only in laboratories, they are required to meet the needs of society and further research and
< ICSSC 2017 Proceeding > 89 pageICSSC 2017 International Conference on Software & Smart Convergence 87 page
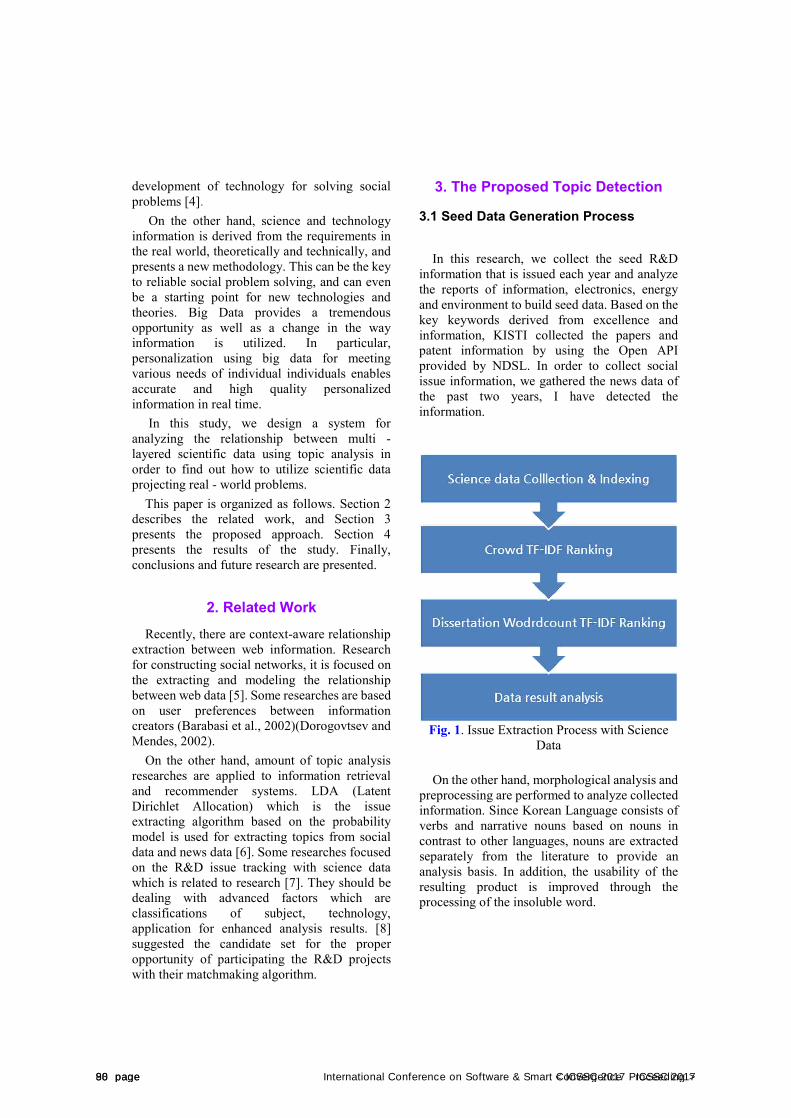
development of technology for solving social problems [4].
On the other hand, science and technology information is derived from the requirements in the real world, theoretically and technically, and presents a new methodology. This can be the key to reliable social problem solving, and can even be a starting point for new technologies and theories. Big Data provides a tremendous opportunity as well as a change in the way information is utilized. In particular, personalization using big data for meeting various needs of individual individuals enables accurate and high quality personalized information in real time.
In this study, we design a system for analyzing the relationship between multi - layered scientific data using topic analysis in order to find out how to utilize scientific data projecting real - world problems.
This paper is organized as follows. Section 2 describes the related work, and Section 3 presents the proposed approach. Section 4 presents the results of the study. Finally, conclusions and future research are presented.
2. Related WorkRecently, there are context-aware relationship
extraction between web information. Research for constructing social networks, it is focused on the extracting and modeling the relationship between web data [5]. Some researches are based on user preferences between information creators (Barabasi et al., 2002)(Dorogovtsev and Mendes, 2002).
On the other hand, amount of topic analysis researches are applied to information retrieval and recommender systems. LDA (Latent Dirichlet Allocation) which is the issue extracting algorithm based on the probability model is used for extracting topics from social data and news data [6]. Some researches focused on the R&D issue tracking with science data which is related to research [7]. They should be dealing with advanced factors which are classifications of subject, technology, application for enhanced analysis results. [8] suggested the candidate set for the proper opportunity of participating the R&D projects with their matchmaking algorithm.
3. The Proposed Topic Detection
3.1 Seed Data Generation Process
In this research, we collect the seed R&D information that is issued each year and analyze the reports of information, electronics, energy and environment to build seed data. Based on the key keywords derived from excellence and information, KISTI collected the papers and patent information by using the Open API provided by NDSL. In order to collect social issue information, we gathered the news data of the past two years, I have detected the information.
Fig. 1. Issue Extraction Process with Science Data
On the other hand, morphological analysis and preprocessing are performed to analyze collected information. Since Korean Language consists of verbs and narrative nouns based on nouns in contrast to other languages, nouns are extracted separately from the literature to provide an analysis basis. In addition, the usability of the resulting product is improved through the processing of the insoluble word.
90 page < ICSSC 2017 Proceeding >88 page International Conference on Software & Smart Convergence ICSSC 2017
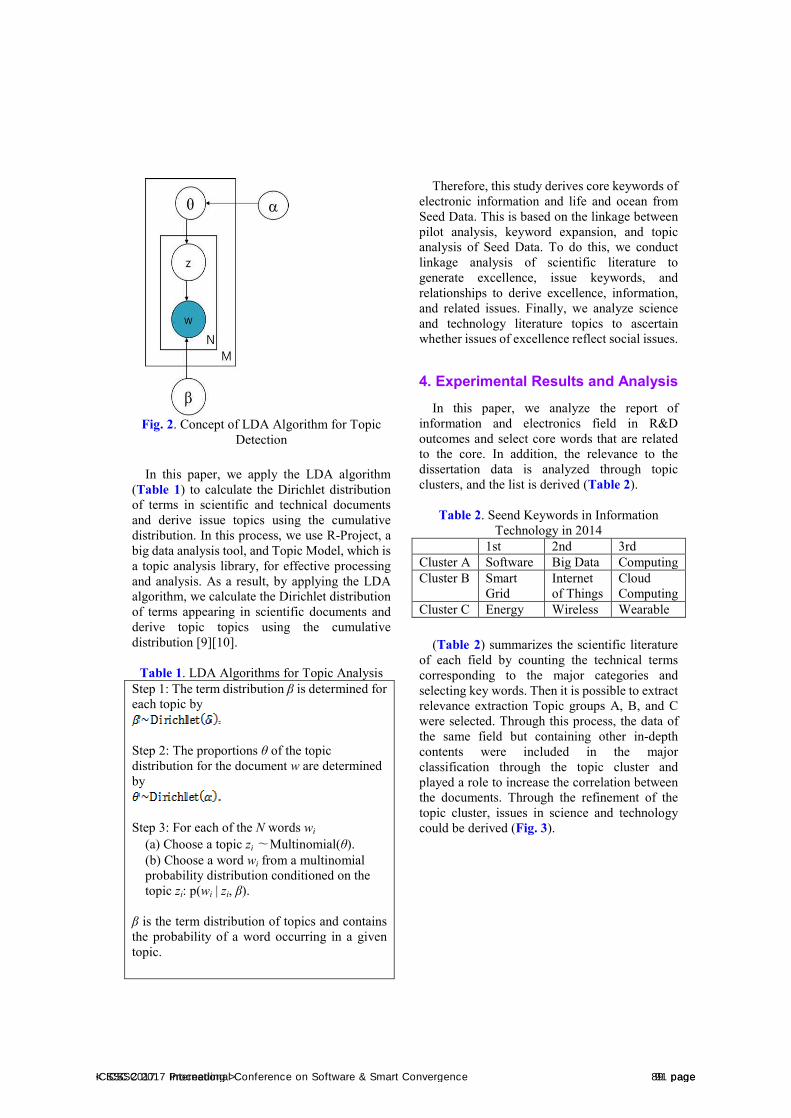
Fig. 2. Concept of LDA Algorithm for Topic Detection
In this paper, we apply the LDA algorithm (Table 1) to calculate the Dirichlet distribution of terms in scientific and technical documents and derive issue topics using the cumulative distribution. In this process, we use R-Project, a big data analysis tool, and Topic Model, which is a topic analysis library, for effective processing and analysis. As a result, by applying the LDA algorithm, we calculate the Dirichlet distribution of terms appearing in scientific documents and derive topic topics using the cumulative distribution [9][10].
Table 1. LDA Algorithms for Topic Analysis Step 1: The term distribution β is determined for each topic by
Step 2: The proportions θ of the topic distribution for the document w are determined by
Step 3: For each of the N words wi (a) Choose a topic zi ∼Multinomial(θ). (b) Choose a word wi from a multinomial probability distribution conditioned on the topic zi: p(wi | zi, β).
β is the term distribution of topics and contains the probability of a word occurring in a given topic.
Therefore, this study derives core keywords of electronic information and life and ocean from Seed Data. This is based on the linkage between pilot analysis, keyword expansion, and topic analysis of Seed Data. To do this, we conduct linkage analysis of scientific literature to generate excellence, issue keywords, and relationships to derive excellence, information, and related issues. Finally, we analyze science and technology literature topics to ascertain whether issues of excellence reflect social issues.
4. Experimental Results and AnalysisIn this paper, we analyze the report of
information and electronics field in R&D outcomes and select core words that are related to the core. In addition, the relevance to the dissertation data is analyzed through topic clusters, and the list is derived (Table 2).
Table 2. Seend Keywords in Information Technology in 2014
1st 2nd 3rd Cluster A Software Big Data Computing Cluster B Smart
Grid Internet of Things
Cloud Computing
Cluster C Energy Wireless Wearable
(Table 2) summarizes the scientific literature of each field by counting the technical terms corresponding to the major categories and selecting key words. Then it is possible to extract relevance extraction Topic groups A, B, and C were selected. Through this process, the data of the same field but containing other in-depth contents were included in the major classification through the topic cluster and played a role to increase the correlation between the documents. Through the refinement of the topic cluster, issues in science and technology could be derived (Fig. 3).
< ICSSC 2017 Proceeding > 91 pageICSSC 2017 International Conference on Software & Smart Convergence 89 page

International Conference on Software & Smart Convergence (ICSSC) 2017, June 2017 Copyright ⓒ 2017 ICSSC
Fig. 3. Relationship between science terms
5. Conclusions
This paper suggested the topic analysis from science data from diverse level in ‘Information Technology’. At first we analyzed the seed terms, then we gathered science data such as journal articles. After that we could generated the typical topic clusters with LDA algorithms. In addition, it appears that it would be able to provide user-customized information and increase its reusability based on the results of the big data analysis.
In future, we should be constructing the recommendation system for matchmaking with social issues.
References [1] Kim, Mucheol, and Sang Oh Park. "Group
affinity based social trust model for an intelligent movie recommender system." Multimedia tools and applications, vo. 64, no. 2, pp.505-516, 2013.
[2] O'Reilly Radar Team, "Big Data Now: Current Perspectives from O'Reilly Radar," O'Reilly, 2012
[3] Yoon, So-Young, “A Study on National Linking System Implementation based on Linked Data for Public Data,” Journal of the Korean Society for information Management, vo. 30, no. 1, pp.259-284, 2013.
[4] Kim, Mucheol, “Research of Topic Analysis for Extracting the Relationship between Science Data “, The Jounal of Society for e-Business Studies, pp.119-129,
2016. [5] Kim, Mucheol, et al. "Identity
management‐ based social trust model formediating information sharing and privacy enhancement." Security and Communication Networks, vo. 5, no. 8, pp. 887-897, 2012.
[6] Jung, D., Kim, J., Kim, K., Hur, J., Ohn, B., and Kang, M. “A Proposal of a Keyword Extraction System for Detecting Social Issues,” Journal of Intelligence and Information Systems, vo. 19, no. 3, pp. 1-23, 2013.
[7] Hyun, Y., Han, H., Choi, H., Park, J., Lee, K., Kwak, K., and Kim, N., “Methodology using Text Analysis for Packaging R&D Information Services on Pending National Issues”, Journal of Information Technology Applications and Management, vo. 20, pp.31-257, 2013
[8] Xu, W., Sun, J., Ma., J., Du, W, “A personalized information recommendation system for R&D project opportunity finding in big data contexts.” Journal of Network and Computer Applications, vo. 59, pp. 362-369, 2016.
[9] Blei, D., Ng, A., Jordan, M., and Lafferty, J., “Latent Dirichlet Allocations”, Journal of Machine Learning Research, vo. 3, no.4-5, pp. 993-1022, 2003.
[10] Blei, D. M. , “Probabilistic topic models”, Communications of the ACM, vo. 55, no.4, pp. 77-84, 2012.
92 page < ICSSC 2017 Proceeding >90 page International Conference on Software & Smart Convergence ICSSC 2017
International Conference on Software & Smart Convergence (ICSSC) 2017, June 2017 Copyright ⓒ 2017 ICSSC
This research was supported by a research grant from the IT R&D program of MKE/IITA, the Korean government [2005-Y-001-04, Development of Next Generation Security Technology]. We express our thanks to Dr. Richard Berke who checked our manuscript.
Diagnostic and Testing Methods to Ensure Security of Protected Distribution Systems
Yuri. V. Dobrzhinskii 1, Tatiana Yu. Dobrzhinskaia 2, Olesya S. Rogova 3 Department of Information Security
Far Eastern Federal University (FEFU) Vladivostok, Russian Federation
1[[email protected]] 2[[email protected]] 3[[email protected]]
*Corresponding author: Tatiana Yu. Dobrzhinskaia
Abstract
This work explores the issues of adaptation of classical mechanisms to ensure observability, manageability, testability of digital devices for distributed information systems both in the context of ensuring their fault tolerance and their resistance to threats and vulnerabilities. The related models and specific problems of their implementation are studied.
Keywords: Distributed systems, observability; manageability, security models, diagnostic models
1. Introduction
The problems of ensuring high quality and reliable functioning of distributed information systems are complex and vitally important nowadays due to the presence of the following factors, to say the least: large sizes, geographically remoted components, unreliable communication channels between the components, parallel processes, asynchronous interactions, complex synchronization systems, global time support. Additional problems are caused by the fact that nowadays there is no universally accepted systematization of distributed systems functionality features.
Principal requirement to distributed information systems is their fault tolerance. The algorithms used to ensure fault tolerance are related to interaction of the systems’ various
components. Fault tolerance of information system is ensured both on the computer level and on the whole system level. Fault tolerance of information system is defined by its capability to remain functional in the situation of failure of one or several components. Based on the typical architecture of such systems, it is possible to single out several components of general fault tolerance: software fault tolerance (both system and application software); system hardware fault tolerance on the level of a single device; fault tolerance of separate modules within the device; fault tolerance of a separate site (in case if the system has a geographically distributed structure) [1].
Observability is the capability to observe the reactions registered at the devices outputs to the input impacts (tests) which are generated with the help of testbench program, i.e. the possibility
< ICSSC 2017 Proceeding > 93 pageICSSC 2017 International Conference on Software & Smart Convergence 91 page
to observe the results of impact in input (and internal) lines of code or structure. Observability may be defined by the fact of getting different or similar output values by entering these or that input data.
Manageability is a possibility to stimulate (activate) a certain line of code or within the project. Within the scope of manageability it is possible to consider such parameters as: code lines coverage, code branches coverage, routes coverage, expressions’ coverage. Manageability determines which part of output values area can be reviewed by setting all possible variants of input values.
The implementation of testable design approaches at the earliest stage of development (at the system level) makes it possible to significantly raise the quality of released products, as well as efficiency of testing procedures by way of introducing allowable hardware and time redundancy.
2. Discussion of the problem andsetting a task
In practice there exist no absolutely reliable and invincible distributed systems, which fact explains the significant importance of solving both the complex of diagnostic tasks, as well as the tasks to ensure security, especially for important and special spheres of application. A new approach is recently gaining popularity, where a certain model is developed in the course of the system design, which describes the given system with the required level of abstractness; further on the program code is generated based on the model, then the documentation is made and the testing performed. This approach is called the model-driven development.
The computer systems security models [2] and diagnostic models [3] are highly important for the quality system design, but their traditional variations significantly differ by the mathematical apparatus they use; they are implemented and tested, as a rule, by different specialists, and achieving complex solutions to ensure threat and fault tolerance of distributed system is a very complicated job[4].
3. The proposed approach
The article reviews the approach to build aggregate model of distributed system based on the rational choice of the model components. On doing so, the model component aimed at ensuring security is implemented based on the modified Kripke structure [2]. In general, Kripke structure is a set of 4 elements: K = (S, S0, R, L), where S is finite set of the system states; S0 is the finite state of the system initial states; R: S × S is the total relation of transitions, totality here means that from any state there is a transition to another state, including transition to the same state, L is the function of tags, which makes a correlation to each state a set of atomic sentences performed in this state. In other words, L: S → 2AP, where AP is a set of atomic sentences.
Applied to distributed system, consisting of several modules, in the modified Kripke structure, the distribution system states are combinations of module states included in the system.
To solve the tasks of diagnostics, testing, fault tolerance of distributed system, it is necessary to research them in the faultless technical states, as well as taking into consideration their possible defects and other unfavorable factors. The tasks of synthesizing tests to check the hardware good standing and search for defects, have been traditionally solved for digital devices only, as for distributed networks with their sophisticated and heterogeneous structure, they are relatively new objects in this sense.
To build diagnostic components, it is offered to use one of the most extended formalisms of Petri networks, E-networks. E-network is determined by the aggregate of the following sets NE = (B, Bp, BR ,D, M0), where B is the finite non-empty set of positions; Bp is the finite state of decision-making positions; D is the finite non-empty set of description of transitions di . At that, the transition is defined the following way: di =(s, t(di ), l) , where s is transition type, t(di ) is transition time, l is transition procedure. Along with the said specific features, significant differences of E-networks from Petri networks are sophistication of logic of transition operation, singling out of several basic transition types, introducing various operations to the model under tags descriptions, each of which bears a
94 page < ICSSC 2017 Proceeding >92 page International Conference on Software & Smart Convergence ICSSC 2017
certain quantitative information about the modeled object.
Kripke model and E-network are formalisms structurally close to each other.
4. Conclusions
The article reviews the tasks of determining manageability, observability, testability based on building the distributed system modules.
The experience of building joint implementation of Kripke model and E-network As a tool of implementing the models it is offered to use VHDL-AMS language. It makes is possible to describe analog and mixed (analog-digital) devices, which is highly important for peripheral objects of distributed systems [5].
References
[1] C.F. Hempelmann, U. Sakoglu, V.P. Gurupur, S. Jampana. "An entropy-based evaluation method for knowledge bases of medical information systems," Expert Syst. Appl., pp. 262–273, 2016.
[2] P.N. Devyatinin. Models of computer systems security. Managing access and information flows. Textbook for higher educational institutions. Moscow, Goryachaya Liniya-Telecom, 320 pages, 2011.
[3] Yu. Dobrzhinskii. "Simulation and analysis of electronic circuits’ tests," Far Eastern State Technical University, 124 pages, 2008.
[4] S. Skorobogatov, C. Woods. "Breakthrough silicon scanning discovers backdoor in military chip," Cryptographic hardware and embedded systems / Eds. E. Prouff, P. Schaumont. Lecture notes in computer science ser. Heidelberg: Springer, vo. 7428, pp. 23, 2012.
[5] Specific features of transceiver diagnostic simulation in VHDL-AMS environment. T. Dobrzhinskaya, Yu. Dobrzhinskii // Collection of materials of International Scientific and Practical Conference Education and Science Issues: Theoretical and Practical Aspects. Samara, Ofort LLC, pp. 330-331, 2015.
< ICSSC 2017 Proceeding > 95 pageICSSC 2017 International Conference on Software & Smart Convergence 93 page
International Conference on Software & Smart Convergence (ICSSC) 2017, June 2017Copyright ⓒ 2017 ICSSC
A New Approach to Overcome One-way Data Analytic Process
Hwa Jong KimComputer and Communications Engineering Department
Kangwon National University, Korea [e-mail: [email protected]]
Abstract
Currently, most data projects start with a rough idea of what data might be useful and then gather as much data as possible. However, as the amount of data generated continues to grow exponentially, it will become more and more difficult to extract useful signals from the noise. Three particularly chal-lenging problems are filtering noise from the raw data, incorporating the application-specific needs of the data scientist into the data analysis process, and fusing data from multiple domains. This paper describes the need for an Adaptive Analytics Framework (AAF), a structured feedback loop between the goals of the data scientist and an automatic data preparation module, which tackles all three prob-lems.
Keywords: one-way data analytics, adaptive analytics, feedback loop
1. IntroductionThe performance of many of the machine learn-ing and artificial intelligence algorithms driving these services is known to be primarily depen-dent on the quantity of data used to train the algorithms [1].
Because of this, many data analysis projects focus on gathering as much data as possible. However, as the amount of data generated continues to increase exponentially [2], it will become more and more difficult to extract useful signals from the noise. Three issues are expected to be particularly challenging: data fusion, data filtering, incorporating application-specific needs (“adaptive analytics”).
Data fusion: Most intelligent services require fusing data from multiple domains together, a process currently done primarily by hand and thus not scalable. Additionally, it is
usually difficult for organizations to open their data for many reasons like privacy management, quality assurance, and legal responsibility.
Data filtering: Data scientists are spending more and more time generating, storing, and otherwise managing increasingly complicated data storage systems. We need a schema that helps sensors generate an optimal amount of data or automatically filter the raw data into an amount that data scientists can analyze to achieve the goal of the project at hand.
Adaptive analytics: Each data project has its own specific goal and thus requires its own specific data sources, level of sampling resolution, and data quality requirements. Data that might be considered signal for one application might be considered completely noise for another application. Additionally, the data requirements for a single application may vary over time.
This work was supported by Korea Institute of Planning and Evaluation for Technology in Food, Agriculture, Forestry and Fisheries (IPET) through (Advanced Production Technology Development Program), funded by Ministry of Agriculture, Food and rural Affairs (MAFRA) (116116-03-1-SB010).
96 page < ICSSC 2017 Proceeding >94 page International Conference on Software & Smart Convergence ICSSC 2017
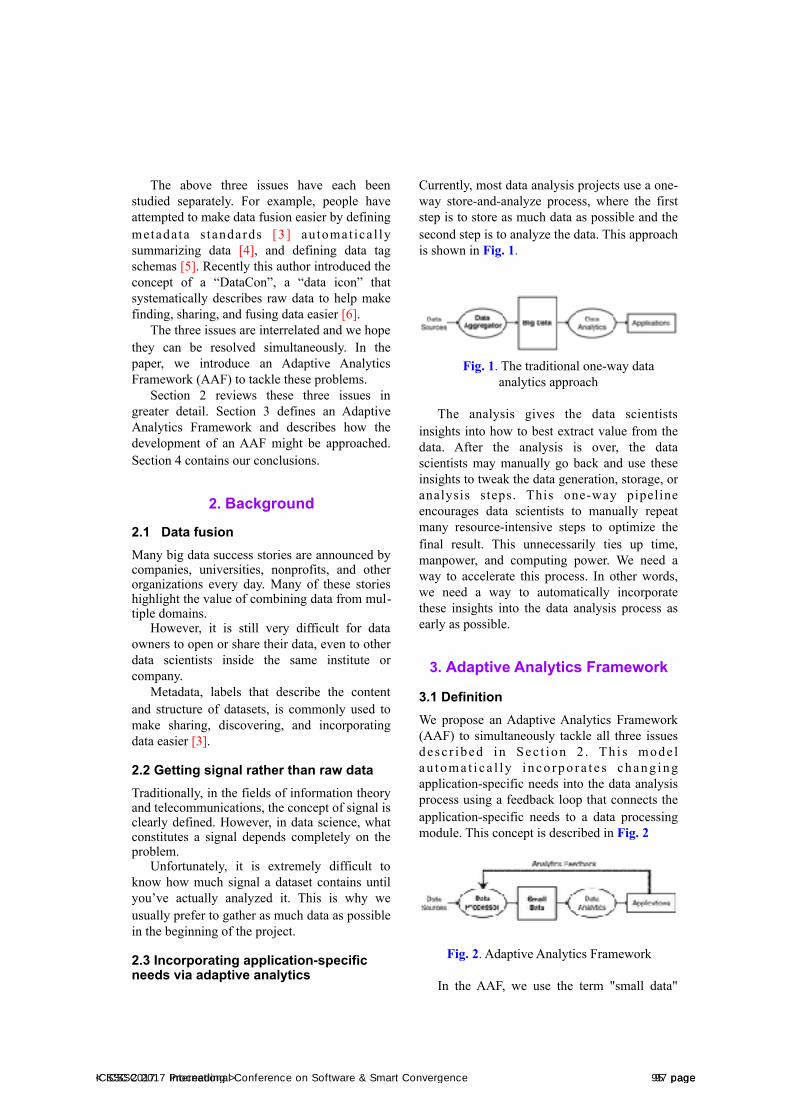
The above three issues have each been studied separately. For example, people have attempted to make data fusion easier by defining metadata s tandards [3] automat ica l ly summarizing data [4], and defining data tag schemas [5]. Recently this author introduced the concept of a “DataCon”, a “data icon” that systematically describes raw data to help make finding, sharing, and fusing data easier [6].
The three issues are interrelated and we hope they can be resolved simultaneously. In the paper, we introduce an Adaptive Analytics Framework (AAF) to tackle these problems.
Section 2 reviews these three issues in greater detail. Section 3 defines an Adaptive Analytics Framework and describes how the development of an AAF might be approached. Section 4 contains our conclusions.
2. Background
2.1 Data fusion Many big data success stories are announced by companies, universities, nonprofits, and other organizations every day. Many of these stories highlight the value of combining data from mul-tiple domains.
However, it is still very difficult for data owners to open or share their data, even to other data scientists inside the same institute or company.
Metadata, labels that describe the content and structure of datasets, is commonly used to make sharing, discovering, and incorporating data easier [3].
2.2 Getting signal rather than raw data Traditionally, in the fields of information theory and telecommunications, the concept of signal is clearly defined. However, in data science, what constitutes a signal depends completely on the problem.
Unfortunately, it is extremely difficult to know how much signal a dataset contains until you’ve actually analyzed it. This is why we usually prefer to gather as much data as possible in the beginning of the project.
2.3 Incorporating application-specific needs via adaptive analytics
Currently, most data analysis projects use a one-way store-and-analyze process, where the first step is to store as much data as possible and the second step is to analyze the data. This approach is shown in Fig. 1.
Fig. 1. The traditional one-way data analytics approach
The analysis gives the data scientists insights into how to best extract value from the data. After the analysis is over, the data scientists may manually go back and use these insights to tweak the data generation, storage, or analysis steps. This one-way pipeline encourages data scientists to manually repeat many resource-intensive steps to optimize the final result. This unnecessarily ties up time, manpower, and computing power. We need a way to accelerate this process. In other words, we need a way to automatically incorporate these insights into the data analysis process as early as possible.
3. Adaptive Analytics Framework
3.1 Definition We propose an Adaptive Analytics Framework (AAF) to simultaneously tackle all three issues desc r ibed in Sec t ion 2 . Th i s mode l a u t o m a t i c a l l y i n c o r p o r a t e s c h a n g i n g application-specific needs into the data analysis process using a feedback loop that connects the application-specific needs to a data processing module. This concept is described in Fig. 2
Fig. 2. Adaptive Analytics Framework
In the AAF, we use the term "small data"
< ICSSC 2017 Proceeding > 97 pageICSSC 2017 International Conference on Software & Smart Convergence 95 page
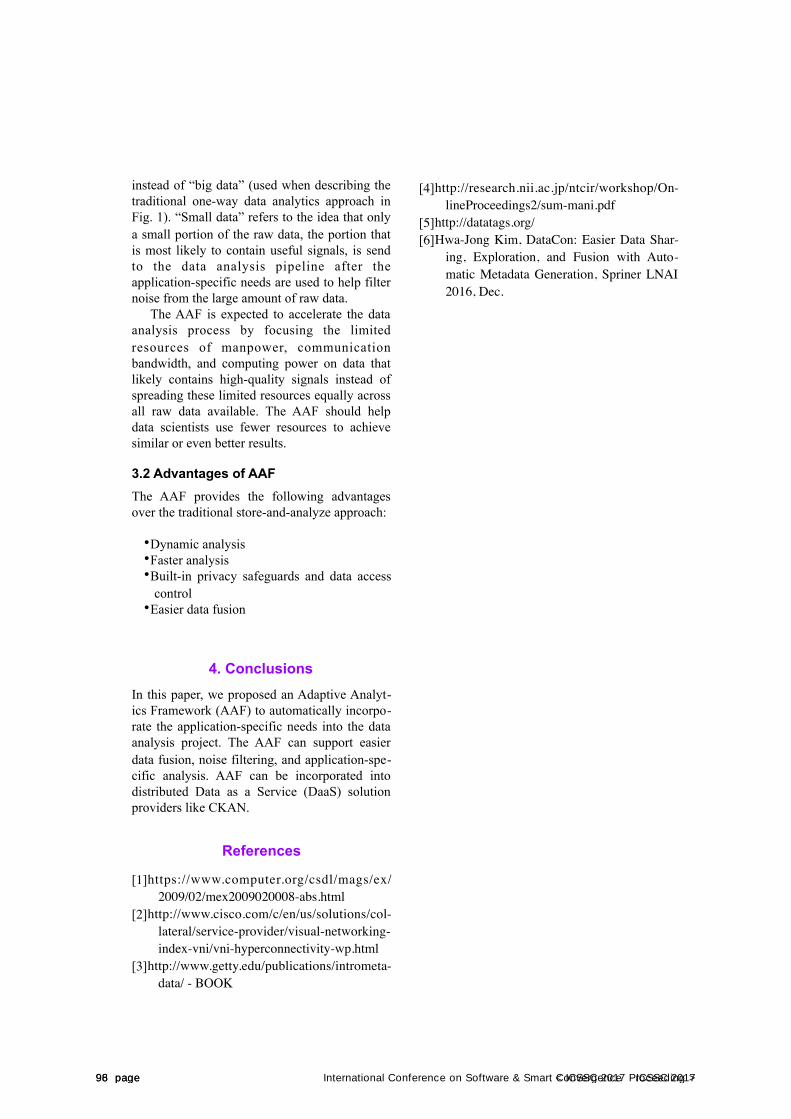
instead of “big data” (used when describing the traditional one-way data analytics approach in Fig. 1). “Small data” refers to the idea that only a small portion of the raw data, the portion that is most likely to contain useful signals, is send to the data analysis pipeline after the application-specific needs are used to help filter noise from the large amount of raw data.
The AAF is expected to accelerate the data analysis process by focusing the limited resources of manpower, communication bandwidth, and computing power on data that likely contains high-quality signals instead of spreading these limited resources equally across all raw data available. The AAF should help data scientists use fewer resources to achieve similar or even better results.
3.2 Advantages of AAF The AAF provides the following advantages over the traditional store-and-analyze approach:
•Dynamic analysis•Faster analysis•Built-in privacy safeguards and data access
control•Easier data fusion
4. ConclusionsIn this paper, we proposed an Adaptive Analyt-ics Framework (AAF) to automatically incorpo-rate the application-specific needs into the data analysis project. The AAF can support easier data fusion, noise filtering, and application-spe-cific analysis. AAF can be incorporated into distributed Data as a Service (DaaS) solution providers like CKAN.
References
[1]https://www.computer.org/csdl/mags/ex/2009/02/mex2009020008-abs.html
[2]http://www.cisco.com/c/en/us/solutions/col-lateral/service-provider/visual-networking-index-vni/vni-hyperconnectivity-wp.html
[3]http://www.getty.edu/publications/intrometa-data/ - BOOK
[4]http://research.nii.ac.jp/ntcir/workshop/On-lineProceedings2/sum-mani.pdf
[5]http://datatags.org/[6]Hwa-Jong Kim, DataCon: Easier Data Shar-
ing, Exploration, and Fusion with Auto-matic Metadata Generation, Spriner LNAI 2016, Dec.
98 page < ICSSC 2017 Proceeding >96 page International Conference on Software & Smart Convergence ICSSC 2017
International Conference on Software & Smart Convergence (ICSSC) 2017, June 2017 Copyright ⓒ 2017 ICSSC
The features of designing of underwater acoustic sensor networks for shelf zones of North-Western Pacific regional seas
A.Yu. Rodionov1, P.P. Unru1, A.V. Kirianov1, L.G. Statsenko1 and B.A. Salnikov1 1 School of Engineering, Far Eastern Federal University
Vladivostok, Primorsky krai 690922 - Russia [e-mail: [email protected]]
*Corresponding author: Aleksandr Yu. Rodionov
Abstract Underwater acoustic sensor network (UASN) is a powerful tool for sea media analyzing,
ecological monitoring, sea bottom resource exploration, preventing natural and man-made disasters, providing underwater navigation, etc. But some of the aquatic areas of the World Ocean impose special requirements to every element of the UASN: signal processing technique, modulation, MAC-protocol, topology, etc. In the paper features of UASN designing for the conditions of North-Western Pacific regional seas (Sea of Japan, Sea of Okhotsk, Bering Sea) are considered. Hydrological-acoustical, climatic and ice conditions of this region differ from the majority of equatorial, subequatorial and temperate zones seas. That imposes requirements for the network nodes displacement and leads to the necessity of designing of a trick solution for establishing a reliable and efficient communication link.
Keywords: underwater acoustic sensor networks, underwater acoustic communication, digital modulation.
1. Introduction
The past decade is noted with big-scale and all-around development of resources of the Global Ocean. Research and development of extractable resources, fishing and culturing of hydrobionts, data mining campaigns on water conditions in the interests of ecology, meteorology, emergency preventions, etc. – all conducted in shelf zone and in deep sea areas. Moreover, each of the industries needs measurements of particular parameters of various natures. Thus, there is an emerging necessity of monitoring of integral characteristics of temperature and stream fields, seismic activities, seawater impurity content and so on. [1]
With increasing tempo of the World Ocean Development, technical and methodical support of oceanological measurements is progressing.
At present day, the new paradigm of “network-centric technology” is forming in the field of oceanology; it poses the whole of means and methods of autonomous contact measuring of essential parameters based on the principles of network-centric systems. These systems involve a group of diverse devices united in an informational network for the continuous information flow and increase of efficiency in general. UASN are seen as one the most widespread and efficient types.
At present day, sensor technology is already at a high level of development for motivation of engineering full-function UASN. For its technical implementation only the problem of power efficient and high-productive underwater acoustic network of data transmission has to be solved.
In the paper features of UASN designing for the conditions of North-Western Pacific regional seas (Sea of Japan, Okhotsk Sea,
< ICSSC 2017 Proceeding > 99 pageICSSC 2017 International Conference on Software & Smart Convergence 97 page
Bering Sea) are considered. The aquatic areas of these seas were chosen due to the growing attention to this region from governmental and private institutions. The reason for this is the high potential of the region in oil-and-gas extraction, deep-sea resources exploration (sulfide deposits along the Kuriles Islands [2]) and sea farming.
The paper is organized as follows: in Section 2 features of the North-Western Pacific regional seas are considered; in Section 3 the influence of the climatic, hydrological-acoustical and ice conditions of the chosen aquatic areas on aspects of UANS designing is analyzed, and the possible ways of solving arising problems are given.
2. Features of chosen aquatic areas
1. Sea of JapanSea of Japan is located in north-western
part of Pacific Ocean between mainlands of the Asia, Japanese archipelago and Sakhalin Island. This sea is distinguished by high horizontal and vertical gradients of water salinity, temperature and, as a consequence, sounds velocity. The water temperature season fluctuations are equal to -1.8…18º С in the north and 13…27º С in the sound. The horizontal temperature difference on the whole sea surface is season independent and equals 13…15º С with decreasing to 1…4º С on depth of 200 m. The water salinity space distribution is highly seasonal and spatial dependable and varies from 25‰ near the shore in summer to 34.5‰ in the central regions of the sea in winter [3].
On the surface the winter speed of sound is equal to 1440…1445 m\s in the north and 1500-1510 m\s in the south with the seasonal fluctuations of 35-45 m\s. The vertical distribution of sound speed in the Sea of Japan has a significant homogeneous layer located from the surface to depth of 200-300 m (in some regions to 600 m). This layer is characterized by high gradients of 0.5…0.8 s-1 on depths of 0-100 m. The winter water convection causes the axis of underwater acoustic channel movement: in winter the near-surface channel is formed, in summer the channel axis is slowly descends to 200-300 m [4].
The surface of the ice coverage of he Sea of Japan is hardly predictive and can vary from year to year. According to [5] the extreme bounds of the ice coverage are the latitude 43° N along the Japan coast and the latitude 39° N along the Korean peninsula coast.
2. Sea of OkhotskSea of Okhotsk is located in north-western
part of Pacific Ocean near the Asia mainlands and separated from the Ocean by Kuril Islands and Kamchatka peninsula.
Usually the surface temperature of the Sea is fluctuates in the range of -1.8…18º C during the year with positive gradient in south direction. Seasonal fluctuations on depth of 50 m are equal to 3…4º C, and on depth of 200 m – 2.0…2.5º C [6].
The water salinity during the year varies from 20-22‰ in summer to 30-33‰ in winter. With a rise of depth the salinity fluctuations decreases to 0.5-1.5‰ on depth of 50 m with absolute magnitude of 32.0…33.5‰ depending on the region.
The Sea of Okhotsk is distinguished by high seasonal and spatial variations. In winter the minimum of sound speed is located near the surface and equals to 1445-1450 m\s. In summer the heating of the surface increases the surface sound speed to 1500 m\s. Winter vertical distribution of sound speed is distinguished by the presence of near-surface layer with low sound speed and negative gradient of 0.1 s-1 located on depths of 0-200 m. In summer time the axis of underwateracoustic channel is located on depths of 80-120 m. In this time the layer with high negativegradient of sound speed (0.5 s-1) is formed on 0-80 m depth.
The aquatic areas of the Sea of Okhotsk is usually on 70-80% are covered with ice, but in some hard winters this parameter can reach 99%. The average duration of the ice coverage presence is 260 days in north-western part of the sea, 190-200 days near the Sakhalin Island coast and 110-120 in the southern part. Only straights between Kurile Islands are always ice free [7].
3. Bering SeaThe Bering Sea is a semi-secretive
peripheral sea of continent-ocean type and is
100 page < ICSSC 2017 Proceeding >98 page International Conference on Software & Smart Convergence ICSSC 2017
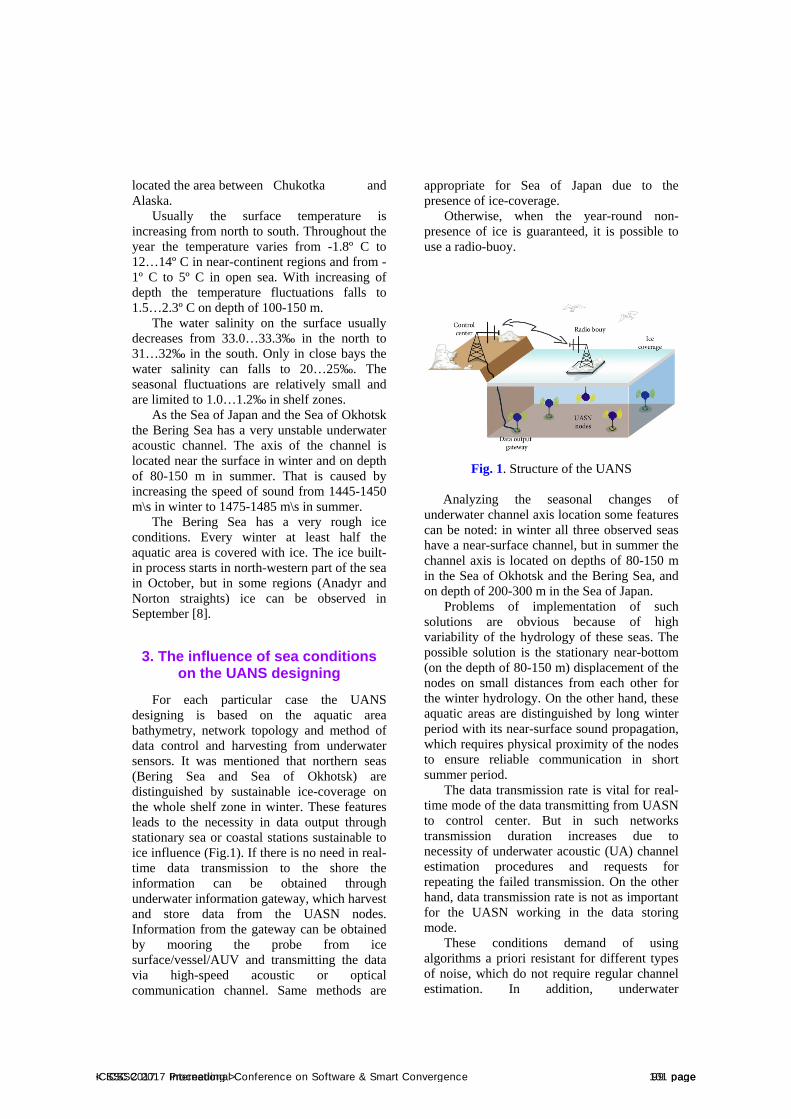
located the area between Chukotka and Alaska.
Usually the surface temperature is increasing from north to south. Throughout the year the temperature varies from -1.8º C to 12…14º C in near-continent regions and from -1º C to 5º C in open sea. With increasing of depth the temperature fluctuations falls to 1.5…2.3º C on depth of 100-150 m.
The water salinity on the surface usually decreases from 33.0…33.3‰ in the north to 31…32‰ in the south. Only in close bays the water salinity can falls to 20…25‰. The seasonal fluctuations are relatively small and are limited to 1.0…1.2‰ in shelf zones.
As the Sea of Japan and the Sea of Okhotsk the Bering Sea has a very unstable underwater acoustic channel. The axis of the channel is located near the surface in winter and on depth of 80-150 m in summer. That is caused by increasing the speed of sound from 1445-1450 m\s in winter to 1475-1485 m\s in summer.
The Bering Sea has a very rough ice conditions. Every winter at least half the aquatic area is covered with ice. The ice built-in process starts in north-western part of the sea in October, but in some regions (Anadyr and Norton straights) ice can be observed in September [8].
3. The influence of sea conditionson the UANS designing
For each particular case the UANS designing is based on the aquatic area bathymetry, network topology and method of data control and harvesting from underwater sensors. It was mentioned that northern seas (Bering Sea and Sea of Okhotsk) are distinguished by sustainable ice-coverage on the whole shelf zone in winter. These features leads to the necessity in data output through stationary sea or coastal stations sustainable to ice influence (Fig.1). If there is no need in real-time data transmission to the shore the information can be obtained through underwater information gateway, which harvest and store data from the UASN nodes. Information from the gateway can be obtained by mooring the probe from ice surface/vessel/AUV and transmitting the data via high-speed acoustic or optical communication channel. Same methods are
appropriate for Sea of Japan due to the presence of ice-coverage.
Otherwise, when the year-round non-presence of ice is guaranteed, it is possible to use a radio-buoy.
Fig. 1. Structure of the UANS
Analyzing the seasonal changes of underwater channel axis location some features can be noted: in winter all three observed seas have a near-surface channel, but in summer the channel axis is located on depths of 80-150 m in the Sea of Okhotsk and the Bering Sea, and on depth of 200-300 m in the Sea of Japan.
Problems of implementation of such solutions are obvious because of high variability of the hydrology of these seas. The possible solution is the stationary near-bottom (on the depth of 80-150 m) displacement of the nodes on small distances from each other for the winter hydrology. On the other hand, these aquatic areas are distinguished by long winter period with its near-surface sound propagation, which requires physical proximity of the nodes to ensure reliable communication in short summer period.
The data transmission rate is vital for real-time mode of the data transmitting from UASN to control center. But in such networks transmission duration increases due to necessity of underwater acoustic (UA) channel estimation procedures and requests for repeating the failed transmission. On the other hand, data transmission rate is not as important for the UASN working in the data storing mode.
These conditions demand of using algorithms a priori resistant for different types of noise, which do not require regular channel estimation. In addition, underwater
< ICSSC 2017 Proceeding > 101 pageICSSC 2017 International Conference on Software & Smart Convergence 99 page
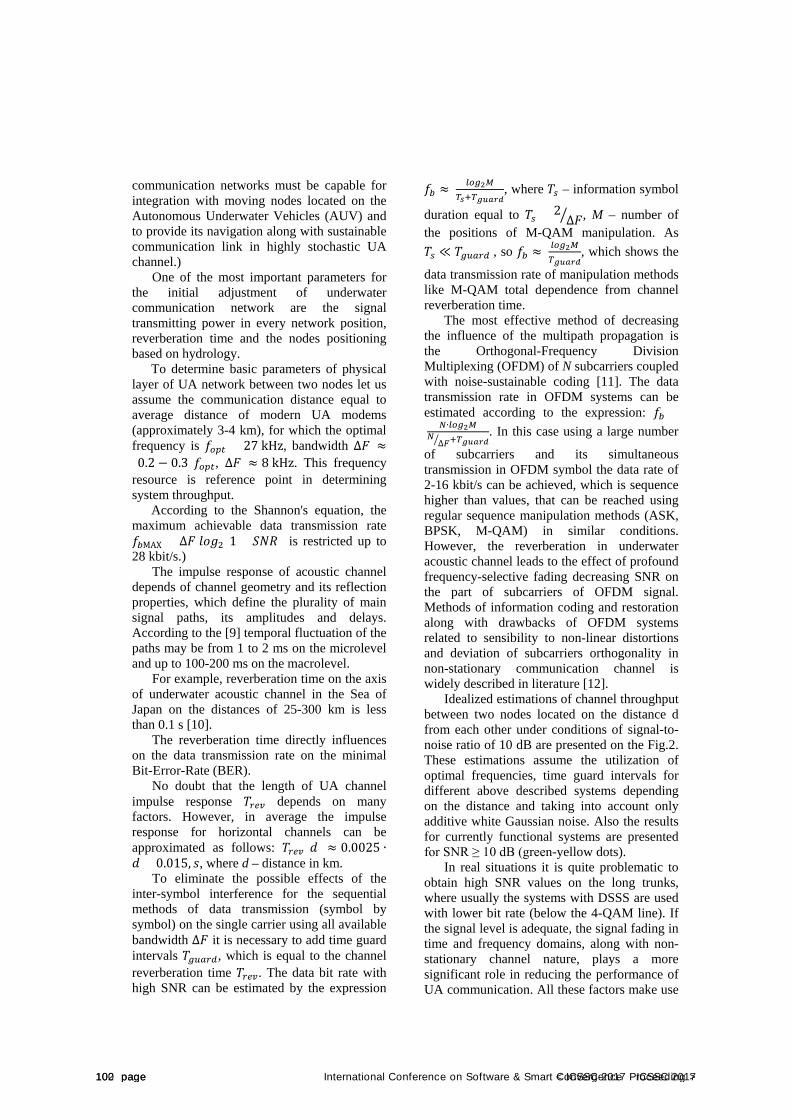
communication networks must be capable for integration with moving nodes located on the Autonomous Underwater Vehicles (AUV) and to provide its navigation along with sustainable communication link in highly stochastic UA channel.)
One of the most important parameters for the initial adjustment of underwater communication network are the signal transmitting power in every network position, reverberation time and the nodes positioning based on hydrology.
To determine basic parameters of physical layer of UA network between two nodes let us assume the communication distance equal to average distance of modern UA modems (approximately 3-4 km), for which the optimal frequency is 𝑓𝑓𝑜𝑜𝑜𝑜𝑜𝑜 = 27 kHz, bandwidth ∆𝐹𝐹 ≈(0.2 − 0.3)𝑓𝑓𝑜𝑜𝑜𝑜𝑜𝑜, ∆𝐹𝐹 ≈ 8 kHz. This frequency resource is reference point in determining system throughput.
According to the Shannon's equation, the maximum achievable data transmission rate 𝑓𝑓𝑏𝑏МАХ = ∆𝐹𝐹 𝑙𝑙𝑜𝑜𝑔𝑔2(1 + 𝑆𝑆𝑆𝑆𝑆𝑆) is restricted up to 28 kbit/s.)
The impulse response of acoustic channel depends of channel geometry and its reflection properties, which define the plurality of main signal paths, its amplitudes and delays. According to the [9] temporal fluctuation of the paths may be from 1 to 2 ms on the microlevel and up to 100-200 ms on the macrolevel.
For example, reverberation time on the axis of underwater acoustic channel in the Sea of Japan on the distances of 25-300 km is less than 0.1 s [10].
The reverberation time directly influences on the data transmission rate on the minimal Bit-Error-Rate (BER).
No doubt that the length of UA channel impulse response 𝑇𝑇𝑟𝑟𝑟𝑟𝑟𝑟 depends on many factors. However, in average the impulse response for horizontal channels can be approximated as follows: 𝑇𝑇𝑟𝑟𝑟𝑟𝑟𝑟(𝑑𝑑) ≈ 0.0025 ∙𝑑𝑑 + 0.015, 𝑠𝑠, where d – distance in km.
To eliminate the possible effects of the inter-symbol interference for the sequential methods of data transmission (symbol by symbol) on the single carrier using all available bandwidth ∆𝐹𝐹 it is necessary to add time guard intervals 𝑇𝑇𝑔𝑔𝑔𝑔𝑔𝑔𝑟𝑟𝑔𝑔, which is equal to the channel reverberation time 𝑇𝑇𝑟𝑟𝑟𝑟𝑟𝑟. The data bit rate with high SNR can be estimated by the expression
𝑓𝑓𝑏𝑏 ≈ 𝑙𝑙𝑜𝑜𝑔𝑔2𝑀𝑀𝑇𝑇𝑠𝑠+𝑇𝑇𝑔𝑔𝑔𝑔𝑔𝑔𝑔𝑔𝑔𝑔
, where 𝑇𝑇𝑠𝑠 – information symbol
duration equal to 𝑇𝑇𝑠𝑠 = 2∆𝐹𝐹� , M – number of
the positions of M-QAM manipulation. As 𝑇𝑇𝑠𝑠 ≪ 𝑇𝑇𝑔𝑔𝑔𝑔𝑔𝑔𝑟𝑟𝑔𝑔 , so 𝑓𝑓𝑏𝑏 ≈ 𝑙𝑙𝑜𝑜𝑔𝑔2𝑀𝑀
𝑇𝑇𝑔𝑔𝑔𝑔𝑔𝑔𝑔𝑔𝑔𝑔, which shows the
data transmission rate of manipulation methods like M-QAM total dependence from channel reverberation time.
The most effective method of decreasing the influence of the multipath propagation is the Orthogonal-Frequency Division Multiplexing (OFDM) of N subcarriers coupled with noise-sustainable coding [11]. The data transmission rate in OFDM systems can be estimated according to the expression: 𝑓𝑓𝑏𝑏 = 𝑁𝑁∙𝑙𝑙𝑜𝑜𝑔𝑔2𝑀𝑀𝑁𝑁∆𝐹𝐹� +𝑇𝑇𝑔𝑔𝑔𝑔𝑔𝑔𝑔𝑔𝑔𝑔
. In this case using a large number
of subcarriers and its simultaneous transmission in OFDM symbol the data rate of 2-16 kbit/s can be achieved, which is sequence higher than values, that can be reached using regular sequence manipulation methods (ASK, BPSK, M-QAM) in similar conditions. However, the reverberation in underwater acoustic channel leads to the effect of profound frequency-selective fading decreasing SNR on the part of subcarriers of OFDM signal. Methods of information coding and restoration along with drawbacks of OFDM systems related to sensibility to non-linear distortions and deviation of subcarriers orthogonality in non-stationary communication channel is widely described in literature [12].
Idealized estimations of channel throughput between two nodes located on the distance d from each other under conditions of signal-to-noise ratio of 10 dB are presented on the Fig.2. These estimations assume the utilization of optimal frequencies, time guard intervals for different above described systems depending on the distance and taking into account only additive white Gaussian noise. Also the results for currently functional systems are presented for SNR ≥ 10 dB (green-yellow dots).
In real situations it is quite problematic to obtain high SNR values on the long trunks, where usually the systems with DSSS are used with lower bit rate (below the 4-QAM line). If the signal level is adequate, the signal fading in time and frequency domains, along with non-stationary channel nature, plays a more significant role in reducing the performance of UA communication. All these factors make use
102 page < ICSSC 2017 Proceeding >100 page International Conference on Software & Smart Convergence ICSSC 2017
of Orthogonal Frequency Division Multiplexing (OFDM) techniques not so efficient.
Multiple practical results shows that effective transmission rate between nodes of the UA network can reach 10-100 bps for distances of tens km, 100-2000 bps for the 3-5 km, and up to 10 kbps for 1-2 km. these estimations are fair for the systems, which don’t utilize multi-element antenna arrays and algorithms of regular channel estimation.
For UASN nodes with all-year operation period in the given aquatic areas, which are displaced in optimal coordinates, it is necessary to take into account the seasonal variations of radiating power to break the seasonal hydrological fluctuations of the UA channel. But this steps leads to increasing of the reverberation time and noise level as well as decreasing total energy efficiency of the system.
Fig. 2. Idealized estimations of channel
throughput between two nodes located on the distance d, km
4. Conclusion
In the paper the possibilities of designing the UASNs in north-western aquatic areas of the Pacific Ocean are considered, along with significant technical difficulties in implementing of such networks due to high
variability of hydrology and strong ice coverage. The estimations of throughput between nodes located on different distances in such conditions are shown.
References
[1] Heidemann J., Stojanovic M., Zorzi M. Underwater sensor networks: applications, advances and challenges //Phil. Trans. R. Soc. A. – 2012. – Т. 370. – №. 1958. – С. 158-175.
[2] Boschen R.E. et al. Mining of deep-sea seafloor massive sulfides: a review of the deposits, their benthic communities, impacts from mining, regulatory frameworks and management strategies //Ocean & Coastal Management. – 2013. – Т. 84. – С. 54-67.
[3] Zuenko Y.I., Yurasov G. I. Water masses of the northwestern Japan Sea //Oceanographic Literature Review. – 1997. – Т. 6. – №. 44. – С. 542.
[4] Vanin N.S. et al. Variability of thermohaline structure of North Pacific water masses //Oceanographic Literature Review. – 1997. – Т. 4. – №. 44. – С. 295-296
[5] Plotnikov V. V., Podtelezhnikova S. P. Ice Archives and Statistical Analysis of Ice Concentration in the North of the Sea of Japan //Russian Meteorology and Hydrology. – 2002. – №. 5. – С. 30-38
[6] Luchin V. A., Zhigalov I. A., Plotnikov V. V. The interannual variability of the water temperature of the Okhotsk Sea //THE OKHOTSK SEA AND ADJACENT AREAS. – 2004. – С. 27
[7] Muktepavel L. S., Plotnikov V. V., Colony R. L. The causes of anomalous ice conditions in the Okhotsk and Bering Seas //Proceedings of the Arctic Regional Centre. – 2001. – Т. 3. – С. 29-39.
[8] Vakulskaya N. M., Plotnikov V. V. Condition, ice cover, variability, ice concentration, ice thickness, ice form //EARTH. – 2014. – Т. 18. – №. 1. – С. 92-100.
[9] P. van Walree, Multicarrier spread spectrum for covert acoustic communications / P. van Walree, E. Sangfelt, and G. Leus // Oceans 2008. – Vol. 1–4. – pp. 264–271.
< ICSSC 2017 Proceeding > 103 pageICSSC 2017 International Conference on Software & Smart Convergence 101 page

[10] E.V. Voytenko, Yu. V. Morgunov A Doppler estimation technique based on the signals with good correlation properties: experimental results// 2nd Underwater Acoustics, At Greece Rhodes, 2014. – 10.13140/2.1.4856.5126
[11] Chitre, M. Underwater Acoustic Communications and Networking: Recent Advances and Future Challenges / M. Chitre, S. Shahabodeen, M. Stojanovic // Marine Technology Society Journal. – Sterrett Place, Columbia, USA: Marine
Technology Society, 2008. – Vol. 42, No. 1. - P. 103-116.
[12] Chitre, M. Underwater Acoustic Communications and Networking: Recent Advances and Future Challenges / M. Chitre, S. Shahabodeen, M. Stojanovic // Marine Technology Society Journal. – Sterrett Place, Columbia, USA: Marine Technology Society, 2008. – Vol. 42, No. 1. - P. 103-116.
104 page < ICSSC 2017 Proceeding >102 page International Conference on Software & Smart Convergence ICSSC 2017
International Conference on Software & Smart Convergence (ICSSC) 2017, June 2017
Copyright ⓒ 2017 ICSSC
PM-10 Forecasting using Separated MLP Neural Networks
S. H. Yu1 and H. Y. Kwon
2
1 Dept. of Info. And Comm. Eng., Anyang University
Anyang-shi, KOREA
[e-mail: [email protected]] 2 Dept. of Computer Eng., Anyang University
Anyang-shi, KOREA
[e-mail: [email protected]]
*Corresponding author: H. Y. Kwon
Abstract
Recently PM-10 has become social and global issues. It is one of major air pollutants which affect on
human health. Therefore, it needs to be forecasted rapid and precisely. However, PM-10 comes from
various emission sources and its level of concentration is largely dependent on meteorological and
geographical factors of the local and the global region, so the forecasting of PM-10 concentration is
very difficult. Neural network model can be used in the case, but their input parameters are too many to
operate. In this paper, we developed and tested an efficient neural network PM-10 forecasting model.
The root mean square errors of the prediction and the air quality index consistency were improved in
test runs.
Keywords: PM-10, air quality, neural networks, supervised learning, clustering
1. Introduction
Air pollution is a contamination of the
atmosphere by gaseous, liquid, or solid waste or
by products that have a serious affect on human
health and the biosphere, reduce visibility, and
damage materials. One of the major pollutants
throughout the country is PM(Particulate Matter).
PM is a complex mixture of solid and liquid
particles that vary in size and composition, and
remain suspended in the air. The size of ambient
air particles ranges from approximately 0.005 to
100 μm in diameter. PM-10 is defined as
particulate matter with a diameter less than 10
μm. Over the past decades, many health effect
studies have shown an association between
exposure to PM-10 and increase in daily
mortality and symptoms of certain illnesses such
as asthma, chronic bronchitis, decreased lung
function, and premature death. Sources of PM-10
are numerous; naturally occurring processes and
human activities all contribute to PM-10
concentrations. Some sources are natural, such as
dust from the earth's surface, sea salt in coastal
area, and biologic pollen. Periodic events like
forest fires and dust storm can produce large
amount of PM-10. In cities, PM-10 is mainly a
product of combustion from mobile sources such
as cars, buses, ships, trucks, and construction
equipments, and from stationary sources such as
municipal incinerators, power plants, and
factories. Some PM are emitted directly into the
atmosphere as particles, while other PM are
produced by chemical reactions from the air
pollutants in the air. The major developed
countries such as USA and UK have developed
PM forecasting system using the statistical
methods.[1,2,3,4]. A new efficient neural
network PM-10 forecasting models were
developed in this study. In order to determine the
major variables as the model input, various
environmental and meteorological factors were
< ICSSC 2017 Proceeding > 105 pageICSSC 2017 International Conference on Software & Smart Convergence 103 page
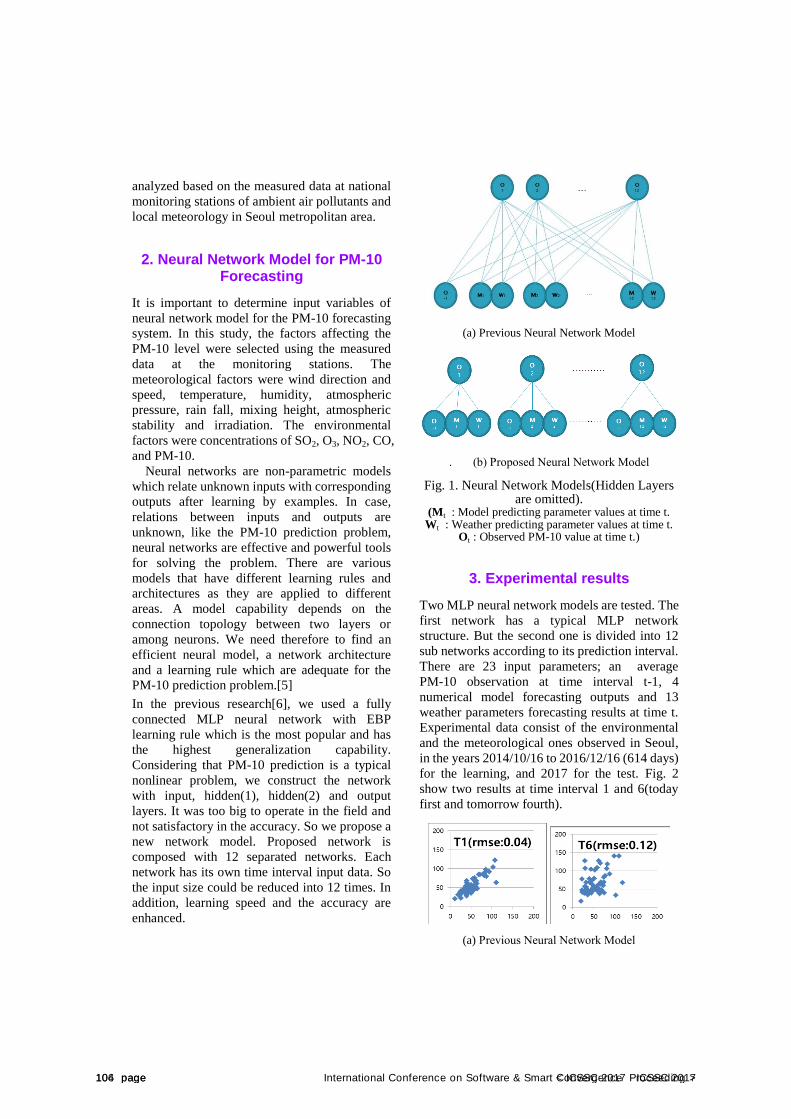
analyzed based on the measured data at national
monitoring stations of ambient air pollutants and
local meteorology in Seoul metropolitan area.
2. Neural Network Model for PM-10Forecasting
It is important to determine input variables of
neural network model for the PM-10 forecasting
system. In this study, the factors affecting the
PM-10 level were selected using the measured
data at the monitoring stations. The
meteorological factors were wind direction and
speed, temperature, humidity, atmospheric
pressure, rain fall, mixing height, atmospheric
stability and irradiation. The environmental
factors were concentrations of SO2, O3, NO2, CO,
and PM-10.
Neural networks are non-parametric models
which relate unknown inputs with corresponding
outputs after learning by examples. In case,
relations between inputs and outputs are
unknown, like the PM-10 prediction problem,
neural networks are effective and powerful tools
for solving the problem. There are various
models that have different learning rules and
architectures as they are applied to different
areas. A model capability depends on the
connection topology between two layers or
among neurons. We need therefore to find an
efficient neural model, a network architecture
and a learning rule which are adequate for the
PM-10 prediction problem.[5]
In the previous research[6], we used a fully
connected MLP neural network with EBP
learning rule which is the most popular and has
the highest generalization capability.
Considering that PM-10 prediction is a typical
nonlinear problem, we construct the network
with input, hidden(1), hidden(2) and output
layers. It was too big to operate in the field and
not satisfactory in the accuracy. So we propose a
new network model. Proposed network is
composed with 12 separated networks. Each
network has its own time interval input data. So
the input size could be reduced into 12 times. In
addition, learning speed and the accuracy are
enhanced.
(a) Previous Neural Network Model
. (b) Proposed Neural Network Model
Fig. 1. Neural Network Models(Hidden Layers are omitted).
(Mt : Model predicting parameter values at time t. Wt : Weather predicting parameter values at time t.
Ot : Observed PM-10 value at time t.)
3. Experimental results
Two MLP neural network models are tested. The
first network has a typical MLP network
structure. But the second one is divided into 12
sub networks according to its prediction interval.
There are 23 input parameters; an average
PM-10 observation at time interval t-1, 4
numerical model forecasting outputs and 13
weather parameters forecasting results at time t.
Experimental data consist of the environmental
and the meteorological ones observed in Seoul,
in the years 2014/10/16 to 2016/12/16 (614 days)
for the learning, and 2017 for the test. Fig. 2
show two results at time interval 1 and 6(today
first and tomorrow fourth).
(a) Previous Neural Network Model
106 page < ICSSC 2017 Proceeding >104 page International Conference on Software & Smart Convergence ICSSC 2017
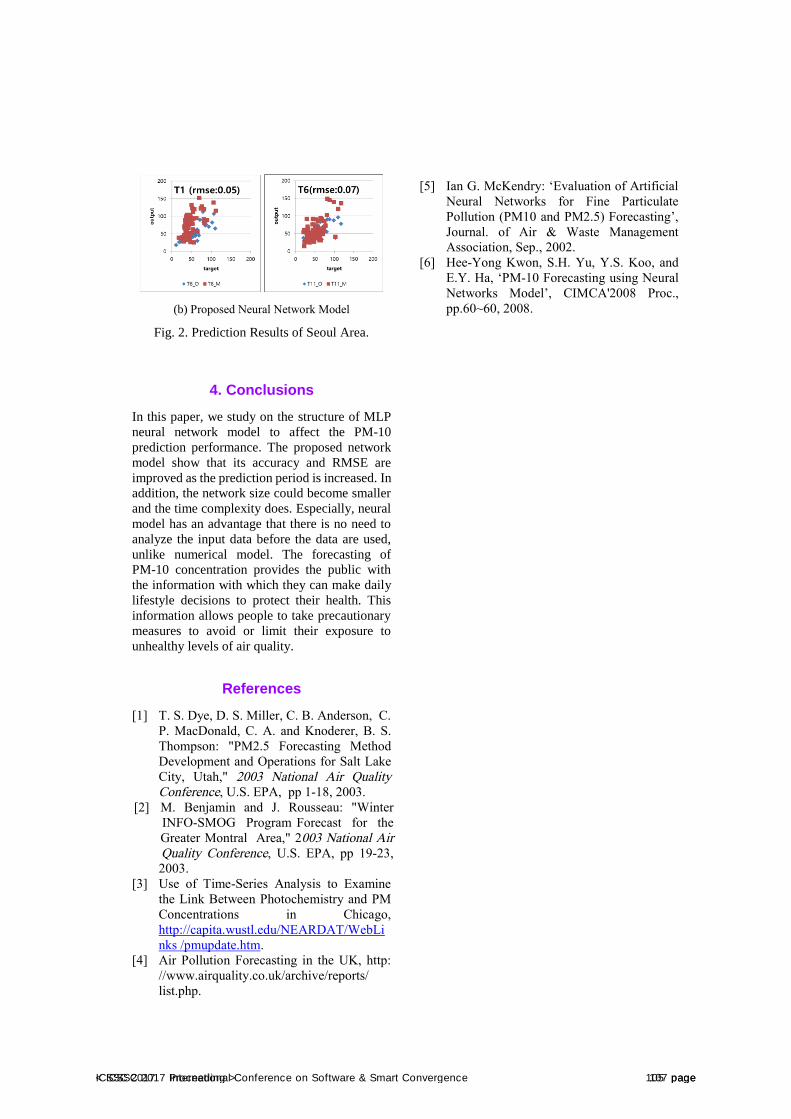
(b) Proposed Neural Network Model
Fig. 2. Prediction Results of Seoul Area.
4. Conclusions
In this paper, we study on the structure of MLP
neural network model to affect the PM-10
prediction performance. The proposed network
model show that its accuracy and RMSE are
improved as the prediction period is increased. In
addition, the network size could become smaller
and the time complexity does. Especially, neural
model has an advantage that there is no need to
analyze the input data before the data are used,
unlike numerical model. The forecasting of
PM-10 concentration provides the public with
the information with which they can make daily
lifestyle decisions to protect their health. This
information allows people to take precautionary
measures to avoid or limit their exposure to
unhealthy levels of air quality.
References
[1] T. S. Dye, D. S. Miller, C. B. Anderson, C.
P. MacDonald, C. A. and Knoderer, B. S.
Thompson: "PM2.5 Forecasting Method
Development and Operations for Salt Lake
City, Utah," 2003 National Air QualityConference, U.S. EPA, pp 1-18, 2003.
[2] M. Benjamin and J. Rousseau: "Winter
INFO-SMOG Program Forecast for the
Greater Montral Area," 2003 National AirQuality Conference, U.S. EPA, pp 19-23,
2003.
[3] Use of Time-Series Analysis to Examine
the Link Between Photochemistry and PM
Concentrations in Chicago,
http://capita.wustl.edu/NEARDAT/WebLi
nks /pmupdate.htm.
[4] Air Pollution Forecasting in the UK, http:
//www.airquality.co.uk/archive/reports/
list.php.
[5] Ian G. McKendry: ‘Evaluation of Artificial
Neural Networks for Fine Particulate
Pollution (PM10 and PM2.5) Forecasting’,
Journal. of Air & Waste Management
Association, Sep., 2002.
[6] Hee-Yong Kwon, S.H. Yu, Y.S. Koo, and
E.Y. Ha, ‘PM-10 Forecasting using Neural
Networks Model’, CIMCA'2008 Proc.,
pp.60~60, 2008.
< ICSSC 2017 Proceeding > 107 pageICSSC 2017 International Conference on Software & Smart Convergence 105 page
International Conference on Software & Smart Convergence (ICSSC) 2017, June 2017 Copyright ⓒ 2017 ICSSC
This research was supported by Korea Electric Power Cooperation through Korea Electric Engineering & Science Research Institute. (Grant Number: R15XA03-70)
A Novel Abnormal Behavior Detection Framework to Maximize the Availability in
Smart Grid Jeongshik Hwang and Incheol Shin
Computer Security Department, Mokpo National University 61 Dorim-Ri, 1666 Youngsan-Ro, Cheonggye-Myoun, Muan-Goon, Jeon-Nam, South Korea
[e-mail: [email protected], [email protected]] *Corresponding author: Incheol Shin
Abstract
A large volume of research has been devoted to the development of security tools for protecting the Smart Grid systems, however the most of them have not taken the AIC (Availability, Integrity, Confidentiality) security triad model, not like CIA triad model in traditional IT system, into account the security measures for the electricity control systems. Thus, this study would propose a novel security framework, an abnormal behavior detection system, to maximize the availability of the control systems by considering a unique set of characteristics of the systems.
Keywords: Smart Grid, Security, Abnormal Behavior Detection, Cyber-Physical Attacks
1. IntroductionThe Smart Grid initiative aims to propel utilities and their electricity delivery systems into the 21st century with the aid of various information and communication technologies. A wide range of different control devices/systems will be interconnected through the internet and peer-to-peer connections as well as closed networks like those used in the Smart Grid infrastructures. That is, not only can the internet be attacked, but the devices and networks at the Smart Grid systems that controls the electrical power grids can also serve as an attack vector, eventually. A key difference between the Smart Grid systems and ICT (Information Communications Technology) in terms of security is the availability, primary security requirement in electricity systems. However,
most development of security countermeasures against cyber threats on Smart Grid systems employ the best practices associated with CIA triad security model – in that order of importance, from ICT based security designs. Section 2 provides the literature on previous studies on abnormal behavior detection in Smart Grid by highlighting the problems or limits with them, and the next Section with the explanation of Smart Grid. Section 4 describes our security frameworkd of abnormal behavior detection architecture to maximize the availability in Smart Grid. Section 5 concludes our study in this paper.
108 page < ICSSC 2017 Proceeding >106 page International Conference on Software & Smart Convergence ICSSC 2017
2. Related WorkThere have been a lots of devotion in the research of abnormal detection systems for the internet systems and, as the advent of Smart Grid, new design of the detection approaches are necessitated for different security requirements from the Internet to the Smart Grid. However, a few number of studies have addressed the issue of the different approaches to design the security system in Smart Grid against cyber-physical attacks. Isaac Ghansah [1] addressed the security issues on Smart Grid systems and networks with the differences between the Internet and Smart Grid search in terms of the security triad, three core goals of cybersecurity: confidentiality, integrity, availability or CIA. The Confidentiality is to keep the information in secrete and be accessed by only those who have legally authorized permission to do that. Integrity would be able to maintain the information valid and verifiably correct, and the availability is the meaning that systems or data should guarantee the reliable accesss to the information by authorized entities. The study investigates threats, vulnerabilities and risks on the Smart Grid systems with the approaches for mitigation and countermeasures against various cyber-physical attacks in the priority order of the security triad, Availability, Integrity, Credentiality. However, it has not discussed the system designs to support the ideas of the approaches with the security triad, AIC. Furthermore, in accordance with Jess Smith and etc. [2], the limitations on the IDS(Intrusion Detection System) and IPS(Intrusion Protection System) from the Internet has been investigated as applying to the ICS(Industrial Control Systems) systems with the explanation on the security objectives in the control systems which are different from the Internet. That is, the security from the Internet is to protect the informaton on the network, but the control systems should keep not only the information data but also the control messages out of the various security threats. However, it has not discuss about the design on the security system in ICS as well. R. Bala Sri Swetha and K. Goklia Meena in [3] investigates a signature based IDS with the study on the smart grid network signature and SVM(Support Vector Machine) in order to protect the Smart Grid by placing IDS in several
stages of the network hierarchy abainst various cyber attacks, DDoS attacks, damaging the integrity of configuration, routing and communicatino traffic, iilegitimate network operation, man-in-the-middle attack and so on. That is, the concept of IDS from the study is merely different from the Internet by idenfication of its placement in the Smart Grid networks, HAN (Home Area Network), NAN (Neighborhood Area Network) and WAN (Wide Area Network). The appropriate or efficient design of IDS for the Smart Grid has not been discussed by the research. Since the Smart Grid is consisted with various networks, there have been several literature recommending the efficient placement or deployment of IDS or IPS on Smart Grid networks. However, due to the fact that not only the information data but also the control messages are to be flown through the control network, due to the fact that the security objectives on the control systems are differenct from the Internet. That is the security system design to protect the Smart Grid should be reconsidered and redesigned to augment the robustness of the system. This paper proposes the new design of the IDS to identify the abnormal behaviors in the Smart Grid networks.
3. Smart GridThe Smart Grid is a new modernized electrical grid to support the efficient energy consumption. The efficiency includes the reliable electricity delivery, more agile outage detection and recovery mechanism, DR(Demand and Response) and so on by employing various two-way communication technologies to the existing electrical grid. The communication systems and networks contains various advanced technologies like advanced sensors kown as Phasor Measurement Units (PMUs), advanced digital meters called Smart Meters to report the outages, relay information data and control messages and intelligent substation, automated feeder switches re-routing electrical power aroud the fault systems and etc. Furthermore, consumers would be able to manage their own energy consumption with affordable costs by utilizing those systems or services by them. Fig. 1 depicts the structure and network of Smart Grid.
< ICSSC 2017 Proceeding > 109 pageICSSC 2017 International Conference on Software & Smart Convergence 107 page
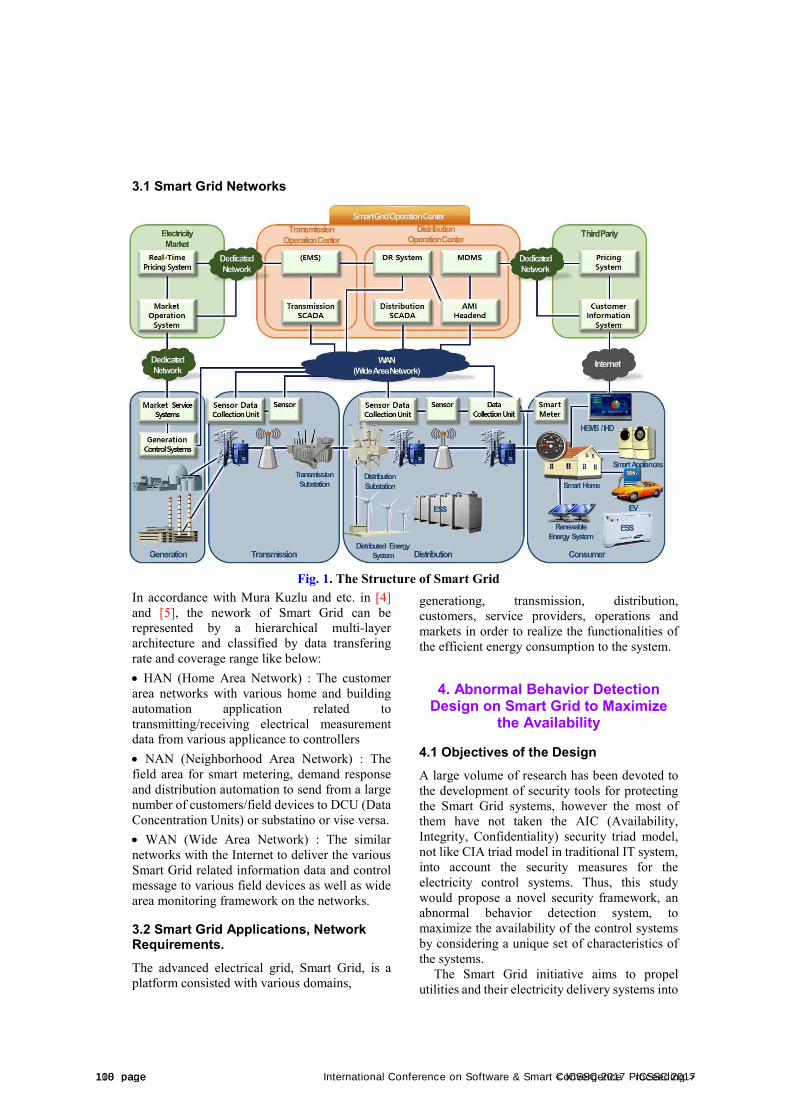
3.1 Smart Grid Networks
In accordance with Mura Kuzlu and etc. in [4] and [5], the nework of Smart Grid can be represented by a hierarchical multi-layer architecture and classified by data transfering rate and coverage range like below: · HAN (Home Area Network) : The customerarea networks with various home and building automation application related to transmitting/receiving electrical measurement data from various applicance to controllers · NAN (Neighborhood Area Network) : Thefield area for smart metering, demand response and distribution automation to send from a large number of customers/field devices to DCU (Data Concentration Units) or substatino or vise versa. · WAN (Wide Area Network) : The similarnetworks with the Internet to deliver the various Smart Grid related information data and control message to various field devices as well as wide area monitoring framework on the networks.
3.2 Smart Grid Applications, Network Requirements. The advanced electrical grid, Smart Grid, is a platform consisted with various domains,
generationg, transmission, distribution, customers, service providers, operations and markets in order to realize the functionalities of the efficient energy consumption to the system.
4. Abnormal Behavior DetectionDesign on Smart Grid to Maximize
the Availability
4.1 Objectives of the Design A large volume of research has been devoted to the development of security tools for protecting the Smart Grid systems, however the most of them have not taken the AIC (Availability, Integrity, Confidentiality) security triad model, not like CIA triad model in traditional IT system, into account the security measures for the electricity control systems. Thus, this study would propose a novel security framework, an abnormal behavior detection system, to maximize the availability of the control systems by considering a unique set of characteristics of the systems.
The Smart Grid initiative aims to propel utilities and their electricity delivery systems into
Fig. 1. The Structure of Smart Grid
110 page < ICSSC 2017 Proceeding >108 page International Conference on Software & Smart Convergence ICSSC 2017
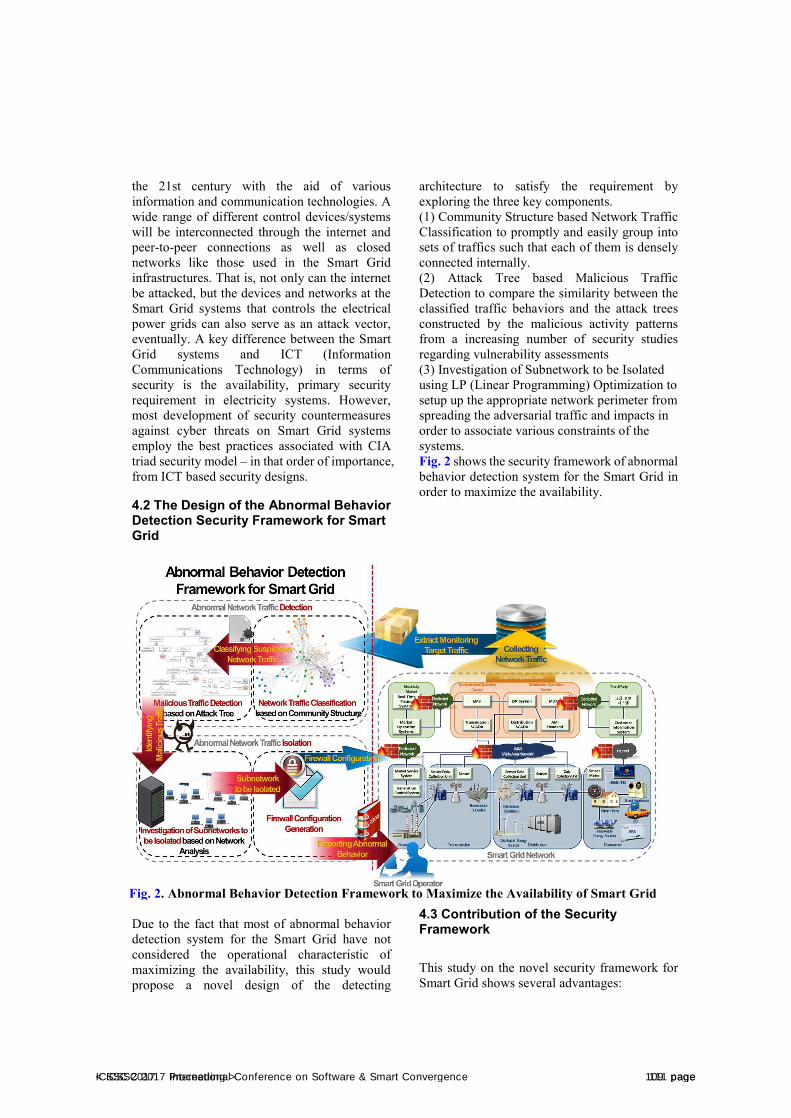
the 21st century with the aid of various information and communication technologies. A wide range of different control devices/systems will be interconnected through the internet and peer-to-peer connections as well as closed networks like those used in the Smart Grid infrastructures. That is, not only can the internet be attacked, but the devices and networks at the Smart Grid systems that controls the electrical power grids can also serve as an attack vector, eventually. A key difference between the Smart Grid systems and ICT (Information Communications Technology) in terms of security is the availability, primary security requirement in electricity systems. However, most development of security countermeasures against cyber threats on Smart Grid systems employ the best practices associated with CIA triad security model – in that order of importance, from ICT based security designs.
4.2 The Design of the Abnormal Behavior Detection Security Framework for Smart Grid
Due to the fact that most of abnormal behavior detection system for the Smart Grid have not considered the operational characteristic of maximizing the availability, this study would propose a novel design of the detecting
architecture to satisfy the requirement by exploring the three key components. (1) Community Structure based Network Traffic Classification to promptly and easily group into sets of traffics such that each of them is densely connected internally. (2) Attack Tree based Malicious Traffic Detection to compare the similarity between the classified traffic behaviors and the attack trees constructed by the malicious activity patterns from a increasing number of security studies regarding vulnerability assessments (3) Investigation of Subnetwork to be Isolated using LP (Linear Programming) Optimization to setup up the appropriate network perimeter from spreading the adversarial traffic and impacts in order to associate various constraints of the systems. Fig. 2 shows the security framework of abnormal behavior detection system for the Smart Grid in order to maximize the availability.
4.3 Contribution of the Security Framework
This study on the novel security framework for Smart Grid shows several advantages:
Fig. 2. Abnormal Behavior Detection Framework to Maximize the Availability of Smart Grid
< ICSSC 2017 Proceeding > 111 pageICSSC 2017 International Conference on Software & Smart Convergence 109 page

· The significance of supporting availability andthe design of the adequate security framework for the next generation of power grid systems have been highlighted. · The efficient way to facilitate the existing andpotential research outcomes of vulnerabilities, potential threats and risks of Smart Grid devices/systems and networks has been described. · There have been a wide range of research onidentifying the vulnerabilities on Smart Grid devices, but our study investigates the way to utilize the results into reference set to keep the Smart Grid safe from the harms. · In order to protect the Smart Grid, our securityframework provide the operator options to make optimized decisions.
5. ConclusionsThere have been increasing number of threats
from the threat vectors by shifting the legacy electrical systems into advanced power grid systems, Smart Grid. However, the security technologies have not been considered properly, but employing existing security methods from the Internet. The important problem of those approaches is that it has been proved that the security objective of the advanced electrical control systems are drastically different from the Internet in terms of security triad, AIC not CIA. That is, even though there have been a wide range of research on the Smart Grid security, only a few number of them have been addressing the problem of maximizing or guaranteeing the availability on the Smart Grid yet. Our study has investigated the appropriate design of the security framework to maximizing the availability of the advanced control systems during the protecting them. There are three technologies has been deployed this security framework, attack tree, community structure, critical point detection. Furthermore, This framework would be equipped with integrity preserving security architecture to protect the Smart Grid against various cyber-physical attacks.
References [1] Isaac Ghansah, “Smart Grid Cyber Security
Potential Threats, Vulnerabilities and
Risks,” Public Interest Energy Research(PIER) Program Project Report
[2] Jess Smith, Nathan Kipp, Dennis Gammel and Tim Watkins, “Defense-in-Depth Security for Industrial Control Systems,” EEA Conference, 2016.
[3] R. Bala Sri Swetha, K. Goklia Meena, “Smart Grid – A Network based Intrusino Detection System,” in International Journal of Computer Applications, International Conference on Innovations in Computing Techniques (ICICT 2015),2015.
[4] The Smart Grid Interoperability Panel Cyber Security Working Group, “Introduction to NISTIR 7628 Guidelines for Smart Grid Cyber Security,” https://www.nist.gov/sites/default/files/documents/smartgrid/nistir-7628_total.pdf
[5] Murat Kuzlu, Manisa Pipattanasomporn and Saifur Rahman, “Communication Network Requirement for Major Smart Grid Applications in HAN, NAN and WAN,” Computer Networks, pp.74-88, 2014.
112 page < ICSSC 2017 Proceeding >110 page International Conference on Software & Smart Convergence ICSSC 2017

International Conference on Software & Smart Convergence (ICSSC) 2017, June 2017
Copyright ⓒ 2017 ICSSC
This research was supported by a research grant from the IT R&D program of MKE/IITA, the Korean government
[2005-Y-001-04, Development of Next Generation Security Technology]. We express our thanks to Dr. Richard
Berke who checked our manuscript.
Production of Medical Knowledge in theForm of Supporting Sets
Dobrzhinskii Y.V. 1, Moskalenko Y.S.,
2 Zotov S.S.
3
Department of Information Security
Far Eastern Federal University (FEFU)
Vladivostok, Russian Federation 1[e-mail: [email protected]]
2[e-mail: [email protected]]
3[e-mail: [email protected]]
*Corresponding author: Dobrzhinskii Y.V.
Abstract
The work investigates the problems of formation of knowledge specified depending on the context in
which it was obtained, as well as on the situations where it will be used. This category of knowledge
includes reference sets, sets of features, which identify, based on the context and non-redundantly,
certain groups of objects within expertise area. The main idea of proposed approach is to shift from the
initial set of feature descriptions to simple predicate model, which is determined by prescribing an
aggregate of basic relations and allowable feature transformations. This work formulates requirements
to this model structure, offers validation procedures for reference sets, as well as researches the
problems of their interpretability and visualization.
Keywords: Objects feature descriptions; concordance partitioning; elementary predicate matrix;
basic relations; equivalency; dis / similarity; feature measurement scales and allowable transformations.
1. Introduction
Strategy of knowledge formation (production) is
based on in-depth data analysis, detecting hidden
empirical regularities in large information
volumes by means of special mathematical and
programming tools. The purpose of such analysis
is to search for information patterns intended for
decision making in various domains. Typical
representatives of this knowledge category are
reference sets, aggregates of features, properties,
attributes, indirectly (contextually) and
non-redundantly identifying certain groups of
objects within a domain. Division of domain into
objects may be made in different ways
depending on the objective [1]. A simple object
is viewed as a bearer of characterizing properties
(features). Its essence is revealed in these
properties, they are inseparable from this object.
By feature we mean the representation.
X:A→Ax (1)
which matches each object with its value
х, belonging to prescribed set of values ,
property х. Formally each feature may be
prescribed with the help of sets and set Ф of
allowable transformations characterizing type of
measurement scale for this property. Each
elementary indirect object description may be
naturally viewed as a triplet: <object name;
object feature (property); object feature value>.
Mechanisms of reference sets formation are
predetermined by the results of aggregation of
3-tuples into subsets, representing classes of
objects and types of prescribed basic relations
between feature descriptions of these classes.
Basic relations include relations of dis/similarity,
< ICSSC 2017 Proceeding > 113 pageICSSC 2017 International Conference on Software & Smart Convergence 111 page
quality and order.
Range of researches formed within the
frames of problem area under discussion here,
includes the following aspects (directions of
research):
data reduction;
detection of locally maximum shrinking variants for feature description of objects under study;
detection of empirical regularities in very large databases (VLDB);
generation of production rules from the fact bases;
building of decision-making association schemes for identification and explanation tasks;
determining of feature weights when evaluating the descriptors relevancy;
formation of terms of the object information description;
increase of interpretability for decision-making procedures, including voting procedures, grades calculations, partial and full precedency.
The directions listed above are by no means
exhaustive as far as the discussed problems are
concerned, but they can be undoubtedly referred
to as the major ones.
2. Discussion of the problem and setting a task
The proposed methodology of reference sets
formation is based on the following substantial
pre-conditions:
Aggregate of objects feature descriptions should
be structured according to the objectives
definition.
In case of absence of explicit identification to the
class quantity and contents of object descriptions
under analysis, the procedure of reference sets
search should be preceded by procedure of
automatic classification of the objects aggregate
in question.
On the conceptual level, the way of
representation of objects structured descriptions
may be implemented based on the lists, relation
tables, graphs or sections. Further on, without
loss of generality, let us focus on relation tables
(m is number of objects descriptions, n is
dimension of feature space, l is structuring
parameter defining number of subsets (classes)
of objects), since they possess fundamental
property of closedness of relations .
From initial model it is necessary to shift to
such its form , where the following
relations types of practical importance for
achieving objective may be explicitly
represented: dissimilarity R, similarity S,
equality V and order H. Equivalency of
indistinguishable, content-similar objects and
non-equivalency of content-distinguishable
objects is an obligatory condition of information
model adequacy to its initial representation
. The second natural adequacy condition is
its extensionality, which ensures minimization of
feature space Х. One may always ensure
fulfillment of this condition, because from
aggregates of equivalent properties it is possible
to select only one. In this sense, set Х is a
modeling parameter, with the help of which the
model irreducibility is ensured.
The forming structure should be universal
from the point of feature measurement scales,
which means that it should be invariable towards
allowable transformations of their values.
Feature is set not only by representation
, but also by representations of the type
, where is a set of allowable numerical
transformations, which determine type of feature
scale. Mutually exclusive, monotonically
increasing positive linear identical
transformation and similarity transformation
determine nominal, range, interval, absolute
scales and ratio scales accordingly. Difference of
scales in the objects description brings along a
number of problems related to concordance of
feature measurement scales, for example, by way
of their strengthening or weakening. It results in
loss of information and breaking of integrity
when transforming (for instance,
when using level quantization or coding
procedures). For strong scales, where feature
values are represented by real numbers,
formation of model should rely upon
mechanisms of evaluation of relations R, S, V
and H between objects descriptions with
consequent elimination of conclusions on the
level of feature values measurement errors.
114 page < ICSSC 2017 Proceeding >112 page International Conference on Software & Smart Convergence ICSSC 2017
The procedure of reference sets definition based
on model should not reduce to complete
enumeration, whereas its productivity should not
considerably depend upon operations related to
editing (modification) of initial model .
In the process of searching and utilization of
reference sets the problem of objectives validity
occurs. Validity in the process of searching boils
down to formal definition of weights of the
features included in the reference sets, as well as
to evaluation of relevancy of reference sets as a
whole. The higher is such evaluation, the more
certainly one may speak about the conceptual
validity of information patterns. Validation is
equal to screening of obtained constructions and
requires asking additional questions: what for is
this validation? for which purpose?
Reference sets obtained after validation should
be represented in the form convenient for
decision-making and for their interpretability, for
instance, in the form of productions represented
with the help of graphs.
In practice, non-transitivity of feature
descriptions pair-wise comparisons can be come
across very often. Non-transitivity of
indistinguishability relation is connected with
presence of ℇ dissimilarity threshold. In
numerical values, this threshold is interpreted as
a relative property measurement error. For
instance, when measuring feature, characterizing
height with 1.5 cm error, indistinguishable
values are 170 cm and 171 cm, 171 and 172 cm,
whereas 172 and 170 cm are distinguishable
values. Implementation of relations induced by
measuring with errors in , extends the class of
pair-wise comparisons, represented by numerical
functions .
3. The proposed approach
Let us suppose that specified set ofobjects descriptions А is structured, giventhat
; (2) (2)
where l is a number of objects subsets or
their classes.
Moreover, feature measurement scales and allowable transformation sets of their values are known to us, as well as basic relations at the set { }
.
Per each feature let us formulatelogical statement as logical function onthe set of allowable situations (separatedaggregates of objects and their domainproperties), i.e. let us prescribe predicateP . Specific predicate type is determinedby relation type (R, S, V, H), featuremeasurement scale and allowabletransformation [6] .
For instance, for feature measured at the nominal scale and for basic relation V, the following predicate P is justified: “value of feature object is
equal to value of feature object
; k, t = ; j, r = ;
.” For the feature measured at the interval scale and basic relation S, allowable variable statement looks as follows: “module of difference of the values of feature object and object , is less than the value of
similarity threshold E; ;
”. Since predicate formation is made per each feature separately, in accordance with с , to approximate initial model
(А, Х) concordance of measurement
scales is not required.
As a result of described transformation
(А, Х)
(3) we have received a predicate form which is natural to represent in the matrix form [2]. This representation will be referred to as Elementary Predicate Matrix (EPM), the number of rows in which is determined by the number of compared pairs of objects in the subsets , whereas the number of columns is determined by the length of predicate description, which coincides with dimensions of feature space n of
initial model (А, Х).
Analysis of
based on research of logical dependencies
is applied to all data models, since these
dependencies are properties of data, not
of models.
Practically any analysis task connected
< ICSSC 2017 Proceeding > 115 pageICSSC 2017 International Conference on Software & Smart Convergence 113 page

with search of reference sets may be viewed as a task of. F reduction:
(4)
Let us prescribe upon the set of EPMrows the function
) (5)
Expression (5) is a record of function F in conjunctive form. Multiplication of terms in (5) with subsequent opening of brackets and performing absorption and paste operation results in representation of in reduced disjunctive normal form. A set of DNF (disjunctive normal form) implicates is a desirable non-redundant set of predicates in (4), which corresponds to a set of reference sets of
initial model .
Let us consider practically important aspects of predicate form EPM-type formation and determining reference sets based on it.
The first aspect is related to determining
thresholds of dis/similarity of features values in
case of interval or absolute scales and ratio scales.
For strong scales one may always determine
subsets of dis/similarity thresholds,
whereas and = |
|; ;
j, r = ; k, t = ; .
Each threshold value results in set А
partitioning into subsets based on i-th feature.
Let us remind that the system (2) of non-empty
sets is called partitioning of А set, if each
element is contained in one and the same set
( ). Let us represent through prescribed partition
of objects descriptions sets (2). Each threshold
value results in corresponding partition
of the same set of objects description . In the
set of all partitions into A one may determine
partitions lying “between” others [2]. For
instance, if partition is obtained from partition
by uniting of several of its classes, whereas
partition is obtained by similar way from ,
then partition lies between and
[ ].
At the same time, if partitions
correspond to the relations of equivalency
partition lies between partitions и
then and only then when
(6) in terms “between” extremal partitions will be: trivial, consisting of one object and universal consisting of all objects if А set. To evaluate “similarity” of partitions it is natural to introduce the distance between then as a certain indicator function determined by value of the differences between adjacency matrixes correlating to these partitions. In this situation, the task is to arrange a procedure of consecutive evaluation of the following partition in relation to the previous one with the help of the found distance between them. If this distance preserves its minimal value and
(7)
where is constant characterizing stability of grouping at some predetermined interval, then the partitions included into this interval are the desirable partitions. It is easy to notice that the described approach is invariable towards the character of objects A descriptions distribution and does not rely upon any topological constraints imposed from outside.
The described procedure to determine the dis/similarity threshold sets in case of quantitative features has a drawback, namely that the search of “the best” parameter is made upon each feature separately, not taking into account the interrelations, existing, as a rule, between the properties .
In order to eliminate the said drawback, it is offered to construct EPM based on the parity principle. In accordance with this principle, in the process of predicate form construction only such aggregates of threshold parameters are searched, with which truth values are fixed for only those predicates, which fulfillment reliably confirms dis/similarity of initial objects descriptions.
Parity is based upon the following principles:
1) On the whole set of objective variables,
predicates should not have the empty set of truth.
2) On the whole set of objective variables,
predicates should not have the universal set of
truth.
3) Fixation of the concrete threshold
variable should result in occurrence of at least
one truth value of predicate in the EPM.
4) Change of truth value for each predicate
included in the predicate form has a monotonous
character.
116 page < ICSSC 2017 Proceeding >114 page International Conference on Software & Smart Convergence ICSSC 2017

The above requirements have a very general
character. It is possible to extend the list of
requirements at the account of specific
peculiarities of the concrete domain [3].
As shown in (1), parity mechanism results in
considerable reduction of the number of EPM
generated to be selected from, up to the only one
left, excluding this way the conclusions on the
level of features measurement errors in the initial
representations (А, Х) [4].
The second aspect is related to the problem of
interpretation of reference sets obtained by way
(5). In general case, sets of reference sets and , obtained with the application of basic
relations of dis/similarity may contain the
coinciding elements. This statement truth may be
justified by the EPM inversion properties.
Meaningfully, the possibility to detect the same
reference sets for different basic relations
signifies the necessity of their elimination from
the found aggregates because of contradictory
interpretation. After validation procedures of this
kind there occurs a practical necessity to evaluate
weight of reference sets . Of special
importance it is to have such an evaluation in
case of a large number of purpose constructions
{ }.
(8)
where is weight of i-th feature included in the
evaluated reference set, k is length of reference
set.
Value may be determined as a number of
occurrences of feature in the whole aggregate
of found reference sets related to the norm of this
aggregate.
And now let us get down to the final aspect.
Reference sets { } may be represented in the
form of productions to which procedural
interpretation of the rules “if A then B” may be
applied both as a belief-invoked interpretation
and as a goal-invoked interpretation. Taking into
account the user demands, the most suitable
means of visualization of reference sets in the
form of productions is an association graph or
simple graph scheme [5].
4. Conclusions
The problem area of knowledge production in
the intellectual systems covers a broad range of
issues related to deep data analysis with the
purposes of finding the most meaningful
candidates into empirical regularities.
[6].Transformation (8) makes it possible to
express certain initial predicates possessing the
properties of relevant types, in the terms of
predicates which have lesser number of places
and possess no properties which allow their
exchange into simpler ones. Implementation and
further development of the offered methodology
of reference sets search should facilitate working
out of unified approach to formation of simple,
vivid and interpretable constructions intended
for decision-making in various domains.
References
[1] C.F. Hempelmann, U. Sakoglu, V.P.
Gurupur, S. Jampana. "An entropy-based
evaluation method for knowledge bases of
medical information systems," Expert Syst. Appl., pp. 262–273, 2016.
[2] Yu.S. Moskalenko. "Organization of
k nowledge-based systems," Vladivostok.FEFU Publishing House, pp. 241,2013.
[3] T.Yu. Dobrzhinskaya, Yu.V. Dobrzhinskii.
"Tutorial system for hardware description
language VHDL-AMS," Materials of the 8 International Research and Practical Conference, October 14-15, Westwood,
Canada, pp. 234-238, 2015.[4] J.H. Dai, Q. Xu. "Approximations and
uncertainty measures in incomplete
information systems," Inf. Sci., pp. 62–80, 2012.
[5] T.T. Zheng, L.Y. Zhu. "Uncertainty measures
of neighborhood system-based rough
sets," Knowl. Based Syst., pp. 57–65, 2015.[6] J.F. Luger "Artificial Intelligence: strategies
and methods for solving complex problems,"Williams, pp.864, 2005.
< ICSSC 2017 Proceeding > 117 pageICSSC 2017 International Conference on Software & Smart Convergence 115 page
International Conference on Software & Smart Convergence (ICSSC) 2017, June 2017 Copyright ⓒ 2017 ICSSC
This research was supported by a research grant from the IT R&D program of MKE/IITA, the Korean government [2005-Y-001-04, Development of Next Generation Security Technology]. We express our thanks to Dr. Richard Berke who checked our manuscript.
Object Recognition based Detailed Information Retrieval using Deep Learning
Architecture Seonwoo Kim, Yeonwoo Kim, and Chilwoo Lee
Chonnam National University Electronics & Computer Engineering [e-mail : [email protected], [email protected], [email protected]]
Abstract
The conventional object detection algorithms usually use feature vectors composed of the general attribute of the object, for example, color, texture, and geometric structure, and matches the feature vector with the input image to determine the location of the object in the image. The algorithms provide with only general classification information of objects. However, the user often needs detailed information about the object rather than general classification information. In this paper, we first describe an algorithm that recognizes an object by deep learning technique and then provides detailed information about the object from the internet by using the result as a query of internet browser. In the first step, the YOLO-v2 algorithm, which is widely used for object detection and recognition, is applied. And then the detailed information is obtained by analyzing the texts which is obtained from the search result of the browsing. Experimental results show that the accuracy of conventional object detection is not better than that of conventional object detection. However, it can be seen that more detailed information can be obtained from images with unusual shapes and characteristics than conventional methods.
Keywords: object detection, convolutional neural network, YOLO-v2
1. IntroductionFinding detailed information about an object in an image has long been an important theme in computer vision research. The conventional image retrieval algorithm generally follows the following procedure. First, the foreground and background are separated to find the object area. Then, vector quantities of general attributes of the object in the area, for instance, color, texture, and geometric structure are measured for the region. Finally object matching with the vector feature is performed, and search results are outputted in order according to the matching
degree. However, this method so called ‘Content Based Image Retrieval’ has limitations in detailed information because it expresses model and query image by only 2-dimensional feature vector of object.
Recently, a variety of algorithms utilizing CNN (Convolutional Neural Network) architecture have been proposed to recognize the objects included in the image. CNN is a kind of extended artificial neural network developed by imitating the visual recognition process of human or animal, and can provide accurate recognition results over human level through learning process.
118 page < ICSSC 2017 Proceeding >116 page International Conference on Software & Smart Convergence ICSSC 2017
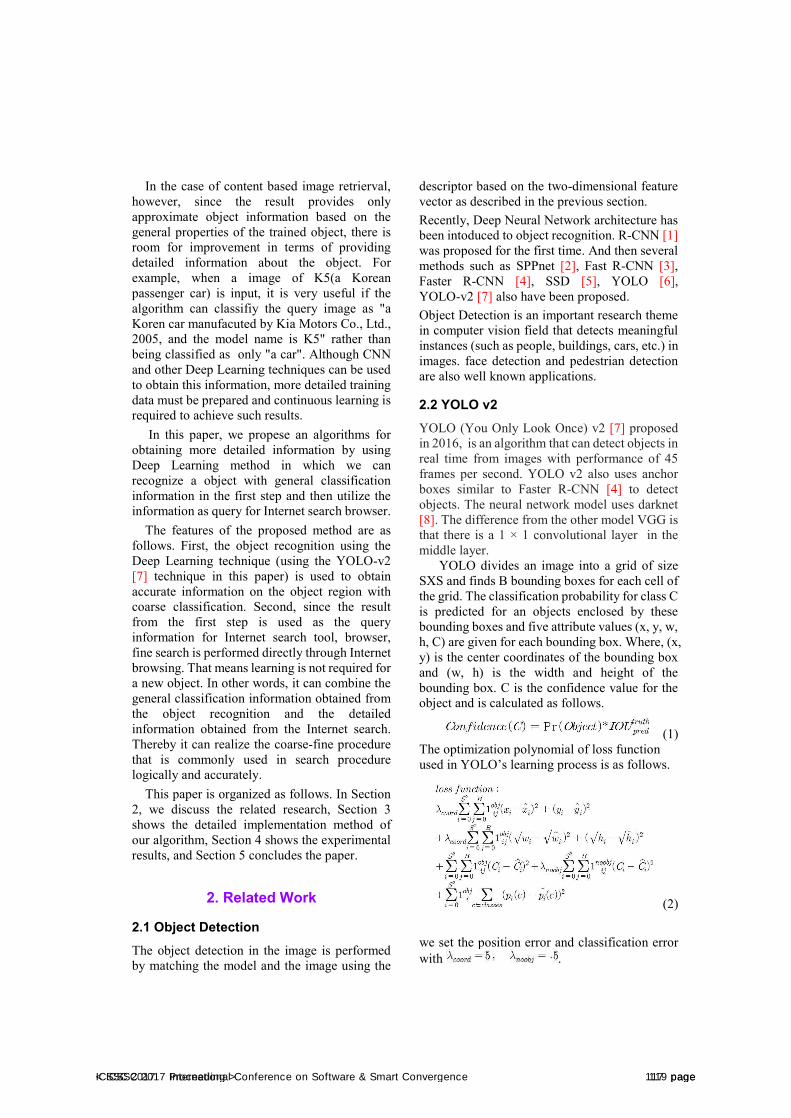
In the case of content based image retrierval, however, since the result provides only approximate object information based on the general properties of the trained object, there is room for improvement in terms of providing detailed information about the object. For example, when a image of K5(a Korean passenger car) is input, it is very useful if the algorithm can classifiy the query image as "a Koren car manufacuted by Kia Motors Co., Ltd., 2005, and the model name is K5" rather than being classified as only "a car". Although CNN and other Deep Learning techniques can be used to obtain this information, more detailed training data must be prepared and continuous learning is required to achieve such results.
In this paper, we propese an algorithms for obtaining more detailed information by using Deep Learning method in which we can recognize a object with general classification information in the first step and then utilize the information as query for Internet search browser.
The features of the proposed method are as follows. First, the object recognition using the Deep Learning technique (using the YOLO-v2 [7] technique in this paper) is used to obtain accurate information on the object region with coarse classification. Second, since the result from the first step is used as the query information for Internet search tool, browser, fine search is performed directly through Internet browsing. That means learning is not required for a new object. In other words, it can combine the general classification information obtained from the object recognition and the detailed information obtained from the Internet search. Thereby it can realize the coarse-fine procedure that is commonly used in search procedure logically and accurately.
This paper is organized as follows. In Section 2, we discuss the related research, Section 3 shows the detailed implementation method of our algorithm, Section 4 shows the experimental results, and Section 5 concludes the paper.
2. Related Work
2.1 Object Detection The object detection in the image is performed by matching the model and the image using the
descriptor based on the two-dimensional feature vector as described in the previous section. Recently, Deep Neural Network architecture has been intoduced to object recognition. R-CNN [1] was proposed for the first time. And then several methods such as SPPnet [2], Fast R-CNN [3], Faster R-CNN [4], SSD [5], YOLO [6], YOLO-v2 [7] also have been proposed. Object Detection is an important research theme in computer vision field that detects meaningful instances (such as people, buildings, cars, etc.) in images. face detection and pedestrian detection are also well known applications.
2.2 YOLO v2
YOLO (You Only Look Once) v2 [7] proposed in 2016, is an algorithm that can detect objects in real time from images with performance of 45 frames per second. YOLO v2 also uses anchor boxes similar to Faster R-CNN [4] to detect objects. The neural network model uses darknet [8]. The difference from the other model VGG is that there is a 1 × 1 convolutional layer in the middle layer.
YOLO divides an image into a grid of size SXS and finds B bounding boxes for each cell of the grid. The classification probability for class C is predicted for an objects enclosed by these bounding boxes and five attribute values (x, y, w, h, C) are given for each bounding box. Where, (x, y) is the center coordinates of the bounding boxand (w, h) is the width and height of the bounding box. C is the confidence value for the object and is calculated as follows.
(1) The optimization polynomial of loss function used in YOLO’s learning process is as follows.
(2)
we set the position error and classification error with .
< ICSSC 2017 Proceeding > 119 pageICSSC 2017 International Conference on Software & Smart Convergence 117 page
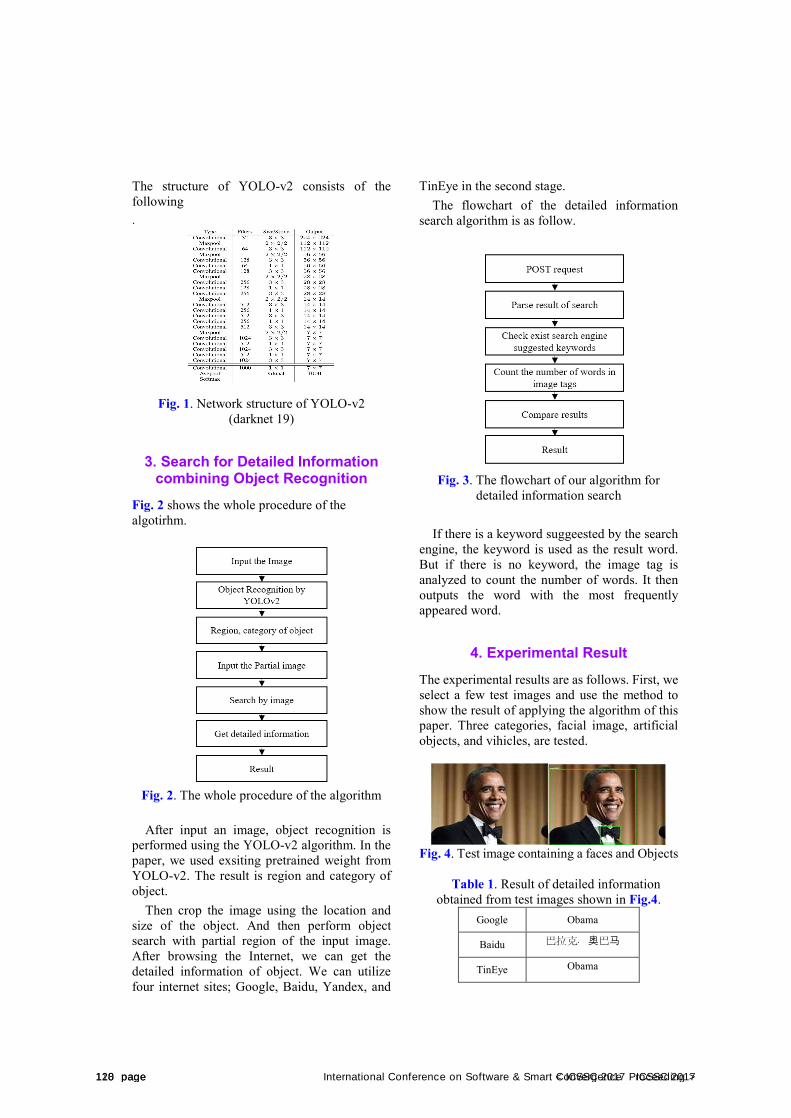
The structure of YOLO-v2 consists of the following .
Fig. 1. Network structure of YOLO-v2 (darknet 19)
3. Search for Detailed Informationcombining Object Recognition
Fig. 2 shows the whole procedure of the algotirhm.
Fig. 2. The whole procedure of the algorithm
After input an image, object recognition is performed using the YOLO-v2 algorithm. In the paper, we used exsiting pretrained weight from YOLO-v2. The result is region and category of object.
Then crop the image using the location and size of the object. And then perform object search with partial region of the input image. After browsing the Internet, we can get the detailed information of object. We can utilize four internet sites; Google, Baidu, Yandex, and
TinEye in the second stage. The flowchart of the detailed information
search algorithm is as follow.
Fig. 3. The flowchart of our algorithm for detailed information search
If there is a keyword suggeested by the search engine, the keyword is used as the result word. But if there is no keyword, the image tag is analyzed to count the number of words. It then outputs the word with the most frequently appeared word.
4. Experimental ResultThe experimental results are as follows. First, we select a few test images and use the method to show the result of applying the algorithm of this paper. Three categories, facial image, artificial objects, and vihicles, are tested.
Fig. 4. Test image containing a faces and Objects
Table 1. Result of detailed information obtained from test images shown in Fig.4.
Google Obama
Baidu ·巴拉克 奥巴马
TinEye Obama
120 page < ICSSC 2017 Proceeding >118 page International Conference on Software & Smart Convergence ICSSC 2017
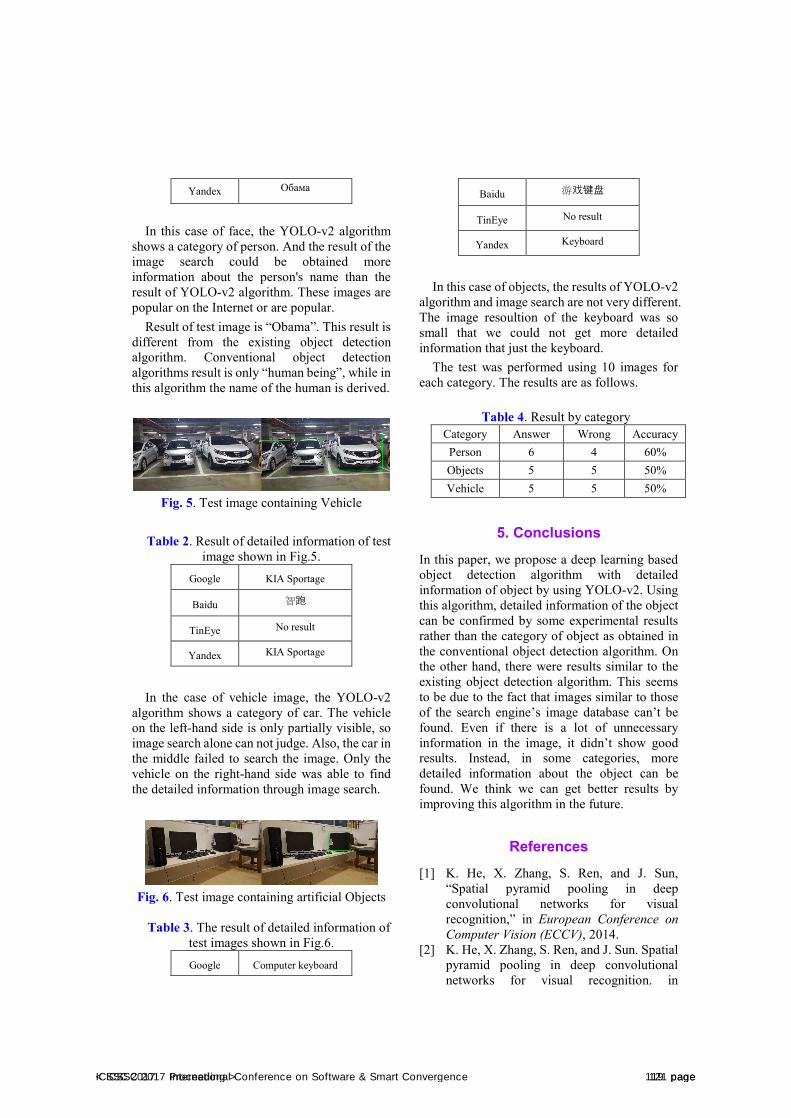
Yandex Обама
In this case of face, the YOLO-v2 algorithm shows a category of person. And the result of the image search could be obtained more information about the person's name than the result of YOLO-v2 algorithm. These images are popular on the Internet or are popular.
Result of test image is “Obama”. This result is different from the existing object detection algorithm. Conventional object detection algorithms result is only “human being”, while in this algorithm the name of the human is derived.
Fig. 5. Test image containing Vehicle
Table 2. Result of detailed information of test image shown in Fig.5.
Google KIA Sportage
Baidu 智跑
TinEye No result
Yandex KIA Sportage
In the case of vehicle image, the YOLO-v2 algorithm shows a category of car. The vehicle on the left-hand side is only partially visible, so image search alone can not judge. Also, the car in the middle failed to search the image. Only the vehicle on the right-hand side was able to find the detailed information through image search.
Fig. 6. Test image containing artificial Objects
Table 3. The result of detailed information of test images shown in Fig.6. Google Computer keyboard
Baidu 游戏键盘
TinEye No result
Yandex Keyboard
In this case of objects, the results of YOLO-v2 algorithm and image search are not very different. The image resoultion of the keyboard was so small that we could not get more detailed information that just the keyboard.
The test was performed using 10 images for each category. The results are as follows.
Table 4. Result by category Category Answer Wrong Accuracy Person 6 4 60% Objects 5 5 50% Vehicle 5 5 50%
5. ConclusionsIn this paper, we propose a deep learning based object detection algorithm with detailed information of object by using YOLO-v2. Using this algorithm, detailed information of the object can be confirmed by some experimental results rather than the category of object as obtained in the conventional object detection algorithm. On the other hand, there were results similar to the existing object detection algorithm. This seems to be due to the fact that images similar to those of the search engine’s image database can’t be found. Even if there is a lot of unnecessary information in the image, it didn’t show good results. Instead, in some categories, more detailed information about the object can be found. We think we can get better results by improving this algorithm in the future.
References [1] K. He, X. Zhang, S. Ren, and J. Sun,
“Spatial pyramid pooling in deep convolutional networks for visual recognition,” in European Conference on Computer Vision (ECCV), 2014.
[2] K. He, X. Zhang, S. Ren, and J. Sun. Spatial pyramid pooling in deep convolutional networks for visual recognition. in
< ICSSC 2017 Proceeding > 121 pageICSSC 2017 International Conference on Software & Smart Convergence 119 page
European Conference on Computer Vision (ECCV), 2014.
[3] R. Girshick, “Fast R-CNN,” in IEEE International Conference on Computer Vision (ICCV), 2015.
[4] S. Ren, K. He, R. Girshick, and J. Sun. “Faster r-cnn: Towards real-time object detection with region proposal networks.” in Neural Information Processing Systems (NIPS), 2015.
[5] W. Liu, D. Anguelov, D. Erhan, C. Szegedy, S. Reed, C.Y. Fu, and A. C. Berg. “SSD: Single shot multibox detector.” in arXiv preprint arXiv:1512.02325, 2015.
[6] J. Redmon, S. Divvala, R. Girshick, and A. Farhadi. “You only look once: Unified, real-time object detection.” in arXiv preprint arXiv:1506.02640, 2015.
[7] J. Redmon and A. Farhadi. “Yolo9000: Better, faster, stronger.” in arXiv preprint arXiv:1612.08242, 2016..
[8] J. Redmon. “Darknet: Open source neural networks” in c. http://pjreddie.com/darknet/, 2013–2016.
122 page < ICSSC 2017 Proceeding >120 page International Conference on Software & Smart Convergence ICSSC 2017
International Conference on Software & Smart Convergence (ICSSC) 2017, June 2017 Copyright ⓒ 2017 ICSSC
This work was supported by Institute for Information & communications Technology Promotion(IITP) grant funded by the Korea government(MSIP) (B0713-16-0007) and Institute for Information & communications Technology Promotion(IITP) grant funded by the Korea government(MSIP) (IITP-2017-2014-0-00636)
A Study on Overseas Cloud-based Medical Service Trends
Onechul Na1, Lee Won Park2, Sangho Park3 and Hangbae Chang4 1 Department of Security Convergence, Chung-Ang University 84, Heukseok-ro, Dongjak-gu, Seoul, 06974 – South Korea
[e-mail: {1 nastop, 2 lwpark, 3 sanghopark}@cau.ac.kr] 2 Department of Industrial Security, Chung-Ang University 84, Heukseok-ro, Dongjak-gu, Seoul, 06974 – South Korea
[e-mail: [email protected]] *Corresponding author: Hangbae Chang
Abstract
Recently, Korea has amended the Medical Law Enforcement Regulations on the facilities and equipment necessary for the management and preservation of electronic medical records of patient information, so that the medical systems which existed only as internal assets can be provided through external resources (cloud). As a result, the hospital industry is putting in effort to respond to the rapid changes in the medical environment. In this study, we analyzed the cloud - based health service environment (Candescent Health, Watson Health Cloud, Fujitsu 往診先生) conducted overseas and conducted studies to activate the cloud medical service in the domestic hospitals industry. This study suggests various approaches to build cloud - based medical services in the future and will help to construct future oriented medical service environment.
Keywords: Electronic medical record, Cloud healthcare, Building medical environments, Medical data flow, Candescent Health, Watson Health Cloud, Fujitsu 往診先生
1. IntroductionRecently, the Ministry of Health and Welfare
revised the Enforcement Regulations of Medical Law, and announced new standards on facilities and equipment necessary for the management and preservation of electronic medical records of patient information. Through this, medical systems which existed only as internal assets can be provided through external resources (cloud).
This reflects the era of the expansion of the new medical market, the rapid globalization of the medical industry, and the requirement for
high quality medical services for patients [1,3]. Healthcare providers are making the effort to adapt to and actively be involved in the adoption of cloud-based health services, an innovative healthcare service model [2]. However, compared to large hospitals, small and medium-sized hospitals are experiencing a lag in innovation, due to lacking IT investment capacity and IT competence [1].
Therefore, in order to promote the activation of domestic cloud-based health services, in this study we attempt to analyze various cloud-based
< ICSSC 2017 Proceeding > 123 pageICSSC 2017 International Conference on Software & Smart Convergence 121 page
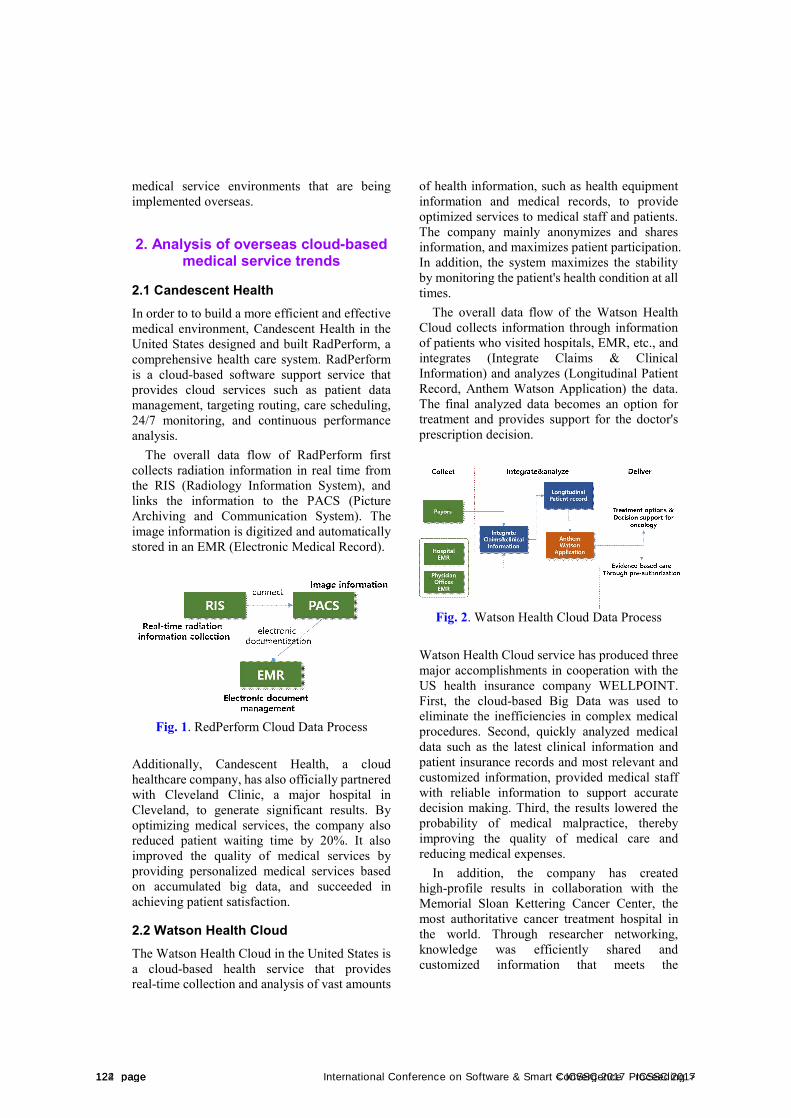
medical service environments that are being implemented overseas.
2. Analysis of overseas cloud-basedmedical service trends
2.1 Candescent Health In order to to build a more efficient and effective medical environment, Candescent Health in the United States designed and built RadPerform, a comprehensive health care system. RadPerform is a cloud-based software support service that provides cloud services such as patient data management, targeting routing, care scheduling, 24/7 monitoring, and continuous performance analysis.
The overall data flow of RadPerform first collects radiation information in real time from the RIS (Radiology Information System), and links the information to the PACS (Picture Archiving and Communication System). The image information is digitized and automatically stored in an EMR (Electronic Medical Record).
Fig. 1. RedPerform Cloud Data Process
Additionally, Candescent Health, a cloud healthcare company, has also officially partnered with Cleveland Clinic, a major hospital in Cleveland, to generate significant results. By optimizing medical services, the company also reduced patient waiting time by 20%. It also improved the quality of medical services by providing personalized medical services based on accumulated big data, and succeeded in achieving patient satisfaction.
2.2 Watson Health Cloud The Watson Health Cloud in the United States is a cloud-based health service that provides real-time collection and analysis of vast amounts
of health information, such as health equipment information and medical records, to provide optimized services to medical staff and patients. The company mainly anonymizes and shares information, and maximizes patient participation. In addition, the system maximizes the stability by monitoring the patient's health condition at all times.
The overall data flow of the Watson Health Cloud collects information through information of patients who visited hospitals, EMR, etc., and integrates (Integrate Claims & Clinical Information) and analyzes (Longitudinal Patient Record, Anthem Watson Application) the data. The final analyzed data becomes an option for treatment and provides support for the doctor's prescription decision.
Fig. 2. Watson Health Cloud Data Process
Watson Health Cloud service has produced three major accomplishments in cooperation with the US health insurance company WELLPOINT. First, the cloud-based Big Data was used to eliminate the inefficiencies in complex medical procedures. Second, quickly analyzed medical data such as the latest clinical information and patient insurance records and most relevant and customized information, provided medical staff with reliable information to support accurate decision making. Third, the results lowered the probability of medical malpractice, thereby improving the quality of medical care and reducing medical expenses.
In addition, the company has created high-profile results in collaboration with the Memorial Sloan Kettering Cancer Center, the most authoritative cancer treatment hospital in the world. Through researcher networking, knowledge was efficiently shared and customized information that meets the
124 page < ICSSC 2017 Proceeding >122 page International Conference on Software & Smart Convergence ICSSC 2017
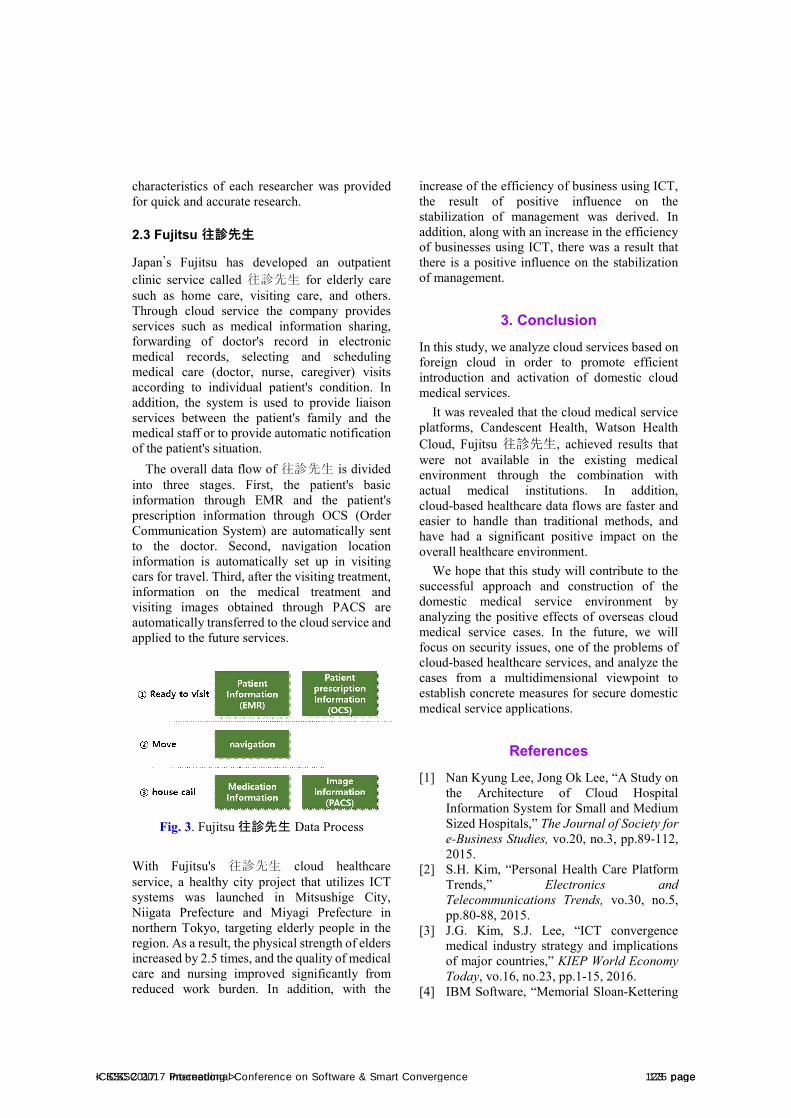
characteristics of each researcher was provided for quick and accurate research.
2.3 Fujitsu 往診先生
Japan’s Fujitsu has developed an outpatient clinic service called 往診先生 for elderly care such as home care, visiting care, and others. Through cloud service the company provides services such as medical information sharing, forwarding of doctor's record in electronic medical records, selecting and scheduling medical care (doctor, nurse, caregiver) visits according to individual patient's condition. In addition, the system is used to provide liaison services between the patient's family and the medical staff or to provide automatic notification of the patient's situation.
The overall data flow of 往診先生 is divided into three stages. First, the patient's basic information through EMR and the patient's prescription information through OCS (Order Communication System) are automatically sent to the doctor. Second, navigation location information is automatically set up in visiting cars for travel. Third, after the visiting treatment, information on the medical treatment and visiting images obtained through PACS are automatically transferred to the cloud service and applied to the future services.
Fig. 3. Fujitsu 往診先生 Data Process
With Fujitsu's 往診先生 cloud healthcare service, a healthy city project that utilizes ICT systems was launched in Mitsushige City, Niigata Prefecture and Miyagi Prefecture in northern Tokyo, targeting elderly people in the region. As a result, the physical strength of elders increased by 2.5 times, and the quality of medical care and nursing improved significantly from reduced work burden. In addition, with the
increase of the efficiency of business using ICT, the result of positive influence on the stabilization of management was derived. In addition, along with an increase in the efficiency of businesses using ICT, there was a result that there is a positive influence on the stabilization of management.
3. ConclusionIn this study, we analyze cloud services based on foreign cloud in order to promote efficient introduction and activation of domestic cloud medical services.
It was revealed that the cloud medical service platforms, Candescent Health, Watson Health Cloud, Fujitsu 往診先生, achieved results that were not available in the existing medical environment through the combination with actual medical institutions. In addition, cloud-based healthcare data flows are faster and easier to handle than traditional methods, and have had a significant positive impact on the overall healthcare environment.
We hope that this study will contribute to the successful approach and construction of the domestic medical service environment by analyzing the positive effects of overseas cloud medical service cases. In the future, we will focus on security issues, one of the problems of cloud-based healthcare services, and analyze the cases from a multidimensional viewpoint to establish concrete measures for secure domestic medical service applications.
References [1] Nan Kyung Lee, Jong Ok Lee, “A Study on
the Architecture of Cloud Hospital Information System for Small and Medium Sized Hospitals,” The Journal of Society for e-Business Studies, vo.20, no.3, pp.89-112, 2015.
[2] S.H. Kim, “Personal Health Care Platform Trends,” Electronics and Telecommunications Trends, vo.30, no.5, pp.80-88, 2015.
[3] J.G. Kim, S.J. Lee, “ICT convergence medical industry strategy and implications of major countries,” KIEP World Economy Today, vo.16, no.23, pp.1-15, 2016.
[4] IBM Software, “Memorial Sloan-Kettering
< ICSSC 2017 Proceeding > 125 pageICSSC 2017 International Conference on Software & Smart Convergence 123 page
Cancer Center: IBM Watson helps fight cancer with evidence-based diagnosis and treatment suggestions,” 2013.
[5] IBM Software, “WellPoint works to accelerate pre-approvals, targeting the 1 in 9 Americans they serve: First IBM Watson pilot goes live in healthcare aiming to improve outcomes for 33.5M members,” 2012
[6] Fujitsu, “往診先生 「在宅医療支援
SaaS」,” 2015. [7] Candescent Health,
https://www.linkedin.com/company/candescenthealth
[8] Candescent Health, http://candescenthealth.com/
[9] Candescent Health, http://medcitynews.com/2015/10/candescent-health-announces-official-partnership-with-cleveland-clinic/
[10] Watson Health Cloud, http://spri.kr/post/7154
[11] Watson Health Cloud, http://www.slideshare.net/informaoz/todd-kalyniuk-ibm-watson-group
[12] Watson Health Cloud, http://marketrealist.com/2015/05/ibm-aims-enhance-watson-health-phytel-acquisition/
[13] Fujitsu 往診先生, http://jp.fujitsu.com/solutions/cloud/elderly-care/teamcare/
126 page < ICSSC 2017 Proceeding >124 page International Conference on Software & Smart Convergence ICSSC 2017

International Conference on Software & Smart Convergence (ICSSC) 2017, June 2017
Copyright ⓒ 2017 ICSSC
This research was supported by a research grant from the IT R&D program of MKE/IITA, the Korean government
[2005-Y-001-04, Development of Next Generation Security Technology]. We express our thanks to Dr. Richard
Berke who checked our manuscript.
Development of Information Security based on Modern Intelligent Technologies
- An Agent Approach Varlataya S.K.
1, Fayzenger A.A.
2 and Shiryaev S.V.
3
1 candidate of technical sciences, docent, FEFU - Russia
2 graduate student, FEFU – Russia
2 graduate student, ITMO University - Russia
Abstract
Intelligent technologies are applicable to the protection of information in firewalls, intrusion detection
systems, access control systems, when both elements of expert and multi-agent systems are used
together, and can significantly improve the effectiveness of the protection tools used. When monitoring
the protection of the information system, it is necessary to determine which objects and from which
attacks should be protected, and accordingly, what opportunities should be used to assess the protection
of the information structure.
Keywords: Multi-agent system, intelligent technologies, information security system, agent sets
1. Introduction
Multi-agent systems are a collection of
stand-alone agent objects that interact with each
other to make a common decision and perform
each of their tasks.
Intelligent agents are programs that can
process, store, and share information. Single
agents are characterized by certain
characteristics, they can have different structure,
level of intelligence, capabilities and tasks, and
they can also be created and destroyed by the
system in the process of work. The advantage of
this technology is that the intelligent agent is able
to perceive and use both its capabilities and the
capabilities of other agents to perform the task.
2. Related Work
So, the use of intelligent technologies for
firewalls is a packet filtering of expert type,
which works simultaneously on several levels of
network interaction at the same time. This
technology allows you to determine the
communication session to which the packets
belong. In addition, it has the ability to
automatically control the load and traffic
distribution to protect against overload and DOS
attacks.
The intrusion prevention system has five
subsystems:
1. first - has the property of
monitoring traffic;
2. second - decides an attack is being
carried out or not;
3. the third - reacts in the form of
response actions based on the
analysis results;
ICSSC 2017 International Conference on Software & Smart Convergence 125 page
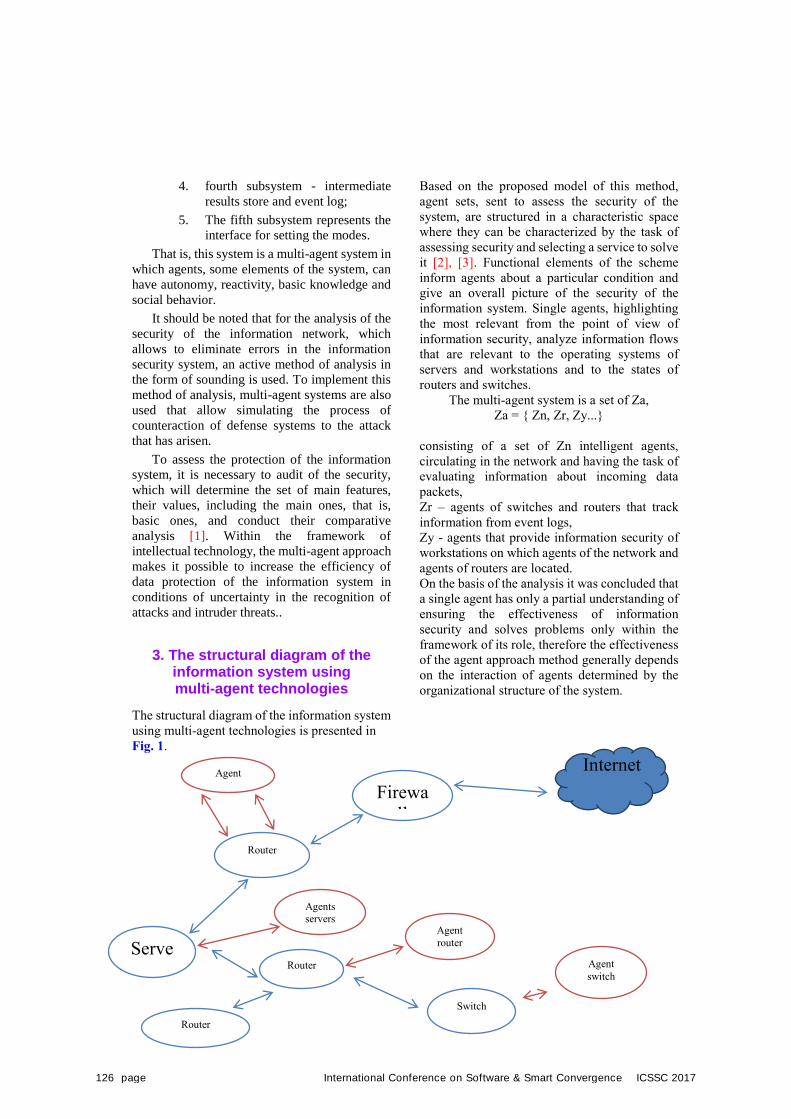
4. fourth subsystem - intermediate
results store and event log;
5. The fifth subsystem represents the
interface for setting the modes.
That is, this system is a multi-agent system in
which agents, some elements of the system, can
have autonomy, reactivity, basic knowledge and
social behavior.
It should be noted that for the analysis of the
security of the information network, which
allows to eliminate errors in the information
security system, an active method of analysis in
the form of sounding is used. To implement this
method of analysis, multi-agent systems are also
used that allow simulating the process of
counteraction of defense systems to the attack
that has arisen.
To assess the protection of the information
system, it is necessary to audit of the security,
which will determine the set of main features,
their values, including the main ones, that is,
basic ones, and conduct their comparative
analysis [1]. Within the framework of
intellectual technology, the multi-agent approach
makes it possible to increase the efficiency of
data protection of the information system in
conditions of uncertainty in the recognition of
attacks and intruder threats..
3. The structural diagram of the information system using multi-agent technologies
The structural diagram of the information system
using multi-agent technologies is presented in
Fig. 1.
Based on the proposed model of this method,
agent sets, sent to assess the security of the
system, are structured in a characteristic space
where they can be characterized by the task of
assessing security and selecting a service to solve
it [2], [3]. Functional elements of the scheme
inform agents about a particular condition and
give an overall picture of the security of the
information system. Single agents, highlighting
the most relevant from the point of view of
information security, analyze information flows
that are relevant to the operating systems of
servers and workstations and to the states of
routers and switches.
The multi-agent system is a set of Za,
Za = { Zn, Zr, Zy...}
consisting of a set of Zn intelligent agents,
circulating in the network and having the task of
evaluating information about incoming data
packets,
Zr – agents of switches and routers that track
information from event logs,
Zy - agents that provide information security of
workstations on which agents of the network and
agents of routers are located.
On the basis of the analysis it was concluded that
a single agent has only a partial understanding of
ensuring the effectiveness of information
security and solves problems only within the
framework of its role, therefore the effectiveness
of the agent approach method generally depends
on the interaction of agents determined by the
organizational structure of the system.
Firewa
ll
Router
Serve
rs Router
Switch
Agent
router
Agents
servers
Agent
switch
Router
Internet Agent router
126 page International Conference on Software & Smart Convergence ICSSC 2017
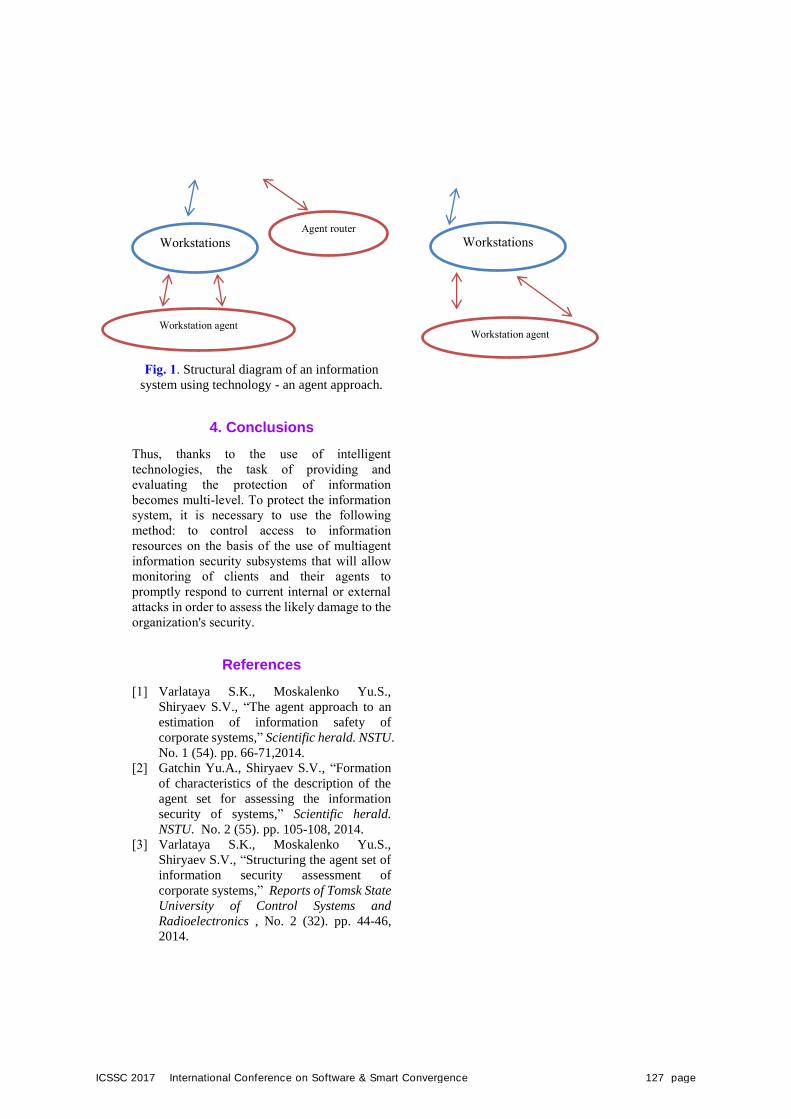
Fig. 1. Structural diagram of an information
system using technology - an agent approach.
4. Conclusions
Thus, thanks to the use of intelligent
technologies, the task of providing and
evaluating the protection of information
becomes multi-level. To protect the information
system, it is necessary to use the following
method: to control access to information
resources on the basis of the use of multiagent
information security subsystems that will allow
monitoring of clients and their agents to
promptly respond to current internal or external
attacks in order to assess the likely damage to the
organization's security.
References
[1] Varlataya S.K., Moskalenko Yu.S.,
Shiryaev S.V., “The agent approach to an
estimation of information safety of
corporate systems,” Scientific herald. NSTU.
No. 1 (54). pp. 66-71,2014.
[2] Gatchin Yu.A., Shiryaev S.V., “Formation
of characteristics of the description of the
agent set for assessing the information
security of systems,” Scientific herald.
NSTU. No. 2 (55). pp. 105-108, 2014.
[3] Varlataya S.K., Moskalenko Yu.S.,
Shiryaev S.V., “Structuring the agent set of
information security assessment of
corporate systems,” Reports of Tomsk State
University of Control Systems and
Radioelectronics , No. 2 (32). pp. 44-46,
2014.
Workstations
Workstation agent
Workstations
Workstation agent
Agent router
ICSSC 2017 International Conference on Software & Smart Convergence 127 page
International Conference on Software & Smart Convergence (ICSSC) 2017, June 2017 Copyright ⓒ 2017 ICSSC
This research was supported by a research grant from the IT R&D program of MKE/IITA, the Korean government [2005-Y-001-04, Development of Next Generation Security Technology]. We express our thanks to Dr. Richard Berke who checked our manuscript.
Mobile Application Development on Domain Analysis and Reuse-Oriented
Software (ROS) Mechelle Grace Zaragoza1 and Haeng-Kon Kim2
1&2School of Information Technology,Catholic University of Daegu, South Korea
[e-mail: [email protected]] [e-mail: [email protected]]
*Corresponding author: Haeng-Kon Kim
Abstract
The term reuse is suggested to be a key to improving of any software development and productivity, particularly where one can identify a family of systems. As to Mobile Application Development, one should consider not only component development, but also a classification for reusable domain pertaining to software. We classify the domain component considering functional and non-functional factor identified through domain analysis. This paper briefly describes the study of Mobile Application development with the use of Domain Analysis. How to reuse software will cause certain advantages and issues upon reviewing this study. Also, we proposed a flowchart based on the reuse method of large-scale embedded software based on inter-module relations on process flow of the proposed reuse method.
Keywords: Mobile Application, Domain Analysis, Reuse-Oriented Software
1. IntroductionThe number of demands the mobile
application industry gets every single day is rapidly demanding. As it continues to burst, developers need a great part of their skills to develop mobile application in a limited time, but maintain good and high quality mobile application products to satisfy the needs of their customers. Nowadays, as demand for software is growing, the lines of code that must be developed tend to increase; moreover, much shorter development time is required [1] Recorded currently, application development for smart devices is an evolving field with great economic and scientific interest. [Gartner] as the total number of mobile app used and is being downloaded worldwide will eventually increase
to 81 billion in 2013, and paid downloads will surpass 8 billion and free downloads 73 billion. [2]
Collected facts about mobile development market is dominated by these five big Platform providers, namely: As to Nokia with its Symbian OS in (46.6%), 2 Apple with its iPhone OS in (17.3%), RIM with its Blackberry OS (15.2%), Microsoft with its Windows CE OS family in (13.6%), and LiMo Foundation with its Linux Mobile operating system in (5.1%). Google recently launched its Android operating system and more likely to become part of the big players in the industry. [3]
1.2. Domain Analysis By all means, domain analysis is a process by
which information is used in developing
128 page International Conference on Software & Smart Convergence ICSSC 2017
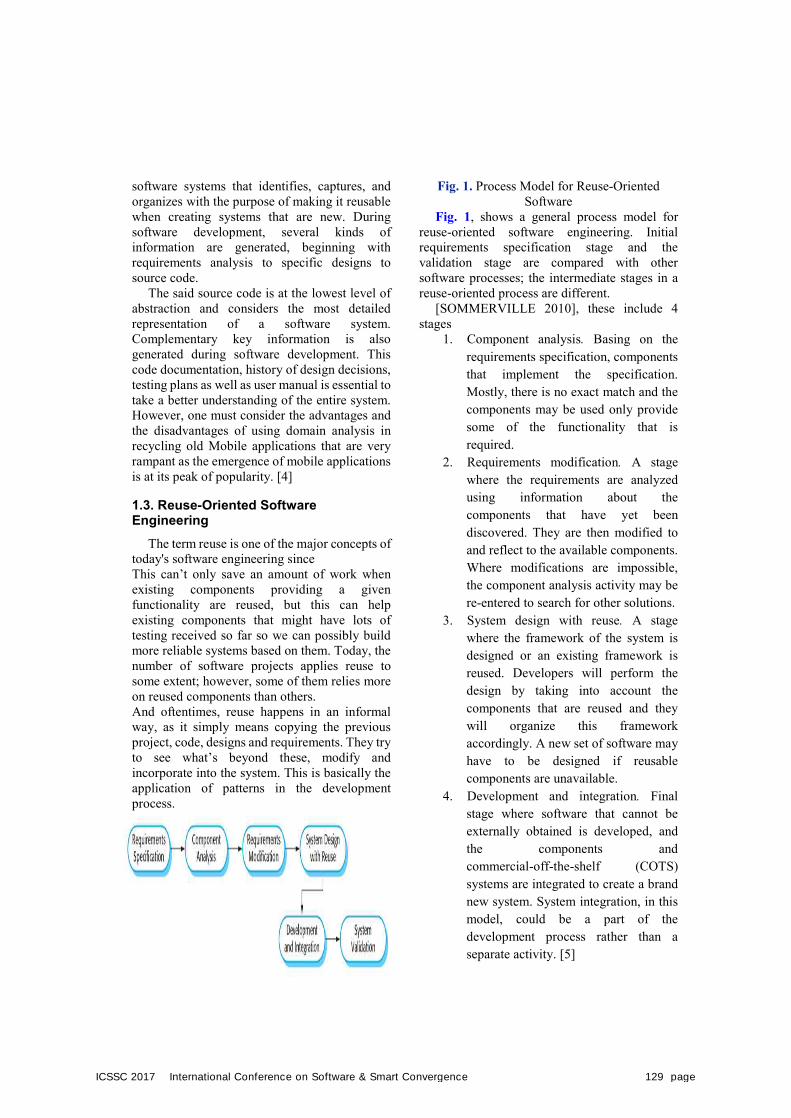
software systems that identifies, captures, and organizes with the purpose of making it reusable when creating systems that are new. During software development, several kinds of information are generated, beginning with requirements analysis to specific designs to source code.
The said source code is at the lowest level of abstraction and considers the most detailed representation of a software system. Complementary key information is also generated during software development. This code documentation, history of design decisions, testing plans as well as user manual is essential to take a better understanding of the entire system. However, one must consider the advantages and the disadvantages of using domain analysis in recycling old Mobile applications that are very rampant as the emergence of mobile applications is at its peak of popularity. [4]
1.3. Reuse-Oriented Software Engineering
The term reuse is one of the major concepts of today's software engineering since This can’t only save an amount of work when existing components providing a given functionality are reused, but this can help existing components that might have lots of testing received so far so we can possibly build more reliable systems based on them. Today, the number of software projects applies reuse to some extent; however, some of them relies more on reused components than others. And oftentimes, reuse happens in an informal way, as it simply means copying the previous project, code, designs and requirements. They try to see what’s beyond these, modify and incorporate into the system. This is basically the application of patterns in the development process.
Fig. 1. Process Model for Reuse-Oriented Software
Fig. 1, shows a general process model for reuse-oriented software engineering. Initial requirements specification stage and the validation stage are compared with other software processes; the intermediate stages in a reuse-oriented process are different.
[SOMMERVILLE 2010], these include 4 stages
1. Component analysis. Basing on therequirements specification, componentsthat implement the specification.Mostly, there is no exact match and thecomponents may be used only providesome of the functionality that isrequired.
2. Requirements modification. A stagewhere the requirements are analyzedusing information about thecomponents that have yet beendiscovered. They are then modified toand reflect to the available components.Where modifications are impossible,the component analysis activity may bere-entered to search for other solutions.
3. System design with reuse. A stagewhere the framework of the system isdesigned or an existing framework isreused. Developers will perform thedesign by taking into account thecomponents that are reused and theywill organize this frameworkaccordingly. A new set of software mayhave to be designed if reusablecomponents are unavailable.
4. Development and integration. Finalstage where software that cannot beexternally obtained is developed, andthe components and commercial-off-the-shelf (COTS) systems are integrated to create a brandnew system. System integration, in thismodel, could be a part of thedevelopment process rather than aseparate activity. [5]
ICSSC 2017 International Conference on Software & Smart Convergence 129 page
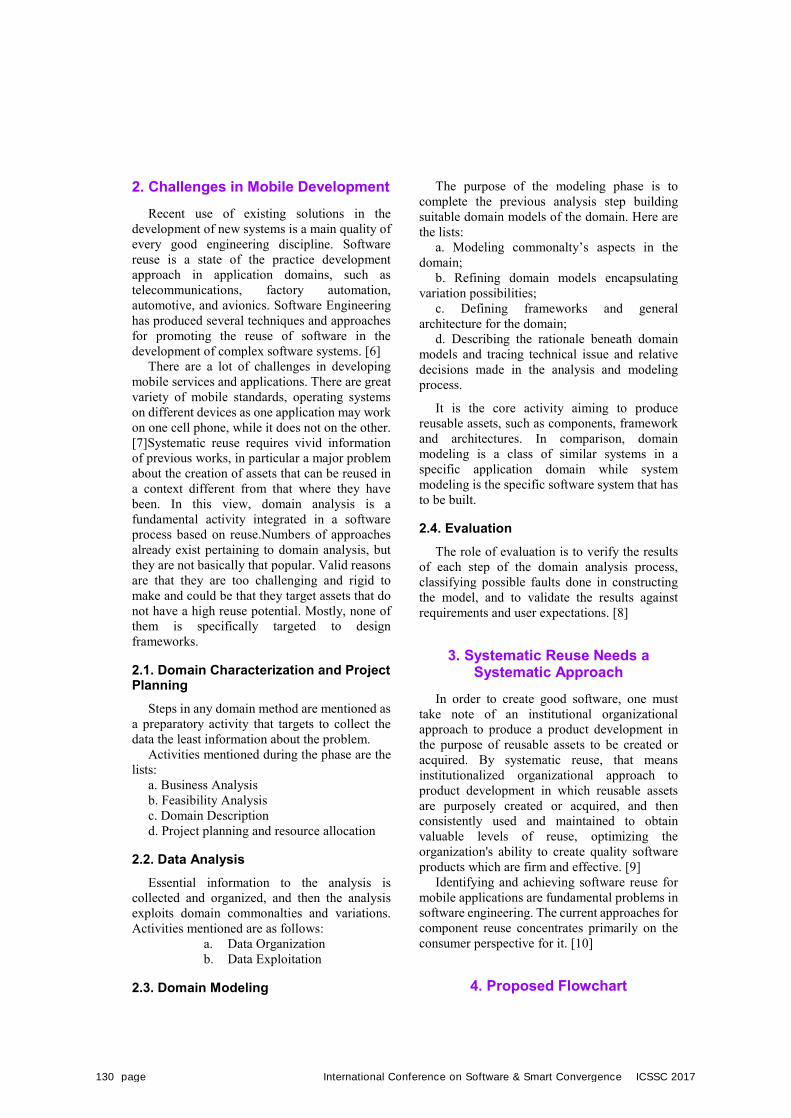
2. Challenges in Mobile DevelopmentRecent use of existing solutions in the
development of new systems is a main quality of every good engineering discipline. Software reuse is a state of the practice development approach in application domains, such as telecommunications, factory automation, automotive, and avionics. Software Engineering has produced several techniques and approaches for promoting the reuse of software in the development of complex software systems. [6]
There are a lot of challenges in developing mobile services and applications. There are great variety of mobile standards, operating systems on different devices as one application may work on one cell phone, while it does not on the other. [7]Systematic reuse requires vivid information of previous works, in particular a major problem about the creation of assets that can be reused in a context different from that where they have been. In this view, domain analysis is a fundamental activity integrated in a software process based on reuse.Numbers of approaches already exist pertaining to domain analysis, but they are not basically that popular. Valid reasons are that they are too challenging and rigid to make and could be that they target assets that do not have a high reuse potential. Mostly, none of them is specifically targeted to design frameworks.
2.1. Domain Characterization and Project Planning
Steps in any domain method are mentioned as a preparatory activity that targets to collect the data the least information about the problem.
Activities mentioned during the phase are the lists:
a. Business Analysisb. Feasibility Analysisc. Domain Descriptiond. Project planning and resource allocation
2.2. Data Analysis Essential information to the analysis is
collected and organized, and then the analysis exploits domain commonalties and variations. Activities mentioned are as follows:
a. Data Organizationb. Data Exploitation
2.3. Domain Modeling
The purpose of the modeling phase is to complete the previous analysis step building suitable domain models of the domain. Here are the lists:
a. Modeling commonalty’s aspects in thedomain;
b. Refining domain models encapsulatingvariation possibilities;
c. Defining frameworks and generalarchitecture for the domain;
d. Describing the rationale beneath domainmodels and tracing technical issue and relative decisions made in the analysis and modeling process.
It is the core activity aiming to produce reusable assets, such as components, framework and architectures. In comparison, domain modeling is a class of similar systems in a specific application domain while system modeling is the specific software system that has to be built.
2.4. Evaluation The role of evaluation is to verify the results
of each step of the domain analysis process, classifying possible faults done in constructing the model, and to validate the results against requirements and user expectations. [8]
3. Systematic Reuse Needs aSystematic Approach
In order to create good software, one must take note of an institutional organizational approach to produce a product development in the purpose of reusable assets to be created or acquired. By systematic reuse, that means institutionalized organizational approach to product development in which reusable assets are purposely created or acquired, and then consistently used and maintained to obtain valuable levels of reuse, optimizing the organization's ability to create quality software products which are firm and effective. [9]
Identifying and achieving software reuse for mobile applications are fundamental problems in software engineering. The current approaches for component reuse concentrates primarily on the consumer perspective for it. [10]
4. Proposed Flowchart
130 page International Conference on Software & Smart Convergence ICSSC 2017
Fig. 2. Reuse Process Flow by Inter-Module Relation Analysis and Visualizing Associated
Information
Fig. 2, depicts the process flow of the proposed method in which new software Product-B is developed by reusing the existing application software: Product-A
(1) Gathering of Data Setting up the specifications of Product-B to
be developed (2) Relation Analyzation The associated information about the symbols
among the files is analyzed. Furthermore, the software, structural data and the software block diagram are created for the group of software.
(3) Investigation The developer then investigates the reused
software modules by visualizing their software structure displayed in a block diagram based on relation analysis information. The data of all software modules associated with the modified module to reuse is displayed in the block diagram.
(4) Design In the design phase, the developer performs
modification of the existing software modules, and addition of new software modules.
(5) Testing
Testing takes place after enormous data gathering and investigation to make sure its usability.
(6) Build The developer builds the software through the
compile and link steps to create executable code of software Product-B. [1]
5. ConclusionsChange is unavoidable even the system that
we put into the operating environment of our techy world. Developers only focused on the new things they might come up but lately but developers started to recognize the use of achieving better results in using reuse software based on a well-planed systematic approach. This has been tested and proven to reduce the risks of time consumption, cost and effort. When building a new software, one must first consider the previous system used if it has something to do with the latest one. By doing this, it will save the cost of developing, testing, and documenting and maintaining list of developing software. In order to come up with less programming and efforts as reusing software might be complex, it is very safe to deliberate first the functionality and uses. There have certainly successful reuse software in the market with sophisticated frameworks and components.
Acknowledgments This Research was supported by the MSIP
(Ministry of Science, ICT and Future Planning), Korea, under the C-ITRC (Convergence Information Technology Research Center) support program (IITP-2016-H8601-15-1007) supervised by the IITP (Institute for Information & Communication Technology Promotion).
This Research was supported by the International Research & Development Program of the National Research Foundation of Korea (NRF) funded by the Ministry of Science, ICT & Future Planning (Grant Number: K 2014075112).
References [1] Hidetoshi, K.: “A Reuse Method of
Large-scale Embedded Software Based on
ICSSC 2017 International Conference on Software & Smart Convergence 131 page
Inter-module Relations," Software Engineering vo. 4, no. 1, pp.1-9, 2014.
[2] Xanthopoulos, S., Xinogalos, S., “A Comparative Analysis of Cross-platform Development Approaches for Mobile Applications,” Conference Paper September,2013. DOI: 10.1145/2490257.2490292
[3] Holzer, A., Ondrus, J., “Trends in mobile application development. International Conference on Mobile Wireless Middleware, Operating Systems, and Applications.” Springer Berlin Heidelberg, 2009.
[4] Prieto-Diaz, R.: DOMAIN ANALYSIS: AN INTRODUCTION ACM SIGSOFT SOFTWARE ENGINEERING NOTES, vo. 15, no. 2, pp. 47.
[5] Sterbinszky, N.: Case study in system development – Notes.
[6] Brugali, D., “A reuse-oriented development process for component-based robotic systems. International Conference on Simulation, Modeling, and Programming for Autonomous Robots,” Springer Berlin Heidelberg, 2012.
[7] Amatya, S., Kurti, A. Cross-Platform Mobile Development: An Alternative to Native Mobile Development, 013-10-29.
[8] Valerio, A., Succi, G., Fenaroli M. “Domain Analysis and Framework-based Software Development,” Software Production Engineering Lab (LIPS),
[9] Griss, M. L. Systematic Software Reuse: Architecture, Process and Organization are Crucial, Laboratory Scientist. Software Technology Laboratory, HP Laboratories.
[10] Kim, HK.: Mobile Application Development Using Component Features and Inheritance, Computer Applications for Software Engineering, Disaster Recovery, and Business Continuity pp 53-62.
132 page International Conference on Software & Smart Convergence ICSSC 2017
International Conference on Software & Smart Convergence (ICSSC) 2017, June 2017 Copyright ⓒ 2017 ICSSC
This work was supported by Institute for Information & communications Technology Promotion(IITP) grant funded by the Korea government(MSIP) (B0713-16-0007) and Institute for Information & communications Technology Promotion(IITP) grant funded by the Korea government(MSIP) (IITP-2017-2014-0-00636)
Future Industry Analysis Research for Diffusion and Application of
Blockchain Technology
Lee Won Park1, Sangho Park2, Onechul Na3, Yanghoon Kim4 and Hangbae Chang5 1,2,3 Department of Security Convergence, Chung-Ang University
84, Heukseok-ro, Dongjak-gu, Seoul, 06974 – South Korea [e-mail: {1 lwpark, 2 sanghopark, 3 nastop}@cau.ac.kr]
4 Department of Industrial Security, Far East University 76-32, Daehak-gil, Gamgok-myeon, Eumseong-gun, Chungbuk, 27601– South Korea
[e-mail: [email protected]] 5 Department of Industrial Security, Chung-Ang University 84, Heukseok-ro, Dongjak-gu, Seoul, 06974 – South Korea
[e-mail: [email protected]] *Corresponding author: Hangbae Chang
Abstract
With the start of the fourth industrial revolution, blockchain technology has emerged as a core technology. However, as of 2017, 8 years after the initial release of the blockchain technology, the blockchain is still mostly being used in limited areas such as the financial sector. Therefore, in this paper, we analyze the future industry that is suitable for the fourth industrial revolution through the analysis of the blockchain big data tree, and accordingly derive a new industry group that can spread and utilize the blockchain technology. The results of this study are expected to maximize the possibilities of the blockchain technology, which is emerging as the key infrastructure technology in the fourth industrial revolution era, and contribute to creating new value by applying the technology to various industries. Keywords: Blockchain, Fintech, Healthcare, Prosumer, Future New Industry
1. Introduction The fourth industrial revolution that uses
technological convergence to break the boundaries between various disciplines is quickly emerging, and the blockchain technology is developing as a core technology. The blockchain technology has the potential to be applied to various industries while maintaining integrity and reliability through decentralized agreement technology that collectively verifies and stores information
without requiring the intervention of an authorized third-party [1]. However, as of 2017, 8 years after the initial release of the blockchain technology, the blockchain is still mostly being used in limited areas such as the financial sector. Therefore, in this paper, we analyze the future industry that is suitable for the fourth industrial revolution through the analysis of the blockchain big data tree, and accordingly derive a new industry group that can spread and utilize the blockchain technology.
ICSSC 2017 International Conference on Software & Smart Convergence 133 page
2. Related Work
2.1 Blockchain The blockchain is one of the key infrastructure
technologies that has been gathering immense attention in the era of the fourth industrial revolution created by the disappearance of the boundaries in science and technology. The blockchain is essentially a list of connection structures that store data in the form of a distributed database. It is a storage platform designed to make arbitrary manipulation difficult by verifying, linking, and storing data through a collective network. Based on these characteristics, the blockchain can maintain integrity, reliability, and security by making it impossible to falsify or modulate past or future transaction information [2]. Also, the technology is managed by a distributed P2P management system, thus being able to maintain content consistency, and has the advantage of recovering lost information by utilizing characteristics of distributed management system.
However, the blockchain technology has limitations such as the block generation time, which in turn makes it difficult for industries that require immediate real-time processing to easily utilize the blockchain. Additionally, the technology is problematic due to the fact that discarding a block freely is nearly impossible, whereas creating a block is relatively easy [3].
2.2 Application of the Blockchain Technology in the Industrial Field
Before exploring the new industrial field for spreading and applying the block chain technology, we analyzed the current status of the application of blockchain technology in the industrial field from 2009, the year when it was first announced.
In 2009, an anonymous group called “Satoshi Nakamoto” published a paper that introduced the bitcoin, the first model to apply blockchain technology. In 2010, after the first transaction of purchasing 25 USD worth of pizza with 10,000 BTCs, the value of the bitcoin continued to rise rapidly. In 2011, 1 BTC had a value of 1 US Dollar, and with the continuous rise in bitcoin value, as of 2017, 1 BTC has the worth of about 2,400 USD [4]. Along with the rise in the value of these bitcoins, in 2014, 40 financial groups
from around the world established a blockchain consortium called R3 to start a joint technology research on blockchain technology, developing mainly in financial fields such as FinTech. Since 2016, global companies such as IBM have been expanding blockchain’s industrial field beyond the financial sector, developing a blockchain-based IoT platform and applying it to digital authentication services. However, there are no prominent cases thus far. The reason why the blockchain research and development and application of the industrial sector is still focused heavily on the financial sector is because the blockchain bitcoin platforms that utilize the P2P method and distributed general ledger satisfies the demands of the financial industry [5].
Additionally, the existing blockchain bitcoin platform cannot be easily applied to other industries because there are lingering problems such as energy consumption, difficulty of permanent disposal, and privacy concerns.
3. Future Industry Analysis Researchfor Diffusion and Application of
Blockchain Technology
3.1 Research Methodology In this paper, we analyze the limitations of
blockchain technology that make the application to industries other than the financial sector difficult. Based on this analysis, we will analyze the future industry that meets the trend of the fourth industrial revolution through the analysis of the big data tree of the block chain and derive a new industrial field that can spread the blockchain technology. Blockchain Big-tree analysis collects and analyzes all the elements related to the blockchain and classifies them into three major categories: blockchain technology, industry group, and intelligent information technology. This categorization then aided the selection of a new industry group that can apply the blockchain technology.
3.2 Blockchain Technology Among the three major categories of
blockchain technology, industry group, and intelligent information technology, a blockchain big data tree analysis was first performed on the blockchain technology. The factors related to the blockchain technology are largely derived from
134 page International Conference on Software & Smart Convergence ICSSC 2017
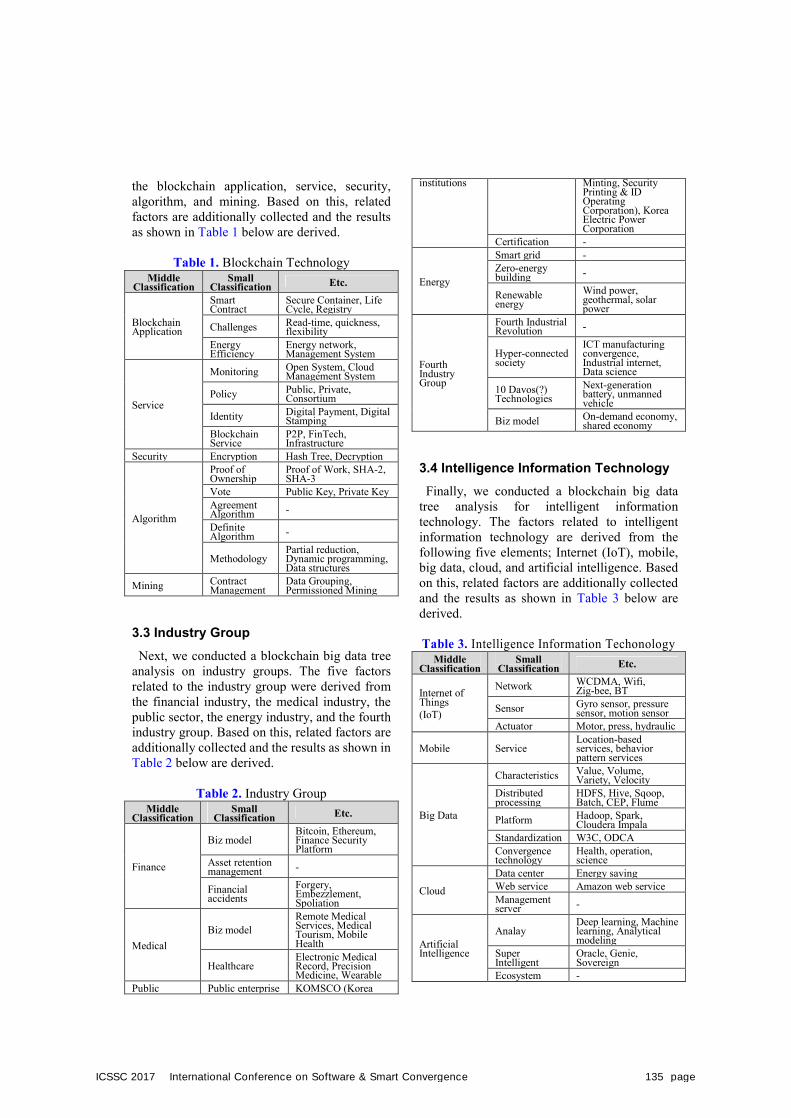
the blockchain application, service, security, algorithm, and mining. Based on this, related factors are additionally collected and the results as shown in Table 1 below are derived.
Table 1. Blockchain Technology Middle
Classification Small
Classification Etc.
Blockchain Application
Smart Contract
Secure Container, Life Cycle, Registry
Challenges Read-time, quickness, flexibility
Energy Efficiency
Energy network, Management System
Service
Monitoring Open System, Cloud Management System
Policy Public, Private, Consortium
Identity Digital Payment, Digital Stamping
Blockchain Service
P2P, FinTech, Infrastructure
Security Encryption Hash Tree, Decryption
Algorithm
Proof of Ownership
Proof of Work, SHA-2, SHA-3
Vote Public Key, Private Key Agreement Algorithm -
Definite Algorithm -
Methodology Partial reduction, Dynamic programming, Data structures
Mining Contract Management
Data Grouping, Permissioned Mining
3.3 Industry Group Next, we conducted a blockchain big data tree
analysis on industry groups. The five factors related to the industry group were derived from the financial industry, the medical industry, the public sector, the energy industry, and the fourth industry group. Based on this, related factors are additionally collected and the results as shown in Table 2 below are derived.
Table 2. Industry Group Middle
Classification Small
Classification Etc.
Finance
Biz model Bitcoin, Ethereum, Finance Security Platform
Asset retention management -
Financial accidents
Forgery, Embezzlement, Spoliation
Medical Biz model
Remote Medical Services, Medical Tourism, Mobile Health
Healthcare Electronic Medical Record, Precision Medicine, Wearable
Public Public enterprise KOMSCO (Korea
institutions Minting, Security Printing & ID Operating Corporation), Korea Electric Power Corporation
Certification -
Energy
Smart grid - Zero-energy building -
Renewable energy
Wind power, geothermal, solar power
Fourth Industry Group
Fourth Industrial Revolution -
Hyper-connected society
ICT manufacturing convergence, Industrial internet, Data science
10 Davos(?) Technologies
Next-generation battery, unmanned vehicle
Biz model On-demand economy, shared economy
3.4 Intelligence Information Technology Finally, we conducted a blockchain big data
tree analysis for intelligent information technology. The factors related to intelligent information technology are derived from the following five elements; Internet (IoT), mobile, big data, cloud, and artificial intelligence. Based on this, related factors are additionally collected and the results as shown in Table 3 below are derived.
Table 3. Intelligence Information Techonology Middle
Classification Small
Classification Etc.
Internet of Things (IoT)
Network WCDMA, Wifi, Zig-bee, BT
Sensor Gyro sensor, pressure sensor, motion sensor
Actuator Motor, press, hydraulic
Mobile Service Location-based services, behavior pattern services
Big Data
Characteristics Value, Volume, Variety, Velocity
Distributed processing
HDFS, Hive, Sqoop, Batch, CEP, Flume
Platform Hadoop, Spark, Cloudera Impala
Standardization W3C, ODCA Convergence technology
Health, operation, science
Cloud
Data center Energy saving Web service Amazon web service Management server -
Artificial Intelligence
Analay Deep learning, Machine learning, Analytical modeling
Super Intelligent
Oracle, Genie, Sovereign
Ecosystem -
ICSSC 2017 International Conference on Software & Smart Convergence 135 page
3.5 Blockchain New Industry Development and Status Analysis
As a result of the big data tree analysis based on three major categories of blockchain technology, industry group, and intelligence information technology, it is possible to apply blockchain technology to three industries: the healthcare industry, the energy prosumer industry and the public industry. In addition, we analyzed the application of blockchain technology in the healthcare industry, the energy industry, and the public goods industry, which are new industries for spreading and applying the blockchain technology. In the case of the healthcare industry, it is difficult to permanently discard the information recorded in the block chain. Due to the problem that personal healthcare data may be disclosed to all the participants, privacy may be infringed. These problems make blockchain technology utilization rate fairly low in non-financial fields. Just recently the US Department of Health and Welfare has introduced the blockchain to medical records and is now in the beginning stage of applying the blockchain technology such as using the blockchain for PHILIPS customers' healthcare records. Next, in the case of the energy prosumer industry, the energy generation technology such as the photovoltaic panel has recently developed. At the same time, the age in which anyone can produce energy such as electricity has come. The use of blockchain technology in the energy prosumer industry has been full-fledged, including supporting electricity trading among neighbors. However, as in the healthcare industry, the application is still in the beginning stages, and it is necessary to solve the problems such as standardized and unified protocol required for energy exchange. Finally, within the public goods industry group, recently the Estonian government applied blockchain technology to its public works. In Korea, the blockchain has recently been to mint construction and is starting to be applied to public works in Korea. In the field of public goods industry, due to the blockchain characteristic of being without a central organization, there is concern that the object of legal liability is ambiguous when a problem occurs. In order to further apply blockchain technology to the public goods industry, such problems must be solved.
4. Conclusions In this paper, we analyze the future industries in
line with the trend of the fourth Industrial Revolution and analyze the big block tree data tree in order to derive the new industry groups so as to spread the blockchain technology and utilize them in various industrial fields. This analysis led to three new industries: healthcare, energy prosumers, and public goods industries. In addition, by analyzing the current status and problems of the three new industry groups, we propose a solution to activate the application of blockchain technology in the future industrial sectors. The results of this study will contribute to the maximization of the blockchain technology, which is emerging as the core technology of the fourth industrial revolution era, and will create new value by applying the technology to various industries. In future research, we will study an open platform technology that will improve the current blockchain platform to effectively apply the blockchain technology to the new industry groups derived from this study.
References [1] Ernst & Young. “Blockchain Reaction Tech
Companies Plan for Critical Mass”, 2016. [2] Financial Security Institute, “Blockchain
Overview and Use Case,” Security Research Department, 2015.
[3] M. Swan, “Blockchain : Blueprint for a New Economy,” O’Reilly Media, 2015.
[4] H. Yang, Y. Kwon, “Virtual Currency – Bitcoin Trends,” Korea Multimedia Society Quarterly, vo. 19, no. 1, pp.28-36, 2015.
[5] Y. Ko, H. Choi, “Changing Business Paradigm and Its Application - Focused on the Block Chain Technology -,” Korea Science & Art Forum, vo. 27, pp.13-29, 2017.
[6] H. Kakavand, N. K. De Sevres, “The Blockchain Revolution: An Analysis of Regulation and Technology Related to Distributed Ledger Technologies,” Luther System & DLA Piper, 2016.
[7] S. Huckle, R. Bhattacharya, M. White, N. Beloff, “Internet of Things, Blockchain and Shared Economy Applications,” Procedia Computer Science, vo. 98, 2016.
136 page International Conference on Software & Smart Convergence ICSSC 2017
International Conference on Software & Smart Convergence (ICSSC) 2017, June 2017
Copyright ⓒ 2017 ICSSC
This research was supported by a research grant from the IT R&D program of MKE/IITA, the Korean government
[2005-Y-001-04, Development of Next Generation Security Technology]. We express our thanks to Dr. Richard
Berke who checked our manuscript.
Methods of the Signal Processing for Sound Field Visualization
Nadezhda V. Zlobina1, Boris A. Kasatkin
1, Sergey B. Kasatkin
1, Lubov G. Statsenko
2 and
Dmitry V. Zlobin2
1 Institute of Marine Technology Problems FEB RAS, Vladivostok, Russia
[e-mail: [email protected], [email protected], [email protected]] 2 Far Eastern Federal University, Vladivostok, Russia
[e-mail: [email protected], [email protected]]
Abstract
The paper deals with the features of the processing of acoustic signals generated by an underwater
low-frequency radiator in shallow sea. Data from four channels of a combined hydroacoustic receiver is
processed to identify a signal against noise and build 3D sonograms of the sound field. Linear and
non-linear processing algorithms were applied to separate the useful signal. Comparison of the
sonograms shows the advantage of the nonlinear algorithm which completely eliminates the fluctuation
component of the noise interference and provides a better visual detection of the signal component.
Keywords:
1. Introduction
Sound propagation in shallow water is
characterized by multiple reflections from
surface and bottom and by a high level of noise,
which are generated by passing ships, and
industrial facilities in the coastal zone. High
noise greatly complicates the task of identifying
the source of the useful signal. Reliable signal
extraction against the background noise requires
algorithms taking into account the features of
sound propagation at the pass. The study used
data of the experiment held in the Peter the Great
Bay, Sea of Japan, in the autumn of 2014. A
towed underwater radiator worked in the
frequency range of Hz. The system consisting of
two combined receivers was placed for the
reception of hydroacoustic signals. Each
combined receiver had four receiving channels: a
single hydrophone channel of pressure and three
vector channels measuring components of
particle velocity. Data from four channels of
each receiver was processed for separation of
useful signal against background interference
and creation of 3D sonograms of the sound field.
The task of preprocessing included the selection
of a discrete component of the operation signal
by FFT methods and computation of pass
characteristics as a dependence of the modulus of
complex amplitude of the sound pressure and the
component of particular acceleration vector from
observation time on the pass. The sonograms
were calculated for the set of informative
parameters, which included sound pressure,
three real components of the intensity vector and
three imaginary components of the intensity
vector. Furthermore, additional sonograms were
built for the informative parameter, which
ICSSC 2017 International Conference on Software & Smart Convergence 137 page
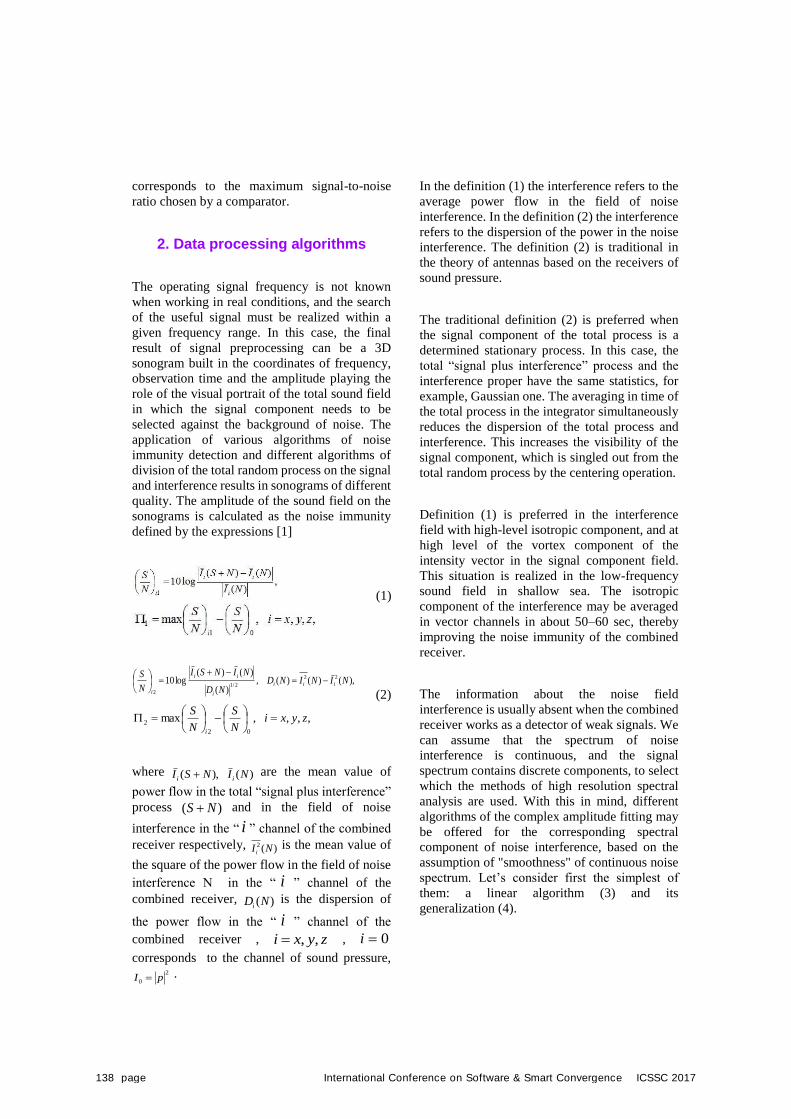
corresponds to the maximum signal-to-noise
ratio chosen by a comparator.
2. Data processing algorithms
The operating signal frequency is not known
when working in real conditions, and the search
of the useful signal must be realized within a
given frequency range. In this case, the final
result of signal preprocessing can be a 3D
sonogram built in the coordinates of frequency,
observation time and the amplitude playing the
role of the visual portrait of the total sound field
in which the signal component needs to be
selected against the background of noise. The
application of various algorithms of noise
immunity detection and different algorithms of
division of the total random process on the signal
and interference results in sonograms of different
quality. The amplitude of the sound field on the
sonograms is calculated as the noise immunity
defined by the expressions [1]
(1)
),()()(,)(
)()(log10 22
2/1
2
NININDND
NINSI
N
Siii
i
ii
i
(2)
,,,,max02
2 zyxiN
S
N
S
i
where )(),( NINSI ii are the mean value of
power flow in the total “signal plus interference”
process )( NS and in the field of noise
interference in the “ i ” channel of the combined
receiver respectively, )(2 NI i is the mean value of
the square of the power flow in the field of noise
interference N in the “ i ” channel of the
combined receiver, )(NDi is the dispersion of
the power flow in the “ i ” channel of the
combined receiver , zyxi ,, , 0i
corresponds to the channel of sound pressure, 2
0 pI .
In the definition (1) the interference refers to the
average power flow in the field of noise
interference. In the definition (2) the interference
refers to the dispersion of the power in the noise
interference. The definition (2) is traditional in
the theory of antennas based on the receivers of
sound pressure.
The traditional definition (2) is preferred when
the signal component of the total process is a
determined stationary process. In this case, the
total “signal plus interference” process and the
interference proper have the same statistics, for
example, Gaussian one. The averaging in time of
the total process in the integrator simultaneously
reduces the dispersion of the total process and
interference. This increases the visibility of the
signal component, which is singled out from the
total random process by the centering operation.
Definition (1) is preferred in the interference
field with high-level isotropic component, and at
high level of the vortex component of the
intensity vector in the signal component field.
This situation is realized in the low-frequency
sound field in shallow sea. The isotropic
component of the interference may be averaged
in vector channels in about 50–60 sec, thereby
improving the noise immunity of the combined
receiver.
The information about the noise field
interference is usually absent when the combined
receiver works as a detector of weak signals. We
can assume that the spectrum of noise
interference is continuous, and the signal
spectrum contains discrete components, to select
which the methods of high resolution spectral
analysis are used. With this in mind, different
algorithms of the complex amplitude fitting may
be offered for the corresponding spectral
component of noise interference, based on the
assumption of "smoothness" of continuous noise
spectrum. Let’s consider first the simplest of
them: a linear algorithm (3) and its
generalization (4).
138 page International Conference on Software & Smart Convergence ICSSC 2017

,),(),(2
1),( 00000 tffAtffAtfA NSNSN
(3)
where 0f is the average frequency of the
frequency channel, 0f – variable parameter that
exceeds the width of the discrete component f
in the spectrum of the total "signal plus noise"
process by about an order.
If necessary, the algorithm (3) can be generalized
to include the procedure of averaging a set of
discrete components (frequency window) with
weight coefficients (Hamming window)
,),(1
),(00
00
0
ff
ff
iNSiN tfAaM
tfA(4)
,2
sin,)2
,1(,2
,2 0
00M
ia
Mi
f
fM
M
ifff ii
02 f –the width of Hamming window.
Algorithms of noise interference selection from
the total process (3), (4) are applied to the linear
in the field values ),( tfA , i.e., complex
amplitudes of spectral components in the
pressure channel and in vector channels.
Quadratic in the field values are calculated on the
basis of the identidied complex amplitudes of the
spectral components of noise interference.
In addition to these algorithms, let’s present
nonlinear algorithms for detection of noise
interference for positive definite quadratic in the
field values ),( tfB , i.e. the power flow in the
pressure channel and in vector channels
,),(),(2
1),( 00000 tffBtffBtfB NSNSN
(5)
,2
,),(lnln1
expexp),( 000
00
00M
iffftfB
MtfB i
ff
ff
iNSN
.),(log),(log
1
0
00
00
Mff
ff
iNSN tfBtfB
(6)
Three algorithms are applied to build sonograms
in the paper.
① A linear algorithm for the selection of
interference from the total process "signal
plus interference" (3) and the identification
of noise immunity by the formula (1),
denoted as algorithm 1-I.
② Non-linear algorithm for selection of
interference from the total process "signal
plus interference" (6) and the identification
of noise immunity by the formula (1),
denoted as algorithm 5-I.
③ A linear algorithm for the selection of
interference from the total process "signal
plus interference" (3) and the identification
of noise immunity by the formula (2),
denoted as algorithm 1-D, which is
considered as traditional in underwater
acoustics using only sound pressure
receivers [2-4].
3. Sound Field Visualization on 3DSonograms
Sonograms of the sound field were calculated
according to the experiment data for the
operating frequency of 123 hz. In the calculation
of sonograms, sound pressure, three components
of the real component of the intensity vector, and
three components of the imaginary component of
the intensity vector were used as informative
parameters. The final sonogram is based on the
results of selection in the comparator of the
informative parameter, to which the maximum
signal-to-noise ratio corresponds.
The sonograms shown in Fig. 1 - Fig. 4 were
obtained using the algorithms (1) and (3).
ICSSC 2017 International Conference on Software & Smart Convergence 139 page
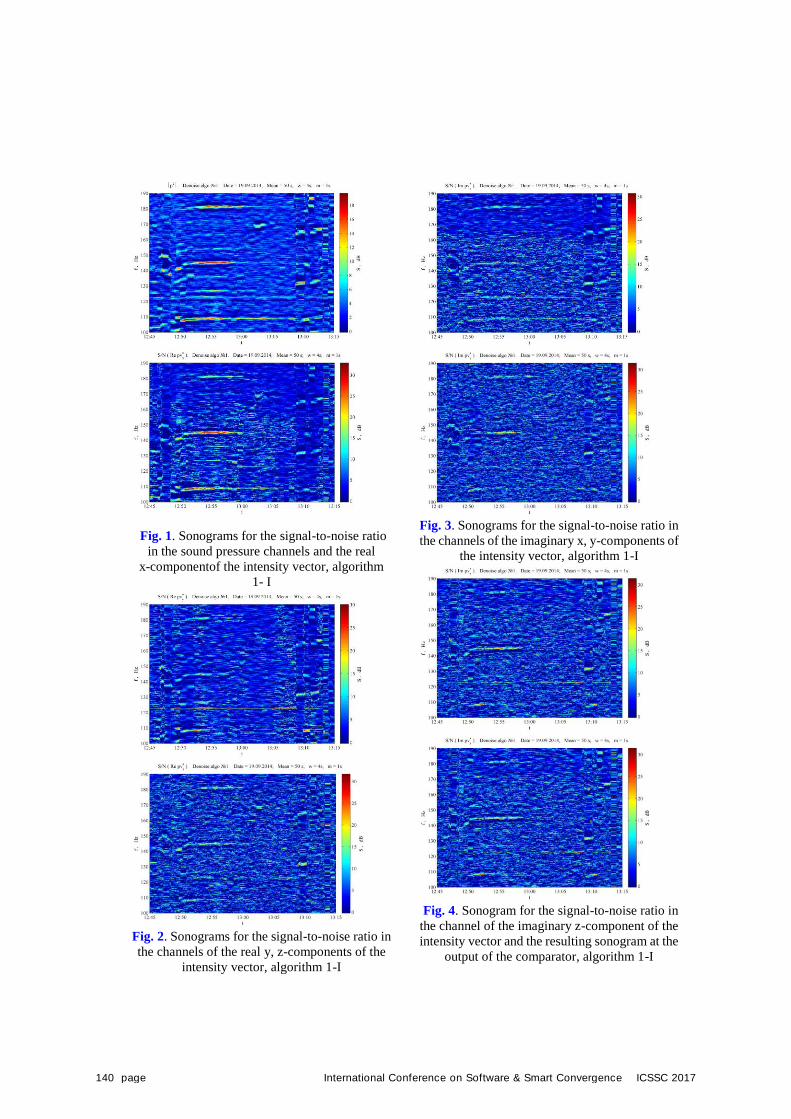
Fig. 1. Sonograms for the signal-to-noise ratio
in the sound pressure channels and the real
x-componentof the intensity vector, algorithm
1- I
Fig. 2. Sonograms for the signal-to-noise ratio in
the channels of the real y, z-components of the
intensity vector, algorithm 1-I
Fig. 3. Sonograms for the signal-to-noise ratio in
the channels of the imaginary x, y-components of
the intensity vector, algorithm 1-I
Fig. 4. Sonogram for the signal-to-noise ratio in
the channel of the imaginary z-component of the
intensity vector and the resulting sonogram at the
output of the comparator, algorithm 1-I
140 page International Conference on Software & Smart Convergence ICSSC 2017
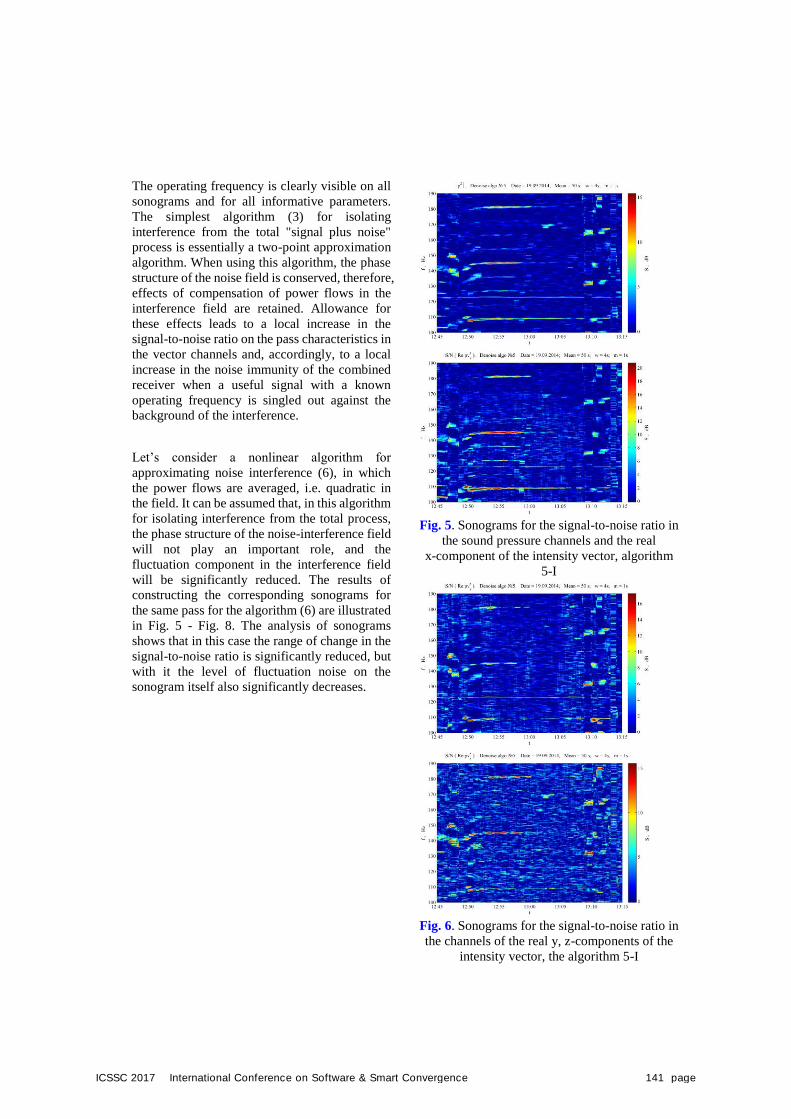
The operating frequency is clearly visible on all
sonograms and for all informative parameters.
The simplest algorithm (3) for isolating
interference from the total "signal plus noise"
process is essentially a two-point approximation
algorithm. When using this algorithm, the phase
structure of the noise field is conserved, therefore,
effects of compensation of power flows in the
interference field are retained. Allowance for
these effects leads to a local increase in the
signal-to-noise ratio on the pass characteristics in
the vector channels and, accordingly, to a local
increase in the noise immunity of the combined
receiver when a useful signal with a known
operating frequency is singled out against the
background of the interference.
Let’s consider a nonlinear algorithm for
approximating noise interference (6), in which
the power flows are averaged, i.e. quadratic in
the field. It can be assumed that, in this algorithm
for isolating interference from the total process,
the phase structure of the noise-interference field
will not play an important role, and the
fluctuation component in the interference field
will be significantly reduced. The results of
constructing the corresponding sonograms for
the same pass for the algorithm (6) are illustrated
in Fig. 5 - Fig. 8. The analysis of sonograms
shows that in this case the range of change in the
signal-to-noise ratio is significantly reduced, but
with it the level of fluctuation noise on the
sonogram itself also significantly decreases.
Fig. 5. Sonograms for the signal-to-noise ratio in
the sound pressure channels and the real
x-component of the intensity vector, algorithm
5-I
Fig. 6. Sonograms for the signal-to-noise ratio in
the channels of the real y, z-components of the
intensity vector, the algorithm 5-I
ICSSC 2017 International Conference on Software & Smart Convergence 141 page

Fig. 7. Sonograms for the signal-to-noise ratio in
the channels of the imaginary x, y-components of
the intensity vector, the algorithm 5-I
Fig. 8. Sonogram for the signal-to-noise ratio in
the channel of the imaginary z-component of the
intensity vector and the resulting sonogram at the
output of the comparator, algorithm 5-I
When noise interference is approximated by the
linear algorithm (3), the maximum
signal-to-noise ratio in the hydrophone channel
is 18 dB, and at the output of the comparator it
increases to 25 dB, but the noise background on
the sonogram at the comparator output makes it
difficult to visualize the signal. It can also be
noted that the noise interference extraction
algorithm (3) understates its noise level and does
not eliminate the fluctuation component of the
interference, which makes it difficult to isolate
the signal component.
When noise interference is approximated by the
nonlinear algorithm (6), the maximum
signal-to-noise ratio in the hydrophone channel
is 15 dB, and at the output of the comparator it
increases to 20 dB, the noise background on the
sonogram at the comparator output decreases
noticeably. The algorithm (6) overstates the level
of interference, but, completely eliminating the
fluctuation component of the interference, it
improves the visual detection of the signal
component.
4. Conclusions
The most contrast sonograms with minimal
dispersion of background noise correspond to a
nonlinear interference allocation algorithm (6).
However, even this algorithm does not eliminate
the discrete components of interference from
near-shipping noise.
The signal-to-interference ratio for all operating
frequencies depends significantly on the level of
anisotropic interference and on the compensation
processes occurring in the sound field of vector
interference.
References
[1] Gordienko V.A. "Vector-phase methods in
acoustics," M.: Fizmatlit, pp.479, 2007.
[2] Smaryshev M.D., "On the noise immunity
of a combined hydroacoustic receiver,"
Acoustical Physics, vo.51, no.4, pp.558-559,
2005.
[3] Smaryshev M.D., "Comparative evaluation
of noise immunity of antennas including
combined receivers in anisotropic noise
142 page International Conference on Software & Smart Convergence ICSSC 2017

field," Hydroacoustics, no.6, pp.18-24,
2006.
[4] Shenderov E.L. "On the noise immunity of
receiving antenna including receivers of
sound pressure and particle velocity
receivers," Hydroacoustics, no.3, pp.24-40,
2002.
ICSSC 2017 International Conference on Software & Smart Convergence 143 page
International Conference on Software & Smart Convergence (ICSSC) 2017, June 2017 Copyright ⓒ 2017 ICSSC
This research was supported by the University of Creative Korea (CK-I) program of the ministry of education (MOE) and the National Research Foundation (NRF) of Korea.
Analysis of Job Postings for Three Software Careers :
Developer, Programmer, and Engineer Hyeongyeong Gim and Soyeon Kim
Department of Management Information Systems, Keimyung University1095 Dalgubeol-daero, Dalseo-Gu Daegu 42601, Korea
[E-mail : [email protected]] *Corresponding author : Hyeongyeong Gim
Abstract
Along with the continued growth of the global software market, there is a growing demand for jobs that require software-related knowledge and skills, such as software developer, software programmer, and software engineer. The requirements of these jobs have been continuously investigated by many researchers. However, there is no previous study that addresses the job requirement differences among them, which have similar characteristics but classified into different categories. This study aims to investigate the job requirement differences among these jobs. Job crawling software was developed to collect ads for these jobs and a total of 18,000 ads collected from April 2015 to November 2016 from 13 countries in 6 regions served by 'Monster.com'. Applying text mining techniques to these job ads, we obtained top XXX words representing hard skills for each job. Research results show that while software developer and programmer are very similar hard skill requirements, they differ from software engineer. Practically this implies that software developer and programmer can be regarded as the same job category, while engineer differs from these two job roles. Theoretically it is desirable to combine these two job roles together when we analyse job requirements.
Keywords: software career, requirement, job finder, job offer
1. IntroductionResearch on the requirements of the IT profession by each occupation has been steadily progressing. However, there have been no studies on the differences in the detailed requirements of jobs in which software-related jobs have similar meanings but are classified as other occupations. Therefore, in this study, after analyzing the difference between each software job, we want to reduce the information gap between job seekers and job offers by accurately grasping the skills required by t
he industry. We would like to study the differences in the requirements of the software developer, software programmer, and software engineer who are highly demanded professionals in the IT industry.
2. Research method
2.1. Data preperation Job crawler software has been developed and collected advertisements for IT related jobs in 13 countries provided by Monster.com
144 page International Conference on Software & Smart Convergence ICSSC 2017
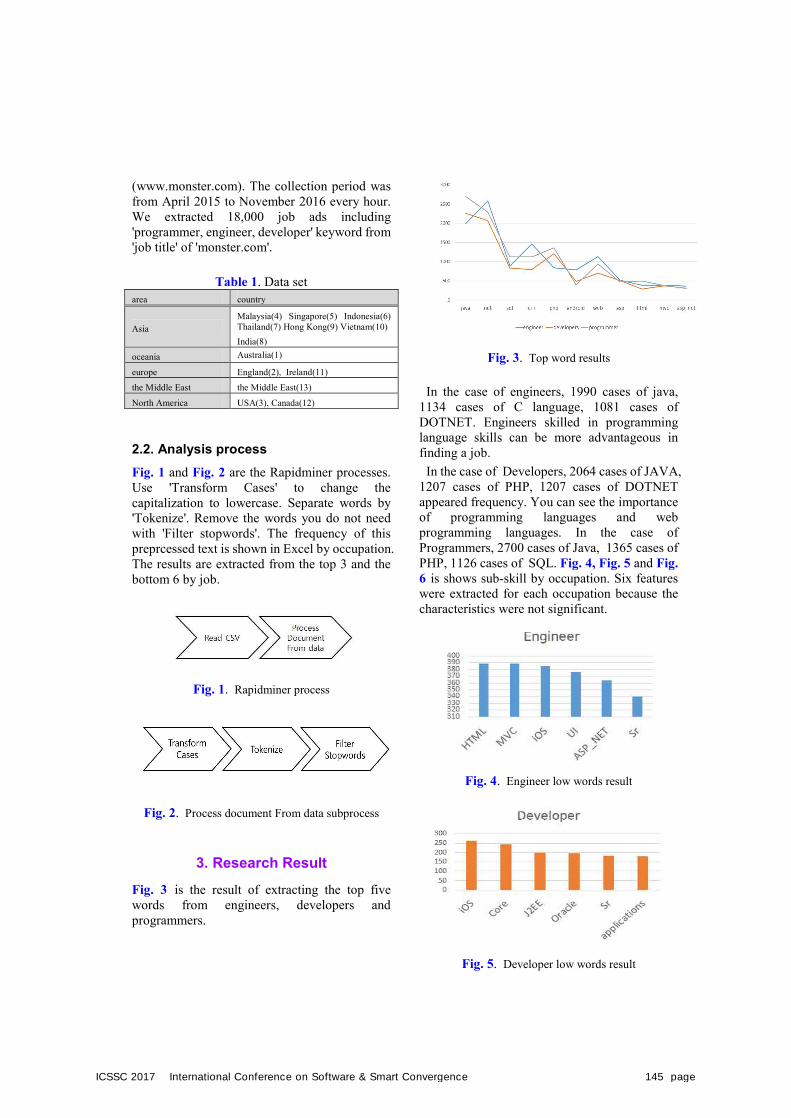
(www.monster.com). The collection period was from April 2015 to November 2016 every hour. We extracted 18,000 job ads including 'programmer, engineer, developer' keyword from 'job title' of 'monster.com'.
Table 1. Data set area country
Asia Malaysia(4) Singapore(5) Indonesia(6) Thailand(7) Hong Kong(9) Vietnam(10) India(8)
oceania Australia(1)
europe England(2), Ireland(11) the Middle East the Middle East(13)
North America USA(3), Canada(12)
2.2. Analysis process
Fig. 1 and Fig. 2 are the Rapidminer processes. Use 'Transform Cases' to change the capitalization to lowercase. Separate words by 'Tokenize'. Remove the words you do not need with 'Filter stopwords'. The frequency of this preprcessed text is shown in Excel by occupation. The results are extracted from the top 3 and the bottom 6 by job.
Fig. 1. Rapidminer process
Fig. 2. Process document From data subprocess
3. Research ResultFig. 3 is the result of extracting the top five words from engineers, developers and programmers.
Fig. 3. Top word results
In the case of engineers, 1990 cases of java, 1134 cases of C language, 1081 cases of DOTNET. Engineers skilled in programming language skills can be more advantageous in finding a job.
In the case of Developers, 2064 cases of JAVA, 1207 cases of PHP, 1207 cases of DOTNET appeared frequency. You can see the importance of programming languages and web programming languages. In the case of Programmers, 2700 cases of Java, 1365 cases of PHP, 1126 cases of SQL. Fig. 4, Fig. 5 and Fig. 6 is shows sub-skill by occupation. Six features were extracted for each occupation because the characteristics were not significant.
Fig. 4. Engineer low words result
Fig. 5. Developer low words result
ICSSC 2017 International Conference on Software & Smart Convergence 145 page
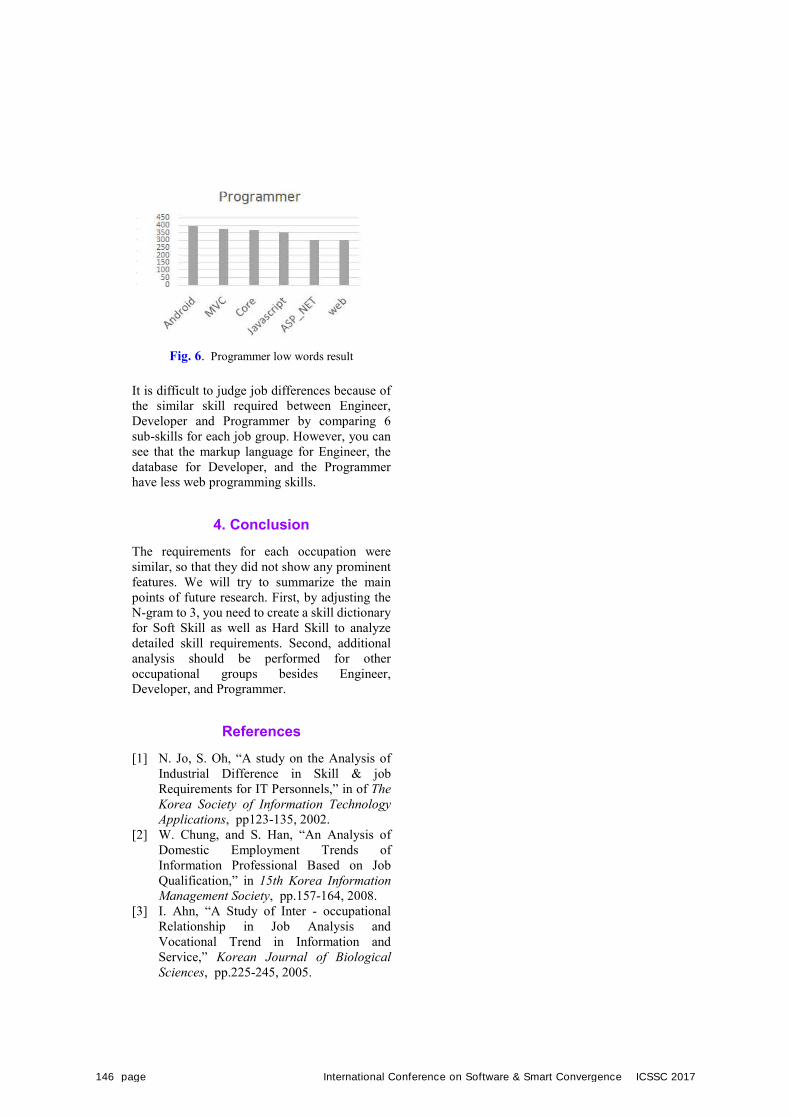
Fig. 6. Programmer low words result
It is difficult to judge job differences because of the similar skill required between Engineer, Developer and Programmer by comparing 6 sub-skills for each job group. However, you can see that the markup language for Engineer, the database for Developer, and the Programmer have less web programming skills.
4. ConclusionThe requirements for each occupation were similar, so that they did not show any prominent features. We will try to summarize the main points of future research. First, by adjusting the N-gram to 3, you need to create a skill dictionary for Soft Skill as well as Hard Skill to analyze detailed skill requirements. Second, additional analysis should be performed for other occupational groups besides Engineer, Developer, and Programmer.
References [1] N. Jo, S. Oh, “A study on the Analysis of
Industrial Difference in Skill & job Requirements for IT Personnels,” in of The Korea Society of Information Technology Applications, pp123-135, 2002.
[2] W. Chung, and S. Han, “An Analysis of Domestic Employment Trends of Information Professional Based on Job Qualification,” in 15th Korea Information Management Society, pp.157-164, 2008.
[3] I. Ahn, “A Study of Inter - occupational Relationship in Job Analysis and Vocational Trend in Information and Service,” Korean Journal of Biological Sciences, pp.225-245, 2005.
146 page International Conference on Software & Smart Convergence ICSSC 2017
International Conference on Software & Smart Convergence (ICSSC) 2017, June 2017 Copyright ⓒ 2017 ICSSC
This research was supported by the University of Creative Korea (CK-I) program of the ministry of education (MOE) and the National Research Foundation (NRF) of Korea.
In Search of Factors Affecting the Ranking of the Songs
Gyubok Lee, Seungyeon Lee and Jihye Choi Keimyung University of South Korea
1095 Dalgubeol-daero, Dalseo-Gu, Daegu 42601, Korea [e-mail: [email protected]]
*Corresponding author: Gyubok Lee
Abstract
Many websites provide music streaming services in South Korea. They also provide ranking services for songs every week using their own ranking algorithms. The ranks tend to fluctuate very fast due to the rapid changes of customers’ preferences. This study aims to investigate the factors that influcence music rankings using data releated to songs. For this research, we collected data from Gaon service, a public ranking service website for songs in South Korea. The data include singer, gender, solo or group, genre, streaming number, number of downloads, company, distributor, singer’s number of awards, and releasing information. Regression analysis showed that streaming, gender, and current rank of the song mainly influence on the ranks of the songs. Contrary to our expectations, the company size has a negaitve impact on the rank. While some genre positively impact on the rank, others do not. This study is expected to help producers and investors make better decisions when planning to create songs, produce records, and provide people with information of the songs.
Keywords: music, prediction, rank, regression, k-pop
1. IntroductionMusic is a place for modern people who should live in harmony with rapid changes caused by human societies and organizations. Technological developments allow people to be able to listen to the songs whenever and wherever you want to. We can also obtain enough information about the songs as well as the activities of the artist and the evaluation from the public [1].
It is important to analyze trends and develop strategies to attract people in music market, because many artists are competitively producing every day. Mass media provide much
information about songs and their rankings. Seungyoup Choo et al. [2] adopted some of factors that assumably affect the rankings. However, little research has been conducted on what factors influence actual rankings of the songs and what factors actually exert great influence on the public in South Korea.
This study attempts to analyze what causes the competitive advantage in the music market and analyze each factor. The purpose of this study is to provide useful information to help song producers and singers make better decisions.
2. Pretreatment and Regression
ICSSC 2017 International Conference on Software & Smart Convergence 147 page
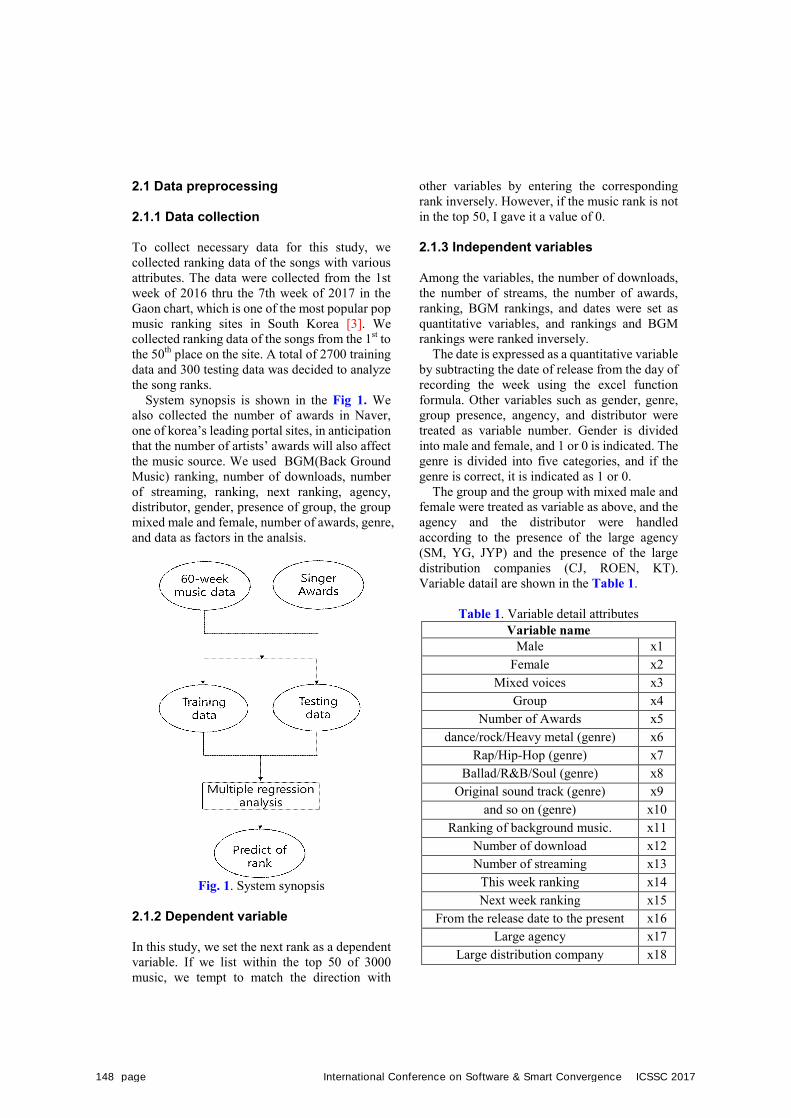
2.1 Data preprocessing 2.1.1 Data collection To collect necessary data for this study, we collected ranking data of the songs with various attributes. The data were collected from the 1st week of 2016 thru the 7th week of 2017 in the Gaon chart, which is one of the most popular pop music ranking sites in South Korea [3]. We collected ranking data of the songs from the 1st to the 50th place on the site. A total of 2700 training data and 300 testing data was decided to analyze the song ranks. System synopsis is shown in the Fig 1. We also collected the number of awards in Naver, one of korea’s leading portal sites, in anticipation that the number of artists’ awards will also affect the music source. We used BGM(Back Ground Music) ranking, number of downloads, number of streaming, ranking, next ranking, agency, distributor, gender, presence of group, the group mixed male and female, number of awards, genre, and data as factors in the analsis.
Fig. 1. System synopsis
2.1.2 Dependent variable In this study, we set the next rank as a dependent variable. If we list within the top 50 of 3000 music, we tempt to match the direction with
other variables by entering the corresponding rank inversely. However, if the music rank is not in the top 50, I gave it a value of 0. 2.1.3 Independent variables Among the variables, the number of downloads, the number of streams, the number of awards, ranking, BGM rankings, and dates were set as quantitative variables, and rankings and BGM rankings were ranked inversely. The date is expressed as a quantitative variable by subtracting the date of release from the day of recording the week using the excel function formula. Other variables such as gender, genre, group presence, angency, and distributor were treated as variable number. Gender is divided into male and female, and 1 or 0 is indicated. The genre is divided into five categories, and if the genre is correct, it is indicated as 1 or 0.
The group and the group with mixed male and female were treated as variable as above, and the agency and the distributor were handled according to the presence of the large agency (SM, YG, JYP) and the presence of the large distribution companies (CJ, ROEN, KT). Variable datail are shown in the Table 1.
Table 1. Variable detail attributes Variable name
Male x1 Female x2
Mixed voices x3 Group x4
Number of Awards x5 dance/rock/Heavy metal (genre) x6
Rap/Hip-Hop (genre) x7 Ballad/R&B/Soul (genre) x8
Original sound track (genre) x9 and so on (genre) x10
Ranking of background music. x11 Number of download x12 Number of streaming x13
This week ranking x14 Next week ranking x15
From the release date to the present x16 Large agency x17
Large distribution company x18
148 page International Conference on Software & Smart Convergence ICSSC 2017
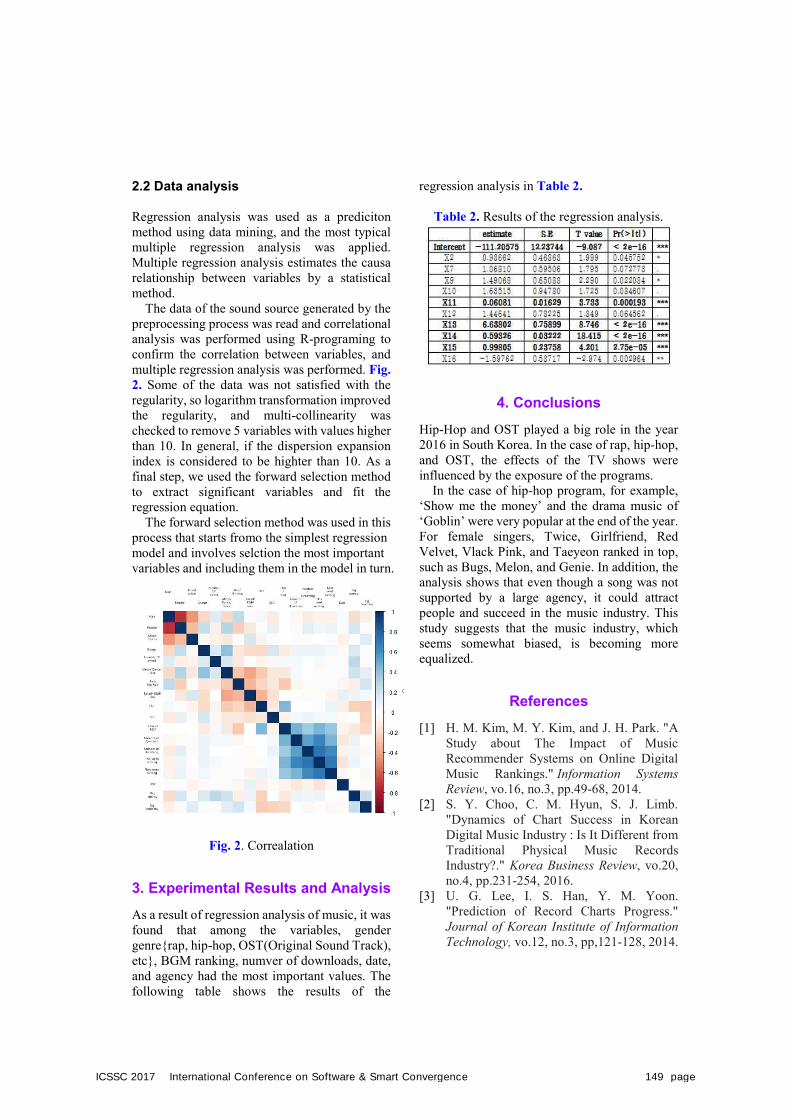
2.2 Data analysis
Regression analysis was used as a prediciton method using data mining, and the most typical multiple regression analysis was applied. Multiple regression analysis estimates the causa relationship between variables by a statistical method.
The data of the sound source generated by the preprocessing process was read and correlational analysis was performed using R-programing to confirm the correlation between variables, and multiple regression analysis was performed. Fig. 2. Some of the data was not satisfied with theregularity, so logarithm transformation improved the regularity, and multi-collinearity was checked to remove 5 variables with values higher than 10. In general, if the dispersion expansion index is considered to be highter than 10. As a final step, we used the forward selection method to extract significant variables and fit the regression equation.
The forward selection method was used in this process that starts fromo the simplest regression model and involves selction the most important variables and including them in the model in turn.
Fig. 2. Correalation
3. Experimental Results and AnalysisAs a result of regression analysis of music, it was found that among the variables, gender genre{rap, hip-hop, OST(Original Sound Track), etc}, BGM ranking, numver of downloads, date, and agency had the most important values. The following table shows the results of the
regression analysis in Table 2.
Table 2. Results of the regression analysis.
4. ConclusionsHip-Hop and OST played a big role in the year 2016 in South Korea. In the case of rap, hip-hop, and OST, the effects of the TV shows were influenced by the exposure of the programs.
In the case of hip-hop program, for example, ‘Show me the money’ and the drama music of ‘Goblin’ were very popular at the end of the year. For female singers, Twice, Girlfriend, Red Velvet, Vlack Pink, and Taeyeon ranked in top, such as Bugs, Melon, and Genie. In addition, the analysis shows that even though a song was not supported by a large agency, it could attract people and succeed in the music industry. This study suggests that the music industry, which seems somewhat biased, is becoming more equalized.
References [1] H. M. Kim, M. Y. Kim, and J. H. Park. "A
Study about The Impact of Music Recommender Systems on Online Digital Music Rankings." Information Systems Review, vo.16, no.3, pp.49-68, 2014.
[2] S. Y. Choo, C. M. Hyun, S. J. Limb. "Dynamics of Chart Success in Korean Digital Music Industry : Is It Different from Traditional Physical Music Records Industry?." Korea Business Review, vo.20, no.4, pp.231-254, 2016.
[3] U. G. Lee, I. S. Han, Y. M. Yoon. "Prediction of Record Charts Progress." Journal of Korean Institute of Information Technology, vo.12, no.3, pp,121-128, 2014.
ICSSC 2017 International Conference on Software & Smart Convergence 149 page
International Conference on Software & Smart Convergence (ICSSC) 2017, June 2017 Copyright ⓒ 2017 ICSSC
This research was supported by the University of Creative Korea (CK-I) program of the ministry of education (MOE) and the National Research Foundation (NRF) of Korea.
Development of News Crawling Systems Using Really Simple Syndication
Jinyoung An*, Gyujin Pyo and Myeongjun Jeon Department of Management Information Systems, Keimyung University
1095 Dalgubeol-daero, Dalseo-Gu, Daegu 42601, Korea [e-mail: [email protected]]
*Corresponding author: Jinyoung An
Abstract
RSS is an abbreviation of "Really Simple Syndication". It is an XML-based format for distributing web contents. It is used to easily distribute the latest information to users in frequently updated websites such as personal web blogs and media websites. In this study, we developed an RSS - based news article crawling system that collects addresses from media companies using RSS service in Korea. And we were divides newspaper articles into 11 categories according to the topic. A total of 1,780 RSS addresses were extracted from 194 media websites, and 11 categories were identified to distinguish articles from the database. The collection period of the crawling system was collected from December 2, 2016 to February 24, 2017 for about 84 days. The collected initial collected data were 51,277, collected at 1 hour intervals every day, and a total of 1,284,478 data were collected. We collected 14,508 articles per day excluding the initial collection price. Finally, by developing such a system and improving the limitations, it will be a resource for fast-big-data analysis that extracts and analyzes only the right information at the right time using the article data without ending the data collection.
Keywords : Big data, RSS, Data collecting, crawling, news article
1. IntroductionRSS is an abbreviation of both Really Simple Syndication and Rich Site Summary. RSS is a technique for providing summarized information about newly added or changed pages. It can reduce the frequency for users to access the site. The users can easily access the sites they want to by remembering the RSS channel’s address in RSS Reader[1].
Online news treats the issues of diverse fields such as economy, society and politics, which can little be treated by formalized paper media. Thus, this research attempts to develop a crawling system that collects online newspaper data efficiently[2, 3].
2. Related Work
2.1 RSS It is RDF(Resource Description Framework) -based contents-distributing protocol which is used for providers of web information to notice the updates to users. In the past, previous studies have been conducted regarding extracting new information from RSS collector by individual preferences. When a user puts a word down in RSS collector, the system searches for all the associated ones and extracts them to serve the user’s request. It is necessary for another different system to be develed to store the words obtained from the RSS collector system.
150 page International Conference on Software & Smart Convergence ICSSC 2017
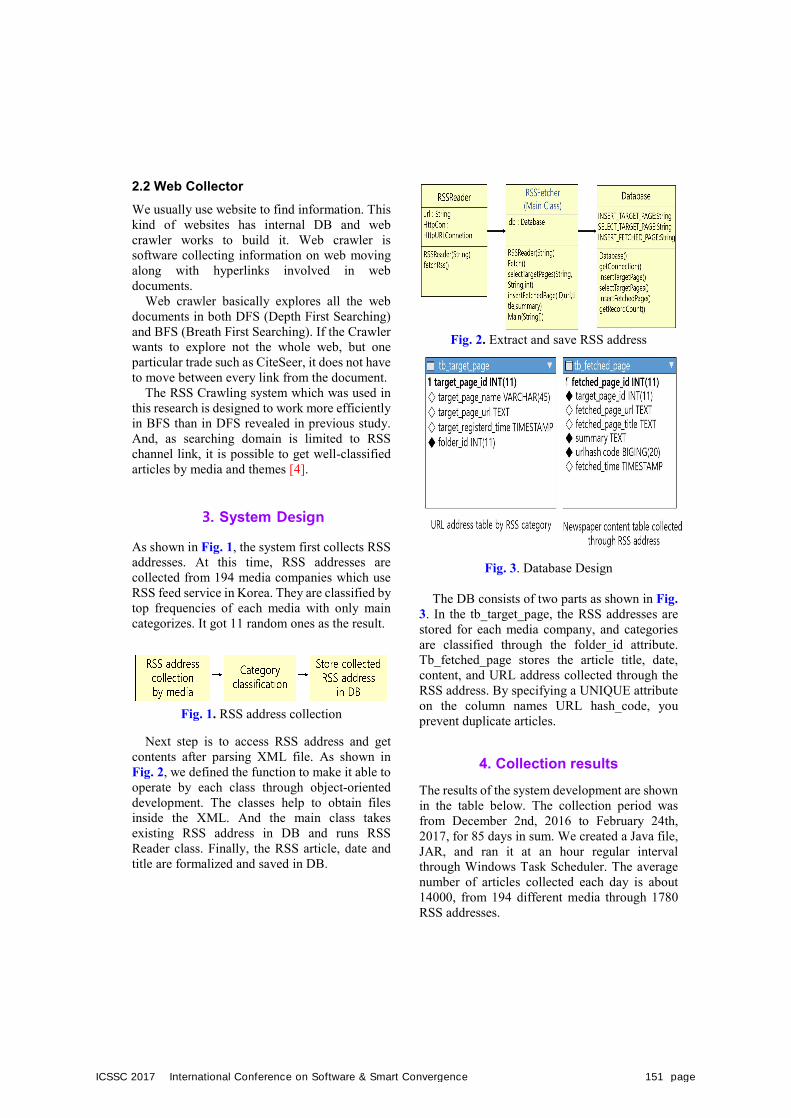
2.2 Web Collector We usually use website to find information. This kind of websites has internal DB and web crawler works to build it. Web crawler is software collecting information on web moving along with hyperlinks involved in web documents.
Web crawler basically explores all the web documents in both DFS (Depth First Searching) and BFS (Breath First Searching). If the Crawler wants to explore not the whole web, but one particular trade such as CiteSeer, it does not have to move between every link from the document.
The RSS Crawling system which was used in this research is designed to work more efficiently in BFS than in DFS revealed in previous study. And, as searching domain is limited to RSS channel link, it is possible to get well-classified articles by media and themes [4].
3. System Design
As shown in Fig. 1, the system first collects RSS addresses. At this time, RSS addresses are collected from 194 media companies which use RSS feed service in Korea. They are classified by top frequencies of each media with only main categorizes. It got 11 random ones as the result.
Fig. 1. RSS address collection
Next step is to access RSS address and get contents after parsing XML file. As shown in Fig. 2, we defined the function to make it able to operate by each class through object-oriented development. The classes help to obtain files inside the XML. And the main class takes existing RSS address in DB and runs RSS Reader class. Finally, the RSS article, date and title are formalized and saved in DB.
Fig. 2. Extract and save RSS address
Fig. 3. Database Design
The DB consists of two parts as shown in Fig. 3. In the tb_target_page, the RSS addresses arestored for each media company, and categories are classified through the folder_id attribute. Tb_fetched_page stores the article title, date, content, and URL address collected through the RSS address. By specifying a UNIQUE attribute on the column names URL hash_code, you prevent duplicate articles.
4. Collection resultsThe results of the system development are shown in the table below. The collection period was from December 2nd, 2016 to February 24th, 2017, for 85 days in sum. We created a Java file, JAR, and ran it at an hour regular interval through Windows Task Scheduler. The average number of articles collected each day is about 14000, from 194 different media through 1780 RSS addresses.
ICSSC 2017 International Conference on Software & Smart Convergence 151 page

Table 1. RSS articles collection status
Total number of articles collected 1,284,478
Number of initial articles collected 51,277
One system collection time
Approximately 18 to 23 minutes
Average number of collectors per day (excluding initial collection count)
About 14,508
The results are shown in the Table 1. The category classified as All Articles got top-ranked and followed by Social, Economic and Entertainments parts. What is remarkable is that unclassified sector got the fifth. It is because the respective mass media had variant categorization standards from each other’s. Opinion, IT/Science, Life sectors got low-ranked which can be unpopular categories.
Table 2. Number of articles collected by news
Category Collected Count Category Collected
Count
All articles 880,466 Popular
articles 16,203
Politics 37,740 Economic 63,515
Social 64,512 Culture 18,043
Life 14,670 Opinion 7,635
International 17,017 Entertainments 61,686
Sports 38,369 IT/ Science 9,339
Unclassified 55,191
5. Conclusions
RSS is a technique for providing summarized information on changed pages. In addition, online news offers a variety of information quickly and accurately with the characteristic of responding promptly to social issues. In this study, we developed RSS-based online news collection system. This collection system stores RSS feeds of categories in 194 mass media in Korea. The period of collection was 85 days from 16.12.2 to 17.2.24. The total number of collected articles was 1284478 and the average number of them each day was about 14000. The most popular categories were social, economic, entertainment, and sports. It was not generalized for both the limitation of this system and the way it would be improved henceforth because we randomly set the classification of categories. The number of unclassified articles implies the necessity of resetting categories by different media. Also, we will begin on developing a system which can scrap the whole article. At last, collecting by topics and keywords based on dictionary will make it much more sophisticated and useful system.
References [1] J.I. Kim, Y.S. Lee, J.W. Cho, B.U. Choi,
“RSS Channel Recommendation System based on Interesting Field,” in Proc. of The Institute of Electronics Engineers of Korea – Computer and Information, pp.1153-1156,2005.
[2] C. MUNKHZAYA, S.W. Ko, “System Design for Collecting Real – Time Product Information Using RSS,” in Proc. of Journal of the Society of Korea Industrial and Systems Engineering, vo.35, no.1, pp.1-9, 2012.
[3] M.S. Shin, J.J. Oh, J. Lee, “Realization of a Web-based Distribution System for the Monitoring of Business Press Releases and News Gathering Robots,” in Proc. of Journal of the Korea Society of Computer and Information, vo.18, no.12, pp.103-111, 2013.
[4] Y.S. Lee, J.W. Cho, J.l. Kim, B.U. Choi, “RSS Channel Recommendation System using Focused Crawler,” The Institute of Electronics Engineers of Korea – Computer and Information, vo.43, no.6, pp.52-59, 2006.
152 page International Conference on Software & Smart Convergence ICSSC 2017
International Conference on Software & Smart Convergence (ICSSC) 2017, June 2017 Copyright ⓒ 2017 ICSSC
This research was supported by the University of Creative Korea (CK-I) program of the ministry of education (MOE) and the National Research Foundation (NRF) of Korea.
Development of a Portal System for Data Sharing and Utilization
Mingi Jeong, Donghyeok Kim, Eunmin Choi
Keimyung University of South Korea 1095 Dalgubeol-daero, Dalseo-Gu, Deagu 42601, Republic of Korea
[e-mail: [email protected]] *Corresponding author: Mingi Jeong
Abstract
With the advent of big data era, data mining is drawing attention in statistical rules and pattern
retrieval of large datasets. Without a doubt, data must be central in these trends. We attempted to develop a portal system for sharing and utilization data that can be uploaded and downloaded by the users. The system is expected to be used to produce research results by sharing datasets uploaded. The users can have data analysis contests using the datasets, and the analysis results of a user can also be shared with other users. Keywords: dataset portal, data mining
1. Introduction In the age of the Internet, we are experiencing many types of information, and research results are coming from a wide range of data. However, no system is available to efficiently manage and view the results at a glance. In addition, unless supported by a specific institution, most researchers have economic problems in preserving large amounts of data for their research. Even after solving these problems, when managing and sharing a large dataset, problems like personal information and security are still critical issues. It is not easy to manage data efficiently, and data collection is prioritized rather than research and design [1, 2].
It is also very difficult for everyone, who is int
erested in a number of results in a research domain, to access the results. Little space is available for the researchers to freely share data and results from the research. It is necessary for anyone to upload and download datasets. To this end, the proposed system enables users to upload and download datasets managed by the system.
Many other users can evaluate the results posted by a user who uploaded his/her research results. Administrators can hold contests using public or private datasets using this system. It also has a process that can hold a contest by the request of the system users. The system scores the contest results in real-time and the results are evaluated by both experts and public.
2. Research Method
ICSSC 2017 International Conference on Software & Smart Convergence 153 page
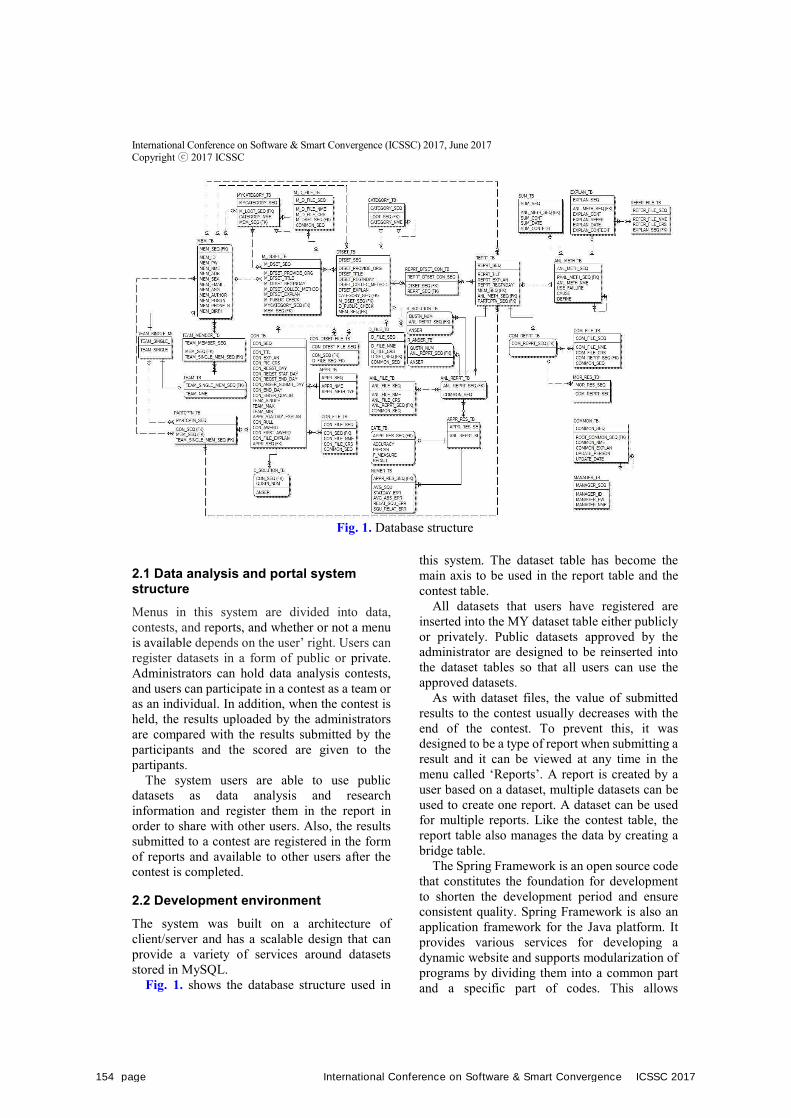
International Conference on Software & Smart Convergence (ICSSC) 2017, June 2017 Copyright ⓒ 2017 ICSSC
Fig. 1. Database structure
2.1 Data analysis and portal system structure Menus in this system are divided into data, contests, and reports, and whether or not a menu is available depends on the user’ right. Users can register datasets in a form of public or private. Administrators can hold data analysis contests, and users can participate in a contest as a team or as an individual. In addition, when the contest is held, the results uploaded by the administrators are compared with the results submitted by the participants and the scored are given to the partipants.
The system users are able to use public datasets as data analysis and research information and register them in the report in order to share with other users. Also, the results submitted to a contest are registered in the form of reports and available to other users after the contest is completed.
2.2 Development environment The system was built on a architecture of client/server and has a scalable design that can provide a variety of services around datasets stored in MySQL.
Fig. 1. shows the database structure used in
this system. The dataset table has become the main axis to be used in the report table and the contest table.
All datasets that users have registered are inserted into the MY dataset table either publicly or privately. Public datasets approved by the administrator are designed to be reinserted into the dataset tables so that all users can use the approved datasets.
As with dataset files, the value of submitted results to the contest usually decreases with the end of the contest. To prevent this, it was designed to be a type of report when submitting a result and it can be viewed at any time in the menu called ‘Reports’. A report is created by a user based on a dataset, multiple datasets can be used to create one report. A dataset can be used for multiple reports. Like the contest table, the report table also manages the data by creating a bridge table.
The Spring Framework is an open source code that constitutes the foundation for development to shorten the development period and ensure consistent quality. Spring Framework is also an application framework for the Java platform. It provides various services for developing a dynamic website and supports modularization of programs by dividing them into a common part and a specific part of codes. This allows
154 page International Conference on Software & Smart Convergence ICSSC 2017
developers to focus on system logic and to develop code that is easy to maintain. While existing frameworks often only support specialized areas such as the web, hardware, and databases, Spring helps developers to design the whole structure of the system.
3. Research ResultsThe user can register the dataset either publicly or privately and all the datasets are stored in the MY dataset preferentially regardless of whether they are public or not. Public data in the MY dataset is approved by the administrator to prevent unintentional registration of datasets that are of low objective value. The dataset approved by the administrator can not only be shared with other users who use the system in real time but can also be used for creating a report or holding a contest. The private data of a MY dataset refers to storing the collected dataset in the user's account without sharing it with other users.
Administrator can use the approved dataset files to hold contest, and users can participate in the contest either as an individual or as a team. When holding the contest, the administrator writes the rules, schedule, evaluation criteria, qualifications and uploads the dataset to be used for the contest. The dataset to be uploaded was divided into three parts. One is the original dataset which is the correct answer of the contest. Another is a verification dataset which enables the participants to verify the analysis results themselves. And the other is a question dataset
which is provided to the participants. A report is a space in which users publish their
research results using an approved set of data. Published reports are automatically shared with system users who can see which datasets have been used to conduct the research. MY dataset is visible only to the creator, but when users can create reports using MY dataset, which can be shared with other users, even though it is private.
4. ConclusionsThe proposed system was developed based on Spring Framework and MySQL for the purpose of improving efficiency and accessibility of collection and management of datasets. It is expected to operate efficitiently by integrating the existing time-consuming methods such as collecting dataset, holding contest, registering reports. In addition, holding the contests based on the registered datasets and converting the submitted results to the reports are avantages of the system.
References [1] S. Y. Bang. “A Study on BigData-Based
Software Architecture Design for Utilizing Public Open Data”, Master’s Thesis, Soongsil University, 2015.
[2] D. B. Kim. “A Case Study for Effective Accessing in Open Data Portal”, Master’s Thesis, Seoul City University, 2015.
ICSSC 2017 International Conference on Software & Smart Convergence 155 page
International Conference on Software & Smart Convergence (ICSSC) 2017, June 2017 Copyright ⓒ 2017 ICSSC
This research was supported by the University of Creative Korea (CK-I) program of the ministry of education (MOE) and the National Research Foundation (NRF) of Korea.
Analysis of Soft Skills Needed for Analytic Jobs in Information Technology
Jae Ik Son* and Yeseul Park Department of Management Information Systems, Keimyung University
1095 Dalgubeol-daero, Dalseo-Gu, Daegu 42601, Korea [e-mail: [email protected]]
*Corresponding Author: Jae Ik Son
Abstract
Since company operations largely depend on information communication technology (ICT), it becomes important to recruit appropriate ICT personnel. Among them, business analyst(BA), business intellegence(BI), data analyst(DA), data scientist(DS), and system analyst(SA) are increasingly interested in analytical work, but most people do not understand the importance of the required soft skills of the job. In addition, many companies are increasing their efficiency by outsourcing the IT-man-power globally. Therefore, this study compares the major soft skills comparison and occupational similarity by the anylysis of the frequency of soft skills used, from both the supplying and buying countries of the IT personnel. According to the analysis, all 5 jobs are required a lot of communication skill. In the case of BA and BI, there is not a large difference in the ratio of major soft skills between the IT outsourcing recipient country and the supplying country. But DA, DS, SA have some difference by the country. In the case of similarity, higher values were found in 4 jobs except DS, which showed similar results.
Keywords: Text Mining, Online Job advertisement, Analyst, Soft Skill, Similarity, Outsourcing
1. IntroductionThe hiring of IT staff is important because companies' activities are largely dependent on IT. The demand for analytics-related work has increased as the increase of the amount of data generated by the companies. Most of all, demand for BA, DA, SA, BI and DS is growing. In job search, soft skill is basic requirement to be equipped. Currently, IT advanced countries are importing the IT by outsourcing from underdeveloped countries, and secure high-quality human resources with such ability. However, this does not mean that the two countries need the same skills. Rather, the two countries might not have different requirements. Therefore, this study focuses on the differences
and similarities of job - specific soft skills among the IT Outsourcers and Outsourcees through analytic job search advertisements of analytical jobs such as BA, BI, DA, DS and SA. This is goal at improving efficiency in job seeking and job offering.
2. Related WorkResearch to analyze the requirements of IT-related jobs has been doing continuously. Bailey et al. [1] performed analysis by focusing on soft skills that system analysts should possess. Todd et al. [2] analyzed knowledge and technology requirements by using job advertisements from programmers, system analysts, and IS managers. A research on demand skills through analysis of job
156 page International Conference on Software & Smart Convergence ICSSC 2017
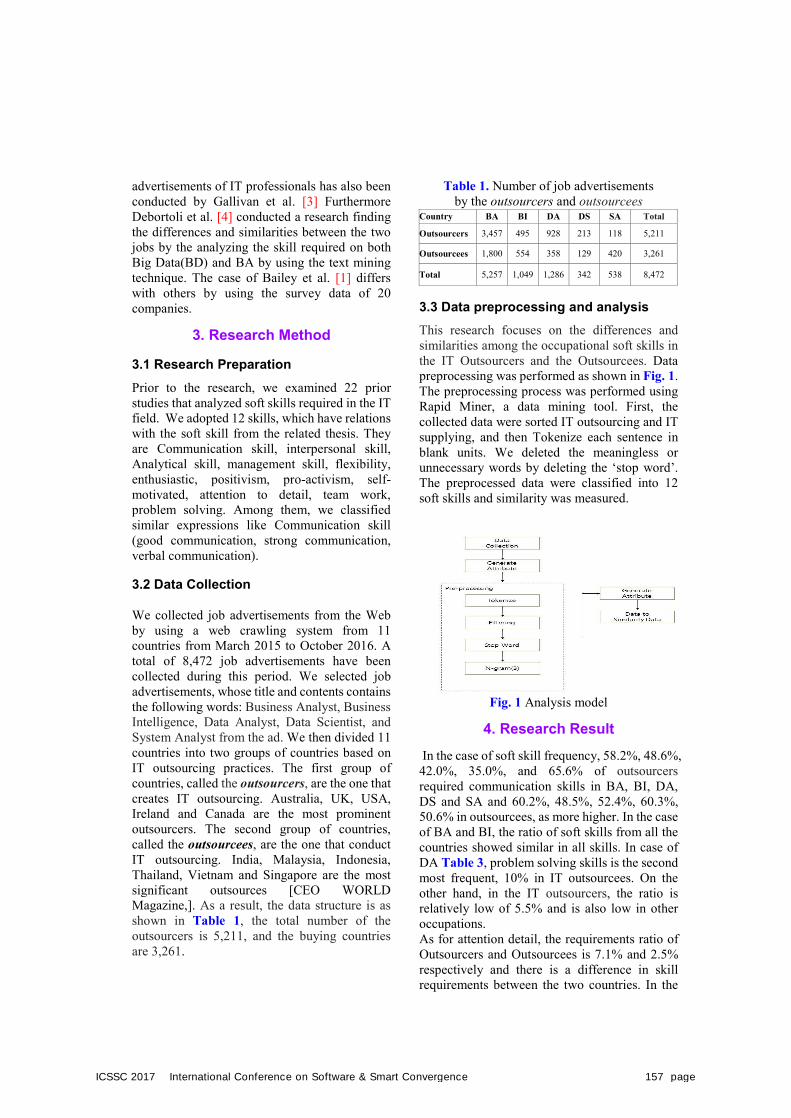
advertisements of IT professionals has also been conducted by Gallivan et al. [3] Furthermore Debortoli et al. [4] conducted a research finding the differences and similarities between the two jobs by the analyzing the skill required on both Big Data(BD) and BA by using the text mining technique. The case of Bailey et al. [1] differs with others by using the survey data of 20 companies.
3. Research Method
3.1 Research Preparation
Prior to the research, we examined 22 prior studies that analyzed soft skills required in the IT field. We adopted 12 skills, which have relations with the soft skill from the related thesis. They are Communication skill, interpersonal skill, Analytical skill, management skill, flexibility, enthusiastic, positivism, pro-activism, self- motivated, attention to detail, team work, problem solving. Among them, we classified similar expressions like Communication skill (good communication, strong communication, verbal communication).
3.2 Data Collection
We collected job advertisements from the Web by using a web crawling system from 11 countries from March 2015 to October 2016. A total of 8,472 job advertisements have been collected during this period. We selected job advertisements, whose title and contents contains the following words: Business Analyst, Business Intelligence, Data Analyst, Data Scientist, and System Analyst from the ad. We then divided 11 countries into two groups of countries based on IT outsourcing practices. The first group of countries, called the outsourcers, are the one that creates IT outsourcing. Australia, UK, USA, Ireland and Canada are the most prominent outsourcers. The second group of countries, called the outsourcees, are the one that conduct IT outsourcing. India, Malaysia, Indonesia, Thailand, Vietnam and Singapore are the most significant outsources [CEO WORLD Magazine,]. As a result, the data structure is as shown in Table 1, the total number of the outsourcers is 5,211, and the buying countries are 3,261.
Table 1. Number of job advertisements by the outsourcers and outsourcees
Country BA BI DA DS SA Total Outsourcers 3,457 495 928 213 118 5,211
Outsourcees 1,800 554 358 129 420 3,261
Total 5,257 1,049 1,286 342 538 8,472
3.3 Data preprocessing and analysis This research focuses on the differences and similarities among the occupational soft skills in the IT Outsourcers and the Outsourcees. Data preprocessing was performed as shown in Fig. 1. The preprocessing process was performed using Rapid Miner, a data mining tool. First, the collected data were sorted IT outsourcing and IT supplying, and then Tokenize each sentence in blank units. We deleted the meaningless or unnecessary words by deleting the ‘stop word’. The preprocessed data were classified into 12 soft skills and similarity was measured.
Fig. 1 Analysis model
4. Research Result In the case of soft skill frequency, 58.2%, 48.6%, 42.0%, 35.0%, and 65.6% of outsourcers required communication skills in BA, BI, DA, DS and SA and 60.2%, 48.5%, 52.4%, 60.3%, 50.6% in outsourcees, as more higher. In the case of BA and BI, the ratio of soft skills from all the countries showed similar in all skills. In case of DA Table 3, problem solving skills is the second most frequent, 10% in IT outsourcees. On the other hand, in the IT outsourcers, the ratio is relatively low of 5.5% and is also low in other occupations. As for attention detail, the requirements ratio of Outsourcers and Outsourcees is 7.1% and 2.5% respectively and there is a difference in skill requirements between the two countries. In the
ICSSC 2017 International Conference on Software & Smart Convergence 157 page
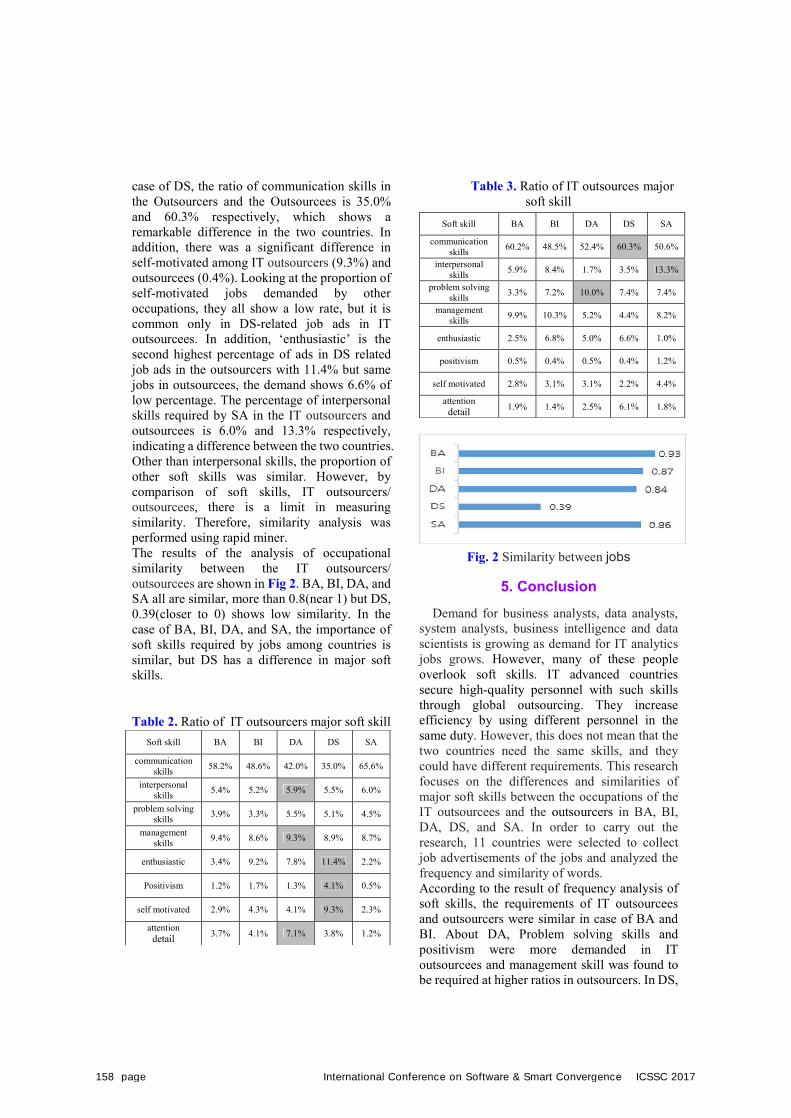
case of DS, the ratio of communication skills in the Outsourcers and the Outsourcees is 35.0% and 60.3% respectively, which shows a remarkable difference in the two countries. In addition, there was a significant difference in self-motivated among IT outsourcers (9.3%) and outsourcees (0.4%). Looking at the proportion of self-motivated jobs demanded by other occupations, they all show a low rate, but it is common only in DS-related job ads in IT outsourcees. In addition, ‘enthusiastic’ is the second highest percentage of ads in DS related job ads in the outsourcers with 11.4% but same jobs in outsourcees, the demand shows 6.6% of low percentage. The percentage of interpersonal skills required by SA in the IT outsourcers and outsourcees is 6.0% and 13.3% respectively, indicating a difference between the two countries. Other than interpersonal skills, the proportion of other soft skills was similar. However, by comparison of soft skills, IT outsourcers/ outsourcees, there is a limit in measuring similarity. Therefore, similarity analysis was performed using rapid miner. The results of the analysis of occupational similarity between the IT outsourcers/ outsourcees are shown in Fig 2. BA, BI, DA, and SA all are similar, more than 0.8(near 1) but DS, 0.39(closer to 0) shows low similarity. In the case of BA, BI, DA, and SA, the importance of soft skills required by jobs among countries is similar, but DS has a difference in major soft skills.
Table 2. Ratio of IT outsourcers major soft skill
Table 3. Ratio of IT outsources major soft skill
Fig. 2 Similarity between jobs
5. ConclusionDemand for business analysts, data analysts,
system analysts, business intelligence and data scientists is growing as demand for IT analytics jobs grows. However, many of these people overlook soft skills. IT advanced countries secure high-quality personnel with such skills through global outsourcing. They increase efficiency by using different personnel in the same duty. However, this does not mean that the two countries need the same skills, and they could have different requirements. This research focuses on the differences and similarities of major soft skills between the occupations of the IT outsourcees and the outsourcers in BA, BI, DA, DS, and SA. In order to carry out the research, 11 countries were selected to collect job advertisements of the jobs and analyzed the frequency and similarity of words. According to the result of frequency analysis of soft skills, the requirements of IT outsourcees and outsourcers were similar in case of BA and BI. About DA, Problem solving skills and positivism were more demanded in IT outsourcees and management skill was found to be required at higher ratios in outsourcers. In DS,
Soft skill BA BI DA DS SA
communication skills 58.2% 48.6% 42.0% 35.0% 65.6%
interpersonal skills 5.4% 5.2% 5.9% 5.5% 6.0%
problem solving skills 3.9% 3.3% 5.5% 5.1% 4.5%
management skills 9.4% 8.6% 9.3% 8.9% 8.7%
enthusiastic 3.4% 9.2% 7.8% 11.4% 2.2%
Positivism 1.2% 1.7% 1.3% 4.1% 0.5%
self motivated 2.9% 4.3% 4.1% 9.3% 2.3%
attention detail 3.7% 4.1% 7.1% 3.8% 1.2%
Soft skill BA BI DA DS SA
communication skills 60.2% 48.5% 52.4% 60.3% 50.6%
interpersonal skills 5.9% 8.4% 1.7% 3.5% 13.3%
problem solving skills 3.3% 7.2% 10.0% 7.4% 7.4%
management skills 9.9% 10.3% 5.2% 4.4% 8.2%
enthusiastic 2.5% 6.8% 5.0% 6.6% 1.0%
positivism 0.5% 0.4% 0.5% 0.4% 1.2%
self motivated 2.8% 3.1% 3.1% 2.2% 4.4%
attention detail 1.9% 1.4% 2.5% 6.1% 1.8%
158 page International Conference on Software & Smart Convergence ICSSC 2017
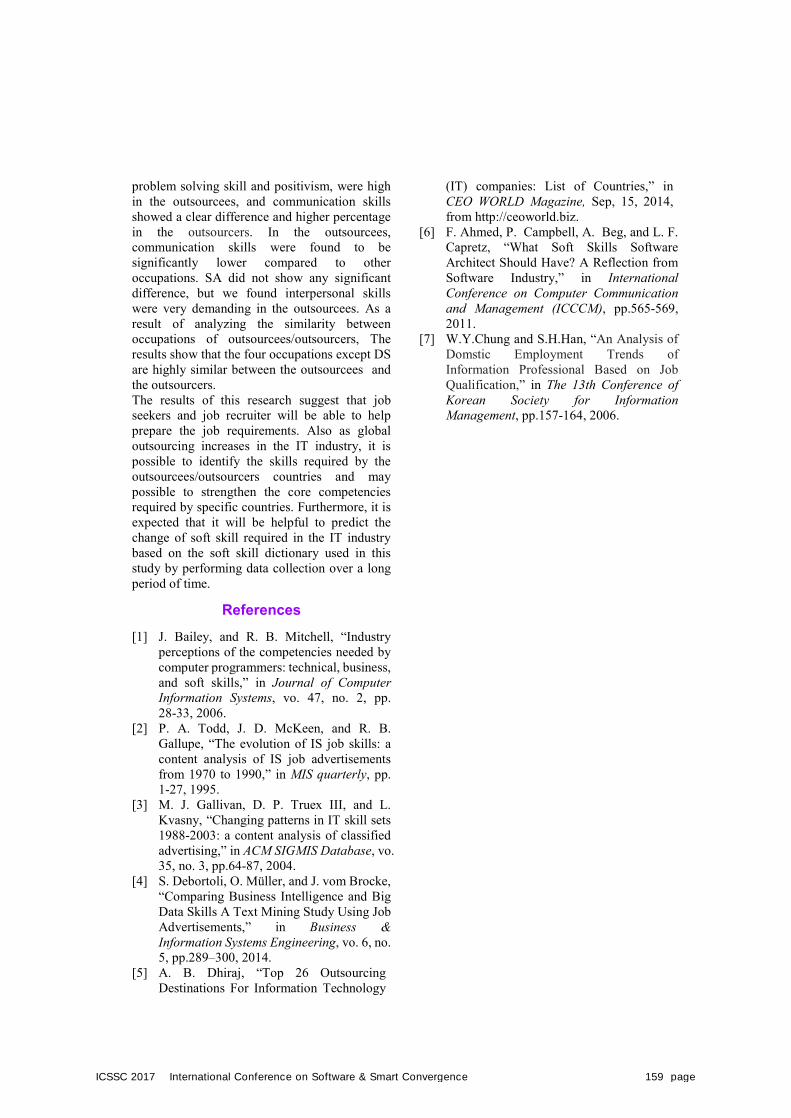
problem solving skill and positivism, were high in the outsourcees, and communication skills showed a clear difference and higher percentage in the outsourcers. In the outsourcees, communication skills were found to be significantly lower compared to other occupations. SA did not show any significant difference, but we found interpersonal skills were very demanding in the outsourcees. As a result of analyzing the similarity between occupations of outsourcees/outsourcers, The results show that the four occupations except DS are highly similar between the outsourcees and the outsourcers. The results of this research suggest that job seekers and job recruiter will be able to help prepare the job requirements. Also as global outsourcing increases in the IT industry, it is possible to identify the skills required by the outsourcees/outsourcers countries and may possible to strengthen the core competencies required by specific countries. Furthermore, it is expected that it will be helpful to predict the change of soft skill required in the IT industry based on the soft skill dictionary used in this study by performing data collection over a long period of time.
References [1] J. Bailey, and R. B. Mitchell, “Industry
perceptions of the competencies needed by computer programmers: technical, business, and soft skills,” in Journal of Computer Information Systems, vo. 47, no. 2, pp. 28-33, 2006.
[2] P. A. Todd, J. D. McKeen, and R. B. Gallupe, “The evolution of IS job skills: a content analysis of IS job advertisements from 1970 to 1990,” in MIS quarterly, pp. 1-27, 1995.
[3] M. J. Gallivan, D. P. Truex III, and L. Kvasny, “Changing patterns in IT skill sets 1988-2003: a content analysis of classified advertising,” in ACM SIGMIS Database, vo. 35, no. 3, pp.64-87, 2004.
[4] S. Debortoli, O. Müller, and J. vom Brocke, “Comparing Business Intelligence and Big Data Skills A Text Mining Study Using Job Advertisements,” in Business & Information Systems Engineering, vo. 6, no. 5, pp.289–300, 2014.
[5] A. B. Dhiraj, “Top 26 Outsourcing Destinations For Information Technology
(IT) companies: List of Countries,” in CEO WORLD Magazine, Sep, 15, 2014, from http://ceoworld.biz.
[6] F. Ahmed, P. Campbell, A. Beg, and L. F. Capretz, “What Soft Skills Software Architect Should Have? A Reflection from Software Industry,” in International Conference on Computer Communication and Management (ICCCM), pp.565-569, 2011.
[7] W.Y.Chung and S.H.Han, “An Analysis of Domstic Employment Trends of Information Professional Based on Job Qualification,” in The 13th Conference of Korean Society for Information Management, pp.157-164, 2006.
ICSSC 2017 International Conference on Software & Smart Convergence 159 page

International Conference on Software & Smart Convergence (ICSSC) 2017, June 2017 Copyright ⓒ 2017 ICSSC
This research was supported by the University of Creative Korea (CK-I) program of the ministry of education (MOE) and the National Research Foundation (NRF) of Korea.
Prediction of Ticket Sales before the Opening of the Movies
Kyoungmin Go, Jungmin Kim and Hyewon LeeKeimyung University
1095, Dalgubeol-daero, Daegu, Republic of Korea [e-mail : [email protected]]
Abstract
As the movie market has increased consistently, the studies on the forecasting of movies sales have been published. Based upon the 314 movie data with more than 100,000 cumulative number of viewers through 'Korean Film Promotion Committee' and 'Naver Movie Search', this study attempted to find the factors influencing the ticket sales before the opening. A forecasting model was designed to perform multiple regression analysis. Of the twenty-five variables in the model, we had eleven factors found to be significant to the dependent variable, ticket sales. The factors range from the genres, rating, distributor, actors/actresses to viewing time. This study is expected to help film-makers to persuade investors to make films and distributors to make efficient decisions when securing the number of screens.
Keywords: movie, multiple regression, forecasting model
1. IntroductionThe movie industry in Korea is receiving attention as a fast-growing industry in the market. Unlike the past, the Korean movie industry has been growing rapidly. The main purpose of this study is to develop an economic statistical model to predict the performance of the released movie by Kim and Pyo [1].
Unlike other industries due to the nature of the movie industry that the process of estimating the demand size of a product or calculating an appropriate production cost in anticipation of sales are large variability. Thus, a universally valid criterion that can predict the performance of all movies is impossible to find. Because of all of this, investment in the movie industry is riskier, and holds much more uncertainty when compared to other industries. It is therefore very
important in the profitability area of the movie, to identify the elements of the movie's popularity and to predict whether or not the movie will be featured.
This study is based on the information of previously released movies, and is used as a way of analyzing the information and to reveal the performance of these movies in order to deal with the problem of predicting the number of viewers for a new movie. In particular, this applies an excellent and accurate model that predicts the total number of viewers for a movie yet to be released. Appropriate features for applying the method of predicting the number of viewers in a movie in Korea are: Opening ratings, distributors, actors, genre, among other variables.
2. Main Topic
160 page International Conference on Software & Smart Convergence ICSSC 2017
In this study, factors concerning the prediction of the box-office was collected. The collected factors were determined using a stepwise regression method and the predicted factors were determined through multiple regression analysis using the determined factors.
2.1 Factors
• GenreA movie can be divided into several genres depending on its content attributes. These genres have also been hypothesized or proven to have a direct impact on movie performance through existing research.
• Movie RatingsA rating is assumed to affect the performance of a movie in a number of studies that distinguished between the ages that can be seen according to the contents of the movie.
• Actors/DirectorsThe lead actor or director may be an important component of the film. Information of these leading actors or directors having received good appraisal from other audiences, in previous films, reduces the anxiety of choosing a new movie by Jang et al. [2].
• Rating Before OpeningAs the Internet emerged as an important communication medium, a new form of oral communication has expanded its influence further. Among these things, when netizens choose a movie, the opinions of the audience about the movie in the internet has a big impact on the movie’s popularity by Lee [3].
• DistributorThe distributor forms a dynamic relationship with the theater with theater chains and line-ups. A distributor who receives many good movies will be bigger. Currently, the distributor that dominates the market in Korea is: CJ E&M, ShowBox, NEW, and Lotte Entertainer.
Of course, there are no guarantees that a movie will be successful if a major distributor delivers a movie, but it is difficult to ignore that influence by Chung [4].
• Number of Producers/Staff
The film crew refers to people who are involved in the production of the film in accordance with the request of the director. The higher the number of production crew, the higher the quality of the film, and the more likely that the audience will be interested. As a result, this is a factor that influences the movie’s performance. In addition, Gu and Kim [5] classified the production, distribution, and screening as factors that affects the movie box-office.
As such, this study synthesizes the contents of these prior studies and sets the characteristic variables related to the movie’s popularity. This was analyzed with 25 factors including nine genres, four movie ratings, diversity movies, commercial movies, quarterly divisions, distributors, impressions, actors, and preleased ratings.
2.2 Data Collection and Preprocessing The data used in this study were 342 films screened in Korea from January 2010 to December 2015 and used to predict 35 movies in 2016. Data were collected through the Korean Film Commission and their website. In order to classify the discrete variables with the discrete values and the characteristics of the measured objects, we divided the numbers and classified them into variable numbers according to the characteristics of each independent variable.
The total number of spectators in each movie was selected as a dependent variable and the remaining factors were used as independent variables for analysis.
2.3 Analysis Multiple regression analysis was conducted to analyze the effects of factors on the total number of viewers in the movie Multiple regression analysis was conducted to analyze the effects of factors on the total number of viewers in the movie. The following regression model was used as an economic statistical model to predict the number of viewers before opening.
(1)
Before applying the model mentioned, 11 independent variables among 25 independent variables were selected through the stepwise regression method. After investigation, it was seen that the multicollinearity variable showed
ICSSC 2017 International Conference on Software & Smart Convergence 161 page
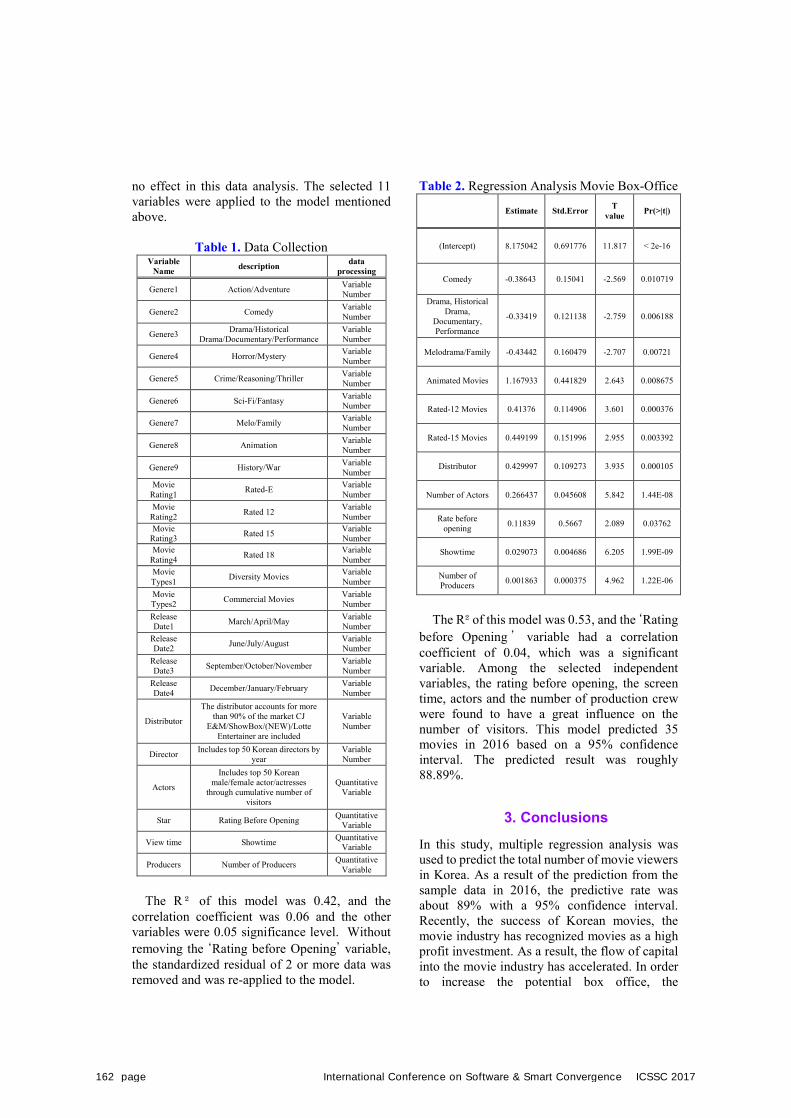
no effect in this data analysis. The selected 11 variables were applied to the model mentioned above.
Table 1. Data Collection Variable
Name description data processing
Genere1 Action/Adventure Variable Number
Genere2 Comedy Variable Number
Genere3 Drama/Historical Drama/Documentary/Performance
Variable Number
Genere4 Horror/Mystery Variable Number
Genere5 Crime/Reasoning/Thriller Variable Number
Genere6 Sci-Fi/Fantasy Variable Number
Genere7 Melo/Family Variable Number
Genere8 Animation Variable Number
Genere9 History/War Variable Number
Movie Rating1 Rated-E Variable
Number Movie
Rating2 Rated 12 Variable Number
Movie Rating3 Rated 15 Variable
Number Movie
Rating4 Rated 18 Variable Number
Movie Types1 Diversity Movies Variable
Number Movie Types2 Commercial Movies Variable
Number Release Date1 March/April/May Variable
Number Release Date2 June/July/August Variable
Number Release Date3 September/October/November Variable
Number Release Date4 December/January/February Variable
Number
Distributor
The distributor accounts for more than 90% of the market CJ
E&M/ShowBox/(NEW)/Lotte Entertainer are included
Variable Number
Director Includes top 50 Korean directors by year
Variable Number
Actors
Includes top 50 Korean male/female actor/actresses
through cumulative number of visitors
Quantitative Variable
Star Rating Before Opening Quantitative Variable
View time Showtime Quantitative Variable
Producers Number of Producers Quantitative Variable
The R ² of this model was 0.42, and the correlation coefficient was 0.06 and the other variables were 0.05 significance level. Without removing the ‘Rating before Opening’ variable, the standardized residual of 2 or more data was removed and was re-applied to the model.
Table 2. Regression Analysis Movie Box-Office
Estimate Std.Error T value Pr(>|t|)
(Intercept) 8.175042 0.691776 11.817 < 2e-16
Comedy -0.38643 0.15041 -2.569 0.010719
Drama, Historical Drama,
Documentary, Performance
-0.33419 0.121138 -2.759 0.006188
Melodrama/Family -0.43442 0.160479 -2.707 0.00721
Animated Movies 1.167933 0.441829 2.643 0.008675
Rated-12 Movies 0.41376 0.114906 3.601 0.000376
Rated-15 Movies 0.449199 0.151996 2.955 0.003392
Distributor 0.429997 0.109273 3.935 0.000105
Number of Actors 0.266437 0.045608 5.842 1.44E-08
Rate before opening 0.11839 0.5667 2.089 0.03762
Showtime 0.029073 0.004686 6.205 1.99E-09
Number of Producers 0.001863 0.000375 4.962 1.22E-06
The R² of this model was 0.53, and the ‘Rating before Opening ’ variable had a correlation coefficient of 0.04, which was a significant variable. Among the selected independent variables, the rating before opening, the screen time, actors and the number of production crew were found to have a great influence on the number of visitors. This model predicted 35 movies in 2016 based on a 95% confidence interval. The predicted result was roughly 88.89%.
3. ConclusionsIn this study, multiple regression analysis was used to predict the total number of movie viewers in Korea. As a result of the prediction from the sample data in 2016, the predictive rate was about 89% with a 95% confidence interval. Recently, the success of Korean movies, the movie industry has recognized movies as a high profit investment. As a result, the flow of capital into the movie industry has accelerated. In order to increase the potential box office, the
162 page International Conference on Software & Smart Convergence ICSSC 2017
investment increased and the risk burden increased due to the inherent uncertainty of movies. To combat these uncertainties, filmmakers help investors make investment decisions through the prediction model developed in this study.
In addition, strategic investors will be able to make more informed decisions in determining the number of viewers before opening.
Reference [1] B. Kim and T. Pyo, “Forecasting Model for
Box-Office Revenue of Motion Pictures”, Management Journal (Institute of Management Research at Seoul National University), vo.36, no.1, pp.1-23, 2002.
[2] B. Jang, Y. Lee, B. Kim and S. Nam, “Elaborating Movie Performance Forecast Through Psychological Variables”, Korean Society for the Study of Journalism, vo.53, no.4, pp.4-6, 2009.
[3] J. Lee, “Influence of Online Netizen Review Before Movie Opening”, Master’s Thesis, Chugye University, 2008.
[4] M. Chung, “The Law of Movie Investment – Something more Interesting than the Movie Itself”, Eulyoo Publishing Co., 2005.
[5] E. Gu and H. Kim, “A Study on Spectators' Motivation Factors Affecting Box-Office of Korean Creative Musical”, Proceedings of the Fall Conference of Korea Academia-Industrial Cooperation Society, pp.127-130, 2011.
ICSSC 2017 International Conference on Software & Smart Convergence 163 page
International Conference on Software & Smart Convergence (ICSSC) 2017, June 2017 Copyright ⓒ 2017 ICSSC
This research was supported by the University of Creative Korea (CK-I) program of the ministry of education (MOE) and the National Research Foundation (NRF) of Korea.
Automated Classification of Job Advertisements : Causes of Incorrectness
and Its Implications In Hyeok Choi and Myeongjoon Jeon
Department of Management Information Systems, Keimyung University, 1095 Dakgubeol-daero, Dalseo Gu,Daegu 42601, Korea
[e-mail: [email protected]]
Abstract
With the advent of the fourth industrial revolution in recent years, new jobs based on the convergence of information and communication technology (ICT) frequently come and go. Moreover, the changes in IT skill requirements are very diverse. Recently most job advertisements are posted on the online job web sites. Job seekers find their job using categories on the web sites, while companies place their advertisements to the specific categories, expecting their candidate employees can find their job advertisement easily. Manual job classification is tedious and sometime difficult task for job offers. Therefore, it is important to classify job advertisements into the job category automatically and precisely. In this study, we aim to develop classification models using machine learning approaches and evaluate their performances in order to find the best approach. We collected 6,328 advertisement data, which classified into 30 IT job categories, for four months in CareerBuilder website. After preprocessing the unstructured data, we created a formal data set and created models using Naive Bayes, k-NN and deep learning algorithms. The best accuracy rate of the classification model was 87.47% with deep learning algorithm. Although the classification performance is significantly high, some job advertisements are still classified incorrectly. Some incorrect classifications are caused by high similarity of job description, represented by high correlation and similarity of frequent words (e.g., Windows administrator and system administrator), while others are caused by insufficient of job description (e.g., project analyst). This reflects the changing characteristics of jobs in the modern IT job market and implies that companies should careful when they preparing job advertisements.
Keywords: Text Mining, Deep Learning, K-NN, Naïve Bayes, Job Classification, IT Job
1. IntroductionAt the World Economic Forum in 2016 [1],
the effects of the Fourth Industrial Revolution were forecasted that by 2020, 7.1 million jobs in developed countries would disappear while 400,000 jobs in computer and mathematical fields would be created. This Fourth Industrial Revolution is based on the convergence of
information and communication technology. As the IT profession is differentiated and integrated in the job advertisement market due to the rapid technological change, researches on the classification of IT job categories and occupational skills have been continually performed. Therefore, this study aims to create a model that automatically classifies IT job categories by using IT job ads. The second goal
164 page International Conference on Software & Smart Convergence ICSSC 2017
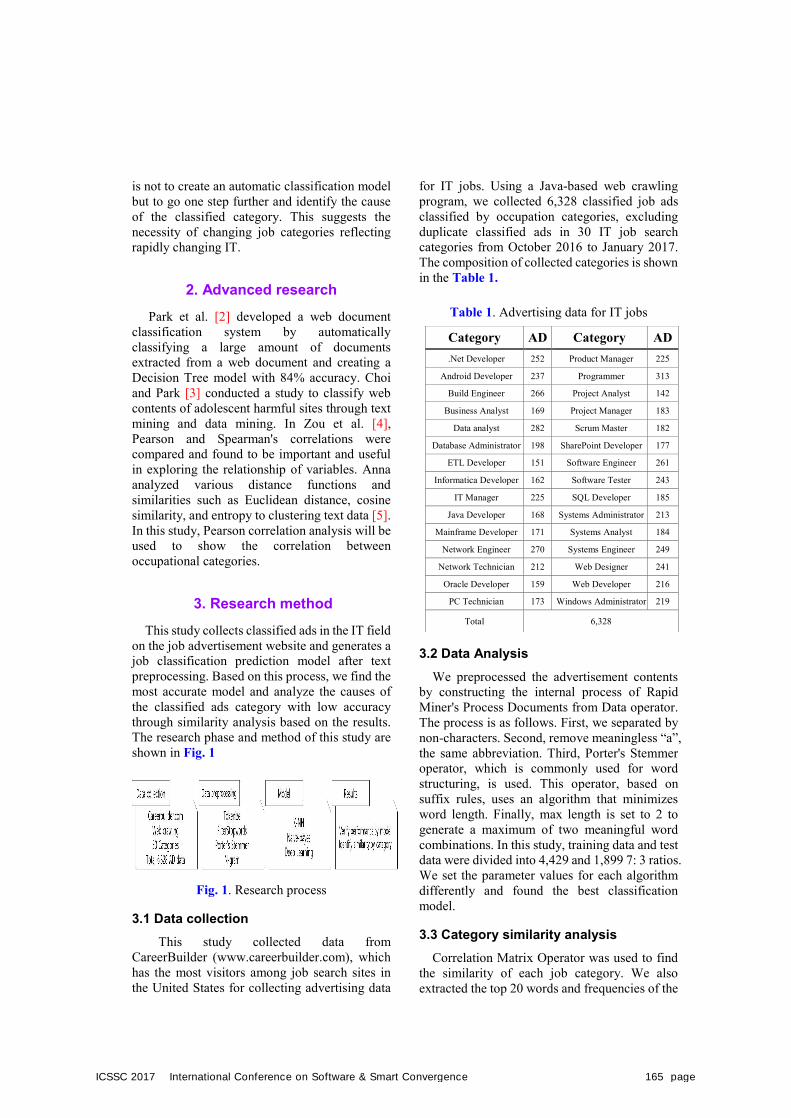
is not to create an automatic classification model but to go one step further and identify the cause of the classified category. This suggests the necessity of changing job categories reflecting rapidly changing IT.
2. Advanced research Park et al. [2] developed a web document
classification system by automatically classifying a large amount of documents extracted from a web document and creating a Decision Tree model with 84% accuracy. Choi and Park [3] conducted a study to classify web contents of adolescent harmful sites through text mining and data mining. In Zou et al. [4], Pearson and Spearman's correlations were compared and found to be important and useful in exploring the relationship of variables. Anna analyzed various distance functions and similarities such as Euclidean distance, cosine similarity, and entropy to clustering text data [5]. In this study, Pearson correlation analysis will be used to show the correlation between occupational categories.
3. Research methodThis study collects classified ads in the IT field
on the job advertisement website and generates a job classification prediction model after text preprocessing. Based on this process, we find the most accurate model and analyze the causes of the classified ads category with low accuracy through similarity analysis based on the results. The research phase and method of this study are shown in Fig. 1
Fig. 1. Research process
3.1 Data collection This study collected data from
CareerBuilder (www.careerbuilder.com), which has the most visitors among job search sites in the United States for collecting advertising data
for IT jobs. Using a Java-based web crawling program, we collected 6,328 classified job ads classified by occupation categories, excluding duplicate classified ads in 30 IT job search categories from October 2016 to January 2017. The composition of collected categories is shown in the Table 1.
Table 1. Advertising data for IT jobs
3.2 Data Analysis
We preprocessed the advertisement contents by constructing the internal process of Rapid Miner's Process Documents from Data operator. The process is as follows. First, we separated by non-characters. Second, remove meaningless “a”, the same abbreviation. Third, Porter's Stemmer operator, which is commonly used for word structuring, is used. This operator, based on suffix rules, uses an algorithm that minimizes word length. Finally, max length is set to 2 to generate a maximum of two meaningful word combinations. In this study, training data and test data were divided into 4,429 and 1,899 7: 3 ratios. We set the parameter values for each algorithm differently and found the best classification model.
3.3 Category similarity analysis
Correlation Matrix Operator was used to find the similarity of each job category. We also extracted the top 20 words and frequencies of the
Category AD Category AD .Net Developer 252 Product Manager 225
Android Developer 237 Programmer 313
Build Engineer 266 Project Analyst 142
Business Analyst 169 Project Manager 183
Data analyst 282 Scrum Master 182
Database Administrator 198 SharePoint Developer 177
ETL Developer 151 Software Engineer 261
Informatica Developer 162 Software Tester 243
IT Manager 225 SQL Developer 185
Java Developer 168 Systems Administrator 213
Mainframe Developer 171 Systems Analyst 184
Network Engineer 270 Systems Engineer 249
Network Technician 212 Web Designer 241
Oracle Developer 159 Web Developer 216
PC Technician 173 Windows Administrator 219
Total 6,328
ICSSC 2017 International Conference on Software & Smart Convergence 165 page
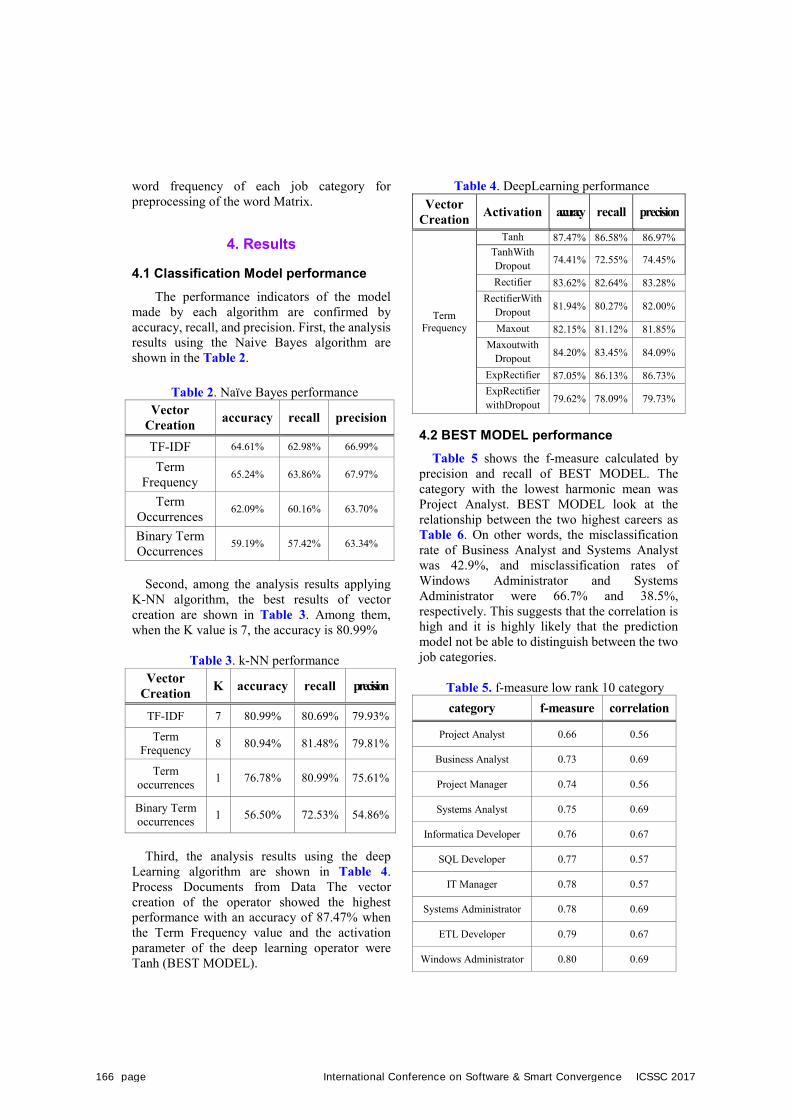
word frequency of each job category for preprocessing of the word Matrix.
4. Results
4.1 Classification Model performance The performance indicators of the model
made by each algorithm are confirmed by accuracy, recall, and precision. First, the analysis results using the Naive Bayes algorithm are shown in the Table 2.
Table 2. Naïve Bayes performance Vector
Creation accuracy recall precision
TF-IDF 64.61% 62.98% 66.99%
Term Frequency 65.24% 63.86% 67.97%
Term Occurrences 62.09% 60.16% 63.70%
Binary Term Occurrences 59.19% 57.42% 63.34%
Second, among the analysis results applying K-NN algorithm, the best results of vector creation are shown in Table 3. Among them, when the K value is 7, the accuracy is 80.99%
Table 3. k-NN performance Vector
Creation K accuracy recall precision
TF-IDF 7 80.99% 80.69% 79.93%
Term Frequency 8 80.94% 81.48% 79.81%
Term occurrences 1 76.78% 80.99% 75.61%
Binary Term occurrences 1 56.50% 72.53% 54.86%
Third, the analysis results using the deep Learning algorithm are shown in Table 4. Process Documents from Data The vector creation of the operator showed the highest performance with an accuracy of 87.47% when the Term Frequency value and the activation parameter of the deep learning operator were Tanh (BEST MODEL).
Table 4. DeepLearning performance Vector
Creation Activation accuracy recall precision
Term Frequency
Tanh 87.47% 86.58% 86.97% TanhWith Dropout 74.41% 72.55% 74.45%
Rectifier 83.62% 82.64% 83.28% RectifierWith
Dropout 81.94% 80.27% 82.00%
Maxout 82.15% 81.12% 81.85% Maxoutwith
Dropout 84.20% 83.45% 84.09%
ExpRectifier 87.05% 86.13% 86.73% ExpRectifier withDropout 79.62% 78.09% 79.73%
4.2 BEST MODEL performance Table 5 shows the f-measure calculated by
precision and recall of BEST MODEL. The category with the lowest harmonic mean was Project Analyst. BEST MODEL look at the relationship between the two highest careers as Table 6. On other words, the misclassification rate of Business Analyst and Systems Analyst was 42.9%, and misclassification rates of Windows Administrator and Systems Administrator were 66.7% and 38.5%, respectively. This suggests that the correlation is high and it is highly likely that the prediction model not be able to distinguish between the two job categories.
Table 5. f-measure low rank 10 category category f-measure correlation
Project Analyst 0.66 0.56
Business Analyst 0.73 0.69
Project Manager 0.74 0.56
Systems Analyst 0.75 0.69
Informatica Developer 0.76 0.67
SQL Developer 0.77 0.57
IT Manager 0.78 0.57
Systems Administrator 0.78 0.69
ETL Developer 0.79 0.67
Windows Administrator 0.80 0.69
166 page International Conference on Software & Smart Convergence ICSSC 2017
Table 6. Misclassification rate First
Category Second
Category Mis
classfication correlatio
n Business Analyst Systems Analyst 42.9%
.695 Systems Analyst Business Analyst 42.9%
Windows Administrator
Systems Administrator 38.5%
.691 Systems Administrator
Windows Administrator 66.7%
Project Analyst's correlation is 0.562, which is
not the highest. Nevertheless, the prediction accuracy is the lowest as seen in the Table 5. This is because the word frequency of the Project Analyst category is evenly distributed without special features. The contents are shown in Fig.2
Fig. 2 f-measure low rank 10 category wordlist
5. Conclusions This study collected job search data in the IT
field from job search advertisement website "Careerbuilder.com" and created an automatic classification model for each job category. First, we tried to find the model with the highest prediction rate. Second, we wanted to find the cause of the category with low prediction rate. The highest accuracy model was Deep Learning (Term Frequency-Tanh) model (BEST MODEL). When the K value was 7 (TF-IDF), 80.99% of the models using K-nn showed the highest accuracy. For the Naive Bayes model, the accuracy is 65%
The causes of the misclassifications found through this study are as follows. First, correlation analysis showed that the category misclassification rate of two ads with high correlation coefficient was high. The correlation coefficient between Windows Administrator and System Administrator is strongly correlated to .691. As a result, the two categories were the
percentage of incorrect predictions each other. Second, Project Analyst, which has the highest misclassification rate categories does not have special words that distinguish it from other categories. Therefore, the academic implication of this paper is that it suggests an algorithm with high prediction rate of classification by IT job category. One step further and it proposed a classification predictive cause of the low category. The practical implication is that the occupational groups in the highly correlated categories show similarities and can be referred to when looking for a job. It is suggested to check again the job category that shows similarity among the subdivided job types.
This study has a limit that does not reflect all the meaningful keywords. In addition, errors may occur because text-based research excludes interpretation of experts with domain knowledge. Future research aims to develop a prediction algorithm after extracting keywords that can represent a job in job advertisements so as to overcome these limitations. In addition, by analyzing the change of similarity according to category of job advertisement according to time series, it would be a meaningful research to study the change of job.
References [1] WEF (2016). “The Future of Jobs,” 2016. 1. [2] Dan-Ho Park, Won-Sik Choi, Hong-Jo Kim,
Seok-Lyong Lee, “Web document Classification System Using the Text Analysis and Decision Tree Model,” KOREA INFORMATION SCIENCE SOCIETY, vo.38, no.2A, pp.248-251, 2011.
[3] Yun-Jeong Choi, Seung-Soo Park, “Interplay of Text Mining and Data Mining for Classification Web Contents,” Korean Journal of Cognitive Science, vo.13, no.3, pp.33-46, 2002.
[4] Zou, Kelly H., Tuncali Kemal, & Stuart G. Silverman. “Correlation and simple linear regression,” Radiology vo.227, no.3, pp.617-628, 2003.
[5] Huang, Anna, “Similarity measures for text document clustering,” In Proceedings of the sixth new zealand computer science research student conference (NZCSRSC2008), Christchurch, New Zealand, pp.49-56, 2008.
ICSSC 2017 International Conference on Software & Smart Convergence 167 page
International Conference on Software & Smart Convergence (ICSSC) 2017, June 2017 Copyright ⓒ 2017 ICSSC
This research was supported by a research grant from the IT R&D program of MKE/IITA, the Korean government [2005-Y-001-04, Development of Next Generation Security Technology]. We express our thanks to Dr. Richard Berke who checked our manuscript.
A Study on Responsive Web Development for Food Management and Analysis of
Customized Refrigerator Jin Woo Nam, Jae Uk Choi, Kyoung Min Kim
Keimyung University of South Korea 1095 Dalgubeol-daero, Dalseo-Gu, Deagu 42601, Republic of Korea
[e-mail: [email protected]] *Corresponding author: Jin woo-Nam
Abstract
The economic loss due to food waste is very large and the disposal cost of processed food, which has expired over the expiration date, is increasing geometrically. Reducing these costs is a benefit for both countries and individuals. In this study, we developed the Refrigerator Food Management and Analysis System for reducing disposal cost and increasing utilization of food. This system is possible to record nutritional information and shelf life of food by using a Bluetooth module-based barcode reader for the convenience of users. In addition, the user can directly modify the inputted data through adding or changing the data of the food without the barcode. Also, possible to accumulate the user’s data by selecting the ingested food and based on this data, system shows the various analysis results.
Keywords: Food waste, refrigerator management, barcode, customization
1. IntroductionAt the end of December 2015, the government of South Korea announced the National Health Promotion Act based on the National Nutrition Management Act. Since the enactment of the National Nutrition Management Act, there has been an increasing interest of people in the food nutrition information for their health along with the analysis of the food nutritional content. Nevertheless the interest of food consumption is increasing, the cost of the disposing food waste in Korea is billions of dollars a year, and this problem is becoming a major global issue.
Almost 70% of the food waste comes from household and small restaurants, and one tenth of
the scraps is just thrown away due to the passed expiration date. To solve this situation, we develop a customized refrigerator food management and analysis system, and it is designed to link with electronic equipments such as computers, tablets, and mobile phones to increase the usability.
This paper will have four more main sections. In section 2 introduces the structure, design and development environment of the system. Section 3 shows the results for this system. Section 4 presents the limitations of the system and its subsequent steps.
2. System Design2.1. Food Management and Analysis
168 page International Conference on Software & Smart Convergence ICSSC 2017
System Structure Fig. 1 shows the structure of the system. Barcode recognition is used to recognizing the
details of the food in the refrigerator. And also identify food items in the refrigerator, and to analyze ans visualize the ingested food.
Fig. 1. System Structure
Briefly, if the reader recognizes the barcode first, it displays the food with the corresponding barcode on the tablet connected with Bluetooth. If the foodsof the corresponding barcode is present in a database, it will registered together with the name of the food, not just the name of the food, but also the nutrients ans shelf life.
These registered foods can be viewed or consumed at any time by user. Based on these data, this system provide various analysis result for the period, nutrition, life, pattern, and family members.
2.2. Database Structure
Fig. 2 shows the database structure of this system. Food details such as calorie and carbohydrates in the received history table are linked to the barcode table referenced to public data. But consider the case when the barcode is not registered with the table, it is made into a column to register the food.
We tried to make the received history table and the retention foods table combined into the received/retention food table. But considering the efficiency and scalable of the query, we put the retention foods table into the child table of the received history table.
Fig. 2. DataBase Structure
ICSSC 2017 International Conference on Software & Smart Convergence 169 page
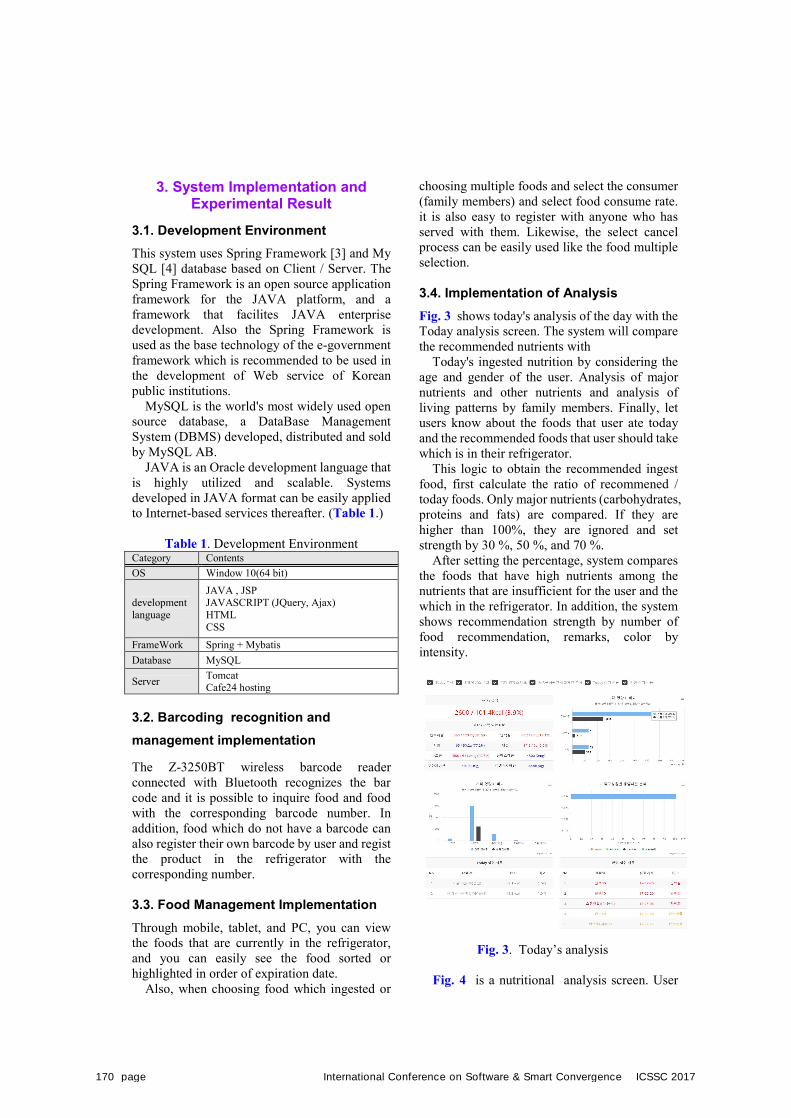
3. System Implementation andExperimental Result
3.1. Development Environment This system uses Spring Framework [3] and My SQL [4] database based on Client / Server. The Spring Framework is an open source application framework for the JAVA platform, and a framework that facilites JAVA enterprise development. Also the Spring Framework is used as the base technology of the e-government framework which is recommended to be used in the development of Web service of Korean public institutions.
MySQL is the world's most widely used open source database, a DataBase Management System (DBMS) developed, distributed and sold by MySQL AB.
JAVA is an Oracle development language that is highly utilized and scalable. Systems developed in JAVA format can be easily applied to Internet-based services thereafter. (Table 1.)
Table 1. Development Environment Category Contents OS Window 10(64 bit)
development language
JAVA , JSP JAVASCRIPT (JQuery, Ajax) HTML CSS
FrameWork Spring + Mybatis Database MySQL
Server Tomcat Cafe24 hosting
3.2. Barcoding recognition and management implementation
The Z-3250BT wireless barcode reader connected with Bluetooth recognizes the bar code and it is possible to inquire food and food with the corresponding barcode number. In addition, food which do not have a barcode can also register their own barcode by user and regist the product in the refrigerator with the corresponding number.
3.3. Food Management Implementation Through mobile, tablet, and PC, you can view the foods that are currently in the refrigerator, and you can easily see the food sorted or highlighted in order of expiration date.
Also, when choosing food which ingested or
choosing multiple foods and select the consumer (family members) and select food consume rate. it is also easy to register with anyone who has served with them. Likewise, the select cancel process can be easily used like the food multiple selection.
3.4. Implementation of Analysis Fig. 3 shows today's analysis of the day with the Today analysis screen. The system will compare the recommended nutrients with
Today's ingested nutrition by considering the age and gender of the user. Analysis of major nutrients and other nutrients and analysis of living patterns by family members. Finally, let users know about the foods that user ate today and the recommended foods that user should take which is in their refrigerator.
This logic to obtain the recommended ingest food, first calculate the ratio of recommened / today foods. Only major nutrients (carbohydrates, proteins and fats) are compared. If they are higher than 100%, they are ignored and set strength by 30 %, 50 %, and 70 %.
After setting the percentage, system compares the foods that have high nutrients among the nutrients that are insufficient for the user and the which in the refrigerator. In addition, the system shows recommendation strength by number of food recommendation, remarks, color by intensity.
Fig. 3. Today’s analysis
Fig. 4 is a nutritional analysis screen. User
170 page International Conference on Software & Smart Convergence ICSSC 2017
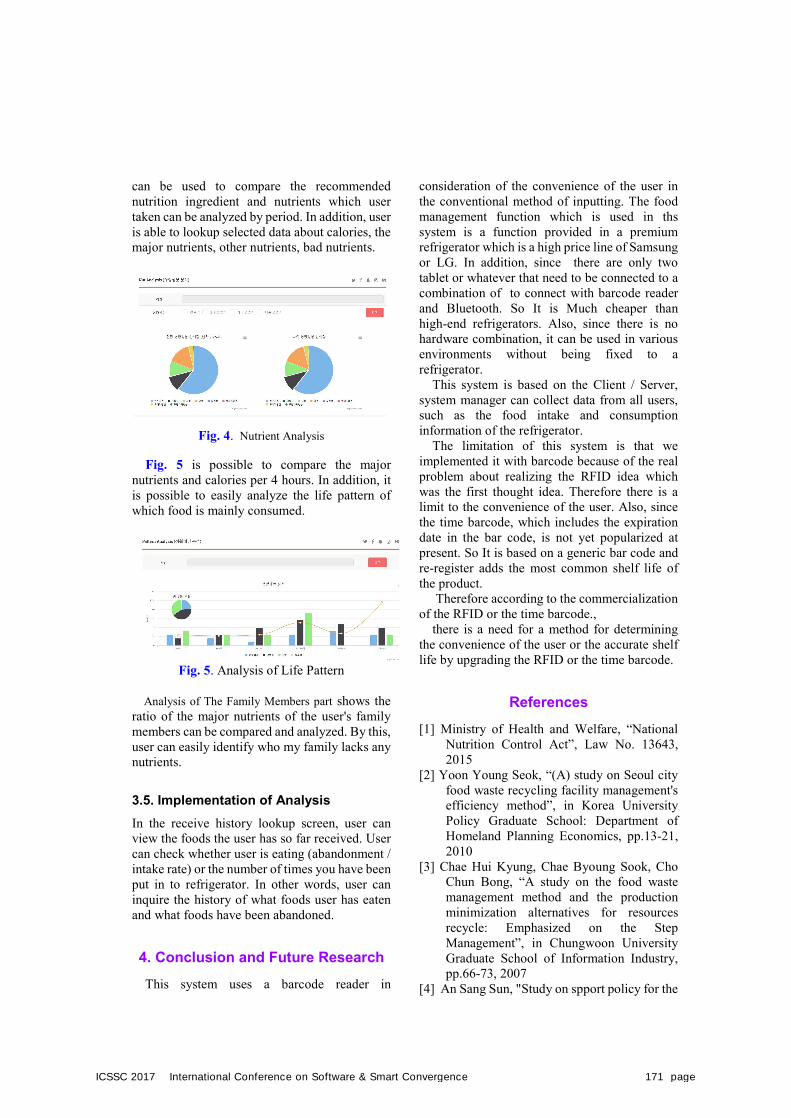
can be used to compare the recommended nutrition ingredient and nutrients which user taken can be analyzed by period. In addition, user is able to lookup selected data about calories, the major nutrients, other nutrients, bad nutrients.
Fig. 4. Nutrient Analysis
Fig. 5 is possible to compare the major nutrients and calories per 4 hours. In addition, it is possible to easily analyze the life pattern of which food is mainly consumed.
Fig. 5. Analysis of Life Pattern
Analysis of The Family Members part shows the ratio of the major nutrients of the user's family members can be compared and analyzed. By this, user can easily identify who my family lacks any nutrients.
3.5. Implementation of Analysis In the receive history lookup screen, user can view the foods the user has so far received. User can check whether user is eating (abandonment / intake rate) or the number of times you have been put in to refrigerator. In other words, user can inquire the history of what foods user has eaten and what foods have been abandoned.
4. Conclusion and Future ResearchThis system uses a barcode reader in
consideration of the convenience of the user in the conventional method of inputting. The food management function which is used in ths system is a function provided in a premium refrigerator which is a high price line of Samsung or LG. In addition, since there are only two tablet or whatever that need to be connected to a combination of to connect with barcode reader and Bluetooth. So It is Much cheaper than high-end refrigerators. Also, since there is no hardware combination, it can be used in various environments without being fixed to a refrigerator.
This system is based on the Client / Server, system manager can collect data from all users, such as the food intake and consumption information of the refrigerator.
The limitation of this system is that we implemented it with barcode because of the real problem about realizing the RFID idea which was the first thought idea. Therefore there is a limit to the convenience of the user. Also, since the time barcode, which includes the expiration date in the bar code, is not yet popularized at present. So It is based on a generic bar code and re-register adds the most common shelf life of the product.
Therefore according to the commercialization of the RFID or the time barcode.,
there is a need for a method for determining the convenience of the user or the accurate shelf life by upgrading the RFID or the time barcode.
References [1] Ministry of Health and Welfare, “National
Nutrition Control Act”, Law No. 13643, 2015
[2] Yoon Young Seok, “(A) study on Seoul city food waste recycling facility management's efficiency method”, in Korea University Policy Graduate School: Department of Homeland Planning Economics, pp.13-21, 2010
[3] Chae Hui Kyung, Chae Byoung Sook, Cho Chun Bong, “A study on the food waste management method and the production minimization alternatives for resources recycle: Emphasized on the Step Management”, in Chungwoon University Graduate School of Information Industry, pp.66-73, 2007
[4] An Sang Sun, "Study on spport policy for the
ICSSC 2017 International Conference on Software & Smart Convergence 171 page

efficient recycling system of food wastes", in Kangwon National University Graduate School: Department of Environmental Engineering, pp.113-136, 2005
172 page International Conference on Software & Smart Convergence ICSSC 2017
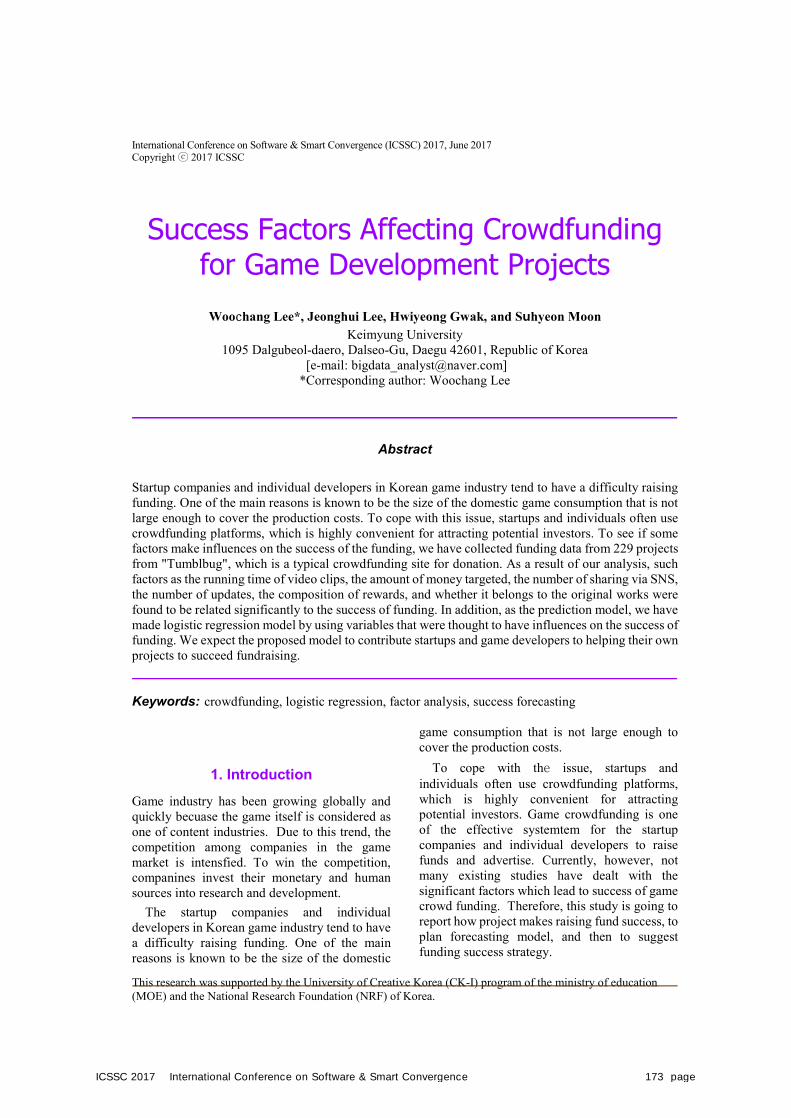
International Conference on Software & Smart Convergence (ICSSC) 2017, June 2017 Copyright ⓒ 2017 ICSSC
This research was supported by the University of Creative Korea (CK-I) program of the ministry of education (MOE) and the National Research Foundation (NRF) of Korea.
Success Factors Affecting Crowdfunding for Game Development Projects
Woochang Lee*, Jeonghui Lee, Hwiyeong Gwak, and Suhyeon Moon
Keimyung University 1095 Dalgubeol-daero, Dalseo-Gu, Daegu 42601, Republic of Korea
[e-mail: [email protected]] *Corresponding author: Woochang Lee
Abstract
Startup companies and individual developers in Korean game industry tend to have a difficulty raising funding. One of the main reasons is known to be the size of the domestic game consumption that is not large enough to cover the production costs. To cope with this issue, startups and individuals often use crowdfunding platforms, which is highly convenient for attracting potential investors. To see if some factors make influences on the success of the funding, we have collected funding data from 229 projects from "Tumblbug", which is a typical crowdfunding site for donation. As a result of our analysis, such factors as the running time of video clips, the amount of money targeted, the number of sharing via SNS, the number of updates, the composition of rewards, and whether it belongs to the original works were found to be related significantly to the success of funding. In addition, as the prediction model, we have made logistic regression model by using variables that were thought to have influences on the success of funding. We expect the proposed model to contribute startups and game developers to helping their own projects to succeed fundraising.
Keywords: crowdfunding, logistic regression, factor analysis, success forecasting
1. IntroductionGame industry has been growing globally and quickly becuase the game itself is considered as one of content industries. Due to this trend, the competition among companies in the game market is intensfied. To win the competition, companines invest their monetary and human sources into research and development.
The startup companies and individual developers in Korean game industry tend to have a difficulty raising funding. One of the main reasons is known to be the size of the domestic
game consumption that is not large enough to cover the production costs.
To cope with the issue, startups and individuals often use crowdfunding platforms, which is highly convenient for attracting potential investors. Game crowdfunding is one of the effective systemtem for the startup companies and individual developers to raise funds and advertise. Currently, however, not many existing studies have dealt with the significant factors which lead to success of game crowd funding. Therefore, this study is going to report how project makes raising fund success, to plan forecasting model, and then to suggest funding success strategy.
ICSSC 2017 International Conference on Software & Smart Convergence 173 page
2. Method Works
2.1 Data Collection Many game projectors should try to raise funds using crowd funding. Though, they have faced various problems. First of all, the main problem is getting proper sponsors. However, in the regard of inveteters, they also have a hard time figiuring out the chance of success or failure of the game for right funding. This is especially hard task for investors becuase the considered games are in the process of development so they cannot experience and examine the product. In addition, the sponsors need to determine whether they will invest or not only with the information on online article. In this situation where the information is totally lack, furthermore, the investors cannot have the opportunity to meet the projectors in person. Therefore, this paper suggest that the project leaders should understand these disturbing problmes to foster the firm relationship with invesotrs throguh online.
This paper uses crowd funding site, tublbug (www.tumblbug.com), to explore this topic and 229 tumblbug’s crowdfunding projects as unit of analysis for the study. And then this paper used statistical analysis program ‘R’ to organize the data.
2.2 Variable Setting This paper sets the chance of success of crownfunding according to a dependent variable. If the dependent variable is ‘1’, this can be interpreted that the project raises all amount of funding money. If the dependent variable is ‘0,' this can be interpreted as one did not achieve one's goal. In the case of Tumblbug, this site provides the projector leaders all the deposit sponsors have invested only when achieveing the targeted amount of deposit. If fund do not achieve the targeted amount of fund, the project would become nullity [1]. This system is the basic principle of why we pick 1s and 0s.
A Video from article can show the investors much visual information about the game product that will be developed. According to an existing research by Lee and Shin(2014), when the article has proper video information, it can have significant impact on the success of crowd funding [1].
Advertisment with SNS can have positiv impact on project promotion. SNS is a social media to make people do daily communication for building relationships among individuals. Therefore, online advertisment can be expected to have positive possibility for their crowdfunding since SNS users can share information immediately.
The project leader needs to target proper amount of money to produce game. If the amount of fund projectors suggest is too much high, it can make sponsors and investors feel uncomfortble. On the contrary, if projectors suggest low targeted amount of fund, the sponsors and invesotrs can have a doubt about the project. Therefore, setting proper goal is important.
The communication between project leaders and investors can be formed by game projects shwoing the constance update of the game and the investors providing appopriate feedback to the leaders so that the project can be successful [2].
Furthermore, the parody games from comics and animation make friendly image to sponsors and make them have more interest for game. A tangible reward is the specific reward for the sponsors. Sponsors can get particular reward by watching project developed. This tangible reward is one of important element to attract people to become sponsor.
According to existing research, the tangible reward brings significant impact for winning crowdfunding [1]. Therefore, this project uses the weighted average of the price of reward box as variable for each project.
To predict percentage of success, this paper tries to make logistic regression model design to use variables mentioned above. Table 1 explains the variables used in this model..
Table 1 Variable Dependent
Variable Success Crowdfunding success of failure
Independent
Variable
Video(second) Video play time
Target money(\) Target money
SNS(number) Number of share
Update(number) Number of update
Reward(number) Tangible reward
Original(binary) Having originality in animation,
comic, or games
174 page International Conference on Software & Smart Convergence ICSSC 2017
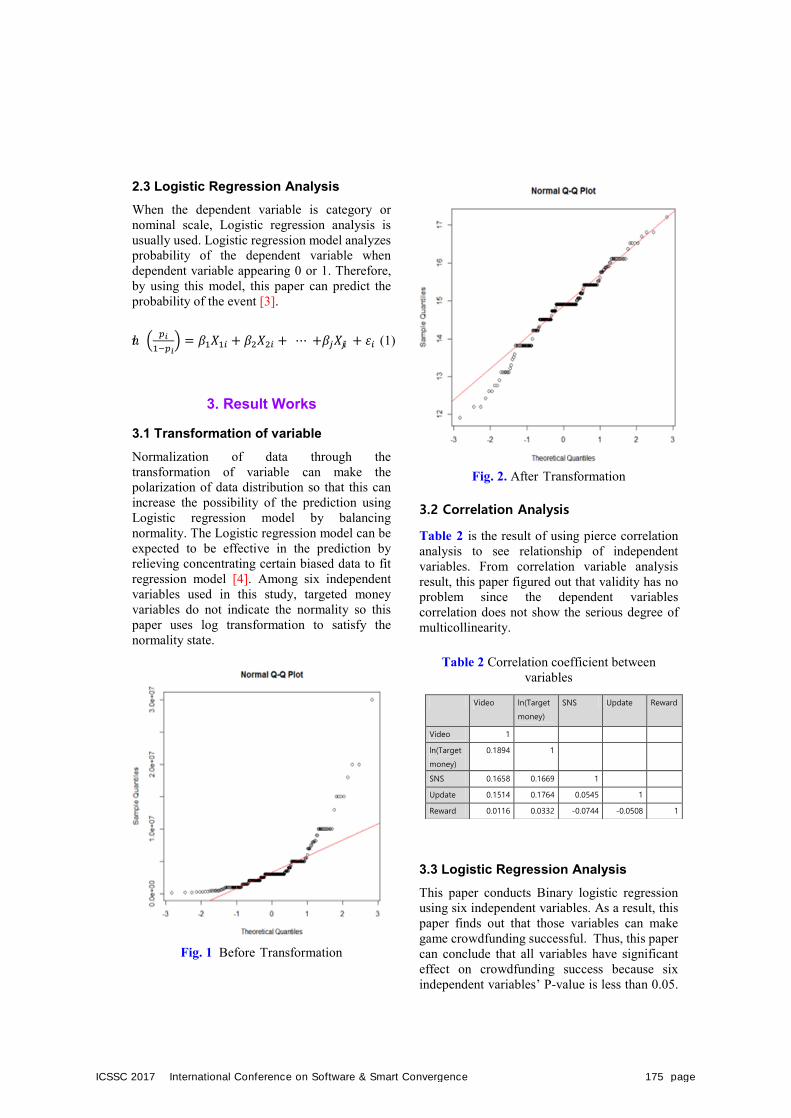
2.3 Logistic Regression Analysis When the dependent variable is category or nominal scale, Logistic regression analysis is usually used. Logistic regression model analyzes probability of the dependent variable when dependent variable appearing 0 or 1. Therefore, by using this model, this paper can predict the probability of the event [3].
= + + ⋯ + + (1)
3. Result Works
3.1 Transformation of variable Normalization of data through the transformation of variable can make the polarization of data distribution so that this can increase the possibility of the prediction using Logistic regression model by balancing normality. The Logistic regression model can be expected to be effective in the prediction by relieving concentrating certain biased data to fit regression model [4]. Among six independent variables used in this study, targeted money variables do not indicate the normality so this paper uses log transformation to satisfy the normality state.
Fig. 1 Before Transformation
Fig. 2. After Transformation
3.2 Correlation Analysis
Table 2 is the result of using pierce correlation analysis to see relationship of independent variables. From correlation variable analysis result, this paper figured out that validity has no problem since the dependent variables correlation does not show the serious degree of multicollinearity.
Table 2 Correlation coefficient between variables
3.3 Logistic Regression Analysis This paper conducts Binary logistic regression using six independent variables. As a result, this paper finds out that those variables can make game crowdfunding successful. Thus, this paper can conclude that all variables have significant effect on crowdfunding success because six independent variables’ P-value is less than 0.05.
Video ln(Target
money)
SNS Update Reward
Video 1
ln(Target
money)
0.1894 1
SNS 0.1658 0.1669 1
Update 0.1514 0.1764 0.0545 1
Reward 0.0116 0.0332 -0.0744 -0.0508 1
ICSSC 2017 International Conference on Software & Smart Convergence 175 page
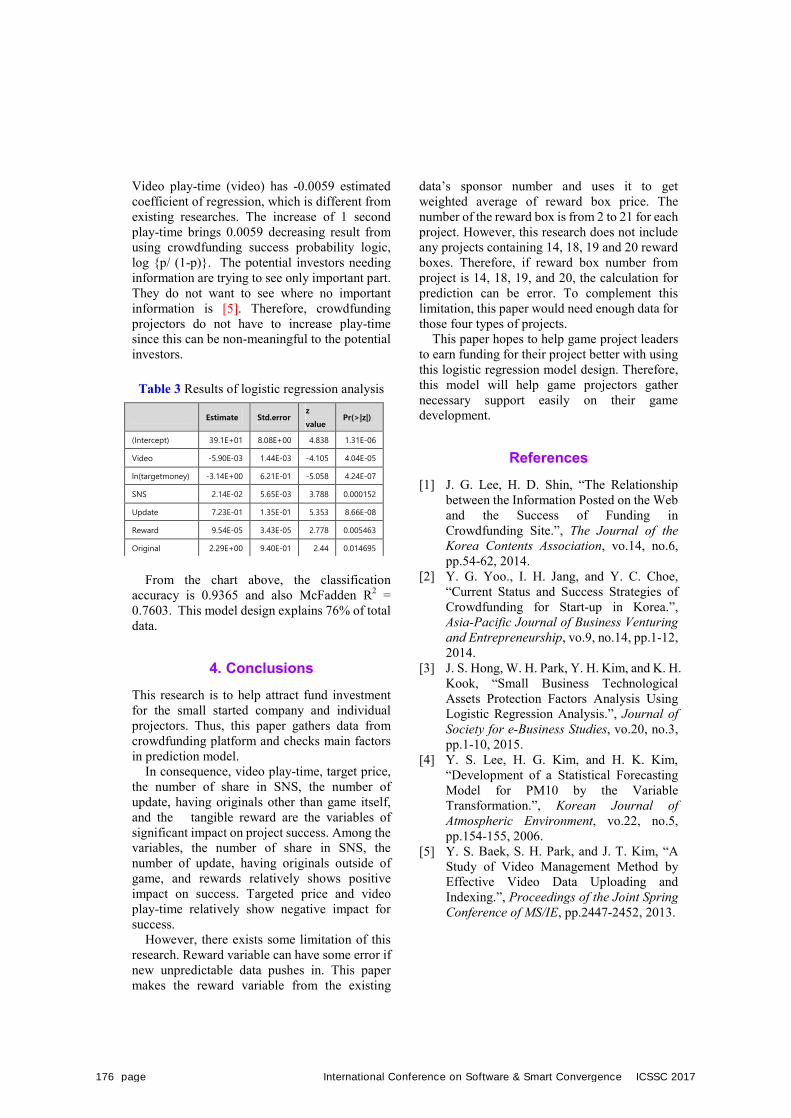
Video play-time (video) has -0.0059 estimated coefficient of regression, which is different from existing researches. The increase of 1 second play-time brings 0.0059 decreasing result from using crowdfunding success probability logic, log {p/ (1-p)}. The potential investors needing information are trying to see only important part. They do not want to see where no important information is [5]. Therefore, crowdfunding projectors do not have to increase play-time since this can be non-meaningful to the potential investors. Table 3 Results of logistic regression analysis
From the chart above, the classification
accuracy is 0.9365 and also McFadden R2 = 0.7603. This model design explains 76% of total data.
4. Conclusions This research is to help attract fund investment for the small started company and individual projectors. Thus, this paper gathers data from crowdfunding platform and checks main factors in prediction model.
In consequence, video play-time, target price, the number of share in SNS, the number of update, having originals other than game itself, and the tangible reward are the variables of significant impact on project success. Among the variables, the number of share in SNS, the number of update, having originals outside of game, and rewards relatively shows positive impact on success. Targeted price and video play-time relatively show negative impact for success.
However, there exists some limitation of this research. Reward variable can have some error if new unpredictable data pushes in. This paper makes the reward variable from the existing
data’s sponsor number and uses it to get weighted average of reward box price. The number of the reward box is from 2 to 21 for each project. However, this research does not include any projects containing 14, 18, 19 and 20 reward boxes. Therefore, if reward box number from project is 14, 18, 19, and 20, the calculation for prediction can be error. To complement this limitation, this paper would need enough data for those four types of projects.
This paper hopes to help game project leaders to earn funding for their project better with using this logistic regression model design. Therefore, this model will help game projectors gather necessary support easily on their game development.
References [1] J. G. Lee, H. D. Shin, “The Relationship
between the Information Posted on the Web and the Success of Funding in Crowdfunding Site.”, The Journal of the Korea Contents Association, vo.14, no.6, pp.54-62, 2014.
[2] Y. G. Yoo., I. H. Jang, and Y. C. Choe, “Current Status and Success Strategies of Crowdfunding for Start-up in Korea.”, Asia-Pacific Journal of Business Venturing and Entrepreneurship, vo.9, no.14, pp.1-12, 2014.
[3] J. S. Hong, W. H. Park, Y. H. Kim, and K. H. Kook, “Small Business Technological Assets Protection Factors Analysis Using Logistic Regression Analysis.”, Journal of Society for e-Business Studies, vo.20, no.3, pp.1-10, 2015.
[4] Y. S. Lee, H. G. Kim, and H. K. Kim, “Development of a Statistical Forecasting Model for PM10 by the Variable Transformation.”, Korean Journal of Atmospheric Environment, vo.22, no.5, pp.154-155, 2006.
[5] Y. S. Baek, S. H. Park, and J. T. Kim, “A Study of Video Management Method by Effective Video Data Uploading and Indexing.”, Proceedings of the Joint Spring Conference of MS/IE, pp.2447-2452, 2013.
Estimate Std.error z
value Pr(>|z|)
(Intercept) 39.1E+01 8.08E+00 4.838 1.31E-06
Video -5.90E-03 1.44E-03 -4.105 4.04E-05
ln(targetmoney) -3.14E+00 6.21E-01 -5.058 4.24E-07
SNS 2.14E-02 5.65E-03 3.788 0.000152
Update 7.23E-01 1.35E-01 5.353 8.66E-08
Reward 9.54E-05 3.43E-05 2.778 0.005463
Original 2.29E+00 9.40E-01 2.44 0.014695
176 page International Conference on Software & Smart Convergence ICSSC 2017
This research was supported by the University of Creative Korea (CK-I) program of the ministry of education (MOE) and the National Research Foundation (NRF) of Korea.
Development of Integrated Delivery Systems at Grocery Stores in South Korea
Jungin Lee, Hyunjin Park, Sujin Lee, Minji Kim Keimyung University of South Korea
1095 Dalgubeol-daero, Dalseo-Gu, Deagu 42601, Republic of Korea [e-mail: [email protected]]
*Corresponding author: Jungin Lee
Abstract
A system was developed to respond to demand-driven market changes and provide users with convenient ordering and better delivery service, which not only raises the satisfaction of consumers but also contributes to the competitiveness of small business owners. The main functions of the system were to accumulate customers' purchasing records in a database and to use it as a differentiated strategy to strengthen the competitiveness of small business owners. Analyzing the accumulated purchasing records helps small business owners to understand consumer needs as well as to provide better services. It also provides the system users with a preview of the actual photos of the product before delivery in order to enhance customers’ satisfaction.
Keywords: Grocery business, Mobile application, Process improvement, Order management system
1. IntroductionConsumers are turning to a demand-driven market. It is customer-oriented economy to provide customized services even in small deliveries by grasping needs through collecting and analyzing customers’ movement data using GPS(Global Positioning System) in their smartphones. In this market situation, it is necessary for business owners to combine IT(Information Technology) with personalized responses to individual consumers’ needs [1, 2]. We have developed a customized integration delivery system that provides convenience to real-time customers and provides inventory management, sales management, and order management service.
The main contents of this study are as follows.Section 2 introduces the structure and design of the system and development environment. Section 3 introduces the function description and algorithm. And, section 4 shows the results of this system.
2. System StructureFig. 1 is a diagram of the proposed delivery system consisting of order management, sales management, and customer management service on web pages. As a mobile application, the system provides order placement, push notification, and payment service. The order status and order type are coded so that it is easy to change when changes occur. The integrated delivery system based on client/server utilizes Spring Framework and MySql database systems.
ICSSC 2017 International Conference on Software & Smart Convergence 177 page
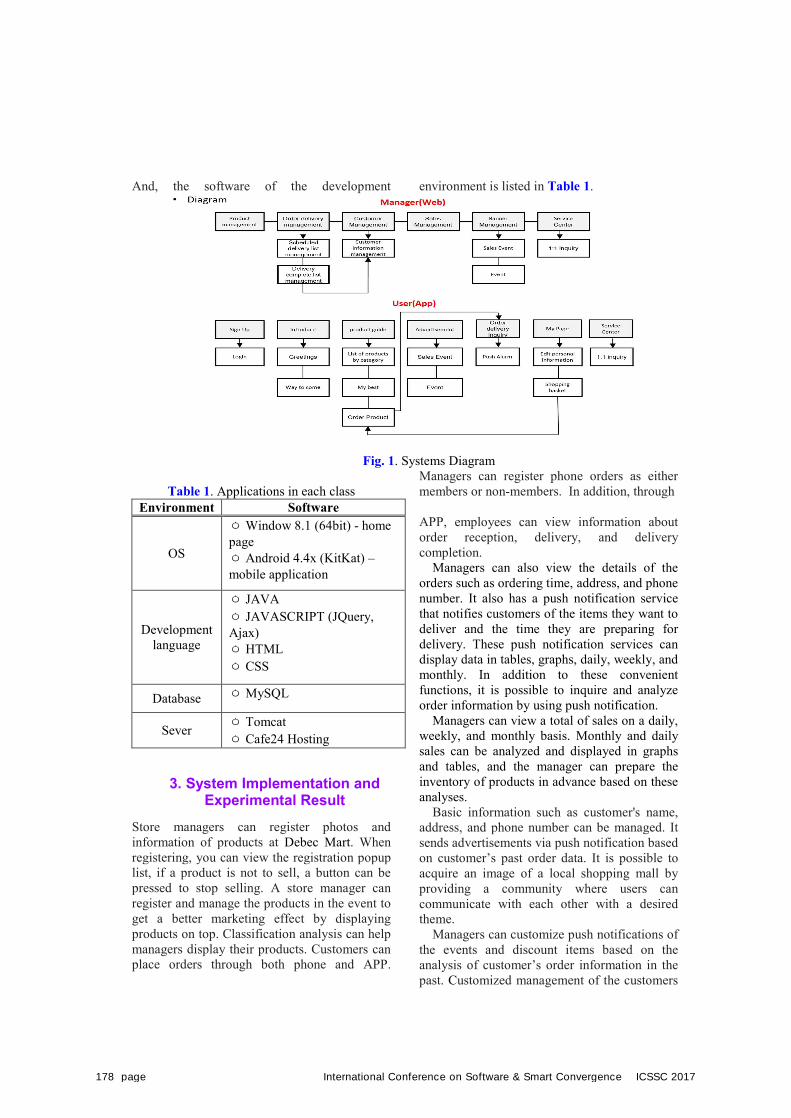
And, the software of the development environment is listed in Table 1.
Fig. 1. Systems Diagram
Table 1. Applications in each class Environment Software
OS
ㅇWindow 8.1 (64bit) - home page ㅇ Android 4.4x (KitKat) – mobile application
Development language
ㅇ JAVA ㅇ JAVASCRIPT (JQuery, Ajax) ㅇ HTML ㅇ CSS
Database ㅇMySQL
Sever ㅇ Tomcat ㅇ Cafe24 Hosting
3. System Implementation andExperimental Result
Store managers can register photos and information of products at Debec Mart. When registering, you can view the registration popup list, if a product is not to sell, a button can be pressed to stop selling. A store manager can register and manage the products in the event to get a better marketing effect by displaying products on top. Classification analysis can help managers display their products. Customers can place orders through both phone and APP.
Managers can register phone orders as either members or non-members. In addition, through
APP, employees can view information about order reception, delivery, and delivery completion.
Managers can also view the details of the orders such as ordering time, address, and phone number. It also has a push notification service that notifies customers of the items they want to deliver and the time they are preparing for delivery. These push notification services can display data in tables, graphs, daily, weekly, and monthly. In addition to these convenient functions, it is possible to inquire and analyze order information by using push notification.
Managers can view a total of sales on a daily, weekly, and monthly basis. Monthly and daily sales can be analyzed and displayed in graphs and tables, and the manager can prepare the inventory of products in advance based on these analyses.
Basic information such as customer's name, address, and phone number can be managed. It sends advertisements via push notification based on customer’s past order data. It is possible to acquire an image of a local shopping mall by providing a community where users can communicate with each other with a desired theme.
Managers can customize push notifications of the events and discount items based on the analysis of customer’s order information in the past. Customized management of the customers
178 page International Conference on Software & Smart Convergence ICSSC 2017
was implemented by notifying customers to check the order shopping cart pictures and confirmation of delivery time.
4. ResultsThe proposed system was developed to deliver products of grocery stores by enabling customers to place orders through smart phones. Managers of the system can manage delivery lists and analyze the order history data. Customers can manage their order history and receive customized services through push notification.
In the past, there were limitations in writing handwritten documents of small business owners and using regular POS(point of sales). Users of this system can easily deliver orders by using the developed app and provide a space to create a community network. As a result, by using this system, Debec-mart can provide a differentiated
service from other competitors can. Because of lack of marketing efforts, however, the app is not known very well and being hardly used by users. Therefore, the shop needs to develop differentiated strategies to attract more users to the app.
References [1] D. S. Kwak, K. H. Kim, J. H. Kwon, “A
Study on the Effect of Shopping Application Information Offering on Application Preference and Repurchase Intention: mediating effect of frequency of utilization”, Journal of Digital Convergence, vo.12, no.11, pp.113-121, 2014.
[2] K.Y. Lee, “The Impacts of Perceived Attributes on Continuance of the Smart Phone App Store”, Korea Management Science, vo.30, no. 3, pp.30-54, 2013.
ICSSC 2017 International Conference on Software & Smart Convergence 179 page
International Conference on Software & Smart Convergence (ICSSC) 2017, June 2017 Copyright ⓒ 2017 ICSSC
This research was supported by the University of Creative Korea (CK-I) program of the ministry of education (MOE) and the National Research Foundation (NRF) of Korea.
Analysis of Knowledge and Skills Needed for Software Architects
Yeongkwang Han*, Gyulhee Kim, and Mina Kim Keimyung University
1095 Dalgubeol-daero, Dalseo-Gu, Daegu 42601, Republic of Korea [e-mail: [email protected]]
*Corresponding author: Yeongkwang Han
Abstract
As the impact of IT on business grows, businesses that use IT are becoming more important than ever. Although many companies seek software architects at various business sites, little agreement has been made on definition of a software architect. The purpose of this research is to explore the definition of a software architect by examining how it is accepted by these industries and businesses by way of identifying what skills and knowledge are required for the job. A content analysis was conducted on 6,863 job advertisements. Through the window of job postings collected, this study attempted to look into knowledge and skills needed for software architects in eleven countries. As a result, software architects were shown to be highly experienced professionals with advanced degrees. The main areas of profession were software architecture, development methodology, and problem solving.
Keywords: Software architects, job advertisement, content analysis, skills
1. IntroductionA software architect is a responsible designer playing an important role for developing software systems using computer technologies. As organizations realize the importance of developing software architecture, they are beginning to pay attention to the human resources who possess the proper knowledge and skills to achieve these goals [1]. As more organizations attempt to develop competitive information systems, they continue to look for competent software architects who understand the business requirements.
However, being a relatively new job title, the definition of software architect is vague in understanding what exactly it is and what it does. We attempt to examine how software architects
are accepted by industries and businesses as well as to identify what knowledge and skills are needed. To understand the reality of the knowledge and skills that organizations require, most previous studies have been conducted by using data sources obtained from interviews and surveys. This study collects and analyzes job advertisements posted on major job seeking web sites at many countries in different continents because they are the primary sources connecting between employers and job seekers.
2. DataWe collected job advertisements as suggested by Kim and his colleagues [2]. Job advertisements have been collected using a customized web crawling system, called WebMon, for job post
180 page International Conference on Software & Smart Convergence ICSSC 2017
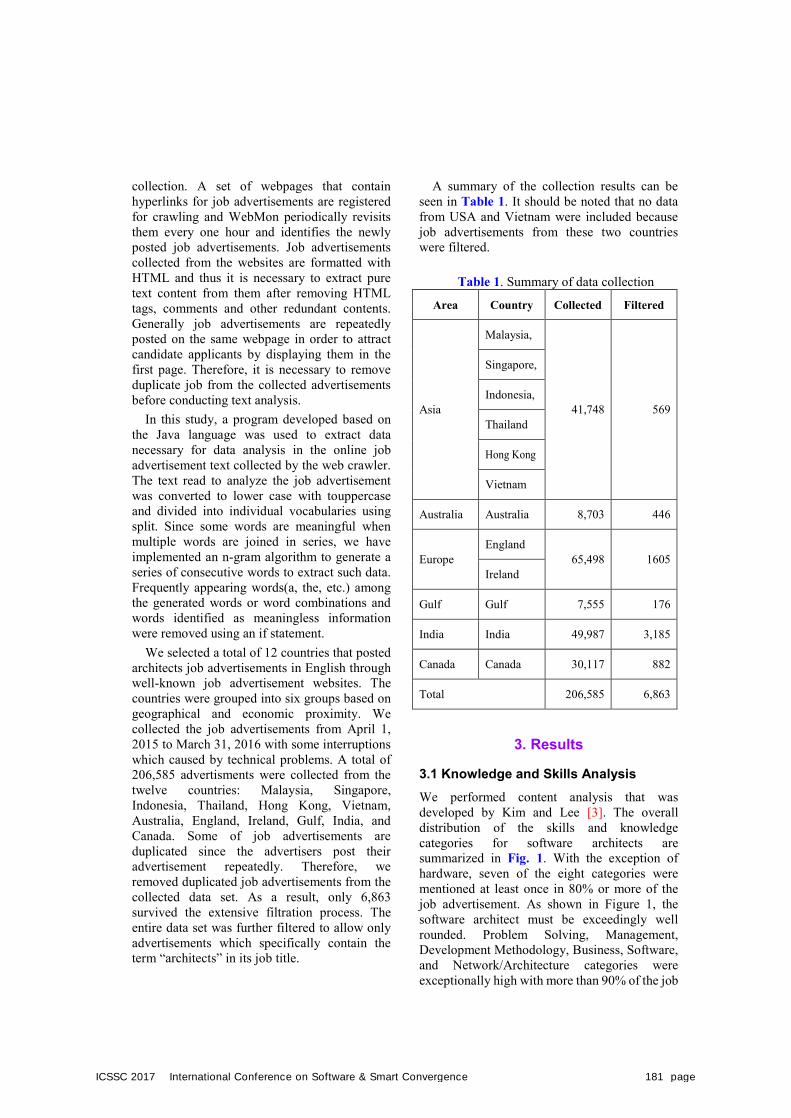
collection. A set of webpages that contain hyperlinks for job advertisements are registered for crawling and WebMon periodically revisits them every one hour and identifies the newly posted job advertisements. Job advertisements collected from the websites are formatted with HTML and thus it is necessary to extract pure text content from them after removing HTML tags, comments and other redundant contents. Generally job advertisements are repeatedly posted on the same webpage in order to attract candidate applicants by displaying them in the first page. Therefore, it is necessary to remove duplicate job from the collected advertisements before conducting text analysis.
In this study, a program developed based on the Java language was used to extract data necessary for data analysis in the online job advertisement text collected by the web crawler. The text read to analyze the job advertisement was converted to lower case with touppercase and divided into individual vocabularies using split. Since some words are meaningful when multiple words are joined in series, we have implemented an n-gram algorithm to generate a series of consecutive words to extract such data. Frequently appearing words(a, the, etc.) among the generated words or word combinations and words identified as meaningless information were removed using an if statement.
We selected a total of 12 countries that posted architects job advertisements in English through well-known job advertisement websites. The countries were grouped into six groups based on geographical and economic proximity. We collected the job advertisements from April 1, 2015 to March 31, 2016 with some interruptions which caused by technical problems. A total of 206,585 advertisments were collected from the twelve countries: Malaysia, Singapore, Indonesia, Thailand, Hong Kong, Vietnam, Australia, England, Ireland, Gulf, India, and Canada. Some of job advertisements are duplicated since the advertisers post their advertisement repeatedly. Therefore, we removed duplicated job advertisements from the collected data set. As a result, only 6,863 survived the extensive filtration process. The entire data set was further filtered to allow only advertisements which specifically contain the term “architects” in its job title.
A summary of the collection results can be seen in Table 1. It should be noted that no data from USA and Vietnam were included because job advertisements from these two countries were filtered.
Table 1. Summary of data collection
Area Country Collected Filtered
Asia
Malaysia,
41,748 569
Singapore,
Indonesia,
Thailand
Hong Kong
Vietnam
Australia Australia 8,703 446
Europe England
65,498 1605 Ireland
Gulf Gulf 7,555 176
India India 49,987 3,185
Canada Canada 30,117 882
Total 206,585 6,863
3. Results
3.1 Knowledge and Skills Analysis We performed content analysis that was developed by Kim and Lee [3]. The overall distribution of the skills and knowledge categories for software architects are summarized in Fig. 1. With the exception of hardware, seven of the eight categories were mentioned at least once in 80% or more of the job advertisement. As shown in Figure 1, the software architect must be exceedingly well rounded. Problem Solving, Management, Development Methodology, Business, Software, and Network/Architecture categories were exceptionally high with more than 90% of the job
ICSSC 2017 International Conference on Software & Smart Convergence 181 page
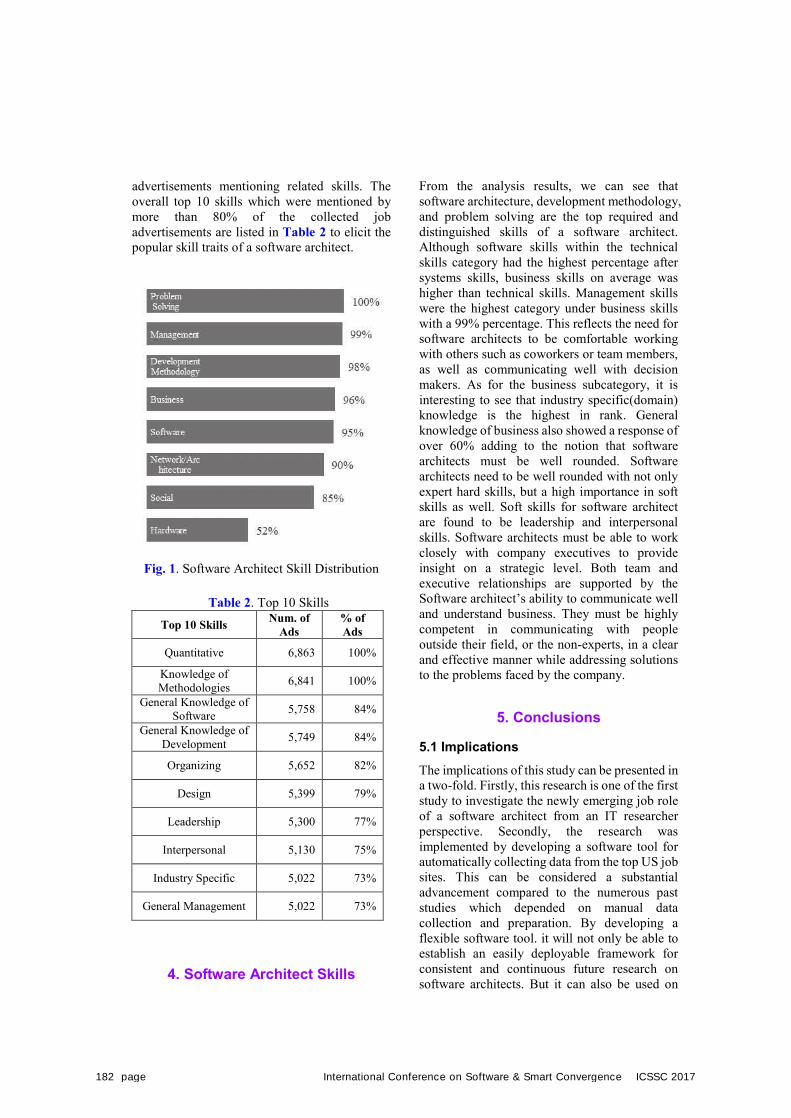
advertisements mentioning related skills. The overall top 10 skills which were mentioned by more than 80% of the collected job advertisements are listed in Table 2 to elicit the popular skill traits of a software architect.
Fig. 1. Software Architect Skill Distribution
Table 2. Top 10 Skills
Top 10 Skills Num. of Ads
% of Ads
Quantitative 6,863 100%
Knowledge of Methodologies 6,841 100%
General Knowledge of Software 5,758 84%
General Knowledge of Development 5,749 84%
Organizing 5,652 82%
Design 5,399 79%
Leadership 5,300 77%
Interpersonal 5,130 75%
Industry Specific 5,022 73%
General Management 5,022 73%
4. Software Architect Skills
From the analysis results, we can see that software architecture, development methodology, and problem solving are the top required and distinguished skills of a software architect. Although software skills within the technical skills category had the highest percentage after systems skills, business skills on average was higher than technical skills. Management skills were the highest category under business skills with a 99% percentage. This reflects the need for software architects to be comfortable working with others such as coworkers or team members, as well as communicating well with decision makers. As for the business subcategory, it is interesting to see that industry specific(domain) knowledge is the highest in rank. General knowledge of business also showed a response of over 60% adding to the notion that software architects must be well rounded. Software architects need to be well rounded with not only expert hard skills, but a high importance in soft skills as well. Soft skills for software architect are found to be leadership and interpersonal skills. Software architects must be able to work closely with company executives to provide insight on a strategic level. Both team and executive relationships are supported by the Software architect’s ability to communicate well and understand business. They must be highly competent in communicating with people outside their field, or the non-experts, in a clear and effective manner while addressing solutions to the problems faced by the company.
5. Conclusions
5.1 Implications The implications of this study can be presented in a two-fold. Firstly, this research is one of the first study to investigate the newly emerging job role of a software architect from an IT researcher perspective. Secondly, the research was implemented by developing a software tool for automatically collecting data from the top US job sites. This can be considered a substantial advancement compared to the numerous past studies which depended on manual data collection and preparation. By developing a flexible software tool. it will not only be able to establish an easily deployable framework for consistent and continuous future research on software architects. But it can also be used on
182 page International Conference on Software & Smart Convergence ICSSC 2017
any other job categories as well.
5.2 The challenge In this research, we reported job requirement analysis results using online job advertisements. Also it would be interesting if we analyze the contents of job advertisements. However, this research does not consider content analysis of job advertisements. This will be our future work.
References [1] L. Bass, “Software architecture in
practice,” Pearson Education India, 2007. [2] Y. S. Kim, C. K. Lee, J. H. Lee, E. H. Kim,
and S. J. Shim, “An Empirical Analysis of IT Job Requirements Using Online Job Postings”, Proceedings of the 4th International Conference on Smart Media and Applications, pp. 36-39, 2016.
[3] J. Kim, C. K. Lee, “An Empirical Analysis of Requirements for Data Scientists Using Online Job Postings,” International Journal of Software Engineering and Its Applications. vo. 10, no. 4, pp. 161-172, 2016.
ICSSC 2017 International Conference on Software & Smart Convergence 183 page
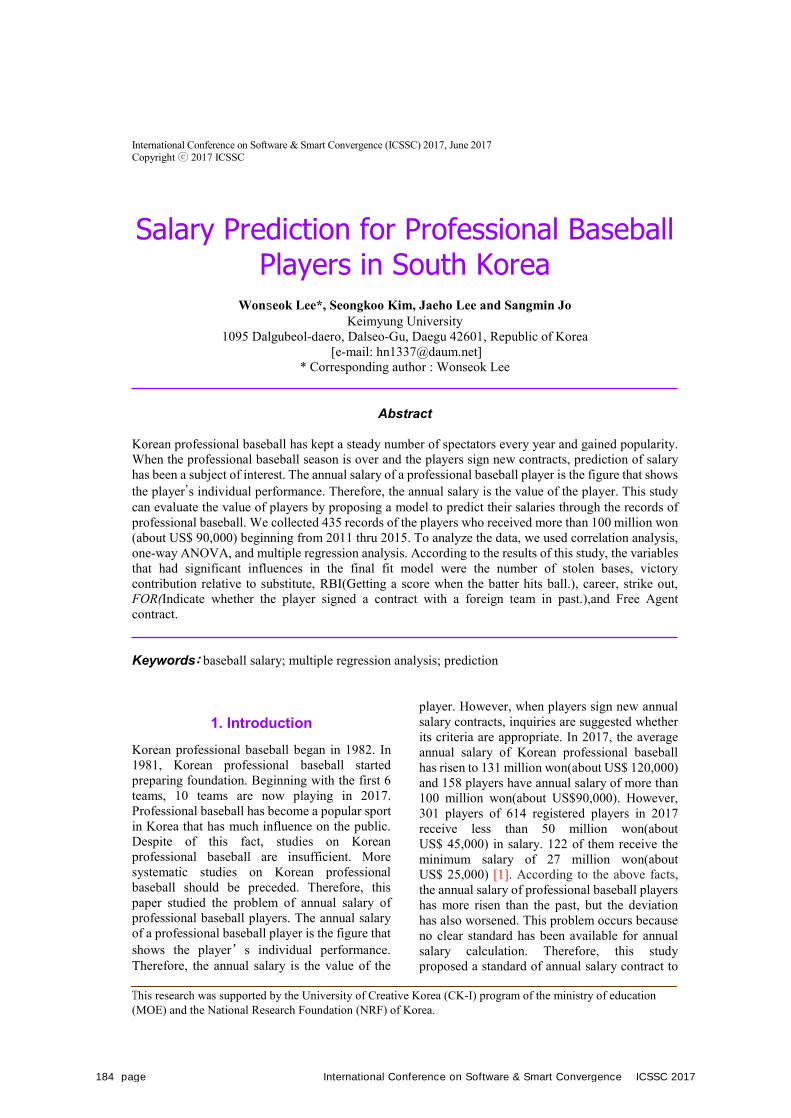
International Conference on Software & Smart Convergence (ICSSC) 2017, June 2017 Copyright ⓒ 2017 ICSSC
This research was supported by the University of Creative Korea (CK-I) program of the ministry of education (MOE) and the National Research Foundation (NRF) of Korea.
Salary Prediction for Professional Baseball Players in South Korea
Wonseok Lee*, Seongkoo Kim, Jaeho Lee and Sangmin Jo Keimyung University
1095 Dalgubeol-daero, Dalseo-Gu, Daegu 42601, Republic of Korea [e-mail: [email protected]]
* Corresponding author : Wonseok Lee
Abstract
Korean professional baseball has kept a steady number of spectators every year and gained popularity. When the professional baseball season is over and the players sign new contracts, prediction of salary has been a subject of interest. The annual salary of a professional baseball player is the figure that shows the player’s individual performance. Therefore, the annual salary is the value of the player. This study can evaluate the value of players by proposing a model to predict their salaries through the records of professional baseball. We collected 435 records of the players who received more than 100 million won (about US$ 90,000) beginning from 2011 thru 2015. To analyze the data, we used correlation analysis, one-way ANOVA, and multiple regression analysis. According to the results of this study, the variables that had significant influences in the final fit model were the number of stolen bases, victory contribution relative to substitute, RBI(Getting a score when the batter hits ball.), career, strike out, FOR(Indicate whether the player signed a contract with a foreign team in past.),and Free Agent contract.
Keywords: baseball salary; multiple regression analysis; prediction
1. IntroductionKorean professional baseball began in 1982. In 1981, Korean professional baseball started preparing foundation. Beginning with the first 6 teams, 10 teams are now playing in 2017. Professional baseball has become a popular sport in Korea that has much influence on the public. Despite of this fact, studies on Korean professional baseball are insufficient. More systematic studies on Korean professional baseball should be preceded. Therefore, this paper studied the problem of annual salary of professional baseball players. The annual salary of a professional baseball player is the figure that shows the player’s individual performance. Therefore, the annual salary is the value of the
player. However, when players sign new annual salary contracts, inquiries are suggested whether its criteria are appropriate. In 2017, the average annual salary of Korean professional baseball has risen to 131 million won(about US$ 120,000) and 158 players have annual salary of more than 100 million won(about US$90,000). However, 301 players of 614 registered players in 2017 receive less than 50 million won(about US$ 45,000) in salary. 122 of them receive the minimum salary of 27 million won(about US$ 25,000) [1]. According to the above facts, the annual salary of professional baseball players has more risen than the past, but the deviation has also worsened. This problem occurs because no clear standard has been available for annual salary calculation. Therefore, this study proposed a standard of annual salary contract to
184 page International Conference on Software & Smart Convergence ICSSC 2017

help decision making between the club and the player.
2. Research Method
2.1 data collection In this study used only performance of batter.435 records were collected on players who received more than 100 million won (about US$ 90,000), and excepted foreign players beginning from 2011 thru 2016 in STATIZ that has information of Korean professional baseball. Based on individual performance of players, 31 variables were used as shown in Table 1.
Table 1. Variables Variable
Team
AGE
PA
AB
R
H
Doubles
Triples
HR
TB
RBI
STL
STLF
BB
HBP
IBB
SO
GDP
SAC
SF
AVG
OBP
SLG
OPS
wOBA
WAR
Career
Award
FOR
DEG
FA
Total 31
2.2 multiple regression Regression analysis is a method of identifying and evaluating the relationship between the observed variables. Regression analysis constructs a linear model showing the correlation between independent and dependent variables and measures the fitness of the model [2]. One of regression analysis, multiple regression analysis constructs a regression model between several independent variables and dependent variables. The regression coefficients of each variable are estimated by the least squares method and tested by the t-test [3].
2.3 Data analysis
The characteristics of the data should be well understood to construct model for salary prediction. Therefore, EDA(Exploratory Data Analysis) was conducted. First, to confirm the distribution of the data, box plot, bar plot and histogram were used. Next, the correlation between dependent and independent variables was identified through correlation analysis [4]. After that, regression model was constructed used all possible variable and the best model was selected by removing the outliers, multicollinearity and using backward elimination. All of the above processes were performed by R program.
3. Research ResultThe box plot was used to determine receiving different salary depending on the player’s team. Fig. 1 shows that HanWha and KT box length is short. Through the above result, it was confirmed that the deviation of salary on players in HanWha and KT were smaller than the other teams. Therefore, one way ANOVA was conducted to verify whether salaries of each team differ. According to the result, p-value was 0.06. P-value exceeded significance level(α=0.05). Therefore, variables about belong were removed as the salaries of each team were not different.
Fig. 1 Box plot of salaries according to teams
The scatter plot and the correlation plot were used to determine the correlation between dependent variable and each independent variable. Fig. 2 shows that each independent variable has a high correlation with each other. This problem causes multicollinearity when
ICSSC 2017 International Conference on Software & Smart Convergence 185 page

fitting the regression model and may reduce the reliability of the analysis results. Therefore, the variables with high correlation were decided to remove in the variable selection stage.
Fig. 2 Correlation plot between variables
In regression analysis, the dependent variable must follow the assumption of normality. QQ-plot is a method to test the assumption of normality. If the scatter plot points in the plot are linearly close to the diagonal, it can be said that dependent variable satisfies the assumption of normality. However, Fig. 3 shows that the dependent variable, annual salary, is not satisfied with the assumption of normality. Therefore, by performing the log transformation, QQ-plot was changed to Fig. 4. Fig. 4 shows that the dependent variable is satisfied with the assumption of normality.
Fig. 3 Q-Q plot of before Transformation
Fig. 4 Q-Q plot of after Transformation
Based on previous analysis, a preliminary regression model was constructed with all possible variables. Next, outlier and influential observation were removed by viewing standardized residual plot and cook’s distance of the model. The causes influential observation was severely poor performance and, injuries. After that, it was determined that variable has multicollinearity when the VIF value of specific independent variables in the model exceeds 10. To solve this problem, the classified variables that cause multicollinearity were appropriately removed. Finally, the best model was suggested through the backward elimination method and validity was confirmed by examining the assumptions of the error term of the best model. The fit results of the best model are shown in Table 2. R-square of the best model was 0.66. Table 3 shows the results of prediction the salaries of 2017 players through using the best model.
Table 2 Result of multiple regression analysis Variable Estimate T value Pr(>|t|) R² adj-R² (intercept
)
9.02449 129.4 0.000
0.6634 0.6574
WAR 0.09716 5.731 0.000
STL 0.00415 2.272 0.024
CAR 0.04174 5.504 0.000
FOR 0.04670 4.411 0.085
FA 0.48618 7.956 0.000
SO -0.00267 -2.58
3
0.010
RBI 0.00829 5.904 0.000
186 page International Conference on Software & Smart Convergence ICSSC 2017
Table 3 2017 salary predict Name 2016
salary Prediction Actual 2017 salary
Won Seok, Lee 15000 34300 30000 Jae Ho, Kim 41000 48000 65000 Hyung Wu, Choi 70000 129500 150000 Ha Sung, Kim 16000 27400 22000 Ji Wan, Na 20000 50600 60000 Sung Hoon, Jung 50000 31400 30000
(unit: 10,000 won(about US$ 9))
4. ConclusionsAs mentioned in the introduction, the annual salary is an indicator of the player’s individual performance, and many conflicts occur between the teams and the players because there is no standard to determine salary clearly. The purpose of this study was to find out the variables that influence annual salary estimation using regression analysis, and to solve the problem by predicting the annual salary.
According to the result of analysis, the variables that affect salary raise were RBI(Getting a score when the batter hits ball.), career, WAR(victory contribution relative to substitute), number of stolen, Free Agent contract and FOR(Indicate whether the player signed a contract with a foreign team in past.). The variable that affects salary cut was only SO(Strike Out).
Among the many significant variables, WAR(victory contribution relative to substitute) was the most notable variable. An alternative player is a player who is easily available in the trade market. For example, if the WAR is a 5, it means that a player can contribute five victories. In fact, at that time 2017, Hyung-Woo Choi who had a WAR of 7.9 in 2016 signed the contract with the largest amount in the history of Korean professional baseball for the first time.
The limitation of this study did not reflect the recognition of players. If a player has a high level of awareness, the player will have ability to attract many spectators. The model of predicting the annual salary by performance of players was limited to reflect these factors. Later on, we hope that this problem will be secured and better research will be done in prediction Korean professional baseball Salary.
References
[1] yonhapnews.co.kr, “Shadow of the 100 million salary era of Professional Baseball,”
http://www.yonhapnews.co.kr/bulletin/2017/02/09/0200000000AKR20170209066100007.HTML?input=1195m, 2017. 2. 9, 2017. 2. 25.
[2] S. Kim, “A Study on Prediction of Blood Donation Number Using Multiple Linear Regression Analysis,” Master’s Thesis, Sungkyunkwan University, 2015.
[3] B.H. Jung and S.G. Kim, “A Festival Satisfaction Evaluation Method using Multiple Regression Analysis,” International Journal of Software Engineering and Its Applications, vo.8. no.4, pp.187-196, 2014.
[4] K.M. Oh and J.T. Lee, “A Model Study on Salaries of Korean Pro-Baseball Players Using Data Mining,” Journal of Korean Sociology of Sport, vo.16, no.2, pp.295-309, 2003.
ICSSC 2017 International Conference on Software & Smart Convergence 187 page
International Conference on Software & Smart Convergence (ICSSC) 2017, June 2017
Copyright ⓒ 2017 ICSSC
This research was a part of the project titled „Development of an automated fish-counter system and measurement
of underwater farming-fish‟, funded by the Ministry of Oceans and Fisheries, Korea.
Algorithm for the Amount Estimation of a Minor Fish School in a Net
Aleksandr Golov1,
Yury Morgunov1, Byunghyun Lim
2, Lubov Stasenko
3 and Kiseon Kim
2
1 V.I. ll‟ichev Pacific Oceanological Institute
Primorsky Region, Vladivostok, 690041 – Russian Federation
[e-mail: [email protected] , [email protected]] 2 Gwangju Institute of Science and Technologies,
Gwangju, 61005 – Republic of Korea
[e-mail: {corelim, kskim}@gist.ac.kr ] 1 V.I. ll‟ichev Pacific Oceanological Institute
Primorsky Region, Vladivostok, 690041 – Russian Federation
[e-mail: [email protected] , [email protected]] 3 Far Eastern Federal University
Primorsky Region, Vladivostok, 690090 – Russian Federation
[e-mail: [email protected]]
Abstract
The idea of the fish amount estimation by means of acoustic have being developing for more than thirty
years. In our days, the most advanced methodic for fish amount estimation in a net is the
echo-integration. Current paper represents a new data on the developed algorithms and the
software-hardware solution for the real time minor fish school species amount estimation on an example
of young sebastes schlegeli. A methodic of increasing the measurement accuracy based on fish school
form approximation is proposed. The results of the experimental testing in real conditions are presented.
Keywords: Echo-sounder, enclosed pounds, fish amount estimation, fishery acoustic
1. Introduction
Acoustic echo-sounding is a popular method
to determine fish stock abundance. Typically, the
acoustic energy backscattered from fish is
analyzed by a receiver located at the same site as
the transmitter. The main idea of the using sound
to detect objects because of the aquatic media are
similar to visual detection: both methods rely on
the detection of energy produced by or reflected
from an object. Sound waves do not have the
resolution of electromagnetic waves, but they do
propagate far better in water. The scientific use
of acoustics for counting the fish amount has
been widespread over the past thirty years. Texts
specific to fishery acoustics include [1-3].
The primary instrument for acoustic
measurements is the echosounder system. There
are three basic components of an echosounder
system: the signal generator, the transducer and
PC (Laptop) with installed software. The signal
generator produces a voltage pulse that is
converted by the transducer to a burst or pulse of
sound that propagates through the water. Echoes
from the objects in the water are received by the
transducer, converted back to an electrical
voltage and displayed, graphically as an
"echogram" in the software.
188 page International Conference on Software & Smart Convergence ICSSC 2017
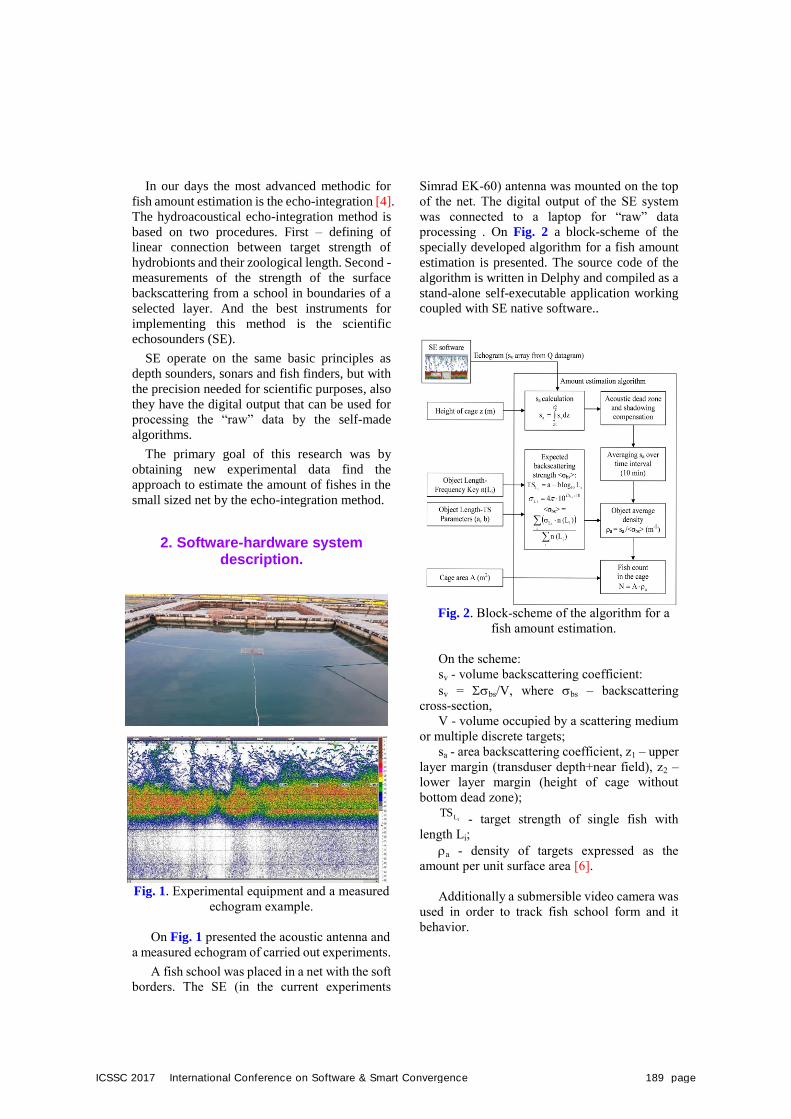
In our days the most advanced methodic for
fish amount estimation is the echo-integration [4].
The hydroacoustical echo-integration method is
based on two procedures. First – defining of
linear connection between target strength of
hydrobionts and their zoological length. Second -
measurements of the strength of the surface
backscattering from a school in boundaries of a
selected layer. And the best instruments for
implementing this method is the scientific
echosounders (SE).
SE operate on the same basic principles as
depth sounders, sonars and fish finders, but with
the precision needed for scientific purposes, also
they have the digital output that can be used for
processing the “raw” data by the self-made
algorithms.
The primary goal of this research was by
obtaining new experimental data find the
approach to estimate the amount of fishes in the
small sized net by the echo-integration method.
2. Software-hardware systemdescription.
Fig. 1. Experimental equipment and a measured
echogram example.
On Fig. 1 presented the acoustic antenna and
a measured echogram of carried out experiments.
A fish school was placed in a net with the soft
borders. The SE (in the current experiments
Simrad EK-60) antenna was mounted on the top
of the net. The digital output of the SE system
was connected to a laptop for “raw” data
processing . On Fig. 2 a block-scheme of the
specially developed algorithm for a fish amount
estimation is presented. The source code of the
algorithm is written in Delphy and compiled as a
stand-alone self-executable application working
coupled with SE native software..
Fig. 2. Block-scheme of the algorithm for a
fish amount estimation.
On the scheme:
sv - volume backscattering coefficient:
sv = bs/V, where bs – backscattering
cross-section,
V - volume occupied by a scattering medium
or multiple discrete targets;
sa - area backscattering coefficient, z1 – upper
layer margin (transduser depth+near field), z2 –
lower layer margin (height of cage without
bottom dead zone);
iLTS - target strength of single fish with
length Li;
a - density of targets expressed as the
amount per unit surface area [6].
Additionally a submersible video camera was
used in order to track fish school form and it
behavior.
ICSSC 2017 International Conference on Software & Smart Convergence 189 page
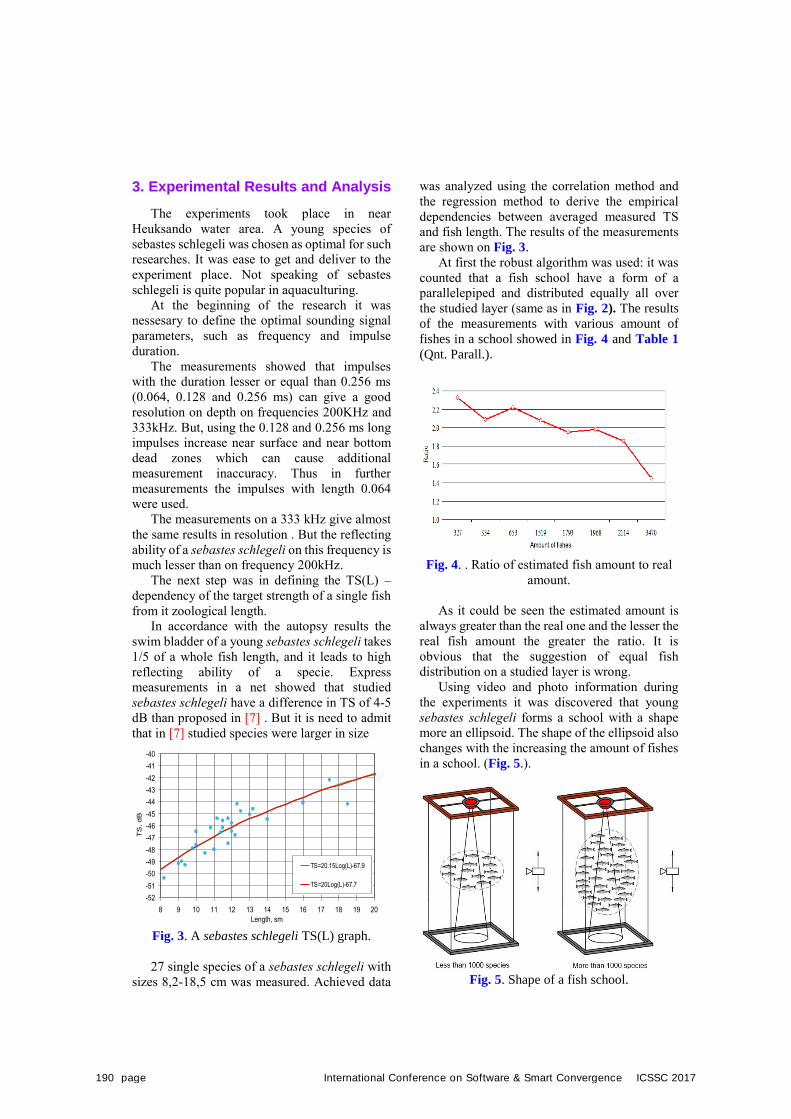
3. Experimental Results and Analysis
The experiments took place in near
Heuksando water area. A young species of
sebastes schlegeli was chosen as optimal for such
researches. It was ease to get and deliver to the
experiment place. Not speaking of sebastes
schlegeli is quite popular in aquaculturing.
At the beginning of the research it was
nessesary to define the optimal sounding signal
parameters, such as frequency and impulse
duration.
The measurements showed that impulses
with the duration lesser or equal than 0.256 ms
(0.064, 0.128 and 0.256 ms) can give a good
resolution on depth on frequencies 200KHz and
333kHz. But, using the 0.128 and 0.256 ms long
impulses increase near surface and near bottom
dead zones which can cause additional
measurement inaccuracy. Thus in further
measurements the impulses with length 0.064
were used.
The measurements on a 333 kHz give almost
the same results in resolution . But the reflecting
ability of a sebastes schlegeli on this frequency is
much lesser than on frequency 200kHz.
The next step was in defining the TS(L) –
dependency of the target strength of a single fish
from it zoological length.
In accordance with the autopsy results the
swim bladder of a young sebastes schlegeli takes
1/5 of a whole fish length, and it leads to high
reflecting ability of a specie. Express
measurements in a net showed that studied
sebastes schlegeli have a difference in TS of 4-5
dB than proposed in [7] . But it is need to admit
that in [7] studied species were larger in size
-52
-51
-50
-49
-48
-47
-46
-45
-44
-43
-42
-41
-40
8 9 10 11 12 13 14 15 16 17 18 19 20
Length, sm
TS
, d
B
TS=20.15Log(L)-67.9
TS=20Log(L)-67.7
Fig. 3. A sebastes schlegeli TS(L) graph.
27 single species of a sebastes schlegeli with
sizes 8,2-18,5 cm was measured. Achieved data
was analyzed using the correlation method and
the regression method to derive the empirical
dependencies between averaged measured TS
and fish length. The results of the measurements
are shown on Fig. 3.
At first the robust algorithm was used: it was
counted that a fish school have a form of a
parallelepiped and distributed equally all over
the studied layer (same as in Fig. 2). The results
of the measurements with various amount of
fishes in a school showed in Fig. 4 and Table 1
(Qnt. Parall.).
Fig. 4. . Ratio of estimated fish amount to real
amount.
As it could be seen the estimated amount is
always greater than the real one and the lesser the
real fish amount the greater the ratio. It is
obvious that the suggestion of equal fish
distribution on a studied layer is wrong.
Using video and photo information during
the experiments it was discovered that young
sebastes schlegeli forms a school with a shape
more an ellipsoid. The shape of the ellipsoid also
changes with the increasing the amount of fishes
in a school. (Fig. 5.).
Fig. 5. Shape of a fish school.
190 page International Conference on Software & Smart Convergence ICSSC 2017
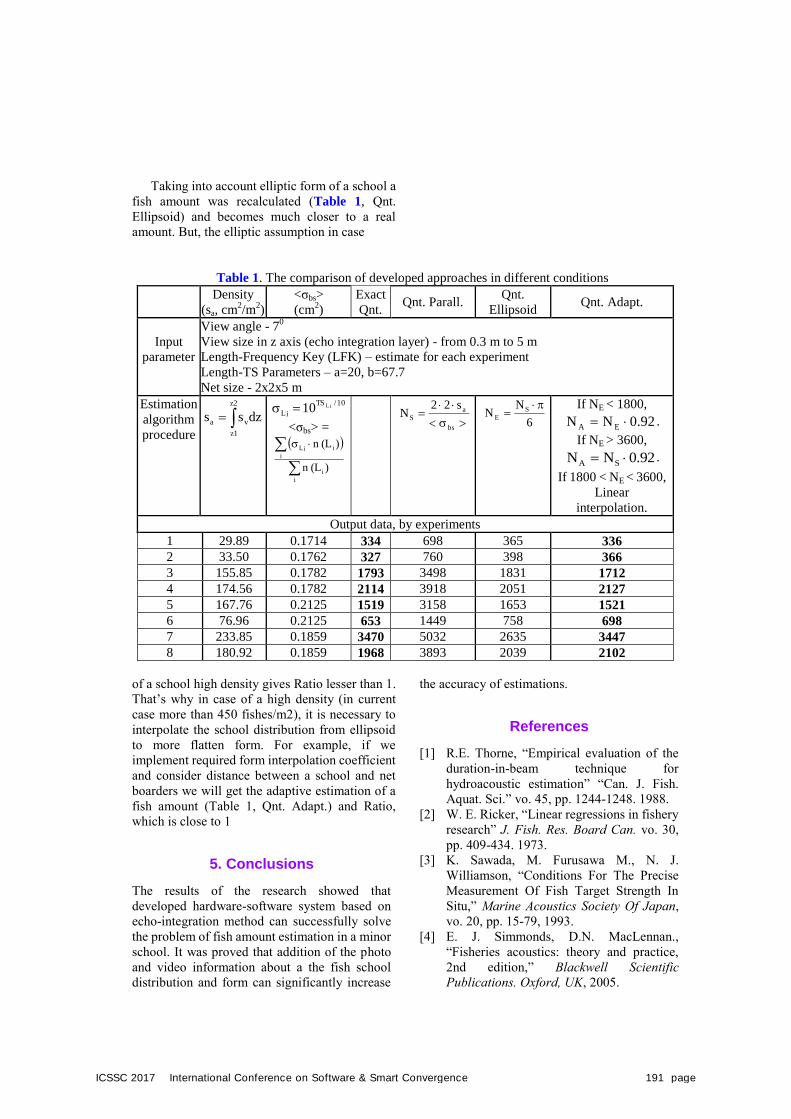
Taking into account elliptic form of a school a
fish amount was recalculated (Table 1, Qnt.
Ellipsoid) and becomes much closer to a real
amount. But, the elliptic assumption in case
Table 1. The comparison of developed approaches in different conditions
Density
(sa, cm2/m
2)
<σbs>
(cm2)
Exact
Qnt. Qnt. Parall.
Qnt.
Ellipsoid Qnt. Adapt.
Input
parameter
View angle - 70
View size in z axis (echo integration layer) - from 0.3 m to 5 m
Length-Frequency Key (LFK) – estimate for each experiment
Length-TS Parameters – a=20, b=67.7
Net size - 2x2x5 m
Estimation
algorithm
procedure z2
z1
va dzss 10/TS
iLiL10
<σbs> =
i
i
i
iiL
)(Ln
)(Ln
s22N
bs
a
S
6
NN S
E
If NE < 1800,
92.0NN EA .
If NE > 3600,
92.0NN SA .
If 1800 < NE < 3600,
Linear
interpolation.
Output data, by experiments
1 29.89 0.1714 334 698 365 336
2 33.50 0.1762 327 760 398 366
3 155.85 0.1782 1793 3498 1831 1712
4 174.56 0.1782 2114 3918 2051 2127
5 167.76 0.2125 1519 3158 1653 1521
6 76.96 0.2125 653 1449 758 698
7 233.85 0.1859 3470 5032 2635 3447
8 180.92 0.1859 1968 3893 2039 2102
of a school high density gives Ratio lesser than 1.
That’s why in case of a high density (in current
case more than 450 fishes/m2), it is necessary to
interpolate the school distribution from ellipsoid
to more flatten form. For example, if we
implement required form interpolation coefficient
and consider distance between a school and net
boarders we will get the adaptive estimation of a
fish amount (Table 1, Qnt. Adapt.) and Ratio,
which is close to 1
5. Conclusions
The results of the research showed that
developed hardware-software system based on
echo-integration method can successfully solve
the problem of fish amount estimation in a minor
school. It was proved that addition of the photo
and video information about a the fish school
distribution and form can significantly increase
the accuracy of estimations.
References
[1] R.E. Thorne, “Empirical evaluation of the
duration-in-beam technique for
hydroacoustic estimation” “Can. J. Fish.
Aquat. Sci.” vo. 45, pp. 1244-1248. 1988.
[2] W. E. Ricker, “Linear regressions in fishery
research” J. Fish. Res. Board Can. vo. 30,
pp. 409-434. 1973.
[3] K. Sawada, M. Furusawa M., N. J.
Williamson, “Conditions For The Precise
Measurement Of Fish Target Strength In
Situ,” Marine Acoustics Society Of Japan,
vo. 20, pp. 15-79, 1993.
[4] E. J. Simmonds, D.N. MacLennan.,
“Fisheries acoustics: theory and practice,
2nd edition,” Blackwell Scientific
Publications. Oxford, UK, 2005.
ICSSC 2017 International Conference on Software & Smart Convergence 191 page

[5] R.E. Thorne, “Assessment of population
abundance by echo integration,” J. Biol.
Oceanogr., pp. 253-262,1983.
[6] D.N. MacLennan, P.G. Fernandes, J. Dalen,
“A consistent approach to definitions and
symbols in fisheries acoustics” ICES
Journal of Marine Science, vo. 59.
pp.365-369, 2002.
[7] D. Kang, D. Hwang “Ex situ target strength
of rockfish (Sebastes schlegeli) and red
seabream (Pagrus major) in the Northwest
Pacific” ICES Journal of Marine Science,
vo. 60, pp. 538-543, 2003.
192 page International Conference on Software & Smart Convergence ICSSC 2017

International Conference on Software & Smart Convergence (ICSSC) 2017, June 2017
Copyright ⓒ 2017 ICSSC
This research was a part of the project titled „Development of an automated fish-counter system and measurement
of underwater farming-fish‟, funded by the Ministry of Oceans and Fisheries, Korea
Fish Count Estimation of Dense Population in Aquaculturing Nets
Sungjin Park1, Yury Morgunov
2, Aleksandr Golov
2, Peter Unru
3 and Kiseon Kim
1
1 Gwangju Institute of Science and Technologies,
Gwangju, 61005 – Republic of Korea
[e-mail: {psj6763, kskim}@gist.ac.kr ] 2 V.I. ll‟ichev Pacific Oceanological Institute
Primorsky Region, Vladivostok, 690041 – Russian Federation
[e-mail: [email protected] , [email protected]] 3 Far Eastern Federal University
Primorsky Region, Vladivostok, 690090 – Russian Federation
[e-mail: [email protected]]
Abstract
In this paper, we propose an algorithm for hydrobionts counting issue, using noncontact fishery
acoustics. We report new experimental data of the echo-integration experiments using the developed
algorithms for the dense fish school on an example of sebastes schlegeli grown in nets of Republic of
Korea. Real time approaches of increasing the measurement accuracy, and corresponding results of the
experimental testing in real conditions are presented.
Keywords: Echo-sounder, aquaculturing nets, fish counting, fishery acoustics
1. Introduction
The solution of the problem of the noncontact
fish count estimation is very important for most
of the hydrobionts aquaculturing. Especially this
problem becomes actual during the hot summer
time, when hydrobionts can easily be infected
even from a single touch.
It‟s well known that the most practical
methodic for noncontact fish amount estimation
is the digital echo-integration [1-2]. The fishery
acoustic echo-integration method is based on two
procedures. First – defining of linear connection
between target strength of hydrobionts and their
zoological length. Second - measurements of the
strength of the surface backscattering from a
school in boundaries of a selected layer. Also, the
best instrument for implementing this method is
named as the scientific echosounder (SE).
The SE operates on the same basic principles
as depth sounders, sonars and fish finders, but
with the precision needed for scientific purposes,
also they have the digital output that can be used
for processing the “raw” data by the various
fishery acoustics algorithms.
The goal of this research is extending and
improving the fish count estimation presented in
the first part of this paper in [3] by the
echo-integration method, further to estimate the
amount of dense fish in the realistic full-scale
aquaculture net.
2. Algorithm description.
The basic experimental equipment and
measurement configuration for the realistic
full-scale aquaculture net are similar like those
in [3], with SE of Simrad EK-15 rather than
ICSSC 2017 International Conference on Software & Smart Convergence 193 page
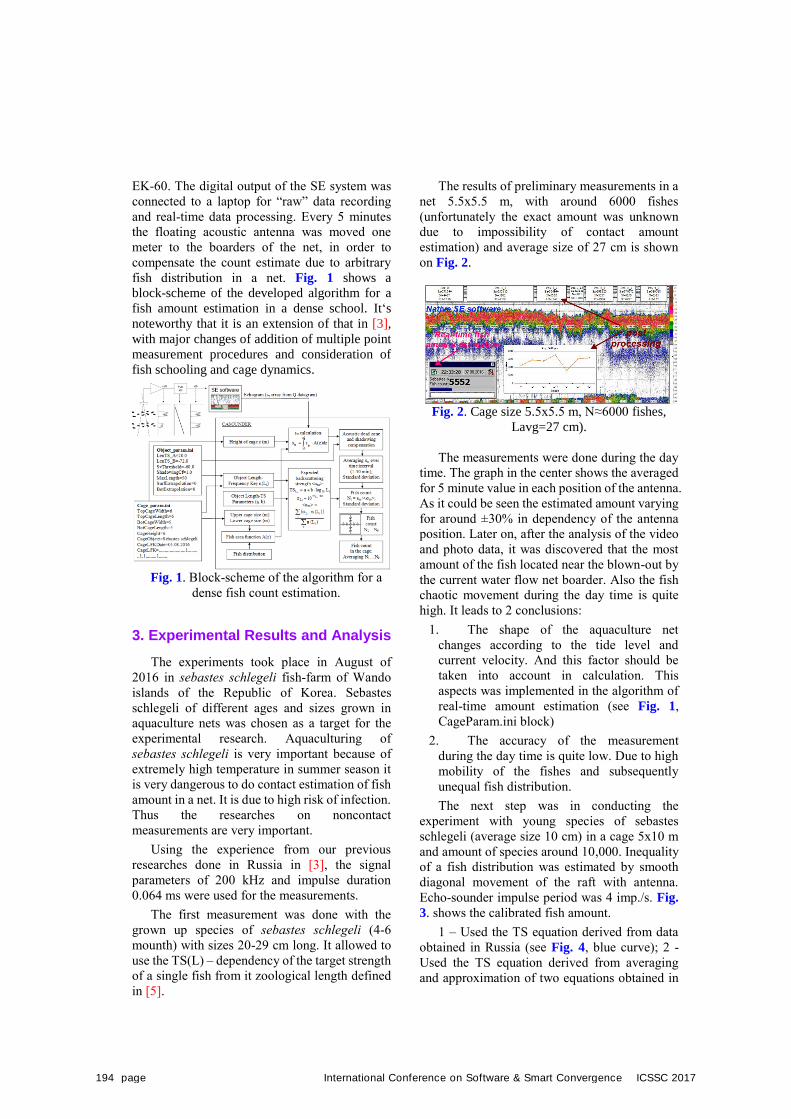
EK-60. The digital output of the SE system was
connected to a laptop for “raw” data recording
and real-time data processing. Every 5 minutes
the floating acoustic antenna was moved one
meter to the boarders of the net, in order to
compensate the count estimate due to arbitrary
fish distribution in a net. Fig. 1 shows a
block-scheme of the developed algorithm for a
fish amount estimation in a dense school. It„s
noteworthy that it is an extension of that in [3],
with major changes of addition of multiple point
measurement procedures and consideration of
fish schooling and cage dynamics.
Fig. 1. Block-scheme of the algorithm for a
dense fish count estimation.
3. Experimental Results and Analysis
The experiments took place in August of
2016 in sebastes schlegeli fish-farm of Wando
islands of the Republic of Korea. Sebastes
schlegeli of different ages and sizes grown in
aquaculture nets was chosen as a target for the
experimental research. Aquaculturing of
sebastes schlegeli is very important because of
extremely high temperature in summer season it
is very dangerous to do contact estimation of fish
amount in a net. It is due to high risk of infection.
Thus the researches on noncontact
measurements are very important.
Using the experience from our previous
researches done in Russia in [3], the signal
parameters of 200 kHz and impulse duration
0.064 ms were used for the measurements.
The first measurement was done with the
grown up species of sebastes schlegeli (4-6
mounth) with sizes 20-29 cm long. It allowed to
use the TS(L) – dependency of the target strength
of a single fish from it zoological length defined
in [5].
The results of preliminary measurements in a
net 5.5x5.5 m, with around 6000 fishes
(unfortunately the exact amount was unknown
due to impossibility of contact amount
estimation) and average size of 27 cm is shown
on Fig. 2.
Fig. 2. Cage size 5.5х5.5 m, N≈6000 fishes,
Lavg=27 cm).
The measurements were done during the day
time. The graph in the center shows the averaged
for 5 minute value in each position of the antenna.
As it could be seen the estimated amount varying
for around ±30% in dependency of the antenna
position. Later on, after the analysis of the video
and photo data, it was discovered that the most
amount of the fish located near the blown-out by
the current water flow net boarder. Also the fish
chaotic movement during the day time is quite
high. It leads to 2 conclusions:
1. The shape of the aquaculture net
changes according to the tide level and
current velocity. And this factor should be
taken into account in calculation. This
aspects was implemented in the algorithm of
real-time amount estimation (see Fig. 1,
CageParam.ini block)
2. The accuracy of the measurement
during the day time is quite low. Due to high
mobility of the fishes and subsequently
unequal fish distribution.
The next step was in conducting the
experiment with young species of sebastes
schlegeli (average size 10 cm) in a cage 5х10 m
and amount of species around 10,000. Inequality
of a fish distribution was estimated by smooth
diagonal movement of the raft with antenna.
Echo-sounder impulse period was 4 imp./s. Fig.
3. shows the calibrated fish amount.
1 – Used the TS equation derived from data
obtained in Russia (see Fig. 4, blue curve); 2 -
Used the TS equation derived from averaging
and approximation of two equations obtained in
194 page International Conference on Software & Smart Convergence ICSSC 2017
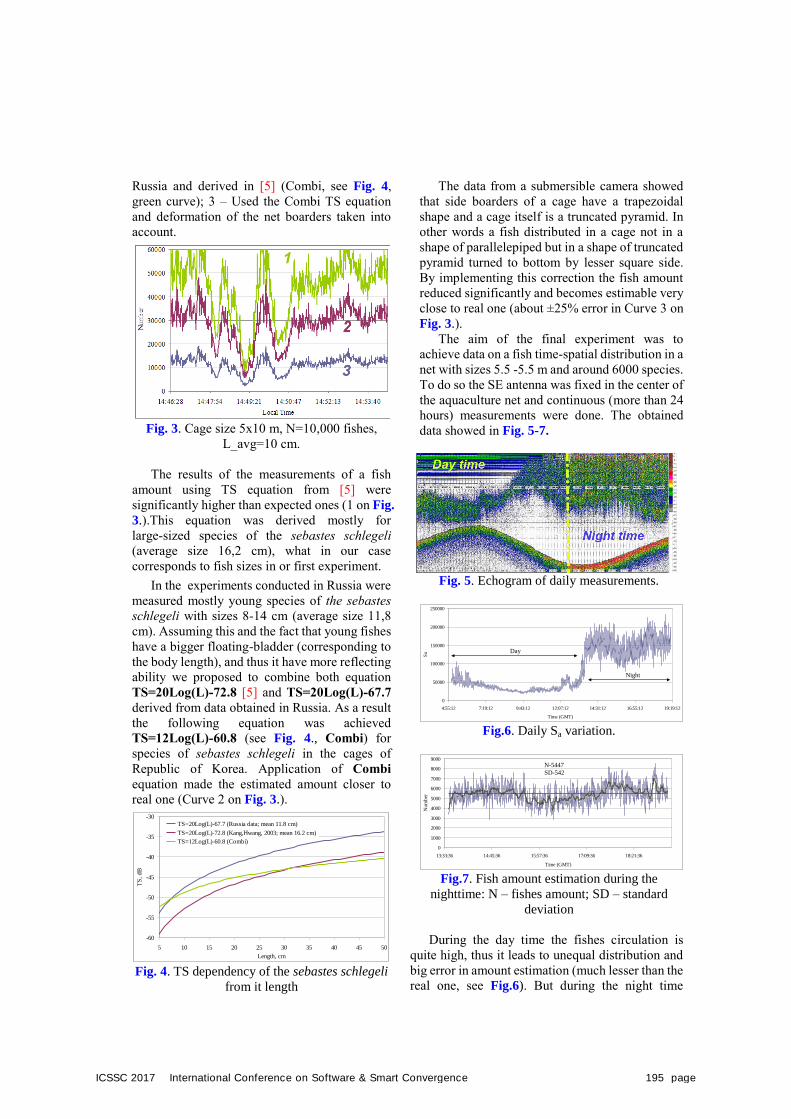
Russia and derived in [5] (Combi, see Fig. 4,
green curve); 3 – Used the Combi TS equation
and deformation of the net boarders taken into
account.
Fig. 3. Cage size 5х10 m, N=10,000 fishes,
L_avg=10 cm.
The results of the measurements of a fish
amount using TS equation from [5] were
significantly higher than expected ones (1 on Fig.
3.).This equation was derived mostly for
large-sized species of the sebastes schlegeli
(average size 16,2 cm), what in our case
corresponds to fish sizes in or first experiment.
In the experiments conducted in Russia were
measured mostly young species of the sebastes
schlegeli with sizes 8-14 cm (average size 11,8
cm). Assuming this and the fact that young fishes
have a bigger floating-bladder (corresponding to
the body length), and thus it have more reflecting
ability we proposed to combine both equation
TS=20Log(L)-72.8 [5] and TS=20Log(L)-67.7
derived from data obtained in Russia. As a result
the following equation was achieved
TS=12Log(L)-60.8 (see Fig. 4., Combi) for
species of sebastes schlegeli in the cages of
Republic of Korea. Application of Combi
equation made the estimated amount closer to
real one (Curve 2 on Fig. 3.).
-60
-55
-50
-45
-40
-35
-30
5 10 15 20 25 30 35 40 45 50
Length, cm
TS
, d
B
TS=20Log(L)-67.7 (Russia data; mean 11.8 cm)
TS=20Log(L)-72.8 (Kang,Hwang, 2003; mean 16.2 cm)
TS=12Log(L)-60.8 (Combi)
Fig. 4. TS dependency of the sebastes schlegeli
from it length
The data from a submersible camera showed
that side boarders of a cage have a trapezoidal
shape and a cage itself is a truncated pyramid. In
other words a fish distributed in a cage not in a
shape of parallelepiped but in a shape of truncated
pyramid turned to bottom by lesser square side.
By implementing this correction the fish amount
reduced significantly and becomes estimable very
close to real one (about ±25% error in Curve 3 on
Fig. 3.).
The aim of the final experiment was to
achieve data on a fish time-spatial distribution in a
net with sizes 5.5 -5.5 m and around 6000 species.
To do so the SE antenna was fixed in the center of
the aquaculture net and continuous (more than 24
hours) measurements were done. The obtained
data showed in Fig. 5-7.
Fig. 5. Echogram of daily measurements.
0
50000
100000
150000
200000
250000
4:55:12 7:19:12 9:43:12 12:07:12 14:31:12 16:55:12 19:19:12
Time (GMT)
Sa Day
Night
Fig.6. Daily Sa variation.
0
1000
2000
3000
4000
5000
6000
7000
8000
9000
13:33:36 14:45:36 15:57:36 17:09:36 18:21:36
Time (GMT)
Nu
mb
er
N-5447
SD-542
Fig.7. Fish amount estimation during the
nighttime: N – fishes amount; SD – standard
deviation
During the day time the fishes circulation is
quite high, thus it leads to unequal distribution and
big error in amount estimation (much lesser than the
real one, see Fig.6). But during the night time
ICSSC 2017 International Conference on Software & Smart Convergence 195 page
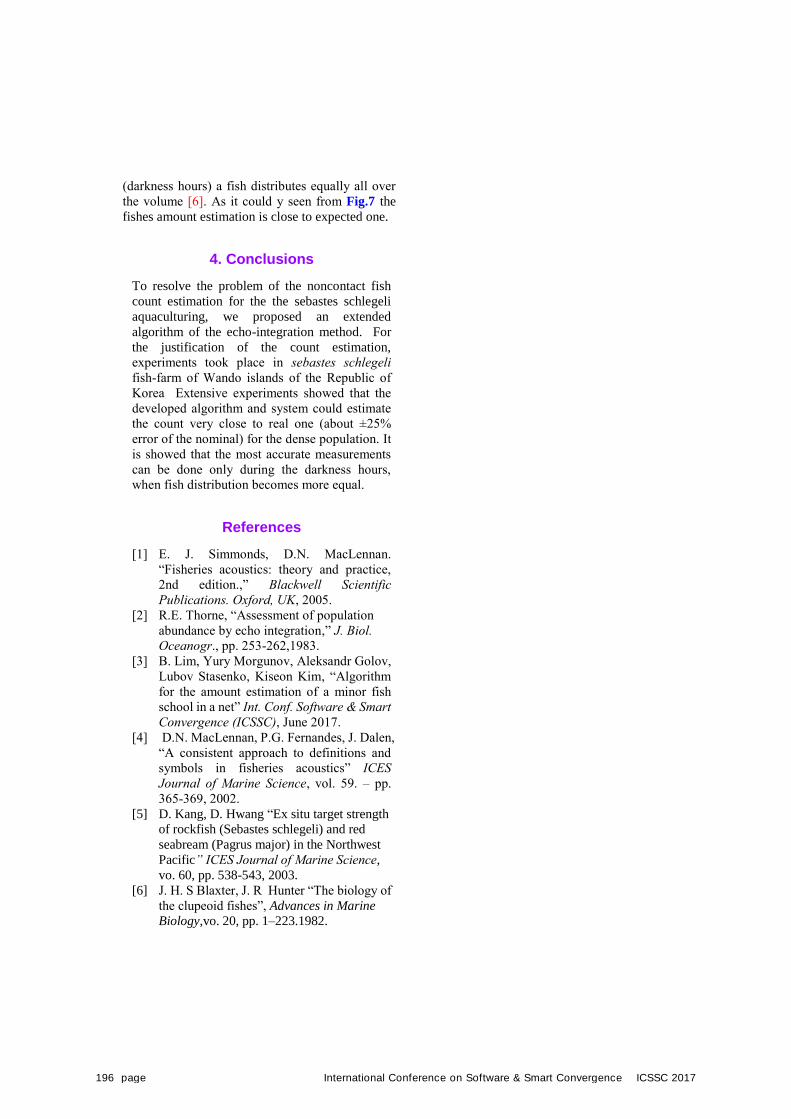
(darkness hours) a fish distributes equally all over
the volume [6]. As it could у seen from Fig.7 the
fishes amount estimation is close to expected one.
4. Conclusions
To resolve the problem of the noncontact fish
count estimation for the the sebastes schlegeli
aquaculturing, we proposed an extended
algorithm of the echo-integration method. For
the justification of the count estimation,
experiments took place in sebastes schlegeli
fish-farm of Wando islands of the Republic of
Korea Extensive experiments showed that the
developed algorithm and system could estimate
the count very close to real one (about ±25%
error of the nominal) for the dense population. It
is showed that the most accurate measurements
can be done only during the darkness hours,
when fish distribution becomes more equal.
References
[1] E. J. Simmonds, D.N. MacLennan.
“Fisheries acoustics: theory and practice,
2nd edition.,” Blackwell Scientific
Publications. Oxford, UK, 2005.
[2] R.E. Thorne, “Assessment of population
abundance by echo integration,” J. Biol.
Oceanogr., pp. 253-262,1983.
[3] B. Lim, Yury Morgunov, Aleksandr Golov,
Lubov Stasenko, Kiseon Kim, “Algorithm
for the amount estimation of a minor fish
school in a net” Int. Conf. Software & Smart
Convergence (ICSSC), June 2017.
[4] D.N. MacLennan, P.G. Fernandes, J. Dalen,
“A consistent approach to definitions and
symbols in fisheries acoustics” ICES
Journal of Marine Science, vol. 59. – pp.
365-369, 2002.
[5] D. Kang, D. Hwang “Ex situ target strength
of rockfish (Sebastes schlegeli) and red
seabream (Pagrus major) in the Northwest
Pacific” ICES Journal of Marine Science,
vo. 60, pp. 538-543, 2003.
[6] J. H. S Blaxter, J. R Hunter “The biology of
the clupeoid fishes”, Advances in Marine
Biology,vo. 20, pp. 1–223.1982.
196 page International Conference on Software & Smart Convergence ICSSC 2017
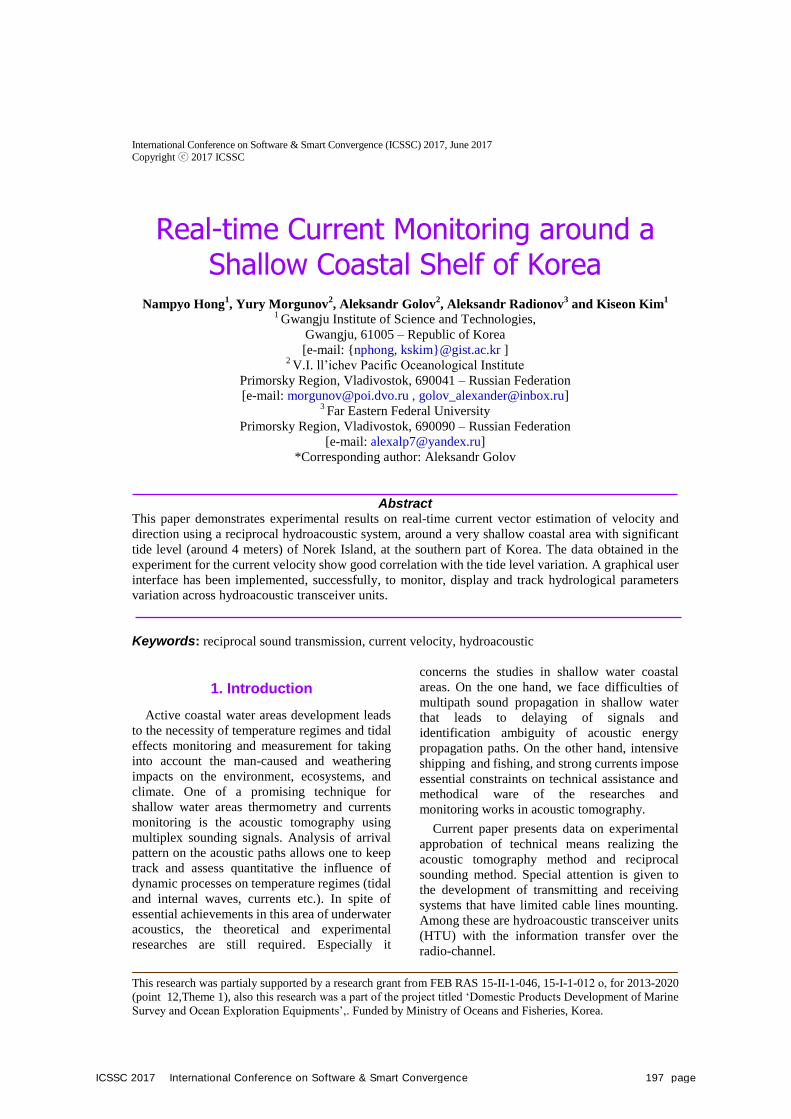
International Conference on Software & Smart Convergence (ICSSC) 2017, June 2017
Copyright ⓒ 2017 ICSSC
This research was partialy supported by a research grant from FEB RAS 15-II-1-046, 15-I-1-012 о, for 2013-2020
(point 12,Theme 1), also this research was a part of the project titled „Domestic Products Development of Marine
Survey and Ocean Exploration Equipments‟,. Funded by Ministry of Oceans and Fisheries, Korea.
Real-time Current Monitoring around a Shallow Coastal Shelf of Korea
Nampyo Hong1, Yury Morgunov
2, Aleksandr Golov
2, Aleksandr Radionov
3 and Kiseon Kim
1
1 Gwangju Institute of Science and Technologies,
Gwangju, 61005 – Republic of Korea
[e-mail: {nphong, kskim}@gist.ac.kr ] 2 V.I. ll‟ichev Pacific Oceanological Institute
Primorsky Region, Vladivostok, 690041 – Russian Federation
[e-mail: [email protected] , [email protected]] 3 Far Eastern Federal University
Primorsky Region, Vladivostok, 690090 – Russian Federation
[e-mail: [email protected]]
*Corresponding author: Aleksandr Golov
Abstract This paper demonstrates experimental results on real-time current vector estimation of velocity and
direction using a reciprocal hydroacoustic system, around a very shallow coastal area with significant
tide level (around 4 meters) of Norek Island, at the southern part of Korea. The data obtained in the
experiment for the current velocity show good correlation with the tide level variation. A graphical user
interface has been implemented, successfully, to monitor, display and track hydrological parameters
variation across hydroacoustic transceiver units.
Keywords: reciprocal sound transmission, current velocity, hydroacoustic
1. Introduction
Active coastal water areas development leads
to the necessity of temperature regimes and tidal
effects monitoring and measurement for taking
into account the man-caused and weathering
impacts on the environment, ecosystems, and
climate. One of a promising technique for
shallow water areas thermometry and currents
monitoring is the acoustic tomography using
multiplex sounding signals. Analysis of arrival
pattern on the acoustic paths allows one to keep
track and assess quantitative the influence of
dynamic processes on temperature regimes (tidal
and internal waves, currents etc.). In spite of
essential achievements in this area of underwater
acoustics, the theoretical and experimental
researches are still required. Especially it
concerns the studies in shallow water coastal
areas. On the one hand, we face difficulties of
multipath sound propagation in shallow water
that leads to delaying of signals and
identification ambiguity of acoustic energy
propagation paths. On the other hand, intensive
shipping and fishing, and strong currents impose
essential constraints on technical assistance and
methodical ware of the researches and
monitoring works in acoustic tomography.
Current paper presents data on experimental
approbation of technical means realizing the
acoustic tomography method and reciprocal
sounding method. Special attention is given to
the development of transmitting and receiving
systems that have limited cable lines mounting.
Among these are hydroacoustic transceiver units
(HTU) with the information transfer over the
radio-channel.
ICSSC 2017 International Conference on Software & Smart Convergence 197 page
Additionally the developed special graphical
user interfaces, that could correctly and
presentable display collected and processed data
is described.
2. The reciprocal sound transmissionmethod and system
The application of the hydroacoustic transceivers
in a reciprocal sound transmission configuration
where the time difference between sound
propagation in direct and opposite directions is
obtained can give information about current
velocity. In [1,2] a method to quantify the
influence of a current on sound speed was
proposed, as shown in Fig. 1.
Fig. 1. Description of the reciprocal sound
transmission method.
The idea was that the time difference is due to
the current flow between transceivers so from
knowledge of the sound propagation time in both
directions from a pair of transceivers it is
possible to estimate the relative speed and
direction of the current as well as average water
temperature.
Later Kaneko in his papers [3,4]
demonstrated the possibility to estimate current
velocity and direction in the horizontal plane
corresponding to the center of the triangle
formed by 3 hydroacoustic transceivers. To do so
the calculated relative velocities from two tracks
need to be recalculated in North and East
components of the current:
1 2 2 1
1 2 2 1
cos cos
sin cos sin cosE
U UU
1 2 2 1
1 2 2 1
sin sin
sin cos sin cosN
U UU
where U1 and U2 are calculated from tracks 1 and
2 current relative velocities and 1 ,
2 are the
angles between North and the track directions.
The amplitude of the current and its direction in
the horizontal plane can be estimated as :
2 2( ) ( )E NU U U ; arctan(U / U )E N
To realize in real time and get experimental
results on the above mentioned schemes a special
software-hardware composite system based on
emission and correlation processing of
pseudo-random phase-modulated signals was
developed in collaboration between the MT-IT
Collaboration Center of Gwangju Institute of
Science and Technologies in Korea and the
Department of Technical Means of Ocean Study
of POI.
The hardware part of the system consists of a
hydroacoustic transducer able to receive and
transmit acoustic signals. The transducer in the
underwater block is connected by a cable to the
shore block, which details are available in [5].
3. The software-hardware systemdescription
The post-processed messages are sent
through an RS-232 cable to a PC where they can
be displayed and stored or processed in real time.
In order to produce a real-time current vector
data interpretation a graphical user interface
(GUI) assigned for processing of received from
HTU messages was designed in JAVA, which
example is shown in Fig. 3. The GUI extracts the
information about each HTU signal and defines
the reciprocal arrival from the counter direction
for each pair of HTUs. Then using preliminary
inserted parameters (HTUs coordinates, depths,
salinity and etc) it calculates propagation time
differences and sums, mean temperature along
track, relative current velocity for each track and
horizontal plane current velocity and direction
corresponding to the center of the triangle
formed by the HTU. All calculated data are
plotted in a corresponding window or presented
in text boxes of the GUI.
198 page International Conference on Software & Smart Convergence ICSSC 2017
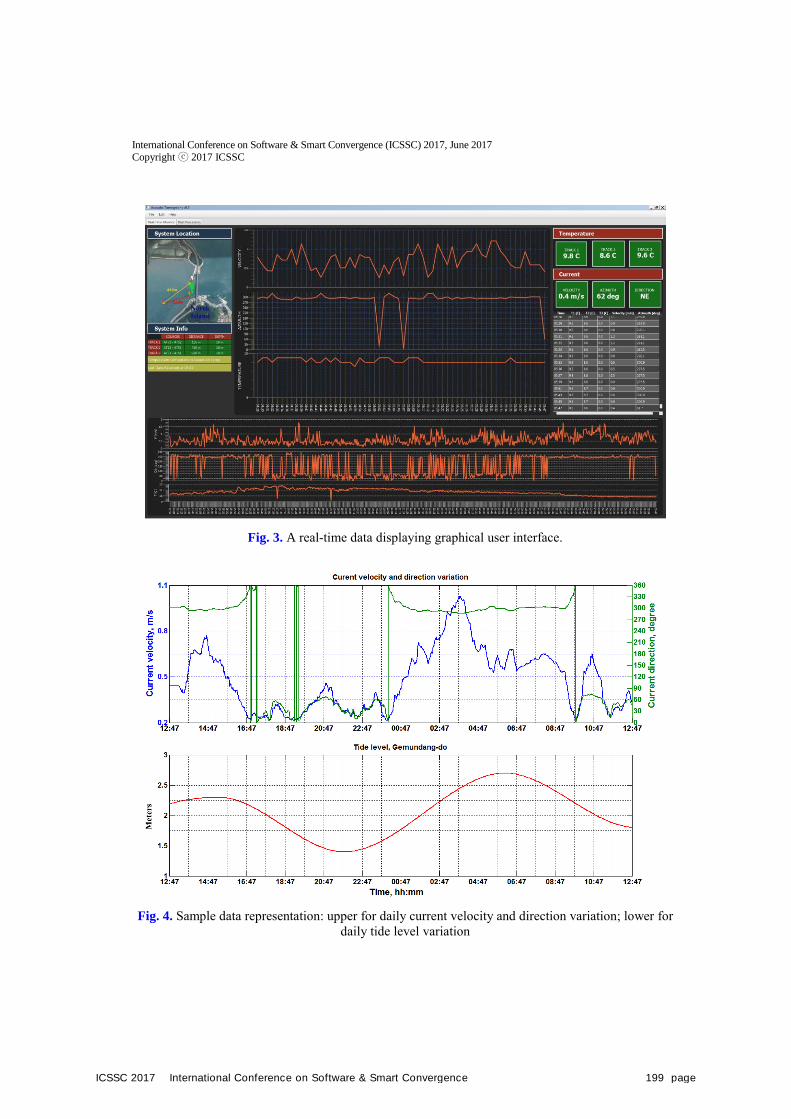
International Conference on Software & Smart Convergence (ICSSC) 2017, June 2017
Copyright ⓒ 2017 ICSSC
Fig. 3. A real-time data displaying graphical user interface.
Fig. 4. Sample data representation: upper for daily current velocity and direction variation; lower for
daily tide level variation
ICSSC 2017 International Conference on Software & Smart Convergence 199 page
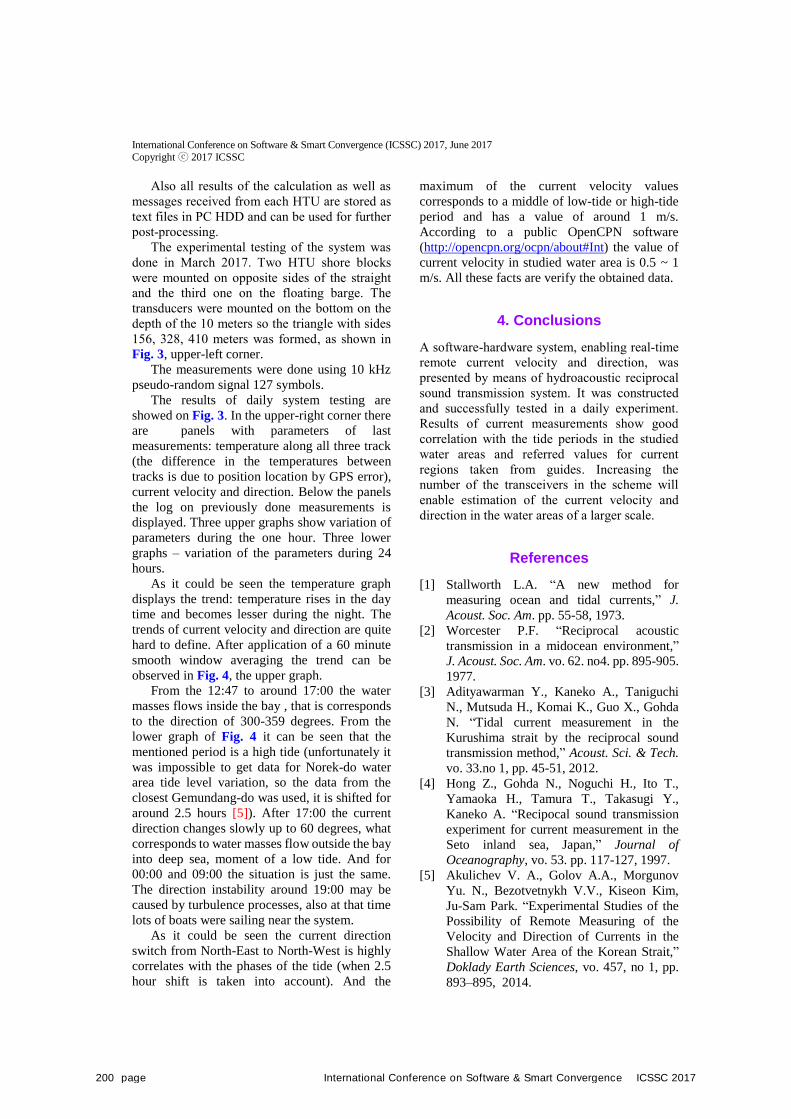
International Conference on Software & Smart Convergence (ICSSC) 2017, June 2017
Copyright ⓒ 2017 ICSSC
Also all results of the calculation as well as
messages received from each HTU are stored as
text files in PC HDD and can be used for further
post-processing.
The experimental testing of the system was
done in March 2017. Two HTU shore blocks
were mounted on opposite sides of the straight
and the third one on the floating barge. The
transducers were mounted on the bottom on the
depth of the 10 meters so the triangle with sides
156, 328, 410 meters was formed, as shown in
Fig. 3, upper-left corner.
The measurements were done using 10 kHz
pseudo-random signal 127 symbols.
The results of daily system testing are
showed on Fig. 3. In the upper-right corner there
are panels with parameters of last
measurements: temperature along all three track
(the difference in the temperatures between
tracks is due to position location by GPS error),
current velocity and direction. Below the panels
the log on previously done measurements is
displayed. Three upper graphs show variation of
parameters during the one hour. Three lower
graphs – variation of the parameters during 24
hours.
As it could be seen the temperature graph
displays the trend: temperature rises in the day
time and becomes lesser during the night. The
trends of current velocity and direction are quite
hard to define. After application of a 60 minute
smooth window averaging the trend can be
observed in Fig. 4, the upper graph.
From the 12:47 to around 17:00 the water
masses flows inside the bay , that is corresponds
to the direction of 300-359 degrees. From the
lower graph of Fig. 4 it can be seen that the
mentioned period is a high tide (unfortunately it
was impossible to get data for Norek-do water
area tide level variation, so the data from the
closest Gemundang-do was used, it is shifted for
around 2.5 hours [5]). After 17:00 the current
direction changes slowly up to 60 degrees, what
corresponds to water masses flow outside the bay
into deep sea, moment of a low tide. And for
00:00 and 09:00 the situation is just the same.
The direction instability around 19:00 may be
caused by turbulence processes, also at that time
lots of boats were sailing near the system.
As it could be seen the current direction
switch from North-East to North-West is highly
correlates with the phases of the tide (when 2.5
hour shift is taken into account). And the
maximum of the current velocity values
corresponds to a middle of low-tide or high-tide
period and has a value of around 1 m/s.
According to a public OpenCPN software
(http://opencpn.org/ocpn/about#Int) the value of
current velocity in studied water area is 0.5 ~ 1
m/s. All these facts are verify the obtained data.
4. Conclusions
A software-hardware system, enabling real-time
remote current velocity and direction, was
presented by means of hydroacoustic reciprocal
sound transmission system. It was constructed
and successfully tested in a daily experiment.
Results of current measurements show good
correlation with the tide periods in the studied
water areas and referred values for current
regions taken from guides. Increasing the
number of the transceivers in the scheme will
enable estimation of the current velocity and
direction in the water areas of a larger scale.
References
[1] Stallworth L.A. “A new method for
measuring ocean and tidal currents,” J.
Acoust. Soc. Am. pp. 55-58, 1973.
[2] Worcester P.F. “Reciprocal acoustic
transmission in a midocean environment,”
J. Acoust. Soc. Am. vo. 62. no4. pp. 895-905.
1977.
[3] Adityawarman Y., Kaneko A., Taniguchi
N., Mutsuda H., Komai K., Guo X., Gohda
N. “Tidal current measurement in the
Kurushima strait by the reciprocal sound
transmission method,” Acoust. Sci. & Tech.
vo. 33.no 1, pp. 45-51, 2012.
[4] Hong Z., Gohda N., Noguchi H., Ito T.,
Yamaoka H., Tamura T., Takasugi Y.,
Kaneko A. “Recipocal sound transmission
experiment for current measurement in the
Seto inland sea, Japan,” Journal of
Oceanography, vo. 53. pp. 117-127, 1997.
[5] Akulichev V. A., Golov A.A., Morgunov
Yu. N., Bezotvetnykh V.V., Kiseon Kim,
Ju-Sam Park. “Experimental Studies of the
Possibility of Remote Measuring of the
Velocity and Direction of Currents in the
Shallow Water Area of the Korean Strait,”
Doklady Earth Sciences, vo. 457, no 1, pp.
893–895, 2014.
200 page International Conference on Software & Smart Convergence ICSSC 2017
International Conference on Software & Smart Convergence (ICSSC) 2017, June 2017 Copyright ⓒ 2017 ICSSC
This research was supported by a research grant from the IT R&D program of MKE/IITA, the Korean government [2005-Y-001-04, Development of Next Generation Security Technology]. We express our thanks to Dr. Richard Berke who checked our manuscript.
Design and Implementation of Event Detection System on Hadoop
Van Quan Nguyen, Huyng-Jeong Yang*, Young-chul Kim, Soo-hyung Kim, Guee Sang Lee, Minku Kwon
Department of Electronics and Computer Engineering Chonnam National University
Gwangjusi, South Korea [e-mail: [email protected], [email protected], [email protected], [email protected],
[email protected], [email protected]] *Corresponding author: Hyung-Jeong Yang
Abstract
Hadoop framework currently is becoming the best option for big data analysis as well as distributed data, streaming data. Nowadays, social data media have become the potential platform across the global to explore useful information, especially in the disaster situation. This paper proposed a novel approach for social analysis data on disasters based on filtering to obtain informative data, classifying data and event detection. This paper provide Hadoop-based architecture to process Twitter data collected via Flume tool to isolate informative tweet using Hadoop Streaming for MapReduce, then Recurrent Neural Network module was implemented for event detection. Besides, Hive, a data warehouse infrastructure tool built on top of Hadoop can access data and parse contents of JSON format which is loaded from HDFS storage. The proposed event detection system promised to respond in tolerant time.
Keywords: Social data, disaster, CNN, LSTM, Hadoop ecosystem
1. IntroductionHadoop includes fault-tolerant storage system called Hadoop Distributed File System (HDFS) for distributed storage and large scale distributed processing of data on clusters [4]. Hadoop enables applications with MapReduce technique, in which the data is processed in parallel on different clusters nodes. In other words, a Hadoop-based application could perform analysis for a large amount of data on large clusters of commodity hardware in a reliable.
The Twitter platform, one of the most vital sources, is subjective of our research. Considering disaster circumstance, our approach
will present how to filter noise information as well as classify informative data into different categories, that will be useful to support humanitarian during the occurrence of a disaster.
Hence, we design and implement an event detection system on Hadoop ecosystem. It includes Convolutional Neural Network (CNN) [8, 10] approach for filter and sorting, whereas Long Short-Term Memory (LSTM) [2] network model for time detection. Hadoop ecosystem with some useful tool will be the best option for analysis distributed Big data, streaming data, timestamped data, unstructured data like tweet data. Flume [12] is used to gather streaming data from social source and store into HDFS under JSON. SerDe standing for Serializer and
ICSSC 2017 International Conference on Software & Smart Convergence 201 page
Deserializer will help Hive tool [13] understand the JSON format in HDFS and readable these data will be processed by MapReduce with the support of Hadoop Streaming utility. After processed data is stored HDFS again for visualization on Zeppelin dash-board [14].
The remain of paper is structured: Section II provides motivation and related works. Section III shows the proposed approach and Hadoop-based architecture. The demonstration is presented in Section IV. Finally, Section V are the conclusion and future works of our research.
2. Related WorkTo detect a new event in noisy environment as disaster, we have to preprocess to filter outlier out as [1, 3] for informative data. The social network also played as a communication and interactive platform during a disaster, this trend expressed in [1, 3, 7]. Although approaches in [1, 3] are a feature-based method for machinelearning technique, they still have some limitations as features need to be done by an expert. To avoid this dependence, we intend use deep learning way to learn feature of texture data automatically. Indeed, SVM has been shallow architecture only, CNN [8, 10] and LSTM [2] have become as a popular technology with some advantages of deep architecture.
Several researches have attempted to use the discrete signal to find high frequency or “burst” feature in data stream [11]. For time series data in event detection, we used LSTM model in our system as powerful technique on time series for event detection to come over the limitation of traditional Recurrent Neural Network.
As traditional SQL database can not efficiently store and manage massive data, when analyzing the large data and complex from the social network it required a power tool, so we used Hadoop as an open source implementing MapReduce algorithm [18]. Hadoop ecosystem also provides many powerful tools for deep analysis and transformation of big data [7, 16, 17]. With supporting from Hadoop tools, CyberGIS framework [7] automatically synthesize data to track disaster events, to produce maps, and to perform statistical analysis for disaster management. Such system also has geo-visual analysis implemented using Dojo framework, HTML5, and JavaScripts. Big-SoSA
system [17] focus on sentiment analysis social data and visualization on big data. Authors proposed a method of sentiment analysis on Twitter by using Hadoop and its ecosystems that process the large volume of data on a Hadoop, and the MapReduce function performs the sentiment analysis. Paper [16] discussed how to use Flume [12] for collecting data from Twitter and store into HDFS storage for analysis and then used Hadoop ecosystem for analyzing these data. From the trend of using Hadoop in big data problem, we will utilize Hadoop ecosystem to analyze social data in event detection.
3. Event detection system
3.1 Hadoop Ecosystem Apache Hadoop is a good choice for our project since it enables to play with distributed big data. Hadoop Ecosystem [16] is an open-source framework along with various types of complex and evolving tools and components which have proficient advantages in solving problems. As shown in Fig. 1, Hadoop Ecosystem composes four different layers: data storage, data processing, data access, and data management.
Fig. 1. Hadoop Ecosystem
In the scope of our problem, we will pick some tools such as Flume, Hive, and HDFS from Hadoop ecosystem to implement our approach.
Fig. 2. Implementation for visualization
202 page International Conference on Software & Smart Convergence ICSSC 2017
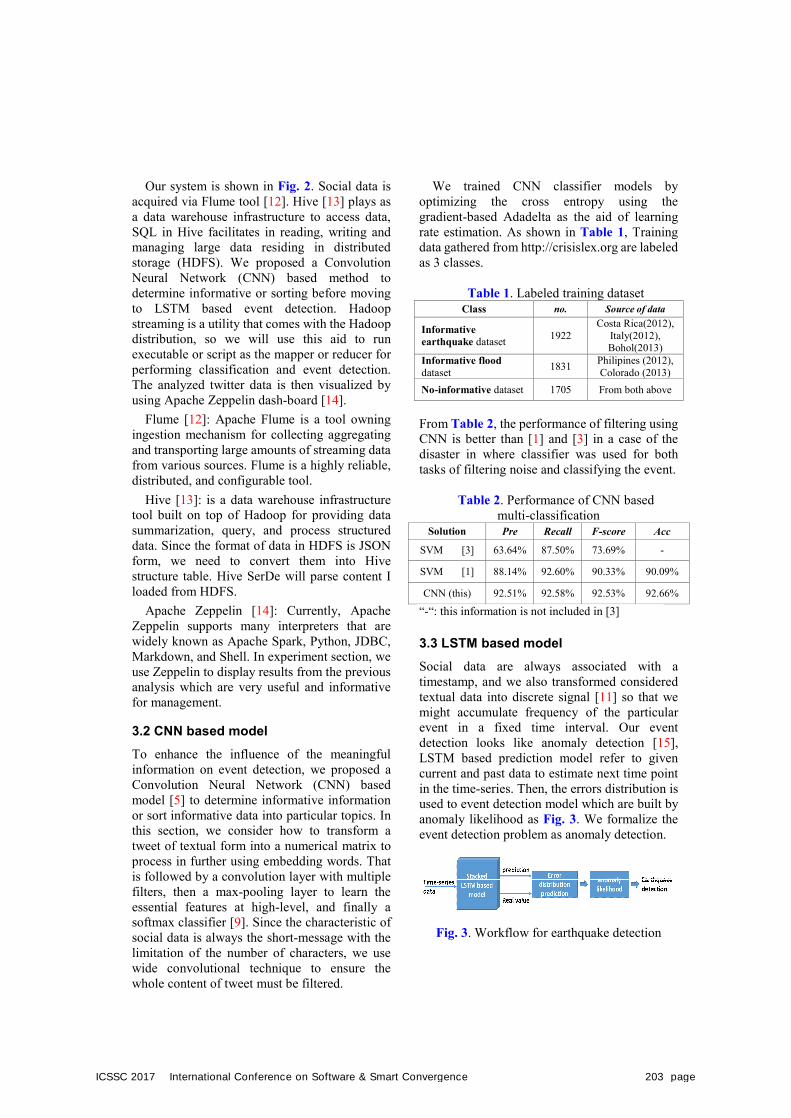
Our system is shown in Fig. 2. Social data is acquired via Flume tool [12]. Hive [13] plays as a data warehouse infrastructure to access data, SQL in Hive facilitates in reading, writing and managing large data residing in distributed storage (HDFS). We proposed a Convolution Neural Network (CNN) based method to determine informative or sorting before moving to LSTM based event detection. Hadoop streaming is a utility that comes with the Hadoop distribution, so we will use this aid to run executable or script as the mapper or reducer for performing classification and event detection. The analyzed twitter data is then visualized by using Apache Zeppelin dash-board [14].
Flume [12]: Apache Flume is a tool owning ingestion mechanism for collecting aggregating and transporting large amounts of streaming data from various sources. Flume is a highly reliable, distributed, and configurable tool.
Hive [13]: is a data warehouse infrastructure tool built on top of Hadoop for providing data summarization, query, and process structured data. Since the format of data in HDFS is JSON form, we need to convert them into Hive structure table. Hive SerDe will parse content I loaded from HDFS.
Apache Zeppelin [14]: Currently, Apache Zeppelin supports many interpreters that are widely known as Apache Spark, Python, JDBC, Markdown, and Shell. In experiment section, we use Zeppelin to display results from the previous analysis which are very useful and informative for management.
3.2 CNN based model To enhance the influence of the meaningful information on event detection, we proposed a Convolution Neural Network (CNN) based model [5] to determine informative information or sort informative data into particular topics. In this section, we consider how to transform a tweet of textual form into a numerical matrix to process in further using embedding words. That is followed by a convolution layer with multiple filters, then a max-pooling layer to learn the essential features at high-level, and finally a softmax classifier [9]. Since the characteristic of social data is always the short-message with the limitation of the number of characters, we use wide convolutional technique to ensure the whole content of tweet must be filtered.
We trained CNN classifier models by optimizing the cross entropy using the gradient-based Adadelta as the aid of learning rate estimation. As shown in Table 1, Training data gathered from http://crisislex.org are labeled as 3 classes.
Table 1. Labeled training dataset Class no. Source of data
Informative earthquake dataset 1922
Costa Rica(2012), Italy(2012), Bohol(2013)
Informative flood dataset 1831 Philipines (2012),
Colorado (2013) No-informative dataset 1705 From both above
From Table 2, the performance of filtering using CNN is better than [1] and [3] in a case of the disaster in where classifier was used for both tasks of filtering noise and classifying the event.
Table 2. Performance of CNN based multi-classification
Solution Pre Recall F-score Acc
SVM [3] 63.64% 87.50% 73.69% -
SVM [1] 88.14% 92.60% 90.33% 90.09%
CNN (this) 92.51% 92.58% 92.53% 92.66%
“-“: this information is not included in [3]
3.3 LSTM based model Social data are always associated with a timestamp, and we also transformed considered textual data into discrete signal [11] so that we might accumulate frequency of the particular event in a fixed time interval. Our event detection looks like anomaly detection [15], LSTM based prediction model refer to given current and past data to estimate next time point in the time-series. Then, the errors distribution is used to event detection model which are built by anomaly likelihood as Fig. 3. We formalize the event detection problem as anomaly detection.
Fig. 3. Workflow for earthquake detection
ICSSC 2017 International Conference on Software & Smart Convergence 203 page
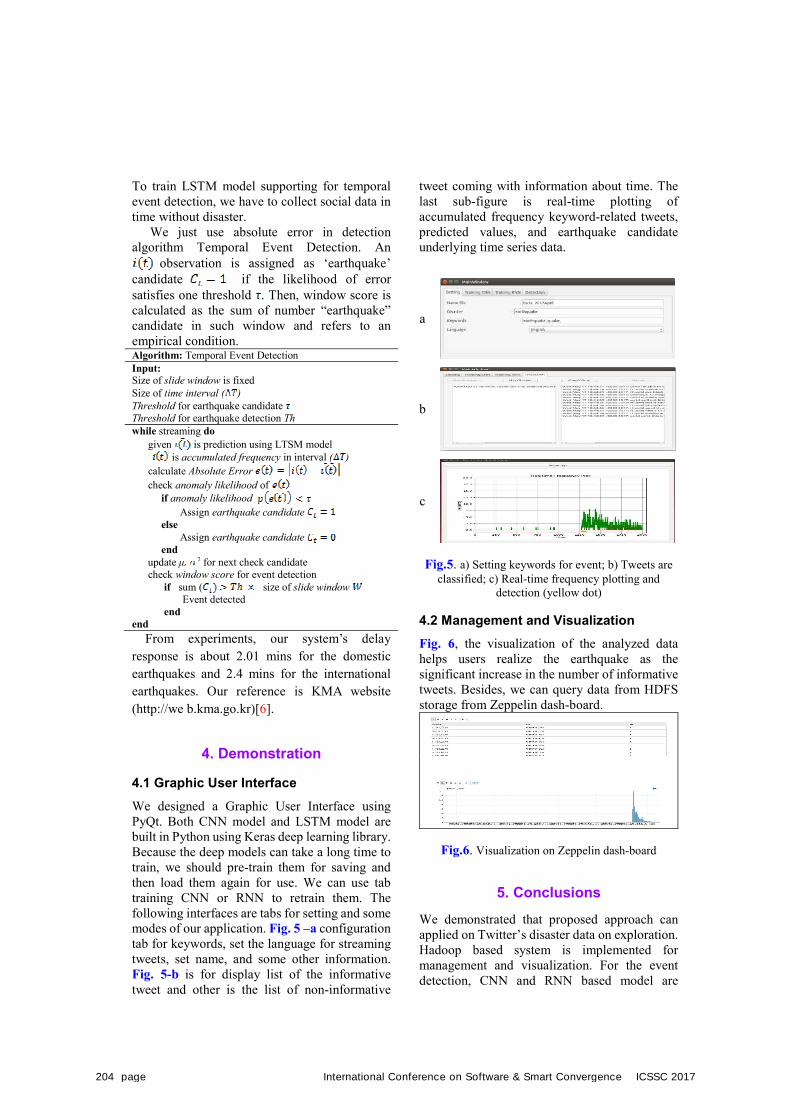
To train LSTM model supporting for temporal event detection, we have to collect social data in time without disaster.
We just use absolute error in detection algorithm Temporal Event Detection. An
observation is assigned as ‘earthquake’ candidate if the likelihood of error satisfies one threshold . Then, window score is calculated as the sum of number “earthquake” candidate in such window and refers to an empirical condition. Algorithm: Temporal Event Detection Input: Size of slide window is fixed Size of time interval ( ) Threshold for earthquake candidate Threshold for earthquake detection Th while streaming do
given is prediction using LTSM model is accumulated frequency in interval ( )
calculate Absolute Error check anomaly likelihood of
if anomaly likelihood Assign earthquake candidate
else Assign earthquake candidate
end update μ for next check candidate check window score for event detection
if sum ( size of slide window Event detected
end end
From experiments, our system’s delay response is about 2.01 mins for the domestic earthquakes and 2.4 mins for the international earthquakes. Our reference is KMA website (http://we b.kma.go.kr)[6].
4. Demonstration
4.1 Graphic User Interface We designed a Graphic User Interface using PyQt. Both CNN model and LSTM model are built in Python using Keras deep learning library. Because the deep models can take a long time to train, we should pre-train them for saving and then load them again for use. We can use tab training CNN or RNN to retrain them. The following interfaces are tabs for setting and some modes of our application. Fig. 5 –a configuration tab for keywords, set the language for streaming tweets, set name, and some other information. Fig. 5-b is for display list of the informative tweet and other is the list of non-informative
tweet coming with information about time. The last sub-figure is real-time plotting of accumulated frequency keyword-related tweets, predicted values, and earthquake candidate underlying time series data.
a
b
c
Fig.5. a) Setting keywords for event; b) Tweets are classified; c) Real-time frequency plotting and
detection (yellow dot)
4.2 Management and Visualization Fig. 6, the visualization of the analyzed data helps users realize the earthquake as the significant increase in the number of informative tweets. Besides, we can query data from HDFS storage from Zeppelin dash-board.
Fig.6. Visualization on Zeppelin dash-board
5. ConclusionsWe demonstrated that proposed approach can applied on Twitter’s disaster data on exploration. Hadoop based system is implemented for management and visualization. For the event detection, CNN and RNN based model are
204 page International Conference on Software & Smart Convergence ICSSC 2017
capable of learning feature automatically, this feature belong to Convolution layer. Our system is potential for both filtering outlier data as well as accommodating in many events detection in the same time. Besides, LSTM architecture currently is an excellent candidate for time series data. Analysis and management of social data based on Hadoop framework presented its potential, in the future, we focus on improvement performance of system on real-time application as well as adding space resolution since detection always aims at finding event occurrences that unfold both space and time.
Acknowledgement 1. “This research was supported by the MSIP(Ministry of Science, ICT and Future Planning), Korea, under the ITRC(Information Technology Research Center) support program (IITP-2017-2016-0-00314) supervised by the IITP(Institute for Information & communications Technology Promotion)”. 2. “This research was supported by Ministry ofRegional Innovation, creative business training Research Foundation of Korea, 2014 (NRF-2014H1C1A1066771)”. 3. “This work was carried out with the support of“Cooperative Research Program for Agriculture Science and Technology Development (Project No. PJ011823022017)” Rural Development Administration, Republic of Korea”.
References [1] M. Avvenuti, S. Cresci, M.N. La Polla, A.
Marchetti and M. Tesconi, “Earthquake emergency management by Social Sensing,” The Second IEEE International Workshop on Social and Community Intelligence, 2014.
[2] Hochreiter, S., Schmidhuber, J., “Long short-term memory,” Neural Comput. vo.9, no. 8, pp. 1735–1780, 1997.
[3] T. Sakaki, M. Okazaki, and Y. Matsuo, “Earthquake shakes twitter users: real-time event detection by social sensors,” Proceedings of the 19th international conference on World Wide Web. ACM, 2010.
[4] http://hadoop.apache.org [5] V. Q. Nguyen, H. Yang, K. Kim, A. Oh
"Real-time Earthquake Detection using Convolutional Neural Network and Social Data", in 3rd IEEE International Conference on Multimedia Big Data (BigMM), 2017.
[6] http://web.kma.go.kr [7] Q. Huang, G. Cervone, D. Jing, and C.
Chang, “DisasterMapper: A CyberGIS framework for disaster management using social media data,” in Proceedings of the 4th International ACM SIGSPATIAL Workshop on Analytics for Big Geospatial Data, 2015.
[8] Y. LeCun, Y. Bengio, and G. Hinton, “Deep learning,” Nature, vo. 521, no. 7553, pp. 436–444, 2015.
[9] Y. Kim, “Convolutional Neural Networks for Sentence Classification,” in Proceedings of the 2014 Conference on Empirical Methods in Natural Language Processing (EMNLP 2014), pp. 1746–1751, 2014.
[10] R. Johnson and T. Zhang, “Effective use of word order for text categorization with convolutional neural networks,” in ICML, 2015.
[11] D. T. Nguyen, and E. J. Jai, “Real-time event detection for online behavioral analysis of big social data,” Future Generation Comp. Syst, vo. 66, pp. 137-145, 2017.
[12] http://flume.apache.org/ [13] https://hive.apache.org/ [14] https://zeppelin.apache.org/docs/0.6.2/ [15] P. Malhotra, L. Vig, G. Shroff, P. Agarwal,
“Long short term memory networks for anomaly detection in time series,” Proceedings Presses universitaires de Louvain , pp. 89-94, 2015.
[16] M. Wankhede1, V. Trivedi , D. V. Richhariya, “Analysis of Social Data Using Hadoop Ecosystem,” International Journal of Computer Science and Information Technologies, vo. 7, no. 6, 2016.
[17] R. Mahalakshmi, S Suseela, “Big-SoSA: Social Sentiment Analysis and Data Visualization on Big Data,” International Journal of Advanced Research in Computer and Communication Engineering, vo. 4, no. 4, pp. 304-306, April 2015.
[18] J. Dean, S. Ghemawat, “Mapreduce: simplified data processing on large clusters,” Communication of ACM 51, vo. 4, no. 1, pp. 107-113, 2008.
ICSSC 2017 International Conference on Software & Smart Convergence 205 page
International Conference on Software & Smart Convergence (ICSSC) 2017, June 2017 Copyright ⓒ 2017 ICSSC
The authors wish to acknowledge that this paper is a result of work of 2016 Industry-academic cooperation technology development project(No.S2431298) funded by Small and Medium Business Administration of Korea.
A Study on Next-Generation Bus Information System
applied to User’s Smart Phone Application Hwa-Jeong Lee1, Dong-Ok Cho1, Jin-Gwang Koh1, Seok-Chul Lee2,
Seung-Jae Oh3, Jin-Yong Jung3 and Gyu-Geun Lim4
1Department of Computer Engineering, Sunchon National University, R.O.Korea [e-mail: [email protected],, c515dk@scnu,ac.kr, kjg@scnu,ac.kr]
2 LTSKorea, 255 Jungang-ro Suncheon-si Jeollanam-do. Korea [e-mail: [email protected]]
3Department of Computer Information, Cheongam College, Republic of Korea [e-mail: [email protected], [email protected]]
4Department of EEE, Songwon University, Republic of Korea [e-mail:[email protected]]
*Corresponding author: Seok-Chul Lee
Abstract
A Bus Information System(BIS) is a transport information system which provides real-time bus travelling information. In this system, transport information sent by an individual bus are collected through Global Positioning System(GPS) or Dedicated Short Range Communications(DSRC) and passed to transport information center. The BIS processes the collected information, notifiies the processed information to several users such as bus transportation companies, drivers and passengers and displays the information to digital panels installed at bus stops. The BIS allows users to check boarding time at origin stop and landing time at destination. Even when illegal incidents or accidents happen, the emergency situation can be dealt with in real-time manner because the bus is being connected to bus company or information center wirelessly. Since information keeps updated in real-time basis through internet, anyone can see the bus travelling situation at home. As such, this paper proposes next-generation bus information system. Next-generation BIS is expected to be implemented faster than the traditional first and second-genenration bus information systems. Additionally, it overcomes problems and limitations of traditional BISs based on the improved cost-effectiveness. Moreover the improved next-generation bus information system will be interconnected with TAGO for providing integrated form of information gathered from all intra-city and inter-city buses around the whole country in the long run.
Keywords: BIS, TAGO, Smart Phone, GP
1. Introduction
BIS is a transport information system which
provides bus travelling information in real-time basis. In this system, an individual bus gathers transportation information while travelling and sends them to the transport information center
206 page International Conference on Software & Smart Convergence ICSSC 2017
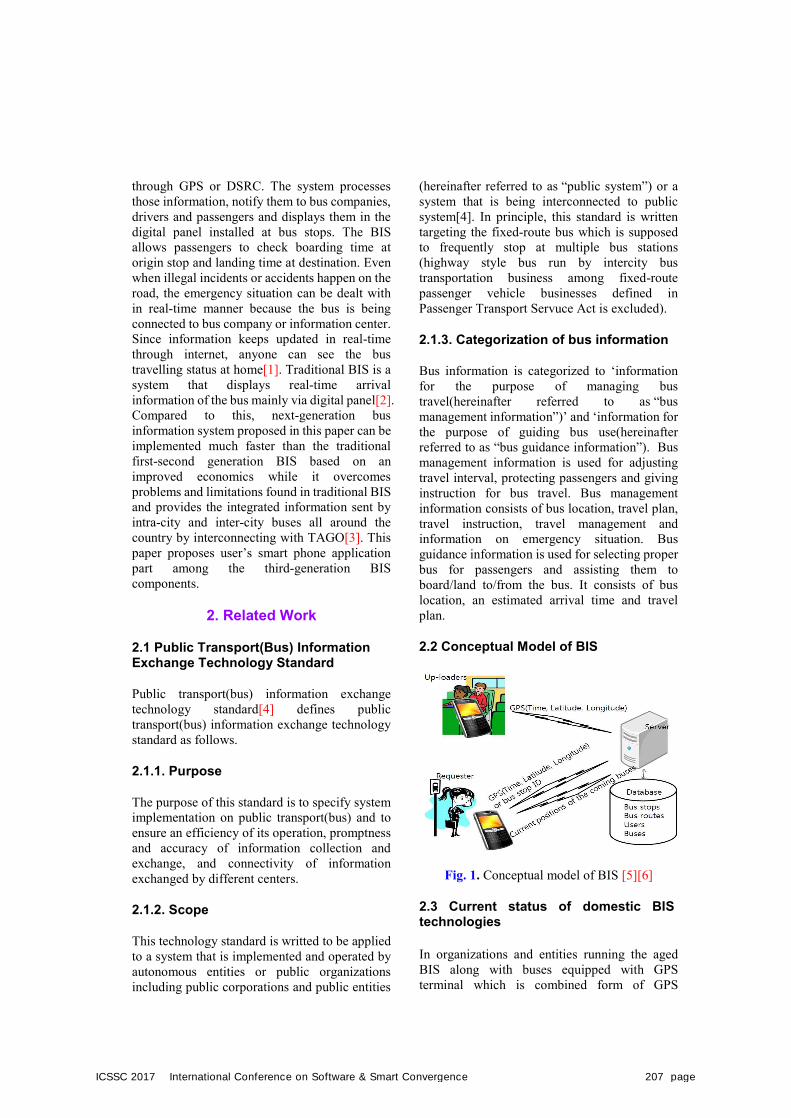
through GPS or DSRC. The system processes those information, notify them to bus companies, drivers and passengers and displays them in the digital panel installed at bus stops. The BIS allows passengers to check boarding time at origin stop and landing time at destination. Even when illegal incidents or accidents happen on the road, the emergency situation can be dealt with in real-time manner because the bus is being connected to bus company or information center. Since information keeps updated in real-time through internet, anyone can see the bus travelling status at home[1]. Traditional BIS is a system that displays real-time arrival information of the bus mainly via digital panel[2]. Compared to this, next-generation bus information system proposed in this paper can be implemented much faster than the traditional first-second generation BIS based on an improved economics while it overcomes problems and limitations found in traditional BIS and provides the integrated information sent by intra-city and inter-city buses all around the country by interconnecting with TAGO[3]. This paper proposes user’s smart phone application part among the third-generation BIS components.
2. Related Work
2.1 Public Transport(Bus) Information Exchange Technology Standard
Public transport(bus) information exchange technology standard[4] defines public transport(bus) information exchange technology standard as follows.
2.1.1. Purpose
The purpose of this standard is to specify system implementation on public transport(bus) and to ensure an efficiency of its operation, promptness and accuracy of information collection and exchange, and connectivity of information exchanged by different centers.
2.1.2. Scope
This technology standard is writted to be applied to a system that is implemented and operated by autonomous entities or public organizations including public corporations and public entities
(hereinafter referred to as “public system”) or a system that is being interconnected to public system[4]. In principle, this standard is written targeting the fixed-route bus which is supposed to frequently stop at multiple bus stations (highway style bus run by intercity bus transportation business among fixed-route passenger vehicle businesses defined in Passenger Transport Servuce Act is excluded).
2.1.3. Categorization of bus information
Bus information is categorized to ‘information for the purpose of managing bus travel(hereinafter referred to as “bus management information”)’ and ‘information for the purpose of guiding bus use(hereinafter referred to as “bus guidance information”). Bus management information is used for adjusting travel interval, protecting passengers and giving instruction for bus travel. Bus management information consists of bus location, travel plan, travel instruction, travel management and information on emergency situation. Bus guidance information is used for selecting proper bus for passengers and assisting them to board/land to/from the bus. It consists of bus location, an estimated arrival time and travel plan.
2.2 Conceptual Model of BIS
Fig. 1. Conceptual model of BIS [5][6]
2.3 Current status of domestic BIS technologies
In organizations and entities running the aged BIS along with buses equipped with GPS terminal which is combined form of GPS
ICSSC 2017 International Conference on Software & Smart Convergence 207 page
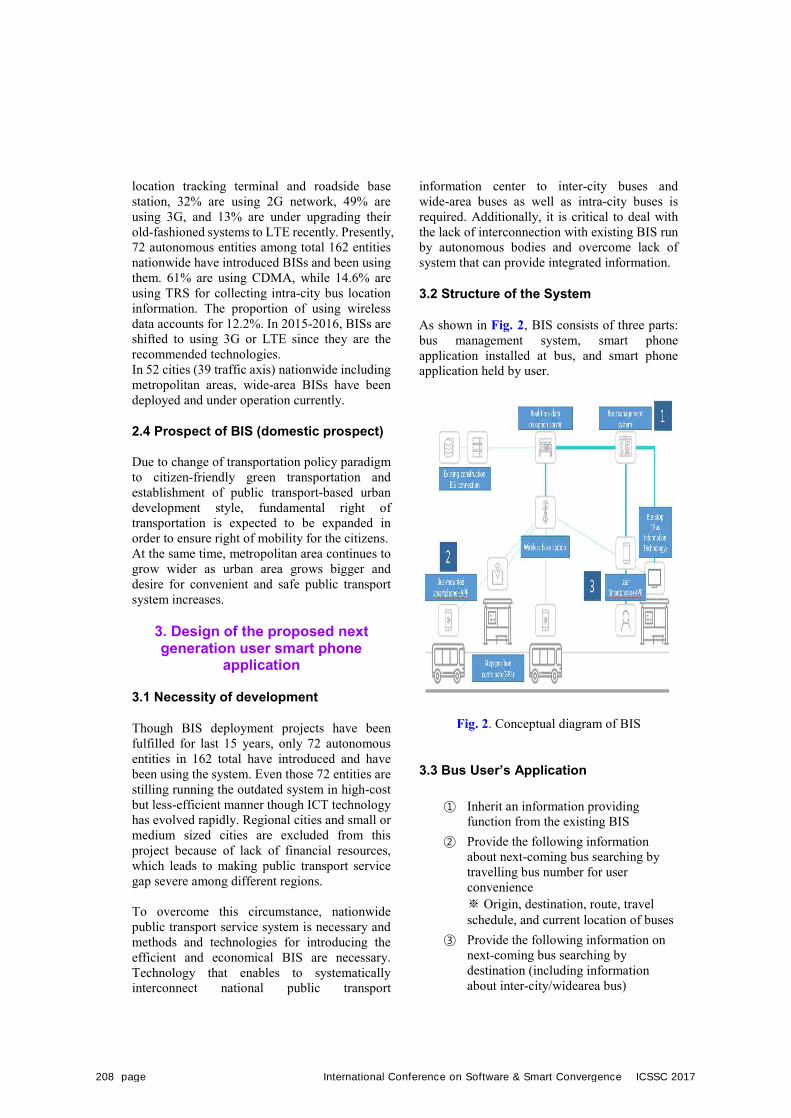
location tracking terminal and roadside base station, 32% are using 2G network, 49% are using 3G, and 13% are under upgrading their old-fashioned systems to LTE recently. Presently, 72 autonomous entities among total 162 entities nationwide have introduced BISs and been using them. 61% are using CDMA, while 14.6% are using TRS for collecting intra-city bus location information. The proportion of using wireless data accounts for 12.2%. In 2015-2016, BISs are shifted to using 3G or LTE since they are the recommended technologies. In 52 cities (39 traffic axis) nationwide including metropolitan areas, wide-area BISs have been deployed and under operation currently.
2.4 Prospect of BIS (domestic prospect)
Due to change of transportation policy paradigm to citizen-friendly green transportation and establishment of public transport-based urban development style, fundamental right of transportation is expected to be expanded in order to ensure right of mobility for the citizens. At the same time, metropolitan area continues to grow wider as urban area grows bigger and desire for convenient and safe public transport system increases.
3. Design of the proposed nextgeneration user smart phone
application
3.1 Necessity of development
Though BIS deployment projects have been fulfilled for last 15 years, only 72 autonomous entities in 162 total have introduced and have been using the system. Even those 72 entities are stilling running the outdated system in high-cost but less-efficient manner though ICT technology has evolved rapidly. Regional cities and small or medium sized cities are excluded from this project because of lack of financial resources, which leads to making public transport service gap severe among different regions.
To overcome this circumstance, nationwide public transport service system is necessary and methods and technologies for introducing the efficient and economical BIS are necessary. Technology that enables to systematically interconnect national public transport
information center to inter-city buses and wide-area buses as well as intra-city buses is required. Additionally, it is critical to deal with the lack of interconnection with existing BIS run by autonomous bodies and overcome lack of system that can provide integrated information.
3.2 Structure of the System
As shown in Fig. 2, BIS consists of three parts: bus management system, smart phone application installed at bus, and smart phone application held by user.
Fig. 2. Conceptual diagram of BIS
3.3 Bus User’s Application
① Inherit an information providingfunction from the existing BIS
② Provide the following informationabout next-coming bus searching bytravelling bus number for userconvenience※ Origin, destination, route, travelschedule, and current location of buses
③ Provide the following information onnext-coming bus searching bydestination (including informationabout inter-city/widearea bus)
208 page International Conference on Software & Smart Convergence ICSSC 2017
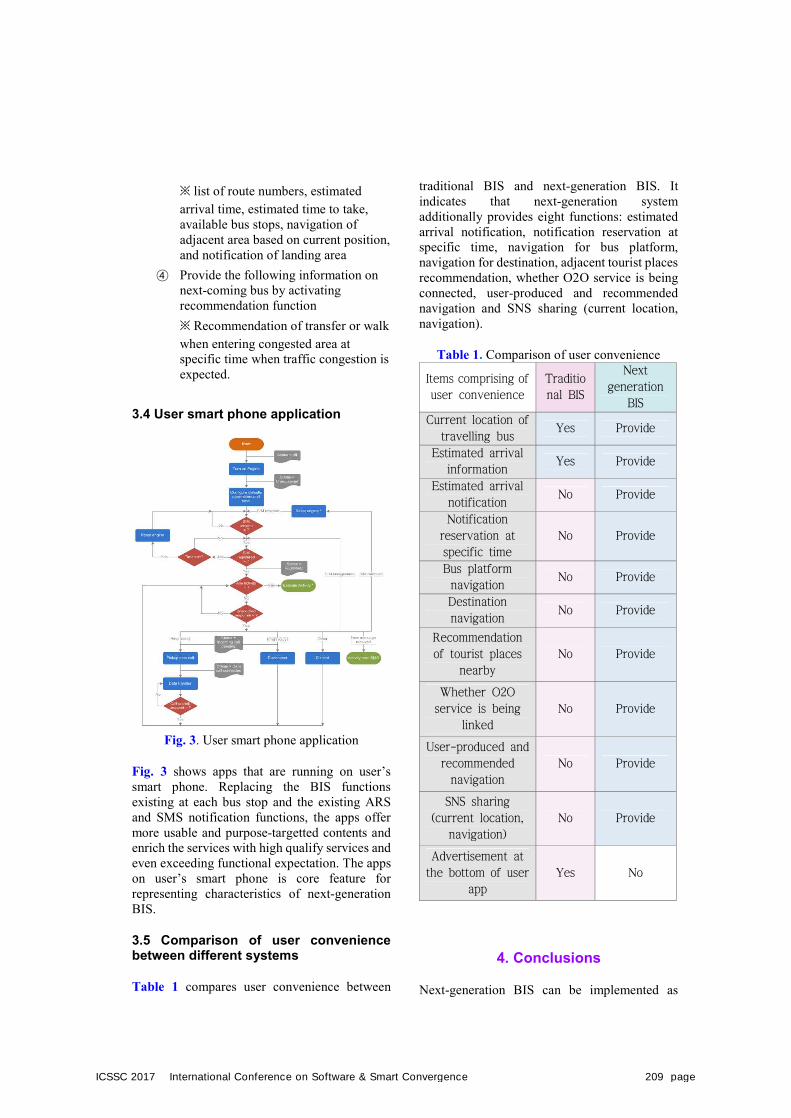
※ list of route numbers, estimated arrival time, estimated time to take, available bus stops, navigation of adjacent area based on current position, and notification of landing area
④ Provide the following information onnext-coming bus by activating recommendation function ※ Recommendation of transfer or walk when entering congested area at specific time when traffic congestion is expected.
3.4 User smart phone application
Fig. 3. User smart phone application
Fig. 3 shows apps that are running on user’s smart phone. Replacing the BIS functions existing at each bus stop and the existing ARS and SMS notification functions, the apps offer more usable and purpose-targetted contents and enrich the services with high qualify services and even exceeding functional expectation. The apps on user’s smart phone is core feature for representing characteristics of next-generation BIS.
3.5 Comparison of user convenience between different systems
Table 1 compares user convenience between
traditional BIS and next-generation BIS. It indicates that next-generation system additionally provides eight functions: estimated arrival notification, notification reservation at specific time, navigation for bus platform, navigation for destination, adjacent tourist places recommendation, whether O2O service is being connected, user-produced and recommended navigation and SNS sharing (current location, navigation).
Table 1. Comparison of user convenience
Items comprising of
user convenience
Traditio
nal BIS
Next
generation
BIS
Current location of
travelling bus Yes Provide
Estimated arrival
information Yes Provide
Estimated arrival
notification No Provide
Notification
reservation at
specific time
No Provide
Bus platform
navigation No Provide
Destination
navigation No Provide
Recommendation
of tourist places
nearby
No Provide
Whether O2O
service is being
linked
No Provide
User-produced and
recommended
navigation
No Provide
SNS sharing
(current location,
navigation)
No Provide
Advertisement at
the bottom of user
app
Yes No
4. Conclusions
Next-generation BIS can be implemented as
ICSSC 2017 International Conference on Software & Smart Convergence 209 page
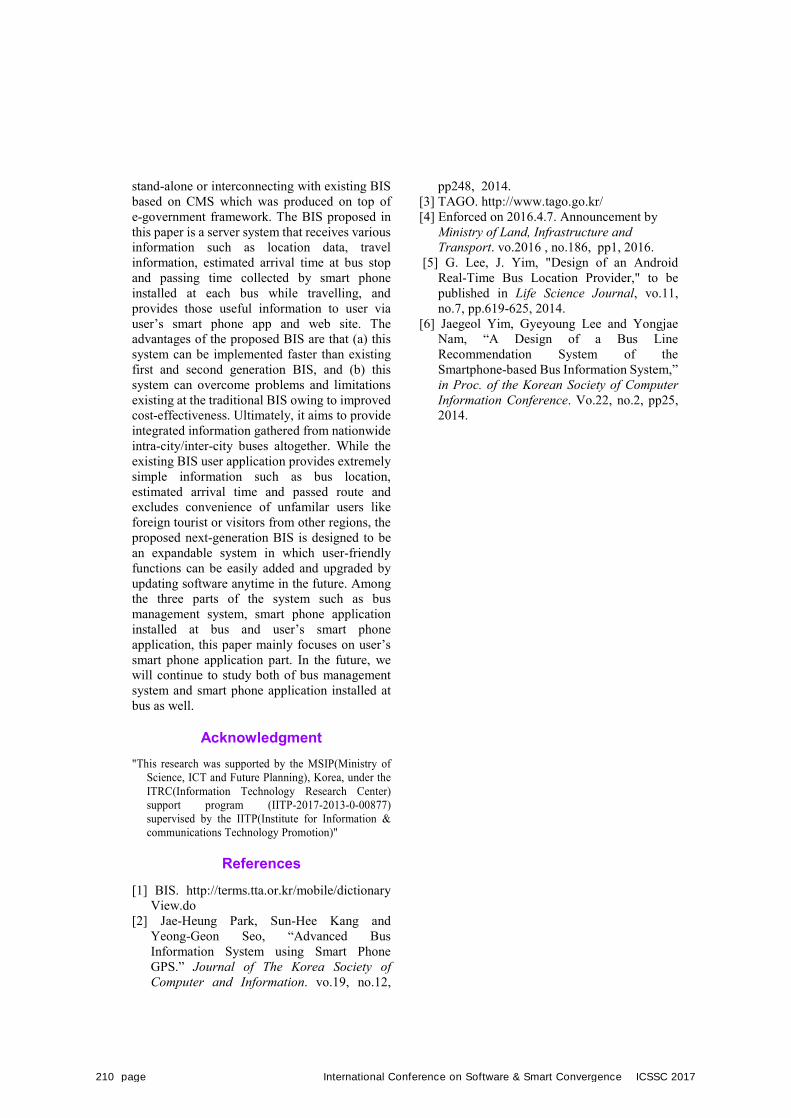
stand-alone or interconnecting with existing BIS based on CMS which was produced on top of e-government framework. The BIS proposed in this paper is a server system that receives various information such as location data, travel information, estimated arrival time at bus stop and passing time collected by smart phone installed at each bus while travelling, and provides those useful information to user via user’s smart phone app and web site. The advantages of the proposed BIS are that (a) this system can be implemented faster than existing first and second generation BIS, and (b) this system can overcome problems and limitations existing at the traditional BIS owing to improved cost-effectiveness. Ultimately, it aims to provide integrated information gathered from nationwide intra-city/inter-city buses altogether. While the existing BIS user application provides extremely simple information such as bus location, estimated arrival time and passed route and excludes convenience of unfamilar users like foreign tourist or visitors from other regions, the proposed next-generation BIS is designed to be an expandable system in which user-friendly functions can be easily added and upgraded by updating software anytime in the future. Among the three parts of the system such as bus management system, smart phone application installed at bus and user’s smart phone application, this paper mainly focuses on user’s smart phone application part. In the future, we will continue to study both of bus management system and smart phone application installed at bus as well.
Acknowledgment "This research was supported by the MSIP(Ministry of
Science, ICT and Future Planning), Korea, under the ITRC(Information Technology Research Center) support program (IITP-2017-2013-0-00877) supervised by the IITP(Institute for Information & communications Technology Promotion)"
References [1] BIS. http://terms.tta.or.kr/mobile/dictionary
View.do [2] Jae-Heung Park, Sun-Hee Kang and
Yeong-Geon Seo, “Advanced Bus Information System using Smart Phone GPS.” Journal of The Korea Society of Computer and Information. vo.19, no.12,
pp248, 2014. [3] TAGO. http://www.tago.go.kr/ [4] Enforced on 2016.4.7. Announcement by
Ministry of Land, Infrastructure and Transport. vo.2016 , no.186, pp1, 2016.
[5] G. Lee, J. Yim, "Design of an Android Real-Time Bus Location Provider," to be published in Life Science Journal, vo.11, no.7, pp.619-625, 2014.
[6] Jaegeol Yim, Gyeyoung Lee and Yongjae Nam, “A Design of a Bus Line Recommendation System of the Smartphone-based Bus Information System,” in Proc. of the Korean Society of Computer Information Conference. Vo.22, no.2, pp25, 2014.
210 page International Conference on Software & Smart Convergence ICSSC 2017
International Conference on Software & Smart Convergence (ICSSC) 2017, June 2017 Copyright ⓒ 2017 ICSSC
This research was supported by Basic Science Research Program through the National Research Foundation of Korea (NRF) funded by MEST (NRF-2015R1D1A1A01060172) and by MSIP, Korea, under the ITRC support program (IITP-2017-2013-0-00877) supervised by IITP.
Using Fully Convolutional Network for Text Detection
Son Tung Trieu*, Soo-hyung Kim*, Huyng-Jeong Yang*, Guee Sang Lee*, Dong-Ok Cho**, Jin-Gwang Koh**,
Dept. of ECE, Chonnam National University, Gwangju, Korea* [e-mail: [email protected], [email protected], [email protected], [email protected]]
Dept. of Computer Eng., Suncheon National University, Korea** [email : [email protected], [email protected]]
*Corresponding author: Guee Sang Lee
Abstract As one of the most influential inventions of humanity, text is important in human life. The information contained in text is very useful in a wide range of vision-based applications. Especially, text detection in natural scenes is important, and is the source of active research issues in computer vision and document analysis. Existing methods often result in a lot of false positive and true negative regions, which give poor performances. In this paper, a method using supervised architecture based on Fully Convolutional Network is presented to localize text regions in natural scene images.
Keywords: Text, detection, CNN, ICDAR, FCN
1. IntroductionText in natural scene images directly carries
high level semantics and it makes text present in natural scenes or videos a special, important source of information. The rich and precise information embodied in text can be very beneficial to a variety of vision-based applications, such as image search, target geolocation, human-computer interaction, robot navigation and industrial automation.
Consequently, automatic text detection offering a means to access and utilize textual information in images and videos, therefore, have become active research topics in computer vision and document analysis.
But, localizing texts in natural scenes are extremely difficult tasks. The major challenges
in scene text detection can be roughly categorized into three types [1, 2].
Diversity of scene text: In contrast to characters in document images, which are usually with regular fonts, single color, consistent size and uniform arrangement, texts in natural scene may bear entirely different fonts, colors, scales and orientations, even in the same scene.
Complexity of background: The backgrounds in natural scene images and videos can be very complex.
Elements like signs, fences, bricks and grasses are virtually undistinguishable from true text, and thus are easily to cause confusions and errors.
Interference factors: Various interference factors, for instance, noise, blur, distortion, low resolutions, non-uniform illumination and partial
ICSSC 2017 International Conference on Software & Smart Convergence 211 page
occlusion, may give rise to failures in scene text detection.
To tackle these challenges, a rich body of approaches have been proposed and substantial progresses have been achieved. In the past two decades, researchers have proposed numerous methods for detecting texts in natural images or videos. Current approaches for text detection mostly employ a bottom-up pipeline. They commonly start from low-level character or stroke detection, etc. There are mainly two types of methods: texture based methods, component based methods and hybrid methods.
Texture based methods [4, 5, 6, 7] treat texts
as a special type of texture and make use of their textual properties, such as local intensities, filter responses and wavelet coefficients, to distinguish between text and non-text areas in the images. These methods mostly handle horizontal texts and are sensitive to rotation and scale change.
In an early work, Zhong et al. [5] proposed a method for text localization in color images. Horizontal spatial variance was utilized to roughly localize text and then color segmentation was performed within the localized regions to find texts. Kim et al. [6] trained a SVM classifier to classify each pixel by directly using the raw pixel intensity as local feature. Text areas were sought via adaptive MeanShift [7] in probability maps. The method produces excellent detection results with simple background, but it is difficult to generalize this method to complex natural scene images.
To handle multilingual texts (mainly Chinese and English), Lyu et al. [8] proposed a coarse-to-fine multi-scale search scheme. The scheme used properties such as strong edge and high contrast of texts to distinguish between text and non-text regions. Moreover, this algorithm provides a local adaptive binary strategy to segment detected text areas. Similar to many other approaches, this method involves numerous rules and parameters, so it is very hard to deal with different qualities and texts of different types.
Different from conventional methods, Zhong et al. [9] proposed an interesting algorithm that can directly detect text in the Discrete Cosine Transform (DCT) domain. The advantage of this algorithm lies in its high efficiency, as it is not
necessary to decode the image before detection. However, the detection accuracy of this method is limited.
In order to speed up the text detection procedure, Chen et al. [4] proposed a fast text detector. The detector is a cascade Adaboost [10] classifier, in which each weak classifier is trained from a set of features. The feature pool includes mean strength, intensity variance, horizontal difference, vertical difference, and gradient histogram. The detection efficiency of this method is significantly higher than other algorithms [11-13], but the detection accuracy on real-world images is limited.
Recently, Wang et al. [14] proposed a method for locating specific words from natural scenes. Firstly, single characters are detected by sliding window. Then, possible combinations are scored according to the structural relationships between characters. Finally, the most similar combinations are selected from the given list as the output results. Unlike traditional text detection methods, this algorithm can only detect words in the given list, incapable of handling words out of the given list. In reality, however, a word list that contains all possible cases is not always available for each image. This makes the applicability range of the method narrow, compared to other text detection methods.
Component based methods [15-19] first extract candidate components through a variety of ways (e.g., color clustering or extreme region extraction), and then filter out non-text components using manually designed rules or automatically trained classifiers. Generally speaking, these methods are much more efficient, because the number of components to be processed is relatively small. In addition, these methods are insensitive to rotation, scale change and font variation. In recent years, component based methods have become the mainstream in the field of scene text detection. The method proposed by Jain et al. [19] decomposed images into several non-overlapping components by color clustering, grouped components into text lines through component analysis, and then removed non-text components according to geometric rules. Because of the artificially defined rules and parameter, this method performs poorly on complex natural images.
Making used of the property that characters have nearly constant stroke width, Epshtein et.al
212 page International Conference on Software & Smart Convergence ICSSC 2017
[15] proposed a new image operator: Stroke Width Transform (SWT). This operator provides an easy ways to recover character strokes from edge maps and is able to efficiently extract text components of different scales and directions from complex scenes. However, this method also comes with a series of human defined rules and parameter, and only consider horizontal texts.
Neumann et al. [20] proposed a text detection algorithm based on Maximally Stable Extremal Regions (MSER). This algorithm extracts from the original images MSER regions as candidates, and eliminates invalid candidates using a trained classifier. At a later stage, the remained candidates are grouped into text lines through a series of connection rules. However, such connection rules can only adapt to horizontal or nearly horizontal text, therefore this algorithm is unable to handle texts with larger inclination angle.
SWT [15] and MSER [20] are two representative methods in the field of scene text detection, which constitute the basis of a lot of subsequent works [16].
The great success of sparse representation in face recognition and image denoising has inspired numerous researchers [21, 22]. For example, Zhao et al. [23] constructed a sparse dictionary from training samples and used it to judge whether a particular area in the image contains text. However, the generalization ability of the learned sparse dictionary is restricted, so that this method is unable to handle issue like rotation and scale change.
Different from the aforementioned algorithms, the approach proposed by Yi et al. [17] can detect tilted texts in natural images. Firstly, the image is divided into different regions according to the distribution pixels in color space, and then regions are combined into connected components according to the properties such as color similarity, spatial distance and relative size of regions. Finally, non-text components are discarded by a set of rules. However, the prerequisite of this method is that it assumes the input images consists of several main colors, which is not necessarily true for complex natural images. In addition, this method relies on a lot of artificially designed filtering rules and parameters, so that it is difficult to generalize to large-scale complex image datasets.
Shivakumara et al. [24] also proposed a method for multi oriented text detection. The method extracted candidate regions by clustering in the Fourier-Laplace space and divided the regions into distinct components using skeletonization. However, these components generally do not correspond to strokes or characters, but just text blocks. This method cannot directly compare with other methods quantitatively, since it is not able to detect characters or words directly.
Based on SWT [15], Yao et al [16] proposed an algorithm that can detect text of arbitrary orientations in natural images. This algorithm is equipped with a two-level classification scheme and two sets of rotation and rotation-invariant features specially designed for capturing the intrinsic characteristics of characters in natural scenes.
Huang et al. [17] presented a new operator based on Stroke Width Transform, called Stroke Feature Transform (SFT). In order to solve the mismatch problem of edge points in the original Stroke Width Transforms, SFT introduces color consistency and constrains relations of local edge points, producing better component extraction results. The detection performance of SFT on standard datasets is significantly higher than other methods, but only for horizontal texts.
Recently, architectures based on Deep Convolutional Neural Networks (CNN) have advanced general object detection substantially [25]. Especially, Fully Convolutional Network (FCN) achieved a great success on semantic segmentation using pixelwise prediction [26]. However, due to the lack of deep supervision, the multiscale responses produced at the hidden layers are less meaningful, which leads to less satisfactory results. In this paper, a Supervised Fully Convolutional Network for text detection in natural scene images is presented. The paper is structured as following: Section 2 gives the details of the method. Next, Section 3 shows the experimental results. Finally, Section 4 addresses the conclusion.
2. Proposed MethodIn the past few years, most of the leading
methods in scene text detection are based on detecting characters. In early practice, a large number of manually designed features are used
ICSSC 2017 International Conference on Software & Smart Convergence 213 page
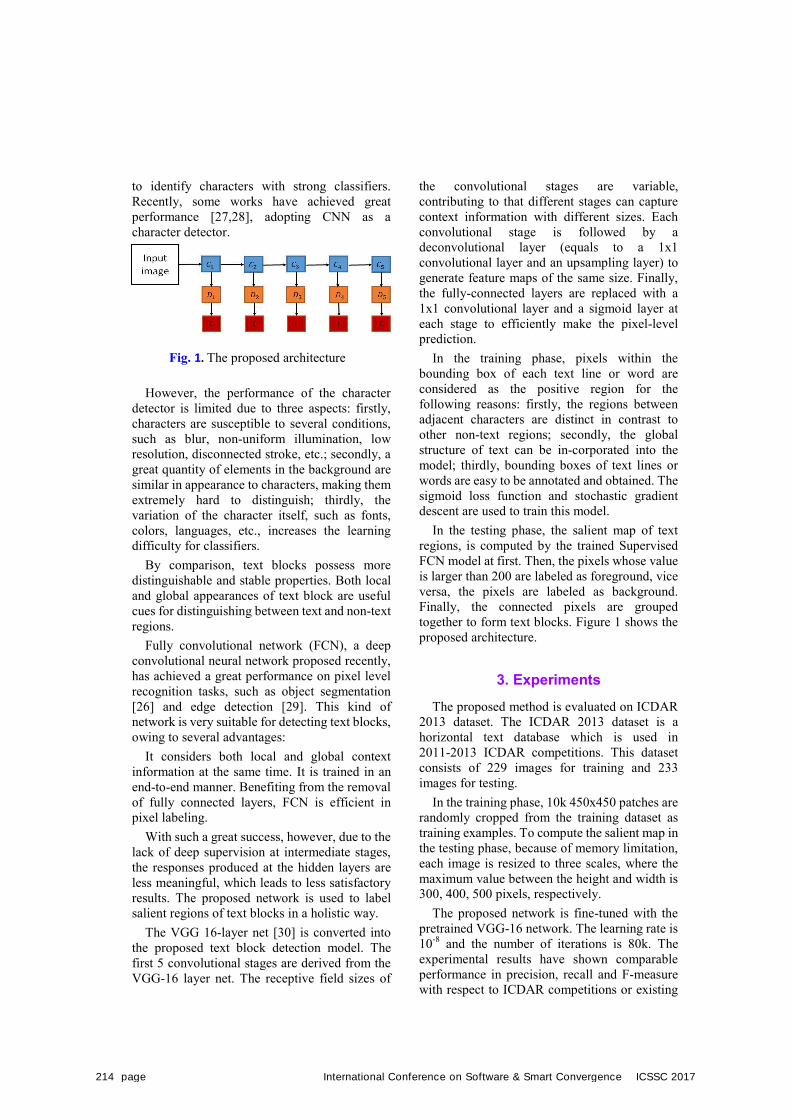
to identify characters with strong classifiers. Recently, some works have achieved great performance [27,28], adopting CNN as a character detector.
However, the performance of the character detector is limited due to three aspects: firstly, characters are susceptible to several conditions, such as blur, non-uniform illumination, low resolution, disconnected stroke, etc.; secondly, a great quantity of elements in the background are similar in appearance to characters, making them extremely hard to distinguish; thirdly, the variation of the character itself, such as fonts, colors, languages, etc., increases the learning difficulty for classifiers.
By comparison, text blocks possess more distinguishable and stable properties. Both local and global appearances of text block are useful cues for distinguishing between text and non-text regions.
Fully convolutional network (FCN), a deep convolutional neural network proposed recently, has achieved a great performance on pixel level recognition tasks, such as object segmentation [26] and edge detection [29]. This kind of network is very suitable for detecting text blocks, owing to several advantages:
It considers both local and global context information at the same time. It is trained in an end-to-end manner. Benefiting from the removal of fully connected layers, FCN is efficient in pixel labeling.
With such a great success, however, due to the lack of deep supervision at intermediate stages, the responses produced at the hidden layers are less meaningful, which leads to less satisfactory results. The proposed network is used to label salient regions of text blocks in a holistic way.
The VGG 16-layer net [30] is converted into the proposed text block detection model. The first 5 convolutional stages are derived from the VGG-16 layer net. The receptive field sizes of
the convolutional stages are variable, contributing to that different stages can capture context information with different sizes. Each convolutional stage is followed by a deconvolutional layer (equals to a 1x1 convolutional layer and an upsampling layer) to generate feature maps of the same size. Finally, the fully-connected layers are replaced with a 1x1 convolutional layer and a sigmoid layer at each stage to efficiently make the pixel-level prediction.
In the training phase, pixels within the bounding box of each text line or word are considered as the positive region for the following reasons: firstly, the regions between adjacent characters are distinct in contrast to other non-text regions; secondly, the global structure of text can be in-corporated into the model; thirdly, bounding boxes of text lines or words are easy to be annotated and obtained. The sigmoid loss function and stochastic gradient descent are used to train this model.
In the testing phase, the salient map of text regions, is computed by the trained Supervised FCN model at first. Then, the pixels whose value is larger than 200 are labeled as foreground, vice versa, the pixels are labeled as background. Finally, the connected pixels are grouped together to form text blocks. Figure 1 shows the proposed architecture.
3. Experiments The proposed method is evaluated on ICDAR
2013 dataset. The ICDAR 2013 dataset is a horizontal text database which is used in 2011-2013 ICDAR competitions. This dataset consists of 229 images for training and 233 images for testing.
In the training phase, 10k 450x450 patches are randomly cropped from the training dataset as training examples. To compute the salient map in the testing phase, because of memory limitation, each image is resized to three scales, where the maximum value between the height and width is 300, 400, 500 pixels, respectively.
The proposed network is fine-tuned with the pretrained VGG-16 network. The learning rate is 10-8 and the number of iterations is 80k. The experimental results have shown comparable performance in precision, recall and F-measure with respect to ICDAR competitions or existing
Fig. 1. The proposed architecture
214 page International Conference on Software & Smart Convergence ICSSC 2017
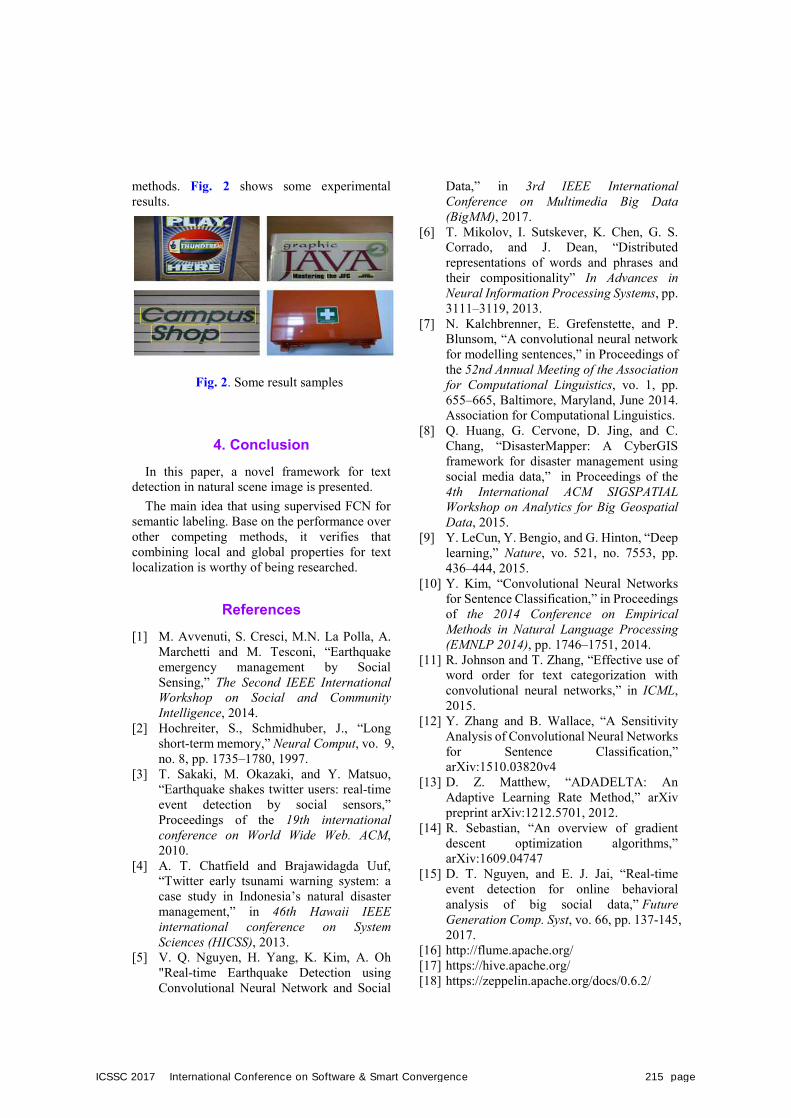
methods. Fig. 2 shows some experimental results.
4. ConclusionIn this paper, a novel framework for text
detection in natural scene image is presented. The main idea that using supervised FCN for
semantic labeling. Base on the performance over other competing methods, it verifies that combining local and global properties for text localization is worthy of being researched.
References [1] M. Avvenuti, S. Cresci, M.N. La Polla, A.
Marchetti and M. Tesconi, “Earthquake emergency management by Social Sensing,” The Second IEEE International Workshop on Social and Community Intelligence, 2014.
[2] Hochreiter, S., Schmidhuber, J., “Long short-term memory,” Neural Comput, vo. 9, no. 8, pp. 1735–1780, 1997.
[3] T. Sakaki, M. Okazaki, and Y. Matsuo, “Earthquake shakes twitter users: real-time event detection by social sensors,” Proceedings of the 19th international conference on World Wide Web. ACM, 2010.
[4] A. T. Chatfield and Brajawidagda Uuf, “Twitter early tsunami warning system: a case study in Indonesia’s natural disaster management,” in 46th Hawaii IEEE international conference on System Sciences (HICSS), 2013.
[5] V. Q. Nguyen, H. Yang, K. Kim, A. Oh "Real-time Earthquake Detection using Convolutional Neural Network and Social
Data,” in 3rd IEEE International Conference on Multimedia Big Data (BigMM), 2017.
[6] T. Mikolov, I. Sutskever, K. Chen, G. S. Corrado, and J. Dean, “Distributed representations of words and phrases and their compositionality” In Advances in Neural Information Processing Systems, pp. 3111–3119, 2013.
[7] N. Kalchbrenner, E. Grefenstette, and P. Blunsom, “A convolutional neural network for modelling sentences,” in Proceedings of the 52nd Annual Meeting of the Association for Computational Linguistics, vo. 1, pp. 655–665, Baltimore, Maryland, June 2014. Association for Computational Linguistics.
[8] Q. Huang, G. Cervone, D. Jing, and C. Chang, “DisasterMapper: A CyberGIS framework for disaster management using social media data,” in Proceedings of the 4th International ACM SIGSPATIAL Workshop on Analytics for Big Geospatial Data, 2015.
[9] Y. LeCun, Y. Bengio, and G. Hinton, “Deep learning,” Nature, vo. 521, no. 7553, pp. 436–444, 2015.
[10] Y. Kim, “Convolutional Neural Networks for Sentence Classification,” in Proceedings of the 2014 Conference on Empirical Methods in Natural Language Processing (EMNLP 2014), pp. 1746–1751, 2014.
[11] R. Johnson and T. Zhang, “Effective use of word order for text categorization with convolutional neural networks,” in ICML, 2015.
[12] Y. Zhang and B. Wallace, “A Sensitivity Analysis of Convolutional Neural Networks for Sentence Classification,” arXiv:1510.03820v4
[13] D. Z. Matthew, “ADADELTA: An Adaptive Learning Rate Method,” arXiv preprint arXiv:1212.5701, 2012.
[14] R. Sebastian, “An overview of gradient descent optimization algorithms,” arXiv:1609.04747
[15] D. T. Nguyen, and E. J. Jai, “Real-time event detection for online behavioral analysis of big social data,” Future Generation Comp. Syst, vo. 66, pp. 137-145, 2017.
[16] http://flume.apache.org/ [17] https://hive.apache.org/ [18] https://zeppelin.apache.org/docs/0.6.2/
Fig. 2. Some result samples
ICSSC 2017 International Conference on Software & Smart Convergence 215 page
[19] P. Malhotra, L. Vig, G. Shroff, P. Agarwal, “Long short term memory networks for anomaly detection in time series,” Proceedings, p. 89. Presses universitaires de Louvain, 2015.
[20] M. Wankhede1, V. Trivedi , D. V. Richhariya, “Analysis of Social Data Using Hadoop Ecosystem,” International Journal of Computer Science and Information Technologies, vo. 7, no. 6, 2016.
[21] R. Mahalakshmi, S Suseela, “Big-SoSA: Social Sentiment Analysis and Data Visualization on Big Data,” International Journal of Advanced Research in Computer and Communication Engineering, vo. 4, no. 4, pp 304-306, April 2015.
[22] J. Dean, S. Ghemawat, “Mapreduce: simplified data processing on large clusters,” Communication of ACM 51, vo. 4, no. 1, pp 107-113, 2008.
[23] http://hadoop.apache.org
216 page International Conference on Software & Smart Convergence ICSSC 2017

International Conference on Software & Smart Convergence (ICSSC) 2017, June 2017 Copyright ⓒ 2017 ICSSC
The research was supported by ‘Software Convergence Technology Development Program’, through the Ministry of Science, ICT and Future Palnning(S0503-17-1009)
Development of acupuncture simulator for oriental medicine learner-centered
education
- Focus on software- Kang-Jun Lee1, Tae-Jin Ha1, Seung-Won Cho1 and Guk-Jeong Kim1
1 210ho, 26, Jeongbohwa-gil, Naju-si, Jeollanam-do, 58323 – KR [e-mail: [email protected]]
[e-mail: [email protected]] [e-mail: [email protected]] [e-mail: [email protected]]
*Corresponding author: Guk-Jeong Kim
Abstract
Medical simulator capable of training and assessment of medical technology is able to systematize new medical technology training through assessment of capability and proficiency and acquire original technology of medical simulator and lead related industries with the development of medical technology and realization of medical powerhouse through the development and advertisement of domestic medical device technology. Yet, in domestic oriental medicine education field, there is no precedent for a simulator to train and assess acupuncture, this dissertation has developed education system which provides acupuncture instruments for the development of it and educational contents. Developed acupuncture simulator offers a video about information about acupoint based on standard data, blood point information, blood point therapy and its function of monitoring practice data of acupuncture as numerical value is certified.
Keywords: Korean Medicine, Acupuncture, training, education, simulator
1. IntroductionRecent tendency of medical education shows
attempts to foster learning environment to develop competency in real situations, breaking from mere knowledge transmission classes. [1] This tendency emphasizes that education that conveys specific clinical skills should go abreast, discarding traditional education, the complete partiality to lecture. However, without
systematic clinical training framework, various medical simulator education is implemented by making artificial human body model or using haptic devices to overcome the increase of social cost due to high risks of medical accidents with immature medical technology. Clinical education using medical simulator can secure impartiality and objectivity of education assessment, reduce risks that patients take and be free from ethical problems. In addition, as
ICSSC 2017 International Conference on Software & Smart Convergence 217 page
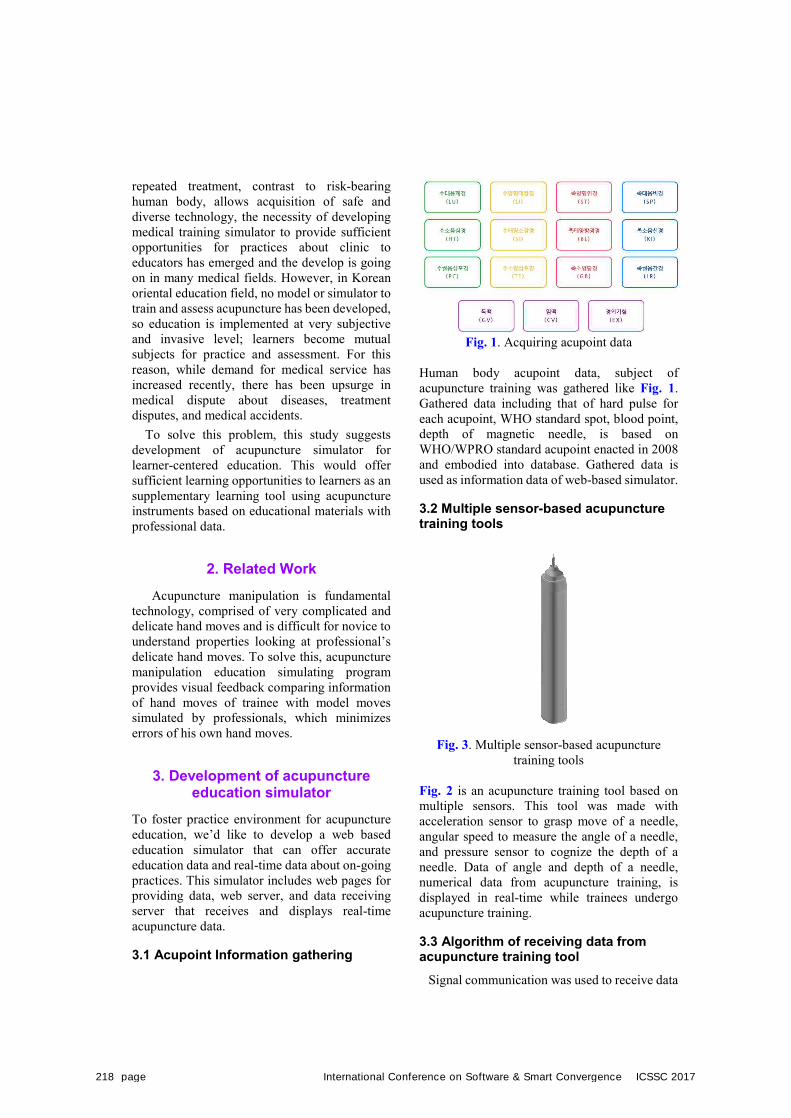
repeated treatment, contrast to risk-bearing human body, allows acquisition of safe and diverse technology, the necessity of developing medical training simulator to provide sufficient opportunities for practices about clinic to educators has emerged and the develop is going on in many medical fields. However, in Korean oriental education field, no model or simulator to train and assess acupuncture has been developed, so education is implemented at very subjective and invasive level; learners become mutual subjects for practice and assessment. For this reason, while demand for medical service has increased recently, there has been upsurge in medical dispute about diseases, treatment disputes, and medical accidents.
To solve this problem, this study suggests development of acupuncture simulator for learner-centered education. This would offer sufficient learning opportunities to learners as an supplementary learning tool using acupuncture instruments based on educational materials with professional data.
2. Related WorkAcupuncture manipulation is fundamental
technology, comprised of very complicated and delicate hand moves and is difficult for novice to understand properties looking at professional’s delicate hand moves. To solve this, acupuncture manipulation education simulating program provides visual feedback comparing information of hand moves of trainee with model moves simulated by professionals, which minimizes errors of his own hand moves.
3. Development of acupunctureeducation simulator
To foster practice environment for acupuncture education, we’d like to develop a web based education simulator that can offer accurate education data and real-time data about on-going practices. This simulator includes web pages for providing data, web server, and data receiving server that receives and displays real-time acupuncture data.
3.1 Acupoint Information gathering
Fig. 1. Acquiring acupoint data
Human body acupoint data, subject of acupuncture training was gathered like Fig. 1. Gathered data including that of hard pulse for each acupoint, WHO standard spot, blood point, depth of magnetic needle, is based on WHO/WPRO standard acupoint enacted in 2008 and embodied into database. Gathered data is used as information data of web-based simulator.
3.2 Multiple sensor-based acupuncture training tools
Fig. 3. Multiple sensor-based acupuncture training tools
Fig. 2 is an acupuncture training tool based on multiple sensors. This tool was made with acceleration sensor to grasp move of a needle, angular speed to measure the angle of a needle, and pressure sensor to cognize the depth of a needle. Data of angle and depth of a needle, numerical data from acupuncture training, is displayed in real-time while trainees undergo acupuncture training.
3.3 Algorithm of receiving data from acupuncture training tool
Signal communication was used to receive data
218 page International Conference on Software & Smart Convergence ICSSC 2017
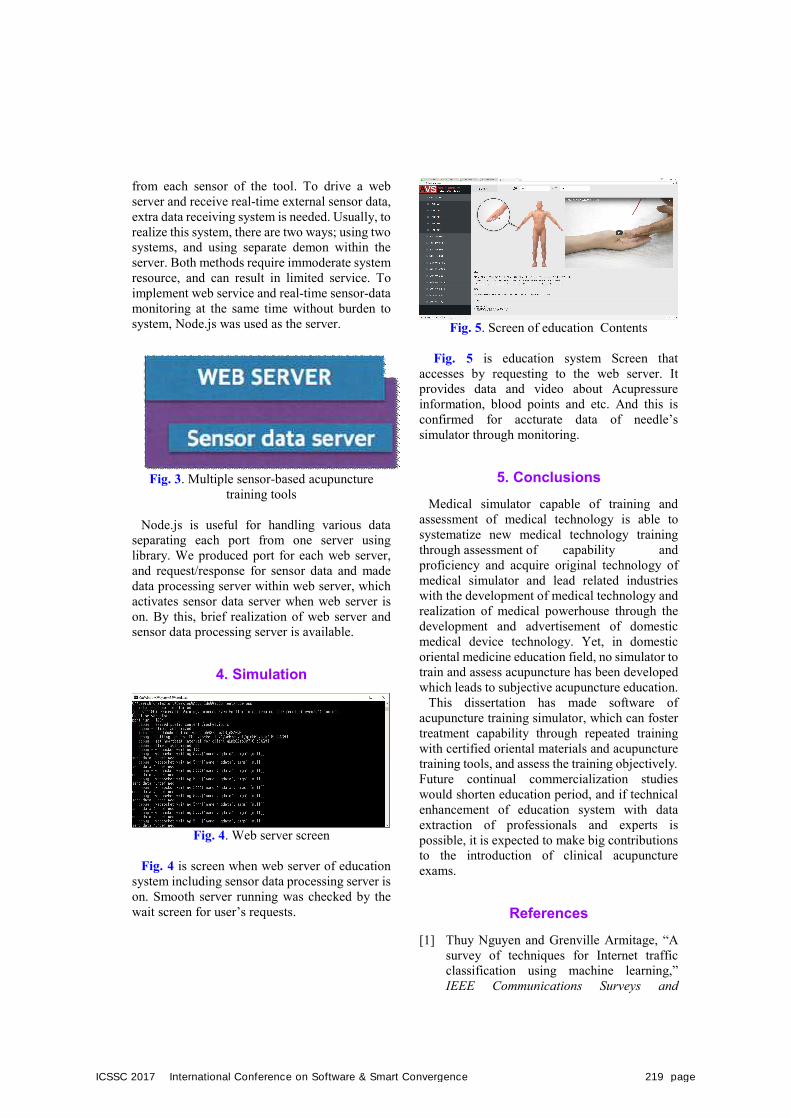
from each sensor of the tool. To drive a web server and receive real-time external sensor data, extra data receiving system is needed. Usually, to realize this system, there are two ways; using two systems, and using separate demon within the server. Both methods require immoderate system resource, and can result in limited service. To implement web service and real-time sensor-data monitoring at the same time without burden to system, Node.js was used as the server.
Fig. 3. Multiple sensor-based acupuncture training tools
Node.js is useful for handling various data separating each port from one server using library. We produced port for each web server, and request/response for sensor data and made data processing server within web server, which activates sensor data server when web server is on. By this, brief realization of web server and sensor data processing server is available.
4. Simulation
Fig. 4. Web server screen
Fig. 4 is screen when web server of education system including sensor data processing server is on. Smooth server running was checked by the wait screen for user’s requests.
Fig. 5. Screen of education Contents
Fig. 5 is education system Screen that accesses by requesting to the web server. It provides data and video about Acupressure information, blood points and etc. And this is confirmed for accturate data of needle’s simulator through monitoring.
5. ConclusionsMedical simulator capable of training and
assessment of medical technology is able to systematize new medical technology training through assessment of capability and proficiency and acquire original technology of medical simulator and lead related industries with the development of medical technology and realization of medical powerhouse through the development and advertisement of domestic medical device technology. Yet, in domestic oriental medicine education field, no simulator to train and assess acupuncture has been developed which leads to subjective acupuncture education.
This dissertation has made software of acupuncture training simulator, which can foster treatment capability through repeated training with certified oriental materials and acupuncture training tools, and assess the training objectively. Future continual commercialization studies would shorten education period, and if technical enhancement of education system with data extraction of professionals and experts is possible, it is expected to make big contributions to the introduction of clinical acupuncture exams.
References [1] Thuy Nguyen and Grenville Armitage, “A
survey of techniques for Internet traffic classification using machine learning,” IEEE Communications Surveys and
ICSSC 2017 International Conference on Software & Smart Convergence 219 page
Tutorials, vo.10, no.4, pp.56-76, 2008. [2] Patel. A, Koshy N and Ortega-Barnett J.
“Neurosurgical tactile discrimination training withhaptic-based virtual reality simulation.”, NeurolRes, vo.36, no.12,pp.1035-1039, 2014.
[3] Luciano C, Banerjee P and Defanti T. “Haptics-basedvirtual reality periodontal training simulator.”, Virtual reality, vo.13, no.2, pp.69-85 2009.
[4] Byoung-guk Min, Hee-ja Jeong, Hyun-jun Lee, Jeong-min Park and Nam-ho Kim. “A study on the Acupuncture Simulator Expressional method for Oriental medicine Acupuncture training”, Jounal of Korean institute of smart media, vo.5, no.2, pp.307-311, 2016.
220 page International Conference on Software & Smart Convergence ICSSC 2017

International Conference on Software & Smart Convergence (ICSSC) 2017, June 2017 Copyright ⓒ 2017 ICSSC
This research was supported by a research grant from the IT R&D program of MKE/IITA, the Korean government [2005-Y-001-04, Development of Next Generation Security Technology]. We express our thanks to Dr. Richard Berke who checked our manuscript.
Gyroscopes for Text Entry with Mobile Phones
Ashok Choudhary1 and Jongman Kim2 1 Department of Electrical Engineering Computer Science, Cleveland State University
OH 44115 - USA [e-mail: [email protected]]
2 Department of Computer Science, Cleveland State University OH 44115 - USA
[e-mail: [email protected]] *Corresponding author: Jongman Kim
Abstract
The concept of tracking the motion path of handwritten text on drawing surface to our smartphone by using the phones built-in sensor, this idea of recording the motion is possible by gyroscope and accelerometer and using the phones corner as a pen. Angular trajectory is used to find the accurate absolute 3D position. As the mobile devices are getting popular these days and still the text entry is not satisfactory, even after various input method have been proposed since the first mobile phone, at first the 12-button phones and then replaced with touchscreen softkeyboards, which suffer from the problem of fat finger, where the fingers are thicker than the keys on virtual keyboard, so to overcome this problem, the auto correction comes into role then SHARK, Shape Writer and SwiftKey were proposed. So, the ease to record small piece of data quickly will be useful. With the help of in-built sensors, accelerometer can recognize human writing. We can write short messages and even draw simple diagrams in the air. The accelerometer due to hand gestures can be converted into image and send to users email address.
Keywords: Mobile Phones, Gyroscope, Accelerometers, Input Device, Gestures, Strokes, Handwriting, Sketching, Electronic Pen, Mobile Computing Applications
1. IntroductionFrom the beginning of evaluation in mobile electronic devices, virtual input methods were proposed like PDA, cellphone, image of a keyboard [9]. This input devices projects the image of keyboard on the work surface, here the sensors in the electronic devices locate the position of the finger, when the user try to enter some input. Considering the fingers location, velocity and path in which the users fingers are
moving, this device can detect what the user is typing. Now it becomes difficult while entering the small piece of information like taking a quick note of a word, texting in a moving vehicle, when our one hand is occupied. With the help of the inbuilt sensors in our phone the gyroscope and accelerometer, we can come with a new idea of text entry. we can make gestures in air or move our phone by holding it like a pen on any surface can solve the problem of text entry[10].
As we see the phone help use in storing the information or data, consider a situation where in
ICSSC 2017 International Conference on Software & Smart Convergence 221 page
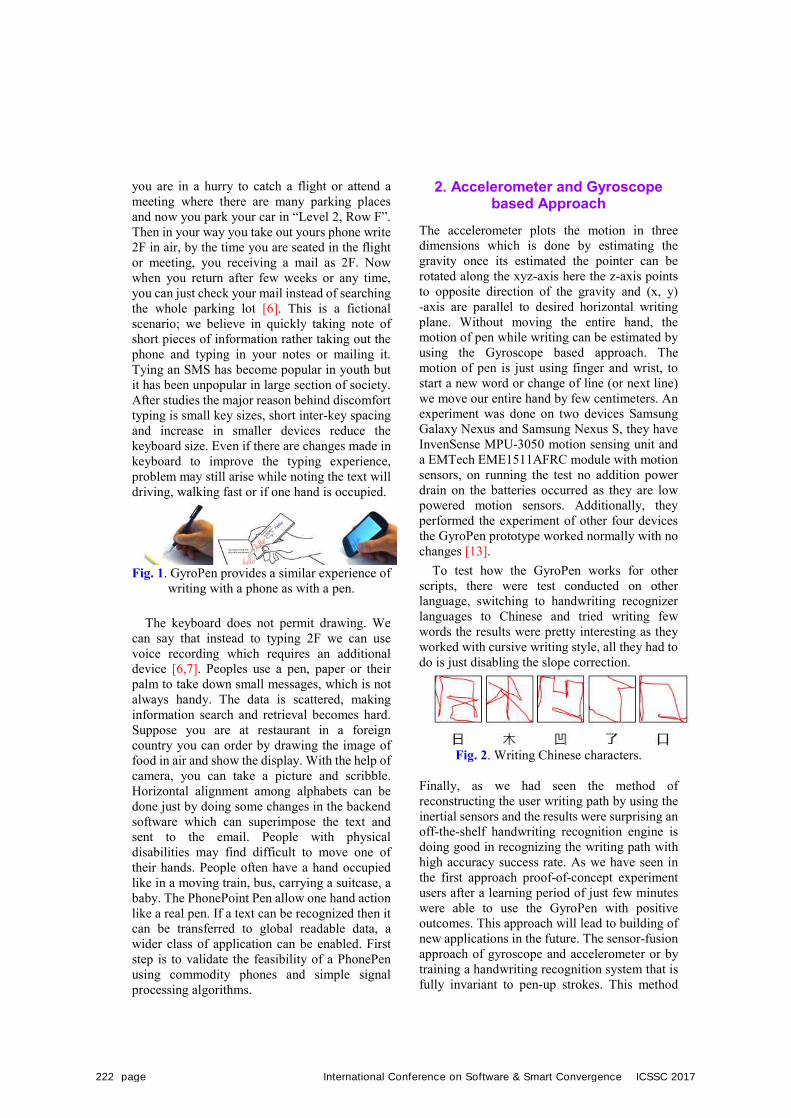
you are in a hurry to catch a flight or attend a meeting where there are many parking places and now you park your car in “Level 2, Row F”. Then in your way you take out yours phone write 2F in air, by the time you are seated in the flight or meeting, you receiving a mail as 2F. Now when you return after few weeks or any time, you can just check your mail instead of searching the whole parking lot [6]. This is a fictional scenario; we believe in quickly taking note of short pieces of information rather taking out the phone and typing in your notes or mailing it. Tying an SMS has become popular in youth but it has been unpopular in large section of society. After studies the major reason behind discomfort typing is small key sizes, short inter-key spacing and increase in smaller devices reduce the keyboard size. Even if there are changes made in keyboard to improve the typing experience, problem may still arise while noting the text will driving, walking fast or if one hand is occupied.
Fig. 1. GyroPen provides a similar experience of writing with a phone as with a pen.
The keyboard does not permit drawing. We can say that instead to typing 2F we can use voice recording which requires an additional device [6,7]. Peoples use a pen, paper or their palm to take down small messages, which is not always handy. The data is scattered, making information search and retrieval becomes hard. Suppose you are at restaurant in a foreign country you can order by drawing the image of food in air and show the display. With the help of camera, you can take a picture and scribble. Horizontal alignment among alphabets can be done just by doing some changes in the backend software which can superimpose the text and sent to the email. People with physical disabilities may find difficult to move one of their hands. People often have a hand occupied like in a moving train, bus, carrying a suitcase, a baby. The PhonePoint Pen allow one hand action like a real pen. If a text can be recognized then it can be transferred to global readable data, a wider class of application can be enabled. First step is to validate the feasibility of a PhonePen using commodity phones and simple signal processing algorithms.
2. Accelerometer and Gyroscopebased Approach
The accelerometer plots the motion in three dimensions which is done by estimating the gravity once its estimated the pointer can be rotated along the xyz-axis here the z-axis points to opposite direction of the gravity and (x, y) -axis are parallel to desired horizontal writing plane. Without moving the entire hand, the motion of pen while writing can be estimated by using the Gyroscope based approach. The motion of pen is just using finger and wrist, to start a new word or change of line (or next line) we move our entire hand by few centimeters. An experiment was done on two devices Samsung Galaxy Nexus and Samsung Nexus S, they have InvenSense MPU-3050 motion sensing unit and a EMTech EME1511AFRC module with motion sensors, on running the test no addition power drain on the batteries occurred as they are low powered motion sensors. Additionally, they performed the experiment of other four devices the GyroPen prototype worked normally with no changes [13].
To test how the GyroPen works for other scripts, there were test conducted on other language, switching to handwriting recognizer languages to Chinese and tried writing few words the results were pretty interesting as they worked with cursive writing style, all they had to do is just disabling the slope correction.
Fig. 2. Writing Chinese characters.
Finally, as we had seen the method of reconstructing the user writing path by using the inertial sensors and the results were surprising an off-the-shelf handwriting recognition engine is doing good in recognizing the writing path with high accuracy success rate. As we have seen in the first approach proof-of-concept experiment users after a learning period of just few minutes were able to use the GyroPen with positive outcomes. This approach will lead to building of new applications in the future. The sensor-fusion approach of gyroscope and accelerometer or by training a handwriting recognition system that is fully invariant to pen-up strokes. This method
222 page International Conference on Software & Smart Convergence ICSSC 2017
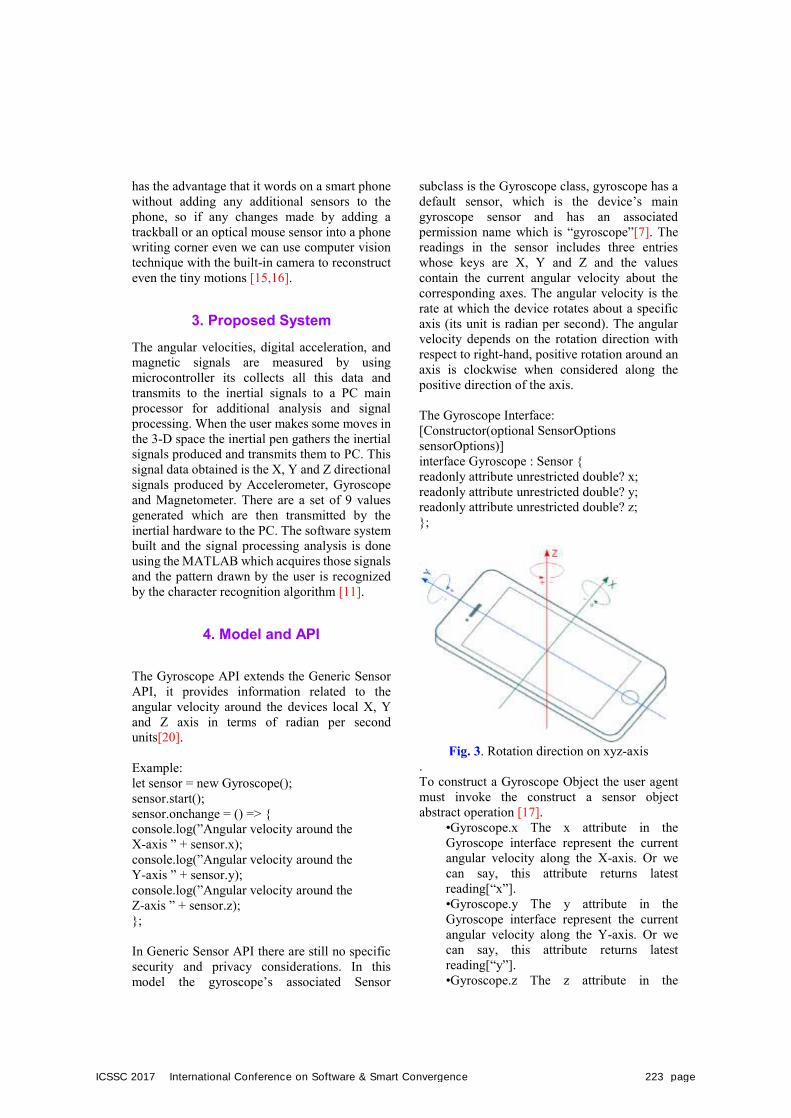
has the advantage that it words on a smart phone without adding any additional sensors to the phone, so if any changes made by adding a trackball or an optical mouse sensor into a phone writing corner even we can use computer vision technique with the built-in camera to reconstruct even the tiny motions [15,16].
3. Proposed SystemThe angular velocities, digital acceleration, and magnetic signals are measured by using microcontroller its collects all this data and transmits to the inertial signals to a PC main processor for additional analysis and signal processing. When the user makes some moves in the 3-D space the inertial pen gathers the inertial signals produced and transmits them to PC. This signal data obtained is the X, Y and Z directional signals produced by Accelerometer, Gyroscope and Magnetometer. There are a set of 9 values generated which are then transmitted by the inertial hardware to the PC. The software system built and the signal processing analysis is done using the MATLAB which acquires those signals and the pattern drawn by the user is recognized by the character recognition algorithm [11].
4. Model and API
The Gyroscope API extends the Generic Sensor API, it provides information related to the angular velocity around the devices local X, Y and Z axis in terms of radian per second units[20].
Example: let sensor = new Gyroscope(); sensor.start(); sensor.onchange = () => { console.log(”Angular velocity around the X-axis ” + sensor.x); console.log(”Angular velocity around the Y-axis ” + sensor.y); console.log(”Angular velocity around the Z-axis ” + sensor.z); };
In Generic Sensor API there are still no specific security and privacy considerations. In this model the gyroscope’s associated Sensor
subclass is the Gyroscope class, gyroscope has a default sensor, which is the device’s main gyroscope sensor and has an associated permission name which is “gyroscope”[7]. The readings in the sensor includes three entries whose keys are X, Y and Z and the values contain the current angular velocity about the corresponding axes. The angular velocity is the rate at which the device rotates about a specific axis (its unit is radian per second). The angular velocity depends on the rotation direction with respect to right-hand, positive rotation around an axis is clockwise when considered along the positive direction of the axis.
The Gyroscope Interface: [Constructor(optional SensorOptions sensorOptions)] interface Gyroscope : Sensor { readonly attribute unrestricted double? x; readonly attribute unrestricted double? y; readonly attribute unrestricted double? z; };
Fig. 3. Rotation direction on xyz-axis . To construct a Gyroscope Object the user agent must invoke the construct a sensor object abstract operation [17].
•Gyroscope.x The x attribute in theGyroscope interface represent the current angular velocity along the X-axis. Or we can say, this attribute returns latest reading[“x”]. •Gyroscope.y The y attribute in theGyroscope interface represent the current angular velocity along the Y-axis. Or we can say, this attribute returns latest reading[“y”]. •Gyroscope.z The z attribute in the
ICSSC 2017 International Conference on Software & Smart Convergence 223 page
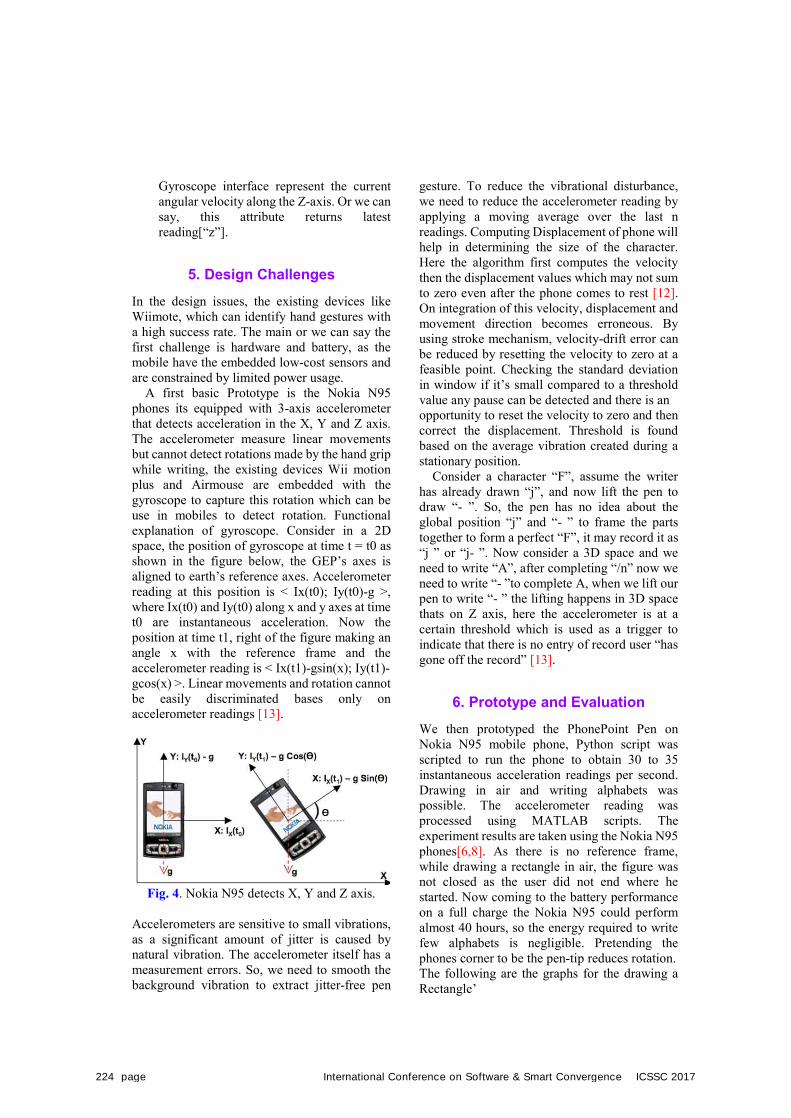
Gyroscope interface represent the current angular velocity along the Z-axis. Or we can say, this attribute returns latest reading[“z”].
5. Design Challenges In the design issues, the existing devices like Wiimote, which can identify hand gestures with a high success rate. The main or we can say the first challenge is hardware and battery, as the mobile have the embedded low-cost sensors and are constrained by limited power usage.
A first basic Prototype is the Nokia N95 phones its equipped with 3-axis accelerometer that detects acceleration in the X, Y and Z axis. The accelerometer measure linear movements but cannot detect rotations made by the hand grip while writing, the existing devices Wii motion plus and Airmouse are embedded with the gyroscope to capture this rotation which can be use in mobiles to detect rotation. Functional explanation of gyroscope. Consider in a 2D space, the position of gyroscope at time t = t0 as shown in the figure below, the GEP’s axes is aligned to earth’s reference axes. Accelerometer reading at this position is < Ix(t0); Iy(t0)-g >, where Ix(t0) and Iy(t0) along x and y axes at time t0 are instantaneous acceleration. Now the position at time t1, right of the figure making an angle x with the reference frame and the accelerometer reading is < Ix(t1)-gsin(x); Iy(t1)- gcos(x) >. Linear movements and rotation cannot be easily discriminated bases only on accelerometer readings [13].
Fig. 4. Nokia N95 detects X, Y and Z axis.
Accelerometers are sensitive to small vibrations, as a significant amount of jitter is caused by natural vibration. The accelerometer itself has a measurement errors. So, we need to smooth the background vibration to extract jitter-free pen
gesture. To reduce the vibrational disturbance, we need to reduce the accelerometer reading by applying a moving average over the last n readings. Computing Displacement of phone will help in determining the size of the character. Here the algorithm first computes the velocity then the displacement values which may not sum to zero even after the phone comes to rest [12]. On integration of this velocity, displacement and movement direction becomes erroneous. By using stroke mechanism, velocity-drift error can be reduced by resetting the velocity to zero at a feasible point. Checking the standard deviation in window if it’s small compared to a threshold value any pause can be detected and there is an opportunity to reset the velocity to zero and then correct the displacement. Threshold is found based on the average vibration created during a stationary position.
Consider a character “F”, assume the writer has already drawn “j”, and now lift the pen to draw “- ”. So, the pen has no idea about the global position “j” and “- ” to frame the parts together to form a perfect “F”, it may record it as “j ” or “j- ”. Now consider a 3D space and we need to write “A”, after completing “/n” now we need to write “- ”to complete A, when we lift our pen to write “- ” the lifting happens in 3D space thats on Z axis, here the accelerometer is at a certain threshold which is used as a trigger to indicate that there is no entry of record user “has gone off the record” [13].
6. Prototype and Evaluation We then prototyped the PhonePoint Pen on Nokia N95 mobile phone, Python script was scripted to run the phone to obtain 30 to 35 instantaneous acceleration readings per second. Drawing in air and writing alphabets was possible. The accelerometer reading was processed using MATLAB scripts. The experiment results are taken using the Nokia N95 phones[6,8]. As there is no reference frame, while drawing a rectangle in air, the figure was not closed as the user did not end where he started. Now coming to the battery performance on a full charge the Nokia N95 could perform almost 40 hours, so the energy required to write few alphabets is negligible. Pretending the phones corner to be the pen-tip reduces rotation. The following are the graphs for the drawing a Rectangle’
224 page International Conference on Software & Smart Convergence ICSSC 2017

Fig. 5. Raw accelerometer data while drawing a rectangle(note gravity on the Z axis).
Fig. 6. Accelerometer noise smoothing
Fig. 7. Rectangle in the final output
7. Related WorkThe Wii Remote also known as colloquially as
the Wiimote, used by the Nintendo Wii console [5], it’s a mobile device which is capable of tracking hand movement. The main feature of this device is to interact with and manipulate items on screen with the help of gesture recognition and pointing by using a 3-axes accelerometer ADXL330 for forward and backward movements. It also features a Pix Art optical sensors in positioning, accurate pointing, and rotation of the device relative to the ground. An optical sensor is embedded on the Wiimote and lean on a fixed reference (and a sensor bar) centered on top of the gameplay screen. The “Wiimote” can be augmented with the “Wii Motion Plus”, a pluggable device containing an integrated gyroscope. Using this feature rotational motion is captured. These three sensors the accelerometer, the gyroscope, and the optical sensor can reproduce motions like real arm-motion. The Nokia N95 consists of only a (low-cost) accelerometer, and limited processing capabilities, in comparison to the Wii. Developing the pen on this platform entails a variety of new challenges.
We then draw shapes and write English alphabets in air and used MATLAB script to process. Users hand movements on air can be displayed on screen in real time using MATLAB but the feedback can enhance the users experience and make system less prone to error. Then we figured out to solve this issue in two ways, first send the acceleration data to a server and require it to respond in real time with the output image. Second port the accelerometer data analysis code from MATLAB to Python to record the hand movements and display on the phone itself.
So, what is user wants to erase some of the characters which were taken by mistake? The user can erase by shaking the phone horizontally, now for every character he writes which is to be deleted the phone checks it with the previous entry of characters and eliminated is drawn. So, the users may remove some other character is the phone does not decode correctly. In powerful phones the machine learning techniques can be applied to enhance the accelerometer reading with certain characters. Now if we consider writing will running, driving and the user may move which the accelerometer will reflect this movements. This arbitrary movements are hard to remove the accelerometer may record this movements and provide an uneven output. This
ICSSC 2017 International Conference on Software & Smart Convergence 225 page
is the ongoing work to fix this issue. Typing of long messages on paper using the phones camera where in the phone first recognizes the characters written on the paper through calibration phase. The writing of short messages on air and typing long messages on paper are the parts of ongoing work.
Logitech in now working on the PC Navigation, (FREMONT, Calif. July 12) new MX air mouse work on the desk and in the air, Logitech introduces a rechargeable cordless air mouse which helps in moving the curser by using the mouse on surface or in air. The Logitech Air Mouse [6] targets people who use computers as multimedia devices. This Air Mouse provides a functionality like mouse, the device is moved in 3-D space like a regular remote control. The accurate linear and rotational motion of the pointer on the screen is possible by using the gyroscope and accelerometer. Unlike the Air Mouse, Phone- Point Pen are not equipped with gyroscopes and relies on just the accelerometers. Furthermore, the proposed phone-based pen does not have a screen on which one may see the pen movement in real time. The absence of gyroscopes and visual cues makes positioning of the pen a difficult problem.
A series of applications for the Nokia N95 use the built-in accelerometer. The NiiMe [10] project transformed the N95 phone into a Bluetooth PC mouse. The PyAcceleREMOTER [11] project developed a remote control for the Linux media player MPlayer. By tilting the phone, the play, stop, volume, fast-forward, and rewind functions of the player are controlled. Lastly many video games for the N95 phone make use of the accelerometer, e.g., to guide a ball through a maze. Being able to write in the air, we believe, is a more challenging problem than the ones in existing systems.
Livescribe SmartPen [12] is a pen-like device, which can track a person’s hand writing. This device requires a surface area with a special finely dotted paper to monitor the movement of the pen. It recognizes the alphabets and numbers, and can be downloaded to a PC. However, the dotted paper may not be always accessible, making ubiquitous note-taking difficult. Tablet PCs also suffer from this problem of ubiquitous accessibility.
8. Future Work
In future work the sensors will collect data that illustrates the variety of naturally generated pen motions, gestures and postures that users exhibit in the wild. As the peoples learn from their experience, in the same way the machine also is programmed in such a way that even they can predict what should be done, here the machines learn from the sensor data collected.
There is research going on the Gyroscope to make it as Machine learning based device, which can predict what the user want to enter and kind of output is he expecting, for example, the way the Swift keyboard records some frequently used words and provide the word in suggestion list when the user enters the first character of that word of its following word. Apart from the gyroscope based products, there are various other devices built by deploying IoT on machine learning devices like AlphaGo, Cozmo, Nvidia BB8, Moley, Sawyer, DeepMind, Hand-Eye Coordination, Solo (Emotional Radio), Speech Recognition, BRETT and Kuka.
The co-happening multi-touch data sources and pen strokes, such an attempt could yield fascinating bits of knowledge on what individuals do with the stylus amid average utilize, or propose extra logical signs with which to assault issues, for example, coincidental palm contact while composing (palm dismissal). Issues such the inclination of a few clients to squirm or play with the pen when it is not being used (bringing on potential false actuations), or weakness from movement motions, additionally should be painstakingly inspected.
We additionally foresee that expanding the barrel of the stylus with full capacitive multi-touch detecting (e.g. [18,19]) may empower detecting more hearty motions or extra logical signals. Our present stylus equipment model as of now incorporates the essential hardware, yet as of this composition we have not yet mechanically coordinated an adaptable multi-touch substrate with our stylus plan.
Our investigation of stylus movement detecting expands on the current writing of improved stylus input that, taken all in all, recommends clients can profit by these better approaches for connecting on or close shows. Numerous innovative and convincing strategies that consolidate pen strokes, movement detecting, and direct-touch contribution to unforeseen ways likely yet stay to be found and refined.
226 page International Conference on Software & Smart Convergence ICSSC 2017
9. ConclusionsWe can conclude by saying that Phone like a pen can ease the way of entering text quickly, which has been accomplished with the help of the built-in sensors. We can hold the phone like a pen and write messages and draw in air, the hand gestures are converted into images and all the data recorded by the PhonePen is send to the email address. The ongoing work plans to augment the pen with the real-time feedback, character recognition, and provide a better platform to draw diagram.
Acknowledgment The author would like to thank Kim Jongman, Cleveland State University. He provided us most valuable knowledge on different topics of Computer Programming Languages and Advanced Computer Architecture, which made me capable of writing this paper. We can conclude by saying that Phone like a pen
References [1] C. Soriano, G. K. Raikundalia, and J.
Szajman, “A usability study of short message service on middle-aged users,” in Proceedings of the 19th conference of the computer-human interaction special interest group (CHISIG) of Australia, 2005.
[2] V. Balakrishnan and P. H.P. Yeow, “A study of the effect of thumb sizes on mobile phone texting satisfaction”, in Journal of Usability Studies, 2008.
[3] V. Balakrishnan and P. H.P. Yeow, “Sms usage satisfaction: Influences of hand anthropometry and gender”, in Human IT 9.2, 2007.
[4] Nokia, “Virtual keyboard”, http://www.unwiredview.com/wpcontent/uploads/2008/01/nokia-virtual-keyboardpatent. pdf.
[5] Nintendo, “Wii Console, Wii Motion Plus”, http://www.nintendo.com/wii.
[6] Logitech, “Air mouse”, http://www.logitech.com
[7] J. Mntyjrvi, J. Kela, P. Korpip, and S. Kallio, “Enabling fast and effortless customisation in accelerometer based gesture interaction,” in Proceedings of the 3rd international
conference on Mobile and ubiquitous multimedia, 2004.
[8] P. Korpipaa, E. J. Malm, T. Rantakokko, V. Kyllonen, J. Kela, J. Mantyjarvi, J. Hakkila, and I. Kansala, “Customizing user interaction in smart phones”, IEEE Pervasive Computing, 2006.
[9] J. Liu, Z. Wang, L. Zhong, J. Wickramasuriya, and V. Vasudevan, “uWave: Accelerometer-based personalized gesture recognition and its applications”, in IEEE PerCom, 2009.
[10] A. Arranz, “Niime”, http://www.niime.com/
[11] Pyacceleremoter project, http://serk01.wordpress.com/pyacceleremoter-fors60/
[12] LiveScribe,‘‘Smartpen’’,http://www.livescribe.com/
[13] http://synrg.csl.illinois.edu/papers/phonepen.pdf
[14] Sandip Agrawal, Ionut Constandache, Shravan Gaonkar, Romit Roy Choudhury, Kevin Caves, and Frank DeRuyter,“Using mobile phones to write in air”, in MobiSys, 2011.
[15] Christoph Amma, Marcus Georgi, and Schultz Tanja, “Airwriting : Hands-free mobile text input by spotting and continuous recognition of 3D-space handwriting with inertial sensors”, in International Symposium on Wearable Computers, 2012.
[16] David J. Ward, Alan F. Blackwell, and David J. C. MacKay, “Dasher: A gesture-driven data entry interface for mobile computing” , Human Computer Interaction, vol. 17, no. 2-3, pp. 199228, 2002.
[17] https://www.w3.org/TR/gyroscope/ [18] Song, H., et al. Grips and Gestures on a
Multi-Touch Pen. CHI 2011. [19] Sun, M., et al. Enhancing Naturalness of
Pen-and-Tablet Drawing through Context Sensing. ITS 2011.
ICSSC 2017 International Conference on Software & Smart Convergence 227 page
International Conference on Software & Smart Convergence (ICSSC) 2017, June 2017 Copyright ⓒ 2017 ICSSC
This research was supported by a research grant from the IT R&D program of MKE/IITA, the Korean government [2005-Y-001-04, Development of Next Generation Security Technology]. We express our thanks to Dr. Richard Berke who checked our manuscript.
Verification and Validation of Automotive Embedded Software
Subramaniam Ganesan1 and Kokula Krishna Hari Kunasekaran2 1 Department of Electrical and Computer Engineering, Oakland University
MI 48309 USA 2 , Chief Scientist, Techno Forum R&D Center, India
[e-mail: [email protected]] *Corresponding author: Kokula Krishna Hari Kunasekaran
Abstract
Embedded Software plays a big role in automotive performance and safety. Reliability, real time response, and analysis of critical tasks execution time, and critical tasks meeting the deadlines for critical tasks are important for automotive software. This paper starts with a brief introduction to embedded software system and covers model driven architecture for embedded software, nonfunctional requirements, verification tools, software testing, validation testing, defect testing, processor-in the loop, model-in the loop and software-in the loop testing. An automotive embedded system example, control operation, requirement, validation, design analysis, verification and testing are presented.
Keywords:
1. IntroductionAny embedded system where a timely response by the computer to an external input/condition is vital is a real time system. The tasks need to be completed before the deadline. The terms Validation and Verification have special meaning in software systems. Validation answers the question: “are we building the right product?” Verification answers the question: “are we building the product right?” (Boehm, 1979). We can also state Verification makes sure that Software conforms to specification, while Validation makes sure that the Software meets the customer’s expectations [1-4]. The system engineers call Software Validation as Verification and vice versa. Today’s automobile contains nearly 40 to 100 embedded controllers communicating with each other using serial protocol like CAN, LIN, FlexRay and automotive Ethernet. The automotive
environment can be considered as distributed real time computing network.
Validation testing checks for embedded software meeting customer’s requirements. Verification testing checks performance and reliability. Defect testing looks for inconsistencies between program and specification. Debugging locates and corrects software defects found during V&V.
Fig. 1 shows the V diagram showing the various Validation and Verification activities. Fig. 2 shows the various tests: Subsystem test, integration test, and acceptance test. Structure of Test plan includes, Testing process, Requirements traceability, Tested items, Testing schedule, Test recording procedures, Hardware and software requirements and constraints.
228 page International Conference on Software & Smart Convergence ICSSC 2017
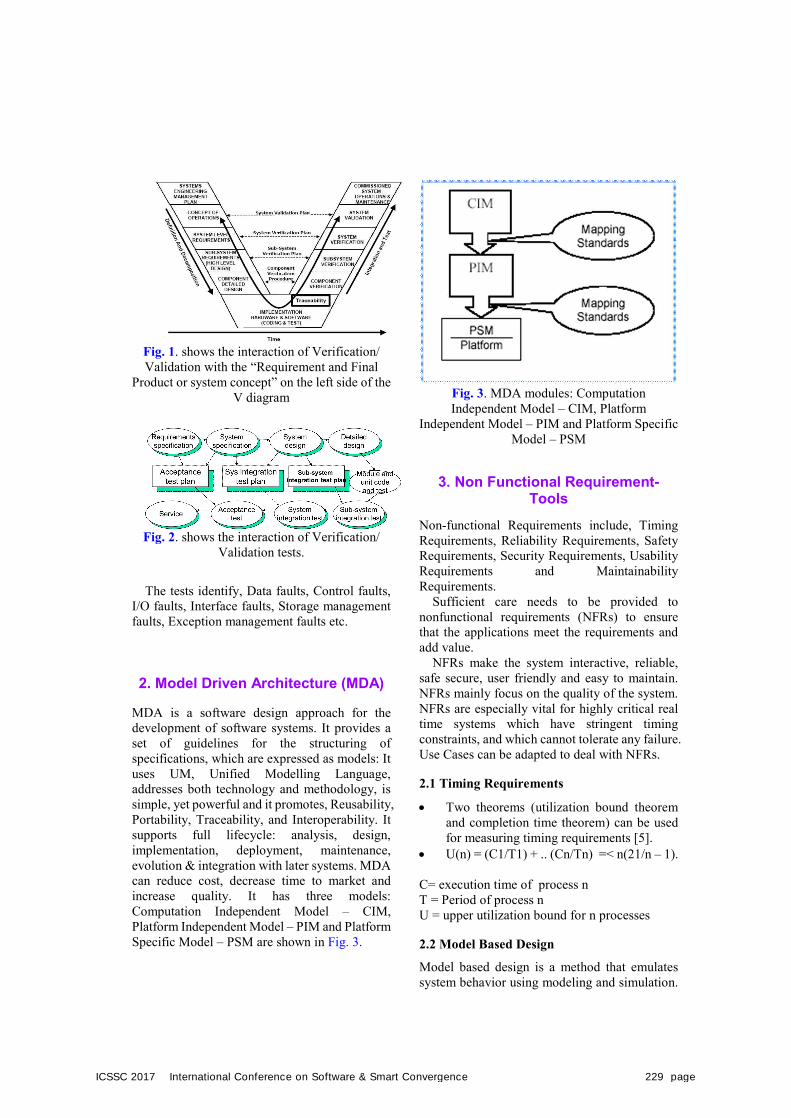
Fig. 1. shows the interaction of Verification/ Validation with the “Requirement and Final
Product or system concept” on the left side of the V diagram
Fig. 2. shows the interaction of Verification/ Validation tests.
The tests identify, Data faults, Control faults, I/O faults, Interface faults, Storage management faults, Exception management faults etc.
2. Model Driven Architecture (MDA)
MDA is a software design approach for the development of software systems. It provides a set of guidelines for the structuring of specifications, which are expressed as models: It uses UM, Unified Modelling Language, addresses both technology and methodology, is simple, yet powerful and it promotes, Reusability, Portability, Traceability, and Interoperability. It supports full lifecycle: analysis, design, implementation, deployment, maintenance, evolution & integration with later systems. MDA can reduce cost, decrease time to market and increase quality. It has three models: Computation Independent Model – CIM, Platform Independent Model – PIM and Platform Specific Model – PSM are shown in Fig. 3.
Fig. 3. MDA modules: Computation Independent Model – CIM, Platform
Independent Model – PIM and Platform Specific Model – PSM
3. Non Functional Requirement-Tools
Non-functional Requirements include, Timing Requirements, Reliability Requirements, Safety Requirements, Security Requirements, Usability Requirements and Maintainability Requirements.
Sufficient care needs to be provided to nonfunctional requirements (NFRs) to ensure that the applications meet the requirements and add value.
NFRs make the system interactive, reliable, safe secure, user friendly and easy to maintain. NFRs mainly focus on the quality of the system. NFRs are especially vital for highly critical real time systems which have stringent timing constraints, and which cannot tolerate any failure. Use Cases can be adapted to deal with NFRs.
2.1 Timing Requirements
· Two theorems (utilization bound theoremand completion time theorem) can be usedfor measuring timing requirements [5].
· U(n) = (C1/T1) + .. (Cn/Tn) =< n(21/n – 1).
C= execution time of process n T = Period of process n U = upper utilization bound for n processes
2.2 Model Based Design
Model based design is a method that emulates system behavior using modeling and simulation.
ICSSC 2017 International Conference on Software & Smart Convergence 229 page
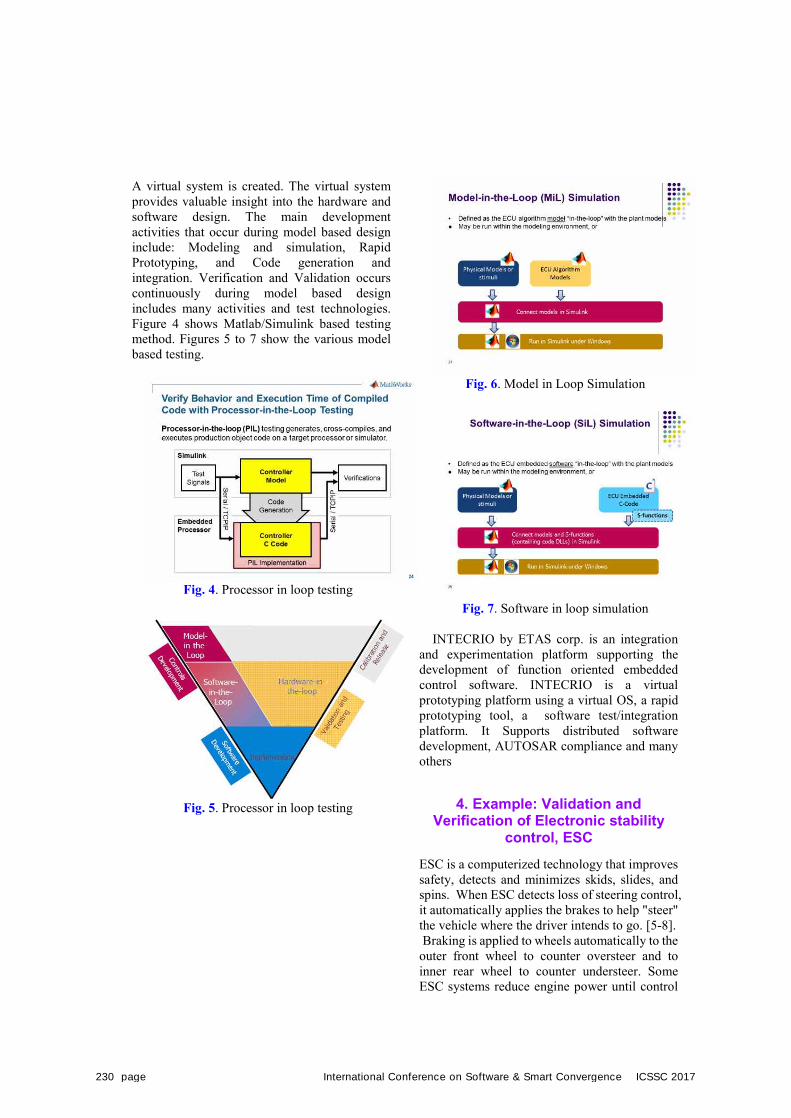
A virtual system is created. The virtual system provides valuable insight into the hardware and software design. The main development activities that occur during model based design include: Modeling and simulation, Rapid Prototyping, and Code generation and integration. Verification and Validation occurs continuously during model based design includes many activities and test technologies. Figure 4 shows Matlab/Simulink based testing method. Figures 5 to 7 show the various model based testing.
Fig. 4. Processor in loop testing
Fig. 5. Processor in loop testing
Fig. 6. Model in Loop Simulation
Fig. 7. Software in loop simulation
INTECRIO by ETAS corp. is an integration and experimentation platform supporting the development of function oriented embedded control software. INTECRIO is a virtual prototyping platform using a virtual OS, a rapid prototyping tool, a software test/integration platform. It Supports distributed software development, AUTOSAR compliance and many others
4. Example: Validation andVerification of Electronic stability
control, ESC ESC is a computerized technology that improves safety, detects and minimizes skids, slides, and spins. When ESC detects loss of steering control, it automatically applies the brakes to help "steer" the vehicle where the driver intends to go. [5-8]. Braking is applied to wheels automatically to the outer front wheel to counter oversteer and to inner rear wheel to counter understeer. Some ESC systems reduce engine power until control
230 page International Conference on Software & Smart Convergence ICSSC 2017
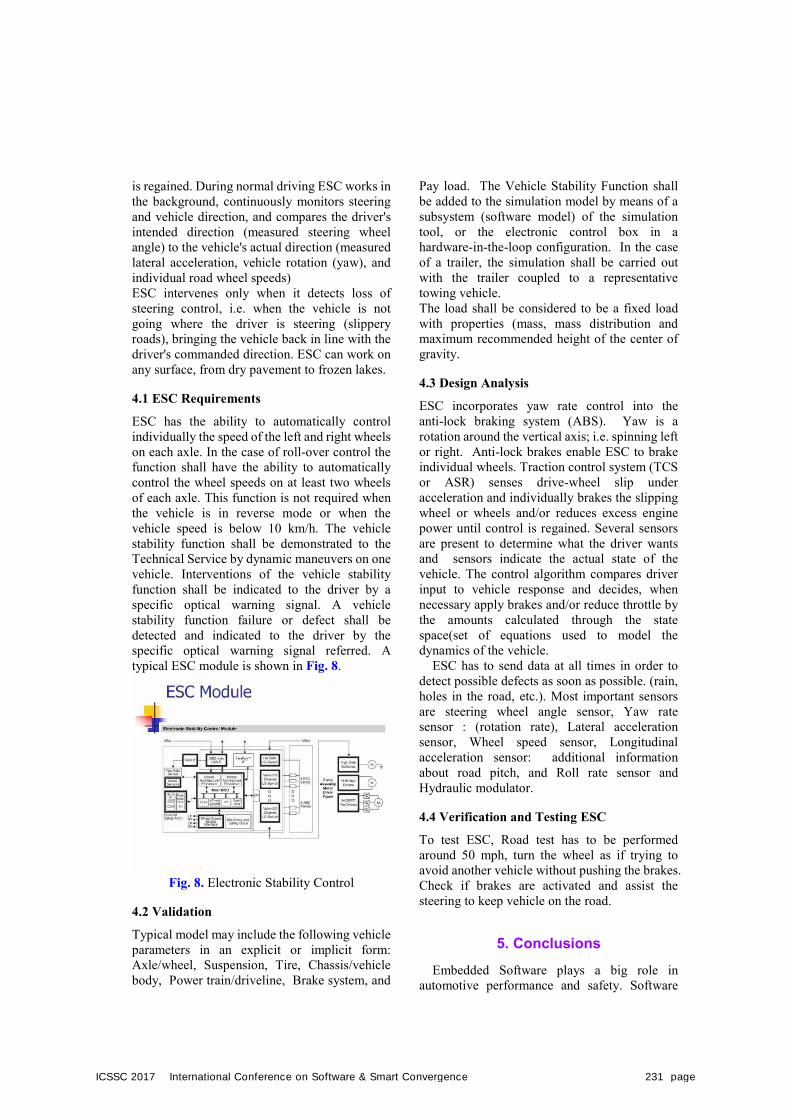
is regained. During normal driving ESC works in the background, continuously monitors steering and vehicle direction, and compares the driver's intended direction (measured steering wheel angle) to the vehicle's actual direction (measured lateral acceleration, vehicle rotation (yaw), and individual road wheel speeds) ESC intervenes only when it detects loss of steering control, i.e. when the vehicle is not going where the driver is steering (slippery roads), bringing the vehicle back in line with the driver's commanded direction. ESC can work on any surface, from dry pavement to frozen lakes.
4.1 ESC Requirements
ESC has the ability to automatically control individually the speed of the left and right wheels on each axle. In the case of roll-over control the function shall have the ability to automatically control the wheel speeds on at least two wheels of each axle. This function is not required when the vehicle is in reverse mode or when the vehicle speed is below 10 km/h. The vehicle stability function shall be demonstrated to the Technical Service by dynamic maneuvers on one vehicle. Interventions of the vehicle stability function shall be indicated to the driver by a specific optical warning signal. A vehicle stability function failure or defect shall be detected and indicated to the driver by the specific optical warning signal referred. A typical ESC module is shown in Fig. 8.
Fig. 8. Electronic Stability Control
4.2 Validation
Typical model may include the following vehicle parameters in an explicit or implicit form: Axle/wheel, Suspension, Tire, Chassis/vehicle body, Power train/driveline, Brake system, and
Pay load. The Vehicle Stability Function shall be added to the simulation model by means of a subsystem (software model) of the simulation tool, or the electronic control box in a hardware-in-the-loop configuration. In the case of a trailer, the simulation shall be carried out with the trailer coupled to a representative towing vehicle. The load shall be considered to be a fixed load with properties (mass, mass distribution and maximum recommended height of the center of gravity.
4.3 Design Analysis
ESC incorporates yaw rate control into the anti-lock braking system (ABS). Yaw is a rotation around the vertical axis; i.e. spinning left or right. Anti-lock brakes enable ESC to brake individual wheels. Traction control system (TCS or ASR) senses drive-wheel slip under acceleration and individually brakes the slipping wheel or wheels and/or reduces excess engine power until control is regained. Several sensors are present to determine what the driver wants and sensors indicate the actual state of the vehicle. The control algorithm compares driver input to vehicle response and decides, when necessary apply brakes and/or reduce throttle by the amounts calculated through the state space(set of equations used to model the dynamics of the vehicle.
ESC has to send data at all times in order to detect possible defects as soon as possible. (rain, holes in the road, etc.). Most important sensors are steering wheel angle sensor, Yaw rate sensor : (rotation rate), Lateral acceleration sensor, Wheel speed sensor, Longitudinal acceleration sensor: additional information about road pitch, and Roll rate sensor and Hydraulic modulator.
4.4 Verification and Testing ESC
To test ESC, Road test has to be performed around 50 mph, turn the wheel as if trying to avoid another vehicle without pushing the brakes. Check if brakes are activated and assist the steering to keep vehicle on the road.
5. ConclusionsEmbedded Software plays a big role in
automotive performance and safety. Software
ICSSC 2017 International Conference on Software & Smart Convergence 231 page
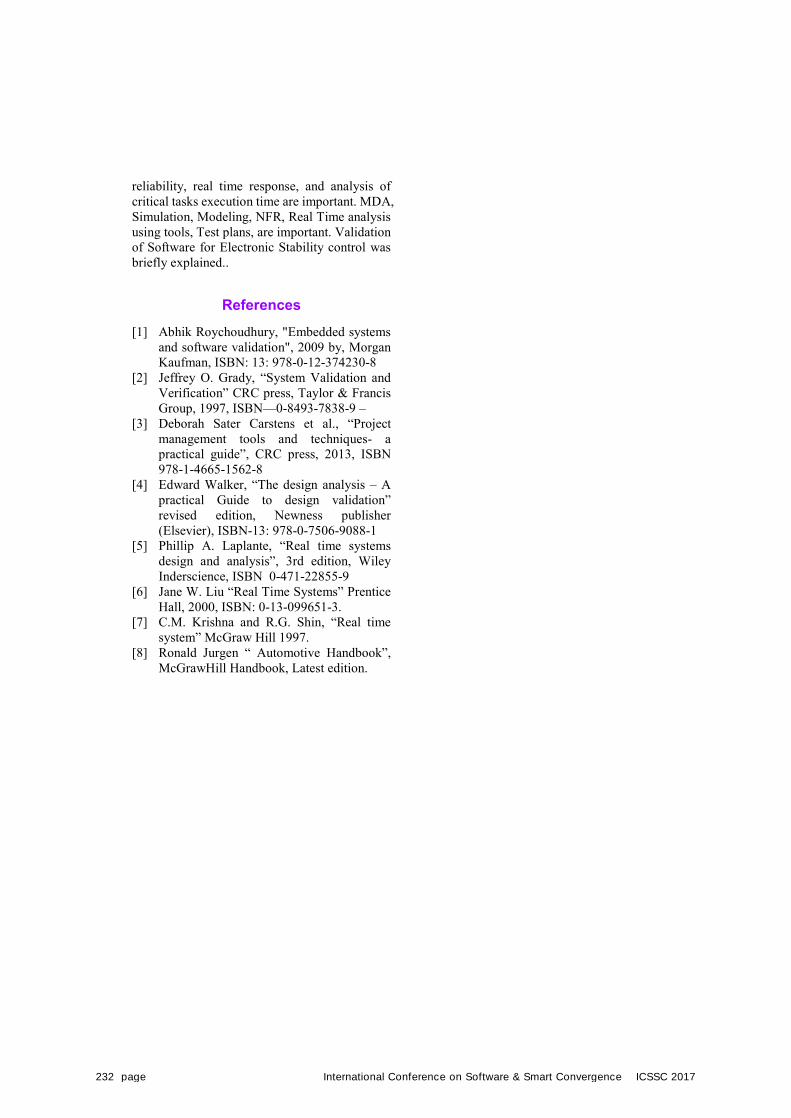
reliability, real time response, and analysis of critical tasks execution time are important. MDA, Simulation, Modeling, NFR, Real Time analysis using tools, Test plans, are important. Validation of Software for Electronic Stability control was briefly explained..
References [1] Abhik Roychoudhury, "Embedded systems
and software validation", 2009 by, Morgan Kaufman, ISBN: 13: 978-0-12-374230-8
[2] Jeffrey O. Grady, “System Validation and Verification” CRC press, Taylor & Francis Group, 1997, ISBN—0-8493-7838-9 –
[3] Deborah Sater Carstens et al., “Project management tools and techniques- a practical guide”, CRC press, 2013, ISBN 978-1-4665-1562-8
[4] Edward Walker, “The design analysis – A practical Guide to design validation” revised edition, Newness publisher (Elsevier), ISBN-13: 978-0-7506-9088-1
[5] Phillip A. Laplante, “Real time systems design and analysis”, 3rd edition, Wiley Inderscience, ISBN 0-471-22855-9
[6] Jane W. Liu “Real Time Systems” Prentice Hall, 2000, ISBN: 0-13-099651-3.
[7] C.M. Krishna and R.G. Shin, “Real time system” McGraw Hill 1997.
[8] Ronald Jurgen “ Automotive Handbook”, McGrawHill Handbook, Latest edition.
232 page International Conference on Software & Smart Convergence ICSSC 2017
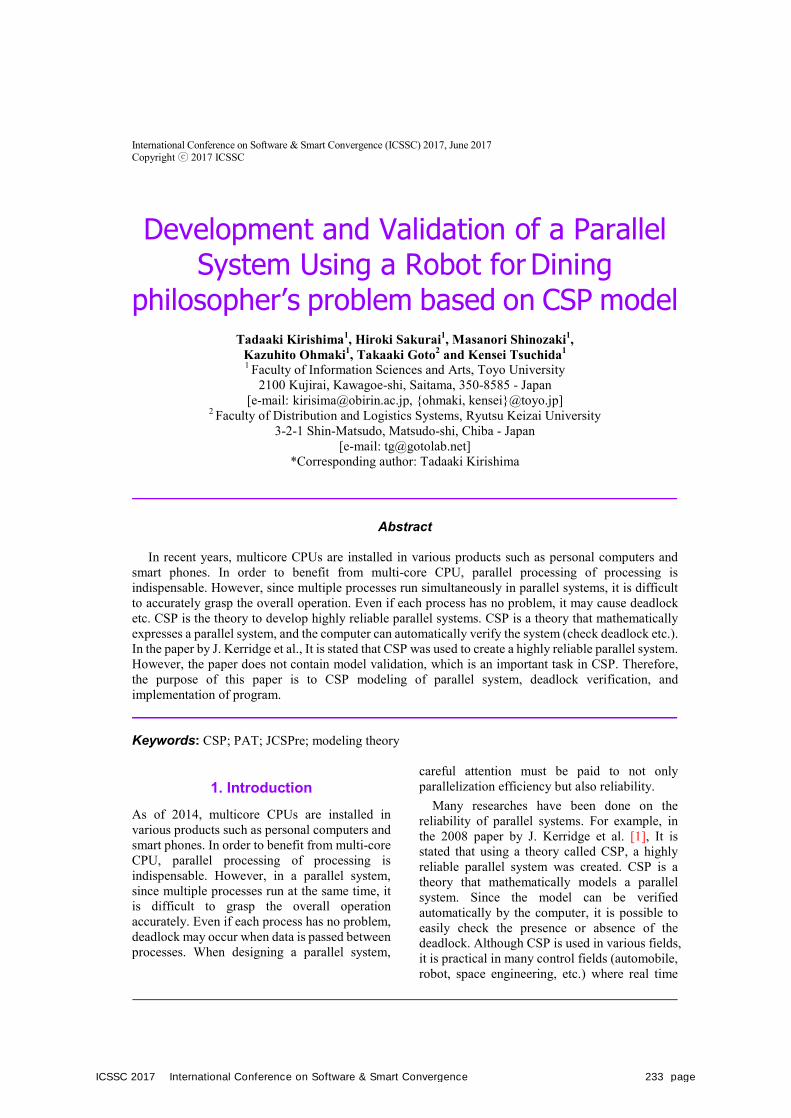
International Conference on Software & Smart Convergence (ICSSC) 2017, June 2017 Copyright ⓒ 2017 ICSSC
Development and Validation of a Parallel System Using a Robot for Dining
philosopher’s problem based on CSP model Tadaaki Kirishima1, Hiroki Sakurai1, Masanori Shinozaki1,
Kazuhito Ohmaki1, Takaaki Goto2 and Kensei Tsuchida1 1 Faculty of Information Sciences and Arts, Toyo University
2100 Kujirai, Kawagoe-shi, Saitama, 350-8585 - Japan [e-mail: [email protected], {ohmaki, kensei}@toyo.jp]
2 Faculty of Distribution and Logistics Systems, Ryutsu Keizai University 3-2-1 Shin-Matsudo, Matsudo-shi, Chiba - Japan
[e-mail: [email protected]] *Corresponding author: Tadaaki Kirishima
Abstract
In recent years, multicore CPUs are installed in various products such as personal computers and smart phones. In order to benefit from multi-core CPU, parallel processing of processing is indispensable. However, since multiple processes run simultaneously in parallel systems, it is difficult to accurately grasp the overall operation. Even if each process has no problem, it may cause deadlock etc. CSP is the theory to develop highly reliable parallel systems. CSP is a theory that mathematically expresses a parallel system, and the computer can automatically verify the system (check deadlock etc.). In the paper by J. Kerridge et al., It is stated that CSP was used to create a highly reliable parallel system. However, the paper does not contain model validation, which is an important task in CSP. Therefore, the purpose of this paper is to CSP modeling of parallel system, deadlock verification, and implementation of program.
Keywords: CSP; PAT; JCSPre; modeling theory
1. IntroductionAs of 2014, multicore CPUs are installed in various products such as personal computers and smart phones. In order to benefit from multi-core CPU, parallel processing of processing is indispensable. However, in a parallel system, since multiple processes run at the same time, it is difficult to grasp the overall operation accurately. Even if each process has no problem, deadlock may occur when data is passed between processes. When designing a parallel system,
careful attention must be paid to not only parallelization efficiency but also reliability.
Many researches have been done on the reliability of parallel systems. For example, in the 2008 paper by J. Kerridge et al. [1], It is stated that using a theory called CSP, a highly reliable parallel system was created. CSP is a theory that mathematically models a parallel system. Since the model can be verified automatically by the computer, it is possible to easily check the presence or absence of the deadlock. Although CSP is used in various fields, it is practical in many control fields (automobile, robot, space engineering, etc.) where real time
ICSSC 2017 International Conference on Software & Smart Convergence 233 page
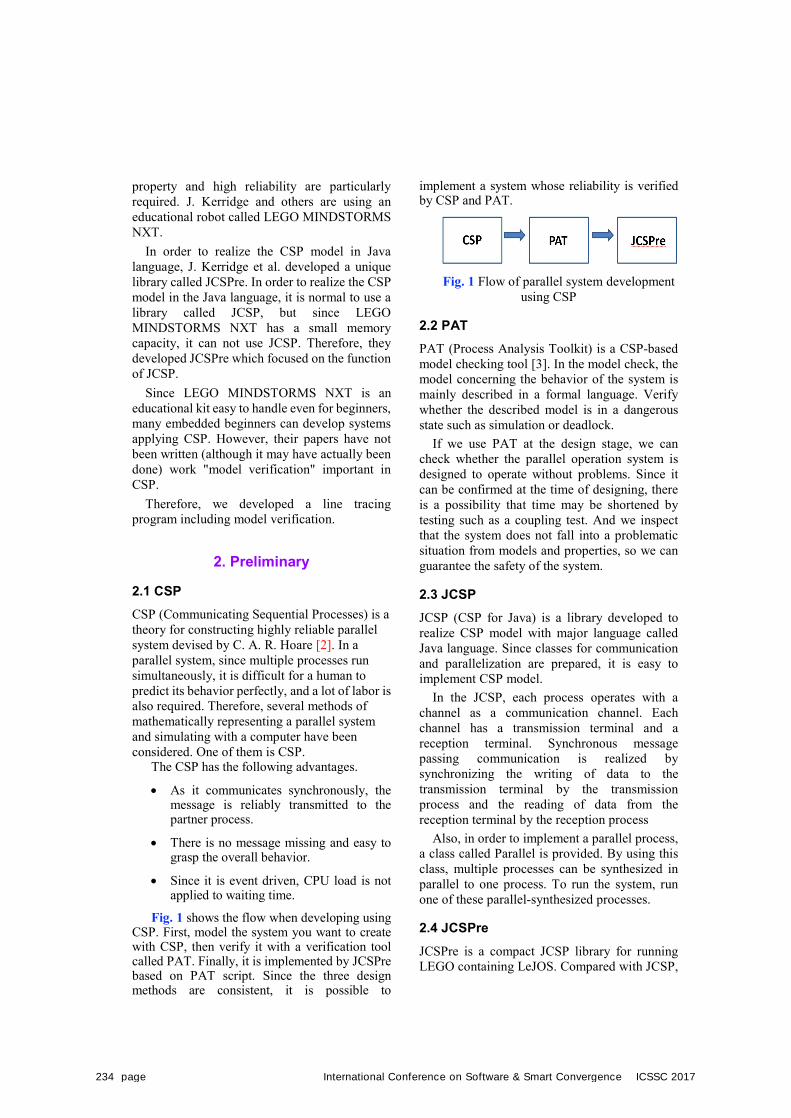
property and high reliability are particularly required. J. Kerridge and others are using an educational robot called LEGO MINDSTORMS NXT.
In order to realize the CSP model in Java language, J. Kerridge et al. developed a unique library called JCSPre. In order to realize the CSP model in the Java language, it is normal to use a library called JCSP, but since LEGO MINDSTORMS NXT has a small memory capacity, it can not use JCSP. Therefore, they developed JCSPre which focused on the function of JCSP.
Since LEGO MINDSTORMS NXT is an educational kit easy to handle even for beginners, many embedded beginners can develop systems applying CSP. However, their papers have not been written (although it may have actually been done) work "model verification" important in CSP.
Therefore, we developed a line tracing program including model verification.
2. Preliminary
2.1 CSP CSP (Communicating Sequential Processes) is a theory for constructing highly reliable parallel system devised by C. A. R. Hoare [2]. In a parallel system, since multiple processes run simultaneously, it is difficult for a human to predict its behavior perfectly, and a lot of labor is also required. Therefore, several methods of mathematically representing a parallel system and simulating with a computer have been considered. One of them is CSP.
The CSP has the following advantages.
· As it communicates synchronously, themessage is reliably transmitted to thepartner process.
· There is no message missing and easy tograsp the overall behavior.
· Since it is event driven, CPU load is notapplied to waiting time.
Fig. 1 shows the flow when developing using CSP. First, model the system you want to create with CSP, then verify it with a verification tool called PAT. Finally, it is implemented by JCSPre based on PAT script. Since the three design methods are consistent, it is possible to
implement a system whose reliability is verified by CSP and PAT.
Fig. 1 Flow of parallel system development using CSP
2.2 PAT PAT (Process Analysis Toolkit) is a CSP-based model checking tool [3]. In the model check, the model concerning the behavior of the system is mainly described in a formal language. Verify whether the described model is in a dangerous state such as simulation or deadlock.
If we use PAT at the design stage, we can check whether the parallel operation system is designed to operate without problems. Since it can be confirmed at the time of designing, there is a possibility that time may be shortened by testing such as a coupling test. And we inspect that the system does not fall into a problematic situation from models and properties, so we can guarantee the safety of the system.
2.3 JCSP JCSP (CSP for Java) is a library developed to realize CSP model with major language called Java language. Since classes for communication and parallelization are prepared, it is easy to implement CSP model.
In the JCSP, each process operates with a channel as a communication channel. Each channel has a transmission terminal and a reception terminal. Synchronous message passing communication is realized by synchronizing the writing of data to the transmission terminal by the transmission process and the reading of data from the reception terminal by the reception process
Also, in order to implement a parallel process, a class called Parallel is provided. By using this class, multiple processes can be synthesized in parallel to one process. To run the system, run one of these parallel-synthesized processes.
2.4 JCSPre JCSPre is a compact JCSP library for running LEGO containing LeJOS. Compared with JCSP,
234 page International Conference on Software & Smart Convergence ICSSC 2017
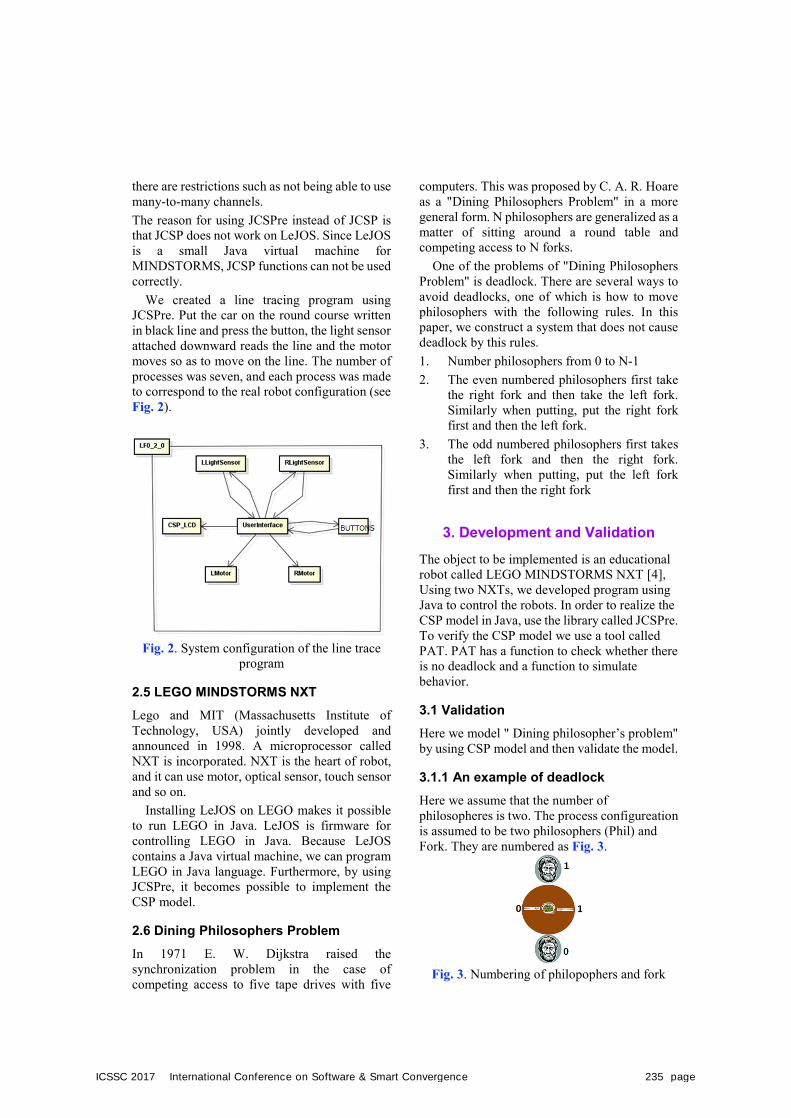
there are restrictions such as not being able to use many-to-many channels. The reason for using JCSPre instead of JCSP is that JCSP does not work on LeJOS. Since LeJOS is a small Java virtual machine for MINDSTORMS, JCSP functions can not be used correctly.
We created a line tracing program using JCSPre. Put the car on the round course written in black line and press the button, the light sensor attached downward reads the line and the motor moves so as to move on the line. The number of processes was seven, and each process was made to correspond to the real robot configuration (see Fig. 2).
Fig. 2. System configuration of the line trace program
2.5 LEGO MINDSTORMS NXT Lego and MIT (Massachusetts Institute of Technology, USA) jointly developed and announced in 1998. A microprocessor called NXT is incorporated. NXT is the heart of robot, and it can use motor, optical sensor, touch sensor and so on.
Installing LeJOS on LEGO makes it possible to run LEGO in Java. LeJOS is firmware for controlling LEGO in Java. Because LeJOS contains a Java virtual machine, we can program LEGO in Java language. Furthermore, by using JCSPre, it becomes possible to implement the CSP model.
2.6 Dining Philosophers Problem In 1971 E. W. Dijkstra raised the synchronization problem in the case of competing access to five tape drives with five
computers. This was proposed by C. A. R. Hoare as a "Dining Philosophers Problem" in a more general form. N philosophers are generalized as a matter of sitting around a round table and competing access to N forks.
One of the problems of "Dining Philosophers Problem" is deadlock. There are several ways to avoid deadlocks, one of which is how to move philosophers with the following rules. In this paper, we construct a system that does not cause deadlock by this rules. 1. Number philosophers from 0 to N-12. The even numbered philosophers first take
the right fork and then take the left fork.Similarly when putting, put the right forkfirst and then the left fork.
3. The odd numbered philosophers first takesthe left fork and then the right fork.Similarly when putting, put the left forkfirst and then the right fork
3. Development and ValidationThe object to be implemented is an educational robot called LEGO MINDSTORMS NXT [4], Using two NXTs, we developed program using Java to control the robots. In order to realize the CSP model in Java, use the library called JCSPre. To verify the CSP model we use a tool called PAT. PAT has a function to check whether there is no deadlock and a function to simulate behavior.
3.1 Validation Here we model " Dining philosopher’s problem" by using CSP model and then validate the model.
3.1.1 An example of deadlock Here we assume that the number of philosopheres is two. The process configureation is assumed to be two philosophers (Phil) and Fork. They are numbered as Fig. 3.
Fig. 3. Numbering of philopophers and fork
ICSSC 2017 International Conference on Software & Smart Convergence 235 page
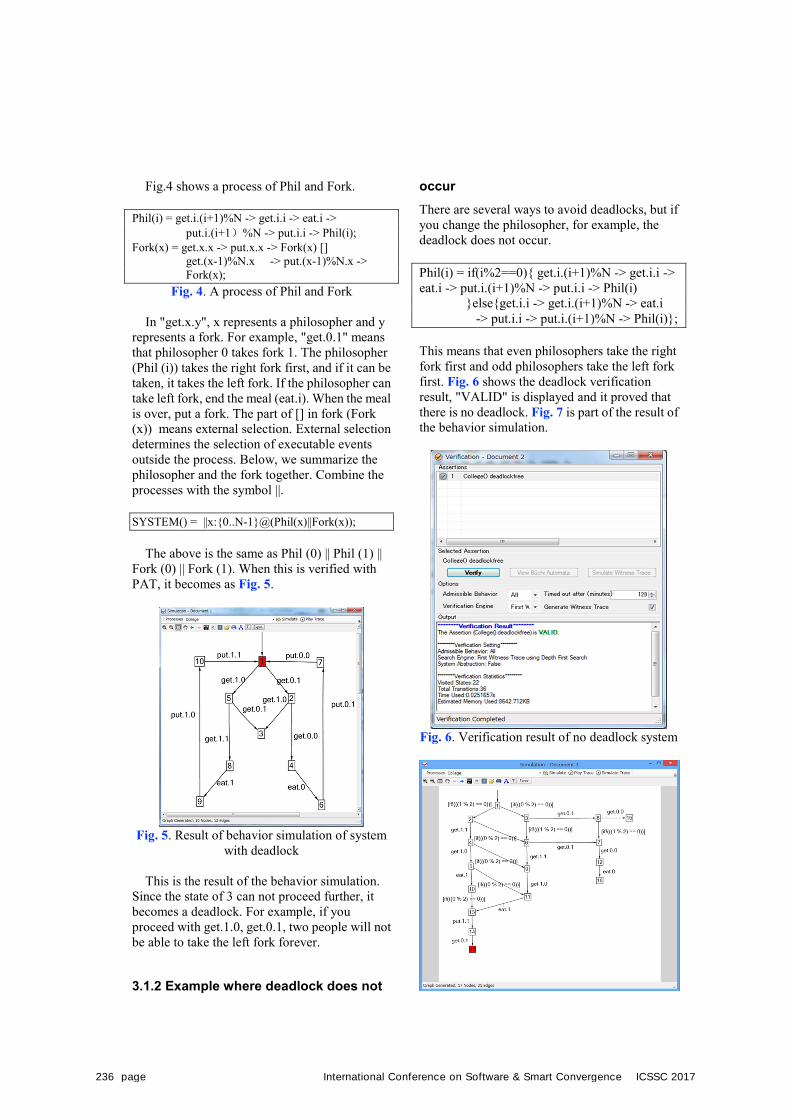
Fig.4 shows a process of Phil and Fork.
Phil(i) = get.i.(i+1)%N -> get.i.i -> eat.i -> put.i.(i+1)%N -> put.i.i -> Phil(i);
Fork(x) = get.x.x -> put.x.x -> Fork(x) [] get.(x-1)%N.x -> put.(x-1)%N.x -> Fork(x);
Fig. 4. A process of Phil and Fork
In "get.x.y", x represents a philosopher and y represents a fork. For example, "get.0.1" means that philosopher 0 takes fork 1. The philosopher (Phil (i)) takes the right fork first, and if it can be taken, it takes the left fork. If the philosopher can take left fork, end the meal (eat.i). When the meal is over, put a fork. The part of [] in fork (Fork (x)) means external selection. External selection determines the selection of executable events outside the process. Below, we summarize the philosopher and the fork together. Combine the processes with the symbol ||.
SYSTEM() = ||x:{0..N-1}@(Phil(x)||Fork(x));
The above is the same as Phil (0) || Phil (1) || Fork (0) || Fork (1). When this is verified with PAT, it becomes as Fig. 5.
Fig. 5. Result of behavior simulation of system with deadlock
This is the result of the behavior simulation. Since the state of 3 can not proceed further, it becomes a deadlock. For example, if you proceed with get.1.0, get.0.1, two people will not be able to take the left fork forever.
3.1.2 Example where deadlock does not
occur There are several ways to avoid deadlocks, but if you change the philosopher, for example, the deadlock does not occur.
Phil(i) = if(i%2==0){ get.i.(i+1)%N -> get.i.i -> eat.i -> put.i.(i+1)%N -> put.i.i -> Phil(i)
}else{get.i.i -> get.i.(i+1)%N -> eat.i -> put.i.i -> put.i.(i+1)%N -> Phil(i)};
This means that even philosophers take the right fork first and odd philosophers take the left fork first. Fig. 6 shows the deadlock verification result, "VALID" is displayed and it proved that there is no deadlock. Fig. 7 is part of the result of the behavior simulation.
Fig. 6. Verification result of no deadlock system
236 page International Conference on Software & Smart Convergence ICSSC 2017
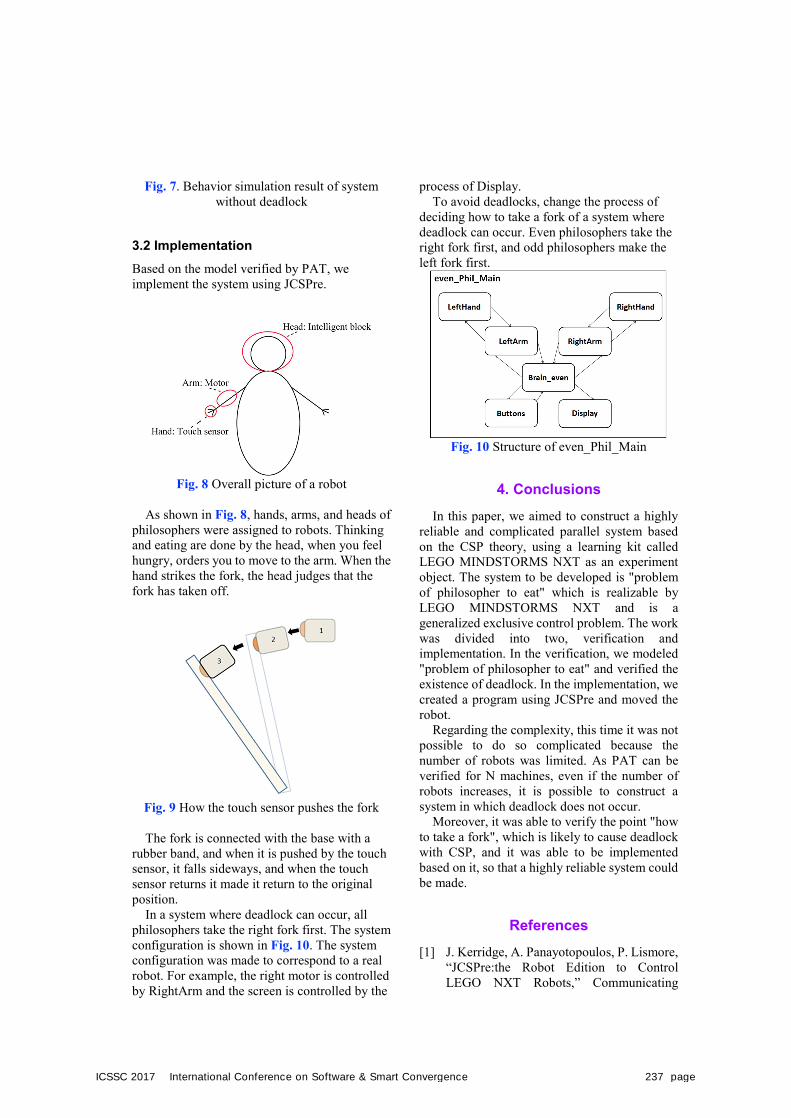
Fig. 7. Behavior simulation result of system without deadlock
3.2 Implementation Based on the model verified by PAT, we implement the system using JCSPre.
Fig. 8 Overall picture of a robot
As shown in Fig. 8, hands, arms, and heads of philosophers were assigned to robots. Thinking and eating are done by the head, when you feel hungry, orders you to move to the arm. When the hand strikes the fork, the head judges that the fork has taken off.
Fig. 9 How the touch sensor pushes the fork
The fork is connected with the base with a rubber band, and when it is pushed by the touch sensor, it falls sideways, and when the touch sensor returns it made it return to the original position.
In a system where deadlock can occur, all philosophers take the right fork first. The system configuration is shown in Fig. 10. The system configuration was made to correspond to a real robot. For example, the right motor is controlled by RightArm and the screen is controlled by the
process of Display. To avoid deadlocks, change the process of
deciding how to take a fork of a system where deadlock can occur. Even philosophers take the right fork first, and odd philosophers make the left fork first.
Fig. 10 Structure of even_Phil_Main
4. ConclusionsIn this paper, we aimed to construct a highly
reliable and complicated parallel system based on the CSP theory, using a learning kit called LEGO MINDSTORMS NXT as an experiment object. The system to be developed is "problem of philosopher to eat" which is realizable by LEGO MINDSTORMS NXT and is a generalized exclusive control problem. The work was divided into two, verification and implementation. In the verification, we modeled "problem of philosopher to eat" and verified the existence of deadlock. In the implementation, we created a program using JCSPre and moved the robot.
Regarding the complexity, this time it was not possible to do so complicated because the number of robots was limited. As PAT can be verified for N machines, even if the number of robots increases, it is possible to construct a system in which deadlock does not occur.
Moreover, it was able to verify the point "how to take a fork", which is likely to cause deadlock with CSP, and it was able to be implemented based on it, so that a highly reliable system could be made.
References [1] J. Kerridge, A. Panayotopoulos, P. Lismore,
“JCSPre:the Robot Edition to Control LEGO NXT Robots,” Communicating
ICSSC 2017 International Conference on Software & Smart Convergence 237 page

Process Architectures 2008, IOS Press, 2008, pp.255–270.
[2] C.A.R.Hoare, “Communicating Sequential Processes,” Prentice Hall International, 1985.
[3] Process Analysis Toolkit (PAT), http://www.comp.nus.edu.sg/~pat/OnlineHelp/webhelpleft.htm.
[4] LEGO MINDSTORMS, https://www.lego.com/en-us/mindstorms?ignorereferer=true.
238 page International Conference on Software & Smart Convergence ICSSC 2017
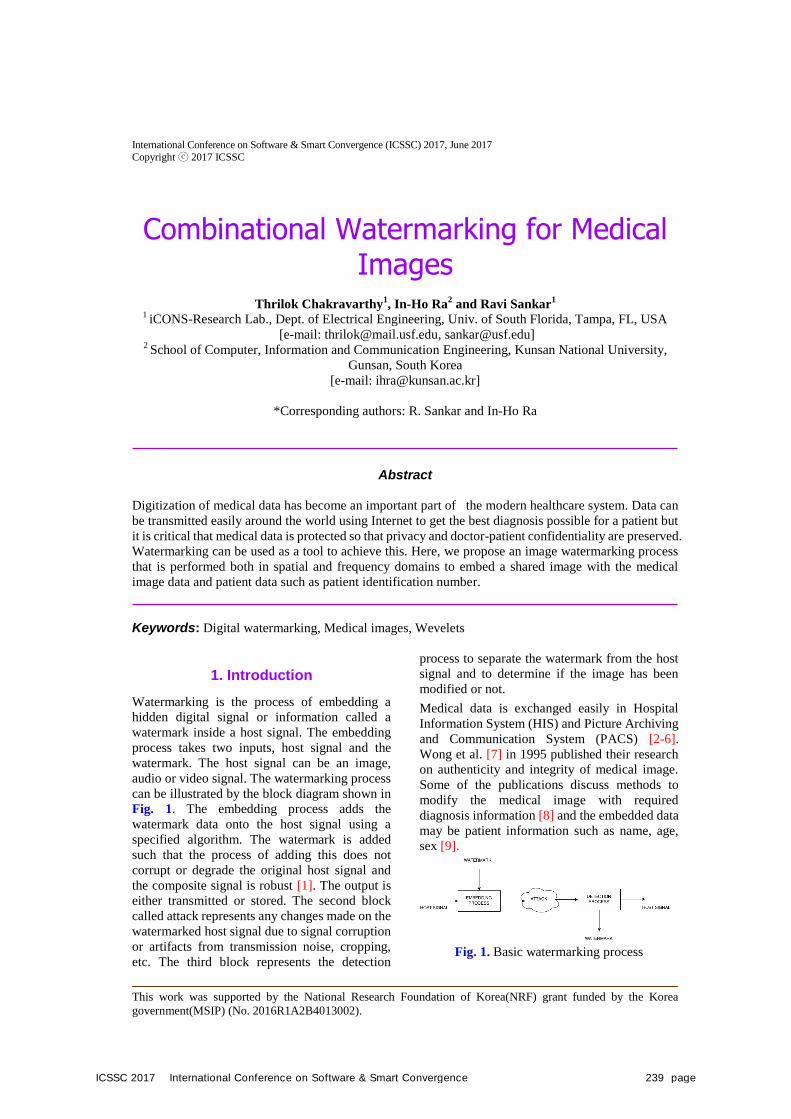
International Conference on Software & Smart Convergence (ICSSC) 2017, June 2017
Copyright ⓒ 2017 ICSSC
This work was supported by the National Research Foundation of Korea(NRF) grant funded by the Korea
government(MSIP) (No. 2016R1A2B4013002).
Combinational Watermarking for Medical Images
Thrilok Chakravarthy1, In-Ho Ra
2 and Ravi Sankar
1
1 iCONS-Research Lab., Dept. of Electrical Engineering, Univ. of South Florida, Tampa, FL, USA
[e-mail: [email protected], [email protected]] 2 School of Computer, Information and Communication Engineering, Kunsan National University,
Gunsan, South Korea
[e-mail: [email protected]]
*Corresponding authors: R. Sankar and In-Ho Ra
Abstract
Digitization of medical data has become an important part of the modern healthcare system. Data can
be transmitted easily around the world using Internet to get the best diagnosis possible for a patient but
it is critical that medical data is protected so that privacy and doctor-patient confidentiality are preserved.
Watermarking can be used as a tool to achieve this. Here, we propose an image watermarking process
that is performed both in spatial and frequency domains to embed a shared image with the medical
image data and patient data such as patient identification number.
Keywords: Digital watermarking, Medical images, Wevelets
1. Introduction
Watermarking is the process of embedding a
hidden digital signal or information called a
watermark inside a host signal. The embedding
process takes two inputs, host signal and the
watermark. The host signal can be an image,
audio or video signal. The watermarking process
can be illustrated by the block diagram shown in
Fig. 1. The embedding process adds the
watermark data onto the host signal using a
specified algorithm. The watermark is added
such that the process of adding this does not
corrupt or degrade the original host signal and
the composite signal is robust [1]. The output is
either transmitted or stored. The second block
called attack represents any changes made on the
watermarked host signal due to signal corruption
or artifacts from transmission noise, cropping,
etc. The third block represents the detection
process to separate the watermark from the host
signal and to determine if the image has been
modified or not.
Medical data is exchanged easily in Hospital
Information System (HIS) and Picture Archiving
and Communication System (PACS) [2-6].
Wong et al. [7] in 1995 published their research
on authenticity and integrity of medical image.
Some of the publications discuss methods to
modify the medical image with required
diagnosis information [8] and the embedded data
may be patient information such as name, age,
sex [9].
Fig. 1. Basic watermarking process
ICSSC 2017 International Conference on Software & Smart Convergence 239 page
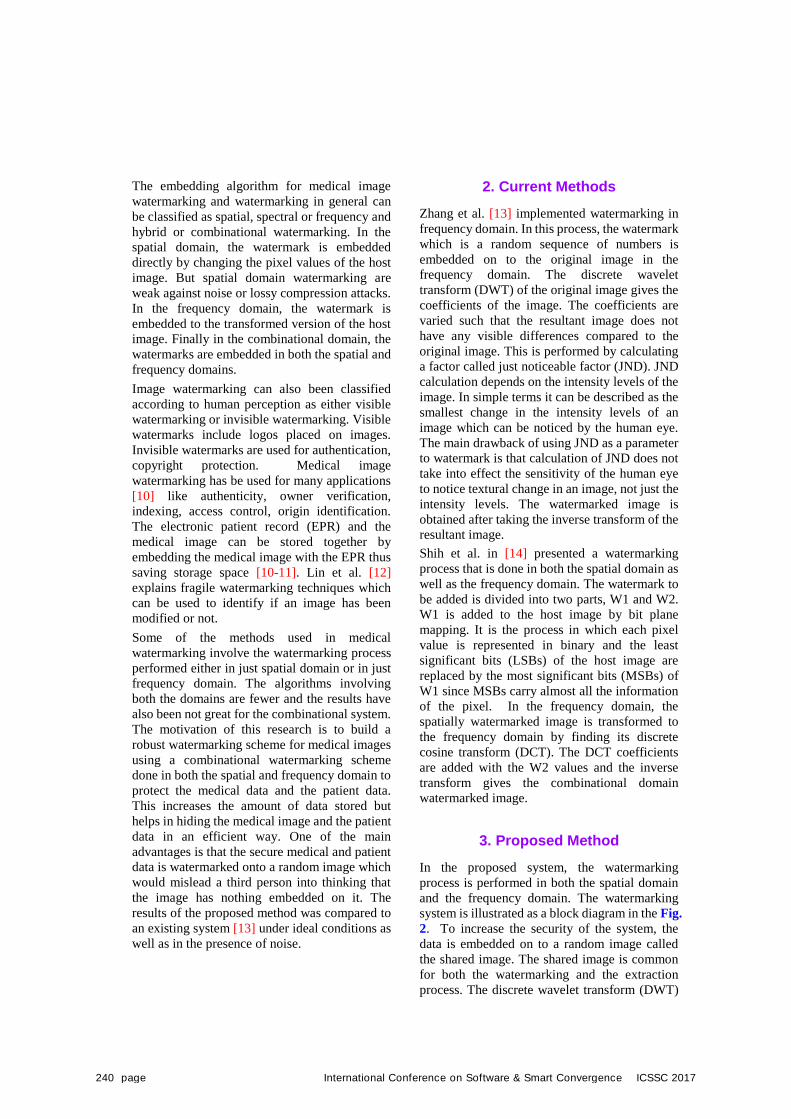
The embedding algorithm for medical image
watermarking and watermarking in general can
be classified as spatial, spectral or frequency and
hybrid or combinational watermarking. In the
spatial domain, the watermark is embedded
directly by changing the pixel values of the host
image. But spatial domain watermarking are
weak against noise or lossy compression attacks.
In the frequency domain, the watermark is
embedded to the transformed version of the host
image. Finally in the combinational domain, the
watermarks are embedded in both the spatial and
frequency domains.
Image watermarking can also been classified
according to human perception as either visible
watermarking or invisible watermarking. Visible
watermarks include logos placed on images.
Invisible watermarks are used for authentication,
copyright protection. Medical image
watermarking has be used for many applications
[10] like authenticity, owner verification,
indexing, access control, origin identification.
The electronic patient record (EPR) and the
medical image can be stored together by
embedding the medical image with the EPR thus
saving storage space [10-11]. Lin et al. [12]
explains fragile watermarking techniques which
can be used to identify if an image has been
modified or not.
Some of the methods used in medical
watermarking involve the watermarking process
performed either in just spatial domain or in just
frequency domain. The algorithms involving
both the domains are fewer and the results have
also been not great for the combinational system.
The motivation of this research is to build a
robust watermarking scheme for medical images
using a combinational watermarking scheme
done in both the spatial and frequency domain to
protect the medical data and the patient data.
This increases the amount of data stored but
helps in hiding the medical image and the patient
data in an efficient way. One of the main
advantages is that the secure medical and patient
data is watermarked onto a random image which
would mislead a third person into thinking that
the image has nothing embedded on it. The
results of the proposed method was compared to
an existing system [13] under ideal conditions as
well as in the presence of noise.
2. Current Methods
Zhang et al. [13] implemented watermarking in
frequency domain. In this process, the watermark
which is a random sequence of numbers is
embedded on to the original image in the
frequency domain. The discrete wavelet
transform (DWT) of the original image gives the
coefficients of the image. The coefficients are
varied such that the resultant image does not
have any visible differences compared to the
original image. This is performed by calculating
a factor called just noticeable factor (JND). JND
calculation depends on the intensity levels of the
image. In simple terms it can be described as the
smallest change in the intensity levels of an
image which can be noticed by the human eye.
The main drawback of using JND as a parameter
to watermark is that calculation of JND does not
take into effect the sensitivity of the human eye
to notice textural change in an image, not just the
intensity levels. The watermarked image is
obtained after taking the inverse transform of the
resultant image.
Shih et al. in [14] presented a watermarking
process that is done in both the spatial domain as
well as the frequency domain. The watermark to
be added is divided into two parts, W1 and W2.
W1 is added to the host image by bit plane
mapping. It is the process in which each pixel
value is represented in binary and the least
significant bits (LSBs) of the host image are
replaced by the most significant bits (MSBs) of
W1 since MSBs carry almost all the information
of the pixel. In the frequency domain, the
spatially watermarked image is transformed to
the frequency domain by finding its discrete
cosine transform (DCT). The DCT coefficients
are added with the W2 values and the inverse
transform gives the combinational domain
watermarked image.
3. Proposed Method
In the proposed system, the watermarking
process is performed in both the spatial domain
and the frequency domain. The watermarking
system is illustrated as a block diagram in the Fig.
2. To increase the security of the system, the
data is embedded on to a random image called
the shared image. The shared image is common
for both the watermarking and the extraction
process. The discrete wavelet transform (DWT)
240 page International Conference on Software & Smart Convergence ICSSC 2017
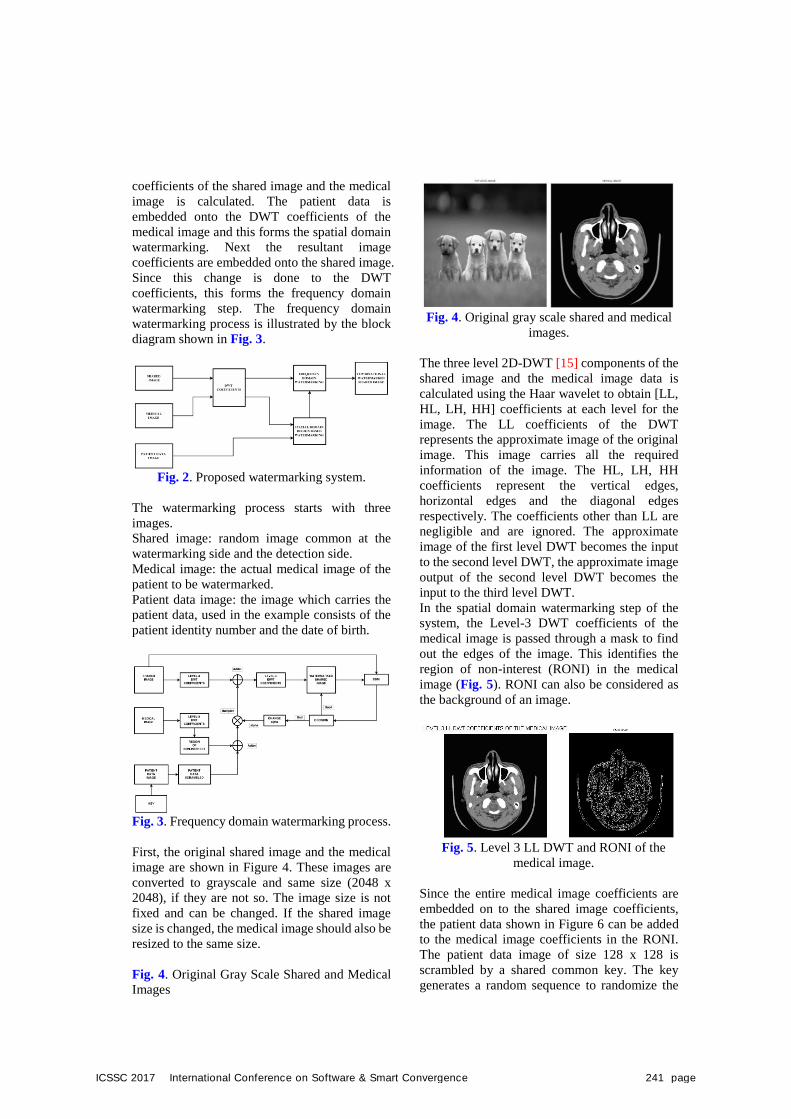
coefficients of the shared image and the medical
image is calculated. The patient data is
embedded onto the DWT coefficients of the
medical image and this forms the spatial domain
watermarking. Next the resultant image
coefficients are embedded onto the shared image.
Since this change is done to the DWT
coefficients, this forms the frequency domain
watermarking step. The frequency domain
watermarking process is illustrated by the block
diagram shown in Fig. 3.
Fig. 2. Proposed watermarking system.
The watermarking process starts with three
images.
Shared image: random image common at the
watermarking side and the detection side.
Medical image: the actual medical image of the
patient to be watermarked.
Patient data image: the image which carries the
patient data, used in the example consists of the
patient identity number and the date of birth.
Fig. 3. Frequency domain watermarking process.
First, the original shared image and the medical
image are shown in Figure 4. These images are
converted to grayscale and same size (2048 x
2048), if they are not so. The image size is not
fixed and can be changed. If the shared image
size is changed, the medical image should also be
resized to the same size.
Fig. 4. Original Gray Scale Shared and Medical
Images
Fig. 4. Original gray scale shared and medical
images.
The three level 2D-DWT [15] components of the
shared image and the medical image data is
calculated using the Haar wavelet to obtain [LL,
HL, LH, HH] coefficients at each level for the
image. The LL coefficients of the DWT
represents the approximate image of the original
image. This image carries all the required
information of the image. The HL, LH, HH
coefficients represent the vertical edges,
horizontal edges and the diagonal edges
respectively. The coefficients other than LL are
negligible and are ignored. The approximate
image of the first level DWT becomes the input
to the second level DWT, the approximate image
output of the second level DWT becomes the
input to the third level DWT.
In the spatial domain watermarking step of the
system, the Level-3 DWT coefficients of the
medical image is passed through a mask to find
out the edges of the image. This identifies the
region of non-interest (RONI) in the medical
image (Fig. 5). RONI can also be considered as
the background of an image.
Fig. 5. Level 3 LL DWT and RONI of the
medical image.
Since the entire medical image coefficients are
embedded on to the shared image coefficients,
the patient data shown in Figure 6 can be added
to the medical image coefficients in the RONI.
The patient data image of size 128 x 128 is
scrambled by a shared common key. The key
generates a random sequence to randomize the
ICSSC 2017 International Conference on Software & Smart Convergence 241 page
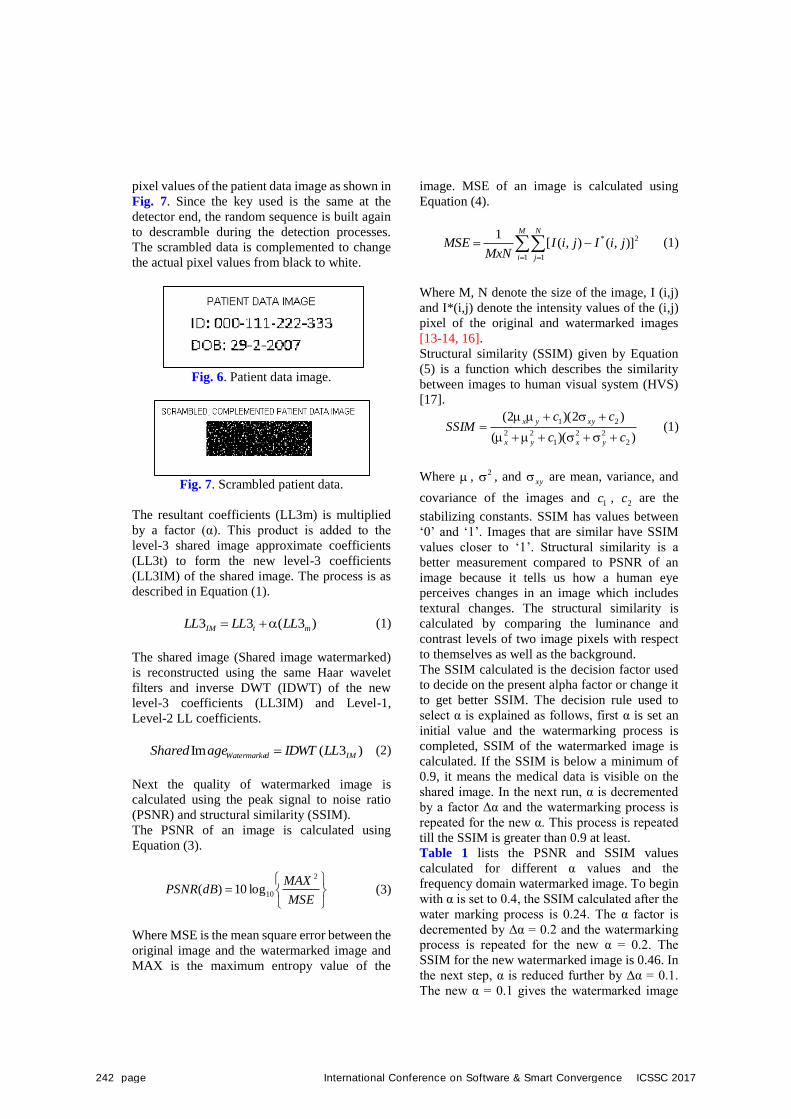
pixel values of the patient data image as shown in
Fig. 7. Since the key used is the same at the
detector end, the random sequence is built again
to descramble during the detection processes.
The scrambled data is complemented to change
the actual pixel values from black to white.
Fig. 6. Patient data image.
Fig. 7. Scrambled patient data.
The resultant coefficients (LL3m) is multiplied
by a factor (α). This product is added to the
level-3 shared image approximate coefficients
(LL3t) to form the new level-3 coefficients
(LL3IM) of the shared image. The process is as
described in Equation (1).
)3(33 mtIM LLLLLL (1)
The shared image (Shared image watermarked)
is reconstructed using the same Haar wavelet
filters and inverse DWT (IDWT) of the new
level-3 coefficients (LL3IM) and Level-1,
Level-2 LL coefficients.
)3(Im IMdWatermarke LLIDWTageShared (2)
Next the quality of watermarked image is
calculated using the peak signal to noise ratio
(PSNR) and structural similarity (SSIM).
The PSNR of an image is calculated using
Equation (3).
MSE
MAXdBPSNR
2
10log10)( (3)
Where MSE is the mean square error between the
original image and the watermarked image and
MAX is the maximum entropy value of the
image. MSE of an image is calculated using
Equation (4).
M
i
N
j
jiIjiIMxN
MSE1 1
2* )],(),([1
(1)
Where M, N denote the size of the image, I (i,j)
and I*(i,j) denote the intensity values of the (i,j)
pixel of the original and watermarked images
[13-14, 16].
Structural similarity (SSIM) given by Equation
(5) is a function which describes the similarity
between images to human visual system (HVS)
[17].
))((
)2)(2(
2
22
1
22
21
cc
ccSSIM
yxyx
xyyx
(1)
Where , 2 , and xy are mean, variance, and
covariance of the images and 1c ,
2c are the
stabilizing constants. SSIM has values between
‘0’ and ‘1’. Images that are similar have SSIM
values closer to ‘1’. Structural similarity is a
better measurement compared to PSNR of an
image because it tells us how a human eye
perceives changes in an image which includes
textural changes. The structural similarity is
calculated by comparing the luminance and
contrast levels of two image pixels with respect
to themselves as well as the background.
The SSIM calculated is the decision factor used
to decide on the present alpha factor or change it
to get better SSIM. The decision rule used to
select α is explained as follows, first α is set an
initial value and the watermarking process is
completed, SSIM of the watermarked image is
calculated. If the SSIM is below a minimum of
0.9, it means the medical data is visible on the
shared image. In the next run, α is decremented
by a factor Δα and the watermarking process is
repeated for the new α. This process is repeated
till the SSIM is greater than 0.9 at least.
Table 1 lists the PSNR and SSIM values
calculated for different α values and the
frequency domain watermarked image. To begin
with α is set to 0.4, the SSIM calculated after the
water marking process is 0.24. The α factor is
decremented by Δα = 0.2 and the watermarking
process is repeated for the new α = 0.2. The
SSIM for the new watermarked image is 0.46. In
the next step, α is reduced further by Δα = 0.1.
The new α = 0.1 gives the watermarked image
242 page International Conference on Software & Smart Convergence ICSSC 2017
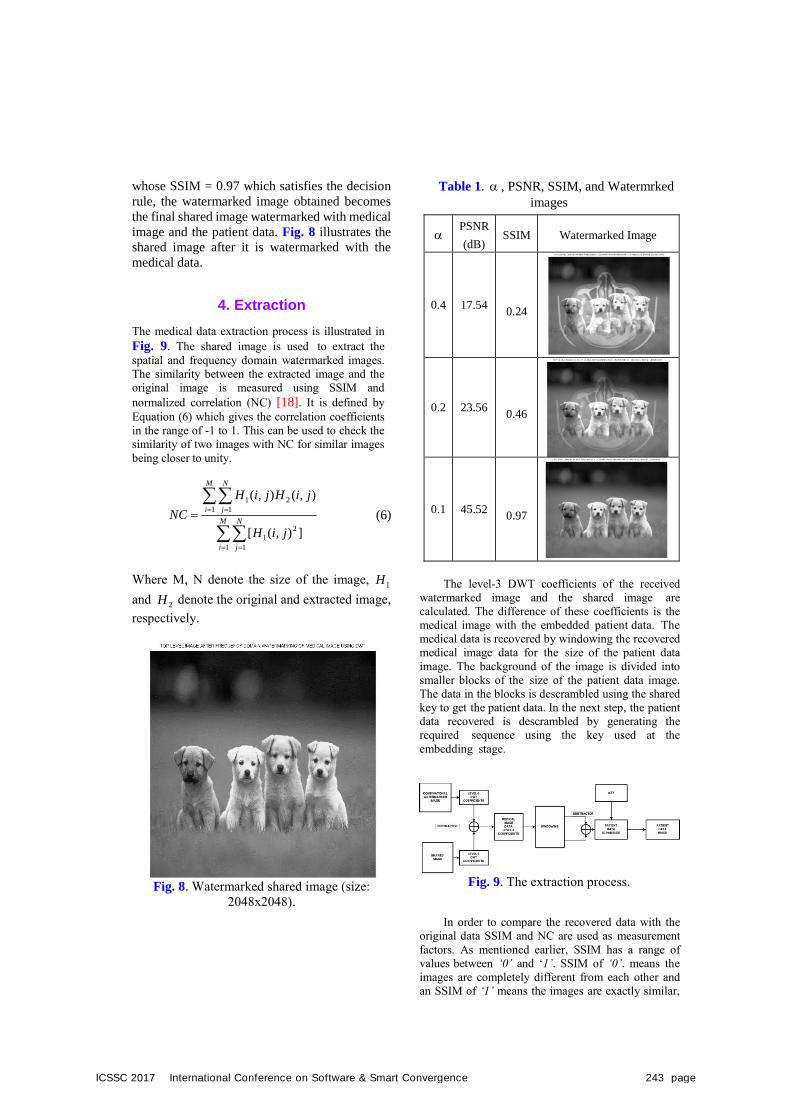
whose SSIM = 0.97 which satisfies the decision
rule, the watermarked image obtained becomes
the final shared image watermarked with medical
image and the patient data. Fig. 8 illustrates the
shared image after it is watermarked with the
medical data.
4. Extraction
The medical data extraction process is illustrated in
Fig. 9. The shared image is used to extract the
spatial and frequency domain watermarked images.
The similarity between the extracted image and the
original image is measured using SSIM and
normalized correlation (NC) [18]. It is defined by
Equation (6) which gives the correlation coefficients
in the range of -1 to 1. This can be used to check the
similarity of two images with NC for similar images
being closer to unity.
M
i
N
j
M
i
N
j
jiH
jiHjiH
NC
1 1
2
1
1 1
21
]),([
),(),(
(6)
Where M, N denote the size of the image, 1H
and 2H denote the original and extracted image,
respectively.
Fig. 8. Watermarked shared image (size:
2048x2048).
Table 1. , PSNR, SSIM, and Watermrked
images
The level-3 DWT coefficients of the received
watermarked image and the shared image are
calculated. The difference of these coefficients is the
medical image with the embedded patient data. The
medical data is recovered by windowing the recovered
medical image data for the size of the patient data
image. The background of the image is divided into
smaller blocks of the size of the patient data image.
The data in the blocks is descrambled using the shared
key to get the patient data. In the next step, the patient
data recovered is descrambled by generating the
required sequence using the key used at the
embedding stage.
Fig. 9. The extraction process.
In order to compare the recovered data with the
original data SSIM and NC are used as measurement
factors. As mentioned earlier, SSIM has a range of
values between ‘0’ and ‗1’. SSIM of ‘0’. means the
images are completely different from each other and
an SSIM of ‘1’ means the images are exactly similar,
PSNR
(dB) SSIM Watermarked Image
0.4 17.54 0.24
0.2 23.56 0.46
0.1 45.52 0.97
ICSSC 2017 International Conference on Software & Smart Convergence 243 page
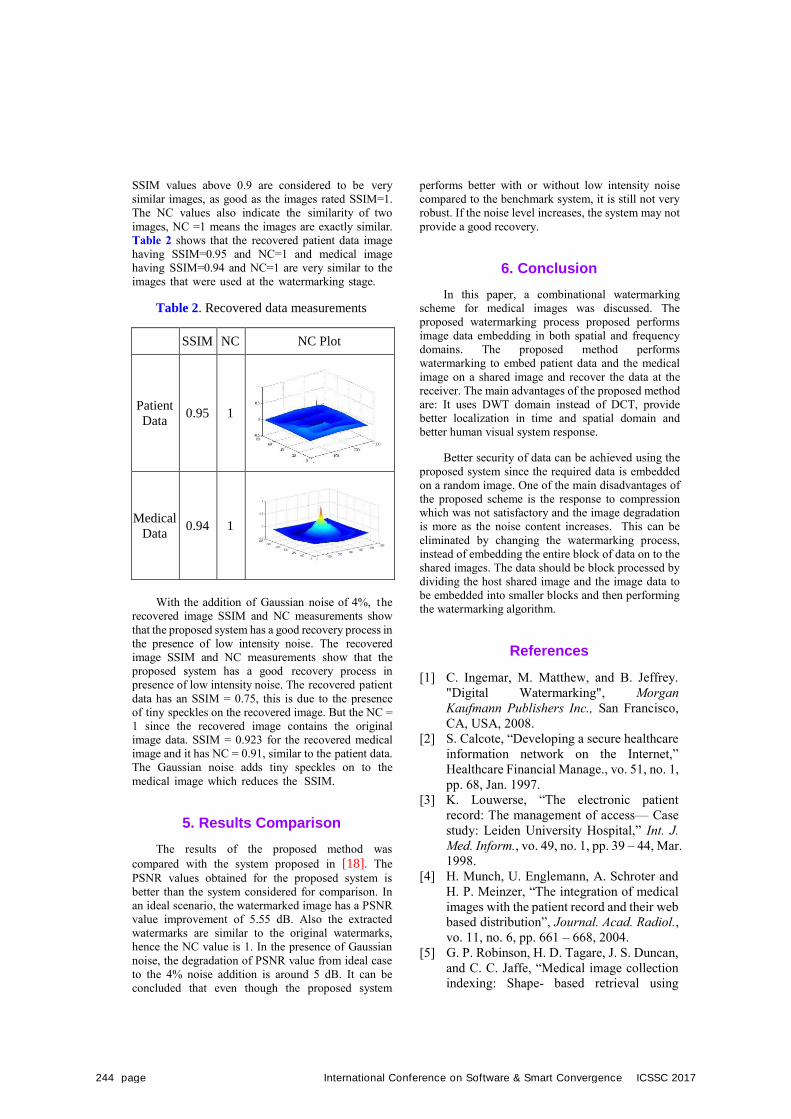
SSIM values above 0.9 are considered to be very
similar images, as good as the images rated SSIM=1.
The NC values also indicate the similarity of two
images, NC =1 means the images are exactly similar.
Table 2 shows that the recovered patient data image
having SSIM=0.95 and NC=1 and medical image
having SSIM=0.94 and NC=1 are very similar to the
images that were used at the watermarking stage.
Table 2. Recovered data measurements
SSIM NC NC Plot
Patient
Data 0.95 1
Medical
Data 0.94 1
With the addition of Gaussian noise of 4%, the
recovered image SSIM and NC measurements show
that the proposed system has a good recovery process in
the presence of low intensity noise. The recovered
image SSIM and NC measurements show that the
proposed system has a good recovery process in
presence of low intensity noise. The recovered patient
data has an SSIM = 0.75, this is due to the presence
of tiny speckles on the recovered image. But the NC =
1 since the recovered image contains the original
image data. SSIM = 0.923 for the recovered medical
image and it has NC = 0.91, similar to the patient data.
The Gaussian noise adds tiny speckles on to the
medical image which reduces the SSIM.
5. Results Comparison
The results of the proposed method was
compared with the system proposed in [18]. The
PSNR values obtained for the proposed system is
better than the system considered for comparison. In
an ideal scenario, the watermarked image has a PSNR
value improvement of 5.55 dB. Also the extracted
watermarks are similar to the original watermarks,
hence the NC value is 1. In the presence of Gaussian
noise, the degradation of PSNR value from ideal case
to the 4% noise addition is around 5 dB. It can be
concluded that even though the proposed system
performs better with or without low intensity noise
compared to the benchmark system, it is still not very
robust. If the noise level increases, the system may not
provide a good recovery.
6. Conclusion
In this paper, a combinational watermarking
scheme for medical images was discussed. The
proposed watermarking process proposed performs
image data embedding in both spatial and frequency
domains. The proposed method performs
watermarking to embed patient data and the medical
image on a shared image and recover the data at the
receiver. The main advantages of the proposed method
are: It uses DWT domain instead of DCT, provide
better localization in time and spatial domain and
better human visual system response.
Better security of data can be achieved using the
proposed system since the required data is embedded
on a random image. One of the main disadvantages of
the proposed scheme is the response to compression
which was not satisfactory and the image degradation
is more as the noise content increases. This can be
eliminated by changing the watermarking process,
instead of embedding the entire block of data on to the
shared images. The data should be block processed by
dividing the host shared image and the image data to
be embedded into smaller blocks and then performing
the watermarking algorithm.
References
[1] C. Ingemar, M. Matthew, and B. Jeffrey.
"Digital Watermarking", Morgan
Kaufmann Publishers Inc., San Francisco,
CA, USA, 2008.
[2] S. Calcote, ―Developing a secure healthcare
information network on the Internet,‖
Healthcare Financial Manage., vo. 51, no. 1,
pp. 68, Jan. 1997.
[3] K. Louwerse, ―The electronic patient
record: The management of access— Case
study: Leiden University Hospital,‖ Int. J.
Med. Inform., vo. 49, no. 1, pp. 39 – 44, Mar.
1998.
[4] H. Munch, U. Englemann, A. Schroter and
H. P. Meinzer, ―The integration of medical
images with the patient record and their web
based distribution‖, Journal. Acad. Radiol.,
vo. 11, no. 6, pp. 661 – 668, 2004.
[5] G. P. Robinson, H. D. Tagare, J. S. Duncan,
and C. C. Jaffe, ―Medical image collection
indexing: Shape- based retrieval using
244 page International Conference on Software & Smart Convergence ICSSC 2017
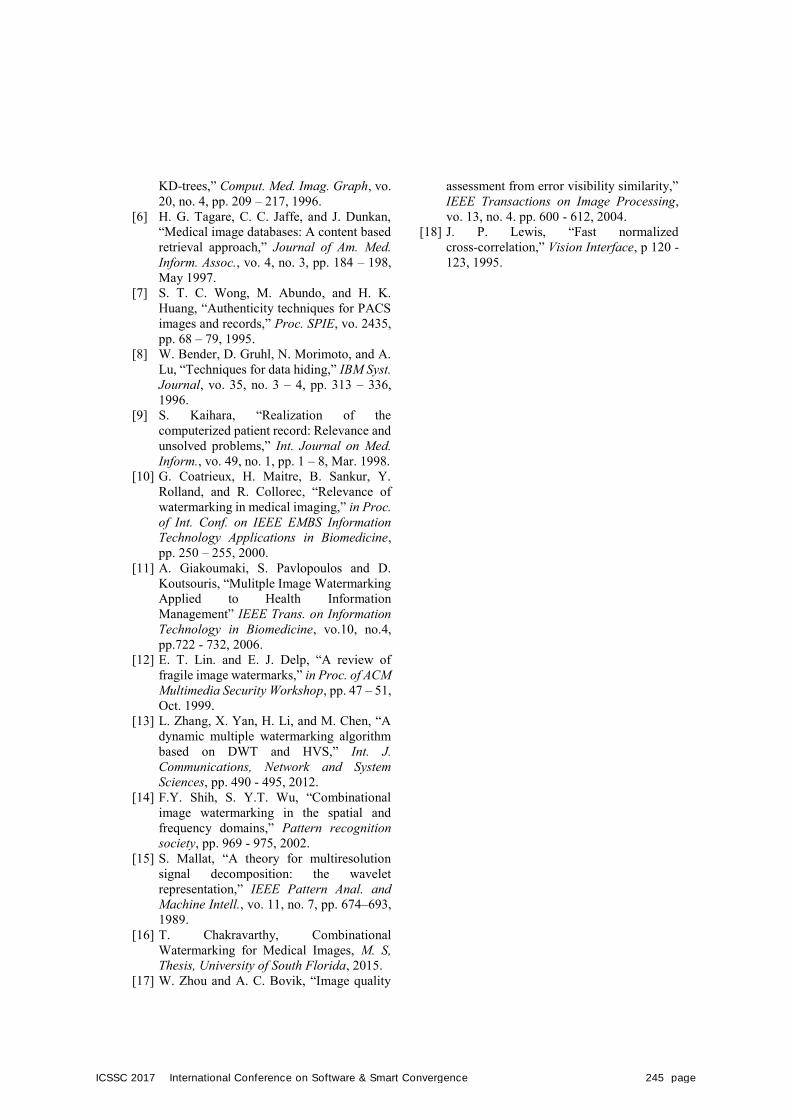
KD-trees,‖ Comput. Med. Imag. Graph, vo.
20, no. 4, pp. 209 – 217, 1996.
[6] H. G. Tagare, C. C. Jaffe, and J. Dunkan,
―Medical image databases: A content based
retrieval approach,‖ Journal of Am. Med.
Inform. Assoc., vo. 4, no. 3, pp. 184 – 198,
May 1997.
[7] S. T. C. Wong, M. Abundo, and H. K.
Huang, ―Authenticity techniques for PACS
images and records,‖ Proc. SPIE, vo. 2435,
pp. 68 – 79, 1995.
[8] W. Bender, D. Gruhl, N. Morimoto, and A.
Lu, ―Techniques for data hiding,‖ IBM Syst.
Journal, vo. 35, no. 3 – 4, pp. 313 – 336,
1996.
[9] S. Kaihara, ―Realization of the
computerized patient record: Relevance and
unsolved problems,‖ Int. Journal on Med.
Inform., vo. 49, no. 1, pp. 1 – 8, Mar. 1998.
[10] G. Coatrieux, H. Maitre, B. Sankur, Y.
Rolland, and R. Collorec, ―Relevance of
watermarking in medical imaging,‖ in Proc.
of Int. Conf. on IEEE EMBS Information
Technology Applications in Biomedicine,
pp. 250 – 255, 2000.
[11] A. Giakoumaki, S. Pavlopoulos and D.
Koutsouris, ―Mulitple Image Watermarking
Applied to Health Information
Management‖ IEEE Trans. on Information
Technology in Biomedicine, vo.10, no.4,
pp.722 - 732, 2006.
[12] E. T. Lin. and E. J. Delp, ―A review of
fragile image watermarks,‖ in Proc. of ACM
Multimedia Security Workshop, pp. 47 – 51,
Oct. 1999.
[13] L. Zhang, X. Yan, H. Li, and M. Chen, ―A
dynamic multiple watermarking algorithm
based on DWT and HVS,‖ Int. J.
Communications, Network and System
Sciences, pp. 490 - 495, 2012.
[14] F.Y. Shih, S. Y.T. Wu, ―Combinational
image watermarking in the spatial and
frequency domains,‖ Pattern recognition
society, pp. 969 - 975, 2002.
[15] S. Mallat, ―A theory for multiresolution
signal decomposition: the wavelet
representation,‖ IEEE Pattern Anal. and
Machine Intell., vo. 11, no. 7, pp. 674–693,
1989.
[16] T. Chakravarthy, Combinational
Watermarking for Medical Images, M. S,
Thesis, University of South Florida, 2015.
[17] W. Zhou and A. C. Bovik, ―Image quality
assessment from error visibility similarity,‖
IEEE Transactions on Image Processing,
vo. 13, no. 4. pp. 600 - 612, 2004.
[18] J. P. Lewis, ―Fast normalized
cross-correlation,‖ Vision Interface, p 120 -
123, 1995.
ICSSC 2017 International Conference on Software & Smart Convergence 245 page
International Conference on Software & Smart Convergence (ICSSC) 2017, June 2017 Copyright ⓒ 2017 ICSSC
This work was supported by the National Research Foundation of Korea(NRF) grant funded by the Korea government(MSIP) (No. 2016R1A2B4013002).
Bio Acoustic Signal Feature Extraction and Pattern Recognition Framework
P. Chetlur Adithya1, S. R. Pandey1, R. Sankar1, W. A. Moreno1, S. Hart2 and In-Ho Ra3 1 Dept. of Electrical Engineering, University of South Florida, Tampa – FL.
[E-mail: [email protected], [email protected]] 2 Morsani College of Medicine, University of South Florida, Tampa – FL.
3 School of Computer, Information and Communication Engineering, Kunsan National University, Gunsan, South Korea
[e-mail: [email protected]] *Corresponding authors: R. Sankar and In-Ho Ra
Abstract
This study presents a feature extraction and pattern recognition framework for biomedical acoustic signals of the novel acoustic catheter stethoscope. Initially, blood flow sounds collected using the novel acoustic catheter stethoscope are preprocessed to identify acoustic heart pulses. Then, the extracted acoustic heart pulses are post processed using a novel time-frequency feature extraction and cluster analysis based pattern recognition framework developed in this study. Finally, the developed framework is qualitatively and quantitatively validated by providing visual results of the clustering and by computing the clustering accuracy, sensitivity and specificity. The validation results show that the developed framework recognizes the patterns of the sinus rhythms with an accuracy rate of 90%.
Keywords: Blood flow sounds, arrhythmia, sinus rhythm, pattern recognition, K-means clustering, unsupervised learning, confusion matrix.
1. Introduction
Center for disease control estimates that more than 600,000 people die of heart diseases every year in the United States [1]. In addition to this overwhelming number of heart disease cases, critical care units in the United States have reported a very high false arrhythmia alarm rate [2]. Blood pressure, heart and respiratory rates are among other vital bio signals that are acquired and monitored in the critical care units. Traditional assessment methodologies use either an electrocardiogram or a phonocardiogram based feature extraction and pattern recognition framework for arrhythmia detection. Despite the advancements in the data acquisition systems, signal processing and artificial intelligence
techniques, the false arrhythmia rates are found to be at 90% [2]. Based on this observation, the authors have found the motivation to develop a feature extraction and pattern recognition framework for biomedical acoustic signals of the novel acoustic catheter stethoscope.
Extensive research has been dedicated towards analysis of acoustic signals like heart sounds, respiratory sounds and speech signal. Automated analysis of any acoustic signal is dependent on noise cancellation, segmentation, feature extraction, cluster analysis and/or classification. Noise cancellation and segmentation techniques are selected based on the objective of the clustering and/or classification. Studies in the literature have used standard features like mean, variance, zero crossing rate [3], time-frequency distribution [4],
246 page International Conference on Software & Smart Convergence ICSSC 2017

Fourier transform, Mel frequency cepstral coefficients and linear predictive coding for representation of an acoustic signal [5]. Clustering and/or classification techniques such as hierarchical [4], K-means clustering [6], K-nearest-neighbor, Gaussian–Bayes [7] and neural networks [8] have been used by studies in conjunction with feature extraction to accomplish bio acoustic signal pattern recognition.
The objective of the current study is to recognize the sinus rhythm patterns from the bio acoustic signals obtained via the novel acoustic catheter stethoscope using an extended version of the previously validated signal processing framework [9]. Initially, the blood flow sounds collected using the acoustic catheter stethoscope are preprocessed to identify acoustic heart pulses. Then, the extended framework introduced in this study processes the extracted acoustic heart pulses using a novel feature extraction and pattern recognition based machine learning framework. Finally, the developed framework is qualitatively and quantitatively validated by providing visual results of the clustering and by computing the clustering accuracy, sensitivity and specificity. The developed feature extraction and pattern recognition framework is the key contribution of this study.
Section 2 introduces the framework that was used for the acoustic heart pulse feature extraction and pattern recognition. Section 3 presents the results obtained from the developed framework in detail. Section 4 highlights the existing challenges of the developed framework and also proposes potential directions for future work. Section 5 provides a summary of all aspects involved in this study.
2. Feature Extraction and PatternRecognition Framework
The previous study, brings out a comprehensive explanation of the data acquisition system and the implemented preprocessing that includes noise cancellation and wavelet source separation [9]. In this study, the extracted acoustic heart pulses are subjected to feature extraction and pattern recognition framework for sinus rhythm pattern detection. The acoustic heart pulses used in this study were extracted from the carotid artery of an animal model corresponding to
normal and abnormal sinus rhythms. The developed framework initially segments the data, extracts the features and recognizes the pattern from the extracted features. The implemented feature extraction and pattern recognition framework was able to independently cluster normal and abnormal sinus rhythm patterns of the acoustic heart pulses. Fig. 1 shows the developed signal analysis and processing framework for the acoustic heart pulses.
Fig. 1. Acoustic Heart Pulse Feature Extraction and Pattern Recognition Framework.
2.1. Multiscale Energy
A continuous time wavelet transform (CTWT) based feature called multiscale energy was developed and computed for each segment of the acoustic heart pulse. Normalized CTWT of a continuous signal h(t) is given by (1).
Wh;𝜓(τ, s) = 1√s∫ h(t) ∗ 𝜓∗ �t−τ
s� dt∞
−∞ (1)
Here W is the computed continuous wavelet transform, h(t) is a segment of the acoustic heart pulse, s is the scale coefficient associated to stretching or compression of the signal in time, τ is the translation parameter, 𝜓 is the chosen mother wavelet [10]. The multiscale energy (MSE) is computed using (2).
𝑀𝑀𝑀(𝑠) = ∑ � Wh;𝜓(τ, s)�2𝜏 (2)
The MSE feature is computed at each scale of the CTWT of h(t) using Coiflet wavelet with four vanishing moments as chosen mother wavelet.
2.2 K-Means Clustering
In this study, K-means, a hard clustering algorithm, is applied to MSE features of the acoustic heart pulse segments for sinus rhythm pattern recognition. Following procedure is adapted from [11] to cluster the MSE features:
1. Input to the algorithm is the computed MSEfeature vector set (v) of the extracted acousticheart pulses with dimensions np x fp. Here, np is
ICSSC 2017 International Conference on Software & Smart Convergence 247 page
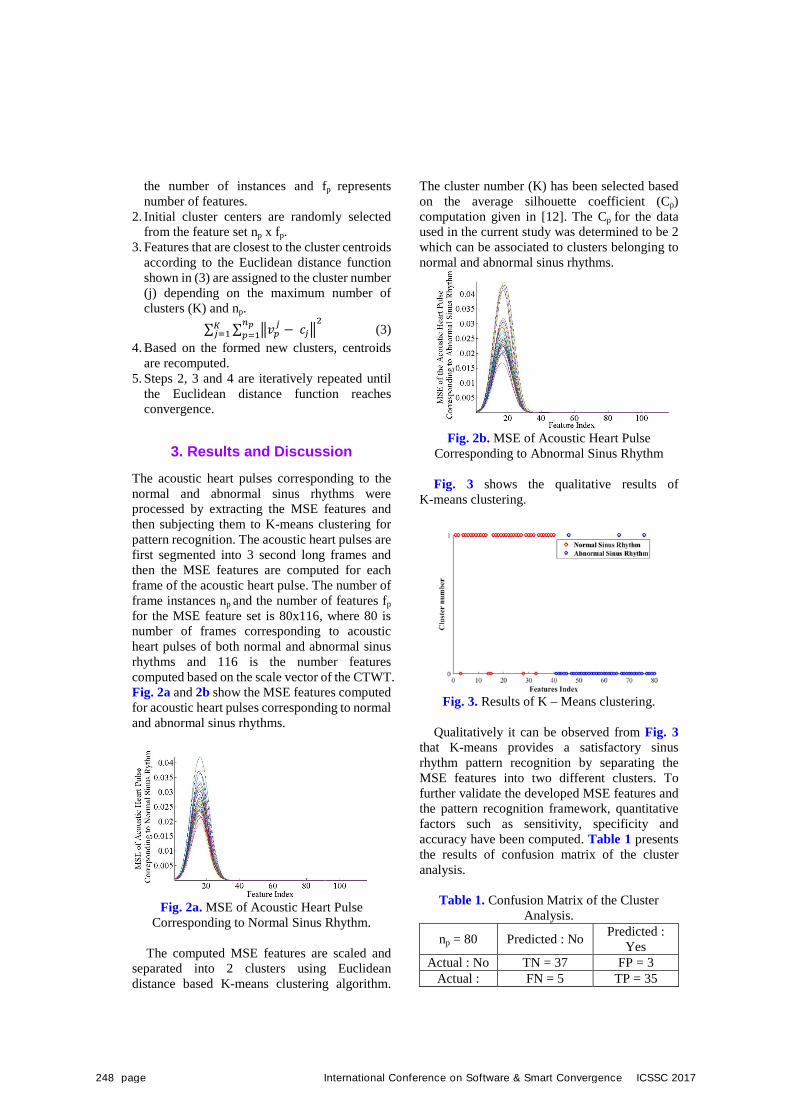
the number of instances and fp represents number of features.
2. Initial cluster centers are randomly selectedfrom the feature set np x fp.
3. Features that are closest to the cluster centroidsaccording to the Euclidean distance functionshown in (3) are assigned to the cluster number(j) depending on the maximum number ofclusters (K) and np.
∑ ∑ �𝑣𝑝𝑗 − 𝑐𝑗�
2𝑛𝑝𝑝=1
𝐾𝑗=1 (3)
4. Based on the formed new clusters, centroidsare recomputed.
5. Steps 2, 3 and 4 are iteratively repeated untilthe Euclidean distance function reachesconvergence.
3. Results and Discussion
The acoustic heart pulses corresponding to the normal and abnormal sinus rhythms were processed by extracting the MSE features and then subjecting them to K-means clustering for pattern recognition. The acoustic heart pulses are first segmented into 3 second long frames and then the MSE features are computed for each frame of the acoustic heart pulse. The number of frame instances np and the number of features fpfor the MSE feature set is 80x116, where 80 is number of frames corresponding to acoustic heart pulses of both normal and abnormal sinus rhythms and 116 is the number features computed based on the scale vector of the CTWT. Fig. 2a and 2b show the MSE features computed for acoustic heart pulses corresponding to normal and abnormal sinus rhythms.
Fig. 2a. MSE of Acoustic Heart Pulse Corresponding to Normal Sinus Rhythm.
The computed MSE features are scaled and separated into 2 clusters using Euclidean distance based K-means clustering algorithm.
The cluster number (K) has been selected based on the average silhouette coefficient (Cp) computation given in [12]. The Cp for the data used in the current study was determined to be 2 which can be associated to clusters belonging to normal and abnormal sinus rhythms.
Fig. 2b. MSE of Acoustic Heart Pulse Corresponding to Abnormal Sinus Rhythm
Fig. 3 shows the qualitative results of K-means clustering.
Fig. 3. Results of K – Means clustering.
Qualitatively it can be observed from Fig. 3 that K-means provides a satisfactory sinus rhythm pattern recognition by separating the MSE features into two different clusters. To further validate the developed MSE features and the pattern recognition framework, quantitative factors such as sensitivity, specificity and accuracy have been computed. Table 1 presents the results of confusion matrix of the cluster analysis.
Table 1. Confusion Matrix of the Cluster Analysis.
np = 80 Predicted : No Predicted : Yes
Actual : No TN = 37 FP = 3 Actual : FN = 5 TP = 35
248 page International Conference on Software & Smart Convergence ICSSC 2017
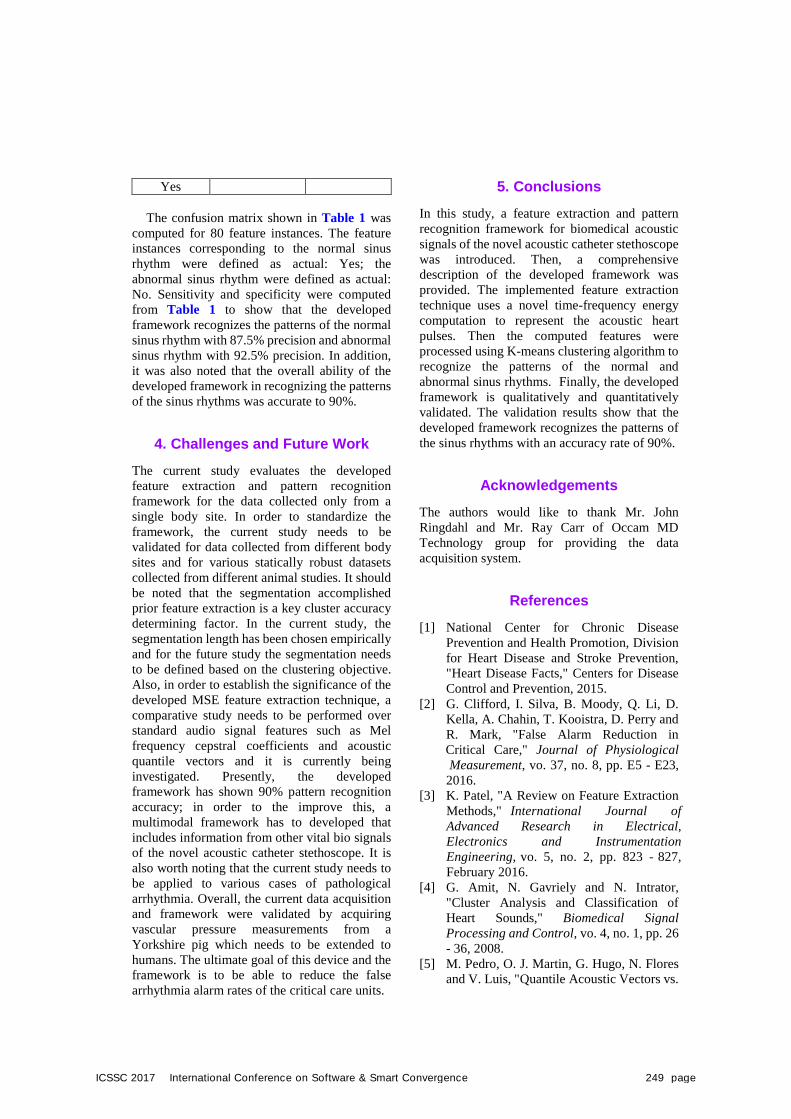
Yes
The confusion matrix shown in Table 1 was computed for 80 feature instances. The feature instances corresponding to the normal sinus rhythm were defined as actual: Yes; the abnormal sinus rhythm were defined as actual: No. Sensitivity and specificity were computed from Table 1 to show that the developed framework recognizes the patterns of the normal sinus rhythm with 87.5% precision and abnormal sinus rhythm with 92.5% precision. In addition, it was also noted that the overall ability of the developed framework in recognizing the patterns of the sinus rhythms was accurate to 90%.
4. Challenges and Future Work
The current study evaluates the developed feature extraction and pattern recognition framework for the data collected only from a single body site. In order to standardize the framework, the current study needs to be validated for data collected from different body sites and for various statically robust datasets collected from different animal studies. It should be noted that the segmentation accomplished prior feature extraction is a key cluster accuracy determining factor. In the current study, the segmentation length has been chosen empirically and for the future study the segmentation needs to be defined based on the clustering objective. Also, in order to establish the significance of the developed MSE feature extraction technique, a comparative study needs to be performed over standard audio signal features such as Mel frequency cepstral coefficients and acoustic quantile vectors and it is currently being investigated. Presently, the developed framework has shown 90% pattern recognition accuracy; in order to the improve this, a multimodal framework has to developed that includes information from other vital bio signals of the novel acoustic catheter stethoscope. It is also worth noting that the current study needs to be applied to various cases of pathological arrhythmia. Overall, the current data acquisition and framework were validated by acquiring vascular pressure measurements from a Yorkshire pig which needs to be extended to humans. The ultimate goal of this device and the framework is to be able to reduce the false arrhythmia alarm rates of the critical care units.
5. Conclusions
In this study, a feature extraction and pattern recognition framework for biomedical acoustic signals of the novel acoustic catheter stethoscope was introduced. Then, a comprehensive description of the developed framework was provided. The implemented feature extraction technique uses a novel time-frequency energy computation to represent the acoustic heart pulses. Then the computed features were processed using K-means clustering algorithm to recognize the patterns of the normal and abnormal sinus rhythms. Finally, the developed framework is qualitatively and quantitatively validated. The validation results show that the developed framework recognizes the patterns of the sinus rhythms with an accuracy rate of 90%.
Acknowledgements
The authors would like to thank Mr. John Ringdahl and Mr. Ray Carr of Occam MD Technology group for providing the data acquisition system.
References
[1] National Center for Chronic Disease Prevention and Health Promotion, Division for Heart Disease and Stroke Prevention, "Heart Disease Facts," Centers for Disease Control and Prevention, 2015.
[2] G. Clifford, I. Silva, B. Moody, Q. Li, D. Kella, A. Chahin, T. Kooistra, D. Perry and R. Mark, "False Alarm Reduction in Critical Care," Journal of Physiological Measurement, vo. 37, no. 8, pp. E5 - E23,
2016. [3] K. Patel, "A Review on Feature Extraction
Methods," International Journal of Advanced Research in Electrical, Electronics and Instrumentation Engineering, vo. 5, no. 2, pp. 823 - 827, February 2016.
[4] G. Amit, N. Gavriely and N. Intrator, "Cluster Analysis and Classification of Heart Sounds," Biomedical Signal Processing and Control, vo. 4, no. 1, pp. 26 - 36, 2008.
[5] M. Pedro, O. J. Martin, G. Hugo, N. Flores and V. Luis, "Quantile Acoustic Vectors vs.
ICSSC 2017 International Conference on Software & Smart Convergence 249 page
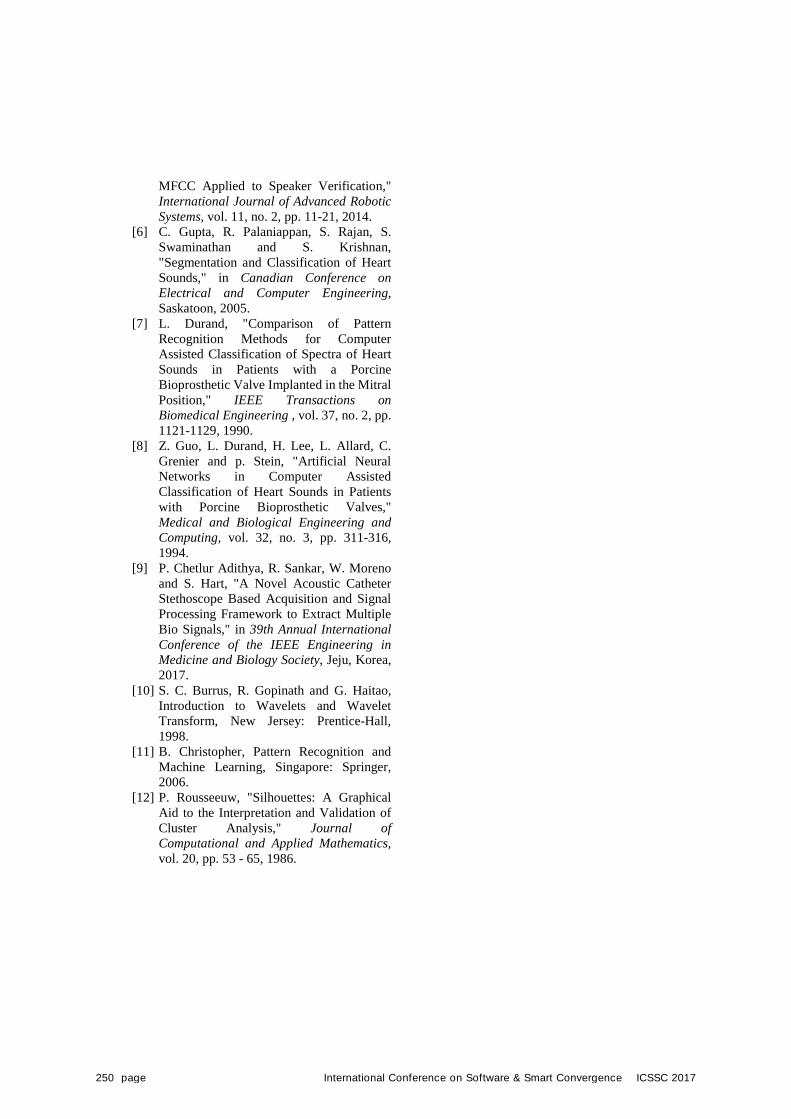
MFCC Applied to Speaker Verification," International Journal of Advanced Robotic Systems, vol. 11, no. 2, pp. 11-21, 2014.
[6] C. Gupta, R. Palaniappan, S. Rajan, S. Swaminathan and S. Krishnan, "Segmentation and Classification of Heart Sounds," in Canadian Conference on Electrical and Computer Engineering, Saskatoon, 2005.
[7] L. Durand, "Comparison of Pattern Recognition Methods for Computer Assisted Classification of Spectra of Heart Sounds in Patients with a Porcine Bioprosthetic Valve Implanted in the Mitral Position," IEEE Transactions on Biomedical Engineering , vol. 37, no. 2, pp. 1121-1129, 1990.
[8] Z. Guo, L. Durand, H. Lee, L. Allard, C. Grenier and p. Stein, "Artificial Neural Networks in Computer Assisted Classification of Heart Sounds in Patients with Porcine Bioprosthetic Valves," Medical and Biological Engineering and Computing, vol. 32, no. 3, pp. 311-316, 1994.
[9] P. Chetlur Adithya, R. Sankar, W. Moreno and S. Hart, "A Novel Acoustic Catheter Stethoscope Based Acquisition and Signal Processing Framework to Extract Multiple Bio Signals," in 39th Annual International Conference of the IEEE Engineering in Medicine and Biology Society, Jeju, Korea, 2017.
[10] S. C. Burrus, R. Gopinath and G. Haitao, Introduction to Wavelets and Wavelet Transform, New Jersey: Prentice-Hall, 1998.
[11] B. Christopher, Pattern Recognition and Machine Learning, Singapore: Springer, 2006.
[12] P. Rousseeuw, "Silhouettes: A Graphical Aid to the Interpretation and Validation of Cluster Analysis," Journal of Computational and Applied Mathematics, vol. 20, pp. 53 - 65, 1986.
250 page International Conference on Software & Smart Convergence ICSSC 2017
International Conference on Software & Smart Convergence (ICSSC) 2017, June 2017
Copyright ⓒ 2017 ICSSC
This work was partly supported by Institute for Information & communications Technology Promotion(IITP) grant
funded by the Korea government(MSIP) (No.2017-0-00383,스마트 회의실: 빅 스크린을 활용한 지능형 회의
솔루션 개발) .And This research was supported by Ministry of Regional Innovation, creative business training
Research Foundation of Korea, 2014 (NRF-2014H1C1A1066771). Also,This research was supported by Basic
Science Research Program through the National Research Foundation of Korea(NRF) funded by the Ministry of
Science, ICT & Future Planning(NRF-2015R1C1A1A02036495).
Human Face Tracking with Cascaded CNN Face Detector and Enhanced Active
Appearance Model Hong Tai Tran1, Min Ku Kwon1, Guee Sang Lee1, Hyung Jeong Yang1, Young Chul Kim1,
In Seop Na 2, Soo Hyung Kim1
1 School of Elec. and Comp. Eng., Chonnam National University
Gwangju, South Korea [e-mail: [email protected], [email protected], [email protected], [email protected],
[email protected], [email protected]] 2 Agric. Robotics and Automation Research Center, Chonnam National University
Gwangju, South Korea
[e-mail: [email protected]]
*Corresponding author: Soo Hyung Kim
Abstract
Human faces in images and videos are great sources of information. Thus, extracting human face
correctly is a very popular and important topic in computer vision. However, in real life, human face
can be seen with various shapes and textures even in the video of the same person. These variations can
be caused by the differences between people, the changing of expression, pose or illumination change
within the same person. To adapt with these variations, a model based approach is a promising candidate
where the unknown data can be represented by the built models. However, the model-based tracking
also have their flaw with fast motion between frames. Because of that, in this paper, we propose a
combination method for human face tracking. Our approach included two main technique, the Cascaded
Convolutional Neural Networks (Cascaded CNN) for human face detection and the Active Appearance
Model (AAM) for human face tracking and Modeling. The system has its advantage when running on
most normal life activity. However, in some extreme cases of fast-movement or low-contrast, there still
remains a problem to solve.
Keywords: Computer vision, Image processing, Human face tracking, Active Appearance Model
1. Introduction
With the recent development of science, and
technology, extracting information from human
face is an important necessity for many
applications such as face security system, facial
expression recognition, automatic improving a
taken human photo from camera, or automatic
robot interaction with human, etc. Therefore, a
ICSSC 2017 International Conference on Software & Smart Convergence 251 page

system to accuraly extract the human face
information automatically from video is a very
urgent requirement for many applications.
Following that necessity, there are many
approaches proposed with various techniques
and their combinations for human face tracking.
Among those approaches, we decide to use the
Active Appearance Model (AAM) for the face
tracking task because the AAM is not only
suitable for adapting to the change of a human
face – due to expression or illumination – but the
landmarks from AAM can also be used as
features for further development or other
processings.
Human face detection and tracking, most of
times, is a simple task for a normal human.
However, to develop a machine able to do this
task is a challenging problem. Scientists has
spent many years researching and still not
completed such a machine. There are many
problems that needed to overcome in this field
such as the change of face location, shape,
texture, interaction with other faces, processing
time, etc. Because of that, in this paper, we want
to propose a tracking system that overcome some
of these difficulties and make a closer step to
complete this challenging problem. Our
approach is a combination of AMM tracker and
Cascaded CNN detector which try to utilize the
adaptive power and landmark extract of AMM
with the robustness of the classical cascade
method that have been improved by the powerful
deep learning technique.
In this paper, we will describe the approach to
human face tracking using the AAM through the
following sections. Section II will briefly
describe the related research which used in our
paper. After that, Section III will describe our
proposed method and some experimental result
can be seen in Section IV. Section V points the
conclusion and future development for our
research.
2. Related Work
2.1 Active Appearance Model (AAM)
Active Appearance Model (AAM), which
proposed by Cootes [1],[8], is a very popular
method in the field Computer Vision. The
advantages of AAM is that the models can define
the varying shape and appearance of an object
based on trained model from a representative
training set. AMM is a combination of shape and
texture models is a combination of shape and
texture (sometimes called appearance) models.
For the shape model, we require a fixed set of
landmarks over the sets of training images which
will define the shape of the learning object. Then,
the highly similar shapes will be removed using
Procrustes Analysis. Finally, we apply PCA to
obtain the final shape model which defined by a
mean shape (𝑠𝑜) and the eigen-vectors set (S).
When fitting to a new sample, the estimate model
�̂� can be calculate as:
�̂� = 𝑠𝑜 + 𝑆𝑝
Where p is the estimated shape
weights/parameters to fit �̅� to the sample.
Similarly, the texture model can be learned by
taking the texture from marked regions of
learning objects and warp them into the mean
shape. Then, we apply PCA to obtain the texture
model t. As mention above, in this model, the
shape is all warp into the mean shape so while the
color changing the shape is remaining the same
when changing texture model parameter. When
apply to a new target, the model can be estimate
as:
�̂� = 𝑡0 + 𝑇𝑞
Where p is the estimated texture to fit 𝑡0 to the
sample.
After that, when input a new target, the model
will be fit onto the target by minimizing the
difference between the target texture and shape
with the model follow either fitting them
separately or after combined them into one
model. Both methods have their own strong and
weak points [2].
2.2 Cascaded CNN Face Detector
Cascade face detector was first proposed by
Viola [5] using Haar-like features to train
cascaded classifiers which can do the task of face
detection in real-time with notable efficiency in
frontal face detection. However, the Viola
cascades is tend to fail in cases of unexpected
lightning or faces poses. To improve the
accuracy of detection in real environment, H.li
[3] and K.Zhang [6] using the deep learning
technique, convolution neural network (CNN), to
252 page International Conference on Software & Smart Convergence ICSSC 2017
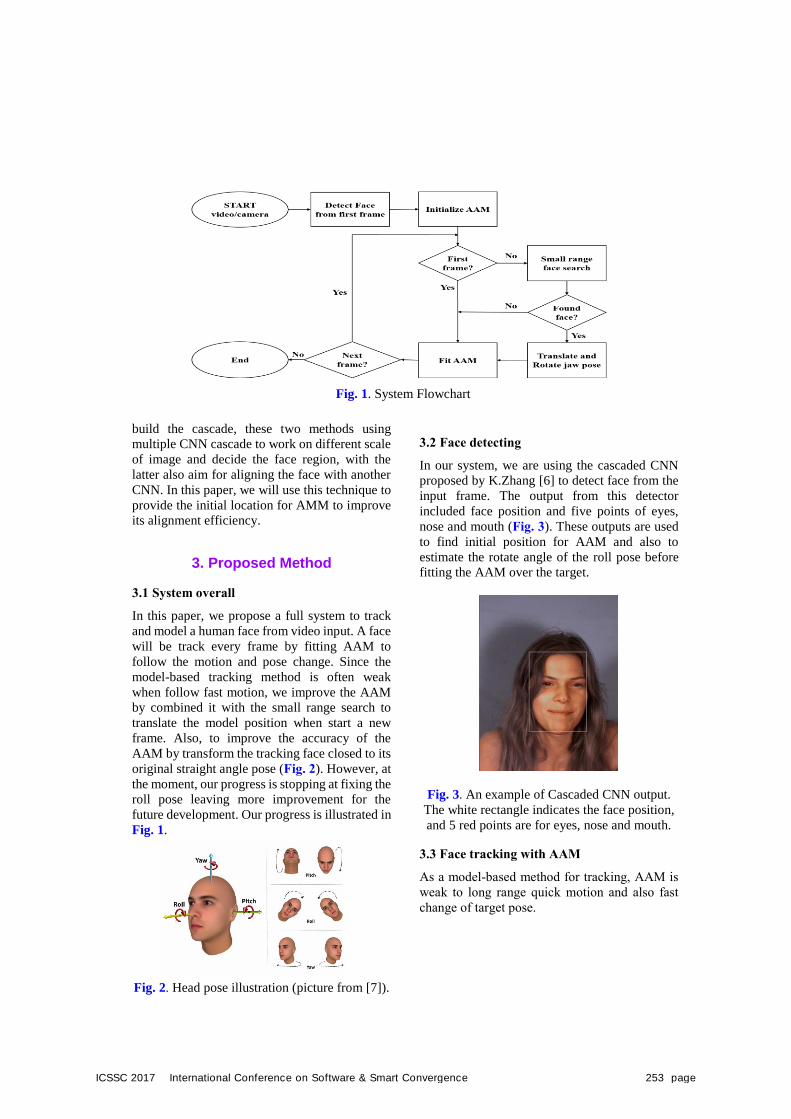
build the cascade, these two methods using
multiple CNN cascade to work on different scale
of image and decide the face region, with the
latter also aim for aligning the face with another
CNN. In this paper, we will use this technique to
provide the initial location for AMM to improve
its alignment efficiency.
3. Proposed Method
3.1 System overall
In this paper, we propose a full system to track
and model a human face from video input. A face
will be track every frame by fitting AAM to
follow the motion and pose change. Since the
model-based tracking method is often weak
when follow fast motion, we improve the AAM
by combined it with the small range search to
translate the model position when start a new
frame. Also, to improve the accuracy of the
AAM by transform the tracking face closed to its
original straight angle pose (Fig. 2). However, at
the moment, our progress is stopping at fixing the
roll pose leaving more improvement for the
future development. Our progress is illustrated in
Fig. 1.
Fig. 2. Head pose illustration (picture from [7]).
3.2 Face detecting
In our system, we are using the cascaded CNN
proposed by K.Zhang [6] to detect face from the
input frame. The output from this detector
included face position and five points of eyes,
nose and mouth (Fig. 3). These outputs are used
to find initial position for AAM and also to
estimate the rotate angle of the roll pose before
fitting the AAM over the target.
Fig. 3. An example of Cascaded CNN output.
The white rectangle indicates the face position,
and 5 red points are for eyes, nose and mouth.
3.3 Face tracking with AAM
As a model-based method for tracking, AAM is
weak to long range quick motion and also fast
change of target pose.
Fig. 1. System Flowchart
ICSSC 2017 International Conference on Software & Smart Convergence 253 page
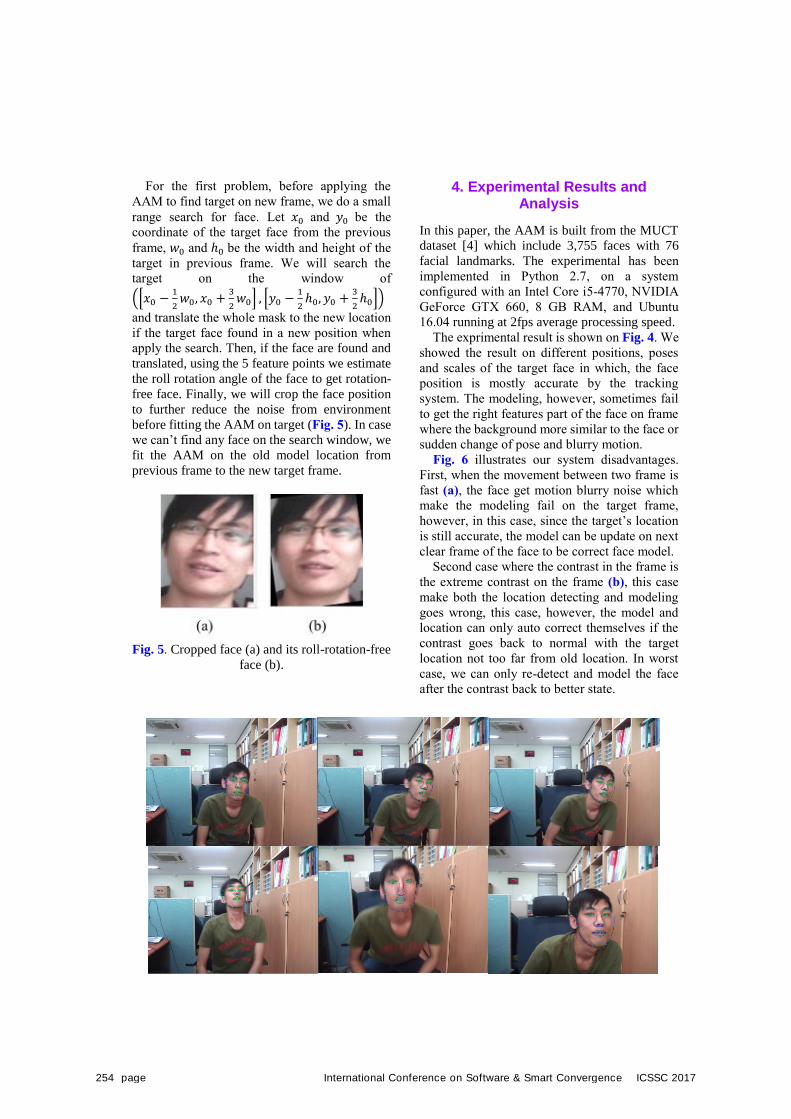
For the first problem, before applying the
AAM to find target on new frame, we do a small
range search for face. Let 𝑥0 and 𝑦0 be the
coordinate of the target face from the previous
frame, 𝑤0 and ℎ0 be the width and height of the
target in previous frame. We will search the
target on the window of
([𝑥0 −1
2𝑤0, 𝑥0 +
3
2𝑤0] , [𝑦0 −
1
2ℎ0, 𝑦0 +
3
2ℎ0])
and translate the whole mask to the new location
if the target face found in a new position when
apply the search. Then, if the face are found and
translated, using the 5 feature points we estimate
the roll rotation angle of the face to get rotation-
free face. Finally, we will crop the face position
to further reduce the noise from environment
before fitting the AAM on target (Fig. 5). In case
we can’t find any face on the search window, we
fit the AAM on the old model location from
previous frame to the new target frame.
Fig. 5. Cropped face (a) and its roll-rotation-free
face (b).
4. Experimental Results andAnalysis
In this paper, the AAM is built from the MUCT
dataset [4] which include 3,755 faces with 76
facial landmarks. The experimental has been
implemented in Python 2.7, on a system
configured with an Intel Core i5-4770, NVIDIA
GeForce GTX 660, 8 GB RAM, and Ubuntu
16.04 running at 2fps average processing speed.
The exprimental result is shown on Fig. 4. We
showed the result on different positions, poses
and scales of the target face in which, the face
position is mostly accurate by the tracking
system. The modeling, however, sometimes fail
to get the right features part of the face on frame
where the background more similar to the face or
sudden change of pose and blurry motion.
Fig. 6 illustrates our system disadvantages.
First, when the movement between two frame is
fast (a), the face get motion blurry noise which
make the modeling fail on the target frame,
however, in this case, since the target’s location
is still accurate, the model can be update on next
clear frame of the face to be correct face model.
Second case where the contrast in the frame is
the extreme contrast on the frame (b), this case
make both the location detecting and modeling
goes wrong, this case, however, the model and
location can only auto correct themselves if the
contrast goes back to normal with the target
location not too far from old location. In worst
case, we can only re-detect and model the face
after the contrast back to better state.
Fig. 4. Our experimental tracking result on a video input frame 1,5,10,40,150,400
254 page International Conference on Software & Smart Convergence ICSSC 2017
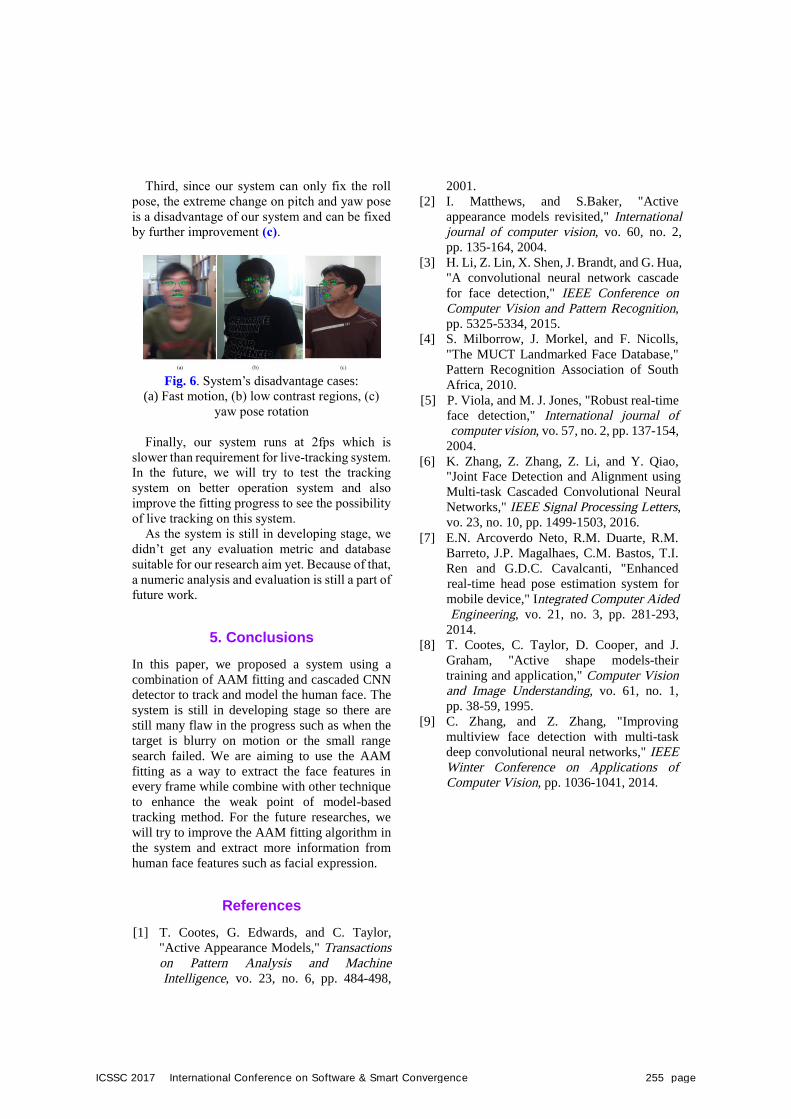
Third, since our system can only fix the roll
pose, the extreme change on pitch and yaw pose
is a disadvantage of our system and can be fixed
by further improvement (c).
Fig. 6. System’s disadvantage cases:
(a) Fast motion, (b) low contrast regions, (c)
yaw pose rotation
Finally, our system runs at 2fps which is
slower than requirement for live-tracking system.
In the future, we will try to test the tracking
system on better operation system and also
improve the fitting progress to see the possibility
of live tracking on this system.
As the system is still in developing stage, we
didn’t get any evaluation metric and database
suitable for our research aim yet. Because of that,
a numeric analysis and evaluation is still a part of
future work.
5. Conclusions
In this paper, we proposed a system using a
combination of AAM fitting and cascaded CNN
detector to track and model the human face. The
system is still in developing stage so there are
still many flaw in the progress such as when the
target is blurry on motion or the small range
search failed. We are aiming to use the AAM
fitting as a way to extract the face features in
every frame while combine with other technique
to enhance the weak point of model-based
tracking method. For the future researches, we
will try to improve the AAM fitting algorithm in
the system and extract more information from
human face features such as facial expression.
References
[1] T. Cootes, G. Edwards, and C. Taylor,
"Active Appearance Models," Transactions on Pattern Analysis and Machine Intelligence, vo. 23, no. 6, pp. 484-498,
2001.
[2] I. Matthews, and S.Baker, "Active
appearance models revisited," International journal of computer vision, vo. 60, no. 2,
pp. 135-164, 2004.
[3] H. Li, Z. Lin, X. Shen, J. Brandt, and G. Hua,
"A convolutional neural network cascade
for face detection," IEEE Conference on Computer Vision and Pattern Recognition,
pp. 5325-5334, 2015.
[4] S. Milborrow, J. Morkel, and F. Nicolls,
"The MUCT Landmarked Face Database,"
Pattern Recognition Association of South
Africa, 2010.
[5] P. Viola, and M. J. Jones, "Robust real-time
face detection," International journal of computer vision, vo. 57, no. 2, pp. 137-154,
2004.
[6] K. Zhang, Z. Zhang, Z. Li, and Y. Qiao,
"Joint Face Detection and Alignment using
Multi-task Cascaded Convolutional Neural
Networks," IEEE Signal Processing Letters,
vo. 23, no. 10, pp. 1499-1503, 2016.
[7] E.N. Arcoverdo Neto, R.M. Duarte, R.M.
Barreto, J.P. Magalhaes, C.M. Bastos, T.I.
Ren and G.D.C. Cavalcanti, "Enhanced
real-time head pose estimation system for
mobile device," Integrated Computer Aided Engineering, vo. 21, no. 3, pp. 281-293,
2014.
[8] T. Cootes, C. Taylor, D. Cooper, and J.
Graham, "Active shape models-their
training and application," Computer Vision and Image Understanding, vo. 61, no. 1,
pp. 38-59, 1995.
[9] C. Zhang, and Z. Zhang, "Improving
multiview face detection with multi-task
deep convolutional neural networks," IEEE Winter Conference on Applications of Computer Vision, pp. 1036-1041, 2014.
ICSSC 2017 International Conference on Software & Smart Convergence 255 page
International Conference on Software & Smart Convergence (ICSSC) 2017, June 2017 Copyright ⓒ 2017 ICSSC
This research was supported by SEC R&D of KEPCO.
Development of Context Awareness System for Smart Lab Environments
Prabesh Paudel, Sangkyoon Kim, Soonyoung Park and Kyoungho Choi Department of Electronics Engineering, Mokpo National University
Muan-gun, Jeonnam 58554, South Korea [e-mail: {prabesh123,narciss76,sypark.khchoi}@mokpo.ac.kr]
Abstract
Context awareness system has gained a lot of attention in recent years in the field of Internet of Things (IoT) to manage energy consumption in a building. Various researches have been ongoing to convert traditional building environments into smart environments using information and communication technologies. In this paper, we propose and design a novel context awareness system for energy management in smart buildings. More specifically, combination of hardware and software techniques are utilized for connecting home appliances to sensors with motion detection, luminance, and humidity measurement according to the context in smart buildings.
Keywords: IOT, Context awareness, sensors, Smart lab, raspberry pi
1. IntroductionInternet of things (IoT) is considered as the next and new phase of evolution of the internet and connects objects like sensors, electrical appliances and mobile devices to improve quality of life [1]. This concept is used to promote the development of smart cities through the use of information and communication technologies (ICTs) [2]. With the advancement of sensors and actuator technologies, our indoor environment such as buildings has been instrumented with various sensors, including temperature, humidity, illumination and occupancy sensors. Thus we can be aware of changes in the users’ state and surroundings. Accordingly, for indoor tracking, passive infrared (PIR) sensors are well known occupancy detectors. It has been widely employed for human tracking system, due to their low cost and power consumption, small form factor and unobtrusive and privacy-preserving interaction.
Similarly, humidity sensors are used to record and track the humidity level in a smart lab. LED light bulb controlled by remotes can be used to lower energy consumption while luminance is varied according to the surrounding illumination condition [3]. In this paper, a novel context awareness system is presented. More specifically, an on-going research result is presented, which includes the hardware implementation based on Raspberry pi and various sensors such as temperatrue, humidity, illumination sensors, etc, and a software architecture based on python and MySQL. Statistics of sensor data collected in our lab is shown and future research direction is also discussed in the experimental and conclusion sections.
2. Context awareness system
256 page International Conference on Software & Smart Convergence ICSSC 2017
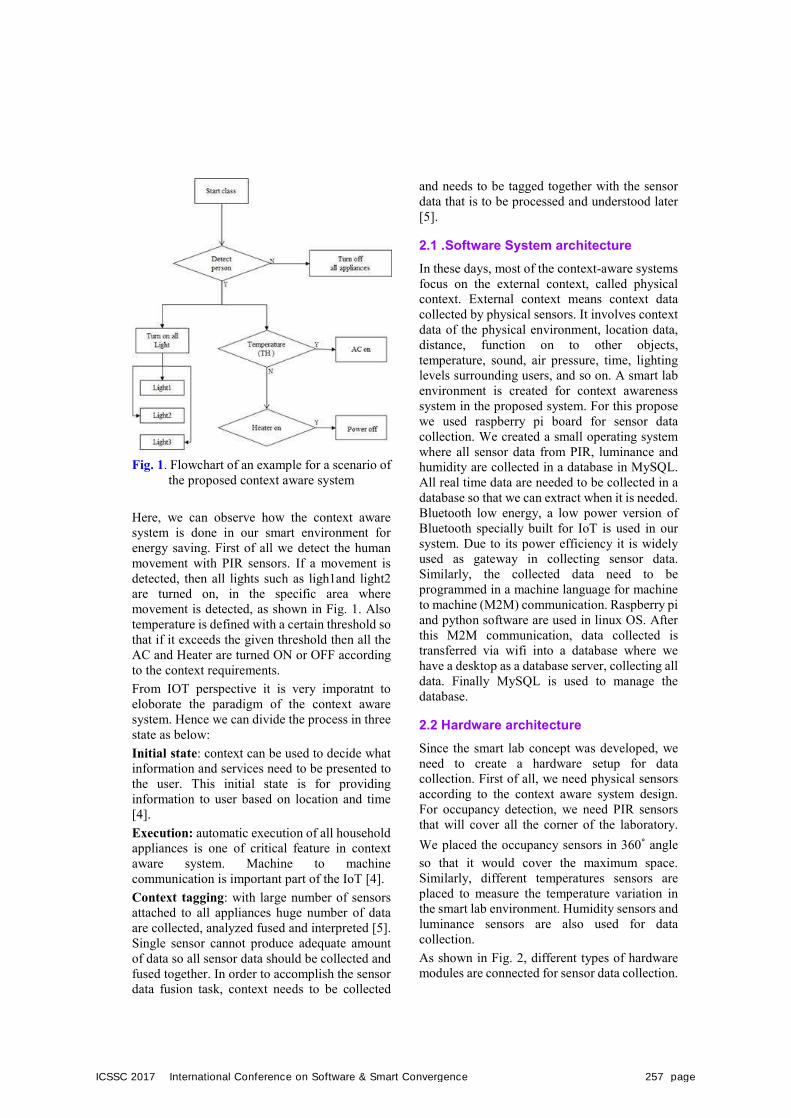
Fig. 1. Flowchart of an example for a scenario of the proposed context aware system
Here, we can observe how the context aware system is done in our smart environment for energy saving. First of all we detect the human movement with PIR sensors. If a movement is detected, then all lights such as ligh1and light2 are turned on, in the specific area where movement is detected, as shown in Fig. 1. Also temperature is defined with a certain threshold so that if it exceeds the given threshold then all the AC and Heater are turned ON or OFF according to the context requirements. From IOT perspective it is very imporatnt to eloborate the paradigm of the context aware system. Hence we can divide the process in three state as below: Initial state: context can be used to decide what information and services need to be presented to the user. This initial state is for providing information to user based on location and time [4]. Execution: automatic execution of all household appliances is one of critical feature in context aware system. Machine to machine communication is important part of the IoT [4]. Context tagging: with large number of sensors attached to all appliances huge number of data are collected, analyzed fused and interpreted [5]. Single sensor cannot produce adequate amount of data so all sensor data should be collected and fused together. In order to accomplish the sensor data fusion task, context needs to be collected
and needs to be tagged together with the sensor data that is to be processed and understood later [5].
2.1 .Software System architecture In these days, most of the context-aware systems focus on the external context, called physical context. External context means context data collected by physical sensors. It involves context data of the physical environment, location data, distance, function on to other objects, temperature, sound, air pressure, time, lighting levels surrounding users, and so on. A smart lab environment is created for context awareness system in the proposed system. For this propose we used raspberry pi board for sensor data collection. We created a small operating system where all sensor data from PIR, luminance and humidity are collected in a database in MySQL. All real time data are needed to be collected in a database so that we can extract when it is needed. Bluetooth low energy, a low power version of Bluetooth specially built for IoT is used in our system. Due to its power efficiency it is widely used as gateway in collecting sensor data. Similarly, the collected data need to be programmed in a machine language for machine to machine (M2M) communication. Raspberry pi and python software are used in linux OS. After this M2M communication, data collected is transferred via wifi into a database where we have a desktop as a database server, collecting all data. Finally MySQL is used to manage the database.
2.2 Hardware architecture Since the smart lab concept was developed, we need to create a hardware setup for data collection. First of all, we need physical sensors according to the context aware system design. For occupancy detection, we need PIR sensors that will cover all the corner of the laboratory. We placed the occupancy sensors in 360˚ angle so that it would cover the maximum space. Similarly, different temperatures sensors are placed to measure the temperature variation in the smart lab environment. Humidity sensors and luminance sensors are also used for data collection. As shown in Fig. 2, different types of hardware modules are connected for sensor data collection.
ICSSC 2017 International Conference on Software & Smart Convergence 257 page
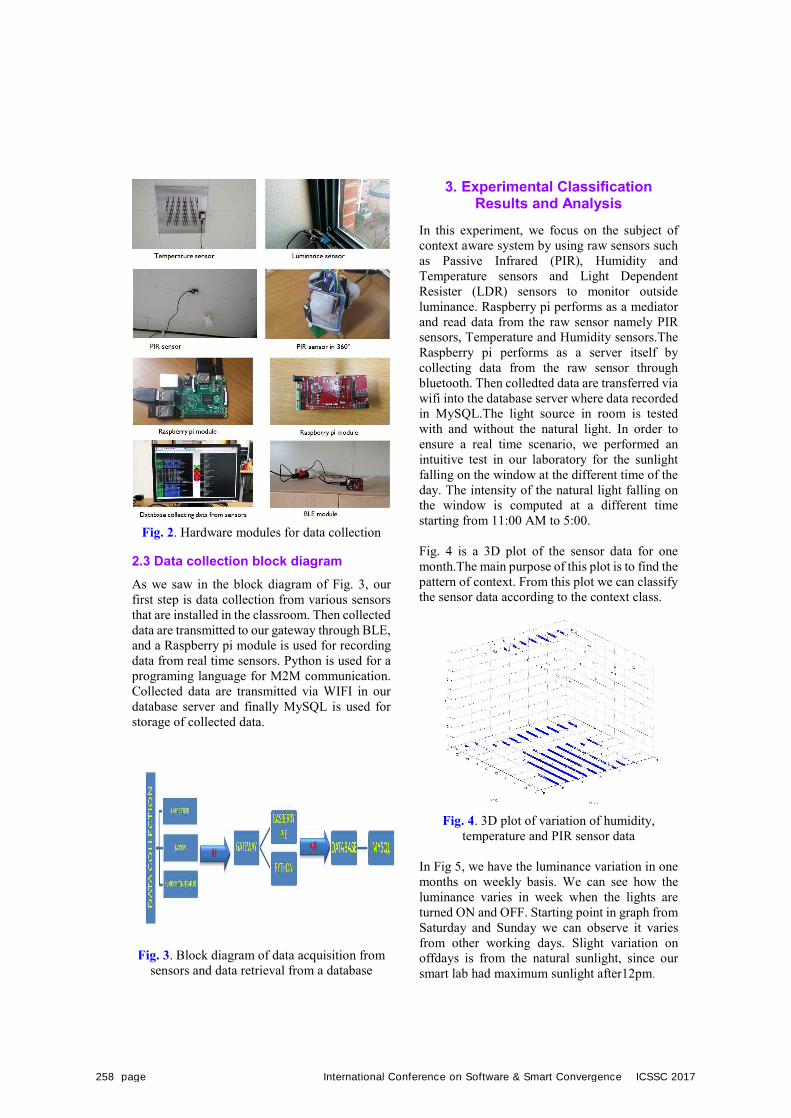
Fig. 2. Hardware modules for data collection
2.3 Data collection block diagram As we saw in the block diagram of Fig. 3, our first step is data collection from various sensors that are installed in the classroom. Then collected data are transmitted to our gateway through BLE, and a Raspberry pi module is used for recording data from real time sensors. Python is used for a programing language for M2M communication. Collected data are transmitted via WIFI in our database server and finally MySQL is used for storage of collected data.
Fig. 3. Block diagram of data acquisition from sensors and data retrieval from a database
3. Experimental ClassificationResults and Analysis
In this experiment, we focus on the subject of context aware system by using raw sensors such as Passive Infrared (PIR), Humidity and Temperature sensors and Light Dependent Resister (LDR) sensors to monitor outside luminance. Raspberry pi performs as a mediator and read data from the raw sensor namely PIR sensors, Temperature and Humidity sensors.The Raspberry pi performs as a server itself by collecting data from the raw sensor through bluetooth. Then colledted data are transferred via wifi into the database server where data recorded in MySQL.The light source in room is tested with and without the natural light. In order to ensure a real time scenario, we performed an intuitive test in our laboratory for the sunlight falling on the window at the different time of the day. The intensity of the natural light falling on the window is computed at a different time starting from 11:00 AM to 5:00.
Fig. 4 is a 3D plot of the sensor data for one month.The main purpose of this plot is to find the pattern of context. From this plot we can classify the sensor data according to the context class.
Fig. 4. 3D plot of variation of humidity, temperature and PIR sensor data
In Fig 5, we have the luminance variation in one months on weekly basis. We can see how the luminance varies in week when the lights are turned ON and OFF. Starting point in graph from Saturday and Sunday we can observe it varies from other working days. Slight variation on offdays is from the natural sunlight, since our smart lab had maximum sunlight after12pm.
258 page International Conference on Software & Smart Convergence ICSSC 2017
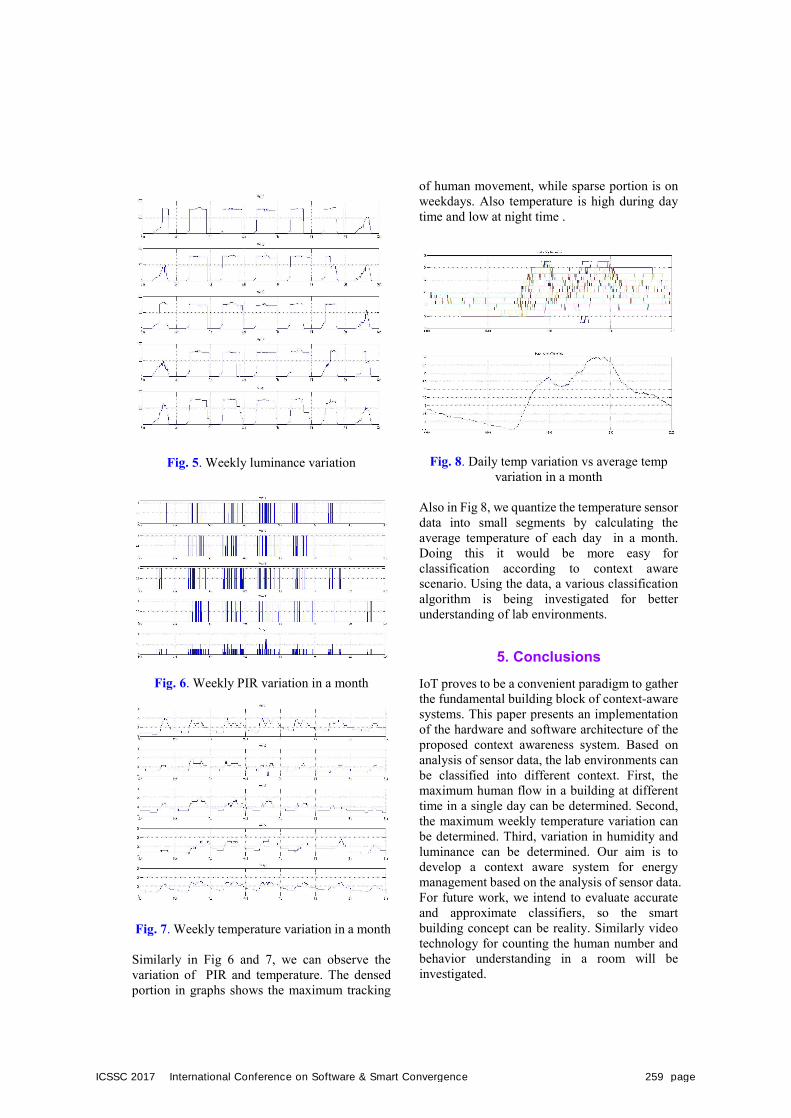
Fig. 5. Weekly luminance variation
Fig. 6. Weekly PIR variation in a month
Fig. 7. Weekly temperature variation in a month
Similarly in Fig 6 and 7, we can observe the variation of PIR and temperature. The densed portion in graphs shows the maximum tracking
of human movement, while sparse portion is on weekdays. Also temperature is high during day time and low at night time .
Fig. 8. Daily temp variation vs average temp variation in a month
Also in Fig 8, we quantize the temperature sensor data into small segments by calculating the average temperature of each day in a month. Doing this it would be more easy for classification according to context aware scenario. Using the data, a various classification algorithm is being investigated for better understanding of lab environments.
5. ConclusionsIoT proves to be a convenient paradigm to gather the fundamental building block of context-aware systems. This paper presents an implementation of the hardware and software architecture of the proposed context awareness system. Based on analysis of sensor data, the lab environments can be classified into different context. First, the maximum human flow in a building at different time in a single day can be determined. Second, the maximum weekly temperature variation can be determined. Third, variation in humidity and luminance can be determined. Our aim is to develop a context aware system for energy management based on the analysis of sensor data. For future work, we intend to evaluate accurate and approximate classifiers, so the smart building concept can be reality. Similarly video technology for counting the human number and behavior understanding in a room will be investigated.
ICSSC 2017 International Conference on Software & Smart Convergence 259 page
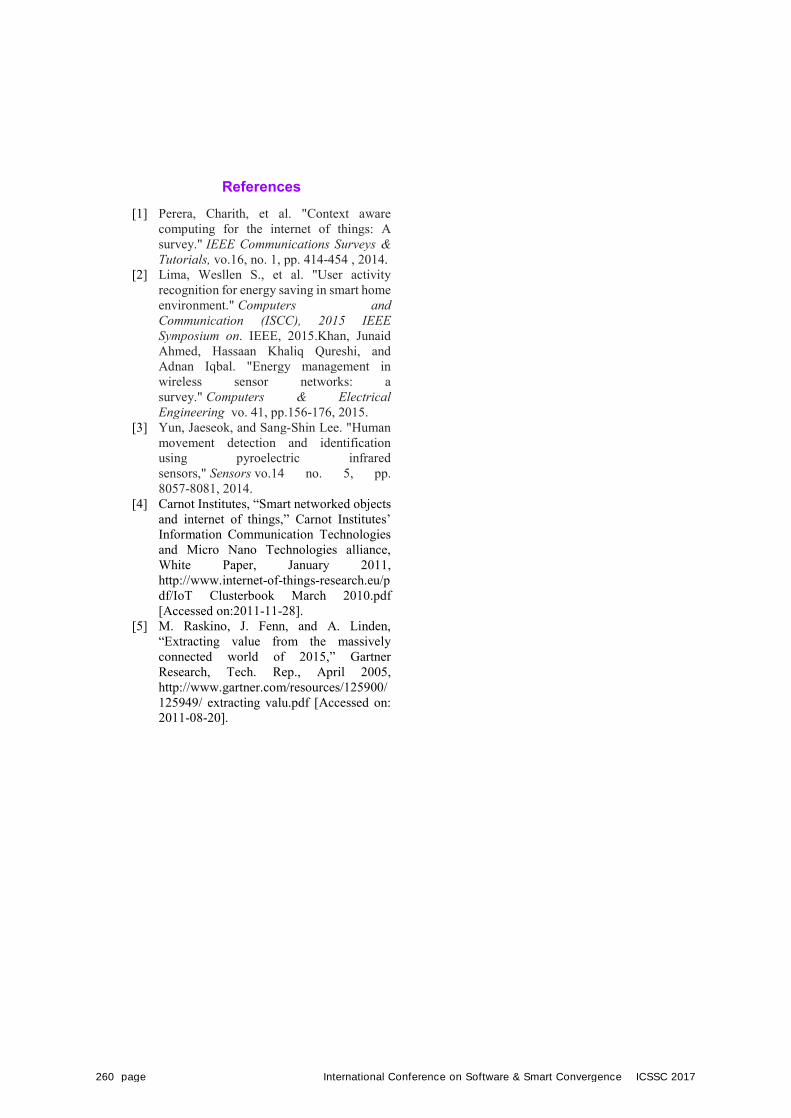
References [1] Perera, Charith, et al. "Context aware
computing for the internet of things: A survey." IEEE Communications Surveys & Tutorials, vo.16, no. 1, pp. 414-454 , 2014.
[2] Lima, Wesllen S., et al. "User activity recognition for energy saving in smart home environment." Computers and Communication (ISCC), 2015 IEEE Symposium on. IEEE, 2015.Khan, Junaid Ahmed, Hassaan Khaliq Qureshi, and Adnan Iqbal. "Energy management in wireless sensor networks: a survey." Computers & Electrical Engineering vo. 41, pp.156-176, 2015.
[3] Yun, Jaeseok, and Sang-Shin Lee. "Human movement detection and identification using pyroelectric infrared sensors," Sensors vo.14 no. 5, pp. 8057-8081, 2014.
[4] Carnot Institutes, “Smart networked objects and internet of things,” Carnot Institutes’ Information Communication Technologies and Micro Nano Technologies alliance, White Paper, January 2011, http://www.internet-of-things-research.eu/pdf/IoT Clusterbook March 2010.pdf [Accessed on:2011-11-28].
[5] M. Raskino, J. Fenn, and A. Linden, “Extracting value from the massively connected world of 2015,” Gartner Research, Tech. Rep., April 2005, http://www.gartner.com/resources/125900/125949/ extracting valu.pdf [Accessed on: 2011-08-20].
260 page International Conference on Software & Smart Convergence ICSSC 2017
International Conference on Software & Smart Convergence (ICSSC) 2017, June 2017 Copyright ⓒ 2017 ICSSC
This research was supported in part by Basic Science Research Program through the National Research Foundation of Korea (NRF) funded by the Ministry of Education (NRF-2016R1D1A1A09918974).
Distributed MAC Protocols for Cognitive Radio Networks: A Comparative Survey
Subash Luitel and Sangman Moh* Department of Computer Engineering, Chosun University
Gwanju, Republic of Korea [e-mail: [email protected]]
*Corresponding author: Sangman Moh
Abstract
As most of the available radio spectrum bands have been allocated already, the need of dynamic spectrum management is being increased more and more. However, many white spaces exist on those spectra because the allocated bands are significantly underutilized. The cognitive radio technology smartly addresses this situation by using the spectrum of licensed primary users when the allocated bands are not in use. The distributed medium access control (MAC) protocols for cognitive radio networks (CRNs) does not have central entity such as base-station; the design of MAC protocol with more adaptive and effective in dynamic mode is indispensable. Common control channel (CCC) plays a pivotal role in the design of MAC protocols for CRNs. This paper surveys decentralized or distributed MAC protocols using CCC for CRNs and compares them qualitatively with respect to features, performance, and pros and cons. Challenging issues for the efficient design of distributed MAC protocols for CRNs are also discussed.
Keywords: Cognitive radio, cognitive radio network, medium access control, distributed medium access control, common control channel
1. Introduction
The demand of wireless communication is increasing day by day. According to the FCC (Fedral Communications Commission) report [1], almost all frequency bands have already been assigned. With the static strategy of spectrum allocation, however, there are temporal and geographical holes called white space. On the other hand, the great success in wireless technologies based on unlicensed ISM (Industrial, Scientific and Medical) bands like Wi-Fi, Bluetooth, Cordless phones, etc. has given rise to the problem of coexistence of heterogeneous systems having the issue of interference with each other. In cognitive radio
networks (CRNs), the underutilized licensed and unlicensed spectrum bands are opportunistically utilized by cognitive secondary users (SUs) without interfering with licensed primary users (PUs).
PUs are the licensed nodes to operate in a certain spectrum whereas SUs are unlicensed nodes. In cognitive radio technology, a primary network is not responsible for any cognitive behavior and it doesn’t need to have specific functionalities. During communication, if a PU is detected, SUs immediately should reconfigure their parameters such as radio power, data rate, etc. In addition, SUs should coordinate their access to available spectrum channels and the collision between different cognitive radios should be avoided.
ICSSC 2017 International Conference on Software & Smart Convergence 261 page
A CRN is the solution to the shortage of radio spectrum and the inefficiency of spectrum utilization[2,3]. It allows unlicensed users to access a radio spectrum when the spectrum is not in use by the licensed users. It is important to consider the control and coordination of communication over wireless channels.
Medium access control (MAC) is mainly responsible for various cognitive radio functions such as spectrum mobility, channel sensing, spectrum decision, and spectrum sharing . When a PU is detected, SUs should vacate the channel by accessing an idle band for the connection reestablishment. This function is called spectrum mobility. Channel sensing is the technique which collects the information about spectrum usage. Resource allocation is employed to opportunistically assign available channels to cognitive users. And spectrum access deals with heterogeneous primary and secondary users so as to avoid harmful interference. For the network
There are some distributed MAC protocols which do not use any common control channel (CCC). SYN MAC [4] uses a dedicated radio for tracking the channel for control messages. Similarly, POMDP [5] also does not use CCC but it continuously monitors with considering the probability of the extended receiver to be tuned. In this paper, the distributed MAC protocols using CCC for CRNs are reviewed and qualitatively compared with each other. Some challenging issues are also discussed for designing efficient distributed MAC protocols for CRNs.
The rest of this paper is organized as follows: In the following section, the classification of MAC protocols for CRNs are introduced. In section 2, classification of cognitive radio MAC protocol on the basis of control channel selection is explained. In section 3, major distributed MAC protocols for CRNS are investigated. In Section 4, the MAC protocols are qualitatively compared. Some challenging issues are summarized in Section 5. Finally, the paper is concluded in Section 6.
2. Classification of MAC protocols forCognitive Radio Networks
According to network topology, the MAC protocol for CRNs is classified as centralized and distributed ones [6]. The centralized topology
which is also called as infrastructure based topology consists of a base station or a central entity for network management such as synchronization and coordination operations among nodes. The distrbuted toplogy lacks the central entity. However, it is more scalable, effecient and dynamic in nature.
The classification of the cognitive radio MAC protocol is further done considering the control channel that it adapts, and is explained in detail below: The common control channel (CCC) can be effectively used for network initialization, nodes negotiation, reporting available channels and neighbors list [7]. The CCC design is classified as underlay and overlay CCC schemes and also as in-band and out-of-band depending upon the nature of the channel preferences schemes [8]. The underlay CCC schemes mainly utilizes ultra-wideband (UWB) transmission technology whereas the overlay CCC scheme possesses two primary spectrum sharing approaches of in-band and out-of-band. On the basis of coverage, the in-band and out-of-band approaches are local and global, respectively. Furthermore, the in-band scheme is also divided into two categories of link-based and group-based CCC design. The out-of-band schemes are primarily composed of dedicated CCC designs. With regards to the CCC establishment methods, there can be subcategories such as sequence-based, group-based, and dedicated CCC design. The more explanation of these schemes
2.1 Overlay vs. Underlay
In the overlay scheme, the CCC is permanently or temporarily allocated to the vacant spectrum that is not used by PUs. As soon as the allocated CCC are affected by the PU activity, SUs must vacate the CCCs and re-establish new CCCs in other available spectrum. In the underlay approach, however, the CCC can be allocated to the same band used by PUs. Control messages are transmitted in low power by using short pulses, which are spread over large bandwidth such that the control transmission appears to PUs as noise. The spread spectrum technique is used in this approach. Beside the fact that cognitive radio control messages and PU data are transmitted simultaneously in a licensed spectrum, the underlay approach is regarded as dedicated CCC virtually not affected by PU activity.
262 page International Conference on Software & Smart Convergence ICSSC 2017

2.2 In-Band vs. Out-of-Band
In-band CCCs are the CCCs which are allocated to data channels whereas the CCCs allocated in dedicated spectrum (unlicensed bands or the spectrum licensed to CRN operators) are called out-of-band CCCs. The coverage of the CCCs is related to the fashion on which they are allocated in the spectrum. The CCC coverage area is the area where SUs can exchange control messages by one or more hops on the allocated CCC. From the definition of the in-band channel, it is clear that it is susceptible to PU activity in different regions. So their coverage is local. On the contrary, the coverage of the out-of-band is considered to be global so as to facilitate network-wide coordination without switching latency and overhead. But the dedicated CCCs can be allocated to different bands in different geographical regions. So the coverage can also be local.
The main challenge of the in-band CCC is the overhead of CCC establishment. The CCCs are allocated in licensed data channels affecting the PU activity, hence making it difficult to re-establish the CCCs whenever PUs return to the channels. Moreover, there is also a major challenge on control message overhead which must be minimized to achieve the satisfying throughput. The out-of-band CCCs generally not affected by PU activities which is due to the reason that the CCCs are always available in the dedicated spectrum. But, if the out-of-band CCCs are allocated in unlicensed bands, its reliability cannot be guaranteed due to the interference from other wireless services. Nevertheless, the out-of-band CCCs provide a relatively more reliable CCC establishment for control purposes compared to the in-bound ones.
2.3 CCC Design Schemes
The selection of the different design scheme for the design of MAC protocol directly affects to the network discovery and channel negoation process as the handshake between the transmitter and receiver will occur in CCC for these operations more depth classification of overlay/underlay and in-bound/out-of-band classifications can be explained based on the establishment of CCC. The CCC design method has been classified as sequence-based and group-based scheme which falls into in-band schemes. On the other hand, dedicated design
scheme falls under out-of-band approach. In addition, the UWB CCC design scheme is the underlay scheme
2.3.1 Sequence-based CCC
This design scheme focuses on diversifying the CCC allocation over spectrum and time spaces. This design promises the better performance mitigating the impact of PU activities. As SUs may use different hopping sequences, different neighboring pairs may communicate on different control channel. In the other hand, PUs affect them less due to the diversity of CCC allocation in time and frequency. However, it suffers from control overhead as the link is established in link-by-link basis.
2.3.2 Group-based CCC
In the group-based CCC, a channel is commonly available to a group of SUs. The grouping can be done either using neighbor coordination or using different clustering schemes, and it is quite convincible to find a CCC between the neighboring nodes as the activity of the users of a group on the particular channel is quite similar. The selection of the CCC can also be done after or before forming a group. The channel hopping schemes are used to establish the initial CCC link among SUs in this design scheme.
2.3.3 Dedicated Control Channel
In this scheme, an ‘always on’ channel is assigned just for passing the control information and it not affected by PU activities. The dedicated channel may be licensed or unlicensed. But, unlicensed channels are more affected by other ISM band spectrum. Hence, it is normally a licensed dedicated channel as CCC is always preferred. For both licensed and unlicensed channels, there exists the drawback of channel saturation and security issue, particularly vulnerable to DOS attack.
2.3.4 Ultra-wideband (UWB) CCC
In UWB communication, spreading sequences are used for modulation, and the transmission is carried out at low power. It exhibits an ultra-wide signal bandwidth compared to the channel bandwidth. There is a trade-off between signal range and control throughput. In addition, the design of spreading code adaptable to different control traffic is difficult.
ICSSC 2017 International Conference on Software & Smart Convergence 263 page

3. Distributed MAC Protocols for Cognitive Radio Network
In this section, three representative distributed MAC protocols for CRNs are investigated with respect to their major features and key characteristics
3.1 CREAM-MAC Protocol
The CREAM-MAC (Cognitive Radio-Enabled Multichannel MAC) protocol [9] is a multichannel cognitive radio MAC protocol, which assumes that a CCC has already been found and all of the cognitive radio nodes have agreed to use the CCC already. The transmitter sends four types of packets for the initiation of communication. They are RTS (Request To Send), CTS (Clear To Send), CST (Channel State Transmitter), and CSR (Channel State Receiver). The control information dialogue contains the information about the number of available channels, channel’s reliability, and the length of the transmission.
After satisfying all the communication rules exchanged, data is transmitted over one of the free channels, which is common to both SUs. The CREAM MAC calculates the PU interference probability, PU channel utilization, and aggregated throughput. However, this MAC protocol uses the unrealistic assumption that the control channel is already available and always reliable. As mentioned in Section 2, in general, finding a CCC is one of the main functions of CRNs.
3.2 OC-MAC Protocol
The OC-MAC (Opportunistic Cognitive MAC) protocol [10] uses a dedicated channel for control information. On that channel, cognitive radio nodes compete for data channel reservation. It implements DCF (Distributed Coordination Mechanism) and the status of each channel is recorded with the execution of DCF. The OC-MAC protocol uses RTS, CTS, CRTS (Control Channel Request To Send) and ACK for the initiation of communication. The statistics of each channel is maintained in CST (Channel State Table). And SUs update the information after each scan. This updated statistics facilitate OC-MAC to avoid collision and hence maximizes the throughput.
3.3 SCA-MAC Protocol
The SCA-MAC (Statistical Channel Allocation MAC) protocol [11] employs the cyclostationary feature detection technique for spectrum sensing. The sensing is performed continuously and rapidly. There is an exchange of CRTS (Control Channel Request To Send) and CCTS (Control Channel Clear To Send) frames in GCCC (Global Common Control Channel). Then, both sender and receiver tune their transceivers to the agreed channel. This protocol speeds up the transmission and can wait for some time for a channel with higher bandwidth to become available. Thus, this MAC protocol emphasizes data transmission by double handshaking (CRTS and CCTS) and it is quite good in terms of energy efficiency. But, there exists the issue of additional delay.
4. Comparison of Distributed MAC Protocols
In this section, we deal with the qualitative comparison of the MAC protocols reviewed in the previous section. It enables readers to make clear and concise picture of the protocols in a comprehensive way.
Table 1. Shows the comparison of the three MAC protocols with respect to different parameters. From the table, CREAM-MAC is better than the others as far as energy and delay parameters are considered. The low energy consumption in this MAC protocol is due to the energy detection based sensing technique which preserves a significant amount of energy during spectrum sensing. On the contrary, the SCA-MAC uses a cyclostationary approach which is comparatively improvident in terms of energy consumption. In fact, CREAM-MAC compromises with the average throughput of the system to ensure more efficiency in term of energy and it lowers end-to-end delay. On the other hand, SCA-MAC promises high throughput due to back-up data channel that can be used even during PU arrival and mobility of cognitive radio users.
Both CREAM-MAC and SCA-MAC have a dedicated control channel to make sure that control packets follow their own path without intervening the data packets whereas the OC-MAC adopts a non-dedicated approach for control packet dissemination.
264 page International Conference on Software & Smart Convergence ICSSC 2017
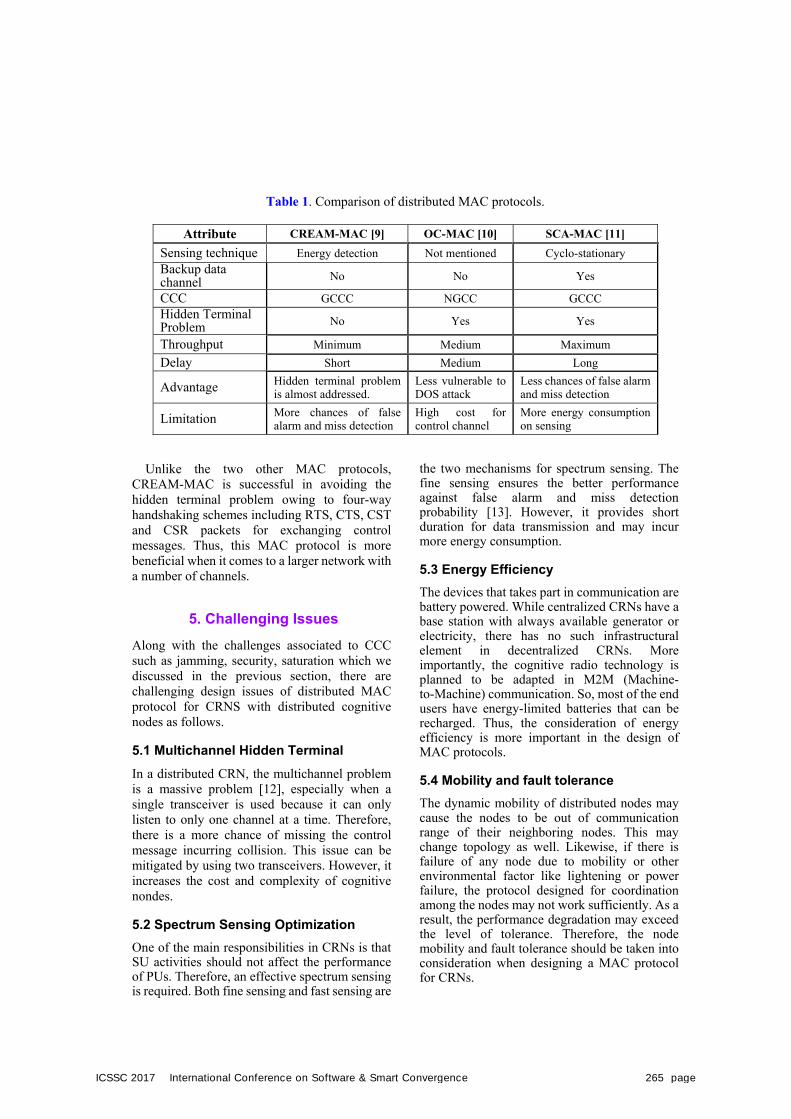
Table 1. Comparison of distributed MAC protocols.
Attribute CREAM-MAC [9] OC-MAC [10] SCA-MAC [11]
Sensing technique Energy detection Not mentioned Cyclo-stationary Backup data channel No No Yes
CCC GCCC NGCC GCCCHidden Terminal Problem No Yes Yes
Throughput Minimum Medium Maximum
Delay Short Medium Long
Advantage Hidden terminal problem is almost addressed.
Less vulnerable to DOS attack
Less chances of false alarm and miss detection
Limitation More chances of false alarm and miss detection
High cost for control channel
More energy consumption on sensing
Unlike the two other MAC protocols, CREAM-MAC is successful in avoiding the hidden terminal problem owing to four-way handshaking schemes including RTS, CTS, CST and CSR packets for exchanging control messages. Thus, this MAC protocol is more beneficial when it comes to a larger network with a number of channels.
5. Challenging Issues
Along with the challenges associated to CCC such as jamming, security, saturation which we discussed in the previous section, there are challenging design issues of distributed MAC protocol for CRNS with distributed cognitive nodes as follows.
5.1 Multichannel Hidden Terminal
In a distributed CRN, the multichannel problem is a massive problem [12], especially when a single transceiver is used because it can only listen to only one channel at a time. Therefore, there is a more chance of missing the control message incurring collision. This issue can be mitigated by using two transceivers. However, it increases the cost and complexity of cognitive nondes.
5.2 Spectrum Sensing Optimization
One of the main responsibilities in CRNs is that SU activities should not affect the performance of PUs. Therefore, an effective spectrum sensing is required. Both fine sensing and fast sensing are
the two mechanisms for spectrum sensing. The fine sensing ensures the better performance against false alarm and miss detection probability [13]. However, it provides short duration for data transmission and may incur more energy consumption.
5.3 Energy Efficiency
The devices that takes part in communication are battery powered. While centralized CRNs have a base station with always available generator or electricity, there has no such infrastructural element in decentralized CRNs. More importantly, the cognitive radio technology is planned to be adapted in M2M (Machine- to-Machine) communication. So, most of the end users have energy-limited batteries that can be recharged. Thus, the consideration of energy efficiency is more important in the design of MAC protocols.
5.4 Mobility and fault tolerance
The dynamic mobility of distributed nodes may cause the nodes to be out of communication range of their neighboring nodes. This may change topology as well. Likewise, if there is failure of any node due to mobility or other environmental factor like lightening or power failure, the protocol designed for coordination among the nodes may not work sufficiently. As a result, the performance degradation may exceed the level of tolerance. Therefore, the node mobility and fault tolerance should be taken into consideration when designing a MAC protocol for CRNs.
ICSSC 2017 International Conference on Software & Smart Convergence 265 page
6. Conclusions
The CCC plays one of the most important roles in the design of MAC protocol in CRNs and particularly in distributed SCRNs. We have investigated and compared the three different MAC protocols associated with CCC (i.e., CREAM-MAC, OC-MAC and SCA-MAC) in terms of various features and performance metrics. This comparative study would be helpful for researchers to implement the right technique according to their need of different applications and scenarios.
References
[1] I. Akyildiz, W. Lee, M. Vuran et al., “NeXt generation/dynamic spectrum access/ cognitive radio wireless networks: A survey,” Computer Networks, vo. 50, pp. 2127-2159, 2006.
[2] J. Mitola and G. Q. Maguire, “Cognitive radio: making software radios more personal,” IEEE Personal Communications, vo. 6, no. 4, pp. 13–18, 1999.
[3] J. Mitola, “Cognitive radio—an integrated agent architecture for software defined radio,” 2000.
[4] Kondareddy, Yogesh Reddy, and Prathima Agrawal. “Synchronized MAC protocol for multi-hop cognitive radio networks.” in Proc. of IEEE International Conference on Communications, 2008.
[5] Zhao, Qing, et al., “Decentralized cognitive MAC for opportunistic spectrum access in ad hoc networks: A POMDP framework,” IEEE Journal on selected areas in communications, vo. 25, no. 3, 2007.
[6] L. Gavrilovska, D. Denkovski, V. Rakovic and M. Angjelichinoski, “Medium Access Control Protocols in Cognitive Radio Networks: Overview and General Classification” IEEE Communications Surveys & Tutorials, vo. 16, no. 4, pp. 2092-2124, 2014.
[7] M. Chowdhury, and M. F. Kader. “Cognitive Radio MAC Protocols.” SmartCR, vo. 5, no. 1, pp. 19-29, 2015.
[8] B. F. Lo, “A Survey of Common Control Channel Design in Cognitive Radio Networks,” Physical Comm., vo. 4, pp. 26-39, 2011.
[9] [9] H. Su and X. Zhang, “CREAM-MAC:
An efficient cognitive radioenabled multi-channel MAC protocol for wireless networks,” in Proc. of IEEE World of Wireless Mobile and Multimedia, pp.1-8, 2008.
[10] S. Y. Hung, E. H. K. Wu and G. H. Chen, “An opportunistic cognitive MAC protocol for coexistence with WLAN”, in Proc. of IEEE International Conference on Communication, pp. 4059-4063, 2008.
[11] A. C. C. Hsu, D. S. L. Wei, and C.-C. J. Kuo, “A cognitive MAC protocol using statistical channel allocation for wireless ad-hoc networks,” in Proc. of IEEE WCNC’07, 2007.
[12] Sami, Mahmoud, et al., “A Survey and Taxonomy on Medium Access Control Strategies for Cooperative Communication in Wireless Networks: Research Issues and Challenges,” IEEE Communications Surveys & Tutorials, vo. 18, no. 4, pp. 2493-2521, 2016.
[13] Su, Hang, and X. Zhang. “Power-efficient periodic spectrum sensing for cognitive MAC in dynamic spectrum access networks,” in Proc. of Wireless Communications and Networking Conf. (WCNC), 2010.
266 page International Conference on Software & Smart Convergence ICSSC 2017

International Conference on Software & Smart Convergence (ICSSC) 2017, June 2017 Copyright ⓒ 2017 ICSSC
This research was supported by Basic Science Research Program through the National Research Foundation of
Korea(NRF) funded by the Ministry of Education, Science and Technology(NRF-2014R1A1 A2058667).
Design of a Flexible Three-Dimensional Geofence Model depending on
Context Changes
Rankwon Kim 1, Hyunmi Ryu 2, Youngsoo Choi 3, Gyowoong Hwang 4, Kyungho Park 5, Sungguk Cho 6 and Byungkook Jeon 7
1 KOSTEC Co., Wonju City, Gangwon Prov. 26403, Korea [e-mail: [email protected]]
2,3,4,5 Department of Software, Gangneung-Wonju Nat’l. Univ., Wonju City, Gangwon Prov. 26403, Korea
[e-mail: alekf81, metos10, hky5399, [email protected]] 6 Department of Multimedia Eng., Gangneung-Wonju Nat’l. Univ.,
Wonju City, Gangwon Prov. 26403, Korea [e-mail: [email protected]]
7 Department of Software, Gangneung-Wonju Nat’l. Univ., Wonju City, Gangwon Prov. 26403, Korea
[e-mail: [email protected]] *Corresponding author: Byungkook Jeon
Abstract
Geofencing usages and its applications are a very wide range. However, conventional geofences do not provide fixed sizes and fixed zones regardless of whether they are changing contexts or situations as well as three-dimensional location information. Therefore, in this paper, we propose a flexible three-dimensional geofence model depending on the changes of context or situation such as connected cars services based on V2X(Vehicle to Everything). The proposed geofence model responds to changes in the context, which can be varied in size of geofence. The structure of the proposed model consists of 4 components and an app platform based on the previous 3D geofence framework. So the proposed model and the mechanism of the FloGeo system will be applied as an important technology for the connected car services. Keywords: Three Demensional Geofence, Location-based Service, Flexible geofence, Connected car, Vehicle to Everything, FloGeo system
1. Introduction Most of geofencing usages and its applications are a very wide range such as asset management, retail marketing, human resource management, home quarantine, law enforcement, fleet management, compliance management, mobile
device management, and isolation of certain event areas [1-11]. However, conventional geofences do not provide 3D(three-dimensional) location information regardless of whether it is used indoors or outdoors [3-10]. Also, they have characterized by a fixed size as well as a fixed zone regardless of whether they are changing contexts or situations [3, 7].
ICSSC 2017 International Conference on Software & Smart Convergence 267 page
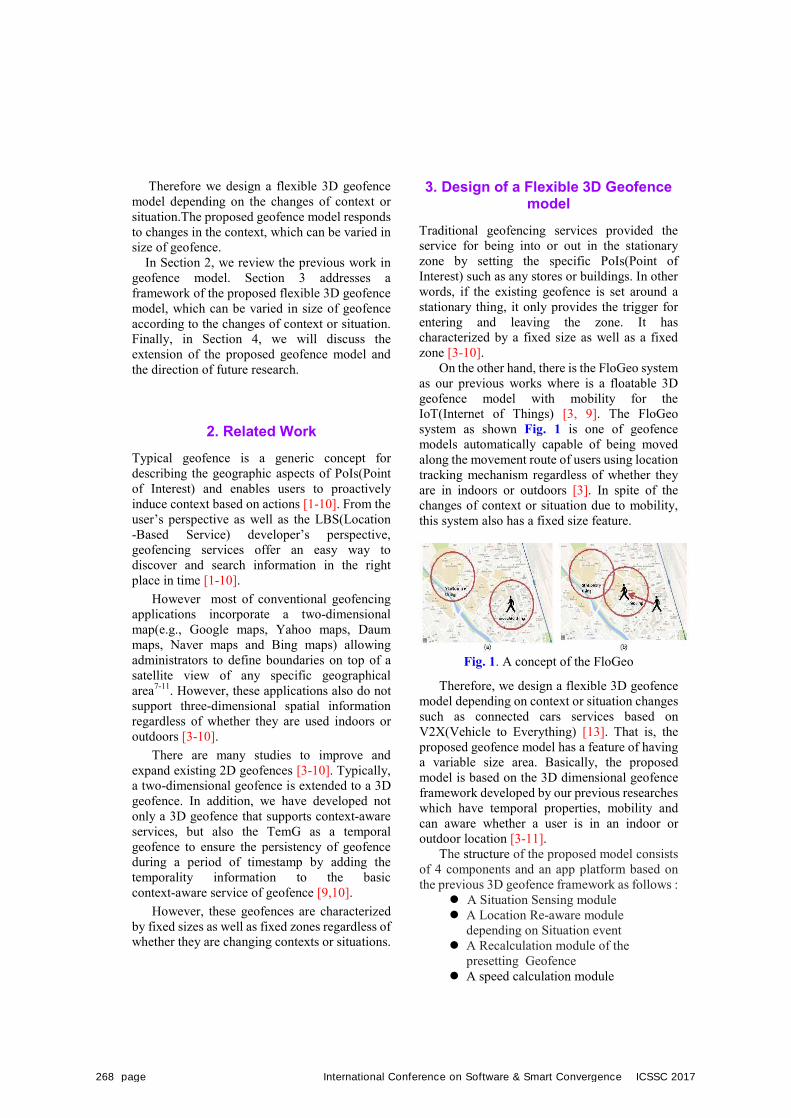
Therefore we design a flexible 3D geofence model depending on the changes of context or situation.The proposed geofence model responds to changes in the context, which can be varied in size of geofence.
In Section 2, we review the previous work in geofence model. Section 3 addresses a framework of the proposed flexible 3D geofence model, which can be varied in size of geofence according to the changes of context or situation. Finally, in Section 4, we will discuss the extension of the proposed geofence model and the direction of future research.
2. Related Work Typical geofence is a generic concept for describing the geographic aspects of PoIs(Point of Interest) and enables users to proactively induce context based on actions [1-10]. From the user’s perspective as well as the LBS(Location -Based Service) developer’s perspective, geofencing services offer an easy way to discover and search information in the right place in time [1-10].
However most of conventional geofencing applications incorporate a two-dimensional map(e.g., Google maps, Yahoo maps, Daum maps, Naver maps and Bing maps) allowing administrators to define boundaries on top of a satellite view of any specific geographical area7-11. However, these applications also do not support three-dimensional spatial information regardless of whether they are used indoors or outdoors [3-10].
There are many studies to improve and expand existing 2D geofences [3-10]. Typically, a two-dimensional geofence is extended to a 3D geofence. In addition, we have developed not only a 3D geofence that supports context-aware services, but also the TemG as a temporal geofence to ensure the persistency of geofence during a period of timestamp by adding the temporality information to the basic context-aware service of geofence [9,10].
However, these geofences are characterized by fixed sizes as well as fixed zones regardless of whether they are changing contexts or situations.
3. Design of a Flexible 3D Geofence model
Traditional geofencing services provided the service for being into or out in the stationary zone by setting the specific PoIs(Point of Interest) such as any stores or buildings. In other words, if the existing geofence is set around a stationary thing, it only provides the trigger for entering and leaving the zone. It has characterized by a fixed size as well as a fixed zone [3-10].
On the other hand, there is the FloGeo system as our previous works where is a floatable 3D geofence model with mobility for the IoT(Internet of Things) [3, 9]. The FloGeo system as shown Fig. 1 is one of geofence models automatically capable of being moved along the movement route of users using location tracking mechanism regardless of whether they are in indoors or outdoors [3]. In spite of the changes of context or situation due to mobility, this system also has a fixed size feature.
Fig. 1. A concept of the FloGeo
Therefore, we design a flexible 3D geofence model depending on context or situation changes such as connected cars services based on V2X(Vehicle to Everything) [13]. That is, the proposed geofence model has a feature of having a variable size area. Basically, the proposed model is based on the 3D dimensional geofence framework developed by our previous researches which have temporal properties, mobility and can aware whether a user is in an indoor or outdoor location [3-11].
The structure of the proposed model consists of 4 components and an app platform based on the previous 3D geofence framework as follows :
l A Situation Sensing module l A Location Re-aware module
depending on Situation event l A Recalculation module of the
presetting Geofence l A speed calculation module
268 page International Conference on Software & Smart Convergence ICSSC 2017
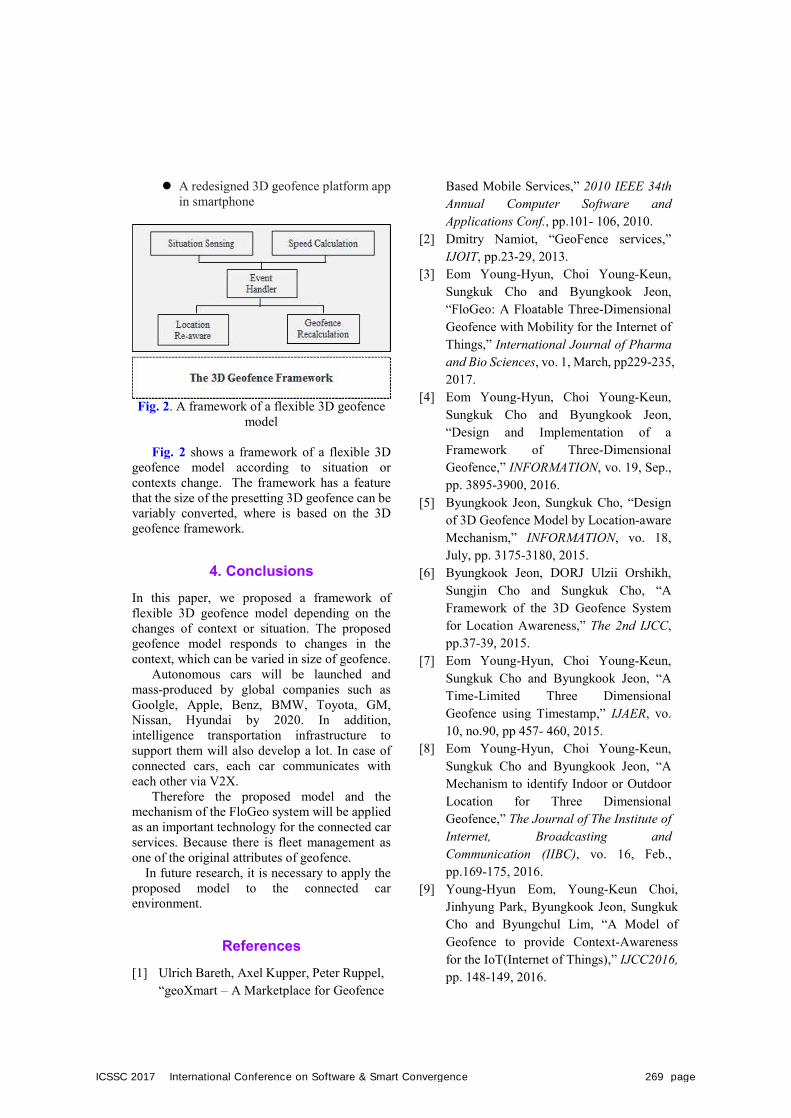
l A redesigned 3D geofence platform app in smartphone
Fig. 2. A framework of a flexible 3D geofence model
Fig. 2 shows a framework of a flexible 3D geofence model according to situation or contexts change. The framework has a feature that the size of the presetting 3D geofence can be variably converted, where is based on the 3D geofence framework.
4. ConclusionsIn this paper, we proposed a framework of flexible 3D geofence model depending on the changes of context or situation. The proposed geofence model responds to changes in the context, which can be varied in size of geofence.
Autonomous cars will be launched and mass-produced by global companies such as Goolgle, Apple, Benz, BMW, Toyota, GM, Nissan, Hyundai by 2020. In addition, intelligence transportation infrastructure to support them will also develop a lot. In case of connected cars, each car communicates with each other via V2X.
Therefore the proposed model and the mechanism of the FloGeo system will be applied as an important technology for the connected car services. Because there is fleet management as one of the original attributes of geofence.
In future research, it is necessary to apply the proposed model to the connected car environment.
References
[1] Ulrich Bareth, Axel Kupper, Peter Ruppel, “geoXmart – A Marketplace for Geofence
Based Mobile Services,” 2010 IEEE 34th Annual Computer Software and Applications Conf., pp.101- 106, 2010.
[2] Dmitry Namiot, “GeoFence services,” IJOIT, pp.23-29, 2013.
[3] Eom Young-Hyun, Choi Young-Keun, Sungkuk Cho and Byungkook Jeon, “FloGeo: A Floatable Three-Dimensional Geofence with Mobility for the Internet of Things,” International Journal of Pharma and Bio Sciences, vo. 1, March, pp229-235, 2017.
[4] Eom Young-Hyun, Choi Young-Keun, Sungkuk Cho and Byungkook Jeon, “Design and Implementation of a Framework of Three-Dimensional Geofence,” INFORMATION, vo. 19, Sep., pp. 3895-3900, 2016.
[5] Byungkook Jeon, Sungkuk Cho, “Design of 3D Geofence Model by Location-aware Mechanism,” INFORMATION, vo. 18, July, pp. 3175-3180, 2015.
[6] Byungkook Jeon, DORJ Ulzii Orshikh, Sungjin Cho and Sungkuk Cho, “A Framework of the 3D Geofence System for Location Awareness,” The 2nd IJCC, pp.37-39, 2015.
[7] Eom Young-Hyun, Choi Young-Keun, Sungkuk Cho and Byungkook Jeon, “A Time-Limited Three Dimensional Geofence using Timestamp,” IJAER, vo. 10, no.90, pp 457- 460, 2015.
[8] Eom Young-Hyun, Choi Young-Keun, Sungkuk Cho and Byungkook Jeon, “A Mechanism to identify Indoor or Outdoor Location for Three Dimensional Geofence,” The Journal of The Institute of Internet, Broadcasting and Communication (IIBC), vo. 16, Feb., pp.169-175, 2016.
[9] Young-Hyun Eom, Young-Keun Choi, Jinhyung Park, Byungkook Jeon, Sungkuk Cho and Byungchul Lim, “A Model of Geofence to provide Context-Awareness for the IoT(Internet of Things),” IJCC2016, pp. 148-149, 2016.
ICSSC 2017 International Conference on Software & Smart Convergence 269 page

[10] Eom Young-Hyun, Choi Young-Keun, Sungkuk Cho and Byungkook Jeon, “TemG : A Geofence Platform with Time-Limited Property,” The Journal of The Institute of Internet, Broadcasting and Communication (IIBC), vo. 16, Feb., pp.177-182, 2016.
[11] Byungkook Jeon, R. Young Chul Kim, “A System for detecting the Stray of Objects within User-defined Region using Location-Based Services,” IJSEA, pp.355-362, 2013.
[12] Charith Perera, Arkady Zaslavsky, Peter Christen and Dimitrios Georgakopoulos, “Context Aware Computing for The Internet of Things: A Survey,” IEEE Communications Surveys Tutorials, pp.1-44, 2013.
[13] J. Harding, “Vehicle-to-vehicle communications : Readiness of V2V technology for application,” nhtsa.gov, 2014.
270 page International Conference on Software & Smart Convergence ICSSC 2017

Proceeding� of� the� ICSSC� 2017
June� 2017� Publishing
� � � � � � � � � � Publisher /� JoonSeub� Cha� (President� of� KISM)
� � � � � � � � � � Editor /� InHo� Ra� (Kunsan� National� Univ.)
� � � � � � � � � � Publication /� Korean� Institute� of� Smart� Media
� � � � � � � � � � � � � � � � � � � � � � � � � � Tel� :� +82-62-655-3507
� � � � � � � � � � � � � � � � � � � � � � � � � � Website� :� http://kism.or.kr
� � � � � � � � � � � � � � � � � � � � � � � � � � E-Mail� :� [email protected]
� � � � � � � � � � Design & Editing /� HwaJeong� Lee(Researcher� of� KISM)
� � � � � � � � � � Sponsored by� FEFU-Far� Eastern� Federal� University,� Vladivostok,� Russia
� � � � � � � � � � � � � � � � � � � � � � � � Society� for� e-Business� Studies
� � � � � � � � � � � � � � � � � � � � � � � � Korea� BigData� Society