Embed Size (px)
Citation preview

See discussions, stats, and author profiles for this publication at: https://www.researchgate.net/publication/359691597
ICEES 2021 Book of Conference Proceedings
Conference Paper · November 2021
CITATIONS
0READS
4
2 authors, including:
Some of the authors of this publication are also working on these related projects:
EVALUATION OF LOW DENSITY POLYETHYLENE TEREPHTHALATE MODIFIED BITUMEN WITH MILLED CORN COB AS A PARTIAL REPLACEMENT FOR FILLER IN ASPHALTIC
CONCRETE View project
INVESTIGATING THE GEOTECHNICAL PROPERTIES OF CLAY-GRAVEL MIXTURES View project
Lukman Olaide Salami
Adeleke University
12 PUBLICATIONS 4 CITATIONS
SEE PROFILE
All content following this page was uploaded by Lukman Olaide Salami on 02 April 2022.
The user has requested enhancement of the downloaded file.

FACULTIES OF ENGINEERING AND
ENVIRONMENTAL SCIENCES
OSUN STATE UNIVERSITY
OSOGBO, OSUN STATE, NIGERIA
PROCEEDINGS
OF THE
2ND INTERNATIONAL CONFERENCE ON
ENGINEERING AND ENVIRONMENTAL SCIENCES
(ICEES)
(NOVEMBER 23-25, 2021)
THEME
RE-THINKING ENGINEERING AND
TECHNOLOGY FOR ENVIRONMENTAL
SUSTAINABILITY IN THE FACE OF GLOBAL
PANDEMIC
EDITORS: Alawode, K.O.; Ibrahim, R.B.; Adebanjo, A.U.

ICEES 2021 ISSN: 2714-4186
ii
© Faculties of Engineering and Environmental Sciences, Osun State
University, 2021
Proceedings of the 2ND International Conference on Engineering and
Environmental Sciences.
All rights reserved.
No part of this publication may be reproduced or stored in a retrieval
system, transmitted in any form or by any means, electronics, mechanical
photocopying, recording or otherwise without the prior permission of the
publishers.
Published in March 2022
ISSN: 2714-4186
Published by: Faculties of Engineering and Environmental Sciences, Osun
State University, Osogbo, Osun State, Nigeria.

ICEES 2021 ISSN: 2714-4186
iii
PREFACE
The second edition of the International Conference on Engineering and Environmental Sciences (ICEES 2021) was co-hosted by the Faculty of Engineering and the Faculty of Environmental Sciences of Osun State University, Osogbo from 23rd-25th November, 2021. The Conference with the theme, “Re-Thinking Engineering and Technology for Environmental Sustainability in the Face of Global Pandemic” took place at a time the world is still re-adjusting to life in the COVID/post-COVID-19 era. The conference which had both on-site and online participants from within and outside Nigeria provided opportunities to foster interactions and collaborations among members of academia, industries and stakeholders across the globe, with a view to proffering informed solutions to various technological and environmental challenges confronting Nigeria and the world at large.
ICEES 2021 brought to the fore, the need for a re-think on how to build our cities, especially as world is working towards exiting the COVID-19 pandemic era. Efficient technologies that make social distancing, regular hand-washing and vaccination possible with little or no stress were highlighted. The need for wider deployment of frontier technologies like Artificial Intelligence, Internet-of-Things, Drones and Unmanned Vehicles, Virtual Reality, Quantum Computing, Renewable Energy, Big Data Analytics, Nanotechnology and Technology-Enhanced Learning in a bid to achieve quick economic recovery, growth and adaptation; combat COVID-19 and improve public health; provide high quality education as well as reduce the global digital divide was emphasized. During the conference, local, national and international participants demonstrated various approaches to the solutions theoretically, empirically and numerically.
Having evaluated, revised and edited the various submissions by the participants to produce this publication, readers of this Conference Proceedings will find in it intellectual treasures. It is our hope that they will also derive from it, inspiration for areas of further research to expand the frontiers of knowledge and produce qualitative works to qualify for the next edition of the ICEES conference.
Finally, our immense appreciations go to the members of the local organizing committee as well as the local, national and international participants for using their time, energy and material resources to make the event worthwhile.
Engr. Dr. S.O.A. Olawale
Ag. Dean, Faculty of Engineering
ICEES 2021 ISSN: 2714-4186
iv
TABLE OF CONTENTS
ENGINEERING PROPERTIES OF WARM MIX ASPHALT MODIFIED WITH WASTE PLASTIC BOTTLE AND SACHET WATER: A REVIEW
Salami, L. O. and Bello, A. A. 1-9
PLASTICITY AND STRENGTH CHARACTERISTICS OF OKE-BALE LATERITIC SOIL TREATED WITH CALCIUM CHLORIDE SALT Ishola, K., Adeyemo, K. A., Yohanna, P., Etim, R. K., Sani, J. E. and Olawuyi, M. Y. 10-17
SYNTHESIS, EVALUATION AND OPTIMIZATION OF GREEN DEMULSIFIERS FOR CRUDE OIL/WATER DEMULSIFICATION
Olabiyi, B. S., Agbabiaka, H. O., Okweri, U. A, Oni, A. T. and Arinkoola, A. O. 18-27
EFFECT OF PLASTICITY AND BRITISH STANDARD LIGHT COMPACTIVE EFFORT ON THE LATERITIC SOIL STABILIZED WITH BAMBOO LEAF ASH ADMIXED WITH LIME
Ameen, I. O, Bello, A. A. and Oluwasola, E. A. 28-38
ANALYSIS OF AN ARTIFICIAL NEURAL NETWORK, ANN-BASED FREQUENCY CONTROL SYSTEM OF A THREE PHASE SELF-EXCITED INDUCTION GENERATOR
Badrudeen, T. U., Ayinde, T. O., Ariyo, F. K. and Ogunnigbo C. O. 39-47
ENHANCEMENT OF AMPLIFY AND FORWARD COOPERATIVE RELAY TECHNIQUE OVER NAKAGAMI FADING CHANNEL
Owolabi, D. E., Adeyemo, Z. K. and Ojo, S. I. 48-56
EFFECT OF SECONDARY USERS AND CLUSTERS ON ENERGY EFFICIENT COOPERATIVE SPECTRUM HOLE DETECTION IN A COGNITIVE RADIO NETWORK
Ojo, S. I. and Adeyemo, Z. K. 57-67
POTENTIALS FOR BIO-OIL PRODUCTION FROM SAWDUST IN SOUTHWEST NIGERIA
Okedere, O. B., Lasisi, H. O. and Adewale, S. A. 68-74
OPTIMAL PLACEMENT OF STATCOM USING FAST VOLTAGE STABILITY INDEX FOR POWER LOSS REDUCTION AND VOLTAGE PROFILE IMPROVEMENT
Ayanlade, S. O., Ogunwole, E. I. and Salimon, S. A. 75-85
ICEES 2021 ISSN: 2714-4186
v
RBF NEURAL NETWORK SURROGATE-ASSISTED NSGA-II FORSOLVING ECONOMIC ENVIRONMENTAL DISPATCH PROBLEM
Ajayi, S. A., Alawode, K. O. and Okedere, O. B. 86-97
DEVELOPMENT OF A MOBILE ROBOTIC SYSTEM FOR AIR POLLUTION DATA CAPTURE
Owolabi, O. O., Alawode, K. O., Olukayode O. and Ofoegbu, E. O. 98-106
IMPACT OF INFORMAL SECTOR ACTIVITIES ON THE BUILT ENVIRONMENT: IFE CITY, NIGERIA
Agbolade, O. O. 107-113
CHALLENGES AND RESPONSE OF RELEVANT AGENCIES TO LAND USE CHANGE IN ILORIN METROPOLIS, KWARA STATE, NIGERIA.
Asiyanbi, A. and Oloruntoba, A. O. 114-125
SUSTAINABLE HYDROPOWER GENERATION FOR HOMES USING ELEVATED WATER TANK
Oladejo, O. S., Adesokan, R. A., Yusuf, I. A. and Adenle, A. A. 126-135
PREDICTING THE BEHAVIOR OF RUBBERIZED MASONRY HOLLOW CONCRETE BLOCK WALLS UNDER THE ACTION OF LATERAL LOAD
Sanni, M.Y., Salami, A.A. and Ismail, U.A. 136-146
DYNAMIC MECHANICAL BEHAVIOUR OF RUBBERIZED MASONRY CONCRETE
Sanni, M.Y., Salami, A.A., and Ismail, U. A. 147-158
EXPERIMENTAL STUDY OF ADSORPTION OF METHYLENE BLUE SYNTHETIC WASTEWATER USING POLYMERIC COMPOSITE AS A LOW-COST ADSORBENT
Dauda, M. O., Alade, A. O., Afolabi, T. J., Araromi, D. O., Salam, K. K., Arinkoola, A. O., Adeniji, A.T., Atolagbe, R.O. and Olayiwola A.O. 159-168
AN ASSESSMENT OF THE USE OF ELECTRONIC DOCUMENT MANAGEMENT SYSTEMS IN THE NIGERIAN CONSTRUCTION FIRMS
Nathaniel, F., Lawal, F. M., Ibrahim, E. C. and Bello, A. S. 169-176
MANAGEMENT OF PUBLIC OPEN SPACES IN OSOGBO, OSUN STATE NIGERIA.
Ajayi, A. O., and Alonge, A. I. 177-185
DESIGN AND CONSTRUCTION OF MINI HYDRO-ELECTRIC POWER PLANT
ICEES 2021 ISSN: 2714-4186
vi
Oyelami S., Kayode O., Adeniyi R. A. and Adufe J. I. 186-194
MICROSTRUCTURAL AND CHEMICAL CHANGES IN CARBONATED SILICATE AND BASALT POROUS MEDIA
Rabiu, K. O and Das, D. B. 195-201
EXAMINATION OF OPERATIONS OF WATER VENDORS IN HAUSA COMMUNITIES IN IBADAN, NIGERIA
Adejumo, S. A. and Folorunso, T. 202-213
SPATIAL DISTRIBUTION OF COMMERCIAL BANKS IN OSOGBO, OSUN STATE
Yakubu, D. A., Ogundahunsi, D. S and Amos, C. 214-223
ADVANCING PROPERTY INVESTMENT RETURNS THROUGH IMPROVED URBAN NEIGHBOURHOOD INFRASTRUCTURE CONDITIONS IN JOS CITY
Adeogun, A. S., Shittu, W. O, Agava, H. Y. and Oladimeji, S. B. 224-234
DEVELOPMENT OF CATFISH HARVESTING MACHINE
Francis, A. A. and Dauda, S. M. 235-246
AN INVESTIGATION INTO SOUND PERFORMANCE OF LIFT SYSTEM CABINS OF SELECTED HIGH-RISE BUILDINGS IN ABUJA, NIGERIA
Ibrahim, E. C. and Manzuma, B. M. 247-254
CARBON DIOXIDE CAPTURE AND SEQUESTRATION: AN OVERVIEW OF THE CHALLENGES, POTENTIALS AND OPPORTUNITIES FOR CEMENT INDUSTRY IN NIGERIA
Adebanjo, A. U., Olonade, K.A. and Emmanuel, E. 255-269
ISOTHERM, KINETIC AND THERMODYNAMIC STUDIES OF MODIFIED FELDSPAR COMPOSITE IN THE HEAVY METALS ADSORPTION FROM WASTEWATER
Yakubu Yahaya, Murtala Maidamma Ambursa, Aminu Rabiu Koko
and Sanusi Kabir Adebayo 270-283
DEVELOPMENT OF CORDLESS POWER TRANSFER PACK FOR SMART CHARGING
Ajewole, T. O., Olaoye, B. O., Olabode, E. O., Akinyele, D. O. and Okakwu, I. G. 284-292
ADSORPTION OF CRYSTAL VIOLET ON RICE HUSK ACTIVATED CARBON
Nurudeen Salahudeen and Abdulkareem Alhassan 293-298
ICEES 2021 ISSN: 2714-4186
vii
MINERALOGICAL, MORPHOLOGICAL AND PHYSICOCHEMICAL CHARACTERIZATION OF ALKALERI CLAY
Nurudeen Salahudeen and Faisal Idris 299-303
COMPRESSIVE STRENGTH OF CONCRETE MADE WITH PALM KERNEL SHELL AS PARTIAL REPLACEMENT FOR SAND INCORPORATING SUPERPLASTICIZER
Kareem, M. A., Raheem, A. A., Ayanlere, S. A., Ige, A. I, Orogbade, B. O., Ibiwoye, E. O., Fatubarin, T., Yunus, S. and Ojo, O.Y. 304-313
CHALLENGES AND POSSIBILITIES OF HYBRID HYDROKINETIC/PHOTOVOLTAIC POWER GENERATION IN SELECTED COMMUNITIES ACROSS OSUN STATE
Oladepo, O., Lasisi, H., Ariyo F. K and Lawal, M. O. 314-323
THE APPLICATION OF GREEN TECHNOLOGIES IN COMPACTED SOILS USED FOR MUNICIPAL WASTE CONTAINMENT: A REVIEW
Adeyemo, K. A., Ishola, K., Bello, A. A. and Adewale, S. A. 324-332
EVALUATION OF LIGHTING ENERGY CONSUMPTION PATTERN AND COST BENEFIT OF LAMPS IN ACADEMIC INSTITUTION LECTURE HALLS USING FIELD MEASUREMENT APPROACH
Adeleke, J. S., Wahab, A. B., Omotehinshe, O. J. and Poopola O. C. 333-345
3D FLUID TRANSPORT IN LAYERED HETEROGENEOUS POROUS MEDIA
Alabi, O. O. and Akanni, I. A. 346-355
ESTIMATION AND CORRELATION OF REFERENCE EVAPOTRANSPIRATION USING DIFFERENT EMPIRICAL MODELS FOR OSOGBO, OSUN STATE NIGERIA.
Fadipe, O. O., Alawode, G. A., Thanni, M. O, Olawuyi O.A. and Bolorunduro, K.A 356-365
INAUGURATION OF KIFILIDEEN TRINOMIAL THEOREM OF NEGATIVE POWER OF – N BY EMPLOYING MATRIX AND STANDARDIZED TECHNIQUES
Osanyinpeju, K. L. 366-385
APPLICATION OF EXPANSION OF NEGATIVE POWER OF OF
KIFILIDEEN TRINOMIAL THEOREM FOR THE TRANSFORMATION OF COMPOUND FRACTION INTO SERIES OF PARTIAL FRACTIONS WITH OTHER DEVELOPMENTS
Osanyinpeju, K. L. 386-407
ICEES 2021 ISSN: 2714-4186
viii
A STUDY OF PUBLIC SECONDARY SCHOOLS STUDENTS AND TEACHING STAFF INDEX ANALYSIS IN OSUN WEST SENATORIAL DISTRICT, NIGERIA
Olayode, O., Ogundahunsi, D. S., Olayode, C., and Akintayo, A. O. 408-418
RESPONSE SURFACE OPTIMIZATION OF PRODUCTION OF DELONIX REGIA POD ACTIVATED CARBON FOR THE DECOLOURIZATION OF DYE-BURDENED EFFLUENT
Ajani, A. O., Ojo, I. A., Olu-arotiowa, O. A., Oladapo, J. A., Olayiwola, A. O., Akinsola, A. and Alade, A. O. 419-430
NANO-BASED DRILLING FLUIDS: A REVIEW
Jimoh, M. O., Arinkoola, A. O., Salawudeen, T. O., Olufayo, A. F., Bello, W. O. and Daramola, M. O. 431-440
HYDROTHERMAL ANALYSIS OF SQUEEZING NANOFLUID WITH HALL AND RADIATION EFFECT
Ilegbusi, A. O. and Akinbowale T. Akinshilo 441-454
OCCUPANCY RATIO AND RESIDENTS’ HEALTH IN URBAN RESIDENTIAL DENSITIES IN OSUN STATE, NIGERIA
Adedotun, D. O. 455-467
ANALYSIS OF THE CHALLENGES OF PHYSICAL PLANNING ADMINISTRATION IN NIGERIA
Oluwadare, O. A., Adedotun, S. B. and Ibrahim, R. B. 468-478
REVIEW OF ROAD NETWORK ANALYSIS BASED ON QUANTITATIVE AND QUALITATIVE APPROACH
Adeyanju D. O. *, Busari, A. A. and Bello, A. A 479-483
ANTIBACTERIA EFFECTS OF BITTER LEAF PLANT (VERNONIA AMYGDALINA), GROWN AT KAURA NAMODA AGAINST SELECTED PATHOGENS
Hassan, A.B, Adegboye, Y. and Tanko, H. A. O. 484-489
ANALYSIS OF ROAD TRAFFIC SITUATION IN SABO AND ATAKUMOSA MARKET ILESA, OSUN STATE NIGERIA
Ibrahim, R. B., ADEDOTUN, S. B., Ogundahunsi, D. S., and Ibironke, O. O. 490-504
RESIDENTIAL PROPERTY USE CONVERSIONS: THE LESSONS FROM AKURE RENTAL MARKET
Ankeli, I. A 505-514

ICEES 2021 ISSN: 2714-4186
ix
ATMOSPHERIC VARIABLES AND ITS IMPLICATION ON UHF RADIO SIGNAL; A CASE STUDY OF EMMANUEL ALAYANDE COLLEGE OF EDUCATION, OYO
Sheu, A. L. and Oladejo, O. P. 515-519
THE USE OF WEB SERVICES IN CLOUD COMPUTING INTEGRATION FOR BETTER ONLINE BUSINESS PRESENCE IN NIGERIA
Alabi, S., Odeniyi , O., Agboola, G. and Makinde, O. 520-528
REVIEW OF STABILIZATION AND SOLIDIFICATION CHARACTERISTICS OF AGRICULTURAL WASTE ASH TREATED HEAVY METALS CONTAMINATED LATERITIC SOIL
Adelowo, T.C and Bello, A.A. 529-538
ICEES 2021 ISSN: 2714-4186
1
ENGINEERING PROPERTIES OF WARM MIX ASPHALT MODIFIED WITH WASTE PLASTIC BOTTLE AND SACHET WATER: A REVIEW
Salami, L.O.1*and Bello, A.A.2
1Department of Civil Engineering, Adeleke University, Ede, Nigeria
2Department of Civil Engineering, Osun State University, Osogbo, Nigeria
*Email of Corresponding Author: [email protected]
ABSTRACT
This study reviews recent literature on the engineering properties of Warm Mix Asphalt (WMA) containing Waste Plastic Bottle (WPB) and Waste Sachet Water (WSW) as a modifier and as a partial replacement for conventional bitumen. The study summarizes various contributions elucidating the various WPB and WSW utilized, their growing production and usage, WPB and WSW material preparation and treatment, physical composition and different engineering test methods adopted by previous studies such as Penetration, Softening point, Ductility, Viscosity, Flash and fire point, Loss on heating, Specific gravity, Stability and Flow. This study showed a significant improvement in the engineering properties of WPB modified WMA compared to the unmodified sample. The review also showed that WPB and WSW improve the engineering properties of warm mix asphalt when they were used separately. Furthermore, the sasobit manufacturer recommended a 3% addition of sasobit to bitumen when aiming at maximum temperature reduction and to achieve optimum performance. Previous researchers adopted the sasobit manufactures recommendation which reduces the production temperature of asphalt concrete by 30 oC. Therefore, it is recommended that further studies should use WSW and WPB in a combined form for use as a modifier in improving WMA. Also, further study should vary the percentage of sasobit to be blended with bitumen in other ascertain the modification that is most suitable for Nigeria’s condition using the locally available materials in asphalt production
Keywords: WPB; WMA; Engineering Properties; Modified; Unmodified; WSW.
1.0 INTRODUCTION
In Nigeria, Waste Plastic Bottles (WPB) is extensively used to package portable water and soft drinks while Waste Sachet Water (WSW) is used to package portable water. WPB and WSW are found everywhere in today's lifestyle, and it indeed constitutes a significant portion of municipal waste in Nigeria, ranging from 7 – 14 % by weight (Adetunji and Illias, 2010; Babatunde et al., 2013 and Benjamin et al., 2014). Similarly, in research carried out by Dhoke et al. (2020), it was discovered that WPB and WSW constitute 12.7 % of total waste produced, and they cannot be disposed of by discarding or burning, as they produce unrestrained fire or contaminate the soil and vegetation.
Burning and land-filling WPB and WSW are not environmentally friendly and sustainable because the process releases smoke, carbon dioxide, carbon monoxide and nitrous oxide, which are major contributors to global warming and methane (Amaniampong, 2015; Appiah et al., 2017; Tulashie and Boadu, 2020). Moreover, it was reported by Quartey et al. (2015), that livestock animal dies and gets choked as they diet plastic materials in the environment while choked gutters with WPB and WSW becomes a fertile breeding ground for mosquitoes and other

ICEES 2021 ISSN: 2714-4186
2
pathogenic organisms infesting the general populace with malaria attended health challenges like epidemic cholera, dysentery among others via food and water contaminations (Miezah et al., 2015; Douti et al., 2017; Kumi-Larbi et al., 2018).
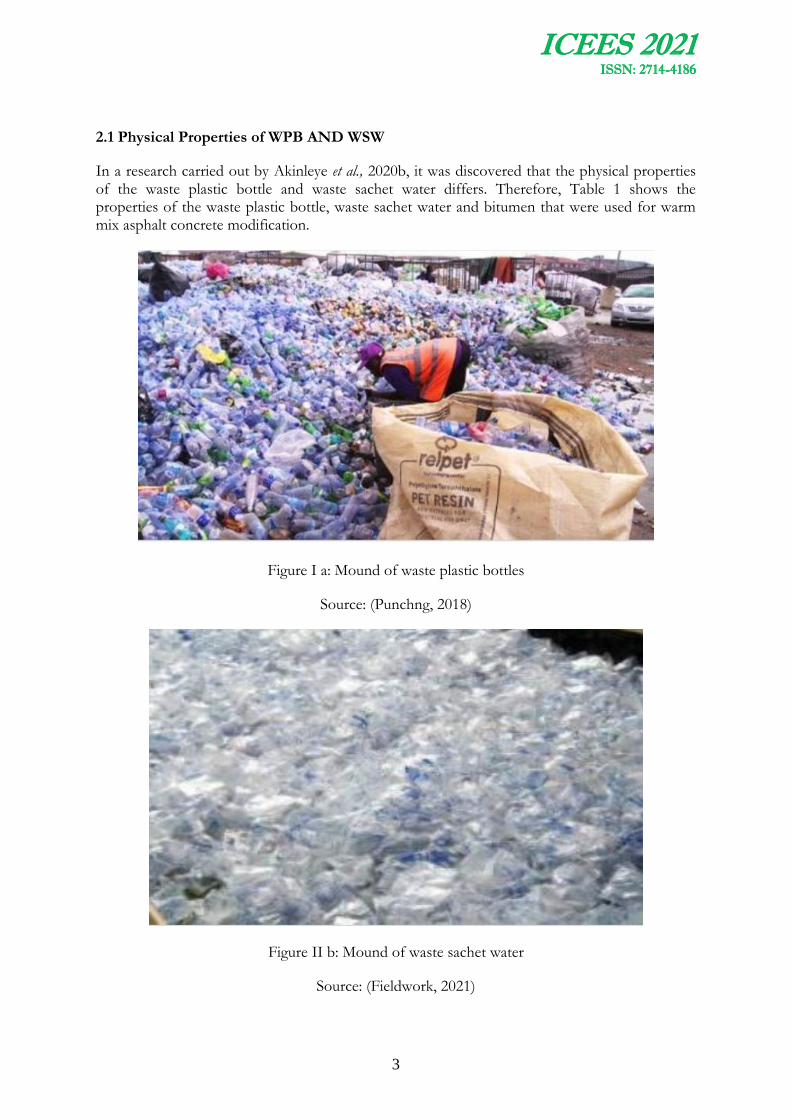
Several studies have shown that WPB and WSW are non-biodegradable materials and can remain on the surface of the earth once there is no special treatment and thus accumulates after that (Ahmadinia et al., 2012; Kalantar et al., 2012; Dahunsi et al., 2013; Awaeed et al., 2015; Ajagbe et al., 2020; Akinleye et al., 2020a). Figure I a shows mound of waste plastic bottles at a landfill in Nigeria while Figure II b indicates a mound of waste sachet water at a landfill in Nigeria.
There is a need for the highway construction industry to use cheaper and locally available materials to reduce over-reliance on natural resources and construction costs for sustainable development. Several researches have been done on modifying asphalt with WPB and WSW, and their findings showed that there was an improvement in the engineering properties of conventional bitumen (Kalantar et al., 2010; Jain et al., 2011; Osuolale and Agbalaya, 2012; Dahunsi et al., 2013; Awaeed et al., 2015; Ajagbe et al., 2018; Ajagbe et al., 2020; Akinleye et al., 2020a; 2020b).
Hill (2011) classified asphalt based on the production temperature as Hot Mix Asphalt (HMA) having a temperature above 140 oC and Warm Mix Asphalt (WMA) having a temperature between 100 oC – 140 oC. HMA is produced at a temperature above 140 oC to ensure optimum workability of the HMA mixes and adequate coating of aggregates, filler and binder. However, the production of HMA results causes intolerable high energy consumption, occupational health hazard and environmental discomfort due to the release of harmful gaseous emissions such as CO2 and SO2.
WMA is a sustainable paving technology used by the HMA industry to reduce the production temperature, gaseous emissions, paving temperature and improve the working conditions (Hill, 2011; Rashwan, 2012; Guo et al., 2014; Akinleye et al., 2020a; 2020b). Diab et al. (2016) discovered that WMA technology reduces the production and paving temperatures of asphalt concrete mixtures between 20-30 oC. According to Hill (2011), WMA can reduce production costs and environmental impacts by reducing fuel consumption and emissions. From the review of literatures, it was discovered that there are certain additives used in the production of warm mix asphalt. The additive is referred to as sasobit. It is a granulate material. The manufacturer recommended that a 3 % addition of sasobit yields the best result when aiming at a maximum temperature reduction of 30 oC. This study would help in reducing WPB and WSW in our environment; it will also help in reducing high energy consumption, environmental discomfort, and occupational health hazard which is generated from the production and paving of HMA.
2.0 PREPARATION AND TREATMENT OF WPB AND WSW
There are two ways of modifying an asphalt concrete with WPB and WSW namely; the wet and dry method. The wet method involves dissolving the WPB and WSW. The dissolved WPB and WSW were then used in modifying the asphalt concrete. The dry method of modification involves shredding the WPB and WSW. The shredded WPB and WSW were then used in modifying the asphalt concrete. A review of the literature reveals that WPB and WSW are non-biodegradable and thereby accumulate. In addition, there are three methods of treating the WPB and WSW namely; reducing, reusing and recycling. The most viable option is to recycle the polymers.
ICEES 2021 ISSN: 2714-4186
3
2.1 Physical Properties of WPB AND WSW
In a research carried out by Akinleye et al., 2020b, it was discovered that the physical properties of the waste plastic bottle and waste sachet water differs. Therefore, Table 1 shows the properties of the waste plastic bottle, waste sachet water and bitumen that were used for warm mix asphalt concrete modification.
Figure I a: Mound of waste plastic bottles
Source: (Punchng, 2018)
Figure II b: Mound of waste sachet water
Source: (Fieldwork, 2021)

ICEES 2021 ISSN: 2714-4186
4
Table I: Properties of Waste Plastic Bottle, Waste Sachet Water and Bitumen (Akinleye et al., 2020b)
PROPERTY DETAILS
WSW WPB BITUMEN
Type shredded water sachet shredded plastic water bottle VG-30 Color White White Black
Material Low density Polyethylene (LDPE)
High density Polyethylene (HDPE)
Size (mm) - 15.00-25.00 Density (g/cm3) 0.92 1.38 0.98
Melting point (°C)
105 260 -
Penetration - - 60-70dmm Temperature - - 25°C
3.0 MIX COMPOSITION
This is the quantity of each component of WPB, WSW and sasobit mixed with a certain measure of asphalt concrete. In a research carried out by Akinleye et al., 2020b, 1%, 3%, 5%, 7%, 9%, 11%, 13%, 15% and 17% percentage modifications of dissolved waste plastic bottles were used to modify asphalt concrete. Also, a 3% addition of sasobit was in accordance with the manufacturer’s recommendation when aiming at a maximum temperature reduction of 30 oC was used to produce the warm mix asphalt. Similarly, Jamshidi et al. 2012 investigated the effects of Sasobit content on the rheological characteristics of un-aged and aged asphalt binders at high and intermediate temperatures. A 3% addition of sasobit was also adopted in their research. Furthermore, Ajagbe et al. 2020 investigated the effect of waste polymer modified bitumen with milled corn cob as a partial replacement for filler in asphaltic concrete. The following percentage modifications were used for the study; 5%, 10%, and 15%.
4.0 ENGINEERING PROPERTIES OF WMA MODIFIED WITH WPB AND WSW
4.1 Penetration
Akinleye et al., 2020b stated that the results of penetration values of plain bitumen decrease with an increase in the dissolved plastic bottle content for both hot and warm mix asphalt. The penetration values for 0, 1, 3, 5, 7, 9, 11, 13, 15 and 17% dissolved plastic bottle addition were 77, 75, 73, 71, 67, 61, 56, 52, 45 and 40 mm for hot mix asphalt and 77, 71, 69, 68, 68, 64, 61, 58, 52 and 49 mm for mix asphalt respectively. Furthermore, Ajagbe et al., 2020 reported that the penetration values of the 0% (control), 5%, and 10% modifications were found to fall within the range specified by the Federal Ministry of Works General specifications for roads and bridges,
1997. The reduction in the penetration values indicates an increase in stiff ness of the modified bitumen with an increase in plastic content, a condition which was also reported by Essawy et al., 2013 and Fang et al., 2013.

ICEES 2021 ISSN: 2714-4186
5
4.2 Softening Point
Essawy et al., 2013; Fang et al., 2013; Ajagbe et al., 2020; Akinleye et al., 2020b reported that the softening point values increase with an increase in dissolved waste plastic content. It was concluded that the higher the softening point, the more stable the asphalt is at a high temperature. This implies that the waste plastic bottle content in modified bitumen improved the high-temperature stability of the asphalt.
4.3 Ductility
Essawy et al., 2013; Fang et al., 2013; Ajagbe et al., 2020; Akinleye et al., 2020b reported that the ductility values were found to decrease with an increase in WPB contents. The ductility test results show that the addition of waste plastic bottles reduces the ductility property of the asphalt cement.
4.4 Viscosity
Akinleye et al., 2020b reported that there was a decrease in the values of viscosity as the WPB content increased. It was concluded that the decrease in the viscosity values of warm mix asphalt could be due to the addition of Sasobit. Similarly, in research conducted by Ajagbe et al., 2020, it was also reported that there was a decrease in the values of viscosity as the WPB content increased.
4.5 Flash and Fire Point
Ajagbe et al., 2020; Akinleye et al., 2020b reported that the flash and fire point values increase with an increase in WPB contents. All values obtained for the various percentage modifications conform with the Federal Ministry of Works General specifications for roads and bridges, 1997.
4.6 Loss on Heating
Ajagbe et al., 2020 reported that the loss on heating values increases with an increase in WPB contents. All values obtained for the various percentage modifications conform with the Federal Ministry of Works General specifications for roads and bridges, 1997.
4.7 Specific Gravity
Ajagbe et al., 2020; Akinleye et al., 2020b reported that the specific gravity values increase with an increase in WPB contents. These values satisfied the requirement of Federal Ministry of Works General specifications for roads and bridges, 1997 and ASTM standard.
4.8 Stability
Akinleye et al., 2020b reported that the stability values of WMA increase as the amount of dissolved plastic bottles increases up to a maximum level of 7% before it started decreasing. This shows that to get the highest stability, a dissolved plastic bottle can be used up to 7% in WMA. The stability of WMA satisfied the requirement of the Federal Ministry of Works General specifications for roads and bridges, 1997 (≥3.5).
4.9 Flow
Akinleye et al., 2020b reported that the flow values decrease from 0 to 7% DPB addition for Hot Mix Asphalt (HMA) before increasing again but the highest flow was at 15% dissolved plastic
ICEES 2021 ISSN: 2714-4186
6
bottles. In the case of WMA, the flow values were lower than that of HMA. It decreases up to 11% DPB addition before increasing to a maximum of 12.2 mm at 17% dissolved plastic bottles. However, the flow for both HMA and WMA satisfied the requirement of 8 – 16 mm flow stated in the Federal Ministry of works standard.
5.0 WPB AND WSW FOR ASPHALT MODIFICATION
The use of WPB and WSW is advantageous to the environment. Modifying conventional asphalt with WPB and WSW can reduce land-fill waste and save natural resources from extinction.
Khan and Gundaliya (2012) stated that the modification of bitumen with waste polyethylene enhances resistance to cracking, pothole formation and rutting by increasing softening point, hardness and reducing stripping due to water, thereby improving the general performance of roads over a long period. According to them, the waste polymer utilized in the mix forms a coating over the mixture's aggregates, reducing porosity, absorption of moisture, and improving the binding property.
Swami et al. (2012) investigated that the total material cost of the project is reduced by 7.99% with the addition of plastic to bitumen between the ranges of 5 % to 10 %. It was concluded that by modification of bitumen, the problems like bleeding in hot temperature regions and sound pollution due to heavy traffic are reduced, and it ultimately improves the quality and performance of the road.
Pareek et al. (2012) carried out an experimental study on conventional bitumen and polymer modified binder and observed a significant improvement in rutting resistance, indirect tensile strength and resilient modulus of the bituminous concrete mix with polymer-modified bitumen. It was concluded that polymer-modified bitumen results in a high elastic recovery (79 %) and better age resistance properties.
Dahunsi et al, (2013) investigated the properties of Pure Water Sachet (PWS) modified bitumen. The test results showed that PWS influences more on the penetration of the modified sample with the increase in the viscosity of the bitumen, as can be observed by the decrease in the value of penetration with the increase in the concentration of PWS. The penetration index values of Samples 2.5 % PWS and 7.5 % PWS make them classified as blown bitumen. The P.I. value of Sample 5 % PWS makes it less susceptible to temperature changes and classified as oxidized bitumen.
6.0 LIMITATION OF THE CURRENT STUDY AND FUTURE IMPROVEMENT
Based on the review, previous researchers have focused on using WPB and WSW separately for asphalt modification. Also, the current study adopted the 3% addition of sasobit in the production of warm mix asphalt which was recommended by the sasobit manufacturer. This paper hence recommends that further studies should make use of WSW and WPB in a combined form for use as a modifier in improving WMA in other to maximize the utilization of those wastes. Furthermore, future studies should vary the percentage of sasobit to be blended with bitumen in other ascertain the modification that is most suitable for Nigeria’s condition using the locally available materials in asphalt production
7.0 CONCLUSION
This paper reviewed the contribution of WPB and WSW sourced in Nigeria to improve warm mix asphalt performance. The study summarizes various contributions elucidating the various
ICEES 2021 ISSN: 2714-4186
7
WPB and WSW utilized, their growing production and usage, WPB and WSW material preparation and treatment, physical composition and different engineering test methods adopted by previous studies such as Penetration, Softening point, Ductility, Viscosity, Flash and fire point, Loss on heating, Specific gravity, Stability and Flow in other to assess the effectiveness of WPB and WSW in WMA production. This study showed that there was a significant improvement in the engineering properties of WPB and WSW modified WMA compared to the unmodified sample. Moreover, the review showed that WSW and WPB improved the engineering properties of bitumen when they were used separately. Furthermore, the review showed that the use of WPB and WSW is more appropriate to reduce over-reliance on natural resources and construction costs for sustainable development. This led to a reduction in environmental pollution associated with waste generated from plastic bottles and sachet water. Reusing WPB and WSW helps to reduce the overreliance on natural resources, thereby saving them from extinction.
REFERENCES
Adetunji, M. B. and Ilias, B. M. (2010). Externality Effects of Sachet Water Consumption and the Choice of Policy Instruments in Nigeria: Evidence from Kwara State. Journals of Economics, 1 (2): 113-131
Ahmadinia, E., Majid Z., Mohamed R., Mahrez A., and Payam, S. (2012). Performance evaluation of utilization of waste Polyethylene Terephthalate (PET) in stone mastic asphalt. Construction and Building Materials. 36 (6): 984-989.
Ajagbe, W.O., Salami, L.O., Akinleye, M.T., and Salami, M.O. (2020). Effect of Waste Polymer Modified Bitumen with Milled Corn Cob as a Partial Replacement for Filler in Asphaltic Concrete. Journal of Research Information in Civil Engineering, 17 (1): 3003-3017.
Ajagbe, W.O., Salami, L.O., Salami, M.O., Balogun, L.A., Akinleye, M.T. (2018) Evaluation of Low-Density Polyethylene Terephthalate Modified Bitumen with Milled
Corn Cob as a Partial Replacement for Filler in Asphaltic Concrete. Conference
Proceedings: 17th National Conference of the Nigerian Institution of Environmental Engineers, NIEE.17.007, Ogba Lagos, Nigeria, 25th October, 2018 pp. 46-56.
Akinleye, M.T., Jimoh, Y.A. and Salami, L.O. (2020a). Marshall Properties Evaluation of Hot and Warm Asphalt Mixes Incorporating Dissolved Plastic Bottle Modified Bitumen. Journal of Materials and Engineering Structures, 7(3): 439-450.
Akinleye, M.T., Salami, L.O., Okpidi, A.O., Ayeni, I.M. and Laoye, A.A. (2020b). The Study of Rheological Properties of Bitumen Blends Modified with Dissolved Plastic Water Sachet, LAUTECH Journal of Engineering and Technology, 14(1): 21-30.
Amaniampong, S. B. (2015). Developing an option for sustainable plastic waste management in Ghana: a case study of Sunyani Municipality, Ghana. MSc Thesis Submitted to the Polymer Science and Technology Department, Kwame Nkrumah University of Science and Technology, Kumasi, Ghana.
Appiah, J. K., Berko-Boateng, V. N. and Tagbor, T. A. (2017). Use of waste plastic materials for road construction in Ghana. Case Study in Construction Materials 6: 1–7.
ASTM D70-03, (2003). Standard Test Method for Specific Gravity and Density of Semi-Solid Bituminous Materials (Pycnometer Method), ASTM International, West Conshohocken, PA.
ICEES 2021 ISSN: 2714-4186
8
Awaeed, K.M., Fahad, B.M., and Rasool, D.A., (2015). Utilization of Waste Plastic water Bottles as a Modifier for Asphalt Mixture Properties, Journal of Engineering and Sustainable Development, 19(2): 89-108.
Babatunde B. B., Vincent-AkpuI. F., Woke G. N., Atarhinyo E., Aharanwa, U.C., Green, A. F., Isaac-Joe O. (2013). Comparative analysis of municipal solid waste composition in three local government areas in Rivers State, Nigeria. African Journal of Environmental Science and Technology. 7(9): 874-881.
Benjamin, T. A., Emmanuel, E. O. and Gideon, A. D. 2014. Characterization of Municipal Solid Waste in the Federal Capital Abuja, Nigeria. Global Journal of Science Frontier Research: H Environment & Earth Science. 14(2): 1 - 6.
Dahunsi B. I. O., Awogboro O.S., Akinpelu M., and Oladipupo S. Olafusi O.S. (2013). Investigation of the Properties of Pure Water Sachet Modified Bitumen. Journal of Civil and Environmental Research. 3(2): 47-61.
Dhoke, A., Shingne, N., Rana, A., Murodiya, P., and Nimje, S. (2020). Reuse of PET waste plastic in paver blocks. International Research Journal of Engineering and Technology. 7(4): 320-332.
Diab, A., Sangiorgi, C., Ghabchi, R., Zaman, N., Wahaballa, A.M., (2016). Warm Mix Asphalt Technologies: Benefits and drawbacks, Journal of Pavement and Engineering, 9 (12): 1145-1154.
Douti, N. B., Abanyie, S. K. and Ampofo, S. (2017). Solid waste management challenges in urban areas of Ghana: a case study of Bawku Municipality. International Journal of Geosciences 8(4): 494–513.
Essawy, A.I., Saleh, A.M.M., Zaky, M.T., Farag, R.K., & Ragab, A.A. (2013). “Environmentally friendly road construction. Egyptian Journal of Petroleum”, 22, 189–198.
Fang, C., Yu, R., Li, Y., Zhang, M., Hu, J., and Zhang, M. (2013). “Preparation and characterization of an asphalt modifying agent with waste packaging polyethylene and organic montmorillonite”, Polymer Testing, 32, 953–960.
Federal Ministry of Works. (1997). General Specifications (Roads and Bridges) Lagos, Nigeria, Vol. 11.
Guo, N., You, Z., Zhao, Y., Tan, Y., and Diab, A. (2014). Laboratory performance of warm mix asphalt containing recycled asphalt mixtures. Construction and Building Materials, 64(4): 141–149. doi:10.1016/j.conbuildmat.2014.04.002
Hill, B. (2011). Performance Evaluation of Warm Mix Asphalt mixtures Incorporating Reclaimed Asphalt Pavement, M.Sc. Thesis, submitted to Civil Engineering Department, University of Illinois, Urbana, Illinois, United States of America.
Jain, P.K., Kumar, S. and Sengupta, J. B. (2011). Mitigation of Rutting in Bituminous Roads by use of Waste Polymeric Packaging Materials. Indian Journal of Engineering & Materials Sciences, 18 (3): 233-238.
ICEES 2021 ISSN: 2714-4186
9
Jamshidi, A., Hamzah, M.O., Aman, M.Y. (2012). Effects of Sasobit content on the rheological characteristics of un-aged and aged asphalt binders at high and intermediate temperatures. Journal of Material Resources, 15 (4): 1–11.
Kalantar, Z. N., Karim, M. R. and Mahrez, A. (2012). A review of using waste and virgin polymer in pavement. Construction and Building Materials. 33(4): 55-62.
Kalantar, Z.N., Mahrez, A. and Karim, M.R., (2010). Properties of Bituminous Binder Modified with Waste Polyethylene Terephthalate, MUTRFC 2010: Proceedings of Malaysian Universities Transportation Research Forum & Conferences, 21 December 2010, University Tenaga Nasional, Malaysia
Khan, I. and Gundaliya, P.J. (2012). Utilization of Waste Polyethylene Materials in Bituminous Concrete Mix for Improved Performance of Flexible Pavements, Journal of Applied Research, 1(12): 85-86.
Kumi-Larbi, A., Yunana, D., Kamsouloum, P., Webster, M., Wilson, D. C. and Cheeseman, C. (2018). Recycling waste plastics in developing countries: use of low-density polyethylene water sachets to form plastic bonded sand blocks. Journal of Waste Management 80: 112–118.
Miezah, K., Obiri-danso, K., Kádár, Z., Fei-baffoe, B., and Mensah, M. Y. (2015). Municipal solid waste characterization and quantification as a measure towards effective waste management in Ghana. Journal of Waste Management. 46: 15–27.
Osuolale, O.M. and Agbalaya, K.S. (2012). Influence of Shredded Waste Water Sachet on Engineering Properties of Asphalt, Journal of Natural Sciences Research, 2 (10): 134-140.
Pareek, A., Gupta, T. and Sharma, R.K. (2012). Performance of Polymer Modified Bitumen for Flexible Pavements, International Journal of structural and Civil Engineering Research, 1 (1): 1-10.
Punchng (2018). Plastic pollution: Nigeria untapped waste wealth fuels environmental disaster. Available online https://punchng.com/plastic-pollution-nigerias-untapped-waste-wealth-fuels-environmental-disaster/
Quartey, E. T., Tosefa, H., Danquah, K. A. B. and Obrsalova, I. (2015). Theoretical framework for plastic waste management in Ghana through extended producer responsibility: case of sachet water waste. International Journal of Environmental Research Public Health 12(8) 9907–9919.
Rashwan, M. H. (2012). Characterization of Warm Mix Asphalt (WMA) performance in different asphalt applications, Unpublished Ph.D. Thesis, submitted to Civil Engineering Department, Iowa State University, Ames, Iowa, Capstone.
Swami, V., Jirge, A., Patil, K., Patil S., Patil, S. and Salokhe, K. (2012). Use of Waste Plastic in Construction of Bituminous Road. International Journal of Engineering Science and Technology, 4(3): 2351- 2355.
Tulashie, S. K. and Boadu, E. K. (2020). Plastic wastes to pavement blocks: A significant alternative way to reducing plastic wastes generation and accumulation in Ghana. Journal of Construction and Building Materials. 24(1): 118044.

ICEES 2021 ISSN: 2714-4186
10
PLASTICITY AND STRENGTH CHARACTERISTICS OF OKE-BALE LATERITIC SOIL TREATED WITH CALCIUM CHLORIDE SALT
Ishola, K 1., Adeyemo, K.A 1., Yohanna, P 2., Etim, R. K3., Sani, J. E.4 and Olawuyi, M.Y.5
1Department of Civil Engineering, Osun State University, Osogbo, Osun State, Nigeria.
2Department of Civil Engineering, University of Jos, Plateau State, Nigeria
3Department of Civil Engineering, Akwa Ibom State University, Ikot Akpaden, Nigeria. 4Department of Civil Engineering, Nigeria Defense Academy, Kaduna, Nigeria.
5Department of Civil Engineering, Federal Polytechnic Offa, Kwara State, Nigeria Email of Corresponding Author:: [email protected]
ABSTRACT This paper investigated the effect of calcium chloride salt (CCS) on the selected Oke bale lateritic soil in Osogbo, Osun State for use as a pavement material in highway construction. The laboratory tests considered in this study were specific gravity, particle size distribution, Atterberg limits, compaction (British Standard Light), unsoaked California bearing ratio (CBR) for the unmodified and stabilized lateritic soil. The lateritic soil was mixed with different concentrations of calcium chloride salt of 0, 4, 8, 12 and 16% and results were analysed using Analysis Toolpak incorporated in Microsoft excel 2013 package. The study revealed that natural lateritic soil contains fine particles, as defined by the American Association of State Highway Officers. Furthermore, plasticity index decreased from 14.68% of the natural soil to 11.49% at 12% CCS content and later increased to 15.6 % at 16% CCS content while the liquid limit of natural lateritic soil reduced from 60.05% up to 35.55 at 16% CCS content. The maximum dry density of untreated lateritic soil decreased from 1.63 Mg/m3 to 1.45 Mg/m3 at 4% CCS content and thereafter increased to 1.97 Mg/m3 up to 16% CCS content. The corresponding optimum moisture content increased from 19.47% to 24.0% at 4% and later decreased up to 16% CCS. The unsoaked CBR value of the unmodified lateritic soil increased from 13.22 to 24.65% at 8% CCS contents. Analysis of variance on the lateritic-CCS mixture for the entire test were statistically significant except MDD and CBR which were not significant and showed a significant increase, on the 0.05 significance level. Based on the results of the CBR, 8% CCS - lateritic soil could be used to improve subgrade sections of low-traffic roads. Keywords: Compaction, Lateritic soil, Calcium chloride salt, California bearing ratio, Particle size
distribution. 1.0 INTRODUCTION Compaction and plasticity are properties that are commonly used by geotechnical engineers for the determination of densification and workability of soil to be used for construction purposes. Strength determination involves the application of mechanical energy for the improvement of the soil's properties. However, densified soil particles are reorganized, reducing the void ratio and limit water movement in the soil matrix (Alhassan and Mustapha, 2017). This technique is widely used in the construction of embankments, such as dams and roadways (Ishola et al., 2019). Laterite is a type of soil that forms as a result of weathering process that allows for laterization and it is commonly found in the leached soils of the humid tropics (Alhassan and Mustapha, 2017; Oke and Olowoyo, 2019). The presence of iron and aluminum in laterite allows it to form in hot, humid tropical climates (Oluremi et al., 2016). Furthermore, due to the presence of significant iron oxide content, most lateritic soils have a rusty red colouration (Alhassan and Mustapha, 2017). However, it is a common soil material utilized by engineers in Nigeria and other regions of the country to construct road pavements. The presence of cementing agents
ICEES 2021 ISSN: 2714-4186
11
(sesquioxides) in a lateritic soil makes it valuable as a construction material (Joel and Agbede, 2011). Some lateritic soils contain excessive clay minerals, compromising its strength and stability, as well as its ability to withstand the intended traffic load. These categories of laterites are usually known for their behaviors such as swelling or expansion, depressions, and lateral movement (Obeahon 1993). When compared to lateritic soils containing mostly kaolinite and chlorite minerals, some laterite soils contain swelling clay minerals such as illite and montmorillonite, which reduce shear strength, raise pore pressure, and increase swelling potential (Gidigasu, 1976). Some lateritic soils are lacking engineering qualities for use as sub-base and base materials in road pavements due to the presence of such clay minerals (Francis and Venantus, 2013). This prompts researchers to look for various ways to improve the geotechnical properties of soils, particularly those that have been proven to be problematic for use in construction (Joel and Agbede, 2011, Ishola et al., 2019). Cement, lime, and bitumen are some of the traditional soil-improvement additives that have been used, but they have not proven to be cost-effective. This draws the attention of researchers to wastes locally sourced from industry and agriculture such as iron ore tailing, steel slag, locust bean, rice husk ash, plantain peel ash among others (Ishola et al., 2019; Oluremi et al., 2017). Calcium chloride is an inorganic salt created as a byproduct of the sodium carbonate production process. Calcium chloride was chosen over lime because "it is easier to make into calcium charged supernatant than lime (Petry and Amstrong, 1989). Hausmann (1990) discussed the use of environmentally friendly calcium chlorides as a dust suppressant on unpaved roads, haul roads in mining, and as a secondary additive to increase the strength of soils treated with cement or lime. According to Shon et al. (2010), treating soil with calcium chloride increases the density and strength of compacted soil. According to Zumrawi and Eltayeb (2016), increasing CaCl2 content increases dry density and decreases optimal moisture content, resulting in increased strength. Sani et al., (2018) also reported that CaCl2 improved the geotechnical properties of lateritic soil collected at Shika, Zaria. However, there is limited research on the use of CaCl2 to improve Oke bale lateritic soil. Therefore, this study aimed at investigating the effect of strength and plasticity characteristics of the lateritic soil mixed with CaCl2. This study will also add to limited investigation and data on the use of CaCl2 for soil improvement. 2.0 MATERIALS AND METHODS 2.1 Materials 2.1.1 Lateritic soil The lateritic soil utilized for this work was gathered from Oke bale area Osogbo, Osun State, Nigeria. According to (Bello et al., 2015), the original material in the study area is a basic igneous rock that weathers into weakly developed lateritic soils. 2.1.2 Calcium chloride The calcium chloride was obtained at a chemical laboratory shop in Osogbo. 2.2 Methods of Testing The laboratory tests conducted on the natural soil include particle size distribution, Atterberg limit, compaction, CBR and UCS. Properties of the natural lateritic soil were tested using (BS 1377, 1990) and the stabilized tests in line with (BS 1924, 1990) procedures. California Bearing Ratio (CBR) tests were established at the optimum moisture contents (OMC) and maximum dry densities (MDD). British Standard Light (BSL) compactive efforts were utilized for soil-CaCl2.

ICEES 2021 ISSN: 2714-4186
12
The tests especially CBR were guided as stated in the (Nigerian general specification, 1997). The compacted soil samples were allowed to cure for six days prior to testing at a steady stacking rate. 2.2.1 Atterberg limits The liquid limit test was performed using Cassagrande apparatus in accordance with (BS.1337,1990). The plastic limit test was carried out in accordance with (BS.1337,1990).The purpose of these tests was to see how the addition of calcium chloride salt affect the consistency limits of the soil samples. 2.2.2 California bearing ratio The compacted sample was placed in a mould with a volume of 2360 cm3 and kept in a sealed plastic bag for 6 days to cure before being immersed in water for 24 hours and tested according to the (BS 1377, 1990) procedures. The California bearing ratio (CBR) is calculated using the plunger's force and the depth of penetration into the specimen to determine the relationship between force and penetration. A force-versus-penetration curve was calculated using the recorded penetration and force values. The CBR of lateritic soil – CaCl2 mixture was calculated at 2.5 mm and 5.0 mm penetrations, with the CBR value obtained at 2.5 mm penetration being used for the calculation. 3.0 RESULTS AND DISCUSSION 3.1 Soil Index Properties The soil was characterized by the following tests: Particle size analysis, Specific gravity of soil solids, liquid limit, plastic limit, plasticity index,moisture-density relationships, unconfined compressive strength; and California bearing ratio. Figure 1 shows the Particle size distribution curve of natural soil. A synopsis of the soil properties (Table 1) and the Physiochemical composition of Lateritic soil is shown in Table 2. 3.2 Atterberg Limits The Atterberg limits of CaCl2- lateritic soil mixture is shown in Figure 2. as the CaCl2 treatment increased with a corresponding decrease in the liquid limits (LL), plastic limits (PL), and plasticity index (PI). The liquid limit and Plastic limit decreased from 60.05 to 35.55%; 45.37 to 17.95% up to 16% CaCl2 content respectively. The plasticity index initially decreased from 14.68 to 11.49% at 12% CaCl2 content; thereafter, further addition of CaCl2 increased the PI to 15.6%. The possible reason for these results was attributed to the complete chemical hydration of CaCl2 in the lateritic soil mixture which resulted in the aggregation and cementation of particles into larger clusters (Chew et al. 2004; Osinubi et al. 2012).
Table 1: Index properties of the natural soil
Properties Quantity
Natural Moisture Content (%) 19.3 Specific Gravity 2.67 Liquid Limit (%) 60.05 Plastic Limit (%) 45.37 Plasticity Index (%) 14.68 Linear shrinkage (%) 8.6 Percentage Passing BS No 200 Sieve 37.14 AASHTO Classification USCS Classification
A-7-6 (5) CL
Optimum Moisture Content (%) 19.47 Maximum dry density, Mg/m3 1.63

ICEES 2021 ISSN: 2714-4186
13
Table 2: Physiochemical Composition of Lateritic soil
Oxide Composition Lateritic Soil
SiO2 35.60
Al2O3 27.40 Fe2O3 24.0 P2O5 - SO3 0.85 K2O - TiO2 - MnO 2.00 Na2O - CuO - CaO 0.28 ZnO 0.09 MgO -
Loss of Ignition 14.6
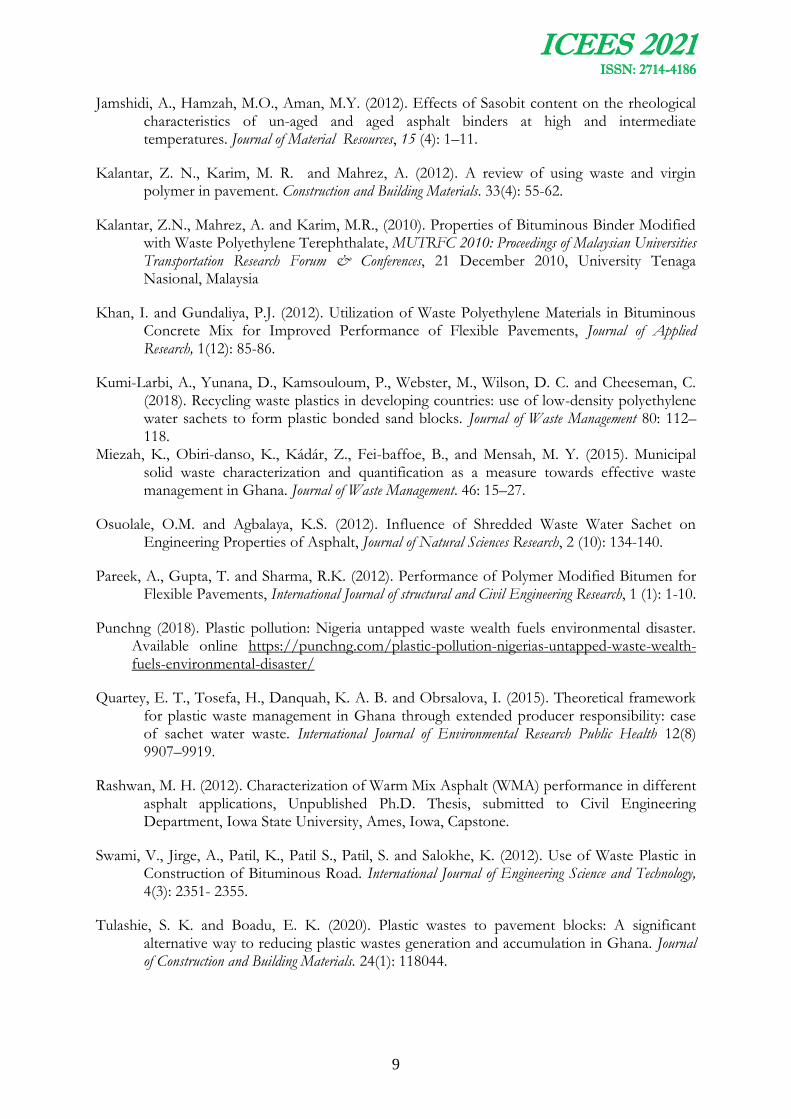
Figure 1: Particle size distribution curve of the natural soil
Figure 2: Variation of Atterberg limits of lateritic soil treated with calcium chloride salt

ICEES 2021 ISSN: 2714-4186
14
3.3 Compaction Characteristics
3.3.1 Maximum Dry Density
The curve of the soil maximum dry density is depicted in Fig. 3 for BSL compactive efforts. The MDD value initially decreased from 1.63 Mg/m3 to 1.45 Mg/m3 at 4% CaCl2 thereafter increased with higher percentage of CaCl2. A similar trend was reported by (Edeh et al., 2014) where sawdust ash was used to improve lateritic soil properties. The observed MDD trend was probably due to agglomeration of the CaCl2 and the fine fraction of lateritic soil. The lateritic soil aggregates occupied larger spaces, thus increasing their volume and consequently decreasing their dry densities (Osinubi et al. 2012b). The increase in MDD was due to CaCl2 occupying the space found in the soil moisture leading to the flocculation and agglomeration of the clay particles as a result of the ions exchange ( Salahudeen et al., 2014). An analysis of variance (ANOVA) of the MDD BSL results show no significant effect of CaCl2 on the lateritic soil (FCAL = 4.90 < FCRIT = 5.31)
Figure 3: Variation of MDD of lateritic soil treated with calcium chloride salt
3.3.2 Optimum Moisture Content The variation of Optimum moisture content with CaCl2- lateritic treated soil is shown in Fig. 4. The OMC for British Standard Light (BSL) compactive effort increased from 19.47% to 24% at 4% CaCl2 thereafter decreased with higher content of CaCl2 up to 16%. The increase in OMC was attributed to the higher content of CaCl2 in the lateritic soil which increased the surface area of the particles, thus requiring more water to lubricate the entire matrix of the mixes (Ishola et al., 2019). An analysis of variance (ANOVA) of the OMC for BSL results show a significant effect of CacCl2 (FCAL = 19.12 > FCRIT = 5.31) on the lateritic soil mixture.
ICEES 2021 ISSN: 2714-4186
15
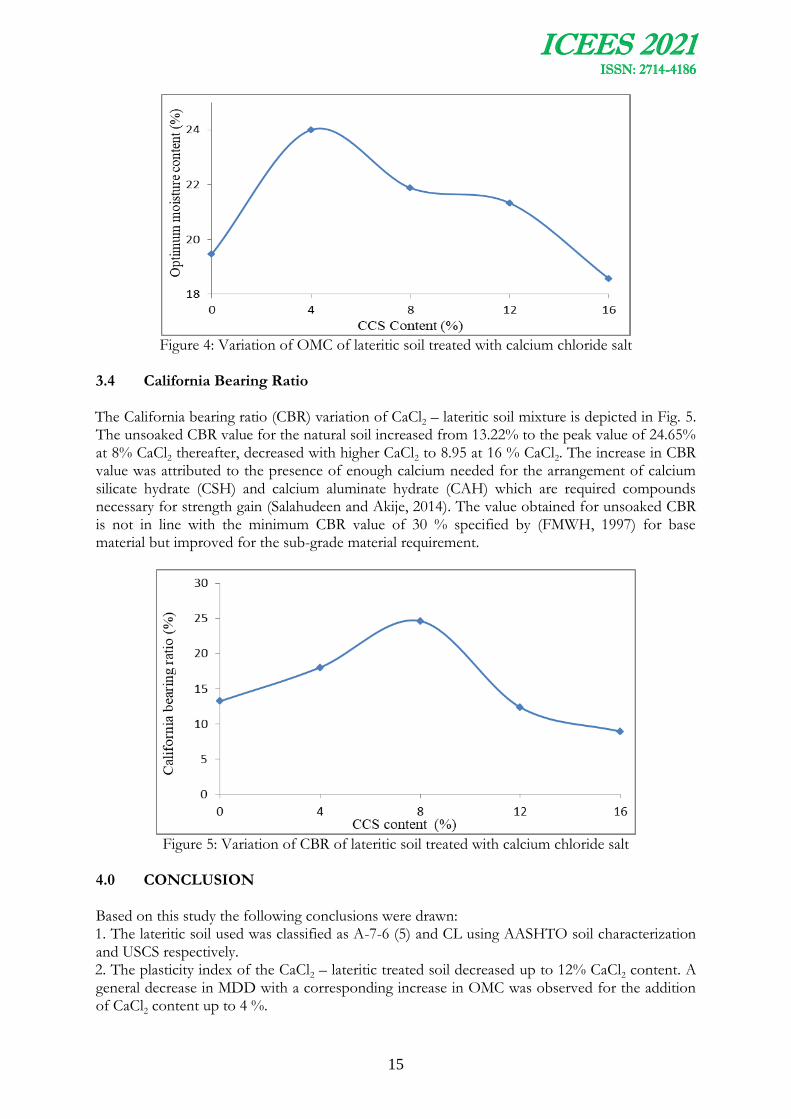
Figure 4: Variation of OMC of lateritic soil treated with calcium chloride salt
3.4 California Bearing Ratio The California bearing ratio (CBR) variation of CaCl2 – lateritic soil mixture is depicted in Fig. 5. The unsoaked CBR value for the natural soil increased from 13.22% to the peak value of 24.65% at 8% CaCl2 thereafter, decreased with higher CaCl2 to 8.95 at 16 % CaCl2. The increase in CBR value was attributed to the presence of enough calcium needed for the arrangement of calcium silicate hydrate (CSH) and calcium aluminate hydrate (CAH) which are required compounds necessary for strength gain (Salahudeen and Akije, 2014). The value obtained for unsoaked CBR is not in line with the minimum CBR value of 30 % specified by (FMWH, 1997) for base material but improved for the sub-grade material requirement.
Figure 5: Variation of CBR of lateritic soil treated with calcium chloride salt
4.0 CONCLUSION Based on this study the following conclusions were drawn: 1. The lateritic soil used was classified as A-7-6 (5) and CL using AASHTO soil characterization and USCS respectively. 2. The plasticity index of the CaCl2 – lateritic treated soil decreased up to 12% CaCl2 content. A general decrease in MDD with a corresponding increase in OMC was observed for the addition of CaCl2 content up to 4 %.

ICEES 2021 ISSN: 2714-4186
16
3. The optimum CBR value for CaCl2 - lateritic soil mixture was obtained using to 8 % CaCl2 content. This signifies improvements in the strength of the lateritic soil used, thus increasing the load-carrying capacity of pavement and could be used to improve low-traffic roads REFERENCES Alhassan, M. and Mustapha, A.M. (2017) “Review: Utilization of rice husk ash for improvement
of deficient soils in Nigeria” Nigerian Journal of Technology, 36(2):386 – 394. ASTM. (1994e). “Standard test methods for liquid limit, plastic limit, and plasticity index of
soils.” D4318-10, West Conshohocken, PA, 1–16. Bello, A.A., Ige, J.A. and Ayodele, H. (2015)“Stabilization of Lateritic Soil with Cassava Peels
Ash British, Journal of Applied Science and Technology,7(6):642-650. B.S.1377 (1990) “Methods of testing soil for civil engineering purposes, British standards
institute London. B. S.1924 (1990) “Methods of testing for stabilized soils, British standards institute”, London. Chew, S.H., Kamruzzaman, A.H.M., and Lee, F.H. 2004. Physicochemical and engineering
behavior of cement-treated clays. Journal of Geotechnical and Geoenvironmental Engineering, 130(7): 696–706.
Edeh, J., Agbede, I., and Tyoyila, A. (2014).”Evaluation of Sawdust Ash-Stabilized Lateritic Soil
as Highway Pavement Material.” J. Mater. Civ. Eng., 2014, 26(2): 367-373 Francis, I.A. and Venantus, A. (2013). “Models and optimization of rice husk ash-clay soil
stabilization.” Journal of Civil En- gineering and Architecture, 7(10):1260-1266. http://dx.doi.org/10.17265/1934-7359/2013.10.009.
Gidigasu, M.D. (1976). Laterite Soil Engineering, Elsevier Sci- entific Publishing Company,
Amsterdam. Hausmann, M.N. (1990) Engineering principles of ground mod- ification. McGraw- Hill, New
York. Ishola, K., Olawuyi, O.A., Bello, A.A. and Yohanna, P. (2019) “Effect of Plantain Peel Ash on the Strength Properties of Tropical Red Soil Nigerian” Research Journal of Engineering
and Environmental Sciences,4(1): 447-459 Joel, M. and Agbede, I.O. (2011) Mechanical-Cement Stabilization of Laterite for Use as
Flexible Pavement Material. J. Mater. Civ. Eng.23:146-152. Nigerian General Specifications (1997). Roads and Bridges. Federal Ministry of Works, Abuja,
Nigeria Oke, J. A. and Olowoyo, M. K. (2019) Stabilizationoflaterite soil with eggshell powder and
sodium silicate used as fill material in road construction. AZOJETE, 15(3):586-597.

ICEES 2021 ISSN: 2714-4186
17
Oluremi, J.R., Siddique, R., and Adeboje, E.P (2016). “Stabilization Potential of Cement Kiln Dust Treated Lateritic Soil” International Journal of Engineering Research in Africa, 23:52-63.
Osinubi, K.J. (1998a) Influence of compaction delay on the properties of cement-stabilized
lateritic soil. J Eng Res 6(1):13–26 Osinubi, K. J., Edeh, J. E., and Onoja, O. W. (2012b). “Sawdust ash stabilization of reclaimed
asphalt pavements.” J. ASTM Int., 9(2), 454–467 Salahudeen, A.B., and Akiije, I. (2014) “Stabilization of highway expansive soils with a high loss
on ignition content kiln dust”. Nigerian Journal of Technology, 33(2):141-148. Salahudeen, A.B., Eberemu, A.O., Osinubi, K.J. (2014) Assessment of cement kiln dust-treated
expansive soil for the construction of flexible pavements. Geotech Geol Eng J 32(4):923–931. https://doi.org/10.1007/s10706-014-9769
Sani, J. E., Etim, R.K. and Joseph, A. (2018). Compaction behaviour of lateritic soil–calcium
chloride mixtures. Geotechnical and Geological Engineering, 37: 2343-2362.

ICEES 2021 ISSN: 2714-4186
18
SYNTHESIS, EVALUATION AND OPTIMIZATION OF GREEN DEMULSIFIERS FOR CRUDE OIL/WATER DEMULSIFICATION
Olabiyi, B. S., Agbabiaka, H. O., Okweri, U. A, Oni, A. T. and Arinkoola, A.O
Department of Chemical Engineering, Ladoke Akintola University of Technology, Ogbomoso, Nigeria
Email of Corresponding Author [email protected]
Abstract
Emulsion formation causes operational problems such as tripping of separation equipment in gas oil separation plants (GOSPs), production of off specification crude oil and creating high pressure drops in flow lines. The use of conventional chemical demulsifiers for resolving water-in-oil emulsions is limited by the toxicity and environmental challenges. In this research, Luffa cylindrica, Blighia sapida and Calotropis procera extracts were evaluated for emulsion resolution using the bottled test method. The demulsifiers were extracted using the Soxhlet extractor and characterised for chemical constituents using Gas Chromatography-Mass Spectrometer (GC-MS). Emulsions were prepared using crude oils and formation water in the ratio of 2:7. To stabilise the emulsion, 50 ml of sodium dodecyl sulphate solution was added and the mixture homogenised at 8000 rpm for 10 min. The demulsifying efficiency of different green demulsifiers was evaluated using experimental design and response surface methodologies. The percentage water resolution and interfacial tension were measured and optimised. Luffa cylindrical extract exhibited superior performance and is therefore recommended for further evaluation.
Keywords: Green demulsifiers, Interfacial tension, Bottle test, RSM, Experimental design, Optimization
1.0 Introduction
Hydrocarbons are generally produced along with the formation water. When water droplets are dispersed in oil, a water-in-oil emulsion is formed. For emulsions to form, three conditions must be satisfied: (a) the two liquids forming the emulsion must be immiscible; (b) there must be sufficient agitation to disperse one liquid as droplets in the other, and (c) the presence of an emulsifier. The stability of the emulsion is dependent on the nature and amount of the surface active agents also known as the emulsifiers. Emulsifiers concentrate themselves at the oil-water interface and form interfacial films which reduce the interfacial tension and promote emulsification and dispersion of droplets. Naturally occurring surfactants such as the asphaltenes, resins, organic acids and bases are present in crude oil. The quantity of these organic compounds varies depending on the API gravity of the crude. Heavier crudes are associated with high concentration of asphaltenes and other organic surfactants (Lu et al., 2017). Emulsion formation is one of the major issues in the petroleum production, transportation and refining. Emulsion formation leads to an increase in crude oil viscosity and hence to high pumping cost (Fridjonsson et al., 2014).
The traditional methods of separating oil from O/W emulsion include gravity, coagulation, ultracentrifugation and membrane filtration (Rajak et al., 2016). However, these techniques are characterised by low efficiency, complicated equipment and high energy consumption (Rajak et al., 2015). The most celebrated approach is the use of chemical demulsification methods. In chemical methods, chemical additives are mixed with the emulsion thereby accelerating the emulsion breaking process (Li et al., 2016). However, synthetic additives such as silicone, ethyl cellulose and ethylene glycol (Valencia et al., 2013) among others are expensive and

ICEES 2021 ISSN: 2714-4186
19
environmentally unfriendly. Therefore, it is necessary to develop cost-effective materials for resolving emulsion issues.
This present study evaluates Luffa cylindrica, Blighia sapida and Calotropis procera extracts for emulsion resolution potentials using the bottled test method. The extracts are eco-friendly and available widely. The optimum conditions for maximum water separation using plant extracts were established.
2.0 Materials and method
2.1 Materials and Reagents
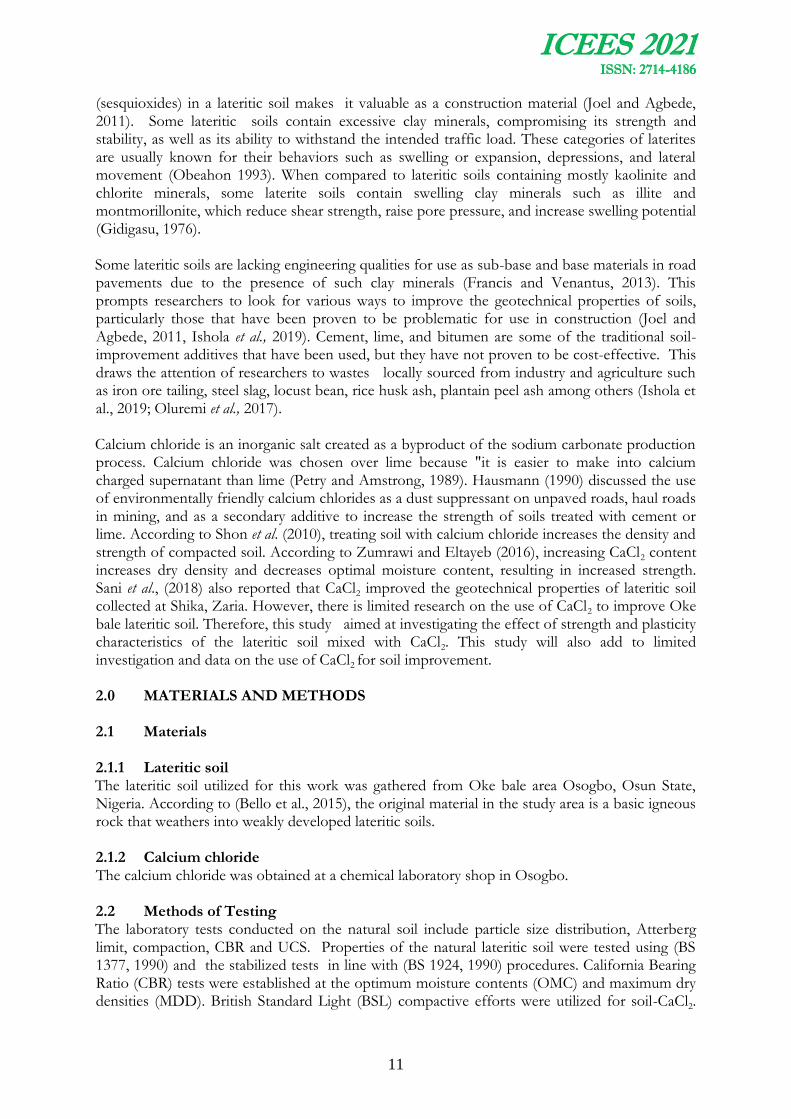
Oil samples used were provided by the Chevron oilfield (Excravos Niger Delta province, Nigeria). All glass wares were rinsed with deionized water. All the chemicals such as sodium dodecyl benzene sulfonate, sodium chloride and sodium hydroxide used are of analytical grade. Luffa cylindrica leaves, Calotropis procera leaves and Blighia sapida bark were sourced locally and identified at the Department of Pure and Applied Biology, Ladoke Akintola University of Technology, Ogbomoso. Figure 1 shows the pictorial diagram of the plants.
Figure 1 (a) Luffa cylindrica, (b) Calotropis procera and (c) Blighia sapida plants
2.2 Equipment and apparatus
The equipment used in the making of emulsion include a homogenizer (Model 125), Tensiometer (Model: 2725 ARL) was used for the measurement of surface and interfacial tensions. Also,Soxhlet extractor (Model: NNN-F-240) was used for the synthesis of the green demulsifiers. Others include rotary evaporator, digital balance, centrifuge, pH metre and filter papers. For the bottle test experiment, 100 mL sized measuring cylinder, 50 mL beaker, 250 mL beaker, 300 mL beaker, 10 mL measuring cup and volumetric flask were used.
2.3 Extraction and analysis of demulsifiers
The dried leaves of Luffa cylindrica leaves, Calotropis procera leaves and Blighia sapida bark were pulverised mechanically and screened to approximately 20 μm prior to extraction. Approximately 100 g of each sample was soaked in 1000 ml of ethanol in a soxhlet extraction apparatus. The extract was then concentrated in a rotary evaporator and stored in an air-tight sterile container. The detailed description of the extraction process is available elsewhere (Ogunleye et al., 2020). The constituents of the extracts were identified using GC-MS. The dominant functional groups present in the extracts were identified using Fourier Transform Infrared Spectroscopy FT-IR.

ICEES 2021 ISSN: 2714-4186
20
2.4 Preparation of Water-in-Oil emulsion
Approximately 1050 ml of crude oil sample was mixed with 50 ml of sodium dodecyl sulphate (SDS). The mixture was homogenised at a speed of 5000 rpm for 20 minutes. 300 ml of the simulated produce water was added and the mixture homogenised at a speed of 8000 rpm for another 10 min. The final mixture was left for three days to enable the free water to settle out of emulsion. A droplet of each resulting emulsion was placed on a filter paper to ascertain the formation of the water-in-oil emulsion (Bhattacharyya, 1992).
2.5 Bottle test method
The bottle test (Figure 2) is an empirical test in which varying amounts of potential demulsifiers are added into a series of tubes or bottles containing subsample of an emulsion to be broken (Adulredha, 2018). After some specific time, the extent of phase separation and appearance of the interface separating the phases are noted. This method is done by inserting emulsion that was prepared inside the bottle and demulsifiers were added. The percentage water separation was measured while the interfacial tension was determined using a Spinning Drop Tensiometer.
Figure 2 Bottle test experimental set up
2.6 Experimental Design
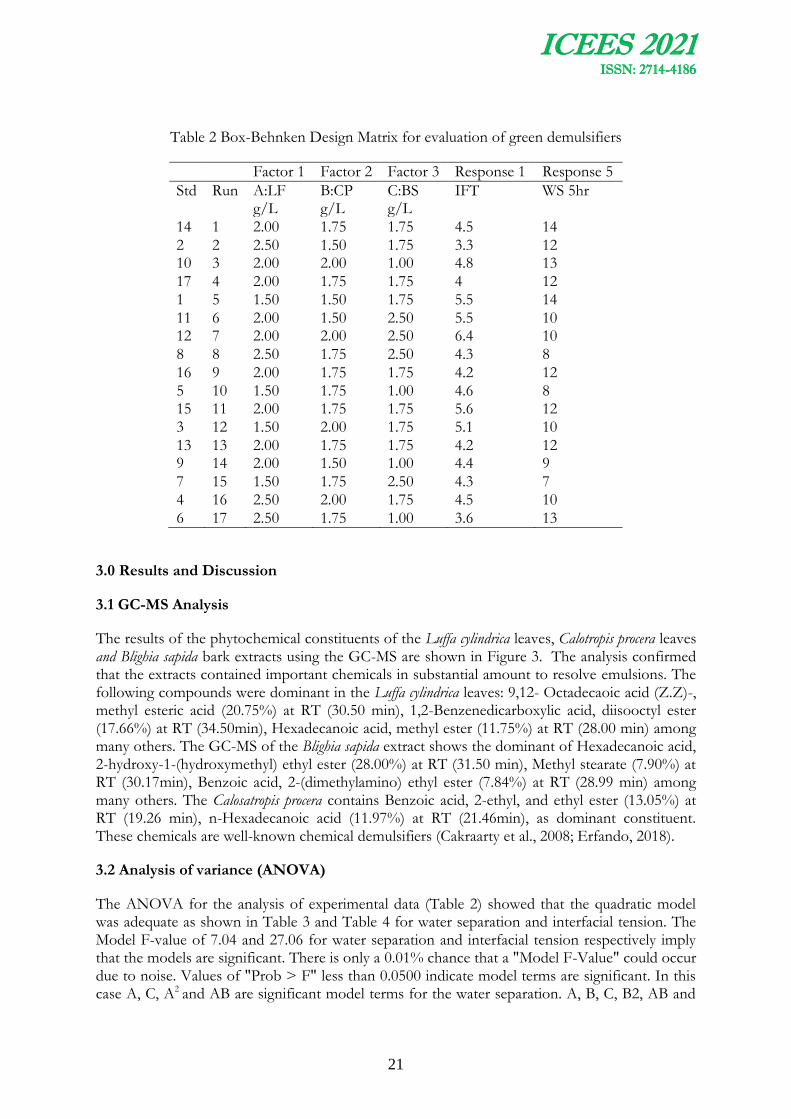
The Box-Behnken Design (BBD) was used for the experimental design. Here, the three proposed green demulsifiers were added to the emulsion at different concentrations. Table 1 shows the range of concentration used for the experiment. For the three factors, seventeen experimental runs were made based on the selected response surface method. Table 2 shows the design matrix used for the evaluation.
Table 1 Level of demulsifiers concentrations used for the experiment
Factor Name
Units
Minimum Maximum Coded Low
Coded High
Mean Std. Dev.
A LF g/L 1.50 2.50 -1 +1 2.00 0.3536 B CP g/L 1.50 2.00 - +1 1.75 0.1768 C BS g/L 1.0000 2.50 -1 +1 1.75 0.5303
ICEES 2021 ISSN: 2714-4186
21
Table 2 Box-Behnken Design Matrix for evaluation of green demulsifiers
Factor 1 Factor 2 Factor 3 Response 1 Response 5
Std Run A:LF B:CP C:BS IFT WS 5hr g/L g/L g/L
14 1 2.00 1.75 1.75 4.5 14
2 2 2.50 1.50 1.75 3.3 12 10 3 2.00 2.00 1.00 4.8 13
17 4 2.00 1.75 1.75 4 12 1 5 1.50 1.50 1.75 5.5 14
11 6 2.00 1.50 2.50 5.5 10 12 7 2.00 2.00 2.50 6.4 10
8 8 2.50 1.75 2.50 4.3 8
16 9 2.00 1.75 1.75 4.2 12 5 10 1.50 1.75 1.00 4.6 8 15 11 2.00 1.75 1.75 5.6 12 3 12 1.50 2.00 1.75 5.1 10
13 13 2.00 1.75 1.75 4.2 12 9 14 2.00 1.50 1.00 4.4 9
7 15 1.50 1.75 2.50 4.3 7 4 16 2.50 2.00 1.75 4.5 10
6 17 2.50 1.75 1.00 3.6 13
3.0 Results and Discussion
3.1 GC-MS Analysis
The results of the phytochemical constituents of the Luffa cylindrica leaves, Calotropis procera leaves and Blighia sapida bark extracts using the GC-MS are shown in Figure 3. The analysis confirmed that the extracts contained important chemicals in substantial amount to resolve emulsions. The following compounds were dominant in the Luffa cylindrica leaves: 9,12- Octadecaoic acid (Z.Z)-, methyl esteric acid (20.75%) at RT (30.50 min), 1,2-Benzenedicarboxylic acid, diisooctyl ester (17.66%) at RT (34.50min), Hexadecanoic acid, methyl ester (11.75%) at RT (28.00 min) among many others. The GC-MS of the Blighia sapida extract shows the dominant of Hexadecanoic acid, 2-hydroxy-1-(hydroxymethyl) ethyl ester (28.00%) at RT (31.50 min), Methyl stearate (7.90%) at RT (30.17min), Benzoic acid, 2-(dimethylamino) ethyl ester (7.84%) at RT (28.99 min) among many others. The Calosatropis procera contains Benzoic acid, 2-ethyl, and ethyl ester (13.05%) at RT (19.26 min), n-Hexadecanoic acid (11.97%) at RT (21.46min), as dominant constituent. These chemicals are well-known chemical demulsifiers (Cakraarty et al., 2008; Erfando, 2018).
3.2 Analysis of variance (ANOVA)
The ANOVA for the analysis of experimental data (Table 2) showed that the quadratic model was adequate as shown in Table 3 and Table 4 for water separation and interfacial tension. The Model F-value of 7.04 and 27.06 for water separation and interfacial tension respectively imply that the models are significant. There is only a 0.01% chance that a "Model F-Value" could occur due to noise. Values of "Prob > F" less than 0.0500 indicate model terms are significant. In this case A, C, A2 and AB are significant model terms for the water separation. A, B, C, B2, AB and

ICEES 2021 ISSN: 2714-4186
22
C2 are significant model terms for the interfacial tension. Values greater than 0.050 indicate the
3.3 Effect of demulsifiers on Water Separation WS and Interfacial Tension IFT
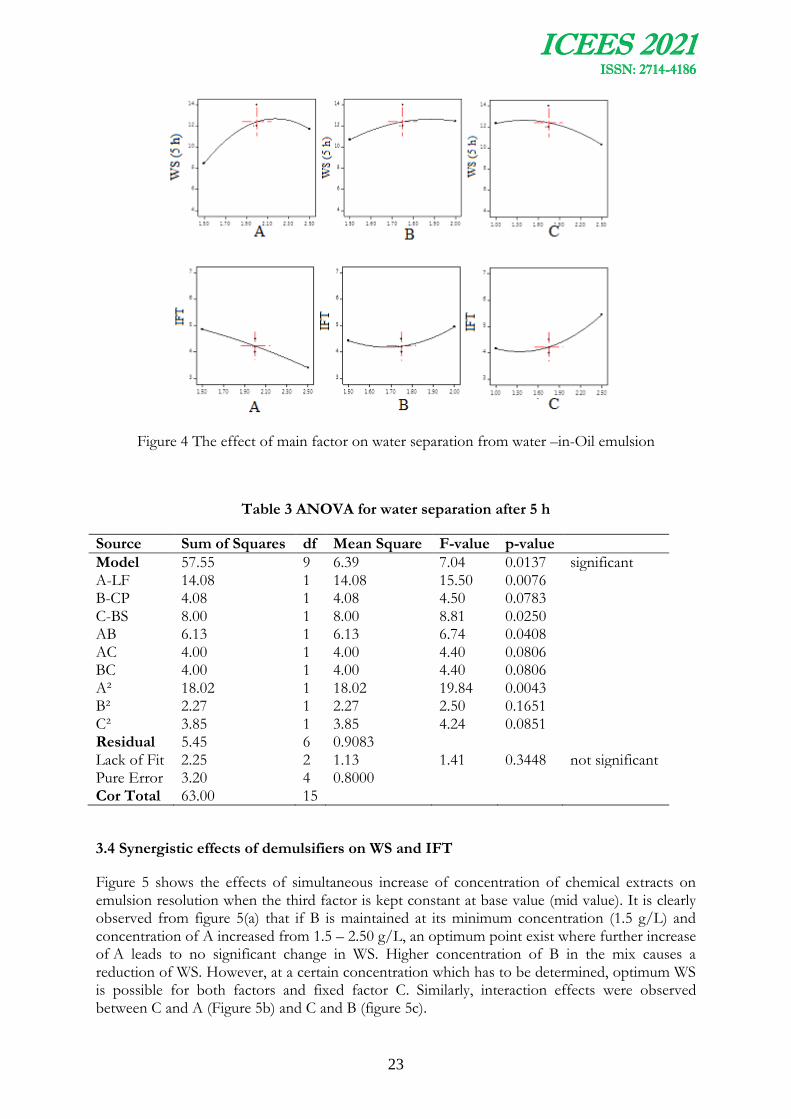
Figure 4 shows the main effects of A, B and C on WS and IFT. For effective functionality of demulsifiers, the volume of water separated out of emulsion has to increase with time. After 5 h of treatment, there was an increase in WS as the concentration of factor A increased until an optimum concentration was reached and further increase in concentration of A caused a reduction of WS. An increase in concentration of B causes a gentle increase in WS until an optimum concentration was reached beyond which a further increase in concentration yielded no significant increase in WS. We observed that factor C is needed in relatively quantity in the mixture to have a meaningful effect on WS. In all these, the variation in the behaviour of these green demulsifiers is highly related to their chemical composition.
The observations from the effects of A, B and C on the IFT show that factor A exhibited maximum potential in lowering the IFT between the water and oil when compared with B and C. The degree to which the IFT is reduced indicates the chemical potential for emulsion resolution. Thus, factor A showed a great potential when compared with the other two factors. This observation is consistent with that observed for the WS.
Figure 3: GC-MS Analysis for (a) Luffa cylindrica (b) Blighia sapida (c) Calotropis procera
ICEES 2021 ISSN: 2714-4186
23
Figure 4 The effect of main factor on water separation from water –in-Oil emulsion
Table 3 ANOVA for water separation after 5 h
Source Sum of Squares df Mean Square F-value p-value
Model 57.55 9 6.39 7.04 0.0137 significant A-LF 14.08 1 14.08 15.50 0.0076 B-CP 4.08 1 4.08 4.50 0.0783 C-BS 8.00 1 8.00 8.81 0.0250 AB 6.13 1 6.13 6.74 0.0408 AC 4.00 1 4.00 4.40 0.0806 BC 4.00 1 4.00 4.40 0.0806 A² 18.02 1 18.02 19.84 0.0043 B² 2.27 1 2.27 2.50 0.1651 C² 3.85 1 3.85 4.24 0.0851 Residual 5.45 6 0.9083 Lack of Fit 2.25 2 1.13 1.41 0.3448 not significant Pure Error 3.20 4 0.8000 Cor Total 63.00 15
3.4 Synergistic effects of demulsifiers on WS and IFT
Figure 5 shows the effects of simultaneous increase of concentration of chemical extracts on emulsion resolution when the third factor is kept constant at base value (mid value). It is clearly observed from figure 5(a) that if B is maintained at its minimum concentration (1.5 g/L) and concentration of A increased from 1.5 – 2.50 g/L, an optimum point exist where further increase of A leads to no significant change in WS. Higher concentration of B in the mix causes a reduction of WS. However, at a certain concentration which has to be determined, optimum WS is possible for both factors and fixed factor C. Similarly, interaction effects were observed between C and A (Figure 5b) and C and B (figure 5c).
ICEES 2021 ISSN: 2714-4186
24
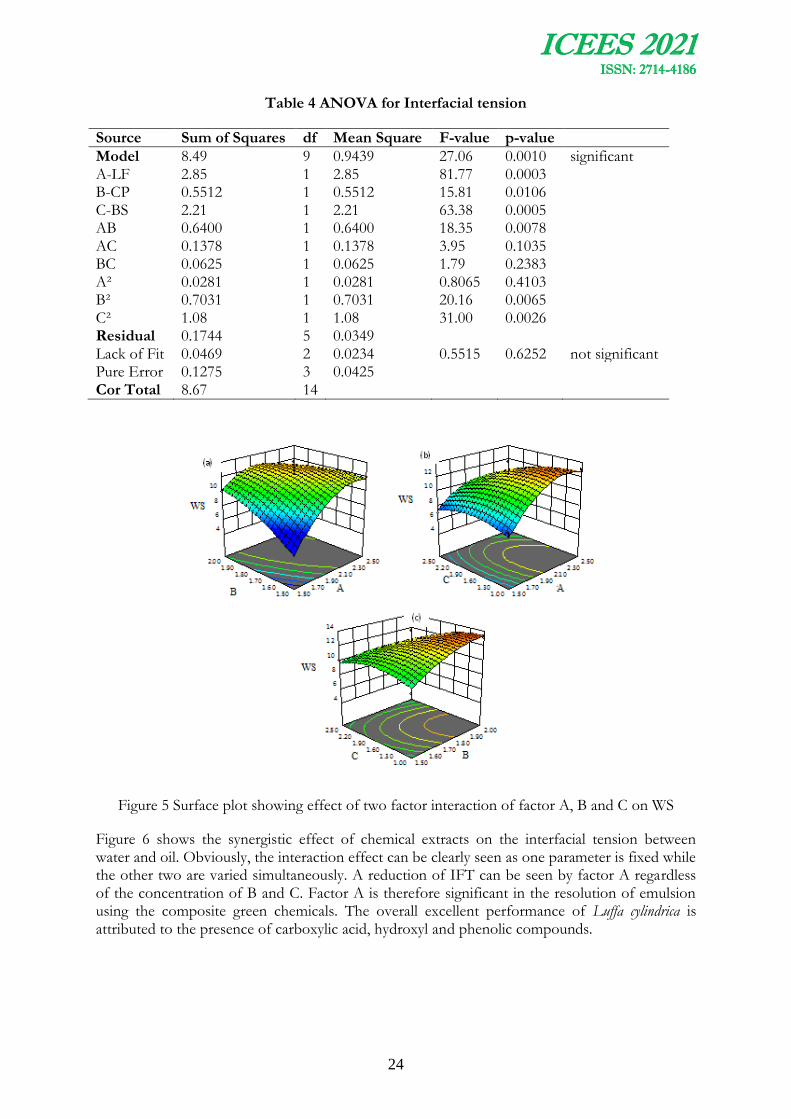
Table 4 ANOVA for Interfacial tension
Source Sum of Squares df Mean Square F-value p-value
Model 8.49 9 0.9439 27.06 0.0010 significant A-LF 2.85 1 2.85 81.77 0.0003 B-CP 0.5512 1 0.5512 15.81 0.0106 C-BS 2.21 1 2.21 63.38 0.0005 AB 0.6400 1 0.6400 18.35 0.0078 AC 0.1378 1 0.1378 3.95 0.1035 BC 0.0625 1 0.0625 1.79 0.2383 A² 0.0281 1 0.0281 0.8065 0.4103 B² 0.7031 1 0.7031 20.16 0.0065 C² 1.08 1 1.08 31.00 0.0026 Residual 0.1744 5 0.0349 Lack of Fit 0.0469 2 0.0234 0.5515 0.6252 not significant Pure Error 0.1275 3 0.0425 Cor Total 8.67 14
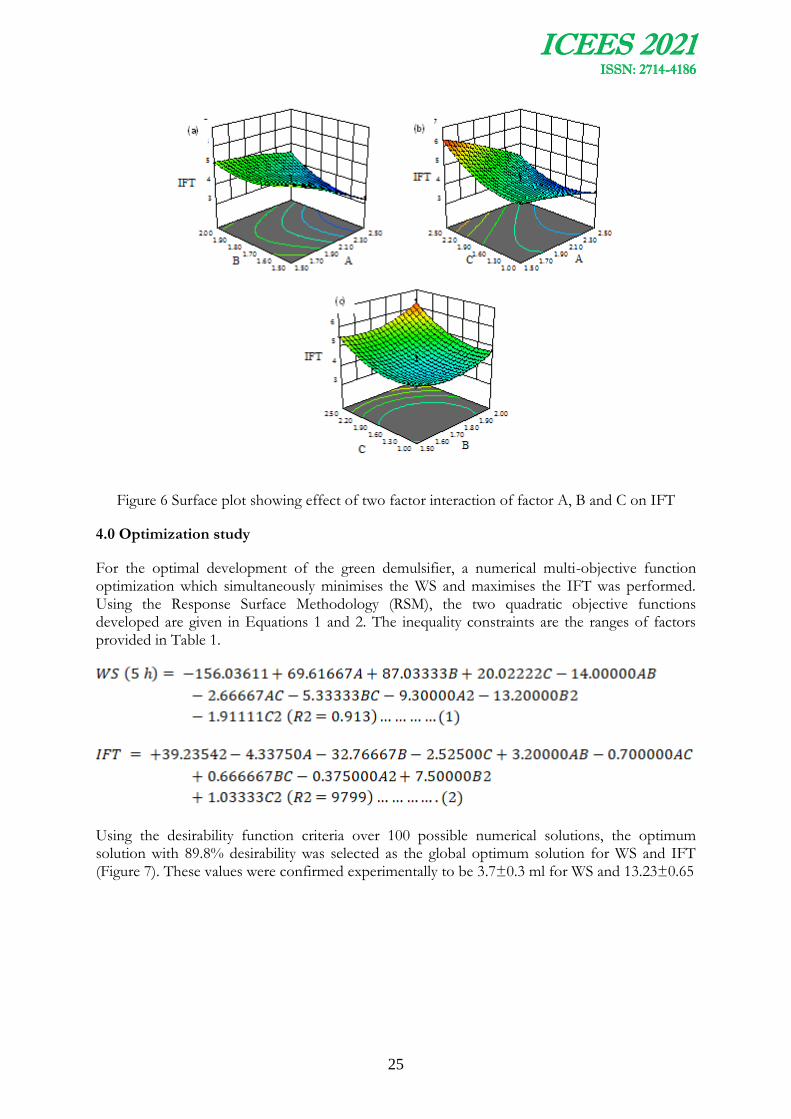
Figure 5 Surface plot showing effect of two factor interaction of factor A, B and C on WS
Figure 6 shows the synergistic effect of chemical extracts on the interfacial tension between water and oil. Obviously, the interaction effect can be clearly seen as one parameter is fixed while the other two are varied simultaneously. A reduction of IFT can be seen by factor A regardless of the concentration of B and C. Factor A is therefore significant in the resolution of emulsion using the composite green chemicals. The overall excellent performance of Luffa cylindrica is attributed to the presence of carboxylic acid, hydroxyl and phenolic compounds.
ICEES 2021 ISSN: 2714-4186
25
Figure 6 Surface plot showing effect of two factor interaction of factor A, B and C on IFT
4.0 Optimization study
For the optimal development of the green demulsifier, a numerical multi-objective function optimization which simultaneously minimises the WS and maximises the IFT was performed. Using the Response Surface Methodology (RSM), the two quadratic objective functions developed are given in Equations 1 and 2. The inequality constraints are the ranges of factors provided in Table 1.
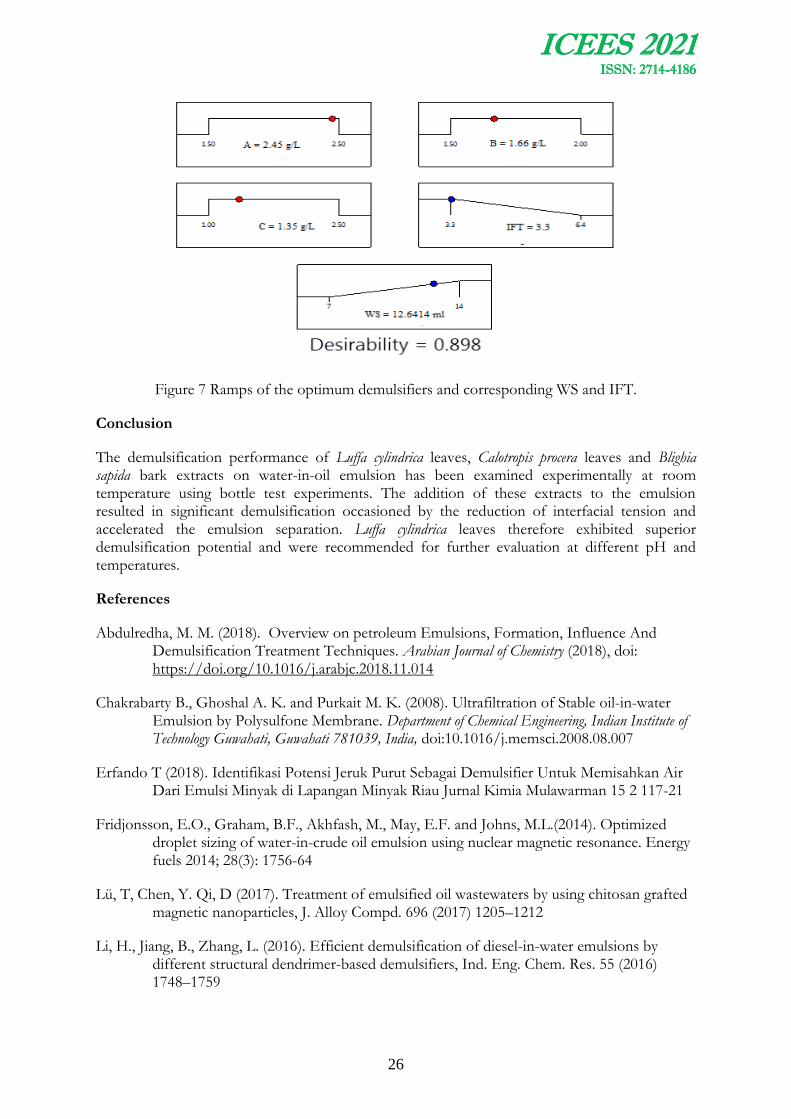
Using the desirability function criteria over 100 possible numerical solutions, the optimum solution with 89.8% desirability was selected as the global optimum solution for WS and IFT (Figure 7). These values were confirmed experimentally to be 3.7±0.3 ml for WS and 13.23±0.65
ICEES 2021 ISSN: 2714-4186
26
Figure 7 Ramps of the optimum demulsifiers and corresponding WS and IFT.
Conclusion
The demulsification performance of Luffa cylindrica leaves, Calotropis procera leaves and Blighia sapida bark extracts on water-in-oil emulsion has been examined experimentally at room temperature using bottle test experiments. The addition of these extracts to the emulsion resulted in significant demulsification occasioned by the reduction of interfacial tension and accelerated the emulsion separation. Luffa cylindrica leaves therefore exhibited superior demulsification potential and were recommended for further evaluation at different pH and temperatures.
References
Abdulredha, M. M. (2018). Overview on petroleum Emulsions, Formation, Influence And Demulsification Treatment Techniques. Arabian Journal of Chemistry (2018), doi: https://doi.org/10.1016/j.arabjc.2018.11.014
Chakrabarty B., Ghoshal A. K. and Purkait M. K. (2008). Ultrafiltration of Stable oil-in-water Emulsion by Polysulfone Membrane. Department of Chemical Engineering, Indian Institute of Technology Guwahati, Guwahati 781039, India, doi:10.1016/j.memsci.2008.08.007
Erfando T (2018). Identifikasi Potensi Jeruk Purut Sebagai Demulsifier Untuk Memisahkan Air Dari Emulsi Minyak di Lapangan Minyak Riau Jurnal Kimia Mulawarman 15 2 117-21
Fridjonsson, E.O., Graham, B.F., Akhfash, M., May, E.F. and Johns, M.L.(2014). Optimized droplet sizing of water-in-crude oil emulsion using nuclear magnetic resonance. Energy fuels 2014; 28(3): 1756-64
Lü, T, Chen, Y. Qi, D (2017). Treatment of emulsified oil wastewaters by using chitosan grafted magnetic nanoparticles, J. Alloy Compd. 696 (2017) 1205–1212
Li, H., Jiang, B., Zhang, L. (2016). Efficient demulsification of diesel-in-water emulsions by different structural dendrimer-based demulsifiers, Ind. Eng. Chem. Res. 55 (2016) 1748–1759

ICEES 2021 ISSN: 2714-4186
27
Rajak, V. K., Singh, I., Kumar, A. (2016). Optimization of separation of oil from oil-in-water emulsion by demulsification using different demulsifiers, Petrol. Sci. Technol. 34 (2016) 1026–1032.
Rajak, V. K., Relish, K. K., Kumar, S. (2015). Mechanism and kinetics of separation of oil from oil-in-water emulsion by air flotation, Petrol. Sci. Technol. 33 (2015) 1861–1868.
Valencia, D., Aburto, J., Cruz, I. G. (2013). Electronic structure and mesoscopic simulations of nonylphenol ethoxylate surfactants. A combined DFT and DPD study, Molecules 18 (2013) 9441–9450.
ICEES 2021 ISSN: 2714-4186
28
EFFECT OF PLASTICITY AND BRITISH STANDARD LIGHTCOMPACTIVE EFFORT ON THE LATERITIC SOIL
STABILIZED WITH BAMBOO LEAF ASH ADMIXED WITH LIME
1*Ameen, I. O, 1Bello, A. A.2 and Oluwasola, E. A.
*1, 1 Department of Civil Engineering, Osun State University, Osogbo, Osun State, Nigeria 2Department of Civil Engineering, Federal Polytechnic, Ede, Osun State, Nigeria
* Email of Corresponding Author [email protected]
Abstract
This study investigates the impact of British Standard Light Compactive effort on A-7-5 lateritic soil stabilized with Bamboo Leaf Ash (BLA) mixed with lime. Preliminary tests were conducted on the soil sample for identification and classification purposes. Samples were compacted in both the natural and stabilized states incorporating 2, 4, 6 and 8% Bamboo Leaf Ash (BLA) mixed with 1, 2, and 3% lime by weight of the soil. The chemical composition test carried out on the BLA shows that the ash is a pozzolan and it belongs to class F. The plasticity analysis revealed that the untreated soil falls into the high plasticity soil group with a value of 64%, but the addition of additives caused a variation in the liquid limit range with a minimum value of 43.42% at 3% lime-8% BLA. The plasticity index (PI) decreases with the percentage increase in the additive, from 18% to a minimum of 5% at 3% lime-8% BLA. The Maximum dry density (MDD) value increased from 1412 kg/m3 at 0% to 1766 kg/m3 at 3% lime 6% BLA, while the optimum moisture content value decreased from 19.40% at 0% to 12.70% at 3% lime 8% BLA. Based on these findings, the addition of lime-BLA enhanced the soil and has a promising prospect for stabilization of lateritic soil and can be used in the construction of hydraulic barrier.
Keywords: Bamboo leaf ash, British Standard Light Compactive effort, Lateritic soil, Lime, Stabilization
1.0 INTRODUCTION
Laterite is a type of soil that is rich in iron and aluminum and is found primarily in humid and temperate climates with hot and humid weather. Lateritic soil is characterised by high plastic clay, which can weaken and damage pavements, highways, building foundations, hydraulic structures, and other civil engineering works (Fitsum, 2018). Lateritic soil normally has low bearing ability and strength due to the presence of clay in it. Laterites are weathering products formed on a wide range of rocks with high iron concentration, which can be volcanic, sedimentary, or metamorphic in origin. High seasonal precipitation, high temperature, extreme leaching, heavy oxidizing climate, subdued topography, long weathering period, and chemically unstable parent rock have all been found to be optimum conditions for lateritization (Bello, 2013). It has been noticed that in the formation process, an appropriate supply of iron sesquioxide, which may come from the underlying parent material or from a nearby location of higher topography is essential. High water content and high temperatures induce extreme chemical weathering resulting in well-formed residual soils (De Vallejo and Ferrer, 2012).
when the lateritic soil comprises a significant number of clay products, the intensity and firmness of the soil cannot be accredited under load especially in the presence of water which necessitate the need for stabilization (Bello et al., 2015). In other to improve the geotechnical properties of

ICEES 2021 ISSN: 2714-4186
29
deficient soil, more attention should be paid to the use of cost-effective, easily accessible and locally sourced materials from agricultural waste rather than providing alternative soils that may prove financially unwise. Blending natural lateritic soil with agricultural waste products will not only advances its engineering properties, but will also improve the safe disposal of these waste products and this will create a cost-effective solution to the debilitating effect of these materials on the environment and the health risks they create (Asha et al., 2014).
Bamboo is an essential non-timber forest product that has numerous uses for people. One of the most foremost and outstanding uses of bamboo is its utilization by humans for construction. Bamboo has been used as a construction material from times past, especially by people who live in places where bamboo grew naturally and in large quantities. In ancient times bamboo was used to build houses because of its natural potency and flexibility. In the modern context and due to advancements in manufacturing technology and rising market demand, it has been widely employed for domestic products and applied to engineering settings (Rashmi et al, 2019).
Bamboo is one of the most ornamental and easy-to-grow gardens and potted plants. It is particularly suited to the Nigerian rainforest belt, where it is widely grown around banks of the river and other generally waterlogged areas. It has been identified that more than 1,200 species of bamboo are widely available and that seven of these varieties are present in Nigeria, 80 percent of which is the Bambusa Vulgaris species and is generally alluded to as Indian bamboo (Omotosho, 2003).
Bamboo leaf is a regularly used term for branches of a taxonomic group of large wood grasses. The component of the bamboo leaf consists of two parts, the sheath and the blade. It has two unique types of leaves: the culm leaf and the foliage leaf. Culm leaves are coupled at the base of their sheaths directly to the Culm nodes at the sheath scar, while the foliage leaf blade is often connected to its sheath by a stem or a petiole, as evaluate to the Culm leaf blade, which is often without a petiole (Omotosho, 2003). Bamboo also has high strength properties to absorb shocks and impacts, a high strength to weight ratio and a high specific load bearing capacity effect (Yusoffet al, 2002). This makes it extremely suitable for building houses to withstand seismic and high wind force.
Bamboo, along with fast growing plantation and specie, is a very effective carbon sequesters and contributes to the decrease of the greenhouse effect (Yusoff et al, 2002).. Bamboo produces a higher percentage of polluting leaves, and one of the greatest methods to reduce the risk they provide is to investigate how they might be utilized as a soil supplement
Lime is a chemical additive that is used in stabilizing soil and the techniques referred to as lime stabilization. Investigation has shown that lime combines well with moderate, generally coarse, fine-grained clay soils. The major advantage of lime stabilization in clay soil is an increase in soil plasticity, which is achieved by lowering the moisture content of the soil and increased the soil strength and longevity, limits the soil's tendency to swell (Bello, 2013). Lime exists in the form of quicklime (calcium oxide – CaO), hydrated lime (calcium hydroxide – Ca[OH]2) or lime slurry1 and can be used for soil treatment (Lime treated soil construction manual, 2004). Quicklime is formed by the chemical transformation of calcium carbonate (CaCO3) into calcium oxide. Hydrated lime is formed when the quicklime reacts chemically with water. It is a hydrated lime that mixes with clay particles and eventually turns them into a solid cement matrix. (Lime treated soil construction manual, 2004).

ICEES 2021 ISSN: 2714-4186
30
2.0 MATERIALS AND METHODS
2.1 Materials
Lateritic soil
The lateritic soil sample was collected (disturbed) from a borrowed pit along Fountain University Osogbo(with coordinate of 7044`37.5``N 4032`46.3``E) using a trial pitting process. This sample was collected in large bags while significant amounts were packed and sealed in polythene bags to avoid moisture absorption. Subsequently, the soil sample was air-dried, crushed and sieved through regular sieves for various types of tests, with the large sieve being BS No 4 sieve. (Aperture of 4.76 mm).
Bamboo leaf ash (BLA)
The bamboo leaves used for this study were collected from two locations in Ede. The leaf was dried under laboratory condition to remove moisture content content and burned in the open air to change it to powdery form and then heated in furnace at 6000C for 2 hours to obtain the true ash content required and allowed to cool, then sieved through sieve No 200 to obtain the ash. The ash was kept in an enclosed polythene bag to halt the moisture.
Lime
The lime utilized for this study was bought from a chemical shop in Ado-Ekiti and was sieved through sieve No 200.
2.2 Methods
Oxide Composition
The test was carried out to determine the chemical composition of both the soil, lime and the BLA. The chemical compositions of the samples were obtained using Thermo Scientific ARL QUANT'X EDXRF Spectrometer. X-ray Flourescence (XRF) analysis was done using the standard method with Montana soil SRM 2710 as a Thermo Fisher Scientific standard reference material.
Index Properties
Particle size distribution, natural moisture content, specific gravity and Atterberg limit tests were conducted on the soil sample in accordance with British Standards (BS 1377, 1990).
Compaction
This test is to determine the maximum dry density and the optimum moisture content at a given compactive effort. As specified by BS 1377: 1990, British Standard Light (BSL) Compactive effort was adopted for this research.
The BSL compactive effort is the conventional energy level which involves using a cylindrical metal mould (Proctor mould) of about 1000cm3 and a rammer of 2.5kg. The soil was compacted inside the mould by separating it to 3 layers and 27 blows was applied to each layer using 2.5kg rammer falling from a height of 300mm. Air dried soil sample that passed through BS sieve with 4.76mm aperture mixed with 1% lime-2% BLA, 1% lime-4% BLA, 1% lime-6% BLA, 1% lime-8% BLA, 2% lime-2% BLA, 2% lime-4% BLA, 2% lime-6% BLA, 2% lime-8% BLA, 3% lime-
ICEES 2021 ISSN: 2714-4186
31
2% BLA, 3% lime-4% BLA, 3% lime-6% BLA, 3% lime with 8% BLA by weight of dry soil was used for the compactive effort.
The moisture content samples were taken from the top and bottom of the mould and the optimum moisture content was taken as the moisture content at which the maximum dry density is attained.
3.0 RESULTS AND DISCUSSION
3.1 Oxide Composition
The elemental analysis carried out on lime, bamboo leaf ash (BLA) and the lateritic soil using X-Ray Flourescence revealed their oxide components as shown in Table 1. It was revealed that the lime contains high amount of CaO (69.5%) which aids in the stabilization process and invariably makes lime an effective stabilizer. On the other hand, the BLA can be regarded as a pozzolan since it contains an appreciable content of SiO2 (75.35%) and this tends to improve the engineering properties of the lateritic soil used. The BLA qualifies as a pozzolan and it belong to class F since the percentage sum of its SiO2, Al2O3 and Fe2O3 components (84.44%) is greater than 70%.
3.2 Index Properties Test
The natural moisture content of the soil sample is high and this indicates that the soil comprises wide open spaces. The specific gravity of the soil sample is 2.31 and falls in the range suggested in Bello (2013) for clay minerals as halloysite (2.0-2.55). The outcome of the result suggests that the soil sample belongs to the lateritic soil type, with Halloysite as the dominant clay. The specific gravity of the lime used is 2.35 and falls within the range of hydrated lime (2.3-2.4) as specified by the National Lime Association (2004). Bamboo leaf ash has specific gravity value of 2.05 which is in line with that used by Dhinakaran (2016) where the strength and durability of bamboo leaf ash was determined. The index properties of the soil are shown inTable 2.
AASHTO classification system (1986) and the Unified Soil Classification System (USCS) were used to characterize the soil sample. The soil sample comes under silt-clay material and A-7-5 with group index of 6 (A-7-5 (6)) category using the AASHTO classification system with more than 35 percent passing through sieve No 200. In addition, the soil sample falls under MH (sandy elastic silt) using USCS with more than 50% pass-through sieve No 200. Figure 1 shows the particle distribution curve.
The results of the Atterberg limit test (Liquid Limit (LL), Plastic Limits (PL) and Plastic Index (PI)) before and after adding bamboo leaf ash and lime are shown in Fig. 2(a-c). However according to Bello (2015), low plasticity soils have a liquid limit of less than 35% percent, medium plasticity soils have a liquid limit of 35% to 50%, high plasticity soils have a liquid limit of 50% to 70%, very high plasticity soils have a liquid limit of 70% to 90%, and exceptionally high plasticity soils have a liquid limit of 90% or greater.
The analysis revealed that the untreated soil falls into the high plasticity soil group with a value of 64%, but the addition of additives caused a variation in the liquid limit range with a minimum value of 43.42% at 3% lime-8% BLA. The plasticity index (PI) decreases with the percentage increase in the additive, from 18% to a minimum of 5% at 3% lime-8% BLA. This improvement can be attributed to the reaction of lime and BLA to soil, which decreased soil sensitivity to water and filled the entire gap present in natural soil, indicating soil improvement.
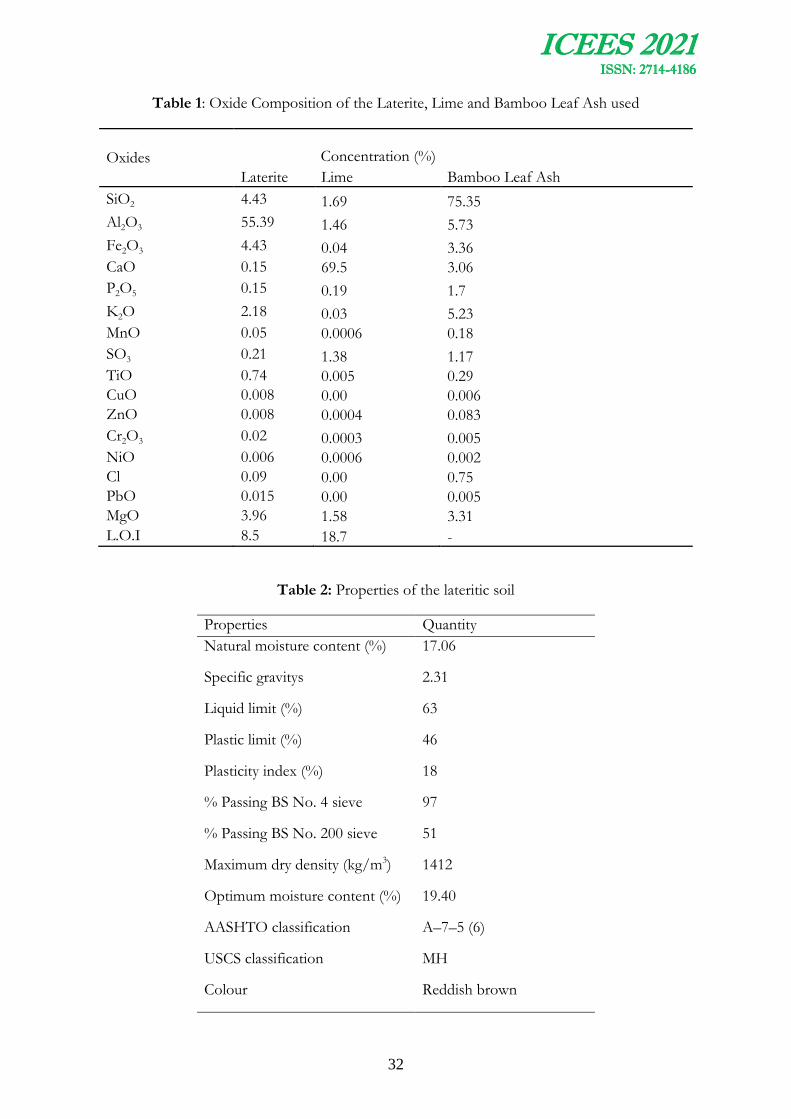
ICEES 2021 ISSN: 2714-4186
32
Table 1: Oxide Composition of the Laterite, Lime and Bamboo Leaf Ash used
Oxides
Concentration (%)
Laterite Lime Bamboo Leaf Ash
SiO2 4.43 1.69 75.35
Al2O3 55.39 1.46 5.73
Fe2O3 4.43 0.04 3.36
CaO 0.15 69.5 3.06
P2O5 0.15 0.19 1.7
K2O 2.18 0.03 5.23
MnO 0.05 0.0006 0.18
SO3 0.21 1.38 1.17
TiO 0.74 0.005 0.29
CuO 0.008 0.00 0.006
ZnO 0.008 0.0004 0.083
Cr2O3 0.02 0.0003 0.005
NiO 0.006 0.0006 0.002
Cl 0.09 0.00 0.75
PbO 0.015 0.00 0.005
MgO 3.96 1.58 3.31
L.O.I 8.5 18.7 -
Table 2: Properties of the lateritic soil
Properties Quantity
Natural moisture content (%) 17.06
Specific gravitys 2.31
Liquid limit (%) 63
Plastic limit (%) 46
Plasticity index (%) 18
% Passing BS No. 4 sieve 97
% Passing BS No. 200 sieve 51
Maximum dry density (kg/m3) 1412
Optimum moisture content (%) 19.40
AASHTO classification A–7–5 (6)
USCS classification
Colour
MH
Reddish brown
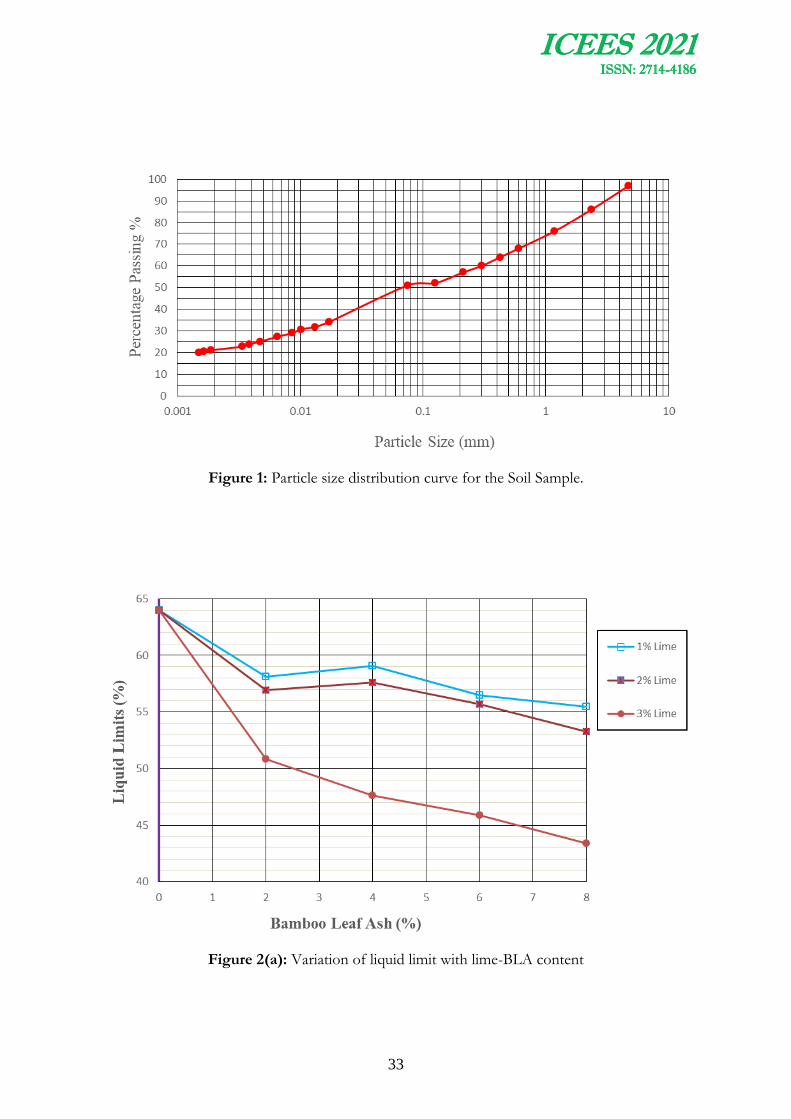
ICEES 2021 ISSN: 2714-4186
33
Figure 1: Particle size distribution curve for the Soil Sample.
Figure 2(a): Variation of liquid limit with lime-BLA content
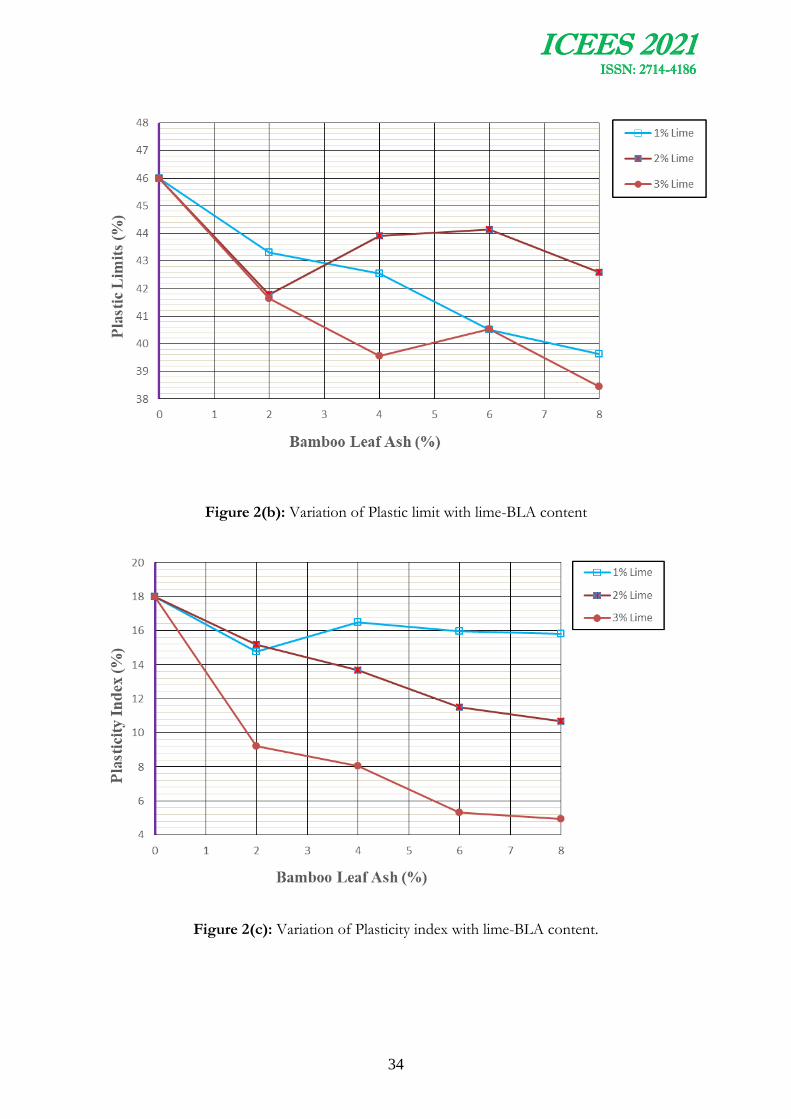
ICEES 2021 ISSN: 2714-4186
34
Figure 2(b): Variation of Plastic limit with lime-BLA content
Figure 2(c): Variation of Plasticity index with lime-BLA content.
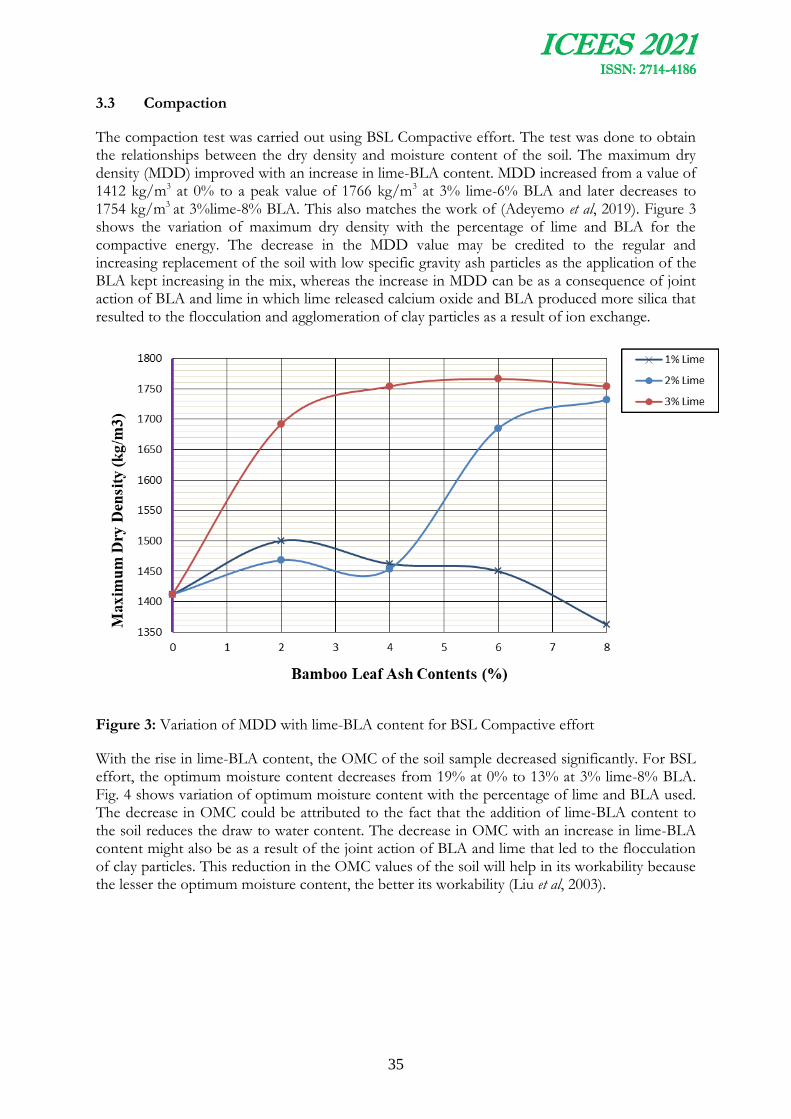
ICEES 2021 ISSN: 2714-4186
35
3.3 Compaction
The compaction test was carried out using BSL Compactive effort. The test was done to obtain the relationships between the dry density and moisture content of the soil. The maximum dry density (MDD) improved with an increase in lime-BLA content. MDD increased from a value of 1412 kg/m3 at 0% to a peak value of 1766 kg/m3 at 3% lime-6% BLA and later decreases to 1754 kg/m3 at 3%lime-8% BLA. This also matches the work of (Adeyemo et al, 2019). Figure 3 shows the variation of maximum dry density with the percentage of lime and BLA for the compactive energy. The decrease in the MDD value may be credited to the regular and increasing replacement of the soil with low specific gravity ash particles as the application of the BLA kept increasing in the mix, whereas the increase in MDD can be as a consequence of joint action of BLA and lime in which lime released calcium oxide and BLA produced more silica that resulted to the flocculation and agglomeration of clay particles as a result of ion exchange.
Figure 3: Variation of MDD with lime-BLA content for BSL Compactive effort
With the rise in lime-BLA content, the OMC of the soil sample decreased significantly. For BSL effort, the optimum moisture content decreases from 19% at 0% to 13% at 3% lime-8% BLA. Fig. 4 shows variation of optimum moisture content with the percentage of lime and BLA used. The decrease in OMC could be attributed to the fact that the addition of lime-BLA content to the soil reduces the draw to water content. The decrease in OMC with an increase in lime-BLA content might also be as a result of the joint action of BLA and lime that led to the flocculation of clay particles. This reduction in the OMC values of the soil will help in its workability because the lesser the optimum moisture content, the better its workability (Liu et al, 2003).

ICEES 2021 ISSN: 2714-4186
36
Figure 4: Variation of OMC with lime-BLA content for BSL Compactive effort
4.0 CONCLUSION AND RECOMMENDATION
From the study, the following conclusions were drawn:
(1) Under general classification, the soil falls within silt-clay materials and can be classified as an A-7-5(6) and MH soil by AASHTO and the Unified Soil Classification structure respectively.
(2) Lime and BLA improved the qualities of the soil samples by reducing the plastic index (PI) appreciably, and this decline in PI is a sign that the soil enhanced.
(3) The maximum dry density values increased considerably for all the trials while the optimum moisture contents values also reduced.
RECOMENDATION
Based on the results, 3% lime 6% BLA content performed better and would be recommended as the optimal percentage suitable for stabilizing and improving lateritic soil using British standard Compactive effort.
ACKNOWLEDGMENT
The authors wish to acknowledge the effort of Engr. Kareem, M.A in proof reading this article

ICEES 2021 ISSN: 2714-4186
37
REFERENCES
AASHTO. Standard Specifications for Transportation Materials and Method of Sampling and Testing. Amer. Assoc. State Highway and Transportation Officials, Washington, DC, USA; 1986.
Adeyemo, K.A., Yunusa, G. H. and Bello, A.A. (2019). Effect of Compactive efforts on hydraulic conductivity of black cotton soil treated with cassava peel ash. Proceedings of the UNIOSUN Faculty of Engineering and Environmental Sciences Conference, Osun State University, Osogbo, 5th-7th November, 2017, pp.11-18
Asha, P., Salman, A., & Kumar, R. A. (2014). Experimental Study on Concrete with Bamboo Leaf Ash. International Journal of Engineering and Advanced Technology, 3(6):46–51.
Bello, A.A (2013). Introductory Soil Mechanics I, Tony Terry Prints, Lagos, pp 112-128.
Bello, A. A., Ige, J.A. and Hammed, A. (2015). Stabilization of Lateritic Soil with Cassava Peels
Ash, British Journal of Applied Science and Technology 7(6): 642-650.
British Standard Institution (1990): “Methods of Test for Soils for Civil Engineering Properties
(1377),” British Standard Institution: London, UK.14.
De Vallejo, L. G. and Ferrer, M. (2012) Geological Engineering Book, CRC Press, Taylor and Francis Group, Boca Raton London New York. Pp 112-120.
Dhinakaran, G., & Chandana, G. H. (2016). Compressive Strength and Durability of Bamboo Leaf Ash Concrete. Jordan Journal of Civil Engineering, 10(3), 279–289.
Fitsum, M. D. (2018).Recent Literatures Review on Stabilization of Lateritic Soil. International
Journal of Scientific Research Engineering &Technology (IJSRET). 7 (11):120-127.
Hailu B. (2011). “Bagasse ash as cement replacing material.”Unpublished Master’s thesis, Addis Ababa University, Addis Ababa.
John, L. K. (2015). The Mineralogy, Geology and Occurrences of Halloysite. Geological Survey of South Australia Department for Manufacturing, Innovation, Trade, Resources and Energy, South Australia.
Lime-Treated Soil Construction Manual: Lime Stabilization & Lime Modification. Published by National Lime Association. January, 2004
Liu, C. and Evett, J. (2003). Soils and Foundation, 6th ed. USA: Prentice Hall.
Nnochiri, E. S. (2017). Effects of Periwinkle Shell Ash on Lime-Stabilized Lateritic Soil. Journal of Applied Science and Environmental Management. 21 (6): 1023-1028
Ojuri, O.O., Akinwumi, I.I. and Oluwatuyi, O.E (2017). Nigerian Lateritic Clay Soils as Hydraulic Barriers to Adsorb Metals. Geotechnical Characterization and Chemical Compatibility. Environment Protection Engineering. 10 (3):41-50

ICEES 2021 ISSN: 2714-4186
38
Omotosho, T.O. (2003). The Propagation and Utilization of Bamboo in Nigeria (Independent
Student Project). Federal Forestry Research Institute, Ibadan.
Rashmi, M., Jin-Hee, K. and Jun-Tae K. (2019). Environmental, social and economic sustainability of bamboo and bamboo-based construction materials in buildings. Journal of Asian Architecture and Building Engineering, 18 (2):49-59
Yusoff, M.N.M., AbdulKadir, A., and Mohamed, A.H.J. (2002). Utilization of bamboo for pulp and paper and medium density fiberboard. CPS Press Limited, India.
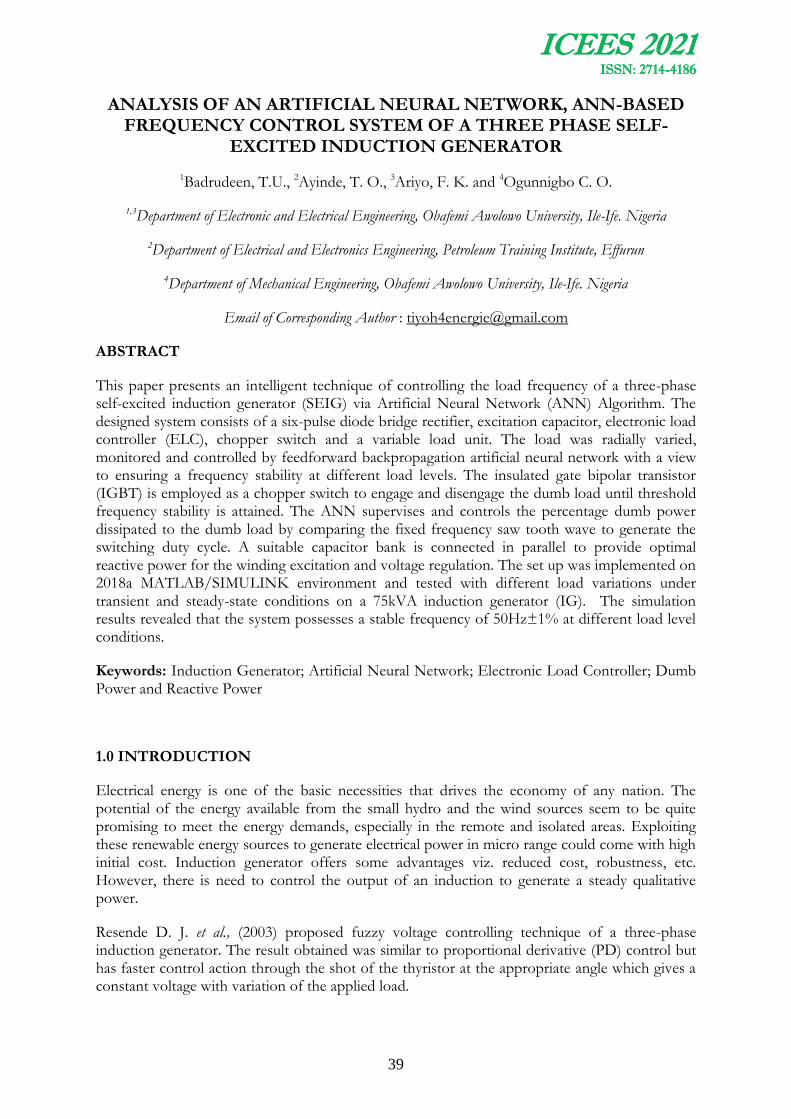
ICEES 2021 ISSN: 2714-4186
39
ANALYSIS OF AN ARTIFICIAL NEURAL NETWORK, ANN-BASED FREQUENCY CONTROL SYSTEM OF A THREE PHASE SELF-
EXCITED INDUCTION GENERATOR
1Badrudeen, T.U., 2Ayinde, T. O., 3Ariyo, F. K. and 4Ogunnigbo C. O.
1,3Department of Electronic and Electrical Engineering, Obafemi Awolowo University, Ile-Ife. Nigeria
2Department of Electrical and Electronics Engineering, Petroleum Training Institute, Effurun
4Department of Mechanical Engineering, Obafemi Awolowo University, Ile-Ife. Nigeria
Email of Corresponding Author : [email protected]
ABSTRACT
This paper presents an intelligent technique of controlling the load frequency of a three-phase self-excited induction generator (SEIG) via Artificial Neural Network (ANN) Algorithm. The designed system consists of a six-pulse diode bridge rectifier, excitation capacitor, electronic load controller (ELC), chopper switch and a variable load unit. The load was radially varied, monitored and controlled by feedforward backpropagation artificial neural network with a view to ensuring a frequency stability at different load levels. The insulated gate bipolar transistor (IGBT) is employed as a chopper switch to engage and disengage the dumb load until threshold frequency stability is attained. The ANN supervises and controls the percentage dumb power dissipated to the dumb load by comparing the fixed frequency saw tooth wave to generate the switching duty cycle. A suitable capacitor bank is connected in parallel to provide optimal reactive power for the winding excitation and voltage regulation. The set up was implemented on 2018a MATLAB/SIMULINK environment and tested with different load variations under transient and steady-state conditions on a 75kVA induction generator (IG). The simulation results revealed that the system possesses a stable frequency of 50Hz±1% at different load level conditions.
Keywords: Induction Generator; Artificial Neural Network; Electronic Load Controller; Dumb Power and Reactive Power
1.0 INTRODUCTION
Electrical energy is one of the basic necessities that drives the economy of any nation. The potential of the energy available from the small hydro and the wind sources seem to be quite promising to meet the energy demands, especially in the remote and isolated areas. Exploiting these renewable energy sources to generate electrical power in micro range could come with high initial cost. Induction generator offers some advantages viz. reduced cost, robustness, etc. However, there is need to control the output of an induction to generate a steady qualitative power.
Resende D. J. et al., (2003) proposed fuzzy voltage controlling technique of a three-phase induction generator. The result obtained was similar to proportional derivative (PD) control but has faster control action through the shot of the thyristor at the appropriate angle which gives a constant voltage with variation of the applied load.
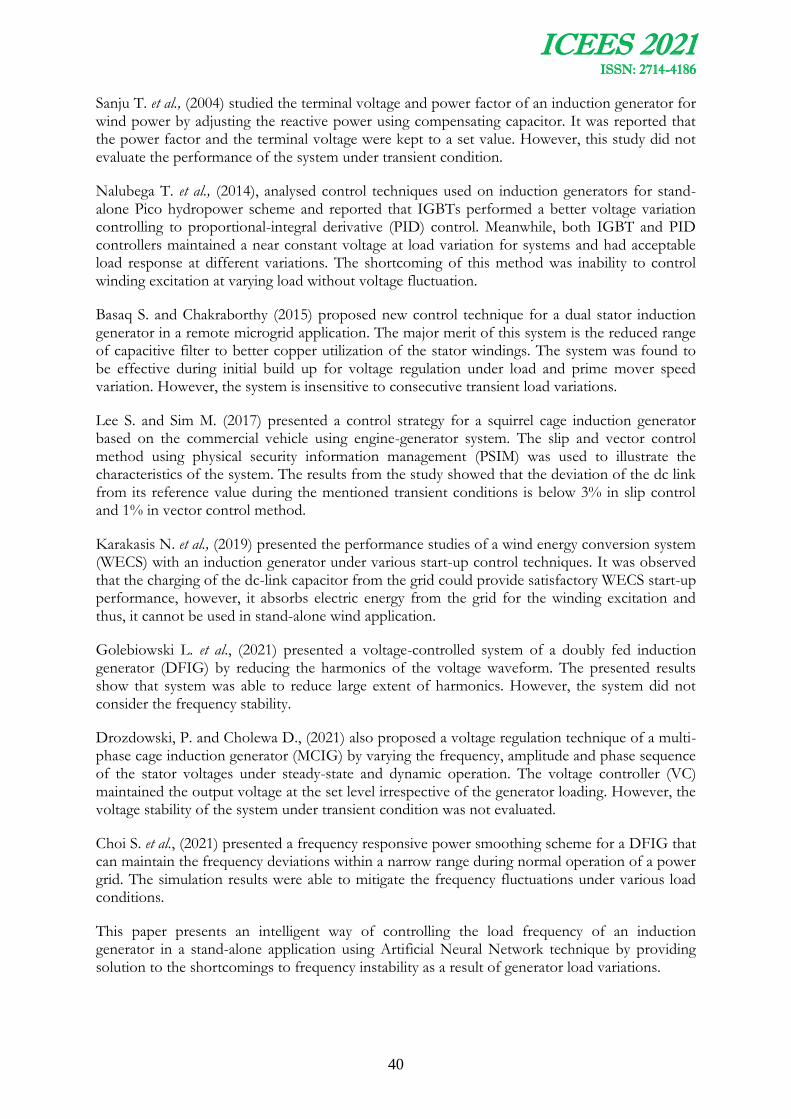
ICEES 2021 ISSN: 2714-4186
40
Sanju T. et al., (2004) studied the terminal voltage and power factor of an induction generator for wind power by adjusting the reactive power using compensating capacitor. It was reported that the power factor and the terminal voltage were kept to a set value. However, this study did not evaluate the performance of the system under transient condition.
Nalubega T. et al., (2014), analysed control techniques used on induction generators for stand- alone Pico hydropower scheme and reported that IGBTs performed a better voltage variation controlling to proportional-integral derivative (PID) control. Meanwhile, both IGBT and PID controllers maintained a near constant voltage at load variation for systems and had acceptable load response at different variations. The shortcoming of this method was inability to control winding excitation at varying load without voltage fluctuation.
Basaq S. and Chakraborthy (2015) proposed new control technique for a dual stator induction generator in a remote microgrid application. The major merit of this system is the reduced range of capacitive filter to better copper utilization of the stator windings. The system was found to be effective during initial build up for voltage regulation under load and prime mover speed variation. However, the system is insensitive to consecutive transient load variations.
Lee S. and Sim M. (2017) presented a control strategy for a squirrel cage induction generator based on the commercial vehicle using engine-generator system. The slip and vector control method using physical security information management (PSIM) was used to illustrate the characteristics of the system. The results from the study showed that the deviation of the dc link from its reference value during the mentioned transient conditions is below 3% in slip control and 1% in vector control method.
Karakasis N. et al., (2019) presented the performance studies of a wind energy conversion system (WECS) with an induction generator under various start-up control techniques. It was observed that the charging of the dc-link capacitor from the grid could provide satisfactory WECS start-up performance, however, it absorbs electric energy from the grid for the winding excitation and thus, it cannot be used in stand-alone wind application.
Golebiowski L. et al., (2021) presented a voltage-controlled system of a doubly fed induction generator (DFIG) by reducing the harmonics of the voltage waveform. The presented results show that system was able to reduce large extent of harmonics. However, the system did not consider the frequency stability.
Drozdowski, P. and Cholewa D., (2021) also proposed a voltage regulation technique of a multi-phase cage induction generator (MCIG) by varying the frequency, amplitude and phase sequence of the stator voltages under steady-state and dynamic operation. The voltage controller (VC) maintained the output voltage at the set level irrespective of the generator loading. However, the voltage stability of the system under transient condition was not evaluated.
Choi S. et al., (2021) presented a frequency responsive power smoothing scheme for a DFIG that can maintain the frequency deviations within a narrow range during normal operation of a power grid. The simulation results were able to mitigate the frequency fluctuations under various load conditions.
This paper presents an intelligent way of controlling the load frequency of an induction generator in a stand-alone application using Artificial Neural Network technique by providing solution to the shortcomings to frequency instability as a result of generator load variations.

ICEES 2021 ISSN: 2714-4186
41
2.0 MATERIALS AND METHODS
The design of an ANN algorithm for the rotor frequency control of a stand-alone three phase induction generator will be examined. The steady-state and transient analysis at different load conditions will be assessed to evaluate the performance of the controller.
2.1 System Configuration and Control Scheme
The block diagram of the SEIG connected to ELC system with a three-phase linear/non-linear load is shown in Fig. 1.
Fig. 1: Block Diagram of an ANN-Based Control Technique of a Stand Alone SEIG
The reference frequency, f*ref and rotor frequency, f are fed to the comparator to generate an error signal. The ANN controller generate a sinusoidal waveform of frequency, Uf signal which was compared with the sawtooth waveform. The output of the relational operator generates a duty cycle which controls the gate of the IGBT to determine the percentage of the dissipated dumb power across the dumb load, Rd.
The IGBT is used as a chopper switch to provide a variable DC voltage such that when the chopper switch is ON, the comparator compares the reference frequency signal (50Hz), f*ref with the sensed rotor frequency, f. The differential frequency signal from the comparator is trained on an ANN to generate the varying duty cycle switching signal after comparing with a reference sawtooth waveform which controls the gate of the IGBT. The generator power, PGen supplies both load power, PLoad and dumb power PDump across the purely resistive load, Rd, such that the total power is appeared constant at varying PLoad as depicted in Equation 1. The capacitor bank is connected to the secondary winding of the generator to provide the magnetizing current for the excitation. The 6-pulse bridge diode converts the varying AC voltage from the generator to DC voltage of an approximate value. The pulsating DC signal is filtered by the shunt capacitor.

ICEES 2021 ISSN: 2714-4186
42
The dump power ( ) may be used for space heating, water heating, battery charging,
cooking, baking etc.
2.2 ANN Controlling Algorithm
ANN was designed based on least mean square (LMS) algorithm which has the capability of controlling the frequency output of the SEIG in an integrated manner in spite of varying load power.
2.2.1 Selection of network structure
The general structure of a constructed feedforward backpropagation is shown in Fig. 2. The input layer consists of the target frequency and differential frequency from rotor frequency and the reference frequency. The output layer produces a trained frequency, Uf.
Fig. 2: General Structure of Constructed Feedforward Backpropagation ANN
2.2.2 Testing the network
The appropriate outputs from the trained data are given by the network to control inputs of the ELC DC chopper circuit. A test point of different samples was used to evaluate the performance of the ANN after training of the neural network. Fig. 3 and 4 show the network in the MATLAB NNET and MATLAB/SIMULINK environment, respectively.

ICEES 2021 ISSN: 2714-4186
43
Fig. 3: ANN Training with MATLAB NNET Toolbox
3.0 RESULTS AND DISCUSSION
The performance of the controller under transient and steady-state conditions under different load variations were evaluated and their results were discussed accordingly.
3.1 Performance of the designed ANN controller
The performance evaluation of trained system is shown in Fig. 5 and data points are shown in Table 1.
Fig. 4: MATLAB/Simulink of SEIG-ELC with ANN Controller

ICEES 2021 ISSN: 2714-4186
44
3.1.1 Performance of SEIG-ELC with ANN controller under transient condition
A sudden load of 50 kW was switched ON at 0.2 second under opened circuit breaker to evaluate the performance of the SEIG-ELC based on ANN under transient condition. There was a drop in the voltage, however, there is also a sudden surge in the stator currents as a result of sudden load application as depicted in Fig. 6. The rotor speed instability settles to normal at about 0.45 second after the IGBT has activated the percentage dumb power to dumb load, Rd as shown in Fig. 7.
Fig. 5: Performance of Neural network
Table 1: Rotor Frequency and ANN controlled Rotor Frequency
Test point Load (kW)
Pload PDumb
Rotor
Frequency
(f) (Hz)
Trained Rotor
Frequency
(Hz)
1 20.00 38.85 53.50 49.70
2 25.00 45.00 52.70 49.70
2 30.00 29.50 52.35 49.50
4 35.00 25.00 52.35 49.50
5 40.00 19.70 52.20 50.00
6 45.00 15.00 51.77 50.00
7 50.00 10.00 51.70 50.40
8 55.00 4.50 51.35 50.00
9 57.00 3.00 51.05 50.40
10 60.00 0.00 50.10 50.30
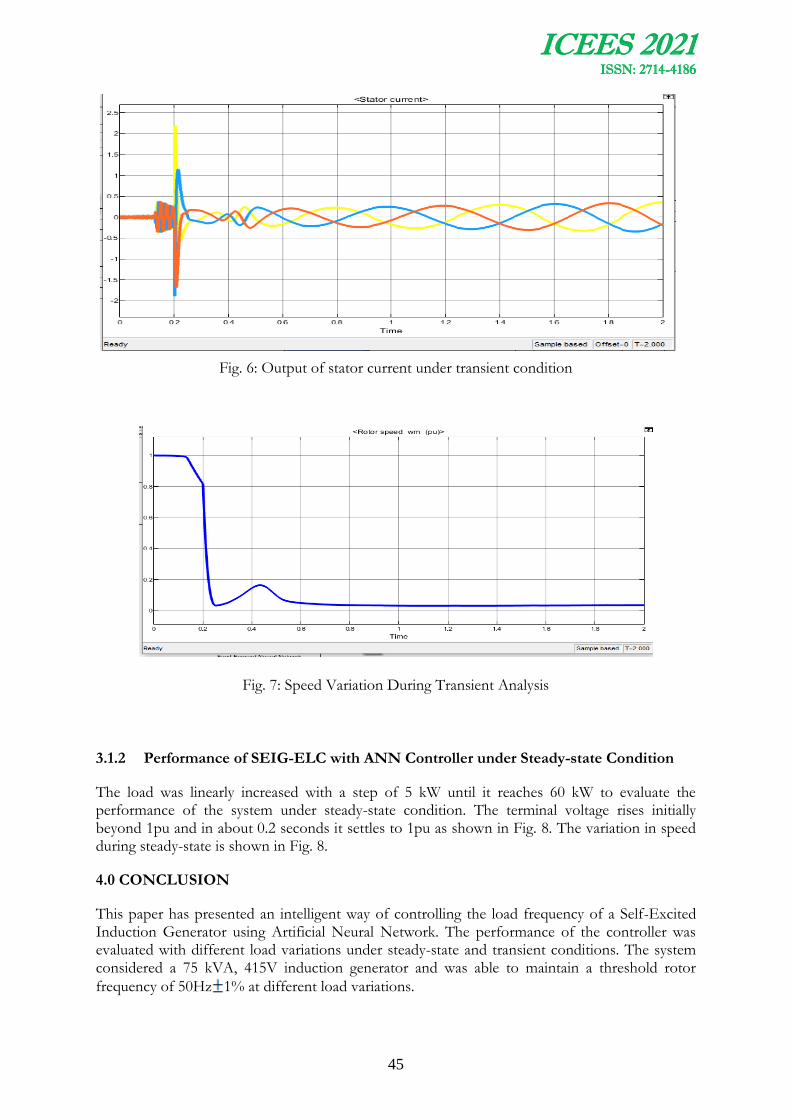
ICEES 2021 ISSN: 2714-4186
45
Fig. 6: Output of stator current under transient condition
Fig. 7: Speed Variation During Transient Analysis
3.1.2 Performance of SEIG-ELC with ANN Controller under Steady-state Condition
The load was linearly increased with a step of 5 kW until it reaches 60 kW to evaluate the performance of the system under steady-state condition. The terminal voltage rises initially beyond 1pu and in about 0.2 seconds it settles to 1pu as shown in Fig. 8. The variation in speed during steady-state is shown in Fig. 8.
4.0 CONCLUSION
This paper has presented an intelligent way of controlling the load frequency of a Self-Excited Induction Generator using Artificial Neural Network. The performance of the controller was evaluated with different load variations under steady-state and transient conditions. The system considered a 75 kVA, 415V induction generator and was able to maintain a threshold rotor
frequency of 50Hz 1% at different load variations.
ICEES 2021 ISSN: 2714-4186
46
Fig. 8: Variation in Power Dumped During Steady State Analysis
REFERENCES
Basak S. and Chakraborthy (2015). A new control technique for dual stator induction generator used in standalone applications. IECON 2015- 41st Annual conference of the IEEE industrial electronics society, 2015, pp.004772-004777. doi: 10.1109/IECON.2015.7392846
Choi S., Kang Y. C., Kim Y. L. and Terzija V. (2021). A frequency responsive power-smoothing scheme of a doubly fed induction generator for enhancing the energy-absorbing capability. International Journal of Electrical Power and Energies Systems. http://doi.org/10.1016/j.ijepes.2021.107053
Drozdowski, P., Cholewa D. (2021). Voltage control of multiphase cage induction generators at a speed varying over a wide range. Energies 2021, 14, 7080. https://doi.org/10.3390/en14217080
Golebiowski L., Golebiowski M. and Golebiowski B. (2021). Optimal control of a doubly fed induction generator of a wind turbine in island grid operation. Energies 2021, 14, 7883. https://doi.org/10.3390/en14237883
Karakasis, N., Tsioumas E., Jabbour N., Bazzi A. M. and Mademlis C. (2019). Optimal efficiency control in a wind system with doubly fed induction generator. IEEE Transactions on Power Electronics, vol. 34, no.1, pp. 356-368, Jan. 2019.
Lee S. and Sim M. (2017). A study on induction generator control methods for commercial vehicle based on slip and vector control. 2017 20th international conference on electrical machines and systems, 2017, pp.1-5: doi:10.1109/ICEMS.2017.8056248
Nalubega T., Da Silva I. , Richard O. and Abbo M.S. (2014). Analysis of induction generator controller techniques for pico hydropower scheme in Kasese, Western Uganda. 2014

ICEES 2021 ISSN: 2714-4186
47
international conference on the eleventh industrial and commercial use of energy, 2014, pp. 1-9 doi: 10.1109/ICUE.2014.6904210
Resende de J.T., Schelb A. J.H.C., Ferreira R. and Mannasses, E. P. (2003). Control of the generated voltage by the three-phase induction self-excited by capacitors using control techniques. IEEE international conference on Industrial technology 2003, pp.530-535 vol.1, doi: 10.1109/ICIT.2003.1290386
Senju Tomonobu., Sueyoshi, N., Kuninaka R., Uezato H. F. and Funabashi T. (2004). Study on terminal voltage and power factor control of induction generator for wind power generation system. 2014 international conference on Power system technology, 2004. PowerCon 2004, pp. 753-758 vol.1 doi: 10.1109/ICPST.2004.1460092
ICEES 2021 ISSN: 2714-4186
48
ENHANCEMENT OF AMPLIFY AND FORWARD COOPERATIVE RELAY TECHNIQUE OVER NAKAGAMI FADING CHANNEL
1* Owolabi, D. E., 2Adeyemo, Z. K. and 3Ojo, S. I.
123Department of Electronic and Electrical Engineering, Ladoke Akintola University of Technology, Ogbomoso, Nigeria
Email of Corresponding Author : [email protected]
ABSTRACT
Wireless communication system is of paramount importance in the world of telecommunication infrastructure and is expected to play a leading role in the development of a nation. However, the system is characterized by multipath propagation effects that degrade the performance. Amplify and Forward (AF) cooperative relay network which is one of the techniques previously used to solve this problem suffers from poor performance due to signal amplification that amplifies the noise before transmission. Hence, in this paper, an enhanced AF cooperative relay technique using Kalman filter is proposed. The received signal at the relay node is amplified and used as input to Kalman filter to remove the noise present before signal amplification. The output signal is multiplied with the relay gain to amplify the strength of the received signal before forwarding to the destination. Mathematical expression of Bit Error Rate (BER) is derived using Probability Density Function (PDF) of the received signal. The technique is simulated using Matrix Laboratory software and evaluated using BER to determine the performance of the technique and compare with the existing AF technique. The results obtained show that the enhanced AF gives better performance with low BER values than the existing AF.
Keywords: Multipath Fading (MF), Cooperative Communication (CC), Amplify and Forward (AF), Decode and Forward (DF), Kalman Filter (KF) and Bit Error Rate (BER).
1. 1NTRODUCTION
Wireless Communication (WC) is the exchange of information between two or more points that are not physically connected. The medium of communication in WC is through space, therefore, it does not require the use of electrical conductor making it unlimited by distance. Nowadays, the number of users accessing wireless communication services is increasing rapid due to exponential rise in its demand (Kiilerich, 2012; Goldsmith, 2005 and Adeyemo et al., 2019). However, the performance of WC is limited by Multipath Fading (MF) due to channel impairment that affect signal propagation resulting in signal fading. Channel impairment are factors that attenuate or distort signals as they are propagating through the channel from the source to the destination. Channel impairment includes multipath propagation, shadowing and path loss. Multipath propagation occurs when signal propagate in multiple copies from source to destination due to obstructions along the propagation path. Shadowing described the fluctuation in the power of the received signal, while, path loss describes the degradation or decaying in the received power (Admoon and Nordin, 2017; Adeyemo and Ojedokun, 2014; Elechi and Otasowie, 2015 and Abolade et al., 2019). In order to improve the performance of WC system, Cooperative Communication (CC) was proposed. CC comprises of two basic relaying mechanisms namely: Decode and Forward (DF) and Amplify and Forward (AF). In DF technique, relay decodes the received signal from the source and forwarded to the destination via single or multiple antennas. However, in AF, decode of signal is require, relay only amplify the
ICEES 2021 ISSN: 2714-4186
49
received signal and forward the amplified signal to the destination (Ashish and Sunnel, 2017; Ojo et al., 2018; Olfat and Olfat, 2011). DF show better performance than AF in term of error due to signal amplification that amplify noise thereby degrading system performance. However, if the channel between the source and relay is corrupt, the relay will not decode the signal perfectly and thereby leading to signal outage at the destination (Nasir, 2017; Tafzeel, 2012; Danna and Onwuli, 2010 and Liu et al., 2009). Therefore, in this paper, AF relay with kalman filter that reduce the noise amplification at the relay node is proposed to improve the performance of the existing AF technique. Also, multiple relay selection was carried out based on Signal to Noise Ratio (SNR) to select the relay that participate during the second hub transmission. The statistical effects of multipath propagation followed different fading distributions such as Nakagami-m, Rician and Rayleigh fading channel. Many researches have been carried out using Rayleigh and Rician distribution which are good for terrestrial and satellite modeling (Rappaport, 2002). This paper adopts the use of Nakagami-m fading distribution that combines both Rayleigh and Rician distributions.
2. Related Works
There have been various existing works on Amplify and Forward (AF) cooperative communication technique. In (Qiang et al., 2018), linear processing design of amplify and forward relays for maximizing the systems throughput was proposed to solve the of signal fluctuation at the destination due to fading using cooperative communication. Multiple relays network was designed based on fixed gain amplify and forward technique. Threshold for relay selection was set using received SNR at the relay node. Threshold of 2 dB was set and when the SNR at the relay node is greater than the set threshold such relay will participate in the second hop transmission by amplify and forward the amplified signal to the destination. The multiple copies of transmitted signal were combined at the destination using Maximal Ratio Combiner (MRC). The results obtained revealed that technique showed improvement in system BER when compared with existing amplify and forward technique without relay selection.
However, the technique suffers from noise enhancement due to signal amplification that increase the noise present in the received signal thereby affecting overall system performance. Assisted cooperative communication for wireless sensor networks was proposed in (Aishwarya and Kirthiga, 2018), to solve the problem of signal fading. Multiple relays network was designed based on fixed gain amplify and forward technique, considering single hop and multi-hop system. In the multi-hop, multiple relay selection was carried out based on SNR. Threshold of 1 dB was set to select the best relays and any relay with SNR greater than the set threshold were selected and perform signal amplification. The amplified signals were forwarded to the destination during the second hub transmission. At the destination, Maximal Ratio Combiner (MRC) was used to combined the multiple copies of the received signal.
Closed form expression of BER for the two hops system were derived and used to measure the performance of the system. The results obtained showed that, the multi-hop system showed a better performance with low BER than single hop. However, the overall performance of the technique showed that, the technique has higher error rate when compared with decode and forward relaying technique due to signal amplification that amplify the noise at the relay node before forwarded to the destination. Furthermore, in (Adeyemo et al., 2019), modification of multiple antennas amplify and forward relay over Nakagami fading channel was carried out to solve the problem of hardware complexity in conventional AF. The existing AF relay protocol was modified using MRC with single Radio Frequency (RF) chain and match filter. The transmitted signal over Nakagami fading channel was received using multiple antenna at the relay

ICEES 2021 ISSN: 2714-4186
50
node and amplified before forwarded to the destination. The multiple copies of the transmitted signal at the destination were combined using MRC with single RF chain and match filter. Closed form expression of BER was derived and used to evaluate the performance of modified technique. The results obtained showed that, the modified technique has better performance with low BER and processing time than the existing AF technique. However, the modified technique suffers from noise amplification resulting in poor performance with increase in error rate when compared with decode and forward technique. The existing work on AF suffers from noise enhancement due to signal amplification at the relay node thereby degrade the overall system performance. Therefore, in this paper, enhancement of AF is proposed using kalman filter to remove the noise present at the relay node before carry out signal amplification.
2.1. Amplify and Forward (AF) Relay Technique
Amplify and Forward (AF) relay technique modifies the signal received at the relay node by amplifying the received signal before forwarded to the destination. AF technique behaves like a traditional analog repeaters station that amplifies the noisy version of transmitted signal from the source without performing any kind of decoding. The relay technique has reduced hardware complexity due to absence of signal processing however, it suffers from amplification of noise in
the received signal resulting in poor overall system performance The gain of relay is given by
(Zijian et al., 2016) as
(1)
where,
= the relay power
= the signal transmitting power at the source
= the source to relay channel gain
= the noise present at the relay node
Hence, the signal received signal at the destination in the second phase is given by
(Rappaport, 2012) as
(2)
where,
= the relay to source destination channel coefficient
= the signal received at the relay node
= the noise at the destination
2.2. Decode and Forward (DF) Relay Technique

ICEES 2021 ISSN: 2714-4186
51
Decode and Forward (DF) relay technique behave as an intelligent repeater station that decodes the signal transmitted by the source over a source to relay channel in the first transmission phase. The purpose of decoding in DF is to remove the noise present in the received signal at the relay node. The relay re-encodes the received signal and forwarded to the destination during second hub transmission. Destination then combines the multiple copies of signal transmitted from the relay node and extract the information sent by the source using signal processing technique. The performance of this type of relaying protocol depends on channel between source and relay as well as channel between relay and destination. DF relaying protocol showed better performance with improve in Quality of Service (QoS) when compared with AF. However, in DF, if the channel between the source and relay is corrupted due to fading effect, the relay will not be able to decode the signal perfectly and thereby leading to signal outage at the destination (Nasir, 2017).
2.3. The Kalman Filter
The perceived speech quality and intelligibility of the noisy speech signal is improved by speech enhancement techniques. There are many speech enhancement techniques, categorized on transformed domain, adaptive time domain, and model-based domain. In transform-based, the time domain signal is transformed into frequency domain, to enhance the speech signal. In adaptive filtering technique, noise is cancelled using adaptive filtering methods such as the Kalman filter thereby enhancing the noisy speech signals (Imad et al., 2019). The filter models the noisy signal in terms of observation equations and state space equations. It is a recursive filter that run continuously on the noisy signal to produce a clean signal. The filter can be easily applied for the real time applications to enhance the quality of the degraded signal due to presence of noise (Ashish and Suneel, 2017). Kalman filter is used in this paper to remove the noise present in the signal at the relay node before signal amplification.
3. METHODOLOGY
3.1. Enhancement of Amplify and Forward Relay Technique
The multiple copies of the transmitted signal from the source were received at the relay node using multiple relays. The relay selection was carried out by comparing the received signal at the relay node with the set threshold of 1.5 dB to determine the relay that participated in the second hub transmission. The selected relays carried out signal amplification by multiplying the received signal with the relay gain using Equation (1). The amplified signals were then made to passed through kalman filter to remove the amplified noise before forwarded to the destination. The multiple copies of the signal at the destination were combined using Equal Gain Combiner (EGC). The received signal at the second hub transmission is given in Equation (2) and the response of kalman filter is given as
(3)
where,
= the output (clean) signal
= the assumed clean signal
= the noise present
From Equation (3), the noise present is obtained as

ICEES 2021 ISSN: 2714-4186
52
(4)
Therefore, substituting Equation (4) into Equation (2) gives
(5)
Equation (5) is the signal power for individual branch at the destination
EGC was used to combine the multiple copies of the received signal at the destination and the
SNR of EGC output is given by (Goldsmith, 2005) as
(6)
where,
= the signal power on each branch,
L = the number of branches, and
w = the noise present on each branch
Therefore, substituting Equation (5) into Equation (6) gives
(7)
using the PDF of Nakagami-m fading channel and Equation (7), the PDF of the received signal
is obtained as
(8)
Therefore, the expression for Bit Error Rate (BER) for the enhanced technique is obtained as
The performance of the technique was evaluated using Bit Error Rate (BER) and Throughput (TP).
According to (Hima and Seema, 2016; Haitao et al., 2011), conditional error probability
is given as
(10)
Substituting Equation (10) into Equation (9) gives
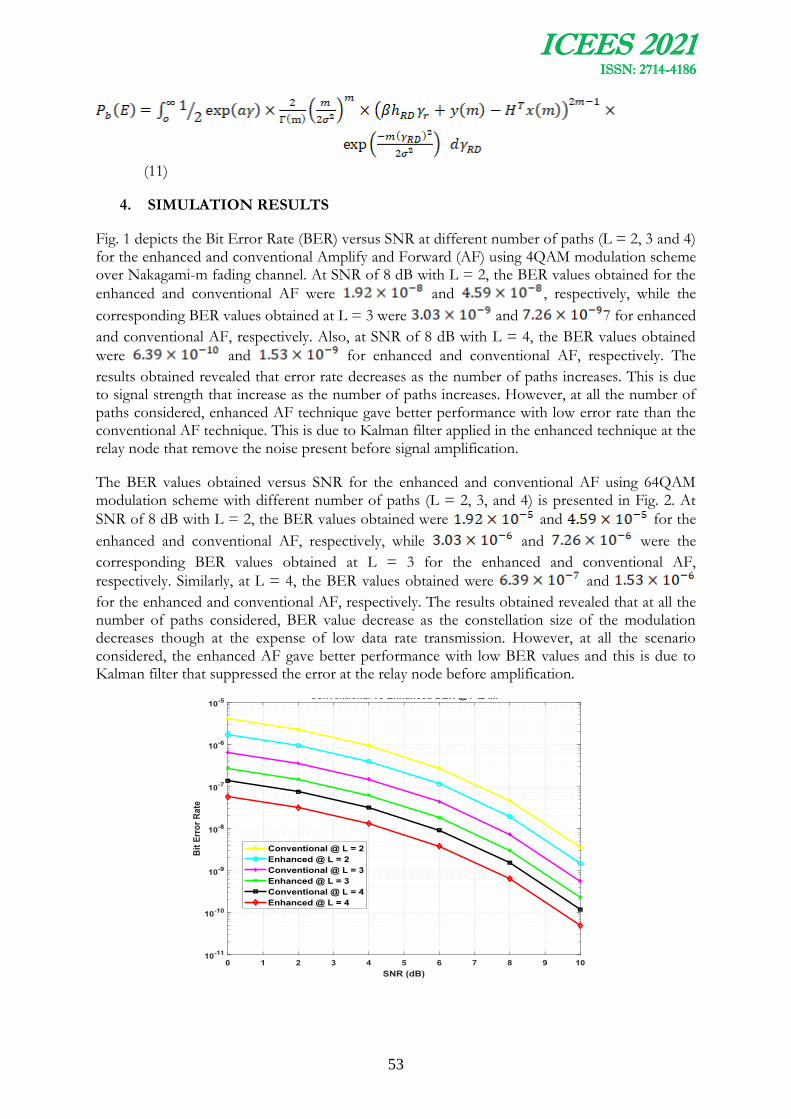
ICEES 2021 ISSN: 2714-4186
53
(11)
4. SIMULATION RESULTS
Fig. 1 depicts the Bit Error Rate (BER) versus SNR at different number of paths (L = 2, 3 and 4) for the enhanced and conventional Amplify and Forward (AF) using 4QAM modulation scheme over Nakagami-m fading channel. At SNR of 8 dB with L = 2, the BER values obtained for the
enhanced and conventional AF were and , respectively, while the
corresponding BER values obtained at L = 3 were and 7 for enhanced
and conventional AF, respectively. Also, at SNR of 8 dB with L = 4, the BER values obtained
were and for enhanced and conventional AF, respectively. The
results obtained revealed that error rate decreases as the number of paths increases. This is due to signal strength that increase as the number of paths increases. However, at all the number of paths considered, enhanced AF technique gave better performance with low error rate than the conventional AF technique. This is due to Kalman filter applied in the enhanced technique at the relay node that remove the noise present before signal amplification.
The BER values obtained versus SNR for the enhanced and conventional AF using 64QAM modulation scheme with different number of paths (L = 2, 3, and 4) is presented in Fig. 2. At
SNR of 8 dB with L = 2, the BER values obtained were and for the
enhanced and conventional AF, respectively, while and were the
corresponding BER values obtained at L = 3 for the enhanced and conventional AF,
respectively. Similarly, at L = 4, the BER values obtained were and
for the enhanced and conventional AF, respectively. The results obtained revealed that at all the number of paths considered, BER value decrease as the constellation size of the modulation decreases though at the expense of low data rate transmission. However, at all the scenario considered, the enhanced AF gave better performance with low BER values and this is due to Kalman filter that suppressed the error at the relay node before amplification.

ICEES 2021 ISSN: 2714-4186
54
Figure 1: Bit Error Rate (BER) versus SNR for enhanced and conventional AF at different number of paths with 4QAM modulation scheme.
Figure 2: Bit Error Rate (BER) versus SNR for enhanced and conventional AF at different number of paths with 4QAM modulation scheme.
5. CONCLUSION
In this paper, the Enhancement of Amplify and Forward (AF) cooperative relay technique over Nakagami fading channel is carried out. The expression of the received signal for the enhanced technique was derived using Probability Density Function (PDF). The expression of the received signal was used to derive the Bit Error Rate (BER) and used to measure the performance of the enhanced technique. The performance was detected at different number of propagation path and constellation size of the modulation schemes. The results obtained revealed that BER values reduces as the number of propagation path increases, while, BER values reduces as the constellation size of the modulation increase though at the expense of low data rate transmission. However, at all the scenario considered, enhanced AF technique gave better performance with low error rate than the existing AF and this is due to Kalman filter that suppressed the noise at the relay node before signal amplification.
REFERENCES
Abolade, R.O., Ojo, S.I., Adeyemo, Z.K., Akintoye, N.O. and Salami, H.T. (2019). Enhancement of Maximal Ratio Combiner over Log-Normal Fading Channel using Firefly Algorithm, Transactions on Networks and Communications journal, 7(2): 1-11.
Adeyemo, Z. K., Abolade, R.O., Oladimeji, O.B., Ojo, S.I. (2019). Modification of multiple antenna amplify and forward relay over Nakagami fading channel, Ubiquitous Computing and Communication Journal, ISSN 1992-8424, pp 1630-1638.

ICEES 2021 ISSN: 2714-4186
55
Adeyemo, Z.K., Ojo, S.I., Abolade, R.O. and Oladimeji, O.B. (2019). Modification of a Square-Law Combiner for Detection in a Cognitive Radio Network, International Journal of Wireless and Microwave Technologies, 4(2): 32-45.
Adeyemo, Z.K and Ojedokun, I.A. (2014). EGC Receiver using Single Radio Frequency Chain and Single Matched Filter over Combined Rayleigh and Rician Fading Channels, ARPN Journal of Engineering and Applied Sciences, 9(7): 992-994.
Admoon, A. R. and Nordin, M. I. (2017). Energy harvesting with cooperative networks and adaptive transmission, IEEE Jordan Conference on Applied Electrical Engineering and Computing Technologies (AEECT), pp 1-6.
Aishwarya M. and Kirthiga, S. (2018). Relay Assisted Cooperative Communication for Wireless Sensor Networks, Second International Conference on Advances in Electronics, Computer and Communications, India, pp 1-6.
Ashish, K.S. and Suneel, Y. (2017). Performance analysis of incremental hybriddecode-amplify-forward cooperative relaying with opportunistic relay selection under Rayleigh fading channels, IEEE WiSPNET, 2017 conference, India, pp 1728-1732.
Danna, N. M. and Onwuli, C. L. (2010). Cooperative communication techniques in wireless Networks (analysis with variable relay positioning), Master of Science thesis submitted to School of Engineering, Blekinge Institute of Technology, pp 1-64.
Elechi, P and Otasowie P.O. (2015). Determination of Path Loss Exponent for GSM Wireless Access in Rivers State Using Building Penetration Loss, The Mediterranean Journal of Electronics and Communications, 11(1): 2-8.
Goldsmith, A.J. (2005). “Wireless Communication” first Edition, Cambridge University press,Cambridge. England: 205-214.
Haitao, Z., Emiliano, G. P.,Song, A. and Jibo, W. (2011). Calculating End-to-End Throughput Capacity in Wireless Networks with Consideration of Hidden Nodes and Multi-rate Terminals, IEEE ccess, pp 1-5.
Hima P.V. and Seema P. (2016). Performance Analysis MRC/ECG Diversity Combining Technique over AWGN channel, IOSR Journal of Electronics and Communication Engineering 42 (2): 25-26.
Imad, I., Imane, D., Ouadoudi, Z., Mohammed, R. and Driss, A. (2019). A Kalman Filter Process for Energy Optimization in WSNs, Journal of Communications Software and Systems 15 (1):1-10.
Kiilerich, P.N. (2012). Novel cooperative spectrum sensing methods and their limitations PhD dissertation submitted to Aalborg university, pp 1-35.
Liu, R, Sadek A. and Kwasinski, (2009). A cooperatives communication and networking, Cambridge University, New York, pp 20-222.
Nasir, H. (2017). Cooperative communication in relay assisted wireless access networks, PhD thesis submitted to Faculty of Science and Engineering, Queensland University of Technology, pp 1-179.

ICEES 2021 ISSN: 2714-4186
56
Ojo, F.K., Akande, D.O. and Salleh, M. F. M. (2018). An overview of RF energy harvesting and information transmission in cooperative communication networks, International Journal of Telecommunication Systems, Springer7(2):1-4.
Olfat, E. and Olfat, A. (2011). Performance of hybrid decode–amplify–forward protocol for multiple relay networks over independent and non-identical flat fading channels, IEEE Waveform and signal processing, 5(14): 2018–2027.
Qiang, W., Tiejun, C. and Tingting, L. (2018). Linear Processing Design of amplify and Forward Relays for Maximizing the system thoughput, Journal of Electrical and Computer Engineering, 5(2):1-11.
Rappaport, T.S. (2002). Wireless communications principle and practice, Even publishers Chicago: 240-250.
Tafzeel, R. A. (2012). Cooperative communications, PhD thesis submitted to Department of Communication Engineering, Stockholm University, Sweden, pp 1-328.
Zijian, M., Weifeng, S. and John, D. M. (2016). Amplify and forward relaying protocol design with optimum power and time allocation, IEEE Waveform and signal processing, 10(3): pp 1-6.
ICEES 2021 ISSN: 2714-4186
57
EFFECT OF SECONDARY USERS AND CLUSTERS ON ENERGY EFFICIENT COOPERATIVE SPECTRUM HOLE DETECTION IN A
COGNITIVE RADIO NETWORK
Ojo, S. I. and *Adeyemo, Z. K.
Department of Electronic and Electrical Engineering, Ladoke Akintola University of Technology, Ogbomoso, Nigeria
Email of Corresponding Author : {siojo83|zkadeyemo}@lautech.edu.ng
Abstract
Detection of Spectrum Hole (SH) is a critical operation in a Cognitive Radio Network (CRN) to prevent Primary User (PU) from harmful interference. However, channel impairment affects the accurate detection of the SH resulting in poor detection rate. Energy-Efficient Cooperative Spectrum Hole (EECSH) detection which is proposed to solve the poor detection rate depends on the number of Secondary Users (SUs) and clusters used for its performance. This paper, therefore, investigates the effect of SUs and clusters on EECSH detection using Eigenvalue Detector (EVD). The investigation is carried out using multiple SUs and clusters. The SUs are used to carry out local sensing and the outputs are combined at individual clusters using majority fusion rule. The sensing values from individual clusters are combined to obtain global sensing result using OR fusion rule. The technique is simulated using MATLAB R2018a software and evaluated at different number of SU and cluster using Probability of Detection (PD), Spectral Efficiency (SE) and Sensing Time (ST). The results obtained reveal that, PD and SE increase as number of SUs and cluster increase, while ST reduces as number of cluster increases. The study reveals that, the number of SU has little or no effect on the sensing rate.
Keywords— Cognitive Radio (CR), Spectrum Hole (SH), Spectrum Sensing (SS), Probability of Detection (PD) and cluster.
1. INTRODUCTION
The worldwide acceptability of Wireless Communication (WC) system has led to rapid increase in the demand of its services due to exponential increase in the number of users accessing WC services. The exponential rise in the number of users accessing WC services resulting in shortage of wireless frequency spectrum to support an ever-increasing demand (Kiilerich, 2012; Adeyemo et al., 2019; Ojo et al., 2020). However, the shortage of spectrum is not only due to unavailability of radio spectrum but majorly due to fixed spectrum access, with the International Telecommunication Union (ITU), dividing the frequencies into bands for different applications. The license holder known as Primary User (PU), has the exclusive rights to make use of the assigned spectrum as no other users can access it, thereby protecting the licensed users from interference (Ojo et al., 2020, Ojo et al., 2021).
But research conducted on the spectrum usage revealed that many portions of the assigned spectrum are not used during significant time periods since spectrum usage is a function of time. Therefore, traditional fixed spectrum policy is no longer a feasible approach and happened to be the major causes of shortage of wireless spectrum (Noor, 2017). The traditional fixed spectrum management approach shows that spectrum is wasted when the license holder is not utilizing the spectrum as no other users can access it. Several portions of the assigned spectrum are not used over a considerable periods and average usage of some spectrum is below 15% (Kevin, 2012; Abeer et al., 2019). Therefore, since the regulatory process of the new frequency spectrum is

ICEES 2021 ISSN: 2714-4186
58
time consuming and highly expensive, the efficient use of assigned spectrum is required in solving the problem of shortage of spectrum known as spectrum scarcity in WC. Cognitive Radio (CR) technique is proposed to overcome the problem of spectrum scarcity by allowing unlicensed user known as Secondary User (SU) to exploit the assigned spectrum when it becomes idle (Abolade et al., 2020).
CR performs spectrum sensing by scanning through the assigned (licensed) spectrum over a certain frequency band to detect the idle spectrum known as Spectrum Hole (SH) and opportunistically provide communication links for the SU through the unused spectrum. It provides optimal utilization of spectrum by allowing the unlicensed users to have access to the licensed (assigned) spectrum without interfering with the PU (Abdul and Mehemet, 2018; Komal, and Tanuja, 2016). The performance of CR depends on the ability of the SU to accurately detect SH and opportunistically transmit signal through the detected spectrum without causing interference to PU (Abhishek et al., 2016; Akintoye et al., 2020). Non-Cooperative Spectrum Sensing (NCSS) and Cooperative Spectrum Sensing (CSS) are the two major basic sensing techniques used in CR system (Akintoye et al., 2020). In NCSS only one SU carried out the sensing and making decision on its own, while, in CSS group of SUs performs sensing operation and share the results among one another. CSS shows better performance with higher detection rate than NCSS but at expense of long sensing time, high power consumption and bandwidth inefficiency (Lan et al., 2011).
Energy-Efficient Spectrum Hole (EESH) detection was proposed to solve the problem of CSS (Ojo et al., 2021; Manikandan et al., 2016; Gevira, 2016). However, the performance of EECSH depends on the number of SUs and clusters used. Therefore, this paper investigates the effect of SUs and clusters on EESH detection using Eigenvalue Detector (EVD).
Various works have been carried out on EECSH detection in CR network that focus on reduction of reporting overhead thereby reducing the energy consumption, sensing time and bandwidth consumption. Abeer et al. (2019) proposed Hierarchical Cluster-Based CSS (HCBCSS) with adaptive threshold to address the problem of large reporting overhead and poor detection. In the paper, Energy Detector (ED) that make use of adaptive threshold was proposed based on the noise variance. Multiple SUs used to perform local sensing were group into three clusters to reduce the reporting overhead. The results of the local sensing from individual SU were combined using majority fusing rule. The global sensing result was then obtained by combining the sensing results from individual cluster using OR fusion rule. The results obtained revealed the reduction in sensing time and increase in bandwidth efficiency which justify reduction in reporting overhead. However, the effect of number of SU and cluster was not carried out.
Also, Saud et al. (2020) carried out overview of EECSS in CR system was carried out. The review focused on one of the major challenges of CSS, that is, the high energy consumption. The authors were able to discover that the high consumption of energy usually occur during the local spectrum sensing stage. Authors also stated that, the high-power consumption has a serious impact on the transmission stage. The extensive review on some of the algorithms that have been developed to increase energy efficiency of CSS in CR systems were also carried out. However, the effect of number of SU and cluster on EECSS was not investigated. Furthermore, EECSS based on spatial correlation for Cognitive Internet of Things (CIoT) was proposed by Runze et al. (2017) to reduce the reporting overhead between SU and ensure sufficient accurate detection. Multiple SUs were grouped into several clusters before carried out local sensing. The member nodes, that is, SU performs local sensing using ED and communicate the local sensing results obtained to their respective cluster head. The global sensing result was obtained by combining the local sensing results using likelihood ratio test with hard fusion. The technique

ICEES 2021 ISSN: 2714-4186
59
gave better performance with reduction in sensing time and power consumption. However, the technique could not address the effect of SUs and cluster on EESH detection. Therefore, in this paper, the effect of SUs and cluster in EECSS with Eigenvalue Detector (EVD) is investigated.
2. LITERATURE AND THEORIES
2.1 Eigenvalue Detector
Eigenvalue Detector (EVD) is a non-coherent detector that make use of eigenvalues of the received signal. In this detector, the covariance matrix of the received signal is first derived before obtaining the maximum and minimum eigenvalues. The ratio of maximum to minimum eigenvalue is obtained and compared with the set threshold of one to determine the presence or absence of spectrum hole (Yonghong et al., 2009). If the ratio of maximum to minimum eigenvalue is equal to set threshold, spectrum hole is present otherwise spectrum hole is absent due to ongoing transmission of PU. EVD has the ability to detect highly correlated signal. However, EVD has high computational complexity due to formulation and decomposition of
covariance matrix of the received signal. Under hypothesis, the received signal is given
by (Nandkishor, and sonawane, 2016) as
(1)
where: is the number of PU antenna,
is the number of branch received by individual Antenna
is the PU signals,
is the channel response from PU signal,
is the noise samples.
The sample covariance matrix is given by Yonghong et al. (2009) as
(2)
where: Z is the number of collected samples,
is the square matrix, and
is the transpose of matrix
According to Suseela and, the characteristic equation of a square covariance matrix is given as
(3)
where: is the eigenvalue, and
ICEES 2021 ISSN: 2714-4186
60
is the identity matrix.
2.2 Cooperative Spectrum Hole Detection
Cooperative Spectrum Hole Detection (CSHD) is a technique in which group of SU performs the sensing operation and share their sensing information among one another. The assigned frequency spectrum is continuously monitored by the group of SUs to detect Spectrum Hole (SH) in the networks and communicate one another (Samrat and Ajitsinh, 2016). The information obtained about the presence or absent of SH is share among SUs to obtain a more accurate detections than the individual decision.
The results from individuals SU are combined using fusion scheme. Hard Fusion (HF) and Soft Fusion (SF) are the two most commonly used fusion schemes in CSHD. The results of the past researches on fusion scheme showed that HF gave better performance with reduced bandwidth than SF (Noor, 2017). Therefore, HF is used in this paper to combine the sensing results from individual SUs. HF is a technique in which the decision from individual local sensing are sent as one-bit among SUs to make global decisions on the presence or absence of SH. In this fusion technique, individual SU obtains sensing result and forward the results to the Fusion Centre (FC). The sensing results at the FC are processed using linear rule to obtain the final decision. The three most commonly used linear rules in the literature are AND, OR and majority rule. In OR rule, SH is not present if at least one of the SUs identifies that spectrum is not idle. OR rule protects PU but suffers from poor utilization of spectrum. If the total number of sensing system
is and the total number of systems that decides the absence of SH is , the global probability
is given by Noor (2017); Jingwen et al. (2018) as
(4)
where: is the probability of detection for the sensing system
The major idea behind cooperative sensing is to improve detection rate by exploiting multiple PU with spatially located SUs. According to the rule, R is 1 since SH is absent, if at least one of the SU decides that the spectrum is occupied. Therefore, equation (4) becomes
(5)
For the case of AND rule, SH is absent if all the SUs decide that the spectrum is occupied. AND rule provides optimal utilization of the assigned spectrum but at the expense of poor PU protection from the interference. Also, if the total number of SU the jointly carried out sensing is
and the total number of SU that decide the presence of SH is . In AND rule, ,
therefore, the final probability of detection is given by (Jingwen et al., 2018) as
(6)
In the case of majority fusion, the rule counts the number of SU that identify the absence of SH and compares the outcome with the predefined threshold. In majority fusion rule, the spectrum
is occupied if at least of SUs decide that spectrum is busy. The rule maintains a balance
between optimal spectrum utilization and PU protection. The probability of this rule is
given by Noor (2017) as

ICEES 2021 ISSN: 2714-4186
61
(6)
where: P is the total SU that perform sensing operation
K is the SU that decides the absence of SH
In this paper, majority fusion rule is used between SUs within a cluster due to harmonization of other two fusion rules and OR rule is used between clusters due to high licensed user protection (Samrat and Ajitsinh, 2016).
2.3 Cluster in Cooperative Spectrum Sensing
Cluster in CSS is a technique in which the available SUs within the network are divided into groups according to their geographical locations. In each cluster, there are nodes which are defined as either Cluster Head (CH) or Cluster Member (CM) based on the role played in the network. The user that is nearest to Fusion Centre (FC) is classified as CH while the remaining users are classified as CM. Cluster-based CSS is executed in two levels namely: internal level and external level. Internal level is intra-cluster which is executed among the CMs while external level which is inter-cluster, is executed between the CHs. CMs carry out local sensing in which individual SU performs sensing operation to detect the presence or absent of SH. The decision at the local sensing is forwarded to the CH and combined before forwarding to the FC for global decision (Noor, 2017). The purpose of cluster in CSS is to reduce the reporting overhead that causes congestion and computational complexity that leads to high energy consumption (Chen et al., 2009).
3. METHODOLOGY
3.1 Energy Efficient Cooperative Network
The effect of Secondary Users (SUs) and cluster in Energy Efficient Cooperative Spectrum Hole
(EECSH) detection is investigated with multiple SUs and cluster. In this paper, SUs and
clusters are considered, each cluster contains SUs and a CH as shown in Fig. 1. The distance
between individual SU and a CH is determined using cluster radius denoted as given by
(Ekpenyong and Isabona, 2017) as
(7)
where: is the licensed user coverage area
is the path loss exponent of the environment
Urban environment is considered in the investigation and path loss exponent for urban area is 3.1 obtained from existing researches (Abdul and Mehemet, 2018). Solving Equation (7) by substituting the value of path loss exponent, cluster radius is obtained as
(8)
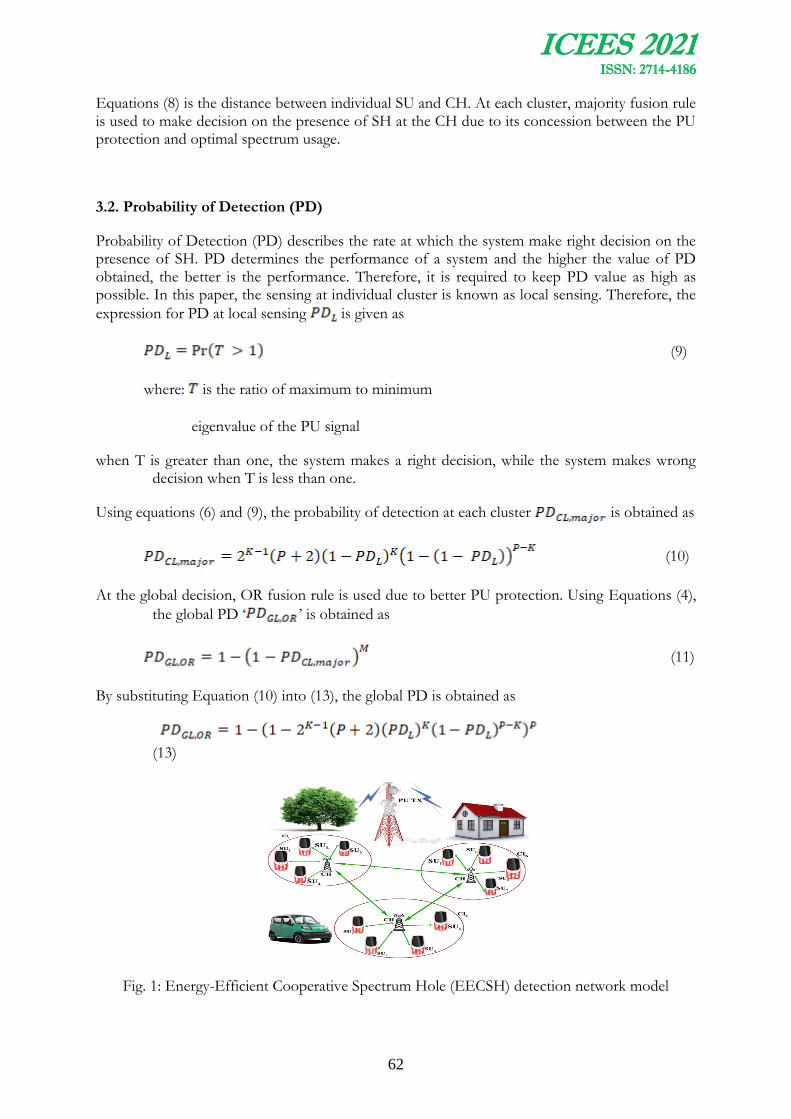
ICEES 2021 ISSN: 2714-4186
62
Equations (8) is the distance between individual SU and CH. At each cluster, majority fusion rule is used to make decision on the presence of SH at the CH due to its concession between the PU protection and optimal spectrum usage.
3.2. Probability of Detection (PD)
Probability of Detection (PD) describes the rate at which the system make right decision on the presence of SH. PD determines the performance of a system and the higher the value of PD obtained, the better is the performance. Therefore, it is required to keep PD value as high as possible. In this paper, the sensing at individual cluster is known as local sensing. Therefore, the
expression for PD at local sensing is given as
(9)
where: is the ratio of maximum to minimum
eigenvalue of the PU signal
when T is greater than one, the system makes a right decision, while the system makes wrong decision when T is less than one.
Using equations (6) and (9), the probability of detection at each cluster is obtained as
(10)
At the global decision, OR fusion rule is used due to better PU protection. Using Equations (4),
the global PD ‘ ’ is obtained as
(11)
By substituting Equation (10) into (13), the global PD is obtained as
(13)
Fig. 1: Energy-Efficient Cooperative Spectrum Hole (EECSH) detection network model
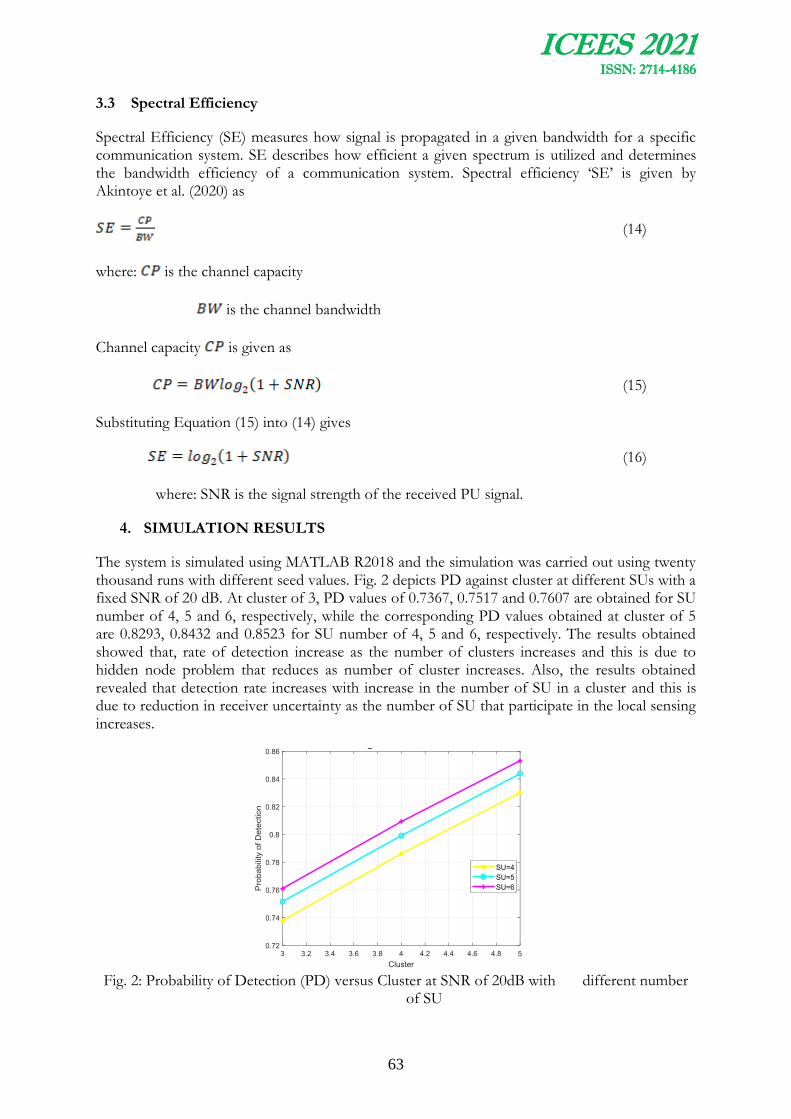
ICEES 2021 ISSN: 2714-4186
63
3.3 Spectral Efficiency
Spectral Efficiency (SE) measures how signal is propagated in a given bandwidth for a specific communication system. SE describes how efficient a given spectrum is utilized and determines the bandwidth efficiency of a communication system. Spectral efficiency ‘SE’ is given by Akintoye et al. (2020) as
(14)
where: is the channel capacity
is the channel bandwidth
Channel capacity is given as
(15)
Substituting Equation (15) into (14) gives
(16)
where: SNR is the signal strength of the received PU signal.
4. SIMULATION RESULTS
The system is simulated using MATLAB R2018 and the simulation was carried out using twenty thousand runs with different seed values. Fig. 2 depicts PD against cluster at different SUs with a fixed SNR of 20 dB. At cluster of 3, PD values of 0.7367, 0.7517 and 0.7607 are obtained for SU number of 4, 5 and 6, respectively, while the corresponding PD values obtained at cluster of 5 are 0.8293, 0.8432 and 0.8523 for SU number of 4, 5 and 6, respectively. The results obtained showed that, rate of detection increase as the number of clusters increases and this is due to hidden node problem that reduces as number of cluster increases. Also, the results obtained revealed that detection rate increases with increase in the number of SU in a cluster and this is due to reduction in receiver uncertainty as the number of SU that participate in the local sensing increases.
Fig. 2: Probability of Detection (PD) versus Cluster at SNR of 20dB with different number
of SU
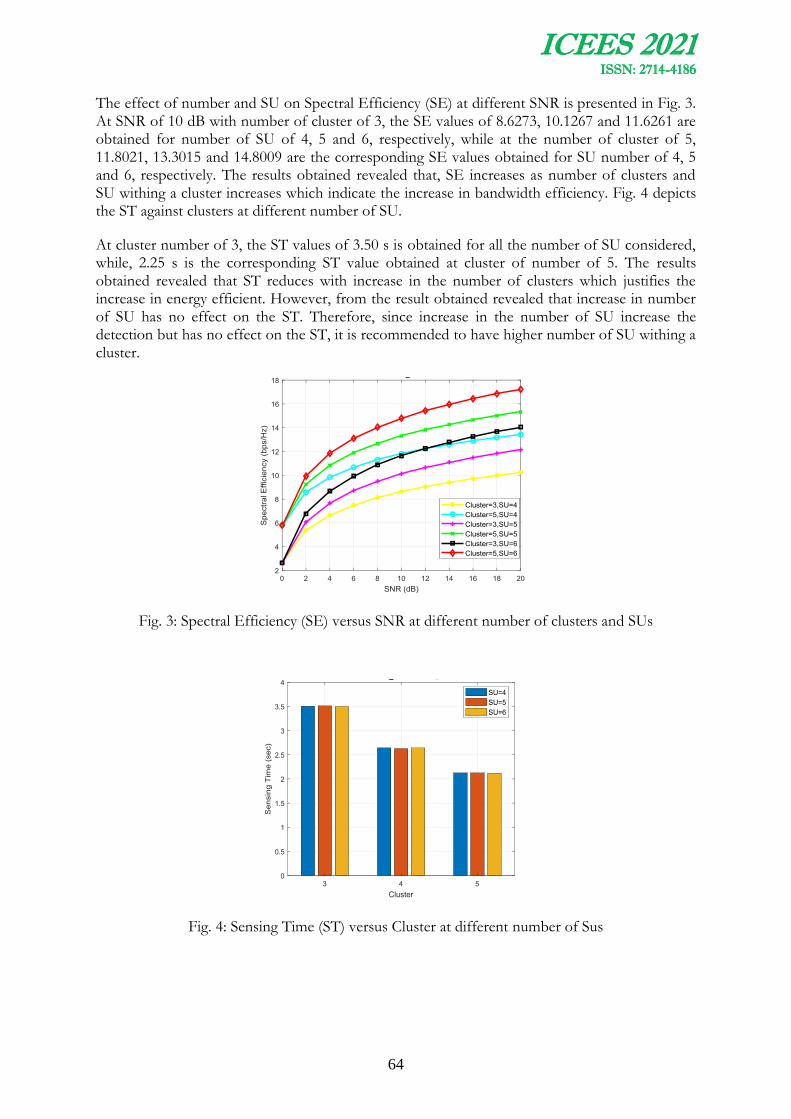
ICEES 2021 ISSN: 2714-4186
64
The effect of number and SU on Spectral Efficiency (SE) at different SNR is presented in Fig. 3. At SNR of 10 dB with number of cluster of 3, the SE values of 8.6273, 10.1267 and 11.6261 are obtained for number of SU of 4, 5 and 6, respectively, while at the number of cluster of 5, 11.8021, 13.3015 and 14.8009 are the corresponding SE values obtained for SU number of 4, 5 and 6, respectively. The results obtained revealed that, SE increases as number of clusters and SU withing a cluster increases which indicate the increase in bandwidth efficiency. Fig. 4 depicts the ST against clusters at different number of SU.
At cluster number of 3, the ST values of 3.50 s is obtained for all the number of SU considered, while, 2.25 s is the corresponding ST value obtained at cluster of number of 5. The results obtained revealed that ST reduces with increase in the number of clusters which justifies the increase in energy efficient. However, from the result obtained revealed that increase in number of SU has no effect on the ST. Therefore, since increase in the number of SU increase the detection but has no effect on the ST, it is recommended to have higher number of SU withing a cluster.
Fig. 3: Spectral Efficiency (SE) versus SNR at different number of clusters and SUs
Fig. 4: Sensing Time (ST) versus Cluster at different number of Sus
ICEES 2021 ISSN: 2714-4186
65
5. Conclusion
In this paper, the effect of number of clusters and SUs in Energy-Efficient Spectrum Hole (EESH) detection is investigated. The PD, SE and ST were the performance metrics used to evaluate the effect of number of cluster and SUs. The formation of clusters is obtained using multiple SUs and cluster radius. The results of sensing at individual clusters were combined using majority fusion rule and the global sensing results were obtained using OR fusion rule at the cluster heads. The results obtained revealed that, PD and SE values increase as the number of cluster and SUs increases, while ST values reduce as number of cluster increases. However, increase in the number of SU does not has any effect on the sensing time. This indicates that, the energy and bandwidth efficiency of the technique increase as the number of clusters increases. Also, rate of detection increases as the number of cluster and SU increases. It is therefore, recommended to keep the number of cluster and SU withing a cluster as high as possible in designing EESH detection technique.
References
Abeer, F. A., Faroq A. A., Esam, A. R. and Kemal, T. (2019) Hierarchical Cluster-Based Cooperative Spectrum Sensing in Cognitive Radio Networks Using Adaptive Threshold, IEEE Access, pp 210-213.
Abdul S. and Mehmet C. (2018) EM-based wireless underground sensor networks, effects of soil on channel capacity, https://www.sciencedirect.com/topics/engineering/channel-capacity, pp 2-6.
Abhishek, P. P., Dan J. K. and Lionel M. N. (2016) A study of indoor location sensing and frequency interference with 802.11b and Bluetooth technologies, International Journal of Mobile Communications, 4(6): 621-644.
Abolade, R.O, Ojo, S.I, Ojerinde, I.A, Adetunji, J.S, Lawal, A.T. (2020) Modification of Maximal Ratio Combining Technique for Detection of Spectrum Hole in a Cognitive Radio Network, International Journal of Wireless and Microwave Technologies, 10(2): 9-21.
Adeyemo, Z.K., Ojo, S.I., Abolade, R.O. and Oladimeji, O.B. (2019). Modification of a Square-Law Combiner for Detection in a Cognitive Radio Network, International Journal of Wireless and Microwave Technologies, 4(2): 32-45.
Akintoye, N. O. Adesina, A. A., Salami, S. A., Alabi, T. I. and Ojo, S. I. (2020) Comparative Analysis of Higher Constellation in Intercarrier Interference Self-cancellation Orthogonal Frequency Division Multiplexing, International Journal of Networks and Communication, 2020, 10(2):47-53.
Chen, G., Tao, P., Shaoyi, X., Haiming, W. and Wenbo, W. (2009). Cooperative Spectrum Sensing with Luster-Based Architecture in Cogntive Radio Networks, IEEE transaction on mobile communication 7(4): 2-4.
Ekpenyong, M. and Isabona, J. (2017) Improving Spectral Efficiency of Spectrum Spread Systems over Peak Load Network Conditions, the Sixth International Conference on Networks and Systems Communications, pp 1-8.

ICEES 2021 ISSN: 2714-4186
66
Gevira, O. O. (2016). Design of an optimal eigen value-based spectrum sensing algorithm for Cognitive Radio, Master thesis submitted to University of Nairobi, pp 12-47.
Jingwen, T., Ming, J., Qinghua, G. and Youming, L. (2018) Cooperative Spectrum Sensing: A blind and Soft Fusion Detector, IEEE Transactions on Wireless Communications, 17(4):2726-2737.
Kevin, C. (2012). Spectrum Sensing, Detection and Optimization in Cognitive Radio for Non- Stationary Primary User Signals, unpublished Ph.D Thesis submitted to Queensland University of Technology, Network and Communication, Faculty of Science and Engineering, pp 23-189.
Komal, P. and Tanuja D. (2016). Review on: spectrum sensing in Cognitive Radio using multiple antenna, International Journal of Innovative Science, Engineering and Technology 3(4):313-318.
Kiilerich, P. N. (2012). Novel cooperative spectrum sensing methods and their limitations. Ph.D dissertation submitted to Aalborg university, pp 1-35.
Lan, F.A., Brandon, F.L. and Ravikumar, B. (2011) Cooperative spectrum sensing in Cognitive Radio networks: A survey, Elsevier on Physical Communication, 4(3):40-62.
Manikandan, G., Mathavan, N., Suresh, M., Paramasivam, M. and Lavanya, V. (2016). Cognitive Radio spectrum sensing techniques: a survey, International Journal of Advanced Engineering Technology 7(2):48-52.
Nandkishor, P. S. and Sonawane, V. A. (2016). Proportional study of Eigen value Based Spectrum Sensing Techniques for Cognitive Radio Network, International Journal of Computer Networks and Wireless Communications, 6(3): 1-5.
Noor, S. (2017). Combined soft hard cooperative spectrum sensing in Cognitive Radio networks, Ph.D dissertations submitted to University of Windsor, pp 1-79.
Ojo, S. I., Adeyemo, Z. K., Akande, D. O. and Fawole, O. A. (2021). Energy-Efficient Cluster-Based Cooperative Spectrum Sensing in a Multiple Antenna Cognitive Radio Network, International Journal of Electrical and Electronic Engineering & Telecommunications 10 (3): 176-185.
Ojo S. I., Adeyemo Z. K., Ojo F. K., Adedeji A. A, Semire F. A. (2020). Enhancement of Equal Gain Combiner for Detection of Spectrum Hole in a Cognitive Radio System, Universal Journal of Electrical and Electronic Engineering, 7(5):289 – 298.
Runze, W., Mou, W., Luokai, H. and Haijun, W. (2017) Energy- efficient cooperative spectrum sensing scheme based on spatial correlation for cognitive Internet of Things, IEEE Access, 20(1): 1-11.
Samrat, C. S. and Ajitsinh, N. J. (2016) Centralized cooperative spectrum sensing with energy detection in Cognitive Radio and optimization, IEEE International Conference on Recent Trends in Electronics Information Communication Technology, India, PP 1002- 1006.
Saud, A., Marco, D and Fabrizio, G. (2020) Towards energy-efficient cooperative spectrum sensing for cognitive radio networks: an overview, Telecommunication Systems, Springer Verlag, Germany, 59(1): 77-91.

ICEES 2021 ISSN: 2714-4186
67
Suseela, B. and Sivakumar, D. (2015). Non-cooperative spectrum sensing techniques in cognitive radio-a survey, IEEE International Conference on Technological Innovations in ICT for Agriculture and Rural Development, pp 127-132.
Yonghong, Z. and Ying-Chang L. (2009). Eigenvalue-based spectrum sensing algorithms for Cognitive Radio, IEEE Transactions on Communications 57(6):1784-1788.
ICEES 2021 ISSN: 2714-4186
68
POTENTIALS FOR BIO-OIL PRODUCTION FROM SAWDUST IN SOUTHWEST NIGERIA
Okedere, Oyetunji B.,1* Lasisi, Hammed O.2 and Adewale Saheed A. 3
1Department of Chemical Engineering, Osun State University, Nigeria
2Department of Electrical and Electronic Engineering, Osun State University, Nigeria
3Department of Civil Engineering, Osun State University, Nigeria
Email of Corresponding Author :: [email protected];
ABSTRACT
Sawdust generated by sawmills presently constitute solid waste and air pollution challenges as the principal means of disposal is by open burning. This study examined the potentials of bio-oil production from sawdust in Southwest Nigeria with a view to creating economic advantage from the waste while eliminating environmental pollution and human health risks. The annual quantity of bio –oil (L/annum) that can be generated from the sawdust was calculated using sawdust generated in each State that make up the Southwestern Nigeria. Cost and benefit determination were also carried out based on information that is available in the literature. Results showed that the quantity of bio-oil that could be produced from sawdust generated in Southwest Nigeria ranged between 13.3 – 93.6 million L/annum with Ekiti and Lagos having the least and largest production rate respectively. The corresponding financial gain accruable to the two States from the production and sale of the bio-oil could range between $2 million and $14 million respectively while the total financial gain for the region was obtained to be about $40 million. Considering the fact that solid waste challenge, air pollution and public health issues would be resolved, it is suggested that consideration be given to production of bio- oil from sawdust in southwest Nigeria
Keyword: Solid waste, Sawdust, Air pollution, Public health, Bio-oil
1. INTRODUCTION
Environmental pollution by solid wastes is a major challenge facing urban centers across the globe (Okedere et al., 2017; Fakinle et al., 2020). This is even more pronounced in developing countries where there are no effective waste management plans and modern disposal facilities. Solid wastes contain wide varies of substances including cloth, papers, plastics, metals, cans, wood, sawdust, food residues as well as semi solid substances like sludge and sewage. A survey of the literature reveals that the principal means of disposal of solid wastes in most developing countries including Nigeria is via open dumping and burning at dumpsite (Ogunbode et al., 2013).
Among these solid wastes, wood residues, most especially sawdust is gaining tremendous attention because of the huge volume of waste being generated on daily basis. In the United States, the volume of wood waste generated is said to be up to 84 million tons annually (Howard, 2012). The Nigerian wood industry is also massive accounting for up to 5.2 million tonnes on annual basis (Ohimain 2011). The southern part of Nigeria has a tropical rain forest belt and houses most of the forest reserves where timbers are grown (Kehinde et al., 2009). Wood is one of the chief construction materials available to man. Due to increase in construction activities in Nigeria, the demand for wood for construction purposes by individuals, private developers and
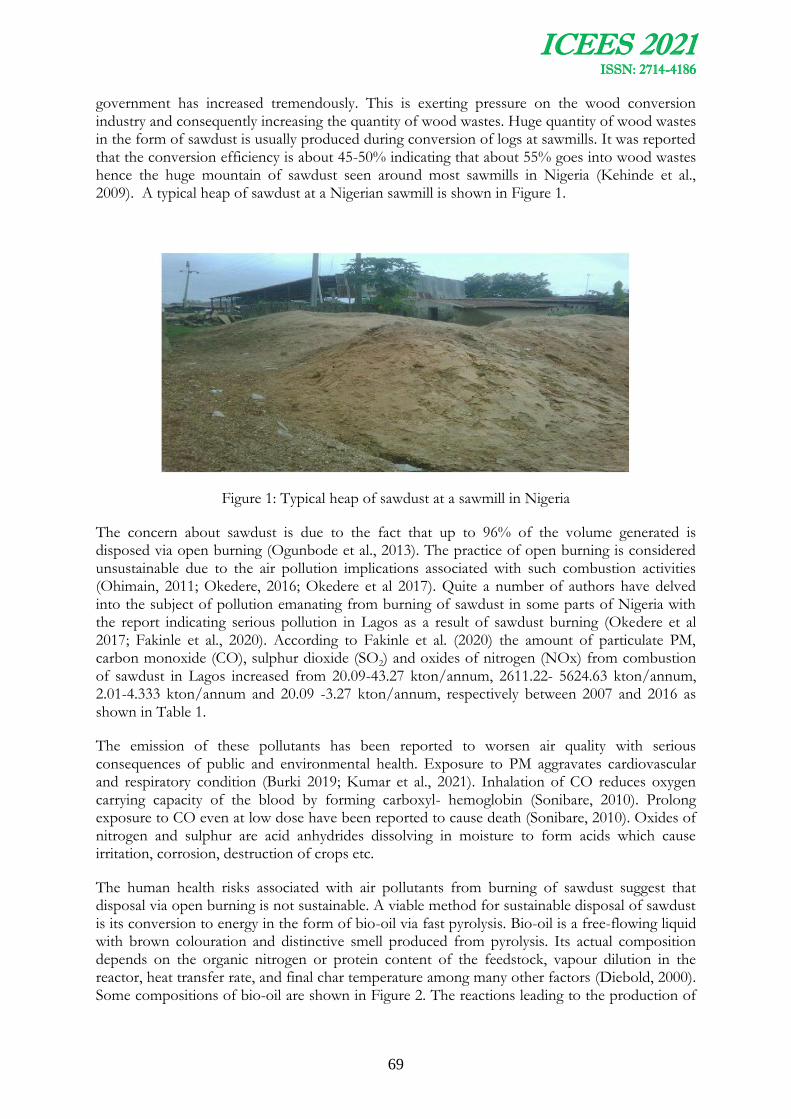
ICEES 2021 ISSN: 2714-4186
69
government has increased tremendously. This is exerting pressure on the wood conversion industry and consequently increasing the quantity of wood wastes. Huge quantity of wood wastes in the form of sawdust is usually produced during conversion of logs at sawmills. It was reported that the conversion efficiency is about 45-50% indicating that about 55% goes into wood wastes hence the huge mountain of sawdust seen around most sawmills in Nigeria (Kehinde et al., 2009). A typical heap of sawdust at a Nigerian sawmill is shown in Figure 1.
Figure 1: Typical heap of sawdust at a sawmill in Nigeria
The concern about sawdust is due to the fact that up to 96% of the volume generated is disposed via open burning (Ogunbode et al., 2013). The practice of open burning is considered unsustainable due to the air pollution implications associated with such combustion activities (Ohimain, 2011; Okedere, 2016; Okedere et al 2017). Quite a number of authors have delved into the subject of pollution emanating from burning of sawdust in some parts of Nigeria with the report indicating serious pollution in Lagos as a result of sawdust burning (Okedere et al 2017; Fakinle et al., 2020). According to Fakinle et al. (2020) the amount of particulate PM, carbon monoxide (CO), sulphur dioxide (SO2) and oxides of nitrogen (NOx) from combustion of sawdust in Lagos increased from 20.09-43.27 kton/annum, 2611.22- 5624.63 kton/annum, 2.01-4.333 kton/annum and 20.09 -3.27 kton/annum, respectively between 2007 and 2016 as shown in Table 1.
The emission of these pollutants has been reported to worsen air quality with serious consequences of public and environmental health. Exposure to PM aggravates cardiovascular and respiratory condition (Burki 2019; Kumar et al., 2021). Inhalation of CO reduces oxygen carrying capacity of the blood by forming carboxyl- hemoglobin (Sonibare, 2010). Prolong exposure to CO even at low dose have been reported to cause death (Sonibare, 2010). Oxides of nitrogen and sulphur are acid anhydrides dissolving in moisture to form acids which cause irritation, corrosion, destruction of crops etc.
The human health risks associated with air pollutants from burning of sawdust suggest that disposal via open burning is not sustainable. A viable method for sustainable disposal of sawdust is its conversion to energy in the form of bio-oil via fast pyrolysis. Bio-oil is a free-flowing liquid with brown colouration and distinctive smell produced from pyrolysis. Its actual composition depends on the organic nitrogen or protein content of the feedstock, vapour dilution in the reactor, heat transfer rate, and final char temperature among many other factors (Diebold, 2000). Some compositions of bio-oil are shown in Figure 2. The reactions leading to the production of

ICEES 2021 ISSN: 2714-4186
70
bio-oil are numerous and they include hydrolysis, dehydration, isomerization, dehydrogenation, aromatization, retro-condensation and coking.
Table 1: Air pollutants from sawdust burning in Lagos (kton/annum)
Year PM CO SO2 NOx
2007 20.09 2611.22 2.01 20.09
2008 21.87 2843.62 2.19 21.87
2009 23.82 3096.7 2.38 23.82
2010 25.94 3372.31 2.59 25.94
2011 28.25 3672.44 2.82 28.25
2012 30.76 3999.29 3.08 30.76
2013 33.5 4355.22 3.35 33.5
2014 36.48 4742.84 3.65 36.48
2015 39.73 5164.95 3.97 39.73
2016 43.27 5624.63 4.33 43.27
Fakinle et al. (2020)
To produce bio-oil from wood residue such as sawdust, there is need for preparation of the feedstock. This involves drying the wood feedstock so that it attains less than 10% weight of moisture. This is necessary if the eventual bio-oil is to have reduced quantity of water. The wood residue is ground into between 1-3 mm diameter to aid heat transfer (Popoola et al., 2013). The feedstock is fed into the pyrolysis reactor via a hopper. The reactor is usually a bubbling fluidized bed reactor which converts the feed into solid char, condensable and non –condensable gases (Popoola et al., 2013). Silica (sand) is used as the inert in the reactor as it aids heat transfer and can withstand temperature up to 1500 oC. Nitrogen is the fluidizing gas while the bed flue gases supply heat via the reactor jacket to raise the reactor temperature to between 700°C to 1000°C . A cyclone separator is deployed to separate the char from the gaseous products. The gaseous products are cooled to form bio-oil and non-condensable. Figure 3 illustrates the fast pyrolysis process. This study therefore investigates the annual tonnage of fuel that can be obtained from pyrolysis of sawdust wastes in Lagos State with a view to recommending it as an alternative to open burning which is plagued with serious human and environmental health consequences.
Figure 2: Some components of bio-oil (Popoola et al., 2013)

ICEES 2021 ISSN: 2714-4186
71
Figure 3: Pyrolysis system (Popoola et al., 2013)
2. METHODOLOGY
According to Bio-Energy News (2000), about 22,000 tons (18.3 million L/year or 50,137 L/day) of bio-oil is achievable from a commercial bio-oil production plant pyrolysing 100 tonnes of wood wastes per day. Hence, 1 ton/day of wood residue generates 501.4 L/day of Bio-oil. This information was combined with annual rates of generation of sawdust in Southwestern Nigeria (Figure 4) to obtain the potential amount of bio-oil as shown in Eq. 1.
[1]
Where:
BPA = Potential annual quantity of bio-oil (L/year)
SEA = Estimated annual generation rate of sawdust (tons/year)
According to Popoola et al. (2013), 1 litre of boi-oil cost about $0.32. In this study, the cost-benefit analysis associated with the production of bio - oil was based on $0.10/L production cost and standard selling price of $0.36/L (Kass, 2019).
Figure 4: Sawdust Generated in Southwestern States (Okedere, 2016, Okedere et al., 2017)
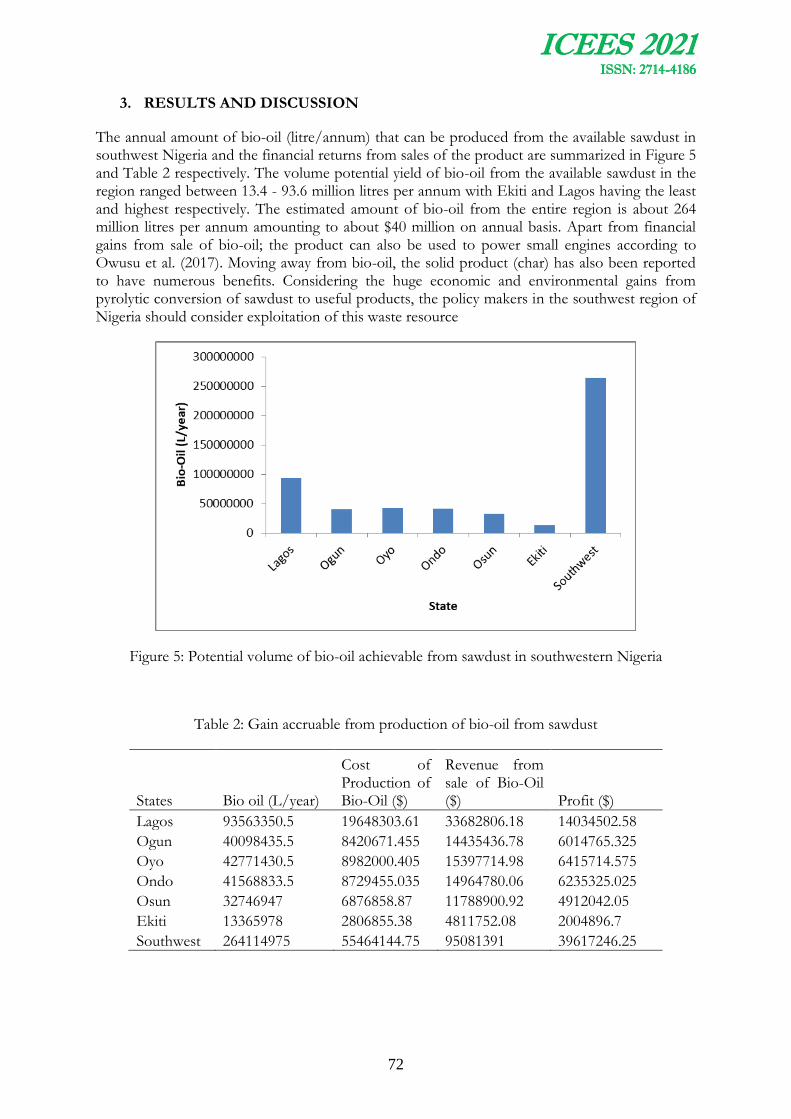
ICEES 2021 ISSN: 2714-4186
72
3. RESULTS AND DISCUSSION
The annual amount of bio-oil (litre/annum) that can be produced from the available sawdust in southwest Nigeria and the financial returns from sales of the product are summarized in Figure 5 and Table 2 respectively. The volume potential yield of bio-oil from the available sawdust in the region ranged between 13.4 - 93.6 million litres per annum with Ekiti and Lagos having the least and highest respectively. The estimated amount of bio-oil from the entire region is about 264 million litres per annum amounting to about $40 million on annual basis. Apart from financial gains from sale of bio-oil; the product can also be used to power small engines according to Owusu et al. (2017). Moving away from bio-oil, the solid product (char) has also been reported to have numerous benefits. Considering the huge economic and environmental gains from pyrolytic conversion of sawdust to useful products, the policy makers in the southwest region of Nigeria should consider exploitation of this waste resource
Figure 5: Potential volume of bio-oil achievable from sawdust in southwestern Nigeria
Table 2: Gain accruable from production of bio-oil from sawdust
States Bio oil (L/year)
Cost of Production of Bio-Oil ($)
Revenue from sale of Bio-Oil ($) Profit ($)
Lagos 93563350.5 19648303.61 33682806.18 14034502.58
Ogun 40098435.5 8420671.455 14435436.78 6014765.325
Oyo 42771430.5 8982000.405 15397714.98 6415714.575
Ondo 41568833.5 8729455.035 14964780.06 6235325.025
Osun 32746947 6876858.87 11788900.92 4912042.05
Ekiti 13365978 2806855.38 4811752.08 2004896.7
Southwest 264114975 55464144.75 95081391 39617246.25
ICEES 2021 ISSN: 2714-4186
73
4. CONCLUSION
Due to the environmental pollution from open burning of sawdust as the predominant means of disposal of the waste in southwest Nigeria, the study examined the potential economic gains from pyrolytic conversion of the wastes to an energy resource – the bio-oil. The study reveals that the potential for bio-oil production in the region stands at 264 million litres on annual basis with an economic gain of about $40 million. The study concluded the exploitation of this waste will in addition to solving the problem of solid waste management, air pollution and public health provide economic and energy benefits. The policy makers in the southwest region of Nigeria are hereby called upon to provide policy framework and take bold steps in the exploitation of this resource that presently constitutes nuisance in the environment.
REFERENCES
O.B. Okedere, B.S. Fakinle, J.A. Sonibare, F.B. Elehinafe & O.A. Adesina (2017) Particulate matter pollution from open burning of sawdust in Southwestern Nigeria, Cogent Environmental Science , 3: 1367112.
B. S. Fakinle, E.L. Odekanle, A.P. Olalekan, H.E. Ije, D.O. Oke and J.A Sonibare (2020) Air pollutant emissions by anthropogenic combustion processes in Lagos, Nigeria, Cogent Engineering (2020), 7:1808285.
E.B., Ogunbode, F.O. Fabunmi, S.M. Ibrahim, I.O. Jimoh and O.O., Idowu (2013). Management of Sawmill wastes in Nigeria: Case study of Minna, Niger State. Greener Journal of Science, Engineering and Technology Research, 3, 34–41. https://doi.org/10.15580/GJSETR
J.L. Howard (2012) US timber production, trade, consumption and price statistics, 1965-2010
E.I. Ohimain (2012). The prospects and challenges of waste wood biomass conversion to bioelectricity in Nigeria. Journal of Waste Conversion, Bioproducts and Biotechnology, 1, 3–8.
A.L. Kehinde, T.T. Awoyemi, B.T. Omonona, J.A. Akande (2009). Technical efficiency of sawdust production in Ondo and Osun state Nigeria. Journal of forest economics, 16, 11–18.
O.B. Okedere (2016) An assessment of air emissions from open burning of some common southwestern Nigeria wood dust in the country’s energy mix (Unpublished PhD Thesis). Department of Chemical Engineering, Obafemi Awolowo University, Ile-Ife, Nigeria.
T.K. Burki (2019). The innovations cleaning our air. The Lancet Respiratory Medicine, 7:111 112. PMID, 30638907. Doi: 10.1016/S2213-2600(19)30002-5.
P. Kumar, G. Kalaiarasan, A.E. Porter, A. Pinna, M.M. Klosowski, P. Demokritou, K.F. Chung, C. Pain, D.K. Arvind, R. Arcucci, I.M. Adcock and C. Dilliway (2021). An overview of fine and ultrafine particle collection for physicochemical characterization and toxicity assessments. Science of The Total Environment, 756:143553. https://doi.org/10.1016/j.scitotenv.2020.143553.
J.A. Sonibare (2010). Air pollution implications of Nigeria’s present strategy on improved electricity generation. Energy Policy,38, 5783–5789. https://doi.org/10.1016/j.enpol.2010.05.029
J.P. Diebold (2000) National Renewable Energy Laboratory, http://www.osti.gov/bridge.

ICEES 2021 ISSN: 2714-4186
74
L.T. Popoola, B. Gutti, J.A. Adeniran and B.K. Adeoye (2013) The potentials of waste-to-energy system in Nigeria: A study of pyrolysis conversion of wood residue to bio-oil in major cities of south-western Nigeria. Advances in Applied Science Research 4(2):243-251
Bio-Energy News (2000) Technical Memorandum on R & D Activities in Waste-to-Energy, India.
M. Kass (2019) Evaluation off bio-oils for use in marine engines. 3.5.5.1. Oak Ridge, TN: Oak Ridge National Laboratory
P.A Owusu, N. Banadda and N. Kiggundu (2017) Mass Balance of Plastic Waste Conversion to Fuel Oil- A case in Uganda. Journal of Sustainable Development, 10(6): 41-50 https://doi.org/10.5539/jsd.v10n6p41

ICEES 2021 ISSN: 2714-4186
75
OPTIMAL PLACEMENT OF STATCOM USING FAST VOLTAGE STABILITY INDEX FOR POWER LOSS REDUCTION AND VOLTAGE
PROFILE IMPROVEMENT
1Ayanlade, S. O., 2*Ogunwole, E. I. and 2Salimon, S. A.
1Department of Electrical and Electronic Engineering, Lead City University, Ibadan, Oyo State, Nigeria.
2Department of Electronic and Electrical Engineering, Faculty of Engineering and Technology, Ladoke Akintola University of Technology, Ogbomoso, Oyo State, Nigeria.
Email of Corresponding Author:: [email protected];
ABSTRACT
Transmission systems are subjected to unavoidably power losses resulting in low efficiency of the systems. These losses can be minimized to a reasonable extent by the placement of static synchronous compensator (STATCOM), which is one of the family of flexible alternating current transmission system (FACTS) devices, on the system. However, to fully maximize the application of STATCOM devices on the system, they must be adequately placed. In this paper, the use of fast voltage stability index (FVSI), which is a technique used to determine the nodes vulnerable to voltage collapse, in a transmission system, was investigated to indicate the optimal placement of a STATCOM device. The technique presented was implemented using Matlab software and validated on standard IEEE 14-bus system. The results of the simulations showed that the proposed FVSI is a good indicator of appropriate STATCOM device location to minimize the system power losses and voltage magnitude deviations.
Keywords: STATCOM, FACTS devices, FVSI, voltage collapse, power loss.
1. INTRODUCTION
An electric power transmission system serves as the link between the electric power generation and distribution system. The tremendous increase in load demands from the distribution ends results in shortage of reactive power and hence, overloading of the transmission lines. Consequently, power systems become more vulnerable to losses and poor voltage profile (Ebeed et al., 2017).
To minimize these losses and enhance the system voltage profile, flexible alternating current transmission system (FACTS) devices are used since there is an existence of several difficulties in the expansion of the existing transmission networks (Majumdar et al., 2009; Fadhil and Vural, 2018). According to IEEE, FACTS is defined as an alternating current transmission system device with the incorporation of power electronics and static controllers for controllability and power transfer capacity enhancement of the transmission network.
Examples of FACTS controllers are SVC, STATCOM, TCSC, IPFC, UPFC, SSSC etc. They do not only mitigate the transmission line losses but also improve the network voltage profile as well as to enhance the power transfer capability of the transmission network by varying the transmission network parameters such as terminal voltage, voltage phase angle and line
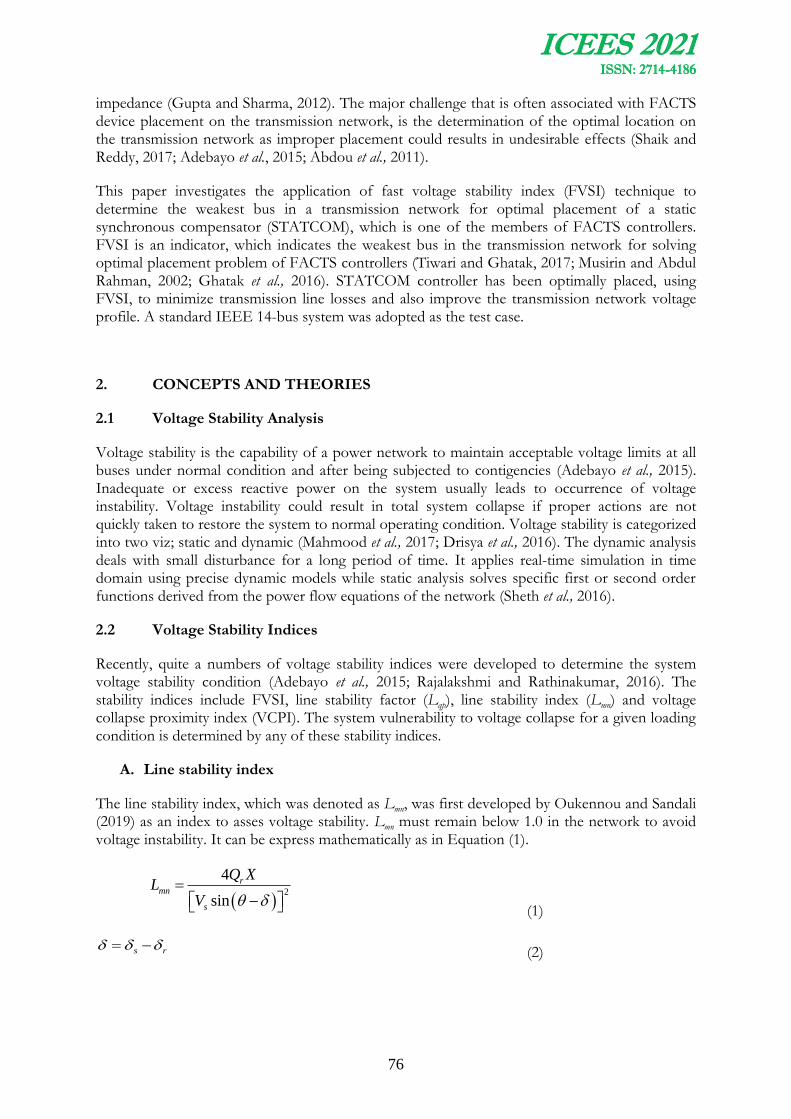
ICEES 2021 ISSN: 2714-4186
76
impedance (Gupta and Sharma, 2012). The major challenge that is often associated with FACTS device placement on the transmission network, is the determination of the optimal location on the transmission network as improper placement could results in undesirable effects (Shaik and Reddy, 2017; Adebayo et al., 2015; Abdou et al., 2011).
This paper investigates the application of fast voltage stability index (FVSI) technique to determine the weakest bus in a transmission network for optimal placement of a static synchronous compensator (STATCOM), which is one of the members of FACTS controllers. FVSI is an indicator, which indicates the weakest bus in the transmission network for solving optimal placement problem of FACTS controllers (Tiwari and Ghatak, 2017; Musirin and Abdul Rahman, 2002; Ghatak et al., 2016). STATCOM controller has been optimally placed, using FVSI, to minimize transmission line losses and also improve the transmission network voltage profile. A standard IEEE 14-bus system was adopted as the test case.
2. CONCEPTS AND THEORIES
2.1 Voltage Stability Analysis
Voltage stability is the capability of a power network to maintain acceptable voltage limits at all buses under normal condition and after being subjected to contigencies (Adebayo et al., 2015). Inadequate or excess reactive power on the system usually leads to occurrence of voltage instability. Voltage instability could result in total system collapse if proper actions are not quickly taken to restore the system to normal operating condition. Voltage stability is categorized into two viz; static and dynamic (Mahmood et al., 2017; Drisya et al., 2016). The dynamic analysis deals with small disturbance for a long period of time. It applies real-time simulation in time domain using precise dynamic models while static analysis solves specific first or second order functions derived from the power flow equations of the network (Sheth et al., 2016).
2.2 Voltage Stability Indices
Recently, quite a numbers of voltage stability indices were developed to determine the system voltage stability condition (Adebayo et al., 2015; Rajalakshmi and Rathinakumar, 2016). The stability indices include FVSI, line stability factor (Lqp), line stability index (Lmn) and voltage collapse proximity index (VCPI). The system vulnerability to voltage collapse for a given loading condition is determined by any of these stability indices.
A. Line stability index
The line stability index, which was denoted as Lmn, was first developed by Oukennou and Sandali (2019) as an index to asses voltage stability. Lmn must remain below 1.0 in the network to avoid voltage instability. It can be express mathematically as in Equation (1).
2
4
sin
rmn
s
Q XL
V
(1)
s r (2)

ICEES 2021 ISSN: 2714-4186
77
where, δ is the phase difference between the sending end voltage and receiving end voltage angles, Qr is the reactive power at the receiving end, X is the line reactance, Vs is the sending end voltage, and θ is the reactance angle.
B. Fast voltage stability index
Fast voltage stability index (FVSI) was first launch by Musirin and Abdul Rahman (2002) and it is based on the simplified model. The mathematical expression for FVSI is deduced from Equation (1) by neglecting the gap of the angle between the sending and receiving end buses This mathematical expression is given by Equation (3).
2
2
4 r
r
Z QFVSI
V X
(3)
where, Z is the line impedance, Qr is the reactive power at the receiving end, Vr is the voltage at the receiving end, and X is the reactance of the line.
C. Line stability factor
The expression can be obtained by using the approach as in Equations (1) and (3). Here, the index must be kept to less than 1 for better and secure operation. The mathematical expression is given as in Equation (4).
2
2 24QP s r
s s
X XL P Q
V V
(4)
where, X is the reactance of the line segment, Vs is the sending end voltage magnitude, Ps is the active power at the sending end, and Qr is the reactive power at the receiving end.
In this paper, the effectiveness of FVSI as an indicator of the weakest bus in transmission networks, for optimal placement of a STATCOM device was investigated.
2.3 Static Synchronous Compensator
STATCOM is a very important second-generation member of FACTS devices. It is a shunt connected device, which could inject or absorb AC current or reactive power at a particular bus on a transmission network, to regulate the bus voltage magnitude and reduce transmission losses (Ebeed et al., 2017).
It comprises a voltage source converter (VSC), a coupling transformer and a capacitor on the DC side of the converter with a controller that supply pulse for the converter (Mahmood et al., 2017). The interaction between the voltage of the ac system and the voltage at the STATCOM ac side terminals control the reactive power flow. If the STATCOM terminal voltage is greater than the network bus voltage, where the STATCOM is placed, reactive power is injected by the STATCOM to the network and STATCOM behaves as a capacitor. When the STATCOM voltage is less than the network bus voltage, STATCOM behaves as an inductor and reactive power is absorbed from the network (Abdou et al., 2011; Chakrabarti et al., 2015; Fadhil and Vural, 2018). Fig. 1 illustrates the simple configuration of STATCOM. The active and reactive powers are mathematically expressed as in Equations (12) and (13) (Okelola et al., 2021).

ICEES 2021 ISSN: 2714-4186
78
sinbus vsc
L
V VP
X
(12)
2 cosbus bus vsc
L
V V VQ
X
(13)
where, Vbus is the bus voltage magnitude, Vvsc is the STATCOM output voltage, XL is the inductive reactance of coupling transformer, δ is the phase difference between the sending end and receiving end voltage angles.
Energy source
(Optional)
Con
tro
ller
Coupling
Transformer
P Q
Voltage
Sourced
Converter
P
Figure 1: The simple configuration of STATCOM (Aduragba et al., 2017)
In Fig. 2, a STATCOM device is connected to bus m. m mV is the voltage at bus m, sh shV is the injected shunt voltage. After connecting STATCOM at bus m, the power flow equations are expressed as in Equations (14)-(15) (Gupta and Sharma, 2012).
Bus m
m mV
sh shV
sh shG jB
shI
Figure 2: Equivalent circuit model of STATCOM (Aduragba et al., 2017)
cos1
NP P V V Ym m j mj mj mjsh
j
(14)

ICEES 2021 ISSN: 2714-4186
79
sin1
NQ Q V V Ym m j mj mj mjsh
j
(15)
2
cosP G V V V Ym msh sh sh sh msh sh (16)
2
sinQ B V V V Ym msh sh sh sh msh sh (17)
where, Pm, and Qm are the active and reactive powers of the STATCOM, Psh, and Qsh are the active and reactive powers at bus m, Ysh, Gsh and Bsh are the admittance, conductance and susceptance of the STATCOM, respectively, Ymj and θmj are the admittance and angle of the line between bus m and j, N is the number of buses connected to bus m, Vj is the voltage at bus j, Vm is the voltage at bus m, δmj is the phase difference between voltage angles of the bus between bus m and j, θmsh is the angle between the voltage angle at bus m and STATCOM voltage angle.
3. MATERIALS AND METHOD
3.1 Mathematical Formulation of Fast Voltage Stability Index
By denoting the sending and receiving end buses by m and n, respectively in Fig. 3. Taking bus m
as the reference (i.e. 0m and n ).
00mV nV
mP mQ mS nSnQnP
mn mn mnZ R jX m n
Figure 3: Transmission line
where, Pm, Pn are the active powers at both sending and receiving of the buses, mQ , nQ are the
reactive powers at both sending and receiving end of the buses, mS, nS
are the apparent powers
at both sending and receiving end of the line, mV, nV are the magnitude of the voltages at both
sending and receiving end of the buses, mnZ, mnR
and mnX are the line impedance, resistance and
reactance, respectively, δ is the voltage phase angle at bus n.
The general current equation in a line between two buses m and n can be expressed as in Equation (5).
0m nmn
mn
V VI
Z
(5)
The received complex power at bus n can be found by multiplying Equation (5) by the voltage at bus n and it is expressed as in Equation (6).
m nmn n n n
mn
V VS V P jQ
Z
(6)

ICEES 2021 ISSN: 2714-4186
80
The reactive power received at bus m is the imaginary part of the above equation, which can be expressed as in Equation (7).
2
2 2
sin cosm n mn mn mn n
n
mn mn
V V R X X VQ
R X
(7)
Equation (7), written as a second-order equation, can be expressed as in Equation (8).
22
sin cos 0R Rmn mn
V V V X Qn m n mn nX Xmn mn
(8)
The roots for nV will be
2
sin cos sin cos 4R R Rmn mn mn
V V V X Qn m n mn nX X Xmn mn mn
(9)
To get the real roots of nV , the discriminant is set greater than or equal to ‘0’; i.e;
2
22
41
sin cos
mn n mn
m mn mn
Z Q X
V R X
(10)
Assuming that the angle difference (δm ‒ δn) is normally very small (δm ‒ δn = 0, Xmn cos δ ≈ Xmn and Rmn sin δ ≈ 0), hence, the FVSI for a typical transmission line can be express as Equation (11).
2
2
4 mn n
m mn
Z QFVSI
V X
(11)
where, Zmn, Xmn, Qmn, and Vm are the impedance of the line, reactance of the line, reactive power at the receiving end and voltage at the sending end, respectively. The voltage Vm can be determined from the power flow solution.
The FVSI, proposed by Musirin and Abdul Rahman (2002) is dependent on the concept of
power flow through a line segment within stable operating zone (i.e. FVSI 1). And if the FVSI value of any line is beyond unity, one of the buses connected to that line will undergo a sudden voltage drop leading to system collapse. That bus, which is vulnerable to voltage collapse, is referred to as the weakest bus in the network and thus has the minimum reactive power load.
4. RESULTS AND DISCUSSION
To verify the effectiveness and performance of the proposed approach, it was tested on a standard IEEE 14-bus network. The simulation was carried out in two different stages: the first stage is the identification of the weakest buses using FVSI. The values of the parameters used to compute FVSI values of the lines, were obtained from the network power flow solution. The second stage is the application of STATCOM to mitigate power losses and also to enhance voltage profile.
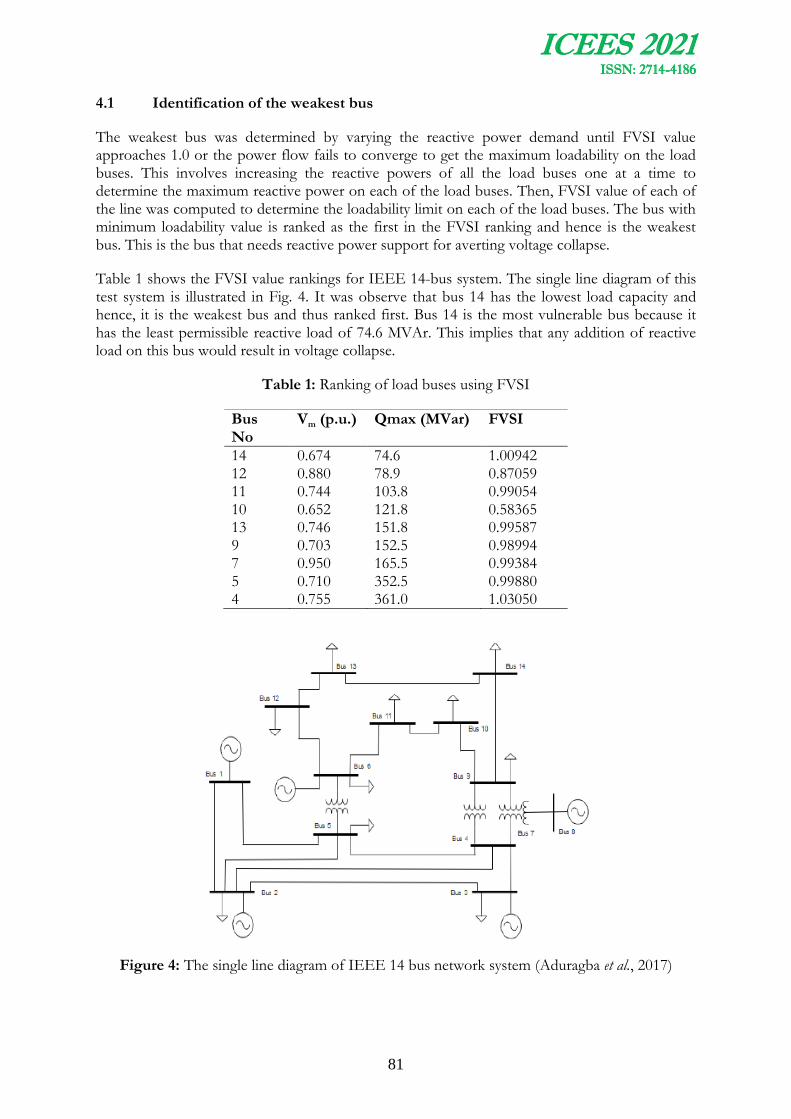
ICEES 2021 ISSN: 2714-4186
81
4.1 Identification of the weakest bus
The weakest bus was determined by varying the reactive power demand until FVSI value approaches 1.0 or the power flow fails to converge to get the maximum loadability on the load buses. This involves increasing the reactive powers of all the load buses one at a time to determine the maximum reactive power on each of the load buses. Then, FVSI value of each of the line was computed to determine the loadability limit on each of the load buses. The bus with minimum loadability value is ranked as the first in the FVSI ranking and hence is the weakest bus. This is the bus that needs reactive power support for averting voltage collapse.
Table 1 shows the FVSI value rankings for IEEE 14-bus system. The single line diagram of this test system is illustrated in Fig. 4. It was observe that bus 14 has the lowest load capacity and hence, it is the weakest bus and thus ranked first. Bus 14 is the most vulnerable bus because it has the least permissible reactive load of 74.6 MVAr. This implies that any addition of reactive load on this bus would result in voltage collapse.
Table 1: Ranking of load buses using FVSI
Bus No
Vm (p.u.) Qmax (MVar) FVSI
14 12 11 10 13 9 7 5 4
0.674 0.880 0.744 0.652 0.746 0.703 0.950 0.710 0.755
74.6 78.9 103.8 121.8 151.8 152.5 165.5 352.5 361.0
1.00942 0.87059 0.99054 0.58365 0.99587 0.98994 0.99384 0.99880 1.03050
Figure 4: The single line diagram of IEEE 14 bus network system (Aduragba et al., 2017)

ICEES 2021 ISSN: 2714-4186
82
4.2 Voltage Profile Improvement and Mitigation of Losses
Fig. 4 shows the simulation result of voltage profile without and with STATCOM device, incorporated at bus 14, for visual inspection and better understanding. It was observed that the bus voltage profile improved significantly. This shows that STATCOM performed and contribute greatly in voltage profile improvement when optimally placed.
Figure 4: Voltage magnitudes without and with STATCOM placement
Fig. 5 shows the result of the active power losses in the transmission lines of the network without and with STATCOM placement while the reactive power losses in the transmission lines of the network without and with STATCOM placement is illustrated by Fig. 6. From Fig. 5, there is a significant reduction in the active power losses in the transmission lines when a STATCOM device was incorporated at bus 14 of the network. Similarly, there is a significant reduction in the reactive power losses in the transmission lines when a STATCOM device was incorporated at bus 14 as illustrated in Fig. 6. Furthermore, the optimal placement of the STATCOM device resulted in reductions in the total active and reactive power losses from 1.44 to 1.11 MW and 5.03 to 3.84 MVar, respectively. The reactive power compensation of STATCOM dislodged power flow by injecting reactive power to compensate for system reactive power hitherto being consumed to maintained bus voltage profile and this has resulted in the reduction of overall active and reactive power losses on the network, which consequently improved the network operational performance.
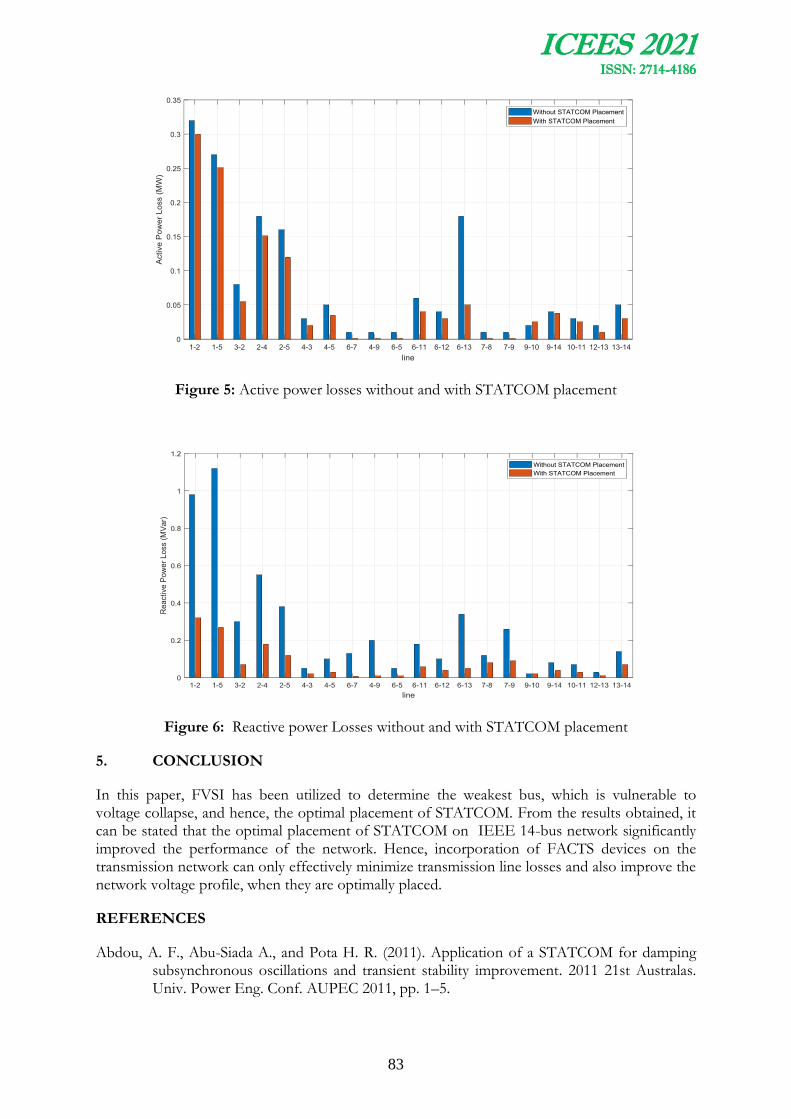
ICEES 2021 ISSN: 2714-4186
83
Figure 5: Active power losses without and with STATCOM placement
Figure 6: Reactive power Losses without and with STATCOM placement
5. CONCLUSION
In this paper, FVSI has been utilized to determine the weakest bus, which is vulnerable to voltage collapse, and hence, the optimal placement of STATCOM. From the results obtained, it can be stated that the optimal placement of STATCOM on IEEE 14-bus network significantly improved the performance of the network. Hence, incorporation of FACTS devices on the transmission network can only effectively minimize transmission line losses and also improve the network voltage profile, when they are optimally placed.
REFERENCES
Abdou, A. F., Abu-Siada A., and Pota H. R. (2011). Application of a STATCOM for damping subsynchronous oscillations and transient stability improvement. 2011 21st Australas. Univ. Power Eng. Conf. AUPEC 2011, pp. 1–5.

ICEES 2021 ISSN: 2714-4186
84
Adebayo, I. G., Jimoh A. A., and Yusuff A. A. (2015). Detection of weak bus through Fast Voltage Stability index and inherent structural characteristics of power system. 2015 4th Int. Conf. Electr. Power Energy Convers. Syst. EPECS 2015, pp. 1–5.
Aduragba A. A. (2017). Investigating the Application of Static Synchronous Compensator (STATCOM). M.Eng. Dissertation, Durban University of Technology, South Africa.
Chakrabarti, R., Chakraborty S., Mitra S., Choudhury R. R., and Chowdhury R. (2015). Comparative Analysis of STATCOM and SVC Operation in Electric Transmission Line, vol. 5, no. 8.
Drisya, K. P., Jayamohan M., Bindumol E. K., and Babu C. A. (2016). Identification of Weakest Node in Radial Distribution System Using Fast Voltage, vol. 5, no. 5, pp. 124–130.
Ebeed, M., Kamel S., and Youssef H. (2017). Optimal setting of STATCOM based on voltage stability improvement and power loss minimization using Moth-Flame algorithm. 2016 18th Int. Middle-East Power Syst. Conf. MEPCON 2016 - Proc., pp. 815–820.
Fadhil, S. T. and Vural A. M. (2018). Comparison of dynamic performances of TCSC, Statcom, SSSC on inter-area oscillations. 2018 5th Int. Conf. Electr. Electron. Eng. ICEEE 2018, pp. 138–142.
Ghatak, S. R., Basu D., and Acharjee P. (2016). Voltage Profile Improvement and loss reduction using optimal allocation of SVC. 12th IEEE Int. Conf. Electron. Energy, Environ. Commun. Comput. Control (E3-C3), INDICON 2015, pp. 1–6.
Gupta, A. and Sharma P. R. (2012). Optimal placement of FACTS devices for voltage stability using line indicators. 2012 IEEE 5th Power India Conf. PICONF 2012, no. May, pp. 4–6.
Mahmood, F. B. K. et al., (2017). Weakest location exploration in IEEE-14 bus system for voltage stability improvement using STATCOM, synchronous condenser and static capacitor. ECCE 2017 - Int. Conf. Electr. Comput. Commun. Eng., pp. 623–629.
Majumda, S., Chakraborty A. K., and Chattopadhyay P. K. (2009). Active power loss minimization with FACTS devices using SA/PSO techniques. 2009 Int. Conf. Power Syst. ICPS ’09, no. 216, pp. 1–5.
Musirin, I. and Abdul Rahman T. K. (2002). Novel fast voltage stability index (FVSI) for voltage stability analysis in power transmission system. 2002 Student Conf. Res. Dev. Glob. Res. Dev. Electr. Electron. Eng. SCOReD 2002 - Proc., pp. 265–268.
Okelola, M. O, Ayanlade, S. O, Ogunwole, E. I. (2021). Particle swarm optimization for optimal allocation of STATCOM on transmission network. Journal of Physics: Conference series, 1880 (2021)012035, : 480–498.
Oukennou, A. and Sandali A.(2019). An improved reactive line index for line ranking and voltage collapse prediction in transmission power system. J. Electr. Syst., 15 (3): 480–498.
Rajalakshmi, P. and Rathinakumar M. (2016). A comparison of transmission line voltage stability indices. Proceeding IEEE - 2nd Int. Conf. Adv. Electr. Electron. Information, Commun. Bio-Informatics, IEEE - AEEICB 2016, pp. 44–48.

ICEES 2021 ISSN: 2714-4186
85
Shaik, M. R. and Reddy A. S. (2017). Optimal placement and sizing of FACTS device to overcome contingencies in power systems. Int. Conf. Signal Process. Commun. Power Embed. Syst. SCOPES 2016 - Proc., pp. 838–842.
Sheth, A., Kotwal C. D., and Pujara S. (2016). Optimal placement of TCSC for improvement of static voltage stability. NUiCONE 2015 - 5th Nirma Univ. Int. Conf. Eng., pp. 1–6.
Tiwari, D. and Ghatak S. R. (2017). Performance enhancement of distribution system using optimal allocation of distributed generation & DSTATCOM. IEEE Int. Conf. Innov. Mech. Ind. Appl. ICIMIA 2017 - Proc., no. Icimia, pp. 533–538.
ICEES 2021 ISSN: 2714-4186
86
RBF NEURAL NETWORK SURROGATE-ASSISTED NSGA-II FOR SOLVING ECONOMIC ENVIRONMENTAL DISPATCH PROBLEM
Ajayi S.A. 1,*, Alawode K.O. 1 and Okedere O.B. 2
1. Department of Electrical and Electronic Engineering, Osun State University, Osogbo
2. Department of Chemical Engineering, Osun State University, Osogbo
Email of Corresponding Author: [email protected])
ABSTRACT
The Economic Environmental Dispatch (EED) problem is a multiobjective optimization problem that attempts to simultaneously minimize both the cost of power production and the emissions generated by the power plants, while satisfying various practical constraints imposed by the operation of the system. Different techniques have been reported in the literature to solve the EED problem. However, many of them are not able to converge to a diverse set of Pareto front solutions. Hence, the power system operators don’t have much flexibility in optimally scheduling the generation. In this present work, a RBF/NSGA-II algorithm is developed by hybridizing the Non-dominated Sorting Genetic Algorithm (NSGA-II) with a Radial Basis Function (RBF) neural network surrogate to solve the EED problem. The results show that the developed hybrid algorithm produced better convergence to the Pareto-optimal front than the stand-alone NSGA-II while also preserving the diversity of the obtained solution set.
Keywords: Fuel cost, emission, EED, performance metrics, NSGA-II, RBF, surrogate
1. INTRODUCTION
A solution of the economic dispatch problem seeks to obtain the schedule of generating units in a power plant that will minimize the total generation cost while satisfying all unit and system equality and inequality constraints. However, thermal power plants emit gaseous pollutants like sulfur dioxide (SO2), nitrogen oxides, and carbon dioxide (CO2) emissions into the atmosphere causing health and environmental problems, including global warming. Greater environmental consciousness has made reduction of these emissions a requirement for power plants and the traditional economic dispatch problem no longer satisfies the environmental need (El-Keib, et al., 1994). This expands the definition into the economic environmental dispatch (EED) problem. Both the economic and environmental objectives are conflicting in nature and is a high dimensional non-convex optimization problem.
Different methods have been used by various researchers to solve the economic environmental dispatch problem. These methods can be categorized into classical, evolutionary algorithm, and hybridized approaches. Classical approaches include weighted sum (Dhillon, et al., 1993) and e-constraint approach (Dhillon, et al., 1994). In the weighted sum approach, the different objective functions are combined into one by forming their weighted sum. The method is simple to implement but it involves many runs with different weight settings to achieve different non-dominated solutions. Also, it cannot find Pareto-optimal solutions located in a non-convex
Pareto-optimal front (Abido, 2003). The -constraint approach optimizes a preferred objective
and restricts the others within specified values. This overcomes the difficulties of the weighted
sum method, although the solution set depends on proper choice of -vector (Engau & Wiecek,
2005).

ICEES 2021 ISSN: 2714-4186
87
Evolutionary Algorithm (EA) approaches are a class of nature-inspired, population based method which finds multiple Pareto optimal solutions in a single optimization run. These are less susceptible to the shape of the Pareto front (Deb, 2001). There are many different classes of EAs such as genetic algorithms, particle swarm optimization, ant colony optimization, harmony search algorithm, bacteria foraging algorithm etc. Many different variants of EAs have been widely used to solve the EED problem. These include the Strength Pareto Evolutionary Algorithm SPEA, Niched Pareto Genetic Algorithm NPGA and Non-dominated Sorting Genetic Algorithm NSGA (Abido, 2003).
Despite the success of evolutionary algorithms for solving complex optimization problems, their convergence to the true Pareto front is still not guaranteed (Laumanns, et al., 2002). Also, they may not yield a diverse set of non-dominated solutions. Different hybrid methods to improve the quality of solutions achieved by evolutionary algorithms have been developed. A review of different hybrid architectures reported in the literature is given by (Zmuda, et al., 2003) and examples include hybridization between different EAs, neural network assisted EA, and Ant Colony Optimization assisted EA.
The major contribution to knowledge is hybridizing the NSGA-II algorithm with a radial basis function (RBF) surrogate to solve the economic environmental dispatch problem to improve the convergence and diversity.
2. ECONOMIC ENVIRONMENTAL DISPATCH PROBLEM
The economic environmental dispatch (EED) problem seeks to minimize two opposing objective functions, fuel cost and gaseous emissions, while meeting various equality and inequality constraints imposed by various power system requirements. The problem can be expressed mathematically as
where and represent the fuel cost and emission cost functions, jg are the equality
constraints and h k are the inequality constraints. is the real power output of the generator
while represents the vector of real power output of the generators and is defined as
is the number of generating units while and are the number of
equality and inequality constraints respectively.
2.1 Objectives functions
a. Total fuel cost: The overall fuel cost (in /h) can be represented by a quadratic function
expressed as
(1)

ICEES 2021 ISSN: 2714-4186
88
where and are the fuel cost coefficients of the generator.
b. Total emission: The total emission of atmospheric pollutants in ton/h can be
expressed mathematically as
2.2 Problem Constraints
The problem constraints consists of both equality (power balance) and inequality (generation capacity) constraints.
a. Power balance constraint- The total power generated must be adequate to satisfy the load
demand in the presence of real power losses during transmission, i.e.
can be calculated from the load flow solution or approximated using the Kron’s loss
formula:
where and are the loss coefficients.
b. Generation capacity constraint- Each generator's real power output is limited by its lower and upper limits, i.e.
3. METHODOLOGY
In this section, the NSGA-II algorithm, surrogate assisted evolutionary algorithms and the development of the hybrid surrogate assisted NSGA-II algorithm are presented. Various

ICEES 2021 ISSN: 2714-4186
89
performance metrics to compare the performance of multiobjective evolutionary algorithms are also presented.
3.1 NSGA-II algorithm
Deb et al. (2002) presented the Non-dominated Sorting Genetic Algorithm (NSGA-II) which is one of the most popular elitist multi objective optimization algorithms. It uses a fast non-dominated sorting to rank non-dominated solutions into different fronts to preserve convergence and a crowded distance estimation procedure to preserve diversity in the solution set. A crowded comparison operator is then used to select the next generation of solutions. These features make the NSGA-II an efficient algorithm for both Pareto front convergence and solutions diversification. Details about the crowding distance assignment and fast non-dominated sorting algorithms can be found in (Deb, et al., 2002) and (Deb, et al., 2005). In spite of the successes of this algorithm in solving various practical optimization problems, the crowded comparison operator often leads to non-uniform convergence to the Pareto front. The flowchart of NSGA-II implementation is shown in Fig. 1.
3.2 Surrogate assisted evolutionary algorithms
One approach to solving optimization problems, especially where it is computationally expensive to perform function evaluations is to introduce computationally efficient surrogates for approximating the expensive fitness evaluations (Jin, 2011). Various types of surrogates commonly used include polynomial response surface methodology, radial basis function, Gaussian process model, artificial neural networks and support vector machines (Pan, et al., 2018).
In multi-objective surrogate assisted evolutionary algorithms (SAEAs), the surrogate can be used to approximate different functions apart from the objective function to accelerate the evolution. Roughly speaking, existing SAEAs can be classified into two different categories according to the target function of the surrogate. In the first category, the fitness function is approximated using single or multiple surrogates. Examples include ParEGO (Knowles, 2006), SMS-EGO (Ponweiser, et al., 2008) and k-RVEA (Zhang, et al., 2010). In the second category, the surrogate serves as a classifier that divides the candidate solutions into good or bad solutions, e.g., dominated or non-dominated solutions (Bandaru, et al., 2014, Bhattacharjee & Ray, 2015, Pan, et al., 2018).
3.3 RBF neural network-assisted NSGA-II (RBF/NSGA-II) algorithm
In this work, a radial basis function (RBF) neural network surrogate is hybridized with the NSGA-II algorithm and herein called the RBF/NSGA-II. The NSGA-II is first used to produce a child population of size (using the crossover, mutation and crowded comparison operators)
and an elite sub-population selected from it. Function evaluation is performed using the cost functions and a radial basis function neural network is created and trained using values in the decision variable space as inputs and the objective function values as targets. An inverse RBF neural network is then created and then trained with the function values for the elite sub-population in order to generate a new population (in the decision variable space). The solutions produced by NSGA-II and the RBF are then combined together and the best solutions of size
are selected on the basis of crowding distance operator. The flowchart for the hybrid
RBF/NSGA-II approach is shown in Figure 2 while its pseudocode is shown in Algorithm 1.

ICEES 2021 ISSN: 2714-4186
90
Figure 1: NSGA-II Flowchart
Figure 2: RBF/NSGA-II flowchart

ICEES 2021 ISSN: 2714-4186
91
Algorithm 1: RBF/NSGA-II
Input: Generation counter t=0, population p(t) of size , Number of generations gen,
useRBF=True/False, RBFspread, Number of iterations: ,
OUTPUT: Non-dominated solution set Phyb (t=gen)
1: Initialize random population P(t) of size
2: Perform objective function/constraints evaluation of the population
3: Assign rank (level) to each solution based on non dominated sorting
4: for t=1 to gen do
5: Generate child population of size using genetic operators
6: perform objective function/constraints evaluation for the child population
7: combine parent and child populations to have a population of size 2
8: Assign rank to each solution based on non dominated sorting
9: Assign crowding distance to each solution
10: Select best N solutions from 2 using their ranks and crowding distances
11: Replace old parent population with the selected solutions
12: if (t>0.9gen&& useRBF=True) then
13: Generate child population of size using genetic operators
14: perform objective function/constraints evaluation for the child population
15: Create radial basis function neural network (RBFnn) with spread of RBFspread
16:Train RBFnn and use it to generate new child population 17: combine parent and child populations
18: Create a new population Phyb by selecting the best solutions
19: end if
20: end for
3.4 Performance Metrics
The performance metrics considered in this work include the spacing, set coverage and extent metrics. While the set coverage metric provides a measure of the convergence, the spacing and

ICEES 2021 ISSN: 2714-4186
92
extent metrics measure the diversity in the solution set. Details of these metrics can be found in (Schott, 1995; Zitzler, 1999 and Abido, 2003).
4. RESULTS AND DISCUSSION
The line diagram of the standard IEEE 30-bus test system used in this study to test the effectiveness of the hybrid RBF/NSGA-II in solving the EED problem is shown in Fig. 3 It consists of six thermal generators interconnected with 41 transmission lines, to serve a total system demand of 283.4 MW. The line data, bus data, the fuel cost coefficients and emission coefficients were taken from (Abido, 2006). The NSGA-II algorithm was initialized with a
population of while the number of generations was set at 500. The crossover
probability was set at 0.9 while the mutation probability was set at 1/N where N=6. For the hybrid RBF/NSGA-II algorithm, was fixed at 450 while the spread of the radial
basis function was set at 1/N where N=6.
Figure 3: IEEE 30 bus test system line diagram
In order to establish a good basis for comparing both NSGA-II and RBF/NSGA-II algorithms, twenty different optimization runs were carried out for each algorithm and their performance compared by considering their best solutions for both minimum fuel cost and minimum emissions. Further comparison was also done in terms of the performance metrics.
Figure 4 shows the Pareto-optimal fronts obtained by NSGA-II and RBF/NSGA-II. It indicates that RBF/NSGA-II is able to find non-dominated solutions with good convergence and diversity characteristics. The extreme solutions in Table 1 and 2 for both NSGA-II and RBF/NSGA-II are the solutions corresponding to minimum fuel cost and minimum emissions.

ICEES 2021 ISSN: 2714-4186
93
Figure 4: Pareto optimal fronts for IEEE 30 Bus system
These are compared with some other methods presented in literature in Tables 1 and 2 respectively.
Table 1: Best solutions out of twenty runs for fuel cost
NSGA NPGA SPEA RBF/NSGA-II NSGA-II
(Abido, (Abido, (Abido, 2003) 2003) 2003)
PG1
PG2
PG3
PG4
PG5
PG6
0.1168 0.1245 0.1086 0.1703 0.0795
0.3165 0.2792 0.3056 0.2941 0.3698
0.5441 0.6284 0.5818 0.6060 0.5239
0.9447 1.0254 0.9846 0.8401 0.9443
0.5498 0.4693 0.5288 0.5675 0.4974
0.3964 0.3993 0.3584 0.3794 0.4476
FC
EM
608.245 608.147 607.807 607.9292 608.2219
0.2166 0.2236 0.2202 0.2105 0.2169
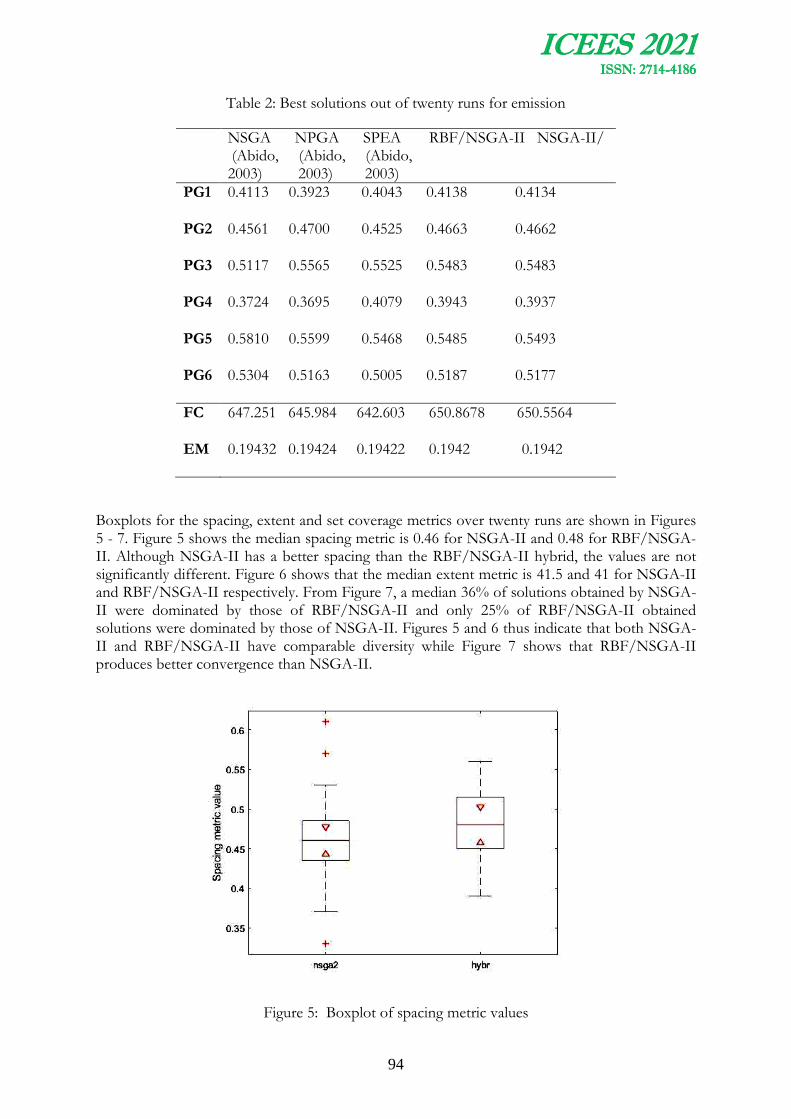
ICEES 2021 ISSN: 2714-4186
94
Table 2: Best solutions out of twenty runs for emission
NSGA NPGA SPEA RBF/NSGA-II NSGA-II/ (Abido, (Abido, (Abido, 2003) 2003) 2003)
PG1
PG2
PG3
PG4
PG5
PG6
0.4113 0.3923 0.4043 0.4138 0.4134
0.4561 0.4700 0.4525 0.4663 0.4662
0.5117 0.5565 0.5525 0.5483 0.5483
0.3724 0.3695 0.4079 0.3943 0.3937
0.5810 0.5599 0.5468 0.5485 0.5493
0.5304 0.5163 0.5005 0.5187 0.5177
FC
EM
647.251 645.984 642.603 650.8678 650.5564
0.19432 0.19424 0.19422 0.1942 0.1942
Boxplots for the spacing, extent and set coverage metrics over twenty runs are shown in Figures 5 - 7. Figure 5 shows the median spacing metric is 0.46 for NSGA-II and 0.48 for RBF/NSGA-II. Although NSGA-II has a better spacing than the RBF/NSGA-II hybrid, the values are not significantly different. Figure 6 shows that the median extent metric is 41.5 and 41 for NSGA-II and RBF/NSGA-II respectively. From Figure 7, a median 36% of solutions obtained by NSGA-II were dominated by those of RBF/NSGA-II and only 25% of RBF/NSGA-II obtained solutions were dominated by those of NSGA-II. Figures 5 and 6 thus indicate that both NSGA-II and RBF/NSGA-II have comparable diversity while Figure 7 shows that RBF/NSGA-II produces better convergence than NSGA-II.
Figure 5: Boxplot of spacing metric values

ICEES 2021 ISSN: 2714-4186
95
Figure 6: Boxplot of extent metric values
Figure 7: Boxplot of set coverage metric values
5. CONCLUSION
This paper presents a hybrid RBF neural network surrogate-assisted NSGA-II algorithm. This algorithm called the RBF/NSGA-II has been used in this study to solve the EED problem using the IEEE 30-bus test system dataset. The hybrid algorithm has been developed to solve the
ICEES 2021 ISSN: 2714-4186
96
Economic and Environmental dispatch problem and the performance of this hybrid evolutionary system has been evaluated. The effectiveness of the developed hybrid algorithm in improving the convergence while maintaining the diversity properties of the obtained solution set over the stand-alone NSGA-II algorithm has also been demonstrated. This research will contribute immensely and also assist the power administration in decision making.
REFERENCES
Abido, M., 2003. Environmental/economic power dispatch using multiobjective evolutionary algorithms. IEEE Trans. Power Syst.,, 18(4), p. 1529–1537.
Abido, M., 2006. Multi-objective evolutionary algorithms for electric power dispatch problem. IEEE Trans. Evolution Computation, 10(3), p. 315–329.
Aravindhababu, P. & Nayar, K. R., 2002. Economic Dispatch Based on Optimal Lambda using Radial Basis Function Network. International Journal of Electrical Power and Energy Systems, 24(7), pp. 551-56.
Bandaru, S., Ng, A. H. C. & Deb, K., 2014. On the performance of classification algorithms for learning Pareto-dominance relations in 2014 IEEE Congress on Evolutionary Computation (CEC). s.l., s.n., p. 1139–1146.
Bhattacharjee, K. S. & Ray, T., 2015. A novel constraint handling strategy for expensive optimization problems. s.l., s.n.
Deb, K., 2001. Multiobjective Optimization Using Evolutionary Algorithms. Chichester: John Wiley and Sons, Ltd..
Deb, K., Agrawal, S., Pratap, A. & Meyarivan, T., 2002. A fast and elitist multiobjective genetic algorithm: NSGA-II. IEEE Trans. Evolut. Comput., 6(2), p. 182–194.
Deb, K., Thiele, L., Laumanns, M. & Zitzler, E., 2005. Scalable test problems for evolutionary multiobjective optimization. In: A. Abraham, L. Jain & R. Goldberg, eds. Evolutionary multiobjective optimization. London, UK: Springer-Verlag, pp. 105-145.
Dhillon, J., Parti, S. & Kothari, D., 1993. Stochastic economic emission load dispatch. Electr. Power Syst. Res., , 26(3), p. 179–197.
Dhillon, J., Parti, S. & Kothari, D., 1994. Multiobjective optimal thermal dispatch. Int. J. Electr. Power Energy Syst., 16(6), p. 383–389.
Dodu, J. C., Martin, P., Merlin, A. & Pouget, J., 1972. An Optimal formulation and solution of short-range operating problems for a power system with flow constraints. s.l., s.n., pp. 54-63.
El-Keib, A. A., Ma, H. & Hart, J. L., 1994. Environmental Constrained Economic Dispatch Using the Lagrangian Relaxation Method. IEEE Transactions on Power Systems, 9(4), pp. 1723-29.
El-Keib, A., Ma, H. & Hart, L., 1994. Economic dispatch in view of the clean air act of 1990. IEEE Transastions on Power Systems, 9(2), p. 972–978.
ICEES 2021 ISSN: 2714-4186
97
Engau, M. & Wiecek, M., 2005. Exact generation of epsilon efficient solutions in multiple objective programming, s.l.: Department of Mathematical Sciences, Clemson University.
Jin, Y., 2011. Surrogate-assisted evolutionary computation: Recent advances and future challenges. Swarm and Evolutionary Computation, 1(2), p. 61–70.
Knowles, J., 2006. ParEGO: a hybrid algorithm with on-line landscape approximation for expensive multiobjective optimization problems. IEEE Transactions on Evolutionary Computation, 10(1), p. 50–66.
Laumanns, M., Thiele, L., Deb, K. & Zitzler, E., 2002. Combining convergence and diversity in evolutionary multi-objective optimization. Evolution Computation, 10(3), p. 263–282.
Nanda, J., 1994. Economic Emission Load Dispatch with line flow constraints using a classical technique. s.l., s.n., pp. 1-10.
Pan, L., Cheng, H., Tian, Y. & Wang, H., 2018. A classification based surrogate-assisted evolutionary algorithm for expensive many-objective optimization. IEEE Transactions on Evolutionary Computation, Issue DOI: 10.1109/TEVC.2018.2802.
Parikh, J. & Chattopadhyah, D., 1996. A multi area linear programming approach for analysis of economic operation of the Indian power system. IEEE Transactions on Power System, 11(1), pp. 52-58.
Ponweiser, W., Wagner, T., Biermann, D. & Vincze, M., 2008. Multiobjective optimization on a limited budget of evaluations using model-assisted S-Metric selection. s.l., Springer, p. 784–794.
Schott, J., 1995. Fault tolerant design using single and multi-criteria genetic algorithms, Boston, MA: Master’s thesis, Department of Aeronautics and Astronautics, Massachusetts Institute of Technology.
Sihem , Z. & Abderrahim, B., 2021. Solution of Combined economic and emission dispatch Problems of Power Systems without penalty. Applied Artificial Intelligence.
Zhang, Q., Liu, W., Tsang, E. & Virginas, B., 2010. Expensive multiobjective optimization by MOEA/D with gaussian process model. IEEE Transactions on Evolutionary Computation, 14(3), p. 456–474.
Zitzler, E., 1999. Evolutionary algorithms for multiobjective optimization methods and applications, s.l.: Ph.D Dissertation, Swiss Federal Institute of Technology, Zurich, Switzerland.
Zmuda, M. A., Rizki, M. M. & Tamburino, L. A., 2003. Hybrid evolutionary learning for synthesizing multi-class pattern recognition systems,. Appl. Soft Comput., 2(4), pp. 269-282.
ICEES 2021 ISSN: 2714-4186
98
DEVELOPMENT OF A MOBILE ROBOTIC SYSTEM FOR AIR POLLUTION DATA CAPTURE
1,2Owolabi, O. O., 1Alawode K.O., 3Olukayode O. and 2Ofoegbu E.O.
1 Department of Electrical and Electronic Engineering, Osun State University, Osogbo
2Department of Electrical and Electronic Engineering, Adeleke University, Ede, Osun State, Osogbo
3Department of Mechanical Engineering, Osun State University, Osogbo
Email of Corresponding Author:
ABSTRACT
Air pollution is a major problem in Nigeria. In most areas, there is a lack of existing data on the pollutant type andpollution level. Furthermore, in areas where such measurements are available, data collection is often done physically by a human subject entering the polluted site with hand-held measuring units, thereby exposing such individual to health hazards. The measurement process can also be time-consuming and monotonous,leading to boredom and data falsification. To overcome these problems, this paper, therefore, proposes a mobile robotic system to measure the level of air pollutants in specific areas and transmit the same for remote monitoring and analysis. The methodology involves designing a system with an autonomous robot to sense environmental data such as temperature, air quality and store them in the cloud. The mobile robot will be controlled and communicates with the cloud via Arduino. The collected data are stored in a cloud server which would be viewed through a mobile app and can be used to create awareness about the environmental changes of the location under study. To evaluate the performance of the developed system, a standard instrument for measuring selected air pollutants concentration was deployed alongside at the measurement sites. The measured values from both systems were compared, and the developed system was found to be accurate. In conclusion, this paper has provided a system that will make air pollution data collection and monitoring easier in Nigeria. The developed system will reduce the health hazards involved during measurements.
Keywords: Air Pollution, Mobile Robots, Data Collection, Sensors, Health Hazard and Arduino
1. Introduction
Air pollution is the presence of extra unwanted biological molecules, particulates or other harmful things in the earth’s atmosphere (Muhammad et al., 2019). The presence of major air pollutants such as nitrous oxide, carbon monoxide, ozone, sulfur dioxide and particulate matter is a major cause of respiratory infections, cancer, allergies, and if humans are exposed to toxins or chemicals for lengthy periods of time, it can lead to death (Bennetts et al., 2016; Fu, Chen, Ding, & He, 2019). It also causes harm to other creatures like animals and plants, as well as the ecological or built environment.
Various air-quality measurement sensors that can identify and observe the incidence of air pollution have been developed (Subashini et al., 2019; Zhang et al., 2021). They can be employed

ICEES 2021 ISSN: 2714-4186
99
for both indoor and outdoor pollution measurement. These equipment for pollution measurement are however very costly and are often not accessible for use in the general environment. It is hoped that with technological improvements, these sensors will become cheaper, more common and portable/wearable, thereby making air quality monitoring easier (Hu et al., 2020).
Air pollution is a major problem in Nigeria (Abdallah & Nasr, 2021). In most areas, there is a lack of existing data on the pollutant type as well as the level of pollution. Furthermore, in areas where such measurements are available, data collection is often done physically by a human subject entering into the polluted site with hand-held measuring units, thereby exposing such individuals to health hazards (Qian et al., 2016). The measurement process can also be time-consuming and monotonous and this can lead to boredom and data falsification (Arain et al., 2021). To overcome these problems, a mobile robotic system to measure the level of air pollutants is developed in this paper.The developed system makes air pollution data collection and monitoring easier and reduces the health hazards involved during measurements.
2. Materials and Method
In this section, the architecture and working principle of the robotic air pollution measurement system are presented.
2.1 Architecture
Fig. 1 shows the block diagram of the mobile robotic system for air pollution data measurement. It consists of a mobile robot on which is mounted an Arduino microcontroller board connected with gas sensors (for measuring the concentration of CO and SO2 pollutants), temperature and humidity sensor, ultrasonic sensor (for measuring the distance between the robot and obstacles in its path)and a GPS shield (to tag the coordinates of the robot’s position). This is then interfaced via Bluetooth to a mobile device having a navigation control Android app for the robot.
ATMEGA
(Microcontroller)
Light Emitting
Diodes
Temperature and Humidity
Sensor
(DHT 22)
LITHIUM
BATTERIES
BLUETOOTH
MODULE
NAVIGATION, CONTROL,
AND IOT ANDROID APP
VOLTAGE REGULATORS
5V 12V
MOBILE DEVICE MOBILE ROBOT CONTROL AND MONITORING UNIT
BLUETOOTH LINK
DC MOTORS
H-BRIDGES
DRIVER CIRCUIT
HIGH POWER
12V SUPPLY
CONTROL AND DATA
COLLECTION UNIT
MOBILE
Internet
Connection
IOT
PLATFORM/ CLOUD SERVER
MQ-7 AND MQ-135
GAS SENSORS
DISTANCE
SENSOR
(ULTRASOUND
MODULE)
GPS
AND COMPASS
MODULE
LIQUID CRYSTAL DISPLAY (LCD)
MOBILE
APPSWEB APPS
Figure 1: Block diagram of developed air pollution measurement system

ICEES 2021 ISSN: 2714-4186
100
2.1.1 Gas sensors
a. Carbon monoxide (CO) sensor- CO is a colourless, odourless, tasteless, combustible gas with a density somewhat lower than that of air. It is a toxic air pollutant produced largely from vehicle emissions and back-up generators. Carbon monoxide results from the incomplete combustion of fuels, such as wood, kerosene, gasoline, charcoal, propane, etc. Breathing CO at high concentrations leads to reduced oxygen transported by hemoglobin, which has health effects that include impaired reaction timing, headaches, lightheadedness, nausea, vomiting, weakness, clouding of consciousness and coma. Long term exposure and high concentrations can lead to death (Transportation Research Board and National Research Council, 2002).
In this paper, the MQ7 sensor (see Fig. 2) is used to measure the concentration of carbon monoxide. It detects the concentrations of CO in the air and ouputs its reading as an analog voltage. The sensor can measure concentrations of 10 to 10,000 ppm, and can operate at temperatures from -10 to 50°C and consumes less than 150 mA at 5 V.
Figure 2: MQ7 gas sensor
b. Sulfur dioxide ( ) sensor- is a heavy, colorless, and toxic gas that is produced
when sulfur-containing fuel such as coal, oil, or diesel is burned. The largest sources of sulfur dioxide emissions are electricity generation companies using fossil fuels, industrial boilers, and other industrial processes such as petroleum refining and metal processing. Diesel engines are another major source, including old buses and trucks, locomotives, ships, and off-road diesel
equipment (American Lung Association, 2020). Short-term exposures to can harm the
human respiratory system and make breathing difficult. People with asthma, particularly children,
are sensitive to these effects of . Other sulfur oxides such as SOx are formed when there is
high concentration of SO2 emission in the air. can react with other compounds in the
atmosphere to form small particles. These particles contribute to particulate matter (PM) pollution. Small particles may penetrate deeply into the lungs and in sufficient quantity can contribute to health problems (United States Environmental Protection Agency, n.d.).
The MQ 135 sensor is used in this paper to measure the concentration of gas. It has a wide
detecting scope, fast response and high sensitivity. Its operating voltage is +5V and can be used as a digital or analog sensor. The sensitivity of the digital pin can be varied using a potentiometer. The MQ 135 sensor is shown in Fig. 3.
2.1.2 Obstacle detection and avoidance
An ultrasonic sensor is placed on the front side of the robot to automatically detect if any obstacle is present in its path. On detecting an obstacle, the robot takes action such as moving in the reverse direction or rotating before moving. Ultrasonic sensors emit short, high-frequency

ICEES 2021 ISSN: 2714-4186
101
sound pulses at regular intervals. These propagate in the air at the velocity of sound. If they strike an object, then they are reflected back as echo signals to the sensor, which itself computes the distance to the target based on the time-span between emitting the signal and receiving the echo. As the distance to an object is determined by measuring the time of flight and not by the intensity of the sound, ultrasonic sensors are excellent at suppressing background interference.
Figure 3: MQ 135 sensor
The HC-SR04 ultrasonic distance sensor (see Fig. 4) is used in this paper. It provides 2cm to 400cm of non-contact measurement functionality with a ranging accuracy that can reach up to 3mm. Each HC-SR04 module includes an ultrasonic transmitter, a receiver and a control circuit.
Figure 4: Ultrasonic Sensor
2.1.3 Temperature and Humidity Sensors
Temperature and humidity sensors are connected to the board to observe the variables in the environment. The sensor used is the DHT22 shown in Fig. 5 which measures the ambient air humidity and temperature using a capacitive humidity sensor and a thermistor, and outputs a digital signal on the data pin.
Figure 5: Temperature and Humidity Sensor
2.2 Working Principle of the System
The circuit diagram of the mobile robot air pollution measurement system is shown in Figure 6 while the final device developed is shown in Fig. 7. The 12 V DC servomotors are powered by a
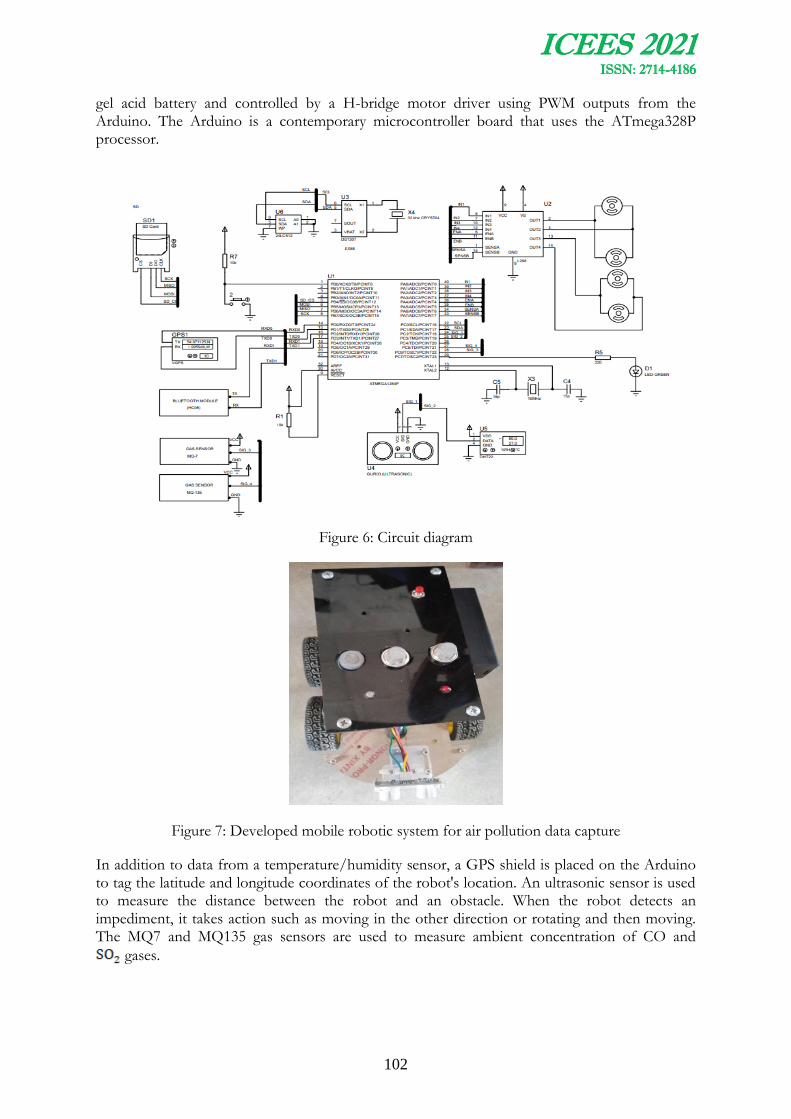
ICEES 2021 ISSN: 2714-4186
102
gel acid battery and controlled by a H-bridge motor driver using PWM outputs from the Arduino. The Arduino is a contemporary microcontroller board that uses the ATmega328P processor.
Figure 6: Circuit diagram
Figure 7: Developed mobile robotic system for air pollution data capture
In addition to data from a temperature/humidity sensor, a GPS shield is placed on the Arduino to tag the latitude and longitude coordinates of the robot's location. An ultrasonic sensor is used to measure the distance between the robot and an obstacle. When the robot detects an impediment, it takes action such as moving in the other direction or rotating and then moving. The MQ7 and MQ135 gas sensors are used to measure ambient concentration of CO and
gases.
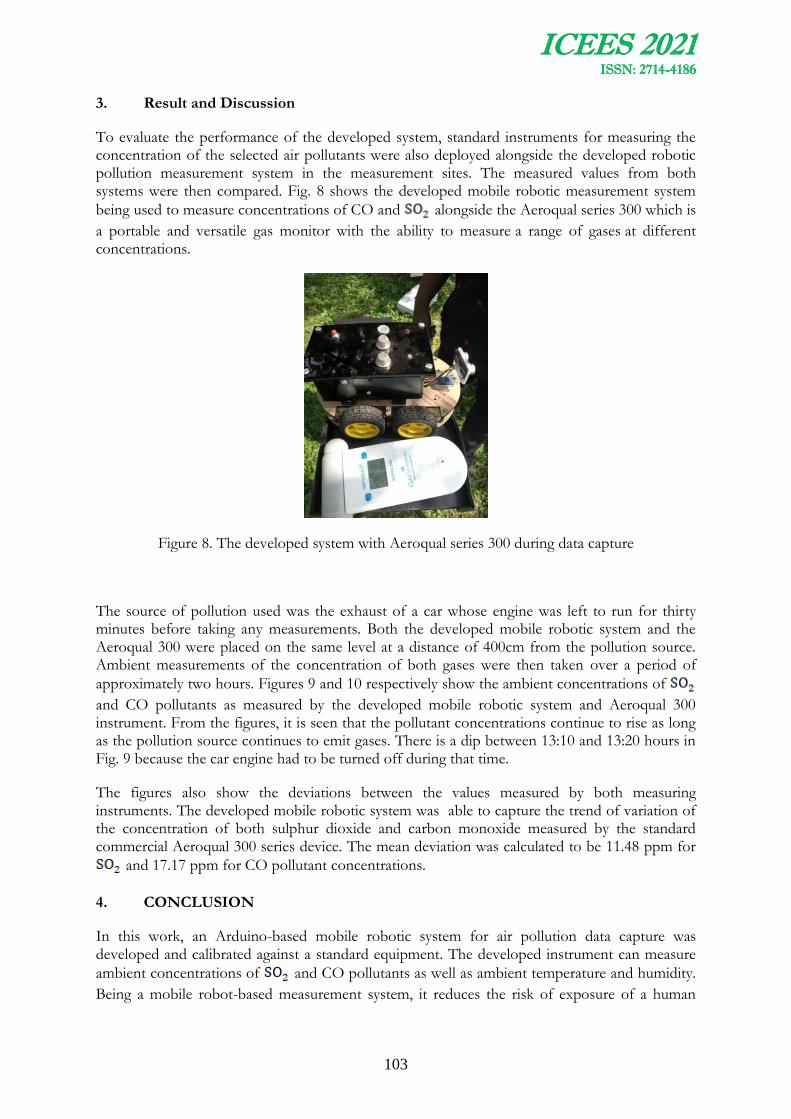
ICEES 2021 ISSN: 2714-4186
103
3. Result and Discussion
To evaluate the performance of the developed system, standard instruments for measuring the concentration of the selected air pollutants were also deployed alongside the developed robotic pollution measurement system in the measurement sites. The measured values from both systems were then compared. Fig. 8 shows the developed mobile robotic measurement system
being used to measure concentrations of CO and alongside the Aeroqual series 300 which is
a portable and versatile gas monitor with the ability to measure a range of gases at different concentrations.
Figure 8. The developed system with Aeroqual series 300 during data capture
The source of pollution used was the exhaust of a car whose engine was left to run for thirty minutes before taking any measurements. Both the developed mobile robotic system and the Aeroqual 300 were placed on the same level at a distance of 400cm from the pollution source. Ambient measurements of the concentration of both gases were then taken over a period of
approximately two hours. Figures 9 and 10 respectively show the ambient concentrations of
and CO pollutants as measured by the developed mobile robotic system and Aeroqual 300 instrument. From the figures, it is seen that the pollutant concentrations continue to rise as long as the pollution source continues to emit gases. There is a dip between 13:10 and 13:20 hours in Fig. 9 because the car engine had to be turned off during that time.
The figures also show the deviations between the values measured by both measuring instruments. The developed mobile robotic system was able to capture the trend of variation of the concentration of both sulphur dioxide and carbon monoxide measured by the standard commercial Aeroqual 300 series device. The mean deviation was calculated to be 11.48 ppm for
and 17.17 ppm for CO pollutant concentrations.
4. CONCLUSION
In this work, an Arduino-based mobile robotic system for air pollution data capture was developed and calibrated against a standard equipment. The developed instrument can measure
ambient concentrations of and CO pollutants as well as ambient temperature and humidity.
Being a mobile robot-based measurement system, it reduces the risk of exposure of a human

ICEES 2021 ISSN: 2714-4186
104
subject to harmful pollutants entering into the polluted site with hand-held measuring units. The robotic system can also be used for learning purposes in institutions of higher learning.
Figure 9: Ambient pollutant concentration
Figure 10: Ambient pollutant concentration

ICEES 2021 ISSN: 2714-4186
105
5. REFERENCES
Abdallah, L., & Nasr, A. (2021). Using robots to improve indoor air quality and reduce COVID-19 exposure. Journal of Applied Research and Technology, 19(3). https://doi.org/10.22201/icat.24486736e.2021.19.3.1694
American Lung Association (2020). Sulfur dioxiode. https://www.lung.org/clean-air/outdoors/what-makes-air-unhealthy/sulfur-dioxide
Arain, M. A., Hernandez Bennetts, V., Schaffernicht, E., & Lilienthal, A. J. (2021). Sniffing out fugitive methane emissions: autonomous remote gas inspection with a mobile robot. International Journal of Robotics Research, 40(4–5). https://doi.org/10.1177/0278364920954907
Bennetts, V. H., Kucner, T. P., Schaffernicht, E., Neumann, P. P., Fan, H., & Lilienthal, A. J. (2017). Probabilistic Air Flow Modelling Using Turbulent and Laminar Characteristics for Ground and Aerial Robots. IEEE Robotics and Automation Letters, 2(2). https://doi.org/10.1109/LRA.2017.2661803
Bennetts, V. H., Schaffernicht, E., Lilienthal, A. J., Fan, H., Kucner, T. P., Andersson, L., & Johansson, A. (2016). Towards occupational health improvement in foundries through dense dust and pollution monitoring using a complementary approach with mobile and stationary sensing nodes. In IEEE International Conference on Intelligent Robots and Systems (Vol. 2016-November). https://doi.org/10.1109/IROS.2016.7759045
Fu, Z., Chen, Y., Ding, Y., & He, D. (2019). Pollution Source Localization Based on Multi-UAV Cooperative Communication. IEEE Access, 7. https://doi.org/10.1109/ACCESS.2019.2900475
Hanafi, D., & A.Rahman, K. A. (2016). THE MOBILE ROBOT DEVELOPMENT FOR AIR POLLUTION TELE DATA CAPTURE. Jurnal Teknologi Elektro, 7(2). https://doi.org/10.22441/jte.v7i2.830
Hu, Z., Cong, S., Song, T., Bian, K., & Song, L. (2020). AirScope: Mobile Robots-Assisted Cooperative Indoor Air Quality Sensing by Distributed Deep Reinforcement Learning. IEEE Internet of Things Journal, 7(9). https://doi.org/10.1109/JIOT.2020.3004339
Kafumbe, S. (2018). IRovers: Real-time unmanned four-wheel IOT vehicles for air and noise pollution monitoring. In 2018 Advances in Science and Engineering Technology International Conferences, ASET 2018. https://doi.org/10.1109/ICASET.2018.8376838
Muhammad, S., Mohammad, N., Bashar, A., & Khan, M. A. (2019). Designing Human Assisted Wireless Sensor and Robot Networks Using Probabilistic Model Checking. Journal of Intelligent and Robotic Systems: Theory and Applications, 94(3–4). https://doi.org/10.1007/s10846-018-0901-x
Pattanashetty, K., Balaji, K. P., & Pandian, S. R. (2016). Educational outdoor mobile robot for trash pickup. In GHTC 2016 - IEEE Global Humanitarian Technology Conference: Technology for the Benefit of Humanity, Conference Proceedings. https://doi.org/10.1109/GHTC.2016.7857304
Pozo, D., Solórzano, S., Pérez-Medina, J. L., Jaramillo, K., López, R., & Zalakeviciute, R. (2020). Remote monitoring air quality in dangerous environments for human activities. In Advances
ICEES 2021 ISSN: 2714-4186
106
in Intelligent Systems and Computing (Vol. 959). https://doi.org/10.1007/978-3-030-20040-4_45
Qian, K., Ma, X., Dai, X., Fang, F., & Zhou, B. (2016). Gaussian process based IAQ distribution mapping using an interactive service robot. Journal of Ambient Intelligence and Smart Environments, 8(3). https://doi.org/10.3233/AIS-160376
Salman, H., Rahman, M. S., Tarek, M. A. Y., & Wang, J. (2019). The Design and Implementation of GPS Controlled Environment Monitoring Robotic System based on IoT and ARM. In 4th International Conference on Control and Robotics Engineering, ICCRE 2019. https://doi.org/10.1109/ICCRE.2019.8724268
Stan, A. C., Oprea, M., Moise, A., & Popescu, C. (2020). Environmental scada system using mobile robots. In International Multidisciplinary Scientific GeoConference Surveying Geology and Mining Ecology Management, SGEM (Vol. 2020-August). https://doi.org/10.5593/sgem2020/4.1/s19.051
Subashini, V., Arthi, M., Anbarasi, M., & Rajaveni, R. (2019). Irovers: Real time unmanned four wheeled iot vehicles for fire monitoring and extinguishing using sonic waves. International Journal of Recent Technology and Engineering, 8(2 Special issue 5). https://doi.org/10.35940/ijrte.B1013.0782S519
Transportation Research Board and National Research Council. 2002. The Ongoing Challenge of Managing Carbon Monoxide Pollution in Fairbanks, Alaska: Interim Report. Washington, DC: The National Academies Press.https://doi.org/10.17226/10378.
United States Environmental Protection Agency (n.d.) Sulfur dioxiodebasicshttps://www.epa.gov/so2-pollution/sulfur-dioxide-basics
Widyantara, H., Rivai, M., & Purwanto, D. (2019). Wind direction sensor based on thermal anemometer for olfactory mobile robot. Indonesian Journal of Electrical Engineering and Computer Science, 13(2). https://doi.org/10.11591/ijeecs.v13.i2.pp475-484
Zhang, K., & Samaan, N. (2020). Optimized Look-Ahead Offloading Decisions Using Deep Reinforcement Learning for Battery Constrained Mobile IoT Devices. In Proceedings - 2020 IEEE International Conference on Smart Cloud, SmartCloud 2020. https://doi.org/10.1109/SmartCloud49737.2020.00042
Zhang, S., Liu, Z., Liu, J., Ding, T., & Wei, S. (2021). Simulation implementation of air pollution traceability algorithm based on unmanned aerial vehicle. In IOP Conference Series: Earth and Environmental Science (Vol. 675). https://doi.org/10.1088/1755-1315/675/1/012012
ICEES 2021 ISSN: 2714-4186
107
IMPACT OF INFORMAL SECTOR ACTIVITIES ON THE BUILT ENVIRONMENT: IFE CITY, NIGERIA
Agbolade, O. O
Department Of Urban and Regional Planning, Osun State University, Osogbo, Nigeria
Email of Corresponding Author: [email protected]
ABSTRACT
The built environment refers to the man-made environment that provides the setting for human activity, including homes, buildings, zoning, streets, sidewalks, open spaces, transportation options and more. It is the human-made space in which people live, work and recreate on a day-to-day basis. Informal activities, like other human activities, are majorly carried out in the built environment and this has a number of effects on the environment. Such effects are the main focus of this study. Data for the study were obtained through the use of questionnaires which were administered on 555 operators of informal activities through multi-stage (stratification, systematic random, cluster) sampling techniques. The data obtained were analyzed using descriptive statistics. The identified effects of the activities of the informal sector in the study area include; on-street parking of vehicles (12.5%), traffic hold-up (10.5%), haphazard erection of structures (6.2%) and encroachment into open spaces (3.5%), among others. The study concluded that there is need for the regulation of the activities of the sector, most especially the location of the activities in the study area.
Keywords: Built environment, informal activities, multi-stage sampling
1.0 INTRODUCTION
Informal sector activities are small scale, non-agricultural activities through which the means of livelihood are provided for people (Afon, 2006). The activities are usually unregulated and non-formal (Agbolade, 2011). The informal sector (economy) is the part of any economy that is neither taxed nor monitored by any form of government. It is a sector that is usually stigmatized as troublesome and unmanageable, even though it makes up a significant portion of the economies (Dean, 2010). As observed by IMF (2021), the informal economy is a global phenomenon that absorbs about 60% of the world’s population. It is present in both developing and advanced economies. The informal economy consists of activities that are not formally registered though they have good market value. Economic challenges, especially in the developing countries had resulted in the influx of people into the informal sector. This is largely because the formal economy has not been able to adequately absorb the teeming population of youths and people in the working class age bracket (Agbolade et al, 2018). The sector provides critical economic opportunities for the populace, especially the poor and this is one of the major reasons for the high influx of people experienced in the sector.
The sector has greatly penetrated the urban centers due to the large human population characterizing the world’s urban centers. Hence, there is an uncontrolled infiltration of informal sector activities in virtually every segment of urban space (Jelili and Adedibu, 2006; Agbolade, 2014). This incessant widespread of the sector in developed and developing nations of the world
ICEES 2021 ISSN: 2714-4186
108
has resulted in a myriad of problems and major environmental challenges. The operation of the sector has defied land use planning and consequently defaced the built landscape (Agbolade, 2011). It is against this background that it becomes imperative to examine the impact of the activities of the sector on the built environment on the ancient city of Ife.
2.0 MATERIALS AND METHODS
One of the major sources of data for this study was questionnaire. The questionnaires were administered on the operators of the informal sector activities. In the administration of the questionnaires, multi-stage (stratification, systematic random and cluster) sampling was used. Each of the two Local Governments in the study area was stratified into the ten political wards delineated by the Independent National Electoral Commission (INEC) for election purposes. Three wards were selected for study in each local government. The selection was made in a way that the three identifiable residential zones in a typical African traditional city like Ile-Ife as well as the three hierarchies of roads were represented. The residential zones are the traditional residential zone (pre- colonial residential development), the transition zone (pre-independence residential development), and the sub-urban zone (post-independence residential development). This method was adopted because the three residential zones show variation in population density, socio-economic characteristics as well as environmental characteristics. This stratified sampling is essential to identify how informal activities were distributed in the study area.
The federal, state and local roads in each residential zone were identified and listed. For the purpose of this study, the roads in the study area were categorized into the following:
Federal roads
State roads exclusively in each Local Government
State roads shared by the two Local Governments
Local roads exclusively in each Local Government
Twenty percent of the operators of informal sector activities along all the identified federal roads were sampled. Similarly, twenty percent of the operators of the informal sector activities along three of the state roads that are exclusively in Ife Central Local Government and three of the state roads exclusively in Ife East Local Government were sampled. Twenty percent of the operators along all the state roads shared by the two local governments were also sampled. A local road was chosen from each of the residential zones in each Local Government and twenty percent of the operators of informal sector activities along the roads were sampled. The roads to be sampled were randomly selected from the list. The operators of the informal activities were selected after clustering each category of activity in order to ensure full representation.
The operator of the first informal activity to be sampled along each of the chosen roads and in each cluster was randomly selected. Subsequent units of investigation were operators of every fifth informal activity in each cluster and along both sides of the road. The use of road was instigated by the fact that most informal sector activities are concentrated along road axis. This will help to examine and establish the widespread of informal activities along different road types, residential zones, and Local Governments. The sample frame is all the operators of
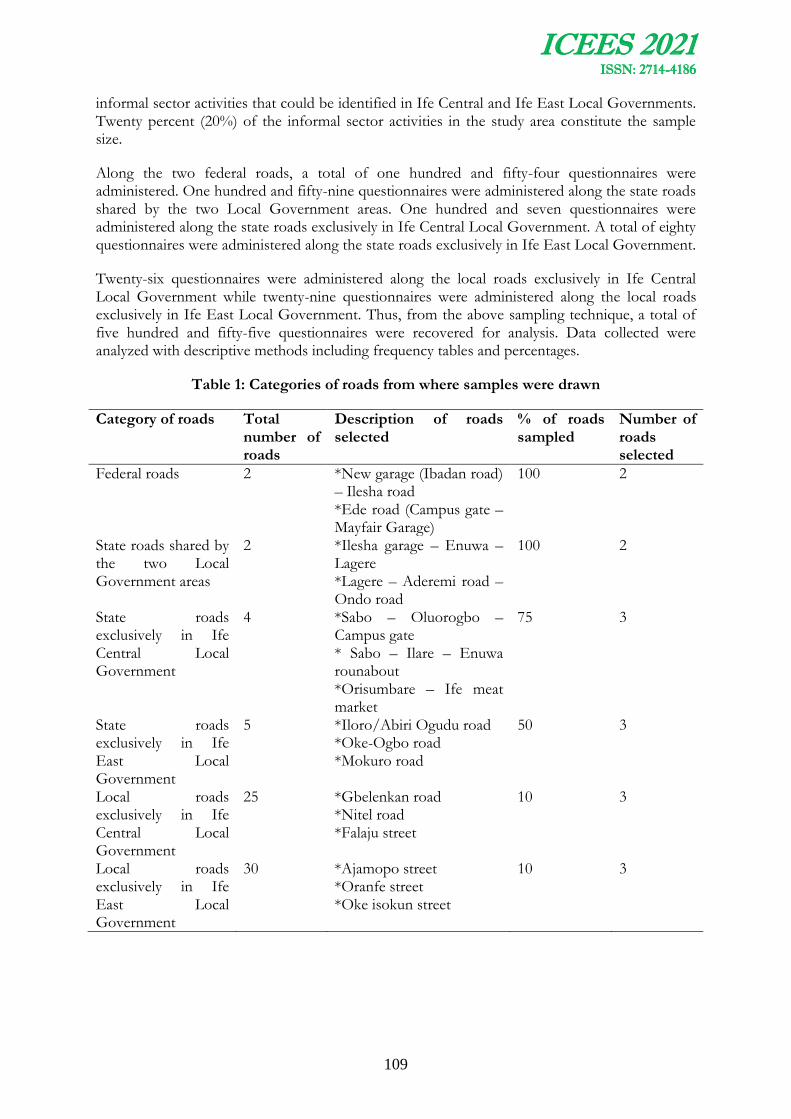
ICEES 2021 ISSN: 2714-4186
109
informal sector activities that could be identified in Ife Central and Ife East Local Governments. Twenty percent (20%) of the informal sector activities in the study area constitute the sample size.
Along the two federal roads, a total of one hundred and fifty-four questionnaires were administered. One hundred and fifty-nine questionnaires were administered along the state roads shared by the two Local Government areas. One hundred and seven questionnaires were administered along the state roads exclusively in Ife Central Local Government. A total of eighty questionnaires were administered along the state roads exclusively in Ife East Local Government.
Twenty-six questionnaires were administered along the local roads exclusively in Ife Central Local Government while twenty-nine questionnaires were administered along the local roads exclusively in Ife East Local Government. Thus, from the above sampling technique, a total of five hundred and fifty-five questionnaires were recovered for analysis. Data collected were analyzed with descriptive methods including frequency tables and percentages.
Table 1: Categories of roads from where samples were drawn
Category of roads Total number of roads
Description of roads selected
% of roads sampled
Number of roads selected
Federal roads 2 *New garage (Ibadan road) – Ilesha road *Ede road (Campus gate – Mayfair Garage)
100 2
State roads shared by the two Local Government areas
2 *Ilesha garage – Enuwa – Lagere *Lagere – Aderemi road – Ondo road
100 2
State roads exclusively in Ife Central Local Government
4 *Sabo – Oluorogbo – Campus gate * Sabo – Ilare – Enuwa rounabout *Orisumbare – Ife meat market
75 3
State roads exclusively in Ife East Local Government
5 *Iloro/Abiri Ogudu road *Oke-Ogbo road *Mokuro road
50 3
Local roads exclusively in Ife Central Local Government
25 *Gbelenkan road *Nitel road *Falaju street
10 3
Local roads exclusively in Ife East Local Government
30 *Ajamopo street *Oranfe street *Oke isokun street
10 3

ICEES 2021 ISSN: 2714-4186
110
3.0 RESULTS AND DISCUSSION
The research findings are highlighted under the various sub-headings below. The tables through which information were summarized are the products of the survey carried out by the authors.
3.1 SPATIAL DISTRIBUTION OF INFORMAL SECTOR ACTIVITIES IN THE STUDY AREA
In the literature, it was identified that informal sector activities seek to locate along major streets. This section therefore seeks to identify how these activities were located along the different categories of roads and within the residential zones in the study area. Presented in Table 2 were details of the spatial distribution of the informal sector activities in Ife city.
Table 2: Spatial Distribution of Informal Sector Activities in Ife City
Road category Category of occupation Total Trading and Commercial activities
Cottage Industry
Tertiary Services
No % No % No % No %
Federal roads 90 16.2 15 2.7 39 7.0 144 25.9 4 0.7 2 0.4 4 0.7 10 1.8
State roads (shared by both LG)
59 10.6 5 0.9 20 3.6 84 15.1 52 9.4 6 1.1 17 3.1 75 13.5
State roads (Ife Central LG only)
19 3.4 3 0.5 15 2.7 37 6.7 38 6.9 10 1.8 20 3.6 68 12.3 1 0.2 0 0 1 0.2 2 0.4
State roads (Ife East LG only) 22 4.0 5 0.9 11 2.0 38 6.9 11 2.0 7 1.3 11 2.0 29 5.2 8 1.4 1 0.2 4 0.7 13 2.3
Local roads (Ife Central LG only)
6 1.1 2 0.4 6 1.1 14 2.5 6 1.1 2 0.4 1 0.2 9 1.6 3 0.5 0 0 0 0 3 0.5
Local roads (Ife East LG only) 5 0.9 1 0.2 6 1.1 12 2.2 6 1.1 4 0.7 5 0.9 15 2.7 2 0.4 0 0 0 0 2 0.4
Total 332 59.8 63 11.3 160 28.8 555 100
From the findings, 27.7% of informal sector activities in the study area were located along the Federal roads, 62.3% along State roads and 10.0% were along the local roads. A total of 500 (90.1%) informal activities were located along the federal and state roads. This implied that informal activities in Ile-Ife tend to locate along major street corridors (federal and state roads). Also established is the fact that 310 (55.9%) of the informal activities in the study area were located within the transition zone. Thus, a greater percentage of the activities were located within this zone. The sub- urban zone had the fewest informal activities. Within it were located 3.6% of all the sampled activities.
The preponderance of informal activities along the federal and state roads as well as within the transition residential zone was due to the fact that many of the activities that pull crowd in the city had their location there. Such activities include the major market, the central business district, banks, hospitals, students’ hostels and high schools.
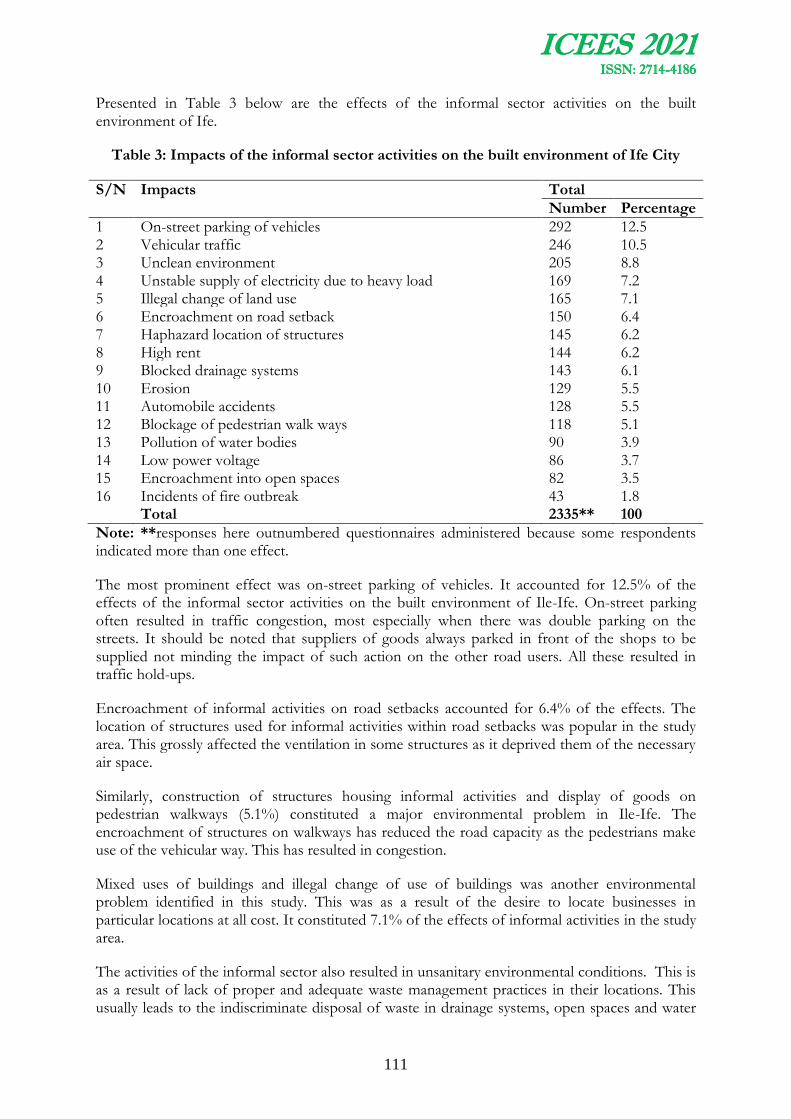
ICEES 2021 ISSN: 2714-4186
111
Presented in Table 3 below are the effects of the informal sector activities on the built environment of Ife.
Table 3: Impacts of the informal sector activities on the built environment of Ife City
S/N Impacts Total
Number Percentage
1 On-street parking of vehicles 292 12.5 2 Vehicular traffic 246 10.5 3 Unclean environment 205 8.8 4 Unstable supply of electricity due to heavy load 169 7.2 5 Illegal change of land use 165 7.1 6 Encroachment on road setback 150 6.4 7 Haphazard location of structures 145 6.2 8 High rent 144 6.2 9 Blocked drainage systems 143 6.1 10 Erosion 129 5.5 11 Automobile accidents 128 5.5 12 Blockage of pedestrian walk ways 118 5.1 13 Pollution of water bodies 90 3.9 14 Low power voltage 86 3.7 15 Encroachment into open spaces 82 3.5 16 Incidents of fire outbreak 43 1.8 Total 2335** 100
Note: **responses here outnumbered questionnaires administered because some respondents indicated more than one effect.
The most prominent effect was on-street parking of vehicles. It accounted for 12.5% of the effects of the informal sector activities on the built environment of Ile-Ife. On-street parking often resulted in traffic congestion, most especially when there was double parking on the streets. It should be noted that suppliers of goods always parked in front of the shops to be supplied not minding the impact of such action on the other road users. All these resulted in traffic hold-ups.
Encroachment of informal activities on road setbacks accounted for 6.4% of the effects. The location of structures used for informal activities within road setbacks was popular in the study area. This grossly affected the ventilation in some structures as it deprived them of the necessary air space.
Similarly, construction of structures housing informal activities and display of goods on pedestrian walkways (5.1%) constituted a major environmental problem in Ile-Ife. The encroachment of structures on walkways has reduced the road capacity as the pedestrians make use of the vehicular way. This has resulted in congestion.
Mixed uses of buildings and illegal change of use of buildings was another environmental problem identified in this study. This was as a result of the desire to locate businesses in particular locations at all cost. It constituted 7.1% of the effects of informal activities in the study area.
The activities of the informal sector also resulted in unsanitary environmental conditions. This is as a result of lack of proper and adequate waste management practices in their locations. This usually leads to the indiscriminate disposal of waste in drainage systems, open spaces and water
ICEES 2021 ISSN: 2714-4186
112
bodies, thereby polluting the environment. This also explains the incidence of blocked drainage systems in the town.
4.0 CONCLUSION AND RECOMMENDATIONS
This study in the previous section has presented the impacts of the informal sector activities on the built environment of Ile-Ife. It noted among other things the effects of the indiscriminate location of the activities of the sector on the built environment. The identified impacts include haphazard erection of structures, encroachment on road setbacks, location of shops/display of goods on pedestrian walkways, mixed uses in buildings/illegal change of use, unsanitary environment and pollution of water bodies.
To eradicate, or at least reduce the intensity of the identified negative impacts, there is need for public participation. Enlightenment campaign should therefore be embarked upon to educate the public on the hazards of locating these activities indiscriminately and polluting the environment. The campaign could be done through the organization of lectures, symposiums and workshops by the local government for the various trade unions, as well as the elected and career officers of the local government. It is imperative to include both the elected and the career officers of the local government in general, and the department of water and environmental sanitation with the town planning and land services department at the local government level in particular, in the list of those to be educated. This is because it is the local government that is expected to design and enforce waste storage standards and control the development of structures in the study area.
All agencies in charge of land use and development control should be empowered and adequately funded to meet the challenges of informal sector activities. There is also the need for the preparation of master plan / land use map for Ile-Ife. This will serve as a guide to development control officers in carrying out their duties of controlling the development of the town. Adequate portions of land should be provided for commercial land use. In areas where road side traders are concentrated, there is the need for the provision of alternative markets. The road side traders should then be mandated through appropriate legislations to move their businesses into the new market. It is hoped that this would help in controlling problems such as haphazard erection of structures, encroachment of structures on road setbacks, location of shops/display of goods on pedestrian walkways and illegal change of land use.
The agencies should also pull down all illegal and haphazardly erected structures. This should however be done after enlightening the owners of such structures on the challenges posed on the environment by the location of their structures. The development control agencies should ensure that structures used for informal activities obtain the necessary approval or permit, from the relevant planning authority. They should as well ensure that the development of the structure conform to the approval granted. All structures for informal activities should have attached toilet facilities. There should be proper monitoring of the study area by the development control agencies and other relevant agencies, including the law enforcement agencies, in order to ensure that the operators abide by the regulations.
There is the need for improvement in waste management practices in the study area. Waste receptacles (Franziska and Vest 2005) should be provided by the government at a distance of 50–100m to the operators (Saliman 2010). These storage facilities should be with lids. Government should also provide waste collection vehicles that would be evacuating these wastes regularly. In addition, the operators of informal activities should be mandated to store their wastes in an approved receptacle as prescribed to them by the government. These receptacles should be emptied into the government’s own receptacles for evacuation as and when due. The evacuation should be done on a regular basis to ensure the cleanliness of the environment. The
ICEES 2021 ISSN: 2714-4186
113
operators should be made to pay a token for this service on a monthly basis. Sanitary inspectors should be assigned to different places in the study area to curb the indiscriminate dumping of refuse and ensure that defaulters are punished. They should carry out inspections from time to time. They should also instruct and supervise the cleaning of the environment by the operators of informal activities during their inspections.
5.0 REFERENCES
Afon, A.O. (2006): Estimating the Quantity of Solid Waste Generation in Oyo, Oyo State, Nigeria. Journal of the Nigerian Institute of Town Planners, Vol.XIX, No.1.
Agbolade, O.O (2011) Effects of Informal Sector Activities on the Built Environment of Ile-Ife, Osun State, Nigeria. MSc Thesis submitted to the Department of Urban and Regional Planning, Obafemi Awolowo University, Ile-Ife, Osun State.
Agbolade, O.O (2014) Spatial Distribution of Informal Sector Activities in Ile-Ife, Nigeria. Researchjournali’s Journal of Sociology. Vol. 2, No 12, Dec. 2014
Agbolade, O.O; Alalade, T.A; Mbamara, B.E; Albert, M.F; Fatoke, M.T and Afon, A.O (2018) Solid Waste Management Practices in the Informal Sector of Ile-Ife, Nigeria. FUOYE Journal of Pure and Applied Sciences. Vol.3, Issue 1
Calbreath, D (2010) Hidden Economy a Hidden Danger. Union-Tribune San Diego (Wikipedia: The Informal Economy)
International Monetary Fund (2021) Five Things to Know about the Informal Economy. IMF Country Focus. imf.org
Jelili, M.O and Adedibu, A.A (2006) Land Use Classification and Informal Sector Question in Ogbomoso, Nigeria. Journal of Human Ecology, 20.

ICEES 2021 ISSN: 2714-4186
114
CHALLENGES AND RESPONSE OF RELEVANT AGENCIES TO LAND USE CHANGE IN ILORIN METROPOLIS, KWARA STATE,
NIGERIA.
1Asiyanbi Adedolapo Oloruntoba 2 and Abolade Olajoke
1, 2, Department of Urban and Regional Planning, Ladoke Akintola University of Technology, P.M.B. 4000, Ogbomoso Nigeria.
Email of Corresponding Author: [email protected] or [email protected]
ABSTRACT
Land-use change in Ilorin seems to be growing at an unprecedented rate altering the existing land use pattern, this poses a great challenge on the town planners. Thus, this study examines the nature, challenges and response of relevant agencies to land-use change in the Ilorin metropolis, Kwara State, and suggests measures to ameliorating these challenges. Information on land-use change was sourced from the Town planning office in the three local governments that made up Ilorin metropolis (Ilorin East, West and South) local governments and the Ministry of Housing and Urban Development through interviews. Questionnaires were used to collect data from the residents of land use change. Direct observation was also employed to augment information gotten from the interview and questionnaire and backed by pictures from the field. Content analysis was used to analyse the information collected from the agencies and results presented in themes and tables. The finding shows that from 2000-2018, a total of 216 land-use changes occurred. It shows that residential use was predominant in previous use with 82.41% while commercial use took the highest in current use with 59.25%. The study revealed that land-use changes taken place in Ilorin are incompatible and injurious to man and the environment. The planning authorities reported that they have little or no response to the problem of land-use change in the city because they were not given any responsibility to attend to any issue relating to land-use change in the study area be it approval or monitoring. The responsibility has been handed over to the Ministry of Housing and Urban Development with little or no knowledge about town planning. The ministry reported that they are faced with financial and leadership challenges. To mitigate the negative impact of land-use changes on the environment, the study recommends that the responsibility to oversee issues relating to land-use change be given back to the planning authority.
Key Words: Land-use, Development, Planning, Compatibility, Urbanization
1.0 INTRODUCTION
The earth comprises the atmosphere (air), hydrosphere (water), and lithosphere (land) (Botkin & Keller 1998). The hydrosphere took the highest portion of the earth which is 71% while the lithosphere (land) took the smallest portion of the earth’s surface with just 29% (Olomo, 1999). Similarly, urban settlements account for only two percent of the earth’s land surface; although over half of the world’s population resides in cities (United Nations, 2001). Coupled with this, is the fact that land is very limited in supply and this makes competition for land to increase among land users. The limitation in the supply of land is one of the factors that contributed to continuous land-use change, even though the preference for a specific location also contributes to land-use change. Land-use change has a strong correlation with urbanisation; thus unprecedented urbanisation is a major factor for incessant land-use changes (Asiyanbi, 2020).

ICEES 2021 ISSN: 2714-4186
115
The migration of people from the surrounding towns around Ilorin metropolis into the metropolis for various purposes such as jobs, businesses and academics has often led to the unprecedented market centre for businessmen and women. The unprecedented population poses a great demand for shops and housing and consequently causes an increase in land consumption and land-use changes.
Land use is conceptualised as the use to which a property is put. This is as human activities mostly take place within the shell (buildings) (Asiyanbi, 2020). Thus, buildings are the primary reflector of human activities. Land-use change happens on the land which means once the land is converted from one use to another, the use of that particular land automatically changes. According to Essaghah, (1997), land use is simply defined as the use to which land is put as a result of man activities. Also, according to Akintola, (2011), land use refers to the use to which a plot, site, or building is put. Not all land uses involved the erection of buildings or structures e.g refuse dump, cemetery or crematoria. From these definitions above, it can be deduced that land-use change is the change in the use of site, plot or building from its previous use to its current use.
Several scholars have worked on land use and land cover change in their respective areas. McKinney (2002) reported that urban areas threaten the ecosystem through direct habitat land-use changes and various indirect effects of the dense human population such as resource use, habitat fragmentation, waste generation, and freshwater cooption. As succinctly summarized by Our Common Future (WCED, 1987): “The uncontrolled land use change and physical expansion of cities has serious implications for the urban environment and economy’’. Uncontrolled development and land-use change make the provision of housing, roads, water supply, sewers, and public services prohibitively expensive.
Urban and Regional Planning Decree 1992 imposes an obligation on the different bodies of planning authority (commission, board, and local authority) to have a department known as the development control department, vested with the power over control of development on all land within the federal, state and local government respectively. Any person who seeks to develop any land in the area of jurisdiction of either federal, state or local government shall submit a development plan for approval of such development to the development control department of his/her area of jurisdiction. (F.R.N.G, 1992). This implies that every development, be it a new development or land-use change must be approved by the planning authority in that jurisdiction where such development is to take place.
Most of the land-use changes directly or indirectly breach the planning law of compatibility because most of the changes do not in any way complement the planning law and regulation, as evident in the study area. In most cases, incompatible land uses are located at close range to each other. For instance, filling stations located within the residential area, markets, or shops located beside hospitals among other haphazard locations of other land use on physical development. It is against this background that this study examines the challenges and response of the relevant authorities to land-use changes in Ilorin Metropolis. This is to ensure maximum compliance level to planning laws and regulations in the Ilorin metropolis.
2.0 THE STUDY AREA
Ilorin city is one of the large cities in Nigeria and the capital of Kwara State. It lies between longitude 4032’0″ and 5000’0″ East of Greenwich meridian and between Latitude 8020’0″ and 8044’0″ North of Equator as shown in Figure 1. It is bounded in the north by Moro L.G.A; in the East by some villages within Ilorin LGA itself, and Ifelodun L.G.A; while in the South and to the West, by Asa LGA as shown in Figure 1. The city of Ilorin is also the headquarters of Ilorin
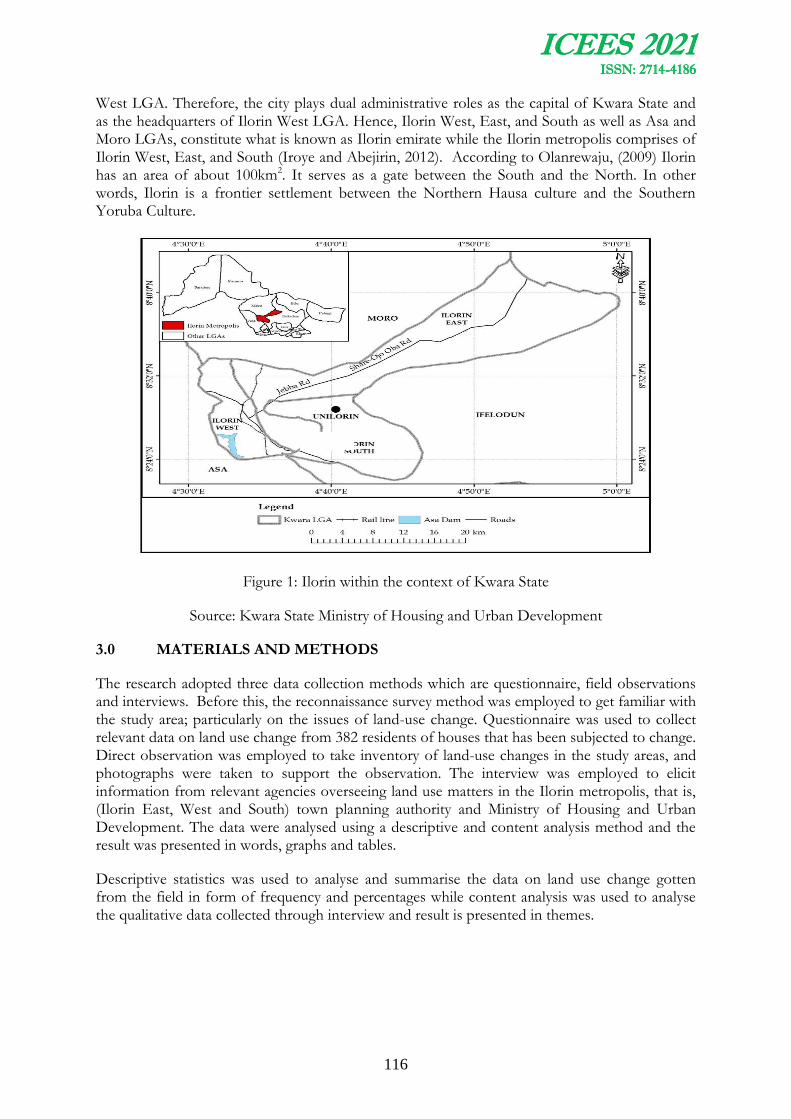
ICEES 2021 ISSN: 2714-4186
116
West LGA. Therefore, the city plays dual administrative roles as the capital of Kwara State and as the headquarters of Ilorin West LGA. Hence, Ilorin West, East, and South as well as Asa and Moro LGAs, constitute what is known as Ilorin emirate while the Ilorin metropolis comprises of Ilorin West, East, and South (Iroye and Abejirin, 2012). According to Olanrewaju, (2009) Ilorin has an area of about 100km2. It serves as a gate between the South and the North. In other words, Ilorin is a frontier settlement between the Northern Hausa culture and the Southern Yoruba Culture.
Figure 1: Ilorin within the context of Kwara State
Source: Kwara State Ministry of Housing and Urban Development
3.0 MATERIALS AND METHODS
The research adopted three data collection methods which are questionnaire, field observations and interviews. Before this, the reconnaissance survey method was employed to get familiar with the study area; particularly on the issues of land-use change. Questionnaire was used to collect relevant data on land use change from 382 residents of houses that has been subjected to change. Direct observation was employed to take inventory of land-use changes in the study areas, and photographs were taken to support the observation. The interview was employed to elicit information from relevant agencies overseeing land use matters in the Ilorin metropolis, that is, (Ilorin East, West and South) town planning authority and Ministry of Housing and Urban Development. The data were analysed using a descriptive and content analysis method and the result was presented in words, graphs and tables.
Descriptive statistics was used to analyse and summarise the data on land use change gotten from the field in form of frequency and percentages while content analysis was used to analyse the qualitative data collected through interview and result is presented in themes.

ICEES 2021 ISSN: 2714-4186
117
4.0 RESULTS AND DISCUSSION
This section discusses the challenges and response of the planning authority and the Ministry of Housing and Urban Development to issues relating to land-use changes in Ilorin metropolis.
4.1 Response of Ilorin East, West and South Planning Authority to Land Use Change
This section discusses the response of planning authority towards solving the challenges arising from land-use change in the study area. It utilises data collected through personal observation and interviews and qualitatively presented thematically and backed up with photographs. The information analysed was collected from Ilorin south and west town planning area officers. Ilorin east area officer declined to give any information by claiming the three local governments that form metropolis practice the same thing.
4.1.1 Number of Plans Submitted for Approval with Respect to Land Use Change and Number Approved from 2000-2018
Land-use change is going on at an unprecedented rate in Ilorin metropolis (See plate 1 and 2) and some of these changes are against the planning laws. This is evident as many incompatible land uses are seen springing up in different parts of the metropolis (plate 3 and 4). The result of the interview conducted with the Planning authority in Ilorin metropolis to confirm the plans submitted and approved for land use change shows that;
‘‘.... Change of Land-use plans have never been submitted for approval at the planning authority, the plans have always been submitted to the Ministry of Housing and Urban Development as ordered by the State Government. Various disciplines other than town planners are part of the staff of the ministry and most of the people that occupied the leadership position lack planning knowledge. These are the people that grant approvals for land-use change, planning authority are only allowed to approve new plans’’. (Town Planning Area officer for Ilorin South)
4.1.2 Approval Status of Change of Use of Building
The result of analysis on approval status by developers as shown in Figure 2 revealed that a greater (43.2%) percentage of the developers got the approval before the change of use was carried out, while (37.7%) do not know if the change was approved and (19.1%) got no approval but still carried out the change of use. Considering the percentage of approval status, many developers got approval despite all the incompatible land-use changes observed in the study area. This suggests that the agency responsible is only interested in generating money for the Government. They are not interested in the impact of the change in the environment, neither do they carry out proper monitoring and visitation to the site of the conversion to check the compatibility of such change on the existing land uses. The respondents that do not know if the change was approved was because some are tenants that do not know the approval status since they are not the owner of the building.
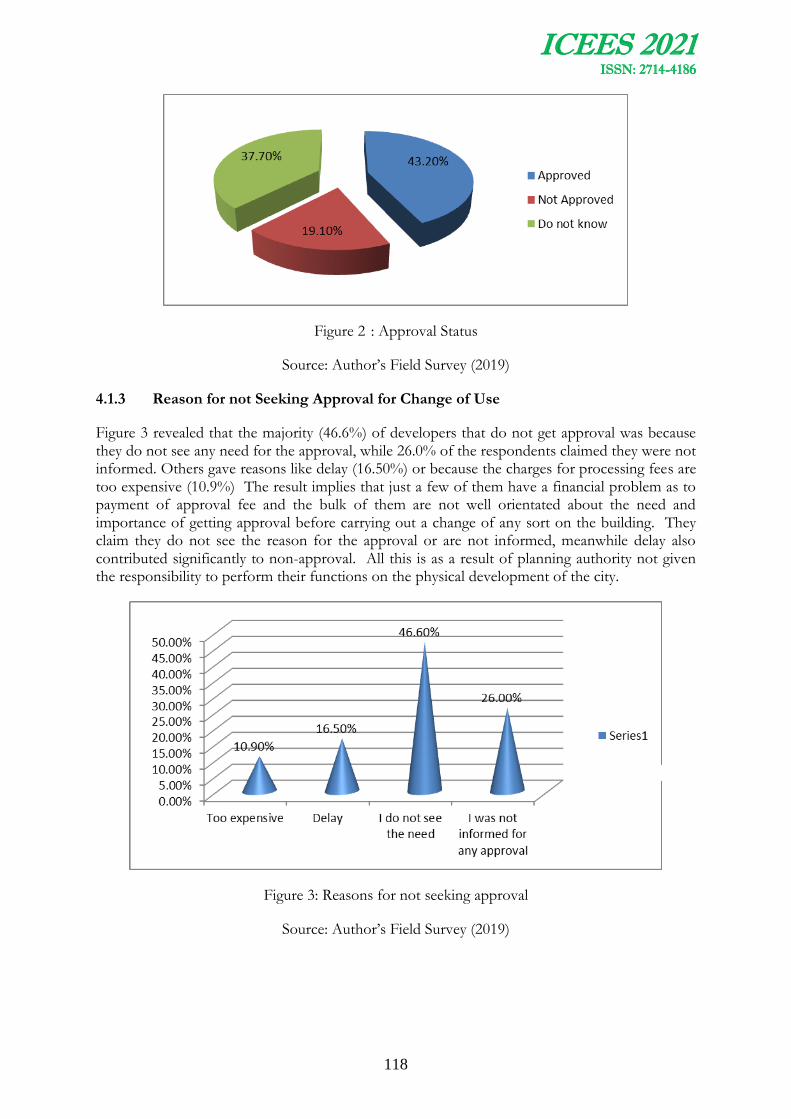
ICEES 2021 ISSN: 2714-4186
118
Figure 2 : Approval Status
Source: Author’s Field Survey (2019)
4.1.3 Reason for not Seeking Approval for Change of Use
Figure 3 revealed that the majority (46.6%) of developers that do not get approval was because they do not see any need for the approval, while 26.0% of the respondents claimed they were not informed. Others gave reasons like delay (16.50%) or because the charges for processing fees are too expensive (10.9%) The result implies that just a few of them have a financial problem as to payment of approval fee and the bulk of them are not well orientated about the need and importance of getting approval before carrying out a change of any sort on the building. They claim they do not see the reason for the approval or are not informed, meanwhile delay also contributed significantly to non-approval. All this is as a result of planning authority not given the responsibility to perform their functions on the physical development of the city.
Figure 3: Reasons for not seeking approval
Source: Author’s Field Survey (2019)
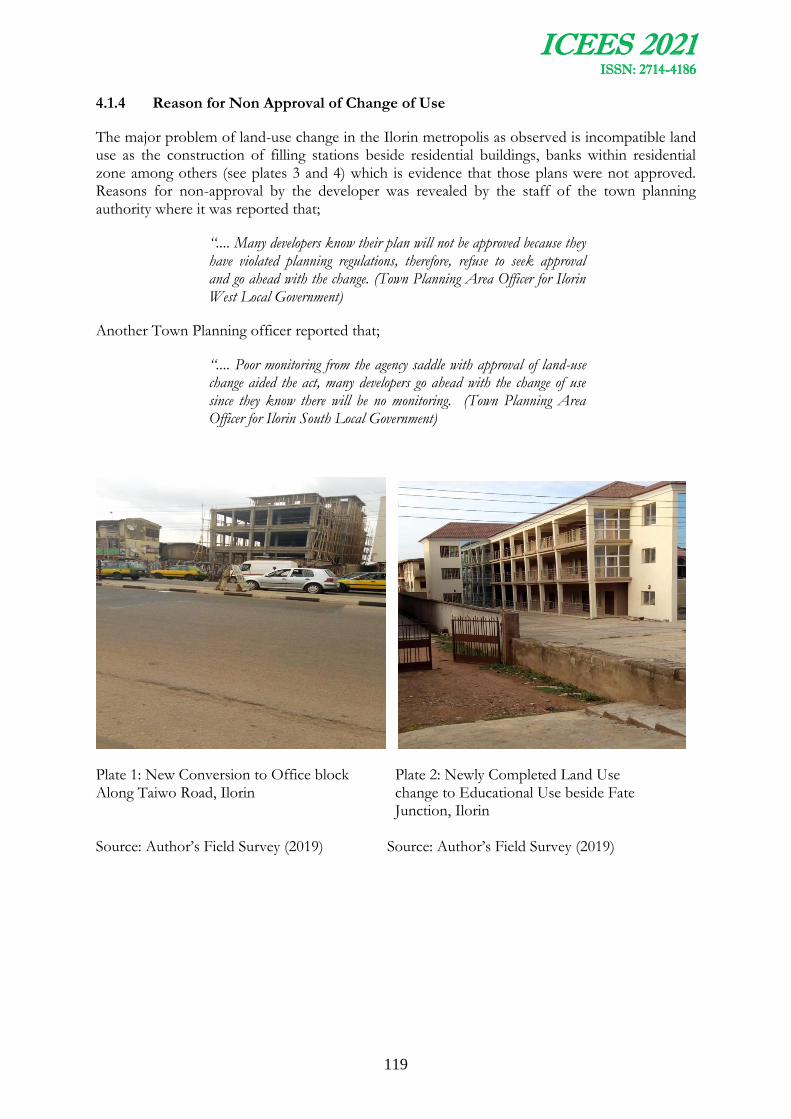
ICEES 2021 ISSN: 2714-4186
119
4.1.4 Reason for Non Approval of Change of Use
The major problem of land-use change in the Ilorin metropolis as observed is incompatible land use as the construction of filling stations beside residential buildings, banks within residential zone among others (see plates 3 and 4) which is evidence that those plans were not approved. Reasons for non-approval by the developer was revealed by the staff of the town planning authority where it was reported that;
‘‘.... Many developers know their plan will not be approved because they have violated planning regulations, therefore, refuse to seek approval and go ahead with the change. (Town Planning Area Officer for Ilorin West Local Government)
Another Town Planning officer reported that;
‘‘.... Poor monitoring from the agency saddle with approval of land-use change aided the act, many developers go ahead with the change of use since they know there will be no monitoring. (Town Planning Area Officer for Ilorin South Local Government)
Plate 1: New Conversion to Office block Plate 2: Newly Completed Land Use Along Taiwo Road, Ilorin change to Educational Use beside Fate Junction, Ilorin Source: Author’s Field Survey (2019) Source: Author’s Field Survey (2019)

ICEES 2021 ISSN: 2714-4186
120
Plate 3: Land Use Conversion to a Hostel Plate 4: Bank within Residential Buildings Close to Filling Station at MFM along Taiwo Road, Ilorin Junction, Tanke, Ilorin Source: Author’s Field Survey (2019) Source: Author’s Field Survey (2019) 4.1.5 Challenges faced by Planning Authority in Curbing Illegal Change of Use The information gathered from the interview conducted with the planning authority officers revealed that the authority was not allowed to take responsibility relating to land-use change in Ilorin. The main challenge of planning authorities is the inability to supervise the land-use change process even though they are the main custodian of physical development according to the Urban and Regional Planning Decree of 1992. A town Planning officer reported that;
‘‘ We have been deprived of our function, Political factor is the main challenge faced by the planning authority, Political office holders in power take decision as it pleases them without involving the relevant authority.’’ (Town Planning Area officer for Ilorin South Local Government)
Another Town Planning Officer also reported that;
‘‘ I have no comment to make regarding what we are facing as planning authority because I am not in the position to do that, all I can say is that laws are not been enforced in this country, that is why the planning profession is facing many challenges.’’(Town Planning Area officer for Ilorin West Local Government)
4.1.6 Solution to Illegal Land Use Changes from Planning Authority Perspective
As to various problems arising from land-use changes as revealed from the findings such as unapproved land use change, incompatible land uses, traffic congestion, noise pollution, land pollution, among others, see (plates 3 and 4). There is a need to curb this problem which is injurious to the residents where such illegal and incompatible land-use changes are taken place. Dust and noise generation during conversion may pose health risk, air pollution during heavy traffic in conversion areas may result in health challenges like cardiovascular disease (Asiyanbi, 2020). Also, incompatible land uses may become nuisance to the environment, preventing adjacent land uses from performing their functions. Example is erection of viewing centre beside a hospital, industry besides a residential building, among others. The outcome can be disastrous

ICEES 2021 ISSN: 2714-4186
121
if the menace is allowed to remain in our environment and neighbourhoods. This can result in loss of life as seen in the case of Offa robbery on April 5, 2018, where 33 people lost their lives (Pulse, 2018) as a result of the closeness of residential buildings to the bank. It can also result in loss of property, for example, if a filling station within the residential zone catches fire, it can easily extend to the closer residential buildings. This may consequently result in the loss of lives and properties. In other to prevent this disastrous occurrence, there is an urgent need to tackle the problem of illegal land-use changes. From an interview conducted with the staff of the town planning authority, it was reported that;
‘‘The best way to solve the problem is to give the responsibility of land-use change to the agency the law permits to oversee it to have the desired and sustainable physical development. (Town Planning Area officer for Ilorin South Local Government)
According to another Town Planning officer;
‘‘I will not give any information as to this because am not allowed to give any information as to land-use change because it is not my responsibility to do so. My agency is not saddled with the work but government can make things work if they so wish’’ (Town Planning Area officer for Ilorin West Local Government)
This finding implies that planning authority has little or no response to the problem arising from Illegal land-use changes. The planning authority is not given any responsibility as to the issue of land-use change in the study area. This may be the major reason behind the environmental problems resulting from illegal and incompatible land-use changes as observed in the study area.
4.2 Response of Kwara State Ministry of Housing and Urban Development to Land Use Change.
This section discusses the challenges and response of the Ministry of Housing and Urban Development to land-use changes in the study area. It utilises data collected through personal observation and interviews. The result is presented in tables, graph and themes. The information utilised was collected from the ministry and staff of the ministry.
4.2.1 Numbers of Approved Plans with Respect to Land Use Change from 2000 – 2018.
The result of the findings on the numbers of plans approved from the year 2000 – 2018 is presented in Figure 4 and Table 1. A total of 216 buildings were changed from one use to another, the previous use was residential (82.41%), next to it was commercial (7.41%), agricultural (5.09%), industrial (3.24%), Educational (1.39%) and mixed (0.46%). However, the current dominant land use from 2000 -2018 is commercial (59.25%), next to it is mixed-use (22.22%), and other uses are educational (9.25%), religious (5.55%), residential (1.85%), Agricultural (0.95%) and Industrial (0.93%). Further investigation revealed the changes that occurred in each year from the year 2000 to 2018. Majority (14.35%) of changes that occurred was in the year 2014, next to it was (12.04%) in the year 2015, other changes decrease through the years to the least (0.46%) change that happened in the year 2003 and no change was recorded in the year 2002 as revealed in Table `1. The implication of this is that commercial use dominated the change to which land is put. It also means land-use change is higher in recent years compared to previous years. This information from the ministry agrees with the findings from the field as conversion in recent years is happening at an unprecedented rate. Meanwhile,
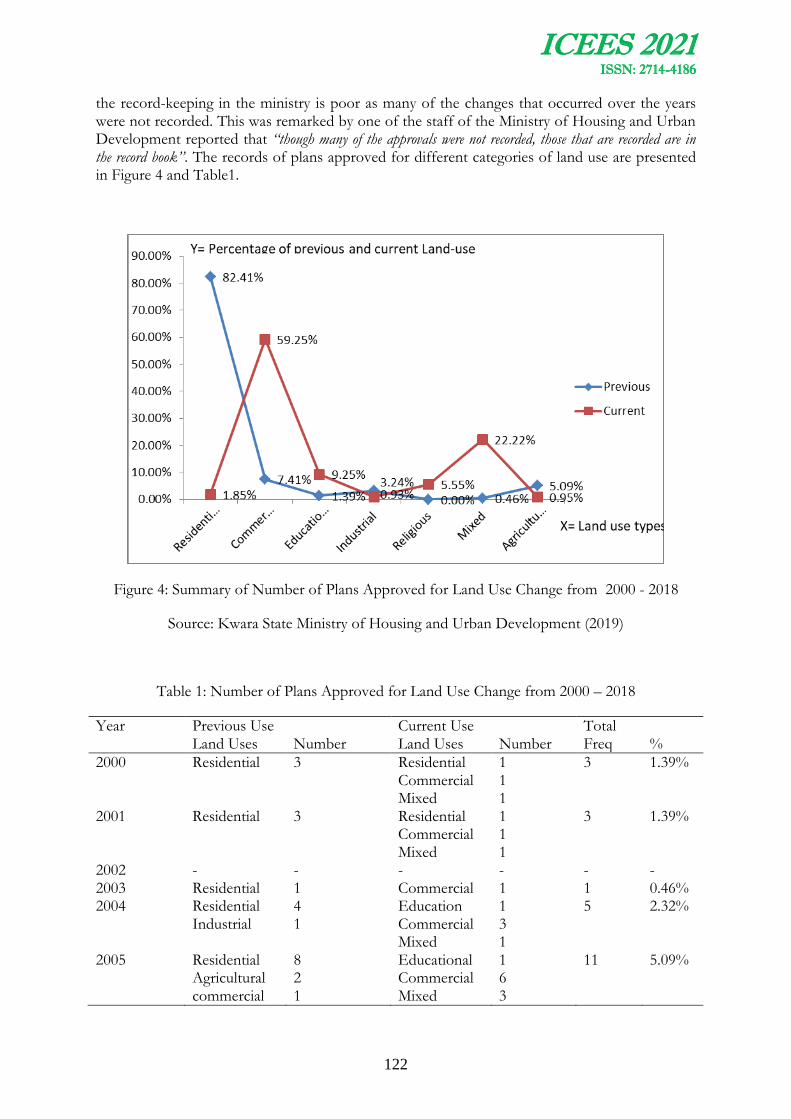
ICEES 2021 ISSN: 2714-4186
122
the record-keeping in the ministry is poor as many of the changes that occurred over the years were not recorded. This was remarked by one of the staff of the Ministry of Housing and Urban Development reported that ‘‘though many of the approvals were not recorded, those that are recorded are in the record book’’. The records of plans approved for different categories of land use are presented in Figure 4 and Table1.
Figure 4: Summary of Number of Plans Approved for Land Use Change from 2000 - 2018
Source: Kwara State Ministry of Housing and Urban Development (2019)
Table 1: Number of Plans Approved for Land Use Change from 2000 – 2018
Year Previous Use Current Use Total Land Uses Number Land Uses Number Freq %
2000 Residential 3 Residential Commercial Mixed
1 1 1
3 1.39%
2001 Residential 3 Residential Commercial Mixed
1 1 1
3 1.39%
2002 - - - - - - 2003 Residential 1 Commercial 1 1 0.46% 2004 Residential
Industrial 4 1
Education Commercial Mixed
1 3 1
5 2.32%
2005 Residential Agricultural commercial
8 2 1
Educational Commercial Mixed
1 6 3
11 5.09%
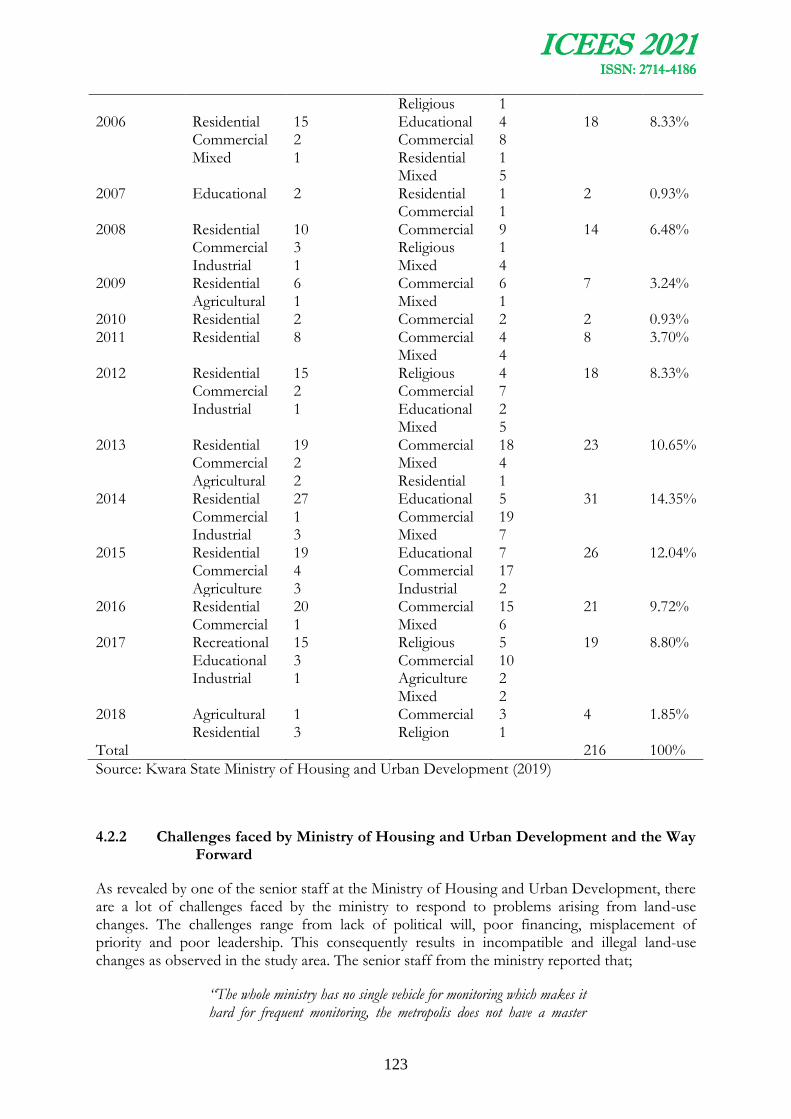
ICEES 2021 ISSN: 2714-4186
123
Religious 1 2006 Residential
Commercial Mixed
15 2 1
Educational Commercial Residential Mixed
4 8 1 5
18 8.33%
2007 Educational 2 Residential Commercial
1 1
2 0.93%
2008 Residential Commercial Industrial
10 3 1
Commercial Religious Mixed
9 1 4
14 6.48%
2009 Residential Agricultural
6 1
Commercial Mixed
6 1
7 3.24%
2010 Residential 2 Commercial 2 2 0.93% 2011 Residential 8 Commercial
Mixed 4 4
8 3.70%
2012 Residential Commercial Industrial
15 2 1
Religious Commercial Educational Mixed
4 7 2 5
18 8.33%
2013 Residential Commercial Agricultural
19 2 2
Commercial Mixed Residential
18 4 1
23 10.65%
2014 Residential Commercial Industrial
27 1 3
Educational Commercial Mixed
5 19 7
31 14.35%
2015 Residential Commercial Agriculture
19 4 3
Educational Commercial Industrial
7 17 2
26 12.04%
2016 Residential Commercial
20 1
Commercial Mixed
15 6
21 9.72%
2017 Recreational Educational Industrial
15 3 1
Religious Commercial Agriculture Mixed
5 10 2 2
19 8.80%
2018 Agricultural Residential
1 3
Commercial Religion
3 1
4 1.85%
Total 216 100%
Source: Kwara State Ministry of Housing and Urban Development (2019)
4.2.2 Challenges faced by Ministry of Housing and Urban Development and the Way Forward
As revealed by one of the senior staff at the Ministry of Housing and Urban Development, there are a lot of challenges faced by the ministry to respond to problems arising from land-use changes. The challenges range from lack of political will, poor financing, misplacement of priority and poor leadership. This consequently results in incompatible and illegal land-use changes as observed in the study area. The senior staff from the ministry reported that;
‘‘The whole ministry has no single vehicle for monitoring which makes it hard for frequent monitoring, the metropolis does not have a master

ICEES 2021 ISSN: 2714-4186
124
plan to guide the development and the government is not ready to design one. He further stressed that the leadership is very bad, he cited an example of past Commissioner of Ministry of Housing and Urban Development having just SSCE certificate with no knowledge about the environment’’ (Senior staff in the ministry of Housing and Urban Development)
As regards the solution to the problem, a staff of the ministry pointed to the political factor as the main problem of planning and if the political will can change concerning physical planning in the country and Ilorin in particular the problem will be solved. The staff reported that;
‘‘If the political will is changed, 90% of the problems will be solved because almost all the development we see that are causing nuisance in the metropolis are not approved and the owners are either politicians or relatives of a politician that cannot be touched’’. (Senior staff in the ministry of Housing and Urban Development)
From the foregoing, it can be deduced that the Ministry of Housing and Urban Development is facing a lot of challenges regarding land-use changes in the study area, the problem ranges from poor leadership, poor financing, lack of qualified professionals to take up the responsibility, political problems, among others.
5.0 CONCLUSION AND RECOMMENDATION
The study has established that land-use change is predominant in the study area. This conversion is evident within the metropolis. Since unguided and uncontrolled land-use changes harm physical development as reported in this paper, land-use change should be given adequate attention, it should be well monitored and guided to avoid a negative impact on the overall physical development. The effect of uncontrolled land-use change in the metropolis often leads to incompatible and unpleasant land uses as evident in the study area. It is therefore recommended that government should provide a framework for effective utilization of the Urban and Regional Planning Law of 1992. The law gave responsibility to the planning authority to plan, guide and monitor the physical development of her jurisdiction. No other agency constituted by the government is entitled to do such. This will help the planning authority to respond adequately to the challenges of land-use change.
References
Akintola, B. L (2011). A Compendium of Town Planning and Physical Development Terms. DCI Global Resources Limited, Osogbo. Bright Research Consult Publishers
Asiyanbi A. O. (2020). Analysis of Land Use and Land Cover Change in Ilorin Metropolis, Kwara State, Nigeria. M.Tech Thesis Submitted to the Department of Urban and Regional Planning, Ladoke Akintola University of Technology, Ogbomosho, Nigeria.
Botkin, D. B. & Keller E. A. (1998). Environmental Science. Earth as a Living Planet; Second Edition, John Wiley and Sons Inc.
Essaghah, A. (1997). Urban Planning Concepts, standards and symbols. Lagos; Amfitop Books.

ICEES 2021 ISSN: 2714-4186
125
Federal Republic of Nigeria Gazette (1992). Urban and Regional Planning Decree 1992, No 75, Vol 79. Printed and Published by the Federal Government Press, Lagos Nigeria.
Iroye, K. A., & Abejirin O. J., (2012): Community Perception of Climate Change in Ilorin Metropolis. Geo-Studies; Forum 5(1), 7-9
Mckinney. M. L. (2002). Urbanization, Biodiversity and Conservation. Bioscience 52(2), 883-890
Oki. M., (2019) Town Planning Area Officer for Ilorin South Local Government. Interviewed 19th September, 2019
Olanrewaju, R.M (2009). The Effect or Urbanisation in a City of Developing Country: The Case Study of Ilorin, Kwara State, Nigeria. Ethiopian Journal of Environmental Studies and Management 2(2), 67-72
Olomo. R. O., (1999) ‘‘Element of Environmental Studies’’ in History and Philosophy of Question of Sustainable Living
Oni (2019), Senior Staff in the Ministry of Housing and Urban Development Interviewed February, 2019
Pulse News (2018), http://www.pulse.ng/news/local/offa-robbery-read-confessions-of-gang-leaders-that-killed-33-people/6ze0jpp
Taye. M. (2019). Town planning Area Officer for Ilorin West Local Government. Interviewed 19th September, 2019
United Nations, (2001). The State of the World’s Cities. United Nations Centre for Human Settlements. Nairobi, Kenya.
World Commission on Environment and Development (1987): Our Common Future, p.240-241

ICEES 2021 ISSN: 2714-4186
126
SUSTAINABLE HYDROPOWER GENERATION FOR HOMES USING ELEVATED WATER TANK
Oladipupo Seun Oladejo, Ridwanulahi Akano Adesokan, Idris Ademola Yusuf and Adeyinka Abdultoheeb Adenle
Department of Civil Engineering, Ladoke Akintola University of Technology Ogbomoso Oyo State Nigeria
Email of Corresponding Author:: [email protected], [email protected]
ABSTRACT
Pico hydro power generation is a suitable, cost effective, environmentally friendly and sustainable technology that provides reliable electric power. It contributes to delivering hydropower to remote and off grid areas, especially in developing countries.
In this paper, Pico hydropower system was constructed, using flowing water in elevated tank to rotate locally fabricated turbine to light a low voltage electrical bulb. The water flow rate was measured using bucket method. Water-filled tube and calibrated pressure gauge were used to determine the head. Multimeter was used to measure the current, voltage and power. The falling water, under gravity, flowing through pipe exerts force on a turbine wheel which causes a generator to rotate and converts the mechanical energy from the turbine into electrical energy.
The results obtained from the experimental set up showed a flow rate of 0.0014m3/s at total elevated head of 3m generating a power output of 4.73W. There was a reduction of about 4.25% compared to 4.94W from power estimated from equation. The discrepancy may be due to power loss from friction or heating effects. With varying heads of 3.5m, 4m, 4.5m, and 5m there is a trend of proportionality between current and voltage measured as compared with the power dissipated in the experimental setup.
The setup is an economical and renewable power generating system that will drive the economy and industrial revolution in countries where power generation is still very low or poor. Industrially fabricated turbine is recommended to improve the power output.
Keyword: Elevated water tank, Flow rate, Pico hydropower, Renewable power, Sustainable Technology
1. Introduction
Day by day the demand of electricity increases, due to growing population & commercialization. The power consumption is more than generation by conventional method. Hence, hydroelectricity exist as one of the option to meet the growing demand for energy by nonconventional method (Kothavale et al, 2017)
In 2008, it was estimated by the International Energy Agency (IEA) that 1.5 billion people, or 22% of the global population, do not have access to electricity (International Energy Agency, 2009); 85% of this population group are situated in rural areas. In Sub-Saharan Africa, only 29% of the population is electrified, and this percentage is decreasing as population growth outstripped electrification since 2001.
Due to depletion of fossil fuels, there is a challenge to establish a system of non-conventional energy sources as economy to everyone at optimum rate. Many researchers found the application
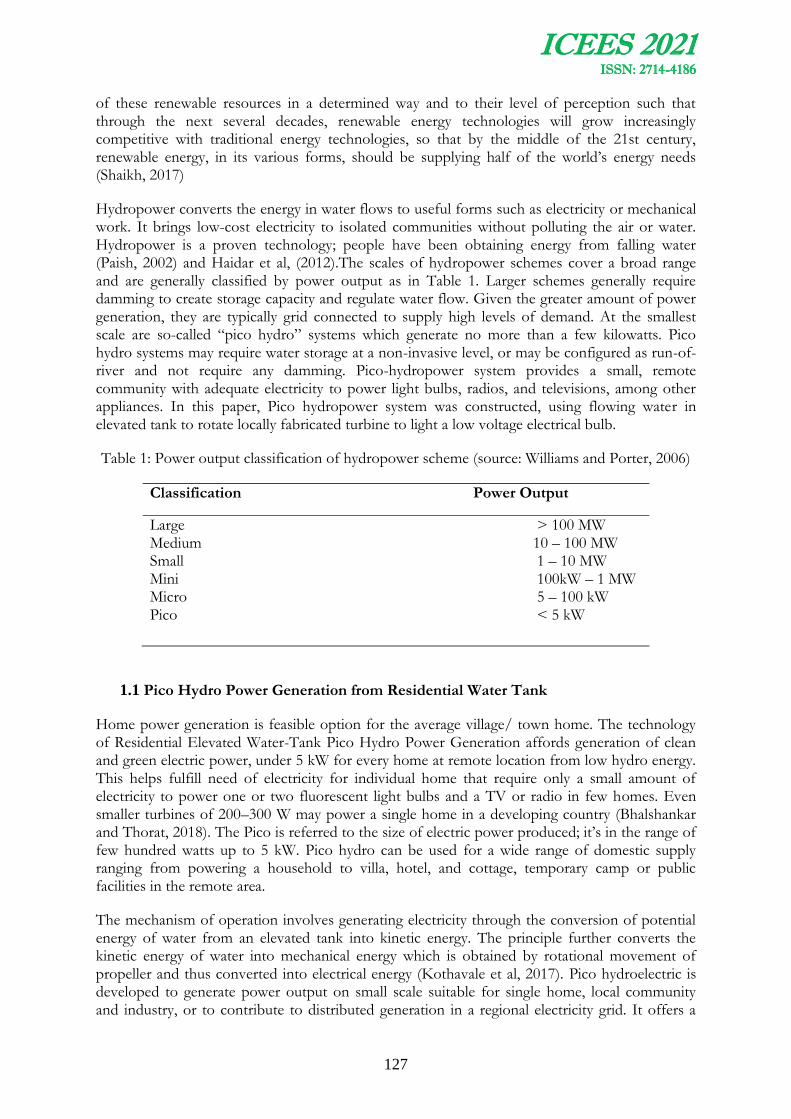
ICEES 2021 ISSN: 2714-4186
127
of these renewable resources in a determined way and to their level of perception such that through the next several decades, renewable energy technologies will grow increasingly competitive with traditional energy technologies, so that by the middle of the 21st century, renewable energy, in its various forms, should be supplying half of the world’s energy needs (Shaikh, 2017)
Hydropower converts the energy in water flows to useful forms such as electricity or mechanical work. It brings low-cost electricity to isolated communities without polluting the air or water. Hydropower is a proven technology; people have been obtaining energy from falling water (Paish, 2002) and Haidar et al, (2012).The scales of hydropower schemes cover a broad range and are generally classified by power output as in Table 1. Larger schemes generally require damming to create storage capacity and regulate water flow. Given the greater amount of power generation, they are typically grid connected to supply high levels of demand. At the smallest scale are so-called “pico hydro” systems which generate no more than a few kilowatts. Pico hydro systems may require water storage at a non-invasive level, or may be configured as run-of-river and not require any damming. Pico-hydropower system provides a small, remote community with adequate electricity to power light bulbs, radios, and televisions, among other appliances. In this paper, Pico hydropower system was constructed, using flowing water in elevated tank to rotate locally fabricated turbine to light a low voltage electrical bulb.
Table 1: Power output classification of hydropower scheme (source: Williams and Porter, 2006)
Classification Power Output
Large > 100 MW Medium 10 – 100 MW Small 1 – 10 MW Mini 100kW – 1 MW Micro 5 – 100 kW Pico < 5 kW
1.1 Pico Hydro Power Generation from Residential Water Tank
Home power generation is feasible option for the average village/ town home. The technology of Residential Elevated Water-Tank Pico Hydro Power Generation affords generation of clean and green electric power, under 5 kW for every home at remote location from low hydro energy. This helps fulfill need of electricity for individual home that require only a small amount of electricity to power one or two fluorescent light bulbs and a TV or radio in few homes. Even smaller turbines of 200–300 W may power a single home in a developing country (Bhalshankar and Thorat, 2018). The Pico is referred to the size of electric power produced; it’s in the range of few hundred watts up to 5 kW. Pico hydro can be used for a wide range of domestic supply ranging from powering a household to villa, hotel, and cottage, temporary camp or public facilities in the remote area.
The mechanism of operation involves generating electricity through the conversion of potential energy of water from an elevated tank into kinetic energy. The principle further converts the kinetic energy of water into mechanical energy which is obtained by rotational movement of propeller and thus converted into electrical energy (Kothavale et al, 2017). Pico hydroelectric is developed to generate power output on small scale suitable for single home, local community and industry, or to contribute to distributed generation in a regional electricity grid. It offers a

ICEES 2021 ISSN: 2714-4186
128
stable, low cost, eco-friendly and pollution free electricity generation. As illustrated in figures 1 and 2, the water is admitted into the power house through the penstock.
Figure 1: Block diagram for the design of an elevated water-tank Pico Hydro Power Generation technology.
Figure 2: Elevated Water-Tank Pico Hydro Power Generation technology Source: Bhalshankar and Thorat (2018) The penstock end is channeled to the wicket gate through a snail-like shell structure called the scroll case, with its diameter at the tip of the wicket gate getting smaller as the water advances to the turbine shaft. The speed of rotation of the turbine depends on the amount of water allowed

ICEES 2021 ISSN: 2714-4186
129
to hit the turbine and the pressure of the falling water which is mainly controlled by the wicket gate opening.
2. Materials and Methods
The materials used consist of components which can be classified into two main categories, namely:
(i) Mechanical components: Power wheel (turbine), generator, nozzle, drive belt, pipes, etc.
(ii) Electric components: Inverter, electric load (LED bulb), wires, rectifier, etc.
The methods adopted in carrying out this project can be broadly classified into two major aspects:
2.1 Civil Engineering aspect:
2.1.1 Determination of Water Flow Rate or Water Discharge
The most simple of flow measurement for small streams is the bucket method. Therefore, this method has been used due to the capacity of the proposed hydropower system which is significantly small. In this method, the flow rate of the distributed water is diverted into a bucket or barrel and the time it takes for the container to filled is recorded. The volume of the container is known and the flow rate is simply obtained by dividing this volume by the filling time. A 25 liters gallon is filled within 18 seconds, this is repeated several times to give more consistent and accurate measurement. Then the water discharge from the tank is estimated as follow:
Volume of tank = 0.025m3
Time taken to fill bucket = 18 seconds
Flow rate (Q) = 0.0014m3/s
2.1.2 Head Measurement (Height of falling Water)
When determining head (falling water), gross or “static” head and net or “dynamic” head must be considered. Gross head is the vertical distance between the top of the penstock and the point where the water hits the turbine. Net head is gross head minus the pressure or head losses due to friction and turbulence in the penstock. These head losses depend on the type, diameter, and length of the penstock piping, and the number of bends or elbows. Gross head can be used to estimate power availability and determine general feasibility, but net head is used to calculate the actual power available. There are many methods of head measurement. The simplest and most practical method for head measurement is water-filled tube and calibrated pressure gauge. The measured Total head H = 3m
2.2 Electrical and Mechanical Aspect:
2.2.1 Power Estimation from formulae

ICEES 2021 ISSN: 2714-4186
130
The general formula for the determination of hydraulic power is given as
The mechanical power available at the output of the turbine could be determined with the relationship
Ph is the power produced by the falling water (in Watts)
Pm is the mechanical power produced at the turbine shaft (in Watts)
is the density of water (1000 kg/m3)
g is the acceleration due to gravity (9.81 m/s2)
Q is the water flow rate passing through the turbine (m3/s)
H is the effective pressure head of water across the turbine (m)
is the efficiency of the turbine.
2.2.2 Electrical Components of Pico hydropower setup
i. Fabrication of Pico hydro-power generating system
Pico power generating system is used for generation of power with relatively low power output. A low cost, locally available materials is used for small prototype of the system using residential water tank in place of river or dam. The components coupled for generating stable power output included, light plastic material, large diameter shaft, diameter of penstock pipes and water tank at an elevation. The water flows from the reservoir through the penstock. At the outlet of the penstock a nozzle is fitted which increases the kinetic energy of the water flowing through the penstock to the runner. At the outlet of the nozzle, the water comes out in the form of a jet which forcedly strikes the buckets of the turbine which enables it to rotate the shaft. There are two factors that determine the kind of or selection of turbine to be used. These are head (H) and the volumetric discharge (Q) of the river. A cross sectional view of the fabricated system is presented in fig.3.
ii. Locally fabricated Turbine blades
A turbine is a mechanical device that harnesses the kinetic energy of water, and turns this into the rotational motion of the device itself. The turbine used is a locally fabricated simple turbine made from materials such as hollow plastic spoons attached to a cylindrical pipe as shown in Fig. 4.
This turbine is made to be an impulse turbine because when the water strikes the bucket of the turbine, it does in the tangent direction which makes it a tangential flow turbine. The energy available at the inlet of the turbine is the kinetic energy.

ICEES 2021 ISSN: 2714-4186
131
iii. Dynamo Generator
A DC generator is a machine for converting energy in form of dynamic power into the form of electrical currents, by the operation of setting conductors (usually in the form of coils of copper wire) to rotate in the magnetic field.
An Induced e.m.f is produced in it according to Faraday's law of electromagnetic induction. This e.m.f causes a current to flow if the conductor circuit is closed. The current output of the dynamo generator is alternating current (A.C) with low output and not easily magnified (fig.5).
iv. Rectifier
A rectifier is an electrical device that converts alternating current (AC), which periodically reverses direction, to direct current (DC), which flows in only one direction. The reverse operation is performed by the inverter. Rectifiers have many uses, but the major function in this project is to serve as components of DC power supplies and high-voltage direct current power transmission systems (fig.6). Multimeter was used to measure the current, voltage and power.
Figure 3: Fabricated power generating system
Figure 4: Locally fabricated Turbine blades used in the hydro power set up

ICEES 2021 ISSN: 2714-4186
132
Figure 5: DC Generator (Dynamo) used in hydro power setup
v. Inverter
A power inverter is an electronic device or circuitry that changes direct current (DC) to alternating current (AC) (fig.7). The resulting AC frequency obtained depends on the particular device employed. Inverters do the opposite of “converters” which were originally large electromechanical devices converting AC to DC. The output voltage, frequency, and overall power handling depend on the design of the specific device or circuitry. The inverter does not produce any power; the power is provided by the DC source.
3. Results and Discussion
The selected load for testing was a low voltage 5W led bulb. The actuals power generated from the set up was measured and shown in Table 2. Generated and estimated power dissipation, based on different water heads are presented in Table 3. From the comparison, it can be deduced that the efficiency the hydro power turbine is also important variable in generating the power output. The graph of relationship between actual power and water head was shown in Figure 8.
Table 2: Measured Values from the set up
Parameters Result
Reservoir capacity 1000litres
Flow rate 0.0014m3/s
Penstock length 1.8m
Penstock diameter 0.00635m
Current 21.5mA
Hydraulic Power (Ph) 4.73 Watts
Dynamo 6v, 3 Watts
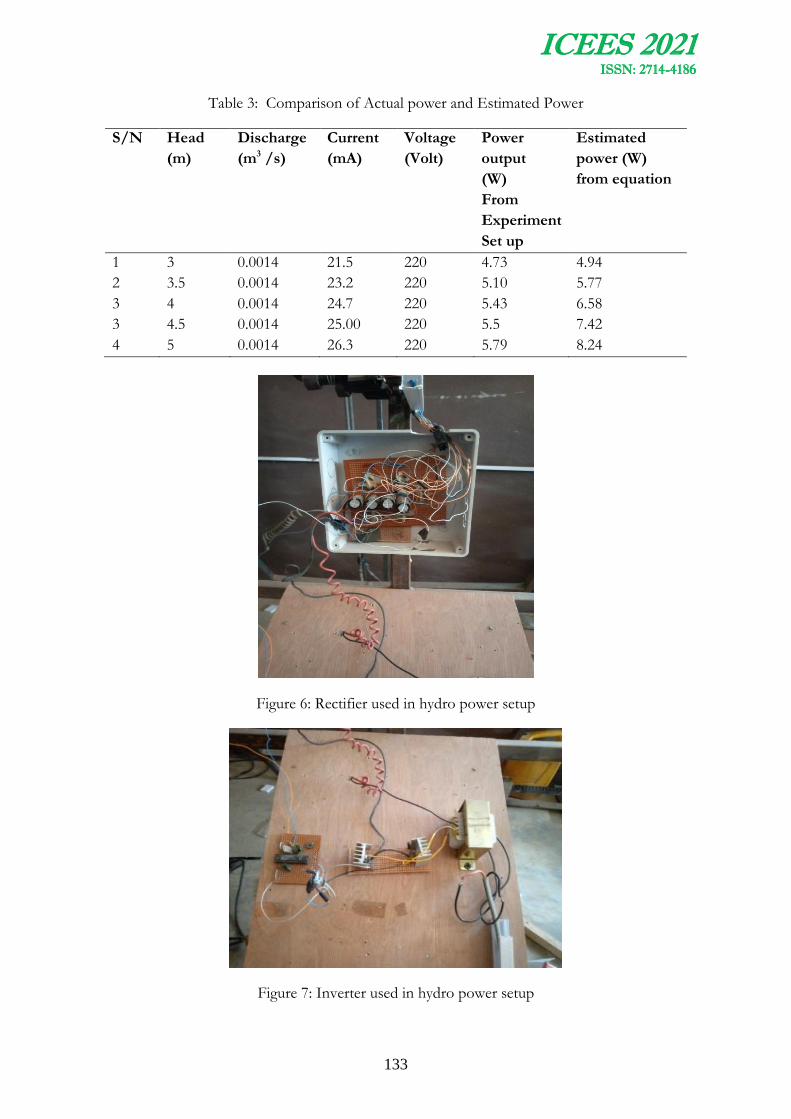
ICEES 2021 ISSN: 2714-4186
133
Table 3: Comparison of Actual power and Estimated Power
S/N Head
(m)
Discharge
(m3 /s)
Current
(mA)
Voltage
(Volt)
Power
output
(W)
From
Experiment
Set up
Estimated
power (W)
from equation
1 3 0.0014 21.5 220 4.73 4.94
2 3.5 0.0014 23.2 220 5.10 5.77
3 4 0.0014 24.7 220 5.43 6.58
3 4.5 0.0014 25.00 220 5.5 7.42
4 5 0.0014 26.3 220 5.79 8.24
Figure 6: Rectifier used in hydro power setup
Figure 7: Inverter used in hydro power setup

ICEES 2021 ISSN: 2714-4186
134
Figure 8: Relation between actual power and water head
The discharge from the hydropower system is 0.0014m3/sec while the head measured is 3m, with a hydraulic power generation of 4.73 Watts. The rate of turbine discharge and head of the hydropower system is an important factor to be considered in power generation. An increase in the rate of discharge of water through the penstock pipe allowed a steady and faster rotation of the turbine which produced a proportional increase in the amount of power generated.
At constant flow rate and varying heads of 3.5m, 4m, 4.5m, 5m there is a proportional increase in the amount of current which in turns gives a proportional increase in the power dissipated from the setup. In line with Aung Ze Ya (2004) view, It was noted that the generating system (DC dynamo) for a hydro power scheme was selected based on the estimated power supply system of a hydropower system, electrical load, available generating capacity in the market and generator with cost effectiveness suitable for preliminary laboratory experiment.
4. Conclusion
From this project work, a power generation of 4.73W to light a low voltage coil bulb from local manufacture of Pico hydropower system is possible. The design principles and fabrication can be easily learned. This keeps some equipment costs in proportion with local wages. Pico hydro equipment is small and compact. The component parts can be easily transported into remote and inaccessible areas.
Only small water flows are required for Pico hydro so there are numerous suitable sites. A small stream or spring often provides enough water, this makes it economical and environmentally friendly to generate alternative electricity classified as renewable power generation system.
The construction and mass production of this Pico hydro power plant will serve as alternative to power generation for domestic and small industrial consumption there by pulling such load off the national grid, which will then help the transmission company to redirect their power to heavy

ICEES 2021 ISSN: 2714-4186
135
load centres. This leads to improved power quality, power security and reliability of power to the end users.
5. Recommendations
1. Industrially fabricated turbine is recommended to improve the power output.
2. Hybrid combination and integration of two or more renewable sources make best utilize of their operating characteristics and improve the system performance and efficiency (Williamson et al, 2014) and Juhari and Razak (2009).
3. Low cost IoT embedded system device for real time monitoring of water level, flow rate, and even pH sensor would be an added advantage to control and maintain service reduction and to optimize the process.
References
Aung Ze Ya, Maung “Design and Construction of Mini-Hydropower Plant,” Ph.D..thesis, Yangon Technological university, Yangon, Myanmar, Dec, 2004.
Bhalshankar, Surekha S. and C. S. Thorat, Home Water-Tank Pico-Hydro Power Generator Modeling and Analysis for Smart Home Distributed Generation System. International Journal of Electrical Engineering & Technology, 9(4), 2018, pp. 1–8.
Haidar, A. M. A. Senan, M. F.M. Noman, A. Radman, T. "Utilization of Pico Hydro Generation in Domestic and Commercial Loads", Renewable and Sustainable Energy Reviews, vol. 16, no. 1, pp. 518-524, Jan. 2012.
International Energy Agency. (2009). World energy outlook 2009. Paris, France: Organisation for Economic Co-operation and Development.
Shaikh, Ilyas Danish Jahagirdar,.Nawaz Motiwala "Design and fabrication of domestic wind turbine",International journal of innovations in engineering and technology, Volume 4, Issue 2,Feb.-2017.
Juhari, Kamaruzzaman Sopian and Ab. Razak, "Pico Hydro: Clean Power From Small Streams", Proceedings of the 3RD WSEAS International Conference On Energy Planning Saving Environmental Education EPESE '09 Renewable Energy Sources RES '09, pp. 414-419, 2009.
Kothavale, Ashlesha Sonal Salunkhe, Pooja Wadkar, Nawaz Motiwala. 2017: Design and Fabrication of Domestic Hydro Turbine. International Journal of Latest Technology in Engineering, Management & Applied Science (IJLTEMAS) Volume VI, Issue III, March 2017, Pages 61- 63
Paish, O. "Small Hydro Power: Technology and Current Status", Renewable and Sustainable Energy Reviews, vol. 6, no. 6, pp. 537-556, 2002.
Williams, A., and Porter, S. (2006). Comparison of hydropower options for developing countries with regard to the environmental, social and economic aspects. International Conference on Renewable Energy for Developing Countries, Washington DC, USA.
Williamson, S. J., Stark, B. H., and Booker, J. D. "Low Head Pico Hydro Turbine Selection using a Multi-Criteria Analysis", Renewable Energy, vol. 61, pp. 43-50, Jan. 2014.
ICEES 2021 ISSN: 2714-4186
136
PREDICTING THE BEHAVIOR OF RUBBERIZED MASONRY HOLLOW CONCRETE BLOCK WALLS UNDER THE ACTION OF
LATERAL LOAD
1* Sanni, M.Y., 2Salami, A.A. and 3Ismail, U.A.
1 Department of Civil Engineering, Ahmadu Bello University, Zaria.
2 Department of Building Technology, The Federal Polytechnic, Offa.
3 Department of Computer Science, The Federal Polytechnic, Kaura Namoda.
* Email of Corresponding Author:: [email protected];
ABSTRACT
This paper presents the initial shear strength and characteristic shear strength, flexural strength and characteristic flexural strength of rubberized masonry walls for plane of failure parallel and perpendicular to the bed joint. They were predicted from the normalized compressive strength of the hollow concrete block unit, mortar strength and characteristic compressive strength of walls. Six mixtures were prepared with 0, 5, 10, 15, 20 and 25% crumb-rubber particles for the production of the hollow concrete blocks units. The compressive and normalized compressive strength decreased by 49% while the characteristic compressive strength of walls determined experimentally and predicted reduced by 65% and 37% respectively with 25% crumb-rubber content. The predicted initial shear strength reduced from 0.83 to 0.6 N/mm2 indicating 26.5% reduction while the predicted characteristic shear strength reduced from 0.66 to 0.50 N/mm2 indicating 25.8% reduction. The flexural strength (parallel and perpendicular to bed joint) reduced from 0.15 to 0.10 N/mm2 and 0.60 to 0.30 N/mm2 indicating 33.3% and 50% reduction respectively while the characteristic flexural strength decreased from 0.10 to 0.06 N/mm2 and 0.40 to 0.20N/mm2 indicating 40% and 50% reduction, respectively. The predicted results disagree with the results of the shear strength and flexural strength of rubberized masonry hollow concrete block units which reported a slight increase with 10% crumb-rubber content. The outcome of the results suggests an experimental investigation into the flexural and Initial shear strength of rubberized masonry hollow concrete block walls in accordance BS EN 1052-2:1999 and BS EN 1052-3:2002, respectively to validate the predicted results.
Keywords: Crumb-Rubber; Concrete Blocks; Walls; Flexural Strength; Shear Strength.
1.0 INTRODUCTION:
Masonry hollow concrete block structures are widely used in many parts of the world including Nigeria compared to other masonry units such as clay, calcium silicate and natural stone. This can be attributed to its relative advantages such as its low-cost, high bearing capacity, good sound and heat insulation (Zhao et al., 2015; Kaushik et al., 2007).
Masonry wall is typically a nonelastic, nonhomogeneous, and anisotropic material composed of two materials of quite different properties: stiffer unit blocks or bricks and relatively softer mortar (Kaushik et al., 2007). They are majorly subjected to loading under compression (axial

ICEES 2021 ISSN: 2714-4186
137
load) such as its self-weight, live load and dead load from the roof and floors. This makes most designers to provide and expect masonry to resist only compressive forces with little emphasis on lateraling load which can manifest from wind, directional rain, earth pressure and impact (Kaushik et al., 2007).
The behaviour of masonry walls is inelastic under lateral loads, even in the range of small deformations and they are very weak in tension because it is composed of two different materials distributed at regular intervals with weak bonding (mortar) Kaushik et al. (2007).
Waste tyres are ductile and elastic in nature and they also constitute environmental nuisance. Processing them into crumb-rubber and incorporating them as partial replacement for coarse aggregate in masonry concrete tends to enhance the flexural strength (Sanni et al., (2020).
This paper is concerned with the prediction of the behaviour of rubberized masonry hollow concrete block walls under the action of lateral load. Numerous research studies have been carried out to characterize masonry hollow concrete block walls and prism columns containing crumb-rubber from waste tyre under the action of uniaxial compressive load. Sadek et al.(2014) reported that the use of rubber as aggregate can improve certain properties of masonry walls for particular design applications. Rubberized masonry walls, especially those containing coarse rubber have higher toughness and capability to withstand post-failure loads with some further deformations than unrubberized walls Sadek et al.(2014). The use of coarse rubber for the production of solid cement bricks was limited to 20% with 300 kg/m3 cement content which can be used as load-bearing units and 40% coarse rubber with 250 kg/m3 cement content as non-load bearing units which can be use for building in earthquake zone Sadek et al.(2014).
Gheni et al. (2017) reported that using crumb-rubber generally reduced the compressive strengths of the investigated un-grouted masonry prisms with ratios ranging from 31 to 71% proportional to the rubber contents. The loss in strength was attributed to (i) The large disparity between the modulus of elasticity (E) for rubber particles and the cement paste; (ii) The high Poisson ratio (v) for rubber particles, which may encourage premature cracking under load; and (iii) Weak bonding in the interfacial transition zone (ITZ) between the cement paste and crumb-rubber particles.
2.0 CONCEPT AND THEORIES:
2.1 Design for Horizontal/Lateral Resistance:
The flow chart for the design of masonry walls to resist lateral actions is shown in Fig. 1. There are two approaches to the design of laterally loaded panels according to Eurocode 6 (BS EN 1996-4:2006): The first method is based on flexural strength of the masonry and making use of yield line analysis to provide bending moment coefficients while the second method is based on arching and the assumption of a three-pinned arch formed within the wall. The flexural strength approach is the most widely used and does not depend upon rigid supports to resist arch thrust.
2.2 Flexural Strength (fx):
The experimental flexural strength of masonry concrete block walls (fx) is given by Equation 1:
)/(5.1
2mmNf
f xxk
(1)
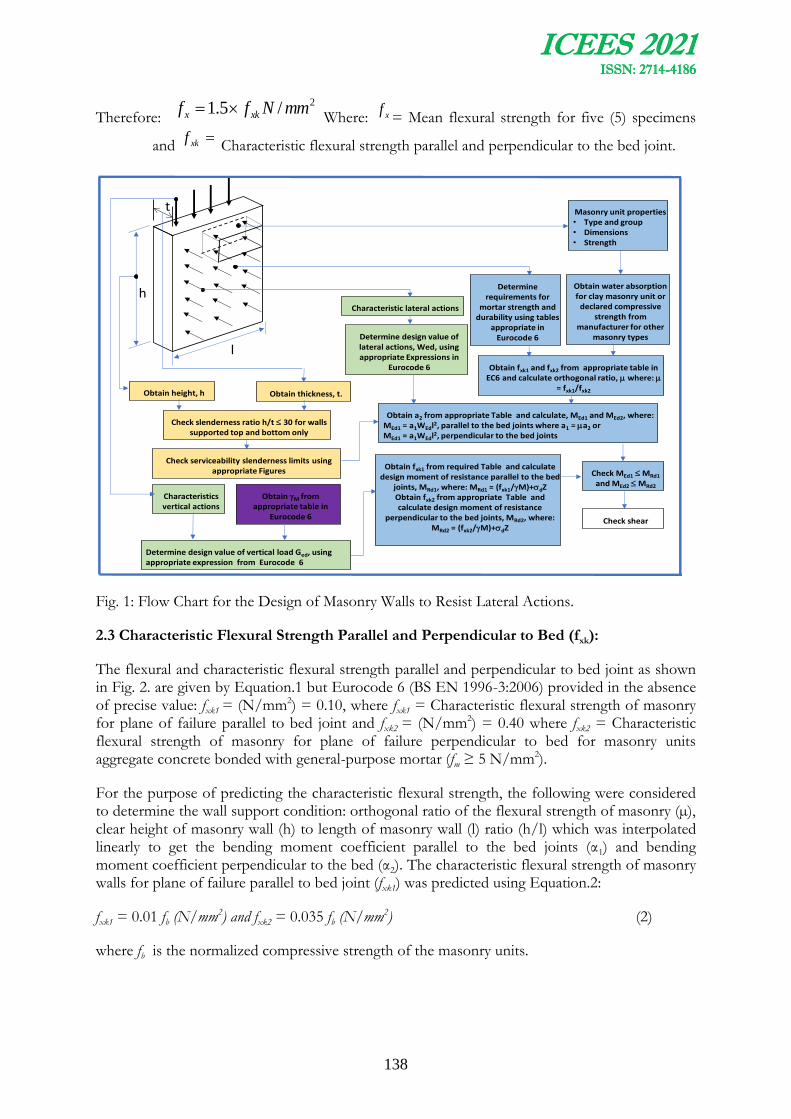
ICEES 2021 ISSN: 2714-4186
138
Therefore: 2/5.1 mmNff xkx
Where: xf= Mean flexural strength for five (5) specimens
and xkf
Characteristic flexural strength parallel and perpendicular to the bed joint.
Obtain height, h Obtain thickness, t.
Check slenderness ratio h/t 30 for walls supported top and bottom only
Check serviceability slenderness limits using appropriate Figures
Characteristics vertical actions
Obtain M from appropriate table in
Eurocode 6
Determine design value of vertical load Ged, using appropriate expression from Eurocode 6
Masonry unit properties• Type and group• Dimensions• Strength
Obtain water absorption for clay masonry unit or
declared compressive strength from
manufacturer for other masonry types
Determine requirements for
mortar strength and durability using tables
appropriate in Eurocode 6Determine design value of
lateral actions, Wed, using appropriate Expressions in
Eurocode 6
Characteristic lateral actions
Obtain a2 from appropriate Table and calculate, MEd1 and MEd2, where:MEd1 = a1WEdl2, parallel to the bed joints where a1 = a2 orMEd1 = a1WEdl2, perpendicular to the bed joints
Obtain fxk1 and fxk2 from appropriate table in EC6 and calculate orthogonal ratio, where:
= fxk1/fxk2
Obtain fxk1 from required Table and calculate design moment of resistance parallel to the bed
joints, MRd1, where: MRd1 = (fxk1/M)+dZObtain fxk2 from appropriate Table and calculate design moment of resistance
perpendicular to the bed joints, MRd2, where: MRd2 = (fxk2/M)+dZ
Check MEd1 MRd1
and MEd2 MRd2
Check shear
h
t
l
Fig. 1: Flow Chart for the Design of Masonry Walls to Resist Lateral Actions.
2.3 Characteristic Flexural Strength Parallel and Perpendicular to Bed (fxk):
The flexural and characteristic flexural strength parallel and perpendicular to bed joint as shown in Fig. 2. are given by Equation.1 but Eurocode 6 (BS EN 1996-3:2006) provided in the absence of precise value: fxk1 = (N/mm2) = 0.10, where fxk1 = Characteristic flexural strength of masonry for plane of failure parallel to bed joint and fxk2 = (N/mm2) = 0.40 where fxk2 = Characteristic flexural strength of masonry for plane of failure perpendicular to bed for masonry units aggregate concrete bonded with general-purpose mortar (fm ≥ 5 N/mm2).
For the purpose of predicting the characteristic flexural strength, the following were considered to determine the wall support condition: orthogonal ratio of the flexural strength of masonry (µ), clear height of masonry wall (h) to length of masonry wall (l) ratio (h/l) which was interpolated linearly to get the bending moment coefficient parallel to the bed joints (α1) and bending moment coefficient perpendicular to the bed (α2). The characteristic flexural strength of masonry walls for plane of failure parallel to bed joint (fxk1) was predicted using Equation.2:
fxk1 = 0.01 fb (N/mm2) and fxk2 = 0.035 fb (N/mm2) (2)
where fb is the normalized compressive strength of the masonry units.

ICEES 2021 ISSN: 2714-4186
139
a) Flexural Strength for a Plane of Failure b) Flexural Strength for a Plane of Failure
Parallel to the Bed Joints Perpendicular to the Bed Joints
Fig. 2: Flexural Strength Test of Masonry
2.4 Shear strength of masonry
The characteristic shear strength of masonry is a function of the characteristic initial shear strength of the masonry and the design compressive stress orthogonal to the shear plane being considered. The value of initial shear strength of masonry is given in annex of Eurocode 6.
The characteristic shear strength is given by the following relationships:
For fully filled mortar joints: fvk = fvko + 0.4 σd ≤ 0.065fb
For unfilled perpend joints, units abutting: fvk = 0.5fvko + 0.4 σd ≤ 0.045fb
Where: fvk = characteristic shear strength of masonry
fvko = characteristic initial shear strength of masonry, under zero compressive stress
σd = design compressive stress perpendicular to the shear in the member at the level under consideration, using the appropriate load combination based on the average vertical stress over the compressed part of the wall that is providing shear resistance.
fb = normalized compressive strength of the masonry units (as described in Cl.3.1.2.1 of BS EN 1996–1–1:2005+A1:2012) for the direction of application of the load on the test specimens being perpendicular to the bed face.
2.4.1 Initial Shear Strength (fvo):
The initial shear strength (fvo) for masonry concrete block walls with mortar joints, a factor of 0.8 as prescribed by BS EN 1052-3:(2002) was multiplied by shear strength to obtained characteristic shear strength as given in Equation 2:

ICEES 2021 ISSN: 2714-4186
140
vovok ff 8.0 (2)
Where: fvok = is characteristic shear strength and fvo = is the Initial Shear Strength
2.4.2 Characteristic Initial Shear Strength (fvx):
The characteristic shear strength ( vkf) N/mm2 for masonry concrete block walls with mortar
joints is given by Equation 3:
dvkovk ff 4.0 (3)
Where: 0vkf
characteristic initial shear strength under zero compressive stress, df design
compressive strength,df m
kf
where:kf characteristic compressive strength of the masonry,
m partial safety factor for material strength, Aff d
, where: f design load, A =area
and c
dlt
f
.
min
where:d
design compressive stress perpendicular to the shear, f design
load, t = thickness of masonry wall, cl = length of masonry wall.
3.0 MATERIAL AND METHODS:
3.1 Materials:
A general-purpose blended limestone Portland cement CEM II (42.5R MPa) with a specific gravity G of approximately 3.15 that conforms to BS EN 197-1:2011 was used in this work. The natural river quartzite sand smaller than 4.76 mm but larger than 75 μm with average bulk specific gravity (SSD) of 2.65 was used for both fine and medium-fine aggregate. Natural crushed (granite) with nominal maximum sizes of 9.52-10 mm and bulk specific gravity (SSD) of 2.66 was used as coarse aggregate. Crumb-rubber with nominal size of 4 - 9 mm as shown in Fig. 3. with bulk specific gravity (SSD) of 1.14 was treated with sodium hydroxide and used for the research. Ordinary tap water was used for all concrete mixes and curing.
Fig. 3: Crumb-Rubber partialy used for the Production of Masonry Hollow Concrete Blocks.
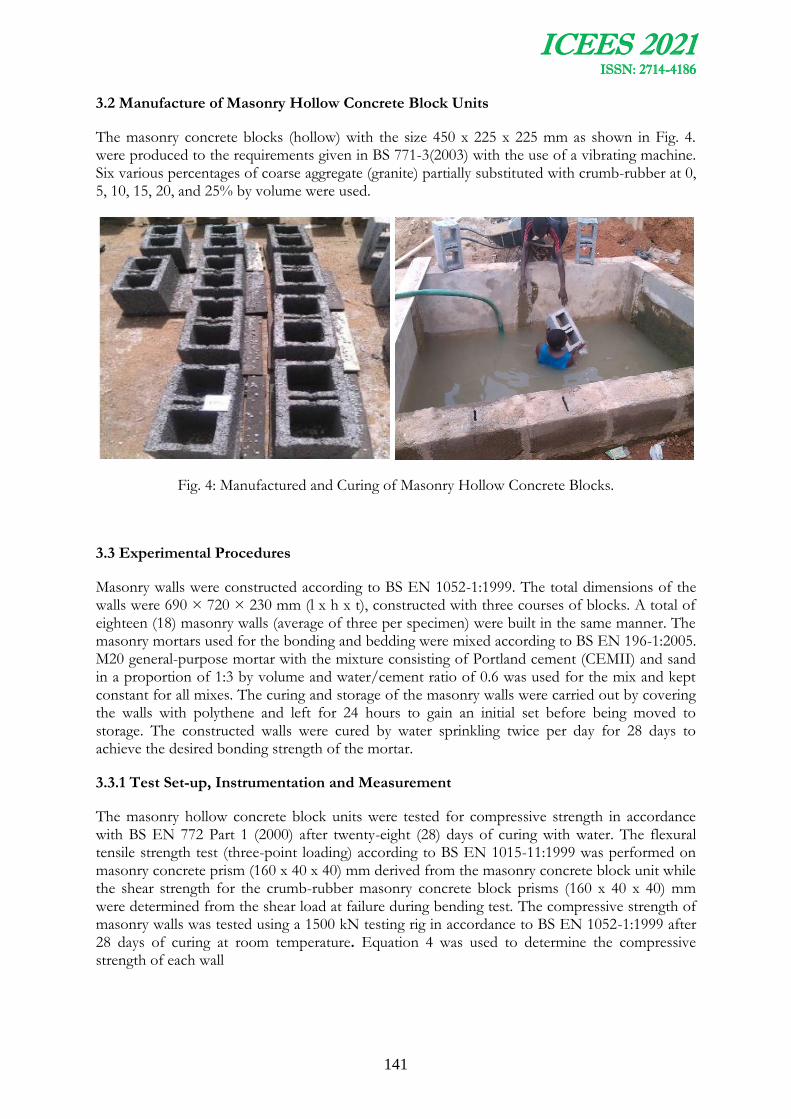
ICEES 2021 ISSN: 2714-4186
141
3.2 Manufacture of Masonry Hollow Concrete Block Units
The masonry concrete blocks (hollow) with the size 450 x 225 x 225 mm as shown in Fig. 4. were produced to the requirements given in BS 771-3(2003) with the use of a vibrating machine. Six various percentages of coarse aggregate (granite) partially substituted with crumb-rubber at 0, 5, 10, 15, 20, and 25% by volume were used.
Fig. 4: Manufactured and Curing of Masonry Hollow Concrete Blocks.
3.3 Experimental Procedures
Masonry walls were constructed according to BS EN 1052-1:1999. The total dimensions of the walls were 690 × 720 × 230 mm (l x h x t), constructed with three courses of blocks. A total of eighteen (18) masonry walls (average of three per specimen) were built in the same manner. The masonry mortars used for the bonding and bedding were mixed according to BS EN 196-1:2005. M20 general-purpose mortar with the mixture consisting of Portland cement (CEMII) and sand in a proportion of 1:3 by volume and water/cement ratio of 0.6 was used for the mix and kept constant for all mixes. The curing and storage of the masonry walls were carried out by covering the walls with polythene and left for 24 hours to gain an initial set before being moved to storage. The constructed walls were cured by water sprinkling twice per day for 28 days to achieve the desired bonding strength of the mortar.
3.3.1 Test Set-up, Instrumentation and Measurement
The masonry hollow concrete block units were tested for compressive strength in accordance with BS EN 772 Part 1 (2000) after twenty-eight (28) days of curing with water. The flexural tensile strength test (three-point loading) according to BS EN 1015-11:1999 was performed on masonry concrete prism (160 x 40 x 40) mm derived from the masonry concrete block unit while the shear strength for the crumb-rubber masonry concrete block prisms (160 x 40 x 40) mm were determined from the shear load at failure during bending test. The compressive strength of masonry walls was tested using a 1500 kN testing rig in accordance to BS EN 1052-1:1999 after 28 days of curing at room temperature. Equation 4 was used to determine the compressive strength of each wall

ICEES 2021 ISSN: 2714-4186
142
)/( 2max mmNA
ff
i
i
i
(4)
Where fi is the compressive strength of an individual masonry specimen, (N/mm2); fimax is the maximum load reached on an individual masonry specimen, (N); Ai is the loaded cross-section of an individual specimen, (mm2). The characteristic compressive strength was determined using the Equation 5.
2.1
ff k
or )/( 2
min mmNff ik whichever is smaller (5)
The prediction of the characteristic compressive strength of the masonry walls under compression loads from the strength of their components was carried out for the purpose of predicting the shear and lateral behaviour.
The Eurocode 6 (BS EN 1991-1:2005) suggested Equation 6:
mbk fKff (6)
where fk is the characteristic compressive strength of masonry walls, in N/mm2; K is a constant depending on the types of units and mortar being used; α and β are constants; and fb and fm are the normalised mean strength of a unit in the direction of the applied action and the compressive strength of the mortar.
The initial and characteristic shear strength, flexural and characteristic flexural strength of masonry wall constructed with hollow concrete block units containing various proportion of crumb-rubber was predicted from the normalized compressive strength of the masonry units (fb) and characteristic compressive strength of the wall (fk).
4.0 RESULTS AND DISCUSSION:
4.1 Compressive Strength of Rubberized Masonry Hollow Concrete Block Units
The strength of rubberized masonry hollow concrete block unit’s and walls after 28 days of curing with water is shown in the Table 1. From the results obtained, it can be seen that the addition of crumb-rubber aggregates up to 25% in concrete mixes decreased the compressive (fcu), normalized compressive (fb) and characteristic compressive strength (fk) significantly.
4.2 Flexural and Shear Strength of Rubberized Masonry Concrete Block Units
Flexural and shear strengths of masonry concrete block are presented in Fig. 5. The results reveal an increase in flexural strength to a maximum of 4.93 N/mm2 with crumb-rubber aggregate content up to 10% which indicates 5% gain compared to the control mixes (0%) with strength of 4.71 N/mm2. The result further shows a decline in flexural strength with increase in crumb-rubber aggregate for 15, 20 and 25%. The shear strength (fs) results indicate an increase with percentage increase in the crumb-rubber particles up to 10% and gradually reduced with 15% crumb-rubber particles content replacement up to 25% optimum mixes. The reference prism has a shear strength of 0.63 N/mm2 while 5, 10, 15, 20 and 25% modified mixes with crumb-rubber particles have shear strength of 0.65, 0.66, 0.60, 0.45 and 0.39 N/mm2, respectively indicating percentage gain and loss of +3.2, +4.5, -4.8, -29 and -38%, respectively.
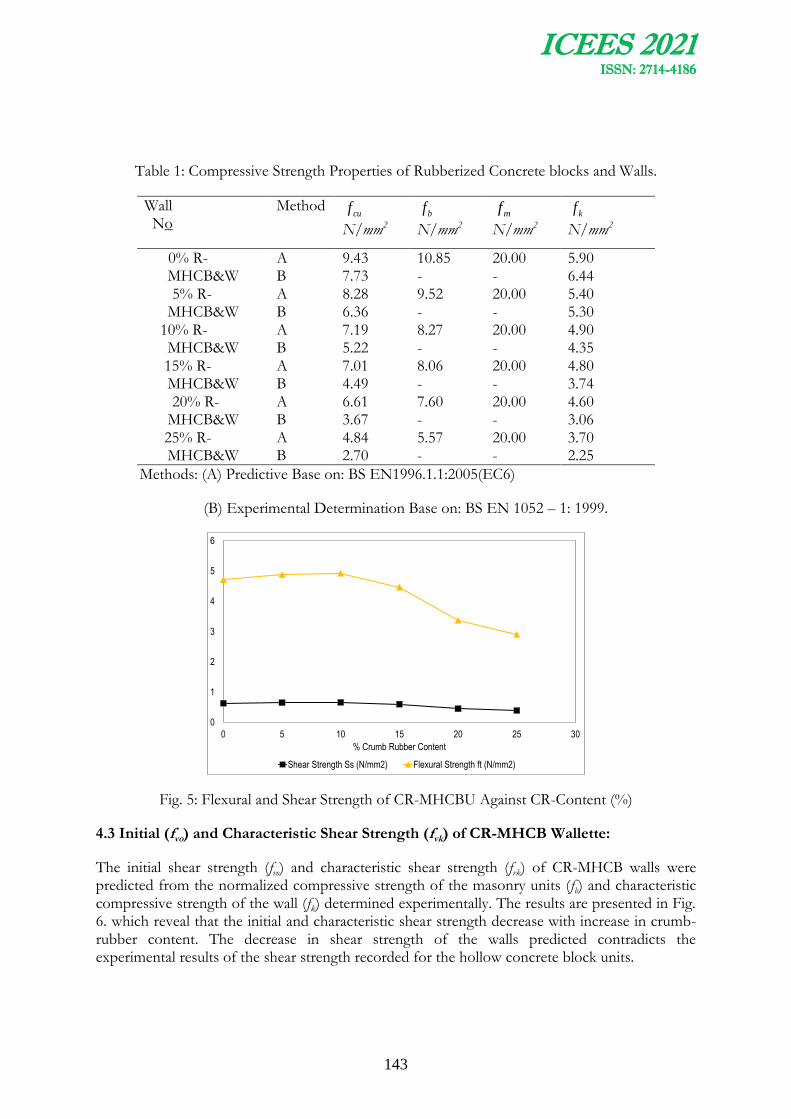
ICEES 2021 ISSN: 2714-4186
143
Table 1: Compressive Strength Properties of Rubberized Concrete blocks and Walls.
Wall No
Method cuf
N/mm2
bf N/mm2
mf N/mm2
kf N/mm2
0% R-MHCB&W
A 9.43 10.85 20.00 5.90 B 7.73 - - 6.44
5% R-MHCB&W
A 8.28 9.52 20.00 5.40 B 6.36 - - 5.30
10% R-MHCB&W
A 7.19 8.27 20.00 4.90 B 5.22 - - 4.35
15% R-MHCB&W
A 7.01 8.06 20.00 4.80 B 4.49 - - 3.74
20% R-MHCB&W
A 6.61 7.60 20.00 4.60 B 3.67 - - 3.06
25% R-MHCB&W
A 4.84 5.57 20.00 3.70 B 2.70 - - 2.25
Methods: (A) Predictive Base on: BS EN1996.1.1:2005(EC6)
(B) Experimental Determination Base on: BS EN 1052 – 1: 1999.
0
1
2
3
4
5
6
0 5 10 15 20 25 30
% Crumb Rubber Content
Shear Strength Ss (N/mm2) Flexural Strength ft (N/mm2)
Fig. 5: Flexural and Shear Strength of CR-MHCBU Against CR-Content (%)
4.3 Initial (fvo) and Characteristic Shear Strength (fvk) of CR-MHCB Wallette:
The initial shear strength (fvo) and characteristic shear strength (fvk) of CR-MHCB walls were predicted from the normalized compressive strength of the masonry units (fb) and characteristic compressive strength of the wall (fk) determined experimentally. The results are presented in Fig. 6. which reveal that the initial and characteristic shear strength decrease with increase in crumb-rubber content. The decrease in shear strength of the walls predicted contradicts the experimental results of the shear strength recorded for the hollow concrete block units.

ICEES 2021 ISSN: 2714-4186
144
0
0.1
0.2
0.3
0.4
0.5
0.6
0.7
0.8
0.9
1
0 5 10 15 20 25 30
Initia
l f
vo
and
Cha
racte
ristic
f vk
She
ar
Str
eng
th
(N/m
m2)
% Crumb Rubber Content
A_fvo B_fvo A_fvk B_fvk
A: Predictive Base on: BS EN1996.1.12005(EC6)
B: Laboratory Determination Base on: BS EN 1052 - 1 – 1999
Fig. 6: Initial (fvo) and Characteristic Shear Strength (fvk) of CR-MHCB Walls Against CR-Content (%)
4.4 Flexural (fx and fxk) Strength of CR-MHCB Walls:
The flexural strength (fx) and characteristic flexural strength (fxk) of the CR-MHCB wall were predicted from compressive strength parameters base on A (BS EN 1996.1.1.2005 (EC6)) and B (BS EN 1996-3:2006) with the results presented in Fig. 7. From the result, it is obvious that the two methods have the same trend in terms of flexural and characteristic flexural strength reduction with a percentage increase in crumb-rubber content. Increasing the crumb-rubber content from 0 - 25% decreased the flexural (fx1 & fx2) from 0.15 to 0.10 N/mm2 and 0.60 to 0.30 N/mm2 indicating 33.3% and 50% reduction in flexural strength respectively. Furthermore, increasing the crumb-rubber content from 0 - 25% decreased the characteristic flexural strength (fxk1 & fxk2) from 0.10 to 0.06 N/mm2 and 0.40 to 0.20 N/mm2, respectively which represents a reduction of 40% and 50%, respectively. In a similar observation to the shear strength, flexural strength of the walls predicted contradicts the results of the flexural strength recorded for the hollow concrete block units determined experimentally.
0
0.1
0.2
0.3
0.4
0.5
0.6
0.7
0 5 10 15 20 25 30
Flex
ural
fx a
nd C
hara
cteris
tic F
lexur
al St
reng
th fx
k (N
/mm
2)
% Crumb Rubber Content
A_fx1 A_fx2 A_fxk1 A_fxk2
A: Predictive Base on: BS EN1996.1.12005(EC6)
Fig. 7: Flexural (fx) and Characteristic Flexural Strength (fxk) of CR-MHCB Wall Against %CR Content

ICEES 2021 ISSN: 2714-4186
145
5.0 CONCLUSIONS AND RECOMENDATIONS:
The following conclusions are drawn on the compressive strength of rubberized masonry hollow concrete block units and the predicted behaviour of the walls under lateral loading conditions.
1. The compressive and normalized compressive strength of hollow concrete block units decreased from 9.43 and 10.85 N/mm2 to 4.84 and 5.57 N/mm2, respectively indicating 49% loss in strength with 25% crumb-rubber content.
2. The experimental and predicted characteristic compressive strength of masonry concrete block walls decreased by 65% and 37%, respectively with increase in crumb-rubber content up to 25%. The reference masonry walls recorded a strength of 6.44 and 5.90 N/mm2 while 5, 10, 15, 20 and 25% crumb-rubber modified masonry concrete block walls have strengths of 5.30 and 5.40 N/mm2, 4.35 and 4.90 N/mm2, 3.74 and 4.80 N/mm2, 3.06 and 4.60 N/mm2 and 2.25 and 3.70 N/mm2, respectively.
3. Flexural and shear strength of the hollow concrete block increased slightly with 10% crumb-rubber content. The reference mix recorded 4.71 and 0.63 N/mm2 while the 10% crumb-rubber content recorded 4.93 and 0.66 N/mm2 indicating gain in strength of 5% and 4.5% respectively. Increase in crumb-rubber content up to 25% reduces the flexural and shear strength, with strength of 2.91 and 0.39 N/mm2 recorded respectively which indicates 38 % strength loss after 28 days of curing.
4. The initial shear strength (fvo) and characteristic shear strength (fvk) of masonry walls reduced with percentage increase in crumb-rubber content.
5. The flexural strength (fx1 and fx2) and characteristic flexural strength (fxk1 and fxk2) of masonry hollow concrete block walls decreased by (33.3% and 50%) and (40% and 50%) respectively with percentage increase in crumb-rubber content up to 25%.
Based on the results obtained, it is recommended that the flexural and shear strength of crumb rubber masonry hollow concrete walls be tested experimentally (perpendicular and parallel to bed joint) in accordance to BS EN 1052-2:1999 and BS EN 1052-3:2002, respectively. This will help to validate the predicted results or proof otherwise.
ACKNOWLEDGMENTS
‘‘The Authors’’ will like to acknowledge and appreciate members and staff of Structures and Concrete Laboratory of the Department of Civil Engineering, Ahmadu Bello University, Zaria for their assistance while conducting the laboratory test.
REFERENCES
BS EN 1015 - 11: 1999, Methods of test for mortar for masonry: Determination of flexural and compressive strength of hardened mortar. British Standard Institute, London.
BS EN 1052-1:1999, Method of test masonry: Determination of compressive strength. British Standard Institute, London.
BS EN 1052-2: 1999, Method of test masonry: Determination of flexural strength. British Standard Institute, London.
ICEES 2021 ISSN: 2714-4186
146
BS EN 1052-3:2002, Method of test masonry: Determination of Initial shear strength. British Standard Institute, London.
BS EN 196- Part 1: 2005, Methods of testing cement: Determination of strength. British Standard Institute, London.
BS EN 1996-1-1:2005+A1:2012, Eurocode 6-Design of masonry structures: General rules for reinforced and unreinforced masonry structures. British Standard Institute, London.
BS EN 1996-3: 2006, Eurocode 6 – Design of masonry structures: Simplified calculation methods for unreinforced masonry structures. British Standard Institute, London 2006. Including NA to BS EN 1996-3:2006:2007.
BS EN 1996-4:2006, Eurocode 6 – Design of masonry structures. British Standard Institute, London.
BS EN 771-3: 2003, Specification for masonry units: Aggregate concrete masonry (dense and light-weight aggregates), British Standard Institute, London, 2003.
BS EN 772-1:2000, Methods of test for masonry units. Part 1: Determination of compressive strength. British Standard Institute, London.
BS EN 197- Part 1: 2011, Composition, specifications and conformity criteria for common cements. Milton Keynes: British Standard Institute, London.
Gheni, A.A., Mohamed A. E. and John J. M. (2017). Mechanical Characterization of Concrete Masonry Units Manufactured with Crumb Rubber Aggregate. ACI Materials Journal Technical Paper, V. 114, No. 1.
Kaushik, H. B. Rai., D. C. and Jain S. K. (2007). Stress-Strain Characteristic of Clay brick Masonry Under Uniaxial Compression. Journal of Material Civil Engineering 19(9): 728-739.
Sadek, D. M. and Mohamed, M. E. (2014). Structural behavior of rubberized masonry walls Journal of Cleaner Production., V. 89, No.11. Page 174 -186.
Sanni, M. Y., Ocholi A, Tyoden J. N. and Ejeh S. P. (2019). Strength Characteristics Analysis of Crumb-Rubber Masonry Concrete. University of Ibadan Journal of Civil Engineering and Technology Vol.1. No. 1.
Zhao Y, and Wang F. L. (2015). Experimental studies on behaviour of fully grouted reinforced-concrete masonry shear walls. Earthquake Engineering Vibration 14(4):743–757.
ICEES 2021 ISSN: 2714-4186
147
DYNAMIC MECHANICAL BEHAVIOUR OF RUBBERIZED MASONRY CONCRETE
1* Sanni, M.Y., 2Salami, A.A., and 3Ismail, U. A.
1 Department of Civil Engineering, Ahmadu Bello University, Zaria.
2 Department of Building Technology, The Federal Polytechnic, Offa.
3 Department of Computer Science, The Federal Polytechnic, Kaura Namoda.
* Email of Corresponding Author: [email protected]
ABSTRACT
In this study, an investigation into the dynamic mechanical performance of crumb-rubber masonry concrete was carried out. Crumb-rubber (CR) particle ranging from 0, 5, 10, 15, 20 and 25% was partially replaced by volume of coarse granite. A total number of six mix batches (using a mix ratio of 1:1.5:3 and a water-cement ratio of 0.42) was used for the investigation. The results showed that the density and compressive strength of masonry concrete reduced by 12.3% and 47% with 25% increase in CR contents after 28 days curing. The dynamic modulus of elasticity (ED) reduced from 35.10 to 26.68 GPa with 25% crumb-rubber content indicating 24% reduction. Ultrasonic pulse velocity (UPV) reduced from 4,581 to 2,907 m/s indicating 36.5% reduction with 25% increase in CR content. Dynamic shear modulus (GD) also reduced from
28.10 to 20.05GPa indicating 29% reduction while the dynamic Poisson ratio ( D ) reduced from 0.375 to 0.335 indicating 10.7% reduction. The quality of rubberized masonry concrete based on UPV test conducted in this study is classified as ‘excellent’ quality for 0% CR, ‘good’ quality for 5% CR, ‘good’ quality for 10% CR, ‘questionable’ for 15% CR, ‘poor’ quality for 20% CR and ‘poor’ quality also for 25% CR. Systematically reduction in dynamic modulus of elasticity, dynamic shear modulus and poisson ratio with percentage increase in crumb-rubber particles up 25% indicates reduction in soundness in terms of durability. Based on the outcome of the results obtained in this study, 5% crumb-rubber content can be considered to be the optimum for partial replacement of coarse aggregate (granite) in masonry concrete mix in other to protect the quality, durability and integrity of the concrete mix.
Keywords: Rubberized Concrete; Density; Dynamic Modulus of Elasticity; Ultrasonic Pulse Velocity; Dynamic Shear Modulus and Dynamic Poisson Ratio.
1.0 INTRODUCTION
The dynamic properties of concrete which includes the dynamic shear modulus, dynamic poison’s ratio, vibrational damping coefficient, natural resonant frequency and dynamic modulus of elasticity are very important in concrete structures most especially with respect to noise and structural vibration control. Understanding and enhancing these dynamic properties could significantly improve structural reliability with respect to hazards such as earthquakes, accidental load, hydrostatic and wind loading, explosive blasts and fragmentations (Zheng et al.,2008; Zainalabdin et al.,2000).
The increasing amounts of solid waste materials such as waste tyre are being investigated across the world to supplement natural components used for building construction. Waste automobile
ICEES 2021 ISSN: 2714-4186
148
tyres occupy a large space in the environment which is due to their size and shape. Such waste constitutes an environmental nuisance and health risk. According to Yang et al.(2000), each year about 9 million tons of waste rubber-tyres are disposed of all over the world, which was also estimated to be around 1 billion tyres withdrawn from use in the world annually (Erdogan et al.2010).
Based on 2018 statistics with a 15% annual generation rate, it is estimated that around 37 million waste tyres exist in Nigeria according to Ocholi et al.(2018).
Many researchers have studied and developed various recycling methods for the re-use of waste rubber-tyres in construction materials such as the use of waste rubber-tyres in asphalt concrete mixture; use of waste rubber-tyres in some plastic and rubber products; utilizing waste rubber-tyres in Portland cement concrete; use of waste tyres as a visco-elastic material for vibration dampers and utilizing waste tyres in cement mortar (Yunping et al.2010).
Al Sakini (1998), Edeskar (2004) and Al-Mashhadani J (2001) have characterized crumb-rubber waste tyres to have a low specific gravity 0.95 kg/m3, small water absorption 2-4%, low thermal conductivity 0.15-0.30 w/mk and high resistance to weather (i.e. non-biodegradable). Tyre shreds
is a relatively weak material with modulus of elasticity (E) ≈1 N/mm2, Poisson’s ratio (ʋ) ≈ 0.3, tensile resistance oof 4.2 – 15 N/mm2 and apparent density (ρ) 500-900 kg/m3.
The dynamic modulus of elasticity (ED) of Plain Rubberized Concrete has been reported in literature to decrease continually with increase in crumb-rubber aggregate replacement also it has been reported that the ED of rubberized concrete is always lower than the ED of ordinary concrete (Zheng et al., (2008a;), Benazzouk et al., (2007) and Benazzouk et al., (2003). Zheng et al., (2008b) further revealed that replacement with crumb-rubber has a lesser effect than chipped rubber on the modulus of elasticity ED of concrete. Zheng et al., (2008a) reported that the size of the rubber particles and the percentage of rubber particle replacement in a concrete mix affect the damping ratio response amplitude.
This paper presents the dynamic mechanical performance of masonry concrete containing crumb-rubber as a partial substitution of natural coarse aggregate (granite).
2.0 CONCEPT AND THEORIES
2.1 Dynamic Modulus of Elastic (ED)
The dynamic elastic modulus is defined as the ratio of the stress to that part of strain corresponding to elastic deformation only (BS 1881-209, 1990). It is significantly greater than the static modulus of elasticity (BS 1881-209, 1990). Neville (1995), show that, the ratio of the static to dynamic moduli is higher with the increase in strength of concrete and also increased with age. Mehta (1986), reported that, the dynamic modulus of elasticity is generally 20, 30, and 40% higher than the static modulus of elasticity for high, medium, and low strength concrete respectively. ED is used to evaluate soundness of concrete in durability tests; it is more appropriate value to use when concrete is to be used in structures subjected to dynamic loading. ED is also used as a quality control indicator in evaluating concrete material and also in understanding dynamic response behavior Mehta (1986).
The British Code of Practice for the structural use of concrete CP110: 1972 relates the dynamic modulus of elasticity of concrete ED to its compressive strength fc as shown in Equation 1:

ICEES 2021 ISSN: 2714-4186
149
228.25.0 cD fE
(1)
where: ED =The dynamic modulus of elasticity of concrete (GN/m2)
fc = The compressive strength of concrete of cylinder (MN/m2)
2.2 Dynamic Shear Modulus (GD)
Dynamic shear modulus, known sometimes as dynamic modulus of rigidity, GD, is the ratio of dynamic shear stress to the dynamic shear strain.
2.3 Dynamic Poisson’s Ratio (ʋD)
Poisson’s ratio, μ, is known as the ratio of the lateral strain to the longitudinal strain under a static uniaxial load. Likewise, it can be dynamically calculated, which is known as the dynamic Poisson ratio, μD, under dynamic load conditions utilizing ED and GD. It is usually higher than the ratio obtained from a static test (Neville, 1995; Zainalabin et al., 2000).
2.4 Ultrasonic Pulse Velocity (UPV)
Ultrasonic Pulse Velocity (UPV) is a non-destructive testing method used to determine the passage of velocity through the concrete cubes within a particular time interval. This test measures the travel time, T of an ultrasonic pulse that is produced by an electro-acoustical transducer. The UPV is given by the ratio between the length of the specimen and the travel time of the specimen. It has been widely used in evaluating concrete quality control by correlating the velocity and concrete strength and as a prime check-in monitoring the health of the concrete structure in addition to determine the dynamic modulus of elasticity (ED) and dynamic Poisson’s ratio (μD) Solis-Carcano et al. (2008).
The UPV assesses and classifies concrete based on the quality of concrete as shown in Table 1. It relates the quality in terms of density, homogeneity and continuity in concrete without cracks. Higher velocity indicates good quality and continuity in cross-section whereas lower quality indicates flaws like cracks and voids. Concrete imperfections such as cracks and voids can be detected by passing longitudinal vibrations through the concrete sample/structure.
Table 1: Concrete Classification based on Ultrasonic Pulse Velocity (UPV)
Ultrasonic Pulse velocity (m/s) Concrete Classification
V ˃ 4575 Excellent
4575 ˃ V < 3660 Good
3660 ˃ V < 3050 Questionable
3050 ˃ V < 2135 Poor
V < 2135 Very Poor
(Adapted from: Solis-Carcano et al. 2008)
Ultrasonic Pulse Velocity (UPV) is dependent on the density and elastic properties of the material and is measured in terms of direct and semi-direct UPV values. Semi-direct UPV is used when accessibility of specimen is limited and the direct UPV is measured by placing the transmitting and receiving transducers on opposite faces of the concrete cubes.
3.0 MATERIAL AND METHODS
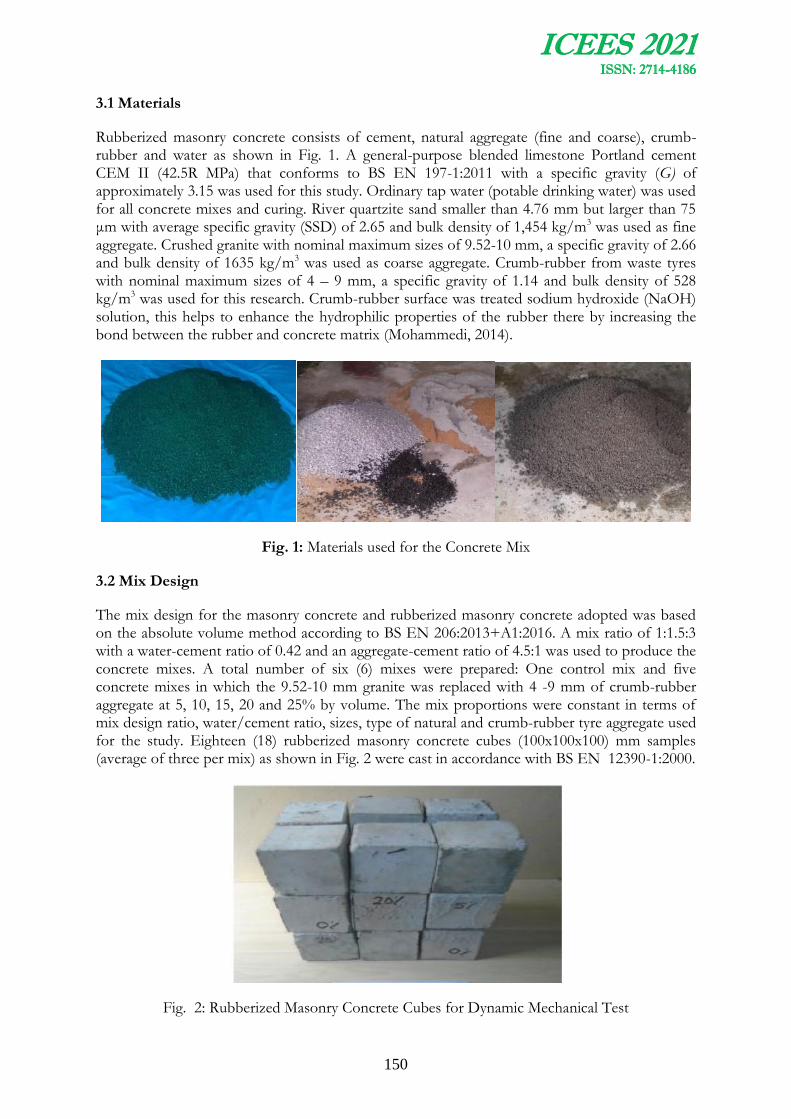
ICEES 2021 ISSN: 2714-4186
150
3.1 Materials
Rubberized masonry concrete consists of cement, natural aggregate (fine and coarse), crumb-rubber and water as shown in Fig. 1. A general-purpose blended limestone Portland cement CEM II (42.5R MPa) that conforms to BS EN 197-1:2011 with a specific gravity (G) of approximately 3.15 was used for this study. Ordinary tap water (potable drinking water) was used for all concrete mixes and curing. River quartzite sand smaller than 4.76 mm but larger than 75 μm with average specific gravity (SSD) of 2.65 and bulk density of 1,454 kg/m3 was used as fine aggregate. Crushed granite with nominal maximum sizes of 9.52-10 mm, a specific gravity of 2.66 and bulk density of 1635 kg/m3 was used as coarse aggregate. Crumb-rubber from waste tyres with nominal maximum sizes of 4 – 9 mm, a specific gravity of 1.14 and bulk density of 528 kg/m3 was used for this research. Crumb-rubber surface was treated sodium hydroxide (NaOH) solution, this helps to enhance the hydrophilic properties of the rubber there by increasing the bond between the rubber and concrete matrix (Mohammedi, 2014).
Fig. 1: Materials used for the Concrete Mix
3.2 Mix Design
The mix design for the masonry concrete and rubberized masonry concrete adopted was based on the absolute volume method according to BS EN 206:2013+A1:2016. A mix ratio of 1:1.5:3 with a water-cement ratio of 0.42 and an aggregate-cement ratio of 4.5:1 was used to produce the concrete mixes. A total number of six (6) mixes were prepared: One control mix and five concrete mixes in which the 9.52-10 mm granite was replaced with 4 -9 mm of crumb-rubber aggregate at 5, 10, 15, 20 and 25% by volume. The mix proportions were constant in terms of mix design ratio, water/cement ratio, sizes, type of natural and crumb-rubber tyre aggregate used for the study. Eighteen (18) rubberized masonry concrete cubes (100x100x100) mm samples (average of three per mix) as shown in Fig. 2 were cast in accordance with BS EN 12390-1:2000.
Fig. 2: Rubberized Masonry Concrete Cubes for Dynamic Mechanical Test
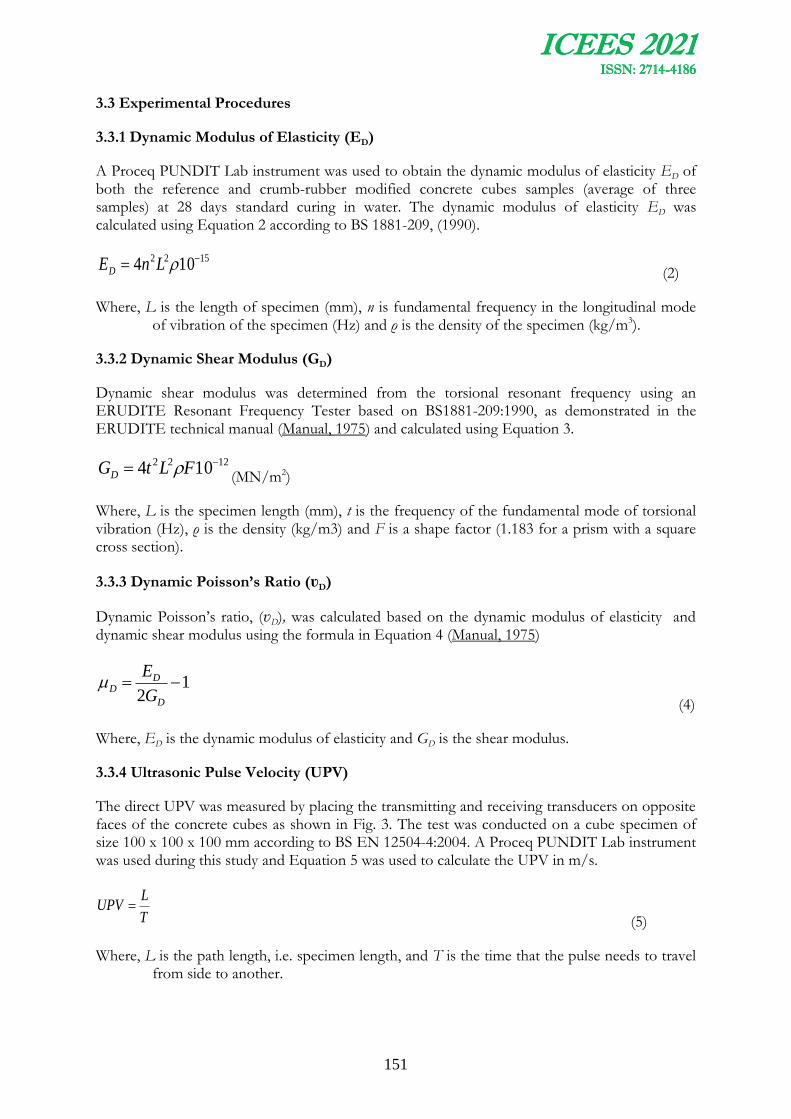
ICEES 2021 ISSN: 2714-4186
151
3.3 Experimental Procedures
3.3.1 Dynamic Modulus of Elasticity (ED)
A Proceq PUNDIT Lab instrument was used to obtain the dynamic modulus of elasticity ED of both the reference and crumb-rubber modified concrete cubes samples (average of three samples) at 28 days standard curing in water. The dynamic modulus of elasticity ED was calculated using Equation 2 according to BS 1881-209, (1990).
1522 104 LnED (2)
Where, L is the length of specimen (mm), n is fundamental frequency in the longitudinal mode of vibration of the specimen (Hz) and ρ is the density of the specimen (kg/m3).
3.3.2 Dynamic Shear Modulus (GD)
Dynamic shear modulus was determined from the torsional resonant frequency using an ERUDITE Resonant Frequency Tester based on BS1881-209:1990, as demonstrated in the ERUDITE technical manual (Manual, 1975) and calculated using Equation 3.
1222 104 FLtGD (MN/m2)
Where, L is the specimen length (mm), t is the frequency of the fundamental mode of torsional vibration (Hz), ρ is the density (kg/m3) and F is a shape factor (1.183 for a prism with a square cross section).
3.3.3 Dynamic Poisson’s Ratio (ʋD)
Dynamic Poisson’s ratio, (ʋD), was calculated based on the dynamic modulus of elasticity and dynamic shear modulus using the formula in Equation 4 (Manual, 1975)
12
D
DD
G
E
(4)
Where, ED is the dynamic modulus of elasticity and GD is the shear modulus.
3.3.4 Ultrasonic Pulse Velocity (UPV)
The direct UPV was measured by placing the transmitting and receiving transducers on opposite faces of the concrete cubes as shown in Fig. 3. The test was conducted on a cube specimen of size 100 x 100 x 100 mm according to BS EN 12504-4:2004. A Proceq PUNDIT Lab instrument was used during this study and Equation 5 was used to calculate the UPV in m/s.
T
LUPV
(5)
Where, L is the path length, i.e. specimen length, and T is the time that the pulse needs to travel from side to another.
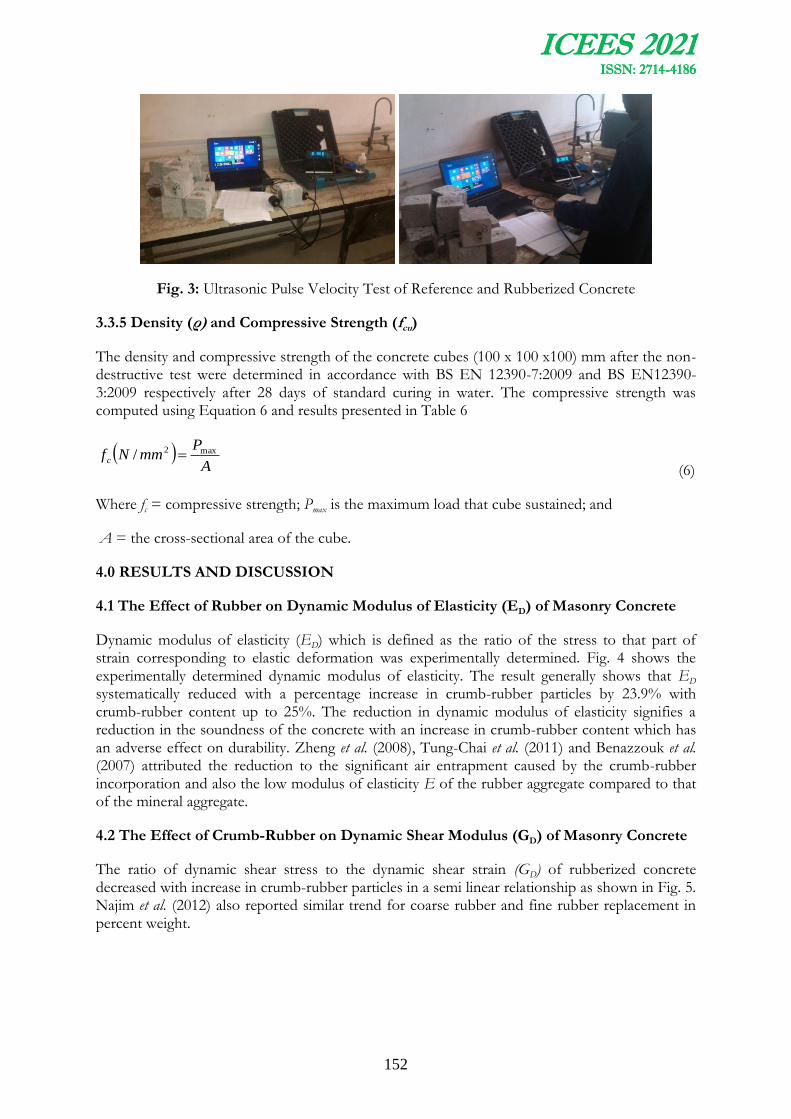
ICEES 2021 ISSN: 2714-4186
152
Fig. 3: Ultrasonic Pulse Velocity Test of Reference and Rubberized Concrete
3.3.5 Density (ρ) and Compressive Strength (fcu)
The density and compressive strength of the concrete cubes (100 x 100 x100) mm after the non-destructive test were determined in accordance with BS EN 12390-7:2009 and BS EN12390-3:2009 respectively after 28 days of standard curing in water. The compressive strength was computed using Equation 6 and results presented in Table 6
A
PmmNfc
max2/ (6)
Where fc = compressive strength; Pmax is the maximum load that cube sustained; and
A = the cross-sectional area of the cube.
4.0 RESULTS AND DISCUSSION
4.1 The Effect of Rubber on Dynamic Modulus of Elasticity (ED) of Masonry Concrete
Dynamic modulus of elasticity (ED) which is defined as the ratio of the stress to that part of strain corresponding to elastic deformation was experimentally determined. Fig. 4 shows the experimentally determined dynamic modulus of elasticity. The result generally shows that ED systematically reduced with a percentage increase in crumb-rubber particles by 23.9% with crumb-rubber content up to 25%. The reduction in dynamic modulus of elasticity signifies a reduction in the soundness of the concrete with an increase in crumb-rubber content which has an adverse effect on durability. Zheng et al. (2008), Tung-Chai et al. (2011) and Benazzouk et al. (2007) attributed the reduction to the significant air entrapment caused by the crumb-rubber incorporation and also the low modulus of elasticity E of the rubber aggregate compared to that of the mineral aggregate.
4.2 The Effect of Crumb-Rubber on Dynamic Shear Modulus (GD) of Masonry Concrete
The ratio of dynamic shear stress to the dynamic shear strain (GD) of rubberized concrete decreased with increase in crumb-rubber particles in a semi linear relationship as shown in Fig. 5. Najim et al. (2012) also reported similar trend for coarse rubber and fine rubber replacement in percent weight.
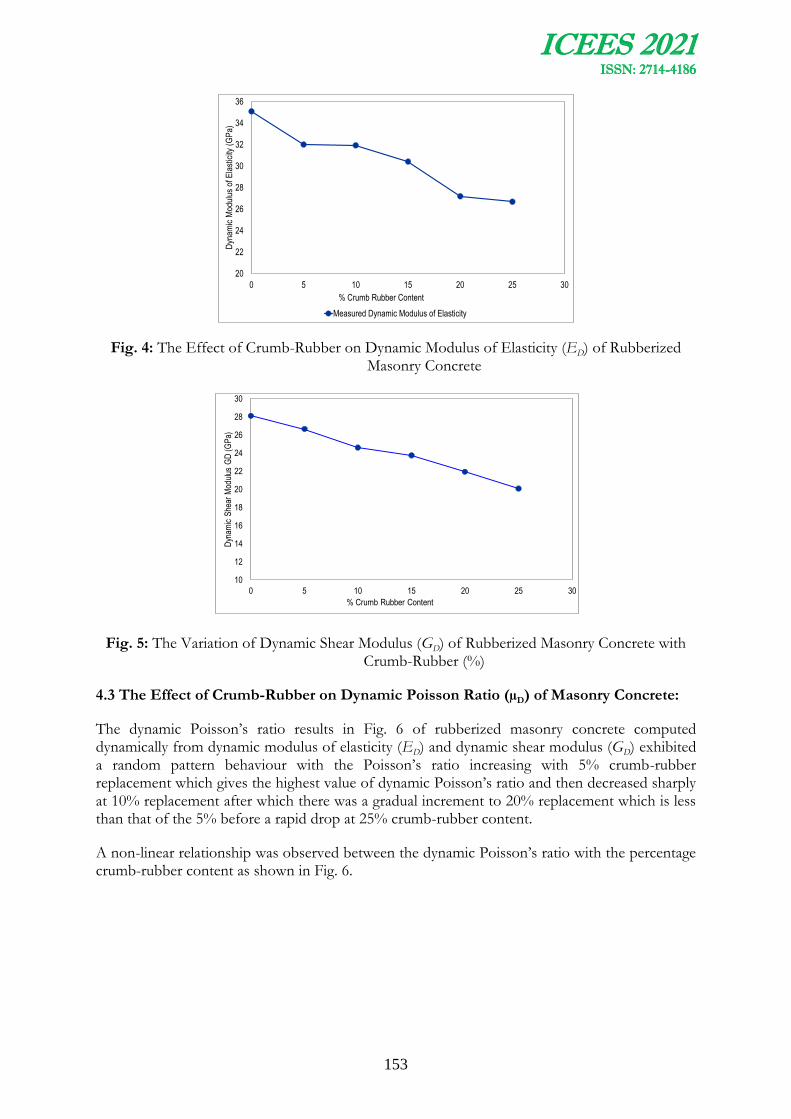
ICEES 2021 ISSN: 2714-4186
153
20
22
24
26
28
30
32
34
36
0 5 10 15 20 25 30
Dyn
amic
Mod
ulus
of E
last
icity
(G
Pa)
% Crumb Rubber Content
Measured Dynamic Modulus of Elasticity
Fig. 4: The Effect of Crumb-Rubber on Dynamic Modulus of Elasticity (ED) of Rubberized Masonry Concrete
10
12
14
16
18
20
22
24
26
28
30
0 5 10 15 20 25 30
Dyn
amic
She
ar M
odul
us G
D (
GP
a)
% Crumb Rubber Content
CR-CB
Fig. 5: The Variation of Dynamic Shear Modulus (GD) of Rubberized Masonry Concrete with Crumb-Rubber (%)
4.3 The Effect of Crumb-Rubber on Dynamic Poisson Ratio (µD) of Masonry Concrete:
The dynamic Poisson’s ratio results in Fig. 6 of rubberized masonry concrete computed dynamically from dynamic modulus of elasticity (ED) and dynamic shear modulus (GD) exhibited a random pattern behaviour with the Poisson’s ratio increasing with 5% crumb-rubber replacement which gives the highest value of dynamic Poisson’s ratio and then decreased sharply at 10% replacement after which there was a gradual increment to 20% replacement which is less than that of the 5% before a rapid drop at 25% crumb-rubber content.
A non-linear relationship was observed between the dynamic Poisson’s ratio with the percentage crumb-rubber content as shown in Fig. 6.
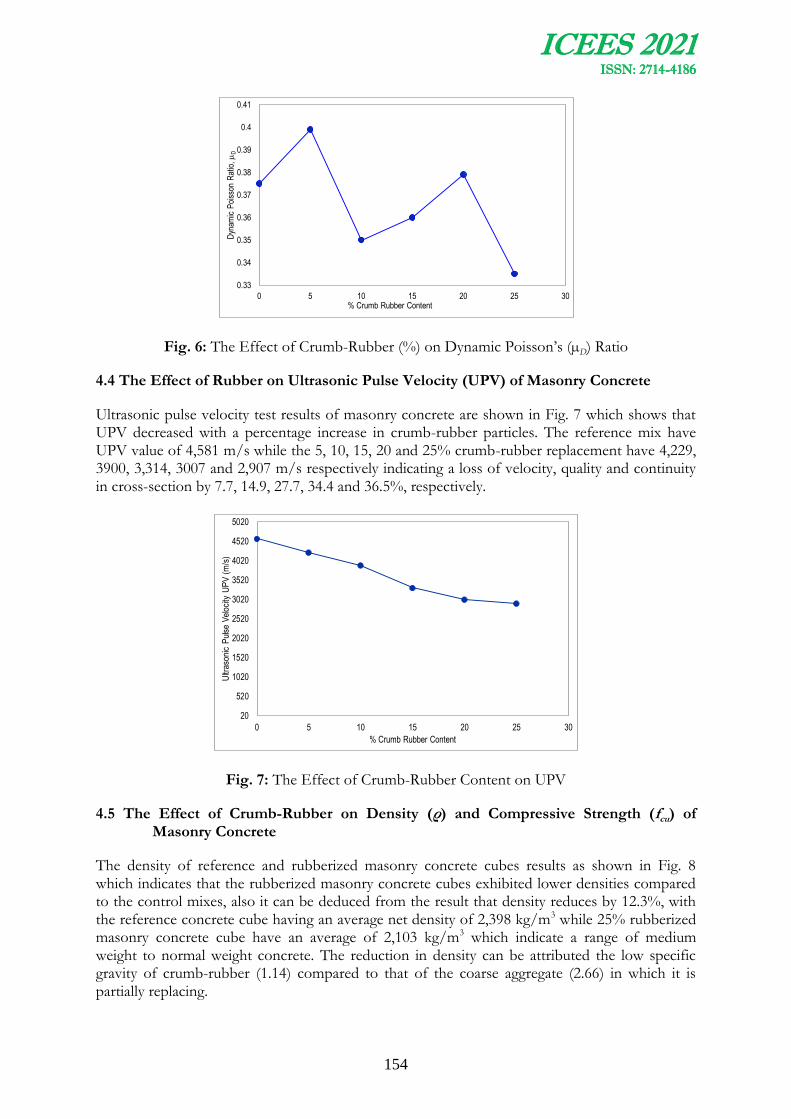
ICEES 2021 ISSN: 2714-4186
154
0.33
0.34
0.35
0.36
0.37
0.38
0.39
0.4
0.41
0 5 10 15 20 25 30
Dyn
amic
Poi
sson
Rat
io,
D
% Crumb Rubber Content
CR-CB
Fig. 6: The Effect of Crumb-Rubber (%) on Dynamic Poisson’s (µD) Ratio
4.4 The Effect of Rubber on Ultrasonic Pulse Velocity (UPV) of Masonry Concrete
Ultrasonic pulse velocity test results of masonry concrete are shown in Fig. 7 which shows that UPV decreased with a percentage increase in crumb-rubber particles. The reference mix have UPV value of 4,581 m/s while the 5, 10, 15, 20 and 25% crumb-rubber replacement have 4,229, 3900, 3,314, 3007 and 2,907 m/s respectively indicating a loss of velocity, quality and continuity in cross-section by 7.7, 14.9, 27.7, 34.4 and 36.5%, respectively.
20
520
1020
1520
2020
2520
3020
3520
4020
4520
5020
0 5 10 15 20 25 30
Ultr
ason
ic P
ulse
Vel
ocity
UP
V (
m/s
)
% Crumb Rubber Content
CR-CB
Fig. 7: The Effect of Crumb-Rubber Content on UPV
4.5 The Effect of Crumb-Rubber on Density (ρ) and Compressive Strength (fcu) of Masonry Concrete
The density of reference and rubberized masonry concrete cubes results as shown in Fig. 8 which indicates that the rubberized masonry concrete cubes exhibited lower densities compared to the control mixes, also it can be deduced from the result that density reduces by 12.3%, with the reference concrete cube having an average net density of 2,398 kg/m3 while 25% rubberized masonry concrete cube have an average of 2,103 kg/m3 which indicate a range of medium weight to normal weight concrete. The reduction in density can be attributed the low specific gravity of crumb-rubber (1.14) compared to that of the coarse aggregate (2.66) in which it is partially replacing.
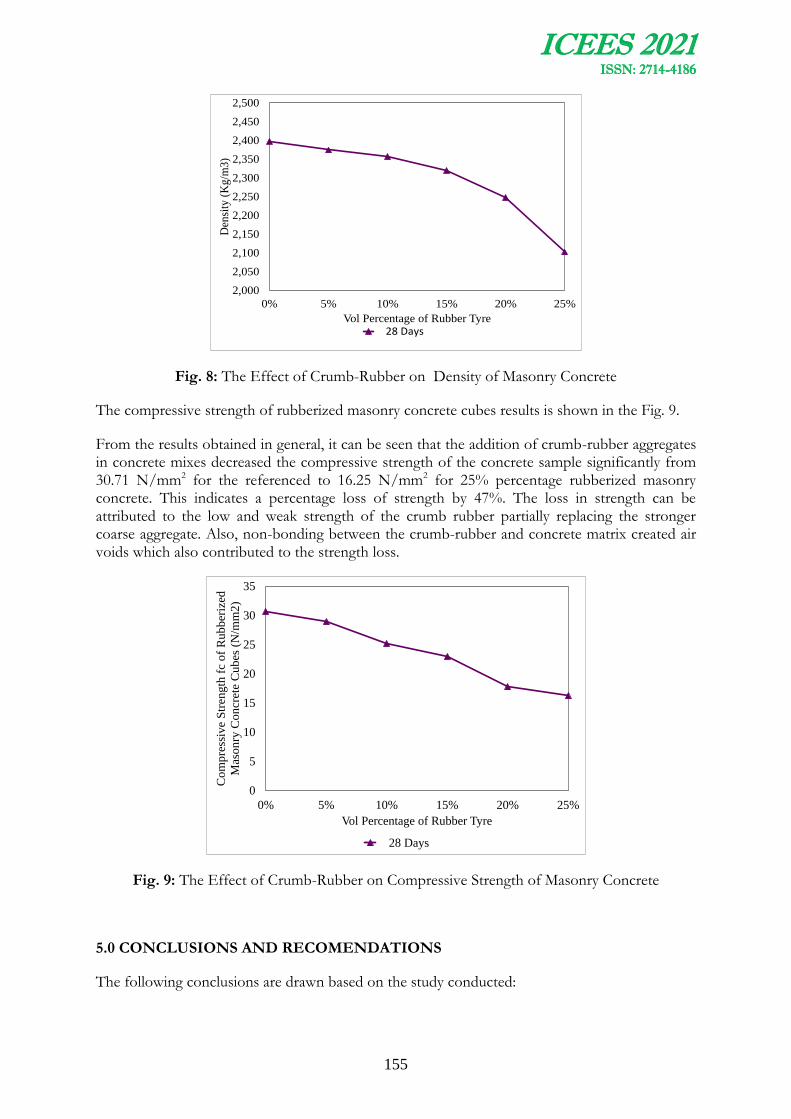
ICEES 2021 ISSN: 2714-4186
155
2,000
2,050
2,100
2,150
2,200
2,250
2,300
2,350
2,400
2,450
2,500
0% 5% 10% 15% 20% 25%
Den
sity
(K
g/m
3)
Vol Percentage of Rubber Tyre 28 Days
Fig. 8: The Effect of Crumb-Rubber on Density of Masonry Concrete
The compressive strength of rubberized masonry concrete cubes results is shown in the Fig. 9.
From the results obtained in general, it can be seen that the addition of crumb-rubber aggregates in concrete mixes decreased the compressive strength of the concrete sample significantly from 30.71 N/mm2 for the referenced to 16.25 N/mm2 for 25% percentage rubberized masonry concrete. This indicates a percentage loss of strength by 47%. The loss in strength can be attributed to the low and weak strength of the crumb rubber partially replacing the stronger coarse aggregate. Also, non-bonding between the crumb-rubber and concrete matrix created air voids which also contributed to the strength loss.
0
5
10
15
20
25
30
35
0% 5% 10% 15% 20% 25%
Co
mp
ress
ive
Str
eng
th f
c o
f R
ub
ber
ized
Mas
on
ry C
on
cret
e C
ub
es (
N/m
m2
)
Vol Percentage of Rubber Tyre
28 Days
Fig. 9: The Effect of Crumb-Rubber on Compressive Strength of Masonry Concrete
5.0 CONCLUSIONS AND RECOMENDATIONS
The following conclusions are drawn based on the study conducted:
ICEES 2021 ISSN: 2714-4186
156
1. Dynamic modulus of elasticity of masonry concrete cubes decreased from 35.10 to 26.68 GPa indicating 23.9% loss respectively with 25% crumb-rubber content. This indicates a decrease in the soundness of the concrete in terms of its durability.
2. The decrease in the dynamic modulus of elasticity can be attributed to the low modulus of elasticity of the crumb-rubber particles compared to the replaced granite, which negatively affected the overall value of the concrete elastic modulus.
3. Dynamic shear modulus of masonry concrete decreased with increase in crumb-rubber particles in a semi linear relationship. The reference mix recorded a value of 28.10 GPa while the 25% crumb-rubber content recorded 20.05 GPa indicating loss of 28.65%.
4. The dynamic Poisson ratio of masonry concrete increased to the highest value of 0.399 with 5% crumb-rubber content.
5. The ultrasonic pulse velocity (UPV) of masonry concrete cubes decreased with a percentage increase in crumb-rubber particles. The reference mix have UPV value of 4,581m/s while the 5, 10, 15, 20 and 25% crumb-rubber replacement have 4,229, 3900, 3,314, 3007 and 2,907 m/s respectively indicating a loss in velocity, quality and continuity in cross-section by 7.7, 14.9, 27.7, 34.4 and 36.5% respectively.
6. The density of masonry concrete reduced by 12.3% and the compressive strength reduced by 47% with 25% increase in crumb-rubber content after 28 days curing.
7. The quality of masonry concrete in this study is classified as ‘excellent’ for 0% crumb-rubber (CR), ‘good’ for 5% CR, ‘good’ for 10% CR, ‘questionable’ for 15% CR, ‘poor’ for 20% CR and ‘poor’ also for 25% CR.
Based on the outcome of the results obtained in this study, 5% crumb-rubber content can be considered to be the optimum for partial replacement of coarse aggregate (granite) in masonry concrete mix in other to protect the quality, durability and integrity of the concrete mix.
ACKNOWLEDGMENTS
‘‘The Authors’’ will like to acknowledge and appreciate members and staff of Structures and Concrete Laboratory of the Department of Civil Engineering, Ahmadu Bello University, Zaria for their assistance while conducting the laboratory test.
REFERENCES
Al-Mashhadani, J. (2001). Physical Properties and Impact Resistance of Rubber Tyre Waste Concrete” MSc Thesis, The University of Technology, Baghdad, Iraq.
Al-Sakini, (1998). Behaviour and Characteristics of chopped worn-out tyres lightweight concrete. MSc Thesis university of Technology, Baghdad, Iraq.
Benazzouk, A., Douzane, O., Langlet, T., Mezreb, K., Roucoult, J. M. and Quéneudec, M. (2007). Physico-mechanical properties and water absorption of cement composite containing shredded rubber wastes. Cement and Concrete Composites, 29(10): 732-740.
Benazzouk, A., Mezreb, K., Doyen, G., Goullieux, A. and Quéneudec, M. (2003). Effect of rubber aggregates on the physico-mechanical behaviour of cement-rubber composites-

ICEES 2021 ISSN: 2714-4186
157
influence of the alveolar texture of rubber aggregates. Cement and Concrete Composites.
BS 1881-Part 209:1990, Recommendations for the measurement of the dynamic modulus of elasticity. British Standard Institute, London, UK.
BS EN 12390-1:2000, Testing hardened concrete, Part 1: Shape, dimensions and other requirements for specimens and moulds. British Standards Institute London, UK.
BS EN 12390-3:2009, Testing hardened concrete: Compressive strength of test specimens. British Standard Institute., London.
BS EN 12390-7:2009, Testing hardened Concrete: Density of hardened Concrete. British Standard Institute, London.
BS EN 12504-4:2004, Testing Concrete: Determination of ultrasonic pulse velocity. British Standard Institute, London.
BS EN 197-1: 2011, Cement Composition: Specification and Conformity Criteria for Common Cements. British Standard Institute, London.
BS EN 206:2013+A1 2016, Concrete Specification: Performance, production and Conformity. British Standard Institute, London.
CP 110-1:1972, Code of Practice for the structural use of concrete: Design, materials and workmanship.
Edesker, T. (2004). Technical and Environmental Properties of tyre shreds focusing on ground engineering applications. Department of civil and mining engineering division of soil mechanics and foundation engineering Lulea University of Technology
Erdogan, S. O., Mohammed, L. and Umur. K. S. (2010). Compressive Strength Abrasion Resistance and Energy Absorption Capacity of Rubberized Concrete with and without slag.
Manual of ERUDITE (1975). Resonant frequency tester, London, UK.
Mehta, K. (1986). Concrete Structure Properties and Materials, Englewood Cliffs, New Jersey.
Mohammadi, I. (2014). Investigation on the Use of Crumb Rubber Concrete (CRC) for Rigid Pavements.
Najim, K.B. and Hall, M.R. (2012). Mechanical and dynamic properties of self-compacting crumb-rubber modified concrete. Construction and Building materials, 27(1):521-530.
Neville, A.M. (1995). Properties of Concrete, 4th Edition New York: John Wiley and Sons.
Ocholi, A., Sanni, M.Y. and Ejeh, S.P. (2018). The impact resistance effect of partially replacing coarse aggregate with ground-rubber aggregate in concrete. Nigeria Journal of Technology (NIJOTECH) pp.330-337 http://dx.doi.org/10.4314/njt.v37i2.7.

ICEES 2021 ISSN: 2714-4186
158
Solis-Carcano, R. and Moreno, E. (2008). Evaluation of concrete made with crushed limestone aggregate based on ultrasonic pulse velocity,. Construction and Building Materials, 22(6):1225-1231.
Tung, C. L. (2011). Prediction of density and compressive strength for rubberized concrete blocks. Construction and Building materials, 25(11):4303-4306.
Yang, Y. Chen, J. and Zhao, G. (2000). Technical Advance on the Pyrolysis of Used Tires in China, Dept. of Chem. Eng., Zhejiang University YuQuan Campus, Hangzhou, 310027, P.R. CHINA.
Yunping, X, Paria, M., Okpin N.A. and Yue L. (2010). Premixed Rubberized Insulation Mortar (PRIM). University of Colorado at Boulder.
Zainalabdin, R. and Al-Sammaray, M.A. (2000). Concrete non-destructive tests. Alsharqa University, Alsharqa, UAE.
Zheng, L., Sharon H. and Yuan Y. (2008a). Strength, Modulus of Elasticity, and Brittleness Index of Rubberized Concrete. Jornal of Materials in Civil Endineering 20(11): 692-699.
Zheng, L., Sharon H.X. and Yuan, Y. (2008b). Experimental investigation on dynamic properties of rubberized concrete. Construction and Building Materials, 22(5):939-947.
ICEES 2021 ISSN: 2714-4186
159
EXPERIMENTAL STUDY OF ADSORPTION OF METHYLENE BLUE SYNTHETIC WASTEWATER USING POLYMERIC
COMPOSITE AS A LOW-COST ADSORBENT
1, 2*Dauda, M.O., 1,2,3Alade, A.O., 1,2Afolabi, T.J., 1Araromi, D.O., 1Salam, K.K., 1Arinkoola, A.O., 1, 2Adeniji, A.T., 1Atolagbe, R.O. and 2 Olayiwola A.O.
1Department of Chemical Engineering, Faculty of Engineering, Ladoke Akintola University of Technology, Ogbomoso, Nigeria
2 Bioenvironmental, Water and Engineering Research Group (BWERG), Ladoke Akintola University of Technology, Ogbomoso, Nigeria
3 Science and Engineering Research Group (SAERG), Ladoke Akintola University of Technology, Ogbomoso, Nigeria
Email of Corresponding Author:: [email protected]
ABSTRACT
Methylene Blue (MB) is the most famous cationic dye. The removal of methylene blue (MB) dye from industrial waste via adsorption pathway has been widely investigated, promising high MB removal efficiency. In this work, batch adsorption experiment was carried out to remove MB from simulated water using modified Styrofoam, Intruded Expanded Polystyrene, and Sunflower Xylem “Tithonia diversifolia xylem” (TDX) as a low-cost tricomposite adsorbent. Phosphoric acid, H3PO4 (3 M) was used for chemical activation, and Simplex Centroid Design of the Design-Expert (7.1.6) software was employed to optimize the effective ratio mix of the mass composition (20–60 %) of the three samples. The polymeric composite (0.5 g) was added to 50 ml of 50 mg/l of MB solution inside 250 mL flasks. The residual dye concentration in the reaction mixture was determined using a UV-visible spectrophotometer set at a maximum wavelength of 665 nm. The MB solution's maximum Adsorption Capacity (qe) was 4.993548 mg/g, while the minimum is 4.377419 mg/g. The liner model developed for adsorption capacity gave R2 and Standard deviation 0.7063 and 2.74, respectively. The adjusted R2 from the model
was 0.6529. The model equation for the adsorption capacity is 1980.96726 + 1175.19381 +
904.56726 for Styrofoam, Intruded EPS, and TDX, respectively. The established optimum adsorption conditions of 20% of material A (Styrofoam) to 20% of material B (Intruded EPS) to 60% of material C (TDX) could be useful for large-scale adsorption of methylene blue from wastewater
Keywords: Low-cost Adsorbent, Methylene Blue, Polymeric Adsorbent, and Tithonia diversifolia xylem
1.0 INTRODUCTION
Many industrial effluents released from textile refineries, paint, paper, varnishes, ink, plastics, pulp, cosmetics, tannery, and food-processing plants are one of the key causes of water pollution since these runoffs are characterized by a perceptible content of organics with strong color (Ouissal, et al., 2020; Ali & Kamel, 2017). The release of these effluents into the environment can have an important ecological impact on ecosystems due to their strong toxicity and environmental persistence, such as foul-smelling water, discolouration, and life disruption of water ecosystems due to reduction in sunlight penetration and depletion into the water bodies.
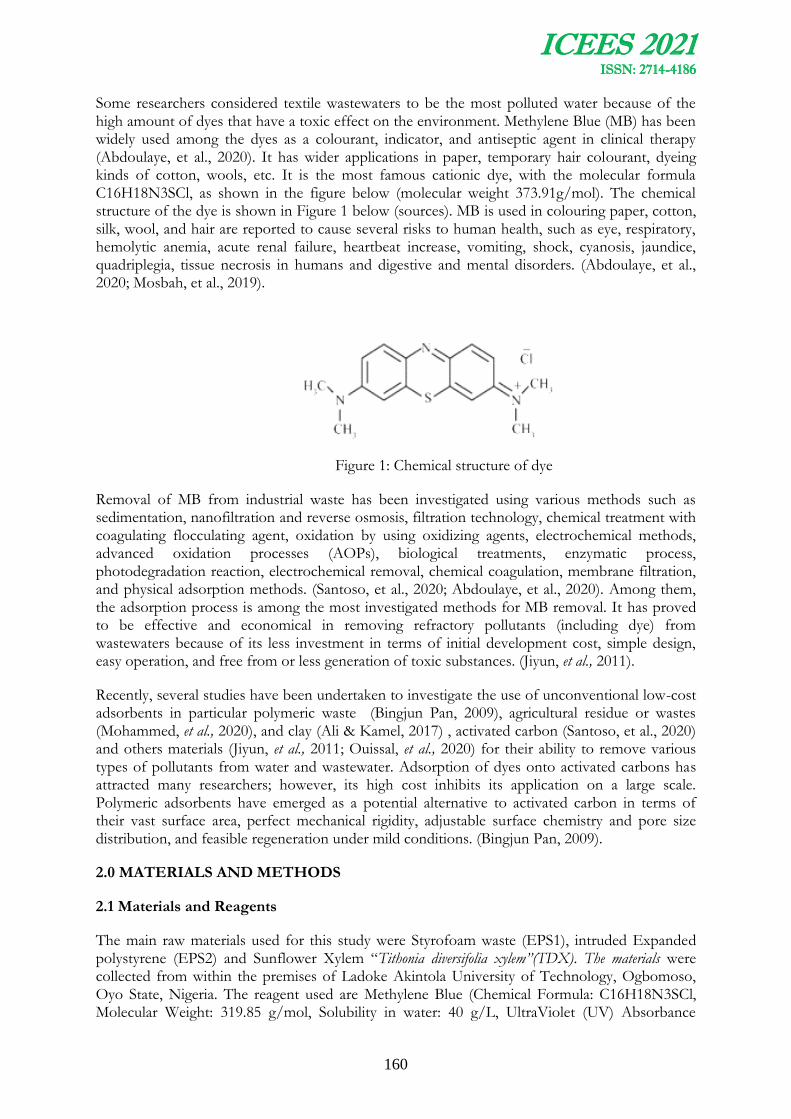
ICEES 2021 ISSN: 2714-4186
160
Some researchers considered textile wastewaters to be the most polluted water because of the high amount of dyes that have a toxic effect on the environment. Methylene Blue (MB) has been widely used among the dyes as a colourant, indicator, and antiseptic agent in clinical therapy (Abdoulaye, et al., 2020). It has wider applications in paper, temporary hair colourant, dyeing kinds of cotton, wools, etc. It is the most famous cationic dye, with the molecular formula C16H18N3SCl, as shown in the figure below (molecular weight 373.91g/mol). The chemical structure of the dye is shown in Figure 1 below (sources). MB is used in colouring paper, cotton, silk, wool, and hair are reported to cause several risks to human health, such as eye, respiratory, hemolytic anemia, acute renal failure, heartbeat increase, vomiting, shock, cyanosis, jaundice, quadriplegia, tissue necrosis in humans and digestive and mental disorders. (Abdoulaye, et al., 2020; Mosbah, et al., 2019).
Figure 1: Chemical structure of dye
Removal of MB from industrial waste has been investigated using various methods such as sedimentation, nanofiltration and reverse osmosis, filtration technology, chemical treatment with coagulating flocculating agent, oxidation by using oxidizing agents, electrochemical methods, advanced oxidation processes (AOPs), biological treatments, enzymatic process, photodegradation reaction, electrochemical removal, chemical coagulation, membrane filtration, and physical adsorption methods. (Santoso, et al., 2020; Abdoulaye, et al., 2020). Among them, the adsorption process is among the most investigated methods for MB removal. It has proved to be effective and economical in removing refractory pollutants (including dye) from wastewaters because of its less investment in terms of initial development cost, simple design, easy operation, and free from or less generation of toxic substances. (Jiyun, et al., 2011).
Recently, several studies have been undertaken to investigate the use of unconventional low-cost adsorbents in particular polymeric waste (Bingjun Pan, 2009), agricultural residue or wastes (Mohammed, et al., 2020), and clay (Ali & Kamel, 2017) , activated carbon (Santoso, et al., 2020) and others materials (Jiyun, et al., 2011; Ouissal, et al., 2020) for their ability to remove various types of pollutants from water and wastewater. Adsorption of dyes onto activated carbons has attracted many researchers; however, its high cost inhibits its application on a large scale. Polymeric adsorbents have emerged as a potential alternative to activated carbon in terms of their vast surface area, perfect mechanical rigidity, adjustable surface chemistry and pore size distribution, and feasible regeneration under mild conditions. (Bingjun Pan, 2009).
2.0 MATERIALS AND METHODS
2.1 Materials and Reagents
The main raw materials used for this study were Styrofoam waste (EPS1), intruded Expanded polystyrene (EPS2) and Sunflower Xylem “Tithonia diversifolia xylem”(TDX). The materials were collected from within the premises of Ladoke Akintola University of Technology, Ogbomoso, Oyo State, Nigeria. The reagent used are Methylene Blue (Chemical Formula: C16H18N3SCl, Molecular Weight: 319.85 g/mol, Solubility in water: 40 g/L, UltraViolet (UV) Absorbance

ICEES 2021 ISSN: 2714-4186
161
Value: 665nm), distilled water, analytical grade phosphoric acid (H3PO4) and sodium hydroxide (NaOH) purchased from Bond Chemicals, Ibadan, Oyo State, Nigeria.
2.2 Adsorbent preparation and chemical modification
The materials were washed slightly with faintly soapy (not foaming) water and rinsed with distilled water to remove the sand particles, oil and specks of dust from it. Washed materials were sun-dried until they became very dry and then underwent milling processes to reduce their surface area. The Automatic Sieve Shaker D403 and US Tyler Standard Screens were used to obtaining uniform particle diameter. Phosphoric acid, H3PO4 (3 M) was used for chemical activation with an impregnation ratio of 1:2 acid-materials for 24hrs. The adsorbents were neutralized to a pH range of 6.8 - 7.0 by rinsing it with sodium hydroxide, NaOH. Immediately after the neutralization process, the samples were filtered and drained very well. The samples were then dried under the sun; the adsorbent was ready after drying.
2.3 Characterization of the Adsorbent (SEM Images)
To observe the microscopic surface morphology changes before and after the intercalation of samples, SEM images were obtained using a Scanning electron microscopy (SEM) system. SEM is a test process that scans a sample with an electron beam to produce a magnified image for analysis. The operating voltage selection was within the range of 10–20 kV). (Mingliang, et al., 2019)
2.4 Preparation of composite adsorbent
After the preparation of the adsorbents, the three-level factorial design in the design expert software (7.1.6) was used to generate the number of the experimental run at random for selected factors. The selected factors were; mix ratio of EPS1, EPS2, and TDX ranging within (20 – 60 %) (Table 1). The experimental design information (Table 2), to attain the one with maximum efficiency from the experimental work.
Table 1: Mix ratio of EPS1, EPS2, and TDX
Component Unit Level Low High A % 20 60 B % 20 60 C % 20 60
Table 2: Experimental Design Summary
Design Summary Study Type Mixture
Initial Design Simplex Lattice Design Model Quadratic Runs 14 Blocks No Blocks

ICEES 2021 ISSN: 2714-4186
162
2.5 Preparation of MB solution
All of the Methylene blue solutions were prepared with distilled water. The Methylene blue was used without further purification. A stock solution of 1000mgl-1 was first prepared by dissolving 1.127g Methylene blue in 1000ml distilled water. The experimental solution (50mgl-1) was prepared by diluting the stock solution with distilled water. The concentration of MB was then determined at 665nm by the UV – visible spectrophotometer.
2.6 Adsorption of Methylene-blue
Adsorption experiments were then performed in a set of 250 mL flasks containing 500 mg (0.5g) of prepared adsorbent composite (0.5 g) containing EPS1, EPS2, and TDX in different ratios obtained from Design of Experiment (DOE) and 50mL of MB solution with 50 mg/L concentration. The flasks were shaken in a thermostatted rotary shaker at 180 rpm for 1 hour. The flasks were withdrawn from the shaker, and the residual dye concentration in the reaction mixture was determined using a UV-visible spectrophotometer set at a maximum wavelength of 665 nm. The experimental concentration was calculated from the standard curve with known concentrations (Figure 3). The standard curve was obtained by plotting absorbance capacity against the known concentration of methylene blue. The amount of MB adsorbed per unit
weight of adsorbent, (mg g−1), adsorption efficiency (%RE), and specific surface areas of tri
composite adsorbents were experimentally performed to determine the optimum tri composite formulation ratio.
The calculation for adsorption capacity was done using relation
(1)
Also, the percentage removal efficiency of MB in each run was calculated using the relation:
(2)
Where, is the initial concentration (mg/l) (50 mg/L), is the experimental concentration
(mg/l), V is the volume of the diluted adsorbate (L) (50 mL) and m is the mass of the composite (g) (0.5 g).
2.7 Measurement of the MB specific surface areas of composite adsorbents
The Langmuir equation was used to calculate the specific surface area of the composite mixture. The general form of Langmuir isotherm is:
(3)
Where, Y is the fraction of absorbents surface covered by adsorbed methylene blue molecules, K
is a constant, and C is the equilibrium methylene blue solution concentration (taken as ). In
this study, Y = N/Nm, where N represents the number of moles of methylene blue adsorbed per gram of absorbents composite at equilibrium concentration (taken as qe) and Nm is the number of moles of methylene blue per gram of absorbents composite required to form a monolayer. After making the substitution and rearranging Eq. (1), we obtain:

ICEES 2021 ISSN: 2714-4186
163
(4)
The specific surface area was calculated using equation (5) below:
(5)
Where is the specific surface area in 10 -3 km2 kg-1; is the number of molecules of
methylene blue adsorbed at the monolayer of fibers in kg kg-1 (or = *M); is the
occupied surface area of one molecule of methylene blue =197.2 Ų; is Avogadro’s number,
6.02 x 10²³ mol-1; and M is the molecular weight of methylene blue, 373.9 g mol-1 (Chongrak, et al., 1998).
3.0 RESULTS AND DISCUSSION
3.1 Adsorption, qe (mg g−1), adsorption efficiency (%RE), and the surface area of the composite adsorbents
The concentration of methylene blue solution at equilibrium was obtained using a standard curve by plotting absorbance capacity against concentration. Figure 2 provided a relationship between
Re and versus Run. The composition of the adsorbent composite that gave the best
adsorption capacity (mg/g) values is Run 14 of Re of 99.96774 and Qe of 4.9935 with 20% of material A (Styrofoam) to 20% of material B (Intruded EPS) to 60% of material C (TDS). The Styrofoam, Intruded EPS and Tithonia diversifolia xylem composite adsorbent developed satisfactory efficiency for methylene blue removal.
Figure 2: Relationship between Re and Qe versus Runs
3.2 Measurement of Surface Area of the Composite
The plot of C/N against C (figure 3) gives a straight line with a slope equal to 1/Nm, and intercept equal to 1/KNm. The K value was found to be -17.02. The Nm parameter was also found to be 4.4.3347 as shown in Table 4. The Coefficient of Determination (R2) is estimated as 0.9993. The R2 value of the for this model is highly significant and since the values of the surface
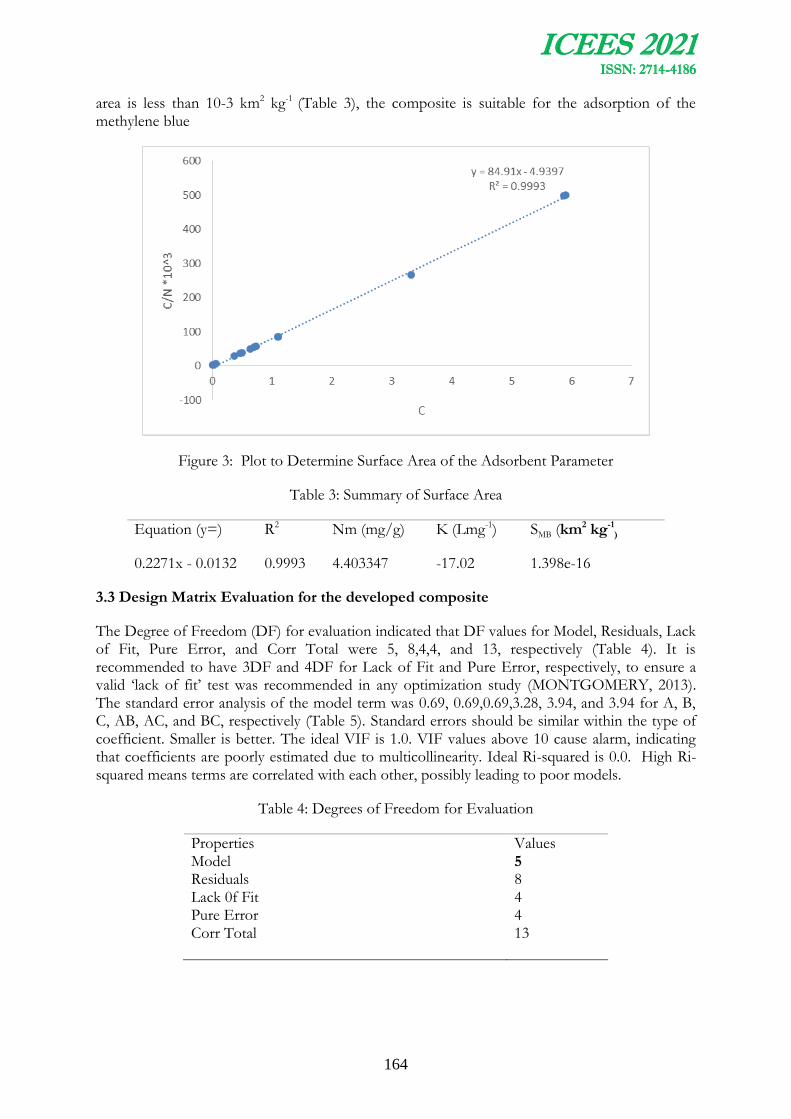
ICEES 2021 ISSN: 2714-4186
164
area is less than 10-3 km2 kg-1 (Table 3), the composite is suitable for the adsorption of the methylene blue
Figure 3: Plot to Determine Surface Area of the Adsorbent Parameter
Table 3: Summary of Surface Area
Equation (y=) R2 Nm (mg/g) K (Lmg-1) SMB (km2 kg-1)
0.2271x - 0.0132 0.9993 4.403347 -17.02 1.398e-16
3.3 Design Matrix Evaluation for the developed composite
The Degree of Freedom (DF) for evaluation indicated that DF values for Model, Residuals, Lack of Fit, Pure Error, and Corr Total were 5, 8,4,4, and 13, respectively (Table 4). It is recommended to have 3DF and 4DF for Lack of Fit and Pure Error, respectively, to ensure a valid ‘lack of fit’ test was recommended in any optimization study (MONTGOMERY, 2013). The standard error analysis of the model term was 0.69, 0.69,0.69,3.28, 3.94, and 3.94 for A, B, C, AB, AC, and BC, respectively (Table 5). Standard errors should be similar within the type of coefficient. Smaller is better. The ideal VIF is 1.0. VIF values above 10 cause alarm, indicating that coefficients are poorly estimated due to multicollinearity. Ideal Ri-squared is 0.0. High Ri-squared means terms are correlated with each other, possibly leading to poor models.
Table 4: Degrees of Freedom for Evaluation
Properties Values Model 5 Residuals 8 Lack 0f Fit 4 Pure Error 4 Corr Total 13
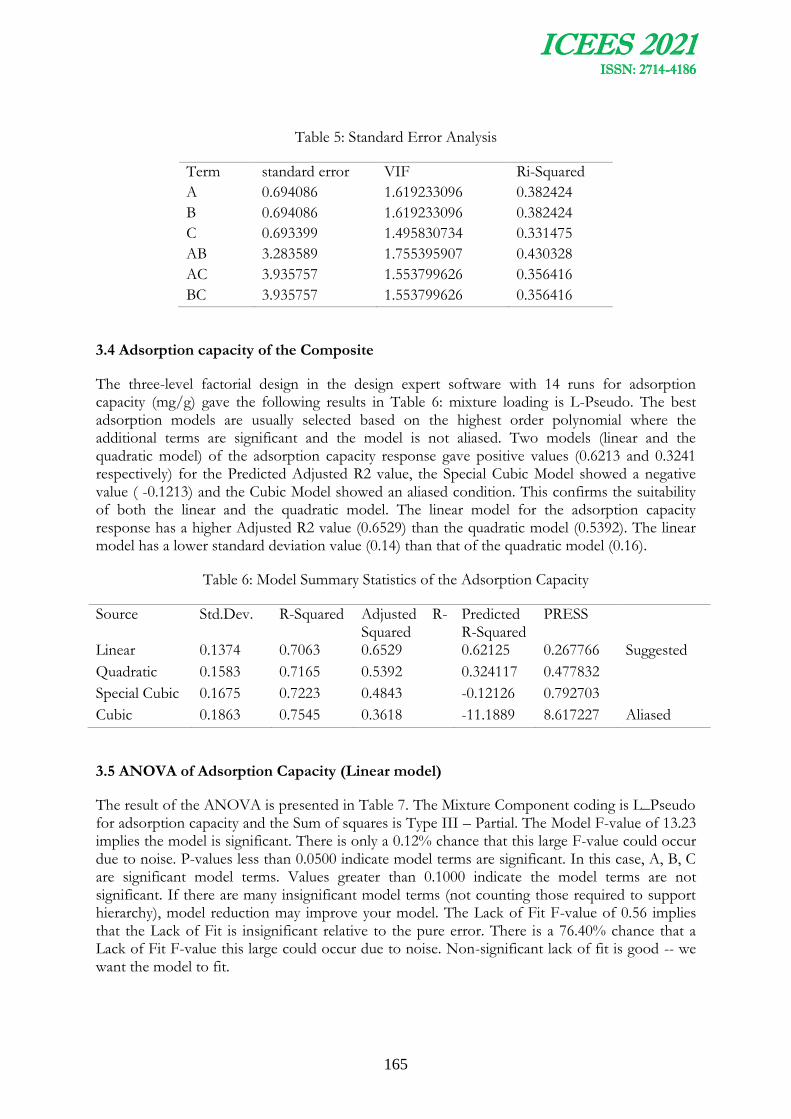
ICEES 2021 ISSN: 2714-4186
165
Table 5: Standard Error Analysis
Term standard error VIF Ri-Squared
A 0.694086 1.619233096 0.382424
B 0.694086 1.619233096 0.382424
C 0.693399 1.495830734 0.331475
AB 3.283589 1.755395907 0.430328
AC 3.935757 1.553799626 0.356416
BC 3.935757 1.553799626 0.356416
3.4 Adsorption capacity of the Composite
The three-level factorial design in the design expert software with 14 runs for adsorption capacity (mg/g) gave the following results in Table 6: mixture loading is L-Pseudo. The best adsorption models are usually selected based on the highest order polynomial where the additional terms are significant and the model is not aliased. Two models (linear and the quadratic model) of the adsorption capacity response gave positive values (0.6213 and 0.3241 respectively) for the Predicted Adjusted R2 value, the Special Cubic Model showed a negative value ( -0.1213) and the Cubic Model showed an aliased condition. This confirms the suitability of both the linear and the quadratic model. The linear model for the adsorption capacity response has a higher Adjusted R2 value (0.6529) than the quadratic model (0.5392). The linear model has a lower standard deviation value (0.14) than that of the quadratic model (0.16).
Table 6: Model Summary Statistics of the Adsorption Capacity
Source Std.Dev. R-Squared Adjusted R-Squared
Predicted R-Squared
PRESS
Linear 0.1374 0.7063 0.6529 0.62125 0.267766 Suggested
Quadratic 0.1583 0.7165 0.5392 0.324117 0.477832
Special Cubic 0.1675 0.7223 0.4843 -0.12126 0.792703
Cubic 0.1863 0.7545 0.3618 -11.1889 8.617227 Aliased
3.5 ANOVA of Adsorption Capacity (Linear model)
The result of the ANOVA is presented in Table 7. The Mixture Component coding is L_Pseudo for adsorption capacity and the Sum of squares is Type III – Partial. The Model F-value of 13.23 implies the model is significant. There is only a 0.12% chance that this large F-value could occur due to noise. P-values less than 0.0500 indicate model terms are significant. In this case, A, B, C are significant model terms. Values greater than 0.1000 indicate the model terms are not significant. If there are many insignificant model terms (not counting those required to support hierarchy), model reduction may improve your model. The Lack of Fit F-value of 0.56 implies that the Lack of Fit is insignificant relative to the pure error. There is a 76.40% chance that a Lack of Fit F-value this large could occur due to noise. Non-significant lack of fit is good -- we want the model to fit.

ICEES 2021 ISSN: 2714-4186
166
Table 7: ANOVA for Response Surface model Analysis for adsorption capacity
Source Sum of Squares Df Mean square F-Value P-Value
Model 0.4993 2 0.2497 13.23 0.0012 Linear Mixture 0.4993 2 0.2497 13.23 0.0012
Residual 0.2076 11 0.0189
Lack of Fit 0.1028 7 0.0147 0.5599 0.7640 Pure Error 0.1049 4 0.0262
Cor Total 0.7070 13
3.6 Fit Statistics for Adsorption Capacity
The Positive Predicted R² of 0.6213 is in reasonable agreement with the Adjusted R² of 0.6529; i.e. the difference is less than 0.2. A ratio greater than 4 is desirable. Your ratio of 9.007 indicates an adequate signal. This model can be used to navigate the design space. This model can be used to navigate the design space. The plot of the predicted versus actual R2 justifies the correlation coefficient R2, which shows most of the points are close to the straight line expressed in the plot (Figure 3) and Model Graphs of Component Mix Model graph (figure 4-5). Thus, this is the reason for the high value of R2.
3.7 Final Equation for Adsorption capacity in terms of the actual component
The equation in terms of actual factors can be used to make predictions about the response for given levels of each factor and the levels should be specified in the original units for each factor. The final equation derived from the statistical analysis of the experimental runs for adsorption capacity is expressed in the equation below.
Where Adq is the Adsorption Capacity (mg/g), A is the mass (g) of Styrofoam and B is the mass (g) of intruded EPS, and C is the mass (g) of TDX.
Figure 4: Plot of Predicted versus Actual values for adsorption capacity
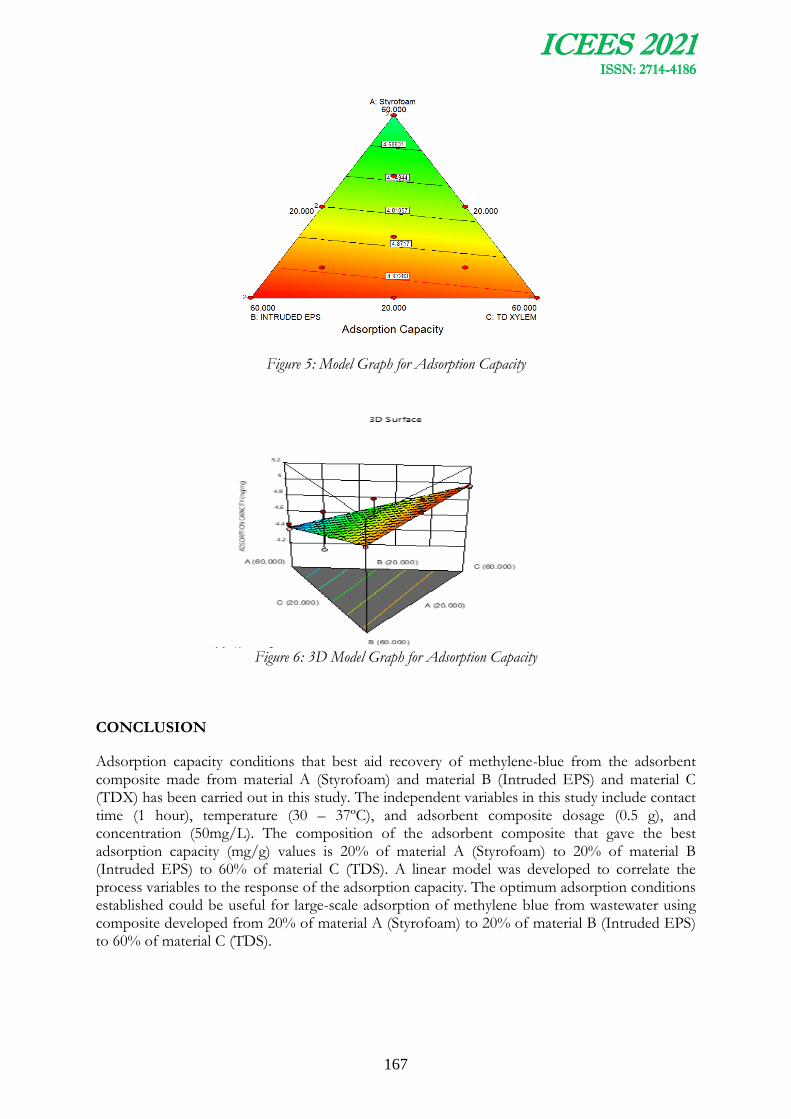
ICEES 2021 ISSN: 2714-4186
167
Figure 5: Model Graph for Adsorption Capacity
Figure 6: 3D Model Graph for Adsorption Capacity
CONCLUSION
Adsorption capacity conditions that best aid recovery of methylene-blue from the adsorbent composite made from material A (Styrofoam) and material B (Intruded EPS) and material C (TDX) has been carried out in this study. The independent variables in this study include contact time (1 hour), temperature (30 – 37ºC), and adsorbent composite dosage (0.5 g), and concentration (50mg/L). The composition of the adsorbent composite that gave the best adsorption capacity (mg/g) values is 20% of material A (Styrofoam) to 20% of material B (Intruded EPS) to 60% of material C (TDS). A linear model was developed to correlate the process variables to the response of the adsorption capacity. The optimum adsorption conditions established could be useful for large-scale adsorption of methylene blue from wastewater using composite developed from 20% of material A (Styrofoam) to 20% of material B (Intruded EPS) to 60% of material C (TDS).
ICEES 2021 ISSN: 2714-4186
168
REFERENCES
Abdoulaye, D. N., Youssef, A. E., M. A., Mostafa, S., Mohamed, S. K., & Driss, F. (2020). Adsorption of Methylene Blue from aqueous solution using Senegal River Typha australis. Mediterranean Journal of Chemistry, 10(1), 22-32. doi:http://dx.doi.org/10.13171/mjc10102001221185adn
Ali, B., & Kamel, R. (2017). Improvement adsorption capacity of methylene blue onto modified Tamazert kaolin. Adsorption Science & Technology, 35(9–10), 753–773. doi:10.1177/0263617416684835
Bingjun Pan, B. P. (2009). Development of polymeric and polymer-based hybrid adsorbents for pollutants removal from waters. Chemical Engineering Journal, 151 (2009) 19–29. doi:https://doi.org/10.1016/j.cej.2009.02.036
Chongrak, K., Eric, H., Noureddine, A., & Jean, P. G. (1998). Application of Methylene Blue Adsorption to Cotton Fiber Specific Surface Area Measurement: Part I. Methodology. The Journal of Cotton Science, 164-173. Retrieved from http://journal.cotton.org
El-Khaiary, M. I. (2008). Least-squares regression of adsorption equilibrium data: comparing the options. Journal of Hazardous Materials, 158, 1, 73–87.
Jiyun, S., Weihua, Z., Yangyang, B., Fengyun, S., & Runping, H. (2011). Adsorption characteristics of methylene blue by peanut husk in batch and column modes. Desalination, 265(1-3), 13. doi:https://doi.org/10.1016/j.desal.2010.07.041
Langmuir, I. (1916). he constitution and fundamental properties of solids and liquids. J. Am. Chem. Soc., 38, 2221–2295.
Mingliang, G., Wang, X., Mingyi, D., Liang, G., Guoqing, H., & Jahangir, A. (2019, November). Adsorption Analyses of Phenol from Aqueous Solutions Using Magadiite Modified with Organo-Functional Groups: Kinetic and Equilibrium Studies. Material, 1-16.
Mohammed, K., Noor, A., Hayder, A., & Al-Furaji, M. (2020). Removal of dyes by agricultural waste. Sustainable Chemistry and Pharmacy, 16, 1-9. doi:https://doi.org/10.1016/j.scp.2020.100259
MONTGOMERY, D. C. (2013). Design and Analysis of Experiment (Eight ed.).
Mosbah, A., Chouchane, H., Abdelwahed, S., Redissi, A., Hamdi, M., Kouidhi, S., . . . Mnif, W. (2019). Peptides fixing industrial textile Dyes : a new biochemical method in wastewater treatment. Hindawi J. Chem. 2019 (2019), 2019, 7. doi:https://doi.org/10.1155/2019/5081807
Ouissal, A., Karim, T., Morad, Z., Abdellah, A., Loubna, N., Farid, Z., & Abdelhak, K. (2020). Adsorption Studies on the Removal of Textile Effluent over Two Natural Eco-Friendly Adsorbents. Journal of Chemistry, 2020, 13. doi:https://doi.org/10.1155/2020/6457825
Santoso, E., Ediati, R., Kusumawati, Y., Bahruji, H., Sulistiono, D. O., & Prasetyoko, D. (2020). Review on recent advances of carbon based adsorbent for methylene blue removal from waste water. Materials Today Chemistry, 16. doi:100233. doi:10.1016/j.mtchem.

ICEES 2021 ISSN: 2714-4186
169
AN ASSESSMENT OF THE USE OF ELECTRONIC DOCUMENT MANAGEMENT SYSTEMS IN THE NIGERIAN CONSTRUCTION
FIRMS
Nathaniel, F.1, Lawal, F. M 1, Ibrahim, E. C1 and Bello, A. S.2
1Department of Building, Ahmadu Bello University, Zaria – Nigeria
2Department of Quantity Surveying, Ahmadu Bello University, Zaria – Nigeria
Email of Corresponding Author:: [email protected]
ABSTRACT
Electronic Document Management System (EDMS) is needed by many firms to properly manage large volumes of documents. The Nigerian construction firms are often confronted with problems associated with large document management as the Traditional method of document management has proven to be insufficient. The study assessed the benefit of electronic EDMS and the challenges associated with its usage with the view to enhancing management of large document within the Nigerian construction firms. The study adopted a quantitative research approach through the use of structured questionnaire. Findings revealed that 54.9% of the construction firms operate centralized system of organization as such, will require the use of an effective document management system such as the EDMS. The result shows that 94.4% of the documents incurred in construction projects have been largely managed electronically, but only a few numbers of these EDMS have been in used. Also, findings revealed major benefits of EDMS. These include; it saves time of file retrieval which is ranked 1st, reduces risk of information loss or misinterpretation ranked 2nd, decreases need for travelling ranked 3rd and effectively secure and manages documents and data ranked 4th. However, the study further revealed challenges of EDMS faced by firms. These include; poor internet network ranked 1st, change in technology and market ranked 2nd and expensive to maintain ranked 3rd. Based of the findings it is recommended that construction firms should engaged EDMS towards enhancing document management systems of the firms.
Keywords: Construction document, Construction firms, Document management, EDMS
1.0 INTRODUCTION
The need for managing the use, storage and creation of documents that are generated from various construction activities within the construction firms are increasingly becoming a big issue due to the complex nature of the construction firms.
According to Maqsood, Walker, and Finegan (2004) a major construction process demands heavy exchange of data and information between project participants on a daily basis, and the majority of construction process information is based upon traditional means of communication and the exchange of paper document in the form of technical drawings, specifications and site instructions. Construction documents include all building plans, specifications, and supporting documents used during the completion of a construction project. These documents serve several purposes, one of which is that it provides a comprehensive instruction to the contractor as to how the project should be constructed (Turner, 2014).
Mohammed and Stewart (2003) outlined that document management and project management are closely related together. In an information intensive project such as construction work, the

ICEES 2021 ISSN: 2714-4186
170
outcome of the project is typically dependent on the documents that describe the product to be delivered (Abdulkadhim, Bahari, Bakri, and Ismail, 2015). Document management, often referred to as Document Management Systems (DMS), is the use of a computer system and software to store, manage and track electronic documents and electronic images. A document management system can be used to capture and organize all of documents into easy-to-find electronic documents (Balogun et al., 2019).
However, Mohammed and Stewart (2003) asserted that the core issue in the drive for increased productivity in the construction firm is the effective of management information, both in the form of information flows between project participants particularly in storage, accessibility, security, retrieval and handling. Hence, it is essential for a construction firm to employ a very reliable document management system, in order to efficiently achieved optimum productivity of construction work.
In view of this, it has been observed from previous researches (Rosario, Rosario, Nieva, Tan, Tangkeko, 2016; Estrera, 2017; Balogun, Raheem, Abdulrahaman and Balogun, 2019) asserted that the traditional method of document management has proven to be insufficient, resulting to poor document management which have a serious consequence to the construction project processes. Therefore, electronic document management system needs to be employed to achieve efficiency in information/document storage and transfer.
Ayaz, and Yanartas, (2020) defined electronic document as information recorded in a manner that requires a computer or other electronic device to display, interpret, and process it. Documents that exist only in electronic form such as data stored on a computer, network, backup, archive or other storage media (Estrera, 2017). This includes documents generated by a software and stored on magnetic media (disks) or optical media (CDs, DVDs), as well as electronic mail and documents transmitted in electronic data interchange (Burtylev, Mokhun, Bodnya, and Yukhnevich, 2013)
According to Fangyu, Charles, and Yelda, (2021) the lack of utilization of electronic document management systems in the Nigerian construction firms has often resulted to resulted to inability of many firms to manage large document generated from construction activities efficiently despites the change in technology. EDMS systems such as Masterbill, SPSS, Accubuild Construction Management Software, QS Elite, MS access are mostly not known/used by construction firms, while some avoid its use because of the cost implication involved (Balogun et al., 2019).
Therefore, this paper aimed at assessing the benefit of Electronic Document Management Systems in the Nigerian construction firms with a view to enhance document management practice.
1.1 EDMS in construction firms
The nature of the construction industry is such that virtual teams are often brought together for projects before being broken apart again on completion, which leads to a very fragmented communication platform (Maqsood et al., 2004). Due to fragmentation, the exchanges of information between major players such as project managers, architects, contractors, engineers occur very frequently. In view of that, a document management system is employed since more efficient information management is a primary mechanism for the construction industry to increase its productivity (Egan 1998).
ICEES 2021 ISSN: 2714-4186
171
According to Honkenan (1992), organizations need a complete record of its past and present and a way of keeping important information for future use. The goal of documents management is to share information by making documents secure, accessible, retrievable and interchangeable via the use of Electronic Document Management Systems (Tutty, Rosa, Pustokhina, Lydia, Shankar, and Huda, 2019).
1.2 Benefits of EDMS
According to Fangyu, et al., (2021) efficient document management software for construction has become of great help to the increasingly international nature of the project. A document management system would not only save money on printing and organizing information, it would also reduce mistakes and the Request for Information (RFI) during the construction phase. The managers on-site would spend less time organizing information and change orders, and could instead concentrate on administrating activities and the client would also benefit from increased productivity (Turner, 2014). Also, fully automated system can actually help keep administrative costs down and this is possible due to the streamlined procedure used for document delivery and ease of retrieval. Files can be managed in bulk with a low chance of errors occurring, and most document management servers provide some form of file encryption to ensure the security of sensitive information (Estrera, 2017).
2.0 Research Methodology
For the purpose of this study, quantitative research design was adopted. This involves the generation of data in quantitative form which can be subjected to rigorous quantitative analysis in a formal and rigid fashion. It begins by reviewing relevant literature from journals, textbooks, conference papers, research papers and publications so as to obtain the background knowledge of Electronic Document Management. The data collected from structured questionnaire was used to determine impact of EDMS to construction firms in terms of its benefits and challenges involve in its implementation.
The study sample 90 construction firms of all levels in Kaduna state and F.C.T Abuja, which happen to be among the states with quite a number of construction firms 71 of which responded adequately consisting up to 79% of the targeted construction firms. Questionnaire was distributed using random sampling method to construction firms in F.C.T Abuja (40) and Kaduna state (50) because of its proximity, accessibility and financial constraint. The instrument for the study requested respondent to provide background information about their firm. The questionnaire comprised of four parts. Part 1 sought the background information. Part 2 gives information about the project handled. Part 3 captures the benefits of electronic document management systems (EDMS) in the respective firms. Part 4 challenges of EDMS in construction firms.
Ninety questionnaires were administered to all levels of building construction firms with the questionnaires being completed by their representatives, of which71 firms responded adequately consisting of up to 79% of the targeted construction firms. The response is considered to be adequate which can be attributed to the follow up efforts made. A descriptive analysis was conducted with the collected data from the returned questionnaire using Statistical Product and Services Solution (SPSS) software. And the results from analysis were presented in charts and tables.
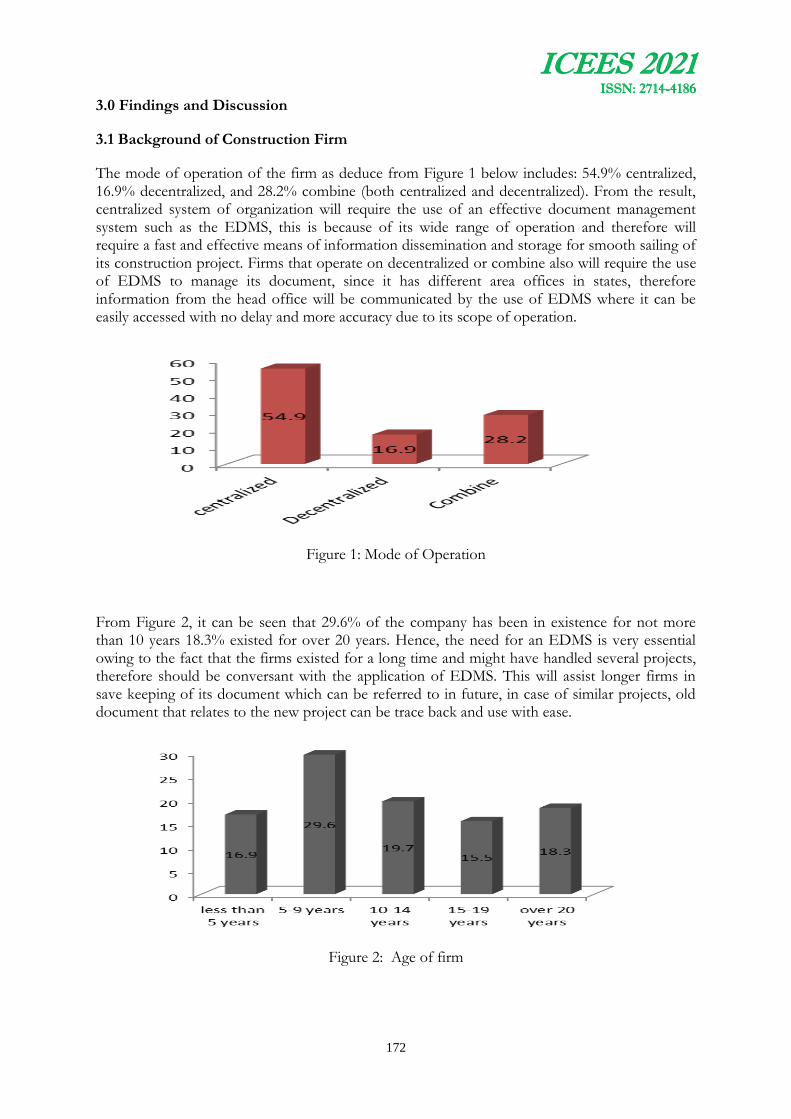
ICEES 2021 ISSN: 2714-4186
172
3.0 Findings and Discussion
3.1 Background of Construction Firm
The mode of operation of the firm as deduce from Figure 1 below includes: 54.9% centralized, 16.9% decentralized, and 28.2% combine (both centralized and decentralized). From the result, centralized system of organization will require the use of an effective document management system such as the EDMS, this is because of its wide range of operation and therefore will require a fast and effective means of information dissemination and storage for smooth sailing of its construction project. Firms that operate on decentralized or combine also will require the use of EDMS to manage its document, since it has different area offices in states, therefore information from the head office will be communicated by the use of EDMS where it can be easily accessed with no delay and more accuracy due to its scope of operation.
Figure 1: Mode of Operation
From Figure 2, it can be seen that 29.6% of the company has been in existence for not more than 10 years 18.3% existed for over 20 years. Hence, the need for an EDMS is very essential owing to the fact that the firms existed for a long time and might have handled several projects, therefore should be conversant with the application of EDMS. This will assist longer firms in save keeping of its document which can be referred to in future, in case of similar projects, old document that relates to the new project can be trace back and use with ease.
Figure 2: Age of firm
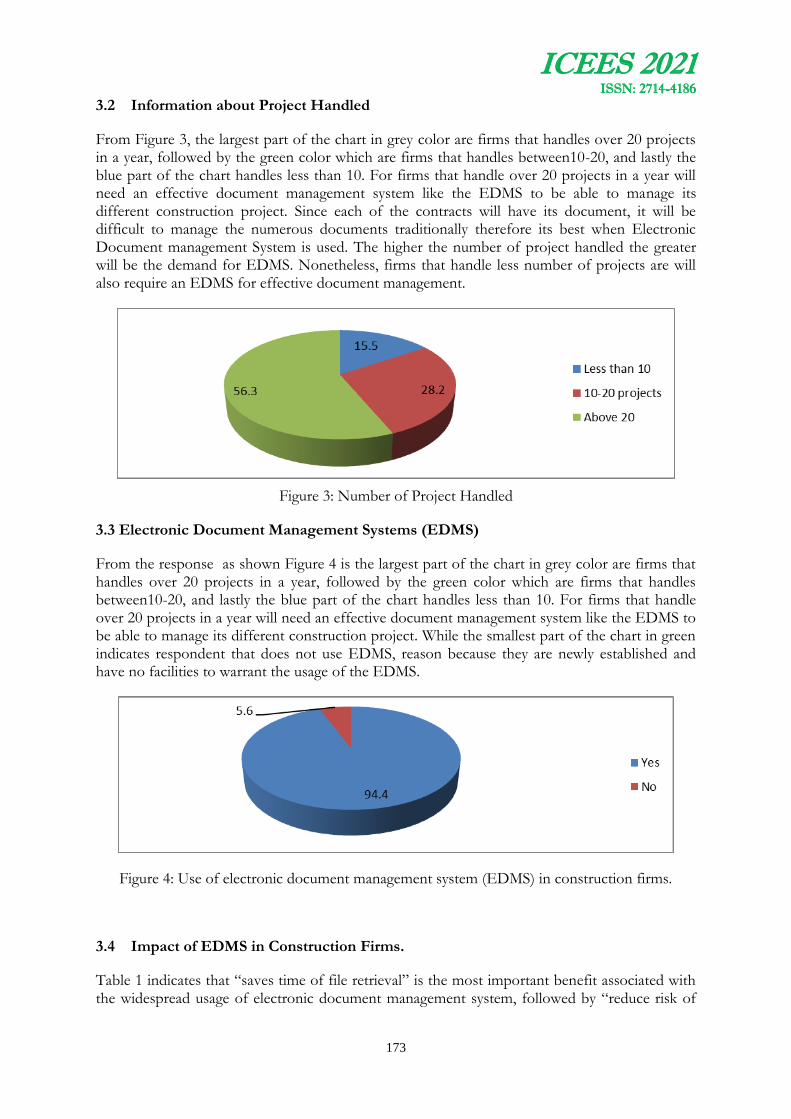
ICEES 2021 ISSN: 2714-4186
173
3.2 Information about Project Handled
From Figure 3, the largest part of the chart in grey color are firms that handles over 20 projects in a year, followed by the green color which are firms that handles between10-20, and lastly the blue part of the chart handles less than 10. For firms that handle over 20 projects in a year will need an effective document management system like the EDMS to be able to manage its different construction project. Since each of the contracts will have its document, it will be difficult to manage the numerous documents traditionally therefore its best when Electronic Document management System is used. The higher the number of project handled the greater will be the demand for EDMS. Nonetheless, firms that handle less number of projects are will also require an EDMS for effective document management.
Figure 3: Number of Project Handled
3.3 Electronic Document Management Systems (EDMS)
From the response as shown Figure 4 is the largest part of the chart in grey color are firms that handles over 20 projects in a year, followed by the green color which are firms that handles between10-20, and lastly the blue part of the chart handles less than 10. For firms that handle over 20 projects in a year will need an effective document management system like the EDMS to be able to manage its different construction project. While the smallest part of the chart in green indicates respondent that does not use EDMS, reason because they are newly established and have no facilities to warrant the usage of the EDMS.
Figure 4: Use of electronic document management system (EDMS) in construction firms.
3.4 Impact of EDMS in Construction Firms.
Table 1 indicates that “saves time of file retrieval” is the most important benefit associated with the widespread usage of electronic document management system, followed by “reduce risk of
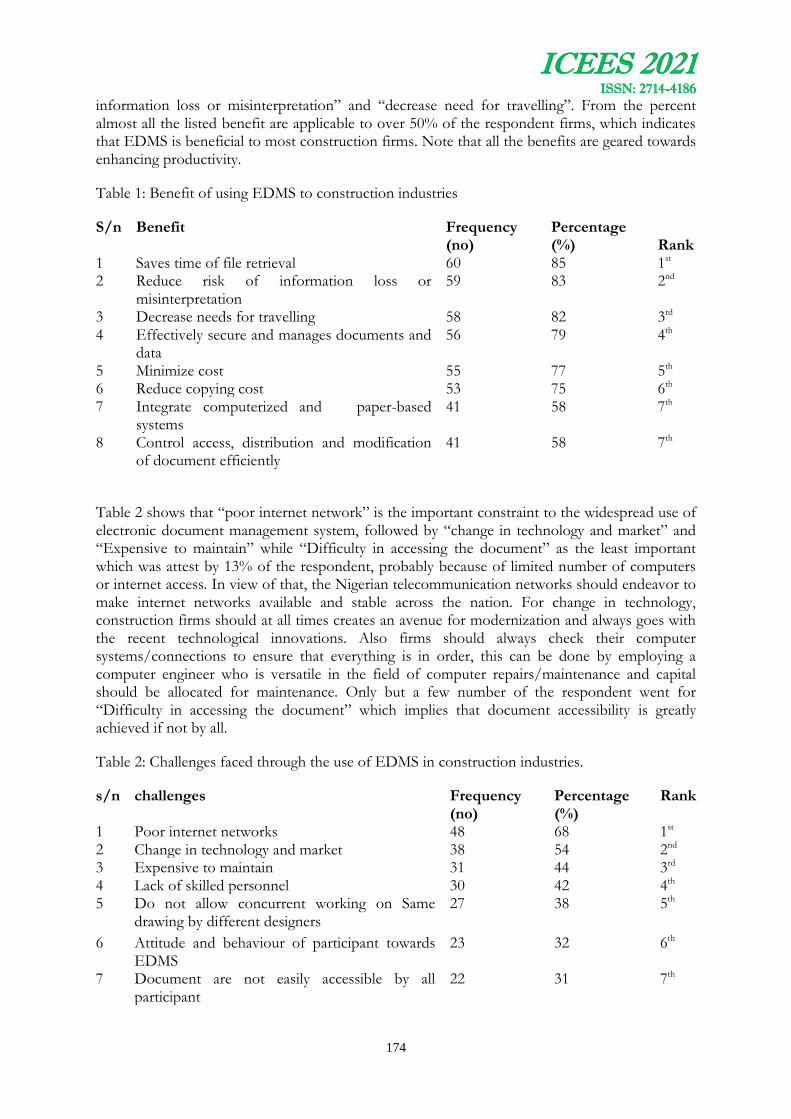
ICEES 2021 ISSN: 2714-4186
174
information loss or misinterpretation” and “decrease need for travelling”. From the percent almost all the listed benefit are applicable to over 50% of the respondent firms, which indicates that EDMS is beneficial to most construction firms. Note that all the benefits are geared towards enhancing productivity.
Table 1: Benefit of using EDMS to construction industries
S/n Benefit Frequency (no)
Percentage (%)
Rank
1 Saves time of file retrieval 60 85 1st 2 Reduce risk of information loss or
misinterpretation 59 83 2nd
3 Decrease needs for travelling 58 82 3rd 4 Effectively secure and manages documents and
data 56 79 4th
5 Minimize cost 55 77 5th 6 Reduce copying cost 53 75 6th 7 Integrate computerized and paper-based
systems 41 58 7th
8 Control access, distribution and modification of document efficiently
41 58 7th
Table 2 shows that “poor internet network” is the important constraint to the widespread use of electronic document management system, followed by “change in technology and market” and “Expensive to maintain” while “Difficulty in accessing the document” as the least important which was attest by 13% of the respondent, probably because of limited number of computers or internet access. In view of that, the Nigerian telecommunication networks should endeavor to make internet networks available and stable across the nation. For change in technology, construction firms should at all times creates an avenue for modernization and always goes with the recent technological innovations. Also firms should always check their computer systems/connections to ensure that everything is in order, this can be done by employing a computer engineer who is versatile in the field of computer repairs/maintenance and capital should be allocated for maintenance. Only but a few number of the respondent went for “Difficulty in accessing the document” which implies that document accessibility is greatly achieved if not by all.
Table 2: Challenges faced through the use of EDMS in construction industries.
s/n challenges Frequency (no)
Percentage (%)
Rank
1 Poor internet networks 48 68 1st 2 Change in technology and market 38 54 2nd 3 Expensive to maintain 31 44 3rd 4 Lack of skilled personnel 30 42 4th 5 Do not allow concurrent working on Same
drawing by different designers 27 38 5th
6 Attitude and behaviour of participant towards EDMS
23 32 6th
7 Document are not easily accessible by all participant
22 31 7th

ICEES 2021 ISSN: 2714-4186
175
8 Waste effort in converting paper document to electronic format
22 31 8th
9 Difficulty to change organizational process to meet the EDMS requirement
18 25 9th
10 Difficulty in accessing document 9 13 10th
4.0 Conclusion and Recommendation
Electronic Document Management Systems are basically able to solve large parts of the document management problem of construction firms. They provide powerful features including conversion of documents into digital form (capture), adequate storage of document, ability to search for documents (full text or index search), security features, workflow and provide output (view, email, fax, print). The used of EDMS has contributed greatly to the management of construction document in firms. Its benefits which includes; saving time of file retrieval when needed by participant or by the firm, reduces the risk involved through information loss and misinterpretation, decreases the need for travelling a long distance to deliver an information etc.
The implementation of various technologies typically produces a considerable amount of digital data for construction sector; therefore, it is desirable to have electronic document management (EDM) systems to promote efficient data-sharing among stakeholders. Awareness on the benefit/application of EDMS should be organized, in order to enlighten Nigerian construction firms on the need for an effective document management system (EDMS). Training should be organized in construction firms on the use of EDMS by professionals in order to improve on the firm’s skilled personnel.
References
Abdulkadhim, H., Bahari, M., Bakri, A., and Ismail, W. (2015). A research framework of electronic document management systems (EDMS) implementation process in government. Journal of Theoretical and Applied Information Technology, 81 (3) 420-431.
Ayaz, A., and Yanartas, M. (2020). Computers in Human Behavior Reports An analysis on the unified theory of acceptance and use of technology theory (UTAUT): Acceptance of electronic document management system (EDMS). Computers in Human Behavior Reports 2.
Burtylev, I.N., Mokhun, K.V., Bodnya, Y.V. and Yukhnevich, D.N. (2013). Development of Electronic Document Management Systems: Advantage and Efficiency. Journal of Science and Technology, 1(9), 23-42.
Balogun, N. A., Raheem, L. A., Abdulrahaman, M. D., and Balogun, U. O. (2019). Adoptability of Electronic Document Management System in Ilorin Businesses. Nigerian Journal of Technology (NIJOTECH), 38(3), 707–715.
Egan, J. (1998). Rethinking Construction, Report of the Construction Task Force on the Scope for Improving the Quality and Efficiency of the UK Construction Industry, Department of Environment, London.
Estrera, P. J. M. (2017). Electronic Document Management System for Higher Education Institution. International Journal of Innovative Science and Research Technology, 2(5)549-556.

ICEES 2021 ISSN: 2714-4186
176
Fangyu, G., Charles, T. J. and Yelda, T. (2021). Electronic Document Management Systems for the Transportation Construction Industry, International Journal of Construction Education and Research, 17 (1) 52-67.
Honkanen, L.R. (1992). The role of records and information management in improving the productivity of business. Inform, 6(10) November: 42-45.
Maqsood, T., Walker, D.H.T. & Finegan, A.D. (2004). An Investigation of ICT Diffusion in an Australian Construction Contractor Company Using SSM, Proc. of the joint CIB-W107 and CIB-TG23 Symposium on Globalization and Construction, Bangkok, Thailand, 17-19 November, 485-495.
Mohamed, S. & Stewart, R.A. (2003). An Empirical Investigation of Users’ Perceptions of Web-based Communication on a Construction Project, Automation in Construction, 12, 43-53.
Rosario, E., Rosario, J., Nieva, M., Tan, T., & Tangkeko, M. (2016). Collaborate IT : A CCS IT Thesis Portal with Electronic Document Management System. A conference paper presented at the DLSU Research Congress 2016. 4, 4–9.
Tutty, A., Rosa, R., Pustokhina, I. V., Lydia, E. L., Shankar, K., and Huda, M. (2019). Concept of Electronic Document Management System (EDMS) as an Efficient Tool for Storing Document. Journal of Critical Reviews, 6(5), 85–90.
Turner, B. (2014). What Are Construction Document. Retrieved from http://www.wisegeek.org/what-are-construction-documents.htm.
ICEES 2021 ISSN: 2714-4186
177
MANAGEMENT OF PUBLIC OPEN SPACES IN OSOGBO, OSUN STATE NIGERIA.
Ajayi. A. O. and Alonge.A. I.
Department of Urban and Regional Planning, Osun State University,Osogbo.
* Email of Corresponding Author:: [email protected]
ABSTRACT
The aim of this study was to evaluate the management of open spaces in the study area with a view to improving the quality and usage of open spaces. The study took an inventory of the open spaces in the residential neighbourhoods of Osogbo and analyzed the management practices employed. Two densely populated residential neighbourhoods were purposively selected ( Alekuwodo and Isale-Osun). Having estimated the number of households, systematic random sampling was used to select 1% of the households. Data were obtained primarily through the use of questionnaire, observation guides, photographic materials and interviews guide. Data analysis was done using descriptive analysis to generate frequencies and percentages on socio-economic profile, maintenance practices and factors affecting open space management. Findings show that lack of proper maintenance was an issue of concern as indicated by 64% of the respondents. Furthermore, mowing and trimming of greenery, waste removal, litter pick up and tree maintenance were some of the prevalent practices observed in the study area. Results also reveals that 49% of respondents reported that open spaces were being neglected because there was no specific agency of government saddled with their maintenance. The study concludes that open space is an essential part of any urban development and serves several functions that are expedient for basic living. It also concluded that a comprehensive plan will be the best option for decision to revitalize many parts of the study areas rather than the piece meal planning approach often engaged in by the government.
Keywords: Management, Open Spaces, Residential Neighbourhood
1.0 BACKGROUND TO THE STUDY
The utility of Public Open spaces for urban planners can be seen through many lenses ( Van Leeuwen et al., 2010). Some scholars opine that Public Open Spaces (POS) are multi-functional and encompass all unbuilt land within rural or urban landscapes, and they have also been reported to be essential for the well-being of residents and societies(Cox et al,2017;Ferdous,2013). According to Officha, et al.,(2013), well maintained POS can improve the sense of identity of a neighbourhood, help create community spirit, and improve the image of an area. Moreover, POS help build and strengthen ties within communities by bringing people together, including those who may otherwise be separated by ethnic or social background. In addition, POS can have a positive impact on physical and mental well-being as they provide spaces to meet, interact, exercise and relax (Pitas et al.,2017).
Therefore, appropriately-designed, properly located and well maintained POS are needed to improve the quality of the residential environment and encourage outdoor recreation. In the same way, well-designed and maintained public spaces help lower rates of crime and violence and make space for formal and informal social, cultural and economic activities that contribute to improving mutual trust and safety (Özdemirand Polat,2014). In a study conducted in 2015, Lee et al., asserts that neighborhood environmental decay in rundown areas negatively affects residents’ sense of security and heightens perceptions (and possibly the incidence) of crime.

ICEES 2021 ISSN: 2714-4186
178
Similarly, in many cities some public spaces are not maintained but left derelict, their vibrancy and potential are lost.
The challenge to maintain public spaces is the responsibility of government, but there is also a role for the citizens, communities and private sector(Buenos Aires 2014). Public space lends itself well to participatory approaches, because access and participation in public space is a first step toward civic empowerment. Public space creation, protection, management and enjoyment are ideal opportunities for the involvement of all citizens, ensuring that individual and differentiated interests are transformed into collaborative practices(UN-Habitat, 2015). Globally, planning and management of POS is significant from the aspect of sustainable urban development (Özdemirand Polat,2014; Shah,2011). Given the significance of POS in achieving sustainable environment, the development and management of open spaces is very important, since almost half of the world population now live in urban areas.
However, studies indicate that the provision of public open space in low socio-economic neighbourhoods is extremely poor regardless of the Global North or South classifications. Many of such neighbourhoods are either lacking public open spaces or those that are available are of poor quality. Open spaces that are provided are typically non-green spaces, thereby depriving such communities of more natural public open spaces (Astell-Burt et al.,2013; Vaughan et al. 2013).
With respect to previous research on open space management in residential areas, it could be claimed that the diversity and complexity of the issue have to a large extent been neglected. Studies have usually focused on rather well-organised and well established self-management groups, ignoring numerous processes that are of a more spontaneous and/or temporary character (Lindgren and Castell,2008;Castell, 2006). The absence of specific and significant studies on POS management within the Nigerian setting validated this study. Consequently, evaluating and exploring the management of POS in high-density( low-income) residential areas can offer valuable insights for landscape studies research, especially from a developing nation context.
2.0 STUDY SETTINGS
The study area is Osogbo the capital city of Osun State, which is one of the thirty six states in Nigeria. It is located between latitude 7º46’N, longitude 4º34’W and 7.767ºN, 4.567ºE. Osogbo has two local government areas (Osogbo and Olorunda Local Governments) (Figure 1). Based on the 2006 census (provisional result) the population of Osogbo is about 156,694 people (Peter, 2011).Preliminary survey across the city led to the identification of different categories of open spaces in the neighbourhoods. This study considered and assessed public amenity or incidental open spaces, school playgrounds, public parks, heritage site and gardens from selected neighbourhoods in Osogbo (Figures 2&3).
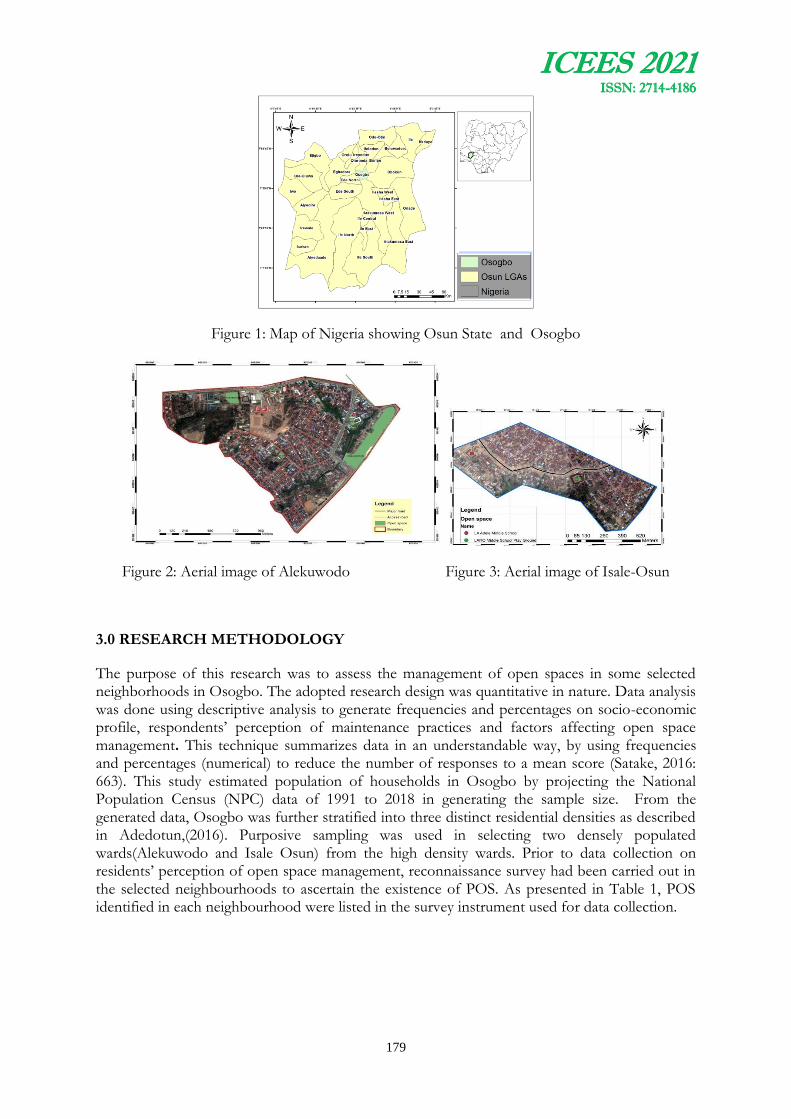
ICEES 2021 ISSN: 2714-4186
179
Figure 1: Map of Nigeria showing Osun State and Osogbo
Figure 2: Aerial image of Alekuwodo Figure 3: Aerial image of Isale-Osun
3.0 RESEARCH METHODOLOGY
The purpose of this research was to assess the management of open spaces in some selected neighborhoods in Osogbo. The adopted research design was quantitative in nature. Data analysis was done using descriptive analysis to generate frequencies and percentages on socio-economic profile, respondents’ perception of maintenance practices and factors affecting open space management. This technique summarizes data in an understandable way, by using frequencies and percentages (numerical) to reduce the number of responses to a mean score (Satake, 2016: 663). This study estimated population of households in Osogbo by projecting the National Population Census (NPC) data of 1991 to 2018 in generating the sample size. From the generated data, Osogbo was further stratified into three distinct residential densities as described in Adedotun,(2016). Purposive sampling was used in selecting two densely populated wards(Alekuwodo and Isale Osun) from the high density wards. Prior to data collection on residents’ perception of open space management, reconnaissance survey had been carried out in the selected neighbourhoods to ascertain the existence of POS. As presented in Table 1, POS identified in each neighbourhood were listed in the survey instrument used for data collection.
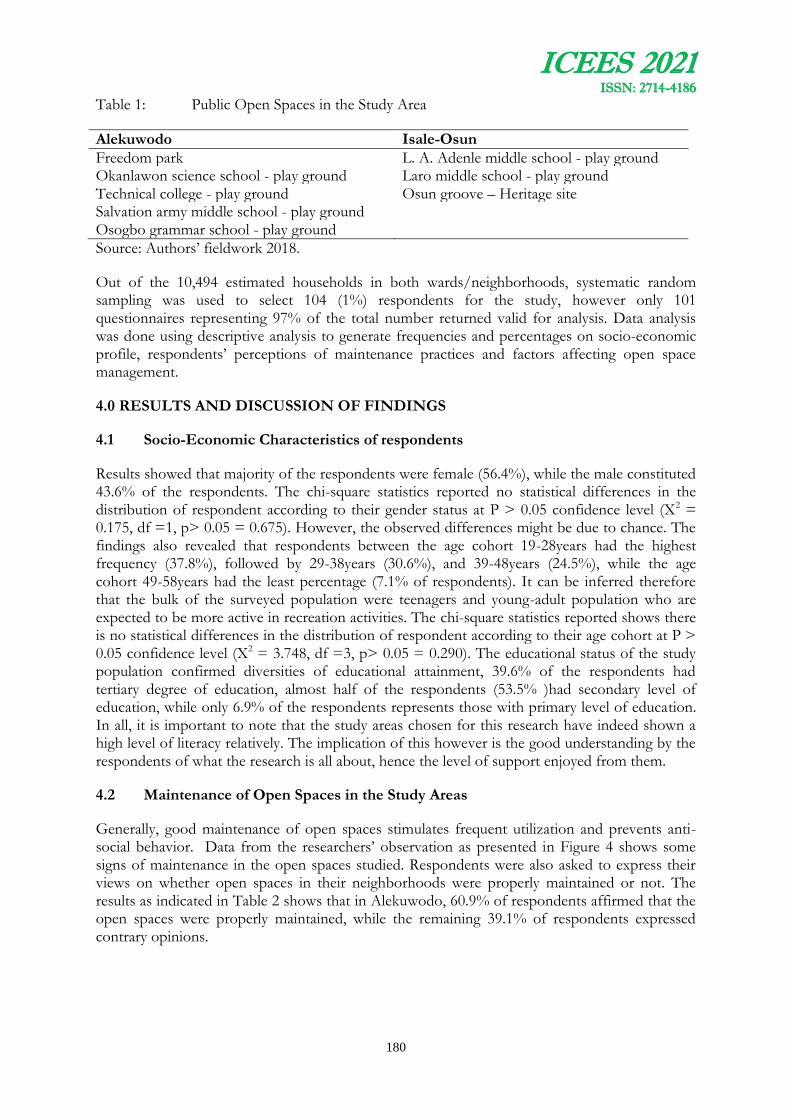
ICEES 2021 ISSN: 2714-4186
180
Table 1: Public Open Spaces in the Study Area
Alekuwodo Isale-Osun
Freedom park L. A. Adenle middle school - play ground Okanlawon science school - play ground Laro middle school - play ground Technical college - play ground Osun groove – Heritage site Salvation army middle school - play ground Osogbo grammar school - play ground
Source: Authors’ fieldwork 2018.
Out of the 10,494 estimated households in both wards/neighborhoods, systematic random sampling was used to select 104 (1%) respondents for the study, however only 101 questionnaires representing 97% of the total number returned valid for analysis. Data analysis was done using descriptive analysis to generate frequencies and percentages on socio-economic profile, respondents’ perceptions of maintenance practices and factors affecting open space management.
4.0 RESULTS AND DISCUSSION OF FINDINGS
4.1 Socio-Economic Characteristics of respondents
Results showed that majority of the respondents were female (56.4%), while the male constituted 43.6% of the respondents. The chi-square statistics reported no statistical differences in the distribution of respondent according to their gender status at P > 0.05 confidence level (X2 = 0.175, df =1, p> 0.05 = 0.675). However, the observed differences might be due to chance. The findings also revealed that respondents between the age cohort 19-28years had the highest frequency (37.8%), followed by 29-38years (30.6%), and 39-48years (24.5%), while the age cohort 49-58years had the least percentage (7.1% of respondents). It can be inferred therefore that the bulk of the surveyed population were teenagers and young-adult population who are expected to be more active in recreation activities. The chi-square statistics reported shows there is no statistical differences in the distribution of respondent according to their age cohort at P > 0.05 confidence level (X2 = 3.748, df =3, p> 0.05 = 0.290). The educational status of the study population confirmed diversities of educational attainment, 39.6% of the respondents had tertiary degree of education, almost half of the respondents (53.5% )had secondary level of education, while only 6.9% of the respondents represents those with primary level of education. In all, it is important to note that the study areas chosen for this research have indeed shown a high level of literacy relatively. The implication of this however is the good understanding by the respondents of what the research is all about, hence the level of support enjoyed from them.
4.2 Maintenance of Open Spaces in the Study Areas
Generally, good maintenance of open spaces stimulates frequent utilization and prevents anti-social behavior. Data from the researchers’ observation as presented in Figure 4 shows some signs of maintenance in the open spaces studied. Respondents were also asked to express their views on whether open spaces in their neighborhoods were properly maintained or not. The results as indicated in Table 2 shows that in Alekuwodo, 60.9% of respondents affirmed that the open spaces were properly maintained, while the remaining 39.1% of respondents expressed contrary opinions.

ICEES 2021 ISSN: 2714-4186
181
Figure 4: Physical condition of some of the open spaces in the study area.
Source: Authors’ fieldwork, 2018.
The perception of residents in Isale-Osun was different because only 14% respondents considered that the open spaces were properly maintained, while 86% affirmed that the open spaces lacked periodic maintenance. The results from observation checklist also corroborated the views expressed by the majority of the respondents that the open spaces were not properly maintained. The authors also observed that the extent of vandalism, litter, unkempt plants was higher in Isale-osun than Alekuwodo. This might be responsible for the presence of drug users and other illegitimate users seen in the POS at Isale-Osun. A previous study has suggested that open spaces lacking maintenance and the presence of security measures can be inhabited by the homeless and street urchins(Sreetheran and VandenBosch 2014). Anti-social behaviour such as harassment (racial and otherwise), verbal abuse, bullying, noise, intimidating dogs and people, littering, graffiti and vandalism are likely to be experienced . In addition, residents who perceived open spaces as risky and unsafe may show withdrawal tendencies which will ultimately prevent them from tapping into the positive effects open spaces offer (Wheater et.al., 2007).
Table 2: Maintenance of Open Spaces in the Study Area
Maintenance of the open space Alekuwodo Isale-Osun Total
Yes 28(60.9%) 7(14%) 35(36.5%) No 18(39.1%) 43(86%) 61(63.5%)
Total 46(100%) 50(100%) 96(100%)
Residents’ opinion on who should maintain open spaces
This section further describes the three main aspects of organisational structure, and also provides a presentation of the frequency and distribution of different managerial structures among the open spaces studied. Residents were asked to choose their most preferable method for managing open spaces in their neighborhoods. Table 3 presents respondents most desirable approach in maintain their open spaces. Results showed that 53.5% of the respondents wanted

ICEES 2021 ISSN: 2714-4186
182
government agencies to take charge of the maintenance the open spaces, but approximately a quarter of the respondents(25.6%) felt that private organizations or contractors should perform the maintenance, while the remaining 20.9% opined that community and self-initiative were the best methods of preventing open spaces from sliding into decay. The predominance of respondents waiting on government to maintain open space may explain the high proportion of unsafe or poorly maintained open spaces in the city.
It therefore goes without saying that residents in the study area are missing out on the social integration potential of public open spaces because a key benefit of high-quality public space is its potential as a venue for social events. Well managed events can have a substantial positive effect on the urban environment, drawing the community together and bringing financial, social and environmental benefits. To reverse this trend, relevant government agencies are encouraged to embrace public participation in open space development. Non-governmental, private and public sectors as well as citizens of all ages should be involved in planning and implementing initiatives to encourage active living and maintenance of public spaces.
Table 3: Respondents’ opinion on who should maintain open spaces
Alekuwodo Isale-Osun Total
Government 21(63.6%) 2(20.0%) 23(53.5%) Private Agency(contractor) 8(24.2%) 1(10.0%) 9(20.9%) Self (Individual/Community) 4(12.1%) 7(70.0%) 11(25.6%) Total 33(100%) 10(100%) 43(100%)
Source: Author’s fieldwork 2018.
Nature of maintenance of the open space
Information presented in Table 4 encapsulates the observation data collected on the various modes of maintenance employed in taking care of the open spaces. It is obvious from the results presented that maintenance processes vary across the open spaces.
Table 4: Nature of maintenance of the open space
Name and types of open space Type of maintenance observed
Freedom park :Neighborhood Park mowing and trimming of greenery/lawn
Waste removal and litter pick up;
tree maintenance;
integrated pest management;
irrigation;
gardening - weeding, edging, pruning of shrubs
Okanlawon Science School : Play ground
mowing and trimming of greenery/lawn
Waste removal and litter pick up;
gardening - weeding, edging, pruning of shrubs
Technical College - Play ground Waste removal and litter pick up;
weeding, edging, pruning shrubs Salvation Army Middle School - Play ground
mowing and trimming of greenery/lawn
Waste removal and litter pick up;
gardening - weeding, edging, pruning of
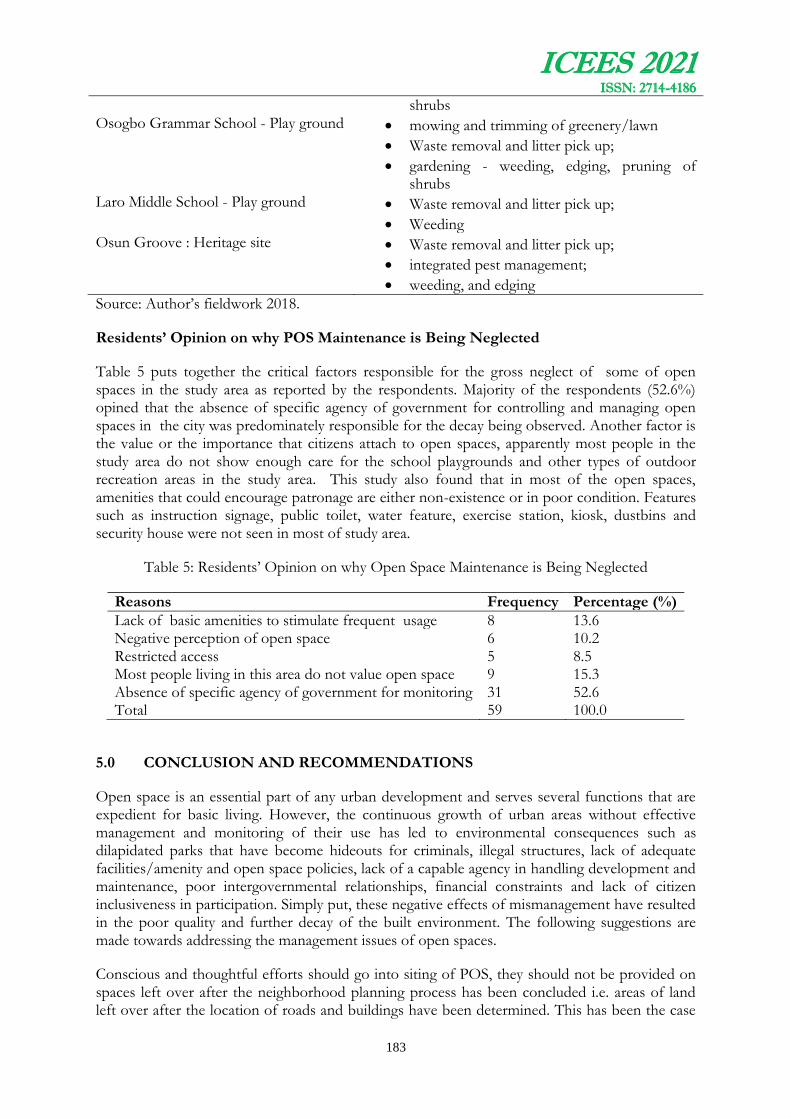
ICEES 2021 ISSN: 2714-4186
183
shrubs Osogbo Grammar School - Play ground mowing and trimming of greenery/lawn
Waste removal and litter pick up;
gardening - weeding, edging, pruning of shrubs
Laro Middle School - Play ground Waste removal and litter pick up;
Weeding Osun Groove : Heritage site Waste removal and litter pick up;
integrated pest management;
weeding, and edging
Source: Author’s fieldwork 2018.
Residents’ Opinion on why POS Maintenance is Being Neglected
Table 5 puts together the critical factors responsible for the gross neglect of some of open spaces in the study area as reported by the respondents. Majority of the respondents (52.6%) opined that the absence of specific agency of government for controlling and managing open spaces in the city was predominately responsible for the decay being observed. Another factor is the value or the importance that citizens attach to open spaces, apparently most people in the study area do not show enough care for the school playgrounds and other types of outdoor recreation areas in the study area. This study also found that in most of the open spaces, amenities that could encourage patronage are either non-existence or in poor condition. Features such as instruction signage, public toilet, water feature, exercise station, kiosk, dustbins and security house were not seen in most of study area.
Table 5: Residents’ Opinion on why Open Space Maintenance is Being Neglected
Reasons Frequency Percentage (%)
Lack of basic amenities to stimulate frequent usage 8 13.6 Negative perception of open space 6 10.2 Restricted access 5 8.5 Most people living in this area do not value open space 9 15.3 Absence of specific agency of government for monitoring 31 52.6 Total 59 100.0
5.0 CONCLUSION AND RECOMMENDATIONS
Open space is an essential part of any urban development and serves several functions that are expedient for basic living. However, the continuous growth of urban areas without effective management and monitoring of their use has led to environmental consequences such as dilapidated parks that have become hideouts for criminals, illegal structures, lack of adequate facilities/amenity and open space policies, lack of a capable agency in handling development and maintenance, poor intergovernmental relationships, financial constraints and lack of citizen inclusiveness in participation. Simply put, these negative effects of mismanagement have resulted in the poor quality and further decay of the built environment. The following suggestions are made towards addressing the management issues of open spaces.
Conscious and thoughtful efforts should go into siting of POS, they should not be provided on spaces left over after the neighborhood planning process has been concluded i.e. areas of land left over after the location of roads and buildings have been determined. This has been the case

ICEES 2021 ISSN: 2714-4186
184
too often in the past and can lead to unusable or undesirable areas of public open space. To combat city degradation and dilapidation of open space structures and facilities; there is need for urban land monitoring, development control and effective management. Furthermore, well-planned, suitably designed and landscaped open spaces that will enhance the aesthetics of the environment should be provided. These should include tree plantings, shrubs, grassing, ground cover, and water fountains which add to the beauty of the environment by providing shade, beauty, circulation, serenity and promoting well-being. The role of citizens’ participation in managing open spaces cannot be overemphasized, hence proper education and awareness should be delivered to the public.
6.0 REFERENCES
Adedotun, S. B. (2016). Urban Form and Household Mobility Patterns in Osun State, Nigeria, Unpublished Ph.D. Thesis, Department of URP Lautech, Ogbomoso.
Astell-Burt, T., Feng, X and, Kolt, G.S. (2013). Does Access to Neighbourhood Green Space Promote a Healthy Duration of Sleep? Novel findings from across-sectional study of 259 319Australians. BMJOpen 2013; 3.
Buenos Aires 2014 - http://futureofplaces.com/2014/12/key-messages-frombuenos-aires-co, Key Messages, Future of Places Conference II
Castell, P. (2006) Space for Community: On the study of resident involvement in neighborhood space management. In: Mander, Ü. et al. (eds.) The Sustainable City IV: Urban Regeneration and Sustainability, Wessex: WIT Press, pp. 703–712.
Cox, D.T.C., Shanahan,D., Hudson,H.L.,Fuller,R.A., Anderson,K., Hancock,S.Gaston,K.J. (2017). Doses of Nearby Nature Simultaneously Associated with Multiple Health Benefits. Int. J. Environ. Res. Public Health 2017, 14, 172.
Ferdous,F.(2013). Examining the Relationship between Key Visual Characteristics of Urban Plazas and Aesthetic Response SAGE Open April-June 2013: 1 –10
Özdemir,B., and Polat,A.T.(2014). The Evaluation of User Preferences: The Case of Urban Parks in Konya the Journal of Macro Trends in Energy and Sustainability Vol 2 Iss 1
UN-Habitat ( March 2015). Report of the Seventh Session of the Word Urban Forum: Urban Equity in Development – Cities for Life
Lee A.C.K., Jordan H.C. and Horsley J. (2015). Value of urban green spaces in promoting healthy living and wellbeing: prospects for planning. Risk Management and Healthcare Policy 2015:8 131–137 (doi:10.2147/RMHP.S61654)
Lindgren,T and Castell,P.(2008). Open Space Management In Residential Areas – How It Is Organised and Why . International Journal of Strategic Property Management (2008) 12, 141–160
Officha, M.C., Onwuemesi, F.E. Enete, I.C.; 1Nzeamalu, I.C. (2013). Assessing the Need for
Developing and Managing Recreational Facilities in Nigeria. IOSR Journal of EnvironmentalScience, Toxicology and Food Technology (IOSR-JESTFT) e-ISSN: 2319-2402, p- ISSN:2319-2399. Volume 3, Issue 1 (Jan. - Feb. 2013), PP 26-29
ICEES 2021 ISSN: 2714-4186
185
Pitas, N.A.D., Barrett, A.G., Mowen, A.J., Graefe, A.R., Godbey, G.C.and Sciamanna, C.N. (2017). The Relationship between Self-Rated Health and Use of Parks and Participation in Recreation Programs, United States, 1991 and2015. Preventing Chronic Diseases. Public Health Research, Practice, and Policy Volume 14, E02
Satake, E.B. (2016). Basic statistical tools in research and data analysis. Indian Journal of Anesthesia, 60(9), pp. 662-669. https://doi. org/10.4103/0019-5049.190623
Sreetheran, M and VandenBosch, C.C.K. (2014). A socio-ecological exploration of fear of crime in urban green spaces –A systematic review.UrbanForestry&UrbanGreening13 (2014)1–18
Wheater,C, Potts,E., Shaw,E., Perkin,C,Smith,H ,Casstles.H., Cook,P., and Bellis,M.(2007).Returning urban parks to their public health roots, Department of Environmental land and Geographical Sciences, Manchester, Metropolitan University, Centre for Public Health, Liverpool, John Moores University
Shah Md.A. (2011). Urban Green Spaces and an Integrative Approach to Sustainable Environment)JournalofEnvironmentalProtection,2011,2,pp.601-608 doi:10.4236/jep.2011.25069
Van Leeuwen E, Nijkamp P, de Noronha Vaz T. The multifunctional use of urban greenspace. Int J Agr Sustain. 2010;8(1–2):20–25.
Vaughan, K. B., Kaczynski A. T., Wilhelm Stanis, S. A., and Bergstrom, R. (2013). Exploring the Distribution of Park Availability, Features, and Quality across Kansas City,Missouri by Income and Race/Ethnicity. An Environmental Justice Investigation .Annals of behavioural medicine. (2013) 45 (Suppl 1): S28–S38

ICEES 2021 ISSN: 2714-4186
186
DESIGN AND CONSTRUCTION OF MINI HYDRO-ELECTRIC POWER PLANT
Oyelami, S., Kayode, O., Adeniyi, R. A. and Adufe, J. I.
Department of Mechanical Engineering, Faculty of Engineering, College of Science, Engineering and Technology, Osun State University, Osogbo, Nigeria.
* Email of Corresponding Author:: [email protected];
ABSTRACT
The incessant increase in the global population and increase in demand for power supply in the world has led to many technologies to meet up with the increasing demand. As at 2011, hydroelectric power plants already supplies over 6% of the total world energy needs and over the next decades much of the growth in renewable energy source will be generated from large-scale hydroelectric power project particularly in the developing world. In this research work, a mini hydroelectric power plant was proposed in this project which has been designed and fabricated to supply power from small streams commonly found in our neighbourhood. This machine involves two major parts namely: the wheel and the generator; the wheel is driven by the moving stream to turn the generator which in turn produces power. The machine was able to generate an average power of 2.63W without causing any harm to the environment.
Keyword: population, power, renewable energy.
1.0 INTRODUCTION
Energy is one of the indispensable elements in our universe. It is based for survival and unavoidably for the advancement of activities for promoting education, transportation, health and infrastructure for attaining a reasonable standard of living and is also a significant factor for economic development and employment (Delson et al., 2014). Out of many forms of energy, electrical energy is one of the forms and it is greatly important to mankind. Electrical power is generated using several means and hydropower plays a vital role.
Hydropower is a renewable energy source that is extensively used in most parts of the world to complement with electricity needs. Hydropower has been used for centuries, it was initially used in 250BC, and it was recorded that waterpower was used to power the clock (Belqasem, 2016).
Hydropower is a very clean source of energy, which does not consume the water but only used the water and again make it accessible for other uses. Hydropower involves the conversion of the potential energy of water into mechanical energy, which is a technology with higher efficiency, in most cases it twice that of other conventional electric power plants (Al-shemmeri, 2012).
Hydroelectric power generation is one of the best options for generating electricity. One of the global problems that the world’s engineers and other affected bodies have been trying to solve is global warming which was caused due to the emission of greenhouse gases. In 2007, Oparaku study showed that Nigeria depends greatly on fossil fuel for electricity generation due to the gigantic deposits of crude oil and natural gas in the country. In spite of the vast deposit of crude oil, Nigeria still generates less than 4000MW of electricity with per capita consumption of 0.03kw. Thus hydroelectric power generation can compliment power generation and it is also
ICEES 2021 ISSN: 2714-4186
187
preferable when comparing the effect of emissions from fossil fuels and nuclear energy to hydroelectric power generation as also suggested by Ardizzon study in 2014.
Apart from its environmental friendly, Kader et al., (2016) established that these plants are also used for flood control & irrigation purpose which is very useful for agriculture and the plant efficiency does not change with age. Also, Emmanuel and Robert, 2011 also established that hydroelectricity is elimination of fuel cost. The cost of operating a hydroelectric plant is nearly immune to increases in the cost of fossil fuels such as oil, natural gas or coal, and no imports are needed, hence it is rarely affected by global economic and political changes.
Hydropower plants range in size from large power plants that supply many consumers with electricity to small and mini and micro plants that individuals operate for their own energy needs or to sell power to utilities (Okonkwo and Ezeonu, 2011). The large-scale hydropower installation has a capacity more than 30MW and this type of power plant requires huge sum of money, has a high environmental cost, loss of available fertile lands, forced migration of large group of people and danger of malaria and bilharzias inherent in non-moving water. The small-scale hydropower installation is associated with capacity below 10MW and hardly has any disadvantage. It can be decentralized and locally implemented and managed. Power generated with the small-scale hydro station can be used for agro processing, water pumps and small businesses. The mini and micro hydropower installations are very similar to the small-scale hydropower. They also have little or no environmental effects, low cost of installations and maintenance and very little disadvantage, only that their power is much lower than the small scale hydro. The mini hydropower has a capacity between 100kW to 500kWwhile the micro hydropower installation has a capacity less than 100kW.
According to U.S. Department of Energy, Hydroelectric power plant has three types of facilities. They are:
i. Impoundment
ii. Diversion
iii. Pumped storage.
An impoundment facility is the most common type of hydroelectric power plant. An impoundment facility, typically a large hydropower system, uses a dam to store river water in a reservoir. Water released from the reservoir flows through a turbine, spinning it, which in turn activates a generator to produce electricity. The water may be released either to maintain a constant reservoir level or to meet changing electricity needs.
A diversion is also called run-of-river; facility channels a portion of a river through a canal or penstock. It may not require the use of a dam.
Another type of hydropower is pumped storage which works like a battery, storing the electricity generated by other power sources like solar, wind, and nuclear for later use. It stores energy by pumping water uphill to a reservoir at higher elevation from a second reservoir at a lower elevation. When the demand for electricity is low, pumped storage facility stores energy by pumping water from a lower reservoir to an upper reservoir. During periods of high electrical demand, the water is released back to the lower reservoir and turns a turbine. Hence, it generates electricity (Wazed and Shamsuddin, 2008).

ICEES 2021 ISSN: 2714-4186
188
Kader et al. (2016) designed and constructed a mini hydro electric generator. The generator successfully generates electricity and has an efficiency of 14.38%. The basement of the machine designed was made of wood. The components of their system are: Dynamo, shaft, screw, nut and bolt, tin sheet, wooden basement, LED light, resistor, diode.
Okonkwo and Ezeonu (2011) designed and installed a mini hydroelectric. After the installation system was operated and the output voltage was measured using digital multimeter. The reading obtained was 219Vac. The output was again measured with an Oscilloscope and a sine wave pattern was indicated. The system was able to power a 200W bulb with some laboratory equipment. A storage tank was used as a reservoir which provides water to the system.
2.0 MATERIALS AND METHODS
2.1. Design methodology
All components were designed and constructed in line with the design value that was obtained with respect to the flow rate, depth and head of the stream used for testing. A proper size of the wheel and number of cups were estimated. Also materials used were properly selected considering the cost, durability and functionality before the parts were constructed and assembled.
2.2. Principle of operation
The machine is placed in the moving stream having its cups facing the direction of the moving stream. The wheel is joined with a shaft which is simply supported at two ends with a ball bearing each. The ball bearing helps in reducing friction and helps in achieving smooth running of the wheel. The wheel rotates simultaneously with its shaft and pulley due to the energy impacted on it by the stream. The wheel pulley which is of bigger diameter is connected to the smaller pulley of the generator using rope. A smaller pulley is connected to the generator to increase the rotation provided by the wheel at the generator. The output of the generator was connected to a LED light. Also, Voltmeter and Ammeter was connected to the output of the generator in order to determine the output voltage, current and power.
2.3. Components of machine
The major components of the machine are:
i. The wheel
ii. Ball bearings
iii. Pulleys and belt
iv. Generator
2.4 Design Calculation
One of the first steps in planning is to measure the power potential of the stream. The amount of power that can be obtained from a stream depends on the amount of water flow, the height from which the water falls (head) and also the efficiency of the plant to convert mechanical energy to electrical energy (Zaman and Khan, 2012). Hydroelectric power depends on the dynamic head, the amount of water flow and the efficiency of the generator/ turbine. To know the power potential of the water, it is necessary to know the flow of the water and the available

ICEES 2021 ISSN: 2714-4186
189
head. The theoretical power P available from a giving head of the water is exactly equal to the head H and flow Q.
Also, Hussein (1987) make it known that the following are the aspects to be considered while designing the wheel turbine: velocity of stream, stream flow rate, power potential, velocity of wheel and speed of the wheel.
2.4.1 Velocity of the stream
The velocity of the stream was determined by floating a float for a specific time and measuring the distance the float covered within the specified time. The expression was given mathematically by:
2.1
Where:
Hence
2.4.2 Stream flow rate
According to Al-shemmeri (2012), flow rate can be expressed mathematically as:
2.2
Where
The cross sectional area was determined by multiplying the stream average depth by the stream. That is:
2.3
Hence,
2.4.3 Power potential

ICEES 2021 ISSN: 2714-4186
190
The amount of power available from water according to Al-shemmeri (2012) can be expressed as:
2.4
Where:
Overall efficiency
Velocity of the stream can also be given as:
2.5
Therefore,
2.4.4 Velocity of wheel
The velocity of wheel (u) is given by:
2.6
Where:
speed ratio = 0.43 to 0.48
Therefore,
2.4.5 Speed of the wheel
The speed of the wheel can be calculated by:
2.7

ICEES 2021 ISSN: 2714-4186
191
Where N = speed of the wheel
2.4.6 Bucket Dimensions
The dimension of the bucket is given below:
2.5. Design specifications of component parts
The components parts were designed and the dimensions of the major components are shown in Table 1. A complete assembly of the mini hydroelectric power plant is shown in Figure 1 and Table 2 shows the parts list.
Table1: Component Parts and Dimension
S/ Component Dimension
1 Volume of cup 720mm2
2 Diameter of the wheel 700mm
3 Diameter of the wheel shaft 31.5mm
4 Diameter of the larger pulley 200mm
5 Diameter of the smaller pulley 30mm
6 Surface Area of the base 440 000mm2
Figure 1: Complete assembly of the mini-hydro electric power system

ICEES 2021 ISSN: 2714-4186
192
Table 2: Part list
PARTS LIST
ITEM QTY PART NUMBER
1 1 Base
2 2 Ball bearing
3 12 Cup
4 1 Generator
5 1 Larger pulley
6 1 Smaller pulley
7 1 Rope
8 1 Shaft of the wheel
3.0 RESULTS AND DISCUSSION
The machine was constructed to generate power using a free energy. Output voltage and current was measured for the period of three days to determine the output of the generator and to determine the efficiency of the system. Table 3 shows the result obtained during the test, Table 4 shows the economic analysis and Figure 2 shows the graphical representatives.
The result showed that the machine has its highest efficiency on the third day follow by second day and lastly the third day. The first day was a normal day without rain, the second day was after a heavy rain and the third day was after a consecutive two raining days.
Hence, the machine has a good efficiency of 66% on the third day and its primary objective is achieved.
Table 3: Result
SN Time (min)
Voltage Current (A)
Power (W)
Day 1
Day 2
Day 3
Day 1
Day 2
Day 3
1 5 0.85 1.85 2.55 1.00 0.85 1.85 2.55 2 10 0.77 1.78 2.73 1.00 0.77 1.78 2.73 3 15 0.83 1.94 2.77 1.00 0.83 1.94 2.77 4 20 0.83 1.92 2.58 1.00 0.83 1.92 2.58 5 25 0.78 1.87 2.46 1.00 0.78 1.87 2.46 6 30 0.78 1.79 2.72 1.00 0.78 1.79 2.72 7 35 0.70 1.88 2.58 1.00 0.70 1.88 2.58 8 40 0.70 1.88 2.53 1.00 0.70 1.88 2.53 9 45 0.80 1.92 2.48 1.00 0.80 1.92 2.48 10 50 0.72 1.95 2.87 1.00 0.72 1.95 2.87 11 55 0.74 1.88 2.54 1.00 0.74 1.88 2.54 12 60 0.72 1.91 2.72 1.00 0.72 1.91 2.72
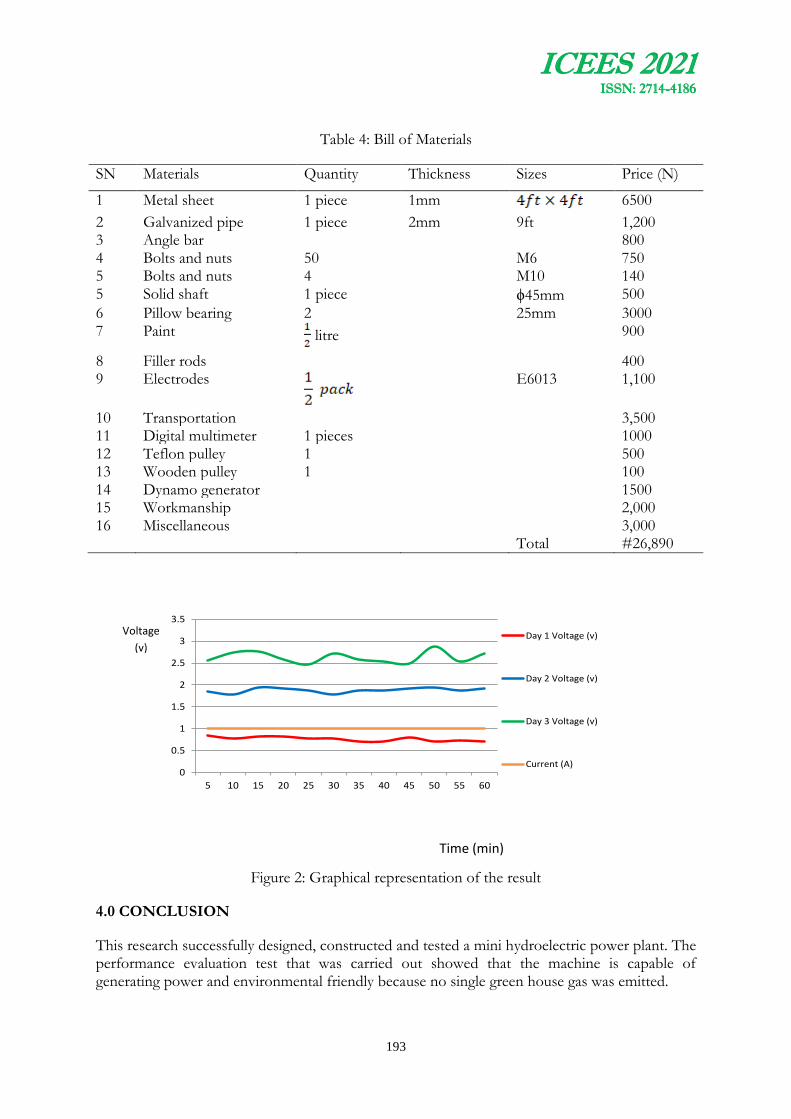
ICEES 2021 ISSN: 2714-4186
193
Table 4: Bill of Materials
SN Materials Quantity Thickness Sizes Price (N)
1 Metal sheet 1 piece 1mm
6500
2 Galvanized pipe 1 piece 2mm 9ft 1,200 3 Angle bar 800 4 Bolts and nuts 50 M6 750 5 Bolts and nuts 4 M10 140 5 Solid shaft 1 piece ϕ45mm 500
6 Pillow bearing 2 25mm 3000 7 Paint litre 900
8 Filler rods 400 9 Electrodes
E6013 1,100
10 Transportation 3,500 11 Digital multimeter 1 pieces 1000 12 Teflon pulley 1 500 13 Wooden pulley 1 100 14 Dynamo generator 1500 15 Workmanship 2,000 16 Miscellaneous 3,000 Total #26,890
0
0.5
1
1.5
2
2.5
3
3.5
5 10 15 20 25 30 35 40 45 50 55 60
Day 1 Voltage (v)
Day 2 Voltage (v)
Day 3 Voltage (v)
Current (A)
Figure 2: Graphical representation of the result
4.0 CONCLUSION
This research successfully designed, constructed and tested a mini hydroelectric power plant. The performance evaluation test that was carried out showed that the machine is capable of generating power and environmental friendly because no single green house gas was emitted.
Voltage
(v)
Time (min)

ICEES 2021 ISSN: 2714-4186
194
In addition, this research also revealed that the stream used for this research can be used for power generation which can light up the small community streets if some advance technology can be employed and a mini dam can be constructed to aid the flow.
REFERENCES
Al-shemmeri T.T. (2012). Engineering fluid mechanics.Bookboon.
Ardizzon G., Cavazzini G. & Pavesi G. (2014). A new generation of small hydro and pumped-hydro power plants: advances and future challenges. Renewable and Sustainable Energy Reviews 31. pp. 746-761.
Belqasem Aljafari(2016). Recent Trends in Hydroelectric Power Technology. American Journal of Engineering Research (AJER)
Delson Josel, Lini Varghese, Renjini G., Design of Small Hydro Electric Project Using Tailrace Extension Scheme, International Journal of Advanced Research in Electrical and Electronics Engineering, Volume 3, (2014), Issue 1, pp. 79-87.
Emmanuel I. Igweonu and Robert Ben Joshua 2011, small hydropower (SHP) development in Nigeria: issues, challenges and prospects. Global journal of pure and applied sciences vol. 18, no. 1&2, 2012: 53-58
M. A. Wazed and Shamsuddin Ahmed, 2008. Micro Hydro Energy Resources in Bangladesh: A Review. Australian Journal of Basic and Applied Sciences, 2(4): 1209-1222..
Md. Golam Kader, Md. Sourove Akther Momin, Mihir Dutta, Md. Sahid Hassan, Ariful Hossen (2016). Design and Construction of a Mini-Hydrodynamic generator. International Conference on Mechanical, Industrial and Energy Engineering 2016
Okonkwo G.N, Ezeonu S.O, (2011). Design and installation of a mini hydroelectric power plant. Scholarly Journal of Engineering Research Vol. 1(1), pp. 11-15.
Oparaku, O. U., 2007. Decentralized Electric Power Generation in Nigeria: The role of renewable energy resources. The 1st proceedings of the international workshop on renewable energy resources for sustainable development Africa, IWRESDA 28 – 36.
U.S.Department of Energy. https://www.energy.gov/eere/water/types-hydropower-plants. Retrieved on 22/3/2019
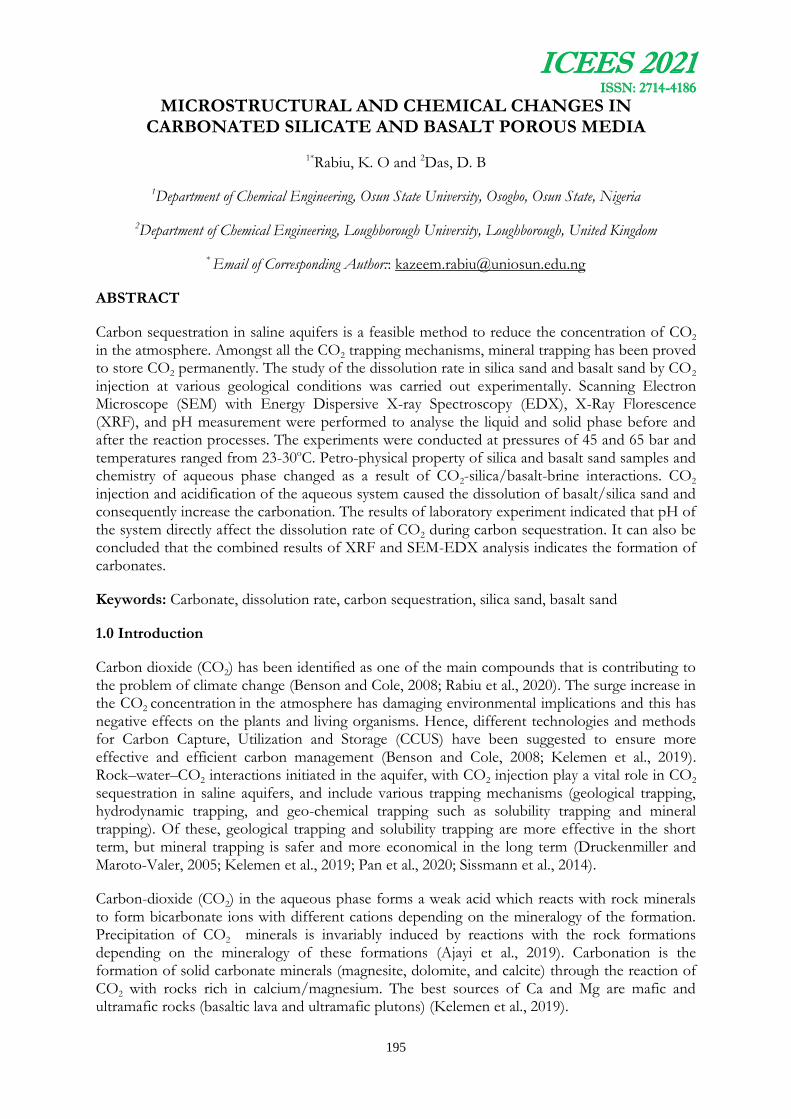
ICEES 2021 ISSN: 2714-4186
195
MICROSTRUCTURAL AND CHEMICAL CHANGES IN CARBONATED SILICATE AND BASALT POROUS MEDIA
1*Rabiu, K. O and 2Das, D. B
1Department of Chemical Engineering, Osun State University, Osogbo, Osun State, Nigeria
2Department of Chemical Engineering, Loughborough University, Loughborough, United Kingdom
* Email of Corresponding Author:: [email protected]
ABSTRACT
Carbon sequestration in saline aquifers is a feasible method to reduce the concentration of CO2 in the atmosphere. Amongst all the CO2 trapping mechanisms, mineral trapping has been proved to store CO2 permanently. The study of the dissolution rate in silica sand and basalt sand by CO2 injection at various geological conditions was carried out experimentally. Scanning Electron Microscope (SEM) with Energy Dispersive X-ray Spectroscopy (EDX), X-Ray Florescence (XRF), and pH measurement were performed to analyse the liquid and solid phase before and after the reaction processes. The experiments were conducted at pressures of 45 and 65 bar and temperatures ranged from 23-30oC. Petro-physical property of silica and basalt sand samples and chemistry of aqueous phase changed as a result of CO2-silica/basalt-brine interactions. CO2 injection and acidification of the aqueous system caused the dissolution of basalt/silica sand and consequently increase the carbonation. The results of laboratory experiment indicated that pH of the system directly affect the dissolution rate of CO2 during carbon sequestration. It can also be concluded that the combined results of XRF and SEM-EDX analysis indicates the formation of carbonates.
Keywords: Carbonate, dissolution rate, carbon sequestration, silica sand, basalt sand
1.0 Introduction
Carbon dioxide (CO2) has been identified as one of the main compounds that is contributing to the problem of climate change (Benson and Cole, 2008; Rabiu et al., 2020). The surge increase in the CO2 concentration in the atmosphere has damaging environmental implications and this has negative effects on the plants and living organisms. Hence, different technologies and methods for Carbon Capture, Utilization and Storage (CCUS) have been suggested to ensure more effective and efficient carbon management (Benson and Cole, 2008; Kelemen et al., 2019). Rock–water–CO2 interactions initiated in the aquifer, with CO2 injection play a vital role in CO2
sequestration in saline aquifers, and include various trapping mechanisms (geological trapping, hydrodynamic trapping, and geo-chemical trapping such as solubility trapping and mineral trapping). Of these, geological trapping and solubility trapping are more effective in the short term, but mineral trapping is safer and more economical in the long term (Druckenmiller and Maroto-Valer, 2005; Kelemen et al., 2019; Pan et al., 2020; Sissmann et al., 2014).
Carbon-dioxide (CO2) in the aqueous phase forms a weak acid which reacts with rock minerals to form bicarbonate ions with different cations depending on the mineralogy of the formation. Precipitation of CO2 minerals is invariably induced by reactions with the rock formations depending on the mineralogy of these formations (Ajayi et al., 2019). Carbonation is the formation of solid carbonate minerals (magnesite, dolomite, and calcite) through the reaction of CO2 with rocks rich in calcium/magnesium. The best sources of Ca and Mg are mafic and ultramafic rocks (basaltic lava and ultramafic plutons) (Kelemen et al., 2019).

ICEES 2021 ISSN: 2714-4186
196
There are various techniques that exist for mineralization and these include surficial, in-situ and ex-situ processes. The rate and cost implication of CO2 mineralization depends on available alkaline in the solution, available dissolved CO2 in solution and optimal dissolution conditions. pH variation are particularly paramount, as low pH favours mineral dissolution whereas high pH accelerate the precipitation of carbonate (Kelemen et al., 2019). Druckenmiller and Maroto-Valer (2005) concluded that pH of a system along with pressure, temperature and brine composition plays a vital role in effectiveness and efficiency of mineral trapping mechanism (Druckenmiller and Maroto-Valer, 2005).
Some studies have suggested that huge carbonate growth may employ high crystallization pressures sufficient to produce microfractures in geologic formations which would unveil additional unreacted mineral surface and increase the carbon storage capacity. However, there are other assertions which stated that the carbonate crystals formation in minerals would simply block the pore spaces and reduce the reactive surface area and subsequently slow down the in-situ carbon mineralization process. This research explored a number of these questions regarding reaction kinetics and mechanisms during carbonation. The mineral carbonation of some of the most widely investigated minerals (basalt and silica sand) were studied to understand the marching changes in the chemical compositions and morphological structures during CO2–basalt/silica–water interactions. In addition to ascertaining the morphological changes, there has been a discussion and an emerging concern related to appropriate methods for the quantification of CO2. Hence, the extents of carbonation were estimated using two separate methods: X-Ray Fluorescence (XRF) and pH measurement.
2.0 Materials and Methods
This work examined two unconsolidated sand samples: basalt sand (Aqua Maniac, Delaware, US) and silica sand (Minerals Marketing Company, Cheshire, UK). The physical properties such as average particle size and porosity of each mentioned porous materials were determined experimentally and are listed in Table 1. SEM (Zeiss 1530VP) images were taken before the experiment to examine surface morphology and roughness of the porous materials used. As shown in Figure 1, silica sand looks more angular while basalt sand exhibits hexagonal shape. The X-ray Fluorescence (XRF) analyses were used to determine mineralogy of the samples. Each of the two porous media samples, (the silica and basalt sand) were examined for both major and trace elemental analysis. The Orbis Micro X-ray Fluorescence (Micro-XRF) analyser was used to analyse the elements such as (Si, Ti, Al, Fe, Mn, Mg, Ca, Na, K, P) in the porous materials. The analysis results can be seen in the Figure 2a and 2b.
Table 1 Characteristics of the porous media used in the experiments
Parameters Silica Sand Basalt Sand
Porosity (%) 39±0.25 42±0.30
Average particle size (µm) 968±253 1000±296
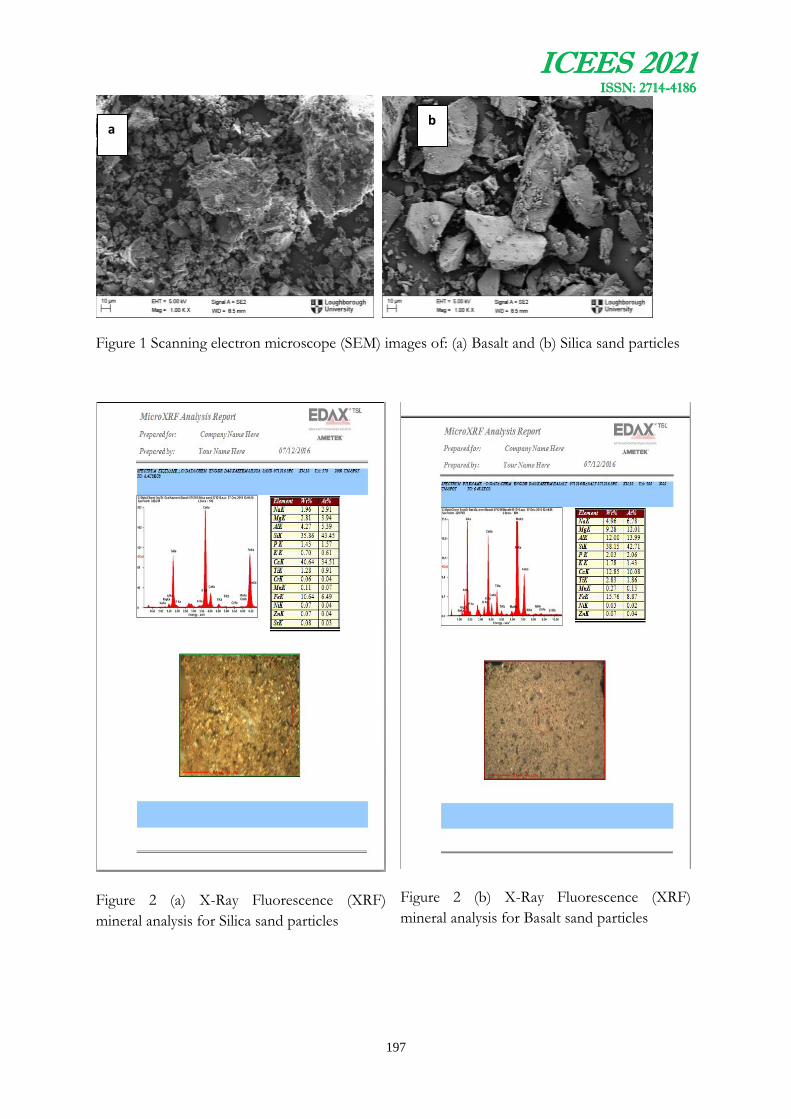
ICEES 2021 ISSN: 2714-4186
197
Figure 1 Scanning electron microscope (SEM) images of: (a) Basalt and (b) Silica sand particles
Figure 2 (a) X-Ray Fluorescence (XRF)
mineral analysis for Silica sand particles
Figure 2 (b) X-Ray Fluorescence (XRF)
mineral analysis for Basalt sand particles
a b
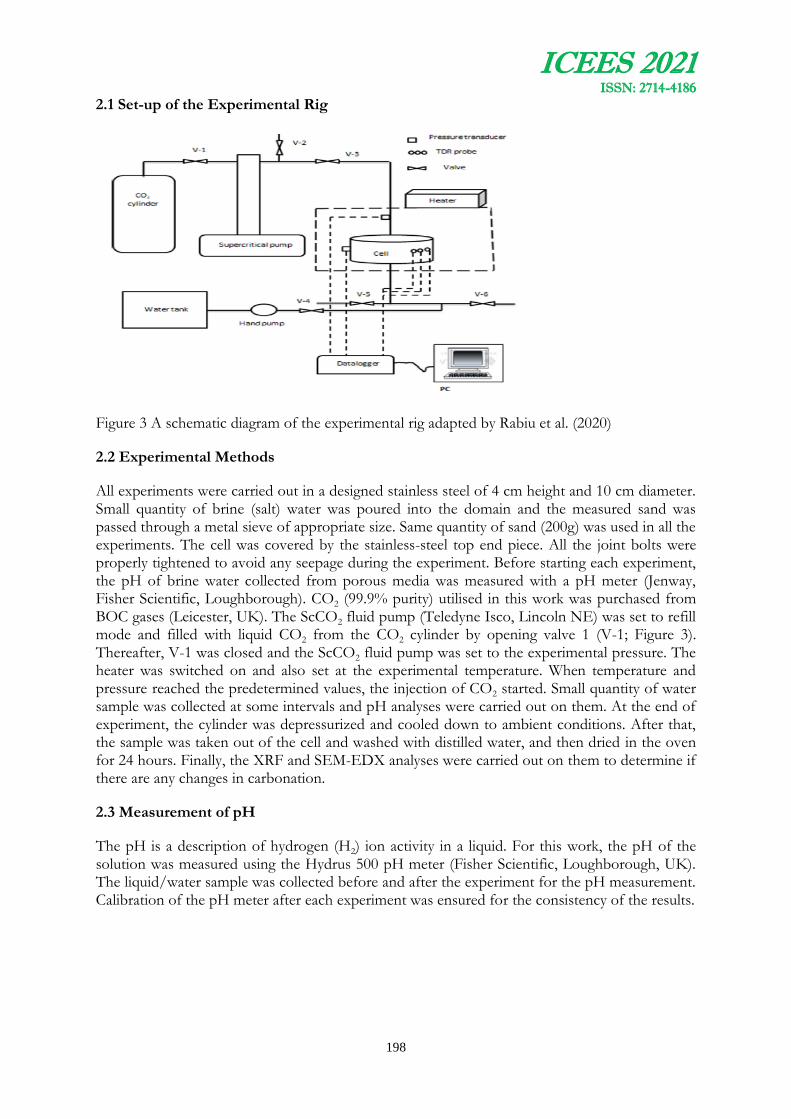
ICEES 2021 ISSN: 2714-4186
198
2.1 Set-up of the Experimental Rig
Figure 3 A schematic diagram of the experimental rig adapted by Rabiu et al. (2020)
2.2 Experimental Methods
All experiments were carried out in a designed stainless steel of 4 cm height and 10 cm diameter. Small quantity of brine (salt) water was poured into the domain and the measured sand was passed through a metal sieve of appropriate size. Same quantity of sand (200g) was used in all the experiments. The cell was covered by the stainless-steel top end piece. All the joint bolts were properly tightened to avoid any seepage during the experiment. Before starting each experiment, the pH of brine water collected from porous media was measured with a pH meter (Jenway, Fisher Scientific, Loughborough). CO2 (99.9% purity) utilised in this work was purchased from BOC gases (Leicester, UK). The ScCO2 fluid pump (Teledyne Isco, Lincoln NE) was set to refill mode and filled with liquid CO2 from the CO2 cylinder by opening valve 1 (V-1; Figure 3). Thereafter, V-1 was closed and the ScCO2 fluid pump was set to the experimental pressure. The heater was switched on and also set at the experimental temperature. When temperature and pressure reached the predetermined values, the injection of CO2 started. Small quantity of water sample was collected at some intervals and pH analyses were carried out on them. At the end of experiment, the cylinder was depressurized and cooled down to ambient conditions. After that, the sample was taken out of the cell and washed with distilled water, and then dried in the oven for 24 hours. Finally, the XRF and SEM-EDX analyses were carried out on them to determine if there are any changes in carbonation.
2.3 Measurement of pH
The pH is a description of hydrogen (H2) ion activity in a liquid. For this work, the pH of the solution was measured using the Hydrus 500 pH meter (Fisher Scientific, Loughborough, UK). The liquid/water sample was collected before and after the experiment for the pH measurement. Calibration of the pH meter after each experiment was ensured for the consistency of the results.
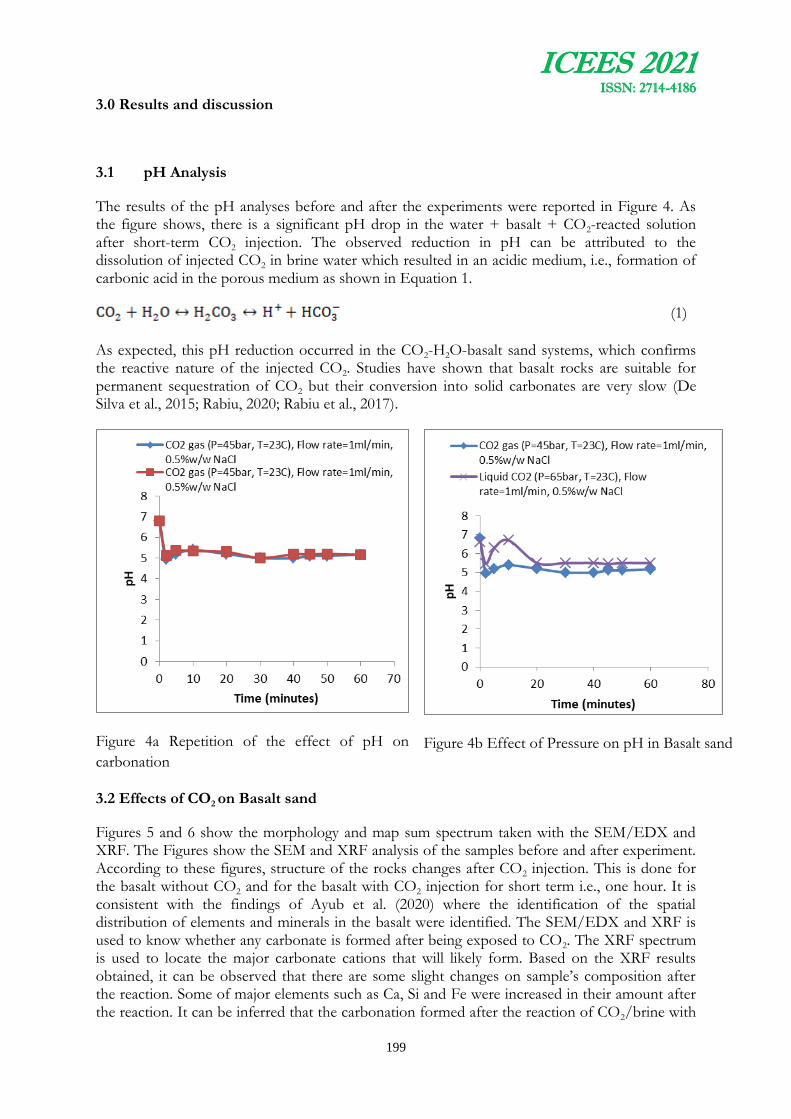
ICEES 2021 ISSN: 2714-4186
199
3.0 Results and discussion
3.1 pH Analysis
The results of the pH analyses before and after the experiments were reported in Figure 4. As the figure shows, there is a significant pH drop in the water + basalt + CO2-reacted solution after short-term CO2 injection. The observed reduction in pH can be attributed to the dissolution of injected CO2 in brine water which resulted in an acidic medium, i.e., formation of carbonic acid in the porous medium as shown in Equation 1.
(1)
As expected, this pH reduction occurred in the CO2-H2O-basalt sand systems, which confirms the reactive nature of the injected CO2. Studies have shown that basalt rocks are suitable for permanent sequestration of CO2 but their conversion into solid carbonates are very slow (De Silva et al., 2015; Rabiu, 2020; Rabiu et al., 2017).
Figure 4a Repetition of the effect of pH on
carbonation
Figure 4b Effect of Pressure on pH in Basalt sand
3.2 Effects of CO2 on Basalt sand
Figures 5 and 6 show the morphology and map sum spectrum taken with the SEM/EDX and XRF. The Figures show the SEM and XRF analysis of the samples before and after experiment. According to these figures, structure of the rocks changes after CO2 injection. This is done for the basalt without CO2 and for the basalt with CO2 injection for short term i.e., one hour. It is consistent with the findings of Ayub et al. (2020) where the identification of the spatial distribution of elements and minerals in the basalt were identified. The SEM/EDX and XRF is used to know whether any carbonate is formed after being exposed to CO2. The XRF spectrum is used to locate the major carbonate cations that will likely form. Based on the XRF results obtained, it can be observed that there are some slight changes on sample’s composition after the reaction. Some of major elements such as Ca, Si and Fe were increased in their amount after the reaction. It can be inferred that the carbonation formed after the reaction of CO2/brine with
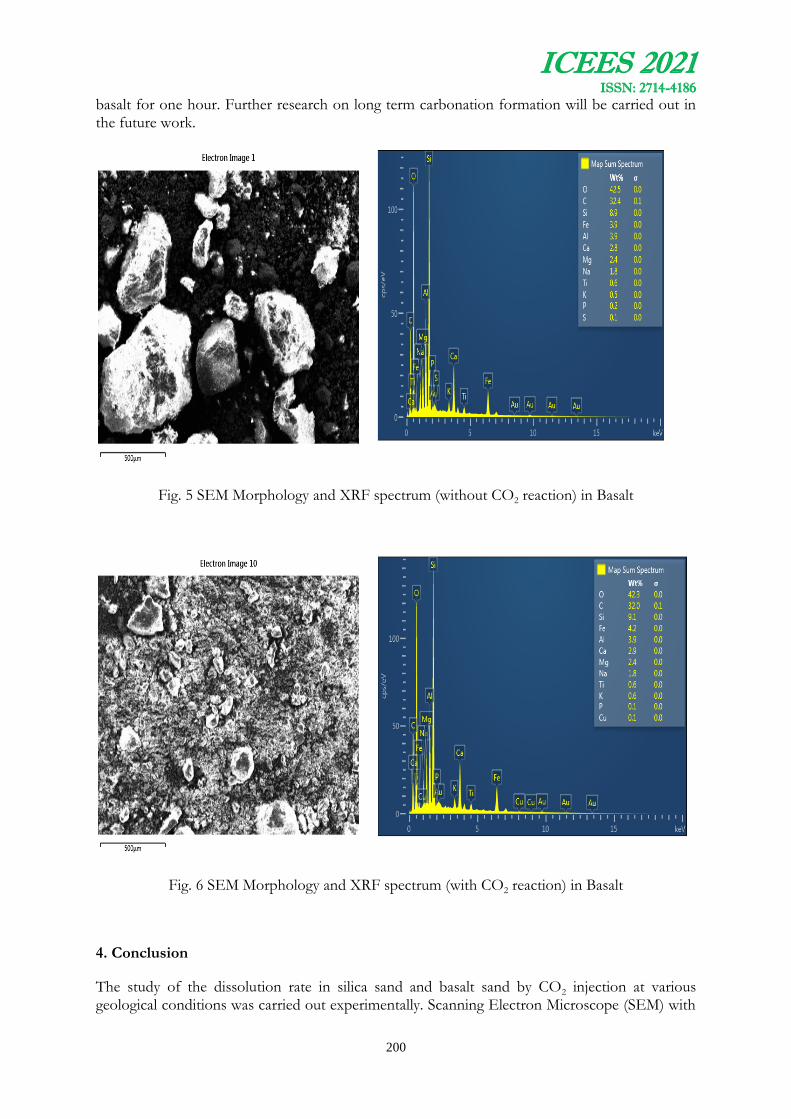
ICEES 2021 ISSN: 2714-4186
200
basalt for one hour. Further research on long term carbonation formation will be carried out in the future work.
Fig. 5 SEM Morphology and XRF spectrum (without CO2 reaction) in Basalt
Fig. 6 SEM Morphology and XRF spectrum (with CO2 reaction) in Basalt
4. Conclusion
The study of the dissolution rate in silica sand and basalt sand by CO2 injection at various geological conditions was carried out experimentally. Scanning Electron Microscope (SEM) with
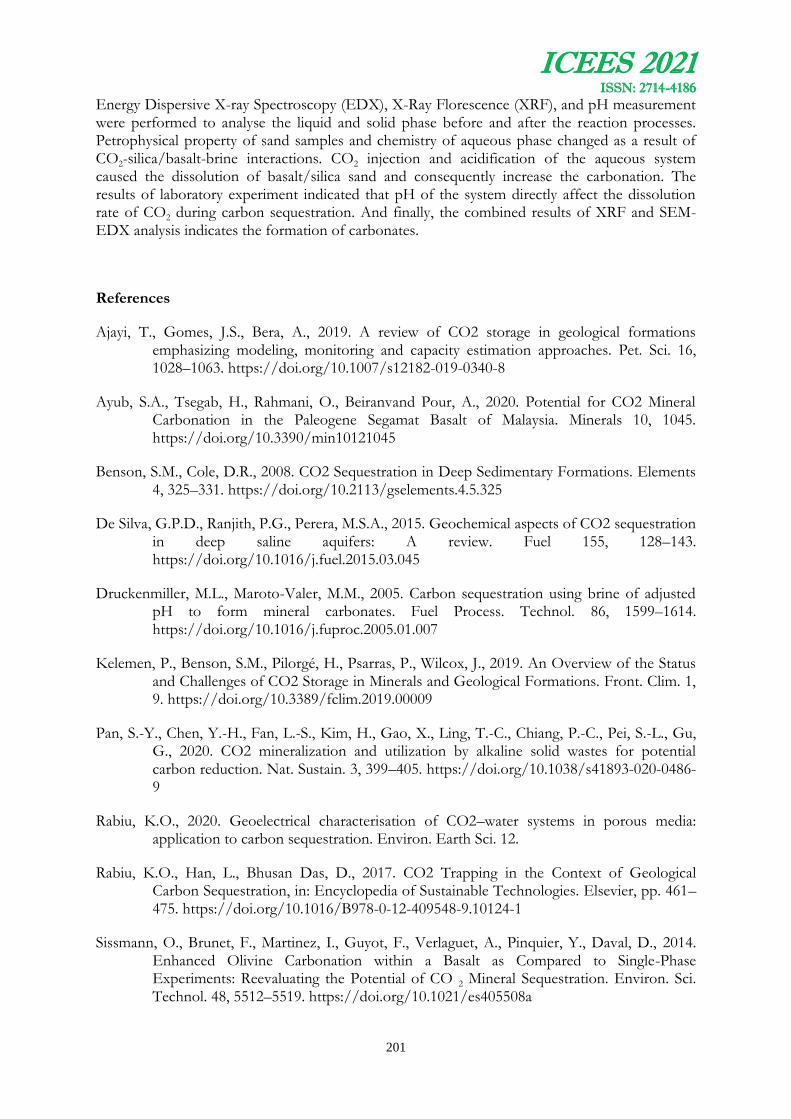
ICEES 2021 ISSN: 2714-4186
201
Energy Dispersive X-ray Spectroscopy (EDX), X-Ray Florescence (XRF), and pH measurement were performed to analyse the liquid and solid phase before and after the reaction processes. Petrophysical property of sand samples and chemistry of aqueous phase changed as a result of CO2-silica/basalt-brine interactions. CO2 injection and acidification of the aqueous system caused the dissolution of basalt/silica sand and consequently increase the carbonation. The results of laboratory experiment indicated that pH of the system directly affect the dissolution rate of CO2 during carbon sequestration. And finally, the combined results of XRF and SEM-EDX analysis indicates the formation of carbonates.
References
Ajayi, T., Gomes, J.S., Bera, A., 2019. A review of CO2 storage in geological formations emphasizing modeling, monitoring and capacity estimation approaches. Pet. Sci. 16, 1028–1063. https://doi.org/10.1007/s12182-019-0340-8
Ayub, S.A., Tsegab, H., Rahmani, O., Beiranvand Pour, A., 2020. Potential for CO2 Mineral Carbonation in the Paleogene Segamat Basalt of Malaysia. Minerals 10, 1045. https://doi.org/10.3390/min10121045
Benson, S.M., Cole, D.R., 2008. CO2 Sequestration in Deep Sedimentary Formations. Elements 4, 325–331. https://doi.org/10.2113/gselements.4.5.325
De Silva, G.P.D., Ranjith, P.G., Perera, M.S.A., 2015. Geochemical aspects of CO2 sequestration in deep saline aquifers: A review. Fuel 155, 128–143. https://doi.org/10.1016/j.fuel.2015.03.045
Druckenmiller, M.L., Maroto-Valer, M.M., 2005. Carbon sequestration using brine of adjusted pH to form mineral carbonates. Fuel Process. Technol. 86, 1599–1614. https://doi.org/10.1016/j.fuproc.2005.01.007
Kelemen, P., Benson, S.M., Pilorgé, H., Psarras, P., Wilcox, J., 2019. An Overview of the Status and Challenges of CO2 Storage in Minerals and Geological Formations. Front. Clim. 1, 9. https://doi.org/10.3389/fclim.2019.00009
Pan, S.-Y., Chen, Y.-H., Fan, L.-S., Kim, H., Gao, X., Ling, T.-C., Chiang, P.-C., Pei, S.-L., Gu, G., 2020. CO2 mineralization and utilization by alkaline solid wastes for potential carbon reduction. Nat. Sustain. 3, 399–405. https://doi.org/10.1038/s41893-020-0486-9
Rabiu, K.O., 2020. Geoelectrical characterisation of CO2–water systems in porous media: application to carbon sequestration. Environ. Earth Sci. 12.
Rabiu, K.O., Han, L., Bhusan Das, D., 2017. CO2 Trapping in the Context of Geological Carbon Sequestration, in: Encyclopedia of Sustainable Technologies. Elsevier, pp. 461–475. https://doi.org/10.1016/B978-0-12-409548-9.10124-1
Sissmann, O., Brunet, F., Martinez, I., Guyot, F., Verlaguet, A., Pinquier, Y., Daval, D., 2014. Enhanced Olivine Carbonation within a Basalt as Compared to Single-Phase Experiments: Reevaluating the Potential of CO 2 Mineral Sequestration. Environ. Sci. Technol. 48, 5512–5519. https://doi.org/10.1021/es405508a

ICEES 2021 ISSN: 2714-4186
202
EXAMINATION OF OPERATIONS OF WATER VENDORS IN HAUSA COMMUNITIES IN IBADAN, NIGERIA
* Adejumo1 S. A. and 2Folorunso, Tomilayo
*Department of Urban and Regional Planning, Faculty of Environmental Design and Management
University of Ibadan, Ibadan, Nigeria
Email of Corresponding Author:: [email protected]
ABSTRACT
The study examined the operations and challenges of water vending in Hausa communities (Sabo, Ojoo and Sasa) of Ibadan. Both primary and secondary data were sourced for the study. The study is cross-sectional survey involving purposive random sampling technique to select 120 vendors. Male gender among the vendors was 78.3%, ages 21 to 40 years accounted for 59.2%, majority, 39% of the vendors attended elementary school only. Of all the respondents, 30% involved in water vending because it is a reliable source of livelihood,15% was involved for less skill requirement, low capital requirement encouraged 9.2%, 8.3% inherited the job while 18.3% and 20% were involved because of joblessness and peer group influence respectively. Only 31.7% have spent between 4 to 6 years on the trade while 14.2% have spent 16years and above. The vendors sourced water sold from well (65.8%), borehole (15.8%) while 18.3% sourced water from both well and borehole. Majority,67.5% obtained water at no cost, 56.7% sold a keg of water for #30, 20% sold same size for #25, 15% sold a keg for #20 while 4.2% and 3.3% sold for #40 and #50 respectively. Half of the vendors (50.8%) obtained profit margin of 501 to 1000 naira daily in wet season while 39.2% realised as much as 1,501 to 2,000 naira per day in dry season. Chi-square test result (84.418 and p-value of 0.000) revealed a significant variation in the challenges encountered by vendors across the study areas. Similarly, ANOVA test (f-value is 2.829 and p-value is 0.063 (when p>0.05)) revealed no significant variation in the financial benefit of vendors across the locations. The study concludes that water vending has potential to generate employment opportunities for more vendors and government should provide more public water collection points to enhance the operation of the vendors.
Keywords: Water vending, livelihood, potentials, challenges, Hausa community, Ibadan
1. Introduction
Many years of neglect by government and inadequate investment in public infrastructure has left the public drinking water supply in Nigeria in an unreliable state (Dada, 2009; Balogun et al., 2017). Public water shortage has become a common attribute of most Nigerian cities and most of sub-Sahara African cities (WHO and UNICEF, 2015). Access to water of adequate quantity and satisfactory quality remains one of the major challenges for many households in most cities of developing countries especially in low income areas (Abubakar, 2016). To solve this problem of water provision by public utilities in many cities, alternative suppliers exist such as non-state water providers (NSPs) including both formal and informal local private providers usually known as water vendors (Ahmad, 2016). In addition, residents have evolved other adaptive measures of alleviating water shortage ranging from provision of hand dug well, borehole to rain harvesting. Among these strategies, water vending has become an integral part of water supply system in developing countries and a potential source of livelihood for the operators.
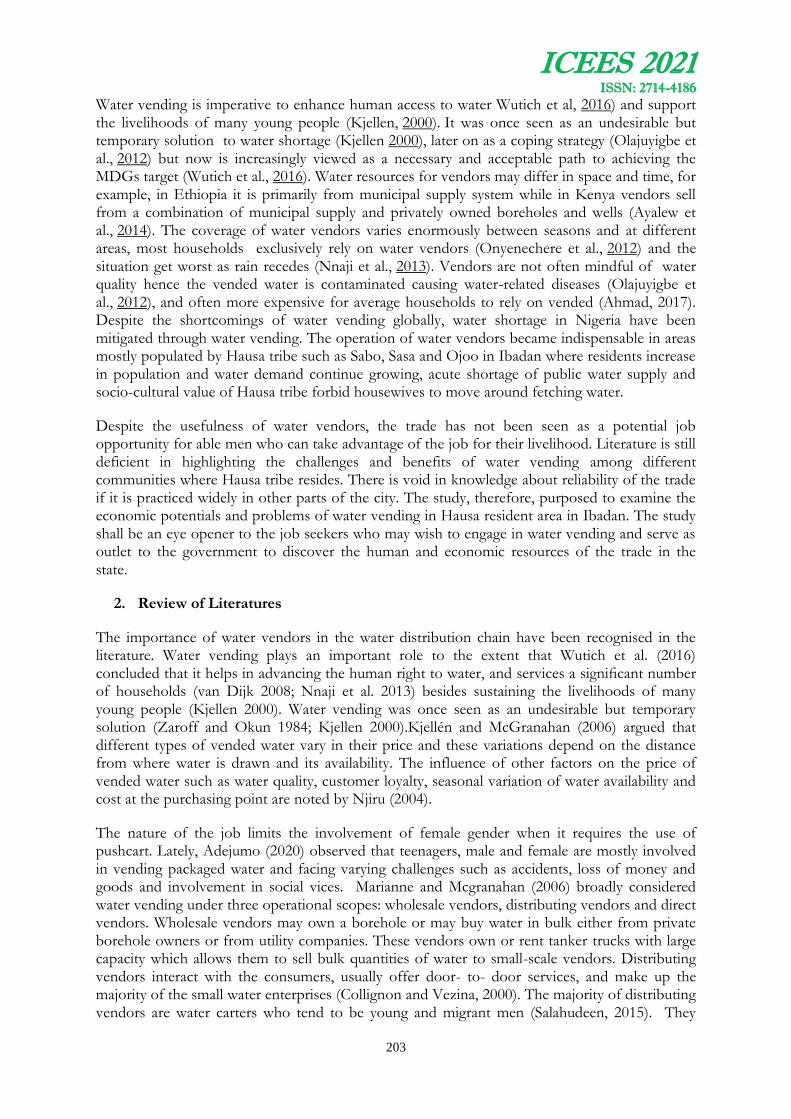
ICEES 2021 ISSN: 2714-4186
203
Water vending is imperative to enhance human access to water Wutich et al, 2016) and support the livelihoods of many young people (Kjellen, 2000). It was once seen as an undesirable but temporary solution to water shortage (Kjellen 2000), later on as a coping strategy (Olajuyigbe et al., 2012) but now is increasingly viewed as a necessary and acceptable path to achieving the MDGs target (Wutich et al., 2016). Water resources for vendors may differ in space and time, for example, in Ethiopia it is primarily from municipal supply system while in Kenya vendors sell from a combination of municipal supply and privately owned boreholes and wells (Ayalew et al., 2014). The coverage of water vendors varies enormously between seasons and at different areas, most households exclusively rely on water vendors (Onyenechere et al., 2012) and the situation get worst as rain recedes (Nnaji et al., 2013). Vendors are not often mindful of water quality hence the vended water is contaminated causing water-related diseases (Olajuyigbe et al., 2012), and often more expensive for average households to rely on vended (Ahmad, 2017). Despite the shortcomings of water vending globally, water shortage in Nigeria have been mitigated through water vending. The operation of water vendors became indispensable in areas mostly populated by Hausa tribe such as Sabo, Sasa and Ojoo in Ibadan where residents increase in population and water demand continue growing, acute shortage of public water supply and socio-cultural value of Hausa tribe forbid housewives to move around fetching water.
Despite the usefulness of water vendors, the trade has not been seen as a potential job opportunity for able men who can take advantage of the job for their livelihood. Literature is still deficient in highlighting the challenges and benefits of water vending among different communities where Hausa tribe resides. There is void in knowledge about reliability of the trade if it is practiced widely in other parts of the city. The study, therefore, purposed to examine the economic potentials and problems of water vending in Hausa resident area in Ibadan. The study shall be an eye opener to the job seekers who may wish to engage in water vending and serve as outlet to the government to discover the human and economic resources of the trade in the state.
2. Review of Literatures
The importance of water vendors in the water distribution chain have been recognised in the literature. Water vending plays an important role to the extent that Wutich et al. (2016) concluded that it helps in advancing the human right to water, and services a significant number of households (van Dijk 2008; Nnaji et al. 2013) besides sustaining the livelihoods of many young people (Kjellen 2000). Water vending was once seen as an undesirable but temporary solution (Zaroff and Okun 1984; Kjellen 2000).Kjellén and McGranahan (2006) argued that different types of vended water vary in their price and these variations depend on the distance from where water is drawn and its availability. The influence of other factors on the price of vended water such as water quality, customer loyalty, seasonal variation of water availability and cost at the purchasing point are noted by Njiru (2004).
The nature of the job limits the involvement of female gender when it requires the use of pushcart. Lately, Adejumo (2020) observed that teenagers, male and female are mostly involved in vending packaged water and facing varying challenges such as accidents, loss of money and goods and involvement in social vices. Marianne and Mcgranahan (2006) broadly considered water vending under three operational scopes: wholesale vendors, distributing vendors and direct vendors. Wholesale vendors may own a borehole or may buy water in bulk either from private borehole owners or from utility companies. These vendors own or rent tanker trucks with large capacity which allows them to sell bulk quantities of water to small-scale vendors. Distributing vendors interact with the consumers, usually offer door- to- door services, and make up the majority of the small water enterprises (Collignon and Vezina, 2000). The majority of distributing vendors are water carters who tend to be young and migrant men (Salahudeen, 2015). They

ICEES 2021 ISSN: 2714-4186
204
carry the water in carts drawn by hand, animals, bicycles or motorbikes. Hand-carrying water vendors haul water in buckets or other smaller containers by hand, without carts or animals, and earn very small wages. This category formed the bulk of the respondents to this study. The third category, direct vendors have consumers that come to them. They also tend to charge mid-range prices and are in greatest demand where well water is of poor quality or is too expensive (Snell, 1998).
The role of water vendors is inevitable in some communities particularly in urban centres where there is acute water shortage. Onyenechere et al. (2012) observed that the coverage of vendors varies enormously between season and at different areas, for example, most households in Nsukka, Nigeria rely almost exclusively on water vendors and the situation get worse as rain recedes (Nnaji et al., 2013). Nevertheless the consumers of vended water are ignorantly susceptible to water-related diseases associated with informal water vendors (Olajuyigbe et al., 2012). Another dimension of problem caused by vendors is the risk of increased traffic accidents (Kjellen, 2000). Some of the vendors using push-cart obstruct traffic in major cities often result to accident (Alberto, 2003). Other challenges bedevilling water vending is lack of recognition and regulation by government. It is of no doubt that recognizing them as part of a regulatory framework will assist in the realisation of MDGs target (Ayalew et al., 2014) while safeguarding extensive surveillance will ensure safety (Sheshe and Magashi 2014). The distribution of water by vendors is expensive (Ahamad, 2017) whether the vehicles are powered by people, animals or engines.
3. Study area
Ibadan is a heterogeneous city, fastest growing in Oyo State situated in the south-west geo-political zone of Nigeria. The city is made up of different ethnic groups consisting Yoruba, Hausa, Igbo, Urobo, Ebira among others. The study was carried out in the three prominent Hausa communities (Sabo, Ojoo and Sasa) in Ibadan. Sabo is located in Ibadan Northwest Local Government area (LGA) while Ojoo and Sasa are situated in Akinyele Local Government Area (LGA). Historically, Sabo is the oldest among the three communities established in 1916 on a land donated by head of traditional ruler (Bale of Irefin) who ruled between 1912 and 1914. The location started with simple cottages until later when people began to build permanent structures. Major business at Sabo was cattle trade until around 1916 when the cattle market was moved to Oremeji, a neighbouring community and later extended to Sango near railway (Albert, 1991)
Both Ojoo and Sasa are other prominent Hausa communities in Ibadan situated in Akinyele LGA where Hausa migrants carry out their business and livelihoods activities. Sasa market is known as a commercial center for peper and Onion while Ojoo is bus terminus for Hausa migrants. Basic facility like water is lacking in these study areas. This makes water vending a necessity to meet the demand of households and marker operators.
ICEES 2021 ISSN: 2714-4186
205
Figure 1: The study areas in the context of Ibadan
4. Methodology
The study utilised both primary and secondary information. Since the study was done at a specific point in time, a cross sectional survey was adopted to gather numerical data from the sampled respondents. The targeted population (respondents) is informal, not recognized by law, thus no existing data for their number thus it is difficult to determine the sample frame for the study. A set of pre-tested questionnaire were prepared and administered purposively on those people vending water in the study areas. A total of 120 vendors were sampled from the three communities (Sabo (50), Ojoo (30) and Sasa (40)). Both quantitative and qualitative statistical analyses were adopted in analyzing data collected.
5. Discussion of findings
(a) Socioeconomic attributes of the vendors
Socioeconomic and demographic variables are strong factors compelling involvement of some vendors in the trade. The study revealed that 67.5% of the sampled water vendors in the study areas were Hausa, Yoruba comprises 29.1% while other tribes accounted for 3.4%. Of all the vendors, 59.2% were between ages 21 and 40 years, 25.8% were less than 20 years while 15% were above 40 years. The largest proportion (39%) of the sampled vendors attended primary school, 20% attended Quranic School, 18% attended secondary school while 21.7% did not attend any form of school. The sex ratio revealed that male sex has the largest proportion (78.3%) of the sampled vendors. The study showed that 55.8% were married among the vendors, 35.8% were single while 8.3% were widowed. Of all the married vendors, 14.2% had between 1 and 3 children, 36.7% had between 4 and 6 children, while 15% had more than 7 children. More importantly, 84.2% among the vendors have no other job while 15.8% have some other jobs doing along with water vending.
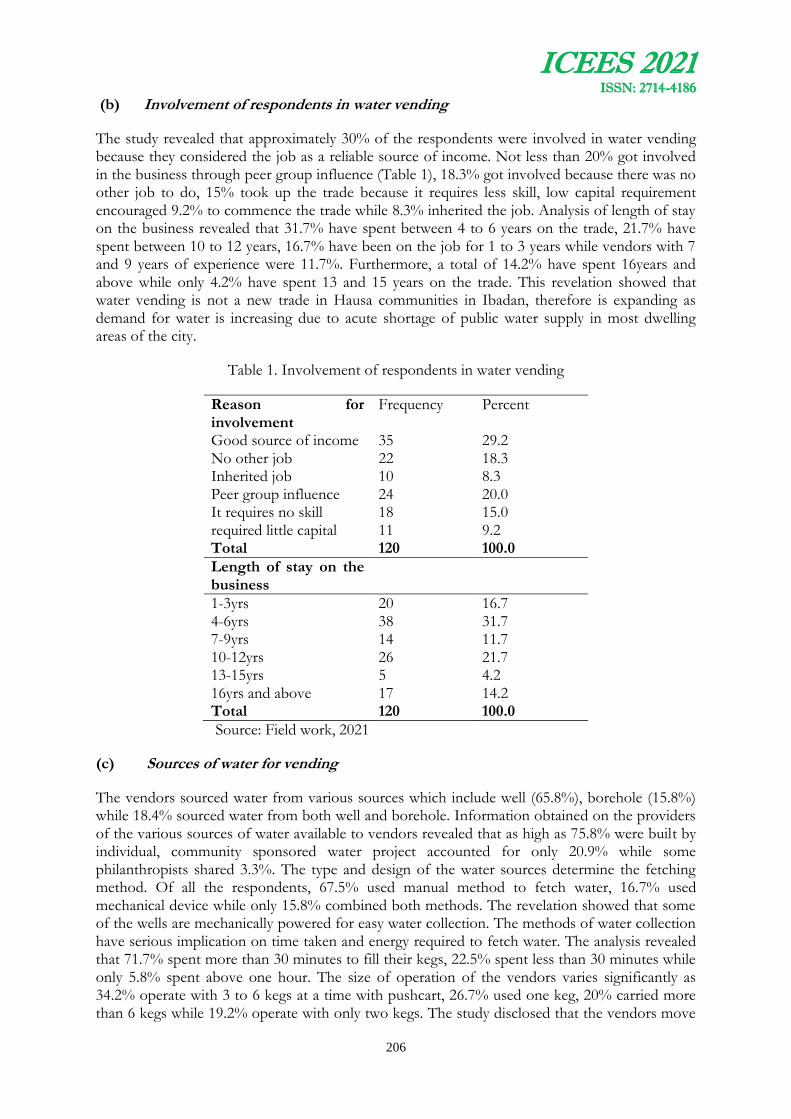
ICEES 2021 ISSN: 2714-4186
206
(b) Involvement of respondents in water vending
The study revealed that approximately 30% of the respondents were involved in water vending because they considered the job as a reliable source of income. Not less than 20% got involved in the business through peer group influence (Table 1), 18.3% got involved because there was no other job to do, 15% took up the trade because it requires less skill, low capital requirement encouraged 9.2% to commence the trade while 8.3% inherited the job. Analysis of length of stay on the business revealed that 31.7% have spent between 4 to 6 years on the trade, 21.7% have spent between 10 to 12 years, 16.7% have been on the job for 1 to 3 years while vendors with 7 and 9 years of experience were 11.7%. Furthermore, a total of 14.2% have spent 16years and above while only 4.2% have spent 13 and 15 years on the trade. This revelation showed that water vending is not a new trade in Hausa communities in Ibadan, therefore is expanding as demand for water is increasing due to acute shortage of public water supply in most dwelling areas of the city.
Table 1. Involvement of respondents in water vending
Reason for involvement
Frequency Percent
Good source of income 35 29.2 No other job 22 18.3 Inherited job 10 8.3 Peer group influence 24 20.0 It requires no skill 18 15.0 required little capital 11 9.2 Total 120 100.0
Length of stay on the business
1-3yrs 20 16.7 4-6yrs 38 31.7 7-9yrs 14 11.7 10-12yrs 26 21.7 13-15yrs 5 4.2 16yrs and above 17 14.2 Total 120 100.0
Source: Field work, 2021
(c) Sources of water for vending
The vendors sourced water from various sources which include well (65.8%), borehole (15.8%) while 18.4% sourced water from both well and borehole. Information obtained on the providers of the various sources of water available to vendors revealed that as high as 75.8% were built by individual, community sponsored water project accounted for only 20.9% while some philanthropists shared 3.3%. The type and design of the water sources determine the fetching method. Of all the respondents, 67.5% used manual method to fetch water, 16.7% used mechanical device while only 15.8% combined both methods. The revelation showed that some of the wells are mechanically powered for easy water collection. The methods of water collection have serious implication on time taken and energy required to fetch water. The analysis revealed that 71.7% spent more than 30 minutes to fill their kegs, 22.5% spent less than 30 minutes while only 5.8% spent above one hour. The size of operation of the vendors varies significantly as 34.2% operate with 3 to 6 kegs at a time with pushcart, 26.7% used one keg, 20% carried more than 6 kegs while 19.2% operate with only two kegs. The study disclosed that the vendors move

ICEES 2021 ISSN: 2714-4186
207
water around with different devices: pushcart (55.0%), as high as 32.5% used hand/shoulder/head to convey water to customers with maximum of two kegs at a time while 12.5% used wheelbarrow.
Plate 1: Sample of pushcarts with multiple kegs use by a vendor
(d) Operational methods of water vendors
The study revealed that majority of the vendors, (67.5%) obtained water at no cost. Only a sum of 32.5% of the respondents paid 10 naira per keg for water sold while the selling price per keg ranges between 20 and 50 naira. A total of 56.7% sold a keg of water for 30 naira, 20% sold a keg for 25 naira, 15% sold a keg for 20 naira while 4.2% and 3.3% sold for 40 and 50 naira respectively. It is interesting to note that 30.8% sold between 31 and 40 kegs per day, 23.3% sold 21 and 30 kegs, 18.3% sold 11 and 20 kegs, while only 8.3% sold above 50 kegs per day. This revelation underscored the profitability of the business. The analysis of average daily income in wet season revealed that about half of the respondents, 50.8% realised between 501 and 1000 naira daily, 38.3% earned between 1001 and 1500 naira, 7.5% made less than 500 naira from the trade while 3.3% realised 1501 and 2000 naira in a day. There is a slight variation in the amount of money realised by the vendors between wet and dry seasons. The analysis showed that the largest proportion 39.2% realised 1501 and 2000 naira per day in dry season. Furthermore, 34.2% realised between 501 and 1000 naira, 23.3% obtained between 1001 and 1500 naira while only 3.3% realised below 500 naira. The increase in turnover in dry season is as a result of increase water demand. The sale coverage is not limited to the Hausa community because the study revealed that 46.7% sold water within and outside the Hausa community, 51.7% have their customers within the Hausa community while 1.7% sold to only customers outside Hausa community. The information obtained on sources of water sold to outside Hausa community revealed that 82.5% fetched water sold from Hausa community while only 17.5 sourced water from other locations.
The consumers are key stakeholder in the feasibility of the trade. The study discovered the various buyers such as food vendors (30%), driver (15%), household 14.2%, dry cleaners (10.8), market trader especially in Sasa area accounted for 2.5% of the customers. Total of 27.5% sold to combination of food vendor, motor drivers, dry cleaners and households. The information obtained on vendor’s consideration for water quality revealed that only 37.5% of the vendors considered the quality of water fetched for sale. Interestingly, the study revealed that 90.8% of the vendors disclosed that customers have never complained about the quality of the water supplied. As high as 90.8% of the vendors disclosed that they have more female customers than

ICEES 2021 ISSN: 2714-4186
208
males. This revelation is a reasonable because women use water mostly than men especially for domestic purposes. The study discovered wide variation in performance of vendors in the study locations. Essentially, only 35.8% of the vendors were able to meet the water needs of their customers in dry season. Information obtained on reasons for inability to meet the customer’s water need particularly in dry season revealed that water shortage (75%) is significant followed by increase in demand (10.0%) and long distance (10.8%). Vendors seldom fail to meet the customer water demand in wet season. However, the study observed that 31.7% have disappointed their customers in wet season for reasons such unfavourable weather (28.3%), fatigue (13.0%), water shortage (19.0%), low demand (10.9%) and illness (28.3%). The identified factors are obvious certainly affect business transaction for both in wet and dry seasons.
(e) Challenges of water vending in the study areas
The study identified some problems confronting water vendors. The investigation showed that 30% of the vendors commonly encounter water shortage mostly in dry season. This is a major problem affecting the water vending in the study area (Table 2). The nature of the job requires serious energy for fetching and carriage of water which often result to body fatigue. As high as 13% disclosed body fatigue as a major challenge encountered on the job. Some customers often purchase water on credit consequently identified as a challenge by 11.7% of the vendors. Loss of kegs was another challenge encountered by respondents. As high as 10.8% have their kegs lost at different times. Other problems identified include bad pedestrian ways 9.2%; low income 8.3%; long distance between source of water and customers locations. Most of the problems identified are making the job difficult for vendors to perform but majority have no alternative job. Despite the above difficulties identified, 80.8% of the vendors are willing to continue with the business. Among other reasons why a huge proportion of the vendors desired to continue in the water sales is livelihood provision. As high as 50.6% considered the job as a major source of their livelihood. Of all the respondents, 19.1% disclosed that water vending gives them money for livelihood. Among the vendors, 11.2% liked to continue because the job is lucrative and offers freedom of entry and exit. Other respondents (4.5%) desired to stay on the job because it is less technical while another 4.5% has no other job to do. The vendors seek for improvement to enable them do the job better with outmost conveniences. As high as 64.8% requested for provision of more wells and boreholes to increase water availability in the study areas. Also, a proportion, 14.3% requested for rehabilitation of pedestrian roads for convenience and easy delivery of services. In addition, 9.5% seeks for prompt payment and construction of more boreholes in the areas while 6.7% are looking forward to having motorised pushcart to enhance their performance. Another revelation from the study is that some of the respondents desire to do other jobs such as taxi driving (19.2%), commercial motorcycle (11.5%), 11.5% desired to engaged in dry cleaning, 7.7% wished to go into trading while 50% loved to go to school.
Table 2: Challenges encountered and reason for continuation in Water vending
Challenges encountered Frequency Percentage
Loss of keg 13 10.8 Low water in well 36 30.0 Fatigue 15 12.5 Loss of keg/low water 10 8.3 loss of Keg/Fatigue 7 5.8 Bad road/water shortage 11 9.2 credit sale 14 11.7 Low income 10 8.3 Long distance 4 3.3

ICEES 2021 ISSN: 2714-4186
209
Total 120 100.0 Reasons for willingness to continue
Livelihood provision 45 37.5 Little technicality 4 3.3 Gives money 17 14.2 Livelihood/Little technicality 6 5.0 Simple to do 3 2.5 Lucrative/Work freedom 10 8.3 No other job 4 3.3 Total 89 74.2 Missing 31 25.8
Source: Field work, 2021
Test of variation in challenges encountered in the selected Hausa communities
It is noteworthy to examine the variation in the challenges encountered by Hausa water vendors across the study areas. The Chi-square value of 84.418 and p-value of 0.000 (since p<0.05) implies that the challenges of water vending significantly varied across the study locations. Though the communities have some common characteristics such as language, religion and cultural values yet the spatial differences could be responsible for variation in challenges encountered. The age and morphology of the environment where the vendors operate is another reasonable factor responsible for variations in the challenges encountered.
Table 1: Cross tabulation of Location and Challenges encountered by water vendors
Location Challenges encountered by water vendors Total
Loss of keg
Low water in well
Fatigue Loss of keg/ low water
loss of Keg/ Fatigue
Bad road/ water shortage
credit sale
Low income
Long distance
Sasa 0 8 3 10 3 9 7 0 0 40 Sabo 4 22 5 0 0 0 5 10 4 50 Ojo 9 6 7 0 4 2 2 0 0 30
Total 13 36 15 10 7 11 1 10 4 120
Chi-Square Tests
Value df Asymp. Sig. (2-sided)
Pearson Chi-Square 84.418a 16 .000 Likelihood Ratio 96.242 16 .000 Linear-by-Linear Association
7.191 1 .007
N of Valid Cases 120
a. 20 cells (74.1%) have expected count less than 5. The minimum expected count is 1.00.
g. Variation in financial benefits derived by vendors
The variation in financial benefits derived by vendors from their daily sales in the three locations: Sabo, Ojo and Sasa was examined. The result of ANOVA test f-value is 2.829 and p-value is

ICEES 2021 ISSN: 2714-4186
210
0.063 (when p>0.05), it implies that there is no significant variation in financial benefit derived by vendors across the study locations. The revelation is true because the cost price is uniform while the selling price of a keg of water is not significantly different. Similarly, the homogeneity of language, religion, ethnic and culture should largely determine similarity in the amount of water demand and use given rise to sales pattern.
Table 2: ANOVA Result of Variation in Financial Benefit of Water Vending Across the Study Locations
Sum of Squares df Mean Square F Sig.
Between Groups 1133450.000 2 566725.000 2.829 .063 Within Groups 23438216.667 117 200326.638 Total 24571666.667 119
h. Vendor age variation and daily financial benefit
The age may determine the personal commitment of vendors to the trade, therefore, the study investigates the relationship between the age and financial gains of respondents. The ANOVA analysis showed that f-value is 16.331 and p-value of 0.000 (p< 0.05) which implies that there is significant difference in financial benefit of water vending across different age groups. The study further revealed that those within the age group of 21 to 40 years earned higher income than those of 20 years and below (p<0.05). Similarly, those within the age group of 41 and 60years earned significantly higher than those in 20 years and below (p<0.05), while there was no significant difference in earning between the age group of 21 to 40 years and 41 to 60years (p>0.05). The finding is realistic because the workforce of the nation largely falls within ages 20 to 60. Consequently, the labour force within this age group should be responsible, hardworking and maximally contributing to the gross domestic income of the nation. It is expected that the group should derive more benefits from the trade that others.
Table 3: Average daily income from the business per day
Sum of Squares df Mean Square F Sig.
Between Groups 5362466.808 2 2681233.404 16.331 .000
Within Groups 19209199.859 117 164181.195
Total 24571666.667 119
Multiple Comparisons LSD
(I) Age of Respondents
(J) Age of Respondents
Mean Difference (I-J)
Std. Error Sig. 95% Confidence Interval Lower Bound
Upper Bound
≤ 20years 21-40years -498.50068* 87.22717 .000 -671.2495 -325.7518 41-60years -343.72760* 120.07225 .005 -581.5244 -105.9308
21-40years 41-60years 154.77308 106.92796 .150 -56.9921 366.5383
*. The mean difference is significant at the 0.05 level.
ICEES 2021 ISSN: 2714-4186
211
6. Conclusion and Recommendation The importance of water vendors in water service provision cannot be underestimated consequently it has been identified as an important source of water in some parts of Ibadan especially in Hausa communities largely owing to gross shortage of public water in these communities. The social, religion and cultural values of Hausa residents does not encourage housewives scouting around for water, therefore, encouraged persistent demand for water vendor services. Due to the nature of the job, middle age men, basically 20 to 40 years young men with full strength commonly found on the job, accordingly realised highest financial benefit from the trade. The highest financial benefit derived by vendors within ages 20 to 40 years is connected to the ability to convey many kegs of water at a time. In dry season, vendors could not fully meet water demand by the consumers due to increase in demand, water shortage from the source and distance from water source to the customer locations. The water vendors encountered some challenges such as loss of water kegs, conflict at water collection point, fatigue and sickness. It is of interest to note that buyers are ready to pay equivalent cost of water obtained from vendors for public water services if government can provide regular public pipe born water in the study areas.
The study therefore suggests designing and implementing effective policy and intervention initiatives that will support water vending and integrate it into public water supply system in form of public private partnership (PPP). Furthermore, the study recommends that the water governing authorities should build water collection points in areas where water vending is exigent to aid water collection by vendors for onward sales within the neighbourhood. The vendors have to register with the appropriate authority in-charge of the water loading bay and pay for quantity of water fetched. This will ease the major difficulties encountered on the job by vendors. The political leaders and philanthropist should see pushcart as important empowerment materials which can be distributed to enhance the water vending services. The gift would improve the operations and livelihoods of the vendors who are less privileged.
References
Abubakar, I. R (2016) Quality dimensions of public water services in Abuja, Nigeria. Utility Policy 38:43–5
Adejumo, S. A. (2020) Characteristics and challenges of teenage water vendors in Traditional markets in Ibadan, Nigeria, African Journal for the psychological study of social issues. Vol. 23 No1.
Alberto, Bull (2003) Traffic Congestion: The Problem and How to Deal with It, United Nations Publication
Albert, I O. (1991) The Hausa community in Ibadan between 1830-1986, an unpublished dissertation submitted to the Institute of African studies, University of Ibadan, Ibadan, Nigeria in partial fulfilment of the requirements for the award of the master of arts in African studies (African history).
Ahmad, M. T. (2017). The role of water vendors in water service delivery in developing countries: a case of Dala local government, Kano, Nigeria. Appl Water Sci , Vol.7, 1191–1201 https://doi.org/10.1007/s13201-016-0507-z
ICEES 2021 ISSN: 2714-4186
212
Ayalew, M.; Chenoweth, J; Malcolm, R; Mulugetta, Y; Okotto, L. G, and Pedley S (2014) Small independent water providers: their position in the regulatory framework for the supply of water in Kenya and Ethiopia. J Environ Law 26:105–128.
Balogun, I. I.; Sojobi, O. O. and Galkaye, E. (2017). Public water supply in Lagos State, Nigeria: Review of importance and challenges, status and concerns and pragmatic solutions, Journal of Cogent Engineering, Volume 4, Issue 1
Collignon, B.and Vézina, M. (2000) Independent Water and Sanitation Providers in African Cities. Full Report of a Ten-Country Study. UNDP–World Bank Water and Sanitation Program, Washington D. C.
Dada, A. C. (2009). Sachet water phenomenon in Nigeria: Assessment of the potential health impacts, African Journal of Microbiology Research, Vol.3 (1) pp. 015-021
Justice, Mensah (2019) Sustainable development: Meaning, history, principles, pillars, and implications for human action: Literature review, Cogent Social Sciences, Vol. 5,
Kjellén, M., and McGranahan, G., (2006). Informal Water Vendors and the Urban Poor, IIED, Human Settlements Discussion Paper Series, Theme: water -3, p. 26.
Kjellen, M (2000) Complementary water systems in Dar es Salaam, Tanzania: the case of water vending. Int. Journal of Water Resources Development 16(1):143–154. doi:10.1080/07900620048626
Marianne, K. and Mcgranahan G. (2006) informal water vendors and the urban poor, international institute for environment and development (iied), Un-Habitat
Njiru, C. (2004). Utility-small water enterprise partnerships: serving informal urban settlements in Africa. Water Policy, 6 (5): 443-452.
Nnaji. C. C, Eluwa, C, and Nwoji, C (2013) Dynamics of domestic water supply and consumption in a semi-urban Nigerian city. Habitat Int 40:127–135
Olajuyigbe, A. E, Rotowa O. O, Adewumi I. J (2012) Water vending in Nigeria—a case study of Festac Town, Lagos. Nigeria. Mediterr. Journal of Soc Sci 3(1):229–239. doi:10.5901/mjss.2012.03.01.229
Onyenechere, E. C., Eleazu, I. E, Azuwike, O.E, Osuji, S and Igwe, C. F. (2012). The Dynamics of Domestic Water Vending in Enugu North L.G.A. of Enugu State, Nigeria.Journal of Water Resource and Protection, 2012, 4, 224-230.
Salahudeen, Hajarat (2015). The role of water vendors in domestic water supply in Nassarawa Local government area of Kano state, Nigeria, a dissertation submitted to the school of post graduate studies, Ahmadu Bello University, Zaria, Nigeria,
Sheshe, M. U, Magashi AM (2014) Assessment of physicochemical quality of sachet water produced in selected local government areas of Kano Metropolis, Kano State, Nigeria. Bayero J. Pure Appl. Sci. 7(2):31–35
Snell, S. (1998) Water and sanitation services for the urban poor. Small-scale providers: typology and profiles. Water and Sanitation Program, World Bank, Washington DC

ICEES 2021 ISSN: 2714-4186
213
Wutich, A.; Beresford, M., and Carvajal, C (2016) Can informal water vendors deliver on the promise of a human right to water? Results from Cochabamba, Bolivia. World Dev 79:14–24.doi:10.1016/j.worlddev.2015.10.043
WHO, UNICEF (2015) Progress on sanitation and drinking water—2015 update and MDG assessment, World Health Organisation, Geneva.
ICEES 2021 ISSN: 2714-4186
214
SPATIAL DISTRIBUTION OF COMMERCIAL BANKS IN OSOGBO, OSUN STATE
Yakubu D. A.,1* Ogundahunsi D. S1 and Amos C1.3
1Department of Urban and Regional Planning, Osun State University Osogbo, Nigeria
* Email of Corresponding Author:: [email protected]
ABSTRACT
This study examines the spatial distribution and attributes of commercial banks in Osogbo. The number of banks available in the study area were ascertained through field survey. GIS techniques was used for spatial query and hyperlink to show the attributes of the commercial banks. The collected data were subjected to nearest neighbor statistical analysis (Rn) to determine the locational pattern. Of the 36 commercial banks identified in the study area, 80% are located in Olorunda Local Government area while the remaining 20% are in Osogbo Local Government area. Nearest neighbour analysis revealed that the banks were clustered along the major road corridors with the value of -0.247. 2% of the banks lack adequate parking space, landscape and ATM booths. The study concludes location of commercial banks is in such a way that the traditional areas of Osogbo lack the facility. Therefore, it is recommended that banking service should be extended to the traditional areas where indigenes reside to encourage and improve their socio-economic status, and also the local planning authority be active to her duty in order to ensure establishment of new banks adhere strictly to the stipulated standards so as to achieve effective development planning and functional urban business environment.
Keywords: Bank, Commercial, Spatial, Location, Marketing
1.0 Introduction
The banking system has witnessed a rapid growth in the last three decades in Nigeria as a result of oil boom, economic development and the awareness of the importance attributed to money. The commercial banks are the most dominant institutions in the financial system of any economy. Faki (2007) defined bank as financial institutions that offer services such as keeping money and other valuable items, exchange currencies, make loans available and offer other financial services.
The spatial distribution of commercial banks describes the geographical spread and pattern of commercial banking activities in a certain area. Ijaiya (2010) established that the location of banks is the most crucial factor retailers and service providers need to put into consideration as basic requirement for business success and growth as well as the visibility of business to potential customers, patronage and level of profitability. Fujita and Krugman (2004) observed that firms enjoy a number of advantages when they clustered around bank branches and provide advantages such as reducing bank customers’ cost of finding and obtaining banking services, share service and costs, security and exterior maintenance. Birkin et.al, (2002) observed that in general, bank location strategy follows the same localization logic as other private services firms, proximity to customers is advantageous to their branches.
Rangel and Lobato (2010) identified three factors to be considered in locating banks such as access to potential customers, sales of banking services and overall bank earning. Jabatan (2008) suggested criteria for new bank location with the population of about 10,000 people to be in trading area such as supermarket or malls that could develop a business matter, the maximum

ICEES 2021 ISSN: 2714-4186
215
area coverage must be within 3 km from existing branch and located in the area that avails security, business establishments and infrastructure support such as good access road. Concentration of banks in specific location have important desirable implications for both local and international economies and its failure may be far more detrimental to the economy than the failure of other types of businesses.
Chang et.al, (1997) maintained that bank branches should be spatially clustered in an area where there is considerable certainty about the profitability of opening a branch. Kutler (1996) observed that bank location is based on its proximity to the customers since customers frequently visit the banks to make deposit, withdraw money and expect use automated teller machine (ATM). Anthony (2007) revealed that geographic information system (GIS) technology can be employed to determine the suitable location of business area including new bank branch by obtaining a snapshot in understanding of markets from a remote location, According to Jafrullah et al. (2003) determining strategic new bank branch location is one of the important elements in marketing a business expansion and can really a challenging task as it requires substantial capital investment
The inability of banks to reach the entire population has reduced the accessibility of its services to all categories of business and this has been a source of worry (Rangel and Lobato 2010). Nevertheless, there is dearth of empirical research on the varying levels of the magnitude of the above subject at various geographical scales of investigation, hence this study focuses on the spatial location of commercial banks in Osogbo, Osun State employing GIS technique as a spatial tool for providing information on the pattern of distribution of the commercial banks in the city.
2.0 The study Area
Osogbo is the capital of Osun state, South-west of Nigeria. It is 88km by road Northeast of Ibadan and 100km by road South of Ilorin and 115km Northwest of Akure. The town is situated on latitude 7o46’0’’N and on longitude 4o34’’E and latitude 7o767’0’’N and the longitude 4o567’0’’E and has a total land area of 47km2 (18sq mi). Osogbo was founded in late 17th century between 1650 and 1700 and became the capital of Osun state in 1991. Osogbo became a commercial town with the arrival of the railway in 1907 which brought the colonial government to the threshold of the town. The city seats the headquarters of both Osogbo local government council (Osogbo South) and Olorunda local government council (Osogbo North) at Oja Oba and Igbonna respectively. The River Osun and its tributaries provide the early settlers with regular source of water supply and through its good drainage a good healthy physical area emerged for development purpose. Industrial and commercial development has always received adequate attention of the settlers and immigrants from other parts of the country. The busiest and most commercial parts of the town are Ayetoro area, Ajegunle area, Gbongan road and Station Road. Almost all the ethnic groups in Nigeria are represented trading side by side in harmony; along these roads are commercial firms and banks. The indigenes initially took to the cottage and handicraft industries such as dyeing, weaving, blacksmithing, pottery, embroidery and small-scale farming. Commercial and industrial establishment are widely spread across the town. These include the TUNS farm, the Integrated Stell PLC of Dangote Group (formerly Nigerian Machine Tools), Osogbo Steel Rolling Company, Industrial Development Centre, Wire and Nails Industry among others. The town became a tourist center for her famous Osun festival celebration which attracts people from far and near places every year.

ICEES 2021 ISSN: 2714-4186
216
3.0 Methodology
The data used for the study was collected through direct observation at banks location. Global positioning system (GPS) was utilized for taking the coordinates and determine the location of each bank. Ilwis 3.3 and AutoCAD software were employed for capturing the physical environment of each bank and for map digitization to provide relevant information about the bank’s boundaries. The acquired data were subjected to spatial query, hyperlink analysis, buffer analysis and nearest neighbour analysis. The development of the GIS database for the commercial banks in the study area involved the creation of attribute data to represent the bank’s location. Based on the spatial entities identified, the bank attribute table was created
3.1 Location and Number of Banks
There are a total of thirty-six (36) banks in Osogbo as shown in Table 1. In terms of distribution, 80.6% of the bank population fall within Olorunda Local Government area while the remaining 19.4% fall within Osogbo Local Government Area. Ola-Iya to Ogo Oluwa corridor have 18 banks the highest concentration in a section of the study area. The location of these banks did not abide by the 3km distance stipulated by Jabatan (2008). The five banks along the station road are all within 500m radius.
Table 1: Location and Number of Banks
S/No Bank Location Number of Banks Local Government
1 Olaiya Junction – Abere 18 Olorunda 2 Olaiya – Igbona 5 Olorunda 3 Olaiya- Oke –Fia 5 Olorunda 4 Old Garage- Station Road 5 Osogbo 5 Olaiya- Fagbewesa 1 Osogbo 6 Olaiya- Odi- Owo 1 Osogbo 7 Stadium Area 1 Olorunda Total 36
Figure 1 shows the search query of the banks in Osogbo, where they are situated, the local government area, name of the bank, and its geographical coordinates. Majority of the banks are found along the Ola-Iya - Abeere Road where most commercial concerns are located. This is in support of Birkin et.al, (2002) that bank is strategically located in close proximity to customers.
Figure 2 shows First Bank along Oke-Fia/ Alekunwodo road. Observation reveals that the bank lacks adequate parking space for vehicles and insufficient set-back at the frontage which do not meet the minimum standard of 15m. This compels customers to park their vehicles by the road side which reduces the effective width of the road. Also, the long queue of people patronizing the automatic teller machine (ATM) usually stretch into the adjoining land use during peak periods.
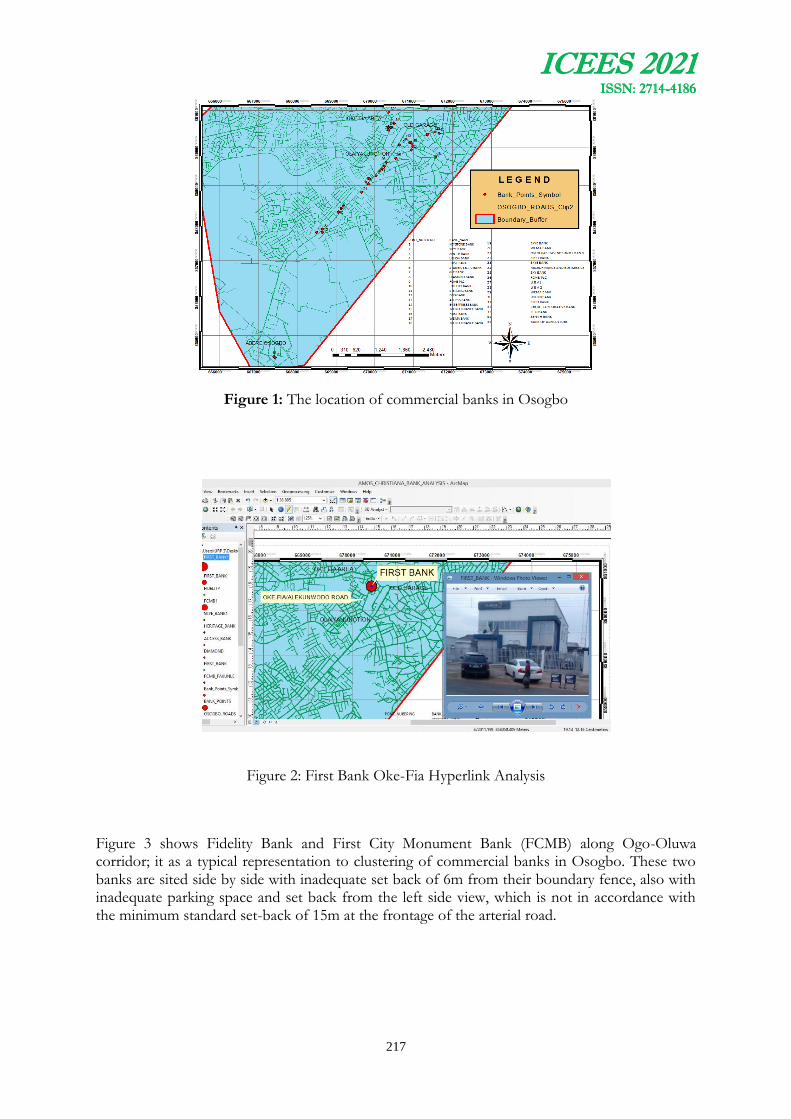
ICEES 2021 ISSN: 2714-4186
217
Figure 1: The location of commercial banks in Osogbo
Figure 2: First Bank Oke-Fia Hyperlink Analysis
Figure 3 shows Fidelity Bank and First City Monument Bank (FCMB) along Ogo-Oluwa corridor; it as a typical representation to clustering of commercial banks in Osogbo. These two banks are sited side by side with inadequate set back of 6m from their boundary fence, also with inadequate parking space and set back from the left side view, which is not in accordance with the minimum standard set-back of 15m at the frontage of the arterial road.

ICEES 2021 ISSN: 2714-4186
218
Figure 3: Fidelity and FCMB Bank Ogo-Oluwa Hyperlink Analysis
Figure 4 shows Zenith Bank along Oke-Fia/ Old Garage Road, with adequate parking space and setback from the road, but with substandard airspace of 6m on both left and right-sides.
Figure 4: Zenith Bank Hyperlink Analysis
Figure 5 displays 1000 metres radius buffer analysis of commercial banks in Osogbo which reveal that most of the banks falls within the 1000m radius. This shows that none of the banks fulfill the 800 meters radius standard stipulated according to Obateru (2012). This contrasts sharply with the situation in Figure 6 which shows wide areas outside the catchment of the banks. Various factors such as competition for prime space, proximity to commercial concerns and good communication network could be responsible for this. The location of the bank premise plays significant role in certifying the success of the business.

ICEES 2021 ISSN: 2714-4186
219
Figure 5: Buffer analysis of the areas with commercial banks in Osogbo
Figure 6: Buffer analysis of the areas without commercial banks in Osogbo
The outdoor facilities available at the banks and their conditions are captured in Table 2. It shows the physical facilities such as parking space, landscape elements, ATM booth of each bank. Twenty banks have sufficient parking space, twelve banks were fairly provided with parking space, four banks with good number of parking space accommodating 20-30 vehicles while Wema Bank in station road have parking space that can accommodate up to 36 cars. It is very important to note that in banks like Zenith Bank, Eco-Bank both at Fakunle area, Union Bank at Onward Area, First Bank at Ayetoro and Polaris Bank at Fagbewesa, customers resort to on-street parking due shortage of parking lots within the bank premises. This often led to traffic delay and hold-up during peak hours at those areas. Table 2 shows the condition of available facilities identified in each bank. 55.6% have poor soft landscape condition, 47.2% have
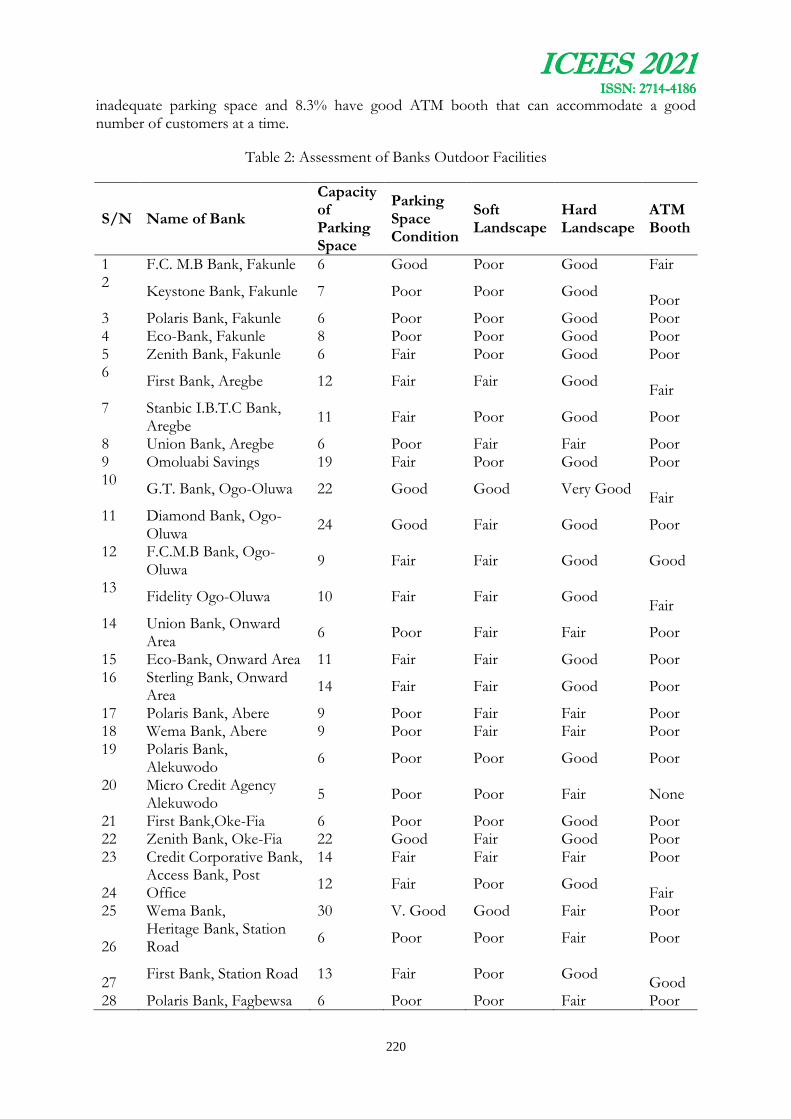
ICEES 2021 ISSN: 2714-4186
220
inadequate parking space and 8.3% have good ATM booth that can accommodate a good number of customers at a time.
Table 2: Assessment of Banks Outdoor Facilities
S/N Name of Bank
Capacity of Parking Space
Parking Space Condition
Soft Landscape
Hard Landscape
ATM Booth
1 F.C. M.B Bank, Fakunle 6 Good Poor Good Fair 2
Keystone Bank, Fakunle 7 Poor Poor Good Poor
3 Polaris Bank, Fakunle 6 Poor Poor Good Poor 4 Eco-Bank, Fakunle 8 Poor Poor Good Poor 5 Zenith Bank, Fakunle 6 Fair Poor Good Poor 6
First Bank, Aregbe 12 Fair Fair Good Fair
7 Stanbic I.B.T.C Bank, Aregbe
11 Fair Poor Good Poor
8 Union Bank, Aregbe 6 Poor Fair Fair Poor 9 Omoluabi Savings 19 Fair Poor Good Poor 10
G.T. Bank, Ogo-Oluwa 22 Good Good Very Good Fair
11 Diamond Bank, Ogo-Oluwa
24 Good Fair Good Poor
12 F.C.M.B Bank, Ogo-Oluwa
9 Fair Fair Good Good
13 Fidelity Ogo-Oluwa 10 Fair Fair Good
Fair
14 Union Bank, Onward Area
6 Poor Fair Fair Poor
15 Eco-Bank, Onward Area 11 Fair Fair Good Poor 16 Sterling Bank, Onward
Area 14 Fair Fair Good Poor
17 Polaris Bank, Abere 9 Poor Fair Fair Poor 18 Wema Bank, Abere 9 Poor Fair Fair Poor 19 Polaris Bank,
Alekuwodo 6 Poor Poor Good Poor
20 Micro Credit Agency Alekuwodo
5 Poor Poor Fair None
21 First Bank,Oke-Fia 6 Poor Poor Good Poor 22 Zenith Bank, Oke-Fia 22 Good Fair Good Poor 23 Credit Corporative Bank, 14 Fair Fair Fair Poor
24 Access Bank, Post Office
12 Fair Poor Good Fair
25 Wema Bank, 30 V. Good Good Fair Poor
26 Heritage Bank, Station Road
6 Poor Poor Fair Poor
27 First Bank, Station Road 13 Fair Poor Good
Good
28 Polaris Bank, Fagbewsa 6 Poor Poor Fair Poor

ICEES 2021 ISSN: 2714-4186
221
29 Micro Finance Bank, Station Road
8 Poor Poor Fair Poor
30 UBA 1 Olonkoro 10 Fair Poor Fair Poor 31 UBA 2 Olonkoro 7 Poor Poor Poor Poor
32 Wema Bank, Igbona 16 Fair Fair Good
Fair
33 First Bank, Ayetoro 6 Poor Poor Good Poor 34 G T Bank, Stadium 24 Good Good Good Good
35 Micro Finance New Orisumbare
10 Fair Poor Good None
36 Bank, of Agriculture Odi- Olowo
6 Poor Fair Fair None
Table 3: Nearest Neighbour Analysis of the Commercial Banks
S/N Name of Bank Nearest Neighbour Distance (M)
1 F.C. M.B Bank, Fakunle Keystone Bank, Fakunle 120.469 2 Keystone Bank, Fakunle Skye Bank, Fakunle 86.784 3 Skye Bank, Fakunle Eco-Bank, Fakunle 77.989 4 Eco-Bank, Fakunle Skye Bank, Fakunle 77.989 5 Zenith Bank, Fakunle Eco-Bank, Fakunle 164.657 6 First Bank, Aregbe Stanbic I.B.T.C Bank, Aregbe 120.216 7 Stanbic I.B.T.C Aregbe Union Bank, Aregbe 79.611 8 Union Bank, Aregbe Stanbic I.B.T.C Bank, Aregbe 79.611 9 Omoluabi Savings and Loan
Bank, Old Governor’s Office Union Bank, Aregbe 284.200
10 G.T. Bank, Ogo-Oluwa Diamond Bank, Ogo-Oluwa 76.275 11 Diamond Bank, Ogo-Oluwa G.T. Bank, Ogo-Oluwa 76.275 12 F.C. M.B Bank, Ogo-Oluwa Fidelity Ogo-Oluwa 10.295 13 Fidelity Ogo-Oluwa F.C. M.B Bank, Ogo-Oluwa 10.295 14 Union Bank, Onward Area Eco-Bank, Onward Area 85.730 15 Eco-Bank, Onward Area Union Bank, Onward Area 85.730 16 Sterling Bank, Onward Area Eco-Bank, Onward Area 150.163 17 Skye Bank, Abere Wema Bank, Abere 45.803 18 Wema Bank, Abere Polaris Bank, Abere 45.803 19 Polaris Bank, Alekuwodo Micro Credit Agency Alekuwodo 53.553 20 Micro Credit Agency
Alekuwodo Polaris Bank, Alekuwodo 53.553
21 First Bank, Oke-Fia Micro Credit Agency Alekuwodo 63.985 22 Zenith Bank,Oke-Fia First Bank, Oke-Fia 139.457 23 Credit Corporative Bank, Zenith Bank, 322.15 24 Access Bank, Post Office Wema Bank, Orisumbare 43.409 25 Wema Bank, Orisumbare Access Bank, Post Office 43.409 26 Heritage Bank, Station Road First Bank, Station Road 64.474 27 First Bank, Station Road Heritage Bank, Station Road 64.474 28 Skye Bank, Fagbewsa First Bank, – Station Road 161.446 29 Micro Finance Station Road First Bank, Station Road 270.08 30 UBA 1 Olonkoro UBA 2Olonkoro 10.532 31 UBA2 Olonkoro UBA1Olonkoro 10.532

ICEES 2021 ISSN: 2714-4186
222
32 Wema Bank, Igbona First Bank, Ayetoro 116.506 33 First Bank, Ayetoro Wema Bank, Igbona 116.506 34 GT Bank, Stadium Area First Bank, Ayetoro 956.74 35 Micro Finance Orisumbare Polaris Bank, Fagbewesa 659.48 36 BOA Odi- Olowo FCMB Bank, Fakunle 262.14
Figure 7: The nearest neighbor curve and values
The nearest neighbour analysis result reveal that computed Rn is -0.247 as shows in figure 7 above which is close to zero. Hence the spatial distribution of commercial banks in Osogbo Township is clustered. An ideal location pattern of an important institution such as banks should not be that of clustered nor random but regular in space for easy access and security due to the fact that they deal with money. In planning, facilities and services should not be haphazardly sited. Siting of banks side by side is disastrous in the case of robbery attack. This implies that the spatial location of commercial banks in Osogbo was not based on any spatial regulation which is an indication of poor strategic planning and management. This is due to the fact that Osogbo developed organically without a master or development plan to guide its growth.
4.0 Conclusion
The study reveals that commercial banks in Osogbo Township are not located in violation of the extant regulations guiding physical development in urban centres. While competing for prime location proximate to potential customers and due to the lack of sufficient space and facilities, they contribute to the transportation challenges of the city. Almost all the banks do not have enough space at the ATM booth to ensure privacy and security of customers and a significant number lack adequate parking space for vehicles. Therefore, this study recommends banks in the area should comply with regulations guiding the location of activity-generating facilities exhibiting effective accessibility, adequate and standard facilities. The existing ones with defective

ICEES 2021 ISSN: 2714-4186
223
facilities should put machineries in motion to upgrade their services such as the ATM booth, parking space and the other outdoor amenities. While it is true that mobile banking has brought banking services closer to the populace, the pressure on the banks is still significant; therefore, locating new banks should be subjected to robust guidance, supervision and monitoring of the cognate Physical Planning, Land and Services Department of the local governments and traditional areas lacking the service should be considered.
REFERENCES
Anthony L (2007) STL released integrated GIS solution for Nigeria’s Banking Industry. http:// www10.giscafe.com. Accessed 7 July 2008
Birkin, M. Clarke, G. and Clarke, M. (2002) Retail Geography and Intelligent Network Planning Sussex UK: John Wiley and Sons.
Chang, A. Chaudhuri. S, and Jayarantne. J. (1997). Rational herding and the Spatial Clustering of Bank Branches: An Empirical Analysis: A Discussion paper series No. 695 Federal Reserve Bank of New York, NY.USA.
Jafrullah M, Uppulurim S, Rajopadhaye N, Reddy VS (2003) An integrated approach for banking GIS. InfoTech Einterprises Limited
Fujuta, M. Krugman. P, and Venables. A. (1999). The Spatial Economy. Cambridge. MA. SUSA: MIT Press.
Faki. A. (2007) Challenges of Banking Sector Reforms and Bank Consolidation in Nigeria, Bullion, Vol. 29 (2), pp.26 – 37
Jabatan Perbankan Cawangan, BSN (2008) Penggunaan Kriteria ‘Standard’ Bagi Perlaksanaan Penubuhan/ Penutupan/ Pemindahan/ Percantuman Cawangan-Cawangan BSN
Ijaiya, M.A (2010) Impact of Informal Microfinance in Rural Dwellers Economic Activities unpublished Ph.D. Thesis. University of Ilorin.
Kumar, A. Beck, T. Campos, C. (2005) Assessing Financial Access in Brazil. World Bank WP 50, World Bank. Washington, USA.
Oluremi I. (2005): Land Subdivision Basics (reprinted edition 2012, pp. 89 and 91)
Rangel C.F.A and Lobato J. A. A. (2010) Towards an Explanation of the location pattern of banking system in the intra metropolitan space (A case study of Toluca, Mexico.)

ICEES 2021 ISSN: 2714-4186
224
ADVANCING PROPERTY INVESTMENT RETURNS THROUGH IMPROVED URBAN NEIGHBOURHOOD INFRASTRUCTURE
CONDITIONS IN JOS CITY
1Adeogun, Adekunle Sunday, 2Shittu Wasiu Oyewale, 3Agava Halim Yusuf and 4Oladimeji Samuel Bolaji
1 & 3Department of Estate Management, University of Ilorin, Ilorin, Nigeria
2Department of Estate Management, Federal Polytechnic, Birni Kebbi, Nigeria
4Department of Architecture, University of Ilorin, Ilorin, Nigeria
Email of Corresponding Author:: [email protected]
ABSTRACT
Infrastructure is one of the substantial indicators of neighbourhood and urban quality; it possesses the capability to draw and sustain returns on property investment. This study focuses on the urban neighbourhood infrastructure conditions as a pointer to ideal residential property investment returns in Jos city, Nigeria. The study adopted a survey research design using structured questionnaires to gather the required data. The data required are property transaction data on rental value and capital value of residential properties and the conditions of basic infrastructure in the selected neighbourhoods of Jos city. These data were sourced from practicing Estate Surveyors and Valuers practicing in Jos as well as the residents of the selected neighbourhoods. The estimated sampled size was 251 and only 161 questionnaires were recovered. The data collected were analysed using descriptive and inferential statistics. They are mean score, standard deviation, coefficients of variation and Spearman’s Rank Order Correlation model. The results of the analysis revealed that residential property investment performed better in Gwang layout and Lowcosts than Rayfield and Kufong areas on the basis of risk-return. The risk-return ratios range between 8% and 38%. Rayfield and Kufong residential market showed high level market volatility indicating the risky nature of these property submarkets. Infrastructure condition indices in Rayfield and Kufong is higher than ideal condition index (Benchmark), ranging between 72%-89% and 81%-94%. Few urban neighbourhood infrastructure conditions in Gwang Layout and Lowcosts are found to be below the benchmark. The study concluded that infrastructure has a strong influence on residential property investment returns in the study areas. It therefore, recommended that infrastructure condition should be given special attention when forming opinion on residential property investment.
Keywords: Residential, Returns, Property investment, Neighbourhood, Infrastructure,
Property Market.
1.0 Introduction
Infrastructure is seen as the fundamental facility and system serving a country, city and other areas, including the services and facilities necessary for its economy to function effectively (Tomlinson, 2001). Infrastructure prominently stands out as one of the indicators of an ideal urban economic development and its worth cannot be downplayed because it plays a vital role in the growth and development of any urban setting and its role in-turn creates attraction for all

ICEES 2021 ISSN: 2714-4186
225
forms of investments of which real estate investment is one. Property investment is the real estate property purchased with the intention of earning a return on investment either through rental income, the future resale of the property, or both. Ajayi (2014) asserted that property investment is the act of laying out capital in expectation of future return. Further explained that the anticipated reward from property investment may be in form of an income flow (rent) or by the receipt of a single capital sum (sale) or a combination of both (total return).
The property may be held by an individual investor, or a group of investors, or a corporation. Ajayi Cyril (2014) and Ogbuefi (2002) convincingly discussed it that, development of property investments performance indicators such as value indices, yields and total returns promote improvement in the analysis of the property investment returns at every location where invested real estate, especially, residential property is located. Investment’s efficiency among others is a function of the return, risk and total cost of an investment management structure and this are subject to the infrastructure functionality and other constraints within which investors must operate (Dubben and Sayce 2009) and investment efficiency should be considered as a combination of financial efficiency and non-financial efficiency. Corgel et al. (1998) asserted that infrastructure projects abandonment would always affect property investment values in the vicinity.
Infrastructure, such as water, energy, roads development, transport networks, information, and communication technology for sustainability and these urban services also positively influence the value of real estate as they improve housing conditions and quality (Famuyiwa and Otegbulu, 2012). Olujimi (2009) and Olujimi (2010) opined that whenever infrastructure is inadequately provided, the probability that the expected sustainable real property return will dwindle is very high. Real estate has no value if it has no infrastructure service to effectively support (Ajibola et al., 2013). Gatauwa and Murungi (2015) studied the influence of infrastructural development and real estate investment returns in Meru County, Kenya. The data collected from 955 real estate properties were subjected to regression analysis and the result revealed that, transport and communication factors, social amenities, industrial development, educational institutions and commercial development accounts for 89.3% variation in property investment. The study therefore concludes that infrastructure development has a great impact on real estate investment return among other factors hence infrastructure developments would lead to demand for real estate property and this in turn will affect returns on real estate property.
There is intrinsic problem of lack of functional infrastructure and several attempts had been made by public and private property investors to correct the failure in residential property investment performance in both urban and peri-urban neighbourhoods in Jos city of Nigeria, This paper aimed at examining the effect of infrastructure conditions on residential property investment returns while focusing on residential properties which are meant for investment purpose across the study area.
2.0 Brief Profile Study Area
Jos city is the capital of Plateau State, lies on Latitude 90 30’N and Longitude 50 34’E in the North Central Nigeria. Jos is more populated more than any other town in the state. In-spite of crisis in the area Jos is still experiencing notable evolution in real estate development and property investment. Jos is endowed with infrastructure essential of a city and there is room for more as the city is expanding on daily basis. (NIEVS, 2017)

ICEES 2021 ISSN: 2714-4186
226
Figure 1: Selected Neighbourhoods in the Context of Jos Metropolis
Source: Plateau State Town Planning Authority Planning Unit, (2021)
3.0 Methodology
This study adopted a survey research design in which structured questionnaire was used to collect the required data. The data were sourced primarily from registered estate firms and residents of the selected neighbourhoods. The sample size for this study was determined using the Frankfort Nachmias 1996 model to arrive at 251 respondents. Only 161 respondents correctly completed and returned the questionnaires representing 64% response rate. The required data are rental and capital values of the sampled 1-bedroom, 2-bedroom and 3-bedroom residential properties in the study areas. Data on the state or condition of basic infrastructure were equally retrieved and analysed using both descriptive and inferential statistics. Likert Scaling was used as a ranking method and benchmark for minimum acceptable standard of condition and infrastructure index was taken. From the rental and capital value data, the total returns on investment were computed and the mean average determined and the associated risk on investment return (risk-return) is determined using the coefficient of variation. The Kendall Coefficient of Concordance was employed to test relationship among the ranked infrastructure factors while the Spearman’s Rank Order Correlation was used to determine the relationship between neighbourhood infrastructure condition and residential property investment returns in the study areas.
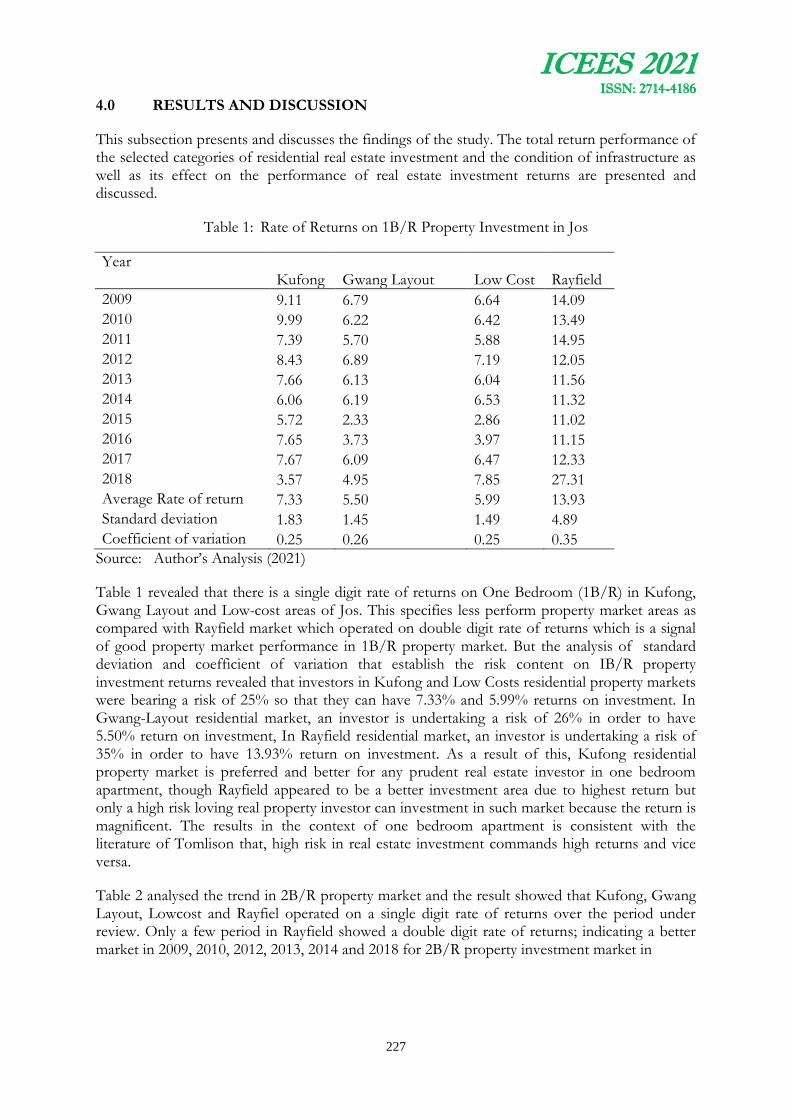
ICEES 2021 ISSN: 2714-4186
227
4.0 RESULTS AND DISCUSSION
This subsection presents and discusses the findings of the study. The total return performance of the selected categories of residential real estate investment and the condition of infrastructure as well as its effect on the performance of real estate investment returns are presented and discussed.
Table 1: Rate of Returns on 1B/R Property Investment in Jos
Year Kufong Gwang Layout Low Cost Rayfield
2009 9.11 6.79 6.64 14.09
2010 9.99 6.22 6.42 13.49
2011 7.39 5.70 5.88 14.95
2012 8.43 6.89 7.19 12.05
2013 7.66 6.13 6.04 11.56
2014 6.06 6.19 6.53 11.32
2015 5.72 2.33 2.86 11.02
2016 7.65 3.73 3.97 11.15
2017 7.67 6.09 6.47 12.33
2018 3.57 4.95 7.85 27.31
Average Rate of return 7.33 5.50 5.99 13.93
Standard deviation 1.83 1.45 1.49 4.89
Coefficient of variation 0.25 0.26 0.25 0.35
Source: Author’s Analysis (2021)
Table 1 revealed that there is a single digit rate of returns on One Bedroom (1B/R) in Kufong, Gwang Layout and Low-cost areas of Jos. This specifies less perform property market areas as compared with Rayfield market which operated on double digit rate of returns which is a signal of good property market performance in 1B/R property market. But the analysis of standard deviation and coefficient of variation that establish the risk content on IB/R property investment returns revealed that investors in Kufong and Low Costs residential property markets were bearing a risk of 25% so that they can have 7.33% and 5.99% returns on investment. In Gwang-Layout residential market, an investor is undertaking a risk of 26% in order to have 5.50% return on investment, In Rayfield residential market, an investor is undertaking a risk of 35% in order to have 13.93% return on investment. As a result of this, Kufong residential property market is preferred and better for any prudent real estate investor in one bedroom apartment, though Rayfield appeared to be a better investment area due to highest return but only a high risk loving real property investor can investment in such market because the return is magnificent. The results in the context of one bedroom apartment is consistent with the literature of Tomlison that, high risk in real estate investment commands high returns and vice versa.
Table 2 analysed the trend in 2B/R property market and the result showed that Kufong, Gwang Layout, Lowcost and Rayfiel operated on a single digit rate of returns over the period under review. Only a few period in Rayfield showed a double digit rate of returns; indicating a better market in 2009, 2010, 2012, 2013, 2014 and 2018 for 2B/R property investment market in

ICEES 2021 ISSN: 2714-4186
228
Table 2: Rate of Returns on 2B/R Property Investment in Jos
Year Kufong Gwang Layout Low Cost Rayfield
2009 7.29 7.79 6.39 11.19
2010 8.24 7.09 7.29 12.02
2011 7.05 6.86 5.76 8.36
2012 7.15 7.45 7.31 13.26
2013 8.46 6.32 6.54 11.17
2014 8.35 6.93 6.31 12.36
2015 4.97 2.79 5.09 6.49
2016 5.13 4.59 5.22 8.86
2017 7.59 7.72 5.99 7.50
2018 6.50 13.80 7.96 10.50
Average Rate of return 7.04 7.13 6.39 10.17
Standard deviation 1.24 2.82 0.93 2.25
Coefficient of variation 0.18 0.39 0.15 0.22
Source: Author’s Analysis (2021)
Rayfield area of Jos. The analysis of individual market was carried out through standard deviation and coefficient of variation on 2B/R property across the selected residential market areas to show the risk contents. In Kufong residential market revealed that an investor is undertaking a risk of 18% in order to have 7.04% return on investment; in Gwang Layout residential property investment market, an investor is undertaking a risk of 39% in order to have 7.13% return on investment; in Low Costs residential property market, an investor is undertaking a risk of 15% in order to gain 6.39% return on investment and investor in Rayfield residential property market is undertaking a risk of 22% in order to have 10.17% return on property investment. This implies that, Low Costs residential property market is considered appropriate and better preferred, because investor is taking a least risk to comparable average returns in other neighbourhoods. Rayfied residential property market appeared more risky than other property investment market in other neighbourhoods. The implication of the results of two bedrooms in the study areas
Table 3: Rate of Returns on 3B/R Property Investment in Jos
Year Kufong Gwang layout Low Cost Rayfield
2009 7.94 6.21 6.16 10.95
2010 7.48 6.62 6.57 10.46
2011 7.31 6.29 6.26 8.08
2012 7.58 6.21 6.45 11.57
2013 7.69 6.25 6.28 11.25
2014 9.02 6.56 6.14 10.19
2015 4.68 5.02 5.92 7.33
2016 6.73 5.68 6.19 8.49
2017 9.79 6.23 7.14 8.54
2018 11.42 14.25 10.38 12.78
Average Rate of return 7.96 6.93 6.75 9.97
Standard deviation 1.82 2.61 1.32 1.77
Coefficient of variation 0.23 0.38 0.19 0.18
Source: Author’s Analysis (2021)

ICEES 2021 ISSN: 2714-4186
229
negate the argument of Olujinmi and Bello that infrastructure is not always have influence on property investment performance due to economic menace, but the results shows that however infinitesimal, infrastructure have influence on real estate investment performance.
The annual rate of returns on 3B/R property investment in Jos presented in Table 3 showed that all selected neighbourhood in Jos operated on single digit rate of return, only a few periods in Rayfield maintained double digit rate of returns in 2009, 2010, 2012, 2013, 2014 and 2018. Kufong, Gwang layout, and Low cost maintained double digit at current year 2018. But the analysis of individual market performance on the basis of risk was carried out using standard deviation and coefficient of variation to establish the risk contents on 3B/R property across the selected residential property market areas. In Kufong residential property market, the investor will bear a risk of 23% in order to gain 7.23% return on investment, in Gwang Layout residential property market, an investor will under a risk of 38% in order to have 6.93% return on investment, In Low Costs residential property market, an investor is undertaking a risk of 19% in order to achieve 6.75% return on investment and while investor in Rayfield residential property market will as well undertake a risk of 18% in order to have 9.97% return on property investment. Therefore, Rayfied residential property investment market is adjudged appropriate compare with other residential property market in other neighbourhoods, because investor is taking a reduced risk at comparable average return. Gwang layout residential market appeared more risky than other property market in other neighnourhoods. The results in the context of three bedroom apartment, by implication gives direction to real estate investor in order to take appropriate decision and this in line with Ajibola et., al which claims that returns on property investment depends on functional infrastructure
Table 5: Analysis of Variance in Residential Property Market in Jos
Source of Variation SS Df MS F P-value F crit
Between Groups 457.3732 3 152.4577 19.32639 0.0000 2.866266
Within Groups 283.9888 36 7.888576
Total 741.3619 39
Between Groups 85.54466 3 28.51489 7.404149 0.00055 2.866266
Within Groups 138.6433 36 3.851204
Total 224.188 39
Between Groups 65.3243 3 21.77477 5.808334 0.002408 2.866266
Within Groups 134.9598 36 3.748883
Total 200.2841 39
Between Groups 32.86023 3 10.95341 2.101209 0.117218 2.866266
Within Groups 187.6647 36 5.212908
Total 220.5249 39
Source: Author’s Analysis (2021)

ICEES 2021 ISSN: 2714-4186
230
The variance in property returns across the market location is presented in table 5 above. The result revealed that 1B/R property market across the study areas showed a significant variation in average return across the study areas since p-value at 0.000 is less than 0.05 level of significance. The result showed a significant variation in average 2B/R property market across the study areas since p-value at 0.00055 is less than 0.05 level of significance. 3B/R property market also showed significant variance in property return across the study areas at p-value of 0.002408 (p<0.05)and 4B/R market also revealed a insignificance variation in property return across the selected location at p-value 0.117218 (p-value >0.05). The implication is that neighborhood differences associated available infrastructure provided inequality in the distribution which caused preference in location and therefore causes different property market performance.
Table 6 showed the analysis five point Liker Scale used to measure the condition of infrastructure across the study areas. The result indicated the reliability test carried out to establish the degree of internal dependable among the items through the use of Cronbach’s Alpha. The result showed that at minimum acceptable alpha at 0.75 (75%), all the items across the study areas maintained high level of internal consistency at 80%, 76%, 85% and 88% for Kufong, Gwang-Layout, Low Cost and Rayfield respectively. The hypothesized mean or benchmark is calculated as (5+4+3+2+1= 15/5=3). Also, any infrastructure with mean condition higher than average threshold or hypothesized mean is referred to as infrastructure with a better condition. Therefore all the infrastructure showed better condition across the selected areas in Jos city.
The hypothesised mean condition index (benchmark ) at 0.6 (3/5) for five –point Likert Scale given in table 6 above is used to determined infrastructure with better condition, this implies that, any infrastructure condition index that is more than 60% (0.60) showed a better condition index. Infrastructural Condition Index in Kufong ranges between 0.62-0.81 (62% -81%), in Gwang-Layout, Infrastructure Condition Index (ICI) ranges 0.73-0.88 (73% -88%), in Low Cost, ICI ranges between 0.60-0.79 (60% - 79%) and in Rayfield, ICI ranges between 0.79 – 0.87 (79%-87%). This further signifies that, infrastructure condition in Rayfield is better than Gwang-Layout, Gwang Layout is better than Low cost and Kufong.
The result of strength of relationship between infrastructural index and property performance index is presented in table 7. There is strong positive significant relationship between water supply and property return across the study areas in Jos City. Electricity maintained strong positive significant relationship property return in Low cost and Rayfield. Access road and neighborhood security maintained strong positive significant relationship property return across the study areas of Jos. Drainage maintained positive significant relationship property return in Gwang layout, Low Cost and Rayfield. Waste disposal only maintained strong positive significant relationship property return in Gwang layout. Recreational facilities educational facilities only maintained strong positive significant relationship property return. Rayfield and Low cost respectively. health facilities did not maintain strong positive significant relationship property across study areas in Jos. Street light maintained strong positive significant relationship property return Gwang layout, Low cost and Rayfield This indicates that these aforementioned infrastructural variables are likely to cause positive significant change in return on property investment cross the aforementioned areas, they are therefore positively and strongly correlated property investment performance in the study areas of Jos city.
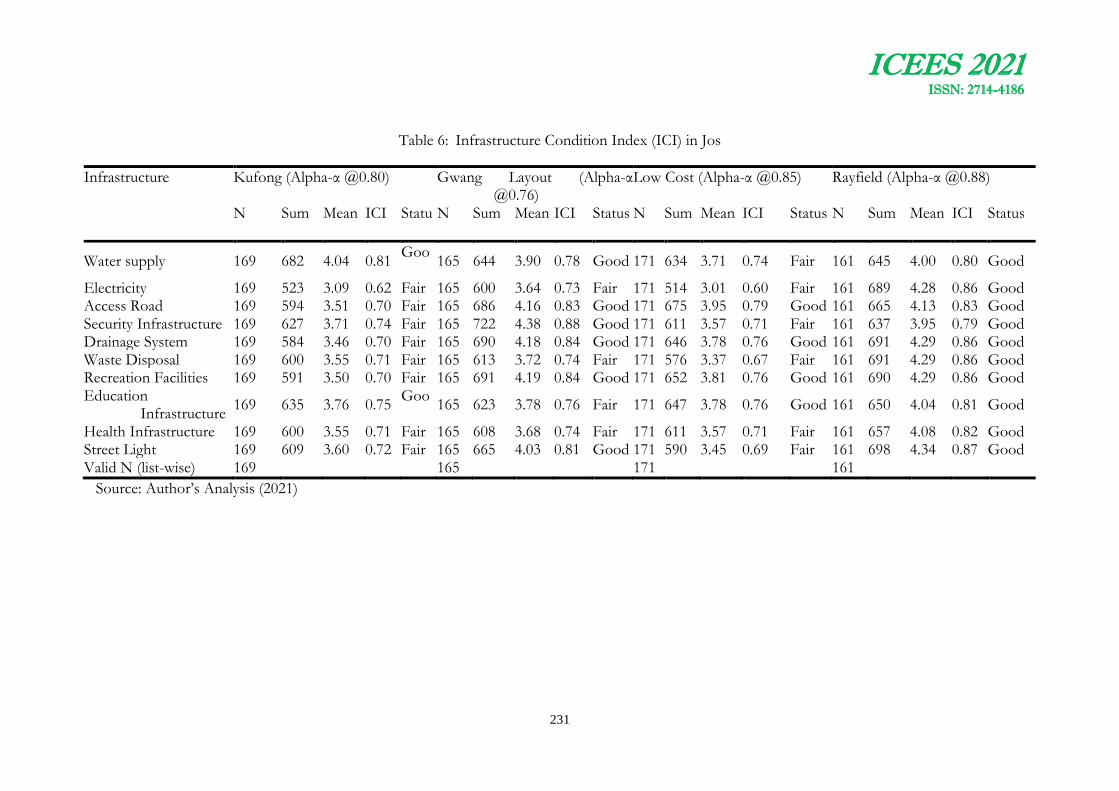
ICEES 2021 ISSN: 2714-4186
231
Table 6: Infrastructure Condition Index (ICI) in Jos
Infrastructure Kufong (Alpha-α @0.80) Gwang Layout (Alpha-α @0.76)
Low Cost (Alpha-α @0.85) Rayfield (Alpha-α @0.88)
N Sum Mean ICI Status
N Sum Mean ICI Status N Sum Mean ICI Status N Sum Mean ICI Status
Water supply 169 682 4.04 0.81 Goo
d 165 644 3.90 0.78 Good 171 634 3.71 0.74 Fair 161 645 4.00 0.80 Good
Electricity 169 523 3.09 0.62 Fair 165 600 3.64 0.73 Fair 171 514 3.01 0.60 Fair 161 689 4.28 0.86 Good Access Road 169 594 3.51 0.70 Fair 165 686 4.16 0.83 Good 171 675 3.95 0.79 Good 161 665 4.13 0.83 Good Security Infrastructure 169 627 3.71 0.74 Fair 165 722 4.38 0.88 Good 171 611 3.57 0.71 Fair 161 637 3.95 0.79 Good Drainage System 169 584 3.46 0.70 Fair 165 690 4.18 0.84 Good 171 646 3.78 0.76 Good 161 691 4.29 0.86 Good Waste Disposal 169 600 3.55 0.71 Fair 165 613 3.72 0.74 Fair 171 576 3.37 0.67 Fair 161 691 4.29 0.86 Good Recreation Facilities 169 591 3.50 0.70 Fair 165 691 4.19 0.84 Good 171 652 3.81 0.76 Good 161 690 4.29 0.86 Good Education
Infrastructure 169 635 3.76 0.75
Good
165 623 3.78 0.76 Fair 171 647 3.78 0.76 Good 161 650 4.04 0.81 Good
Health Infrastructure 169 600 3.55 0.71 Fair 165 608 3.68 0.74 Fair 171 611 3.57 0.71 Fair 161 657 4.08 0.82 Good Street Light 169 609 3.60 0.72 Fair 165 665 4.03 0.81 Good 171 590 3.45 0.69 Fair 161 698 4.34 0.87 Good Valid N (list-wise) 169 165 171 161
Source: Author’s Analysis (2021)

ICEES 2021 ISSN: 2714-4186
232
Table 7: Correlation between Infrastructure and Property Investment Performance in Jos
Infrastructure Kufong ® N Gwang Layout®
N Low Cost ® N Rayfield ® N
Water supply .65(.032) 183 .72(.002) 165 .67(.030) 151 .76(.001) 123
Electricity .58(.041) 183 .51(.054) 165 .47(.048) 151 .42(.039) 123
Access Road .71(.022) 183 .67(.024) 165 .65(.034) 151 .60(.030) 123
Security Infrastructure .56(.045) 183 .61(.026) 165 .75(.001) 151 .75(.001) 123
Drainage System .231(.452) 183 .58(.046) 165 .59(.023) 151 .68(.010) 123
Waste Disposal .34(.385) 183 .49(.073) 165 .41(.104) 151 .44(.341) 123
Recreation Facilities .41(.214) 183 .37(.122) 165 .34(.263) 151 .58(.025) 123
Education Infrastructure .31(.308) 183 .41(.101) 165 .48(.047) 151 .43(.263) 123
Health Infrastructure .21(.422) 183 .31(.213) 165 .38(.243) 151 .212(.432) 123
Street Light .42(.266) 183 .62(.027) 165 .61(.027) 151 .62(.021) 123
Source: Author’s Analysis (2021)
® = Return on Property Investment, N= number of properties
Table 8: Test of Relationship among the Ranked Infrastructure Condition in Jos city, Nigeria
Infrastructure Jos Kufong Gwang
Layout Low Cost
Rayfield T1 ∑T12 W rs
Water supply 1 6 4 7 18 324
0.801 (0.011)
0.455 (0.065)
Electricity 9 10 8 3 30 900
Access Road 6 4 1 4 15 225
Security Infrastructure 3 1 5 8 17 289
Drainage System 8 3 3 1 15 225
Waste Disposal 5 8 7 1 21 441
Recreation Facilities 7 2 2 1 12 144
Education Infrastructure 2 7 3 6 18 324
Health Infrastructure 5 9 5 5 24 576
Street Light 4 5 6 2 17 289
Source: Author’s Analysis (2021)
The result of test of relationship and level of agreement presented in Table 4.21 was carried out using Kendall Coefficient of Concordance to test relationship among the ranked factors and
ICEES 2021 ISSN: 2714-4186
233
Spearman’s Rank Order Correlation to test the level of agreement toward infrastructure condition. The result of Kendall’s Coefficient of Concordance (W) revealed that W = 0.801 indicates a statistical evidence of a fair association in the ranking of the infrastructure condition across the study area in Jos, while the average rank correlation of variables between all possible pairs of the areas rs = 0.455 indicating a weak agreement to the condition of infrastructure across the study area. This result in this context indicates that though each neighborhood has its own peculiarity when it comes to infrastructure condition, therefore the overall ranking of these factors across the selected neighbourhoods in the study areas are fairly related.
Recommendations and Conclusion
There is need for quality and adequate provision of neighbourhood infrastructure for residential property investment returns’ sustainability.
Once it was discovered that, the infrastructure across the study neighbourhoods in Jos were not properly maintained, therefore, planned and unplanned maintained schedule should be employed fully supported by Infrastructure Policy Performance (IPP) and investors should be provided supporting with infrastructure that will enhance performance of residential investment at low maintenance cost. for residential property investment and economic sustainability
In conclusion, this study provided a statistically significant effect on property investment performance in the Nigeria. The result of the study has shown that return in an ideal residential property investment is hanged on the quality of infrastructure conditions.
References
Ajayi, M. T. A., Jimoh, O. J. & Jimoh, R. A. (2014). Effect of infrastructure development on residential property value. Ethiopian Journal of Environmental Studies & Management, 7(4), 452 – 459
Ajibola, M. O. Awodiran, O. & Salu-Kosoko, O. (2013). Effects of Infrastructure on Property Values in Unity Estate, Lagos, Nigeria. International Journal of Economy, Management and Social Sciences, 2(5), 195-201
Corgel, J. B., Smith, H. C. & Ling, D. C. (1998). Investment Risk Management. The Atrium, South Gate, Chichester, West Sussec : John Willy Sons Limited.
Dubben, N. & Sayce, S. (2009). Property Portfolio Management. Routledge, London.
Famuyiwa, F. & Otegbulu, A. C. (2012). Public water infrastructure in property prices: an environmental valuation approach. Elixir Infrastructure Managementt. 51, 11034-11038
Mendez, C. (2007). The Global Concepts of Urban Infrastructure. Journal of Land Use and Development Studie, 2 (1), 30 – 35
Gatauwa1, J. M. & Murungi, M. (2015). Infrastructure Development and Real Estate Values in Meru County, Kenya. Research Journal of Finance and Accounting, 6(8), 222-237
Ogbuefi, J. (2002). Housing Needs to the Low Income People in Nigeria: Policy Issues and Challenges: International Journal of Management, Business Administration, 13 (1), 1-40.

ICEES 2021 ISSN: 2714-4186
234
Olujinmi, A. B. (2010). Analysis of the Relationships of Infrastructural Facilities in the Determination of Rental Values of Residential Properties in Akure, Nigeria. Arts and Social Sciences Journal, 8(1), 1-11
Olujinmi, A. B. & Bello, M. O. (2009). Effects of Infrastructural Facilities on the Rental Values of Residential Property. Journal of Social Sciences, 5(4): 332-34
Shah, A. (2002). Dynamics of Public Infrastructure, Industrial Productivity and Profitability. The Review of Economic and Statistics, 74 (1), 9 – 13
Tomlinson, M. (2001). The State of Urban Infrastructure in Nigerian Cities. Retrieved from woods.stanford.edu/docs/water health/StateofAfricanCities.pdf on Saturday the 02/04/2011.
World Bank (2004). Private Participation in Infrastructure Database. Retrieved from https://ppi.worldbank.org/data.
ICEES 2021 ISSN: 2714-4186
235
DEVELOPMENT OF CATFISH HARVESTING MACHINE
*Francis A.A. and S.M. Dauda
Department of Agricultural and Bio-resources Engineering, Federal University of Technology, Minna.
*Corresponding Author: Email: [email protected]
ABSTRACT
Catfish is widely accepted to be a very important species of fish that is cultured across the length and breadth of Africa. The nutritional value of catfish is such that it is an alternative source of protein with no risk of cholesterol and has a superior nutrient profile to all terrestrial animals. The commonest way to harvest catfish in the pond involve total draining of water from the pond and all fishes are been taken out without a specified selection. Over the years there has always been an increasing demand for and values attached to the quality of catfish harvested from local ponds. This demand created the intuition to provide alternative an automated catfish harvesting machine. The machine design considerations were the nature and behavior of catfish, nature of pond, complexity and usability. The machine uses principle of simple motion (rotational and translational) in operation, it has a conveyor speed of 0.34m/s, effective tension of 50N, a shaft diameter of 25mm, Torsional moment of 20MNm and conveyor capacity of 0..15t/h. Ninety fishes were randomly sampled from fish pond of 4weeks, 6weeks and 8weeks at an average of thirty each and was further subdivided into five groups of eighteen for machine evaluation and machine parameters evaluated are; Harvesting Efficiency which is the total number of fishes harvested by the machine against the total number of fishes in the pond before harvesting and was calculated to be 72.22%. Harvesting Effectiveness is the total number of fishes harvested without any injury or damage against the total number of fishes in the pond before harvest and was evaluated to be 83.33%. Losses is the total number of fishes harvested with injury or damage against the total number of fishes in the pond before harvest and estimated to be 16.67%.. Time Efficiency is the average time taken to harvest a certain number of fishes in a five (5) replicated experiment and was evaluated to be 45seconds. The production cost is Eighty Thousand, Eight Hundred and Fifty Naira Only (N80, 850). The development of catfish harvesting machine will open the gateway for proper marketing of catfish in Nigeria.
Keywords: Automated; Catfish; Conveyor, Harvesting; Machine; pond.
1.0 INTRODUCTION
Clariasgariepinus (catfish) which belong to the Claridae family is among the predominant fresh water fishes that is domesticated and commercialized worldwide at a very large scale. The high market demand of this type of fish has prompted many people to invest in its production due to its uniqueness and comparative advantages when compared with other species of fishes. Clariasgariepinus also known as African mud catfish is widely accepted to be a very important species of fish that is cultured across the length and breadth of Africa. It is a fish that has an eel shape with an elongated cylindrical body. Their fins both anal and dorsal are extremely long containing soft fin rays, the head is ossified, flat and the skill bone formed a casque. Its body is covered with a smooth scale less skin with grayish colour. (Anam; 2009). The omnivorous feeding nature of this aquatic animal is such it has a wide range of feeding materials which may sand grains, zooplanktons, algae, detritus, insects, macrophytes and Amphibians. (Adebayo, 2017). And the nature of these diets may differ with respect to season, Environmental
ICEES 2021 ISSN: 2714-4186
236
boundaries and the fish size. The nutritional value of this catfish is such that it is an alternative source of animal protein with no risk of cholesterol and has a superior nutrient profile to all terrestrial animals. It is a source of sulphur and essential amino acids, supplies in a reasonable quantity thiamine and omega III polysaturate fatty acids. The presence of Omega III oil in a catfish has made it to be a nutritional supplement to patient diagnosed of the following illment; Eye problem, arthritis, muscular degeneration and bowel cancer. (Iheke and Nwagbara; 2014).
Orire A.M, et al, (2013) reported that this species of fish has a high resistance to stress due to handling and its handiness is of high Economic benefit. Adelakun, et al, (2017) estimated about 90% of total cultured fish in Nigeria is catfish, such that in the last four (4) years, hatcheries are constructed only for catfish and fish production is been targeted at catfish production.
Fish harvesting is a post production activities that entails any means through which a matured sizable fish is been identified and taken out of the pond which is their habitat either for sale or for consumption. Fishes are harvested after attaining a consumable size after six months and its demand must be readily available. There are two major ways to harvest a catfish in a pond via complete harvesting and partial harvesting. Complete harvesting of fish in a pond involve total draining of water from the pond and all fishes are been taken out without a specified selection. This method is costly in the refilling of water to the pond and effluent of the pond may be pollutant to the surrounding water bodies. Partial harvesting of catfish involve the use of specified mesh size to single handedly pick the demanded fish size without disturbance to the entire pond.
Statement of the Research Problem
The demand for mechanization of agricultural activities has always been the drive for development of sophisticated machines because agricultural activities are highly labour intensive. The effectiveness and efficiency of agricultural processing machine is obviously cheap, fast and reliable when compared with human skill and its effectiveness. Over the years, there has always been an increasing demand for and values attached to the quality of catfish harvested from local ponds. An average demand for catfish is more interested in already harvested and properly graded catfish. This demand created the intuition to provide an automated catfish harvesting and grading system. In a typical traditional method of catfish harvesting, the pond will be first drained of water before the selection of the demanded size and this harvesting process may induce unnecessary stress to the entire fish population. hence the choice of automation of this process.
Aim and Objectives
The aim of this study is to develop a catfish harvesting machine.
The Specific Objectives are:
1. Design and develop of a catfish harvesting machine.
2. To evaluate the performance of the machine.
3. To carry out costing of the machine.

ICEES 2021 ISSN: 2714-4186
237
2.0 MATERIALS AND METHODS Design Considerations and Assumptions
The development of catfish harvesting machine is tasking assignment such that without looking into the following detailed peculiarities extensively it may not accomplished.
2.1.1 Catfish Nature and Behavior: Clarias gariepinus is a fish species that is difficult in handling but highly profitable in marketing and rich in nutrient. There are among the most intelligent and sensitive breed of fishes that is found within the coastal region. In a domesticated pond, there are bottom bed fish, that is, they carry out most of their activities at the bottom bed of the pond and also live in clusters. Hence, any handling equipment for catfish must withstand their mould of rigidity and violence nature.
2.1.2 Pond: This is the habitat for catfish. Ponds exist in different dimensions, in different geometric shapes and made from different material but for the purpose of this study, pond is assumed to exist in a uniform dimension, and made from single material.
2.1.3 Complexity and usability: This study considered that the usability of any machine is a function of its complexity and vice versa. Hence, the same machine can exist in different complexity scales like small, medium and large scales depending on the purpose at which it serves. Again the machine size developed for less than six weeks old catfish will not be the same size for six months old catfish.
2.2 Working Principle of the Machine
Catfish harvesting machine is small scale adaptive machine for harvesting of mostly catfish from the pond after the pond must have been drained of water. The machine is made up of two components namely; Mechanical components and electrical component. The mechanical component use principles of simple motion (rotational and translational motion) in operation. Attached at the lower end of the machine is a pseudo-pond (basin) with a uniform dimension and inbuilt with a scepter that helps to push the fish to the catcher. The catcher is a toothless spike that is been driven by electronic motors in a rotational motion through which action the fish is trapped and pushed into a conveyor belt. The first conveyor belt attached to the catcher transport the fish to the second conveyor belt on which through the end of an embedded technology the catfish is been graded according to their size and weight. Each is been collected through an outlet for further processing, storage or marketing. A water hose (pipe) is been connected to each conveyor belt to supply water that will lubricate the system to make it slippery for fishes to move in the direction of the conveyor without much stress or body injury.
2.3 Design Analysis
2.3.1 Conveyor design
There are two conveyor mechanisms in the machine via a horizontal and inclined conveyor.
(A) Horizontal Conveyor and Inclined Conveyorwith the diameters of the pulleys same and different respectively.
(B) The Length of the Belt
L = D + d x + 2C (1)
2

ICEES 2021 ISSN: 2714-4186
238
Where L = Belt length
D = Diameter of pulley (3inches)
d = Diameter of pulley (3 inches)
= Constant (3.142)
C = Distance between two centres of a pulley (2 inches)
L = + d x + 2C + ( + d) 2 for inclined conveyor (2)
2 4C Where L = Belt length D = Diameter of pulley 3 inches
d = Diameter of pulley 2 inches
= Constant (3.142)
C = Distance between two centers of a pulley (2 inches)
L = 2+3 x 3.142 + 2x2 + (2+3)2 2 4x The Speed of the Belt
S = D X RPM X 0.2618 X 1.021 (3)
Where S = Speed of the belt
D = Diameter of the pulley (3 inches)
RPM = Revolution per minute (60 RPM)
S = 3 x 60 x 0.2618 x 1.021 = 48.11 F/m
The Belt Load
P = G, X C X W (4)
Where P = Belt load (product weight)
G, = Load per square ft (1)
C = Centre to centre distance (2 inches)
W = Belt weight from table (10)
P = 1 x 2 10 = 20 lbs
P = G2 x C For Inclined Conveyor (5)
5x60

ICEES 2021 ISSN: 2714-4186
239
Where P = Belt load
S = Speed of the belt from equation (2)
G2 = Load per hour 0.5 lbs
C = Distance between two centres of a pulley 2 inches
Power Utilized by the Conveyor
Hp = F X S X (P+M) (6) 33,000 Where HP = Horse power (power rating) F = Coefficient of friction from table due to material (0.6)
S = Speed from equation (2) (48.11)
P = Belt load from equation (3) (20 lbs)
M = Overall Belt Weight 10 lbs
Effective Tension on The Belt
E = F x (P+M) (7)
Where E = Effective Tension on the belt
F = Coefficient of friction (0.6)
P = Belt load from equation 3 (20 lbs)
M = Overall Belt Weight 10 lbs
Slack Side Tension
E, = E x K (8)
Where E1 = Slack side tension
E = Effective Tension from equation (5) = (18 lbs)
K = Drive factor from table (0.0319)
Tight Side Tension
E2 = E + E, (9)
Where E2 = Tight side Tension
E = Effective Tension form equation 5 (18 lbs)

ICEES 2021 ISSN: 2714-4186
240
E, = Slack side Tension from equation 6 (0.57 lbs)
Operational Tension
T = E2 (10)
W
Where T = Operational Tension
W = Belt Weight from table 10 lbs
E2 = Tight side tension from equation (7) 18.57 lbs
2.3.2 Shaft Design
Weight of grains acting the shaft
The Maximum estimated mass of the catfish is 200gand the number of catfish is 30
Therefore,
Mass = 200g x 30 = 600g = 6Kg (11)
W= Mg
Where,
W= weight
M = mass
g = Acceleration due to gravity
Torque Transmitted By the Electric Motor
Tt = (12)
Where,
p = power transmitted (3750w)
w = Angular speed of the motor
But
w =
Where

ICEES 2021 ISSN: 2714-4186
241
N = speed of the motor 1500rpm
= constant
Determination of Grinding Shaft Diameter
T = x i x d3 (13) (Khurmi& Gupta, 2006)
Where,
T = torque
i = sheer stress 25 mpa
d = diameter of the shaft
Determination of Torsional Moment in the Shaft
The only force acting on the shaft is Torsional force as a result of the rotation of the shaft.
Mt = (14) (Khurmi& Gupta, 2006)
Where,
Mt = Torsional Moment
T = Torque 61.24Nm
D = Diameter of the shaft 16.26mm
Π = Constant 3.142
Power Required for The Shaft
P =
2.3.3. Capacity of the Conveyor
Q = 60n Øpγ(D2 –d2) (15) (Khurmi& Gupta, 2006)
Where Q = Capacity of a conveyor, t/h
n = number of screw rotations
Ø = factor introduced for inclined conveyor, 0.33

ICEES 2021 ISSN: 2714-4186
242
P = conveyor pitch, 0.002m
Γ = bulk density, 6kg/m3
D = pitch diameter of conveyor, 0.025m
d =d iameter of shaft, 0.025m
π = constant3.14
2.4 Catfish Sampling for Machine Evaluation
It was assumed that fishes that were fed for the same number of weeks in the same pond were of the same size and weight. Therefore, a total number of Ninety (90) fishes were randomly selected (sampled) from fish ponds of 4 weeks, 6 weeks and 8 weeks old of an average of thirty (30) fishes from the same pond to form a heterogeneous mixture of sizes and weights for machine Evaluation. The total sampled fishes subdivided into five (5) groups of Eighteen (18) fishes in order to evaluate the machine capacity in a five (5) replicate experiment.
2.5 Machine Performance Evaluation
Harvesting Efficiency: This is the total number of fishes harvested by the machine against the total number of fishes in the pond before harvesting. It is calculated thus.
Harvesting Efficiency = X 100
Harvesting Effectiveness: This is the total number of fishes harvested without any injury or damage against the total number of fishes in the pond before harvest. It is calculated thus;
Harvesting Effectiveness = X 100
Losses: This is the total number of fishes harvested with injury or damage against the total number of fishes in the pond before harvest. It is calculated thus.
Losses = X 100 or losses = 100% -Harvesting Effectiveness
Time Efficiency: This is the average time taken to harvest a certain number of fishes in a five (5) replicated experiment.
2.6 Usability of the Machine
This study is more concerned about transformation of a common traditional method of catfish harvesting and grading activities into a mechanized operations. The machine developed is usable by small scale fish farmers within the locality and ensure proper discharge of water effluent association with these activities as means of controlling water pollution from fish farming.

ICEES 2021 ISSN: 2714-4186
243
Automation of harvesting and grading processes for fish farmers is a critical issue that will open the gateway for proper marketing of catfish in Nigeria as accurate monetary value will then be attached to the proper fish size. It will further eliminate the prospect of under pricing of fishes and its product in the Local market thereby giving farmers proper worth for their labour. Furthermore, this study will bridge the marketing gap between the quantity of fish demanded and that actual quantity supplied. Vanguard, (2009), reported that demand for catfish in Nigeria is so high that irrespective of the quantity supplied to the markets, buyers would purchase all of them. As a result of this, opportunity for job creation will be adequately harnessed because Olujimi (2010) suggested that fishing industry has the potential capacity of generating 23,000 jobs per year. Hence, this study is important as it will provide for fish farmers a low cost adaptive harvesting and grading machine for catfish.
3.0 RESULT AND DISCUSSION
3.1 Operational Description of the Machine
The engineering operational features of catfish harvesting machine as determined in the design are shown in table 3.1
Table 3.1 Operational Description of Catfish Harvesting Machine
Parameter Specification
The length of the belt 34.11cm(A)/38.05cm(B)
Speed of the conveyor 0.24m/s (A)/0.34m/s( B)
Belt load 89N(A)/0.011N(B)
Power Utilized by the conveyor 20watt (A)/10watt(B)
Effective Tension on the Belt 80N(A)/26.7N(B)
Slack side tension 2.7N(A)/0.85N(B)
Tight Side Tension 82.64N(A)/27.55N(B)
Operational Tensional 8.26N(A)/2.76N (B)
Total Weight acting on the Shaft 6kg
Torque Transmitted by the Electric Motor 23.89NM
Shaft Diameter 16.46mm (Used 25mm)
Torsional Moment For the shaft 20MNm
Power Requirement For the Shaft 5Hp
Capacity of the conveyor 0.15t/h
Note: A stands for Horizontal conveyor. B Stands for Inclined Conveyor
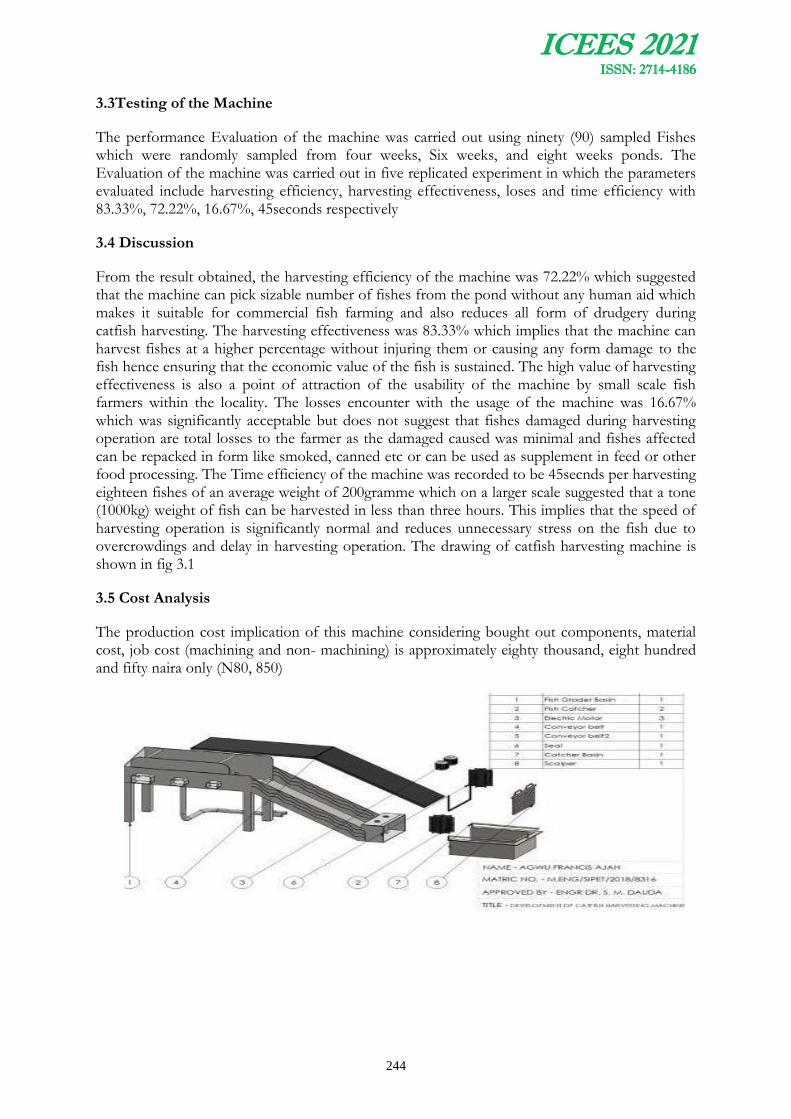
ICEES 2021 ISSN: 2714-4186
244
3.3Testing of the Machine
The performance Evaluation of the machine was carried out using ninety (90) sampled Fishes which were randomly sampled from four weeks, Six weeks, and eight weeks ponds. The Evaluation of the machine was carried out in five replicated experiment in which the parameters evaluated include harvesting efficiency, harvesting effectiveness, loses and time efficiency with 83.33%, 72.22%, 16.67%, 45seconds respectively
3.4 Discussion
From the result obtained, the harvesting efficiency of the machine was 72.22% which suggested that the machine can pick sizable number of fishes from the pond without any human aid which makes it suitable for commercial fish farming and also reduces all form of drudgery during catfish harvesting. The harvesting effectiveness was 83.33% which implies that the machine can harvest fishes at a higher percentage without injuring them or causing any form damage to the fish hence ensuring that the economic value of the fish is sustained. The high value of harvesting effectiveness is also a point of attraction of the usability of the machine by small scale fish farmers within the locality. The losses encounter with the usage of the machine was 16.67% which was significantly acceptable but does not suggest that fishes damaged during harvesting operation are total losses to the farmer as the damaged caused was minimal and fishes affected can be repacked in form like smoked, canned etc or can be used as supplement in feed or other food processing. The Time efficiency of the machine was recorded to be 45secnds per harvesting eighteen fishes of an average weight of 200gramme which on a larger scale suggested that a tone (1000kg) weight of fish can be harvested in less than three hours. This implies that the speed of harvesting operation is significantly normal and reduces unnecessary stress on the fish due to overcrowdings and delay in harvesting operation. The drawing of catfish harvesting machine is shown in fig 3.1
3.5 Cost Analysis
The production cost implication of this machine considering bought out components, material cost, job cost (machining and non- machining) is approximately eighty thousand, eight hundred and fifty naira only (N80, 850)
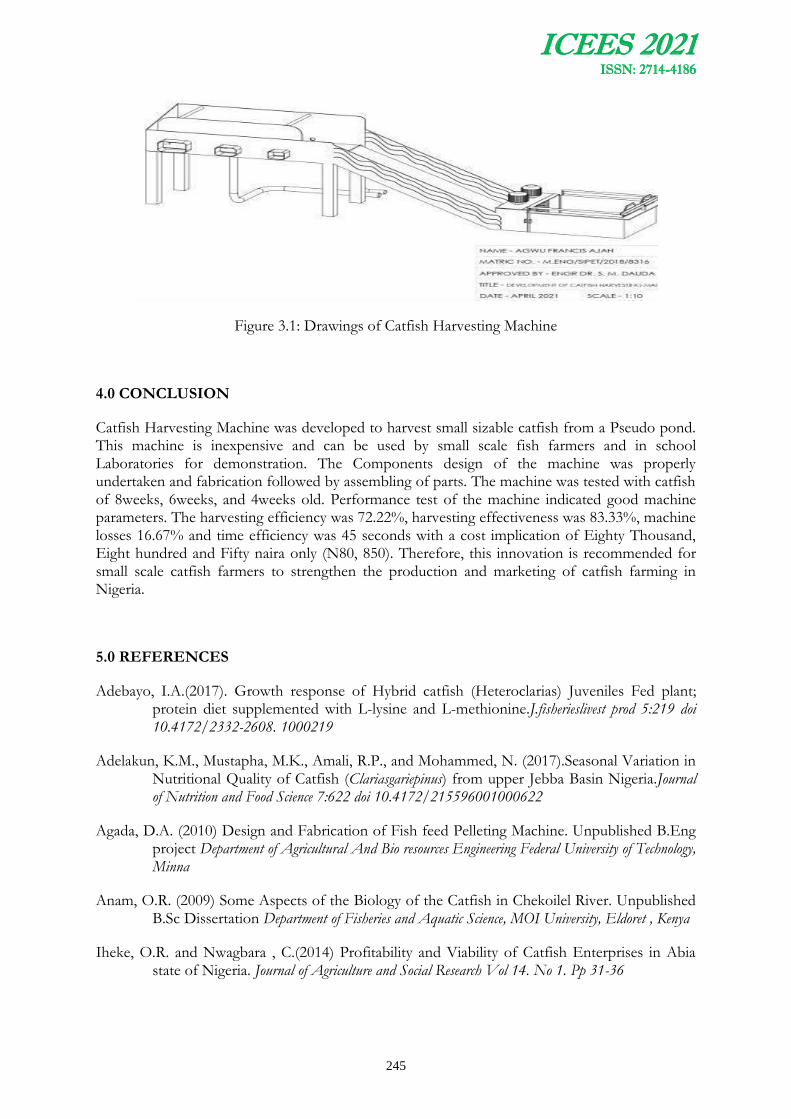
ICEES 2021 ISSN: 2714-4186
245
Figure 3.1: Drawings of Catfish Harvesting Machine
4.0 CONCLUSION
Catfish Harvesting Machine was developed to harvest small sizable catfish from a Pseudo pond. This machine is inexpensive and can be used by small scale fish farmers and in school Laboratories for demonstration. The Components design of the machine was properly undertaken and fabrication followed by assembling of parts. The machine was tested with catfish of 8weeks, 6weeks, and 4weeks old. Performance test of the machine indicated good machine parameters. The harvesting efficiency was 72.22%, harvesting effectiveness was 83.33%, machine losses 16.67% and time efficiency was 45 seconds with a cost implication of Eighty Thousand, Eight hundred and Fifty naira only (N80, 850). Therefore, this innovation is recommended for small scale catfish farmers to strengthen the production and marketing of catfish farming in Nigeria.
5.0 REFERENCES
Adebayo, I.A.(2017). Growth response of Hybrid catfish (Heteroclarias) Juveniles Fed plant; protein diet supplemented with L-lysine and L-methionine.J.fisherieslivest prod 5:219 doi 10.4172/2332-2608. 1000219
Adelakun, K.M., Mustapha, M.K., Amali, R.P., and Mohammed, N. (2017).Seasonal Variation in Nutritional Quality of Catfish (Clariasgariepinus) from upper Jebba Basin Nigeria.Journal of Nutrition and Food Science 7:622 doi 10.4172/215596001000622
Agada, D.A. (2010) Design and Fabrication of Fish feed Pelleting Machine. Unpublished B.Eng project Department of Agricultural And Bio resources Engineering Federal University of Technology, Minna
Anam, O.R. (2009) Some Aspects of the Biology of the Catfish in Chekoilel River. Unpublished B.Sc Dissertation Department of Fisheries and Aquatic Science, MOI University, Eldoret , Kenya
Iheke, O.R. and Nwagbara , C.(2014) Profitability and Viability of Catfish Enterprises in Abia state of Nigeria. Journal of Agriculture and Social Research Vol 14. No 1. Pp 31-36

ICEES 2021 ISSN: 2714-4186
246
Khurmi, R.S. (2007). Theory of Machine S,Chand and Company ltd Ram Nagar , New Delhi India 167-139 20354355369380493495
Khurmi, R.S. and Gupta , J.K. (2006). A Textbook of Machine Design, S,Chand and Company ltd Ram Nagar , New Delhi India 647-680 6476009891000
Olujimi , F.(2010). Nigeria Fisheries Contributes $1Billion dollars to Economy, available at “http:/assembly online info Nigeria contributes us 1billiondollars to economy” Retrieved may31st 2021
Orire, A.M.,Omotoyinbo, S.O. and Sadiku , S.O.E. (2013). The growth and Body compostion of clariasgariepinus fingerlings fed with combined Different Sources of lipid. Journal of Aquaculture research and development 4:4 doi 4172/2155-9546.1000182
Vanguard(2009). Nigeria: catfish farming –a reliable investment available “http:/vanguard .com/ Nigeria: catfish farming –a reliable investment” retrivedJune 21st, 2021

ICEES 2021 ISSN: 2714-4186
247
AN INVESTIGATION INTO SOUND PERFORMANCE OF LIFT SYSTEM CABINS OF SELECTED HIGH-RISE BUILDINGS IN ABUJA,
NIGERIA
Ibrahim, E. C. and Manzuma, B. M.
Department of Building, Faculty of Environmental Design, Ahmadu Bello University, Zaria.
Corresponding email: [email protected]:
ABSTRACT
In today’s buildings, lift systems are a necessary building component providing vertical movement and access for building users with numerous floors. The noise during lift operation can cause discomfort to lift users especial in the lift cabin. Lift system users in high-rise buildings are however often confronted with problems associated with noise due to high sound level during lift ride. This study explores the sound level of lift cabin of selected high-rise buildings within Central Business District (CBD) of Abuja, Nigeria and established the lift cabin sound level and cabin door operation sound level during ride across different buildings, lift brands and lift maintenance companies. The study adopted field survey research design, encompassing measurements and a structured checklist for data collection. WST85 digital sound level meter was used for the measurement. Sound level was evaluated against the standard performance requirements for interior sound level for lift cabin (≤55dBA) and door operation sound of the cabin (≤60dBA). From the findings, 64.0% of these buildings have lift systems with unsatisfactory interior sound and all the buildings have lift systems with optimum cabin door operation sound level within the acceptance criteria (≤60dBA). Results from the inferential statistics shows no significant differences (p<0.05) in the mean values of interior sound level of lift cabin and door operation sound level. The study provides lift cabin sound performance data for optimizing the sound level in lift cabin to avoid noise in order to enhance passenger comfort during lift system ride.
Key words: Door operation, High-rise building, Lift cabin, Noise, Sound level
1.0 INTRODUCTION
Lift systems are necessary for vertical transportation of people and goods from one floor level to another in high rise buildings (Chattered Institute of Building Services Engineers, (CIBSE), 2010; Al-Sharif, 2016). Optimum sound level is essential for buildings and systems in the built environment. Aside the physical building structure, systems like lifts used for the vertical transportation of people and goods in buildings requires optimum sound level during operation to ensure that lift users appreciate good ride with minimal discomfort. Monitoring of sound level in lift cabin is very important in terms of both safety and comfort (Strakosch, and Caporale, 2010). According to National Elevator Industry Inc. (NEII) (2017) sound level requirement in lift cabin is slightly different than in other areas. Because lift systems usually have narrow roof range and it is constantly in motion so, frequent vibrations and sounds are generated during ride which could have both negative and positive effect on lift user’s comfort (Adekomaya, and Samuel, 2016; Al-Kodmany,2015). Generally, sound level of less than or equal to 55dbA for cabin and 60dbA for door sound operation is adequate for lift cabins and cabin door operation respectively (CIBSE, 2010; University of New South Wales (UNSW), 2015). However, lift systems in buildings present the potential for intrusive noise to the cabin which is the major

ICEES 2021 ISSN: 2714-4186
248
component of the lift system responsible for carrying passengers from one floor to another (Monge, and Gómez, 2014). When the sound level exceeds the standard limit for optimum performance inside the cabin it produces noise that can result to discomfort of passenger during ride (Li, Andy and Eddie, 2004).
According to Esteban, Iturrospe and Salgado (2013) lift consists of complex structural, mechanical and electrical components. The typical arrangements and components for electric traction lift system are illustrated in the Figure 1.
Figure 1: Principal components of a typical passenger electric lift
Source: CIBSE Guide D (2002)
Therefore, the standard for designing lift systems clearly explains the details of how to have lift cabin with optimum sound level. The sound produce by the lift cabin is usually resulting from the lift equipment located in the shafts (Wit, 2017).
According to American Society of Mechanical Engineers (ASME) (2017) before planning for lift design, the standard for optimum sound level should be carefully examined to avoid excessive noise generation in lift cabins and during door operation. Even though criteria for evaluating sound performance of lift system vary in the industry. Nonetheless, lift system industry criteria typically apply to the sound levels in the cab or the machine room, rather than the adjacent spaces (Monge and Gómez, 2014; Bhatia, 2012). However, for the purpose of this study, only sound generated in lift cabins was measured and evaluated against standards.
More so, CIBSE (2010); UNSW (2015); NEII (2017) provides standards and guidelines for building transportation systems that include sound levels. The sound guidelines provide levels for sound within the lift cabin during ride. The sound guidelines do not provide suggestions for sound levels within adjacent spaces. These guidelines are concluded with approaches to mitigating issues related to ambient sound. Conversely, noise produced during lift operation is a salient factor for consideration when evaluating the ride quality of lift systems as such lift cabin and doors are expected to be operated at their highest speed yet still need to commensurate with safety, smoothness and noise requirement (Monge and Gómez 2014). The interior of lift cabin should ensure optimum interior noise levels to less than 48–52 dB (A) for superior ride comfort. Noise levels above 60 dB (A) usually result to poor ride quality of the lift system (CIBSE, 2014). However, Aliyu et al, (2015) observed that more than 20% of the lifts studied in Nigeria were found to be vibrating too much with rising interior noise making about 25% of the passengers

ICEES 2021 ISSN: 2714-4186
249
uncomfortable especially the age class that could not use the stairs in getting to the upper floors easily.
The issue of lift ride quality would likely become a basic requirement in the specifications for new and modern lift system and a symbol of quality lift service (Li, Suen and Wu, 2004; Aliyu, Hussaini, Abubakar, Baba and Mu’awuya, 2015). Hence the need for this study to investigate the sound performance of lift system cabin and door operation during ride quality in the selected high-rise buildings in Abuja City.
2.0 METHODOLOGY
The study was carried out within the Central Business District (CBD) of Abuja metropolis, Nigeria. The study area is characterized by high-rise building serving different purposes such as commercial and residential hence, the reason for selecting Abuja for the study. Field survey approach was adopted to achieve the objectives of this study. A well-structured checklist was also developed to obtain information on lift systems brands, rated speed categories as observed during field work. A preliminary survey was carried to establish the population for this study. This was due to the lack of finite population record of the number of buildings with functional lift systems in the study area. Fourteen (14) accessible high-rise buildings were identified and used as the population frame for the study. The study adopted a purposive sampling technique. The sample size was based on the following selection criteria;
i. Building should have a minimum of four (4) floors to be considered as high-rise;
ii. The building should be accessible within CBD Abuja city;
iii. Building must have a functional lift installed;
iv. Lift system should be accessible during up peak period within the selected buildings;
v. Lift system should be accessible within the building
From the selected high-rise buildings, 70 lift systems were identified and 41 lifts systems met the sampling criteria and were used for the study. The selected lift systems for the study were of different brands, categories, machine room location and maintained by different lift companies. Field measurement data were obtained from the selected by using appropriate scientific equipment for computation and analysis. WT85 digital sound level meter was used for the purpose of this study. The sound level meter is an easy to use and handy mini sound level meter designed for sound quality or performance control that measures sound level from 30dBA up ~ 130dBA. The WT85 digital sound level meter (Figure 2) is applicable for measurement of noise engineering, sound performance and quality control, health prevention and various environmental noises, including noise measurement in such various places as factories, offices, transporting routes, families, stereo equipment and other places. It has auto range, wide measuring and frequency range (31.5Hz ~ 8 KHz), max/min hold, Frequency Weighting A and Wide dynamic range. This was used to establish the lift cabin sound and the door cabin door operation sound.

ICEES 2021 ISSN: 2714-4186
250
Figure 2: WT85 Digital Sound Level Meter
WT85 sound level meter was held by hand at a height of about 1.5m at human sight level above the floor level at various points of the lift cabin indoor space during ride. Data were collected and recorded three (3) times in the record sheet. Descriptive statistics was used to summarize the frequency distribution and the percentage of various lift system information collected by checklist within the study area. In addition, one-way analysis of variance (ANOVA), a parametric test, was used to determine whether there are significant differences between the means of two or more independent groups of variables. The Duncan multiple comparison post hoc test was performed on significant ANOVA findings to identify significant pairwise differences between interior illuminance of lift in the selected high-rise buildings.
3.0 RESULT AND DISCUSSION
3.1 Building/Lift Systems Characteristics
Table1: Selected High rise building in CBD, Abuja Metropolis
S/N
Building No of floors
Approximate Height (m)
Number of functional lifts
Number of lifts Selected for study
Building Type
Commercial Building
Administrative Building
1 BLA 15 54 19 4 √
2 BLB 12 49 15 4 √
3 BLC 12 49 3 3 √
4 BLD 10 39 2 2 √ 5 BLE 10 39 3 3 √ 6 BLF 8 33 3 3 √
7 BLG 7 23 2 2 √
8 BLH 5 24 3 3 √
9 BLI 5 24 4 3 √
10 BLJ 5 23 3 3 √
11 BLK 5 23 4 3 √
12 BLL 5 23 2 2 √
13 BLM 4 20 3 3 √
14 BLN 4 20 4 3 √ Total 70 41 7(50%) 7(50%)

ICEES 2021 ISSN: 2714-4186
251
For the purpose of anonymity, the selected high-rise buildings under study were represented by label BLA, BLB, BLC, BLD, BLE, BLF, BLG, BLH, BLI, BLJ, BLK, BLL, BLM and BLN as shown in Table1 above.
Table 1, presents the characteristics of the buildings and the lift systems identified in the study area. From the Identified buildings 41 buildings were studied. From the Table Building BLA and BLB are considered to be building with highest number of floors and installed lift systems of 15;12 and 19;15 respectively.
Likewise, from the 14 high-rise buildings selected for the study, 7 (50%) buildings are administrative buildings while 7 (50%) are commercial buildings as shown in Table1.
Base on machine room location, 25 (61.0%) are Machine Room (MR) and 16 (39.0%) are Machine Room Less (MRL) therefore indicating that majority of the lift system operate from a machine room as presented in fig. 3.
Fig. 3: Lift system Machine Room Location
3.2 Sound Level Measurement in High Rise Building
Table 2 showed the result of the statistical analysis of the data measured from lift systems cabin and operation of the selected buildings.
Table 2: Sound Level Measurement of Lift Cabin and Door Operation Buildings DOS (dBA)
(Mean ± S.E) DCS (dBA) (Mean ± S.E)
BM (dBA)
60
Cabin Sound Level (dBA) (Mean ± S.E)
BM 55Dba
BLA 39.40 ± 0.64a 41.55 ± 0.14ab ST 51.60 ± 1.04ab ST
BLB 41.96 ± 2.10ab 40.25 ± 4.53ab ST 48.45 ± 1.59a ST
BLC 48.05 ± 4.92bcd 47.55 ± 3.43bc ST 51.95 ± 0.49ab ST BLD 48.10 ± 0.46bcd 47.80 ± 2.25bc ST 58.20 ± 1.38bcd UST BLE 50.70 ± 1.67d 40.40 ± 1.04ab ST 52.90 ± 4.44ab ST BLF 48.95 ± 1.53bcd 40.35 ± 4.01ab ST 62.30 ± 1.67cd UST BLG 42.25 ± 0.26abc 38.60 ± 1.73a ST 56.25 ± 0.03bc UST
BLH 46.00 ± 0.40abcd 41.80 ± 0.29abc ST 63.70 ± 3.75d UST BLI 52.70 ± 2.31d 47.66 ± 2.29bc ST 58.00 ± 0.40bcd UST
BLJ 50.00 ± 4.21bcd 47.05 ± 3.03abc ST 60.45 ± 3.20cd UST

ICEES 2021 ISSN: 2714-4186
252
BLK 49.50 ± 4.16bcd 47.25 ± 2.34bc ST 52.65 ± 1.76ab ST BL L 50.25 ± 1.70cd 46.35 ± 2.97abc ST 55.65 ± 0.95bc ST
BLM 45.80 ± 0.87abcd 45.10 ± 0.12abc ST 58.20 ± 1.09bcd UST
BLN 50.20 ± 1.50bcd 50.20 ± 2.02c ST 58.50 ± 2.42bc UST
F 2.578 2.181 4.148
p-Value 0.017 0.041 0.001
BM- Bench Mark; ST-Satisfactory; UST-Unsatisfactory; Data analyzed using one way
ANOVA followed by Duncan multiple comparison post hoc test. Values along the same column with different superscripts a, b and c are significantly different within the groups (p < 0.05).
Referring to Table 2, the sound level during door operation is considered to be to be adequate across all the lift systems within the selected buildings. According to Monge and Gómez (2014) door operation are expected to be operated at their highest speed yet still need to commensurate noise requirement. Likewise, the sound level in lift cabin within BLA, BLB, BLC, BLE, BLK, BLL are considered to be adequate with optimum sound level. Whereas, the lift systems cabins in building BLD, BLF, BLG, BLH, BLI, BLJ, BLL, BLM and BLN were considered to have unsatisfactory sound level resulting to noise in lift car of most buildings. This could be as the result sound produce by lift equipment located in the shafts as revealed by Wit (2017). This implies that the rising interior noise in the lift cabin may result to passengers’ discomfort especially the age class that could not use the stairs in getting to the upper floors easily (Aliyu et al, 2015).
3.3 Door operation and Lift Cabin Sound Level Measurement
Table 3 showed the result of the statistical analysis of the different lift maintenance companies. Values along the column with different subperscript are indicating a significant difference in values of the various maintenance companies.
Table 3 ANOVA of Lift Ride Quality of Different Company Lift Company DOS (dBA)
(Mean ± S.E)
DCS (dBA)
(Mean ± S.E)
Cabin Sound (dB)
(Mean ± S.E)
Company A 39.40 ± 0.63a 41.55 ± 0.14 51.60 ± 1.04ab
Company B 41.96 ± 2.10ab 40.25 ± 4.53 48.45 ± 1.59a
Company C 45.15 ± 2.56abc 43.08 ± 2.64 54.10 ± 0.98abc
Company D 49.49 ± 0.88c 45.20 ± 1.44 56.31 ± 1.37bcd
Company E 49.35 ± 1.82c 44.73 ± 1.67 60.85 ± 2.11d
Company F 47.90 ± 2.14bc 46.07 ± 1.42 59.32 ± 1.59cd
Company G 50.25 ± 1.70c 46.35 ± 2.97 55.65 ± 0.95bcd
F 3.858 0.754 4.041
p-Value 0.005 0.611 0.004
BM- Bench Mark; ST-Satisfactory; UST-Unsatisfactory; Data analyzed using one way ANOVA followed by Duncan multiple comparison post hoc test. Values along the same columns with different superscripts a, b and c are significantly different within the groups (p < 0.05).
Table 4 shows that majority of the lift system maintained by company A, B, C and G are found to have optimum interior sound level (≤55dBA) except for company D, E and F (>55dBA). The
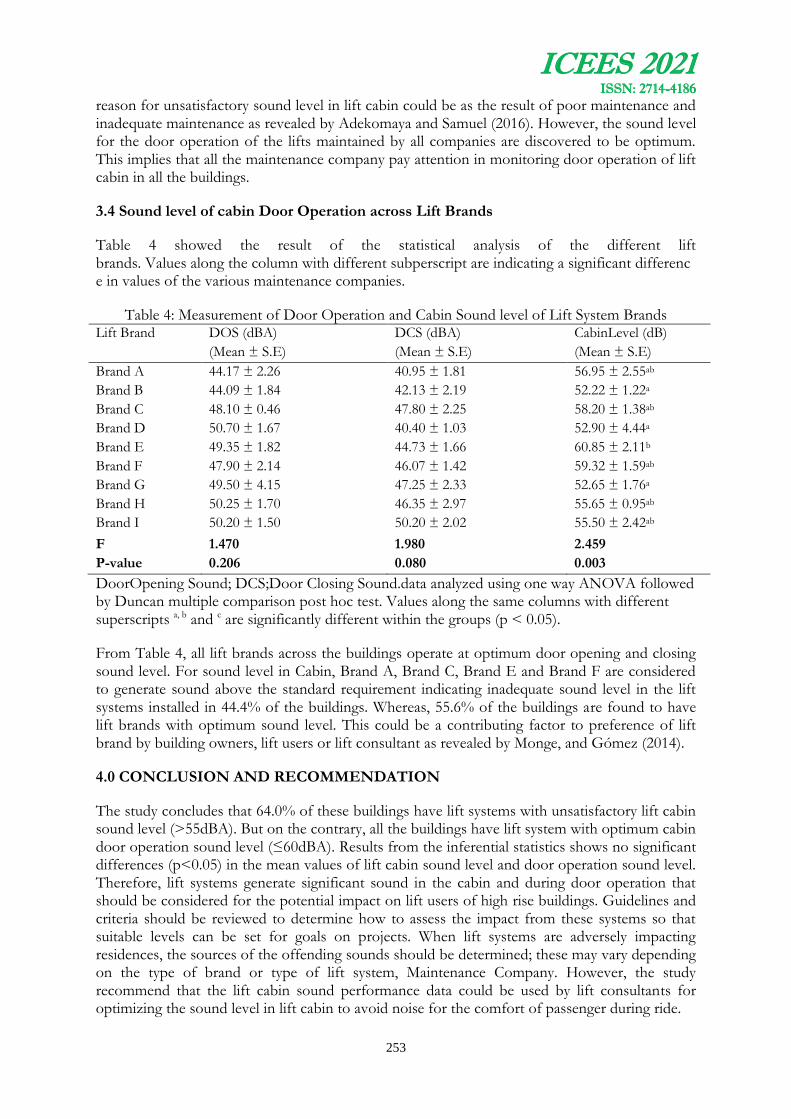
ICEES 2021 ISSN: 2714-4186
253
reason for unsatisfactory sound level in lift cabin could be as the result of poor maintenance and inadequate maintenance as revealed by Adekomaya and Samuel (2016). However, the sound level for the door operation of the lifts maintained by all companies are discovered to be optimum. This implies that all the maintenance company pay attention in monitoring door operation of lift cabin in all the buildings.
3.4 Sound level of cabin Door Operation across Lift Brands
Table 4 showed the result of the statistical analysis of the different lift brands. Values along the column with different subperscript are indicating a significant difference in values of the various maintenance companies.
Table 4: Measurement of Door Operation and Cabin Sound level of Lift System Brands Lift Brand DOS (dBA)
(Mean ± S.E)
DCS (dBA)
(Mean ± S.E)
CabinLevel (dB)
(Mean ± S.E)
Brand A 44.17 ± 2.26 40.95 ± 1.81 56.95 ± 2.55ab
Brand B 44.09 ± 1.84 42.13 ± 2.19 52.22 ± 1.22a
Brand C 48.10 ± 0.46 47.80 ± 2.25 58.20 ± 1.38ab
Brand D 50.70 ± 1.67 40.40 ± 1.03 52.90 ± 4.44a
Brand E 49.35 ± 1.82 44.73 ± 1.66 60.85 ± 2.11b
Brand F 47.90 ± 2.14 46.07 ± 1.42 59.32 ± 1.59ab
Brand G 49.50 ± 4.15 47.25 ± 2.33 52.65 ± 1.76a
Brand H 50.25 ± 1.70 46.35 ± 2.97 55.65 ± 0.95ab
Brand I 50.20 ± 1.50 50.20 ± 2.02 55.50 ± 2.42ab
F 1.470 1.980 2.459
P-value 0.206 0.080 0.003
DoorOpening Sound; DCS;Door Closing Sound.data analyzed using one way ANOVA followedby Duncan multiple comparison post hoc test. Values along the same columns with different superscripts a, b and c are significantly different within the groups (p < 0.05).
From Table 4, all lift brands across the buildings operate at optimum door opening and closing sound level. For sound level in Cabin, Brand A, Brand C, Brand E and Brand F are considered to generate sound above the standard requirement indicating inadequate sound level in the lift systems installed in 44.4% of the buildings. Whereas, 55.6% of the buildings are found to have lift brands with optimum sound level. This could be a contributing factor to preference of lift brand by building owners, lift users or lift consultant as revealed by Monge, and Gómez (2014).
4.0 CONCLUSION AND RECOMMENDATION
The study concludes that 64.0% of these buildings have lift systems with unsatisfactory lift cabin sound level (>55dBA). But on the contrary, all the buildings have lift system with optimum cabin door operation sound level (≤60dBA). Results from the inferential statistics shows no significant differences (p<0.05) in the mean values of lift cabin sound level and door operation sound level. Therefore, lift systems generate significant sound in the cabin and during door operation that should be considered for the potential impact on lift users of high rise buildings. Guidelines and criteria should be reviewed to determine how to assess the impact from these systems so that suitable levels can be set for goals on projects. When lift systems are adversely impacting residences, the sources of the offending sounds should be determined; these may vary depending on the type of brand or type of lift system, Maintenance Company. However, the study recommend that the lift cabin sound performance data could be used by lift consultants for optimizing the sound level in lift cabin to avoid noise for the comfort of passenger during ride.

ICEES 2021 ISSN: 2714-4186
254
REFERENCES
Adekomaya, O., and Samuel, O. D. (2016). Assessment of Risk in Maintenance and Repairs of Elevators in Nigeria.
Aliyu, A. A., Hussaini, A. F., Abubakar, M Baba G. B., and Mu’awuya, M. A. (2015). Problems Associated with Elevators in High-Rise Commercial Buildings in North-Western State Capitals of Nigeria. Journal of Energy Technologies and Policy.
Al-Kodmany, K. (2015). Tall Buildings and Elevators: A Review of Recent Technological Advances; 5(1), Pp. 1070-1104. Retrieved from www.mdp i.com/journal/buildings/.
Al-Sharif, L. (2016). Modern Elevator Traffic Engineering: Elevator Traffic Surveys. An article on Selected Topics in Mechatronics: Elevator Traffic Analysis and Design. 25(4):133-187.
ASME (American Society of Mechanical Engineers) (2017). Safety Code for Existing Elevators and Escalators.
Bhatia, A. (2012). Building Elevator Systems. Continuing Education and Development, Inc. Greyridge Farm Court. Retrieved https://pdhonline.com/courses/m376/m376content.pdf
CIBSE (2010). CIBSE Guide D: Transportation Systems in Buildings. The Chartered Institution of Building Services Engineers; London.
Esteban, E., Iturrospe, A. and Salgado, O. (2013). Vibration-based condition monitoring for residential lifts. Retrieved from https://www.research gate.net/ publication /263468252_ Vibration based condition monitoring for residential lifts/citation/download.
Li, K. K., Andy, M.T. and Eddie, W. K. (2004). A General Survey on Lift Ride Quality at Public Buildings of the Hong Kong Special Administrative Region. Retrieved from The Government of the Hong Kong Special Administration Region. http://www.iaq.gov.hk/cert/doc/CertGuide-eng.pdf.(accessed on January, 2020).
Monge, R. and Gómez, A. (2014). Methodology to identify noise and vibrations problems for ride Retrieved from https://liftsymposium.org/download/ Lift and Escalator Symposium Proceedings 2015.pdf
NEII (National Elevator Industry, Inc) (2017). Vertical Transportation Standards. Retrieved from http://www.neii.org/neii1.cfm
Strakosch, G. and Caporale, R. (2010). The Vertical Transportation Handbook. Hoboken; New Jersey: John Wiley & Sons, Inc.
University of New South Wales (UNSW) (2015). Design and Construction Specifications Lift Design Standards. Retrieved from https://www.estate.unsw.edu.au/sites/ default/ files/ documents/SECTION-E.5-Lift-Design-Standards.pdf.
Wit J. (2017). Elevator Planning for High-Rise Buildings. Deerns Consulting Engineers Publication, The Netherlands, Amsterdam, www.deerns.com.
ICEES 2021 ISSN: 2714-4186
255
CARBON DIOXIDE CAPTURE AND SEQUESTRATION: AN OVERVIEW OF THE CHALLENGES, POTENTIALS AND OPPORTUNITIES FOR CEMENT INDUSTRY IN NIGERIA
1* Adebanjo, A. U. 2 Olonade K.A. and 3Emmanuel, E.
1Department of Civil Engineering, Osun State University, Osogbo, Nigeria
2 Department of Civil and Environmental Engineering, University of Lagos, Akoka, Nigeria
3 Department of Civil Engineering, RECTEM, Redemption Camp, Ogun State, Nigeria
*Corresponding Author: [email protected]
ABSTRACT
Cement production contributes about 10% of carbon dioxide (CO2) of the global greenhouse gases emitted into the atmosphere, causing devastating effects of climate change. In this paper, an overview of the effect and sources of CO2 emission in cement production was presented. A meticulous estimation of CO2 emitted in the Nigeria cement industry was made, while potential and opportunities for CO2 sequestration in Nigeria were x-rayed. Challenges for utilizing these opportunities and solutions to address the challenges were equally presented. It was shown that Nigeria produces about 54 million tonnes of cement per annum, corresponding to an equivalent amount of CO2 emitted, which is huge. Nigeria is categorised as one of the largest emitter of CO2 for its cement productions. Unfortunately, at present none of the cement industries examined in this review has the technology to capture CO2 for sequestration. Therefore, there is a need for collaborative researches to develop local techniques to utilize this dangerous gas, which in itself is a raw material if adequately captured. If the country’s dream of achieving Sustainable Dveleopment Goals (SDGs) on climate change is to become a reality, the government and stakeholders in the cement industries are also called upon to develop policies to checkmate the continuous release of CO2 to the atmosphere.
Keywords: Carbon capture technique, Carbon-dioxide sequestration, Climate change, Global warming, Greenhouse gases.
1.0 Introduction
Nigeria continues to be a formidable competitor in the African cement industry, with some of the continent's leading manufacturers based within its borders. Between 2011 and 2013, the country achieved a self-sufficiency state in the production of cement, when domestic production exceeded national demand for the product, and since then, the country has been exporting to neighbouring countries as a viable source of foreign exchange. The country's total production capacity is expected to be around 54 million metric tonnes (MMT) per year by 2021 (Ohimain, 2014; Perili, 2021). On a global scale, cement production has both positive and negative consequences. On the positive side, the cement industry may provide local residents with employment and business opportunities, especially in remote areas of developing countries where other avenues for economic development are limited. On the other hand, activities such as limestone quarrying, sourcing of other raw materials, biodiversity disruption, and carbon (iv) oxide (CO2) emissions during the manufacturing process may have a negative impact on the environment (Inegbenebor et al., 2018).

ICEES 2021 ISSN: 2714-4186
256
The amount of CO2 emitted from cement industries is becoming a source of concern for most nations around the world. It is predicted that if policies and technologies are not implemented, particularly in developing countries, to strategically revamp the current situation, the emission of CO2 from cement industries, as well as other notable sources in this region, will have a devastating impact on the environment and the gains that have been recorded globally in goals 11- Sustainable Cites and Communities, 13- Climate Action, 14-Life below Water, and 15- Life on Land of the SDGs
Several technologies have been developed around the world in the last half-century to reduce the impact of CO2 emissions; some of these technologies have been deemed perfect, while others are still being studied by scientists. According to Thakur et al. (2018), one such technology is Carbon Capture and Sequestration (CCS), which is well recognized in industrial systems but can be very expensive; it is estimated that the capturing aspect accounts for more than 80% of the cost of operation, and storage capacity may also be an issue, particularly in large scale operations where the amount of CO2 is substantial. Nonetheless, CCS has a high potential for providing a corrective solution to the threat of CO2 emissions. Furthermore, the fact that the stored CO2 can be used in biofuel technology attests to the concept's ingenuity and can be a driving force for developing economies in the near future.
Nigeria, as a member of the United Nations General Assembly and an active competitor in the African cement industry, as well as a rapidly developing economy, has a critical role to play in ensuring that the continent's contribution of CO2 to greenhouse gasses is relatively reduced by harnessing technology such as CCS. In an attempt to evaluate the current situation, this paper assessed the contribution of the cement industry to global carbon emissions, carefully explained some of the prevalent effects of CO2 emissions on climate change, and presented an overview of the cement industry in Nigeria from the pre-colonial era to the present. In addition, efforts were made to comprehend some of the various advances and challenges of implementing CCS technology in a developing country like Nigeria, as well as to identify some of the potentials and opportunities of carbon dioxide capture for the Nigerian cement market.
2.0 Cement Industry as a Major Emitter of CO2
The outstanding characteristics of concrete over other construction materials have made it a material of choice in the construction sector. In the global context, demand for concrete in infrastructure construction has risen, and scholarly surveys show that between 1990 and 2010, the demand for concrete nearly doubled those of steel and wood put together (Monterio et al., 2017). Cement is a very important part of the concrete composites alongside inert mineral aggregates and water, it is practically manufactured in most countries due to its importance as a building material and the geographic availability of the primary raw ingredients (Worrell et al., 2001).
Until recently, the role of the cement sector in greenhouse gas emissions had not received great attention. In the previous 50 years, most of the emissions recorded have come from the combustion of fossil fuels (coal, petroleum and gas) with substantial contributions from forest removal and agricultural activities. However, the cement industry in recent times has proven to be an important source of industrial emissions of greenhouse gasses and contributes about 5-7% of worldwide anthropogenic greenhouse emissions. A report by International Energy Agency modelling shows that energy-related emissions of CO2 must be halved by 2050 in order to fulfil the environmental imperative of sustainable climate change (Barcelo et al. 2014; Bjerge and Brevik, 2014).

ICEES 2021 ISSN: 2714-4186
257
China is the world's largest cement manufacturer, responsible for about 57.1% of the global cement production, and as a result, the cement industry in China emits the highest amount of CO2 as shown in Figure 1. In 2010, China’s CO2 emission from the production of cement peaked at 1000 million tonnes and increased by almost 20%. As of 2014, China remains the top country by CO2 emissions from cement production in the world. China emitted 338.912 MMT of CO2 from cement manufacturing, accounting for 60.30% of global CO2 emissions from cement production. In 2014, China, India, the United States of America, Turkey, and Brazil make up the top five nations, accounting for 72.42 % of the global CO2 emissions from cement manufacturing which was approximately 562.007 MMT as represented in Figure 2 below (Knoema, 2020). Gao et al. (2017), is of the opinion that the emission of carbon from the cement industry in China is affected by numerous factors such as energy efficiency, applied processes and technologies, use of alternative materials, and the level of management and the same is true for other nations of the world
Figure 1: Major countries in worldwide cement production from 2010-2020(in million metric tonnes)
Source: Statista (2021)
Figure 2: Global CO2 emissions from cement production in million metric tonnes (MMT) as of 2014
Source: Knoema (2020)

ICEES 2021 ISSN: 2714-4186
258
On a worldwide scale, it is anticipated that increased cement production will result in a significant increase in global CO2 emissions. In the early ’90s, global CO2 emissions from cement plants were barely more than 0.5 billion tons but by 2006 the value had nearly tripled, reaching 1.88 billion tonnes. With this trend in mind and the exponential rate of the modern industrial revolution, environmentalists believe that if the current trends continue without fundamental regulations and strategies in place to address the problem, CO2 emissions from the worldwide cement sector will be around 2.5 billion tonnes in 2050 (Benhelal et al.,2013; Boden et al., 2011).
3.0 CO2 Emission and its Effect on Climate Change.
The emission of CO2 remains a major concern for most governments throughout the world. Although recent findings by Peter et al. (2019) suggest that the growth of CO2 emission in developed societies has slowed in the last two decades, much of the progress made in these climes has been thwarted by the consistent unregulated actions of developing and underdeveloped societies on this subject, therefore, making it difficult to assess the quality and quantity of progress made.
According to Peters et al. (2019), the present inability to establish a globally accepted strategy for reducing c CO2 emission will bolster the global warming narrative. It is well known that greenhouse gases tend to maintain the earth's temperature at a certain level in order to sustain life. However, the uncontrolled combustion of fossil fuels and other human activities are increasing thereby trapping more heat than is necessary and causing global warming, this has been seen as one of the most serious threats facing humanity today.
For example, Gillet et al. (2011) stated that the knowledge that carbon emissions inflict permanent damage should motivate many people to take action to combat climate change. Using a Canadian Earth System Model to illustrate substantial regional variations continuing at virtually constant global mean temperatures and precipitation at a near-zero carbon dioxide emissions in 2100. Their calculations indicated how terrible the situation might be if not managed, at the current pace of warming and by the year 3000, the West Antarctic Ice Sheet might have completely collapsed, resulting in a 3-4 metre rise in sea level.
Another aspect of climate change that environmentalists are concerned about is the vast amount of dry land that would result from global warming as shown in Figure 3. As the earth warms, certain areas are projected to grow wetter, while others that are currently dry are expected to become dryer. This is because, just as global warming affects the world's extreme cold regions, hotspots like Australia, Southern Africa, the Middle East, Southern Asia, the Sahel region of Africa, and some parts of the United States are becoming dryer due to an imbalance in evapotranspiration, which is expected to lead to drought if it persists for a long time. By 2050, scientists predict that the amount of territory affected by drought will have increased, and that water resources in afflicted areas will have decreased by up to 30% (Arndt et al., 2010; Miller et al., 2009; Serreze et al., 2009). These changes are partly caused by a phenomenon known as the Hadley Cell, whereby warm air in the tropics rises, loses moisture to tropical thunderstorms, and thereafter descends as dry air in the subtropics. As a result of this, it is expected that Semi-arid and desert areas will continue to grow as jet streams continue to shift to higher latitudes, causing storm patterns to shift as well.
Greenhouse gas emissions have a wide range of environmental and health consequences. They contribute to climate change by trapping heat, resulting in record high temperatures and intense rainstorms, as well as changes in temperature and rainfall patterns, which affect plant and animal behaviour and have serious consequences for humans. Other implications of climate change produced by greenhouse gases include harsh weather conditions that contribute to respiratory
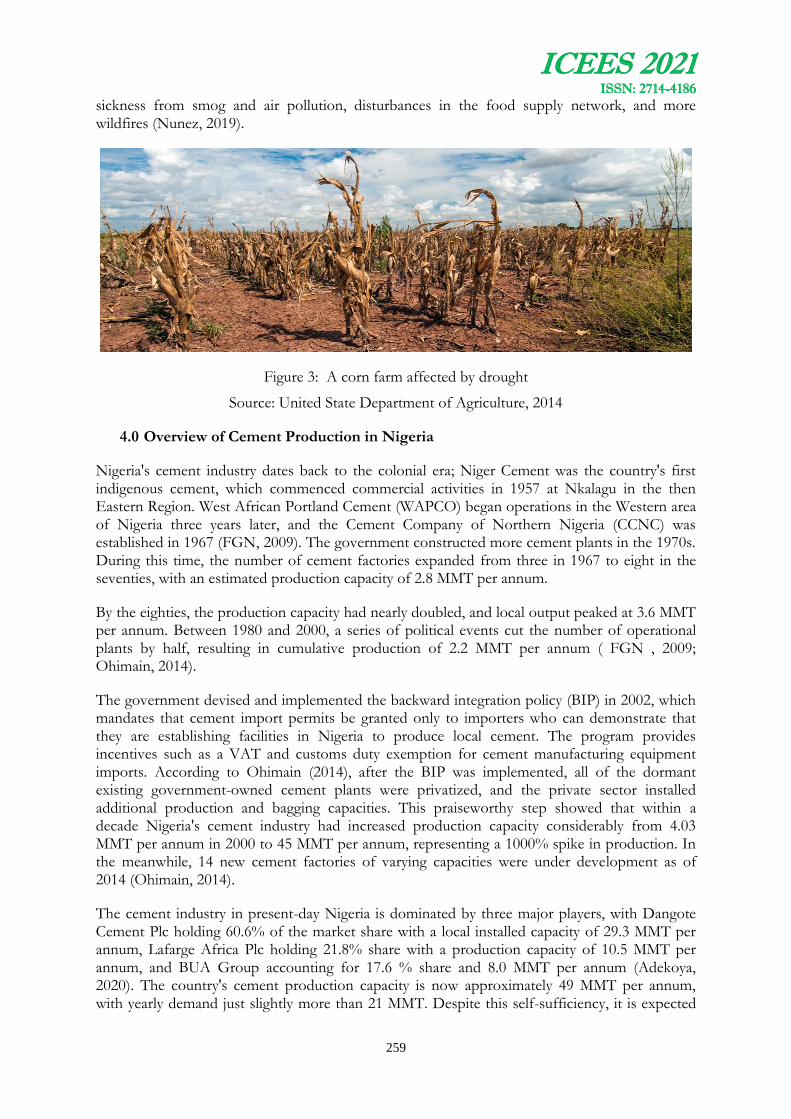
ICEES 2021 ISSN: 2714-4186
259
sickness from smog and air pollution, disturbances in the food supply network, and more wildfires (Nunez, 2019).
Figure 3: A corn farm affected by drought
Source: United State Department of Agriculture, 2014
4.0 Overview of Cement Production in Nigeria
Nigeria's cement industry dates back to the colonial era; Niger Cement was the country's first indigenous cement, which commenced commercial activities in 1957 at Nkalagu in the then Eastern Region. West African Portland Cement (WAPCO) began operations in the Western area of Nigeria three years later, and the Cement Company of Northern Nigeria (CCNC) was established in 1967 (FGN, 2009). The government constructed more cement plants in the 1970s. During this time, the number of cement factories expanded from three in 1967 to eight in the seventies, with an estimated production capacity of 2.8 MMT per annum.
By the eighties, the production capacity had nearly doubled, and local output peaked at 3.6 MMT per annum. Between 1980 and 2000, a series of political events cut the number of operational plants by half, resulting in cumulative production of 2.2 MMT per annum ( FGN , 2009; Ohimain, 2014).
The government devised and implemented the backward integration policy (BIP) in 2002, which mandates that cement import permits be granted only to importers who can demonstrate that they are establishing facilities in Nigeria to produce local cement. The program provides incentives such as a VAT and customs duty exemption for cement manufacturing equipment imports. According to Ohimain (2014), after the BIP was implemented, all of the dormant existing government-owned cement plants were privatized, and the private sector installed additional production and bagging capacities. This praiseworthy step showed that within a decade Nigeria's cement industry had increased production capacity considerably from 4.03 MMT per annum in 2000 to 45 MMT per annum, representing a 1000% spike in production. In the meanwhile, 14 new cement factories of varying capacities were under development as of 2014 (Ohimain, 2014).
The cement industry in present-day Nigeria is dominated by three major players, with Dangote Cement Plc holding 60.6% of the market share with a local installed capacity of 29.3 MMT per annum, Lafarge Africa Plc holding 21.8% share with a production capacity of 10.5 MMT per annum, and BUA Group accounting for 17.6 % share and 8.0 MMT per annum (Adekoya, 2020). The country's cement production capacity is now approximately 49 MMT per annum, with yearly demand just slightly more than 21 MMT. Despite this self-sufficiency, it is expected

ICEES 2021 ISSN: 2714-4186
260
that the production capacity will rise further to 53.8 MMT by 2021 as some of the sector's main companies are constructing additional lines of production around the Nation (Perili, 2021).
The increase in production capacity has resulted in several economic benefits for the country, but it is not without the negative impacts of greenhouse gases caused by CO2 emissions. According to the Carbon Dioxide Analysis Centre (CDIAC), emissions from cement manufacturing in Nigeria grew from 491 thousand metric tons (TMT) of CO2 in 1965 to 9.97 MMT of CO2 in 2014, rising at an annual rate of 8.29 % on average and is just about 10% of the total CO2 emissions from fossil-fuels as shown in Figures 4 and 5. In 2017, Dangote Cement, a major competitor in the cement industry made its sustainability report available to the public in line with standard practice and reported a total emission of 8.45 MMT in all its domestic operations as well as providing 37,000 direct, indirect and induced jobs in Nigeria (Global Cement News, 2019).
If Hendriks et al. (2004) are correct in their claim that for every 1kg of cement produced, 0.9kg of CO2 is emitted, then with a predicted production capacity of 53.8 MMT by 2021, yearly CO2 emissions in Nigeria are estimated to be in the neighbourhood of 48.5 MMT. These numbers are mainly conservative since they exclude emissions from closely related activities such as limestone quarrying and other emissions produced during cement transportation to end-users.
Odemba (2011) showed that CO2 emissions had a positive and significant influence on Nigeria's GDP, with a percentage increase in emissions from fossil fuels, solid fuels, bunker fuels, and cement manufacture resulting in a 0.71, 0.56, 0.62, and 0.44-unit increase in GDP, respectively. According to Adesina and Adejuwom (2008), biological productivity in Nigeria would decline as a result of global warming with significant shortages in fuelwood as an unbearable side effect. Also, consider the fact that Nigeria in recent times has witnessed a clear shift in long-term rainfall patterns toward drier conditions. Climate change has had a negative impact on the availability of water resources for power generation and agriculture. As a backdrop to the preceding argument, it clearly shows that developing a climate change-response development strategy would not only be economically advantageous for Nigeria, but that including climate change mitigation into the broader economic growth plan is also critical for the country's survival. This will aid in reducing the negative economic impacts of carbon emissions.
Figure 4: CO2 emissions from cement production in Nigeria between 1915 – 2014
*To convert to CO2, the values of emission in carbon is multiplied by 3.667 (Knoema (2020))
Source: Knoema (2020)

ICEES 2021 ISSN: 2714-4186
261
Figure 5: Nigeria - Total CO2 emissions from fossil fuels between 1915 -2014
*To convert to CO2, the values of emission in carbon is multiplied by 3.667 Knoema (2020)
Source: Knoema (2020)
5.0 CO2 Sequestration: Techniques and Challenges
Goal 13 of the SDGs is about taking immediate action to combat the negative effects of climate change in our immediate environment. To accomplish this, it is expected that reducing and capturing CO2, the most commonly produced greenhouse gas, will play a significant role in achieving this goal. In a 2021 report on progress toward the SDGs, the Secretary-General emphasized that, despite the gains recorded in the ecosystem from the COVID-19 global lockdown. Preliminary data indicates that failure to address climate change caused by greenhouse gasses will pose a threat to all other SDGs because emissions still increased in 2020.
Scientists suggest that, in order to keep global warming temperature at 1.5°C by 2030, global emissions must be reduced by 45% (IPCC, 2018). When compared with 2010 levels, emissions from developed nations decreased by around 6.2% in 2019 while those from developing countries increased by 14.4% in 2014. There are several explanations for the disparities in the results attained in both situations, one of which being the former's adoption of CCS technology.
Rahman et al. (2017) described CCS as the removal of CO2 directly from industrial or utility plants and subsequent storage in a secure medium. It is one of the most significant technologies available for reducing CO2 emissions. CCS is still the most advantageous technology for reducing CO2 today, and it is also the most cost-effective in a large-scale setting. Given the rising pace of emissions into the atmosphere, it is critical to guarantee that CO2 emissions from burning of fossil fuel and other emerging sources, such as the cement industry, are captured and reduced as soon as possible before they are released into the environment. As a result, the pollution caused by the release of these gases will be reduced, and efforts will be made to use the CO2 collected in the development of cleaner and efficient energy systems (Han et al., 2012; Huang et al., 2008; Martunus et al., 2008).
In terms of CO2 mitigation, there are three well-established strategies typically employed to reduce CO2 emissions into the atmosphere: carbon sinking, carbon minimization, and carbon sourcing. As previously mentioned, CCS comes under the first approach, in which CO2 is collected at the source before being released into the atmosphere, transported to an injection

ICEES 2021 ISSN: 2714-4186
262
location via an impermeable medium, and then stored in geological or biological formations for an extended period of time.
As far as geological carbon sequestration (GCS) is concerned, CO2 is secured in deep geologic formations in order to avoid its contribution to global warming, a schematic diagram of the process has been presented as Figure 6 while biological carbon sequestration (BCS), on the other hand, entails the effects of the ecosystem on the natural and anthropogenic processes of carbon management.
This is based on the earlier findings that terrestrial and aquatic ecosystems in the United States are important carbon sinks and accounts for the sequestration of around one-quarter of the country's CO2 emissions (Duncan and Morrissey, 2011; Yu et al., 2019 ).
Figure 6: Schematic diagram illustrating the theory of geologic carbon sequestration.
Source: Duncan and Morrissey, 2011
5.1 Techniques of CCS Technology
In terms of CCS, there are a variety of techniques that may be used, and each of these approaches can be roughly classified into two sub-techniques: separation and capture techniques. The most common separation techniques as described by Figueroa et al. (2008) and Yang et al. (2008) are gas phase separation, absorption, adsorption, membrane system as well as a hybrid processes involving a combination of the last two techniques. The absorption process, according to Herzog and Golomb (2004), occurs when CO2 gas is absorbed in a liquid solvent by the creation of a chemically linked compound. As a result, once the solvent has been bound, the resultant product is transferred to a separate compartment and heated to release CO2. They also described the adsorption process as including the selective absorption of CO2 onto a solid surface, which is then regenerated by adjusting the pressure or temperature to release the adsorbed CO2. The active gas is isolated from flue gas in the membrane system by selectively permeating it via a membrane material.
The capturing approach also includes the employment of any of the most often documented capture procedures in the literature, namely the post combustion capture system (PCCS-1), the
ICEES 2021 ISSN: 2714-4186
263
pre-combustion capture system (PCCS-2), and the oxyfuel capture system (OCS) (Rahman et al., 2017). In PCCS-1, just before the emissions are released into the environment, a final processing stage is used to remove the majority of the CO2 from the emission stage of the combustion process. The most common commercial CO2 separation technique is wet scrubbing with aqueous amine solutions. CO2 is extracted from the exhaust gas using an amine solvent at a temperature of 50°C. The CO2 absorbed by the solvent, which is then heated to a higher temperature, cooled, and continuously recycled for use in the next separation cycle. The extracted CO2 is then dried, compressed, and transferred to a secure storage location; this process is believed to be the most effective for existing power plants, with an estimated recovery rate of 800 tonnes per day (Gibbins and Chalmers, 2008; Herzog and Golomb, 2004; Thakur et al., 2018).
The majority of the capturing for PCCS-2 occurs before the combustion begins, and this is accomplished by gasifying (partially combusting) the fossil fuel with some oxygen at high pressures to produce a synthetic mixture of H2 and CO, which is then steamed and passed through a catalyst system to enable what is referred to as the water-gas shift (WGS). CO2 separated in this way, results in the production of a fuel gas that is rich in hydrogen at a much lower heat than is required in PCCS-1 process. As a result, in terms of energy consumption, the PCCS-2 is more efficient than the PCCS-2 (Pennline et al.,2008; Guerrero-Lemus and Martínez-Duart, 2012).
Oxyfuel capture system (OCS) requires the use of oxygen as the only active gas in the combustion process to produce a flue gas containing CO2 and compensated vapour that can be easily separated. However, if the CO2 to be captured comes from the combustion of coal, the oxides of nitrogen and sulphur must be carefully removed from the CO2 mixture before compression and storage in a suitable medium (Gibbins and Chalmers, 2008). Apart from the previously described technologies, there are emerging technologies in the industry, some of which are still in the experimental stage and have not been adopted in large scale capturing. These technologies include solid sorbent adsorption, liquid solvent absorption, mineralization, and membranes technology. Though still in its early stages, the membrane technology has shown a lot of promise for capturing and sequestering CO2 emissions and is regarded as the most suitable CCS technology for the future (Ho et al., 2008; Khalilpour et al., 2015; Krishnamurthy et al., 2014; Zevenhoven et al., 2009).
5.2 Challenges of CCS Technology in Developing Countries
The use of CCS technology is fraught with difficulties, some of which are; high implementation costs, life cycle effects, storage capacity, lack of favourable government policies, and high energy demand. Among these challenges, the cost of implementing and commercializing this technology is the most significant. In developed countries, the average cost of capturing and storing one tonne of CO2 is $ 0.5-5 and $ 6-12 for onshore and offshore conditions, respectively.Whereas, some studies have revealed that the cost of operation (cost of sourcing CO2 from emission plants and cost of transportation to storage site) can be as high as $56 in the early stages of operation (Metz et al., 2005, Oh, 2010, Theeyattuparampil et al., 2013).
Furthermore, estimating the cost of a large-scale CCS system is difficult because the cost of external and social influences is frequently explicitly excluded in most of the available scenarios where the cost implication was evaluated.
According to the British Geological Survey (BGS), energy demand is an intrinsic aspect of CCS technology, the cost of capturing and compressing CO2 increases a coal plant's fuel demand by 25-40%, whereas the cost of electricity incurred by end-users for obtaining electricity from a new
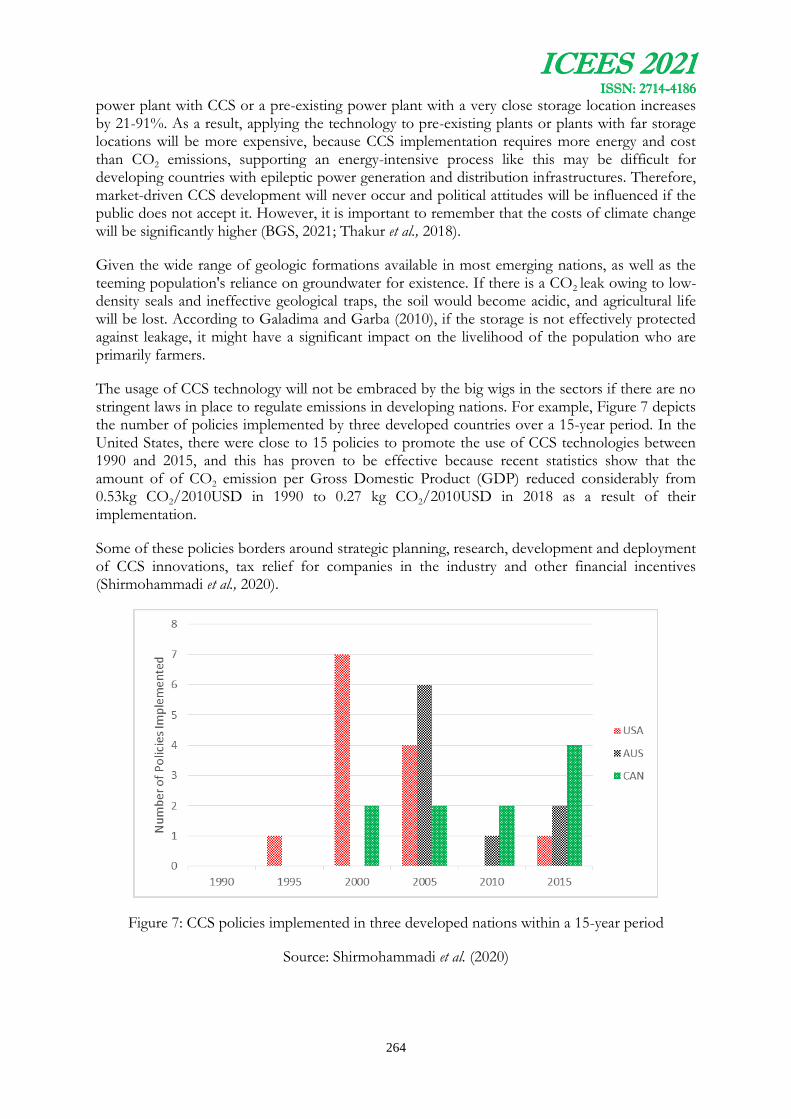
ICEES 2021 ISSN: 2714-4186
264
power plant with CCS or a pre-existing power plant with a very close storage location increases by 21-91%. As a result, applying the technology to pre-existing plants or plants with far storage locations will be more expensive, because CCS implementation requires more energy and cost than CO2 emissions, supporting an energy-intensive process like this may be difficult for developing countries with epileptic power generation and distribution infrastructures. Therefore, market-driven CCS development will never occur and political attitudes will be influenced if the public does not accept it. However, it is important to remember that the costs of climate change will be significantly higher (BGS, 2021; Thakur et al., 2018).
Given the wide range of geologic formations available in most emerging nations, as well as the teeming population's reliance on groundwater for existence. If there is a CO2 leak owing to low-density seals and ineffective geological traps, the soil would become acidic, and agricultural life will be lost. According to Galadima and Garba (2010), if the storage is not effectively protected against leakage, it might have a significant impact on the livelihood of the population who are primarily farmers.
The usage of CCS technology will not be embraced by the big wigs in the sectors if there are no stringent laws in place to regulate emissions in developing nations. For example, Figure 7 depicts the number of policies implemented by three developed countries over a 15-year period. In the United States, there were close to 15 policies to promote the use of CCS technologies between 1990 and 2015, and this has proven to be effective because recent statistics show that the amount of of CO2 emission per Gross Domestic Product (GDP) reduced considerably from 0.53kg CO2/2010USD in 1990 to 0.27 kg CO2/2010USD in 2018 as a result of their implementation.
Some of these policies borders around strategic planning, research, development and deployment of CCS innovations, tax relief for companies in the industry and other financial incentives (Shirmohammadi et al., 2020).
Figure 7: CCS policies implemented in three developed nations within a 15-year period
Source: Shirmohammadi et al. (2020)
ICEES 2021 ISSN: 2714-4186
265
6.0 Potentials and Opportunities of CO2 Capturing for Nigerian Cement Market.
Nigeria has had a considerably stable administration in the previous two decades, with a generally smooth change of power from one political party to the next, resulting in positive economic progress. Many have seen the country's numerous infrastructural developments in this era as proof of a stable government. The cement sector is not immune to this trend, since it is reported in the literature that the number of cement manufacturing units grows every year. Despite this commendable achievement, the government and other stakeholders have implemented few, if any, strategic policies to reduce CO2 emissions arising from the activities of such industries and promote the use of CCS technology in the country.
The Kwale and Ovade Ogharefe projects are notable examples of the few CCS technology deployed by the government. The former, which is overseen by the Nigerian National Petroleum Corporation (NNPC), Nigerian Agip Oil Company Ltd, and Phillips Oil Company Nigeria Ltd, has reduced CO2 emissions by 800,000 metric tonnes as of 2008, while the latter is expected to reduce CO2 emissions by approximately 25 million metric tonnes by 2017 (Anastassia et al., 2010). In both situations, the technology was exclusively used in the oil and gas industry, with no implementation in the cement industry. Given the massive amounts of CO2 emissions produced in recent years by the cement industry, one would expect the country to be at the forefront of the discussion on sustainable methods of converting this readily available raw material into an effective form of renewable energy, but this has not been the case.
However, it is important to note that the adoption of CCS technology in Nigeria’s cement sector, has a lot of promise for the country. As of now, Nigeria is mainly dependent on fossil fuels for power generation, and because the amount of electricity generated is relatively low in comparison to its population, many enterprises and small companies must rely on the usage of generators to carry out their daily operations. If the infrastructure is in place, CO2 collected from these facilities can be processed and transferred to a nearby gas turbine for power generation thereby increasing the quantity of electricity available for generation.
Researchers like Peters et al. (2011), Thakur et al. (2018) and Yoshida and Ihara (2004) have shown that industrially collected CO2 may be used to make key products and chemicals for biofuels and biorefineries. Furthermore, because it is easily converted into other useful products like carbonates, poly (carbonates), carbamate derivatives, and carboxylic acids, which form excellent aprotic polar solvents and fine chemical intermediates, it is bound to have a wide acceptance in the oil and gas sector, paints and coatings industries, electronics, and pharmaceutical industries. CO2 as a commodity can be used in firefighting, food industry, fish farms, agricultural greenhouse and other chemical industries (Psarras et al., 2017).
7.0 Conclusion
Cement manufacturing produces around 10% of the world greenhouse gases in the form of CO2, when released into the atmosphere it creates severe impacts on the climate. Presently, Nigeria produces around 54 million tonnes of cement each year and there are plans by the manufacturing companies to increase this figure in the near future thereby resulting in a massive quantity of CO2 emissions. As of today, there are no active Carbon Capture Technologies and policies in the nation to mitigate the massive quantity of CO2 emitted on a daily basis. The non-existence of this technology puts the entire nation at risk, and one can only expect the worse in terms of occasional climate change. As a result, the Government needs to make policies that will aid joint research to create home grown technologies, especially when the cost of the readily available technologies are taken into consideration. Also, if the country's ambition of reaching the SDGs

ICEES 2021 ISSN: 2714-4186
266
on climate change were to become a reality, the Government and cement industry stakeholders must create rules to halt the continual emission of CO2 into the atmosphere.
References
Adekoya, Femi (2020) Local cement production capacity to hit 53.8mtpa by 2021, Guardian News Paper https://guardian.ng/business-services/industry/local-cement-production-capacity-to-hit-53-8mtpa-by-2021/
Adesina, F.A and Adejuwon, J.O., (2008). Climate Change And Potential Impact On Biomass Energy Production In Nigeria. A Preliminary Assessment. Paper Presented at The International Workshop On The Impact Of Global Climate Change On Energy Development, Lagos, Nigeria, March 28-30.
Anastassia, M., Fredrick, O., and Malcolm, W. (2010). The future of Carbon Capture and Storage (CCS) in Nigeria. Science World Journal, 4(3). doi:10.4314/swj.v4i3.51848
Arndt, D.S., M.O. Baringer, and M.R. Johnson, eds. (2010): State of the climate in 2009. Bulletin of the American Meteorology Society 91(6):S1-S224.
Barcelo, Laurent, Kline, John, Walenta, Gunther, Gartner, Ellis (2014). Cement and carbon emissions. , 47(6), 1055–1065. doi:10.1617/s11527-013-0114-5
Benhelal, E., Zahedi, G., Shamsaei, E., and Bahadori, A. (2013). Global strategies and potentials to curb CO2 emissions in cement industry. Journal of Cleaner Production, 51, 142–161. doi:10.1016/j.jclepro.2012.10.049
Bjerge, Liv-Margrethe and Brevik, Per (2014) CO2 Capture in the Cement Industry, Norcem CO2 Capture Project (Norway), 12th International Conference on Greenhouse Gas Control Technologies, GHGT-12 Edited by Tim Dixon, Howard Herzog, Sian Twinnin Energy Procedia, Volume 63, 2014, Pages 6455-6463, ISSN 1876-6102,
Boden, T., Marland, G. and Andres, B. (2011) Global CO2 Emissions from Fossil-fuel Burning, Cement Manufacture, and Gas Flaring: 1751e2008. Carbon Dioxide Information Analysis Center, Oak Ridge National Laboratory, Oak Ridge, Tennessee, U.S.A.. cdiac.ornl.gov/ftp/ndp030/global.1751_2008.ems (accessed 02.04.12.).
British Geological Survey (2021) Understanding carbon capture and storage Discovering Geology — Climate change https://www.bgs.ac.uk/discovering-geology/climate-change/carbon-capture-and-storage/
Duncan, Douglas W. and Morrissey and Eric A. (2011) The Concept of Geologic Carbon Sequestration U.S. Geological Survey Fact Sheet 2010–3122, 2p available at http:// pubs.usgs.gov/fs/2010/3122/
Federal Government of Nigeria, (2009) Report of The Vision 2020 National Technical Working Group On Manufacturing Thematic Area, 2009.
Figueroa JD, Fout T, Plasynski S, McIlvried H and Srivastava RD. (2008) Advances in CO 2 capture technology—the US Department of energy's carbon sequestration program. Int J Greenh Gas Control 2008;2(1):9–20.

ICEES 2021 ISSN: 2714-4186
267
Galadima, A. and Garba, Z. . (2010). Carbon capture and storage (CCS) in Nigeria: fundamental science and potential implementation risks. Science World Journal, 3(2). doi:10.4314/swj.v3i2.51802
Gao, Tianming; Shen, Lei; Shen, Ming; Liu, Litao; Chen, Fengnan and Gao, Li (2017). Evolution and projection of CO 2 emissions for China's cement industry from 1980 to 2020. Renewable and Sustainable Energy Reviews, 74(), 522–537. doi:10.1016/j.rser.2017.02.006
Gibbins J. and Chalmers H. (2008) Carbon capture and storage. Energy Policy 36(12):4317–22.
Gillett, Nathan P.; Arora, Vivek K.; Zickfeld, Kirsten; Marshall, Shawn J.; Merryfield and William J. (2011). Ongoing climate change following a complete cessation of carbon dioxide emissions., 4(2), 83–87. doi:10.1038/ngeo1047
Global Cement News (2019) “Dangote Cement release sustainability report for 2018” https://www.globalcement.com/news/item/9353-dangote-cement-release-sustainability-report-for-2018 Retrieved on 15/07/2021
Guerrero-Lemus R and Martínez-Duart J. (2012) Renewable energies and CO2. Lect Notes Energy 2012:3
Han J-H, Ahn Y-C, Lee J-U and Lee I-B. (2012) Optimal strategy for carbon capture and storage infrastructure: a review. Korean Journal of Chemical Engineering ;29(8):975–84.
Hendriks, C. A., Worrell, E., Jager, D. De, Blok, K. and Riemer, P. (2004) (n.d.). Emission Reduction of Greenhouse Gases from the Cement Industry, 1–11.
Herzog, H. and Golomb, D. (2004) Carbon capture and storage from fossil fuel use. Encycl Energy;1:1–11.
Ho M. T., Allinson G. W. and Wiley D. E. (2008) Reducing the cost of CO2 capture from flue gases using pressure swing adsorption. Ind Eng Chem Res 47(14):4883–90.
https://doi.org/10.1016/j.egypro.2014.11.680.
Huang, Y., Rezvani S., McIlveen-Wright D., Minchener, A. and Hewitt N. (2008) Technoeconomic study of CO 2 capture and storage in coal fired oxygen fed entrained flow IGCC power plants. Fuel Process Technology ;89(9):916–25.
Inegbenebor, A. I., Mordi, R.C., Idowu, A.O., Siyanbola, T.O., Akanle, B.M., Evbuoma, I.K. and Inegbenebor, A.O. (2018) Consequences of the Activities of a Nigerian Cement Industry on the Environment, International Journal of Applied and Natural Sciences (IJANS) ISSN(P): 2319-4014; ISSN(E): 2319-4022 Vol. 7, Issue 4, pg ;67-74
IPCC (2018) Summary for Policymakers. In: Global Warming of 1.5°C. An IPCC Special Report on the impacts of global warming of 1.5°C above pre-industrial levels and related global greenhouse gas emission pathways, in the context of strengthening the global response to the threat of climate change, sustainable development, and efforts to eradicate poverty [Masson-Delmotte, V., P. Zhai, H.-O. Pörtner, D. Roberts, J. Skea, P.R. Shukla, A. Pirani, W. Moufouma-Okia, C. Péan, R. Pidcock, S. Connors, J.B.R. Matthews, Y. Chen, X. Zhou, M.I. Gomis, E. Lonnoy, T. Maycock, M. Tignor, and T. Waterfield (eds.)]. World Meteorological Organization, Geneva, Switzerland, 32 pp

ICEES 2021 ISSN: 2714-4186
268
Khalilpour R, Mumford K., Zhai H., Abbas A., Stevens G. and Rubin E. S. (2015) Membranebased carbon capture from flue gas: a review. Journal of Cleaner Production 103:286–300.
Knoema (2020) Nigeria - CO2 emissions from cement production https://knoema.com/atlas/Nigeria/topics/Environment/CO2-Emissions-from-Fossil-fuel/CO2-emissions-from-cement-production
Krishnamurthy, S., Rao V. R., Guntuka S., Sharratt P., Haghpanah R., Rajendran A., Amanullah M., Karimi, I. A. and Farooq S. (2014) CO2 capture from dry flue gas by vacuum swing adsorption: a pilot plant study. American Institute of Chemical Engineering Journal;60(5):1830–42.
Martunus M, Othman M, Zakaria R and Fernando W. (2008) Co2 emission and carbon capture for coal fired power plants In Malaysia And Indonesia
Metz, B., Davidson, O., de Coninck, H., Loos, M. and Meyer, L. (2005) Carbon dioxide capture and storage; In: IPCC Report 2005 (Eds.) Cambridge University Press, UK. pp 431. Available from Cambridge University Press, The Edinburgh Building Shaftesbury Road, Cambridge CB2 2RU ENGLAND
Miller J., E. Muller, C. Rogers, R. Waara, A. Atkinson, K.R.T. Whelan, M. Patterson, and B. Witcher. (2009). Coral disease following massive bleaching in 2005 causes 60% decline in coral cover on reefs in the US Virgin Islands. Coral Reefs 28:925-937.
Monterio, P.J.M., Miller S.A and Horvath A. (2017) Towards Sustainable Concrete, Nature Materials, Vol. 16, pp 698-699
Nunez, Christina (2019) Carbon dioxide levels are at a record high. Here's what you need to know. National Geographic
Oh T.H. (2010) Carbon capture and storage potential in coal-fired plant in Malaysia—A review. Renew Sustain Energy Rev;14(9):2697–709.
Ohimain, E. I (2014). The Success of the Backward Integration Policy in the Nigerian Cement Sector. International Journal of Materials Science and Applications. Vol. 3, No. 2, 2014, pp. 70-78. doi: 10.11648/j.ijmsa.20140302.19
Pennline, H.W., Luebke, D.R, Jones, K.L, Myers, C.R, Morsi, B.I, Heintz, Y.J. and Ilconich, J.B. (2008) Progress in carbon dioxide capture and separation research for gasification-based power generation point sources. Fuel Process Technol 89(9):897–907.
Perilli, David (2021) The price of cement in Nigeria, Global Cement https://www.globalcement.com/news/item/12333-the-price-of-cement-in-nigeria
Peters, G. P.; Andrew, R. M.; Canadell, J. G.; Friedlingstein, P.; Jackson, R. B.; Korsbakken, J. I.; Le Quéré, C and Peregon, A. (2019). Carbon dioxide emissions continue to grow amidst slowly emerging climate policies. Nature Climate Change, –. doi:10.1038/s41558-019-0659-6
Peters, M., Köhler, B., Kuckshinrichs, W., Leitner, W., Markewitz, P. and Müller, T.E., (2011). Chemical technologies for exploiting and recycling carbon dioxide into the value chain. ChemSusChem 4, 1216–1240.

ICEES 2021 ISSN: 2714-4186
269
Psarras, P.C., Comello, S., Bains, P., Charoensawadpong, P., Reichelstein, S. and Wilcox, J. (2017). Carbon capture and utilization in the industrial sector. Environ. Sci. Technol. 51, 11440–11449.
Rahman, F. A., Aziz, M. M. A., Saidur, R., Bakar, W. A. W. A., Hainin, M. ., Putrajaya, R., and Hassan, N. A. (2017). Pollution to solution: Capture and sequestration of carbon dioxide (CO2 ) and its utilization as a renewable energy source for a sustainable future. Renewable and Sustainable Energy Reviews, 71, 112–126. doi:10.1016/j.rser.2017.01.011
Serreze, M.C., A.P. Barrett, J.C. Stroeve, D.N. Kindig, and M.M. Holland. (2009). The emergence of surface-based Arctic amplification. The Cryosphere 3:11-19. doi:10.5194/tc-3-11-2009.
Shirmohammadi, R., Aslani, A. and Ghasempour, R. (2020) Challenges of carbon capture technologies deployment in developing countries. Sustainable Energy Technologies and Assessments.Volume 42, 100837-1-14,ISSN 2213-1388. https://doi.org/10.1016/j.seta.2020.100837.
Statistia (2021) Major countries in worldwide cement production from 2010 to 2020(in million metric tons). https://www.statista.com/statistics/267364/world-cement-production-by-country/ Accessed July 30, 2021
Thakur, I. S., Kumar, M., Varjani, S. J., Wu, Y., Gnansounou, E., and Ravindran, S. (2018). Sequestration and utilization of carbon dioxide by chemical and biological methods for biofuels and biomaterials by chemoautotrophs:Opportunities and challenges. Bioresource Technology, 256, 478–490. doi:10.1016/j.biortech.2018.02.039
Theeyattuparampil V. V., Zarzour O. A., Koukouzas N., Vidican G., Al-Saleh, Y. and Katsimnd, Pardi I. (2013) Carbon capture and storage: state of play, challenges and opportunities for the GCC countries. Int J Energy Sect Manag;7(2):223–42.
Yang H., Xu Z., Fan M., Gupta R., Slimane R.B., Bland A.E and Wright I. (2008) Progress in carbon dioxide separation and capture: a review. J Environ Sci;20(1):14–27.
Yoshida, M.and Ihara, M., (2004). Novel methodologies for the synthesis of cyclic carbonates. Chem. Eur. J. 10, 2886–2893.
Yu, X., Ye, S., Olsson, L., Wei, M., Krauss, K.W., and Brix, H., (2019). A 3-year in-situ measurement of CO2 efflux in coastal wetlands: understanding carbon loss through ecosystem respiration and its partitioning: Wetlands, First Online, https://doi.org/10.1007/s13157-019-01197-0.
Zevenhoven, R. and Fagerlund, J. (2009) CO2 fixation by mineral matter; the potential of different mineralization routes. In: IOP conference series: Earth and environmental science. IOP Publishing

ICEES 2021 ISSN: 2714-4186
270
ISOTHERM, KINETIC AND THERMODYNAMIC STUDIES OF MODIFIED FELDSPAR COMPOSITE IN THE HEAVY METALS
ADSORPTION FROM WASTEWATER
1*Yakubu Yahaya, 1Murtala Maidamma Ambursa, 1Aminu Rabiu Koko and 1&2Sanusi Kabir Adebayo
1. Department of Pure and Applied Chemistry, Kebbi State University of Science and Technology, Aliero. Kebbi State, Nigeria
2. Department of Chemical Sciences Federal University Kashere, P.M.B. 0182, Gombe State, Nigeria.
*Corresponding Author: Email: [email protected]
ABSTRACT
In this study, a modified feldspar composite (MFC) adsorbent from feldspar and Theobroma cacao pods (TCP) was prepared using the calcination method. It was characterized and tested for adsorption of Pb (II), Cd (II), As (III) and Cr (VI) in wastewater sample. The MFC had an improved cation exchange capacity, large surface area and small particle size. The optimization results from Central Composite Design (CCD) predicted the adsorption percentages of 99.95, 99.93, 98.72 and 92.48 for Pb (II), Cd (II), As (III) and Cr (VI) ions respectively. The experimental results revealed the removal percentages of Pb (II), Cd (II), As (III) and Cr (VI) ions as 99.98%, 99.91%, 98.80% and 92.24%, which were in good correlation with the values predicted by the CCD for the respective metal ions at the optimum conditions of adsorption. The isotherm studies showed that the adsorption of Pb (II), Cd (II) and As (III) ions onto MFC best fitted the Langmuir isotherm model while that of Cr (VI) ion followed the Freundlich isotherm model. The kinetic studies showed that rate of adsorption of Pb (II), Cd (III) and As (III) ions followed the pseudo second- order kinetic model while the rate of adsorption of Cr (VI) ions onto MFC best fitted pseudo first order kinetic model. Thermodynamic studies revealed that metal adsorption onto MFC was feasible, spontaneous and endothermic for Pb (II) and Cd (II) ions while the uptake of As (III) and Cr (VI) ions followed an exothermic process. The MFC, owing to its improved cation exchange capacity and eco-friendliness, has a good potential to be utilized as an alternative adsorbent in wastewater treatment.
Key words: Theobroma cacao, isotherms, kinetics, thermodynamics, modified feldspar
1.0 INTRODUCTION
The presence of heavy metals in water sources has become an important topic of concern for scientists in various fields associated with quality of life and safety of the natural environment as well as concern of the general public (Dang et al., 2009). Heavy metals are one of the most problematic pollutants in the environment due to their potential toxicity, persistence and bio-accumulation problems. Direct toxicity to man and other forms of life and indirect toxicity through the food chains are the focus of this concern (Sanusi et al., 2016). Heavy metals such as cadmium, lead, chromium, arsenic and copper are released into the water bodies from several industrial activities such as mining, electroplating, battery manufacture, metallurgy and tannery. The effluents released from the industries contain heavy metals at a concentration above the tolerable limit (Ogbu et al., 2019). In order to maintain a healthy living, essential metals such as Cu, Fe, Zn and Mn are required as micro-nutrients or macro-nutrients. However, other metals like Cd, Pb and As are poisonous; increased exposure to these metals can be hazardous as they
ICEES 2021 ISSN: 2714-4186
271
damage nerves, brain, liver, heart, lung, bones and cause gastrointestinal dysfunction (Sanusi et al., 2021).
To alleviate the problem of water pollution by heavy metals, various conventional methods including coagulation, floatation, adsorption, ion exchange, reverse osmosis, ultrafiltration, electro-dialysis and membrane filtration processes have been used. However, most of these water treatment methods suffer several techno-economic limitations such as inefficiency, cost expensive, sludge production, membrane filters scarcity (Dang et al., 2009). Removing of toxic chemical substances by adsorption using low-cost adsorbents is the latest method of choice in wastewater treatment. Among available natural materials, agricultural wastes and aluminosilicate materials are regarded as suitable adsorbents because they are non-toxic, abundant, eco-friendly and have multifunctional group properties. Several researchers have utilized a wide variety of clays and agro-wastes for adsorption experiments. These include clays like illite (Ozdes et al., 2011), kaolinite (Unuabonah et al., 2008), feldspar (Awala and El-Jamal, 2011), bentonite (Olu-Owolabi et al., 2016); and agrowastes such as pineapple leaves (Amphol et al., 2020), Sawdust (Ogbu et al., 2019), Carica papaya seed (Sanusi et al., 2016) and mango seed (Olu-Owolabi et al., 2012).
Theobroma cacao pod (TCP) is the main by-products of cocoa processing discarded as wastes, constituting environmental pollution. Theobroma cacao pod (TCP) is a lignocellulosic waste consisting of cellulose 26.1%, hemicellulose 12.8% and lignin 28% (Sanusi et al., 2021). Feldspar is a crystalline aluminosilicate mineral, belong to the tectosilicate group and is characterized by a framework of layered silicate structure (Sanusi et al., 2021). The species of feldspar are orthoclase (KAlSi3O8), albite (NaAlSi3O8) and anorthite (CaAl2Si2O8) (Yazdani et al., 2014).
Despite the excellent adsorption performance of clays and agrowastes, they are cumbersome to utilize as adsorbents on industrial scales for reasons like clogging, bleeding and decomposition in industrial sieves, very low flow rates for clays infixed bed columns. The drawbacks are circumvented by modification methods such as intercalation, pillaring, surfactant treatment, thermal activation and acid-alkaline treatment (Yazdani et al., 2014). This study aims to investigate the isotherms, kinetics and thermodynamics of adsorption of Cd (II), Pb (II), As (III), and Cr (VI) ions onto modified feldspar composite (MFC) adsorbent in wastewater.
2. MATERIAL AND METHODS
2.1 Collection and pretreatment of Adsorbent samples.
Theobroma cacao pods (TCP) were collected from cocoa plantations in Ifetedo town, Osun State. The TCP samples were washed with tap water and then rinsed with distilled water to remove dust, dirt impurities, oven-dried at 70C for 72 h and ground to powder using mortar and pestle. The TCP was sieved in a 0.230 mm sieve and stored plastic container (Olu-Owolabi et al., 2012).
The feldspar (FS) sample was obtained from the Federal Institute of Industrial Research Oshodi (FIIRO), Lagos, Nigeria. The feldspar sample was pre-treated by suspension in deionized water for 24 h (Unuabonah et al., 2013). The organic matters in the sample were removed by adding 30% hydrogen peroxide solution with stirring until effervescence ceased. The mixture was decanted, washed with deionized water to remove all traces of hydrogen peroxide, oven-dried at 105•C and stored in a pre-cleaned dry air-tight plastic container (Sanusi et al., 2016).

ICEES 2021 ISSN: 2714-4186
272
2.2 Preparation of modified feldspar composite adsorbent (MFC)
Equal weight of feldspar sample and TCP sample (50 g each) were weighed into a 500 mL beaker and 300 mL of 0.1M NaOH was added. The content was thoroughly stirred and heated in an oven at 150•C until dryness (Olu-Owolabi et al., 2016). Samples of the dried mixtures were weighed into crucibles and calcined at 300•C for 6 h. The resulting dark powdery composite was washed with deionized water to remove residual NaOH from its surface. The modified feldspar composite (MFC) was oven-dried at 105•C and stored in a dry plastic container (Unuabonah et al., 2013).
2.3 Characterization of adsorbents
The cation exchange capacity (CEC) of FS and MFC were determined using the ammonium acetate method as reported by Unuabonah et al. (2013). Na+ and K+ were determined using AES (Agilent PG 10T), while Ca2+ and Mg2+ were determined by atomic absorption spectrophotometer (SHIMAZU 360H Model). The functional groups present in the adsorbents were obtained using Shimadzu 8400S FTIR spectrometer (Adebowale et al., 2008). The surface morphology, surface area and porosity of the adsorbent were analyzed using scanning electron microscopy (SEM), Philips XL30 model and Brunauer, Emmet and Teller (BET) (Singh and Bhateria, 2020).
2.4 Preparation of standard and working solutions of heavy metals
A stock solution of the metal ions (Pb2+, Cd2+, As3+ and Cr6+) were prepared by dissolving 1.598g of Pb(NO3)2, 2.711g of Cd(NO3)2, 1.320 g of As2O3 and 2.8289 g of K2Cr2O7 salts in 200cm3
deionized water and then made up to the mark in a 1L standard volumetric flask. Working solutions of various concentrations were prepared from the stock solution as required by serial dilution.
2.5 Batch adsorption experiment
Batch adsorption studies were carried out in 100mL plastic bottles by contacting 0.5 g of adsorbent with 20 ml of wastewater containing 100mg/L each of Pb (II), Cd (II), As (III) and Cr (VI) ions. The adsorbent/metal ions mixtures were placed on a rotary shaker and shaken at 120 rpm at a room temperature (3000K) for a period of 120 min to attain equilibrium (Ogbu et al., 2019). The sample mixtures were filtered using whatman 0.45 filter paper and the filtrates were analyzed for the concentration of the metal ions left using AAS method (Unuabonah et al 2013; Gusain et al., 2019). All adsorption experiments were carried out in triplicate for all the metal ions studied.
2.6 Optimization of Adsorption Parameters
The central composite design (CCD) and Design-Expert 12 software was applied to determine the optimum set of adsorption parameters as presented in Table 1.

ICEES 2021 ISSN: 2714-4186
273
Table 1: Parameters for optimization of adsorption of Pb (II), Cd (II), As (III) and Cr (VI) on MFC
Independent variables Ranges and Coded Levels
- α -1 0 +1 + α
Initial metal conc. (C0) (mg/L) 50 75 100 125 150
pH 2 3 5 6 8
Adsorbent dose (D) (g) 0.5 1 1.5 2 2.5 Contact time (T)(min) 30 60 120 180 210
2.7 Data Treatment
The amount of metal ions adsorbed per gram of MFC was calculated using Equation 1.
M
VCCq eO
e
)(
(1)
The percentage removal of metal ions by MFC was calculated using Equation 2.
%R = x 100 (2)
where; R is the removal efficiency of the metal ions by adsorbent; Co is the initial metal ions
concentration in wastewater (mg/L); is the metal ions concentration adsorbed by an
adsorbent at equilibrium (mg/L); eq, V and M are the amount of metal ions adsorbed (mg/g),
volume of the solution (mL) used for experiment and mass (g) of the sample, respectively.
2.7.1 Adsorption Isotherm Models
The equilibrium isotherm modeling of Pb (II), Cd (II), As (III) and Cr (VI) ions adsorbed onto the MFC adsorbent was carried out by the application of the Langmuir and Freundlich models.
The Langmuir isotherm is represented in linear form by Equation 3 as:
o
e
oe
e 1
Q
C
bQq
C
(3)
When is plotted against Ce, the slope is and the intercept is . Where oQ and b are the
maximal adsorption capacity per weight of MFC and solute-surface interaction energy parameters.
The Freundlich isotherm in linear form is represented by Equation 4 as:
(4)

ICEES 2021 ISSN: 2714-4186
274
Where FK and n are the Freundlich model capacity factor and the linearity parameter
respectively. The values of and n may be calculated by plotting log ( ) versus log ( ). The
slope is equal to and the intercept is equal to log (Unuabonah et al., 2008; Das and Mondal,
2011).
2.7.2 Adsorption Kinetic Models
The Lagergren pseudo-first-order (PFO), pseudo second-order (PSO), intra-particle diffusion (IPD) and Elovich kinetic models were employed in describing the rate of the adsorption process.
. The Equations are expressed below:
PFO: t
kqqq ete
303.2log)log(
1
(5)
PSO: eet q
t
qkq
t
2
2
1
(6)
Intra-particle diffusion: Ctkq it )( 2/1
(7)
Elovich: t
1
1q t LnLn
(8)
Where qe and qt are adsorption quantity (mg/g) at equilibrium and at time t, respectively; k1
(min−1) and k2 (g/mg1min1) are the rate constants of the PFO and PSO, respectively; ik
(mg/gmin1/2) is the rate constant of the intra-particle diffusion with intercept C; α is the initial
adsorption rate (mgg−1min−1) and is the surface activation energy for chemisorption (g/mg). The qe and rate constants were calculated from the slope and intercept of the plots of log (qe−qt)
vs. t; t/q vs. t and tq vs
2/1t for PFO, PSO and IPD respectively (Adebowale et al., 2008, Sanusi et al., 2016).
2.7.3 Equilibrium Adsorption Analysis
A good statistical tool for evaluating the applicability and fitness of isotherm or kinetic models besides the regression coefficient (R2) is the non-linear chi-square test (X2). It is expressed as:
Where, qe exp (mg/g) and qe cal (mg/g) are the experimental and calculated equilibrium adsorption capacities respectively. The smaller the X2 value, the closer the agreement between the experimental data and data calculated from the model equations (Akpomie and Dawodu, 2015)

ICEES 2021 ISSN: 2714-4186
275
2.7.4 Thermodynamic parameters
The thermodynamic parameters, i.e. standard enthalpy change oH , standard entropy
change oS , standard Gibbs free energy change oG and equilibrium constant CK were evaluated using data from equilibrium metal adsorption studies through the following Equations:
e
ads
CC
CK
(10)
C
o RTInKG = T (11)
R
S
RT
HK
oo
C303.2303.2
log
(12)
Where adsC and eC
are the amount of metal ions adsorbed and the amount left in solution after equilibrium; R and T are the universal gas constant (8.314 Jmol-1K-1) and temperature respectively.
3 RESULTS AND DISCUSSION
3.1 Characterization of adsorbent.
From the results in Table 2, MFC had the higher value for CEC (30.66 ± 0.21 meq/100g) than FS (6.42 ± 0.45 meq/100g). The results indicated that MFC, a composite from the combination of FS and TCP had an improved ion-exchange capacity from the surface modification process.
Table 2: The pH and Cation Exchange Capacity of the FS and MFC adsorbents.
Adsorbents pH Exchangeable cations(meq/100g)
CEC (meq/100g)
Ca Mg K Na
FS
4.95±0.36 1.08±0.1 0.45±0.02 3.31±0.4 1.58±0.23
6.42 ± 0.45
MFC
7.60±0.01 5.57±0.9 3.85±0.00 13.88±0.5 7.36±0.99
30.66± 0.21
The infrared spectra of FS, and MFC were shown in Figure 1 (a and b). As shown in Figure (1a), the shift in absorption bands observed in MFC spectra after the calcination with the TCP is an indication of the successful synthesis of the composite adsorbent. The absorption band of the MFC appearing at 3432 and 3696 cm−1 has been enhanced, which resulted from vibration bands of TCP (O–H and N–H stretching) overlap with the bands of FS (–OH stretching of H2O). The bands at 2928-2849 cm−1, 1380 cm−1 and 1034cm–1 related to the intercalated TCP (–CH2 stretching on methylene groups) and Si–O bending were seen in the MFC spectra suggesting the active sites for interaction of the feldspar with the TCP biomass (Unuabonah et al., 2013 and Yazdani et al., 2014).

ICEES 2021 ISSN: 2714-4186
276
Figure 1 (a) FTIR spectra of modified feldspar composite (MFC).
Figure 1 (b) FTIR spectra of raw feldspar composite (FS).
Figure 2 shows SEM micrographs of MFC. The composite adsorbent is porous, consists of a considerable number of heterogeneous pores, irregular surface and aggregate of pore size and shapes typical of feldspar mineral (Awala and El-Jamal, 2011). The MFC adsorbent showed an increased surface area (53.60 ± 0.3 m2/g) indicating the smaller particle sizes i.e. micropores. Similar results have been reported by (Awala and El-Jamal, 2011; Sanusi et al., 2016).
Figure 2. Scanning Electron Micrograph of MFC adsorbent.

ICEES 2021 ISSN: 2714-4186
277
3.2 Effect of adsorption parameters and optimization.
Table 2 presented the combined effect of interaction of pH, initial metal concentration, contact time and adsorbent dosage on the adsorptive behaviour of Pb (II), Cd (II), As (III) and Cr (VI) onto MFC adsorbent. For all the metal ions, the removal percentage increased with increasing adsorbent dosage, and this was due to the presence of more active adsorption sites and large adsorbent surface area that is readily available for metal uptake (Adebowale et al., 2008; Sanusi et al., 2016). More so, the removal of metal ions onto MFC reached the maximum at 60 min for Pb (II) and Cr (VI), but 120 min for Cd (II), As (III). Furthermore, the metal adsorption onto MFC depends on the pH of the solution. Pb (II), Cd (II) and As (III) removal at lower pH is lower than the metal removal at higher pH in the experimental pH range. On the contrary, Cr (VI) ions adsorption was higher at lower pH 2. Similar observations were reported by other researchers (Ozde et al., 2011; Yazdani et al., 2014, Sanusi et al., 2016). As shown in Table 2, the optimization results using central composite design (CCD) revealed that the predicted adsorption capacities and percentages for the heavy metal ions (Pb (II), Cd (II), As (III) and Cr (VI)) were close to the experimental results of the respective metal ions at the optimum conditions of adsorption parameters (pH 2, 5, 6; 0.5 g; 100 mg/L; 60-120 min and 3000K).
Table 2. Optimization results for predicted and experimental values of adsorption capacity and percentages of Pb (II), Cd (II), As (III) and Cr (VI) on MFC.
Heavy Metals
pH
Time (min)
Dose (g)
conc. (mg/L)
Adjusted R2
Predicted R2
Adsorption Adsorption capacity (%) (mg/g)
Exp. Pred. qe exp. qe pred.
Pb (II) 6 60 0.5 100 0.9986 0.9996 99.98 99.95 24.23 24.21
Cd (II) 5 120 0.5 100 0.9978 0.9990 99.91 99.93 21.65 21.64
As (III) 5 120 0.5 100 0.9959 0.9981 98.80 98.72 16.88 16.90
Cr (VI) 2 60 0.5 100 0.9919 0.9966 92.24 92.48 12.50 12.45
3.3 Adsorption Isotherm Studies
The equilibrium data obtained from the adsorption of Pb (II), Cd (II), As (III) and Cr (VI) ions onto MFC were fitted to Langmuir and Freundlich isotherm models. All of the isotherm parameters, constants and regression coefficients were calculated from the linear equations of the isotherm model plots and presented in Table 3.The maximum Langmuir monolayer adsorption capacity, Qo (mg/g), were 99.98, 96.91, 91.80 and 85.64 for Pb (II), Cd (II), As (III) and Cr (VI) uptake by MFC respectively. It was observed that the maximum adsorption capacity for Pb (II) was the highest i.e. Pb (II) > Cd (II) > As (III) > Cr (VI). The higher adsorption of Pb (II) as compared to the other metal ions suggests that the adsorbent surface acts as a base and invariably have a stronger affinity for Pb (II) which was adsorbed in a borderline acidic solution (pH 6). The Qo values for Pb (II) and Cd (II) were higher than the values reported by Unuabonah et al. (2008) and Ozdes et al. (2011). As shown in Table 3, the Langmuir isotherm model was best fitted to adsorption of Pb (II), Cd (II), As (III) ions onto the adsorbents with R2
greater than 0.99 and low X2 values (0.073- 0.917). This suggests that the adsorption process might be attributed to monolayer adsorption onto a homogenous surface of the adsorbent. However, the Freundlich isotherm model was found to present the best fit for Cr (VI) adsorption process considering the high R2 (0.9997) and low X2 values (0.976). The better fitness of the data to the Freundlich model suggests multilayer adsorption for Cr (VI) ions unto a heterogeneous surface of the adsorbents (Ozdes et al., 2011; Akpomie and Dawodu, 2015).

ICEES 2021 ISSN: 2714-4186
278
Table 3: Adsorption Isotherm Parameters of Pb (II), Cd (II), As (III) and Cr (VI) adsorption onto MFC.
Metal Pb (II) Cd (II) As (III) Cr (VI) Isotherm
Langmuir
Qo (mg/g) 99.98 96.91 91.80 85.64
b (L/mg) 0.096 0.084 0.064 0.011
R2 0.9999 X2 0.073
0.9996 0.416
0.9990 0.073
0.8862 10.251
Freundlich
KF 39.03 30.75 8.916 0.069
n 1.352 1.262 2.577 3.223
R2 0.9358 X2 5.746
0.8997 8.409
0.8766 8.258
0.9997 0.976
Key: MFC: modified feldspar composite, Qo = Maximal adsorption capacity per unit weight of adsorbent, b = Solute–surface interaction energy-related parameter, R2 = Regression coefficient, KF = Freundlich model capacity factor, n = Isotherm linearity parameter, X2 = Chi square test. 3.4 Adsorption Kinetic Studies
The pseudo-first-order (PFO), pseudo second-order (PSO), Elovich and intraparticle diffusion (IPD) kinetic models were applied to investigate the rate of the heavy metals adsorption. The calculated parameters, constants, regression coefficients (R2) and chi-square (X2) test for the adsorption of Pb (II), Cd (II), As (III) and Cr (VI) ions obtained from the kinetic models were given in Table 4 (a and b). Plots of the four kinetic models are shown in Figure 3 (a - d). From Table 4 (b), the experimental data calculated from pseudo-second order (PSO) kinetic model for Pb (II), Cd (II), As (III) ions have higher R2 (0.99 < R2 ≤ 1) and very low X2 values ranging from (0.108 – 0.225). The higher R2 and lower χ2 values obtained suggested that the pseudo-second-order kinetic model provided a better fit for Pb (II), Cd (II), As (III) ions than the pseudo-first-order model (Ogbu et al., 2019; Sanusi et al., 2021). However, for the adsorption of Cr (VI) ion on the various adsorbents, the R2 values were higher (0.9987) and X2 values were lower (0.979) for PFO kinetic model in Table 4(a). The higher R2 values supported by the very lower X2 values indicated that pseudo-first-order (PFO) kinetic model was found to best fit the experimental data for adsorption of Cr (VI) onto the MFC (Md.Sayedur and Sathasivam, 2015; Amphol et al.,
2020). However, the low 2 values shown in Table 4 (b) suggested that Elovich kinetic model did
not fit the adsorption of the metal. Figure 3(d) revealed that the plot of tq vs
2/1t is a straight line
with a slope ik and intercept C. The R2 values were greater than 0.99, suggesting that the uptake
of metal ions involved intraparticle diffusion. However, the plot’s linear fitting did not passing through the origin, which indicated that the intraparticle diffusion is not the only rate-controlling step during the metal adsorption process (Sanusi et al., 2016; Gusain et al., 2019). The
multilinearity of the plot of tq vs
2/1t and the occurrence of non-zero intercept suggested that
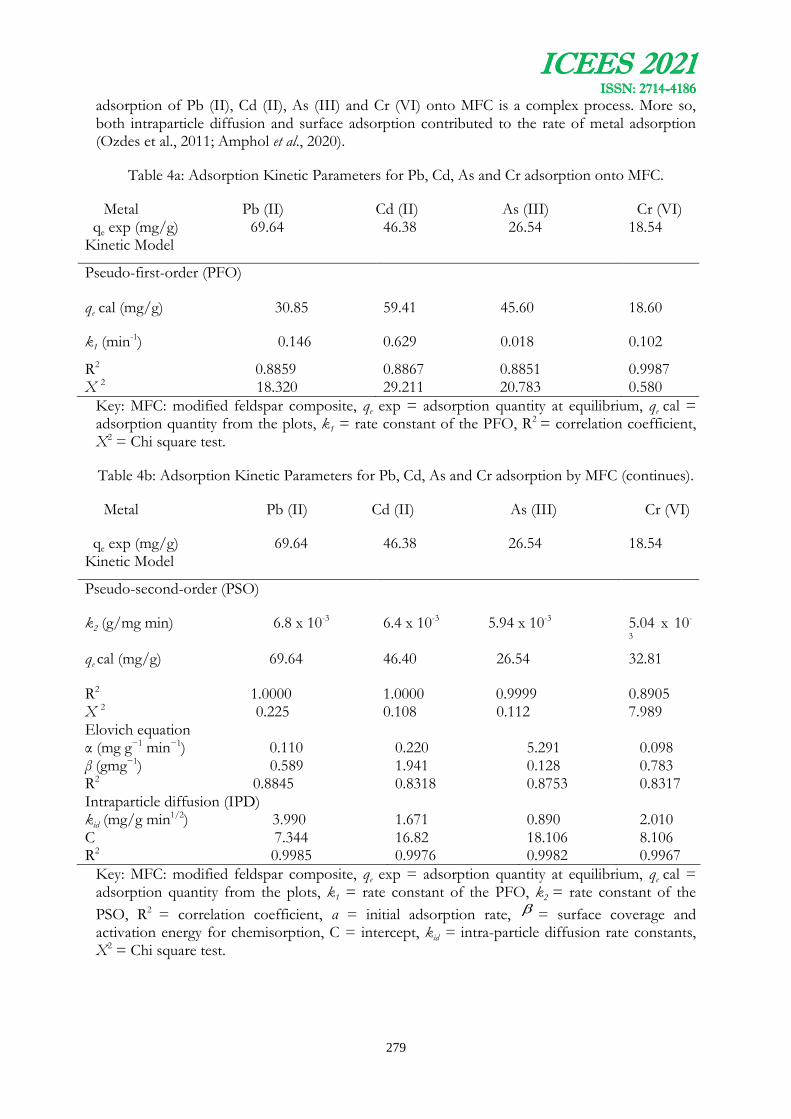
ICEES 2021 ISSN: 2714-4186
279
adsorption of Pb (II), Cd (II), As (III) and Cr (VI) onto MFC is a complex process. More so, both intraparticle diffusion and surface adsorption contributed to the rate of metal adsorption (Ozdes et al., 2011; Amphol et al., 2020).
Table 4a: Adsorption Kinetic Parameters for Pb, Cd, As and Cr adsorption onto MFC.
Metal Pb (II) Cd (II) As (III) Cr (VI) qe exp (mg/g) 69.64 Kinetic Model
46.38 26.54 18.54
Pseudo-first-order (PFO)
qe cal (mg/g) 30.85 59.41 45.60 18.60
k1 (min-1) 0.146 0.629 0.018 0.102
R2 0.8859 X 2 18.320
0.8867 0.8851 29.211 20.783
0.9987 0.580
Key: MFC: modified feldspar composite, qe exp = adsorption quantity at equilibrium, qe cal = adsorption quantity from the plots, k1 = rate constant of the PFO, R2 = correlation coefficient, X2 = Chi square test.
Table 4b: Adsorption Kinetic Parameters for Pb, Cd, As and Cr adsorption by MFC (continues).
Metal Pb (II) Cd (II) As (III) Cr (VI)
qe exp (mg/g) 69.64 Kinetic Model
46.38 26.54 18.54
Pseudo-second-order (PSO)
k2 (g/mg min) 6.8 x 10⁻³ 6.4 x 10⁻³ 5.94 x 10⁻³ 5.04 x 10-
3 qe cal (mg/g) 69.64 46.40 26.54 32.81
R2 1.0000 X 2 0.225
1.0000 0.9999 0.108 0.112
0.8905 7.989
Elovich equation α (mg g−1 min−1) 0.110 β (gmg−1) 0.589 R2 0.8845 Intraparticle diffusion (IPD) kid (mg/g min1/2) 3.990 C 7.344 R2 0.9985
0.220 1.941 0.8318 1.671 16.82 0.9976
5.291 0.128 0.8753 0.890 18.106 0.9982
0.098 0.783 0.8317 2.010 8.106 0.9967
Key: MFC: modified feldspar composite, qe exp = adsorption quantity at equilibrium, qe cal = adsorption quantity from the plots, k1 = rate constant of the PFO, k2 = rate constant of the
PSO, R2 = correlation coefficient, α = initial adsorption rate, = surface coverage and activation energy for chemisorption, C = intercept, kid = intra-particle diffusion rate constants, X2 = Chi square test.

ICEES 2021 ISSN: 2714-4186
280
Figure 3: (a) PFO kinetic (b) PSO kinetic plots of adsorption of Pb, Cd, As and Cr onto MFC.
Figure 3: (c) Elovich and (d) IPD plots of adsorption of Pb, Cd, As and Cr onto MFC adsorbent.
3.5 Thermodynamics of metal adsorption
The calculated values of the thermodynamic parameters such as a change in standard Gibbs free energy (ΔGθ), change in standard enthalpy (ΔHθ) and change in standard entropy (ΔSθ) for metal
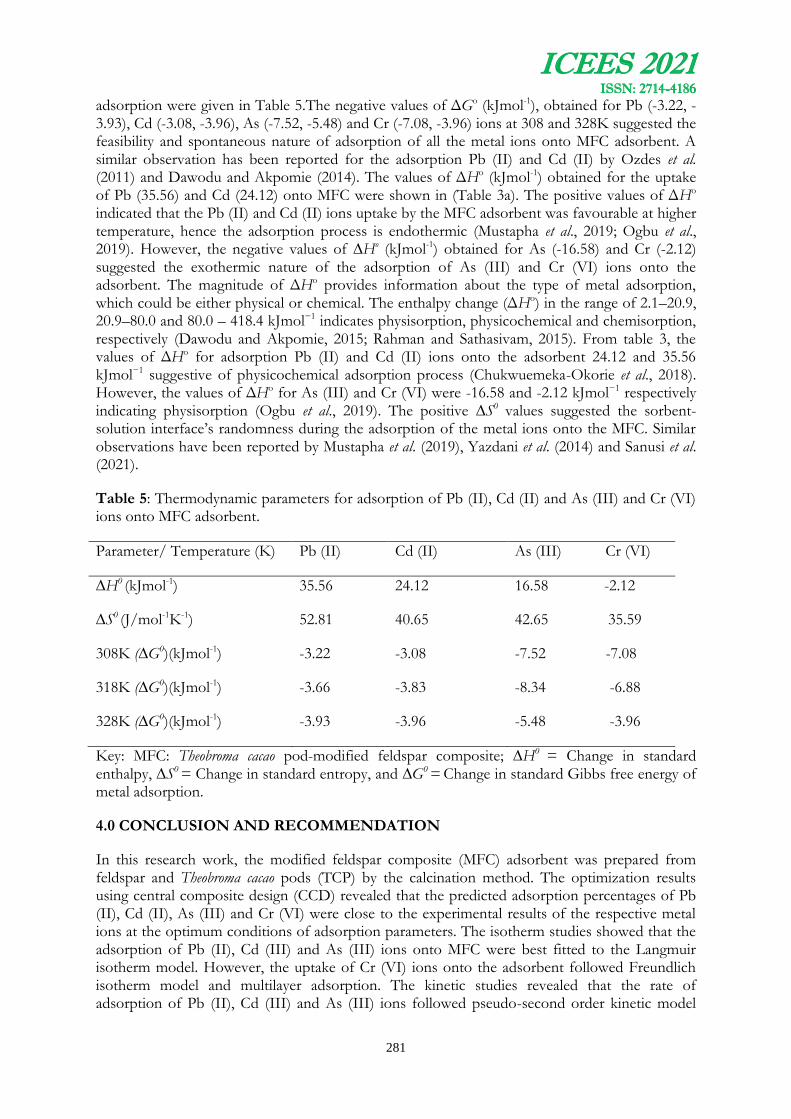
ICEES 2021 ISSN: 2714-4186
281
adsorption were given in Table 5.The negative values of ΔGo (kJmol-1), obtained for Pb (-3.22, -3.93), Cd (-3.08, -3.96), As (-7.52, -5.48) and Cr (-7.08, -3.96) ions at 308 and 328K suggested the feasibility and spontaneous nature of adsorption of all the metal ions onto MFC adsorbent. A similar observation has been reported for the adsorption Pb (II) and Cd (II) by Ozdes et al. (2011) and Dawodu and Akpomie (2014). The values of ΔHo (kJmol-1) obtained for the uptake of Pb (35.56) and Cd (24.12) onto MFC were shown in (Table 3a). The positive values of ΔHo indicated that the Pb (II) and Cd (II) ions uptake by the MFC adsorbent was favourable at higher temperature, hence the adsorption process is endothermic (Mustapha et al., 2019; Ogbu et al., 2019). However, the negative values of ∆Ho (kJmol-1) obtained for As (-16.58) and Cr (-2.12) suggested the exothermic nature of the adsorption of As (III) and Cr (VI) ions onto the adsorbent. The magnitude of ΔHo provides information about the type of metal adsorption, which could be either physical or chemical. The enthalpy change (ΔHo) in the range of 2.1–20.9, 20.9–80.0 and 80.0 – 418.4 kJmol−1 indicates physisorption, physicochemical and chemisorption, respectively (Dawodu and Akpomie, 2015; Rahman and Sathasivam, 2015). From table 3, the values of ΔHo for adsorption Pb (II) and Cd (II) ions onto the adsorbent 24.12 and 35.56 kJmol−1 suggestive of physicochemical adsorption process (Chukwuemeka-Okorie et al., 2018). However, the values of ΔHo for As (III) and Cr (VI) were -16.58 and -2.12 kJmol−1 respectively indicating physisorption (Ogbu et al., 2019). The positive ∆S0 values suggested the sorbent-solution interface’s randomness during the adsorption of the metal ions onto the MFC. Similar observations have been reported by Mustapha et al. (2019), Yazdani et al. (2014) and Sanusi et al. (2021).
Table 5: Thermodynamic parameters for adsorption of Pb (II), Cd (II) and As (III) and Cr (VI) ions onto MFC adsorbent.
Parameter/ Temperature (K) Pb (II) Cd (II) As (III) Cr (VI)
∆H0 (kJmol-1) 35.56 24.12 16.58 -2.12
∆S0 (J/mol-1K-1) 52.81 40.65 42.65 35.59
308K (∆G0)(kJmol-1) -3.22 -3.08 -7.52 -7.08
318K (∆G0)(kJmol-1) -3.66 -3.83 -8.34 -6.88
328K (∆G0)(kJmol-1) -3.93 -3.96 -5.48 -3.96
Key: MFC: Theobroma cacao pod-modified feldspar composite; ∆H0 = Change in standard enthalpy, ∆S0 = Change in standard entropy, and ∆G0 = Change in standard Gibbs free energy of metal adsorption.
4.0 CONCLUSION AND RECOMMENDATION
In this research work, the modified feldspar composite (MFC) adsorbent was prepared from feldspar and Theobroma cacao pods (TCP) by the calcination method. The optimization results using central composite design (CCD) revealed that the predicted adsorption percentages of Pb (II), Cd (II), As (III) and Cr (VI) were close to the experimental results of the respective metal ions at the optimum conditions of adsorption parameters. The isotherm studies showed that the adsorption of Pb (II), Cd (III) and As (III) ions onto MFC were best fitted to the Langmuir isotherm model. However, the uptake of Cr (VI) ions onto the adsorbent followed Freundlich isotherm model and multilayer adsorption. The kinetic studies revealed that the rate of adsorption of Pb (II), Cd (III) and As (III) ions followed pseudo-second order kinetic model
ICEES 2021 ISSN: 2714-4186
282
while the rate of adsorption of Cr (VI) ions onto the adsorbents best fitted pseudo-first order kinetic model. From thermodynamic studies, the metal adsorption process was feasible, spontaneous and endothermic for the case of Pb (II) and Cd (II) while the uptake of As (III) and Cr (VI) ions was feasible, spontaneous but exothermic. The results indicated that MFC had better adsorbent properties such as high cation exchange capacity, good adsorption performance, durability and low-cost. Therefore, MFC is recommended as an excellent adsorbent for heavy metals in wastewater treatment.
REFERENCES
Adebowale, K.O., Unuabonah, I.E. and Olu-Owolabi, B.I. (2008). Kinetic and thermodynamic aspects of the adsorption of Pb2+ and Cd2+ ions on tripolyphosphate-modified kaolinite clay. Chemical Engineering Journal, 13(6): 99–107.
Akpomie, K.G. and Dawodu, F.A. (2015). Physicochemical analysis of automobile effluent before and after treatment with an alkaline-activated montmorillonite. Journal of Taibah University for Science, 9: 465–476.
Amphol, D., Napassorn, C., Kriangsak, S., Peerapan, D., Chalida, N. and Anusorn, S (2020). Removal of Heavy Metal Ions Using Modified Celluloses Prepared from Pineapple Leaf Fiber. ACS Omega, 5: 5285−5296.
Awala, H.A. and El Jamal, M.M. (2011). Equilibrium and kinetics study of adsorption of some dyes onto feldspar. Journal of Chemical Technology and Metallurgy, 46(1): 45-52.
Chukwuemeka-Okorie, H. O., Peter N. E., Akpomie K.G. and Olikagu, C.S. (2018). Calcined Corncob-Kaolinite Combo as New Sorbent for Sequestration of Toxic Metal Ions from Polluted Aqua Media and Desorption. Frontiers in Chemistry, 273(6): 1-13.
Dang, V.B.H., Doan, H.D., Dang, V.T. and Lohi, A. (2009). A Study on Heavy Metal Adsorption Using Shrimp Shell. Journal of Bio-resources Technology, 10(5): 211-223.
Gusain, Rashi., Neeraj, Kumar., Elvis, Fosso-Kankeu. and Suprakas, Sinha Ray (2019). Efficient Removal of Pb (II) and Cd (II) from Industrial Mine Water by a Hierarchical MoS2/SH-MWCNT Nanocomposite. ACS Omega, 4:13922−13935.
Md. Sayedur Rahman and Kathiresan V. Sathasivam (2015). Heavy Metal Adsorption onto Kappaphycus sp. from Aqueous Solutions: The Use of Error Functions for Validation of Isotherm and Kinetics Models. BioMed Research International, Hindawi, Pg 1-13.
Mustapha, S., Shuaib, D.T., Ndamitso, M. M., Etsuyankpa M. B. and Sumaila, A (2019). Isotherm, kinetic and thermodynamic studies for the removal of Pb (II), Cd (II), Zn (II) and Cu (II) ions from aqueous solutions using Albizia lebbeck pods. Applied Water Sci, 9:142.
Ogbu, I. C., Akpomie, K. G., Osunkunle A. A., and Eze, S.I. (2019). Sawdust-kaolinite composite as efficient sorbent for heavy metal ions. Bangladesh J. Sci. Ind. Res. 54(1): 99-110.

ICEES 2021 ISSN: 2714-4186
283
Olu-Owolabi, B., Oputu, O. U., Adebowale, K. O., Ogunsolu, O. and Olujimi, O. O. (2012). Biosorption of Cd2+ and Pb2+ ions onto mango stone and cocoa pod waste: Kinetic and equilibrium studies. Scientific Research and Essays, 7(15):1614-1629.
Olu-Owolabi, B.I, Alimoh H. Alabi, Emmanuel I. Unuabonah and Paul N. Diagboya (2016). Calcined bentonite-biomass composites for removal of aqueous metal ions. Journal of chemical and engineering technology, 4:1379-1383.
Ozdes, Duygu. Celal Duran and Hasan, Basri Senturk. (2011). Adsorptive removal of Cd (II) and Pb (II) ions from aqueous solutions by using Turkish illitic clay. Journal of Environ. Management, 92: 3082-3090.
Sanusi, K.A., Babayo, A. U. and Isyaka, M. S. (2016). Evaluation of the Application of Modified Feldspar Clay for Adsorption of Pb+2 and Cu+2 in Aqueous Media: Equilibrium and Thermodynamic studies. Journal of Environmental & Analytical Toxicology, 6 (2):02-09.
Sanusi, K. A., Yahaya, Y., Ambrusa, M. M., Rabiu, A. K. and Hammed, A. M. (2021). Optimization of Adsorption of Pb (II) and Cr (VI) from Aqueous Solution using Modified Feldspar Composite: Isotherm and Kinetic Studies. International Journal of Engineering Science Technologies, 5(4), 18–53.
Singh Rimmy and Rachna Bhateria (2020). Optimization and Experimental Design of the Pb2+ Adsorption Process on a Nano-Fe3O4-Based Adsorbent Using the Response Surface Methodology. ACS Omega, 5: 28305−28318.
Unuabonah, I.E., Olu-Owolabi, B.I., Adebowale, K.O. and Ofomaja, A.E. (2008). Adsorption of lead and cadmium ions from aqueous solutions by tripolyphosphate-impregnated kaolinite clay. Journal of Colloids and surfaces, 82:202-211.
Unuabonah, I.E., Olu-Owolabi, B.1., Andreas, Taubert and Adebowale. K.O (2013). SAPK: A Novel Composite Resin for Water Treatment with Very High Zn2+, Cd2+ and Pb2+ Adsorption Capacity. Industrial and Engineering Chemical Research, 52: 578−585.
Yazdani, M., Bahrami, H. and Arami, M. (2014). Preparation and Characterization of Chitosan/Feldspar Biohybrid as an Adsorbent: Optimization of Adsorption Process via Response Surface Modeling. The Scientific World Journal, 20 (14):1-13.
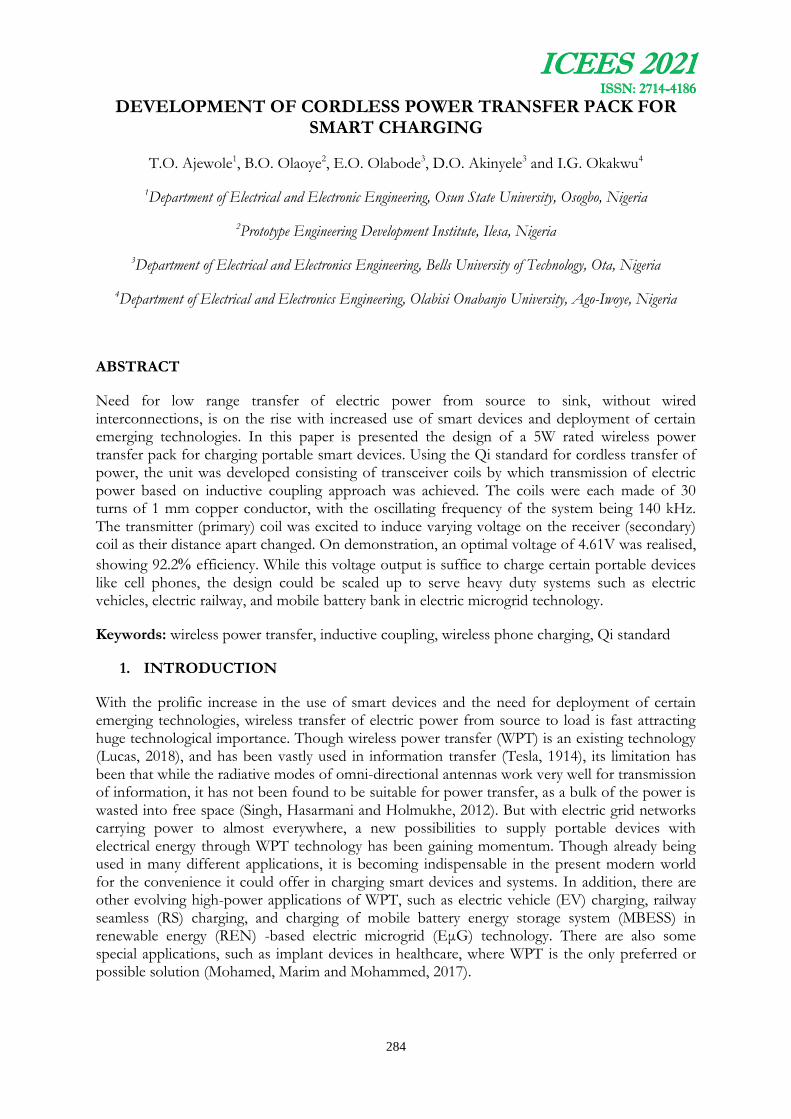
ICEES 2021 ISSN: 2714-4186
284
DEVELOPMENT OF CORDLESS POWER TRANSFER PACK FOR SMART CHARGING
T.O. Ajewole1, B.O. Olaoye2, E.O. Olabode3, D.O. Akinyele3 and I.G. Okakwu4
1Department of Electrical and Electronic Engineering, Osun State University, Osogbo, Nigeria
2Prototype Engineering Development Institute, Ilesa, Nigeria
3Department of Electrical and Electronics Engineering, Bells University of Technology, Ota, Nigeria
4Department of Electrical and Electronics Engineering, Olabisi Onabanjo University, Ago-Iwoye, Nigeria
ABSTRACT
Need for low range transfer of electric power from source to sink, without wired interconnections, is on the rise with increased use of smart devices and deployment of certain emerging technologies. In this paper is presented the design of a 5W rated wireless power transfer pack for charging portable smart devices. Using the Qi standard for cordless transfer of power, the unit was developed consisting of transceiver coils by which transmission of electric power based on inductive coupling approach was achieved. The coils were each made of 30 turns of 1 mm copper conductor, with the oscillating frequency of the system being 140 kHz. The transmitter (primary) coil was excited to induce varying voltage on the receiver (secondary) coil as their distance apart changed. On demonstration, an optimal voltage of 4.61V was realised,
showing 92.2 efficiency. While this voltage output is suffice to charge certain portable devices like cell phones, the design could be scaled up to serve heavy duty systems such as electric vehicles, electric railway, and mobile battery bank in electric microgrid technology.
Keywords: wireless power transfer, inductive coupling, wireless phone charging, Qi standard
1. INTRODUCTION
With the prolific increase in the use of smart devices and the need for deployment of certain emerging technologies, wireless transfer of electric power from source to load is fast attracting huge technological importance. Though wireless power transfer (WPT) is an existing technology (Lucas, 2018), and has been vastly used in information transfer (Tesla, 1914), its limitation has been that while the radiative modes of omni-directional antennas work very well for transmission of information, it has not been found to be suitable for power transfer, as a bulk of the power is wasted into free space (Singh, Hasarmani and Holmukhe, 2012). But with electric grid networks carrying power to almost everywhere, a new possibilities to supply portable devices with electrical energy through WPT technology has been gaining momentum. Though already being used in many different applications, it is becoming indispensable in the present modern world for the convenience it could offer in charging smart devices and systems. In addition, there are other evolving high-power applications of WPT, such as electric vehicle (EV) charging, railway seamless (RS) charging, and charging of mobile battery energy storage system (MBESS) in renewable energy (REN) -based electric microgrid (EμG) technology. There are also some special applications, such as implant devices in healthcare, where WPT is the only preferred or possible solution (Mohamed, Marim and Mohammed, 2017).
ICEES 2021 ISSN: 2714-4186
285
Seamless charging is a major advantage of WPT in the use of portable appliances. This means charging of device is possible whenever, so long the device is near a charging pad (Covic and Boys, 2013). This reduces charging intervals and therefore enable reduction in the size and weight of batteries. The convenience and the promise of reducing the battery size is most likely to boost the wideness of the applications of the technology among users of mobile electronic devices.
In EV technology, charging and re-charging of batteries and energy storage systems are of immense importance (Ma et al., 2021; Armenta-Deu and Cattin, 2021). It has been established that public EV charging networks are facing the challenge shortage in supplied electricity compared to the fast increasing number of electric cars (Pallonetto,2020). Bons et al. (2020) profiled 39 public EV charging stations for smart charging using three indicators: average charging power, amount of transferred energy, and share of positively and negatively affected sessions. It was obtained that charging was limited during the peak hours of the electricity grid. In a similar trend, the widespread deployment of renewable electricity and EμG technologies has been earning power systems fast improvement in performance and robustness (Ajewole, Lawal and Omoigui, 2016; Ajewole et al., 2017a; Nyirenda-Jere et al., 2018; Ajewole et al., 2017b; Ajewole et al., 2019a; Karahan, Özan and Bağriyanik, 2021; Ajewole et al., 2019b; Ajewole et al., 2020). Connection of energy storage units to distribution systems in order to provide stable electricity supply is an advancement that is greatly enhancing the performances of μG systems (Samara, Shaaban and Osman, 2019; Barra et al., 2018; Abdeltawab and Mohamed, 2019). Both EV and EμG applications could be enhanced further by WPT. By its versatility, it has been estimated that the potential market for WPT technology is expected to be worth more than 11.3 billion by the year 2022 (Rohan, 2016).
Low range cordless charging has been found to be highly beneficial. According to (Sidiku, Eronu and Ashigwuike, 2020; Li et al., 2018), various methods of transmitting power cordlessly are available and but broadly categorized into: Near Field (with capacitive coupling and inductive coupling types) and Far Field (comprising of Laser, Solar Power Satellite, and Microwave approaches). In the low range WPT, while capacitive coupling has the advantages of high operational efficiency, negligible radiation loss, provision of much greater range and direction; the advantages of the inductive coupling, as compared to capacitive coupling, include ease of implementation, convenient operation, safe and high efficiency in close distance, among others (Mohamed, Marim, and Mohammed, 2017; Zhang et al., 2011). One typical industrial application where capacitive coupling has gained more popularity is the electronic consumer manufacturing, where it has been successfully commercialized to make a number of products, including electric toothbrush, charging pad for cell phone or laptop, and medical implants (Jadidian and Katabi, 2014).
In the present study, a low range cordless charger, purposed for charging portable smart devices, is developed using magnetic resonant coupling method that is a form of inductive coupling. This paper is structured as follows: Section 2 describes in detail the method applied in the design and construction, which includes simulation and experimentation; while the result of the demonstration of the developed system is presented and discussed in Section 3; and the work is concluded in Section 4 with some recommendations.
2. MATERIALS AND METHOD
In the magnetic resonant coupling method, wireless power transfer is achieved with the combination of inductive coupling and resonance (Kurs et al., 2007). Energy shifts back and forth between magnetic field surrounding the coils and electric field surrounding the capacitor as figure 1 shows. Alternating current in the primary coil (connected to a source) generates a

ICEES 2021 ISSN: 2714-4186
286
varying magnetic field that induces voltage across the terminals of a secondary coil at the receiver end. In this phenomenon, energy can be transferred efficiently from a source coil to a receiving coil with little loss.
Fig 1: Magnetic resonance coupling model for WPT (Xiao et al., 2015).
The Qi standard of the wireless power consortium (WPC) is adopted in the designing. The standard describes inductive wireless charging system for single- and multi-coil topologies, which can transfer power within 5W on the bandwidth of 110 kHz – 205 kHz frequency for low power category, and up to 120W on 80 kHz – 300 kHz frequency range for medium power category. A typical model for the standard is shown in figure 2, which describes how Qi allows the charging device to be in control by the charging procedure. Qi-compliant charger is capable of adjusting the transmitted power density as requested by the charging device through signalling. It uses the magnetic inductive coupling technique, typically within the range of 40 millimetres and generally of a flat surface charger (charging pad) where a mobile device can be placed.
Fig 2: Model of Qi standard for WPT (Zhang et al., 2011).
Figure 3 is the block diagram of the prototype cordless power transfer pack developed in this study. An AC–DC converter connects to utility supply and its DC output is converted to a high frequency AC voltage before being passed to the primary coil. The secondary coil receives the AC voltage signal over the air gap and the received voltage is rectified and regulated to charging voltage.
2.1 System Design
Copper wire of 1 mm thickness was wound into 30 turns coils of 60mm internal diameters for both the transmitter and the receiver coils. The coils were tightly wounded to realise the minimum possible spacing between each strands, thus bringing the external diameter and length of each of the coils to 75mm and 5654mm respectively. A multivibrator circuit that switches at a high oscillation was used to provide the needed frequency of operation.

ICEES 2021 ISSN: 2714-4186
287
Fig 3: Block diagram of the designed prototype
As shown in figure 4, power from the AC–DC converter’s output is transformed from DC to high frequency AC and applied to the transmitter winding. A combination of MOSFET Q1 and 555 timer formed the astable multivibrator circuit that inverts the DC signal, such that 140 kHz AC is achieved at the transmitter coil. The value of the frequency is determined from the capacitor and resistor included in the circuit. While Q1 provides a switching circuit, the oscillator produces a sustained oscillation frequency, and the transistor Q2 regulates the current that drives the primary coil. The transmitter winding, in turn, creates varying magnetic field around its coil, and the varying field induces voltage across the terminals of the receiver coil (Mohamed, 2016; Cannon et al., 2009; Bhutkar and Sapre, 2009; Ladan et al., 2013; ) as the receiver coil cuts through the magnetic field generated by the transmitter coil. The receiver circuit consists of the secondary coil, diode-based bridged rectifier, capacitors and voltage regulator. The rectifier converts the AC to DC that is filtered and regulated to 5V, which is the required charging voltage for most portable smart devices.
Fig 4: Circuitry of the cordless power transfer pack.
Current flowing through a conductor produces magnetic field around the conductor, which depends upon the amount of current passing through the coil and the frequency of the AC signal, among other things.
(1)
AC-to-DC Converter Multivibrator
Transmitter (Primary) Coil
Receiver (Secondary) Coil
AC-to-DC Converter Regulator
Supply Load
High Frequency AC Voltage
Induced AC Voltage
Electromagnetic Signal

ICEES 2021 ISSN: 2714-4186
288
Where B is the magnetic field, I is the current, r is the radius of the wire, and 0 is the magnetic permeability of air.
An emf is induced, which by Faraday’s Law, equals the negative of the rate of change of the magnetic flux, times the number of turns in the coil.
(2)
Where E is the emf, N is the Number of turns in the coil, is the magnetic flux, and t is the time. Maximum power efficiency is realised when the two coils resonate at the same frequency,
called resonant frequency, when inductive and capacitive impedances are equal.
(3)
Where is the resonant frequency, L is the inductance of the coils, and C is the capacitance of
the circuit. The self-inductance of a single layer helical spring of wheeler’s formula was modified and considered for flat spiral coils as shown in figure 5.
Fig 5: Flat spiral coil design.
(4)
(5)
) (6)
) (7)
From equations (4), (5), (6) and (7)
henry (8)
Where L is the self-inductance, D0 is the outer diameter of coil, Di is the inner diameter of coil, N is the number of turns, w is the coil diameter and p is the pitch. It is worth noting that this equation has not produced a very accurate result since series resonators boundary condition gives low inductance and low Q whereas a high value of Q is needed for cordless power transfer (Bhagat and Nalbalwar, 2017).
The parasitic self-capacitance is considered negligible because it is very small compared to the tuning resonance capacitance. Therefore, the required coil capacitance is given as:
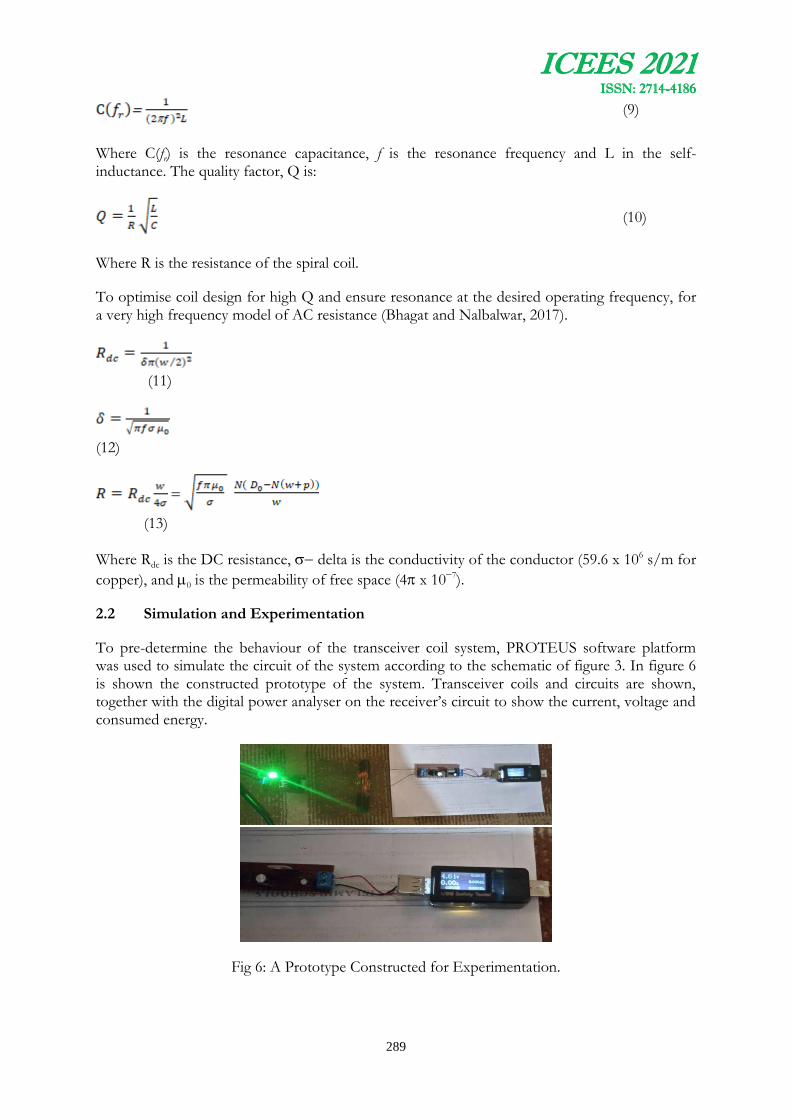
ICEES 2021 ISSN: 2714-4186
289
(9)
Where C(fr) is the resonance capacitance, f is the resonance frequency and L in the self-inductance. The quality factor, Q is:
(10)
Where R is the resistance of the spiral coil.
To optimise coil design for high Q and ensure resonance at the desired operating frequency, for a very high frequency model of AC resistance (Bhagat and Nalbalwar, 2017).
(11)
(12)
(13)
Where Rdc is the DC resistance, delta is the conductivity of the conductor (59.6 x 10⁶ s/m for
copper), and 0 is the permeability of free space (4 x 10⁷).
2.2 Simulation and Experimentation
To pre-determine the behaviour of the transceiver coil system, PROTEUS software platform was used to simulate the circuit of the system according to the schematic of figure 3. In figure 6 is shown the constructed prototype of the system. Transceiver coils and circuits are shown, together with the digital power analyser on the receiver’s circuit to show the current, voltage and consumed energy.
Fig 6: A Prototype Constructed for Experimentation.

ICEES 2021 ISSN: 2714-4186
290
3 RESULTS AND DISCUSSION
On the exciting the circuit in the simulation environment, power transfer efficiency of 100% was obtained. It was observed, however, that the simulation algorithm did not take into consideration any power loss in the course of the transfer and neither did the effect of the airgap between the coils accommodated. During experimental demonstration with the prototype, it was found that as the coils were increasingly moved apart, the voltage realised at the receiver end reduced accordingly. Likewise the energy loss became increasingly noticeable the moment the coils misaligned, even if they were at optimum distance apart. Optimal voltage of 4.61V was received
at 30mm proximity of the two coils, showing an efficiency of 92.2.
At the experimentation, it was noted that a lot of heat was dissipated by the transistor due to the high rate of switching and the resistant developed by the component. To avoid failure or mal-functioning of the transistor at high temperature, a heat sink was attached to it.
4. CONCLUSION
Design, construction and demonstration of a wireless power transfer device that is meant for charging mobile and portable smart devices like cell phones and the likes, is presented in this paper. On practical test trial of the device by using it to charge a mobile phone, a performance efficiency of 92.2% efficiency was exhibited. It was observed that efficiency of the system was dependent on the proximity and the alignment of the transmitter and the receiver coils. It was,
however, found that the circuitry of system needed to be properly provided with heatsink to prevent failure or mal-functioning of some active components of the circuit.
REFERENCES
Lucas, M., 2018. Wireless Charging Explained: what is it and how does it work. Computerworld Article. Available online: https://www.google.com/amp/s/www.computerworld.com/article/3235176/wireless-charging-explai ned-what-is-it-and-how-does-it-work.amp.html
Tesla, N., 1914. Apparatus for Transmitting Electrical Energy,” USA Patent Office, Patent No 1,119,732, December 1914.
Singh, S.K., Hasarman, T.S. and Holmukhe, R.M., 2012. Wireless Transmission of Electrical Power Overview of Recent Research & Development. International Journal of Computer and Electrical Engineering, 4(2), pp. 207-211.
Mohamed, A.A.S, Marim, A.A. and Mohammed, O.A., 2017. Magnetic Design Considerations of Bidirectional Inductive Wireless Power Transfer System for EV Applications. IEEE Transactions on Magnetics, 53(6), pp. 1-5.
Covic, G.A. and Boys, J.T., 2013. Inductive Power Transfer. Proceedings of the IEEE, vol. 101, no. 6, pp. 1276-1289.
Ma, L., Zhang, C., Wang, J., Wang, K. and Chen, J., 2021. Study on Capacity Estimation Methods of Second-Life Application Batteries. World Electric Vehicle Journal, 12(4), 163, https://doi.org/10.3390/wevj12040163.

ICEES 2021 ISSN: 2714-4186
291
Armenta-Deu, C. and Cattin, E., 2021. Real Driving Range in Electric Vehicles: Influence on Fuel Consumption and Carbon Emissions. World Electric Vehicle Journal, 12(4), 166, https://doi.org/10.3390/wevj12040166.
Pallonetto, F., Galvani, M., Torti, A. and Vantini, S., 2020. A Framework for Analysis and Expansion of Public Charging Infrastructure under Fast Penetration of Electric Vehicles. World Electric Vehicle Journal, 11(1), 18, https://doi.org/10.3390/wevj11010018.
Bons, P.C., Buatois, A., Lightart, G., Geerts, F., Piersma, N. and Van de Hoed, R., 2020. Impact of Smart Charging for Consumers in a Real World Pilot. World Electric Vehicle Journal, 11(1), 21, https://doi.org/10.3390/wevj11010021.
Ajewole, T.O., Lawal, M.O. and Omoigui, M.O., 2016. Development of a lab-demo facility for wind energy conversion systems. International Journal of Energy Conversion, 4, pp. 1–6.
Ajewole, T.O., Oyekanmi, W.A., Babalola, A.A. and Omoigui M.O., 2017a. RTDS modelling of a hybrid-source autonomous electric microgrid. International Journal of Emerging Electric Power Systems, 18, 1–11.
Nyirenda-Jere, T., Ajewole, T.O., Mutale, J., Dauenhauer, P. and Ambali, A., 2018. Microgrids Empowering Communities and Enabling Transformation in African. A Report by the High Level African Panel on Emerging Technologies. Available online: https://www.nepad.org/file-download/download/public/114349.
Ajewole, T.O., Alawode, K.O., Omoigui, M.O. and Oyekanmi, W.A., 2017b. Design validation of a laboratory-scale wind turbine emulator. Cogent Engineering, 4 (1), pp. 1–11.
Ajewole, T.O., Momoh, O.D., Ayedun, O.D. and Omoigui, M.O., 2019a. Optimal component configuration and capacity sizing of a mini integrated power system. Environmental Quality Management, 28(4), 57–62.
Karahan, O., Özan A. and Bağriyanik, M., 2021. The effect of mobile battery energy storage systems on the distribution network. Turkish Journal of Electrical Power and Energy Systems, 1(2), pp. 1-6.
Ajewole, T.O., Lawal, M.O., Alawode, K.O. and Omoigui, M.O., 2019b. Rotor Angle Dynamics in Multi-Machine Grid-Independent District Minigrid. In the Proceedings of the 1st International Conference on Engineering and Environmental Sciences, November 5 – 7, Osogbo, Nigeria, pp. 776 – 784.
Ajewole, T.O., Olabode, O.E., Alawode, K.O. and Lawal, M.O., 2020. Small-scale electricity generation through thermal harvesting in rooftop photovoltaic picogrid using passively cooled heat conversion devices. Environmental Quality Management, 29, 95–102.
Samara, S.M., Shaaban, M.F. and Osman, A., 2019. Management of Mobile Energy Generation and Storage System”, In the Proceedings of 2019 IEEE/PES GTD Grand International Conference and Exposition Asia, March 2019, pp. 450–454.

ICEES 2021 ISSN: 2714-4186
292
Barra, P.H.A., Campos, G.P., Coury, D.V., Oleskovics, M. and Bicskowski, M., 2018. Mobile battery energy storage systems influence on overcurrent protection of distribution networks”, 2018 Brazilian Electrical Systems Symposium, May 2018, pp. 1–6.
Abdeltawab, H. and Mohamed, Y.A.I., 2019. Mobile Energy Storage Sizing and Allocation for Multi-Services in Power Distribution Systems. IEEE Access, 7, pp. 176613–176623.
Rohan, M., 2016. Wireless power transmission market worth 13.11 billion USD by 2020. Available online: http://www.marketwatch.com/story/Wireless-power-transmission-market-worth-1311-billion-usd-by-202 0-2016-01-20-1020311329.
Sidiku, M.B., Eronu, E.M. and Ashigwuike, E.C., 2020. A Review on Wireless Power Transfer: Concepts, Implementations, Challenges, and Mitigation Schemes. Nigeria Journal of Technology, 39(4), pp. 1206 – 1215.
Li, L., Liu, H., Zhang, H. and Xue, W., 2018. Efficient Wireless Power Transfer System Integrating with Metasurface for Biological Applications. IEEE Transactions on Industrial Electronics, 65(4), pp. 3230-3239.
Zhang, F., Hackworth, S. A., Fu, W., Li, C., Mao, Z. and Sun, M., 2011. Relay Effect of Wireless Power Transfer Using Strongly Coupled Magnetic Resonances. IEEE Transactions on Magnetics, 47(5), pp. 1478-1481.
Jadidian, J. and Katabi, D., 2014. Magnetic MIMO: How to Charge Your Phone in Your Pocket. In Proceedings of the Annual International Conference on Mobile Computing and Networking, Maui, Hawaii, pp. 495-506, http://dx.doi.org/10.1145/2639108.2639130.
Kurs, A., Karalis, A., Moffatt, R., Joannopoulos, J.D., Fisher, P. and Soljaˇci´c, M., 2007. Wireless Power Transfer via Strongly Coupled Magnetic Resonances. Science, 317, 83–86.
Xiao, L., Wang, P. Niyato, D., Kim, D.I. and Han, Z., 2015. Wireless Charging Technologies: Fundamentals, Standards and Network Applications. IEEE Communication Survey and Tutorials, 18(2), 1413 – 1452, https://doi.org/ 10.1109/COMST.2015.2499783.
Mohamed, M., Rayes, El, Gihan, N., Wahied, G. and Ali, A., 2016. A Review on Wireless Power Transfer. International Journal of Engineering Trends and Technology, 40(5), pp. 272-280, 10.14445/22315381/IJETT-V40P24.
Cannon, B., Hoburg, J., Stancil, D. and Goldstein, S., 2009. Magnetic Resonant Coupling as a Potential Means for Wireless Power Transfer to Multiple Small Receivers. IEEE Trans. Power Electron, 24(7), pp. 1819-1825, https://doi.org/ 10.1109/TPEL.2009.2017195.
Bhutkar, R. and Sapre, S., Wireless Energy Transfer Using Magnetic Resonance. In the Proceedings of International Conference on Computer and Electrical Engineering. Dubai, UAE, December 2009, https://doi.org/10.1109/ICCEE.2009.194.
Ladan, S., Ghassemi, N., Ghiotto, A. and Wu, K., 2013. Highly Efficient Compact Rectenna for Wireless Energy Harvesting Application. IEEE Microwave Magazine, 14(1), pp. 117-122.
Bhagat, M. and Nalbalwar, S., 2017. Wireless Transmission of Solar Power for Charging Mobile Devices in a Vehicle. Advances in Intelligent Systems Research, 137, pp. 673-677
ICEES 2021 ISSN: 2714-4186
293
.ADSORPTION OF CRYSTAL VIOLET ON RICE HUSK ACTIVATED CARBON
Nurudeen Salahudeen* and Abdulkareem Alhassan
Department of Chemical and Petroleum Engineering, Bayero University, Kano
*Email of Corresponding Author: [email protected]
ABSTRACT
Dyes are major pollutants responsible for the environmentally detrimental effects of wastewater effluent of some common industries such as textile, printing, paper, plastic and tannery industries. Growing interests in advancing the efficiency and economics of industrial wastewater treatment techniques is a global plan to save humanity from the dangerous and carcinogenic effects of dyes in industrial wastewater. This study presents the adsorption of aqueous crystal violet (CV) solution on synthesized rice husk activated carbon. Low temperature synthesis of activated carbon (AC) was carried out at varying activation ratios of 1:0 1:1, 1:2, 1:3, 1:4, 1:5, 1:6, 1:7 and 1:8. An adsorption study of the synthesized AC was carried out using an aqueous solution of crystal violet (CV) as the sorbate and varying samples of the synthesized AC as the sorbent. The adsorption study was carried out at varying sorbent loading and varying adsorption time. The optimally synthesized activated carbon was the 1:2 sample. The optimum activated carbon dosage for the adsorption process was 1000 mg/L. The optimum adsorption time and percentage adsorptions were 150 min and 87.5%, respectively.
Keywords: Rice husk; Activated carbon; Crystal violet; Adsorption.
1. INTRODUCTION
Various types of dyes are used in process industries like textile, paints, pulp and paper, carpet and printing etc. Dye is one of the significant toxic components of industrial effluent. The dye content of industrial effluents constitute a significant source of surface water pollution. Dyes are classified as anionic, cationic, nonionic, and zwitter-ionic, depending on the ionic charge on the dye molecules. Cationic dyes are more toxic than anionic ones (Hao et al., 2000). Crystal violet (CV) dye is a cationic triphenyl methane dye widely used in the industry for various colouring applications, such as dying of cotton in the textile industries. Other applications include colouring wool, silk, nylon, ink production, biological staining, and a dermatological agent in veterinary medicine (Bertholini et al., 2013). The dye is well-known for its unsafe, mutagenic and carcinogenic effects on human and aquatic lives (Bertholini et al., 2013).
Industrial wastewater treatment for removing dyes and other contaminants becomes a highly sought research to address the global rising concerns of surface water contamination resulting from industrial waste effluents. Different conventional treatments methods such as precipitation, photo-catalytic decolourization, coagulation, flocculation, membrane separation, adsorption, electrochemical and biological degradation have been examined with varying levels of success by researchers (Ma et al., 2017). Each of the above processes has its benefits and limitations. Still, adsorption on a solid surface is of growing interest in this field because of its efficacy and economic advantages over other methods (Parshetti et al., 2011).
ICEES 2021 ISSN: 2714-4186
294
Adsorption is a process that occurs when a gas or liquid solute accumulates on the surface of a solid or a liquid (sorbent), forming a molecular or atomic film (sorbate). The adsorption process is perceived as an efficient and admirable method to other heavy metal wastewater treatment technologies. It provides treated effluent with high quality. In this process, waste is transferred by physical or chemical interest into the active sites present in the adsorbent used (Ojedokun et al., 2016).
Activated carbon is the most commonly used treatment method for dye removal by adsorption. It is very effective for the adsorption of cationic, mordant and acid dyes (Raghavacharya, 1997). Activated carbon adsorption treatment process is one of the best available treatment technologies. Different materials like peat, wood chips, silica gel, fly ash, corn cobs and rice husks etc., are widely used for the production of commercial activated carbons and remove dye from wastewaters. These materials are advantageous mainly due to their widespread availability and low cost. Adsorption methods also have some drawbacks since the processes are not selective. Thus, the other components of the wastewater may compete for the adsorbing sites, reducing the dye-binding capacity of sorbent (Forgacs et al., 2004).
Moreover, an adsorption process removes the synthetic dye by concentrating it on the surface and retaining an unchanged structure. When the support is to be regenerated, the concentrated dye sludge causes a problem for its subsequent disposal into the environment (Forgacs et al., 2004). This work investigates the efficacy of adsorption of dye (CV) contaminated water over a low temperature synthesized activated carbon using rice husk as the raw material.
2. MATERIALS AND METHODS
2.1 Materials
Rice husk was obtained from a rice milling industry (Gidan Shinkafa) Dakata Area, Kano State. Phosphoric acid and crystal violet powder were purchased, and distilled water was prepared from a water distiller. Equipment used include weighing balance (Model; PE-160), shaker (KJ-201 BS OSILLATOR), UV-Vis spectrophotometer (Model; Zuzi-4201/20), milling machine and laboratory oven. Apparatus used include measuring cylinder, conical flask, crucibles, beakers and spatula.
2.2 Methods
2.2.1 Sample collection and pretreatment
Dried raw millet stover collected from the farm was washed to remove debris and other impurities. The washed millet stover was sun-dried for two days, after which it was crushed and milled using a milling machine.
2.2.2. Low-temperature synthesis of activated carbon (AC)
Low-temperature synthesis of activated carbon was carried out using phosphoric acid as the activating agent. For a typical synthesis of 1:1 activated carbon, 5.0 g of powdered millet stover was measured into a crucible and mixed with an equal weight of phosphoric acid. The mixture was homogenized by mixing with a spatula. The mixture was then heated in the oven at 120° C for 1 h. Similar steps were carried out for the 1:2, 1:3, 1:4, 1:5, 1:6, 1:7 and 1:8 samples with a phosphoric acid weight of 10, 15, 20, 25, 30, 35 and 40 g, respectively. After activation, the activated carbon was washed with distilled water until the pH was neutral. The washed activated carbon samples were dried in the oven at 110°C for 1 h to remove the moisture content.
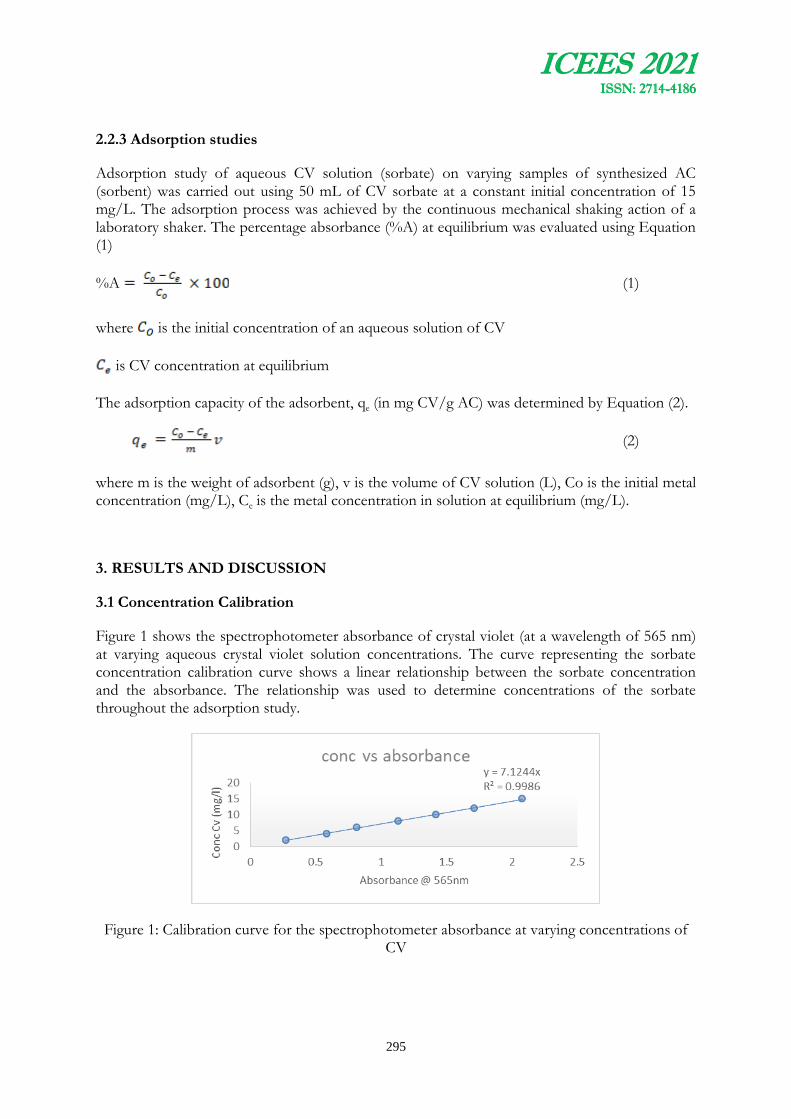
ICEES 2021 ISSN: 2714-4186
295
2.2.3 Adsorption studies
Adsorption study of aqueous CV solution (sorbate) on varying samples of synthesized AC (sorbent) was carried out using 50 mL of CV sorbate at a constant initial concentration of 15 mg/L. The adsorption process was achieved by the continuous mechanical shaking action of a laboratory shaker. The percentage absorbance (%A) at equilibrium was evaluated using Equation (1)
%A (1)
where is the initial concentration of an aqueous solution of CV
is CV concentration at equilibrium
The adsorption capacity of the adsorbent, qe (in mg CV/g AC) was determined by Equation (2).
(2)
where m is the weight of adsorbent (g), v is the volume of CV solution (L), Co is the initial metal concentration (mg/L), Ce is the metal concentration in solution at equilibrium (mg/L).
3. RESULTS AND DISCUSSION
3.1 Concentration Calibration
Figure 1 shows the spectrophotometer absorbance of crystal violet (at a wavelength of 565 nm) at varying aqueous crystal violet solution concentrations. The curve representing the sorbate concentration calibration curve shows a linear relationship between the sorbate concentration and the absorbance. The relationship was used to determine concentrations of the sorbate throughout the adsorption study.
Figure 1: Calibration curve for the spectrophotometer absorbance at varying concentrations of CV

ICEES 2021 ISSN: 2714-4186
296
3.2 Effect of Activation Impregnation Ratio on Percentage Adsorption
Table 1 presents the adsorption results using 30 mg varying samples of the synthesized AC. It could be observed that the inactivated sample of the rice husk (1:0) sorbent had an adsorption capacity of 75.1%.
Table 1: Percentage adsorption of CV on the various samples of the synthesized AC
AC Sample Ce (mg/L) %A
1:0 3.731 75.13
1:1 2.899 80.67
1:2 2.500 83.33
1:3 2.458 83.61
1:4 2.600 82.66
1:5 2.699 82.0
1:6 2.978 80.15
1:7 3.419 77.21
1:8 2.557 82.95
However, impregnation of the stover at 1:1 ratio improved the adsorption capacity of the sorbent by 5.6%. Further increase of the sorbent activation ratio from 1:1 to 1:2 resulted in 2.6% further increase in the adsorption capacity of the sorbent. Further increase in activation ratio from 1:2 up to 1:8 did not translate into a meaningful increase in the percentage adsorption. Hence, the 1:2 sample can be considered as the optimally activated sample.
3.3 Effect of Sorbent Dosage on the Adsorption of CV
Table 2 presents the change in the equilibrium concentration of the CV solution (sorbate) at a varying dosage of AC for the 1:2 AC sample. For AC loading range of 200 – 1800 mg/L, equivalent to 10 – 90 mg of AC in 50 mL of the sorbate, the equilibrium concentration of the sorbate showed a continuous reduction on average. For the 10 mg loading equivalent to 200 mg/L of AC in the sorbate, the equilibrium concentration of the sorbate was 3.88 mg/L. Further increase in the AC loading of 10 mg resulted into additional 12.9% reduction. additional increase of the AC dosage in 10 mg steps resulted into substantial reductions in the equilibrium concentration of the sorbate until the optimum loading point was obtained at 50 mg. More increase of the AC loading above the 50 mg point showed no substantial reduction in the equilibrium concentration of the sorbate.
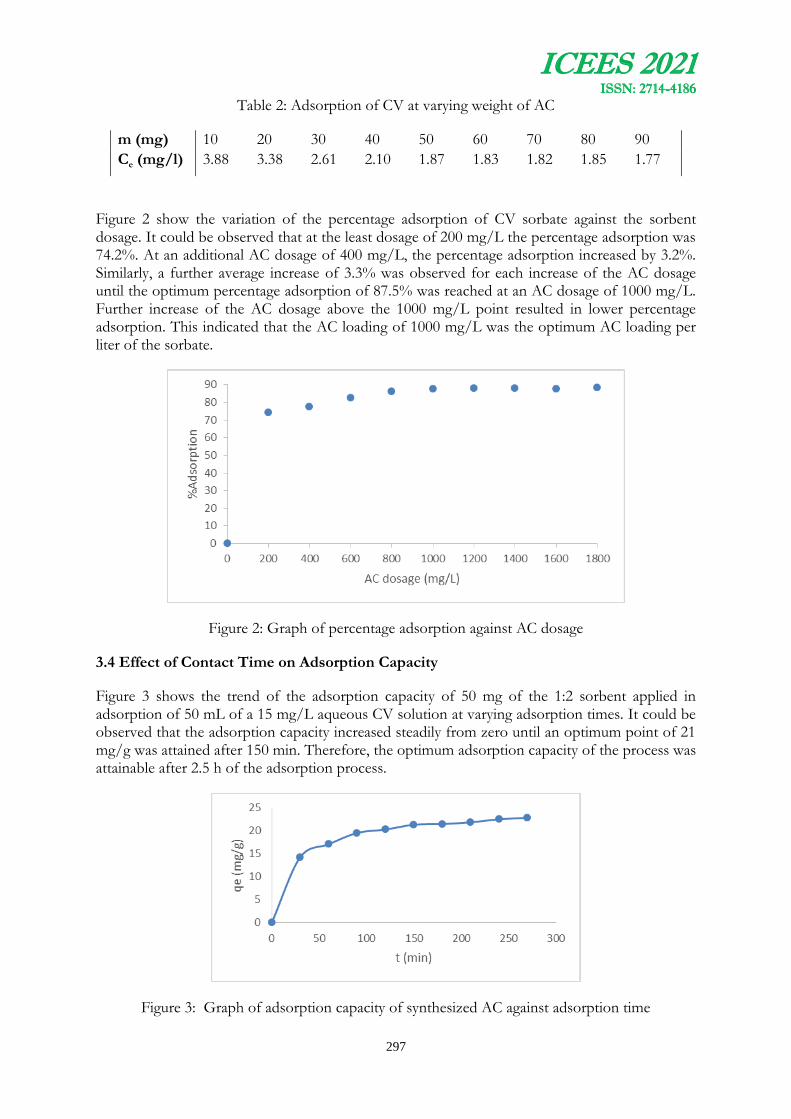
ICEES 2021 ISSN: 2714-4186
297
Table 2: Adsorption of CV at varying weight of AC
m (mg) 10 20 30 40 50 60 70 80 90
Ce (mg/l) 3.88 3.38 2.61 2.10 1.87 1.83 1.82 1.85 1.77
Figure 2 show the variation of the percentage adsorption of CV sorbate against the sorbent dosage. It could be observed that at the least dosage of 200 mg/L the percentage adsorption was 74.2%. At an additional AC dosage of 400 mg/L, the percentage adsorption increased by 3.2%. Similarly, a further average increase of 3.3% was observed for each increase of the AC dosage until the optimum percentage adsorption of 87.5% was reached at an AC dosage of 1000 mg/L. Further increase of the AC dosage above the 1000 mg/L point resulted in lower percentage adsorption. This indicated that the AC loading of 1000 mg/L was the optimum AC loading per liter of the sorbate.
Figure 2: Graph of percentage adsorption against AC dosage
3.4 Effect of Contact Time on Adsorption Capacity
Figure 3 shows the trend of the adsorption capacity of 50 mg of the 1:2 sorbent applied in adsorption of 50 mL of a 15 mg/L aqueous CV solution at varying adsorption times. It could be observed that the adsorption capacity increased steadily from zero until an optimum point of 21 mg/g was attained after 150 min. Therefore, the optimum adsorption capacity of the process was attainable after 2.5 h of the adsorption process.
Figure 3: Graph of adsorption capacity of synthesized AC against adsorption time

ICEES 2021 ISSN: 2714-4186
298
4. CONCLUSION
Adsorption of an aqueous solution of crystal violet on low temperature synthesized activated carbon of rice husk was found to be efficient. The optimally activated sample of the synthesized activated carbon was the 1:2 AC which had an adsorption capacity of 21 mg sorbate /g sorbent. The adsorption capacity of the inactivated sample (1:0 AC) was 14.2 mg sorbate /g sorbent. Activation at optimum activation ratio had improved the adsorption capacity by 48%. The optimum percentage adsorption of the synthesized activated carbon was 87.5%. The optimum activated carbon loading for the adsorption process was 1000 mg/L and the optimum time to achieve a stable equilibrium was 150 min. Application of the low temperature synthesized activated carbon can be said to be effective for treating dye contaminated wastewater given the sorbent removal efficiency of 87.5% obtained in this study.
REFERENCES
Bertholini, T.C.R., Izidoro, J. C., Magdalena, C. P., & Fungaro, D.A. (2013). Adsorption of crystal violet dye from aqueous solution to zeolites from coal fly and bottom ashes. Orbital: The Electronic Journal of chemistry, 5(3), 179-191.
Forgacs, E., Cserhati, T., & Oros, G. (2004). Removal of synthetic dyes from waste waters :a review. Environment international, 30(7), 953-971.
Hao, O. J., Kim, H., & Chiang, P. C. (2000). Decolorization of waste water. Critical reviews in environmental science and technology, 30(4), 449-505.
Ma, H.T., Ly, H.C., Pham, N.B., Nguyen, D.C., Vo, K.T.D., & Tuan, P.D. (2017). Effect of the carbonization and activation process on the adsorption capacity of rice husk activated carbon. Vietnam Journal of Science and Technology, 55(4), 494-494.
Ojedokun, A. T., & Bello, O. S. (2016). Sequestering heavy metals from wastewater using cow dung. Water Resources and Industry, 13, 7-13.
Parshetti, G.K., Parshetti, S.G., Telke, A.A., Kalyani, D.C., Doong, R.A., & Govindwar, S.P. (2011). Biodegradation of crystal violet by Agro bacterium radiobacter. Journal of environmental sciences, 23(8), 1384-1393.
Raghavacharya, C. (1997). Colour removal from industrial effluents: a comparative review of available technologies. Chemical engineering world, 32(7), 53-54.
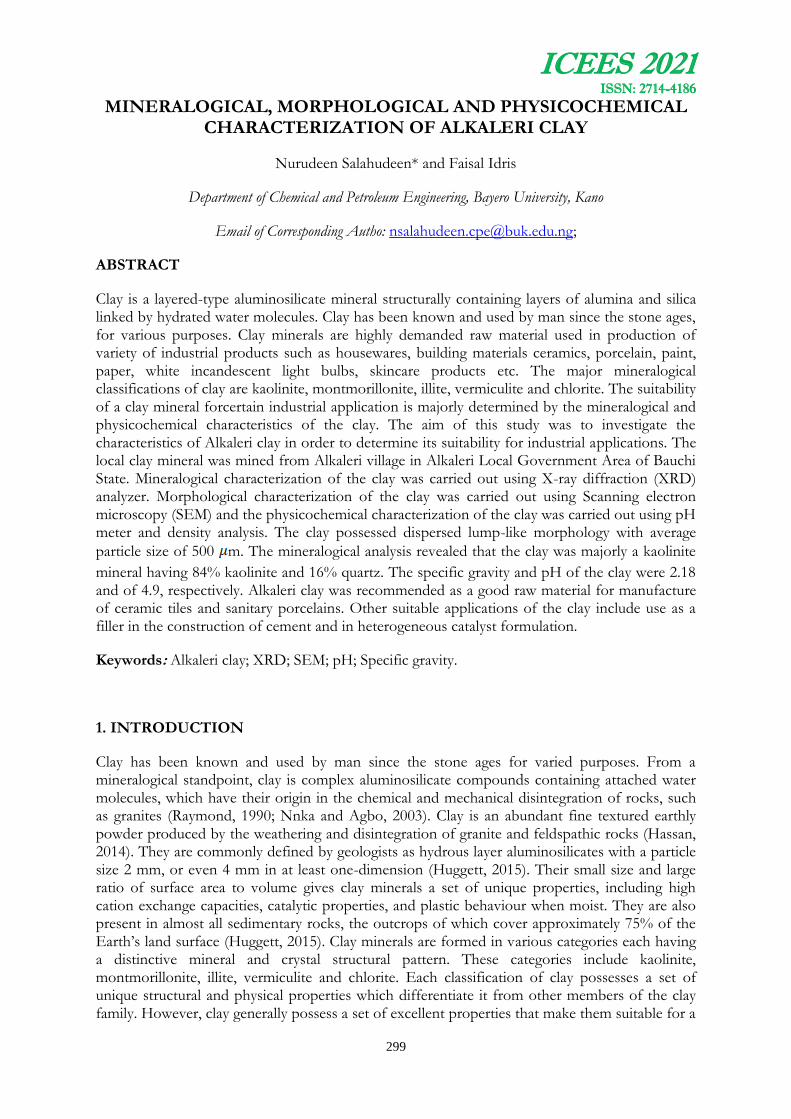
ICEES 2021 ISSN: 2714-4186
299
MINERALOGICAL, MORPHOLOGICAL AND PHYSICOCHEMICAL CHARACTERIZATION OF ALKALERI CLAY
Nurudeen Salahudeen* and Faisal Idris
Department of Chemical and Petroleum Engineering, Bayero University, Kano
Email of Corresponding Autho: [email protected];
ABSTRACT
Clay is a layered-type aluminosilicate mineral structurally containing layers of alumina and silica linked by hydrated water molecules. Clay has been known and used by man since the stone ages, for various purposes. Clay minerals are highly demanded raw material used in production of variety of industrial products such as housewares, building materials ceramics, porcelain, paint, paper, white incandescent light bulbs, skincare products etc. The major mineralogical classifications of clay are kaolinite, montmorillonite, illite, vermiculite and chlorite. The suitability of a clay mineral forcertain industrial application is majorly determined by the mineralogical and physicochemical characteristics of the clay. The aim of this study was to investigate the characteristics of Alkaleri clay in order to determine its suitability for industrial applications. The local clay mineral was mined from Alkaleri village in Alkaleri Local Government Area of Bauchi State. Mineralogical characterization of the clay was carried out using X-ray diffraction (XRD) analyzer. Morphological characterization of the clay was carried out using Scanning electron microscopy (SEM) and the physicochemical characterization of the clay was carried out using pH meter and density analysis. The clay possessed dispersed lump-like morphology with average
particle size of 500 m. The mineralogical analysis revealed that the clay was majorly a kaolinite
mineral having 84% kaolinite and 16% quartz. The specific gravity and pH of the clay were 2.18 and of 4.9, respectively. Alkaleri clay was recommended as a good raw material for manufacture of ceramic tiles and sanitary porcelains. Other suitable applications of the clay include use as a filler in the construction of cement and in heterogeneous catalyst formulation.
Keywords: Alkaleri clay; XRD; SEM; pH; Specific gravity.
1. INTRODUCTION
Clay has been known and used by man since the stone ages for varied purposes. From a mineralogical standpoint, clay is complex aluminosilicate compounds containing attached water molecules, which have their origin in the chemical and mechanical disintegration of rocks, such as granites (Raymond, 1990; Nnka and Agbo, 2003). Clay is an abundant fine textured earthly powder produced by the weathering and disintegration of granite and feldspathic rocks (Hassan, 2014). They are commonly defined by geologists as hydrous layer aluminosilicates with a particle size 2 mm, or even 4 mm in at least one-dimension (Huggett, 2015). Their small size and large ratio of surface area to volume gives clay minerals a set of unique properties, including high cation exchange capacities, catalytic properties, and plastic behaviour when moist. They are also present in almost all sedimentary rocks, the outcrops of which cover approximately 75% of the Earth’s land surface (Huggett, 2015). Clay minerals are formed in various categories each having a distinctive mineral and crystal structural pattern. These categories include kaolinite, montmorillonite, illite, vermiculite and chlorite. Each classification of clay possesses a set of unique structural and physical properties which differentiate it from other members of the clay family. However, clay generally possess a set of excellent properties that make them suitable for a
ICEES 2021 ISSN: 2714-4186
300
wide industrial and domestic applications. These properties include plasticity, chemical and temperature resistance, malleability, and complex composite formulations.
Kaolin also called china clay is a highly demanded raw material used in production of variety of industrial products which include housewares, building materials ceramics, porcelain, paint, paper, white incandescent light bulbs, skincare products etc. The kaolinite group is chemically represented as Al2Si2O5(OH)4. Structurally, it possesses one silica and one alumina unit stacked in alternating fashion known as 1:1 lattice type (Reed, 2001). Owing to its relatively large particles and low specific surface, kaolinite exhibits less plasticity, cohesion and swelling as compared to other clay minerals. Nigeria has been reported to have huge reserves of kaolin mineral which can be harnessed for great economic benefits (Omowumi, 2000). This work is aimed at investigating the mineralogical, physicochemical and morphological characteristics of Alkaleri clay to determine its suitability for industrial applications.
2. MATERIALS AND METHODS
2.1 Study Area and Materials
Raw Alkaleri clay sample was mined from Alkaleri village in Alkaleri Local Government Area of Bauchi State - Nigeria. The GPS coordinate of the deposit is 10°16.662’N, 10°18.405’E. Equipment used include, pH Meter (Model; 3510 pH meter), XRD machine and SEM machine (model; Phenom ProX). Apparatus used include weighting balance, glassware and density bottle.
2.2 Mineralogical characterization
The clay material was pulverized and homogenized. Wafer of the powdered sample was prepared by compressing the clay sample in the sample block. The smooth surfaced wafer was later mounted on the sample stage in the XRD cabinet. The sample was analyzed using the reflection-
transmission spinner stage at Theta-Theta settings. XRD scan was carried out at 2θ range of 4⁰
– 75⁰ using 2θ step of 0.026261⁰ at 8.67 s/step. Tube current was set at 40 mA and the tension was 45 VA. A Programmable Divergent Slit was used with a 5 mm Width Mask and the Gonio Scan was used (Salahudeen, 2018).
2.3 Morphological characterization
SEM analysis was carried out using SEM machine. Before the SEM scanning the sample was sputter-coated with 5 nm gold film using the Quorum sputter (Model; Q150R0). The coated sample was taken to the SEM chamber where the SEM gun was focused on selected representative focal areas of the sample and SEM micrographs of the sample were shot at different magnifications (Salahudeen, 2018).
2.4 Physicochemical characterization
Specific gravity analysis was carried out using density bottle. Using a weighing balance, the various weights were determined and the specific gravity was determined by the density bottle calculation (Salahudeen, 2021).
pH analysis was carried out by reading the pH of varying clay-water mix ratios of 1:2, 1:4, 1:6, 1:8 and 1:10. The ratio 1:2 for instance contained 10 g of kaolin in 20 ml of distilled water, 1:4 contained 4 g of kaolin in 16 ml of distilled water. All other mix ratio were prepared in similar proportion. The mixture in each sample was thoroughly mixed then the pH meter's electrode

ICEES 2021 ISSN: 2714-4186
301
was inserted into the mixture and allowed until the pH meter’s reading stabilized. Reading for each sample was taking in triplet and an average determined.
3. RESULT AND DISCUSSION
3.1 Mineralogical Characterization
Figure 1 shows the qualitative XRD patterns of Alkaleri clay. It could be observed that the mineral phases present in the clay are kaolinite and quartz. Kaolinite which could be observed as
the dominant mineral phase was identified at Bragg’s angle values of 12.4⁰ , 20.5⁰ , 24.9⁰ ,
35.1⁰ , 55.4⁰ and 62.3⁰ and each correspont to intensity reading of 1314, 569, 1749, 602, 577,
816 counts, respectively. The quartz phase present wasidentified at Bragg’s angle values of 26.6⁰
and 38.5⁰ which correspond to intensity reading of 545 and 863 counts, respectively.
Figure 2 shows the quantitative XRD analysis of Alkaleri clay. It could be observed that the kaolinite content of the clay was 84% and the quartz impurity composition was 16%. This further validate the dominance of kaolinite already observed in the analysis of the qualitative XRD analysis as discussed earlier.
Figure 1: Qualitative XRD diffractogram of Alkaleri clay
Figure 2: Quantitative XRD diffractogram of Alkaleri clay

ICEES 2021 ISSN: 2714-4186
302
3.2 Morphological Characterization
Figure 3 shows the SEM morphological micrograph of Alkaleri clay at 1000X magnification. It could be observed that the clay possessed dispersed lump-like morphology with tetrahedral or
hexagonal imperfect crystal shape. The average particle size was estimated as 500 m.
Figure 3: SEM image of raw kaolin at magnification of 1000x
3.3 Physicochemical Characterization
Table 1 presents the specific gravity analysis of Alkaleri clay. Applying Equation (1) the specific gravity of the clay was determined as 2.11.
Table 1: Specific gravity analysis of Alkaleri clay
Weight Raw Clay (g)
W1 26.8 W2 70.4 W3 99.8 W4 76.2
Specific gravity 2.18
Table 2 presents the pH analysis of Alkaleri clay using clay-water mixture at varying mixture ratio. It could be observed that the clay was slightly acidic having average pH value of 4.9. The basic pH value of the clay was likely due to presence of associated basic impurities phases in the raw clay mineral.
Table 2: pH analysis of Alkaleri clay
Clay to water ratio 1:2 1:4 1:6 1:8 1:10 Average pH of Sample
pH 5.1 4.9 4.8 4.8 4.7 4.9

ICEES 2021 ISSN: 2714-4186
303
4. CONCLUSION
Mineralogical characterization of Alkaleri clay has revealed that the clay is a kaolinite clay having 84% kaolin content and 16% quartz impurity. Physicochemical characterization of Alkaleri kaolin revealed the specific gravity and pH of the clay were 2.18 and of 4.9, respectively. Morphological characterization of the clay revealed that it possessed dispersed lump-like morphology with tetrahedral or hexagonal imperfect crystal shape and the average particle size
was estimated to be 500 m. The high kaolinite content of Alkaleri clay makes it a good raw
material recommended for manufacture of construction materials such as ceramic tiles and sanitary porcelains. It can also be used as a filler in the construction of cement and as a support material in heterogeneous catalyst formulation. Beneficiation of Alkaleri clay is recommended to improve the kaolinite content and reduce its quartz impurities.
REFERENCES
Hassan, M. D. (2014). Geochemistry and Origin of the Cretaceous Sedimentary Kaolin Deposits, Red Sea, Egypt. Geochemistry, 74; 195-203.
Huggett, J. M. (2015). Clay Minerals, Reference Module in Earth Systems and Environmental Sciences, Elsevier, doi: 10.1016/B978-0-12-409548-9.09519-1.
Nnka, E. E. and Agbo, U.J.E. (2003), An Evaluation of the refractory characteristics of Otukpo clay deposits, N.S.E. Technical Transaction 32 (1); 34-41.
OmowumiI, O.J (2000) Characterization of some Nigerian Clay as Refractory Materials for Furnace Lining, Nigerian Journal of Engineering Management, 2 (3);1-4.
Raymond, W. M and Donahue E, R. (1990). An introduction to soil and plant growth. 5th Edition, Prentice Hall Inc, U.S.A. 83- 97.
Reed, J. S (2001). Introduction to the Principles of Ceramic Processing New York: John Wiley. 20-23.
Salahudeen, N. (2018). Metakaolinization effect on the thermal and physiochemical properties of Kankara kaolin. International Journal of Applied Science and Technology, 11 (2); 127-135.
Salahudeen, N., Mohammed, U., Yahya, M. N. (2021). Chemical, Morphological Characterizations of RiriwaiBiotite and Determination of Yield Point of its WeightingAgent Application in Drilling Mud. Nigerian Journal of Technology. 40 (20); 269–274.
ICEES 2021 ISSN: 2714-4186
304
COMPRESSIVE STRENGTH OF CONCRETE MADE WITH PALM KERNEL SHELL AS PARTIAL REPLACEMENT FOR SAND
INCORPORATING SUPERPLASTICIZER
1*Kareem, M. A., 2Raheem, A. A., 2Ayanlere, S. A., 3Ige, A. I, 4Orogbade, B. O., 5Ibiwoye, E. O., 1Fatubarin, T., 6Yunus, S. 1 and Ojo, O.Y.
1Department of Civil Engineering, Osun State University, Osogbo, Nigeria.
2Department of Civil Engineering, Ladoke Akintola University of Technology, Ogbomoso, Nigeria.
3Department of Civil Engineering, Federal University of Agriculture, Makurdi, Nigeria.
4Department of Civil Engineering, Olabisi Onabanjo University, Ago Iwoye, Nigeria.
5Department of Civil Engineering, Kwara State Polytechnic, Ilorin, Nigeria
6Department of Architecture, Ladoke Akintola University of Technology, Ogbomoso, Nigeria.
Email of Corresponding Author: [email protected]
Abstract
The use of agricultural waste in concrete production as an alternative to the conventional materials is part of efforts to conserve natural resources and protect the environment from natural disasters. This study investigates the effect of replacing natural sand with Palm Kernel Shell (PKS) on the slump and compressive strength of concrete with Superplasticizer (SP). Concrete mixes of 1:1.73:2.11 (cement:sand:granite) with natural sand replaced with PKS at 10, 20, 30, 40, and 50% were produced using a water-to-binder ratio of 0.45. SP of 0.6, 0.7, 0.8, 0.9 and 1.0% by weight of cement were added to the concrete mixes containing 10 to 50% PKS, respectively, while the concrete mix without PKS and SP served as the control. Fresh concrete was tested for slump and hardened concrete specimens of 100 x 100 x 100 mm were tested for compressive strength after 7, 14, 21, and 28 days of curing. The results showed that the concrete with up to 20% PKS exhibited higher slump than the control while those with PKS beyond 20% had lower slump than the control. The 28-day compressive strength decreased from 25.8 to 16.04 N/mm2 as the PKS contents increased from 0 to 50%. The concrete with 10% PKS had a comparable compressive strength (25.2 N/mm2) as that of the control (25.8 N/mm2) at 28 days. Thus, the inclusion of 10% PKS as sand replacement with 0.6% SP is suitable for use in normal concrete.
Keywords: Agricultural waste; Compressive strength; Concrete; Superplasticiser; Workability.
1.0 INTRODUCTION
Concrete is the most widely used construction material globally. After air and water, it is the third most consumed commodity on the planet (CEMBUREAU, 2018). It is generally applicable in the construction of infrastructures such as buildings, pavements, bridges, dams, retaining structures, stadiums, and airports constructions. The world's population which was projected to grow from 1.2 to 9 billion by 2050 would greatly contributes to increase in demand for

ICEES 2021 ISSN: 2714-4186
305
humanity's basic requirements, such as food, shelter, and concrete for infrastructure, with an annual production of 18 billion tons expected by 2050 (Aprianti et al., 2015).
Aggregate remains the most mined materials on the planet (Pit and Quarry, 2020) since it is an essential material in concrete with the proportion of 70 to 80% of the total volume of concrete (Alexander and Mindess, 2010). The annual consumption of natural aggregate is estimated at 10 to 12 million tons globally (Aslam et al., 2017). However, the mining of aggregates has environmental consequences, including soil, water and air contamination, disruption of ecosystem and depletion of natural resources (Niyazi et al., 2017). An attempt to reduce the reduce the environmental pollution and preserve the natural resources has led to the consideration of alternative material as substitute for aggregate in concrete production. Alternative materials used as aggregate in concrete production are agricultural waste such as sawdust (Nathan, 2018), palm kernel shell (Adeyemi et al., 2017), groundnut shell (Sada et al., 2013), coconut shell (Regin et al., 2016), periwinkle shell (Aboshio et al., 2018). Findings have revealed the production of lightweight concrete with the use of these materials as full or partial replacement of the conventional aggregates.
PKS is derived from the oil palm tree as a by-product of oil palm fruit processing during palm oil and palm kernel oil production, and are bits of shells that result. Oil palm is a major tree crop that grows in hot climates with coastal rain forests, such as Southeast Asia's Malaysia, Indonesia, and Thailand, Africa's Nigeria, South America's Colombia and Ecuador, and Oceania's Papua New Guinea (Yew et al., 2014). The utilization of PKS in concrete production is an innovative way of reducing environmental pollution converting and adding values to the materials which are indiscriminately discharged into the environment (Bahrami et al., 2015; Raheem et al., 2021). The use of PKS in construction shall promote waste management and it will go a long way in the reduction of cost of aggregate. Additionally, the use of PKS like other lightweight aggregate as an alternative to conventional aggregates in concrete could aid the reduction of structural members’ size and this brought immense changes in the development of high rise structures using lightweight concrete (Alengaram et al., 2008).
The addition of PKS as full or partial replacement for coarse aggregate (CA) has been shown to cause reduction in concrete workability (Oriola et al., 2021; Maghfouri et al., 2018; Sobuz et al., 2014). The low workability of PKS concrete is due to the porous nature as well as flaky shape of PKS as part of the mixing water is absorbed by PKS and less water is available to lubricate the concrete mix resulting to harsh mix with low workability (Okpala, 1990; Maghfouri et al., 2018). In addition, the decrease in concrete workability with increase in the content of PKS can be attributed to the fact that more surface area available for wetting by the amount of mixing water available (Okpala, 1990). The presence of large number of pores in PKS is responsible for high rate of water absorption of PKS concrete than that of normal concrete. This is the factor which results in the lighter weight exhibited by PKS compared to normal aggregate and is also related to the low workability, densities and mechanical strength of PKS concrete (Oriola et al., 2021; Maghfouri et al., 2018; Sobuz et al., 2014).
Recently, several published researches have considered the application of different techniques to improve the workability and consequently the mechanical strength of PKS concrete. According to Maghfouri et al. (2018) and Tjahono et al. (2017), the workability of PKS concrete can be enhanced with the optimum use of superplasticizer (SP) as admixture. Okafor (1991) observed higher workability for fresh PKS concrete with increased strength as the dosage level of SP. This was attributed the fluidifying action of SP in fresh concrete, which either enhanced the workability of the fresh concrete at normal water content or allowed for a water reduction of at least 9% while keeping the same workability. According to Yew et al. (2014), the increased strength of PKS concrete was owing to a strong link at the interfacial transition zones between

ICEES 2021 ISSN: 2714-4186
306
the cement paste and aggregates as a result of PKS concrete's improved workability and compactibility in the presence of SP. Shafigh et al. (2011) reported that the rise in slump up to 250 mm with 28-day compressive strength values of 45.4 MPa when the maximum size of PKS was changed from 9.5-12.5 mm in the presence of SP.
Most of the previous studies were focused on using PKS as replacement for CA have been widely reported whereas limited studies are available considering PKS as substitute for fine aggregate (FA). Raheem et al. (2008) observed higher strength for PKSC with substitution of FA with varied PKS contents. Sulymon (2005) reported lowest reduction in compressive strength of 7% when FA was replaced by 20% OPS content compared to those with higher PKS contents. Although, the available studies showed better strength for PKSC with PKS as substitution for FA than CA. However, the workability and strength are still on the lower side when compared with conventional concrete. In this current studies, the workability and compressive strength of concrete with PKS as substitution for FA in the presence of chemical admixture (superplasticizer) were investigated.
3. MATERIALS AND METHOD
3.1 Materials
The materials used for this study are BUA brand of grade 42.5N, Portland Limestone Cement (PLC), sand, crushed granite, PKS, water and conplast superplasticizer. The PLC serves as the binding agent, river sand which passes through 4.75 mm sieve size also serves as FA, crushed granite with the maximum size of 19 mm serves as the CA, PKS with the maximum size of 5 mm as partial replacement for sand, water was used to facilitate mixing of other concrete constituents and conplast superplasticizer as chemical admixture. PLC was procured from building materials retail shop at Oke-Baale, Osogbo, Nigeria. The sand and granite were obtained from burrow pit and quarry site within Osogbo, Osun State. PKS was obtained from a mini oil palm processing mill at Ogbaagba, Osun State. Conplast superplasticizer was obtained from chemical store within Osogbo, Nigeria. Potable water was obtained from the tap at Osun State University's Structural and Material Laboratory in Osogbo, Nigeria.
3.2 Methods
3.2.1 Tests conducted on Materials
The tests conducted on river sand, granite and PKS were sieve analysis as specified in ASTM D2487 (2011), specific gravity as specified in ASTM C127 (2015) and water absorption according to BS 812-109 (1990).
3.2.2 Batching, concrete mix preparation and casting
Six batches of concrete mixes were made using the mix ratio of 1:1.73:2.11 (cement:sand:granite) and water-to-cement ratio of 0.45 with a target mean strength of 25 N/mm2 based on Building Research and Establishment method. Concrete without PKS (NC0) served as the control concrete while the other mixtures (NC-PKS) with the substitution of 10, 20, 30, 40 and 50% by the total weight of sand were produced. Superplasticiser (SP) of 0.6, 0.7, 0.8, 0.9 and 1.0% by weight of cement were added to the concrete mixes containing 10 to 50% PKS, respectively, while no SP was added control concrete. Table 1 shows the details of mix proportions used for the concrete produced. Mixing was done manually as specified in BS 1881-125 (2013). Fresh concrete was placed in the mould in three layers and compaction was made at each layer placement using the compacting rod. The moulds with the specimens was placed in a cool dry
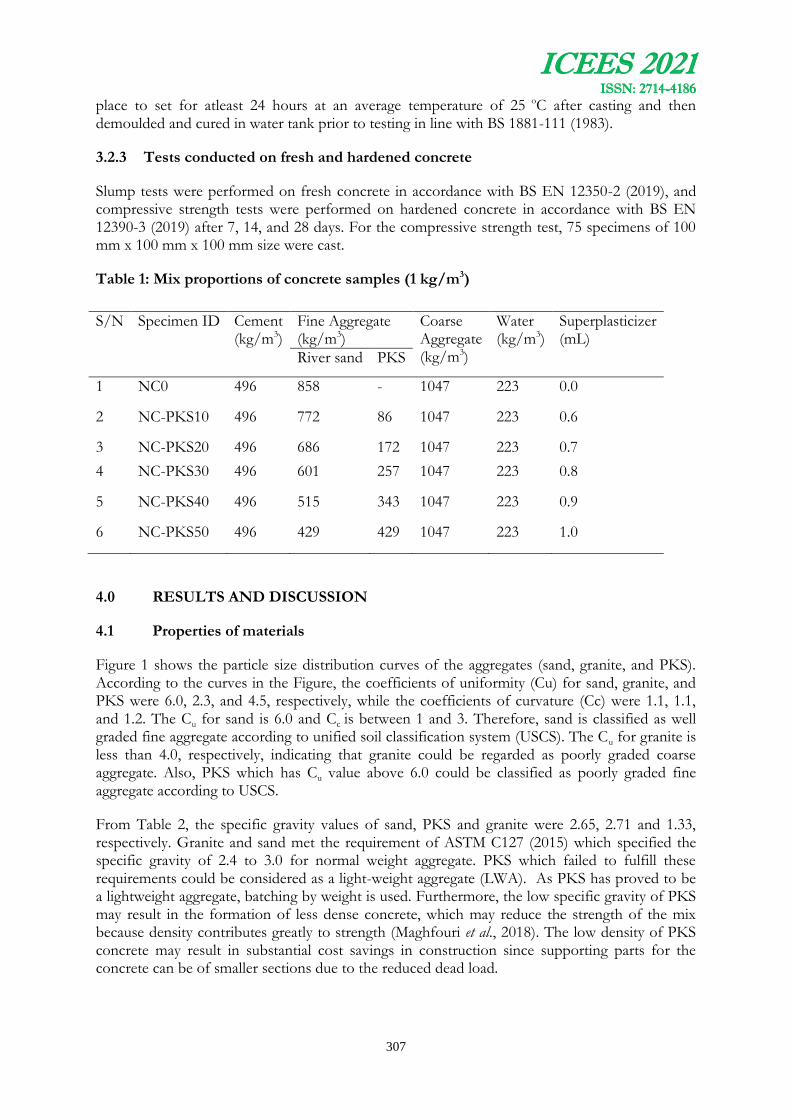
ICEES 2021 ISSN: 2714-4186
307
place to set for atleast 24 hours at an average temperature of 25 oC after casting and then demoulded and cured in water tank prior to testing in line with BS 1881-111 (1983).
3.2.3 Tests conducted on fresh and hardened concrete
Slump tests were performed on fresh concrete in accordance with BS EN 12350-2 (2019), and compressive strength tests were performed on hardened concrete in accordance with BS EN 12390-3 (2019) after 7, 14, and 28 days. For the compressive strength test, 75 specimens of 100 mm x 100 mm x 100 mm size were cast.
Table 1: Mix proportions of concrete samples (1 kg/m3)
4.0 RESULTS AND DISCUSSION
4.1 Properties of materials
Figure 1 shows the particle size distribution curves of the aggregates (sand, granite, and PKS). According to the curves in the Figure, the coefficients of uniformity (Cu) for sand, granite, and PKS were 6.0, 2.3, and 4.5, respectively, while the coefficients of curvature (Cc) were 1.1, 1.1, and 1.2. The Cu for sand is 6.0 and Cc is between 1 and 3. Therefore, sand is classified as well graded fine aggregate according to unified soil classification system (USCS). The Cu for granite is less than 4.0, respectively, indicating that granite could be regarded as poorly graded coarse aggregate. Also, PKS which has Cu value above 6.0 could be classified as poorly graded fine aggregate according to USCS.
From Table 2, the specific gravity values of sand, PKS and granite were 2.65, 2.71 and 1.33, respectively. Granite and sand met the requirement of ASTM C127 (2015) which specified the specific gravity of 2.4 to 3.0 for normal weight aggregate. PKS which failed to fulfill these requirements could be considered as a light-weight aggregate (LWA). As PKS has proved to be a lightweight aggregate, batching by weight is used. Furthermore, the low specific gravity of PKS may result in the formation of less dense concrete, which may reduce the strength of the mix because density contributes greatly to strength (Maghfouri et al., 2018). The low density of PKS concrete may result in substantial cost savings in construction since supporting parts for the concrete can be of smaller sections due to the reduced dead load.
S/N
Specimen ID Cement (kg/m3)
Fine Aggregate (kg/m3)
Coarse Aggregate (kg/m3)
Water (kg/m3)
Superplasticizer (mL) River sand PKS
1 NC0 496 858 - 1047 223 0.0
2 NC-PKS10 496 772 86 1047 223 0.6
3 NC-PKS20 496 686 172 1047 223 0.7
4 NC-PKS30 496 601 257 1047 223 0.8
5 NC-PKS40 496 515 343 1047 223 0.9
6 NC-PKS50 496 429 429 1047 223 1.0
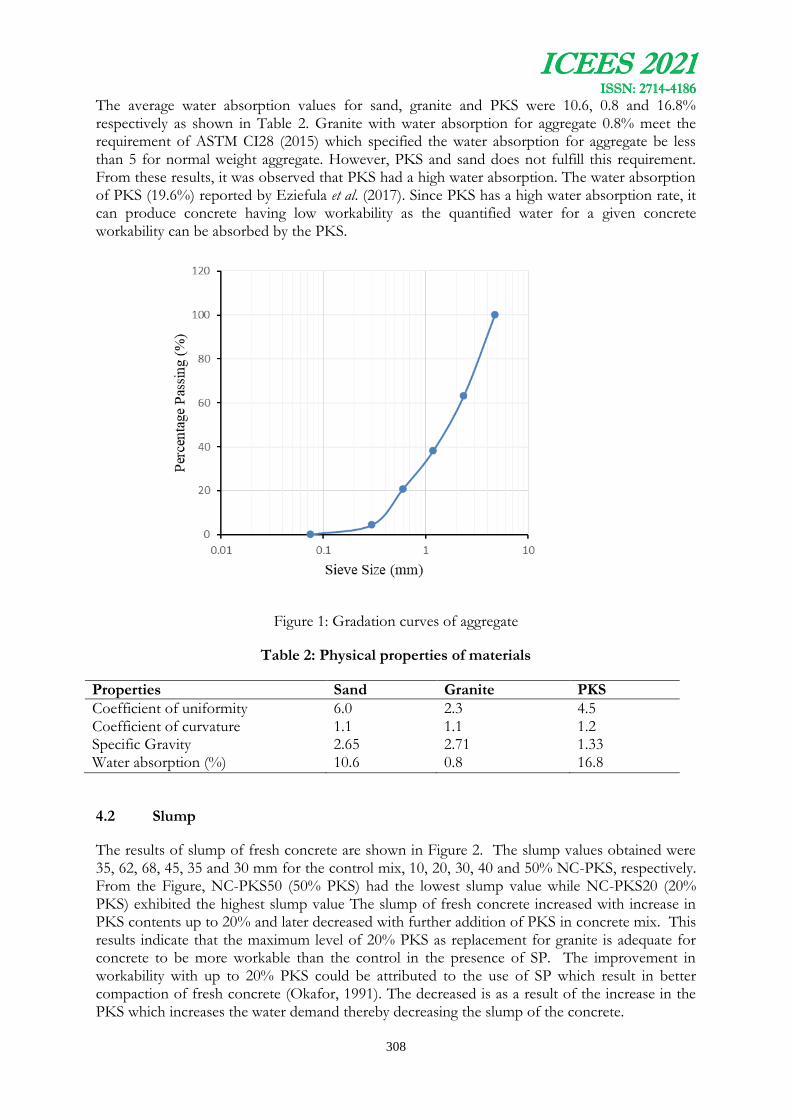
ICEES 2021 ISSN: 2714-4186
308
The average water absorption values for sand, granite and PKS were 10.6, 0.8 and 16.8% respectively as shown in Table 2. Granite with water absorption for aggregate 0.8% meet the requirement of ASTM CI28 (2015) which specified the water absorption for aggregate be less than 5 for normal weight aggregate. However, PKS and sand does not fulfill this requirement. From these results, it was observed that PKS had a high water absorption. The water absorption of PKS (19.6%) reported by Eziefula et al. (2017). Since PKS has a high water absorption rate, it can produce concrete having low workability as the quantified water for a given concrete workability can be absorbed by the PKS.
Figure 1: Gradation curves of aggregate
Table 2: Physical properties of materials
Properties Sand Granite PKS
Coefficient of uniformity 6.0 2.3 4.5 Coefficient of curvature 1.1 1.1 1.2 Specific Gravity 2.65 2.71 1.33 Water absorption (%) 10.6 0.8 16.8
4.2 Slump
The results of slump of fresh concrete are shown in Figure 2. The slump values obtained were 35, 62, 68, 45, 35 and 30 mm for the control mix, 10, 20, 30, 40 and 50% NC-PKS, respectively. From the Figure, NC-PKS50 (50% PKS) had the lowest slump value while NC-PKS20 (20% PKS) exhibited the highest slump value The slump of fresh concrete increased with increase in PKS contents up to 20% and later decreased with further addition of PKS in concrete mix. This results indicate that the maximum level of 20% PKS as replacement for granite is adequate for concrete to be more workable than the control in the presence of SP. The improvement in workability with up to 20% PKS could be attributed to the use of SP which result in better compaction of fresh concrete (Okafor, 1991). The decreased is as a result of the increase in the PKS which increases the water demand thereby decreasing the slump of the concrete.

ICEES 2021 ISSN: 2714-4186
309
Figure 2: Slump of fresh concrete
4.3 Compressive strength
Figure 3 shows the compressive strength of concrete after 7, 14, 21, and 28 days. According to the Figure, the strength of the concrete increased with age from 7 to 28 days of curing. The compressive strength obtained for the control mix after 7 days of curing was 16.67 N/mm2 and ranged from 16.16 to 10.75 N/mm2 for 10 - 50% NC-PKS. This results indicate that concrete with PKS as replacement for FA exhibited lower values of 7-day compressive strength than the control concrete mix. Similar trends of compressive strength were observed at 14 and 21 days as the control concrete continued to show higher compressive strength values than the concrete with PKS.
At 28 days, the compressive strength of concrete specimens continued to increase with 25.80 N/mm2 for the control concrete while the range of 25.2 to 16.04 N/mm2 were recorded for 10 - 50% NC-PKS, respectively. This results showed that NC-PKS10 (10% PKS) showed comparable strength as the control as it developed approximately 98% of the control concrete strength at the age of 28 days. The addition of SP enhanced the degree of compaction achieved and also caused the dispersion of cement particles near the aggregates (PKS and granite) (Okpala, 1991; Neville, 2008). This results to better adhesion between the aggregates and cement matrix with the subsequent improvement achieved in the compressive strength of PKS concrete with 10% PKS.

ICEES 2021 ISSN: 2714-4186
310
Figure 3: Compressive strength of concrete
5.0 CONCLUSIONS AND RECOMMENDATIONS
The following conclusions and recommendations were drawn from the results obtained in this study:
1. The physical properties of PKS reveals that it has lower specific gravity value and higher water absorption indicating its suitability for producing less dense concrete.
2. Replacement of fine aggregate with up to 20% PKS leads to increase in concrete workability while further addition decreased the concrete workability.
3. The compressive strength of control concrete is higher than the concrete with PKS while concrete with 10% PKS exhibited the closest strength which is about 98% of the strength developed by the control at 28 days.
4. Concrete containing 10% PKS with SP as chemical admixture can be adopted for producing concrete with comparable strength as the control.
5. Pre-treatment of PKS to lower the material's high water absorption can be studied because it may improve the characteristics of the concrete.
REFERENCES
Aboshio, A., Shuaibu, H. G. and Abdulwahab, M. T. (2018). Properties of Rice Husk Ash Concrete with Periwinkle Shell as Coarse Aggregates. Nigerian Journal of Technological Development, 15(2): 33-38.

ICEES 2021 ISSN: 2714-4186
311
Adeyemi, A. O., Anifowose, M. A., Adebarab, S. A., Olawuyia, M. Y. and Amototoa, I. O. (2017). Effect of Palm Kernel Shell (PKS) as Aggregate in Concrete with Varying Water Cement Ratio, International Conference of Science, Engineering & Environmental Technology, 2(8): 55-62.
Alegaram, U. J., Jumaat, M. Z. and Mahmud, H. (2008). Ductility Behaviour of Reinforced Palm Kernel Concrete Beam, European Journal of Scientific Research, 23(3): 406-420.
Alexander, M. and Mindess, S. (2010). Aggregates in concrete. Taylor and Francis group, New York.
Aprianti, E., Shafigh, P., Bahri, S. and Farahani, J. N. (2015). Supplementary Cementitious Materials Origin from Agricultural Wastes – A Review. Construction and Building Materials 74, 176-187.
Aslam, M., Shafigh, P. and Jumaat, M. Z. (2017). High Strength Lightweight Aggregate Concrete using Blended Coarse Lightweight Aggregate Origin from Palm Oil Industry. Sains Malaysiana, 46(4), 667–675. http://dx.doi.org/10.17576/jsm-2017-4604-20.
ASTM C127 (2015). Standard test method for density, relative density (Specific Gravity), and Absorption of Coarse Aggregate, American Society of Testing Materials (ASTM), West Conshohocken, PA, USA.
ASTM C128 (2015). Standard test method for relative density (Specific Gravity), and Absorption of fine Aggregate, American Society of Testing Materials (ASTM), West Conshohocken, PA, USA.
ASTM D2487 (2011). Standard practice for classification of soils for engineering purposes, ASTM International, West Conshohocken, PA, USA.
Bahrami, A., Soltani, N., Pech-Canul, M. I. and Gutiérrez, C. A. (2015). Development of Metal-Matrix Composites from Industrial/Agricultural Waste Materials and their Derivatives. Critical Reviews in Environmental Science and Technology, 1-66. doi:10.1080/10643389.2015.1077067.
BS 1881-125 (2013) Testing Concrete. Methods for mixing and sampling fresh concrete in the laboratory. London: British Standards Institution, London.
BS EN 12350-2 (2009). Testing fresh concrete. Slump-test. British Standards Institution, London.
BS EN 12390-3 (2019). Testing hardened concrete. Compressive strength of test specimens. British Standards Institution, London.
BS 1881 Part 111 (1983). Testing concrete. Method of normal curing of test specimens. Bristish Standards Institution, London.
CEMBUREAU, (2018). The role of cement in the 2050 low carbon economy. The European
Cement Association. Retrieved June 6, 2018 from http:/www.cembureau.cu/activity-report.

ICEES 2021 ISSN: 2714-4186
312
Eziefula, U. G., Opara, H. E. and Anya, C. U. (2017). Mechanical Properties of Palm Kernel Shell Concrete in Comparison with Periwinkle Shell Concrete, Malaysia Journal of Civil Engineering, 29(1), 1-14.
Maghfouri, M., Shafigh, P. and Aslam, M. (2018). Optimum Oil Palm Shell Content as Coarse Aggregate in Concrete based on Mechanical and Durability Properties. Advanced Materials Science and Engineering, 4271497, 1-14. http://dx.doi.org/10.1155/2018/4271497.
Nathan, M. V. (2018). Effect of Sawdust as Fine Aggerate in Concrete Mixture, International Journal of Engeering and Technique, 4(3): 1-12.
Neville, A. M., 2008. Properties of Concrete, Fourteen ed. Prentice Hall, New Jersey, USA.
Bilim, N., Çelik, A. and Kekeç, B. (2017). A Study in Cost Analysis of Aggerate Production as Depending on Drilling and Blasting Design, International journal of Environmental Science and Development, 8(5): 213-224.
Okafor, F. O. (1991). An Investigation of the Use of Superplasticizer in Palm Kernel Shell Aggregate Concrete Cement. Cement and Concrete Research, 21: 551-557.
Okpala, D. C. (1990). Palm Kernel Shell as Lightweight Aggregate in Concrete, Building and Environment, 25: 291 296.
Oriola, K. O., Raheem, A. A., Kareem, M. A. and Abdulwahab, R. (2021). Assessment of Workability and Compressive Strength of Rice Husk Ash-Blended Palm Kernel Shell Concrete, LAUTECH Journal of Civil and Environmental Studies, 7(1): 100-115.
Pit and quarry (2020). Aggregates Production Statistics, Retrieved October 2020 from htttp://www.pitandquarry.com/2106-aggreagate-production-statistics.
Raheem, A. A., Nwakanma, E. O. and Ogunleye, K. O. (2008). Engineering Properties of Concrete with Palm Kernel Shell as Fine and Coarse Aggregates, USEP: Journal of Research in Civil Engineering, 5(1): 56-67.
Raheem, A. A., Oriola, K. O., Kareem, M. A. and Abdulwahab, R. (2021). Investigation on Thermal Properties of Rice Husk Ash-Blended Palm Kernel Shell Concrete, Environmental Challenges, 5: 100284.
Regin, J. J., Vincent, P. and Ganapathy, C. (2016). Effect of mineral admixtures on mechanical properties and chemical resistance of lightweight coconut shell concrete, Arab Journal of Science and Engineering, 41: 1239-1242.
Sada, B. H., Amartey, Y. D. and Bako, S. (2013). An Investigation into the Use of Groundnut Shell As Fine Aggregate Aggregate Replacement. Nigerian Journal of Technology (NIJOTECH), 32(1): 54–60.
Shafigh. P., Jumaat, M. Z. and Mahmud H. B. (2011). Oil Palm Shell as a Lightweight Aggregate for Production of High Strength Lightweight Concrete, Construction and Building Materials, 25: 1848-1853.

ICEES 2021 ISSN: 2714-4186
313
Sobuz, H. R., Hasan, N. Md. S., Tamanna, N. and Islam, Md. S. (2014). Structural lightweight concrete production by using oil palm shell. Journal of Materials, Article ID 870247, 1-6. doi:10.1155/2014/870247.
Sulymon, N. A. (2005). Palm-Kernel Shell Concrete for Structural Use – A Preliminary Investigation. Global Journal of Environmental Science, 4(1), 87-91.
Tjahono, E., Fani, A. M., Dodi, D. D., Purnamaseri, E., Silaban, F. A. and Arijoeniu, E. (2017). The Study of Oil Palm Shell (OPS) Lightweight Concrete Using Superplasticizer, Silica Fume and Fly Ash. Material Science Forum 902: 65-73. doi:10.4028/www.scientific.net/MSF.902.65.
Yew, M. K., Mahmud, H. B., Ang, B. C., and Yew, M. C. (2014). Effects of Oil Palm Shell Coarse Aggregate Species on High Strength Lightweight Concrete. Advances in Materials Science and Engineering. Article ID 387647: 1-12. http://dx.doi.org/10.1155/2014/387647.
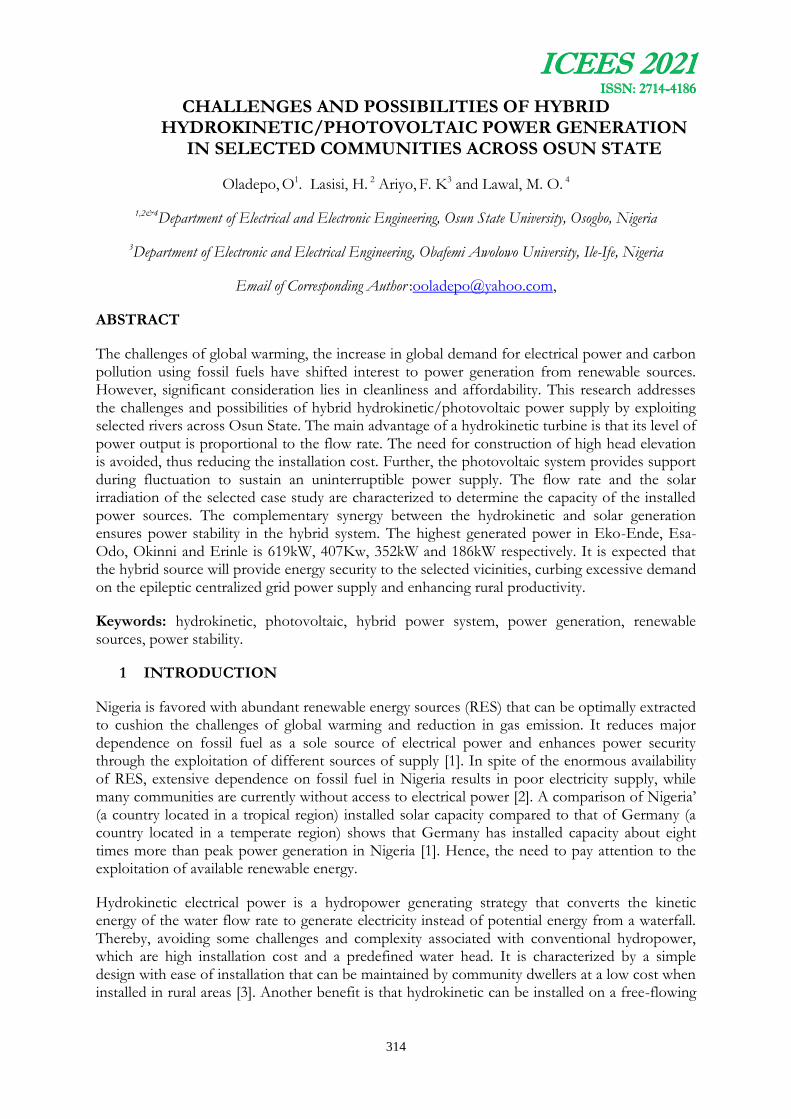
ICEES 2021 ISSN: 2714-4186
314
CHALLENGES AND POSSIBILITIES OF HYBRID HYDROKINETIC/PHOTOVOLTAIC POWER GENERATION
IN SELECTED COMMUNITIES ACROSS OSUN STATE
Oladepo, O1. Lasisi, H. 2 Ariyo, F. K3 and Lawal, M. O. 4
1,2&4Department of Electrical and Electronic Engineering, Osun State University, Osogbo, Nigeria
3Department of Electronic and Electrical Engineering, Obafemi Awolowo University, Ile-Ife, Nigeria
Email of Corresponding Author :[email protected],
ABSTRACT
The challenges of global warming, the increase in global demand for electrical power and carbon pollution using fossil fuels have shifted interest to power generation from renewable sources. However, significant consideration lies in cleanliness and affordability. This research addresses the challenges and possibilities of hybrid hydrokinetic/photovoltaic power supply by exploiting selected rivers across Osun State. The main advantage of a hydrokinetic turbine is that its level of power output is proportional to the flow rate. The need for construction of high head elevation is avoided, thus reducing the installation cost. Further, the photovoltaic system provides support during fluctuation to sustain an uninterruptible power supply. The flow rate and the solar irradiation of the selected case study are characterized to determine the capacity of the installed power sources. The complementary synergy between the hydrokinetic and solar generation ensures power stability in the hybrid system. The highest generated power in Eko-Ende, Esa-Odo, Okinni and Erinle is 619kW, 407Kw, 352kW and 186kW respectively. It is expected that the hybrid source will provide energy security to the selected vicinities, curbing excessive demand on the epileptic centralized grid power supply and enhancing rural productivity.
Keywords: hydrokinetic, photovoltaic, hybrid power system, power generation, renewable sources, power stability.
1 INTRODUCTION
Nigeria is favored with abundant renewable energy sources (RES) that can be optimally extracted to cushion the challenges of global warming and reduction in gas emission. It reduces major dependence on fossil fuel as a sole source of electrical power and enhances power security through the exploitation of different sources of supply [1]. In spite of the enormous availability of RES, extensive dependence on fossil fuel in Nigeria results in poor electricity supply, while many communities are currently without access to electrical power [2]. A comparison of Nigeria’ (a country located in a tropical region) installed solar capacity compared to that of Germany (a country located in a temperate region) shows that Germany has installed capacity about eight times more than peak power generation in Nigeria [1]. Hence, the need to pay attention to the exploitation of available renewable energy.
Hydrokinetic electrical power is a hydropower generating strategy that converts the kinetic energy of the water flow rate to generate electricity instead of potential energy from a waterfall. Thereby, avoiding some challenges and complexity associated with conventional hydropower, which are high installation cost and a predefined water head. It is characterized by a simple design with ease of installation that can be maintained by community dwellers at a low cost when installed in rural areas [3]. Another benefit is that hydrokinetic can be installed on a free-flowing
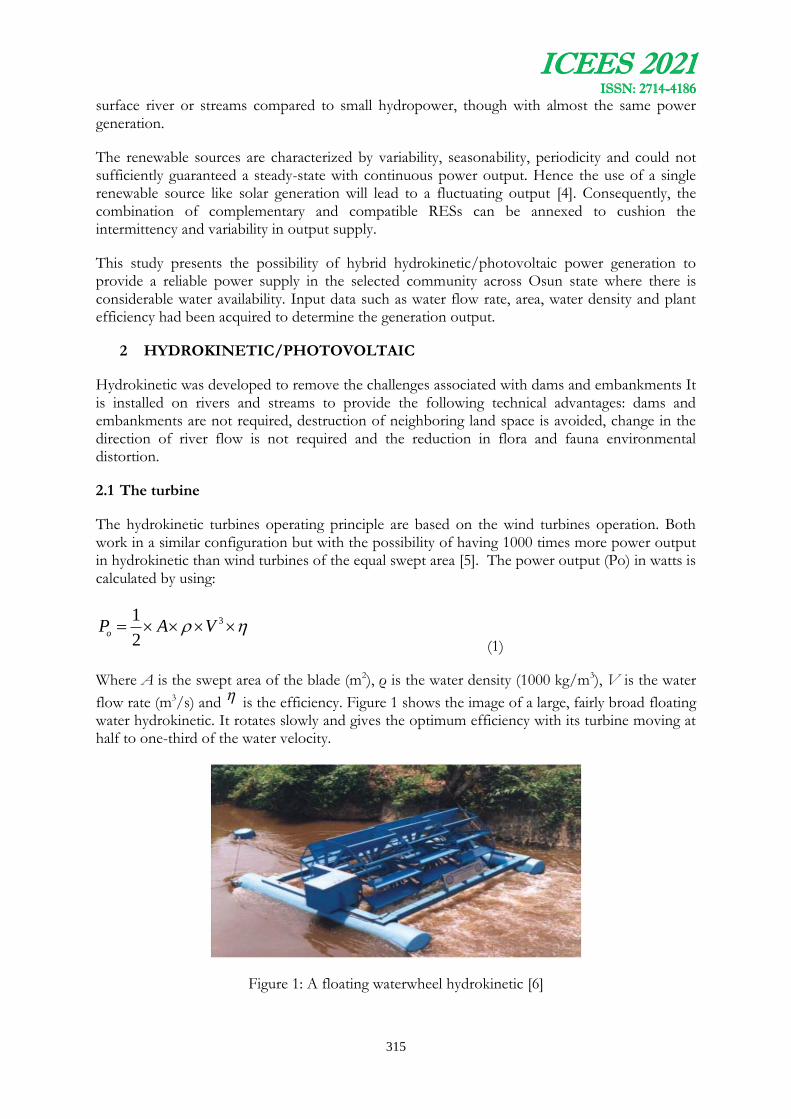
ICEES 2021 ISSN: 2714-4186
315
surface river or streams compared to small hydropower, though with almost the same power generation.
The renewable sources are characterized by variability, seasonability, periodicity and could not sufficiently guaranteed a steady-state with continuous power output. Hence the use of a single renewable source like solar generation will lead to a fluctuating output [4]. Consequently, the combination of complementary and compatible RESs can be annexed to cushion the intermittency and variability in output supply.
This study presents the possibility of hybrid hydrokinetic/photovoltaic power generation to provide a reliable power supply in the selected community across Osun state where there is considerable water availability. Input data such as water flow rate, area, water density and plant efficiency had been acquired to determine the generation output.
2 HYDROKINETIC/PHOTOVOLTAIC
Hydrokinetic was developed to remove the challenges associated with dams and embankments It is installed on rivers and streams to provide the following technical advantages: dams and embankments are not required, destruction of neighboring land space is avoided, change in the direction of river flow is not required and the reduction in flora and fauna environmental distortion.
2.1 The turbine
The hydrokinetic turbines operating principle are based on the wind turbines operation. Both work in a similar configuration but with the possibility of having 1000 times more power output in hydrokinetic than wind turbines of the equal swept area [5]. The power output (Po) in watts is calculated by using:
31
2o
P A V
(1)
Where A is the swept area of the blade (m2), ρ is the water density (1000 kg/m3), V is the water
flow rate (m3/s) and is the efficiency. Figure 1 shows the image of a large, fairly broad floating water hydrokinetic. It rotates slowly and gives the optimum efficiency with its turbine moving at half to one-third of the water velocity.
Figure 1: A floating waterwheel hydrokinetic [6]

ICEES 2021 ISSN: 2714-4186
316
2.2 Solar photovoltaic
Photovoltaic cell consists of the photodiode that converts irradiation to electrical energy. It can be connected in parallel and series configurations to make an array of solar panels required to produce direct current and voltage output. It is connected with an inverter system to generate an alternating current power output. The characteristic equation for a single cell is expressed as [7]:
exp 1 S
PH S
C P
V R IqI I I V RI
kT R
(2)
where PHI
is the photocurrent based on solar radiation and temperature, CT
is the cell’s
temperature, SI
is saturated diode current, k represent the Boltzmann’s constant, is the
ideality factor, q is the electron charge, SR
and PR
are series and parallel resistance of the cell.
2.3 Generator
The permanent magnet is preferable to be economical and reliance on locally constructed technology. The magnet makes way for a reduction in generation speed and reduced equipment cost. With lower speed, gearboxes or an electrical machine with high poles could be employed [8].
3 CHALLENGES OF EXPLOITING HYDROKINETIC POWER GENERATION
In spite of great opportunities in hydrokinetic technology, it is also challenged by some factors that lower or impede the utilization of the technology in our part of the globe. The possible challenges in the development of hydrokinetic technology are highlighted as follows:
3.1 Climatic condition
One of the main drawbacks of the technology is that its output is resource-dependent. It relies on weather conditions [9]. Nigeria has two major seasons: the wet season lasts between April and September and the dry season between October and March. Therefore, its energy production fluctuates to match the continuous load requirement over a year. In order to cushion that, this study suggests the hybridization of hydrokinetic with solar photovoltaic generation.
3.2 Economic factor
The capital, operating and maintenance costs require the partnership of various investors and the rural dwellers. However, most rural dwellers are subsistence farmers who may not afford the electricity bill and the running cost due to low per capita income [10]. In addition, there is a small population in the rural areas and the investors are always slow to invest resources where there is no assurance of profit and returns.
4 MATERIAL AND METHOD
Water is an abundant resource on earth that is vital to the survival of living things and proper maintenance of the ecosystem. Nigeria is potentially rich in water supply due to the flow of two major rivers: the river Niger and river Benue. The two rivers meet at the central part of Nigeria,

ICEES 2021 ISSN: 2714-4186
317
called the middle belt. It flows and spills through the southwest and southern part of the country down to the Atlantic Ocean. Osun state is a southwestern state of Nigeria. The state is named after the river Osun, which pictures the abundance of her water resources in the form of dams, waterfall, streams and rivers. Three dams and one waterfall are selected for this study: Okinni dam, Esa-Odo dam, Eko-Ende dam, and Erin-Ijesha waterfall. The water flow rate does not show a significant change when considering an hourly analysis. However, the flow rate varies from one quarter of the year to another due to variations in rainfall. Therefore, to ensure a stable and continuous power supply, there is a need for a complementary renewable source from solar photovoltaic generation.
Okinni dam is located on coordinate between 7.780N, 4.420E and 7.950N, 4.600E. The access to Okinni is a road that branches at a junction about 14km from Osogbo on Ilobu-Osogbo road. The dam site is about 8km from Ilobu. The dam has a good flow rate for power generation as obtained from Osun State Water Corporation. Figure 2 shows the embankment crest with spillway afar and the reservoir with intake gallery
(a)
(b)
Figure 2: (a) Embankment crest showing the spillway afar (b) Upstream of dam showing the reservoir and intake gallery
Esa-Odo dam is on coordinate 7.650N, 4.770E and 7.850N, 4.860E. It is situated between Ilare and Esa-Odo. It is 1.2km from Ilare on Ilare-Ijebu-Jesha road. The dam gets its abundance of water from the Osun river with a reasonable flow rate for electrical power potential. The embankment crest is strong enough to a large volume of water and spill through the weir spillway. Figure 3 shows the view of the spillway weir and the reservoir of the Esa-Odo dam.
(a)
(b)
Figure 3: (a) View of spillway weir (b) View of the reservoir

ICEES 2021 ISSN: 2714-4186
318
Eko-Ende is located 10km from Ikirun on Ikirun-Ilie road and on coordinate 7.830N, 4.500E and 8.150N, 4.750E. The dam gets its water source from Otin river with high water volume and good flow rate for power potential. Its embankment crest is coated with asphaltic finishing, which leads to the dam spillway. Figure 4 shows the view of the dam.
(a)
(b)
Figure 4: (a) View of the bank (b) View of the water reservoir
The waterfall at Erin-Ijesa town is called Olumirin waterfall in Oriade local government of Osun State. The waterfall fall is also called Erinle waterfall. It is located on latitude 7030’/8045’N and longitude 4031’/50E. The fall elevation is 60.6m with a high head/flow rate for power potential [11]. The variation in water flow changes within a year due to the variation in water level from different rainfall patterns. Figure 5 shows the topology of the fall.
Figure 5: The topology of the Erin-Ijesha waterfall [11]
The approach adopted involves extensive data collection, review and site investigation; The water flow rate of the dams is obtained from the Osun State Water Corporation, the agency is responsible for the operation and maintenance of dams in the state. At the same time, the flow rate for the Olumirin waterfall is obtained from the Osun State Tourism Board. Based on the figures and data collected, Equation (1) and (2) are majorly employed in the evaluation and computation of the expected output power. The water flow rate differs in a different seasons of the year; therefore, there is a variation in power output from one quarter to another. Hence, the study characterized and investigated the complementary combination of solar photovoltaic
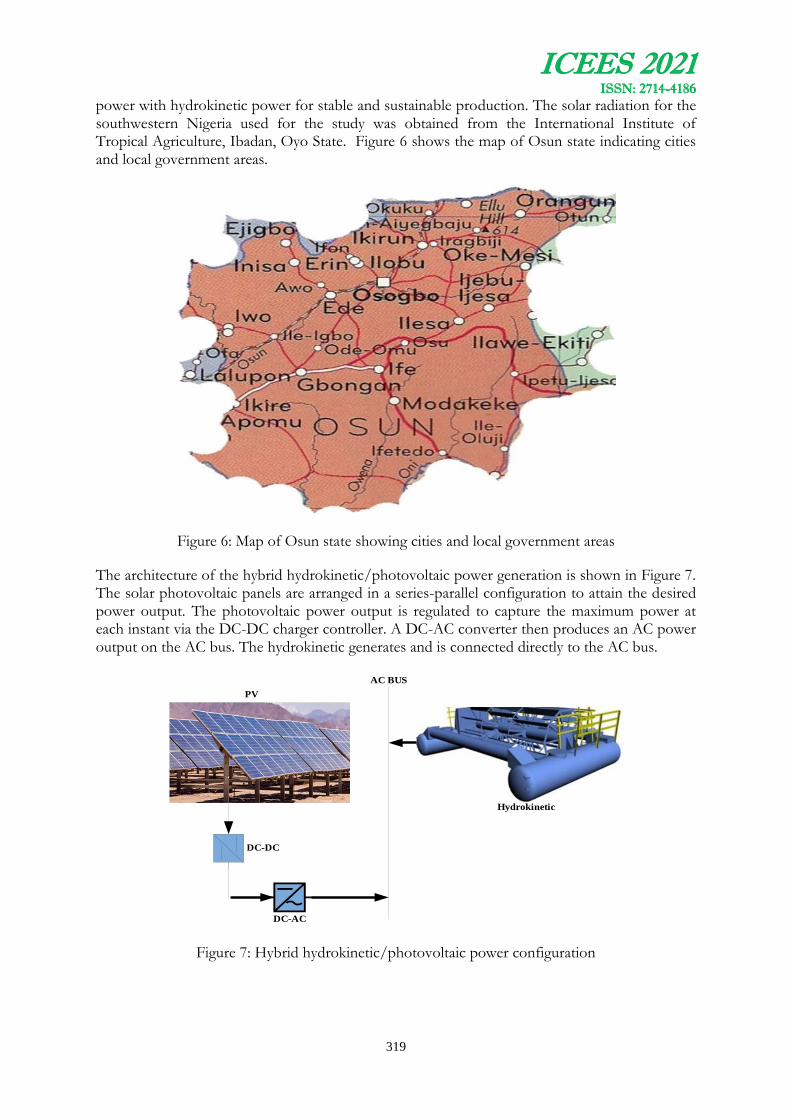
ICEES 2021 ISSN: 2714-4186
319
power with hydrokinetic power for stable and sustainable production. The solar radiation for the southwestern Nigeria used for the study was obtained from the International Institute of Tropical Agriculture, Ibadan, Oyo State. Figure 6 shows the map of Osun state indicating cities and local government areas.
Figure 6: Map of Osun state showing cities and local government areas
The architecture of the hybrid hydrokinetic/photovoltaic power generation is shown in Figure 7. The solar photovoltaic panels are arranged in a series-parallel configuration to attain the desired power output. The photovoltaic power output is regulated to capture the maximum power at each instant via the DC-DC charger controller. A DC-AC converter then produces an AC power output on the AC bus. The hydrokinetic generates and is connected directly to the AC bus.
PV
DC-DC
DC-AC
AC BUS
Hydrokinetic
Figure 7: Hybrid hydrokinetic/photovoltaic power configuration
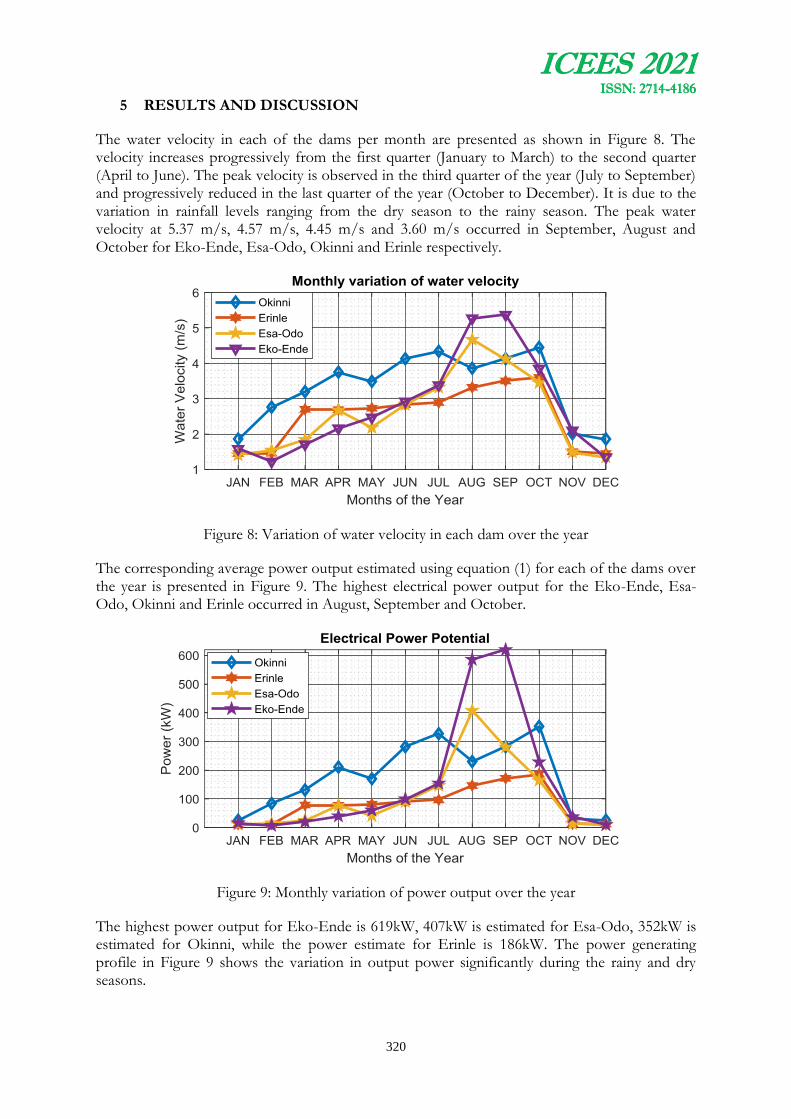
ICEES 2021 ISSN: 2714-4186
320
5 RESULTS AND DISCUSSION
The water velocity in each of the dams per month are presented as shown in Figure 8. The velocity increases progressively from the first quarter (January to March) to the second quarter (April to June). The peak velocity is observed in the third quarter of the year (July to September) and progressively reduced in the last quarter of the year (October to December). It is due to the variation in rainfall levels ranging from the dry season to the rainy season. The peak water velocity at 5.37 m/s, 4.57 m/s, 4.45 m/s and 3.60 m/s occurred in September, August and October for Eko-Ende, Esa-Odo, Okinni and Erinle respectively.
Figure 8: Variation of water velocity in each dam over the year
The corresponding average power output estimated using equation (1) for each of the dams over the year is presented in Figure 9. The highest electrical power output for the Eko-Ende, Esa-Odo, Okinni and Erinle occurred in August, September and October.
Figure 9: Monthly variation of power output over the year
The highest power output for Eko-Ende is 619kW, 407kW is estimated for Esa-Odo, 352kW is estimated for Okinni, while the power estimate for Erinle is 186kW. The power generating profile in Figure 9 shows the variation in output power significantly during the rainy and dry seasons.

ICEES 2021 ISSN: 2714-4186
321
The average daily solar radiation level over a month for the southwestern part of Nigeria is presented in Figure 10, with the highest radiation experienced on the seventh day at 1.001 W/m2 while the lowest radiation is 327.7 W/m2 on the twenty-second of the month.
Figure 10: Daily solar radiation for the first month of the year.
The corresponding electrical power output over the month is shown in Figure 11, with the highest power output at 52.24kW and the lowest at 17.07 kW using the series-parallel arrangement of 108 pieces of 500Watt solar panel.
Figure 11: Daily electrical power output over the month
The monthly photovoltaic power generation over the year is shown in Figure 12; the power generation shows the progressive increment from the first month of the year to the third month (First quarter of the year), being the peak time of the dry season. The highest power generation is 102.3kW, which occurred in March. In the second and third quarters of the year, the power generation reduced drastically and the lower generations occurred in June and August at 31.62kW and 32.74kW respectively. However, the generation picks up at the tail end of the year, being the beginning of another dry season. Both the number of hydrokinetic unit and the solar panel series-parallel arrangement can be increased or decreased at any time to suit the power demand.
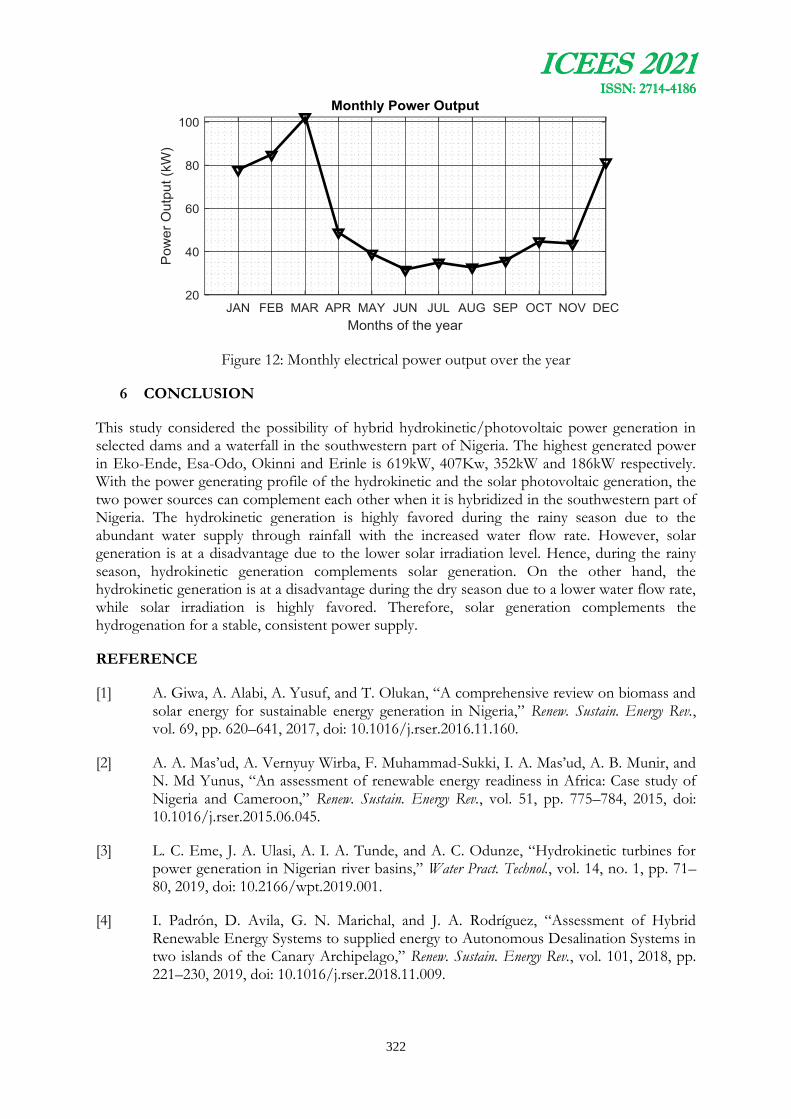
ICEES 2021 ISSN: 2714-4186
322
Figure 12: Monthly electrical power output over the year
6 CONCLUSION
This study considered the possibility of hybrid hydrokinetic/photovoltaic power generation in selected dams and a waterfall in the southwestern part of Nigeria. The highest generated power in Eko-Ende, Esa-Odo, Okinni and Erinle is 619kW, 407Kw, 352kW and 186kW respectively. With the power generating profile of the hydrokinetic and the solar photovoltaic generation, the two power sources can complement each other when it is hybridized in the southwestern part of Nigeria. The hydrokinetic generation is highly favored during the rainy season due to the abundant water supply through rainfall with the increased water flow rate. However, solar generation is at a disadvantage due to the lower solar irradiation level. Hence, during the rainy season, hydrokinetic generation complements solar generation. On the other hand, the hydrokinetic generation is at a disadvantage during the dry season due to a lower water flow rate, while solar irradiation is highly favored. Therefore, solar generation complements the hydrogenation for a stable, consistent power supply.
REFERENCE
[1] A. Giwa, A. Alabi, A. Yusuf, and T. Olukan, “A comprehensive review on biomass and solar energy for sustainable energy generation in Nigeria,” Renew. Sustain. Energy Rev., vol. 69, pp. 620–641, 2017, doi: 10.1016/j.rser.2016.11.160.
[2] A. A. Mas’ud, A. Vernyuy Wirba, F. Muhammad-Sukki, I. A. Mas’ud, A. B. Munir, and N. Md Yunus, “An assessment of renewable energy readiness in Africa: Case study of Nigeria and Cameroon,” Renew. Sustain. Energy Rev., vol. 51, pp. 775–784, 2015, doi: 10.1016/j.rser.2015.06.045.
[3] L. C. Eme, J. A. Ulasi, A. I. A. Tunde, and A. C. Odunze, “Hydrokinetic turbines for power generation in Nigerian river basins,” Water Pract. Technol., vol. 14, no. 1, pp. 71–80, 2019, doi: 10.2166/wpt.2019.001.
[4] I. Padrón, D. Avila, G. N. Marichal, and J. A. Rodríguez, “Assessment of Hybrid Renewable Energy Systems to supplied energy to Autonomous Desalination Systems in two islands of the Canary Archipelago,” Renew. Sustain. Energy Rev., vol. 101, 2018, pp. 221–230, 2019, doi: 10.1016/j.rser.2018.11.009.

ICEES 2021 ISSN: 2714-4186
323
[5] J. Susanto and S. Stamp, “Local installation methods for low head pico-hydropower in the Lao PDR,” Renew. Energy, vol. 44, pp. 439–447, 2012, doi: 0.1016/j.renene.2012.01.089.
[6] B. Kirke, “Hydrokinetic turbines for moderate-sized rivers,” Energy Sustain. Dev., vol. 58, pp. 182–195, 2020, doi: 10.1016/j.esd.2020.08.003.
[7] A. Hatefi Einaddin, A. Sadeghi Yazdankhah, and R. Kazemzadeh, “Power Management in a Utility Connected Micro-Grid with Multiple Renewable Energy Sources,” J. Oper. Autom. Power Eng., vol. 5, no. 1, pp. 1–10, 2017, doi: 10.22098/JOAPE.2017.543.
[8] M. Grabbe, K. Yuen, A. Goude, E. Lalander, and M. Leijon, “Design of an experimental setup for hydro-kinetic energy conversion,” Int. J. Hydropower Dams, vol. 16, no. 5, pp. 112–116, 2009.
[9] F. Chen, N. Duic, L. Manuel Alves, and M. da Graça Carvalho, “Renewislands-Renewable energy solutions for islands,” Renew. Sustain. Energy Rev., vol. 11, no. 8, pp. 1888–1902, 2007, doi: 10.1016/j.rser.2005.12.009.
[10] M. T. Adenipekun, “Sustainable rural infrastructural \ndevelopment in Nigeria within the context of Vision 20:2020,” Int. J. Dev. Sustain., vol. 2, no. 1, pp. 254–269, 2013.
[11] T. Ajewole and M. Omoigui, “A Study on the Hydro-Electric Potential of Olumirin Waterfall at Erin-Ijesa in Osun State of Nigeria,” Uniosun J. Sci., vol. 3, no. 1, pp. 64–72, 2018.
ICEES 2021 ISSN: 2714-4186
324
THE APPLICATION OF GREEN TECHNOLOGIES IN COMPACTED SOILS USED FOR MUNICIPAL WASTE CONTAINMENT: A REVIEW
1*Adeyemo, K. A., 1Ishola, K., 1Bello, A. A. and 1Adewale, S. A.
1Department of Civil Engineering, Osun State University, Osogbo, Nigeria
*Email of Corresponding Author: [email protected]
ABSTRACT
Landfilling is the most common method for managing municipal solid waste (MSW) owing to its low capital and operational cost. Compacted clay liners are normally used as an integral part of waste containment facilities to impede the transport of contaminated leachate. Nevertheless, the seepage of leachate through compacted clay liner is solely responsible for the transportation of pollutants into the environment, posing major threat to the groundwater and soil. There has been increase in the volume of solid waste generated daily, due to increasing population growth, industrialization and urbanization, therefore adequate MSW management facilities are required to attenuate the environmental hazards of these wastes and ensure a cost-effective management. This paper reviews studies on the applications of compacted natural soil, agricultural/industrial waste and microbial-induced calcite precipitation (MICP) treated soils in MSW containment systems. Works on expansive/weak soils treated with industrial and agricultural wastes yielded positive outcomes on the hydraulic barrier parameters of tested specimen. Findings from this review reveals that the use of micro-organisms in MICP produced huge amounts of extracellular polymeric substances and coalesced to form a confluent plugging biofilm which eventually resulted in the decrease of soil permeability and in the increase of the breakthrough time.
Keywords: Dumpsite, Hydraulic Conductivity, Leachate, Unconfined Compressive Strength, Volumetric Shrinkage.
1.0 INTRODUCTION
Proper management of waste is pertinent for creating sustainable and liveable communities, but most developing countries and cities face difficulties in this area. Waste management often gulp 20–50% of municipal budgets, thus, it is costly to manage waste effectively. Operating this vital municipal service necessitates the use of integrated systems that are sustainable and environmentally safe. MSW management methods include recycling, composting, anaerobic digestion, incineration, dumping into the sea, and landfilling (Tang et al., 2018). Sanitary landfilling is the most common method of removing MSWs due to its cost effectiveness, particularly in developing and underdeveloped countries (Tang et al., 2018). Although sanitary landfilling is widely used, it is becoming an emerging environmental threat due to leachate infiltration at landfill sites, which is a complex mixture characterized by high toxicity and usually results in soils and groundwater contamination. This kind of contamination is particularly common in developing countries where engineered landfills with liners and covers are still lacking. To prevent leachate from leaking out of landfill, the standard for MSW sanitary landfill requires that a compacted clay liner should have a maximum hydraulic conductivity of 1 × 10⁻⁹ m/s.
Several techniques have been employed to protect soil and groundwater from leachate contamination, these include the use of composite liners geomembrane (GMB) and geosynthetic clay liner (GCL), improvement of soil with industrial and agricultural wastes and microbial growth. Thus, this paper reviews studies on the applications of compacted natural soil,
ICEES 2021 ISSN: 2714-4186
325
agricultural/industrial waste and microbial-induced calcite precipitation treated soils in MSW containment systems.
2.0 Natural Soil as Compacted Liner
2.1 Permeability
To provide a long term isolation of waste leachate from reaching the groundwater, a liner material of permeability less than 1.0 x 10⁻⁹ m/s is required. Bello (2010) investigated the use of abandoned dumpsite and lateritic soils as barriers in waste containment facilities. The study shows that abandoned dumpsite and lateritic soils possess hydraulic conductivities less than 1.0 x 10⁻⁹ m/s when compacted with not less than Standard Proctor compactive energy. Adeyemo et al. (2019a) also observed low permeability in black cotton soil compacted with at least British Standard Light compactive effort and it was attributed to the high clay content of the studied soil. Amadi and Eberemu (2013) studied lateritic soil mixed with 0, 2.5, 5.0, 7.5 and 10.0 % bentonite contents prepared at varying compaction states (2 % dry of optimum, optimum and 2 % wet of optimum) and compacted using West African standard (WAS) compactive effort. The admixture of bentonite triggered upsurge in Atterberg limits as well as the shrinkage potential but lower hydraulic conductivities were attained. They observed that hydraulic conductivities fell from 7.91 x 10⁻⁹ m/s to 1.49 x 10⁻¹¹ m/s at highest bentonite content of 10 %. The gradation of natural soil is also an influencing factor on its barrier performance (Yamusa et al., 2020), according to their findings soils with 50 % fine content has permeating rate of less than 1.0 x 10⁻⁹ m/s.
2.2 Strength
Chinade et al. (2017) recorded strength depletion while extending permeating period, when tropical soils compacted at water contents of -2, 0, and +2 % relative to the optimum moisture contents, and permeated with MSW leachate for period of 7, 21, 42, 84, and 120 days, however 200 kN/m2 or greater strength values were observed for permeating periods up to 42 days for BSH and 21 days for WAS compactive efforts. Strength reduction was also noticed as the bentonite content of admixed natural soil increased, although 200 kN/m2 strength limit for hydraulic barrier were met/exceeded by some specimen (Amadi and Eberemu, 2013). Higher moulding water content generally results in strength depletion. Decrease in the strength of abandoned dumpsite and lateritic soils below 200 kN/m2 is inevitable when compacted with water content greater than 21 % (Bello, 2010). However, Yamusa et al. (2020) repoted that soils with 50 % fine content produced acceptable strength values when prepared with moulding water content within the range of 24 – 28 %.
2.3 Shrinkage/Swell
For expansive soils, shrinkage and swelling characteristics are common phenomenon largely due to the moisture content variation as well as the type and amount of clay mineral present in the soil. Soils with higher clay content and higher plasticity index have a greater affinity for water and thus this explains the high shrinkage tendency while drying (Amadi and Eberemu, 2013). Volumetric shrinkage in expansive soil can be as high as 15.5 % (Adeyemo et al., 2019b), which is nexused to the presence of montmorillonite clay mineral. Lateritic soil studied by Amadi and Eberemu (2013) produces volumetric shrinkage of less than 1 %, but the shrinkage values increase steadily as admixed bentonite content is increases. They observed that shrinkage strain slightly exceeding regulatory 4 % limit was recorded at maximun bentonite blend.
ICEES 2021 ISSN: 2714-4186
326
3.0 Agricultural/Industrial Wastes Admixed Soil as Compacted Soil Liner
Several investigations have been conducted using industrial and agrigutural waste or combination of both as stabilizer in the treatment of soil as barrier material in waste containment structures (Oriola and Moses, 2011; Amadi and Eberemu, 2013; Yusuf et al., 2016; Moses et al., 2016, 2018 and Adeyemo et al., 2019a, b). The effectiveness of these waste materials as soil stabilizer is controlled by their pozollanic properties. Some of these studies are reviewed as follow.
3.1 Permeability
One of the contributions of pozzolanic additives in soil treatment is plugging of pores in soil with consequential fall in hydraulic conductivitywhich is beneficial in waste containment structures. Oriola and Moses (2011) investigated black cotton soil admixed with Cement Kiln Dust (CKD) to determine geotechnical properties useful for the design of hydraulic barrier in MSW containment structures. They prepared specimens at various moulding water contents between -2 and +4 % relative to optimum moisture content adopting compactive energy levels replicable in the field. Results from their experimental study showed that hydraulic conductivity values recorded at both BSL and WAS produced satisfactory results that met the regulatory 1 x 10⁻⁹ m/s requirement at all treatment levels. Black cotton soil blended with cassava peel ash (CPA) exhibited low hydraulic conductivities as CPA particles clog into soil pores (Adeyemo et al., 2019a). Yusuf et al. (2016) reported the performance of hydraulic conductivity of iron ore tailing (IOT) admixed laterite, they used up to 20 % IOT and established decreased permeation rate at every treatment level.
3.2 Strength
Liners and covers require adequate strength to withstand compressive/shear stresses from waste and waste delivery into containment system. The binding potential exhibited by pozzolana gives it advantage over other materials when considering strength improvement in soil. It has been established that CKD has the potential to improve the strength of expansive soils. According to Oriola and Moses (2011), at 4 % CKD treatment of black cotton soil, compacted under WAS energy conditions, minimum regulatory value of 200 kN/m2 for shear strength was obtained. The combined influence of metakaolin and lime on the strength properties of lateritic soil has been demonstrated by Tan et al. (2020), it was discovered that the combination of 5 % lime and 4 % metakaolin can improve the UCS and shearing resistance of metakaolin-lime-soil blend such that the strength specification of MSW hydraulic barrier system is satisfied.
3.3 Shrinkage/Swell
Shrinkage/swell properties of soil is a function of clay mineral type and moisture variation. The shrinkage/swell suitability of any material for use in waste containment structure is measured through volumetric shrinkage strain (VSS). Maximum allowable VSS of 4 % has been established and adopted as the regulatory requirement for the design of waste management structure by most researchers (Daniel and Wu, 1993; Bello, 2010; Oriola and Moses, 2011; Amadi and Eberemu, 2013 and Adeyemo et al., 2019a, b). Oriole and Moses (2011) employed the pozzolanic activities of CKD to retard the excessive shrinkage/swelling behaviour of black cotton soil. Upon the completion of their experimental study, less than 4 % volumetric shrinkage strain at 16 % CKD content for BSL and 12 and 16 % CKD contents for WAS energy level were established. Adeyemo et al. (2019b) also demonstrated the potential of CPA as a shrinkage-swell restraining agent in an highly expansive soil. Their investigation revealed that at 16% CPA treatment, values of VSS reduced by 73% (BSL), 92% (BSH) and 74% (WAS). Moses et al. (2016) observed gradual reduction in the volumetric shrinkage of expansive soil treated with metakaolin.

ICEES 2021 ISSN: 2714-4186
327
Although values in excess of 4 % VSS were obtained for 4 – 16 % metakaolin contents, less than 4 % VSS were recorded at 20 and 24 % metakaolin contents, which is solely due to pozzolanic input of metakaolin. Nevertheless, in the work of Moses et al. (2018) in which up to 50 % concrete waste collected from demolished structures was used to stabilize tropical black clay, they established that none of the admixed specimens yield to the regulatory VSS value of ≤ 4 % required for waste containment application.
4.0 Microbial-Induced Calcite Precipitation (MICP) Treated Soil as Compacted Soil Liner
Microbial-induced calcite precipitation (MICP) is an emerging technique that has found its application in geo-environmental engineering and other aspects of Civil Engineering due to environmental consideration and its cost effectiveness (Rahman et al., 2020). The process employs the activities of naturally occurring bacteria to cement soil particles together via calcium carbonate (CaCO3) precipitation, as shown in Figure 1.
Figure 1: A schematic diagram of CaCO3 precipitation in the pore space of the soil matrix via MICP (Rahman et al., 2020)
The effectiveness of MICP in binding soil is premised on the following: types of biological process adopted, type and concentration of bacteria employed, the pH and temperature, the concentration and volume of cementation solution, the soil properties and so on (Rahman et al., 2020).
The most commonly used biological processes in MICP are bio-stimulation and bio-augmentation. In bio-stimulation, microbes present in the soil are stimulated with external nutrient medium, thereby causing growth, but in bio-augmentation, external microbes are introduced into the soil along with nutrient medium to facilitate their growth. Raveh-Amit and Tsesarsky (2020) demonstrated that bio-stimulation is most favourable in the low-carbon mineral soils.
Some of the bacteria, nutrients, and major metabolic processes involved in MICP are presented in Table 1 (Castro-Alonso et al., 2019).
ICEES 2021 ISSN: 2714-4186
328
Table 1: Commonly used Bacteria and Nutrients in MICP Technique
Bacteria Metabolism Nutrients
Sporosarcina pasteurii, Bacillus sphaericus, Bacillus mucilaginous, Enterobacter sp., Bacillus cereus, Pseudomona aeruginosa, Diaphorobacter nitroreducens, T-Bacillus subtilis, Bacillus cohnii, Bacterium BKH1, Bacterium BKH4, Spoloactobacilus, Clostridium, Desulfotomaculum
Urea Hydrolisis, Denitrification, Dissimilatory sulfate reduction, Silicification, Ammonification of amino acids, Photosynthesis
Lactose Mother Liquor wastewater, Urea,Nutrient broth, Yeast Extract, Corn Steep Liquor wastewater, Calcium Nitrate, Peptone, Tryptone, Urea, Calcium formate, Calcium nitrate, Saccharose, Lentil seeds, Sugar, Urea, Beef extract
4.1 Permeability
In MICP, the formation of calcium carbonate from the interaction among various metabolic by-products, such as HCO3
− and Ca2+ present in the microenvironment results in the clogging of micro pores in the soil mass with consequent decrease in permeation rate by 81 – 95 % and increase the breakthrough time by 345 % (Perito and Mastromei, 2011; Salman et al., 2016; Tang et al., 2018: Castro-Alonso et al., 2019) (). The study of MICP performance on indigenous landfill bacteria against commercially purchased bacteria (Bacillus megaterium) using sand columns was carried out by Rajasekar et al. (2021). They concluded that bio-stimulation of indigenous bacteria performed slightly better than the foreign bio-augmented bacteria in terms of permeation rate reduction and CaCO3 precipitation. Gollapudi et al. (1995) conducted investigation into the viability of using microbial plugging in reducing permeation rate of highly porous mass subjected to various conditions. The study observed that fractures within the porous mass serve as nucleation sites for capturing bacteria clusters thereby causing pore plugging and later completely plugged pore was noticed within days of nutrient injection in a sand packed column containing bacteria. Osinubi et al. (2019b) reported slight decline in the permeation rate of soil treated with MICP technique using Bacillus coagulans bacteria and compacted under BSL conditions. In spite of consistent decline as bacteria suspension density was increased, permeation rates in excess of 1 x 10⁻⁹ m/s were obtained. The study recommended the use of higher compactive energy. The effectiveness of MICP on the permeation rate of sand was also demonstrated in the work of Yasuhara et al. (2011) where percentage reduction of 60 – 70 % was established. Osinubi et al. (2018b) also obtained a maximum of 98.18 % decline in the permeation rate of lateritic soil moulded at +2 % of OMC and treated with a 6.0 × 10⁸ cells/ml suspension density of Sporosarcina pasteurii.
4.2 Strength
Over the past years, several investigations have been conducted on the strength improvement of soil treated with MICP technique for general engineering use. According to Gomez et al. (2014) shear strength of soil improves with calcite precipitation, from 1070 kN/m2 to 5340 kN/m2 corresponding to 6.0 – 13.2 % calcite content. Li et al. (2015) also recorded a significant increase in excess of 200 kN/m2 for the UCS of soil treated with asparaginase enzyme using MICP technique. Neupane (2016) studied the effectiveness of MICP technique in treating expansive soil. The study employed both bio-stimulation and bio-augmentation MICP techniques to evaluate their UCS and then compared the results with lime treated specimen. Improvement in UCS values of MICP treated soil specimen was observed, but the strength increase was low when compared with that of lime treated soil. The influence of bacteria “Bacillus coagulans”

ICEES 2021 ISSN: 2714-4186
329
suspension density on the strength of lateritic soil was studied by Osinubi et al. (2019a). The UCS of the natural soil was slightly greater than the minimum specified strength value for a barrier facility. Steady UCS improvement of up to 560 % increase was recorded as the bacteria suspension density increased. However, the study observed a steady fall in the UCS of specimens with higher moulding water content. Osinubi et al. (2019c and d) observed strength improvement in MICP treated lateritic soil using Bacillus pumilus and Sporosarcina pasteurii bacteria respectively. The research team recorded increase from 66.74 kN/m2 to 2345.15 kN/m2 at 2.40 × 10⁹ cells/ml and from 120 kN/m2 to 2232 kN/m2 at 1.2 × 10⁹ cells/ml suspension density, upon treatment with Bacillus pumilus and Sporosarcina pasteurii bacteria respectively.
4.3 Shrinkage/Swell
Without mineralogical alteration of clay soil, reduction in 1-dimensional swell property observed in the MICP treated soil was equivalent to that noticed in lime treated specimen (Neupane, 2016). The VSS of MICP treated lateritic soil was investigated by Osinubi et al. (2018a) using Bacillus pumilus bacteria, various bacteria suspension densities were employed but at 24 x 108/ml VSS value in compliance with hydraulic barrier specification (i.e. ≤ 4 %) was recorded. Minimum VSS value of 2.5 % was also recorded when Sporosarcina pasteurii suspension density of 2.4 x 10⁹/ml was used in the treatment of compacted lateritic soil (Osinubi et al., 2018c). As demonstrated in the study of desiccation cracking behaviour of MICP treated bentonite, the combination of bacteria and cementation solution in the ratio 1:1 effectively retard the desiccation cracking potential of bentonite (Vail et al., 2019).
5.0 Conclusion
Liners and covers are important components of waste containment facilities, thus studying the behaviour of materials employed for their construction and operation has been point of focus to many researchers. This study reviews the application of compacted natural soil, agricultural/industrial-waste treated soil and MICP treated soil in waste containment structures. The study focuses on the important parameters of hydraulic barrier system (i.e. permeability, shrinkage/cracking and strength). The study observed adequate permeability, strength and shrinkage performance of natural lateritic soil with adequate proportion of fines, but excessive shrinkage/cracking is inevitable when expansive clay mineral represents the dominant clay mineral. Furthermore, the introduction of modifiers processed from agricultural and/or industrial (such as lime, CKD, CPA, IOT etc.) wastes help ameliorates the excesses of expansive clay mineral. Finally, MICP technique in waste containment facility is a green technique, due to its cost effectiveness and most environmentally friendly in leu of other treatment methods. While MICP technique has found popular applications in concrete technology, less attention has been given to its applications in active dumpsite soils. This study therefore recommends intensive studies in this direction.
References
Achal, V., Mukherjee, A., Kumari, D., & Zhang, Q. (2015). Biomineralization for sustainable construction–a review of processes and applications. Earth. Sci. Rev., 148, 1–17. doi:doi: 10.1016/j.earscirev.2015.05.008
Adeyemo, K. A., Yunusa, G. A., Bello, A. A., & Muhammed, A. (2019b). Effect of Compactive Efforts on the Dessication-Induced Volumetric Shrinkage of Black Cotton Soil Treated with Cassava Peel Ash. 1st International Conference on Engineering and Environmental Sciences (pp. 512-523). Osogbo: Faculty of Engineering and Environmental Sciences, Osun State University.

ICEES 2021 ISSN: 2714-4186
330
Adeyemo, K. A., Yunusa, G. H., & Bello, A. A. (2019a). Effect of Compactive Efforts on Hydraulic Conductivity of Black Cotton Soil Treated with Cassava Peel Ash. Uniosun Journal of Engineering and Environmental Sciences (UJEES), 1(1), 11-18. doi:DOI: 10.36108/ujees/9102.10.0120
Amadi, A. A., & Eberemu, A. O. (2013). Characterization of Geotechnical Properties of Lateritic Soil-Bentonite Mixtures Relevant To Their Use as Barrier in Engineered Waste Landfills. Nigerian Journal of Technology, 32(1), 93-100.
Baderna, D., Caloni, F., & Benfenati, E. (2018). Investigating landfill leachate toxicity in vitro: A review of cell models and endpoints. Environment International, 122(2019), 21-30.
Bello, A. A. (2010). The Use of Abandoned Dumpsite and Lateritic Soil as Hydraulic Barriers in Waste Containment Structures. Unpublished Ph.D Thesis, Department of Civil Engineering, Ahmadu Bello University, Zaria, Nigeria.
Chinade, A. U., Yusuf, U. S., & Osinubi, K. J. (2017). Effect of Mmunicipal Solid Waste Leachate on the Strength of Compacted Tropical Soil for Landfill Liner. International Research Journal of Engineering and Technology (IRJET), 4(6), 3248-3253.
Daniel, D. E., & Wu, Y. K. (1993). Compacted Clay Liners and Covers for Arid Sites. Journal of Geotechnical Engineering, ASCE, 119(2), 228-237.
Gollapudi, U. K., Knutson, C. L., Bang, S. S., & Islam, M. R. (1995). A New Method of Controlling Leaching Through Permeable Channels. Chemosphere, 30(4), 695-705. doi:https://doi.org/10.1016/0045-6535(94)00435-W
Gomez, M., Anderson, C. M., Dejong, J. T., Nelson, D. C., & Lau, X. H. (2014). Bacteria, bio-films and invertebrates… the next generation of geotechnical engineers. Proceedings of geo-congress 2014: technical papers. 234, pp. 1674–1682. ASCE, Geotechnical Special Publication.
Li, M., Fu, Q., Zhang, Q., Achal, V., & Kawasaki, S. (2015). Bio-grout based on microbially induced sand solidification by means of Asparaginase activity. Sci Rep, 5(16128), 1-9. doi:https ://doi.org/10.1038/srep1 6128
Moses, G., Etim, R. K., Sani, J. E., & Nwude, M. (2018). Desiccation effect of compacted tropical black clay treated with concrete waste. Leonardo Electronic Journal of Practices and Technologies, 33, 69-88.
Moses, G., Peter, O. F., & Osinubi, K. J. (2016). Desiccation-Induced Volumetric Shrinkage of Compacted Metakaolin-Treated Black Cotton Soil for a Hydraulic Barriers System. Slovak Journal of Civil Engineering, 24(1), 1-5. doi:10.1515/sjce-2016-0001
Oriola, F., & Moses, G. (2011). Compacted Black Cotton Soil Treated With Cement Kiln Dust As Hydraulic Barrier Material. American Journal of Scientific and Industrial Research, 2(4), 521-530.
Osinubi, K. J., Eberemu, A. O., Ijimidiya, T. S., Sani, J. E., & Yakubu, S. E. (2018a). Volumetric Shrinkage of Lateritic Soil Treated with Bacillus Pumilus. In A. Farid, & H. Chen, Proceedings of GeoShanghai 2018 International Conference: Geoenvironmental and Geohazard. Singapore: Springer. doi:https://doi.org/10.1007/978-981-13-0128-5_36

ICEES 2021 ISSN: 2714-4186
331
Osinubi, K. J., Gadzama, E. W., Eberemu, A. O., & Ijimdiya, T. S. (2018b). Influence of Sporosarcina pasteurii induced precipitate on the hydraulic conductivity of lateritic soil compacted with reduced standard proctor energy. National Engineering Conference 2018: The Role of Engineering in the Diversification of Nigerian Economy (pp. 109-114). Zaria: Faculty of Engineering Ahmadu Bello University.
Osinubi, K. J., Gadzama, E. W., Ijimdiya, T. S., & Eberemu, A. O. (2018c). Volumetric Shrinkage of Compacted Lateritic Soil Treated with Sporosarcina Pasteurii. 1st International Civil Engineering Conference (ICEC 2018) (pp. 184-192). Minna, Nigeria: Department of Civil Engineering, Federal University of Technology.
Osinubi, K. J., Yohanna, P., Eberemu, A. O., & Ijimdiya, T. S. (2019a). Unconfined Compressive Strength of Lateritic Soil Treated with Bacillus Coagulans for use as Liner and Cover Material in Waste Containment System. IOP Conference Series: Materials Science and Engineering (pp. 1-12). IOP Publishing Ltd. doi:doi:10.1088/1757-899X/640/1/012081
Osinubi, K. J., Yohanna, P., Eberemu, A. O., & Ijimdiya, T. S. (2019b). Evaluation of Hydraulic Conductivity of Lateritic Soil Treated with Bacillus Coagulans for Use in Waste Containment Applications. Springer Nature(50), 401-409. doi: https://doi.org/10.1007/978-981-13-2227-3_50
Osinubi, K., Gadzama, E. W., Eberemu, A. O., Ijimdiya, T. S., & Yakubu, S. E. (2019c). Evaluation of the strength of compacted lateritic soil treated with Bacillus Pumilus. In L. Zhan, Y. Chen, & A. Bouazza, Proceedings of the 8th international congress on environmental geotechnics (ICEG 2018). Towards a sustainable geoenvironment (Vol. 3, pp. 410–418). Hangzhou: Springer. doi:https ://doi.org/10.1007/978-981-13-2227-3_51
Osinubi, K., Gadzama, E. W., Eberemu, A. O., Ijimdiya, T. S., & Yakubu, S. E. (2019d). Evaluation of the strength of compacted lateritic soil treated with Sporosarcina pasteurii. In L. Zhan, Y. Chen, & A. Bouazza, Proceedings of the 8th international congress on environmental geotechnics (ICEG 2018). Towards a sustainable geoenvironment (Vol. 3, pp. 410–418). Hangzhou: Springer. doi:https ://doi.org/10.1007/978-981-13-2227-3_51
Perito, B., & Mastromei, G. (2011). Molecular basis of bacterial calcium carbonate precipitation. In B. Perito, G. Mastromei, & W. E. Müller (Ed.), Molecular Biomineralization: Aquatic Organisms Forming Extraordinary Materials (pp. 113–139.). Berlin, Heidelberg: Springer. doi:doi: 10.1007/978-3-642-21230-7_5
Rahman, M. M., Hora, R. N., Ahenkorah, I., Beecham, S., Karim, M. R., & Iqbal, A. (2020, August 4). State-of-the-Art Review of Microbial-Induced Calcite Precipitation and Its Sustainability in Engineering Applications. Sustainability, 12, 1-41. Retrieved 10 7, 2021, from encyclopedia: https://encyclopedia.pub/2186
Raveh-Amit, H., & Tsesarsky, M. (2020). Biostimulation in Desert Soils for Microbial-Induced Calcite Precipitation. Applied Sciences, 10, 2905-2914. doi:doi:10.3390/app10082905
Salman, V., Berben, T., Bowers, R. M., Woyke, T., Teske, A., & Angert, E. R. (2016). Insights into the single cell draft genome of “Candidatus Achromatium palustre”. Stand Genomic. Sci., 11-28. doi:doi: 10.1186/s40793-016-0146-x

ICEES 2021 ISSN: 2714-4186
332
Tan, Y., Hu, Y., Chen, R., & Sun, W. (2020). Shrinkage Mechanism of Laterite Modified by Lime and Metakaolin. Advances in Civil Engineering, 1-9. doi:https://doi.org/10.1155/2020/6347597
Tang, Q., Gue, F., Zhang, Y., Zhang, Y., & Mo, J. (2018). Impact of biological clogging on the barrier performance of landfill liners. Journal of Environmental Management, 1-23. https://doi.org/10.1016/j.jenvman.2018.05.039.
Vail, M., Zhu, C., Tang, C., Anderson, L., Moroski, M., & Montalbo-Lomboy, M. T. (2019). Desication Cracking Behaviour of MICP-Treated Bentonite. Geosiences, 9, 385-400. doi:https://doi.org/10.3390/geosciences9090385
Yamusa, Y. B., Alias, N., Ahmad, K., Sa’ari, R., Osinubi, K. J., Eberemu, O. A., & Moses, G. (2020). Engineering Characteristics of Compacted Laterite Soil as Hydraulic Barrier in Waste Containment Application. Journal of Engineering Science and Technology, 15(1), 508-523.
Yasuhara, H., Hayashi, K., & Okamura, M. (2011). Evolution in Mechanical and Hydraulic Properties of Calcite-Cemented Sand Mediated by Biocatalyst. In Proceedings of Geo-Frontiers 2011: Advances in Geotechnical Engineering (Vol. 211, pp. 3984–3992). Dallas TX: ASCE, Geotechnical Special Publication.
Yusuf, U. S., Slim, M. D., & Uchechukwu, E. A. (2016). Hydraulic Conductivity of Compacted Laterite Treated with Iron Ore Tailings. Advances in Civil Engineering, 1-8. doi:http://dx.doi.org/10.1155/2016/4275736

ICEES 2021 ISSN: 2714-4186
333
EVALUATION OF LIGHTING ENERGY CONSUMPTION PATTERN AND COST BENEFIT OF LAMPS IN ACADEMIC INSTITUTION LECTURE HALLS USING FIELD MEASUREMENT APPROACH
2*Adeleke J. S. 1 Wahab A. B. 2 Omotehinshe O. J. and 2Poopola O. C.
1Department of Building, Obafemi Awolowo University, Ile-Ife, Nigeria
2Department of Building Technology, Federal Polytechnic Ede, Osun State, Nigeria
*Email of Corresponding Author: :[email protected];
ABSTRACT
The significant of lighting in lecture halls cannot be overemphasised in any academic institution. However, university institution requires a copious amount of artificial lighting in lecture halls for academic activities. This paper examined the lighting energy consumption pattern and economic benefit of both the existing fluorescent lamps and energy efficient lamps in selected lecture halls of Obafemi Awolowo University Ile-Ife, Nigeria. The study obtained data through a quantitative approach by carrying out periodic measurement of real time energy consumption. Three out of the eleven categories of lecture halls were purposively selected using design typology and simulations using energy monitor. Records of energy consumptions were obtained at predetermined intervals of 1hr, 3hrs, 6hr, and 12hrs, 7days, 14days, 1 month, 2 months and 3 months respectively. Data collected were analysed using descriptive statistical tools comprising of frequency distribution, mean average and percentage. The energy consumption of the simulated lamps increased as the time under consideration increased, and the pattern of the energy consumption increased, showing a similar curve across the three selected lecture halls. Finding further shows that the economic benefit of adopting the retrofitting with either
26WCFL or 18W LED lamps reduces annual energy cost by ₦72,048.19; ₦95758.53 in ALT,
₦227, 4090.16; ₦292, 632.44 in ODLT and ₦911,576.44; ₦1,018,914.52 in SLT lecture hall respectively. The study concluded that the use of CFL and LED for lighting substantially reduced the energy bills in lecture halls. The study, therefore, recommends the possible replacement of all existing fluorescent lamps in public lecture halls with LED and CFL lamps and in subsequent construction of public lecture halls.
Keywords: Economic Benefit, Electricity Consumption, Energy Monitor, Lecture Halls
1.0 INTRODUCTION
Electricity is a major sources of energy used for lighting in institutional, commercial and industrial buildings (Norhafiza, 2015). Artificial lighting consumes about 25-30% electricity supply globally, with lighting system of an educational institution consuming an average of 30% annually of the total electricity supply and usage in United State of America (United State Department of Energy, 2013). This figure could amount to a high running cost for academic institutions management. Again, most of the lighting energy consumptions in the educational institutions takes place in lecture halls due to the fact that artificial lighting is among the second largest consumption in lecture halls after hostel accommodation in institutions due its higher number of lighting stock and its ability to complements natural lighting during the day and at night, it serves as an alternative sources of illumination for the academic activities in the university. Furthermore, the provision of artificial lighting for educational institution lecture halls

ICEES 2021 ISSN: 2714-4186
334
contributes significantly to the academic performance of students in such institution. Rashid, (2002) considered a lecture hall as a place within the campus where students converged to learn through seeing the teaching materials presented to them by their lecturers. For instance, illuminating engineering society (IES), chartered institute of building service engineer (CIBSE), and Deutsches Institut fur Normung (DIN EN) 12464 recommend 300-500lux illumination level for educational institution lecture halls. To meet this statutory requirement, adequate lighting fittings using lamps with greater efficacy is a prerequisite for active learning in university environment. However, sufficient lighting in lecture halls consumes significant amount of electricity which in turns increased the electricity bills of various institutions. This is attributed to the type of lamps in use and the hours of operation of such lamps installed in lecture halls. This regular high electricity consumption further necessitate the need for critical evaluation of various categories of lighting fixtures usually installed on the energy consumption in university lecture halls (Ryckaert, et al., 2010). The impact of various lamps types has resulted to the continuous increase in electricity tariff imposed by the electricity distribution companies on educational institution. Obaju, et al., (2019) also revealed that lighting energy constitutes a substantial portion of electricity wastage. This increase in lighting energy wastages are attributed to continuous use of lamps during off-peak hours occasioned by ineffective controls and bad switches. Obaju, et al., (2019) also reported that six out of thirteen energy wastage-areas were connected with lighting energy, and the highest-ranked wastage-areas occurred in unoccupied spaces with their lighting lamps fully energised.
Thus, it is essential to study the pattern of electricity consumption of the lighting scheme using various common lamp options that are usually installed in these lecture halls in order to achieve the much-desired optimum electricity cost using field measurement approach. Sustainable Energy Authority of Ireland, (2014) observed that electricity consumption pattern have the most tangible direct impact in cutting greenhouse gases and further constitutes the only means of mitigating electricity consumption in lighting fittings coupled with design of the lighting scheme and effective controls. Previous studies on the pattern of electricity consumption were based on theoretical estimations which are equally based on the numbers and hours of lamps in used. Regrettably, this estimated method did not provide sufficient data that would provide available information on the pattern of electricity consumption of the existing lamp fixtures in institutional lecture halls.
Thus, this paper examine the pattern of electricity consumption and economic benefits of selected lamps installed in lecture halls at periodic logins using device for field measurement and its impact on energy bills on selected lecture halls in Obafemi Awolowo University (OAU) Ile-Ife. The study adopts the use of an energy monitor for data collection. Data collection was done under a controlled environment through simulation of both the as-built and energy efficient lamps similar to the selected university lecture halls.
2.0 METHODOLOGY
Eleven typology of lecture hall were identified in Obafemi Awolowo University, Ile Ife, Nigeria, three were selected as the sampling frame using a purposive sampling approach. The three are Agriculture Lecture Theatre (ALT), Oduduwa Lecture Theatre (ODLT) and Science Lecture Theatre (SLT). A purposive sampling technique (a non-probability sampling method) was used in determining the sampling size. Using legal judgments, the researchers often believed in the representative of the samples represented, which usually resulted in saving time and money (Black, 2010). The three lecture halls comprises of a small, medium and a large halls. Physical characteristics such as the shape, height, size of floor areas (m2) and seating capacities were significant factors of consideration. These characteristics were used to determine their design typologies as contained in Table I. The study adopted a quantitative approach by simulating the

ICEES 2021 ISSN: 2714-4186
335
selected lecture halls. The study utilized field measurement approach to examine the existing lighting energy consumption patterns of the fluorescent lamps in the selected halls. The fluorescent lamps were then replaced via simulation with compact fluorescent lamps CFL and light emitting diode lamps LED respectively and the electricity consumption patterns was re-examined and compared using similar field device in figures 1, 2, 3, and 4 respectively. The study obtained data periodically at periodic logins of 1hr, 3hrs, 6hrs, and 12hrs, 1day, 3days, 7days, 14days, 1month, 2months and 3months respectively. Measurement of lighting electricity consumption trend in each of the selected lecture hall was done through improvised energy monitor device, which was connected to a lighting load set-up. The study used a wireless microcomputer interface of the end-use module to obtain the required electricity data from the lamps, which were uploaded at the micro-computer interface. Electricity supply was through a single-phase connection, consisting of live and neutral cable. The live cable of the electricity supply was conspicuously marked on the distribution board/consumer unit before the installation of the current transformer (CT) sensor. The sensor was then clipped to the live cable so that it could measure the current at the predetermined intervals. The voltage transformer (VT) was also plugged in, like a typical appliance, to monitor the voltage at intervals of periodic logins. Finally, the calculations and the processing were done in the micro-controller, by multiplying the (CT) and (VT) to give the real time voltage dropped. Product of each value of the power obtained and the time intervals provided the electricity consumption data. All these measurements took place at the micro-controller interface and were stored at the internal memory as shown in figures 1-4 respectively.
Table 1: Design Typology of Lecture Halls in Obafemi Awolowo University Ile-Ife
S/N Lecture Halls in OAU Seating Capacity Number of As-Built Lamps
1 ALT 110 16 (FLs) 2 Law 209 180 48(FLs) 3 BOOA and BOOC 140 44 (FLs) 4 HSLT A and B 220 65(FLs) 5 Ajose AJSLT 500 98 (FLs) 6 BOOC 400 46 (FLs) 7 White House 420 50 (FLs) 8 HSLT C 450 200 (FLs) 9 ODLT 360 30 (FLs) 10 1000 SLT Seated Capacity 1000 69 (FLs) 11 Oduduwa hall 1000 105(FLs)
FLs = Fluorescent Lamps
BOOA = Biological Lecture Theatre A
BOOB = Biological Lecture Theatre B
BOOC = Biological Lecture Theatre C
HSLT = Health Sciences Lecture Theatre
ODLT = Oduduwa Lecture Theatre
SLT = Science Lecture Theatre

ICEES 2021 ISSN: 2714-4186
336
Figure 1: Connection of Energy Monitor to the Simulated Lighting Set-up
Figure 2: Pre-retrofits Data Collection Process of the As-built Fluorescent Lamps
Figure 3: Post-retrofits Simulation Process using CFLs Lamps
Figure 4: Output of the Microcomputer Users Interface

ICEES 2021 ISSN: 2714-4186
337
3.0: DATA PRESENTATION
3.1 Data Presentation on the Selected Simulated Lecture Halls in Obafemi Awolowo University Ile-Ife
This section presents the data collected from ALT, ODLT and SLT lecture halls of the Obafemi Awolowo University, Ile-Ife. Figures 1, 2 and 3 respectively show the typologies of the as-built designs of the lecture halls selected for the study. The halls show their floor areas (m2), seating capacities and the numbers of lighting fittings available in each of the halls. The smallest (ALT) lecture hall has a floor area of 330m2, 110 seating capacity and installed with 16 numbers of as-built 36W doubled paired fluorescent lamps. The medium-sized lecture hall (ODLT) has a floor area of 460m2, 30 numbers of installed 36W fluorescent bulbs and 360 seating capacity. The largest hall (SLT) has a capacity of 1000 seats with a floor area of 1032m2 and installed with 69 as-built 36W fluorescent lamps. The existing fluorescent lamps in ALT and SLT are mounted on the ceiling soffits while those at the ODLT are suspended, 0.6m below the ceiling with metal chain in a regular array of design intervals. Records of the lighting energy consumption of the existing fluorescent and the replaced lamps at ALT, ODLT and SLT halls are summarised in Table II and illustrated in Figures 5, 6, and 7 respectively and cost patterns of the lighting energy consumption for the replaced lamps are illustrated in Figures 8, 9 and 10 respectively. The figures revealed a progressive increase in energy consumption of the simulated lamps at lower energy bills. The three selected lecture halls show consistent and similar energy cost pattern throughout the experiment. Table 2 shows all records of periodic logins for 1-hour, 3-hour, 6-hour, 12-hours and 24-hour periodic logins respectively.
Figure 5: Sketch of ALT Lecture Hall Showing a Floor Area of 330m2, 110 Seating Capacity
and 16 Numbers of As-Built 36W Doubled Paired Fluorescent Lamps

ICEES 2021 ISSN: 2714-4186
338
Figure 6: Sketch of ODLT Lecture Hall Showing a Floor Area of 460m2, 360 Seating
Capacity and 30 Numbers of As-Built 36W Fluorescent Bulbs

ICEES 2021 ISSN: 2714-4186
339
Figure 7: Sketch of SLT Lecture Hall Showing a Floor Area of 1032m2, 1000 Seating Capacity and 69 Numbers of As-Built 36W Fluorescent Lamps

ICEES 2021 ISSN: 2714-4186
340
4.0 Results and Discussion
4.1 Lighting Energy Consumption Pattern of the Simulated Lamps at Periodic Logins
Table 4.1 shows the lighting energy consumption of existing simulated fluorescent lamps, compact fluorescent lamps and light emitting diode lamps at the periodic logins. The ALT hall is installed with 16 numbers of 36W of as-built fluorescent lamps, consumed 0.32kWh in 1 hour. This was increased to 7.60kWh in 1 day, 229.10kWh in 1 month and 681.58kWh in 3 months logins. Furthermore, simulating with 26W CFL lamps reduced the energy consumption to 0.18kWh (43.75%); 4.30kWh (43.42%); 129.10kWh (43.65%), and 387.30kWh (43.18%). Simulation with 18W LED lamps equally reduced lighting energy consumption to 0.13kWh (59.38%); 3.31kWh (54.48%); 96.40kWh (57.92%), and 294.19kWh (56.84%) within the same login periods. Likewise, in ODLT with 30 numbers of 36W installed fluorescent lamps recorded lighting energy consumption of 0.76kWh in 1 hour was increased to 18.99kWh in 1 day, 531.13kWh in 1 month and 1619.47kWh in 3 months of logins. Simulated with 26W CFL lamps reduced the energy consumption to 0.31kWh (59.21%); 7.91kWh (58.35%); 216.24kWh (59.29%), and 692.48kWh (57.24%) and simulation with 18W LED lamps equally reduced lighting electricity consumption to 0.21kWh (72.37%); 5.27kWh (72.25%); 142.54kWh (73.16%), and 426.61kWh (73.66%) within the same login periods. Similarly, the 69 as-built 36W fluorescent lamps installed at SLT hall consumed 2.63kWh, 60.03kWh, 1840.85kWh, and 5652.43kWh within the same corresponding login periods. Simulated with 26W CFL lamps respectively reduced these electricity consumptions to 0.91kWh (65.40%); 22.84kWh (61.93%); 657.24kWh (64.30%), and 1936.60kWh (65.74%). Simulation with 18W LED lamps reduced the corresponding lighting energy consumption to 0.75kWh (71.48%); 17.05kWh (71.58%); 500.17kWh (72.83%), and 1499.02kWh (73.48%) within the same login periods.
Table 2: Lighting Energy Consumption Pattern of the Selected Lecture Halls at Obafemi Awolowo University Ile-Ife
HALL
ENERGY CONSUMPTION (kWh)
ALT
PERIODIC LOGINS
1hr 3hrs
6hrs 12hrs
1day 7days 15days
1month 2 month
s
3 month
s
LAMPS TYPES 36W FL
0.3
2
0.
95
1.94
3.95
7.60
54.33
112.1
0
229.10
448.19
681.58
26W CFL 0.18
0.53
1.06 1.96 4.30 30.12 64.55 129.10 260.02 387.30
18W LED 0.13
0.41
0.79 1.67 3.31 23.18 44.98 96.40 191.79 294.19
ODLT
36W FL 0.76
2.28
4.61 9.00 18.9 125.68
265.91
531.13 1058.26 1619.4
7
26W CFL 0.31
0.8
1.72 3.96 7.91 52.15 112.64
216.24 428.42 692.48

ICEES 2021 ISSN: 2714-4186
341
6 18W LED 0.2
1 0.
58
1.26 2.56 5.27 34.57 71.76 142.54 284.09 426.61
SLT
36W FL 2.63
7.97
14.32
33.51
60.03
439.20
939.44
1840.85 3641.9
3 5652.4
3
26W CFL 0.91
2.65
5.55 9.93 22.84
155.85
328.50
657.24 1321.47 1936.6
0
18W LED 0.75
2.36
4.86 8.99 17.05
124.17
258.35
500.17 1002.33 1499.0
2
Figure 8: Electricity Consumption Pattern for the Simulated Lamps in ALT in OAU
Figure 9: Electricity Consumption Pattern for the simulated Lamps in the ODLT in OAU
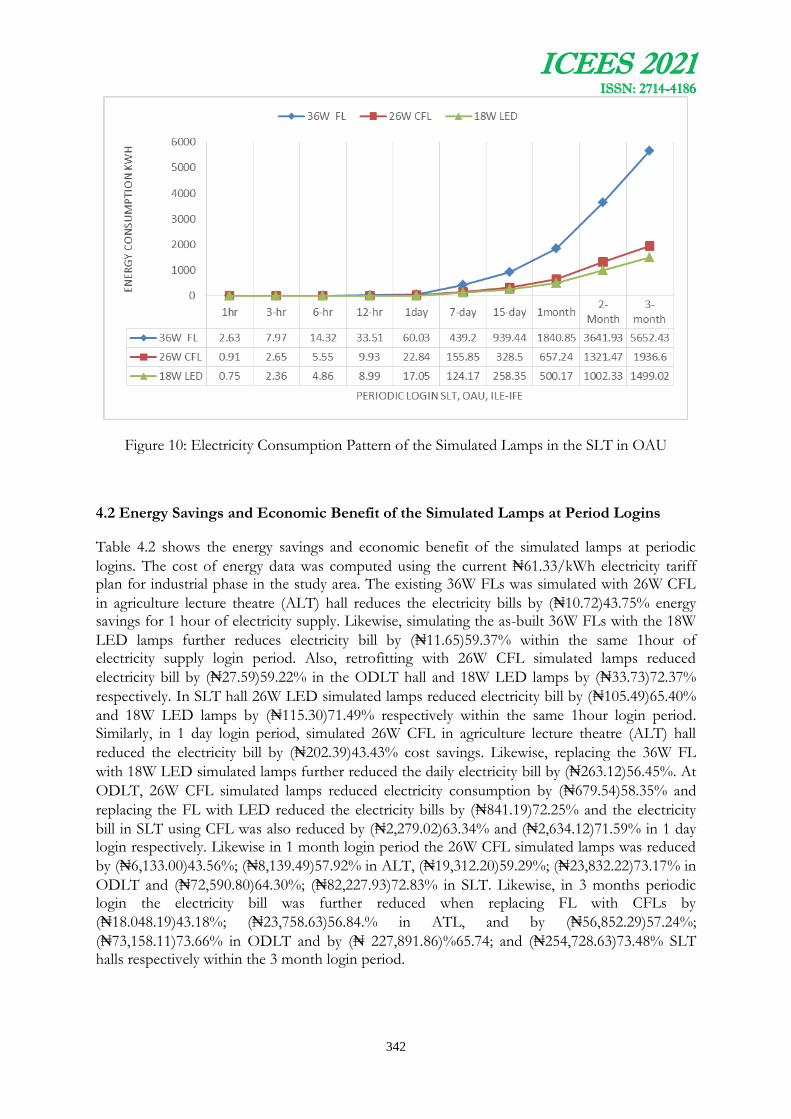
ICEES 2021 ISSN: 2714-4186
342
Figure 10: Electricity Consumption Pattern of the Simulated Lamps in the SLT in OAU
4.2 Energy Savings and Economic Benefit of the Simulated Lamps at Period Logins
Table 4.2 shows the energy savings and economic benefit of the simulated lamps at periodic
logins. The cost of energy data was computed using the current ₦61.33/kWh electricity tariff plan for industrial phase in the study area. The existing 36W FLs was simulated with 26W CFL
in agriculture lecture theatre (ALT) hall reduces the electricity bills by (₦10.72)43.75% energy savings for 1 hour of electricity supply. Likewise, simulating the as-built 36W FLs with the 18W
LED lamps further reduces electricity bill by (₦11.65)59.37% within the same 1hour of electricity supply login period. Also, retrofitting with 26W CFL simulated lamps reduced
electricity bill by (₦27.59)59.22% in the ODLT hall and 18W LED lamps by (₦33.73)72.37%
respectively. In SLT hall 26W LED simulated lamps reduced electricity bill by (₦105.49)65.40%
and 18W LED lamps by (₦115.30)71.49% respectively within the same 1hour login period. Similarly, in 1 day login period, simulated 26W CFL in agriculture lecture theatre (ALT) hall
reduced the electricity bill by (₦202.39)43.43% cost savings. Likewise, replacing the 36W FL
with 18W LED simulated lamps further reduced the daily electricity bill by (₦263.12)56.45%. At
ODLT, 26W CFL simulated lamps reduced electricity consumption by (₦679.54)58.35% and
replacing the FL with LED reduced the electricity bills by (₦841.19)72.25% and the electricity
bill in SLT using CFL was also reduced by (₦2,279.02)63.34% and (₦2,634.12)71.59% in 1 day login respectively. Likewise in 1 month login period the 26W CFL simulated lamps was reduced
by (₦6,133.00)43.56%; (₦8,139.49)57.92% in ALT, (₦19,312.20)59.29%; (₦23,832.22)73.17% in
ODLT and (₦72,590.80)64.30%; (₦82,227.93)72.83% in SLT. Likewise, in 3 months periodic login the electricity bill was further reduced when replacing FL with CFLs by
(₦18.048.19)43.18%; (₦23,758.63)56.84.% in ATL, and by (₦56,852.29)57.24%;
(₦73,158.11)73.66% in ODLT and by (₦ 227,891.86)%65.74; and (₦254,728.63)73.48% SLT halls respectively within the 3 month login period.
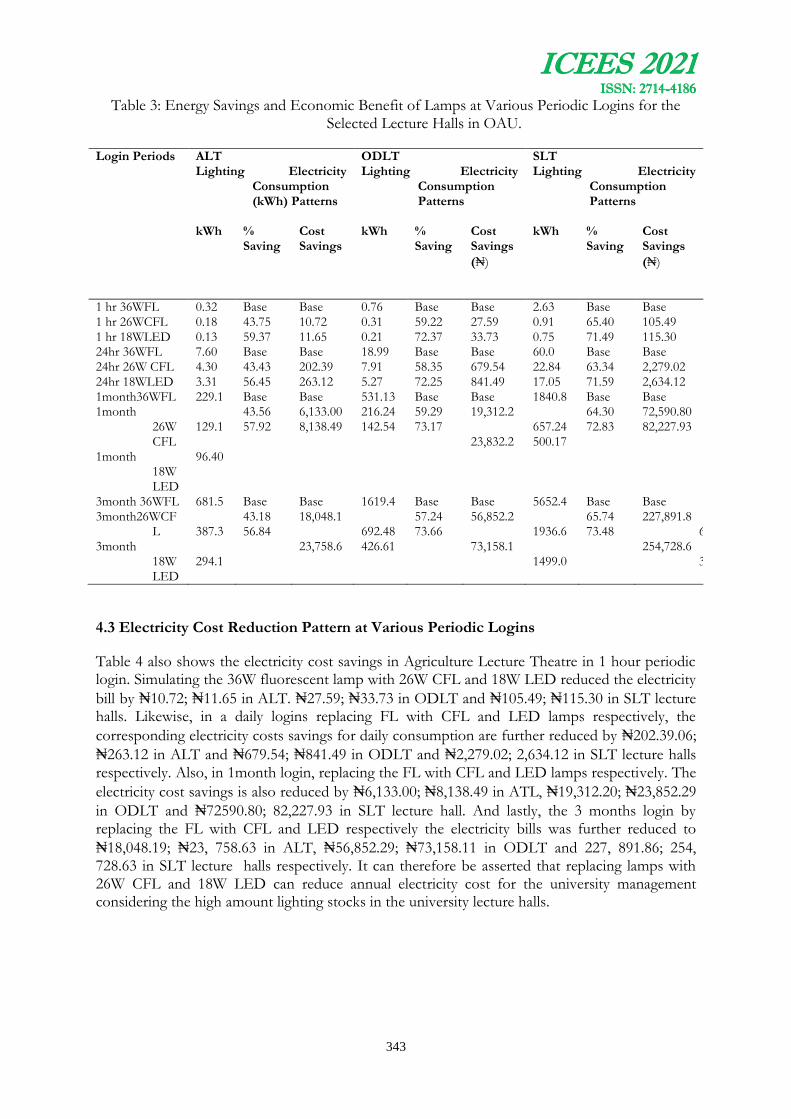
ICEES 2021 ISSN: 2714-4186
343
Table 3: Energy Savings and Economic Benefit of Lamps at Various Periodic Logins for the Selected Lecture Halls in OAU.
Login Periods ALT Lighting Electricity
Consumption (kWh) Patterns
ODLT Lighting Electricity
Consumption Patterns
SLT Lighting Electricity
Consumption Patterns
kWh %
Savings
Cost Savings
(
₦)
kWh % Saving
s
Cost Savings
(₦)
kWh % Saving
s
Cost Savings
(₦)
1 hr 36WFL 1 hr 26WCFL 1 hr 18WLED
0.32 0.18 0.13
Base 43.75 59.37
Base 10.72 11.65
0.76 0.31 0.21
Base 59.22 72.37
Base 27.59 33.73
2.63 0.91 0.75
Base 65.40 71.49
Base 105.49 115.30
24hr 36WFL 24hr 26W CFL 24hr 18WLED
7.60 4.30 3.31
Base 43.43 56.45
Base 202.39 263.12
18.99 7.91 5.27
Base 58.35 72.25
Base 679.54 841.49
60.0 22.84 17.05
Base 63.34 71.59
Base 2,279.02 2,634.12
1month36WFL 1month
26WCFL
1month 18WLED
229.10
129.10
96.40
Base 43.56 57.92
Base 6,133.00 8,138.49
531.13 216.24 142.54
Base 59.29 73.17
Base 19,312.2
0 23,832.2
2
1840.85
657.24 500.17
Base 64.30 72.83
Base 72,590.80 82,227.93
3month 36WFL 3month26WCF
L 3month
18WLED
681.58
387.30
294.19
Base 43.18 56.84
Base 18,048.1
9 23,758.6
3
1619.47
692.48 426.61
Base 57.24 73.66
Base 56,852.2
9 73,158.1
1
5652.43
1936.60
1499.02
Base 65.74 73.48
Base 227,891.8
6 254,728.6
3
4.3 Electricity Cost Reduction Pattern at Various Periodic Logins
Table 4 also shows the electricity cost savings in Agriculture Lecture Theatre in 1 hour periodic login. Simulating the 36W fluorescent lamp with 26W CFL and 18W LED reduced the electricity
bill by ₦10.72; ₦11.65 in ALT. ₦27.59; ₦33.73 in ODLT and ₦105.49; ₦115.30 in SLT lecture halls. Likewise, in a daily logins replacing FL with CFL and LED lamps respectively, the
corresponding electricity costs savings for daily consumption are further reduced by ₦202.39.06;
₦263.12 in ALT and ₦679.54; ₦841.49 in ODLT and ₦2,279.02; 2,634.12 in SLT lecture halls respectively. Also, in 1month login, replacing the FL with CFL and LED lamps respectively. The
electricity cost savings is also reduced by ₦6,133.00; ₦8,138.49 in ATL, ₦19,312.20; ₦23,852.29
in ODLT and ₦72590.80; 82,227.93 in SLT lecture hall. And lastly, the 3 months login by replacing the FL with CFL and LED respectively the electricity bills was further reduced to
₦18,048.19; ₦23, 758.63 in ALT, ₦56,852.29; ₦73,158.11 in ODLT and 227, 891.86; 254, 728.63 in SLT lecture halls respectively. It can therefore be asserted that replacing lamps with 26W CFL and 18W LED can reduce annual electricity cost for the university management considering the high amount lighting stocks in the university lecture halls.

ICEES 2021 ISSN: 2714-4186
344
Table 4: Electricity Cost Reduction for the Lecture Halls
Lamps ALT % Cost
Reduction(₦)
ODLT % Cost
Reduction(₦)
SLT % Cost
Reduction(₦)
1hr FL 00.00 CFL 10.72 LED 11.65
00.00 27. 57 33. 73
000.00 105.49 115.30
1day FL 000.00 CFL 202.39 LED 263.12
000.00 679.54 841.49
0,000,00 2,279.02 2,634.12
1month FL 0,000.00 CFL 6,133.00 LED 8,138.49
00,000.00 19,312.20 23,832.22
00,000.00 72,590.80 82,227.93
3months FL 00,000.00 CFL 18,048.19 LED 23,758.63
00,000.00 56,852.29 73,158.11
000,000.00 227,891.86 254,728.63
4.4 Findiings
The study revealed that the 26W and 18W lamp provides a better energy consumption outputs than the as-built traditional twin fluorescent lamps. The findings also show that there was a progressive increase in energy consumption for both the as-built florescent and the retrofitted
lamps. The study further reveals that with the current energy tariff of ₦61.33kWh for industrial layout used for replacing 26W CFL and 18W LED lamps could reduce annual energy cost at
ALT by ₦72,048.19; ₦95758.53 in ALT, ₦227, 4090.16; ₦292, 632.44 in ODLT and
₦911,576.44; ₦1,018,914.52 in SLT lecture hall respectively. Furthermore, selecting any of the energy savings lamps would represent a greater electricity cost savings for the institutions. On the other hand, such funds can be channeled into other areas of the institution economy.
5.0 Conclusion and recommendations
The study concluded that the energy consumption of the as-built simulated lamps increased as the time under consideration increased, and the pattern of the electricity consumption increased, showing similar curve pattern across the three selected lecture halls. The study further concluded that replacing fluorescent lamp with compact fluorescent lamp and light emitting diode lamp remain a feasible option in order to enhance optimal cost performance of the lecture halls, but in terms of economic benefit, it would be beneficial to replace fluorescent lamps with LED lamps in the lecture halls.
The study recommends the followings:
a. The present study focused on the simulation of the selected lecture halls in the study area; further research could focus on actual field measurements of the as-built lamps in the lecture halls.

ICEES 2021 ISSN: 2714-4186
345
b. The existing lecture halls should be retrofitted or replaced with CFLs and LED for better optimal performance and cost savings for the institution.
c. All future lighting installations should adopt the use of energy efficient lamps for cost savings.
References
Black, K. (2010). Business Statistics: Contemporary Decision Making. John Wiley & Sons
Norhafiza I. (2015). Assessing the Progress: Green Retrofitting of an Office Space in University of Malaya, Journal of Built Environment. 23(3): 450-461.
Obaju, B. N., Adeleke J. S., Yusuf T. O., Buari T. A. & Tokede, C. A. (2019). Assessment of Energy Wastage and saving Potentials for Higher Education Institution Buildings in South-Western Nigeria. In IOP Conference Series: Earth and Environmental Science, Vol.331, International Conference on Energy and Sustainable Environment 18-20 June 2019. Covenant University, Nigeria
Rashid, M. S. B, (2002). Physiological Reaction to Light: The Understanding of Lighting Design Trough Health and Visual Safety. Makalah disajikan dalam The 6th International Seminar on Sustainable Environment and Architecture, 12-14 August 2002. Department of Architecture, Institute Technology Bandung, Bandung.
Ryckaert, W. R., Lootens, C., Geldof, J., and Hanselaer, P. (2010). Criteria for Energy Efficient Lighting in Buildings. Energy and buildings, 42(3): 341-347.
Sustainable Energy Authority of Ireland (2014). Residential Energy Roadmap to 2050. Dublin, Ireland.
United State Department of Energy (2013). Building Energy Software Tools Directory. http://apps1. eere.energy.gov/buildings/tools directory/alpha_list.cfm

ICEES 2021 ISSN: 2714-4186
346
3D FLUID TRANSPORT IN LAYERED HETEROGENEOUS POROUS MEDIA
1Alabi O.O. and 1*Akanni I.A.
1 Solid Earth Physics Research Laboratory, Physics Department, Osun State University, Osogbo, Nigeria
Email of Correponding Author: [email protected];
Abstract
The study of Layered Heterogeneous Porous Media (LHPM) provides a better understanding of fluid transport through soil stratifications in nature. This is done by making use of numerical models. These models have been largely employed to investigate pore-scale dynamics, both in real and in synthetic geometries. Two-dimensional (2D) model has been largely used by previous studies, but it has the limitations of low visualization of flow patterns. Thus, three-dimensional (3D) models are necessary for the full prediction of the effect of the properties of heterogeneous porous media on flow patterns. In this work, a 3D model was obtained from the 2D model earlier obtained from experimental data, by making use of a transformation from Cartesian to Cylindrical coordinate system. The 3D model revealed that our model is better suited for modeling an Ascending Layer Heterogenous (ALH) form of flow. In addition, the point of interface contact of the soil layers acts as a point of convergence of fluid. The 3D model obtained by computation is an innovation to provide more features and properties of a reservoir with less rigorous computation. This could be used to map the points of highest concentration in a reservoir or system of heterogeneous compounds and map the transport of fluids in LHPMs. This has major applications in the tracking of by-passed oil in complex reservoirs.
Keywords: Non-Darcian flow; 3D modeling; Fluid transport; LHPM; Porosity
1.0 INTRODUCTION
Layered Heterogeneous Porous Media (LHPM) is a morphological term used to refer to the property of layered media exhibiting two systems of porosity that are of significantly different permeabilities (Boutin and Royer, 2015; Nakshatrala et al., 2018; Solnyshkinaa et al., 2021; Lasseux et al., 2021). LHPM systems have found a wide range of use in science, in areas such as geotechnics, CO2 sequestration, enhanced recovery of oil and gas, landfills’ leachate collection systems, and pollution control systems (Salimzadeh and Khalili, 2014; Hosking et al., 2017; March et al., 2018; Zhang and Yuan, 2019; Banihashem and Karrabi, 2020; Hu et al., 2020; Priya1 et al., 2020). It is important to note that, LHPM, as one of the heterogeneity properties of reservoir permeability stratification, is significantly responsible for by-passed (not recovered) oil.
The study of seepage flow in the surface in many geological and environmental engineering systems such as petroleum and gas exploration is of great significance. However, fluid flow in heterogeneous porous media often results in complex hydraulic behaviors in aquifers and reservoirs (Yao et al., 2019).
Numerical models help in understanding these complex hydraulic behaviors. Numerical models have been largely employed to investigate pore-scale dynamics, both in real (Adler et al. 1992; Blunt et al. 2002; Mostaghimi et al. 2013) and in synthetic geometries (Koponen et al., 1998; Nabovati and Sousa, 2007; Matyka et al., 2008; Khirevich et al., 2011; Ghassemi and Pak 2011; de

ICEES 2021 ISSN: 2714-4186
347
Anna et al., 2017). 2D models have been widely proposed and employed to simulate flow in porous media. However, the validity of such models has not only been extensively questioned (Koponen et al. 1997; Goudarzi et al. 2018; Marafini et al., 2020) but also proven as inferior to 3D models (Lang et al., 2014; Huang et al., 2016; Jiang et al., 2018; 24, Yao et al., 2019). Some of the shortcomings of 2D models are the underestimation and inability to show some features in fractured porous media. Thus, 3D models are necessary for the prediction of properties of heterogeneous porous media.
In this study, a novel approach is developed using the cylindrical coordinate system to model 3D fluid transport in LHPM. The proposed approach is applied to study the pattern of fluid flow in a complex reservoir that may be encountered during exploration in oil fields. The result of this research could bring scientific breakthroughs and innovations that are required to secure the supply of affordable hydrocarbon and to minimize the environmental impact of hydrocarbon recovery due to oil depletion in reservoirs.
2.0 THEORETICAL BACKGROUND
The path of fluid flow through an LHPM contained in a cylinder can best be represented using a cylindrical coordinate system since the flow path is influenced by the shape of the container (boundary constituting the porous media). Fig. 1 illustrates the relationship between the cartesian coordinate system and the cylindrical coordinate system.
Figure 1: Cylinder illustrating the Cylindrical Coordinate System (Deen, 2011)
To derive the relationship between a point P(x,y,z) in cartesian coordinate, and a point P(r,θ,z) in the cylindrical coordinate system, some mathematical reasoning is required.
From fig. 1, drawing a line connecting the x-axis with the corresponding projection of the point P at the base of the cylinder results in a triangle. The triangle is illustrated in fig. 2 below:

ICEES 2021 ISSN: 2714-4186
348
Figure 2: Triangle obtained from the cylinder
From fig. 2, using trigonometry, we know that:
(1)
(2)
Therefore, making x the subject of the formula in equation (2) results in equation (3):
(3)
(4)
(5)
Therefore, making y the subject of the formula in equation (5) results in equation (6):
(6)
From fig. 1, equation (7) can be deduced:
(7)
Since fig. 2 is a right-angle triangle, the Pythagoras theorem can be used to derive r. This result in:
(8)
To derive an expression for obtaining , a tangent can be taken, which leads to equation (10)
(9)
Hence,
(10)

ICEES 2021 ISSN: 2714-4186
349
Ordinarily, these equations given above are common knowledge, but their application in the transformation of fluid flow data from 2D to 3D models has been of a limited use based on our observation. For an LHPM contained in a cylindrical pipe through which fluid is made to pass through, a non-Darcian flow is expected. This is due to the heterogeneity of the medium. Hence, obtaining parameters like porosity, permeability, and other hydraulic properties that characterize the medium can be done using already well-established mathematical relations (Alabi and Sedara, 2020). From the obtained results, a 2D model can then normally be obtained.
To transform into 3D, it is safe to infer the following: the z-axis is equivalent to the distance
traveled by the fluid flowing through the cylindrical pipe. which is the angle through the x-axis
can be inferred as the angle of deflection of the fluid flow path. While r is the distance of the point of reference to the midpoint or z. The distance from the laminar flow path (the normal) can also be said to be r. These three parameters are more than sufficient to give a 3D representation of the flow path.
3.0 METHODOLOGY
Using the 2D model ( ) obtained by numerical method
(Appendix 1) a full prediction cannot be made in 2D to visualize the fluid flow path. Therefore, to determine the distance traveled by the fluid in the heterogeneous medium and the direction of flow at every instant, there is a need to employ a 3D model.
A cylindrical coordinate system was used to provide information that is lacking in the 2D model earlier obtained:
Step 1: A plot was made by making use of the obtained 2D equation model from Appendix 1,
with (angle of deflection in the medium) ranging from 0° – 90°, and β (porosity ratio)
ranging from 0 – 4.0 (Shown in Appendix 2)
Step 2: A 3D cartesian coordinate system (fig. 3) was obtained from the plot using Maple 2020 edition (Shown in Appendix 2)
Step 3: The 3D cartesian coordinate system plot obtained was then transformed to the cylindrical coordinate system. This is shown in fig. 4 (Appendix 2)
4.0 RESULT AND DISCUSSION
Figure 3: 3D in cartesian coordinate system Figure 4: 3D in cylindrical coordinate system

ICEES 2021 ISSN: 2714-4186
350
In fig. 3, a non-detailed 3D plane is shown to have been generated when the equation model was plotted in a cartesian coordinate system as shown in Appendix 2.
Based on the shape of the 3D plot in fig. 4, it is safe to infer that, the plot shows the flow pattern in both sections (layers) of the LHPMs. And at the interface of contact between the two layers, there’s a form of convergence before the fluid spreads out. This flow pattern conforms to that expected of an Ascending Layer Heterogenous (ALH) (Alabi, 2015). This implies a flow in the direction of positive porosity change, resulting in the probable flow path being spread out from the interface of contact of the two layers, as seen in fig. 4 (Alabi and Olaleye, 2016).
Since the experimental setup was given varying inclination angles from 0° – 20° (Table 1A in the Appendix); fig. 4 corresponds to the expected pattern of flow, as the cylindrical pipe is inclined. Therefore, the earlier assumption of the pipe’s shape influencing the pattern of flow is good.
As this inclination increases, there will eventually be no flow in the upper section of the LHPM, when it is in the second layer. This we have noted with an arrow in the plot. Also, it can be observed that, with the increase in the distance covered, the flow path tends to spread, hence θ increases as z increases, and the distance from the midpoint r, also increases.
The increase in r can be explained experimentally. Since, a flow through the normal is seen as laminar flow (Popoola et al., 2009; Popoola et al., 2010), we can then infer that the flow gets more turbulent, with an increase in r (that is, as r moves away from z). Hence, with a non-laminar flow, a flow pattern that spreads in different directions, due to the increase in seepage velocity, a consequence of the increasing inclination angle, is well represented by fig. 4. We can also infer this flow pattern to be a result of the ALH form of low as stated earlier. This is responsible for the negative section of the β axis being limited when compared to that of the positive section. The former simply denotes the short interval within which fluid flow occurred in the direction opposite the angle of inclination (see the triangle in fig. 4). This short interval is mostly in the first layer.
From the above, it indicates that the variation in the porosity ratio as a factor of the angle of deflection in the medium is well defined in the 3D model (fig. 4). Apart from predicting the angle of deflection, the 3D model (fig. 4) shows the best condition our model is suited for. This information is an improvement on the information provided by the 2D model. The information provided is significant in tracking the spread of the fluid for a particular porosity ratio and the angle of deflection. The 2D model could not provide information because of its limitation as earlier mentioned. Previous studies have also confirmed these limitations. This is an advantage of the 3D over the 2D model in predicting reservoirs properties.
It must be emphasized that the 3D model that was obtained by this new approach gives clearer information about the heterogeneous porous media with less rigorous computation. Furthermore, the 3D model of layered heterogeneous porous media has not been given much consideration especially in the study of oil reservoirs. Therefore, the 3D model obtained in this work will be of great advantage and improvement over 2D to describe or predict the nature (pattern) of fluid transport in any complex heterogeneous media.
5.0 CONCLUSION AND RECOMMENDATION
A 3D model was obtained from an experimental 2D model, by making use of cartesian to cylindrical coordinate systems transformation. Information such as the direction of flow

ICEES 2021 ISSN: 2714-4186
351
or compartment and location at each travel distance in a heterogeneous porous media that could not be provided by the 2D model was provided in the 3D model:
i. Through the help of the 3D model, it was found that the provided model enchanced more properties of the ALH form of flow in a reservoir, due to the 3D plot shape.
ii. The model showed that the point of interface contact of the two layers acted as a point of convergence. This could be used to map the points of highest concentration in a reservoir or system of heterogeneous compounds.
iii. The information was obtained with less rigorous computation and cost. This could help in the reduction of the cost of mapping transport of fluid in LHPM. It could find great usage in the tracking of by-passed oil in complex reservoirs.
ACKNOWLEDGEMENTS
The authors are grateful to the head of Solid Earth Physics Research laboratory, Osun State University, Nigeria for making their experimental data available for this work.
REFERENCES
Alabi O.O., and Sedara S.O. (2020). Validity of series and parallel bed layer permeability equations from experimental and numerical modeling. Scientific African, (10): e00579
Alabi, O. O. (2015). Velocity profile of fluid flow in heterogeneous porous media. Electronic Journal of Geotechnical Engineering, 20(3), 943–952.
Alabi, O. O., & Olaleye, K. O. (2016). Modifying Hagen-Poiseullie’s equation for an inclined porous media with varying porosity. Journal of Indian Geophysical Union, 20(20), 231–240.
Banihashem S., and Karrabi M. (2020). Investigation of suspended particle size effects on clogging of soil filters under laminar flow. European Journal of Environment and Civil Engineering.
Boutin, C., and Royer P. (2015). On models of double porosity poro-elastic media. Geophysical Journal International, 203: 1694–1725.
Deen W. M. (2011). Analysis of Transport Phenomena (Topics in Chemical Engineering), 2nd edition. Oxford University Press.
Hosking L.J., Thomas H.R., and Sedighi M. (2017). A dual porosity model of high-pressure gas flow for geo-energy applications. Can. Geotechnical Journal, (6): 839-851.
Huang N., Jiang Y., Li B., and Liu R. (2016). A numerical method for simulating fluid flow through 3-D fracture networks. Journal of Natural Gas Science and Engineering, 33:1271–1281.
Hu J., Ke H., Lan J., Chen Y., and Meng M. (2020). A dual-porosity model for coupled leachateand gas flow to vertical wells in municipal solid waste landfills. Geotechnique, 70(5): 406-420.
ICEES 2021 ISSN: 2714-4186
352
Jiang Q., Sun Y., Yi B., Li T., and Xiong F. (2018). Inverse analysis for geomaterial parameteridentification using Pareto multiobjective optimization. International Journal for Numerical and Analytical Methods in Geomechanics, 42 (14): 1698–1718.
Lasseux D., Valdés-Parada F., Thovert J., and Mourzenko V. (2021). Exuding porous media:deviations from Darcy’s law. Journal of Fluid Mechanics., 911(A48): 1- 29.
Lang P. S., Paluszny A., and Zimmerman R. W. (2014). Permeability tensor of three- dimensional fractured porous rock and a comparison to trace map predictions. Journal of Geophysical Research: Solid Earth, 119 (8): 6288–6307.
March R., Doster F., and Geiger S. (2018). Assessment of CO2 storage potential in naturally fractured reservoirs with dual–porosity models. Water Resources Research, 54 (3): 1650 1668.
Marafini E., Rocca M. L., Fiori A., Battiato I., and Prestininzi P. (2020). Suitability of 2D modelling to evaluate flow properties in 3D porous media. Transport in Porous Media, 134: 315–329.
Nakshatrala K.B., Joodat S.H.S., and Ballarini R. (2018). Modeling flow in porous media with double porosity/permeability: Mathematical model, properties, and analytical solutions. Journal of Applied Mechanics, 85(8).
Popoola O. I., Adegoke J. A., and Alabi O. O. (2009). The effects of porosity and angle of inclination on the deflection of fluid flow in porous media. Global Journal of Pure and Applied Science, 15: 401-416.
Popoola O. I., Adegoke J. A., Alabi O. O., Akinluyi F. O., and Fayemiwo K. A. (2010). Controlling Contaminated Fluid from Polluting Groundwater using Porous Media. Journal of American Science, 6: 247-255.
Priya1 Y.S.J., Kumar P.A., and Rao B.R.S. (2020). Modelling recovery process in dual porosity and dual permeability reservoirs. International Research Journal of Engineering and Technology, 7 (10): 1854-1863.
Salimzadeh S., and Khalili N. (2014). Double porosity behavior and application in geotechnical problems. Proceedings of the 8th European Conference on Numerical Methods in Geotechnical Engineering, the Netherlands, 18-20th June, 2014, pp.1031-1036.
Solnyshkinaa O.A., Batyrshina E.S., and Pityuka Yu.A. (2021). Investigation of hydrodynamic flows in micromodels of double porosity media. Fluid Dynamics, 56 (4): 451–459.
Yao C., He C., Yang J., Jiang Q., Huang J., and Zhou C. (2019). A Novel Numerical Model for Fluid Flow in 3D Fractured Porous Media Based on an Equivalent Matrix-Fracture Network. Geofluids, article ID 9736729.
Zhang W., and Yuan S. (2019). Characterizing preferential flow in landfilled municipal solid waste, Waste Management, 84: 20–28.
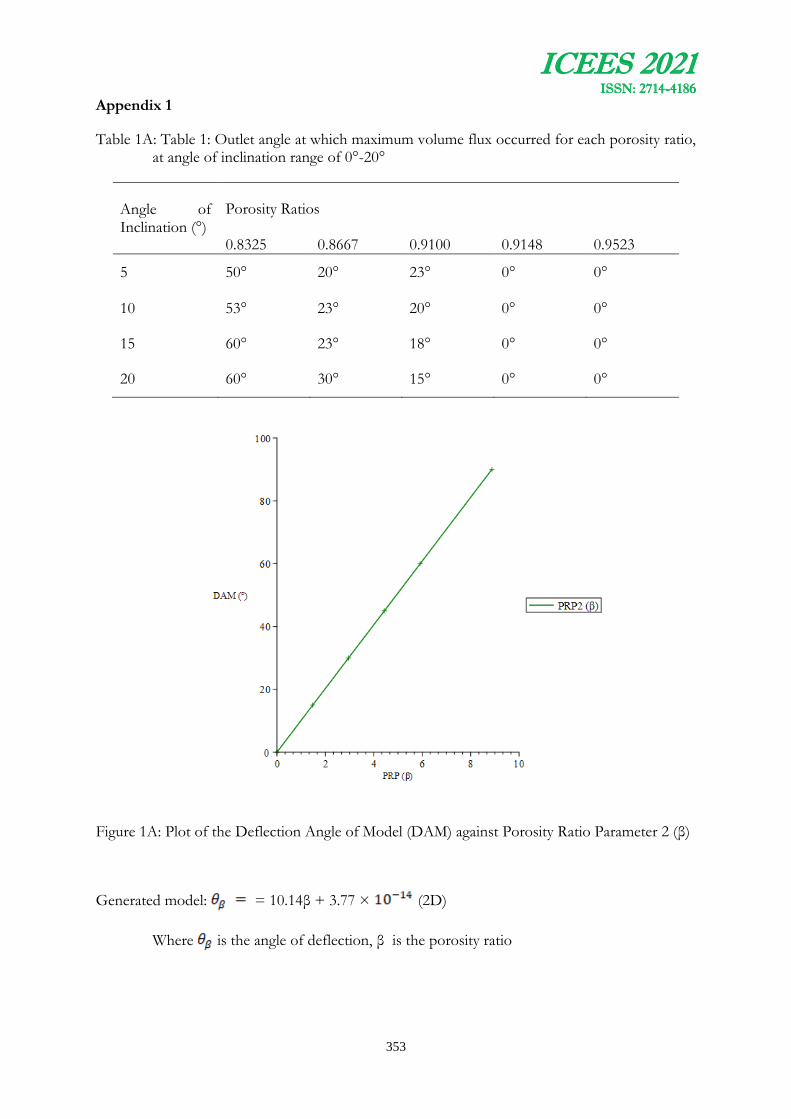
ICEES 2021 ISSN: 2714-4186
353
Appendix 1
Table 1A: Table 1: Outlet angle at which maximum volume flux occurred for each porosity ratio, at angle of inclination range of 0°-20°
Angle of Inclination (°)
Porosity Ratios
0.8325 0.8667 0.9100 0.9148 0.9523
5 50° 20° 23° 0° 0°
10 53° 23° 20° 0° 0°
15 60° 23° 18° 0° 0°
20 60° 30° 15° 0° 0°
Figure 1A: Plot of the Deflection Angle of Model (DAM) against Porosity Ratio Parameter 2 (β)
Generated model: = 10.14β + 3.77 × (2D)
Where is the angle of deflection, β is the porosity ratio
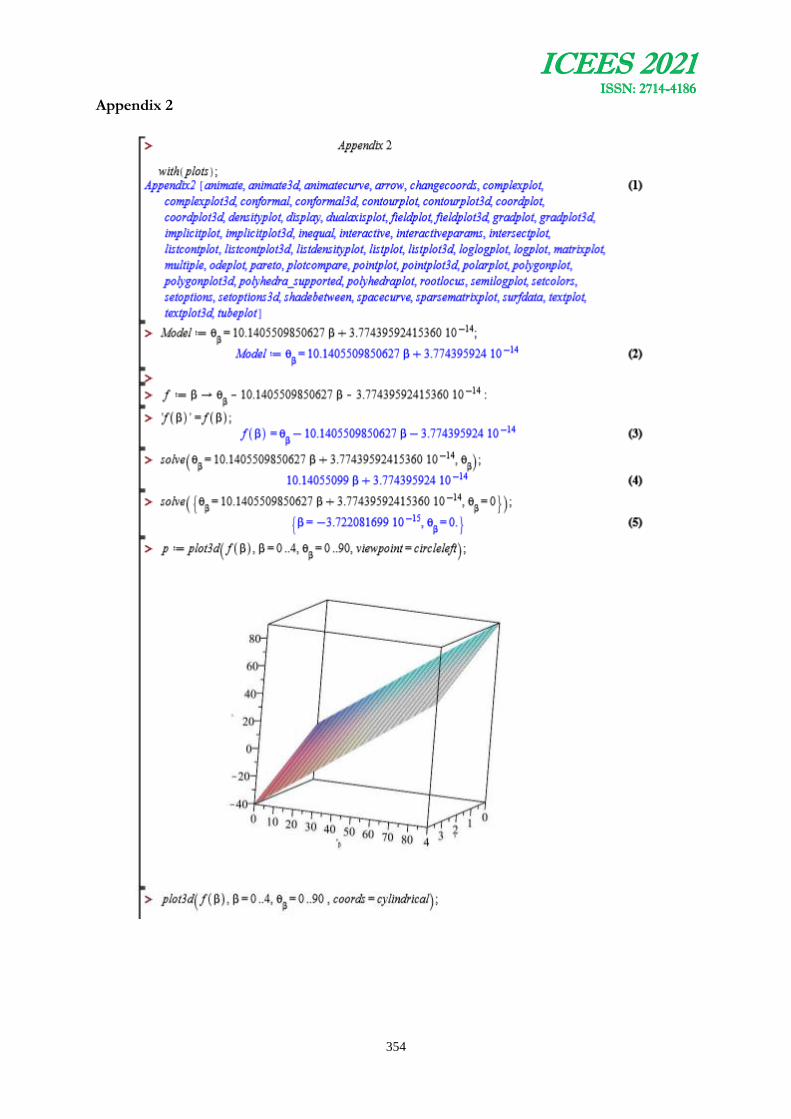
ICEES 2021 ISSN: 2714-4186
354
Appendix 2

ICEES 2021 ISSN: 2714-4186
355
ICEES 2021 ISSN: 2714-4186
356
ESTIMATION AND CORRELATION OF REFERENCE EVAPOTRANSPIRATION USING DIFFERENT EMPIRICAL MODELS FOR OSOGBO, OSUN STATE
NIGERIA.
Fadipe O.O.1, Alawode G.A.2, Thanni M.O3, Olawuyi A.O.4, and Bolorunduro K.A5
1,2,3,4 Department of Civil Engineering, Osun State University, Osogbo, Osun State Nigeria
5 Department of Civil Engineering, Federal University, Oye-Ekiti, Ekiti State, Nigeria
Email of Corresponding Author:[email protected]
ABSTRACT
The estimation of reference evapotranspiration (ETO) is necessary for any irrigation project planning, crop yield and optimal irrigation scheduling. The FAO-Penman method proposed by Food and Agricultural Organization (FAO) requires a lot of climatic data and estimation becomes cumbersome without software application. Using empirical formula requires less data but estimation must well have correlated with the standard. This study collected 20 years (2001-2020) climatic data of Osogbo, Osun State from Nigeria Metrological station, Abuja. The data were subjected to different empirical models (Blaney Criddle (BM), Thornmwaithe, (TM)Hargreaves (HM) and Piche evaporimeter (PM) and it was compared with FAO Penman-Monteith (FPM). The results of the five methods were subjected to the Pearson Correlation of PAST 3.0 software. The results from PE gave the lowest (ETO) value (30.38mm/month) while TM gave the highest value of 551mm/month. The highest (ETO) values of BCM and HM are 184mm/month and 210mm/month respectively. The highest values of (ETO) occurred in March and this is general to all the models. The highest (ETO) from FPM is 120.6mm/month and this occurred in April. The lowest value for all the models is recorded in August except for BCM that also reported a minimum value in February. The HM has the highest correlation and confidence index of 0.76 and 0.71 with FPM respectively and the Autoregressive integrated moving average model (ARIMA) predicted the 10 years’ values for (ETO) with RMSE of 0.30, 0.29, 0.45 for BM, Hargreaves, PM and 0.64 for TM. In the absence of adequate climatic data, the HM model could well predict the (ETO) with a very high accuracy.
Keywords: Reference Evapotranspiration, Empirical Models, Osogbo, Correlation,
1. INTRODUCTION
The components of the hydrologic cycle (precipitation, evaporation, evapotranspiration, run off, infiltration, percolation, transpiration etc) describe the movement of water in and around the earth surface ; most times, it is viewed as starting from precipitation and ending with evaporation and vice versa. The process in which a liquid changes to the gaseous state at the free surface, below the boiling point through the transfer of heat energy is called evaporation while transpiration is the process by which water leaves the body of a living plant and reaches the atmosphere as water. The process of evaporation from water bodies and soil masses together with transpiration from vegetation is known as evapotranspiration and it is taken into consideration as one of crucial components of the hydrological cycle (Singh et al. 2021) because a significant amounts of water are taken from the agroecosystems through transpiration (Yueping et al., 2018). The estimation of evapotranspiration is of utmost importance in planning and operation of water resources and irrigation systems (Ertek, 2011, Yahaya et. al., 2020). It provides
ICEES 2021 ISSN: 2714-4186
357
a reliable estimates of water requirement of actively growing plants in any agricultural system. Evapotranspiration is a complex process in the hydrologic cycle because of the different factors (temperature sunlight, wind, humidity) controlling it (Zeng et al., 2019)
Reference evapotranspiration is a concept used as a standard to estimate evapotranspiration. The term reference evapotranspiration refers to the evapotranspiration rate from a well- watered hypothetical surface of green grass of 120mm in crop height, surface resistance of 70s/m and albedo of 0.23 (Ndulue et al., 2020). This means Reference evapotranspiration, measured or calculated at different locations or in different seasons are comparable as they refer to the evapotranspiration from the same reference surface (Lincoln et al. 2020). The estimation of reference evapotranspiration helps in irrigation scheduling, improving water productivity, crop yield, soil-plant water-atmosphere relationship and to predict whether there would be any direct deficit or excess in demand for water (Ramirez and Hamsen, 2011, Onwuegbunam et al., 2020). With the water shortage in Nigeria and particularly during dry season, the information of reference evapotranspiration can provide an objective estimate which can be used in conjunction with the subjective scheduling methods to upgrade farming for sustainable food security. The Food and Agriculture Organization (FAO) recommend a method called FAO Penman- Moitheth method to estimate reference evapotranspiration but its use requires large climatic data such as radiation, air temperature, air humidity and wind speed for estimation. A large number of empirical formula such as Blaney Criddle, Jansen-Haise, Linacre, Makkink, solar radiation, Hargreaves-Samani, Thornthwaite, Priestley- Taylor, Carmago, Piche evaporimeter etc (Melo and Fernandes, 2012, Onwuegbunam et al,. 2020) that requires few data have been proposed but they all have their peculiarities. Several studies have been conducted in different parts of Nigeria (Isikwue, et al., 2014, Abdussalam and Zaharadden, 2017, Aweda et al., 2018 Onwuegbunam et al., 2020, etc) to obtain the best empirical methods that correlated with the FAO Penman method of reference evapotranspiration but limited study have been conducted on the study area. Information on irrigation practices is scarce as most farmers practice on-farm water supply and data for future planning is limited, hence this study.
2. METHODOLOGY
2.1 Study Area
The study area (Figure 1) is Osogbo, the state capital of Osun State, located in the South-Western part of Nigeria. The city has two Local Government Areas (LGAs); Osogbo and Olorunda. It is located on latitude of 7°42'06.00''N and 7°51'33.00''N and longitudes 4°27'52.00''E and 4°38'30.00''E and has a landmass of 47 km2.The land use pattern is 28.94 km2 grassland and 17.95km2 bare-land but it has been reported that agricultural lands have decreased considerably from 86.28 % to 41.53 % (Oladehinde et al., 2019). The temperature fluctuates with season; the driest and warmest months are January and March respectively.
2.2 Data Collection and Analysis
Twenty years (2001-2020) of daily climatic data such as; Evaporation, Maximum Temperature, Minimum Temperature, Sunshine, Windspeed, and Relative Humidity were collected from Nigeria Meteorological Agency (NiMET), Abuja, Nigeria. The averages of the data collected from NiMET were calculated for each month from year 2001-2020. The mean was estimated for minimum temperature, maximum temperature, relative humidity, wind speed, sunshine, and evaporation using Microsoft Excel 2019.
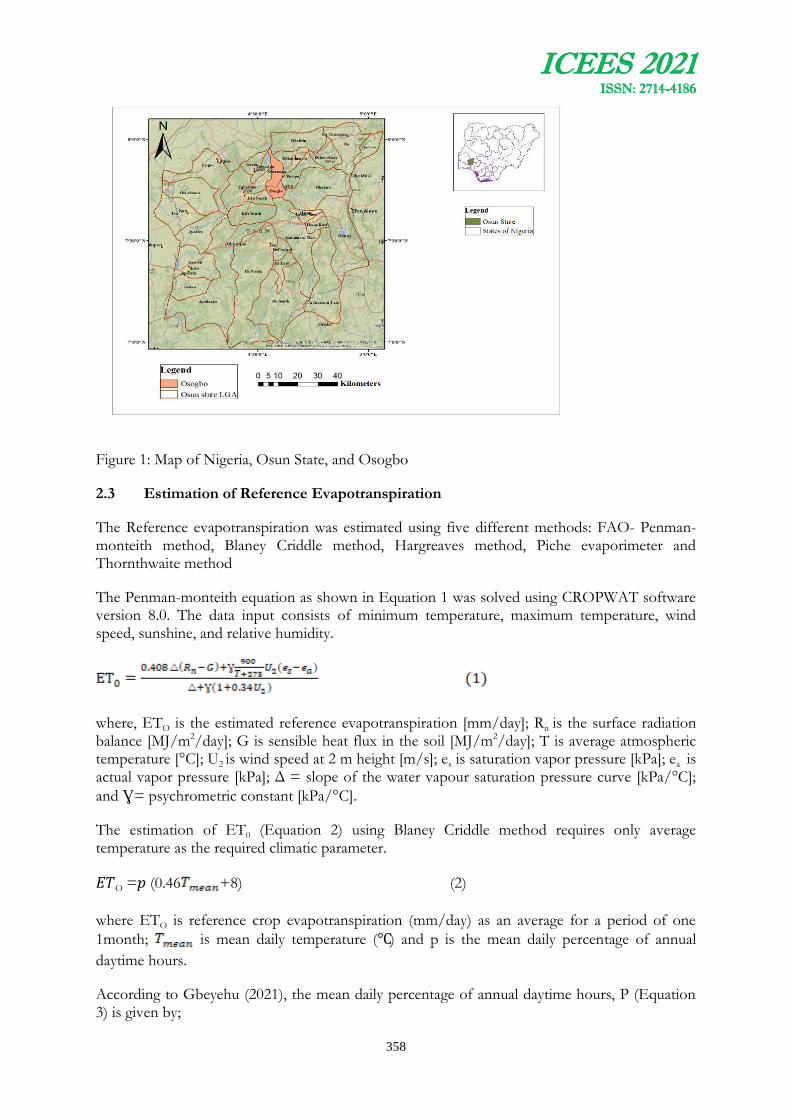
ICEES 2021 ISSN: 2714-4186
358
Figure 1: Map of Nigeria, Osun State, and Osogbo
2.3 Estimation of Reference Evapotranspiration
The Reference evapotranspiration was estimated using five different methods: FAO- Penman-monteith method, Blaney Criddle method, Hargreaves method, Piche evaporimeter and Thornthwaite method
The Penman-monteith equation as shown in Equation 1 was solved using CROPWAT software version 8.0. The data input consists of minimum temperature, maximum temperature, wind speed, sunshine, and relative humidity.
where, ETO is the estimated reference evapotranspiration [mm/day]; Rn is the surface radiation balance [MJ/m2/day]; G is sensible heat flux in the soil [MJ/m2/day]; T is average atmospheric temperature [°C]; U2 is wind speed at 2 m height [m/s]; es is saturation vapor pressure [kPa]; ea is actual vapor pressure [kPa]; Δ = slope of the water vapour saturation pressure curve [kPa/°C];
and Ɣ= psychrometric constant [kPa/°C].
The estimation of ET0 (Equation 2) using Blaney Criddle method requires only average temperature as the required climatic parameter.
O = (0.46 +8) (2)
where ETO is reference crop evapotranspiration (mm/day) as an average for a period of one
1month; is mean daily temperature (℃) and p is the mean daily percentage of annual
daytime hours.
According to Gbeyehu (2021), the mean daily percentage of annual daytime hours, P (Equation 3) is given by;

ICEES 2021 ISSN: 2714-4186
359
The Piche evaporimeter formula (Equation 4) is written as;
O = α Epiρ(σ) (4)
Where, α = a factor that considers the semi-protection of the Piche evaporimeter from the solar radiation (= 0.27) and Epi = the evaporation reading by Piche evaporimeter (mm/day)
ρ(σ) = a prevailing temperature-dependent factor (=2.41)
Using the Hargreaves formula given in Equation 5;
Where, are the mean, maximum and minimum temperature respectively
(℃) and is the extraterrestrial radiation of the crop surface (MJ/ /day).
According to Gebeyehu (2021), Estimation of ET0 using Thornthwaite method can be calculated using Equations 6-9
ETO=1.6 (6)
Where the mean temperature in °C
I = the annual heat index
I =ℇ i (7)
i = ( (8)
(9)
2.4 Estimation of Concordance Index and Coefficient of Correlation
The different empirical methods were subjected to statistical regression analyses. According to Onwuegbunam et al., (2020), the formula for statistical regression analyses is given in Equation 10-11
(10)
Where is the predicted reference evapotranspiration for Blaney Criddle, Hargreaves, Piche
evaporimeter, and Thronthwaite
is the predicted reference evapotranspiration of FAO Penman monteith and O is the mean
of observed values
C= r⨯d (11)

ICEES 2021 ISSN: 2714-4186
360
Where, C is the confidence or performance index, d is the concordance index and r is the correlation values
The final r and c obtained were then subjected to performance rating as shown in Table 1
Table 1 : Criteria for interpreting Confidence index and Correlation Coefficient
S/N Confidence index Performance rating
1 › 0.85 Excellent 2 0.76-0.85 Very good 3 0.66 -0.75 Good 4 0.61-0.65 Medium 5 0.51-0.60 Affordable 6 0.41-0.50 Bad 7 ‹ 0.40 Terrible
Correlation coefficient Precision
1 0.90-1.0 Almost perfect 2 0.7-0.9 Very high 3 0.5-0.7 High 4 0.3-0.5 Moderate 5 0.1-0.3 Low
Source : Onwuegbunam et al. (2020)
2.5 Projection of Reference Evapotranspiration
In order to estimate the Reference Evapotranspiration for future planning, the Auto Regressive Integrated Moving Average of ARIMA software 2021 model was used for the prediction. ARIMA time series model was used to predict the future behavior of the reference evapotranspiration from 20-year climatological data. The model parameters considered were p, d, q, s P, D, Q, where p is the order of the autoregressive part of the model, q is the order of the moving average part of the model, d is the differencing order of the model, s is the period of the model, D is the differencing order of the seasonal part of the model, P is the order of the autoregressive seasonal part of the model, Q is the order of the moving average seasonal part of the model. The model parameters used in the projection of reference evapotranspiration on the different methods checked were p = 6, d=0, q = 0, P =8, D = 1, Q = 0 and s = 12.
3. RESULTS AND DISCUSSION
3.1 Average of Climatic Data
The results of the mean monthly climatic data of the study area from 2001- 2020 is presented in Table 2. The highest evaporation amount occurred in February (Table 2) with a total of 5.6 mm and the lowest occurred in August with a total amount 1.4 mm. The variation in the amount can be explained with the temperature change; the highest (350C) was reported in February. The study expects the wind speed and humidity to be high in February because they have been stated as part of the factors affecting evaporation (Subramanya, 2008); the highest reported in March may have resulted from other factors not captured in the data
The study noted that the sunshine hours is not influencing the temperature values as the highest sunshine (7.5 hours respectively) occurred in the month of November and December while the
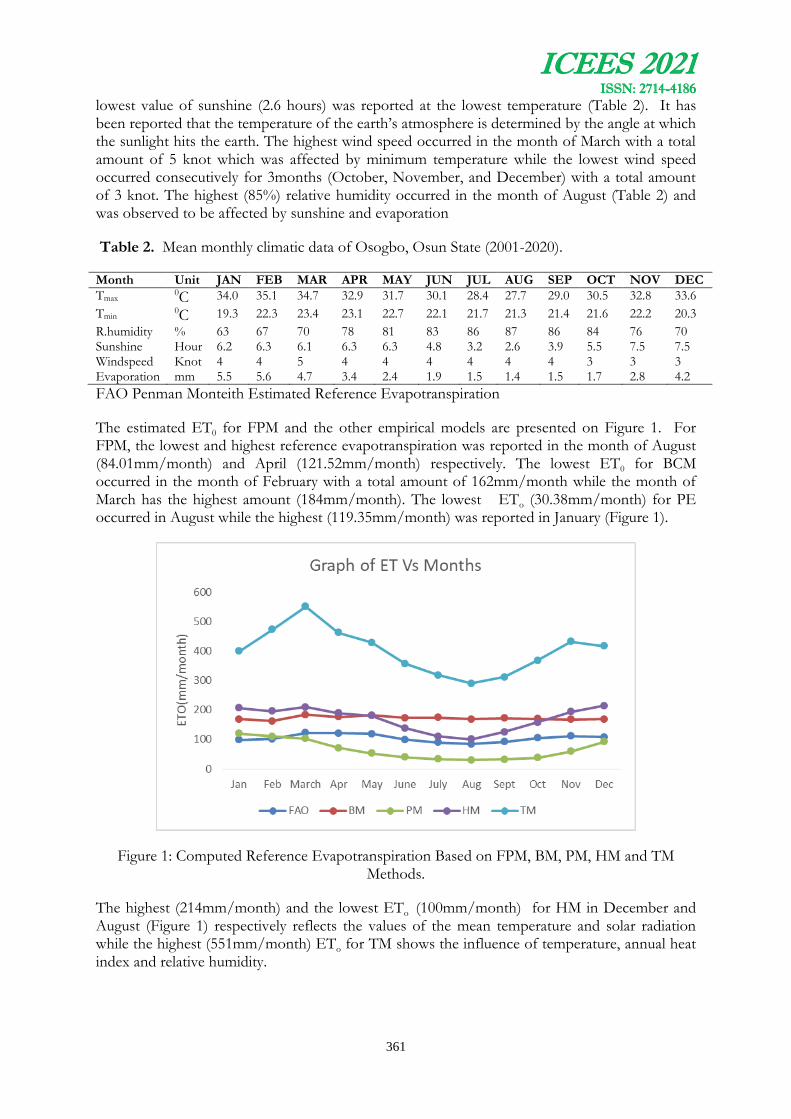
ICEES 2021 ISSN: 2714-4186
361
lowest value of sunshine (2.6 hours) was reported at the lowest temperature (Table 2). It has been reported that the temperature of the earth’s atmosphere is determined by the angle at which the sunlight hits the earth. The highest wind speed occurred in the month of March with a total amount of 5 knot which was affected by minimum temperature while the lowest wind speed occurred consecutively for 3months (October, November, and December) with a total amount of 3 knot. The highest (85%) relative humidity occurred in the month of August (Table 2) and was observed to be affected by sunshine and evaporation
Table 2. Mean monthly climatic data of Osogbo, Osun State (2001-2020).
Month Unit JAN FEB MAR APR MAY JUN JUL AUG SEP OCT NOV DEC
Tmax 0C 34.0 35.1 34.7 32.9 31.7 30.1 28.4 27.7 29.0 30.5 32.8 33.6
Tmin 0C 19.3 22.3 23.4 23.1 22.7 22.1 21.7 21.3 21.4 21.6 22.2 20.3
R.humidity % 63 67 70 78 81 83 86 87 86 84 76 70 Sunshine Hour 6.2 6.3 6.1 6.3 6.3 4.8 3.2 2.6 3.9 5.5 7.5 7.5 Windspeed Knot 4 4 5 4 4 4 4 4 4 3 3 3 Evaporation mm 5.5 5.6 4.7 3.4 2.4 1.9 1.5 1.4 1.5 1.7 2.8 4.2
FAO Penman Monteith Estimated Reference Evapotranspiration
The estimated ET0 for FPM and the other empirical models are presented on Figure 1. For FPM, the lowest and highest reference evapotranspiration was reported in the month of August (84.01mm/month) and April (121.52mm/month) respectively. The lowest ET0 for BCM occurred in the month of February with a total amount of 162mm/month while the month of March has the highest amount (184mm/month). The lowest ETo (30.38mm/month) for PE occurred in August while the highest (119.35mm/month) was reported in January (Figure 1).
Figure 1: Computed Reference Evapotranspiration Based on FPM, BM, PM, HM and TM Methods.
The highest (214mm/month) and the lowest ETo (100mm/month) for HM in December and August (Figure 1) respectively reflects the values of the mean temperature and solar radiation while the highest (551mm/month) ETo for TM shows the influence of temperature, annual heat index and relative humidity.
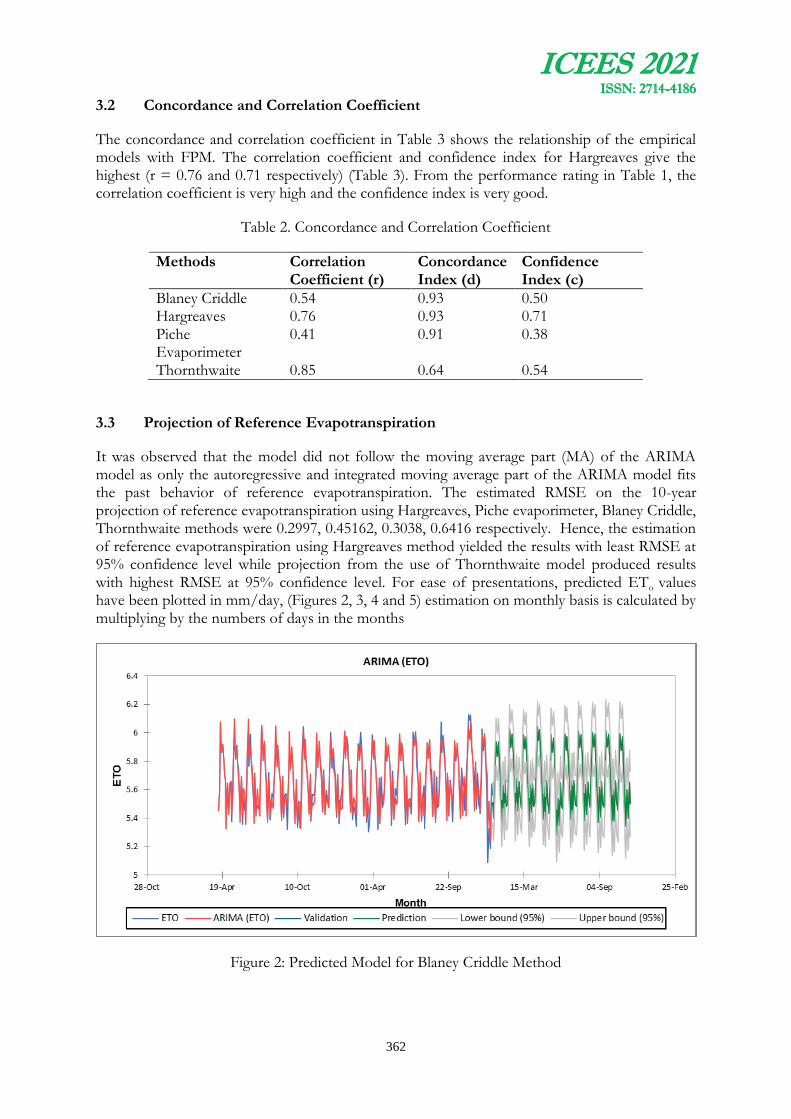
ICEES 2021 ISSN: 2714-4186
362
3.2 Concordance and Correlation Coefficient
The concordance and correlation coefficient in Table 3 shows the relationship of the empirical models with FPM. The correlation coefficient and confidence index for Hargreaves give the highest (r = 0.76 and 0.71 respectively) (Table 3). From the performance rating in Table 1, the correlation coefficient is very high and the confidence index is very good.
Table 2. Concordance and Correlation Coefficient
Methods Correlation Coefficient (r)
Concordance Index (d)
Confidence Index (c)
Blaney Criddle 0.54 0.93 0.50 Hargreaves 0.76 0.93 0.71 Piche Evaporimeter
0.41 0.91 0.38
Thornthwaite 0.85 0.64 0.54
3.3 Projection of Reference Evapotranspiration
It was observed that the model did not follow the moving average part (MA) of the ARIMA model as only the autoregressive and integrated moving average part of the ARIMA model fits the past behavior of reference evapotranspiration. The estimated RMSE on the 10-year projection of reference evapotranspiration using Hargreaves, Piche evaporimeter, Blaney Criddle, Thornthwaite methods were 0.2997, 0.45162, 0.3038, 0.6416 respectively. Hence, the estimation of reference evapotranspiration using Hargreaves method yielded the results with least RMSE at 95% confidence level while projection from the use of Thornthwaite model produced results with highest RMSE at 95% confidence level. For ease of presentations, predicted ETo values have been plotted in mm/day, (Figures 2, 3, 4 and 5) estimation on monthly basis is calculated by multiplying by the numbers of days in the months
Figure 2: Predicted Model for Blaney Criddle Method
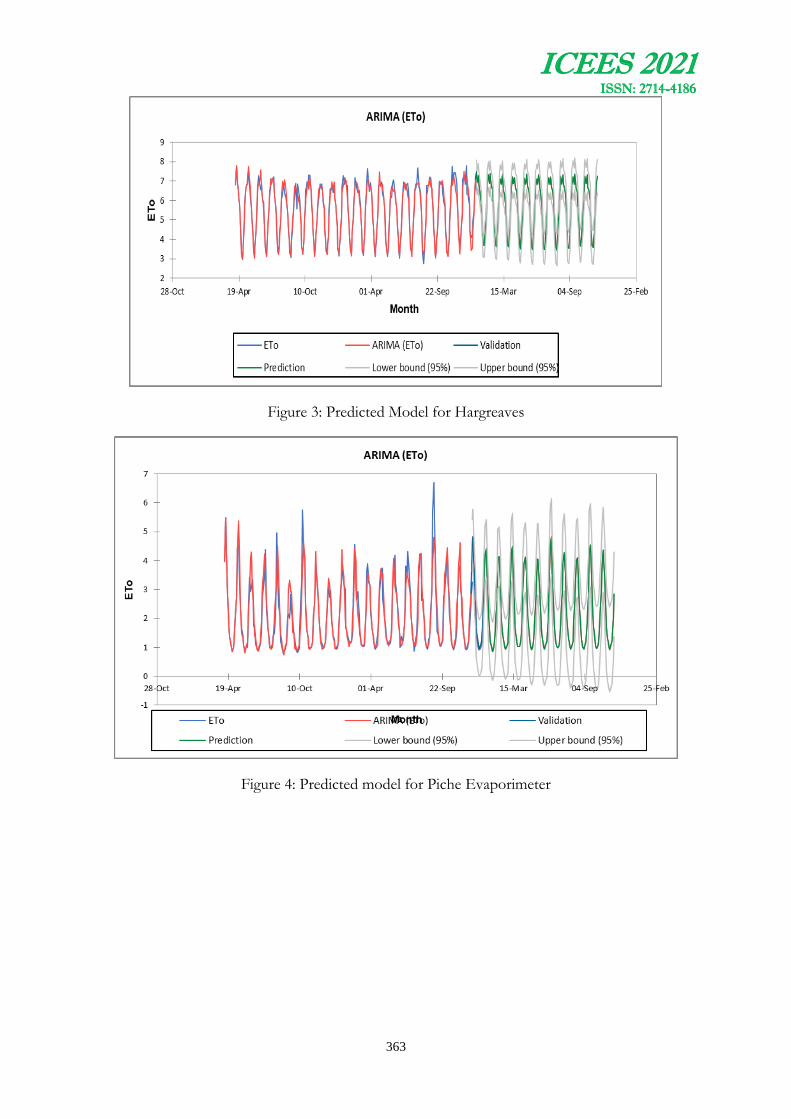
ICEES 2021 ISSN: 2714-4186
363
Figure 3: Predicted Model for Hargreaves
Figure 4: Predicted model for Piche Evaporimeter

ICEES 2021 ISSN: 2714-4186
364
Figure 5: Predicted model for Thornthwaite
4. CONCLUSIONS AND RECOMMENDATION
The study has estimated the reference evapotranspiration for Osogbo using the different empirical methods to obtain the best correlated method with FAO- Penman. It has also predicted the values of evapotranspiration that can be used for future planning
The highest Reference evapotranspiration from FAO-Penman monteith method is 121.52mm/month and this occurred in March while the lowest gave the value of 84.01mm/month which was reported in the month of August. However, the results from Piche evaporimeter method gave the lowest reference evapotranspiration value (30.38mm/month) and the lowest value for all the models was recorded in August except for Blaney Criddle that also reported a minimum value in February. Thornthwaite method gave the highest value of reference evapotranspiration out of all the models with an amount of 551mm/month but Hargreaves method has the highest correlation coefficient and confidence index (r = 0.76 and c = 0.76) with FAO Penman monteith respectively. The highest values of reference evapotranspiration occurred in March and this is general for all the models. In the absence of adequate climatic data forFAO- Penman, the Hargreaves model could well estimate and predict the reference evapotranspiration adequately. The method can be used for irrigation scheduling in Osogbo town and any other community within Osun State.
References
Abdussalam A.F and Zaharadden, I 2017. Temporal Variation of Reference Evapotranspiration in Lower River Kaduna Catchment Area, Nigeria. Archives of current research international 8(1):1-11

ICEES 2021 ISSN: 2714-4186
365
Aweda, F.O., Oyeewole, J.A., Falaiye, O.A. and Opatokun, I.O. (2018) Estimation of Evaporation rate in Ilorin, Using Penman Modified equation, Zimbabwe Journal of Science and Technology, 3:20-25.
Ertek, A (2011). Importance of Pan Evaporation for Irrigation Scheduling and Proper Use of Crop-Pan Coefficient (Kcp), Crop Coefficient (Kc) and Pan Coefficient (kp)..African Journal of Agricultural Research 6(32): 6706-6718
Isikwue, C.B., Audu, O.M. and Isikwue, O.M. (2014) Evaluation of Evapotranspiration Using
FAO Penman- Monteith Method in Kano, Nigeria, International Journal of Science and Technology, 3(11): 698-699,
Lincoln, Z., Michael, D.D., Consuelo, C.R., Kati, W.M. and Kelly,T.M. (2020) Step by Step Calculation of the Penman-Monteith Evapotranspiration, Department of Agricultural and Biological Engineering, University of Florida, Florida.
Melo G.L.D and Fernandes, A.L.T (2012), Evaluation Of Empirical Methods To Estimate Reference Evapotranspiration In Uberaba, State Of Minas Gerais, Brazil. Engineering. Agrículture., Jaboticabal, 32, (5): 875-888,
Ndulue, E., Ikenna, O., Kingsley, N.O. and Vintus, O. (2019). Performance Evaluation of Solar Radiation Equations for Estimating Reference Evapotranspiration in a Humid Tropical Environment, 42(vii-ix): 124-135. DOI:10.2478jwld-2019-0053.
Onwuegbunam, N.E., Onwuegbunam, O.O. and Dare, A. (2020) Estimation and Comparison of Reference Evapotranspiration within Kaduna central district, Nigeria, Using four Different methods. Nigerian Journal of Technology. 39(1):306-314.
Singh, P., Mall, R.K. and Srivastava P. K.. (2021). Estimation of Potential Evapotranspiration UsingINSAT-3D Satellite Data over an Agriculture Area, Banaras Hindu University, Varanasi, Utlar Pradesh, India. Agricultural water management 143-155
Subramanya, K. (2008) Engineering hydrology, Third Edition, New Delhi, India.
Yahaya, O., Iyawe, H., Olatunde, M.B. and Olatunde, F.O. (2020) Assessment of Reference
Evapotranspiration Estimation Models: Asian Review of Environmental and Earth Sciences, 7(1):26-34. Doi:10.20448/journal.506.2020.71.26.34.
Zeng, Z, Wu,W, Zhou, Y, Li,,Z, Hou, M,,Huang,H (2019). Changes in Reference Evapotranspiration Over Southwest China During 1960-2018: Attributions and Implications for Drought Atmosphere. 10: 705: doi:10.3390/atmos10110705

ICEES 2021 ISSN: 2714-4186
366
INAUGURATION OF KIFILIDEEN TRINOMIAL THEOREM OF NEGATIVE POWER OF – N BY EMPLOYING MATRIX AND
STANDARDIZED TECHNIQUES
Kifilideen L. Osanyinpeju
Agricultural and Bio-Resources Engineering Department, College of Engineering, Federal University of Agriculture Abeokuta, Ogun State, Nigeria.
Email of Corresponding Author [email protected], [email protected]
ABSTRACT
The Kifilideen trinomial theorem of positive power of n built on matrix and standardized procedures had been developed and implemented in company with the Kifilideen general power combination formula which helps to determine the terms in the kif expansion of trinomial expression of positive power of n. This research work inaugurated Kifilideen trinomial theorem of negative power of – n by employing matrix and standardized techniques. Matrix was used in this study to arrange the terms of the series of the negative power of the Kifilideen trinomial theorem. The Kifilideen general power combination formula of any term in the series of the Kifilideen trinomial theorem of negative power of – n was invented. The Kifilideen general term formula to determine the term of a given power combination was also originated. It has been proving that the theorem and formulas generated are accurate, reliable, easy and interesting. The theorem helps in generating the terms of Kifilideen trinomial theorem of negative power of – n in an orderly form and makes it easy in obtaining the power combination that produce any given term and vice versa.
Keywords: Kif matrix, Kif power combination formula, Kif row column formula, Kif term formula, Kif group formula
1.0 INTRODUCTION
Creation of numbers is established in a unique way (Fritz et al., 2013; Hurst and Hurrell, 2014; Posamentier, 2015; Penn, 2021). Permutation and combination of numbers in different ways to generate different sets of numbers which when study critically; the set of numbers produce have marvelous and miraculous in pattern, structure, series and arrangement (Liljedahl, 2004; Itaketo, 2010; Mulligan et al., 2010; Yesildere and Akkoc, 2010; Ernest, 2015; Hessman, 2020). This makes mathematics to stand out from all other subjects such as physics, chemistry, computer science or biology (Peter, 2011; Ziegler and Loss, 2017; Rajah, 2020). Uniqueness of mathematics is not limited to the area of multiplication, calculus, and trigonometry but can also be seen in trinomial theorem which its terms can also be transformed into matrix for both trinomial expression of positive and negative power of n and – n (Osanyinpeju, 2020a, Osanyinpeju, 2022). Although to get numerous facts, latent revelation, trick, great discoveries and invention on mathematics; it required a lot of interactions with it, sacrifices of time, effort and persistence with the subject matter ‘mathematics’ (Osanyinpeju et al., 2019; Osanyinpeju 2020d). Good things do not come out with easy. Sir Isaac Newton was able to invent theorems and concepts in mathematics as a result of interaction with number and permutation of numbers. Development is occurring in mathematics because of its beauty and pleasure derived from it when required result is obtained and achieved (Cairbre, 2009; Mordukovich, 2011; Zeki et al., 2014; Osanyinpeju, 2019; Reynolds and Lemma, 2021).

ICEES 2021 ISSN: 2714-4186
367
The Kifilideen general formula for obtaining the power combination for a given term of negative power of – n of Newton binomial theorem is given as:
CP = – 11t + 10 n + 11
Where CP is the power combination to be obtained when tth term of series of the expansion of the Newton binomial theorem is provided. More so, n is the value of negative power of – n of the Newton binomial theorem. The general formula for the power combination for negative power of – n of the Newton binomial theorem was achieved by having full representation of the component parts of the power combination (Osanyinpeju, 2020b).
The arrangement of terms of trinomial expression of positive and negative power of n and – n in periodicity and orderly manners as break ways in developing a standardized trinomial theorem which can be formulated into matrix where position of terms and power combination of each terms can be determined with easy (Osanyinpeju, 2020c). This also lead to discovery of general formulas for terms and power combination of positive and negative power of n and – n of trinomial theorem. Matrix is used in this research work to arrange the terms of the series of the negative power of – n of Kifilideen trinomial theorem. The Kifilideen general power combination formula of any term in the series of the negative power of – n of Kifilideen trinomial theorem was invented. The Kifilideen general term formula to determine the term of a given power combination was also originated. The theorem helps in generating the terms of Kifilideen trinomial theorem of negative power of – n in an orderly form and makes it easy in obtaining the power combination that produce any given term and vice versa. This research work inaugurated Kifilideen trinomial theorem of negative power of – n by employing matrix and standardized techniques.
2.0 MATERIALS AND METHODS
2.1 The Kifilideen Expansion of Trinomial Expression [x+y+z] of Negative Power of – 3
The kif power combination of trinomial expression of negative power of – 3 in orderly manner by employing matrix and standardized techniques are – 300, – 410, – 401, – 520, – 511, – 502, – 630, – 621, – 612, – 603, – 740, – 731, – 722, – 713, – 704, – 850, – 841, – 832, – 823, – 814, – 805, – 960, – 951, – 942, – 933, – 924, – 915, – 906, – 1070, – 1061, –1052, – 1043, – 1034, –1025, – 1016, –1007,… .
Arrangement of this power combination in Kif matrix, we have;
– 300 – 410 – 401 – 520 – 511 – 630 – 502 – 621 – 740 – 612 – 731 – 850 – 603 – 722 – 841 – 960 – 713 – 832 – 951 . . . . .. . . … . . …

ICEES 2021 ISSN: 2714-4186
368
For each power combination of any term of the series of kif expansion of trinomial theorem of negative power of – 3; the sum of the three parts of the power combination of that particular term gives a total of – 3. The group of a trinomial expression of negative power of – 3 is infinity. The numbers of members in groups 1, 2, 3, 4, 5, 6, 7, 8, 9 … are 1, 2, 3, 4, 5, 6, 7, 8, 9 … respectively. The value of the middle part of the power combination of the first member of the group 1, 2, 3, 4, 5, 6, 7, … are 0,1, 2, 3, ,4, 5 , 6, … respectively which can be shown in the kif matrix above. For group that is having more than one member; the members are arithmetically increasing by a value of 9. To migrate from one group (first member of that group) to a successive group (first member of the proceeding group) a value of – 110 is added up. Across the period, the members are decreasing by a value of 119. The first member of the power combination of the series is – 300 because the negative power of the trinomial expression looking into is – 3. The Kifilideen trinomial theorem of negative power of – 3 generates infinite series.
The Kifilideen expansion of a trinomial expression [x+y+z] of negative power of – 3 is given as:
+
+
[1]

ICEES 2021 ISSN: 2714-4186
369
[2]

ICEES 2021 ISSN: 2714-4186
370
[3]
2.2 The Kifilideen Expansion of a Trinomial Expression [x+y+z] of Negative Power of – n
The kif power combination of a trinomial expression [x+y+z] of negative power of – n in an orderly manner by employing matrix and standardized techniques are – n00, (– n–1)10, (–n–1)01, (–n–2)20, (–n–2)11, (–n–2)02, (–n–3)30, (–n–3)21, (–n–3)12, (–n–3)03, (–n–4)40, (–n–4)31, (–n–4)22, (–n–4)13, (–n–4)04, (–n–5)50, (–n–5)41, (–n–5)32, (–n–5)23, (–n–5)14, (–n–5)05, (–n–6)60, (–n–6)51, (–n–6)42, (–n–6)33, (–n–6)24, (–n–6)15, (–n–6)06, (–n–7)70, (–n–7)61, (–n–7)52, (–n–7)43, (–n–7)34, (–n–7)25, (–n–7)16, (–n–7)07, (–n–8)80, (–n–8)71, (–n–8)62, (–n–8)53, (–n–8)44, (–n–8)35, (–n–8)26, (–n–8)17, (–n–8)08,… .

ICEES 2021 ISSN: 2714-4186
371
Arrangement of this power combination in Kif matrix, we have;
– n00 (– n–1)10 (–n–1)01 (–n–2)20 (–n–2)11 (–n–3)30 (–n–2)02 (–n–3)21 (–n–4)40 (–n–3)12 (–n–4)31 (–n–5)50 (–n–3)03 (–n–4)22 (–n–5)41 (–n–6)60 . . . . . . . .. . . …
For each power combination of any term of the series of kif expansion of a trinomial theorem of negative power of – n; the sum of the three parts of the power combination of that particular term gives a total of – n. The group of a trinomial expression of negative power of – n is infinity. The number of members in groups 1, 2, 3, 4 , 5, 6, 7 … are 1, 2, 3, 4, 5, 6, 7 … respectively. The value of the middle part of the power combination of the first member of the group 1, 2, 3, 4, 5, 6, 7… are 0, 1, 2, 3, 4, 5, 6 … which can be shown in the kif matrix above. For group that is having more than one member; the members are arithmetically increasing by a value of 9. To migrate from one group (first member of that group) to a successive group (first member of the processing group) a value of – 110 is added up. Across the period, the members are decreasing by a value of 119. The first member of the power combination of the series is – n00 because the negative power of the trinomial expression looking into is – n. Furthermore, down the group the middle part of the power combination is decreasing by 1 until it get to zero while the end part of the power combination is increasing by 1. The Kifilideen trinomial theorem of negative power of – n generates infinite series.
The Kifilideen expansion of a trinomial expression [x+y+z] of negative power of – n is given as:

ICEES 2021 ISSN: 2714-4186
372
[4]

ICEES 2021 ISSN: 2714-4186
373
[5]

ICEES 2021 ISSN: 2714-4186
374
[6]
Table 1 presents the Kifilideen Power combination table of the terms of the series of Kifilideen
expansion of trinomial expression of negative power of – n in a standardized
technique and order.
Table 1. The Kifilideen Power Combination Table of the Terms of the Series of Kifilideen
Expansion of Trinomial Expression of Negative Power of – n in a Standardized
Technique and Order
Terms
n =
1
n =
2
n =
3
n =
4
n =
5
n =
6
n =
7
n =
8
n =
9
n =
10
n =
11
n =
12 n =
13
1 -100 -200 -300 -400 -500 -600 -700 -800 -900 -1000 -1100 -1200 -1300 2 -210 -310 -410 -510 -610 -710 -810 -910 -1010 -1110 -1210 -1310 -1410 3 -201 -301 -401 -501 -601 -701 -801 -901 -1001 -1101 -1201 -1301 -1401 4 -320 -420 -520 -620 -720 -820 -920 -1020 -1120 -1220 -1320 -1420 -1520 5 -311 -411 -511 -611 -711 -811 -911 -1011 -1111 -1211 -1311 -1411 -1511 6 -302 -402 -502 -602 -702 -802 -902 -1002 -1102 -1202 -1302 -1402 -1502 7 -430 -530 -630 -730 -830 -930 -1030 -1130 -1230 -1330 -1430 -1530 -1630 8 -421 -521 -621 -721 -821 -921 -1021 -1121 -1221 -1321 -1421 -1521 -1621 9 -412 -512 -612 -712 -812 -912 -1012 -1112 -1212 -1312 -1412 -1512 -1612 10 -403 -503 -603 -703 -803 -903 -1003 -1103 -1203 -1303 -1403 -1503 -1603 11 -540 -640 -740 -840 -940 -1040 -1140 -1240 -1340 -1440 -1540 -1640 -1740 12 -531 -631 -731 -831 -931 -1031 -1131 -1231 -1331 -1431 -1531 -1631 -1731 13 -522 -622 -722 -822 -922 -1022 -1122 -1222 -1322 -1422 -1522 -1622 -1722 14 -513 -613 -713 -813 -913 -1013 -1113 -1213 -1313 -1413 -1513 -1613 -1713 15 -504 -604 -704 -804 -904 -1004 -1104 -1204 -1304 -1404 -1504 -1604 -1704

ICEES 2021 ISSN: 2714-4186
375
16 -650 -750 -850 -950 -1050 -1150 -1250 -1350 -1450 -1550 -1650 -1750 -1850 17 -641 -741 -841 -941 -1041 -1141 -1241 -1341 -1441 -1541 -1641 -1741 -1841 18 -632 -732 -832 -932 -1032 -1132 -1232 -1332 -1432 -1532 -1632 -1732 -1832 19 -623 -723 -823 -923 -1023 -1123 -1223 -1323 -1423 -1523 -1623 -1723 -1823 20 -614 -714 -814 -914 -1014 -1114 -1214 -1314 -1414 -1514 -1614 -1714 -1814 21 -605 -705 -805 -905 -1005 -1105 -1205 -1305 -1405 -1505 -1605 -1705 -1805 22 -760 -860 -960 -1060 -1160 -1260 -1360 -1460 -1560 -1660 -1760 -1860 -1960 23 -751 -851 -951 -1051 -1151 -1251 -1351 -1451 -1551 -1651 -1751 -1851 -1951 24 -742 -842 -942 -1042 -1142 -1242 -1342 -1442 -1542 -1642 -1742 -1842 -1942 25 -733 -833 -933 -1033 -1133 -1233 -1333 -1433 -1533 -1633 -1733 -1833 -1933 26 -724 -824 -924 -1024 -1124 -1224 -1324 -1424 -1524 -1624 -1724 -1824 -1924 27 -715 -815 -915 -1015 -1115 -1215 -1315 -1415 -1515 -1615 -1715 -1815 -1915 28 -706 -806 -906 -1006 -1106 -1206 -1306 -1406 -1506 -1606 -1706 -1806 -1906 29 -870 -970 -1070 -1170 -1270 -1370 -1470 -1570 -1670 -1770 -1870 -1970 -2070 30 -861 -961 -1061 -1161 -1261 -1361 -1461 -1561 -1661 -1761 -1861 -1961 -2061 31 -852 -952 -1052 -1152 -1252 -1352 -1452 -1552 -1652 -1752 -1852 -1952 -2052 32 -843 -943 -1043 -1143 -1243 -1343 -1443 -1543 -1643 -1743 -1843 -1943 -2043 33 -834 -934 -1034 -1134 -1234 -1334 -1434 -1534 -1634 -1734 -1834 -1934 -2034 34 -825 -925 -1025 -1125 -1225 -1325 -1425 -1525 -1625 -1725 -1825 -1925 -2025 35 -816 -916 -1016 -1116 -1216 -1316 -1416 -1516 -1616 -1716 -1816 -1916 -2016 36 -807 -907 -1007 -1107 -1207 -1307 -1407 -1507 -1607 -1707 -1807 -1907 -2007 37 -980 -1080 -1180 -1280 -1380 -1480 -1580 -1680 -1780 -1880 -1980 -2080 -2180 38 -971 -1071 -1171 -1271 -1371 -1471 -1571 -1671 -1771 -1871 -1971 -2071 -2171 39 -962 -1062 -1162 -1262 -1362 -1462 -1562 -1662 -1762 -1862 -1962 -2062 -2162 40 -953 -1053 -1153 -1253 -1353 -1453 -1553 -1653 -1753 -1853 -1953 -2053 -2153 41 -944 -1044 -1144 -1244 -1344 -1444 -1544 -1644 -1744 -1844 -1944 -2044 -2144 42 -935 -1035 -1135 -1235 -1335 -1435 -1535 -1635 -1735 -1835 -1935 -2035 -2135 43 -926 -1026 -1126 -1226 -1326 -1426 -1526 -1626 -1726 -1826 -1926 -2026 -2126 44 -917 -1017 -1117 -1217 -1317 -1417 -1517 -1617 -1717 -1817 -1917 -2017 -2117 45 -908 -1008 -1108 -1208 -1308 -1408 -1508 -1608 -1708 -1808 -1908 -2008 -2108 46 -1090 -1190 -1290 -1390 -1490 -1590 -1690 -1790 -1890 -1990 -2090 -2190 -2290 47 -1081 -1181 -1281 -1381 -1481 -1581 -1681 -1781 -1881 -1981 -2081 -2181 -2281 48 -1072 -1172 -1272 -1372 -1472 -1572 -1672 -1772 -1872 -1972 -2072 -2172 -2272 49 -1063 -1163 -1263 -1363 -1463 -1563 -1663 -1763 -1863 -1963 -2063 -2163 -2263 50 -1054 -1154 -1254 -1354 -1454 -1554 -1654 -1754 -1854 -1954 -2054 -2154 -2254 51 -1045 -1145 -1245 -1345 -1445 -1545 -1645 -1745 -1845 -1945 -2045 -2145 -2245 52 -1036 -1136 -1236 -1336 -1436 -1536 -1636 -1736 -1836 -1936 -2036 -2136 -2236 53 -1027 -1127 -1227 -1327 -1427 -1527 -1627 -1727 -1827 -1927 -2027 -2127 -2227 54 -1018 -1118 -1218 -1318 -1418 -1518 -1618 -1718 -1818 -1918 -2018 -2118 -2218 55 -1009 -1109 -1209 -1309 -1409 -1509 -1609 -1709 -1809 -1909 -2009 -2109 -2209 56 -
11100
-12100
-13100
-14100 -15100 -16100 -17100
-18100
-19100
-20100 -21100 -22100 -23100
57 -1191 -1291 -1391 -1491 -1591 -1691 -1791 -1891 -1991 -2091 -2191 -2291 -2391 58 -1182 -1282 -1382 -1482 -1582 -1682 -1782 -1882 -1982 -2082 -2182 -2282 -2382 59 -1173 -1273 -1373 -1473 -1573 -1673 -1773 -1873 -1973 -2073 -2173 -2273 -2373 60 -1164 -1264 -1364 -1464 -1564 -1664 -1764 -1864 -1964 -2064 -2164 -2264 -2364 61 -1155 -1255 -1355 -1455 -1555 -1655 -1755 -1855 -1955 -2055 -2155 -2255 -2355 62 -1146 -1246 -1346 -1446 -1546 -1646 -1746 -1846 -1946 -2046 -2146 -2246 -2346 63 -1137 -1237 -1337 -1437 -1537 -1637 -1737 -1837 -1937 -2037 -2137 -2237 -2337 64 -1128 -1228 -1328 -1428 -1528 -1628 -1728 -1828 -1928 -2028 -2128 -2228 -2328 65 -1119 -1219 -1319 -1419 -1519 -1619 -1719 -1819 -1919 -2019 -2119 -2219 -2319
66 -11010
-12010
-13010
-14010 -15010 -16010 -17010
-18010
-19010
-20010 -21010 -22010 -23010
2.3 Inauguration of the Kifilideen General Power Combination Formula of any Term
of a Trinomial Expression of Negative Power of – n
The Kifilideen general power combination formula of Kifilideen expansion of trinomial
expression of negative power of – n is given as:

ICEES 2021 ISSN: 2714-4186
376
[7]
Where,
the negative power of the trinomial expression
the power combination of the term
the power combination of the term
the tth term
the tth term of the first term in the group the t term belong to
The value of y is determined from:
[8]
[9]
Where, is a constant value for the group the tth term belongs to. If the value of x obtained is
decimal, only the whole number part of the decimal of x is considered. When the whole number
part of x is considered; the value obtained is equivalent to value of the middle part, of the
power combination of the first member of the group of the tth term given belongs to.
Also, and [10]
To determine the group the tth term belongs to in the kif matrix of the negative power of – n, the Kifilideen general group formula for trinomial theorem of negative power of – n which is originated as shown below:
or [11]
2.4 Development of Kifilideen General Term Formula for a Given Power
Combination of Kifilideen Expansion of Trinomial Expression of Negative
Power of – n
The Kifilideen general term formula that generates a particular power combination [ of
Kifildeen expansion of trinomial expression of negative power of – n is given as:
If the power combination of the term of the Kifilideen expansion of trinomial expression
of negative power of – n is
Where,

ICEES 2021 ISSN: 2714-4186
377
the power combination,
the first component part of the power combination
the second component part of the power combination
the third component part of the power combination
the degree of the negative power of – n of the trinomial expression
So we have,
[12]
Where,
the required tth term
the first component part of the power combination
the second component part of the power combination
the third component part of the power combination
the degree of the negative power of – n of the trinomial expression
2.5 Kifilideen General Position Formula to Determine the Position of Member in a Particular Group of Kif Matrix of Kifilideen Expansion of Trinomial Expression
of Negative Power of – n
The Kifilideen general position formula to determine the position of member in a particular
group of kif matrix of kifilideen expansion of trinomial expression of negative
power of – n is given as:
[13]
[14]
Where,
the required power combination in which its position in the group it belong to in the
kif matrix is to be known
the power combination of the first member of the group in which the required
power combination belong to
the position of the required power combination

ICEES 2021 ISSN: 2714-4186
378
the group the required power combination belong to in the kif matrix
the degree of the negative power of – n of the kifilideen expansion of trinomial expression
the first component part of the required power combination
3.6 Kifilideen General Row Column Matrix Formula for Kifilideen Expansion of
Trinomial Expression of Negative Power of – n
[15]
Where,
the power combination of row r and column c in the kif matrix
the row of the required power combination
c the column of the required power combination
the degree of the negative power of – n of the kifilideen expansion of trinomial expression
3.0 RESULTS AND DISCUSSIONS
3.1 Demonstration on How to Utilize the Kifilideen General Power Combination Formula of Kifilideen Trinomial Theorem of Negative Power of – n
[i] Establish the power combination, of the 38th term of Kifilideen expansion of the
trinomial expression of the negative power of – 5. Hence determine the group the
38th term belong in the kif matrix.
Solution
[16]
From the question and
[17]
[18]
[19]

ICEES 2021 ISSN: 2714-4186
379
Note the whole number part of the value of x is recorded as its value always. So,
[20]
[21]
[22]
[23]
[24]
[25]
[26]
So, and are the components of the power combination of the 38th term.
Note that, the value y = 37 indicate that the term of first member of the group in which the 38th term belong to is the 37th term. The power combination of the 38th term of the Kifilideen
expansion of trinomial expression of negative power of – 5 is – 1371.
[ib] [27]
[28]
[29]
Note the whole number part of the value of g is recorded as its value always. So,
Or
[30]
This indicates that 38th term belongs to group 9 in the kif matrix of negative power of – 5.
[ii] Provide the power combination, of the 129th term of the Kifilideen expansion of the
negative power of – 6 of the trinomial expression
Solution
[31]

ICEES 2021 ISSN: 2714-4186
380
From the question and [32]
[33]
[34]
.51 [35]
Note the whole number part of the value of x is recorded as its value always. So,
[36]
[37]
[38]
[39]
[40]
[41]
[42]
So, and are the components of the power combination of the 129th term.
Note that, the value y = 121 indicate that the term of first member of the group in which the 129th term belong to is the 121th term. The power combination of the 129th term of the Kifilideen
expansion of the trinomial expression of negative power of – 6 is – 2178.
[iii] Reckon the value of the term of Kifilideen expansion of trinomial expression
of negative power of – 9 whose power combination is
Solution
negative power of the trinomial expression = [43]
[44]
So, [45]
Note,
[46]

ICEES 2021 ISSN: 2714-4186
381
and [47]
[48]
[49]
[50]
th term [51]
OR
[52]
–2139= –110 [53]
th term [54]
3.2 Illustration on the Implementation of the General Term Formula that Generate a
Particular Power Combination [
[i] Determine the negative power of – n of Kifilideen trinomial theorem that generate the power combination – 1828 and the tth term of the power combination.
Solution
[ai] the degree of the negative power of n = [55]
Where,
the first component part of the power combination
the second component part of the power combination
the third component part of the power combination
the degree of the negative power of – n of the trinomial expression
From the question,
[56]
Therefore, [57]
[58]

ICEES 2021 ISSN: 2714-4186
382
[aii] [59]
[60]
th term [61]
3.3 Utilization of the Kifilideen General Position Formula to Determine the Position of Member in a Particular Group of Kif Matrix of Kifilideen Expansion of Trinomial
Expression of Negative Power of – n
[i] Work out the group and the position of the power combination in the group it
belong to in the kif matrix
Solution
[62]
So, and [63]
[64]
group [65]
So, power combination – 2036 belong to group 10 of the kif matrix of negative power of – 11
The first member of the group 10 of the kif matrix of negative power of – 11 =
[66]
[67]
th position [68]
3.4 Demonstration on the Usage of the Kifilideen General Row Column Matrix
Formula for Kifilideen Expansion of Trinomial Expression of Negative
Power of – n
[i] Figure out the power combination of the Kifilideen trinomial expansion of negative power of – 4 in the row (period) 10 and column (group) 6 of the kif matrix of the expansion of
Solution

ICEES 2021 ISSN: 2714-4186
383
From the question, and [69]
[70]
[71]
1354 [72]
4.0 CONCLUSIONS
This study inaugurated Kifilideen trinomial theorem of negative power of n by employing
matrix and standardized techniques. The Kifilideen general power combination formula of any term in the series was developed. The Kifilideen general term formula to determine the term of a given power combination was also invented. Preliminary evaluation has been done on the developed theorem and formulas originated to ascertain their accuracy and workability. It has been proved that the theorem and formulas generated are accurate, reliable, easy and interesting. The theorem helps in generating the terms of Kifilideen trinomial theorem of negative power of – n in an orderly form and makes it easy in obtaining the power combination that produce any given term and vice versa.
REFERENCES
Cairbre F.O. (2009). The Importance of Being Beautiful in Mathematics. IMTA Newletter 109: 29 – 44.
Ernest P. (2015). Mathematics and Beauty. University of Exeter 6 pp.
Fritz A., Ehlert A., Balzer L. (2013). Development of Mathematical Concepts as Basis for an Elaborated Mathematical Understanding. South African Journal of Childhood Education 3 (1): 38 – 67.
Hessman J.M. (2020). The Importance of Technology and Learning Patterning in Early Math Education. Master Project, Northwestern College, Evanston, Illinois, United State 35 pp.
Hurst C., Hurrell D. (2014). Developing the Big Ideas of Number. International Journal of Educational Studies in Mathematics 1 (2): 1 – 18.
Itaketo U.T. (2010). Application of the Principles of Permutation and Combination (in Mathematics) in Telecommunications. International Journal of Engineering Science and Technology 2 (10): 2963 – 2967.
Liljedahl P. (2004). Repeating Pattern or Number Pattern: The Distinction is Blurred. Focus on Learning Problems in Mathematics 26 (3): 24 – 42.
Mordukhovick B. (2011). Beauty of Mathematics. Atti della Accademia Peloritana dei Pericolanti
89 (2): 1 3.

ICEES 2021 ISSN: 2714-4186
384
Mulligan J.T., Mitchelmore M.C., English L.D., Robertson G. (2010). Implementing a Pattern and Structure Mathematics Awareness Program (PASMAP) in Kindergarten. Shaping the Future of Mathematics Education: Proceedings of the 33rd Annual Conference of the Mathematics Education Research Group of Australasia. Fremantle: MERGA pp 796 – 803.
Osanyinpeju K.L., Aderinlewo A.A., Dairo O.U., Adetunji O.R., Ajisegiri E.S.A (2019). Development, Conversion and Application of Osanyinpeju (Power of Base 2) And Antiosanyinpeju (Antipower of Base 2) With Lekan (Power of Base 5) and Antilekan (Antipower of Base 5) Tables. 1st International Conference on Engineering and Environmental Sciences (ICEES) Theme: Advancing Technology and Environment Burdens (Challenges and Sustainable Solution 5th- 7th November 2019 pp 969 – 981.
Osanyinpeju K.L. (2019). Development of Kifilideen (Power of Base 11) and Antikifilideen (Antipower of Base 11) Tables. 1st International Conference on Engineering and Environmental Sciences (ICEES) Theme: Advancing Technology and Environment Burdens (Challenges and Sustainable Solution 5th - 7th November 2019 pp 957 – 968.
Osanyinpeju K.L. (2020a). Computation of the Power of Base of Two Digits Number Using Kifilideen (Matrix, Combination and Distributive (MCD)) Approach. Matrix Science Mathematics (MSMK) 4 (1): 14 – 19.
Osanyinpeju K.L. (2020b). Development of Kifilideen Trinomial Theorem Using Matrix Approach. International Journal of Innovations in Engineering Research and Technology 7 (7): 117 – 135.
Osanyinpeju K.L. (2020c). Utilization of Kifilideen Trinomial Theorem based on Matrix Approach in Computation of the Power of Base of Tri-Digits Number. International Conference on Electrical Engineering Applications (ICEEA'2020), Department of Electrical Engineering, Ahmadu Bello University, Zaria, Nigeria. 23rd-25th September, 2020 pp 192 – 199.
Osanyinpeju K.L. (2020d). Development of Kifilideen (Power of Base 11), Antikifilideen (Antipower of Base 11) and Other Tables. Eliva Press SRL Publisher, MD-2060, bd. Cuza-Voda, ¼, of. 21 Chisinau, Republica Moldova, Europe 136 pp.
Osanyinpeju K.L. (2022). Inauguration of Kifilideen Theorem of Matrix Transformation of Negative Power of – n of Trinomial Expression in which Three Variables x, y and z are Found in Parts of the Trinomial Expression with some other Applications. Selforganizology 1 – 18.
Penn (2021). Where Math Meets Physics. Penn University of Pennsylvania, Suite 200, 3901 Walnut Street Philadelphia, Pennsylvania, United State 8 pp.
Peter E.E. (2011). Mathematics: Indispensible Tool for Successful and Balance Human Existence on This Planet. Adances in Applied Science Research 2 (5): 449 – 456.
Posanebtier A.S. (2015). Math Wonders to Inspire Teachers and Students: Beauty of Numbers.Association for Supervision and Curriculum Devlopment; Illustrated Edition 294 pp.

ICEES 2021 ISSN: 2714-4186
385
Rajah A. (2020). 5 Reasons Why I love Mathematics. Faculty of Natural, Mathematical and Engineering Sciences, King’s College, Strand Campus, London 3 pp.
Reynolds W. Lemma M. (2021). The Mathematics Beauty of the Perfect Numbers. International Journal of Mathematics 4 (6): 43 – 51.
Yesildere S., Akkoc H. (2010). Algebraic Generalization Strategies of Number Patterns used by Pre – Service Elementary Mathematics Teachers. Procedia Social and Behavioral Sciences 2: 1142 – 1147.
Zeki S., Romaya J.P., Benincasa D.M.T., Atiyah M.F. (2014). The Experience of Mathematical Beauty and its Neual Correlates. Frontiers in Human Neuroscience 8: 68.
Ziegler G.M., Loos A. (2017). ‘What is Mathematics?’ and Why We Should Ask, Where One Should Experience and Learn That, and How to Teach it. Proceedings of the 13th International Congress on Mathematical Education pp 63 – 77.

ICEES 2021 ISSN: 2714-4186
386
APPLICATION OF EXPANSION OF NEGATIVE POWER OF OF
KIFILIDEEN TRINOMIAL THEOREM FOR THE TRANSFORMATION OF COMPOUND FRACTION INTO SERIES OF PARTIAL FRACTIONS WITH
OTHER DEVELOPMENTS
Kifilideen L. Osanyinpeju
Agricultural and Bio-Resources Engineering Department, College of Engineering, Federal University of Agriculture Abeokuta, Ogun State, Nigeria.
Email of Corresponding Author [email protected], [email protected]
ABSTRACT
Kifilideen trinomial theorem of negative power of is theorem which is used to generate the
series and terms of a trinomial expression of negative power of in an orderly and periodicity
manner that is based on standardized and matrix methods. Negative power of Newton binomial theorem had been used to produce series of partial fractions of a compound fraction. The
establishment of the negative power of of trinomial theorem would extend the number of
compound fraction in which series (expansion) can be produced. This study applied Kifilideen
expansion of negative power of of Kifilideen trinomial theorem for the transformation of
compound fraction into series of partial fractions with other developments. Kifilideen theorem
of matrix transformation of negative power of of trinomial expression in which three
variables are found in parts of the trinomial expression was developed. The
development would ease the process of evaluating such trinomial expression of negative power
of . This standardized and matrix method used in arranging the terms of the Kifilideen
expansion of negative power of of trinomial expression yield an interesting results in which
it is utilized in transforming compound fraction into series of partial fractions in a unique way.
Keywords: compound fraction, combination, Kif matrix, Kifilideen standardized method, partial fraction, series
1.0 INTRODUCTION
Sir Isaac Newton (1642 – 1727) was the first mathematician and physicist to inaugurate negative and fraction power of binomial theorem (Dennis and Addington, 2009; Goss, 2011; Youngmee and Sangwook, 2014; Schwart, 2015; Cooley, 2019; Osanyinpeju, 2019a). He established formula for binomial theorem that could work for negative, fraction powers of binomial expression (Francia, 2000; Haggstrom, 2012; Aljohani, 2016; Anekwe, 2018; Tavora, 2020). The binomial theorem is a general expression for any power of the sum or difference of any two things, terms or quantities (Godman et al., 1984, Talber et al., 1995; Bird, 2003; Stroud and Booth, 2007, Tuttuh – Adegun, and Adegoke, 2014 Bunday and Mulholland, 2014). Binomial is widely used in the field of Physics, Biology and Engineering to expand power of binomial expression (Costa, 2017; Gavrikov, 2018). Binomial series (expansions) are utilized in area of mathematical analysis link to data modeling, probability theory, algebra and approximation techniques (Yang, 2017).
Kifilideen trinomial theorem of negative power of – n is theorem which is used to generate the series and terms of a trinomial expression of negative power of – n in an orderly and periodicity

ICEES 2021 ISSN: 2714-4186
387
manner that is based on standardized and matrix method (Osanyinpeju, 2021). Negative power of Newton binomial theorem had been used to produce series of partial fractions of a
compound fraction (Horn, 2020). The establishment of the negative power of n of trinomial
theorem would extend the number of compound fraction in which series can be produced. The
negative power of of kifilideen trinomial theorem can be used to generate the series of
compound fraction number (examples are partial fraction series of ).
The terms of negative power of of trinomial theorem produce an infinite series unlike the
terms of power of n of trinomial theorem which generate finite series (Osanyinpeju, 2020a). The
terms of negative power of of trinomial theorem when arranged in the form of matrix, the
number of elements in each column has finite value which is also the same for positive power of
n of trinomial theorem (Osanyinpeju, 2022). Although, the column of any negative power of
of trinomial theorem is infinite while that of positive power of of trinomial theorem is finite.
The power combination of each term of the negative power of of kifilideen trinomial
theorem is arranged in groups (columns) and periods (rows) in the kif matrix where each power combination takes a designated position. No two power combinations have the same position in
the kif matrix for a particular negative power of of Kifilideen trinomial theorem. This is also
applied to positive power of trinomial theorem (Osanyinpeju, 2020b). The power combination of each term; down the group (column) and across the period (row) decreases and increases respectively at regular pattern for both positive and negative powers of Kifilideen trinomial theorem in the kif matrix format. Also, to transit from one group to another the power combination progress with unique addition of regular figure which occur for both positive and negative power of trinomial theorem.
This standardized and matrix method used in arranging the terms of the Kifilideen expansion of
negative power of of trinomial expression yield an interesting results in which it is utilized
in transforming compound fraction into series of partial fractions in a unique way. Kifilideen Matrix approach had been extended in evaluating and computation of power of base of eleven, other bi – digits and tri – digit numbers (Osanyinpeju, 2019b; Osanyinpeju, 2020c, Osaanyinpeju,
2020d). This study applied kifilideen expansion of negative power of of Kifilideen trinomial
theorem for the transformation of compound fraction into series of partial fraction with other developments.
2.0 MATERIALS AND METHODS
2.1 Kifilideen Theorem of Matrix Transformation of Negative Power of of
Trinomial Expression
If three variables are found in each part of trinomial expression of negative power of
such as
(1)

ICEES 2021 ISSN: 2714-4186
388
and the power combination of any term in the Kifilideen expansion of that kind of negative
power of of the trinomial expression is set as while the value of this term is designated
as .
Then, the kifilideen matrix transformation of such negative power of of trinomial expression
is of the form;
: (2)
Thus and where and are constants
More so,
(3)
2.2 Transformation of Compound Fraction into Series of Partial Fractions
The Kifilideen trinomial theorem of negative power of is used in the transformation of the
compound fraction into series of partial fractions. First, a trinomial expression of power of
is generated in which is found in part(s) of the trinomial expression where when the value of
is put in the trinomial expression it will produce the compound fraction. Afterward, the trinomial
expression of power of established is expanded using the Kifilideen trinomial theorem of
negative power of . The value of which would produce the compound fraction when
inserted in the trinomial expression of the power is put in both the trinomial expression
of the power of and anywhere is found in the series of the expansion of the trinomial
expression of the power of to obtain the series of the partial fractions of the compound
fraction.
2.2.1 Demonstration on the utilization of Kifilideen procedure in generating trinomial
expression of power of that would represent the compound fractions when the value
of is inserted in the trinomial expression
[1] Generate a trinomial expression of power of in which is found in part(s) of the
trinomial expression where when the value of is put in the trinomial expression it will produce
the following compound fractions.
[a] [b] [c]

ICEES 2021 ISSN: 2714-4186
389
Solution
[a]
(4)
where .
Therefore trinomial expression would produce the compound fraction
when is inserted in the trinomial expression
[b]
(5)
where .
Therefore trinomial expression would produce the compound fraction when
is inserted in the trinomial expression
[c] (6)
(7)
where . (8)
Therefore trinomial expression would produce the compound fraction
when is inserted in the trinomial expression. The Kifilideen coefficient table of negative
power of Kifilideen trinomial theorem was used in generating the power coefficient of each term of series of the trinomial expansion.
3.0 RESULTS AND DISCUSSIONS
3.1 Illustration on the utilization of Kifilideen Theorem of Matrix Transformation of
Negative Power of of Trinomial Expression

ICEES 2021 ISSN: 2714-4186
390
[1] Given that a term in the Kifilideen expansion of is where is a
constant value. Using Kifilideen theorem of matrix transformation method of negative power of
of trinomial expression. Find
[i] the power combination of the given term
[ii] the power of the trinomial expression
[iii] the term
[iv] the value of .
Solution
[i] Trinomial expression: (9)
Power combination to be obtained: (10)
tth term of the power combination: (11)
Using the kifilideen matrix transformation method, so
: (12)
Using Crammer’s rule, so (13)
(15)

ICEES 2021 ISSN: 2714-4186
391
(17)
(19)
So, the power combination (20)
[ii] the negative power of of the trinomial expression =
(21)
(22)
[iii] (23)
(24)
th term (25)
[iv] from the question, (26)
sing Kifilideen matrix transformation method,
(27)
(28)

ICEES 2021 ISSN: 2714-4186
392
From the Kifilideen coefficient table, the coefficient of the on the column is
(29)
(30)
(31)
3.2 Application of Kifilideen Series (Expansion) of Negative Power of – n of Trinomial Theorem using Standardized Method
[2] Establish the trinomial expression of power of where x is found in part(s) of the
trinomial expression that would produce the compound fraction when the value of
is put in the trinomial expression.
[b] Generate the series of the trinomial expression of power of established using Kifilideen
standardized method. Otherwise determine the series (partial fractions) of the
compound fraction by inserting the value of in the trinomial expression of power of
generated.
Solution
where . (32)
Therefore trinomial expression would produce the compound fraction when
is inserted in the trinomial expression
[b] Using Kifilideen coefficient table of negative power of – 1 of trinomial theorem, the coefficient in ascending order are 1, - 1, - 1, 1, 2, 1, - 1, - 3, - 3, - 1, 1, 4, 6, 4, 1, -1, - 5, - 10, - 10, - 5, - 1, ….

ICEES 2021 ISSN: 2714-4186
393
(33)
(34)

ICEES 2021 ISSN: 2714-4186
394
(35)
[ii]
(36)
The evaluation of the above series gives 0.872774 to 6 decimal places. Also, using calculator
gives 0.872774 to 6 decimal places. This indicates that the negative power of 1 of Kifilideen
trinomial theorem and coefficient of negative power of from the Kifilideen Coefficient table
are valid.
[3] Produce the trinomial expression of power of where is found in part(s) of the
trinomial expression that would produce the compound fraction when the value of is put
in the trinomial expression.
[b] Generate the series of the trinomial expression of power of established using Kifilideen
standardized method. Otherwise determine the series (partial fractions) of the compound
fraction by inserting the value of in the trinomial expression of power of generated.
Solution
[3a] (37)
(38)
where .
Therefore trinomial expression would produce the compound fraction
when is inserted in the trinomial expression

ICEES 2021 ISSN: 2714-4186
395
[b] Using Kifilideen coefficient table of negative power of – 2 of trinomial theorem, the coefficient in ascending order are 1, - 2, - 2, 3, 6, 3, - 4, - 12, - 12, - 4, 5, 20, 30, 20, 5, - 6, - 30, - 60, - 60, - 30, - 6, 7, 42, 105, 140, 105, 42, 7, - 8, - 56, - 168, - 280, - 280, - 168, - 56, - 8, …
(39)
(40)
(41)

ICEES 2021 ISSN: 2714-4186
396
[ii]
(42)
The evaluation of the above series gives 0.13933 to 5 decimal places. Also, using calculator
gives 0.13933 to 5 decimal places. This indicates that the negative power of - 2 of Kifilideen trinomial theorem and coefficient of negative power of - 2 from the Kifilideen Coefficient table are valid.
3.3 Generating Series of Partial Fractions of Compound Fraction which Denominator is Decimal Number
[4] Create the trinomial expression of power of where is found in part(s) of the trinomial
expression that would produce the compound fraction when the value of is put in the
trinomial expression.
[b] Generate the series of the trinomial expression of power of established using Kifilideen
standardized method. Otherwise determine the series (partial fractions) of the compound
fraction by inserting the value of in the trinomial expression of power of generated.
Solution
[4]
(43)
(44)
where . (45)
Therefore trinomial expression would create the compound fraction when
is inserted in the trinomial expression.

ICEES 2021 ISSN: 2714-4186
397
[b] Using Kifilideen coefficient table of negative power of – 1 of trinomial theorem, the coefficient in ascending order are 1, - 1, - 1, 1, 2, 1, - 1, - 3, - 3, - 1, 1, 4, 6, 4, 1, -1, - 5, - 10, - 10, - 5, - 1, ….
(46)

ICEES 2021 ISSN: 2714-4186
398
(47)
(48)
[ii]
(49)
The evaluation of the above series gives 0.5714 to 4 decimal places. Also, using calculator
gives 0.5714 to 4 decimal places. This indicates that the negative power of -1 of Kifilideen trinomial theorem and coefficient of negative power of -1 from the Kifilideen Coefficient table are valid.
3.4 General Application of Negative Power of of Kifilideen Trinomial Theorem
using Standardized Method
[5] If a in the Kifilideen expansion of yields .
Determine the following
[i] the power combination of the term
[ii] the
[iii] the value of
Solution
[i] For any given term in the Kifilideen expansion of is given as
(50)
(51)
Comparing (51) with , so
(52)
(53)
Therefore, (54)
Also, (55)

ICEES 2021 ISSN: 2714-4186
399
where, are the component parts of the power combination and is the negative
power of of the trinomial expression
(56)
(57)
(58)
(59)
[ii]
(60)
(61)
(62)
(63)
[iii] 7680 (64)
7680 (65)
From the Kifilideen coefficient table, the coefficient of the on the column
is or
7680 (66)
7680 (67)
7680 (68)

ICEES 2021 ISSN: 2714-4186
400
7680 (69)
7680 (70)
(71)
(72)
(73)
[6] If a term of the Kifilideen expansion of is 7560 . Find
[i] the power combination of the term
[ii] the
[iii] the value of
Solution
(74)
(75)
(76)
Comparing (76) with , so
(77)
(78)
(79)
(80)
(81)
Therefore,
Also,
(82)

ICEES 2021 ISSN: 2714-4186
401
(83)
(84)
(85)
[ii] (86)
Note, (87)
(88)
So,
(89)
(90)
(91)
th term (92)
[iii] Comparing (76) with , then
(93)
(94)
(95)
From the Kifilideen coefficient table, the coefficient of the on the column
is
(96)
(97)

ICEES 2021 ISSN: 2714-4186
402
(98)
(99)
(100)
[7] If a term in the Kifilideen expansion of of is
Determine the value of
[i] the power combination
[ii] show that the negative power of of the trinomial expression is
[iii] the
[iv] the value of
Solution
[i] (100)
(102)
(103)
Comparing (103) with , so
(104)
(105)
(106)
Also,

ICEES 2021 ISSN: 2714-4186
403
(107)
(108)
Put (105) in (104)
(109)
From (109) and (106), then
(110)
(111)
(112)
(113)
From (105) put (113) in (114), (114)
(115)
(116)
From (104) put (116) in (117) (117)
(118)
(119)
Power combination (120)
[ii] From (107), negative power of of the trinomial expression
(121)
Put (113), (116) and (119) in (121), so (122)
(123)
Proved

ICEES 2021 ISSN: 2714-4186
404
[iii] (124)
(125)
(126)
(127)
[iv] Comparing (103) with , so
(128)
(129)
From the Kifilideen coefficient table, the coefficient of the on the column
is
(130)
(131)
(132)
(133)
(134)
4.0 CONCLUSION
This study applied Kifilideen expansion of negative power of of Kifilideen trinomial
theorem for the transformation of compound fraction into series of partial fractions with other
developments. Kifilideen theorem of matrix transformation of negative power of of
trinomial expression in which three variables are found in parts of the trinomial
expression was invented. The invention would ease the process of evaluating such trinomial
expression of negative power of . The standardized and matrix method used in arranging the
terms of the Kifilideen expansion of negative power of of trinomial expression yield an
interesting results in which it is utilized in transforming compound fraction into series of partial fractions in a unique way.

ICEES 2021 ISSN: 2714-4186
405
REFERENCES
Aljohani S. (2016). History of Bionomial Theory. International Journal of Scientific and Engineering Research 7 (4): 161 – 162.
Anekwe U.O. (2018). Awekwe’s Corrections on the Negative Binomial Expansion. Scientific Review 4 (4): 26 – 33.
Bird J., (2003). Engineering Mathematics. Newnes, Oxford, An imprint of Elsevier ScienceLinacre House, Jordan Hill, Oxford OX2 8DP 200 Wheeler Road, Burlington MA 01803, Ontario, Canada 545 pp.
Bunday B.D., Mulholland H. (2014). Pure Mathematics for Advanced Level. Second edition, Elsevier Science 526 pp.
Cooley H.R. (2019). Binomial Theorem. Mc Graw Hill, Access Science, The Science Authority 3 pp.
Costa L.I. (2017). A Linear Transformation to Accelerate the Convergence of the Negative Binomial Series. Math.NA Winterthur, Switzerland 16 pp.
Dennis D., Addington S. (2009). The Binomial Series of Isaac Newton. Mathematical Intentions 12 pp.
Francia G.A. (2000). Derivation and Visualization of the Binomial Theorem. Internationl Journal
of Computers for Mathematical Learning 1 24.
Gavrikov V.L. (2018). Some Properties of Binomial Coefficients and their Application to Growth Modeling. Arab Journal of Basic and Applied Sciences 25 (1): 38 – 43.
Godman A., Telbert J.F., Ogum G.E.O (1984). Additional Mathematics for West Africa. Harlow, Longman, London, England 605 pp.
Goss, D. (2011). The Ongoing Binomial Revolution. Number Theory, Spring 8 pp.
Haggstrom P. (2012). The Binomial Series for Negative Integral Exponents. Maths at Bondi Beach, Sydney, Australia 6 pp.
Horn M.E. (2020). If You Split Something into Two Parts, You Will Get Three Pieces: The Bilateral Bionmial Theorem and its Consequences. Journal of Physics: Conference Series 1612:1 – 23.
Osanyinpeju K.L., Aderinlewo A.A., Dairo O.U., Adetunji O.R., Emmanuel S.A. Ajisegiri E.S.A (2019a). Development, Conversion and Application of Osanyinpeju (Power of Base 2) And Antiosanyinpeju (Antipower of Base 2) With Lekan (Power of Base 5) and Antilekan (Antipower of Base 5) Tables. 1st International Conference on Engineering and Environmental Sciences (ICEES) Theme: Advancing Technology and Environment Burdens (Challenges and Sustainable Solution 5th- 7th November 2019 p. 969 - 981.
Osanyinpeju K.L. (2019b). Development of Kifilideen (Power of Base 11) and Antikifilideen (Antipower of Base 11) Tables. 1st International Conference on Engineering and
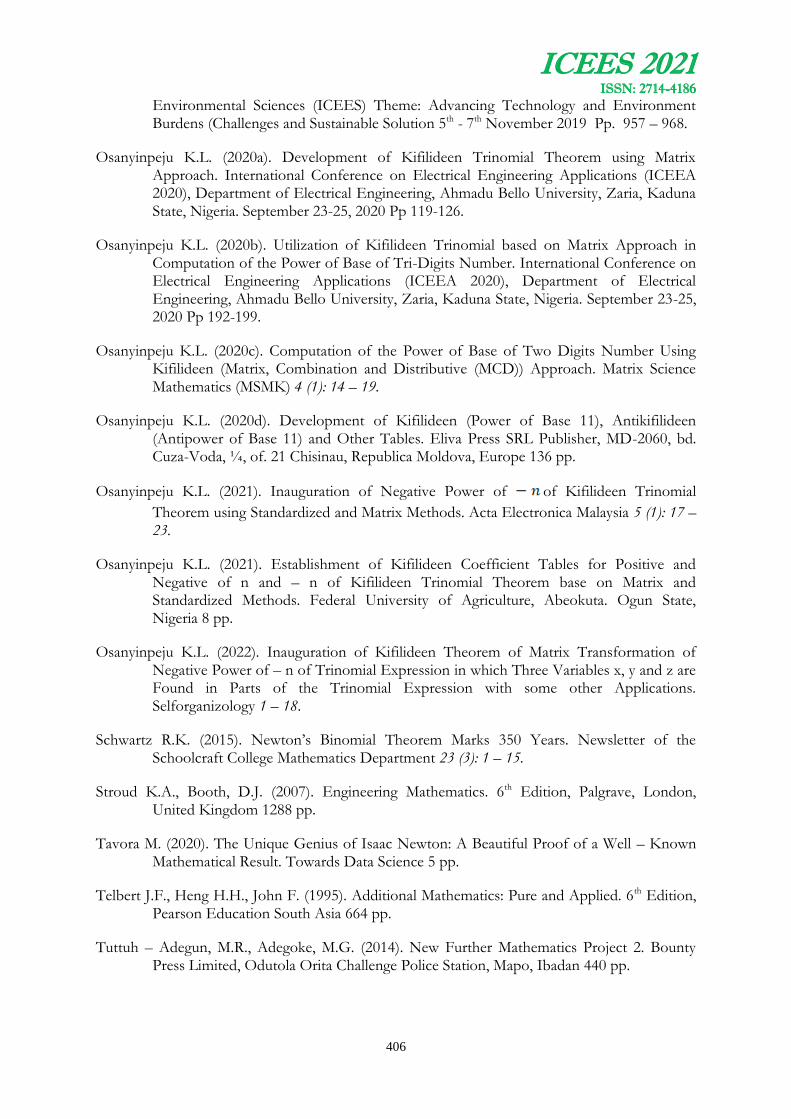
ICEES 2021 ISSN: 2714-4186
406
Environmental Sciences (ICEES) Theme: Advancing Technology and Environment Burdens (Challenges and Sustainable Solution 5th - 7th November 2019 Pp. 957 – 968.
Osanyinpeju K.L. (2020a). Development of Kifilideen Trinomial Theorem using Matrix Approach. International Conference on Electrical Engineering Applications (ICEEA 2020), Department of Electrical Engineering, Ahmadu Bello University, Zaria, Kaduna State, Nigeria. September 23-25, 2020 Pp 119-126.
Osanyinpeju K.L. (2020b). Utilization of Kifilideen Trinomial based on Matrix Approach in Computation of the Power of Base of Tri-Digits Number. International Conference on Electrical Engineering Applications (ICEEA 2020), Department of Electrical Engineering, Ahmadu Bello University, Zaria, Kaduna State, Nigeria. September 23-25, 2020 Pp 192-199.
Osanyinpeju K.L. (2020c). Computation of the Power of Base of Two Digits Number Using Kifilideen (Matrix, Combination and Distributive (MCD)) Approach. Matrix Science Mathematics (MSMK) 4 (1): 14 – 19.
Osanyinpeju K.L. (2020d). Development of Kifilideen (Power of Base 11), Antikifilideen (Antipower of Base 11) and Other Tables. Eliva Press SRL Publisher, MD-2060, bd. Cuza-Voda, ¼, of. 21 Chisinau, Republica Moldova, Europe 136 pp.
Osanyinpeju K.L. (2021). Inauguration of Negative Power of of Kifilideen Trinomial
Theorem using Standardized and Matrix Methods. Acta Electronica Malaysia 5 (1): 17 – 23.
Osanyinpeju K.L. (2021). Establishment of Kifilideen Coefficient Tables for Positive and Negative of n and – n of Kifilideen Trinomial Theorem base on Matrix and Standardized Methods. Federal University of Agriculture, Abeokuta. Ogun State, Nigeria 8 pp.
Osanyinpeju K.L. (2022). Inauguration of Kifilideen Theorem of Matrix Transformation of Negative Power of – n of Trinomial Expression in which Three Variables x, y and z are Found in Parts of the Trinomial Expression with some other Applications. Selforganizology 1 – 18.
Schwartz R.K. (2015). Newton’s Binomial Theorem Marks 350 Years. Newsletter of the Schoolcraft College Mathematics Department 23 (3): 1 – 15.
Stroud K.A., Booth, D.J. (2007). Engineering Mathematics. 6th Edition, Palgrave, London, United Kingdom 1288 pp.
Tavora M. (2020). The Unique Genius of Isaac Newton: A Beautiful Proof of a Well – Known Mathematical Result. Towards Data Science 5 pp.
Telbert J.F., Heng H.H., John F. (1995). Additional Mathematics: Pure and Applied. 6th Edition, Pearson Education South Asia 664 pp.
Tuttuh – Adegun, M.R., Adegoke, M.G. (2014). New Further Mathematics Project 2. Bounty Press Limited, Odutola Orita Challenge Police Station, Mapo, Ibadan 440 pp.

ICEES 2021 ISSN: 2714-4186
407
Yang X. (2017). Engineering Mathematics with Examples and Applications: Binomial Theorem and Expansions. Middlesex University, School of Science and Technology, London, United Kingdom Science Direct pp 31 – 35.
Youngmee K., Sangwook R. (2014). The Origin of Newton’s Generalized Binomial Theorem. Journal for of Mathematics 27 (2): 127 – 138.

ICEES 2021 ISSN: 2714-4186
408
A STUDY OF PUBLIC SECONDARY SCHOOLS STUDENTS AND TEACHING STAFF INDEX ANALYSIS IN OSUN WEST SENATORIAL
DISTRICT, NIGERIA
Olayiwola OLAYODE1; D. S. OGUNDAHUNSI1; Christiana OLAYODE1; and A. O. AKINTAYO2
1Department of Urban and Regional Planning, Osun State University, Osogbo Osun State
2Department of Urban and Regional Planning, Obafemi Awolowo University, Ile-Ife, Nigeria
Email of Corresponding Author [email protected]
ABSTRACT
This study used the application of Geographic Information System (GIS) to analyse students’ staff index in Public Secondary Schools (PSSs) of Osun West Senatorial District (OWSD), Nigeria with a view to providing information that could guide the ineffective distribution of human resources (teaching staff) to enhancing secondary school education planning. The specific objectives are to determine the number of staff and students of the public secondary schools in the district and examine the staff index. Data for this study were obtained through questionnaire administration. Areas with secondary schools were stratified into three categories based on population density: suburb (less than 10,000 people), semi-urban (between 10,000-19,999 people), and urban (20,000 people and above). Eleven urban with a total of 59 secondary schools, twelve semi-urban with a total of 16 secondary schools, and twenty-eight suburb areas were identified with a total of 41 secondary schools. All the schools were sampled while students’ enrolment and staff data were collected from the principal of each school. Findings revealed, that the largest proportion of settlements with inadequate staff strength is the suburb with eleven (11) public secondary schools, a mean value of 26 and standard deviation of 2.87, urban settlement category have seven (7), with a mean value of 23 and standard deviation of 6.007 and semi-urban with just one (1) school, denoting 26 mean value and 0.0 standard deviation. Summary of the findings across OWSD revealed inadequate staffing in urban (36.8%), semi-urban (5.3%), and suburb (57.9%) as the mean score of the student to staff is 44 and the standard deviation is 13.771. It is therefore recommended that government and other school administrators should come together to employ adequate teaching staff to secondary schools at all categories of settlements.
Keywords: Public Secondary Schools, staff, students, Index, Settlements Categorisation, Osun West Senatorial District.
1.0. Introduction
An adequate number of staff in relation to the proportion of students as well as sufficient facilities to serve users of educational facilities is the principal focus to determining education satisfaction in any geographical space (Olufemi, 2012; Boyi, 2013; Olayiwola & Adeleye, 2005). Spatial distribution using a geographic information system is a modern means to judiciously allocate resources such as human, financial, infrastructure among others to the lagging locations (Olayode, 2015; Fabiyi and Ogunyemi, 2015; Olayode, 2019; Ogundahunsi and Olayode, 2018). Effective distribution of teachers to required and needed schools is an integral part of physical planning that have influenced the equal distribution of human resources and even basic facilities within urban space to those regions, area and communities that are in dare needs (Ogundahunsi and Olayode, 2018; Ojo, 2018, Adeyinka et al., 2019).

ICEES 2021 ISSN: 2714-4186
409
The concept of spatial distribution attempt to accentuate the adequate distribution of teaching staff to educational facilities with the view to meet the need of the available student threshold population in schools (Khalid, Hamdy and El-Gamily, 2013; Olubadewo, Abdulkarim and Ahmed, 2013; Fabiyi and Ogunyemi, 2015; Ogundahunsi, 2014; Agrawal and Gupta, 2016). Spatial distribution to great extent impacts the degree of accessibility of facilities by the patrons which in this study regards as teaching staff ratio to the student population.
Christaller (1993), clearly stated that the location and availability of services influence their utilization and patronage with respect to the number of staff to students that will be willing to make use of the facilities. A good number of studies on the distribution of human resources to educational facilities were focused on the urban areas while the rural areas have been neglected. However, Song (1996), observed that the closer the destination of a facility, the higher the level of accessibility. This means that spatial distribution influences the level of accessibility. Awoyemi et al (2003), observed that longer distances caused by users of education facilities in rural areas constitute barriers to the accessibility of such facilities.
Recent studies have shown the relevance of spatial distribution of post-primary schools as the determinant of access to primary education in developing countries. Buor (2003), revealed that location and distance are the most factors that influence the accessibility and utilization of facilities in a study in the Ano South district of Ghana. This simply implies that the effect of travel time on utilization reflects that of distance embarked on. On this note, the principle of spatial equity should apply in the distribution of educational facilities in rural or suburb settlements Ogundahunsi (2014), Fabiyi and Ogunyemi (2015), Olayode (2015), Ogundahunsi and Olayode (2018), Akintayo (2018), Olayode (2019) not only that but also to be considered is the distribution of staff in relations to the number of students in the study area to ensure equity in the allocation of students and staff of the PSs in OWSD. Spatial equity according to Davies, 1968, is the distribution of activities or facilities according to the needs of the population of that area Davies (1968), Olayode (2019), Fabiyi, and Ogunyemi (2015). However, the concept of equity in a spatial context can be measured through the adoption of some socially imposed minimum standards with which spatial patterns of equitable location, resources (man and power), and materials of a particular facility may be considered equitable if less than a small proportion of people are more than this critical standard, Dickson (1996).
1.1. Study Area
OWSD comprises 56 settlements (11 urban settlements with 20,000 and above people, 11 semi-urban with 10,000-19,999 people, and 28 suburbs with less than 10,000 people) with 116 PSS 59 in the urban, 16 in the semi-urban, and 41 in the suburb. The district is situated in Osun State of Western Nigeria. It is located between Latitudes 70 30’N and 7.50N, and Longitudes 40 30’E and 4.50E.
2.0. Methodology
Data for this study were obtained through questionnaire administration. Areas with secondary schools were stratified into three categories based on population density: suburb (less than 10,000 people), semi-urban (between 10,000-19,999 people) and urban (20,000 people and above). In addition, secondary schools directories were obtained from the Osun State Ministry of Education. Table 1 revealed that, there were 116 PSS in the study area.

ICEES 2021 ISSN: 2714-4186
410
Figure 1: Osun West Senatorial District in the Context of Osun State Source: Ministry of Lands and Physical Planning, Osun State.
In total, there are 116 PSSs in OWSD, 50.9% in the urban, 13.8% in the semi-urban and 35.3% in the suburb. Eleven in the urban settlement with a total of 59 secondary schools, twelve semi-urban settlements with a total of 16 secondary schools and twenty-eight suburb areas were identified with a total of 41 secondary schools, all the schools were sampled while student’s enrolment in view of class category and staff data were collected from the principal of each school.
2.1. GIS Analysis Procedure
The following GIS techniques were used in achieving Buffer Analysis:
1. Digitisation of OWSD from Osun State Map;
2. Georeferencing of the digitised map;
3. Creation of Database on the acquired PSS coordinates using Microsoft Excel;
4. Saving of the Database as a shape for GIS enablement;
5. Exporting and overlaid of the database as point map on OWSD area map in ArcGIS environment;
6. Transformation of the points to shapefiles for further analysis; and
7. Creation of query analysis to assess the spatial ratio of student and staff index in the study area.
2.2 Secondary Source of Data Directories of school and students’ enrolment in Osun State were collected from the State Ministry of Education.
3.0. Discussion of Findings
3.1 Distribution of Students and Members of Staff across the Settlements
The analysis shows the query search and distribution of student and staff index across the categories of settlements in OSWD. It can be deduced from Table 1 and Figure 2, 3, 4, 4, 5 and

ICEES 2021 ISSN: 2714-4186
411
6 that, eleven (11), seven (7) and one (1) schools of the public secondary schools in the suburb, urban and semi-urban respectively are less to the proportion of student and staff ratio in respect to UNESCO specification of thirty (30) students to one (1) staff with the approximated mean of 26, 26 and 23 and the standard deviation is 6.007, 0.0 and 2.879 across the categorised settlements suburb, semi-urban and urban in Osun West senatorial district. In addition, Table 1 and Figure 2, 3, 4, 5, 6 and 7 revealed that fifty-two (52), fifteen (15) and thirty (30) schools meet the set standard with the mean of 50, 37, 38 and standard deviation of 15.662, 5.222 and 5.934 in urban, semi-urban and suburb settlements respectively.
It is important to note that the distribution of students and staff within the senatorial district, as shown in Table 1 and Figure 8, revealed that nineteen (19) of the public secondary schools do not meet the set standard implying that students are more populated than staff strength while ninety-seven (97) public secondary schools in the study area meet the set standard.
The result thus, explained the clustering of students on staff in the nineteen (19) schools with inadequate staff strength as the mean value equals 44 and the standard deviation around the mean equals 13.771 while Table 1 and Figure 9 also revealed the adequacy of staff to students ratio in nineteen (97) schools of the study area as the mean is 25 and the standard deviation is 4.44, in the sum of the public secondary schools in OWSD as shown in Figure 10 is the students’ staff ratio mean of one-hundred and sixteen (116) public secondary schools in Osun West senatorial district is 41 while the standard deviation is 14.62 which denote that there is need to increase staff in public secondary schools of the study area as the available ones are insufficient to meet the student enrolment.
Findings revealed, that the largest proportion of settlements with inadequate staff strength is the suburb with eleven (11) public secondary schools, the mean value of 26, and standard deviation of 2.87 where schools in the urban settlement category have seven (7), with a mean value of 23 and standard deviation of 6.007 and semi-urban with just one (1) school, denoting 26 mean value and 0.0 standard deviation. These findings could be attributed to the desired distance staff wishes to travel as that could result from deployment of service to nearer location to their place of residence Thus, the suburb is lagging inadequate staff to effectively train students.
Table 1: Student and Staff Index
Student/Staff Index Settlement Osun West (Total)
Urban Semi urban
Suburb
Below 30 Count 7 1 11 19 Maximum 12 26.11 21.33 12 Minimum 29.47 26.11 29.16 29.47 Sum 160.99 26.11 284.8 471.9 Mean 23 26 26 25 Standard Deviation 6.007 0.0 2.879 4.443
Above 30 Count 52 15 30 97 Maximum 30.09 30.36 30.11 30.09 Minimum 84.78 48.2 56 84.78 Sum 2622.455 550.11 1127.94 4300.505 Mean 50 37 38 44 Standard Deviation 15.662 5.222 5.934 13.771
Source: Authors fieldwork, 2021
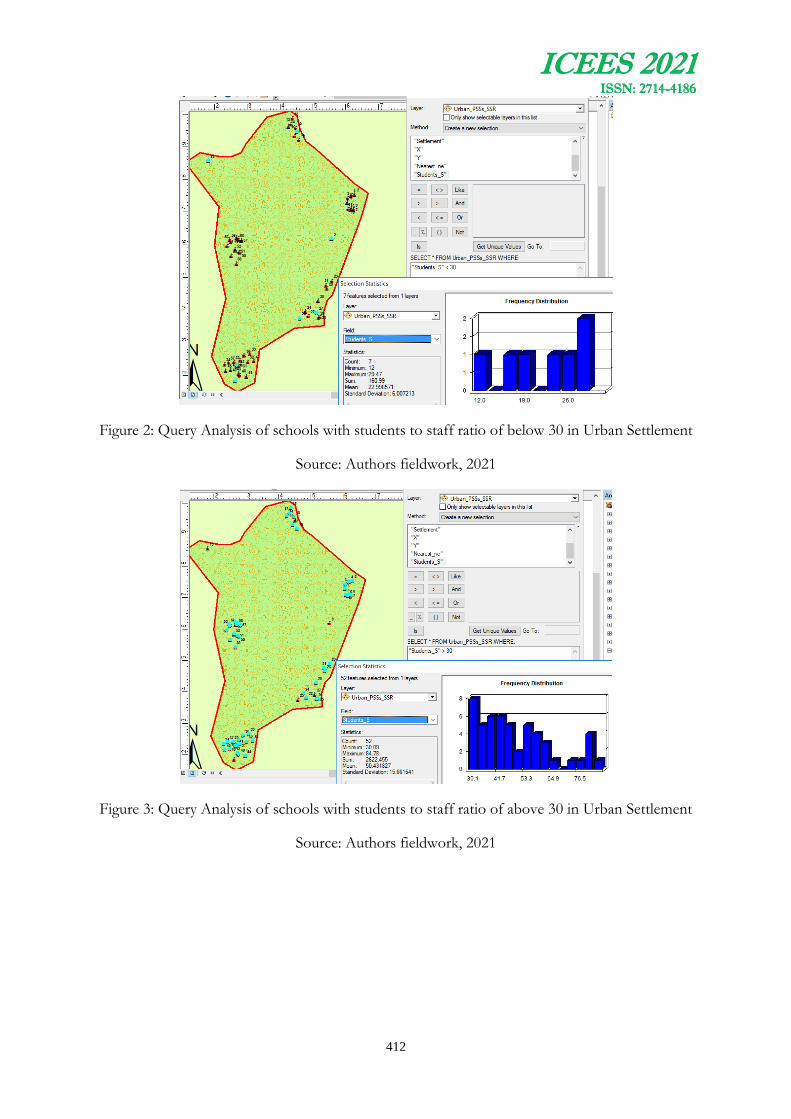
ICEES 2021 ISSN: 2714-4186
412
Figure 2: Query Analysis of schools with students to staff ratio of below 30 in Urban Settlement
Source: Authors fieldwork, 2021
Figure 3: Query Analysis of schools with students to staff ratio of above 30 in Urban Settlement
Source: Authors fieldwork, 2021

ICEES 2021 ISSN: 2714-4186
413
Figure 4: Query Analysis of schools with students to staff ratio of below 30 in Semi-urban Settlement
Source: Authors fieldwork, 2021
Figure 5: Query Analysis of schools with students to staff ratio of above 30 in Semi-urban Settlement
Source: Authors fieldwork, 2021
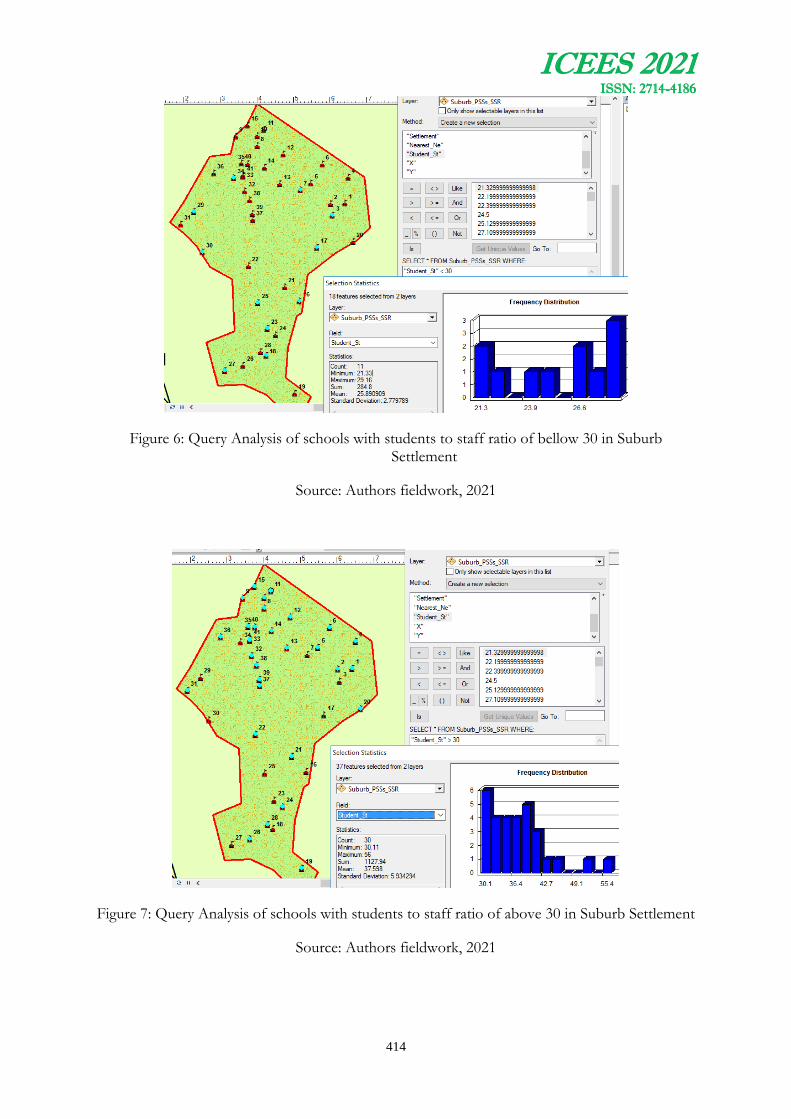
ICEES 2021 ISSN: 2714-4186
414
Figure 6: Query Analysis of schools with students to staff ratio of bellow 30 in Suburb Settlement
Source: Authors fieldwork, 2021
Figure 7: Query Analysis of schools with students to staff ratio of above 30 in Suburb Settlement
Source: Authors fieldwork, 2021
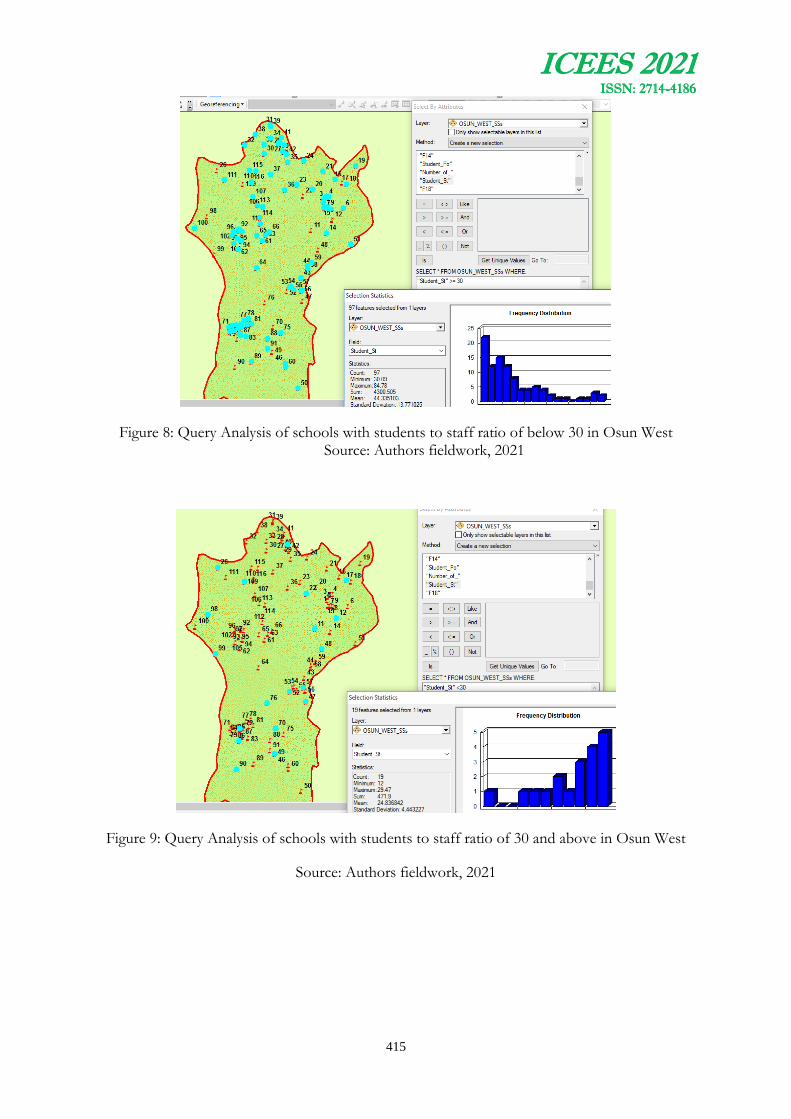
ICEES 2021 ISSN: 2714-4186
415
Figure 8: Query Analysis of schools with students to staff ratio of below 30 in Osun West Source: Authors fieldwork, 2021
Figure 9: Query Analysis of schools with students to staff ratio of 30 and above in Osun West
Source: Authors fieldwork, 2021
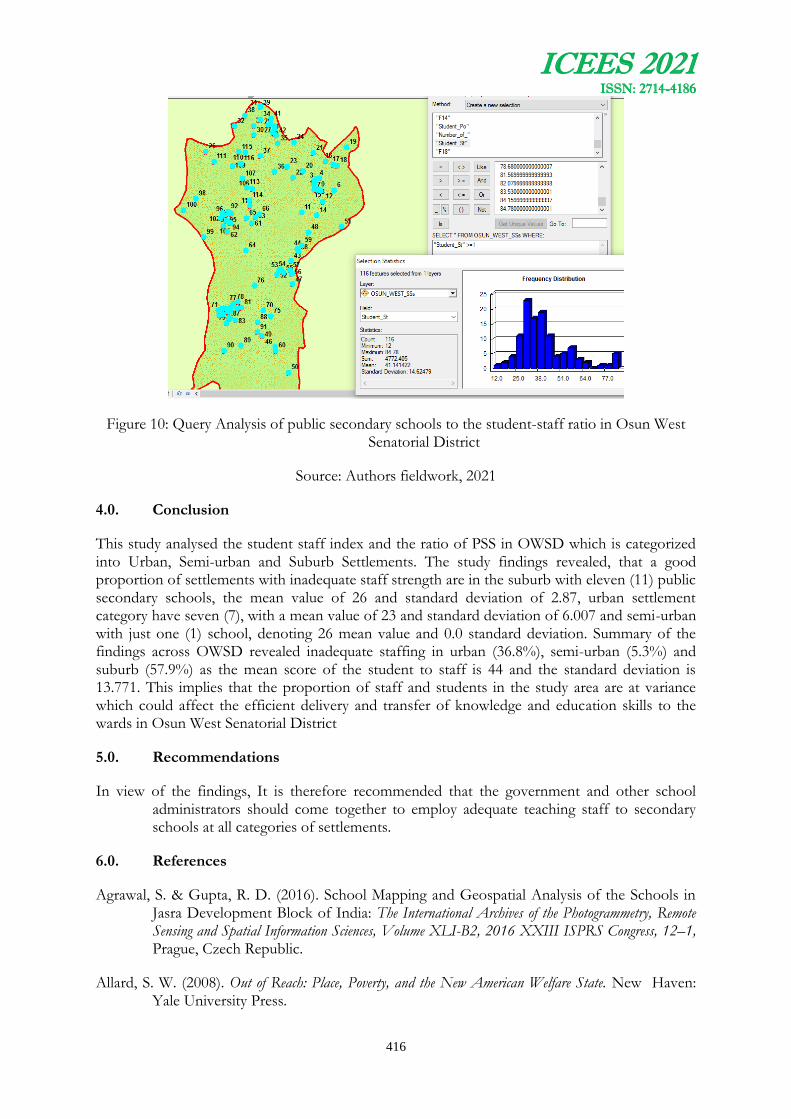
ICEES 2021 ISSN: 2714-4186
416
Figure 10: Query Analysis of public secondary schools to the student-staff ratio in Osun West Senatorial District
Source: Authors fieldwork, 2021
4.0. Conclusion
This study analysed the student staff index and the ratio of PSS in OWSD which is categorized into Urban, Semi-urban and Suburb Settlements. The study findings revealed, that a good proportion of settlements with inadequate staff strength are in the suburb with eleven (11) public secondary schools, the mean value of 26 and standard deviation of 2.87, urban settlement category have seven (7), with a mean value of 23 and standard deviation of 6.007 and semi-urban with just one (1) school, denoting 26 mean value and 0.0 standard deviation. Summary of the findings across OWSD revealed inadequate staffing in urban (36.8%), semi-urban (5.3%) and suburb (57.9%) as the mean score of the student to staff is 44 and the standard deviation is 13.771. This implies that the proportion of staff and students in the study area are at variance which could affect the efficient delivery and transfer of knowledge and education skills to the wards in Osun West Senatorial District
5.0. Recommendations
In view of the findings, It is therefore recommended that the government and other school administrators should come together to employ adequate teaching staff to secondary schools at all categories of settlements.
6.0. References
Agrawal, S. & Gupta, R. D. (2016). School Mapping and Geospatial Analysis of the Schools in Jasra Development Block of India: The International Archives of the Photogrammetry, Remote Sensing and Spatial Information Sciences, Volume XLI-B2, 2016 XXIII ISPRS Congress, 12–1, Prague, Czech Republic.
Allard, S. W. (2008). Out of Reach: Place, Poverty, and the New American Welfare State. New Haven: Yale University Press.

ICEES 2021 ISSN: 2714-4186
417
Aliyu, A., Shahisah, M. A., & Aliyu, R. M. (2013). Mapping and Spatial Distribution of Post Primary Schools in Yola North Local Government Area of Adamawa State, Nigeria. International Journal of Science and Technology, 2(5), 405-422
Amsterdam, C. (2010). School Infrastructure in South Africa: Views and Experiences of Educators and Learners.
D’Haese, S., De Meester, F., De Ourdeaudhuij, I., Deforche, B., and Cardon, G. (2011). Criterion Distances and Environmental Correlates of Active Commuting to School in Children. International Journal of Behavioural, Nutrition Physical Activity., Vol. 8, p. 88
Fabiyi, O. O. & Ogunyemi S. A. (2015). Spatial Distribution and Accessibility to Post Primary Educational Institution in Ogun State, Southwestern Nigeria: Case Study of Yewa South Local Government Area, Nigeria. Journal of Scientific Research & Reports 5(7): pp, 542-552.
Giles-Corti B, Wood, G., Pikora, T., Learnihan, V., Bulsara, M., Van Niel, K. et al. (2011). School Site and the Potential to Walk to School: the Impact of Street Connectivity and Traffic Exposure in School Neighborhoods. Health and Place 17(2).
Ikoya, P. O. & Onoyase, D. (2008). Universal Basic Education In Nigeria: Availability of Infrastructures for Effective Programme Implementation. Educational Studies: 34, 11-24.
Khalid, A., Hamdy, I. & El-Gamily. (2013). GIS as an Efficient Tool to Manage Educational Services and Infrastructure in Kuwait: Journal of Geographic Information System, 2013, 5, 75-86
Maangi, E. N. (2014). Factors Influencing Parental Patronage of Private Primary Schools in Kenya Despite Free Primary Education (FPE) in Public Schools. Journal of Education and Practice, 5(26), 119-128. Retrieved from www.iiste.org
Meskarian, R, Penn, M. L, Williams, S, and Monks, T. (2017). A Facility Location Model for Analysis of Current and Future Demand of Sexual Health Service. Journal Plos.org.
Mustapha, O. O., Akintunde, O. S., Alaga, A. T., Badru, R. A., Ogbole, J. O., Popoola, O. S., & Samuel, S. A. (2016). Spatial Distribution of Primary Schools in Ilorin West Local Government Area, Kwara State, Nigeria. Journal of Scientific Research & Report, 9(6), 1-10.
Naidoo, A. G. V., Van E. & Munch, Z. (2014). Spatial variation in school performance, a local analysis of socio-economic factors in Cape Town. South African Journal of Geomatics, 3(1): 78-94.
Olubadewo, O. O., Abdulkarim, I. A. and Ahmed, M. (2013). The Use Of Gis as Educational Decision Support System (Edss) for Primary Schools in Fagge Local Government Area of Kano State, Nigeria; ISSN-L: 2223-9553, ISSN: 2223-9944; Vol. 4 No. 6
Ogundahunsi, D. S. (2014). Locational Analysis of Fuel Stations, in Ilesa, Osun State, Nigeria. International Journal of Development and Strategies in Humanities, Management and Social Sciences Vol. 2, July 2014. Page 249, and 252-254

ICEES 2021 ISSN: 2714-4186
418
Ogundahunsi, D. S. and Olayode O. (2018). An Assessment of Public Secondary School Infrastructure in Osogbo, Osun State, Nigeria. Journal of Geography and Planning Sciences 3(1), pp. 112-124.
Ojedele, P and Ilusanya, G (2006). Planning and Policy of Higher Education in Nigeria. In J. B. Babalola, A. O. Ayeni, S. O. Adedeji, A. A. Suleiman and M. O. Arikewuyo (eds). Educational management: thoughts and practice. Ibadan: Codat Publications.
Ojo, A. O. (2018). A Study of Accessibility to Secondary School Facility in Lagos Metropolis, Nigeria, A PhD. Thesis, Submitted to the Department of Urban and Regional Planning, Obafemi Awolowo University, Ile-Ife, Nigeria, Unpublished.
Onuka, A. O. and Arowojolu, A. F (2008): An Evaluation of Parents’ Patronage of Private Primary Schools in Abeokuta, Nigeria. International Journal of African & African American Studies Vol. 2, 58-70
Nelson, N. M., Foley, E., O’Gorman, D. J., Moyna, N. M. and Woods, C. B. (2008) Active Commuting to School: International Journal of Behavioural, Nutrition Physical Activity., Vol. 5, p. 1
Vagale, L. R. (1971). Manual of Space Standards for Urban Development. Ibadan, Nigeria: Ministry of Lands and Survey.
Van Dyck, D., De Bourdeaudhuij, I., Cardon, G. and Deforche, B. (2010). Criterion Distances and Correlates of Active Transportation to School in Belgian Older Adolescents. International Journal of Behavioural, Nutrition Physical Activity., Vol. 7, p. 87
World Bank (2005): World Development Report 2006: Equity and Development. New
York: Oxford University Press.

ICEES 2021 ISSN: 2714-4186
419
RESPONSE SURFACE OPTIMIZATION OF PRODUCTION OF DELONIX REGIA POD ACTIVATED CARBON FOR THE DECOLOURIZATION OF DYE-BURDENED EFFLUENT
a Ajani, Ayobami O., *a,b,e Ojo, Ilesanmi A., a Olu-arotiowa, Olusesan A., a,b Oladapo, Joshua A., d
Olayiwola, Akeem O., e Akinsola, Ameen N and a,b c*Alade, Abass O.
aDepartment of Chemical Engineering, Faculty of Engineering, Ladoke Akintola University of Technology, Ogbomoso, Nigeria
bBioenvironmental, Water and Engineering Research Group (BWERG), Ladoke Akintola University of Technology, Ogbomoso, Nigeria
cScience and Engineering Research Group (SAERG), Ladoke Akintola University of Technology, Ogbomoso, Nigeria
dDepartment of Pure and Applied Chemistry, Ladoke Akintola University of Technology, Ogbomoso, Nigeria
eScience Laboratory Unit, Al-Hikmah University, Ilorin, Nigeria
Email of Corresponding Author : [email protected]
ABSTRACT
The increased use of synthetic dyes in process industries has led to the generation of effluents that are characterized by their abnormal properties. The application of adsorption process, using Activated Carbon (AC) has been well embraced for the decolourization of different types of dyes effluents to alleviate their impacts on the environment. The production parameter such as Activant concentrations (0.5-1.0 mg/l), Impregnation time (18-24 h), Carbonisation temperature (300-500 °C) and Carbonisation time (25-40 min) was optimised under the Face Central Composite Design (FCCD) of the Design Expert (12.0.1) to produce effective adsorbent from Delonix regia Pod (DRP). The software generated thirty experimental runs, which were conducted accordingly. The AC produced was then used to decolourise effluent containing 100 mg/l of Methylene Blue (MB) at room temperature, 150 rpm and 2 h. The maximum and minimum yields of the DRP Activated Carbon (DRPAC) were 69.6 and 22 %, respectively, while the maximum and minimum of MB removed were 17.14 and 19.54 mg/g, respectively. These two
responses were well fitted to the Quadratic model with Coefficient of Determination ( ) 0.9539
and 0.9560, respectively. This study demonstrated the suitability of optimisation tools for producing effective AC from renewable resources for effective decolourisation of effluent containing MB.
Keywords; Adsorption, Delonix regia pod, Dyes, Optimisation
Area of Research: Chemical Engineering
1.0 INTRODUCTION
Wastewater is any water that has been adversely affected in quality by manmade influence. Wastewater is 99.9% water, and the other 0.1% is of great concern (Agrawal et al., 2017). Water is a natural resource needed for the survival of all species on earth. Water is not just a basic human need; it is an irreplaceable substance to ensure the continuance of life. Wastewater management is a major contributing factor to most water problems faced worldwide. This crisis directly

ICEES 2021 ISSN: 2714-4186
420
impacts on all our lives (Dube et al., 2019; Lach, 2019). Many people around the world have become victims of the diseases caused by contaminated water. Some of the diseases spread by polluted water include cholera, giardia, diarrhea, typhoid, cancer, hepatitis, gastroenteritis, encephalitis, stomach cramps and ulcers, and respiratory infections (Abdelkarim and Djamila, 2020).
Several physical and chemical methods have been used to remove dye from wastewater, including oxidation, coagulation/flocculation, membrane separation, photochemical degradation, microbiological decomposition, chemical precipitation, photolysis, and electrochemical. These methods are challenged by high cost and low efficiency (Dada, et al., 2020). Adsorption was found to be a very effective and cheap method among all available dye removal methods. (Azarpira et al., 2019; Latinwo et al., 2019; Al-Musawi et al., 2020; Giovanela et al., 2020; Iwar et al., 2020).
Some of the proven efficiently adsorbent materials are orange and Banana peels (Al Khusaibi et al., 2015); Soya bean husk (Gaur et al., 2018); Rice husk (Yunita et al., 2019); Peanut shell (Wu et al., 2019); Rice straw (Wang et al., 2019); Coconut leaves (Oribayo et al., 2020); Papaya seeds (Diego et al., 2020); Sawdust (Chikri et al., 2020); Sugar cane bagasse (Harripersadth et al., 2020); Banana peel (Afolabi et al., 2021); Maize corn cob (Igwegbe et al., 2021); Maize stems and sugarcane stems (Dada et al., 2021); Nut Shells (Papadaki et al., 2021); Oakwood sawdust (Marjani et al., 2021) etc.
The Delonix regia trees are grown widely for ornamental reasons, preserving the soil and conserving the environment (Daud et al., 2018). Yet, the tree produces flowers and pods which litter the environment. Thus, this development necessitates the need to convert this waste to useful and value-added products such as adsorbents that can be used to remove pollutants, such as dyes in wastewater. The specific objective of the study is to optimize the process parameters (carbonization time, carbonization temperature, impregnation time, and activating agent concentration) for the development of effective activated carbon from DRP under the FCCD of the Design Expert (12.0.1) software.
2.0 MATERIALS AND METHOD
2.1 Sample Collection and Material Preparation
Four variables such as activant concentrations (0.5-1.0 mg/L), impregnation time (18-24 h), carbonization temperature (300-500 °C) and carbonization time (25-40 mins) (Table 1) were optimised under the Face Central Composite Design (FCCD) of the Design Expert 12.0.1 to produce an effective adsorbent from the Delonix regia Pod (DRP) at optimum condition. The software generated thirty experimental runs, which were conducted accordingly. The DRP Activated Carbon (DRPAC) developed was used to decolourise wastewater containing MB 100 mg/L at room temperature, 150 rpm and 2 hrs (Nomngongo and Chaba, 2019).
Table 1: Factors Level Selected for Activation and Carbonisation of DRP
Factor Name Units Type Minimum Maximum
A Concentration mg/L Numeric 0.50 1.00
B Impregnation Time h Numeric 18.00 24.00
C Temperature °C Numeric 300.00 500.00
D Carbonisation Time min Numeric 25.00 40.00

ICEES 2021 ISSN: 2714-4186
421
Matured (DRP) collected from Mandate Estate, Ilorin, Kwara State, Nigeria. were washed severally with tap water and thoroughly rinsed with distilled water to remove any surface adhered particles attached to the pod. They were sun-dried for three days to remove the moisture and cut into pieces of about 3 to 4 cm sizes before being ground to a smaller size and sieved to 425-850 µm. The samples were activated with potassium hydroxide solution at room temperature (Rohman et al., 2018; Dada et al., 2020), while the carbonization was carried out according to the method adopted by Nomngongo and Chaba (2019).
2.2 Determination of Yield
The percentage yield of carbonized carbon was determined according to the method adopted by (Yuvarat et al., 2020) shown in Equation 1
Yield % = X 100 (1)
where is the weight of the carbonized carbon and is the dried weight of raw precursor?
Standard Solution Preparation
A 100 mg/L of MB stock solution was prepared by dissolving 0.1 g of MB powder in 1.0 L of distilled water. The working solution of different concentrations such as 20, 40, 60, 80 and 100 mg/L was prepared by appropriate dilution method (Itodo et al. 2017). The absorbance corresponding to the residual amount of MB was recorded at 665 nm using a UV/VIS spectrophotometer (Gangadware and Jadhav 2016). A calibration curve was plotted to obtain the absorbance-concentration profile of MB solution.
2.3 Batch Adsorption of and Methylene Blue
DRPAC sample (0.1 g) was transferred to a 25 ml labelled universal bottle containing 20 ml of MB solution and agitated for 5 mins, and left to stand. The clear MB solution was decanted after 24 h into another set of labelled bottles (Dada et al. 2020). Adsorption capacity and percentage removal were determined accordingly, as indicated in Equations 2 and 3 (Pandimadevi et al., 2016; Okoye et al., 2018).
= (2)
= X 100% (3)
where v is the volume of solution contacted with the adsorbent; and are initial and
equilibrium (final) concentration of the adsorbate (mg/L); w is the amount of adsorbent usually expressed as dry weight.
3.0 RESULTS AND DISCUSSION
3.1 Model Summary for the Development of DRPAC
The quadratic model suggested yield and Methylene Blue Removal (MBR) has a standard
deviation of 3.59 and 234.70, respectively (Table 2). The values of (0.9539 and 0.9560) with
adjusted of 0.9043 and 0.9048 for yield and MBR respectively were in reasonable agreement
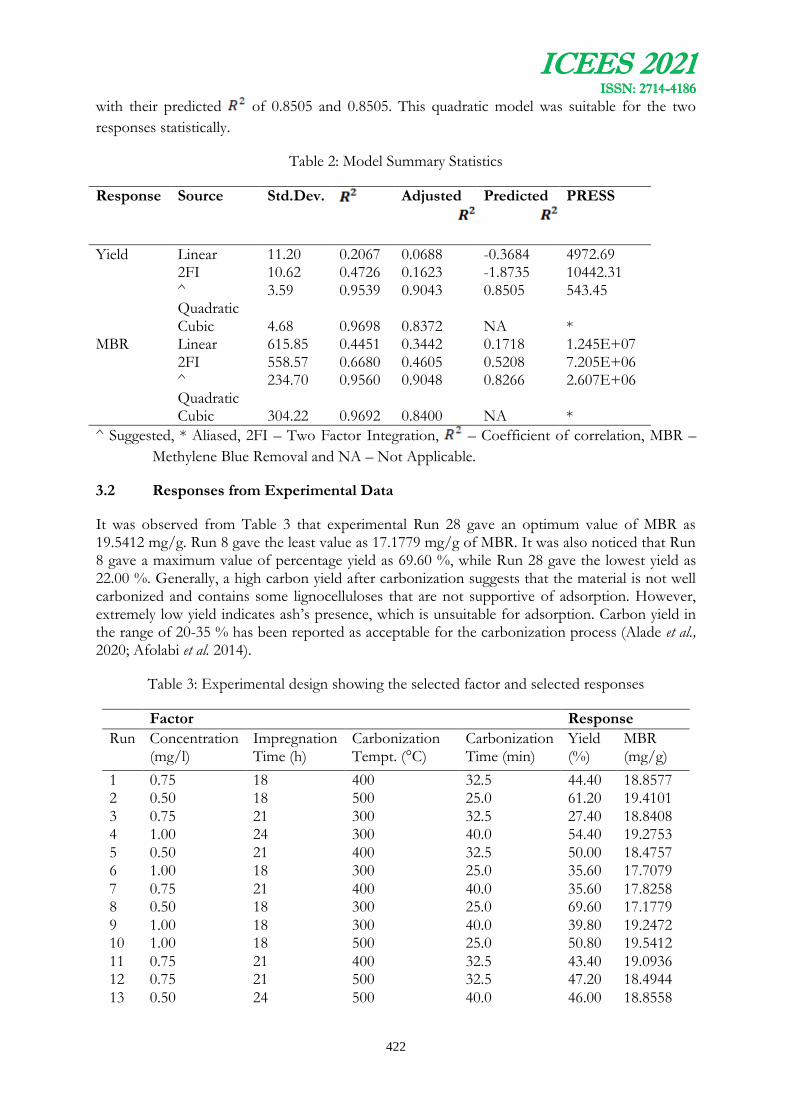
ICEES 2021 ISSN: 2714-4186
422
with their predicted of 0.8505 and 0.8505. This quadratic model was suitable for the two
responses statistically.
Table 2: Model Summary Statistics
Response Source Std.Dev.
Adjusted
Predicted
PRESS
Yield Linear 11.20 0.2067 0.0688 -0.3684 4972.69 2FI 10.62 0.4726 0.1623 -1.8735 10442.31 ^ Quadratic
3.59 0.9539 0.9043 0.8505 543.45
Cubic 4.68 0.9698 0.8372 NA * MBR Linear 615.85 0.4451 0.3442 0.1718 1.245E+07
2FI 558.57 0.6680 0.4605 0.5208 7.205E+06 ^ Quadratic
234.70 0.9560 0.9048 0.8266 2.607E+06
Cubic 304.22 0.9692 0.8400 NA *
^ Suggested, * Aliased, 2FI – Two Factor Integration, – Coefficient of correlation, MBR –
Methylene Blue Removal and NA – Not Applicable.
3.2 Responses from Experimental Data
It was observed from Table 3 that experimental Run 28 gave an optimum value of MBR as 19.5412 mg/g. Run 8 gave the least value as 17.1779 mg/g of MBR. It was also noticed that Run 8 gave a maximum value of percentage yield as 69.60 %, while Run 28 gave the lowest yield as 22.00 %. Generally, a high carbon yield after carbonization suggests that the material is not well carbonized and contains some lignocelluloses that are not supportive of adsorption. However, extremely low yield indicates ash’s presence, which is unsuitable for adsorption. Carbon yield in the range of 20-35 % has been reported as acceptable for the carbonization process (Alade et al., 2020; Afolabi et al. 2014).
Table 3: Experimental design showing the selected factor and selected responses
Factor Response
Run Concentration (mg/l)
Impregnation Time (h)
Carbonization Tempt. (°C)
Carbonization Time (min)
Yield (%)
MBR (mg/g)
1 0.75 18 400 32.5 44.40 18.8577 2 0.50 18 500 25.0 61.20 19.4101 3 0.75 21 300 32.5 27.40 18.8408 4 1.00 24 300 40.0 54.40 19.2753 5 0.50 21 400 32.5 50.00 18.4757 6 1.00 18 300 25.0 35.60 17.7079
7 0.75 21 400 40.0 35.60 17.8258 8 0.50 18 300 25.0 69.60 17.1779
9 1.00 18 300 40.0 39.80 19.2472 10 1.00 18 500 25.0 50.80 19.5412
11 0.75 21 400 32.5 43.40 19.0936 12 0.75 21 500 32.5 47.20 18.4944
13 0.50 24 500 40.0 46.00 18.8558
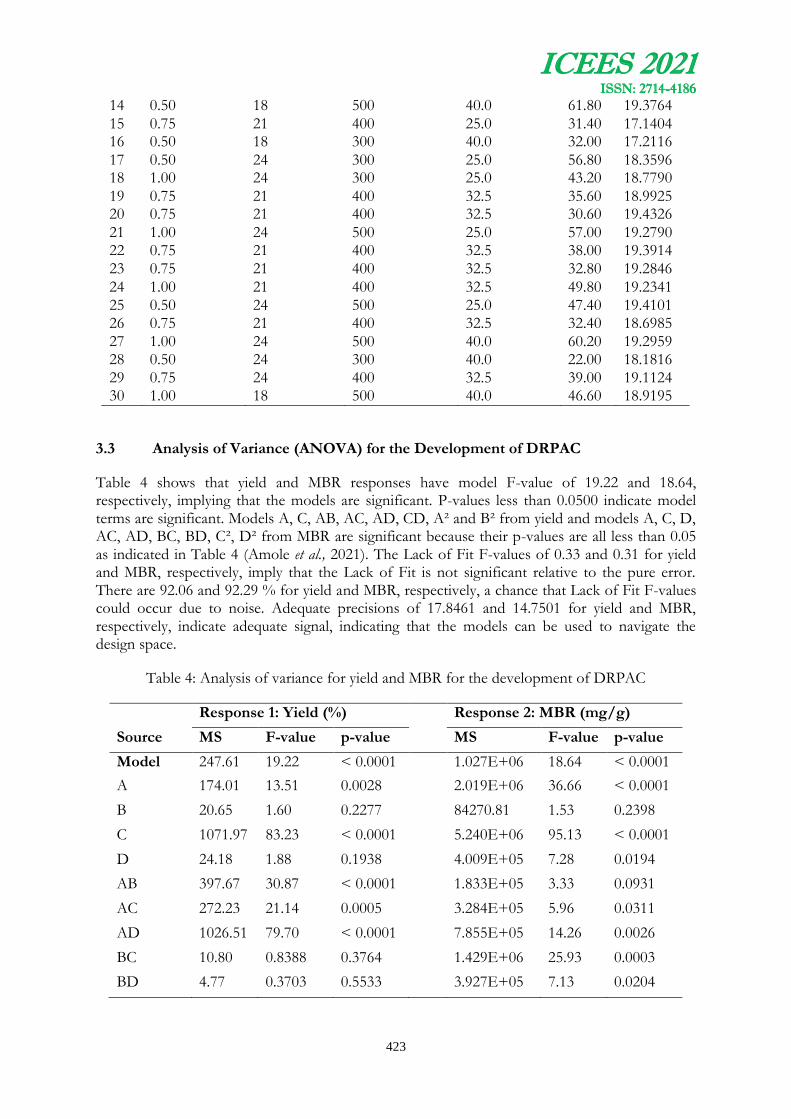
ICEES 2021 ISSN: 2714-4186
423
14 0.50 18 500 40.0 61.80 19.3764
15 0.75 21 400 25.0 31.40 17.1404 16 0.50 18 300 40.0 32.00 17.2116
17 0.50 24 300 25.0 56.80 18.3596 18 1.00 24 300 25.0 43.20 18.7790
19 0.75 21 400 32.5 35.60 18.9925 20 0.75 21 400 32.5 30.60 19.4326
21 1.00 24 500 25.0 57.00 19.2790 22 0.75 21 400 32.5 38.00 19.3914 23 0.75 21 400 32.5 32.80 19.2846
24 1.00 21 400 32.5 49.80 19.2341 25 0.50 24 500 25.0 47.40 19.4101 26 0.75 21 400 32.5 32.40 18.6985 27 1.00 24 500 40.0 60.20 19.2959 28 0.50 24 300 40.0 22.00 18.1816 29 0.75 24 400 32.5 39.00 19.1124 30 1.00 18 500 40.0 46.60 18.9195
3.3 Analysis of Variance (ANOVA) for the Development of DRPAC
Table 4 shows that yield and MBR responses have model F-value of 19.22 and 18.64, respectively, implying that the models are significant. P-values less than 0.0500 indicate model terms are significant. Models A, C, AB, AC, AD, CD, A² and B² from yield and models A, C, D, AC, AD, BC, BD, C², D² from MBR are significant because their p-values are all less than 0.05 as indicated in Table 4 (Amole et al., 2021). The Lack of Fit F-values of 0.33 and 0.31 for yield and MBR, respectively, imply that the Lack of Fit is not significant relative to the pure error. There are 92.06 and 92.29 % for yield and MBR, respectively, a chance that Lack of Fit F-values could occur due to noise. Adequate precisions of 17.8461 and 14.7501 for yield and MBR, respectively, indicate adequate signal, indicating that the models can be used to navigate the design space.
Table 4: Analysis of variance for yield and MBR for the development of DRPAC
Response 1: Yield (%) Response 2: MBR (mg/g)
Source MS F-value p-value MS F-value p-value
Model 247.61 19.22 < 0.0001 1.027E+06 18.64 < 0.0001
A 174.01 13.51 0.0028 2.019E+06 36.66 < 0.0001
B 20.65 1.60 0.2277 84270.81 1.53 0.2398
C 1071.97 83.23 < 0.0001 5.240E+06 95.13 < 0.0001
D 24.18 1.88 0.1938 4.009E+05 7.28 0.0194
AB 397.67 30.87 < 0.0001 1.833E+05 3.33 0.0931
AC 272.23 21.14 0.0005 3.284E+05 5.96 0.0311
AD 1026.51 79.70 < 0.0001 7.855E+05 14.26 0.0026
BC 10.80 0.8388 0.3764 1.429E+06 25.93 0.0003
BD 4.77 0.3703 0.5533 3.927E+05 7.13 0.0204
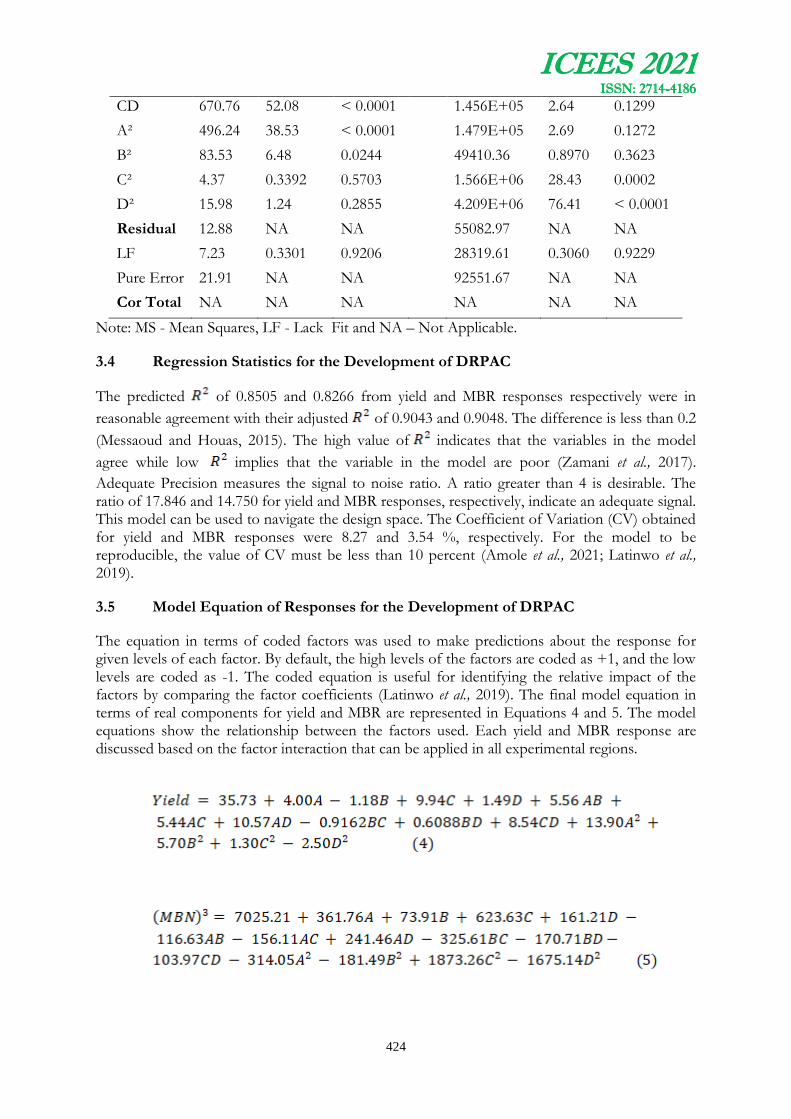
ICEES 2021 ISSN: 2714-4186
424
CD 670.76 52.08 < 0.0001 1.456E+05 2.64 0.1299
A² 496.24 38.53 < 0.0001 1.479E+05 2.69 0.1272
B² 83.53 6.48 0.0244 49410.36 0.8970 0.3623
C² 4.37 0.3392 0.5703 1.566E+06 28.43 0.0002
D² 15.98 1.24 0.2855 4.209E+06 76.41 < 0.0001
Residual 12.88 NA NA 55082.97 NA NA
LF 7.23 0.3301 0.9206 28319.61 0.3060 0.9229
Pure Error 21.91 NA NA 92551.67 NA NA
Cor Total NA NA NA NA NA NA
Note: MS - Mean Squares, LF - Lack Fit and NA – Not Applicable.
3.4 Regression Statistics for the Development of DRPAC
The predicted of 0.8505 and 0.8266 from yield and MBR responses respectively were in
reasonable agreement with their adjusted of 0.9043 and 0.9048. The difference is less than 0.2
(Messaoud and Houas, 2015). The high value of indicates that the variables in the model
agree while low implies that the variable in the model are poor (Zamani et al., 2017).
Adequate Precision measures the signal to noise ratio. A ratio greater than 4 is desirable. The ratio of 17.846 and 14.750 for yield and MBR responses, respectively, indicate an adequate signal. This model can be used to navigate the design space. The Coefficient of Variation (CV) obtained for yield and MBR responses were 8.27 and 3.54 %, respectively. For the model to be reproducible, the value of CV must be less than 10 percent (Amole et al., 2021; Latinwo et al., 2019).
3.5 Model Equation of Responses for the Development of DRPAC
The equation in terms of coded factors was used to make predictions about the response for given levels of each factor. By default, the high levels of the factors are coded as +1, and the low levels are coded as -1. The coded equation is useful for identifying the relative impact of the factors by comparing the factor coefficients (Latinwo et al., 2019). The final model equation in terms of real components for yield and MBR are represented in Equations 4 and 5. The model equations show the relationship between the factors used. Each yield and MBR response are discussed based on the factor interaction that can be applied in all experimental regions.

ICEES 2021 ISSN: 2714-4186
425
where A is the activant concentration, B is the impregnation time, C is the carbonization temperature and D is the carbonization time.
3.6 Model Graphs of Responses for the Development of DRPAC
The model graphs for yield and MBR are represented in Figures 1 and 2. Figure 1 (a-f) represent the 3-D plots of yield response, while Figure 2 (a-f) represent the 3-D plots of MBR response. The interactive effect of activant concentration, impregnation time, carbonization temperature and carbonization time on the yield and MBR, respectively, for dye removal are shown in Figures 1 and 2.
(a) (b) (c)
(d) (e) (f)
Figure 1: 3-D plots of yield response between a) A and B b) A and C c) A and D d) B and C e) B and D f) C and D
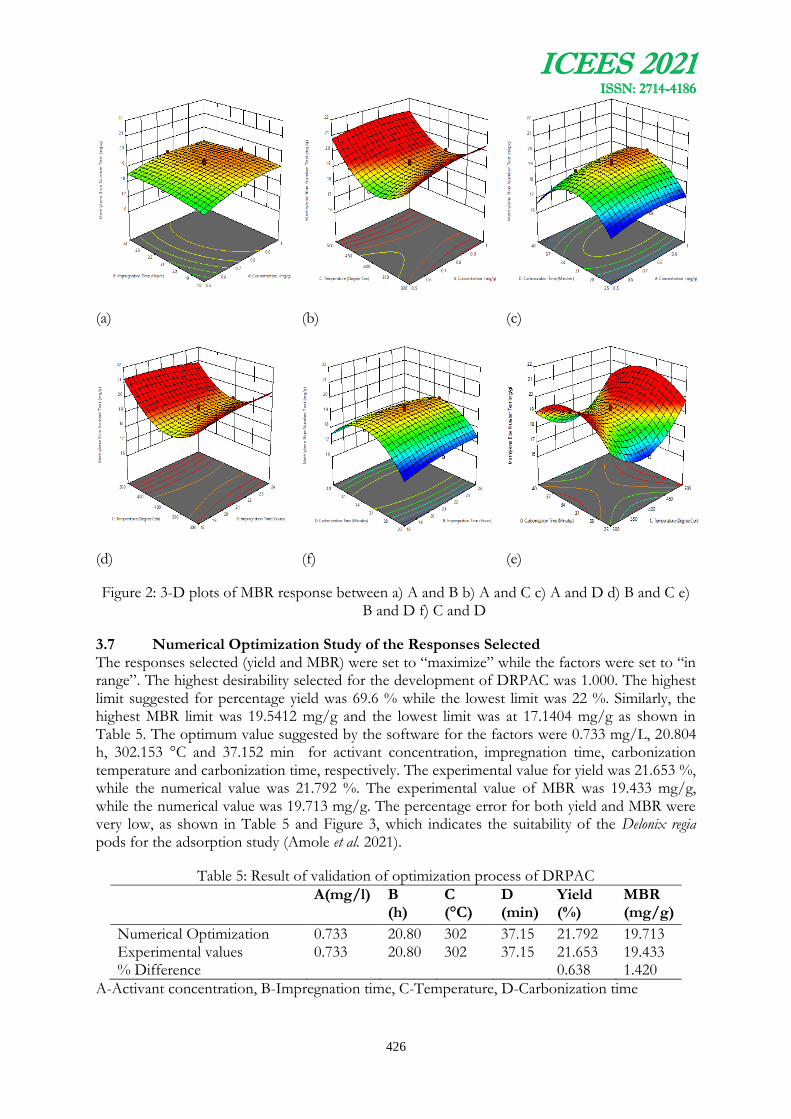
ICEES 2021 ISSN: 2714-4186
426
(a) (b) (c)
(d) (f) (e)
Figure 2: 3-D plots of MBR response between a) A and B b) A and C c) A and D d) B and C e) B and D f) C and D
3.7 Numerical Optimization Study of the Responses Selected The responses selected (yield and MBR) were set to “maximize” while the factors were set to “in range”. The highest desirability selected for the development of DRPAC was 1.000. The highest limit suggested for percentage yield was 69.6 % while the lowest limit was 22 %. Similarly, the highest MBR limit was 19.5412 mg/g and the lowest limit was at 17.1404 mg/g as shown in Table 5. The optimum value suggested by the software for the factors were 0.733 mg/L, 20.804 h, 302.153 °C and 37.152 min for activant concentration, impregnation time, carbonization temperature and carbonization time, respectively. The experimental value for yield was 21.653 %, while the numerical value was 21.792 %. The experimental value of MBR was 19.433 mg/g, while the numerical value was 19.713 mg/g. The percentage error for both yield and MBR were very low, as shown in Table 5 and Figure 3, which indicates the suitability of the Delonix regia pods for the adsorption study (Amole et al. 2021).
Table 5: Result of validation of optimization process of DRPAC
A(mg/l) B (h)
C (°C)
D (min)
Yield (%)
MBR (mg/g)
Numerical Optimization 0.733 20.80 302 37.15 21.792 19.713 Experimental values 0.733 20.80 302 37.15 21.653 19.433 % Difference 0.638 1.420
A-Activant concentration, B-Impregnation time, C-Temperature, D-Carbonization time
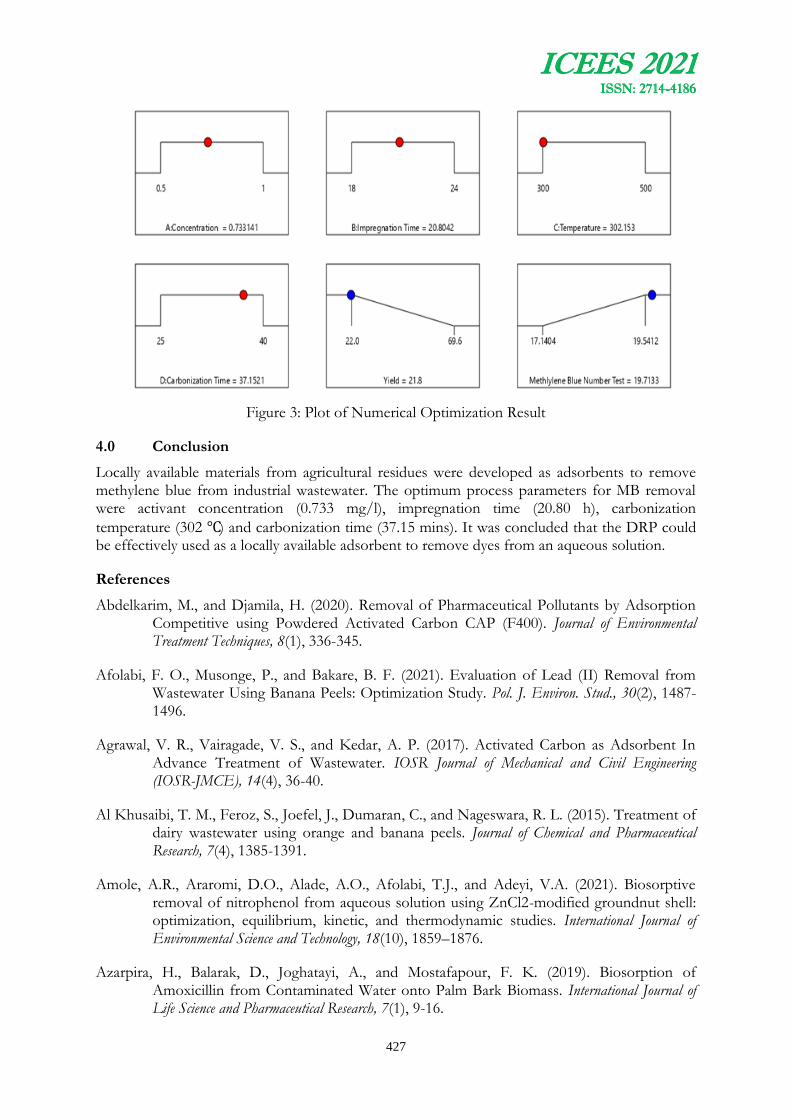
ICEES 2021 ISSN: 2714-4186
427
Figure 3: Plot of Numerical Optimization Result
4.0 Conclusion
Locally available materials from agricultural residues were developed as adsorbents to remove methylene blue from industrial wastewater. The optimum process parameters for MB removal were activant concentration (0.733 mg/l), impregnation time (20.80 h), carbonization
temperature (302 ℃) and carbonization time (37.15 mins). It was concluded that the DRP could be effectively used as a locally available adsorbent to remove dyes from an aqueous solution.
References
Abdelkarim, M., and Djamila, H. (2020). Removal of Pharmaceutical Pollutants by Adsorption Competitive using Powdered Activated Carbon CAP (F400). Journal of Environmental Treatment Techniques, 8(1), 336-345.
Afolabi, F. O., Musonge, P., and Bakare, B. F. (2021). Evaluation of Lead (II) Removal from Wastewater Using Banana Peels: Optimization Study. Pol. J. Environ. Stud., 30(2), 1487-1496.
Agrawal, V. R., Vairagade, V. S., and Kedar, A. P. (2017). Activated Carbon as Adsorbent In Advance Treatment of Wastewater. IOSR Journal of Mechanical and Civil Engineering (IOSR-JMCE), 14(4), 36-40.
Al Khusaibi, T. M., Feroz, S., Joefel, J., Dumaran, C., and Nageswara, R. L. (2015). Treatment of dairy wastewater using orange and banana peels. Journal of Chemical and Pharmaceutical Research, 7(4), 1385-1391.
Amole, A.R., Araromi, D.O., Alade, A.O., Afolabi, T.J., and Adeyi, V.A. (2021). Biosorptive removal of nitrophenol from aqueous solution using ZnCl2-modified groundnut shell: optimization, equilibrium, kinetic, and thermodynamic studies. International Journal of Environmental Science and Technology, 18(10), 1859–1876.
Azarpira, H., Balarak, D., Joghatayi, A., and Mostafapour, F. K. (2019). Biosorption of Amoxicillin from Contaminated Water onto Palm Bark Biomass. International Journal of Life Science and Pharmaceutical Research, 7(1), 9-16.

ICEES 2021 ISSN: 2714-4186
428
Chikri, R., Elhadiri, N., Benchanaa, M., and El-Maguana, Y. (2020). Efficiency of Sawdust as Low-Cost Adsorbent for Dyes Removal. Journal of Chemistry, 1(2), 1-17.
Dada, A., Inyinbor, A., and Oluyori, A. (2021). Comparative Adsorption Of Dyes Unto Activated Carbon Prepared From Maize Stems And Sugar Cane Stems. IOSR Journal of Applied Chemistry (IOSR-JAC), 2(3), 38-43.
Dada, E. O., Ojo, I. A., Alade, A. O., Afolabi, T. J., Amuda, O. S., and Jameel, A. T. (2020). Biosorption of Bromophenol Blue from Aqueous Solution Using Flamboyant (Delonix regia) Pod. Chemical Science International Journal, 29(5), 32-50.
Dada, E. O., Ojo, I. A., Alade, A. O., Afolabi, T. J., Jimoh, M. O., and Dauda, M. O. (2020). Biosorption of Bromo-based Dyes from Wastewater Using Low-Cost Adsorbents: A Review. Journal of Scientific Research and Reports, 26(8), 34-56.
Daud, Z., Ahmad, B., Awang, H., Abubakar, H. M., Nasir, N., and Tajarudin, H. A. (2018). Ammoniacal Nitrogen Removal Using flamboyant pods (Delonix regia) Adsorbent for Natural Rubber Wastewater Treatment. International Journal of Integrated Engineering: Innovations in Civil Engineering, 10(9), 184-189.
Diego, S. P., Alexandre, B., Marcio, S., Mazutti, M., Bassaco, M. M., Bertuol, D. A., . . . Meili, L. (2020). Use of papaya seeds as a biosorbent of methylene blue from aqueous solution. Water Science and Technology, 68(2), 441-447.
Dube, S., Kebede, T. G., and Nindi, M. M. (2019). Removal of Multi-Class Antibiotic Drugs from Wastewater Using Water-Soluble Protein of Moringa stenopetala Seeds. MDPI, Water Journal, 11(9), 1-13.
Ejikeme, P., Ejikeme, E.M., and Onwu, D.O. (2013). Optimization of Process Conditions for the Concentration of Isopropyl Alcohol-Water Solution using Response Surface Methodology. International Journal of Scientific and Engineering Research, 4(2), 1-9.
Gangadware, M. M., and Jadhav, M. V. (2016). Removal of Methylene Blue from Wastewater by using Delonix regia Seed Powder as Adsorbent. International Journal of Science, Engineering and Technology Research (IJSETR), 5(6), 2244-2248.
Giovanela, M., Bortoluz, J., Ferrarini, F., Bonetto, L. R., and Crespo, J. d. (2020). Use of low-cost natural waste from the furniture industry for the removal of methylene blue by adsorption: isotherms, kinetics and thermodynamics. Cellulose, 27, 6445–6466.
Itodo, A., Abdulrahman, F., Hassan, L., Maigandi, S., and Itodo, H. (2010). Application of Methylene Blue and Iodine Adsorption in the Measurement of Specific Surface Area by four Acid and Salt Treated Activated Carbons. New York Science Journal, 3(5), 25-33.
Iwar, R. T., Utsev, J. T., and Ifyalem, K. J. (2020). Adsorption of Methylene Blue from Aqueous Solution onto Delonix regia Pod Activated Carbon: Batch Equilibrium Isotherm, Kinetic and Thermodynamic Studies. Journal of Materials and Environmental Science, 11(7), 1058-1078.
Lach, J. (2019). Adsorption of Chloramphenicol on Commercial and Modified Activated Carbons. Water, 11(41), 1-17.
ICEES 2021 ISSN: 2714-4186
429
Latinwo, G. K., Alade, A. O., Agarry, S. E., and Dada, E. O. (2019). Process Optimization and Modeling the Adsorption of Polycyclic Aromatic-Congo Red Dye onto Delonix regia Pod-Derived Activated Carbon. Polycyclic Aromatic Compounds, 1-19.
Marjani, A., Pelalak, R., Heidari, Z., Khatami, S. M., Kurniawan, T. A., and Shirazian, S. (2021). Oakwood ash/GO/Fe3O4 adsorption efficiencies for cadmium and lead removal from aqueous solution: Kinetics, equilibrium and thermodynamic evaluation. Arabian Journal of Chemistry, 14(3), 1-17.
Messaoud, J., and Houas, A. (2015). Preparation of activated carbon from residues coffee by physical activation: using Response surface methodology. International Journal of Advanced Research, 3(3), 1025-1033.
Nomngongo, P. N., and Chaba, J. M. (2019). Effective adsorptive removal of amoxicillin from aqueous solutions and wastewater samples using zinc oxide coated carbon nanofiber composite. Emerging Contaminants, 5(8), 143-149.
Okoye, C. C., Okey-Onyesolu, C. F., Chime, D. C., and Achike, C. C. (2018). Adsorptive Removal of Bromophenol Blue Dye from Aqueous Solution using Acid Activated Clay. International Journal of Scientific Research and Management, 6(3), 2321-3418.
Oribayo, O., Olaleye, O. O., Akinyanju, A. S., Omoloja, K. O., and Williams, S. O. (2020). Coconut Shell-Based Activated Carbon as Adsorbent for the Removal of Dye from Aqueous Solution: Equilibrium, Kinetics, and Thermodynamic Studies. Nigerian Journal of Technology (NIJOTECH), 39(4), 1076-1084.
Pandimadevi, M. A., Rajalekshmi, G. A., Mrithaa, T. S., and Viji-Chandran, S. A. (2016). Preparation and Characterization of Activated Carbon from Delonix regia Seeds for the Removal of Methylene Blue Dye. Journal of Industrial Pollution Control, 32(2), 572-579.
Papadaki, M. I., Mendoza, D. I., Avila, H. E., Petriciolet, A., and Georgopoulos, S. (2021). Nut Shells as Adsorbents of Pollutants: Research and Perspectives. Research and Perspectives Frontiers in Chemical Engineering, 3, 1-15.
Rohman, A., Siregar, C., and Martono, S. (2018). Application of Fourier transforms infrared (FTIR) spectroscopy coupled with multivariate calibration for quantitative analysis of curcuminoid in tablet dosage form. Journal of Applied Pharmaceutical Science, 8(8), 151-156.
Wang, S., Wang, N., Yao, K., Fan, Y., Li, W., Han, W., and Yin, X. (2019). Characterization and Interpretation of Cd (II) Adsorption by Different Modified Rice Straws under Contrasting Conditions. Scientific Report is an open-access journal, 9(2), 1-13.
Yunita, T., Rinawati, S., Hidayat, D., Supriyanto, R., and Permana, D. F. (2019). Adsorption of Polycyclic Aromatic Hydrocarbons using Low-Cost Activated Carbon Derived from Rice Husk. Journal of Physics: Conference Series, 4(7), 1-9.
Yuvarat, N., Andrew, J. H., Nontipa, S., Chantakorn, P., Ketsara, S., and Somchai, C.-U. (2020). Preparation of activated carbon from Dipterocarpus alatus fruit and its application for methylene blue adsorption. RSC Advances, Royal Society of Chemistry, 10(2), 21082–21091.

ICEES 2021 ISSN: 2714-4186
430
Zamani, S. A., Yunus, R., Samsuri, A. W., Salleh, M. A., and Asady, B. (2017). Removal of Zinc from Aqueous Solution by Optimized Oil Palm Empty Fruit Bunches Biochar as Low-Cost Adsorbent. Bioinorganic Chemistry and Applications, 3(6), 1-9.

ICEES 2021 ISSN: 2714-4186
431
NANO-BASED DRILLING FLUIDS: A REVIEW
Jimoh Monsurat Omolola1,*, Arinkoola Akeem Olatunde1,2, SalawudeenTaofeek Olalekan1, Olufayo Augustina Folakemi1, Bello Wasiat Omowumi1, Daramola Michael Olawale3
1 Chemical Engineering Department, Ladoke Akintola University of Technology, Ogbomoso
2 Department of Petroleum Engineering, African University of Science and Technology, Abuja
3Department of Chemical Engineering, Faculty of Engineering, Built Environment and Information Technology, University of Pretoria, Hatfield 0028, Pretoria, South Africa.
* Email of Corresponding Author: [email protected]
ABSTRACT
Development of various materials on nano-meter scale has revolutionized several industries including oil and gas sector. Nanotechnology is the science, engineering and technology of the development and application of nano-materials which are either natural or synthetic. The projection that oil and gas sector will be confronted with various complicated technical challenges in the next few decades has prompted researchers to investigate various nanotechnology techniques to address current and possible future technical challenges. The use of nanomaterials for drilling fluid (DF) formulation has gained attention in recent times. This is because as the demand of natural oil and gas increases globally, there is continuous need to drill deeper through complicated and unconventional formations. In order to achieve successful drilling process through these unconventional formations, a carefully formulated drilling fluid must be used. Nano-based DFs are considered to have great potential for successful drilling through complicated formations such as shale. Several researchers have investigated various nano-particles as drilling fluid additives for formulation of DFs that can withstand severe down-hole conditions such as high pressure and temperature. This review article summarizes recent progress made on nano-based DF formulation. Effects of nano-particles on drilling fluid rheological and filtration properties were highlighted. Current challenges and future prospects in nano-based drilling fluids formulation were also discussed.
Keywords: Drilling fluids, nano-particles, nano-fluids, nano-additives, rheology
1. INTRODUCTION
The natural oil and gas exploration industry face a range of challenges. The results of which have resulted into an increase in costs, and limitations in the operating envelope of DF applications (Mattew, 2004). This disadvantage presents a significant market opportunity for nanomaterials-based solution providers in oil and gas business. Nanotechnology is a branch of science and technology that produces particles with size ranging between 1-100 nm. Nano-materials exhibit unique properties which can extensively improve the rheological properties of DFs (Mattew, 2004). Amanullah and Al-Tahini (2009) described nano-materials as the most promising materials for smart fluid design in oil and gas field application due to its extremely improved physical, chemical, mechanical, electrical, thermal and hydrodynamic properties. The interaction potential of nano-materials is excellent when compared to parent materials. Nano- fluids can be classified as simple (fluid with one nano-sized additive) and advanced nano-fluids (fluids containing more than one nano-sized additive) (Abdul Rasak et al., 2014).

ICEES 2021 ISSN: 2714-4186
432
Nader and Milad (2012) highlighted the possible effect of nanomaterials in oil and gas industry. The author presented a critical review covering assessment of nano-fluid in drilling operations and economic benefits in the exploration industry. The authors concluded that application of nanoparticles could reduce circulation loss, by creating a carrying capacity sufficient enough to transport drill cuttings efficiently and maintain the density and pressure over a broad range of operational conditions. Nano-fluid decreases the exposure of shale to drilling fluids. This is due to ultrafine particle sizes which are smaller than pore throat sizes of shales. Nano-particles plug the pores and hence, prevent swelling and wellbore instability.
Moreover, nano-based fluids provide significantly reduce the frictional resistance between the pipe and the borehole wall by forming of thin lubricating film in the wall-pipe interface. The authors also stated that the future possibilities for nanotechnology in
oil and gas sector include corrosion management for offshore and onshore, environmental management, lighter-weight, rigid and stronger structural composites for drilling facilities. Similar reviews from Friedheim et al. (2012) and Hoelscher et al. (2013) on application of nanotechnology in oil fields have been published. A review of various nano-particles for the formulation of enhanced DF has also been reported by Vrysaz and Kelessidis (2017). Their review is focused mainly on experimental results with a view to providing information to companies and researchers towards formulating a better and smarter drilling fluid.
In this paper, effects of these nano-particles on drilling fluid properties such as rheology, filtration and thermal properties are comprehensively discussed. Challenges of nano-based drilling fluid including its possible environmental effects are reported. Various synthetic approaches were critically reviewed. Future research and innovation on application of nanoparticles in oil and gas operation is highlighted.
2.0 Nano-Additives in Drilling Fluid Formulation
Quite a number of different Nano-Particles (NPs) have been used to develop water-based DF on the laboratory scale and only very few have been tested on the field (Borisov et al. 2015; Taha and Lee, 2015; Pan et al., 2018). NPs can be synthesized via physical, chemical and biological methods. Basically, the two approaches employed in the synthesis of NPs are bottom-up and top-down techniques. Bottom-up is when the nano-structure is created from smaller building blocks, and most chemical synthesis are typically bottom-up. The top-down is when the nano-structure is from a bigger piece. Physical method is the simplest method of making nano-particles in form of powder. This is usually achieved using various types of mills. Previously used nano-particles for drilling fluid formulation and their respective synthesis methods are summarized in Table 1.
Table 1: Nano-Particles previously used in Drilling Fluid Formulation
Type Method References
Al2O3 NP Commercial Alsaba et al. 2020 CuO NP Commercial Vryzas et al. 2015; Alsaba
et al. 2020 Polymer-based nano-silica composite
Inverse micro Emulsion polymerization
Mao et al. 2015
SiO2 Commercial Li et al. 2015 SiO2 NP Commercial Vryzas et al. 2015 Magnetic Fe3O4 NP Synthetic approach (custom
made) Vrysaz et al. 2016
ICEES 2021 ISSN: 2714-4186
433
Polyanionic cellulose NP Ball milling Fereydouni et al. 2012 MWCNT Chemical vapour deposition Abdul Rasak et al. 2014 CNT Chemical vapour deposition Functionalized CNT Nitric Acid treatment of CNT Fazelabdolabadi et al.
2015 -COOH functionalized CNT Ball milling, -COOH treatment Chai et al. 2014 Carboxy methylcelluose NP Ball milling Manea, 2012 Carboxy methylcelluose NP Saboori et al. 2012 Cellulose nano-crystals (CNC) Hydrolysis of Microfibrillated
Cellulose (MFC) Li et al., 2015
Nano-grahite and nano- silicon wires
Synthetic approach Naseer et al. 2013
Fe (OH)3 NP Synthesis between Fe III chloride and NaOH
Zakaria et al. 2011
ZnO and CuO NP Commercial William et al. 2014 TiO2NP Synthesis with so-gel method Alsaba et al. 2020 Nano graphite and nano-silicon wires
Water in oil micro emulsion Naseer et al. 2013
3. EFFECTS OF NANO-ADDITIVES ON DRILLING FLUID PROPERTIES
3.1 Rheology
Li et al. (2015) investigated the effect of cellulose nano-particles as rheology and filtration modifiers in bentonite (BT) water-based DF. The NPs used were Micro-fibrillated Cellulose (MFC) and Cellulose nano-crystals (CNCs). The CNCs were isolated from the sulfuric acid hydrolysis of the MFC. The resulting CNCs had smaller dimension, more negative surface charges and superior stability in aqueous solution. Rheological results showed CNC/BT suspension exhibited improved rheological properties than MFC/BT suspension but with a shear thinning behaviour. The authors attributed the result to strong surface interaction among the BT layers, CNCs and immobilized H2O molecules compared to MFC. Addition of Polyanionic Cellulose (PAC) remarkably improves the rheological properties of the CNCs/BT suspension signifying a synergetic effect between the PAC and CNCs.
Fereydouni et al. (2012) studied the effect of bulk polyanionic cellulose polymer and polyanionic cellulose nano-particles on rheological properties of DF. The authors investigated the effect of nano-PAC and bulk PAC on fluid cake thickness and H2O loss of DF. Experimental result showed that increase in area to volume ratio of nano-particles resulted in increase absorption on the clay particle. Moreover, polymeric nano-particles results in more colloidal particle formation in the fluid. The authors concluded that the addition of nano-PAC caused the quantity of water loss and cake thickness to be reduced. Hence, the fluid can preserve gel specification for longer time.
Abdul-Rasak et al. (2014) studied the effect of multiwall carbon nanotubes (MWCNTs) on the rheological properties of DF. The authors focused their research on the determination of optimal concentration of multiwall carbon nanotubes (MWCNTs) to produce improved rheological properties in water-based and ester-based DFs at different temperatures. Their results revealed that rheological properties like plastic viscosity, yield point and gel strength were significantly affected by various concentrations of MWCNTs. However, 0.01 ppb of MWCNTs gave the lowest fluid volume of 4.4 and 1.9 ml at low pressure and temperature condition and at high pressure and temperature condition, respectively. In ester-based DF, gel strength and
ICEES 2021 ISSN: 2714-4186
434
emulsion stability are slightly increased as MWCNTs concentration increases. The result indicated that MWCNTs can be used with conventional fluid loss control additives. It was also discovered that temperature had effect on the drilling fluid rheological properties. The authors concluded that MWCNTs can be used as additive in DF based on the improvement observed in the DF rheological properties.
Abdo and Hannef (2013) developed beneficiated drilling fluids using clay nano-particles to explore of deep hydrocarbon wells. Oman palygoskite (Pal) was processed for the first time in nano-form (10–20 nm diameter). The authors stated that significant improvement in rheology was observed when Pal nano particles were added in little quantity with montmorillonite and water. Hence, it could be used as rheology control agent and substitute expensive drilling fluid additives. They also reported that the formulated fluid exhibited good stability at high temperature and pressure. They concluded that DF with Pal nanoparticles can be designed for utmost versatility to achieve optimum drilling performance.
Amanullah et al. (2011) presented a paper that described the formulation and preliminary results for various nano-based DFs. The authors developed a nano-based drilling fluid using a blend of nano additives. The rheological and filtration properties were evaluated. Time dependent behaviour of the rheological properties of the fluid was determined. Initial fluid formulation with water soluble polymeric viscosifier indicated that the development of an efficient and functional nano-based DF is difficult using water or salt water as a fluid phase. The results showed that the nano-based fluid had virtually similar rheological properties immediately after preparation, and also after 18, 48 and 72 hrs of static ageing. This shows that the newly formulated nano-based DF had both short as well as long term stability. The authors concluded that macro material has lower surface area to volume ratio, and possesses and possesses lower mechanical, chemical, physical and thermal properties compared to micro and nano-material.
3.2 Filtration Properties
Infiltration of DF into the porous permeable formation could result in swelling and well bore damage (Kosynkin et al. 2011). Invasion of fluid into the formation may create a zone of reduced permeability around the well bore which may result in lower production rate (Navarrete et al. 2000). Thus, a functional DF should have suitable filtration properties (low filtrate loss and thin permeable filter cake).
Yang et al. (2014) prepared nano- graphene oxide (GO) for use as an ultra-strong filtrate loss control in water-based DF. The performance on filtrate loss was evaluated using API standard filtration tests and the result was compared with various fluid-loss-control additives. Their results show that GO performances are much better than the additives for comparison at relatively low concentration, due to adequate dispersion of nano-sheets. The authors concluded that GO exhibited exceptional effect on controlling fluid loss even in the absence of bentonite, which is a significant improvement over conventional polymer additives.
Adel et al. (2014) investigated the reduction of formation damage and fluid loss using nano-sized silica oxide as additive in DF. The authors studied the effect of three different sizes of nano-sized silica oxide to determine the nanoparticle size range that yields minimum filtrate loss. Experiments were conducted to determine the relationship between the filtrate volume and nanoparticles concentration that gave lowest filtrate loss and cost. Their result showed that the optimum size range of nano-particles was 5-15 nm. The most economic and yet efficient concentration of nanoparticles is 10 %wt/vol, which leads to 49.31 % reduction in fluid loss when compared with the base fluid. The authors concluded that nanoparticles proved to be more effective in reducing the filtrate losses than conventional fluid loss reducer.
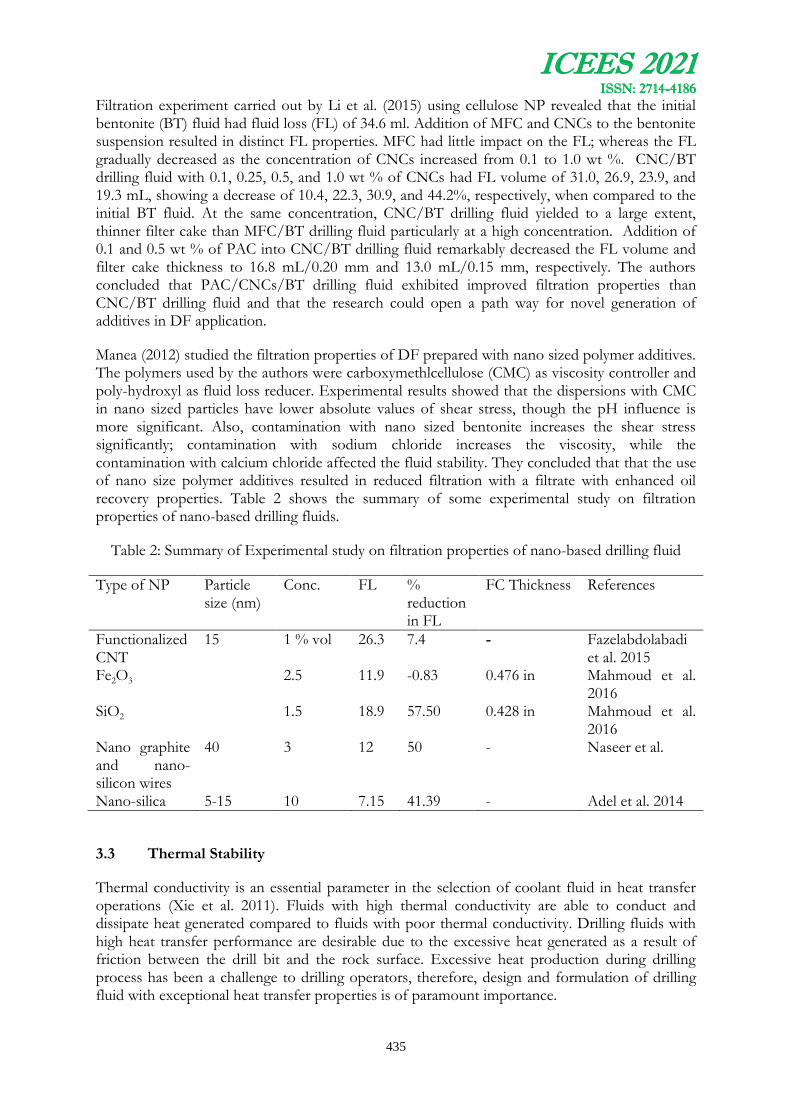
ICEES 2021 ISSN: 2714-4186
435
Filtration experiment carried out by Li et al. (2015) using cellulose NP revealed that the initial bentonite (BT) fluid had fluid loss (FL) of 34.6 ml. Addition of MFC and CNCs to the bentonite suspension resulted in distinct FL properties. MFC had little impact on the FL; whereas the FL gradually decreased as the concentration of CNCs increased from 0.1 to 1.0 wt %. CNC/BT drilling fluid with 0.1, 0.25, 0.5, and 1.0 wt % of CNCs had FL volume of 31.0, 26.9, 23.9, and 19.3 mL, showing a decrease of 10.4, 22.3, 30.9, and 44.2%, respectively, when compared to the initial BT fluid. At the same concentration, CNC/BT drilling fluid yielded to a large extent, thinner filter cake than MFC/BT drilling fluid particularly at a high concentration. Addition of 0.1 and 0.5 wt % of PAC into CNC/BT drilling fluid remarkably decreased the FL volume and filter cake thickness to 16.8 mL/0.20 mm and 13.0 mL/0.15 mm, respectively. The authors concluded that PAC/CNCs/BT drilling fluid exhibited improved filtration properties than CNC/BT drilling fluid and that the research could open a path way for novel generation of additives in DF application.
Manea (2012) studied the filtration properties of DF prepared with nano sized polymer additives. The polymers used by the authors were carboxymethlcellulose (CMC) as viscosity controller and poly-hydroxyl as fluid loss reducer. Experimental results showed that the dispersions with CMC in nano sized particles have lower absolute values of shear stress, though the pH influence is more significant. Also, contamination with nano sized bentonite increases the shear stress significantly; contamination with sodium chloride increases the viscosity, while the contamination with calcium chloride affected the fluid stability. They concluded that that the use of nano size polymer additives resulted in reduced filtration with a filtrate with enhanced oil recovery properties. Table 2 shows the summary of some experimental study on filtration properties of nano-based drilling fluids.
Table 2: Summary of Experimental study on filtration properties of nano-based drilling fluid
Type of NP Particle size (nm)
Conc. FL % reduction in FL
FC Thickness References
Functionalized CNT
15 1 % vol 26.3 7.4 - Fazelabdolabadi et al. 2015
Fe2O3 2.5 11.9 -0.83 0.476 in Mahmoud et al. 2016
SiO2 1.5 18.9 57.50 0.428 in Mahmoud et al. 2016
Nano graphite and nano-silicon wires
40 3 12 50 - Naseer et al.
Nano-silica 5-15 10 7.15 41.39 - Adel et al. 2014
3.3 Thermal Stability
Thermal conductivity is an essential parameter in the selection of coolant fluid in heat transfer operations (Xie et al. 2011). Fluids with high thermal conductivity are able to conduct and dissipate heat generated compared to fluids with poor thermal conductivity. Drilling fluids with high heat transfer performance are desirable due to the excessive heat generated as a result of friction between the drill bit and the rock surface. Excessive heat production during drilling process has been a challenge to drilling operators, therefore, design and formulation of drilling fluid with exceptional heat transfer properties is of paramount importance.

ICEES 2021 ISSN: 2714-4186
436
Williams et al. (2014) studied the effect of ZnO and CuO nanoparticles on thermal properties of water-based DFs. The nano-drilling fluid was developed at concentrations 0.1, 0.3 and 0.5 wt% in xanthan aqueous solution as a base fluid. Experimental results showed an increment in thermal conductivity of the nano-drilling fluid as concentration increases. The authors reported that CuO nano DF had better thermal conductivity compared to ZnO nano-DF. The authors concluded that improvement in the thermal conductivity gives the nano-drilling fluid an opportunity in high temperature and pressure drilling environment.
Fazelabdolabadi, et al. (2015) investigated the effect of functionalized CNT on thermal conductivity of water-based drilling fluid. The CNT was functionalized via nitric acid treatment. Results showed that there was 23.2 % increment in the thermal conductivity at ambient temperature at 1 % vol. functionalized CNT. There was further increment to 31.8 % when the temperature was increased to 50 °C indicating its applicability at higher temperatures.
Naseer et al. (2013) developed a DF using nano-graphite and nano- silicon wires to increase the efficiency of drilling operations and ensure maximum accessibility to new and matured oil reserves. Experimental results showed that increase in temperature (up to 90 ºC) had detrimental effect on the rheological properties of the normal DF while nano fluid was able to retain all the desired rheological properties at elevated temperature and pressure. The authors concluded that the formulated nano fluid has prospect for application in deep wells where elevated temperatures and pressures are common. Experimental studies on thermal conductivity of nano-based drilling fluids are summarized in Table 3.
Table 3: Summary of experimental study on thermal conductivity of nano-based drilling fluid
Type of NP Particle size
Conc. wt%
TC of Nano-fluid (W/mK)
% increase in TC over base mud
References
ZnO <50 nm 0.5 0.652 34.43 William et al. 2014
CuO <50nm 0.5 0.673 38.76 William et al. 2014
TiO2 20nm 0.3 150 Sabbaghi et al. 2015
MWCNT 1 22.3 Sedaghatzadeh et al. 2012
Functionalised CNT
15 1 - 31.8 Fazelabdolabadi, et al. 2015
TC = Thermal conductivity
4. CHALLENGES OF USE OF NANO PARTICLES
Despite the huge success recorded in the use of nano particles as DF additives, some identified challenges associated with the use of nano particles in DF formulations cannot be ignored. Addressing these challenges will encourage the use of nano-based drilling fluids on the oil field. The cost of nano-particles has been a serious challenge. The process of chemical synthesis of nano particles should be economically viable for its successful application on the oil field. Most of the chemical synthesis processes has been investigated on a laboratory scale, only few techniques are currently adopted for commercial scale production. How economical is the large-scale production of the nano-particles for its successful application in drilling fluid formulation on the oil field? This is an important research question that must be answered. Treatment and disposal of nano-based DF is another pressing challenge. In recent studies, most nano-particles
ICEES 2021 ISSN: 2714-4186
437
used are non-biodegradable, which could pose serious threat to the environment if not properly treated and disposed.
5. CONCLUSIONS AND FUTURE PROSPECTS
This review has highlighted recent advancements in the development of nano-based DFs for application in oil and gas exploration. The article presents various synthesis techniques, and the effects of various nanoparticles on the rheology, filtration and thermal properties of the developed drilling fluids. No doubt, addition of nanoparticles to water-based drilling fluid has significantly improved the rheological, filtration and thermal properties of the DF. Hence, nano-based drilling fluid could be said to be viable alternative to the conventional micro and macro-based drilling fluids when exploring unconventional hydrocarbon reservoirs such as shale especially at high pressure and high temperature conditions.
So far, physical and mechanical particle size reduction of existing additives without the addition of nano-particles has not received much attention. Particle size reduction from micro to nano size using ball milling could be a viable alternative to various expensive chemical synthesis processes of nanoparticles. Development of nanoparticles from existing drilling fluid additives will encourage the formulation of complex nano drilling fluid that can cope with various well conditions without incurring additional cost.
Information regarding the flow hydraulics of nano-based drilling fluids is very diminutive in literature. Effort should be made to investigate further the dynamic flow properties of nano-based drilling fluid especially when pressure loss in the annulus could pose extreme danger. Furthermore, the addition of nano-particles to drilling fluid formulated using non-synthetic bio-polymers should be given attention. The use of non-synthetic biopolymers as substitute for imported synthetic additives has gain attention in recent time. However, the integrity of such drilling fluid regarding the ability to withstand harsh conditions experienced in unconventional wells is still questionable. Addition of nanoparticles could possibly address the challenges identified with such fluid.
REFERENCES
Abdul Rasak I., Norhana M.R., MohdZaidi J., Wan Rosli W.S., and Nor Aziah B. (2014). Effect of nanomaterials on the rheology of drilling fluids. Journal of Applied Sciences, 14 (11): 1192-1197
Abdo, J. and Hannef, M.D. (2013). Clay nano-particles modified drilling fluid for drilling of deep hydrocarbon well. Applied Clay Science, 86: 76-82
Adel M., Salem R., and Ahmed N. (2014). Reduction of Formation Damage and Fluid Loss using Nano-sized Silica Drilling Fluids. Petroleum Technology Development Journal, 2:75-88
Alsaba M.T., Al Dushaishi M.F., and Abbas A.K. (2020) Application of nano water‑ based drilling fluid in improving hole cleaning. SN Applied Sciences, 2:905 | https://doi.org/10.1007/s42452-020-2723-2
Amanullah, M. and Al-Tahini, A.M. (2009). Nano- technology – its significance in smart fluid development for oil and gas field application. Proceedings of the SPE Saudi Arabia Section Technical Sympossium and Exhibition, May 9-11, 2009, Alkhobar, Saudi Arabia.

ICEES 2021 ISSN: 2714-4186
438
Ariffin S. and Amir H. (2011). Water based fluid lifting capacity improvement by multiwall carbon nanotubes additive. Journal of Petroleum and Gas Engineering, 2(5): 99-107.
Borisov, A.S., Husein, M., Hareland, G. (2015). A field application of nanoparticle-based invert emulsion drilling fluids. J. Nanopart. Res. 17, 340.
Chai Y.H, Suzana Y and Chok V.S. (2014). Study on the Effect of Nanoparticle Loadings in Base Fluids for Improvement of Drilling Fluid Properties. Advance Chemical Engineering, 4(3): 1-6
Fazelabdolabadi, B., Khodadadi, A.A., andSedaghatzadeh, M. (2015). Thermal and rheological properties improvement of drilling fluids using functionalized carbon nanotubes. Appl. Nanosci. 5, 651–659.
Fereydouni, M., Sabbaghi, S., Saboori, R., and Zeinali, S.(2012). Effect of Polyanionic Cellulose Polymer Nanoparticles on Rheological Properties of Drilling Fluid. International Journal of Nanoscience and Nanotechnology, 8(3): 171-174
Friedheim, J., Young, S., De Stefano, G., Lee, J., and Guo, Q. (2012). Nanotechnology for oilfield applications—Hype or reality? In Proceedings of the SPE International Nanotechnology Conference, Noordwjik, The Netherlands, 12–14 June.
Hoelscher, K.P., Young, S., Friedheim, J. and De Stefano, G. (2013). Nanotechnology application in drilling fluids. In Proceedings of the 11th Offshore Mediterranean Conference and Exhibition, Ravenna, Italy, 20–22 March.
Kosynkin, D. V., Ceriotti, G., Wilson, K. C., Lomeda, J. R., Scorsone, J. T., Patel, A. D., Friedheim, J. E. and Tour, J. M. (2011). Graphene Oxide as a High-Performance Fluid-Loss-Control Additive in Waterbased Drilling Fluids. ACS Appl. Mater. Interfaces, 4, 222−227.
Li, M.-C., Wu, Q., Song, K., Qing, Y. and Wu, Y. (2015) Cellulose nanoparticles as modifiers for rheology and fluid loss in bentonite water-based fluids. ACS Appl. Mater. Interfaces. 7, 5006–5016.
Li, S., Osisanya, S. and Haroun, M. (2016). Development of new smart drilling fluids using nano-materials for unconventional reservoirs. In Proceedings of the Abu Dhabi International Petroleum Exhibition & Conference, Abu Dhabi, UAE, 7–10 November .
Mahmoud, O., Nasr-El-Din, H.A., Vryzas, Z. and Kelessidis, V.C. (2016). Nanoparticle-based drilling fluids for minimizing formation damage in HP/HT applications. In Proceedings of the International Conference and Exhibition on Formation Damage Control, Lafayette, LA, USA, 24–26 February.
Manea M. (2012). Rheological Properties of Drilling Fluids Prepared with Nano Sized Polymer Additives. Rev. Chim. (Bucharest), 63(11): 1132-1137.
Mao, H., Qiu, Z., Shen, Z., Huang, W., Zhong, H. and Dai, W. (2015). Novel hydrophobic associated polymer based nano-silica composite with core-shell structure for intelligent drilling fluid under ultra-high temperature and ultra-high pressure. Prog. Nat. Sci. Mater. 2: 90–93.
ICEES 2021 ISSN: 2714-4186
439
Matthew, R.G. (2004). A Case for Nanomaterials in the Oil & Gas Exploration & Production Business. International Congress of Nanotechnology (ICNT), November 7-10, 2004 San Francisco.
Nader N. and Milad, E. (2012). The Potenial Impact of Nanomaterials in Oil Drilling Industry. Nano conference, 23-25 October, Brno, Czech Republic.
Naseer, J., Jesi, A., Mohiuddin, T., Al Ruqeshi, M., Devi, G. and Mohataram, S. (2013). Experimental Investigation of Drilling Fluid Performance as Nanoparticles. World Journal of Nano Science and Engineering, 3:57-61.
Navarrete, R. C., Himes, R. E. and Seheult, J. M. (2000). Applications of Xanthan Gum in Fluid-Loss Control and Related Formation Damage. SPE Permian Basin Oil and Gas Recovery Conference. 21-23 March, Midland, Texas: Society of Petroleum Engineers Inc.
Pan D, Vipulanandan C, Amani N, Reddy S, Chockalingam C (2018) Efects of nanoclay on the rheological properties and resistivity of synthetic based drilling fuids under high temperature. In: Offshore technology conference. Society of Petroleum Engineers. https://doi.org/10.4043/28751-MS 1
Sabbaghi, S., Saboori, R. and Barahoei, M. (2015). Enhanced heat transfer of drilling fluid with titania nanofluid. Res. Rev. J. Eng. Technol. 4, 12–17.
Saboori, R., Sabbaghi, S., Mowla, D. and Soltani, A. (2012). Decreasing of water loss and mud cake thickness by CMC nanoparticles in mud drilling. Int. J. Nano Dimens. 3, 101–104.
Sedaghatzadeh, M., Khodadali, A.A. and TahmasebiBirgani, M.R. (2012). An improvement in thermal and rheological properties of water-based drilling fluids using multiwall carbon nanotube. Iran. J. Oil Gas Sci. Technol. 1, 55–65.
Taha, N.M. and Lee, S. (2015). Nano graphene application improving drilling fluids performance. In Proceedings of the International Petroleum Technology Conference (IPTC 18539), Doha, Qatar, 6–9 December.
Vryzas S. and Kelessidis V. C. (2017). Nano-based drilling fluids: A review. Energies, 10: 540, pp 1-34.
Vryzas, Z., Zaspalis, V., Nalbantian, L., Mahmoud, O., Nasr-El-Din, H.A. and Kelessidis, V.C. (2016). A comprehensive approach for the development of new magnetite nanoparticles giving smart drilling fluids with superior rheological and fluid loss properties for HP/HT applications. In Proceedings of the International Petroleum Technology Conference (IPTC), Bangkok, Thailand, 14–16 November.
Vryzas, Z., Mahmoud, O., Nasr-El-Din, H.A., Zaspalis, V. and Kelessidis, V.C. (2016). Incorporation of Fe3O4 nanoparticles as drilling fluid additives for improved drilling operations. In Proceedings of the ASME-OMAE International Conference, Busan, Korea, 19–24 June.
Vryzas, Z., Mahmoud, O., Nasr-El-Din, H.A. and Kelessidis, V.C. (2015). Development and testing of novel drilling fluids using Fe2O3 and SiO2 nanoparticles for enhanced

ICEES 2021 ISSN: 2714-4186
440
drilling operations. In Proceedings of the International Petroleum Technology Conference, Doha, Qatar, 7–9 December.
Williams J.K.M., Ponman S., Samuel Nagarajan R., and Sangwai J.S. (2014). Effect of CuO and ZnO nanofluids in xanthan gum on thermal, electrical and high pressure rheology of water-based drilling fluids. Journal of Petroleum Science and Technology, 117: 15-27
Xie H., Yu W., Li Y. and Chen L. (2011). Discussions on the thermal conductivity enhancement of nano-fluids. Nanoscale Res. Letters, 6, 124.
Yang X., Guancheng J.and Yingying L. (2014). Nanographite oxide as ultra strong fluid loss additive in water-based drilling fluids. Journal of Dispersion Science and Technology, 35(10):1386-1392.
Zakaria M.F., Mostafavi V., Hareland G. and Husein M. (2011). Novel nano-particles containing drilling fluid to mitigate circulation loss. Clean Technology, 383-387.
Zhixin Yu, et al. The Potential of Nanotechnology in Petroleum Industry with Focus on Drilling Fluids. Pet Petro Chem Eng J 2017, 1(1): 000106.
ICEES 2021 ISSN: 2714-4186
HYDROTHERMAL ANALYSIS OF SQUEEZING NANOFLUID WITH HALL AND RADIATION EFFECT
Ilegbusi Adeleke O.1* and Akinbowale T. Akinshilo2
1 Department of Mechanical Engineering, Yaba College of Technology, Nigeria.
2 Department of Mechanical Engineering, University of Lagos, Akoka-Yaba, Nigeria.
* Email of Corresponding Author [email protected]
ABSTRACT
This study focuses on the hydrothermal squeezing effect on fluid transport. Fluid properties effects arising from the transport phenomenon of the nanofluid are investigated. Fluid parameters such as hall, thermal radiation, heat generation and variably applied magnetic field on parallel plates are presented. The fluid transport mechanics through the parallel plates are described by highly successive, coupled, order of partial differentials. This is reduced to ordinary form utilizing similarity variables, analyzed with the aid of the variation of parameters method. Results obtained from analysis reveals high hall effects abates flow of fluid particles towards the boundary of the upper plates, conversely thermal transfer improves rapidly towards the upper plates with enhanced thermal radiation .Obtained results validated against literatures at simple conditions shows good accuracy. Study provides useful insight to practical applications including food processing, lubrication, and polymer processing amongst other similar applications.
Keywords: Hydrothermal flow; Nanofluids; Squeezing; Hall Effect; Thermal Radiation.
1.0 INTRODUCTION
The study of nanofluids through transport mediums has been a wide and interesting topic to researchers over the years. As this fluid category having nano sizing metallic filings has improved heat exchange capacity tremendously in process and thermal exchange applications. This is highly important in these modern times of energy conservation, energy pricing and process optimization. In the light of these, the computational analysis of nanofluid under magnetic biconvection flow with multiple slips over a wedge was studied by (Uddin et al. 2018). Flow and radiation heat transfer was simulated by (Hosseini et al. 2019) having variable heat flux and chemical reaction through porous medium. (More and Jones, 2015) proposed solution to heat transfer nonlinear problem. Auxiliary parameter for analytical heat transfer problem was studied by (Sikander et al.2016). Newtonian and non-Newtonian analysis of nanofluid was performed by (Hatami and Jing, 2016). Nanofluid forced convection flow considering shape particles was presented by (Sheikholeslami and Batti, 2017). Unsteady analysis of magneto hydrodynamic Eyring Powell squeezing flow under radiation and joule heating through a stretch channel was presented by (Ghadikolahi et al, 2017)) . Magneto hydrodynamic nanofluid of water and GO through porous channel under effect of thermal radiation was presented by (Dogonchi, 2017). (Bank and Dash, 2015) investigated the chemical reaction effect through porous medium having heat absorption. Thermophoresis and Brownian unsteady flow over slandering surface with slip effects was studied by (Ramana Reddy et al, 2017). Heat transfer effect of nanofluid through expanding and contracting channel was presented by (Akinshilo, 2018). Hydrothermal analysis of nanofluid through squeezing parallel plates was studied by (Hosseinzadeh et al, 2018). Nonlinear equations for fluid flow in varying geometry was analyzed by (Sikander et al, 2018). The combined electric and magnetic effect on Maxwell nanofluid over a stretching surface under heat and theral radiation was studied by (Khan et al,2018). Thermal radiation and nanoparticles
441
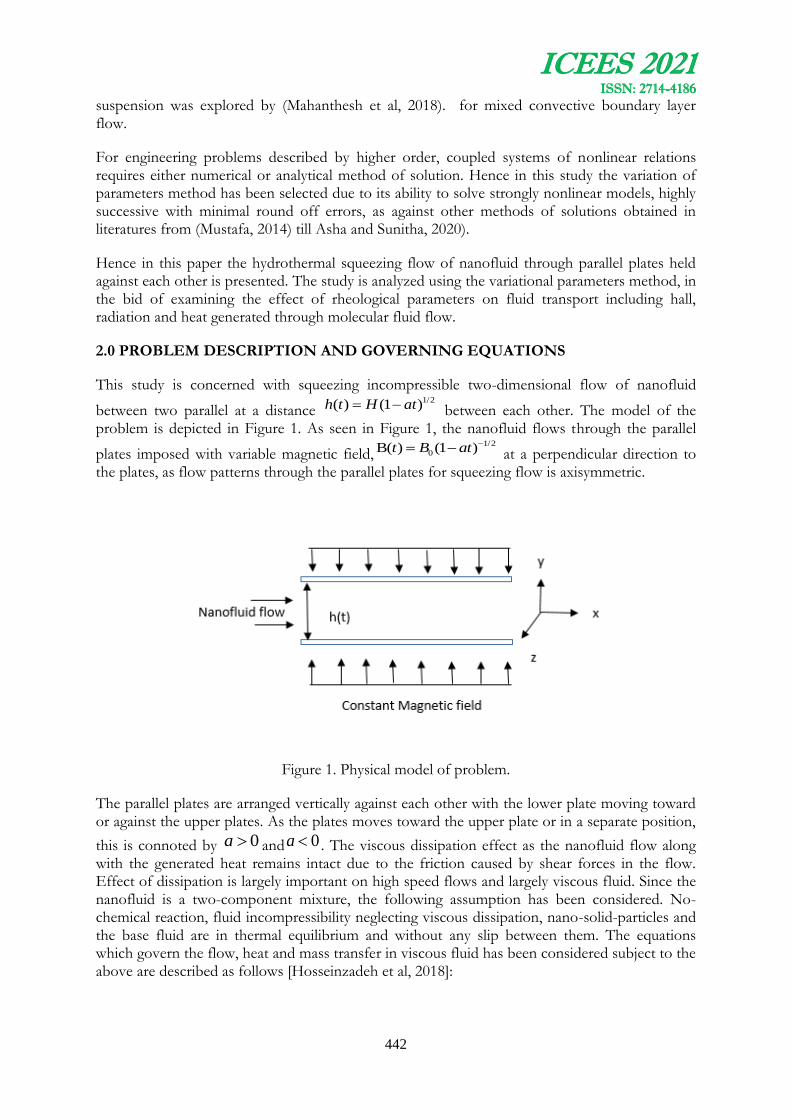
ICEES 2021 ISSN: 2714-4186
suspension was explored by (Mahanthesh et al, 2018). for mixed convective boundary layer flow.
For engineering problems described by higher order, coupled systems of nonlinear relations requires either numerical or analytical method of solution. Hence in this study the variation of parameters method has been selected due to its ability to solve strongly nonlinear models, highly successive with minimal round off errors, as against other methods of solutions obtained in literatures from (Mustafa, 2014) till Asha and Sunitha, 2020).
Hence in this paper the hydrothermal squeezing flow of nanofluid through parallel plates held against each other is presented. The study is analyzed using the variational parameters method, in the bid of examining the effect of rheological parameters on fluid transport including hall, radiation and heat generated through molecular fluid flow.
2.0 PROBLEM DESCRIPTION AND GOVERNING EQUATIONS
This study is concerned with squeezing incompressible two-dimensional flow of nanofluid
between two parallel at a distance 1/2( ) (1 )h t H at between each other. The model of the
problem is depicted in Figure 1. As seen in Figure 1, the nanofluid flows through the parallel
plates imposed with variable magnetic field,1/2
0B( ) (1 )t B at at a perpendicular direction to the plates, as flow patterns through the parallel plates for squeezing flow is axisymmetric.
Figure 1. Physical model of problem.
The parallel plates are arranged vertically against each other with the lower plate moving toward or against the upper plates. As the plates moves toward the upper plate or in a separate position,
this is connoted by 0a and 0a . The viscous dissipation effect as the nanofluid flow along with the generated heat remains intact due to the friction caused by shear forces in the flow. Effect of dissipation is largely important on high speed flows and largely viscous fluid. Since the nanofluid is a two-component mixture, the following assumption has been considered. No-chemical reaction, fluid incompressibility neglecting viscous dissipation, nano-solid-particles and the base fluid are in thermal equilibrium and without any slip between them. The equations which govern the flow, heat and mass transfer in viscous fluid has been considered subject to the above are described as follows [Hosseinzadeh et al, 2018]:
442

ICEES 2021 ISSN: 2714-4186
. 0V (1)
2. p J Bt
(2)
2. . .Tp B
m
DTc T K T Q T D T C T T
t T
(3)
2 2. Tp B
m
DCc C D C T
t T
(4)
Where
1
e
J E VxB JxBen
, E is neglected due to no applied voltage, is fluid
electrical conductivity, so
2
0
2, ,0
1
BB U mV mUJ V
m
as given in (Asha and
Sunitha, 2020), velocity vector can be expressed as , , V U V W
, ,, , , ,C , ,P eT P K e n are
temperature, pressure, density, viscosity, heat capacitance, thermal conductivity of nanofluid,
electric charge and number of density electrons respectively. Also, the operation of can be presented as:
, ,X y z
(5)
The boundary conditions are as follows:
( ) :z h t 0u
dhw
dt
hT ThC C
(6)
0:z 0,u
0 ,1
ww
at
,WT T WC C
here u and v are represent velocity components in the r- and z-directions, respectively, ρ is the density, μ is the dynamic viscosity, p is the pressure, T is the temperature, C is the nanoparticles
concentration, α is the thermal diffusivity, BD is the Brownian motion coefficient, mT
is the mean fluid temperature and k is the thermal conductivity. The total diffusion mass flux for nanoparticles is the last term in the energy equation which is given as a sum of the Brownian motion and thermophoresis terms. The parameters of similarity solution are as follows:
( ), w ( ),2(1 ) 1 1
ar aH zu f f
at at H at
(7)
443

ICEES 2021 ISSN: 2714-4186
0(t) , ,1
h h
W h W h
B T T C CB
T T C Cat
Radiation effect due to heat flux is expressed using the Rooseland approximation in (Hosseini et al, 2019). For radiation to be valid an optically dense medium is required, owing to short travel distance of radiation before been absorbed or scattered. The heat flux due to radiation is presented as follows:
* 44
3r
Tq
k y
(8)
The linear expression of temperature4T , assuming thermal flow differences is very small.
Expanding 4T using the Taylor series about mT , which is the free stream temperature. Upon
neglecting higher order terms yields4 3 44 3m mT T T , this can be simply shown as:
* 3
*
16
3
mrTq T
y k y
(8b)
By removing the pressure gradient from Eqs. (2) and (3), then rewriting Eqs. (4) and (5), the final nonlinear equations can be obtained as follows according to (Asha and Sunitha, 2020):
2
2
( 3 2 ) 01
41 (2 ) 0
3
(2 ) 0
Mf S f f ff f
m
R prS f prNb prNt
NtLeS f
Nb
(9)
Boundary conditions are described as follows:
(0) , (0) 0, (0) (0) 1f A f
1(1) , (1) 0, (1) (1) 0
2f f
(10)
Where S is the Squeeze number, A is the suction/blowing parameter, M is the Hartmann number, Nb is the Brownian motion parameter, m is the hall parameter, R is the radiation parameter Nt is the Thermophoretic parameter, Pr is the Prandtl number and Le is the Lewis
number, is the heat generation term and are defined as follows:
444

ICEES 2021 ISSN: 2714-4186
2 2 32
0 0
*
4,S , ,Pr , ,
2
m
p
W B H TaH Q TA M R
aH kk C
0( ) ( ) ( ) (T )
, Nt ,( ) ( )
p B W h p T w h
f f m e
c D C C c D T BNb m
c c T en
(11)
The continuity equation is identically satisfied. It should be noted that A > 0 indicates the suction of fluid from the lower disk, while A < 0 represents the injection flow.
2.1 Principles of the variation of parameter’s method
The technical procedures or procedural concept of the variation of parameters method (VPM) for the analysis of coupled, nonlinear, differential higher order equation systems are expressed as follows, Nonlinear differential equation is the operator form.
Lf Wf Nf Z (12)
L is the highest order derivative and easily convertible
W is the linear operator remainder and less compared with L
Z is the system input or source term
N is the nonlinear equation term
Eq. (12) after decomposing into linear and nonlinear terms L and N respectively. Therefore, the VPM can be expressed as shown
1 0
0
( ) ( )( ( ) ( ) ( )n n nf f s wf s Nf s g s ds
(13)
With as initial approximation given by
0
0
(0)( )
!
imi
i
k ff
i
(14)
M is the order of the given differential equation
Ki is an unknown constant which could be obtained using initial or final boundary condition.
( , )s is the multiplier which reduces the equation integration order. This is obtained upon the application of the Wronskian technique stated in (Akinshilo, 2018).
11 1 1
0
( 1)( , )
1 !( )! 1 !
mi i mm
i
sss
i m i m
(15)
2.2 Application of the variation of parameter’s method
445

ICEES 2021 ISSN: 2714-4186
Applying the standard procedural method of the variation of parameters expressed in Eq. (15). The governing equations are expressed as:
23 2 2 3 4 3 2 3 2
2 3
1 1 2 3 4 4 3 2 3 2
0
33 2
3! 2! 2! 3! 1n
s s d f d f d f d f M d ff k k s k s k s S f
d d d d m d
(16)
22
1 1 2 2
0
41 Pr 2 Pr Pr
3n
d d d d d dk k s s R s f Nb Nt
d df d df df df
(17)
2 2
1 1 2 2 2
0
2n
d d d Nt dk k s s LeS f
d df df Nb d
(18)
The constants 1k , 2k , 3k and 4k are constants of integration. They are obtained by taking the highest order in the linear term Eqs. (16) - (18). This is integrated to derive the final scheme form. Upon applying the boundary condition Eq. (10), the iterative scheme can be easily expressed as:
2 3
0 (6 1) / 2 (12 3) / 6f A A A (19)
0 1 (20)
0 1 (21)
3 2 3
2 2
1 2 2 2 3
6 2 2 4 3 2 3 8
20 6 6 9 /140 9 / 35( / 40 (4 ) / 35 7 / 40 / 203 72 18 / 6
36 6 / 2(6 6) / 4 3 /15
/ 240 / 60 AS / 40 AS /15 / 48 36 6 24(6 6) / 8) / 840 / 21
m AS ASS S S Sf A AM M
AM M m AS AS
S S S AM m AS s AS
0 ....
(22)
6 4
1
3 2
((3Pr 12 Pr)) ) / (120R 90) ((3Pr 18 Pr 3Pr 3Pr 18 Pr ) / (48 36)
(96 Pr 3 3Pr ) ) / (24 18) ((3 3 Pr 3 Pr 6 Pr ) )(8 6) ((3Pr 18 Pr
3Pr 12 Pr ) / (80 60) ...
S AS S A S S S A S R
A S S R Nb Nt A S R S A S
S A S R
(23)
6 5 5 4 3
1
3
(4 1) / 30 (6 1) / 20 ( 6 1) /12 (2 ) / 6
/10 / 6 / 5 7 /10 1)
LeS A LeS A A LeS A LeS A
ALeS LeS ALeS LeS ALeS
(24)
As observed in the analysis for velocity, thermal and concentration profiles in Eqs. (19)- (27). The final expression of the velocity, thermal and concentration profile can be represented as
446
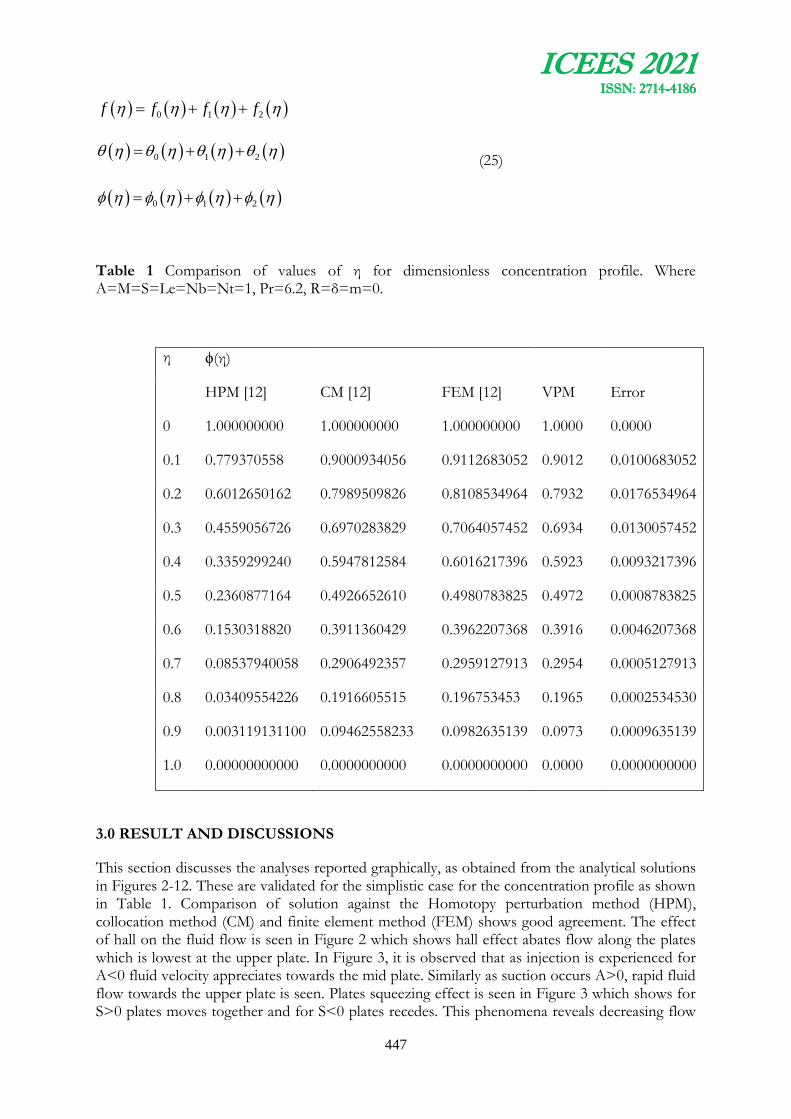
ICEES 2021 ISSN: 2714-4186
0 1 2f f f f
0 1 2 (25)
0 1 2
Table 1 Comparison of values of η for dimensionless concentration profile. Where A=M=S=Le=Nb=Nt=1, Pr=6.2, R=δ=m=0.
η ϕ(η)
HPM [12] CM [12] FEM [12] VPM Error
0 1.000000000 1.000000000 1.000000000 1.0000 0.0000
0.1 0.779370558 0.9000934056 0.9112683052 0.9012 0.0100683052
0.2 0.6012650162 0.7989509826 0.8108534964 0.7932 0.0176534964
0.3 0.4559056726 0.6970283829 0.7064057452 0.6934 0.0130057452
0.4 0.3359299240 0.5947812584 0.6016217396 0.5923 0.0093217396
0.5 0.2360877164 0.4926652610 0.4980783825 0.4972 0.0008783825
0.6 0.1530318820 0.3911360429 0.3962207368 0.3916 0.0046207368
0.7 0.08537940058 0.2906492357 0.2959127913 0.2954 0.0005127913
0.8 0.03409554226 0.1916605515 0.196753453 0.1965 0.0002534530
0.9 0.003119131100 0.09462558233 0.0982635139 0.0973 0.0009635139
1.0 0.00000000000 0.0000000000 0.0000000000 0.0000 0.0000000000
3.0 RESULT AND DISCUSSIONS
This section discusses the analyses reported graphically, as obtained from the analytical solutions in Figures 2-12. These are validated for the simplistic case for the concentration profile as shown in Table 1. Comparison of solution against the Homotopy perturbation method (HPM), collocation method (CM) and finite element method (FEM) shows good agreement. The effect of hall on the fluid flow is seen in Figure 2 which shows hall effect abates flow along the plates which is lowest at the upper plate. In Figure 3, it is observed that as injection is experienced for A<0 fluid velocity appreciates towards the mid plate. Similarly as suction occurs A>0, rapid fluid flow towards the upper plate is seen. Plates squeezing effect is seen in Figure 3 which shows for S>0 plates moves together and for S<0 plates recedes. This phenomena reveals decreasing flow
447

ICEES 2021 ISSN: 2714-4186
through the plates. However the rate of flow of receding plates is lower compared to the squeezing flow.
Figure 2. Effects of hall parameter (m) on velocity.
Figure 3. Effects of A constant on velocity.
448
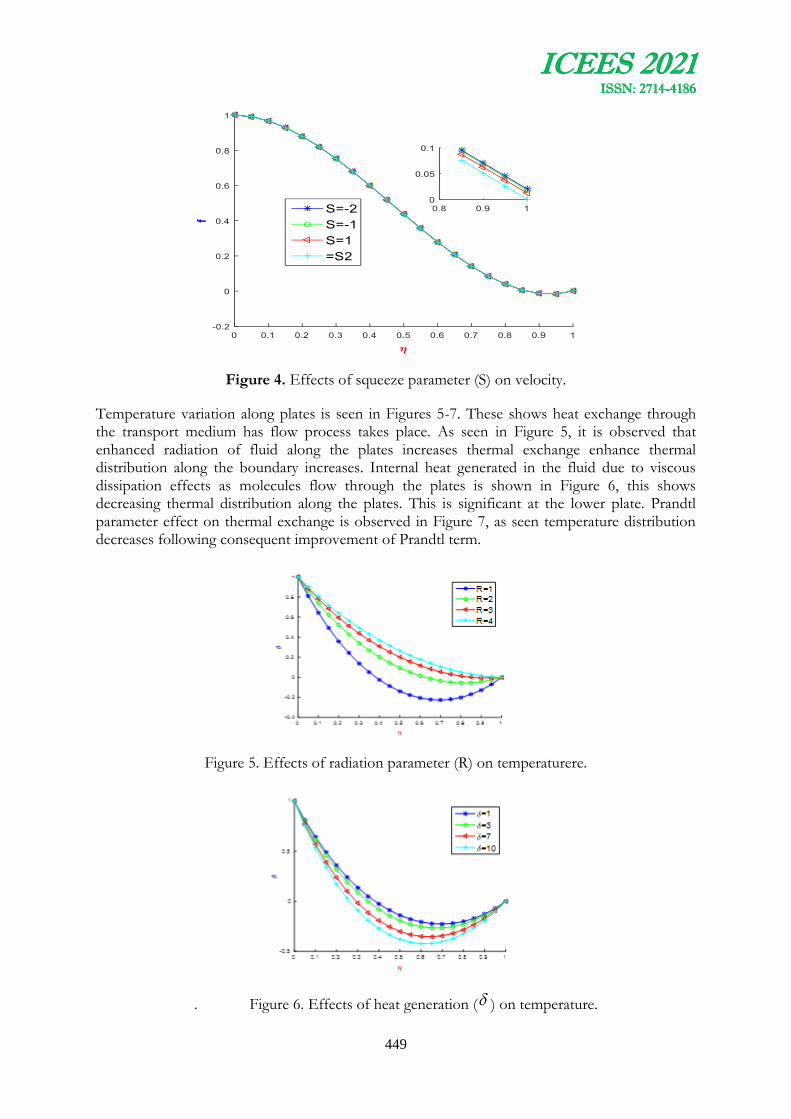
ICEES 2021 ISSN: 2714-4186
Figure 4. Effects of squeeze parameter (S) on velocity.
Temperature variation along plates is seen in Figures 5-7. These shows heat exchange through the transport medium has flow process takes place. As seen in Figure 5, it is observed that enhanced radiation of fluid along the plates increases thermal exchange enhance thermal distribution along the boundary increases. Internal heat generated in the fluid due to viscous dissipation effects as molecules flow through the plates is shown in Figure 6, this shows decreasing thermal distribution along the plates. This is significant at the lower plate. Prandtl parameter effect on thermal exchange is observed in Figure 7, as seen temperature distribution decreases following consequent improvement of Prandtl term.
Figure 5. Effects of radiation parameter (R) on temperaturere.
. Figure 6. Effects of heat generation ( ) on temperature.
449
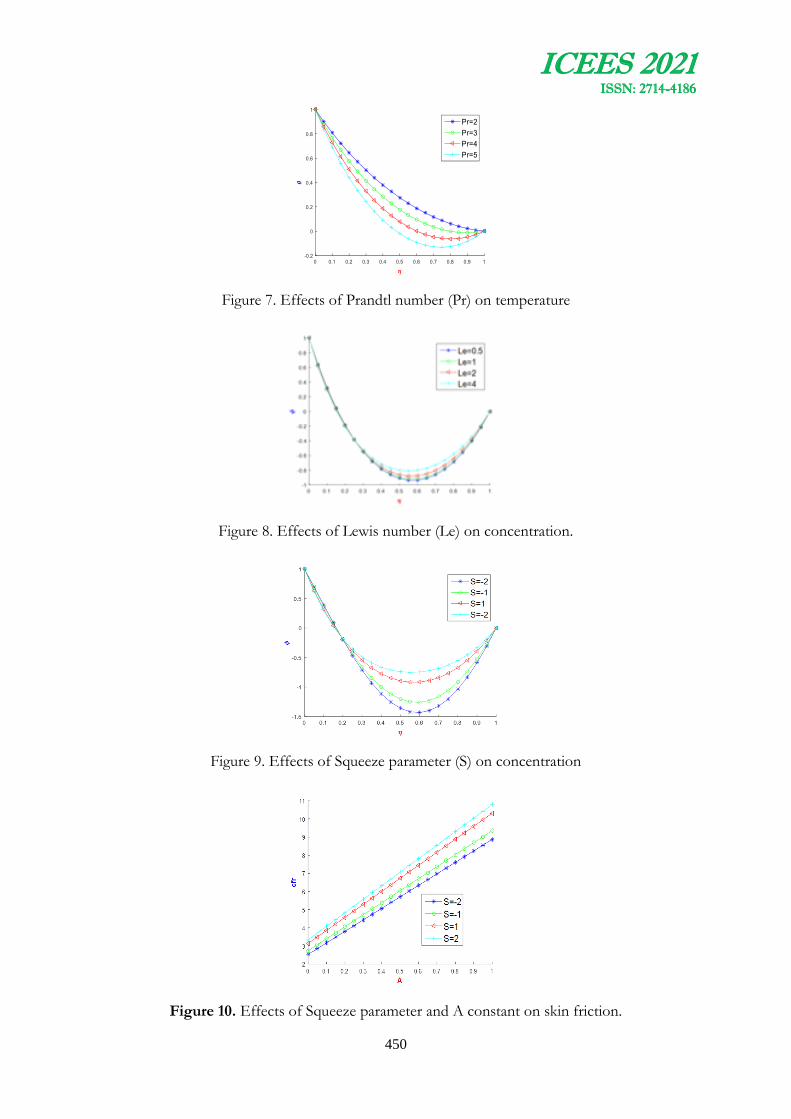
ICEES 2021 ISSN: 2714-4186
Figure 7. Effects of Prandtl number (Pr) on temperature
Figure 8. Effects of Lewis number (Le) on concentration.
Figure 9. Effects of Squeeze parameter (S) on concentration
Figure 10. Effects of Squeeze parameter and A constant on skin friction.
450
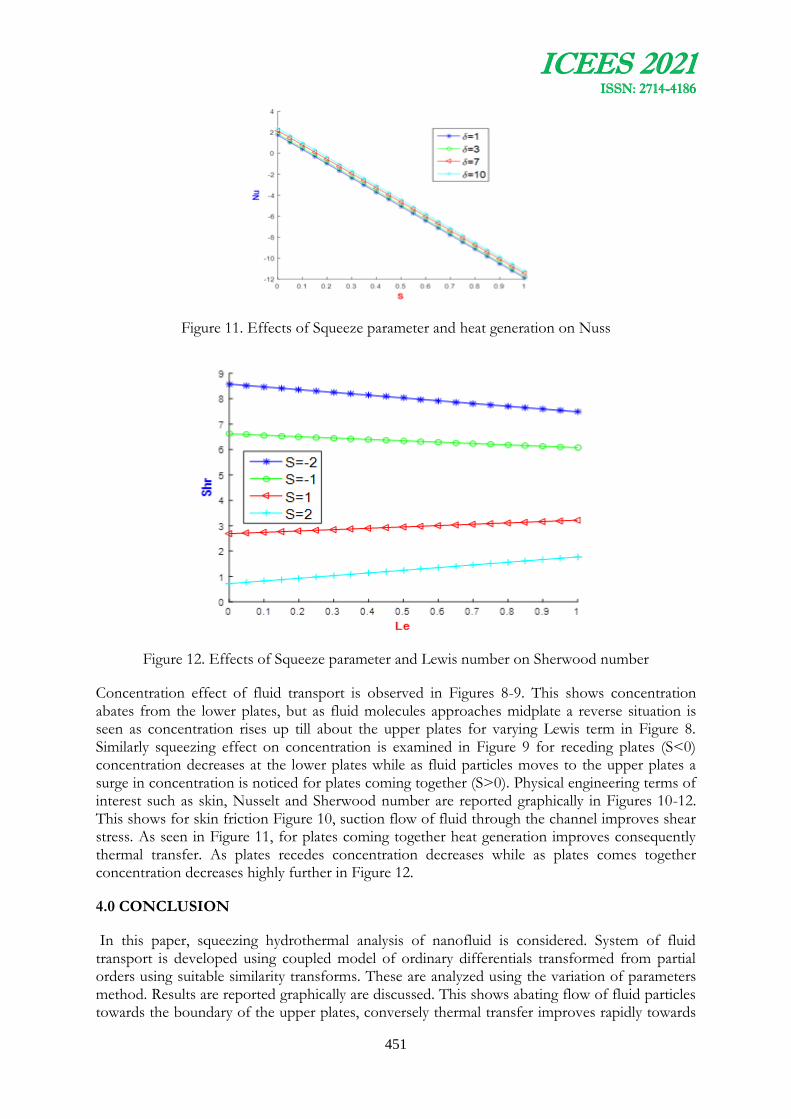
ICEES 2021 ISSN: 2714-4186
Figure 11. Effects of Squeeze parameter and heat generation on Nuss
Figure 12. Effects of Squeeze parameter and Lewis number on Sherwood number
Concentration effect of fluid transport is observed in Figures 8-9. This shows concentration abates from the lower plates, but as fluid molecules approaches midplate a reverse situation is seen as concentration rises up till about the upper plates for varying Lewis term in Figure 8. Similarly squeezing effect on concentration is examined in Figure 9 for receding plates (S<0) concentration decreases at the lower plates while as fluid particles moves to the upper plates a surge in concentration is noticed for plates coming together (S>0). Physical engineering terms of interest such as skin, Nusselt and Sherwood number are reported graphically in Figures 10-12. This shows for skin friction Figure 10, suction flow of fluid through the channel improves shear stress. As seen in Figure 11, for plates coming together heat generation improves consequently thermal transfer. As plates recedes concentration decreases while as plates comes together concentration decreases highly further in Figure 12.
4.0 CONCLUSION
In this paper, squeezing hydrothermal analysis of nanofluid is considered. System of fluid transport is developed using coupled model of ordinary differentials transformed from partial orders using suitable similarity transforms. These are analyzed using the variation of parameters method. Results are reported graphically are discussed. This shows abating flow of fluid particles towards the boundary of the upper plates, conversely thermal transfer improves rapidly towards
451
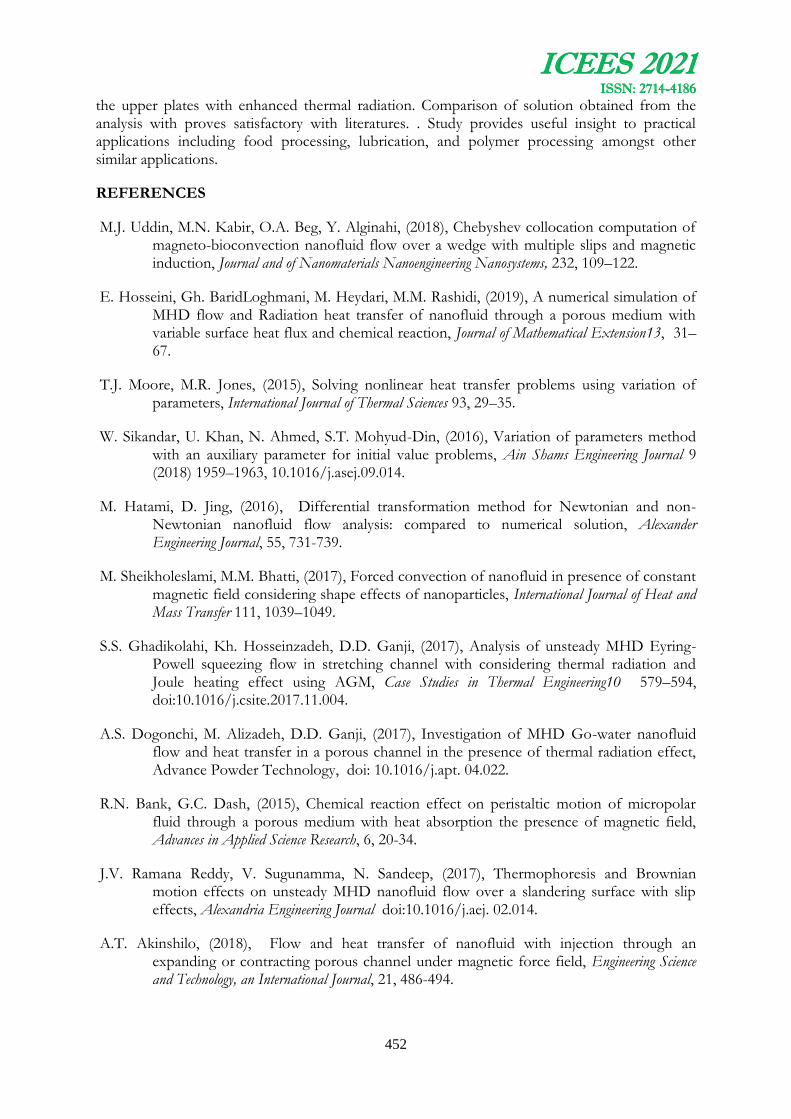
ICEES 2021 ISSN: 2714-4186
the upper plates with enhanced thermal radiation. Comparison of solution obtained from the analysis with proves satisfactory with literatures. . Study provides useful insight to practical applications including food processing, lubrication, and polymer processing amongst other similar applications.
REFERENCES
M.J. Uddin, M.N. Kabir, O.A. Beg, Y. Alginahi, (2018), Chebyshev collocation computation of magneto-bioconvection nanofluid flow over a wedge with multiple slips and magnetic induction, Journal and of Nanomaterials Nanoengineering Nanosystems, 232, 109–122.
E. Hosseini, Gh. BaridLoghmani, M. Heydari, M.M. Rashidi, (2019), A numerical simulation of MHD flow and Radiation heat transfer of nanofluid through a porous medium with variable surface heat flux and chemical reaction, Journal of Mathematical Extension13, 31–67.
T.J. Moore, M.R. Jones, (2015), Solving nonlinear heat transfer problems using variation of parameters, International Journal of Thermal Sciences 93, 29–35.
W. Sikandar, U. Khan, N. Ahmed, S.T. Mohyud-Din, (2016), Variation of parameters method with an auxiliary parameter for initial value problems, Ain Shams Engineering Journal 9 (2018) 1959–1963, 10.1016/j.asej.09.014.
M. Hatami, D. Jing, (2016), Differential transformation method for Newtonian and non-Newtonian nanofluid flow analysis: compared to numerical solution, Alexander Engineering Journal, 55, 731-739.
M. Sheikholeslami, M.M. Bhatti, (2017), Forced convection of nanofluid in presence of constant magnetic field considering shape effects of nanoparticles, International Journal of Heat and Mass Transfer 111, 1039–1049.
S.S. Ghadikolahi, Kh. Hosseinzadeh, D.D. Ganji, (2017), Analysis of unsteady MHD Eyring-Powell squeezing flow in stretching channel with considering thermal radiation and Joule heating effect using AGM, Case Studies in Thermal Engineering10 579–594, doi:10.1016/j.csite.2017.11.004.
A.S. Dogonchi, M. Alizadeh, D.D. Ganji, (2017), Investigation of MHD Go-water nanofluid flow and heat transfer in a porous channel in the presence of thermal radiation effect, Advance Powder Technology, doi: 10.1016/j.apt. 04.022.
R.N. Bank, G.C. Dash, (2015), Chemical reaction effect on peristaltic motion of micropolar fluid through a porous medium with heat absorption the presence of magnetic field, Advances in Applied Science Research, 6, 20-34.
J.V. Ramana Reddy, V. Sugunamma, N. Sandeep, (2017), Thermophoresis and Brownian motion effects on unsteady MHD nanofluid flow over a slandering surface with slip effects, Alexandria Engineering Journal doi:10.1016/j.aej. 02.014.
A.T. Akinshilo, (2018), Flow and heat transfer of nanofluid with injection through an expanding or contracting porous channel under magnetic force field, Engineering Science and Technology, an International Journal, 21, 486-494.
452

ICEES 2021 ISSN: 2714-4186
Kh. Hosseinzadeh, M. Alizadeeh, D.D. Ganji, (2018), Hydrothermal analysis on MHD squeezing nanofluid flow in parallel plates by analytical method, International Journal of Mechanical and Material Engineering 13 (4), pp. 1-12.
W.Sikander, N. Ahmed, U. Khan, S.T. Mohyud-Din,(2018), Coupling of optimal variation of parameters method with Adomian's polynomial‘s for nonlinear equations representing fluid flow in different geometrics, Neural Comput and Applic 30 3431–3444.
H. Khan, M. Haneef, Z. Shah, S. Muhammad, S. Islam, W. Khan, (2018), The combined magneto hydrodynamic and electric field effect on unsteady Maxwell nanofluid flow over a stretching surface under the influence of variable heat and thermal radiation, Applied Science, 8 (2), 160.
B. Mahanthesh, B.J. Gireesha, I.L. Animasaun, (2018), Exploration of non-linear thermal radiation and suspended nanoparticles effects on mixed convection boundary layer flow on nano liquids on a melting vertical surface , Journal of Nanofluids 7 (5) ,833-843.
M. Mustafa, A. Mushtaq, T. Hayat, B. Ahmad, (2014), Nonlinear radiation heat transfer effects in the natural convective boundary layer flow of nanofluid past a vertical plate: a numerical study, PlosOne, 9(9), e103946. https://doi.org/10.1371/journal.pone.0103946.
L. Dianchen, M. Ramzan, N.U. Huda, J.D. Chung, U. Farooq, (2018), Nonlinear radiation effect on MHD Carreau nanofluid over a radially stretching surface , Science Reports, 8, 3709, https://doi.org/10.1038/s41598-018-2200-w.
J.V. Ramana Reddy, V. Sugunamma, N. Sandeep, )2017), Thermophoresis and Brownian motion effects on unsteady MHD nanofluid flow over a slandering surface with slip effects, Alexandria Engineering Journal, 2017. https://doi.org/10.1016/j.aej.02.014.
M.K. Nayak, F. Mabood, O.D. Makinde, (2019), Heat transfer and buoyancy‐driven convective MHD flow of nanofluids impinging over a thin needle moving in a parallel stream influenced by Prandtl number, Heat Transfer—Asian Research, 1–18.
S.N.A. Salleh, N. Bachok, N. Md. Arifin, F. Md. Ali, I. Pop, (2018), Stability analysis of mixed convection flow towards moving a thin needle in nanofluid, Applied Science, 8(6), 842, https://doi.org/10.3390/app8060842.
P. Mohan Khrishna, R. Prakash Sharma, N. Sandeep, (2017), Boundary layer analysis of persistent moving horizontal needle in Blasius and Sakiadis magnetohydrodynamic radiative nanofluid flow, Nuclear Engineering Technology, 49 (8), 1654-1659.
C. Sulochana, G.P. Ashwinkumar, N. Sandeep, (2017), Joule heating effect on a continuously moving thin needle in MHD Sakiadis flow with thermophoresis and Brownian moment , The European Physical Journal Plus, 132, 387, https://doi.org/10.1140/epjp/i2017-11633-3.
S. Ahmad, N.M. Arifin, R. Nazar, I.Pop, (2008), Mixed convection boundary layer flow along vertical thin needles: assisting and opposing flows, International Communications in Heat and Mass Transfer, 3592, 157-162.
453

ICEES 2021 ISSN: 2714-4186
R. Ahmad, M. Mustafa, S. Hina, (2017), Boungiomo‘s model for fluid flow around a moving needle in a flowing nanofluid: a numerical study, Chinese Journal of Physics, 55 (4), 1264-1274.
R. Trimibitas, T. Grosan, I. Pop, (2014), Mixed convective boundary layer flow along vertical thin needle in nanofluids , International Journal of Numerical Methods for Heat and Fluid Flow, 24 (3), 579-594.
S. Mukhopadhyay, K. Vajravelu, (2012), Effects of transpiration and internal heat generation/absorption on the unsteady flow of a Maxwell fluid at a stretching surface, 79 (4), 044508.
G.M. Pavithra, B.J. Gireesha, (2013), Effect of internal heat generation/absorption on dusty fluid flow over an exponentially stretching sheet with viscous dissipation, Journal of Mathematics, Article ID 583615. https://doi.org/10.1155/2013/583615.
Z. Iqbal, E. Azhar, Z. Mehmood, E.N. Maraj, (2018), Unique outcomes of internal heat generation and thermal deposition on viscous dissipative transport of visco plastic fluid over a riga-plate, Communications in Theoretical Physics 69 (1) , https://doi.org/10.1088/0253-6102/69/1/68.
A.T. Akinshilo, (2017), Steady flow and heat transfer analysis of third grade fluid with porous medium and heat generation, Engineering Science and Technology, an Internal Journal, 20, 1602-1620. https://doi.org/10.1016/j.jestch.2017.11.012.
A.T. Akinshilo, (2018), Flow and heat transfer of nanofluid with injection through an expanding or contracting porous channel under magnetic force field, Engineering Science and Technology, an Internal Journal, 21 (3), 486-494. https://doi.org/10.1016/j.jestch.2018.03.014.
S.K. Asha, G. Sunitha, (2020),Thermal radiation and hall effects on peristaltic blood flow with double diffusion in the presence of nanoparticles, Case Studies in Thermal Engineering 17 (100560).
454

455
OCCUPANCY RATIO AND RESIDENTS’ HEALTH IN URBAN RESIDENTIAL DENSITIES IN OSUN STATE, NIGERIA
Adedotun, D. O.
Department of Urban and Regional Planning, Osun State University, Osogbo
Email of Corresponding Author: [email protected]
Introduction
Since the word “health” appeared approximately in the year 1000AD, there have been many definitions of health in literature (Rebhan, 2010). World Health Organization (WHO, 1948) defined health as: “a state of complete physical, mental and social well-being and not merely the absence of disease or infirmity’’. This definition has been widely used though it is also much criticized as an impossible condition (Last, 2001 and Gatrell and Elliot, 2009). In the World Health Organization, health promotion initiative was defined as the extent to which an individual or a group is able to realize aspirations and satisfy needs, and to change or cope with the environment; a resource of everyday living, not objective of living. (WHO 1984).
A dictionary of epidemiology defines health as a state characterized by anatomical, physiological and psychological integrity; an ability to perform personally valued family, work and community roles to deal with physical, biological and psychological stress, a feeling of well-being and freedom from the risk of disease and untimely death. Gatrell and Elliot (2009) defined health, as the availability of resources, both personal and societal that help man to achieve individual potential; being physically and mentally `fit’ and capable of functioning effectively for the good of the wider society; a ‘strength’, fitness or energy or engaging in healthy life styles.
Health is a multidimensional concept that can be measured in many different ways such as life satisfaction and self-reported health status. Self-reported is a widely used measure of current and future well-being and health (Koivumaa –Hon Kanen, 1998; Schaefer et al. 2007; Strine et al. 2008 and WHO, 2000 ). It has been found to predict morbidity and it is an independent predictor of mortality (Kaplam et al. 1996 and Manor et al. 2001 ).
Aspects that people consider, when assessing their health include: physical aspects (mental and somatic illness, medical treatment), functional ability, do they generally feel good or fit, adaptation and attitude towards an illness and also to some extent health behaviour and life style. Manor et al (2011) has studied the validity of both self-reported health and limiting long term illness among young adults and concluded that they are valid measures of serious diseases (cancer, diabetes and epilepsy) and also milder conditions (enzema and hay fever).
Rather than restricting health to an absence of illness or disease, health should be conceptualized more in terms of the presence of absolute and positive qualities of well-being in which physical health is only one of the aspects involved (Agbola et al, 2007).
Aim and Objectives
The study investigates residents’ health status within the context of occupancy ratio in different residential density areas in Osun State.
The specific objectives are:
456
- to examine respondents’ number of habitable rooms and household size and its impact on the incidence of malaria and measles.
- to determine the variation of occupancy ratio across the three residential densities.
Hypothesis
There is no relationship between occupancy ratio and residents’ health status.
Theoretical Framework and Literature Review
Crowding Theory
Crowding theory refers to the behaviours of man in relation to his environment. Crowding theory is concerned with the importance of privacy. According to Angel, (2010), people feel crowded when privacy mechanism is not functioning effectively. Man's behaviour can be conscious or unconscious which falls within a range of normal or abnormal. Density is a spatial concept while crowding is a motivational state aroused through interaction of spatial, social and personal factors (Agboola et al, 2007).
Crowding occurs when the expected privacy is less than the observed privacy. It has been observed according to this theory that when people are engaged in high intensive activities such as attending to too many people or looking at too many things at the same time can cause the system to be overloaded which may result in depression, ill-health and fatigue. Crowding exposes the individual to the level of social and medical contact higher than his ability or what he desires. It is worthy of note at this point that crowding theory does not tie crowding to a particular spatial measure, as density, but crowding is' as a result of the awareness that one is being observed. Certain situations of high density cause people to lose control over social interaction because they are fired against their own wish to interact with other people such that they have no control over regulations of such interaction.
The above analogy goes with the spread of some contagious and infectious diseases. In a crowded environment where one has a disease that is transferable such as cough, others have no control on the spread of the cough in the air and consciously or unconsciously others may be infected. Crowding theory helps to know the social and medical implications of violation of personal space. It equally helps to know the actions and reactions of people in relation to their physical and social environments. Crowding as a theoretical construct is most useful in housing management. This theory is applicable to tenement buildings where six to eight people (sometimes more) live in one apartment in an insalubrious environment (Agbola et al, 2007). This high occupancy ratio leads to over utilization of facilities and most often the tenants may not be happy. The theory is used for this study because it addresses how man responds mentally, physiologically and psychologically to overcrowding as a phenomenon
Housing Condition, Residential Density and Health
Housing condition is generally referred to as the state of fitness of dwelling unit for habitation. It is used to express the functional level of housing facilities. It portrays both the physical and internal appearances of a house. Residents' health, on the other hand, is a state of health of persons residing in a particular house. It is a state of physical, mental and social well being and not merely the absence of disease or infirmity. Livingstone (1998) stated that a healthy person is someone that is economically and socially active. Any condition outside this means the person is unhealthy. The idea of health-and-housing nexus has been raising head for long. Proscio (2004)

457
said it started in 1920, when it was discovered that lead poison infants is caused by lead based paint. It was not agreed upon until 1978 when lead based paint was banned in United States of America. The involvement of town planning in healthy home is recent but the idea of housing condition and health has been as old as man.
It will be discovered from the above statement that the issue of housing conditions and health has been with us since the beginning of life. People are only shying away because of the cost that will involve in the healthy house provision. So, it is the duty of planners to embrace health - and housing nexus for better design and construction of healthy home. This is why this study is coming up at a time the campaign is oozing loud. WHO (2009) states that the stagnant nature-of drainage in many cities of developing countries is compounding the infection of mosquitoes. Mosquitoes are the vectors of malaria fever. They can only be combated through construction of free-flow drainage system and regular empty of stagnant water in the environment. Health Canada (2005) organized a research to assess the nexus between housing conditions and Tuberculosis. It was discovered that overcrowding and poor ventilation increased the rate of infection and transmission of tuberculosis among Canadians. They argued that anybody that has smear-positive diagnose could cough out ten contaminated droplets of M-tuberculosis basic droplets into the air. This M-tuberculosis bacilli may remain suspended in the air for several hours especially if the air exchange in the house is slow (Beggs et al, 2003).
People may readily get infected when sharing the same apartment. Overcrowding and density is a long reported case which facilitates the spread of infectious diseases such as tuberculosis and communicable disease. It leads to plague occurrence in many places and subsequence slum clearance (Meade and Emch, 2010 ): It also contributes to easy spread of infectious diseases, accidental death, asthma, cardio vascular diseases, stress and, depression, both physical and mental illness (Krieger and Higgius 2002). There is a strong link between improved housing condition and healthy living in Liverpool U.K when extensive renovation took place in the area.The general health questionnaire for assessing mental health and other related shows that there is improvement in heart problems, high blood pressure and allergy improvement (Hunt and Mckemma, 1992). Yabanet E.H. (2005) assessed the living condition on' health conditions of Palestinian refugees in an unofficial camp in Lebanon. He used questionnaire administered on 97 households and 437 residents. He found that the use of wood and charcoal increased mould and dampness. The logistic regression showed overcrowding odd ratio (OR) 3.26. He concluded that the refugees camp resembles the slum of the United Kingdom in the last' century, which has detrimental effects on health condition.
Bonnefoy et al (2006) in their study titled Housing conditions and self-reported health status carried out in three cities of Eastern Europe undertook a survey of panel block housing estates in Eastern Germany. The study aimed to assess housing conditions and their potential health consequences. It was based on the empirical data collected from 259 dwellings and '601 residents. It was concluded that several housing conditions have impact on the residents’ health. The survey also clearly indicated that effect of rehabilitation of residential units can lead to better health. Conclusively, it would be noted from the above review that the link between housing and health needs no scientific proof to incorporate the ensured panorama of external factors that have impact on people’s health (Yabanet, 2005). Most of available research on housing condition and health of residents are Western oriented. They have forgotten that there are people who live without toilet, kitchen, electricity, water supply and dump waste indiscriminately. This is the main reason this research is relevant to the prevention of ill-health that rent the air everywhere in Nigeria especially Osun State.

458
Study Area
Location
Osun State is located between latitudes 70 30’ N, Longitude 40 30’E and Latitudes 7.50 N and Longitudes 4.50 E. The State shares boundary with Kwara State in the North, Ekiti State in East, Ondo State in the South East, Ogun State in the South and Oyo State in the West as shown in fig. 1
Figure 1 Osun state in the context of nigeria in 2021
Climate
Climatically, Osun State is located in the tropical, hinterland region with recognizable wet and dry season. Wet season is between April and October while dry season is between November and March. The mean annual rainfall is about 1150mm, The daily temperature is about 27°C - 37°C and the temperature range is about 4 - 6°C The climate of Osun State is 'suitable for the breeding of mosquitoe which is the causative agent of malaria, which is about the most prominent disease in the study area.
Population
Osun State is highly, heterogeneous in terms of population. However, since the beginning of the twentieth century, the population of the state has increased greatly. This increase was brought about by widespread adoption of modern medicine, which has resulted in a marked decline in infant mortality. According to 1963 census, Osun State has population of 2.72 million people. In 1986, the population of the state was estimated at 4,802,665 based on 2.5 percent annual growth rate (Osun State in perspective, 1991).
Socio-Economic Structure of Osun State
Before the era of colonial government, the economy of the state was characterized by farming, craft production, dying and some few government services. However, since the establishment of

459
colonial rule, new forms of economic activities emerged. This was typical western economy such as street trading and industries in Osogbo and Ilesha these include consolidated brewery, steel rolling, machine tools, rubber/plastic industries to mention a few. Most people in the state can still be classified into medium and low income 'earners. Therefore majority cannot afford to live in a well deserved accommodation despite the increment in their household sizes. The consequence of this is high occupancy ratio which has direct effect on their health.
Housing Types and Conditions
The predominant people in the study area are Yoruba. The extended family system of Yoruba nation makes houses to be compacted together because relations want their houses to be together. Most houses were constructed without the standard set back or standard space between two houses' thereby making ventilation obstructed. Two major types of houses are predominant in the study area. These are bungalow and storey buildings. Housing types by materials are much of cement blocks with or without plastering. Roofing and ceiling are much of Iron sheets and asbestos. In the core areas, there are houses built of mud with rusted iron roofing sheets ith or without plastering and ceiling in all the three cities selected for the study.
Health Services
Health services in the state are largely provided by the Federal, the State and the Local Governments. Other agencies such as commercial and industrial films, statutory corporations as well as private individuals also provide medical services. Apart from the Government Health Institutions, there are private registered ones. There are also infections Isolations Units, Child Welfare Centres, Rural Health Centres, Dental Centres and Health Offices all over the state.
Residential Landuse in Osogbo, Ilesha and Iwo
The proportion of landuse to residential is more than any other landuse pattern in these three cities selected. Residential landuse in these cities can be classified into three, which are the high density, medium density and low density residential landuse areas. The high density areas are characterized with the buildings built of local materials which are partially plastered with cement and roofed with corrugated iron sheets. Buildings in these areas were haphazardly arranged and there is hardly any provision for access roads and packing facilities. Population density in this area is very high. Most of the buildings are poor in terms of quality of construction materials and simple architectural design. The area is characterized with inadequate planning, irregular building shapes and incompatible structures juxtaposing one another. However, it was noted that as the cities grow, some of the old structures are being demolished and replaced with modern buildings in these areas for multipurpose use.
The medium density zone comprises independent workingman’s homes largely comprising residences of second-generation immigrants into the cities. The buildings are made up of modern Brazilian type of buildings of face-to-face rooms. Most of the buildings in this zone are of good quality in terms of structure and architectural design. Unlike the high density areas, the zone shows some elements of planning, regular building shapes, and compatible mix landuse.
The last zone is the low density areas where the population is relatively low. This zone is made up of modern buildings of various categories and designs. The absence of urban sprawl in the peripheral areas of Osogbo and Ilesha was noted, where people develop without recall to planning standards.

460
Methodology and Data Analysis
Types, Sources and Instruments of Data Collection
Both primary and secondary data were employed. Occupancy ratio and building condition were sourced from primary data. Types of buildings and occupancy ratio were determined by the researcher himself based on field observation and knowledge of how to calculate occupancy ratio. This was done by dividing the number of people in the household by the number of habitable rooms in the house. Data on the number of times respondents visited hospital per annum as well as number of times respondents visited hospital for each of the two diseases were equally sourced as primary data from the respondents with the use of questionnaire. Also, level of awareness of what overcrowding is and its health implication on respondents was sourced as primary data. Data on the incidence of the two diseases (malaria and measles) were sourced as secondary data from Obafemi Awolowo University Teaching Hospital (Wesley Campus) Ilesha, Osun State University Teaching Hospital, Osogbo and Osun State General Hospital, Iwo.
Residents’ health proxy index was computed by aggregating responses to awareness of effect of overcrowding on the incidence of measles and malaria. This was done by assigning one (1) to represent ‘yes’ response to each of the diseases for the past one year while two (2) was assigned to ‘no’ response to each of the diseases. The aggregate score for each household provides an index which serves as a proxy for the health’s status of each household and the higher the value obtained for each household better their health status.
Data collected were analyzed using descriptive and inferential statistics. Differences in observations were tested with chi-square statistical technique. For more rigorous analysis, emphatic conclusions and cross regional comparability of results, Multiple Regression Analysis (MRA) was employed to analyze the relationship between one independent variable (occupancy ratio) with two dependent variables measuring incidence of measles and malaria
Results of Findings
One of the noticeable effects of occupancy density and overcrowding is ill-health. Malaria and Measles are transferable; therefore, their magnitude of incidence was determined. It was observed from the survey that the incidence of malaria and measles was high in crowded residential housing units than where the occupancy ratio was moderately low. Occupancy ratio was determined with the use of number of persons per habitable room. As with many health determinants, the quality of accommodation and occupancy ratio is strongly related to people’s health status (Riva et al, 2011).
City Variations in the Number of Habitable Rooms
Table 1 shows that in the low residential density areas, Osogbo and Ilesha had 100.0% each of the respondents who had between 1–5 rooms. The case was a bit different in Iwo with 90.7%, 7.4% and 1.9% respondents who had between 1 – 5, 6 – 10 and 11 – 15 rooms that are habitable. In the medium residential density areas, Osogbo equally had 100.0% respondents who had between 1 – 5 rooms while in Ilesha 97.5% and 2.4% respondents had between 1- 5 and 6 – 10 habitable rooms and Iwo had 92.6% and 7.4% respondents had between 1 – 5 and 6 – 10 rooms that are habitable.
High residential density areas had 77.0%, 20.8%, .3% and 1.9 % respondents in Osogbo who had between 1 – 5, 6 – 10, 11 – 15 and 16 – 20 rooms that are habitable. Ilesha had 90.1% and 9.9% respondents who had between 1 – 5 and 6 – 10 room that are habitable respectively. The
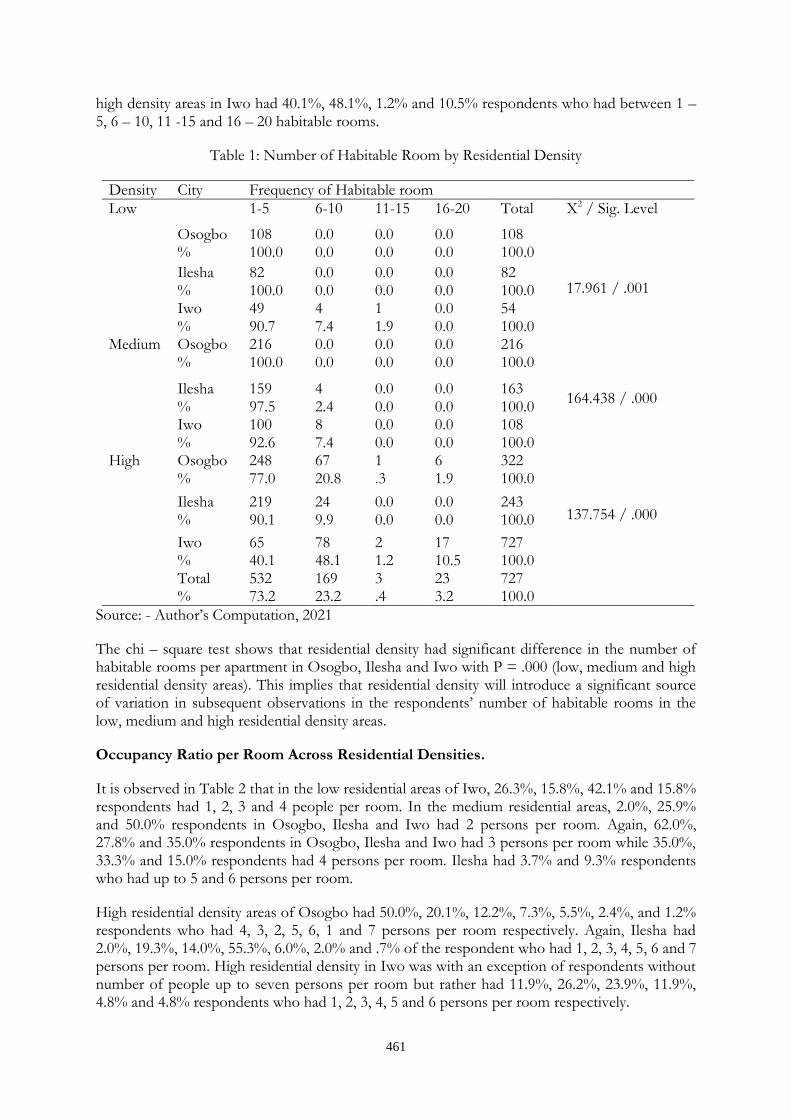
461
high density areas in Iwo had 40.1%, 48.1%, 1.2% and 10.5% respondents who had between 1 – 5, 6 – 10, 11 -15 and 16 – 20 habitable rooms.
Table 1: Number of Habitable Room by Residential Density
Density City Frequency of Habitable room
Low 1-5 6-10 11-15 16-20 Total X2 / Sig. Level
Osogbo %
108 100.0
0.0 0.0
0.0 0.0
0.0 0.0
108 100.0
17.961 / .001
Ilesha %
82 100.0
0.0 0.0
0.0 0.0
0.0 0.0
82 100.0
Iwo %
49 90.7
4 7.4
1 1.9
0.0 0.0
54 100.0
Medium Osogbo %
216 100.0
0.0 0.0
0.0 0.0
0.0 0.0
216 100.0
164.438 / .000
Ilesha %
159 97.5
4 2.4
0.0 0.0
0.0 0.0
163 100.0
Iwo %
100 92.6
8 7.4
0.0 0.0
0.0 0.0
108 100.0
High Osogbo %
248 77.0
67 20.8
1 .3
6 1.9
322 100.0
137.754 / .000
Ilesha %
219 90.1
24 9.9
0.0 0.0
0.0 0.0
243 100.0
Iwo %
65 40.1
78 48.1
2 1.2
17 10.5
727 100.0
Total %
532 73.2
169 23.2
3 .4
23 3.2
727 100.0
Source: - Author’s Computation, 2021
The chi – square test shows that residential density had significant difference in the number of habitable rooms per apartment in Osogbo, Ilesha and Iwo with P = .000 (low, medium and high residential density areas). This implies that residential density will introduce a significant source of variation in subsequent observations in the respondents’ number of habitable rooms in the low, medium and high residential density areas.
Occupancy Ratio per Room Across Residential Densities.
It is observed in Table 2 that in the low residential areas of Iwo, 26.3%, 15.8%, 42.1% and 15.8% respondents had 1, 2, 3 and 4 people per room. In the medium residential areas, 2.0%, 25.9% and 50.0% respondents in Osogbo, Ilesha and Iwo had 2 persons per room. Again, 62.0%, 27.8% and 35.0% respondents in Osogbo, Ilesha and Iwo had 3 persons per room while 35.0%, 33.3% and 15.0% respondents had 4 persons per room. Ilesha had 3.7% and 9.3% respondents who had up to 5 and 6 persons per room.
High residential density areas of Osogbo had 50.0%, 20.1%, 12.2%, 7.3%, 5.5%, 2.4%, and 1.2% respondents who had 4, 3, 2, 5, 6, 1 and 7 persons per room respectively. Again, Ilesha had 2.0%, 19.3%, 14.0%, 55.3%, 6.0%, 2.0% and .7% of the respondent who had 1, 2, 3, 4, 5, 6 and 7 persons per room. High residential density in Iwo was with an exception of respondents without number of people up to seven persons per room but rather had 11.9%, 26.2%, 23.9%, 11.9%, 4.8% and 4.8% respondents who had 1, 2, 3, 4, 5 and 6 persons per room respectively.
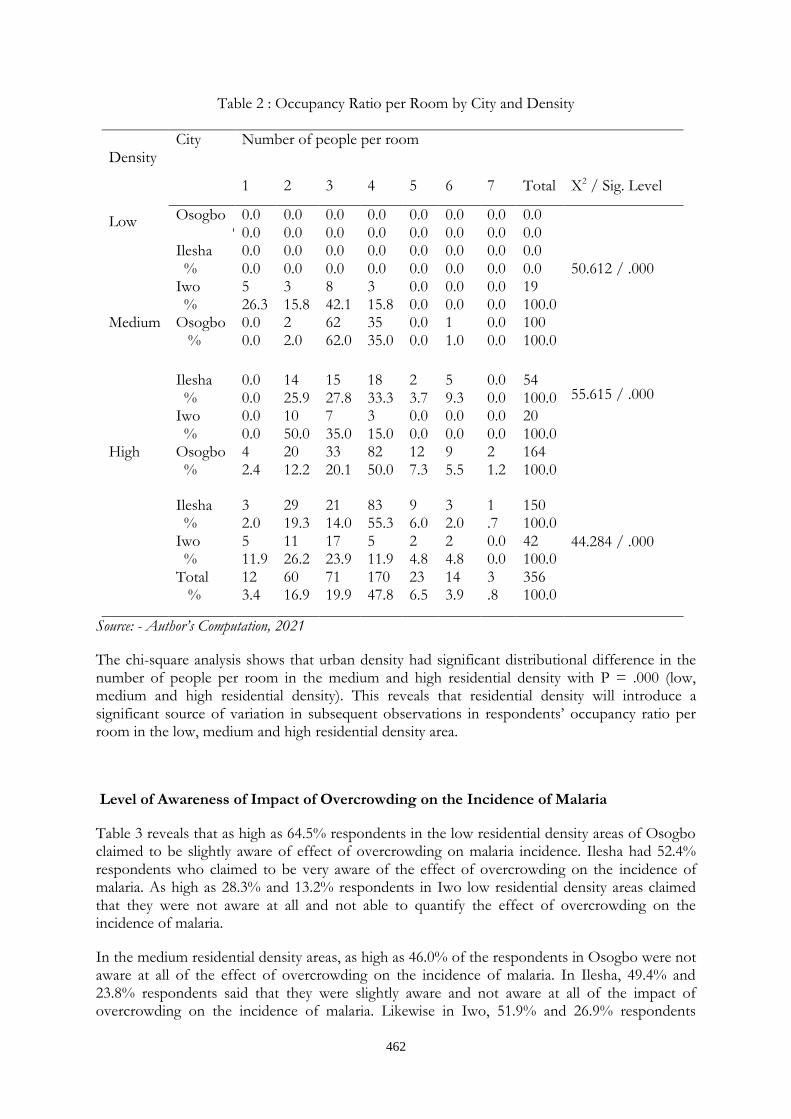
462
Table 2 : Occupancy Ratio per Room by City and Density
Source: - Author’s Computation, 2021
The chi-square analysis shows that urban density had significant distributional difference in the number of people per room in the medium and high residential density with P = .000 (low, medium and high residential density). This reveals that residential density will introduce a significant source of variation in subsequent observations in respondents’ occupancy ratio per room in the low, medium and high residential density area.
Level of Awareness of Impact of Overcrowding on the Incidence of Malaria
Table 3 reveals that as high as 64.5% respondents in the low residential density areas of Osogbo claimed to be slightly aware of effect of overcrowding on malaria incidence. Ilesha had 52.4% respondents who claimed to be very aware of the effect of overcrowding on the incidence of malaria. As high as 28.3% and 13.2% respondents in Iwo low residential density areas claimed that they were not aware at all and not able to quantify the effect of overcrowding on the incidence of malaria.
In the medium residential density areas, as high as 46.0% of the respondents in Osogbo were not aware at all of the effect of overcrowding on the incidence of malaria. In Ilesha, 49.4% and 23.8% respondents said that they were slightly aware and not aware at all of the impact of overcrowding on the incidence of malaria. Likewise in Iwo, 51.9% and 26.9% respondents
Density
City Number of people per room
Low
1 2 3 4 5 6 7 Total X2 / Sig. Level
Osogbo %
0.0 0.0
0.0 0.0
0.0 0.0
0.0 0.0
0.0 0.0
0.0 0.0
0.0 0.0
0.0 0.0
50.612 / .000
Ilesha %
0.0 0.0
0.0 0.0
0.0 0.0
0.0 0.0
0.0 0.0
0.0 0.0
0.0 0.0
0.0 0.0
Iwo %
5 26.3
3 15.8
8 42.1
3 15.8
0.0 0.0
0.0 0.0
0.0 0.0
19 100.0
Medium Osogbo %
0.0 0.0
2 2.0
62 62.0
35 35.0
0.0 0.0
1 1.0
0.0 0.0
100 100.0
55.615 / .000
Ilesha %
0.0 0.0
14 25.9
15 27.8
18 33.3
2 3.7
5 9.3
0.0 0.0
54 100.0
Iwo %
0.0 0.0
10 50.0
7 35.0
3 15.0
0.0 0.0
0.0 0.0
0.0 0.0
20 100.0
High Osogbo %
4 2.4
20 12.2
33 20.1
82 50.0
12 7.3
9 5.5
2 1.2
164 100.0
44.284 / .000
Ilesha %
3 2.0
29 19.3
21 14.0
83 55.3
9 6.0
3 2.0
1 .7
150 100.0
Iwo %
5 11.9
11 26.2
17 23.9
5 11.9
2 4.8
2 4.8
0.0 0.0
42 100.0
Total %
12 3.4
60 16.9
71 19.9
170 47.8
23 6.5
14 3.9
3 .8
356 100.0
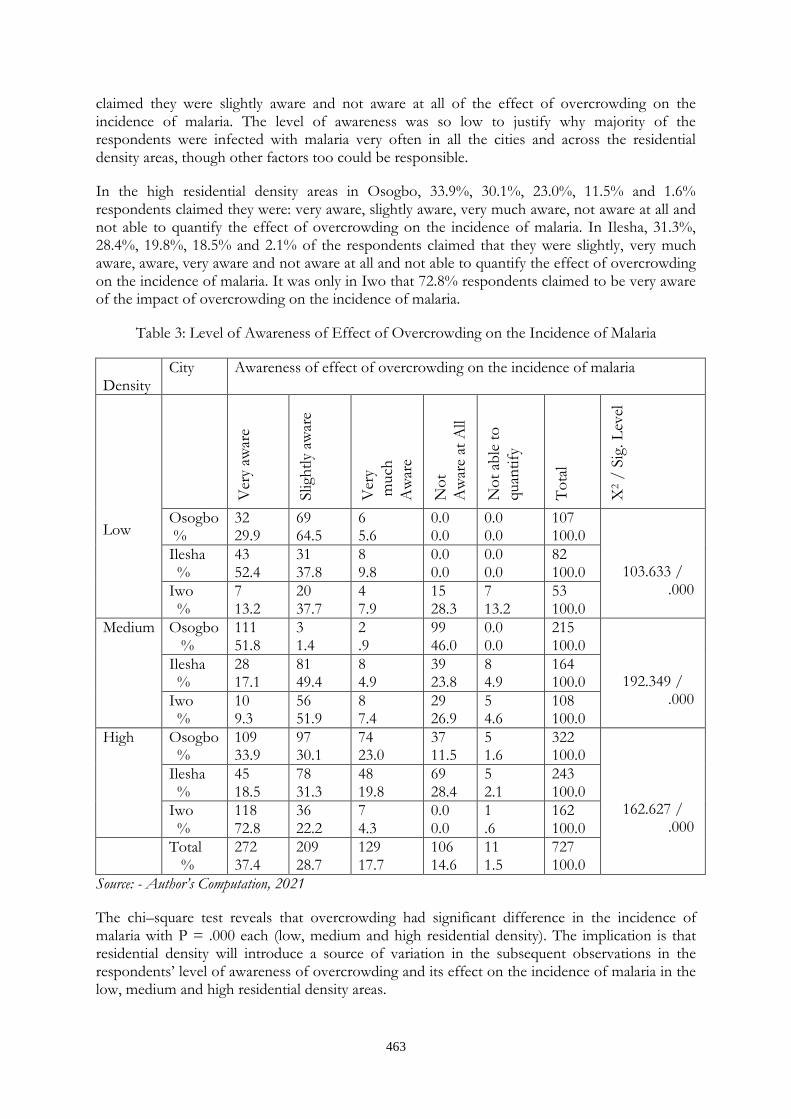
463
claimed they were slightly aware and not aware at all of the effect of overcrowding on the incidence of malaria. The level of awareness was so low to justify why majority of the respondents were infected with malaria very often in all the cities and across the residential density areas, though other factors too could be responsible.
In the high residential density areas in Osogbo, 33.9%, 30.1%, 23.0%, 11.5% and 1.6% respondents claimed they were: very aware, slightly aware, very much aware, not aware at all and not able to quantify the effect of overcrowding on the incidence of malaria. In Ilesha, 31.3%, 28.4%, 19.8%, 18.5% and 2.1% of the respondents claimed that they were slightly, very much aware, aware, very aware and not aware at all and not able to quantify the effect of overcrowding on the incidence of malaria. It was only in Iwo that 72.8% respondents claimed to be very aware of the impact of overcrowding on the incidence of malaria.
Table 3: Level of Awareness of Effect of Overcrowding on the Incidence of Malaria
Density
City Awareness of effect of overcrowding on the incidence of malaria
Low
Ver
y aw
are
Sligh
tly
awar
e
Ver
y
much
Aw
are
No
t
Aw
are
at A
ll
No
t ab
le t
o
quan
tify
To
tal
X2 /
Sig
. L
evel
Osogbo %
32 29.9
69 64.5
6 5.6
0.0 0.0
0.0 0.0
107 100.0
103.633 / .000
Ilesha %
43 52.4
31 37.8
8 9.8
0.0 0.0
0.0 0.0
82 100.0
Iwo %
7 13.2
20 37.7
4 7.9
15 28.3
7 13.2
53 100.0
Medium Osogbo %
111 51.8
3 1.4
2 .9
99 46.0
0.0 0.0
215 100.0
192.349 / .000
Ilesha %
28 17.1
81 49.4
8 4.9
39 23.8
8 4.9
164 100.0
Iwo %
10 9.3
56 51.9
8 7.4
29 26.9
5 4.6
108 100.0
High Osogbo %
109 33.9
97 30.1
74 23.0
37 11.5
5 1.6
322 100.0
162.627 / .000
Ilesha %
45 18.5
78 31.3
48 19.8
69 28.4
5 2.1
243 100.0
Iwo %
118 72.8
36 22.2
7 4.3
0.0 0.0
1 .6
162 100.0
Total %
272 37.4
209 28.7
129 17.7
106 14.6
11 1.5
727 100.0
Source: - Author’s Computation, 2021
The chi–square test reveals that overcrowding had significant difference in the incidence of malaria with P = .000 each (low, medium and high residential density). The implication is that residential density will introduce a source of variation in the subsequent observations in the respondents’ level of awareness of overcrowding and its effect on the incidence of malaria in the low, medium and high residential density areas.

464
Residents’ Level of Awareness of the impact of Overcrowding on the Incidence of Measles
Table 4 shows that in the low residential density areas 74.1% (Osogbo), 59.8% (Ilesha), and 24.1% (Iwo) respondents claimed to be very aware of the effect of overcrowding on the incidence of measles. Again, 18.5% (Osogbo), 23.2% (Ilesha) and 24.1% (Iwo) respondents’ claimed to be slightly aware of the impact. Up to 40.7% of respondents in Iwo claimed not to be aware at all of the impact of overcrowding on the incidence of measles.
In medium residential density areas 38.6% and 33.0% respondents in Osogbo claimed to be very aware and not aware at all of the effect of overcrowding on the incidence of measles in the area. As high as 59.1% respondents in Ilesha and 30.6% in Iwo claimed to be slightly aware of the impact of overcrowding on the incidence of measles. In Iwo, 28.7% and 4.5% respondents claimed that they are not aware at all and even not able to quantify the effect of overcrowding on the incidence of measles.
In the high residential density areas Table 6 shows that 38.1%, 26.6% and 47.5% respondents in Osogbo, Ilesha and Iwo claimed to be slightly aware of the impact of overcrowding on the incidence of measles. Again, 22.0%, 21.7% and 34.6% respondents in Osogbo, Ilesha and Iwo claimed to be very aware of the impact of overcrowding on the incidence of measles in the study area. Again, 17.3%, 30.7% and 13.6% respondents in Osogbo, Ilesha and Iwo claimed not to be aware at all of the effect of overcrowding on the incidence of measles in the area.
Table 4: Level of Awareness of Effect of Overcrowding on the Incidence of Measles
Density City Awareness of effect of overcrowding on the incidence of measles
Low
Ver
y aw
are
Sligh
tly
awar
e
Ver
y m
uch
aw
are
No
t aw
are
at a
ll
No
t ab
le t
o
quan
tify
To
tal
X2
/
Sig
. L
evel
Osogbo %
80 74.1
20 18.5
5 4.6
3 2.8
0.0 0.0
108 100.0
68.599 / .000
Ilesha %
49 59.8
19 23.2
10 12.2
4 4.9
0.0 0.0
82 100.0
Iwo %
13 24.1
13 24.1
8 11.1
22 40.7
0.0 0.0
54 100.0
Medium Osogbo %
83 38.6
23 10.7
38 17.7
71 33.0
0.0 0.0
215 100.0
152.192
/ .000
Ilesha %
12 7.3
97 59.1
9 5.5
42 25.6
4 2.4
164 100.0
Iwo %
10 9.3
33 30.6
29 26.9
31 28.7
5 4.5
108 100.0
High Osogbo %
7122.0 123 38.1
68 21.1
56 17.3
5 1.5
323 100.0
85.009 / .000
Ilesha %
53 21.7
65 26.6
47 19.3
75 30.7
4 1.6
244 100.0
Iwo %
56 34.6
77 47.5
3 1.9
22 13.6
4 2.5
162 100.0
Source:- Author’s Computation 2021
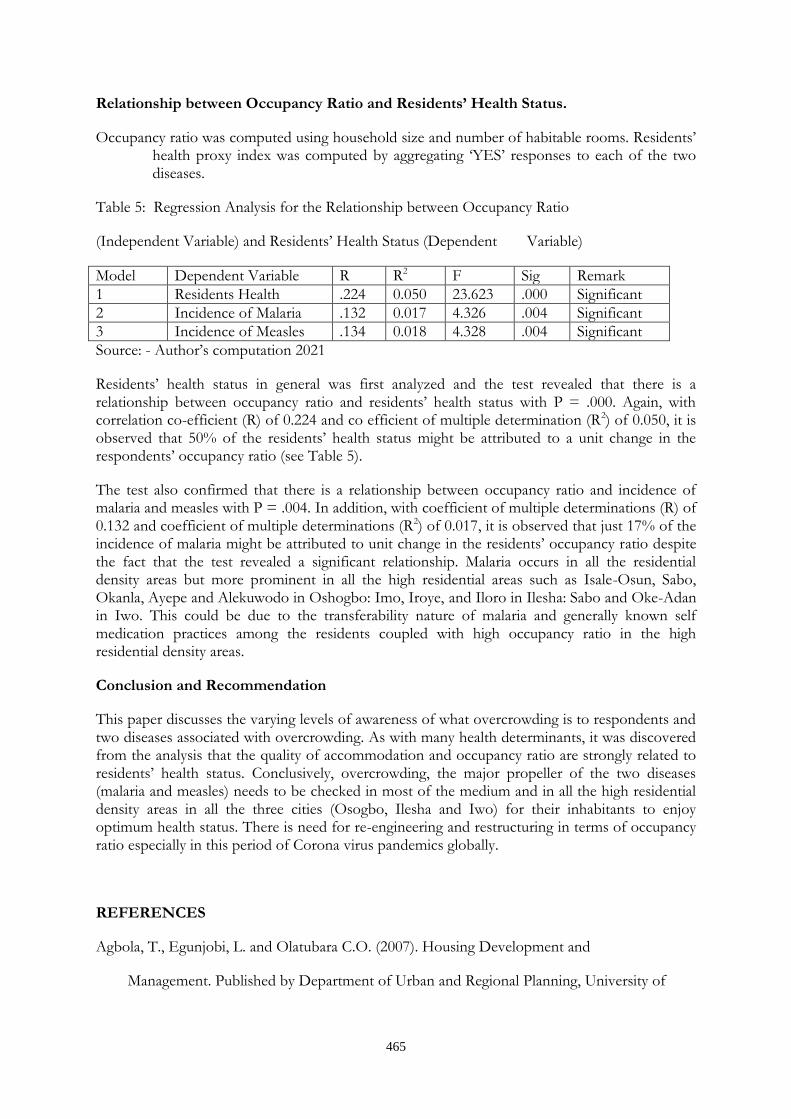
465
Relationship between Occupancy Ratio and Residents’ Health Status.
Occupancy ratio was computed using household size and number of habitable rooms. Residents’ health proxy index was computed by aggregating ‘YES’ responses to each of the two diseases.
Table 5: Regression Analysis for the Relationship between Occupancy Ratio
(Independent Variable) and Residents’ Health Status (Dependent Variable)
Model Dependent Variable R R2 F Sig Remark
1 Residents Health .224 0.050 23.623 .000 Significant
2 Incidence of Malaria .132 0.017 4.326 .004 Significant
3 Incidence of Measles .134 0.018 4.328 .004 Significant
Source: - Author’s computation 2021
Residents’ health status in general was first analyzed and the test revealed that there is a relationship between occupancy ratio and residents’ health status with P = .000. Again, with correlation co-efficient (R) of 0.224 and co efficient of multiple determination (R2) of 0.050, it is observed that 50% of the residents’ health status might be attributed to a unit change in the respondents’ occupancy ratio (see Table 5).
The test also confirmed that there is a relationship between occupancy ratio and incidence of malaria and measles with P = .004. In addition, with coefficient of multiple determinations (R) of 0.132 and coefficient of multiple determinations (R2) of 0.017, it is observed that just 17% of the incidence of malaria might be attributed to unit change in the residents’ occupancy ratio despite the fact that the test revealed a significant relationship. Malaria occurs in all the residential density areas but more prominent in all the high residential areas such as Isale-Osun, Sabo, Okanla, Ayepe and Alekuwodo in Oshogbo: Imo, Iroye, and Iloro in Ilesha: Sabo and Oke-Adan in Iwo. This could be due to the transferability nature of malaria and generally known self medication practices among the residents coupled with high occupancy ratio in the high residential density areas.
Conclusion and Recommendation
This paper discusses the varying levels of awareness of what overcrowding is to respondents and two diseases associated with overcrowding. As with many health determinants, it was discovered from the analysis that the quality of accommodation and occupancy ratio are strongly related to residents’ health status. Conclusively, overcrowding, the major propeller of the two diseases (malaria and measles) needs to be checked in most of the medium and in all the high residential density areas in all the three cities (Osogbo, Ilesha and Iwo) for their inhabitants to enjoy optimum health status. There is need for re-engineering and restructuring in terms of occupancy ratio especially in this period of Corona virus pandemics globally.
REFERENCES
Agbola, T., Egunjobi, L. and Olatubara C.O. (2007). Housing Development and
Management. Published by Department of Urban and Regional Planning, University of

466
Ibadan, Nigeria. PP 101-217
Angel, S.Y. (2010). Making Room for a planet of cities. Policy Focus Report. Cambridge, Massachusetts: Lincola Institute of Land Policy.
Beggs, C. B, Noakes C. J, Sleigh P. A. (2003). The transmission of tuberculosis in Condined
Spaces: Ananalytical Review of Alternative Epidemiological Models. Int J Tubers Lung
Dis 7: 1015 – 26.
Bonnefoy X, Branibach M, Kraparickaite D, Omandy D, and Zurlyte (2006). Housing
conditions and Self reported Health Status: A Study in Panel Block Buildings in Three
Cities of Eastern Europe’ World Health Organization, Bonn Office, Germany. 303-351
Gatrell, A.C. and Elliot, S.J. (2009). Geographies of Health, an Introduction 2nd ed. West
Sussex, Wiley-Blackwell. 290-380.
Health Canada. (2006). Guidelines for Preventing the transmission of tuberculosis in
Canadian Health Care facilities and other institutional Settings. CCDR 1996; 22SIYRL:
http://www.phac-aspc.gc.ca/publicat/ccdr-rmtc/96vol2251/ Assessed 9 October, 2013.
Koivamaa-Honkanen, H.T. (1998). Life satisfaction as a health predictor. Kuopio University
Publications D. Medical Sciences 143.
Last, M. (2001). A Dictionary of Epidemiology 4th ed. International Epidemilogical
association. New York, Oxford University Press.Livingstone, C. (1998). ‘Pocket Medical Dictionary. Edited by Roper N. Harcourt Braze and Company Limited London. PP 233-285.
Manor, O. Matthews, S. and Power, C. (2001). Self-rated health and limiting lond-standing
illness: Inter-relationships with Morbidity in early adulthood. International Journal of
Epidemiology 30: 600-607.
Meade, M.S. and Emch, M. (2010). Medical Geography 3rd ed. New York, The Quilford
Press.
Parkes, A and Kearns, A.(2004).’The Multidimensional Neighbourhood and Health. A cross sectional analysis of the scotch Household survey 2001. CNR paper 19 ESRE centre for neighbourhood Research.
Payne, W.A and Hahn, D.B. (2000). Understanding your Health, 6th edition. St. Louis:
Proscio, T. (2004). Healthy Housing, Healthy Families’. National centre for Healthy

467
Housing; The Enterprise Foundation Inc. Columbia MD21044.
Rebhan, D.P. (2010). Health Care Utilization: Understanding and Applying Theories and
Models of Health Seeking Behaviour. Case Western Reserve University.
Sutton, S. (2002) Health Behaviour: Psycho – social Theories. University of Cambridge,
United Kingdom.
Riva, M. Curtis, S. and Norman, P. (2011). Residential Mobility with England and Urban-
rural inequalities in mortality. Social Science and Medicine 73: 1698-1706.
Schaefer, S.A., King, K.A. and Benard, A.L (2007), is there a relationship between life
satisfaction and the five health dimensions? American Journal of Health Studies 22:
139-147.
Strine, T.W; Chapman, D.P., Balluz, L.S, Moriarty, D.G and Mokdad, A.H. (2008). The
association between life satisfaction and health-related quality of life, Chronic illness,
and health behaviour among U.S. Community-dwelling adult: Journal of Community
Health 33: 40-50
WHO. (1948). World Health Organization. (1948). Preamble to Constitution of the World Health Organization. Official Records of the World Health Organization, 2:100-130;
Presented at the International Health Conference, New York, 19th-22nd June, 1946.
WHO. (2009). World Health Organization (2009). Health Inequalities and Social Group
Differences. What should we measure? Int. J. Public Health Bulletin, 77: 537 -543.
WHO. (2000). World Health Organization. (2000). Regional Guidelines for Developing
Health Cities Project. New York: WHO.
Yabanet, E H. (2005). Dwelling Disparities. How Poor Housing Leads to Poor Health.
Economics-Lookisng Glass News Browsed
468
ANALYSIS OF THE CHALLENGES OF PHYSICAL PLANNING ADMINISTRATION IN NIGERIA
Oluwadare O. A., Adedotun S. B. and Ibrahim R. B.
Department of Urban and Regional Planning, Faculty of Environmental Sciences, Osun State UniversityOsogbo.
Corresponding Author Email: [email protected].
ABSTRACT
Physical planning is simply the art and science of organizing the use of land for the greater good of the society. The study reviewed existing literature and analysed physical planning administration in Nigeria. It categorized the history of physical planning administration into traditional and modern physical planning administration. The study observed that physical planning administration is carried out at the three tiers of government in Nigeria and identified, political instability, poor funding of planning agencies, pluralism in urban governance, corruption and lack of political wisdom and will and dearth of qualified hands and modern equipment. The study concluded that if the administration of physical planning will be effective, the challenges of physical planning administration should be addressed at all levels of physical planning activities with the view to establish acceptable recommendations for effective development of urban areas in Nigeria.
Keywords: physical planning, administration, land, development, Nigeria
1.0 Introduction
Rapid migration of people to urban areas has continued to place pressure on conventional approaches of land administration and development thus calling for a sustainable physical planning approach of urban areas (Lamond et al, 2015). Physical planning is an inclusive and systematic process through which plans, policies and programs evolve for enhancing the quality of the environment and its inhabitants (Nnah, et al, 2007; Falade, 2011). The formulation of policies for physical planning and supervision of the use of land in urban areas is piloted through physical planning administration (Umezurike, 2011;Owolabi, 2019).
Physical planning administration is invariably is the bedrock upon which the physical planning objectives rest on. In order to achieve this, government at all levels must establish a functional framework for the administration of physical planning within their territorial jurisdiction. It can therefore be conceived that physical planning administration encompasses the organization of interrelated statutory and administrative instruments and techniques designed to safeguard, regulate, conserve and disburse land that is in the interest of the overall community, as well as control the character, appearance and arrangements of building facilities to ensure economy, convenience and aesthetic appeal (Enoguanbhor et asl, 2021).
According to Owolabi (2019), physical planning administration is a branch of public policy which encompasses various disciplines to regulate the use of land in an effective and proper way, thus preventing conflict with the use of land. It involves the political organization comprising individuals and institution authorized to formulate public policies and control land management matters (Sani, 2019). The objectives of planning administration are to make provision for land requirements for human settlement through sound physical planning policies. This is achieved by considering socioeconomic trends as well as physical and geographical features (such as topography and ecology), for preferred land uses that supports development goals.
469
One of the major challenges confronting urban areas especially in the developing world like Nigeria is how to meet the increasing basic human needs while sustaining the resources (water, soil, fauna and flora) upon which these needs depend. The challenges of inappropriate land uses, over-exploitation of natural resources and environmental degradation are not only being experienced in urban areas in Nigeria, they have become complex issues with long term implications due to the ineffective way in which physical planning administration matters in Nigeria are pursued. This study therefore conceptually analysed administration of physical planning in Nigeria with the view to establish acceptable recommendations for effective development of urban areas in Nigeria.
2.0 Methods of Study and Organization of the Paper
The exploratory method of research is sued to analyze the challenges of physical planning administration in Nigeria, Careful attention is given to review existing relevant literature. Thus, recommendation to reduce to barest minimum, the challenges of physical planning administration for effective development of urban areas in Nigeria is proffered. The writers depend made use of published documents using commission and non-commission studies and various secondary sources, gazettes, library books and from the internet. The paper was organized in following sub themes:
i. The Introduction
ii. Methods of Study and Organization of the Paper
iii. Evolution of Planning Administration in Nigeria
iv. The Scope of Physical Planning in the Three Tiers of Government
v. Challenges of Physical Planning Administration in Nigeria
vi. The Conclusion
2.1 Evolution of Planning Administration in Nigeria
Generally, latent elements of spatial or physical planning administration had been inherent in the way settlements emerged and grew in Nigeria even before the country assumed its nationhood, and long before it was colonised. For instance, by the middle of 1800s, many indigenous Nigerian cities had a form of arrangement of land uses in their domain. As relevant examples here are the Sokoto Caliphate and much part of the Old Oyo Kingdom seats of governments which had one form of deliberate spatial arrangement of land uses around the palaces. However, contemporary planning in the context of Western culture and tradition may be said to be a phenomenon that emerged in the early 1900s in the country. Since then, series of legislation, policies and programmes have provided the framework for planning (NITP, 1991; Oyesiku et al, 1999).
2.2 Traditional Planning Administration
According to Modupe and Olujimi (1989) the entire territory that is now known as Nigeria has witnessed spatial planning in form of local indigenous administration before the coming of the colonial masters. This is often referred to as traditional settlement planning (Omole & Akinbamijo, 2012). Many of the pre-colonial indigenous settlements had a form of arrangement of land uses in their domain that were structured according to the local customs and practices, the traditional land tenure system, the agrarian nature of the economy, and the existing mode of
470
transportation (Federal Government of Nigeria, 1863; Daramola & Olojede, 2015). These form of land arrangement guided the way towns were developed and arranged in the traditional period (Okwuashi & Beulah, 2012).
During the traditional era of land administration, communal land was vested in the hands of community heads such as Obis, Obongs, Obas and Emirs, while family land was vested in family heads whose legal status was that of a trustee (Omole & Akinbamijo, 2012). According to Okwuashi and Beulah (2012), the traditional rulers allocated, re-allocated, and supervised the uses of land by their subjects. In fact, the organization of traditional settlements in Nigeria was established around palaces of traditional rulers. This promoted efficient communal interactions and reduced cost of transportation (NITP, 1991; Aluko, 2000; Owolabi, 2019). The development and control of the total environment was the joint administrative responsibility of the entire community. As such, it is clear that there were no formal or written laws promulgated to guide the administration of their settlement planning.
2.3 Modern Planning Administration
Modern planning administration in Nigeria started with the advent of colonialism and it was based on the various ordinances that were enacted for parts and whole of Nigeria in the era (Daramola & Olojde, 2015). It started with the 1863 Township Improvement Ordinance which came into being consequent upon the annexation of Lagos as a British Colony in the year 1861 under the Treaty of Cession. This was followed with the promulgation of the Cantonment Proclamation of 1904 with a view to ensuring effectiveness in the control of sanitation in the European quarters (Owolabi, 2019). The 1904 ordinance brought about the segregation of expatriate officials from the residential areas of the natives and also served as the avenue to administer planning standards for the various segments of the city giving more physical planning attention and infrastructural provision to the Government Reservation Areas (GRAs) (Owolabi, 2019).
The enactment of the Township Ordinance No. 29 of 1917 was the first attempt at introducing spatial orderliness into the land use pattern in Nigerian cities. It was a landmark in the evolution of town and country planning in the country. The impact of the ordinance, which laid down guide lines for physical layout of towns, is still visible in such towns as Aba, Port Harcourt, Enugu, Jos, Minna and Kaduna today (Omole, 1999; NITP, 1991t ensured a nationwide focus for the administration of physical planning. The promulgation of Lagos Town Planning Ordinance in 1928 gave a new dimension to planning administration in Nigeria. This was the first time that a particular planning agency would be created for effective planning administration in the country (NITP, 2012). The ordinance provided for the establishment of the Lagos Executive Development Board (LEDB), slum clearance, land reclamation, residential and industrial estates, and comprehensive land use planning and development in Lagos. Through this ordinance, town planning was made a government activity.
Obviously consequent on the outbreak of bubonic plague in Lagos in 1925 the need for a new town planning law became necessitous. As a means of ensuring a planned environment that could continuously provide safe and healthy living conditions and possible checks on future outbreaks of the plague, the Lagos Town Planning Ordinance was enacted (Federal Government of Nigeria, 1928). This ordinance made provision for the establishment of the Lagos Executive Development Board (LEDB), slum clearance, land reclamation, residential and industrial estates, and comprehensive land use planning and development in Lagos. It is noteworthy that the 1928 Lagos Town Planning Ordinance made town planning a government activity. It also ensured that LEDB undertook several assignments ranging from reclamation of swampy areas and the

471
resettlement of the displaced people from the area. Moreover, the Ordinance paved the way for the 1946 law.
In 1946, the Nigerian Town and Country Planning Ordinance No. 4 of 1946 was enacted. This legislation is widely acknowledged as the first comprehensive town planning legislation that covers the entire country, and which provided for planning and implementation of schemes by Town Planning Authorities (Omole & Akinbamijo, 2011). It was fashioned after the British Town and Country Planning Act of 1932. One of the reasons that fast-tracked the promulgation of the 1946 Ordinance was the realisation by the Colonial administration in the country then that urban planning was conspicuously missing from the country’s constitution, an omission that called for urgent attention. Inter alia, the law was made to provide for the re-planning, improvement and development of different parts of Nigeria by means of planning schemes and planning authorities. The Ordinance covered a wide area of planning operations ranging from planning schemes and planning authorities, preparation and approval of schemes and supply of schemes, executions of schemes, acquisition and disposal of land for schemes, compensation and betterment, the legal procedures for the operations of the schemes, and financial matters for the successful implementation of the scheme. In addition, the Ordinance provided the legislative basis for village re-planning.
Based on the 1946 Nigerian Town and Country Planning Ordinance, the regional governments enacted their planning laws. Following the introduction of the Federal structure, the Ordinance became regional [or later state] planning law. For instance, it is also Town and Country Planning Law of Western Nigeria—W.R. 1959 Cap. 128, Town and Country Planning (Amendment and Validation Acts) Law, 1975, former Western Nigeria—Gazette No. 2 Vol. 24 of 9th January, 1975—applicable to Oyo, Ondo and Ogun States, Town and Country Planning Law of Ogun State (Cap. 127) of 1978; Town and Country Planning Law of Oyo State, 1978; Town and Country Planning Law of Bendel State, 1976—applicable to Edo and Delta States; Town and Country Planning Law of Eastern Nigeria, 1963—applicable to Anambra, Imo, Enugu, Abia, Cross River, Rivers and Akwa Ibom States; and Town and Country Planning Law—applicable to all the Northern States, including the Federal Capital Territory, Abuja.
Enforcement of this law was the responsibility of the Town Planning Division of the Ministry of Lands and Housing. Among other provisions, the law established Town Planning Authorities (TPAs), which were to control and guide the orderly development of the settlements within their jurisdiction by approving proposals for physical development and through the preparation of development schemes and land use plans (Daramola & Olojede, 2015). The TPAs were independent of the local government council administration. Each TPA was controlled by a board, whose members were appointed by the Regional Government. The Board members of the TPAs were representatives of government agencies such as the Electricity Board, the Water Corporation, the Regional Ministry of Works and Housing, the Ministry of Finance and representatives of the community in which the TPA was located. By virtue of the functions expected of the TPAs, they operated at a level at which planning activities touch the people directly (Ikejide, 2011).
At independence, the administration of physical planning became the responsibility of the federal and state governments. Various strategies and laws were promulgated to solve the challenges associated with physical planning administration in the country (Alabi &Akinbode, 2010; Aribigbola, 2008). Among such law promulgated to guide land use matters include Land use Act of 1978, Urban Development Policy of 1992, Urban and Regional Planning Act 1992, Housing and Urban Development Policy of 2002 among others. Also at various state levels, several planning laws were promulgated to guide land administration. However, the application of the laws is limited to the states in which they were operative and the law serve as the framework for
472
planning administration in the states. The extent of the practice of state governments in physical planning administration is influenced by operations of state planning laws. In fact, the operations of the physical planning administration differed between various states in the country. Despite the existence, of these laws and policies, physical planning administration in Nigeria is still confronted with several challenges.
As noted by Oyesiku (2010) physical planning administration in Nigeria is not creating spatially sustainable new settlement and cites because of the enormous challenges confronting it. Among the challenges that have been identified by studies (Oyesiku, 2010; Olujimi, 1999; Daramola, 2019), are political instability, pluralism in urban governance, poor funding, dearth of qualified hands and modern equipment, corruption, lack of political will. Others include non-adoption and utilization of modern planning approaches, obsolete and out-of-date land use planning policies, laws and regulations; and weak institutional framework for land management (Olajuyigbe & Rotowa, 2011; Aribigbola, 2007).
2.4 Planning Administration Acts, Decrees and Edicts in Nigeria after Independence
As obtained in the Constitution of the Federal Republic of Nigeria, town planning is found listed neither on the Exclusive Legislative List nor on the Concurrent Legislative List (NITP, 1991). This makes town planning strictly a residual matter in Nigeria, and as such it is relegated to the domain of state governments in the country. But for the 1992 Urban and Regional Planning Decree No. 86, there is no Nigerian urban and regional planning law made at the federal level. In other words, technically, hitherto, Nigeria has never promulgated any urban and regional planning act since it gained independence (Daramola & Olojede, 2015). Even the 1992 legislation was enacted during a military regime, and that only after the Nigerian Constitution had been suspended. The 1978 Land Use Decree (LUD), later adopted as The Land Use Act by the subsequent civilian administration, happens to be the only other post-Independence planning-administration law with a national coverage (Olajuyigbe & Rotawa, 2011). Land use law is never a town planning law. It only emphasizes land ownership/tenure and availability/access, especially to the government, rather than coordinated physical planning. Operationally, its provisions and enforcement have had considerable and significant impacts on urban and regional planning administration in Nigeria.
2.4 The 1992 Urban and Regional Planning Law Decree Number 88
The Urban and Regional Planning Decree No. 86 of 1992 raised the hopes for effective planning administration in the country. The law provides for the setting up of the commission at the federal level for dealing with federal matters, Board to be set up at the state government level to deal with all state matters, and Local Planning Authority to be set up in each local government area and area council in the country (Owolabi, 2019). By implication, there should be at least a Commission, 36 Boards and 774 Local Planning Authorities (LPAs) in the country. Nevertheless, the implementation of the law has suffered a setback with the transition from military rule to civilian regime. Furthermore, the nobility of the law for planning administration suffered a great setback with the judicial pronouncement by the Supreme Court of Nigeria in 2003 where some provisions of the law that were said to be inconsistent with the constitution of Nigeria and these sections of the 1992 Urban and Regional Planning Law were repealed by the apex court.
The 1992 Urban and Regional Planning law was promulgated to facilitate the preparation and implementation of urban development plans and planning schemes with a view to create an environment the is conducive for living, working and recreation (Adeleye et al, 2019). The decree is structured into six parts which expresses the objectives of the decree. These objectives are summarized as follows:

473
6. To identify type and level of physical development plans, plan preparation procedures and responsibilities of the administrative bodies concern (plan preparation and implementation).
7. To give more seriousness to development control (development control).
8. To ensure effective control in special cases like wasteland, tree preservation, building of special architectural and historical significance and advertisement (additional control in special cases).
9. To empower the planning authority in acquisition of land for planning purpose and payment of compensation and betterment (land acquisition and compensation).
10. To ensure that areas that need improvement are attended to by the planning authority in conjunction with residents in the areas (improvement areas: rehabilitation, renewal, upgrading).
11. To ensure fair-hearing and justice to everybody as far as planning is concern through the establishment of Urban and Regional Planning Tribunal in each state and the Federal Capital Territory
2.5 The Scope of Physical Planning in the Three Tiers of Government
The role of urban and regional planning in urban development is carefully articulated in the Nigerian Urban and Regional Planning Law (decree 88 of 1992) and the National Urban Development Policy (2006). These two documents form the basis for the legal and policy instruments that defines the role of all government in land administration in Nigeria. These documents categorized the type and levels of plans that each tier of government is expected to prepare under the law. The 1992 Urban and Regional Planning Law decentralised urban planning by recognising the role of Federal, State and Local Governments in urban planning in Nigeria. This is a clever departure from the 1946 law which concentrate almost all urban planning responsibilities in the hands of state governments (Daramola & Olojede, 2015). The federal government is vested with the responsibilities of formulating policies on urban and regional planning, setting national urban and regional planning standards, promoting research and offering technical and financial assistance to states on the preparation and implementation of plans and preparation of National Physical Development Plan.
The National Physical Development Plan, according to the law is the highest plan that can be prepared and its jurisdiction is to cover the entire country. The law makes it mandatory for the establishment of national physical planning commission to oversee the preparation and implementation of the national physical development plan. The law also makes provision for the establishment of state development boards, at the state level, and at the local government levels, the Local Planning Authorities. These bodies were not only to implement the provisions of the Nigerian Urban and Regional Planning law of 1992, but also the National Urban Development Policy and other policies, programmes and projects aimed at advancing urban and regional planning practice and improving social and economic wellbeing of the people (Agbola, 2009).
2.6 Planning Administration at the Federal Level
As enshrined in the Urban and Regional Planning law no 88 of 1992, Planning Agency at the Federal levels are to be known as National Physical Planning Commissions. So, at federal level, we have Federal Planning Authority (FPA), Federal Housing Authority (FHA), Federal Ministry

474
of Transportation and Federal Ministry of Works, Federal Ministry of Housing and Urban Development, Ministry of Environment and Federal capital development Authority among others. These agencies are not only conflictual but duplicate one another in many instances. Some of these agencies do not see themselves entirely as planning bodies because they are not directly in charge of urban planning activities.
2.7 Planning Administration at the State Level
At state level, the law makes provision for establishment of development boards to oversee urban development and urban planning activities. In many states, these boards are also used as revenue generating outfits through issuance of development permits and penalties to defaulters. These boards are charged with the responsibilities of initiating and preparation of.
i. Regional plan;
ii. Sub-regional Plan;
iii. Urban Plan;
iv. Local Plan and
v. Subject Plan
2.8 Planning Administration at local Government Level
At the local government level, the law provides for the establishment of Local Planning Authorities and they are to perform the following functions.
i. Formulation of Town Plan
ii. Rural Area Plan Local Plan
iii. Subject plan.
Planning administration at the local government level is carried out by the Local Planning Authority, which is a direct arm of the State Planning Board. They are to monitor all the development of the land within their jurisdiction with constant report to the State Planning Board. The 1992 Law included the local government in building control (Okoro, 2014). What gives the Local Planning Authorities control is that they are the only ones that can recommend approval for any development, except if there is an overwriting interest from the state. They are to report all cases requiring demolition or restructuring that are beyond the limit of the power of the local government to the state planning board. Such cases are faulty canals that spread over more than a local government, faulty arterial roads within the local government; they also report cases of slum and blighted areas that need urgent attention. They are also to represent the state planning authority at local level. They also generate revenues through the collection of development approval processing fees and collection of penal fees from planning law contraveners. The Chief Executive Officer (CEO) is the head of the Local Planning Authority.
475
2.9 Challenges of Planning Administration in Nigeria
2.9.1 Political Instability
The Nigerian political scene has undergone varied experiences that bear directly on urban and regional planning development and administration in the country. There was the colonial government that imposed its planning decisions based on authoritarian caprice. This is followed by the independence era when the Nigerian political terrain suffered from consistent instability save the fair stability experienced in the fourth republic that started with 1999 transition to civilian rule. Prior to this stability, there were series of military intervention in the political affairs of the country. For instance, following the colonial experience of almost a century (1861-1906) and before 1999 transition to civil rule, the country experienced a relatively shorter post-independence democratic rule than military rule. Specifically, there were only 10 years of civilian administration (1960-1966 and 1979-1983), while the military administration (with eight regimes of varying durations) lasted about 28 years (1966-1979 and 1984-1999). As such, several conceived and documented planning policies and programmes were not successfully implemented or never implemented in the periods (Darmola & Olojede, 2015). This experience has also transited into the present civilian regime and has adversely affected urban planning administration in Nigeria. Specific examples in this regard are the partial inconsistence of the Urban and Regional Planning Decree No. 88 of 1992 with the Constitution of the Federal Republic of Nigeria and also the change of the ministry in charge of urban and regional planning at the federal and state levels with varying political administrations in the country (Owolabi, 2019).
2.9.2 Pluralism in Urban Governance
There is not gainsaying that there is problem of urban governance in Nigeria because of lack of city-wide governments. This event is not without adverse effects on urban and regional planning administration in Nigeria. For instance, the 1992 Urban and Regional Planning Decree provides for promotion of land use planning and development control functions of the three-tier government structure in the country with the setup of a federal planning commission, 36 state planning boards and 774 local planning authorities in the country with overlapping functions. All these three bodies are saddled with the responsibility of carrying out land use and development control functions within their respective areas of jurisdiction. Therefore, there will be lack of coordinated urban planning administration. This pluralism no doubt results in conflicts of interests and become a bane to planning administration.
2.9.3 Poor Funding of Planning Agencies
In Nigeria today, the government, especially at the state and local government levels focus on planning offices as sources of internally-generated revenue (IGR) but reward the offices with despicable budgetary allocations to town planning. Thus, the offices responsible for planning administration are not adequately funded for effective planning administration. For instance, as at 1997, it was expressed that very few planning authorities could claim to have initiated and implemented planning schemes of any form over the past few decades (Oyesiku, 2009). Since then, the situation has not improved. Planning authorities in most cases are given the targeted amount to attract into the coffer of the government every month and this has reduced the activities of most planning authorities to development control that is popularly known with ‘red-marking’. Yet, cases of poor development control abound in the country (Agbonta & Olowoporoku, 2017). This is partly because many development control units are immobile, and therefore cannot effectively monitor physical development in their areas of jurisdiction. This poor funding of planning agencies by the governments at all levels have left planning

476
administration to be without adequate financial and institutional support. There is no enabling environment to function optimally as the government does not deem it fit to equip the town planning department not to talk of retraining town planning staff.
2.9.4 Dearth of Qualified Hands and Modern Equipment
Before and just after Nigerian independence, many of the officers in charge of town planning administration were at best half-literate as far as the art and science of town planning is concerned. According to Olujimi (1999), this is because most of them were technical assistants trained in the Town Planning Training School at the Ministry of Lands and Housing, and the then Technical College in Ibadan. Consequently, their level of training was not adequate to provide the background knowledge required for meaningful administration of any Town Planning Authority (TPA). Even as at today, Nigeria with a population of over 200 million people cannot boast of 10,000 registered town planners and these are not evenly distributed across the country and a significant proportion of them are not employed in the public sector, from which planning administration holds sway. As at now, there are states in Nigeria with not more than 10 registered town planners in the public sector and there are local planning authorities without any registered town planners, even in the southern part of Nigeria. Also, some town planners are technically outdated. They still live in the ancient world of drawing board and t-square technology and layout designs are carried out manually largely owing to the officers’ poor or no computer literacy. The knowledge of basic computer packages that could enhance their activities for effective planning administration is far away from them.
2.9.5 Corruption and Lack of Political Wisdom and Will
Planning administration requires the input of both the political and the professional classes to be effective. However, the mode of planning administration in Nigeria reveals that both classes contain agents of corruption. Many leaders in different levels of government in Nigeria lack the political will to steer the ship of the country in such a way as to make her compete favourably in the comity of nations. Even when some are offered sound policy advice, the wisdom and the will to take it are wanting. These characterise several policies and programmes of the government that have to do with planning administration in the country. Also, some political office holders use their political power to suppress any activities in support of effective planning administration. At times when the town planner in charge wants to put his foot down on what is right, the unscrupulous among the political class, who incidentally are the ‘employers’, bend the rules. The professional town planners are also not spared in these acts of corruption. It is common to hear people saying that if the town planners come when you are developing your site, there is nothing that they want apart from money. As such, some people no longer care as to acknowledging the existence of any form of planning. Hundreds of private physical developments spring up on a daily basis without approval by the appropriate planning authority. All these and many more have plagued planning administration in Nigeria.
3.0 Conclusion
Physical planning ensures the ground rules for sustainable development. Physical planning is simply the art and science of organizing the use of land for the greater good of the society. It entails a spatial expression of social and economic growth which guarantees compatibility of land uses, and provides functional and visually pleasing environment with adequate services in a sustainable manner. It can therefore be said that urban sustainability is directly influenced by the control of land and its efficient use. In order to ensure that developments are carried out without harming the environment, effective physical planning administration must be pursued. Effective administration of land is an integral factor in promoting a healthy environment in urban centres.

477
Therefore, enabling law that can stand the test of time must be in operation. Urban and Regional Planning Law Decree 88 of 1992 must be domesticated in all States of the Federation and enforced. By so doing, physical planning administrators will be properly guided and guarded to face out the challenges of planning administration in urban environment in Nigeria.
References
Adeleye, A., Salami, F and Ajobiewe, T. (2018). A Review of Section One (Plan Preparation and Administration) of the Nigerian Urban and Regional Planning Decree No. 88 of 1992 and Cases Where the Dictates of the Section Have Been Applied In Nigeria A Term Paper Presented at the Department of Urban and Regional Planning, School of Environmental Design and Management University of Ibadan, Nigeria
Agbola, T (2009). Sustainable Urbanization: Reflection on Growth and Development of African Cities. Our Cities, Our Future. Dialogue on Urban Planning Challenges and Management, Edited and published by Kadiri W.2009.
Agbonta, W. and Olowoporoku, O. (2017). Residents’ Perception and Response to Development Control Activities in Ibadan and Akure South West Nigeria. Nigeria Journal of Environmental Sciences and Technology. University of Benin, Benin, Nigeria 1 (2): 116-127. https://doi.org/10.36263/nijest.2017.02.0041
Alabi, M.O. and Akinbode, A. (2010). Toward Effective Physical Planning in Local Governments in Nigeria, Environmental Research Journal, 4(2): 173-176
Aluko O. E (2000). Development control in Nigeria’s new civil rule programmed. JNITP 13: 78-88.
Aribigbola A (2008) Improving urban land use planning and management in Nigeria, The case of Akure, Theoretical and Empirical Researches in Urban Management (9): 1-14.
Daramola. O. (2019). Revisiting the Legal Framework of Urban Planning in the Global South: An Explanatory Example of Nigeria Source Title: Smart Cities and Smart Spaces: Concepts, Methodologies, Tools, and ApplicationsDOI: 10.4018/978-1-5225 7030-1.ch010
Enoguanbhor, E.C. Gollnow, F. Walker, B. B. Nielsen, J. O.; Lakes, T. (2021). Key Challenges for Land Use Planning and Its Environmental Assessments in the Abuja City-Region, Nigeria. Land, 10, 443. https://doi.org/10.3390/land10050443
Falade J. B. (2011) Urbanization & Physical Planning in Nigeria, being paper presented at the International Conference on 50years of urbanization in Nigeria, held at the Airport Hotel, Lagos 20-21 October, 2011.
Ikejide, C. W. (2011). The Impact of Planning Administrative Structure of Town Planning Authorities on Development Control in Enugu Metropolis Presented in Partial Fulfilment of the Requirements for the Award of Masters in Urban and Regional Planning (MURP) Department of Urban and Regional Planning Faculty of Environmental Studies University of Nigeria Enugu Campus
Lamond J., Awuah, B. K., Lewis E., Bloch R., and Falade B. J. (2015) Urban Land, Planning and Governance Systems in Nigeria. Urbanisation Research Nigeria (URN) Research

478
Report. London: ICF International. Creative Commons Attribution-Non Commercial Share Alike CC BY-NC-SA.
Nigeria Institute of Town Planning (NITP) (1991).: Twenty-five years of Physical Planning in Nigeria, Silver Jubilee Anniversary Bulletin Published by NITP Silver Jubilee Publications Committee, Nigeria.
Nnah, W.W., Owei, O.B. and Ikpoki, M.I. (2007) Development Control and the Public Interest in Obio-Akpor Local Government Area of Rivers State, Nigeria. Journal of the Nigerian Institute of Town Planners, 20, 71-86
Okoro, H. I. (2014). Physical Development Planning Sub-Components as Veritable Instruments for Ordering Integrated Growth and Sustainable Development in Nigeria. Journal of Integrative Humanism – Ghana March, 2014 ISSN: 2026-6286
Olajuyigbe A. E, Rotowa O. O (2011) Optimizing physical planning in the developing countries. A Case Study of Ondo State, Nigeria, Journal of Sustainable Development 4(4)
Olujimi, B. A. J. (1993). The Administration of Physical Planning in Nigeria: The Ondo State Experience. Landscape and Urban Planning 25. 115-126.
Omole, F. K and Akinbamijo, O. B. (2012). Land Development and Planning Laws in Nigeria: The Historical Account. Journal of Law, Policy and Globalization. 8,
Omole, F. K. (1999). Planning Issues in Nigeria Land Tenure System and the Land Use Act. Frontline/KenOye Publications Company, Lagos, Nigeria.
Owolabi B . O. (2019). Assessment of Physical Planning Administration in Nigeria. Environ Anal Eco stud. 5(1). EAES.000602. 2019. 452 DOI: 10.31031/EAES.2019.05.000602
Oyesiku, O. K. (2009) “City Live ability: Implications and Challenges”. Lead Paper presented at the Commonwealth Association of Planners, West Africa Workshop. Lagos. Nov. 2009.
Oyesiku, O. O. (2010). New cities in urban and regional development planning. Longman Nigeria.
Sani, K. I. (2019). The Impact of Building Regulation Contravention on Rapid Urbanisation: Case of Kano Metropolis. European Journal of Sustainable Development 8, (5) 350 357 Doi: 10.14207/ejsd. 2019.v8n5p350
Umezuruike, S. O. (2015). Physical planning administration in Nigeria: Abia State experience. Journal of geography and regional planning, 8(3), 47-5
479
REVIEW OF ROAD NETWORK ANALYSIS BASED ON QUANTITATIVE AND QUALITATIVE APPROACH
Adeyanju D. O.1*, Busari, A. A.2, Bello, A.A.1
1Department of Civil Engineering, Osun State University, Nigeria
2Department of Civil Engineering, Federal University Oye - Ekiti, Nigeria
*Email of Corresponding Author: [email protected]
ABSTRACT
Road networks are illustration of complex systems that are vital to our society and economy, the growing pressure on road networks is usually intense in urban areas as a result of their naturally
high traffic volume and high vehicle‑ to‑ population ratio. The position of nation’s social, economic and household activities, as well as employment centers in urban areas is influenced by its transportation network structures. This has an effect on travelers' accessibility and destination choices. The review of analysis of different road networks was presented in this report, the urban road networks were analyzed based on quantitative approach (Non-spatial) which are connectivity and topology (centrality measurement); and qualitative approach (Saptial) which are graphical characteristics of road network. From the various journal reviewed, it was shown that graphical features were used to identify various road patterns, as road network structure affects traffic performance, transit safety, and even social activities in a specific region. It was revealed that thorough understanding of different road patterns is highly effective on traffic circulation. Also, topology analysis (centrality measurement) plays a pivotal role in monitoring the efficiency and accessibility of transportation networks. These approaches should be recommended for an effective analysis thereby provides a sustainable and efficacy road network.
Keywords: Road network, Connectivity, Topology, Centrality.
1.0 Introduction
Rapid urbanization and a rise in the vehicle-to-population ratio, as well as the pressures imposed
on road networks have been widely documented Agyemang, 2017; Amoh‑ Gyimah and Aidoo, 2013; Dumedah, 2017; Nutsugbodo et al., 2018; Sam et al., 2018). Our society and economy rely heavily on urban road networks (Shang, 2017), given their naturally high traffic volumes and high vehicle-to-population ratios, urban areas experience the greatest pressure on road networks.
In topological maps, nautical maps, and other types of maps, roads are vital. A road network is made up of a number of interconnected routes. The road network is a topological graph made up of nodes and edges that expresses road data, edges represent connectedness between nodes, while nodes identify distinctive locations such as intersections, terminal points, and so on (Zhang et al., 2011). This method is known as primal approach, other method is dual approach where nodes represent line between intersections and edges represent the intersections in the road network.
For city planners and engineers, road network research is a critical method for avoiding gridlock and immobility, as well as identifying potential solutions. The safety, travel actions and performance can all be influenced by road network patterns.

480
2.0 Quantitative Approach
Berli et al. (2020) and Crucitti et al. (2006) investigated that centrality calculated is used to identify which central points in a network are the most appropriate, as well as their attributes which are critical for monitoring the efficiency and usability of transportation networks. The centralities will aid analysts in better comprehending complex networks.
He et al. (2019) and Ližbetin (2019) used centrality measurements to assist domain users in the order to conduct more advanced research in the urban transportation network. Von Ferber et al. (2009) concluded that the greater the degree core value, the more open the node is and the more useful the geographic space is for real-time traffic planning. This also serves purpose of bus system's hub where most nodes have only two neighbors and a few main nodes that have a higher degree of centrality.
Yonca et al. (2018) discovered that road network connection is very vulnerable to natural events such as earthquakes. Identifying key network points ahead of time can aid with evacuation preparations.
Jayaweera et al. (2017) compute and correlate classical centrality measures such as Degree, Betweenness, Closeness, and Clustering for three different networks of a small area in the Sri Lanka city of Kiribathgoda, in order to identify the most important points in the network that directly affect traffic congestions.
Puzis et al. (2013) combined betweenness centrality (BC) and traffic flow, as measured by GPS traces provided by drivers' smartphones, to choose the ideal locations for traffic monitoring units. They propose a comprehensive network research that shows that the original definition of BC, which computes shortest paths by counting hops, does not adequately capture the real evolution of traffic flow.
3.0 Qualitative Approach
Marshall et al. (2018) discovered that informal settlements are associated with poor road layout, which leads to a number of dead ends, as well as poor connectivity and continuity of road segments, and the study employs approaches based on a simple morphological analysis as well as the global importance of network elements.
Human connection from social networks generates travel movement, according to studies by Bapierre et al. (2015) and Cho et al. (2011), and social network links have a significant impact on long distance trip compared to short distance travel. According to Barthelemy (2011) and Wang et al. (2012), the failure to incorporate the structural aspects, for example, in traffic management, shows that road networks in these places are likely to be inefficient and susceptible to traffic congestion.
According to Rodrigo and Ana (2015), the bulk of Ghana's urban road networks had a radial pattern at the global scale and a gridded or branching structure at the local scale. It was revealed that the predominance of informal human settlement contributes to the number of dead ends, resulting to a lack of continuity and connection in road networks.
According to Zhang et al. (2011), road networks are classified into five groups based on their graphical characteristics: gridiron fractured parallel, warped parallel, loops and lollipops, and lollipops on a stick, which is a commonly used classification method in road network pattern analysis.
481
Zhang et al. (2011) explore the graphical categorization of Traffic Analysis Zone (TAZ) road network patterns and discover that not all TAZ road networks can be clearly recognized as a specific kind; some networks are made up of unconnected roads, while others are extremely difficult to define. More than one-third of TAZ road networks are pure pattern types, with the remainder being a combination of two or more patterns. The loops-and-lollipops pattern is the most widely used in network design across all TAZ road networks.
4.0 Observations
To quantify the importance of network nodes, the quantitative analysis applies centrality attributes. Degree centrality, proximity centrality, betweenness centrality, straightness centrality, and information centrality (or network efficiency) are the most essential measurements of centrality in road analysis. Because centrality has a direct impact on road network performance, any disruption to roads with high centrality can result in significant loss of accessibility or cause massive portions of the road network to collapse.
It was observed that qualitative analysis employs morphological and graphical patterns to find optimal approaches and best practices for road networks in order to improve transportation planning and management decision making. Spatial networks express spatial interactions, including the geometry and structural structure of the network. As a result, topological metrics examine the network's configuration, connectedness, and robustness, as well as the distribution of these qualities.
5.0 Conclusion
According to the review, graphical elements were enabled to identify various road layouts, as road network structure effects traffic performance, transit safety, and even social activities in a specific region. To measure the effects of road network patterns on traffic circulation, distinct road network patterns must first be characterized and comprehended. The review also indicated that topology analysis (centrality measurement) is used to identify the most important central points in the network as well as their attributes, which are critical in monitoring the efficiency and accessibility of transportation networks. Therefore, it is highly imperative to recommend both approaches which is not inclusive in the most previous researches for an effective analysis thereby provide a sustainable and efficacy road network.
REFERENCE
Agyemang, E. (2017). Mode choice for long distance trips: Evidence from the Greater Accra Metropolitan Area of Ghana. Journal of Transport Geography, 64:150–157. https://doi.org/10.1016/j.jtrangeo.2017.09.003
Amoh-Gyimah, R. and Aidoo, E. N. (2013). Mode of transport to work by government employees in the Kumasi metropolis, Ghana. Journal of Transport Geography, 31:35– 43. https://doi.org/10.1016/j.jtrangeo
Bapierre, H., Jesdabodi, C., and Groh, G. (2015). Mobile Homophily and Social Location Prediction. arXiv preprint, arXiv:150607763.
Barthelemy, M. (2011). Spatial networks. Physics Reports, 499:1–101. https://doi.org/10.1016/j.physrep.2010.11.002
482
Berli, J., Ducruet, C., Martin, R. and Seten, S. (2020). The Changing Interplay Between European Cities and Intermodal Transport Networks (1970s–2010s). In European Port Cities in Transition; Springer: Berlin, Germany, pp. 241–263.
Berli, J., Ducruet, C., Martin, R. and Seten, S. (2020). The Changing Interplay Between European Cities and Intermodal Transport Networks (1970s–2010s). In European Portcities in Transition; Springer: Berlin, Germany, pp. 241–263.
Cho, E., Myers, S. A. and Leskovec, J. (2011). Friendship and mobility: User movement in
location‑ based social networks. In Proceedings of the 17th ACM SIGKDD International Conference on Knowledge Discovery and Data Mining. New York, NY, USA, pp. 1082– 1090. https://doi. org/10.1145/2020408.202057.
Crucitti, P., Latora, V. and Porta, S. (2006). Centrality in networks of urban streets. Chaos Interdisciplinary Journal, Nonlinear Science, 16(1):5-113.
Dumedah, G. (2017). Challenges and opportunities for geospatial integration into ’trotro’ road travel in Ghana. Journal of Applied Geospatial Information, 1:82–87.
He, S., Yu, S., Wei, P. and Fang, C. (2019).A spatial design network analysis of street networks and the locations of leisure entertainment activities: A case study of Wuhan, China. Sustenance Cities Society, 44:880–887.
Jayaweera, N., Perera, R. and Munasinghe, J. (2017). Centrality measures to identify traffic congestion on road networks: A case study of Sri Lanka. IOSR Journal of Mathematics, 13:13-19.
Ližbetin, J. (2019). Methodology for determining the location of intermodal transport terminals for the development of sustainable transport systems: A case study from Slovakia. Sustainability, MDPI, 11(5):1-17.
Nutsugbodo, R. Y., Amenumey, E. K. and Mensah, C. A. (2018). Public transport mode references of international tourists in Ghana: Implications for transport planning. Travel Behaviour and Society, 11:1–8. https://doi.org/10.1016/j.tbs.2017.11.002
O’Sullivan, D. (2014). Spatial network analysis. In M. M. Fischer, & P. Nijkamp (Eds.), Handbook of regional science, pp. 1253–1273. Berlin, Germany: Springe.
Puzis, R., Altshuler, Y., Elovici, Y., Bekhor, S., Shiftan, Y. and Pentland, A. (2013). Augmented betweenness centrality for environmentally aware traffic monitoring in transportation networks. Journal of Intelligent Transportation Systems, 17:91–105.
Rodrigo, A. B. and Ana, L. C. B. (2015). Identification of Central Points in Road Networks using Betweenness Centrality Combined with Traffic Demand. Research Journal on Computer Science and Computer Engineering with Applications, 52:85-91. http://dx.doi.org/10.17562/PB-52-9
Sam, E. F., Hamidu, O. and Daniels, S. (2018). SERVQUAL analysis of public bus transport services in Kumasi metropolis, Ghana: Core user perspectives. Case Studies on Transport Policy, 6:25–31. https://doi.org/10.1016/j.cstp.2017.12.004
Shang, W. L. (2017). Robustness and resilience analysis of urban road networks, Ph.D. -thesis, Imperial College London, London, UK.

483
Marshall, S., Gil, J., Kropf, K., Tomko, M. and Figueiredo, L. (2018). Street network studies: From networks to models and their representations. Networks and Spatial Economics,
18:735–749. https://doi.org/10.1007/s11067‑ 018‑ 9427‑ 9
Von Ferber C., Holovatch T. and Holovatch Y. (2009). Public transport networks: empirical analysis and modeling. The European Physical Journal B, 68(2):261-275.
Wang, P., Hunter, T., Bayen, A. M., Schechtner, K. and Gonzalez, M. C. (2012). Understanding road usage patterns in urban areas. Scientific Reports, 2:1001. https://doi.org/10.1038/srep01001
Yonca A. N., Duzgun, H. S., Wenzel, F. and Heinimann, H. R. (2018). Integration of stress testing with graph theory to assess the resilience of urban road networks under seismic hazards. Journal of Natural Hazards, 91:37-68.
Zhang, Y., Zeng, P., Wang, X., and Chen, X. (2011). Centrality Characteristics of Road Network Patterns of Traffic Analysis Zones. Transportation Research Record: Journal of the Transportation Research Board, 2256(1):16-24. Doi:10.3141/2256-03.

484
ANTIBACTERIA EFFECTS OF BITTER LEAF PLANT (VERNONIA AMYGDALINA), GROWN AT KAURA NAMODA AGAINST
SELECTED PATHOGENS
Hassan A.B, Adegboye Yemisi & Tanko Hussain A. O.
Departments of Science Laboratory Technology & Hospitality Management, School of Science and Technology, Federal Polytechnic, Kaura Namoda, Zamfara State
Email of Corresponding Author [email protected],
ABSTRACT
Antibacterial activity from aqueous and ethanol extracts of Vernonia amygdalina was carried out. Different parts such as leaves and roots were investigated for antibacterial activity on bacteria such as (Escherichia coli, Staphylococcus aurous, Staphylococcus albus, Streptococcus pneumonia, Klebsiella pneumonia, Pseudomonas aeruginosa). Antibacterial activity was determined by the Agar well diffusion and filter paper disc methods, and minimum inhibitory concentration was also determined. The widest zone of inhibition (25 mm) was observed by ethanol extract of V. amygdalina leaf extract against Streptococcus pneumonia and Klebsiella pneumonia. The antibacterial effects of V. amygdalina had a stronger effect on Gram positive bacterial than the Gram negative bacterial with exception of E. coli. The findings from this study provide evidence that supports the use of V. amygdalina in traditional medicine.
Keywords: Antibacteria Effect, Vernonia amygdalina, Kaura Namoda, Selected Pathogens
1. INTRODUCTION
Medicinal plants have been used for centuries as remedies for human diseases because they contain components of therapeutic value (Tanaka, 2002). Traditional medicine is an important part of African cultures and local medicinal systems vary between different cultural groups and regions (Makhubu, 2006). Herbs are now very popular in developing countries on account of improved knowledge about the safety, efficacy and quality assurance of ethno- medicine. In recent years, secondary plant metabolites (phyto-chemicals) have been extensively investigated as a source of medicinal agents. Thus, it is anticipated that phyto-chemicals with good antibacterial activity will be used for the treatment of bacterial infections. This is because, according to Arora and Keur (1999), the success story of chemotherapy lies in the continuous search of new drugs to counter the challenges posed by resistant strains of microorganisms. Studies indicate that in some plants there are many substances such as peptides, tannins, alkaloids, essential oils, phenols, and flavonoids among others which could serve as sources for antimicrobial production. These substances or compounds have potentially significant therapeutic application against human pathogens including bacteria, fungi and viruses (Okigbo and Omodamiro 2006).
Herbal products have been used since ancient times in folk medicine, involving both eastern and western medical traditions (Groppo et al. 2008). Some have been evaluated for possible use in modern medicine, while thousands of other potentially useful plants have not been tested (Tichy et al. 1998). During the last two decades, the development of drug resistance as well as the appearance of undesirable side effects of certain antibiotics has lead to the search of new antimicrobial agents mainly among plant extracts with the goal to discover new chemical structures which overcome the foregoing disadvantages (Marchese et al. 2001). However plant used in traditional medicines are still understudied, particularly in chemical laboratory (Kirby, 1996). In developing countries where medicines are quite expensive, investigation on
485
antimicrobial activities from ethno medicinal plants may still be needed (Damintoti et al., 2005). Traditional knowledge forms the basis for the origin of not only alternative medicine but also paved way to evolution of a gamut of new and novel modern medicines. Several plants are known to possess antimicrobial properties in the literature (Dash & Murthy, 2011).
Vernonia amygdalina popularly called Ewuro by the Yoruba’s is an herb widely used in traditional medicine in many tropical and subtropical regions. Adebayo (2017) corroborated that V. amygdalina is the mother of leaves and thus all leaves should have a respect for it. It has been used in the treatment of diarrhea and abdominal pain. Thus the aim of this study is to test the leaves and root extract of V. amygdalina for its antimicrobial activities against some clinical isolates of six bacteria namely Escherichia coli, Staphylococcus aureus, Staphylococcus albus, Streptococcus pneumonia, Klebsiella pneumonia, and Pseudomonas aeruginosa.
2. MATERIALS AND METHODS
Plant collection- The plant parts used were obtained as described by traditional medical practitioners from Kaura Namoda market in Kaura Namoda, Zamfara state Nigeria.
Preparation and Extraction of Plant material- Extraction of leaf and root of the plant was done with water and 60% ethanol. The leaf powder and root (10g each) were soaked in 100 ml of each solvent. The suspended solutions were left to stand for 5 days, and labeled accordingly. The extracts were filtered and stored at 4°C until when needed.
Test organisms- Nine microorganisms used in this study as test organisms comprising of clinical isolates of six bacteria (Escherichia coli, Staphylococcus aureus, Staphylococcus albus, Streptococcus pneumoniae, Klebsiella pneumoniae, Pseudomonas aeruginosa ) were obtained from the Microbiology Department of General Hospital, Kaura Namoda. The typed cultures of bacteria Nutrient agar (Oxoid) slants and stored at 4°C until required for study.
Screening for antimicrobial activity- The antibacterial and antifungal susceptibilities were tested using the agar well diffusion method and paper disc method.
i. Paper Disc Technique
Sterile filter paper discs (7.0 mm diameter) were soaked with the test extracts and dried at 400C for 30 minutes. The prepared Nutrient agar plates were seeded with each of the test bacteria and the filter paper discs were placed on each plate. The plates were incubated at 370C for 24 hours. The fungal isolates were similarly cultured on PDA plates and incubated at 300C for 48 hours.
ii. Agar Well Diffusion
The culture plates seeded with test organisms were allowed to solidify and punched with a sterile cork borer (7.0 mm diameter) to make open wells. The open wells were filled with 0.05 ml of the extract. The plates were incubated at 370C for 24 hours. For the fungi, the test was carried out on PDA plates and incubated at 300C for 48 hours. The zones of inhibition were measured and recorded.
Minimum Inhibitory Concentration- Activated culture of respective organisms were inoculated (about 0.2ml) in nutrient agar ( for bacteria) and potato dextrose agar (for fungi and yeast) at about 45°–50°C. After well mixing, the agar was poured in a sterile Petri plate. After the solidification of agar, the paper disc previously dipped in extract and the solvent from extract
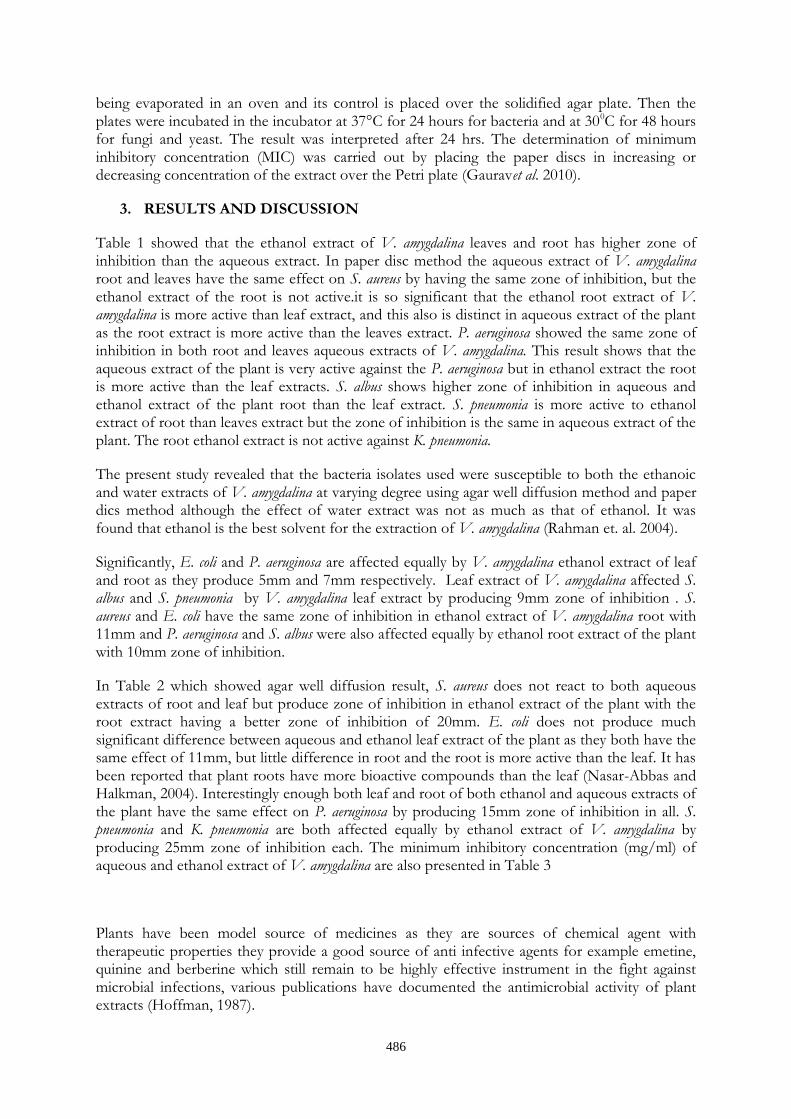
486
being evaporated in an oven and its control is placed over the solidified agar plate. Then the plates were incubated in the incubator at 37°C for 24 hours for bacteria and at 300C for 48 hours for fungi and yeast. The result was interpreted after 24 hrs. The determination of minimum inhibitory concentration (MIC) was carried out by placing the paper discs in increasing or decreasing concentration of the extract over the Petri plate (Gauravet al. 2010).
3. RESULTS AND DISCUSSION
Table 1 showed that the ethanol extract of V. amygdalina leaves and root has higher zone of inhibition than the aqueous extract. In paper disc method the aqueous extract of V. amygdalina root and leaves have the same effect on S. aureus by having the same zone of inhibition, but the ethanol extract of the root is not active.it is so significant that the ethanol root extract of V. amygdalina is more active than leaf extract, and this also is distinct in aqueous extract of the plant as the root extract is more active than the leaves extract. P. aeruginosa showed the same zone of inhibition in both root and leaves aqueous extracts of V. amygdalina. This result shows that the aqueous extract of the plant is very active against the P. aeruginosa but in ethanol extract the root is more active than the leaf extracts. S. albus shows higher zone of inhibition in aqueous and ethanol extract of the plant root than the leaf extract. S. pneumonia is more active to ethanol extract of root than leaves extract but the zone of inhibition is the same in aqueous extract of the plant. The root ethanol extract is not active against K. pneumonia.
The present study revealed that the bacteria isolates used were susceptible to both the ethanoic and water extracts of V. amygdalina at varying degree using agar well diffusion method and paper dics method although the effect of water extract was not as much as that of ethanol. It was found that ethanol is the best solvent for the extraction of V. amygdalina (Rahman et. al. 2004).
Significantly, E. coli and P. aeruginosa are affected equally by V. amygdalina ethanol extract of leaf and root as they produce 5mm and 7mm respectively. Leaf extract of V. amygdalina affected S. albus and S. pneumonia by V. amygdalina leaf extract by producing 9mm zone of inhibition . S. aureus and E. coli have the same zone of inhibition in ethanol extract of V. amygdalina root with 11mm and P. aeruginosa and S. albus were also affected equally by ethanol root extract of the plant with 10mm zone of inhibition.
In Table 2 which showed agar well diffusion result, S. aureus does not react to both aqueous extracts of root and leaf but produce zone of inhibition in ethanol extract of the plant with the root extract having a better zone of inhibition of 20mm. E. coli does not produce much significant difference between aqueous and ethanol leaf extract of the plant as they both have the same effect of 11mm, but little difference in root and the root is more active than the leaf. It has been reported that plant roots have more bioactive compounds than the leaf (Nasar-Abbas and Halkman, 2004). Interestingly enough both leaf and root of both ethanol and aqueous extracts of the plant have the same effect on P. aeruginosa by producing 15mm zone of inhibition in all. S. pneumonia and K. pneumonia are both affected equally by ethanol extract of V. amygdalina by producing 25mm zone of inhibition each. The minimum inhibitory concentration (mg/ml) of aqueous and ethanol extract of V. amygdalina are also presented in Table 3
Plants have been model source of medicines as they are sources of chemical agent with therapeutic properties they provide a good source of anti infective agents for example emetine, quinine and berberine which still remain to be highly effective instrument in the fight against microbial infections, various publications have documented the antimicrobial activity of plant extracts (Hoffman, 1987).
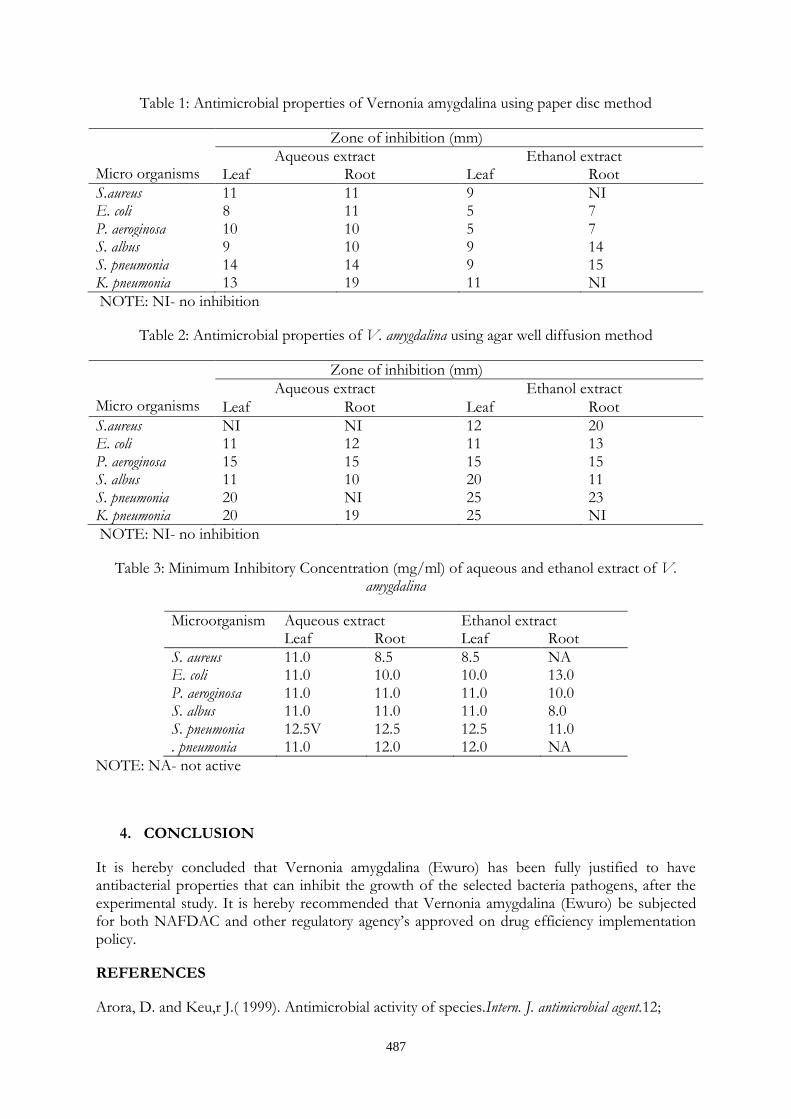
487
Table 1: Antimicrobial properties of Vernonia amygdalina using paper disc method
Micro organisms
Zone of inhibition (mm)
Aqueous extract Ethanol extract Leaf Root Leaf Root
S.aureus 11 11 9 NI E. coli 8 11 5 7 P. aeroginosa 10 10 5 7 S. albus 9 10 9 14 S. pneumonia 14 14 9 15 K. pneumonia 13 19 11 NI
NOTE: NI- no inhibition
Table 2: Antimicrobial properties of V. amygdalina using agar well diffusion method
Micro organisms
Zone of inhibition (mm)
Aqueous extract Ethanol extract
Leaf Root Leaf Root
S.aureus NI NI 12 20 E. coli 11 12 11 13 P. aeroginosa 15 15 15 15 S. albus 11 10 20 11 S. pneumonia 20 NI 25 23 K. pneumonia 20 19 25 NI
NOTE: NI- no inhibition
Table 3: Minimum Inhibitory Concentration (mg/ml) of aqueous and ethanol extract of V. amygdalina
Microorganism Aqueous extract Ethanol extract Leaf Root Leaf Root
S. aureus 11.0 8.5 8.5 NA E. coli 11.0 10.0 10.0 13.0 P. aeroginosa 11.0 11.0 11.0 10.0 S. albus 11.0 11.0 11.0 8.0 S. pneumonia 12.5V 12.5 12.5 11.0 . pneumonia 11.0 12.0 12.0 NA
NOTE: NA- not active
4. CONCLUSION
It is hereby concluded that Vernonia amygdalina (Ewuro) has been fully justified to have antibacterial properties that can inhibit the growth of the selected bacteria pathogens, after the experimental study. It is hereby recommended that Vernonia amygdalina (Ewuro) be subjected for both NAFDAC and other regulatory agency’s approved on drug efficiency implementation policy.
REFERENCES
Arora, D. and Keu,r J.( 1999). Antimicrobial activity of species.Intern. J. antimicrobial agent.12;

488
257.
Damintoti, K., Mamoudou, H.D., Jacques S. and Alfred, S.T. (2005) Antioxidant and
antibacterial activities of polyphenols from ethno,medicinal plants of Burkino Faso.
Africa journal of microbiology 4(8); 823-828.
Dash, G.K. and Murth,y P.N.( 2011). Antimicrobial activity of few selected medicinal
plants.International research journal of pharmacy 2(1): 146-152.
Gourav, S., Sharmina, G., Nabal, M., Mansi, M. and Kaiposh, M. (2010). Determination of
antimicrobial activity and MIC of crude extract of Abriusprecatoroius.L
Groppo, F.C.,Bergamaschi, C.C., Cogon, K., Franz, M.M., Molta, R.H.L. and Andrade, E.D.
(2008). Use of phototherapy in dentistry: a review articlephytother Res. 22: 993-998.
Hoffman, D.L. (1987). The herb uses guide thomsorieus publishing group center for diarhoeal
disease research ben gladesh(icddrb). Dhaka.
Kirby, G.C. (1996). Medicinal plants and control of parasites.Trans. Roy. Soc. Trop. Med. Hyg.
90:605-609.
Makhubu, L. (2006). Traditional ,medicine in switzerland. African journal of traditional
complementary and alternative medicine.
Marcheseb, A., Schito, G.C. (2001). Resistance pattern of lower respiratory tract pathogen in
Europe.Int. J. Antimicrob. Agents 16 suppl 1: S25-2S9.
Nasar-Abbas, and Halkman, A.K. (2004).Antimicrobial effect of water extract of sumac
(Rhuscariaria L.) on the growth of some food borne bacteria including pathogens. Int.
J. Food. Microbial 97: 63-69.
Okigbo, R.N. and Omodamiro, O.D. (2006). Antimicrobial effect of leabve extracts of pigeon
pea (cayanuscajan (L) mill (sp) on some human pathogens. Journal of Herbs, spices
and medicina plants (USA) 12(1/2): 117-127.
Rahman, A., Parvex, M.A.K., Parvin, T., Paul, D.K. and Sattar M.A. (2004). Antimicrobial
activity of three bioactive compound from the stream bark of pipperchaba. Int. Bioscie
Res. 1:16-20.

489
Tanaka, H., Sato, M. and Fijuwara, S.(2002). Antimicrobial activity of isoflavonoids isolated
from Erythrinia variegate against methicillin resistance of Staphylococcus aureusLett.
Appl. Microbiol. 35: 228-489.
Tichy, J. and Novec, J. (1998).Extraction assay and analysis of antimicrobials from plants with
activity against dental pathogens (streptococcus sp). J. Alter. Compl Med. 4(1): 39-45.
490
ANALYSIS OF ROAD TRAFFIC SITUATION IN SABO AND ATAKUMOSA MARKET ILESA, OSUN STATE NIGERIA
* Rafiu Babatunde IBRAHIM, Samuel Babatunde ADEDOTUN, Dele Sunday OGUNDAHUNSI and Olatoyosi Omolara IBIRONKE
Department of Urban and Regional PlanningOsun State University Osogbo Nigeria
*Email of Corresponding Author: [email protected]
ABSTRACT
This study examines the situation of road traffic in Sabo and Atakumosa markets, Ilesa. It assesses the level of road encroachment in the study area; assess traffic flow and congestion; evaluates the condition of road infrastructure and as well appraises management technique for the road traffic in the study area. Degree of encroachment was measured using calibration to obtain the areas of spaces the encroachers covered. A volumetric analysis was carried out to assess the traffic flow and congestion in the market. A total of 241 questionnaire were administered using random and systematic sampling method in the two markets. The data were analyzed using descriptive statistics of frequency and percentages. Findings show that the percentage of encroachment in Sabo market is 43% while that of Atakumosa market is 32%. The average degree of encroachment in the two markets is 37.5%. Also, from the volumetric analysis of both markets it can be concluded that; both markets have high vehicular count of motorcycle (456,672), private cars (328,334), and passengers’ bus (250,260) respectively. The hour with the highest vehicular count in both markets is the same but the hour with the least vehicular count in both markets differs. Findings also shown that the condition of infrastructures is fair, not too bad but can be improved upon. Also, the compliance to available road traffic management techniques is above average but needs also to be more attended to. It is recommended that encroachment on roads in markets should be discouraged through public awareness, enlightenment programme and punitive measures.
Keywords: Traffic flow, Markets, Encroachment, Congestion, Traders
1. Introduction
Road became an important means of transport during the rule of the Roman Empire. Roman empire modernized, using road efficiently relative to the current use of road by which horse, donkey, camel, bull were used as major carrier in road transport. But the advent of the motor vehicle indicated the highways were no longer designed for pedestrians, carts and horses. The invention has led to more traffic on road. Road traffic comprises of road users, including riders, horses or groups, trucks, street cars, busses and other means of transport, whether alone or together, while using the public road for travel purposes.(Fadamiro,2005)
According to Fakeye and Fadamiro (2012), road traffic is officially structured in a variety of states, including designated roads, junctions, ramps, interchanges, traffic signals or signs. Road traffic is often categorized by type: large motor vehicles (e.g. buses, trucks), smaller automobiles (e.g. mopeds, bicycles) and pedestrians. Different classes may share speed limits and easements or may be segregated. Many jurisdictions may have very detailed and complex road rules, while others may depend more on the common sense and ability of drivers to comply. Things that disrupt the flow and may cause traffic to degenerate into a mess include road construction,

491
crashes, and road debris. A minor disruption in a phenomenon known as traffic waves can linger in particularly busy freeways. A complete breakdown of the organization can contribute to traffic congestion and gridlock.
Institutions abound in most cities of the world. In Africa, particularly Nigeria, markets, just like many other institutions, lack sanitary centers and offerings essential to preserve the standard hygiene of the environment. They may also pose health hazard aside from being eye sores and resources of unpleasant odour. Very often, refuse has encroached on or completely blocked roads thereby obstructing traffic. Refuse frequently block gutters and different channels thereby cause flooding all through rain session. Another commonplace characteristic of markets in Nigeria is gross inadequacy of sanitary facilities along with potable water, bathroom and toilets, refuse disposal bays among others. Open urination and defecation is massive and the resultant infection of the environment contribution to environmental degradation. Blockage of access roads within the market and in the market surroundings sometimes lead to unnecessary loss of lives and properties at the event of emergencies such as fire accident (Yusuf, 2013) .
Traffic congestion occurs when cities’ road network is unable to accommodate the volume of traffic that uses it. This situation is caused by rapid growth in motorization and with less than corresponding improvement in road network, traffic management techniques and related transport facilities. This road traffic congestion is a phenomenon that is associated with urban environment all over the world. This is because transport is needed to move from one place to another, especially when trekking becomes inefficient. While traffic congestion has been managed very well in some developed countries, it has continued to defy solutions in developing world especially in Metropolitan cities of Nigeria like Lagos, Port Harcourt and Kano as well as medium sized cities like Osogbo, Akure, Ilesa and many others. Most of these cities suffer from inadequate facilities that could ensure smooth urban movement (Muili, 2007).
The problem of road traffic congestion has reached an alarming rate in Ilesha especially around Sabo and Atakunmosa market. There is, therefore, a general feeling that the flow of traffic should be open to enable the free movement of goods and services, but the reverse is true of the overcrowding of road users (vehicles) on the road and this expresses itself through a number of problems, including: delay, inability to accurately predict travel time, contributing vehicles to more travel time and less time spent on productive activities, waste of fuel and growing air pollution.
Different scholars such as Adedotun, Ogundahunsi and Oyeniyi, (2016), Joslin, (2011) amongst others have carried out different researches on traffic congestions in cities and towns in Nigeria. Most of these works bothers on factors responsible for traffic congestion which include lack of park place, no effective drainage and the likes. These authors and many others have all worked on traffic congestion but not mainly on road traffic situation in market. This research is thereby focusing on analyzing the road traffic situation in the two major markets in Ilesa, Nigeria with the aim of filling the perceived gaps not touched by the previously mentioned scholars. Some of issued examined are the level of road encroachment, nature of the traffic flow and congestion, the conditions of available road infrastructures as well as management technique used for road traffic in both market, with a view to suggesting appropriate strategies for effective road traffic management.
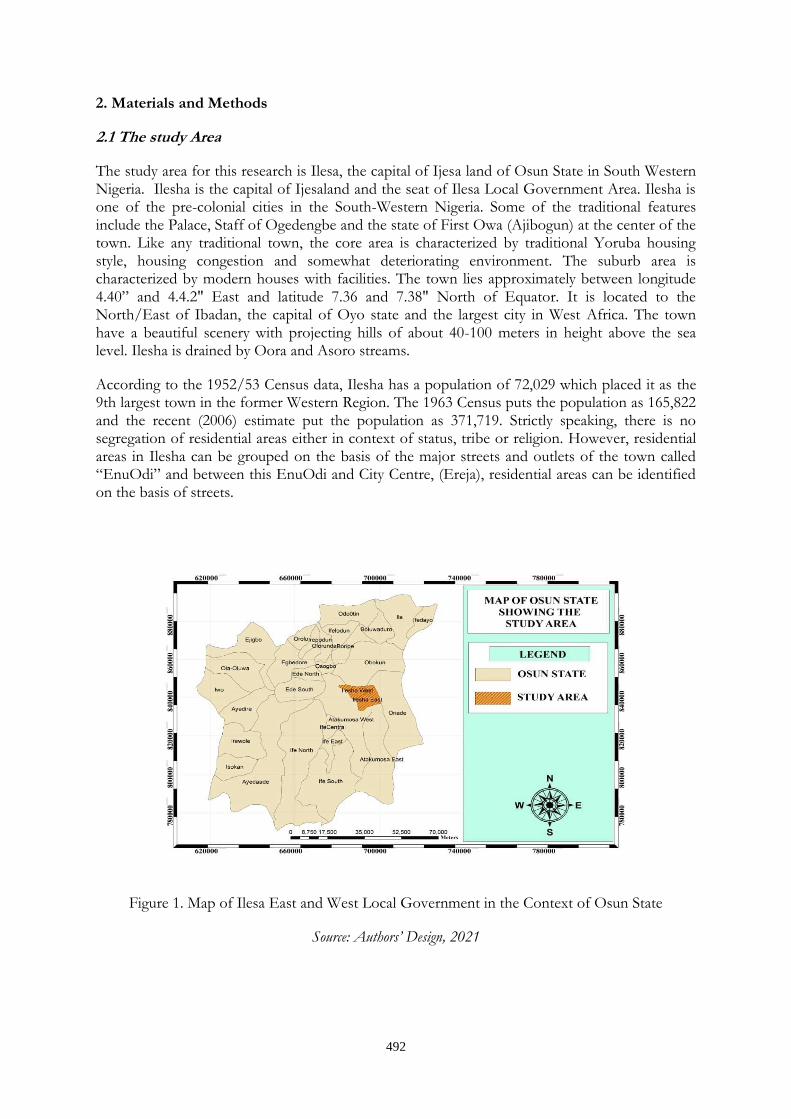
492
2. Materials and Methods
2.1 The study Area
The study area for this research is Ilesa, the capital of Ijesa land of Osun State in South Western Nigeria. Ilesha is the capital of Ijesaland and the seat of Ilesa Local Government Area. Ilesha is one of the pre-colonial cities in the South-Western Nigeria. Some of the traditional features include the Palace, Staff of Ogedengbe and the state of First Owa (Ajibogun) at the center of the town. Like any traditional town, the core area is characterized by traditional Yoruba housing style, housing congestion and somewhat deteriorating environment. The suburb area is characterized by modern houses with facilities. The town lies approximately between longitude 4.40” and 4.4.2" East and latitude 7.36 and 7.38" North of Equator. It is located to the North/East of Ibadan, the capital of Oyo state and the largest city in West Africa. The town have a beautiful scenery with projecting hills of about 40-100 meters in height above the sea level. Ilesha is drained by Oora and Asoro streams.
According to the 1952/53 Census data, Ilesha has a population of 72,029 which placed it as the 9th largest town in the former Western Region. The 1963 Census puts the population as 165,822 and the recent (2006) estimate put the population as 371,719. Strictly speaking, there is no segregation of residential areas either in context of status, tribe or religion. However, residential areas in Ilesha can be grouped on the basis of the major streets and outlets of the town called “EnuOdi” and between this EnuOdi and City Centre, (Ereja), residential areas can be identified on the basis of streets.
Figure 1. Map of Ilesa East and West Local Government in the Context of Osun State
Source: Authors’ Design, 2021

493
Figure 2. Map of Location of Markets in the Study
Source: Authors’ Design, 2021
2.2 Method of Data Collection and Analysis
The two markets and their population is the sample frame for this research. Degree of encroachment was measured using calibration to obtain the areas of spaces which the encroachers covered. A volumetric analysis was carried out to assess the traffic flow and congestion in the market. A total of 241 questionnaires were administered using random and systematic sampling method for the research in the two markets. The data collected were analyzed using descriptive of frequency and percentage as well as mean computation. For descriptive, cross tabulation of frequency and percentage was used to analyze the level of road encroachment, the flow of traffic and congestion, the condition of road infrastructure and also to evaluate the management techniques for road traffic.
3. Research Findings
3.1 Level of Road Encroachment by Market Trading activities.
This sub-section presents the measurement of the market road on market days and non-market days. Degree of Road Encroachment which is presented in Table 1 was computed using the following parameters:
A= width of road
B= length of road
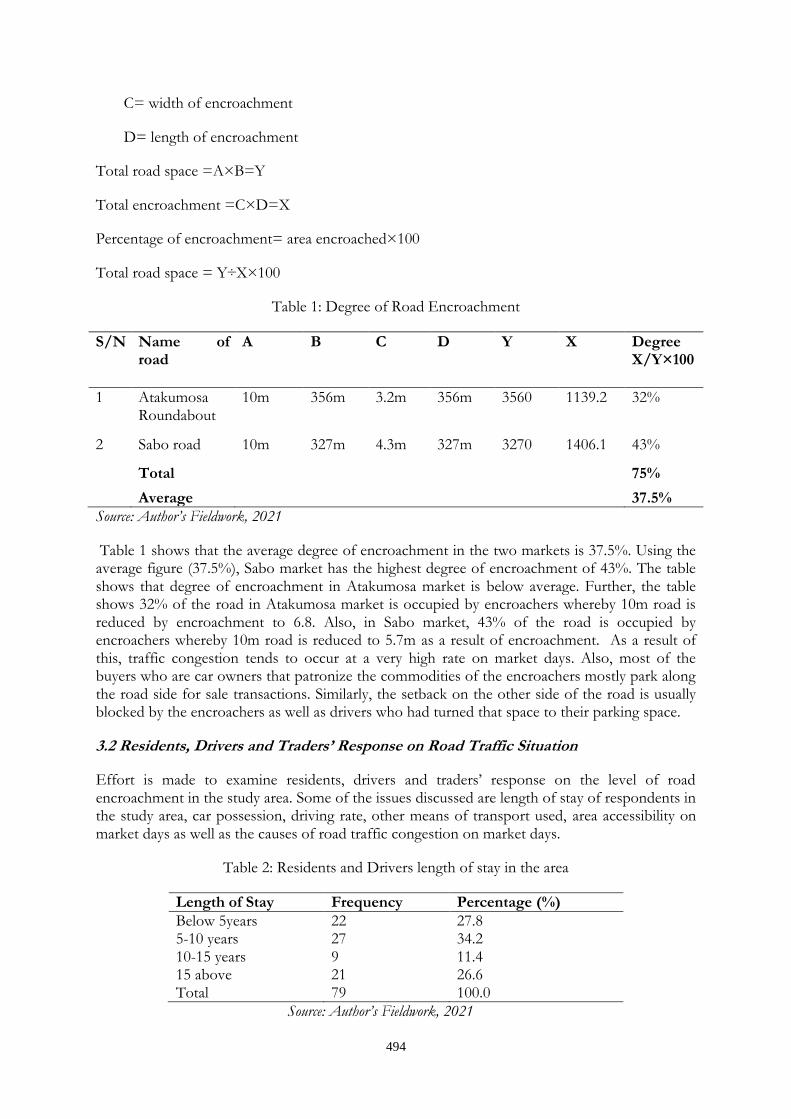
494
C= width of encroachment
D= length of encroachment
Total road space =A×B=Y
Total encroachment =C×D=X
Percentage of encroachment= area encroached×100
Total road space = Y÷X×100
Table 1: Degree of Road Encroachment
S/N Name of road
A B C D Y X Degree X/Y×100
1 Atakumosa Roundabout
10m 356m 3.2m 356m 3560 1139.2 32%
2 Sabo road 10m 327m 4.3m 327m 3270 1406.1 43%
Total 75%
Average 37.5%
Source: Author’s Fieldwork, 2021
Table 1 shows that the average degree of encroachment in the two markets is 37.5%. Using the average figure (37.5%), Sabo market has the highest degree of encroachment of 43%. The table shows that degree of encroachment in Atakumosa market is below average. Further, the table shows 32% of the road in Atakumosa market is occupied by encroachers whereby 10m road is reduced by encroachment to 6.8. Also, in Sabo market, 43% of the road is occupied by encroachers whereby 10m road is reduced to 5.7m as a result of encroachment. As a result of this, traffic congestion tends to occur at a very high rate on market days. Also, most of the buyers who are car owners that patronize the commodities of the encroachers mostly park along the road side for sale transactions. Similarly, the setback on the other side of the road is usually blocked by the encroachers as well as drivers who had turned that space to their parking space.
3.2 Residents, Drivers and Traders’ Response on Road Traffic Situation
Effort is made to examine residents, drivers and traders’ response on the level of road encroachment in the study area. Some of the issues discussed are length of stay of respondents in the study area, car possession, driving rate, other means of transport used, area accessibility on market days as well as the causes of road traffic congestion on market days.
Table 2: Residents and Drivers length of stay in the area
Length of Stay Frequency Percentage (%)
Below 5years 22 27.8 5-10 years 27 34.2 10-15 years 9 11.4 15 above 21 26.6 Total 79 100.0
Source: Author’s Fieldwork, 2021
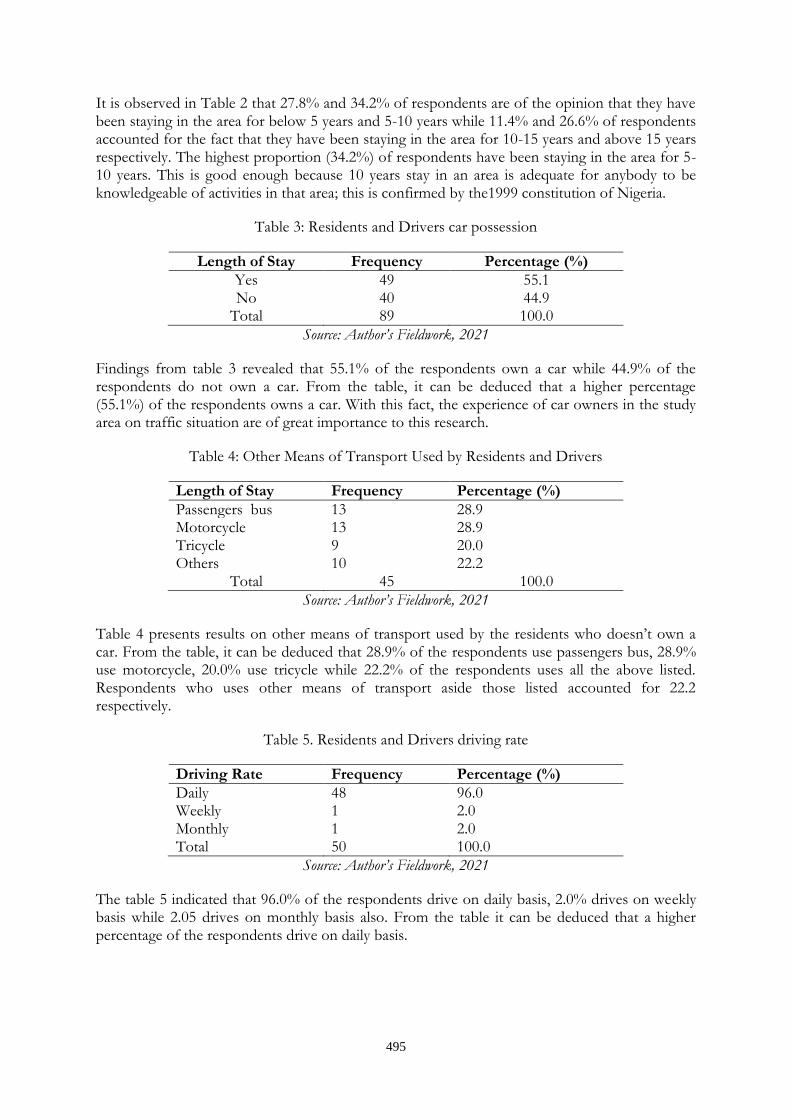
495
It is observed in Table 2 that 27.8% and 34.2% of respondents are of the opinion that they have been staying in the area for below 5 years and 5-10 years while 11.4% and 26.6% of respondents accounted for the fact that they have been staying in the area for 10-15 years and above 15 years respectively. The highest proportion (34.2%) of respondents have been staying in the area for 5-10 years. This is good enough because 10 years stay in an area is adequate for anybody to be knowledgeable of activities in that area; this is confirmed by the1999 constitution of Nigeria.
Table 3: Residents and Drivers car possession
Length of Stay Frequency Percentage (%)
Yes 49 55.1 No 40 44.9
Total 89 100.0
Source: Author’s Fieldwork, 2021
Findings from table 3 revealed that 55.1% of the respondents own a car while 44.9% of the respondents do not own a car. From the table, it can be deduced that a higher percentage (55.1%) of the respondents owns a car. With this fact, the experience of car owners in the study area on traffic situation are of great importance to this research.
Table 4: Other Means of Transport Used by Residents and Drivers
Length of Stay Frequency Percentage (%)
Passengers bus 13 28.9 Motorcycle 13 28.9 Tricycle 9 20.0 Others 10 22.2
Total 45 100.0
Source: Author’s Fieldwork, 2021
Table 4 presents results on other means of transport used by the residents who doesn’t own a car. From the table, it can be deduced that 28.9% of the respondents use passengers bus, 28.9% use motorcycle, 20.0% use tricycle while 22.2% of the respondents uses all the above listed. Respondents who uses other means of transport aside those listed accounted for 22.2 respectively.
Table 5. Residents and Drivers driving rate
Driving Rate Frequency Percentage (%)
Daily 48 96.0 Weekly 1 2.0 Monthly 1 2.0 Total 50 100.0
Source: Author’s Fieldwork, 2021
The table 5 indicated that 96.0% of the respondents drive on daily basis, 2.0% drives on weekly basis while 2.05 drives on monthly basis also. From the table it can be deduced that a higher percentage of the respondents drive on daily basis.

496
Table 6: Area Accessibility on Market Days
Street name How accessible is your area on market days
Very accessible
Rarely accessible
Not accessible
Total
Olaniyi Afonja
F % of row % of column
2 26.6 33.3
5 71.4 8.6
0 0.0 0.0
7 100.0 7.5
Orisunbare F % of row % of column
0 0.0 0.0
6 100.0 10.3
0 0.0 0.0
6 100.0 6.7
Sabo F % of row % of column
1 5.9 16.7
6 35.3 10.3
10 58.8 38.5
17 100.0 18.9
Irojo F % of row % of column
0 0.0 0.0
11 91.7 19.0
1 8.3 3.8
12 100.0 13.3
Okesa F % of row % of column
2 12.5 33.3
11 91.7 19.0
1 8.3 3.8
12 100.0 13.3
Maranatha F % of row % of column
0 0.0 0.0
10 62.5 17.2
6 37.5 23.1
16 100.0 17.8
Ikoti F % of row % of column
0 0.0 0.0
1 20.0 1.7
4 80.0 15.0
5 100.0 5.6
Igbogi F % of row % of column
1 33.3 16.7
2 66.7 3.4
0 0.0 0.0
3 100.0 3.3
Muslim F % of row % of column
0 0.0 0.0
8 100.0 13.8
0 0.0 0.0
8 100.0 8.9
Total
F % of row % of column
6 6.7 100.0
58 64.4 100.0
26 28.9 100.0
90 100.0 100.0
X² =39.260, df=16, p < 0.05=0.000 F =Frequency, % = Percentage
Source: Author’s Fieldwork, 2021
Table 6 presents the respondents’ opinion on how accessible is their area on market days. It is observed that 6.7% of the respondents indicated that the area is very accessible, 64.4% argued its rarely accessible while 28.9% of the respondent noted that the area is not accessible on market days. The highest proportion of respondents are of the view that the area is rarely accessible on market days. This situation actually confirmed that there used to be traffic congestion on market days.

497
Table 7: Traders’ response on where they park vehicles
Vehicle Parking Frequency Percentage (%) Car park 3 8.8 On street 31 91.2 Total 34 100.0
Source: Author’s Fieldwork, 2021
Table 7 describes where respondents with car do park whenever they patronize the market. From the table, 8.8% of them accounted for the fact that they use the car park, while 91.2% of respondents claimed that they park on the street.
Table 8: Residents and Drivers response on causes of congestion on market days
Causes of Traffic Congestion
Frequency Percentage
On street parking 8 8.8 Ineffectiveness of traffic wardens
1 1.1
Traders displaying goods on road
28 30.8
Bad road 17 18.7 All of the above 37 40.7 Total 91 100.0
Source: Author’s Fieldwork, 2021
Table 8 represents respondents’ position on causes of road traffic congestion on market days. Accordingly, 8.8% of respondents adduced street parking as the cause, 1.1% said its ineffectiveness of traffic warden, 30.8% disclosed its traders displaying goods on the road, 18.7% claimed its bad road while 40.7% of the respondents are of the notion that the congestion is caused by all the reasons listed above.
Table 9 Traders’ level of patronage to the study area
Market name Level of patronage
Market days Non market days
Rarely Total
Sabo market F % of row % of column
34 53.1 41.0
27 42.2 48.2
3 4.7 42.9
64 100.0 43.8
Atakumosa market F % of row % of column
49 59.8 59.0
29 35.4 51.8
4 4.9 57.1
82 100.0 56.2
Total
F % of row % of column
83 56.8 100.0
56 38.4 100.0
7 4.8 100.0
146 100.0 100.0
X² =0.717, df=2, p < 0.05=0.699 F =Frequency, % = Percentage
Source: Author’s Fieldwork, 2021

498
Table 9 discusses the rate at which the respondents (traders) patronize the market. From the table, 56.8% of them asserted that they patronize the market on market days, 38.4% stressed that they patronize on non-market days while 4.8% of the respondents highlighted the fact that they patronize the market rarely.
Table 10: Traders’ response on availability of park space
Market name Availability of parking space
Yes No Total
Sabo market F % of row % of column
0 0.0 0.0
63 100.0 47.0
63 100.0 46.7
Atakumosa market F % of row % of column
1 1.4 100.0
71 98.6 53.0
72 100.0 53.3
Total F % of row % of column
1 0.7 100.0
134 99.3 100.0
135 100.0 100.0
X² =0.882, df=1, p > 0.05=0.348 F =Frequency, % = Percentage
Source: Author’s Fieldwork, 2021
Table 10 explains the respondents’ position on availability of parking space in the study area. From the table, 0.7% of the respondent responded to availability of park space while
99.3% responded to no availability of park space in the study area.
Table 11: Space occupied by Respondents
Market name Occupied space
Stall/ store Open space
On street Total
Sabo market F % of row % of column
14 20.6 28.6
22 32.4 44.0
32 47.1 64.0
68 100.0 45.6
Atakumosa market F % of row %of column
35 43.2 71.4
28 34.6 56.0
18 22.2 36.0
81 100.0 54.4
Total F % of row % of column
49 32.9 100.0
50 33.6 100.0
50 33.6 100.0
149 100.0 100.0
X² =12.602, df=2, p < 0.05=0.002 F =Frequency, % = Percentage
Source: Author’s Fieldwork, 2021
Table 11 shows that 32.9% of the respondents claimed to occupy stall/store, 33.6% occupy open space, while 33.6% make use of on street. It can therefore be deduced from the table that the same percentage of respondents (33.6%) occupies open space and on street respectively.
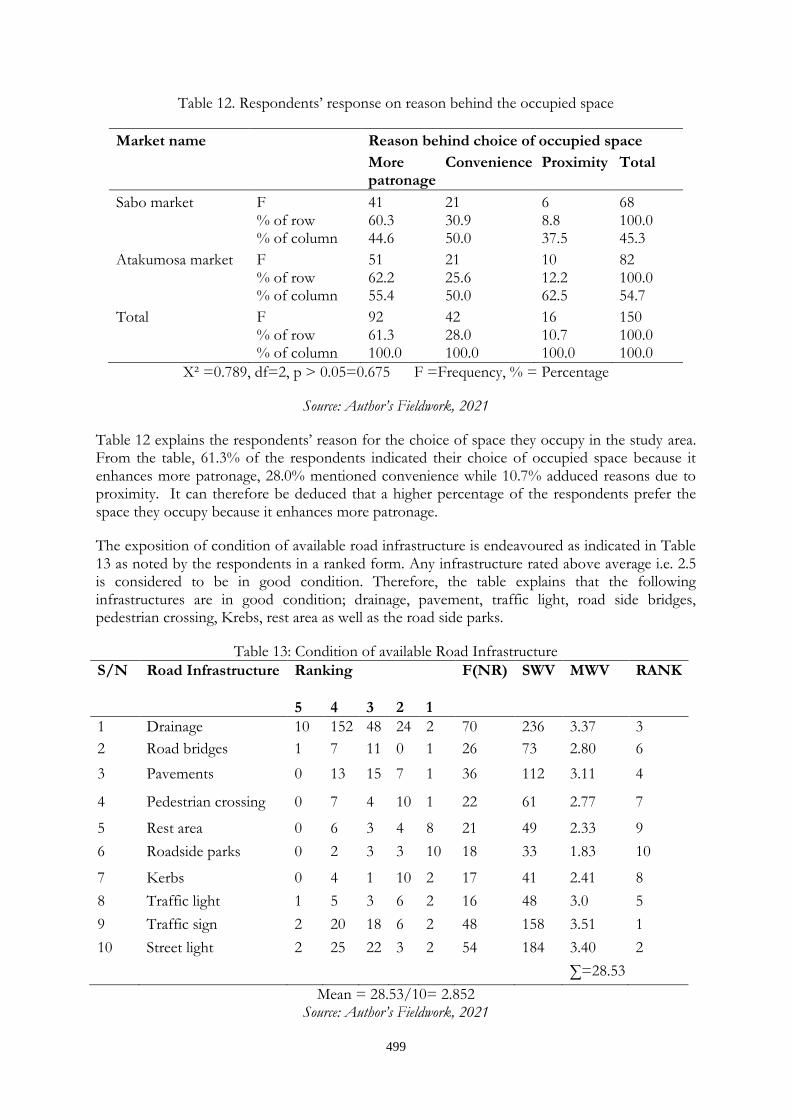
499
Table 12. Respondents’ response on reason behind the occupied space
Market name Reason behind choice of occupied space
More patronage
Convenience Proximity Total
Sabo market F % of row % of column
41 60.3 44.6
21 30.9 50.0
6 8.8 37.5
68 100.0 45.3
Atakumosa market F % of row % of column
51 62.2 55.4
21 25.6 50.0
10 12.2 62.5
82 100.0 54.7
Total F % of row % of column
92 61.3 100.0
42 28.0 100.0
16 10.7 100.0
150 100.0 100.0
X² =0.789, df=2, p > 0.05=0.675 F =Frequency, % = Percentage
Source: Author’s Fieldwork, 2021
Table 12 explains the respondents’ reason for the choice of space they occupy in the study area. From the table, 61.3% of the respondents indicated their choice of occupied space because it enhances more patronage, 28.0% mentioned convenience while 10.7% adduced reasons due to proximity. It can therefore be deduced that a higher percentage of the respondents prefer the space they occupy because it enhances more patronage.
The exposition of condition of available road infrastructure is endeavoured as indicated in Table 13 as noted by the respondents in a ranked form. Any infrastructure rated above average i.e. 2.5 is considered to be in good condition. Therefore, the table explains that the following infrastructures are in good condition; drainage, pavement, traffic light, road side bridges, pedestrian crossing, Krebs, rest area as well as the road side parks.
Table 13: Condition of available Road Infrastructure
S/N
Road Infrastructure
Ranking F(NR)
SWV
MWV
RANK
5 4 3 2 1
1 Drainage 10 152 48 24 2 70 236 3.37 3
2 Road bridges 1 7 11 0 1 26 73 2.80 6
3 Pavements 0 13 15 7 1 36 112 3.11 4
4 Pedestrian crossing 0 7 4 10 1 22 61 2.77 7
5 Rest area 0 6 3 4 8 21 49 2.33 9
6 Roadside parks 0 2 3 3 10 18 33 1.83 10
7 Kerbs 0 4 1 10 2 17 41 2.41 8
8 Traffic light 1 5 3 6 2 16 48 3.0 5
9 Traffic sign 2 20 18 6 2 48 158 3.51 1
10 Street light 2 25 22 3 2 54 184 3.40 2
∑=28.53
Mean = 28.53/10= 2.852 Source: Author’s Fieldwork, 2021
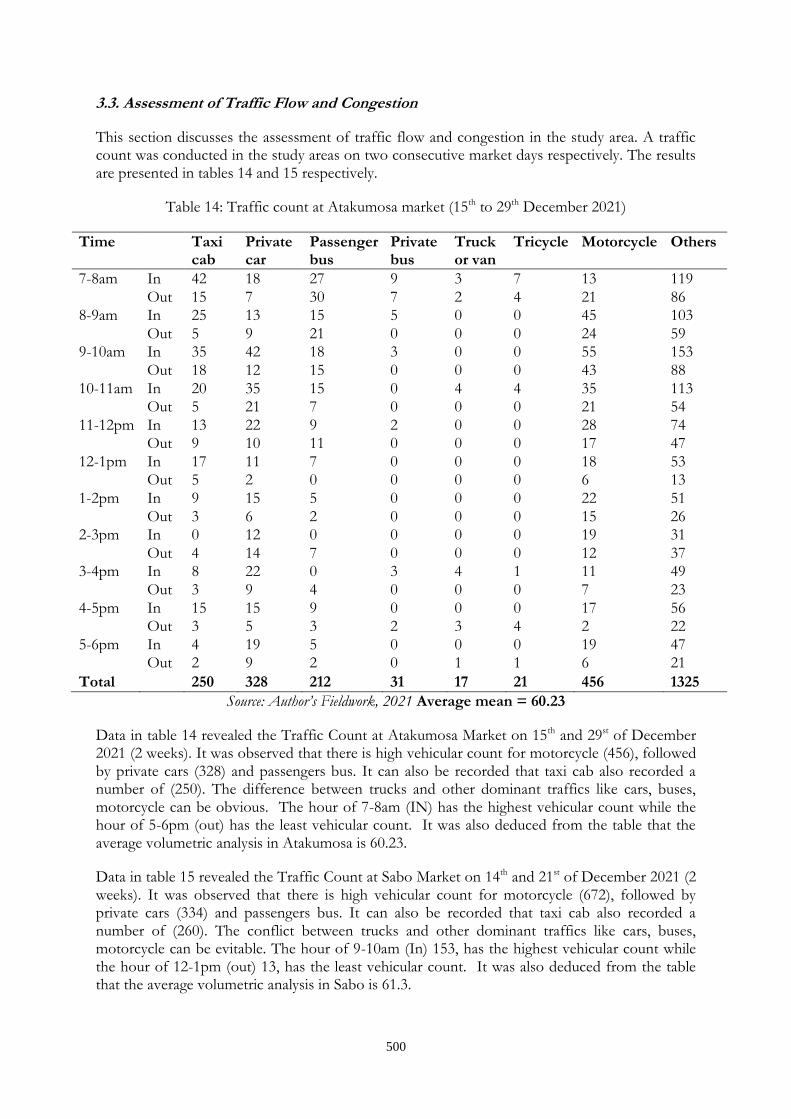
500
3.3. Assessment of Traffic Flow and Congestion
This section discusses the assessment of traffic flow and congestion in the study area. A traffic count was conducted in the study areas on two consecutive market days respectively. The results are presented in tables 14 and 15 respectively.
Table 14: Traffic count at Atakumosa market (15th to 29th December 2021)
Time Taxi cab
Private car
Passenger bus
Private bus
Truck or van
Tricycle Motorcycle Others
7-8am In 42 18 27 9 3 7 13 119
Out 15 7 30 7 2 4 21 86 8-9am In 25 13 15 5 0 0 45 103
Out 5 9 21 0 0 0 24 59 9-10am In 35 42 18 3 0 0 55 153
Out 18 12 15 0 0 0 43 88
10-11am In 20 35 15 0 4 4 35 113 Out 5 21 7 0 0 0 21 54
11-12pm In 13 22 9 2 0 0 28 74 Out 9 10 11 0 0 0 17 47
12-1pm In 17 11 7 0 0 0 18 53 Out 5 2 0 0 0 0 6 13
1-2pm In 9 15 5 0 0 0 22 51
Out 3 6 2 0 0 0 15 26 2-3pm In 0 12 0 0 0 0 19 31
Out 4 14 7 0 0 0 12 37 3-4pm In 8 22 0 3 4 1 11 49
Out 3 9 4 0 0 0 7 23
4-5pm In 15 15 9 0 0 0 17 56 Out 3 5 3 2 3 4 2 22
5-6pm In 4 19 5 0 0 0 19 47 Out 2 9 2 0 1 1 6 21
Total 250 328 212 31 17 21 456 1325
Source: Author’s Fieldwork, 2021 Average mean = 60.23
Data in table 14 revealed the Traffic Count at Atakumosa Market on 15th and 29st of December 2021 (2 weeks). It was observed that there is high vehicular count for motorcycle (456), followed by private cars (328) and passengers bus. It can also be recorded that taxi cab also recorded a number of (250). The difference between trucks and other dominant traffics like cars, buses, motorcycle can be obvious. The hour of 7-8am (IN) has the highest vehicular count while the hour of 5-6pm (out) has the least vehicular count. It was also deduced from the table that the average volumetric analysis in Atakumosa is 60.23.
Data in table 15 revealed the Traffic Count at Sabo Market on 14th and 21st of December 2021 (2 weeks). It was observed that there is high vehicular count for motorcycle (672), followed by private cars (334) and passengers bus. It can also be recorded that taxi cab also recorded a number of (260). The conflict between trucks and other dominant traffics like cars, buses, motorcycle can be evitable. The hour of 9-10am (In) 153, has the highest vehicular count while the hour of 12-1pm (out) 13, has the least vehicular count. It was also deduced from the table that the average volumetric analysis in Sabo is 61.3.
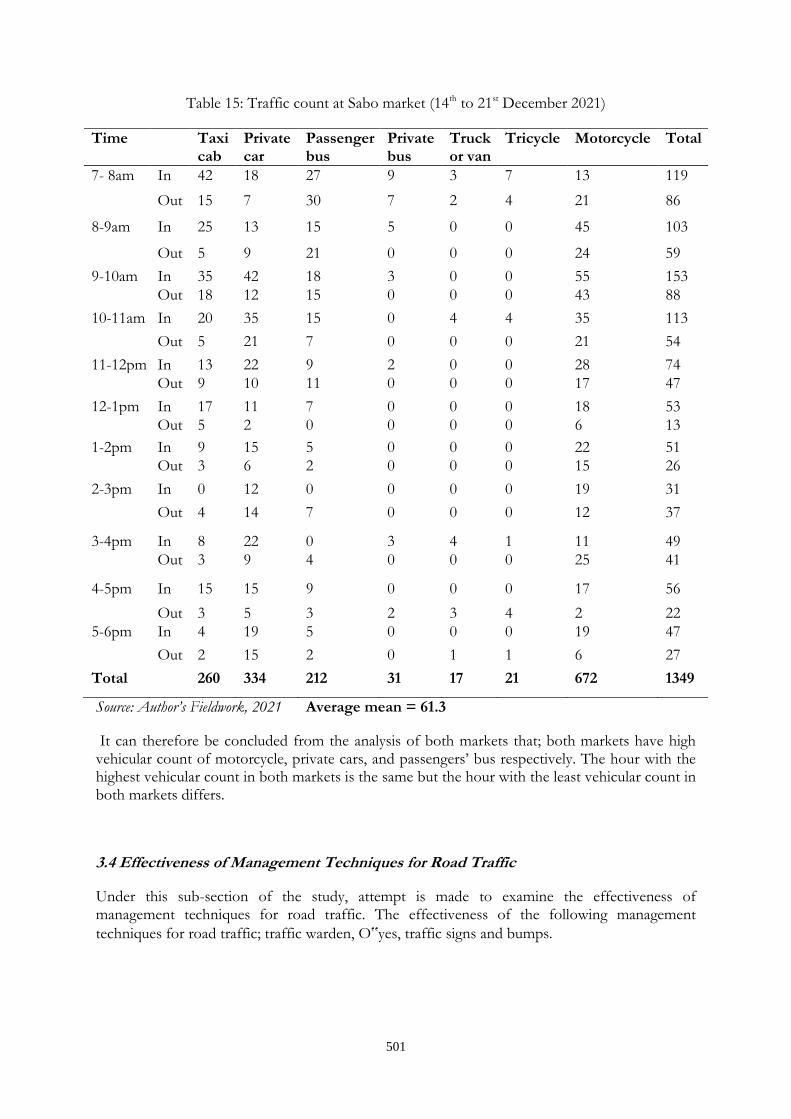
501
Table 15: Traffic count at Sabo market (14th to 21st December 2021)
Time Taxi cab
Private car
Passenger bus
Private bus
Truck or van
Tricycle Motorcycle Total
7- 8am In 42 18 27 9 3 7 13 119
Out 15 7 30 7 2 4 21 86
8-9am In 25 13 15 5 0 0 45 103
Out 5 9 21 0 0 0 24 59
9-10am In 35 42 18 3 0 0 55 153
Out 18 12 15 0 0 0 43 88
10-11am In 20 35 15 0 4 4 35 113
Out 5 21 7 0 0 0 21 54
11-12pm In 13 22 9 2 0 0 28 74
Out 9 10 11 0 0 0 17 47
12-1pm In 17 11 7 0 0 0 18 53
Out 5 2 0 0 0 0 6 13
1-2pm In 9 15 5 0 0 0 22 51
Out 3 6 2 0 0 0 15 26
2-3pm In 0 12 0 0 0 0 19 31
Out 4 14 7 0 0 0 12 37
3-4pm In 8 22 0 3 4 1 11 49
Out 3 9 4 0 0 0 25 41
4-5pm In 15 15 9 0 0 0 17 56
Out 3 5 3 2 3 4 2 22
5-6pm In 4 19 5 0 0 0 19 47
Out 2 15 2 0 1 1 6 27
Total 260 334 212 31 17 21 672 1349
Source: Author’s Fieldwork, 2021 Average mean = 61.3
It can therefore be concluded from the analysis of both markets that; both markets have high vehicular count of motorcycle, private cars, and passengers’ bus respectively. The hour with the highest vehicular count in both markets is the same but the hour with the least vehicular count in both markets differs.
3.4 Effectiveness of Management Techniques for Road Traffic
Under this sub-section of the study, attempt is made to examine the effectiveness of management techniques for road traffic. The effectiveness of the following management
techniques for road traffic; traffic warden, O‟yes, traffic signs and bumps.

502
Table 16. Effectiveness of management techniques for road traffic
S/N Management techniques
Ranking F(NR) SWV MWV Rank
3 2 1
1 Traffic warden 12 72 27 67 111 1.66 4
2 O’YES 33 136 6 85 175 2.06 2
3 Traffic signs 18 132 12 84 162 1.92 3
4 Bumps 21 45 12 78 165 2.12 1
∑=7.76
Mean = 7.76/4= 1.94
Source: Author’s Fieldwork, 2021
The table16 shows the respondents’ opinion on the effectiveness of the available management techniques for road traffic in the study area. It can be deduced that Traffic signs and Traffic warden are the most effective in the study area as they both rank above average which is 2.5
3.5 Compliance of Management Techniques for Road Traffic
Under this sub-section of the study, attempt is made to examine the compliance to the management techniques for road traffic. The compliance to the following management techniques for road traffic; traffic warden, O’yes, traffic signs and bumps. Table 17 shows that Traffic signs and Traffic wardens are the most complied with management techniques in the study area as they both rank above average which is 2.5.
Table 12. Compliance of management techniques for road traffic
S/N Management techniques compliance
Ranking F(NR) SWV MWV Rank
5 4 3 2 1
1 Traffic warden 10 64 66 4 13 57 161 2.82 4
2 O’YES 35 140 102 4 3 71 284 4.0 2
3 Traffic signs 90 144 42 12 1 75 289 3.85 3
4 Bumps 105 120 45 2 0 67 272 4.06 1
∑=14.73
Mean = 14.73/4= 3.68 Source: Author’s Fieldwork, 2021
4. Conclusion and Policy Issues
It was observed from the research findings that the percentage of encroachment in Sabo market is 43% while that of Atakumosa market is 32%. The average degree of encroachment in the two markets is 37.5%. Also, from the volumetric analysis of both markets it can be concluded that

503
both markets have high vehicular count of motorcycle, private cars, and passengers’ bus respectively. The hour with the highest vehicular count in both markets is the same but the hour with the least vehicular count in both markets differs. From the analysis as well, the condition of infrastructure is fair, not too bad but can be improved upon. Also, the compliance to available management techniques is above average but needs also to be more attended to.
Based on the findings of the study, the following recommendations were made:
i. Government should provide (recruit) and empower more traffic management wardens to improve and ensure diligence in the discharge of their duty.
ii. Environmental and traffic laws (regulation) need to be reviewed so as to minimizes the problems of traffic congestion.
iii. Encroachment on roads in markets should be discouraged through public awareness, and public enlightenment programme.
iv. There should be provision of additional stalls within the market where traders can display their goods
v. There should be the enforcement rules and sanction on encroachers through market associations with collaboration with the government to curb the actions from encroachers who has stalls but still prefer to encroach the road for whatsoever reason.
References
Adedotun S.B., Ogundahunsi D.S., and Oyeniyi A.S. (2016). Assessment of Road Transport Infrastucture in Osogbo, Osun State, Nigeria. WIT Transaction on the Built Environment, Vol 164, copyright 2016 WIT Press. Witpress.Com, ISSN 1743-3509 (Online). Page 62.
Joslin Chris, (2011). Traffic and Transportation in Nigeria.
Bromley, R.J. (1971). The Organization of Quito’s Urban Markets; Towards a reinterpretation of periodic central places, institute of British Geographers; transaction.
Callon, M. (2003). Purchasing software components at the dawn of markets. Herkules publication, Oulu University.
Cooper.N. (2008). Nigerian women as traders. A report on Nigeria lesson plan. Accessed 14th
December, 2010.
Fadamiro J. A. (2005). Urban Aesthetics and Environmental Quality; the challenges for architectural profession in Nigeria. The built environment journal 1 (2), 212-219.
Fakeye A.A. and Fadamiro J.A. (2012). Decentralization of markets and environmental sanitation scheme; a focus on urban core of Akure, Nigeria. Journal of Environment and Earth Science www.iiste.org ISSN2224-3216(paper) ISSN 2225-0948 (online) volume 2 no.8.
FAO. (1999). State of worlds market 1999. Rome.

504
Hoddler, B.W. and Ukwu, U.I.(1969). Markets in West Africa; studies of markets and trade among Yoruba and Ibadan. Ibadan; Indian university press.
Hougendoorn, S.P. and Bovy, P.H.I (2001). State –of-the-art of vehicles traffic flow modeling. Journal of system and control engineering. 215(4), 283-303.
Muli, S.J. (2007). Analysis of market typology and function in development. University of
London press, London.
World Bank (2009). Ghana innovation market place 2009 in Tema, Ghana news
agency. The freedictionary.com/market; accessed on 25th may, 2013.
Yusuf (2013). traffic law and the implication of traffic congestion at Sabon Gari market, Kano state.

505
RESIDENTIAL PROPERTY USE CONVERSIONS: THE LESSONS FROM AKURE RENTAL MARKET
Ankeli, Ikpeme Anthony.
Department of Estate Management and Valuation, Federal Polytechnic Ede, Osun State, Nigeria
Email of Corresponding Author:: [email protected]:
ABSTRACT:
The current emerging trend in Property Use Conversions (PUC), especially from residential use to commercial use have devastating consequences on property market transactions and the city morphology. The study identifies PUC determinants and examine the trend in property rental values in the study area between 2011 and 2020 with the view to determine the effect of PUC on property rental values in the study area. Primary data was collected and used for the study. Rental data were collected from tenants, Estate Surveyors and Valuers (ESV) while property use conversion data were collected from the Ondo State Ministry of Works, Lands and Housing (OSMWLH) and tenants of converted properties. Data were collected through questionnaires survey. Three strategic locations in Akure were selected and used for the study. To achieve the aim of the study, 300 questionnaires were administered on the respondents with only 250 questionnaires properly filled and returned for analysis. Both descriptive and inferential statistical tool were used for data analysis. The research findings revealed that economic, demographic and biophysical factors are the most critical PUC factors, and that PUC have significant influence on rental value trend. It recommended proactive policy formulations and aggressive public enlightenment as means to curb the menace.
Keywords: Residential Property, Use Conversions, Akure, Rental Values.
1.0 INTRODUCTION
The rapid rate of urbanization especially in the emerging nations like Nigeria and other countries in the sub-Saharan Africa has led to the shaping and reshaping of land uses (Ankeli, et al., 2020; Thuo 2013 and Olayinka, 2012). The reshaping of the vital magnitudes of cities economic, demographic, sociological and physical structure is said to have indelible contributory effects on property use conversions and rental value regimes (Ankeli, et al., 2019; Adegunle, et al., 2016; Ayo-Odifiri, et al., 2017). Conversions of use is becoming the new trend and part of urban structure as it is gradually extending from the urban areas to the rural areas. Findings of earlier studies on use conversions and urban structures as Ankeli et al. (2020a); Ankeli et al. (2019); Adegunde et al. (2016); Egbenta (2009) and Fabiyi (2006) have affirmed that the uncontrollable urbanization rate in the country, agglomeration of industries and the presences of infrastructural facilities in the urban areas has helped in strengthening land use conversions activities as property owners/users prefer to put their properties to their highest and best uses.
According to Falade cited in Ankeli et al. (2020) the structure or formation of Nigeria cities and towns appears to be entirely different from the way they used to be in some few decades back as a result of population explosion and urbanization or city expansion which is on the increase. Nigeria population that was projected in 2006 to reach 167 million by 2011 was 206.1million in 2020 with about 2.6% average annual growth rate and 52% urban population (National Population Commission NPC, 2006 and World Population Index WPI 2019). More so the
506
interplay of the economic forces of demand and supply, infrastructure provision, institutional interference, environmental and socio factors have been identified as drivers of urban land use conversions in Nigeria cities (Ankeli et al., 2019; Akanbi, et al., 2019; Gbadamosi and Ibrahim, 2013; Ifeoluwa, 2011 and Ayotaminu, et al., 2010). Ankeli, et al., (2020a) opined that besides the distortion of urban morphology, the matchless and unabated urban population explosion in Nigeria urban settlements has created problems of different rental regime, city heath, land ownership contestation and land use infiltration or conversions.
The morphology of Akure has transformed over time from the old small quite city to assume its current status with the attendant hustling and bustling, land use conversion issues and other rental housing problems which other similar medium sized Nigeria urban settlements are experiencing. Akure, become state capital/seat of government in 1976 when its administrative status changed from being a divisional and provincial headquarter. The change in status engender the influx of people to the city with the attendant problems of land use infiltration, contestation and rental instability. It therefore become necessary to examine the determinant of property use conversion in Akure, the effects of PUC on rental values and the current trend in property rental values in the city. The study however, focused attention on the effect of PUC factors on the rental values trend of converted properties between 2011 and 2020 in some selected neighbourhood of Akure, the capital of Ondo state, Nigeria.
2.0 Literature Review
Owoeye (2020) investigated the upshot of sprawl incidence on pattern of land use changes and building physiognomies in Akure and its environs. Data were collected through the administration of structured questionnaires. Both inferential and descriptive statistical tools were used in the analysis of data collected. Findings from the study show regular massive influx of people into Akure due to unguided city expansions that have serious sway on land use determinant in Akure and its adjoining communities, with substantial influence on building arrangement variations and the distribution of urban facilities across the study area. The study concluded that, there is the need for proactive efforts of stakeholders in urban management through logical engagement of inventive measures over private and public lands. It therefore suggested the adoption of regional developmental programs that will checkmate the rate of incursion into state. Mtawali (2019) studied the implications of land use change from residential use to commercial use on urban planning of the city of Livingstone, in Zambia using simple random sampling method for the selections of the respondents for the study. Data were collected through the use of questionnaire and the study’s finding revealed that property use conversion drivers in the study area are businesses with about 70% rate, accessibility to the Central Business District with 16% and rental value increase inducement with 14% while the predominant conversion type is the change in use from residential to commercial (72%). The study concluded that the action could constitute serious planning problems of infrastructure use over stretched thereby increasing Local Authority Administrative cost. The study however recommended the inclusion of relevant bodies in the approval of property use conversion approval exercise and improvement in development control mechanism to avoid sectorial planning. This did not exhaustively treated issues of property use conversion in an all-important city as Livingstone City Council as demographic, policies and environmental variables were not discussed; hence there is a gap that need to be fill.
Nkolika et al. (2018) examined the causes and consequences of the changing urban land use and neighbourhood quality of Abuja, the Nigeria Federal Capital Territory. Data collected were analysed using descriptive statistical tools. The study found that the commonest changing land use types were agrarian and residential land use types. That changing land use pattern observed are residential, public land use, retail and office properties which involves the renovation or
507
rehabilitations of existing properties; development or redevelopment; modification or the alterations of existing use. The study further identified property use conversion drivers to include economic and spatial political factors with the consequences of infrastructure overuse, landscape distortion and arbitrary land/rental value. It however, recommended the need for the achievement of sustainable urban cities through the striking of the needed balance between land administrative system and economic development which can be achieve by encouraging and adherence to land use control measures by policymakers and the private stakeholders. The study like Mtawali (2019) omitted other important land use conversion determiners as urbanization and population explosion, institutional and socio-political influences, infrastructure and environmental variables. This have created a gap that need to fill in literature. Degualem (2018) investigated the impact of urban land use changes on residential property values using Bole Sub City as the case study area. Data collected were analyzed using Relative Importance Index (RII), regression analysis, and descriptive analysis. The findings revealed significant level of change in land use from agrarian land use to other forms of urban land uses as residential, commercial, mixed-use and other uses. The RII value further shows that housing demand, road construction and transport access, agglomeration of business activities, utility development were some of the identified significant attributes for land use change that have impact on residential property values in the study area while factors as public service development was found to be the least influential determinant. It was also found that land use change has positive effects on residential property values and similarly increases its sales and rental value. The study suggested the need for efficient scheme that will minimize broker’s negative role in the distortions of value determination.
3.0 MATERIALS AND METHOD
3.1 Study Area
Akure is both a Local Government Headquarters and the capital of Ondo State. This two-status combined with the springing up of educational institutions, other public and private operational offices and its natural serene and friendly business locations have led to the influx of people to the city with the resultant consequences of land use infiltrations, land contestations, urban crime and other similar unrest (Adeoye 2016 and Ogunleye 2013). However, the unabated land use infiltrations in Akure in the last ten years call for serious concern. The city is characterized by the confused mixture of purpose-built residential buildings converted to shopping mall/plaza, offices, super markets, stores or lock-up shops.
3.2 Methods of Data Collection and Analysis
The study adopted quantitative research approach through survey questionnaire with strict adherence to the Presidential Task Force Order on Covid-19 to elicit information and fact on the determinants and influence of property or land use conversion factors on rental values of converted two, three bedrooms and tenement buildings around Oke Ijebu, Oke Aro and Fanibi in Akure. A thorough reconnaissance survey of the study locations was done to familiarize the researcher and his team on the current occurrences in the areas. During this period, properties that exhibits conversion characteristics were enumerated. Three hundred (300) of such property types were identified and questionnaires administered on the occupants. Out of the Three hundred questionnaires administered, only two hundred and fifty (250) were adequately filled and returned for analysis representing 83.33% response rate. Both descriptive and inferential statistical tool was use for the analysis.
To ensure that the research data were obtained from credible sources, the respondents were profiled. The study further adopted a perception trilogy model using Likert type scale in the

508
assessment of the respondents’ views on the relevant conversion factors in the study area. To achieve this, analysis of the affective response (emotional state of mind) variable which are usually subjective, the cognitive response (the moral convictions) which is usually the objective variables and the behavioural aspect of the subject were obtained through the perceptions of the respondents. This further shows the reliability of the information obtained from the field. More so, relevant literatures were reviewed from where several land use conversion factors or determinants were identified. Nkolika et al. (2018) land use conversion determinants classification was subjected to test using the perceptions of the respondents in the study area to assess their applicability. The study adopted five-point Likert scale format to measure the cognitive and affective reasoning of the respondents as it allow degree of independent opinion and a more friendly way of data analysis on the expectations that the strength of experience is linear. The scores range adopted are from strongly agree = 5, Agree = 4, Undecided = 3, Disagree = 2 to strongly disagree = 1. The Relative Importance Index (RII) conducted on the respondents’ perception assess their cognitive and affective workings. The Relative Importance Index (RII) formula used is:
RII = =
Where;
W = weight given to each statement by the respondents’ ranges from 1 to 5; n5 = strongly agreed; n4 = agreed; n3 = uncertain; n2 = disagreed; n1 = strongly disagreed A = Highest response integer (5) and N = Total number of respondents.
4.0 RESULTS AND DISCUSSION
The targeted respondents’ profile and the questionnaires administered are presented in Tables 1 and 2. Out of the thirty (30) active practicing Estate Surveyors and Valuers in the study area, twenty (20) Estate Surveyors and Valuers (ESV) were randomly selected as each of the ESV have equal opportunity to be selected and used for the study. 60% of the ESV holds Higher National Diploma (HND) certificates/ Bachelor’s Degree (BSc/B.Tech) while 40% are holders of Masters of Science (M. Sc) / Masters of Technology (M. Tech) Degrees in Estate Management and valuation. 75% of the ESV are principal partners who are by law qualify to give advice on rental and capital values. This imply that, data on rental values obtained are from the appropriate sources; hence have positively contributed to the robustness of research work as reflected in the outcome of the final output of the result.
Table 1: Estate Surveyors and Valuers Profile
Qualification Frequencies Percentage
Academic Qualification PhD - M.Sc/ M. Tech 8 40 B.Sc/HND 12 60 Total 20 100 Professional Qualifications Anivs + RSV 20 100 Anivs - - Total 20 100
Source: Field Survey Data 2021
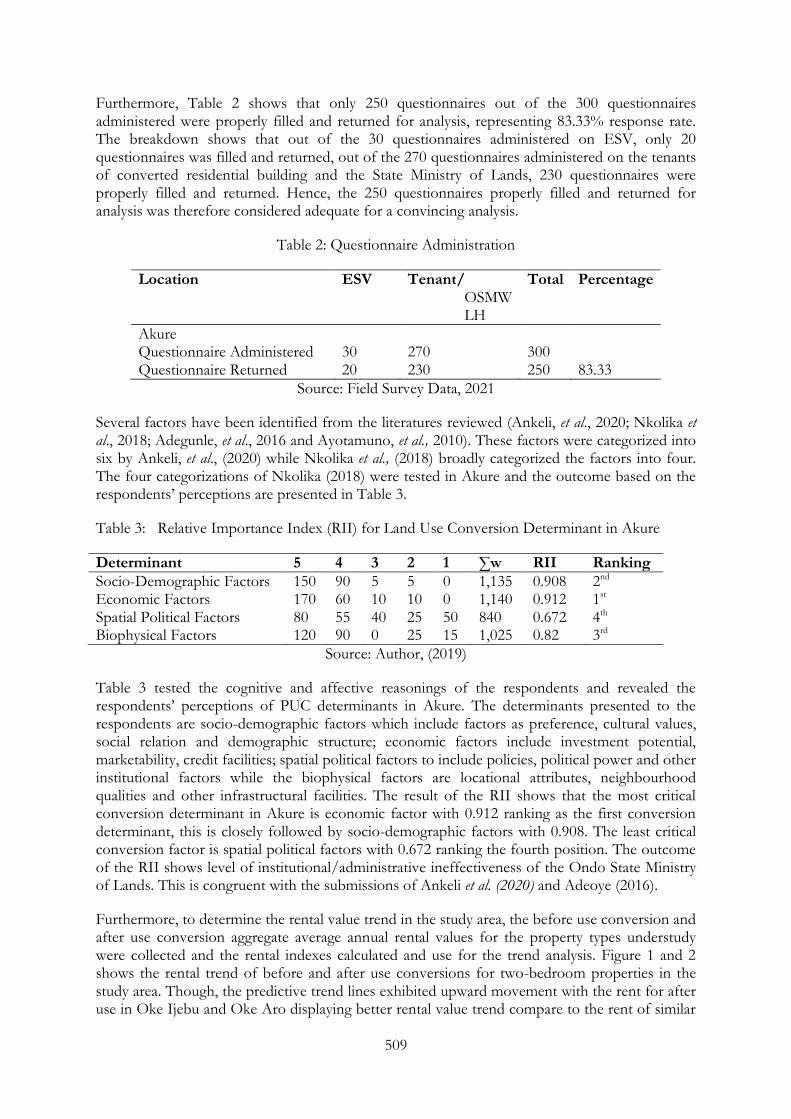
509
Furthermore, Table 2 shows that only 250 questionnaires out of the 300 questionnaires administered were properly filled and returned for analysis, representing 83.33% response rate. The breakdown shows that out of the 30 questionnaires administered on ESV, only 20 questionnaires was filled and returned, out of the 270 questionnaires administered on the tenants of converted residential building and the State Ministry of Lands, 230 questionnaires were properly filled and returned. Hence, the 250 questionnaires properly filled and returned for analysis was therefore considered adequate for a convincing analysis.
Table 2: Questionnaire Administration
Location ESV Tenant/ OSMWLH
Total Percentage
Akure Questionnaire Administered 30 270 300 Questionnaire Returned 20 230 250 83.33
Source: Field Survey Data, 2021
Several factors have been identified from the literatures reviewed (Ankeli, et al., 2020; Nkolika et al., 2018; Adegunle, et al., 2016 and Ayotamuno, et al., 2010). These factors were categorized into six by Ankeli, et al., (2020) while Nkolika et al., (2018) broadly categorized the factors into four. The four categorizations of Nkolika (2018) were tested in Akure and the outcome based on the respondents’ perceptions are presented in Table 3.
Table 3: Relative Importance Index (RII) for Land Use Conversion Determinant in Akure
Determinant 5 4 3 2 1 ∑w RII Ranking
Socio-Demographic Factors 150 90 5 5 0 1,135 0.908 2nd Economic Factors 170 60 10 10 0 1,140 0.912 1st Spatial Political Factors 80 55 40 25 50 840 0.672 4th Biophysical Factors 120 90 0 25 15 1,025 0.82 3rd
Source: Author, (2019)
Table 3 tested the cognitive and affective reasonings of the respondents and revealed the respondents’ perceptions of PUC determinants in Akure. The determinants presented to the respondents are socio-demographic factors which include factors as preference, cultural values, social relation and demographic structure; economic factors include investment potential, marketability, credit facilities; spatial political factors to include policies, political power and other institutional factors while the biophysical factors are locational attributes, neighbourhood qualities and other infrastructural facilities. The result of the RII shows that the most critical conversion determinant in Akure is economic factor with 0.912 ranking as the first conversion determinant, this is closely followed by socio-demographic factors with 0.908. The least critical conversion factor is spatial political factors with 0.672 ranking the fourth position. The outcome of the RII shows level of institutional/administrative ineffectiveness of the Ondo State Ministry of Lands. This is congruent with the submissions of Ankeli et al. (2020) and Adeoye (2016).
Furthermore, to determine the rental value trend in the study area, the before use conversion and after use conversion aggregate average annual rental values for the property types understudy were collected and the rental indexes calculated and use for the trend analysis. Figure 1 and 2 shows the rental trend of before and after use conversions for two-bedroom properties in the study area. Though, the predictive trend lines exhibited upward movement with the rent for after use in Oke Ijebu and Oke Aro displaying better rental value trend compare to the rent of similar

510
properties at Fanibi. This may not be unconnected with the proximity of these locations to Oba Adesida (Oja Oba) and Arakale which are the commercial hub of Akure. This however, supported the assertions of Ankeli et al. (2020) and Degualem (2018), that economic and demographic factors encourage property use conversions in most cities.
Figure1: Annual Rental Trend for Before Use Conversion (Two Bedroom)
Figure 2: Annual Rental Trend for After Use Conversion (Two Bedroom)
Figure 3 and 4 shows the trend in the rental values of both before and after use conversions of three-bedroom properties in the study area. Both use conversions in the study area revealed consistent upward movement with Oke Ijebu after use conversions performing better between 2011 and 2019 than rentals in the other locations. Though, the before use conversions rental for Oke Aro shows an explosive upward trend between 2019 and 2020.

511
Figure3: Annual Rental Trend for Before Use Conversion (Three Bedroom)
Figure 4: Annual Rental Trend for After Use Conversion (Three Bedroom)
Figure 5 and 6 shows the annual rental trend of tenement properties in the study area. The two years forecast revealed continuous upward trend for both use conversions with Oke Ijebu after use conversion rental performing better compare to the rent in the other locations. This is congruent with Ankeli et al. (2019) and Mtawali, (2019) who opined that after use conversions are better investment options.
Figure 5: Annual Rental Trend for Before Use Conversion (Tenement Building)
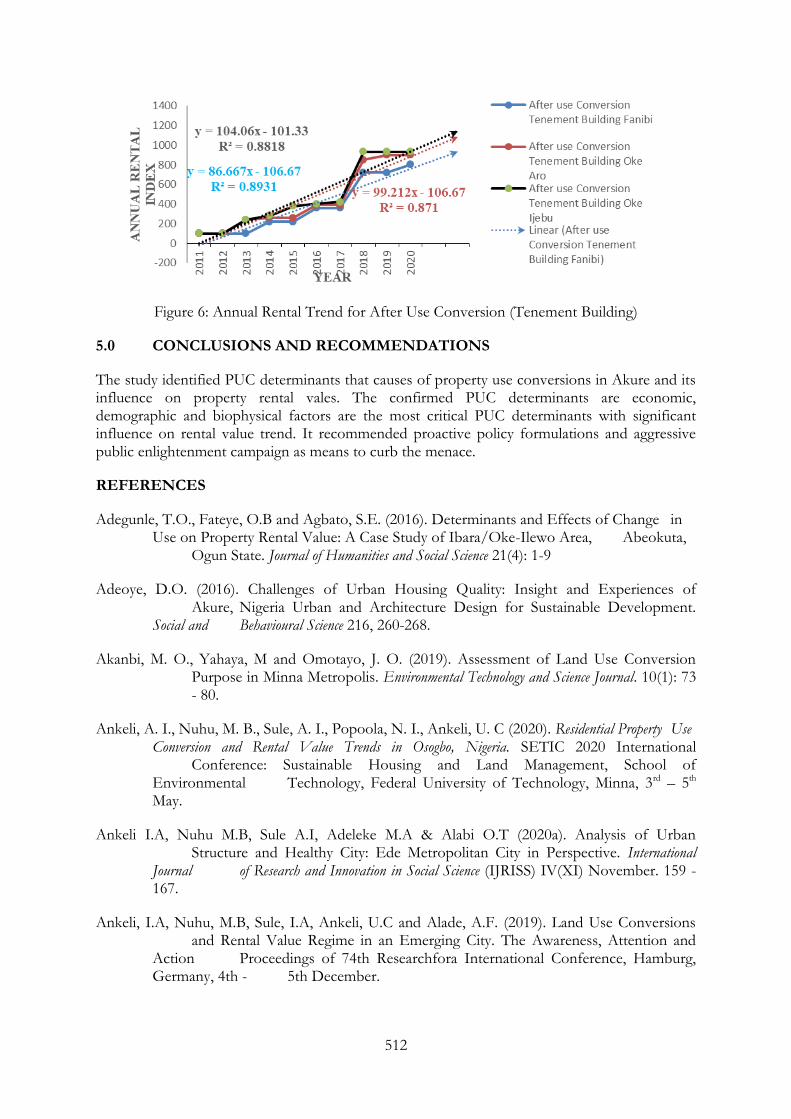
512
Figure 6: Annual Rental Trend for After Use Conversion (Tenement Building)
5.0 CONCLUSIONS AND RECOMMENDATIONS
The study identified PUC determinants that causes of property use conversions in Akure and its influence on property rental vales. The confirmed PUC determinants are economic, demographic and biophysical factors are the most critical PUC determinants with significant influence on rental value trend. It recommended proactive policy formulations and aggressive public enlightenment campaign as means to curb the menace.
REFERENCES
Adegunle, T.O., Fateye, O.B and Agbato, S.E. (2016). Determinants and Effects of Change in Use on Property Rental Value: A Case Study of Ibara/Oke-Ilewo Area, Abeokuta, Ogun State. Journal of Humanities and Social Science 21(4): 1-9
Adeoye, D.O. (2016). Challenges of Urban Housing Quality: Insight and Experiences of Akure, Nigeria Urban and Architecture Design for Sustainable Development. Social and Behavioural Science 216, 260-268.
Akanbi, M. O., Yahaya, M and Omotayo, J. O. (2019). Assessment of Land Use Conversion Purpose in Minna Metropolis. Environmental Technology and Science Journal. 10(1): 73 - 80.
Ankeli, A. I., Nuhu, M. B., Sule, A. I., Popoola, N. I., Ankeli, U. C (2020). Residential Property Use Conversion and Rental Value Trends in Osogbo, Nigeria. SETIC 2020 International Conference: Sustainable Housing and Land Management, School of Environmental Technology, Federal University of Technology, Minna, 3rd – 5th May.
Ankeli I.A, Nuhu M.B, Sule A.I, Adeleke M.A & Alabi O.T (2020a). Analysis of Urban Structure and Healthy City: Ede Metropolitan City in Perspective. International Journal of Research and Innovation in Social Science (IJRISS) IV(XI) November. 159 -167.
Ankeli, I.A, Nuhu, M.B, Sule, I.A, Ankeli, U.C and Alade, A.F. (2019). Land Use Conversions and Rental Value Regime in an Emerging City. The Awareness, Attention and Action Proceedings of 74th Researchfora International Conference, Hamburg, Germany, 4th - 5th December.
513
Ayo-Odifiri, O.S, Egenti, C, Bada, A.O and Okosun, S.E (2017). The Planning Implication for Changing the Use of Residential Buildings in Auchi, Nigeria. Applied Science Report 19 (2): 73-80
Ayotamuno, A, Gobo, A. E and O B Owei (2010). The Impact of Land Use Conversion on a Residential District in Port Harcourt. International Institute for Environment and Development (IIED) 22(1): 259–265.
Balogun, I. A., Adeyewa, Z. A & Mrakinyo, T. E (2011). Analysis of Urban Expansion and Land Use Changes in Akure, Nigeria, Using Remote Sensing and Geographic Information System (GIS) Techniques. Journal of Geography and Regional Planning. 4(9) :533-54.
Degualem, M. A (2018). The Impact of Urban Land Use Changes on Residential Property Values: The Case of Bole Sub City, Addis Ababa. M.Sc Thesis submitted to the School of Graduate Studies of Addis Ababa University, Ethiopian Institute of Architecture, Building Construction and City Development (EiABC).
Egbenta, I. (2009). Analysis of Residential Land Use Change in Enugu Urban. Journal of
Environmental Management and Safety 1(1), 110-123.
Fabiyi, O.O (2006). Urban Land use Change Analysis of a Traditional City from Remote
Sensing Data: The Case of Ibadan Metropolis. Humanity and Social Sciences Journal,
1(1): 42-64.
Gbadamosi, K & Ibrahim, S. A (2013). Land Use Conversion and Traffic Situation in Lagos, Nigeria: An Impact Assessment of Victoria Island. A paper to be presented at 13th WCTR held in Windsor Barra Hotel Rio de Janeiro, Brazil, on July 15-18.
Mtawali, T. (2019). Change of Land Use from Residential to Commercial in Livingstone: Implications for Urban Planning. A Dissertation Submitted to the University of Zambia in partial fulfillment of the requirement for the degree of Master of Science in Spatial Planning. The University of Zambia
Nkolika, J. P., Oluwatosin, B. F., Olayinka, O & Iyanda, P (2018). Changing Urban Land Use and Neighbourhood Quality: Evidence from Federal Capital Territory (FCT), Abuja, Nigeria, International Journal of Civil Engineering and Technology (IJCIET) 9(11) 23– 36.
Ogunleye, M. B (2013). Analysis of the Socio-Economic Characteristics and Housing Condition in the Core Neighbourhood of Akure, Nigeria. Journal of Geography and Regional Planning. 6(6): 229-236, August.
Olayinka, A. O (2012). Factors Influencing Change of Use and Its Attendant Problems: Case Study of Yaya Abatan Ogba, Lagos State. Journal of Emerging Trends in Economics and Management Sciences (JETEMS) 3(6): 901-906
Owoeye J.O. (2020). Upshot of Sprawl Incidence on Pattern of Land Use Changes and Building Physiognomies in Akure Region, Nigeria. Journal of Geographical Research. 03(04) October

514
Thuo, A.D.M. (2013). Impacts of Urbanization on Land Use Planning, Livelihood and Environment in the Nairobi Rural-Urban Fringe, Kenya. International Journal of Scientific & Technology Research 2(7), 70-79.
World Population Index, (2019). World Population Prospect. Worldometer (www.worldometer.info) assessed on 5/8/2021
515
ATMOSPHERIC VARIABLES AND ITS IMPLICATION ON UHF RADIO SIGNAL; A CASE STUDY OF EMMANUEL ALAYANDE
COLLEGE OF EDUCATION, OYO
SHEU, A. L. and OLADEJO, O. P.
Department of Physics, Emmanuel Alayande College of Education, Oyo, Oyo State, Nigeria
Email of Corresponding Author: [email protected]
ABSTRACT
The measurements of the weather conditions and radio signal strengths were carried out simultaneously with the aid of a self-designed low-cost handy weather monitoring system. The measuring technique is stationed at the premises of Emmanuel Alayande College of Education (EACOED), Oyo through engaging the monitoring system beyond ground level for the measurements of the atmospheric temperature within January to December 2020. The received signal was measured only on the downlink and the receiver antenna was adjusted until the best accessible result of signal strength was captured on the micro SD card storage for consequent documentation. It is revealed from the research that signal strength decreased with a slight rise in temperature. Hence, the higher the temperature, the lower the signal strength. The correlation between the two parameters mathematically is -0.78 in value. The study shows that increase in temperature results in the degradation of signal strength, provided other atmospheric variables remain constant. The curves of signal strength on temperature and the signal field strength propagation profile in EACOED, Oyo Metropolis are shown based on the statistical data developed from the study. The efficient link margin and budget of radio transmission can be developed with this result for the study area more enthusiastically than applying prevailing link margin invented from other regions data evaluation.
Key Words: Atmospheric temperature, Monitoring systems, Radio Signal, Radio transmission, Signal strength, Ultra High Frequency (UHF), Weather variables
1.0 INTRODUCTION
The extreme effects to the extent of total breakdown of communication between the transmitters and the receivers can be caused by unforeseen radio wave propagations. This can eventually results to complete target missing of the radar (Ukhurebor and Azi, 2018). As revealed by the previous researchers, the inconsistencies in the atmospheric weather variables is highly responsible for the chronological deviations by UHF radio signals transmission (Alam et al., 2016). The primary atmospheric weather variables are the major influencers of radio signal transmission in the troposphere (Yeeken and Michael, 2011). The rise in altitude within the troposphere results to steady degeneration and eventually levels out the temperature gradient. The operation of radio propagation within this sphere is significantly affected (Isikwue et al., 2013).
Signal path loss is fundamentally articulated as the degradation in strength of a signal as it travails through a specific region or medium (Akinwumi et al., 2017). The signal losses are caused by the variation of weather conditions (atmospheric temperature, pressure, humidity, wind speed and direction) and are requisite factors in the design of any radio communications system (Ukhurebor et al., 2018). The free space path losses, absorption losses, diffraction losses,

516
multipath, terrain, buildings, vegetation and the atmosphere are some of the factors that may cause path losses during signal path propagation (Agbo et al., 2013, Aremu et al., 2018).
The results from the previous studies show that temperature has a slight significant negative effect on signal strength (Ayantunji et al., 2018). The measure of temperature at different levels of earth’s atmosphere is termed as the air temperature and expressed in degree Celsius (oC). This study is focused to examine and analyze the atmospheric variables and its implication on UHF radio signal at Emmanuel Alayande College of Education (EACOED), Oyo, Oyo State, Nigeria.
The measurement is carried out at campus of EACOED for a period of one year (January to December, 2020) using a self-designed cost effective portable weather monitoring systems. The fallouts of the study would be treasured to the management of radio communication systems for enhancement and developmental purposes.
2.0 METHODOLOGY
A data logger digital field strength meter interfaced to the personal computer is the applied measuring tool adopted in this study for the field strength measurement. The measurements of the various weather variables was carried out with the aid of a self-designed low-cost handy weather monitoring system. The measuring technique is positioned by engaging the monitoring system outside ground level for the measurements and micro SD card storage of the air temperature at the premises of EACOED, Oyo, Oyo State, Nigeria.
The acquisition of numerical data of signal strengths and meteorological components in the College Administrative Block is the purpose of the research to determine the atmospheric variables and its implication on UHF radio signal at EACOED, Oyo. The measurements were executed for a period of one year (January to December, 2020). The established signal was measured merely on the downlink and the receiver antenna was accustomed in anticipation of the unsurpassed accessible result of signal strength was apprehended on the micro SD card storage prior recording.
3.0 RESULTS AND DISCUSSION
The result of the study is evaluated to validate the atmospheric variables and its implication on UHF radio signal at Emmanuel Alayande College of Education, Oyo, Oyo State, Southwest, Nigeria. The curves of signal strength on temperature and the signal field strength propagation profile in EACOED, Oyo are shown in Figures 1 and 2 based on the statistical data developed from the study. The received UHF signal strength from the research is inversely proportional to temperature due to its rise or fall during propagation. Temperature is perceived at the troposphere to degenerate expeditiously with altitude 10 degrees Celsius per kilometer rate.

517
Figure 1: Relationship between Signal Strength (dBμV) and Atmospheric Temperature (0C) in EACOED, Oyo
Figure 2: Signal Field Strength Propagation Profile in EACOED, Oyo
The magnitude of how certain factors affect radio communication is a challenge based on this study in the UHF range with many weather conditions interrelating with one another due to disordered system of weather. The study affirmed that the higher the temperature, the lower the signal strength due to its decrease with a slight rise in temperature. The sample data from the Figure 1 shows the inverse variation of the signal strength (dBμV) with air temperature at constant humidity (78%), uniform atmospheric pressure (975.7.8 hpa) and relative constant wind speed (1.03 MpH).
The research evidently proofed that the UHF signal strength is inversely proportional to the air temperature, provided that other weather variables are observed constant (Chima et al., 2018).
518
This study certified that atmospheric temperature variation is vital provided the performance degradation induced by frequency shifts and thermal transceiver noise through crystal accuracy is anticipated. Variation in environmental conditions over various distances is primarily responsible for a change in UHF signal receptions as credibly achieved in this research.
4.0 CONCLUSION AND RECOMMENDATION
The research opined the optimization of UHF radio signal and the atmospheric conditions to examine the atmospheric variables and its implication on UHF radio signal at Emmanuel Alayande College of Education, Oyo, Oyo State, Nigeria. The study accomplishes that as the temperature increases, the UHF signal strength levels decrease, as long as other weather variables remain constant. The efficient link margin and budget of radio transmission can be developed with this available result for the study area instead of applying predominant link margin designed from other regions data evaluation.
The research is restricted to the atmospheric variables (temperature) and its implication on UHF radio signal at Emmanuel Alayande College of Education, Oyo, Oyo State, Nigeria. Further investigations are suggested to reflect on other atmospherical weather conditions in this and other regions with adoption of different methods for authentication of this study on radio signal propagation.
REFERENCES
Agbo, G. A., Okoro, O. N. and Amechi, A. O. (2013). Atmospheric Refractivity over Abuja, Nigeria. International Research Journal of Pure and Applied Physics, 1 (1): 37 – 45.
Akinwumi, S. A., Omotosho, T. V., Willoughby, A. A. and Emetere, M. E. (2017). Sectional Investigation of Seasonal Variations of Surface Refractivity and Water Vapour Density over Nigeria. International Journal of Applied Engineering Research, 12 (14): 4587 –4598.
Alam, I; Mufti, N; Shah, S. A. A. and Yaqoob, M. (2016). The Effect of Refractivity on Propagation at UHF and VHF Frequencies. International Journal of Antennas and Propagation, 2 (4): 1 – 8.
Aremu O. A., Oyinkanola L. O. A., Akande A. and Azeez W. A. (2018). Effects of Radio Refractivity Gradient and k-factor on Radio Signal over Ibadan, South Western, Nigeria. Global Scientific Journal, 6 (5): 2320 – 9186.
Ayantunji B. G., Musa B., Mai-Unguwa H., Sunmonu L. A., Adewumi A .S., Sa'ad L. and Kado A. (2018). Atmospheric Humidity and Its Implication on UHF Signal over Gusau, North West, Nigeria. International Journal of Scientific & Engineering Research, 9 (3): 2229 –5518.
Chima, A. I, Onyia and Udegbe S. U. (2018). The Effects of Atmospheric Temperature and Wind Speed on UHF Radio Signal; a Case Study of ESUT Community and Its Environs in Enugu State. IOSR Journal of Applied Physics, 10 (2): 83 – 90.

519
Isikwue, B. C., Kwen, Y. A. and Chamegh, T. M., (2013). Variations in the Tropospheric Surface Refractivity over Makurdi, Nigeria. Research Journal of Earth and Planetary Sciences, 3 (2): 50 – 59.
Ukhurebor, K. E and Azi, S. O (2018). Review of Methodology to Obtain Parameters for Radio Wave Propagation at Low Altitudes from Meteorological Data: New Results for Auchi Area in Edo State, Nigeria. Journal of King Saud University–Science, 10 (5): 355 – 385.
Ukhurebor, K. E; Azi, S. O; Abiodun, I. C. and Ojiemudia, S. E. (2018). Influence of Weather Variables on Atmospheric Refractivity over Auchi Town, Edo State, Nigeria. Journal of Applied Science and Environmental Management, 22 (4): 471 – 475.
Yeeken, O. O. and Michael, O. K. (2011). Signal Strength Dependence on Atmospheric Particulates. International Journal of Electronics and Communication Engineering, 4 (3): 283 – 286.
520
THE USE OF WEB SERVICES IN CLOUD COMPUTING INTEGRATION FOR BETTER ONLINE BUSINESS PRESENCE IN
NIGERIA
Sunday Alabi1, Olufemi Odeniyi 2, Ghazaly Agboola 3 and Makinde Olubukola 4
Department of Computer Science,Osun State College of Technology Esaoke
Email of Corresponding Author:: [email protected],
ABSTRACT
Web Services involves the use of IT infrastructure services by businesses services and it can also be referred to as Cloud Computing. Cloud Computing provides a simple way to access servers, storage, databases, and a broad set of application services over the Internet. A Cloud services platform such as Amazon Web Services owns and maintains the network-connected hardware required for these application services while using what you need via a web application. Cloud Computing provides a highly reliable, scalable, low-cost infrastructure platform in the Cloud that powers hundreds of thousands of businesses in countries around the world. In Cloud computing, IT infrastructure is very important and much of the merits of cloud computing depend on IT infrastructure. The Infrastructure facility of Amazon Web Services (AWS) and its cloud platform were examined and reviewed in comparison with existing IT Infrastructure in Nigeria following an increment in an online business presence in Nigeria and Africa after the outcome of the global pandemic. More so, the basic architectural features of AWS cloud computing are examined against its functionalities. Therefore, this paper offers an analysis of AWS adoption in an online businesses’ representation, focusing especially in Nigeria. However, the findings show that cloud computing especially using AWS provides the opportunity to replace up-front capital infrastructure expenses with low variable costs that scale with the business in which Nigeria and Africa businesses can benefit with little improvement on existing infrastructures. Also, findings in this research paper indicate that there may be fastness in result delivery of businesses when cloud computing infrastructure is used. With the Cloud, businesses no longer need to plan for and procure servers and other IT infrastructure weeks or months in advance. Instead, they can instantly spin up hundreds or thousands of servers in minutes and deliver results faster.
1.0 INTRODUCTION
E-Commerce growth is generally poor in developing countries where issues of security and other internet infrastructures have been identified as barriers (Japhet et. al. 2011). Before the advent of Covid-19, most business modules in Nigeria have always been conducted through bricks and mortar means (Physical transactional businesses). This has formed a cultural syndrome either due to security, lack of trust, and other barriers that prevented business vendors and citizens to invest and adopting online business presence respectively (Alabi and Olayemi, 2019).
The world is becoming a global village where every opportunity is now seen in terms of Information Communication Technology (ICT) (Alabi et al. 2020) . Internet users across the world are growing and this has provided the opportunity for global e-commerce. An online transaction has been described as a new driver of economic growth, especially for developing countries (Japhet et. al. 2011). Authors further clarified that Internet technologies benefits have created notions that e-commerce growth may assist developing countries to

521
overcome their economic problems because; it will provide a great opportunity for organizations, individuals, and nations at large (Alabi et al. 2020).
On the other hand, e-business researchers have identified barriers limiting the growth of ICT development and e-commerce especially in developing countries (Oluyinka et al. 2013). These barriers were further classified into infrastructure, lack of a functioning ICT policy, bad and corrupt governance, social and cultural problems, and economic problems. Lack of proper adoption of ICT technologies in developing countries has been attributed to these barriers that led citizens into a high digital divide and abject poverty (Kshetri, N. 2007).
In Nigerian, ICT development is also experiencing problems like other developing countries. According to Oluyinka et al.(2013), the high populace of a country is amounting to nothing without ICT and another technological empowerment. Unfortunately, the “vision 2020” of Nigeria aspiring to be one of the top 20 leaders of the world was not realized because of non-proper implementation of ICT. Although, digital divide exists in Nigeria and Oluyinka further clarified that no nation can attain total development without having a digital economy that is widely accepted and reliable e-business management. These will include a secure and reliable e-payment platform that will be trusted by the citizens of Nigeria. All these are far from being achieved. This was the true situation of Nigeria even before Covid-19 issues.
A study conducted on how the COVID-19 pandemic has been affecting Small and Medium Scale Enterprises in Nigeria. The authors’ investigation involved a literature review on how the pandemic has affected the entrepreneurs (Oyewale, Adebayo, and Kehinde, 2020). This paper proposes one of the methods that can be used not only to alleviate the current situation but also to prevent the future occurrence of such effects on Small and Medium Scale Enterprises in Nigeria. Government-imposed partial and total lockdowns are increasingly hindering access to markets and shops (Gabriel et al. 2020).
The COVID-19 pandemic has increased online trade in the world. The world economy has undergone drastic changes, majorly due to the rapid growth of digitalization and the Covid-19 pandemic leading to an increased demand for online services. The traditional economic model to a digital economy model like cryptocurrency, social media platforms, online shopping, online gaming benefited economy of the developed world during the Pandemic period. Contrarily, in Nigeria businesses are negatively impacted; as the reality of the Covid-19 pandemic fully unfolds, particularly the banking and education have more impacts. They were all closed during the lockdown and many of them are still suffering to this moment (Oyewale, Adebayo, and Kehinde, 2020).
Many developed countries have embarked on what could help significantly reduce this burden strategically. Therefore, many technologies can improve business performance, enhance efficiency, and competitive advantage. The internet is the bedrock of the paradigm such that other enabling technologies depend on this digital communication infrastructure the present internet and IT infrastructure is not presently encouraging. The evolution of ethernet-based networks and wireless networks in digital communication has led to the emergence of IoT (Richardson and Ruby, 2007). The implementation of this vision has profound consequences in technology, business organization, and markets, and comes with different opportunities and benefits which can also be applied to Nigeria if the right approach is taken (Alabi et al 2020). Therefore, the main reason why businesses adopt cloud computing includes implementation simplification, cost-saving, and seamless. Cloud computing enables the leasing of computing resources in real-time, with minimal interaction with the provider (Kallel, Rekik and Khemakhem, 2021).

522
In the light of this, Amazon Web Services is examined and reviewed to exploit its benefits to elevate the Business online presence in Nigeria. There are numerous benefits that the business sector will derive by employing Web Services and Cloud for their operations (Peller, 2020). In 2006, Amazon Web Services (AWS) began offering IT infrastructure services to businesses in the form of web services—now commonly known as Cloud Computing (Bisong, 2019). Cloud Computing provides a simple way to access servers, storage, databases, and a broad set of application services over the internet (Peller, 2020). AWS provides a highly reliable, scalable, low-cost infrastructure platform in the Cloud that powers hundreds of thousands of businesses in 190 countries around the world (Kallel, Rekik and Khemakhem, 2021
Amazon Web Services (AWS) are part of cloud architecture developed to meet the present target needs for the E-Business online presence to overcome problems of conventional website hosting methods (Fisher, Craig, and Bentley, 2007). AWS contains various aspects that assist in carrying out different functions. Figure 1 shows cloud computing platform and its different components
Figure 1 Cloud Computing Architecture
https://i.pinimg.com/originals/fc/39/6d/fc396d0ea71e6cfbd2563ba269d12268.jpg
The rest of this paper contains Methodology, Overview of Amazon Web Services (AWS), data gathering, procedure, Findings, Discussion, Conclusion, and Recommendations.
2.0 METHODOLOGY
An Investigative approach is adopted in the research paper with analytic review for the Knowledge production within the field of business encompassing with information technology usage. Amazon Web Services (AWS) was investigated in terms of operations, infrastructures, Security, Reliability, and Benefits to the online representation of E-Business. This approach is

523
aimed to see how such benefits could be replicated in the business sector of developing countries, especially in Nigeria. An effective and well-conducted review as a research method creates a firm foundation for advancing knowledge and facilitating theory development.
The Table 1 shows an extensive review of categories and their functionalities of Amazon Web Services.
Table I: AWS Categories and Functionalities
S/No AWS Category Functionality 1 The AWS
Management Console
the Command Line Interface, or Software Development Kits (SDKs) can be used to access the services.
2 Compute category These are key resources that allow you to carry out computational abilities via a series of instructions used by applications and systems. These resources cover a range of different services and features, these being: EC2 - Amazon Elastic Compute Cloud.
3 AWS Regions These are separate geographic areas that AWS uses to house its infrastructure. These are distributed around the world so that customers can choose a region closest to them to host their cloud infrastructure there. The closer your region is to you, the better so that you can reduce network latency as much as possible for your end-users. You want to be near the data centers for fast service.
4 Availability Zones
The distinct locations within an AWS Region are engineered to be isolated from failures in other Availability Zones. They provide inexpensive, low-latency network connectivity to other Availability Zones in the same AWS Region. Each region is completely independent. Other are functionalities are Lambda, Kubernetes, Docker, Light sails,
5 Amazon Lightsail A Lightsail instance is a virtual private server (VPS) that lives in the AWS Cloud. Your instances can connect and to other AWS resources through both public (Internet) and private (VPC) networking. Whether you're an existing or new AWS customer, you get 750 hours of free usage of the 512 MB Lightsail plan for free. You also can try Lightsail plans that include a Windows Server license for free using the same plan size.
6 elastic block store Amazon Elastic Block Store (EBS) is an easy-to-use, high-performance, block-storage service designed for use with Amazon Elastic Compute Cloud (EC2) for both throughput and transaction-intensive workloads at any scale.
7 Amazon VPC Amazon VPC enables you to build a virtual network in the AWS cloud - no VPNs, hardware, or physical data centers are required. You can define your own network space, and control how your network and the Amazon EC2 resources inside your network are exposed to the Internet
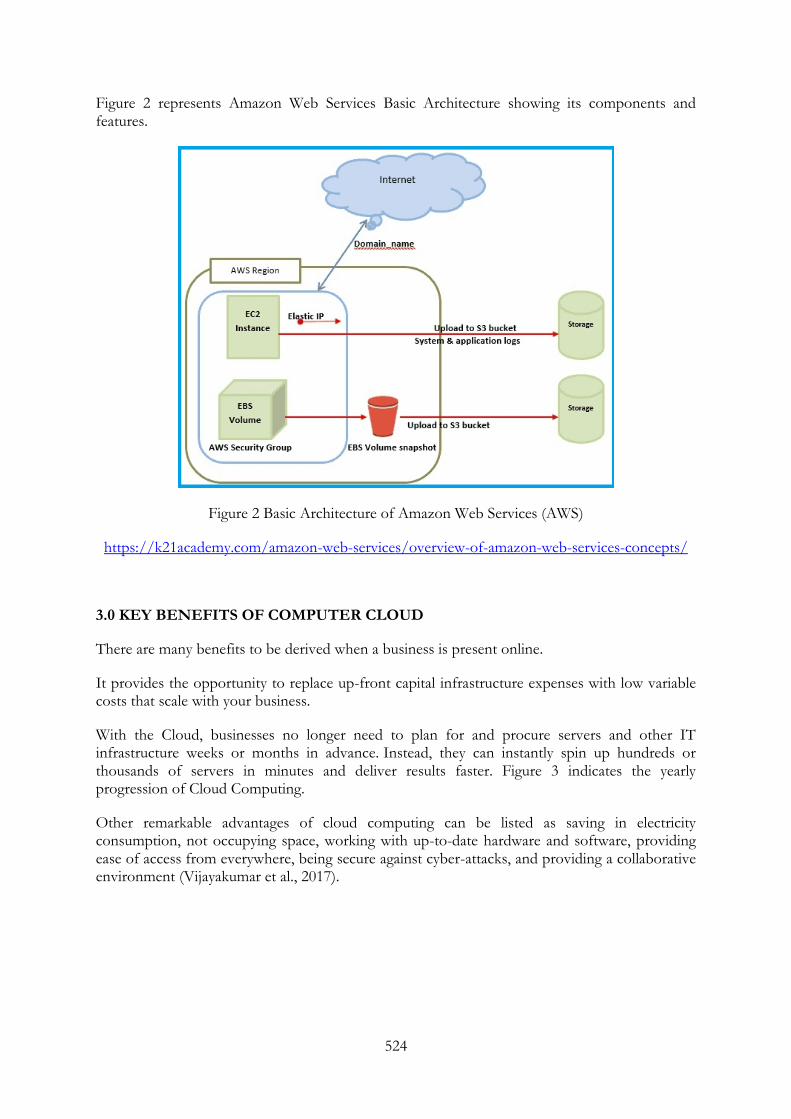
524
Figure 2 represents Amazon Web Services Basic Architecture showing its components and features.
Figure 2 Basic Architecture of Amazon Web Services (AWS)
https://k21academy.com/amazon-web-services/overview-of-amazon-web-services-concepts/
3.0 KEY BENEFITS OF COMPUTER CLOUD
There are many benefits to be derived when a business is present online.
It provides the opportunity to replace up-front capital infrastructure expenses with low variable costs that scale with your business.
With the Cloud, businesses no longer need to plan for and procure servers and other IT infrastructure weeks or months in advance. Instead, they can instantly spin up hundreds or thousands of servers in minutes and deliver results faster. Figure 3 indicates the yearly progression of Cloud Computing.
Other remarkable advantages of cloud computing can be listed as saving in electricity consumption, not occupying space, working with up-to-date hardware and software, providing ease of access from everywhere, being secure against cyber-attacks, and providing a collaborative environment (Vijayakumar et al., 2017).
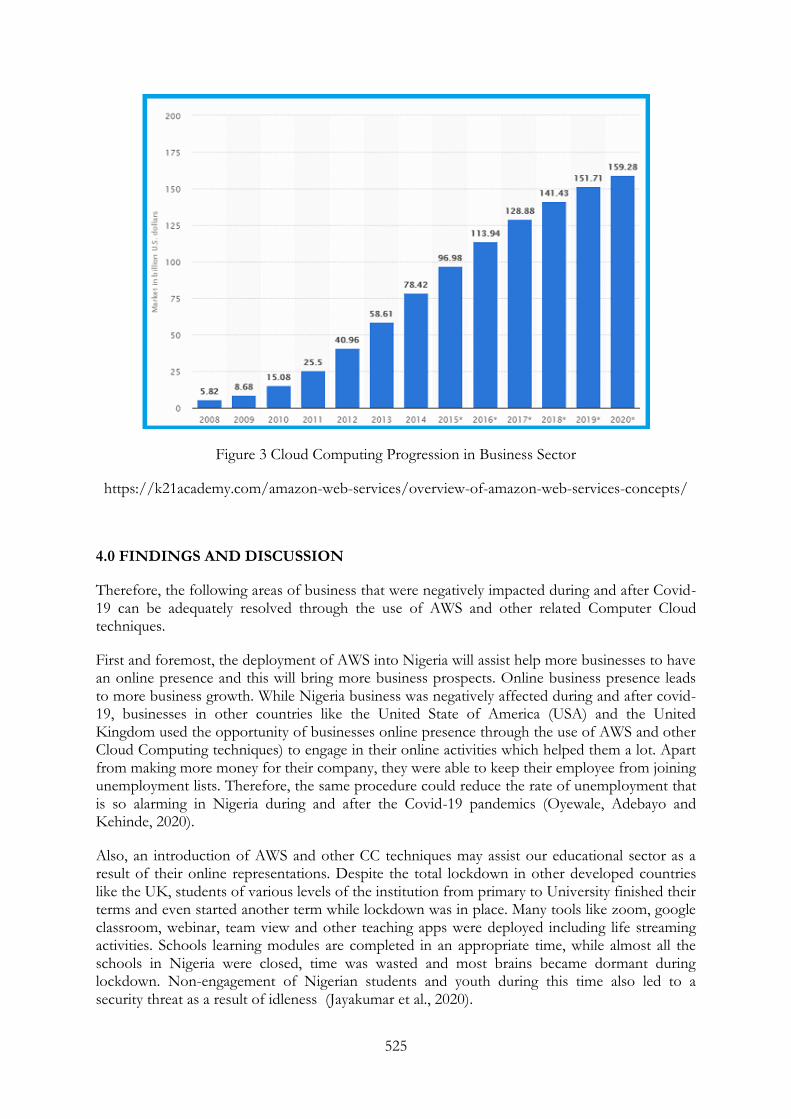
525
Figure 3 Cloud Computing Progression in Business Sector
https://k21academy.com/amazon-web-services/overview-of-amazon-web-services-concepts/
4.0 FINDINGS AND DISCUSSION
Therefore, the following areas of business that were negatively impacted during and after Covid-19 can be adequately resolved through the use of AWS and other related Computer Cloud techniques.
First and foremost, the deployment of AWS into Nigeria will assist help more businesses to have an online presence and this will bring more business prospects. Online business presence leads to more business growth. While Nigeria business was negatively affected during and after covid-19, businesses in other countries like the United State of America (USA) and the United Kingdom used the opportunity of businesses online presence through the use of AWS and other Cloud Computing techniques) to engage in their online activities which helped them a lot. Apart from making more money for their company, they were able to keep their employee from joining unemployment lists. Therefore, the same procedure could reduce the rate of unemployment that is so alarming in Nigeria during and after the Covid-19 pandemics (Oyewale, Adebayo and Kehinde, 2020).
Also, an introduction of AWS and other CC techniques may assist our educational sector as a result of their online representations. Despite the total lockdown in other developed countries like the UK, students of various levels of the institution from primary to University finished their terms and even started another term while lockdown was in place. Many tools like zoom, google classroom, webinar, team view and other teaching apps were deployed including life streaming activities. Schools learning modules are completed in an appropriate time, while almost all the schools in Nigeria were closed, time was wasted and most brains became dormant during lockdown. Non-engagement of Nigerian students and youth during this time also led to a security threat as a result of idleness (Jayakumar et al., 2020).
526
In addition, deploying AWS would have helped Internal Security system during and after lockdown. Another area where AWS and deployment would have benefited during the lockdown is in the health sector. There were different E-Health programme that occurred during the lockdown in developed countries and citizens always got an updated, adequate and reliable information regarding the pandemic (Vijayakumar et al., 2017).
However, the deployment of AWS aftermath covid-19 can still achieve a lot despite the lockdown is not in place for now. By doing so, there will be more relief to the effect of covid-19 on every sector of the economy. Again, even apart from the lockdown and pandemic situation, the use of AWS can promote the country’s economy by encouraging more people to work from home, and help businesses to have a wider audience.
5.0 CONCLUSION AND RECOMMENDATION
Many issues are arising during and after the outbreak of Covid-19 which affected Nigeria's business and other sectors. These negative impacts that affected every country of the world are being alleviated through different means. The developed countries are performing better in reducing these impacts. One of these methods used is the online presence of businesses. Deploying cloud computers for an adequate and effective online presence cannot be over-emphasized. Amazon Web Services (AWS) and its components may help to reduce the problem of web hosting for small and big businesses. This will make their online presence to be improved and gain a wider view. Business continuation will be unhindered even in a case of a lockdown, strike, and civil unrest.
Business continuity reduces unemployment and this has overall turnout on the economy. If the online presence for business can be achieved through the use of the AWS cloud system, the risk of traveling lives of citizens on the bad and non-secure roads will reduce as a result of the availabilities of the online transaction. Also, other areas like education, entertainment, and agriculture industries. Electricity-less consumption devices incorporated cloud devices may be of help for epileptic power supplies in a country like Nigeria.
ACKNOWLEDGMENT
The Authors which to acknowledge Atul Kumar of k21academy.com for his numerous supports on AWS training and Certification. Also, the authors’ thanks go to Amazon Corporation for good innovative ideas and support found their website.
References
Alabi, S. and Olayemi, B. (2019) ‘E-Commerce Development Comparative Analysis Between the Uk and Nigeria, IJTEA. https://analyzea.com/2019/12/31/e-commerce-development-comparative-analysis-between-the-uk-and-nigeria/
Alabi, Sunday, White, Martin, and Beloff, Natalia, (2020), Contactless Palm Vein Authentication (CPVA) security technique for better adoption of E-Commerce in developing countries. Computing Conference 2020, London, 16-17 July 2020. Published in: Advances in Intelligent Systems and Computing. Springer Nature ISSN 2194-5357
Bisong, E. (2019) ‘What Is Cloud Computing?’, Building Machine Learning and Deep Learning Models on Google Cloud Platform, pp. 3–6. doi: 10.1007/978-1-4842-4470-8_1.

527
Fisher, J., Craig, A. and Bentley, J. (2007) ‘Moving from a Web Presence to e-Commerce: The Importance of a Business - Web Strategy for Small-Business Owners’, Electronic Markets, 17(4), pp. 253–262. doi: 10.1080/10196780701635864.
Gabriel Onayante Monday | Okpara, Emmanuel Nwabriegwu | Isaac, Susan Ndidi | Francis, Wendy Nkiru | Mills, Roseline Bamidele, J. M. O. | K. (2020) ‘A Multi-Sectoral Assessment of the Impacts of Covid 19 Pandemic Outbreak on Organisational Functionality in Nigeria’, International Journal of Trend in Scientific Research and Development, 4(6), pp. 918–930. Available at: url: https://www.ijtsrd.com/papers/ijtsrd33563.pdf%0Ahttps://www.ijtsrd.com/management/operations-management/33563/a-multisectoral-assessment-of-the-impacts-of-covid19-pandemic-outbreak-on-organisational-functionality-in-nigeria/gabriel-justin-m-o%0Afile:
Japhet E. Lawrence, Usman A. Tar, P. (2011) ‘Persistent Barriers to E-commerce in Developing Countries’, Journal of Global Information Management, 19(3), pp. 30–44. doi: 10.4018/jgim.2011070102.
Jayakumar, P., Brohi, S. N. and Zaman, N. (2020) ‘Top 7 Lessons Learned from COVID-19 Pandemic’, TechRxiv Powered by IEEE, pp. 1–6. doi: 10.36227/techrxiv.12264722.v1.
Kallel, A., Rekik, M. and Khemakhem, M. (2021) ‘IoT-fog-cloud based architecture for smart systems: Prototypes of autism and COVID-19 monitoring systems’, Software - Practice and Experience, 51(1), pp. 91–116. doi: 10.1002/spe.2924.
Kshetri, N. (2007) ‘Barriers to e-commerce and competitive business models in developing countries: A case study’, Electronic Commerce Research and Applications, 6(4), pp. 443–452. doi: 10.1016/j.elerap.2007.02.004.
Oyewale, A., Adebayo, O. and Kehinde, O. (2020) ‘Estimating the Impact of COVID-19 on
Small and Medium Scale Enterprise : Evidence from Nigeria’, Economics Research Branch, Agri-Food and Biosciences Institute, 1(1), pp. 1–19.
Oluyinka, S., Shamsuddin, A., Ajabe,M. and Enegbuma,I. “A study of electronic commerce adoption factors in Nigeria,” Int. J. Inf. Syst. Change Manag., vol. 6, no. 4, p. 293, 2013
Peller, D. (2020) ‘How Amazon Web Services wants to aid travel brands in recovery’, pp. 1–12.
Richardson, L. and Ruby, S. (2007) RESTful Web Services Copy Editor : Peggy Wallace Printing
History : Cover Designer : Karen Montgomery Interior Designer : David Futato, Architecture. Available at: http://safari.oreilly.com.
Vijayakumar, M., Sunitha, V., Uma, K., & Kannan, A. (2017). Security issues in cloud computing. Journal of Advanced Research in Dynamical and Control Systems, 2017(Special Issue 2), 1001-1014. https://aws.amazon.com/what-is-cloud-computing/ Retrieved on 20 July 2021
https://www.slideshare.net/LCloud/overview-of-amazon-web-services-kwiecie-2017 Retrieved on 20 July 2021.
https://cloudacademy.com/blog/aws-regions-and-availability-zones-the-simplest-explanation-you-will-ever-find. Retrieved on 29 July

528
2021around/#:~:text=As%20of%20November%202019,%20there%20are%2023%20AWS,%20%20us-west-2%20%2019%20more%20rows%20. Retrieved on 20 July 2021
https://k21academy.com. Retrieved on 20 August 2021
529
REVIEW OF STABILIZATION AND SOLIDIFICATION CHARACTERISTICS OF AGRICULTURAL WASTE ASH TREATED
HEAVY METALS CONTAMINATED LATERITIC SOIL
Adelowo, T.C 1*and Bello, A.A.2
1 Osun State Water Corporation, Abere, Osogbo, Nigeria.
2 Department of Civil Engineering, Osun State University, Osogbo, Nigeria
* Email of Corresponding Author [email protected],
ABSTRACT
Researchers have revealed that lateritic soil is contaminated by anthropogenic activities such as mining, fertilizer application and pesticide. The stabilization and Solidification (S/S) method has emerged as an efficient technique for the treatment of sites and soil that are contaminated with potentially toxic metals. It has been revealed that both active and abandoned mine sites are “heavily polluted” with heavy metals such as Cd, Pb, Zn, Cu and Hg. This paper reviewed the usage of Ordinary Portland Cement (OPC), Lime, Fly ash and some agricultural waste (Rice Husk Ash (RHA), Sugarcane bagasse Ash (SCBA), etc) to remediate heavy metals contaminated soil. This review shows that leachability of Pb from crushed block was reduced due to the incorporation of Rice Husk Ash into the binder system, Pb concentration was reduced from 3.70 to 1.06 mg/L (deionized water), 0.66 to 0.08 mg/L (acetic acid) and 3.22 to 1.88 mg/l (sulfuric/nitric acid). It also revealed that partial replacement of cement with Sugarcane Bagasse Ash (SCBA) in S/S of heavy metal contaminated soil was successful increased the strength and reduced the leachability when compared to the controlled sample. Results of the previous studies revealed that presence of SiO2 and other chemical compositions made the bamboo leaf ash (BLA) to be pozzolanic material, hence, use of BLA will be investigated to see if it can be used to remediate the effect of heavy metals in lateritic soil.
Keywords: Stabilization and Solidification, pozzolanic materials, Heavy Metals, Contaminated Soil, Lateritic Soil
1. Introduction
Soil contaminations especially by heavy metals lead to environmental and human health issues that need effective and affordable solutions (Saifu, et al. 2015). The engineering usage of lateritic soil on a daily bases increase across the globe. It is widely used in civil engineering construction works particularly in road constructions, foundations embankments, dams etc (Osuji and Akinwamide, 2018). As a result of massive urbanization, lateritic soil pollution is remarkably increasing over the globe and hence the need for stabilization is needed. Heavy metal pollution is listed as the most crucial problem among different soil pollution issues (Syed et al., 2018).
Contamination of soil alters soil strength characteristics and leads to an increase in loss of lives due to collapse buildings and road failures (Omotosho et al., 2012). Anthropogenic activities such as mining, fertilizer application and pesticide are some of the major sources of heavy metals into the top soil, flowing and underground water, and the surrounding air (Ali et al., 2013). Waste from the gold mining process such as waste rocks are known to contain Hg, Cd, Pb, Al, and other heavy metals (Da Silva et al., 2004). According to various studies, mine sites near farmlands increase the rate of chemical accumulation in arable and cash crops' fruits and leaves, and mine site soil contamination can cause severe heavy metal contamination of water sources and
530
poisoning of humans and animals if ingested (Bartrem et al., 2014; Lo et al., 2012; Oramah et al., 2015; Plumlee et al., 2013).
Solidification and Stabilization is one of the most effective methods of treating heavy metal polluted soils over the world. According to Harris, (1994) Soil Stabilization is better defined as the alteration or preservation of one or more soil properties to improve the Engineering characteristics and performance of a soil. There are three purposes for soil stabilization, which include strength improvement, dust control and soil waterproofing (Harris, 1994). When soil is stabilized and solidified it is bound to exhibit elevated strength when compared to untreated soils. Stabilized and Solidified soil is advantageous to improve various engineering properties such as bearing capacity, shrinking and swelling and permeability of soft, problematic and contaminated soils (Zhang et al., 2018).
Pozzolanic-based stabilization/solidification (S/S) is an effective, yet economical remediation technology to immobilize heavy metals in contaminated soils and sludges (Dimitris and Xiaoguang 2003).Bamboo leaf is a plant that is commonly found in swampy areas. It has a wide range of applications. It is a plant that is readily available in the southwest, so engineering applications are numerous. Bamboo leaf ash, which is obtained by burning bamboo leaves at a controlled temperature, has been confirmed by some researchers to contain high reactive silica, making it suitable for use as a supplementary cementitious material (Villar-Cocia et al., 2011; Dwivedi et al., 2006; Arum et al., 2013). An emerging technology that uses various plants such as rhizofiltration, phytostabilization, phytoextraction, phytovolatilization and phytodegradation to immobilize contaminants in the environment is phytoremediation (Chatterjee et al., 2013; Lee, 2013; Liu et al., 2018). Unfortunately, some of the plant species extensively studied and adopted for phytoremediation are not easily available in most communities, hence the need to investigate Bamboo Leaf Ash (BLA) which has been found to be pozzolanic is important.
2. Stabilization and Solidification
According to Hunce et al., (2012), Stabilization/Solidification (S/S) was defined to be a method or technique that aims in immobilizing contaminants by converting them into a less soluble form and encapsulating them with the creation of durable matrix. Also, Lasheen et al. (2013) submitted in their research that heavy metal wastes normally need S/S method processes to reduce contaminant leaching prior to landfill disposal. Yao et al.(2012) also mentioned in their research work that Stabilization/Solidification (S/S) method is commonly used to reduce the mobilization of contaminants within a hardened mass (solidification) and chemical conversion of contaminants into less soluble form (stabilization). In the same way, Voglar and Lestan (2010) stated that the S/S method has emerged as an efficient technique for the treatment of sites that are contaminated with potentially toxic metals. Research has revealed that the use of Ordinary Portland Cement can be used to S/S lead contaminated soil. Du et al., (2014) in their research work revealed the leaching behavior of Pb contaminants by using OPC as a binder. This research concluded that at pH 2.0, this strongly acidic condition has resulted in substantial lowered leachate pH and significantly increased the amount of Pb leached. Contrary to the condition, when OPC was added in S/S sample from 12% to 18%, it resulted in a decreased amount of Pb leached. In another study, Li et al., (2014) concluded that Pb concentration has been leached out from the solidified specimens using OPC as a binder at 109, 83 and 71 mg respectively with cement ratio of 0.2, 0.3 and 0.4.
Malviya and Chaudhary (2006) investigated the use of OPC to remediate Pb, Zn, Cu, Fe, and Mn-contaminated soil. Their sample containing OPC at pH ≥ 12 leached less Pb as a result. Then it was discovered that alkaline conditions reduced the concentrations of Zn, Cu, Fe, and Mn. The findings of the study revealed that the leachability of the heavy metals studied is pH-

531
dependent. Voglar and Lestan (2011) found that concentrations of Cd, Pb, Zn, and Ni in soils decreased in alkaline conditions after TCLP extraction and reached the regulatory limit for heavy metals in soils.
3. Heavy Metals Contaminated Soil
According to Chao et al., (2012), heavy metals in the soil refers to some significant heavy metals of biological toxicity, including mercury (Hg), cadmium (Cd), lead (Pb), chromium (Cr), and arsenic (As), etc. Excess heavy metals in the soil originate from many sources, which include atmospheric deposition, sewage irrigation, improper stacking of the industrial solid waste, mining activities, the use of pesticides and fertilizers (Zhang et al., 2011), etc. Soil is a basic environmental element that constitutes the ecosystem and is an important basic material for the survival and development for human beings (Yao et al., 2012). Heavy metal in soil can threaten people's health either by accidental soil ingestion, by breathing the contaminated soil dust particles or by the ingestion of polluted drinking water or farm product associated with contaminated soil (Yin & Shi, 2014). According to Adebayo et al (2017), active and abandoned mine sites are “heavily polluted” with heavy metals such as Cd, Pb, Zn, Cu and Hg (except the active mine site), and were “slightly polluted” with Mn and Fe. Experiments analyzing contamination in soil shows that the strength characteristics of various types of soils all seem to be compromised due to the effects of contamination on soils (Khamehchiyan et al, 2006; Ojuri and Omotayo, 2012).
4. Different Materials Used as Remediation of Contaminated Soil
4.1 Ordinary Portland Cement
Ordinary Portland cement (OPC) is the most used binder to immobilize the heavy metals in soils as a remediation technology named the Stabilization/ Solidification (S/S) method. The prevailing binders for S/S are Portland cement and cement-based cementitious materials. (Syed et al. 2018). Malviya and Chaudhary 2006 reported that Cement-based S/S has been widely used for about 50 years. Cement-based S/S technology is effective in immobilizing heavy metals even without additional additives (Napia et. al., 2012). While numerous formulations have been used for the stabilization process, the most common practical binder material for S/S is OPC, which can be combined with fly-ash, lime, steel blast furnace slag or clay, either to reduce cost or enhance final product performance (Moncef and Amjad, 2007). Researchers that used other binders along with their mixtures for S/S treatment confirmed that cement is considered as the most desirable material among all the available materials being used for the remediation of contaminated soils (Goodarzi and Movahedrad, 2017).
The mechanical mixing of cement and contaminated soils and immobilizing the heavy metals by encapsulation, sorption and precipitation (e.g., metal hydroxides) are the phenomenon that are mainly involved in Solidification/Stabilization by cement materials (Syed et al. 2018). When this is done diffusive characteristics of heavy metal will be reduced and consequently satisfy environmental standards (Riley et al., 2016 and Terashi, 1980). However, in the submission of Lee, (2007), it was observed that the strength of the cement-solidified contaminated soils decreased with increasing Pb concentration and Stepnanova et al. (1981), supported the argument that chlorides of Mn, Ni, Cu, Zn and other heavy metals could react with the silicates and aluminates in cement making compounds that prevent its strength development. Liu et al. (2008) used the S/S technology to treat contaminated soil in UK and reported that treatment of contaminated soil using OPC or ACT (accelerated carbonation technology) caused increase in the PI (plasticity index) of the treated soil and made it more stable during long-term weathering. Also, a research study from Voglar & Lestan (2010) shows that the application of Ordinary
532
Portland Cement (OPC) in S/S technique decreased the concentration of Cd, Pb, Zn and Ni compared to the original soil.
In recent years, due to the consequence of high energy consumption in manufacturing cement and the air pollution caused by the release of high quantities of greenhouse gases during its production, the cement industry has been pointed out as one of the major contributors to anthropogenic CO2 emissions of about 5% globally (Oh et. al. 2013). In this respect, several researches have been directed towards partial or total substitution of Portland cement by pozzolanic binders such as lime, fly ash, and natural pozzolan.
4.2 Lime
Lime and other high alkalinity materials are widely used to reduce the solubility of heavy metal contaminants in water and soil (Mickney et al. 2001). Lime is used to mean calcium hydroxide, calcium oxide or calcium carbonate. According to Hassan (2010), the pH of natural soil deposits are typically in the range of 5-8. However, when a substantial proportion of lime is added to soil-fly-ash, the pH of the mixture rises to approximately 12.8, the same pH as that of saturated lime water. At this elevated pH level, the solubility of the silica and alumina present in fly-ash and clay minerals is greatly increased. This makes them available to react with the calcium in the lime and/or fly-ash, to form calcium and alumina silicate hydrates (CAH and CSH), C = CaO, S = SiO2, A=Al2O3, and H=H20. It has been claimed by (Mickney et al., 2001) that lime processes in general, are not as effective as cement-based systems in reducing leachability of metals.
Different researchers have used different additives to substitute OPC in remediating heavy metals contaminated soil. Jing et al., (2004) studied the effects of Pb leachability in S/S method using OPC, lime and fly ash. In the research result, it was gathered that samples that contain 10% of lime showed a significant reduction of 43 mg/L Pb concentration compared to samples containing 10% OPC alone with 699 mg/L Pb concentration at 28 curing days. Boardman et al. (1999, 2004) found that for S/S treated Pb contaminated soils using lime binder, Pb concentration in leachate decreased with the increasing lime content.
4.3 Fly ash
Moon et al. (2006), Anastasiadou et al. (2012), and Xi et al. (2014) discovered that adding fly ash to S/S samples increases strength, but they argued that the strength of the sample was primarily derived from cement in their research on the use of fly ash as additives to cement in remediating heavy metal contaminated soil. However, by partially substituting the cement with fly ash, the leachability was significantly reduced. Additionally, concentrations of heavy metals were reduced to below the regulatory limit for Toxicity Characteristic Leaching Procedure (TCLP) test compared to sample with cement only. Kumpiene et al. (2007) have suggested fly-ashes as possible solutions to treat problems related to acid mine drainage and metal solubility, as they can neutralize the pH of acidic soils, and render most cationic metals less mobile. Fly-ash also increases the surface area available for element adsorption, improve the physical properties of soil. Both Qiao et al. (2006) and Cote et al. (l987) found that the incorporation of Pulverized Fuel Ash (PFA) in the cement-based S/S system resulted in the lowest leaching of heavy metals. According to Dimitris and Xiaoguang (2003), addition of quicklime and fly ash to heavy metals contaminated soils effectively reduced heavy metal leachability well below the non-hazardous regulatory limits. Also, fly ash addition increases the immobilization pH region for all heavy metals tested and significantly improves the stress-strain properties of the treated solids, thus allowing their reuse as readily available construction materials.

533
4.4 OPC with Rice Husk Ash (RHA)
Yin and Shi (2014), used the admixture of OPC with Rice Husk ash (RHA) to remediate the Pb contaminated soil. The result of their research shows that leachability of Pb from crushed block were reduced due to the incorporation of RHA into the binder system where the Pb concentration was reduced from 3.70 to 1.06 mg/L (deionized water), 0.66 to 0.08 mg/L (acetic acid) and 3.22 to 1.88 mg/l (sulfuric/nitric acid). Hegazy (2013), studied the adsorption of Pb contaminant by the rice husk (RH). This research concluded that in a pH between 6 and 7 and a temperature of 25°C, the total amount of metal adsorption by RH was 87.18% greater than it is with the fly ash, which was 76.1%.
In the same conditions of this study, the RH also showed good adsorption for the Cd, which was 67.9%. Yin et al (2006) in their research work proved that the replacement of OPC with RHA for Cement-dried soil (C/Sd) ratio of 1 reduced the leachability of lead from 0.66 to 0.08 mg/L in the acetic acid. This result indicated that the usage of ordinary Portland cement (OPC) with rice husk ash (RHA) as an overall binder system for the S/S of lead-contaminated soils is more favorable in reducing the leachability of lead from the treated samples than a binder system with standalone OPC. Also, the research indicated that, even though partial replacement of OPC with RHA in the binder system reduced the UCS of solidified samples, it was still high enough to exceed the mortar limit of 20 N/mm2, which was more than sufficient to be reused as construction materials.
4.5 Sugarcane Bagasse Ash (SCBA)
The sugarcane bagasse has been used as an additive in S/S heavy metals contaminated soil (Janusa et al. 2000). In there research, concentrations of 10% and 15% of Pb by weight to cement loading have been used and cured for 7, 14, and 28 days at 24°C. The results showed that the samples containing SCBA typically resulted in TCLP (modified) extract concentrations of approximately 0.5 mg/l of lead for all samples. In the other hand, samples containing no bagasse extract concentrations of Pb of approximately 5 mg/l and 45 mg/l for 10% and 15% of Pb nitrate samples respectively. Thus, the utilizationof SCB as an additive to cement effectively improved the S/S of Pb. According to Saifu, et al. (2015), the effectiveness of sugarcane bagasse ash (SCBA) as the substitution binder to Ordinary Portland Cement (OPC) content in Stabilization/Solidification (S/S) method was investigated through the physical and chemical characteristics namely the Unconfined Compressive Strength (UCS) and Toxicity Characteristic Leaching Procedure (TCLP). The OPC and SCBA varying from 5 % to 20 % were added to stabilize and solidify the contaminated soils. Results indicated that all samples containing OPC and SCBA satisfy the US EPA strength requirement of 0.35 MPa for S/S sample.
The TCLP testing shows that sample containing OPC with SCBA has been successful treated which produced the leachability below US EPA limit for lead of 5 mg/L. In conclusion, the use of SCBA as part of replacement of OPC has been successful in increasing the strength and reducing the leachability of heavy metals compared to untreated sample. In another research Mohamad and Mohammad (2015) investigated the effect of soil strength and leachability of lead in S/S method when sugarcane bagasse (SCB) is added to remedy contaminated soil. Cement was added at a proportion of 5%, 10% and 15% in sample weights without SCB while in another sample, the cement replaces SCB at a proportion of 2.5%, 5% and 7.5%. All samples were allowed to harden and cured at room temperature for 7, 14 and 28 days.
The effectiveness of the treatment was assessed by conducting physical testing such as Unconfined Compression test, Density test and Water Absorption test and leaching tests were performed to identify the leachate criteria of lead during treatment. The results of the research
534
indicated that pH and leachability are found to have major influence on metal release, especially on samples containing SCB. Also, the concentration of lead in the TCLP and SPLP test after the curing period of 28 days were detected to reduce and fall below the expected leachability limit as regulated by the United States Environmental Protection Agency (US EPA). It was concluded that the results obtained from both the physical and leaching tests showed that soil samples :7.5% cement :7.5% SCB are the most effective optimum mix since this proportion succeeded in minimizing the leachability of Pb as low as 2.11 mg/L or a total reduction by 99%, and it even produced the strength of 1389 kPa within 28 days. According to Mohamad and Mohammad (2015), partial replacement of cement with SCBA in the binder system has been successful in increasing the strength and reducing the leachability compared to the controlled samples.
5.0 Conclusion
This paper reviewed the Stabilization and Solidification Characteristics of additives treated heavy metals contaminated soil. The review showed the importance of Lateritic soil in the field of construction and also the threat against its sustainability. In this review, it was revealed that contamination of soil by heavy metals alters soil strength characteristics and lead to the increase in loss of lives due to collapse buildings and road failures. The review also revealed different sources of heavy metals in the soil which include: mining activities, application of fertilizers, sewage irrigation and improper stacking of the industrial solid waste. It was established that stabilization and solidification is a major way to remediate the adverse effect of heavy metals in the soil. This reviewed revealed that incorporation of primary pozzolan such as fly ash and some agricultural wastes (RHA and SCBA) with pozzolanic properties can be used as heavy metals’ adsorbents and also remediate heavy metals contaminated soils using solidification and stabilization method.
References
Adebayo, O.E., Abosede T.O, Temitope O. O and Olusegun O.A (2017) Effects of artisanal gold mining activities on soil properties in a part of southwestern Nigeria. Cogent Environmental Science, 3:1, 1305650.
Akinwumi, I. and Aidomojie, O. (2015). Effect of corncob ash on the geotechnical properties of lateritic soil stabilized with Portland cement. International Journal of Geomatics and Geosciences, 5(3):375-392.
Ali, H., Khan, E., & Sajad, M. A. (2013). Phytoremediation of heavy metals—concepts and applications. Chemosphere, 91(7): 869–881.
Amu, O., Ogunniyi, S. and Oladeji, O. (2011).Geotechnical properties of lateritic soil stabilized with sugarcane straw ash, American Journal of Scientific and Industrial Research, 2(2):323-331.
Anastasiadou K, Christopoulos K, Mousios E, and Gidarakos E, (2012) Solidification/stabilization of fly and bottom ash from medical waste incineration facility, J. Hazard. Mater, 207–208: 165–170.
Arum, C. Ikumapayi, C.M. & Aralepo, G.O. (2013). Ashes of biogenic wastes pozzolanicity, prospects for use, and effects on some engineering properties of concrete. Materials Sciences and Applications, 4: 521-527.
535
Bartrem, C., Tirima, S., von Lindern, I., von Braun, M., Worrell, M.C., Mohammad Anka, S., Moller, G. (2014). Unknown risk: co-exposure to lead and other heavy metals among children living in small-scale mining communities in Zamfara State, Nigeria. International Journal of Environmental Health Research, 24, 304–319.
Boardman D.J (1999). Lime stabilization: clay-metallime interactions. Ph.D. Thesis, Civil and Building Engineering, Loughborough University, United Kingdom.
Boardman DJ, Glendinning S, Rogers CDF (2004). The influences of iron (III) and lead (II) contaminants on lime-stabilised clay. Geotechnique, 54(7): 467-486.
Chatterjee, S., Mitra, A., Datta, S., & Veer, V. (2013). Phytoremediation protocols: An overview. Plant- Based Remediation Processes. Springer. 1-18.
Chao-Lung, H., Anh-Tuan, B. and Chun-Tsun, C. (2011). Effect of rice husk ash on the strength and durability characteristics of concrete. Construction and Building Materials, 25(9): 3768–3772.
Cote, P.L., Constable, P.L. and Moreira, A. (1987). An evaluation of cement-based waste forms using the results of approximately two years of dynamic leaching. Nuclear and Chemical Waste Management J. 7(2):l29-139.
Da silva, E.F., Zhang, C.L., Pinto,S.S., Patinha, C., and Reis, P., ( 2004). Hazard assessment on arsenic and lead in soils of Castromil gold mining area, Portugal. Applied. Geochemistry. 19:887–98.
Dimitris, D., and Xiaoguang M., (2003). Utilization of fly ash for stabilization/solidification of heavy metal contaminated soils. Engineering Geology 70:377–394.
Du Y J, Wei M L, Reddy K R, Liu Z P and Jin F, (2014). Effect of acid rain pH on leaching behavior of cement stabilized lead-contaminated soil, J. Hazard. Mater, 271: 131–40.
Dwivedi, V.N., Singh, N.P., Das, S.S. & Singh, N.B.; (2006). A new pozzolanic material for cement industry: Bamboo leaf ash. International Journal of Physical Sciences, 1(3): 106-111.
Goodarzi, A.R, Movahedrad, M. (2017) Stabilization/solidification of zinc-contaminated kaolin clay using ground granulated blast-furnace slag and different types of activators. Applied Geochemistry. 81: 155-165.
Guo li, L., Daxue, L. & Quan-ming, L. I. (2007) Heavy metals contamination characteristics in soil of different mining activity zones. 1–5.
Harris, F. (1994). Modern Construction and Ground Engineering Equipment and Methods. Longman Scientific and Technical. Pg. 97-103
Hassan, E.M. (2010). Remediation of contaminated land and solutions with binders derived from waste material. Doctoral, Sheffield Hallam University (United Kingdom).

536
Hegazy, H.A (2013). Removal of heavy metals from wastewater using agricultural and industrial wastes as adsorbents. HBRC Journal, 9: 276-282.
Hunce S Y, Akgul D, Demir G, and Mertoglu B, (2012) Solidification/stabilization of landfill leachate concentrate using different aggregate materials, Waste Manag., 32(7): 1394–400.
Ishola, K., Olawuyi, O.A., Bello, A.A., Etim, R.K., Yohanna, P., and Sani, J.E (2019) Review of Agricultural Waste Utilization as Improvement Additives for Residual Tropical Soils. AZOJETE, 15(3):733-749.
Janusa,M.A., Champagne, C.A., Fanguy,J.C., Heard, G.E., Laine,P.L and Landry,A.A(2000)
Solidification/stabilization of lead with the aid of bagasse as an additive to Portland cement, Microchemical Journal. 65: 255-259.
Jing C, Meng X, and Korfiatis G P, (2004) Lead leachability in stabilized/solidified soil samples evaluated with different leaching tests, J. Hazard. Mater, 114(1–3): 101–110.
Lasheen M R, Ashmawy A M, Ibrahim H S, and Moniem S.M.A, (2013). Pozzolanic- based materials for stabilization/solidification of contaminated sludge with hazardous heavy metal: case study, Desalin. Water Treat, 51: 2644–2655.
Khamehchiyan, M., Charkhabi, A.H., and Tajik, M. (2006): “Effects of crude oil contamination on geotechnical properties of clayey and sandy soils” Engineering Geology, 89 (3): 220-229.
Kumpiene, K., Lagerkvist, A. and Maurice, C. (2007) Stabilization of Pb- and Cu contaminated soil using coal fly ash and peat. Environmental Pollution. 145:365-373.
Lee, D. (2007). Formation of lead hillite and calcium lead silicate hydrate (C–Pb–S–H) in the solidification stabilization of lead contaminants. Chemosphere. 66: 1727-1733.
Lee, J. H. (2013). An overview of phytoremediation as a potentially promising technology for environmental pollution control. Biotechnology and Bioprocess Engineering, 18(3): 431–439
Li J. S, Xue Q, Wang P, Li Z Z and Liu L, (2014). Effect of drying-wetting cycles on leaching behavior of cement solidified lead-contaminated soil, Chemosphere, 117: 10–13.
Liu, J., Xu, D., Xiong, L., Hills, C., Caret, P. and Gardner, K. (2008) Comparison of properties of traditional and accelerated carbonated solidified/stabilized contaminated soils. Journal of Environmental Science. 20 (5):593-598.
Liu, J., Xin, X., & Zhou, Q. (2018). Phytoremediation of contaminated soils using ornamental plants. Environmental Reviews, 26(1), 43–54.
Lo, Y. C., Dooyema, C. A., Neri, A., Durant, J., Jefferies, T., Medina-Marino, A., & de Ravello, L. (2012). Childhood lead poisoning associated with gold ore processing: A village level investigation—Zamfara State, Nigeria, October -November 2010. Environmental Health Perspectives, 120-1450
537
Malviya R and Chaudhary R, 2006 Factors affecting hazardous waste solidification/stabilization: a review, J. Hazard. Mater, 137(1): 267–76.
Moncef, N. and Mjad, T. (2007). Stabilization of sulphidic mine tailing for preventing of metal release and acid daring using cementatious material, review, Journal of Environmental Eng. Sci 6 (4):423-436.
Mickney, J.H., Thomas, H.R., Willims, K.P. and Ried, J.M. (2001). Chemical analysis of contaminated soil strength by the addition of lime. Engineering Ecology 60:181-192.
Mohamad, A.M. A., S. Azhar, A. Tajudin, A. A. Kadir, M. Nur, S. Mohamed, N. S. Nordin and M. S. Adnan. 2015. Leaching Behavior of Lead Contaminated Soil Sample by Using Sugarcane Bagasse in Stabilization / Solidification Method. Journal of Applied Mechanics and Materials. 774: 1481-1485
Moon D H and Dermatas D, (2006) An evaluation of lead leachability from Stabilized/solidified soils under modified semi-dynamic leaching conditions, Eng. Geol, 85(1–2): 67–74.
Napia, C., Sinsiri, T., Jaturapitakkul, C. & Chindaprasirt, P. (2012) Leaching of heavy metals from solidified waste using Portland cement and zeolite as a binder. Waste
Management. 32: 1459–1467.
Ojuri, O.O. and Omotayo, O. O. (2012): “Modelling Used Engine Oil Impact on the Compaction and strength characteristics of a lateritic soil. “Electronic Journal of Geotechnical Engineering. 17: 3491-3501)
Omotosho O.A., Ojo, O.J., Adetolaju, F.T (2012) Engineering properties of lateritic soil around Dall quary, sango area, Ilorin, Nigeria. Earth Science Research 1(2):1927-0550
Oramah, I. T., Richards, J. P., Summers, R., Garvin, T., & McGee, T. (2015). Artisanal and small-scale mining in Nigeria: Experiences from Niger, Nasarawa and Plateau states. The Extractive Industries and Society, 2, 694–703.
Osuji O.S and Akinwamide J.T, (2018). Engineering Properties of Lateritic Soils in Ado-Ekiti, South Western Nigeria. American Journal of Engineering Research (AJER) 7(1):353-360.
Plumlee, G. S., Durant, J. T., Morman, S. A., Neri, A., Wolf, R. E., Dooyema, C. A., & Hageman, P. L. (2013). Linking geological and health sciences to assess childhood lead poisoning from artisanal gold mining in Nigeria. Environmental Health Perspectives, 121, 744.
Rahman, A.S.A., Jais, I.B.M., Sidek, N., Ahmad, J., and Rosli, M.I. (2018) “Bamboo leaf ash as the stabilizer for soft soil treatment” IOP Conf. Series: Earth and Environmental Science 140(1): 12-68.
Riley, B.J., Vienna, J.D., Strachan D.M, McCloy, J.S, Jerden, J.L. (2016). Materials and processes for the effective capture and immobilization of radioiodine: a review. Journal of Nuclear Materials. 470: 307-326.

538
Qian,G., Caoa, Y., Chui, P. and Tay, J." (2006) Utilization of MSWI fly ash for stabilization/solidification of industrial waste sludge. J. Haz. Mat.129:274-281.
Saiful, A., Ahmad, T., Aminaton, M., Mohamad, A., Mohammad, A., Aziman M., Mohd, H., and Zainal A., (2015). Utilization of Sugarcane Bagasse Ash for Stabilization / Solidification of Lead-Contaminated Soils. Journal Technology Sciences & Engineering 77 :( 11) 119–125
Stepanova I, Lukina L, Svatovskaya L, Sychev M. (1981). Hardening of cement pastes in presence of chlorides of 3d elements. Journal of Applied Chemistry of the USSR 54: 885-888.
Syed, T.A.J. Sajjad, Y. O., Sian, Z., and Longzhu C. (2018). Effect of cement solidification on strength and leaching properties of Heavy Metals Contaminated Soil. Annals of Civil and Environmental Engineering. 2: 016-027.
Terashi, M. (1980) Fundamental properties of lime and cement treated soils. Report of PHRI 19: 33-62.
Umoh, A. and Odesola, I. (2015). Characteristics of Bamboo Leaf Ash Blended Cement Paste and Mortar. Civil Engineering Dimension, 17(1): 22-28.
Villar-Cociña, E, Morales, E.V., Santos, S.F., Savastano Jr. H.& Frías, M. (2011). Pozzolanic behavior of bamboo leaf ash: characterization and determination of the kinetic parameters. Cement and Concrete Composites, 33, 68-73.
Voglar G. E and Lestan D, (2010) Solidification/stabilization of metals contaminated industrial soil from former Zn smelter in Celje, Slovenia, using cement as a hydraulic binder, J. Hazard. Mater, 178(1–3): 926–33.
Voglar G E and Lestan D, (2011) Efficiency modeling of solidification/stabilization of multi-metal contaminated industrial soil using cement and additives, J. Hazard. Mater, 192(2) 753–762.
Xi Y, Wu X and Xiong H, 2014 Solidification/Stabilization of Pb-contaminated Soils with Cement and Other Additives, Soil Sediment Contam. An Int. J, 23(8): 887–898.
Yao Z, Li J, Xie H, and Yu C (2012). Review on Remediation Technologies of Soil Contaminated by Heavy Metals, Procedia Environ. Sci, 16: 722–729.
Yin, P. & Shi, L. (2014) Remediation of Cd, Pb, and Cu-Contaminated Agricultural Soil using three Modified Industrial By-products. Water, Air, Soil Pollution. 225: 2194.
Yin, C.T., Mahmud, H and Shaaban, M.G., (2006). Stabilization/solidification of lead-contaminated soil using cement and rice husk ash, Journal of Hazardous Materials.137:758–1764
Zhang H. (1997). Chromium contamination in the soil from an alloy steel factory in Nanjing. China Environmental Science, 17(2): 80-82
Zhang T, Cai G, Liu S. (2018). Assessment of mechanical properties in recycled lignin-stabilized silty soil as base fill material. Journal of Cleaner Production, 172: 1788-1799
View publication statsView publication stats


