Embed Size (px)
Citation preview
Human-Survey Interaction
Usability and Nonresponse in Online Surveys
Lars Kaczmirek
2008
Abstract: Response rates are a key quality indicator of surveys. The human-surveyinteraction framework developed in this book provides new insight in what makes re-spondents leave or complete an online survey. Many respondents suffer from difficultieswhen trying to answer survey questions. This results in omitted answers and abandonedquestionnaires. Lars Kaczmirek explains how applied usability in surveys increases re-sponse rates. Here, central aspects addressed in the studies include error tolerance anduseful feedback. Recommendations are drawn from seven studies and experiments. Theresults report on more than 33,000 respondents sampled from many different populationssuch as students, people above forty, visually impaired and blind people, and survey panelmembers. The results show that improved usability significantly boosts response ratesand accessibility. This work clearly demonstrates that human-survey interaction is acost-effective approach in the overall context of survey methodology.
Zusammenfassung: Die Teilnahmequote ist eines der zentralen Qualitätsmerkmale beiUmfragen. Deren Erhöhung ist der zentrale Ausgangspunkt des hier entwickelten Modellsder Mensch-Umfrage Interaktion bei Online-Befragungen. Der Teilnahmeprozess ist vonzahlreichen Schwierigkeiten begleitet, was zu unvollständigen Antworten und Abbrüchenführt. Im vorliegenden Buch verdeutlicht Lars Kaczmirek, wie die praktische Umsetzungvon Prinzipien der Gebrauchstauglichkeit Teilnahmequoten erhöht. Zentrale Aspekte ge-lungener Interaktion von Teilnehmern mit Fragebögen beruhen hierbei auf erhöhter Feh-lertoleranz und sinnvollen Rückmeldungen. Die Ergebnisse beruhen auf sieben Studienund Experimenten mit mehr als 33.000 Teilnehmern. Die untersuchten Personengruppenwaren Studenten, Teilnehmer von Online-Panels, Personen über 40 sowie sehbehinder-te und blinde Personen. Die Ergebnisse zeigen deutlich, dass mit gebrauchstauglichenBefragungen signifikant mehr vollständige Teilnahmen erzielt werden. Investitionen zurVerbesserung der Mensch-Umfrage Interaktion zeigen dabei eine hohe Kosteneffektivitätim Rahmen aktueller Umfragemethodik.
An enhanced book version of this work is published by Herbert von Halem Verlag. Moreinformation is available at http://www.kaczmirek.de/book2008

Human-Survey Interaction
Usability and Nonresponse in Online Surveys
Inauguraldissertationzur Erlangung des akademischen Grades eines
Doktors der Sozialwissenschaftender Universität Mannheim
von
Dipl.-Psych.
Lars Kaczmirek
Februar 2008

Dekan:Prof. Dr Josef Brüderl
Gutachter:Prof. Dr. Werner W. WittmanProf. Dr. Michael Bošnjak
Tag der Disputation: 5. Juni 2008

Schriftenreihe: Mannheimer sozialwissenschaftliche Abschlussarbeiten[Series: Theses in Social Sciences in Mannheim]
Foreword
The Faculty of Social Sciences at the University of Mannheim trains future professionalsfor leadership and research in the fields of political science, sociology, psychology andeducational science. Many master’s, and doctoral theses attest to the high academic levelof education in Mannheim, which is especially characterized by its focus on empirical-analytical and quantitative methods.
The results and contents of many of these theses are worth publishing. Therefore, theFaculty of Social Sciences provides an opportunity for broader dissemination of the bestmanuscripts through its series Mannheimer sozialwissenschaftliche Abschlussarbeiten.The goal of this series is to render the scientific results of outstanding work accessible toa broader professional audience. The publication of these research results may serve asa basis for further scientific investigations.
This series publishes only excellent master’s and doctoral theses. Both reviewers havegraded the work as "very good" and the work was approved for publication.
Prof. Dr. Josef BrüderlDean of the Faculty of Social Sciences at the University of Mannheim
v
Acknowledgements
This book provides empirical evidence that applied usability increases response rates insurveys. Results from seven studies are presented which benefitted from many thousandparticipants. Doubtlessly, this project was only made possible with the collaboration andsupport of many people.I would like to especially thank my supervisors Prof. Dr. Michael Bošnjak and Prof.
Dr. Werner W. Wittmann. Without Michael Bošnjak I might never have ventured intothe depths of survey methodology. My research has always profited from his strong focuson quality and coherent argumentation. Werner W. Wittmann’s teaching fundamentallyshaped my methodological thinking. His teaching and the insight that methods have abroad applicability encouraged me to concentrate on methodological issues in my ownresearch.I am very grateful to my colleague Dr. Wolfgang Bandilla and his continued professional
and personal support through the years at GESIS. I am also very grateful to my formerresearch fellow Dr. Wolfgang Neubarth. Exchanging ideas with them has greatly enrichedmy point of view. I am indebted to Prof. Dr. Mick Couper for numerous encouragingas well as enlightening discussions. I am also indebted to Olaf Thiele for our gratifyingcooperation over the years.Conducting studies involves many people. Here, I feel especially thankful for fruit-
ful cooperation with Timo Faaß, Annika Feick, Dr. Lorenz Gräf, Klaus Gunzenhauser,Dr. Otto Hellwig, Steffen Haas, Dirk Jendroska, Dorthe Lübbert, Tom Wirth, andDr. Klaus G. Wolff. I am also very thankful for discussions and working with TinaS. Auer, Dorothée Behr, Michael Blohm, Prof. Dr. Ingwer Borg, Prof. Dr. MichaelBraun, Christoph Constien, PD Dr. Siegfried Gabler, Matthias Ganninger, Alfons Geis,Prof. Dr. Jürgen Hoffmeyer-Zlotnik, Hannah Horneff, Jana Janßen, Kathrin Kaschura,Peter Prüfer, PD Dr. Beatrice Rammstedt, Julia Rector, Margrit Rexroth, BrigitteSchick, Michael Schneid, Karlheinz Schneider, Nicole Schulze, Angelika Stiegler, Prof. Dr.Vasja Vehovar, Dr. Harald Weber, Michael Wiedenbeck, Cornelia Züll, and all my col-leagues at GESIS.For steady friendship, encouraging and enquiring words I especially thank my parents
Helen and Peter Kaczmirek, my brothers Jens and Per, and my friends K. Michael Flach,Dr. Folkert Degenring, Dr. Esther Heinz, Markus Radtke, and Constanze Woltag.Most importantly, I thank Prof. Dr. Sarah Heinz. She helped shaping this work by
discussing, proofreading and commenting on my writing. Thanks to her constant lovingsupport I was able to complete this work.The following work is my doctoral dissertation at the University of Mannheim which
was submitted in February and defended in June 2008 at the Faculty of Social Sciences.I thank the German Society for Online Research (DGOF), the Stiftung LandesbankBaden-Württemberg and GESIS for funding the publication.
Lars Kaczmirek Mannheim, November 2008
vi
Contents
1. Introduction 11.1. The Emerging Relevance of Online Surveys . . . . . . . . . . . . . . . . . 11.2. Outline . . . . . . . . . . . . . . . . . . . . . . . . . . . . . . . . . . . . . 21.3. Sources of Error in the Life Cycle of Online Surveys . . . . . . . . . . . . 4
1.3.1. Coverage Error . . . . . . . . . . . . . . . . . . . . . . . . . . . . . 51.3.2. Sampling Error . . . . . . . . . . . . . . . . . . . . . . . . . . . . . 71.3.3. Nonresponse Error . . . . . . . . . . . . . . . . . . . . . . . . . . . 71.3.4. Measurement Error . . . . . . . . . . . . . . . . . . . . . . . . . . . 81.3.5. Processing Error . . . . . . . . . . . . . . . . . . . . . . . . . . . . 101.3.6. Adjustment Error . . . . . . . . . . . . . . . . . . . . . . . . . . . . 12
I. Concepts and Approaches 14
2. Usability in Online Surveys 152.1. Applying Human-Computer Interaction to Online Surveys . . . . . . . . . 15
2.1.1. The Applicability of the ISO 9241-110 . . . . . . . . . . . . . . . . 162.1.2. Everyday Design: Norman’s Seven . . . . . . . . . . . . . . . . . . 172.1.3. User Interface Design: Shneiderman’s Eight . . . . . . . . . . . . . 192.1.4. Usability Design: Nielsen’s Ten . . . . . . . . . . . . . . . . . . . . 202.1.5. Computer-Assisted Interview Design: Couper’s Ten . . . . . . . . . 232.1.6. Extending the ISO 9241-110 to the Context of Online Surveys . . . 262.1.7. Summary of Usability Heuristics and Their Relation to Each Other 32
2.2. A Proposed Framework for Human-Survey Interaction . . . . . . . . . . . 342.2.1. Interaction: Feedback and Error Tolerance . . . . . . . . . . . . . . 342.2.2. Human: A Model of the Response Process . . . . . . . . . . . . . . 352.2.3. Survey: Response Burden . . . . . . . . . . . . . . . . . . . . . . . 372.2.4. Nonresponse and Successful Human-Survey Interaction . . . . . . . 40
2.3. Connecting Research Goals, Studies, Survey Methodology, and Usability . 43
3. Using the Framework in Survey Design: A Mixed Mode Example (Study 1) 483.1. Deriving Guidelines for Different Modes . . . . . . . . . . . . . . . . . . . 483.2. Survey Design for Visually Impaired and Blind People . . . . . . . . . . . 483.3. Method: Mixed Mode with Paper and Pencil, Braille and Web . . . . . . . 49
3.3.1. Procedure . . . . . . . . . . . . . . . . . . . . . . . . . . . . . . . . 493.3.2. Participants . . . . . . . . . . . . . . . . . . . . . . . . . . . . . . . 503.3.3. Questionnaire . . . . . . . . . . . . . . . . . . . . . . . . . . . . . . 51
vii
Contents
3.4. Cognitive Aspects of Survey Design for Visually Impaired and Blind People 513.4.1. Provide and Support Overview . . . . . . . . . . . . . . . . . . . . 523.4.2. Provide Navigation and Orientation Aids . . . . . . . . . . . . . . 543.4.3. Streamline the Answering Process . . . . . . . . . . . . . . . . . . 55
3.5. Summary and Conclusion . . . . . . . . . . . . . . . . . . . . . . . . . . . 56
II. Instruments 58
4. Developing the Concept of Paradata 594.1. Background . . . . . . . . . . . . . . . . . . . . . . . . . . . . . . . . . . . 594.2. Applications of and Approaches to Paradata . . . . . . . . . . . . . . . . . 614.3. Conceptualizing Paradata . . . . . . . . . . . . . . . . . . . . . . . . . . . 634.4. An Instrument for the Collection of Client-Side Paradata . . . . . . . . . . 654.5. Clicking the Answer Button and Failures in Survey Interaction (Study 2) . 66
4.5.1. Design Rationale . . . . . . . . . . . . . . . . . . . . . . . . . . . . 674.5.2. Questionnaire . . . . . . . . . . . . . . . . . . . . . . . . . . . . . . 674.5.3. Participants . . . . . . . . . . . . . . . . . . . . . . . . . . . . . . . 684.5.4. Results . . . . . . . . . . . . . . . . . . . . . . . . . . . . . . . . . 684.5.5. Discussion . . . . . . . . . . . . . . . . . . . . . . . . . . . . . . . . 69
4.6. Data Quality of Paradata: Different Response Time Measures (Study 3) . 694.6.1. Introduction and Definitions . . . . . . . . . . . . . . . . . . . . . . 694.6.2. Method . . . . . . . . . . . . . . . . . . . . . . . . . . . . . . . . . 714.6.3. Questionnaire . . . . . . . . . . . . . . . . . . . . . . . . . . . . . . 724.6.4. Participants . . . . . . . . . . . . . . . . . . . . . . . . . . . . . . . 724.6.5. Results . . . . . . . . . . . . . . . . . . . . . . . . . . . . . . . . . 724.6.6. Discussion . . . . . . . . . . . . . . . . . . . . . . . . . . . . . . . . 74
4.7. Summary and Conclusion . . . . . . . . . . . . . . . . . . . . . . . . . . . 76
5. Nonresponse as a Result of Missing Accessibility (Study 4) 795.1. Background . . . . . . . . . . . . . . . . . . . . . . . . . . . . . . . . . . . 795.2. Method . . . . . . . . . . . . . . . . . . . . . . . . . . . . . . . . . . . . . 81
5.2.1. Questionnaire . . . . . . . . . . . . . . . . . . . . . . . . . . . . . . 815.2.2. Participants . . . . . . . . . . . . . . . . . . . . . . . . . . . . . . . 83
5.3. Results and Discussion for Client-Side Technology . . . . . . . . . . . . . . 845.3.1. Acceptance and Persistence of Cookies . . . . . . . . . . . . . . . . 845.3.2. Coverage of JavaScript, Java and Flash . . . . . . . . . . . . . . . 875.3.3. Coverage of Video and Scalable Vector Graphics . . . . . . . . . . 895.3.4. Screen Resolution and Browser Usage . . . . . . . . . . . . . . . . 905.3.5. Internet-Related Questions . . . . . . . . . . . . . . . . . . . . . . 91
5.4. Summary and Conclusion . . . . . . . . . . . . . . . . . . . . . . . . . . . 93
viii
Contents
III. Tests on Applications 96
6. Increasing Item Completion Rates: Interactivity in Matrix Questions 976.1. Background . . . . . . . . . . . . . . . . . . . . . . . . . . . . . . . . . . . 976.2. Focusing on Available Answers (Study 2) . . . . . . . . . . . . . . . . . . . 98
6.2.1. Method . . . . . . . . . . . . . . . . . . . . . . . . . . . . . . . . . 986.2.2. Questionnaire . . . . . . . . . . . . . . . . . . . . . . . . . . . . . . 1006.2.3. Participants . . . . . . . . . . . . . . . . . . . . . . . . . . . . . . . 1006.2.4. Results . . . . . . . . . . . . . . . . . . . . . . . . . . . . . . . . . 1016.2.5. Discussion . . . . . . . . . . . . . . . . . . . . . . . . . . . . . . . . 107
6.3. Emphasizing Answer Options in the Pre- and Post-Selection Phase (Study5) . . . . . . . . . . . . . . . . . . . . . . . . . . . . . . . . . . . . . . . . 1086.3.1. Method . . . . . . . . . . . . . . . . . . . . . . . . . . . . . . . . . 1096.3.2. Questionnaire . . . . . . . . . . . . . . . . . . . . . . . . . . . . . . 1106.3.3. Participants . . . . . . . . . . . . . . . . . . . . . . . . . . . . . . . 1106.3.4. Results . . . . . . . . . . . . . . . . . . . . . . . . . . . . . . . . . 1116.3.5. Discussion . . . . . . . . . . . . . . . . . . . . . . . . . . . . . . . . 113
6.4. Summary and Conclusion . . . . . . . . . . . . . . . . . . . . . . . . . . . 113
7. Increasing Survey Completion Rates: Feedback on Survey Progress 1177.1. Background . . . . . . . . . . . . . . . . . . . . . . . . . . . . . . . . . . . 1187.2. Improving the Accuracy of Progress Feedback . . . . . . . . . . . . . . . . 120
7.2.1. Jumping Progress: Problems With Filter Questions . . . . . . . . . 1207.2.2. Static Calculation Approaches . . . . . . . . . . . . . . . . . . . . . 1217.2.3. The Dynamic Calculation Approach . . . . . . . . . . . . . . . . . 121
7.3. Employing Feedback Dynamically and Individually (Study 6) . . . . . . . 1247.3.1. Method . . . . . . . . . . . . . . . . . . . . . . . . . . . . . . . . . 1257.3.2. Questionnaire . . . . . . . . . . . . . . . . . . . . . . . . . . . . . . 1267.3.3. Participants . . . . . . . . . . . . . . . . . . . . . . . . . . . . . . . 1267.3.4. Results . . . . . . . . . . . . . . . . . . . . . . . . . . . . . . . . . 1277.3.5. Discussion . . . . . . . . . . . . . . . . . . . . . . . . . . . . . . . . 131
7.4. Accelerated, Decelerated and Steady Progress Feedback (Study 7) . . . . . 1317.4.1. Method . . . . . . . . . . . . . . . . . . . . . . . . . . . . . . . . . 1327.4.2. Questionnaire . . . . . . . . . . . . . . . . . . . . . . . . . . . . . . 1347.4.3. Participants . . . . . . . . . . . . . . . . . . . . . . . . . . . . . . . 1347.4.4. Results . . . . . . . . . . . . . . . . . . . . . . . . . . . . . . . . . 1357.4.5. Discussion . . . . . . . . . . . . . . . . . . . . . . . . . . . . . . . . 136
7.5. Summary and Conclusion . . . . . . . . . . . . . . . . . . . . . . . . . . . 137
8. Discussion 1408.1. Summary of the Results . . . . . . . . . . . . . . . . . . . . . . . . . . . . 1418.2. Limitations . . . . . . . . . . . . . . . . . . . . . . . . . . . . . . . . . . . 1468.3. Implications . . . . . . . . . . . . . . . . . . . . . . . . . . . . . . . . . . . 148
ix
Contents
9. Bibliography 151
Appendix for Study 1 165
Appendix for Study 2 167
Appendix for Study 3 177
Appendix for Study 4 179
Appendix for Study 5 180
Appendix for Study 6 182
Appendix for Study 7 186
Author Index 187
x
List of Tables
2.1. Summary of usability heuristics and their relation to the ISO 9241-110 . . 332.2. Components of the response process . . . . . . . . . . . . . . . . . . . . . 362.3. Definition of main response rates . . . . . . . . . . . . . . . . . . . . . . . 422.4. Overview of research goals, terminology, and conducted studies . . . . . . 47
3.1. Distribution of responses for each survey mode . . . . . . . . . . . . . . . 503.2. Guidelines for the survey design for visually impaired and blind people . . 57
4.1. Paradata, metadata and data about respondents in surveys . . . . . . . . 604.2. Typology and aspects of paradata . . . . . . . . . . . . . . . . . . . . . . . 644.3. Distribution of click failures . . . . . . . . . . . . . . . . . . . . . . . . . . 684.4. Quality of different time measures . . . . . . . . . . . . . . . . . . . . . . . 73
5.1. Demography of university applicants . . . . . . . . . . . . . . . . . . . . . 835.2. Acceptance of cookies . . . . . . . . . . . . . . . . . . . . . . . . . . . . . 855.3. Persistence of cookies . . . . . . . . . . . . . . . . . . . . . . . . . . . . . . 865.4. Coverage of Technical Features . . . . . . . . . . . . . . . . . . . . . . . . 875.5. Distribution of screen resolutions . . . . . . . . . . . . . . . . . . . . . . . 915.6. Distribution of browser usage . . . . . . . . . . . . . . . . . . . . . . . . . 925.7. Responses to the question about Internet usage at home . . . . . . . . . . 925.8. Responses to the question about the number of actively used e-mail addresses 935.9. Responses to the question about security measures . . . . . . . . . . . . . 94
6.1. Frequency distribution of the number of completed items . . . . . . . . . . 1026.2. Proportion of respondents who completed all items . . . . . . . . . . . . . 1036.3. Significant tests of the hypotheses about completion rates . . . . . . . . . 1046.4. Mean response times . . . . . . . . . . . . . . . . . . . . . . . . . . . . . . 1056.5. Proportion of respondents who switched answers . . . . . . . . . . . . . . 1066.6. Number of respondents and items missing . . . . . . . . . . . . . . . . . . 1126.7. Proportion of complete item responses . . . . . . . . . . . . . . . . . . . . 112
7.1. Completion rates across experimental conditions in study 6 . . . . . . . . 1277.2. Completion rates across experimental conditions in study 7 . . . . . . . . 136
xi
List of Figures
1.1. The life cycle of online surveys in the total survey error framework . . . . 61.2. Example of scale inconsistencies . . . . . . . . . . . . . . . . . . . . . . . . 11
2.1. Proposed framework for human-survey interaction . . . . . . . . . . . . . 352.2. Response types in online surveys . . . . . . . . . . . . . . . . . . . . . . . 41
3.1. Example of survey design in the mixed mode study . . . . . . . . . . . . . 513.2. Traditional standard layout in a paper-based questionnaire . . . . . . . . . 523.3. Demonstration of restrictions in the visual field . . . . . . . . . . . . . . . 533.4. Redesigned survey in the mixed mode study . . . . . . . . . . . . . . . . . 53
4.1. Paradata model . . . . . . . . . . . . . . . . . . . . . . . . . . . . . . . . . 634.2. Answer radio buttons in table cells with labels . . . . . . . . . . . . . . . . 674.3. Different elements in time measurement via the Internet . . . . . . . . . . 714.4. Aggregated answer, page and server times . . . . . . . . . . . . . . . . . . 75
5.1. Online application form of the University of Mannheim . . . . . . . . . . . 82
6.1. Experimental design in study 2 . . . . . . . . . . . . . . . . . . . . . . . . 996.2. Mean number and percentage of items answered in study 2 . . . . . . . . 1016.3. Visual design of matrix question 1 in study 5 . . . . . . . . . . . . . . . . 109
7.1. Examples of progress indicators in human-computer interaction . . . . . . 1177.2. Possible progress indicators in online surveys . . . . . . . . . . . . . . . . 1187.3. Static and dynamic progress indicators . . . . . . . . . . . . . . . . . . . . 1227.4. Development of progress with static and dynamic calculation . . . . . . . 1237.5. Reported progress in the experiment . . . . . . . . . . . . . . . . . . . . . 1257.6. Perceived time flow . . . . . . . . . . . . . . . . . . . . . . . . . . . . . . . 1287.7. Perceived burden . . . . . . . . . . . . . . . . . . . . . . . . . . . . . . . . 1297.8. Expected minutes till completion . . . . . . . . . . . . . . . . . . . . . . . 1307.9. Reported progress across experimental conditions . . . . . . . . . . . . . . 1337.10. Example of the questionnaire used for progress feedback . . . . . . . . . . 135
xii
List of Abbreviations and Translations
AAPOR American Association for Public Opinion ResearchACM Association for Computing MachineryADM Arbeitskreis Deutscher Markt- und Sozialforschungsinstitute e.V.
[German Association for Market and Social Research Agencies]AGOF Arbeitsgemeinschaft Online-Forschung e.V.
[Consortium for Online Research]ALLBUS Allgemeine Bevölkerungsumfrage der Sozialwissenschaften
[General Social Science Survey of German Speaking People in Germany]ASI Arbeitsgemeinschaft Sozialwissenschaftlicher Institute e.V.
[Consortium of Institutes in the Social Sciences]BVM Berufsverband Deutscher Markt- und Sozialforscher e.V.
[Professional Association for German Market and Social Researchers]CAPI Computer-Assisted Personal InterviewingCASI Computer-Assisted Self-InterviewingCATI Computer-Assisted Telephone InterviewingCHI Computer-Human InteractionDGOF Deutsche Gesellschaft für Online Forschung e.V.
[German Society for Online Research]GESIS GESIS - Leibniz-Institut für Sozialwissenschaften
[GESIS - Leibniz Institute for the Social Sciences]Statistisches [Federal Office for Statistics in Germany]BundesamtGOR General Online Research ConferenceGSA U. S. General Services AdministrationHCI Human-Computer InteractionHHS U. S. Department of Health and Human ServicesICPSR Inter-University Consortium for Political and Social ResearchISO International Organization for StandardizationISSP International Social Survey ProgrammeZA Zentralarchiv für Empirische Sozialforschung (now GESIS)
[Central Archive for Empirical Social Research]ZUMA Zentrum für Umfragen, Methoden und Analysen (now GESIS)
[Center for Survey Research and Methodology]
xiii
1. Introduction
1.1. The Emerging Relevance of Online Surveys
In recent years online surveys have been accepted in the canon of possible survey modes:
Web-based surveys have received unique entries in encyclopediae (Alvarez & VanBese-
laere, 2005). At conferences online surveys have moved from being discussed in separate
sessions to being subsumed under the various topics of surveys and survey methodology
(cf., changes in the AAPOR proceedings during the last years). The question of whether
online surveys are to be considered as an alternative to traditional survey modes has
moved to questions as under which circumstances the mode is able to play its strengths
or when to consider other survey modes (Evans & Mathur, 2005). Compared to these tra-
ditional survey modes, online surveys are a growing business sector (ADM, 2004). Several
organizations have written guidelines for good online survey practice (ADM, ASI, BVM,
& DGOF, 2000) or included the mode into an overall framework for the handling of case
codes and response rate calculations (AAPOR, 2006). Even in population samples online
surveys have taken their role as cost-cutting instruments in mixed mode approaches. The
US (Schneider et al., 2005) and Canada (Arora & Gilmour, 2005) both had implemented
online versions of the census.
Online surveys have several advantages compared to other modes as they are easier and
more effective to conduct with respect to the aspects of the global availability of surveys,
multilingual surveys, the timeliness of data collection, data input, available question
types, cost of reminders when using e-mails, filtering or skipping questions, and edit
checks during the interview. The disadvantages are a result of the employed technology.
Not all people of the general population have Internet access, scientific e-mail invitations
compete against spam and advertising e-mails, the computer is more difficult to use
than talking to an interviewer, and additional security and data protection measures are
necessary (Evans & Mathur, 2005; Welker, Werner, & Scholz, 2005). Online surveys
share the problems of self-administration in that there is no interviewer available to
motivate the respondent or to clarify questions. Irrespectively of the mode, all surveys
share threats to data quality due to different types of survey error.
1
Introduction
In the following, I refer to online surveys as Web-based surveys. Respondents start a
survey (login) by visiting the first page of the questionnaire with a browser. Respondents
then proceed through a series of questions and webpages until the end of the survey. The
pages are delivered by a server. This concept is also valid for short surveys which can be
delivered as a single page. Because the questionnaire is substantially a series of webpages
all techniques in current webpage construction can be used. This allows to use visually
rich survey design (Krisch & Lesho, 2006), real-time validations (Peytchev & Crawford,
2005), and video (Fuchs & Funke, 2007; Couper, 2005).
1.2. Outline
The general aim of this research is to improve online surveys with respect to successful
human-survey interaction. This success can be assessed on the basis of accepted quality
criteria in survey methodology, specifically nonresponse (Groves et al., 2004). The theory
applied in this work combines survey methodology and human-computer interaction. The
focus on the usability of surveys leads to several suggestions for survey design. These
suggestions are tested and compared to current design practice.
The theoretical part combines different approaches of usability, the answer process,
and response burden with the criteria of nonresponse (chapter 2). Usability principles
are reviewed and extended to the context of online survey methodology. The result-
ing framework is termed human-survey interaction in an allusion to human-computer
interaction. The human aspect mainly models the answer process, while the survey as-
pect includes survey design and response burden. The interaction is concerned with the
communication between respondents and a survey. The literature review on usability
principles shows that the main focus resides on self-descriptiveness, that is feedback and
information about the system status, and error tolerance. Different feedback techniques
and error tolerance will therefore be the central focus of the later chapters.
Chapter 3 and study 1 demonstrate the usefulness of the proposed framework by
developing specific design guidelines and conducting a survey for visually impaired and
blind people in a mixed mode setting of self-administered interviews.
The second part is concerned with further development of instruments in survey
methodology. Chapter 4 identifies a lack in the conceptualization of process data, known
as paradata. As there is no coherent and conclusive model of paradata, a taxonomy of
paradata is developed. As part of this taxonomy a new instrument for the collection of
paradata is put forward. This universal approach to paradata collection makes it possible
2
Introduction
to observe behavior which was hitherto unaccessible such as a respondent’s mouse clicks
which miss answer controls. This instrument is then used in study 2 which shows that
the current implementation of answer buttons in online surveys is far more error-prone
than expected. A solution is proposed which is tested as part of study 5.
A very common type of paradata are response times. Study 3 uses the paradata model
to define different measures for response times. The developed taxonomy of paradata
makes clear that researchers must choose from these different definitions which differ in
terms of the time and financial investment needed for the implementation. Even more
important however are possible differences in data quality between the definitions. This
is problematic as researchers usually go for only a single measurement criterium and may
be unaware that the others exist. Research has therefore not been able to identify the
most advantageous response latency measurement. To fill this gap, study 3 compares
three definitions of response latencies and identifies the best one.
Chapter 5 identifies technical features which should be used to turn design principles
into practice. Researchers can choose among a variety of technologies such as JavaScript,
Java, Flash, and cookies. Several survey methods require at least one of these technolo-
gies, for example when controlling multiple participation or using visual analog scales in
questions. Unfortunately, due to fast-changing Internet technologies not all users have all
possible technical features available in their browsers. The challenge in surveys is to use
features which have a very high coverage among the respondents while maintaining high
survey quality standards. This is necessary to minimize nonresponse due to technical
inaccessibility. Study 4 assesses the availability of different technology in respondents’
browsers. The results show that JavaScript is widely available and allows for the im-
plementation of both the universal client-side paradata instrument and design principles
without increasing nonresponse. Later chapters test different survey designs which were
implemented with this technology to reduce nonresponse.
The third part beginning with chapter 6 applies the design suggestions from the frame-
work and the previous chapters to online surveys and tests their effects on nonresponse
and other quality criteria. Studies 2 and 5 apply concepts of usability to reduce items
missing which are an aspect of nonresponse. The design suggestions addressed enhance
feedback in survey questions. This is done using interactive color cues which highlight
the item that a respondent is about to answer and the items that have already been
answered. The results show that good interface design reduces item nonresponse.
Chapter 7 with studies 6 and 7 aims to reduce dropout by means of enhancing self-
descriptiveness, and feedback. This is achieved by utilizing progress indicators. The use
3
Introduction
of filter questions commonly results in wrong feedback that becomes visible as ‘jump-
ing’ progress indicators as soon as a major part of a questionnaire was omitted because
it was not applicable for the respondent at hand. An algorithm is developed to over-
come problems in the calculation of progress in all kinds of surveys with filter questions,
irrespective of survey software. Study 6 shows a positive effect of the algorithm on
completion rates, expected time till completion, perceived burden, and perceived time
flow. The algorithm allows for two different calculations: a ‘conservative, accelerated’
and a ‘progressive, decelerated’ feedback. Thus, study 7 compares the effects of both
approaches and recommends the usage of a progressive, decelerated feedback algorithm
that overestimates rather than underestimates the progress at the beginning of a survey
to maximize response rates.
Concluding, this work consists of three parts. The first part develops the theory around
the framework of human-survey interaction. The second part develops instruments for
research within the framework. Finally, the third part uses the framework to develop
survey design strategies which are expected to enhance usability and reduce nonresponse.
The instruments are employed to test these survey design strategies against current design
practice. The next section explains how this work fits into the broader area of survey
methodology.
1.3. Sources of Error in the Life Cycle of Online Surveys
This section positions the content of this work into the broader picture of survey method-
ology by examining the different sources of error in the life cycle of online surveys. Sources
of error are the most prominent problems online surveys face and share with other sur-
veys. The life cycle approach ascribes the types of error to the different steps of a survey
and thereby allows a better understanding of the process of conducting a survey. Here,
the focus of this work is step three, types of nonresponse error where respondents are
interacting with questionnaires.
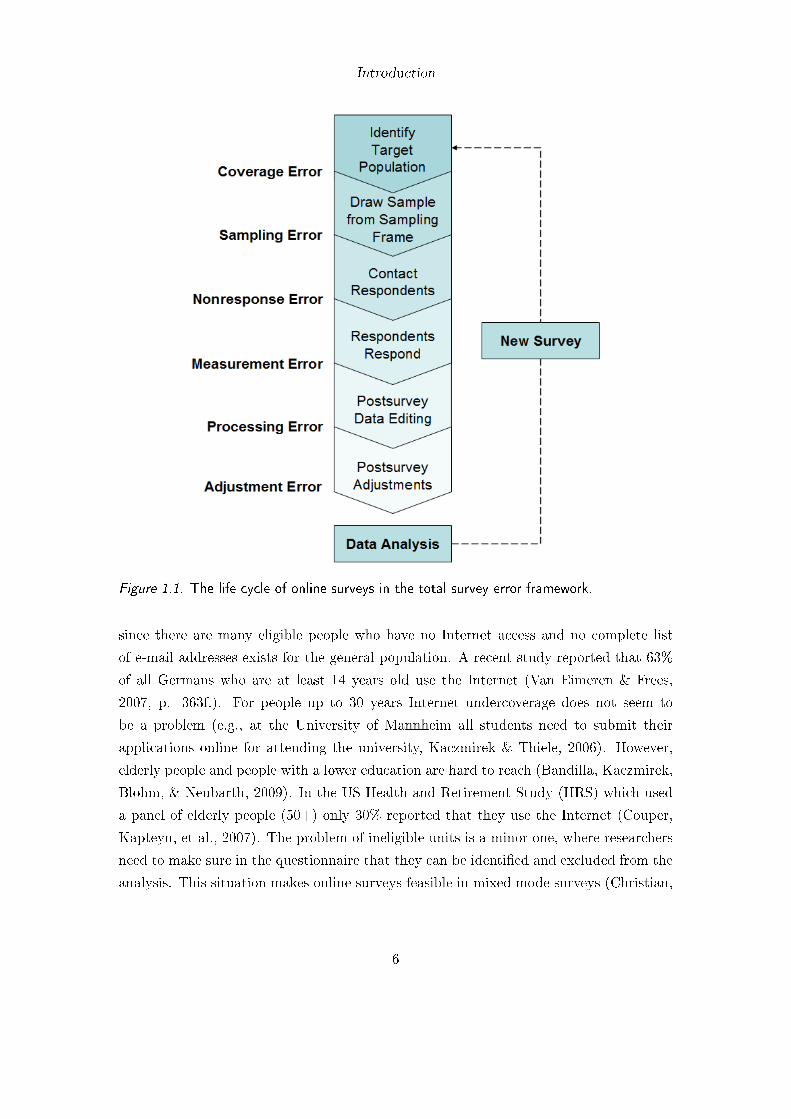
The concept of total survey error is composed of several error types which occur during
the different life cycle stages of a survey project.1 According to Groves et al. (2004, p. 49),
“the job of a survey designer is to minimize the gap between two successive stages of the
1 This section approaches the different stages from an error perspective. Nevertheless, the survey lifecycle approach has been used in other contexts as well: ICPSR (2005) uses the data life cycle as aframework to explain the necessary data documentation during a project. Kaczmirek (2008) discussesthe many decisions involved in survey design from a software tools perspective. The life cycle modelof online surveys integrates other views such as the phases of empirical research (Diekmann, 2007)and research process (Schnell, Hill, & Esser, 2004).
4
Introduction
survey process. This framework is sometimes labeled the ‘total survey error’ framework
or ‘total survey error’ paradigm.”
The most prominent types of error are (Groves et al., 2004, p. 48):
1. Coverage error: Identify target population and define sampling frame, for example
students and list of e-mails of first year students.
2. Sampling error: Draw sample from sampling frame, for example nth visitor sam-
pling on a website.
3. Nonresponse error: Contact respondents, for example refusals.
4. Measurement error: Respondents response, for example acquiescence.
5. Processing error: Postsurvey data editing, for example imputation of missing data.
6. Adjustment error: Postsurvey adjustments, for example weighting.
Each error type marks an important step towards the next phase in the life cycle of a
survey. Survey costs are weighted against the quality features to design the best possible
survey under the given circumstances and constraints of a project (Groves & Heeringa,
2006).
Although the different concepts of error have been discussed extensively (Groves et
al., 2004; Biemer & Lyberg, 2003), a summary of the relevant work explains how my
research fits into the life cycle of a survey and the overarching survey error paradigm.
Figure 1.1 shows the typical tasks for conducting a survey concerning the data. Each
task is associated with a possible source of error which will be discussed in the next
sections with respect to online surveys.
1.3.1. Coverage Error
In order to study a target population the researcher needs to define a sampling frame,
from which to draw a sample. In online surveys the sampling frame would usually be a
list of e-mail addresses of the members of the target population or their postal addresses.
Coverage error is the difference between this sampling frame and the target population.
Coverage error consists of undercoverage and ineligible units (Couper, Kapteyn, Schon-
lau, & Winter, 2007). Undercoverage describes the problem that people who have a
zero-chance of being selected although they are part of the target population differ in
the variables of research interest. Undercoverage is the main threat to online surveys
5
Introduction
Figure 1.1. The life cycle of online surveys in the total survey error framework.
since there are many eligible people who have no Internet access and no complete list
of e-mail addresses exists for the general population. A recent study reported that 63%
of all Germans who are at least 14 years old use the Internet (Van Eimeren & Frees,
2007, p. 363f.). For people up to 30 years Internet undercoverage does not seem to
be a problem (e.g., at the University of Mannheim all students need to submit their
applications online for attending the university, Kaczmirek & Thiele, 2006). However,
elderly people and people with a lower education are hard to reach (Bandilla, Kaczmirek,
Blohm, & Neubarth, 2009). In the US Health and Retirement Study (HRS) which used
a panel of elderly people (50+) only 30% reported that they use the Internet (Couper,
Kapteyn, et al., 2007). The problem of ineligible units is a minor one, where researchers
need to make sure in the questionnaire that they can be identified and excluded from the
analysis. This situation makes online surveys feasible in mixed mode surveys (Christian,
6
Introduction
2007; De Leeuw, 2005) and for special target populations with high Internet coverage,
such as establishments (Auno, 2004), students (Heerwegh, 2005), and employees (Borg
& Faulbaum, 2004).
1.3.2. Sampling Error
In most surveys not all units in the sampling frame are contacted for a response to
minimize costs. An exception is a census which aims at questioning everyone in the
sampling frame. A sample represents one possible realization of all theoretically possible
surveys in the sampling frame. In the case of probability-based methods the error and
its effect on the different statistic variables is known to warrant the extent to which
interference to the target population is possible. “In nonprobability surveys, members
of the target population do not have known nonzero probabilities of selection. Hence,
inference or generalizations to that population are based on leaps of faith rather than
established statistical principles.” (Couper, 2000b, p. 477). With the distinction between
nonprobability and probability-based methods in online surveys made by Couper it is
possible to evaluate the value of a survey relative to its intended goal. For example polls
for entertainment on a website add no or at least questionable value to public opinion
research but may be perceived as adding value for the visitors of the website. On the
contrary, a well-drawn sample within the customers of a large company can reduce costs
while keeping accurate track of the customers’ opinions. Despite the fact that online
surveys have fostered a profitable industry with many survey software tools (Kaczmirek,
2008) they have a bad reputation among more traditional survey researchers. Vehovar,
Batagelj, Manfreda, and Zaletel (2002, p. 239) stress the importance not to blame the
online mode for bad sampling habits:
The threat to validity thus arises only from nonresponse and noncoverage problems, particularly
in nonprobability Web surveys, which are, unfortunately, quite common. As a consequence, Web
surveys are often automatically associated with the validation issues in nonprobability Web surveys,
although this is nothing but the usual problem of statistical inference without scientific/probability
sampling.
1.3.3. Nonresponse Error
After having drawn the sample the prospective participants are contacted. Usually, not
all sample members answer to such a request. Nonresponse error is the difference be-
tween the respondents and the entire sample. It is a problem in so far as nonrespondents
7
Introduction
indeed differ in their answers from respondents and their answers. When the reasons for
nonresponse are linked to the research questions, nonresponse error increases with a de-
clining response. In online surveys the response rates tend to be lower when compared to
other modes. In a meta-analysis examining 45 published and unpublished experimental
comparisons between Web and other survey modes Lozar Manfreda, Bosnjak, Berzelak,
Haas, and Vehovar (2008) on average found an 11% lower response rate compared to
other modes. The main factors affecting response rates were the sampling frame, the
solicitation mode, and the number of contacts. Here, it is noteworthy that no significant
influence of incentives was found. This contrasts meta-analytical findings from tradi-
tional mail surveys were incentives have proven to be effective in increasing response
(Yammarino, Skinner, & Childers, 1991). Effects on solicitation are also reported in a
comparison of online and mail survey response rates by Kaplowitz, Hadlock, and Levine
(2004). They found a non-significant difference between mail invitations (RR2=.315) and
‘postcard followed by-e-mail invitations’ (RR=.297). However, there was a significant dif-
ference between mail and e-mail only (RR=.207) invitations (Kaplowitz et al., 2004, p.
98f.). Even more importantly, the cost differences between the mail and ‘postcard e-mail
condition’ are substantial $10.97 vs. $1.13 per response, stating online surveys as highly
cost-effective. In a meta-analysis of 68 online surveys in 49 studies Cook, Heath, and
Thompson (2000) reported an average response rate of 39.6% (SD=19.6%): “The number
of contacts, personalized contacts, and precontacts were the dominant factors affecting
response rates for our study.” (p. 829).
In this overview of the different types of survey error in the life cycle of a survey it
must be stressed that nonresponse in online surveys plays an important role in research
(Bosnjak, 2002; Heerwegh, 2005; Peytchev, 2007). The comparative research reported
here provides examples that good, that is evidence-based online survey methodology can
keep up with nonresponse rates in other survey modes. My work focuses on nonresponse
as a quality criteria to experimentally assess the usefulness of design decisions which were
derived from the theoretical framework.
1.3.4. Measurement Error
Measurement error is the deviation of the response to the true answer value. There
are two types of measurement errors. The unsystematic error (of classical test theory)
does not negatively affect survey estimates. The main problem in survey research are
2 This response rate is RR6 as defined by the American Association for Public Opinion Research(AAPOR, 2006).
8
Introduction
systematic errors (cf., Biemer, 2004; O’Muircheartaigh, 1997, for a historical perspective).
These errors arise because survey design can cause systematic bias (Biemer, Groves,
Lyberg, Mathiowetz, & Sudman, 2004). It is for example well known that undesirable
behavior is underreported by respondents. This ranges from self-reported health risk
behavior (Brener et al., 2006) such as drug use (Biemer & Brown, 2005) over the amount
of watching television and blood donation to overall satisfaction with life (Stocké &
Hunkler, 2004). The survey mode can also happen to affect the response: “Web surveys
may have some advantages over telephone surveys in terms of observation errors, or errors
arising from the measurement process.” (Fricker, Galesic, Tourangeau, & Yan, 2005, p.
374). Defining survey procedures can help to reduce measurement error (Conrad, 1999).
In online surveys most research activity centers around the visual design of the ques-
tionnaire and the answer formats. The bottomline is that respondents interpret the
available answer options in the context of the presented visual design. This conforms
to findings on question wording and order effects (N. Schwarz, 1999; Bishop & Smith,
2001). Respondents will use available pictures to understand what the questions are
about: Estimation of ‘eating out’ results in higher frequencies for questions accompanied
by a picture of a drive-through than by a picture of people in a restaurant (Couper,
Tourangeau, & Kenyon, 2004). Similarly, “when exposed to a picture of a fit woman,
respondents consistently rate their own health lower than when exposed to a picture of
a sick woman.” (Couper, Conrad, & Tourangeau, 2007, p. 623). These results can be
explained in the light of offline research showing that the range of answer frequencies
functions as a clue to what is seen as ‘normal’ behavior and thus affects the respondents’
estimates (N. Schwarz & Scheuring, 1992). Likewise, color and labels affect the response
in scales (Tourangeau, Couper, & Conrad, 2006).
The use of ‘no opinion’ options results in a higher amount of such non-substantive
answers than the mere possibility to leave the question unanswered (De Rouvray &
Couper, 2002). Similarly, using yes–no grids compared to ‘check all that apply’ yielded
higher endorsement rates (Thomas & Klein, 2006; Smyth, Dillman, Christian, & Stern,
2006). The broader perspective is that respondents are more likely to check answers with
a higher visibility (Tourangeau, Couper, & Conrad, 2004) than more hidden answers,
for example radio buttons vs. drop-down boxes (Healey, 2007; Couper, Tourangeau,
Conrad, & Crawford, 2004) and top vs. bottom answers (Couper, Tourangeau, Conrad,
& Crawford, 2004).
Another case of the potential of visual design to minimize measurement error is the
problem of date answers. Used wisely, visual clues can “improve the likelihood that
9
Introduction
web respondents report date answers in a particular format desired by the researcher,
thus reducing possible deleterious effects of error messages or requests for corrections.”
(Christian, Dillman, & Smyth, 2007, p. 113). Visual guidance is key to help respondents
provide complex answers (Dillman, Gertseva, & Mahon-Haft, 2005), and to help walk
through the branching of paper-questionnaires (Redline & Dillman, 2002). To help re-
searchers in design decisions, design guidelines have been proposed (Baker, Crawford, &
Swinehart, 2004; Crawford, McCabe, & Pope, 2005; Dillman, Tortora, & Bowker, 1999;
Kaczmirek, 2005).
A unique problem in online surveys is the fact that researchers do not have total
control over the layout of the questionnaire. The reason is that webpages are written
in HTML, that is Hypertext Markup Language. This means that text and questions
are marked by their function but that they are not readily formatted like in a paper
questionnaire. This is ideal when considering the many different computers and screens
Internet users have, allowing for example word wrapping to be adjusted to the actual
screen width encountered. It is the task of the browsers to layout the text according to the
intended function. Dillman (2007) warns that different screen sizes can have a negative
impact on the layout of response scales. It is therefore necessary to include additional
measures in the questionnaire to avoid a bias associated with such technicalities. Figure
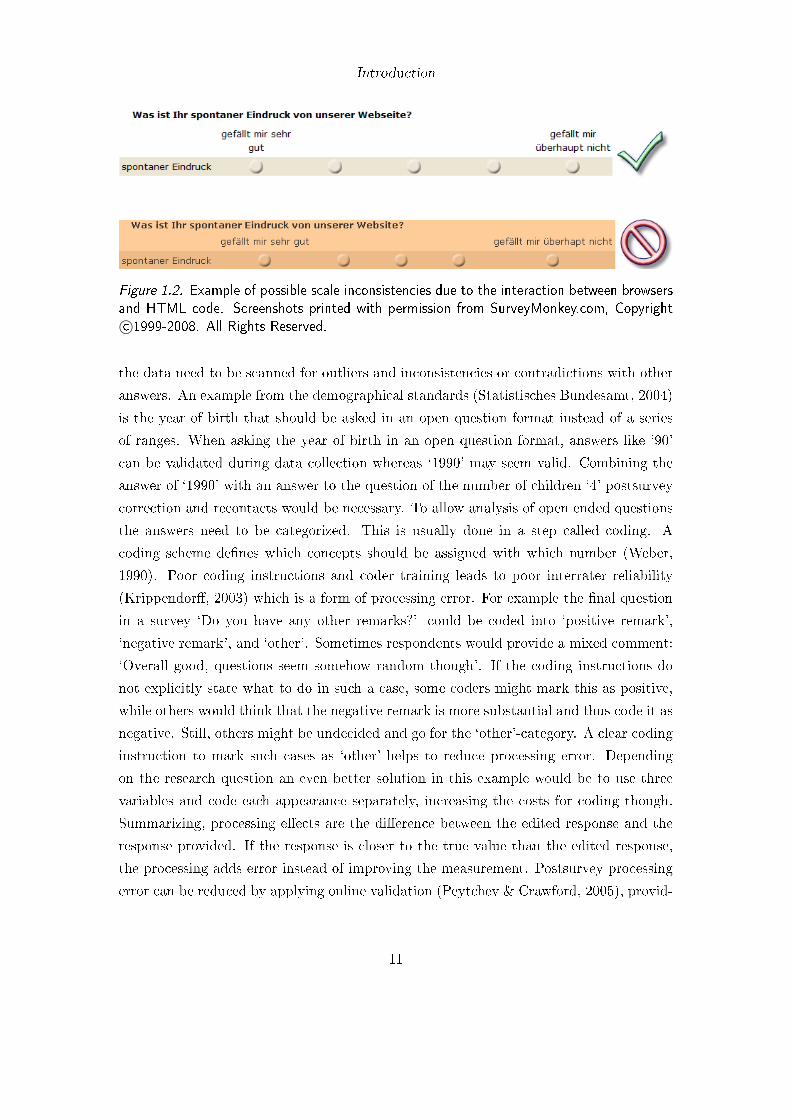
1.2 demonstrates the problem that the same HTML-code can produce different response
scales in different browsers.3 In the lower scale the middle answer values are pronounced
because of unevenly set spaces. This leads to more selections of the middle categories in
the lower scale compared to the upper scale (Dillman & Bowker, 2001). Chapter 5 will
therefore present research on techniques that can be used to improve survey methodology.
1.3.5. Processing Error
After data collection postsurvey processing aims at improving the measurement. Cor-
recting outliers is such a measure. Outliers are a common problem in the analysis of
response times because response times follow a skew distribution and the mean is sen-
sible to outliers (Yan & Tourangeau, 2008). Especially in online surveys people are
known to interrupt participation thus making automatic response time collection diffi-
cult. Postsurvey processing aims at detecting these cases. Among available corrections
Ratcliff (1993) suggests changing the upper and lower one percentile values with the
value of the upper and lower percentile respectively. Generally, in open question formats
3 The problem depicted in figure 1.2 occurred in 2006. At the end of 2007 it was no longer present forthe software Surveymonkey using the browsers Internet Explorer and Firefox.
10
Introduction
Figure 1.2. Example of possible scale inconsistencies due to the interaction between browsers
and HTML code. Screenshots printed with permission from SurveyMonkey.com, Copyrightc○1999-2008. All Rights Reserved.
the data need to be scanned for outliers and inconsistencies or contradictions with other
answers. An example from the demographical standards (Statistisches Bundesamt, 2004)
is the year of birth that should be asked in an open question format instead of a series
of ranges. When asking the year of birth in an open question format, answers like ‘90’
can be validated during data collection whereas ‘1990’ may seem valid. Combining the
answer of ‘1990’ with an answer to the question of the number of children ‘4’ postsurvey
correction and recontacts would be necessary. To allow analysis of open ended questions
the answers need to be categorized. This is usually done in a step called coding. A
coding scheme defines which concepts should be assigned with which number (Weber,
1990). Poor coding instructions and coder training leads to poor interrater reliability
(Krippendorff, 2003) which is a form of processing error. For example the final question
in a survey ‘Do you have any other remarks?’ could be coded into ‘positive remark’,
‘negative remark’, and ‘other’. Sometimes respondents would provide a mixed comment:
‘Overall good, questions seem somehow random though’. If the coding instructions do
not explicitly state what to do in such a case, some coders might mark this as positive,
while others would think that the negative remark is more substantial and thus code it as
negative. Still, others might be undecided and go for the ‘other’-category. A clear coding
instruction to mark such cases as ‘other’ helps to reduce processing error. Depending
on the research question an even better solution in this example would be to use three
variables and code each appearance separately, increasing the costs for coding though.
Summarizing, processing effects are the difference between the edited response and the
response provided. If the response is closer to the true value than the edited response,
the processing adds error instead of improving the measurement. Postsurvey processing
error can be reduced by applying online validation (Peytchev & Crawford, 2005), provid-
11
Introduction
ing clear instructions about the desired formats (Dillman et al., 2005; Christian et al.,
2007) and professional coders (Krippendorff, 2003).
1.3.6. Adjustment Error
In a last step following data collection and editing, the data can be adjusted to correct
nonresponse, sampling and coverage errors. Adjustment uses information about the
target population, sample frame or response rates in the sample to determine the amount
of necessary correction. For example the response patterns might show that there is an
underrepresentation of older people in the data set compared to the target frame. In
online surveys this is a common problem because the Internet coverage is lower for
older people and people with higher education are more likely to participate (Bandilla
et al., 2009). The introduction of weights to different subgroups in the data can improve
survey estimates (Groves et al., 2004). However, it must be understood that weighting
is an inadequate approach if the reasons for non-participation are related to the research
question. For example weighting does not solve the problem that Internet users and non-
Internet users may differ substantially in some of their attitudes (Schonlau et al., 2004;
Bandilla, Bosnjak, & Altdorf, 2003). Regarding weighting, specific sampling procedures
need special adjustments to make up for this systematic but known error. This is for
example the case in the general social survey in Germany (ALLBUS) where oversampling
in East Germany allows for more specific subanalyses in these regions. For a nationwide
analysis the weighting successfully corrects the otherwise overrepresentated subsample.
Another form of postsurvey adjustment is imputation. With imputation missing data
is replaced with estimated responses. Here, the same considerations apply as above:
Unsystematic missing data (missing completely at random, MCAR) is less problematic
than missing data which correlate with known variables (missing at random, MAR).
Missing data which correlate with substantive variables without one being able to predict
the correlation is non-ignorable (NI) and thus imputation or weighting would not be
adequate. With respect to this notation from Little and Rubin (2002) the findings
of Schonlau et al. (2004) and Bandilla et al. (2003) suggest that much of the missing
data is non-ignorable and thus weighting does a poor job in correcting this for online
surveys. Despite these problems, a weighting procedure which would statistically allow
to generalize to the whole population (including those without Internet access) would
be a major breakthrough and so the attempts to apply and research various weighting
procedures in online surveys continue (cf., Terhanian & Bremer, 2005; Lee, 2006; Couper,
Kapteyn, et al., 2007).
12
Introduction
Summarizing, postsurvey adjustments are employed to correct several errors. However,
if badly applied they increase total survey error.
The introduction of the survey life cycle approach has shown that the focus of this work
is at the center of conducting a survey, where respondents interact with the questionnaire.
Much of the earlier steps are under the researchers control. However, once a survey is
online and respondents were invited, the questionnaire must speak for itself. It is the
interaction between the survey and the respondents that is responsible for the success
of a survey project. Bad implementations and design will inevitably result in higher
nonresponse, while a usable design will motivate respondents to complete a survey. The
next chapter describes how human-computer interaction can be applied to online survey
methodology and proposes a framework for human-survey interaction which will then be
used in the later chapters.
13

Concepts and Approaches
2. Usability in Online Surveys
The interaction between respondents and online surveys is the basis for applying knowl-
edge from human-computer interaction research to survey methodology. Chapter 2 there-
fore reviews major frameworks from both fields and proposes an integrated framework
termed human-survey interaction which is then used to derive research maxims for im-
proved instruments and applied survey design.
2.1. Applying Human-Computer Interaction to Online Surveys
With the increasing use of new technology the need for standards arise. Several re-
searchers have developed a set of usability principles with a broad applicability in dif-
ferent contexts. They have proposed heuristics1 to fit this need for ‘the design of every-
day things’ (Norman, 1988), user interface design (Shneiderman, 1998), website design
(Nielsen, 1993, 2005) and also for the design of computer-assisted data collection systems
(Couper, 1994). In the context of (paper-based) surveys Dillman et al. (2005) apply con-
cepts from cognitive design, emotional design and visual design to form questionnaire
usability. They draw especially on the seven principles proposed by Norman (1988).
Research on design issues in online surveys have focused on specific design issues, for
example paging vs. scrolling (Peytchev, Couper, McCabe, & Crawford, 2006), radio but-
tons vs. drop-down boxes (Heerwegh & Loosveldt, 2002), and guidelines (Crawford et
al., 2005; Reips, 2002).
My main thesis in the following is that all heuristics mentioned here are compatible
with each other and can be incorporated in the dialogue principles of the ISO 9241-110.
What all these heuristics have in common is that they guide design decisions. They all
emerged from the field of human-computer interaction. Moreover, I show that the general
principles can be applied to online surveys, leading to recommendations and guidelines
in online survey design. This is possible because online surveys rely on the interaction
1 A remark on the terminology: Heuristics and principles use the most abstract definitions. They canbe used to derive more specific recommendations, or even concrete guidelines. Heuristics have theadvantage of broad applicability, whereas guidelines provide design rules. For example the design rule“Do not require respondents to provide an answer to each question before being allowed to answerany subsequent ones.” (Dillman et al., 1999, p. 11) in online surveys would be supported by themore general heuristic “user control and freedom” (Nielsen, 2005, principle 3).
15
Usability in Online Surveys
between questionnaires and respondents in the same way that webpages and computer
programs rely on the interaction between computers and humans. Furthermore, the
principles are a valuable source for generating new design ideas (or support existing
ones) which can be empirically tested. Firstly, the ISO 9241-110 and the heuristics of
Norman, Shneiderman, Nielsen, and Couper are summarized. Secondly, I expand on
the principles of the ISO 9241-110 standard by applying it on online surveys and the
relation to the heuristics is made clear. Table 2.1 on page 33 finally summarizes the fit
between the heuristics and the standard. I take a close look at each heuristic separately
and provide examples of survey design to scrutinize the existing overlap between the
proposals. Consequently, some repetitiveness in the examples and heuristics cannot be
avoided. As a result I arrive at a set of heuristics to guide the design of online surveys
which is exhaustive and interdisciplinary.
2.1.1. The Applicability of the ISO 9241-110
In 2006 the International Organization for Standardization (ISO) issued a revision of the
dialogue principles for ergonomic human-system interaction which were first published in
1996. This ISO 9241-110:2006 is the result of a documented decision process. Drafts were
adopted by a technical committee, made available to the public to comment, reworked
and finally circulated among member bodies for a vote of acceptance. Although such a
process will naturally result in a compromise, the fact that experts from various fields
are included in the production process makes it suitable for broad application. Indeed
the applicability of the ISO 9241-110 in the context of online surveys is derivable from
the introduction and scope of the standard:
This part of ISO 9241 deals with the ergonomic design of interactive systems and describes dialogue
principles which are generally independent of any specific dialogue technique and which are applicable
in the analysis, design and evaluation of interactive systems. (p. vi).
and
This part of ISO 9241 sets forth ergonomic design principles formulated in general terms (i.e., pre-
sented without reference to situations of use, application, environment or technology) and provides a
framework for applying those principles to the analysis, design and evaluation of interactive systems.
(p. 1).
Online surveys are a type of interactive systems because they receive input from and
produce output to a human respondent in order to support the task of participating
16
Usability in Online Surveys
in the survey. Seven principles were identified which serve as rules for the design and
evaluation of interactive systems and dialogues (ISO, 2006, p. 3):
1. suitability for the task,
2. self-descriptiveness,
3. conformity with user expectations,
4. suitability for learning,
5. controllability,
6. error tolerance, and
7. suitability for individualization.
When comparing ISO 9241-110 with the heuristics of Norman, Shneiderman, Nielsen, and
Couper the importance of visibility, feedback, and error tolerance in interactive systems
comes to mind: Self-descriptiveness (ISO) is matched by ‘make things visible’ (Norman),
‘offer informative feedback’ (Shneiderman), ‘visibility of system status’ (Nielsen), and
‘informative feedback’ (Couper). Even more obvious are the similarities to the demand
of ‘error tolerance’: Norman asks to ‘design for error’, Shneiderman writes about ‘offer
error prevention and simple error handling’, Nielsen would like to see ‘error prevention’
incorporated, and Couper terms it ‘tolerance’. Not only do the heuristics of the authors
overlap, but it also might be necessary to weight dialogue principles against each other
in order to optimize usability.
2.1.2. Everyday Design: Norman’s Seven
In The Design of Everyday Things, Norman (1988, p. 188f.) argues for seven principles.
In the following they are described with examples from online surveys:
1. Use both knowledge in the world and knowledge in the head. When
constructing a questionnaire it is important to understand what respondents need
to know to fill out the survey and what additional information should be provided.
2. Simplify the structure of tasks. Limitations of short term memory should
be considered when writing instructions and questions. To reduce memory load
instructions should be placed at the position of the concerned questions, not in the
beginning.
17
Usability in Online Surveys
3. Make things visible: bridge the gulfs of Execution and Evaluation. Re-
quired action and feedback of action need to be obvious to respondents. Especially
since most questionnaires will only be filled out once per respondent there is little
or no time to learn special knowledge about the dialogues.
4. Get the mappings right. Answer controls such as radio buttons and check
boxes should be in close proximity to the related answer texts. When providing
both ‘next’ and ‘back’-buttons the ‘back’-button should be on the left followed by
the ‘next’-button on the right to map the common settings in Internet browsers.
5. Exploit the power of constraints, both natural and artificial. Limiting the
number of possible user actions means to help users to participate properly. For
example leaving out ‘back’-buttons helps users to proceed through the survey and
stresses that they do not need to bother about their earlier answers. Similarly,
additional help links in proximity to the questions should only be available if they
are substantial to the questions at hand.
6. Design for error. If respondents think that an answer was wrong they should
be able to provide a different answer while the survey software avoids inconsistent
data. In the case of text answers in the form of “please specify” the text entered
should not be saved when respondents change their answer and go for a category
instead. Similarly, edit checks help respondents to enter their answers in the desired
formats.
7. When all else fails, standardize. In some circumstances the principles might
not allow to defer a convincing recommendation. In such arbitrary decisions it is
important to standardize the design decision throughout the survey and preferably
for future designs as well. Although it is clear that a “next”-button should be
placed at the bottom of a page after the last answer it is unknown how to align the
button. Whether it should be placed on the left, middle or right might not have
a big enough impact on user performance to undergo extensive user testing. Still,
different survey organizations have decided differently on this issue but keep their
own surveys consistent within their own rules. This is especially beneficial in the
case of panel members who participate in several surveys of the same organization.
18
Usability in Online Surveys
2.1.3. User Interface Design: Shneiderman’s Eight
In his book Designing the User Interface which is one of the basic class-books in instruct-
ing human-computer interaction Shneiderman (1998) puts forth the three principles “rec-
ognize the diversity”, “use the eight golden rules of interface design”, and “prevent errors”
(p. 67ff.). Shneiderman stresses the importance of considering and dealing with potential
errors by declaring it a principle of its own. In his first principle Shneiderman elaborates
how different contexts, users, and tasks all shape the requirements for the interactive
system. It is therefore a prerequisite or starting point for all interaction designers. Sim-
ilarly, it is important in survey research to know the target population and the method
of data collection to successfully test wordings and field the survey. The second principle
consisting of eight rules of interface design hold the following heuristics for survey design
(Shneiderman, 1998, p. 74f.):2
1. Strive for consistency. Consistency has many forms. Layout, font sizes and
emphasis (bold type), color, labels on rating scales, etc. are just some things to
consider. Often the question text is formatted in bold type. It is then necessary that
this applies to all questions. Validation messages are often in red color. When for
example using rating scales they should use the same labels while changes between
different number of scale points – for example a five-point and a seven-point scale
– should be avoided.
2. Enable frequent users to use shortcuts. If respondents are going to fill in a
survey repeatedly shortcuts to speed up data entry should be available in addition to
the normal interaction behavior of mouse control. This can be the case for diaries
when a respondent is questioned several times per day. A different application
with the same need is a telephone interview which uses an online interface for the
interviewer. Here, the support of number keys for the answer options is a standard
procedure.
3. Offer informative feedback. “For every user action, there should be system
feedback.” (Shneiderman, 1998, p. 74). This rule concerns such basic things as a
radio button being marked with a dot when it has been clicked. Other forms of
feedback are progress indicators, validation messages, and a final thank-you-page
indicating that the survey was successfully finished.
2 Shneiderman uses the term rules. But in line with the argument in footnote 1 I refer to them asheuristics because they still need to be applied to specific contexts of use.
19
Usability in Online Surveys
4. Design dialogs to yield closure. “Sequence of actions should be organized
into groups with a beginning, middle, and end.” (Shneiderman, 1998, p. 75).
For online surveys this seems to be straightforward as respondents only need to
follow the sequence of questions to yield closure. Nevertheless, the structure is
often enhanced by grouping several questions into a logical block. Introductory
sentences are used to mark the beginning of a new block, for example ‘Finally, we
would like to ask you a few questions about yourself.’ for demographic variables.
5. Offer error prevention and simple error handling. “As much as possible,
design the system such that users cannot make a serious error” (Shneiderman, 1998,
p. 75). Visual clues on desired formatting (e.g., YYYY for a four digit year) and
validation of data entry during data collection serve this purpose. Furthermore, the
use of filter questions prevent respondents from answering inapplicable questions
such as the amount of cigarettes per day when they are non-smokers.
6. Permit easy reversal of actions. Allowing respondents to change answers en-
courages responses and reduces anxiety because respondents know they are allowed
to change their mind in the answer process. In correspondence with this heuristic
software systems can allow respondents to ‘unclick’ a rating scale, thus deleting
their answer, an action which is not possible with standard HTML radio buttons.
7. Support internal locus of control. Respondents should be in charge at any
time during a survey. This means that respondents can decide which questions
to answer and which not, when to proceed and even to change their mind and
discontinue participation. This is truly in accordance with the codes of conduct
which state that participation should always be voluntary (ADM et al., 2000).
8. Reduce short-term memory load. Starting an online survey with a list of in-
structions and definitions to be remembered for later questions should be avoided.
Instead it is good practice to place them together with the associated questions
where they are needed. Complex questions should be redesigned so that the in-
formation can be collected with several questions, reducing the memory load in
question understanding and answering.
2.1.4. Usability Design: Nielsen’s Ten
Nielsen developed ten usability principles on the basis of a factor analysis of 249 usability
problems which he presents in his book Usability Engineering Methods (Nielsen, 1993).
20
Usability in Online Surveys
The following list is a more recent rewording of the ten heuristic usability guidelines
(Nielsen, 2005):
1. Visibility of system status. “The system should always keep users informed
about what is going on, through appropriate feedback within reasonable time.”
(Nielsen, 2005). This is of paramount importance when respondents are not able
to provide an answer although a question has been presented. It can occur in de-
signs which reload partial information during the interview to reduce the overall
bandwith needed. For long lists the interview is split into categories and subcat-
egories which can then be loaded and presented on-the-fly, usually without notice
of delay. Because a complete list of all places where a respondent could have ap-
plied as a student is very long, the question could be divided into the city and the
available institutes at that place. With a slow Internet connection the time needed
to load the institutes after the respondent chose the place might be remarkable.
In such a case an animated picture indicating some sort of progress or loading is
a standard practice at least in non-survey settings as can be seen in every browser
animation for loading pages.
2. Match between system and the real world. “The system should speak the
users’ language, with words, phrases and concepts familiar to the user, rather than
system-oriented terms.” (Nielsen, 2005). Technical language should be avoided in
surveys so that respondents are able to understand the questions. The next-button
is often placed on the right side, sometimes with a symbolic ‘»’ added, whereas a ‘«
back’ would be placed on the left. This matches the concept of new pages in a book
which are on the right and the reading habits from left to right. Nevertheless, the
match between the system and the real world must take cultural differences into
account as for example reading from right to left in Asian countries would demand
alternative button placement.
3. User control and freedom. “Users often choose system functions by mistake and
will need a clearly marked ‘emergency exit’ to leave the unwanted state without
having to go through an extended dialogue. Support undo and redo.” (Nielsen,
2005). Respondents might close a survey window by accident. When reentering the
interview the survey should continue where the respondent left off, having saved all
earlier answers. Similar to earlier heuristics respondents should be able to choose
which questions to leave unanswered and to discontinue a survey.
21
Usability in Online Surveys
4. Consistency and standards. “Users should not have to wonder whether dif-
ferent words, situations, or actions mean the same thing. Follow platform conven-
tions.” (Nielsen, 2005). In HTML the circled radio buttons are used for ‘choose one
among many’ forms, whereas the checkboxes are used for ‘choose all that apply’
forms. Hence, online surveys should follow these visual distinguishing clues and
not override them with a single set of boxes known from paper-based surveys.
5. Error prevention. “Even better than good error messages is a careful design
which prevents a problem from occurring in the first place.” (Nielsen, 2005). Here,
Nielsen stresses that a design that prevents items missing in the first place would
be better than a design that sends a validation message to respondents to fill in
missing questions. Chapter 6.2 follows this idea by reducing item-nonresponse.
6. Recognition rather than recall. “Minimize the user’s memory load by making
objects, actions, and options visible. The user should not have to remember infor-
mation from one part of the dialogue [survey] to another. Instructions for use of
the system [questionnaire] should be visible or easily retrievable whenever appropri-
ate.” (Nielsen, 2005). This heuristic states clearly that instructions and definitions
needed for question understanding should be placed together with the question.
Lists of possible answers should not be hidden in hard to access drop-down-fields,
especially not when the answers are to be related to each other (e.g., major, minor
field of study).
7. Flexibility and efficiency of use. “Accelerators – unseen by the novice user –
may often speed up the interaction for the expert user such that the system can
cater to both inexperienced and experienced users.” (Nielsen, 2005). This is very
similar to Shneiderman’s “enable frequent users to use shortcuts”. When online
surveys are used for coding or data entry, shortcuts and key input can speed up
the process and save costs.
8. Aesthetic and minimalist design. “Dialogues should not contain information
which is irrelevant or rarely needed. Every extra unit of information in a dialogue
competes with the relevant units of information and diminishes their relative vis-
ibility.” (Nielsen, 2005). Although definitions need to be placed at the associated
questions circumstances exist where they may be reached via a link, requesting
more information or a definition. This can for example be useful in an establish-
ment survey with many definitions.
22
Usability in Online Surveys
9. Help users recognize, diagnose, and recover from errors. “Error messages
should be expressed in plain language (no codes), precisely indicate the problem,
and constructively suggest a solution.” (Nielsen, 2005). Apart from the question-
naire itself this heuristic also applies to system messages generated by the software.
They appear for example when a survey is unavailable. This can happen because
a survey is closed or because the server limits the amount of simultaneous respon-
dents. Simple messages like ‘the quota is filled’, ‘the survey is out of the time frame’,
or ‘the survey is closed’ might be understandable to survey researchers, but they
might leave most respondents without a clue what to do. A good system message
thanks the respondent for his/her willingness to participate, explains the situation
(e.g., ‘The survey has been finished and participation is no longer possible.’), and
suggests what to do next (e.g., leave the window or return the next day).
10. Help and documentation. “Even though it is better if the system can be used
without documentation, it may be necessary to provide help and documentation.
Any such information should be easy to search, focused on the user’s task, list
concrete steps to be carried out, and not be too large.” (Nielsen, 2005). Surveys
ideally are self-explanatory. However, this was and is not always the case. Dillman
et al. (1999, p. 10) mention several aspects in online surveys which might need
explanation for less experienced Internet users. Two aspects probably also apply
today: “It may not be clear to some respondents what a drop-down menu is, and
how to access the hidden categories.” and “It may not be clear how open-ended
answers are to be entered, or that in some cases there is far more space than shows
on the screen.” Moreover, in e-mail invitations explicit instructions on how to start
participating are very common.
2.1.5. Computer-Assisted Interview Design: Couper’s Ten
Couper (1994) examined the literature on human-computer interaction and derived 10
heuristics for computer-assisted data collection systems. Although Couper probably
had computer-assisted telephone interviewing (CATI) and computer-assisted personal-
interviewing (CAPI) systems in mind when developing this set these systems share some
similarities with online surveys. As with online surveys the interviewer follows the ques-
tions and is automatically led through this process. The difference to a usability perspec-
tive is mainly that the interviewer is able to compensate for shortcomings of the system.
Therefore, these heuristics are even more advisable for self-administered interviews where
23
Usability in Online Surveys
respondents have to understand and interact with the online survey system on their own.
This is supported by the trend of survey software development to merge different modes
into a single survey system allowing computer-assisted telephone interviewers, personal
interviewers, and respondents to use the same online survey.
The previous heuristics have already been shown to apply to online surveys with added
examples in online survey methodology. Couper’s set of heuristics is closest to online
surveys and directly fits with the ISO 9241-110:2006. I therefore highlight the conforming
principles of the standard instead of providing additional examples. Couper (1994, p.
367ff.) argues for the following ten heuristics:
1. Functionality. “The system should meet the needs and requirements of users
when carrying out the tasks.” (p. 367). This means that the functionality and the
dialogue should be based on the task characteristics which are part of the definition
on suitability for the task (ISO, 2006, p. 4).
2. Consistency. “This refers to the look and feel of the system. At its simplest level,
consistency refers to the placement of items on screens, including the use of fonts,
upper or lower case, color, highlighting, etc.” (p. 368). “Another component of
consistency is predictability.” (p. 369). This refers to the conformity of user expec-
tations which state that “dialogue behavior and appearance within an interactive
system should be consistent within tasks and across similar tasks.” (ISO, 2006, p.
7).
3. Informative feedback. “For every user action there should be some feedback
(Shneiderman, 1992: 73).” (p. 369). This relates to conformity : “Immediate
and suitable feedback on user actions should be given, where appropriate to user
expectations.“ (ISO, 2006, p. 7), and self-descriptiveness: “Dialogues should be
designed so that the interaction with the interactive system is apparent to the
user” (ISO, 2006, p. 6).
4. Transparency. “The system should permit the user’s attention to be focused en-
tirely on the task being performed, without concern for the mechanics of the system
(see Galitz, 1993). The computer is ideally suited for automating routine functions,
and these should not detract from those activities requiring human attention.” (p.
369). This means that an online survey should not distract a respondent from pro-
viding answers by automating for example range and consistency checks. It thus
affects suitability for the task : “The dialogue should avoid presenting information
24
Usability in Online Surveys
not needed for the successful completion of relevant tasks.“ (ISO, 2006, p. 5) and
error tolerance: “The interactive system should assist the user in detecting and
avoiding errors in input.” (ISO, 2006, p. 10).
5. Explicitness. “The steps that the user needs to take should be obvious.” (p.
369f.). This relates directly to self-descriptiveness: “it is obvious to the users [. . .]
which actions can be taken and how they can be performed” (ISO, 2006, p. 6).
6. Comprehensibility. “The system should be understandable to users. Jargon,
idiosyncratic language and abbreviations should be avoided.” (p. 370). A general
rule would imply to “use the vocabulary which is familiar to the user” (conformity
of user expectations, ISO, 2006, p. 7).
7. Tolerance. “The system should be tolerant of human capacity to make errors.”
This is equivalent to error tolerance.
8. Efficiency. “The system should be designed to minimize effort and maximize effi-
ciency on the part of the user.” (p. 371). Applying the dialogue principles “supports
usability in terms of effectiveness, efficiency and satisfaction” (ISO, 2006, p. 16).
Common operations are also covered by suitability for the task. However, spe-
cific user demands relate to suitability for individualization “when users can modify
interaction and presentation of information to suit their individual capabilities and
needs.” (ISO, 2006, p. 11). Experienced users might increasingly find operations
common and would benefit from available shortcuts.
9. Supportiveness. “This is closely related to the principles of explicitness and
comprehensibility. Tolerance of errors and facilities for easy recovery from errors
is another characteristic of a supportive system. The limited cognitive capacities
of users should be recognized and accomodated. [. . .] Reliance on recognition
rather than recall will help reduce cognitive burden for the user.” (p.371). This is
closely related to suitability for learning : “If infrequent use or user characteristics
require relearning of the dialogue, then appropriate support should be provided.
[. . .] Appropriate support should be provided to assist the user in becoming familiar
with the dialogue.” (ISO, 2006, p. 8).
10. Optimal complexity. “The early dictums on design (on both screen and paper)
called for keeping things simple and maximizing the use of blank space. [. . .] Users
both prefer and perform better with a moderate amount of complexity, rather than
25
Usability in Online Surveys
too simple or too complex.” (p. 371). In other words the dialogue should be ap-
propriate for the task, unnecessary information should not be presented, necessary
steps to completion should be included and unnecessary steps avoided (suitability
for the task, ISO, 2006, p. 5).
2.1.6. Extending the ISO 9241-110 to the Context of Online Surveys
This section examines the recommendations in the norm. Each subsection begins with the
definition of the principle, followed by a summary of the recommendations provided with
each principle. The heuristics from the previous sections are fit into the set of the dialogue
principles. In some cases a heuristic relates to several dialogue principles. The heuristic
is then displayed only at one central principle to keep this overview readable. For more
specific heuristics it was possible to identify corresponding specific recommendations,
indicated by the number in parentheses. Finally, examples in the context of online
surveys are presented. The main goal is to explain how the norm can be extended to the
context of online surveys. Therefore, the examples should not be understood as being
exhaustive.
The most likely argument against the applicability of the norm in the context of online
surveys arises from an explanation of the recommendation 4.3.4 (ISO, 2006, p. 5):
If typical input values are required, they should be available automatically as defaults.
EXAMPLE 1 In a ticket machine at a railway station, where it has been determined that railway
travellers typically buy railway tickets from the station they start their journey from, the station of
departure is preselected at the start of the dialogue.
EXAMPLE 2 Within a business application, once the user has identified him or herself to the
system based on user name and password, the system automatically makes the e-mail address of the
user available for processing wherever required in the dialogue.
The word “typical” was carefully chosen in the wording of this recommendation. It
is not to be confused with ‘probable’ or ‘most used’. Answers in online surveys are
not typical in the sense conveyed by this recommendation because the whole range of
answers should be collected without biasing the response. Example 2 raises the issue
that when the survey asks for the year of birth in the beginning, it could insert the age
on later pages automatically. Similarly, in panel surveys, gender and age could be taken
from the panel database and be provided in the survey to prevent possible errors by
less caring respondents. In panel surveys these values might already be set as defaults
because respondents have provided these answers earlier. The norm itself contains words
of caution:
26
Usability in Online Surveys
Not every recommendation within this part of ISO 9241 is applicable in every context of use. If the
context of use does not imply user needs that correspond to one or more recommendations of this
part of ISO 9241, then those recommendations do not apply within this particular context of use.
(ISO, 2006, p. 4)
Suitability for the Task
An interactive system is suitable for the task when it supports the user in the completion of the task,
i.e. when the functionality and the dialogue are based on the task characteristics (rather than the
technology chosen to perform the task). (ISO, 2006, p. 4)
All design elements should be targeted towards data quality and survey completion. The
survey should present information related to the successful completion of the survey
and avoid unnecessary information. Also unnecessary steps for participation should be
avoided. If respondents draw the answers for a survey from external source documents
the survey should match the units and layout to these documents. The online survey
should support appropriate input channels, that is mouse and keyboard input.
The related heuristics of Norman, Shneiderman, Nielsen and Couper are: Norman’s
“simplify the structure of tasks” which corresponds to the recommendations 4.3.2 and
4.3.5 of the ISO, Shneiderman’s “design dialogs to yield closure” which corresponds to the
recommendation 4.3.5 of the ISO, Shneiderman’s “reduce short-term memory load”, 4.3.2
of the ISO, Nielsen’s “aesthetic and minimalist design”, 4.3.2 of the ISO, and Couper’s
“functionality” and “optimal complexity” which corresponds to the overall aspect of “suit-
ability for the task”. In the following sections the correspondence between the heuristics
and specific ISO recommendations are pointed out in parentheses.
Guidelines referring to this heuristics would include but are not limited to the follow-
ing examples: A list of answers should be exhaustive. ‘Check all that apply’ instructions
should be used. The introduction of a survey on the first page should be kept short.
Establishment surveys should ask for units which are already available so that respon-
dents do not need to do recalculations to fit the answer format requirements. Online
questionnaires should be organized like their offline counterparts when they are designed
for data entry. Filter questions should be used so that unapplicable questions are not
shown to the respondent (chapter 7). Taylor the design to meet the requirements of
special subgroups, like visually impaired respondents (chapter 3).
27
Usability in Online Surveys
Self-Descriptiveness
A dialogue is self-descriptive to the extent that, at any time, it is obvious to the users which dialogue
they are in, where they are within the dialogue, which actions can be taken and how they can be
performed. (ISO, 2006, p. 6)
Information such as feedback and status information at any step of the questionnaire
should guide the respondent in completing the survey. During participation, the need to
consult help or other external information should be minimized. The respondent should
be kept informed about the status of the survey, for example by providing an overview of
upcoming steps and by making clear when input is expected. The survey should provide
information about the type and format of expected input. The interaction with the
survey should be apparent to the respondent.
The related heuristics are: Norman’s “make things visible” (4.4.1 and 4.4.5 in the ISO),
Shneiderman’s “offer informative feedback” (4.4.1, 4.5.9, 4.5.2), Nielsen’s “visibility of sys-
tem status” (4.4.3), “recognition rather than recall” (4.4.4, 4.4.6), and Couper’s “infor-
mative feedback” (4.4.1, 4.4.5), as well as “explicitness” which covers self-descriptiveness
as a whole.
Examples: The button to proceed with the next page is clearly labelled, (e.g., ‘next’).
When a four digit year is desired, a ‘YYYY’ below the answer field should indicate this.
When asking for the amount of fruit eaten today, the survey could indicate that one unit
is the amount of one adult’s handful of fruit. Questionnaires should use transitions to
notice the respondents when the content of the questions switches to a different topic.
Respondents should easily see which answer they provided after having clicked on an
option (chapter 6). To give feedback about the progress of participation visual or textual
progress indicators can be used (chapter 7).
Conformity with User Expectations
A dialogue conforms with user expectations if it corresponds to predictable contextual needs of the
user and to commonly accepted conventions. (ISO, 2006, p. 6)
The survey should use the vocabulary which is familiar to the respondent. Surveys
should use answer structures and forms of organization which are perceived as natural.
They should follow appropriate cultural and linguistic conventions. Survey behavior and
appearance should be consistent within a question and across a survey. Immediate and
suitable feedback should be given where appropriate to respondents expectations. The
28
Usability in Online Surveys
respondent should be informed if the system response time takes considerably longer
than he/she would normally expect. Feedback and messages should be formulated and
presented in an objective and constructive style. They should be based on respondents’
needs. If a location of input is predictable, it should be ready for input.
The related heuristics are: Norman’s “when all else fails, standardize” (4.5), “use
knowledge in the head and knowledge in the world” (4.5.1), “get the mappings right”
(4.5.4), Shneiderman’s “strive for consistency” (4.5.7), Nielsen’s “consistency and stan-
dards” (4.5.7), “match between system and the real world” (4.5.4), and Couper’s “consis-
tency” (4.5.7), and “comprehensibility” (4.5.1).
Examples: Rating scales should use labels indicating the continuum. When the deliv-
ery of questions to the respondent takes more than the usual time due to heavy server
load, an additional animation can be shown to indicate progress. Having entered a non-
valid year a concise message could be reading ‘Please enter a year between 1890 and
2007.’ Respondents not able to use the mouse may rely on the Tab-key and arrow keys
to move within the questionnaire (cf., blind respondents, chapter 3). Clicking on the
labels instead of the action button should also be considered a valid response (cf., errors
in interaction, section 4.5).
Suitability for Learning
A dialogue is suitable for learning when it supports and guides the user in learning to use the system.
(ISO, 2006, p. 8)
Respondents should have access to rules and underlying concepts which are useful for
learning how to participate. The information should assist respondents in becoming fa-
miliar with online surveys. Information should be available that support infrequent users
of the Internet to participate and start the survey. Feedback and explanations should
help in building a conceptual understanding of online questionnaires. Feedback should
inform respondents about successfully accomplished activities. Online surveys should al-
low respondents to explore the interface without negative consequences. Especially new
or complicated question types should be answerable for test purposes before real answers
are provided. Participation should be possible with minimal learning requirements.
The related heuristics are: Norman’s “exploit the power of constraints”, Nielsen’s “help
and documentation”, which both cover suitability for learning as a whole, and Couper’s
“supportiveness” (4.6.2).
29
Usability in Online Surveys
Examples: E-mail invitations should always include instructions on how to start a
survey, considering infrequent Internet users. Respondents can begin participating by
clicking on a link. Instructions about anonymity, research goals and sampling help to
build a conceptual model about survey research. Instructions to ‘check all that apply’
and to ‘choose a single answer’ help to build an understanding of the different visual
answer pictures employed for these two types of questions (resp. check boxes and radio
buttons). Unusual question types like interactive drag&drop ranking, direct picture
selection, or enhanced matrix questions allow respondents to start with test answers,
and then change their answers (chapter 6). Extended information about how to fill
out and return a braille questionnaire enables blind people to participate in this mode
without external help (chapter 3).
Controllability
A dialogue is controllable when the user is able to initiate and control the direction and pace of the
interaction until the point at which the goal has been met. (ISO, 2006, p. 9)
A respondent should be able to decide when to proceed through the questionnaire. If the
participation has been interrupted, the survey should allow the respondent to continue
where he left the survey. It should be possible to undo at least the last answer step. The
survey should allow different input and output devices to function with the survey. The
related heuristics are: Shneiderman’s “support internal locus of control” (4.7.1, 4.7.2),
“permit easy reversal of actions” (4.7.4), and Nielsen’s “user control and freedom” (4.7.1,
4.7.2).
Examples: Next-, Previous-, and Save&Exit-Buttons allow respondents to navigate
through a survey without loosing earlier answers while allowing to correct answers. A
save&continue function allows respondents to continue a survey where they left off with-
out loosing earlier answers. When respondents again click on a link in the e-mail invi-
tation, they continue where they left off. The survey should allow keyboard and mouse
input. It should allow the use of software which converts the questionnaire onto a braille
line so that it can be read with the help of fingers (chapter 3).
Error Tolerance
A dialogue is error-tolerant if, despite evident errors in input, the intended result may be achieved
with either no, or minimal, corrective action by the user. Error tolerance is achieved by means of
30
Usability in Online Surveys
error control (damage control), error correction, or error management, to cope with the errors that
occur. (ISO, 2006, p. 10)
The survey should assist respondents in detecting and avoiding errors. Explanations
should be issued to help correct errors. When a correction can be done automatically, the
respondent should be given notice and be able to change the correction. The steps needed
for correction should be minimized. Validation and verification should be accomplished
before data analysis. A respondent should be able to leave an error uncorrected unless
absolutely necessary. If severe consequences would result from an action, they should be
explained together with a request for confirmation. Respondents should not be able to
cause survey software failures or reach undefined states in the survey system.
The related heuristics are: Norman’s “design for error”, Shneiderman’s “offer error
prevention and simple error handling” (4.8.8, 4.8.1), Nielsen’s “error prevention” (4.8.8),
and his “help users recognize, diagnose, and recover from errors” (4.8.1), and Couper’s
“tolerance”, and “transparency” (4.8.8). Both Norman and Couper again cover error
tolerance as a whole with their heuristics.
Examples: The last page of a survey should not include a ‘next’-button. If a button is
required it should be labelled ‘Done’ or ‘Finish’. Questions which require an answer (e.g.,
filter questions) could be marked with an asterisk (‘*’) to highlight required questions.
If an incorrectly formatted answer in a field for e-mail addresses requires a correction
the survey should be specific about the type of format required, the question should be
highlighted, and the cursor could be placed in the corresponding input field. However, if
a respondent then chooses not to provide a valid e-mail address this should be possible
instead of having the respondent enter a fake e-mail. If provided answers on the actual
page would be lost when using the ‘previous’-page button the survey should give a notice
to the respondent and request confirmation. Complications can arise when several survey
features are combined. Usually, answers are only saved when proceeding but not when
moving back. This can be changed in some survey software systems. However, when used
together with mandatory questions this could require respondents to first answer a ques-
tion which runs counter to their goal of viewing an earlier page. Obviously, such system
behavior contradicts the demand for ‘controllability’ because the question is not really
required for viewing an early page. For the important aspect of real-time validations in
online surveys Peytchev and Crawford (2005) provide a typology and discussion.
31
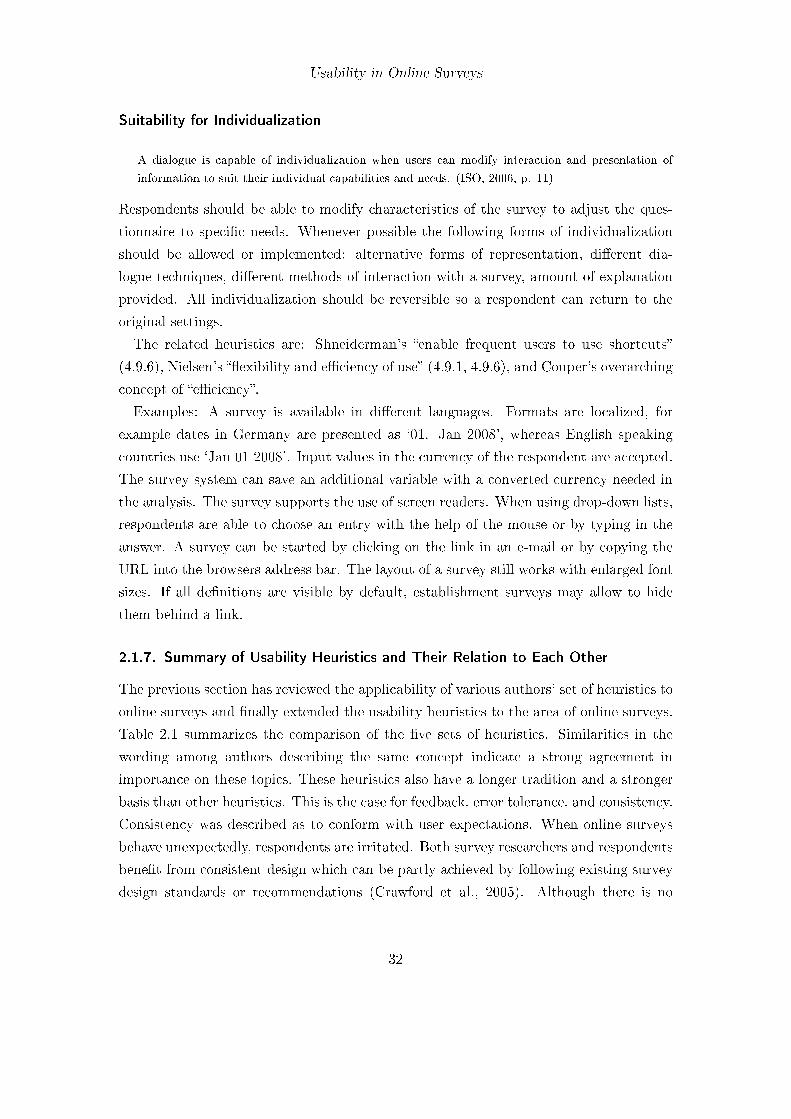
Usability in Online Surveys
Suitability for Individualization
A dialogue is capable of individualization when users can modify interaction and presentation of
information to suit their individual capabilities and needs. (ISO, 2006, p. 11)
Respondents should be able to modify characteristics of the survey to adjust the ques-
tionnaire to specific needs. Whenever possible the following forms of individualization
should be allowed or implemented: alternative forms of representation, different dia-
logue techniques, different methods of interaction with a survey, amount of explanation
provided. All individualization should be reversible so a respondent can return to the
original settings.
The related heuristics are: Shneiderman’s “enable frequent users to use shortcuts”
(4.9.6), Nielsen’s “flexibility and efficiency of use” (4.9.1, 4.9.6), and Couper’s overarching
concept of “efficiency”.
Examples: A survey is available in different languages. Formats are localized, for
example dates in Germany are presented as ‘01. Jan 2008’, whereas English speaking
countries use ‘Jan 01 2008’. Input values in the currency of the respondent are accepted.
The survey system can save an additional variable with a converted currency needed in
the analysis. The survey supports the use of screen readers. When using drop-down lists,
respondents are able to choose an entry with the help of the mouse or by typing in the
answer. A survey can be started by clicking on the link in an e-mail or by copying the
URL into the browsers address bar. The layout of a survey still works with enlarged font
sizes. If all definitions are visible by default, establishment surveys may allow to hide
them behind a link.
2.1.7. Summary of Usability Heuristics and Their Relation to Each Other
The previous section has reviewed the applicability of various authors’ set of heuristics to
online surveys and finally extended the usability heuristics to the area of online surveys.
Table 2.1 summarizes the comparison of the five sets of heuristics. Similarities in the
wording among authors describing the same concept indicate a strong agreement in
importance on these topics. These heuristics also have a longer tradition and a stronger
basis than other heuristics. This is the case for feedback, error tolerance, and consistency.
Consistency was described as to conform with user expectations. When online surveys
behave unexpectedly, respondents are irritated. Both survey researchers and respondents
benefit from consistent design which can be partly achieved by following existing survey
design standards or recommendations (Crawford et al., 2005). Although there is no
32
Usability in Online Surveys
Table
2.1.Summaryofusability
heuristicsandtheirrelationto
theISO
9241-110
ISO
9241-110
Norman1988
Shneiderman1998
Nielsen1993,2005
Couper1994
4.3
Suitabilityforthetask
Sim
plify
thestructure
of
tasks4.3.2,4.3.5
Designdialogsto
yield
closure
4.3.5;Reduce
short-term
mem
ory
load
4.3.2
Aestheticand
minim
alist
design4.3.2
Functionality;Optimal
complexity;
Transparency
4.3.2
4.4
Self-Descriptiveness
Makethingsvisible
4.4.1,4.4.5;
Offer
inform
ative
feedback
4.4.1,4.5.9,
4.5.2
Visibilityofsystem
status4.4.3;
Recognitionrather
than
recall4.4.4,4.4.6
Inform
ativefeedback
4.4.1,4.4.5;Explicitness
4.5
Conform
itywithUser
Expectations
When
allelse
fails,
standardize4.5;Use
know
ledgein
thehead
andknow
ledgein
the
world4.5.1;Get
the
mappingsright4.5.4
Striveforconsistency
4.5.7
Consistency
and
standards4.5.7;Match
betweensystem
andthe
realworld4.5.4
Consistency
4.5.7;
Comprehensibility4.5.1
4.6
SuitabilityforLearning
Exploitthepow
erof
constraints
—Helpanddocumentation
Supportiveness4.6.2
4.7
Controllability
—
Support
internallocus
ofcontrol4.7.1,4.7.2;
Permiteasy
reversalof
actions4.7.4
Usercontroland
freedom
4.7.1,4.7.2
—
4.8
ErrorTolerance
Designforerror
Offer
errorprevention
andsimpleerror
handling4.8.8,4.8.1
Errorprevention4.8.8;
Helpusers
recognize,
diagnose,andrecover
from
errors
4.8.1
Tolerance
4.9
Suitabilityfor
Individualization
—Enablefrequentusers
touse
shortcuts
4.9.6
Flexibilityandeffi
ciency
ofuse
4.9.1,4.9.6
Efficiency
Note.Theheuristicsare
fitinto
thedialogueprinciplesoftheISO
9241-110accordingto
theoriginalnumberingfrom
4.3
to4.9.When
aheuristicrelatesto
severaldialogueprinciples,theheuristicisdisplayed
only
atonecentralprincipleto
keepthisoverviewreadable.When
aheuristicwasveryspecificitwaspossibleto
identify
relatedspecificsubprinciplesin
theISO
9241-110,indicatedbytheassigned
number.
33
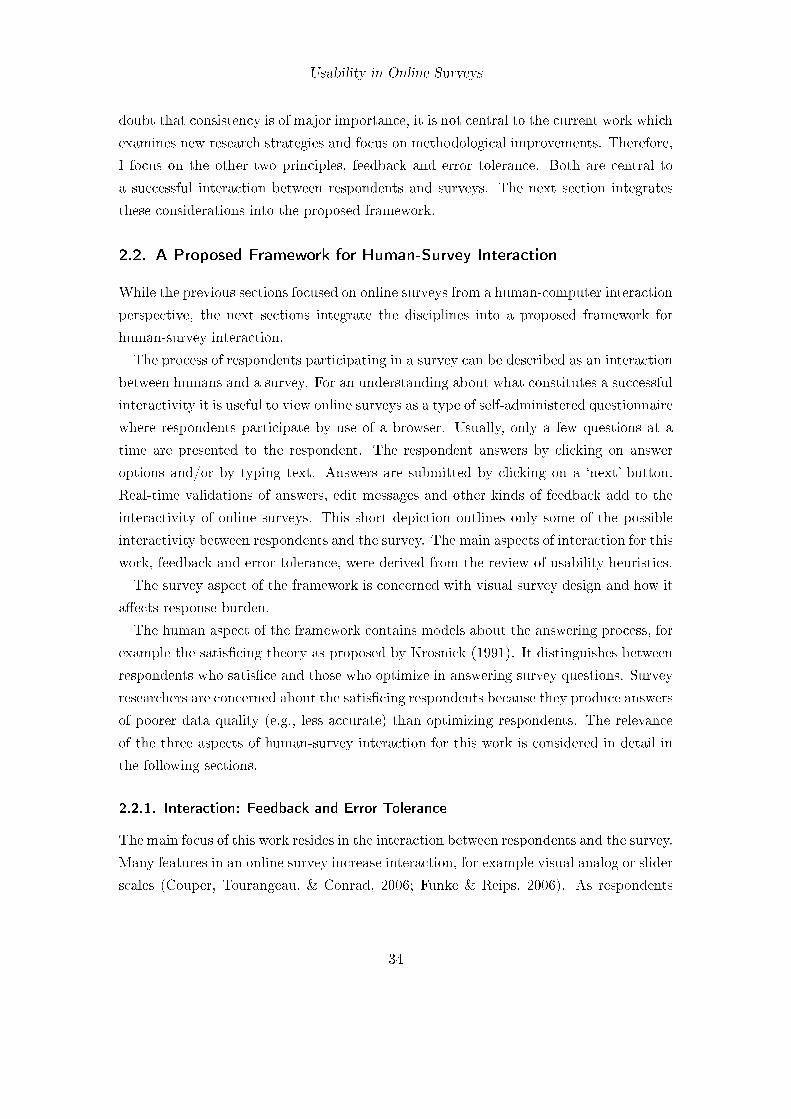
Usability in Online Surveys
doubt that consistency is of major importance, it is not central to the current work which
examines new research strategies and focus on methodological improvements. Therefore,
I focus on the other two principles, feedback and error tolerance. Both are central to
a successful interaction between respondents and surveys. The next section integrates
these considerations into the proposed framework.
2.2. A Proposed Framework for Human-Survey Interaction
While the previous sections focused on online surveys from a human-computer interaction
perspective, the next sections integrate the disciplines into a proposed framework for
human-survey interaction.
The process of respondents participating in a survey can be described as an interaction
between humans and a survey. For an understanding about what constitutes a successful
interactivity it is useful to view online surveys as a type of self-administered questionnaire
where respondents participate by use of a browser. Usually, only a few questions at a
time are presented to the respondent. The respondent answers by clicking on answer
options and/or by typing text. Answers are submitted by clicking on a ‘next’-button.
Real-time validations of answers, edit messages and other kinds of feedback add to the
interactivity of online surveys. This short depiction outlines only some of the possible
interactivity between respondents and the survey. The main aspects of interaction for this
work, feedback and error tolerance, were derived from the review of usability heuristics.
The survey aspect of the framework is concerned with visual survey design and how it
affects response burden.
The human aspect of the framework contains models about the answering process, for
example the satisficing theory as proposed by Krosnick (1991). It distinguishes between
respondents who satisfice and those who optimize in answering survey questions. Survey
researchers are concerned about the satisficing respondents because they produce answers
of poorer data quality (e.g., less accurate) than optimizing respondents. The relevance
of the three aspects of human-survey interaction for this work is considered in detail in
the following sections.
2.2.1. Interaction: Feedback and Error Tolerance
The main focus of this work resides in the interaction between respondents and the survey.
Many features in an online survey increase interaction, for example visual analog or slider
scales (Couper, Tourangeau, & Conrad, 2006; Funke & Reips, 2006). As respondents
34
Usability in Online Surveys
Figure 2.1. Proposed framework for human-survey interaction.
move and click with the mouse or enter answers with their keyboard an online survey
can change the appearance of the questionnaire. Usually, only the answer controls change
to show that a response was successfully placed. Useful approaches provide additional
information as for example with tally questions where several items must add up to a
certain amount. Here, a sum can be shown which is updated with each new entry of
the respondent so that distributions in time estimates add up to 100% (Conrad, Couper,
Tourangeau, & Galesic, 2005). Clarification features can aid respondents with additional
definitions of the terms used in the question (Conrad, Couper, Tourangeau, & Peytchev,
2006). Response can be validated so that respondents are prompted for missing or
inaccurate answers (Peytchev & Crawford, 2005). A usability goal is to reduce the
probability of errors and misinterpretations in online surveys. Reducing errors in the
interaction therefore improves survey quality. The feedback techniques and methods
employed in this work improve the interactive experience of respondents with the survey.
2.2.2. Human: A Model of the Response Process
The human aspect in the framework considers the cognitive capabilities and processes
in humans. The focus in online surveys is the response process. Tourangeau, Rips,
and Rasinski (2000) proposed a cognitive toolbox approach to describe the different
components of the response process. Table 2.2 shows an idealized list of components
with the specific mental processes that they include.
The response process begins with question comprehension: reading the question, in-
structions, and assigning a meaning to the words and form of it. Survey researchers know
that more complicated questions take more time to respond to (Yan & Tourangeau, 2008).
This fact will later be used in study 3 to identify suitable response time indicators. The
second component of the cognitive toolbox concerns retrieval of relevant information from
35
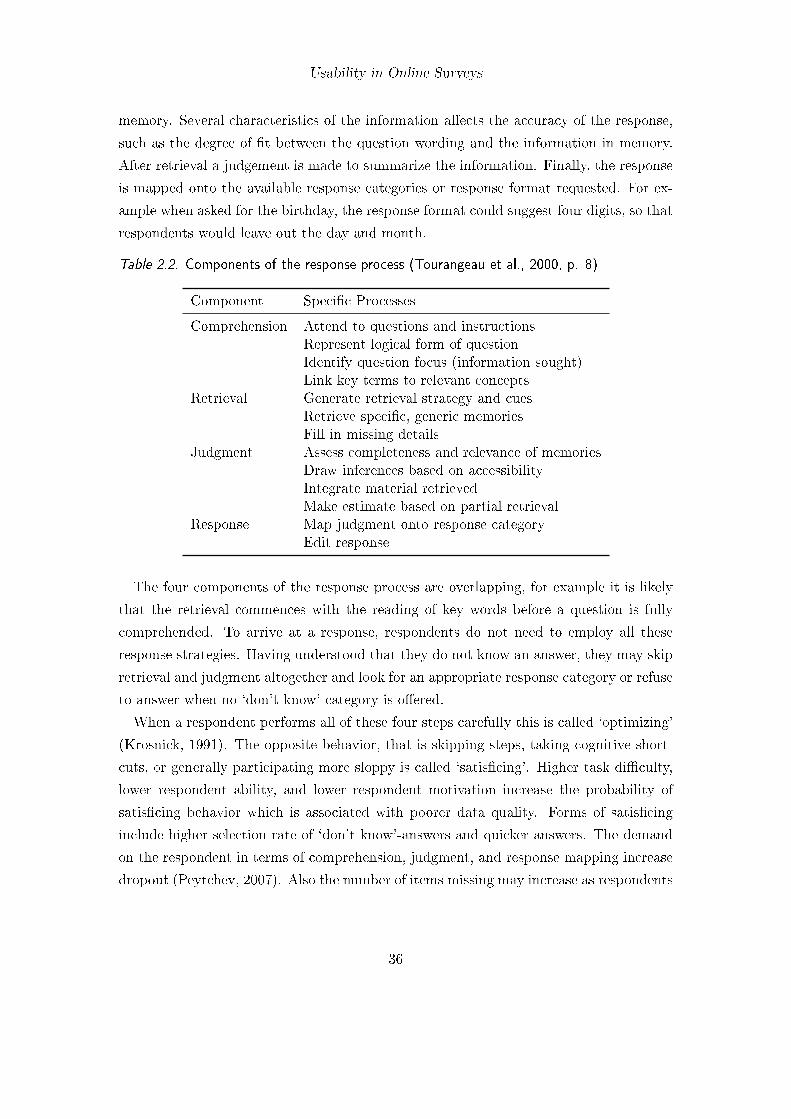
Usability in Online Surveys
memory. Several characteristics of the information affects the accuracy of the response,
such as the degree of fit between the question wording and the information in memory.
After retrieval a judgement is made to summarize the information. Finally, the response
is mapped onto the available response categories or response format requested. For ex-
ample when asked for the birthday, the response format could suggest four digits, so that
respondents would leave out the day and month.
Table 2.2. Components of the response process (Tourangeau et al., 2000, p. 8)
Component Specific Processes
Comprehension Attend to questions and instructionsRepresent logical form of questionIdentify question focus (information sought)Link key terms to relevant concepts
Retrieval Generate retrieval strategy and cuesRetrieve specific, generic memoriesFill in missing details
Judgment Assess completeness and relevance of memoriesDraw inferences based on accessibilityIntegrate material retrievedMake estimate based on partial retrieval
Response Map judgment onto response categoryEdit response
The four components of the response process are overlapping, for example it is likely
that the retrieval commences with the reading of key words before a question is fully
comprehended. To arrive at a response, respondents do not need to employ all these
response strategies. Having understood that they do not know an answer, they may skip
retrieval and judgment altogether and look for an appropriate response category or refuse
to answer when no ‘don’t-know’-category is offered.
When a respondent performs all of these four steps carefully this is called ‘optimizing’
(Krosnick, 1991). The opposite behavior, that is skipping steps, taking cognitive short-
cuts, or generally participating more sloppy is called ‘satisficing’. Higher task difficulty,
lower respondent ability, and lower respondent motivation increase the probability of
satisficing behavior which is associated with poorer data quality. Forms of satisficing
include higher selection rate of ‘don’t know’-answers and quicker answers. The demand
on the respondent in terms of comprehension, judgment, and response mapping increase
dropout (Peytchev, 2007). Also the number of items missing may increase as respondents
36
Usability in Online Surveys
with lower motivation proceed through a questionnaire (Heerwegh, 2005). Accordingly,
indicators of satisficing behavior will be used in this work to show that an achieved
increase in response rates are not burdened with poorer data quality.
2.2.3. Survey: Response Burden
The survey aspect in the framework is mainly concerned with response burden. Usability
heuristics have benefited from concepts in psychology and other areas. Here, response
burden conceptually comes so close to usability and survey research that it is examined
in more detail.
Response burden is an important issue for business organizations due to the time and
costs mandatory governmental questionnaires enforce on them. Considerable effort was
invested to assess this type of response burden (Hedlin, Dale, Haraldsen, & Jones, 2005).
Response burden is also known to impede data quality (Haraldsen, 2004) and to account
for dropout (Galesic, 2006). According to Bradburn (1978) response burden consists of
four aspects:
1. Length. The longer participation takes, the higher the burden imposed on the
respondent.
2. Respondent effort. In addition to the length, different types of questions and
surveys may require different efforts from respondents. For example simple ques-
tions about known facts such as year of birth are easier to answer than detailed
information about finances. Open ended questions require more effort to answer
than rating scales.
3. Respondent stress. The amount of personal discomfort a respondent undergoes
during the interview. For example topics that are anxiety-provoking are more
stressful than others.
4. Frequency of being interviewed. The amount of invitations received and the
amount of participations adds to the overall burden of the respondent.
Regarding the length it is important to note that online surveys often look longer than
paper-based surveys because the questions are spread over more pages. It is evident
that this does not increase the length as such. As Abraham, Steiger, and Sullivan (1998,
p. 839) noted in their study: “Our concern that the proliferation of ‘pages’ in the Web
questionnaire, from 31 pages in the paper version to 67 (screen) pages in the Web,
37
Usability in Online Surveys
might increase response burden did not prove to be an issue”. Besides the factual length
recorded by the system response burden can also be measured as self-reported time or
perceived time (Abraham et al., 1998; Galesic, 2006). Bradburn points out that the
subjective perception of the respondent is important. Also the expected time as an
aspect of burden can have an influence on survey response rates (Walston, Lissitz, &
Rudner, 2006). Trouteaud (2004, p. 388) varied the information about how long the
survey would last in the invitation (3–5 minutes vs. 10–15 minutes), yielding a 4%
higher response rate in the shorter condition. Similarly, a review of the literature on
the effects of questionnaire length on response rates by Bogen (1996) found a positive
relationship between interview length and nonresponse, “but it is surprisingly weak and
inconsistent.” (p. 1024). The length can also be considered in terms of questions asked or
the number of answer decisions a respondent has to make. For example a matrix question
with one question but consisting of five answer items should be counted as similar to five
single questions.
More difficult questions increase response burden and have a negative effect on data
quality, that is the number of nonsubstantial answers in the form of ‘don’t know’ (Knäuper,
Belli, Hill, & Herzog, 2006). The effect of required effort on data quality and nonresponse
is especially visible with ranking tasks. Neubarth (2008) reports higher dropout rates for
a set of pair comparison tasks compared to rating tasks on the same items. In developing
a ranking tool that uses drag&drop techniques several tests were performed to improve
the usability and reduce the burden of the measurement tool. The revisions enabled
most respondents to use the tool without external help (Neubarth, 2008). The respon-
dent effort can also be measured by analyzing the amount of interaction errors within
a survey or by asking respondents. The belief in the usefulness of surveys and “denial
of the privacy-invading character of survey questions were strongly associated with low
burden perceptions.” (Sharp & Frankel, 1983, p. 36).
Respondent’s stress reduces the accuracy of the answers as discomfort increases. A
common notion is that answers to sensitive questions are subject to underreporting of
undesirable behavior. Respondent stress is thus associated with the social desirability
bias which accounts for nonresponse and underreporting (Biemer & Brown, 2005; Couper,
Singer, & Tourangeau, 2004).
The frequency of being interviewed also directly affects nonresponse. It is common
sense that a respondent who receives several invitations a day is unlikely to participate
in all surveys as the available spare time must be divided between work and private life.
Studies using subsequent invitations to new surveys after an initial contact phase show
38
Usability in Online Surveys
decreasing response rates (cf., Bosnjak, Neubarth, Couper, Bandilla, & Kaczmirek, 2008).
Similarly, when respondents are invited to another survey at the end of a questionnaire
the response rate is diminishing (cf., Kjellström & Bälter, 2003; Bandilla et al., 2009).
Here, more respondents would not agree to be reinterviewed when the survey they had
just participated in was longer (27 percent vs. 13 percent in the group with a shorter
survey, Sharp & Frankel, 1983, p. 43). However, there seems to be an optimal amount
of acceptable invitations which can be issued regularly. For example CentERdata in the
Netherlands employs a panel with invitations on a weekly basis (CentERdata, 2008).
In an attempt to assess and reduce overall response burden (Hedlin et al., 2005) in es-
tablishment surveys, Hedlin and Jones (2005) propose the following guidelines for survey
design which are similarly important for personal online surveys:
1. Perceived importance of the survey. The importance of a survey should be
stated in the invitation or introduction of a survey (cf., Sharp & Frankel, 1983;
Stocké & Becker, 2004).
2. Personalising survey communication. Surveys should be addressed to specific
persons (whenever possible).
3. Respondent-friendly instrument. A survey should be well designed and consis-
tent. This corresponds directly to the heuristic ‘conformity with user expectations’.
4. Survey notes and guidance. Notes and instructions should be placed were they
are needed. This corresponds directly to the heuristic ‘Suitability for the task’.
5. Cognitive burden of questions. Questions should pass cognitive testing with
respondents (cf., Converse & Presser, 1986).
Summarizing, response burden negatively affects nonresponse rates and overlaps with
concepts from usability. Studies reported in this work will assess the response burden of
different survey methodologies to support survey design decisions.
Other concepts subsumed under the survey aspect in the framework are questionnaire
design issues. Dillman et al. (2005) approach visual survey design by applying princi-
ples of gestalt psychology and Norman (1988). They show how the principles can be
applied to redesign survey questionnaires, resulting in a higher usability. Several studies
have shown that visual design affects the response process. Some of these effects were
already discussed in the survey life cycle in the introduction. Smyth, Dillman, Christian,
and Stern (2004) provide several examples how visual grouping influences the answers.
39
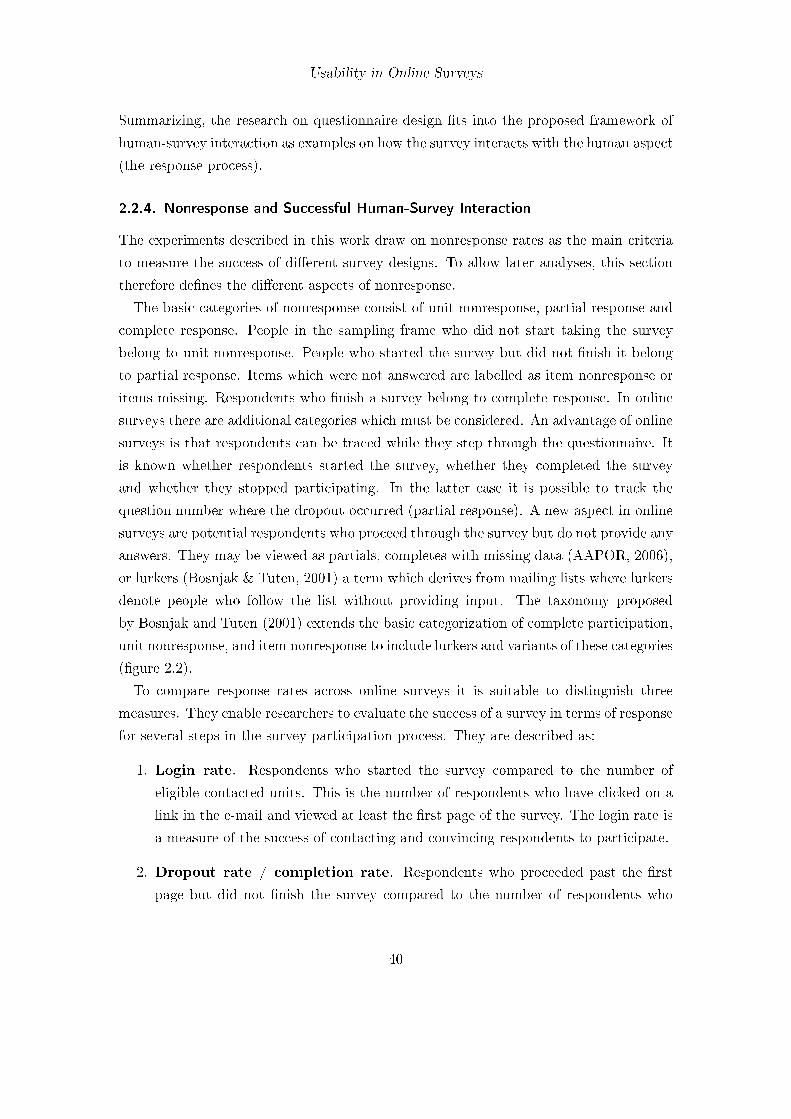
Usability in Online Surveys
Summarizing, the research on questionnaire design fits into the proposed framework of
human-survey interaction as examples on how the survey interacts with the human aspect
(the response process).
2.2.4. Nonresponse and Successful Human-Survey Interaction
The experiments described in this work draw on nonresponse rates as the main criteria
to measure the success of different survey designs. To allow later analyses, this section
therefore defines the different aspects of nonresponse.
The basic categories of nonresponse consist of unit nonresponse, partial response and
complete response. People in the sampling frame who did not start taking the survey
belong to unit nonresponse. People who started the survey but did not finish it belong
to partial response. Items which were not answered are labelled as item nonresponse or
items missing. Respondents who finish a survey belong to complete response. In online
surveys there are additional categories which must be considered. An advantage of online
surveys is that respondents can be traced while they step through the questionnaire. It
is known whether respondents started the survey, whether they completed the survey
and whether they stopped participating. In the latter case it is possible to track the
question number where the dropout occurred (partial response). A new aspect in online
surveys are potential respondents who proceed through the survey but do not provide any
answers. They may be viewed as partials, completes with missing data (AAPOR, 2006),
or lurkers (Bosnjak & Tuten, 2001) a term which derives from mailing lists where lurkers
denote people who follow the list without providing input. The taxonomy proposed
by Bosnjak and Tuten (2001) extends the basic categorization of complete participation,
unit nonresponse, and item nonresponse to include lurkers and variants of these categories
(figure 2.2).
To compare response rates across online surveys it is suitable to distinguish three
measures. They enable researchers to evaluate the success of a survey in terms of response
for several steps in the survey participation process. They are described as:
1. Login rate. Respondents who started the survey compared to the number of
eligible contacted units. This is the number of respondents who have clicked on a
link in the e-mail and viewed at least the first page of the survey. The login rate is
a measure of the success of contacting and convincing respondents to participate.
2. Dropout rate / completion rate. Respondents who proceeded past the first
page but did not finish the survey compared to the number of respondents who
40
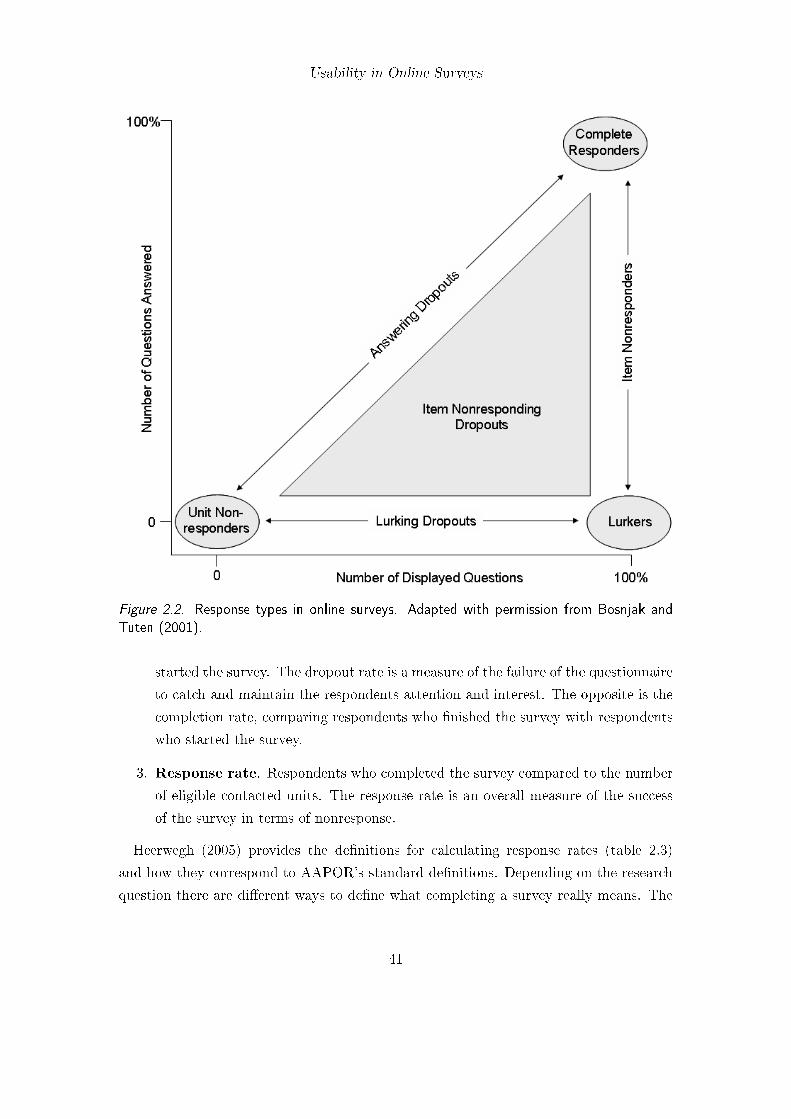
Usability in Online Surveys
Figure 2.2. Response types in online surveys. Adapted with permission from Bosnjak and
Tuten (2001).
started the survey. The dropout rate is a measure of the failure of the questionnaire
to catch and maintain the respondents attention and interest. The opposite is the
completion rate, comparing respondents who finished the survey with respondents
who started the survey.
3. Response rate. Respondents who completed the survey compared to the number
of eligible contacted units. The response rate is an overall measure of the success
of the survey in terms of nonresponse.
Heerwegh (2005) provides the definitions for calculating response rates (table 2.3)
and how they correspond to AAPOR’s standard definitions. Depending on the research
question there are different ways to define what completing a survey really means. The
41
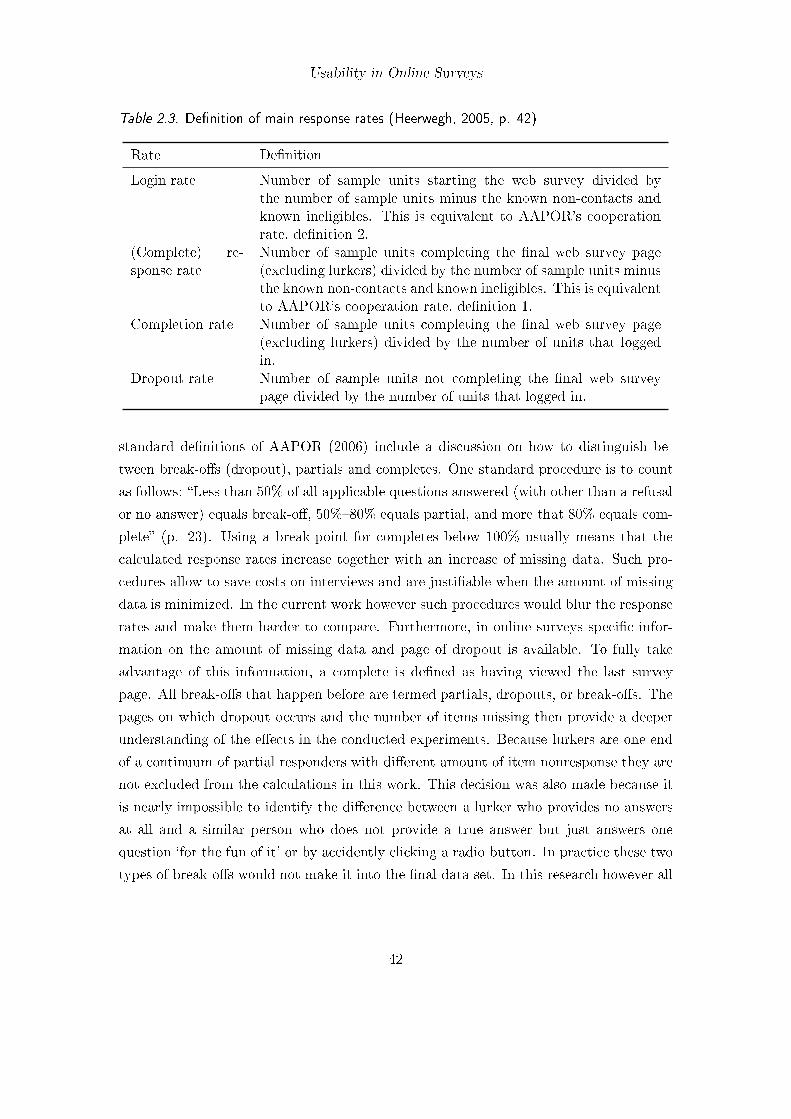
Usability in Online Surveys
Table 2.3. Definition of main response rates (Heerwegh, 2005, p. 42)
Rate Definition
Login rate Number of sample units starting the web survey divided bythe number of sample units minus the known non-contacts andknown ineligibles. This is equivalent to AAPOR’s cooperationrate, definition 2.
(Complete) re-sponse rate
Number of sample units completing the final web survey page(excluding lurkers) divided by the number of sample units minusthe known non-contacts and known ineligibles. This is equivalentto AAPOR’s cooperation rate, definition 1.
Completion rate Number of sample units completing the final web survey page(excluding lurkers) divided by the number of units that loggedin.
Dropout rate Number of sample units not completing the final web surveypage divided by the number of units that logged in.
standard definitions of AAPOR (2006) include a discussion on how to distinguish be-
tween break-offs (dropout), partials and completes. One standard procedure is to count
as follows: “Less than 50% of all applicable questions answered (with other than a refusal
or no answer) equals break-off, 50%–80% equals partial, and more that 80% equals com-
plete” (p. 23). Using a break-point for completes below 100% usually means that the
calculated response rates increase together with an increase of missing data. Such pro-
cedures allow to save costs on interviews and are justifiable when the amount of missing
data is minimized. In the current work however such procedures would blur the response
rates and make them harder to compare. Furthermore, in online surveys specific infor-
mation on the amount of missing data and page of dropout is available. To fully take
advantage of this information, a complete is defined as having viewed the last survey
page. All break-offs that happen before are termed partials, dropouts, or break-offs. The
pages on which dropout occurs and the number of items missing then provide a deeper
understanding of the effects in the conducted experiments. Because lurkers are one end
of a continuum of partial responders with different amount of item nonresponse they are
not excluded from the calculations in this work. This decision was also made because it
is nearly impossible to identify the difference between a lurker who provides no answers
at all and a similar person who does not provide a true answer but just answers one
question ‘for the fun of it’ or by accidently clicking a radio button. In practice these two
types of break-offs would not make it into the final data set. In this research however all
42
Usability in Online Surveys
data is maintained so that the variance in items missing is not arbitrarily reduced in the
analysis.
2.3. Connecting Research Goals, Studies, Survey Methodology, and
Usability
Research Goals
This work combines concepts from survey methodology, human-computer interaction,
cognitive psychology, and usability to improve data quality in online surveys. Based
on a literature review several approaches were integrated and a theoretical framework
of human-survey interaction was proposed. Mapping the literature and terminology
into the framework illuminated areas of major interest and worthwhile further research.
In this context, researchers have been pursuing several methodological approaches to
understand and tackle sources of survey error. In the following I identify areas with a
lack of methodological conceptualization, namely paradata and develop instruments to
support further research. After preparing the framework and instruments for research in
the area of human-survey interaction several experiments apply the concepts to compare
strategies in survey design.
This work argues that usability in online surveys can improve the respondents’ expe-
rience and reduce nonresponse error. The specific research questions are as follows:
Chapter 1. How is this work related to the broader area of survey methodology? What
is its role within the total survey error framework and the survey life cycle approach?
Chapter 2. What constitutes a research framework for human-survey interaction?
How do sources of error and survey design fit into this framework? How do dialogue
principles –namely the ISO 9241-110– concern survey design? How do the heuristics
proposed by various authors relate to survey design and how do they fit into the proposed
framework?
Chapter 3. How can the framework be applied to survey research?
Chapter 4. What instruments are needed to measure and improve the quality of
online surveys? How can paradata be conceptualized? How can errors in the interaction
between respondents and the questionnaire be reduced? What is the best measure for
response times?
Chapter 5. What technologies are available in survey design? What is the amount
of coverage of these technologies among respondents? How much would nonresponse
43
Usability in Online Surveys
increase when specific technologies are used in survey design? Which technology can be
used to improve surveys without increasing nonresponse?
Chapter 6. How can feedback, visibility of answer options and interactive design
increase usability and reduce nonresponse?
Chapter 7. What are current design flaws when providing feedback on survey progress
to respondents? What are necessary aspects of useful progress feedback and how should
it be designed to increase usability and reduce nonresponse?
Outline of Studies
This section shortly outlines the studies addressing the research questions. Overall, seven
studies are reported, including several experiments to examine how questionnaire design,
feedback, error tolerance, and interactivity relate to survey error and shape the usability
of an online survey. The studies target a wide range of people: students, people above
forty, visually impaired and blind people, and survey panel members. Overall, data from
33,821 individuals is analyzed. A first set of studies aimed to improve and assess the
available instruments (paradata, response time measurements, technical availability of
survey design features) which were then used in the second set of studies. The goal of
the second set was to apply human-survey interaction to the design of online surveys to
increase item completions (decrease item nonresponse) and survey completions (decrease
the number of dropouts). The following studies were conducted:
Using the framework in survey design in study 1. In an attempt to make surveys
accessible for visually impaired and blind people, guidelines based on the framework of
human-survey interaction were developed for the three modes online, paper and braille.
Pretesting of the questionnaires helped in refining the guidelines. A self-administered
survey was conducted among the members of the association for the blind and visually
impaired people of Baden in Germany. The application of the guidelines were successful
for the different modes both in terms of response rates and respondents evaluation of the
questionnaire.
Reducing interaction errors and improving response time measurement in
studies 2 and 3. The term paradata has been accepted to refer to process data in
surveys. Nevertheless, as the concept is still young a typology of paradata was developed,
outlining new areas for research. A corresponding technical approach was then developed
to collect all kinds of paradata. The two experiments illustrate how the typology and the
instrument can foster new insights in the process of human-survey interaction. Study 2
illustrates how the typology and the instrument can help to identify and reduce errors
44
Usability in Online Surveys
in the interaction between respondents and answer buttons. The most widely used type
of paradata are time stamps for response latency measurement. Among the different
possible measures study 3 determines which of these are best-suited for online research.
Estimating nonresponse as a result of unavailable client-side survey design
features in study 4, spanning three data collection periods. For the implemen-
tation of online surveys, design decisions about technologies must be made, for example
whether JavaScript should be employed. On the one hand, respondents are expected
to benefit from additional interactive features which could result in an increased data
quality. On the other hand, the technology could lead to an increase of nonresponse
canceling positive effects, because not all respondents might have the necessary equip-
ment. This could result in technical problems and unaccessible surveys. Firstly, the
technologies are discussed with respect to the usefulness in survey methodology. Sec-
ondly, censuses among student applicants clarify the amount by which unit nonresponse
would be increased when specific technologies were to be used in an online survey. More
importantly, they support design decisions about which technologies can be used to the
methodological benefit of survey design.
Increasing item completion rates in studies 2 and 5. The use of matrix questions
which combine several question items into a single question layout is associated with a
higher dropout rate compared to single questions alone. The experiments show that the
use of visual aids and visual feedback suceed in reducing item nonresponse. Moreover,
the increase in responses has no negative effect on the data quality.
Increasing survey completion rates in studies 6 and 7. Feedback on progress is
a common implementation in online surveys. When a questionnaire includes filter ques-
tions, a skip of questions usually leads to an unexpected jump in the progress indicator
which may cause confusion and feelings of unreliability towards the feedback mechanism.
Studies have shown that a poor implementation of progress indicators increase dropout
instead of reducing it. Therefore, a method for dynamic progress calculation is developed
which solves the problems filter questions impose. The experiments on progress feedback
show that the new method is superior compared to other implementations in terms of
response burden and nonresponse.
Connection between Research Goals, Survey Methodology, Usability, and
Conducted Studies
This work is divided into three parts. They focus on theory, instruments and applica-
tions. Table 2.4 illustrates how the research goals are approached in terms of survey
45

Usability in Online Surveys
methodology and usability. The table shows a mapping of the main concepts of human-
survey interaction framework onto goals, studies, and chapters. The next chapter will
continue with developing and applying specific guidelines for visually impaired and blind
people in a mixed mode setting.
46
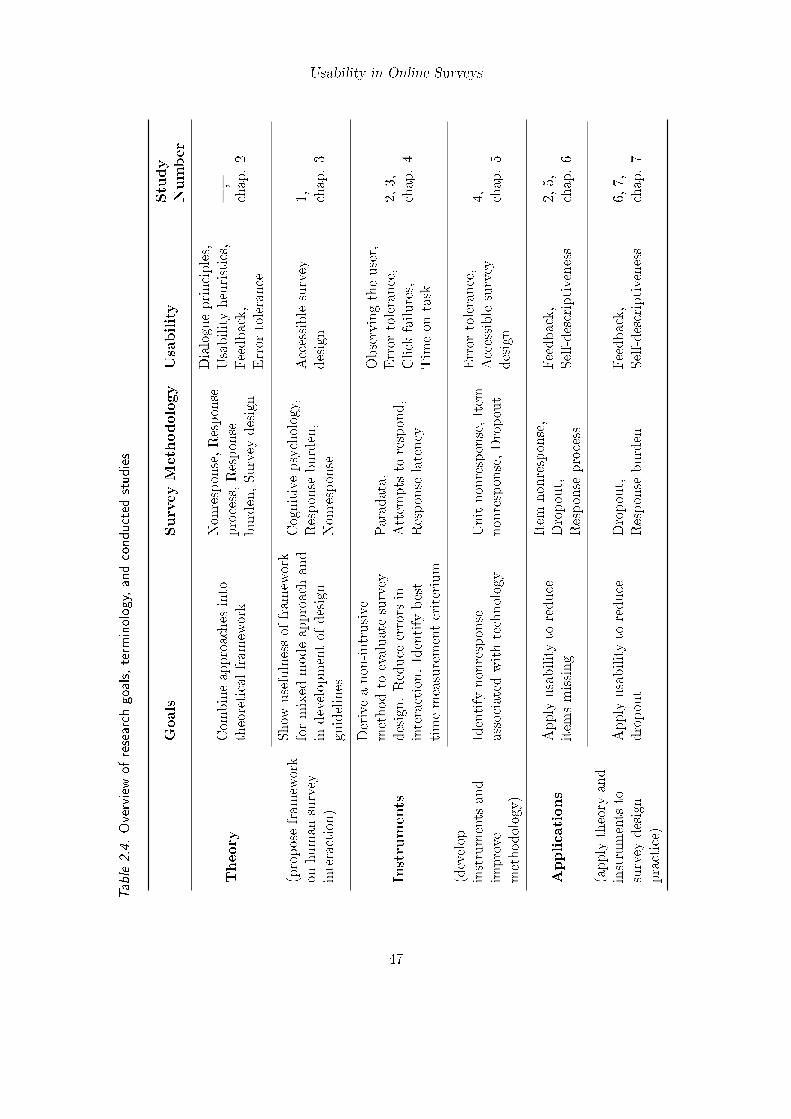
Usability in Online Surveys
Table
2.4.Overviewofresearch
goals,term
inology,andconducted
studies
Goals
SurveyMethodology
Usability
Study
Number
Theory
Com
bineapproaches
into
theoreticalfram
ework
Nonresponse,Response
process,Response
burden,Survey
design
Dialogueprinciples,
Usabilityheuristics,
Feedback,
Error
tolerance
—,
chap.2
(proposefram
ework
onhuman-survey
interaction)
Show
usefulnessof
fram
ework
formixed
modeapproachand
indevelopmentof
design
guidelines
Cognitivepsychology,
Response
burden,
Nonresponse
Accessiblesurvey
design
1, chap.3
Instruments
Deriveanon-intrusive
methodto
evaluatesurvey
design.Reduce
errors
ininteraction.Identify
best
timemeasurementcriterium
Paradata,
Attem
pts
torespond,
Response
latency
Observingtheuser,
Error
tolerance,
Click
failures,
Tim
eon
task
2,3,
chap.4
(develop
instruments
and
improve
methodology)
Identify
nonresponse
associated
withtechnology
Unitnonresponse,Item
nonresponse,Dropout
Error
tolerance,
Accessiblesurvey
design
4, chap.5
Applications
Apply
usabilityto
reduce
item
smissing
Item
nonresponse,
Dropout,
Response
process
Feedback,
Self-descriptiveness
2,5,
chap.6
(apply
theory
and
instruments
tosurvey
design
practice)
Apply
usabilityto
reduce
dropout
Dropout,
Response
burden
Feedback,
Self-descriptiveness
6,7,
chap.7
47
3. Using the Framework in Survey Design: A Mixed Mode
Example (Study 1)
3.1. Deriving Guidelines for Different Modes
Good theories should be fruitful for research in that they foster new ideas, prove them-
self useful in practice and have a broad applicability.1 The demands for conducting a
survey for visually impaired and blind people are ideal to check on these criteria. Firstly,
self-administered surveys with visually impaired and blind people are a worthwile un-
dertaking when trying to understand cognitive processes with respect to questionnaire
design. Constraints in the visual field reduce the possibilities of overcoming bad design
in survey questions. Consequently, all effort must be made to avoid design pitfalls which
in this context can easily result in inaccessible surveys. Secondly, the special demands
of the target population make it necessary to derive practical guidelines and to reasses
traditional survey design standards. Thirdly, the target population makes it necessary
to design the questionnaire in several different modes. Although, I focus on the online
mode, the theory will benefit from demonstrating its broader applicability to other modes
as well.
The following sections illustrate how theory can be transformed into concrete guidelines
for the design of self-administered surveys for visually impaired and blind people within
a mixed mode approach.
3.2. Survey Design for Visually Impaired and Blind People
This chapter is concerned with the questionnaire design and the conducting of surveys for
visually impaired and blind people. These people are challenged by the readability and
1 Acknowledgements. Parts of this chapter are adapted with permission from Kaczmirek and Wolff(2007). I thank the Badischer Blinden- und Sehbehindertenverein (BBSV) [Association for the Blindand Visually Impaired People of Baden], all unnamed visually impaired and blind pretesters, andespecially Karlheinz Schneider and Brigitte Schick for supporting this study. Dr. Harald Weber fromthe Institut für Technologie und Arbeit (ITA) [Institute for Technology and Labour, http://www.ita-kl.de/] in Kaiserslautern, Germany supported the online version by providing an accessible prototypefor online surveys. The online survey was pretested by the initiative LOB: Land ohne Barrieren[country without barriers, http://www.land-ohne-barrieren.de/], Kathrin Kaschura.
48
Using the Framework in Survey Design: A Mixed Mode Example (Study 1)
usability of traditional paper-based text. Associations for visually impaired and blind
people cope with the special requirements by providing various possibilities to obtain
textual material. The text corpus may be printed in a bigger font, text may be converted
to braille2 paper or be read aloud to provide audio material. Additionally, text may be
obtained electronically and listened to with the help of a screen reader or read by means
of a braille display. Special devices can be used (enlargers) which magnify text while
allowing for an increase in contrast and changes in color (e.g., yellow on black instead
of black on white text). All these aids have in common that they enhance the focus of
a specific piece of text and sometimes just a single word. This advantage turns into a
disadvantage in terms of a clear overview and arrangement of the text elements on a page.
Therefore, text needs to be designed with cognitive processes and accessibility standards
in mind. This is especially true for a survey questionnaire because each question and
answer item must be self-explanatory.
Several design guidelines for a large font paper-based version, a braille version and
an online version of the same questionnaire were developed. These guidelines for the
different modes support the various ways in which the target population is used to read
and respond to written material.
3.3. Method: Mixed Mode with Paper and Pencil, Braille and Web
This work originates from a survey conducted among the members of the Association for
the visually impaired and blind people of Baden in Germany. Prerequisites were a low
budget which ruled out the possibility of a telephone survey.
3.3.1. Procedure
To ensure that each member is able to receive information provided by the association it
is a standard procedure to develop a number of versions of a text in different modes. The
newsletter for example is provided in usual font-size, as a braille version, and as e-mail.
Thus, it was a requirement to develop a braille version, a paper-based text version and an
online version of the questionnaire. All members of the association received either a large
font version or a braille version of the questionnaire identical to the mode in which they
receive information material from the association. About three quarters of the members
2 Braille is a system of printing textual material with raised dots that can be read by touching them.Letters and numbers are represented by a specific combination of dots.
49
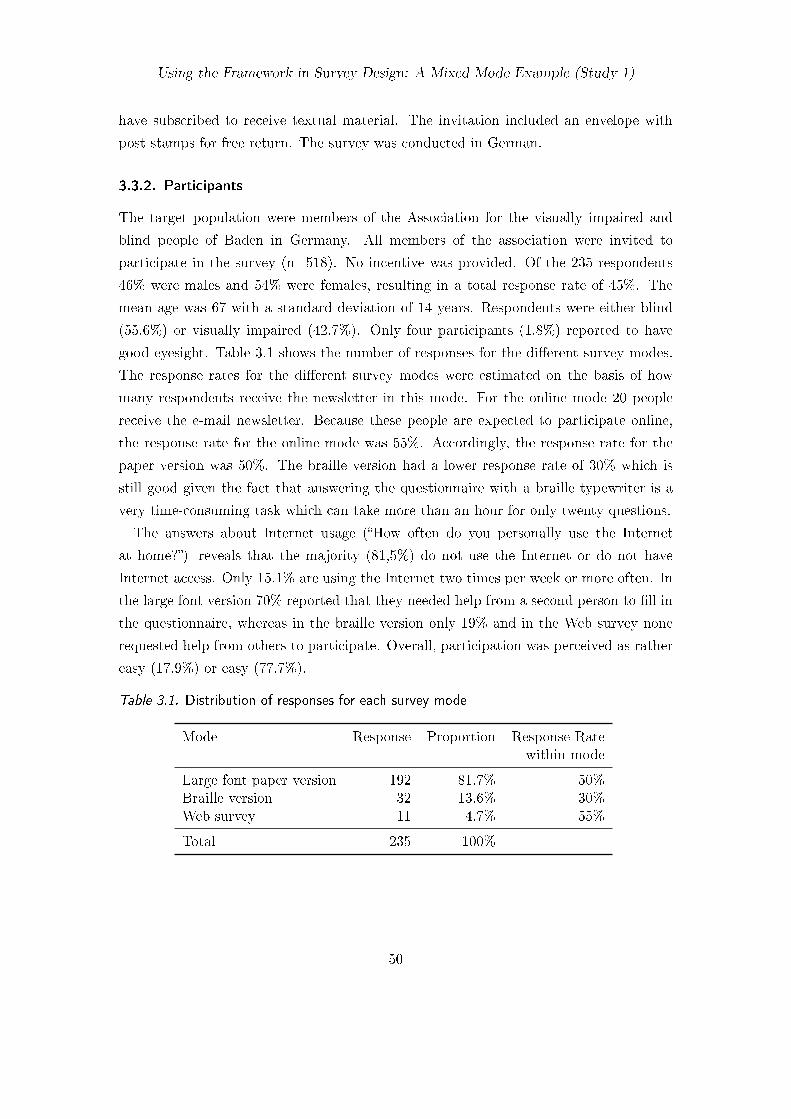
Using the Framework in Survey Design: A Mixed Mode Example (Study 1)
have subscribed to receive textual material. The invitation included an envelope with
post stamps for free return. The survey was conducted in German.
3.3.2. Participants
The target population were members of the Association for the visually impaired and
blind people of Baden in Germany. All members of the association were invited to
participate in the survey (n=518). No incentive was provided. Of the 235 respondents
46% were males and 54% were females, resulting in a total response rate of 45%. The
mean age was 67 with a standard deviation of 14 years. Respondents were either blind
(55.6%) or visually impaired (42.7%). Only four participants (1.8%) reported to have
good eyesight. Table 3.1 shows the number of responses for the different survey modes.
The response rates for the different survey modes were estimated on the basis of how
many respondents receive the newsletter in this mode. For the online mode 20 people
receive the e-mail newsletter. Because these people are expected to participate online,
the response rate for the online mode was 55%. Accordingly, the response rate for the
paper version was 50%. The braille version had a lower response rate of 30% which is
still good given the fact that answering the questionnaire with a braille typewriter is a
very time-consuming task which can take more than an hour for only twenty questions.
The answers about Internet usage (“How often do you personally use the Internet
at home?”) reveals that the majority (81,5%) do not use the Internet or do not have
Internet access. Only 15.1% are using the Internet two times per week or more often. In
the large font version 70% reported that they needed help from a second person to fill in
the questionnaire, whereas in the braille version only 19% and in the Web survey none
requested help from others to participate. Overall, participation was perceived as rather
easy (17.9%) or easy (77.7%).
Table 3.1. Distribution of responses for each survey mode
Mode Response Proportion Response Ratewithin mode
Large font paper version 192 81.7% 50%Braille version 32 13.6% 30%Web survey 11 4.7% 55%
Total 235 100%
50
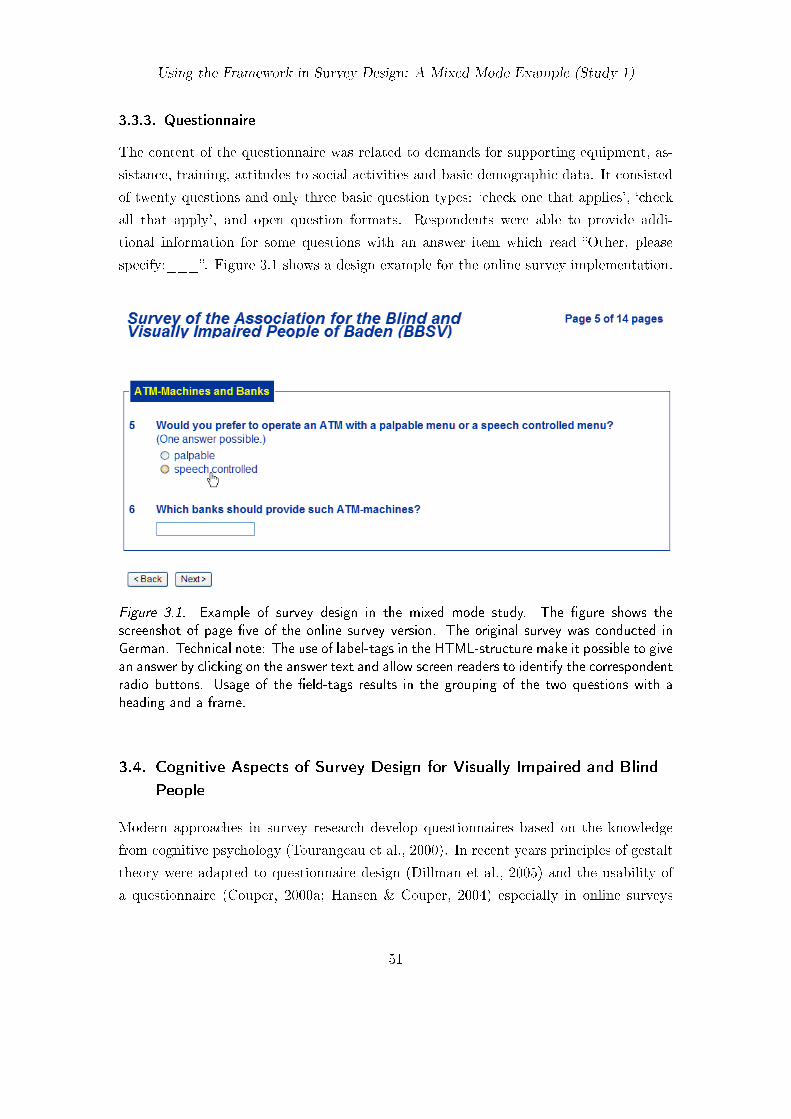
Using the Framework in Survey Design: A Mixed Mode Example (Study 1)
3.3.3. Questionnaire
The content of the questionnaire was related to demands for supporting equipment, as-
sistance, training, attitudes to social activities and basic demographic data. It consisted
of twenty questions and only three basic question types: ‘check one that applies’, ‘check
all that apply’, and open question formats. Respondents were able to provide addi-
tional information for some questions with an answer item which read “Other, please
specify:___”. Figure 3.1 shows a design example for the online survey implementation.
Figure 3.1. Example of survey design in the mixed mode study. The figure shows the
screenshot of page five of the online survey version. The original survey was conducted in
German. Technical note: The use of label-tags in the HTML-structure make it possible to give
an answer by clicking on the answer text and allow screen readers to identify the correspondent
radio buttons. Usage of the field-tags results in the grouping of the two questions with a
heading and a frame.
3.4. Cognitive Aspects of Survey Design for Visually Impaired and Blind
People
Modern approaches in survey research develop questionnaires based on the knowledge
from cognitive psychology (Tourangeau et al., 2000). In recent years principles of gestalt
theory were adapted to questionnaire design (Dillman et al., 2005) and the usability of
a questionnaire (Couper, 2000a; Hansen & Couper, 2004) especially in online surveys
51
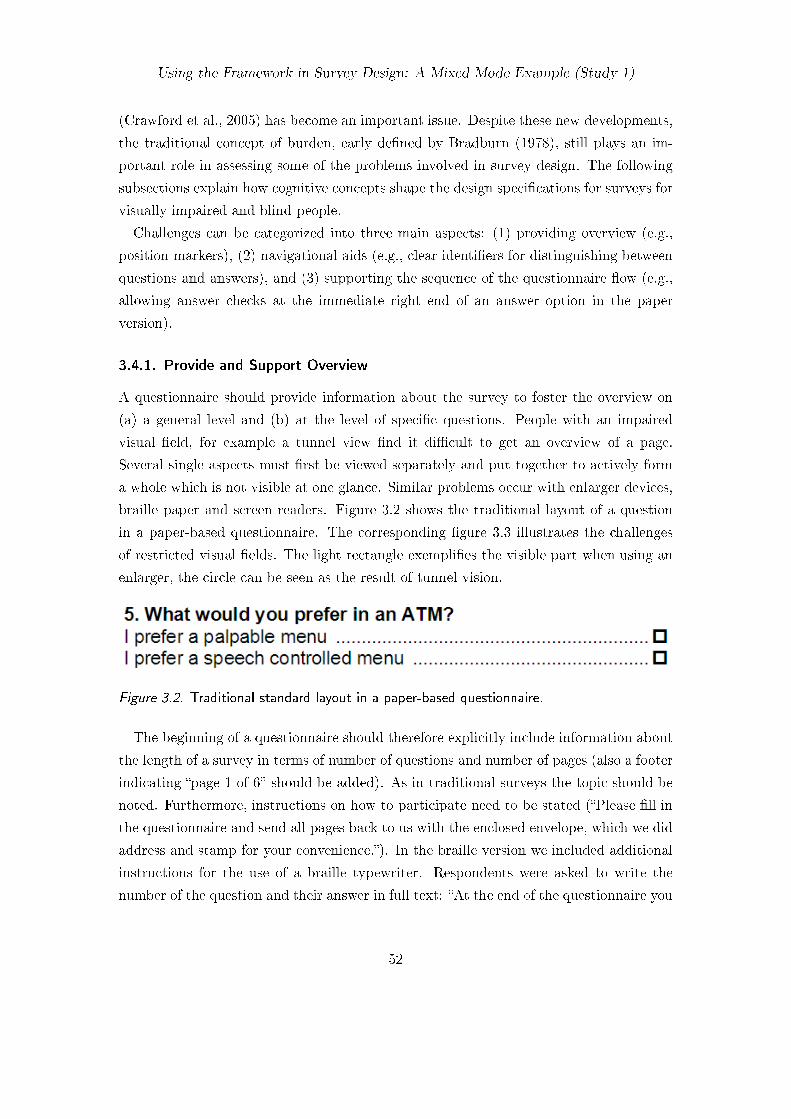
Using the Framework in Survey Design: A Mixed Mode Example (Study 1)
(Crawford et al., 2005) has become an important issue. Despite these new developments,
the traditional concept of burden, early defined by Bradburn (1978), still plays an im-
portant role in assessing some of the problems involved in survey design. The following
subsections explain how cognitive concepts shape the design specifications for surveys for
visually impaired and blind people.
Challenges can be categorized into three main aspects: (1) providing overview (e.g.,
position markers), (2) navigational aids (e.g., clear identifiers for distinguishing between
questions and answers), and (3) supporting the sequence of the questionnaire flow (e.g.,
allowing answer checks at the immediate right end of an answer option in the paper
version).
3.4.1. Provide and Support Overview
A questionnaire should provide information about the survey to foster the overview on
(a) a general level and (b) at the level of specific questions. People with an impaired
visual field, for example a tunnel view find it difficult to get an overview of a page.
Several single aspects must first be viewed separately and put together to actively form
a whole which is not visible at one glance. Similar problems occur with enlarger devices,
braille paper and screen readers. Figure 3.2 shows the traditional layout of a question
in a paper-based questionnaire. The corresponding figure 3.3 illustrates the challenges
of restricted visual fields. The light rectangle exemplifies the visible part when using an
enlarger, the circle can be seen as the result of tunnel vision.
Figure 3.2. Traditional standard layout in a paper-based questionnaire.
The beginning of a questionnaire should therefore explicitly include information about
the length of a survey in terms of number of questions and number of pages (also a footer
indicating “page 1 of 6” should be added). As in traditional surveys the topic should be
noted. Furthermore, instructions on how to participate need to be stated (“Please fill in
the questionnaire and send all pages back to us with the enclosed envelope, which we did
address and stamp for your convenience.”). In the braille version we included additional
instructions for the use of a braille typewriter. Respondents were asked to write the
number of the question and their answer in full text: “At the end of the questionnaire you
52
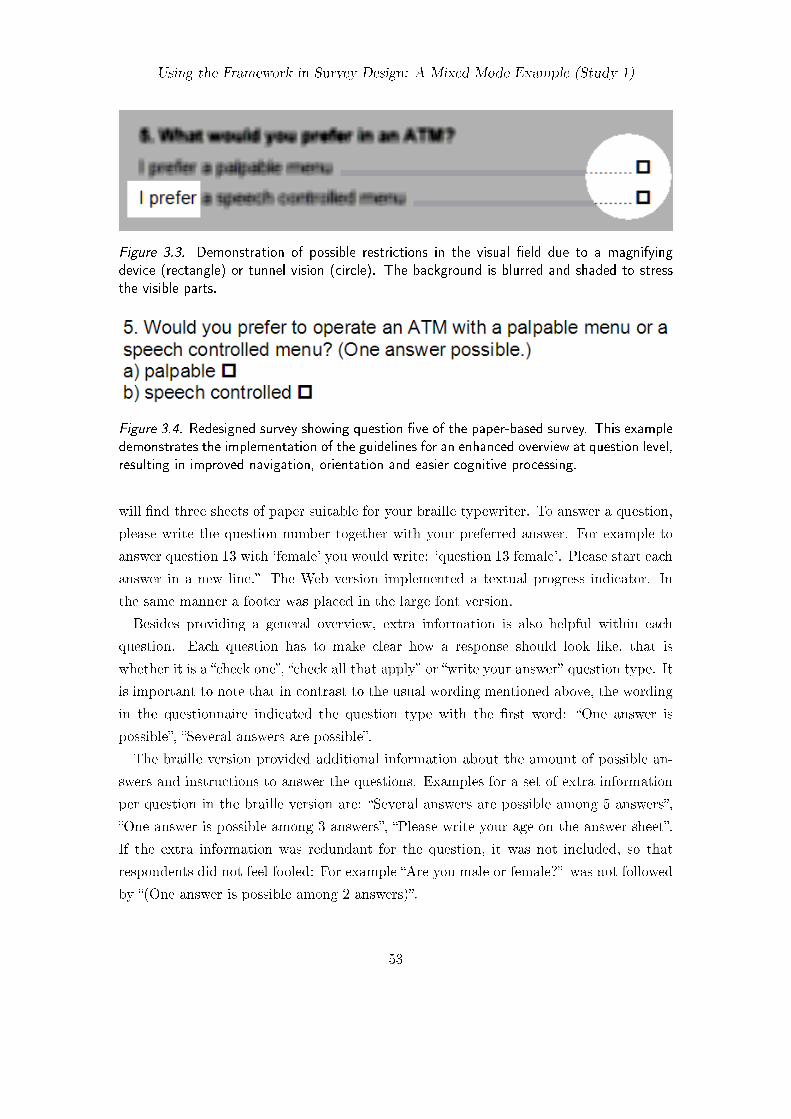
Using the Framework in Survey Design: A Mixed Mode Example (Study 1)
Figure 3.3. Demonstration of possible restrictions in the visual field due to a magnifying
device (rectangle) or tunnel vision (circle). The background is blurred and shaded to stress
the visible parts.
Figure 3.4. Redesigned survey showing question five of the paper-based survey. This example
demonstrates the implementation of the guidelines for an enhanced overview at question level,
resulting in improved navigation, orientation and easier cognitive processing.
will find three sheets of paper suitable for your braille typewriter. To answer a question,
please write the question number together with your preferred answer. For example to
answer question 13 with ‘female’ you would write: ‘question 13 female’. Please start each
answer in a new line.” The Web version implemented a textual progress indicator. In
the same manner a footer was placed in the large font version.
Besides providing a general overview, extra information is also helpful within each
question. Each question has to make clear how a response should look like, that is
whether it is a “check one”, “check all that apply” or “write your answer” question type. It
is important to note that in contrast to the usual wording mentioned above, the wording
in the questionnaire indicated the question type with the first word: “One answer is
possible”, “Several answers are possible”.
The braille version provided additional information about the amount of possible an-
swers and instructions to answer the questions. Examples for a set of extra information
per question in the braille version are: “Several answers are possible among 5 answers”,
“One answer is possible among 3 answers”, “Please write your age on the answer sheet”.
If the extra information was redundant for the question, it was not included, so that
respondents did not feel fooled: For example “Are you male or female?” was not followed
by “(One answer is possible among 2 answers)”.
53
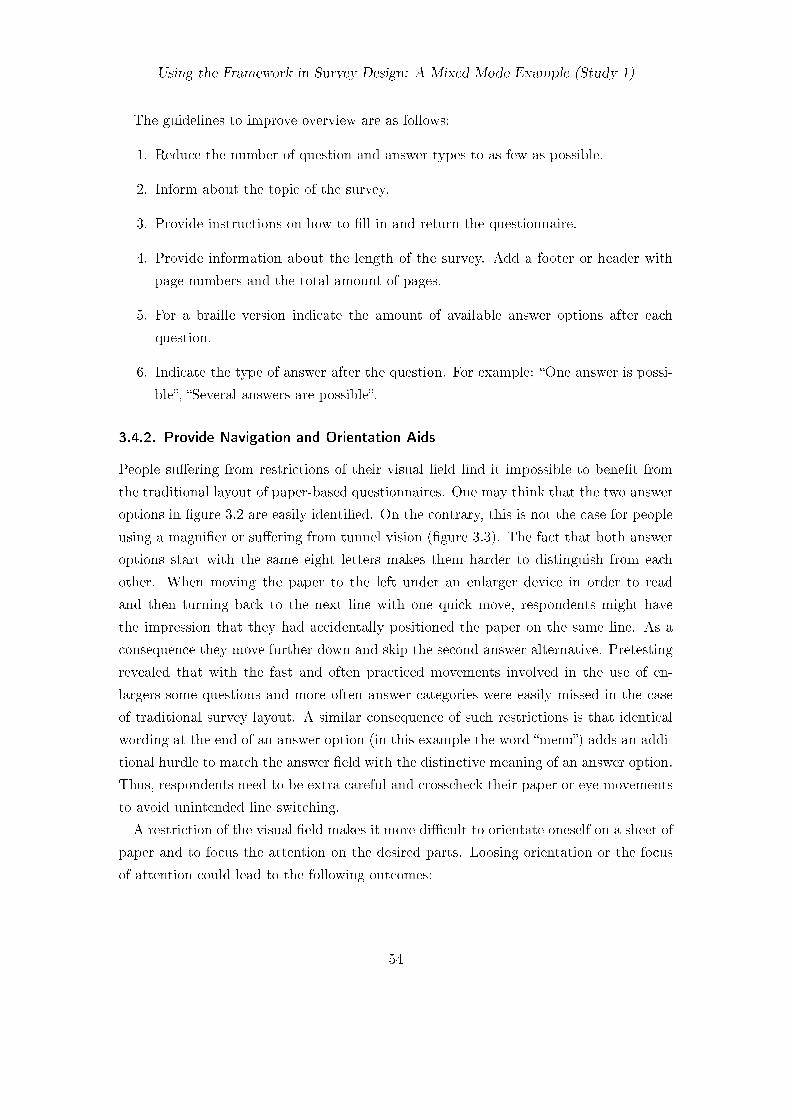
Using the Framework in Survey Design: A Mixed Mode Example (Study 1)
The guidelines to improve overview are as follows:
1. Reduce the number of question and answer types to as few as possible.
2. Inform about the topic of the survey.
3. Provide instructions on how to fill in and return the questionnaire.
4. Provide information about the length of the survey. Add a footer or header with
page numbers and the total amount of pages.
5. For a braille version indicate the amount of available answer options after each
question.
6. Indicate the type of answer after the question. For example: “One answer is possi-
ble”, “Several answers are possible”.
3.4.2. Provide Navigation and Orientation Aids
People suffering from restrictions of their visual field find it impossible to benefit from
the traditional layout of paper-based questionnaires. One may think that the two answer
options in figure 3.2 are easily identified. On the contrary, this is not the case for people
using a magnifier or suffering from tunnel vision (figure 3.3). The fact that both answer
options start with the same eight letters makes them harder to distinguish from each
other. When moving the paper to the left under an enlarger device in order to read
and then turning back to the next line with one quick move, respondents might have
the impression that they had accidentally positioned the paper on the same line. As a
consequence they move further down and skip the second answer alternative. Pretesting
revealed that with the fast and often practiced movements involved in the use of en-
largers some questions and more often answer categories were easily missed in the case
of traditional survey layout. A similar consequence of such restrictions is that identical
wording at the end of an answer option (in this example the word “menu”) adds an addi-
tional hurdle to match the answer field with the distinctive meaning of an answer option.
Thus, respondents need to be extra careful and crosscheck their paper or eye movements
to avoid unintended line switching.
A restriction of the visual field makes it more difficult to orientate oneself on a sheet of
paper and to focus the attention on the desired parts. Loosing orientation or the focus
of attention could lead to the following outcomes:
54
Using the Framework in Survey Design: A Mixed Mode Example (Study 1)
1. A page is skipped and is lost.
2. A question is skipped.
3. Answer categories are skipped and not considered.
An example how a page could be skipped was revealed through pretesting with a braille
version of the questionnaire. The participants started by flipping through the pages,
reading parts of the top and the bottom which contained the numbering. The paper
sheets were turned to also scan the back of the papers for text. Each paper was then laid
on the table or kept on the knees. By accident a paper sheet was put on the table aside
from the other paper sheets. The remaining pile lead to the impression that the survey
consisted of fewer pages resulting in unintentional partial nonresponse.
The derived guidelines draw from the principle that each question and answer option
should be distinguishable from each other. Figure 3.4 shows part of the redesigned
questionnaire for the large font paper version. The following measures proved to be
successful navigation and orientation aids:
7. Start each question with a consecutive number followed by a period, making each
new question distinct from the very beginning.
8. Include empty lines (spacers) only before each new question but neither between
answer categories, nor between the question and the answers. This visually groups
questions and answers together.
9. Start each answer category with a consecutive letter beginning with a) for each
question. This helps to distinguish the answer options from each other and differ-
entiates them from the questions which are numbered.
10. Reformulate the answer options towards a maximum of different letters at the
beginning and at the end of each item while keeping the meaning. This ensures
that each item is easy to distinguish at the start of the line and in the region of
the answer options.
3.4.3. Streamline the Answering Process
Usually, the layout of a questionnaire is based on principles of gestalt theory, like proxim-
ity and grouping (Dillman et al., 2005). As a result, check boxes are aligned on the right
side of a page in paper-based surveys (sometimes with dotted lines to aid eye movement)
55
Using the Framework in Survey Design: A Mixed Mode Example (Study 1)
and the left side in Web surveys. This is only reasonable when a respondent is able to see
the whole of the line and can easily connect the answer boxes with the answer categories.
Obviously, respondents who only see a few words at a time (some people enlarge only
one word at a time) may have difficulties reaching beyond the white gap or following the
dotted line between answers and check boxes. What is worse, pretests made it clear that
due to the fact that the right side looks like a column of similar boxes only, the correctly
corresponding right box is difficult to reach and remains unclear. The intentional effect
of such visual grouping does therefore not hold in this case and the linkage between an-
swers and answer fields is broken. As a solution, traditional grouping may be avoided.
Nevertheless, the answer fields are placed to the right to allow an immediate response
after reading without the need for an errorprone return to the beginning of the answer
option.
As a second point, processing all answer options can be time-consuming when a scan-
ning of the lines is not possible. Reaching a valid answer and considering the available
options can easily be supported by formulating all answer options into the question. As a
positive side effect such wordings also reduce acquiescence (Dillman, 2007). For example
instead of asking “What would you prefer in an ATM?” the question reads “Would you
prefer to operate an ATM with a palpable menu or a speech controlled menu?”
Accordingly, the guidelines supporting the answer process are as follows:
11. In a paper-version include check boxes directly after the answer text, leaving a
ragged right. Instruct respondents to mark either the checkbox at the right end or
the character at the beginning of an answer option.
12. Formulate the questions to include all answer categories wherever possible, if only
a few answer categories exist. Such a procedure is known to reduce burden for the
respondents.
3.5. Summary and Conclusion
This chapter described the development of twelve guidelines for the design of self-adminis-
tered surveys for visually impaired and blind people within a mixed mode approach.
Three modes (paper-based, braille-based, Web-based) were considered to accommodate
to the various channels of communication visually impaired and blind people are used
to.
Visually impaired people use reading aids to process text. These aids have in common
that they enhance the focus of a specific piece of text or single word. This advantage turns
56
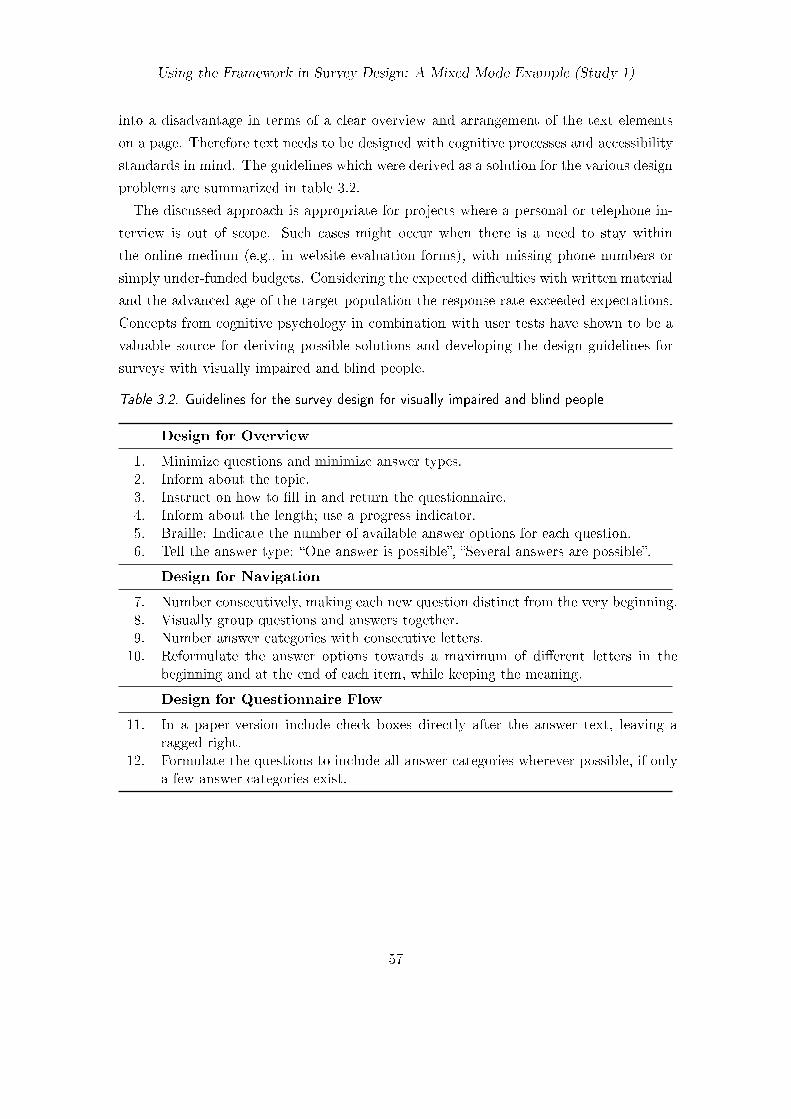
Using the Framework in Survey Design: A Mixed Mode Example (Study 1)
into a disadvantage in terms of a clear overview and arrangement of the text elements
on a page. Therefore text needs to be designed with cognitive processes and accessibility
standards in mind. The guidelines which were derived as a solution for the various design
problems are summarized in table 3.2.
The discussed approach is appropriate for projects where a personal or telephone in-
terview is out of scope. Such cases might occur when there is a need to stay within
the online medium (e.g., in website evaluation forms), with missing phone numbers or
simply under-funded budgets. Considering the expected difficulties with written material
and the advanced age of the target population the response rate exceeded expectations.
Concepts from cognitive psychology in combination with user tests have shown to be a
valuable source for deriving possible solutions and developing the design guidelines for
surveys with visually impaired and blind people.
Table 3.2. Guidelines for the survey design for visually impaired and blind people
Design for Overview
1. Minimize questions and minimize answer types.2. Inform about the topic.3. Instruct on how to fill in and return the questionnaire.4. Inform about the length; use a progress indicator.5. Braille: Indicate the number of available answer options for each question.6. Tell the answer type: “One answer is possible”, “Several answers are possible”.
Design for Navigation
7. Number consecutively, making each new question distinct from the very beginning.8. Visually group questions and answers together.9. Number answer categories with consecutive letters.10. Reformulate the answer options towards a maximum of different letters in the
beginning and at the end of each item, while keeping the meaning.
Design for Questionnaire Flow
11. In a paper-version include check boxes directly after the answer text, leaving aragged right.
12. Formulate the questions to include all answer categories wherever possible, if onlya few answer categories exist.
57

Instruments
4. Developing the Concept of Paradata
4.1. Background
The term paradata has been accepted to refer to process data in surveys (Heerwegh,
2003).1 Nevertheless, as the concept is still relatively young this section starts with a
short history of the different data concepts, namely data, metadata, and paradata. Then,
some of the more common applications of paradata are described. This leads to a typology
of paradata, outlining new areas for research. A corresponding technical approach is then
developed to collect all kinds of paradata. Finally, two empirical experiments illustrate
how the typology and the instrument can foster new insights in the process of human-
survey interaction.
Computers have improved data collection and processing. Answers (reactive data)
are saved in nearly ready-to-analyze data sets and process data (non-reactive data) can
automatically be captured and saved to enrich the information given in the answers (e.g
date and time of an interview).
In this context, a common distinction between reactive and non-reactive data is made
(Diekmann, 2007; Schnell et al., 2004). Answers in surveys are categorized as reactive
data. This reactivity is a possible source of error in surveys because the measuring
process itself can influence the answers. In the case of non-reactive data respondents are
not conscious of the fact that this data can be used for analysis as non-reactive data are
traces of behavioral processes. One example is the duration of an interview. Respondents
are informed about this kind of data collection prior to the survey. Nevertheless, they
are unlikely to be conscious of the collection and usually will not think about the data
being used for data cleaning purposes after the survey. In the Internet non-reactive data
emerge from all activities and is often collected, for example as visitation patterns of
websites. The corresponding logfiles are of ongoing research interest (Sterne, 2002).
This chapter concentrates on non-reactive data in the context of surveys, that is para-
data. Paradata are data points which do not require any explicit data entry on the
1 Acknowledgements. This chapter is based on a German publication by Kaczmirek and Neubarth(2007). Wolfgang Neubarth developed and programmed the initial version of the paradata-tracker-script and reviewed the German manuscript.
59
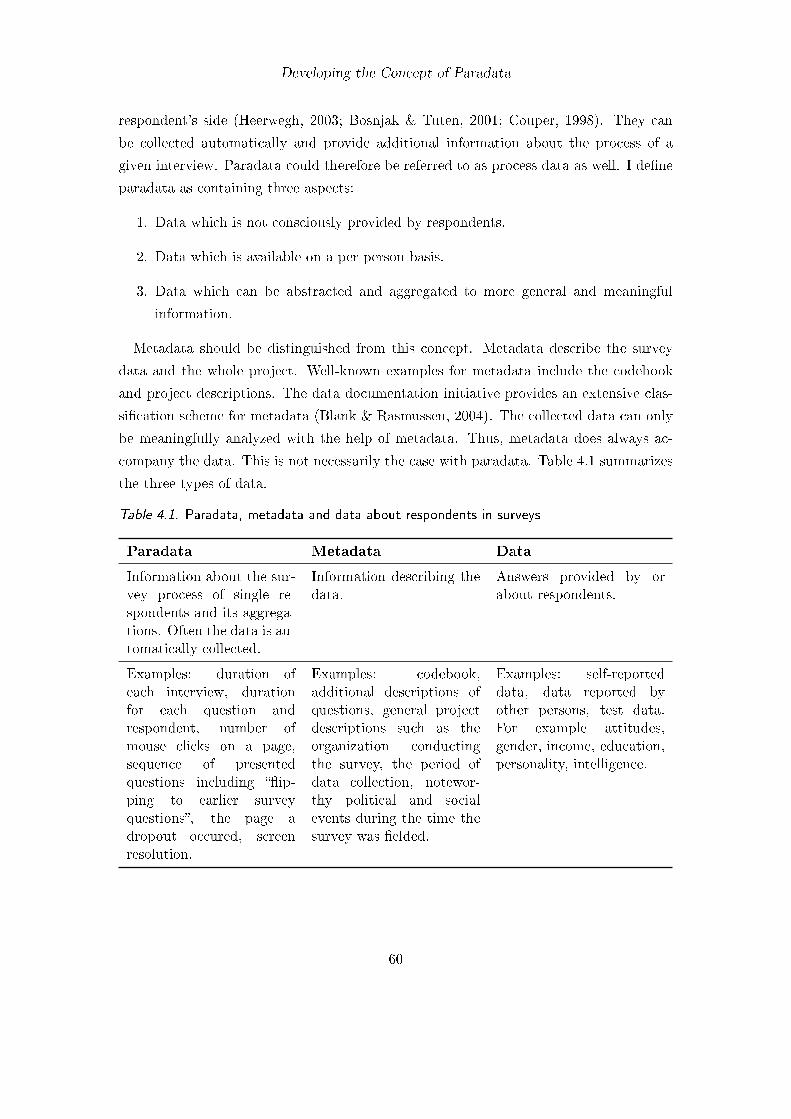
Developing the Concept of Paradata
respondent’s side (Heerwegh, 2003; Bosnjak & Tuten, 2001; Couper, 1998). They can
be collected automatically and provide additional information about the process of a
given interview. Paradata could therefore be referred to as process data as well. I define
paradata as containing three aspects:
1. Data which is not consciously provided by respondents.
2. Data which is available on a per person basis.
3. Data which can be abstracted and aggregated to more general and meaningful
information.
Metadata should be distinguished from this concept. Metadata describe the survey
data and the whole project. Well-known examples for metadata include the codebook
and project descriptions. The data documentation initiative provides an extensive clas-
sification scheme for metadata (Blank & Rasmussen, 2004). The collected data can only
be meaningfully analyzed with the help of metadata. Thus, metadata does always ac-
company the data. This is not necessarily the case with paradata. Table 4.1 summarizes
the three types of data.
Table 4.1. Paradata, metadata and data about respondents in surveys
Paradata Metadata Data
Information about the sur-vey process of single re-spondents and its aggrega-tions. Often the data is au-tomatically collected.
Information describing thedata.
Answers provided by orabout respondents.
Examples: duration ofeach interview, durationfor each question andrespondent, number ofmouse clicks on a page,sequence of presentedquestions including “flip-ping to earlier surveyquestions”, the page adropout occured, screenresolution.
Examples: codebook,additional descriptions ofquestions, general projectdescriptions such as theorganization conductingthe survey, the period ofdata collection, notewor-thy political and socialevents during the time thesurvey was fielded.
Examples: self-reporteddata, data reported byother persons, test data.For example attitudes,gender, income, education,personality, intelligence.
60
Developing the Concept of Paradata
Before the Internet was accepted in the canon of survey modes, paradata was subsumed
under the notion of metadata. With online surveys emerging, the need for an independant
category for paradata became clear. This was mainly due to the fact that online surveys
opened a new research area based on the huge amount of automatically collectable process
data. The conceptual extension of the data concept was first presented by Couper (1998)
who described additional examples of paradata and its distinction to metadata:
As discussed elsewhere (Couper, 1998), one of the benefits of computer-assisted data collection is
that a great deal of automated data is generated by the process and these data can be used in turn
to evaluate the process. I term these sources of information ‘paradata’ (auxiliary data describing the
process) to distinguish them from metadata (describing the data). Sources of paradata include case
management information such as response rates, number of calls per case, average interview length,
and so on. A most useful type of paradata for usability evaluation is keystroke or trace files (also
called audit trails). (Couper, 2000a, p. 393f.).
4.2. Applications of and Approaches to Paradata
Refusals and survey break-offs are the most commonly reported paradata because they
are part of each survey and part of the standard documentation practices (AAPOR,
2006). They can be derived from the collected data without the necessity for addi-
tional programming or data collection. Bosnjak and Tuten (2001) have used this kind
of paradata to develop a typology of response behaviors. A logical next step to col-
lect more information about response behavior is to save the response times per survey
page (Fraley, 2004). To collect response times per question, a more detailed approach
is needed. Janetzko (1999) has provided scripts, which collect reaction times between
different mouse clicks. A more extensive collection of scripts (The CSP Project, Client
Side Paradata) is maintained by Heerwegh (2003, n.d.). The CSP-script saves data on
reaction times, changes in answers, detected pauses and scrolling. The data can be used
to analyze response times.
Draisma and Dijkstra (2004) comprehensively discuss the implications and importance
of response times. The authors emphasize that substantially different causes may lead
to similar response times. To make things worse, wrong answers are associated with a
longer response time. Simultaneously, fast responses lead to a higher degree of wrong
answers as well. Answering complex questions takes more time, and the response time
increases with the length of the question (Yan & Tourangeau, 2008), whereas strong
attitudes shorten the time needed to respond. Similarly, short answer times may be an
indicator of correct answers in knowledge-based questions. Summarizing, it is pointless
61
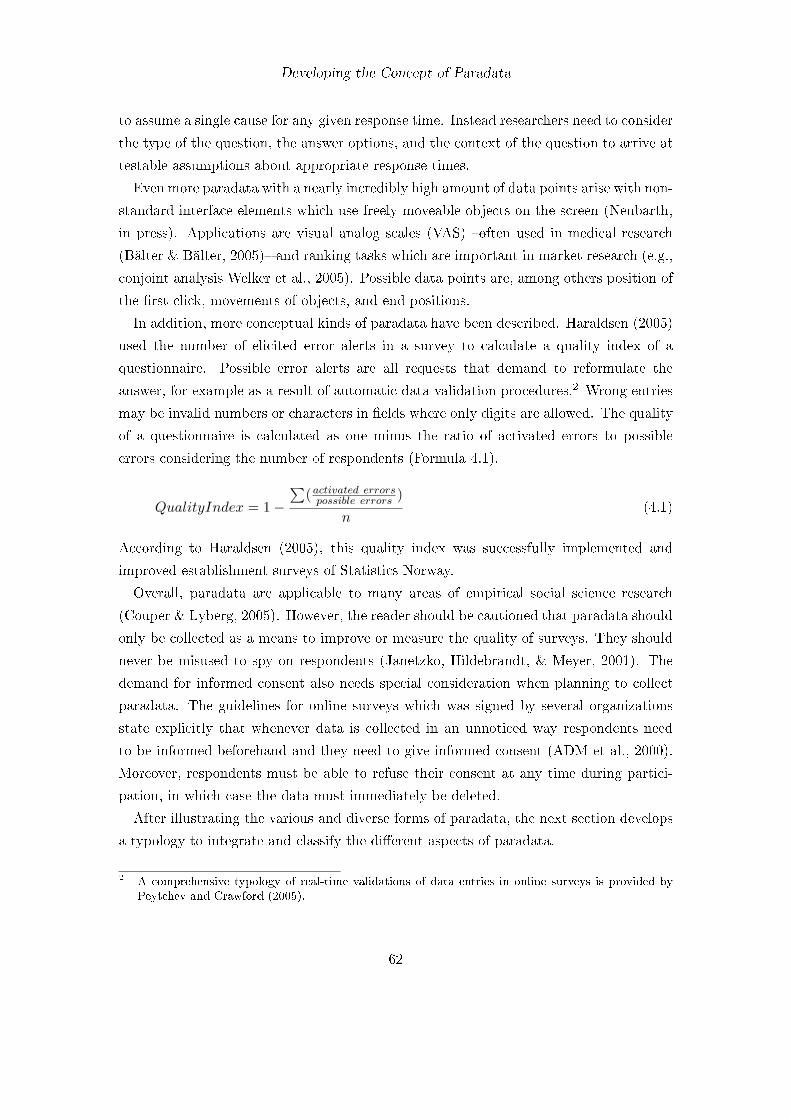
Developing the Concept of Paradata
to assume a single cause for any given response time. Instead researchers need to consider
the type of the question, the answer options, and the context of the question to arrive at
testable assumptions about appropriate response times.
Even more paradata with a nearly incredibly high amount of data points arise with non-
standard interface elements which use freely moveable objects on the screen (Neubarth,
in press). Applications are visual analog scales (VAS) –often used in medical research
(Bälter & Bälter, 2005)– and ranking tasks which are important in market research (e.g.,
conjoint analysis Welker et al., 2005). Possible data points are, among others position of
the first click, movements of objects, and end positions.
In addition, more conceptual kinds of paradata have been described. Haraldsen (2005)
used the number of elicited error alerts in a survey to calculate a quality index of a
questionnaire. Possible error alerts are all requests that demand to reformulate the
answer, for example as a result of automatic data validation procedures.2 Wrong entries
may be invalid numbers or characters in fields where only digits are allowed. The quality
of a questionnaire is calculated as one minus the ratio of activated errors to possible
errors considering the number of respondents (Formula 4.1).
𝑄𝑢𝑎𝑙𝑖𝑡𝑦𝐼𝑛𝑑𝑒𝑥 = 1−∑︀
(𝑎𝑐𝑡𝑖𝑣𝑎𝑡𝑒𝑑 𝑒𝑟𝑟𝑜𝑟𝑠𝑝𝑜𝑠𝑠𝑖𝑏𝑙𝑒 𝑒𝑟𝑟𝑜𝑟𝑠 )
𝑛(4.1)
According to Haraldsen (2005), this quality index was successfully implemented and
improved establishment surveys of Statistics Norway.
Overall, paradata are applicable to many areas of empirical social science research
(Couper & Lyberg, 2005). However, the reader should be cautioned that paradata should
only be collected as a means to improve or measure the quality of surveys. They should
never be misused to spy on respondents (Janetzko, Hildebrandt, & Meyer, 2001). The
demand for informed consent also needs special consideration when planning to collect
paradata. The guidelines for online surveys which was signed by several organizations
state explicitly that whenever data is collected in an unnoticed way respondents need
to be informed beforehand and they need to give informed consent (ADM et al., 2000).
Moreover, respondents must be able to refuse their consent at any time during partici-
pation, in which case the data must immediately be deleted.
After illustrating the various and diverse forms of paradata, the next section develops
a typology to integrate and classify the different aspects of paradata.
2 A comprehensive typology of real-time validations of data entries in online surveys is provided byPeytchev and Crawford (2005).
62
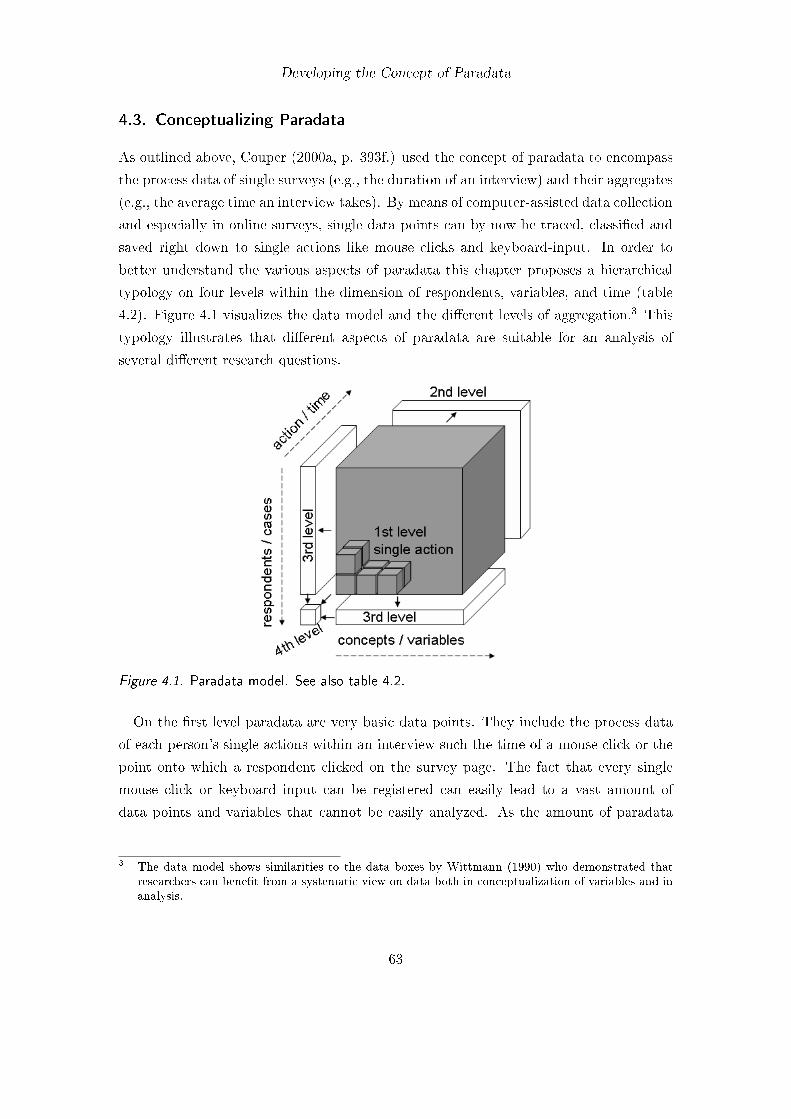
Developing the Concept of Paradata
4.3. Conceptualizing Paradata
As outlined above, Couper (2000a, p. 393f.) used the concept of paradata to encompass
the process data of single surveys (e.g., the duration of an interview) and their aggregates
(e.g., the average time an interview takes). By means of computer-assisted data collection
and especially in online surveys, single data points can by now be traced, classified and
saved right down to single actions like mouse clicks and keyboard-input. In order to
better understand the various aspects of paradata this chapter proposes a hierarchical
typology on four levels within the dimension of respondents, variables, and time (table
4.2). Figure 4.1 visualizes the data model and the different levels of aggregation.3 This
typology illustrates that different aspects of paradata are suitable for an analysis of
several different research questions.
Figure 4.1. Paradata model. See also table 4.2.
On the first level paradata are very basic data points. They include the process data
of each person’s single actions within an interview such the time of a mouse click or the
point onto which a respondent clicked on the survey page. The fact that every single
mouse click or keyboard input can be registered can easily lead to a vast amount of
data points and variables that cannot be easily analyzed. As the amount of paradata
3 The data model shows similarities to the data boxes by Wittmann (1990) who demonstrated thatresearchers can benefit from a systematic view on data both in conceptualization of variables and inanalysis.
63
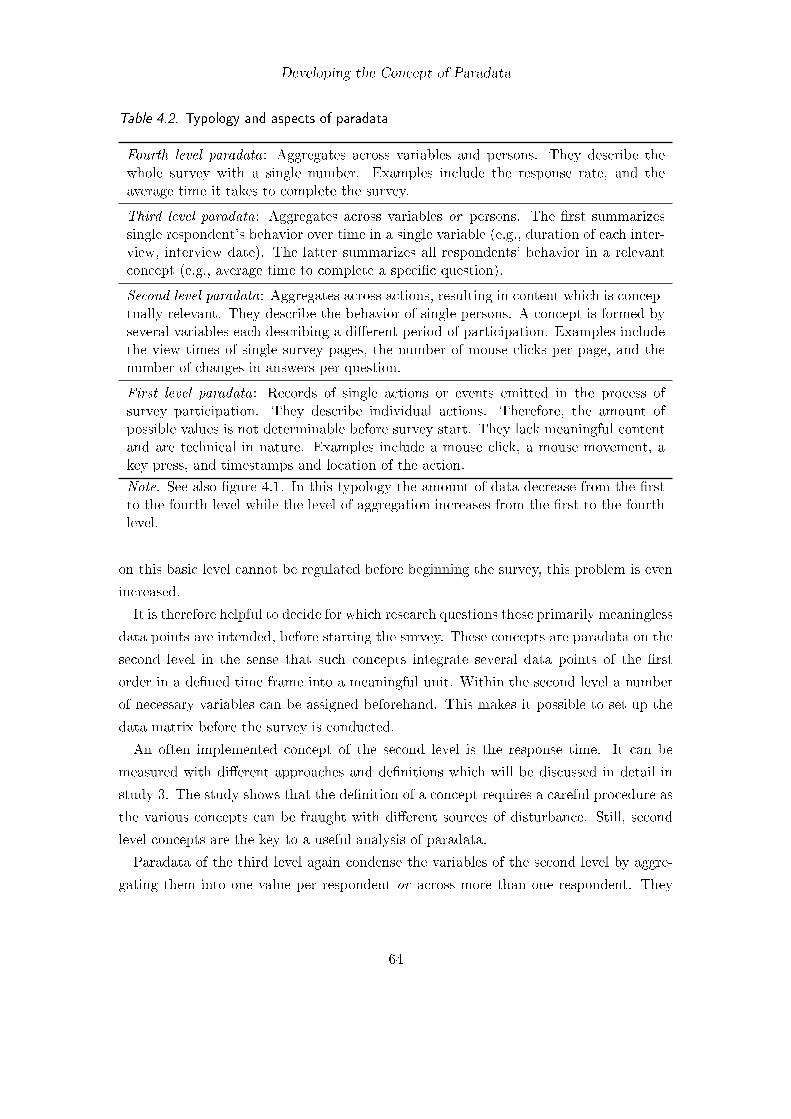
Developing the Concept of Paradata
Table 4.2. Typology and aspects of paradata
Fourth level paradata: Aggregates across variables and persons. They describe thewhole survey with a single number. Examples include the response rate, and theaverage time it takes to complete the survey.
Third level paradata: Aggregates across variables or persons. The first summarizessingle respondent’s behavior over time in a single variable (e.g., duration of each inter-view, interview date). The latter summarizes all respondents’ behavior in a relevantconcept (e.g., average time to complete a specific question).
Second level paradata: Aggregates across actions, resulting in content which is concep-tually relevant. They describe the behavior of single persons. A concept is formed byseveral variables each describing a different period of participation. Examples includethe view times of single survey pages, the number of mouse clicks per page, and thenumber of changes in answers per question.
First level paradata: Records of single actions or events emitted in the process ofsurvey participation. They describe individual actions. Therefore, the amount ofpossible values is not determinable before survey start. They lack meaningful contentand are technical in nature. Examples include a mouse click, a mouse movement, akey press, and timestamps and location of the action.
Note. See also figure 4.1. In this typology the amount of data decrease from the firstto the fourth level while the level of aggregation increases from the first to the fourthlevel.
on this basic level cannot be regulated before beginning the survey, this problem is even
increased.
It is therefore helpful to decide for which research questions these primarily meaningless
data points are intended, before starting the survey. These concepts are paradata on the
second level in the sense that such concepts integrate several data points of the first
order in a defined time frame into a meaningful unit. Within the second level a number
of necessary variables can be assigned beforehand. This makes it possible to set up the
data matrix before the survey is conducted.
An often implemented concept of the second level is the response time. It can be
measured with different approaches and definitions which will be discussed in detail in
study 3. The study shows that the definition of a concept requires a careful procedure as
the various concepts can be fraught with different sources of disturbance. Still, second
level concepts are the key to a useful analysis of paradata.
Paradata of the third level again condense the variables of the second level by aggre-
gating them into one value per respondent or across more than one respondent. They
64
Developing the Concept of Paradata
sum up values to include a whole interview. In the case of response times this would
correspond to the cumulated response time across all questions per respondent, or to the
average response time of all respondents per question.
There are also paradata of the third level that already exist without aggregation.
These include for example the dropout page in case of an interview break off, the time
and date of the beginning of an interview, the screen resolution used, whether JavaScript
can be executed, whether the participant allows Cookies and many more. These para-
data can provide information on whether a valid interview has been taken place and its
circumstances (Kaczmirek & Thiele, 2006).
The most abstract level is formed by paradata on the fourth level. They condense the
complete survey into one value. Such a value can be for example the average duration
of the whole survey among all participants or the response rate. On this high level of
description the separation between paradata and metadata begins to blur. Metadata
as well as paradata on the fourth level provide descriptions of the survey as a whole.
Nevertheless, paradata on the fourth level can be traced back to paradata on a lower
level and therefore back to individual participants. This is not possible for metadata.
For example a project description does not relate to any specific respondent.
Apart from their conceptual meaning and the above proposed hierarchical system
paradata can be divided into server-side and client-side paradata. This depends on
whether they are collected on a Web-server or on the local computer of the participants
(Heerwegh, 2003). Server-side paradata are the most common as most survey software
packages regularly collect information like time stamps for delivered pages, dropouts
or the status of participation (Kaczmirek, 2008). Client-side instruments are necessary
when server-side process data are not enough because information about events within an
interview page or on the pages of the participants is needed. This includes information
on scrolling or the exact time measurement of single actions. Usually, JavaScript is used
for the collection of such information.
The proposed division of paradata into four distinct levels improves the planning,
analysis and evaluation of paradata. It provides a structure in which mere technical data
points can be identified and meaningful paradata can be conceptualized.
4.4. An Instrument for the Collection of Client-Side Paradata
To collect paradata of the first level and to resolve single actions within a page, it is
necessary to employ client-side methods. The proposed approaches so far (cf., Janetzko,
65
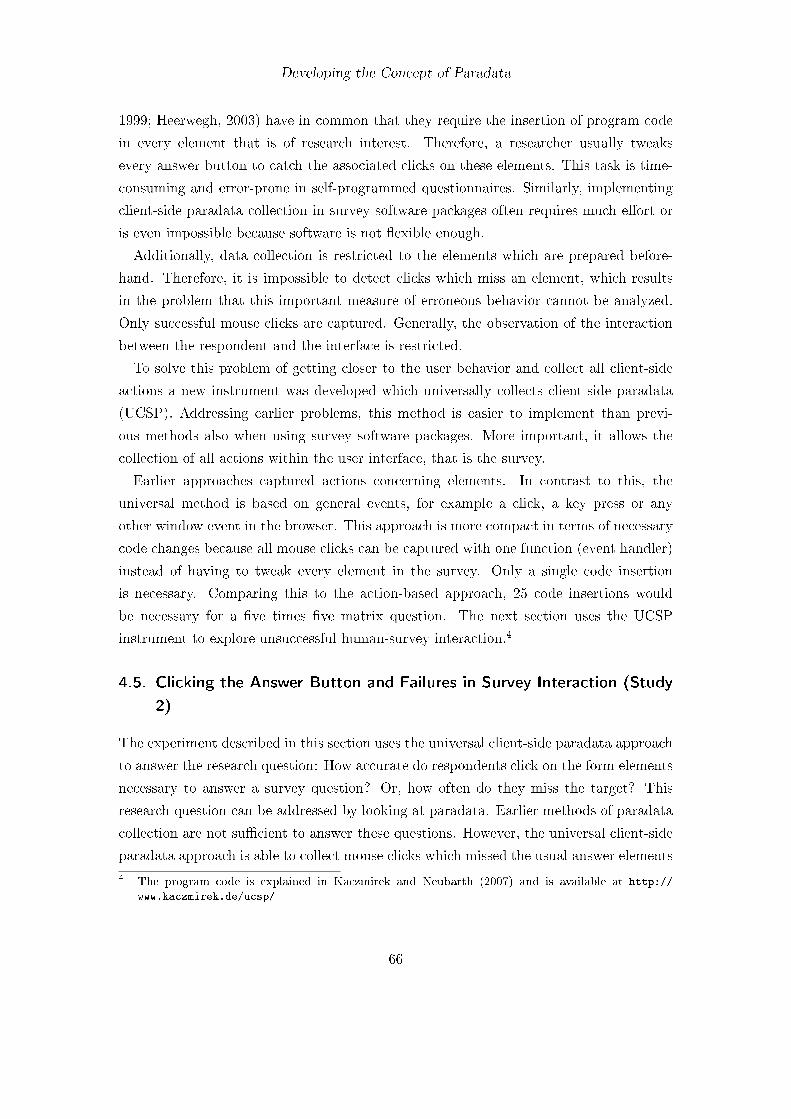
Developing the Concept of Paradata
1999; Heerwegh, 2003) have in common that they require the insertion of program code
in every element that is of research interest. Therefore, a researcher usually tweaks
every answer button to catch the associated clicks on these elements. This task is time-
consuming and error-prone in self-programmed questionnaires. Similarly, implementing
client-side paradata collection in survey software packages often requires much effort or
is even impossible because software is not flexible enough.
Additionally, data collection is restricted to the elements which are prepared before-
hand. Therefore, it is impossible to detect clicks which miss an element, which results
in the problem that this important measure of erroneous behavior cannot be analyzed.
Only successful mouse clicks are captured. Generally, the observation of the interaction
between the respondent and the interface is restricted.
To solve this problem of getting closer to the user behavior and collect all client-side
actions a new instrument was developed which universally collects client-side paradata
(UCSP). Addressing earlier problems, this method is easier to implement than previ-
ous methods also when using survey software packages. More important, it allows the
collection of all actions within the user interface, that is the survey.
Earlier approaches captured actions concerning elements. In contrast to this, the
universal method is based on general events, for example a click, a key press or any
other window event in the browser. This approach is more compact in terms of necessary
code changes because all mouse clicks can be captured with one function (event handler)
instead of having to tweak every element in the survey. Only a single code insertion
is necessary. Comparing this to the action-based approach, 25 code insertions would
be necessary for a five times five matrix question. The next section uses the UCSP
instrument to explore unsuccessful human-survey interaction.4
4.5. Clicking the Answer Button and Failures in Survey Interaction (Study
2)
The experiment described in this section uses the universal client-side paradata approach
to answer the research question: How accurate do respondents click on the form elements
necessary to answer a survey question? Or, how often do they miss the target? This
research question can be addressed by looking at paradata. Earlier methods of paradata
collection are not sufficient to answer these questions. However, the universal client-side
paradata approach is able to collect mouse clicks which missed the usual answer elements
4 The program code is explained in Kaczmirek and Neubarth (2007) and is available at http://
www.kaczmirek.de/ucsp/
66
Developing the Concept of Paradata
in an online survey. Failures to produce a valid answer with a single mouse click would
show a problematic relationship between the respondents and the survey at hand. Survey
designers should always aim to reduce errors in the interaction between the survey and
the respondent.
4.5.1. Design Rationale
Practically, there are three possible ways to implement an answer dialog (in this case a
radio button) in an online survey. Firstly, the technically simplest way is that respondents
need to click the button directly. Secondly, when using HTML-labels a click on the labels
‘male’ or ‘female’ would also yield a response. Thirdly, with the help of Java-Script
also the table cells can become sensitive and allow correct responses (figure 4.2). The
implementation of HTML-labels is part of the Standard HTML specification but is rarely
used in online surveys. Nevertheless, its use is generally demanded for accessible websites
(Hellbusch, 2004). How many times respondents miss the answer elements is unknown
and part of the research question of this study.
Figure 4.2. Answer radio buttons in table cells with labels. The cell borders are drawn in this
example to show the surrounding table.
4.5.2. Questionnaire
The data for answering the research question was obtained from a matrix question within
the survey. The full experiment associated with the matrix question is described in
chapter 6.2 on page 98. For the current research question it is sufficient to note that
there were five experimental conditions and that they differed in visual design aspects.
The matrix question consisted of 16 items and a seven-point-scale with an eighth column
labelled ´don’t know’.
The paradata was collected with the UCSP-script approach described above. Each
mouse click was tracked and recorded together with the clicked element. To give a valid
answer respondents needed to hit a radio button directly. This is the implementation
most often used in online surveys.
67
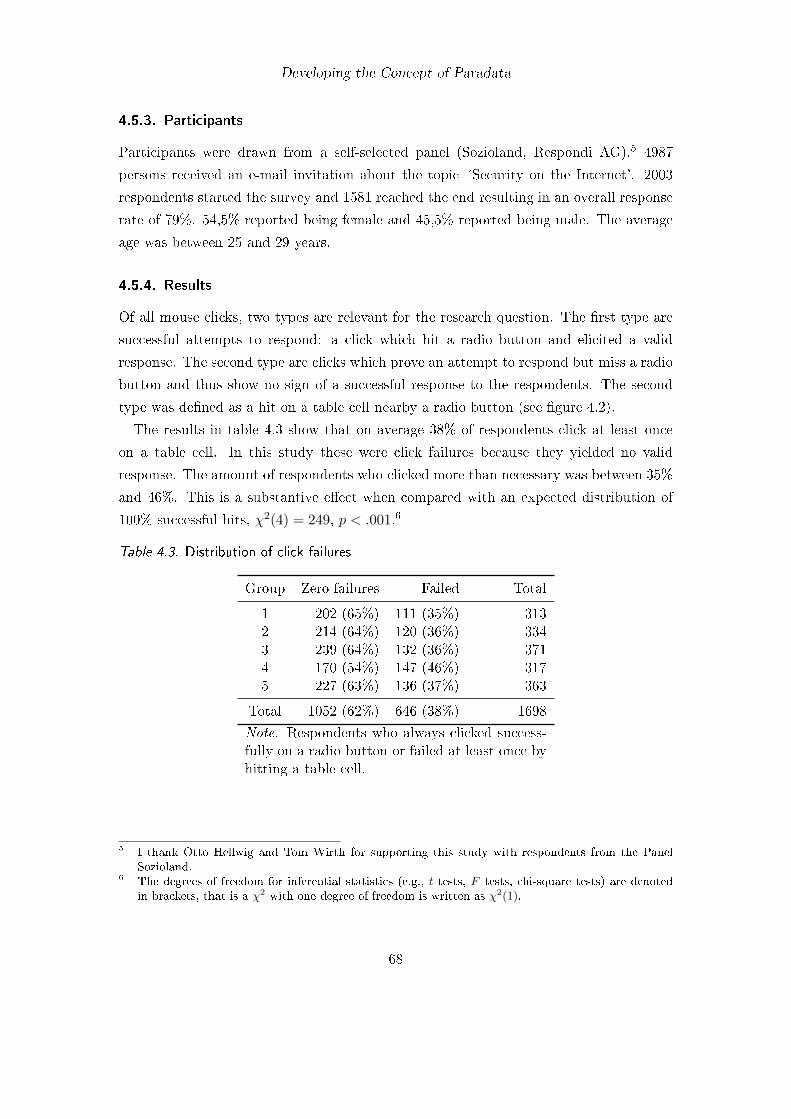
Developing the Concept of Paradata
4.5.3. Participants
Participants were drawn from a self-selected panel (Sozioland, Respondi AG).5 4987
persons received an e-mail invitation about the topic ´Security on the Internet’. 2003
respondents started the survey and 1581 reached the end resulting in an overall response
rate of 79%. 54,5% reported being female and 45,5% reported being male. The average
age was between 25 and 29 years.
4.5.4. Results
Of all mouse clicks, two types are relevant for the research question. The first type are
successful attempts to respond: a click which hit a radio button and elicited a valid
response. The second type are clicks which prove an attempt to respond but miss a radio
button and thus show no sign of a successful response to the respondents. The second
type was defined as a hit on a table cell nearby a radio button (see figure 4.2).
The results in table 4.3 show that on average 38% of respondents click at least once
on a table cell. In this study these were click failures because they yielded no valid
response. The amount of respondents who clicked more than necessary was between 35%
and 46%. This is a substantive effect when compared with an expected distribution of
100% successful hits, 𝜒2(4) = 249, 𝑝 < .001.6
Table 4.3. Distribution of click failures
Group Zero failures Failed Total
1 202 (65%) 111 (35%) 3132 214 (64%) 120 (36%) 3343 239 (64%) 132 (36%) 3714 170 (54%) 147 (46%) 3175 227 (63%) 136 (37%) 363
Total 1052 (62%) 646 (38%) 1698
Note. Respondents who always clicked success-fully on a radio button or failed at least once byhitting a table cell.
5 I thank Otto Hellwig and Tom Wirth for supporting this study with respondents from the PanelSozioland.
6 The degrees of freedom for inferential statistics (e.g., 𝑡 tests, 𝐹 tests, chi-square tests) are denotedin brackets, that is a 𝜒2 with one degree of freedom is written as 𝜒2(1).
68
Developing the Concept of Paradata
4.5.5. Discussion
The study demonstrated that a substantive amount of participants encounter troubles
with the common interface used in online surveys. The interface in online surveys is
not as usable as it could be. However, the problem that radio buttons are not hit with
the first click can easily be solved by implementing the additional measures described
above, namely with HTML-labels and JavaScript. Additionally, this study exemplifies
how a research question can be answered with universal client-side paradata which was
not possible with previous methods for collecting client-side paradata.
Although mouse click failures can have several reasons, the solutions proposed in this
study target the problems and do not hinder irrelevant reasons. An obvious reason would
be that respondents experience difficulty with aiming the mouse at the radio buttons
which are indeed rather small. Another reason could be that respondents think that
clicking a table cell would also be an appropriate action. Both would be solved with
the proposed solution. Also, the second reason is unlikely in the current study because
respondents had to hit the buttons correctly throughout the study to provide an answer.
A third reason would be that respondents might just play around with the mouse to
see what happens. The proposed solution does not pose additional problems to such a
behavior. On the contrary, respondents might even learn that answering is easier surveys
which implement the proposed solutions.
Summarizing, respondents face difficulties when using mouse clicks to answer online
survey questions. The proposed implementations for survey questions can solve the issue
of nearby missed clicks. These failures would then be turned into successful human-survey
interaction.
4.6. Data Quality of Paradata: Different Response Time Measures (Study
3)
4.6.1. Introduction and Definitions
Response time measures are commonly used to indicate response latencies and have a long
tradition in survey research (for an overview see Yan & Tourangeau, 2008). Traditionally,
response latency is defined as the time span beginning with an interviewer having read
the question to a respondent and ending with the respondent giving his final answer
(Draisma & Dijkstra, 2004). In online surveys the time span starts with the presentation
69
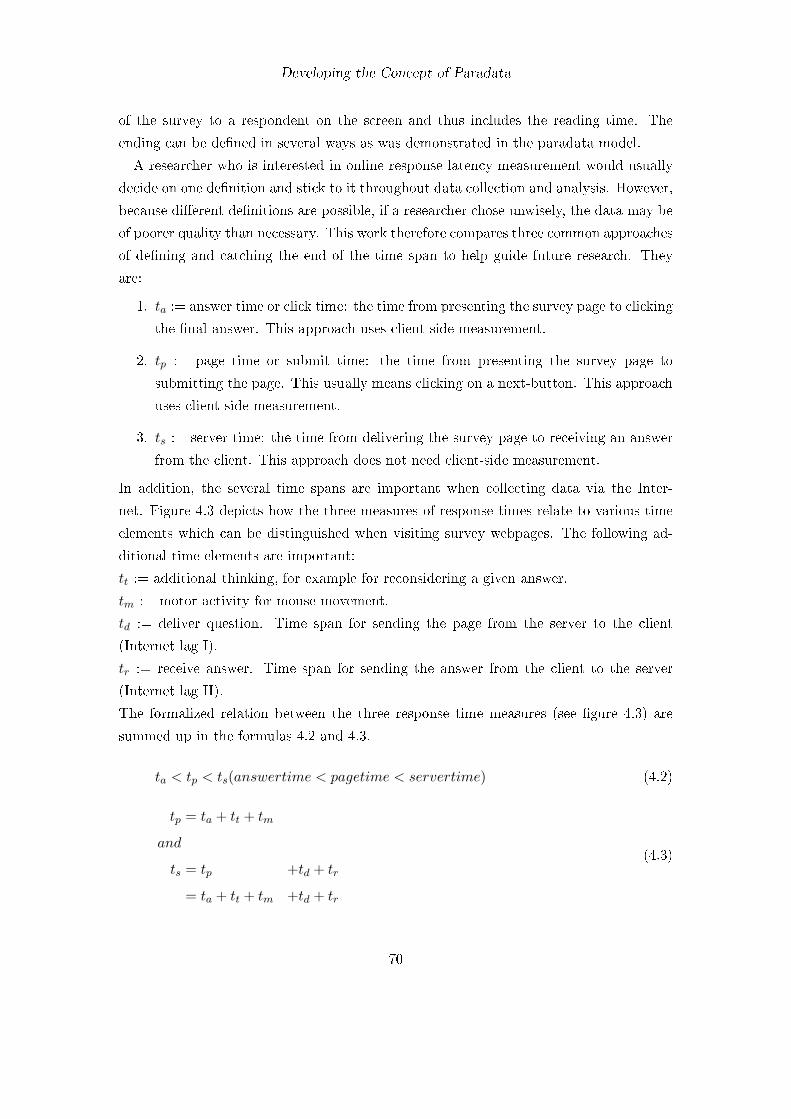
Developing the Concept of Paradata
of the survey to a respondent on the screen and thus includes the reading time. The
ending can be defined in several ways as was demonstrated in the paradata model.
A researcher who is interested in online response latency measurement would usually
decide on one definition and stick to it throughout data collection and analysis. However,
because different definitions are possible, if a researcher chose unwisely, the data may be
of poorer quality than necessary. This work therefore compares three common approaches
of defining and catching the end of the time span to help guide future research. They
are:
1. 𝑡𝑎 := answer time or click time: the time from presenting the survey page to clicking
the final answer. This approach uses client-side measurement.
2. 𝑡𝑝 := page time or submit time: the time from presenting the survey page to
submitting the page. This usually means clicking on a next-button. This approach
uses client-side measurement.
3. 𝑡𝑠 := server time: the time from delivering the survey page to receiving an answer
from the client. This approach does not need client-side measurement.
In addition, the several time spans are important when collecting data via the Inter-
net. Figure 4.3 depicts how the three measures of response times relate to various time
elements which can be distinguished when visiting survey webpages. The following ad-
ditional time elements are important:
𝑡𝑡 := additional thinking, for example for reconsidering a given answer.
𝑡𝑚 := motor activity for mouse movement.
𝑡𝑑 := deliver question. Time span for sending the page from the server to the client
(Internet lag I).
𝑡𝑟 := receive answer. Time span for sending the answer from the client to the server
(Internet lag II).
The formalized relation between the three response time measures (see figure 4.3) are
summed up in the formulas 4.2 and 4.3.
𝑡𝑎 < 𝑡𝑝 < 𝑡𝑠(𝑎𝑛𝑠𝑤𝑒𝑟𝑡𝑖𝑚𝑒 < 𝑝𝑎𝑔𝑒𝑡𝑖𝑚𝑒 < 𝑠𝑒𝑟𝑣𝑒𝑟𝑡𝑖𝑚𝑒) (4.2)
𝑡𝑝 = 𝑡𝑎 + 𝑡𝑡 + 𝑡𝑚
𝑎𝑛𝑑
𝑡𝑠 = 𝑡𝑝 +𝑡𝑑 + 𝑡𝑟
= 𝑡𝑎 + 𝑡𝑡 + 𝑡𝑚 +𝑡𝑑 + 𝑡𝑟
(4.3)
70
Developing the Concept of Paradata
Figure 4.3. Different elements in time measurement via the Internet for a one-question-per-
page design. When several questions are asked per page, several answer times can be recorded
before the page is submitted.
In other words, the page time includes motor acitivity and additional cognitive pro-
cesses after an answer was given. The server time includes the transmission times for
receiving and sending the information over the Internet. The answer time is the strictest
definition of response latency used in this research. These measures were tested in terms
of data quality and accuracy in response latency analysis in an online experiment.
The research questions were:
1. How suitable are the three measures for detecting different response time latencies
in experimental designs?
2. Is there a difference in data quality between the three measures?
Because both 𝑡𝑠 and 𝑡𝑝 add time variables to the strict definition of response latency as
given by 𝑡𝑎 it is assumed that they add noise to the measurement process. Therefore,
the hypotheses are that the answer time should be superior compared to the other two
measures and that page time should be better than the server time.
4.6.2. Method
To check our hypotheses we used an online experiment.7 One group of participants re-
ceived well-formulated survey questions. The other group answered questions which were
suboptimal with respect to various psycholinguistic text features (e.g., word frequency,
7 Acknowledgements. The experiment described here which varied question wording was conductedas part of a Magisterarbeit by Timo Faaß (2007) and replicated findings by Graesser, Cai, Louwerse,and Daniel (2006) in an online survey. Faaß’ research did not overlap with the research questionaddressed in this chapter.
71
Developing the Concept of Paradata
syntactic complexity). These text features have been shown to have a considerable impact
on comprehension difficulty and the cognitive effort required to process survey questions
(Graesser et al., 2006). As a result, participants need more time to respond to badly-
formulated questions than to well-formulated ones. The effect was expected to be strong
enough to use a between-subjects design, that is participants received either the well- or
the badly-formulated questions. Because the condition with well-formulated questions is
expected to result in lower response times, this criterion can be used to decide about the
quality of the three time measures. The time measure that best replicates the known
effects according to theory should be considered in future measurements for response
latency.
4.6.3. Questionnaire
The experiment consisted of 28 questions which were constructed to differ in terms of
comprehension difficulty due to psycholinguistic text features according to Graesser et
al. (2006) and Faaß (2007). These were: word frequency, vague or imprecise term relative
term, vague or ambiguous noun-phrase, complex syntax, working memory load, syntactic
redundancy and inferences. The sequence of the questions was randomized for each
participant. The questionnaire is described by Faaß (2007).
4.6.4. Participants
Participants were recruited by e-mail and a link on the Web site of the Department of
English of the University of Mannheim. Survey participation was not restricted and
respondents were self-selected. Overall 117 participants started the survey. 34 people
were ineligible for analysis because they dropped out (22 people), had technical difficulties
(6) or German was not their native language (6). After random assignment the two groups
consisted of 15 men and 27 women (badly-formulated questions, n=42) vs. 15 men and
26 women (well-formulated questions, n=41). Respondents were between 15 and 65 years
old with a mean age of 28 (SD=8.8). This left 83 respondents in the analysis.
4.6.5. Results
The analysis is threefold. Firstly, I consider the correlations between the three measures
to see whether a researcher might accept them as proxies for each other. Secondly, I test
how well the measures distinguish between the experimental groups. Thirdly, I visualize
the findings to illustrate the differences between the three measures. For each measure
72
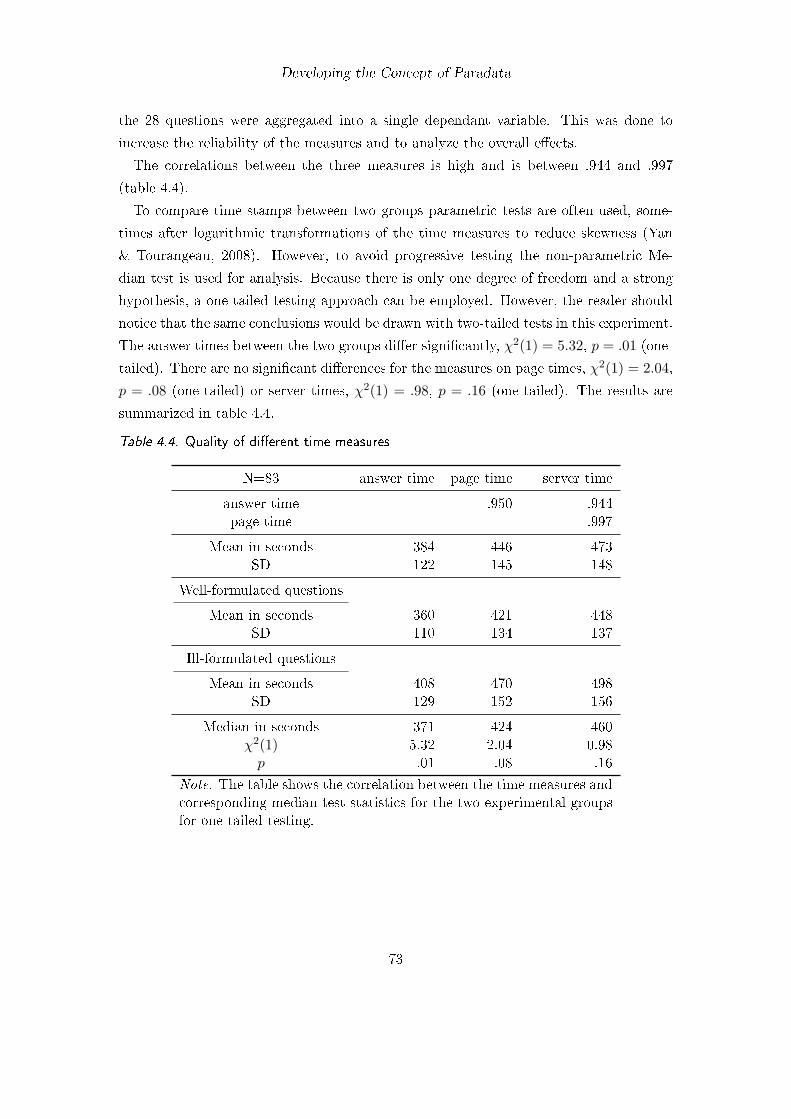
Developing the Concept of Paradata
the 28 questions were aggregated into a single dependant variable. This was done to
increase the reliability of the measures and to analyze the overall effects.
The correlations between the three measures is high and is between .944 and .997
(table 4.4).
To compare time stamps between two groups parametric tests are often used, some-
times after logarithmic transformations of the time measures to reduce skewness (Yan
& Tourangeau, 2008). However, to avoid progressive testing the non-parametric Me-
dian test is used for analysis. Because there is only one degree of freedom and a strong
hypothesis, a one-tailed testing approach can be employed. However, the reader should
notice that the same conclusions would be drawn with two-tailed tests in this experiment.
The answer times between the two groups differ significantly, 𝜒2(1) = 5.32, 𝑝 = .01 (one-
tailed). There are no significant differences for the measures on page times, 𝜒2(1) = 2.04,
𝑝 = .08 (one-tailed) or server times, 𝜒2(1) = .98, 𝑝 = .16 (one-tailed). The results are
summarized in table 4.4.
Table 4.4. Quality of different time measures
N=83 answer time page time server time
answer time .950 .944page time .997
Mean in seconds 384 446 473SD 122 145 148
Well-formulated questions
Mean in seconds 360 421 448SD 110 134 137
Ill-formulated questions
Mean in seconds 408 470 498SD 129 152 156
Median in seconds 371 424 460𝜒2(1) 5.32 2.04 0.98
𝑝 .01 .08 .16
Note. The table shows the correlation between the time measures andcorresponding median test statistics for the two experimental groupsfor one-tailed testing.
73
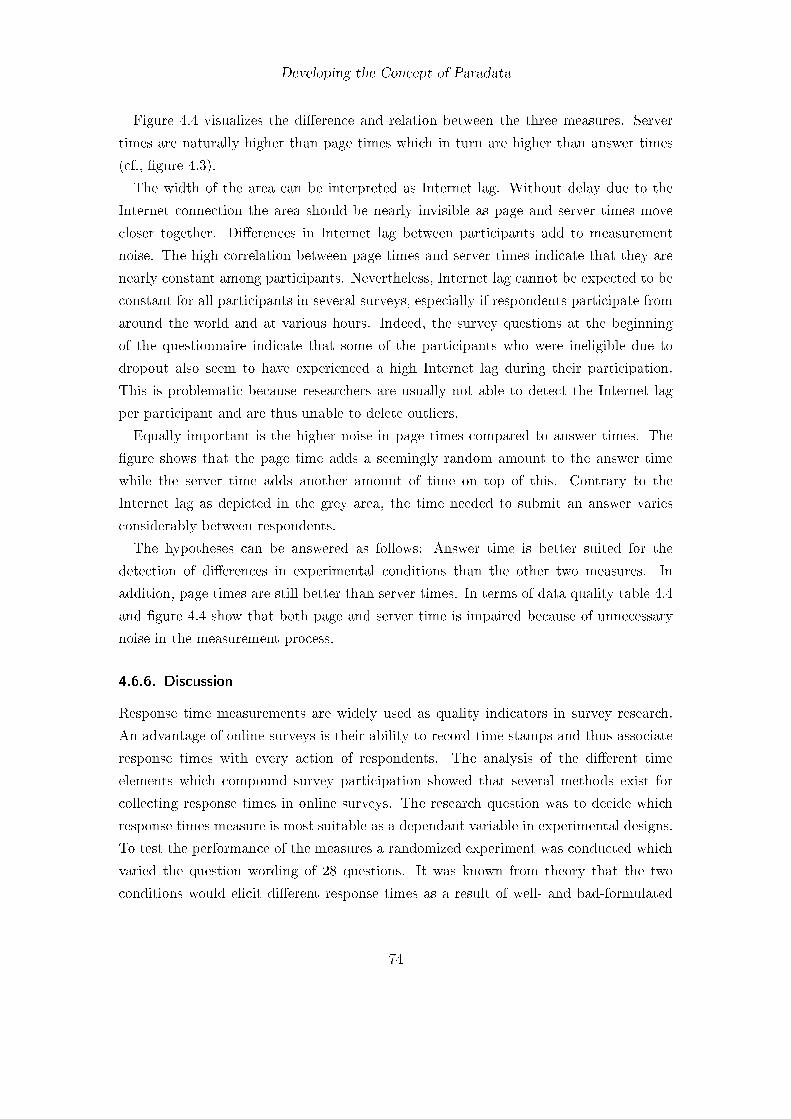
Developing the Concept of Paradata
Figure 4.4 visualizes the difference and relation between the three measures. Server
times are naturally higher than page times which in turn are higher than answer times
(cf., figure 4.3).
The width of the area can be interpreted as Internet lag. Without delay due to the
Internet connection the area should be nearly invisible as page and server times move
closer together. Differences in Internet lag between participants add to measurement
noise. The high correlation between page times and server times indicate that they are
nearly constant among participants. Nevertheless, Internet lag cannot be expected to be
constant for all participants in several surveys, especially if respondents participate from
around the world and at various hours. Indeed, the survey questions at the beginning
of the questionnaire indicate that some of the participants who were ineligible due to
dropout also seem to have experienced a high Internet lag during their participation.
This is problematic because researchers are usually not able to detect the Internet lag
per participant and are thus unable to delete outliers.
Equally important is the higher noise in page times compared to answer times. The
figure shows that the page time adds a seemingly random amount to the answer time
while the server time adds another amount of time on top of this. Contrary to the
Internet lag as depicted in the grey area, the time needed to submit an answer varies
considerably between respondents.
The hypotheses can be answered as follows: Answer time is better suited for the
detection of differences in experimental conditions than the other two measures. In
addition, page times are still better than server times. In terms of data quality table 4.4
and figure 4.4 show that both page and server time is impaired because of unnecessary
noise in the measurement process.
4.6.6. Discussion
Response time measurements are widely used as quality indicators in survey research.
An advantage of online surveys is their ability to record time stamps and thus associate
response times with every action of respondents. The analysis of the different time
elements which compound survey participation showed that several methods exist for
collecting response times in online surveys. The research question was to decide which
response times measure is most suitable as a dependant variable in experimental designs.
To test the performance of the measures a randomized experiment was conducted which
varied the question wording of 28 questions. It was known from theory that the two
conditions would elicit different response times as a result of well- and bad-formulated
74
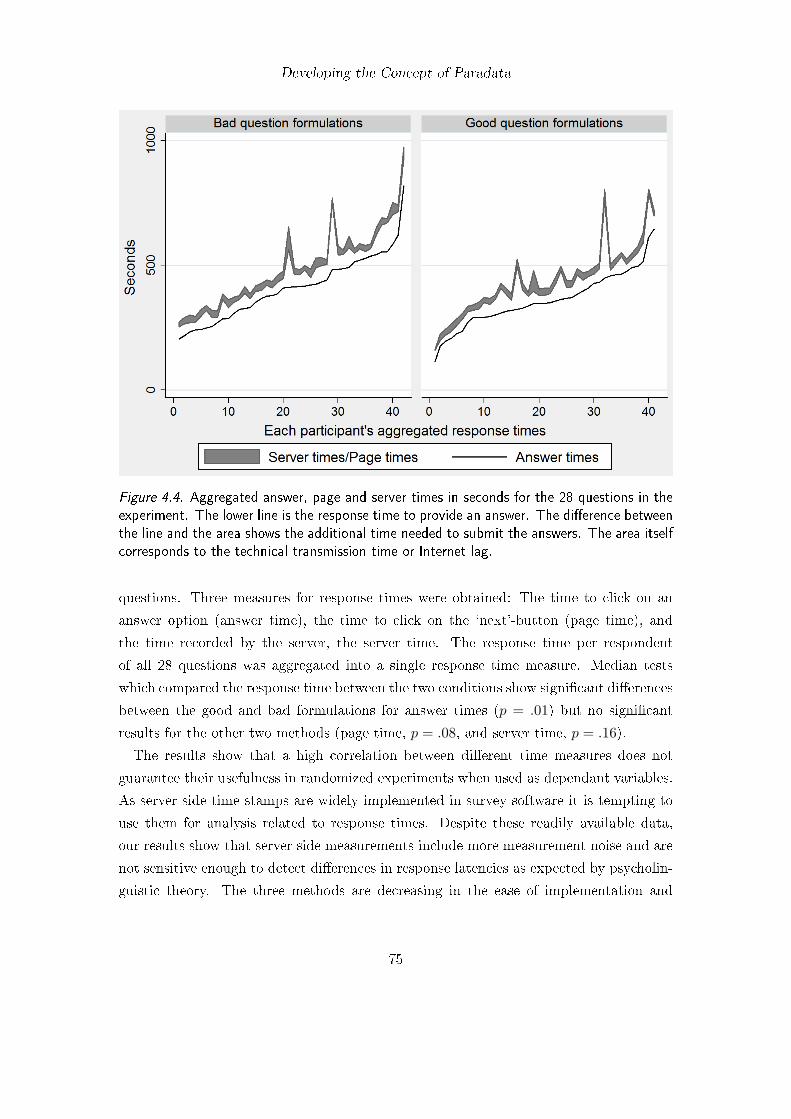
Developing the Concept of Paradata
Figure 4.4. Aggregated answer, page and server times in seconds for the 28 questions in the
experiment. The lower line is the response time to provide an answer. The difference between
the line and the area shows the additional time needed to submit the answers. The area itself
corresponds to the technical transmission time or Internet lag.
questions. Three measures for response times were obtained: The time to click on an
answer option (answer time), the time to click on the ‘next’-button (page time), and
the time recorded by the server, the server time. The response time per respondent
of all 28 questions was aggregated into a single response time measure. Median tests
which compared the response time between the two conditions show significant differences
between the good and bad formulations for answer times (𝑝 = .01) but no significant
results for the other two methods (page time, 𝑝 = .08, and server time, 𝑝 = .16).
The results show that a high correlation between different time measures does not
guarantee their usefulness in randomized experiments when used as dependant variables.
As server side time stamps are widely implemented in survey software it is tempting to
use them for analysis related to response times. Despite these readily available data,
our results show that server side measurements include more measurement noise and are
not sensitive enough to detect differences in response latencies as expected by psycholin-
guistic theory. The three methods are decreasing in the ease of implementation and
75
Developing the Concept of Paradata
increasing in terms of data quality. The results show that ineffective measurement leads
to an underestimation of effects. When working with concepts in the realm of response
latencies, researchers are advised to ignore server side time stamps and rely on the most
accurate client-side measurement, namely answer clicks.
4.7. Summary and Conclusion
In this chapter I developed a data box model for the concept of paradata. Paradata are
process data in surveys which can be collected while respondents answer a questionnaire.
Paradata provide insight into respondents’ behavior such as response times, changes
in answers, and mouse clicks. In addition, paradata serve as performance indicators for
surveys: Dropout patterns, item nonresponse, and response rates are key measures for the
success of a survey. Paradata are already widely used in survey research. Nevertheless,
paradata lack a concise conceptualization. The starting point was therefore to define
paradata and differentiate it from (survey) data and metadata. Next, a data model for
paradata was developed. It distinguishes four levels of paradata within the dimensions of
respondents, variables and time. The higher levels are aggregations of lower levels over
single or multiple dimensions.
The lowest data level consists of single actions such as mouse clicks. These single
actions are easily collected but difficult to analyze because the collected amount of data
points is enormous and still lack conceptualization.
The second level aggregates these mere technical data points resulting in content which
is conceptually relevant for researchers. Such a concept is for example interaction failure
measured as the number of mouse clicks which missed an answer option (this was part
of study 2).
The third level aggregates variables to summarize them into concepts such as the overall
number of items missing. The third level also includes aggregations over respondents,
resulting in concepts such as the average response time on each page.
The fourth level is the most abstract aggregation and summarizes across respondents,
variables and time to yield a single measure such as the average time to complete the
survey or the response rate.
The model clarified that hitherto available instruments for collecting paradata had
blind spots which prevented survey researchers from collecting certain aspects of para-
data: Only successful interaction with a survey was collected. Therefore, an instrument
was developed (universal client-side paradata approach) which allowed to observe all
76
Developing the Concept of Paradata
mouse clicks, whereas earlier methods only captured mouse clicks on answer elements.
Study 2 used this instrument to determine a new indicator for the success of human-
survey interaction, specifically how many respondents suffer from click failures. Between
35% and 46% percent of the respondents made unsuccessful mouse clicks. They clicked in
the vicinity of answer buttons which did not result in a valid answer, making a reclick nec-
essary. This finding shows a huge possibility for improvement in human-interface design.
The proposed solution was to enlarge the clickable area to encompass the surrounding
of the answer elements. The easiest way to accomplish this is by making the table cells
sensitive to mouse clicks. Part of the observed item nonresponse in surveys could be due
to these interaction failures. Study 5 which is described in section 6.3 therefore tested
whether item nonresponse can be reduced by following this recommendation and tested
it against the current standard practice in survey design.
The paradata model also provided a deeper understanding for operationalizations.
Seemingly identical concepts of response latencies were shown to differ significantly. Re-
sponse latencies are part of the second level in the paradata model. Accordingly, the
data at the lowest level –the response times– can be collected as different actions. The
following three types of response times were already used by other survey researchers
and were therefore collected in the study: mouse clicks on answers, page submission
times and server times. Usually, survey researchers decide to implement one of these
measures and conduct their analyses on this basis. In study 3 however, the goal was
to identify the differences between these three types of paradata which are usually sum-
marized under the same concept of response latencies. The study used an experiment
with two conditions varying the question wordings which were known to covary with
the required time for a response. Well-formulated questions take less time to respond
to than badly-formulated questions. The question wording was changed with respect
to psycholinguistic features such as the number of words, the syntactic complexity, and
others. It was therefore possible to compare the three response time measures in their
suitability to detect these differences. The results showed that the client-side paradata
of mouse clicks on answers was able to statistically detect the difference in response
latencies between the two conditions. However, the other two measures were not signifi-
cantly different between experimental groups. In conclusion, the paradata model helped
in identifying the difference between seemingly identical concepts.
The three measures for response times did also differ in the investment needed to
implement them. Server-side time stamps are widely available in software packages and
require nearly no effort from the researcher. Submit times require one change per page,
77
Developing the Concept of Paradata
whereas response time clicks usually require most programming knowledge and invested
time for implementation. The value of the measures for research are reciprocal to the
effort needed for their implementation. The study showed that easier available server-
side time measures should be avoided because they include a loss of accuracy in the
measurement of response times. As a result researchers may be faced with inconclusive
findings which would have been less likely with a client-side measurement approach.
Summarizing, this chapter identified a lack in the conceptualization of paradata.
Therefore, a paradata model was developed and a new instrument provided to fit the
need for indicators of failed human-survey interaction. Two studies applied the paradata
model. Study 5 determined the amount of unsuccessful response behavior and provided a
solution, while study 3 specified and compared different measures for response latencies,
resulting in a recommendation for client-side answer click times.
78
5. Nonresponse as a Result of Missing Accessibility:
Coverage and Usefulness of Technology for Design and
Methodology (Study 4)
Until recently, the preparation phase of online surveys usually led to discussions among
survey researchers whether technologies such as JavaScript should be employed. On the
one hand, respondents were expected to benefit from additional interactive features which
could result in an increased data quality. On the other hand, the technology could lead to
an increase of nonresponse canceling positive effects, because not all respondents might
have the necessary equipment. This could result in technical problems and unaccessible
surveys.
This chapter focuses on the technology in online surveys. The technologies are dis-
cussed with respect to the usefulness in survey methodology. To address these issues
censuses of student applicants at the University of Mannheim from three semester show
the amount of coverage and availability of different technology among respondents.1 The
results clarify the amount by which unit nonresponse would be increased when specific
technologies were to be used in an online survey. More importantly, they support de-
sign decisions about which technologies can be used to the methodological benefit of
survey design. Accordingly, studies 2, 5, 6, and 7 in this work take up these results em-
ploying these technologies in their methodological experiments to further decrease item
nonresponse and dropout.
5.1. Background
Although technology is a central aspect of online surveys (Couper, 2005), a problem is
the diversity of the technical equipment among respondents. Respondents use a variety
of computer equipment with different system software and different browsers. Moreover,
respondents can install a variety of functions via plug-ins (e.g., video support). Worse
for survey researchers, they can also disable standard functionality by changing default
settings, using security plug-ins or extra software (e.g., that browsers accept cookies).
1 Acknowledgements. Parts of this chapter were presented at conferences (Kaczmirek & Thiele,2006; Thiele & Kaczmirek, 2005).
79
Nonresponse as a Result of Missing Accessibility (Study 4)
Ludwig (2004) found that 21% of unit nonresponse was due to technical problems accord-
ing to a follow-up survey asking respondents for reasons for their previous nonresponse
(missing compliance, 35%, no contact, 40%, other reasons, 4%, 97 persons responded to
the follow-up survey, p. 137). This indicates that surveys are not accessible for a consid-
erable number of potential respondents. On the one hand, respondents may experience
problems with the Internet connection or their computer which are out of control of
researchers. On the other hand, there are many possibilities to program a survey which
may all pose different requirements to the respondents’ browsers. The implementation of
new methods is known to impose problems and to exclude participants. “A gap remains
between what is technologically possible and what typical Internet users actually use on
their computer” (Heerwegh, 2005, p. 16). The research goal is therefore to estimate the
amount of this gap and identify which methods can be used in online survey research.
This enables researchers to choose among widely available techniques to further reduce
nonresponse without adding to it by choosing technically inappropriate methods.
Important aspects of technology-driven methods are:
∙ Increase of data quality, for example real-time validations (Peytchev & Crawford,
2005), and immediate feedback and counting in question types which uses the
constant sum method (Conrad, Couper, Tourangeau, & Galesic, 2005).
∙ Simplification of the response process, for example automatic forwarding to next
question, preselected answers, and automatic focus of the cursor into open text
fields.
∙ Collection of paradata (Heerwegh, 2003; Kaczmirek & Neubarth, 2007).
∙ New types of question formats, for example visual ranking (Neubarth, 2008), and
visual analog scales (Couper et al., 2006).
All these methods have in common that they rely on technologies which are optional
and may be disabled or need to be installed on the respondents’ computer. Especially
technologies beyond pure HTML, for example Flash impose problems and exclude par-
ticipants. Nevertheless, each technology has its special advantages which cannot always
be substituted by other forms of implementation. Should the researcher therefore avoid
new technologies and abandon their advantages to match the technical capabilities of
every participant? The most sensible way to deal with this problem is to utilize new
technologies which have a high coverage in the target population and to simultaneously
provide fall-back procedures for participants which would otherwise be excluded. In the
80
Nonresponse as a Result of Missing Accessibility (Study 4)
case of the most widely spread browser extension JavaScript, a good procedure is to check
for its availability at the beginning of a survey. Respondents may then be prompted to
enable JavaScript together with a thorough technical description on how this can be ac-
complished. Because such actions add to the burden even before the survey has started
(which will most likely increase nonresponse) a more sensible approach is to route respon-
dents past question types which they will not be able to respond to or provide alternative
question formats (e.g., a traditional rating scale instead of a visual analog scale). Gen-
erally, disabled or missing technology should not interfere with the accessibility of the
survey. In the case of a constant sum question type this might result in the absence of
automatic calculations but respondents would still be able to fill in the form. In con-
trast to the above illustrated examples where fall-back procedures are possible in case of
unavailable technologies, there are situations where no alternative in pure HTML exists.
Question types using video material are such an example. The considerations in such a
scenario is which video types to support and what can be gained by adding additional
video support.
An important goal in online questionnaire design is to gain the maximum advantage
of possible client-side technology in terms of reducing the various types of survey error
while maintaining a high level of accessibility. This study therefore provides information
about the present coverage of different technologies. Survey researchers can then make
an informed decision for or against specific methods.
5.2. Method
The study analyzed data from more than 29.000 university applicants during three ap-
plication periods in 2005 and 2006. All people who apply for a position as a student
need to fill in an online application form. The application form is a type of online survey
asking many factual questions. The application periods were the periods of data collec-
tion. Wave 1 was the application for the winter term 2005/2006 between May and July
2005. Wave 2 was the application for the summer term 2006 between November 2005
and March 2006. Wave 3 was the application for the winter term 2006/2007 between
May and July 2006.
5.2.1. Questionnaire
An application form consists of four to five pages with approx. 20 questions on each page.
It takes about two hours to complete the questionnaire (see figure 5.1 for an example
81
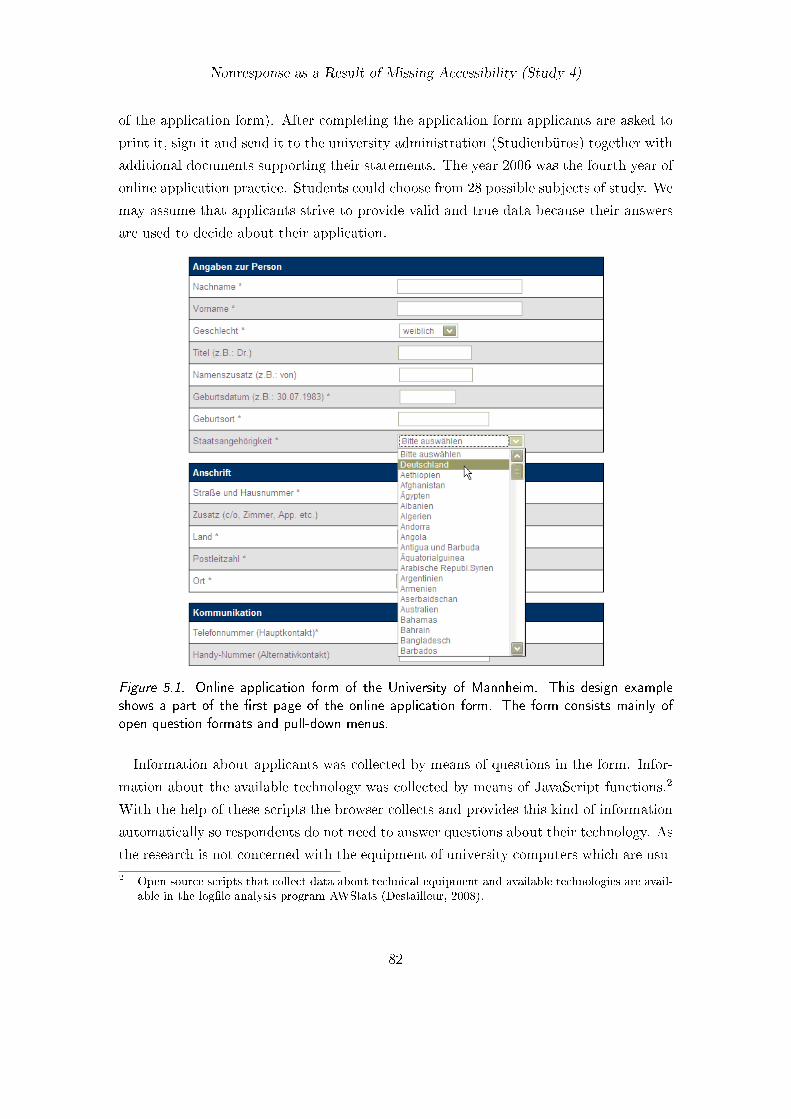
Nonresponse as a Result of Missing Accessibility (Study 4)
of the application form). After completing the application form applicants are asked to
print it, sign it and send it to the university administration (Studienbüros) together with
additional documents supporting their statements. The year 2006 was the fourth year of
online application practice. Students could choose from 28 possible subjects of study. We
may assume that applicants strive to provide valid and true data because their answers
are used to decide about their application.
Figure 5.1. Online application form of the University of Mannheim. This design example
shows a part of the first page of the online application form. The form consists mainly of
open question formats and pull-down menus.
Information about applicants was collected by means of questions in the form. Infor-
mation about the available technology was collected by means of JavaScript functions.2
With the help of these scripts the browser collects and provides this kind of information
automatically so respondents do not need to answer questions about their technology. As
the research is not concerned with the equipment of university computers which are usu-
2 Open source scripts that collect data about technical equipment and available technologies are avail-able in the logfile analysis program AWStats (Destailleur, 2008).
82
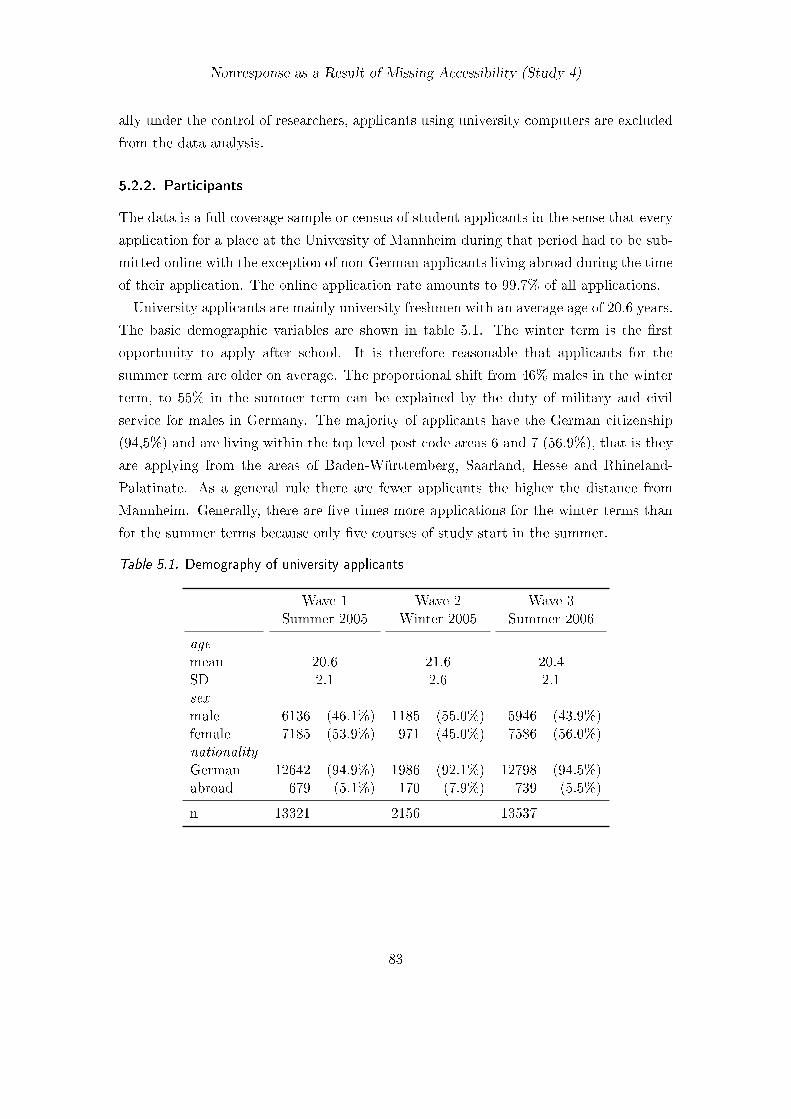
Nonresponse as a Result of Missing Accessibility (Study 4)
ally under the control of researchers, applicants using university computers are excluded
from the data analysis.
5.2.2. Participants
The data is a full coverage sample or census of student applicants in the sense that every
application for a place at the University of Mannheim during that period had to be sub-
mitted online with the exception of non-German applicants living abroad during the time
of their application. The online application rate amounts to 99.7% of all applications.
University applicants are mainly university freshmen with an average age of 20.6 years.
The basic demographic variables are shown in table 5.1. The winter term is the first
opportunity to apply after school. It is therefore reasonable that applicants for the
summer term are older on average. The proportional shift from 46% males in the winter
term, to 55% in the summer term can be explained by the duty of military and civil
service for males in Germany. The majority of applicants have the German citizenship
(94,5%) and are living within the top level post code areas 6 and 7 (56.9%), that is they
are applying from the areas of Baden-Württemberg, Saarland, Hesse and Rhineland-
Palatinate. As a general rule there are fewer applicants the higher the distance from
Mannheim. Generally, there are five times more applications for the winter terms than
for the summer terms because only five courses of study start in the summer.
Table 5.1. Demography of university applicants
Wave 1 Wave 2 Wave 3Summer 2005 Winter 2005 Summer 2006
agemean 20.6 21.6 20.4SD 2.1 2.6 2.1sexmale 6136 (46.1%) 1185 (55.0%) 5946 (43.9%)female 7185 (53.9%) 971 (45.0%) 7586 (56.0%)nationalityGerman 12642 (94.9%) 1986 (92.1%) 12798 (94.5%)abroad 679 (5.1%) 170 (7.9%) 739 (5.5%)
n 13321 2156 13537
83
Nonresponse as a Result of Missing Accessibility (Study 4)
5.3. Results and Discussion for Client-Side Technology
The next sections explain the use of the different technologies in online surveys and draw
conclusions for methodology and design. Generally, there is a trend of an increasing
availability of technologies and improved technical equipment between 2005 and 2006.
5.3.1. Acceptance and Persistence of Cookies
In survey research cookies are used to monitor a respondent throughout survey partic-
ipation and to re-identify returning respondents after they have abandoned the survey.
Stein and Stewart (2003, paragraph Q10) provide a thorough description in the W3C
World Wide Web Security FAQ of the advantages of cookies and outline the associated
privacy risks:
A cookie is a small piece of information, often no more than a short session identifier, that the HTTP
server sends to the browser when the browser connects for the first time. Thereafter, the browser
returns a copy of the cookie to the server each time it connects. [. . .] However cookies can be used for
more controversial purposes. Each access your browser makes to a Web site leaves some information
about you behind, creating a gossamer trail across the Internet. Among the tidbits of data left along
this trail are the name and IP address of your computer, the brand of browser you’re using, the
operating system you’re running, the URL of the Web page you accessed, and the URL of the page
you were last viewing.
From a user perspective cookies may make the Internet experience more convenient in
that they help websites to remember useful information. Cookies make it unnecessary
to enter one’s preferences over and over again. Additionally, cookies are also useful in
analyzing browsing behavior of single websites and help improve the websites to the users
need. Despite these obvious advantages cookies have gained a bad reputation because
they are also used to track the visiting and surfing behavior across different websites for
marketing and advertising purposes. As a result, Internet security software and some
browsers make it easy to automatically delete or reject cookies from being set. Even
worse for researchers, cookies may be accepted during a session but may be automatically
deleted after the browser closes. This overestimates the number of new visitors and leads
to the wrong conclusion that such a user would never revisit a website. Such a visitor
would appear as a new user every time s/he restarts his/her browser. Accordingly, there
are consequences to consider in intercept surveys.3 In intercept surveys cookies are used
to detect revisits. It is good practice not to invite visitors twice who either rejected to
3 Surveys which invite website visitors to participate in a survey by means of a popup, link or bannerare called intercept surveys because they ask visitors to delay their website visit and to take the
84

Nonresponse as a Result of Missing Accessibility (Study 4)
participate or already completed the survey (Kaczmirek & Neubarth, 2005). In the case
of intercept surveys this is usually achieved by means of cookies. More generally, cookies
are needed in online surveys which do not allow a personal enumeration of respondents
but which start without any possible personal identification. Because the functioning of
this mechanism cannot be guaranteed when cookies are deleted intercept surveys should
implement pages and questions in the beginning of a survey to filter out refusals and
returning visitors.
For survey researchers cookies serve two purposes. Firstly, survey researchers use
cookies during one session to identify respondents across different pages and to help
distinguish them from other respondents. Secondly and more importantly, cookies are
used to identify respondents across time and different visits. To test how much cookies
are available, an attempt is made to place a cookie on the respondent’s computer at
the first visit. If this attempt was successful, cookies are accepted. The results show
that nearly all respondents’ computers accept cookies. The possibility to set and retrieve
cookie information reaches nearly a hundred percent (table 5.2).
Table 5.2. Acceptance of cookies
Wave 1 Wave 3n % n %
Accepted 13108 98.4 13408 99.0
To gain information about what happens when a visit is abandoned at least one second
visit of the respondent and a valid personal tracking method is needed. Fortunately, the
online application form meets these requirements. It takes a rather long time to fill in
while requiring detailed biographical information. It is thus most likely that applicants
interrupt their work to collect all necessary information and continue their submission on
a second visit. To measure the persistence of cookies the survey sets a cookie during the
first login and tries to read it at the end of the submission process. The proportion for
the persistence of cookies is surprisingly low (table 5.3), especially when considering the
extremely high acceptance at first. If relying solely on cookies, 31.7% of the respondents
would have been misclassified as new visitors. Nevertheless, there are aspects of over-
and underreporting to consider when looking at this figure. Overreporting can happen
when respondents change computers between their session in which case all client-side
survey. If the frame is narrowly defined as visitors to the site and only every n-th visitor is invited,this survey type may be classified as a probability-based survey (Couper, 2000b).
85
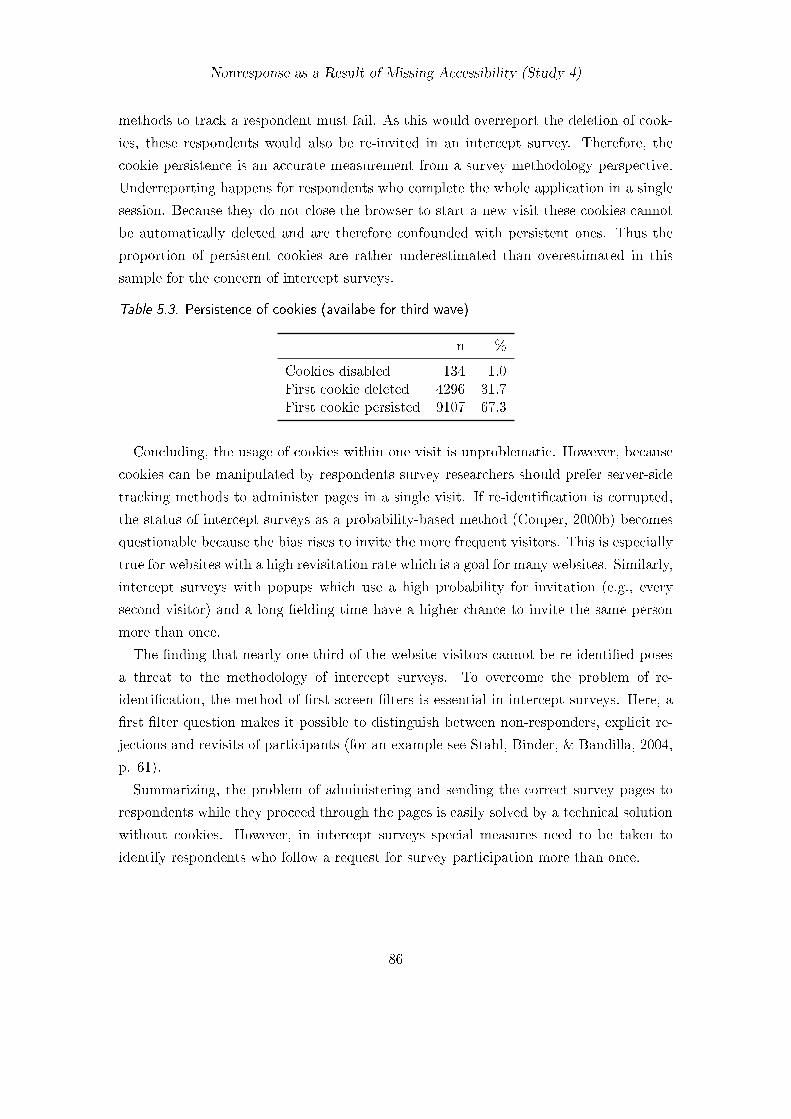
Nonresponse as a Result of Missing Accessibility (Study 4)
methods to track a respondent must fail. As this would overreport the deletion of cook-
ies, these respondents would also be re-invited in an intercept survey. Therefore, the
cookie persistence is an accurate measurement from a survey methodology perspective.
Underreporting happens for respondents who complete the whole application in a single
session. Because they do not close the browser to start a new visit these cookies cannot
be automatically deleted and are therefore confounded with persistent ones. Thus the
proportion of persistent cookies are rather underestimated than overestimated in this
sample for the concern of intercept surveys.
Table 5.3. Persistence of cookies (availabe for third wave)
n %
Cookies disabled 134 1.0First cookie deleted 4296 31.7First cookie persisted 9107 67.3
Concluding, the usage of cookies within one visit is unproblematic. However, because
cookies can be manipulated by respondents survey researchers should prefer server-side
tracking methods to administer pages in a single visit. If re-identification is corrupted,
the status of intercept surveys as a probability-based method (Couper, 2000b) becomes
questionable because the bias rises to invite the more frequent visitors. This is especially
true for websites with a high revisitation rate which is a goal for many websites. Similarly,
intercept surveys with popups which use a high probability for invitation (e.g., every
second visitor) and a long fielding time have a higher chance to invite the same person
more than once.
The finding that nearly one-third of the website visitors cannot be re-identified poses
a threat to the methodology of intercept surveys. To overcome the problem of re-
identification, the method of first screen filters is essential in intercept surveys. Here, a
first filter question makes it possible to distinguish between non-responders, explicit re-
jections and revisits of participants (for an example see Stahl, Binder, & Bandilla, 2004,
p. 61).
Summarizing, the problem of administering and sending the correct survey pages to
respondents while they proceed through the pages is easily solved by a technical solution
without cookies. However, in intercept surveys special measures need to be taken to
identify respondents who follow a request for survey participation more than once.
86
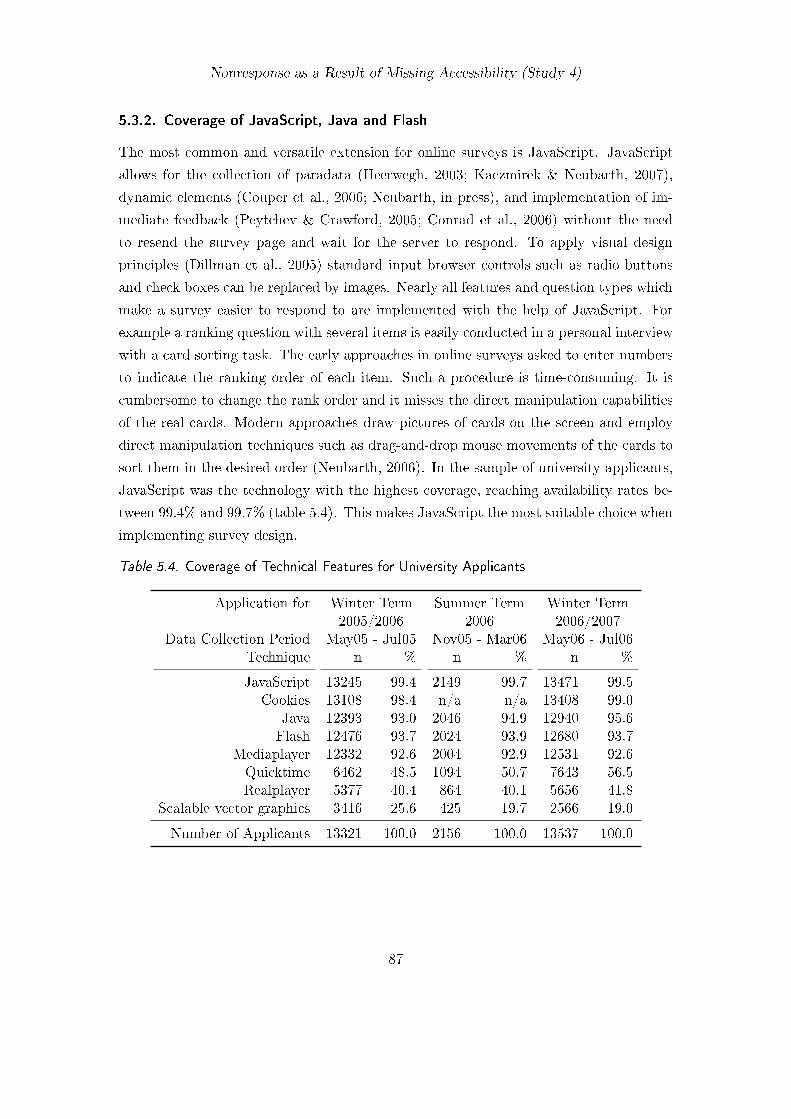
Nonresponse as a Result of Missing Accessibility (Study 4)
5.3.2. Coverage of JavaScript, Java and Flash
The most common and versatile extension for online surveys is JavaScript. JavaScript
allows for the collection of paradata (Heerwegh, 2003; Kaczmirek & Neubarth, 2007),
dynamic elements (Couper et al., 2006; Neubarth, in press), and implementation of im-
mediate feedback (Peytchev & Crawford, 2005; Conrad et al., 2006) without the need
to resend the survey page and wait for the server to respond. To apply visual design
principles (Dillman et al., 2005) standard input browser controls such as radio buttons
and check boxes can be replaced by images. Nearly all features and question types which
make a survey easier to respond to are implemented with the help of JavaScript. For
example a ranking question with several items is easily conducted in a personal interview
with a card sorting task. The early approaches in online surveys asked to enter numbers
to indicate the ranking order of each item. Such a procedure is time-consuming. It is
cumbersome to change the rank order and it misses the direct manipulation capabilities
of the real cards. Modern approaches draw pictures of cards on the screen and employ
direct manipulation techniques such as drag-and-drop mouse movements of the cards to
sort them in the desired order (Neubarth, 2006). In the sample of university applicants,
JavaScript was the technology with the highest coverage, reaching availability rates be-
tween 99.4% and 99.7% (table 5.4). This makes JavaScript the most suitable choice when
implementing survey design.
Table 5.4. Coverage of Technical Features for University Applicants
Application for Winter Term Summer Term Winter Term2005/2006 2006 2006/2007
Data Collection Period May05 - Jul05 Nov05 - Mar06 May06 - Jul06Technique n % n % n %
JavaScript 13245 99.4 2149 99.7 13471 99.5Cookies 13108 98.4 n/a n/a 13408 99.0
Java 12393 93.0 2046 94.9 12940 95.6Flash 12476 93.7 2024 93.9 12680 93.7
Mediaplayer 12332 92.6 2004 92.9 12531 92.6Quicktime 6462 48.5 1094 50.7 7643 56.5Realplayer 5377 40.4 864 40.1 5656 41.8
Scalable vector graphics 3416 25.6 425 19.7 2566 19.0
Number of Applicants 13321 100.0 2156 100.0 13537 100.0
87
Nonresponse as a Result of Missing Accessibility (Study 4)
On the downside, JavaScript is restricted in the control and observation capabilities
of the survey participation process. Being a scripting language JavaScript is also openly
visible to participants who like to have a look at the code. Thus, malicious participants
may produce ineligible data or use the code for their own purpose. Java and Flash
on the other hand work with a compiled code, which makes the code unreadable for
humans and faster in its execution. In addition, they have the control and observation
capabilities which JavaScript lack. To use Java or Flash the survey researcher needs
access to programming knowledge. It is necessary that respondents have installed these
extensions or are willing to install them at the time of survey participation. Contrary to
JavaScript, respondents need to take action to use Java or Flash, whereas with JavaScript
respondents need to take action to disable its use. The results show that if a special
survey interface design is needed, Java and Flash should be considered as alternatives to
JavaScript. In the last wave Java reached a coverage of 95.6% and Flash a coverage of
93.7% (table 5.4).
A promising new development is AJAX (Asynchronous JavaScript and XML). With
AJAX and its ability to transfer data without the need to reload the whole page a
new scope of interaction capabilities arises. AJAX allows for a much more desktop-like
interface design as was previously possible with HTML and JavaScript alone. In the
case of the University application form long lists have to be loaded in advance. This
includes lists of countries (206 items), universities and colleges in Germany (501 items)
and districts of Germany (446). Long lists can considerably lengthen the download time
for dial-up connections to several minutes. It has been reasoned in the past that longer
download times account for dropout in online surveys (Couper, Traugott, & Lamias, 2001;
Heerwegh & Loosveldt, 2002). AJAX solves part of this problem because it is possible
to load and suggest possible entries while a respondent types the answer. This might for
example be used in the complex issue of coding the personal occupation: Open answers
are allowed but suggestions on available terms allow for a pre-coding, thus speeding up
the manual coding work after the survey is finished. Breakoffs are probably reduced for
slower Internet connections because such an approach shortens the download time of the
whole page while providing all necessary terms or a complete dictionary.
Summing up, JavaScript is the first choice when implementing survey design meth-
ods. Nevertheless, alternatives without JavaScript need to be maintained for special
subgroups, for example when visually impaired and blind people should be able to par-
ticipate. Solutions based on Java and Flash can be appropriate in circumstances which
demand a higher control of a survey than is possible with JavaScript.
88
Nonresponse as a Result of Missing Accessibility (Study 4)
The high coverage of JavaScript in the student sample makes it ideal for survey re-
search. However, the question remains whether this is also true for other populations. To
answer this question the availability of JavaScript was assessed in two additional stud-
ies sampling from the general population with Internet access. The first used an online
follow-up survey of a face-to-face survey which employed a probability sample of the
general German population. Here, JavaScript was available for 99.7% of the respondents
(n=386) with only two respondents who had disabled JavaScript. The study is described
in more detail in Bandilla et al. (2009). The second study used a quota sample of a
market research panel. One thousand invitations were e-mailed to respondents with a
sampling distribution equalling the demographic variables school education, age, and sex
in the German general social survey 2004 (ALLBUS). In the quota sample JavaScript was
available to 99.1% of the respondents. Only 5 respondents had not enabled JavaScript.
Overall, 58.8% of the 1000 invited persons responded to the e-mail invitation. Con-
cluding, these additional studies show that JavaScript is highly available to the general
Internet population, not only in market research panels but also in probability-based
surveys.
5.3.3. Coverage of Video and Scalable Vector Graphics
The increase in bandwidth among Internet users with cable/DSL makes it feasible to
include video material in online surveys. Video material is essential for the online evalu-
ation of cinema trailers or commercials. Survey instructions might also be supported by
video and/or audio material (Fuchs & Funke, 2007; Krisch & Lesho, 2006).
Table 5.4 shows that the most widely spread player for video is the Mediaplayer (cov-
erage 92.6%). Thus, video codecs supported by the Mediaplayer are the first to be
supported in online surveys. Further analysis shows that in wave three 25.8% of the
participants who do not use the Mediaplayer use Quicktime (adding 1.9% to the total
video coverage) while 13.5% use the Realplayer (adding 1% to the total video coverage).
Supporting all three players in an online survey leaves 4.5% of the applicants without
the ability to play video material.
An alternative technology to the standard formats of web graphics (gif, jpg, png) is svg
(scalable vector graphics). Vector graphics are supposed to save file space compared to
full pictures but the increasing bandwidth and the lack of support in browsers render this
technology useless for online surveys. Only 19% of the respondents’ computers support
svg (table 5.4) making this technology the only diminishing one.
89
Nonresponse as a Result of Missing Accessibility (Study 4)
Recent developments in online video applications avoid the problem of competing
video players altogether. Instead, online communities which share videos (e.g., YouTube,
Google Video) employ Flash technology. The even higher coverage of Flash compared
to the Mediaplayer and its platform independence makes it ideal for video and audio
transmission in online surveys (Fuchs & Funke, 2007). A recent example is provided by
a survey targeting people with physical and mental disabilities using the Internet which
employed Flash technology to implement sign language videos and speech to achieve
accessible survey design (Deutsche Behindertenhilfe – Aktion Mensch e.V., 2008).
5.3.4. Screen Resolution and Browser Usage
One of the most important design decisions in online surveys is the width of the ques-
tionnaire. It is a basic assumption in survey methodology that horizontal answer scales
should be fully visible to respondents (Dillman, 2007). Therefore, online surveys are op-
timized for the smallest screen expected. Hitherto, this threshold was 800 pixels. In 2006
the proportion of applicants who possessed at least a screen width of 1024 pixels reached
94.9% (table 5.5). The emerging and accepted standard in online surveys will therefore
become 1024 pixels within a few years and is already acceptable for certain subgroups
of the web population. Considering web page design in general, Webtrekk announced
similar findings for their long-term study. Only 7% of their panel possess a resolution of
800x600 pixels (Casamento, 2006). Nielsen (2006) also speaks out in favor of a design
aiming at a resolution of 1024x768 pixels.
Before fielding time, online surveys should be tested with the most common browsers
used in the target sample. During the testing phase oddities of different browser behavior
can be identified and visual and technical problems can be removed. Testing for technical
bugs and errors is necessary and a standard procedure for computer-assisted surveys
(Couper, 2000b). Good testing practice is especially important in self-administered online
surveys due to the fact that no trained interviewer is available to compensate for the
problems during survey participation:
By their very nature, Web questionnaires must run in the uncontrolled and largely unpredictable
environment of the respondent. PC configuration, Internet connection quality, and browser software
all have a significant impact on how the questionnaire is presented and behaves. Ensuring that all
respondents experience the survey in a reasonably standard way is a primary goal of Web question-
naire testing. This dynamic nature of Web questionnaires requires that our testing protocols extend
beyond the techniques now employed both for paper and other computer-based instruments. (Baker
et al., 2004, p. 363)
90
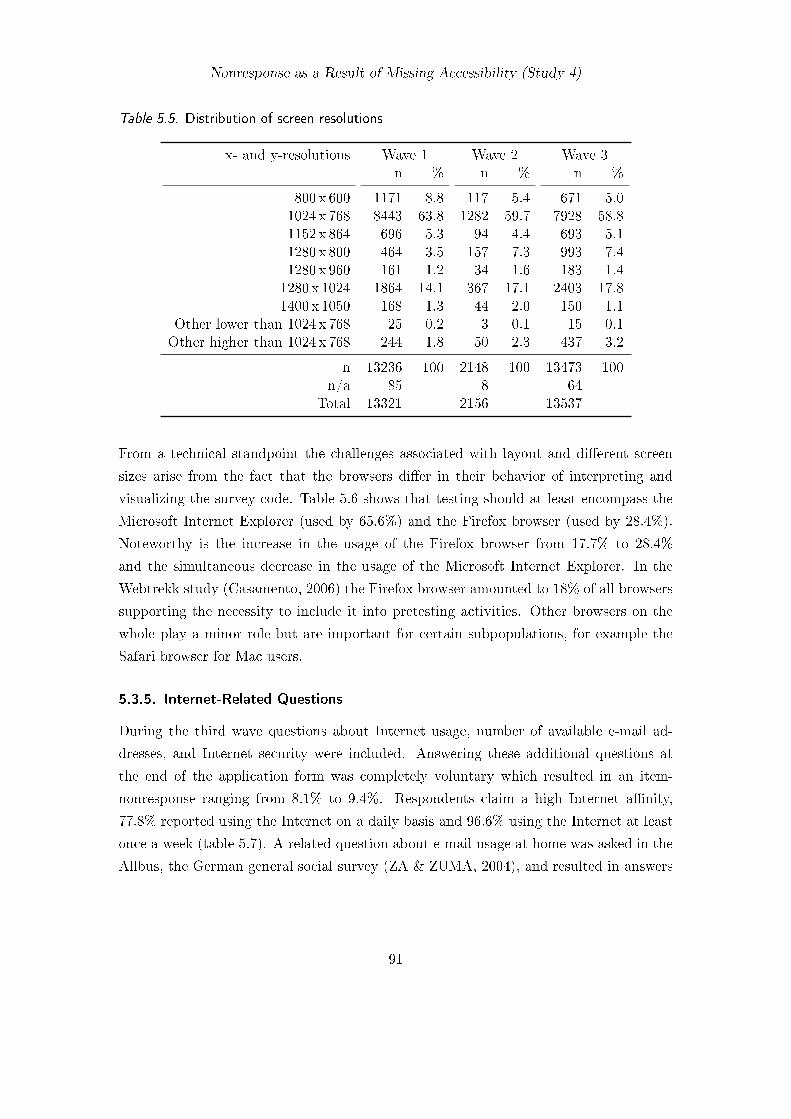
Nonresponse as a Result of Missing Accessibility (Study 4)
Table 5.5. Distribution of screen resolutions
x- and y-resolutions Wave 1 Wave 2 Wave 3n % n % n %
800 x 600 1171 8.8 117 5.4 671 5.01024 x 768 8443 63.8 1282 59.7 7928 58.81152 x 864 696 5.3 94 4.4 693 5.11280 x 800 464 3.5 157 7.3 993 7.41280 x 960 161 1.2 34 1.6 183 1.41280 x 1024 1864 14.1 367 17.1 2403 17.81400 x 1050 168 1.3 44 2.0 150 1.1
Other lower than 1024 x 768 25 0.2 3 0.1 15 0.1Other higher than 1024 x 768 244 1.8 50 2.3 437 3.2
n 13236 100 2148 100 13473 100n/a 85 8 64
Total 13321 2156 13537
From a technical standpoint the challenges associated with layout and different screen
sizes arise from the fact that the browsers differ in their behavior of interpreting and
visualizing the survey code. Table 5.6 shows that testing should at least encompass the
Microsoft Internet Explorer (used by 65.6%) and the Firefox browser (used by 28.4%).
Noteworthy is the increase in the usage of the Firefox browser from 17.7% to 28.4%
and the simultaneous decrease in the usage of the Microsoft Internet Explorer. In the
Webtrekk study (Casamento, 2006) the Firefox browser amounted to 18% of all browsers
supporting the necessity to include it into pretesting activities. Other browsers on the
whole play a minor role but are important for certain subpopulations, for example the
Safari browser for Mac users.
5.3.5. Internet-Related Questions
During the third wave questions about Internet usage, number of available e-mail ad-
dresses, and Internet security were included. Answering these additional questions at
the end of the application form was completely voluntary which resulted in an item-
nonresponse ranging from 8.1% to 9.4%. Respondents claim a high Internet affinity,
77.8% reported using the Internet on a daily basis and 96.6% using the Internet at least
once a week (table 5.7). A related question about e-mail usage at home was asked in the
Allbus, the German general social survey (ZA & ZUMA, 2004), and resulted in answers
91
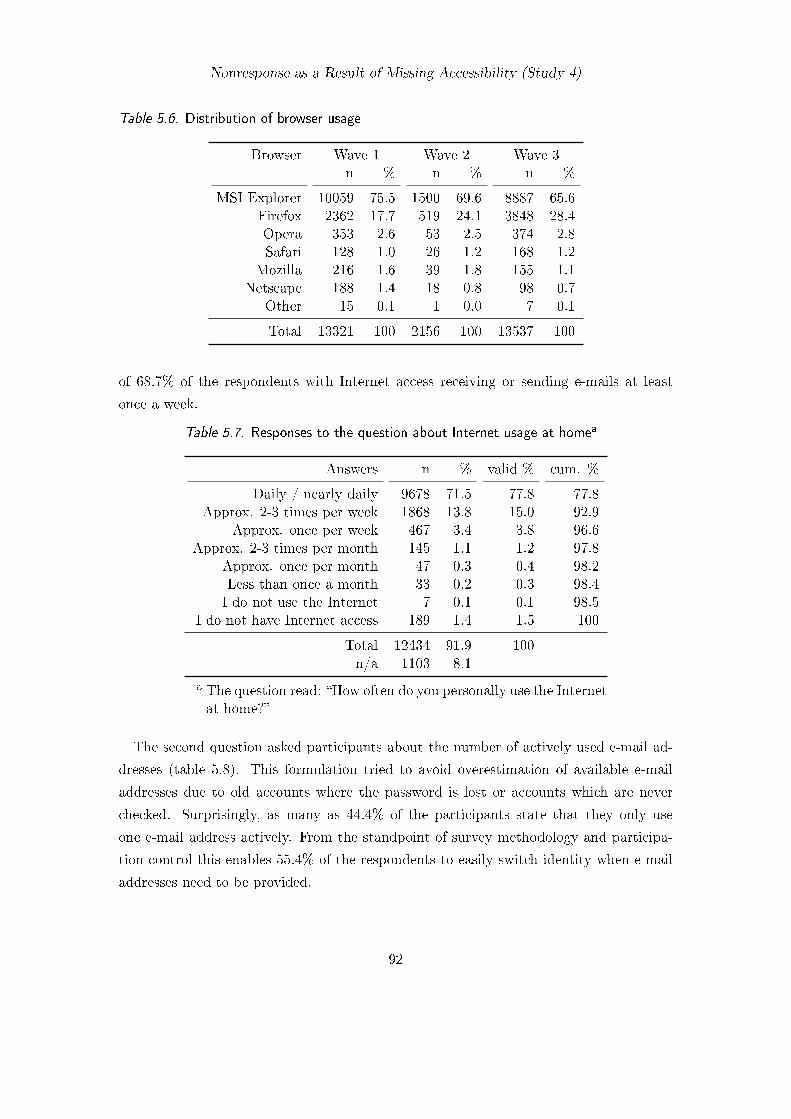
Nonresponse as a Result of Missing Accessibility (Study 4)
Table 5.6. Distribution of browser usage
Browser Wave 1 Wave 2 Wave 3n % n % n %
MSI Explorer 10059 75.5 1500 69.6 8887 65.6Firefox 2362 17.7 519 24.1 3848 28.4Opera 353 2.6 53 2.5 374 2.8Safari 128 1.0 26 1.2 168 1.2
Mozilla 216 1.6 39 1.8 155 1.1Netscape 188 1.4 18 0.8 98 0.7
Other 15 0.1 1 0.0 7 0.1
Total 13321 100 2156 100 13537 100
of 68.7% of the respondents with Internet access receiving or sending e-mails at least
once a week.
Table 5.7. Responses to the question about Internet usage at homea
Answers n % valid % cum. %
Daily / nearly daily 9678 71.5 77.8 77.8Approx. 2-3 times per week 1868 13.8 15.0 92.9
Approx. once per week 467 3.4 3.8 96.6Approx. 2-3 times per month 145 1.1 1.2 97.8
Approx. once per month 47 0.3 0.4 98.2Less than once a month 33 0.2 0.3 98.4I do not use the Internet 7 0.1 0.1 98.5
I do not have Internet access 189 1.4 1.5 100
Total 12434 91.9 100n/a 1103 8.1
a The question read: “How often do you personally use the Internetat home?”
The second question asked participants about the number of actively used e-mail ad-
dresses (table 5.8). This formulation tried to avoid overestimation of available e-mail
addresses due to old accounts where the password is lost or accounts which are never
checked. Surprisingly, as many as 44.4% of the participants state that they only use
one e-mail address actively. From the standpoint of survey methodology and participa-
tion control this enables 55.4% of the respondents to easily switch identity when e-mail
addresses need to be provided.
92
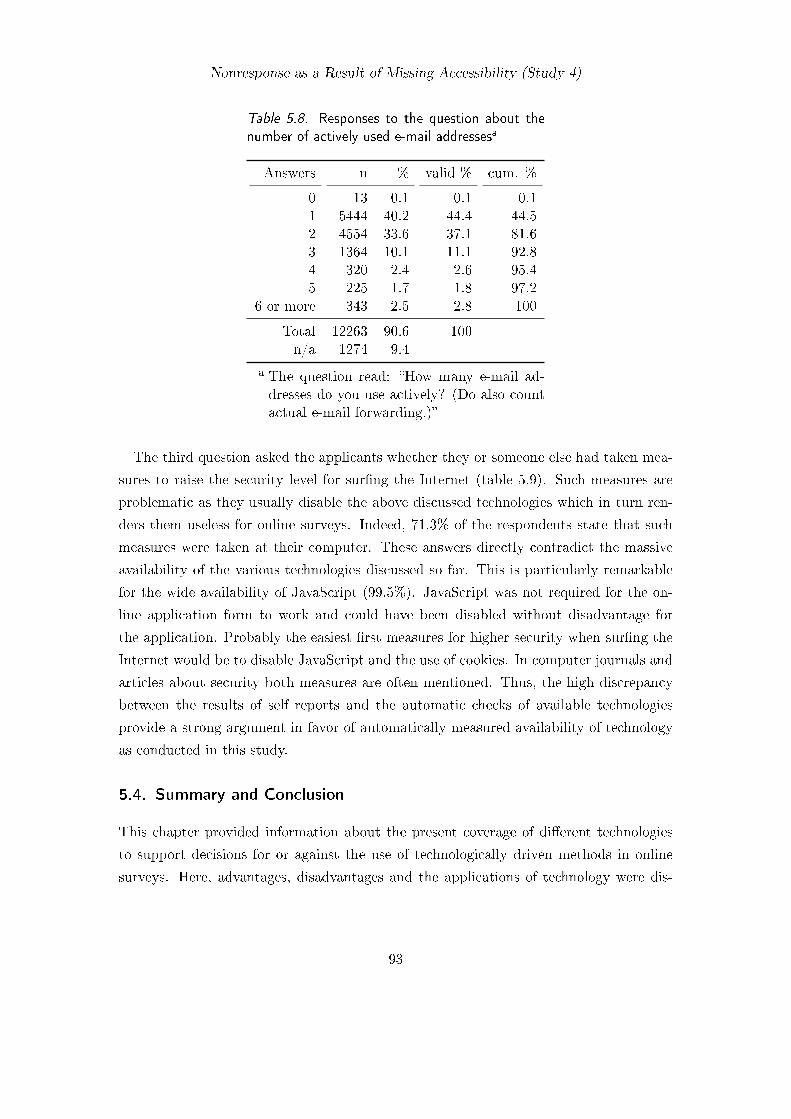
Nonresponse as a Result of Missing Accessibility (Study 4)
Table 5.8. Responses to the question about the
number of actively used e-mail addressesa
Answers n % valid % cum. %
0 13 0.1 0.1 0.11 5444 40.2 44.4 44.52 4554 33.6 37.1 81.63 1364 10.1 11.1 92.84 320 2.4 2.6 95.45 225 1.7 1.8 97.2
6 or more 343 2.5 2.8 100
Total 12263 90.6 100n/a 1274 9.4
a The question read: “How many e-mail ad-dresses do you use actively? (Do also countactual e-mail forwarding.)”
The third question asked the applicants whether they or someone else had taken mea-
sures to raise the security level for surfing the Internet (table 5.9). Such measures are
problematic as they usually disable the above discussed technologies which in turn ren-
ders them useless for online surveys. Indeed, 71.3% of the respondents state that such
measures were taken at their computer. These answers directly contradict the massive
availability of the various technologies discussed so far. This is particularly remarkable
for the wide availability of JavaScript (99.5%). JavaScript was not required for the on-
line application form to work and could have been disabled without disadvantage for
the application. Probably the easiest first measures for higher security when surfing the
Internet would be to disable JavaScript and the use of cookies. In computer journals and
articles about security both measures are often mentioned. Thus, the high discrepancy
between the results of self reports and the automatic checks of available technologies
provide a strong argument in favor of automatically measured availability of technology
as conducted in this study.
5.4. Summary and Conclusion
This chapter provided information about the present coverage of different technologies
to support decisions for or against the use of technologically driven methods in online
surveys. Here, advantages, disadvantages and the applications of technology were dis-
93
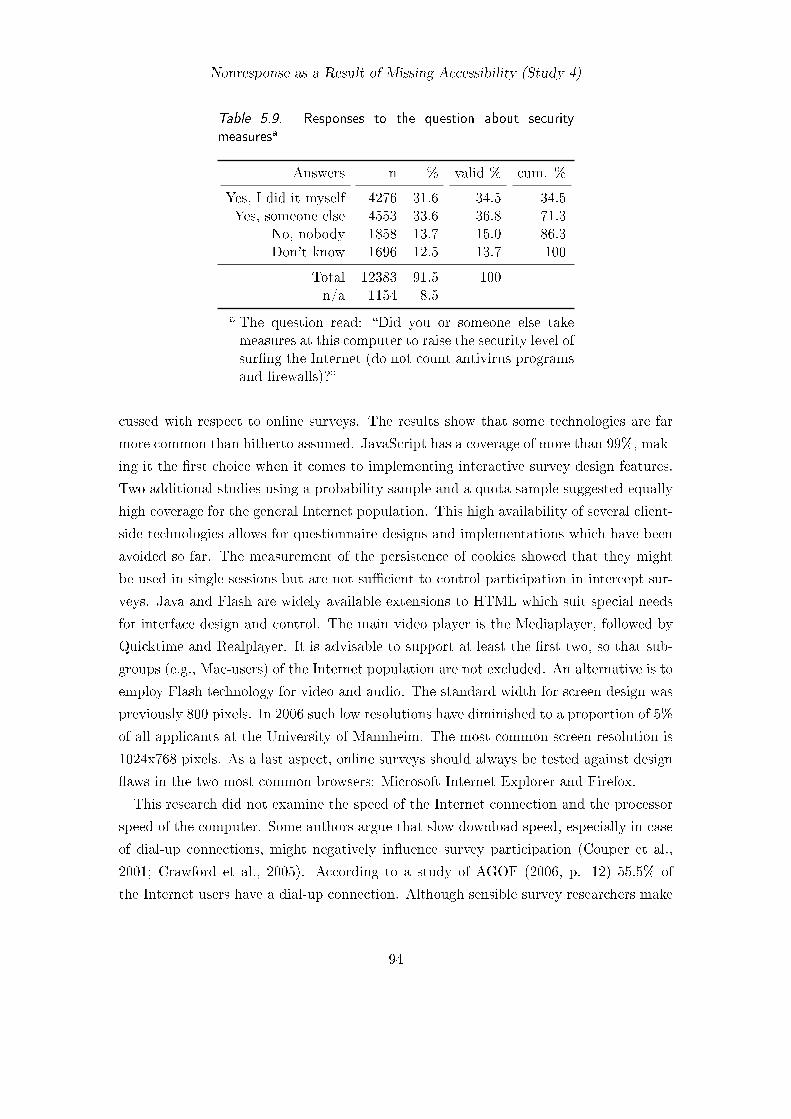
Nonresponse as a Result of Missing Accessibility (Study 4)
Table 5.9. Responses to the question about security
measuresa
Answers n % valid % cum. %
Yes, I did it myself 4276 31.6 34.5 34.5Yes, someone else 4553 33.6 36.8 71.3
No, nobody 1858 13.7 15.0 86.3Don’t know 1696 12.5 13.7 100
Total 12383 91.5 100n/a 1154 8.5
a The question read: “Did you or someone else takemeasures at this computer to raise the security level ofsurfing the Internet (do not count antivirus programsand firewalls)?”
cussed with respect to online surveys. The results show that some technologies are far
more common than hitherto assumed. JavaScript has a coverage of more than 99%, mak-
ing it the first choice when it comes to implementing interactive survey design features.
Two additional studies using a probability sample and a quota sample suggested equally
high coverage for the general Internet population. This high availability of several client-
side technologies allows for questionnaire designs and implementations which have been
avoided so far. The measurement of the persistence of cookies showed that they might
be used in single sessions but are not sufficient to control participation in intercept sur-
veys. Java and Flash are widely available extensions to HTML which suit special needs
for interface design and control. The main video player is the Mediaplayer, followed by
Quicktime and Realplayer. It is advisable to support at least the first two, so that sub-
groups (e.g., Mac-users) of the Internet population are not excluded. An alternative is to
employ Flash technology for video and audio. The standard width for screen design was
previously 800 pixels. In 2006 such low resolutions have diminished to a proportion of 5%
of all applicants at the University of Mannheim. The most common screen resolution is
1024x768 pixels. As a last aspect, online surveys should always be tested against design
flaws in the two most common browsers: Microsoft Internet Explorer and Firefox.
This research did not examine the speed of the Internet connection and the processor
speed of the computer. Some authors argue that slow download speed, especially in case
of dial-up connections, might negatively influence survey participation (Couper et al.,
2001; Crawford et al., 2005). According to a study of AGOF (2006, p. 12) 55.5% of
the Internet users have a dial-up connection. Although sensible survey researchers make
94
Nonresponse as a Result of Missing Accessibility (Study 4)
use of picture compression and caching to avoid long download times, complex material
might still take some minutes to download when using a dial-up connection. In line with
our argument for using fall-back procedures respondents would benefit from survey in-
struments which detect the Internet connection speed and route to alternative question
types. This is especially true in the case of video material where respondents should be
able to skip the questions when they feel videos are not displayed adequately. Similarly,
respondents on slow computers may experience a lag in response with questions which
include dynamic elements updated in real-time as the mouse moves. Response lags might
even counteract the positive effects of immediate feedback. It is still a challenge to au-
tomatically and accurately measure these characteristics while avoiding the introduction
of long download times or processing load during the measurement process itself.
Summing up, the results show that the least common denominator in available tech-
nology on client-side does not necessarily need to be pure HTML-code. For interactive
survey design JavaScript is recommended. This contradicts older findings from 2001
where browsers differed substantially in the support of JavaScript (S. Schwarz & Reips,
2001). The coverage of several promising technologies has reached a high level among
participants enabling online surveys to use methods and questionnaire formats which are
not feasible or impractical to conduct in traditional survey modes. These technologies
can be used to design successful human-survey interaction and enhance the data quality
of online surveys.
95

Tests on Applications
6. Increasing Item Completion Rates: Interactivity in Matrix
Questions
6.1. Background
In question design survey researchers have to choose among several question and answer
formats. The most basic types use categories in the form of ‘choose one that apply’,
‘choose all that apply’, and open-ended questions. A matrix question is a type of question
where a number of questions are subsumed under a single question heading with the
same answer scale for all items. Common examples include questions like ‘To what
extent do you agree or disagree to the following?’ with a series of statements that are
to be evaluated. They are convenient to create by researchers and easily readable by
respondents. The design is space-saving because the introduction is only presented once.
A potentially problematic side effect of such a design is that it elicits a higher inter-item
correlation than a series of the same questions on subsequent pages (Tourangeau et al.,
2004).
On the whole, it is a common experience for survey researchers that respondents are
more likely to abandon a survey when confronted with a matrix question than when
having to answer a single item question. This is not surprising because a larger set of
visible questions imposes a higher burden on respondents than a single visible question.
However, there is no difference in the cumulated dropout between questions presented
together or on different pages (Peytchev et al., 2006). Nevertheless, this means that
the number of completed items is reduced in matrix questions. The dropout on pages
employing matrix questions is a challenge in survey design which is addressed in this
chapter.
The review of different authors’ principles for design in chapter 2 has shown that
all of them emphasized the importance of feedback for a successful human-computer
interaction (Couper, 1994; ISO, 2006; Nielsen, 1993; Norman, 1988; Shneiderman, 1998).
In the context of the framework for human-survey interaction, feedback corresponds to
the interaction part of the framework. There are several aspects in an online survey
where feedback can be provided. Already existing feedback in current online surveys is
often a result of respondents’ interaction with the survey. A subtle but always present
97
Increasing Item Completion Rates: Interactivity in Matrix Questions
example of such feedback is the change in the appearance of an answer button when a
respondent clicks on it, indicating a successful response. The radio buttons and check
boxes implemented in browsers are small, providing only a small visible change of a few
pixels in radio buttons and only a few more in check boxes. Accordingly, the goal of
my work is to enhance the visible feedback when interacting with these types of answer
controls in an online form. This is supposed to enrich the interactivity of the dialogue,
and to strengthen the motivation of respondents. As a result they are expected to answer
more questions resulting in lower item nonresponse.
Before establishing different feedback methods I start with analyzing the task: Provid-
ing a response can be divided into the time before clicking on an answer (pre-selection
phase) and the time after having clicked on an answer (post-selection phase). The post-
selection phase naturally overlaps with the next pre-selection phase for the following
question. Feedback can be applied in both phases as will be shown in the following two
experiments.
6.2. Focusing on Available Answers (Study 2)
This experiment uses feedback techniques to enhance the visibility of available questions
and their answer options.
6.2.1. Method
The basic feedback provided by computers in the pre-selection phase is the position of
the mouse pointer. It indicates which object a mouse click will affect. A corresponding
radio button only provides feedback after it has been clicked. Thus, feedback can be
enhanced in the pre-selectio n phase by interactively highlighting the surrounding area of
a radio button while the mouse pointer is in the immediate vicinity. This was technically
accomplished by colorizing the underlying table cell as a mouse-over effect with a light
blue color. The highlighting was spread as a cross to encompass the whole row and
column in the matrix question.1 The blue cross highlights the position of the answer
within all possible answers and the item text to be answered.
In the post-selection phase a radio button provides feedback by adding a few pixels
in the middle of its circle. This can be enhanced by colorizing the surrounding of the
radio button in dark grey. To increase the visibility of the remaining questions the dark
1 I thank Wolfgang Neubarth for inspiring me with the visual cross using a mouse-over effect and forsharing a technical prototype for the implementation.
98
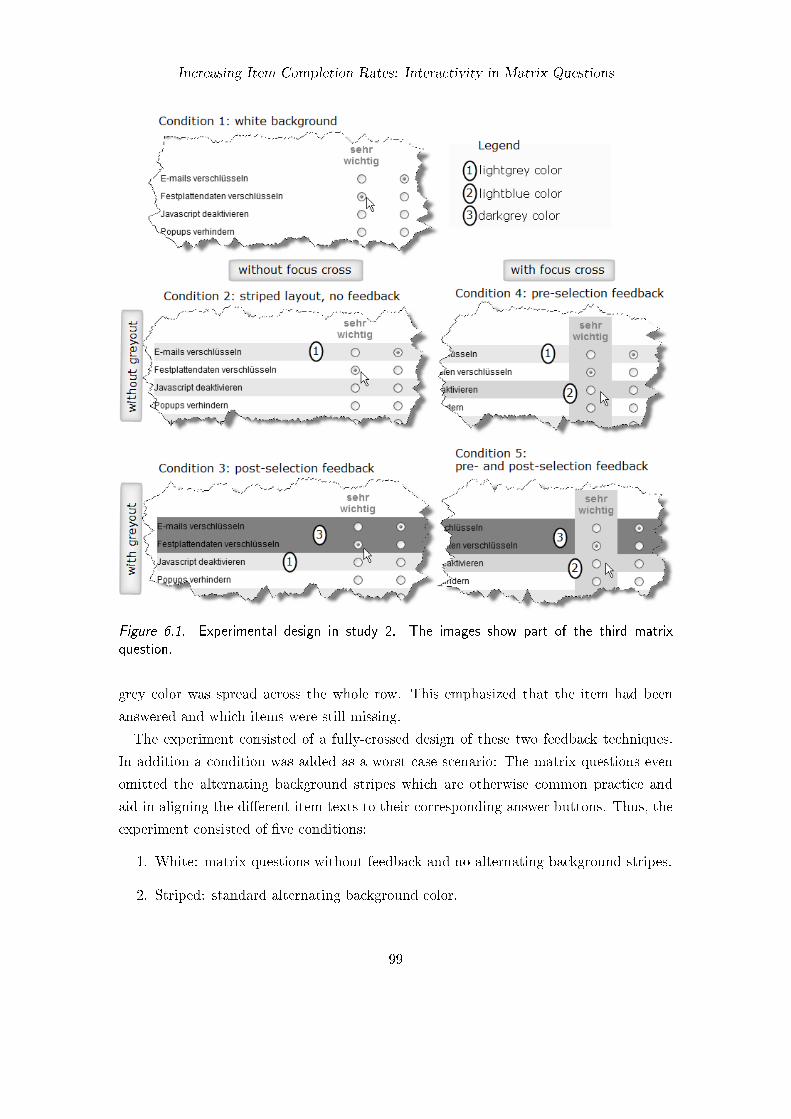
Increasing Item Completion Rates: Interactivity in Matrix Questions
Figure 6.1. Experimental design in study 2. The images show part of the third matrix
question.
grey color was spread across the whole row. This emphasized that the item had been
answered and which items were still missing.
The experiment consisted of a fully-crossed design of these two feedback techniques.
In addition a condition was added as a worst case scenario: The matrix questions even
omitted the alternating background stripes which are otherwise common practice and
aid in aligning the different item texts to their corresponding answer buttons. Thus, the
experiment consisted of five conditions:
1. White: matrix questions without feedback and no alternating background stripes.
2. Striped: standard alternating background color.
99
Increasing Item Completion Rates: Interactivity in Matrix Questions
3. Greyout: post-selection feedback, after a click the row turns to a dark grey color.
4. Cross: pre-selection feedback, mouseover effect which highlights the row and col-
umn in a light blue.
5. Greyout & Cross: both pre- and post-selection feedback activated.
The experiment used three subsequent matrix questions. The visual and experimental
design of the survey conditions is depicted in figure 6.1.
The feedback is expected to reduce item nonresponse. The hypotheses are therefore
that all feedback conditions supersede the conditions ‘white’ and ‘striped’ in terms of
completed items. In addition, the condition ‘white’ should result in fewer item comple-
tions than the condition with stripes. Because both feedback techniques employ heavy
color changes it is not expected that their effects positively add up. Instead the goal was
to explore both techniques in the sense of competing design ideas. No interaction effect
was expected.
6.2.2. Questionnaire
The topic of the survey was announced as ‘security in the Internet’. The questionnaire
asked about security concerns, experience with threats, and security related behavior
regarding the Internet. It consisted of 13 pages and requested 47 answers. The experi-
ment used three matrix questions on three pages. The first question in the experiment
on page nine asked to rate nine browsers. The second question on page ten asked about
the frequency for seven types of Internet communication (e-mail, chat, etc.). The third
question on page eleven asked to rate the importance of sixteen possible measures to en-
hance the security in the Internet (using a firewall, e-mail encryption, etc.). A complete
documentation of all three matrix questions and the conditions is included in appendix .
6.2.3. Participants
Participants were invited by e-mail. 4987 invitations were sent to members of the self-
recruited panel Sozioland of the Respondi AG. Of the 2003 respondents who started
the survey 1581 completed the questionnaire (78.9%). More women (54.5%) than men
(45.5%) completed the survey. The average age was between 25 and 29 years, which was
collected in categories.
100
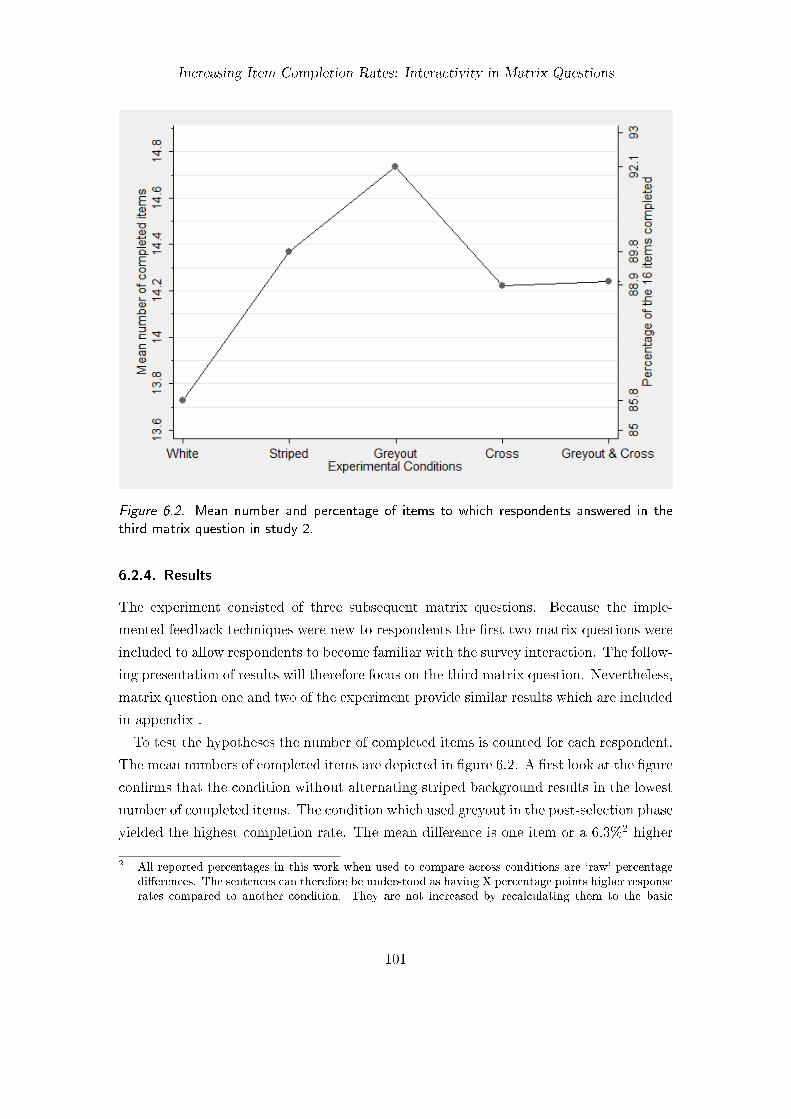
Increasing Item Completion Rates: Interactivity in Matrix Questions
Figure 6.2. Mean number and percentage of items to which respondents answered in the
third matrix question in study 2.
6.2.4. Results
The experiment consisted of three subsequent matrix questions. Because the imple-
mented feedback techniques were new to respondents the first two matrix questions were
included to allow respondents to become familiar with the survey interaction. The follow-
ing presentation of results will therefore focus on the third matrix question. Nevertheless,
matrix question one and two of the experiment provide similar results which are included
in appendix .
To test the hypotheses the number of completed items is counted for each respondent.
The mean numbers of completed items are depicted in figure 6.2. A first look at the figure
confirms that the condition without alternating striped background results in the lowest
number of completed items. The condition which used greyout in the post-selection phase
yielded the highest completion rate. The mean difference is one item or a 6.3%2 higher
2 All reported percentages in this work when used to compare across conditions are ‘raw’ percentagedifferences. The sentences can therefore be understood as having X percentage points higher responserates compared to another condition. They are not increased by recalculating them to the basic
101
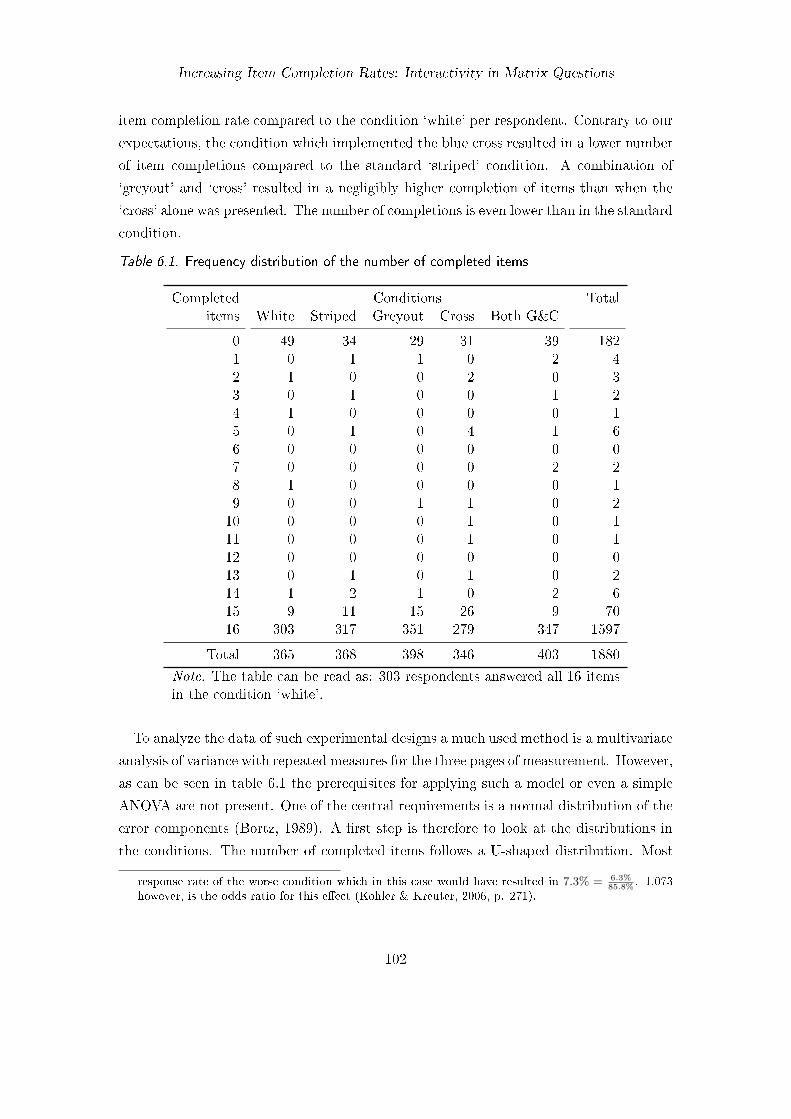
Increasing Item Completion Rates: Interactivity in Matrix Questions
item completion rate compared to the condition ‘white’ per respondent. Contrary to our
expectations, the condition which implemented the blue cross resulted in a lower number
of item completions compared to the standard ‘striped’ condition. A combination of
‘greyout’ and ‘cross’ resulted in a negligibly higher completion of items than when the
‘cross’ alone was presented. The number of completions is even lower than in the standard
condition.
Table 6.1. Frequency distribution of the number of completed items
Completed Conditions Totalitems White Striped Greyout Cross Both G&C
0 49 34 29 31 39 1821 0 1 1 0 2 42 1 0 0 2 0 33 0 1 0 0 1 24 1 0 0 0 0 15 0 1 0 4 1 66 0 0 0 0 0 07 0 0 0 0 2 28 1 0 0 0 0 19 0 0 1 1 0 210 0 0 0 1 0 111 0 0 0 1 0 112 0 0 0 0 0 013 0 1 0 1 0 214 1 2 1 0 2 615 9 11 15 26 9 7016 303 317 351 279 347 1597
Total 365 368 398 346 403 1880
Note. The table can be read as: 303 respondents answered all 16 itemsin the condition ‘white’.
To analyze the data of such experimental designs a much used method is a multivariate
analysis of variance with repeated measures for the three pages of measurement. However,
as can be seen in table 6.1 the prerequisites for applying such a model or even a simple
ANOVA are not present. One of the central requirements is a normal distribution of the
error components (Bortz, 1989). A first step is therefore to look at the distributions in
the conditions. The number of completed items follows a U-shaped distribution. Most
response rate of the worse condition which in this case would have resulted in 7.3% = 6.3%85.8%
. 1.073however, is the odds ratio for this effect (Kohler & Kreuter, 2006, p. 271).
102
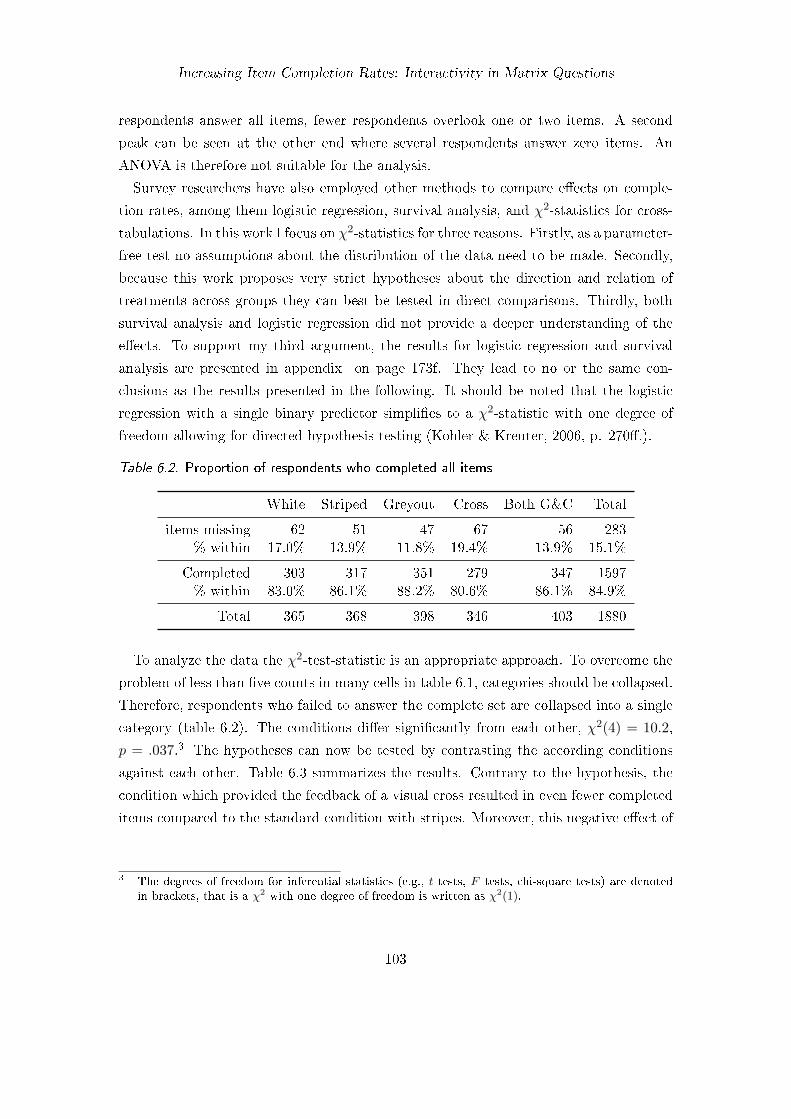
Increasing Item Completion Rates: Interactivity in Matrix Questions
respondents answer all items, fewer respondents overlook one or two items. A second
peak can be seen at the other end where several respondents answer zero items. An
ANOVA is therefore not suitable for the analysis.
Survey researchers have also employed other methods to compare effects on comple-
tion rates, among them logistic regression, survival analysis, and 𝜒2-statistics for cross-
tabulations. In this work I focus on 𝜒2-statistics for three reasons. Firstly, as a parameter-
free test no assumptions about the distribution of the data need to be made. Secondly,
because this work proposes very strict hypotheses about the direction and relation of
treatments across groups they can best be tested in direct comparisons. Thirdly, both
survival analysis and logistic regression did not provide a deeper understanding of the
effects. To support my third argument, the results for logistic regression and survival
analysis are presented in appendix on page 173f. They lead to no or the same con-
clusions as the results presented in the following. It should be noted that the logistic
regression with a single binary predictor simplifies to a 𝜒2-statistic with one degree of
freedom allowing for directed hypothesis testing (Kohler & Kreuter, 2006, p. 270ff.).
Table 6.2. Proportion of respondents who completed all items
White Striped Greyout Cross Both G&C Total
items missing 62 51 47 67 56 283% within 17.0% 13.9% 11.8% 19.4% 13.9% 15.1%
Completed 303 317 351 279 347 1597% within 83.0% 86.1% 88.2% 80.6% 86.1% 84.9%
Total 365 368 398 346 403 1880
To analyze the data the 𝜒2-test-statistic is an appropriate approach. To overcome the
problem of less than five counts in many cells in table 6.1, categories should be collapsed.
Therefore, respondents who failed to answer the complete set are collapsed into a single
category (table 6.2). The conditions differ significantly from each other, 𝜒2(4) = 10.2,
𝑝 = .037.3 The hypotheses can now be tested by contrasting the according conditions
against each other. Table 6.3 summarizes the results. Contrary to the hypothesis, the
condition which provided the feedback of a visual cross resulted in even fewer completed
items compared to the standard condition with stripes. Moreover, this negative effect of
3 The degrees of freedom for inferential statistics (e.g., 𝑡 tests, 𝐹 tests, chi-square tests) are denotedin brackets, that is a 𝜒2 with one degree of freedom is written as 𝜒2(1).
103
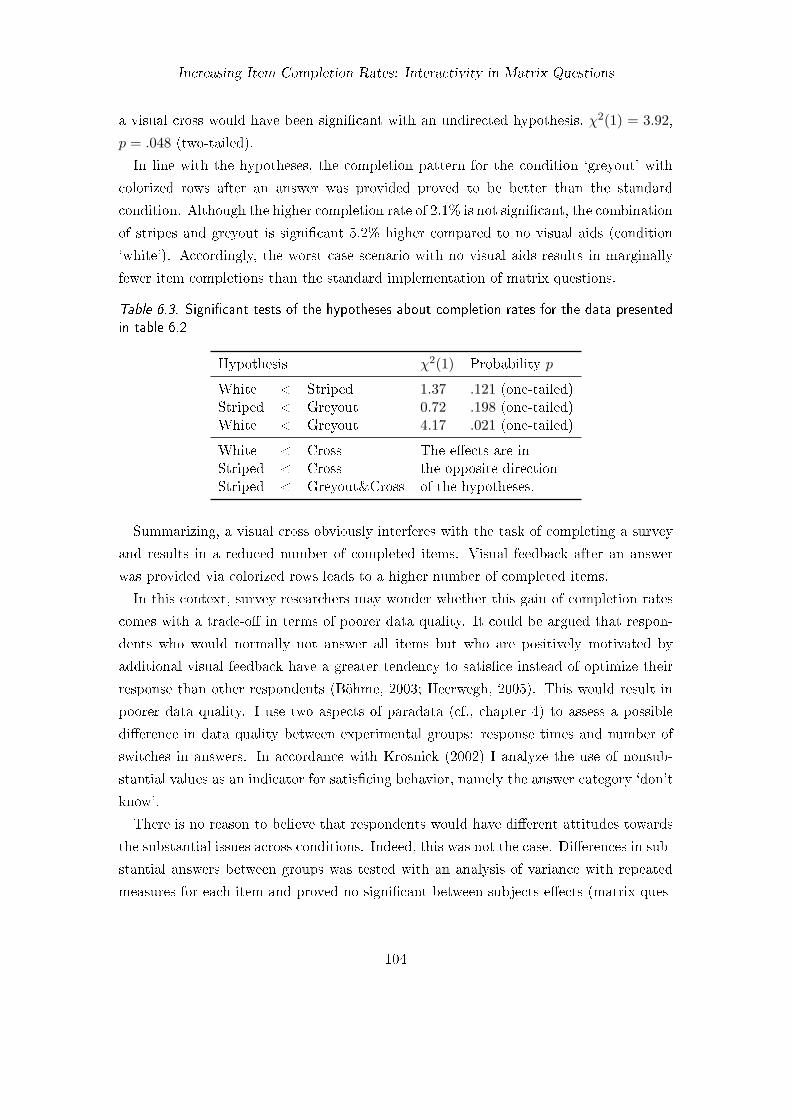
Increasing Item Completion Rates: Interactivity in Matrix Questions
a visual cross would have been significant with an undirected hypothesis, 𝜒2(1) = 3.92,
𝑝 = .048 (two-tailed).
In line with the hypotheses, the completion pattern for the condition ‘greyout’ with
colorized rows after an answer was provided proved to be better than the standard
condition. Although the higher completion rate of 2.1% is not significant, the combination
of stripes and greyout is significant 5.2% higher compared to no visual aids (condition
‘white’). Accordingly, the worst case scenario with no visual aids results in marginally
fewer item completions than the standard implementation of matrix questions.
Table 6.3. Significant tests of the hypotheses about completion rates for the data presented
in table 6.2
Hypothesis 𝜒2(1) Probability 𝑝
White < Striped 1.37 .121 (one-tailed)Striped < Greyout 0.72 .198 (one-tailed)White < Greyout 4.17 .021 (one-tailed)
White < Cross The effects are inStriped < Cross the opposite directionStriped < Greyout&Cross of the hypotheses.
Summarizing, a visual cross obviously interferes with the task of completing a survey
and results in a reduced number of completed items. Visual feedback after an answer
was provided via colorized rows leads to a higher number of completed items.
In this context, survey researchers may wonder whether this gain of completion rates
comes with a trade-off in terms of poorer data quality. It could be argued that respon-
dents who would normally not answer all items but who are positively motivated by
additional visual feedback have a greater tendency to satisfice instead of optimize their
response than other respondents (Böhme, 2003; Heerwegh, 2005). This would result in
poorer data quality. I use two aspects of paradata (cf., chapter 4) to assess a possible
difference in data quality between experimental groups: response times and number of
switches in answers. In accordance with Krosnick (2002) I analyze the use of nonsub-
stantial values as an indicator for satisficing behavior, namely the answer category ‘don’t
know’.
There is no reason to believe that respondents would have different attitudes towards
the substantial issues across conditions. Indeed, this was not the case. Differences in sub-
stantial answers between groups was tested with an analysis of variance with repeated
measures for each item and proved no significant between-subjects effects (matrix ques-
104
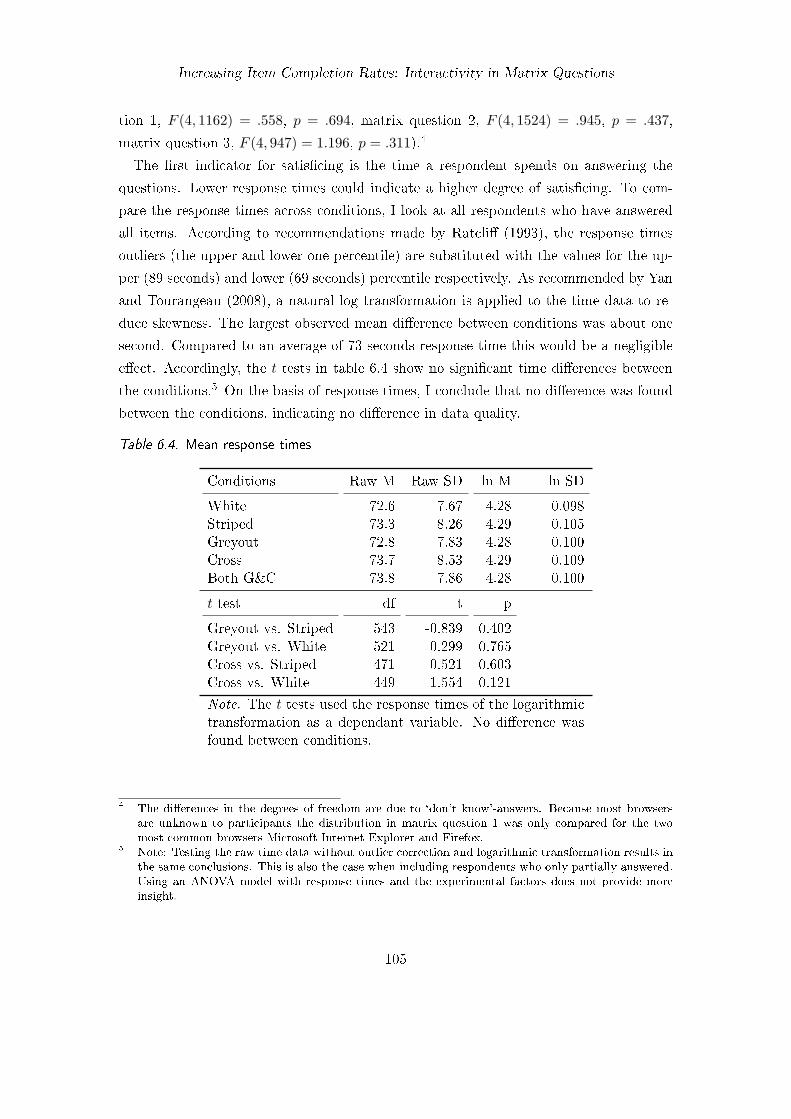
Increasing Item Completion Rates: Interactivity in Matrix Questions
tion 1, 𝐹 (4, 1162) = .558, 𝑝 = .694, matrix question 2, 𝐹 (4, 1524) = .945, 𝑝 = .437,
matrix question 3, 𝐹 (4, 947) = 1.196, 𝑝 = .311).4
The first indicator for satisficing is the time a respondent spends on answering the
questions. Lower response times could indicate a higher degree of satisficing. To com-
pare the response times across conditions, I look at all respondents who have answered
all items. According to recommendations made by Ratcliff (1993), the response times
outliers (the upper and lower one percentile) are substituted with the values for the up-
per (89 seconds) and lower (69 seconds) percentile respectively. As recommended by Yan
and Tourangeau (2008), a natural log transformation is applied to the time data to re-
duce skewness. The largest observed mean difference between conditions was about one
second. Compared to an average of 73 seconds response time this would be a negligible
effect. Accordingly, the 𝑡 tests in table 6.4 show no significant time differences between
the conditions.5 On the basis of response times, I conclude that no difference was found
between the conditions, indicating no difference in data quality.
Table 6.4. Mean response times
Conditions Raw M Raw SD ln M ln SD
White 72.6 7.67 4.28 0.098Striped 73.3 8.26 4.29 0.105Greyout 72.8 7.83 4.28 0.100Cross 73.7 8.53 4.29 0.109Both G&C 73.8 7.86 4.28 0.100
𝑡 test df t p
Greyout vs. Striped 543 -0.839 0.402Greyout vs. White 521 0.299 0.765Cross vs. Striped 471 0.521 0.603Cross vs. White 449 1.554 0.121
Note. The 𝑡 tests used the response times of the logarithmictransformation as a dependant variable. No difference wasfound between conditions.
4 The differences in the degrees of freedom are due to ‘don’t know’-answers. Because most browsersare unknown to participants the distribution in matrix question 1 was only compared for the twomost common browsers Microsoft Internet Explorer and Firefox.
5 Note: Testing the raw time data without outlier correction and logarithmic transformation results inthe same conclusions. This is also the case when including respondents who only partially answered.Using an ANOVA model with response times and the experimental factors does not provide moreinsight.
105
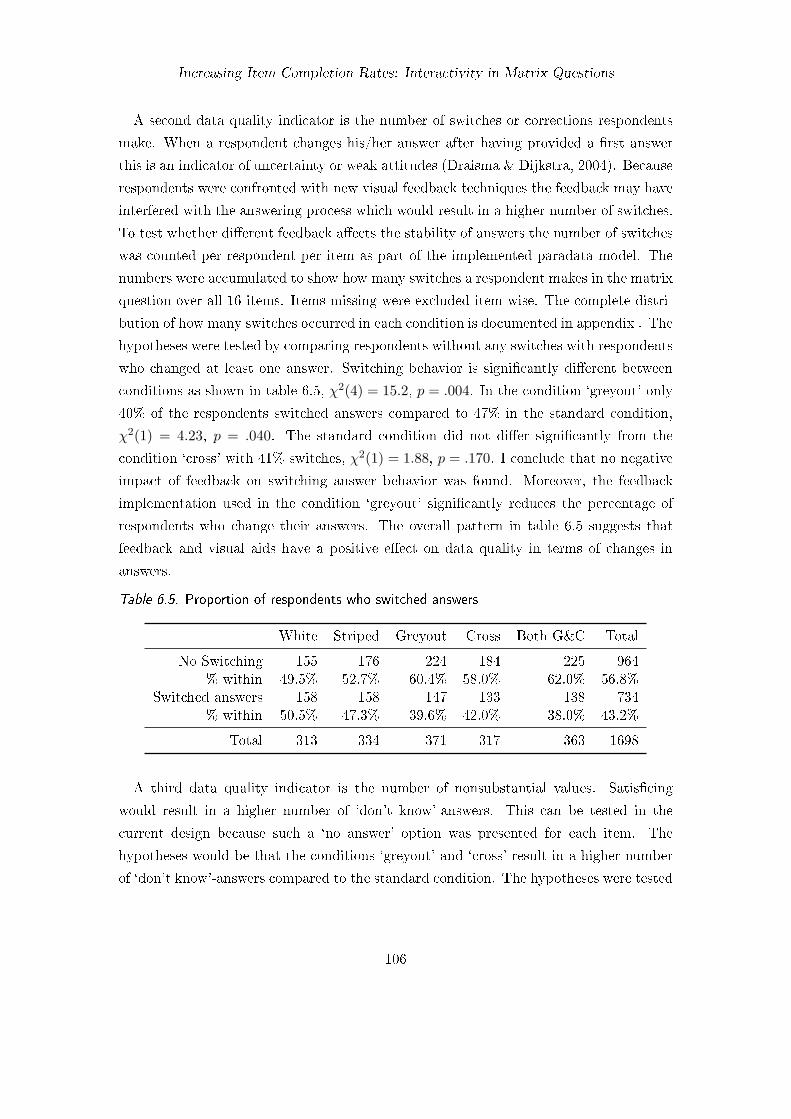
Increasing Item Completion Rates: Interactivity in Matrix Questions
A second data quality indicator is the number of switches or corrections respondents
make. When a respondent changes his/her answer after having provided a first answer
this is an indicator of uncertainty or weak attitudes (Draisma & Dijkstra, 2004). Because
respondents were confronted with new visual feedback techniques the feedback may have
interfered with the answering process which would result in a higher number of switches.
To test whether different feedback affects the stability of answers the number of switches
was counted per respondent per item as part of the implemented paradata model. The
numbers were accumulated to show how many switches a respondent makes in the matrix
question over all 16 items. Items missing were excluded item-wise. The complete distri-
bution of how many switches occurred in each condition is documented in appendix . The
hypotheses were tested by comparing respondents without any switches with respondents
who changed at least one answer. Switching behavior is significantly different between
conditions as shown in table 6.5, 𝜒2(4) = 15.2, 𝑝 = .004. In the condition ‘greyout’ only
40% of the respondents switched answers compared to 47% in the standard condition,
𝜒2(1) = 4.23, 𝑝 = .040. The standard condition did not differ significantly from the
condition ‘cross’ with 41% switches, 𝜒2(1) = 1.88, 𝑝 = .170. I conclude that no negative
impact of feedback on switching answer behavior was found. Moreover, the feedback
implementation used in the condition ‘greyout’ significantly reduces the percentage of
respondents who change their answers. The overall pattern in table 6.5 suggests that
feedback and visual aids have a positive effect on data quality in terms of changes in
answers.
Table 6.5. Proportion of respondents who switched answers
White Striped Greyout Cross Both G&C Total
No Switching 155 176 224 184 225 964% within 49.5% 52.7% 60.4% 58.0% 62.0% 56.8%
Switched answers 158 158 147 133 138 734% within 50.5% 47.3% 39.6% 42.0% 38.0% 43.2%
Total 313 334 371 317 363 1698
A third data quality indicator is the number of nonsubstantial values. Satisficing
would result in a higher number of ‘don’t know’-answers. This can be tested in the
current design because such a ‘no answer’ option was presented for each item. The
hypotheses would be that the conditions ‘greyout’ and ‘cross’ result in a higher number
of ‘don’t know’-answers compared to the standard condition. The hypotheses were tested
106
Increasing Item Completion Rates: Interactivity in Matrix Questions
by comparing respondents who used at least one ‘don’t know’-answer with respondents
who provided only substantial answers. The number of respondents who only provided
substantial answers does not differ between conditions, 𝜒2(2) = .629, 𝑝 = .730. In the
condition ‘striped’ 63% of the respondents provided substantial answers to all items,
compared to 64.1% in the condition ‘greyout’ and 61.3% in the condition ‘cross’. The
complete distribution of how many ‘don’t know’-answers were obtained in each condition
is documented in appendix . In conclusion, either feedback techniques do not affect
whether respondents provide substantial answers or not. Data quality is not affected.
Summarizing all three indicators of data quality, the feedback techniques do not have
a negative impact on data quality in terms of response times, changes in answers, or
number of substantial answers in this sample. Still, there is a positive effect on item
completion rates for the post-selection feedback in the condition ‘greyout’ and a negative
effect on item completions for the pre-selection feedback in the condition ‘cross’.
6.2.5. Discussion
The experiment tested different feedback techniques in online survey matrix questions
which were supposed to reduce items missing. Feedback was provided both before an an-
swer was selected (condition ‘cross’) and after an answer was chosen (condition ‘greyout’).
The experiment used a fully-crossed design plus a fifth condition which was designed as
a worst case scenario with no alternating background stripes.
The results show that contrary to expectations a light blue cross which follows the
mouse pointer and spans across the whole row and column does not increase the number
of completed items. Worse, items missing are significantly increased. The feedback was
expected to help respondents focus on the item wording and the corresponding answer
column they were going to select. However, the results indicate that the additional
interaction and visual animation distract respondents from their task of answering the
items. Observations of respondents who were exposed to such a feedback technique with
matrix questions in the laboratory support this. The videos of the mouse movements and
facial expressions of the respondents show that several respondents start to play with the
design and move the cross across the screen. Only after exploring this, they return to
the task of answering the questions. Without the additional motivation imposed by the
laboratory setting it is likely that these respondents may completely loose interest in the
survey questions and thus complete fewer items. The user testing also revealed that not
all respondents were able to use the cross for their advantage: The cross often highlighted
items and columns which were not in the focus of the attention. This happened when an
107
Increasing Item Completion Rates: Interactivity in Matrix Questions
answer was clicked but the mouse was not moved to the next question. In these situations,
the cross detracts the attention to unimportant –because already completed– aspects of
the questionnaire. Although two pages with matrix questions were presented before the
third matrix question to allow for familiarization to the new interface, the results advice
against the use of such a feedback technique in survey questions. This negative finding
is important because it demonstrates how much the actual design implementation which
is part of the operationalization affects respondents. Although theory clearly advocates
feedback, researchers still need to evaluate how it should be designed. As such, the
condition ‘cross’ is an example of how too much animation has a negative impact on
task completion in a stage where attention is required to process and answer a question.
The next study will address this problem with a much more unobtrusive feedback in the
pre-selection phase.
A positive finding in line with the hypotheses was the higher number of completed
items in the condition ‘greyout’ compared to the standard and worst case condition. The
results show that the combination of a striped background with colorizing the row after
a selection significantly increases the number of completed items compared to a matrix
question with no visual aids. According to theory, the feedback enhances the overview
in terms of which items have already been answered and which are still to be completed.
This makes it easy for respondents to identify items which they accidentally left out.
Finally, the conditions were compared in terms of obtained data quality. The three in-
dicators for data quality were response times, number of changes in answers, and number
of nonsubstantial answers. All three provided no evidence for a loss of data quality in
the conditions with additional feedback. Moreover, the number of switches in answers in
the condition ‘greyout’ was significantly lower than in the standard condition, indicating
an advantage of post-selection feedback for data quality. The next study built on these
results and used less obtrusive feedback techniques to optimize the positive effects on
completion rates.
6.3. Emphasizing Answer Options in the Pre- and Post-Selection Phase
(Study 5)
The previous study 2 has shown that visual feedback after selecting an answer reduces
nonresponse. In the pre-selection phase the study tested a graphical cross which moved
with the mouse to highlight possible answer options and items. This feedback in the
108
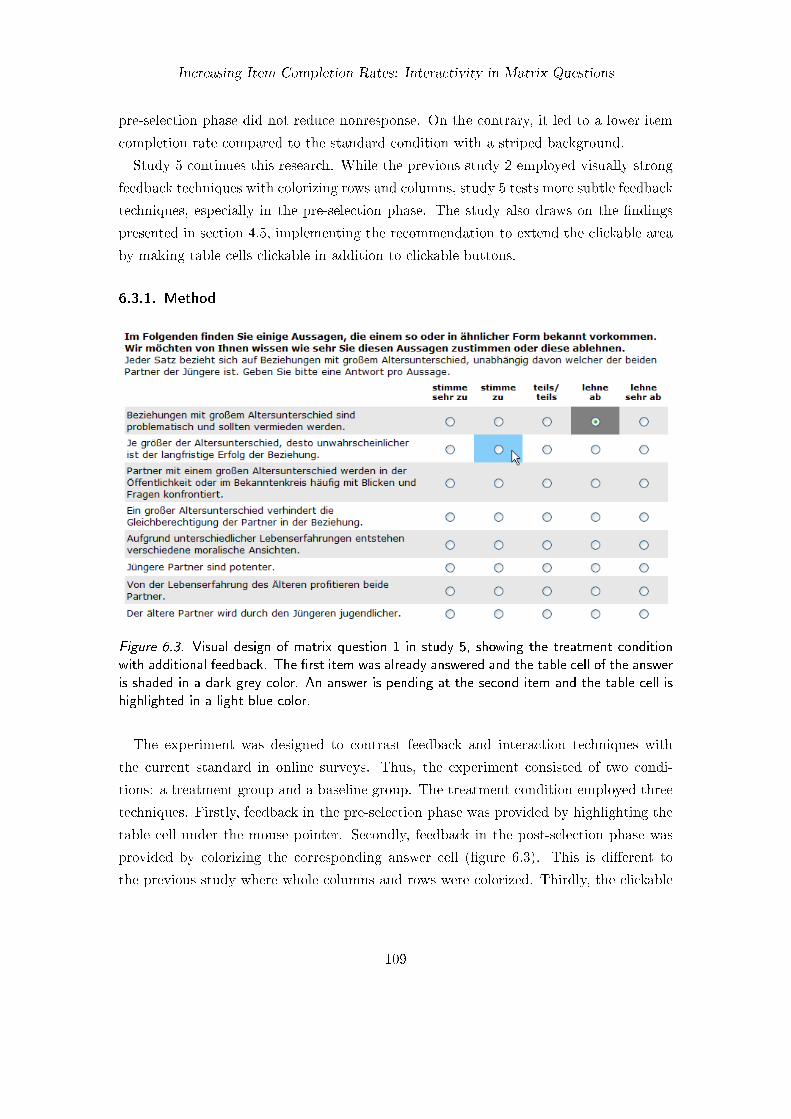
Increasing Item Completion Rates: Interactivity in Matrix Questions
pre-selection phase did not reduce nonresponse. On the contrary, it led to a lower item
completion rate compared to the standard condition with a striped background.
Study 5 continues this research. While the previous study 2 employed visually strong
feedback techniques with colorizing rows and columns, study 5 tests more subtle feedback
techniques, especially in the pre-selection phase. The study also draws on the findings
presented in section 4.5, implementing the recommendation to extend the clickable area
by making table cells clickable in addition to clickable buttons.
6.3.1. Method
Figure 6.3. Visual design of matrix question 1 in study 5, showing the treatment condition
with additional feedback. The first item was already answered and the table cell of the answer
is shaded in a dark grey color. An answer is pending at the second item and the table cell is
highlighted in a light blue color.
The experiment was designed to contrast feedback and interaction techniques with
the current standard in online surveys. Thus, the experiment consisted of two condi-
tions: a treatment group and a baseline group. The treatment condition employed three
techniques. Firstly, feedback in the pre-selection phase was provided by highlighting the
table cell under the mouse pointer. Secondly, feedback in the post-selection phase was
provided by colorizing the corresponding answer cell (figure 6.3). This is different to
the previous study where whole columns and rows were colorized. Thirdly, the clickable
109
Increasing Item Completion Rates: Interactivity in Matrix Questions
area was extended so that also clicks on the table cell provided valid answers. Not only
was this a recommendation of section 4.5 but figure 6.3 visualizes how highlighting the
table cell under the mouse pointer may suggest that this area is indeed clickable. The
figure depicts the first matrix question of the experiment with a first answer given and a
second one pending at the mouse pointer. The second condition in the experiment used
the standard implementation in current survey design without additional feedback and
no clickable cell areas. Thus, the second condition can be viewed as a baseline condition.
The experiment consisted of two matrix questions with eight items each and five an-
swer values. The feedback was designed to assure respondents of their pending answer
possibilities and to enhance the visibility of possible and given answers. The treatment
enhanced the human-survey interaction by including the following three steps of the
response process:
1. A light blue rectangle followed mouse movements to possible answer values.
2. Following an answer, the blue rectangle turned to dark grey, indicating that an
answer had been placed successfully. The rectangle remained grey at the position
of the answer and moved to a new position when the answer was changed.
3. To allow for a valid response when clicking within the blue rectangle the sensitive
area for valid mouse clicks was enlarged. This was a recommendation in section
4.5 which should reduce the number of interaction failures shown in study 2.
The matrix questions were positioned in the second half of the survey, respectively page
nine and ten. The hypothesis was that the treatment results in a higher completion rate
for item response, that is that it reduces item nonresponse compared to the baseline
condition.
6.3.2. Questionnaire
The survey was a short unrestricted online poll about “Age Differences in Relationships”
by the company Der zweite Frühling [The second spring]. The company offers an online
service to connect people above the age of 40. The survey consisted of 20 questions and
17 pages. The mean time to complete the survey was 7 minutes, 30 seconds.
6.3.3. Participants
Invitations were sent to subscribers of the company’s e-mail newsletter and an invitation
link was placed on their website. Survey participation was not restricted and respondents
110
Increasing Item Completion Rates: Interactivity in Matrix Questions
were self-selected. No incentive was offered. The first page informed participants about
the anonymity of the survey and the collection of additional data such as window size,
mouse clicks and times as part of methodological experiments. It was also mentioned
that respondents were able to refuse analysis of their data at the end of the survey if they
had reconsidered their participation. Only one respondent (0.2%) used this possibility
and was deleted from the data set.6
Respondents were between 19 and 75 years old with a mean age of 50.8 (𝑆𝐷 = 8.5).
159 respondents were male (35.4%) and 290 respondents were female (64.6%).
An overall of 708 participants started the survey. 140 participants dropped out on
the introduction screen. 459 respondents completed the survey. Taking the amount of
participants who viewed the first page as basis, the response rate for completions was
64.8%. Participants were randomly assigned to one of two experimental groups in the
beginning of the survey.
6.3.4. Results
The first step in the analysis is to test whether the experimental groups differed in their
dropout rates. This was not the case. During the two matrix questions in the experiment,
12 respondents quit the survey in the treatment condition and 13 respondents abandoned
the survey in the baseline condition. This is 1.7% and 1.8% respectively of those who
had started the survey. There is also no difference in dropout patterns across the whole
survey, with 52 and 50 dropouts per condition.
The hypothesis was that in the treatment group there should be less items missing.
To test this hypothesis the number of items missing for the two matrix questions was
counted. This resulted in a number of items missing per respondent between 0 and 16.
Table 6.6 lists the distribution of items missing. Problematic for analysis is the fact
that many cells have fewer than 5 cases. Therefore, all categories for items missing were
collapsed into a single category (table 6.7). The results support the directed hypothesis:
The treatment condition with added feedback and an extended clickable area resulted in
a significant 3.5% higher completion rate for items, 𝜒2(1) = 3.0, 𝑝 = .041 (one-tailed).
6 He/she was treated as ineligible respondent and was excluded from all following calculations. Al-though researchers might feel uneasy with adding such a last question, the expectation to loose datawas unjustified in this survey. On the contrary, such an approach is in accordance with online surveyresearch guidelines which state that respondents should always have the possibility to withdraw theirconsent: “During the survey respondents must always have the possibility to withdraw their previousconsent. In which case all collected data must be deleted at once.” (ADM et al., 2000, p. 2, mytranslation). The codes of conduct claim that a break-off should always be possible (ADM, ASI,BVM, & DGOF, 2001).
111
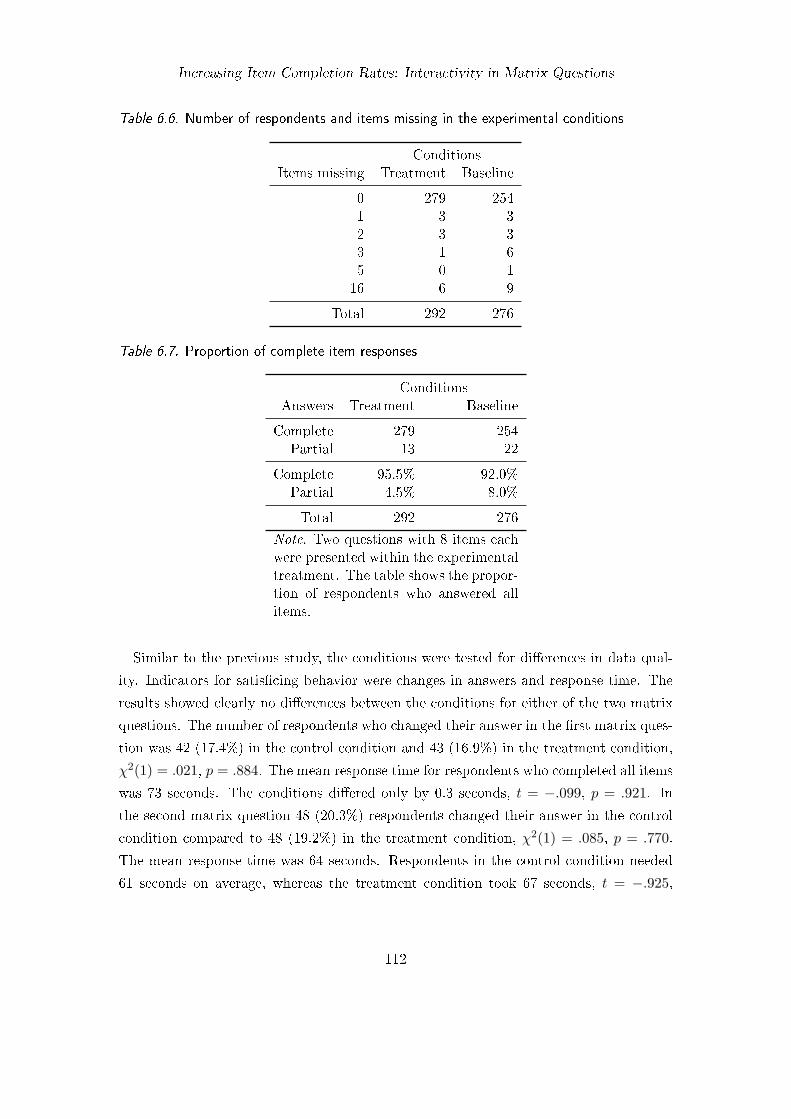
Increasing Item Completion Rates: Interactivity in Matrix Questions
Table 6.6. Number of respondents and items missing in the experimental conditions
ConditionsItems missing Treatment Baseline
0 279 2541 3 32 3 33 1 65 0 116 6 9
Total 292 276
Table 6.7. Proportion of complete item responses
ConditionsAnswers Treatment Baseline
Complete 279 254Partial 13 22
Complete 95.5% 92.0%Partial 4.5% 8.0%
Total 292 276
Note. Two questions with 8 items eachwere presented within the experimentaltreatment. The table shows the propor-tion of respondents who answered allitems.
Similar to the previous study, the conditions were tested for differences in data qual-
ity. Indicators for satisficing behavior were changes in answers and response time. The
results showed clearly no differences between the conditions for either of the two matrix
questions. The number of respondents who changed their answer in the first matrix ques-
tion was 42 (17.4%) in the control condition and 43 (16.9%) in the treatment condition,
𝜒2(1) = .021, 𝑝 = .884. The mean response time for respondents who completed all items
was 73 seconds. The conditions differed only by 0.3 seconds, 𝑡 = −.099, 𝑝 = .921. In
the second matrix question 48 (20.3%) respondents changed their answer in the control
condition compared to 48 (19.2%) in the treatment condition, 𝜒2(1) = .085, 𝑝 = .770.
The mean response time was 64 seconds. Respondents in the control condition needed
61 seconds on average, whereas the treatment condition took 67 seconds, 𝑡 = −.925,
112
Increasing Item Completion Rates: Interactivity in Matrix Questions
𝑝 = .355. Overall, no negative effect on data quality for the treatment was found for the
quality indicators response time and changes in answers.
6.3.5. Discussion
This study was designed according to the recommendations presented in earlier sections of
this work. The goal was to combine several techniques in a single treatment and compare
it with a standard implementation of current online surveys. The treatment provided
additional feedback making respondents more aware of the current answer option they
pointed at and making a given answer option more visible. This was accomplished by
highlighting and colorizing the surrounding of the answer buttons. In addition respon-
dents in the treatment condition had a larger area which they could click to provide a
valid answer. Nearby misses of a button click would thus be interpreted as a correct
answer, resulting in a more successful human-survey interaction. The results support
the hypothesis and show a significantly positive effect for the combination of additional
feedback for pre- and post-click behavior and enhanced interactivity, that is enlarged
clickable areas. The next section therefore summarizes the presented research of this
chapter and embeds the results in the broader are of survey methodology.
6.4. Summary and Conclusion
The research presented in this chapter showed that the use of visual aids and visual
feedback in matrix questions is suitable for reducing item nonresponse. The increase in
responses did not decrease data quality.
The theoretical background was shaped by the assumption that feedback is a principal
part in successful human-survey interaction. To identify possible feedback techniques
the task of survey participation was divided into two phases: The phase before clicking,
the pre-selection phase and the time after a click, the post-selection phase which then
overlaps with the pre-selection phase for the next question. Feedback can be provided in
both phases.
The first experiment used a visual cross spanning the row and column to highlight the
position of the mouse pointer. This enhanced the focus on the item wording and the
answer category. Contrary to expectations, the added visual activity in the pre-selection
phase distracted respondents from their task to answer items. Here, the number of
respondents with missing items was 5.5 percentage points higher than in the baseline
implementation. Another condition in the first experiment colorized the row of the item
113
Increasing Item Completion Rates: Interactivity in Matrix Questions
after an answer was selected. This post-selection feedback successfully increased the
number of item completions. This feedback condition had a 2.1 percentage points higher
number of respondents who completed all items compared to the standard condition, and
a 5.2 percentage points higher number of fully participating respondents compared to the
worst-case condition which used a white background. The post-selection feedback also
provided evidence for higher data quality in terms of fewer corrections of answers: The
condition had 7.7 percentage points fewer respondents who changed an initial answer.
Similarly in line with the hypothesis, a matrix question which used only a white back-
ground resulted in a higher number of respondents with items missing than the standard
practice with an alternating striped background (17% vs. 13.9%). There was no negative
impact of either feedback techniques on data quality in terms of response times, changes
in answers, or nonsubstantial answers in the form of ‘don’t know’.
The second experiment combined feedback techniques and an enlarged clickable area
in a single treatment condition to test a combined effect of less obtrusive feedback.
The enlargement of the clickable area was recommended as a result in chapter 4. The
less obtrusive feedback techniques were designed to solve the negative effect of a visual
cross while keeping a positive effect in the pre-selection phase. The pre-selection phase
implemented a highlighting of the table cell which indicated that the cell was clickable
as well. The post-selection phase implemented a color change to dark grey after an
answer was provided which indicated a successful answer. The results showed that the
combined effects in the treatment group successfully increased item completion rates by
3.5 percentage points. There was no negative effect on data quality in terms of response
times and changes in answers.
Overall, the results showed that visual feedback can successfully reduce the number of
items missing. This is supported by recent work which also report a positive effect of post-
selection color changes on item completions (Galesic, Tourangeau, Couper, & Conrad,
2007). A combination with other measures to enhance human-survey interaction provided
a stronger positive effect than single feedback techniques alone. These enhancements in
human-survey interaction perform well for three reasons: Firstly, feedback in the pre-
selection phase supports the attention of respondents by giving stronger visual cues about
the position of the mouse pointer within the questionnaire and by capturing the attention
(Pashler, Johnston, & Ruthruff, 2001). By changing the underlying color it visualizes
where answer clicks are possible. These subtle unobtrusive visual changes strengthen
the connection between the survey and the respondent by constantly reminding him/her
what s/he is about to do. Secondly, the enlargement of the clickable area makes is
114
Increasing Item Completion Rates: Interactivity in Matrix Questions
much easier for respondents to provide an answer, reducing the amount of click failures
and thus frustration. Thirdly, feedback in the post-selection phase provides a strong
assurance that an answer was successfully placed by making the change more visible
(Rensink, 2002). Moreover, the grey color supports the focus on the remaining items,
making it clearly visible which items are still missing or may have been overlooked.
The first experiment included an operationalization of pre-selection feedback (‘cross’)
which actually increased item nonresponse and thus negatively affected the overall survey
performance. That design implementations can be problematic and reduce response rates
was also found by Dillman, Tortora, Conradt, and Bowker (1998) who compared plain vs.
fancy design. Because online survey methodology and Internet technology has changed
much in the last ten years the following should be noted: Some of what Dillman et al.
termed ‘fancy’ design is part of today’s standards, for example the use of HTML-tables.
Similarly, the argumentation of longer transmission times for more complicated HTML-
code is no longer applicable. Nevertheless, the work demonstrates that online survey
design needs careful implementation and must consider the technical environment of the
respondents (cf., availability of technology in chapter 5).
The conclusion is that standard feedback techniques provided in current browsers are
too weak. Respondents would benefit from much stronger feedback. An example in the
Firefox browser may illustrate how small feedback in current browsers with a standard
HTML implementation really is. This can be done by comparing the size and proportion
of visual changes. Common standard sizes are: A single line question with five answer
options may have the size of 640x20 pixels. A radio button’s size is 13x13 pixels. The
changing dot’s size in the middle is 5x5 pixels. A click results in a change of 14.8% of the
radio button’s area. This might seem enough, but the five answer buttons only take up
6.6% of the whole question area which is the clickable area for valid clicks. Accordingly,
a single click only visibly changes 0.2% of the whole question area. In contrast, the first
experiment changed the appearance of the whole item, that is 100% of the item. The
second experiment increased the visible feedback for a single answer to an area of 12.5%
compared to the standard 0.2%. Moreover, the clickable area was increased from 6.6% to
62.5%. These numbers illustrate why visible feedback helps respondents to understand
how they can interact with the survey. As a result, the human-survey interaction is more
successful in leading to a higher number of completed items.
The accumulated evidence of a positive effect for the tested feedback techniques make
them suitable for implementation in survey software packages where the investment in
programming is made up by the huge number of respondents who benefit from these
115

Increasing Item Completion Rates: Interactivity in Matrix Questions
techniques. When an extra investment for a single survey implementation is necessary,
survey researchers should compare the potential benefit of an increased item response
rate with other possible benefits such as investing in an additional pretest to reduce
measurement error. However, when readily available, researchers could benefit from
applying these techniques in survey research.
116
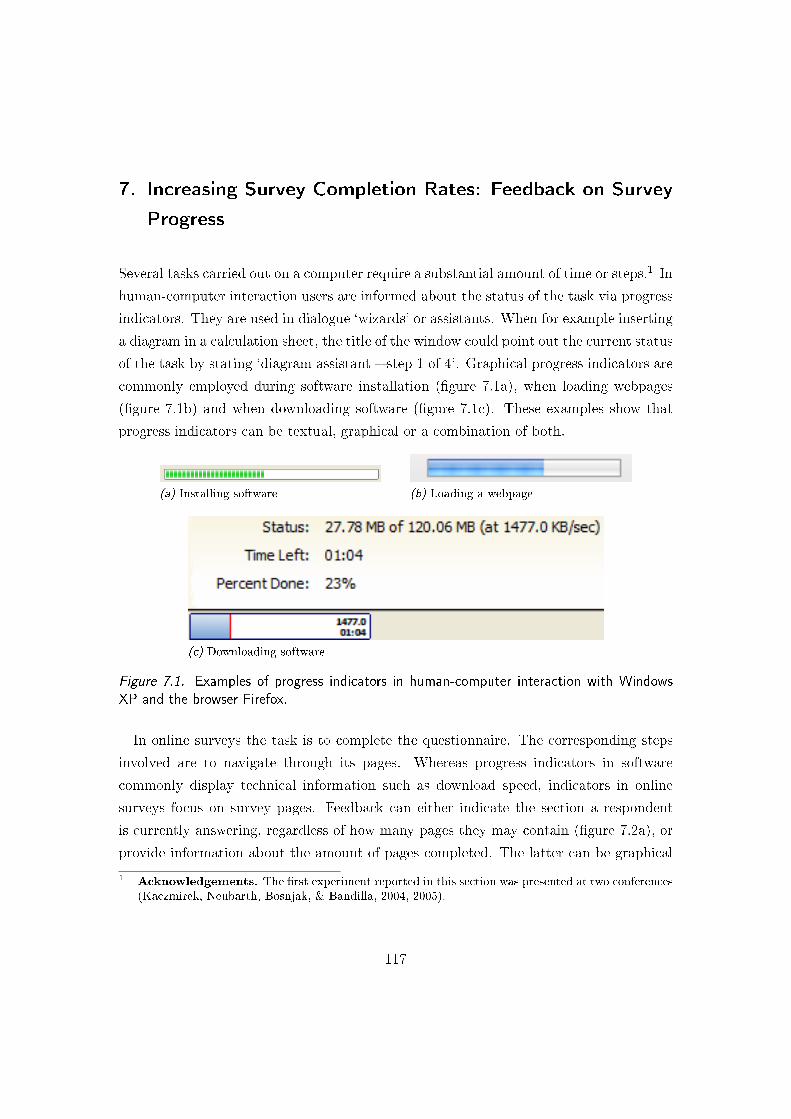
7. Increasing Survey Completion Rates: Feedback on Survey
Progress
Several tasks carried out on a computer require a substantial amount of time or steps.1 In
human-computer interaction users are informed about the status of the task via progress
indicators. They are used in dialogue ‘wizards’ or assistants. When for example inserting
a diagram in a calculation sheet, the title of the window could point out the current status
of the task by stating ‘diagram assistant – step 1 of 4’. Graphical progress indicators are
commonly employed during software installation (figure 7.1a), when loading webpages
(figure 7.1b) and when downloading software (figure 7.1c). These examples show that
progress indicators can be textual, graphical or a combination of both.
(a) Installing software (b) Loading a webpage
(c) Downloading software
Figure 7.1. Examples of progress indicators in human-computer interaction with Windows
XP and the browser Firefox.
In online surveys the task is to complete the questionnaire. The corresponding steps
involved are to navigate through its pages. Whereas progress indicators in software
commonly display technical information such as download speed, indicators in online
surveys focus on survey pages. Feedback can either indicate the section a respondent
is currently answering, regardless of how many pages they may contain (figure 7.2a), or
provide information about the amount of pages completed. The latter can be graphical
1 Acknowledgements. The first experiment reported in this section was presented at two conferences(Kaczmirek, Neubarth, Bosnjak, & Bandilla, 2004, 2005).
117
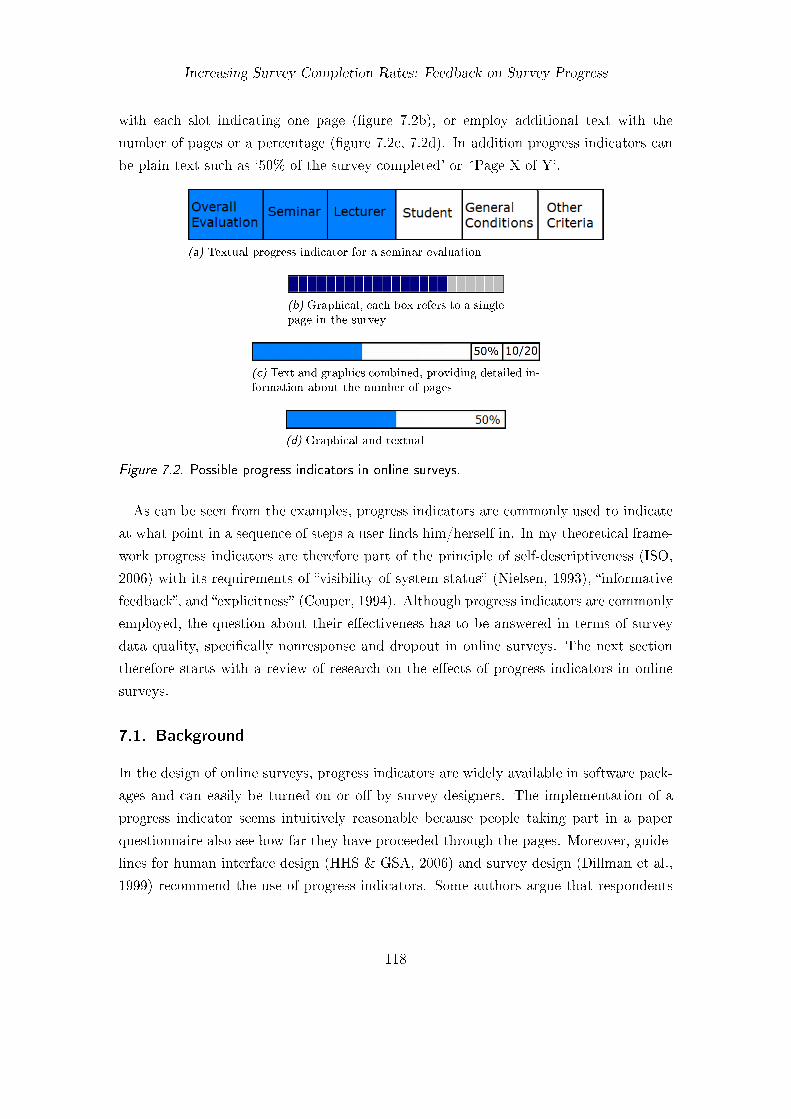
Increasing Survey Completion Rates: Feedback on Survey Progress
with each slot indicating one page (figure 7.2b), or employ additional text with the
number of pages or a percentage (figure 7.2c, 7.2d). In addition progress indicators can
be plain text such as ‘50% of the survey completed’ or ´Page X of Y’.
(a) Textual progress indicator for a seminar evaluation
(b) Graphical, each box refers to a singlepage in the survey
(c) Text and graphics combined, providing detailed in-formation about the number of pages
(d) Graphical and textual
Figure 7.2. Possible progress indicators in online surveys.
As can be seen from the examples, progress indicators are commonly used to indicate
at what point in a sequence of steps a user finds him/herself in. In my theoretical frame-
work progress indicators are therefore part of the principle of self-descriptiveness (ISO,
2006) with its requirements of “visibility of system status” (Nielsen, 1993), “informative
feedback”, and “explicitness” (Couper, 1994). Although progress indicators are commonly
employed, the question about their effectiveness has to be answered in terms of survey
data quality, specifically nonresponse and dropout in online surveys. The next section
therefore starts with a review of research on the effects of progress indicators in online
surveys.
7.1. Background
In the design of online surveys, progress indicators are widely available in software pack-
ages and can easily be turned on or off by survey designers. The implementation of a
progress indicator seems intuitively reasonable because people taking part in a paper
questionnaire also see how far they have proceeded through the pages. Moreover, guide-
lines for human interface design (HHS & GSA, 2006) and survey design (Dillman et al.,
1999) recommend the use of progress indicators. Some authors argue that respondents
118
Increasing Survey Completion Rates: Feedback on Survey Progress
who are likely to quit at the end of a questionnaire might benefit from feedback on
progress that suggests that they have reached the final questions (Dillman et al., 1999;
Couper et al., 2001). Nevertheless, research on progress indicators provided mixed re-
sults, showing no effect of progress indicators (Heerwegh, 2004), a tendency towards a
positive effect (Couper et al., 2001) or a negative effect (Crawford, Couper, & Lamias,
2001).
[Recent research provides evidence] that the degree to which the feedback matches respondents’ ex-
pectations is related to its impact: slower-than-expected progress could be discouraging and increase
break-offs while faster-than expected feedback could be encouraging and reduce breakoffs. (Conrad,
Couper, Tourangeau, & Peytchev, 2005, p. 1921).
Conrad, Couper, Tourangeau, and Peytchev (2005) showed that early and heavy overre-
porting of factual progress increased the completion rate, while heavy underreporting in
the beginning decreased the completion rate. The difference in completion rates between
these two extreme conditions was 10.5% which is more than the 1–8 percent reported by
other authors (Couper et al., 2001; Crawford et al., 2001; Heerwegh, 2004).
Respondents can use a progress indicator to reassess the estimated time to completion
by comparing the elapsed time with the progress shown. When the estimated time to
completion exceeds the time which respondents are willing to spend on the survey dropout
occurs. Thus, a survey underreports the progress when it informs respondents that they
have finished 20% of the pages when these first pages actually take 51% of the time to
completion. In effect such a progress indicator leads to an even higher dropout than
no progress indicator. Crawford et al. (2001) made a post-hoc analysis of the elapsed
time in comparison with the reported feedback which explains the negative effect of such
a progress indicator. Heerwegh (2004) avoided this standard but problematic approach
which uses completed pages for progress calculation. Instead, he used completion times
for each page from pretests to calculate the progress. This resulted in a very accurate
feedback of the necessary time which respondents had invested and still needed to invest
to complete the survey. Hence, he found no negative effect of a progress indicator, but
on the contrary a tendency of 1.3% higher completion rate in favor of progress indicators
was observed.
Summarizing, progress indicators can have a positive effect on completion rates when
implemented with care. Researchers should take precautions to make sure that their
questionnaire does not lead to an underreporting of progress in the beginning of the
questionnaire. This can happen easily when open-ended questions are asked in the be-
ginning. This question type takes considerably more time to answer than rating scales.
119
Increasing Survey Completion Rates: Feedback on Survey Progress
As a result an automatic progress indicator as provided by software packages which use
the number of the pages as a basis for calculation would underreport the actual survey
progress. The countermeasure of overreporting is also problematic as it misleads respon-
dents by an extensive exaggeration of the progress in the beginning to increase completion
rates. This is not an option for companies adhering to the codes of conduct. Heerwegh
(2004) has shown that a thorough preparation of the progress calculations based on
response times can avoid negative effects. However, current surveys do not make this ad-
ditional effort to calibrate their progress indicators on participation times. Instead, they
use the available automatic calculation method based on page numbers. Additionally,
time calibrations become complicated when filter paths are employed. Here, respondents
would need different progress information on the same pages depending on the questions
they have answered or skipped. In the following, my research therefore addresses auto-
matic calculation methods. The next sections explain the problem of ‘jumping progress
indicators’ associated with filter questions and provide a solution.
7.2. Improving the Accuracy of Progress Feedback
7.2.1. Jumping Progress: Problems With Filter Questions
Progress indicators are used to inform participants of surveys about the degree of comple-
tion and the remaining numbers of questions. The main aim of progress indicators is to
reduce dropout rates. Theory holds that this is accomplished by allowing participants to
estimate the remaining time till completion. Participants might base their estimation on
the time invested in relation to the number of completed items and the perceived speed
of the progress indicator. If the estimated time till completion is beyond acceptance the
participant drops out.
A common method displays the number of pages completed and the total number
of pages in the survey. These numbers may be visualized by a graphical bar which
either substitutes the numbers or supports them. Instead of the raw page numbers the
percentage of completed pages may be displayed. These methods can be characterized
as static approaches in computing the percentage till completion. When using surveys
which implement filter techniques this leads to a serious problem: filters used to skip
non-appropriate items for groups of participants cause the progress indicator to jump
to completion rather than progress in a smooth way. For participants, this behavior
results in unpredictable percentages and thus destroys the advantages of predictable
time estimations.
120
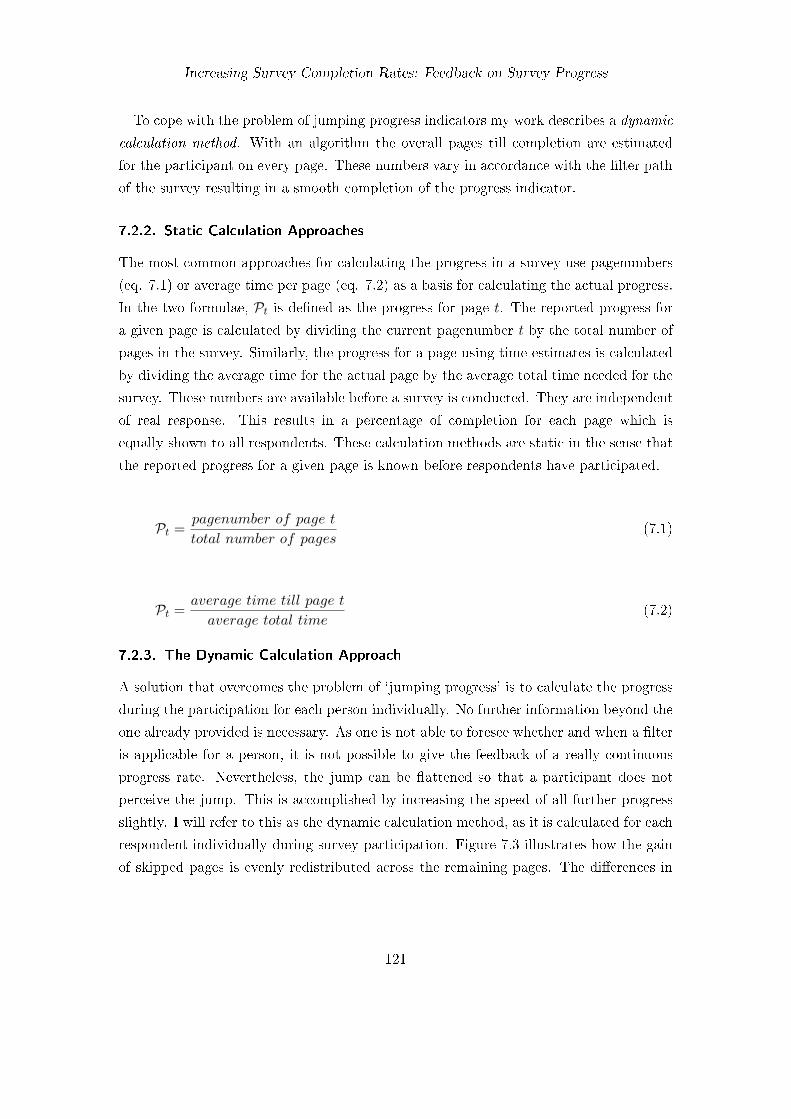
Increasing Survey Completion Rates: Feedback on Survey Progress
To cope with the problem of jumping progress indicators my work describes a dynamic
calculation method. With an algorithm the overall pages till completion are estimated
for the participant on every page. These numbers vary in accordance with the filter path
of the survey resulting in a smooth completion of the progress indicator.
7.2.2. Static Calculation Approaches
The most common approaches for calculating the progress in a survey use pagenumbers
(eq. 7.1) or average time per page (eq. 7.2) as a basis for calculating the actual progress.
In the two formulae, 𝒫𝑡 is defined as the progress for page 𝑡. The reported progress for
a given page is calculated by dividing the current pagenumber 𝑡 by the total number of
pages in the survey. Similarly, the progress for a page using time estimates is calculated
by dividing the average time for the actual page by the average total time needed for the
survey. These numbers are available before a survey is conducted. They are independent
of real response. This results in a percentage of completion for each page which is
equally shown to all respondents. These calculation methods are static in the sense that
the reported progress for a given page is known before respondents have participated.
𝒫𝑡 =𝑝𝑎𝑔𝑒𝑛𝑢𝑚𝑏𝑒𝑟 𝑜𝑓 𝑝𝑎𝑔𝑒 𝑡
𝑡𝑜𝑡𝑎𝑙 𝑛𝑢𝑚𝑏𝑒𝑟 𝑜𝑓 𝑝𝑎𝑔𝑒𝑠(7.1)
𝒫𝑡 =𝑎𝑣𝑒𝑟𝑎𝑔𝑒 𝑡𝑖𝑚𝑒 𝑡𝑖𝑙𝑙 𝑝𝑎𝑔𝑒 𝑡
𝑎𝑣𝑒𝑟𝑎𝑔𝑒 𝑡𝑜𝑡𝑎𝑙 𝑡𝑖𝑚𝑒(7.2)
7.2.3. The Dynamic Calculation Approach
A solution that overcomes the problem of ‘jumping progress’ is to calculate the progress
during the participation for each person individually. No further information beyond the
one already provided is necessary. As one is not able to foresee whether and when a filter
is applicable for a person, it is not possible to give the feedback of a really continuous
progress rate. Nevertheless, the jump can be flattened so that a participant does not
perceive the jump. This is accomplished by increasing the speed of all further progress
slightly. I will refer to this as the dynamic calculation method, as it is calculated for each
respondent individually during survey participation. Figure 7.3 illustrates how the gain
of skipped pages is evenly redistributed across the remaining pages. The differences in
121
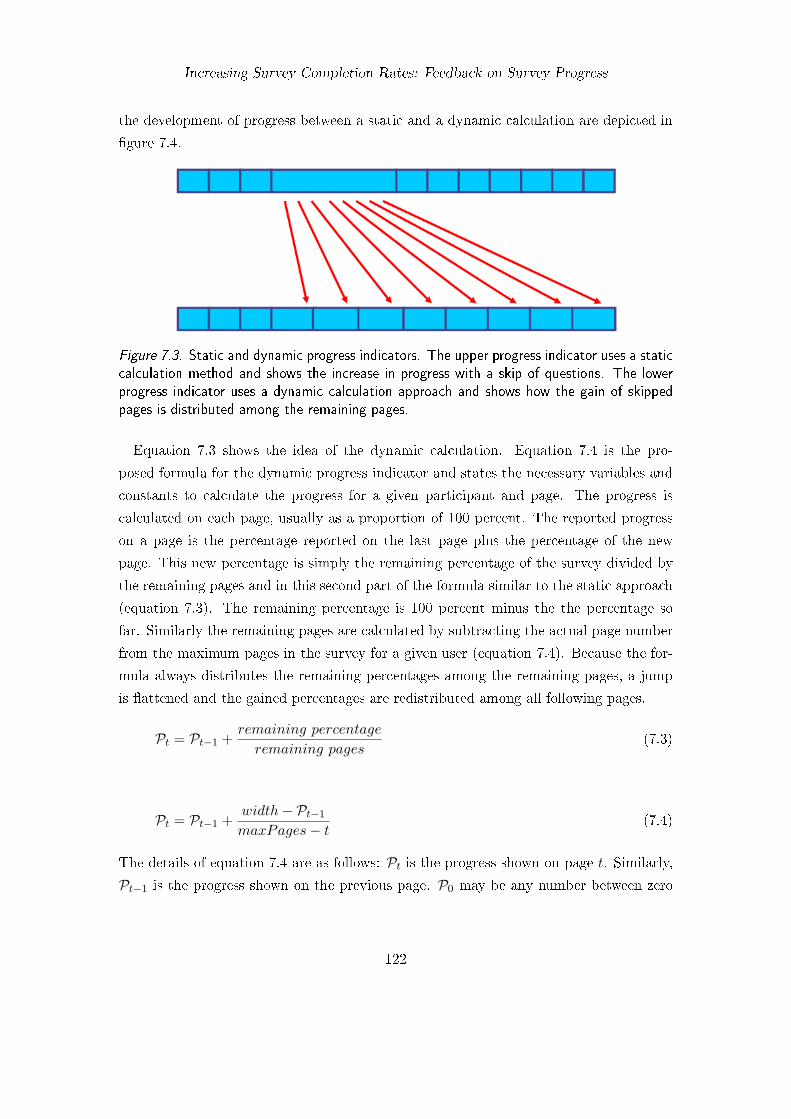
Increasing Survey Completion Rates: Feedback on Survey Progress
the development of progress between a static and a dynamic calculation are depicted in
figure 7.4.
Figure 7.3. Static and dynamic progress indicators. The upper progress indicator uses a static
calculation method and shows the increase in progress with a skip of questions. The lower
progress indicator uses a dynamic calculation approach and shows how the gain of skipped
pages is distributed among the remaining pages.
Equation 7.3 shows the idea of the dynamic calculation. Equation 7.4 is the pro-
posed formula for the dynamic progress indicator and states the necessary variables and
constants to calculate the progress for a given participant and page. The progress is
calculated on each page, usually as a proportion of 100 percent. The reported progress
on a page is the percentage reported on the last page plus the percentage of the new
page. This new percentage is simply the remaining percentage of the survey divided by
the remaining pages and in this second part of the formula similar to the static approach
(equation 7.3). The remaining percentage is 100 percent minus the the percentage so
far. Similarly the remaining pages are calculated by subtracting the actual page number
from the maximum pages in the survey for a given user (equation 7.4). Because the for-
mula always distributes the remaining percentages among the remaining pages, a jump
is flattened and the gained percentages are redistributed among all following pages.
𝒫𝑡 = 𝒫𝑡−1 +𝑟𝑒𝑚𝑎𝑖𝑛𝑖𝑛𝑔 𝑝𝑒𝑟𝑐𝑒𝑛𝑡𝑎𝑔𝑒
𝑟𝑒𝑚𝑎𝑖𝑛𝑖𝑛𝑔 𝑝𝑎𝑔𝑒𝑠(7.3)
𝒫𝑡 = 𝒫𝑡−1 +𝑤𝑖𝑑𝑡ℎ− 𝒫𝑡−1
𝑚𝑎𝑥𝑃𝑎𝑔𝑒𝑠− 𝑡(7.4)
The details of equation 7.4 are as follows: 𝒫𝑡 is the progress shown on page 𝑡. Similarly,
𝒫𝑡−1 is the progress shown on the previous page. 𝒫0 may be any number between zero
122
Increasing Survey Completion Rates: Feedback on Survey Progress
Figure 7.4. Development of progress with static and dynamic calculation.
and 𝑤𝑖𝑑𝑡ℎ. It is an offset for the beginning progress and usually zero. 𝑤𝑖𝑑𝑡ℎ is a constant
and should be set as the number to be reached by completion, usually 100 (=100%). In
other cases, for example when the progress is directly to be translated into the width of a
graphical progress bar, 𝑤𝑖𝑑𝑡ℎ can be set to correspond to the width of a fully completed
survey, for example 300 pixels in technical terms. 𝑚𝑎𝑥𝑃𝑎𝑔𝑒𝑠 is the maximum number
of pages a participant has to visit to complete the survey.
The most flexible way to implement the formula is to increase t by one for every forward
navigation in the questionnaire. The start settings are 𝑡 = 0 on the first page (e.g., the
invitation page without a progress indicator), 𝑤𝑖𝑑𝑡ℎ = 100, 𝒫0 = 0 and 𝑚𝑎𝑥𝑃𝑎𝑔𝑒𝑠
being the highest number of pages a participant has to view to complete the survey.2
If a skip occurs, 𝑚𝑎𝑥𝑃𝑎𝑔𝑒𝑠 is reduced by the number of skipped pages. The following
example uses a survey with 30 pages. The initial settings are 𝑡 = 0, 𝑤𝑖𝑑𝑡ℎ = 100,
𝒫0 = 0 and 𝑚𝑎𝑥𝑃𝑎𝑔𝑒𝑠 = 30. If a participant jumps from page 1 (𝑡 = 1) to page 6,
the next values would be: 𝑡 = 2 and 𝑚𝑎𝑥𝑃𝑎𝑔𝑒𝑠 = 30 − 5 = 25. 𝑚𝑎𝑥𝑃𝑎𝑔𝑒𝑠 is reduced
by the number of pages skipped. If pages are conditionally inserted, for example a
2 If some progress should be shown on the first page, we can set 𝑡 = 1 on the first survey page butmust ensure also to increase 𝑚𝑎𝑥𝑃𝑎𝑔𝑒𝑠 by one.
123
Increasing Survey Completion Rates: Feedback on Survey Progress
question on page one leads to five additional pages, the next values would be: 𝑡 = 2 and
𝑚𝑎𝑥𝑃𝑎𝑔𝑒𝑠 = 30 + 5 = 35. 𝑚𝑎𝑥𝑃𝑎𝑔𝑒𝑠 is increased by the number of pages inserted.
Whether pages are skipped or inserted depends on the implementation of filters and
results in an accelerated or slowed-down progress.3
The following list summarizes the dynamic calculation approach:
∙ The dynamic approach calculates the progress during participation for each person
individually.
∙ There is no need for more information compared to previous calculation methods.
∙ The remaining percentage is distributed among the remaining pages. This way, the
formula avoids a jumping progress in favor of an increased speed of progress.
∙ The progress indicator can be initialised with any percentage.
∙ The dynamic approach can also be used with time estimates or item numbers
instead of page numbers.
∙ Inserting conditional additional questions does not decrease the progress.
∙ The algorithm works in environments where the page numbers are not fixed, for
example due to randomized pages or experimental settings.
∙ The algorithm can be implemented in a way so that even backward navigation
increases the progress.4
The above section developed a solution against irritating behavior of progress indicators
in surveys with filters and skips. The next step was to experimentally compare the
proposed solution of a dynamic calculation method with the traditional static calculation
method.
7.3. Employing Feedback Dynamically and Individually (Study 6)
The online experiment described here compared the different forms of progress indicators
as described in the previous section.
3 Accelerating progress is similar to the ‘slow-to-fast’ and decreasing progress similar to the ‘fast-to-slow’ conditions in the experiments used by Conrad, Couper, Tourangeau, and Peytchev (2005).Because the experiments artificially exaggerated or diminished the progress feedback these terms areavoided in the present context.
4 Although such an implementation is not recommended, one may accomplish this behavior by increas-ing 𝑡 for every navigation forward and backward while adding 1 to 𝑚𝑎𝑥𝑃𝑎𝑔𝑒 for every backwardnavigation. This adds progress to every navigation while slowing the whole survey progress down.
124
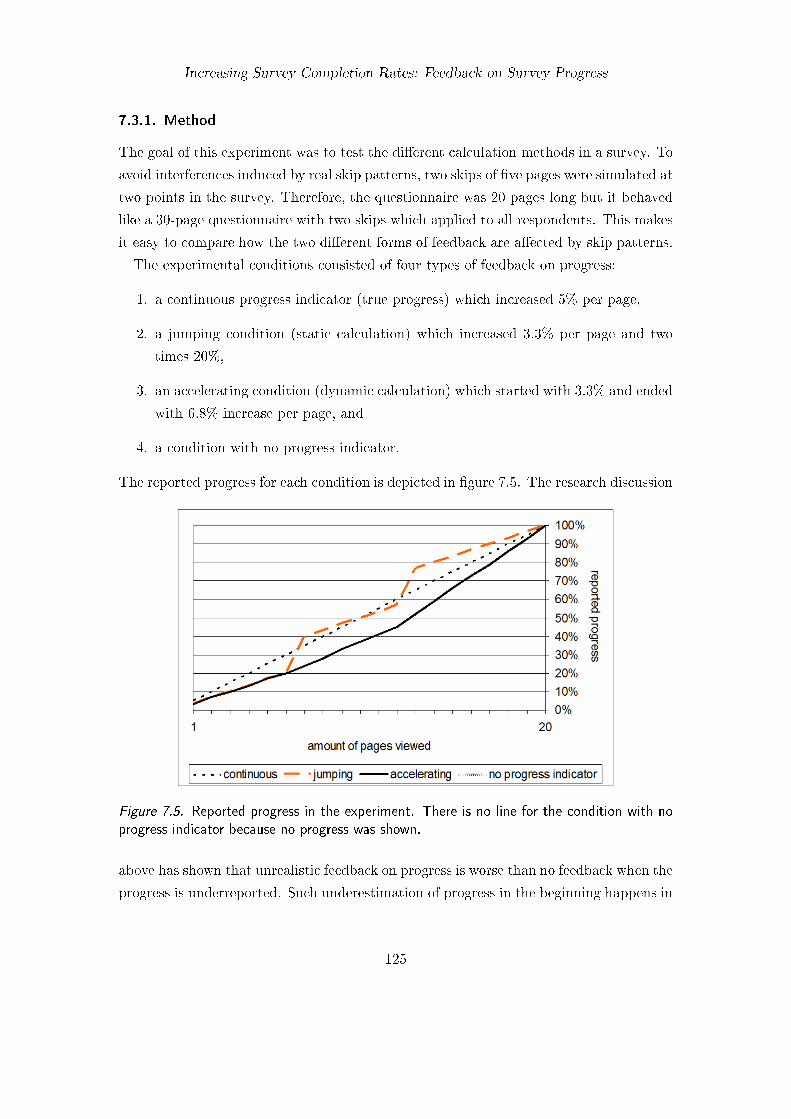
Increasing Survey Completion Rates: Feedback on Survey Progress
7.3.1. Method
The goal of this experiment was to test the different calculation methods in a survey. To
avoid interferences induced by real skip patterns, two skips of five pages were simulated at
two points in the survey. Therefore, the questionnaire was 20 pages long but it behaved
like a 30-page questionnaire with two skips which applied to all respondents. This makes
it easy to compare how the two different forms of feedback are affected by skip patterns.
The experimental conditions consisted of four types of feedback on progress:
1. a continuous progress indicator (true progress) which increased 5% per page,
2. a jumping condition (static calculation) which increased 3.3% per page and two
times 20%,
3. an accelerating condition (dynamic calculation) which started with 3.3% and ended
with 6.8% increase per page, and
4. a condition with no progress indicator.
The reported progress for each condition is depicted in figure 7.5. The research discussion
Figure 7.5. Reported progress in the experiment. There is no line for the condition with no
progress indicator because no progress was shown.
above has shown that unrealistic feedback on progress is worse than no feedback when the
progress is underreported. Such underestimation of progress in the beginning happens in
125
Increasing Survey Completion Rates: Feedback on Survey Progress
surveys with non-applicable filter questions. In the experiment, this was simulated in the
condition with a jumping progress indicator using the static calculation method. Thus,
this condition should lead to a lower completion rate than no progress indicator. A true
feedback on progress however such as in the condition with a continuous progress indica-
tor should be superior. It is important to note that such a true progress is not available
in real survey settings because researchers cannot know whether filter questions apply
or not before they are answered. The best estimate in a real survey setting is therefore
the condition using the dynamic calculation method. The completion rate in this dy-
namic calculation condition should be higher than with a jumping progress indicator but
lower than with a true –but naturally unavailable– progress feedback. Summarizing the
hypothesis for a survey with filter questions, I expect the following order of completion
rates across the different forms of progress indicators: static calculation < no progress
indicator < dynamic calculation < true progress report.
7.3.2. Questionnaire
The topic consisted of 17 pages on cooking and 3 pages with interim questions (on page
6, 12, and 19) about the perceived burden, perceived time flow, and expected time till
completion. A simulated filter jump was attached after pages 6 and 12. The survey
took about 8 minutes to complete. To maintain an identical survey for everyone, each
participant received the same 20 pages. The only difference consisted of the feedback of
the progress indicator.
7.3.3. Participants
Participants were people visiting the Sozioland webpages, which is a site for entertainment
surveys and online access panels. The sample was thus a non-probability self-selected
sample with people interested in polls as entertainment. 1091 respondents started the
survey. 332 participants dropped out on the introduction screen, leaving 759 respon-
dents for the experiment. 620 respondents completed the questionnaire, resulting in a
completion rate of 56.8%. Calculating from page two where the experiment begins, the
completion rate was 81.7%. Age was asked in categories. Most respondents reported
being between 19–29 years old (35%) and 30–39 years old (26%). 495 respondents were
asked whether they were male or female. 66.5% of the respondents reported being female,
27.0% reported being male, and 6.5% refused to answer.
126
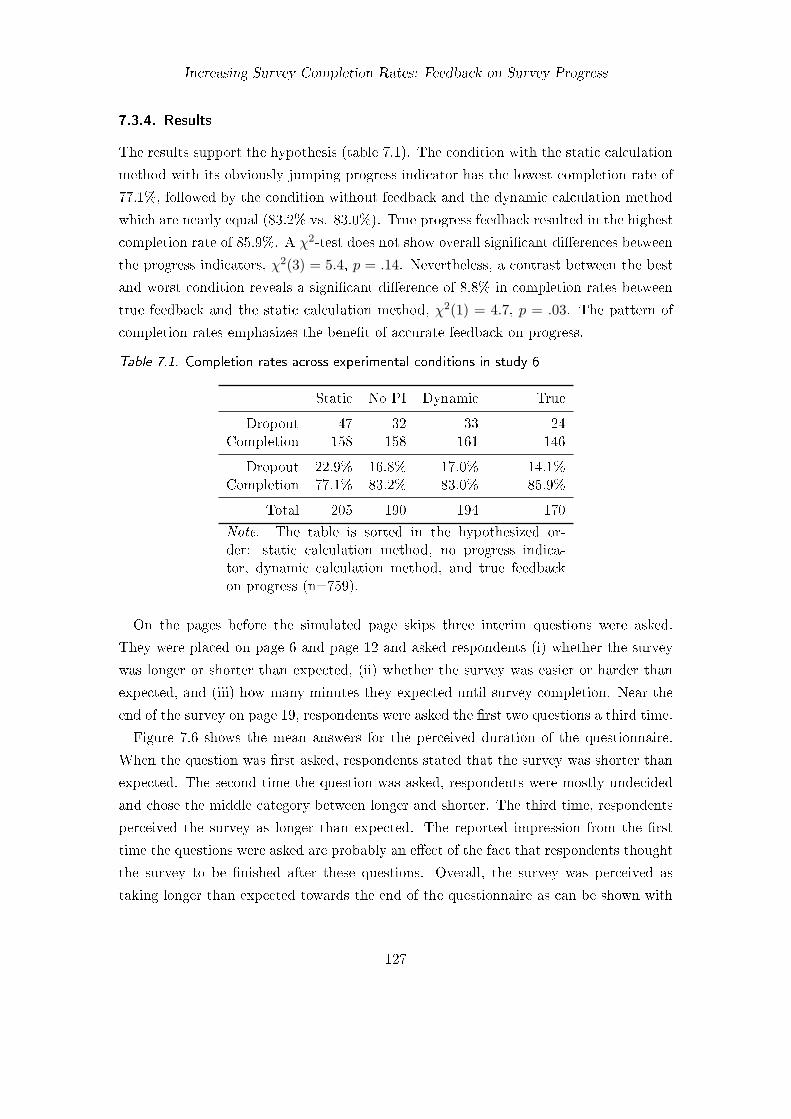
Increasing Survey Completion Rates: Feedback on Survey Progress
7.3.4. Results
The results support the hypothesis (table 7.1). The condition with the static calculation
method with its obviously jumping progress indicator has the lowest completion rate of
77.1%, followed by the condition without feedback and the dynamic calculation method
which are nearly equal (83.2% vs. 83.0%). True progress feedback resulted in the highest
completion rate of 85.9%. A 𝜒2-test does not show overall significant differences between
the progress indicators, 𝜒2(3) = 5.4, 𝑝 = .14. Nevertheless, a contrast between the best
and worst condition reveals a significant difference of 8.8% in completion rates between
true feedback and the static calculation method, 𝜒2(1) = 4.7, 𝑝 = .03. The pattern of
completion rates emphasizes the benefit of accurate feedback on progress.
Table 7.1. Completion rates across experimental conditions in study 6
Static No PI Dynamic True
Dropout 47 32 33 24Completion 158 158 161 146
Dropout 22.9% 16.8% 17.0% 14.1%Completion 77.1% 83.2% 83.0% 85.9%
Total 205 190 194 170
Note. The table is sorted in the hypothesized or-der: static calculation method, no progress indica-tor, dynamic calculation method, and true feedbackon progress (n=759).
On the pages before the simulated page skips three interim questions were asked.
They were placed on page 6 and page 12 and asked respondents (i) whether the survey
was longer or shorter than expected, (ii) whether the survey was easier or harder than
expected, and (iii) how many minutes they expected until survey completion. Near the
end of the survey on page 19, respondents were asked the first two questions a third time.
Figure 7.6 shows the mean answers for the perceived duration of the questionnaire.
When the question was first asked, respondents stated that the survey was shorter than
expected. The second time the question was asked, respondents were mostly undecided
and chose the middle category between longer and shorter. The third time, respondents
perceived the survey as longer than expected. The reported impression from the first
time the questions were asked are probably an effect of the fact that respondents thought
the survey to be finished after these questions. Overall, the survey was perceived as
taking longer than expected towards the end of the questionnaire as can be shown with
127
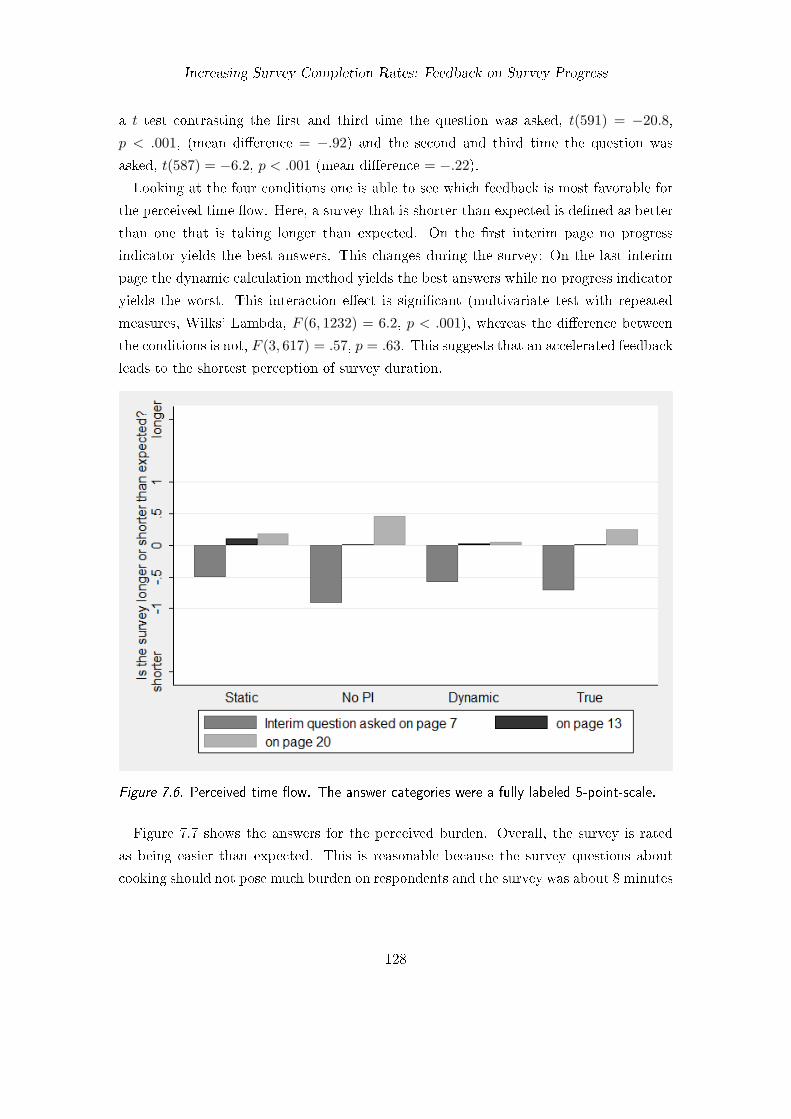
Increasing Survey Completion Rates: Feedback on Survey Progress
a 𝑡 test contrasting the first and third time the question was asked, 𝑡(591) = −20.8,
𝑝 < .001, (mean difference = −.92) and the second and third time the question was
asked, 𝑡(587) = −6.2, 𝑝 < .001 (mean difference = −.22).
Looking at the four conditions one is able to see which feedback is most favorable for
the perceived time flow. Here, a survey that is shorter than expected is defined as better
than one that is taking longer than expected. On the first interim page no progress
indicator yields the best answers. This changes during the survey: On the last interim
page the dynamic calculation method yields the best answers while no progress indicator
yields the worst. This interaction effect is significant (multivariate test with repeated
measures, Wilks’ Lambda, 𝐹 (6, 1232) = 6.2, 𝑝 < .001), whereas the difference between
the conditions is not, 𝐹 (3, 617) = .57, 𝑝 = .63. This suggests that an accelerated feedback
leads to the shortest perception of survey duration.
Figure 7.6. Perceived time flow. The answer categories were a fully labeled 5-point-scale.
Figure 7.7 shows the answers for the perceived burden. Overall, the survey is rated
as being easier than expected. This is reasonable because the survey questions about
cooking should not pose much burden on respondents and the survey was about 8 minutes
128
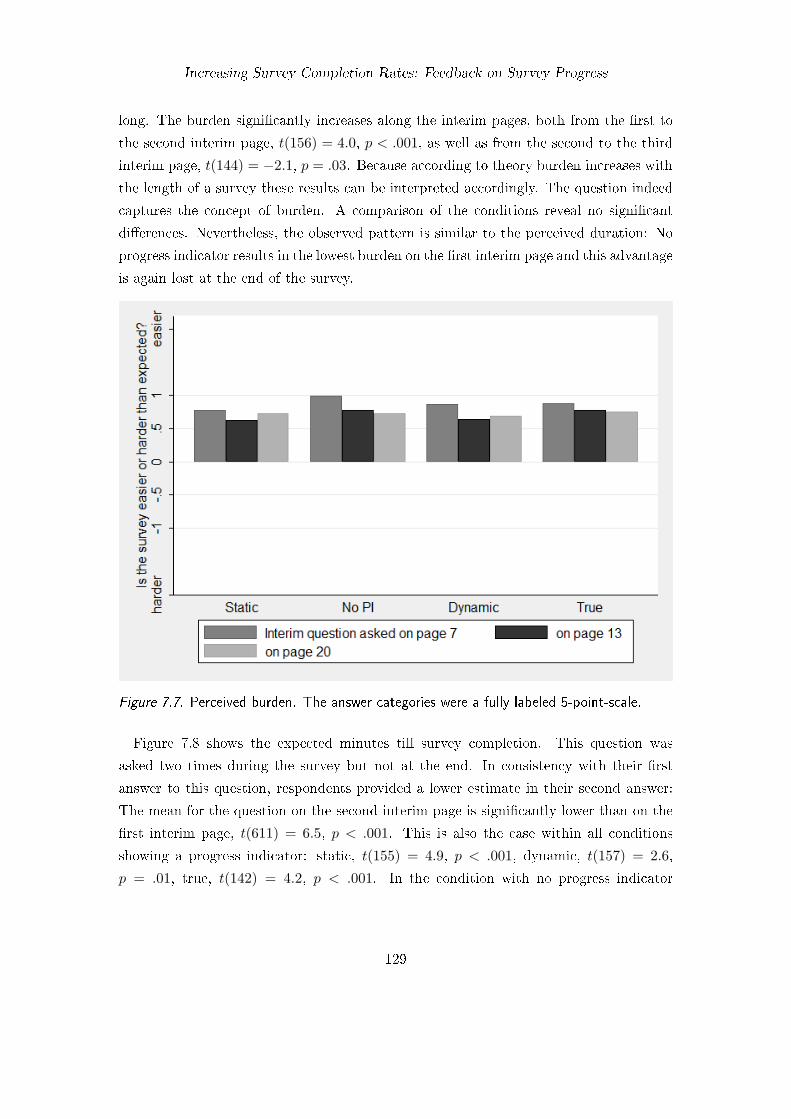
Increasing Survey Completion Rates: Feedback on Survey Progress
long. The burden significantly increases along the interim pages, both from the first to
the second interim page, 𝑡(156) = 4.0, 𝑝 < .001, as well as from the second to the third
interim page, 𝑡(144) = −2.1, 𝑝 = .03. Because according to theory burden increases with
the length of a survey these results can be interpreted accordingly. The question indeed
captures the concept of burden. A comparison of the conditions reveal no significant
differences. Nevertheless, the observed pattern is similar to the perceived duration: No
progress indicator results in the lowest burden on the first interim page and this advantage
is again lost at the end of the survey.
Figure 7.7. Perceived burden. The answer categories were a fully labeled 5-point-scale.
Figure 7.8 shows the expected minutes till survey completion. This question was
asked two times during the survey but not at the end. In consistency with their first
answer to this question, respondents provided a lower estimate in their second answer:
The mean for the question on the second interim page is significantly lower than on the
first interim page, 𝑡(611) = 6.5, 𝑝 < .001. This is also the case within all conditions
showing a progress indicator: static, 𝑡(155) = 4.9, 𝑝 < .001, dynamic, 𝑡(157) = 2.6,
𝑝 = .01, true, 𝑡(142) = 4.2, 𝑝 < .001. In the condition with no progress indicator
129
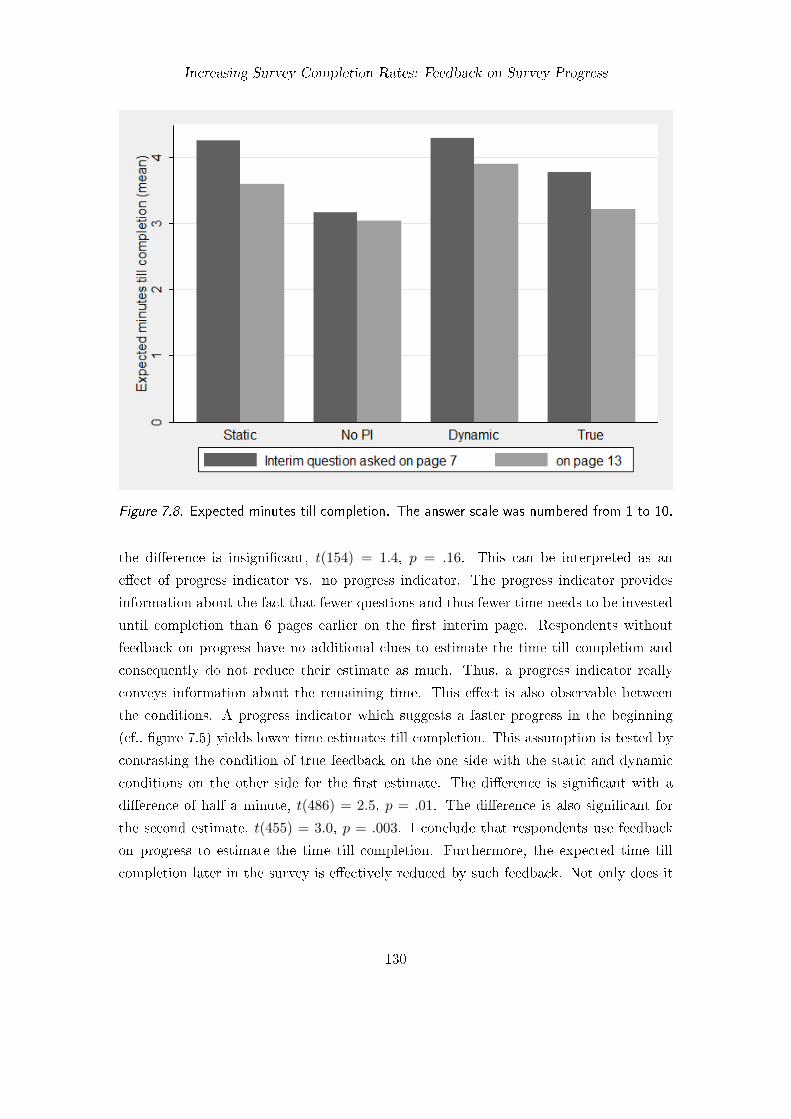
Increasing Survey Completion Rates: Feedback on Survey Progress
Figure 7.8. Expected minutes till completion. The answer scale was numbered from 1 to 10.
the difference is insignificant, 𝑡(154) = 1.4, 𝑝 = .16. This can be interpreted as an
effect of progress indicator vs. no progress indicator. The progress indicator provides
information about the fact that fewer questions and thus fewer time needs to be invested
until completion than 6 pages earlier on the first interim page. Respondents without
feedback on progress have no additional clues to estimate the time till completion and
consequently do not reduce their estimate as much. Thus, a progress indicator really
conveys information about the remaining time. This effect is also observable between
the conditions. A progress indicator which suggests a faster progress in the beginning
(cf., figure 7.5) yields lower time estimates till completion. This assumption is tested by
contrasting the condition of true feedback on the one side with the static and dynamic
conditions on the other side for the first estimate. The difference is significant with a
difference of half a minute, 𝑡(486) = 2.5, 𝑝 = .01. The difference is also significant for
the second estimate, 𝑡(455) = 3.0, 𝑝 = .003. I conclude that respondents use feedback
on progress to estimate the time till completion. Furthermore, the expected time till
completion later in the survey is effectively reduced by such feedback. Not only does it
130
Increasing Survey Completion Rates: Feedback on Survey Progress
make a difference between employing feedback vs. not employing feedback but also the
specific amount of reported progress has a measurable effect on the time estimates.
7.3.5. Discussion
Survey researchers use progress indicators because they expect a positive effect on com-
pletion rates. A straightforward method to calculate the progress to be reported is to
divide the page number by the overall amount of survey pages. This results in a per-
centage for each page which is then shown to the respondents (the static calculation
method). Whenever filter questions are employed in a survey, respondents experience
the phenomenon of a jumping progress indicator as soon as they skip pages. Because it
is impossible to know from the beginning whether a respondent will enter filter paths or
not, the static calculation method is prone to underreport the actual progress of the sur-
vey. Furthermore, jumping behavior of a progress indicator makes it seem less reliable.
To solve this problem I proposed a dynamic calculation method which recalculates the
progress on each page for each respondent individually. The experiment compared these
two calculation methods in a survey with simulated skip patterns. To allow a thorough
analysis it also included conditions with no progress indicators and a progress indicator
which reported the true percentage of completed pages. The hypothesized pattern of
completion rates according to theory was indeed found in the results. Underreporting
the progress in the beginning due to employed filter questions results in lower comple-
tion rates than no progress feedback (static calculation < no progress indicator). The
dynamic calculation method overcomes this problem (static calculation < dynamic cal-
culation) although it starts with the same percentages as the static calculation method.
This is further supported by the fact that a true feedback report results in the highest
completion rates (all other conditions < true progress indicator). Because in a real set-
ting a true progress cannot be calculated from the beginning, the dynamic calculation
method outperforms the other conditions. The positive effect of the dynamic calculation
method is also visible in terms of expected time till completion, perceived burden of the
survey, and the perceived time flow.
7.4. Accelerated, Decelerated and Steady Progress Feedback (Study 7)
In the previous study 6 the dynamic method calculated progress in a conservative way
based on the longest possible survey path. This always results in underreporting of
progress or true progress feedback if no question is skipped. This leads to a speed-up
131
Increasing Survey Completion Rates: Feedback on Survey Progress
of progress feedback as filter questions apply and pages are skipped. The respondent
experiences faster progress towards the end of the survey. Besides beginning with the
longest possible survey path to dynamically calculate progress, one can base the cal-
culations on the shortest possible survey path. This different implementation for the
dynamic calculation of progress is progressive because it tends to overreport progress in
the beginning. The reason is that the calculation starts with the assumption that no
filter questions apply. Here, respondents experience a slowdown of increase in progress
as filter questions apply and he/she is routed through the additional questions in the
filter. The difference between the two methods of dynamic progress calculation is that
in the conservative method the progress is slow in the beginning with possible speed-ups
in the end, whereas in the progressive method the progress is faster in the beginning and
may slow down during participation. The research question addressed in the following
study is therefore which of these two methods for dynamically calculated progress should
be employed.
7.4.1. Method
The experiment tested whether it is better to overreport progress in the beginning and
potentially reduce the added amount of progress reported later on, or whether it is bet-
ter to estimate the progress based on the worst case and adjust progress feedback as
soon as pages are skipped. Three experimental groups were designed. Condition one
reported faster progress in the beginning (progressive calculation method with overre-
porting). Condition two reported faster progress towards the end of the questionnaire
(conservative calculation method with underreporting). Condition three serves as base-
line and employed a constant increase. It was simply the page number divided by the
overall number of pages. Because thirteen pages included a progress indicator the base-
line condition reported an increase of 7.7% per page. The progress calculation for the
progressive and conservative conditions used an equation which raised the value of the
baseline to the power of 1.6. The result was then adjusted so that it fit between 0 and 100
(equations 7.6 and 7.7). Figure 7.9 depicts the percentage respondents were shown on
the pages for each condition. As can be seen, the progressive calculation method steadily
overreports the progress until the end, whereas the conservative method underreports
the progress until the end of the questionnaire.
𝑝 = 𝑏, baseline, with 𝑝 = reported progress, 𝑏 = baseline input (7.5)
132
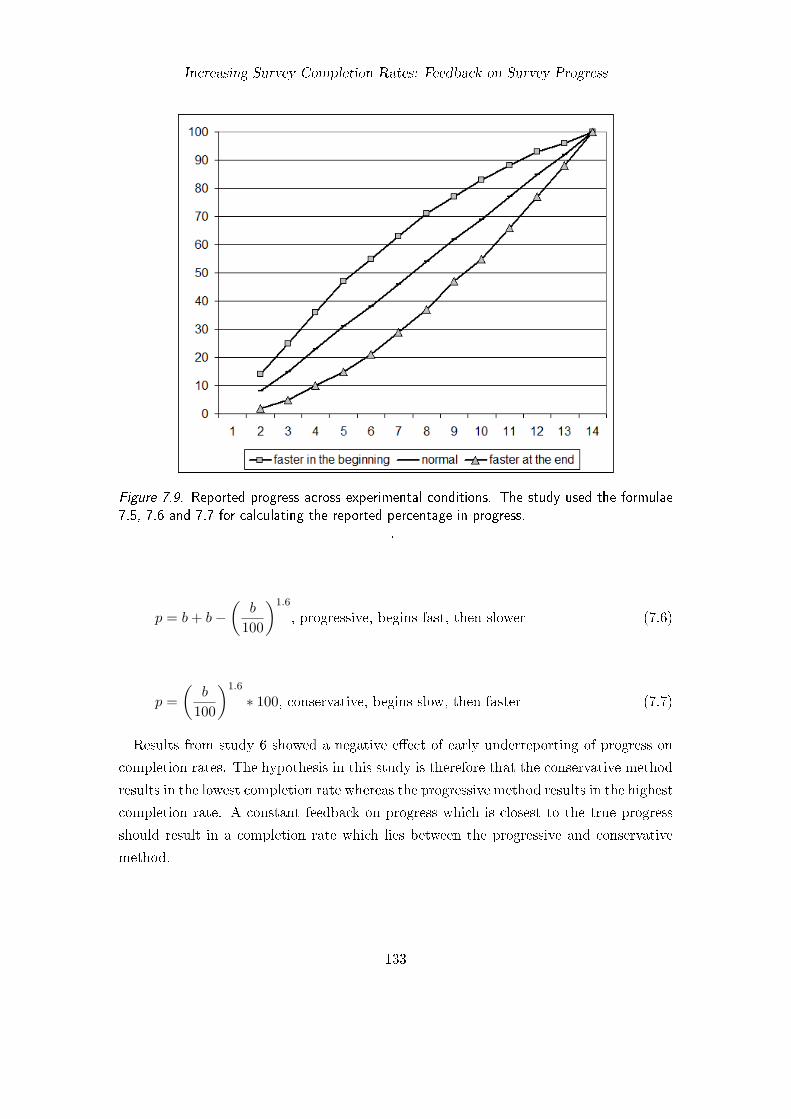
Increasing Survey Completion Rates: Feedback on Survey Progress
Figure 7.9. Reported progress across experimental conditions. The study used the formulae
7.5, 7.6 and 7.7 for calculating the reported percentage in progress.
.
𝑝 = 𝑏 + 𝑏−(︂
𝑏
100
)︂1.6
, progressive, begins fast, then slower (7.6)
𝑝 =(︂
𝑏
100
)︂1.6
* 100, conservative, begins slow, then faster (7.7)
Results from study 6 showed a negative effect of early underreporting of progress on
completion rates. The hypothesis in this study is therefore that the conservative method
results in the lowest completion rate whereas the progressive method results in the highest
completion rate. A constant feedback on progress which is closest to the true progress
should result in a completion rate which lies between the progressive and conservative
method.
133
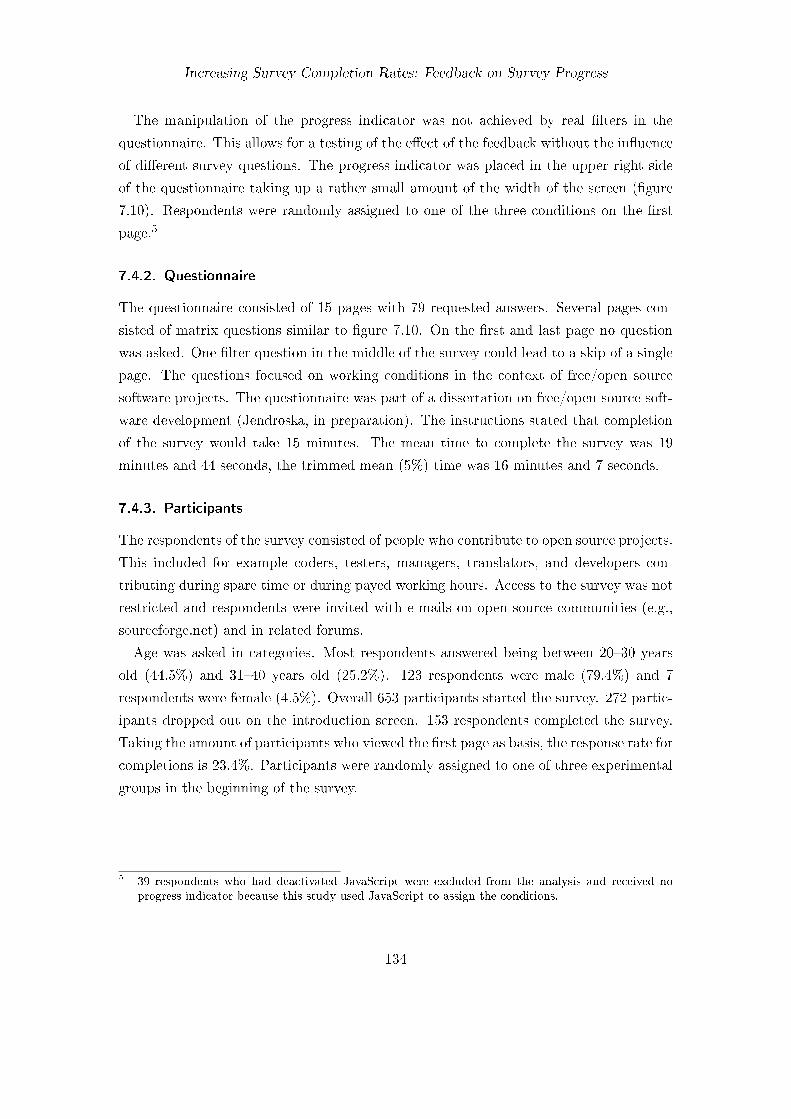
Increasing Survey Completion Rates: Feedback on Survey Progress
The manipulation of the progress indicator was not achieved by real filters in the
questionnaire. This allows for a testing of the effect of the feedback without the influence
of different survey questions. The progress indicator was placed in the upper right side
of the questionnaire taking up a rather small amount of the width of the screen (figure
7.10). Respondents were randomly assigned to one of the three conditions on the first
page.5
7.4.2. Questionnaire
The questionnaire consisted of 15 pages with 79 requested answers. Several pages con-
sisted of matrix questions similar to figure 7.10. On the first and last page no question
was asked. One filter question in the middle of the survey could lead to a skip of a single
page. The questions focused on working conditions in the context of free/open source
software projects. The questionnaire was part of a dissertation on free/open source soft-
ware development (Jendroska, in preparation). The instructions stated that completion
of the survey would take 15 minutes. The mean time to complete the survey was 19
minutes and 44 seconds, the trimmed mean (5%) time was 16 minutes and 7 seconds.
7.4.3. Participants
The respondents of the survey consisted of people who contribute to open source projects.
This included for example coders, testers, managers, translators, and developers con-
tributing during spare time or during payed working hours. Access to the survey was not
restricted and respondents were invited with e-mails on open source communities (e.g.,
sourceforge.net) and in related forums.
Age was asked in categories. Most respondents answered being between 20–30 years
old (44.5%) and 31–40 years old (25.2%). 123 respondents were male (79.4%) and 7
respondents were female (4.5%). Overall 653 participants started the survey. 272 partic-
ipants dropped out on the introduction screen. 153 respondents completed the survey.
Taking the amount of participants who viewed the first page as basis, the response rate for
completions is 23.4%. Participants were randomly assigned to one of three experimental
groups in the beginning of the survey.
5 39 respondents who had deactivated JavaScript were excluded from the analysis and received noprogress indicator because this study used JavaScript to assign the conditions.
134
Increasing Survey Completion Rates: Feedback on Survey Progress
Figure 7.10. Example of the questionnaire used for progress feedback.
7.4.4. Results
The effects of the different progress indicators were analyzed by comparing the differ-
ent completion rates. The results are summarized in table 7.2. The condition which
overreported progress had a 5.7% higher completion rate than the condition which un-
derreported progress. This conforms to the directed hypothesis as stated above. However,
an overall 𝜒2-test reveals that the cell counts do not differ significantly from each other,
𝜒2(2) = 2.98, 𝑝 = .23. In contradiction to the hypothesis, a higher completion rate in
the condition with constant progress was observed than in the condition underreporting
progress. Although this points to the wrong direction, it should be noted that this differ-
ence is within the range of chance as can be seen when comparing these two conditions
only, 𝜒2(1) = .54, 𝑝 = .46. Similarly, the over- and underreporting conditions are not
significantly different from each other, 𝜒2(1) = .90, 𝑝 = .34. A final comparison contrast-
ing the extremes between the condition with constant progress and the condition with
overreporting reveals a marginally significant difference in completion rates, 𝜒2(1) = 3.0,
𝑝 = .086. Considering the direction of the hypothesis one might argue that the directed
hypothesis allows for a one-tailed testing approach which would then be significant. Such
an argumentation is problematic because we may not neglect that the completion rates
135
Increasing Survey Completion Rates: Feedback on Survey Progress
in the constant condition point to the wrong direction, contradicting the directed hy-
pothesis. The results are therefore inconclusive with a tendency to favor a progressive
dynamic calculation method.
Table 7.2. Completion rates across experimental conditions in study 7
Reported progress in the beginningOverreporting Underreporting Constant
Dropout 82 82 95Completion 56 44 42
Dropout 59.4% 65.1% 69.3%Completion 40.6% 34.9% 30.7%
Total 138 126 137
7.4.5. Discussion
The first experiment on progress feedback has provided evidence that a dynamic cal-
culation method is preferable to the traditional static calculation method. The second
study of progress feedback was designed as a decision experiment to determine how the
dynamic calculation method should be implemented. The question was whether to base
the calculation on the longest possible survey path (conservative) or on the shortest
(progressive). Unfortunately, the final number of 401 respondents was below the goal of
964 respondents which would have been necessary to yield a power of 0.80 (Faul & Erd-
felder, 1992). As a consequence the results were inconclusive, pointing only tentatively
towards an advantage of the progressive approach. The experiment was thus underpow-
ered (𝑃𝑜𝑤𝑒𝑟 = .41, for a small effect size with 𝛼 = .05, 𝑛 = 401, 𝑑𝑓 = 2, calculated with
the computer program G*Power provided by Faul & Erdfelder, 1992) making it difficult
to detect a small effect. One reason for this was that the target group of the question-
naire were open source developers. The comments given in the questionnaire indicate
that people belonging to this group are heavily targeted with solicitation e-mails about
open source research. In addition, several respondents remarked on the fact that they
are irritated by such unwanted invitations and that their participation was an exception.
This is an example for an emerging problem in online surveys: Requests from scientific
research compete against masses of unwanted spam e-mails. Finally, some respondents
remarked on the progress indicator and technical implementation of the survey although
no question or remark about progress indicators was presented in the questionnaire.
136
Increasing Survey Completion Rates: Feedback on Survey Progress
The fact that respondents were programmers makes it more likely that they evaluated
the technical aspects of the survey implementation while answering the questions. This
might have diminished the effect of the treatment as those respondents might have a
better understanding of progress indicator inaccuracies and thus do not consider them
very much in their estimates of progress.
7.5. Summary and Conclusion
Progress indicators are used to inform participants of surveys about the degree of com-
pletion and the remaining quantity of questions. Chapter 2 has shown that such feedback
is an important aspect of survey usability. Feedback on progress is part of a successful
interaction between respondents and online surveys. From a data quality perspective sur-
vey researchers would implement progress indicators to prevent dropout. Theory holds
that this is accomplished by allowing participants to estimate the remaining time till
completion. Participants might base their estimation on the time already invested in
relation to the number of completed items and the perceived speed of the progress indi-
cator. If the estimated time till completion is beyond acceptance the participant drops
out.
The type of feedback can be textual, graphical or both. A widely used implementa-
tion is to provide a percentage and a graphical bar. The straightforward method which
is available in most survey software packages calculates the percentage by dividing the
number of pages completed with the total number of pages in the survey. I termed this
the static calculation method. Results from research that tested the effect of static ap-
proach progress indicators are mixed. The presence of progress indicators seems to have
a positive (Couper et al., 2001), negative (Crawford et al., 2001) or no effect (Heerwegh,
2004) on completion rates. Research on the accuracy of feedback which over- and un-
derreports the progress experimentally showed that overreporting increases completion
rates, while underreporting can do more harm than omitting a progress indicator (Böhme,
2003; Conrad, Couper, Tourangeau, & Peytchev, 2005). The mixed findings can there-
fore be explained by inaccuracies of the feedback. Crawford et al. (2001) suggest that
the negative impact of the progress indicator in their experiment might be due to an
underreporting of the progress in the beginning. This happened because the authors
used open ended questions in the beginning. In combination with the progress indicator
this suggested a much longer questionnaire than was actually the case. The study of
Heerwegh (2004) is an example that careful calibration of the progress indicator avoids
137
Increasing Survey Completion Rates: Feedback on Survey Progress
higher dropout rates. The calibration used a pretest to estimate the progress that should
be visible on each page.
The static calculation method together with calibration works in questionnaires were
all respondents answer the same pages and thus experience the same flow of questions.
Unfortunately, this is seldom the case in social science research where filter questions are
employed to skip unapplicable questions. The demographical standards (Statistisches
Bundesamt, 2004) alone include enough skip patterns in household and employment
questions so that an overall progress estimate for a given question is most probably in-
accurate. Moreover, skips lead to the phenomenon of an unsteady or jumping progress
indicator making it seem unreliable to respondents. To solve these problems I devel-
oped two dynamic calculation methods. They estimate the progress for each respondent
individually while he/she is proceeding through the pages. Study 6 demonstrated the
advantage of the dynamic calculation method against the static calculation method in
terms of completion rates. The study also showed that respondents indeed use progress
indicators for the estimation of the time until completion. Because the dynamic ap-
proach needs an initial assumption about the overall survey length, study 7 was designed
to decide whether a conservative or progressive approach should be used. In the static
calculation method the overall survey length is equal to the number of total survey ques-
tions. In the dynamic approach however the overall survey length can be based on two
approaches: The conservative way is to take the longest possible survey including all
filter paths. The progressive approach uses the shortest possible survey. Results from
study 7 tend to favor a progressive approach.
To reach a final conclusion, I will now compare the results of study 6 and 7 with the
results of other authors. First, study 6 showed that underreporting of the true progress
produces higher dropout. Because the conservative implementation is an approach which
rather underreports progress on the basis of the longest survey path it should be avoided
in favor of the progressive implementation. Conrad, Couper, Tourangeau, and Peytchev
(2005) tested how encouraging (overreporting) and discouraging (underreporting) infor-
mation in progress indicators affects completion rates. They found a significant lower
dropout rate of 10.5% percentage points in the encouraging condition (see also Conrad,
Couper, & Tourangeau, 2003). Such a strong effect can be explained by the extreme-
ness of the over- and underreporting of progress in the experiment. In the encouraging
condition a respondent had to complete only 9 pages to pass the 50% mark but had to
complete further 36 pages to reach the 90% mark. Study 7 used less extreme formulae
to allow for a better generalization to surveys with filter questions. Böhme (2003) ex-
138
Increasing Survey Completion Rates: Feedback on Survey Progress
perimented with the accuracy of progress indicators and found that the dropout rate for
overreporting progress was significant 9 percentage points higher than in the condition
underreporting the progress. From these findings and the ones presented in the studies
6 and 7 I conclude that completion rates are positively affected by a progress indica-
tor using the progressive dynamic calculation method. The easier to implement static
method should only be used in questionnaires without filters and skip patterns to avoid an
otherwise occuring increase in dropout. Inaccurate progress indicators have resulted in a
5.9% lower response rate (Crawford et al., 2001). Successful implementations of progress
indicators have resulted in an increase of observed response rates between 1.3%–3.5%
compared to conditions without progress indicators. The possible maximum gain of the
progressive dynamic calculation method will possibly be around 10% (cf., Böhme, 2003;
Conrad, Couper, Tourangeau, & Peytchev, 2005). The benefit of the method increases
with the number of filter questions in a survey.
Nevertheless, survey researchers should also consider the ethical aspect of their deci-
sion. Should they choose to overreport progress in the beginning for some respondents
while providing accurate feedback to others as the findings suggest? Or should they
choose to underreport progress for respondents with ineligible questions, but accurately
report progress for respondents who are going to be asked the most survey questions?
To solve this issue survey researchers could estimate the likelihood and amount of re-
spondents who are expected to take all survey questions. If only a few proportion of
respondents are expected to take the full questionnaire then a progressive method seems
more justifiable.
Generally, survey researchers should invest some time in the accuracy of feedback on
progress because inaccurate progress indicators are known to do more harm than when
no progress indicator is visible. With accurate feedback in the form of a progressive
dynamic calculation method completion rates are equal or higher than without a progress
indicator.
139
8. Discussion
Online surveys continue to increase their market share in the canon of data collection
methods. The reasons are mainly low costs and fast availability of results. As budgets for
surveying are cut, online surveys become more appealing. Western European countries,
the US and Canada are using the online survey mode as part of a multi-mode approach for
their censuses or are considering the implementation in the next round of data collection.
Automatic data collection and processing provide fast access to results which is only
matched by computer assisted telephone interviews.
However, a problem of online surveys is that they are not able to reach the general
population because not everyone has Internet access (coverage problem). Special panel
projects where participants are provided with necessary equipment are currently filling
this need for a full population sampling frame. Nevertheless, there already are special
target groups where the coverage problem does not exist making online surveys an ad-
equate survey mode: examples range from establishment surveys over employee surveys
to seminar evaluation at universities.
A second area of problems centers around nonresponse. Not all contacted persons start
participating in a survey (unit nonresponse), and not all respondents complete a survey
(partial response) or even answer all questions (item nonresponse). This introduces a bias
when respondents differ from nonrespondents since population parameters are estimated
on the basis of respondents answers.
My work focused on the nonresponse aspects of partial response and item nonresponse.
According to the survey life cycle model (figure 1.1 on page 6) this is the stage where
respondents participate in a survey. The general goal was to develop instruments and
methodological designs with which respondents’ behavior could be observed and nonre-
sponse could be reduced. The theoretical background was shaped by combining concepts
from human-computer interaction and survey methodology into a framework which I
termed human-survey interaction. The theory proved to be fruitful in that it fostered
new design ideas and beneficial in that the designs successfully reduced nonresponse when
compared to traditional designs using online experiments.
In total, seven studies were presented with one study including three waves of measure-
ment. The studies targeted a wide range of people: students, people above forty, visually
140
Discussion
impaired and blind people, and survey panel members. Overall, data from 33,821 indi-
viduals were analyzed. A first set of studies aimed to improve and assess the available
instruments (paradata, response time measurements, technical availability of survey de-
sign features) which were then used in the second set of studies. The goal of the second
set was to apply human-survey interaction to the design of online surveys to increase item
completions (decrease item nonresponse) and survey completions (decrease the number
of dropouts). This was done in four online experiments which tested various method-
ological strategies for applying visual feedback to respondents. A summary of research
goals, constructs, conducted studies and their relation to the chapters in this book is
presented in table 2.4 on page 47.
8.1. Summary of the Results
The starting point was to fit this work into the life cycle of online surveys and the total
survey error framework. This research was concerned with the phase in which respondents
read and answer online survey questionnaires. It focused on reducing three sources of
nonresponse error: unit nonresponse, item nonresponse and partial response (dropout).
The first type occurs when respondents are unable or unwilling to access the survey. The
second type occurs when respondents proceed through a survey but fail to answer all
questions, whereas the third type occurs when respondents dropout or abandon a survey.
Chapter 2 developed the theoretical background and proposed a framework of human-
survey interaction. The human part of the framework incorporated theories of the re-
sponse process. Here, the satisficing/optimizing-approach is of importance because it
mediates the data quality of responses. While increasing response rates is a major goal,
this should not lead to an increase in satisficing behavior. Several indicators for satisfic-
ing were later analyzed to ensure that no loss in data quality occurred. The survey part
of the framework subsumed theories of questionnaire design. Here, the response burden
which is imposed by the survey can be seen as one of the most important reasons for
dropout. The interaction part of the framework was concerned with visual changes in
online surveys due to respondents’ actions. A review of human-computer interaction and
usability principles led to the conclusion that principal aspects of successful interaction
are error tolerance and feedback. Subsequent chapters therefore assessed the possibil-
ity of errors due to technology and errors in providing answers. Furthermore, feedback
techniques were employed to reduce both item and partial nonresponse.
141
Discussion
Chapter 3 applied the framework to questionnaire design for visually impaired and
blind people. The research problem was to accommodate the questionnaire design to the
different reading habits and constraints of this specific group. Impairments of the visual
field and a braille text need approaches which make up for the loss of visual overview and
layout. Twelve guidelines were developed through a series of respondent observation and
pretesting. The guidelines focus on providing and supporting overview, navigation and
orientation aids, and on streamlining the answering process. The survey was conducted
with a paper version with large font, a braille version, and an online version (study 1).
The online version allowed blind people to participate without the help of other persons
via screen readers and other technical aids which is an advantage over the other survey
modes. Although the mean age was 67 and no incentive was offered, an overall response
rate of 45% was obtained. This was possible because the survey considered the special
design requirements of the target group in all phases of the survey life cycle. This
included simple measures such as free return envelopes and more complicated ones such
as instructions on how to answer with a braille type writer. The study demonstrated that
the theoretical framework can be used to develop design guidelines, that these guidelines
can be applied to survey design, and that these considerations and implementations lead
to a successful human-survey interaction.
In chapter 4 I developed a data box model for the concept of paradata. Paradata are
process data in surveys which can be collected while respondents answer a questionnaire.
Paradata provide insight into respondents’ behavior such as response times, changes in
answers, and mouse clicks. In addition, paradata serve as performance indicators for
surveys: Dropout patterns, item nonresponse, and response rates are key measures for
the success of a survey. Paradata is already widely used in survey research. Neverthe-
less, paradata lack a concise conceptualization. Therefore, the developed data model
distinguishes four levels of paradata in the dimensions respondents, variables and time.
The higher levels are aggregations of lower levels over single or multiple dimensions. The
lowest data level consists of single actions such as mouse clicks. They are easy to collect
but difficult to analyze because they lack conceptualization. The second level aggregates
over actions, resulting in content which is conceptually relevant for researchers, for exam-
ple interaction failure measured as the number of mouse clicks which missed an answer
option. The third level aggregates over variables to summarize in concepts such as the
overall number of items missing. The third level also includes aggregations over respon-
dents, resulting in concepts such as the average response time on each page. The fourth
level is the most abstract aggregation and summarizes across respondents, variables and
142
Discussion
time to yield a single measure such as the average time to complete the survey or the
response rate.
The model clarified that hitherto available instruments for collecting paradata had
blind spots which prevented survey researchers from collecting certain aspects of para-
data: Only successful interaction with a survey was collected. Therefore, an instrument
was developed (universal client-side paradata approach) which allowed to observe all
mouse clicks whereas earlier methods only captured mouse clicks on answer elements.
Study 2 used this instrument to determine a new indicator for the success of human-
survey interaction, specifically how many respondents suffer from click failures. More
than 35% of the respondents made unsuccessful mouse clicks. They clicked in the vicin-
ity of answer buttons which did not result in a valid answer, so a reclick was necessary.
The conclusion was that standard interface elements in online surveys are too difficult to
interact with. The proposed solution was to enlarge the clickable area to encompass the
surrounding of the answer elements. The easiest way to accomplish this is by making
the table cells sensitive to mouse clicks. (Study 5 which is described below followed this
recommendation and tested it against the current design standard.)
The paradata model also provided a deeper understanding for operationalizations.
Seemingly identical concepts of response latencies were shown to differ significantly
(study 3). Response latencies are part of the second level in the paradata model. Ac-
cordingly, the data at the lowest level –the response times– can be collected as different
actions. The following three types of response times were already used by other survey
researchers and were therefore collected in the study: mouse clicks on answers, page
submission times and server times. Usually, survey researchers decide to implement one
of these measures and conduct their analyses on this basis. In study 3 however, the goal
was to identify the differences between these three types of paradata which are usually
summarized under the same concept of response latencies. The study used an experimen-
tal variation of question wordings which were known to covary with the required time
for a response. It was therefore possible to compare the three response time measures
in their suitability to detect these differences. The results showed that the client-side
paradata of mouse clicks on answers was able to statistically detect the difference in re-
sponse latencies between the two conditions. However, the other two measures were not
significantly different between experimental groups. In conclusion, the paradata model
helped in identifying the difference between seemingly identical concepts. The study
showed that the easier to collect server side time measures should be avoided because
their payload is a loss of necessary accuracy in the measurement of response latencies.
143
Discussion
Summarizing, chapter 4 identified a lack of conceptualization for paradata. Therefore, a
paradata model was developed and a new instrument provided to fit the need for indica-
tors of failed human-survey interaction. Two studies applied the paradata model. Study
5 determined the amount of unsuccessful response behavior while study 3 specified and
compared different measures for response latencies. Both studies provided solutions for
the associated methodological problems.
Chapter 5 focused on the technology employed in online surveys. Survey researchers
can utilize technologies to solve methodological problems or to increase survey quality
and the respondents’ experience. However, if a respondents’ computer does not support
the implemented technology in an online survey, s/he will not be able to view all survey
questions or will be unable to access the survey. The addressed research question was
therefore to estimate the coverage or availability of different technologies in online surveys
among respondents. This enables survey researchers to make an informed decision for or
against specific technologies and to weigh the advantages against a potential increase in
nonresponse. To address these issues data was collected from all student applicants at
the University of Mannheim during three semester.
The results show that JavaScript has a coverage of more than 99% making it the first
choice when it comes to implementing interactive survey design features. Two additional
studies using a probability sample and a quota sample suggested equally high coverage for
the general Internet population. The measurement of the persistence of cookies showed
that they might be used in single sessions but are not sufficient to control participation
in intercept surveys. Java and Flash are widely available extensions to HTML which suit
special needs for interface design and control. The main video player is the Mediaplayer,
followed by Quicktime and Realplayer. It is advisable to support at least the first two,
so that subgroups (e.g., Mac-users) of the Internet population are not excluded. An
alternative is to employ Flash technology for video and audio. The standard width for
screen design was previously 800 pixels. In 2006 such low resolutions had diminished to
a proportion of 5% of all applicants at the University of Mannheim. The most common
screen resolution is 1024x768 pixels. When testing for design flaws at least the two
most common browsers, Microsoft Internet Explorer and Firefox, should be included
in the testing procedures. Concluding, the chapter discussed the advantages of several
technologies for survey methodology and provided data about their coverage to allow
estimations of associated nonresponse.
Chapter 6 showed that visual aids and visual feedback are able to reduce item non-
response. The research question was concerned with the positive influence of additional
144
Discussion
feedback on human-survey interaction. A first experiment used a visual cross which
followed mouse movements and a change in color of the row after an answer was pro-
vided. Contrary to expectations, the visual cross increased the number of items missing
because it distracted respondents from their task to complete the questions. However,
visual feedback after a selection was made resulted in fewer items missing compared to
a condition with no feedback and no alternating background stripes.
The second experiment combined feedback techniques and an enlarged clickable area
in a single treatment condition to test a combined effect of less obtrusive feedback. Here,
only the immediate surrounding of an answer category, the table cell, was highlighted
following mouse movements. Additionally, the answer category changed its color to a dark
grey after an answer was provided. The results showed that the combined effects in the
condition with feedback successfully increased item completion rates by 3.5 percentage
points compared to the condition with no feedback.
The increase in item completion rates had no negative impact on data quality in
terms of response times, changes in answers, or nonsubstantial answers in the form of
‘don’t know’. Overall, the results showed that visual feedback can successfully reduce
the number of items missing.
Chapter 7 examined feedback methods to report on survey progress and their effects
on completion rates. In this context, progress indicators are often employed to reduce
dropout. They allow respondents to estimate the time till completion and weigh this
against their willingness to spend more time in survey participation. A review of the
research on progress indicators showed the consequences: When feedback is unreliable
and underreports survey progress, respondents are more likely to dropout. This is nec-
essarily the case with surveys employing filter questions. As survey researchers cannot
know whether a respondent traverses a filter path, standard implementations of progress
indicators underreport the progress in the beginning. To solve this problem a dynamic
calculation method was developed.
The first experiment compared the new method for calculating progress feedback with
the traditional method, no feedback, and ideal feedback. The experiment was able to use
ideal feedback because the filter paths were emulated so that all respondents received
the same questions. The results showed that the dynamic calculation method is able
to compensate for the problems which are imposed by filter questions leading to an
increase in the completion rate. The dynamic calculation method can be implemented
with either a progressive or a conservative estimation of progress. The second experiment
was designed to identify which approach yields the highest completion rates. The results
145
Discussion
indicated that the dynamic calculation method results in higher completion rates with a
progressive algorithm. This results in an accurate reporting of progress for respondents
who skip filter paths but overreports the progress in the beginning for respondents who
traverse into the filtered questions.
Concluding, survey researchers should invest in the accuracy of progress feedback be-
cause inaccurate progress indicators can result in lower completion rates than a survey
with no progress indicator at all. With accurate feedback in the form of a progressive
dynamic calculation method however, completion rates are equal or higher than without
a progress indicator.
Summarizing the results, the first part of this work shaped a framework for human-
survey interaction and derived guidelines for accessible survey design. The second part
developed the instruments for survey research within the framework. It was concerned
with paradata, interaction errors, response time measurement and technology-induced
nonresponse. The third part tested feedback techniques to enhance the interaction be-
tween humans and surveys beyond current design practices. The application of the
instruments showed that data quality was maintained while nonresponse was reduced.
Finally, answers from respondents indicate that response burden is reduced when feed-
back techniques are applied to surveys.
8.2. Limitations
All of the above presented studies have certain limitations which are discussed in this
section. Study 1 focused on the application of the human-survey interaction framework
in a real survey setting. The special requirements of the target population who were
visually impaired and blind people led to design guidelines. Although, the questionnaire
was designed and pretested in several rounds before it was conducted, the study did
not develop competing design guidelines and included no experimental comparison with
a traditional survey design. After having put considerable effort into development and
pretesting, it would have been impossible to reason for the use of a ‘good’ and a ‘bad’
design. Therefore, the specific impact of each guideline on the response rate could not
be assessed. As a case study however, study 1 demonstrated how the framework is able
to shape the life cycle of a survey in three survey modes, extending the framework to
paper-based and braille surveys.
Study 4 analyzed data from student applicants to estimate the degree of available tech-
nologies for survey research. The three censuses of all student applicants at the University
146
Discussion
of Mannheim provide a profound understanding of this target population. However, the
findings are not generalizable to other populations in a statistical sense because no prob-
ability sampling was invoked from a more general population. In how far can the findings
be applied to other populations then? The findings might provide reasonable estimates
for all students in Germany to the degree that potential students from all over Ger-
many apply at the University of Mannheim. This makes the estimations better for the
surrounding federal states but less valid for the eastern part of Germany. To overcome
this problem results from two additional samples were reported for the most important
technology JavaScript. Both samples targeted the general Internet population. The first
study used a follow-up online survey of a survey with a probability sample of the general
German population. The second survey used a market research approach and applied
quota sampling within an online panel. Both studies confirmed the high availability of
JavaScript of more than 99%. Besides the estimate for JavaScript, the other findings of
study 4 should not be considered as valid point estimations for other population groups.
However, a comparison of the availability between technologies seems reasonable. There
is no reason to believe that students who are technically most developed should show
lower estimates for the availability of for example video players than the general popu-
lation. The findings of study 4 therefore allow researchers to estimate the potential risk
in terms of nonresponse associated with the different technologies.
Studies 2, 3, 5, 6, and 7 employed experiments. Here, the focus resided in internal
validity to analyze effects of different treatments. As such, the studies were able to
identify causal effects. Because no probability sampling was involved in these studies the
findings cannot be generalized statistically. Nevertheless, the different effects were shown
to be present in different samples. For example the positive effect of feedback was shown
in samples targeting survey panel members and people above forty, thus including the
harder to reach older people.
Finally, this work is not based on a single theory of human-survey interaction. Rather
a framework is proposed which subsumes several models from different disciplines and
which is therefore inclusive rather than exclusive. This was necessary because no models
exist in human-survey interaction or survey methodology which encompass the research
goals of this work. The models which were discussed as part of the framework are
not exhaustive. For example, further research may show that response burden is also
related to concepts of split-attention and cognitive resources as put forward by Kalyuga,
Chandler, and Sweller (1999). Furthermore, the theory of reasoned action and the theory
of planned behavior have been shown to explain reasons for nonresponse which relate to
147
Discussion
all aspects of the framework (Bosnjak, 2002; Ludwig, 2004; Heerwegh, 2005; Peytchev,
2007). However, an overall explanation of nonresponse was not the goal of this work.
This work strived for an interdisciplinary approach and therefore focused on models
which could be subsumed under one of the three aspects of human-survey interaction.
The framework illuminated the relations between the models, leading to new instruments
and design strategies. The principal goal was to bring together the human sciences and
the technical sciences for the benefit of survey research and respondents.
8.3. Implications
Every day, numerous people all around the globe interact with all kinds of surveys, online
forms, and questionnaires. These interactions are not always completely voluntary and
can add a huge amount of stress to daily life. However, the importance of providing
an easy-to-handle and usable interface is not always reflected on the side of those who
develop these interfaces. Unlike paper-based surveys, online surveys are a technology-
driven survey mode. Therefore, people from the field of technical sciences are involved in
decisions about survey design implementations. They usually focus on the best possible
implementation in terms of software and hardware. When survey researchers design
online surveys they usually focus on the questionnaire. This specialization can lead to
suboptimal design decisions in online surveys. With the words of Vincente (2004, p. 32):
Unfortunately, this traditional approach has created two breed of Cyclops – the one-eyed Humanist
who can focus on people but not technology, and the one-eyed Mechanistic variety who knows about
technology but not people. We’re all walking around half-blind. To make matters worse, the Human-
istic and Mechanistic world views rarely meet, as anyone who has set foot on a university campus
knows.
The goal of this work was to combine these two views into a framework fostering successful
human-survey interaction. The survey design strategies which were put forward in this
work achieved this goal in several ways.
Visual feedback in survey questions was found to increase item completion rates be-
tween 2.1 and 3.5 percentage points compared to no interactive feedback. This would
amount to 1,050 fewer items missing in a survey of short (30 questions) to moderate (50
questions) length if 1,000 respondents were interviewed. This increase in data quality
helps to reduce the need for data imputation and increases the accuracy of estimations.
148
Discussion
Visual feedback about the progress was found to increase the survey completion rates
between 5.7 and 8.8 percentage points compared to bad but common implementations
of progress indicators. Not alone are these differences in completion rates substantial,
they also point out the importance of considering the interaction between the survey
which reports on the progress and the respondents who interpret the numbers. Although
surveys may indicate progress in terms of pages, respondents relate these numbers to
their experience of time flow. This perception of time is crucial for the motivation of
respondents as described by Conti (2001, p. 1):
Results showed that higher intrinsic motivation was associated with checking and thinking about
time less often, a subjective experience of time passing more quickly, and more of a tendency to
lose track of time. The experience of time awareness was accompanied by a subjective sense of time
moving slowly, a tendency to overestimate the time, and a more negative affective experience. These
findings suggest that time perception is an important dimension of motivational experience.
The increase in completion rates can also be compared to other efforts which aim at re-
ducing nonresponse. Instead of investing resources in reducing dropout rates, researchers
could try to increase initial response rates. Here, a plausible approach is to invest in in-
centives. An exceptional high return on investment was reported by Bosnjak and Tuten
(2003) who found a significant higher completion rate of 23.4% for prize draws compared
to 12.9% in the condition with no incentive on the basis of successful contacts while
investing 200 Dollars in prizes. However, a meta-analytical summary of studies using
small amounts of incentives with an average of 115 Dollars in online panels by Göritz
(2006) showed no reliably increase of response rates. In the realm of other modes than
online surveys, Singer (2002) reported for studies on household surveys an increase in
response rates of 2.8 percentage points for offering 20 Dollars or 0.9 percentage points for
offering 10 Dollars vs. no incentive. Thus, ten responses more in a sample of 1000 con-
tacts would cost 10,000 Dollars. These calculations vividly illustrate that investments in
human-survey interaction are able to achieve similar improvements while inducing much
lower costs. This is especially important when survey researchers have to make decisions
within a fixed budget to reduce total survey error (Groves, 1989). As soon as the design
strategies are implemented in online survey software they are readily available for survey
design without creating additional costs for programming.1
The studies presented in this work have implications not only for survey design but
for online forms in general. Many cities in Germany are maintaining their own websites
1 For example the company Globalpark implemented the dynamic calculation method for progressindicators as put forward in this work.
149
Discussion
from small villages like Sörup with 4,200 residents to larger cities like Mannheim with
310,000 residents. The studies provide suggestions which technologies can be used so
that webpages remain accessible to residents. Furthermore, many cities and government
agencies expanded their citizen services to the Internet. With online forms citizens are
able to order parking IDs or fill in their tax return. The presented research suggests that
citizens would extremely benefit from implementing feedback techniques in complicated
online forms. Similarly, using less error-prone interaction elements as suggested in chapter
7 could reduce frustration among people who interact with online shopping carts, official
forms, or online forms in general.
Human-computer interaction literature provides much anecdotal evidence of users who
abandon their tasks at the computer frustrated by difficult and unintelligible interface
designs. It is my hope that the results and solutions of this work will help people to
successfully interact with online surveys in the future. This work will hopefully also help
respondents of online surveys in their experience of a motivating and valuable contribu-
tion to social science research, thereby furthering our knowledge of what constitutes the
increasingly important aspect of the interaction between humans and machines.
150
9. Bibliography
AAPOR. (2006). Standard Definitions: Final Dispositions of Case Codes and Outcome
Rates for Surveys (Manual for Disposition Codes). Lenexa, Kansas: AAPOR:
AAPOR. Available from http://www.aapor.org/pdfs/standarddefs_4.pdf
Abraham, S. Y., Steiger, D. M., & Sullivan, C. (1998, May). Electronic and Mail
Self-Administered Questionnaires: A Comparative Assessment of Use Among Elite
Populations. Paper presented at the conference of the American Association for
Public Opinion Research, St. Louis, USA, St Louis.
ADM. (2004). Jahresbericht 2004 [Annual Report 2004]. Frankfurt: Arbeitskreis
Deutscher Markt- und Sozialforschungsinstitute e. V. Available from http://
www.adm-ev.de/pdf/Jahresbericht_04.pdf
ADM, ASI, BVM, & DGOF. (2000). Richtlinie für Online-Befragungen [Guidelines
for Online Surveys]. Frankfurt: ADM, ASI, BVM, and DGOF. Available from
http://www.adm-ev.de/pdf/R08_D.pdf
ADM, ASI, BVM, & DGOF. (2001). Standards zur Qualitätssicherung für Online-
Befragungen [Standards for Quality Assurance in Online Surveys]. Frankfurt:
ADM. Available from http://www.adm-ev.de/pdf/Onlinestandards_D.PDF
AGOF. (2006). Internet facts 2005-IV: Graphiken zu dem Berichtsband [Graphs
of the Report]. AGOF. Available from www.agof.de/index.download
.7ee9b8ccd0241cce4b807df0291bdbc2.ppt
Alvarez, R. M., & VanBeselaere, C. (2005). Web-Based Survey. Encylopedia of Social
Measurement , 3 , 955–962.
Arora, A., & Gilmour, G. (2005, June). Statistics Canada: Census on the Net. Pa-
per presented at the Conference of European Statisticians, Geneva, Switzerland,
Genf. Available from http://www.unece.org/stats/documents/2005/seminars/
si.2.add.2.e.pdf
Auno, A. M. (2004). Collecting Accommodation Data via the Internet: the Norwegian
Experience. Presentation at the 7th International Forum on Tourism Statistics,
June 9–11, 2004, Stockholm.
Baker, R. P., Crawford, S., & Swinehart, J. (2004). Development and Testing of Web
Questionnaires. In S. Presser et al. (Eds.), Methods for Testing and Evaluating
151
Bibliography
Survey Questionaires (pp. 361–384). New York: Wiley.
Bandilla, W., Bosnjak, M., & Altdorf, P. (2003). Survey Administration Effects? A Com-
parison of Web-Based and Traditional Written Self-Administered Surveys Using the
ISSP Environment Module. Social Science Computer Review , 21 (2), 235–243.
Bandilla, W., Kaczmirek, L., Blohm, M., & Neubarth, W. (2009). Coverage-
und Nonresponse-Effekte bei Online-Bevölkerungsumfragen [Coverage- and
Nonresponse-Effects in Online Surveys of the General Population]. In N. Jackob,
H. Schoen, & T. Zerback (Eds.), Sozialforschung im Internet: Methodologie und
Praxis der Online-Befragung (pp. 129–143). VS Verlag für Sozialwissenschaften.
Böhme, R. (2003). Fragebogeneffekte bei Online-Befragungen [Effects of the Question-
naire in Online Surveys]. Magisterarbeit, University of Dresden, Dresden.
Biemer, P. (2004). The Twelfth Morris Hansen Lecture Simple Response Variance: Then
and Now. Journal of Official Statistics, 20 (3), 417–439.
Biemer, P., & Brown, G. (2005). Model-based Estimation of Drug Use Prevalence Using
Item Count Data. Journal of Official Statistics, 21 (2), 287–308.
Biemer, P., Groves, R. M., Lyberg, L. E., Mathiowetz, N. A., & Sudman, S. (2004).
Measurement Errors in Surveys. New Jersey: Wiley.
Biemer, P., & Lyberg, L. E. (2003). Introduction to Survey Quality. Hoboken, New
Jersey: Wiley.
Bishop, G., & Smith, A. (2001). Response-Order Effects and the Early Gallup Split-
Ballots. Public Opinion Quarterly , 65 (4), 479–505.
Blank, G., & Rasmussen, K. B. (2004). The Data Documentation Initiative: The Value
and Significance of a Worldwide Standard. Social Science Computer Review , 22 (3),
307–318.
Bälter, O., & Bälter, A. K. (2005). Demands on Web Survey Tools for Epidemiological
Research. European Journal of Epidemiology , 20 (2), 137–139.
Bogen, K. (1996). The Effect of Questionnaire Length on Response Rates: A Review
of the Literature. In Proceedings of the American Statistical Association, Survey
Research Section, Alexandria (pp. 1020–1025).
Borg, I., & Faulbaum, F. (2004, March). Online and Other Methods of Data Collection
in Employee Surveys: A Comparison. Presentation at the General Online Research
Conference, Duisburg-Essen, Germany.
Bortz, J. (1989). Statistik für Sozialwissenschaftler. Berlin: Springer.
Bosnjak, M. (2002). (Non)Response bei Web-Befragungen [(Non)Response in Web Sur-
veys]. Aachen: Shaker.
152
Bibliography
Bosnjak, M., Neubarth, W., Couper, M. P., Bandilla, W., & Kaczmirek, L. (2008).
Prenotification in Web-based Access Panel Surveys: The Influence of Mobile Text
Messaging versus E-Mail on Response Rates and Sample Composition. Social Sci-
ence Computer Review , 26 , 213–223.
Bosnjak, M., & Tuten, T. L. (2001). Classifying Response Behaviors in Web-based
Surveys. Journal of Computer-Mediated Communication, 6 (3), Online. Available
from http://jcmc.indiana.edu/vol6/issue3/boznjak.html
Bosnjak, M., & Tuten, T. L. (2003). Prepaid and Promised Incentives in Web Surveys.
Social Science Computer Review , 21 (2), 208–217.
Bradburn, N. M. (1978). Respondent Burden. In Proceedings of the American Statis-
tical Association, Survey Research Methods Section (pp. 35–40). Alexandria, VA:
American Statistical Association.
Brener, N. D., Eaton, D. K., Kann, L., Grunbaum, J. A., Gross, L. A., Kyle, T. M.,
et al. (2006). The Association of Survey Setting and Mode With Self-Reported
Health Risk Behaviors Among High School Students. Public Opinion Quarterly ,
70 (3), 354–374.
Casamento, C. (2006). Webtrekk Langzeitstudie 2.Quartal. Available from http://
www.webtrekk.de/press.html
CentERdata. (2008). CentERdata Website. Retrieved January 4, 2008, from http://
www.uvt.nl/centerdata/en/.
Christian, L. M. (2007). How Mixed-Mode Surveys are Transforming Social Research:
The Influence of Survey Mode on Measurement in Web and Telephone Surveys.
Doctoral dissertation, Washington State University, Washington.
Christian, L. M., Dillman, D. A., & Smyth, J. D. (2007). Helping Respondents get it
Right the First Time: The Influence of Words, Symbols, and Graphics in Web
Surveys. Public Opinion Quarterly , 71 (1), 113–125.
Cleves, M. A., Gould, W. W., & Gutierrez, R. G. (2004). An Introduction to Survival
Analysis Using Stata. College Station, Texas: Stata Press.
Conrad, F. G. (1999). Customizing Survey Procedures to Reduce Measurement Er-
ror. In M. G. Sirken, D. J. Herrmann, S. Schechter, N. Schwarz, J. M. Tanur, &
R. Tourangeau (Eds.), Cognition and Survey Research (pp. 301–317). New York:
Wiley.
Conrad, F. G., Couper, M. P., & Tourangeau, R. (2003, August). Interactive Features
in Web Surveys. Paper presented at the Joint Meetings of the American Statistical
Association, San Francisco, CA, San Francisco.
153
Bibliography
Conrad, F. G., Couper, M. P., Tourangeau, R., & Galesic, M. (2005, May). Interactive
Feedback Can Improve the Quality of Responses in Web Surveys. Paper presented
at the conference of the American Association for Public Opinion Research, Miami
Beach, Florida.
Conrad, F. G., Couper, M. P., Tourangeau, R., & Peytchev, A. (2005, April). Impact of
Progress Feedback on Task Completion: First Impressions Matter. In Proceedings
of the CHI, Portland, Oregan (pp. 1921–1924). ACM.
Conrad, F. G., Couper, M. P., Tourangeau, R., & Peytchev, A. (2006). Use and Non-
use of Clarification Features in Web Surveys. Journal of Official Statistics, 22 (2),
245–269.
Conti, R. (2001). Time Flies: Investigating the Connection Between Intrinsic Motivation
and the Experience of Time. Journal of Personality , 69 (1), 1–26.
Converse, J. M., & Presser, S. (1986). Survey Questions: Handcrafting the Standardized
Questionnaire. Newbury Park: Sage University Paper.
Cook, C., Heath, F., & Thompson, R. L. (2000). A Meta-Analysis of Response Rates
in Web- or Internet-Based Surveys. Educational and Psychological Measurement ,
60 (6), 821–836.
Couper, M. P. (1994). Discussion: What Can CAI Learn from HCI? In Proceedings of the
Seminar on New Directions in Statistical Methodology (pp. 363–377). Washington:
Statistical Policy Office, Office of Management and Budget.
Couper, M. P. (1998). Measuring Survey Quality in CASIC Environment. Paper pre-
sented at the Joint Statistical Meetings of the American Statistical Association,
Dallas, TX.
Couper, M. P. (2000a). Usability Evaluation of Computer- Assisted Survey Instruments.
Social Science Computer Review , 18 (4), 384–396.
Couper, M. P. (2000b). Web Surveys: A Review of Issues and Approaches. Public
Opinion Quarterly , 64 (4), 464–494.
Couper, M. P. (2005). Technology Trends in Survey Data Collection. Social Science
Computer Review , 23 (4), 486–501.
Couper, M. P., Conrad, F. G., & Tourangeau, R. (2007). Visual Context Effects in Web
Surveys. Public Opinion Quarterly , 71 (4), 623–634.
Couper, M. P., Kapteyn, A., Schonlau, M., & Winter, J. (2007). Noncoverage and
Nonresponse in an Internet Survey. Social Science Research, 36 (1), 131–148.
Couper, M. P., & Lyberg, L. E. (2005). The Use of Paradata in Survey Research. Paper
presented at the 54th Session of the International Statistical Institute, Sydney,
154
Bibliography
Australia.
Couper, M. P., Singer, E., & Tourangeau, R. (2004). Does Voice Matter? An Interactive
Voice Response (IVR) Experiment. Journal of Official Statistics, 20 (3), 551–570.
Couper, M. P., Tourangeau, R., & Conrad, F. G. (2006). Evaluating the Effectiveness
of Visual Analog Scales. Social Science Computer Review , 24 (2), 227–245.
Couper, M. P., Tourangeau, R., Conrad, F. G., & Crawford, S. (2004). What They See
Is What We Get. Social Science Computer Review , 22 (1), 111–127.
Couper, M. P., Tourangeau, R., & Kenyon, K. (2004). Picture This! Exploring Visual
Effects in Web Surveys. Public Opinion Quarterly , 68 (2), 255–266.
Couper, M. P., Traugott, M. W., & Lamias, M. J. (2001). Web Survey Design and
Administration. Public Opinion Quarterly , 65 (2), 230–253.
Crawford, S., Couper, M. P., & Lamias, M. J. (2001). Web Surveys: Perceptions of
Burden. Social Science Computer Review , 19 (2), 146–162.
Crawford, S., McCabe, S. E., & Pope, D. (2005). Applying Web-Based Survey Design
Standards. Journal of Prevention & Intervention in the Community , 29 (1/2), 43–
66.
De Leeuw, E. D. (2005). To Mix or Not to Mix Data Collection Modes in Surveys.
Journal of Official Statistics, 21 , 233–255.
De Rouvray, C., & Couper, M. P. (2002). Designing a Strategy for Reducing “No Opinion”
Responses in Web-Based Surveys. Social Science Computer Review , 20 (1), 3–9.
Destailleur, L. (2008). AWStats: Advanced Web Statistics [Computer Program]. Re-
trieved February 9, 2008, from http://awstats.sourceforge.net.
Deutsche Behindertenhilfe – Aktion Mensch e.V. (2008). Wo sind die Barrieren im Web
2.0? [Where are the barriers in the Web 2.0?] Retrieved January 21, 2008, from
http://www.einfach-fuer-alle.de/blog/eintraege.php?id=2334_0_1_0.
Diekmann, A. (2007). Empirische Sozialforschung: Grundlagen, Methoden und Anwen-
dungen [Empirical Social Research: Basis, Methods, and Applications] (4th ed.).
Reinbek: Rowohlt.
Dillman, D. A. (2007). Mail and Internet Surveys: The Tailored Design Method (2nd
ed.). New Jersey: Wiley.
Dillman, D. A., & Bowker, D. (2001). The Web Questionnaire Challenge to Survey
Methodologists. In U.-D. Reips & M. Bosnjak (Eds.), Dimensions of Internet
Science (pp. 159–178). Lengerich: Pabst Science Publishers.
Dillman, D. A., Gertseva, A., & Mahon-Haft, T. (2005). Achieving Usability in Estab-
lishment Surveys Through the Application of Visual Design Principles. Journal of
155
Bibliography
Official Statistics, 21 , 183–214.
Dillman, D. A., Tortora, R. D., & Bowker, D. (1999). Principles for Constructing Web
Surveys. Washington: SESRC. Available from http://www.isurveys.com.au/
resources/ppr.pdf
Dillman, D. A., Tortora, R. D., Conradt, J., & Bowker, D. (1998). Influence of Plain vs.
Fancy Design on Response Rates for Web Surveys. In Proceedings of the American
Statistical Associations Survey Methods Research Section. Washington, DC.
Draisma, S., & Dijkstra, W. (2004). Response Latency and (Para)Linguistic Expressions
as Indicators of Response Error. In S. Presser et al. (Eds.), Methods for Testing
and Evaluating Survey Questionnaires (pp. 131–147). New York: Wiley.
Evans, J. R., & Mathur, A. (2005). The Value of Online Surveys. Internet Research,
15 (2), 195–219.
Faaß, T. (2007). The Readability of Survey Questions. An Interdisciplinary Approach to
Improving Question Wording. Magisterarbeit, University of Mannheim.
Faul, F., & Erdfelder, E. (1992). GPower: A Priori, Post-hoc, and Compromise Power
Analyses for MS-DOS [Computer Program]. Bonn, FRG: Bonn University, Dep. of
Psychology.
Fraley, C. (2004). How to Conduct Behavioral Research on the Internet. New York:
Guilford Publications.
Fricker, S., Galesic, M., Tourangeau, R., & Yan, T. (2005). An Experimental Comparison
of Web and Telephone Surveys. Public Opinion Quartely , 69 (3), 370–392.
Fuchs, M., & Funke, F. (2007). Video Web Survey: Results of an Experimental Compar-
ison with a Text-Based Web Survey. In M. Trotman et al. (Eds.), The Challenges
of a Changing World: Developments in the Survey Process, Proceedings of the
5th ASC International Conference (pp. 63–80). Berkeley: Association for Survey
Computing. Available from http://www2.asc.org.uk/ASC/Sep2007/Conference/
files/papers/asc30-Fuchs_Funke_Final.pdf
Funke, F., & Reips, U.-D. (2006, March). Visual Analogue Scales in Online Surveys:
Non-Linear Data Categorization by Transformation with Reduced Extremes. Poster
session presented at the General Online Research Conference, Bielefeld, Germany.
Galesic, M. (2006). Dropouts on the Web: Effects of Interest and Burden Experienced
During an Online Survey. Journal of Official Statistics, 22 (2), 313–328.
Galesic, M., Tourangeau, R., Couper, M. P., & Conrad, F. G. (2007, March). Using
Change to Improve Navigation in Grid Questions. Presentation at the General
Online Research Conference, Leipzig, Germany.
156
Bibliography
Graesser, A. C., Cai, Z., Louwerse, M. M., & Daniel, F. (2006). Question Understanding
Aid (QUAID): A Web Facility that Tests Question Comprehensibility. Public
Opinion Quarterly , 70 (1), 3–22.
Göritz, A. S. (2006). Cash Lotteries as Incentives in Online Panels. Social Science
Computer Review , 24 (4), 445–459.
Groves, R. M. (1989). Survey Errors and Survey Costs. New York: Wiley.
Groves, R. M., Fowler, F. J., Couper, M. P., Lepkowski, J. M., Singer, E., & Tourangeau,
R. (2004). Survey Methodology. New York: Wiley.
Groves, R. M., & Heeringa, S. G. (2006). Responsive Design for Household Survey: Tools
for Actively Controlling Survey Errors and Cost. J. R. Statist. Soc. A., 169 (3),
439–457.
Hansen, S. E., & Couper, M. P. (2004). Usability Testing to Evaluating Computer-
Assisted Questionaires. In S. Presser et al. (Eds.), Methods for Testing and Evalu-
ating Survey Questionnaires (pp. 337–360). New York: Wiley.
Haraldsen, G. (2004). Identifying and Reducing Response Burdens in Internet Business
Surveys. Journal of Official Statistics, 20 (2), 393–410.
Haraldsen, G. (2005, October). Using Client Side Paradata as Process Quality Indicators
in Web Surveys. Presentation at the Exploratory Workshop on Internet Survey
Methodology: Towards Concerted European Research Efforts, Dubrovnik, Croatia.
Healey, B. (2007). Drop Downs and Scroll Mice: The Effect of Response Option Format
and Input Mechanism Employed on Data Quality in Web Surveys. Social Science
Computer Review , 25 (1), 111–128.
Hedlin, D., Dale, T., Haraldsen, G., & Jones, J. (Eds.). (2005). Developing Methods for
Assessing Perceived Response Burden. Statistics Sweden/Statistics Norway/Office
for National Statistics, UK.
Hedlin, D., & Jones, J. (2005). Guidelines for Reducing Perceived Response Burden.
In D. Hedlin, T. Dale, G. Haraldsen, & J. Jones (Eds.), Developing Methods for
Assessing Perceived Response Burden (pp. 181–194). Statistics Norway and the
UK Office for National Statistics.
Heerwegh, D. (n.d.). The CSP Project Webpage. Available from http://perswww
.kuleuven.be/~u0034437/public/csp.htm
Heerwegh, D. (2003). Explaining Response Latencies and Changing Answers Using
Client-Side Paradata from a Web Survey. Social Science Computer Review , 21 (3),
360–373.
157
Bibliography
Heerwegh, D. (2004, May). Using Progress Indicators in Web Surveys. Paper presented at
the conference of the American Association for Public Opinion Research, Phoenix,
Arizona, Phoenix.
Heerwegh, D. (2005). Web Surveys. Explaining and Reducing Unit Nonresponse, Item
Nonresponse and Partial Nonresponse. Doctoral dissertation, Katholieke Univer-
siteit Leuven, Belgium.
Heerwegh, D., & Loosveldt, G. (2002). An Evaluation of the Effects of Response Formats
on Data Quality in Web Survey. Social Science Computer Review , 20 (4), 471–484.
Hellbusch, J. E. (2004). Barrierefreies Webdesign. Praxishandbuch für Webgestaltung und
Grafische Programmoberflächen [Webdesign Without Barriers: Practice Handbook
for Web Design and Graphical Interfaces]. Heidelberg: Dpunkt.
HHS, & GSA. (2006). Research-Based Web Design & Usability Guidelines. U.S. Depart-
ment of Health and Human Services. Available from http://www.usability.gov/
pdfs/guidelines.html
Hosmer, D. W., & Lemeshow, S. (2000). Applied Logistic Regression (2nd ed.). New
York: Wiley.
ICPSR. (2005). Guide to Social Science Data Preparation and Archiving. Best Prac-
tice Throughout the Data Life Cycle. Michigan: Inter-University Consortium for
Political and Social Research (ICPSR).
ISO. (2006). ISO 9241-110 [Ergonomics of Human-System Interaction — Part 110:
Dialogue Principles] (International Standard). Geneva, Switzerland: ISO copyright
office.
Janetzko, D. (1999). Statistische Anwendungen im Internet: Daten in Netzumgebungen
Erheben, Auswerten und Präsentieren [Statistical Applications in the Internet: Col-
lection, Analysis, and Presentation of Data in Network Environments]. München:
Addison-Wesley.
Janetzko, D., Hildebrandt, M., & Meyer, H. A. (2001). Zeiterfassung in Online-
Fragebögen [Recording of Time in Online Questionnaires]. In A. Theobald,
M. Dreyer, & T. Starsetzki (Eds.), Online-Marktforschung (pp. 191–212). Wies-
baden: Gabler.
Jendroska, D. (in preparation). Open-Source Software Development. Unpublished doc-
toral dissertation, University of Würzburg.
Kaczmirek, L. (2005). Web Surveys: A Brief Guide on Usability and Implementation
Issues. In M. Hassenzahl & M. Peissner (Eds.), Usability Professionals 2005 (pp.
102–105). Stuttgart: German Chapter der Usability Professionals Association e.V.
158
Bibliography
Kaczmirek, L. (2008). Internet Survey Software Tools. In N. Fielding, R. Lee, & G. Blank
(Eds.), The Handbook of Online Research Methods (pp. 236–254). London: Sage.
Kaczmirek, L., & Neubarth, W. (2005, March). Active User Sampling: Intercept Sur-
veys without Popups. Poster session presented at the General Online Research
Conference, Zurich, Switzerland.
Kaczmirek, L., & Neubarth, W. (2007). Nicht-reaktive Datenerhebung: Teilnahmev-
erhalten bei Befragungen mit Paradaten evaluieren [Non-Reactive Data Collec-
tion: Evaluating Response Behavior with Paradata in Surveys]. In D. G. für
Online-Forschung (Ed.), Online-Forschung 2007: Grundlagen und Fallstudien.
Neue Schriften zur Online-Forschung Band 1. Köln: Herbert von Halem Verlag.
Kaczmirek, L., Neubarth, W., Bosnjak, M., & Bandilla, W. (2004). Progress Indicators in
Filter Based Surveys: Computing Methods and Their Impact on Drop Out. Presen-
tation at the RC33 Sixth International Conference on Social Science Methodology,
Amsterdam, The Netherlands.
Kaczmirek, L., Neubarth, W., Bosnjak, M., & Bandilla, W. (2005, March). Progress
Indicators in Filter Based Surveys: Individual and Dynamic Calculation Methods.
Presentation at the General Online Research Conference, Zurich, Switzerland.
Kaczmirek, L., & Thiele, O. (2006, March). Flash, Javascript or PHP? Comparing the
Availability of Technical Equipment Among University Applicants. Poster session
presented at the General Online Research Conference, Bielefeld, Germany.
Kaczmirek, L., & Wolff, K. G. (2007). Survey Design for Visually Impaired and Blind
People. In Proceedings of the Universal Access in HCI, Part I, HCII 2007, LNCS
4554 (pp. 374–381). Berlin: Springer.
Kalyuga, S., Chandler, P., & Sweller, J. (1999). Managing Split-attention and Redun-
dancy in Multimedia Instruction. Applied Cognitive Psychology , 13 , 351–371.
Kaplowitz, M. D., Hadlock, T. D., & Levine, R. (2004). A Comparison of Web And Mail
Survey Response Rates. Public Opinion Quarterly , 68 (1), 94–101.
Kjellström, O., & Bälter, O. (2003). Design of Follow-Up Questions in Web Surveys.
Paper presented at the 25th International Conference Information Technology In-
terfaces ITI.
Knäuper, B., Belli, R. F., Hill, D. H., & Herzog, A. R. (2006). Question Difficulty and
Respondents’ Cognitive Ability: The Effect on Data Quality. Journal of Official
Statistics, 13 (2), 181–199.
Kohler, U., & Kreuter, F. (2006). Datenanalyse mit Stata [Data Analysis With Stata].
München: Oldenbourg.
159
Bibliography
Krippendorff, K. (2003). Content Analysis: An Introduction to Its Methodology. London:
Sage.
Krisch, J., & Lesho, P. (2006, May). Designing Web Surveys for Children. Presentation at
the International Field Director’s & Technologies Conference, Montréal, Canada.
Krosnick, J. A. (1991). Response Strategies for Coping With the Cognitive Demands of
Attitude Measures in Surveys. Applied Cognitive Psychology , 5 , 213–236.
Krosnick, J. A. (2002). The Causes of Non-Opinion Responses to Attitude Measures in
Surveys: They Are Rarely What They Appear to Be. In R. M. Groves, D. A. Dill-
man, J. L. Eltinge, & R. J. A. Little (Eds.), Survey Nonresponse (pp. 87–102). New
York: Wiley.
Lee, S. (2006). Propensity Score Adjustment as a Weighting Scheme for Volunteer Panel
Web Surveys. Journal of Official Statistics, 22 (2), 329–349.
Little, R. J. A., & Rubin, D. B. (2002). Statistical Analysis With Missing Data. New
York: Wiley.
Lozar Manfreda, K., Bosnjak, M., Berzelak, J., Haas, I., & Vehovar, V. (2008). Web
Surveys Versus other Survey Modes: A Meta-Analysis Comparing Response Rates.
International Journal of Market Research, 50 (1), 79–104.
Ludwig, H. (2004). Rücklauf bei Online Befragungen im Online Access Panel [Response
Rates in Online Surveys in Online Access Panels]. Hamburg: Kovac.
Neubarth, W. (2006, March). Ranking vs. Rating in an Online Environment. Presenta-
tion at the 8th International Conference General Online Research 2006 (GOR06),
March 21-22, 2006, Bielefeld, Germany, Montréal.
Neubarth, W. (2008). Präferenzdaten Online [Online Preference Measurement]. Köln:
Herbert von Halem Verlag.
Neubarth, W. (in press). Online Measurement of Moveable Objects. In S. Gosling &
J. A. Johnson (Eds.), Advanced Methods for Behavioral Research on the Internet.
APA.
Nielsen, J. (1993). Usability Engineering. New York: Academic Press.
Nielsen, J. (2005). Ten Usability Heuristics. useit.com. Available from http://www
.useit.com/papers/heuristic/heuristic_list.html
Nielsen, J. (2006, July 31). Screen Resolution and Page Layout. Jakob Nielsen’s Alertbox.
Available from http://www.useit.com/alertbox/screen_resolution.html
Norman, D. A. (1988). The Psychology of Everyday Things. New York: Basic Books.
O’Muircheartaigh, C. (1997). Measurement Error in Surveys: A Historical Perspective.
In L. Lyberg et al. (Eds.), Survey Measurement and Process Quality (pp. 1–28).
160
Bibliography
New York: Wiley.
Pashler, H., Johnston, J. C., & Ruthruff, E. (2001). Attention and Performance. Annu.
Rev. Psychol., 52 , 629–651.
Peytchev, A. (2007). Participation Decisions and Measurement Error in Web Surveys.
Doctoral dissertation, University of Michigan.
Peytchev, A., Couper, M. P., McCabe, S. E., & Crawford, S. (2006). Web Survey Design:
Paging versus Scrolling. Public Opinion Quarterly , 70 (4), 596–607.
Peytchev, A., & Crawford, S. (2005). A Typology of Real-Time Validations in Web-
Based Surveys. Social Science Computer Review , 23 (2), 235–249.
Ratcliff, R. (1993). Methods for dealing with reaction time outliers. Psychological
Bulletin, 114 , 510–532.
Redline, C. D., & Dillman, D. A. (2002). The Influense of Alternative Visual Designs
on Respondents’ Performance with Branching Instructions in Self-Administered
Questionnaires. In R. M. Groves, D. A. Dillman, J. L. Eltinge, & R. J. A. Little
(Eds.), Survey Nonresponse (pp. 179–193). New York: Wiley.
Reips, U.-D. (2002). Standards for Internet-Based Experimenting. Experimental Psy-
chology , 49 (4), 243–256.
Rensink, R. A. (2002). Change Detention. Annu. Rev. Psychol., 53 , 245–277.
Schneider, S. J., Cantor, D., Malakhoff, L., Arieira, C., Segel, P., Nguyen, K.-L., et al.
(2005). Telephone, Internet, and Paper Data Collection Modes for the Census 2000
Short Form. Journal of Official Statistics, 21 (1), 89–101.
Schnell, R., Hill, P. B., & Esser, E. (2004). Methoden der empirischen Sozialforschung
[Methods of Empirical Social Sciences] (5th ed.). München: Oldenbourg.
Schonlau, M., Zapert, K., Simone, L. P., Sanstad, K. H., Marcus, S. M., Adams, J., et
al. (2004). A Comparison Between Responses From a Propensity-Weighted Web
Survey and an Identical RDD Survey. Social Science Computer Review , 22 (1),
128–138.
Schwarz, N. (1999). Self-reports: How the Questions Shape the Answers. American
Psychologist , 54 (2), 93–105.
Schwarz, N., & Scheuring, B. (1992). Selbstberichtete Verhaltens- und Symp-
tomhäufigkeiten: Was Befragte aus Antwortvorgaben des Fragebogens lernen [Self-
Reported Frequencies of Behavior and Symptoms: What Respondents Learn from
Available Answer Categories in the Questionnaire]. Zeitschrift für Klinische Psy-
chologie, 11 (2), 197–208.
161

Bibliography
Schwarz, S., & Reips, U.-D. (2001). CGI Versus JavaScript: a Web Experiment on
the Reversed Hindsight Bias pp. 75–90. In U.-D. Reips & M. Bosnjak (Eds.),
Dimensions of Internet Science (pp. 75–90). Lengerich: Pabst.
Sharp, L. M., & Frankel, J. (1983). Respondent Burden: A Test of Some Common
Assumptions. Public Opinion Quarterly , 47 (1), 36–53.
Shneiderman, B. (1998). Designing the User Interface: Strategies for Effective Human-
Computer Interaction (3rd ed.). Boston: Addison Wesley.
Singer, E. (2002). The Use of Incentives to Reduce Nonresponse in Household Survey.
In R. M. Groves, D. A. Dillman, J. L. Eltinge, & R. J. A. Little (Eds.), Survey
Nonresponse (pp. 163–178). New York: Wiley.
Smyth, J. D., Dillman, D. A., Christian, L. M., & Stern, M. J. (2004). How Visual Group-
ing Influences Answers to Internet Surveys (Technical Report 04-23). Washington:
SESRC.
Smyth, J. D., Dillman, D. A., Christian, L. M., & Stern, M. J. (2006). Comparing
Check-All and Forced-Choice Question Formats in Web Surveys. Public Opinion
Quarterly , 70 (1), 66–77.
Stahl, M., Binder, G., & Bandilla, W. (2004, Juli). GESIS-Arbeitsbericht Nr. 3: GESIS-
Web-Umfrage [GESIS Web Survey] (IZ-Arbeitsbericht). GESIS.
Statistisches Bundesamt. (2004). Demographische Standards: Methoden,
Verfahren, Entwicklungen [Demographical Standards: Methods, Proce-
dures, Developments]. Wiesbaden: Statistisches Bundesamt. Available
from http://www.gesis.org/Methodenberatung/Untersuchungsplanung/
Standarddemografie/dem_standards/demsta2004.pdf
Stein, L. D., & Stewart, J. N. (2003). The World Wide Web Security FAQ: Q10: Do
‘Cookies’ Pose any Security Risks? Available at http://www.w3.org/Security/
Faq/wwwsf2.html.
Sterne, J. (2002). Web Metrics Proven Methodes for Measuring Web Site Success. New
York: Wiley.
Stocké, V., & Becker, B. (2004). Determinanten und Konsequenzen der Umfragee-
instellung: Bewertungsdimensionen unterschiedlicher Umfragesponsoren und die
Antwortbereitschaft der Befragten [Determinants and Consequences of Attitudes
towards Surveys: Different Survey Sponsors and Willingness to Participate]. ZA-
Information, 54 , 89–116.
Stocké, V., & Hunkler, C. (2004). Die angemessene Erfassung der Stärke und Richtung
von Anreizen durch soziale Erwünschtheit [Measuring Intensity and Direction of
162
Bibliography
Social Desirability]. ZA-Information, 54 , 53–88.
SurveyMonkey.com. (n.d.). http://www.surveymonkey.com/.
Terhanian, G., & Bremer, J. (2005). Creative Applications of Selection Bias Modelling in
Market Research. Retrieved August 8, 2007, from http://vv.ris.org/uploadi/
editor/ISI.TERHANIAN-BREMER%20FINAL.doc.
Thiele, O., & Kaczmirek, L. (2005, July). Flash, Javascript oder PHP? Ein technisch-
methodischer Vergleich am Beispiel von Online-Bewerbungen an Universitäten
[Flash, JavaScript, or PHP: A Technical-Methodological Comparison with the Ex-
ample of Students Applying Online at Universities]. Symposium “Methodische
Fragen der Onlineforschung” conducted by the Methodensektion der Deutschen
Gesellschaft für Soziologie, Mannheim, Germany.
Thomas, R. K., & Klein, J. D. (2006). Merely Incidental? Effects of Response Format
on Self-reported Behavior. Journal of Official Statistics, 22 (2), 221–244.
Tourangeau, R., Couper, M. P., & Conrad, F. G. (2004). Spacing, Position, and Order:
Interpretive Heuristics for Visual Features of Survey Questions. Public Opinion
Quarterly , 68 (3), 368–393.
Tourangeau, R., Couper, M. P., & Conrad, F. G. (2006). Color, Labels, and Interpretive
Heuristics for Response Scales. Public Opinion Quarterly , 71 (1), 91–112.
Tourangeau, R., Rips, L. J., & Rasinski, K. (2000). The Psychology of Survey Response.
Cambridge: Cambridge University Press.
Trouteaud, A. R. (2004). How You Ask Counts: A Test of Internet-Related Components
of Response Rates to a Web-Based Survey. Social Science Computer Review , 22 (3),
385–392.
Van Eimeren, B., & Frees, B. (2007). ARD-Online-Studie 2007: Internetnutzung zwis-
chen Pragmatismus und YouTube-Euphorie [ARD Online Study 2007: Usage of
the Internet between Pragmatism and YouTube-Euphoria]. Media Perspektiven,
8 , 362–378.
Vehovar, V., Batagelj, Z., Manfreda, K. L., & Zaletel, M. (2002). Nonresponse in Web
Surveys. In R. M. Groves, D. A. Dillman, J. L. Eltinge, & R. J. A. Little (Eds.),
Survey Nonresponse (pp. 229–242). New York: Wiley.
Vincente, K. (2004). The Human Factor. New York: Vintage Canada.
Walston, J. T., Lissitz, R. W., & Rudner, L. M. (2006). The Influence of Web-based
Questionnaire Presentation Variations on Survey Cooperation and Perceptions of
Survey Quality. Journal of Official Statistics, 22 (2), 271–291.
Weber, R. P. (1990). Basic Content Analysis. London: Sage.
163
Bibliography
Welker, M., Werner, A., & Scholz, J. (2005). Online-Research: Markt- und Sozial-
forschung mit dem Internet [Online Research: Market and Social Research with
the Internet]. Heidelberg: dpunkt.verlag.
Wittmann, W. W. (1990). Brunswik-Symmetrie und die Konzeption der Fünf-
Datenboxen: Ein Rahmenkonzept für umfassende Evaluationsforschung [Brunswick
Symmetry and the Conception of the Five Data Box Model: A Framework for
Comprehensive Evaluation Research]. Zeitschrift für Pädagogische Psychologie, 4 ,
241–151.
Wolff, K. G., & Schick, B. (2007). Zufriedenheit, Meinungen, Wünsche und Forderun-
gen: Ergebnisse der Mitgliederbefragung 2006 des Badischen Blinden- und Sehbe-
hindertenvereins [Satisfaction, Opionions, Wishes and Demands: Results of the
Member Survey 2006 of the Association for Blind and Visually Impaired People in
Baden]. Mannheim, Germany: BBSV.
Yammarino, F. J., Skinner, S. J., & Childers, T. L. (1991). Understanding Mail Survey
Response Behavior: A Meta-Analysis. Public Opinion Quarterly , 55 (4), 613–639.
Yan, T., & Tourangeau, R. (2008). Fast Times and Easy Questions: The Effects of Age,
Experience and Question Complexity on Web Survey Response Times. Applied
Cognitive Psychology , 22 (1), 51–68.
ZA, & ZUMA. (2004). ALLBUS 2004 [German General Social Survey] (Codebook 2004,
ZA-Nr. 3762). Mannheim, Germany: ZA and ZUMA. ZUMA.
164
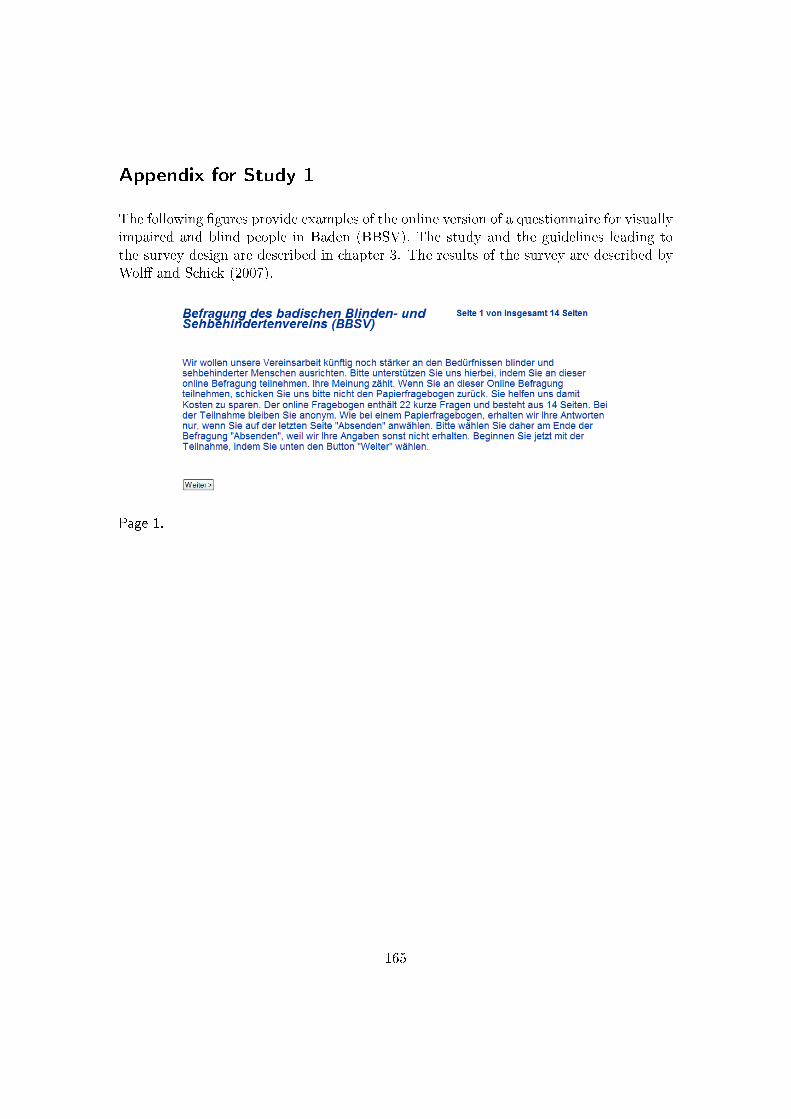
Appendix for Study 1
The following figures provide examples of the online version of a questionnaire for visuallyimpaired and blind people in Baden (BBSV). The study and the guidelines leading tothe survey design are described in chapter 3. The results of the survey are described byWolff and Schick (2007).
Page 1.
165
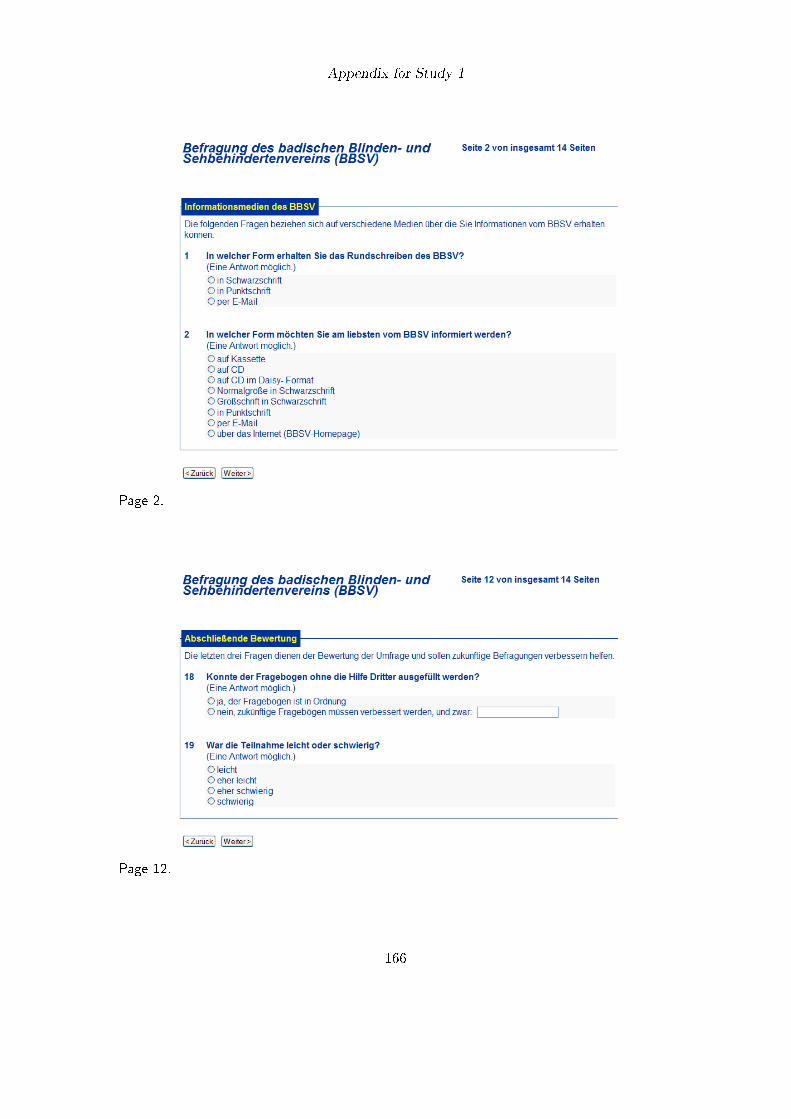
Appendix for Study 1
Page 2.
Page 12.
166
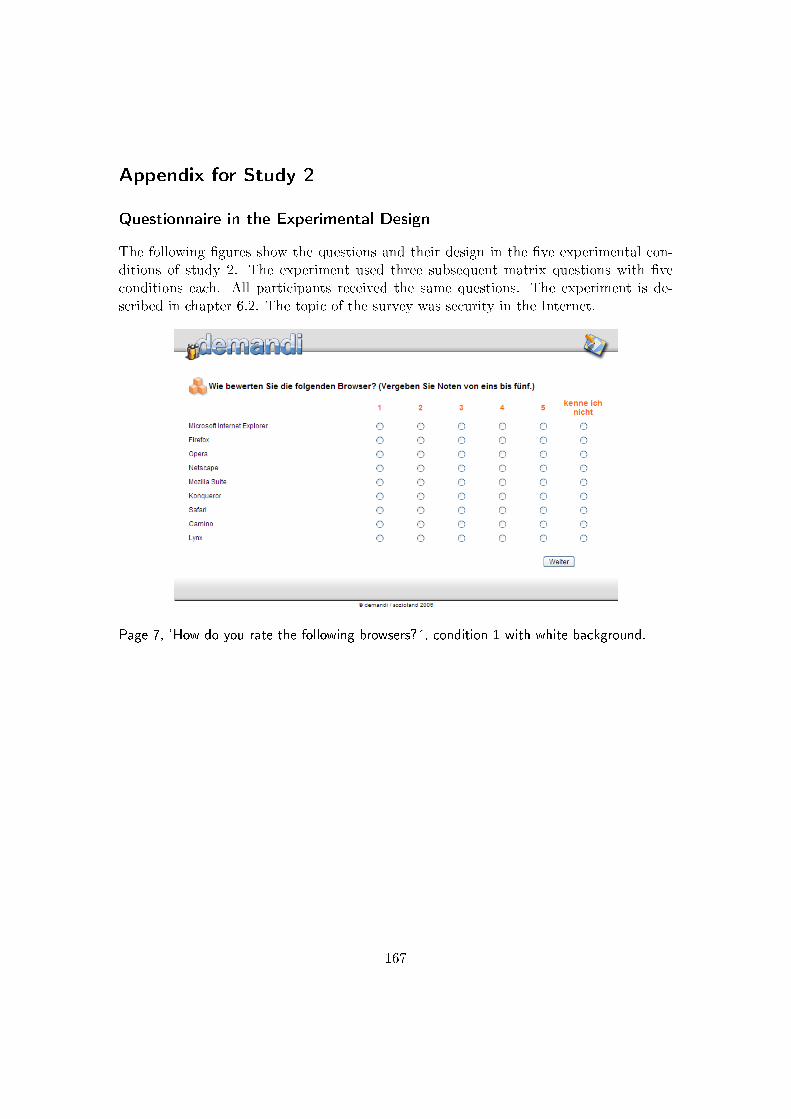
Appendix for Study 2
Questionnaire in the Experimental Design
The following figures show the questions and their design in the five experimental con-ditions of study 2. The experiment used three subsequent matrix questions with fiveconditions each. All participants received the same questions. The experiment is de-scribed in chapter 6.2. The topic of the survey was security in the Internet.
Page 7, ’How do you rate the following browsers?´, condition 1 with white background.
167
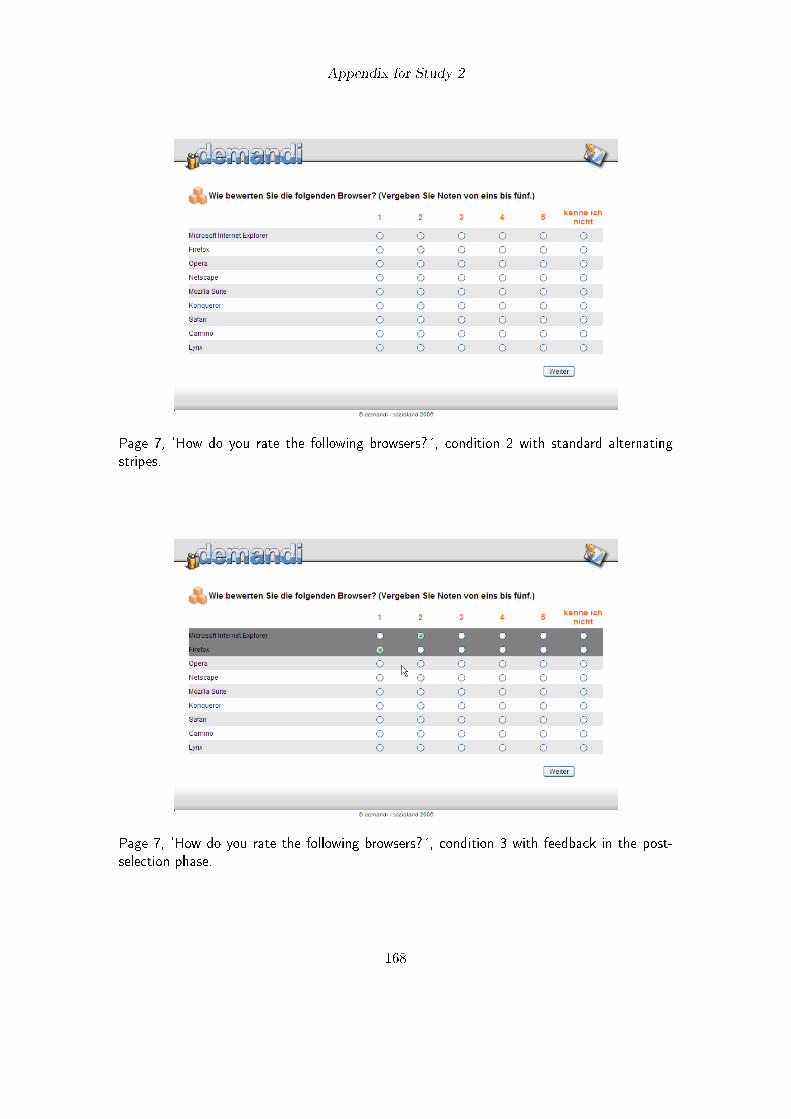
Appendix for Study 2
Page 7, ’How do you rate the following browsers?´, condition 2 with standard alternating
stripes.
Page 7, ’How do you rate the following browsers?´, condition 3 with feedback in the post-
selection phase.
168
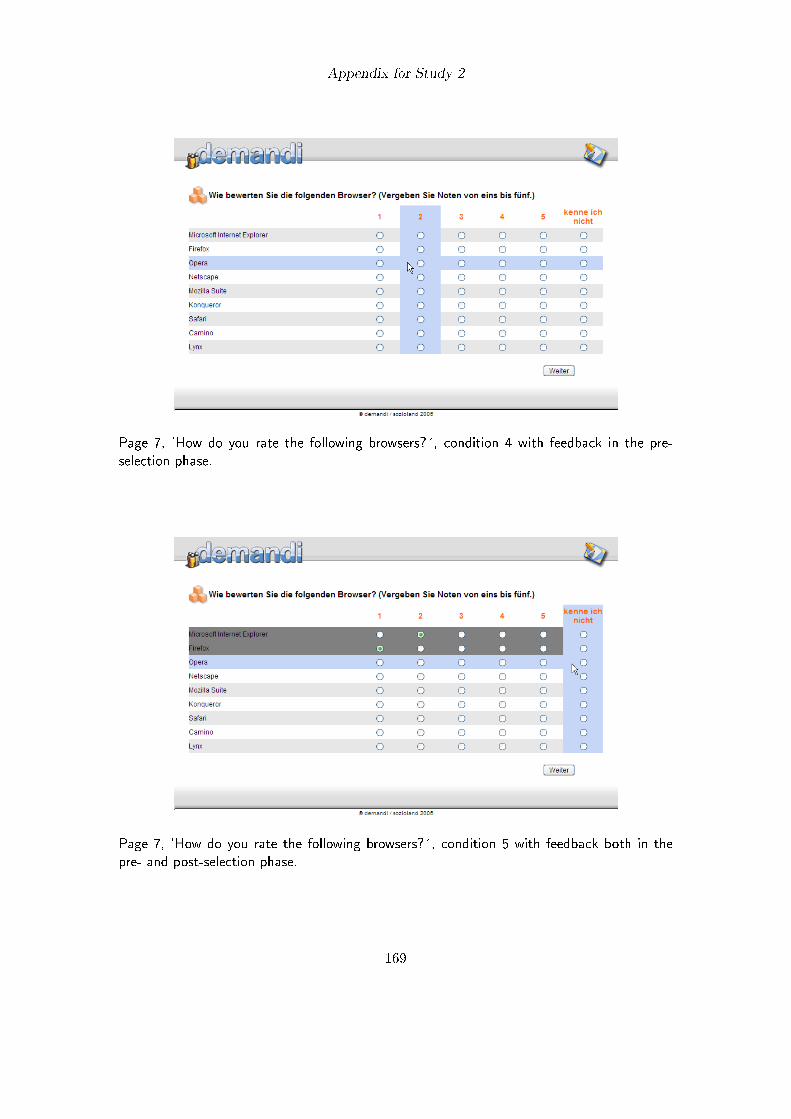
Appendix for Study 2
Page 7, ’How do you rate the following browsers?´, condition 4 with feedback in the pre-
selection phase.
Page 7, ’How do you rate the following browsers?´, condition 5 with feedback both in the
pre- and post-selection phase.
169
Appendix for Study 2
Page 8, condition 2 with standard alternating stripes. The other conditions are equal to the
visual design on page 7 and are therefore not repeated here. The question asks about the
frequency of use of different Internet communication channels.
Page 9, condition 2 with standard alternating stripes. The other conditions are equal to the
visual design on page 7 and are therefore not repeated here. The question asks to rate the
importance of several possible measures to enhance the security in the Internet.
170
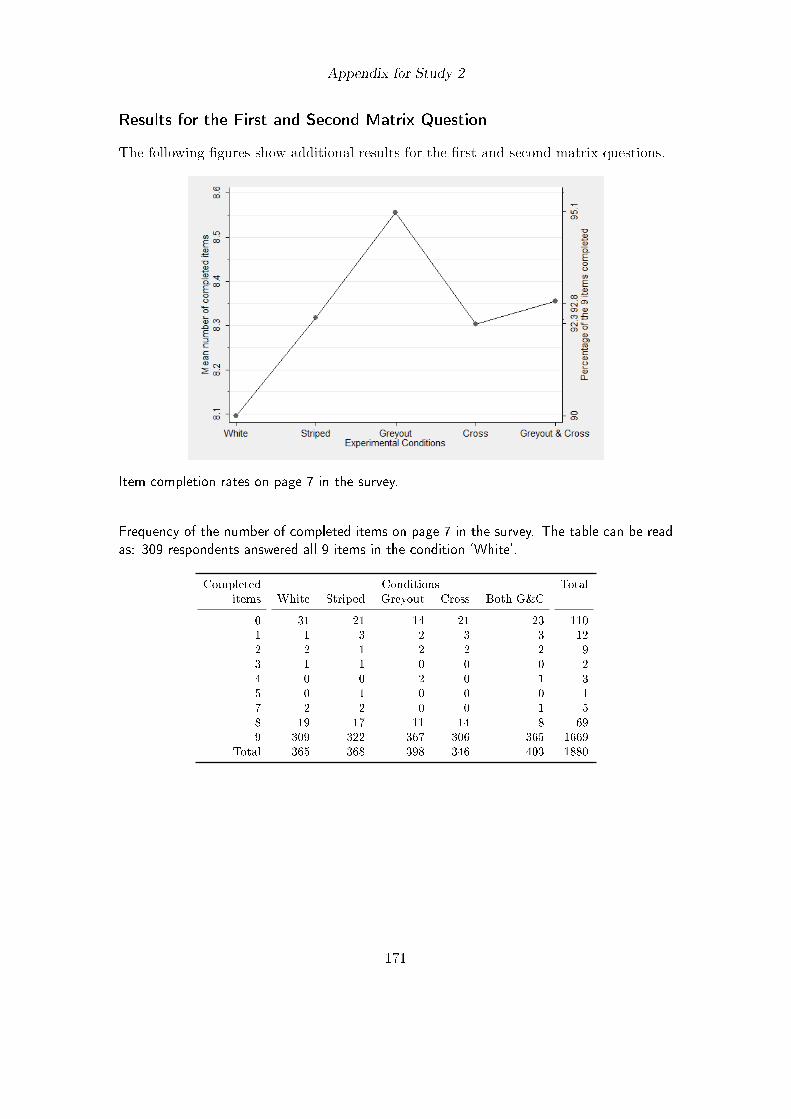
Appendix for Study 2
Results for the First and Second Matrix Question
The following figures show additional results for the first and second matrix questions.
Item completion rates on page 7 in the survey.
Frequency of the number of completed items on page 7 in the survey. The table can be read
as: 309 respondents answered all 9 items in the condition ‘White’.
Completed Conditions Totalitems White Striped Greyout Cross Both G&C
0 31 21 14 21 23 1101 1 3 2 3 3 122 2 1 2 2 2 93 1 1 0 0 0 24 0 0 2 0 1 35 0 1 0 0 0 17 2 2 0 0 1 58 19 17 11 14 8 699 309 322 367 306 365 1669
Total 365 368 398 346 403 1880
171
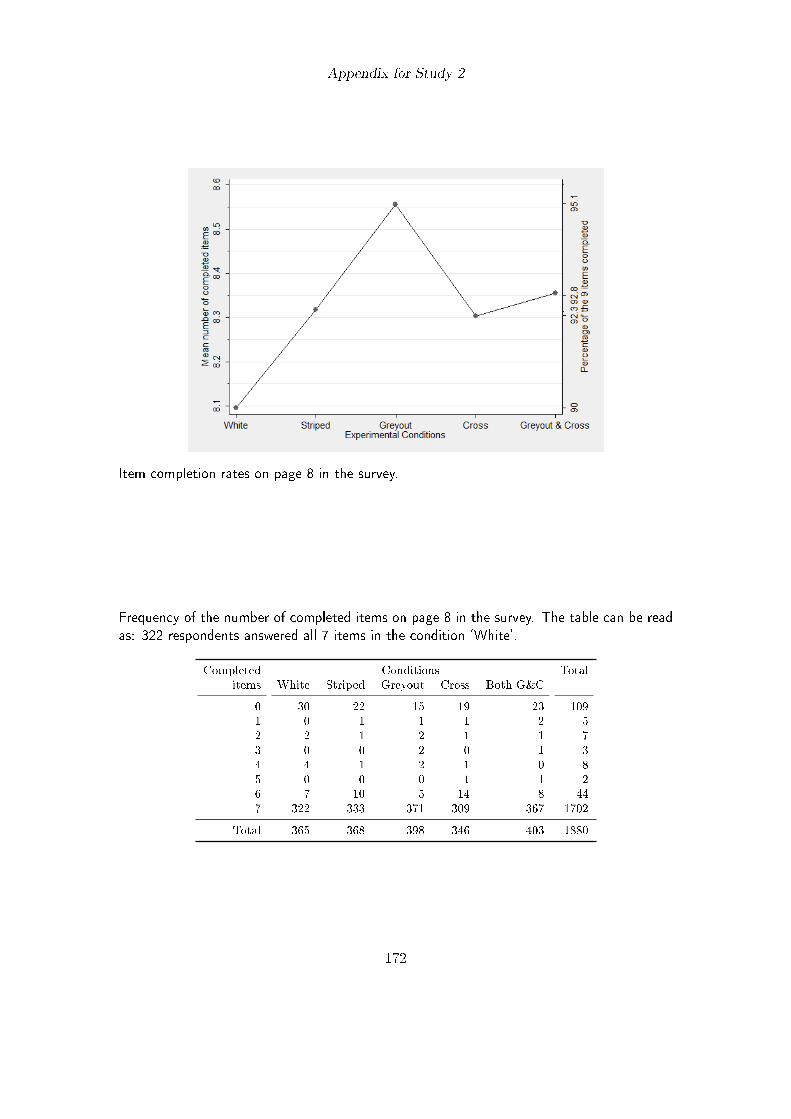
Appendix for Study 2
Item completion rates on page 8 in the survey.
Frequency of the number of completed items on page 8 in the survey. The table can be read
as: 322 respondents answered all 7 items in the condition ‘White’.
Completed Conditions Totalitems White Striped Greyout Cross Both G&C
0 30 22 15 19 23 1091 0 1 1 1 2 52 2 1 2 1 1 73 0 0 2 0 1 34 4 1 2 1 0 85 0 0 0 1 1 26 7 10 5 14 8 447 322 333 371 309 367 1702
Total 365 368 398 346 403 1880
172
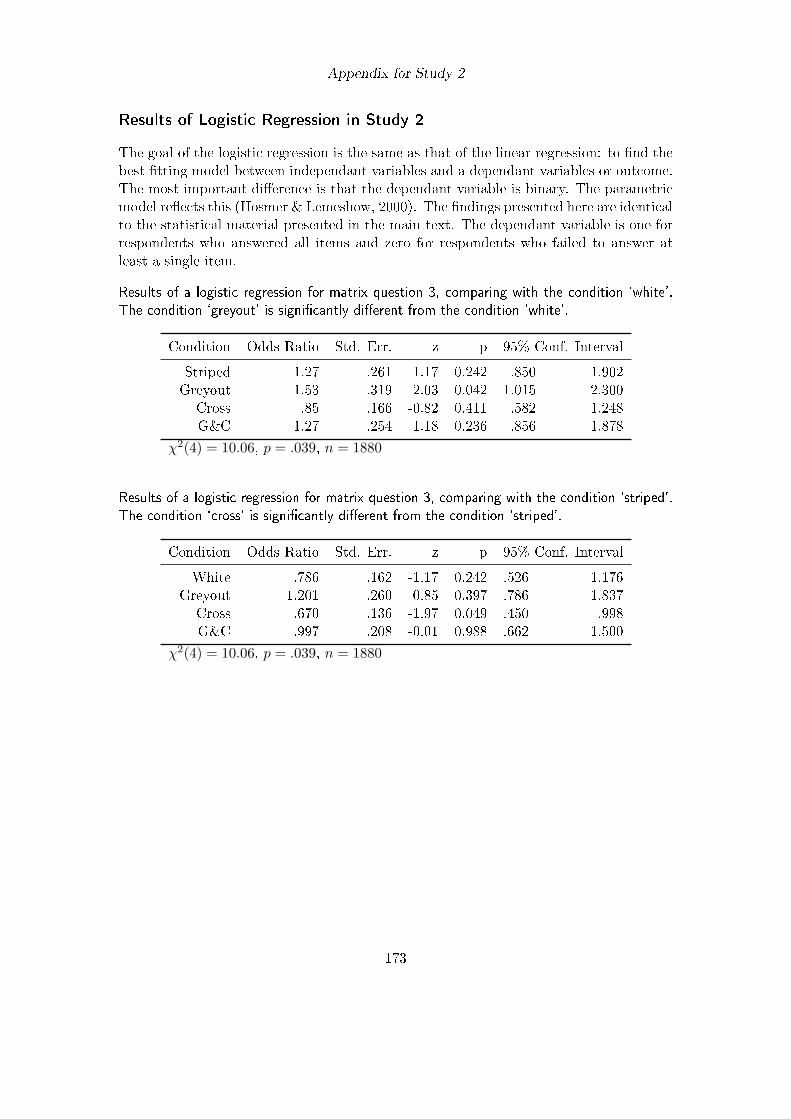
Appendix for Study 2
Results of Logistic Regression in Study 2
The goal of the logistic regression is the same as that of the linear regression: to find thebest fitting model between independant variables and a dependant variables or outcome.The most important difference is that the dependant variable is binary. The parametricmodel reflects this (Hosmer & Lemeshow, 2000). The findings presented here are identicalto the statistical material presented in the main text. The dependant variable is one forrespondents who answered all items and zero for respondents who failed to answer atleast a single item.
Results of a logistic regression for matrix question 3, comparing with the condition ‘white’.
The condition ‘greyout’ is significantly different from the condition ‘white’.
Condition Odds Ratio Std. Err. z p 95% Conf. Interval
Striped 1.27 .261 1.17 0.242 .850 1.902Greyout 1.53 .319 2.03 0.042 1.015 2.300
Cross .85 .166 -0.82 0.411 .582 1.248G&C 1.27 .254 1.18 0.236 .856 1.878
𝜒2(4) = 10.06, 𝑝 = .039, 𝑛 = 1880
Results of a logistic regression for matrix question 3, comparing with the condition ‘striped’.
The condition ‘cross’ is significantly different from the condition ‘striped’.
Condition Odds Ratio Std. Err. z p 95% Conf. Interval
White .786 .162 -1.17 0.242 .526 1.176Greyout 1.201 .260 0.85 0.397 .786 1.837
Cross .670 .136 -1.97 0.049 .450 .998G&C .997 .208 -0.01 0.988 .662 1.500
𝜒2(4) = 10.06, 𝑝 = .039, 𝑛 = 1880
173
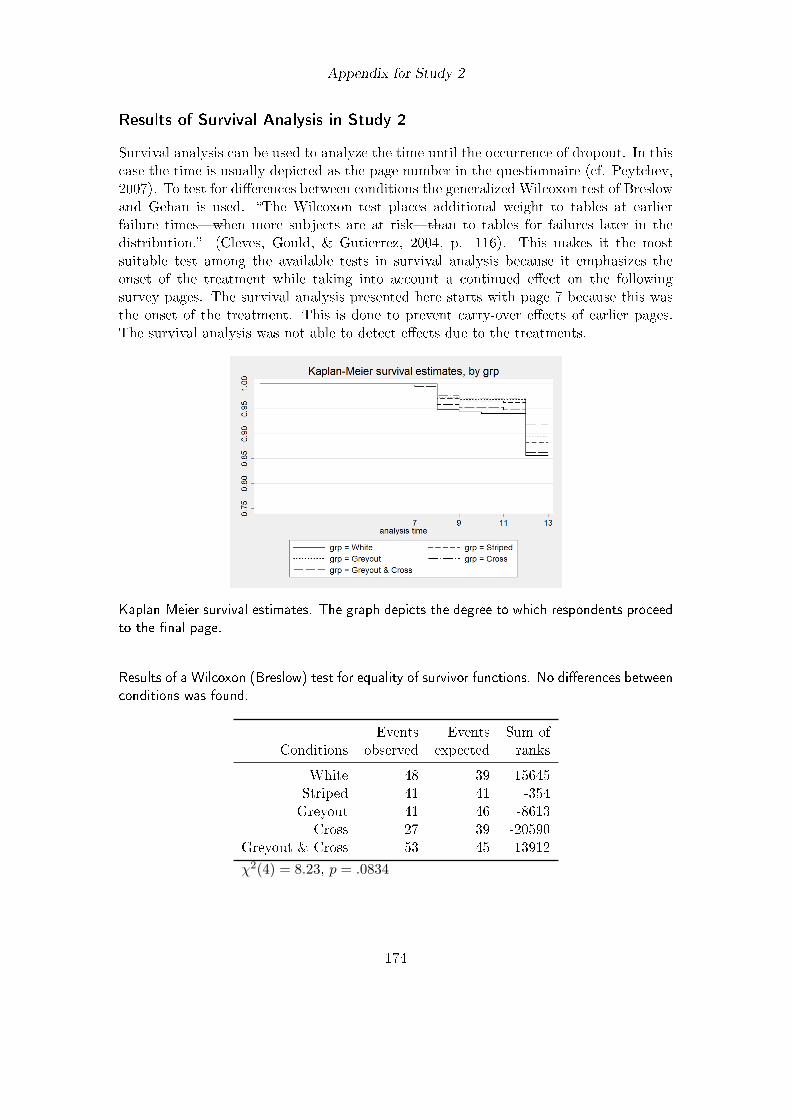
Appendix for Study 2
Results of Survival Analysis in Study 2
Survival analysis can be used to analyze the time until the occurrence of dropout. In thiscase the time is usually depicted as the page number in the questionnaire (cf. Peytchev,2007). To test for differences between conditions the generalized Wilcoxon test of Breslowand Gehan is used. “The Wilcoxon test places additional weight to tables at earlierfailure times—when more subjects are at risk—than to tables for failures later in thedistribution.” (Cleves, Gould, & Gutierrez, 2004, p. 116). This makes it the mostsuitable test among the available tests in survival analysis because it emphasizes theonset of the treatment while taking into account a continued effect on the followingsurvey pages. The survival analysis presented here starts with page 7 because this wasthe onset of the treatment. This is done to prevent carry-over effects of earlier pages.The survival analysis was not able to detect effects due to the treatments.
Kaplan-Meier survival estimates. The graph depicts the degree to which respondents proceed
to the final page.
Results of a Wilcoxon (Breslow) test for equality of survivor functions. No differences between
conditions was found.
Events Events Sum ofConditions observed expected ranks
White 48 39 15645Striped 41 41 -354Greyout 41 46 -8613
Cross 27 39 -20590Greyout & Cross 53 45 13912
𝜒2(4) = 8.23, 𝑝 = .0834
174
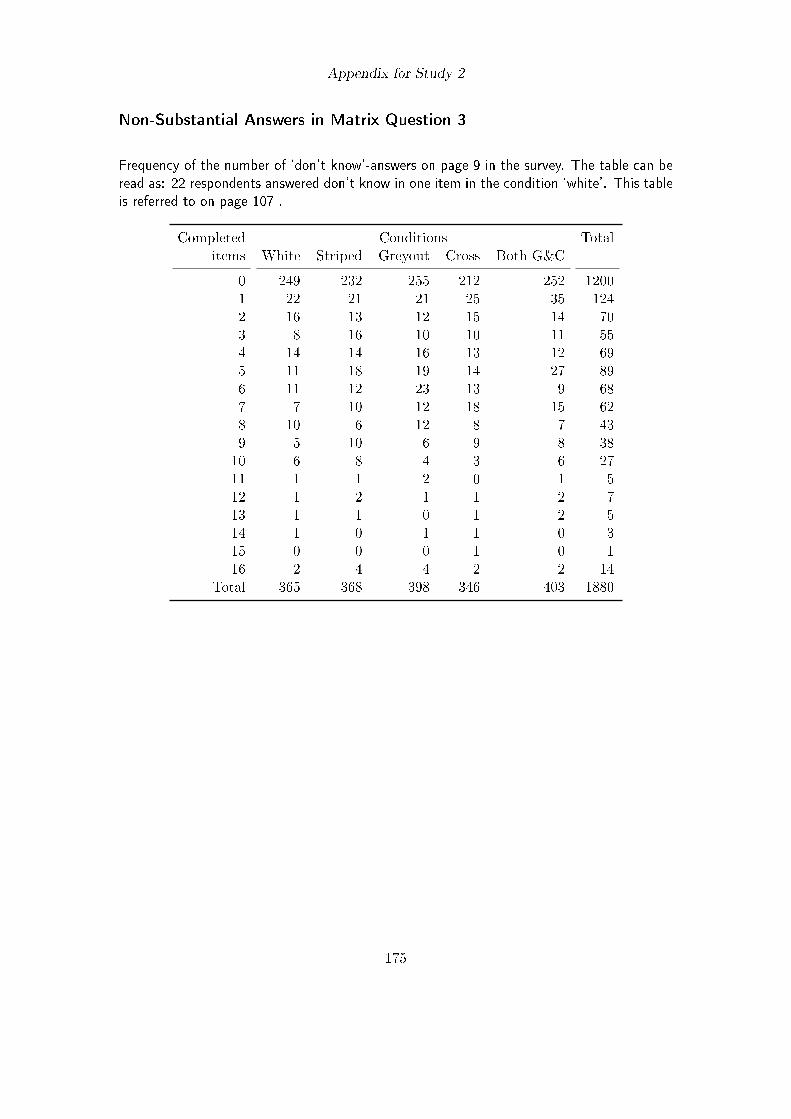
Appendix for Study 2
Non-Substantial Answers in Matrix Question 3
Frequency of the number of ‘don’t know’-answers on page 9 in the survey. The table can be
read as: 22 respondents answered don’t know in one item in the condition ‘white’. This table
is referred to on page 107 .
Completed Conditions Totalitems White Striped Greyout Cross Both G&C
0 249 232 255 212 252 12001 22 21 21 25 35 1242 16 13 12 15 14 703 8 16 10 10 11 554 14 14 16 13 12 695 11 18 19 14 27 896 11 12 23 13 9 687 7 10 12 18 15 628 10 6 12 8 7 439 5 10 6 9 8 3810 6 8 4 3 6 2711 1 1 2 0 1 512 1 2 1 1 2 713 1 1 0 1 2 514 1 0 1 1 0 315 0 0 0 1 0 116 2 4 4 2 2 14
Total 365 368 398 346 403 1880
175
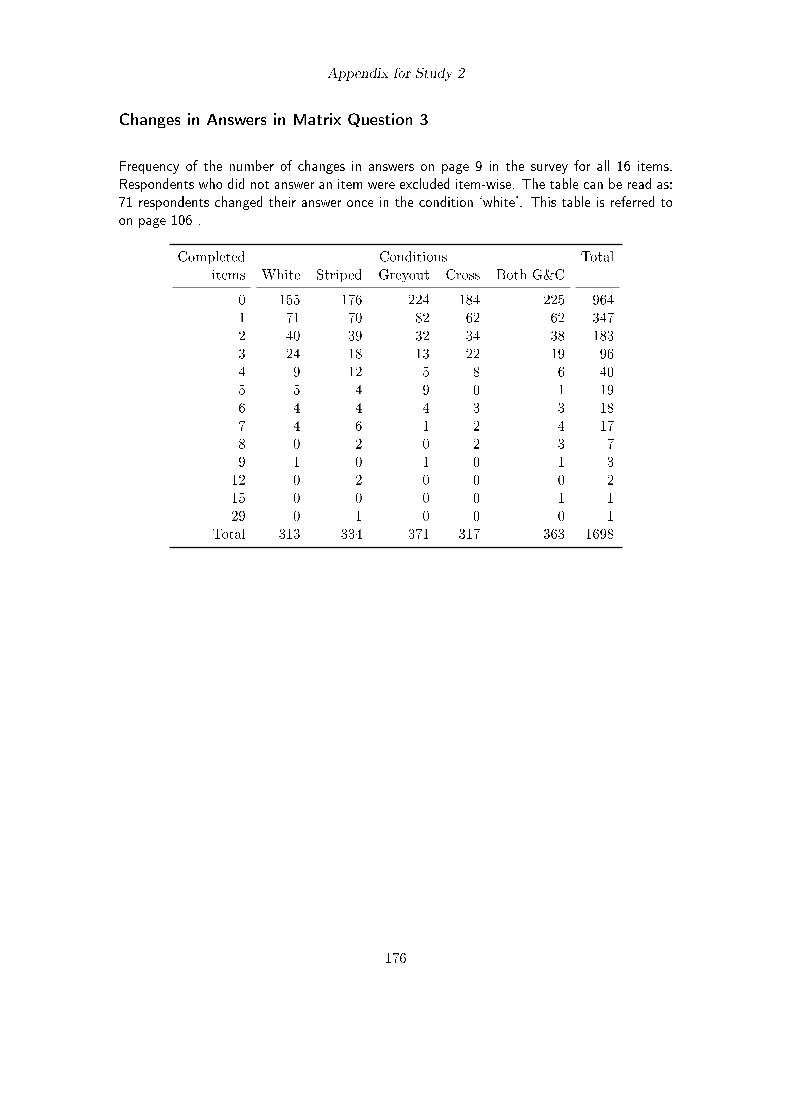
Appendix for Study 2
Changes in Answers in Matrix Question 3
Frequency of the number of changes in answers on page 9 in the survey for all 16 items.
Respondents who did not answer an item were excluded item-wise. The table can be read as:
71 respondents changed their answer once in the condition ‘white’. This table is referred to
on page 106 .
Completed Conditions Totalitems White Striped Greyout Cross Both G&C
0 155 176 224 184 225 9641 71 70 82 62 62 3472 40 39 32 34 38 1833 24 18 13 22 19 964 9 12 5 8 6 405 5 4 9 0 1 196 4 4 4 3 3 187 4 6 1 2 4 178 0 2 0 2 3 79 1 0 1 0 1 312 0 2 0 0 0 215 0 0 0 0 1 129 0 1 0 0 0 1
Total 313 334 371 317 363 1698
176
Appendix for Study 3
The following figures exemplify the survey design of study 3.
Page 1.
177
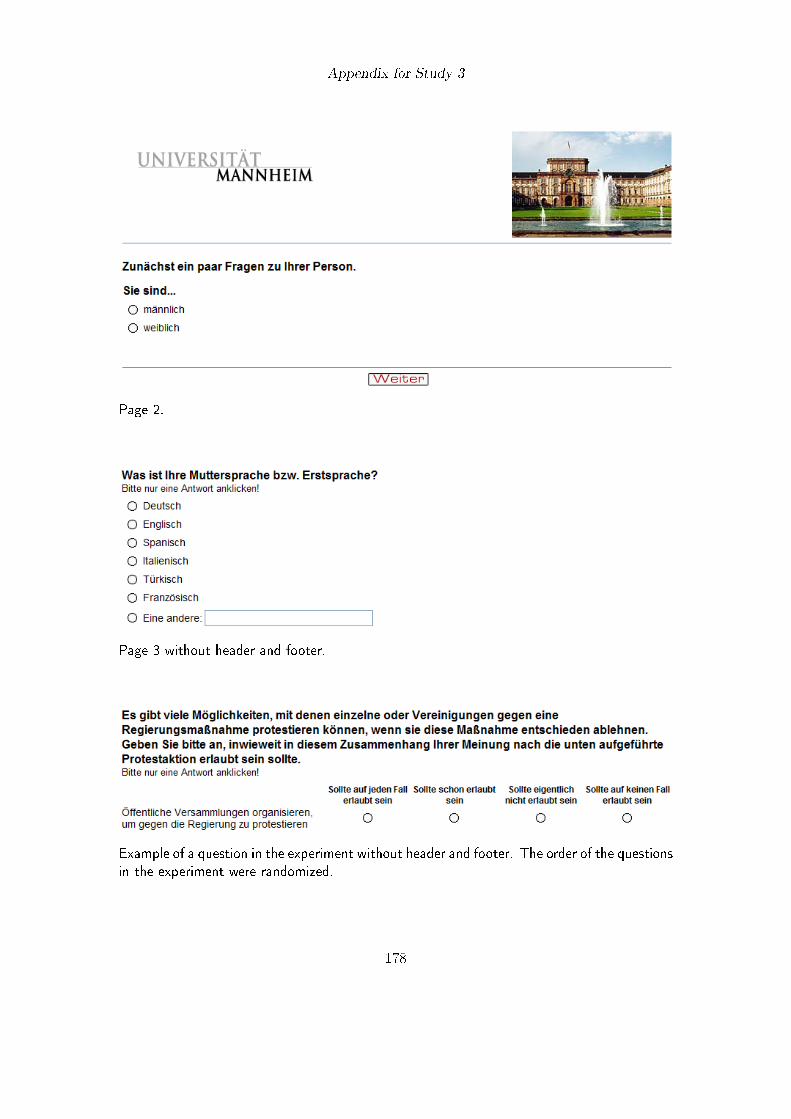
Appendix for Study 3
Page 2.
Page 3 without header and footer.
Example of a question in the experiment without header and footer. The order of the questions
in the experiment were randomized.
178
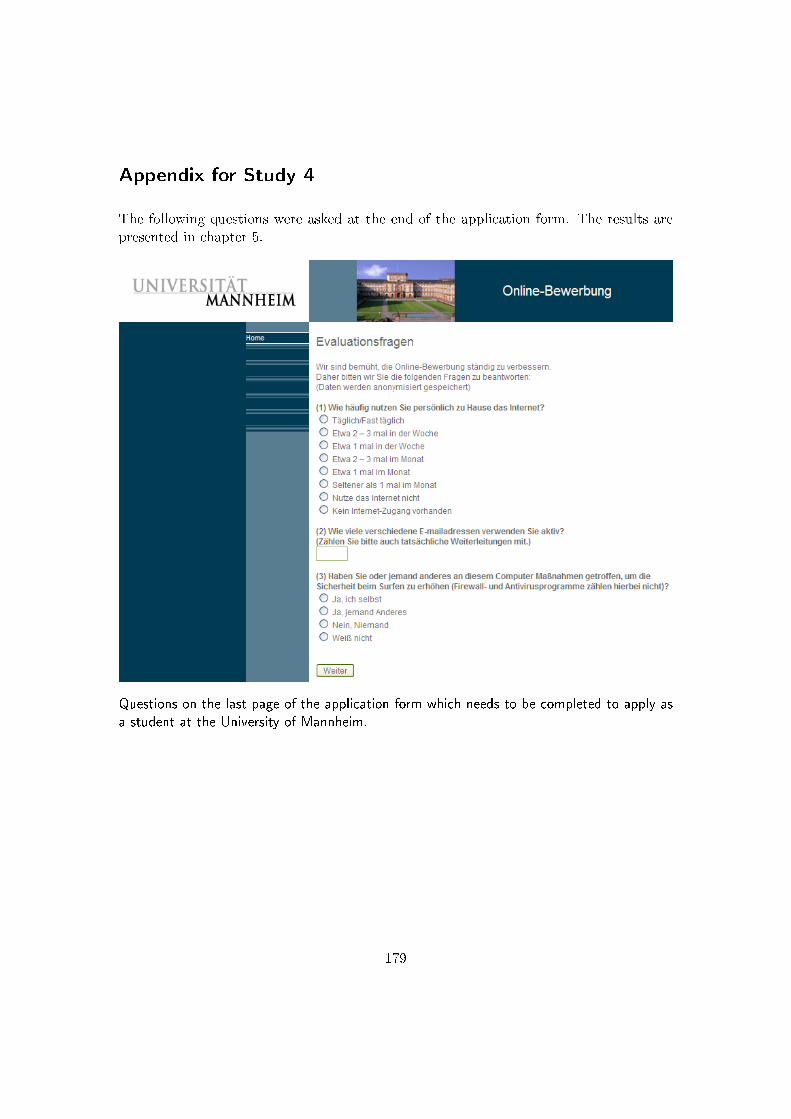
Appendix for Study 4
The following questions were asked at the end of the application form. The results arepresented in chapter 5.
Questions on the last page of the application form which needs to be completed to apply as
a student at the University of Mannheim.
179
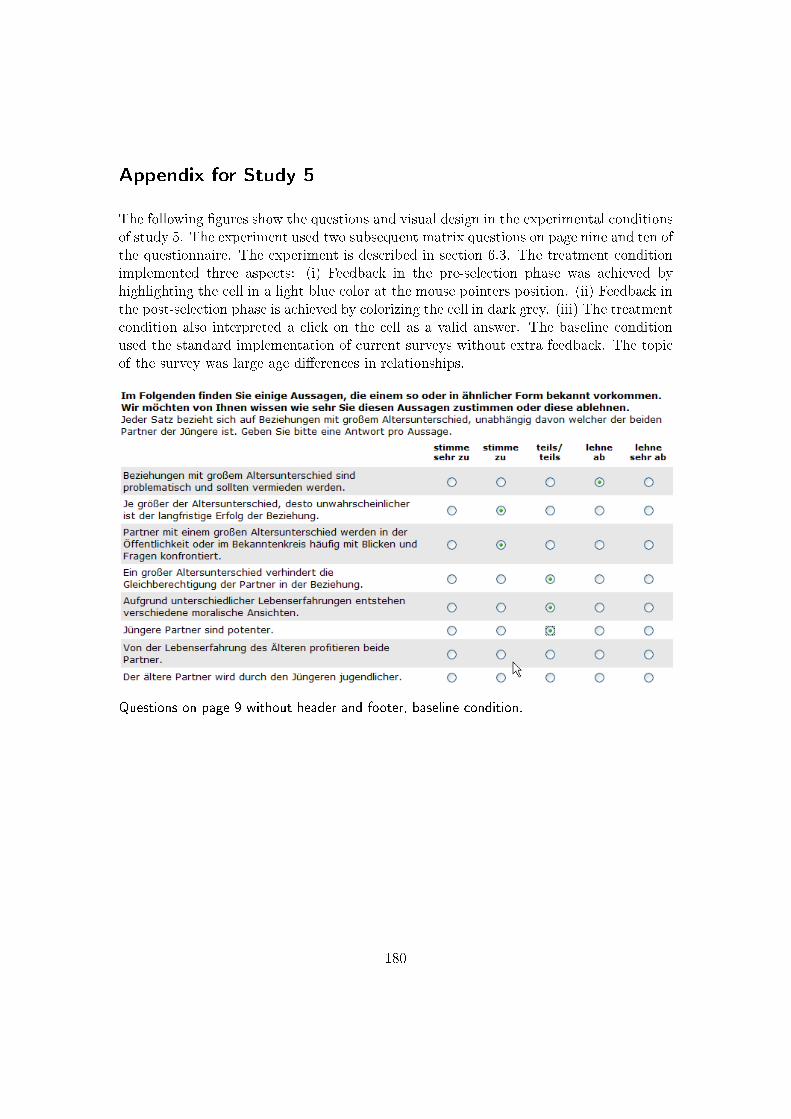
Appendix for Study 5
The following figures show the questions and visual design in the experimental conditionsof study 5. The experiment used two subsequent matrix questions on page nine and ten ofthe questionnaire. The experiment is described in section 6.3. The treatment conditionimplemented three aspects: (i) Feedback in the pre-selection phase was achieved byhighlighting the cell in a light blue color at the mouse pointers position. (ii) Feedback inthe post-selection phase is achieved by colorizing the cell in dark grey. (iii) The treatmentcondition also interpreted a click on the cell as a valid answer. The baseline conditionused the standard implementation of current surveys without extra feedback. The topicof the survey was large age differences in relationships.
Questions on page 9 without header and footer, baseline condition.
180
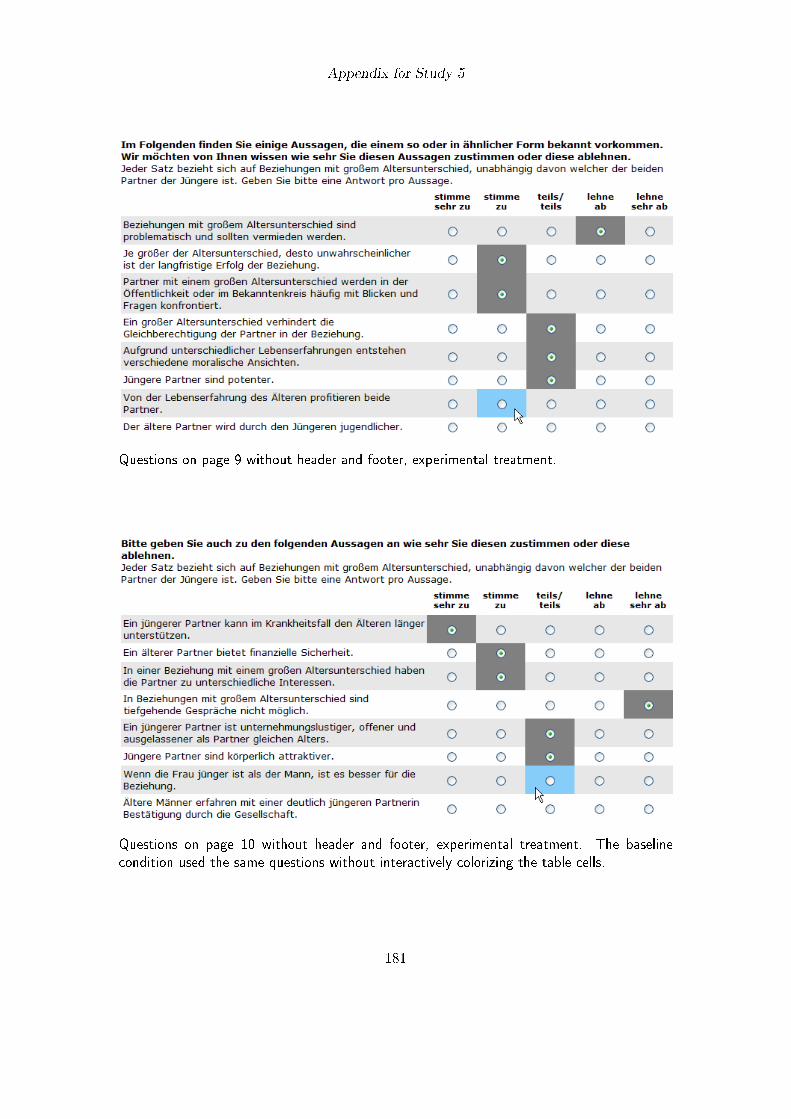
Appendix for Study 5
Questions on page 9 without header and footer, experimental treatment.
Questions on page 10 without header and footer, experimental treatment. The baseline
condition used the same questions without interactively colorizing the table cells.
181
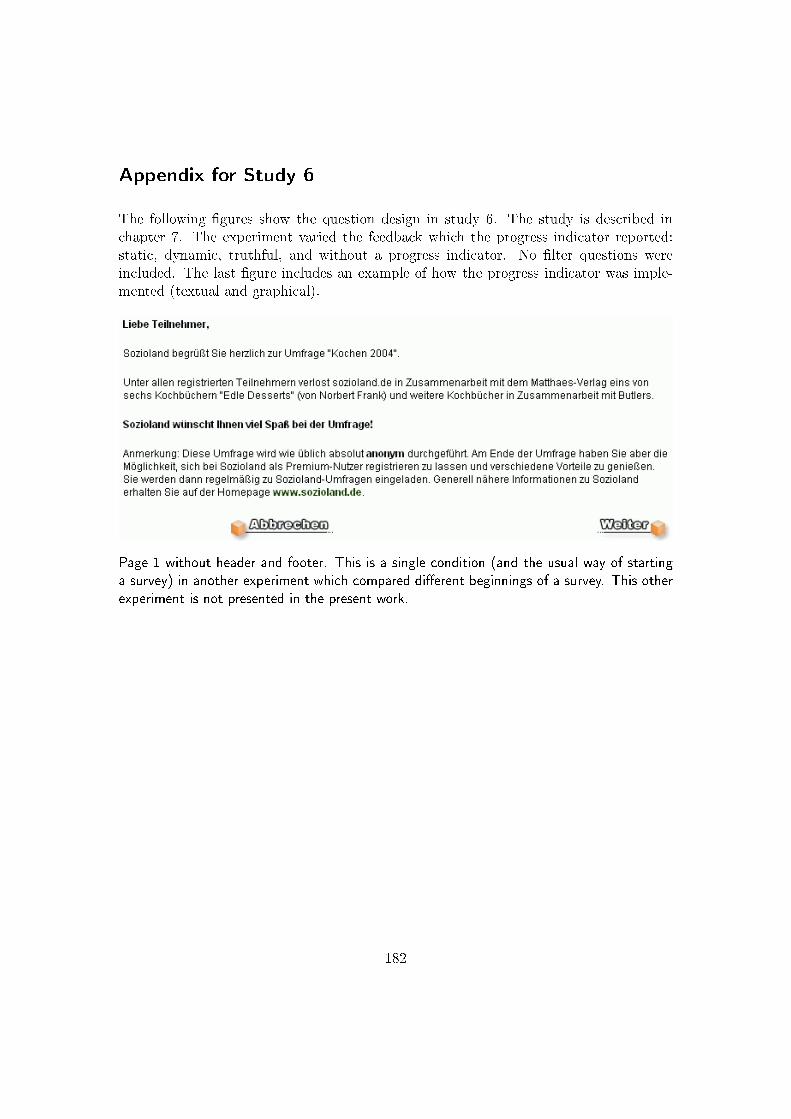
Appendix for Study 6
The following figures show the question design in study 6. The study is described inchapter 7. The experiment varied the feedback which the progress indicator reported:static, dynamic, truthful, and without a progress indicator. No filter questions wereincluded. The last figure includes an example of how the progress indicator was imple-mented (textual and graphical).
Page 1 without header and footer. This is a single condition (and the usual way of starting
a survey) in another experiment which compared different beginnings of a survey. This other
experiment is not presented in the present work.
182
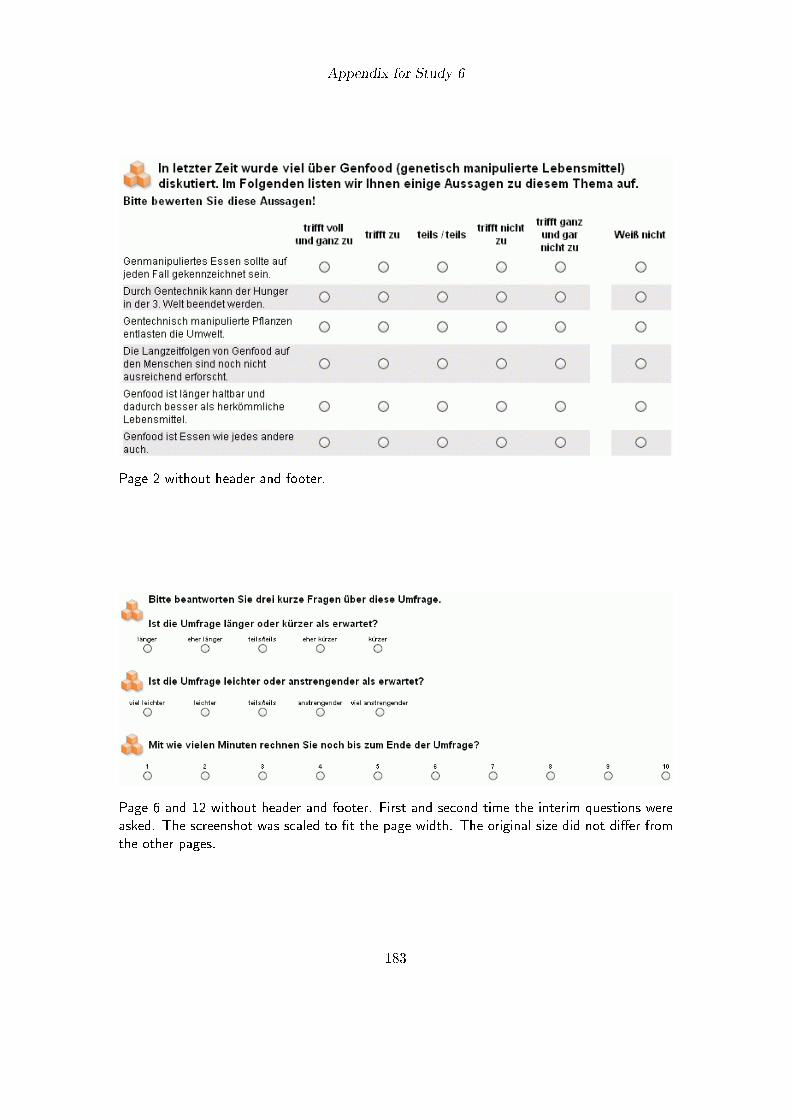
Appendix for Study 6
Page 2 without header and footer.
Page 6 and 12 without header and footer. First and second time the interim questions were
asked. The screenshot was scaled to fit the page width. The original size did not differ from
the other pages.
183
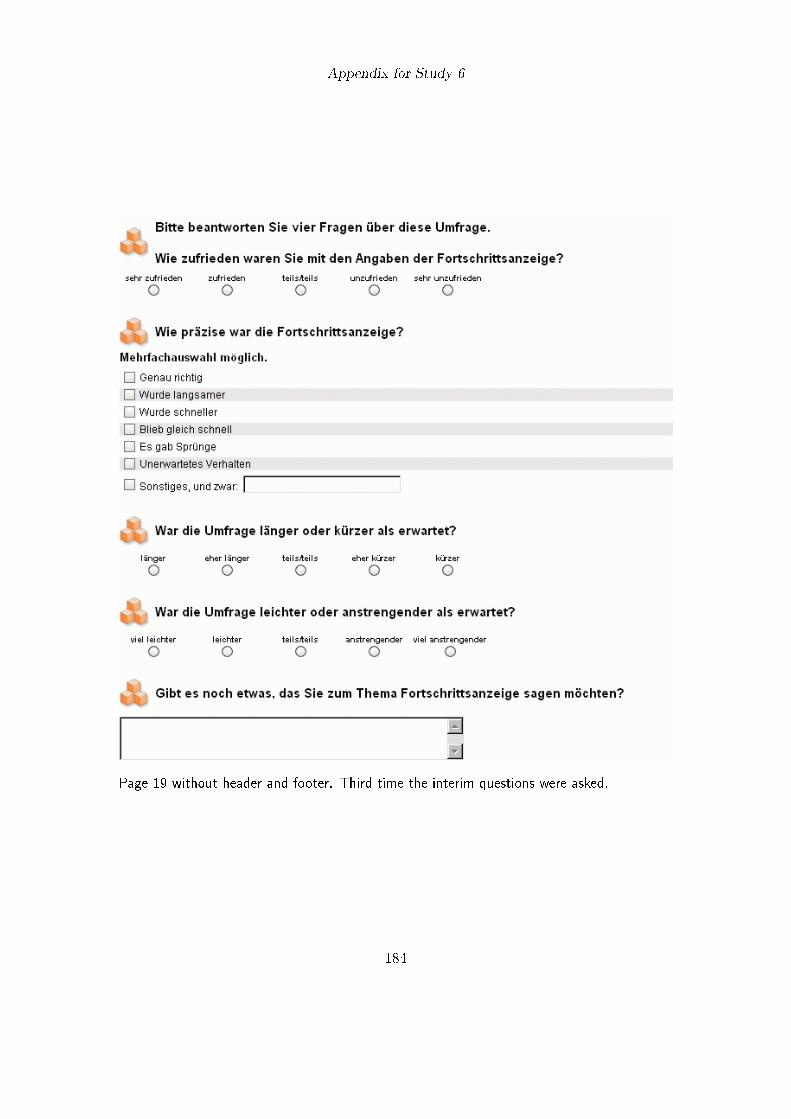
Appendix for Study 6
Page 19 without header and footer. Third time the interim questions were asked.
184
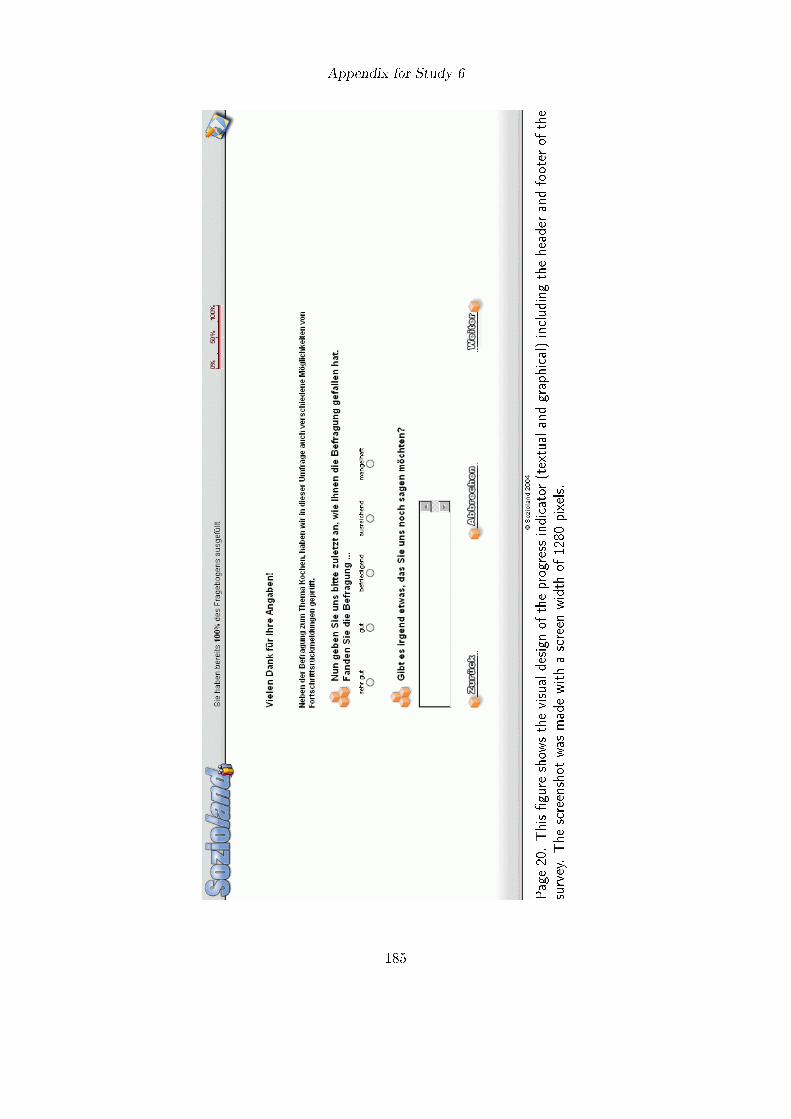
Appendix for Study 6
Page20.Thisfigure
show
sthevisualdesignoftheprogress
indicator
(textualandgraphical)includingtheheader
andfooterofthe
survey.Thescreenshotwas
madewithascreen
width
of1280pixels.
185
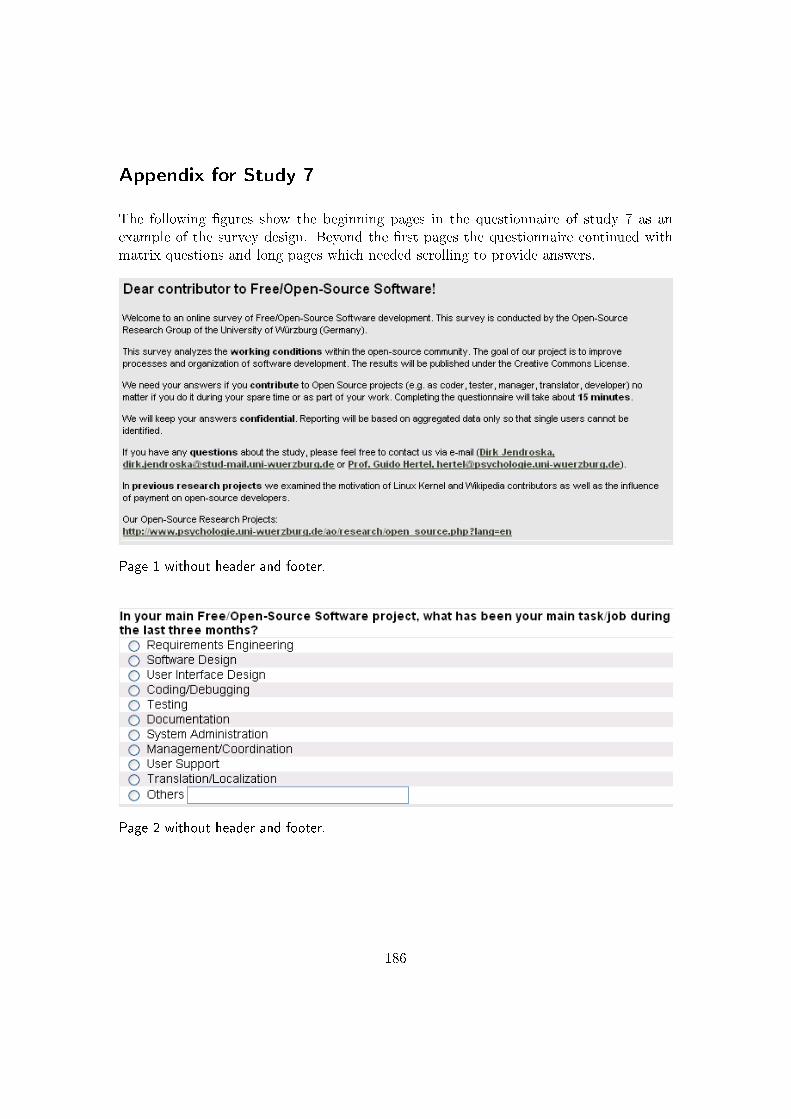
Appendix for Study 7
The following figures show the beginning pages in the questionnaire of study 7 as anexample of the survey design. Beyond the first pages the questionnaire continued withmatrix questions and long pages which needed scrolling to provide answers.
Page 1 without header and footer.
Page 2 without header and footer.
186

Author Index
A
AAPOR 1, 8, 40, 61, 151
Abraham, S. Y. 37f., 151
Adams, J. 161
ADM 1, 20, 62, 111, 151
AGOF 94, 151
Altdorf, P. 12, 152
Alvarez, R. M. 1, 151
Arieira, C. 161
Arora, A. 1, 151
ASI 1, 111, 151
Auno, A. M. 7, 151
B
Baker, R. P. 10, 90, 151
Bandilla, W. 6, 12, 39, 86, 89, 117, 152f.,
159, 162
Batagelj, Z. 7, 163
Becker, B. 39, 162
Belli, R. F. 38, 159
Berzelak, J. 8, 160
Böhme, R. 104, 137ff., 152
Biemer, P. 5, 9, 38, 152
Binder, G. 86, 162
Bishop, G. 9, 152
Blank, G. 60, 152
Blohm, M. 6, 152
Bälter, A. K. 62, 152
Bälter, O. 39, 62, 152, 159
Bogen, K. 38, 152
Borg, I. 7, 152
Bortz, J. 102, 152
Bosnjak, M. 8, 12, 39ff., 60f., 117, 148f.,
152f., 159f.
Bowker, D. 10, 115, 155f.
Bradburn, N. M. 37, 52, 153
Bremer, J. 12, 163
Brener, N. D. 9, 153
Brown, G. 9, 38, 152
BVM 1, 111, 151
C
Cai, Z. 71, 157
Cantor, D. 161
Casamento, C. 90f., 153
CentERdata 39, 153
Chandler, P. 147, 159
Childers, T. L. 8, 164
Christian, L. M. 6, 9f., 12, 39, 153, 162
Cleves, M. A. 153, 174
Conrad, F. G. 9, 34f., 80, 87, 114, 119, 124,
137ff., 153–156, 163
Conradt, J. 115, 156
Conti, R. 149, 154
Converse, J. M. 39, 154
Cook, C. 8, 154
Couper, M. P. 2, 5ff., 9, 12, 15, 23f., 34f.,
38f., 51, 60–63, 79f., 85–88, 90, 94,
97, 114, 118f., 124, 137ff., 153–157,
161, 163
Crawford, S. 2, 9ff., 15, 31f., 35, 52, 62, 80,
87, 94, 119, 137, 139, 151, 155, 161
D
Dale, T. 37, 157
Daniel, F. 71, 157
De Leeuw, E. D. 7, 155
De Rouvray, C. 9, 155
Destailleur, L. 82, 155
Deutsche Behindertenhilfe – Aktion Mensch
e.V. 90, 155
DGOF 1, 111, 151
Diekmann, A. 4, 59, 155
Dijkstra, W. 61, 69, 106, 156
Dillman, D. A. 9f., 12, 15, 23, 39, 51, 55f.,
87, 90, 115, 118f., 153, 155f., 161f.
Draisma, S. 61, 69, 106, 156
E
Eaton, D. K. 153
Erdfelder, E. 136, 156
Esser, E. 4, 161
Evans, J. R. 1, 156
F
Faaß, T. 71f., 156
187
Author Index
Faul, F. 136, 156
Faulbaum, F. 7, 152
Fowler, F. J. 157
Fraley, C. 61, 156
Frankel, J. 38f., 162
Frees, B. 6, 163
Fricker, S. 9, 156
Fuchs, M. 2, 89f., 156
Funke, F. 2, 34, 89f., 156
G
Galesic, M. 9, 35, 37f., 80, 114, 154, 156
Gertseva, A. 10, 155
Gilmour, G. 1, 151
Gould, W. W. 153, 174
Graesser, A. C. 71f., 157
Göritz, A. S. 149, 157
Gross, L. A. 153
Groves, R. M. 2, 4f., 9, 12, 149, 152, 157
Grunbaum, J. A. 153
GSA 118, 158
Gutierrez, R. G. 153, 174
H
Haas, I. 8, 160
Hadlock, T. D. 8, 159
Hansen, S. E. 51, 157
Haraldsen, G. 37, 62, 157
Healey, B. 9, 157
Heath, F. 8, 154
Hedlin, D. 37, 39, 157
Heeringa, S. G. 5, 157
Heerwegh, D. 7f., 15, 37, 41f., 59ff., 65f., 80,
87f., 104, 119f., 137, 148, 157f.
Hellbusch, J. E. 67, 158
Herzog, A. R. 38, 159
HHS 118, 158
Hildebrandt, M. 62, 158
Hill, D. H. 38, 159
Hill, P. B. 4, 161
Hosmer, D. W. 158, 173
Hunkler, C. 9, 162
I
ICPSR 4, 158
ISO 17, 24–32, 97, 118, 158
J
Janetzko, D. 61f., 65, 158
Jendroska, D. 134, 158
Johnston, J. C. 114, 161
Jones, J. 37, 39, 157
K
Kaczmirek, L. 4, 6f., 10, 39, 48, 59, 65f., 79f.,
85, 87, 117, 152f., 158f., 163
Kalyuga, S. 147, 159
Kann, L. 153
Kaplowitz, M. D. 8, 159
Kapteyn, A. 5f., 12, 154
Kenyon, K. 9, 155
Kjellström, O. 39, 159
Klein, J. D. 9, 163
Knäuper, B. 38, 159
Kohler, U. 102f., 159
Kreuter, F. 102f., 159
Krippendorff, K. 11f., 160
Krisch, J. 2, 89, 160
Krosnick, J. A. 34, 36, 104, 160
Kyle, T. M. 153
L
Lamias, M. J. 88, 119, 155
Lee, S. 12, 160
Lemeshow, S. 158, 173
Lepkowski, J. M. 157
Lesho, P. 2, 89, 160
Levine, R. 8, 159
Lissitz, R. W. 38, 163
Little, R. J. A. 12, 160
Loosveldt, G. 15, 88, 158
Louwerse, M. M. 71, 157
Lozar Manfreda, K. 8, 160
Ludwig, H. 80, 148, 160
Lyberg, L. E. 5, 9, 62, 152, 154
M
Mahon-Haft, T. 10, 155
Malakhoff, L. 161
Manfreda, K. L. 7, 163
Marcus, S. M. 161
Mathiowetz, N. A. 9, 152
Mathur, A. 1, 156
McCabe, S. E. 10, 15, 155, 161
Meyer, H. A. 62, 158
N
Neubarth, W. 6, 38f., 59, 62, 66, 80, 85, 87,
117, 152f., 159f.
Nguyen, K.-L. 161
188

Author Index
Nielsen, J. 15, 20–23, 90, 97, 118, 160
Norman, D. A. 15, 17, 39, 97, 160
O
O’Muircheartaigh, C. 9, 160
P
Pashler, H. 114, 161
Peytchev, A. 2, 8, 11, 15, 31, 35f., 62, 80, 87,
97, 119, 124, 137ff., 148, 154, 161,
174
Pope, D. 10, 155
Presser, S. 39, 154
R
Rasinski, K. 35, 163
Rasmussen, K. B. 60, 152
Ratcliff, R. 10, 105, 161
Redline, C. D. 10, 161
Reips, U.-D. 15, 34, 95, 156, 161f.
Rensink, R. A. 115, 161
Rips, L. J. 35, 163
Rubin, D. B. 12, 160
Rudner, L. M. 38, 163
Ruthruff, E. 114, 161
S
Sanstad, K. H. 161
Scheuring, B. 9, 161
Schick, B. 164f.
Schneider, S. J. 1, 161
Schnell, R. 4, 59, 161
Scholz, J. 1, 164
Schonlau, M. 5, 12, 154, 161
Schwarz, N. 9, 161
Schwarz, S. 95, 162
Segel, P. 161
Sharp, L. M. 38f., 162
Shneiderman, B. 15, 19f., 97, 162
Simone, L. P. 161
Singer, E. 38, 149, 155, 157, 162
Skinner, S. J. 8, 164
Smith, A. 9, 152
Smyth, J. D. 9f., 39, 153, 162
Stahl, M. 86, 162
Statistisches Bundesamt 11, 138, 162
Steiger, D. M. 37, 151
Stein, L. D. 84, 162
Stern, M. J. 9, 39, 162
Sterne, J. 59, 162
Stewart, J. N. 84, 162
Stocké, V. 9, 39, 162
Sudman, S. 9, 152
Sullivan, C. 37, 151
SurveyMonkey.com 11, 163
Sweller, J. 147, 159
Swinehart, J. 10, 151
T
Terhanian, G. 12, 163
Thiele, O. 6, 65, 79, 159, 163
Thomas, R. K. 9, 163
Thompson, R. L. 8, 154
Tortora, R. D. 10, 115, 156
Tourangeau, R. 9f., 34ff., 38, 51, 61, 69, 73,
80, 97, 105, 114, 119, 124, 137ff.,
153–157, 163f.
Traugott, M. W. 88, 155
Trouteaud, A. R. 38, 163
Tuten, T. L. 40f., 60f., 149, 153
V
VanBeselaere, C. 1, 151
Van Eimeren, B. 6, 163
Vehovar, V. 7f., 160, 163
Vincente, K. 148, 163
W
Walston, J. T. 38, 163
Weber, R. P. 11, 163
Welker, M. 1, 62, 164
Werner, A. 1, 164
Winter, J. 5, 154
Wittmann, W. W. 63, 164
Wolff, K. G. 48, 159, 164f.
Y
Yammarino, F. J. 8, 164
Yan, T. 9f., 35, 61, 69, 73, 105, 156, 164
Z
ZA 91, 164
Zaletel, M. 7, 163
Zapert, K. 161
ZUMA 91, 164
189


