Embed Size (px)
Citation preview
RESEARCH ARTICLE Open Access
House mouse colonization patterns on thesub-Antarctic Kerguelen Archipelago suggestsingular primary invasions and resilienceagainst re-invasionEmilie A Hardouin1, Jean-Louis Chapuis2, Mark I Stevens3,4, Jansen Bettine van Vuuren5, Petra Quillfeldt6,Rick J Scavetta1, Meike Teschke1, Diethard Tautz1*
Abstract
Background: Starting from Western Europe, the house mouse (Mus musculus domesticus) has spread across theglobe in historic times. However, most oceanic islands were colonized by mice only within the past 300 years. Thismakes them an excellent model for studying the evolutionary processes during early stages of new colonization.We have focused here on the Kerguelen Archipelago, located within the sub-Antarctic area and compare thepatterns with samples from other Southern Ocean islands.
Results: We have typed 18 autosomal and six Y-chromosomal microsatellite loci and obtained mitochondrialD-loop sequences for a total of 534 samples, mainly from the Kerguelen Archipelago, but also from the FalklandIslands, Marion Island, Amsterdam Island, Antipodes Island, Macquarie Island, Auckland Islands and one samplefrom South Georgia. We find that most of the mice on the Kerguelen Archipelago have the same mitochondrialhaplotype and all share the same major Y-chromosomal haplotype. Two small islands (Cochons Island andCimetière Island) within the archipelago show a different mitochondrial haplotype, are genetically distinct forautosomal loci, but share the major Y-chromosomal haplotype. In the mitochondrial D-loop sequences, we findseveral single step mutational derivatives of one of the major mitochondrial haplotypes, suggesting an unusuallyhigh mutation rate, or the occurrence of selective sweeps in mitochondria.
Conclusions: Although there was heavy ship traffic for over a hundred years to the Kerguelen Archipelago, itappears that the mice that have arrived first have colonized the main island (Grande Terre) and most of theassociated small islands. The second invasion that we see in our data has occurred on islands that are detachedfrom Grande Terre and were likely to have had no resident mice prior to their arrival. The genetic data suggestthat the mice of both primary invasions originated from related source populations. Our data suggest that an areacolonized by mice is refractory to further introgression, possibly due to fast adaptations of the resident mice tolocal conditions.
BackgroundIsland colonization dynamics are of general interest inevolutionary biology, both with respect to understandingadaptive radiations, as well as for tracing migration pat-terns. In this context it is of particular interest to askwhether a single colonization can already result in a
new established population that is refractory to furtherinvasions, or whether multiple independent invaders arerequired before a new stable population can be estab-lished. This question can be particularly well studied incases of recent island colonization, since this providesinsights into the early phases of establishment and adap-tation in a population context. The spread of the housemouse (Mus musculus L.) across many oceanic islandsin contemporary times constitutes an excellent modelsystem in this respect [1,2].
* Correspondence: [email protected] Planck Institute of Evolutionary Biology, August-Thienemann-Str. 2,24306 Plön, GermanyFull list of author information is available at the end of the article
Hardouin et al. BMC Evolutionary Biology 2010, 10:325http://www.biomedcentral.com/1471-2148/10/325
© 2010 Hardouin et al; licensee BioMed Central Ltd. This is an Open Access article distributed under the terms of the CreativeCommons Attribution License (http://creativecommons.org/licenses/by/2.0), which permits unrestricted use, distribution, andreproduction in any medium, provided the original work is properly cited.
Mus musculus originated on the Indian subcontinentwithin the past million years and there are currently atleast three recognized subspecies: M. m. domesticus,M. m. musculus, M. m. castaneus [3]. M. m. domesticusinvaded Western Europe about 3,000 years ago [4] andthen colonized the rest of the world (i.e. Africa, Americaand Australia/New Zealand) mostly in the wake ofincreased human travel across the globe that started inthe 16th century [1,3,4]. They were also very successfulin colonizing isolated islands, such as those of theSouthern Ocean [5-9], where they were brought bywhaling ships making stops during their journeys orwent for seal hunting.The Kerguelen archipelago was discovered on the 12th
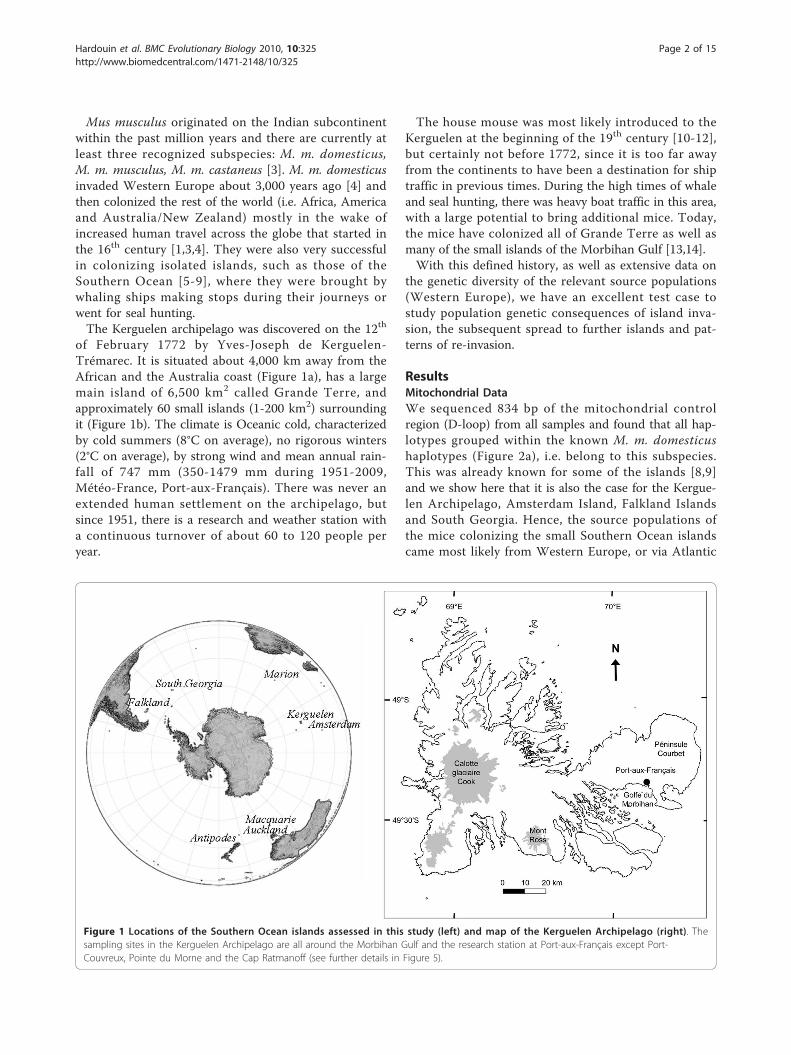
of February 1772 by Yves-Joseph de Kerguelen-Trémarec. It is situated about 4,000 km away from theAfrican and the Australia coast (Figure 1a), has a largemain island of 6,500 km2 called Grande Terre, andapproximately 60 small islands (1-200 km2) surroundingit (Figure 1b). The climate is Oceanic cold, characterizedby cold summers (8°C on average), no rigorous winters(2°C on average), by strong wind and mean annual rain-fall of 747 mm (350-1479 mm during 1951-2009,Météo-France, Port-aux-Français). There was never anextended human settlement on the archipelago, butsince 1951, there is a research and weather station witha continuous turnover of about 60 to 120 people peryear.
The house mouse was most likely introduced to theKerguelen at the beginning of the 19th century [10-12],but certainly not before 1772, since it is too far awayfrom the continents to have been a destination for shiptraffic in previous times. During the high times of whaleand seal hunting, there was heavy boat traffic in this area,with a large potential to bring additional mice. Today,the mice have colonized all of Grande Terre as well asmany of the small islands of the Morbihan Gulf [13,14].With this defined history, as well as extensive data on
the genetic diversity of the relevant source populations(Western Europe), we have an excellent test case tostudy population genetic consequences of island inva-sion, the subsequent spread to further islands and pat-terns of re-invasion.
ResultsMitochondrial DataWe sequenced 834 bp of the mitochondrial controlregion (D-loop) from all samples and found that all hap-lotypes grouped within the known M. m. domesticushaplotypes (Figure 2a), i.e. belong to this subspecies.This was already known for some of the islands [8,9]and we show here that it is also the case for the Kergue-len Archipelago, Amsterdam Island, Falkland Islandsand South Georgia. Hence, the source populations ofthe mice colonizing the small Southern Ocean islandscame most likely from Western Europe, or via Atlantic
Figure 1 Locations of the Southern Ocean islands assessed in this study (left) and map of the Kerguelen Archipelago (right). Thesampling sites in the Kerguelen Archipelago are all around the Morbihan Gulf and the research station at Port-aux-Français except Port-Couvreux, Pointe du Morne and the Cap Ratmanoff (see further details in Figure 5).
Hardouin et al. BMC Evolutionary Biology 2010, 10:325http://www.biomedcentral.com/1471-2148/10/325
Page 2 of 15
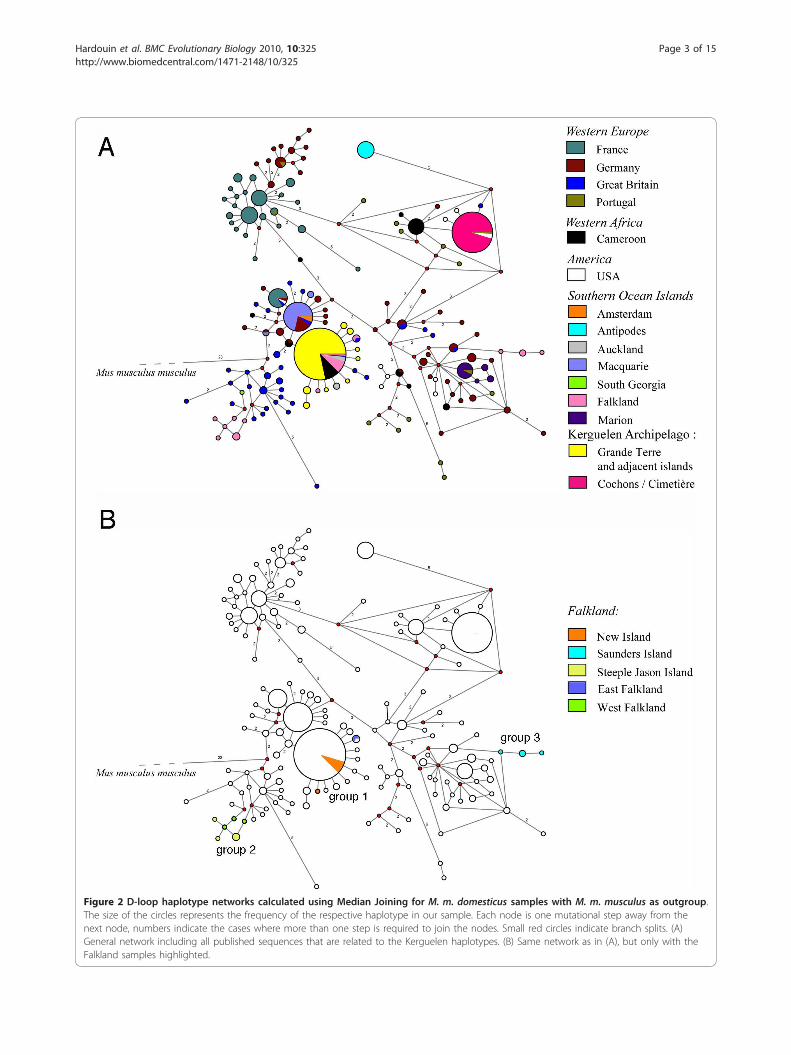
Figure 2 D-loop haplotype networks calculated using Median Joining for M. m. domesticus samples with M. m. musculus as outgroup.The size of the circles represents the frequency of the respective haplotype in our sample. Each node is one mutational step away from thenext node, numbers indicate the cases where more than one step is required to join the nodes. Small red circles indicate branch splits. (A)General network including all published sequences that are related to the Kerguelen haplotypes. (B) Same network as in (A), but only with theFalkland samples highlighted.
Hardouin et al. BMC Evolutionary Biology 2010, 10:325http://www.biomedcentral.com/1471-2148/10/325
Page 3 of 15
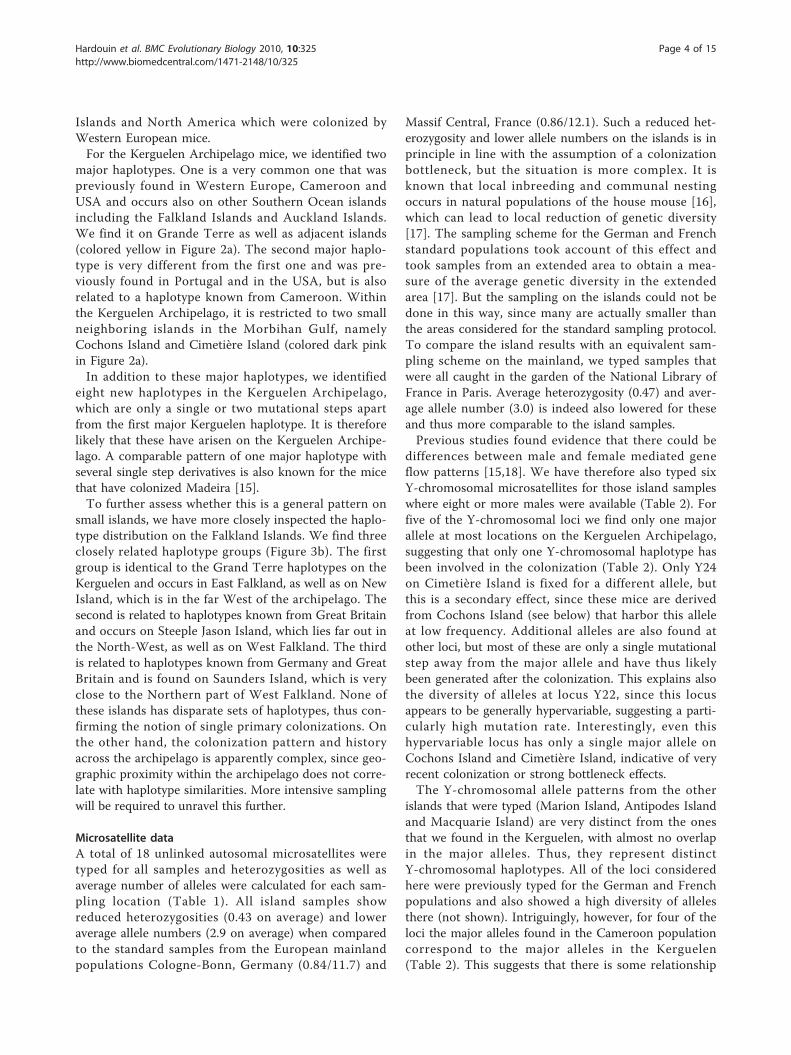
Islands and North America which were colonized byWestern European mice.For the Kerguelen Archipelago mice, we identified two
major haplotypes. One is a very common one that waspreviously found in Western Europe, Cameroon andUSA and occurs also on other Southern Ocean islandsincluding the Falkland Islands and Auckland Islands.We find it on Grande Terre as well as adjacent islands(colored yellow in Figure 2a). The second major haplo-type is very different from the first one and was pre-viously found in Portugal and in the USA, but is alsorelated to a haplotype known from Cameroon. Withinthe Kerguelen Archipelago, it is restricted to two smallneighboring islands in the Morbihan Gulf, namelyCochons Island and Cimetière Island (colored dark pinkin Figure 2a).In addition to these major haplotypes, we identified
eight new haplotypes in the Kerguelen Archipelago,which are only a single or two mutational steps apartfrom the first major Kerguelen haplotype. It is thereforelikely that these have arisen on the Kerguelen Archipe-lago. A comparable pattern of one major haplotype withseveral single step derivatives is also known for the micethat have colonized Madeira [15].To further assess whether this is a general pattern on
small islands, we have more closely inspected the haplo-type distribution on the Falkland Islands. We find threeclosely related haplotype groups (Figure 3b). The firstgroup is identical to the Grand Terre haplotypes on theKerguelen and occurs in East Falkland, as well as on NewIsland, which is in the far West of the archipelago. Thesecond is related to haplotypes known from Great Britainand occurs on Steeple Jason Island, which lies far out inthe North-West, as well as on West Falkland. The thirdis related to haplotypes known from Germany and GreatBritain and is found on Saunders Island, which is veryclose to the Northern part of West Falkland. None ofthese islands has disparate sets of haplotypes, thus con-firming the notion of single primary colonizations. Onthe other hand, the colonization pattern and historyacross the archipelago is apparently complex, since geo-graphic proximity within the archipelago does not corre-late with haplotype similarities. More intensive samplingwill be required to unravel this further.
Microsatellite dataA total of 18 unlinked autosomal microsatellites weretyped for all samples and heterozygosities as well asaverage number of alleles were calculated for each sam-pling location (Table 1). All island samples showreduced heterozygosities (0.43 on average) and loweraverage allele numbers (2.9 on average) when comparedto the standard samples from the European mainlandpopulations Cologne-Bonn, Germany (0.84/11.7) and
Massif Central, France (0.86/12.1). Such a reduced het-erozygosity and lower allele numbers on the islands is inprinciple in line with the assumption of a colonizationbottleneck, but the situation is more complex. It isknown that local inbreeding and communal nestingoccurs in natural populations of the house mouse [16],which can lead to local reduction of genetic diversity[17]. The sampling scheme for the German and Frenchstandard populations took account of this effect andtook samples from an extended area to obtain a mea-sure of the average genetic diversity in the extendedarea [17]. But the sampling on the islands could not bedone in this way, since many are actually smaller thanthe areas considered for the standard sampling protocol.To compare the island results with an equivalent sam-pling scheme on the mainland, we typed samples thatwere all caught in the garden of the National Library ofFrance in Paris. Average heterozygosity (0.47) and aver-age allele number (3.0) is indeed also lowered for theseand thus more comparable to the island samples.Previous studies found evidence that there could be
differences between male and female mediated geneflow patterns [15,18]. We have therefore also typed sixY-chromosomal microsatellites for those island sampleswhere eight or more males were available (Table 2). Forfive of the Y-chromosomal loci we find only one majorallele at most locations on the Kerguelen Archipelago,suggesting that only one Y-chromosomal haplotype hasbeen involved in the colonization (Table 2). Only Y24on Cimetière Island is fixed for a different allele, butthis is a secondary effect, since these mice are derivedfrom Cochons Island (see below) that harbor this alleleat low frequency. Additional alleles are also found atother loci, but most of these are only a single mutationalstep away from the major allele and have thus likelybeen generated after the colonization. This explains alsothe diversity of alleles at locus Y22, since this locusappears to be generally hypervariable, suggesting a parti-cularly high mutation rate. Interestingly, even thishypervariable locus has only a single major allele onCochons Island and Cimetière Island, indicative of veryrecent colonization or strong bottleneck effects.The Y-chromosomal allele patterns from the other
islands that were typed (Marion Island, Antipodes Islandand Macquarie Island) are very distinct from the onesthat we found in the Kerguelen, with almost no overlapin the major alleles. Thus, they represent distinctY-chromosomal haplotypes. All of the loci consideredhere were previously typed for the German and Frenchpopulations and also showed a high diversity of allelesthere (not shown). Intriguingly, however, for four of theloci the major alleles found in the Cameroon populationcorrespond to the major alleles in the Kerguelen(Table 2). This suggests that there is some relationship
Hardouin et al. BMC Evolutionary Biology 2010, 10:325http://www.biomedcentral.com/1471-2148/10/325
Page 4 of 15
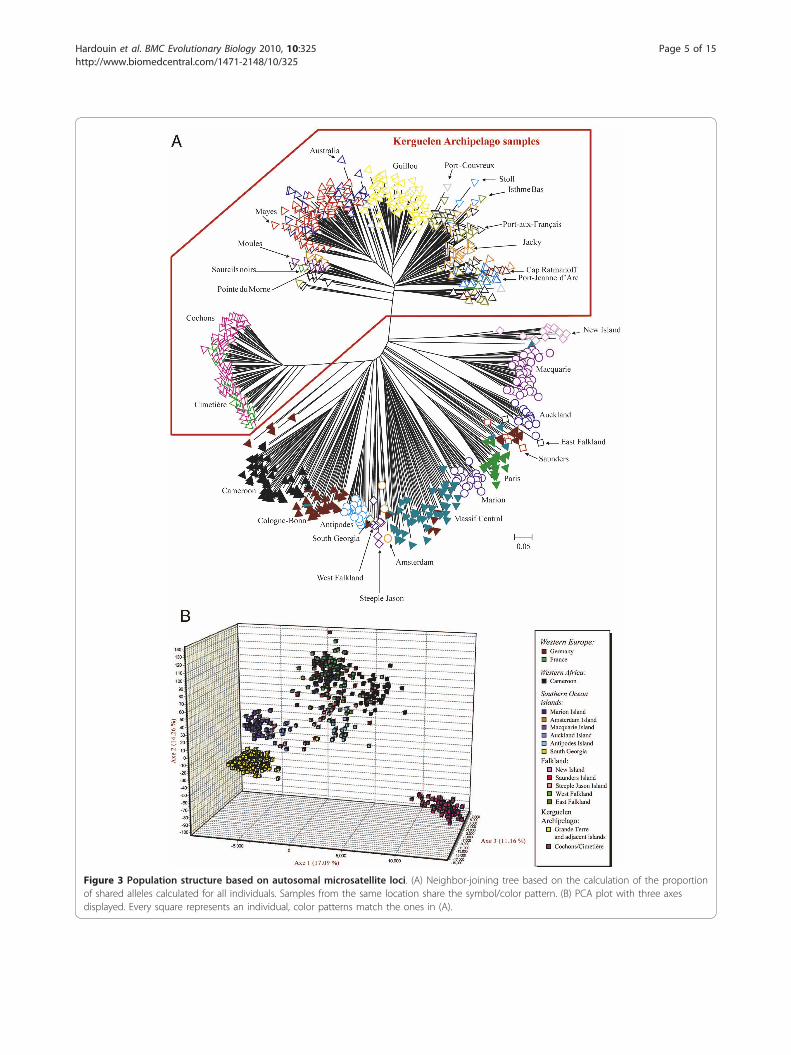
Figure 3 Population structure based on autosomal microsatellite loci. (A) Neighbor-joining tree based on the calculation of the proportionof shared alleles calculated for all individuals. Samples from the same location share the symbol/color pattern. (B) PCA plot with three axesdisplayed. Every square represents an individual, color patterns match the ones in (A).
Hardouin et al. BMC Evolutionary Biology 2010, 10:325http://www.biomedcentral.com/1471-2148/10/325
Page 5 of 15

of the Kerguelen mice to the Cameroon mice, albeit notnecessarily a direct one, since the Cameroon populationrepresents a new colonization by itself.
Population relationshipsTo assess the population structure and relationships onthe basis of the 18 autosomal microsatellites, we pro-duced an allele sharing tree and run a PCA analysis(Figure 3). In the allele sharing tree, we find a coherent
assignment of most populations and samples to distinctclades (Figure 3a). The sole exceptions are populationsamples from the Cologne-Bonn and Massif Centralareas that are represented in multiple clades, likelyreflecting their high diversity. With additional markerstheir genetic clustering was readily recovered in a pre-vious study [17].Two major clades are apparent within the Kerguelen
Archipelago. The Cochons/Cimetière island samples are
Table 1 Population genetic parameters for microsatellite loci and mitochondrial sequences
18 autosomal microsatellite loci D-loop sequences
area location N Hexp Hobs Aav N Nhaplo
Main land populations
Germany Schleswig-Holstein - - - - 9 8
Cologne - Bonn 43 0.84 0.61 11.7 44 26
France Paris 20 0.46 0.47 3.0 18 1
Massif Central 46 0.86 0.75 12.1 62 19
Cameroon Kumba 46 0.61 0.48 6.7 58 8
Kerguelen archipelago
Grande Terre Port-aux-Français 41 0.48 0.44 4.1 28 3
Jacky 29 0.48 0.49 3.3 22 3
Isthme Bas 38 0.48 0.46 3.9 38 1
Cap Ratmanoff 8 0.46 0.49 2.7 6 1
Pointe du Morne 1 0.28 0.56 1.6 1 1
Port-Couvreux 4 0.47 0.49 2.6 4 2
Port-Jeanne d’Arc 16 0.42 0.42 3.3 15 3
Sourcils Noirs 5 0.38 0.43 2.3 5 1
Golfe du Morbihan Moules Island 12 0.33 0.37 2.4 10 1
Stoll Island 4 0.38 0.48 2.1 4 1
Australia Island 28 0.43 0.38 3.5 27 1
Mayes Island 71 0.41 0.36 4.0 71 2
Guillou Island 79 0.36 0.34 2.4 79 1
Cochons Island 69 0.36 0.35 2.4 65 1
Cimetière Island 28 0.38 0.37 2.5 27 1
Falklands
New Island 12 0.44 0.41 3.2 12 2
Steeple Jason 5 0.33 0.33 2.3 5 3
Saunders Island 4 0.55 0.44 3.0 4 1
East Falkland 2 0.49 0.64 2.3 2 1
West Island 3 0.48 0.49 2.7 3 2
other Southern Ocean islands
Marion Island 18 0.56 0.51 4.3 18 2
Amsterdam Island 3 0.49 0.54 2.6 3 1
South Georgia 1 0.16 0.31 1.3 1 1
Antipodes Island 18 0.44 0.51 3.1 17 1
Macquarie Island 40 0.42 0.39 3.3 38 3
Auckland Island 13 0.42 0.39 3.2 13 2
N = number of inviduals analysed, Hexp = expected heterozygosity, Hobs = observed heterzygosity, Aav = is average number of alleles across loci, Nhaplo = numberof different haplotypes found.
Hardouin et al. BMC Evolutionary Biology 2010, 10:325http://www.biomedcentral.com/1471-2148/10/325
Page 6 of 15

Table 2 Distribution of Y-chromosomal microsatellite allele frequencies
Kerguelen Archipelago islands Cameroon other subantarctic islands
locus allele Port aux Francais(28)
Jacky(13)
Isthme Bas(29)
Port Jeanne d’Arc(11)
Moules(8)
Australia(15)
Mayes(52)
Guillou(38)
Cochon(36)
Cimetière(16)
Kumba(21)
Marion(8)
Antipodes(12)
Maquarie(21)
Y6 120 1 1 1 1 1 1 1 1 1 1 0.95 1
122 0.75 1
124 0.05 0.25
Y12 118 0.07 0.02
124 1 1 1 1 1 0.93 0.96 1 1 1 0.93
129 0.02 1
132 0.07
135 0.1
137 1 0.9
140
Y21 295 0.05 0.75
316 1 1 1 0.9 0.5 0.93 1 1 1 1 0.95
318 0.1 0.5 0.07
320 0.25 0.95
321 0.25 0.05
322 0.67
324 0.08
Y22 239 0.67
253 0.25
255
257 0.1 0.05
259 0.07 0.1 0.05
261 0.85 0.13 0.62
263 0.06 0.1 0.5 0.25 0.24
265 0.04 0.07 0.02 0.97 0.94 0.13 0.09
267 0.02 0.03
269 0.04 0.38 0.1 0.4 0.35
271 0.18 0.15 0.03 0.13 0.04 0.16 0.08
273 0.4 0.15 0.14 1 0.2 0.25 0.84
275 0.21 0.23 0.14 0.14 0.13 0.08
277 0.11 0.08 0.31 0.57 0.02
279 0.24 0.29
281 0.04
291 0.03
294 0.03
Hardouin
etal.BM
CEvolutionary
Biology2010,10:325
http://www.biom
edcentral.com/1471-2148/10/325
Page7of
15
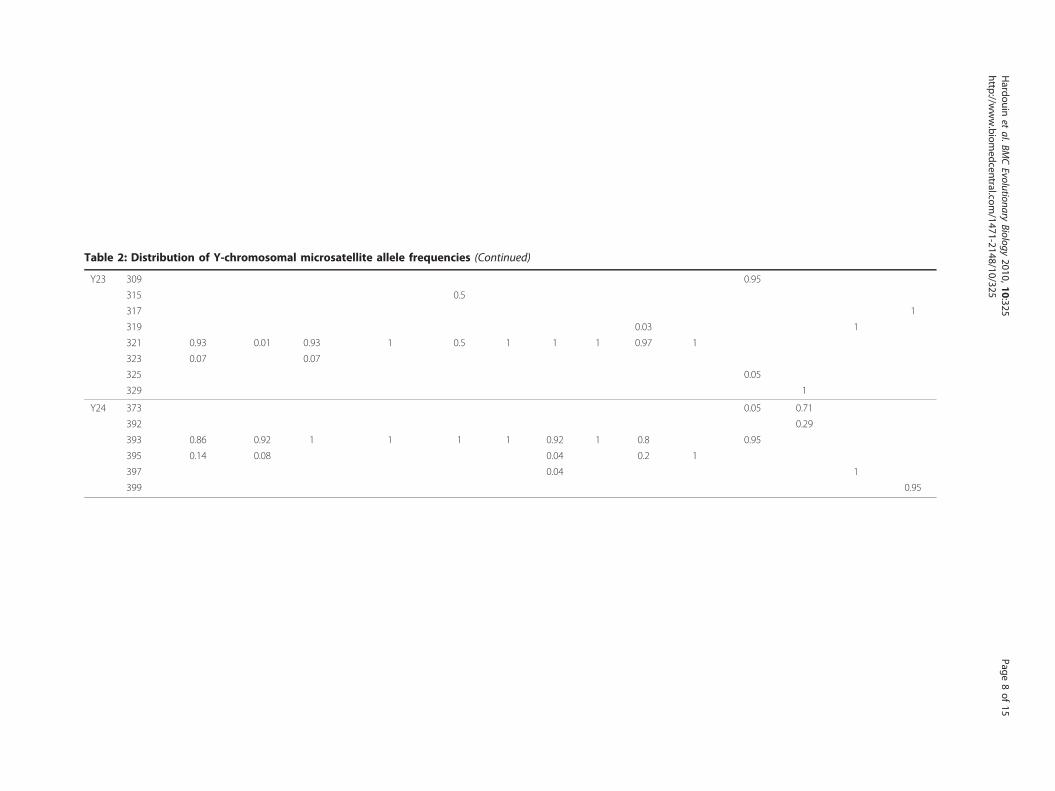
Table 2: Distribution of Y-chromosomal microsatellite allele frequencies (Continued)
Y23 309 0.95
315 0.5
317 1
319 0.03 1
321 0.93 0.01 0.93 1 0.5 1 1 1 0.97 1
323 0.07 0.07
325 0.05
329 1
Y24 373 0.05 0.71
392 0.29
393 0.86 0.92 1 1 1 1 0.92 1 0.8 0.95
395 0.14 0.08 0.04 0.2 1
397 0.04 1
399 0.95
Hardouin
etal.BM
CEvolutionary
Biology2010,10:325
http://www.biom
edcentral.com/1471-2148/10/325
Page8of
15
very different from all the other islands, although theyappear to be somewhat associated to the Cameroon/German clade. Among the other islands, the GuillouIsland samples form a single distinct clade and theisland pair Australia/Mayes a separate mixed clade (Fig-ure 3a). The Grande Terre samples as well as MoulesIsland and Stoll Island are mixed among each other,without clear distinction.The PCA analysis is largely congruent with the allele
sharing tree, but shows a stronger distinction of the twoKerguelen groups and no particular association of theCochons/Cimetière island samples with the Cameroon/German clade (Figure 3b). On the other hand, it pro-vides less resolution within each of the groups.
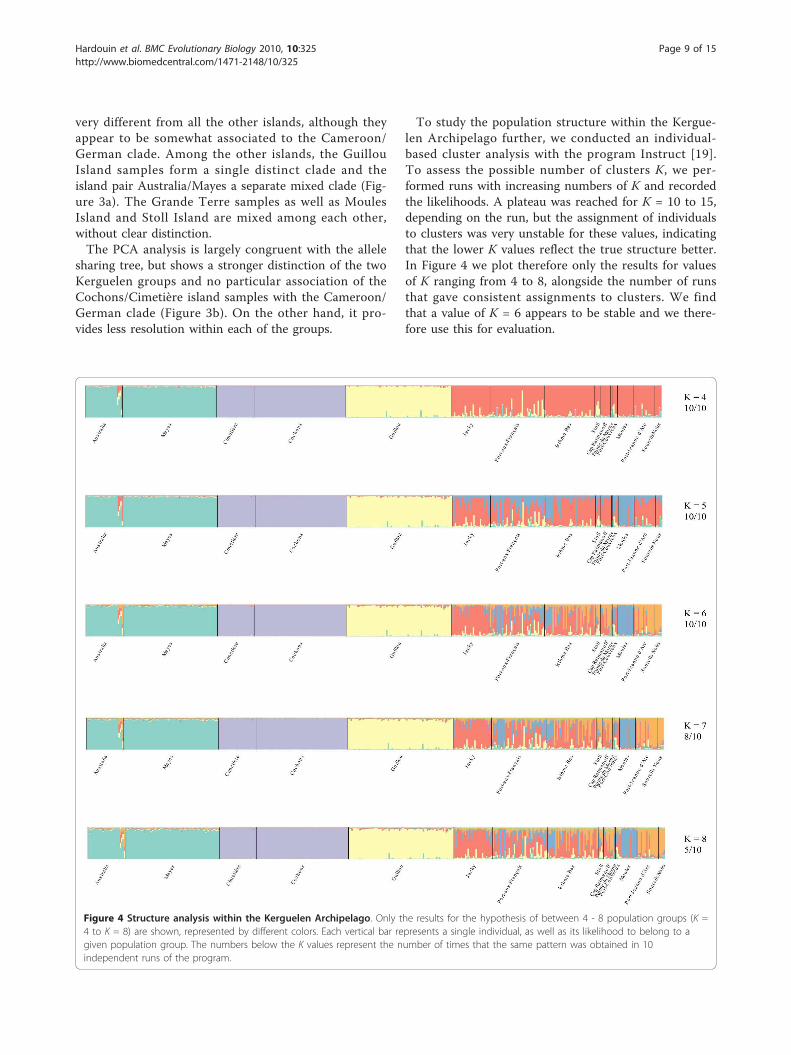
To study the population structure within the Kergue-len Archipelago further, we conducted an individual-based cluster analysis with the program Instruct [19].To assess the possible number of clusters K, we per-formed runs with increasing numbers of K and recordedthe likelihoods. A plateau was reached for K = 10 to 15,depending on the run, but the assignment of individualsto clusters was very unstable for these values, indicatingthat the lower K values reflect the true structure better.In Figure 4 we plot therefore only the results for valuesof K ranging from 4 to 8, alongside the number of runsthat gave consistent assignments to clusters. We findthat a value of K = 6 appears to be stable and we there-fore use this for evaluation.
Figure 4 Structure analysis within the Kerguelen Archipelago. Only the results for the hypothesis of between 4 - 8 population groups (K =4 to K = 8) are shown, represented by different colors. Each vertical bar represents a single individual, as well as its likelihood to belong to agiven population group. The numbers below the K values represent the number of times that the same pattern was obtained in 10independent runs of the program.
Hardouin et al. BMC Evolutionary Biology 2010, 10:325http://www.biomedcentral.com/1471-2148/10/325
Page 9 of 15
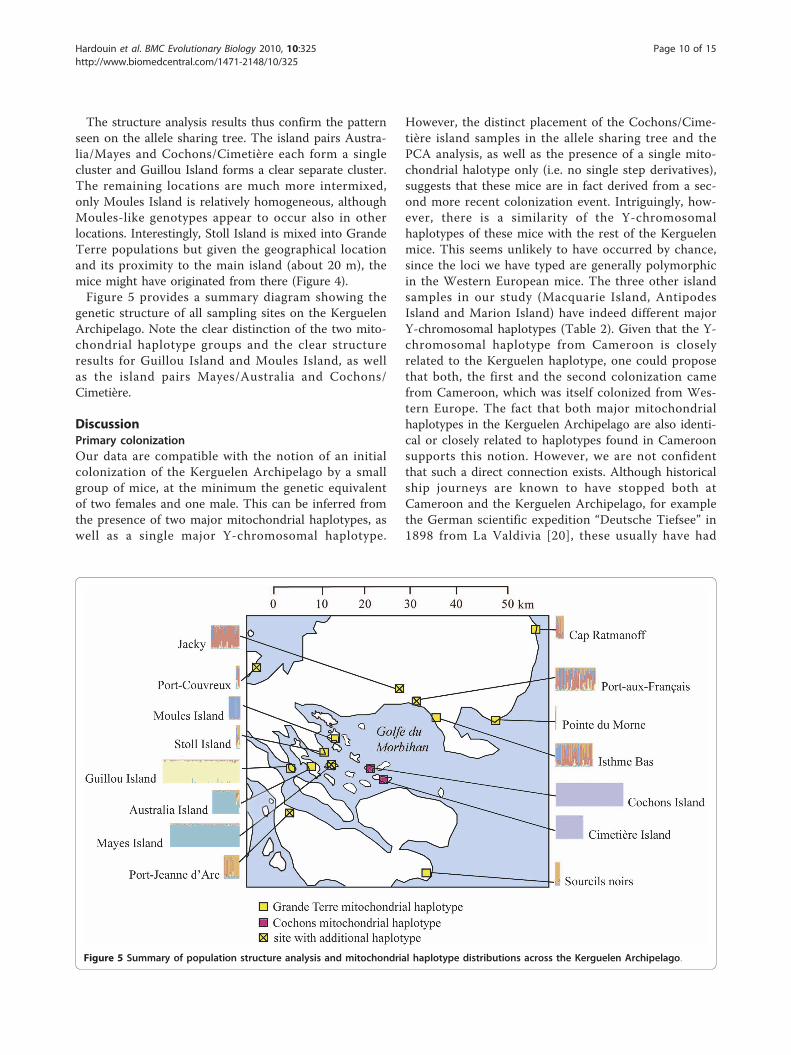
The structure analysis results thus confirm the patternseen on the allele sharing tree. The island pairs Austra-lia/Mayes and Cochons/Cimetière each form a singlecluster and Guillou Island forms a clear separate cluster.The remaining locations are much more intermixed,only Moules Island is relatively homogeneous, althoughMoules-like genotypes appear to occur also in otherlocations. Interestingly, Stoll Island is mixed into GrandeTerre populations but given the geographical locationand its proximity to the main island (about 20 m), themice might have originated from there (Figure 4).Figure 5 provides a summary diagram showing the
genetic structure of all sampling sites on the KerguelenArchipelago. Note the clear distinction of the two mito-chondrial haplotype groups and the clear structureresults for Guillou Island and Moules Island, as wellas the island pairs Mayes/Australia and Cochons/Cimetière.
DiscussionPrimary colonizationOur data are compatible with the notion of an initialcolonization of the Kerguelen Archipelago by a smallgroup of mice, at the minimum the genetic equivalentof two females and one male. This can be inferred fromthe presence of two major mitochondrial haplotypes, aswell as a single major Y-chromosomal haplotype.
However, the distinct placement of the Cochons/Cime-tière island samples in the allele sharing tree and thePCA analysis, as well as the presence of a single mito-chondrial halotype only (i.e. no single step derivatives),suggests that these mice are in fact derived from a sec-ond more recent colonization event. Intriguingly, how-ever, there is a similarity of the Y-chromosomalhaplotypes of these mice with the rest of the Kerguelenmice. This seems unlikely to have occurred by chance,since the loci we have typed are generally polymorphicin the Western European mice. The three other islandsamples in our study (Macquarie Island, AntipodesIsland and Marion Island) have indeed different majorY-chromosomal haplotypes (Table 2). Given that the Y-chromosomal haplotype from Cameroon is closelyrelated to the Kerguelen haplotype, one could proposethat both, the first and the second colonization camefrom Cameroon, which was itself colonized from Wes-tern Europe. The fact that both major mitochondrialhaplotypes in the Kerguelen Archipelago are also identi-cal or closely related to haplotypes found in Cameroonsupports this notion. However, we are not confidentthat such a direct connection exists. Although historicalship journeys are known to have stopped both atCameroon and the Kerguelen Archipelago, for examplethe German scientific expedition “Deutsche Tiefsee” in1898 from La Valdivia [20], these usually have had
Figure 5 Summary of population structure analysis and mitochondrial haplotype distributions across the Kerguelen Archipelago.
Hardouin et al. BMC Evolutionary Biology 2010, 10:325http://www.biomedcentral.com/1471-2148/10/325
Page 10 of 15
several additional stops on other islands and it is verydifficult to trace how many boats went on to the Ker-guelen Archipelago and the routes they took. Thus, itseems also possible that other Atlantic islands or Atlan-tic harbors of the USA, where most whaling boats thatwent to the Kerguelen Archipelago came from (the firstwhaling expedition known came from Nantucket Island(USA) in 1792 - [21]), share the allele patterns with theCameroon population and could thus have been thesource population for a secondary invasion on Cochons/Cimetière Islands. Again we note that the two majormitochondrial haplotypes found in the Kerguelen occuralso in the USA. More intensive sampling of the USAlocations needs to be done before this question can beanswered in a satisfactory way. Still, it remains note-worthy, and also unexpected, that two separate primaryinvasions on the Kerguelen have come from relatedsource populations.Although our study is focused on the Kerguelen
Archipelago, we also identified interesting patterns formice on the Falklands Islands. Both in the mitochon-drial haplotype analysis, as well as in the allele sharingtree, different locations in the archipelago can be mole-cularly differentiated, and therefore may be regarded asdifferent populations. Three mitochondrial haplotypegroups were detected, whereby two of them are sharedbetween disparate islands. Interestingly, West Falklandand Steeple Jason Island, which are about 40 km awayfrom each other, share not only the mitochondrial hap-lotypes but are also grouped together in the allele shar-ing tree (Figure 3a). On the other hand, New Island andEast Island, which share also the mitochondrial haplo-types, are very different in the allele sharing tree. TheFalkland Islands have been regularly visited by boatsfrom different nations (e.g. England, Spain, France etc.)and even today a population of around 3,000 FalklandIslanders lives there. Thus, the geographical location(near South America) and the presence of an extendedhuman population should have increased the number ofpotential colonization events in the Falklands Islands.Still, it appears from our limited data that the differentcolonizations that have occurred on different islands ofthe archipelago may also have been resilient to re-invasions.
Subsequent spreadAs expected, the population and allele patterns foundwithin the Kerguelen Archipelago allow some generalconclusions on the fate of populations after initial colo-nization. First of all, we note that these mice haveretained a certain amount of genetic diversity. The het-erozygosity values, as well as the average number ofalleles, are comparable to the sample that we caughtwithin a single deme in Europe (Paris). Since the mice
that came with the first ship would likely represent thedeme from the harbor where the ship started, we canassume that the mice entering these ships had a simi-larly reduced diversity (when compared to the diversityacross demes in the French and German populations).Hence, there may have been only little additional loss ofgenetic diversity during the ship passage and after colo-nization. In population genetic terms this means thatthe mouse population would have quickly expandedafter arrival on the Kerguelen Archipelago, which wouldhave prevented further loss of genetic diversity due todrift in small populations. Mice generally go throughsuccessions of population expansions and contractionsbetween seasons every year (for Guillou Island, see [22])suggesting that their life history patterns are well com-patible with such a scenario.There were further colonization cycles within the Ker-
guelen Archipelago, namely the ones that lead to thecolonization of the islands in the Morhiban Gulf. Theislands Guillou, Mayes and Australia are close toGrande Terre (< 500 m) and initial colonization mighthave occurred by animals that drifted there, or weretransported by humans. Active swimming, as it wasdirectly observed for rats [23] can also not be excluded,but seems less likely for small rodents due to the lowwater temperatures (about 5°C in summer). Neverthe-less, many small islands close to Grand Terre harbormouse colonies. The initial colonizers on the smallislands would have quickly expanded and retained muchof their genetic variation, although the allelic patternsare sufficiently distinct to make them genetically separ-able from the Grande Terre population. The GrandeTerre samples, on the other hand, are not geneticallydistinct from each other, suggesting that they are con-nected by continuous gene flow. This shows at the sametime that very little re-invasion of the smaller islandsappears to occur, since their genetic distinctness appearsto be maintained (i.e. not subjected to the high levels ofgene flow that occur on Grande Terre).In contrast to the islands close to Grand Terre,
Cochons Island and Cimetière Island are located furtheraway in the Morbihan Gulf and these are the oneswhere we indeed see a different pattern, namely a sec-ondary invasion by mice not coming from Grand Terre(see above). They harbor only a single mitochondrialhaplotype with no additional mutational variants (Figure2) and also only a single major allele at the hypervari-able Y-chromosomal locus Y22 (Table 2). This impliesthat the colonization has occurred later than that of therest of the Archipelago. Indeed for Cimetière Islandmice have only been recorded from 2002 onwards andit is possible that they were inadvertently transferredfrom the neighboring Cochons Island by humans.Another possibility could be a natural migration, since
Hardouin et al. BMC Evolutionary Biology 2010, 10:325http://www.biomedcentral.com/1471-2148/10/325
Page 11 of 15

the distance between the islands is only tenths of metersa low tide. There is evidence to suggest that the islandwas frequently visited for whaling and fishing activitiesaround 100 years ago when the first mice could havearrived, although cauldrons used for extracting fat frompenguin can be found only on Cochons Island today.On Cochons Island the mouse population was also inad-vertently affected by a rabbit eradication program usingpoison from 1992 to 1997 [24]. This could have resultedin a bottleneck and could thus explain the loweredgenetic diversity. The same eradication program wasalso conducted on Guillou Island and could be the rea-son for low genetic diversity on this island as well as thedifferent cluster in the structure and the allele sharingtree compared to other Kerguelen samples.Apart from the Cochons/Cimetière Islands case, we
have no evidence for secondary successful colonizationacross the entire Kerguelen Archipelago, although newmice must have frequently arrived every year duringwhaling times. In other island mice colonization studies,it was found that although mitochondrial patterns simi-larly suggest only a single invasion, there could still becontinued male mediated gene flow [15,18]. However,given that we have only one major Y-chromosomal hap-lotype throughout the archipelago, this seems unlikelyfor the Kerguelen Archipelago. Hence, we can concludethat it must be difficult for newly arriving mice toinvade the already occupied territory in the Kerguelen.Thus, our findings of single primary invasions and resili-ence to re-invasions corroborate the studies by Searle etal. [4,9,25], which have suggested that the phylogeo-graphic patterns seen for mouse populations reflectancient human movements, with only little disturbanceby later movements. The successful experimental intro-duction of house mice into the Scottish Isle of May [26]does not contradict this conclusion, since in this casethe mice came from another Scottish island with similarecology, i.e. are expected to have had the same environ-mental adaptations at the time where they arrived.
D-loop mutation rateWe identified several new mitochondrial haplotypes,mainly in Kerguelen, but also on the Falklands, MarionIsland and Macquarie Island, most of which are onlyone step away from the major resident haplotype (Figure2). These can be expected to have arisen only after colo-nization of the respective islands. We can therefore esti-mate a mutation rate based on the colonization time ofapproximately 200 years ago. A single mutation among834 bp is equivalent to 0.12% sequence divergencewhich, when divided by 200 years, gives a mutation rateof 6 × 10⁻⁶ per year. This is a factor of 150 higher thanthe estimate of 4 × 10⁻⁸ per year for the intraspecificmutation rates of the same D-loop region suggested by
[27,28], which is already higher than the interspecificrate. The dependence of such estimates on the coales-cence times considered is a well known pattern in var-ious taxa [29], although the reasons for this a stilldisputed [30,31]. The sequencing of the mitochondrialgenomes of laboratory derived strains that were estab-lished about 100 years ago indeed suggests a 10-15times higher mitochondrial mutation rate among suchrecently derived lineages, although no new mutationswere found in the D-loop region [32]. But even takingthis rate into account, our estimate is still a factor of 10times higher, suggesting that another process must playa role. This could be selective sweeps caused by advan-tageous mutations elsewhere in the mitochondrial gen-ome and providing a new adaptation in the respectivematriline. For humans it has been suggested that suchmutations do indeed occur and have specifically beenfixed in individuals of populations living at higher lati-tudes indicative of providing an adaptation to the colderclimates [33].
Adaptation and genetic isolationThe ecological situation of the mice on the KerguelenArchipelago is very different from Western Europeanconditions, both with respect to the cold climate, as wellas food conditions and the virtual absence of humansettlements. Still, mouse densities can become very high,at least in regions where they have no predators [34].Also, it has been shown for mice on sub-Antarcticislands that they have changed their preferred diet fromplant seeds to macroinvertebrates for most of the year[14,35]. All of this indicates that mice are likely to belocally adapted to these conditions. This could explainwhy it is so difficult for newly arriving mice to invadethe existing populations. They would not only have pro-blems to become integrated into the existing socialstructure, but would also have to compete with betteradapted competitors. Alternatively, this may be a simplestatistical effect, given that newly arriving mice wouldusually be few in numbers and resident mice form alarge population. Thus, even if newly arriving mice matesuccessfully with the resident mice, the new alleles andhaplotypes that they carry might not rise to sufficientfrequencies to make an impact on the overall pattern.On the other hand, given that the single colonizationpattern appears to be consistently found on all smallislands, it seems more likely that local adaptation playsa role as well. Interestingly, the colonization of themuch larger and ecologically diverse New ZealandIsland is characterized by multiple invasions, includingdifferent sub-species [9]. Thus, it seems possible thatthe mouse populations on small islands can becomemore quickly ecologically and genetically isolated thanmouse populations on larger islands and thereby have a
Hardouin et al. BMC Evolutionary Biology 2010, 10:325http://www.biomedcentral.com/1471-2148/10/325
Page 12 of 15
higher propensity to eventually form a new subspeciesor species, possibly enhanced through the fast formationof new chromosomal races [36].
ConclusionsOur data suggest that on small islands, the primarymouse colonization wave is decisive for the populationthat becomes established. Further introduction of micefrom ships do not appear to have a big impact on thegenetic composition of the resident population.
MethodsMouse samplesPopulation samples from Cologne-Bonn (Germany),Massif Central (France) and Cameroon were describedpreviously [17]. For these we had applied a samplingscheme that took care to sample the genetic variationwithin an area of about 50 km diameter (i.e. trappingsites were at least 300 meters away from each other).Hence we consider these samples to reflect the localpopulation diversity. Additional samples from Schles-wig-Holstein (Northern Germany) were trapped in2006 using the same scheme. In contrast, the micefrom Paris (n = 20) were caught within the confine-ments of the garden of the National French Library(BNF) in 2009, i.e. not following the extended sam-pling scheme above. The mice in the BNF are living ina space of around 1 ha at the center of the nationallibrary building. They are separated from other popula-tions outside the BNF by poisoning. Hence, these areconsidered to represent a single sample from a localpopulation, not necessarily reflecting the diversity inthe extended area.The Kerguelen Archipelago samples were caught mainly
in the Morbihan Gulf area including several islands andthe adjacent Grande Terre (see Table 1 for details). Againit was not possible to apply the extended sampling schemein this case. Instead, the sampling followed the schemedescribed in [24]. All the mice in the Kerguelen Archipe-lago were captured in non-inhabited area except aroundthe research station in Port-aux-Français. The mice weretrapped using a line system, with three parallel lines 40 maway from each other and a length of approx. 100 m eachwith 34 traps along the line (1 trap every 3 m). Mice fromPort-aux-Français (n = 41), Guillou Island (n = 79),Cochons Island (n = 69), Isthme Bas (n = 38), MayesIsland (n = 18), La cabane dite “Jacky” (n = 29), CimetièreIsland (n = 28), Australia Island (n = 24), Port-Jeanned’Arc (n = 16), Cap Ratmanoff (n = 8), Sourcils noirs (n =5), Port-Couvreux (n = 4) and Pointe du Morne (n = 1)were trapped in 2008 and 2009. Mice from Moules Island(n = 12) and Stoll Island (n = 4) were captured in 2005.Other Mayes Island (n = 57) and Australia Island (n = 4)mice were trapped in 1996.
Amsterdam Island (n = 3) samples were collected inDecember 2007. Marion Island mice (n = 18) werecaught at two localities across the island, namely at theMeteorological Station and at Mixed Pickel Cove in1990 (n = 6) and 2004 (n = 12) [8]. Macquarie Island (n= 12), Antipodes Island (n = 18) and Auckland Islands(n = 13) mice where caught in 2005-2006 [9]. Additionalsamples from Macquarie Island (n = 28) from 2005 wereused. Falkland Islands samples from New Island (n =12) were caught in 2006 [37] and 2010 (n = 18). Sam-ples from the other Falkland Islands namely SaundersIsland (n = 4), Steeple Jason Island (n = 5), East Falk-land (n = 2) and West Falkland (n = 3) and a mousefrom South Georgia were caught in 2008/2009.
D-loop sequencingDNA was extracted using salt extraction. The D-loopwas amplified using the primers 5’-CATTACTCTGGTCTTGTAAACC and 5’-GCCAGGACCAAACCTTTGTGT. The reactions were carried out in 10 μLfinal volume with the following cycling parameters: 95°Cfor 15 minutes followed by 35 cycles of 95°C for 30 s,60°C for 1.30 min, 72°C for 1 min and 15 min at 70°Cfor elongation time. Exo-Sap purification (USB Corp.)was performed with the following incubation: 37°C for20 min and 80°C for 20 min. The cycle sequencing reac-tion parameters were 96°C for 1 min followed by 29cycles of 96°C for 10 s, 55°C for 15 s and 60°C for 4min.The sequences generated were visualized using
CodonCodeAligner Ver. 2.0.1 (CodonCode Corp.) BioE-dit ver.7.0.9.0 [38] and MEGA ver. 4 [39]. The haplotypedata file was calculated using DnaSP 4.50.3 [40]. Thenetwork was calculated using the Median Joiningmethod and drawn with Network ver. 4.5.1.0 (FluxusTechnology Ltd), taking care that missing data did notaffect the network [41]. The sequences were submittedto Genbank and are available under accession numbersHQ185258 to HQ185282.
Microsatellite typingFrom a previously described set of 1,000 microsatellites[42,43], we chose 18 (Chr01_25, Chr02_01, Chr03_21,Chr03_24, Chr04_31, Chr05_15, Chr05_45, Chr07_38,Chr08_11, Chr09_20, Chr11_64, Chr12_05, Chr13_22,Chr14_16, Chr16_21, Chr17_09, Chr18_08, Chr19_08)which were known to be polymorphic in the German andFrench populations. Six Y-chromosomal loci which wefound to be polymorphic in the German and Frenchpopulations were also typed for all island samples wheremore than 8 males were available. Primer sequences usedto type the Y-chromosome were: Y6 aaccaccactatcttcattcand acagagtatacgtacgtgtg, Y12 cccaatctaggcatttaatt andattcaccattctccagtgtg, Y21 accatcagatgatcaccaagtgc and
Hardouin et al. BMC Evolutionary Biology 2010, 10:325http://www.biomedcentral.com/1471-2148/10/325
Page 13 of 15
tccagcattcaatggtacaggct, Y22 tcatggtagacaccatggcaac andtcagttttctaggtggaggggtg, Y23 acctcactcaggatgatgccctcand agcctgtgcgcacgtgtgtg, Y24 tctgggggtttcgggtggagcctand gcatcacagctgaggctctgtgg. Forward primers werelabeled with FAM or HEX dye on the 5’ end. The reac-tions were carried out in 5 μL final volumes using 10 ngDNA template using a multiplex PCR kit (Qiagen). ThePCR conditions were: 95°C for 15 min followed by 28cycles at 95°C for 30 s, 60°C for 1.30 min, 72°C for 1.30min with a final extension at 72°C for 10 min. PCR pro-ducts were diluted 1:20 in water. 1 μL of this dilution wasadded to 10 μL of HiDi formamide and 0.1 μL of 500ROX size standard (Applied Biosystems). The denatura-tion step was performed with the following incubationtimes: 90°C for 2 min and 20°C for 5 min. The alleleswere analyzed using GeneMapper ver. 4.0 software(Applied Bioscience). The distances for the allele sharingtree were calculated using MSA3.15 [44]. The tree wasgenerated using R and drawn using MEGA4 [39]. Struc-ture was analyzed using Instruct [19] because thismethod does not assume Hardy Weinberg equilibriumwithin loci. The run parameters were as follow: 2 chainnumber, a burn-in period of 100,000 simulations fol-lowed by a run length of 2,000,000 MCMC simulationsand ten iterations for each K (number of clusters). Todraw the structure diagram the softwares CLUMPP (ver-sion 1.1.2 [45]) and Distruct [46] were used. The PCAwas generated using the software Genetix 4.03 [47].
AcknowledgementsWe are extremely grateful to Quiterie Duron, Hélène Demeringo, AlexiaGarnier and Marine Pascal who collected the samples from the KerguelenArchipelago in 2008 and in 2009 (Institut Paul-Emile Victor, program n°136),Juan F. Masello, Hendrika van Noordwijk, Christie Darren and all the FalklandIslanders which helped us to collect samples on the Falkland Islands andSouth Georgia, Marc Lebouvier (IPEV, 136) for collecting the AmsterdamIsland mice, and to Keith Springer (Tasmania Parks and Wildlife Service) forthe Macquarie Island mice. We also want to thank Jeremy Searle for helpingin sampling collection as well as the Cornell Computational Biology ServiceUnit (CBSU). We are also very grateful to Heinke Buhtz and Conny Burghardtfor technical assistance and Frank Chan for comments on the manuscript.
Author details1Max Planck Institute of Evolutionary Biology, August-Thienemann-Str. 2,24306 Plön, Germany. 2National Museum of Natural History, UMR 7204,Conservation des espèces, restauration et suivi des populations, 61 rueBuffon, CP n°53, 75005 Paris, France. 3South Australian Museum, NorthTerrace, Adelaide SA 5000, Australia. 4University of Adelaide, School of Earthand Environmental Sciences, Adelaide SA 5000, Australia. 5Centre forInvasion Biology, Stellenbosch University, Private Bag X1, Matieland 7602,South Africa. 6Max Planck Institute for Ornithology, Vogelwarte Radolfzell,Schlossallee 2, D-78315 Radolfzell, Germany.
Authors’ contributionsEH developed the project, did the laboratory work and wrote the first draftof the manuscript. JLC organized the sample collection on the Kerguelenand on the National French Library (Paris), MS, JC, BV and PQ provided D-loop sequences, DNA and further samples from the other islands, RS and MTdeveloped the Y-chromosomal primers and provided the information onallele patterns in Cameroon and Europe. DT was the primary supervisor andparticipated in its design and coordination and wrote the final manuscript.
All authors were involved in writing and data interpretation, and read andapproved the final manuscript.
Received: 13 June 2010 Accepted: 26 October 2010Published: 26 October 2010
References1. Guénet J-L, Bonhomme F: Wild mice: an ever-increasing contribution to a
popular mammalian model. Trends in Genetic 2003, 19:24-31.2. Berry RJ, Scriven PN: The genus Mus as a model for evolutionary studies.
Biological Journal of the Linnean Society 2005, 84:332-347.3. Boursot P, Auffray J-C, Britton-Davidian J, Bonhomme F: The evolution of
the house mice. Annual Review of Ecology and Systematics 1993,24:119-152.
4. Cucchi T, Vigne J-D, Auffray J-C: First occurrence of the house mouse(Mus musculus domesticus Schwarz & Schwarz, 1943) in the WesternMediterranean: a zooarchaeological revision of subfossil occurrences.Biological Journal of the Linnean Society 2005, 84:429-446, Searle JB, JonesCS, Gündüz I, Scascitelli M, Jones EP, Herman JS, Rambau RV, Noble LR,Berry RJ, Giménez MD, Jóhannesdóttir F: Of mice and (Viking?) men:phylogeography of British and Irish house mice. Proceedings of the RoyalSociety 2009, 276: 201-207.
5. Berry RJ, Peters J: Macquarie Island House mice: A genetical isolate on aSub-Antartic island. Journal of Zoology, London 1975, 176:375-389.
6. Berry RJ, Peters J, Van Aarde RJ: Sub-Antarctic House mice: colonization,survival and selection. Journal of Zoology, London 1978, 184:127-141.
7. Berry RJ, Bonner WN, Peters J: Natural selection in House mice (Musmusculus) from South Georgia (South Atlantic Ocean). Journal of Zoology,London 1979, 189:385-398.
8. Jansen van Vuuren B, Chown SL: Genetic evidence confirms the origin ofthe house mouse on sub-Antarctic Marion Island. Polar Biology 2007,30:327-332.
9. Searle JB, Jamieson PM, Gunduz I, Stevens MI, Jones EP, Gemmill CEC,King CM: The diverse origins of New Zealand house mice. Proceedings ofthe Royal Society 2009, 276:209-217.
10. Kidder JH: The natural history of Kerguelen Island. The American Naturalist1876, 10:491.
11. Lésel R, Derenne P: Introducing animals to Iles Kerguelen. Polar Reccord1994, 17(110):485-494.
12. Chapuis J-L, Boussès P, Barnaud G: Alien mammals, impact andmanagement in the French subantarctic islands. Biological Conservation1994, 67:97-104.
13. Pisanu B, Chapuis J-L, Durette-Desset M-C: Helminths from introducedsmall mammals on Kerguelen, Crozet, and Amsterdam Islands (SouthernIndian Ocean). Journal of Parasitology 2001, 87:1205-1208.
14. Le Roux V, Chapuis J-L, Frenot Y, Vernon P: Diet of the house mouse (Musmusculus) on Guillou Island, Kerguelen archipelaga, Subantartic. PolarBiology 2002, 25:49-57.
15. Förster DW, Gündüz I, Nunes AC, Gabriel S, Ramalhinho MG, Mathias ML,Britton-Davidian J, Searle JB: Molecular insights into the colonization andchromosomal diversification of Madeiran house mice. Molecular Ecology2009, 18:4477-4494.
16. Berry RJ, Bronson FH: Life history and bioeconomy of the house mouse.Biological reviews of the Cambridge Philosophical Society 1992, 67:519-550.
17. Ihle S, Ravaoarimanana I, Thomas M, Tautz D: An analysis of signatures ofselective sweeps in natural populations of the house mouse. MolecularBiology and Evolution 2006, 23:790-797.
18. Jones CS, Noble LR, Jones JS, Tegelström H, Triggs GS, Berry RJ: Differentialmale genetic success determines gene flow in an experimentallymanipulated mouse population. Proceedings of the Royal Society 1995,260:251-256.
19. Gao H, Williamson S, Bustamante CD: A Markov chain Monte Carloapproach for joint inference of population structure and inbreedingrates from multilocus genotype data. Genetics 2007, 176:1635-1651.
20. Carl Chun: Aus den Tiefen des Weltmeeres. 2. umgearbeitete und starkvermehrte Auflage. Gustav Fischer, Jena 1903 (Online: edoc-Server derHumboldt-Universität zu Berlin) .
21. Delépine G: Les îles australes francaises. Editions Ouest France, Rennes1995.
22. Pisanu B, Chapuis J-L, Durette-Desset M-C, Morand S: Epizootiology ofSyphacia obvelata from a domestic mouse population on the
Hardouin et al. BMC Evolutionary Biology 2010, 10:325http://www.biomedcentral.com/1471-2148/10/325
Page 14 of 15
subantarctic Kerguelen archipelago. Journal of Parasitology 2002,88:645-649.
23. Russell JC, Towns DR, Anderson SH, Clout MN: Intercepting the first ratashore. Nature 2005, 437:1107.
24. Chapuis J-L, Le Roux V, Asseline J, Lefèvre L, Kerleau F: Eradication ofrabbits by poisoning on three islands of the subantarctic KerguelenArchipelago. Wildlife Research 2001, 28:323-331.
25. Searle JB, Kotlík P, Rambau RV, Marková S, Herman JS, McDevitt AD: TheCeltic fringe of Britain: insights from small mammal phylogeography.Proceedings of the Royal Society 2009, 276:4287-4294.
26. Berry RJ, Triggs GS, King P, Nash HR, Noble LR: Hybridization and geneflow in house mice introduced into an existing population on an island.Journal of Zoology, London 1991, 225:615-632.
27. Geraldes A, Basset P, Gibson B, Smith KL, Harr B, Yu HT, Bulatova N, Ziv Y,Nachman MW: Inferring the history of speciation in house mice fromautosomal, X-linked, Y-linked and mitochondrial genes. Molecular Ecology2008, 17:5349-5463.
28. Rajabi-Maham H, Orth A, Bonhomme F: Phylogeography and postglacialexpansion of Mus musculus domesticus inferred from mitochondrial DNAcoalescent, from Iran to Europe. Molecular Ecology 2008, 17:627-641.
29. Ho SYW, Phillips MJ, Cooper A, Drummond AJ: Time dependency ofmolecular rate estimates and systematic overestimation of recentdivergence times. Molecular Biology and Evolution 2005, 22:1561-1568.
30. Woodhams M: Can deleterious mutations explain the time dependencyof molecular rate estimates? Molecular Biology and Evolution 2006,23:2271-2273.
31. Galtier N, Nabholz B, Glémin S, Hurst GD: Mitochondrial DNA as a markerof molecular diversity: a reappraisal. Molecular Ecology 2009, 18:4541-4550.
32. Goios A, Pereira L, Bogue M, Macaulay V, Amorim A: mtDNA phylogenyand evolution of laboratory mouse strains. Genome Research 2007,17:293-298.
33. Ruiz-Pesini E, Mishmar D, Brandon M, Procaccio V, Wallace DC: Effects ofpurifying and adaptive selection on regional variation in human mtDNA.Science 2004, 303:223-226.
34. Angel A, Wanless RM, Cooper J: Review of impacts of the introducedhouse mouse on islands in the Southern Ocean: are mice equivalent torats? Biological Invasions 2009, 11:1743-1754.
35. Smith VR, Avenant NL, Chown SL: The diet and impact of house mice ona sub-Antarctic island. Polar Biology 2002, 25:703-715.
36. Britton-Davidian J, Catalan J, da Graça Ramalhinho M, Ganem G, Auffray JC,Capela R, Biscoito M, Searle JB, da Luz Mathias M: Rapid chromosomalevolution in island mice. Nature 2000, 403:158.
37. Quillfeldt P, Schenk I, McGill RAR, Strange IJ, Masello JF, Gladbach A,Roesch V, Furness RW: Introduced mammals coexist with seabirds at NewIsland, Falkland Islands: abundance, habitat preferences and stableisotope analysis of diet. Polar Biology 2008, 31:333-349.
38. Hall TA: BioEdit: a user-friendly biological sequence alignment editor andanalysis program for Windows 95/98/NT. Nucleic Acids Symposium Series1999, 41:95-98.
39. Tamura K, Dudley J, Nei M, Kumar S: MEGA4: Molecular EvolutionaryGenetics Analysis (MEGA) software version 4.0. Molecular Biology andEvolution 2007, 24:1596-1599.
40. Rozas J, Sanchez-DelBarrio JC, Messeguer X, Rozas R: DnaSP, DNApolymorphism analyses by the coalescent and other methods.Bioinformatics 2003, 19:2496-2497.
41. Joly S, Stevens MI, van Vuuran BJ: Haplotype networks can be misleadingin the presence of missing data. Systematic Biology 2007, 56:857-862.
42. Thomas M, Möller F, Wiehe T, Tautz D: A pooling approach to detectsignatures of selective sweeps in genome scans using microsatellites.Molecular Ecology Notes 2007, 7:400-403.
43. Teschke M, Mukabayire O, Wiehe T, Tautz D: Identification of selectivesweeps in closely related populations of the house mouse based onmicrosatellite scans. Genetics 2008, 180:1537-1545.
44. Dieringer DS, Schlötterer C: Microsatellite analyser (MSA): a platformindependent analysis tool for large microsatellite data sets. MolecularEcology Notes 2003, 3:167-169.
45. Jakobsson M, Rosenberg NA: CLUMPP: a cluster matching andpermutation program for dealing with label switching andmultimodality in analysis of population structure. Bioinformatics 2004,23:1801-1806.
46. Rosenberg NA: Distruct: a program for the graphical display ofpopulation structure. Molecular Ecology 2004, Notes 4:137-138.
47. Belkhir K, Borsa P, Chikhi L, Raufaste N, Bonhomme F: 1996-2004 GENETIX4.05, logiciel sous Windows TM pour la génétique des populations.Laboratoire Génome, Populations, Interactions, CNRS UMR 5171, Universitéde Montpellier II, Montpellier (France).
doi:10.1186/1471-2148-10-325Cite this article as: Hardouin et al.: House mouse colonization patternson the sub-Antarctic Kerguelen Archipelago suggest singular primaryinvasions and resilience against re-invasion. BMC Evolutionary Biology2010 10:325.
Submit your next manuscript to BioMed Centraland take full advantage of:
• Convenient online submission
• Thorough peer review
• No space constraints or color figure charges
• Immediate publication on acceptance
• Inclusion in PubMed, CAS, Scopus and Google Scholar
• Research which is freely available for redistribution
Submit your manuscript at www.biomedcentral.com/submit
Hardouin et al. BMC Evolutionary Biology 2010, 10:325http://www.biomedcentral.com/1471-2148/10/325
Page 15 of 15


