Embed Size (px)
Citation preview
HAL Id: hprints-01831580https://hal-hprints.archives-ouvertes.fr/hprints-01831580
Submitted on 6 Jul 2018
HAL is a multi-disciplinary open accessarchive for the deposit and dissemination of sci-entific research documents, whether they are pub-lished or not. The documents may come fromteaching and research institutions in France orabroad, or from public or private research centers.
L’archive ouverte pluridisciplinaire HAL, estdestinée au dépôt et à la diffusion de documentsscientifiques de niveau recherche, publiés ou non,émanant des établissements d’enseignement et derecherche français ou étrangers, des laboratoirespublics ou privés.
HISTORY & MATHEMATICS Political Demography &Global Ageing
Jack Goldstone, Leonid Grinin, Andrey Korotayev
To cite this version:Jack Goldstone, Leonid Grinin, Andrey Korotayev. HISTORY & MATHEMATICS Political Demog-raphy & Global Ageing. Leonid Grinin, pp.176, 2015, Leonid Grinin, 978-5-7057-4670-5. �hprints-01831580�
RUSSIAN PRESIDENTIAL ACADEMY OF NATIONAL ECONOMY AND PUBLIC ADMINISTRATION
International Laboratory of Political Demography and Social Macro-Dynamics
RUSSIAN ACADEMY OF SCIENCES
Keldysh Institute of Applied Mathematics Institute of Oriental Studies
HISTORY & MATHEMATICS
Political Demography & Global Ageing
Edited by
Jack A. Goldstone, Leonid E. Grinin,
and Andrey V. Korotayev
‘Uchitel’ Publishing House
Volgograd
ББК 22.318 60.5 ‛History & Mathematics’ Yearbook
Editorial Council: Herbert Barry III (Pittsburgh University), Leonid Borodkin (Moscow State University; Cliometric Society), Robert Carneiro (American Museum of Natural History), Christopher Chase-Dunn (University of California, Riverside), Dmitry Chernavsky (Russian Academy of Sciences), Tessaleno Devezas (University of Beira Interior), Leonid Grinin (National Research Univer-sity Higher School of Economics), Antony Harper (Eurasian Center for Big Histo-ry & System Forecasting), Peter Herrmann (University College of Cork, Ireland), Andrey Korotayev (Higher School of Economics), Alexander Logunov (Russian State University for the Humanities), Georgy Malinetsky (Russian Academy of Sciences), Sergey Malkov (Russian Academy of Sciences), Charles Spencer (American Museum of Natural History), Rein Taagapera (University of Califor-nia, Irvine), Arno Tausch (Innsbruck University), William Thompson (Universi-ty of Indiana), Peter Turchin (University of Connecticut), Douglas White (Uni-versity of California, Irvine), Yasuhide Yamanouchi (University of Tokyo). History & Mathematics: Political Demography & Global Ageing. Yearbook / Edited by Jack A. Goldstone, Leonid E. Grinin, and Andrey V. Korotayev. – Volgograd: ‘Uchitel’ Publishing House, 2015. – 176 pp.
Among different important issues, which are discussed in Political Demography the issue of global ageing becomes more and more pressing every year. It is sufficient to take into account the point that within two forthcoming decades a rapid global increase in the number of retirement-age persons will lead to its doubling within this fairly small historical period. The concerns about population ageing apply to both developed and many develop-ing countries and it has turned into a global issue. In forthcoming decades the population ageing is likely to become one of the most important processes determining the future so-ciety characteristics and the direction of technological development.
The present volume of the Yearbook (which is the fifth in the series) is subtitled ‘Po-litical Demography & Global Ageing’. It brings together a number of interesting articles by scholars from Europe, Asia, and America. They examine global ageing from a variety of perspectives.
This issue of the Yearbook consists of two main sections: (I) Aspects of Political Demography; (II) Facing Population Ageing.
We hope that this issue will be interesting and useful both for historians and mathe-maticians, as well as for all those dealing with various social and natural sciences.
This research has been supported by the Russian Science Foundations (Project No 14-11-00634).
‛Uchitel’ Publishing House 143 Kirova St., 400079 Volgograd, Russia Printed in Volgograd polygraphic complex ‘Ofset’ Kim Street, 6, Volgograd, 400001, Russia ISBN 978-5-7057-4670-5 © ‘Uchitel’ Publishing House, 2015 Volgograd 2015
Contents Jack A. Goldstone, Leonid E. Grinin, and Andrey V. Korotayev
Introduction. Research into Global Ageing and Its Consequences . . . . . . . . . . . . . .
5
I. Aspects of Political Demography David. A. Coleman Ethnic Transformation of European Societies by
Immigration . . . . . . . . . . . . . . .
10
David A. Coleman and Robert Rowthorn
Population Decline – Making the Best of Inevitable Destiny? . . . . . . . . . . . .
26
Vasil T. Sakaev Andrey V. Korotayev, Jack A. Goldstone, Julia V. Zinkina, Sergey G. Shulgin, Daria A. Khaltourina, and Daria A. Folomeyeva
The Political Development of Russia in the 21st Century: Challenges of Demographic Factor and the Role of Educational System . . . . . . . . . . . . Mathematical Modeling and Forecasting of the Demo-graphic Future of Russia: Seven Scenarios . . . . .
42
52
II. Facing Population Ageing Leonid E. Grinin and Andrey V. Korotayev
Global Population Ageing, the Sixth Kondratieff Wave, and the Global Financial System . . . . . . . .
81
Donghyun Park and Kwanho Shin
Impact of Population Ageing on Asia's Future Growth
107
Mark L. Haas Population Ageing and the Future of the Great Powers
133
Jack A. Goldstone Population Ageing and Global Economic Growth . . .
147

Сontents 4
Jason L. Powell and Hafiz T. A. Khan
Ageing in Post-Industrial Society: Trends and Trajecto-ries . . . . . . . . . . . . . . . . . .
156
III. Reviews and Notes
Jack A. Goldstone On Great Divergence, Great Convergence, Industrial
Revolution, and California School . . . . . . . . 167 Contributors . . . . . . . . . . . . . . . . . . . . . . . 172
Guidelines for Contributors . . . . . . . . . . . . . . . . . . 176
History & Mathematics: Demography & Ageing 2015 5–9 5
Introduction
Research into Global Ageing
and Its Consequences
Jack A. Goldstone, Leonid E. Grinin, and Andrey V. Korotayev
With the further growth of the world population and the further intensification of the processes of interaction between countries and increasing movements of the masses of people, the role of Political Demography becomes more and more important. Issues of global ageing, migration, low fertility in developed coun-tries (or very high fertility in some African countries), high mortality in many developing states (including deaths from AIDS); rapid change in the ethnic composition in Europe and in several other regions and many other pressing issues are in the focus of this discipline. Some of these problems are analyzed in this yearbook. However, among those issues, the issue of global ageing be-comes more and more pressing every year. It is sufficient to take into account the point that within two forthcoming decades a rapid global increase in the number of retirement-age persons will lead to its doubling within this fairly small historical period. The concerns about population ageing apply to both developed and many developing countries and it has turned into a global issue. In the next decades the population ageing is likely to become one of the most important processes determining the future society characteristics and direc-tions of technological development.
The ancient Greeks thought of the ages of mankind as passing through youth (the Golden Age), a vigorous adulthood (the Silver and Bronze Age), then a period of pain and conflict, the ‘Iron Age’. As we enter the 21st centu-ry, the world's population is entering an era of unprecedented ageing. Howev-er, it is unclear whether it will indeed prove to be an ‘Iron Age’ of pain and conflict.
Certainly, the economic condition of ageing nations will be tested, as their economies are likely to slow while the financial burdens of health and pension support for an ageing population will increase. At the same time, the continued rapid growth and youthfulness of societies in the Middle East and
Introduction 6
Africa are producing waves of international migrants, both those fleeing re-gional conflicts and those looking for greater opportunities than can be found in their own countries. The combination of economic pressures and immigra-tion strains could indeed produce an ‘Iron Age’ of pain and conflict if the world's most developed countries are unable to produce creative responses to these changes.
Yet a brighter future also can be imagined. The stabilization of popula-tions in the rich world could also provide a stabilization of pollution and cli-mate-change inducing emissions. Moreover, ageing populations could well make politicians more inclined to seek peace and avoid war. Properly regulat-ed, an increase in global migration could inject a measure of vigor into the ageing societies and economies of Europe, East Asia, and North America, while serving as a safety valve to release social tensions in the developing world.
This brighter future is what we all hope for. However, it will require a deep understanding of how ageing will affect the global economy and national and global politics to craft the right responses. Richer countries will need to bring health costs under control, and redesign retirement and pension systems for populations where nearly half of the adult population is over 60 years old. Both richer and poorer countries will need to develop plans to regulate international migration that provide fairness and opportunity while restricting exploitation and trafficking of vulnerable people, and that allow the global movement of people to parallel that of capital and information, while still preserving the rich tapestry of the world's cultures and practices.
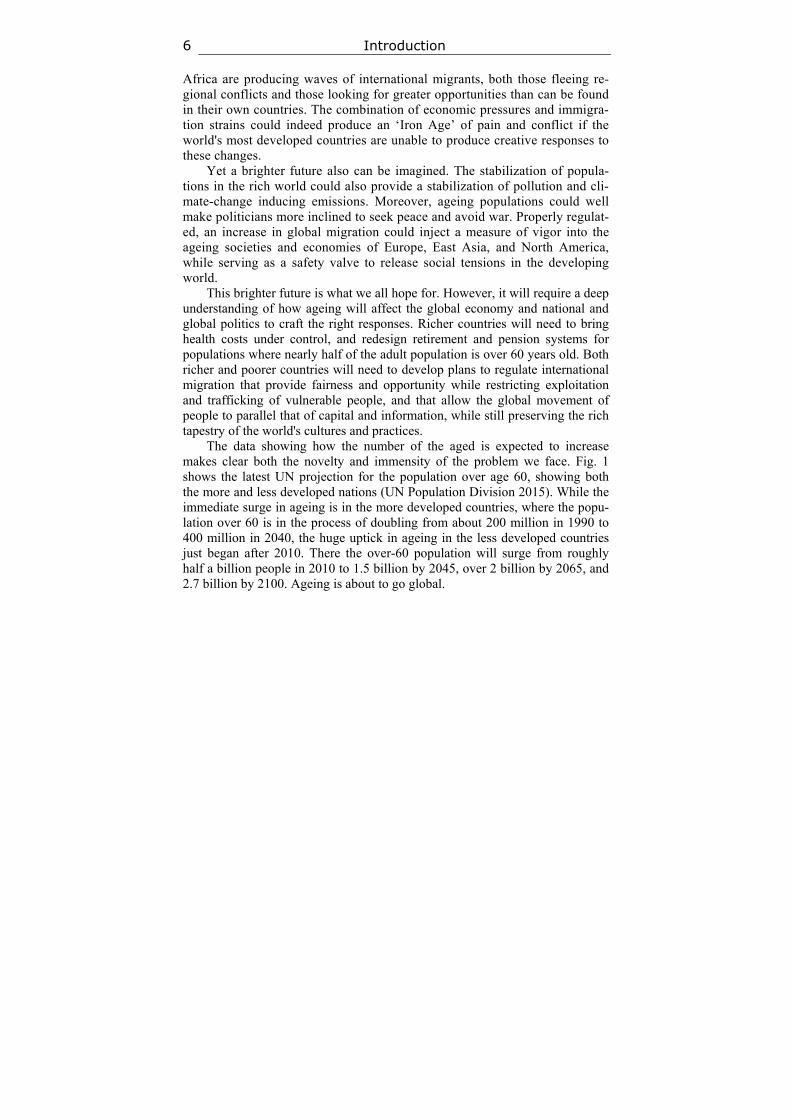
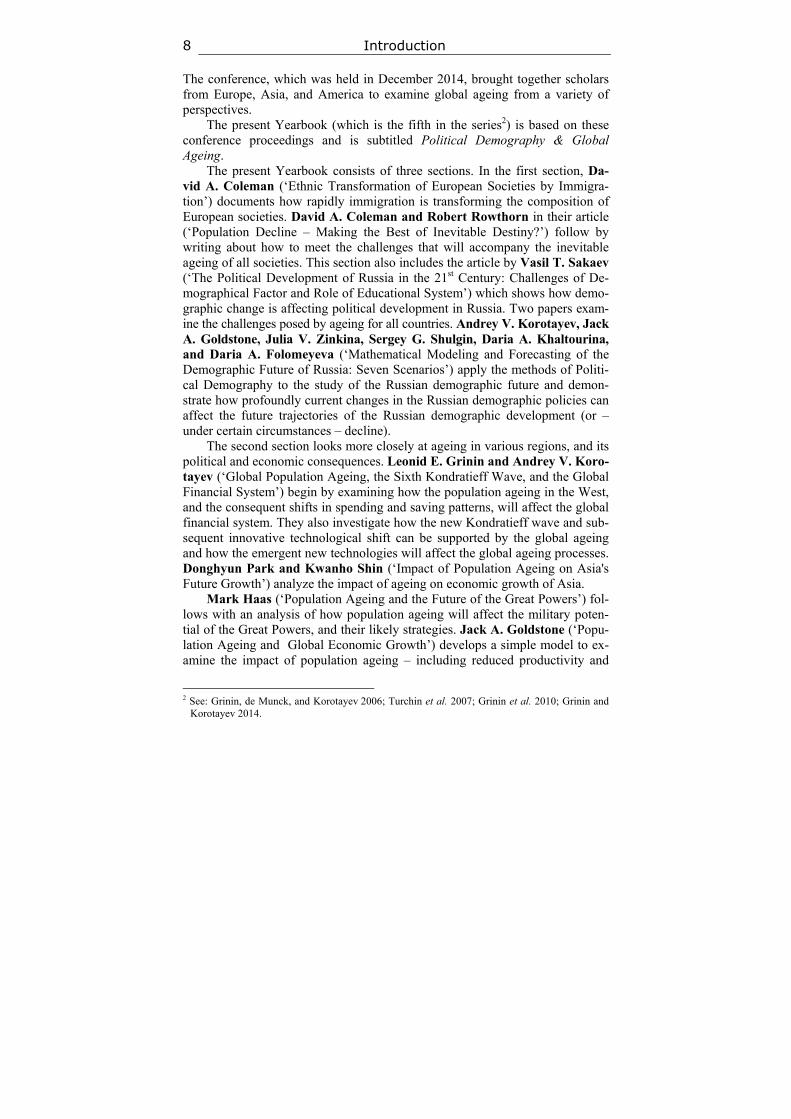
The data showing how the number of the aged is expected to increase makes clear both the novelty and immensity of the problem we face. Fig. 1 shows the latest UN projection for the population over age 60, showing both the more and less developed nations (UN Population Division 2015). While the immediate surge in ageing is in the more developed countries, where the popu-lation over 60 is in the process of doubling from about 200 million in 1990 to 400 million in 2040, the huge uptick in ageing in the less developed countries just began after 2010. There the over-60 population will surge from roughly half a billion people in 2010 to 1.5 billion by 2045, over 2 billion by 2065, and 2.7 billion by 2100. Ageing is about to go global.
Jack A. Goldstone, Leonid Grinin, and Andrey Korotayev 7
Fig. 1. Total global population age 60+, 1950–2100
In this special issue, we present the research discussed at the 2nd Annual Con-ference on Political Demography of the International Research Laboratory on Political Demography and Social Macrodynamics, based at the Russian Acad-emy of National Economy and Public Administration (RANEPA) in Moscow.1
1 Research Laboratory on Political Demography and Social Macrodynamics (PDSM) at the
Russian Presidential Academy of National Economy and Public Administration (RANEPA) is headed by an American sociologist, demographer, and political scientist, Jack A. Goldstone, Elman Family Professor of Public Policy and Director of the Hong Kong University of Science and Technology Institute for Public Policy, and brings together Russian, European, American, and Asian scholars and policy experts. With a special attention to Russian demographic situation and challenges PDSM is studying the scale, dynamics, and consequences of global demographic changes and their global impact. Research laboratory also pays attention to issues of social security and political stability, conditions and trajectories of regime development; geo-strategic competition, especially as it affects Europe and BRICS; opportunities for economic growth, crises and transfor-mation in the global economic system; ethnic competition and conflict; international and regional migration and urbanization; changes in the capabilities of the global work force. International Conference on Political Demography and Social Macrodynamics is organized by the Research Laboratory on Political Demography and Social Macrodynamics, RANEPA and Gaidar Institute. The second conference was devoted to ‘Global Aging of the Population and the Future of Russia’ and brought together participants from Russia, Europe, US and Asia. The first day (December 12th, 2014) of the Conference took place at the Gaidar Institute and was focused mainly on Russian demographic situation and policy. During the first day participants discussed demographic projections and demographic policy, regional specifics of fertility and mortality in Russia, ‘conservative shift’ in the Russian Politics, the role of higher fertility levels in political processes in the Russian North Caucasus and also demographic factors of radical ideologies. The second day (December 13th, 2014) of the Conference took place at the Russian Presidential Academy of National Economy and Public Administration (RANEPA) and was devoted to issues of global ageing in different parts of the world. During the second day the Conference participants discussed such issues as ‘demographic dividend’, impact of ageing on social security systems, impact of ageing on global economic growth and financial system, process of ageing and global security, as well as the role of migration.
Introduction 8
The conference, which was held in December 2014, brought together scholars from Europe, Asia, and America to examine global ageing from a variety of perspectives.
The present Yearbook (which is the fifth in the series2) is based on these conference proceedings and is subtitled Political Demography & Global Ageing.
The present Yearbook consists of three sections. In the first section, Da- vid A. Coleman (‘Ethnic Transformation of European Societies by Immigra-tion’) documents how rapidly immigration is transforming the composition of European societies. David A. Coleman and Robert Rowthorn in their article (‘Population Decline – Making the Best of Inevitable Destiny?’) follow by writing about how to meet the challenges that will accompany the inevitable ageing of all societies. This section also includes the article by Vasil T. Sakaev (‘The Political Development of Russia in the 21st Century: Challenges of De-mographical Factor and Role of Educational System’) which shows how demo-graphic change is affecting political development in Russia. Two papers exam-ine the challenges posed by ageing for all countries. Andrey V. Korotayev, Jack A. Goldstone, Julia V. Zinkina, Sergey G. Shulgin, Daria A. Khaltourina, and Daria A. Folomeyeva (‘Mathematical Modeling and Forecasting of the Demographic Future of Russia: Seven Scenarios’) apply the methods of Politi-cal Demography to the study of the Russian demographic future and demon-strate how profoundly current changes in the Russian demographic policies can affect the future trajectories of the Russian demographic development (or – under certain circumstances – decline).
The second section looks more closely at ageing in various regions, and its political and economic consequences. Leonid E. Grinin and Andrey V. Koro-tayev (‘Global Population Ageing, the Sixth Kondratieff Wave, and the Global Financial System’) begin by examining how the population ageing in the West, and the consequent shifts in spending and saving patterns, will affect the global financial system. They also investigate how the new Kondratieff wave and sub-sequent innovative technological shift can be supported by the global ageing and how the emergent new technologies will affect the global ageing processes. Donghyun Park and Kwanho Shin (‘Impact of Population Ageing on Asia's Future Growth’) analyze the impact of ageing on economic growth of Asia.
Mark Haas (‘Population Ageing and the Future of the Great Powers’) fol-lows with an analysis of how population ageing will affect the military poten-tial of the Great Powers, and their likely strategies. Jack A. Goldstone (‘Popu-lation Ageing and Global Economic Growth’) develops a simple model to ex-amine the impact of population ageing – including reduced productivity and
2 See: Grinin, de Munck, and Korotayev 2006; Turchin et al. 2007; Grinin et al. 2010; Grinin and
Korotayev 2014.
Jack A. Goldstone, Leonid Grinin, and Andrey Korotayev 9
declining labor forces – on global economic growth. Finally, Jason L. Powell and Hafiz T. A. Khan, in a paper (‘Ageing in Post-Industrial Society: Trends and Trajectories’) that was not presented at the conference, look ahead to re-view ageing in post-industrial societies.
The third section contains a review by Jack A. Goldstone of a recent book that studies the interaction of global economic and demographic processes – Great Divergence and Great Convergence by Leonid Grinin and Andrey Koro-tayev (Springer, 2015).
* * * Research on population ageing and its consequences has become one of the most fertile and fast-growing areas of contemporary social science research, as its implications cut across economics, politics, international relations, public policy, and health. We are glad to offer this special issue to show the results of the international collaborations at RANEPA's International Research Laborato-ry in this important field.
References Grinin L. E., de Munck V. C., and Korotayev A. V. (Eds.) 2006. History & Mathe-
matics: Analyzing and Modeling Global Development. Moscow: KomKniga/URSS.
Grinin L. E., Herrmann P., Korotayev A. V., and Tausch A. (Eds.) 2010. History & Mathematics: Processes and Models of Global Dynamics. Volgograd: ‘Uchitel’ Publishing House.
Grinin L. E., and Korotayev A. V. (Eds.) 2014. History & Mathematics: Trends and Cycles. Volgograd: ‘Uchitel’ Publishing House.
Turchin P., Grinin L. E., de Munck V. C., and Korotayev A. V. (Eds.) 2007. History & Mathematics: Historical Dynamics and Development of Complex Societies. Mos-cow: KomKniga/URSS.
UN Population Division. 2015. UN Population Division Database. URL: http://www. un.org/esa/population. Date accessed: 17.11.2015.
History & Mathematics: Demography & Ageing 2015 10–25 10
I. ASPECTS OF POLITICAL DEMOGRAPHY
1
Ethnic Transformation of European Societies by Immigration
David A. Coleman
Abstract This article discusses the implications of recent trends and projections of the ethnic or foreign-origin populations of selected European countries. If their composition continues to change as projected, a radical and irreversible ethnic and social transformation will take place by the end of the century. The conse-quent displacement of the original population from numerical predominance, and its possible relegation to a minority status, would have far-reaching impli-cations and should be regarded as a ‘third demographic transition’. Other populations within Europe, and those outside it with similar combinations of sub-replacement fertility and high immigration rates, may expect similar out-comes. Migration assumptions are more important than fertility assumptions in determining this outcome. The projected transformations are not inevitable but depend in part on political events and policy decisions on migration.
Keywords: ethnic groups, Europe, fertility, migration, demographic transi-tion.
Background The populations of the developed countries are moving into an unknown world of few babies, longer lives, aged populations, diverse family structures and more immigrants. In many Western European countries the population growth of the first demographic transition in the 19th century made possible and in some ways drove a great outflow of emigrant population to destinations outside Europe. Some went to more sparsely populated areas in the Americas and An-tipodes, also to settlement in North and Southern Africa and the East Indies. About 54 million Europeans crossed the Atlantic between 1815 and 1914, very likely delaying the onset of fertility transition in much of Europe by relieving its population pressure. Now, many of those populations which Europeans col-onised are in the middle of their own demographic transitions. This mismatch of the timing of transition means that population pressure is now reversed.
David A. Coleman 11
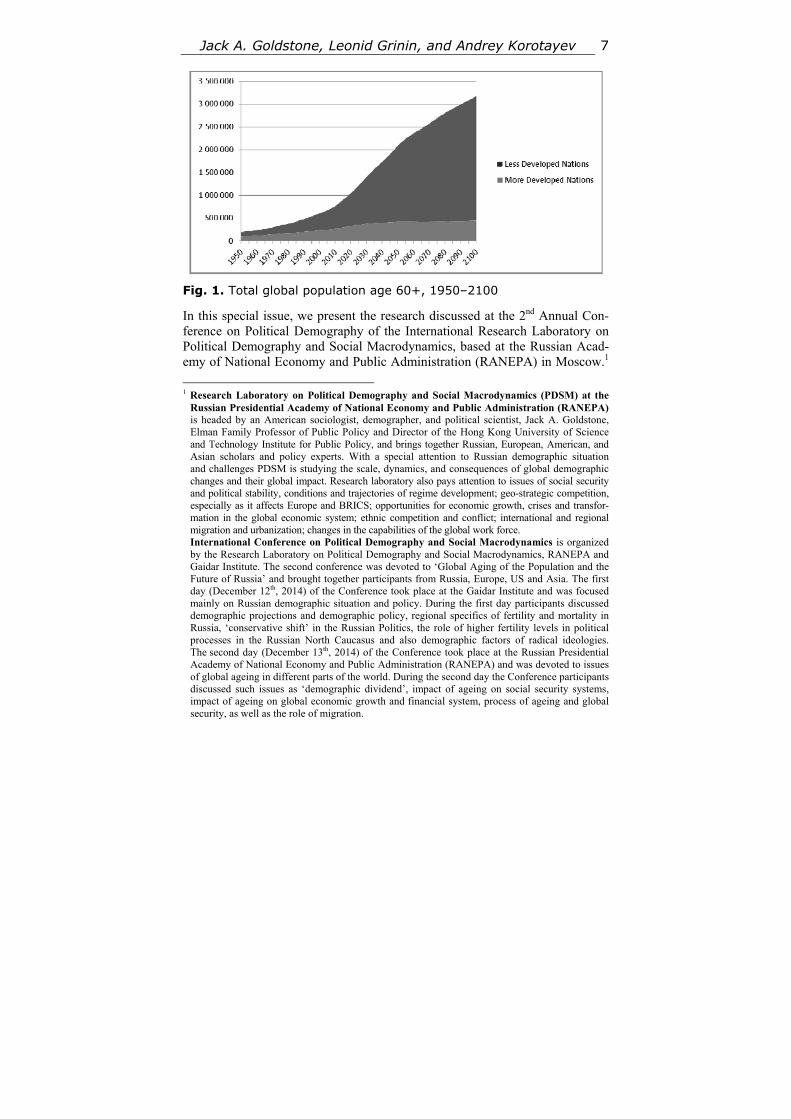
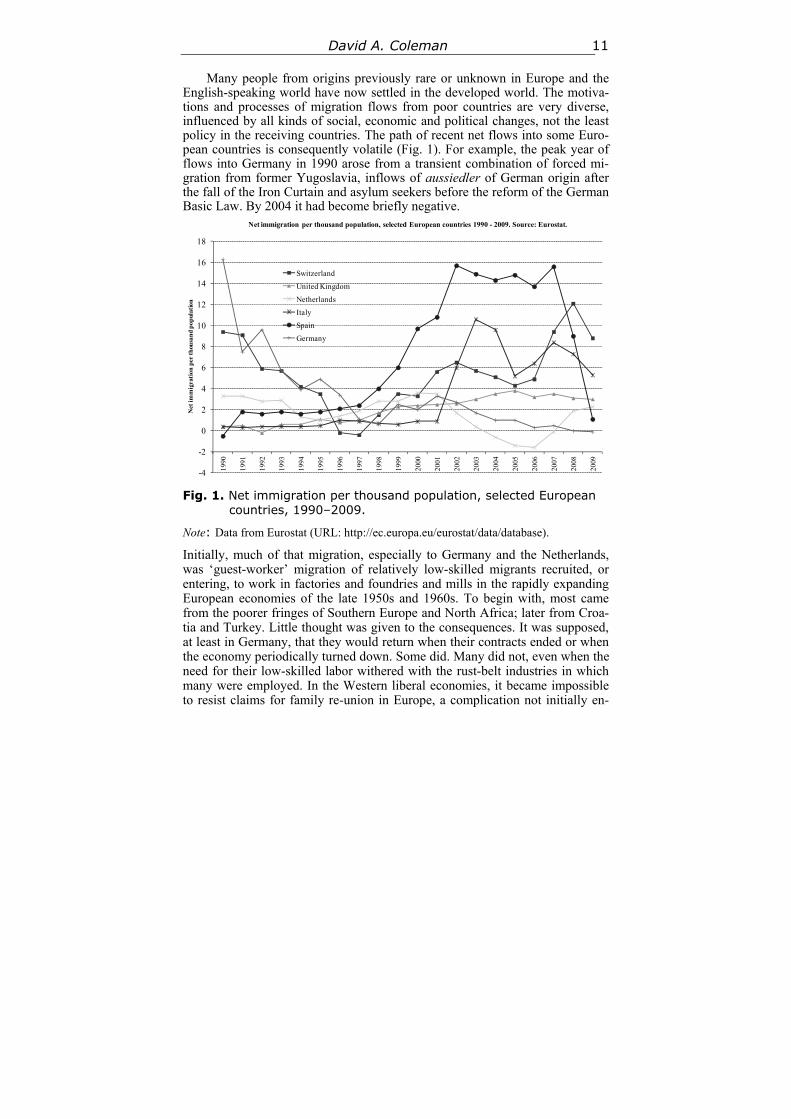
Many people from origins previously rare or unknown in Europe and the English-speaking world have now settled in the developed world. The motiva-tions and processes of migration flows from poor countries are very diverse, influenced by all kinds of social, economic and political changes, not the least policy in the receiving countries. The path of recent net flows into some Euro-pean countries is consequently volatile (Fig. 1). For example, the peak year of flows into Germany in 1990 arose from a transient combination of forced mi-gration from former Yugoslavia, inflows of aussiedler of German origin after the fall of the Iron Curtain and asylum seekers before the reform of the German Basic Law. By 2004 it had become briefly negative.
-4
-2
0
2
4
6
8
10
12
14
16
18
1990
1991
1992
1993
1994
1995
1996
1997
1998
1999
2000
2001
2002
2003
2004
2005
2006
2007
2008
2009
Net
imm
igra
tion
per
th
ousa
nd
pop
ulat
ion
Net immigration per thousand population, selected European countries 1990 - 2009. Source: Eurostat.
Switzerland
United Kingdom
Netherlands
Italy
Spain
Germany
Fig. 1. Net immigration per thousand population, selected European countries, 1990–2009.
Note: Data from Eurostat (URL: http://ec.europa.eu/eurostat/data/database).
Initially, much of that migration, especially to Germany and the Netherlands, was ‘guest-worker’ migration of relatively low-skilled migrants recruited, or entering, to work in factories and foundries and mills in the rapidly expanding European economies of the late 1950s and 1960s. To begin with, most came from the poorer fringes of Southern Europe and North Africa; later from Croa-tia and Turkey. Little thought was given to the consequences. It was supposed, at least in Germany, that they would return when their contracts ended or when the economy periodically turned down. Some did. Many did not, even when the need for their low-skilled labor withered with the rust-belt industries in which many were employed. In the Western liberal economies, it became impossible to resist claims for family re-union in Europe, a complication not initially en-
Ethnic Transformation of European Societies 12
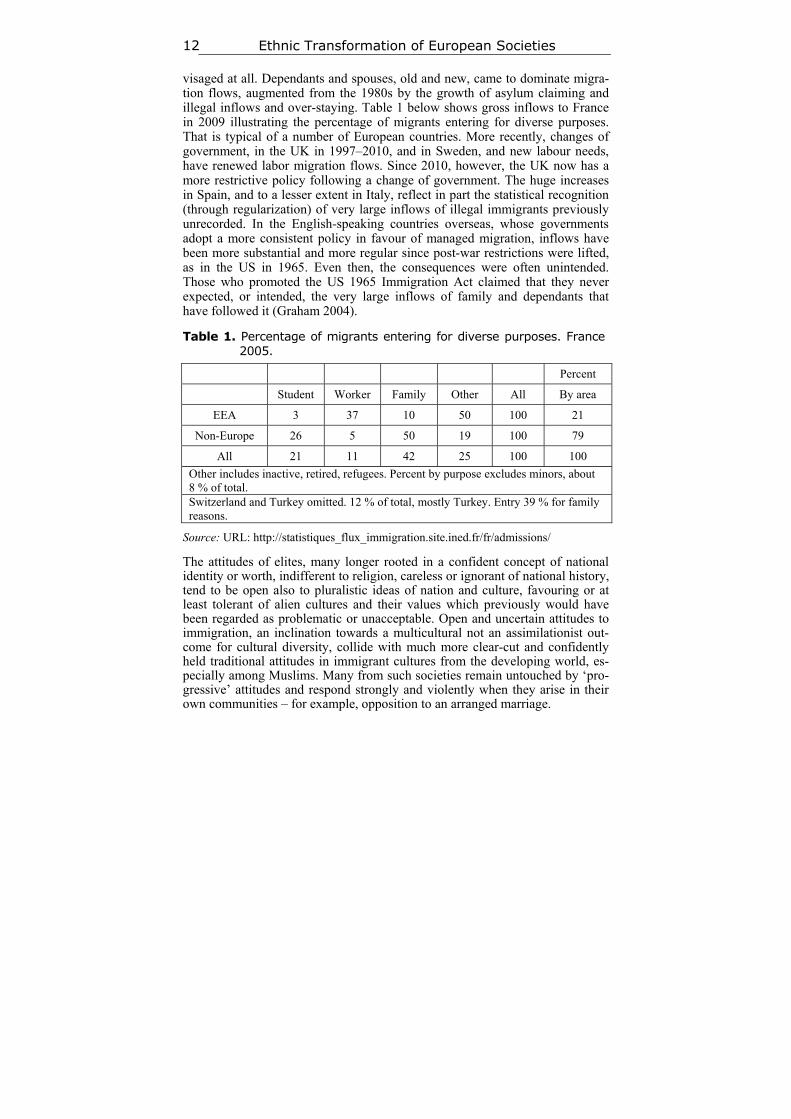
visaged at all. Dependants and spouses, old and new, came to dominate migra-tion flows, augmented from the 1980s by the growth of asylum claiming and illegal inflows and over-staying. Table 1 below shows gross inflows to France in 2009 illustrating the percentage of migrants entering for diverse purposes. That is typical of a number of European countries. More recently, changes of government, in the UK in 1997–2010, and in Sweden, and new labour needs, have renewed labor migration flows. Since 2010, however, the UK now has a more restrictive policy following a change of government. The huge increases in Spain, and to a lesser extent in Italy, reflect in part the statistical recognition (through regularization) of very large inflows of illegal immigrants previously unrecorded. In the English-speaking countries overseas, whose governments adopt a more consistent policy in favour of managed migration, inflows have been more substantial and more regular since post-war restrictions were lifted, as in the US in 1965. Even then, the consequences were often unintended. Those who promoted the US 1965 Immigration Act claimed that they never expected, or intended, the very large inflows of family and dependants that have followed it (Graham 2004).
Table 1. Percentage of migrants entering for diverse purposes. France 2005.
Percent
Student Worker Family Other All By area
EEA 3 37 10 50 100 21
Non-Europe 26 5 50 19 100 79
All 21 11 42 25 100 100
Other includes inactive, retired, refugees. Percent by purpose excludes minors, about 8 % of total. Switzerland and Turkey omitted. 12 % of total, mostly Turkey. Entry 39 % for family reasons.
Source: URL: http://statistiques_flux_immigration.site.ined.fr/fr/admissions/
The attitudes of elites, many longer rooted in a confident concept of national identity or worth, indifferent to religion, careless or ignorant of national history, tend to be open also to pluralistic ideas of nation and culture, favouring or at least tolerant of alien cultures and their values which previously would have been regarded as problematic or unacceptable. Open and uncertain attitudes to immigration, an inclination towards a multicultural not an assimilationist out-come for cultural diversity, collide with much more clear-cut and confidently held traditional attitudes in immigrant cultures from the developing world, es-pecially among Muslims. Many from such societies remain untouched by ‘pro-gressive’ attitudes and respond strongly and violently when they arise in their own communities – for example, opposition to an arranged marriage.
David A. Coleman 13
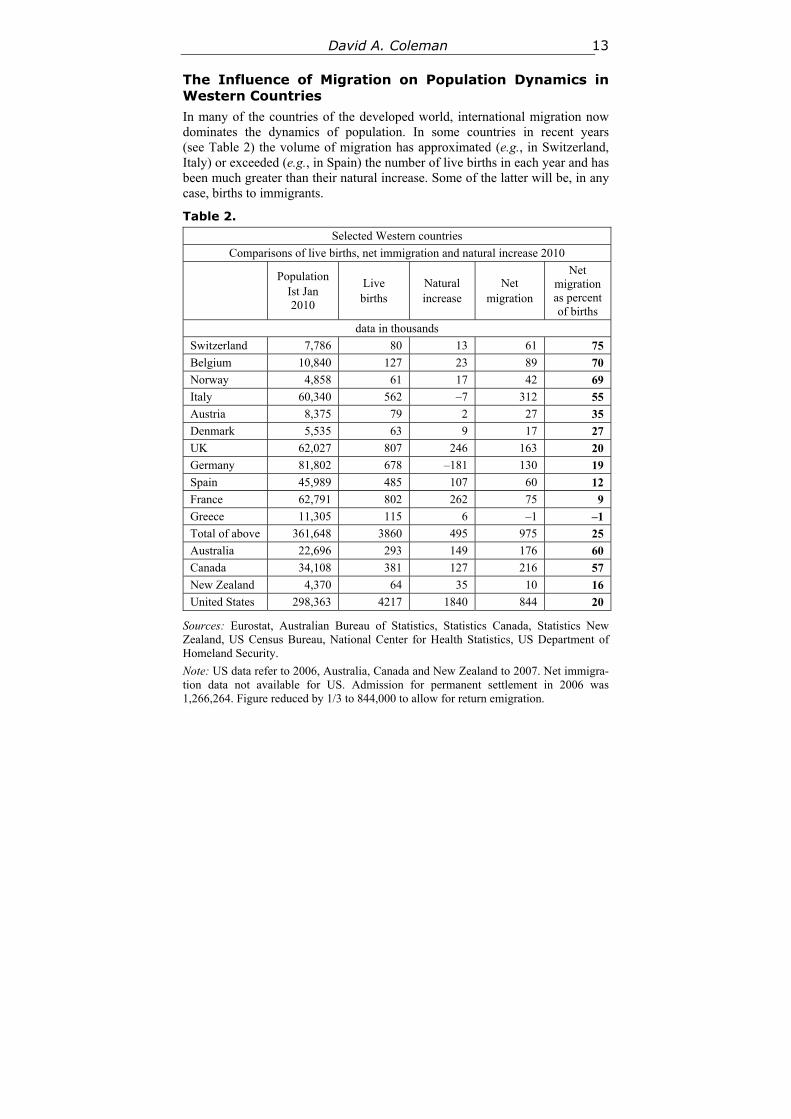
The Influence of Migration on Population Dynamics in Western Countries In many of the countries of the developed world, international migration now dominates the dynamics of population. In some countries in recent years (see Table 2) the volume of migration has approximated (e.g., in Switzerland, Italy) or exceeded (e.g., in Spain) the number of live births in each year and has been much greater than their natural increase. Some of the latter will be, in any case, births to immigrants.
Table 2. Selected Western countries
Comparisons of live births, net immigration and natural increase 2010
Population
Ist Jan 2010
Live births
Natural increase
Net migration
Net migration as percent of births
data in thousands
Switzerland 7,786 80 13 61 75
Belgium 10,840 127 23 89 70
Norway 4,858 61 17 42 69
Italy 60,340 562 –7 312 55
Austria 8,375 79 2 27 35
Denmark 5,535 63 9 17 27
UK 62,027 807 246 163 20
Germany 81,802 678 –181 130 19
Spain 45,989 485 107 60 12
France 62,791 802 262 75 9
Greece 11,305 115 6 –1 –1
Total of above 361,648 3860 495 975 25
Australia 22,696 293 149 176 60
Canada 34,108 381 127 216 57
New Zealand 4,370 64 35 10 16
United States 298,363 4217 1840 844 20
Sources: Eurostat, Australian Bureau of Statistics, Statistics Canada, Statistics New Zealand, US Census Bureau, National Center for Health Statistics, US Department of Homeland Security.
Note: US data refer to 2006, Australia, Canada and New Zealand to 2007. Net immigra-tion data not available for US. Admission for permanent settlement in 2006 was 1,266,264. Figure reduced by 1/3 to 844,000 to allow for return emigration.
Ethnic Transformation of European Societies 14
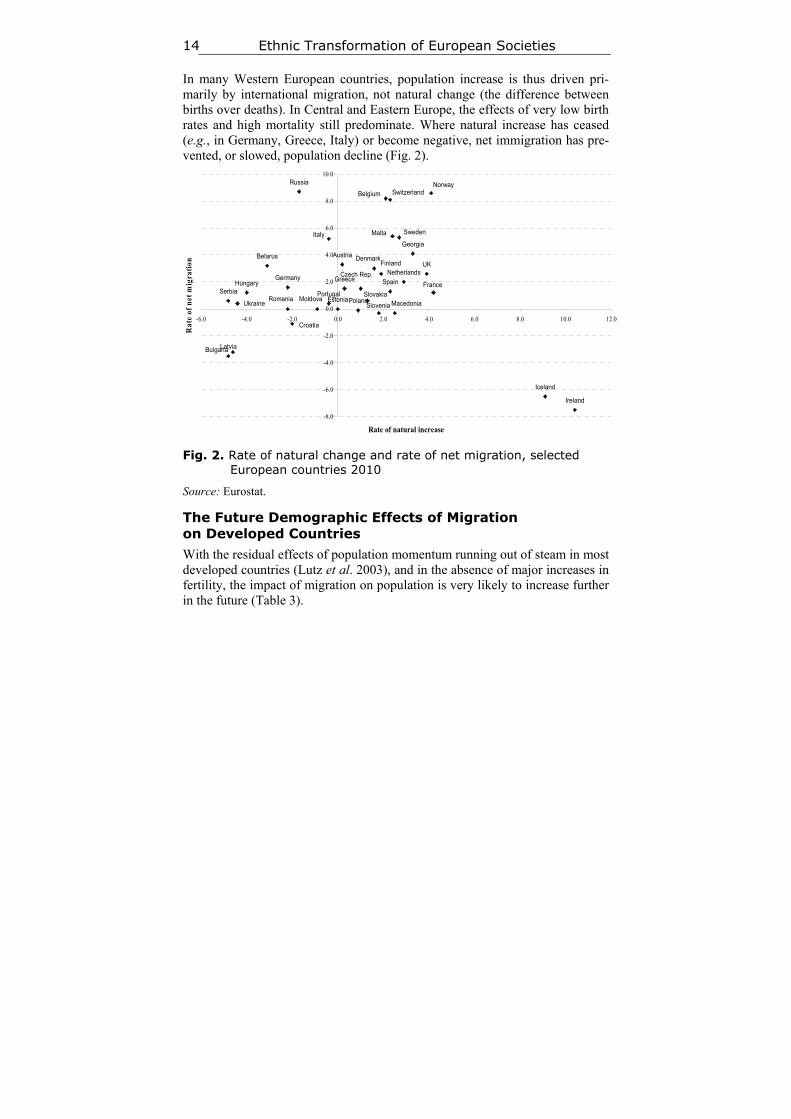
In many Western European countries, population increase is thus driven pri-marily by international migration, not natural change (the difference between births over deaths). In Central and Eastern Europe, the effects of very low birth rates and high mortality still predominate. Where natural increase has ceased (e.g., in Germany, Greece, Italy) or become negative, net immigration has pre-vented, or slowed, population decline (Fig. 2).
Ukraine
Russia
Moldova
Georgia
Belarus
Serbia
SwitzerlandNorway
Iceland
Macedonia
Croatia
UK
Sweden
Finland
Slovakia
SloveniaRomania
PortugalPoland
Austria
Netherlands
Malta
Hungary
Latvia
Italy
FranceSpainGreece
Ireland
Estonia
Germany
Denmark
Czech Rep.
Bulgaria
Belgium
-8.0
-6.0
-4.0
-2.0
0.0
2.0
4.0
6.0
8.0
10.0
-6.0 -4.0 -2.0 0.0 2.0 4.0 6.0 8.0 10.0 12.0
Rate of natural increase
Rat
e of
net
mig
rati
on
Fig. 2. Rate of natural change and rate of net migration, selected European countries 2010
Source: Eurostat.
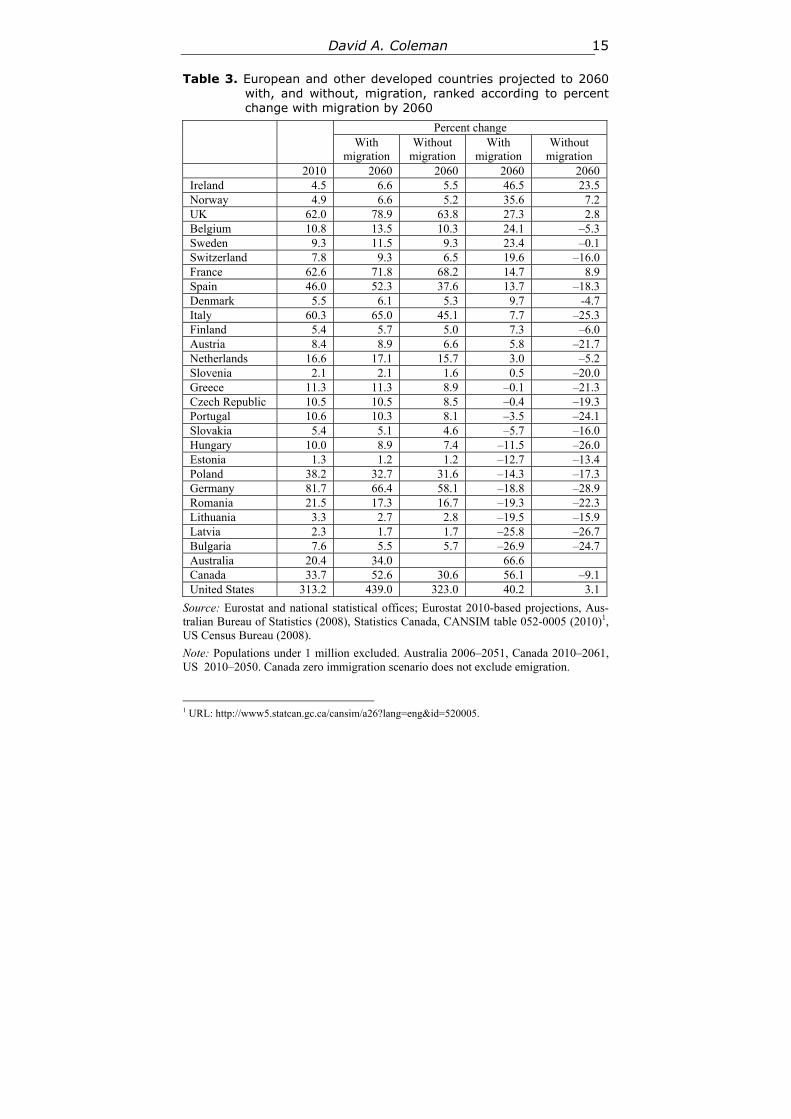
The Future Demographic Effects of Migration on Developed Countries With the residual effects of population momentum running out of steam in most developed countries (Lutz et al. 2003), and in the absence of major increases in fertility, the impact of migration on population is very likely to increase further in the future (Table 3).
David A. Coleman 15
Table 3. European and other developed countries projected to 2060 with, and without, migration, ranked according to percent change with migration by 2060
Percent change
With migration
Without migration
With migration
Without migration
2010 2060 2060 2060 2060 Ireland 4.5 6.6 5.5 46.5 23.5 Norway 4.9 6.6 5.2 35.6 7.2 UK 62.0 78.9 63.8 27.3 2.8 Belgium 10.8 13.5 10.3 24.1 –5.3 Sweden 9.3 11.5 9.3 23.4 –0.1 Switzerland 7.8 9.3 6.5 19.6 –16.0 France 62.6 71.8 68.2 14.7 8.9 Spain 46.0 52.3 37.6 13.7 –18.3 Denmark 5.5 6.1 5.3 9.7 -4.7 Italy 60.3 65.0 45.1 7.7 –25.3 Finland 5.4 5.7 5.0 7.3 –6.0 Austria 8.4 8.9 6.6 5.8 –21.7 Netherlands 16.6 17.1 15.7 3.0 –5.2 Slovenia 2.1 2.1 1.6 0.5 –20.0 Greece 11.3 11.3 8.9 –0.1 –21.3 Czech Republic 10.5 10.5 8.5 –0.4 –19.3 Portugal 10.6 10.3 8.1 –3.5 –24.1 Slovakia 5.4 5.1 4.6 –5.7 –16.0 Hungary 10.0 8.9 7.4 –11.5 –26.0 Estonia 1.3 1.2 1.2 –12.7 –13.4 Poland 38.2 32.7 31.6 –14.3 –17.3 Germany 81.7 66.4 58.1 –18.8 –28.9 Romania 21.5 17.3 16.7 –19.3 –22.3 Lithuania 3.3 2.7 2.8 –19.5 –15.9 Latvia 2.3 1.7 1.7 –25.8 –26.7 Bulgaria 7.6 5.5 5.7 –26.9 –24.7 Australia 20.4 34.0 66.6 Canada 33.7 52.6 30.6 56.1 –9.1 United States 313.2 439.0 323.0 40.2 3.1
Source: Eurostat and national statistical offices; Eurostat 2010-based projections, Aus-tralian Bureau of Statistics (2008), Statistics Canada, CANSIM table 052-0005 (2010)1,
US Census Bureau (2008).
Note: Populations under 1 million excluded. Australia 2006–2051, Canada 2010–2061, US 2010–2050. Canada zero immigration scenario does not exclude emigration.
1 URL: http://www5.statcan.gc.ca/cansim/a26?lang=eng&id=520005.
Ethnic Transformation of European Societies 16
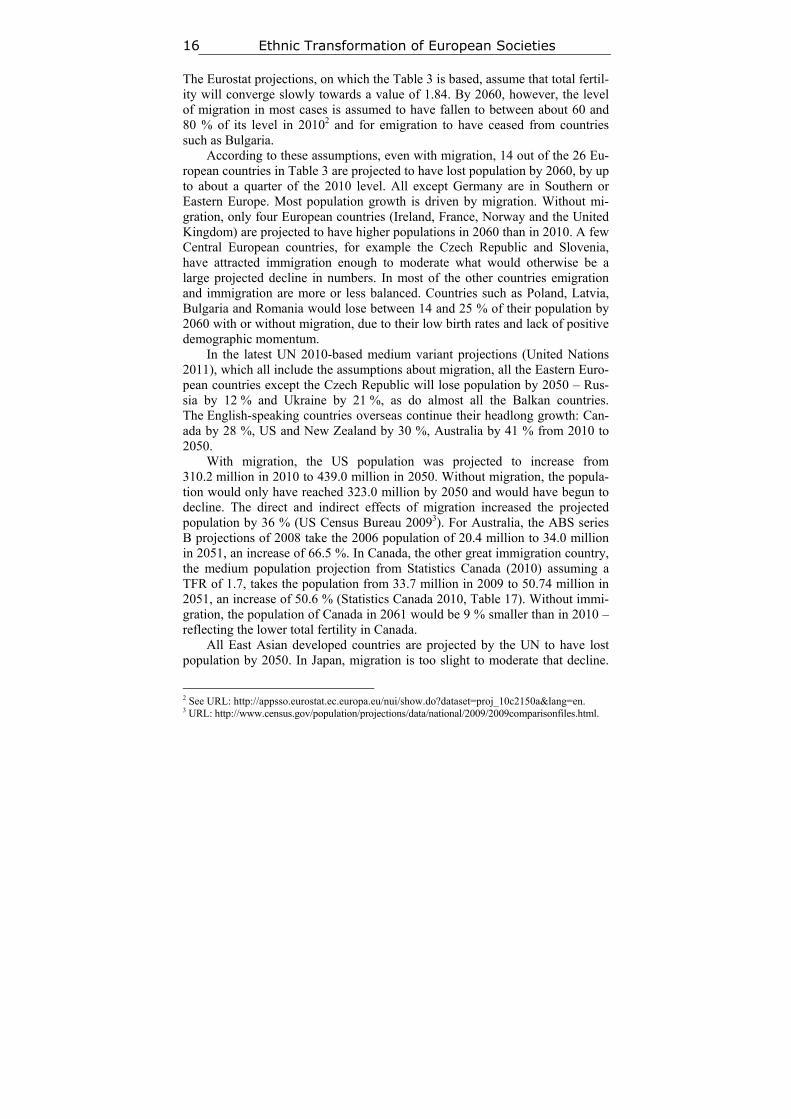
The Eurostat projections, on which the Table 3 is based, assume that total fertil-ity will converge slowly towards a value of 1.84. By 2060, however, the level of migration in most cases is assumed to have fallen to between about 60 and 80 % of its level in 20102 and for emigration to have ceased from countries such as Bulgaria.
According to these assumptions, even with migration, 14 out of the 26 Eu-ropean countries in Table 3 are projected to have lost population by 2060, by up to about a quarter of the 2010 level. All except Germany are in Southern or Eastern Europe. Most population growth is driven by migration. Without mi-gration, only four European countries (Ireland, France, Norway and the United Kingdom) are projected to have higher populations in 2060 than in 2010. A few Central European countries, for example the Czech Republic and Slovenia, have attracted immigration enough to moderate what would otherwise be a large projected decline in numbers. In most of the other countries emigration and immigration are more or less balanced. Countries such as Poland, Latvia, Bulgaria and Romania would lose between 14 and 25 % of their population by 2060 with or without migration, due to their low birth rates and lack of positive demographic momentum.
In the latest UN 2010-based medium variant projections (United Nations 2011), which all include the assumptions about migration, all the Eastern Euro-pean countries except the Czech Republic will lose population by 2050 – Rus-sia by 12 % and Ukraine by 21 %, as do almost all the Balkan countries. The English-speaking countries overseas continue their headlong growth: Can-ada by 28 %, US and New Zealand by 30 %, Australia by 41 % from 2010 to 2050.
With migration, the US population was projected to increase from 310.2 million in 2010 to 439.0 million in 2050. Without migration, the popula-tion would only have reached 323.0 million by 2050 and would have begun to decline. The direct and indirect effects of migration increased the projected population by 36 % (US Census Bureau 20093). For Australia, the ABS series B projections of 2008 take the 2006 population of 20.4 million to 34.0 million in 2051, an increase of 66.5 %. In Canada, the other great immigration country, the medium population projection from Statistics Canada (2010) assuming a TFR of 1.7, takes the population from 33.7 million in 2009 to 50.74 million in 2051, an increase of 50.6 % (Statistics Canada 2010, Table 17). Without immi-gration, the population of Canada in 2061 would be 9 % smaller than in 2010 – reflecting the lower total fertility in Canada.
All East Asian developed countries are projected by the UN to have lost population by 2050. In Japan, migration is too slight to moderate that decline.
2 See URL: http://appsso.eurostat.ec.europa.eu/nui/show.do?dataset=proj_10c2150a&lang=en. 3 URL: http://www.census.gov/population/projections/data/national/2009/2009comparisonfiles.html.
David A. Coleman 17
Until recently, net migration to Korea, Singapore and Taiwan had also been modest. While increasing in recent years, it would need to become very large to reverse the projection of decline in overall numbers.
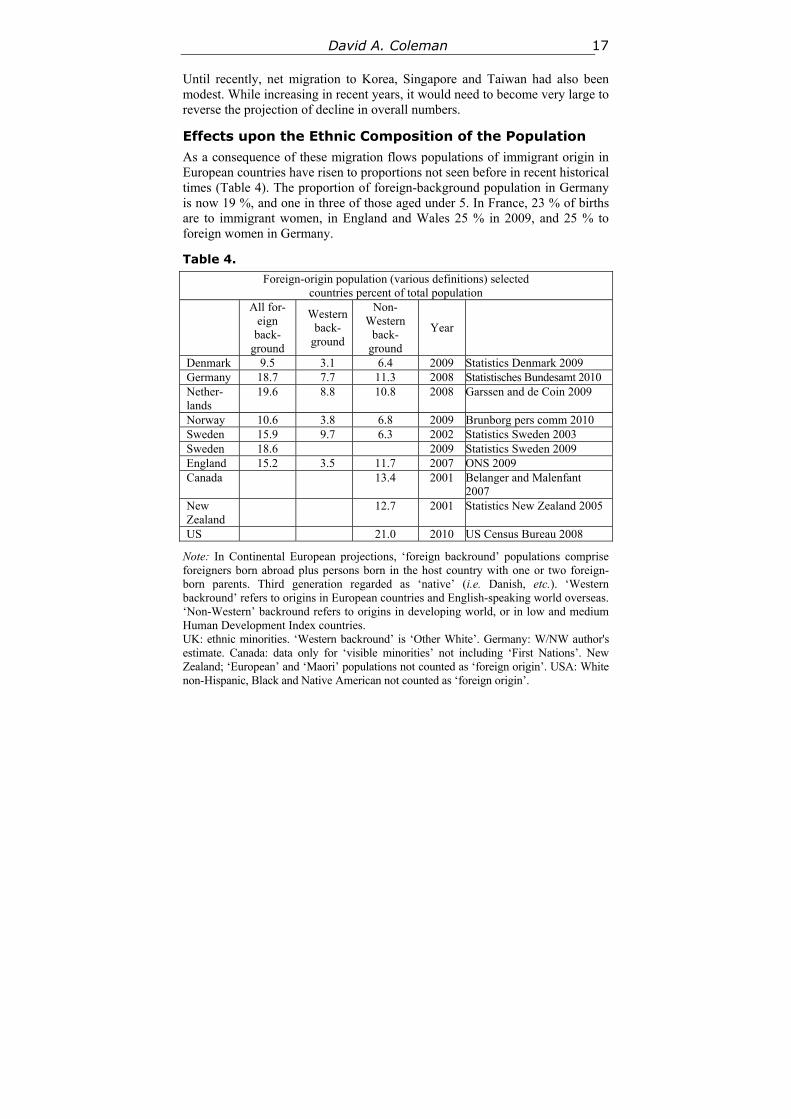
Effects upon the Ethnic Composition of the Population As a consequence of these migration flows populations of immigrant origin in European countries have risen to proportions not seen before in recent historical times (Table 4). The proportion of foreign-background population in Germany is now 19 %, and one in three of those aged under 5. In France, 23 % of births are to immigrant women, in England and Wales 25 % in 2009, and 25 % to foreign women in Germany.
Table 4. Foreign-origin population (various definitions) selected
countries percent of total population All for-
eign back-
ground
Westernback-
ground
Non-Western
back-ground
Year
Denmark 9.5 3.1 6.4 2009 Statistics Denmark 2009 Germany 18.7 7.7 11.3 2008 Statistisches Bundesamt 2010 Nether-lands
19.6 8.8 10.8 2008 Garssen and de Coin 2009
Norway 10.6 3.8 6.8 2009 Brunborg pers comm 2010 Sweden 15.9 9.7 6.3 2002 Statistics Sweden 2003 Sweden 18.6 2009 Statistics Sweden 2009 England 15.2 3.5 11.7 2007 ONS 2009 Canada 13.4 2001 Belanger and Malenfant
2007 New Zealand
12.7 2001 Statistics New Zealand 2005
US 21.0 2010 US Census Bureau 2008
Note: In Continental European projections, ‘foreign backround’ populations comprise foreigners born abroad plus persons born in the host country with one or two foreign-born parents. Third generation regarded as ‘native’ (i.e. Danish, etc.). ‘Western backround’ refers to origins in European countries and English-speaking world overseas. ‘Non-Western’ backround refers to origins in developing world, or in low and medium Human Development Index countries. UK: ethnic minorities. ‘Western backround’ is ‘Other White’. Germany: W/NW author's estimate. Canada: data only for ‘visible minorities’ not including ‘First Nations’. New Zealand; ‘European’ and ‘Maori’ populations not counted as ‘foreign origin’. USA: White non-Hispanic, Black and Native American not counted as ‘foreign origin’.
Ethnic Transformation of European Societies 18
No comparable data exist for Сentral and Eastern European countries, although the ‘nationality’ category in Russian official statistics, analogous to ethnicity, allows estimates to be made. In most of those countries, international migration has been more modest, and was negligible before the fall of the communist regimes except with fraternal socialist countries. The situation in Russia is dif-ferent; it has always had a highly diverse set of indigenous populations. These have been augmented more recently by inflows of persons from the former re-publics of the Soviet Union. Although immigrant minorities are growing, diver-sity in some Central and Eastern European countries arises more from the growth of indigenous minorities through differential fertility, and the emigra-tion of the majority population. The most rapidly growing indigenous minority is the gypsy (Roma) population of between 6 and 8 million people in the Cen-tral and Eastern European countries (Liégeois 2008). Their fertility rate, little touched by the post-1990 downturn, can be double that of the population aver-age, as in Hungary in the 1990s (Meszaros 1999).
Due to its obvious policy importance, some national statistical offices have made formal projections of the future sizes and composition of the new popula-tions (Coleman 2006). Others come from academic sources (Wohland et al. 2010; Coleman 2010; Lebhart and Münz 2003) or from think-tanks. Most Eu-ropean countries do not have the long experience of significant racial diversity of the United States. Nonetheless the European countries are catching up fast with the US in terms of racial diversity. Projections are not available for all countries. France's constitution effectively forbids the collection of official sta-tistics on ethnic origin, race or religion.
The projections from Continental Europe cannot employ the self-ascribed ethnic or racial categories familiar in the English-speaking world. Instead, pro-jections are based upon the concept of ‘foreign origin’ or ‘foreign background’ constructed from register data on citizenship and birthplace. The national-origin categories are usually grouped into larger ‘Western’ and ‘Non-Western-categories, or ‘high, medium and low Human Development Index (HDI) coun-tries’. Those populations are based on two generations (foreign immigrants, plus persons born locally but with one, or both, foreign parents. After the sec-ond generation, all persons of immigrant descent are assumed to become part of the indigenous population, and to be henceforth Dutch, Danish etc., and thus statistically invisible. Between one third and one half of the foreign origin pop-ulations in European countries around 2000 were themselves of ‘Western’, origin, mostly European. But the projected increases are mostly in the ‘non-western’ groups. Given the size, stability, segregation and self-sufficiency of some of those populations, reinforced by the immigration of new spouses and dependents, and the weak level of integration in the third generation may be optimistic.
David A. Coleman 19
Continued growth of those populations has increased their share of the na-tional total and diminished that of the indigenous population, bringing with it the long-term prospect of its displacement as the majority. In theory any popu-lation with sub-replacement fertility, with a regular net inflow of population of different origin, must diminish as a proportion of the total, and eventually be replaced by the new population (Steinmann and Jaeger 2000), except for per-sons of mixed ancestry. These are likely to become numerous. Most Western countries have sub-replacement total fertility and positive immigration and therefore face that outcome unless birth or migration rates change. With re-placement fertility, the indigenous population would persist, but continued mi-gration would diminish its share of the total.
In the projections of the foreign-background population, fertility rates are generally assumed to converge towards the national average, with the locally-born exhibiting lower fertility than immigrants. Despite that, some projections (e.g., Statistics Sweden 2003) assume that fertility of the non-Western immi-grants will remain higher. Net immigration is assumed to be constant in the long run, except for the projections for Norway where it is assumed to diminish over time (Statistics Norway 2010). Most projections except those of Wohland et al. (2010) assume a uniformly falling mortality across all groups, for want of better information.
The projections for the United Kingdom from 2006–2081 are based on the ethnic population distributions in the 2001 census. They assume constant mi-gration, near-convergent fertility and uniformly declining mortality across all groups. The twelve standard official ethnic categories are projected separately but presented here grouped into three major divisions; the ‘indigenous’ British, Scottish and Irish, the non-British white population, and the non-white ethnic minorities (Fig. 3). Four variants assume different levels of migration. The standard projection assumes overall migration as in the ONS 2008-based Principal Projection. By 2051, non-white minorities would comprise 31 % of the UK population, and the white non-British – 10 %. Persons of mixed origin comprise an increasing proportion of the total. These UK projections were con-strained to the same overall total fertility (1.84), net immigration (long-term 180,000) and mortality trends as the ONS 2008-based Principal Projection (ONS 2009a). The overall projected population totals were correspondingly similar. Other variants lead to lower totals and lower proportions of ethnic mi-nority population (Coleman 2010).
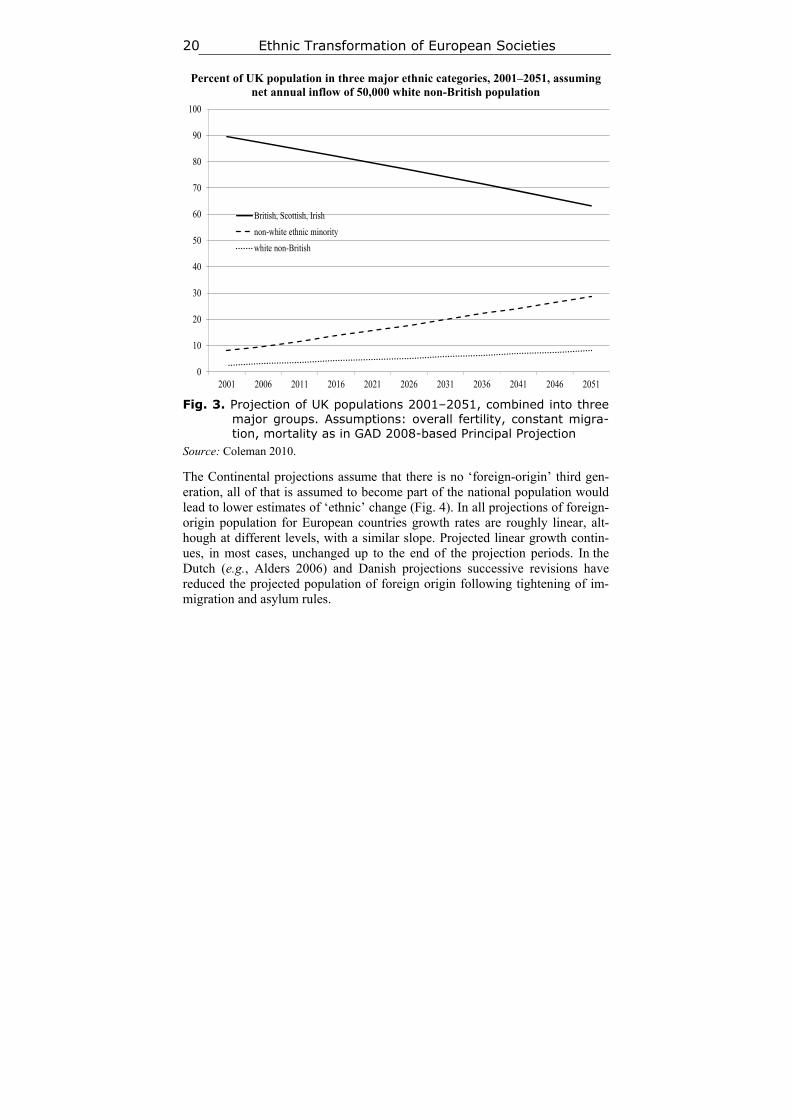
Ethnic Transformation of European Societies 20
Percent of UK population in three major ethnic categories, 2001–2051, assuming net annual inflow of 50,000 white non-British population
0
10
20
30
40
50
60
70
80
90
100
2001 2006 2011 2016 2021 2026 2031 2036 2041 2046 2051
British, Scottish, Irish
non-white ethnic minority
white non-British
Fig. 3. Projection of UK populations 2001–2051, combined into three
major groups. Assumptions: overall fertility, constant migra-tion, mortality as in GAD 2008-based Principal Projection
Source: Coleman 2010.
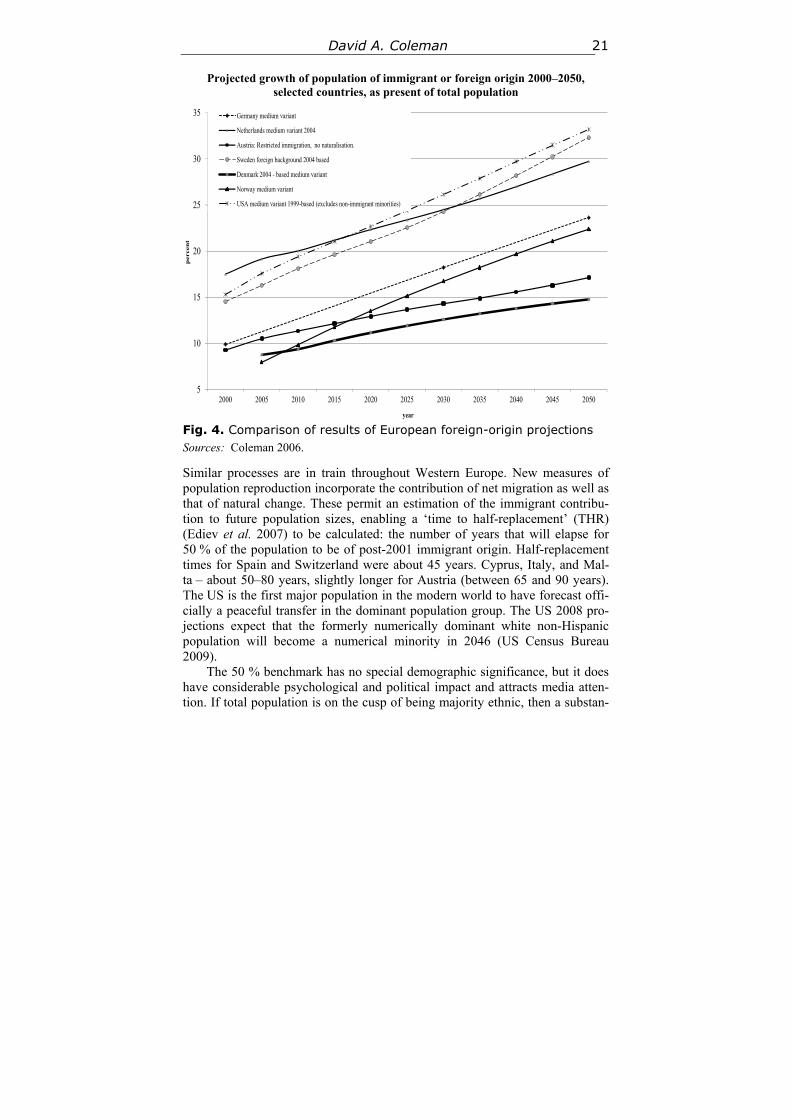
The Continental projections assume that there is no ‘foreign-origin’ third gen-eration, all of that is assumed to become part of the national population would lead to lower estimates of ‘ethnic’ change (Fig. 4). In all projections of foreign-origin population for European countries growth rates are roughly linear, alt-hough at different levels, with a similar slope. Projected linear growth contin-ues, in most cases, unchanged up to the end of the projection periods. In the Dutch (e.g., Alders 2006) and Danish projections successive revisions have reduced the projected population of foreign origin following tightening of im-migration and asylum rules.
David A. Coleman 21
Projected growth of population of immigrant or foreign origin 2000–2050, selected countries, as present of total population
5
10
15
20
25
30
35
2000 2005 2010 2015 2020 2025 2030 2035 2040 2045 2050
percen
t
year
Germany medium variant
Netherlands medium variant 2004
Austria: Restricted immigration, no naturalisation.
Sweden foreign background 2004 based
Denmark 2004 - based medium variant
Norway medium variant
USA medium variant 1999-based (excludes non-immigrant minorities)
Fig. 4. Comparison of results of European foreign-origin projections Sources: Coleman 2006.
Similar processes are in train throughout Western Europe. New measures of population reproduction incorporate the contribution of net migration as well as that of natural change. These permit an estimation of the immigrant contribu-tion to future population sizes, enabling a ‘time to half-replacement’ (THR) (Ediev et al. 2007) to be calculated: the number of years that will elapse for 50 % of the population to be of post-2001 immigrant origin. Half-replacement times for Spain and Switzerland were about 45 years. Cyprus, Italy, and Mal-ta – about 50–80 years, slightly longer for Austria (between 65 and 90 years). The US is the first major population in the modern world to have forecast offi-cially a peaceful transfer in the dominant population group. The US 2008 pro-jections expect that the formerly numerically dominant white non-Hispanic population will become a numerical minority in 2046 (US Census Bureau 2009).
The 50 % benchmark has no special demographic significance, but it does have considerable psychological and political impact and attracts media atten-tion. If total population is on the cusp of being majority ethnic, then a substan-
Ethnic Transformation of European Societies 22
tial majority will already have become so among schoolchildren and urbanites. At local level throughout Europe, transitions in the balance between indigenous and immigrant populations are becoming more common. At the bottom of the age-pyramid the position already looks transformed. In London (with popula-tion of 7 million) in 2007, 60 % of all births were to foreign-born mothers (not the same as non-white ethnic minority), and in 24 out of 32 boroughs such births comprised more than half the total, in some cases over 70 %. In Europe, major cities such as Rotterdam, Amsterdam, The Hague are on the edge of this transition.
The Faces of the Future? So far ethnic groups have been discussed as though membership of them was unambiguous; whether defined bureaucratically by the register statistics of Continental European countries or by the individually self-ascribed racial or ethnic descriptions of the US and UK. Natural human inclinations are begin-ning to erode that neat picture. They may end up, in the very long run, destroy-ing it altogether. That is because, if minority populations become more inte-grated into the educational system and the labour market and more dispersed geographically, the opportunities for sexual unions across ethnic or racial lines become more numerous. Adherence to patterns of arranged marriage, and strong preferences for marriages within closely defined religious, ethnic clan or kin lines keep inter-ethnic unions at a low level in, for example, Asians and Turks in Europe, especially Muslims, and some North African populations. But in general, more and more children are born with mixed parentage as time goes on. They may identify, or be identified, as members of either parental group. But many are content, or even anxious, to describe themselves as of mixed or multiple ancestry.
Responses Initially politicians and public in the Western world were baffled to find an appropriate response to an apparently permanent mass immigration, increasing-ly driven by chain migration that was not planned, intended or desired. Initial assumptions about inevitable assimilation have not been born out by events. In the 1980s, multicultural policies, proposing the formal recognition of cultural diversity as a permanent new feature of Western Society, became formally es-tablished in some European countries (e.g., The Netherlands in 1980) or be-came established gradually by default of any clear or strongly argued alterna-tive as in the UK. There, it became pervasive in all aspects of central and local government activity, with specifically recognized ethnic groups enshrined in law and official statistics.
More recently, statements by, for example, the head of the Equality and Human Rights Commission Trevor Phillips (in a Times interview in April,
David A. Coleman 23
2004) and by the Prime Minister David Cameron at the Munich Security Con-ference, 4 February 2011, have distanced themselves from the multicultural ideal but its assumptions are deeply entrenched now in local government and other organizations, and law. Countries such as Germany, which for long main-tained a jus sanguinis principle on citizenship, refused to acknowledge that they were, in practice, ‘countries of immigration’ until the 1990s. There also, the multicultural ideal has now been rejected forcefully as a failure by German Chancellor Angela Merkel in a speech to a CDU rally in Potsdam on 17 Octo-ber, 2010.
The growing opposition to immigration among many European electorates has changed policy in some Western countries. The governments of the UK, France, Denmark and Netherlands have renewed attempts to limit immigration. But migration for poor countries is easier to permit, or to encourage, than to restrict, in liberal democracies (Freeman 1994). Economies can become distort-ed by it and dependent upon it, creating vested interests among employers, edu-cational institutions and among the growing populations of immigrant origin themselves, to whom politicians increasingly need to appeal in order to assem-ble electoral majorities. It has been claimed that no US Presidential candidate can now support major restrictions on immigration because of the electoral in-fluence of the Hispanic vote. As immigrant-origin populations grow, chain mi-gration through arranged marriages and the inflow of dependants grow with them – the ‘cumulative causation’ described by Massey and Zenteno (1999). In Western Europe, governments have bound themselves to international con-ventions on asylum and human rights the scope of which tend to be widened further and further by activist judges in the European Court of Human Rights and, in the UK at least, by the domestic judiciary.
Countries with persistent low fertility and chain-migration connections with poor immigrant-sending countries with incomplete demographic transi-tions may therefore find themselves in a one-way street to ethnic change. The consequences would be irreversible. How inevitable? Directly, and indi-rectly through births to immigrants, immigration is the main engine of ethnic change. It is widely assumed that immigration into Western Europe, the US and elsewhere will continue at a high level, despite the current recession (Dobson et al. 2009). But immigration can still go down as well as up, often directly or indirectly in response to measures to restrict it and the effect of policies has been underestimated (Hollifield 2000).
The larger that immigrant-origin communities become, and the more nu-merically dominant they become in local areas, the less those communities need to adapt to local norms and use the national language except insofar as it is required to participate in the economic realm. Indeed they may change those local norms into their own, and local schools and facilities and labor market
Ethnic Transformation of European Societies 24
acquire and preserve an ethnic character. Foreign policy is affected too as im-migrant lobbies press for favorable attitudes to causes of concern to their region of origin, not otherwise the concern of the country of settlement. Local politi-cians' chances of being re-elected may depend on their attitude towards contro-versies that strictly belong overseas: in the UK, for example, the status of Kashmir, of Punjab, Israel and Palestine, Kurdistan and other conflicts (Cole-man 2009).
Some of the trends seen earlier in Western societies are now being re-played in East Asia. But Europe is not the global template for the future. Nei-ther marriage, nor fertility, nor immigration seem likely merely to repeat Euro-pean trends in a different setting to create a new-European clone. Although it seems inevitable that Asia and Europe will converge in some respects, their history and geography, their demography and their neighbors will keep them apart. The extreme level of ethnic transition in prospect for the Western devel-oped world seems unlikely to be capable of being duplicated as an equivalently diverse society elsewhere (Ibid.).
References
Alders M. 2006. Forecasting the Population with a Foreign Background in the Nether-lands. Joint Eurostat-UNECE Work Session on Demographic Projections, Vienna, 21–23 September 2005. Vienna: Statistics Netherlands Division for Social and Spa-tial Statistics Department for Statistical Analysis Voorburg.
Australian Bureau of Statistics. 2008. Population Projections, Australia, 2006 to 2101. Canberra: Australian Bureau of Statistics. URL: http://www.abs.gov.au/Auss tats/[email protected]/mf/3222.0.
Coleman D. A. 2006. Immigration and Ethnic Change in Low-Fertility Countries: A Third Demographic Transition. Population and Development Review 32(3): 401–446.
Coleman D. A. 2009. Divergent Patterns in the Ethnic Transformation of Societies. Population and Development Review 35(3): 449–478.
Coleman D. A. 2010. Projections of the Ethnic Minority Populations of the United Kingdom 2006–2056. Population and Development Review 36(3): 441–486.
Dobson J., Latham A., and Salt J. 2009. On the Move? Labour Migration in Times of Recession. What Can We Learn from the Past? London: Policy Network.
Ediev D., Coleman D., and Scherbov S. 2007. Migration as a Factor in Population Reproduction. Research Papers of the Vienna Institute of Demography 1: 1–57.
Freeman G. S. 1994. Can Liberal States Control Unwanted Migration? Annals of the American Association for Political and Social Sciences 534: 17–30.
Graham O. L. 2004. Unguarded Gates: A History of America's Immigration Crisis. Lanham, MD: Rowman and Littlefield.
David A. Coleman 25
Hollifield J. F. 2000. The Politics of International Migration: How Can We ‘Bring the State Back in’? Migration Theory: Talking Across Disciplines / Ed. by C. Brettell, and J. F. Hollifield, pp. 137–185. London: Routledge.
Lebhart G., and Münz R. 2003. Szenarien zur Bevölkerungsentwicklung in Österreich nach Staatsangehörigkeit. Forschungsbericht Nr. 26. Vienna: Vienna Institute of Demography.
Liégeois J.-P. 2008. Roma in Europe. Strasburg: Council of Europe.
Lutz W., O'Neill B. C., and Scherbov S. 2003. Europe's Population at a Turning Point. Science 299(5615): 1991–1992.
Massey D., and Zenteno R. 1999. The Dynamics of Mass Migration. Proceedings of the National Academy of Sciences 96: 5328–5335.
Meszaros A. 1999. The Gypsy Population in Hungary in the 1990s (Romske obyvatelstvo v Madarsku v 90. letech) in Czech with English Abstract. Demografie 41(2): 120–137.
ONS. 2009a. 2008-Based National Population Projections. London: Office for National Statistics.
ONS. 2009b. Population Estimates by Ethnic Group: 2001 to 2007 Commentary. Lon-don: Office for National Statistics.
Statistics Canada. 2010. Population Projections for Canada, Provinces and Territories 2009 to 2036. Ottawa: Statistics Canada. URL: http://www.statcan.gc.ca/pub/91-520-x/91-520-x2010001-eng.pdf.
Statistics Norway. 2010. Projection of Immigrants and Norwegian-born to Immigrant Parents 2010–2060. Oslo: Statistics Norway.
Statistics Sweden. 2003. Sveriges framtida befolkning 2003–2020: svensk och utländsk bakgrund. Demografiska rapporter 5. (Sweden's Future Population 2003–2020 – Swedes and Foreign Background).
Steinmann G., and Jaeger M. 2000. Immigration and Integration: Non-linear Dyna-mics of Minorities. Journal of Mathematical Population Studies 9(1): 65–82.
US Census Bureau. 2008. United States Population Projections by Age, Sex, Race and Hispanic Origin: July 1, 2000–2050. Washington, DC: US Bureau of the Census.
US Census Bureau. 2009. URL: http://www.census.gov/population/www/projections/ 2009comparisonfiles.html.
Wohland P., Rees P., Norman P., Boden P., and Jasinska M. 2010. Ethnic Popula-tion Projections for the UK and Local Areas, 2001–2051. Working Paper 10/02. Leeds: School of Geography, University of Leeds.
History & Mathematics: Demography & Ageing 2015 26–41 26
2
Population Decline – Making the Best of Inevitable Destiny?
David Coleman and Robert Rowthorn
Abstract Population decline confronts almost all the countries of Central and Eastern Europe. Total world population may be declining before the end of this century. Despite that, it is a neglected topic in demography – its analysis and its conse-quences overshadowed by the problem of population ageing. This paper shows that population decline is a diverse phenomenon. The process of decline, and its end-product of smaller population size have different consequences. Modest rates of decline may be manageable and scarcely perceptible. Smaller popula-tion size may be irrelevant to most aspects of political, social and economic welfare and beneficial for environment and sustainability. In the future, adap-tation to it may in any case become unavoidable.
Keywords: population decline, Central Europe, Eastern Europe, environ-ment, sustainability, population ageing.
Introduction Fear of population decline, censuses to warn of it and pro-natalist and other policies to avert it, are almost as old as states themselves (Glass 1940; Teitel-baum and Winter 1985). Rulers and states in the past and present, and stateless tribal societies, found affirmation, strength and protection in population growth and cause for alarm in decline as symptom, and cause, of failure and weakness. Where increases in productivity are difficult or almost unimaginable and where international trade is a zero-sum game, population becomes with land the chief factor of production, its increase to be encouraged by any means including con-quest, the prohibition of emigration, and enslavement; its diminution to be avoided at all costs. Mercantilist thinking gave first place to the power and wealth of the state and regarded population as a prime factor, to be increased irrespective of the effect on individual standards of living.
Between the two World Wars, birth rates in many Western European coun-tries, and in the US, fell to below the level of replacement (van Bavel 2010). The prospect of population decline implicit in those rates, formalized into alarming population projections (e.g., Charles 1938), prompted several gov-
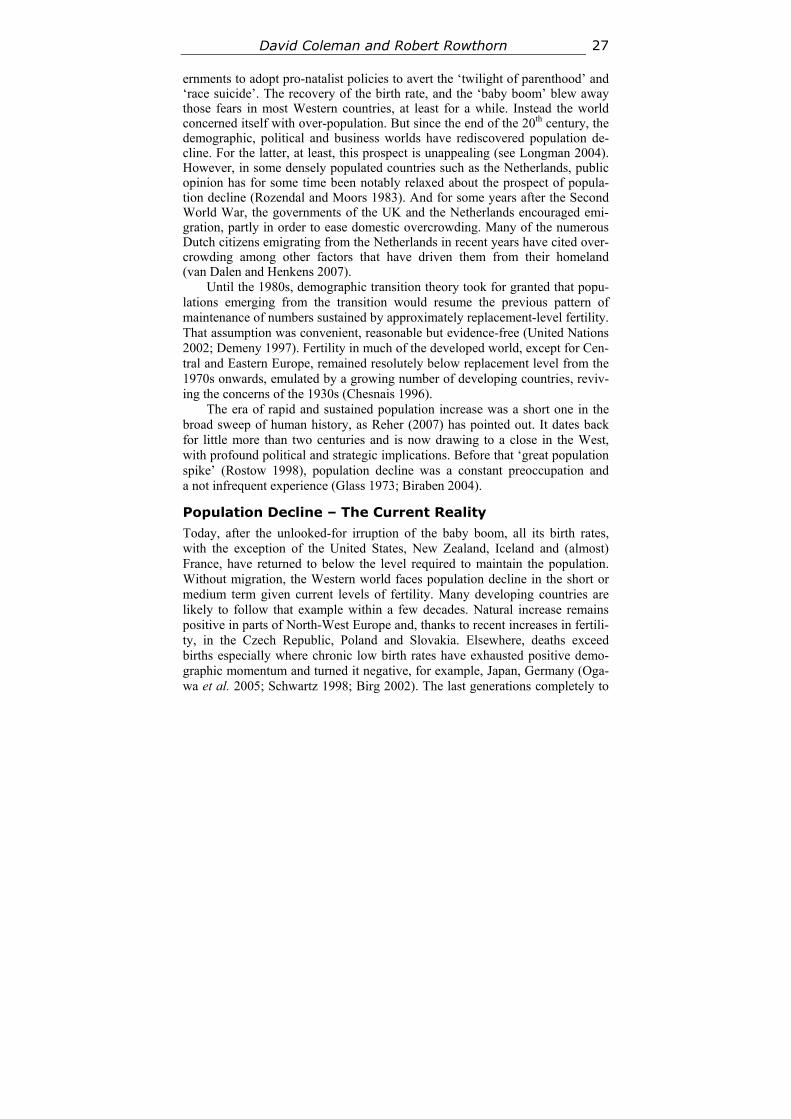
David Coleman and Robert Rowthorn 27
ernments to adopt pro-natalist policies to avert the ‘twilight of parenthood’ and ‘race suicide’. The recovery of the birth rate, and the ‘baby boom’ blew away those fears in most Western countries, at least for a while. Instead the world concerned itself with over-population. But since the end of the 20th century, the demographic, political and business worlds have rediscovered population de-cline. For the latter, at least, this prospect is unappealing (see Longman 2004). However, in some densely populated countries such as the Netherlands, public opinion has for some time been notably relaxed about the prospect of popula-tion decline (Rozendal and Moors 1983). And for some years after the Second World War, the governments of the UK and the Netherlands encouraged emi-gration, partly in order to ease domestic overcrowding. Many of the numerous Dutch citizens emigrating from the Netherlands in recent years have cited over-crowding among other factors that have driven them from their homeland (van Dalen and Henkens 2007).
Until the 1980s, demographic transition theory took for granted that popu-lations emerging from the transition would resume the previous pattern of maintenance of numbers sustained by approximately replacement-level fertility. That assumption was convenient, reasonable but evidence-free (United Nations 2002; Demeny 1997). Fertility in much of the developed world, except for Cen-tral and Eastern Europe, remained resolutely below replacement level from the 1970s onwards, emulated by a growing number of developing countries, reviv-ing the concerns of the 1930s (Chesnais 1996).
The era of rapid and sustained population increase was a short one in the broad sweep of human history, as Reher (2007) has pointed out. It dates back for little more than two centuries and is now drawing to a close in the West, with profound political and strategic implications. Before that ‘great population spike’ (Rostow 1998), population decline was a constant preoccupation and a not infrequent experience (Glass 1973; Biraben 2004).
Population Decline – The Current Reality Today, after the unlooked-for irruption of the baby boom, all its birth rates, with the exception of the United States, New Zealand, Iceland and (almost) France, have returned to below the level required to maintain the population. Without migration, the Western world faces population decline in the short or medium term given current levels of fertility. Many developing countries are likely to follow that example within a few decades. Natural increase remains positive in parts of North-West Europe and, thanks to recent increases in fertili-ty, in the Czech Republic, Poland and Slovakia. Elsewhere, deaths exceed births especially where chronic low birth rates have exhausted positive demo-graphic momentum and turned it negative, for example, Japan, Germany (Oga-wa et al. 2005; Schwartz 1998; Birg 2002). The last generations completely to
Population Decline 28
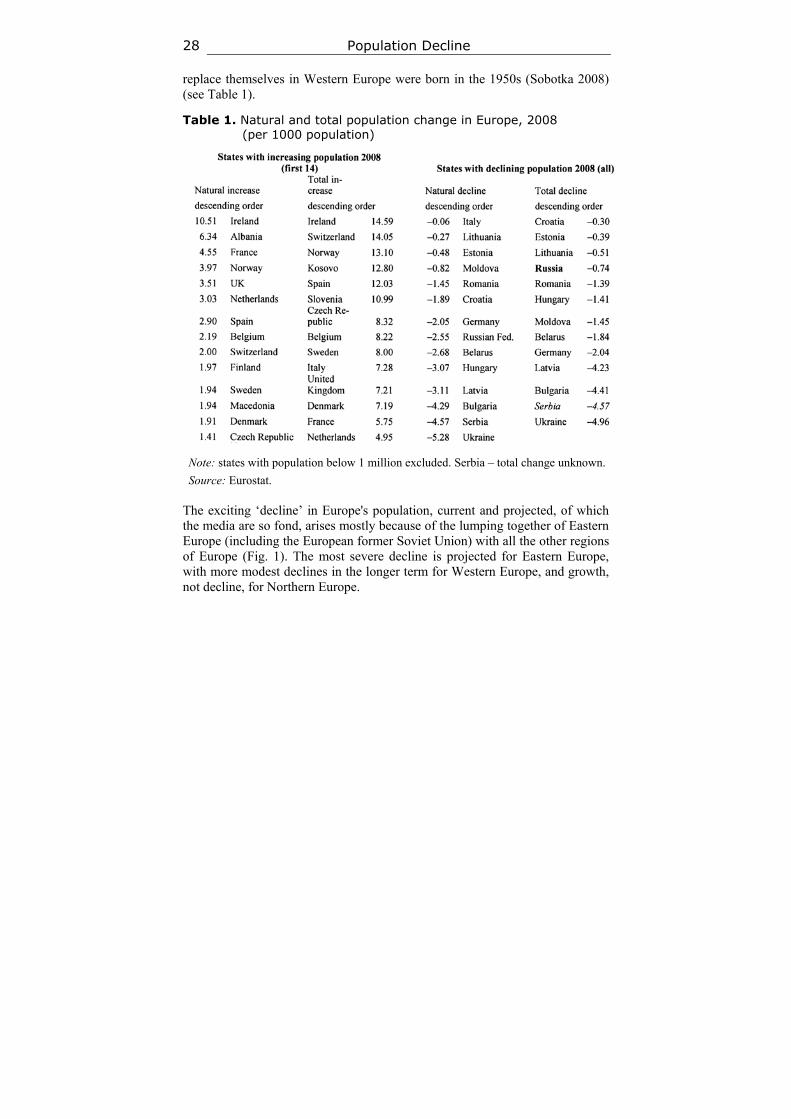
replace themselves in Western Europe were born in the 1950s (Sobotka 2008) (see Table 1).
Table 1. Natural and total population change in Europe, 2008 (per 1000 population)
Note: states with population below 1 million excluded. Serbia – total change unknown. Source: Eurostat.
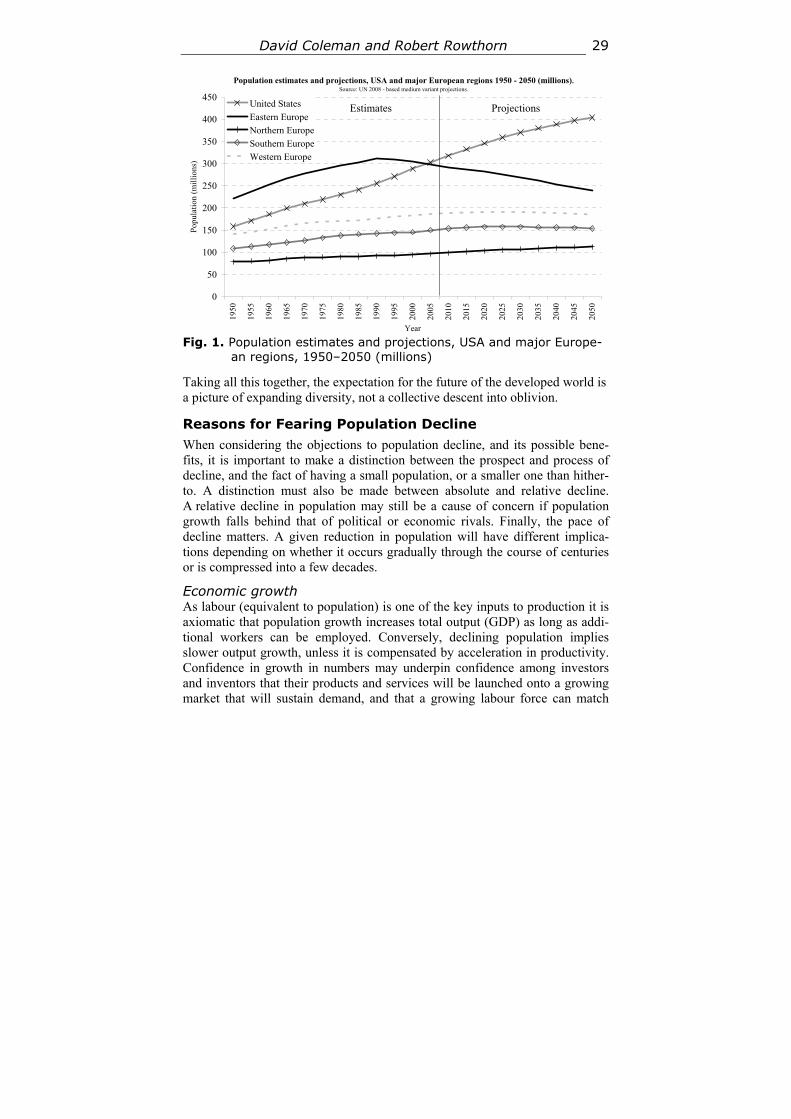
The exciting ‘decline’ in Europe's population, current and projected, of which the media are so fond, arises mostly because of the lumping together of Eastern Europe (including the European former Soviet Union) with all the other regions of Europe (Fig. 1). The most severe decline is projected for Eastern Europe, with more modest declines in the longer term for Western Europe, and growth, not decline, for Northern Europe.
David Coleman and Robert Rowthorn 29
Population estimates and projections, USA and major European regions 1950 - 2050 (millions). Source: UN 2008 - based medium variant projections.
0
50
100
150
200
250
300
350
400
450
1950
1955
1960
1965
1970
1975
1980
1985
1990
1995
2000
2005
2010
2015
2020
2025
2030
2035
2040
2045
2050
Year
Pop
ulat
ion
(mil
lion
s)
United States
Eastern Europe
Northern Europe
Southern Europe
Western Europe
Estimates Projections
Fig. 1. Population estimates and projections, USA and major Europe-
an regions, 1950–2050 (millions)
Taking all this together, the expectation for the future of the developed world is a picture of expanding diversity, not a collective descent into oblivion.
Reasons for Fearing Population Decline When considering the objections to population decline, and its possible bene-fits, it is important to make a distinction between the prospect and process of decline, and the fact of having a small population, or a smaller one than hither-to. A distinction must also be made between absolute and relative decline. A relative decline in population may still be a cause of concern if population growth falls behind that of political or economic rivals. Finally, the pace of decline matters. A given reduction in population will have different implica-tions depending on whether it occurs gradually through the course of centuries or is compressed into a few decades.
Economic growth As labour (equivalent to population) is one of the key inputs to production it is axiomatic that population growth increases total output (GDP) as long as addi-tional workers can be employed. Conversely, declining population implies slower output growth, unless it is compensated by acceleration in productivity. Confidence in growth in numbers may underpin confidence among investors and inventors that their products and services will be launched onto a growing market that will sustain demand, and that a growing labour force can match
Population Decline 30
demand with the required output. In theory, a larger population size permits greater economies of scale and division of labour, thus improving productivity. Manufactured products with high development costs come within the reach of growing capital markets.
In a closed economy, population decline, or even the end of population growth, pulls the rug from under these advantages and reverses them. It is ac-companied by a greater degree of population ageing with all its costs. With given productivity, GDP declines pro rata with numbers of people. Economies of scale may diminish. Shrinking markets and a diminished workforce could squeeze profitability – declining domestic demand accompanied later, as the workforce contracts, by rising wage pressures from an increasingly scarce labour supply. Weaker investment – discouraged by the prospect of declining markets – would mean that plant ages and is less competitive. The psychology of the market be-comes defensive, pessimistic and risk-averse when the cushion of population growth is no longer there, according to Jackson and Howe (2008: 113).
In a closed economy, declining population thus puts the spotlight on in-creasing standards of individual productivity and consumption to maintain the level of investment and confidence. Vulnerability to slumps may be higher without the prospect of long-term growth in demand to buoy up confidence. Products with high research and development costs can no longer be contem-plated solely from the resources of the national economy. Ireland was a unique example of population decline in Europe from the 1840s to the 1950s, although only a nation-state from 1922. Official reports drew attention to high overhead costs in provision of services, the limited domestic market, the discouragement of risk-taking, the lack of optimism about prospects (Walsh 1974).
Military security Other things being equal, big counties have more political and military power than small ones (McNicoll 1999; Kennedy 1988; Kagan 2003). Population de-cline ipso facto reduces the potential size of armed forces. GDP, smaller than hitherto, can no longer support the domestic development of expensive equip-ment, which must then be imported at a cost to the balance of payments or foregone. The mechanization of warfare and the advent of nuclear weapons have not eliminated the importance of the balance of numbers between powers at similar levels of development. A classic example is the failure of French population to grow in the 19th century, following its very early fertility transi-tion. France began the 19th century as Europe's demographic, military and eco-nomic superpower. It ended it on a par with the United Kingdom and Germany, to which it lost two provinces in 1871. Near-defeat in the First World War rein-forced fears of population decline (see Teitelbaum and Winter 1985), con-firmed by the final catastrophe of 1940 among other reverses (Sauvy 1987: ch. 8). More recently, the power residing in the Kremlin has diminished with
David Coleman and Robert Rowthorn 31
the diminution of population, space and economy under its control. After the loss of its satellites in 1989 (total population of the Soviet Union was 385 mil-lion) and the break-up of the Soviet Union itself in 1991, Russia will face an even further loss of capacity if its population declines as projected from 148 million in 1990 to 116 million by mid-century (Balzer 2005; UN 2009). The relative decline of the Western powers projected for the 21st century, com-pared with the population increases of Third World countries, magnified by their economic growth, promises a radical shift in the strategic balance (e.g., Jackson and Howe 2008).
Civil political power Numbers also matter in the peaceful exercise of power. Representation in the European Commission and the European Parliament is directly related to popu-lation, although with a favourable weighting for small countries. G8 member-ship depends on GDP, closely related to population within today's developed realm. Over a few decades relative rank-orders of population will change, with consequences for economic and political weight in the international order (McNicoll 1999), including the rank-order of size in the EU. The UN 2008 – based projections suggest that Germany's population will be eclipsed by that of the UK by 2050, with France not far behind – a development of considerable symbolic power, if nothing else. Smaller countries such as Bulgaria (Sugareva et al. 2006) and Hungary fear damaging depopulation.
Is Population Decline Really Such a Problem? Population decline, therefore, is considered as bringing some disadvantages to any society. So far we lack much empirical evidence that modern population decline will depress innovation, investment or individual wealth – the process has scarcely begun. Population in all the major West European countries, in-cluding the UK, had almost ceased to grow from the 1970s until the 1980s, until the revival of immigration from the mid-1980s. In Germany (Federal Republic) numbers fell slightly from 1973 to 1985. Despite that, German GDP continued to grow substantially, by 26 % over the period compared with 29 % for 13 countries of Western Europe (UNECE Economic Survey of Eu-rope 1989–1990, Table A.1). No crisis of business confidence ensued, or was even discussed, or is now. However, the mood in Japan is more despondent (Chapple 2004; Akihiko 2006; Coulmas 2007). Economic pessimism about Japanese prospects is not universal. Over the decade 1995–2005 Japanese GDP rose by 11.9 % and population by 1.8 %. The IMF forecasted that in the decade, 2005–2015, population would fall slightly by 1.2 %, but GDP would rise by a further 10.6 %.1
1 See IMF, WEO Database.
Population Decline 32
On closer scrutiny, some of the problems listed above lack substance, or may be advantages. Current recession apart, the practical concern most often voiced is not unemployed resources and unemployment, as feared by Keynes (1936), but a shortage of labour hampering output, and inflationary wage pres-sures. Concern about GDP can only be justified if national power, defence and international influence are given a greater weight than individual welfare. As Sauvy (1969: ch. 6) pointed out, the ‘power optimum’ that gives greatest com-fort to strategists and to rulers may be quite different from (usually bigger than) the population size that optimises individual welfare. The interest of the poor might be quite other. Those who sell their labour do better by making them-selves scarce, not abundant.
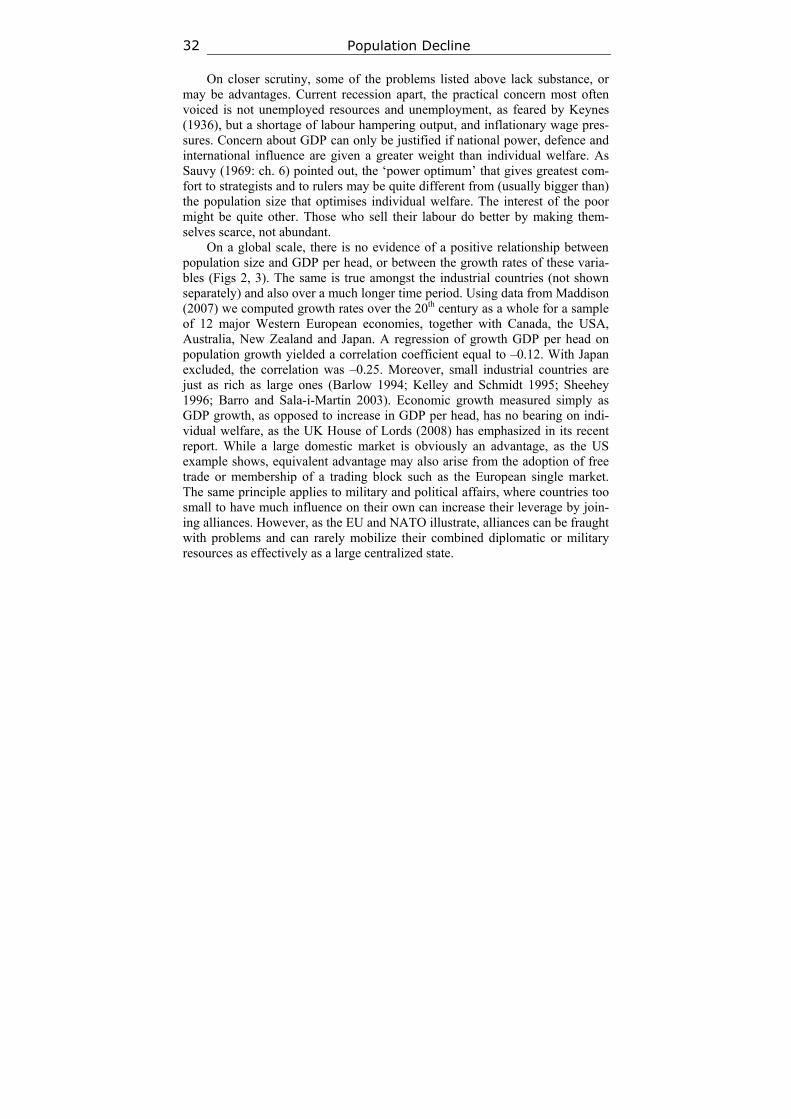
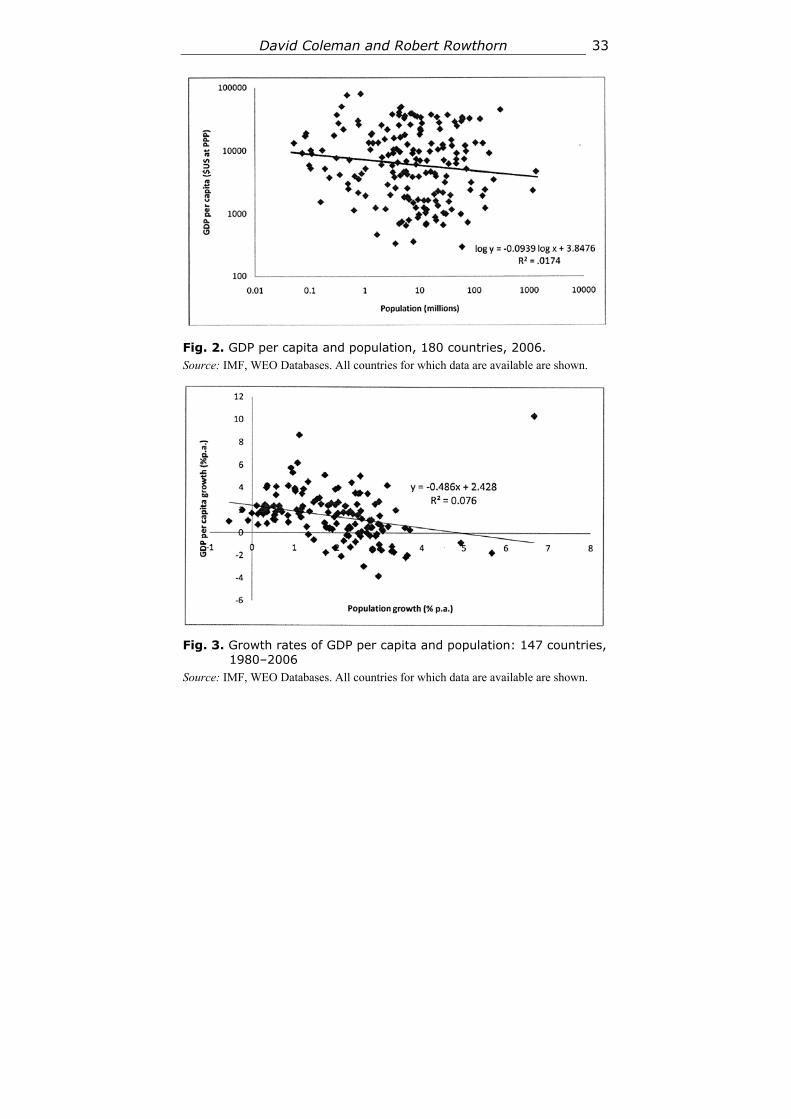
On a global scale, there is no evidence of a positive relationship between population size and GDP per head, or between the growth rates of these varia-bles (Figs 2, 3). The same is true amongst the industrial countries (not shown separately) and also over a much longer time period. Using data from Maddison (2007) we computed growth rates over the 20th century as a whole for a sample of 12 major Western European economies, together with Canada, the USA, Australia, New Zealand and Japan. A regression of growth GDP per head on population growth yielded a correlation coefficient equal to –0.12. With Japan excluded, the correlation was –0.25. Moreover, small industrial countries are just as rich as large ones (Barlow 1994; Kelley and Schmidt 1995; Sheehey 1996; Barro and Sala-i-Martin 2003). Economic growth measured simply as GDP growth, as opposed to increase in GDP per head, has no bearing on indi-vidual welfare, as the UK House of Lords (2008) has emphasized in its recent report. While a large domestic market is obviously an advantage, as the US example shows, equivalent advantage may also arise from the adoption of free trade or membership of a trading block such as the European single market. The same principle applies to military and political affairs, where countries too small to have much influence on their own can increase their leverage by join-ing alliances. However, as the EU and NATO illustrate, alliances can be fraught with problems and can rarely mobilize their combined diplomatic or military resources as effectively as a large centralized state.
David Coleman and Robert Rowthorn 33
Fig. 2. GDP per capita and population, 180 countries, 2006. Source: IMF, WEO Databases. All countries for which data are available are shown.
Fig. 3. Growth rates of GDP per capita and population: 147 countries, 1980–2006
Source: IMF, WEO Databases. All countries for which data are available are shown.

Population Decline 34
Small countries within a peaceful international order can have influence out of proportion to their size, such as the Irish Republic and Iceland (Krebs and Levy 2001; Weiner and Teitelbaum 2001: ch. 3). Their impotence makes them con-venient as neutrals. Some smaller states earn part of their living as uncontrover-sial hosts to international bodies. Small nations, with the same vote as the big-gest, are thereby disproportionately influential in the UN General Assembly and are over-represented among EU institutions. For the most part, it would be vain for countries locked into modern low-fertility demographic regimes to seek radically to change their position in the international league table of popu-lation size. And to try to do so through mass immigration would risk a serious breakdown of cohesion.
As regards question of economies of scale, the significance of this factor depends on the extent to which overseas markets can compensate for the dimi-nution of domestic ones. Free trade makes national-level population decline less important because it increases the proportion of output that is exported. Countries with a small population typically export far more than large countries at the same stage of development. For example, in 2008, total US exports of goods and services were equal to 5.9 thousand dollars per capita. The corre-sponding figures for Finland and the Netherlands were 24.1 and 44.3 respec-tively.2 Smaller economies, however, may lack the resources to invest in new highly competitive products requiring expensive research and development. But that can also apply to very large countries – there may only room in the world for two major manufacturers of civil aircraft, and two or three of aero-engines, and a diminishing number of volume car manufacturers, for example.
As regards demand, some earlier worries have lost impact. Consumer de-mand for ever-cheaper goods appears to be insatiable – contrary to what Keynes (1936) and Reddaway (1939, 1977) – and before them Malthus – had feared. Reddaway's concerns were primarily directed to the economy of a man-ufacturing nation, not one where services predominated, and seem to have been wrong even then. Superior macro and micro-economic policies have developed in the post-war years, with floating exchange rates, more open international trade, better management of inflation and (in many countries) a less regulated labour market and price mechanism. Consumer demand has been fuelled by the accelerating inventiveness of (ever-cheaper) consumer products promoted by advertising in ways unheard of in earlier times, the outsourcing of manufactur-ing, and borrowing. The recent economic crisis had nothing to do with popula-tion decline but was provoked by high consumption fuelled by excessive debt and failings in the financial sector.
Some claim that declining numbers, or small size, deprive countries of crit-ical mass for research and development, driving specialists abroad. But be-tween the prosperous countries of Western Europe there is no brain-drain from small to larger populations. Scholarship has always been mobile and interna-
2 See WTO Database.
David Coleman and Robert Rowthorn 35
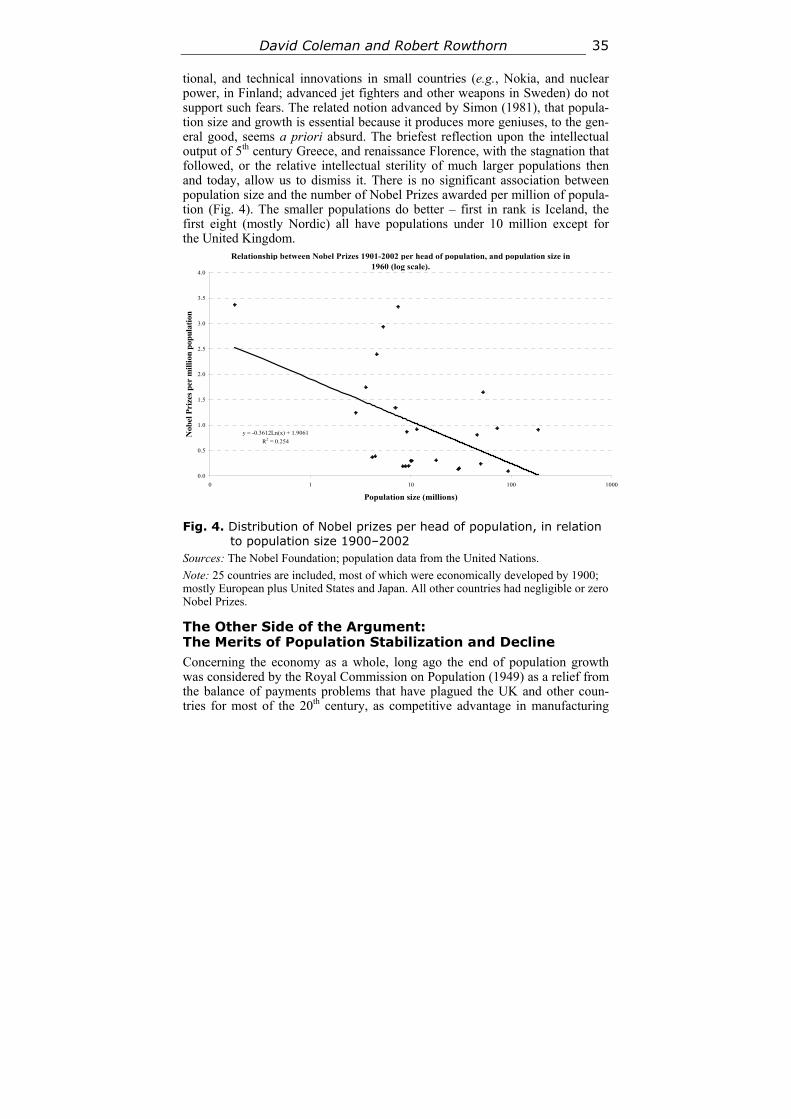
tional, and technical innovations in small countries (e.g., Nokia, and nuclear power, in Finland; advanced jet fighters and other weapons in Sweden) do not support such fears. The related notion advanced by Simon (1981), that popula-tion size and growth is essential because it produces more geniuses, to the gen-eral good, seems a priori absurd. The briefest reflection upon the intellectual output of 5th century Greece, and renaissance Florence, with the stagnation that followed, or the relative intellectual sterility of much larger populations then and today, allow us to dismiss it. There is no significant association between population size and the number of Nobel Prizes awarded per million of popula-tion (Fig. 4). The smaller populations do better – first in rank is Iceland, the first eight (mostly Nordic) all have populations under 10 million except for the United Kingdom.
Relationship between Nobel Prizes 1901-2002 per head of population, and population size in 1960 (log scale).
y = -0.3612Ln(x) + 1.9061
R2 = 0.254
0.0
0.5
1.0
1.5
2.0
2.5
3.0
3.5
4.0
0 1 10 100 1000
Population size (millions)
Nob
el P
rize
s p
er m
illi
on p
opul
atio
n
Fig. 4. Distribution of Nobel prizes per head of population, in relation to population size 1900–2002
Sources: The Nobel Foundation; population data from the United Nations.
Note: 25 countries are included, most of which were economically developed by 1900; mostly European plus United States and Japan. All other countries had negligible or zero Nobel Prizes.
The Other Side of the Argument: The Merits of Population Stabilization and Decline Concerning the economy as a whole, long ago the end of population growth was considered by the Royal Commission on Population (1949) as a relief from the balance of payments problems that have plagued the UK and other coun-tries for most of the 20th century, as competitive advantage in manufacturing
Population Decline 36
was lost. Some imports of food, fuel and raw materials, (in Japan all fossil fuel and most raw materials) are unavoidable. With fixed land area there are limits to sustainable food output; with fewer people self-sufficiency is easier and with it some relief from balance of payment costs. With food cheap on the interna-tional market, and wartime threats long forgotten, concern about food security has waned. But this concern is re-emerging as the era of abundant global food surpluses appears to be drawing to an end (Roberts 2008), a crisis hastened by global climate change and population increase.
As population diminishes and the stock of capital goods does not, the ratio of capital to population improves and average person should be wealthier. Re-sources can be directed to improve standards, not to make wider provision for a growing population (Reddaway 1939). However, the capital stock needs even-tually to be renewed and the annual cost of maintaining the complete transport network and other infrastructure may be unchanged, so that with a much small-er population the cost per head would be greater. Once these factors are taken into account, it is less obvious that, over the long run, a much smaller popula-tion benefits from inheriting a capital stock designed for its more numerous ancestors. Lower levels of usage in fixed distribution systems of drinking water and sewage disposal, for example arising from population decline and other factors in Eastern Germany, can cause serious technical problems potentially affecting health (Hummel and Lux 2007). But in the shorter term, a modest reduction in size would take population back to a more comfortable stage when congestion on the same transport networks was less. In many countries, certain-ly the UK, infrastructure provision – notably in transport – has lagged badly behind population growth and other factors of demand. London is already un-der serious water stress as a consequence of rapid population growth, among other factors (Environment Agency 2010). To avert temporary crises, a large desalination plant will operate in London from 2010 – an extraordinary expedi-ent seemingly more appropriate to the Gulf States or to Australia
The scarcity of labour in a declining population will cause inconvenience to the employers. But there are two important compensations. Employers will be obliged to review the efficiency of their operations and introduce equipment and techniques to increase productivity, substituting capital for labour and cre-ating demand for higher technology products in a more ‘knowledge-based economy’ (Economist 2006; Lind 2006). Governments would be obliged to accelerate overdue reforms of retirement age. Much greater efforts would have to be made to mobilise the substantial population of unemployed youth, the ‘neets’, ‘freeters’ and ‘underclass’, into the workforce. With abundant labour, immigrant or otherwise, this part of the population; unattractive to employers, can be ignored, remaining in its marginalised and often criminalized state. Mo-bilising this population would improve average income, cut crime and reduce inequality.
Costs of congestion and crowding should decline with smaller population, and journey to work fall by times. Traffic could decline pro rata with popula-
David Coleman and Robert Rowthorn 37
tion. With fewer people, fewer resources need to be devoted to new dwellings and their associated infrastructure once household formation had also ceased to grow. Housing, much criticised recently in the UK for its cramped plots, could be built at a somewhat lower density as in the earlier 20th century, with gardens free from the threat, or the temptation, of infill. Unsatisfactory housing, espe-cially in peripheral social housing estates requiring apparently perpetual refur-bishment, would be demolished and returned to open land. Costs of housing and land would eventually fall with a stable or declining population. That might encourage family formation, as discussed later.
Environmental aspects of decline The environmental consequences of lower population density could be consid-erable, and mostly favourable. Human population growth has been the biggest threat to wildlife (Hambler 2004: ch. 2). Most encroachment on countryside would cease. With a relaxation of pressures, the intensification of agriculture, that makes much of the countryside a wildlife desert, would be relaxed.
Emissions and pollution of all kinds would fall, but only roughly pro rata with population size with benefits for human health (Costello et al. 2009). Households are the most important source of emissions, resource consumption and damage to biodiversity (Liu et al. 2003). Household numbers typically in-crease faster than population and could continue to grow even when population had started to decline. The environmental effects of the faster population growth in the US, Canada and Australia (O'Connor et al. 2008) are correspond-ingly more potent, with US oil use projected to increase by 43 % by 2025 (Markham and Steinzor 2006). The projected diminution of Japanese, Russian and eventually Chinese populations must be accounted a blessing as regards emissions, the consumption of hardwood forest products, the protection of whales and other marine species, and mammals used for traditional medicine.
The inevitable end of growth The final argument is that population growth, and economic growth measured as GDP, must come to an end. Evidence for unavoidable shortage of fresh wa-ter in many parts of the world, even more than projections of food shortage, is mounting. Growth in population and economy together are bringing about their own limitation, if climate change projections that they provoke have any validi-ty. The demographic consequences of climate change are even more difficult to project than climate change itself; uncertainty piled upon uncertainty. If the populations of the world do not reverse their growth, then negative feedback from our previous activities may force us to do so, in disagreeable ways.
Conclusion Widespread sub-replacement fertility has focused attention on population de-cline. That is already underway in a number of countries: Germany, Poland and many other countries of Central and Eastern Europe, and in Japan. Some predict it will become universal. Population decline and population ageing in
Population Decline 38
modern societies share a common cause in low fertility. But one does not cause the other.
The process of population decline inevitably brings problems, although rates of decline might hardly be perceptible to contemporary observers. A smaller stable population, once achieved, could have advantages. Smaller population size might of itself arrest further decline and permit the resumption of growth. The notion of homeostatic feedback between population size and family building was the foundation of Malthusian population theory (Malthus 1802) and its existence is well documented for earlier centuries (e.g., Wrigley and Schofield 1981; Lee 1985; Wilson and Airey 1999; Clark 2007). Those processes have been neglected in much recent population thinking (Lee 1987). The advent of population decline suggests that reconsideration is overdue.
Negative feedback in modern societies may have been underestimated. Populations may have ‘overshot’ their sustainable or comfortable limits. Inevi-tably there are lags, protracted by the inertia of culture and tradition, between the beginning of negative effects upon family welfare of larger surviving family size and larger population, and the responses of individuals to it (Ehrlich and Kim 2005). Demographic momentum exacerbates the delay. Fertility at or be-low replacement level was reached in most Western European countries by the 1930s. But their populations have since increased by between 20 % and 80 %, partly thanks to the transient baby-boom and to migration but mostly as a con-sequence of demographic momentum. Recent studies in European countries have shown a negative relationship between population density and fertility, controlling for the effects of other variables (Lutz and Quiang 2002, 2005; Kulu et al. 2009). Negative feedback can be important at the national policy level as well, in attempts to manipulate demographic behaviour to avert the dire conse-quences implicit in the persistence of current demographic behaviour, and thereby to falsify the population projections that herald the bad news.
Defining optimum population for modern societies is difficult if not impos-sible. While it is clear that the process of decline has numerous drawbacks, these are only important if the decline is fast and protracted. Smaller population size, however, has social, economic and environmental advantages. And it may be forced on us, as a requirement for our survival, if the ultimate feedbacks from our growth arising from climate change come to pass (Dyson 2005).
References
Akihiko M. 2006. Shrinking-Population Economics: Lessons from Japan. Transl. by Miller Br. Tokyo: International House of Japan.
Balzer H. 2005. The Implications of Demographic Change for Russian Politics and Security. Weatherhead Center for International Affairs Conference, Harvard Univer-sity, Health and Demography in the States of the Former Soviet Union. April 29–30, p. 38.
Barlow R. 1994. Population Growth and Economic Growth: Some More Correlations. Population and Development Review 20(1): 153–165.
David Coleman and Robert Rowthorn 39
Barro R. J., and Sala-i-Martin X. 2003. Economic Growth. Cambridge, MA: MIT Press.
Biraben J.-N. 2004. L'histoire du peuplement humain des origines à nos jours. Démographie: analyse et synthèse. V. Histoire du Peuplement et Prévisions / Ed. by G. Caselli, J. Vallin, and G. Wunsch, pp. 9–31. Paris: Institut National d'Etudes Dé-mographiques.
Birg H. 2002. Demographic Ageing and Population Decline in Twenty-First-Century – Germany: Consequences for the Systems of Social Insurance. Population Bulletin of the United Nations. Policy Responses to Population Decline and Ageing 44/45: 103–134.
Chapple J. 2004. The Dilemma Posed by Japan's Population Decline. Electronic Jour-nal of Contemporary Japanese Studies. Discussion Paper 5.
Chesnais J.-C. 1996. La crepuscule de l’occident. Paris: Robert Laffont.
Clark G. 2007. A Farewell to Alms: A Brief Economic History of the World. Princeton: Princeton University Press.
Costello A., Abbas M., Allen A., Ball S. et al. 2009. Managing the Health Effects of Climate Change. The Lancet 373 (May 16): 1693–1733. Doi: 10.1016/S0140-6736(09)60935-1.
Coulmas F. 2007. Population Decline and Ageing in Japan – The Social Consequences. London – New York: Routledge.
Demeny P. 1997. Replacement-Level Fertility: The Implausible Endpoint of the Demo-graphic Transition. The Continuing Demographic Transition / Ed. by G. W. Jones, R. M. Douglas, J. C. Caldwell, and R. M. D'Souza, pp. 94–110. Oxford: Clarendon Press.
Dyson T. 2005. On Development, Demography and Climate Change: The End of the World as We Know it? Population and Environment 27(2): 117–149.
Economist. 2006. Incredible Shrinking Countries. Economist. January 5: 12.
Ehrlich I., and Kim J. 2005. Endogenous Fertility, Mortality and Economic Growth: Can a Malthusian Framework Account for the Conflicting Historical Trends in Pop-ulation? Journal of Asian Economics 16: 789–806.
Environment Agency. 2010. London State of the Environment Report 2010. London: Environment Agency.
Glass D. V. 1940. Population Policies and Movements in Europe. London: Oxford Uni-versity Press.
Glass D. V. 1973. Numbering the People. Farnborough: Saxon House. URL: http:// www.unece.org/stats/documents/2005/01/migration/17.e.ppt.
House of Lords Select Committee on Economic Affairs. 2008. 1st Report of Session 2007–08: The Economic Impact of Immigration. Vol. 1. Report HL Paper 82–1: 84. Vol. II. Evidence. HL Paper 82–II: 514. London: The Stationery Office.
Hummel D., and Lux A. 2007. Population Decline and Infrastructure: The Case of the German Water Supply System. Vienna Yearbook of Population Research 2007: 167–191.
Jackson R., and Howe N. 2008. The Graying of the Great Powers. Washington, DC: Center for Strategic and International Studies (CSIS).
Population Decline 40
Kelley A. C., and Schmidt R. M. 1995. Aggregate Population and Economic Growth Correlations: The Role of the Components of Demographic Change. Demography 32(4): 543–555.
Kennedy P. 1988. The Rise and Fall of the Great Powers: Economic Change and Mili-tary Conflict from 1500 to 2000. London: Unwin Hyman.
Keynes J. M. 1936. The Economic Consequences of a Declining Population. Eugenics Review 29: 13–17.
Krebs R. R., and Levy J. S. 2001. Demographic Change and the Sources of Interna-tional Conflict. Demography and National Security / Ed. by M. Weiner, and S. S. Russell, pp. 62–105. New York – Oxford: Berghahn.
Kulu H., Boyle P. J., and Andersson G. 2009. High Suburban Fertility: Evidence from Four Northern European Countries. Demographic Research 21(31): 915–944.
Lee R. D. 1985. Population Homeostasis and English Demographic History. Journal of Interdisciplinary History 15(4): 635–660.
Lee R. D. 1987. Population Dynamics of Humans and Other Animals. Demography 24(4): 443–465.
Lind M. 2006. A Labour Shortage Can Be a Blessing. Financial Times, June, 8.
Liu J., Daily G. C., Ehlich P. R., and Luck G. W. 2003. Effects of Household Dynam-ics on Resource Consumption and Biodiversity. Nature 421(6922): 530–533.
Longman P. 2004. The Empty Cradle: How Falling Birthrates Threaten World Pros-perity and What to Do about it. New York: Basic Books.
Lutz W., and Quiang R. 2002. Determinants of Human Population Growth. Philosoph-ical Transactions of the Royal Society B 357: 1197–1210.
Malthus Th. R. 1802. An Essay on the Principle of Population. 2nd edition.
Markham V. D., and Steinzor N. 2006. US National Report on Population and the Environment. New Canaan, CT: Center for Environment and Population.
McNicoll G. 1999. Population Weights in the International Order. Population and De-velopment Review 25(3): 411–442.
Ogawa N., Kondo M., and Matsukura R. 2005. Japan's Transition from the Demo-graphic Bonus to the Demographic Onus. Asian Population Studies 1(2): 207–226.
Reddaway W. B. 1939. The Economics of a Declining Population. London: Allen and Unwin.
Reddaway W. B. 1977. The Economic Consequences of Zero Population Growth. Lloyd's Bank Review 124: 14–29.
Reher D. S. 2007. Towards Long-term Population Decline: A Discussion of Relevant Issues. European Journal of Population 23(2): 189–207.
Roberts P. 2008. The End of Food. New York: Houghton Mifflin.
Rostow W. W. 1998. The Great Population Spike and After. Reflections on the 21st Century. New York: Oxford University Press.
Royal Commission on Population. 1949. Report Cmd. 7695. London: HMSO.
Rozendal P., and Moors H. 1983. Attitudes towards Population Trends and Population Policy in the Netherlands, Compared with Some Data from Other Western European Countries. European Demographic Information Bulletin 14(4): 141–149.
David Coleman and Robert Rowthorn 41
Sauvy A. 1969. General Theory of Population. Transl. by C. Campos. London: Wei-denfeld and Nicholson.
Sauvy A. 1987. L'Europe submergée: Sud-Nord dans trente ans. Ch. 8 Nos trois defaites demographiques (pp. 125–136). Paris: Dunod.
Schwartz K. 1998. Gibt es Alternativen zu der für Deutschland erwarteten Bevölke-rungsentwicklung? (Are there Alternatives to the Expected Population Trends in Germany?) Zeitschrift für Bevölkerungswissenschaft 23(3): 335–341.
Sheehey E. J. 1996. The Growing Gap between Rich and Poor Countries: A Proposed Explanation. World Development 24(8): 1379–1384.
Simon J. 1981. The Ultimate Resource. Princeton: Princeton University Press.
Sugareva M., Tzekov N., Donev D., and Boshikyov D. 2006. Le vieillissement demo-graphique dans les regions de dépopulation en Bulgarie du Nord-Ouest. (Demo-graphic Ageing in Depopulated Areas of North-West Bulgaria). Les territoires face au vieillissement en Europe – géographie, politique, prospective / Ed. by G.-F. Du-mont, D. Argoud, R. Belot, P. Boquet (Areas Facing Ageing in Europe: Geography, Politics, Outlook). Paris: Ellipses Marketing. Collection Carrefours.
Teitelbaum M. S., and Winter J. 1985. Fear of Population Decline. London: Academ-ic Press.
United Nations. 2002. World Urbanization Prospects. The 2001 Revision. Data Tables and Highlights. New York: United Nations.
United Nations. 2009. World Population Prospects: The 2008 Revision. New York: United Nations.
van Bavel J. 2010. Subreplacement Fertility in the West before the Baby Boom: Past and Current Perspectives. Population Studies 64(1): 1–18.
van Dalen H. P., and Henkens K. 2007. Longing for the Good Life: Understanding Emigration from a High-Income Country. Population and Development Review 33(1): 37–66.
Walsh B. M. 1974. Ireland. Population Policy in Developed Countries / Ed. by B. Ber-elson, pp. 8–41. New York: McGraw Hill for The Population Council.
Weiner M., and Teitelbaum M. S. 2001. Political Demography, Demographic Engi-neering. New York – Oxford: Berghahn.
Wilson Ch., and Airey P. 1999. How Can a Homeostatic Perspective Enhance Demo-graphic Transition Theory? Population Studies 53(2): 117–128.
Wrigley E. A., and Schofield R. S. 1981. The Population of England 1541–1871: A Reconstruction. London: Arnold.
History & Mathematics: Demography & Ageing 2015 42–51 42
3
The Political Development of Russia in the 21st Century:
Challenges of Demographic Factor and the Role of Educational System
Vasil T. Sakaev
Abstract The article is devoted to Russia's political development in the 21st century. The author marks out demographic and migratory processes as one of the lead-ing factors of political development in the Russian Federation. The article con-siders the influence of eventual consequences of the demographic and migra-tion factors on the socio-political processes in the country, including the issues of the socio-political stability, ethno-political, social development, and the na-tional security.
Keywords: Russian Federation, twenty-first century, political development, demographic and migratory processes, educational system.
The political processes taking place in Russia are caused by various groups of factors: economic, social, spiritual, legal, etc. All these groups of factors are permanent, but the significance of a particular group of factors at each histori-cal stage is different. At the current stage of development, in the short-term and long-term perspective, the political processes in the Russian society will be considerably influenced by the demographic factors and migration. This article considers these factors and analyses their impact on the country's political sphere.
The demographic factor manifests in a number of aspects or vectors of in-fluence. The principal meaning of the demographic factor in contemporary Russia consists in the consequences of depopulation and related change in the age-sex structure of the population. The migration factor is caused first of all by demographic processes whose negative consequences are to be corrected by migration, but the migration flows themselves become an essential and inde-pendent factor of political development.
The population decline in Russia will become one of the most important manifestations of the demographic factor in the 21st century. In 1960, Russia
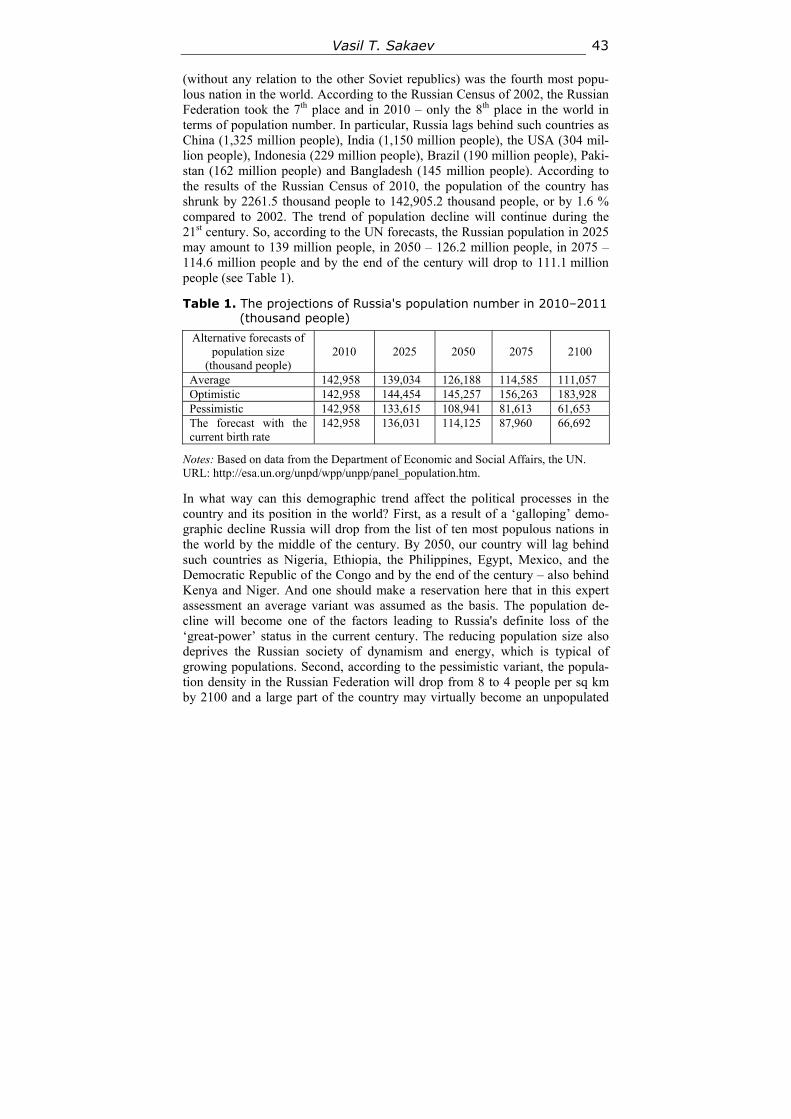
Vasil T. Sakaev 43
(without any relation to the other Soviet republics) was the fourth most popu-lous nation in the world. According to the Russian Census of 2002, the Russian Federation took the 7th place and in 2010 – only the 8th place in the world in terms of population number. In particular, Russia lags behind such countries as China (1,325 million people), India (1,150 million people), the USA (304 mil-lion people), Indonesia (229 million people), Brazil (190 million people), Paki-stan (162 million people) and Bangladesh (145 million people). According to the results of the Russian Census of 2010, the population of the country has shrunk by 2261.5 thousand people to 142,905.2 thousand people, or by 1.6 % compared to 2002. The trend of population decline will continue during the 21st century. So, according to the UN forecasts, the Russian population in 2025 may amount to 139 million people, in 2050 – 126.2 million people, in 2075 – 114.6 million people and by the end of the century will drop to 111.1 million people (see Table 1).
Table 1. The projections of Russia's population number in 2010–2011 (thousand people)
Alternative forecasts of population size
(thousand people) 2010 2025 2050 2075 2100
Average 142,958 139,034 126,188 114,585 111,057 Optimistic 142,958 144,454 145,257 156,263 183,928 Pessimistic 142,958 133,615 108,941 81,613 61,653 The forecast with the current birth rate
142,958 136,031 114,125 87,960 66,692
Notes: Based on data from the Department of Economic and Social Affairs, the UN. URL: http://esa.un.org/unpd/wpp/unpp/panel_population.htm.
In what way can this demographic trend affect the political processes in the country and its position in the world? First, as a result of a ‘galloping’ demo-graphic decline Russia will drop from the list of ten most populous nations in the world by the middle of the century. By 2050, our country will lag behind such countries as Nigeria, Ethiopia, the Philippines, Egypt, Mexico, and the Democratic Republic of the Congo and by the end of the century – also behind Kenya and Niger. And one should make a reservation here that in this expert assessment an average variant was assumed as the basis. The population de-cline will become one of the factors leading to Russia's definite loss of the ‘great-power’ status in the current century. The reducing population size also deprives the Russian society of dynamism and energy, which is typical of growing populations. Second, according to the pessimistic variant, the popula-tion density in the Russian Federation will drop from 8 to 4 people per sq km by 2100 and a large part of the country may virtually become an unpopulated
The Political Development of Russia 44
(unpeopled) territory. The population decline is particularly undesirable and dangerous for Russia with its vast territories whose overwhelming part has been sparsely inhabited and weakly developed. Thereby, the other countries' geopo-litical claims to the Russian territories and resources are objectively becoming stronger. Third, a dramatic drop in the population number will undoubtedly change the geopolitical stereotypes inherited from the Soviet past. The popula-tion will have to put up with the loss of imperial ambitions and in the long run – with the probable loss of some territories. Already now, in consequence of the country's reduced demographic potential, the neighbors' territorial claims are ambiguously appraised within the Russian society. The recent example here is an aggravation of the South-Kuril Islands dispute in the early 2011 which has provoked a number of opinions in Russian society in favor of the concession of these territories to Japan.
The declining population number in Russia in the current century will be-come the main manifestation of the demographic factor. In 1989, in the RSFSR (Russian Soviet Federative Socialist Republic) there lived 119.9 million Rus-sians and in the rest of the Soviet Republics – 25.1 million people more. Be-tween 1989 and 2004, according to the estimate, 5.43 million Russians returned to their Motherland, but over 2 million of them departed back, being unable to adapt to their historical homeland. At the same time between 1989 and 2002, the number of the Russians shrank by nearly 4 million people and their percent-age decreased from 81.5 % to 79.8 %. But the decline in the Russian population in Russia is in fact much larger. According to data of the 2002 Census, more than 1.5 million Ukrainians, Byelorussians and representatives of some other kindred nations or people born from mixed-national parents called themselves Russians. This can be confirmed by the decreased number of the Ukrainians in Russia by 1.4 million and of the Byelorussians by about 400 thousand people between 1989 and 2002. Without these ‘investments’ the number of the Rus-sian population would have shrunk by 8.5–9.0 million and the percentage of the Russians could have dropped to 75 %. The results of the 2010 Census are most likely to record a further reduction in the number of the Russians, taking into account higher mortality indices and relatively low birth-rate indices compared to the other indigenous peoples of the Russian Federation. Taking into consid-eration that Russian nation makes the core of the Russian statehood, these de-mographic processes cannot but find political expression. Thus, in the sphere of political identity, this trend is reinforced by the action of the so-called ‘Russian cross’ (i.e. when mortality exceeds birth rates), discussed in the media over a long period of time, this contributes to the formation of a stereotype of the Rus-sian nation as depopulating and disappearing. With due account of the leading role of the Russians in the Russian statehood, such a stereotype makes the Rus-sian citizens' political identity defective and the Russian state is considered as ‘colossus with feet of clay’.
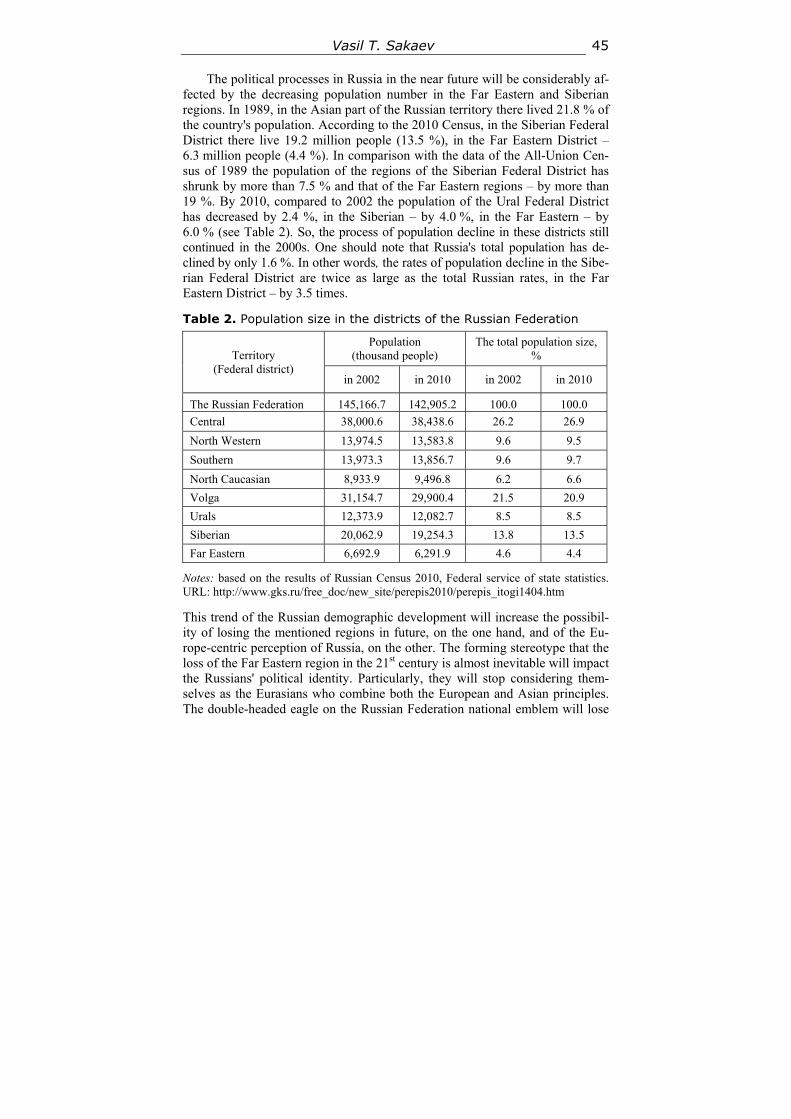
Vasil T. Sakaev 45
The political processes in Russia in the near future will be considerably af-fected by the decreasing population number in the Far Eastern and Siberian regions. In 1989, in the Asian part of the Russian territory there lived 21.8 % of the country's population. According to the 2010 Census, in the Siberian Federal District there live 19.2 million people (13.5 %), in the Far Eastern District – 6.3 million people (4.4 %). In comparison with the data of the All-Union Cen-sus of 1989 the population of the regions of the Siberian Federal District has shrunk by more than 7.5 % and that of the Far Eastern regions – by more than 19 %. By 2010, compared to 2002 the population of the Ural Federal District has decreased by 2.4 %, in the Siberian – by 4.0 %, in the Far Eastern – by 6.0 % (see Table 2). So, the process of population decline in these districts still continued in the 2000s. One should note that Russia's total population has de-clined by only 1.6 %. In other words, the rates of population decline in the Sibe-rian Federal District are twice as large as the total Russian rates, in the Far Eastern District – by 3.5 times.
Table 2. Population size in the districts of the Russian Federation
Territory (Federal district)
Population (thousand people)
The total population size, %
in 2002 in 2010 in 2002 in 2010
The Russian Federation 145,166.7 142,905.2 100.0 100.0
Central 38,000.6 38,438.6 26.2 26.9
North Western 13,974.5 13,583.8 9.6 9.5
Southern 13,973.3 13,856.7 9.6 9.7
North Caucasian 8,933.9 9,496.8 6.2 6.6
Volga 31,154.7 29,900.4 21.5 20.9
Urals 12,373.9 12,082.7 8.5 8.5
Siberian 20,062.9 19,254.3 13.8 13.5
Far Eastern 6,692.9 6,291.9 4.6 4.4
Notes: based on the results of Russian Census 2010, Federal service of state statistics. URL: http://www.gks.ru/free_doc/new_site/perepis2010/perepis_itogi1404.htm
This trend of the Russian demographic development will increase the possibil-ity of losing the mentioned regions in future, on the one hand, and of the Eu-rope-centric perception of Russia, on the other. The forming stereotype that the loss of the Far Eastern region in the 21st century is almost inevitable will impact the Russians' political identity. Particularly, they will stop considering them-selves as the Eurasians who combine both the European and Asian principles. The double-headed eagle on the Russian Federation national emblem will lose
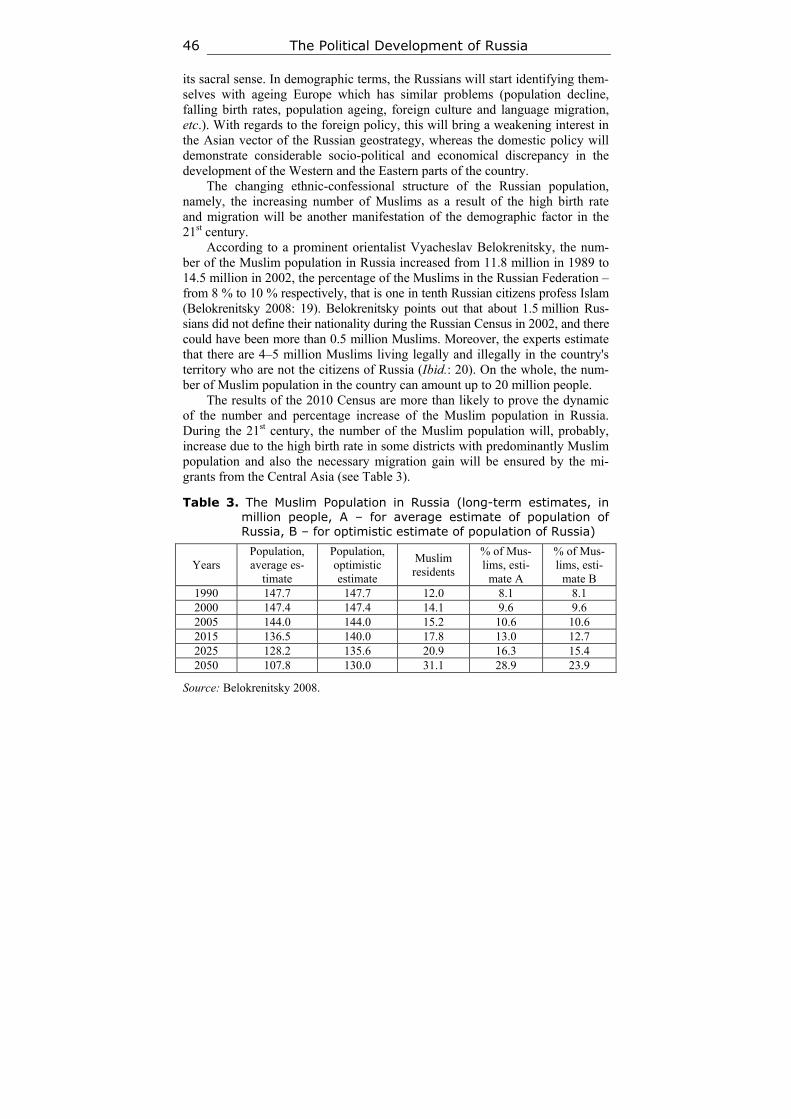
The Political Development of Russia 46
its sacral sense. In demographic terms, the Russians will start identifying them-selves with ageing Europe which has similar problems (population decline, falling birth rates, population ageing, foreign culture and language migration, etc.). With regards to the foreign policy, this will bring a weakening interest in the Asian vector of the Russian geostrategy, whereas the domestic policy will demonstrate considerable socio-political and economical discrepancy in the development of the Western and the Eastern parts of the country.
The changing ethnic-confessional structure of the Russian population, namely, the increasing number of Muslims as a result of the high birth rate and migration will be another manifestation of the demographic factor in the 21st century.
According to a prominent orientalist Vyacheslav Belokrenitsky, the num-ber of the Muslim population in Russia increased from 11.8 million in 1989 to 14.5 million in 2002, the percentage of the Muslims in the Russian Federation – from 8 % to 10 % respectively, that is one in tenth Russian citizens profess Islam (Belokrenitsky 2008: 19). Belokrenitsky points out that about 1.5 million Rus-sians did not define their nationality during the Russian Census in 2002, and there could have been more than 0.5 million Muslims. Moreover, the experts estimate that there are 4–5 million Muslims living legally and illegally in the country's territory who are not the citizens of Russia (Ibid.: 20). On the whole, the num-ber of Muslim population in the country can amount up to 20 million people.
The results of the 2010 Census are more than likely to prove the dynamic of the number and percentage increase of the Muslim population in Russia. During the 21st century, the number of the Muslim population will, probably, increase due to the high birth rate in some districts with predominantly Muslim population and also the necessary migration gain will be ensured by the mi-grants from the Central Asia (see Table 3).
Table 3. The Muslim Population in Russia (long-term estimates, in million people, A – for average estimate of population of Russia, B – for optimistic estimate of population of Russia)
Years Population, average es-
timate
Population, optimistic estimate
Muslim residents
% of Mus-lims, esti-
mate A
% of Mus-lims, esti-
mate B 1990 147.7 147.7 12.0 8.1 8.1 2000 147.4 147.4 14.1 9.6 9.6 2005 144.0 144.0 15.2 10.6 10.6 2015 136.5 140.0 17.8 13.0 12.7 2025 128.2 135.6 20.9 16.3 15.4 2050 107.8 130.0 31.1 28.9 23.9
Source: Belokrenitsky 2008.
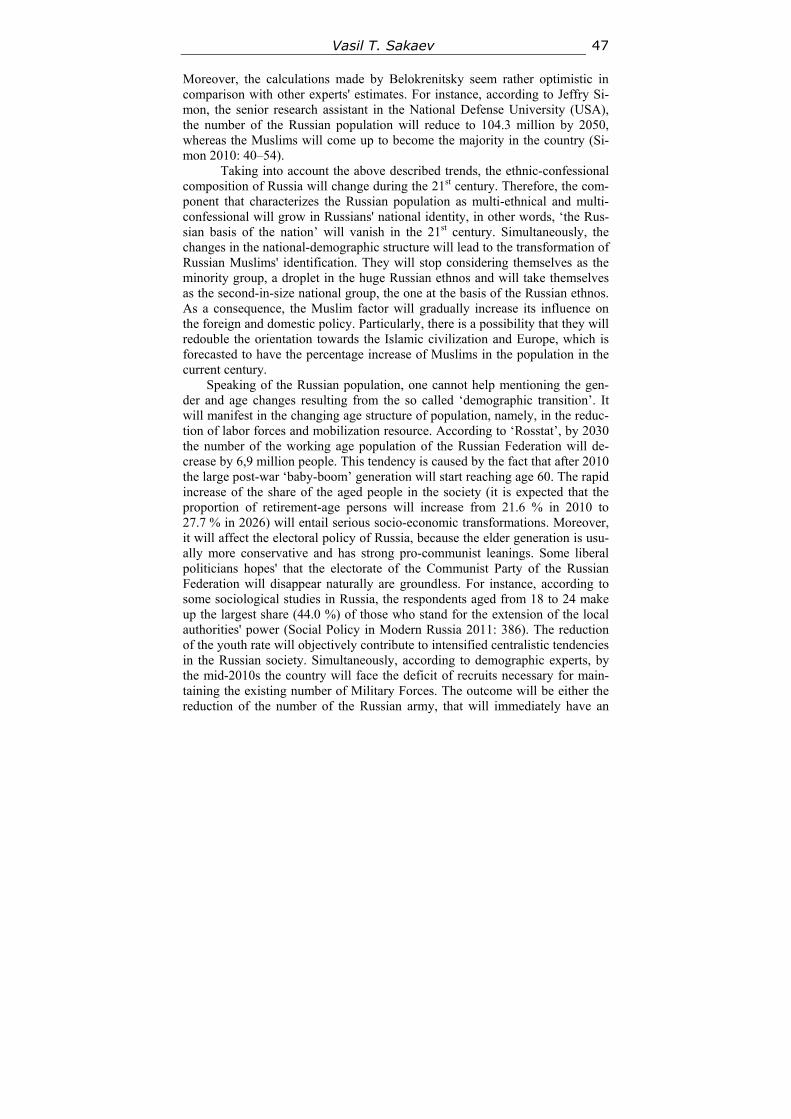
Vasil T. Sakaev 47
Moreover, the calculations made by Belokrenitsky seem rather optimistic in comparison with other experts' estimates. For instance, according to Jeffry Si-mon, the senior research assistant in the National Defense University (USA), the number of the Russian population will reduce to 104.3 million by 2050, whereas the Muslims will come up to become the majority in the country (Si-mon 2010: 40–54).
Taking into account the above described trends, the ethnic-confessional composition of Russia will change during the 21st century. Therefore, the com-ponent that characterizes the Russian population as multi-ethnical and multi-confessional will grow in Russians' national identity, in other words, ‘the Rus-sian basis of the nation’ will vanish in the 21st century. Simultaneously, the changes in the national-demographic structure will lead to the transformation of Russian Muslims' identification. They will stop considering themselves as the minority group, a droplet in the huge Russian ethnos and will take themselves as the second-in-size national group, the one at the basis of the Russian ethnos. As a consequence, the Muslim factor will gradually increase its influence on the foreign and domestic policy. Particularly, there is a possibility that they will redouble the orientation towards the Islamic civilization and Europe, which is forecasted to have the percentage increase of Muslims in the population in the current century.
Speaking of the Russian population, one cannot help mentioning the gen-der and age changes resulting from the so called ‘demographic transition’. It will manifest in the changing age structure of population, namely, in the reduc-tion of labor forces and mobilization resource. According to ‘Rosstat’, by 2030 the number of the working age population of the Russian Federation will de-crease by 6,9 million people. This tendency is caused by the fact that after 2010 the large post-war ‘baby-boom’ generation will start reaching age 60. The rapid increase of the share of the aged people in the society (it is expected that the proportion of retirement-age persons will increase from 21.6 % in 2010 to 27.7 % in 2026) will entail serious socio-economic transformations. Moreover, it will affect the electoral policy of Russia, because the elder generation is usu-ally more conservative and has strong pro-communist leanings. Some liberal politicians hopes' that the electorate of the Communist Party of the Russian Federation will disappear naturally are groundless. For instance, according to some sociological studies in Russia, the respondents aged from 18 to 24 make up the largest share (44.0 %) of those who stand for the extension of the local authorities' power (Social Policy in Modern Russia 2011: 386). The reduction of the youth rate will objectively contribute to intensified centralistic tendencies in the Russian society. Simultaneously, according to demographic experts, by the mid-2010s the country will face the deficit of recruits necessary for main-taining the existing number of Military Forces. The outcome will be either the reduction of the number of the Russian army, that will immediately have an
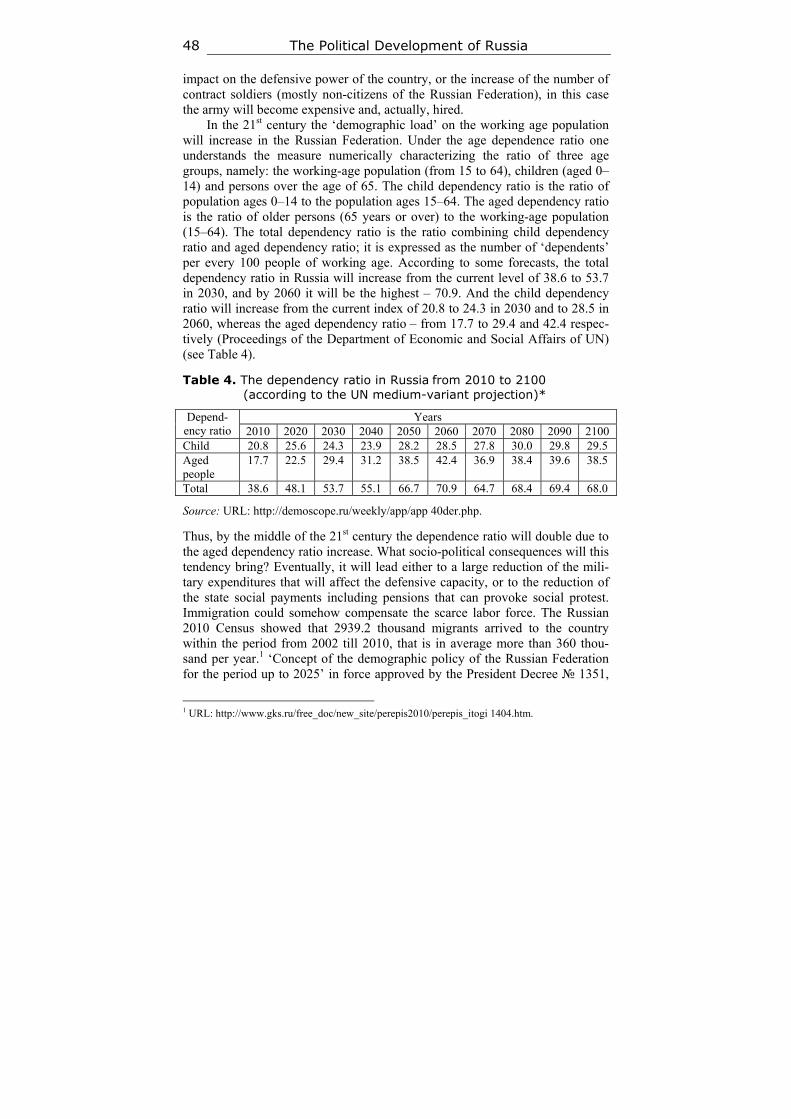
The Political Development of Russia 48
impact on the defensive power of the country, or the increase of the number of contract soldiers (mostly non-citizens of the Russian Federation), in this case the army will become expensive and, actually, hired.
In the 21st century the ‘demographic load’ on the working age population will increase in the Russian Federation. Under the age dependence ratio one understands the measure numerically characterizing the ratio of three age groups, namely: the working-age population (from 15 to 64), children (aged 0–14) and persons over the age of 65. The child dependency ratio is the ratio of population ages 0–14 to the population ages 15–64. The aged dependency ratio is the ratio of older persons (65 years or over) to the working-age population (15–64). The total dependency ratio is the ratio combining child dependency ratio and aged dependency ratio; it is expressed as the number of ‘dependents’ per every 100 people of working age. According to some forecasts, the total dependency ratio in Russia will increase from the current level of 38.6 to 53.7 in 2030, and by 2060 it will be the highest – 70.9. And the child dependency ratio will increase from the current index of 20.8 to 24.3 in 2030 and to 28.5 in 2060, whereas the aged dependency ratio – from 17.7 to 29.4 and 42.4 respec-tively (Proceedings of the Department of Economic and Social Affairs of UN) (see Table 4).
Table 4. The dependency ratio in Russia from 2010 to 2100 (according to the UN medium-variant projection)*
Depend-ency ratio
Years 2010 2020 2030 2040 2050 2060 2070 2080 2090 2100
Child 20.8 25.6 24.3 23.9 28.2 28.5 27.8 30.0 29.8 29.5 Aged people
17.7 22.5 29.4 31.2 38.5 42.4 36.9 38.4 39.6 38.5
Total 38.6 48.1 53.7 55.1 66.7 70.9 64.7 68.4 69.4 68.0
Source: URL: http://demoscope.ru/weekly/app/app 40der.php.
Thus, by the middle of the 21st century the dependence ratio will double due to the aged dependency ratio increase. What socio-political consequences will this tendency bring? Eventually, it will lead either to a large reduction of the mili-tary expenditures that will affect the defensive capacity, or to the reduction of the state social payments including pensions that can provoke social protest. Immigration could somehow compensate the scarce labor force. The Russian 2010 Census showed that 2939.2 thousand migrants arrived to the country within the period from 2002 till 2010, that is in average more than 360 thou-sand per year.1 ‘Concept of the demographic policy of the Russian Federation for the period up to 2025’ in force approved by the President Decree № 1351,
1 URL: http://www.gks.ru/free_doc/new_site/perepis2010/perepis_itogi 1404.htm.
Vasil T. Sakaev 49
September 9, 2007 supposes ensuring the annual migratory gains of more than 200,000 people for the period up to 2015, and of more than 300,000 per year for the period between 2016 and 2025.2 However, this could be not enough. According to Leonid L. Rybakovsky, to maintain the population number Russia needs to accept on average 490,000 migrants per year till 2025 (Kuznetsov and Rybakovsky 2005: 123).
According to the World Bank, to compensate for the scarce labor force, in the next two decades Russia will need 12 million migrants (600,000 per year) while according to the UNFPA, the proportion of migrants among the econom-ically active population is currently 10 % (Kommersant – Vlast' 2010).
Thus, in two decades the number of migrants could amount to 20 % of the population and they will mostly concentrate in the main economical centers of the country (Moscow, St. Petersburg, etc.). Moreover, this is not the largest estimated index with respect to migration prospects in Russia. The Chief of the State Duma Committee Konstantin Kosachev declared in the interview to ‘Russia 24’ channel, that in 40 years there would be 40 million of migrants and they could amount to 30–40 % of the population in Russia. As a result, there will be an essential shift in the ethnic and demographic balance in some regions of the country and, it goes without saying, this will impact the national security and socio-political stability. The migration will become the forming factor of the Russians' political identity, because the representatives of non-Russian and non-Slavic cultures will dominate in the migratory flows. At the same time, under the conditions of long-term population decline and necessity of ensuring the economic development Russia will need the migration flow and open immigration policy.
Since the migration flows to a great extent will be dominated by the representatives of foreign cultures and religions, in the foreground of the political development of Russia there will be the tasks of the migration policy restraining and limiting undesirable migration flows and the measures of national and social policy aimed at successful integration of foreigners in the Russian society. However, the migration flows of the foreign languages and cultures undoubtedly will provoke increasing xenophobia among the Russian population. And this will have a negative effect on the social and political stability and will threaten the Russian statehood.
The demographic characteristics, number and composition of migrants and the age and sex structure of receiving population will have a direct impact on the situation of interethnic relations and interethnic tension. In this case, the formation of ethno-social stratification (i.e. the creation of a social hierarchy based on ethnicity) in the Russian society are dangerous because it will lead to disordered functioning of basic social institutions, including civil services, mili-
2 URL: http://kremlin.ru/acts/bank/26299/page/2.
The Political Development of Russia 50
tary institutions, law enforcement, judicial system, family institutions and edu-cation (Mukomel 2011: 34–50).
Thus, the demographic processes in the 21st century can weaken Russia's geopolitical position as it may lose the position of one of the densely populated countries of the world; the changes in the perceptional stereotypes will occur both within and beyond the country, the demographic situation will, probably, lead even to the territorial compression while the orientation towards the Euro-pean and Islamic civilization will be enhanced. The demographic processes will lead to changes in the ethnic and demographic balance which will be manifest-ed in the decreasing share of the Russian population combined with a growing number of Muslim population, that will affect both foreign and domestic policy. The changes in the age and sex structure will be manifested in the population ageing and increasing aged dependence ratio that will lead to the revision of the state social commitments, and in the sphere of national defence – to the reduction of military expenditures and deficit of the mobilization recourses. Thus, in the 21st century the migratory processes will play a considerable role in Russia.
On the one hand, large migration flows (consisting mostly of foreign-speakers with different cultural identity) will be almost inevitable and seem the only source to improve the demographic situation in the country and to smooth some negative consequences in the political processes; on the other hand, they could cause internal political instability. Due to demographic and migration processes, the Eurasian foundations of the Russian political identity will weak-en while the Eurocentric perception will become stronger. This is also caused by the reduction of population in the Siberian and the Far Eastern regions in the 21st century.
Thus, demographic and migration factors pose serious risks for the devel-opment of Russia in the 21st century. So the Russian government should search for new extraordinary solution to this problem. In our opinion, these risks can be eliminated through the development of the educational system.
First, the educational system in Russia will allow a better integration of migrants and their children in Russian society together with overcoming of lan-guage and cultural barriers. This refers not only to immigrants, but also it might contribute to reducing of xenophobia among the host population. The acquaint-ance with culture, religion and traditions of migrants will help reduce tension in the host society.
Second, improvement and priority development of the general and profes-sional educational system in the Siberian and Far Eastern regions will allow reducing the migration of young population from these regions and, according-ly, to strengthen the geopolitical position in the Asian part of the country.
Thirdly, a system of continuous education will preserve the labor potential of older people allowing them to learn a new profession. This will reduce
Vasil T. Sakaev 51
the aged dependence ratio and positively affect the pension system of the coun-try, preventing its bankruptcy.
Fourthly, the educational system has a priority effect on the formation of a political identity of the country's population. Only within the education process a positive and adequate identity can be formed which will overcome the chal-lenges of identity in the 21st century.
Thus, in this century the overcoming of the negative impact of demograph-ic and migration factors on the Russian Federation development to a large ex-tent depends on the capacity and activity of the educational system, starting with its successful adaptation to the new situation and setting new goals.
References
Belokrenitsky V. Ya. 2008. Russia and the Islamic World: The Dynamics of Changes in Demographic and Political Potentials. Eurasian Studies 2: 3–31. In Russian (Бе-локреницкий В. Я. Россия и исламский мир: динамика изменения демографи-ческого и политического потенциалов. Евразийские исследования 2: 3–31).
Kommersant – Vlast'. 2010. Russia in Figures. March 29. P. 10. In Russian (Коммер-сант – Власть. Россия в цифрах. 29 марта. С. 10).
Kuznetsov V. N., and Rybakovsky L. L. (Eds.) 2005. Strategy of Demographic Devel-opment of Russia. Moscow: TsSP. In Russian (Кузнецов В. Н., Рыбаковский Л. Л. (Ред.). Стратегия демографического развития России. М.: ЦСП).
Mukomel V. I. 2011. Integration of Migrants: Challenges, Policy, Social Practice. World of Russia 20(1): 34–50. In Russian (Мукомель В. И. Интеграция мигран-тов: Вызовы, политика, социальные практики. Мир России 20(1): 34–50).
Simon J. 2010. Is Demography a Destiny? Russia in Global Policy 2: 40–54.
Volgin N. A. (Ed.) 2011. Social Policy in Modern Russia: Analysis, Evaluation, Pro-spection. Moscow: Publishing House ‘Prospekt’. In Russian (Волгин Н. А. (Ред.). Социальная политика в современной России: анализ, оценки, взгляд в будущее. М.: «Проспект»).
History & Mathematics: Demography & Ageing 2015 52–80 52
4
Mathematical Modeling and Forecasting of the Demographic Future of Russia:
Seven Scenarios*
Andrey V. Korotayev, Jack A. Goldstone, Julia V. Zinkina, Sergey G. Shulgin,
Daria A. Khaltourina, and Daria A. Folomeyeva
Abstract Russia is currently experiencing a financial crisis, due to international sanc-tions coupled with a decline in oil prices. The length and consequences of this period of turmoil are unpredictable, but it will surely have a visible negative impact on crucial socio-demographic indicators. Recent demographic im-provements have become one of the most important indicators of the overall success of domestic policy for Vladimir Putin. In the next few years, however, Russia risks facing a repetition of the 1990s' demographic problems once again – with a new wave of mortality increases and a new wave of fertility de-cline. Pressing economic issues are currently receiving much more attention from the Government; yet an effective anti-crisis strategy also requires paying attention to the seemingly ‛long-term’ demographic problems. Several threats to recent demographic gains have appeared with the crisis. As inflation is ris-ing, more of Russia's population is falling into poverty – and risks of impover-ishment have traditionally been the highest for families with many children. As the resources available for families shrink, the recent upturn in fertility rates for second and third children may be reversed. When combined with the rapidly declining numbers of women in active reproductive ages (20–29 years) Russia is almost certain to experience a precipitous decline in fertility. In addition, a dramatic increase in the availability of alcohol is looming, reminiscent of the late 1990s. In 1998 Russia experienced a very serious financial crisis accom-panied by a jump in inflation (by 84 %) – however, the excise duty on spirits was increased only much more modestly, by 20 %. As a result, during a single year the relative value of excise duty fell by one-third, leading to dramatic
* This research has been supported by the Russian Foundation for the Humanities (Project No 14-
11-00634).
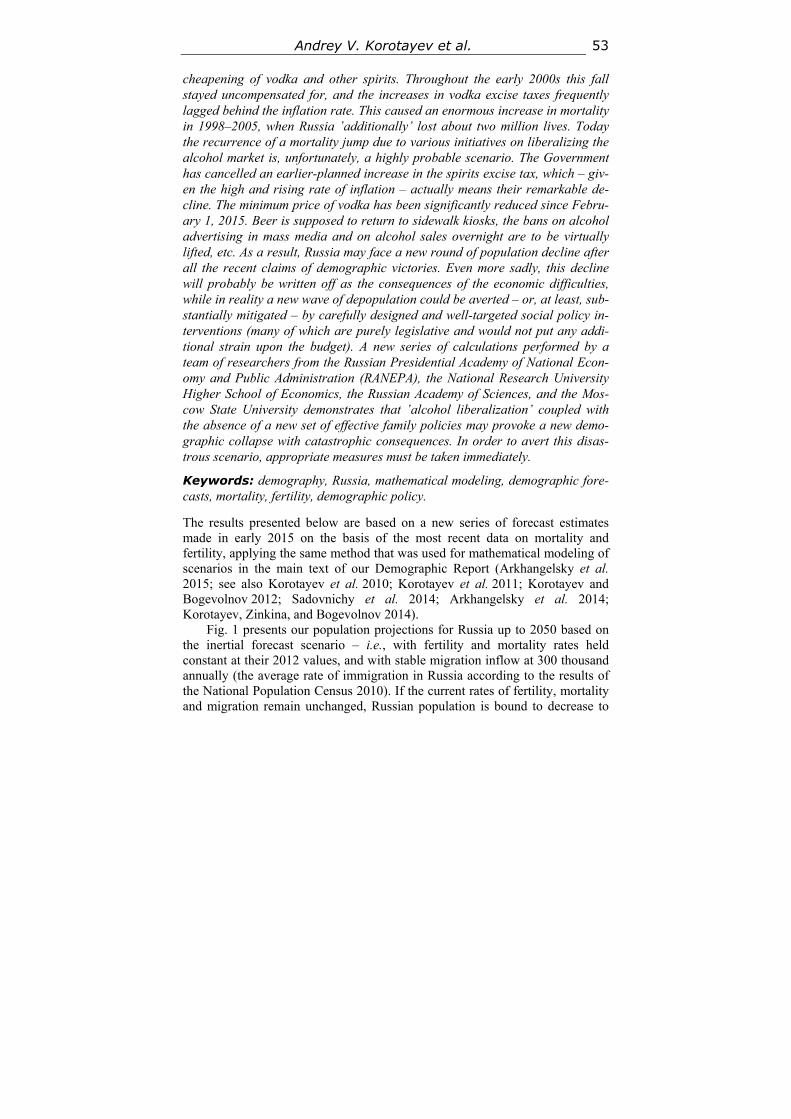
Andrey V. Korotayev et al. 53
cheapening of vodka and other spirits. Throughout the early 2000s this fall stayed uncompensated for, and the increases in vodka excise taxes frequently lagged behind the inflation rate. This caused an enormous increase in mortality in 1998–2005, when Russia ‛additionally’ lost about two million lives. Today the recurrence of a mortality jump due to various initiatives on liberalizing the alcohol market is, unfortunately, a highly probable scenario. The Government has cancelled an earlier-planned increase in the spirits excise tax, which – giv-en the high and rising rate of inflation – actually means their remarkable de-cline. The minimum price of vodka has been significantly reduced since Febru-ary 1, 2015. Beer is supposed to return to sidewalk kiosks, the bans on alcohol advertising in mass media and on alcohol sales overnight are to be virtually lifted, etc. As a result, Russia may face a new round of population decline after all the recent claims of demographic victories. Even more sadly, this decline will probably be written off as the consequences of the economic difficulties, while in reality a new wave of depopulation could be averted – or, at least, sub-stantially mitigated – by carefully designed and well-targeted social policy in-terventions (many of which are purely legislative and would not put any addi-tional strain upon the budget). A new series of calculations performed by a team of researchers from the Russian Presidential Academy of National Econ-omy and Public Administration (RANEPA), the National Research University Higher School of Economics, the Russian Academy of Sciences, and the Mos-cow State University demonstrates that ‛alcohol liberalization’ coupled with the absence of a new set of effective family policies may provoke a new demo-graphic collapse with catastrophic consequences. In order to avert this disas-trous scenario, appropriate measures must be taken immediately.
Keywords: demography, Russia, mathematical modeling, demographic fore-casts, mortality, fertility, demographic policy.
The results presented below are based on a new series of forecast estimates made in early 2015 on the basis of the most recent data on mortality and fertility, applying the same method that was used for mathematical modeling of scenarios in the main text of our Demographic Report (Arkhangelsky et al. 2015; see also Korotayev et al. 2010; Korotayev et al. 2011; Korotayev and Bogevolnov 2012; Sadovnichy et al. 2014; Arkhangelsky et al. 2014; Korotayev, Zinkina, and Bogevolnov 2014).
Fig. 1 presents our population projections for Russia up to 2050 based on the inertial forecast scenario – i.e., with fertility and mortality rates held constant at their 2012 values, and with stable migration inflow at 300 thousand annually (the average rate of immigration in Russia according to the results of the National Population Census 2010). If the current rates of fertility, mortality and migration remain unchanged, Russian population is bound to decrease to
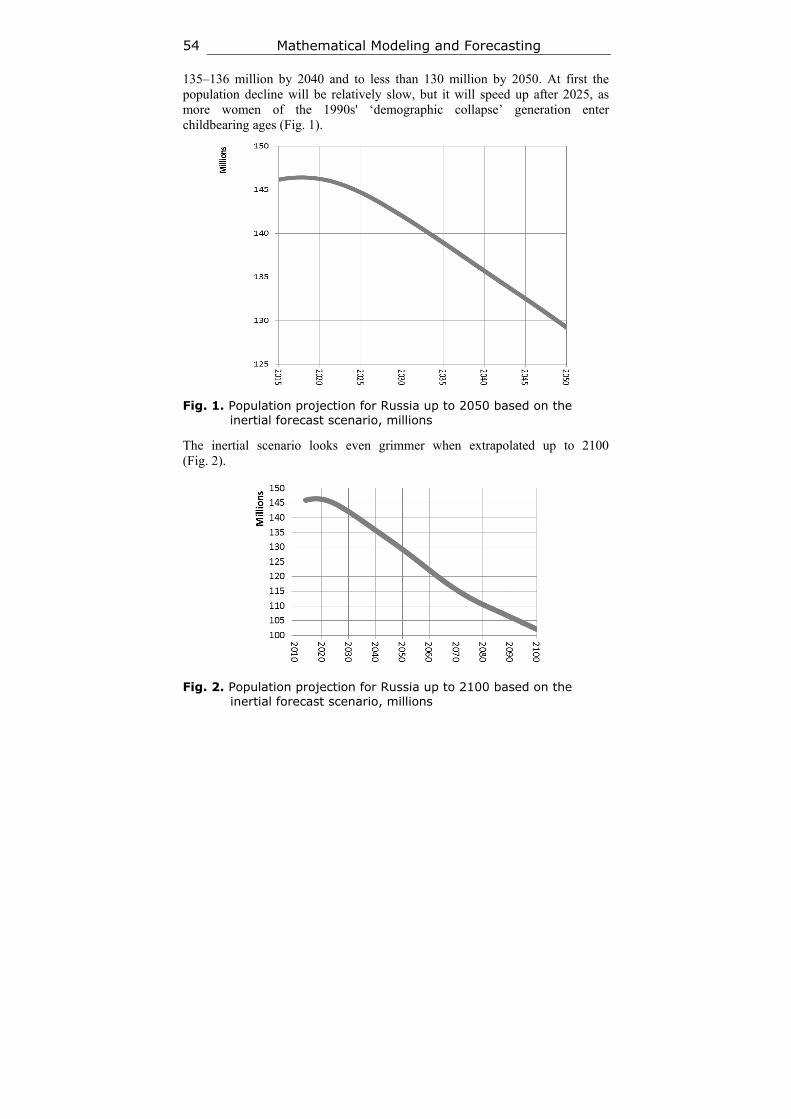
Mathematical Modeling and Forecasting 54
135–136 million by 2040 and to less than 130 million by 2050. At first the population decline will be relatively slow, but it will speed up after 2025, as more women of the 1990s' ‘demographic collapse’ generation enter childbearing ages (Fig. 1).
Fig. 1. Population projection for Russia up to 2050 based on the
inertial forecast scenario, millions
The inertial scenario looks even grimmer when extrapolated up to 2100 (Fig. 2).
Fig. 2. Population projection for Russia up to 2100 based on the
inertial forecast scenario, millions
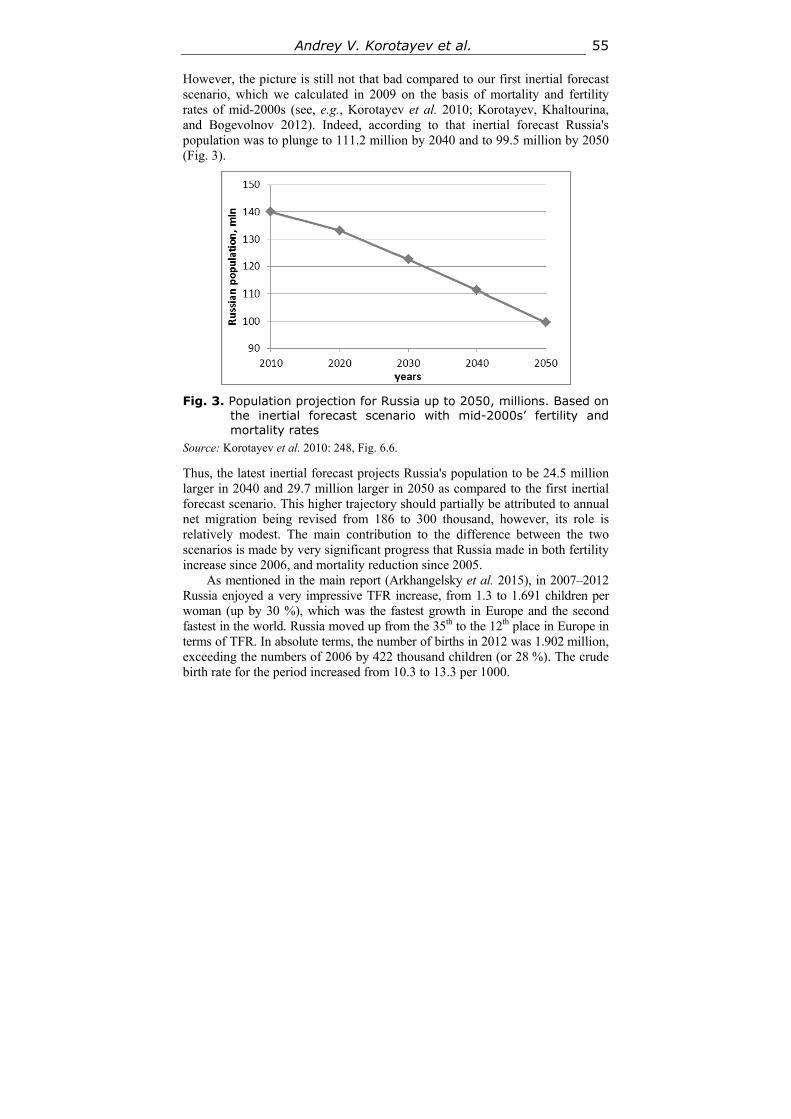
Andrey V. Korotayev et al. 55
However, the picture is still not that bad compared to our first inertial forecast scenario, which we calculated in 2009 on the basis of mortality and fertility rates of mid-2000s (see, e.g., Korotayev et al. 2010; Korotayev, Khaltourina, and Bogevolnov 2012). Indeed, according to that inertial forecast Russia's population was to plunge to 111.2 million by 2040 and to 99.5 million by 2050 (Fig. 3).
Fig. 3. Population projection for Russia up to 2050, millions. Based on
the inertial forecast scenario with mid-2000s’ fertility and mortality rates
Source: Korotayev et al. 2010: 248, Fig. 6.6.
Thus, the latest inertial forecast projects Russia's population to be 24.5 million larger in 2040 and 29.7 million larger in 2050 as compared to the first inertial forecast scenario. This higher trajectory should partially be attributed to annual net migration being revised from 186 to 300 thousand, however, its role is relatively modest. The main contribution to the difference between the two scenarios is made by very significant progress that Russia made in both fertility increase since 2006, and mortality reduction since 2005.
As mentioned in the main report (Arkhangelsky et al. 2015), in 2007–2012 Russia enjoyed a very impressive TFR increase, from 1.3 to 1.691 children per woman (up by 30 %), which was the fastest growth in Europe and the second fastest in the world. Russia moved up from the 35th to the 12th place in Europe in terms of TFR. In absolute terms, the number of births in 2012 was 1.902 million, exceeding the numbers of 2006 by 422 thousand children (or 28 %). The crude birth rate for the period increased from 10.3 to 13.3 per 1000.
Mathematical Modeling and Forecasting 56
Forthcoming Demographic Catastrophe. ‛Alco-pessimistic Scenario‛ The progress in mortality reduction achieved in our country since 2005 is quite significant. In 2005–2013 mortality went down from 2.304 million (Surinov 2013: Table 2.1) to 1.872 million deaths per year1 (by 432 thousand deaths per year). The reduction of alcohol poisoning-related deaths was particularly considerable: the number of lethal intoxications fell from 36,000 in 2005 to 6,700 in 2014.2
The crude death rate fell from 16.1 per thousand to 13.1 per thousand (by 19‰). It was the best performance not only in Europe, but among all the high and middle income countries of the world (World Bank 2015). Mortality reduction was achieved almost exclusively due to an increase in life expectancy in Russia, from 65.5 to 70.5 years (by 5 years) in 2005–2012, which was again the best result among all the countries of Europe, America, and Asia (World Bank 2015). Male life expectancy increased by almost 6 years (Surinov 2013: Table 2.9). The standardized mortality rate among working-age males decreased from 466.8 to 334.3 (almost by 30 %),3 again the best dynamics among all the high and middle income countries (World Bank 2015).
These impressive results were achieved mainly through a reduction in the number of alcohol-related deaths, which had hugely contributed to mortality in the mid-2000s, before the first set of effective anti-alcohol measures was introduced in 2006.4 Alcohol caused excessive mortality in Russia in a variety of ways, of which fatal alcohol poisonings formed only a small proportion. In the mid-2000s 19 % of all deaths in Russia were caused by cardiovascular diseases (including heart attacks and strokes), 68 % of deaths from liver cirrhosis, 60 % deaths from pancreatitis, and 61 % of deaths from all external causes, including 67 % of murders and 50 % of suicides, were associated with alcohol (Nemtsov 2003a, 2003b, 2009, 2011). A large proportion of deaths 1 URL: http://www.gks.ru/free_doc/new_site/population/demo/demo21.xls. 2 URL: http://www.gks.ru/wps/wcm/connect/rosstat_main/rosstat/ru/statistics/publications/catalog/doc
_1140086922125. 3 We use the World Bank indicator of Adult Male Mortality Rate (per 1,000 male adults), which is
essentially a standardized mortality coefficient for working-age males. It shows how many 15-year-old males are bound to die before reaching age of 60 if current age-specific mortality rates persist. It reflects much better the situation with mortality in this age-gender group in comparison with the number of deaths per 1,000 working-age men, since the latter figure is too dependent on the age structure. The values of the standardized mortality rate among working-age men in Russia for the period up to 2010 (inclusive) have been taken from the World Bank database (World Bank 2014); as regards the values for 2011 and 2012, we have calculated them on the basis of the data on the age-specific mortality coefficients published in the Russian Fertility and Mortality Data-base (RusFMD) prepared by the New Economic School in Moscow (http://demogr.nes.ru/en/ demogr_indicat/data).
4 See, e.g., Khaltourina and Korotayev 2005, 2006a, 2006b, 2006c, 2008a, 2008c, 2015; Korotayev 2006; Korotayev and Khaltourina 2005, 2006, 2008; Korotayev, Malkov, and Khaltourina 2005.
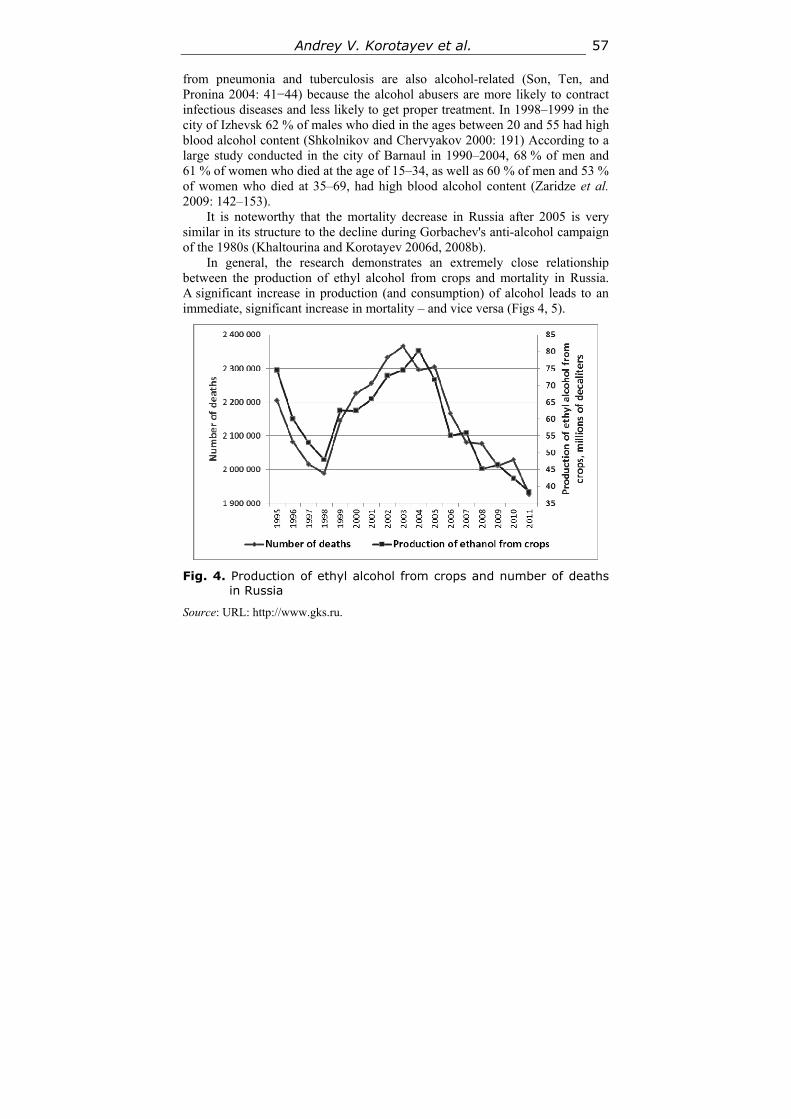
Andrey V. Korotayev et al. 57
from pneumonia and tuberculosis are also alcohol-related (Son, Ten, and Pronina 2004: 41−44) because the alcohol abusers are more likely to contract infectious diseases and less likely to get proper treatment. In 1998–1999 in the city of Izhevsk 62 % of males who died in the ages between 20 and 55 had high blood alcohol content (Shkolnikov and Chervyakov 2000: 191) According to a large study conducted in the city of Barnaul in 1990–2004, 68 % of men and 61 % of women who died at the age of 15–34, as well as 60 % of men and 53 % of women who died at 35–69, had high blood alcohol content (Zaridze et al. 2009: 142–153).
It is noteworthy that the mortality decrease in Russia after 2005 is very similar in its structure to the decline during Gorbachev's anti-alcohol campaign of the 1980s (Khaltourina and Korotayev 2006d, 2008b).
In general, the research demonstrates an extremely close relationship between the production of ethyl alcohol from crops and mortality in Russia. A significant increase in production (and consumption) of alcohol leads to an immediate, significant increase in mortality – and vice versa (Figs 4, 5).
Fig. 4. Production of ethyl alcohol from crops and number of deaths
in Russia
Source: URL: http://www.gks.ru.
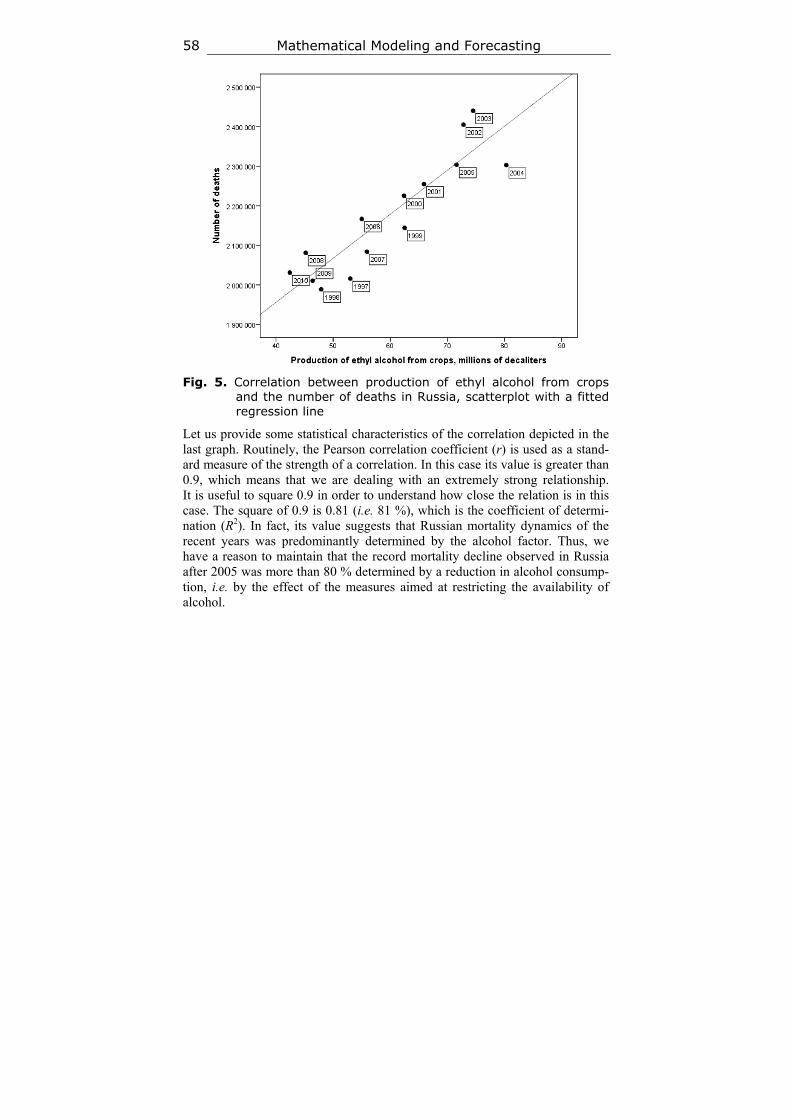
Mathematical Modeling and Forecasting 58
Fig. 5. Correlation between production of ethyl alcohol from crops
and the number of deaths in Russia, scatterplot with a fitted regression line
Let us provide some statistical characteristics of the correlation depicted in the last graph. Routinely, the Pearson correlation coefficient (r) is used as a stand-ard measure of the strength of a correlation. In this case its value is greater than 0.9, which means that we are dealing with an extremely strong relationship. It is useful to square 0.9 in order to understand how close the relation is in this case. The square of 0.9 is 0.81 (i.e. 81 %), which is the coefficient of determi-nation (R2). In fact, its value suggests that Russian mortality dynamics of the recent years was predominantly determined by the alcohol factor. Thus, we have a reason to maintain that the record mortality decline observed in Russia after 2005 was more than 80 % determined by a reduction in alcohol consump-tion, i.e. by the effect of the measures aimed at restricting the availability of alcohol.
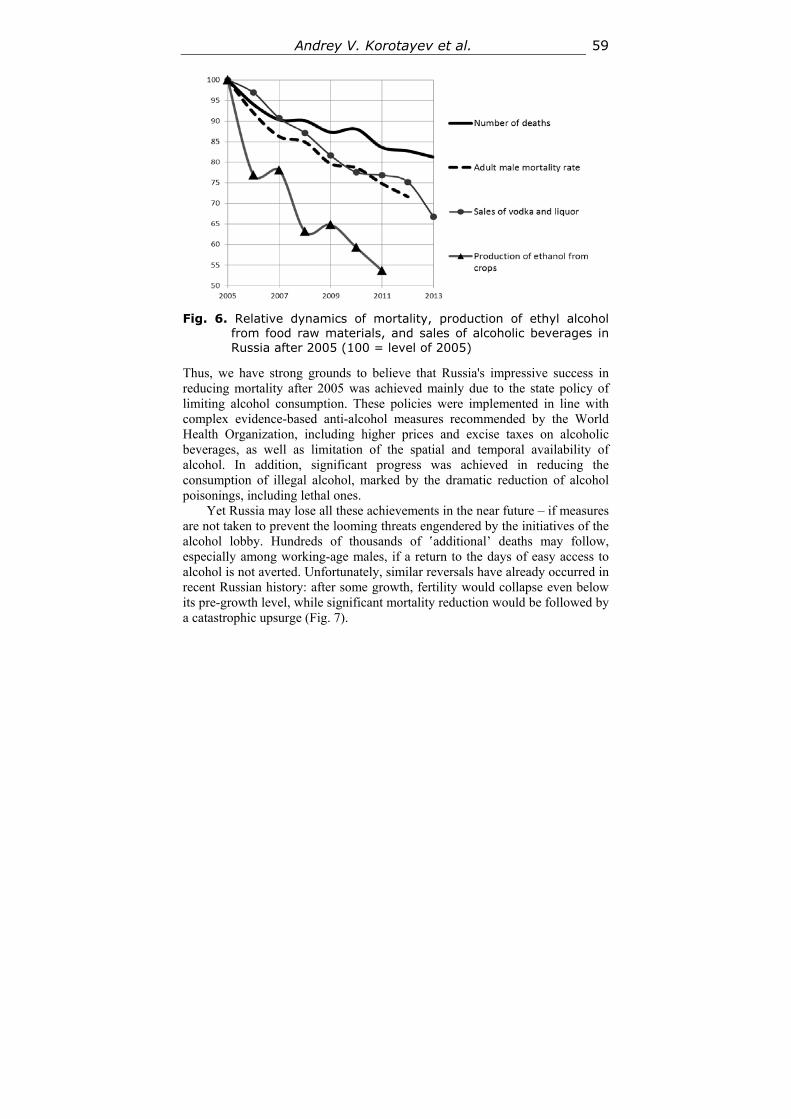
Andrey V. Korotayev et al. 59
Fig. 6. Relative dynamics of mortality, production of ethyl alcohol
from food raw materials, and sales of alcoholic beverages in Russia after 2005 (100 = level of 2005)
Thus, we have strong grounds to believe that Russia's impressive success in reducing mortality after 2005 was achieved mainly due to the state policy of limiting alcohol consumption. These policies were implemented in line with complex evidence-based anti-alcohol measures recommended by the World Health Organization, including higher prices and excise taxes on alcoholic beverages, as well as limitation of the spatial and temporal availability of alcohol. In addition, significant progress was achieved in reducing the consumption of illegal alcohol, marked by the dramatic reduction of alcohol poisonings, including lethal ones.
Yet Russia may lose all these achievements in the near future – if measures are not taken to prevent the looming threats engendered by the initiatives of the alcohol lobby. Hundreds of thousands of ‛additional’ deaths may follow, especially among working-age males, if a return to the days of easy access to alcohol is not averted. Unfortunately, similar reversals have already occurred in recent Russian history: after some growth, fertility would collapse even below its pre-growth level, while significant mortality reduction would be followed by a catastrophic upsurge (Fig. 7).
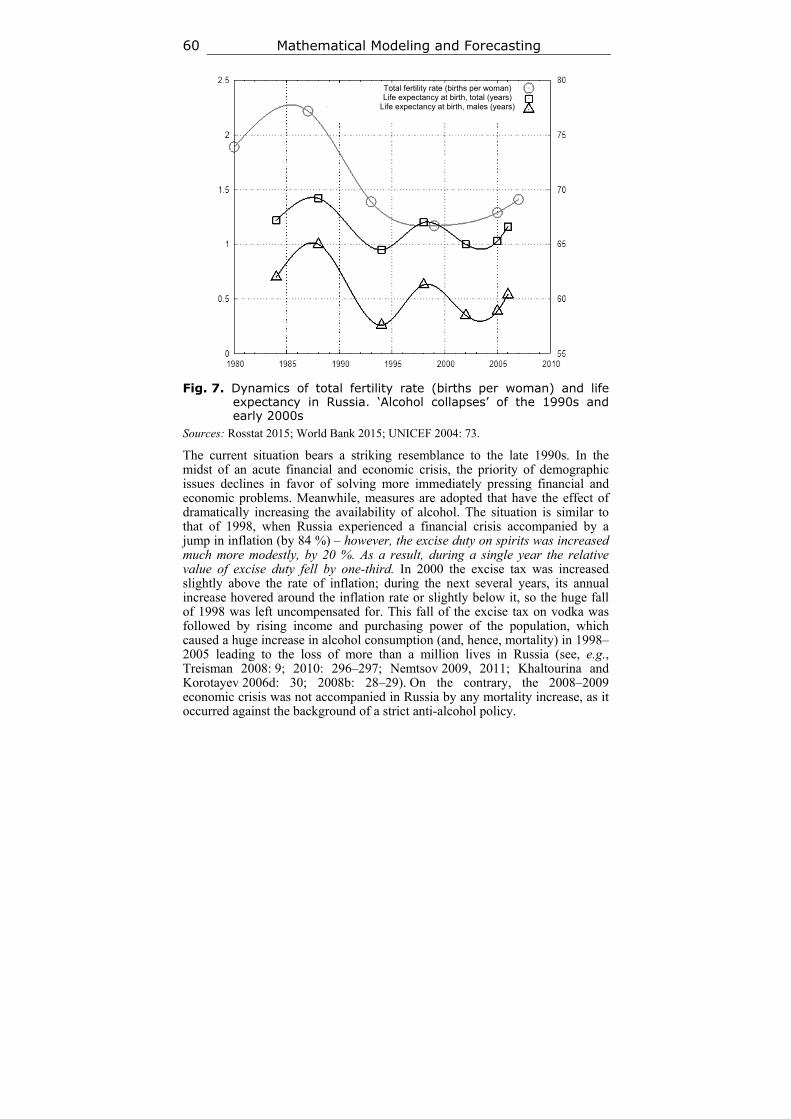
Mathematical Modeling and Forecasting 60
Fig. 7. Dynamics of total fertility rate (births per woman) and life
expectancy in Russia. ‘Alcohol collapses’ of the 1990s and early 2000s
Sources: Rosstat 2015; World Bank 2015; UNICEF 2004: 73.
The current situation bears a striking resemblance to the late 1990s. In the midst of an acute financial and economic crisis, the priority of demographic issues declines in favor of solving more immediately pressing financial and economic problems. Meanwhile, measures are adopted that have the effect of dramatically increasing the availability of alcohol. The situation is similar to that of 1998, when Russia experienced a financial crisis accompanied by a jump in inflation (by 84 %) – however, the excise duty on spirits was increased much more modestly, by 20 %. As a result, during a single year the relative value of excise duty fell by one-third. In 2000 the excise tax was increased slightly above the rate of inflation; during the next several years, its annual increase hovered around the inflation rate or slightly below it, so the huge fall of 1998 was left uncompensated for. This fall of the excise tax on vodka was followed by rising income and purchasing power of the population, which caused a huge increase in alcohol consumption (and, hence, mortality) in 1998–2005 leading to the loss of more than a million lives in Russia (see, e.g., Treisman 2008: 9; 2010: 296–297; Nemtsov 2009, 2011; Khaltourina and Korotayev 2006d: 30; 2008b: 28–29). On the contrary, the 2008–2009 economic crisis was not accompanied in Russia by any mortality increase, as it occurred against the background of a strict anti-alcohol policy.
Total fertility rate (births per woman) Life expectancy at birth, total (years)
Life expectancy at birth, males (years)
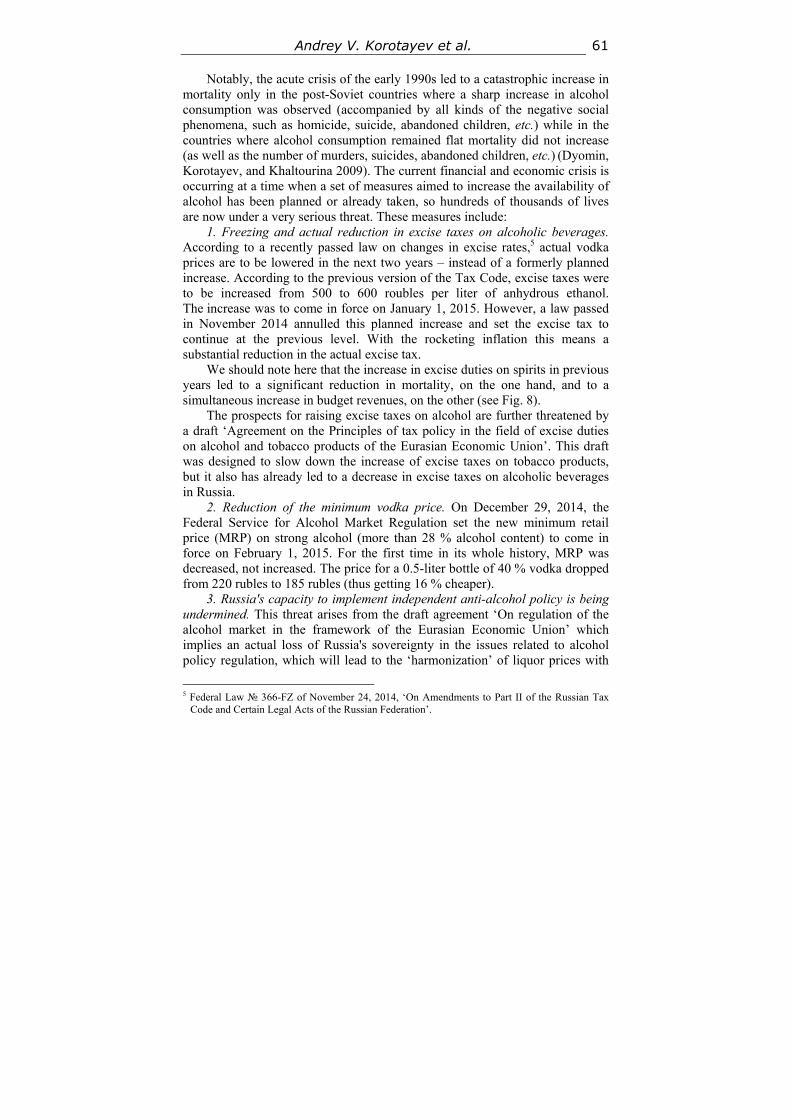
Andrey V. Korotayev et al. 61
Notably, the acute crisis of the early 1990s led to a catastrophic increase in mortality only in the post-Soviet countries where a sharp increase in alcohol consumption was observed (accompanied by all kinds of the negative social phenomena, such as homicide, suicide, abandoned children, etc.) while in the countries where alcohol consumption remained flat mortality did not increase (as well as the number of murders, suicides, abandoned children, etc.) (Dyomin, Korotayev, and Khaltourina 2009). The current financial and economic crisis is occurring at a time when a set of measures aimed to increase the availability of alcohol has been planned or already taken, so hundreds of thousands of lives are now under a very serious threat. These measures include:
1. Freezing and actual reduction in excise taxes on alcoholic beverages. According to a recently passed law on changes in excise rates,5 actual vodka prices are to be lowered in the next two years – instead of a formerly planned increase. According to the previous version of the Tax Code, excise taxes were to be increased from 500 to 600 roubles per liter of anhydrous ethanol. The increase was to come in force on January 1, 2015. However, a law passed in November 2014 annulled this planned increase and set the excise tax to continue at the previous level. With the rocketing inflation this means a substantial reduction in the actual excise tax.
We should note here that the increase in excise duties on spirits in previous years led to a significant reduction in mortality, on the one hand, and to a simultaneous increase in budget revenues, on the other (see Fig. 8).
The prospects for raising excise taxes on alcohol are further threatened by a draft ‘Agreement on the Principles of tax policy in the field of excise duties on alcohol and tobacco products of the Eurasian Economic Union’. This draft was designed to slow down the increase of excise taxes on tobacco products, but it also has already led to a decrease in excise taxes on alcoholic beverages in Russia.
2. Reduction of the minimum vodka price. On December 29, 2014, the Federal Service for Alcohol Market Regulation set the new minimum retail price (MRP) on strong alcohol (more than 28 % alcohol content) to come in force on February 1, 2015. For the first time in its whole history, MRP was decreased, not increased. The price for a 0.5-liter bottle of 40 % vodka dropped from 220 rubles to 185 rubles (thus getting 16 % cheaper).
3. Russia's capacity to implement independent anti-alcohol policy is being undermined. This threat arises from the draft agreement ‘On regulation of the alcohol market in the framework of the Eurasian Economic Union’ which implies an actual loss of Russia's sovereignty in the issues related to alcohol policy regulation, which will lead to the ‘harmonization’ of liquor prices with
5 Federal Law № 366-FZ of November 24, 2014, ‘On Amendments to Part II of the Russian Tax
Code and Certain Legal Acts of the Russian Federation’.
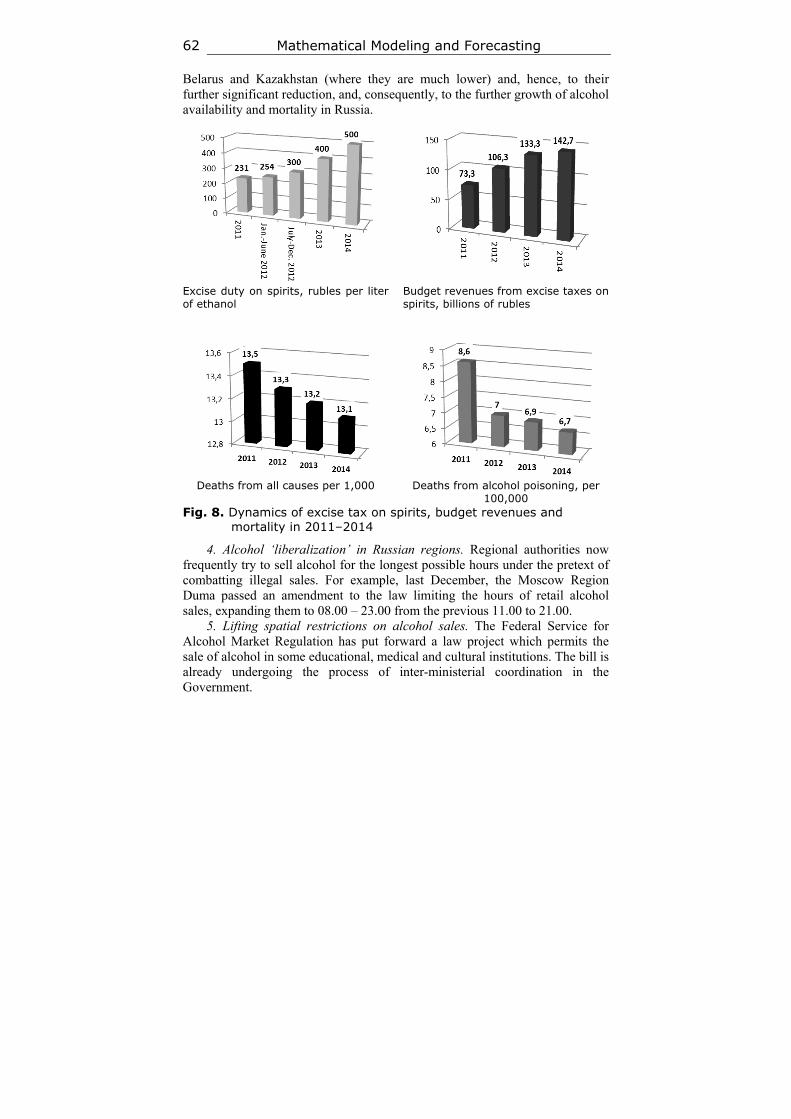
Mathematical Modeling and Forecasting 62
Belarus and Kazakhstan (where they are much lower) and, hence, to their further significant reduction, and, consequently, to the further growth of alcohol availability and mortality in Russia.
Excise duty on spirits, rubles per liter of ethanol
Budget revenues from excise taxes on spirits, billions of rubles
Deaths from all causes per 1,000 Deaths from alcohol poisoning, per
100,000 Fig. 8. Dynamics of excise tax on spirits, budget revenues and
mortality in 2011–2014
4. Alcohol ‘liberalization’ in Russian regions. Regional authorities now frequently try to sell alcohol for the longest possible hours under the pretext of combatting illegal sales. For example, last December, the Moscow Region Duma passed an amendment to the law limiting the hours of retail alcohol sales, expanding them to 08.00 – 23.00 from the previous 11.00 to 21.00.
5. Lifting spatial restrictions on alcohol sales. The Federal Service for Alcohol Market Regulation has put forward a law project which permits the sale of alcohol in some educational, medical and cultural institutions. The bill is already undergoing the process of inter-ministerial coordination in the Government.
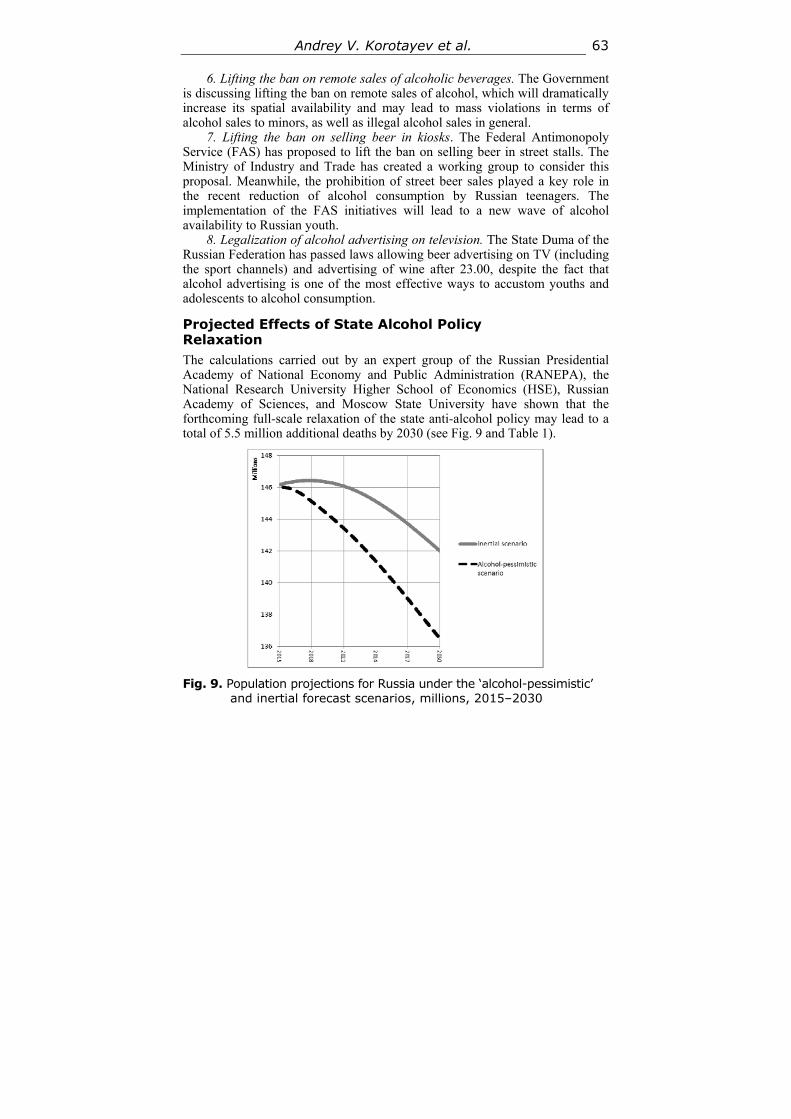
Andrey V. Korotayev et al. 63
6. Lifting the ban on remote sales of alcoholic beverages. The Government is discussing lifting the ban on remote sales of alcohol, which will dramatically increase its spatial availability and may lead to mass violations in terms of alcohol sales to minors, as well as illegal alcohol sales in general.
7. Lifting the ban on selling beer in kiosks. The Federal Antimonopoly Service (FAS) has proposed to lift the ban on selling beer in street stalls. The Ministry of Industry and Trade has created a working group to consider this proposal. Meanwhile, the prohibition of street beer sales played a key role in the recent reduction of alcohol consumption by Russian teenagers. The implementation of the FAS initiatives will lead to a new wave of alcohol availability to Russian youth.
8. Legalization of alcohol advertising on television. The State Duma of the Russian Federation has passed laws allowing beer advertising on TV (including the sport channels) and advertising of wine after 23.00, despite the fact that alcohol advertising is one of the most effective ways to accustom youths and adolescents to alcohol consumption.
Projected Effects of State Alcohol Policy Relaxation The calculations carried out by an expert group of the Russian Presidential Academy of National Economy and Public Administration (RANEPA), the National Research University Higher School of Economics (HSE), Russian Academy of Sciences, and Moscow State University have shown that the forthcoming full-scale relaxation of the state anti-alcohol policy may lead to a total of 5.5 million additional deaths by 2030 (see Fig. 9 and Table 1).
Fig. 9. Population projections for Russia under the ‘alcohol-pessimistic’
and inertial forecast scenarios, millions, 2015–2030
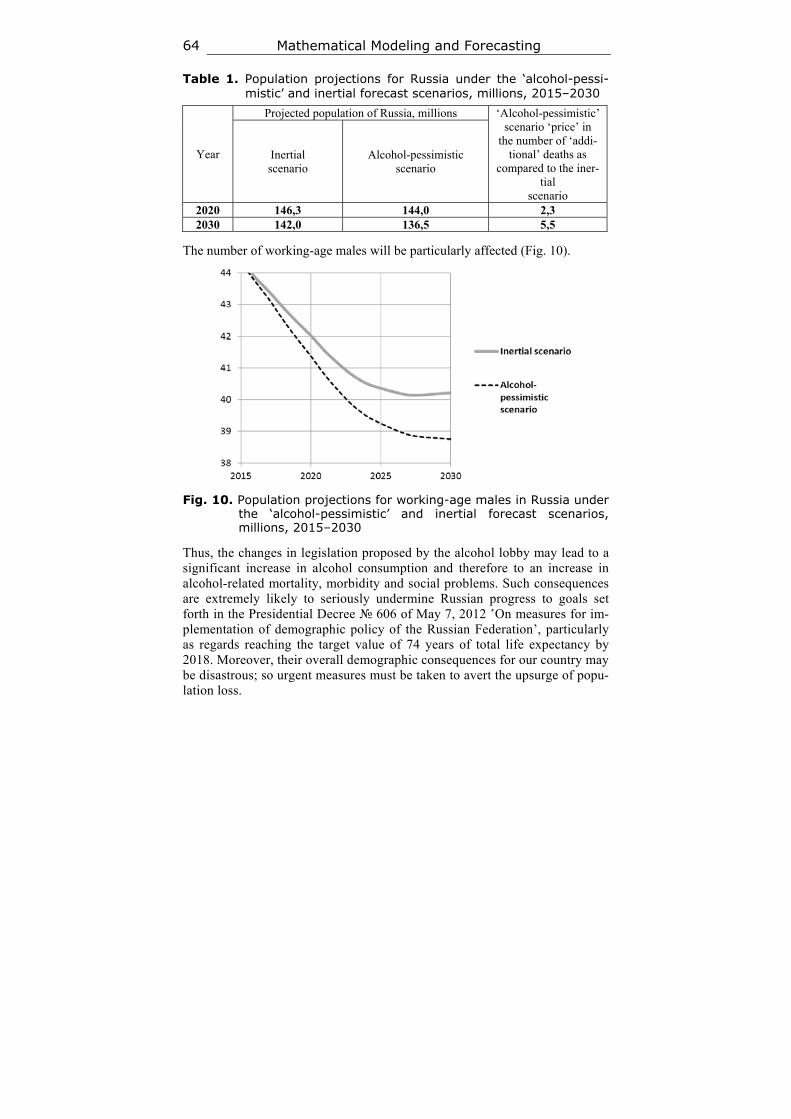
Mathematical Modeling and Forecasting 64
Table 1. Population projections for Russia under the ‘alcohol-pessi-mistic’ and inertial forecast scenarios, millions, 2015–2030
Year
Projected population of Russia, millions ‘Alcohol-pessimistic’ scenario ‘price’ in
the number of ‘addi-tional’ deaths as
compared to the iner-tial
scenario
Inertial scenario
Alcohol-pessimistic scenario
2020 146,3 144,0 2,3 2030 142,0 136,5 5,5
The number of working-age males will be particularly affected (Fig. 10).
Fig. 10. Population projections for working-age males in Russia under
the ‘alcohol-pessimistic’ and inertial forecast scenarios, millions, 2015–2030
Thus, the changes in legislation proposed by the alcohol lobby may lead to a significant increase in alcohol consumption and therefore to an increase in alcohol-related mortality, morbidity and social problems. Such consequences are extremely likely to seriously undermine Russian progress to goals set forth in the Presidential Decree № 606 of May 7, 2012 ‛On measures for im-plementation of demographic policy of the Russian Federation’, particularly as regards reaching the target value of 74 years of total life expectancy by 2018. Moreover, their overall demographic consequences for our country may be disastrous; so urgent measures must be taken to avert the upsurge of popu-lation loss.
Andrey V. Korotayev et al. 65
How to Prevent the Demographic Catastrophe Even if the pending ‘pro-alcohol’ legislative initiatives are simply blocked, life expectancy will not go beyond the current value of 71 years. A simple preservation of the state anti-alcohol policy in itself will not suffice to increase the Russian life expectancies up to 74. For this, we need additional limitations on the availability of alcohol, both in time, in space, and economically. Price availability of alcohol must be seriously curbed. It would no longer suffice to return to the initially planned (starting from January 1, 2015) increase of the excise tax on spirits from 500 to 600 rubles6 (which was derailed by the alcohol lobby). Due to the dramatic inflation jump, the new law should raise the excises not to 600 rubles but at least up to 650 rubles. The ban on the sales of alcohol between 11 p.m. and 8 a.m. should be extended to a bigger time interval between 8 p.m. and 11 a.m. Banning morning alcohol sales has proved highly effective in Nordic countries as this blocks the opportunity to have a morning drink after a hangover (which may often lead to prolonged drinking bouts).
Sales of alcoholic beverages stronger than 15 % are advised to be prohibited in department stores unless separated from other departments with a special entrance. This cuts down on spontaneous purchases, i.e. ‛once entering a shop to buy some bread, one is provoked to purchase some alcohol by seeing it exposed on the shelves’ (Dyomin, Korotayev, and Khaltourina 2009: 47).
We should not exclude the possibility of returning to the state monopoly on retail sales of the strong drinks in Russia. This measure has proven to be a very effective tool for reducing alcohol problems and mortality in Sweden, Iceland, Norway, Finland, Canada, etc. In the USA 19 states also have some form of monopoly on the sale of liquor. In these states alcohol consumption is 14.5 % lower for those aged 14–18, and the frequency of abuse of alcohol by this age group (intake of more than 70 g of ethanol at one time) is 16.7 % lower than in the states without such a monopoly. There is a 9.3 % lower alcohol-impaired driving death rate under age 21 in the monopoly states versus the non-monopoly states (Holder 2007). In the Scandinavian countries such a monopoly allows the sale of alcoholic beverages (usually stronger than 4.7–5 %) only in state stores (except for bar service). In addition such a monopoly helps to fill the state budget. The monopoly countries enjoy higher revenue from the sale of alcoholic beverages than the non-monopoly countries with the same level of economic development (Rehm et al. 2001). A major advantage of the state monopoly on the retail sale of alcoholic beverages is that it minimizes the private interest in maximizing alcohol sales, which in this area often confronts the public interest. An employee of a store belonging to the state has no interest in selling alcohol to minors because his salary does not depend on the store's revenue – while the owner of a private shop may capitalize on it (Ugland 2000).
International experience shows that to maximize health and longevity, national alcohol policy should be regulated by the social branch of the
6 Per liter of anhydrous ethanol.
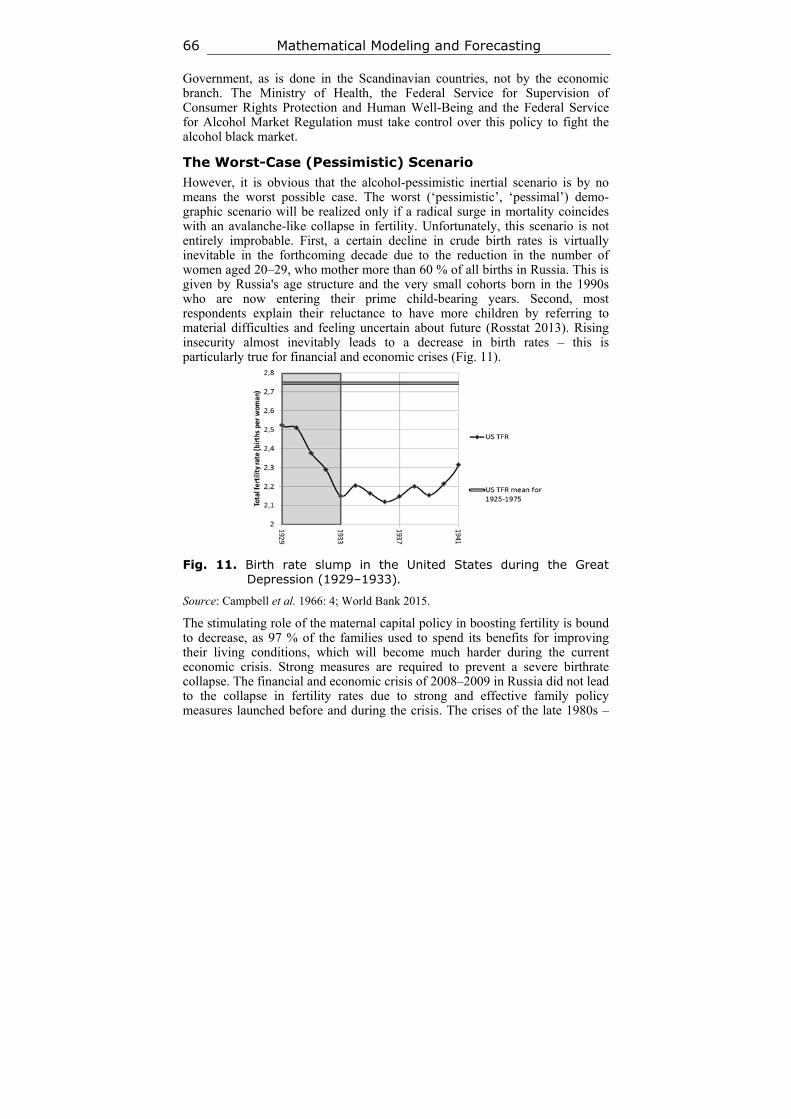
Mathematical Modeling and Forecasting 66
Government, as is done in the Scandinavian countries, not by the economic branch. The Ministry of Health, the Federal Service for Supervision of Consumer Rights Protection and Human Well-Being and the Federal Service for Alcohol Market Regulation must take control over this policy to fight the alcohol black market.
The Worst-Case (Pessimistic) Scenario However, it is obvious that the alcohol-pessimistic inertial scenario is by no means the worst possible case. The worst (‘pessimistic’, ‘pessimal’) demo-graphic scenario will be realized only if a radical surge in mortality coincides with an avalanche-like collapse in fertility. Unfortunately, this scenario is not entirely improbable. First, a certain decline in crude birth rates is virtually inevitable in the forthcoming decade due to the reduction in the number of women aged 20–29, who mother more than 60 % of all births in Russia. This is given by Russia's age structure and the very small cohorts born in the 1990s who are now entering their prime child-bearing years. Second, most respondents explain their reluctance to have more children by referring to material difficulties and feeling uncertain about future (Rosstat 2013). Rising insecurity almost inevitably leads to a decrease in birth rates – this is particularly true for financial and economic crises (Fig. 11).
Fig. 11. Birth rate slump in the United States during the Great Depression (1929–1933).
Source: Campbell et al. 1966: 4; World Bank 2015.
The stimulating role of the maternal capital policy in boosting fertility is bound to decrease, as 97 % of the families used to spend its benefits for improving their living conditions, which will become much harder during the current economic crisis. Strong measures are required to prevent a severe birthrate collapse. The financial and economic crisis of 2008–2009 in Russia did not lead to the collapse in fertility rates due to strong and effective family policy measures launched before and during the crisis. The crises of the late 1980s –
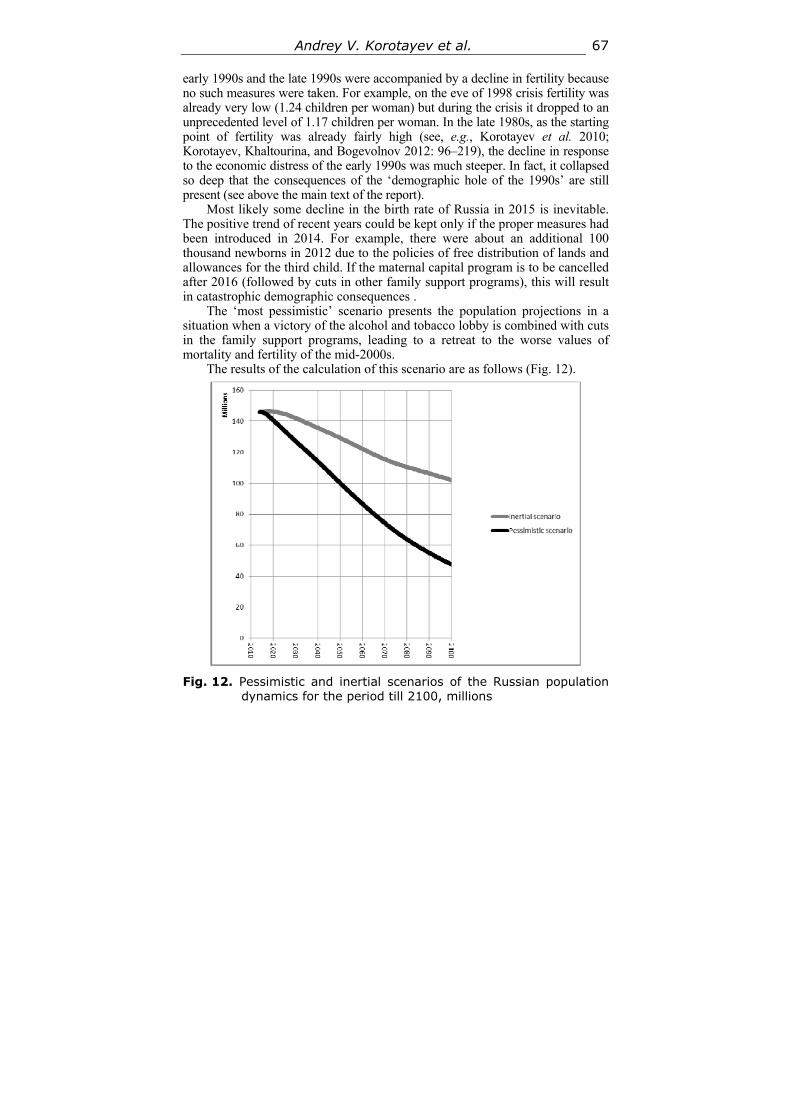
Andrey V. Korotayev et al. 67
early 1990s and the late 1990s were accompanied by a decline in fertility because no such measures were taken. For example, on the eve of 1998 crisis fertility was already very low (1.24 children per woman) but during the crisis it dropped to an unprecedented level of 1.17 children per woman. In the late 1980s, as the starting point of fertility was already fairly high (see, e.g., Korotayev et al. 2010; Korotayev, Khaltourina, and Bogevolnov 2012: 96–219), the decline in response to the economic distress of the early 1990s was much steeper. In fact, it collapsed so deep that the consequences of the ‘demographic hole of the 1990s’ are still present (see above the main text of the report).
Most likely some decline in the birth rate of Russia in 2015 is inevitable. The positive trend of recent years could be kept only if the proper measures had been introduced in 2014. For example, there were about an additional 100 thousand newborns in 2012 due to the policies of free distribution of lands and allowances for the third child. If the maternal capital program is to be cancelled after 2016 (followed by cuts in other family support programs), this will result in catastrophic demographic consequences .
The ‘most pessimistic’ scenario presents the population projections in a situation when a victory of the alcohol and tobacco lobby is combined with cuts in the family support programs, leading to a retreat to the worse values of mortality and fertility of the mid-2000s.
The results of the calculation of this scenario are as follows (Fig. 12).
Fig. 12. Pessimistic and inertial scenarios of the Russian population
dynamics for the period till 2100, millions
Mathematical Modeling and Forecasting 68
Thus, if no strategic priority is given to socio-demographic policy, this result may well lead to the end of geopolitical career of Russia by the end of the century.
Possible Demographic Effect of a Full-Scale Family Policy Consuming Not Less than 3 % of GDP It is also possible to model the effect of developing a high-priority demographic policy structure that would aim to reach Western European levels of fertility, closer to the replacement rate of two children per woman. This effect was modeled by a smooth (for 10 years) transition of age-specific fertility rates by 2020 in Russia to the level of France in 2012 (corresponding to TFR = 2.0), while preserving Russia's age-specific mortality at the level of 2012.
According to international studies and best practice, the most effective measures to improve fertility include a combination of allowances, tax benefits, programs and legislation supporting parents in combining parenting and employment, including access to kindergartens, nurseries, nannies and flexible schedules for employees with family responsibilities. During a crisis the measures stimulating economic activity of parents may be more effective in boosting fertility than cash transfers. An effective system of care for children is also one of the most effective policy measures to support the birth rate. Of all the types of expenditures in OECD the costs of services for child care (namely kindergartens, nursery nurses and payment) correlate the best with the level of fertility. It is extremely important for the child care system to develop a network of services for the care of the youngest children (under 3 years). Comparative analysis shows that all of the most demographically successful countries in Europe have built a wide covering system of free or subsidized services for the care of children under 3 years old. There are not enough kindergartens in Russia and the youngest children are not a priority group. Only 58 % of Russian children under 6 had access to preschool education facilities in contrast with 90 % in France. A set of housing support measures such as subsidized rental housing for young and large families, development of housing and savings cooperatives, as well as substantial subsidies of mortgage rates for families with children may also improve fertility.
The corresponding ‘high demographic priority’ forecast of population of the Russian Federation (as compared to the inertial scenario) is as follows (Fig. 13).
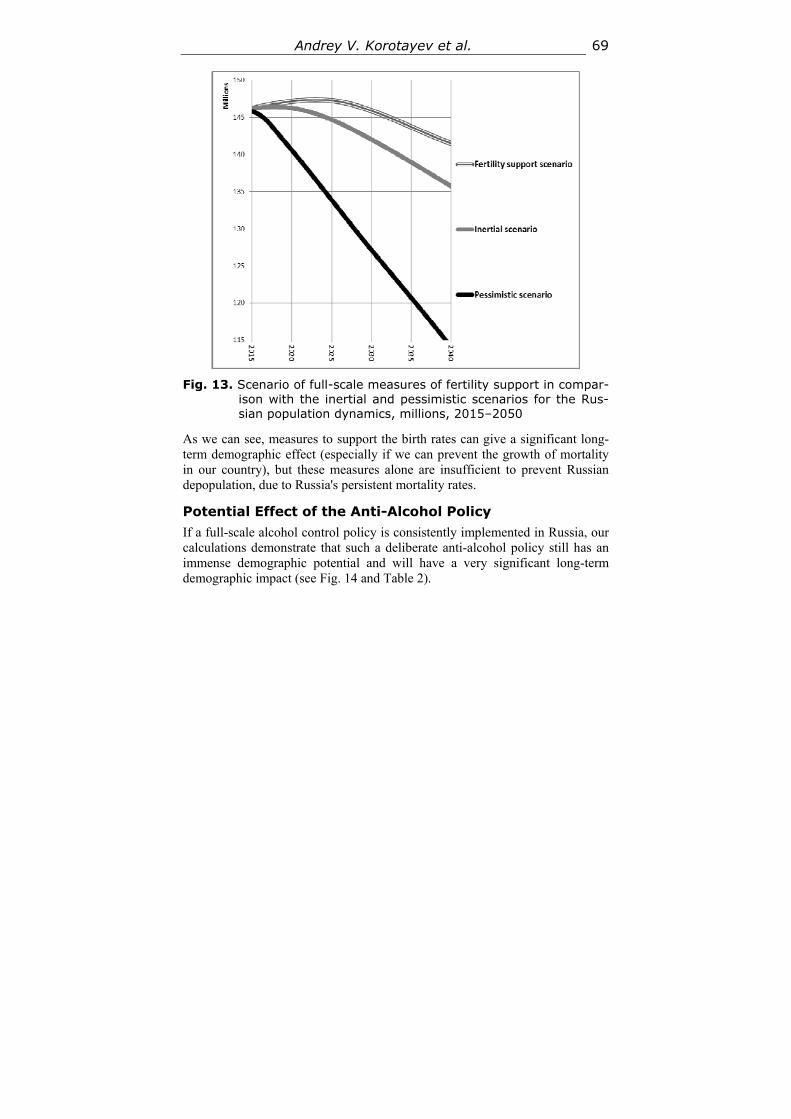
Andrey V. Korotayev et al. 69
Fig. 13. Scenario of full-scale measures of fertility support in compar-
ison with the inertial and pessimistic scenarios for the Rus-sian population dynamics, millions, 2015–2050
As we can see, measures to support the birth rates can give a significant long-term demographic effect (especially if we can prevent the growth of mortality in our country), but these measures alone are insufficient to prevent Russian depopulation, due to Russia's persistent mortality rates.
Potential Effect of the Anti-Alcohol Policy If a full-scale alcohol control policy is consistently implemented in Russia, our calculations demonstrate that such a deliberate anti-alcohol policy still has an immense demographic potential and will have a very significant long-term demographic impact (see Fig. 14 and Table 2).
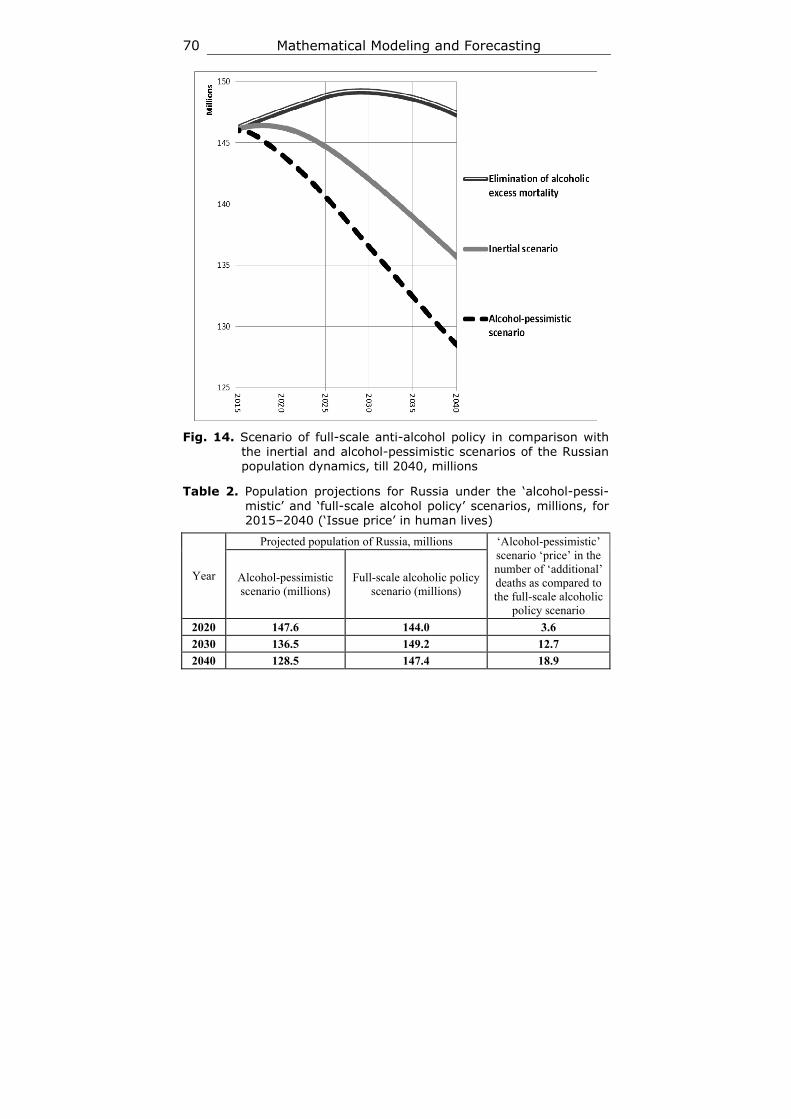
Mathematical Modeling and Forecasting 70
Fig. 14. Scenario of full-scale anti-alcohol policy in comparison with
the inertial and alcohol-pessimistic scenarios of the Russian population dynamics, till 2040, millions
Table 2. Population projections for Russia under the ‘alcohol-pessi-mistic’ and ‘full-scale alcohol policy’ scenarios, millions, for 2015–2040 (‘Issue price’ in human lives)
Year
Projected population of Russia, millions ‘Alcohol-pessimistic’ scenario ‘price’ in the number of ‘additional’ deaths as compared to the full-scale alcoholic
policy scenario
Alcohol-pessimistic scenario (millions)
Full-scale alcoholic policy scenario (millions)
2020 147.6 144.0 3.6
2030 136.5 149.2 12.7
2040 128.5 147.4 18.9
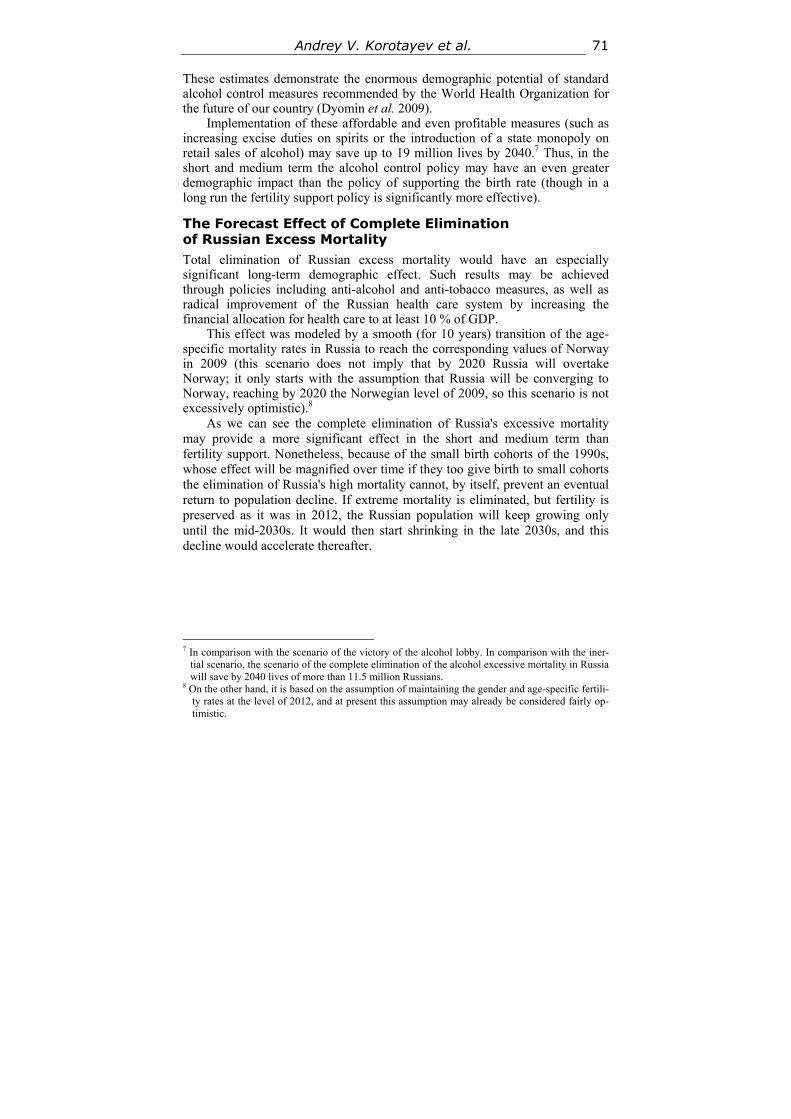
Andrey V. Korotayev et al. 71
These estimates demonstrate the enormous demographic potential of standard alcohol control measures recommended by the World Health Organization for the future of our country (Dyomin et al. 2009).
Implementation of these affordable and even profitable measures (such as increasing excise duties on spirits or the introduction of a state monopoly on retail sales of alcohol) may save up to 19 million lives by 2040.7 Thus, in the short and medium term the alcohol control policy may have an even greater demographic impact than the policy of supporting the birth rate (though in a long run the fertility support policy is significantly more effective).
The Forecast Effect of Complete Elimination of Russian Excess Mortality Total elimination of Russian excess mortality would have an especially significant long-term demographic effect. Such results may be achieved through policies including anti-alcohol and anti-tobacco measures, as well as radical improvement of the Russian health care system by increasing the financial allocation for health care to at least 10 % of GDP.
This effect was modeled by a smooth (for 10 years) transition of the age-specific mortality rates in Russia to reach the corresponding values of Norway in 2009 (this scenario does not imply that by 2020 Russia will overtake Norway; it only starts with the assumption that Russia will be converging to Norway, reaching by 2020 the Norwegian level of 2009, so this scenario is not excessively optimistic).8
As we can see the complete elimination of Russia's excessive mortality may provide a more significant effect in the short and medium term than fertility support. Nonetheless, because of the small birth cohorts of the 1990s, whose effect will be magnified over time if they too give birth to small cohorts the elimination of Russia's high mortality cannot, by itself, prevent an eventual return to population decline. If extreme mortality is eliminated, but fertility is preserved as it was in 2012, the Russian population will keep growing only until the mid-2030s. It would then start shrinking in the late 2030s, and this decline would accelerate thereafter.
7 In comparison with the scenario of the victory of the alcohol lobby. In comparison with the iner-
tial scenario, the scenario of the complete elimination of the alcohol excessive mortality in Russia will save by 2040 lives of more than 11.5 million Russians.
8 On the other hand, it is based on the assumption of maintaining the gender and age-specific fertili-ty rates at the level of 2012, and at present this assumption may already be considered fairly op-timistic.
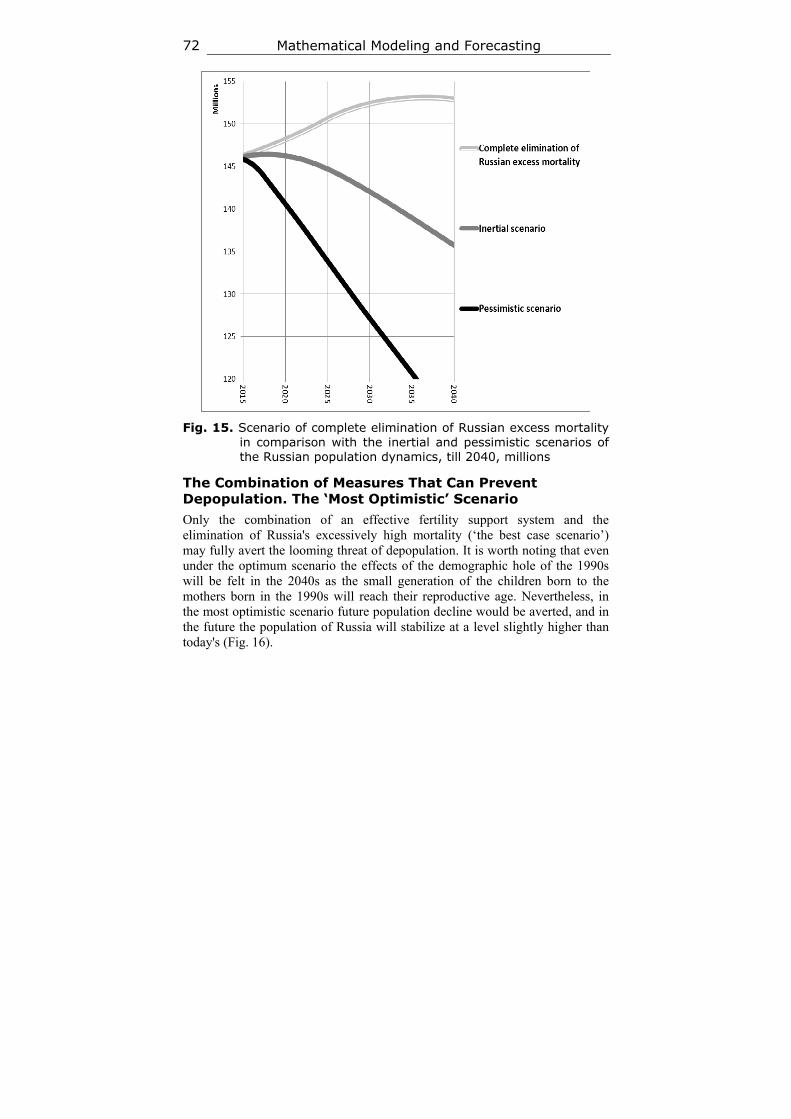
Mathematical Modeling and Forecasting 72
Fig. 15. Scenario of complete elimination of Russian excess mortality in comparison with the inertial and pessimistic scenarios of the Russian population dynamics, till 2040, millions
The Combination of Measures That Can Prevent Depopulation. The ‘Most Optimistic’ Scenario Only the combination of an effective fertility support system and the elimination of Russia's excessively high mortality (‘the best case scenario’) may fully avert the looming threat of depopulation. It is worth noting that even under the optimum scenario the effects of the demographic hole of the 1990s will be felt in the 2040s as the small generation of the children born to the mothers born in the 1990s will reach their reproductive age. Nevertheless, in the most optimistic scenario future population decline would be averted, and in the future the population of Russia will stabilize at a level slightly higher than today's (Fig. 16).
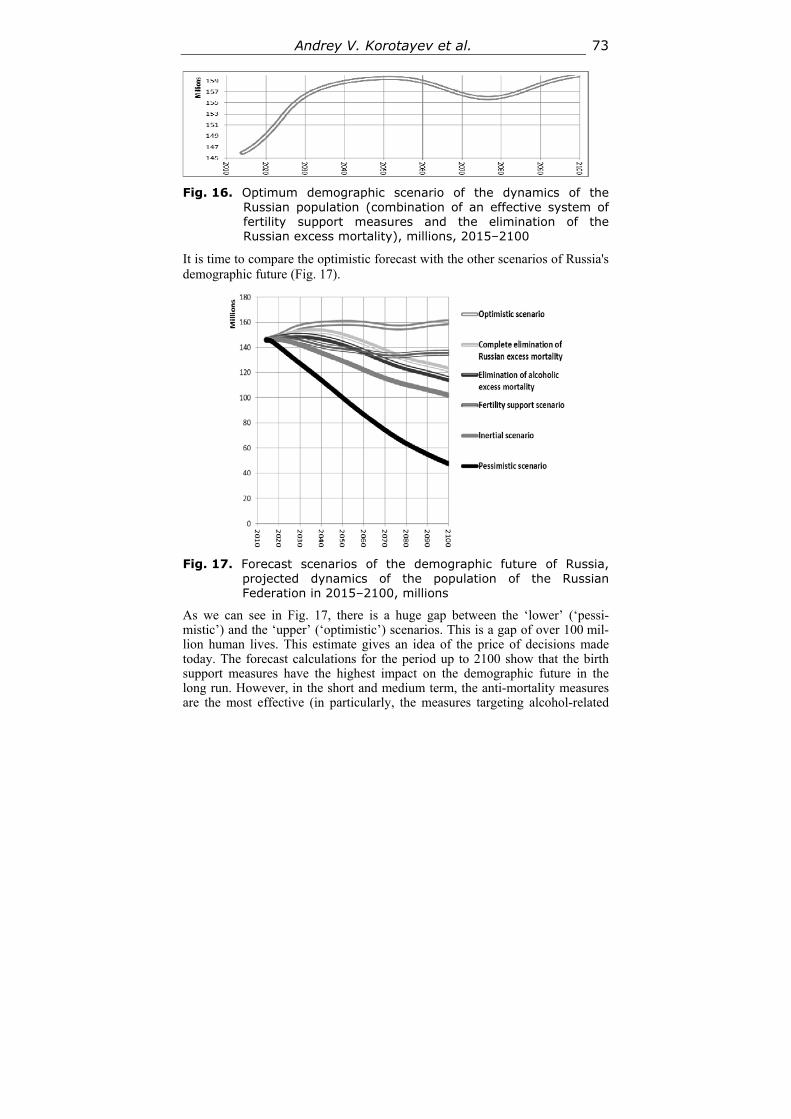
Andrey V. Korotayev et al. 73
Fig. 16. Optimum demographic scenario of the dynamics of the
Russian population (combination of an effective system of fertility support measures and the elimination of the Russian excess mortality), millions, 2015–2100
It is time to compare the optimistic forecast with the other scenarios of Russia's demographic future (Fig. 17).
Fig. 17. Forecast scenarios of the demographic future of Russia, projected dynamics of the population of the Russian Federation in 2015–2100, millions
As we can see in Fig. 17, there is a huge gap between the ‘lower’ (‘pessi-mistic’) and the ‘upper’ (‘optimistic’) scenarios. This is a gap of over 100 mil-lion human lives. This estimate gives an idea of the price of decisions made today. The forecast calculations for the period up to 2100 show that the birth support measures have the highest impact on the demographic future in the long run. However, in the short and medium term, the anti-mortality measures are the most effective (in particularly, the measures targeting alcohol-related
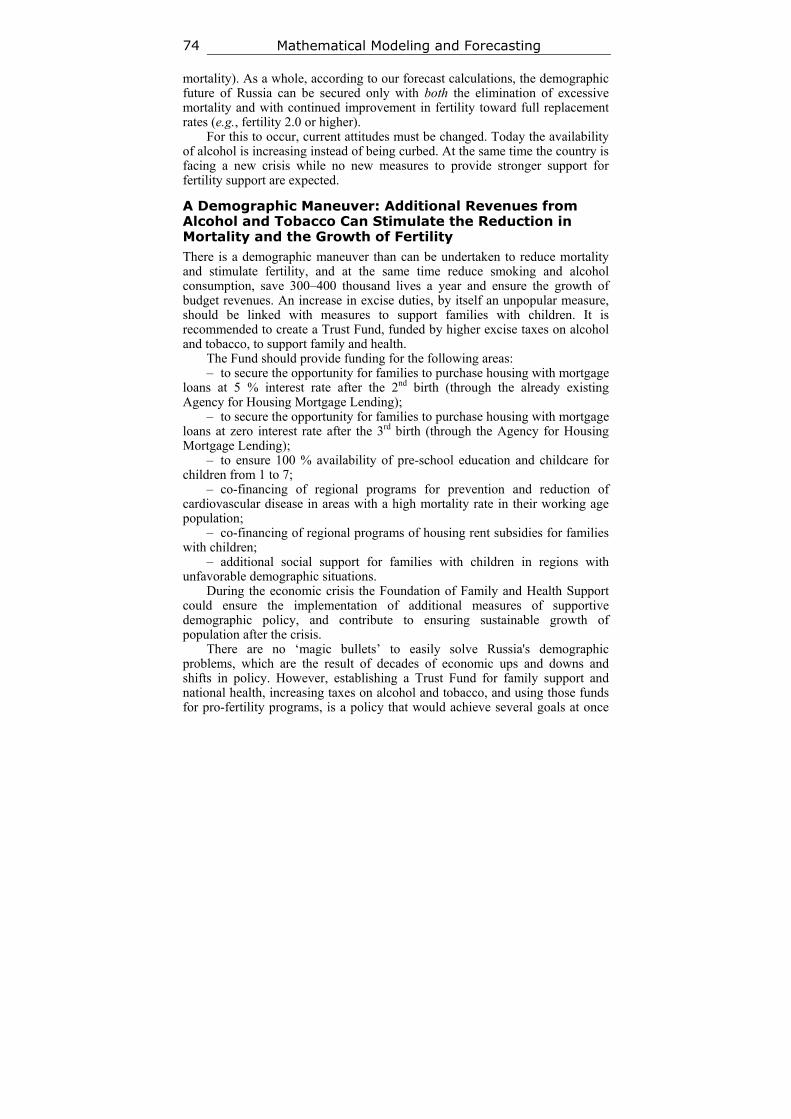
Mathematical Modeling and Forecasting 74
mortality). As a whole, according to our forecast calculations, the demographic future of Russia can be secured only with both the elimination of excessive mortality and with continued improvement in fertility toward full replacement rates (e.g., fertility 2.0 or higher).
For this to occur, current attitudes must be changed. Today the availability of alcohol is increasing instead of being curbed. At the same time the country is facing a new crisis while no new measures to provide stronger support for fertility support are expected.
A Demographic Maneuver: Additional Revenues from Alcohol and Tobacco Can Stimulate the Reduction in Mortality and the Growth of Fertility There is a demographic maneuver than can be undertaken to reduce mortality and stimulate fertility, and at the same time reduce smoking and alcohol consumption, save 300–400 thousand lives a year and ensure the growth of budget revenues. An increase in excise duties, by itself an unpopular measure, should be linked with measures to support families with children. It is recommended to create a Trust Fund, funded by higher excise taxes on alcohol and tobacco, to support family and health.
The Fund should provide funding for the following areas: – to secure the opportunity for families to purchase housing with mortgage
loans at 5 % interest rate after the 2nd birth (through the already existing Agency for Housing Mortgage Lending);
– to secure the opportunity for families to purchase housing with mortgage loans at zero interest rate after the 3rd birth (through the Agency for Housing Mortgage Lending);
– to ensure 100 % availability of pre-school education and childcare for children from 1 to 7;
– co-financing of regional programs for prevention and reduction of cardiovascular disease in areas with a high mortality rate in their working age population;
– co-financing of regional programs of housing rent subsidies for families with children;
– additional social support for families with children in regions with unfavorable demographic situations.
During the economic crisis the Foundation of Family and Health Support could ensure the implementation of additional measures of supportive demographic policy, and contribute to ensuring sustainable growth of population after the crisis.
There are no ‘magic bullets’ to easily solve Russia's demographic problems, which are the result of decades of economic ups and downs and shifts in policy. However, establishing a Trust Fund for family support and national health, increasing taxes on alcohol and tobacco, and using those funds for pro-fertility programs, is a policy that would achieve several goals at once
Andrey V. Korotayev et al. 75
without imposing additional cost on the current budget. It would also focus attention on long-term planning to resolve the problems that threaten Russia's demographic future.
As the earlier sections of the present article have shown, Russia enjoyed great success with its policies to promote fertility and reduce mortality in the last seven years. However, it would be a foolish and costly mistake to believe those successes had ‘solved’ Russia's long-term demographic problems. Quite the reverse; they were only a promising ‘down payment’ on the policies needed to truly put Russia's long-term demographic future on a secure course. Without continuing and expanding the present policies, that future security will dissolve. Worse yet, the policies currently being considered to boost access to alcohol will almost certainly reverse recent progress and set Russia back upon a path of inevitable demographic decay.
Appendix. Calculation Methodology We have based our population projections on the standard methodology of building demographic forecasts (see, e.g., Andreev and Vishnevsky 2008: 265–288; Belotelov et al. 2001: 43–51; Pavlovsky et al. 2005). The calculations were made on an annual basis. At step one, an equation (1) is used to calculate the number of the dead based on annual mortality ratios and migration inflow. The age structure was modified in accordance with the calculation. At step two (equations (2F) and (2M)), the number of infants is calculated based on childbirths and infant survival rate and migrations (migrants with infants). Based on the current age structure, the number of women is calculated for each 5-year group. The number of babies is calculated for each group using age fertility ratios and then summed up. We assumed that 100 girls are born per 105 boys. Then the age structure is moved ‘down’ to the previous year and the number of babies is recorded at the very beginning. The time calculator is increased by one year and then the calculation is repeated (step one and then step two).
Preparation of source data. Source data for birthrates were calculated based on age (5-year groups) fertility ratios and target values (Rosstat 2015) by linear interpolation. A similar procedure (Human Mortality Database)9 was performed for mortality and migration. 10
We took as source data the age and sex structure for 2010 (Rosstat). The calculation started from 2010.
The drawback of the Demographic Concept is that mortality is recorded in relative units. We used age and sex mortality per 1,000 people as a demographic indicator for actual calculations.
9 URL: http://www.mortality.org/hmd/RUS/STATS/Mx_1x1.txt. 10 Our calculations are based on estimates of the demographic structure of migration flow kindly
provided to us by Andreev; it is similar to the ones used by Andreev and Vishnevsky in their pro-jections of the demographic development of Russia until 2050.
Mathematical Modeling and Forecasting 76
Equations used for calculations are as follows:
,
, , ,,
2 1, 1, 1, 1 , ,
2 , 1M F
M F M F M FM F
d tu t u t m t
d t
(Eq. 1)
49 4
015 0
5
1000, 1 , 1 , 1 0, 1 ,
205F F F Fu t L t b t u t m t
(Eq. 2F)
49 4
015 0
5
1050, 1 , 1 , 1 0, 1 ,
205M M F Mu t L t b t u t m t
(Eq. 2M)
where t – time variable (in this case one year);τ – lower band of the age group ;uM, F (τ, t)
– number of persons (hereinafter lower indices mean M – men, F – women) aged from τ to τ + 1 years at the moment of time t;
,M Fu (τ, t)
– annual average number of persons (hereinafter lower indi-ces mean M – men, F – women) aged from τ to τ + 1 years at the moment of time t;
b(τ, t) – age specific birth rates, women, age from τ to τ + 4 (i. е. by 5-year groups) at the moment of time t;
dM, F (τ, t)
– age specific mortality rate, age from τ to τ + 1 at the mo-ment of time t;
mM, F (τ, t)
– number of migrants (arrived in the country), this number (generally) may be negative in case of population outflow from the country;
LM0, F0 (t) – infants survival function at time t.Equation (1) describes shift of the age structure by one year (due to
mortality and migration), equations (2F) and (2M) describe the ‘source’ (i.e. number of babies).
References
Andreev E., and Vishnevsky A. 2008. Demographic Prospects of Russia till 2050. Russia's Population 2006 / Ed. by A. Vishnevsky, pp. 265–288. Moscow: Vysshaya shkola ekonomiki. In Russian (Андреев Е., Вишневский А. Демографическое перспективы России до 2050 г. Население России 2006 / Ред. А. Вишневский, с. 265–288. М.: Высшая школа экономики).
Arkhangelsky V. N., Bozhevolnov Yu. V., Goldstone J., Zvereva N. V., Zinkina Yu. V., Korotayev A. V., Malkov A. S., Rybalchenko S. I., Ryazantsev S. V., Steck P., Khaltourina D. A., Shulgin S. G., and Yuryev Y. L. 2014. It Will Be Late in 10 Years. Population Policy of the Russian Federation: Challenges and Scenarios. Moscow: Institut nauchno-obschestvennoy ekspertizy – RANKhiGS pri Prezidente RF – Rabochaya gruppa ‘Semeynaya politika i detstvo’ Ekspertnogo soveta pri Pravitelstve RF. In Russian (Архангельский В. Н., Божевольнов Ю. В., Голдстоун
Andrey V. Korotayev et al. 77
Д., Зверева Н. В., Зинькина Ю. В., Коротаев А. В., Малков А. С., Рыбальченко С. И., Рязанцев С. В., Стек Ф., Халтурина Д. А., Шульгин С. Г., Юрьев Е. Л. Через 10 лет будет поздно. Демографическая политика Российской Федера-ции: вызовы и сценарии. М.: Институт научно-общественной экспертизы – РАНХиГС при Президенте РФ – Рабочая группа ‘Семейная политика и дет-ство’ Экспертного совета при Правительстве РФ).
Arkhangelsky V., Bogevolnov Yu., Goldstone J., Khaltourina D., Korotayev A., Malkov A., Novikov K., Ryazantsev S., Rybalchenko S., Shulgin S., Steck P., Yuriev Y., Zinkina J., Zvereva N. 2015. Critical 10 Years. Demographic Policies of the Russian Federation: Successes and Challenges. Moscow: Russian Presidential Academy Of National Economy and Public Administration (RANEPA).
Belotelov N. V. et al. 2001. Ecological, Social and Economic Imitating Model: Human and Informational Aspects. Informatsionnoye obshchestvo 6: 43–51. In Russian (Бе-лотелов Н. В. и др. Эколого-социально-экономическая имитационная модель: гуманитарный и информационный аспекты. Информационное общество 6: 43–51).
Campbell A. A., Clague A., Godley F., and Rosenberg H. M. 1966. Natality Statistics Analysis. Washington, DC: U.S. Department of Health, Education, and Welfare (Na-tional Center for Health Statistics Series 21/8).
Dyomin A. K., Korotayev A. V., and Khaltourina D. A. 2009. Alcohol Abuse in the Russian Federation: Socioeconomic Consequences and Counteraction Measures. Report of the Public Chamber of the Russian Federation. Moscow: Obshchestven-naya Palata Rossiyskoy Federatsii. In Russian (Демин А. К., Коротаев А. В., Хал-турина Д. А. Злоупотребление алкоголем в Российской Федерации: социально-экономические последствия и меры противодействия. Доклад общественной палаты Российской Федерации. М.: Общественная Палата РФ).
Holder H. D. 2007. Alcohol Monopolies and Public Health. Evidence from In-ternational Research. Paper presented at the International Seminar on Alcohol Retail Monopolies. Stockholm, 27–29 August.
Khaltourina D. A., and Korotayev A. V. 2005. Russian Demographic Crisis: Factors, Models, Counter-crisis Measures. Mathematical Modeling of Social Dynamics / Ed. by S. Yu. Malkov, pp. 117–191. Мoscow: KomKniga/URSS. In Russian (Хал-турина Д. А., Коротаев А. В. Российский демографический кризис: факторы, модели, пути решения. Математическое моделирование социальной динамики / Ред. С. Ю. Малков, с. 117–191. М.: KomKniga/URSS.
Khaltourina D. A., and Korotayev A. V. 2006a. Alcohol and Narcotics as Factors of Demographic Crisis. Sotsiologicheskiye issledovaniya 7: 104–112. In Russian (Хал-турина Д. А., Коротаев А. В. Алкоголь и наркотики как фактор демографиче-ского кризиса. Социологические исследования 7: 104–112).
Khaltourina D. A., and Korotayev A. V. 2006b. Alcohol and Narcotics as the Major Factors of Demographic Crisis in Russia. Narkologiya 8: 41–57. In Russian (Халту-рина Д. А., Коротаев А. В. Алкоголь и наркотики как важнейшие факторы де-мографического кризиса. Наркология 8: 41–57).
Khaltourina D. A., and Korotayev A. V. 2006c. Potential of Alcohol Policy as a Fac-tor of Bringing down the Mortality in Russia. Mortality in Countries of the Former USSR. Fifteen Years after Break-up: Change or Continuity? / Ed. by J. Vallin, pp. 243–259. Kiev: Institute for Demographic and Social Studies.
Mathematical Modeling and Forecasting 78
Khaltourina D. A., and Korotayev A. V. 2006d. Russian Cross. Factors, Mechanisms and Pathways of Overcoming Demographic Crisis in Russia. Moscow KomKni-ga/URSS. In Russian (Халтурина Д. А., Коротаев А. В. Русский крест. Факторы, механизмы и пути преодоления демографического кризиса в России. M.: Ком-Книга/УРСС).
Khaltourina D. A., and Korotayev A. V. 2008a. Alcohol and Narcotics as Factors of the Demographic Crisis. Sociological Research 47(3): 18–31.
Khaltourina D. A., and Korotayev A. V. 2008b. Introduction. How to Stop Depopula-tion of Russia. Alcohol Catastrophe. Potential for State Policies to Surmount the Al-cohol Mortality in Russia / Ed. by D. A. Khaltourina, and A. V. Korotayev, pp. 5–58. Moscow: Lenand/URSS. In Russian (Халтурина Д. А., Коротаев А. В. Введение. Алкогольная катастрофа: Как остановить вымирание в России. Ал-когольная катастрофа. Возможности государственной политики в преодоле-нии алкогольной смертности в России / Ред. Д. А. Халтурина, А. В. Коротаев, с. 5–58. М.: Ленанд/УРСС).
Khaltourina D. A., and Korotayev A. V. 2008c. Potential for Alcohol Policy to De-crease the Mortality Crisis in Russia. Evaluation & the Health Professions 31(3): 272–281.
Khaltourina D. A., and Korotayev A. V. 2015. Effects of Specific Alcohol Control Policy Measures on Alcohol-Related Mortality in Russia from 1998 to 2013. Alco-hol and Alcoholism 50(5): 588–601.
Korotayev A. V. 2006. Vodka Pattern of Alcohol Consumption as a Factor of Prema-ture Death in Russia. Premature and Preventable Mortality in Russia. Criteria of Population Health Loss / Ed. by V. I. Starodubov, pp. 223–228. Moscow: RIO TsNIIOIZ. In Russian (Коротаев А. В. Водочная культура потребления алкоголя как фактор преждевременной смертности в России. Преждевременная и предотвратимая смертность в России. Критерии потери здоровья населения / Ред. В. И. Стародубов, с. 223–228. М.: РИО ЦНИИОИЗ).
Korotayev А. V, and Bogevolnov J. V. 2012. Scenarios of the Demographic Future of Russia. Modeling and Forecasting of Global, Regional and National Development / Ed. by A. A. Akaev, A. V. Korotayev, G. G. Malinetsky, pp. 436–461. Мoscow: LIBROKOM/URSS. In Russian (Коротаев А. В., Божевольнов Ю. В. Сценарии демографического будущего России. Моделирование и прогнозирование гло-бального, регионального и национального развития / Отв. ред. А. А. Акаев, А. В. Коротаев, Г. Г. Малинецкий, С. Ю. Малков, с. 436–461. М.: ЛИБРОКОМ/ URSS).
Korotayev A. V., and Khaltourina D. A. 2005. Alcoholism, Narcotic Abuse and De-mographic Crisis in Russia and World. Rossiya i sovremenniy mir 1: 77–90. In Rus-sian (Коротаев А. В., Халтурина Д. А. Алкоголизм, наркомания и демографи-ческий кризис в России и мире. Россия и современный мир 1: 77–90).
Korotayev A. V., and Khaltourina D. A. 2006. Alcoholization and Narcotization as Major Factors of Demographic Crisis in Russia. Voprosy sotsialnogo obespecheniya 23: 5–16. In Russian (Коротаев А. В., Халтурина Д. А. Алкоголизм и наркотиза-ция как важнейшие факторы демографического кризиса в России. Вопросы со-циального обеспечения 23: 5–16).
Korotayev A. V., and Khaltourina D. A. 2008. The Russian Demographic Crisis in Cross-National Perspective. Russia and Globalization: Identity, Security, and Socie-
Andrey V. Korotayev et al. 79
ty in an Era of Change / Ed. by D. W. Blum, pp. 37–78. Washington, DC: Woodrow Wilson Center Press.
Korotayev A. V., Khaltourina D. A., Malkov A. S. et al. 2010. Laws of History. Mathematical Modeling and Forecasting of World and Regional Development. Moscow: LKI/URSS. In Russian (Коротаев А. В., Халтурина Д. А., Малков А. С. и др. Законы истории. Математическое моделирование и прогнозирование мирового и регионального развития. М.: LKI/URSS).
Korotayev A. V., Khaltourina D. A., and Bogevolnov Yu. V. 2011. Mathematical Modeling and Forecasting of the Demographic Future of Russia: Five Scenarios. Scenario and Perspectives of Development of Russia / Ed. by V. A. Sadovnichiy, A. A. Akaev, A. V. Korotayev, and G. G. Malinetsky, pp. 196–219. Moscow: Le-nand/URSS. In Russian (Коротаев А. В., Халтурина Д. А., Божевольнов Ю. В. Математическое моделирование и прогнозирование демографического буду-щего России: пять сценариев. Сценарий и перспектива развития России / Ред. В. А. Садовничий, А. А. Акаев, А. В. Коротаев, Г. Г. Малинецкий, c. 196–219. М.: Ленанд/URSS).
Korotayev A. V., Khaltourina D. A., and Bogevolnov Yu. V. 2012. Scenarios of Rus-sian Demographic Future. Modeling and Forecasting Global, Regional and National Development / Ed. by A. A. Akaev, pp. 436–461. Moscow: LIBROKOM/URSS. In Russian (Коротаев А. В., Халтурина Д. А., Божевольнов Ю. В. Сценарии демо-графического будущего России. Моделирование и прогнозирование глобально-го, регионального и национального развития / Ред. А. А. Акаев, с. 436–461. М.: ЛИБРОКОМ/УРСС).
Korotayev A. V., Malkov A. S., and Khaltourina D. A. 2005. Laws of History. Math-ematical Modeling of Historical Macroprocesses. Demography, Economy, Wars. Moscow: KomKniga/URSS. In Russian (Коротаев А. В., Малков А. С., Халтури-на Д. А. Законы истории. Математическое моделирование исторических мак-ропроцессов. Демография, экономика, войны. М.: КомКнига/URSS).
Korotayev A. V., Zinkina J. V., and Bogevolnov Yu. V. 2014. Mathematical Modeling of the Demographic Future of the BRIC Countries. Russia. Complex System Analysis, Mathematical Modeling and Forecasting of Development of the BRICS Countries: Pre-liminary Results / Ed. by A. A. Akaev, A. V. Korotayev, and S. Yu. Malkov, pp. 189–207. Moscow: KRASAND/URSS. In Russian (Коротаев А. В., Зинькина Ю. В., Божевольнов Ю. В. Математическое моделирование демографического буду-щего стран БРИК. Россия. Комплексный системный анализ, математическое моделирование и прогнозирование развития стран БРИКС. Предварительные результаты / Отв. ред. А. А. Акаев, А. В. Коротаев, С. Ю. Малков, с. 189–207. М.: Красанд/URSS).
Nemtsov A. V. 2003a. Alcohol-Induced Deaths in the Regions of Russia. Moscow: NALEX. In Russian (Немцов А. В. Алкогольный урон регионов России. М.: NALEX).
Nemtsov A. V. 2003b. Deadly Force of Russian Drinking. Moscow: URSS. In Russian (Немцов А. В. Убойная сила российского пьянства. М.: УРСС).
Nemtsov A. V. 2009. Alcohol History of Russia. The Latest Period. Moscow: URSS. In Russian (Немцов А. В. Алкогольная история России. Новейший период. М.: УРСС).
Nemtsov A. V. 2011. A Contemporary History of Alcohol in Russia. Stockholm: Söder-törns högskola.

Mathematical Modeling and Forecasting 80
Pavlovsky Yu. N. et al. 2005. Computer Simulation for Analysis of Socioeconomic Phenomena. Moscow: M3 Пресс. In Russian (Павловский Ю. Н. и др. Опыт имитационного моделирования при анализе социально-экономических явлений. М.: M3 Press).
Rehm N., Room R., and Edwards G. 2001. Alcohol in the European Region of WHO − Consumption, Harm and Policy. Copenhagen: Evropeyskoye regionalnoye byuro VOZ. In Russian (Рем Н., Рум Р., Эдвардс Дж. Алкоголь в Европейском регионе ВОЗ − потребление, вред и политика. Копенгаген: Европейское региональное бюро ВОЗ).
Rosstat. 2013. The Analytical Report on Results of Selective Supervision of Reproduc-tive Plans of the Population in 2012 (Published 24.01.2013). In Russian (Росстат. Аналитический отчет по итогам выборочного наблюдения репродуктивных планов населения в 2012 году (опубликовано 24.01.2013). URL: http://www. gks.ru/wps/wcm/connect/rosstat_main/rosstat/ru/statistics/population/demography/. Date accessed: 20.01.2015.
Rosstat. 2015. Electronic Database. Date accessed: 29.01.2015. URL: http://cbsd. gks.ru/.
Sadovnichy V. A., Akaev A. A., Korotayev A. V., and Malkov S. Yu. 2014. Complex Modeling and Forecasting of Development of the BRICS Countries in the Context of World Dynamics (pp. 234–244). Moscow: Nauka. In Russian (Cадовничий В. А., Акаев А. А., Коротаев А. В., Малков С. Ю. Комплексное моделирование и про-гнозирование развития стран БРИКС в контексте мировой динамики, c. 234–244. М.: Наука).
Shkolnikov V. M., and Chervyakov V. V. (Eds.) 2000. Policy on Control of Crisis Mortality in the Transition Period. Moscow: Programma Razvitiya OON. In Rus-sian (Школьников В. М., Червяков В. В. (Ред.) Политика по контролю кризис-ной смертности в переходный период. М.: Программа развития ООН).
Son I. M., Ten M. B., and Pronina T. V. 2004. Features of Identification and Spread of Tuberculosis among Various Social Groups of Population. Medico-Social Problems of Socially Caused Diseases / Ed. by V. I. Starodubov, pp. 41−44. Мoscow: TsNII-OZ. In Russian (Cон И. М., Тен М. Б., Пронина Т. В. Особенности выявления и распространения туберкулеза среди различных социальных групп населения. Медико-социальные проблемы социально обусловленных заболеваний / Ред. В. И. Стародубов, c. 41−44. М.: ЦНИИОЗ).
Surinov A. E. (Ed.) 2013. Demographic Yearbook of Russia. 2013. Moscow: Rosstat. In Russian (Суринов А. Е. (Ред.). Демографический ежегодник России. 2013. M.: Росстат).
Treisman D. 2008. Alcohol and Early Death in Russia: The Political Economy of Self-destructive Drinking. Moscow: State University – Higher School of Economics.
Ugland T. 2000. State Monopoly for Alcohol. Alcohol Policy in Russia and Norway. Moscow – Oslo: SIRUS. In Russian (Угланд Т. Государственная монополия на алкоголь. Алкогольная политика в России и Норвегии. М. – Осло: SIRUS).
UNICEF. 2004. Social Monitoring ‘Innocenti’. Florence: Innocenti Research Centre.
World Bank. 2015. World Development Indicators Online. Washington, DC. URL: http://data.worldbank.org/indicator. Date accessed: 9.01.2015.
History & Mathematics: Demography & Ageing 2015 81–106 81
II. FACING POPULATION AGEING
5 Global Population Ageing, the Sixth Kondratieff Wave, and the Global
Financial System*
Leonid E. Grinin and Andrey V. Korotayev
Abstract Concerns about population ageing apply to both developed and many develop-ing countries and it has turned into a global issue. In the forthcoming decades the population ageing is likely to become one of the most important processes determining the future society characteristics and the direction of technological development. The present paper analyzes some aspects of the population age-ing and its important consequences for particular societies and the whole world. Basing on this analysis, we can draw a conclusion that the future tech-nological breakthrough is likely to take place in the 2030s (which we define as the final phase of the Cybernetic Revolution). In the 2020s – 2030s we will ex-pect the upswing of the forthcoming sixth Kondratieff wave, which will intro-duce the sixth technological paradigm (system). All those revolutionary techno-logical changes will be connected, first of all, with breakthroughs in medicine and related technologies. We also present our ideas about the financial instru-ments that can help to solve the problem of pension provision for an increasing elderly population in the developed countries. We think that a more purposeful use of pension funds' assets together with an allocation (with necessary guar-antees) of the latter into education and upgrading skills of young people in de-veloping countries, perhaps, can partially solve the indicated problem in the developed states.
Keywords: the sixth Kondratieff wave, the sixth technological paradigm, Cybernetic Revolution, population ageing, world finance, pension funds, hu-man capital, developed countries, developing countries.
Human capital is one of the most important drivers of economic development whose contribution to the growth of production and innovations is constantly increasing. According to the OECD definition, human capital is ‘the know-
* This research has been supported by the Russian Foundation for the Humanities (Project № 14-
02-00330).
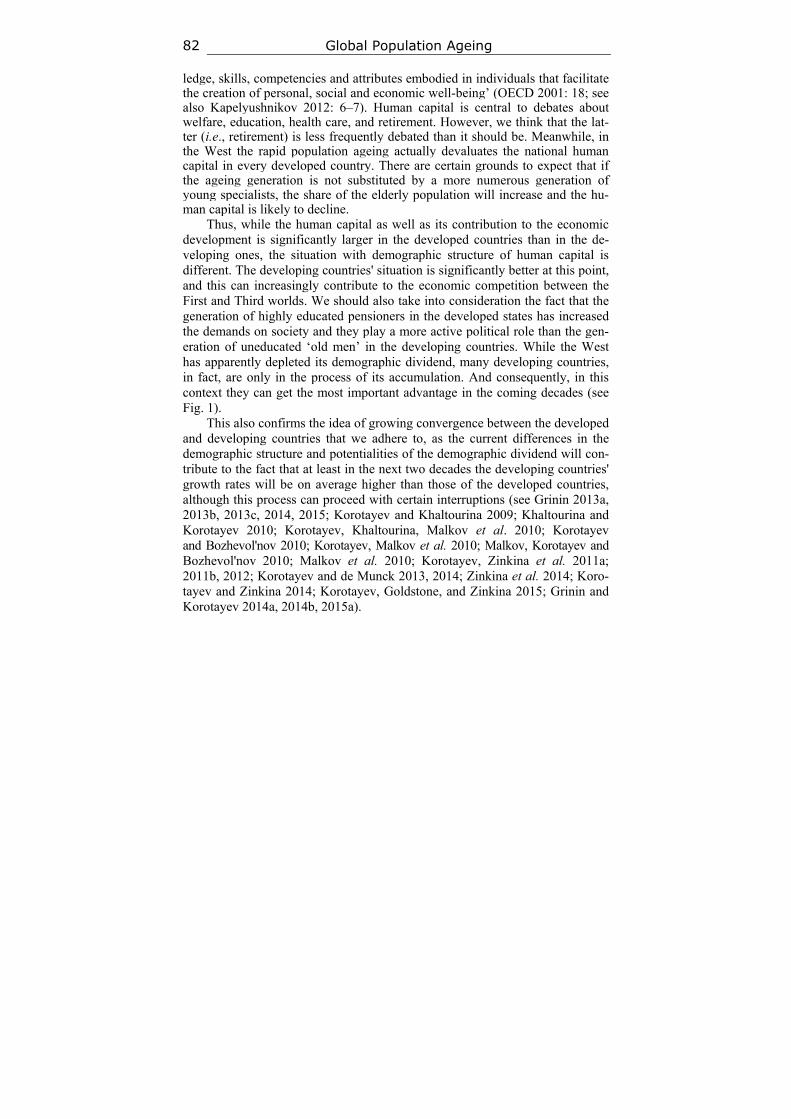
Global Population Ageing 82
ledge, skills, competencies and attributes embodied in individuals that facilitate the creation of personal, social and economic well-being’ (OECD 2001: 18; see also Kapelyushnikov 2012: 6–7). Human capital is central to debates about welfare, education, health care, and retirement. However, we think that the lat-ter (i.e., retirement) is less frequently debated than it should be. Meanwhile, in the West the rapid population ageing actually devaluates the national human capital in every developed country. There are certain grounds to expect that if the ageing generation is not substituted by a more numerous generation of young specialists, the share of the elderly population will increase and the hu-man capital is likely to decline.
Thus, while the human capital as well as its contribution to the economic development is significantly larger in the developed countries than in the de-veloping ones, the situation with demographic structure of human capital is different. The developing countries' situation is significantly better at this point, and this can increasingly contribute to the economic competition between the First and Third worlds. We should also take into consideration the fact that the generation of highly educated pensioners in the developed states has increased the demands on society and they play a more active political role than the gen-eration of uneducated ‘old men’ in the developing countries. While the West has apparently depleted its demographic dividend, many developing countries, in fact, are only in the process of its accumulation. And consequently, in this context they can get the most important advantage in the coming decades (see Fig. 1).
This also confirms the idea of growing convergence between the developed and developing countries that we adhere to, as the current differences in the demographic structure and potentialities of the demographic dividend will con-tribute to the fact that at least in the next two decades the developing countries' growth rates will be on average higher than those of the developed countries, although this process can proceed with certain interruptions (see Grinin 2013а, 2013b, 2013c, 2014, 2015; Korotayev and Khaltourina 2009; Khaltourina and Korotayev 2010; Korotayev, Khaltourina, Malkov et al. 2010; Korotayev and Bozhevol'nov 2010; Korotayev, Malkov et al. 2010; Malkov, Korotayev and Bozhevol'nov 2010; Malkov et al. 2010; Korotayev, Zinkina et al. 2011a; 2011b, 2012; Korotayev and de Munck 2013, 2014; Zinkina et al. 2014; Koro-tayev and Zinkina 2014; Korotayev, Goldstone, and Zinkina 2015; Grinin and Korotayev 2014a, 2014b, 2015а).
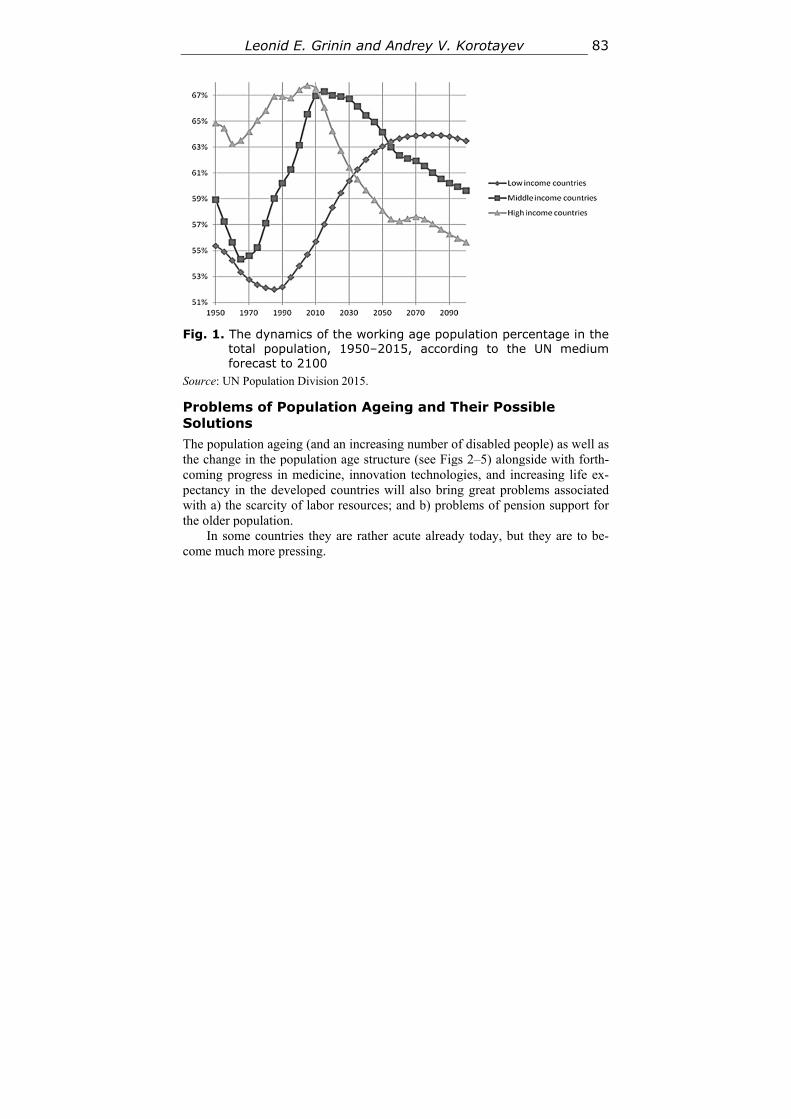
Leonid E. Grinin and Andrey V. Korotayev 83
Fig. 1. The dynamics of the working age population percentage in the total population, 1950–2015, according to the UN medium forecast to 2100
Source: UN Population Division 2015.
Problems of Population Ageing and Their Possible Solutions The population ageing (and an increasing number of disabled people) as well as the change in the population age structure (see Figs 2–5) alongside with forth-coming progress in medicine, innovation technologies, and increasing life ex-pectancy in the developed countries will also bring great problems associated with a) the scarcity of labor resources; and b) problems of pension support for the older population.
In some countries they are rather acute already today, but they are to be-come much more pressing.
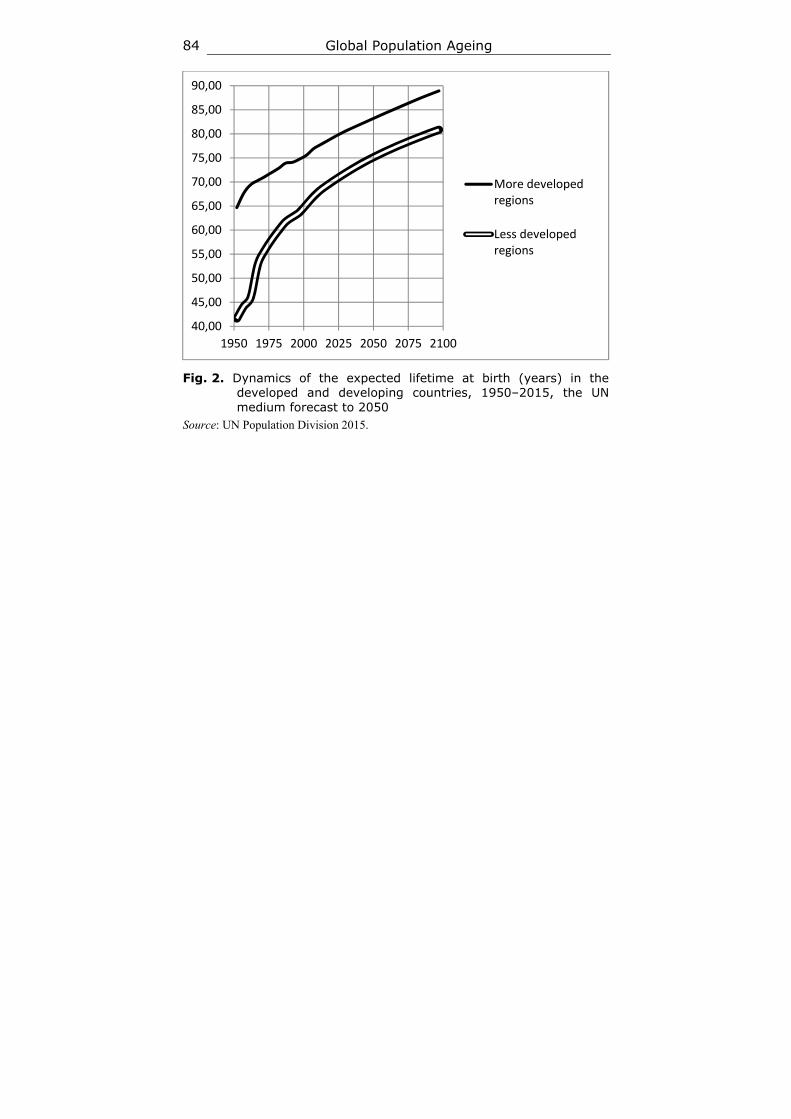
Global Population Ageing 84
Fig. 2. Dynamics of the expected lifetime at birth (years) in the
developed and developing countries, 1950–2015, the UN medium forecast to 2050
Source: UN Population Division 2015.
40,00
45,00
50,00
55,00
60,00
65,00
70,00
75,00
80,00
85,00
90,00
1950 1975 2000 2025 2050 2075 2100
More developedregions
Less developedregions
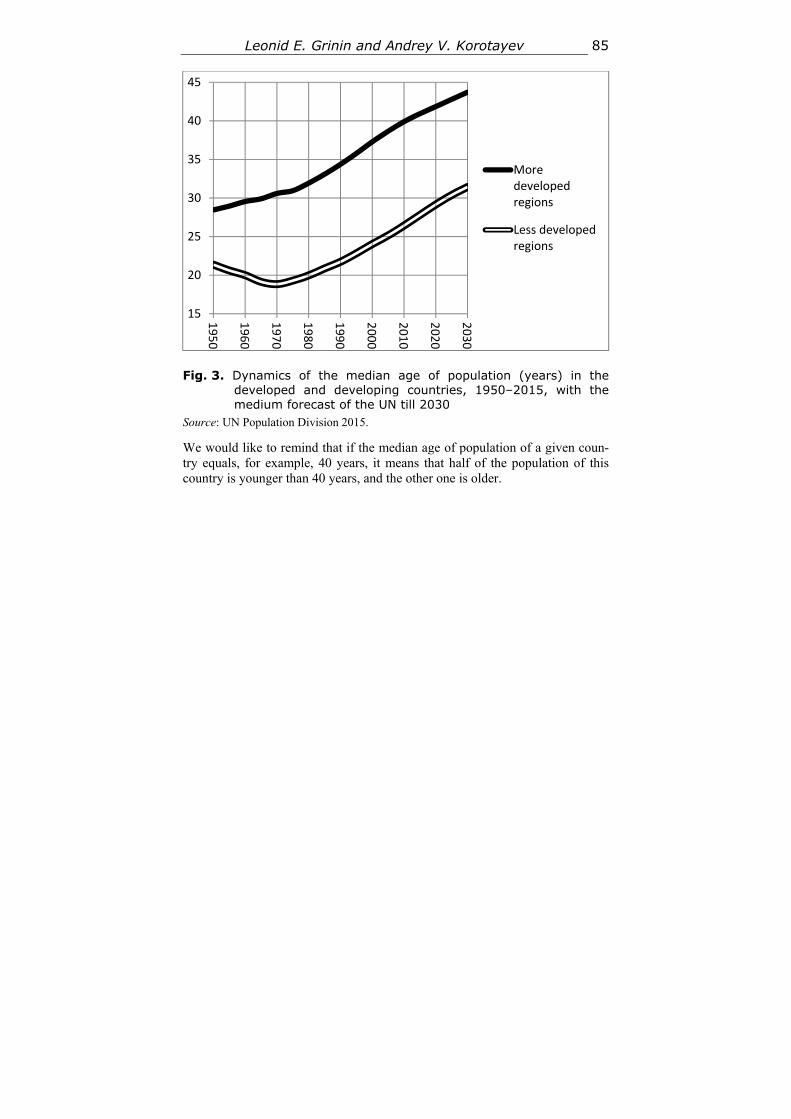
Leonid E. Grinin and Andrey V. Korotayev 85
Fig. 3. Dynamics of the median age of population (years) in the developed and developing countries, 1950–2015, with the medium forecast of the UN till 2030
Source: UN Population Division 2015.
We would like to remind that if the median age of population of a given coun-try equals, for example, 40 years, it means that half of the population of this country is younger than 40 years, and the other one is older.
15
20
25
30
35
40
45
1950
1960
1970
1980
1990
2000
2010
2020
2030
Moredevelopedregions
Less developedregions
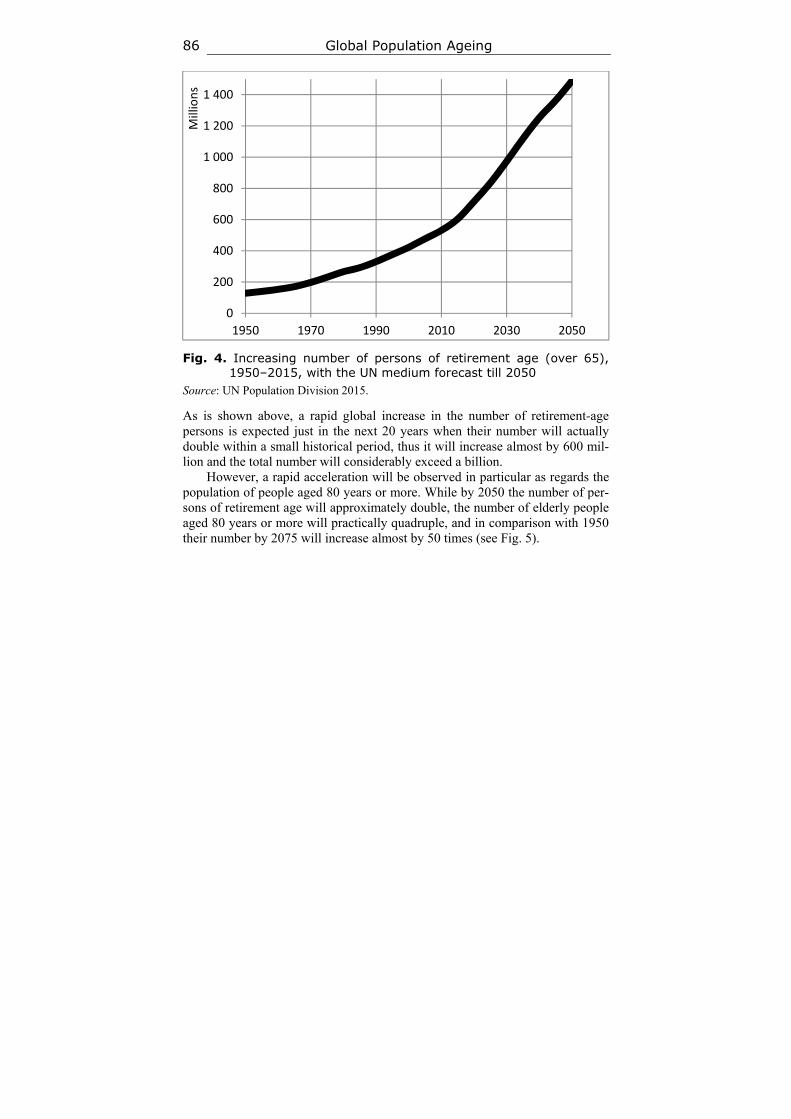
Global Population Ageing 86
Fig. 4. Increasing number of persons of retirement age (over 65), 1950–2015, with the UN medium forecast till 2050
Source: UN Population Division 2015. As is shown above, a rapid global increase in the number of retirement-age persons is expected just in the next 20 years when their number will actually double within a small historical period, thus it will increase almost by 600 mil-lion and the total number will considerably exceed a billion.
However, a rapid acceleration will be observed in particular as regards the population of people aged 80 years or more. While by 2050 the number of per-sons of retirement age will approximately double, the number of elderly people aged 80 years or more will practically quadruple, and in comparison with 1950 their number by 2075 will increase almost by 50 times (see Fig. 5).
0
200
400
600
800
1 000
1 200
1 400
1950 1970 1990 2010 2030 2050
Millions
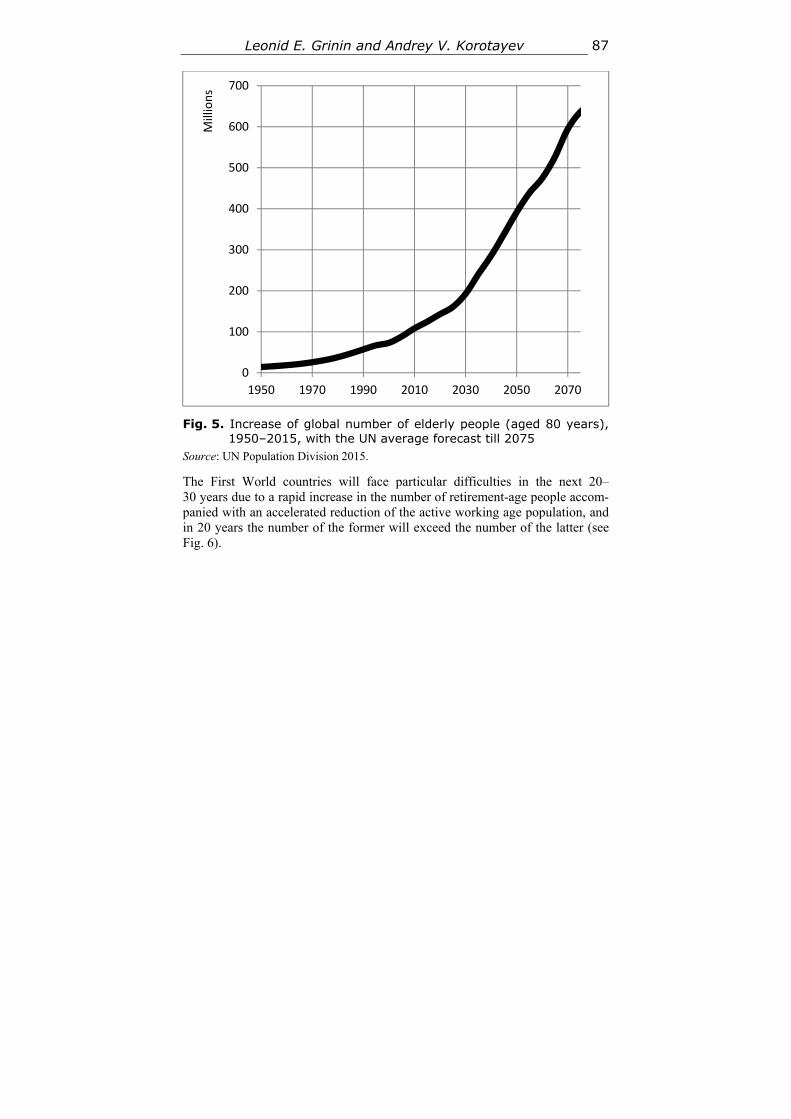
Leonid E. Grinin and Andrey V. Korotayev 87
Fig. 5. Increase of global number of elderly people (aged 80 years),
1950–2015, with the UN average forecast till 2075 Source: UN Population Division 2015.
The First World countries will face particular difficulties in the next 20– 30 years due to a rapid increase in the number of retirement-age people accom-panied with an accelerated reduction of the active working age population, and in 20 years the number of the former will exceed the number of the latter (see Fig. 6).
0
100
200
300
400
500
600
700
1950 1970 1990 2010 2030 2050 2070
Millions
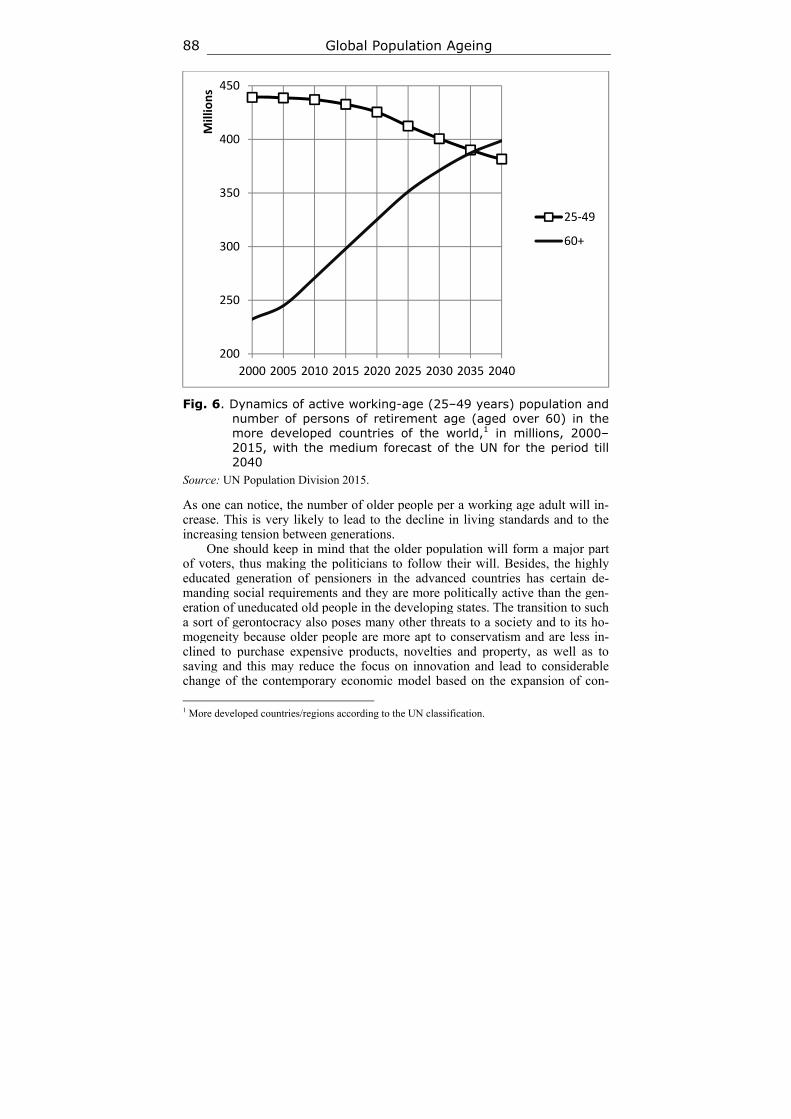
Global Population Ageing 88
Fig. 6. Dynamics of active working-age (25–49 years) population and
number of persons of retirement age (aged over 60) in the more developed countries of the world,1 in millions, 2000–2015, with the medium forecast of the UN for the period till 2040
Source: UN Population Division 2015.
As one can notice, the number of older people per a working age adult will in-crease. This is very likely to lead to the decline in living standards and to the increasing tension between generations.
One should keep in mind that the older population will form a major part of voters, thus making the politicians to follow their will. Besides, the highly educated generation of pensioners in the advanced countries has certain de-manding social requirements and they are more politically active than the gen-eration of uneducated old people in the developing states. The transition to such a sort of gerontocracy also poses many other threats to a society and to its ho-mogeneity because older people are more apt to conservatism and are less in-clined to purchase expensive products, novelties and property, as well as to saving and this may reduce the focus on innovation and lead to considerable change of the contemporary economic model based on the expansion of con-
1 More developed countries/regions according to the UN classification.
200
250
300
350
400
450
2000 2005 2010 2015 2020 2025 2030 2035 2040
Millions
25‐49
60+
Leonid E. Grinin and Andrey V. Korotayev 89
sumerism. In particular, the population ageing in Japan is one of the reasons of the current deflationary trend (for more details see Grinin and Korotayev 2014c, 2015b).
In theoretical terms, it is possible to distinguish the following possible so-lutions for the specified problems (here we suppose that all those solutions will be applied, whereas none of them can solve the problem comprehensively):
1. To increase the number of immigrants in the developed countries. Still the opportunities of this pattern are to a large extent depleted and besides, it leads to the erosion of the society's major ethno-cultural basis (today we face serious challenges in this direction).
2. To raise the retirement age (together with active rehabilitation of the disabled people). Against the background of the forthcoming revolution in medical and rehabilitating technologies this looks like an important (although insufficient) resource.
3. The development of labor-saving technologies, in particular robot tech-niques for nursing, as well as elder and disabled people care (for more details see Grinin L. E. and Grinin A. L. 2015а, 2015b; Grinin A. L. and Grinin L. E. 2015b). This will allow a partial reduction of expenses for care and different ser-vices, but it can hardly bring a complete solution of the problem of scarce re-sources.
4. Finally, the development of the financial system opens another path to the solution of problems with the pension system. The population ageing is directly related to the financial system not only within national systems, but within the global financial system as well. Due to the increasing number of retirees the pen-sion savings have become not simply important, but essential to a certain extent. Besides, we should note that, on the one hand, today pension and other social funds are not isolated only within a framework of national system, but make an important component of the world finance in the long run. On the other hand, stable pension system substantially depends on the stable and efficient global financial system, even to a greater extent than on the national one.
In the present article we will consider the second and the third directions in the solution of the problem of global population ageing which are closely inter-connected, and then we will pass to consideration of the fourth (financial) one.
Global Population Ageing and the Sixth Technological Paradigm The Cybernetic Revolution is a great breakthrough from industrial production to production and services based on the operation of self-regulating systems. Its initial phase dates back to the 1950–1990s. The breakthroughs occurred in the spheres of automation, energy production, synthetic materials, space tech-nologies, exploration of space and sea, agriculture, and especially in the devel-opment of electronic control facilities, communication and information. We assume that the final phase will begin in the nearest decades, that is in the 2030s or a bit later, and will last until the 2070s.
Global Population Ageing 90
We denote the initial phase of the Cybernetic Revolution as a scientific-information one, and the final – as a phase of self-regulating systems. So now we are in its modernization phase which will probably last until the 2030s. This intermediate phase is a period of rapid diffusion and improvement of the innovations made at the previous phase (e.g., computers, internet, cell phones, etc.). The technological and social conditions are also prepared for the future breakthrough. We suppose that the final phase of the Cybernetic Revolution will lead to the emergence of many various self-regulating systems (for more detail see Grinin 2006, 2009, 2012, 2013d; Grinin A. L. and Grinin L. E. 2013, 2015a, 2015c; Grinin L. E. and Grinin A. L. 2015a, 2015c).
So we expect the beginning of the final phase of the Cybernetic revolution in the 2030s and 2040s. We assume that this technological breakthrough at first will be connected with a breakthrough in the field of new medical (and related to them) technologies. Thus, the increasing process of population ageing (as we will show further) will become one of the most important reasons of develop-ment of the final phase of Cybernetic Revolution.
This phase, according to our forecasts, will be imposed on the sixth Kon-dratieff wave (which will probably last from the 2020s to the 2060s). Therefore, the sixth technological paradigm (known also as technological system or style)2 will be connected with major transformations of the Cybernetic Revolution. We consider the widespread ideas that the basis of the sixth technological paradigm will be formed by the NBIC technologies (or NBIC-convergence), which are nano-bio-information and cognitive technologies (see Lynch 2004; Dator 2006; Pride and Korotayev 2008; Akaev 2010, 2011; see also Fukuyama 2002)3 to be only partially true. We believe that the basis of the sixth technological paradigm will be significantly wider. In general medicine, bio- and nanotechnologies, ro-botics, information and cognitive technologies will become the leading techno-logical trends. They will create a complex system of self-regulated production. We could define this complex as MBNRIC-technologies, by the first letters of the listed technological directions. Thus, it makes sense to speak about medicine as the central element of the new technological system (see also Nefiodow 1996; Nefiodow L. and Nefiodow S. 2014). Medicine more than any other field has unique opportunities for merging all these new technologies into a single system. Besides, a number of demographic and economic reasons explain why this is precisely medicine that should start the transition to the new technological pa-radigm.
2 Within this approach every Kondratieff wave is associated with a certain leading sector (or lead-
ing sectors), technological system or technological style (see Korotayev and Grinin 2012; Perez 2002, 2010). For example, the third Kondratieff wave is sometimes characterized as ‘the age of steel, electricity, and heavy engineering. The fourth wave takes in the age of oil, the automobile and mass production. Finally, the current fifth wave is described as the age of information and telecommunications’ (Papenhausen 2008: 789).
3 There are also researchers (Jotterand 2008) who consider GRAIN (Genomics, Robotics, Artificial Intelligence, Nanotechnology) to be the leading set of the technological directions in the future.

Leonid E. Grinin and Andrey V. Korotayev 91
This will be supported by particularly advantageous situation developing by 2030 in economy, demography, culture, a standard of living, etc. that will define a huge need for scientific and technological breakthrough. By advantageous situ-ation, we do not mean that everything will be perfectly good in economy; just on the contrary, everything will be not as good as it could be. Advantageous condi-tions will be created because reserves and resources for continuation of previous trends will be exhausted, and at the same time the requirements of currently de-veloped and developing societies will increase. Consequently, one will search for new developmental patterns.
Let us describe the background. • By this time the problem of population ageing will show up to the full
(for more detail see the previous section). Moreover, this issue can turn simply fatal for democracies in developed countries (because the main electorate will be represented by elderly cohorts, and also the generation gap will increase [see also Fukuyama 2002]). In addition, the problem of population ageing will be-come more acute in a number of developing countries, for example, in China and even in India to a certain extent (about ageing in Asia see contributions of Park and Shin to this volume).
• The pension payments will become an urgent problem (as the number of retirees per an employee will increase) and at the same time the scarcity of la-bor resources will increase, which is already felt rather strongly in a number of countries including Russia (for more detail see Grinin and Korotayev 2015c, 2010; Korotayev and Bozhevolnov 2012; Korotayev, Khaltourina, and Bozhevol'nov 2011; Arkhangelsky et al. 2014; Korotayev et al. 2015). Thus, the problem of scarce labor and pension contributions will have to be solved in such a way that people physically could work for ten, fifteen and even more years (certainly here we can also face a number of social problems). This also implies the disabled people's adaptation for their fuller involvement into labor process due to new technical means and achievements in medicine (for more detail see Grinin L. E. and Grinin A. L. 2015b).4
• Simultaneously, by this time, the birth rate in many developing countries will significantly drop (for example, such developing countries as China, Iran, or Thailand already experience below-replacement fertility). Therefore, the respective governments will begin (and some of them have already started) worrying generally not about the problem of restriction of population growth, but about promotion of population growth and population health.
• A huge volume of medical services in the world makes about 10 % of the GDP (and in a number of developed countries it makes more than 10 %, as, for example, in the USA – 17 % [calculated on the basis of World Bank 2015 da-ta]). The population ageing will make these volumes grow rather significantly.5
4 About the influence of ageing on growth rates see the papers of Goldstone and Park and Shin in
this volume. 5 Some studies find that health care costs of patients aged 75–84 years are almost twice as large as
the costs of 65–74 years old patients; and the expenses on patients of the 85+ age group increase
Global Population Ageing 92
• The development in the Third World countries leads to the growth of a vast stratum of middle class, while poverty and illiteracy are reduced. As a re-sult, the emphasis of these countries' efforts will shift from the elimination of unbearable living conditions to improvement of the quality of life, health care, etc. Thus, large opportunities open up for the development of medicine which will get additional funds.
So by the 2030s, the number of middle-aged and elderly people will in-crease; economy will desperately need additional labor resources while the state will be interested in increasing the working ability of elderly people, whereas the population of wealthy and educated people will grow in a rather significant way. In other words, the unique conditions for the stimulation of business, science and the state to make a breakthrough in the field of medicine will emerge, and just these unique conditions are necessary to start the innova-tive phase of revolution!
It is extremely important to note that enormous financial resources will be ac-cumulated for the technological breakthrough, such as: the pension money whose volume will increase at high rates; spending of governments on medical and social needs; growing expenses of the ageing population on supporting health, and also on health of growing world middle-class. All this can provide initial large invest-ments, high investment appeal of respective venture projects and long-term high demand for innovative products, that is, a full set of favorable conditions for a pow-erful technological breakthrough will become available.
In the context of population ageing problem we will consider some character-istics of the global financial system.
The Crisis and the Characteristics of the Financial System The 2008 crisis and subsequent years aggravated both financial and economic, as well as some global social problems. One of the most important problems among them is the problem of secure social guarantees for rapid ageing popula-tion of the World System core. In each country the security of these guarantees is connected with stability of the world financial system.
Let us recollect some important reasons of the global financial economic crisis:
Random and extremely rapid development of new financial centers and financial flows;
Non-transparency of many financial instruments, which led to the actual concealment of risks and their global underestimation;
An excessive level of public debt in many developed and developing countries combined with ineffective use of credits.
by more than three times in comparison with the latter (Alemayehu and Warner 2004; Fuchs 1998). The cost of home care and short-term stay in the hospital also to a large degree depends on the patients' age (Liang et al. 1996).
Leonid E. Grinin and Andrey V. Korotayev 93
They often also say that modern financial technologies are fundamentally deleterious and only bring the world economy into various troubles and that they are only beneficial to the financiers and speculators. Thus, it would hardly be an exaggeration to maintain that the global crisis, as well as other events, has demonstrated, in an especially salient way, the necessity for major changes in the regulation of international economic activities and movements of world financial flows.
Nevertheless, we believe that it is reasonable to speak not only about the negative role of the world financial flows. On the whole, new financial technolo-gies decrease the risks in a rather effective way and expand opportunities to at-tract and accumulate enormous capitals, involve actors, and penetrate markets.
The positive effects of the new financial technologies consist in the fol-lowing:
1. A powerful expansion of the range of financial instruments and prod-ucts, which leads to the expanding opportunities to choose the most convenient financial instrument.
2. The standardization of financial instruments and products provides a considerable time-saving for those who use financial instruments; it makes it possible to purchase financial securities without a detailed analysis of particular stocks; this leads to an increase in the number of participants by an order of magnitude.
3. The institutionalization of the ways to minimize individual risks. Some financial innovations and new regulations help to minimize both the individual risks of unfulfilled deals and also of bankruptcies in the framework of certain stock markets.
4. The increase in the number of participants and centers for the trade of fi-nancial instruments. Modern financial instruments have made it possible to include a great number of people via various special programs, mediators, and structures.
We also suppose that new financial technologies and modern financial sec-tor have also got such important positive functions as the ‘insurance’ of social guaranties at the global scale. The matter is that the rejection of the gold stand-ard resulted in the movement of the function of the protection of savings from an ‘independent’ guarantor (i.e., precious metals) to the state. However, there was no state left for the capital owners to entirely rely on as on a perfectly se-cure guarantor.
The absence of secure guarantees is especially important in terms of the ways to preserve pension and other social funds.
The sharp increase in the quantity of capitals, the necessity to preserve them from inflation and to find their profitable application objectively pushed the financial market actors to look for new forms of financial activities. Gener-ally, the faster are the movements and transformations of financial objects, the better is the preservation of capitals.
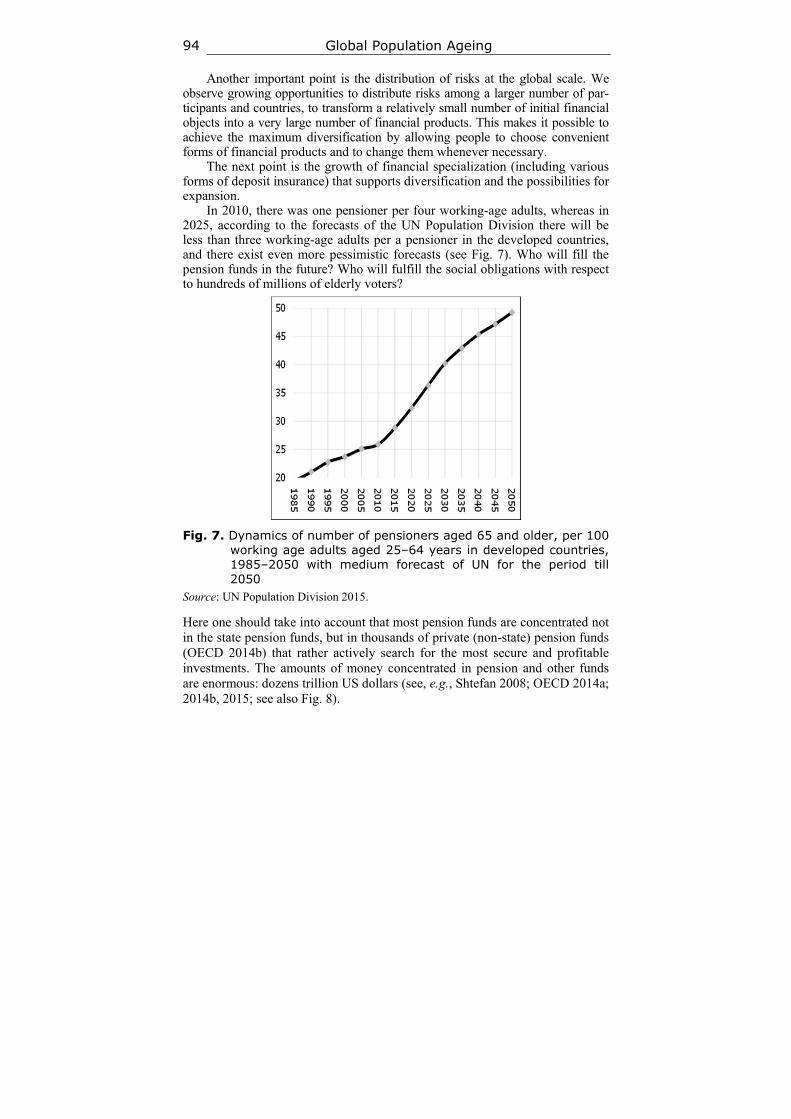
Global Population Ageing 94
Another important point is the distribution of risks at the global scale. We observe growing opportunities to distribute risks among a larger number of par-ticipants and countries, to transform a relatively small number of initial financial objects into a very large number of financial products. This makes it possible to achieve the maximum diversification by allowing people to choose convenient forms of financial products and to change them whenever necessary.
The next point is the growth of financial specialization (including various forms of deposit insurance) that supports diversification and the possibilities for expansion.
In 2010, there was one pensioner per four working-age adults, whereas in 2025, according to the forecasts of the UN Population Division there will be less than three working-age adults per a pensioner in the developed countries, and there exist even more pessimistic forecasts (see Fig. 7). Who will fill the pension funds in the future? Who will fulfill the social obligations with respect to hundreds of millions of elderly voters?
Fig. 7. Dynamics of number of pensioners aged 65 and older, per 100 working age adults aged 25–64 years in developed countries, 1985–2050 with medium forecast of UN for the period till 2050
Source: UN Population Division 2015.
Here one should take into account that most pension funds are concentrated not in the state pension funds, but in thousands of private (non-state) pension funds (OECD 2014b) that rather actively search for the most secure and profitable investments. The amounts of money concentrated in pension and other funds are enormous: dozens trillion US dollars (see, e.g., Shtefan 2008; OECD 2014a; 2014b, 2015; see also Fig. 8).
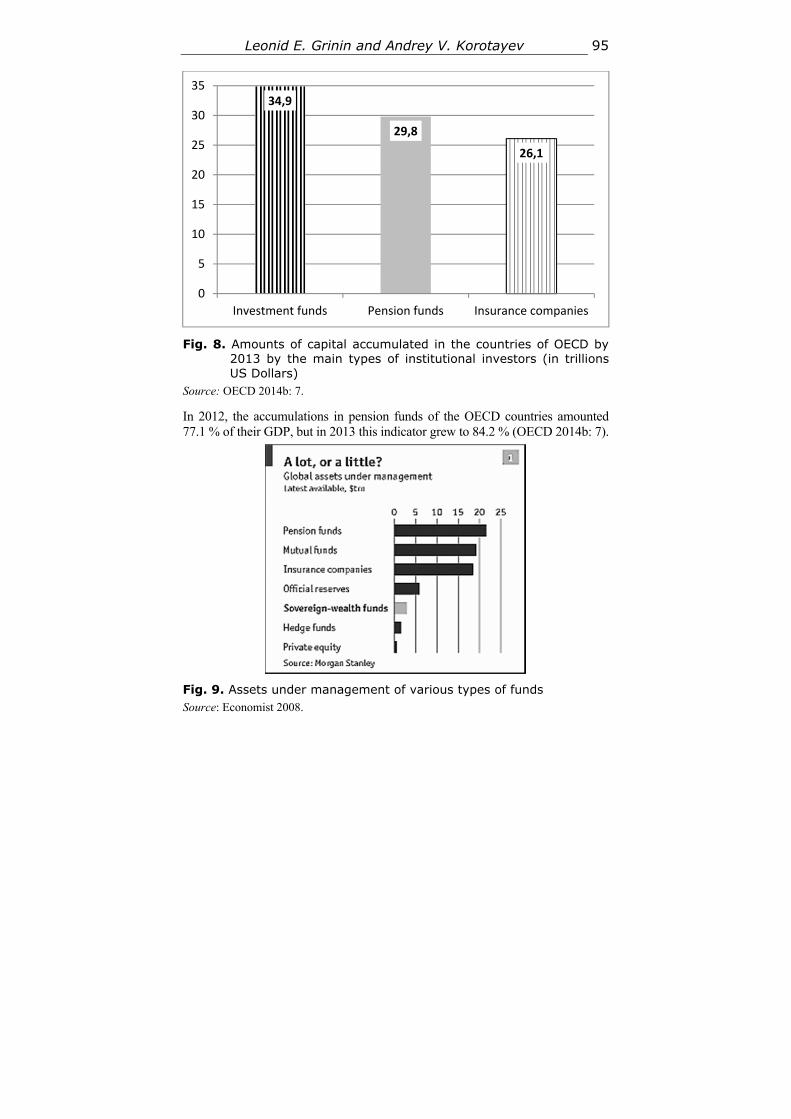
Leonid E. Grinin and Andrey V. Korotayev 95
Fig. 8. Amounts of capital accumulated in the countries of OECD by
2013 by the main types of institutional investors (in trillions US Dollars)
Source: OECD 2014b: 7.
In 2012, the accumulations in pension funds of the OECD countries amounted 77.1 % of their GDP, but in 2013 this indicator grew to 84.2 % (OECD 2014b: 7).
Fig. 9. Assets under management of various types of funds Source: Economist 2008.
34,9
29,8
26,1
0
5
10
15
20
25
30
35
Investment funds Pension funds Insurance companies
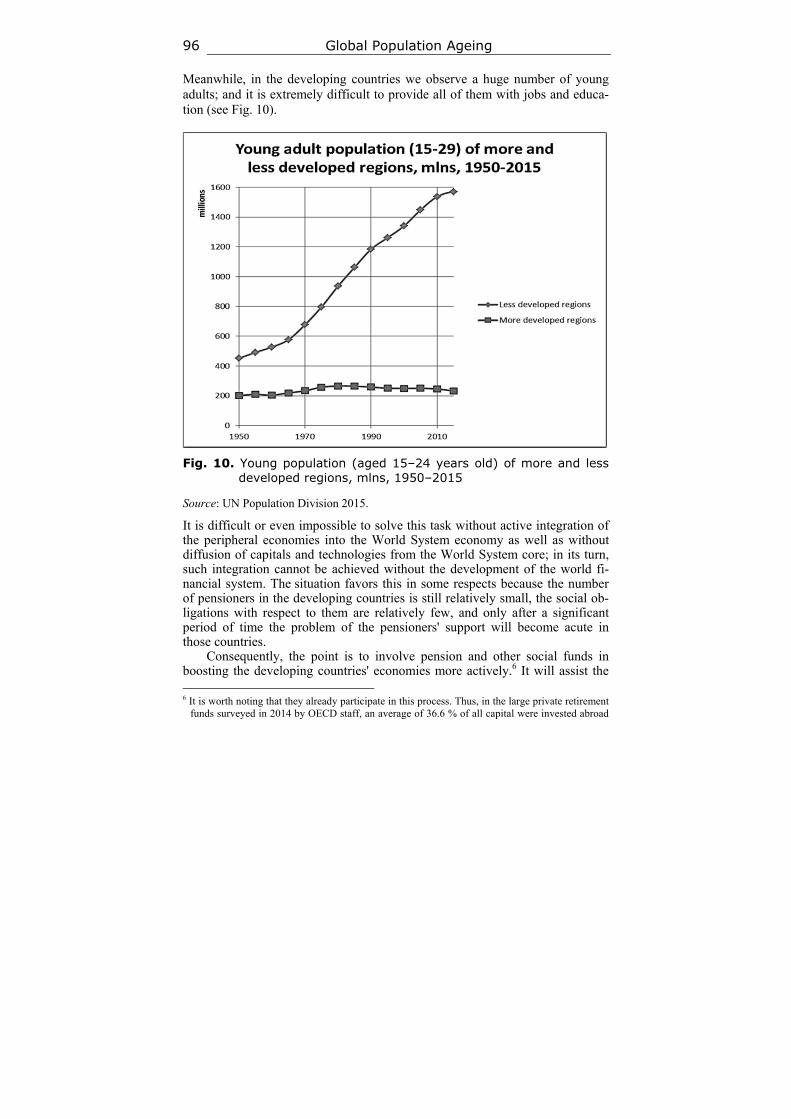
Global Population Ageing 96
Meanwhile, in the developing countries we observe a huge number of young adults; and it is extremely difficult to provide all of them with jobs and educa-tion (see Fig. 10).
Fig. 10. Young population (aged 15–24 years old) of more and less developed regions, mlns, 1950–2015
Source: UN Population Division 2015.
It is difficult or even impossible to solve this task without active integration of the peripheral economies into the World System economy as well as without diffusion of capitals and technologies from the World System core; in its turn, such integration cannot be achieved without the development of the world fi-nancial system. The situation favors this in some respects because the number of pensioners in the developing countries is still relatively small, the social ob-ligations with respect to them are relatively few, and only after a significant period of time the problem of the pensioners' support will become acute in those countries.
Consequently, the point is to involve pension and other social funds in boosting the developing countries' economies more actively.6 It will assist the 6 It is worth noting that they already participate in this process. Thus, in the large private retirement
funds surveyed in 2014 by OECD staff, an average of 36.6 % of all capital were invested abroad
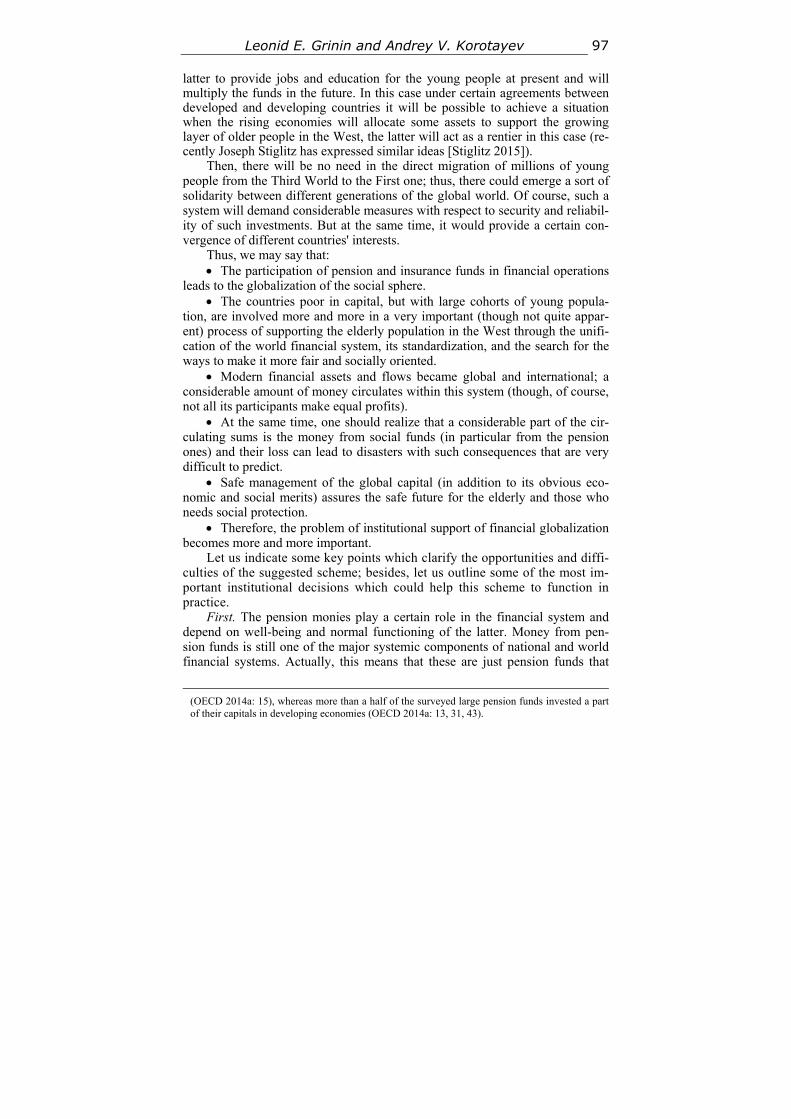
Leonid E. Grinin and Andrey V. Korotayev 97
latter to provide jobs and education for the young people at present and will multiply the funds in the future. In this case under certain agreements between developed and developing countries it will be possible to achieve a situation when the rising economies will allocate some assets to support the growing layer of older people in the West, the latter will act as a rentier in this case (re-cently Joseph Stiglitz has expressed similar ideas [Stiglitz 2015]).
Then, there will be no need in the direct migration of millions of young people from the Third World to the First one; thus, there could emerge a sort of solidarity between different generations of the global world. Of course, such a system will demand considerable measures with respect to security and reliabil-ity of such investments. But at the same time, it would provide a certain con-vergence of different countries' interests.
Thus, we may say that: The participation of pension and insurance funds in financial operations
leads to the globalization of the social sphere. The countries poor in capital, but with large cohorts of young popula-
tion, are involved more and more in a very important (though not quite appar-ent) process of supporting the elderly population in the West through the unifi-cation of the world financial system, its standardization, and the search for the ways to make it more fair and socially oriented.
Modern financial assets and flows became global and international; a considerable amount of money circulates within this system (though, of course, not all its participants make equal profits).
At the same time, one should realize that a considerable part of the cir-culating sums is the money from social funds (in particular from the pension ones) and their loss can lead to disasters with such consequences that are very difficult to predict.
Safe management of the global capital (in addition to its obvious eco-nomic and social merits) assures the safe future for the elderly and those who needs social protection.
Therefore, the problem of institutional support of financial globalization becomes more and more important.
Let us indicate some key points which clarify the opportunities and diffi-culties of the suggested scheme; besides, let us outline some of the most im-portant institutional decisions which could help this scheme to function in practice.
First. The pension monies play a certain role in the financial system and depend on well-being and normal functioning of the latter. Money from pen-sion funds is still one of the major systemic components of national and world financial systems. Actually, this means that these are just pension funds that
(OECD 2014a: 15), whereas more than a half of the surveyed large pension funds invested a part of their capitals in developing economies (ОЕСD 2014а: 13, 31, 43).
Global Population Ageing 98
remain one of the leading traders buying government bonds, and also actively buying shares and other securities at stock markets. While the conservative investment policy of pension funds is quite reasonable in general, at the same time it makes them as well as many other subsystems of the financial system highly dependent on the manipulations of the Central Bank, rating agencies and other actors. Particularly, the income of pension funds has considerably de-creased in recent years due to deflationary tendencies and low rates on the gov-ernment debt securities (as the government pays low interests rates to pension funds on the most reliable debt bonds).
Second. Mounting crisis phenomena in financial system are able to radical-ly undermine the well-being of pension funds. The latter have actively invested in securities; therefore, the cost of their assets largely depends on the price of securities. On the one hand, the governmental authorities and exchange players wish to manipulate this cost and its artificial high price (e.g., the so-called buy-back transaction of the securities by firms), and on the other hand, in case of crisis the assets' slump can be quite serious. For example, while in 2007 the asset value of US pension funds amounted to 78.0 % of the American GDP, during the crisis in 2008 it dropped to 59.6 % of GDP. The situation returned to pre-crisis level only in 2013 (OECD 2015: Funded Pensions Indicators: Occu-pational pension funds' assets as a per cent of GDP); in other words, pension contributions have become entirely dependent on the economic situation. Therefore, we need some mechanisms of preserving accumulations, including the opportunity to lean on the world financial system.
Third. As we have said earlier, today the secure preservation of the value of accumulated funds depends on the speed of their circulation. However, fi-nances do not exist by themselves, they can hardly break from the production base for a long time and has to rely on real production (the increasing separa-tion of the financial system from production is one of the main problems of the current situation which is largely supported by the monetary doctrine). Thus, we face the necessity of driving the finances (and pension money) beyond nation-al borders. Especially at present, since the production is rather actively moved to the developing countries. Therefore, no wonder that many pension funds invest into emerging markets to increase their income (OECD 2014a: 15). Only few funds do not invest in foreign assets, while some, on the contrary, invest a large amount of their capital abroad (Ibid.). Certainly, the foreign investments do not always imply investments into developing countries. Nevertheless, some in-vestments are made, and thus, the proposed scheme already functions in a cer-tain way. But we can face several serious problems. First, this is most often ‘short’, in fact, speculative money, whereas generally these are long-term investments that can serve a real source of economic development and in-come. Second, this money is almost the first to leave the emerging markets because of their volatility (not least connected with the policy of FRS and ECB) and fully justified conservatism of pension funds; and this also increas-
Leonid E. Grinin and Andrey V. Korotayev 99
es the volatility. Third, the emerging markets certainly offer less guarantees than the developed ones, and therefore, the cautiousness of the funds is fully justified.
Fourth. For an effective functioning of the proposed scheme some high-level agreements are necessary. Here various forms could be used, for example, investment of money of pension funds in the assets of such largest international financial institutions, as the IMF, WB, ADB, etc. These investments would be non-voting, but the money would be much securer there, and special obliga-tions could guarantee that these funds would be allocated to increase the level of education and qualification of young people in the developing countries.
It would be quite reasonable to develop some global organizations for the sake of cooperation between pension and other funds, as well as establishing common insurance funds that will make it possible to support countries in case of a crisis. One could establish an International Pension Fund or something of the kind which would realize financial transfers so that the assets of the ‘older’ population of some countries could help to raise the economy in the countries with ‘young’ population and to accumulate funds for donor countries for the future. Some specific arrangements between countries with certain guarantees for safety of funds would seem rather appropriate. In brief, there could be many options. But the main problem is that despite the fast population ageing, the versions of global solution for the problem are poorly considered.
The Russian philosopher, Alexander Zinoviev, deported to Germany in the 1970s, quite accurately described the Western society as a society of monetary totalitarianism (Zinoviev 2003) where the mechanism, realizing and preserving it, had reached enormous scales and had become one of the most important pillars of the society. This mechanism had formed in the period of the gold standard and after its cancellation the scale of financial economy had grown tremendously, having spread all over the world. In fact, a new huge sector of financial services has emerged which in some countries amounts to 25–30 % of their GDP. But the importance of this sector will increase in almost all countries, and will also involve their most important social functions.
Hence, the issue of the institutional support of the financial globalization becomes more and more important. We can speak about an extraordinary im-portance of the reliability and controllability of this system. Its changes should include the increasing coordination between governments and unified interna-tional legislation which regulates financial activities and movements. Besides, one should take into account that today the developed countries generally get more benefits from this system and constantly use it to solve their national is-sues (thus, affecting the whole world) and also they willingly use it as a means to impact other countries' economies.
We suppose that important guarantees for the future Western pensioners will consist in the development pattern of the global economy which should transform into a single organism. Thus, the global financial system would be-
Global Population Ageing 100
come strong but will be used neither to get the developing countries under con-trol nor as a means to collapse the Third World countries' economies, nor as a means of unwarranted sanctions and suppression of societies and regimes which the West considers uneasy. There should occur some transformations in the global financial system that would take into account the growing econo-mies' interests and thus allow the developing countries to more actively use the social funds accumulated by the West. And at the same time, this will prevent certain governments from expropriating the invested funds.
Actually, the world needs a new system of financial-economic regulation at the global scale.
References
Akaev A. A. 2010. Modern Financial and Economic Crisis in the Light of the Theory of the Economy's Innovative and Technological Development of Economy and Con-trolling of Innovative Process. System Monitoring of Global and Regional Develop-ment / Ed. by D. A. Khaltourina, and A. V. Korotayev, pp. 230–258. Moscow: LIBROKOM. In Russian (Акаев А. А. Современный финансово-экономический кризис в свете теории инновационно-технологического развития экономики и управления инновационным процессом. Системный мониторинг глобального и регионального развития / Ред. Д. А. Халтурина, А. В. Коротаев, с. 230–258. М.: ЛИБРОКОМ/URSS).
Akaev A. A. 2011. Mathematical Bases of Kondratieff – Schumpeter's Innovative and Cyclic Theory of Economic Development. Vestnik instituta ekonomiki RAN 2: 39–60. In Russian (Акаев А. А. Математические основы инновационно-циклической теории экономического развития Кондратьева – Шумпетера. Вестник инсти-тута экономики РАН 2: 39–60).
Alemayehu B., and Warner K. E. 2004. The Lifetime Distribution of Health Care Costs. Health Services Research 39(3) June: 627–642.
Arkhangelsky V. N., Bozhevolnov J. V., Goldstone J., Zverevа N. V., Zinkina J. V., Korotayev A. V., Malkov A. S., Rybalchenko S. I., Ryazantsev S. V., Steck P., Khaltourina D. A., Shulgin S. G., and Yuryev Y. L. 2014. In 10 Years It Will Be Late. Population Policy of the Russian Federation: Challenges and Scenarios. Mos-cow: Institut nauchno-obschestvennoy ekspertizy; A RANKhiGS pri Presidente RF; Rabochaya gruppa ‘Semeynaya politika i detstvo’ Ekspertnogo soveta pri Pravi-tel'stve RF. In Russian (Архангельский В. Н., Божевольнов Ю. В., Голдстоун Д., Зверева Н. В., Зинькина Ю. В., Коротаев А. В., Малков А. С., Рыбальченко С. И., Рязанцев С. В., Стек Ф., Халтурина Д. А., Шульгин С. Г., Юрьев Е. Л. Через 10 лет будет поздно. Демографическая политика Российской Федерации: вы-зовы и сценарии. М.: Институт научно-общественной экспертизы; РАНХиГС при Президенте РФ; Рабочая группа «Семейная политика и детство» Эксперт-ного совета при Правительстве РФ).
Dator J. 2006. Alternative Futures for K-Waves. Kondratieff Waves, Warfare and World Security / Ed. by T. C. Devezas, pр. 311–317. Amsterdam: IOS Press.
Fuchs V. 1998. Provide, Provide: The Economics of Aging. NBER Working Paper no. 6642. Cambridge, MA: National Bureau of Economic Research.
Leonid E. Grinin and Andrey V. Korotayev 101
Fukuyama F. 2002. Our Post-human Future: Consequences of the Biotechnology Revo-lution. New York: Farrar, Straus, and Giroux.
Grinin L. E. 2006. Productive Forces and Historical Process. 3rd ed. Moscow: KomKniga. In Russian (Гринин Л. Е. Производительные силы и исторический процесс. Изд. 3-е. М.: КомКнига).
Grinin L. E. 2009. State and Historical Process: Political Cut of Historical Process. 2nd ed., rev. and add. Moscow: LIBROKOM. In Russian (Гринин Л. Е. Государ-ство и исторический процесс: Политический срез исторического процесса. Изд. 2-е, испр. и доп. М.: ЛИБРОКОМ).
Grinin L. E. 2012. Kondratieff Waves, Technological Ways and Theory of Production Revolutions. Kondratieff Waves: Aspects and Perspectives / Ed. by A. A. Akaev, R. S. Greenberg, L. E. Grinin, A. V. Korotayev, and S. Yu. Malkov, pp. 222–262. Volgograd: Uchitel. In Russian (Гринин Л. Е. Кондратьевские волны, технологи-ческие уклады и теория производственных революций. Кондратьевские вол-ны: аспекты и перспективы / Отв. ред. А. А. Акаев, Р. С. Гринберг, Л. Е. Гри-нин, А. В. Коротаев, С. Ю. Малков, с. 222–262. Волгоград: Учитель).
Grinin L. E. 2013a. Globalization Shuffles the Cards (Where does the Global Econom-ic and Political Balance of the World Move?). Vek globalizatsii 2: 63–78. In Russian (Гринин Л. Е. Глобализация тасует карты (Куда сдвигается глобальный эконо-мико-политический баланс мира). Век глобализации 2: 63–78).
Grinin L. E. 2013b. ‘The Dragon’ and ‘the Tiger’: Models of Development and Per-spectives. Istoricheskaya psikhologia i sotsiologia istorii 1: 111–133. In Russian (Гринин Л. Е. «Дракон» и «тигр»: модели развития и перспективы. Историче-ская психология и социология истории 1: 111–133).
Grinin L. E. 2013c. Models of Development of China and India. Gosudarstvennaya sluzhba 2: 87–90. In Russian (Гринин Л. Е. Модели развития Китая и Индии. Государственная служба 2: 87–90).
Grinin L. E. 2013d. Dynamics of Kondratieff Waves in the Light of Theory of Production Revolutions. Kondratieff Waves: Diversity of Views / Ed. by L. E. Grinin, A. V. Koro-tayev, and S. Yu. Malkov, pp. 31–83. Volgograd: Uchitel. In Russian (Гринин Л. Е. Динамика кондратьевских волн в свете теории производственных революций. Кондратьевские волны: палитра взглядов / Отв. ред. Л. Е. Гринин, А. В. Корота-ев, С. Ю. Малков, с. 31–83. Волгоград: Учитель).
Grinin L. E. 2014. India and China: Models of Development and Perspectives in the World. Complex System Analysis, Mathematical Modeling and Forecasting of De-velopment of the BRICS Countries: Preliminary Results / Ed. by A. A. Akaev, A. V. Korotayev, and S. Yu. Malkov, pp. 246–276. Moscow: KRASAND. In Rus-sian (Гринин Л. Е. Индия и Китай: модели развития и перспективы в мире. Комплексный системный анализ, математическое моделирование и прогнози-рование развития стран БРИКС: Предварительные результаты / Отв. ред. А. А. Акаев, А. В. Коротаев, С. Ю. Малков, с. 246–276. М.: КРАСАНД).
Grinin L. E. 2015. A New World Order and Era of Globalization. Article 1. American Hegemony: Culmination and Easing. What is Next? Vek globalizatsii 2: 3–17. In Russian (Гринин Л. Е. Новый мировой порядок и эпоха глобализации. Ст. 1.
Global Population Ageing 102
Американская гегемония: апогей и ослабление. Что дальше? Век глобализации 2: 3–17).
Grinin A. L., and Grinin L. E. 2013. Cybernetic Revolution and Forthcoming Techno-logical Transformations (Development of Leading Technologies in the Light of Theory of Production Revolutions). Evolution of the Earth, Life, Society, Mind / Ed. by L. E. Grinin, A. V. Korotayev, and A. V. Markov, pp. 167–239. Volgograd: Uchitel. In Russian (Гринин А. Л., Гринин Л. Е. Кибернетическая революция и грядущие технологические трансформации (развитие ведущих технологий в свете теории производственных революций). Эволюция Земли, жизни, обще-ства, разума / Ред. Л. Е. Гринин, А. В. Коротаев, А. В. Марков, с. 167–239. Волгоград: Учитель).
Grinin A. L., and Grinin L. E. 2015a. Cybernetic Revolution and Historical Process. Social Evolution & History 14(1): 125–184.
Grinin A. L., and Grinin L. E. 2015b. Cybernetic Revolution and Forthcoming Tech-nological Transformations (Development of the Leading Technologies in the Light of Theory of Production Revolutions). Evolution: from Big Bang to Nanorobots / Ed. by L. E. Grinin, and A. V. Korotayev, pp. 256–335. Volgograd: Uchitel.
Grinin A. L., and Grinin L. E. 2015c. Cybernetic Revolution and Historical Process (Technologies of the Future in the Light of Theory of Production Revolutions). Filosofiya i obschestvo 1: 17–47. In Russian (Гринин А. Л., Гринин Л. Е. Кибер-нетическая революция и исторический процесс (технологии будущего в свете теории производственных революций). Философия и общество 1: 17–47).
Grinin L. E., and Grinin A. L. 2015a. Cybernetic Revolution and the Sixth Technolog-ical Wave. Kondratieff Waves: Heritage and the Present / Ed. by L. E. Grinin, A. V. Korotayev, and V. M. Bondarenko, pp. 51–74. Volgograd: Uchitel. In Russian (Гринин Л. Е., Гринин А. Л. Кибернетическая революция и шестой технологи-ческий уклад. Кондратьевские волны: наследие и современность / Отв. ред. Л. Е. Гринин, А. В. Коротаев, В. М. Бондаренко, с. 51–74. Волгоград: Учитель).
Grinin L. E., and Grinin A. L. 2015b. From the Biface to Nanorobots. The World is on the Way to the Epoch of Self-governed Systems (History of Technologies and the De-scription of Their Future). Volgograd: Uchitel (Forthcoming). In Russian (Гри- нин Л. Е., Гринин А. Л. От рубил до нанороботов. Мир на пути к эпохе само-управляемых систем (история технологий и описание их будущего). Волго-град: Учитель [в печати]).
Grinin L. E., and Grinin A. L. 2015c. Cybernetic Revolution and the Sixth Technolog-ical Wave. Istoricheskaya psikhologiya i sotsiologiya istorii 8(1): 172–197. In Rus-sian (Гринин Л. Е., Гринин А. Л. Кибернетическая революция и шестой техно-логический уклад. Историческая психология и социология истории 8(1): 172–197).
Grinin L. E., and Korotayev A. V. 2010. Will the Global Crisis Lead to Global Trans-formations. 1. The Global Financial System: Pros and Cons. Journal of Globalization Studies 1(1): 70–89.
Grinin L. E., and Korotayev A. V. 2014a. Globalization and the Shifting of Global Economic-Political Balance. The Dialectics of Modernity – Recognizing Globaliza-
Leonid E. Grinin and Andrey V. Korotayev 103
tion. Studies on the Theoretical Perspectives of Globalization / Ed. by Е. Kiss, and A. Kiadó, pp. 184–207. Budapest: Publisherhouse Arostotelész.
Grinin L. E., and Korotayev A. V. 2014b. Globalization Shuffles Cards of the World Pack: In Which Direction is the Global Economic-Political Balance Shifting? World Futures 70(8): 515–545.
Grinin L. E., and Korotayev A. V. 2014c. Inflationary and Deflationary Trends of the World Economy, or the Spread of ‘the Japanese Disease’. History and Mathematics: Aspects of Demographic and Social and Economic Processes / Ed. by L. E. Grinin, and A. V. Korotayev, pp. 229–253. Volgograd: Uchitel. In Russian (Гринин Л. Е., Коротаев А. В. Инфляционные и дефляционные тренды мировой экономики, или распространение «японской болезни». История и Математика: аспекты демографических и социально-экономических процессов / Отв. ред. Л. Е. Гри-нин, А. В. Коротаев, с. 229–253. Волгоград: Учитель).
Grinin L. E., and Korotayev A. V. 2015a. Great Divergence and Great Convergence. A Global Perspective. New York, NY: Springer.
Grinin L. E., and Korotayev A. V. 2015b. Deflation as a Disease of the Modern De-veloped Countries. Analysis and Modeling of World and Country Dynamics: Meth-odology and Basic Models / Ed. by V. A. Sadovnichiy, A. A. Akaev, S. Yu. Malkov, and L. E. Grinin, pp. 241–270. Moscow: Moscow Publishing House ‘Uchitel’. In Russian (Гринин Л. Е., Коротаев А. В. Дефляция как болезнь современных развитых стран. Анализ и моделирование мировой и страновой динамики: методология и базовые модели / Отв. ред. В. А. Садовничий, А. А. Акаев, С. Ю. Малков, Л. Е. Гринин, с. 241–270. М.: Моск. ред. изд-ва «Учитель»).
Grinin L. E., and Korotayev A. V. 2015c. Global Ageing of Population and Global Financial System. History and Mathematics 10 (In the press). In Russian (Гри- нин Л. Е., Коротаев А. В. Глобальное старение населения и глобальная финан-совая система. История и математика 10 [в печати]).
Jotterand F. 2008. Emerging Conceptual, Ethical and Policy Issues in Bionanotechnol-ogy. Vol. 101. N. p.: Springer Science & Business Media.
Kapelyushnikov R. I. 2012. How much does Human Capital in Russia Cost? Moscow: NIU Vysshaya Shkola Ekonomiki. In Russian (Капелюшников Р. И. Сколько стоит человеческий капитал России? М.: НИУ ВШЭ).
Khaltourina D. A., and Korotayev A. V. 2010. System Monitoring of Global and Re-gional Development. System Monitoring. Global and Regional Development / Ed. by D. A. Khaltourina, and A. V. Korotayev, pp. 11–188. Moscow: LIBROKOM/URSS. In Russian (Халтурина Д. А., Коротаев А. В. Системный мониторинг глобаль-ного и регионального развития. Системный мониторинг. Глобальное и регио-нальное развитие / Ред. Д. А. Халтурина, А. В. Коротаев, с. 11–188. М.: ЛИБРОКОМ/URSS).
Korotayev A. V., and Bozhevolnov Yu. V. 2010. Some General Tendencies of the Economic Development of the World System. Forecasting and Modeling of Crises and World Dynamics / Ed. by A. A. Akaev, A. V. Korotayev, and G. G. Malinetsky, pp. 161–172. M.: LKI/URSS. In Russian (Коротаев А. В., Божевольнов Ю. В. Некоторые общие тенденции экономического развития Мир-Системы. Прогноз
Global Population Ageing 104
и моделирование кризисов и мировой динамики / Отв. ред. А. А. Акаев, А. В. Коротаев, Г. Г. Малинецкий, с. 161–172. М.: ЛКИ/URSS).
Korotayev A. V., and Bozhevolnov Yu. V. 2012. Scenarios of Demographic Future of Russia. Modeling and Forecasting of Global, Regional and National Development / Ed. by A. A. Akaev, A. V. Korotayev, G. G. Malinetsky, and S. Yu. Malkov, pp. 436–461. Moscow: LIBROKOM/URSS. In Russian (Коротаев А. В., Боже-вольнов Ю. В. Сценарии демографического будущего России. Моделирование и прогнозирование глобального, регионального и национального развития / Отв. ред. А. А. Акаев, А. В. Коротаев, Г. Г. Малинецкий, С. Ю. Малков, с. 436–461. М.: ЛИБРОКОМ/URSS).
Korotayev A., Goldstone J., and Zinkina J. 2015. Phases of Global Demographic Transition Correlate with Phases of the Great Divergence and Great Convergence. Technological Forecasting and Social Change 95: 163–169.
Korotayev A. V., and Grinin L. E. 2012a. Kondratieff Waves in the World System Perspective. Kondratieff Waves. Dimensions and Prospects at the Dawn of the 21st Century / Ed. by L. Grinin, T. Devezas, and A. Korotayev, pp. 23–64. Volgo-grad: Uchitel.
Korotayev A. V., Malkov A. S., Bozhevolnov Yu. V., and Khaltourina D. A. 2010. To the System Analysis of Global Dynamics: Interaction of the Center and Periph-ery of the World System. Global Studies as an Area of Scientific Research and Sphere of Teaching / Ed. by I. I. Abylgaziev, I. V. Ilyin, and T. L. Shestova, pp. 228–242. Moscow: MAX Press. In Russian (Коротаев А. В., Малков А. С., Божевольнов Ю. В., Халтурина Д. А. К системному анализу глобальной дина-мики: взаимодействие центра и периферии Мир-Системы. Глобалистика как область научных исследований и сфера преподавания / Отв. ред. И. И. Абылга-зиев, И. В. Ильин, Т. Л. Шестова, с. 228–242). М.: МАКС Пресс.
Korotayev A. V., Zinkina Yu. V., Khaltourina D. A., Zykov V. A., Shulgin S. G., and Folomeyeva D. A. 2015. Prospects of the Population Dynamics of Russia. Analysis and Modeling of the World and Country Dynamics: Methodology and Basic Models / Ed. by V. A. Sadovnichiy, A. A. Akaev, S. Yu. Malkov, and L. E. Grinin, pp. 192–240. Moscow: Uchitel. In Russian (Коротаев А. В., Зинькина Ю. В., Халтурина Д. А., Зыков В. А., Шульгин С. Г., Фоломеева Д. А. Пер-спективы демографической динамики России. Анализ и моделирование миро-вой и страновой динамики: методология и базовые модели / Ред. В. А. Садов-ничий, А. А. Акаев, С. Ю. Малков, Л. Е. Гринин, с. 192–240. М.: Учитель).
Korotayev A. V., and Khaltourina D. A. 2009. Current Tendencies of the World De-velopment. Moscow: LIBROKOM/URSS. In Russian (Коротаев А. В., Халтурина Д. А. Современные тенденции мирового развития. М.: ЛИБРОКОМ/ URSS).
Korotayev A. V., Khaltourina D. A., and Bozhevolnov Yu. V. 2011. Mathematical Modeling and Forecasting of the Demographic Future of Russia: Five Scenarios. Scenario and Perspectives of Development of Russia / Ed. by V. A. Sadovnichiy, A. A. Akaev, A. V. Korotayev, and G. G. Malinetsky, pp. 196–219. Moscow: Le-nand/URSS. In Russian (Коротаев А. В., Халтурина Д. А., Божевольнов Ю. В. Математическое моделирование и прогнозирование демографического буду-щего России: пять сценариев. Сценарий и перспектива развития России / Ред.
Leonid E. Grinin and Andrey V. Korotayev 105
В. А. Садовничий, А. А. Акаев, А. В. Коротаев, Г. Г. Малинецкий, с. 196–219. М.: Ленанд/URSS).
Korotayev A. V., Khaltourina D. A., Malkov A. S., Bogevolnov J. V., Kobzeva S. V., and Zinkina J. V. 2010. Laws of History: Mathematical Modeling and Forecasting of the World and Regional Development. 3rd ed., rev. and add. Moscow: LKI/URSS. In Russian (Коротаев А. В., Халтурина Д. А., Малков А. С., Божевольнов Ю. В., Кобзева С. В., Зинькина Ю. В. Законы истории. Математическое моделиро-вание и прогнозирование мирового и регионального развития. 3-е изд., испр. и доп. М.: ЛКИ/URSS).
Korotayev A., and de Munck V. 2013. Advances in Development Reverse Inequality Trends. Journal of Globalization Studies 4(1): 105–124.
Korotayev A., and de Munck V. 2014. Advances in Development Reverse Global Inequality Trends. Globalistics and Globalization Studies 3: 164–183.
Korotayev A., and Zinkina J. 2014. On the Structure of the Present-day Convergence. Campus-Wide Information Systems 31(2): 41–57.
Korotayev A., Zinkina J., Bogevolnov J., and Malkov A. 2011a. Global Uncondition-al Convergence among Larger Economies after 1998? Journal of Globalization Studies 2(2): 25–62.
Korotayev A., Zinkina J., Bogevolnov J., and Malkov A. 2011b. Unconditional Con-vergence among Larger Economies. Great Powers, World Order and International Society: History and Future / Ed. by Debin Liu, pр. 70–107. Changchun: The Insti-tute of International Studies; Jilin University.
Korotayev A., Zinkina J., Bogevolnov J., and Malkov A. 2012. Unconditional Con-vergence among Larger Economies after 1998? Globalistics and Globalization Stud-ies 1: 246–280.
Liang J., Liu X., Tu E., and Whitelaw N. 1996. Probabilities and Lifetime Durations of Short-Stay Hospital and Nursing Home Use in the United States, 1985. Medical Care 34(10): 1018–1036.
Lynch Z. 2004. Neurotechnology and Society 2010–2060. Annals of the New York Academy of Sciences 1031: 229–233.
Malkov A. S., Bozhevolnov Yu. V., Khaltourina D. A., and Korotayev A. V. 2010. To the System Analysis of World Dynamics: Interaction of the Center and Periphery of the World System. Forecasting and Modeling of Crises and World Dynamics / Ed. by A. A. Akaev, A. V. Korotayev, and G. G. Malinetsky, pp. 234–248. Moscow: LKI/URSS. In Russian (Малков А. С., Божевольнов Ю. В., Халтурина Д. А., Ко-ротаев А. В. К системному анализу мировой динамики: взаимодействие центра и периферии Мир-Системы. Прогноз и моделирование кризисов и мировой ди-намики / Ред. А. А. Акаев, А. В. Коротаев, Г. Г. Малинецкий, с. 234–248. М.: ЛКИ/URSS).
Malkov A. S., Korotayev A. V., and Bozhevolnov Yu. V. 2010. Mathematical Model-ing of Interaction of the Center and Periphery of the World System. Forecasting and Modeling of Crises and World Dynamics / Ed. by A. A. Akaev, A. V. Korotayev, and G. G. Malinetsky, pp. 277–286. Moscow: LKI/URSS. In Russian (Мал- ков А. С., Коротаев А. В., Божевольнов Ю. В. Математическое моделирование взаимодействия центра и периферии Мир-Системы. Прогноз и моделирование
Global Population Ageing 106
кризисов и мировой динамики / Отв. ред. А. А. Акаев, А. В. Коротаев, Г. Г. Ма-линецкий, с. 277–286. М.: ЛКИ/URSS).
Nefiodow L. 1996. Der sechste Kondratieff. Wege zur Produktivität und Vollbeschäfti-gung im Zeitalter der Information [The Sixth Kondratieff. Ways to Productivity and Full Employment in the Information Age]. 1. Auflage/Edition. Sankt Augustin.
Nefiodow L., and Nefiodow S. 2014. The Sixth Kondratieff. The New Long Wave of the World Economy. Rhein-Sieg-Verlag: Sankt Augustin.
OECD. 2001. The Well-being of Nations: The Role of Human and Social Capital. Paris: OECD.
OECD. 2014a. Annual Survey of Large Pension Funds and Public Pension Reserve Funds. Report on Pension Funds' Long-term Investments.
OECD. 2014b. Pension Markets in Focus. Paris: OECD.
OECD. 2015. OECD Stat. Public Pension Reserve Funds' Statistics: Asset Allocation. URL: http://stats.oecd.org/index.aspx?queryid=594.
Papenhausen Ch. 2008. Causal Mechanisms of Long Waves. Futures 40: 788–794.
Perez C. 2002. Technological Revolutions and Financial Capital: The Dynamics of Bubbles and Golden Ages. Cheltenham: Elgar.
Perez C. 2010. Technological Revolutions and Techno-Economic Paradigms. Cambridge Journal of Economics 34(1): 185–202.
Pride V., and Korotayev A. (Eds.) 2008. New Technologies and Continuation of the Person's Evolution? Moscow: LKI/URSS. In Russian (Прайд В., Коротаев А. (Ред.) Новые технологии и продолжение эволюции человека? М.: ЛКИ/URSS).
Shtefan J. 2008. Pension Funds of the USA Lost Two Trillion Dollars. New Region 2, October 8. URL: http://www.nr2.ru/economy/199830.html. In Russian (Штефан Е. Пенсионные фонды США потеряли два триллиона долларов. Новый регион 2, 8 октября. URL: http://www.nr2.ru/economy/199830.html).
Stiglitz J. E. 2015. America in the Way. Project Syndicate, August 6. URL: http://www. project-syndicate.org/commentary/us-international-development-finance-by-joseph-e--stiglitz-2015-08.
UN Population Division. 2015. UN Population Division Database. URL: http://www. un.org/esa/population. Date accessed: 17.01.2015.
World Bank 2015. World Development Indicators Online. Washington, DC: World Bank. URL: http://data.worldbank.org/indicator/.
Zinkina J., Malkov A., and Korotayev A. 2014. A Mathematical Model of Technolog-ical, Economic, Demographic and Social Interaction between the Center and Periph-ery of the World System. Socio-economic and Technological Innovations: Mecha-nisms and Institutions / Ed. by K. Mandal, N. Asheulova, S. G. Kirdina, pр. 135–147. New Delhi: Narosa Publishing House.
Zinoviev A. A. 2003. Global Human Warren. Moscow: Eksmo. In Russian (Зи- новьев А. А. Глобальный человейник. М.: Эксмо).
History & Mathematics: Demography & Ageing 2015 107–132 107
6
Impact of Population Ageing on Asia's Future Growth1
Donghyun Park and Kwanho Shin
Abstract The demographic dividend that contributed substantially to economic growth in developing Asia in the past is dissipating. Population ageing affects growth through savings, capital accumulation, labor force participation, and total fac-tor productivity. We examined the impact of ageing on those 4 channels in 12 developing Asian economies that collectively make up the bulk of the region's population and output. We then made projections about the effects of demo-graphic change on the economic growth of the 12 from 2011 to 2020 and from 2021 to 2030. Our results indicate that there will be a sizable adverse econom-ic impact where population ageing is more advanced.
Keywords: ageing, growth, labor force, total factor productivity, saving, investment, Asia.
1. Introduction Logically, demographic structure – the age structure of a country's population – should affect that country's economic performance. A country with a youthful population will be more productive than a country with an older one as it will have a larger labor force relative to population size. More workers produce more goods and services, so younger countries tend to grow faster economical-ly than older countries. A general loss of economic dynamism explains why advanced economies with maturing populations are concerned about population ageing and also helps to explain why such economies have become more open to immigration in recent years. The on-going shift of global economic power from advanced economies to developing economies to some extent reflects the demographic differences between the two.
Due to a wide range of economic and social factors, developing Asia has begun to follow in the demographic footsteps of the advanced economies; the demographic transition now underway in the region shares many of the same
1 This paper was published earlier as a chapter in Aging, Economic Growth, and Old-Age Security in Asia, Park, D., Lee, S.-H., and Mason, A. (co-editors), Routledge, 2012.
Impact of Population Ageing on Asia's Future Growth 108
features. Rising living standards have led to mortality declines that in turn have resulted in a fall in birth rates and a rise in life expectancy. Better healthcare has been a key factor in both, and improvements in female education and the greater participation of women in the labor force along with reduced reliance on children for old-age support have also contributed to lower birth rates. In short, developing Asia's population ageing follows the general historical pattern of countries growing older as they get richer.
Developing Asia's seemingly inexhaustible supply of workers for export-oriented industrialization catapulted the region from the periphery to the center of the world economy, but the working-age population in the region is ageing and is expected to do so at accelerated rates in the coming decades though this will vary from economy to economy. Some economies still have youthful populations while in others ageing is a much more immediate issue. Regardless of these differences, the region as a whole will have to address the economic consequences of the demographic transition to sustain growth in the medium and long term.
Our objective was to project the impact of the demographic transition on the economic growth of 12 developing Asian economies from 2011 to 2020 and from 2021 to 2030 using projections of age structures readily available from the United Nations (UN) population database. To make our projections, we first used past data to estimate the impact of the old-age dependency ratio and the youth dependency ratio on three primary determinants of economic growth: labor force participation, capital accumulation, and the growth of total factor productivity (TFP). On the basis of those estimates, we projected how the two dependency ratios would affect the three determinants in the next two decades. We made separate projections for each of the two channels through which de-mographic change can influence capital accumulation, i.e., directly and indi-rectly via savings. Summing the projected impact of the two demographic vari-ables gave us the projected impact on growth.
Our analysis is based on well-grounded theoretical rationales for why de-mographic change can have a significant influence on economic growth. The economic needs and contributions of individuals vary over the course of their economic lifecycles. It is well known that working-age adults tend to work and save more than youth or those aged 60 and older. That is, the ratio of con-sumption to production is generally high for youth and low for working-age adults. Children rely on parents for material needs during the early years of life. After retirement, adults rely on income from savings, transfers from children, and pension benefits. Between youth and retirement, adults work to provide for their families and to save for retirement. A larger labor force therefore contrib-utes directly to economic growth, and higher savings rates contribute to growth by boosting the investment rate.
Donghyun Park and Kwanho Shin 109
The theoretical basis for the relationship between demographic change on one hand and labor supply and savings on the other is well established. It is also intuitively plausible that population ageing may directly affect investment. To the extent that physical capital can substitute for labor, an economy can accu-mulate more capital in order to compensate for the slowdown in the growth of the labor force. Capital and labor can, however, also be complements; this would dilute the positive effect of ageing on investment. Changes in the age structure of the labor force can also influence the investment rate. For example, older workers may need more capital than younger workers to compensate for their diminished physical strength. In addition, demographic change will have a sizable effect on the structure of demand for services and goods for the elderly and may bring about structural changes in production, for example, the capital intensity of production that can in turn influence the investment rate.
Finally, economic intuition suggests that demographic changes will affect la-bor productivity. Older workers tend to have more experience and knowledge, but younger workers tend to be physically stronger and have stronger incentives to invest in human capital. Alesina, Spolaore, and Wacziarg (2003) point out that declining fertility affects not only the size of the working-age population but also its age structure. Due to age-specific differences in labor productivity, the aggre-gate productivity of a country with larger numbers of older, experienced workers will be higher than that of a younger country. Since labor productivity grows fastest and peaks between the ages of 35 and 54, the productive capacity of a country with a large proportion of workers in the prime age group should be markedly higher than that of a country with more younger or older workers. An analysis of a balanced panel of 84 countries by Gomez and Hernandez de Cos (2008) found evidence that an increase in the share of workers in the prime age group had a positive but curvilinear effect on per capita gross domestic product (GDP). While labor productivity and TFP are separate concepts, the former will have a significant effect on the latter under certain conditions. In fact, the two appear to be equivalent if we assume a Cobb-Douglas production function. In this connection, in a study of 10 Canadian provinces from 1981 to 2001 with projections up to 2046, Tang and MacLeod (2006) found that older workers were, on average, less productive than younger workers and that an ageing la-bor force had a negative effect on productivity.
Our quantitative projections will give developing Asia's policymakers some insights into the impact of demographic change on economic growth that will help them design and implement appropriate policies for sustaining growth as the demographic dividend dissipates. The exact impact of ageing and hence the appropriate policy response will necessarily differ from economy to econ-omy given the wide diversity of demographic profiles in the region.
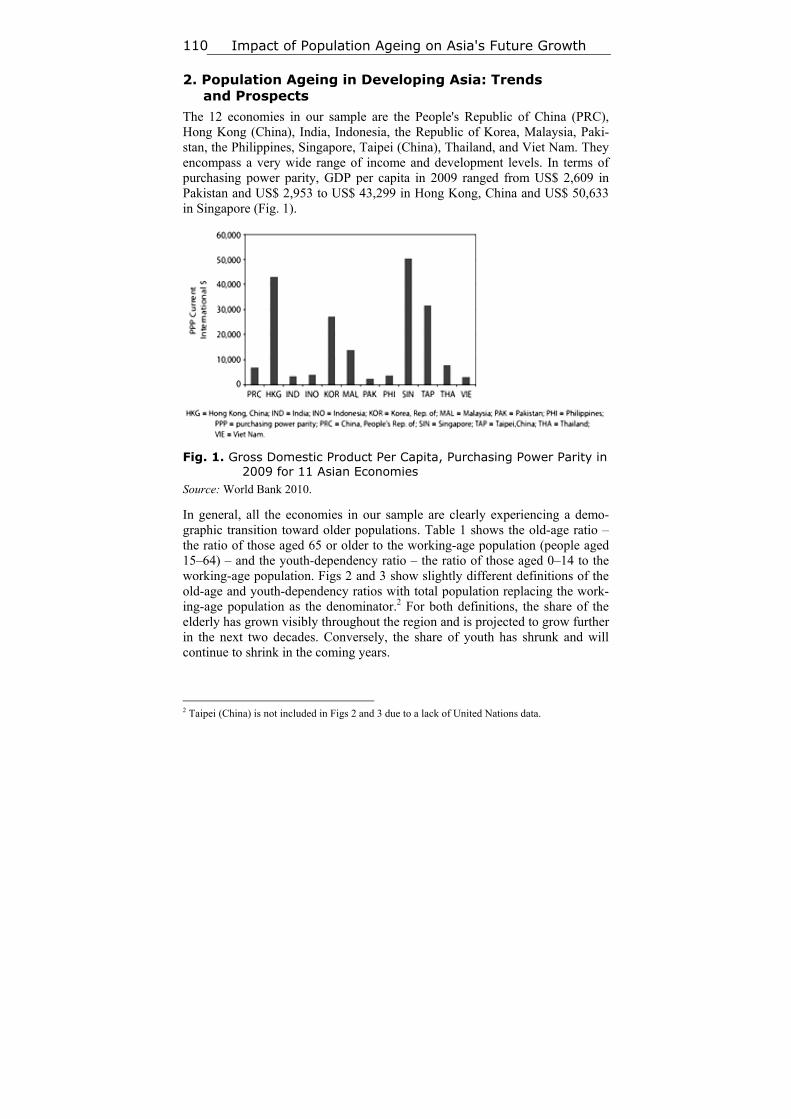
Impact of Population Ageing on Asia's Future Growth 110
2. Population Ageing in Developing Asia: Trends and Prospects
The 12 economies in our sample are the People's Republic of China (PRC), Hong Kong (China), India, Indonesia, the Republic of Korea, Malaysia, Paki-stan, the Philippines, Singapore, Taipei (China), Thailand, and Viet Nam. They encompass a very wide range of income and development levels. In terms of purchasing power parity, GDP per capita in 2009 ranged from US$ 2,609 in Pakistan and US$ 2,953 to US$ 43,299 in Hong Kong, China and US$ 50,633 in Singapore (Fig. 1).
Fig. 1. Gross Domestic Product Per Capita, Purchasing Power Parity in 2009 for 11 Asian Economies
Source: World Bank 2010.
In general, all the economies in our sample are clearly experiencing a demo-graphic transition toward older populations. Table 1 shows the old-age ratio – the ratio of those aged 65 or older to the working-age population (people aged 15–64) – and the youth-dependency ratio – the ratio of those aged 0–14 to the working-age population. Figs 2 and 3 show slightly different definitions of the old-age and youth-dependency ratios with total population replacing the work-ing-age population as the denominator.2 For both definitions, the share of the elderly has grown visibly throughout the region and is projected to grow further in the next two decades. Conversely, the share of youth has shrunk and will continue to shrink in the coming years.
2 Taipei (China) is not included in Figs 2 and 3 due to a lack of United Nations data.
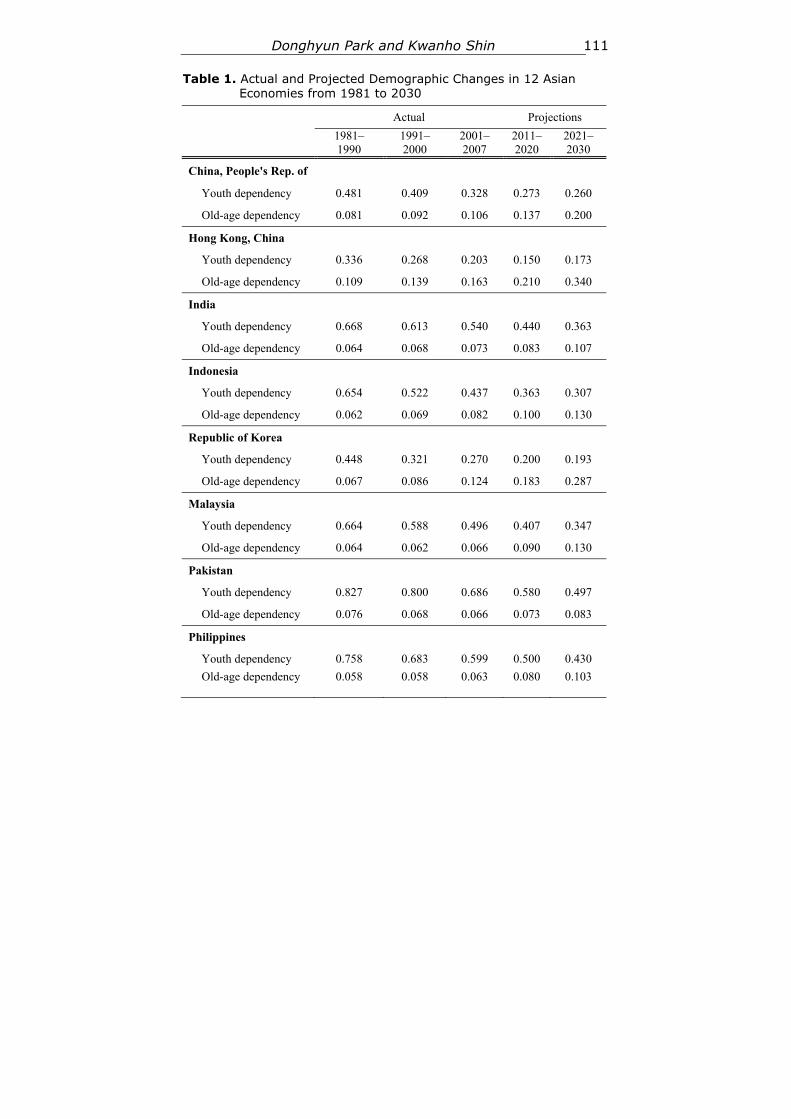
Donghyun Park and Kwanho Shin 111
Table 1. Actual and Projected Demographic Changes in 12 Asian Economies from 1981 to 2030
Actual Projections
1981– 1990
1991–2000
2001–2007
2011–2020
2021–2030
China, People's Rep. of
Youth dependency 0.481 0.409 0.328 0.273 0.260
Old-age dependency 0.081 0.092 0.106 0.137 0.200
Hong Kong, China
Youth dependency 0.336 0.268 0.203 0.150 0.173
Old-age dependency 0.109 0.139 0.163 0.210 0.340
India
Youth dependency 0.668 0.613 0.540 0.440 0.363
Old-age dependency 0.064 0.068 0.073 0.083 0.107
Indonesia
Youth dependency 0.654 0.522 0.437 0.363 0.307
Old-age dependency 0.062 0.069 0.082 0.100 0.130
Republic of Korea
Youth dependency 0.448 0.321 0.270 0.200 0.193
Old-age dependency 0.067 0.086 0.124 0.183 0.287
Malaysia
Youth dependency 0.664 0.588 0.496 0.407 0.347
Old-age dependency 0.064 0.062 0.066 0.090 0.130
Pakistan
Youth dependency 0.827 0.800 0.686 0.580 0.497
Old-age dependency 0.076 0.068 0.066 0.073 0.083
Philippines
Youth dependency 0.758 0.683 0.599 0.500 0.430
Old-age dependency
0.058
0.058
0.063
0.080
0.103
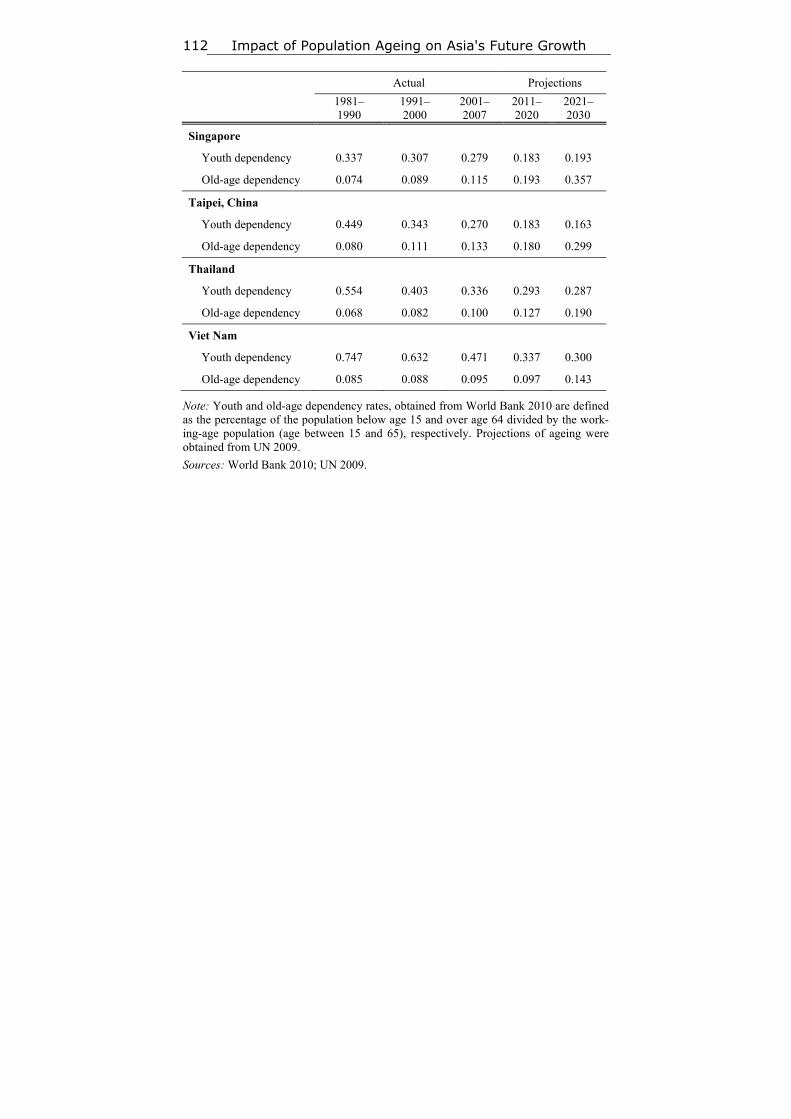
Impact of Population Ageing on Asia's Future Growth 112
Actual Projections
1981– 1990
1991–2000
2001–2007
2011–2020
2021–2030
Singapore
Youth dependency 0.337 0.307 0.279 0.183 0.193
Old-age dependency 0.074 0.089 0.115 0.193 0.357
Taipei, China
Youth dependency 0.449 0.343 0.270 0.183 0.163
Old-age dependency 0.080 0.111 0.133 0.180 0.299
Thailand
Youth dependency 0.554 0.403 0.336 0.293 0.287
Old-age dependency 0.068 0.082 0.100 0.127 0.190
Viet Nam
Youth dependency 0.747 0.632 0.471 0.337 0.300
Old-age dependency 0.085 0.088 0.095 0.097 0.143
Note: Youth and old-age dependency rates, obtained from World Bank 2010 are defined as the percentage of the population below age 15 and over age 64 divided by the work-ing-age population (age between 15 and 65), respectively. Projections of ageing were obtained from UN 2009.
Sources: World Bank 2010; UN 2009.
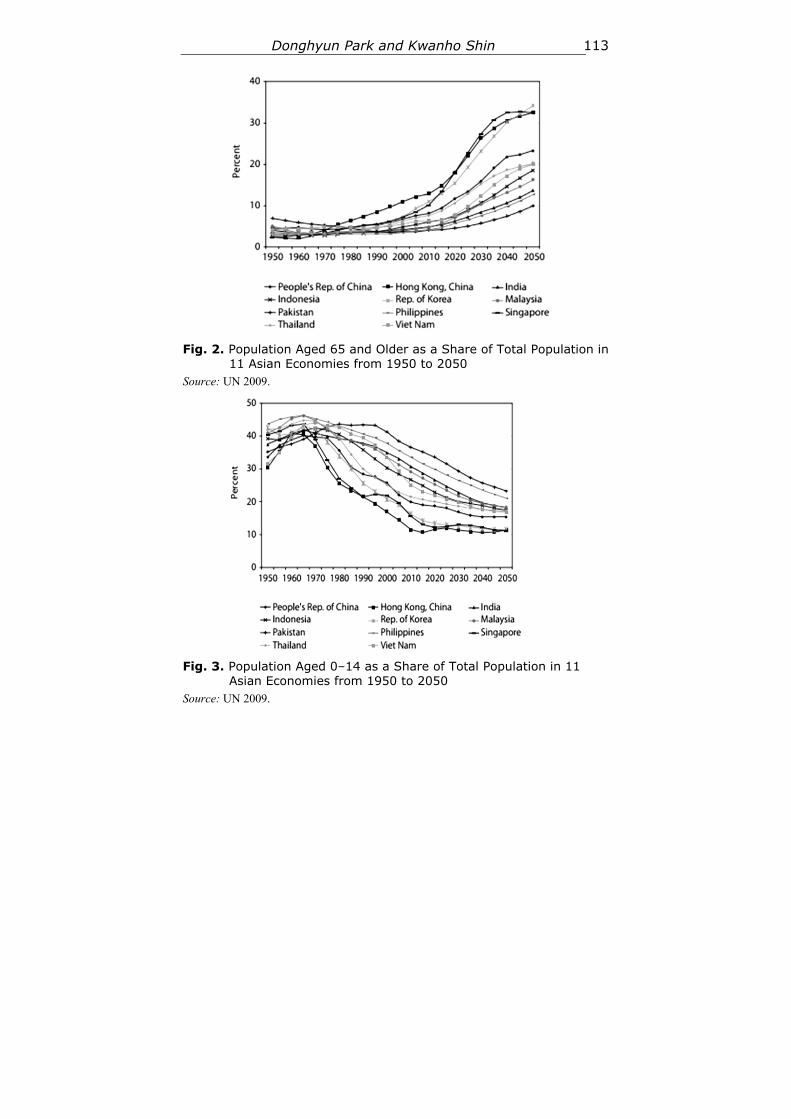
Donghyun Park and Kwanho Shin 113
Fig. 2. Population Aged 65 and Older as a Share of Total Population in
11 Asian Economies from 1950 to 2050 Source: UN 2009.
Fig. 3. Population Aged 0–14 as a Share of Total Population in 11
Asian Economies from 1950 to 2050 Source: UN 2009.
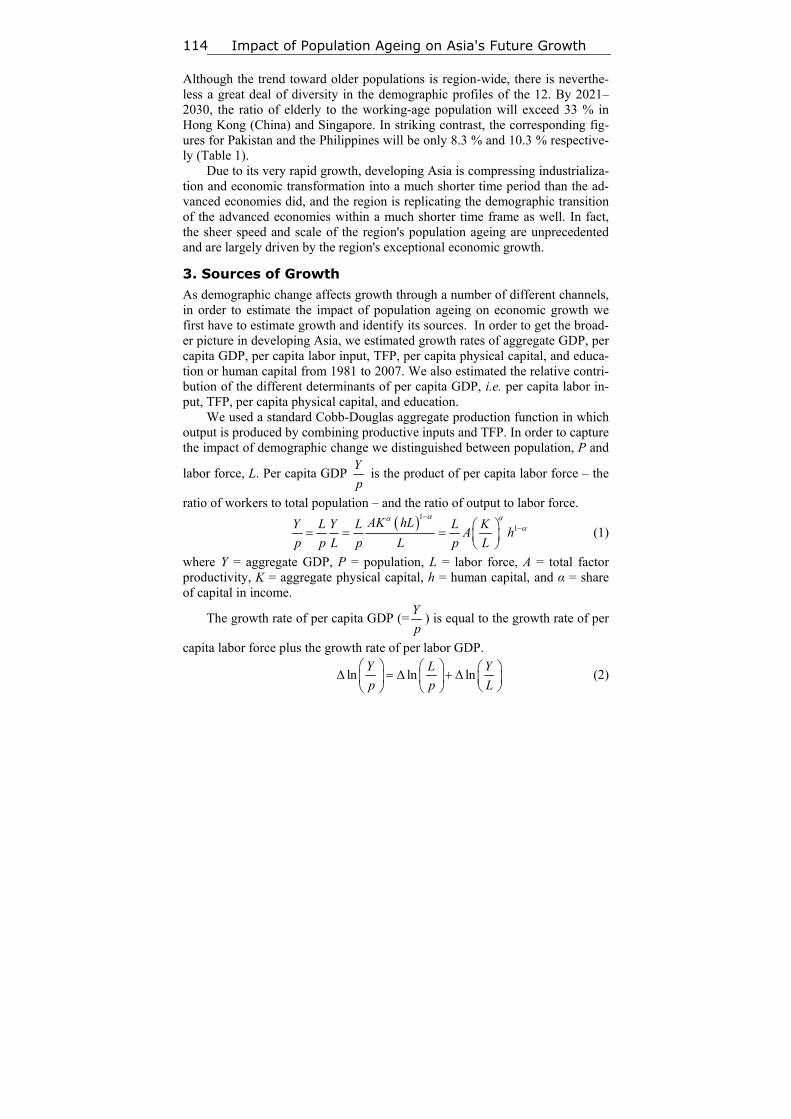
Impact of Population Ageing on Asia's Future Growth 114
Although the trend toward older populations is region-wide, there is neverthe-less a great deal of diversity in the demographic profiles of the 12. By 2021–2030, the ratio of elderly to the working-age population will exceed 33 % in Hong Kong (China) and Singapore. In striking contrast, the corresponding fig-ures for Pakistan and the Philippines will be only 8.3 % and 10.3 % respective-ly (Table 1).
Due to its very rapid growth, developing Asia is compressing industrializa-tion and economic transformation into a much shorter time period than the ad-vanced economies did, and the region is replicating the demographic transition of the advanced economies within a much shorter time frame as well. In fact, the sheer speed and scale of the region's population ageing are unprecedented and are largely driven by the region's exceptional economic growth.
3. Sources of Growth As demographic change affects growth through a number of different channels, in order to estimate the impact of population ageing on economic growth we first have to estimate growth and identify its sources. In order to get the broad-er picture in developing Asia, we estimated growth rates of aggregate GDP, per capita GDP, per capita labor input, TFP, per capita physical capital, and educa-tion or human capital from 1981 to 2007. We also estimated the relative contri-bution of the different determinants of per capita GDP, i.e. per capita labor in-put, TFP, per capita physical capital, and education.
We used a standard Cobb-Douglas aggregate production function in which output is produced by combining productive inputs and TFP. In order to capture the impact of demographic change we distinguished between population, P and
labor force, L. Per capita GDP Y
p is the product of per capita labor force – the
ratio of workers to total population – and the ratio of output to labor force.
1 1AK hLY L Y L L KA h
p p L p L p L
(1)
where Y = aggregate GDP, P = population, L = labor force, A = total factor productivity, K = aggregate physical capital, h = human capital, and α = share of capital in income.
The growth rate of per capita GDP (=Y
p) is equal to the growth rate of per
capita labor force plus the growth rate of per labor GDP.
ln ln lnY L Y
p p L
(2)
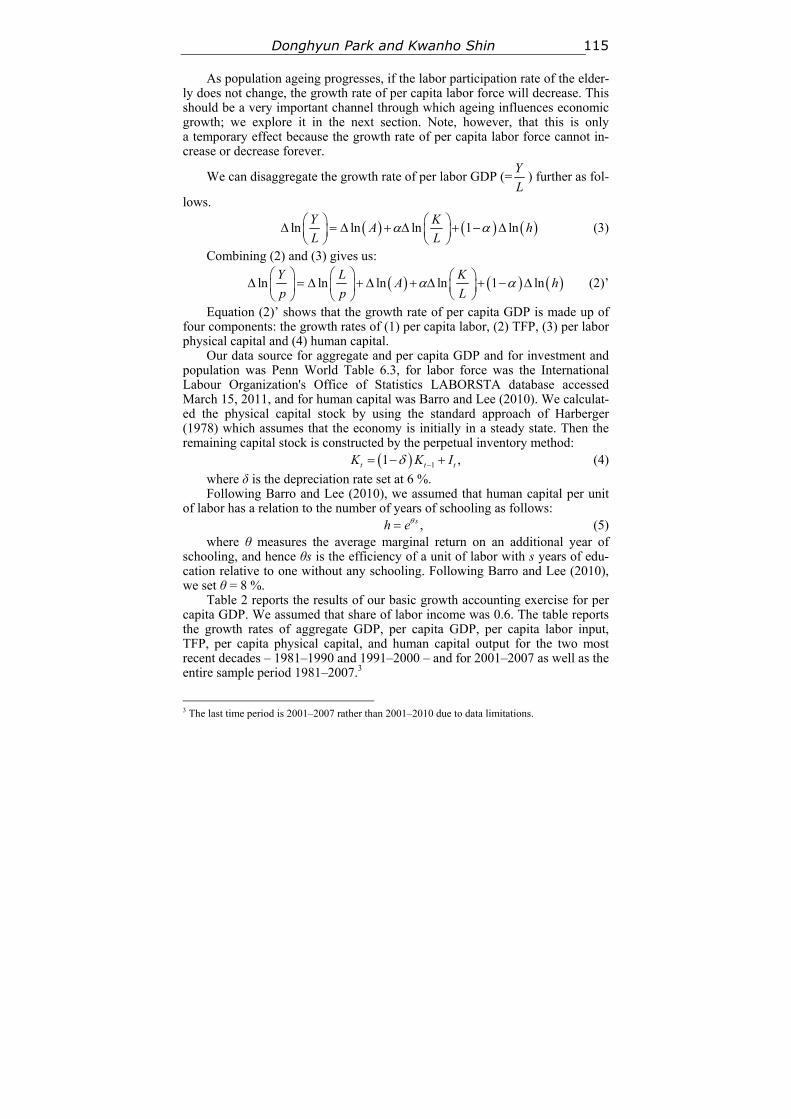
Donghyun Park and Kwanho Shin 115
As population ageing progresses, if the labor participation rate of the elder-ly does not change, the growth rate of per capita labor force will decrease. This should be a very important channel through which ageing influences economic growth; we explore it in the next section. Note, however, that this is only a temporary effect because the growth rate of per capita labor force cannot in-crease or decrease forever.
We can disaggregate the growth rate of per labor GDP (=Y
L) further as fol-
lows.
ln ln ln 1 lnY K
A hL L
(3)
Combining (2) and (3) gives us:
ln ln ln ln 1 lnY L K
A hp p L
(2)’
Equation (2)’ shows that the growth rate of per capita GDP is made up of four components: the growth rates of (1) per capita labor, (2) TFP, (3) per labor physical capital and (4) human capital.
Our data source for aggregate and per capita GDP and for investment and population was Penn World Table 6.3, for labor force was the International Labour Organization's Office of Statistics LABORSTA database accessed March 15, 2011, and for human capital was Barro and Lee (2010). We calculat-ed the physical capital stock by using the standard approach of Harberger (1978) which assumes that the economy is initially in a steady state. Then the remaining capital stock is constructed by the perpetual inventory method:
11 ,t t tK K I (4)
where δ is the depreciation rate set at 6 %. Following Barro and Lee (2010), we assumed that human capital per unit
of labor has a relation to the number of years of schooling as follows: ,sh e (5)
where θ measures the average marginal return on an additional year of schooling, and hence θs is the efficiency of a unit of labor with s years of edu-cation relative to one without any schooling. Following Barro and Lee (2010), we set θ = 8 %.
Table 2 reports the results of our basic growth accounting exercise for per capita GDP. We assumed that share of labor income was 0.6. The table reports the growth rates of aggregate GDP, per capita GDP, per capita labor input, TFP, per capita physical capital, and human capital output for the two most recent decades – 1981–1990 and 1991–2000 – and for 2001–2007 as well as the entire sample period 1981–2007.3
3 The last time period is 2001–2007 rather than 2001–2010 due to data limitations.
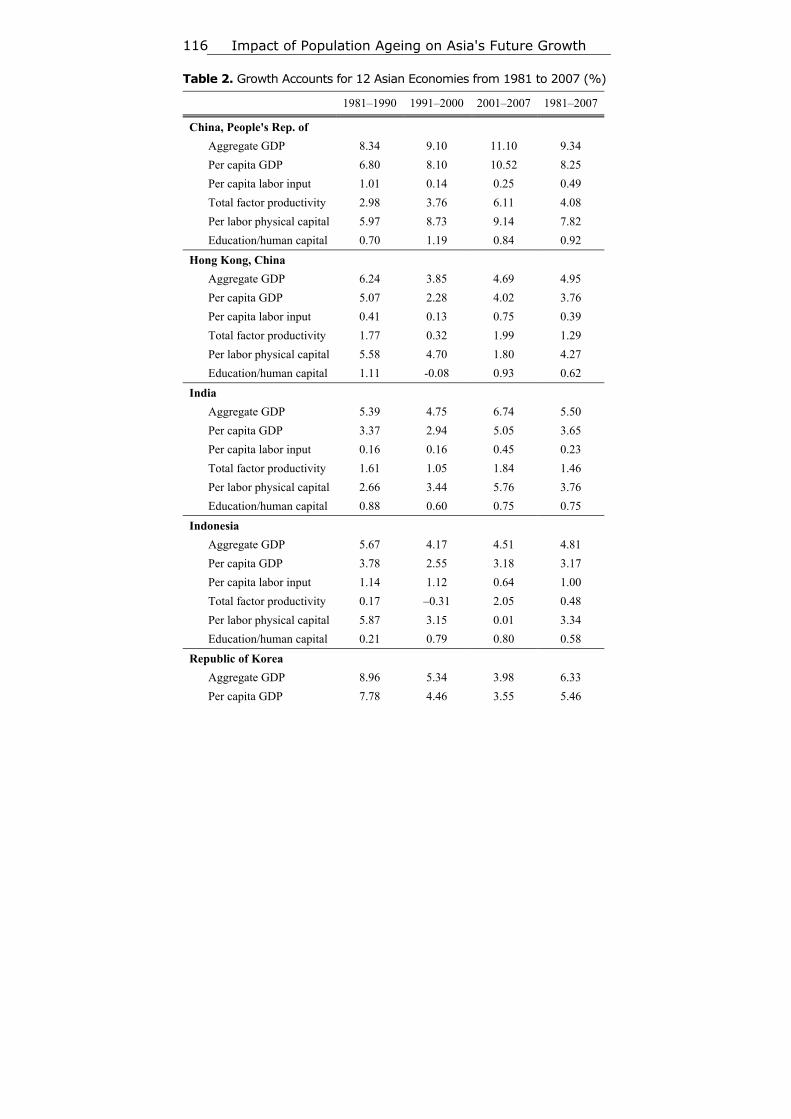
Impact of Population Ageing on Asia's Future Growth 116
Table 2. Growth Accounts for 12 Asian Economies from 1981 to 2007 (%)
1981–1990 1991–2000 2001–2007 1981–2007
China, People's Rep. of
Aggregate GDP 8.34 9.10 11.10 9.34
Per capita GDP 6.80 8.10 10.52 8.25
Per capita labor input 1.01 0.14 0.25 0.49
Total factor productivity 2.98 3.76 6.11 4.08
Per labor physical capital 5.97 8.73 9.14 7.82
Education/human capital 0.70 1.19 0.84 0.92
Hong Kong, China
Aggregate GDP 6.24 3.85 4.69 4.95
Per capita GDP 5.07 2.28 4.02 3.76
Per capita labor input 0.41 0.13 0.75 0.39
Total factor productivity 1.77 0.32 1.99 1.29
Per labor physical capital 5.58 4.70 1.80 4.27
Education/human capital 1.11 -0.08 0.93 0.62
India
Aggregate GDP 5.39 4.75 6.74 5.50
Per capita GDP 3.37 2.94 5.05 3.65
Per capita labor input 0.16 0.16 0.45 0.23
Total factor productivity 1.61 1.05 1.84 1.46
Per labor physical capital 2.66 3.44 5.76 3.76
Education/human capital 0.88 0.60 0.75 0.75
Indonesia
Aggregate GDP 5.67 4.17 4.51 4.81
Per capita GDP 3.78 2.55 3.18 3.17
Per capita labor input 1.14 1.12 0.64 1.00
Total factor productivity 0.17 –0.31 2.05 0.48
Per labor physical capital 5.87 3.15 0.01 3.34
Education/human capital 0.21 0.79 0.80 0.58
Republic of Korea
Aggregate GDP 8.96 5.34 3.98 6.33
Per capita GDP 7.78 4.46 3.55 5.46
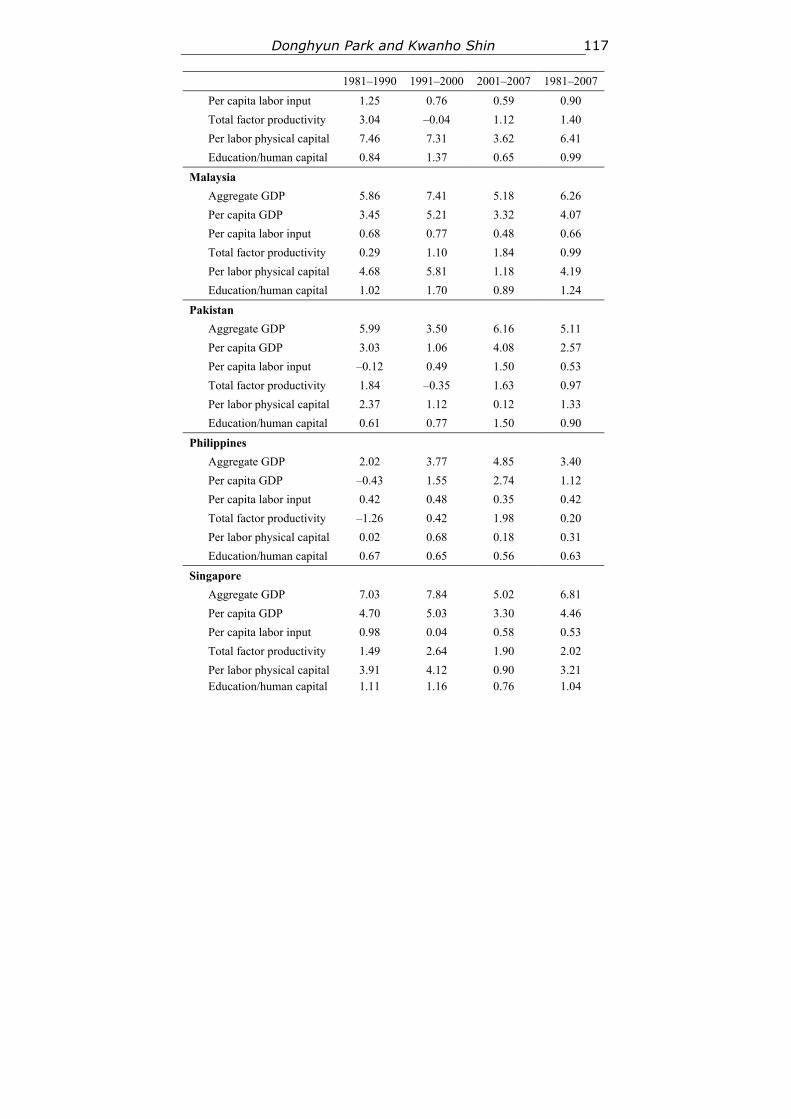
Donghyun Park and Kwanho Shin 117
1981–1990 1991–2000 2001–2007 1981–2007
Per capita labor input 1.25 0.76 0.59 0.90
Total factor productivity 3.04 –0.04 1.12 1.40
Per labor physical capital 7.46 7.31 3.62 6.41
Education/human capital 0.84 1.37 0.65 0.99
Malaysia
Aggregate GDP 5.86 7.41 5.18 6.26
Per capita GDP 3.45 5.21 3.32 4.07
Per capita labor input 0.68 0.77 0.48 0.66
Total factor productivity 0.29 1.10 1.84 0.99
Per labor physical capital 4.68 5.81 1.18 4.19
Education/human capital 1.02 1.70 0.89 1.24
Pakistan
Aggregate GDP 5.99 3.50 6.16 5.11
Per capita GDP 3.03 1.06 4.08 2.57
Per capita labor input –0.12 0.49 1.50 0.53
Total factor productivity 1.84 –0.35 1.63 0.97
Per labor physical capital 2.37 1.12 0.12 1.33
Education/human capital 0.61 0.77 1.50 0.90
Philippines
Aggregate GDP 2.02 3.77 4.85 3.40
Per capita GDP –0.43 1.55 2.74 1.12
Per capita labor input 0.42 0.48 0.35 0.42
Total factor productivity –1.26 0.42 1.98 0.20
Per labor physical capital 0.02 0.68 0.18 0.31
Education/human capital 0.67 0.65 0.56 0.63
Singapore
Aggregate GDP 7.03 7.84 5.02 6.81
Per capita GDP 4.70 5.03 3.30 4.46
Per capita labor input 0.98 0.04 0.58 0.53
Total factor productivity 1.49 2.64 1.90 2.02
Per labor physical capital 3.91 4.12 0.90 3.21 Education/human capital
1.11
1.16
0.76
1.04
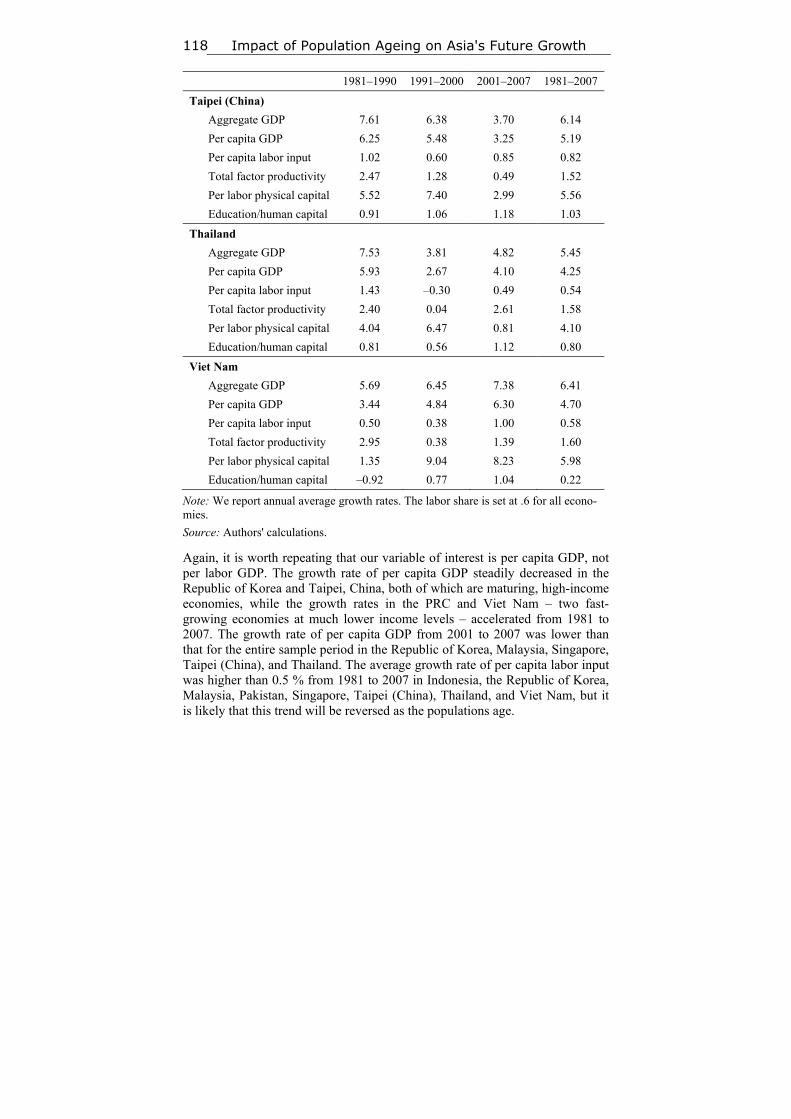
Impact of Population Ageing on Asia's Future Growth 118
1981–1990 1991–2000 2001–2007 1981–2007
Taipei (China)
Aggregate GDP 7.61 6.38 3.70 6.14
Per capita GDP 6.25 5.48 3.25 5.19
Per capita labor input 1.02 0.60 0.85 0.82
Total factor productivity 2.47 1.28 0.49 1.52
Per labor physical capital 5.52 7.40 2.99 5.56
Education/human capital 0.91 1.06 1.18 1.03
Thailand
Aggregate GDP 7.53 3.81 4.82 5.45
Per capita GDP 5.93 2.67 4.10 4.25
Per capita labor input 1.43 –0.30 0.49 0.54
Total factor productivity 2.40 0.04 2.61 1.58
Per labor physical capital 4.04 6.47 0.81 4.10
Education/human capital 0.81 0.56 1.12 0.80
Viet Nam
Aggregate GDP 5.69 6.45 7.38 6.41
Per capita GDP 3.44 4.84 6.30 4.70
Per capita labor input 0.50 0.38 1.00 0.58
Total factor productivity 2.95 0.38 1.39 1.60
Per labor physical capital 1.35 9.04 8.23 5.98
Education/human capital –0.92 0.77 1.04 0.22
Note: We report annual average growth rates. The labor share is set at .6 for all econo-mies.
Source: Authors' calculations.
Again, it is worth repeating that our variable of interest is per capita GDP, not per labor GDP. The growth rate of per capita GDP steadily decreased in the Republic of Korea and Taipei, China, both of which are maturing, high-income economies, while the growth rates in the PRC and Viet Nam – two fast-growing economies at much lower income levels – accelerated from 1981 to 2007. The growth rate of per capita GDP from 2001 to 2007 was lower than that for the entire sample period in the Republic of Korea, Malaysia, Singapore, Taipei (China), and Thailand. The average growth rate of per capita labor input was higher than 0.5 % from 1981 to 2007 in Indonesia, the Republic of Korea, Malaysia, Pakistan, Singapore, Taipei (China), Thailand, and Viet Nam, but it is likely that this trend will be reversed as the populations age.
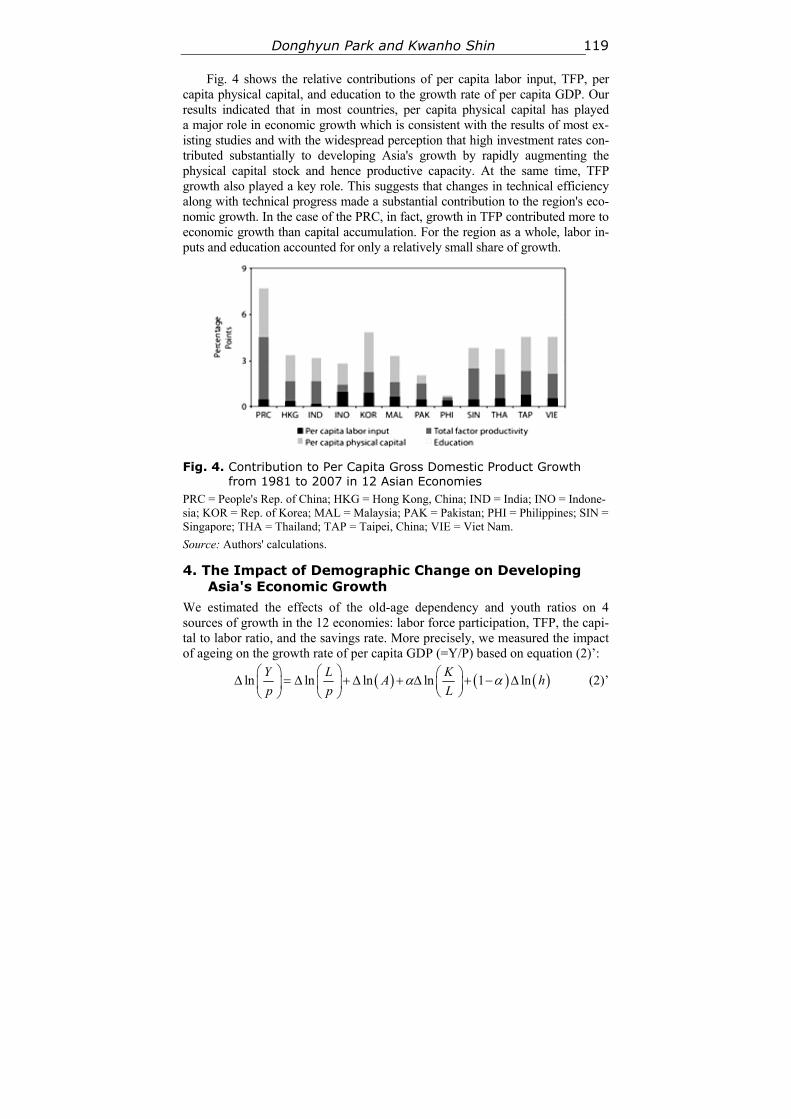
Donghyun Park and Kwanho Shin 119
Fig. 4 shows the relative contributions of per capita labor input, TFP, per capita physical capital, and education to the growth rate of per capita GDP. Our results indicated that in most countries, per capita physical capital has played a major role in economic growth which is consistent with the results of most ex-isting studies and with the widespread perception that high investment rates con-tributed substantially to developing Asia's growth by rapidly augmenting the physical capital stock and hence productive capacity. At the same time, TFP growth also played a key role. This suggests that changes in technical efficiency along with technical progress made a substantial contribution to the region's eco-nomic growth. In the case of the PRC, in fact, growth in TFP contributed more to economic growth than capital accumulation. For the region as a whole, labor in-puts and education accounted for only a relatively small share of growth.
Fig. 4. Contribution to Per Capita Gross Domestic Product Growth from 1981 to 2007 in 12 Asian Economies
PRC = People's Rep. of China; HKG = Hong Kong, China; IND = India; INO = Indone-sia; KOR = Rep. of Korea; MAL = Malaysia; PAK = Pakistan; PHI = Philippines; SIN = Singapore; THA = Thailand; TAP = Taipei, China; VIE = Viet Nam.
Source: Authors' calculations.
4. The Impact of Demographic Change on Developing Asia's Economic Growth
We estimated the effects of the old-age dependency and youth ratios on 4 sources of growth in the 12 economies: labor force participation, TFP, the capi-tal to labor ratio, and the savings rate. More precisely, we measured the impact of ageing on the growth rate of per capita GDP (=Y/P) based on equation (2)’:
ln ln ln ln 1 lnY L K
A hp p L
(2)’
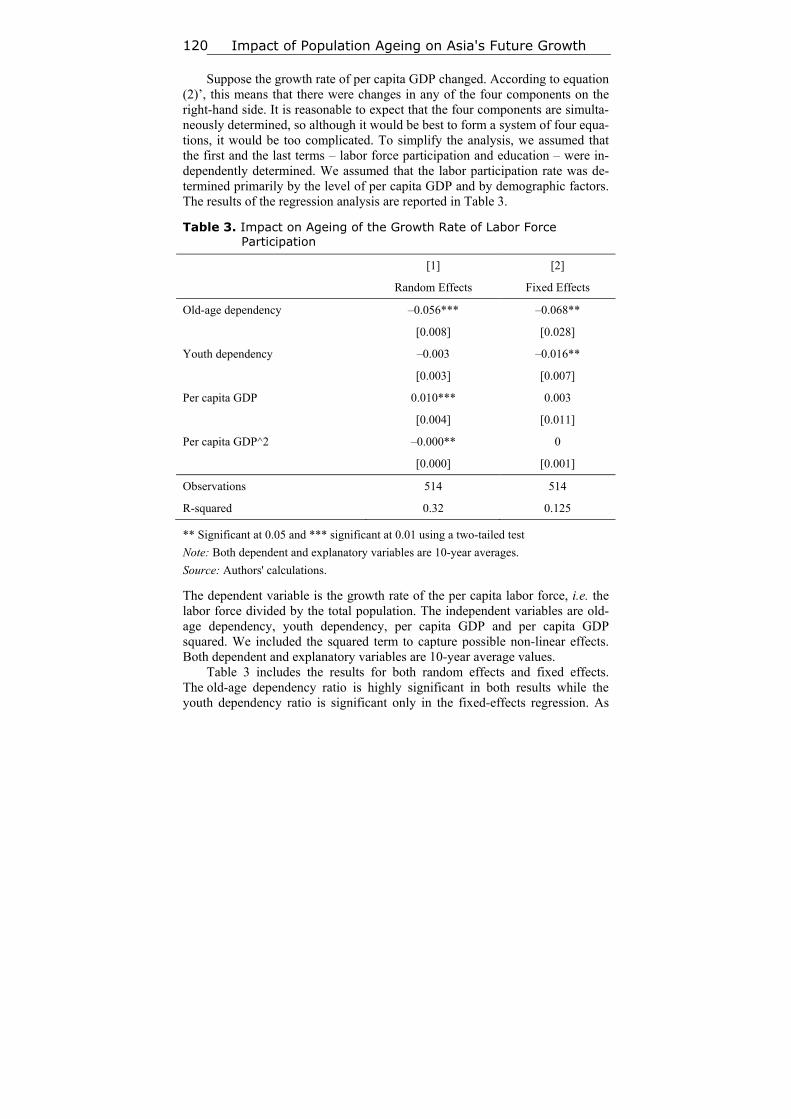
Impact of Population Ageing on Asia's Future Growth 120
Suppose the growth rate of per capita GDP changed. According to equation (2)’, this means that there were changes in any of the four components on the right-hand side. It is reasonable to expect that the four components are simulta-neously determined, so although it would be best to form a system of four equa-tions, it would be too complicated. To simplify the analysis, we assumed that the first and the last terms – labor force participation and education – were in-dependently determined. We assumed that the labor participation rate was de-termined primarily by the level of per capita GDP and by demographic factors. The results of the regression analysis are reported in Table 3.
Table 3. Impact on Ageing of the Growth Rate of Labor Force Participation
[1] [2]
Random Effects Fixed Effects
Old-age dependency –0.056*** –0.068**
[0.008] [0.028]
Youth dependency –0.003 –0.016**
[0.003] [0.007]
Per capita GDP 0.010*** 0.003
[0.004] [0.011]
Per capita GDP^2 –0.000** 0
[0.000] [0.001]
Observations 514 514
R-squared 0.32 0.125
** Significant at 0.05 and *** significant at 0.01 using a two-tailed test
Note: Both dependent and explanatory variables are 10-year averages.
Source: Authors' calculations.
The dependent variable is the growth rate of the per capita labor force, i.e. the labor force divided by the total population. The independent variables are old-age dependency, youth dependency, per capita GDP and per capita GDP squared. We included the squared term to capture possible non-linear effects. Both dependent and explanatory variables are 10-year average values.
Table 3 includes the results for both random effects and fixed effects. The old-age dependency ratio is highly significant in both results while the youth dependency ratio is significant only in the fixed-effects regression. As
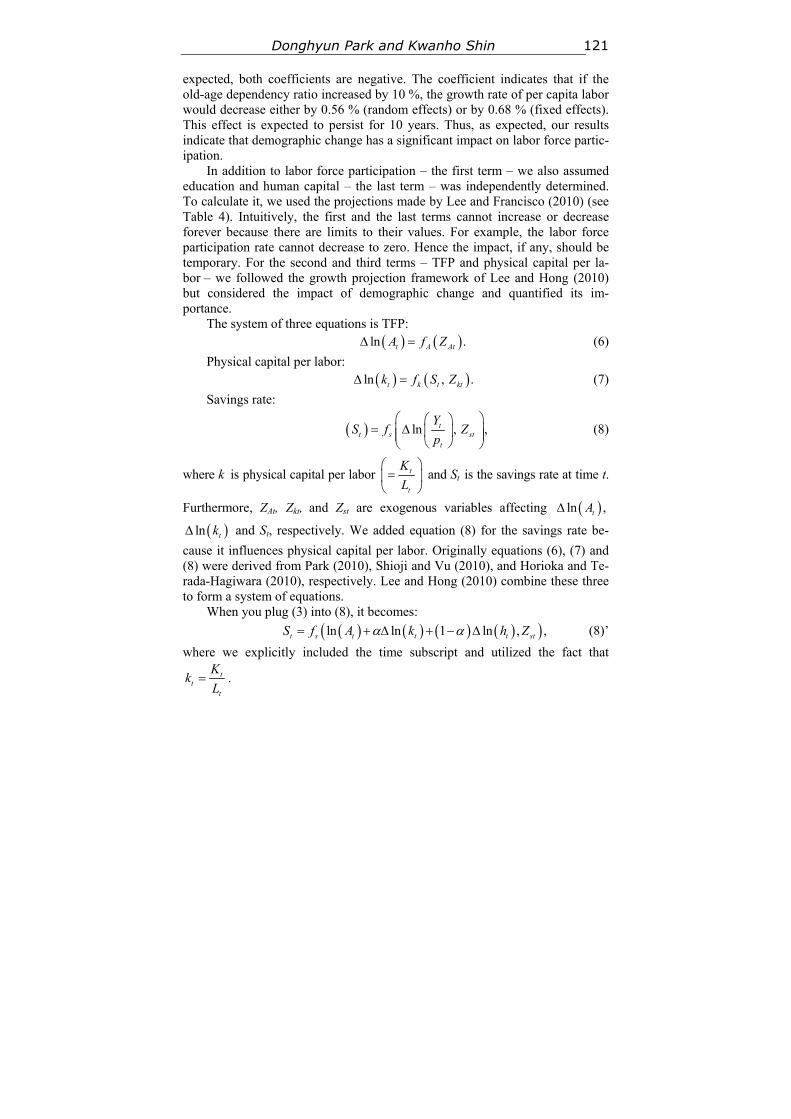
Donghyun Park and Kwanho Shin 121
expected, both coefficients are negative. The coefficient indicates that if the old-age dependency ratio increased by 10 %, the growth rate of per capita labor would decrease either by 0.56 % (random effects) or by 0.68 % (fixed effects). This effect is expected to persist for 10 years. Thus, as expected, our results indicate that demographic change has a significant impact on labor force partic-ipation.
In addition to labor force participation – the first term – we also assumed education and human capital – the last term – was independently determined. To calculate it, we used the projections made by Lee and Francisco (2010) (see Table 4). Intuitively, the first and the last terms cannot increase or decrease forever because there are limits to their values. For example, the labor force participation rate cannot decrease to zero. Hence the impact, if any, should be temporary. For the second and third terms – TFP and physical capital per la-bor – we followed the growth projection framework of Lee and Hong (2010) but considered the impact of demographic change and quantified its im-portance.
The system of three equations is TFP:
ln .t A AtA f Z (6)
Physical capital per labor:
ln , .t k t ktk f S Z (7)
Savings rate:
ln , ,tt s st
t
YS f Z
p
(8)
where k is physical capital per labor t
t
K
L
and St is the savings rate at time t.
Furthermore, ZAt, Zkt, and Zst are exogenous variables affecting ln ,tA
ln tk and St, respectively. We added equation (8) for the savings rate be-
cause it influences physical capital per labor. Originally equations (6), (7) and (8) were derived from Park (2010), Shioji and Vu (2010), and Horioka and Te-rada-Hagiwara (2010), respectively. Lee and Hong (2010) combine these three to form a system of equations.
When you plug (3) into (8), it becomes:
ln ln 1 ln , ,t s t t t stS f A k h Z (8)’
where we explicitly included the time subscript and utilized the fact that
tt
t
Kk
L .
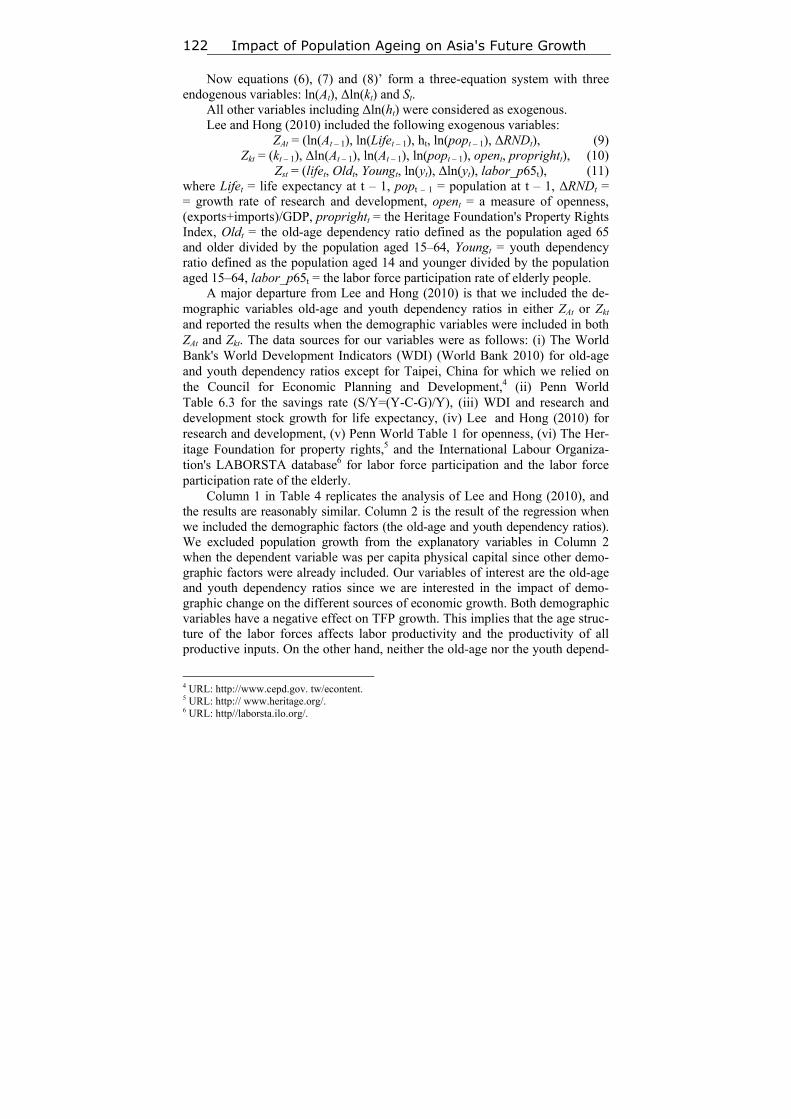
Impact of Population Ageing on Asia's Future Growth 122
Now equations (6), (7) and (8)’ form a three-equation system with three endogenous variables: ln(At), Δln(kt) and St.
All other variables including Δln(ht) were considered as exogenous. Lee and Hong (2010) included the following exogenous variables:
ZAt = (ln(At – 1), ln(Lifet – 1), ht, ln(popt – 1), ΔRNDt), (9) Zkt = (kt – 1), Δln(At – 1), ln(At – 1), ln(popt – 1), opent, proprightt), (10)
Zst = (lifet, Oldt, Youngt, ln(yt), Δln(yt), labor_p65t), (11) where Lifet = life expectancy at t – 1, popt – 1 = population at t – 1, ΔRNDt = = growth rate of research and development, opent = a measure of openness, (exports+imports)/GDP, proprightt = the Heritage Foundation's Property Rights Index, Oldt = the old-age dependency ratio defined as the population aged 65 and older divided by the population aged 15–64, Youngt = youth dependency ratio defined as the population aged 14 and younger divided by the population aged 15–64, labor_p65t = the labor force participation rate of elderly people.
A major departure from Lee and Hong (2010) is that we included the de-mographic variables old-age and youth dependency ratios in either ZAt or Zkt and reported the results when the demographic variables were included in both ZAt and Zkt. The data sources for our variables were as follows: (i) The World Bank's World Development Indicators (WDI) (World Bank 2010) for old-age and youth dependency ratios except for Taipei, China for which we relied on the Council for Economic Planning and Development,4 (ii) Penn World Table 6.3 for the savings rate (S/Y=(Y-C-G)/Y), (iii) WDI and research and development stock growth for life expectancy, (iv) Lee and Hong (2010) for research and development, (v) Penn World Table 1 for openness, (vi) The Her-itage Foundation for property rights,5 and the International Labour Organiza-tion's LABORSTA database6 for labor force participation and the labor force participation rate of the elderly.
Column 1 in Table 4 replicates the analysis of Lee and Hong (2010), and the results are reasonably similar. Column 2 is the result of the regression when we included the demographic factors (the old-age and youth dependency ratios). We excluded population growth from the explanatory variables in Column 2 when the dependent variable was per capita physical capital since other demo-graphic factors were already included. Our variables of interest are the old-age and youth dependency ratios since we are interested in the impact of demo-graphic change on the different sources of economic growth. Both demographic variables have a negative effect on TFP growth. This implies that the age struc-ture of the labor forces affects labor productivity and the productivity of all productive inputs. On the other hand, neither the old-age nor the youth depend-
4 URL: http://www.cepd.gov. tw/econtent. 5 URL: http:// www.heritage.org/. 6 URL: http//laborsta.ilo.org/.
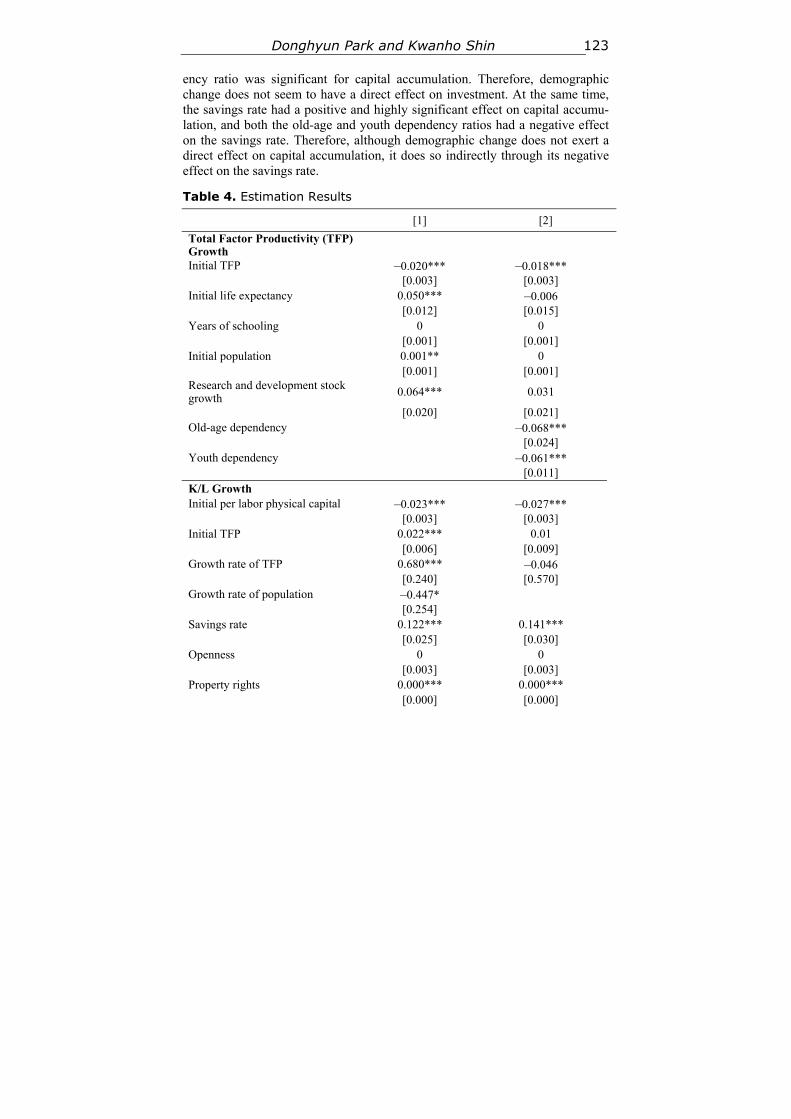
Donghyun Park and Kwanho Shin 123
ency ratio was significant for capital accumulation. Therefore, demographic change does not seem to have a direct effect on investment. At the same time, the savings rate had a positive and highly significant effect on capital accumu-lation, and both the old-age and youth dependency ratios had a negative effect on the savings rate. Therefore, although demographic change does not exert a direct effect on capital accumulation, it does so indirectly through its negative effect on the savings rate.
Table 4. Estimation Results
[1] [2]
Total Factor Productivity (TFP) Growth
Initial TFP –0.020*** –0.018*** [0.003] [0.003] Initial life expectancy 0.050*** –0.006 [0.012] [0.015] Years of schooling 0 0 [0.001] [0.001] Initial population 0.001** 0 [0.001] [0.001] Research and development stock growth 0.064*** 0.031
[0.020] [0.021] Old-age dependency –0.068*** [0.024] Youth dependency –0.061*** [0.011] K/L Growth Initial per labor physical capital –0.023*** –0.027*** [0.003] [0.003] Initial TFP 0.022*** 0.01 [0.006] [0.009] Growth rate of TFP 0.680*** –0.046 [0.240] [0.570] Growth rate of population –0.447* [0.254] Savings rate 0.122*** 0.141*** [0.025] [0.030] Openness 0 0 [0.003] [0.003] Property rights 0.000*** 0.000*** [0.000] [0.000]
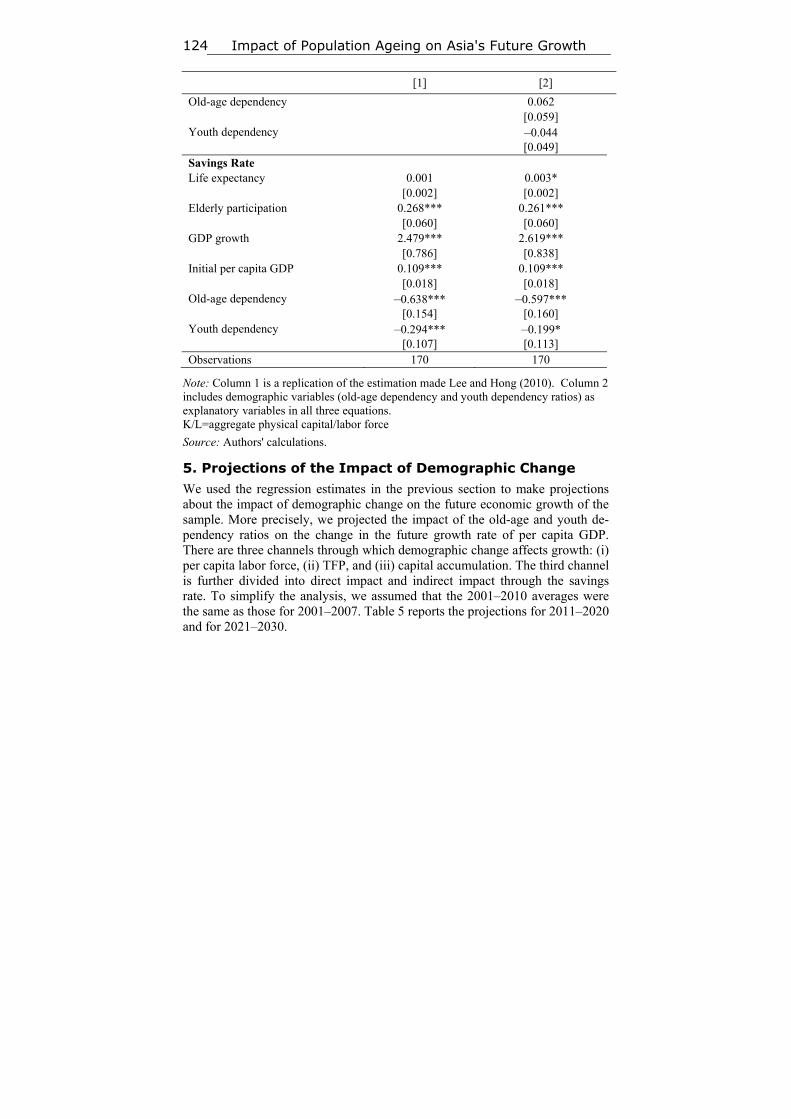
Impact of Population Ageing on Asia's Future Growth 124
[1] [2]
Old-age dependency 0.062 [0.059] Youth dependency –0.044 [0.049] Savings Rate Life expectancy 0.001 0.003* [0.002] [0.002] Elderly participation 0.268*** 0.261*** [0.060] [0.060] GDP growth 2.479*** 2.619*** [0.786] [0.838] Initial per capita GDP 0.109*** 0.109*** [0.018] [0.018] Old-age dependency –0.638*** –0.597*** [0.154] [0.160] Youth dependency –0.294*** –0.199* [0.107] [0.113] Observations 170 170
Note: Column 1 is a replication of the estimation made Lee and Hong (2010). Column 2 includes demographic variables (old-age dependency and youth dependency ratios) as explanatory variables in all three equations. K/L=aggregate physical capital/labor force
Source: Authors' calculations.
5. Projections of the Impact of Demographic Change We used the regression estimates in the previous section to make projections about the impact of demographic change on the future economic growth of the sample. More precisely, we projected the impact of the old-age and youth de-pendency ratios on the change in the future growth rate of per capita GDP. There are three channels through which demographic change affects growth: (i) per capita labor force, (ii) TFP, and (iii) capital accumulation. The third channel is further divided into direct impact and indirect impact through the savings rate. To simplify the analysis, we assumed that the 2001–2010 averages were the same as those for 2001–2007. Table 5 reports the projections for 2011–2020 and for 2021–2030.
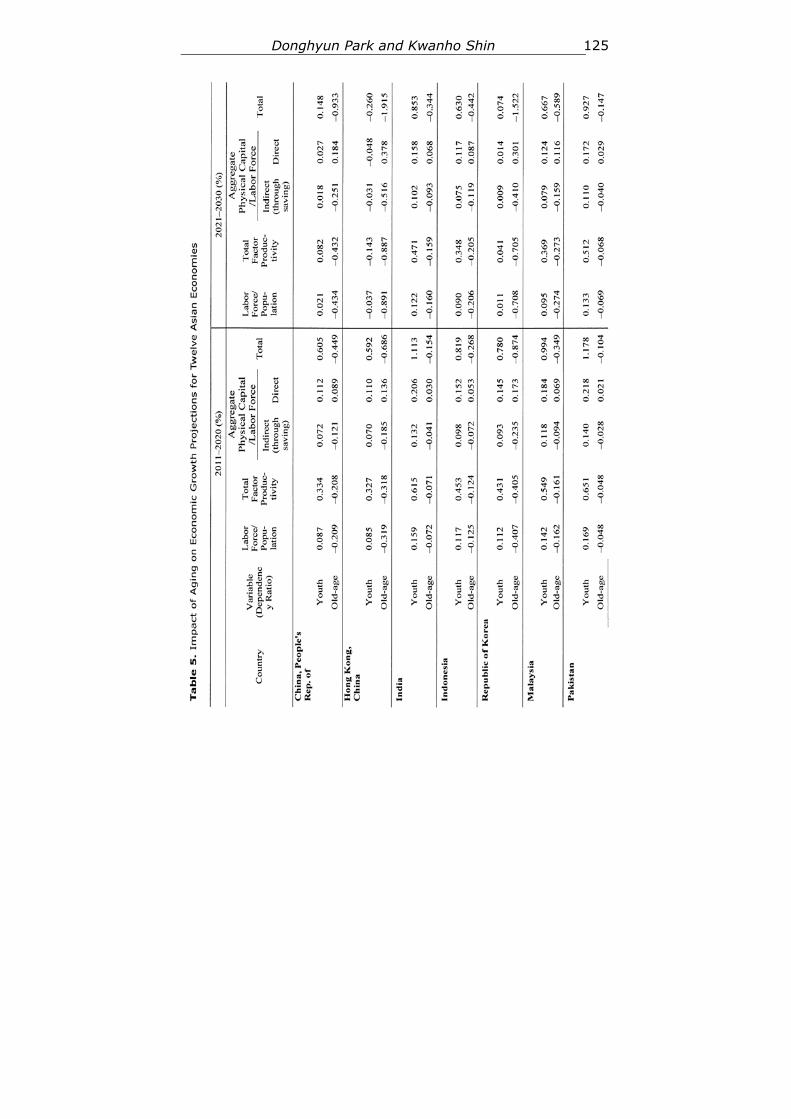
Donghyun Park and Kwanho Shin 125
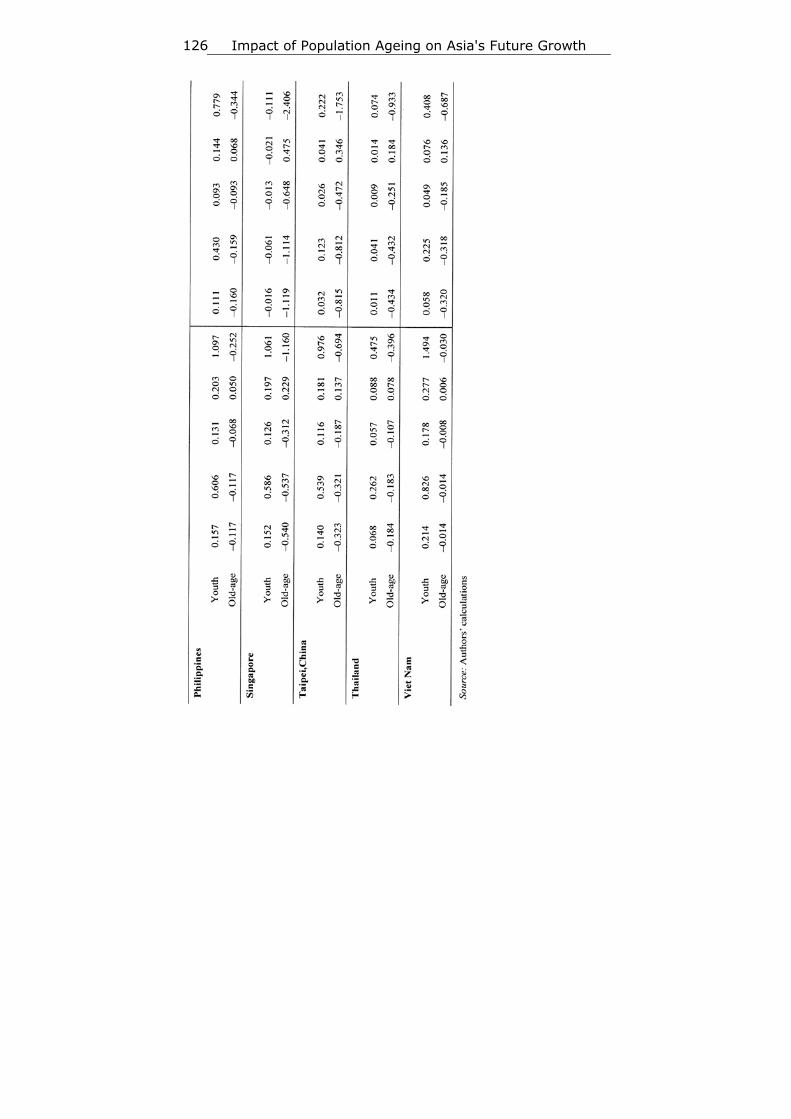
Impact of Population Ageing on Asia's Future Growth 126
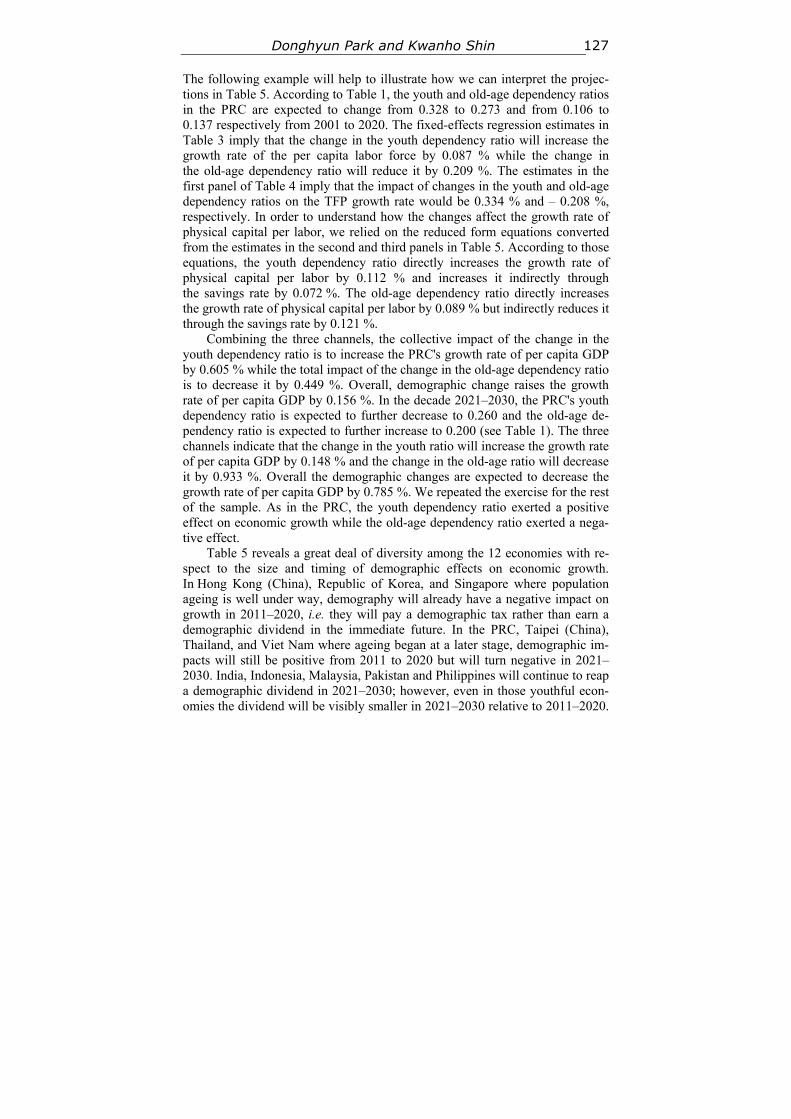
Donghyun Park and Kwanho Shin 127
The following example will help to illustrate how we can interpret the projec-tions in Table 5. According to Table 1, the youth and old-age dependency ratios in the PRC are expected to change from 0.328 to 0.273 and from 0.106 to 0.137 respectively from 2001 to 2020. The fixed-effects regression estimates in Table 3 imply that the change in the youth dependency ratio will increase the growth rate of the per capita labor force by 0.087 % while the change in the old-age dependency ratio will reduce it by 0.209 %. The estimates in the first panel of Table 4 imply that the impact of changes in the youth and old-age dependency ratios on the TFP growth rate would be 0.334 % and – 0.208 %, respectively. In order to understand how the changes affect the growth rate of physical capital per labor, we relied on the reduced form equations converted from the estimates in the second and third panels in Table 5. According to those equations, the youth dependency ratio directly increases the growth rate of physical capital per labor by 0.112 % and increases it indirectly through the savings rate by 0.072 %. The old-age dependency ratio directly increases the growth rate of physical capital per labor by 0.089 % but indirectly reduces it through the savings rate by 0.121 %.
Combining the three channels, the collective impact of the change in the youth dependency ratio is to increase the PRC's growth rate of per capita GDP by 0.605 % while the total impact of the change in the old-age dependency ratio is to decrease it by 0.449 %. Overall, demographic change raises the growth rate of per capita GDP by 0.156 %. In the decade 2021–2030, the PRC's youth dependency ratio is expected to further decrease to 0.260 and the old-age de-pendency ratio is expected to further increase to 0.200 (see Table 1). The three channels indicate that the change in the youth ratio will increase the growth rate of per capita GDP by 0.148 % and the change in the old-age ratio will decrease it by 0.933 %. Overall the demographic changes are expected to decrease the growth rate of per capita GDP by 0.785 %. We repeated the exercise for the rest of the sample. As in the PRC, the youth dependency ratio exerted a positive effect on economic growth while the old-age dependency ratio exerted a nega-tive effect.
Table 5 reveals a great deal of diversity among the 12 economies with re-spect to the size and timing of demographic effects on economic growth. In Hong Kong (China), Republic of Korea, and Singapore where population ageing is well under way, demography will already have a negative impact on growth in 2011–2020, i.e. they will pay a demographic tax rather than earn a demographic dividend in the immediate future. In the PRC, Taipei (China), Thailand, and Viet Nam where ageing began at a later stage, demographic im-pacts will still be positive from 2011 to 2020 but will turn negative in 2021–2030. India, Indonesia, Malaysia, Pakistan and Philippines will continue to reap a demographic dividend in 2021–2030; however, even in those youthful econ-omies the dividend will be visibly smaller in 2021–2030 relative to 2011–2020.
Impact of Population Ageing on Asia's Future Growth 128
All in all, our projections resoundingly supported the popular belief that the contribution of demography to developing Asia's growth is set to decline sub-stantially as the region ages.
6. Quantitative Estimates of Past Demographic Dividends
We used the same regression estimates in Section 4 but combined them with actual changes in the old-age and youth dependency ratios to quantitatively estimate the size of the demographic dividend in the sample in the decades 1981–1990, 1991–2000 and 2001–2010. Quantitative estimates of past demo-graphic dividends are useful for comparative purposes and provide a better per-spective on estimates of future dividends.
In contrast to the projections in Table 5, Table 6 shows that all developing economies in Asia earned a demographic dividend in the past. This was true even for those that according to Table 5 will begin to pay a demographic tax in the immediate future. For example, in 1981–1990 in the Republic of Korea, the collective impact of the change in the youth ratio was to raise the annual growth rate of per capita GDP by 2.196 % while the collective impact of the change in the old-age dependency ratio was to reduce the growth rate by 0.094 %. Overall, therefore, demographic change raised the annual growth rate of per capita GDP in 1981–1990 by 2.102 %, and the country reaped a reduced but still sizable demographic dividend of 1.133 % in 1991–2000, but the divi-dend disappeared in 2001–2010. These estimates resoundingly confirm the no-tion that economic growth in developing Asia benefited substantially from fa-vorable demographic trends in the past.
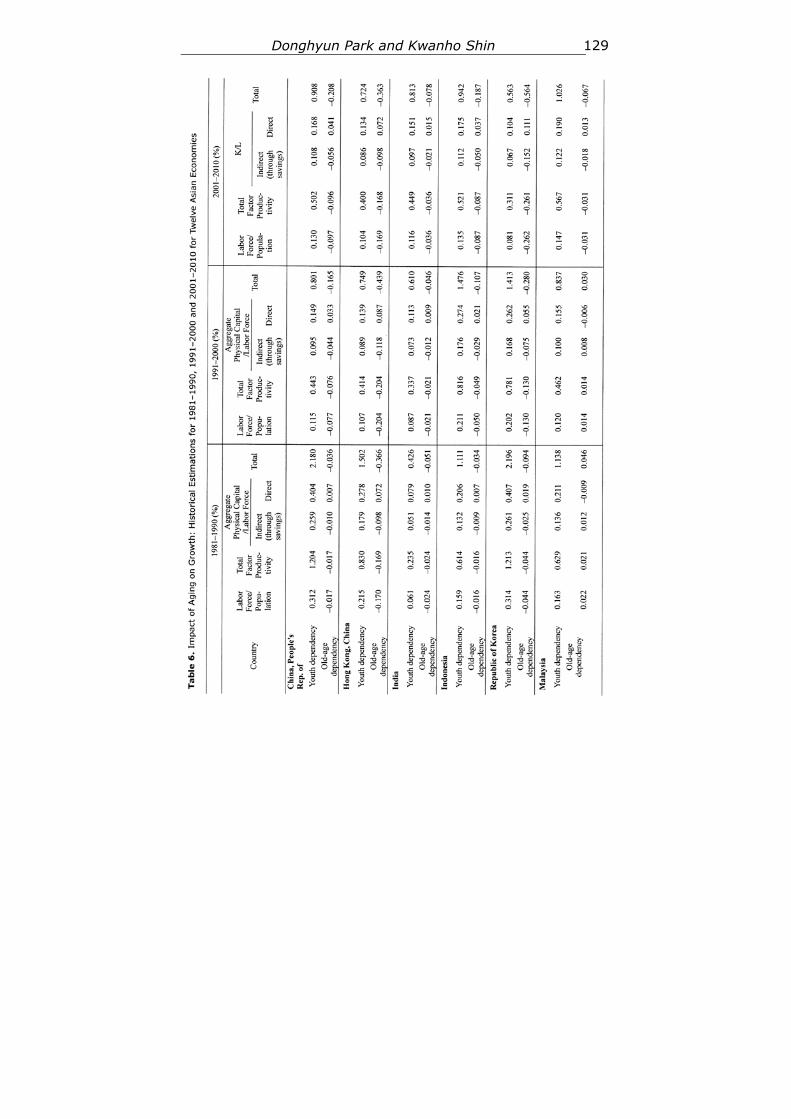
Donghyun Park and Kwanho Shin 129
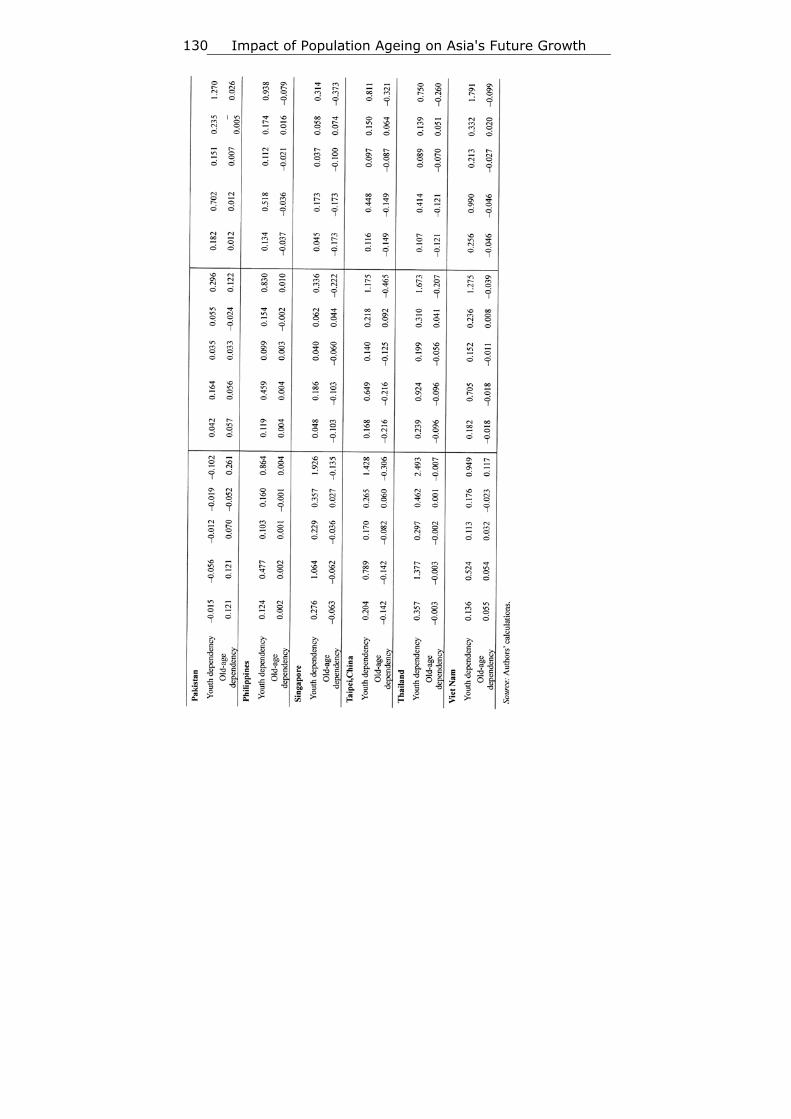
Impact of Population Ageing on Asia's Future Growth 130
Donghyun Park and Kwanho Shin 131
7. Conclusion While developing Asia is following in the demographic footsteps of the ad-vanced economies, the sheer speed and scale of the transition make preparing for a grayer future all the more challenging and complex as the transition to an older population will deprive the region of one of the main drivers of its past economic success. According to Bloom, Canning and Fink (2011), favorable demographics can explain much of East Asia's spectacular economic growth in the second half of the 20th century. The rapid declines in infant and child mor-tality that began in the late 1940s triggered a fall in birth rates from 40 births per 1000 in 1950 to 20 per 1000 by 1980. The lag between mortality and fertili-ty declines gave rise to a baby boom generation that was larger than the cohorts that preceded and followed it. When the baby boomers reached working age, both the savings rate and the size of the labor force shot up. Bloom, Canning and Malaney (2000) found that this demographic dividend accounted for up to 33 % of East Asia's economic miracle between 1965 and 1990.
Our central objective was to project the impact of demographic change on economic growth from 2011 to 2030 in the 12 developing Asian economies that collectively make up the bulk of the region's population and output. Our projec-tions indicate that the region's demographic transition will have a substantial effect on its economic growth in the next two decades; in fact, the demographic dividend that drove economic growth in the past will turn into a demographic tax that will subtract from it. The magnitude and timing of the transition from dividend to tax will differ from economy to economy, but the positive impact of demography on economic growth will weaken across the region even in youthful economies where the demographic dividend will persist in 2021–2030. Our projections support the notion that a primary means of sustaining economic growth in the sample in the future will be successful adaptations to rapidly changing population structures.
Ageing populations pose a number of difficult policy challenges for devel-oping Asian nations; the unprecedented nature of their transition means that the earlier experiences of the advanced economies can provide at best only limited guidance. Although the need to prepare for older populations is greatest where ageing is most advanced, youthful economies should take advantage of their larger window of opportunity to prepare also. Just as reaping the demographic dividend requires appropriate institutions and policies, so does managing the impending demographic transition. Working longer and encouraging more women to participate in the labor force can mitigate the negative impact of age-ing on growth. Therefore, to the extent that governments implement policy re-forms that bring about those responses – more and better childcare and raising the legal retirement age – our projections overestimate the demographic effects. In this context, a particularly challenging issue for policymakers will be to pro-
Impact of Population Ageing on Asia's Future Growth 132
vide adequate income support and healthcare for the elderly without jeopardiz-ing growth by imposing excessive burdens on the working-age population.
References
Alesina A., Spolaore E., and Wacziarg R. 2003. Trade, Growth and the Size of Coun-tries. Handbook of Economic Growth / Ed. by P. Aghion, and S. Durlauf, pp. 1499–1542. North Holland: Amsterdam.
Barro R., and Lee J.-W. 2010. A New Data Set of Educational Attainment in the World, 1950–2010. NBER Working Paper no. 15902. Massachusetts: National Bu-reau of Economic Research.
Bloom D., Canning D., and Fink G. 2011. Implications of Population Aging for Eco-nomic Growth. NBER Working Paper no. 16705. Massachusetts: National Bureau of Economic Research.
Bloom D., Canning D., and Malaney P. 2000. Demographic Change and Economic Growth in Asia. Population and Development Review 26: 257–290.
Gomez R., and Hernandez de Cos P. 2008. Does Population Ageing Promote Faster Economic Growth? Review of Income and Wealth 54(3): 350–372.
Harberger A. 1978. Perspectives on Capital and Technology in Less Developed Coun-tries. Contemporary Economic Analysis / Ed. by M. J. Artis, and A. R. Nobay, pp. 15–40. London: Croom Helm.
Horioka C. Y., and Terada-Hagiwara A. 2010. The Determinants and Long-Term Projections of Saving Rates in Developing Asia. ADB Economics Working Paper Series no. 228. Manila: Asian Development Bank.
Lee J.-W., and Francisco R. 2010. Human Capital Accumulation in Emerging Asia 1970–2030. ADB Economics Working Paper Series no. 216. Manila: Asian Devel-opment Bank.
Lee J.-W., and Hong K. 2010. Economic Growth in Asia: Determinants and Prospects. ADB Economics Working Paper Series no. 220. Manila: Asian Development Bank.
Park J. 2010. Projection of Long-term TFP Growth for 12 Asian Economies. ADB Eco-nomics Working Paper Series no. 227. Manila: Asian Development Bank.
Shioji E., and Vu T. K. 2010. Projection of Investment and Capital Stock for Asia. ADB Economics Working Paper Series. Manila: Asian Development Bank.
Tang J., and MacLeod C. 2006. Labor Force Ageing and Productivity Performance in Canada. Canadian Journal of Economics 39(2): 582–603.
United Nations. 2009. Population Division of the Office of Economics and Social Af-fairs. World Population Prospects: The 2008 Revision Population Database. URL: http:www.un.org/esa/population/.../wpp2008/wpp2008_highlights.pdf.
World Bank. 2010. World Development Indicators. URL: http://data.worldbank.org/ indicator.
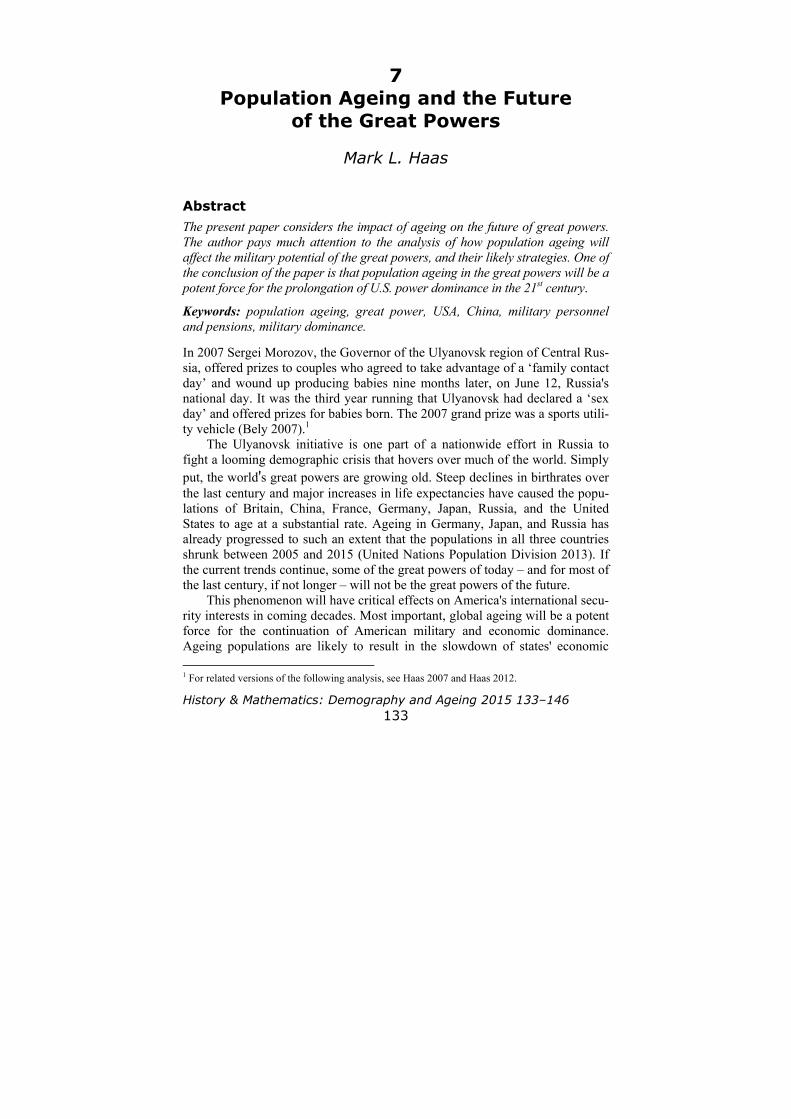
History & Mathematics: Demography and Ageing 2015 133–146 133
7
Population Ageing and the Future of the Great Powers
Mark L. Haas
Abstract The present paper considers the impact of ageing on the future of great powers. The author pays much attention to the analysis of how population ageing will affect the military potential of the great powers, and their likely strategies. One of the conclusion of the paper is that population ageing in the great powers will be a potent force for the prolongation of U.S. power dominance in the 21st century.
Keywords: population ageing, great power, USA, China, military personnel and pensions, military dominance.
In 2007 Sergei Morozov, the Governor of the Ulyanovsk region of Central Rus-sia, offered prizes to couples who agreed to take advantage of a ‘family contact day’ and wound up producing babies nine months later, on June 12, Russia's national day. It was the third year running that Ulyanovsk had declared a ‘sex day’ and offered prizes for babies born. The 2007 grand prize was a sports utili-ty vehicle (Bely 2007).1
The Ulyanovsk initiative is one part of a nationwide effort in Russia to fight a looming demographic crisis that hovers over much of the world. Simply put, the world's great powers are growing old. Steep declines in birthrates over the last century and major increases in life expectancies have caused the popu-lations of Britain, China, France, Germany, Japan, Russia, and the United States to age at a substantial rate. Ageing in Germany, Japan, and Russia has already progressed to such an extent that the populations in all three countries shrunk between 2005 and 2015 (United Nations Population Division 2013). If the current trends continue, some of the great powers of today – and for most of the last century, if not longer – will not be the great powers of the future.
This phenomenon will have critical effects on America's international secu-rity interests in coming decades. Most important, global ageing will be a potent force for the continuation of American military and economic dominance. Ageing populations are likely to result in the slowdown of states' economic 1 For related versions of the following analysis, see Haas 2007 and Haas 2012.
Population Ageing and the Future of the Great Powers 134
growth at the same time that governments face pressure to pay for massive new expenditures for elder care. This double economic dilemma will create such an austere fiscal environment that the other great powers will lack the resources necessary to overtake the United States' huge power lead. This analysis applies even – perhaps especially – to China, which is the state that most analysts point to as America's most likely future rival. China's ageing problem will be particu-larly dramatic over the next 40 years since it is growing old at a pace and extent scarcely before witnessed in history.
Reinforcing these trends is the fact that although the United States is age-ing, it is doing so to a lesser extent and less quickly than the other great powers, to the benefit of America's relative power position. Consequently, the costs created by ageing will be significantly lower for the United States than for po-tential competitors. Global ageing is therefore not only likely to extend U.S. hegemony, but deepen it as these others states are likely to fall even farther behind the United States.
The international security effects created by the ageing world are not all positive for American interests, however. Although the United States is in bet-ter demographic shape than the other great powers, it, too, will confront mas-sive new costs created by its own ageing population. As a result, it will most likely be unable to maintain its current international position. Thus, while the United States in coming decades will be even more secure from the great power rivalry than it is today, it (and its allies) will likely be less able to realize other key international objectives, including preventing the proliferation of weapons of mass destruction (WMD), funding nation building, engaging in military hu-manitarian interventions, and various other costly strategies of international conflict resolution and prevention.
Something New Under the Sun Rarely can analysts of international politics claim to be documenting new phe-nomena. Global population ageing, however, is one of these revolutionary vari-ables. Never before has humanity witnessed such dramatic, widespread ageing in the world's most powerful actors.
Social ageing is a product of two long-term demographic trends: decreas-ing fertility rates and increasing life expectancies. Fertility rates are the average number of children per woman in a given country. For a state to sustain its cur-rent population numbers (assuming zero net immigration), fertility levels must be at 2.1 or higher. Today the United States and France are the only great pow-ers that come close to meeting this requirement, and most are well below this number and have been for decades (see Table 1).
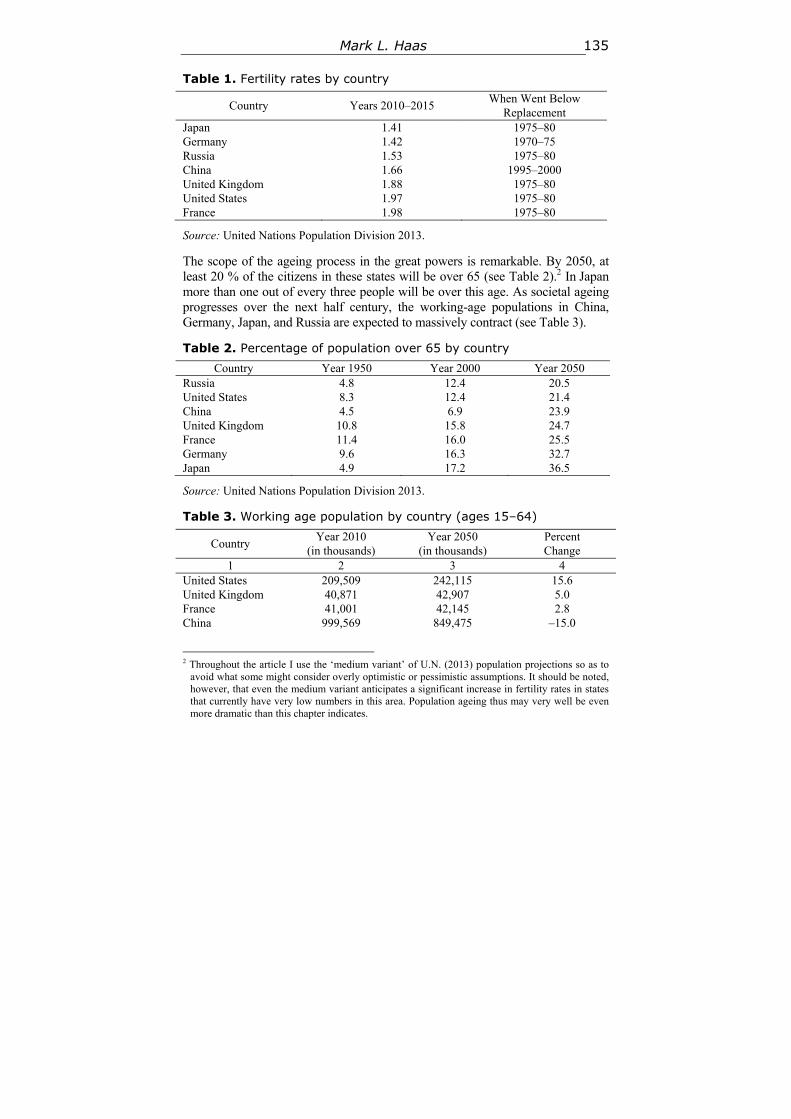
Mark L. Haas 135
Table 1. Fertility rates by country
Country Years 2010–2015 When Went Below
Replacement Japan 1.41 1975–80 Germany 1.42 1970–75 Russia 1.53 1975–80 China 1.66 1995–2000 United Kingdom 1.88 1975–80 United States 1.97 1975–80 France 1.98 1975–80
Source: United Nations Population Division 2013.
The scope of the ageing process in the great powers is remarkable. By 2050, at least 20 % of the citizens in these states will be over 65 (see Table 2).2 In Japan more than one out of every three people will be over this age. As societal ageing progresses over the next half century, the working-age populations in China, Germany, Japan, and Russia are expected to massively contract (see Table 3).
Table 2. Percentage of population over 65 by country Country Year 1950 Year 2000 Year 2050
Russia 4.8 12.4 20.5 United States 8.3 12.4 21.4 China 4.5 6.9 23.9 United Kingdom 10.8 15.8 24.7 France 11.4 16.0 25.5 Germany 9.6 16.3 32.7 Japan 4.9 17.2 36.5
Source: United Nations Population Division 2013.
Table 3. Working age population by country (ages 15–64)
Country Year 2010
(in thousands) Year 2050
(in thousands) Percent Change
1 2 3 4 United States 209,509 242,115 15.6 United Kingdom 40,871 42,907 5.0 France 41,001 42,145 2.8 China 999,569 849,475 –15.0
2 Throughout the article I use the ‘medium variant’ of U.N. (2013) population projections so as to
avoid what some might consider overly optimistic or pessimistic assumptions. It should be noted, however, that even the medium variant anticipates a significant increase in fertility rates in states that currently have very low numbers in this area. Population ageing thus may very well be even more dramatic than this chapter indicates.
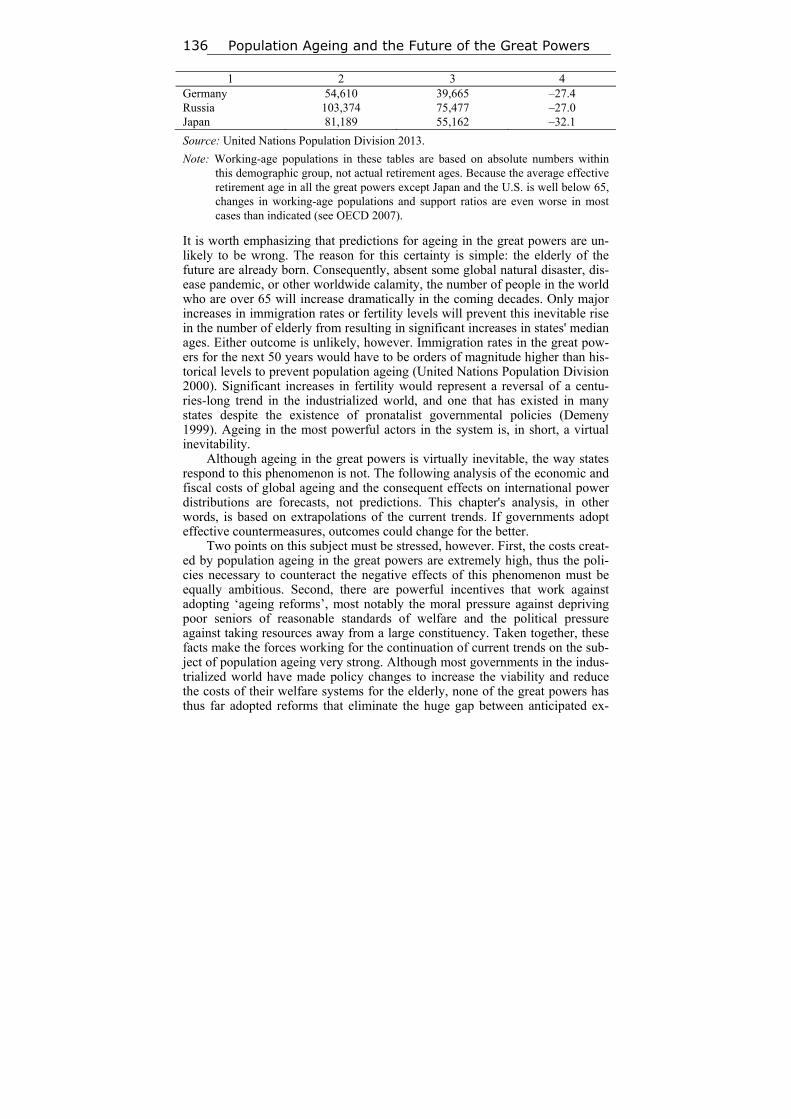
Population Ageing and the Future of the Great Powers 136
1 2 3 4 Germany 54,610 39,665 –27.4 Russia 103,374 75,477 –27.0 Japan 81,189 55,162 –32.1
Source: United Nations Population Division 2013.
Note: Working-age populations in these tables are based on absolute numbers within this demographic group, not actual retirement ages. Because the average effective retirement age in all the great powers except Japan and the U.S. is well below 65, changes in working-age populations and support ratios are even worse in most cases than indicated (see OECD 2007).
It is worth emphasizing that predictions for ageing in the great powers are un-likely to be wrong. The reason for this certainty is simple: the elderly of the future are already born. Consequently, absent some global natural disaster, dis-ease pandemic, or other worldwide calamity, the number of people in the world who are over 65 will increase dramatically in the coming decades. Only major increases in immigration rates or fertility levels will prevent this inevitable rise in the number of elderly from resulting in significant increases in states' median ages. Either outcome is unlikely, however. Immigration rates in the great pow-ers for the next 50 years would have to be orders of magnitude higher than his-torical levels to prevent population ageing (United Nations Population Division 2000). Significant increases in fertility would represent a reversal of a centu-ries-long trend in the industrialized world, and one that has existed in many states despite the existence of pronatalist governmental policies (Demeny 1999). Ageing in the most powerful actors in the system is, in short, a virtual inevitability.
Although ageing in the great powers is virtually inevitable, the way states respond to this phenomenon is not. The following analysis of the economic and fiscal costs of global ageing and the consequent effects on international power distributions are forecasts, not predictions. This chapter's analysis, in other words, is based on extrapolations of the current trends. If governments adopt effective countermeasures, outcomes could change for the better.
Two points on this subject must be stressed, however. First, the costs creat-ed by population ageing in the great powers are extremely high, thus the poli-cies necessary to counteract the negative effects of this phenomenon must be equally ambitious. Second, there are powerful incentives that work against adopting ‘ageing reforms’, most notably the moral pressure against depriving poor seniors of reasonable standards of welfare and the political pressure against taking resources away from a large constituency. Taken together, these facts make the forces working for the continuation of current trends on the sub-ject of population ageing very strong. Although most governments in the indus-trialized world have made policy changes to increase the viability and reduce the costs of their welfare systems for the elderly, none of the great powers has thus far adopted reforms that eliminate the huge gap between anticipated ex-
Mark L. Haas 137
penditures for the aged and resources set aside for these costs (Capretta 2007; Haas 2007: 123–124).
The Costs of Population Ageing Population ageing in the great powers will create substantial economic and fis-cal costs. To begin with, graying populations are likely to slow states' overall economic growth. A state's gross domestic product (GDP), in its most basic formulation, is a product of the number of workers and overall productivity. Since a country's workforce shrinks as more people enter retirement than enter the labor market, so, too, will its GDP unless productivity levels rise sufficient-ly to compensate for this loss. By 2050, Japan's working-age population (ages 15 to 64) is expected to shrink by over 30 %, Germany's and Russia's – by 27 %, and China's – by 15 % (see Table 3). To prevent these workforce reduc-tions from translating into overall GDP decline, states' productivity must in-crease proportionally.3 Although this is likely to be the case in most of the in-dustrialized countries, workforce contraction will still act as a substantial brake on economic growth in the coming decades (Turner et al. 1998: 47).
We are already witnessing this dynamic. For example, even though China is currently the youngest of the great powers, it is experiencing labor shortages that are threatening economic growth. These shortages are due in large part to the ageing of China and reductions in the number of 15 to 35 year olds (Brad-sher 2007). Experts predict that shrinkage in China's working-age population will result in a loss of 1 % per year from this state's GDP growth by the 2020s (Jackson 2005). The economic forecasts are even direr for Germany and Japan, where massively contracting labor forces could result in overall GDP growth of roughly 1 % in coming decades (Lombard Street Research 2003).
Compounding these problems, significant social ageing may also limit productivity growth. The elderly are likely to be more conservative with their investments than younger people. The more risk averse a society's investment portfolio is, the less entrepreneurship that will be funded, and thus the lower the gains in productivity that should be expected. National savings rates may also shrink in ageing states as large numbers of seniors spend down their savings. The Japanese government, for example, has already reported that national sav-ings rates are down substantially from previous levels due to social ageing and seniors' consumption of their savings (Yomiuri 2003). Reduced savings rates may lead to rising interest rates and ultimately to reduced rates of productivity increases (England 2002).
In addition to slowing economic growth, an even more important economic effect of social ageing is the strain that it places on governmental resources. All governments in the industrialized world have made commitments to pay for
3 An ageing population does not necessarily translate into labor force reductions if people continue
to work past 65. Most retirement ages in the industrial world, however, remain well below this number, and people have been resistant to changing them (OECD 2007).
Population Ageing and the Future of the Great Powers 138
substantial portions of the retirement and health care costs of their elderly citi-zens. The projected increases in governmental spending for the elderly in the coming decades are sobering. Annual public benefits to the elderly (both pen-sion and health care) as a percentage of GDP are forecasted to rise between 2010 and 2040 by 2.7 % in Russia (to an overall percentage of 10.9), 5 % in Britain (to an overall percentage of 18.9), 5.7 % in France (to an overall per-centage of 24.3), 5.8 % in Japan (to an overall percentage of 20.9), 6.3 % in Germany (to an overall percentage of 24.3), 7.4 % in the United States (to an overall percentage of 18.5), and 7.6 % in China (to an overall percentage of 11) (Jackson et al. 2013: 14). These costs will be an increase of hundreds of bil-lions of dollars to governments' annual expenditures for many decades.
Pax Americana Geriatrica Population ageing in the great powers will be a potent force for the prolonga-tion of U.S. power dominance in the 21st century for three principal reasons. First, the massive costs created by ageing populations, especially in combina-tion with probable slowdowns in economic growth, will create major barriers in the other great powers to increasing their military expenditures anywhere close to matching U.S. defense spending. These factors are even likely to push many of these states to reduce military expenditures from the current levels. Second, with ageing populations and shrinking workforces, the other great powers will be forced to spend increasing percentages of their defense budgets on personnel costs and military pensions at the expense of purchasing the most technologi-cally sophisticated weaponry. The more money the states spend on military personnel and pensions as opposed to weapons, the lower the likelihood will be of these countries challenging U.S. military dominance. The third factor rein-forces both of the previous points. Although the U.S. population is ageing, it is doing so to a lesser extent and less quickly than those of the other great powers, especially in terms of the growth of the working-age population. As a result, the pressures pushing for the crowding out of military spending in favor of care for the elderly and the increasing substitution of labor for capital within defense budgets will be considerably smaller for the United States than potential great power competitors.
Guns versus Canes Given the magnitude of the costs created by the great powers' ageing popula-tions, substantial increases in the future in these states' expenditures for eco-nomic development and defense are unlikely. We are, in fact, likely already witnessing in the oldest of the great powers the crowding out of military spend-ing for elderly care. Pressure for cuts in defense spending to finance elder-care costs is, for example, building in Germany and France. In February 2006 the EU Commission warned Germany that it had to cut substantially discretionary spending across the board ‘to cope with the costs of an ageing population’ (White 2006). Germany's Finance Minister, Peer Steinbrueck, speaking on be-
Mark L. Haas 139
half of the government, agreed with this analysis and promised to put the com-mission's recommendations into practice. Also in 2006 French President re-quested the creation of a new body, the Public Finance Guidance Council. The council's primary purpose is to reduce France's national debt, which has grown significantly in recent years largely due to increasing costs for elder care. The institution's main policy recommendation is to reduce to a substantial degree expenditures ‘of all public players’, including the military (Office of the Prime Minister, France 2006). Between the last half of the 1990s and 2013, France reduced its military spending as a percentage of GDP by 1 % (from 2.9 to 1.9) and Germany reduced by 0.3 % (from 1.6 to 1.3). In the same period, the United States increased its military spending as a percent of GDP from 3.2 to 4.4 (North Atlantic Treaty Organization 2014: 6).
The tendency of cutting military spending to pay for elder-care costs is likely to repeat itself in the state that is ageing faster than any of the great pow-ers: China. Rising longevity in China and the ‘one-child policy’, which has helped lower dramatically China's fertility levels, have made it a rapidly ageing society. China's median age will climb from just under 30 in 2000 to over 46 in 2050, which will make China one of the oldest states in the world (the oldest great power in the world today, Japan, has a median age of nearly 45). China in 2005 had roughly 100 million citizens over the age of 65. By 2025, this number will almost double. By 2040, it is expected to more than triple (United Nations Population Division 2013).
In relation to the other great powers, China possesses some advantages when it comes to dealing with the negative effects of population ageing. China's current taxation rates and deficit levels are low compared to those of these other states. China's elderly also likely expect lower levels of welfare provision from their government than do citizens in the other great powers. Adding to the ef-fects of this last tendency is the fact that China's illiberal political system low-ers the impact of popular pressure for generous social security spending.
China nevertheless will confront in the coming decades monumental chal-lenges created by its rapidly ageing population. China's elderly have very little savings. Nearly 80 % of Chinese urban households with individuals aged 55 and over today have less than 1 year of income saved, and only 5 % have more than 2 years of income in savings (Jackson and Howe 2004).
China has traditionally relied on the family unit to provide for elder care. Increasing rates of divorce, urbanization, and related migration (French 2006), and female workforce participation will, however, place significant strain on this tradition. Decreasing family size will prove especially problematic for pre-serving elders' welfare within the context of the family. Demographers refer to a rapidly growing ‘4–2–1’ phenomenon in China, in which one child is respon-sible for caring for two parents and four grandparents (Leung 2006: 413–415). Familial elder care in these circumstances is quite burdensome.
Given the facts of an exploding elderly population with very little savings and a weakening family structure, ‘the majority of the people in the People's Republic of China’ will, according to one expert on this subject, ‘be obliged to
Population Ageing and the Future of the Great Powers 140
rely heavily on social security pensions after retirement’ (Takayama 2002: 16). China's government will face both moral and political pressure to meet these obligations. Its leaders have already recognized as much. In a white paper is-sued in 2004, the Chinese government asserted that social security ‘is an im-portant guarantee for the social stability and the long-term political stability of the country’ (State Council Information Office 2004a: 2). Consistent with this thinking, China in 2000 created the National Social Security Fund. This institu-tion's goals is to set aside hundreds of billions of dollars (largely through levy-ing new taxes and selling state assets) to pay off the unfunded pension liabili-ties that have been accumulated by state-owned enterprises, many of which have become obsolete due to governmental policies since the 1980s (Social Security Administration 2004).
Not even the illiberalism of China's government has immunized it from the forces pushing for increased public spending on welfare for the elderly. In 2002, for example, China's attempts to renege on promised benefits to retir-ees led to large-scale protests and riots, including in the major cities of Liao-yang and Daqing. The pressure from these protests was so great that the author-itarian Chinese government promised to extend pension benefits to an addition-al 50 million people (Haas 2007: 124).
Although China's commitments to the elderly are modest compared to the other great powers (though they are growing), these obligations already outstrip by a wide margin resources set aside to meet them. Three-quarters of all Chi-nese workers are without any pension coverage, yet independent estimates have found a potential shortfall between China's governmental obligations to the elderly and saved public assets to be as much as 150 % of GDP (England 2005: 97, 89, 91; Chang 2002). If the percentage of people covered by China's public welfare net continues to grow, fiscal constraints will only worsen.
Finally, it is important to emphasize that China will not be able to ‘grow’ its way out of its ageing dilemma. Despite China's very high levels of economic growth since the 1990s, it will become the first country to grow old before be-coming an advanced industrial state. Even if China's economy continues to grow in coming decades at rates similar to those it has experienced in recent years, by 2035 its median age will reach the levels of France, Germany, and Japan today, but at GDP per capita levels significantly lower than these states currently possess. Consequently, when China's ageing crisis hits with full force, it will, at best, confront similar economic and fiscal constraints as France, Ger-many, and Japan do today (Eberstadt 2006).
Given the preceding facts and trends, China's political leaders beginning in roughly 2020 will be faced with a difficult choice: allow growing levels of pov-erty within an exploding elderly population, or provide the resources necessary to avoid this situation. To the extent that these politicians succumb to the sig-nificant moral and political pressure pushing for the latter decision, America's relative power position will be benefited.4 4 India – which is another state that analysts point to as a potential power challenger to the United
States in the future – is likely to experience many of the same ageing challenges as China, though a generation or so later (Haas 2007: 131–133; Eberstadt 2006).
Mark L. Haas 141
Increasing Money for Military Personnel, Not Weapons The crowding out of military and economic development spending for in-creased care for the elderly is not the only way in which population ageing is likely to affect global power distributions. Social ageing is also likely to push militaries to spend more on personnel and less on other areas, including weap-ons development and procurement. This is important because no nation will be able to challenge U.S. military dominance without the ability to wage highly technologically sophisticated warfare (Posen 2003). When states are forced to spend more of their military budgets on personnel than on research, develop-ment, and weapons procurement, the odds of continued U.S. military primacy increase substantially.
The oldest of the great powers are already devoting significantly more re-sources to military personnel than weapons purchases and research. From 2011 to 2013, Germany and France dedicated nearly 50 % of their military budgets to personnel, Japan – 45 %. Both Germany and Japan spent roughly 3 times as much on personnel as weapons procurement. The United States, in contrast, dedicated less than 1.5 times more money to personnel than weapons purchases (North Atlantic Treaty Organization 2014: 8; Hofbauer et al. 2012: 18).
Population ageing is a key cause of increasing military personnel costs for two main reasons. First, as societies age, more people exit the workforce than enter it. Increasing numbers of retirees in relation to new workers are likely to create labor shortages relative to previous levels of employment. The result of this trend will be increased competition among businesses and organizations – including the military – to hire workers. Consequently, if states' militaries want to be able to attract and keep the best employees, they are going to have to pay more to do so. A 2006 report endorsed by the EU defense ministers made pre-cisely these points, stating that the ageing of Europe's populations will ‘inevita-bly’ lead to rising military personnel per capita costs if European forces are to remain effective (European Defense Agency 2006: 6).
A second factor that is increasing states' military personnel costs at the ex-pense of weapons procurement is the ageing of the military itself. The great powers' pension obligations to retired military personnel are considerable. Rus-sia, for example, in the 2000s consistently spent significantly more on military retirees than on either weapons procurement or military research and develop-ment (Haas 2007: 142). Similarly, rising pension costs are the second most im-portant reason for increases in Chinese military spending in the last decade (af-ter pay increases for active personnel), according to China's government (State Council Information Office 2004b: ch. 4).
Growing pension costs for military retirees are important for international power relationships because these expenditures, which are not one-time costs but ones that governments will have to pay every year for many decades, do nothing to increase states' power-projection capabilities. Every dollar spent on retirees is one less dollar that can be spent on weapons, research, or active per-
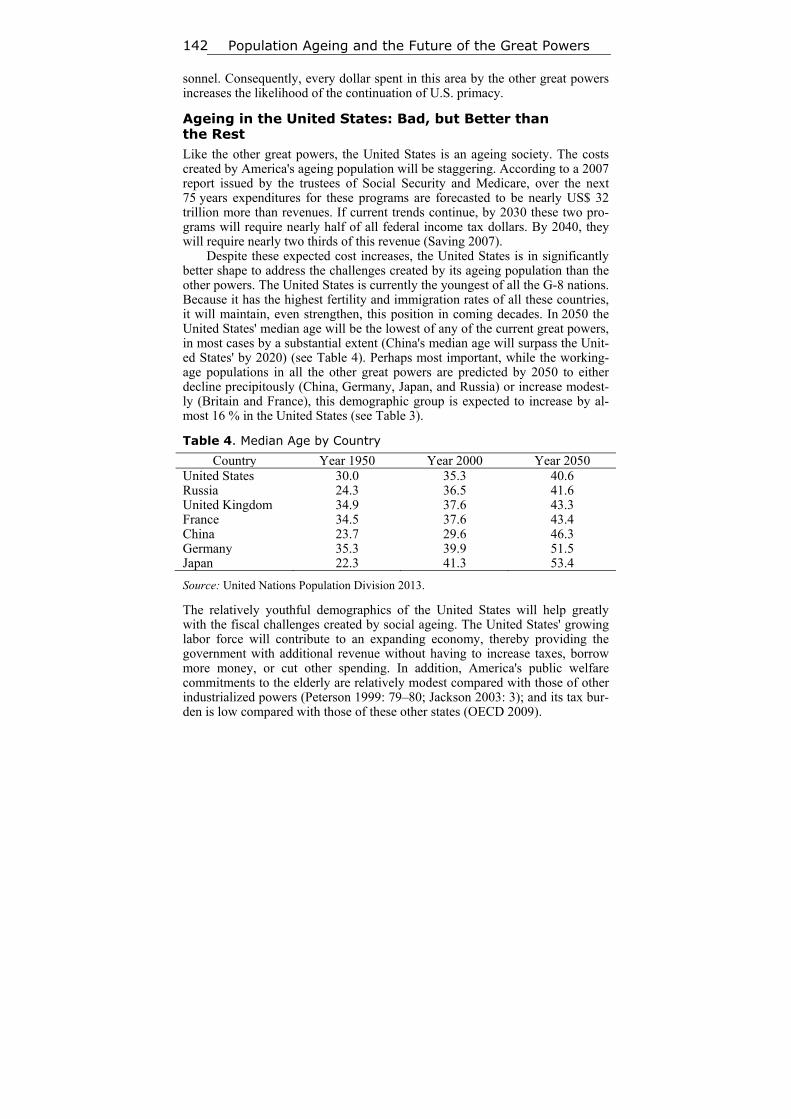
Population Ageing and the Future of the Great Powers 142
sonnel. Consequently, every dollar spent in this area by the other great powers increases the likelihood of the continuation of U.S. primacy.
Ageing in the United States: Bad, but Better than the Rest Like the other great powers, the United States is an ageing society. The costs created by America's ageing population will be staggering. According to a 2007 report issued by the trustees of Social Security and Medicare, over the next 75 years expenditures for these programs are forecasted to be nearly US$ 32 trillion more than revenues. If current trends continue, by 2030 these two pro-grams will require nearly half of all federal income tax dollars. By 2040, they will require nearly two thirds of this revenue (Saving 2007).
Despite these expected cost increases, the United States is in significantly better shape to address the challenges created by its ageing population than the other powers. The United States is currently the youngest of all the G-8 nations. Because it has the highest fertility and immigration rates of all these countries, it will maintain, even strengthen, this position in coming decades. In 2050 the United States' median age will be the lowest of any of the current great powers, in most cases by a substantial extent (China's median age will surpass the Unit-ed States' by 2020) (see Table 4). Perhaps most important, while the working-age populations in all the other great powers are predicted by 2050 to either decline precipitously (China, Germany, Japan, and Russia) or increase modest-ly (Britain and France), this demographic group is expected to increase by al-most 16 % in the United States (see Table 3).
Table 4. Median Age by Country Country Year 1950 Year 2000 Year 2050
United States 30.0 35.3 40.6 Russia 24.3 36.5 41.6 United Kingdom 34.9 37.6 43.3 France 34.5 37.6 43.4 China 23.7 29.6 46.3 Germany 35.3 39.9 51.5 Japan 22.3 41.3 53.4
Source: United Nations Population Division 2013.
The relatively youthful demographics of the United States will help greatly with the fiscal challenges created by social ageing. The United States' growing labor force will contribute to an expanding economy, thereby providing the government with additional revenue without having to increase taxes, borrow more money, or cut other spending. In addition, America's public welfare commitments to the elderly are relatively modest compared with those of other industrialized powers (Peterson 1999: 79–80; Jackson 2003: 3); and its tax bur-den is low compared with those of these other states (OECD 2009).
Mark L. Haas 143
Again, the preceding facts do not mean that the United States will escape the fiscal burdens created by social ageing or that this phenomenon will not create negative ramifications for U.S. security. To the contrary, population age-ing will likely create major costs. Nevertheless, as burdensome as the public costs of ageing will be for the United States, the public benefits (pension and health care) owed to U.S. seniors as a percentage of GDP will likely remain substantially lower than in most of the other great powers. Moreover, America should be better positioned to pay for these costs than the other major actors in the system (Jackson et al. 2013: iii). Global ageing, despite its costs for Ameri-can interests, will therefore be a powerful force for the continuation of the rela-tive power dominance of the United States.
The Future of Great Power Politics The preceding analysis demonstrates how global ageing creates considerable security benefits for the United States. In the context of slowing economic growth, shrinking military expenditures, and increasing substitution of labor for capital within these budgets, no state or combination of states will be able to overtake the United States' position of economic and military dominance.
The same factors that help to preserve U.S. primacy also increase the likeli-hood of continued peace between the United States and the other most powerful states in the system. Numerous studies have shown that power transitions, either actual or anticipated, significantly increase the probability of international con-flict. By implication, the continuation of U.S. hegemony supported by the effects of global ageing will decrease the probability of either hot or cold wars develop-ing with the other powers.
The effects of ageing in the great powers are not all positive for U.S. secu-rity, however. First, the negative impact of their ageing populations on the other powers' economic growth and military spending is in some respects a double-edged sword for U.S. interests. On the one hand, these outcomes will mean that no state will possess sufficient resources to challenge U.S. primacy. The same factor, though, will also reduce the amount of economic or military aid that other states will be able to contribute toward the realization of common interna-tional interests. Instead of increasing ‘burden sharing’ with key allies, the Unit-ed States will have to pay for even more of the costs to realize its international goals than it does today.
As the United States' allies become less active in the international arena, U.S. unilateralism will likely grow. To the extent that unilateral policies foster resentment and feelings of mistrust over the nature of states' intentions, as nu-merous scholars have asserted, the United States' international position will become doubly burdensome. Not only will the United States have to bear an increasing percentage of the costs necessary to advance interests that are common to the great powers, but these very policies are likely to create addi-tional problems due to the animosity and suspicion that unilateralism tends to foster.
Population Ageing and the Future of the Great Powers 144
Second, while the United States should expect less international aid from its allies, it, too, is likely to experience the slowing of economic growth and the crowding out of military expenditures for elderly care. To pay for the massive fiscal costs associated with its ageing population, the United States will in all likelihood have to scale back the scope of its international policies. The current U.S. position of unprecedented power allows its leaders to pursue highly exten-sive international military, economic, and humanitarian commitments. The eco-nomic effects of an ageing population will likely deny even the United States the fiscal room necessary to maintain the extent of its current global position, let alone adopt major new international initiatives. In the face of the exploding costs for elderly care, the crowding out of other spending will occur even for the richest country in the history of the world.
An important consequence of the United States' ageing problem and the fis-cal constraints it will create is that neo-isolationist foreign policy strategies are likely to become more compelling for the U.S. leaders in the coming decades than they would be in the absence of these conditions. The saliency of these strat-egies will increase because they mesh with the need to reduce spending. If isola-tionist strategies come to dominate the United States decision making circles, the United States may end up retreating from the world even more than the burdens created by its ageing population dictate.
The last factor points to a paradox for the future of great power relations. This chapter has focused on how population ageing will support the continua-tion of the relative power dominance of the world's foremost status quo power. This outcome should be a significant source of continued international peace. However, America's absolute power decline due to the costs of ageing may cause it to retreat from the world. This outcome, coupled with potentially clos-ing windows of opportunity due to anticipated reductions in capabilities as the other great powers age, may create a volatile mix that trumps the potential paci-fying effects created by America's continued relative power dominance.
This paradox supports a frequently asserted truism: demography is not des-tiny. Although the indicators of population ageing – such as increasing median ages and shrinking working-age populations – are virtually inevitable, how leaders respond to the forces and incentives created by these developments is not.
References
Bely M. 2007. Patriot Babies: Russian Province Holds ‘Conception Day’. France Presse, September 12.
Bradsher K. 2007. Wages Are on the Rise in China as Young Workers Grow Scarce. New York Times, August 29, p. A1.
Capretta J. C. 2007. Global Ageing and the Sustainability of Public Pension Systems: An Assessment of Reform Efforts in Twelve Developed Countries. Washington, D.C.: Center for Strategic and International Studies.
Mark L. Haas 145
Chang G. G. 2002. The Pension Money Is Running Out: Social Security in China. In-ternational Herald Tribune, July 18.
Demeny P. 1999. Policy Interventions in Response to Below Replacement Fertility. Population Bulletin of the United Nations. Special issues 40/41: 183–193.
Eberstadt N. 2006. Growing Old the Hard Way: China, Russia, India. Policy Review 136: 15–39.
England R. S. 2002. The Macroeconomic Impact of Global Ageing: A New Era of Eco-nomic Frailty? Washington, D.C.: Center for Strategic and International Studies.
England R. S. 2005. Ageing China: The Demographic Challenge to China's Economic Prospects. Westport, CT: Praeger.
European Defense Agency. 2006. An Initial Long-Term Vision for European Defence Capability and Capacity Needs. Brussels: European Defense Agency. URL: http:// ue.eu.int/ueDocs/cms_Data/docs/pressdata/EN/reports/91135.pdf. Date accessed: 28.07.2009.
French H. W. 2006. Rush for Wealth in China's Cities Shatters the Ancient Assurance of Care in Old Age. New York Times, November 3.
Haas M. L. 2007. A Geriatric Peace? The Future of U.S. Power in a World of Ageing Populations. International Security 32(1): 112–147.
Haas M. L. 2012. America's Golden Years? U.S. Security in an Ageing World. Political Demography: Interests, Conflict and Institutions / Ed. by J. Goldstone, M. D. Toft, and E. Kaufmann, pp. 49–62. New York: Oxford University Press.
Hofbauer J., Hermann P., and Raghavan S. 2012. Asian Defense Spending, 2000–2011. Washington, D.C.: Center for Strategic and International Studies.
Jackson R. 2003. Germany and the Challenge of Global Ageing. Washington, D.C.: Center for Strategic and International Studies.
Jackson R. 2005. Population Ageing in China: An Assessment of the Economic, Social, and Political Risks. Paper prepared for the Eurasia Group China Task Force Meet-ing, October 28. URL: http://csis.org/files/media/csis/events/051028_jacksonrema rks.pdf. Date accessed: 28.07.2009.
Jackson R., and Howe N. 2004. The Graying of the Middle Kingdom: The De-mographics and Economics of Retirement Policy in China. Washington, D.C.: Cen-ter for Strategic and International Studies.
Jackson R., Howe N., and Peter T. 2013. The Global Ageing Preparedness Index. 2nd ed. Washington, D.C.: Center for Strategic and International Studies.
Leung J. C. B. 2006. Family Support and Community Services for Older Adults in Chi-na: Integration and Partnership. Handbook of Asian Ageing / Ed. by H. Yoon, and J. Hendricks, pp. 405–430. Amityville, NY: Baywood.
Lombard Street Research. 2003. Baby Boomers' Poverty Trap. Monthly Economic Review, September 22.
North Atlantic Treaty Organization. 2014. Financial and Economic Data Relating to NATO Defence. Brussels: North Atlantic Treaty Organization Public Diplomacy Di-vision.
Office of the Prime Minister. 2006. First National Conference on Public Finance. Pa- ris: Office of the Prime Minister. January 11. URL: http://archives.gouvernement.fr/
Population Ageing and the Future of the Great Powers 146
villepin/en/information/latest_news_97/1st_national_conference_on_55114.html. Date accessed: 28.07.2009.
Organization for Economic Cooperation and Development (OECD). 2007. Average Effective Age of Retirement in 1970–2007 in OECD Countries. Paris: OECD. URL: http://www.oecd.org/dataoecd/3/1/39371913.xls. Date accessed: 28.07.2009.
Organization for Economic Cooperation and Development (OECD). 2009. Taxes on the Average Worker in OECD Factbook 2009. Paris: OECD. URL: http://fiordiliji. sourceoecd.org/pdf/factbook2009/302009011e-10-04-02.pdf. Date accessed: 28.07.2009.
State Council Information Office. 2004a. Social Security White Paper of China. Bei-jing: State Council Information Office. URL: http://unpan1.un.org/intradoc/groups/ public/documents/APCITY/UNPAN019944.pdf. Date accessed: 28.07.2009.
State Council Information Office. 2004b. PRC: 2004 White Paper on National De-fense. Beijing: State Council Information Office. URL: http://www.fas.org/nuke/ guide/china/doctrine/natdef2004.html. Date accessed: 28.07.2009.
Peterson P. G. 1999. Gray Dawn: How the Coming Age Wave Will Transform Ameri-ca – and the World. New York: Times Books.
Posen B. R. 2003. Command of the Commons: The Military Foundation of U.S. He-gemony. International Security 28(1): 5–46.
Saving T. R. 2007. Medicare Meltdown. Wall Street Journal, 9 May: A17.
Social Security Administration. 2004. International Update: Recent Developments in Foreign Public and Private Pensions. Washington, D.C.: Social Security Admin-istration Office of Policy. URL: http://www.socialsecurity.gov/policy/docs/prog desc/intl_update/2004-10/2004-10.html. Date accessed: 28.07.2009.
Takayama N. 2002. Pension Reform of PRC: Incentives, Governance, and Policy Op-tions. Paper prepared for the Fifth Anniversary Conference on Challenges and the New Agenda for the People's Republic of China, Asian Development Bank. Tokyo, Japan, December 5–6.
Turner D., Giorno C., De Serres A., Vourc'h A., and Richardson P. 1998. The Mac-roeconomic Implications of Ageing in a Global Context. Working Paper No. 193. Paris: Economics Department OECD.
United Nations Population Division. 2000. Replacement Migration: Is It a Solution to Declining and Ageing Populations? New York: United Nations Population Division. URL: http://www.un.org/esa/population/publications/migration/migration.htm. Date accessed: 28.07.2009.
United Nations Population Division. 2013. World Population Prospects: The 2012 Revision. New York: United Nations Population Division.
White A. 2006. EU: Germany Must Stick to Spending Cuts to Reduce Budget Deficit by End of 2007. Associated Press, March 1.
Yomiuri Shimbun. 2003. Savings Rate Slides as Population Ages. Yomiuri Shimbun, October 29, p. 8.
History & Mathematics: Demography & Ageing 2015 147–155 147
8
Population Ageing and Global Economic Growth
Jack A. Goldstone
Abstract The author develops a simple model to examine the impact of population age-ing – including reduced productivity and declining labor forces – on global economic growth.
Keywords: global economic growth, labor force, population ageing, demo-graphic bonus, demographic onus. What will be the impact of population ageing on global economic output? How fast will Africa or other regions have to grow to make up for slowing growth in China? Which countries or regions will likely be the prime drivers of global economic growth in the future?
To answer these questions, we can develop a simple model of productivity gains and losses from population growth and population ageing, and apply it to projections of labor force growth (or decline) in various regions. The results provide a set of simulations that allow us to grasp the rough contours of likely global economic growth under various scenarios.
Productivity Gains: From Good to Gone In theory, productivity gains are easy to come by, with several major routes all contributing significant increases in output per employed worker. First is urban-ization; simply shifting workers from lower productivity rural work (mainly agriculture and home production or handicrafts) to urban work (services and machine-aided manufacture) provides major gains. Second is sectoral shifts; the transfer of workers from lower productivity labor-intensive manufacturing and unskilled services (food preparation, janitorial, retail, tourism) to capital inten-sive manufacturing and professional services provides additional boosts to productivity. The education of the labor force, in regard to both secondary and tertiary education, is a requirement for, and hence is associated with, this kind of sectoral change. Finally, the information/communications revolution, by networking workers and linking them to information, can also provide increases
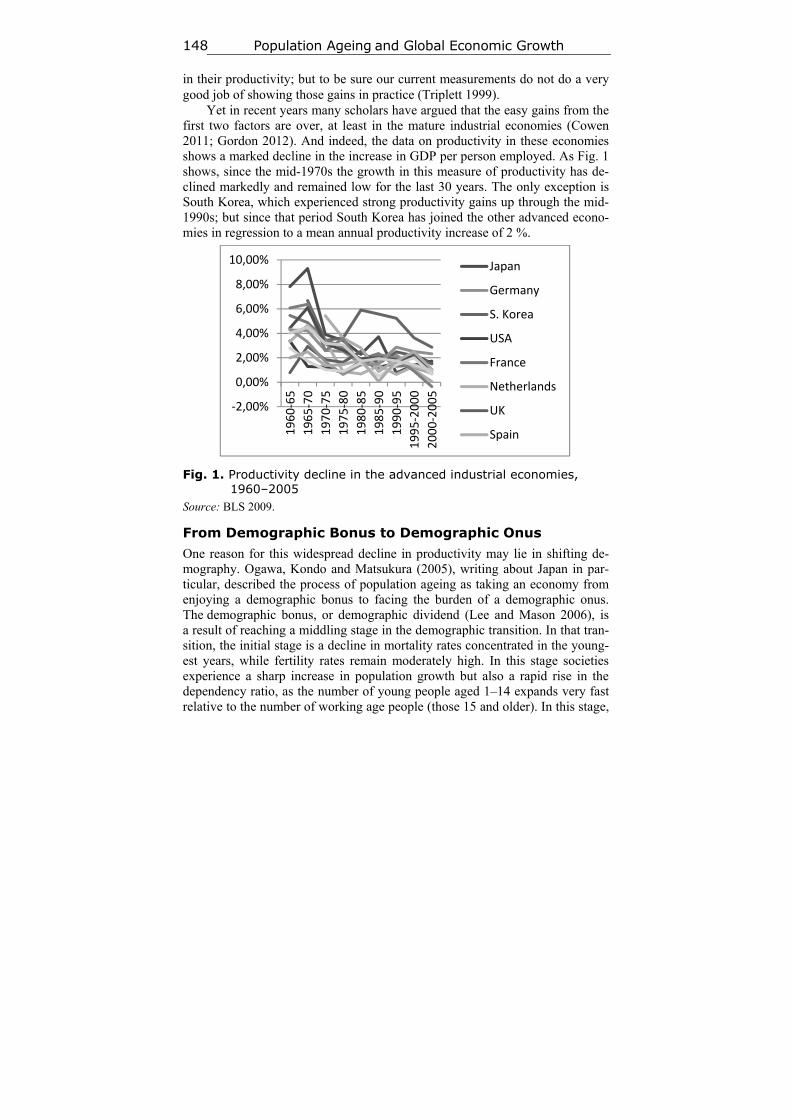
Population Agеing and Global Economic Growth 148
in their productivity; but to be sure our current measurements do not do a very good job of showing those gains in practice (Triplett 1999).
Yet in recent years many scholars have argued that the easy gains from the first two factors are over, at least in the mature industrial economies (Cowen 2011; Gordon 2012). And indeed, the data on productivity in these economies shows a marked decline in the increase in GDP per person employed. As Fig. 1 shows, since the mid-1970s the growth in this measure of productivity has de-clined markedly and remained low for the last 30 years. The only exception is South Korea, which experienced strong productivity gains up through the mid-1990s; but since that period South Korea has joined the other advanced econo-mies in regression to a mean annual productivity increase of 2 %.
Fig. 1. Productivity decline in the advanced industrial economies, 1960–2005
Source: BLS 2009.
From Demographic Bonus to Demographic Onus One reason for this widespread decline in productivity may lie in shifting de-mography. Ogawa, Kondo and Matsukura (2005), writing about Japan in par-ticular, described the process of population ageing as taking an economy from enjoying a demographic bonus to facing the burden of a demographic onus. The demographic bonus, or demographic dividend (Lee and Mason 2006), is a result of reaching a middling stage in the demographic transition. In that tran-sition, the initial stage is a decline in mortality rates concentrated in the young-est years, while fertility rates remain moderately high. In this stage societies experience a sharp increase in population growth but also a rapid rise in the dependency ratio, as the number of young people aged 1–14 expands very fast relative to the number of working age people (those 15 and older). In this stage,
‐2,00%
0,00%
2,00%
4,00%
6,00%
8,00%
10,00%
1960‐65
1965‐70
1970‐75
1975‐80
1980‐85
1985‐90
1990‐95
1995‐2000
2000‐2005
Japan
Germany
S. Korea
USA
France
Netherlands
UK
Spain
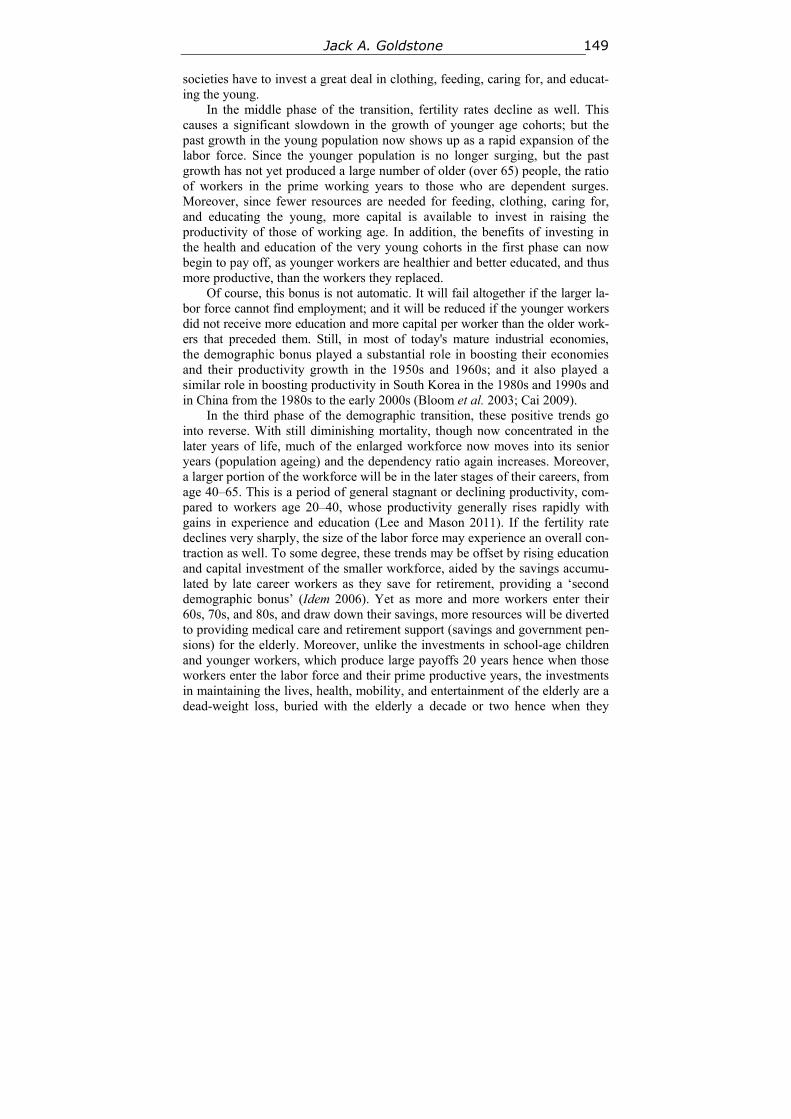
Jack A. Goldstone 149
societies have to invest a great deal in clothing, feeding, caring for, and educat-ing the young.
In the middle phase of the transition, fertility rates decline as well. This causes a significant slowdown in the growth of younger age cohorts; but the past growth in the young population now shows up as a rapid expansion of the labor force. Since the younger population is no longer surging, but the past growth has not yet produced a large number of older (over 65) people, the ratio of workers in the prime working years to those who are dependent surges. Moreover, since fewer resources are needed for feeding, clothing, caring for, and educating the young, more capital is available to invest in raising the productivity of those of working age. In addition, the benefits of investing in the health and education of the very young cohorts in the first phase can now begin to pay off, as younger workers are healthier and better educated, and thus more productive, than the workers they replaced.
Of course, this bonus is not automatic. It will fail altogether if the larger la-bor force cannot find employment; and it will be reduced if the younger workers did not receive more education and more capital per worker than the older work-ers that preceded them. Still, in most of today's mature industrial economies, the demographic bonus played a substantial role in boosting their economies and their productivity growth in the 1950s and 1960s; and it also played a similar role in boosting productivity in South Korea in the 1980s and 1990s and in China from the 1980s to the early 2000s (Bloom et al. 2003; Cai 2009).
In the third phase of the demographic transition, these positive trends go into reverse. With still diminishing mortality, though now concentrated in the later years of life, much of the enlarged workforce now moves into its senior years (population ageing) and the dependency ratio again increases. Moreover, a larger portion of the workforce will be in the later stages of their careers, from age 40–65. This is a period of general stagnant or declining productivity, com-pared to workers age 20–40, whose productivity generally rises rapidly with gains in experience and education (Lee and Mason 2011). If the fertility rate declines very sharply, the size of the labor force may experience an overall con-traction as well. To some degree, these trends may be offset by rising education and capital investment of the smaller workforce, aided by the savings accumu-lated by late career workers as they save for retirement, providing a ‘second demographic bonus’ (Idem 2006). Yet as more and more workers enter their 60s, 70s, and 80s, and draw down their savings, more resources will be diverted to providing medical care and retirement support (savings and government pen-sions) for the elderly. Moreover, unlike the investments in school-age children and younger workers, which produce large payoffs 20 years hence when those workers enter the labor force and their prime productive years, the investments in maintaining the lives, health, mobility, and entertainment of the elderly are a dead-weight loss, buried with the elderly a decade or two hence when they
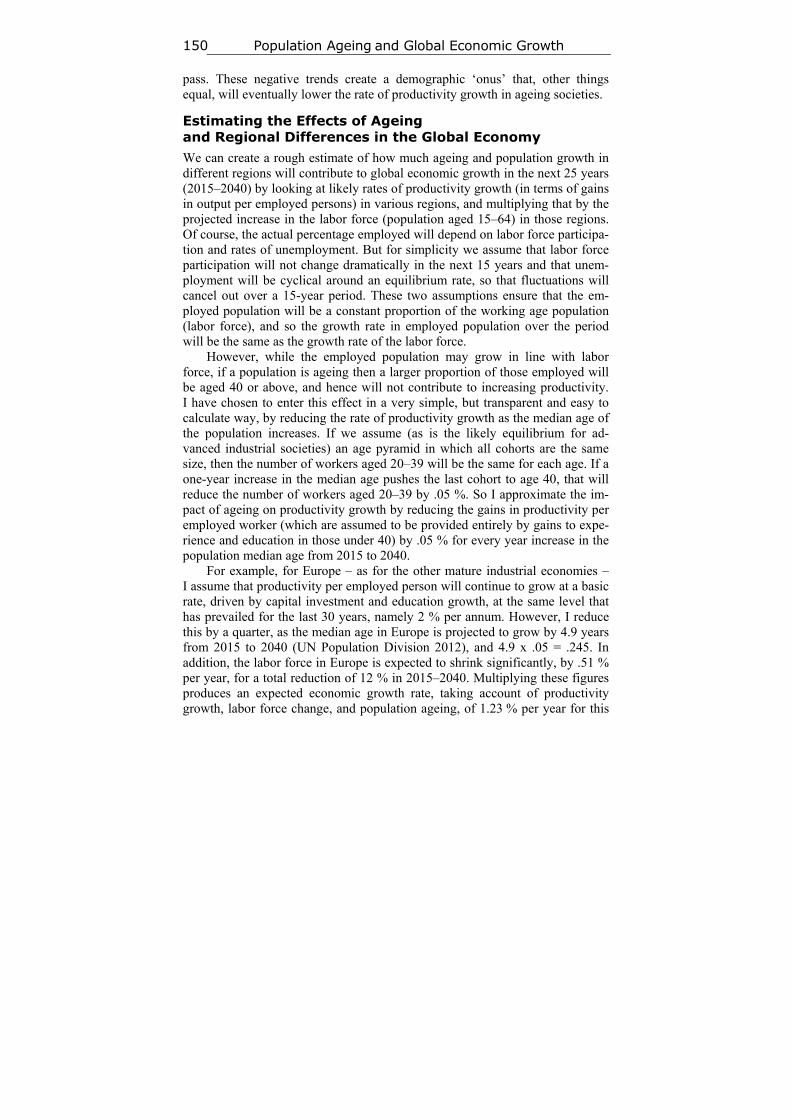
Population Agеing and Global Economic Growth 150
pass. These negative trends create a demographic ‘onus’ that, other things equal, will eventually lower the rate of productivity growth in ageing societies.
Estimating the Effects of Ageing and Regional Differences in the Global Economy We can create a rough estimate of how much ageing and population growth in different regions will contribute to global economic growth in the next 25 years (2015–2040) by looking at likely rates of productivity growth (in terms of gains in output per employed persons) in various regions, and multiplying that by the projected increase in the labor force (population aged 15–64) in those regions. Of course, the actual percentage employed will depend on labor force participa-tion and rates of unemployment. But for simplicity we assume that labor force participation will not change dramatically in the next 15 years and that unem-ployment will be cyclical around an equilibrium rate, so that fluctuations will cancel out over a 15-year period. These two assumptions ensure that the em-ployed population will be a constant proportion of the working age population (labor force), and so the growth rate in employed population over the period will be the same as the growth rate of the labor force.
However, while the employed population may grow in line with labor force, if a population is ageing then a larger proportion of those employed will be aged 40 or above, and hence will not contribute to increasing productivity. I have chosen to enter this effect in a very simple, but transparent and easy to calculate way, by reducing the rate of productivity growth as the median age of the population increases. If we assume (as is the likely equilibrium for ad-vanced industrial societies) an age pyramid in which all cohorts are the same size, then the number of workers aged 20–39 will be the same for each age. If a one-year increase in the median age pushes the last cohort to age 40, that will reduce the number of workers aged 20–39 by .05 %. So I approximate the im-pact of ageing on productivity growth by reducing the gains in productivity per employed worker (which are assumed to be provided entirely by gains to expe-rience and education in those under 40) by .05 % for every year increase in the population median age from 2015 to 2040.
For example, for Europe – as for the other mature industrial economies – I assume that productivity per employed person will continue to grow at a basic rate, driven by capital investment and education growth, at the same level that has prevailed for the last 30 years, namely 2 % per annum. However, I reduce this by a quarter, as the median age in Europe is projected to grow by 4.9 years from 2015 to 2040 (UN Population Division 2012), and 4.9 x .05 = .245. In addition, the labor force in Europe is expected to shrink significantly, by .51 % per year, for a total reduction of 12 % in 2015–2040. Multiplying these figures produces an expected economic growth rate, taking account of productivity growth, labor force change, and population ageing, of 1.23 % per year for this
Jack A. Goldstone 151
period. Starting from Europe's GDP in 2014, and using this growth rate to pro-ject GDP in 2040, and repeating these calculations for every other region, al-lows us to calculate Europe's expected contribution to total global GDP in-crease over this quarter century.
I have divided the world into a variety of economic regions. Europe, the US and Canada, Japan, and Oceania (Australia and New Zealand) are assumed to be mature industrial economies with base productivity growth rates of 2 % per year. Russia and the Former Soviet Union Countries, however, are seen as likely to grow more slowly, due to the constraints that centralized authority and strict information controls will put on their ability to transition to innovation and knowledge-based economies. I assume their base productivity growth rate will be 1 % per year. (If Russia continues to be afflicted by ultra-low oil prices and international sanctions, as it is currently, even that may be optimistic.)
Other regions are assumed to still have much higher growth rates, as they are still benefitting from the first or second demographic bonus. Thus, I assume that China will still enjoy annual gains in productivity per employed person of 6 %, due to continued shifts to employment requiring higher education, greater investments of capital per worker, and further urbanization. I assume India will have productivity gains almost as high, of 5.5 % (representing its most recent rate). Sub-Saharan Africa is also assumed to have a productivity growth rate of at least 5 %, as it enters the first demographic dividend (although that will de-pend on its currently stalled fertility starting to decline [Guengant and May 2013]).
For other regions that are not yet mature industrial economies, but no long-er low-development countries, I assume an annual rate of productivity increase of 4 % (4.2 % for Indonesia as that is its most recent rate); these areas include Latin America and Asia outside of China, India, Indonesia and Japan. For the Middle East and North Africa, I assume a slightly lower rate of productivity growth, given the ravages of the Arab Revolutions of 2011 and the ongoing civil wars still plaguing the region.
Most of these areas will still enjoy a rapid growth of their labor forces in this period (UN Population Division). Using the UN's medium estimates, these rates range from a high of 2.75 % per year in sub-Saharan Africa to just 0.32 % per year in the US and Canada. However, every region on earth is now experi-encing some measure of population ageing. Interestingly, the fastest rises in median age are not in the ‘already old’ areas of Europe or Japan. The rate of ageing is highest in China and Latin America, followed by other areas of Asia. Ageing is lowest in areas of still relatively high population growth (sub-Saharan Africa) or areas of high immigration (US and Canada, and Oceania).
With these estimates, the overall rate of growth of the world's economy is 3.1 %; about the same as the world experienced from 1990 to 2012 (World Bank 2014). However, some people may find a sustained productivity growth
Population Agеing and Global Economic Growth 152
rate for sub-Saharan Africa of 5 % excessively optimistic (Rodrik 2014). Given the increase in population and minimal ageing, SS Africa's economy is project-ed to grow at 7.7 % per year in this model, the highest of any region. While growth has been strong recently, this is still well above the level of growth in most African nations. And as there is no sign that Africa's fertility is declining (Guengant and May 2013), the projected demographic bonus may not arise. We can run the model again with assumed lower productivity growth rates for sub-Saharan Africa.
The results are interesting, even dropping Africa's annual productivity in-crease to 2 % only drops its growth rate to 4.63 %; this implies that much of Africa's recent 5 % per year growth rates are due to labor force gains rather than productivity improvements (World Bank 2014). What is more, the impact on global economic growth is minimal, dropping from 3.1 to 2.96 %. This is because Africa's contribution to global GDP is so small, changes in its growth rate have a minimal impact on total global growth rates. But that means Africa cannot play the role of the ‘next China’ anytime soon. Perhaps after 2040; but in the next 15 years if there is a major slowdown in China's output, there is no way that growth in Africa can compensate.
We can see that by running the model with changes in China's growth rate. In the base projection, China's productivity is set to grow at 6 % per year, but rapid ageing and a sharp decline in the labor force, second only to Japan, re-duce the net expected growth rate to only 4.92 % per year. If China's productiv-ity grows instead by 5 % a year, its new growth falls to 3.93 % per year. That has a modest impact on global economic growth, which declines only from 3.1 % to 2.94 %. But for growth in Africa to offset that decline and restore global growth rates to 3.1 %, African productivity per person would have to increase by 7 % per year, leading to sustained annual growth rates of 9.75 %. In other words, Africa can offset a growth decline in China, but only if it grows just as rapidly as China did during its boom years.
The same is true of India. If China's productivity growth averages only 5 % in this period, India's productivity would have to increase by 7.5 % per annum (a net growth rate of 8 % per year) to keep global economic growth at 3 %.
The biggest gains to the world economy would, naturally, come from boosting output in the biggest regional economies, namely those of Europe and North America. If Europe or the US/Canada increased their annual productivity gains to 3 % per year, the world economy would grow by about 3.3 % per year. If both could achieve such productivity gains, the world growth rate would be 3.5 %, despite demographic ageing and work force changes.
At the same time, this simulation shows how difficult it will be to achieve a 4 % rate of global economic growth, a rate commonly seen or exceeded prior to 1980. In order to boost global growth rates to 4 % per year in 2015–2040, given global demographic trends, here is what must happen: annual productivity gains
Jack A. Goldstone 153
per employed worker of 3 % in both Europe and North America; of 7 % per annum in China; of 8 % per annum in India, of 5 % per annum in Latin Ameri-can and other Asia, and 6 % per year in sub-Saharan Africa. Is this possible? Perhaps – with optimum education and investment in Africa and India, China's economy stabilizing at an overall growth rate of 6 % for the next 25 years, and Latin America boosting its growth rate to ‘miracle’ levels of sustained 5+ % growth. In addition, new technological marvels (3D printing, driverless cars, commercial drones, etc.) would have to boost productivity gains in Europe and North America back to the 3 % per year levels not seen for several decades.
The Future Will be Different These projections seem highly optimistic. It is more likely that we are simply entering a wholly different world than we experienced prior to 1980. In the immediate post-WWII decades, several factors strongly promoted global growth. First, population growth was rapid in the largest and most productivity-advancing regions, namely Europe and the United States. Second, movements of population out of agriculture to the cities and into manufacturing were easy and widespread in Asia and Latin America (and in China after 1980, where urbanization and growth had previously been suppressed under Mao Zedong's strict communist regime). Third, the development of globalized production and trade stimulated markets around the world and created greater efficiencies in the distribution of capital and production. But these advances have now spread to most of the world, and their potential for further rapid growth is diminished. In addition, the world's largest economies – the U.S. and Europe – are now ex-periencing much reduced labor force growth or even decline, in addition to slower productivity increases. Global growth of 3 % per year may be the ‘new normal’ as far as the next quarter century is concerned.
Even Africa, despite its enormous potential for a demographic dividend and increased movement of population from rural work to urban manufactur-ing, will not be able to boost global economic growth back to 4 % on its nu-merous shoulders. At best, growth in Africa should just offset declining growth rates in China. If we use the model to ask – what growth rate in Africa would be necessary to raise the global growth rate to 4 %, if all other regions experi-ence the baseline growth rate, the answer is that sub-Saharan Africa would have to enjoy 25 years of sustained growth of 15 % per year, based on productivity gains of 12 % per year. That is a rate never sustained even by China with its strong government, internal peace, excellent education, and access to rapidly expanding export markets in 1980–2010; and is extremely unlikely to be reached by a divided, poorly governed, and under-educated Africa. Those who saw 4 % global economic growth as ‘normal’ in the 1960s and 1970s are un-likely to see that return in their lifetimes.
Population Agеing and Global Economic Growth 154
Still, 3 % annual growth need not be unpleasant. With global population growth slowing sharply, projected to increase only from 7.32 to 9.04 billion in this period, for an annual increase of under 1 % per year, that still leaves plenty of room for per capita income growth. The real question will be how that net growth is distributed. If most of the world's population enjoys a real annual income increase of 2 % per annum, the future may look bright, with real in-comes doubling each generation. But if, as in recent years, most of those gains go to a small fraction of the global population (Piketty 2014), progress for most people will be minimal. The problem is that there is not enough growth to go around; concentrating gains at the same time that global growth is slowing will likely create a new world politically, as well as economically, in the coming decades.
References
Bloom D. E., Canning D., and Sevilla J. 2003. The Demographic Dividend: A New Perspective on the Economic Consequences of Population Change. Santa Monica, CA: RAND Corporation.
Bureau of Labor Statistics (BLS). 2009. International Comparisons of GDP per Capi-ta and per Employed person: 17 countries, 1960–2008. Washington, DC: Depart-ment of Labor.
Cai F. 2009. Future Demographic Dividend – Tapping the Source of China's Economic Growth. China Economist (July–August): 17–24.
Cowen T. 2011. The Great Stagnation: How America Ate All the Low-Hanging Fruit of Modern History, Got Sick, and Will Feel Better. London: Dutton/Penguin.
Gordon R. J. 2012. Is U.S. Economic Growth Over? Faltering Innovation Confronts the Six Headwinds. NBER Working Paper No. 18315. Cambridge, MA: National Bu-reau of Economic Research.
Guengant J.-P., and May J. F. 2013. African Demography. Global Journal of Emerg-ing Market Economies 5(3): 215–267.
Lee R., and Mason A. 2006. What is the Demographic Dividend? Finance and Devel-opment 43(3): 16–17.
Lee R., and Mason A. 2011. Population Aging and the Generational Economy: A Global Perspective. London: Edward Elgar.
Ogawa, N., Kondo M., and Matsukura R. 2005. Japan's Transition from the Demo-graphic Bonus to the Demographic Onus. Asian Population Studies 1(2): 207–226.
Piketty T. 2014. Capital in the Twenty-First Century. Transl. by Arthur Goldhammer. Cambridge, MA: Harvard University Press.
Rodrik D. 2014. Why an African Growth Miracle is Unlikely. Milken Institute Review: 43–54.
Triplett J. 1999. The Solow Productivity Paradox: What do Computers Do to Produc-tivity? Canadian Journal of Economics 32(2): 309–333.
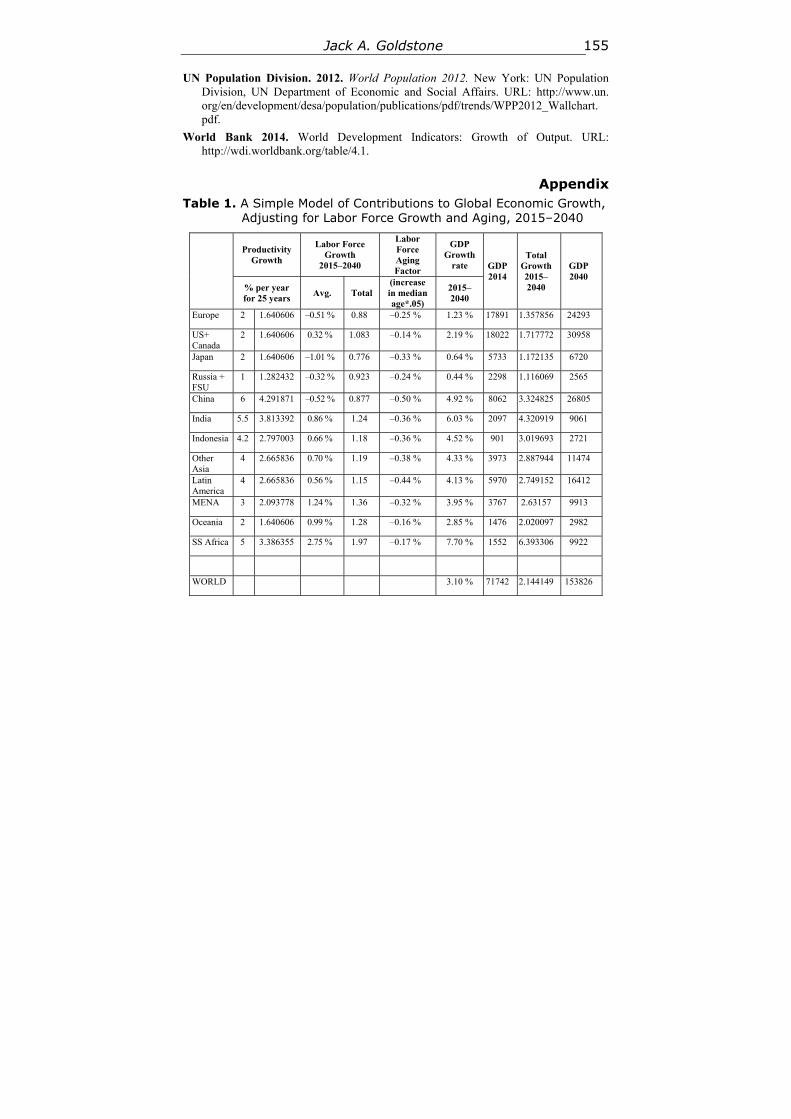
Jack A. Goldstone 155
UN Population Division. 2012. World Population 2012. New York: UN Population Division, UN Department of Economic and Social Affairs. URL: http://www.un. org/en/development/desa/population/publications/pdf/trends/WPP2012_Wallchart. pdf.
World Bank 2014. World Development Indicators: Growth of Output. URL: http://wdi.worldbank.org/table/4.1.
Appendix
Table 1. A Simple Model of Contributions to Global Economic Growth, Adjusting for Labor Force Growth and Aging, 2015–2040
Productivity Growth
Labor Force Growth
2015–2040
Labor Force Aging Factor
GDP Growth
rate GDP 2014
Total Growth 2015–2040
GDP 2040
% per year for 25 years
Avg. Total (increase in median age*.05)
2015–2040
Europe 2 1.640606 –0.51 % 0.88 –0.25 % 1.23 % 17891 1.357856 24293
US+ Canada
2 1.640606 0.32 % 1.083 –0.14 % 2.19 % 18022 1.717772 30958
Japan 2 1.640606 –1.01 % 0.776 –0.33 % 0.64 % 5733 1.172135 6720
Russia + FSU
1 1.282432 –0.32 % 0.923 –0.24 % 0.44 % 2298 1.116069 2565
China 6 4.291871 –0.52 % 0.877 –0.50 % 4.92 % 8062 3.324825 26805
India 5.5 3.813392 0.86 % 1.24 –0.36 % 6.03 % 2097 4.320919 9061
Indonesia 4.2 2.797003 0.66 % 1.18 –0.36 % 4.52 % 901 3.019693 2721
Other Asia
4 2.665836 0.70 % 1.19 –0.38 % 4.33 % 3973 2.887944 11474
Latin America
4 2.665836 0.56 % 1.15 –0.44 % 4.13 % 5970 2.749152 16412
MENA 3 2.093778 1.24 % 1.36 –0.32 % 3.95 % 3767 2.63157 9913
Oceania 2 1.640606 0.99 % 1.28 –0.16 % 2.85 % 1476 2.020097 2982
SS Africa 5 3.386355 2.75 % 1.97 –0.17 % 7.70 % 1552 6.393306 9922
WORLD 3.10 % 71742 2.144149 153826
History & Mathematics: Demography & Ageing 2015 156–166 156
9
Ageing in Post-Industrial Society: Trends and Trajectories
Jason L. Powell and Hafiz T. A. Khan
Abstract This paper aims at examining a global question on the power of population age-ing in the 21st century, particularly the degree to which population ageing is gradually becoming a real challenge to many geographical regions of the world. The global ageing issues are critically analyzed by illustrating valuable scientific inputs including statistical data. A holistic approach has been utilized to under-stand and resolve the complexities of future ageing society. Finally, suggestions are made on the basis of social and economic implications globally.
Keywords: global ageing, trends, trajectories, post-industrial society.
Introduction The challenges posed by welfare in post-industrial society need to be set within the global context of the demographic changes, the stories by which people live, and the flow of people, technology, money, and ideologies around the world (McDaniel and Zimmer 2013; Phillipson 2013; Powell and Khan 2013). The post-industrial societies are characterized by an ageing of the population, in some cases mitigated by immigration of young, fertile people from less prosper-ous countries in search of work and economic security (Powell 2013). A question that only recently has started receiving attention is whether in the future, young immigrant populations in post-industrial societies will be willing to support an ageing population of native residents (Phillipson 2013; Khan et al. 2013).
The Third World countries experience a dramatic population ageing, albeit from a lower base and, since the overall population of the Third World far ex-ceeds that of the post-industrial societies, the sheer numbers of older people in Third World countries will in the future far exceed those in post-industrial soci-eties (United Nations 2012).
This trend alone will pose global political challenges as well as challenges for the countries that face a population explosion of elders. In addition to the quandaries of population ageing associated with development, some African countries face devastation wrought by AIDS which depletes the population of those cohorts in mid-life who could otherwise be counted upon to support chil-
Jason L. Powell and Hafiz T. A. Khan 157
dren and frail elderly (Phillipson 1998; United Nations 2012; Higo and Khan 2015).
The very nature of post-industrial societies is dependent on relationships with the Third World. The process of deindustrialization, which makes these societies become post-industrial, with their economies focused on the produc-tion of services and information technology, resulted from multi-national cor-porations moving manufacturing from advanced industrial societies to Third World countries where costs in terms of wages, benefits, and safety precautions are much smaller than in advanced industrial societies (McDaniel and Zimmer 2013). Workers in Third World countries may be paid as little as one dollar a day, sometime below the local living wage, and far below the wages paid to workers in advanced industrial societies (Powell and Cook 2009).
The use of child labor is a recurrent problem and the one driven by economic considerations. The advent of factories in Third World countries generally pro-vides low wage jobs, but not an adequate living wage, and disrupts local social systems as workers move to cities where factories are located in search for work (Phillipson 2013). Furthermore, not only do post-industrial societies consume products manufactured in Third World countries, they also lure skilled services workers, such as physicians, to provide medical care (McDaniel and Zimmer 2013). The United States' economy is said to be dependent on low paid, often undocumented low skilled workers in agriculture and other service jobs.
This article will discuss the broad dynamics of global ageing, outline the basic features of post-industrial societies, and survey global trends in popula-tion ageing and their consequences. The first task is to discuss the meaning of ‘post-industrial’ in the context of ageing. The idea of post-industrial societies has been a contested theme within social sciences although its shortcomings as a concept have been at least equally matched by the importance of the questions raised (Phillipson 2013).
Essentially, the idea is associated with the work of American sociologist Daniel Bell (1973) who in his book, The Coming of Post-Industrial Society, iden-tified a number of major shifts in the structure of the Western societies, notably the move from a manufacturing to a service economy, the apparent decline of the working class, and the rise of professional and technical groups (reflected in the expansion – from the 1960s onwards – of the university system). These changes were considered to present a fundamental challenge to the basis of indus-trialism, with the creation of a different kind of society – the one which will soon be dominated by technology and automation (Hendricks and Powell 2009).
Many analysts of the ‘post-industrial’ theme have in fact preferred to stress the continuities with previous epochs, suggesting that the driving forces appear little different from those associated with industrialism itself (Phillipson 2013). Against this, the debates around post-industrialization were to spawn a number of linked ideas, many of which do point to social changes relevant to under-
Ageing in Post-Industrial Society 158
standing issues affecting older people. Phillipson (1998), for example, drew a distinction between what they defined as ‘organized’ and ‘disorganized’ capi-talism. The former characterized by the spread of manufacturing industry alongside an increasingly urbanized society; the latter associated with more flexible forms of work, the growth of the service sector, and the movement of people and jobs from the older industrial cities.
The rapid increase in population ageing across the globe signals one of the most important demographic changes in human history. In the latter half of the last century, the world's developed nations completed a long process of demographic transition (Raeside and Khan 2008; Khan 2013). We can define a demographic transition as a shift from a period of high mortality, short lives, and large families to one with a longer life expectancy for an ageing pop-ulation and far fewer children (Powell 2013).
This transformation has taken many years across the globe but particularly in Europe and North America as small unit families moved from agrarian mode of production to urban cities; basic public health measures steadily reduced the risk of contagious disease; and modern medicine has prolonged lives to unprec-edented lengths (United Nations 2012). In developing countries, this demo-graphic transition is certainly underway, though these countries vary widely at their places along the spectrum.
Low birth rates and the resultant population decrease have received considera-ble media attention, particularly in Europe and parts of Eastern Asia (Bengtson and Lowenstein 2004). Historically, when demographers projected national and global populations, the projections commonly assumed that birth rates would decline globally but only to the ‘two-child’ family, that is two children per woman or per couple on average (Phillipson 2013).
An assumption that fertility would fall below this rate would have some hegemonic assumptions: a decrease in population size and an ageing population that would depend upon a dwindling number of younger workers. Today, the global population has come to what we may call a great ‘demographic di-vide’. Very low birth rates have inflicted long-lasting alterations upon the age structure of population (Phillipson 1998; Raeside and Khan 2008; United Na-tions 2012; Leeson and Khan 2013; Higo and Khan 2015).
In order to examine such complex and vast demographic changes, academ-ic researchers use a variety of methodological tools to find, collate and interpret such changes through the guise of ‘post-industrial society’ (Hendricks and Powell 2009). A post-industrial society is a society in which an economic transi-tion has occurred from a manufacturing based economy to a service based econ-omy, a diffusion of national and global capital, and mass privatization.
The prerequisites to this economic shift are the processes of industrialization and liberalization. This economic transition spurs a restructuring in society as
Jason L. Powell and Hafiz T. A. Khan 159
a whole. George Ritzer (2007) claims there have been explicit changes in the social structure associated with the transition to a post-industrial society. Within the economy, there is a transition from goods production to the provision of ser-vices. Production of clothing and steel declines, while services (such as selling consumer goods and investment advice) increase. Although services predominate in a wide range of sectors, health, education, research, and government services are the most decisive for a post-industrial society.
Daniel Bell (1973) emphasized the changes to post-industrial society are not merely socially structural and economic; the values and norms within the post-industrial society are changed as well. Rationality and efficiency become the paramount values within the post-industrial society.
Eventually, according to Bell, these values cause disconnect between social structures and culture. Most of today's unique modern problems can be general-ly attributed to the effects of the post-industrial society. These problems are particularly pronounced where the free market dominates. They can include economic inequality, the outsourcing of domestic jobs.
We can point out various dimensions to measure global ageing such as de-mographic, socio-economic, health, intergenerational support, activities in later life, social security, dependency rates and human right issues as part of the post-industrial age (Phillipson 1998). While the proportions of older people in a popu-lation are typically highest in more developed countries because of measurement data of low birth rates and high life expectancies which are used to understand global ageing, the most rapid increases in older populations are actually occurring in the less developed world (Khan and Leeson 2006; Cook and Powell 2007). Between 2006 and 2030, the increasing number of older people in less developed countries is projected to escalate by 140 % as compared to an increase of 51 % in more developed countries (Phillipson 2013).
A key feature of population ageing is the progressive ageing of the older population itself. Demographers contrast the ‘old’ (65+) with the ‘oldest old’ (85+) and that the oldest old population is growing at an even more rapid pace than the overall old population. Over time, larger numbers of older people sur-vive to even more advanced ages.
Around the world, the 85-and-over population is projected to increase 151 % between 2005 and 2030, compared to a 104 % increase for the popula-tion of age 65 and over and a 21 % increase for the population under age 65 (McDaniel and Zimmer 2013). The most striking increase will occur in Japan: by 2030, nearly 24 % of all older Japanese are expected to be at least 85 years old (Kim and Lee 2007).
As life expectancy increases and people aged 85 and over increase in num-ber, four-generation families may become more common even in developing countries (Khan 2013). Dependency rates, which are the number of dependants
Ageing in Post-Industrial Society 160
related to those of working age, have altered little over the 20th and 21st centu-ries (Leeson and Khan 2013).
The reason there has been so little change during a period of so-called rap-id ageing populations is that there has been a fall in the total fertility rate, TFR (the average number of children that would be born to each woman if the cur-rent age-specific birth rates persisted throughout her child-bearing life).
Dynamics of Global Ageing Populations In every society in the world, there is concern about population ageing and its consequences for nation-states, for sovereign governments and for individuals. It is evident that population is ageing globally. Ageing itself is a ‘triumph’ of our times – a product of improved public health, sanitation and overall development. Increasing longevity is a remarkable achievement for humanity in the 21st centu-ry and for the first time it is a breakthrough in history as four generations begin to live together in the society (Phillipson 2013; Khan 2013; Higo and Khan 2015).
Yet over 100 million older people live on less than a dollar a day. In 1950, eight out of every 100 people were over 60. By 2050, 22 out of every 100 peo-ple will be over 60. By 2045, the global population of people aged 60 years and over will likely surpass, for the first time in history, the number of children under age 15 (Powell 2005). The increasing share of older people in the world's population results from a combination of hugely increased life expectancy and reduced fertility (McDaniel and Zimmer 2013).
Globally total fertility rate is expected to decline from 2.82 children per woman in 1995–2000 to 2.15 children per woman in 2045–2050. Life expectancy worldwide is expected to increase by 11 years, from 65 years in 1995–2000 to 76 years in 2045–2050, despite the impact of HIV/AIDS (Phillipson 2013). Most of the world's older people (about 75 %) live in developing countries (Krug 2002; United Nations 2012).
Even in the poorest countries, life expectancy is increasing and the number of older people is growing. In 2000, there were 374 million people over 60 in developing countries – 62 % of the world's older people. In 2015, there will be 597 million older people in developing countries – 67 % of the world's older people (Powell 2013). In 2005, one in twelve people in developing countries were over 60. By 2015, one in ten people in developing countries will be over 60 and, by 2050, one in five people in developing countries will be over 60. In eve-ry region the rate of population increase for the 65-and-over age group is higher than for the under-14 age group and the 15–64 age group (Bengtson and Low-enstein 2004).
The older women are more in number and they are more likely to be poor. The majority of older persons globally are women. In 2006, there are 82 men for every 100 women over 60 worldwide (Powell 2013). In developing countries,
Jason L. Powell and Hafiz T. A. Khan 161
the gap is less wide: there are 85 men for every 100 women over 60. However, with age this gap increases – for over 80s, there are only 73 men for every 100 (Bengtson and Lowenstein 2004).
Although women live longer than their men counterparts, they possess relatively less resource and in many cases are found to be dependent on their offsprings and other relatives, particularly in developing countries. Longer life is also associated with morbidity and long term care. The demographic trend indicates that people should be prepared for enjoying longer longevity com-pared to the previous generation and they should also be prepared for bearing their own cost of care (Khan and Leeson 2006; Khan et al. 2013).
Social and Economic Implications of Global Ageing While global ageing represents a triumph of medical, social, and economic ad-vances, it also presents tremendous challenges for many regions of the world. Population ageing strains social insurance and pension systems and challenges existing models of social support traditionally given by family structures (Leeson and Khan 2013; Powell and Khan 2013). It affects economic growth, trade, migration, disease patterns and prevalence, and fundamental assumptions about growing older. Global ageing will have dramatic effects on local, region-al, and global economies. Chris Phillipson (2013) has argued that the rise of globalization exerts unequal and highly stratified effects on the lives of older people in different nation-states (Estes 2001; Phillipson 2013).
In the developed world, the magnitude and absolute size of expenditure on programs for older people has made these the first to be targeted with financial cuts. In less developed countries, older people (women especially) have been amongst those most affected by the privatization of health care, and the burden of debt repayments to the World Bank and the IMF (Estes 2001; Powell 2013).
Additionally, globalization as a process that stimulates population move-ment and migration can also produce changes that disrupt the lives of older people (Phillipson 1998). And one should also bear in mind that they may comprise up to one-third of refugees in conflict and emergency situations – a figure which was estimated at over 53 million older people worldwide in 2000 (Estes 2001).
Changes in the age structures of population also have consequences for to-tal levels of labor force participation in society, because the likelihood that an individual will be in the labor force varies systematically by age (Phillipson 2013). Labor itself is viewed as less mobile than capital, although migration could offset partially the effects of population ageing. Currently, 22 % of phy-sicians and 12 % of nurses in the United States are foreign born, representing primarily African countries, the Caribbean, and Southeast Asia (OECD 2007). The foreign-born workforce also is growing in most OECD countries.
Over the next ten years, the European experience will be particularly instruc-tive in terms of the interplay of ageing and migration (Leeson and Khan 2013).
Ageing in Post-Industrial Society 162
It is also because the future is already dawning that global trends impact on state power. In South Korea and Japan, which have strong cultural aversions to immigration, small factories, construction companies, and health clinics are relying more on ‘temporary’ workers from the Philippines, Bangladesh, and Vietnam (OECD 2007).
In China, state industries are struggling over how to lay off unneeded mid-dle-age workers when there is no social safety net to support them (Cook and Powell 2007). What really has pushed ageing to the top of the global agenda, though, is increasing fiscal gaps (in part, due to the ‘global credit crunch’) in the USA, Europe, Japan, and elsewhere that could worsen as populations reach retirement age. While U.S. Social Security is projected to remain solvent until at least 2042, the picture is more acute in Europe. Unlike the USA, where most citizens also have private savings plans, in much of Europe up to 90 % of workers rely almost entirely on public pensions (Walker and Naeghele 2000). Austria guarantees 93 % of pay at retirement, for example, and Spain offers 94.7 %.
Concurrently, global population ageing is projected to lead to lower pro-portions of the population in the labor force in highly industrialized nations, threatening both productivity and the ability to support an ageing population (Krug 2002). It is possible for the elements of production – labor and capital – to flow across national boundaries and mitigate the impact of population ageing (Phillipson 2013).
Studies predict that, in the near term, capital accumulation will flow from Europe and North America to emerging markets in Asia and Latin America, where the population is younger and supplies of capital relatively low. In an-other two decades, when the ‘baby boom’ generation in the West has mostly retired, the consequence is that capital will likely flow in the opposite direction (May and Powell 2008).
It is interesting that the World Bank (1994) foresees growing ‘threats’ to international stability with the consequence of pitting different demographic-economic regions against one another (Phillipson 2013). The United Nations (2002) view the relationship between ageing populations and labor force partic-ipation with panic, recognizing important policy challenges, including the need to reverse recent trends toward decreasing labor force participation of workers in late middle and old age despite mandatory retirement in certain Western countries such as the UK (Powell 2005).
Social welfare provisions and private-sector pension policies influencing retirement income have a major impact on retirement timing. Hence, a major concern for organizations such as United Nations and World Bank centers on the number of such ‘dependent’ older people in all developing societies.
Furthermore, nation-states with extensive social programs targeted to the older population – principally health care and income support programs – find
Jason L. Powell and Hafiz T. A. Khan 163
the costs of these programs escalating as the number of eligible recipients grows and the duration of eligibility lengthens due to global pressures (United Nations 2012). Moreover, few countries have fully funded programs; most countries fund these programs on a pay-as-you-go basis or finance them using general revenue streams. Governments may be limited in how much they can reshape social insurance programs by raising the age of eligibility, increasing contribution rates, and reducing benefits (Phillipson 2013). Consequently, shortfalls may need to be financed using general revenues.
NGOs can also play a vital role. Projections of government expenditures in the United States and other OECD countries show increases in the share of gross domestic product devoted to social entitlements for older populations. In some cases, this share more than doubles as a result of population ageing (OECD 2007). The age groups in different countries have different levels of pace of growth (Phillipson 2013; Estes et al. 2003).
The life-cycle theory of consumption is that family households accumulate wealth during working years to maintain consumption in retirement (Gilleard and Higgs 2001). The total of a country's individual life-cycle savings profiles determines whether households in that country are net savers or non-savers at any point in time (Phillipson 2013).
A country with a high proportion of workers will tend to be dominated by savers, placing downward pressure on the rate of return to capital in that econ-omy. Nation-states with older populations will more tap their savings and driv-ing rates of return because of the scarcity of capital (Gilleard and Higgs 2001).
This surely makes impact on pensions. Most European state-funded pen-sion systems encourage early retirement. Now, 85.5 % of adults in France retire from employment by age 60, and only 1.3 % engages in employment beyond aged 65. In Italy, 62 % of adults retire from full-time work by the age of 55. That compares with 47 % of people who earn wages or salaries until they are 65 in the USA and 55 % in Japan (Estes 2001).
Individual and family resources are important too. These typically include public and private pensions, financial assets, and property. By 2050, pensions and elder-care costs will increase from 14 % of capitalist nations' gross domestic product to 18 % (Powell and Chen 2012). The relative importance of these re-sources varies across countries. For example, a groundbreaking study revealed that only 3 % of Spanish households with at least one member age 50 or older own stocks (shares), compared to 38 % of Swedish households (Ibid.).
The largest component of household wealth in many countries is housing value. This value can fall if large numbers of older homeowners try to sell houses to smaller numbers of younger buyers. How successfully this transition is man-aged around the world could determine the rise and fall of nations and reshape the global economy in the era of the post-credit crunch.
Ageing in Post-Industrial Society 164
Two key vehicles of growth are increases in the labor force and productivi-ty. If nation-states cannot maintain the size of their labor forces by persuading older workers to retire later (or allowing them to replace the workplace) then the challenge will be to maintain growth levels. This will be a particular chal-lenge in Europe, where productivity growth has averaged just 1.3 % since 1995. By 2024, the growth in household financial wealth in the USA, Europe, and Japan will slow from a combined 4.5 % annual reduction now to 1.3 %. That will translate into US$ 31 trillion less wealth than if the average age were to remain the same (Powell 2013).
This also has an impact on older people, family and household. Indeed, older people's living arrangements reflect their need for family, community, or institutional support. Living arrangements also indicate socio-cultural prefer-ences – for example, some choose to live in nuclear households while others prefer extended families (Estes et al. 2003). The number, and often the percent-age, of older people living alone are rising in most countries. In some European countries, more than 40 % of women age 65 and older live alone (McDaniel and Zimmer 2013).
Even in societies with strong traditions of older parents living with chil-dren, such as in Japan, traditional living arrangements are becoming less com-mon. In the past, living alone in older age often was equated with social isola-tion or family abandonment (Phillipson 2013). However, research in many cul-tural settings illustrates that older people, even those living alone, prefer to be in their own homes and local communities (Gilleard and Higgs 2001). This preference is reinforced by greater longevity, expanded social benefits, in-creased home ownership, elder-friendly housing, and an emphasis in many na-tions on community care (Estes et al. 2003).
As people live longer and have fewer children, family structures are also transformed (Bengtson and Lowenstein 2004). This has important implications in terms of providing care to older people. Most older people today have chil-dren, and many have grandchildren and siblings. However, in countries with very low birth rates, future generations will have few if any siblings (Phillipson 2013).
As a result of this trend and the global trend toward having fewer children, people will have less familial care and support as they age (Bengtson and Low-enstein 2004). This is a real threat to our traditional care system in the society particularly in developing countries.
As a consequence of the global demographics of ageing, the changing so-cieties of the post millennia are being confronted with quite profound issues relating to illness and health care, access to housing, food price hike, and eco-nomic resources including pension provision (Powell and Chen 2012). The past several years have witnessed an unprecedented stretching of the human life span.
Jason L. Powell and Hafiz T. A. Khan 165
This ageing of the global population has no parallel in human history (Bengtson and Lowenstein 2004; Krug 2002) and emerged as a new demographic scenario with huge uncertainties. Thus, more research is needed. If these demo-graphic trends continue to escalate, by 2050 the number of older people will glob-ally exceed the number of young for the first time since formal records began rais-ing questions of the power of the nation-state in the context of global ageing.
References Bell D. 1973. The Coming of Post-Industrial Society. New York: Basic Books.
Bengtson V. L., and Lowenstein A. (Eds.) 2004. Global Ageing and Challenges to Families. New York: De Gruyter.
Cook I. G., and Powell J. L. 2007. New Perspectives on China and Ageing. New York: Nova Science.
Estes C. 2001. Social Policy and Ageing. Thousand Oaks: Sage.
Estes C., Biggs S., and Phillipson C. 2003. Social Theory, Social Policy and Ageing. Milton Keynes: Open University Press.
Gilleard C., and Higgs P. 2001. Cultures of Ageing. London: Prentice Hall.
Hendricks J., and Powell J. L. (Eds.) 2009. The Welfare State in Post-Industrial Socie-ty. New York: Springer.
Higo M., and Khan H. T. A. 2015. Global Population Aging: Unequal Distribution of Risks in Later Life between Developed and Developing Countries. Global Social Policy 15(2): 146-166.
Khan H. T. A. 2013. Factors Associated with Intergenerational Social Support across the World. Ageing International 39(4): 289–326.
Khan H. T. A., and Leeson G. 2006. The Demography of Ageing in Bangladesh: A Sce-nario Analysis of Consequence. Hallym International Journal of Ageing 8(1): 1–21.
Khan H. T. A., Leeson G. W., and Findlay H. 2013. Attitudes towards Bearing the Cost of Care in Later Life: Evidence from the Future of Retirement Surveys. Illness, Crisis and Loss 21(1): 49–69.
Kim S., and Lee J-W. 2007. Demographic Changes, Saving and Current Account in East Asia. Asian Economic Papers 6(2): 22–53.
Krug E. G. 2002. World Report on Violence and Health. Geneva: World Health Organi-zation.
Leeson G. W., and Khan H. T. A. 2013. Levels of Welfarism and Intergenerational Transfers within the Family: Evidence from the Global Ageing Survey (GLAS). Glob-al Ageing in the Twenty-First Century: Challenges, Opportunities and Implications / Ed. by S. McDaniel, and Z. Zimmer, pp. 291–308. London: Ashgate.
May T., and Powell J. L. 2008. Situating Social Theory. 2nd ed. McGraw Hill: Maiden-head.
Ageing in Post-Industrial Society 166
McDaniel S., and Zimmer Z. (Eds.) 2013. Global Ageing in the Twenty-First Century: Challenges, Opportunities and Implications. London: Ashgate.
OECD 2007. Disability Trends among Elderly People: Re-Assessing the Evidence in 12 OECD Countries (Interim Report). Directorate for Employment, Labour and Social Affairs Paris, France: OECD.
Phillipson C. 1998. Reconstructing Old Age. London: Sage.
Phillipson C. 2013. Ageing. Bristol: Policy Press.
Powell J. L. 2005. Social Theory and Aging. Lanham: Rowman and Littlefield.
Powell J. L. 2013. Social Gerontology. New York: Nova Science.
Powell J. L., and Chen S. 2012. The Global Dynamics of Aging. New York: Nova Sci-ence.
Powell J. L., and Cook I. 2009. Aging in Asia. New York: Nova Science.
Powell J. L., and Khan H. T. A. 2013. Ageing and Globalization: A Global Analysis. Journal of Globalization Studies 4(1): 150–159.
Raeside R., and Khan H. T. A. 2008. The Ageing Scottish Population: Trends, Conse-quences and Responses. Canadian Studies in Population 35(2): 291–310.
Ritzer G. 2007. The Globalization of Nothing. Thousand Oaks, CA: Pine Forge Press.
UN. 2002. Department of Economic and Social Affair, Population Division. World Pop-ulation Ageing 1950–2050. New York: United Nations.
UN. 2012. Ageing in the Twenty-First Century: A Celebration and a Challenge. New York – London: United Nations Population Fund and Help Age International.
Walker A., and Naeghele G. 2000. The Politics of Ageing in Europe. Milton Keynes: Oxford University Press.
History & Mathematics: Demography & Ageing 2015 167–171 167
III. REVIEWS AND NOTES
10 On Great Divergence, Great Conver-
gence, Industrial Revolution, and California School
Review of L. E. Grinin, A. V. Korotayev ‘Great Divergence and Great Convergence’,
Springer International Publishing; 2015
Jack A. Goldstone
Since man first forged metal tools and started farming for his food, thus emerg-ing from the Stone Age, no event in human history has had a greater impact than the Industrial Revolution of the 18th and 19th centuries. During that span, Europeans increased their use of fossil fuel energy by several orders of magni-tude, began to use that fossil fuel energy to produce motive power as well as heat, and developed a host of high-efficiency industrial processes and new modes of transportation, with spillovers into military technology as well. As a result, Europeans went from ‘underdeveloped’ nations, who mainly traded raw materials and bullion for the manufactured and plantation goods of the ‘devel-oped’ world of Asia (cotton and silk textiles; ceramics and lacquer ware and tropical woods; coffee, tea, indigo, nuts and spices), and who were allowed limited trading roles on the suffrage of India, China, and Japan, to the world's center of manufacturing and manufactured exports, with military dominance and the ability to dictate terms of trade to the major Asian societies.
The shorthand summary of this process for the last two centuries has been the ‘Rise of the West’, and explaining it has been one of the central questions of the social sciences. The traditional view since the time of Karl Marx and Max Weber, extended by the twentieth-century scholars such as William McNeil (1963, 1990) and David Landes (1998), was that since the Middle Ages, Europe was a unique-ly creative society that advanced in agriculture, accounting, use of wind and wa-ter power, and craftsmanship, while Asian societies reached their peak of devel-opment in the medieval period, and thereafter simply maintained themselves in a kind of ‘frozen’ state of development, or even declined. While in the medieval period the societies of Abbasid Islam and Song China might have started at a higher level of economic productivity and technology than Europe, the ‘rise’ of European productivity and technology over the succeeding centuries led to Euro-pean global domination by the 19th century.
On Great Divergence and Great Convergence 168
Yet in the last two decades, a group of comparative sociologists and global historians have offered a counter-narrative, led by scholars of the ‘California School’ of global historians (Goldstone 1991, 2002, 2008a, 2008b; Pomeranz 2000, 2002; Wong 1997; Frank 1998; Marks 2002; Vries 2003, 2010). This counter-narrative called attention to the continuing vitality of agricultural and manufacturing technology in Asia, with India and China remaining world-dominant manufacturing powers up through the 17th century. It illustrated rela-tively high living standards among Asian agricultural population, comparable to those in Europe, up to 1800.
And it demonstrated that Asian merchants and pirates were the equal or superior of European trading companies in wealth and military prowess until the late 1700s. In this counter-narrative, the dominant position of Europe arose rather quickly, not as a long ‘rise’ but as a sudden ‘Great Divergence’ from roughly equal levels of productivity and material well-being c. 1750 to clear European dominance a century later.
Both the traditional view and the California school view prompted similar questions: What caused Europe to reach clear superiority in wealth and power c. 1850? And is this superiority destined to last a long time, or will it disappear as quickly as it arrived? Yet they provided very different answers. The tradi-tional view sought to explain a long-term rise by deep and lasting features of European societies – their religious pluralism and heterodoxy (especially Puri-tanism and Calvinism), their heritage of Greek democracy and science and Roman law, the competitive multi-state system in which they were embedded, regimes of secure property rights and superior accounting of profit and loss, more advanced systems of credit provision, much higher levels of wages achieved by urban workers, and long-lasting experience in transnational and transcontinental trade. From all of these, military superiority and accelerating productivity growth naturally emerged. Yet since it took many centuries for this pattern of modern industrial economic growth to be established, rooted in unique and characteristically European institutions and cultures, it would take a very long time (if ever) for non-European societies to converge in income and productivity levels with the West.
The California School takes the opposite view. Since the divergence was late and rapid, they emphasize advantages that appeared late and somewhat by chance: the discoveries that American colonies could produce bountiful cheap cotton for European industry, and that England's abundant coal could be used to fuel piston and rotary engines; the sudden eighteenth-century breakthroughs in mechanical engines and production techniques by British metalworkers and craftsmen; and the internal conflicts that undermined the efficiency of Chinese, Ottoman, and Indian agriculture and crafts and governance, amplified by Euro-pean military aggression. For many of the California School, since the surge of European dominance was short and based more on recent acquisitions and dis-coveries than long-lasting and unique characteristics, there was every reason to expect that non-European countries would quickly catch up. The success of
Jack A. Goldstone 169
Japan and South Korea in reaching Western levels of technology and living standards, and the recent growth of China and India at much faster rates than Western nations, suggests that this viewpoint is a more accurate template of current conditions.
For the last decade, proponents of the traditional view and the California school have argued, producing more details and additional arguments to but-tress their case. But neither side has won the argument – instead the weaknesses of both positions now stands revealed. On the one hand, many assumptions of the traditional view, that Europe was superior in military technology, trading acumen, and scientific advances as early as the 1500s or earlier, have been shown to be unfounded (cf. Agoston 2008; Andrade 2016; Ragep and Feldhay forthcoming). On the other hand, many assumptions of the California School, especially that the most advanced regions of China had per capita incomes equal to those in the most advanced regions of Europe as late as 1800, have been called into doubt (Allen et al. 2011; Li and van Zanden 2012). As a result, the era from 1500 to 1800 has emerged as central. Yet our view of those centu-ries remains cloudy: of the many characteristics and circumstances that separat-ed European societies from Asian ones in these centuries, which were critical for the later emergence of European domination after 1800?
Leonid Grinin and Andrey Korotayev bring clarity and order into this con-fusion. They treat the period from 1450 to 1830 as a lengthy period of innova-tion and productivity increase in Europe, starting from a relatively low level of inventive activity and technology, but proceeding through a series of phases, of which the last phase – from 1760 to 1830, constituting the ‘classic’ Industrial Revolution – was only the final phase of a lengthy process. These phases began with a ‘preparatory’ period from 1100 to 1450 in which the development of free labor and capitalist relations set the stage for profit-seeking and further eco-nomic developments, peaking in the rich luxury manufactures of Venice and the trade and accounting and artistic and scientific breakthroughs of the Renais-sance. Then the ‘long 16th century’ from the late 15th to the early 17th century showed remarkable advances in oceanic navigation, engineering, windmills and water power, and commercialized high productivity agriculture, led by the Por-tuguese and Spanish, but also Germany and the Netherlands. This was also the age of the great discoveries and the early breakthroughs to the mechanical model of nature in European sciences. After this period, the next phase arose from the early 17th century through the third quarter of the 18th century, led by advances in Britain and especially the Netherlands. This period saw the consol-idation of constitutional monarchy in Britain and oligarchic republican rule in the Netherlands; the latter's development of mechanization, fishing, warehous-ing, and complex industrial centers; and the rise of global trading companies and military advances, especially in naval warfare. All of these prior develop-ments then set the stage for the ‘final phase’ of the Industrial Revolution utiliz-ing fossil-fuel and water-powered machinery and major advances in chemical processes and transport as well.
On Great Divergence and Great Convergence 170
This new view, carefully presented and rigorously modeled by Grinin and Korotayev, provides a richer and more nuanced version of the ‘Great Diver-gence’, bridging many of the differences between the traditional and California viewpoints. Yet they go further. Amazingly, by building a model utilizing hu-man capital (education), global population growth, and regional productivity, they show how both the Great Divergence and the recent ‘Great Convergence’ (the economic catching-up of developing countries) are phases of the same pro-cess of global modernization. They make it clear that once begun, the Great Divergence inevitably leads to later Convergence through the globalization of the world economy. Yet they also explain specific regional lags and variations in this process.
This is a remarkable achievement, and a major advance in the debate on the long-term trajectory of global economic development. The Russian global-historical systems school of scholarship has long been making important con-tributions to identifying and explaining the major patterns in long-term world history (Turchin and Korotayev 2006; Turchin and Nefedov 2009; Korotayev, Malkov and Khaltourina 2006a, 2006b; Korotayev and Tsirel 2010; Grinin 2007, 2011, 2012; Grinin and Korotayev 2006). It is a pleasure to commend it to all those who are interested in the debate on the rise of the West and Great Divergence, and all who ponder the future of global inequality and develop-ment.
References
Agoston G. 2008. Guns for the Sultan: Military Power and the Weapons Industry in the Ottoman Empire. Cambridge: Cambridge University Press.
Allen R. C., Bassino J.-P., Ma D., Moll-Murata C., and van Zanden J. L. 2011. Wages, Prices, and Living Standards in China, Japan, and Europe, 1738–1925. Eco-nomic History Review 64: 8–38.
Andrade T. 2015. The Gunpowder Age: Chine, Military Innovation, and the Rise of the West in World History. Princeton: Princeton University Press.
Frank A. G. 1998. ReOrient: Global Economy in the Asian Age. Berkeley, CA: Univer-sity of California Press.
Goldstone J. A. 1991. Revolution and Rebellion in the Early Modern World. Berkeley, CA: University of California Press.
Goldstone J. A. 2002. Efflorescences and Economic Growth in World History: Re-thinking the ‘Rise of the West’ and the British Industrial Revolution. Journal of World History 13: 323–389.
Goldstone J. A. 2008a. Capitalist Origins, the Advent of Modernity, and Coherent Ex-planation: A Response to Joseph M. Bryant. Canadian Journal of Sociology / Ca-hiers Canadiens de Sociologie 33(1): 119–133.
Goldstone J. A. 2008b. Why Europe? The Rise of the West in Global History, 1500–1850. New York: McGraw-Hill.
Grinin L. E. 2007. Production Revolutions and Periodization of History: A Comparative and Theoretic-Mathematical Approach. Social Evolution & History 6(2): 75–120.
Jack A. Goldstone 171
Grinin L. E. 2011. The Evolution of Statehood. From Early State to Global Society. Saarbrücken: Lambert Academic Publishing.
Grinin L. E. 2012. Macrohistory and Globalization. Volgograd: Uchitel.
Grinin L. E., and Korotayev A. V. 2006. Political Development of the World System: A Formal Quantitative Analysis. History & Mathematics: Historical Dynamics and Development of Complex Societies / Ed. by P. Turchin, L. Grinin, V. de Munck, and A. Korotayev, pp. 63–114. Moscow: KomKniga.
Korotayev A., and Tsirel S. 2010. A Spectral Analysis of World GDP Dynamics: Kon-dratieff Waves, Kuznets Swings, Juglar and Kitchin Cycles in Global Economic De-velopment, and the 2008–2009 Economic Crisis. Structure and Dynamics 4(1): 3–57. URL: http://www.escholar-ship.org/uc/item/9jv108xp.
Korotayev A., Malkov A., and Khaltourina D. 2006a. Introduction to Social Macro-dynamics: Compact Macromodels of the World System Growth. Moscow: KomKni-ga/URSS.
Korotayev A., Malkov A., and Khaltourina D. 2006b. Introduction to Social Macro-dynamics: Secular Cycles and Millennial Trends. Moscow: KomKniga/URSS.
Landes D. 1998. The Wealth and Poverty of Nations. New York: Norton.
Li B., and van Zanden J. L. 2012. Before the Great Divergence? Comparing the Yang-zi Delta and the Netherlands at the Beginning of the Nineteenth Century. The Jour-nal of Economic History 72: 956–989.
Marks R. B. 2002. The Origins of the Modern World. A Global and Ecological Narra-tive. Lanham, MD: Rowman and Littlefield.
McNeill H. W. 1963. The Rise of the West: A History of the Human Community. Chica-go, IL: University of Chicago Press.
McNeil W. H. 1990. The Rise of the West after Twenty-Five Years. Journal of World History 1(1): 1–21.
Pomeranz K. 2000. The Great Divergence: China, Europe, and the Making of the Mod-ern World Economy. Princeton, NJ: Princeton University Press.
Pomeranz K. 2002. Beyond the East-West Binary: Resituating Development Paths in the Eighteenth-Century World. Journal of Asian Studies 61(2): 539–590.
Ragep F. J., and Feldhay R. (Eds.) 2015. Before Copernicus: The Cultures and Con-texts of Scientific Learning in the Fifteenth Century. Cambridge: Cambridge Univer-sity Press.
Turchin P., and Korotayev А. 2006. Population Density and Warfare: A Reconsidera-tion. Social Evolution & History 5(2): 121–158.
Turchin P., and Nefedov S. 2009. Secular Cycles. Princeton, NJ: Princeton University Press.
Vries P. 2003. Via Peking Back to Manchester. Britain, the Industrial Revolution, and Chinа. Leiden: Brill.
Vries P. 2010. The California School and Beyond: How to Study the Great Divergence. History Compass 8: 730–751.
Wong R. B. 1997. China Transformed: Historical Change and the Limits of the Euro-pean Experience. Ithaca: Cornell University Press.
History & Mathematics: Demography & Ageing 2015 172–174
172
Contributors David A. Coleman is the Emeritus Professor of Demography at Oxford University. His
research interests include the effects of international migration on the population and economy of receiving countries, the meaning of demographic transition and the future of the census. His most recent paper ‘The Death of the West: Аn Alternative View’ (with Stuart Basten) was published in a special edition of Population Studies entitled Population: The Long View (2015) of which he was senior guest editor.
Daria A. Folomeyeva is Research Fellow at the International Laboratory for Political Demography and Social Macrodynamics at the Russian Presidential Academy of Na-tional Economy and Public Administration. Her primary research interests are politi-cal demography, social macrodynamics, and population agеing.
Jack A. Goldstone is the Elman Family Professor of Public Policy and Director of the Hong Kong University of Science and Technology Institute for Public Policy and Di-rector of Research Laboratory on Political Demography and Social Macrodynamics at the Russian Presidential Academy of National Economy and Public Administration. He is an author or editor of 13 books and over 140 research articles. His primary re-search interests are the effects of population change on political stability and econom-ic growth, economic history, global population cycles, the causes and outcomes of revolutions, and improving governance in developing nations.
Leonid E. Grinin is Senior Research Professor at the Institute for Oriental Studies of the Russian Academy of Sciences in Moscow and Senior Research Professor at the Laboratory for Destabilization Risk Monitoring at the National Research University Higher School of Economics. He is the Editor-in-Chief of the journal Age of Globali-zation (in Russian), as well as a co-editor of the international journals Social Evolu-tion & History and the Journal of Globalization Studies. Dr. Grinin is the author of more than 400 scholarly publications in Russian and English, including 27 mono-graphs. These monographs include Philosophy, Sociology, and the Theory of History (2007, in Russian); Productive Forces and Historical Process (2006, in Russian); State and Historical Process (3 vols, 2009–2010, in Russian); Social Macroevolution: World System Transformations (2009, in Russian, with A. Korotayev); Macroevolu-tion in Biological and Social Systems (2008, in Russian, with A. Markov and A. Korotayev); Global Crisis in Retrospective: A Brief History of Upswings and Cri-ses (2010, in Russian, with A. Korotayev); The Evolution of Statehood: From Early State to Global Society (2011); The Cycles of Development of Modern World System (2011, in Russian, with A. Korotayev and S. Tsirel); From Confucius to Comte: The Formation of the Theory, Methodology and Philosophy of History (2012, in Rus-sian); Macrohistory and Globalization (2012); Cycles, Crises, and Traps of the Mod-ern World-System (2012, in Russian, with A. Korotayev), and Great Divergence and Great Convergence (2015, with Andrey Korotayev).
Mark L. Haas is Professor of Political Science at Duquesne University in Pittsburgh. He formerly was a National Security Fellow at the Olin Institute for Strategic Studies at Harvard University. He is the author of The Clash of Ideologies: Middle Eastern
Contributors 173
Politics and American Security (Oxford University Press, 2012); The Ideological Ori-gins of Great Power Politics, 1789–1989 (Cornell University Press, 2005), and co-editor of The Arab Spring: Change and Resistance in the Middle East (Westview Press, 2013). Haas's scholarly articles have appeared in such journals as International Security, International Organization, International Studies Quarterly, Security Stud-ies, and The Review of Politics.
Daria A. Khaltourina is Research Professor at the Institute of Scientific and Social Assessment (ISSA) and Chairman of the NGO ‘Council on Public Health Issues and Demographics’. She is Co-Chairman of the Russian Anti-Tobacco Coalition and the Russian Coalition for Alcohol Control. She is an author and co-author of nine books and over 100 research articles on crisis management of social processes, public health and demography.
Hafiz T. A. Khan is a Senior Lecturer in the Department of Criminology and Sociology at Middlesex University in London and is also a visiting fellow at the Oxford Institute of Population Ageing, the University of Oxford (UK). Dr. Khan trained as a statistical demographer and has particular research interests in ageing in Asia and its long-term care and support provisions. Mostly recently he has conducted research on The Global Ageing Surveys (GLAS) at the University of Oxford and has published articles on various aspects of global ageing. He has co-authored two books Research Methods for Business and Social Science (2007 and 2014, Sage).
Andrey V. Korotayev is Senior Research Professor at the International Laboratory for Political Demography and Social Macrodynamics at the Russian Presidential Acade-my of National Economy and Public Administration, Head of the Laboratory for De-stabilization Risk Monitoring at the National Research University Higher School of Economics, Senior Research Professor of the Oriental Institute and Institute for Afri-can Studies, Russian Academy of Sciences, as well as a Professor at the Faculty of Global Studies of the Moscow State University. He is the author of over 300 scholarly publications, including such monographs as Ancient Yemen (1995), World Religions and Social Evolution of the Old World Oikumene Civilizations: A Cross-Cultural Per-spective (2004), Introduction to Social Macrodynamics: Compact Macromodels of the World System Growth (2006), Introduction to Social Macrodynamics: Secular Cycles and Millennial Trends (2006), and Great Divergence and Great Convergence (2015, with Leonid Grinin). At present, together with Askar Akaev and Sergey Malkov, he coordinates the Russian Academy of Sciences Presidium Project ‘Complex System Analysis and Mathematical Modeling of Global Dynamics’. He is a laureate of the Russian Science Support Foundation in ‘The Best Economists of the Russian Acade-my of Sciences’ Nomination (2006).
Donghyun Park is currently a Principal Economist at the Economics and Research Department of the Asian Development Bank (ADB). Prior to joining ADB, he was a tenured Associate Professor of Economics at Nanyang Technological University in Singapore. Dr. Park has a Ph.D. in Economics from UCLA, and his main research fields are international finance and trade. His research, which has been published ex-tensively in journals and books, focuses on policy-oriented topics relevant for Asia's long-term development, including Asian sovereign wealth funds and Asian pension reform. Dr. Park plays a leading role in the production of Asian Development Outlook, ADB's flagship annual publication.
Contributors 174
Jason L. Powell works at University of Chester. He previously was Associate Dean for Research and Professor of Social Gerontology at Coventry University; Professor of Social Justice at MMU; Professor of Community Leadership at UCLan; Associate Dean and Reader at University of Liverpool. He has many publications on social theo-ry, ageing and globalization including 65 academic books such as The Global Dynam-ics of Aging (New York: Nova Science, 2012); and Aging in China (New York: Springer, 2012).
Robert Rowthorn is Emeritus Professor of Economics at the University of Cam-bridge and has been elected as a Life Fellow of King's College. He is also a Senior Research Fellow of the Centre for Population Research at the Department of Social Policy and Intervention, University of Oxford.
Vasil T. Sakaev got his PhD in History from Kazan Federal University in Russia. He is Associate Professor at the Institute of International Relations, History and Oriental Stud-ies at the Kazan Federal University. He is also a member of the International Studies As-sociation (USA), and a member of the Russian Association of Political Science. His re-search interests include Historical and Political Demography. He has authored over 50 publications on demography and migration trends in Russia and abroad.
Kwanho Shin is Professor of Economics at Korea University. He received his BA and MA in Economics from Seoul National University and PhD in Economics from UCLA. He was elected as ‘One of the Fifty Future Leaders in Korea’ by the Seoul Economic Daily in 2010 and a Maekyung Economist by the Maeil Business Newspa-per in 2011. He also served as a council member for the National Economic Advisory Council from 2010 to 2011. He has published widely on the subjects of business cycles, monetary economics, international finance and labor economics in a number of leading academic journals including American Economic Review, Journal of Monetary Econom-ics, Journal of Econometrics, Journal of Money, Credit and Banking, Journal of Inter-national Economics, Journal of International Money and Finance and Journal of Labor Economics.
Sergey G. Shulgin is Vice-Director of the Research Laboratory on Political Demogra-phy and Social Macrodynamics at the Russian Presidential Academy of National Economy and Public Administration. He has published over 40 research articles. His research interests include institutional economics and comparative studies, political cycles, voting behavior and electoral preferences, modeling of demographic processes and the role of demography in political process.
Julia V. Zinkina is Senior Research Fellow at the Research Laboratory on Political Demography and Social Macrodynamics at the Russian Presidential Academy of Na-tional Economy and Public Administration. She is also Research Fellow of the Labor-atory for Destabilization Risk Monitoring at the National Research University Higher School of Economics, an author of 3 books and over 60 research articles.
KONDRATIEFF WAVES:Juglar – Kuznets – Kondratieff
Edited by Leonid E. Grinin (Russia), Tessaleno C. Devezas (Portugal – Brazil), Andrey V. Korotayev (Russia).
Volgograd: ‘Uchitel’ Publishing House, 2014. – 416 pp.
ISBN 978-5-7057-4282-0
In the period from the 1920s to 1930s the theory of eco-nomic cycles underwent dramatic changes. Due to the re-search of such famous economists as Nikolay Kondratieff, Joseph Kitchin, Wesley Mitchell, Simon Kuznets, and Jo-seph Schumpeter the idea of a whole system of economic cycles (with characteristic periods between two and sixty years) was developed. The idea of a system of intertwined economic cycles is nowadays paramount to the school of evolutionary economics and its development promises ra-
ther interesting future outcomes. That is why this issue of our ‘Kondratieff Waves’ Yearbook is devoted to the interconnections between various economic cycles. As to the subtitle of this volume, one should note that many of the contributors refer to the system of cycles and the fact that real economic cycles make up a system, whereas among different types of cycles, the Juglar, Kuznets, and Kondratieff cycles are the most important ones for the present-day economic dynamics.
Although Kondratieff himself considered long waves as above all an economic phenomenon, the theory of the long waves became, however, very actively devel-oped in connection with their political and geopolitical aspects. In this Yearbook, the political aspect of Kondratieff waves is the subject of several articles in the sec-ond section.
The last section of this Yearbook is devoted to the heritage of Kondratieff and other prominent economists. The year 2015 marks the 150th anniversary of the out-standing Russian economist, one of the most prominent researchers of medium-term economic cycles, Mikhail Tugan-Baranovsky, and the volume is concluded with Kondratieff's article about him. Concerning 2015, we should mention another anniversary, namely, 30 years since the death of Simon Kuznets (1901–1985).
This edition will be useful for economists, social scientists, as well as for a wide range of those interested in the problems of the past, present, and future of global economy and globalization.
History and Mathematics Guidelines for Contributors
Preparation of manuscripts. Articles should generally be no longer than 100,000 symbols. The paper's abstract should not exceed 150 words. A separate sheet should give the author's brief CV (up to 250 word). A list of keywords should be supplied. Fig-ures of good quality should be submitted as separate files.
Bibliographical references should be given in parentheses in standard author-date form in the body of the text: (Duffy, Morrison, and Macdonald 2002; Crumley 1987: 164–165; 1995: 4; 2001; Claessen 1985: 196–198, 201, 207; 2000, 2002; Chu et al. 2003: 29).
Examples of references in text: ‘In a larger population there will be proportionally more people lucky or smart
enough to come up with new ideas’ (Kremer 1993: 685); according to Rothmaler (1976: 127–129).
A complete list of references cited, arranged alphabetically by author's surname, should be typed at the end of the article along the following lines:
A) Journal articles: Schaffer W. M. 1985. Order and Chaos in Ecological Systems. Ecology 11(1): 103–109.
B) Edited volumes: Frank A. G., and Gills B. K. (Eds.) 1993. The World System: Five Hundred Years of
Five Thousand? London: Routledge.
C) Contributions to edited volumes: Humphrey N. K. 1976. The Social Function of Intellect. Growing Points in Ethology /
Ed. by P. P. G. Bateson, and R. A. Hinde, pp. 303–317. Cambridge: Cambridge University Press.
D) Monographs: Berryman A. A. 1981. Population Systems: A General Introduction. New York, NY:
Plenum Press.
E) Internet resource: a) If the site does not mention the publication date:
Chase-Dunn C., and Hall T. D. 1999. The Chesapeake World-System. URL: http:// www.wsarch.ucr.edu/archive/papers/c-d&hall/asa99b/asa99b.htm. b) If possible, put the publication date:
U.S. Bureau of the Census. 2008. World Population Information. URL: http://www. census.gov/ipc/www/world.html. Date accessed: 24.02.2008.
Quotations. Single inverted commas should be used except for quotations within quotations, which should have double inverted commas. Quotations of more than 60 words should be set off from the text with an extra line of space above and below, and typed without inverted commas.
The articles are to be sent to the following email addresses: Leonid Grinin [email protected] Andrey Korotayev [email protected]
‘History and Mathematics’ homepage on our website: http://www.sociostudies. org/almanac/ham/