Embed Size (px)
Citation preview
Since 1989 the demography of the Jews in the former Soviet Union(FSU) has changed dramatically. To understand these changes we exam-ine their dynamics in different parts of the FSU according to the resultsof recent post-Soviet censuses. We shall analyze the severe aging of theJewish population in the Russian Federation, Ukraine, and Belarus basedon the results of these censuses. We shall study Jewish emigration fromthe FSU as a whole, and to Israel (aliya) in particular. The vital crisis ofFSU Jewry and the transformation of its fertility as a result of aliya andemigration will also be studied. Out-migration from Israel of FSU immi-grants, and return migration from Israel to Russia and Ukraine in partic-ular will be examined. Recent emigration dramatically changed theplaces of residence of the Jewish population originating from the FSU.The worldwide size and distribution of this Jewry is also examined.
JEWS’ NUMERICAL DECREASE ACCORDING TO
THE POST-SOVIET CENSUSES
The numbers of Jews reported in Soviet censuses have been entirely de-pendent on the self-declaration of respondents. Conceptually, these
13
POST-SOVIET JEWISH DEMOGRAPHY,
1989–2004
Mark Tolts
2 8 3
07_366 Ch 13.qxd 7/16/07 6:34 PM Page 283
numbers correspond to what has been defined as the “core” Jewish pop-ulation.1 The “core” Jewish population is the aggregate of all those who,when asked, identify themselves as Jews or, in the case of children, areidentified as such by their parents. It does not include persons of Jew-ish origin who reported another ethnicity (“nationality”) in the census.
Not only did the Soviet censuses not require documented evidencefor answers to any question, but in regard to nationality the census tak-ers were explicitly given instructions that ethnicity/nationality was to bedetermined solely by the person polled—without any corroboration.2
However, most scholars agree that the Soviet census figures on Jewishethnic nationality (adults only) were very similar to “legal” ethnic na-tionality as recorded in internal passports.3
A broader definition, that of the “enlarged” Jewish population (whichcan also be empirically measured), includes Jews along with their non-Jewish household members.4 In the FSU today this group is significantlylarger than the “core” Jewish population.5 However, even the “enlarged”Jewish population is smaller than the total population entitled to immi-grate to Israel; according to the Israeli Law of Return, Jews, their chil-dren and grandchildren, and all their respective spouses are eligible.
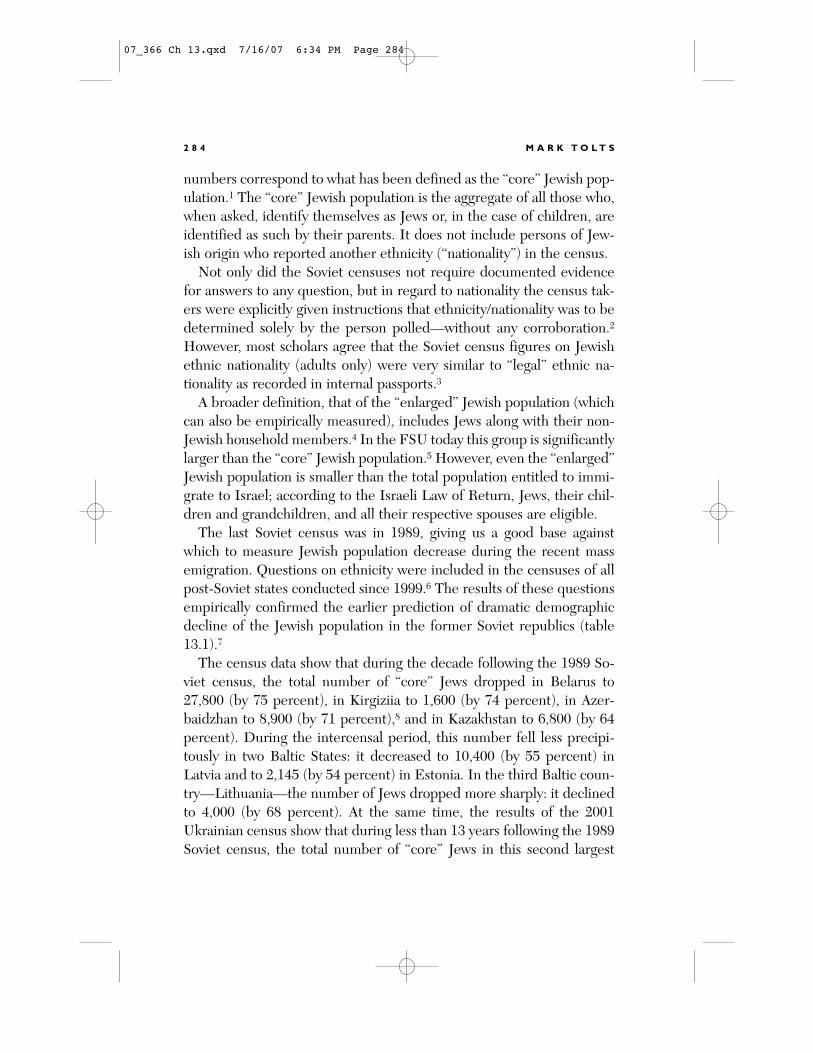
The last Soviet census was in 1989, giving us a good base againstwhich to measure Jewish population decrease during the recent massemigration. Questions on ethnicity were included in the censuses of allpost-Soviet states conducted since 1999.6 The results of these questionsempirically confirmed the earlier prediction of dramatic demographicdecline of the Jewish population in the former Soviet republics (table13.1).7
The census data show that during the decade following the 1989 So-viet census, the total number of “core” Jews dropped in Belarus to27,800 (by 75 percent), in Kirgiziia to 1,600 (by 74 percent), in Azer-baidzhan to 8,900 (by 71 percent),8 and in Kazakhstan to 6,800 (by 64percent). During the intercensal period, this number fell less precipi-tously in two Baltic States: it decreased to 10,400 (by 55 percent) inLatvia and to 2,145 (by 54 percent) in Estonia. In the third Baltic coun-try—Lithuania—the number of Jews dropped more sharply: it declinedto 4,000 (by 68 percent). At the same time, the results of the 2001Ukrainian census show that during less than 13 years following the 1989Soviet census, the total number of “core” Jews in this second largest
2 8 4 M A R K T O L T S
07_366 Ch 13.qxd 7/16/07 6:34 PM Page 284
community in the FSU dropped dramatically to 104,300 (by 79 per-cent). The most pronounced decrease after the civil war was recordedin Tadzhikistan: according to the 2000 census, the total number of“core” Jews there was only 213 (1.5 percent of the 1989 figure).
In the Russian Federation, the October 2002 census indicated about233,600 Jews as against our core Jewish population estimate of 252,000on January 1, 2003 (derived from the February 1994 Russian microcen-sus estimate of 401,000 Jews). We assume that the 2002 Russian censusundercounted the Jews due to the cancellation of the compulsory itemon ethnicity (natsionalnost’) on identification documents and in the cen-sus. Like the previous Soviet censuses, the 2002 Russian census wasbased entirely on self-declaration of respondents. However, the post-So-viet Russian Constitution (Article 26.1) expressly forbids collection ofinformation on an individual’s ethnicity against his or her will. As a re-sult, in the 2002 Russian census there appeared for the first time arather sizable group (about 1.5 million) whose ethnicity was notrecorded. Clearly, there were some Jews among them.
The census data for Jews were adjusted accordingly, and to this endwe used our evaluation of Jewish intercensal demographic decrease.
P O S T- S O V I E T J E W I S H D E M O G R A P H Y , 1 9 8 9 – 2 0 0 4 2 8 5
Table 13.1. “Core” Jewish Population according to Recent Post-Soviet Censuses
(in Thousands)
Numberof Jews Numerical
Number According to the Decrease,
Country Census Date of Jews 1989 Soviet Census %
Azerbaidzhan 27 January 1999 8.9 30.8 71
Belarus 14 February 1999 27.8 112.0 75
Kazakhstan 26 February 1999 6.8 18.9a 64
Kirgiziia 25 March 1999 1.6 6.0 74
Tadzhikistan 20 January 2000 0.2 14.8 98.5
Estonia 31 March 2000 2.15 4.6 54
Latvia 31 March 2000 10.4 22.9 55
Lithuania 6 April 2001 4.0 12.4 68
Ukraine 5 December 2001 104.3 487.3 79
Georgia 17 January 2002 3.6b 24.8 85
Russian Federation 9 October 2002 233.6c 570d 59
aAs published in the results of the 1999 census of Kazakhstan.bResident (de jure) population, not including Abkhazia and South Ossetia.cFor data evaluation, see text.dIncluding “Tats.”Sources: Post-Soviet censuses; 1989 Soviet census.
07_366 Ch 13.qxd 7/16/07 6:34 PM Page 285
The 2002 Russian census presented figures as of October 9, 2002, andfor purposes of comparison we adjusted our estimate of 252,000 for thebeginning of 2003 to the census date. Comparison of the census figureof 233,600 with our estimate of 254,000 (adjusted to the census data)shows a gap of about 20,000.9
This gap clearly demonstrates a growing process of Jewish assimila-tion in contemporary Russia, and shows that a sizable group of Jews inthe country does not want to be recorded as Jewish in the census. Thechanges in the process of Jewish assimilation occurred only after the1994 Russian microcensus with the introduction of the new internalpassport in 1997 that does not record the holder’s ethnicity.10 This fitsour findings from an analysis of the recent dynamics of birth statisticsthat revealed that in present-day Russia a sizable segment among theformer “officially recognized” Jews (Jewish according to Soviet pass-ports) now prefer not to declare their ethnicity even if they are not partof a mixed marriage.11
The ethnicity of every Soviet citizen was written in his or her internalpassport once he or she reached age 16. Anyone with two Jewish parentshad no choice but to be registered as Jewish, in many cases withoutwanting to. Soviet authorities, contrary to their proclaimed goal of as-similation, actually preserved Soviet Jewry by labeling individual Jews assuch.12 Only the offspring of mixed marriages could choose the ethnic-ity of one or the other parent, and most of these preferred the ethnicityof the non-Jewish parent.13 In fact, as noted above, the process of Jew-ish assimilation intensified after the introduction of the new internalpassport, which does not record the holder’s ethnicity.
Moreover, our previous analysis revealed that sizable numbers of Jew-ish emigrants continue to be registered in neighborhood passport officefiles in the Russian Federation.14 They probably retain possession oftheir living quarters, and perhaps rent them out. In addition to thisgroup are those Jews who left Russia as tourists and for various reasonsacquired immigrant status in Israel15 or settled in other countries. Someof these may be included in the results of the Russian census of 2002,and therefore the real number of Jews with unstated ethnicity may beeven larger than the above noted gap of about 20,000, which gave us ourminimum estimate of the spread of ethnic assimilation.
2 8 6 M A R K T O L T S
07_366 Ch 13.qxd 7/16/07 6:34 PM Page 286
Thus, despite all recent changes in the Jewish situation in the RussianFederation and the FSU as a whole, such as greater investment in Jew-ish education, we see a continuation of ethnic assimilation. Moreover,emigration is selective by level of Jewish identity, and is obviously higheramong the more strongly identifying Jews.16 These are the ones mostlikely to have left—and still leave—the FSU.
THE EROSION OF THE “CORE” JEWISH POPULATION
In order to deepen our study of the contemporary demographic compo-sition of the “core” Jewish population in the FSU, we must utilize data ofthe recent post-Soviet censuses by age and religion. For children under5 years of age who were recorded as Jews in the 2002 Russian census wecan carry out such an analysis using vital statistics, and based on the 2000Estonian census, we can evaluate the incidence of apostasy.
ORIGIN OF CHILDREN UNDER 5 RECORDED AS
JEWS IN THE 2002 RUSSIAN CENSUS
The 2002 Russian census recorded only 3,130 Jewish children under 5years of age, a dramatic decrease of 79 percent as compared with the1989 Soviet census, which counted 14,860 children in this age group inthe Russian Federation (table 13.2). However, not only did the numberof children under 5 years of age fall noticeably, but also the origins ofthose children recorded as Jews radically changed.
Since 1989, as a result of both the mass emigration and the decline offertility rates, the number of births in the Jewish population decreaseddramatically (on this see in detail below). Although all the birth cate-gories showed dramatic decline, this was greatest among the childrenborn to endogamous Jewish couples. Compared with the 5-year periodpreceding the 1989 Soviet census in the Russian Federation the numberof births to endogamous Jewish couples had fallen by a full 91 percent bythe 5 years preceding the 2002 Russian census. The decline in the num-ber of births to Jewish mothers was less pronounced—by 82 percent.
P O S T- S O V I E T J E W I S H D E M O G R A P H Y , 1 9 8 9 – 2 0 0 4 2 8 7
07_366 Ch 13.qxd 7/16/07 6:34 PM Page 287
A comparison of the number of children under 5 recorded as Jews inthe 2002 Russian census with the estimated number of children born toJewish mothers with Jewish fathers in the 5 years preceding the censusshows that more than two-thirds (68 percent) of the “core” Jews in thisage group were of mixed origin. The analogous comparison shows thatamong children under 5 recorded as Jews in the 1989 Soviet census inthe Russian Federation, only about a quarter (24 percent) were of mixedorigin.
The majority of small children labeled by their parents as Jews in thelast Russian census are of mixed origin. This is quite a new situation,which is clearly a consequence of the Jewish demographic situation inthe Russian Federation. After the mass emigration of the 1990s even the“core” Jewish population became less homogeneous in origin.
APOSTASY AMONG “CORE” JEWS:A CASE STUDY
BASED ON THE 2000 ESTONIAN CENSUS
Persons of Jewish parentage who adopt another religion are in theoryexcluded from the “core” Jewish population. However, we know thatnot a few cases of apostasy were well documented.17 Moreover, in Rus-sia and Ukraine a sampling of the Jewish population found that “over
2 8 8 M A R K T O L T S
Table 13.2. Comparison of Number of Children Recorded as Jews at Ages under
5 in the Census and Number of Children Born to Endogamous Jewish Couples in
the 5 Years Preceding the Censuses of 1989 and 2002
1989 2002 Dynamics, %
(1) (2) (3) = (2)/(1)
1. Children recorded as Jews at ages under 5 in the 14,860 3,130 21
census
2. Children born to Jewish mothers in the 5 years 21,597a 3,900b 18
preceding the respective census
2a. Of these with Jewish fathers 11,279 1,000b 9
3. Percentage of mixed origin among all children 24 68c 2.8 times
recorded as Jewish in the census
(3) � [(1) � (2a)]/(1)
aRegistered in 1984–1988.bEstimate, for 1999–2002 we applied the percentage of children born to non-Jewish fathers and the rate of
children born to Jewish mothers per 1,000 “core” Jews as in 1998.cMinimum estimate without emigration.Sources: 1989 Soviet census; 2002 Russian census; vital statistics data.
07_366 Ch 13.qxd 7/16/07 6:34 PM Page 288
10 percent see Christianity as most attractive.”18 Very important to ouranalysis is the finding by a study in St. Petersburg that all Jews withtwo Jewish parents who converted to Christianity continued to iden-tify themselves ethnically as Jews.19 Thus, because our estimates of the“core” Jewish population are based on census data, Russian/FSU num-bers of this Jewish population category are obviously somewhat over-stated.
The data of the 2000 Estonian census present concrete informationon the incidence of apostasy among people counted as Jews (see table13.3). According to the 2000 Estonian census data, only 19.8 percent ofthe Jews were recorded as “followers of a particular faith”; of these, 11percent stated Judaism as their religion and more that 7.5 percent de-clared different branches of Christianity as their faith.
Among those who put down Christianity, more than two-thirds arebelievers of the Orthodox [Christian] church (pravoslavnye). This is instriking discord with the fact that Estonian Christians are mostlyLutherans. However, according to the 2000 Estonian census, more than80 percent of Jews listed the Russian language as their mother tongue,and this closeness to Russians leads to apostasy in the form of a switchto Russian Christian Orthodoxy.
According to the 2000 Estonian census, only 38 non-Jews wererecorded with Judaism as their religion, whereas 151 Jews declared dif-ferent branches of Christianity as their faith. Thus, the balance is clearlynegative for Judaism. Of course, all of the above-cited data cannot beutilized for any corrections of the “core” Jewish population: about one-third of the Jews and one-sixth of the non-Jews refused to answer thequestion regarding religious affiliation or their religious affiliation areunknown. At the same time, data from the 2000 Estonian census clearlydemonstrate erosion of the “core” Jewish population by apostasy.
AGING
After the Second World War the Jewish population of the FSU agedsubstantially, and this is linked to the low fertility level. For Jews in 1959the median age was 41.2 in Russia and 39.3 in the Ukraine. But, ac-cording to the 1989 census, the median age of the Jewish population was
P O S T- S O V I E T J E W I S H D E M O G R A P H Y , 1 9 8 9 – 2 0 0 4 2 8 9
07_366 Ch 13.qxd 7/16/07 6:34 PM Page 289
more than 52 in the Russian Federation and only slightly lower inUkraine.20
The recent mass emigration has accelerated this process. In 2002, themedian age of the Jews in the Russian Federation reached 57.5 yearsand according to partial data it was about the same in Ukraine. In Be-larus, already during the first 10 years of the contemporary mass emi-gration, the median age dramatically increased by more than 9 years(table 13.4).
According to the most recent data, about 37 percent of the Jews inRussia were aged 65 and above. In Belarus, the share of this group grewthe fastest: from 20 percent in 1989 to 33 percent in 1999. In the inter-censal period in the Russian Federation, the percentages of all agegroups under 65 decreased.
Our previous analysis of age composition showed that by 1970 Rus-sian Jewry had already reached what has been defined as the “terminalstage” of demographic evolution.21 By 1979, Ukrainian Jewry had also
2 9 0 M A R K T O L T S
Table 13.3. Jews in Estonia by Religious Affiliation,According
to the 2000 Censusa
Number Percent of Total
Total 1,989 100.0
Followers of a particular faith 394 19.8
Of these:
Judaism 219 11.0
Orthodox [Christian] 104 5.2
Lutheran 12 0.60
Roman-Catholic 7 0.35
Baptist 6 0.30
Pentecostal 5 0.25
Other Christian 17 0.85
Buddhist 5 0.25
Hindu 1 0.05
Muslim 3 0.15
Faith unknown 15 0.75
Has no religious affiliation 598 30.1
Atheist 340 17.1
Cannot define the affiliation 327 16.4
Refused to answer 165 8.3
Religious affiliation unknown 165 8.3
aPeople aged 15 and older and those whose age was unknown answered the vol-untary census question “What is your religious affiliation?”
Source:The 2000 Estonian population and housing census.
07_366 Ch 13.qxd 7/16/07 6:34 PM Page 290
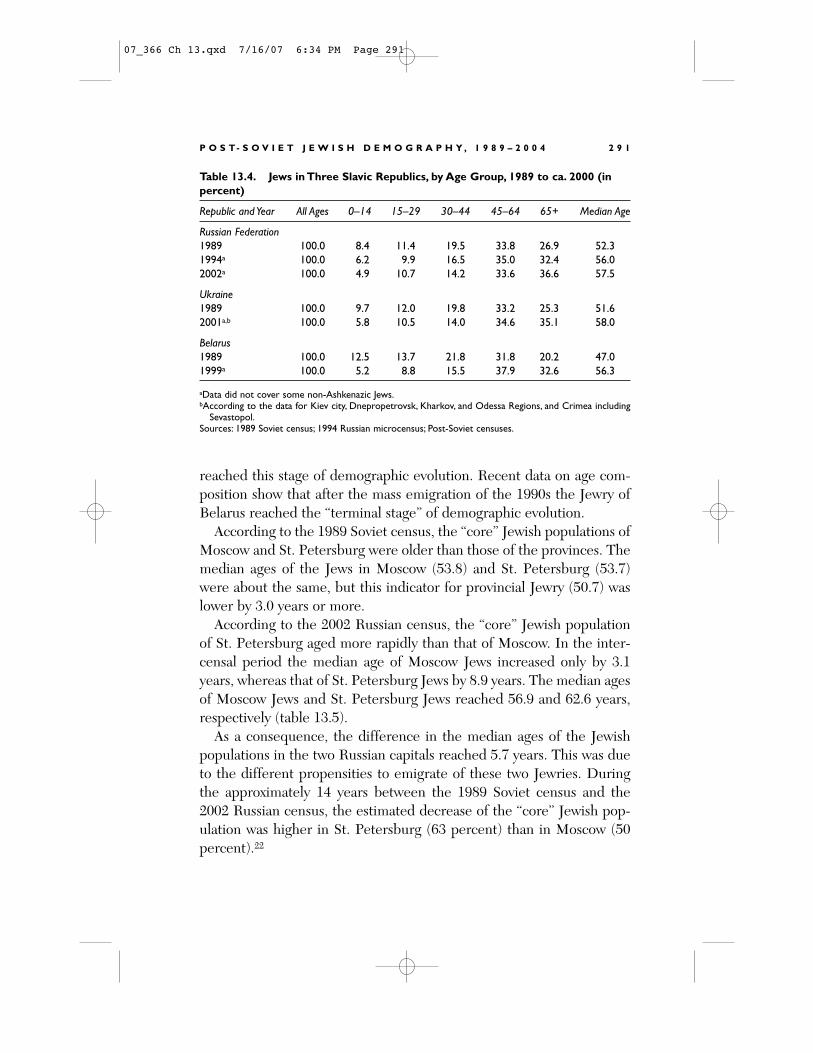
reached this stage of demographic evolution. Recent data on age com-position show that after the mass emigration of the 1990s the Jewry ofBelarus reached the “terminal stage” of demographic evolution.
According to the 1989 Soviet census, the “core” Jewish populations ofMoscow and St. Petersburg were older than those of the provinces. Themedian ages of the Jews in Moscow (53.8) and St. Petersburg (53.7)were about the same, but this indicator for provincial Jewry (50.7) waslower by 3.0 years or more.
According to the 2002 Russian census, the “core” Jewish populationof St. Petersburg aged more rapidly than that of Moscow. In the inter-censal period the median age of Moscow Jews increased only by 3.1years, whereas that of St. Petersburg Jews by 8.9 years. The median agesof Moscow Jews and St. Petersburg Jews reached 56.9 and 62.6 years,respectively (table 13.5).
As a consequence, the difference in the median ages of the Jewishpopulations in the two Russian capitals reached 5.7 years. This was dueto the different propensities to emigrate of these two Jewries. Duringthe approximately 14 years between the 1989 Soviet census and the2002 Russian census, the estimated decrease of the “core” Jewish pop-ulation was higher in St. Petersburg (63 percent) than in Moscow (50percent).22
P O S T- S O V I E T J E W I S H D E M O G R A P H Y , 1 9 8 9 – 2 0 0 4 2 9 1
Table 13.4. Jews in Three Slavic Republics, by Age Group, 1989 to ca. 2000 (in
percent)
Republic and Year All Ages 0–14 15–29 30–44 45–64 65+ Median Age
Russian Federation
1989 100.0 8.4 11.4 19.5 33.8 26.9 52.3
1994a 100.0 6.2 9.9 16.5 35.0 32.4 56.0
2002a 100.0 4.9 10.7 14.2 33.6 36.6 57.5
Ukraine
1989 100.0 9.7 12.0 19.8 33.2 25.3 51.6
2001a,b 100.0 5.8 10.5 14.0 34.6 35.1 58.0
Belarus
1989 100.0 12.5 13.7 21.8 31.8 20.2 47.0
1999a 100.0 5.2 8.8 15.5 37.9 32.6 56.3
aData did not cover some non-Ashkenazic Jews.bAccording to the data for Kiev city, Dnepropetrovsk, Kharkov, and Odessa Regions, and Crimea including
Sevastopol.Sources: 1989 Soviet census; 1994 Russian microcensus; Post-Soviet censuses.
07_366 Ch 13.qxd 7/16/07 6:34 PM Page 291
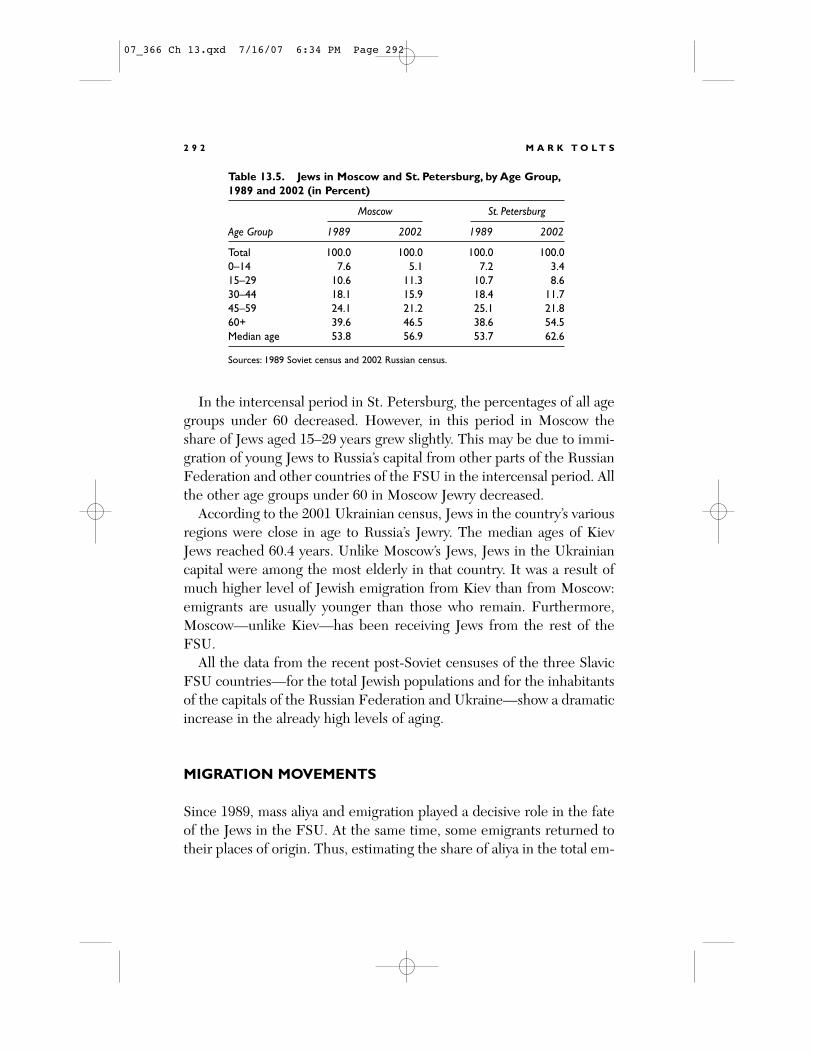
In the intercensal period in St. Petersburg, the percentages of all agegroups under 60 decreased. However, in this period in Moscow theshare of Jews aged 15–29 years grew slightly. This may be due to immi-gration of young Jews to Russia’s capital from other parts of the RussianFederation and other countries of the FSU in the intercensal period. Allthe other age groups under 60 in Moscow Jewry decreased.
According to the 2001 Ukrainian census, Jews in the country’s variousregions were close in age to Russia’s Jewry. The median ages of KievJews reached 60.4 years. Unlike Moscow’s Jews, Jews in the Ukrainiancapital were among the most elderly in that country. It was a result ofmuch higher level of Jewish emigration from Kiev than from Moscow:emigrants are usually younger than those who remain. Furthermore,Moscow—unlike Kiev—has been receiving Jews from the rest of theFSU.
All the data from the recent post-Soviet censuses of the three SlavicFSU countries—for the total Jewish populations and for the inhabitantsof the capitals of the Russian Federation and Ukraine—show a dramaticincrease in the already high levels of aging.
MIGRATION MOVEMENTS
Since 1989, mass aliya and emigration played a decisive role in the fateof the Jews in the FSU. At the same time, some emigrants returned totheir places of origin. Thus, estimating the share of aliya in the total em-
2 9 2 M A R K T O L T S
Table 13.5. Jews in Moscow and St. Petersburg, by Age Group,
1989 and 2002 (in Percent)
Moscow St. Petersburg
Age Group 1989 2002 1989 2002
Total 100.0 100.0 100.0 100.0
0–14 7.6 5.1 7.2 3.4
15–29 10.6 11.3 10.7 8.6
30–44 18.1 15.9 18.4 11.7
45–59 24.1 21.2 25.1 21.8
60+ 39.6 46.5 38.6 54.5
Median age 53.8 56.9 53.7 62.6
Sources: 1989 Soviet census and 2002 Russian census.
07_366 Ch 13.qxd 7/16/07 6:34 PM Page 292
igration, as well the comparison of out-migration from Israel with im-migration to Israel, is among the most important aims of our analysis.
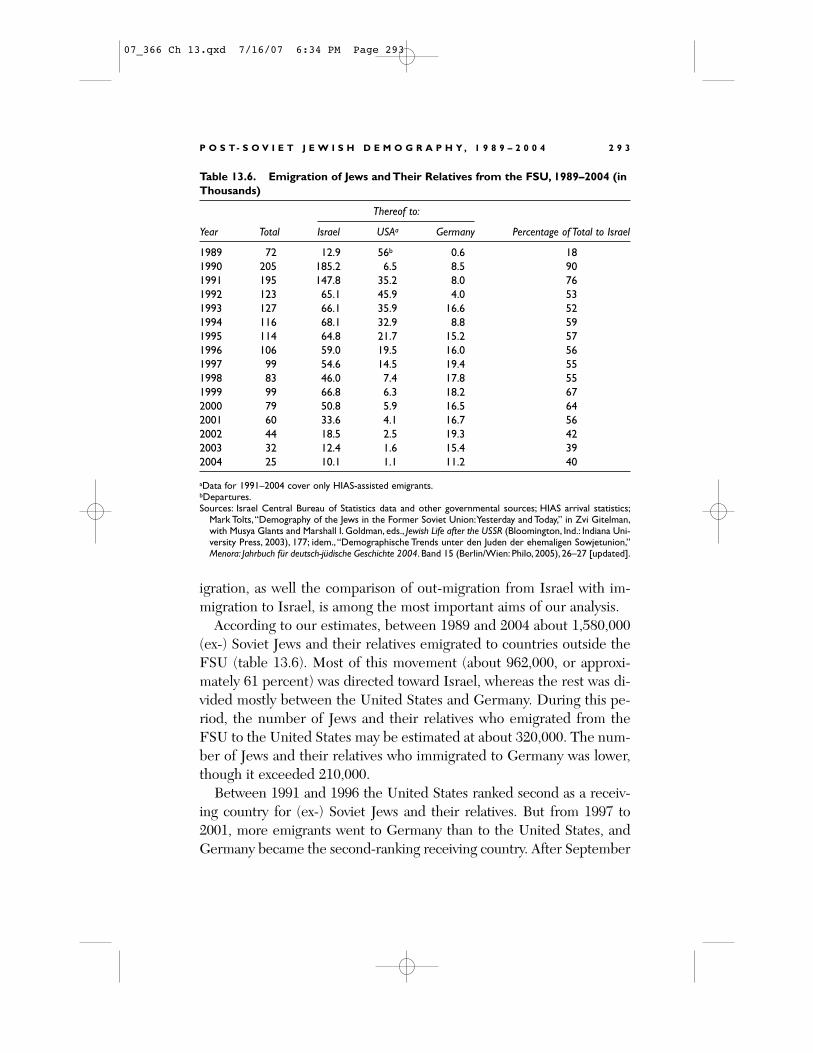
According to our estimates, between 1989 and 2004 about 1,580,000(ex-) Soviet Jews and their relatives emigrated to countries outside theFSU (table 13.6). Most of this movement (about 962,000, or approxi-mately 61 percent) was directed toward Israel, whereas the rest was di-vided mostly between the United States and Germany. During this pe-riod, the number of Jews and their relatives who emigrated from theFSU to the United States may be estimated at about 320,000. The num-ber of Jews and their relatives who immigrated to Germany was lower,though it exceeded 210,000.
Between 1991 and 1996 the United States ranked second as a receiv-ing country for (ex-) Soviet Jews and their relatives. But from 1997 to2001, more emigrants went to Germany than to the United States, andGermany became the second-ranking receiving country. After September
P O S T- S O V I E T J E W I S H D E M O G R A P H Y , 1 9 8 9 – 2 0 0 4 2 9 3
Table 13.6. Emigration of Jews and Their Relatives from the FSU, 1989–2004 (in
Thousands)
Thereof to:
Year Total Israel USAa Germany Percentage of Total to Israel
1989 72 12.9 56b 0.6 18
1990 205 185.2 6.5 8.5 90
1991 195 147.8 35.2 8.0 76
1992 123 65.1 45.9 4.0 53
1993 127 66.1 35.9 16.6 52
1994 116 68.1 32.9 8.8 59
1995 114 64.8 21.7 15.2 57
1996 106 59.0 19.5 16.0 56
1997 99 54.6 14.5 19.4 55
1998 83 46.0 7.4 17.8 55
1999 99 66.8 6.3 18.2 67
2000 79 50.8 5.9 16.5 64
2001 60 33.6 4.1 16.7 56
2002 44 18.5 2.5 19.3 42
2003 32 12.4 1.6 15.4 39
2004 25 10.1 1.1 11.2 40
aData for 1991–2004 cover only HIAS-assisted emigrants.bDepartures.Sources: Israel Central Bureau of Statistics data and other governmental sources; HIAS arrival statistics;
Mark Tolts,“Demography of the Jews in the Former Soviet Union:Yesterday and Today,” in Zvi Gitelman,with Musya Glants and Marshall I. Goldman, eds., Jewish Life after the USSR (Bloomington, Ind.: Indiana Uni-versity Press, 2003), 177; idem., “Demographische Trends unter den Juden der ehemaligen Sowjetunion,”Menora: Jahrbuch für deutsch-jüdische Geschichte 2004. Band 15 (Berlin/Wien: Philo, 2005), 26–27 [updated].
07_366 Ch 13.qxd 7/16/07 6:34 PM Page 293
11, 2001, the United States ceased to be a major destination for post-Soviet Jewish emigration. In 2002, only about 2,500 newcomers from theFSU were assisted by HIAS, and in 2003 this number was smaller by ap-proximately 900. In 2004, only about 1,100 were assisted by HIAS.
Between 2002 and 2004 more emigrants went to Germany than to Is-rael, and Germany temporarily became the first-ranking receiving coun-try. However, in 2004 the number of Jews and their relatives who immi-grated to Germany dropped to 11,200, a decrease of 4,200, which wasmuch higher than that in the movement to Israel—2,300. Recent datashow that the number of emigrants decreased for all three destinations.At the same time, in 2002–2004, the proportion of all emigrants whowent to Israel stabilized at about 40 percent. In 2005 Israel again be-came the first-ranking receiving country.
According to official Russian data, in 1992–1998 and 2000 about half theJews who emigrated beyond the FSU chose Israel, as was the case after thepeak of 1990–1991.23 Only in 1999 did the share of this country among the Jewish emigrants temporarily jump, and according to official Russiandata, 68 percent of the total number of Russia’s Jews who emigrated tocountries outside the FSU chose Israel. In 2001 this share decreased toabout 39 percent, and in 2002 it dropped to 36 percent, but in 2003 Israel’sshare of this emigration returned to 39 percent. In 2004, among Jewishémigrés, the largest proportion chose Israel—42 percent (table 13.7).
The United States’ share of Jewish migrants from the Russian Feder-ation fell from a peak of about 35 percent in 1993–1994 to 14 percent in1999, increased in 2001 to approximately 23 percent, and fell again in2002–2004 to about 14–18 percent. In 1998 for the first time more reg-istered Jewish emigrants went to Germany than to the United States,and Germany ranked second as a receiving country for Jewish emigra-tion from the Russian Federation. In 2002, more emigrants went toGermany than to Israel, and Germany became the first-ranking receiv-ing country; in this year its share reached a peak of 44 percent. How-ever, in 2003–2004 Germany’s share decreased to 39 percent.
In Ukraine some changes preceded those in the Russian Federation:according to official Ukrainian data, until 2000 about half the Jews whoemigrated to countries outside the FSU chose Israel. In 1997, for thefirst time more registered Jewish emigrants went to Germany than tothe United States, and from this year to 2000 Germany ranked second
2 9 4 M A R K T O L T S
07_366 Ch 13.qxd 7/16/07 6:34 PM Page 294
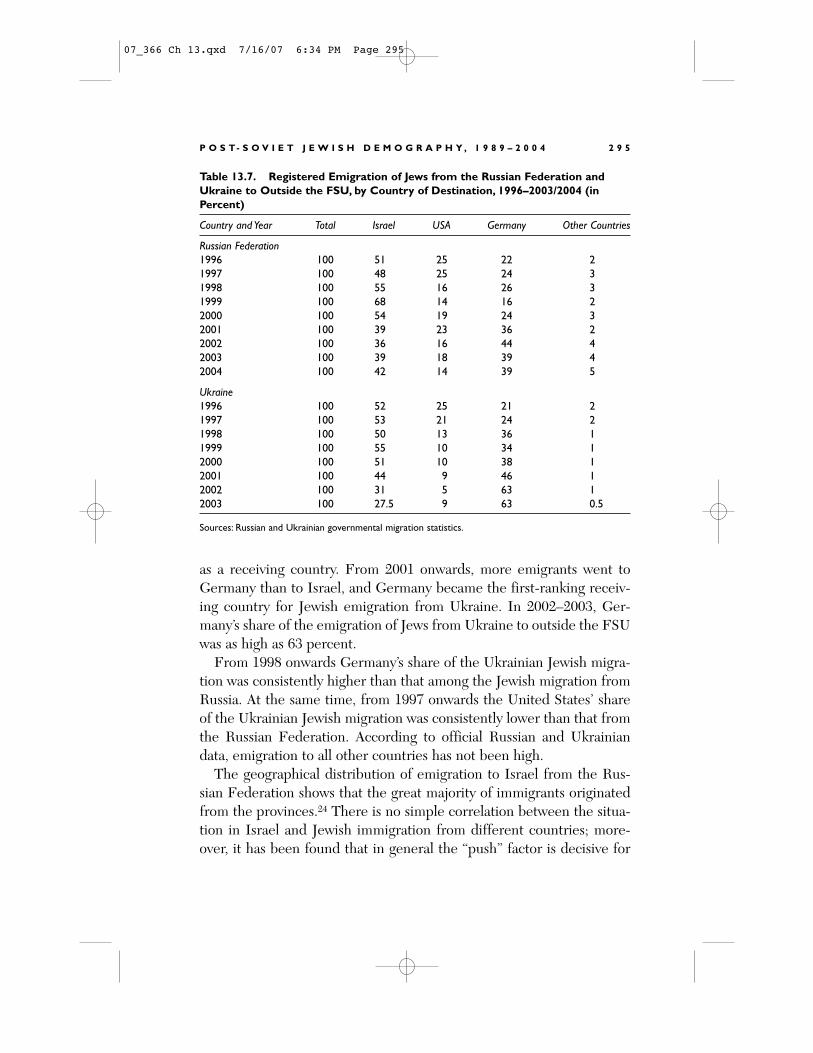
as a receiving country. From 2001 onwards, more emigrants went toGermany than to Israel, and Germany became the first-ranking receiv-ing country for Jewish emigration from Ukraine. In 2002–2003, Ger-many’s share of the emigration of Jews from Ukraine to outside the FSUwas as high as 63 percent.
From 1998 onwards Germany’s share of the Ukrainian Jewish migra-tion was consistently higher than that among the Jewish migration fromRussia. At the same time, from 1997 onwards the United States’ shareof the Ukrainian Jewish migration was consistently lower than that fromthe Russian Federation. According to official Russian and Ukrainiandata, emigration to all other countries has not been high.
The geographical distribution of emigration to Israel from the Rus-sian Federation shows that the great majority of immigrants originatedfrom the provinces.24 There is no simple correlation between the situa-tion in Israel and Jewish immigration from different countries; more-over, it has been found that in general the “push” factor is decisive for
P O S T- S O V I E T J E W I S H D E M O G R A P H Y , 1 9 8 9 – 2 0 0 4 2 9 5
Table 13.7. Registered Emigration of Jews from the Russian Federation and
Ukraine to Outside the FSU, by Country of Destination, 1996–2003/2004 (in
Percent)
Country and Year Total Israel USA Germany Other Countries
Russian Federation
1996 100 51 25 22 2
1997 100 48 25 24 3
1998 100 55 16 26 3
1999 100 68 14 16 2
2000 100 54 19 24 3
2001 100 39 23 36 2
2002 100 36 16 44 4
2003 100 39 18 39 4
2004 100 42 14 39 5
Ukraine
1996 100 52 25 21 2
1997 100 53 21 24 2
1998 100 50 13 36 1
1999 100 55 10 34 1
2000 100 51 10 38 1
2001 100 44 9 46 1
2002 100 31 5 63 1
2003 100 27.5 9 63 0.5
Sources: Russian and Ukrainian governmental migration statistics.
07_366 Ch 13.qxd 7/16/07 6:34 PM Page 295
the regional/country differentiation of emigration to Israel.25 The emi-gration from Russia confirms previous observations on this subject; thedifferentiation by region of origin in the Russian Federation shows thatassociation between quality of life and level of the recent migration toIsrael is strongly negative.26
OUT-MIGRATION FROM ISRAEL OF
FSU IMMIGRANTS
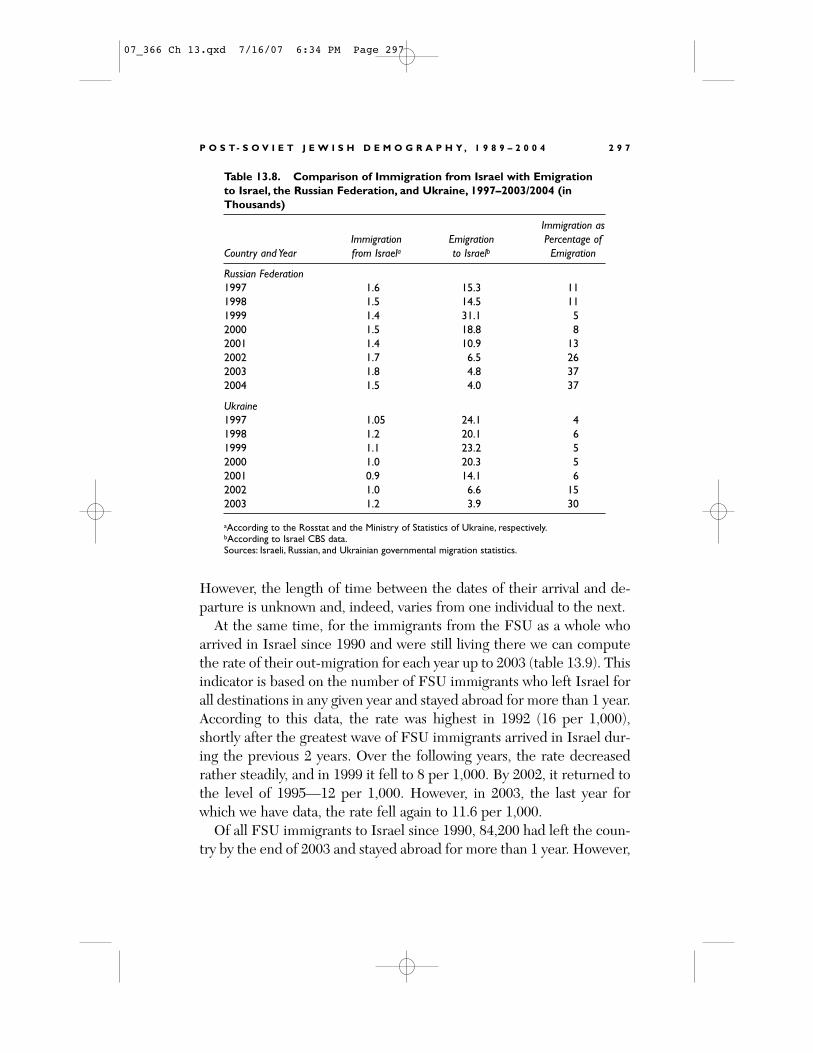
Returning migration from Israel to the Russian Federation was regis-tered in Russian statistics, and these data have been available since 1997for analysis. These statistics are based on neighborhood passport officeregistration of immigrants who resumed residence status in Russia.27
In 1997 the registered number of immigrants from Israel to the Rus-sian Federation was 1,626. If we compare these immigrants with emi-grants to Israel of the same year we see that the ratio between the twomovements is 11 percent. In 1999, the number of immigrants from Is-rael decreased to about 1,400, whereas the number of emigrants fromRussia more than doubled. Accordingly, the ratio between them de-creased to 5 percent (table 13.8).
In 2003, the registered number of immigrants to Russia from Israelreached its maximum to date—1,808. Concurrently, the number of em-igrants from the Russian Federation to Israel had significantly de-creased, thus increasing the ratio between them to 37 percent. How-ever, in 2004 the registered number of immigrants from Israel to Russiadecreased at the same pace as emigration from Russia to Israel (by 18percent each). As a result, in this year the ratio between the movementsfrom and to Israel was the same as in 2003. In 2004 the registered num-ber of immigrants to Russia from Israel was lower than in 1997.
In Ukraine the registered number of immigrants from Israel was con-sistently lower than that in the Russian Federation. In 1997–2001, inUkraine the ratio between the two movements was 4–6 percent. In2002, this ratio increased to 15 percent, and in 2003 it doubled.
In any interpretation of the above-cited indicators, we must rememberthat many people who immigrate from Israel to the Russian Federationand Ukraine in any given year emigrated to Israel in a different year.
2 9 6 M A R K T O L T S
07_366 Ch 13.qxd 7/16/07 6:34 PM Page 296
However, the length of time between the dates of their arrival and de-parture is unknown and, indeed, varies from one individual to the next.
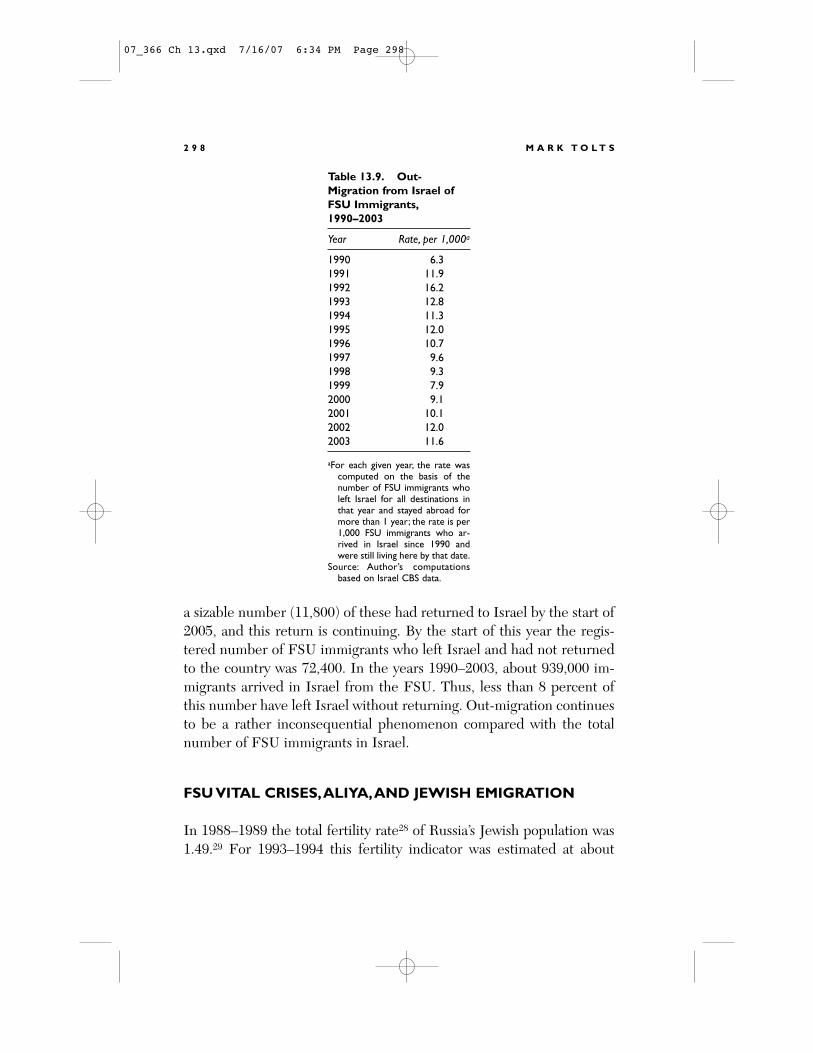
At the same time, for the immigrants from the FSU as a whole whoarrived in Israel since 1990 and were still living there we can computethe rate of their out-migration for each year up to 2003 (table 13.9). Thisindicator is based on the number of FSU immigrants who left Israel forall destinations in any given year and stayed abroad for more than 1 year.According to this data, the rate was highest in 1992 (16 per 1,000),shortly after the greatest wave of FSU immigrants arrived in Israel dur-ing the previous 2 years. Over the following years, the rate decreasedrather steadily, and in 1999 it fell to 8 per 1,000. By 2002, it returned tothe level of 1995—12 per 1,000. However, in 2003, the last year forwhich we have data, the rate fell again to 11.6 per 1,000.
Of all FSU immigrants to Israel since 1990, 84,200 had left the coun-try by the end of 2003 and stayed abroad for more than 1 year. However,
P O S T- S O V I E T J E W I S H D E M O G R A P H Y , 1 9 8 9 – 2 0 0 4 2 9 7
Table 13.8. Comparison of Immigration from Israel with Emigration
to Israel, the Russian Federation, and Ukraine, 1997–2003/2004 (in
Thousands)
Immigration as
Immigration Emigration Percentage of
Country and Year from Israela to Israelb Emigration
Russian Federation
1997 1.6 15.3 11
1998 1.5 14.5 11
1999 1.4 31.1 5
2000 1.5 18.8 8
2001 1.4 10.9 13
2002 1.7 6.5 26
2003 1.8 4.8 37
2004 1.5 4.0 37
Ukraine
1997 1.05 24.1 4
1998 1.2 20.1 6
1999 1.1 23.2 5
2000 1.0 20.3 5
2001 0.9 14.1 6
2002 1.0 6.6 15
2003 1.2 3.9 30
aAccording to the Rosstat and the Ministry of Statistics of Ukraine, respectively.bAccording to Israel CBS data.Sources: Israeli, Russian, and Ukrainian governmental migration statistics.
07_366 Ch 13.qxd 7/16/07 6:34 PM Page 297
a sizable number (11,800) of these had returned to Israel by the start of2005, and this return is continuing. By the start of this year the regis-tered number of FSU immigrants who left Israel and had not returnedto the country was 72,400. In the years 1990–2003, about 939,000 im-migrants arrived in Israel from the FSU. Thus, less than 8 percent ofthis number have left Israel without returning. Out-migration continuesto be a rather inconsequential phenomenon compared with the totalnumber of FSU immigrants in Israel.
FSU VITAL CRISES,ALIYA,AND JEWISH EMIGRATION
In 1988–1989 the total fertility rate28 of Russia’s Jewish population was1.49.29 For 1993–1994 this fertility indicator was estimated at about
2 9 8 M A R K T O L T S
Table 13.9. Out-
Migration from Israel of
FSU Immigrants,
1990–2003
Year Rate, per 1,000a
1990 6.3
1991 11.9
1992 16.2
1993 12.8
1994 11.3
1995 12.0
1996 10.7
1997 9.6
1998 9.3
1999 7.9
2000 9.1
2001 10.1
2002 12.0
2003 11.6
aFor each given year, the rate wascomputed on the basis of thenumber of FSU immigrants wholeft Israel for all destinations inthat year and stayed abroad formore than 1 year; the rate is per1,000 FSU immigrants who ar-rived in Israel since 1990 andwere still living here by that date.
Source: Author’s computationsbased on Israel CBS data.
07_366 Ch 13.qxd 7/16/07 6:34 PM Page 298
0.8;30 that is, it fell dramatically by 46 percent. This coincides with thegenerally negative fertility dynamics in Russia at this time.31 Between1988 and 1994, the fertility indicator for the total urban population fellby 34 percent, from 1.9 to 1.25. And in 1994, in the two major cities ofRussia—Moscow and St. Petersburg—the total fertility rates were low:1.1 and 1.0, respectively. By 1999 the total fertility rate for the entiregeneral urban population of the Russian Federation had fallen to 1.07,and it was as low as 0.9 in St. Petersburg.
In 1988–1989 the total fertility rate of the Jewish population in theSoviet Union as a whole was only slightly higher than in the RussianFederation—1.56.32 We have no direct information on the dynamics ofthis indicator for Jews in other parts of the FSU, but the fertility reduc-tion in the post-Soviet period was very pronounced also outside Rus-sia.33 For example, by 1995 in Ukraine the total fertility rate of the totalurban population had fallen to 1.2, and it was as low as 0.9 in the city ofKiev; by 1999–2000 this indicator was as low as 0.9 in the total urbanpopulation of the country. Thus, for the FSU as a whole we would con-servatively guesstimate the total fertility rate of the Jewish population at
P O S T- S O V I E T J E W I S H D E M O G R A P H Y , 1 9 8 9 – 2 0 0 4 2 9 9
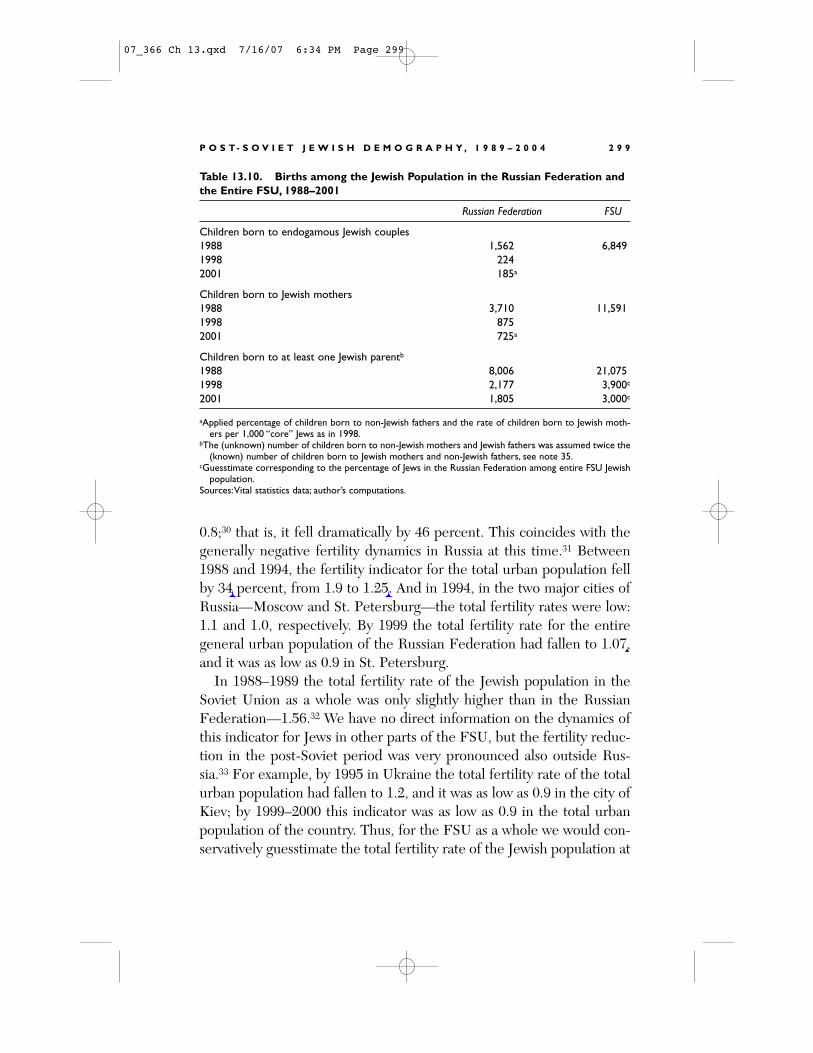
Table 13.10. Births among the Jewish Population in the Russian Federation and
the Entire FSU, 1988–2001
Russian Federation FSU
Children born to endogamous Jewish couples
1988 1,562 6,849
1998 224
2001 185a
Children born to Jewish mothers
1988 3,710 11,591
1998 875
2001 725a
Children born to at least one Jewish parentb
1988 8,006 21,075
1998 2,177 3,900c
2001 1,805 3,000c
aApplied percentage of children born to non-Jewish fathers and the rate of children born to Jewish moth-ers per 1,000 “core” Jews as in 1998.
bThe (unknown) number of children born to non-Jewish mothers and Jewish fathers was assumed twice the(known) number of children born to Jewish mothers and non-Jewish fathers, see note 35.
cGuesstimate corresponding to the percentage of Jews in the Russian Federation among entire FSU Jewishpopulation.
Sources:Vital statistics data; author’s computations.
07_366 Ch 13.qxd 7/16/07 6:34 PM Page 299
0.9 in the mid-1990s, and we assume that it would not have risen sub-sequently.
Since 1989, as a result of the mass emigration and the above noted re-duction in the fertility rate, the number of births in the Jewish popula-tion has decreased dramatically (table 13.10). Based only on the differ-ent categories of births (to endogamous Jewish couples, to Jewishmothers, and to at least one Jewish parent), one can reconstruct the dy-namics of fertility decline among Jews in the FSU. However, the figuresfor each category relate to quantitatively different aspects of internalprocesses among the Jews.34
Although all the birth categories showed dramatic decline, this wasgreatest among the children born to endogamous Jewish couples, andsmallest among those born to at least one Jewish parent. Compared with1988 in the Russian Federation, the number of births to endogamousJewish couples had by 1998 fallen a full 86 percent, and by 2001 thispercentage had grown to 88 percent. The decline in the number ofbirths to Jewish mothers was less pronounced—by 76 and 80 percent,respectively. In the same period in the Russian Federation the drop inthe number of births to at least one Jewish parent can be estimated at73 and 77 percent, respectively. In the entire FSU this category ofbirths, which is the figure for Jewish fertility as a whole, was even morepronounced—by 81 and 86 percent, respectively. According to our esti-mate only about 1,800 children were born to at least one Jewish parentin 2001 in the Russian Federation if we assume the number of childrenborn to non-Jewish mothers and Jewish fathers to be twice that born toJewish mothers and non-Jewish fathers.35 In the FSU as a whole in thesame year this category of births can be estimated according to the sameassumption at about 3,000.
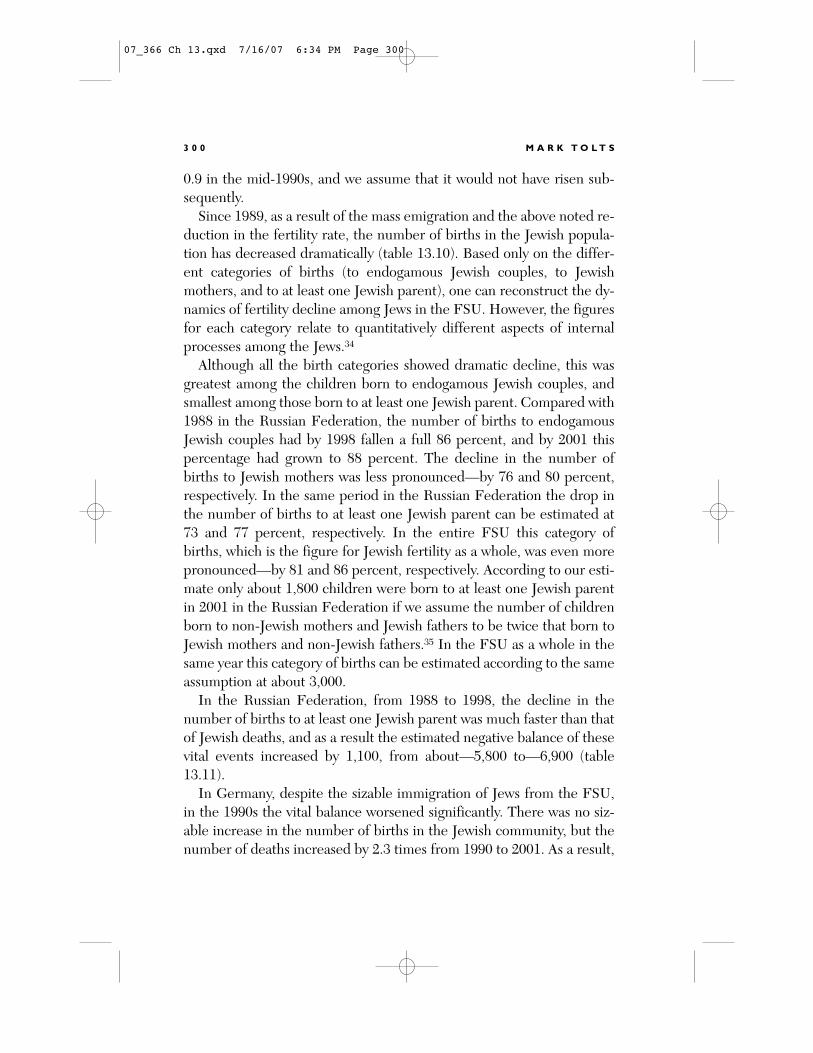
In the Russian Federation, from 1988 to 1998, the decline in thenumber of births to at least one Jewish parent was much faster than thatof Jewish deaths, and as a result the estimated negative balance of thesevital events increased by 1,100, from about—5,800 to—6,900 (table13.11).
In Germany, despite the sizable immigration of Jews from the FSU,in the 1990s the vital balance worsened significantly. There was no siz-able increase in the number of births in the Jewish community, but thenumber of deaths increased by 2.3 times from 1990 to 2001. As a result,
3 0 0 M A R K T O L T S
07_366 Ch 13.qxd 7/16/07 6:34 PM Page 300
the negative vital balance increased from—322 in 1990 to—659 in 1998and—873 in 2001.36 The attempt to revitalize the German Jewish com-munity through FSU immigration was hardly a great success, at least interms of natural growth.
Jews who emigrated to Israel escaped the dramatic fertility reductioncharacteristic of the FSU population as a whole and Jews in particular.In 1999–2004 the total fertility rate among FSU Jewish immigrants was1.7–1.8;37 that is, it doubled the post-Soviet level of Jewish fertility in theFSU (about 0.9; see above) and approached the level of the total fertil-ity rate of Israeli non-religious Jews (2.0–2.2).38 At the same time, ac-cording to our estimate, this indicator for FSU non-Jewish immigrantsin 2001–2002 was as low as approximately 1.3, and even lower in 2004—about 1.2; thus, it was similar to the low level of post-Soviet Slavic pop-ulations in their home countries.
However, 73 percent of FSU immigrants who arrived in Israel since1990 and were still living here by the end of 2004 are Jews.39 Therefore,the vital balance of FSU immigrants in Israel as a whole is decisivelypositive.40 Aliya led to tens of thousands of additional births and post-poned about the same number of deaths.41 This demonstrates the verypositive contribution of aliya to the demography of FSU Jewry.
WORLDWIDE NUMBER OF “CORE” JEWISH
POPULATION ORIGINATING FROM THE FSU
The 1970 Soviet census, taken about the time that the mass Jewish em-igration began, showed that there were about 2.15 million “core” Jewsin the Soviet Union. To evaluate their subsequent dynamics we must es-timate the respective balance of births and deaths, and additions to the
P O S T- S O V I E T J E W I S H D E M O G R A P H Y , 1 9 8 9 – 2 0 0 4 3 0 1
Table 13.11. Balance of Births and Deaths
among Jewish Population in Russia, 1988–1998
Year Birthsa Deaths Balance
1988 8,006 13,826 �5,820
1998 2,177 9,103 �6,926
aChildren born to at least one Jewish parent (see Table 13.10).Sources:Vital statistics data; author’s computations.
07_366 Ch 13.qxd 7/16/07 6:34 PM Page 301
“core” Jewish population as a result of ethnic re-identification in theprocess of migration. All other possible dynamic factors are not as influ-ential as these two, including ethnic reaffiliation of people of mixed ori-gin remaining in the FSU.
For the 25-year period of 1970–2003 the negative vital balance of thispopulation may be tentatively guesstimated at about—0.7 million.42
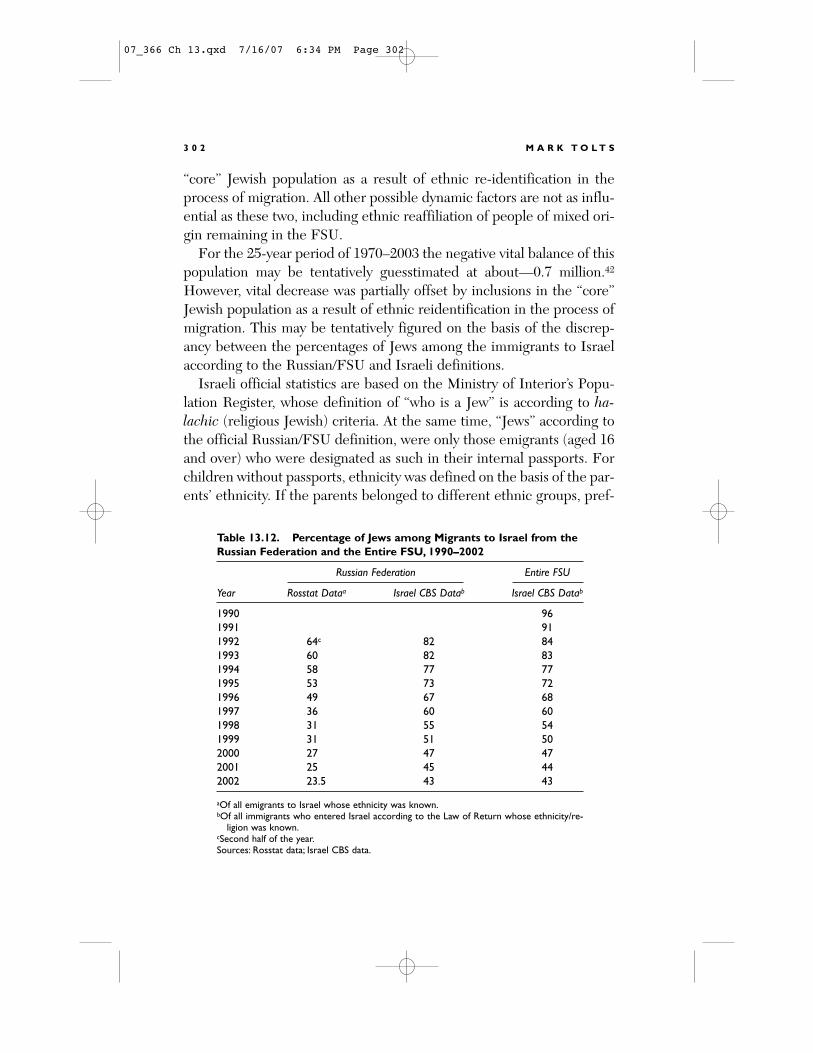
However, vital decrease was partially offset by inclusions in the “core”Jewish population as a result of ethnic reidentification in the process ofmigration. This may be tentatively figured on the basis of the discrep-ancy between the percentages of Jews among the immigrants to Israelaccording to the Russian/FSU and Israeli definitions.
Israeli official statistics are based on the Ministry of Interior’s Popu-lation Register, whose definition of “who is a Jew” is according to ha-lachic (religious Jewish) criteria. At the same time, “Jews” according tothe official Russian/FSU definition, were only those emigrants (aged 16and over) who were designated as such in their internal passports. Forchildren without passports, ethnicity was defined on the basis of the par-ents’ ethnicity. If the parents belonged to different ethnic groups, pref-
3 0 2 M A R K T O L T S
Table 13.12. Percentage of Jews among Migrants to Israel from the
Russian Federation and the Entire FSU, 1990–2002
Russian Federation Entire FSU
Year Rosstat Dataa Israel CBS Datab Israel CBS Datab
1990 96
1991 91
1992 64c 82 84
1993 60 82 83
1994 58 77 77
1995 53 73 72
1996 49 67 68
1997 36 60 60
1998 31 55 54
1999 31 51 50
2000 27 47 47
2001 25 45 44
2002 23.5 43 43
aOf all emigrants to Israel whose ethnicity was known.bOf all immigrants who entered Israel according to the Law of Return whose ethnicity/re-
ligion was known.cSecond half of the year.Sources: Rosstat data; Israel CBS data.
07_366 Ch 13.qxd 7/16/07 6:34 PM Page 302
erence was given to the mother’s ethnicity, although even in the post-So-viet era non-Jewish ethnic affiliation was clearly preferred by the off-spring of such couples.43
One consequence of the post-Soviet Jewish vital crisis and of risingmixed marriage is the recent pronounced decrease in the share of Jewsamong the FSU immigrants to Israel, according to official Israeli data:96 percent in 1990, 72 percent in 1995, 47 percent in 2000, and 43 per-cent in 2002. These proportions were almost the same as those amongthe immigrants from the Russian Federation.44 According to officialRussian data, the proportion of Jews among all those who emigrated toIsrael fell from 64 percent in the second half of 1992 to 53 percent in1995, 27 percent in 2000, and 23.5 percent in 2002 (table 13.12). Thedifferent standards for definition of Jewishness in Israel and the FSU ex-plain the divergence in the respective percentages.
Obviously some of the immigrants, who were considered Jews accord-ing to their former Soviet internal passports (as well as in population cen-suses), that is, the offspring of a Jewish male and non-Jewish female, arecounted as non-Jews by Israeli statistics, which are based on halacha.45
Nonetheless, many more immigrants are counted as Jews in Israel thanwere registered as such in the FSU, and many of these had never identi-fied themselves as Jews before. Based on the data above, the number ofsuch immigrants may be tentatively guesstimated at about 150,000, oreven more.46 This recognition of Judaism/Jewish ethnicity of some indi-viduals who had previously neither identified themselves or been seen byFSU authorities as Jews somewhat slowed the decline of the “core” Jew-ish population originating from the FSU, and contributed some gains tothe Jewish population in Israel.
Thus, the above-noted vital decrease (about—0.7 million) was par-tially offset by accession to the “core” Jewish population in connectionwith migration (approximately +0.15 million). At the beginning of 2004,there were about 1.6 million “core” Jews worldwide who had originatedfrom the FSU (table 13.13). About one-half of these “core” Jews wereliving in Israel, less than one-quarter remained in the FSU, and the restwere mostly in the United States and Germany.
In the United States their estimated number of 0.3 million is only asmall fraction of the total “core” Jewish population, which numberedjust about 5.3 million.47 The figure for the “core” Jewish population in
P O S T- S O V I E T J E W I S H D E M O G R A P H Y , 1 9 8 9 – 2 0 0 4 3 0 3
07_366 Ch 13.qxd 7/16/07 6:34 PM Page 303
the United States originating from the FSU corresponds fairly closely tothe number (252,000) of FSU “core” Jewish adult immigrants who ar-rived since 1970 and were registered in the National Jewish PopulationSurvey in 2000–2001 (NJPS).48 As noted above, after September 11,2001, the United States ceased to exist as a major destination for post-Soviet Jewish emigration. At the same time the newcomers from theFSU in Germany (more than 89,800) constitute approximately 88 per-cent of the registered members of the Jewish community.49
At the beginning of 2004, in the FSU the number of “core” Jews wasestimated at 395,000, of whom 243,000 lived in the Russian Federationand 89,000 in Ukraine. Thus, the numbers of ex-Soviet Jews in these twocountries are now lower than their numbers in the United States andGermany, respectively.
In the West, following the United States and Germany, the largest,though much smaller, number of ex-Soviet Jews, now live in Canada.About 25,000 “core” Jews who were born in the FSU and immigratedsince 1970 lived in Canada in 2004. This figure includes their childrenwho were born after emigration.50 All other diaspora ex-Soviet Jewishcommunities are even smaller.
Out of Israel’s Jewish population of 5.165 million at the start of2004, there were about 0.8 million Jews and their descendants origi-nating from the FSU who had arrived since 1970. According to officialIsraeli data, there were at that time 671,800 Jews in the country whohad immigrated from the FSU in 1990–2003 (this number includes
3 0 4 M A R K T O L T S
Table 13.13. Distribution
of the “Core” Jewish
Population Originating
from the FSU, by Country,
2004 (in Millions)
Country Number
Israel about 0.8
FSU 0.395
USA about 0.3
Germany less than 0.1
Total 1.6a
aIncluding other much smaller ex-So-viet Jewish immigrant communi-ties; for Canada, see text.
07_366 Ch 13.qxd 7/16/07 6:34 PM Page 304
their children who were born in Israel).51 In the previous 20 years(from 1970 to 1989), 178,500 immigrants arrived in the country fromthe Soviet Union.52 Although some of them subsequently emigratedand/or died, this decrease was somewhat offset by their positive vitalbalance.
To sum up, the estimates (that use the 1970 Soviet census as a base-line) show that, by the beginning of 2004, worldwide there were about1.6 million “core” Jews who originated in the FSU and their descen-dants, of whom about one tenth, mostly in Israel, had become part ofthe “core” Jewish population in connection with their migration. In2004, in Israel there were about 0.8 million Jews and their descendantsoriginating from the FSU (approximately half of the estimated world-wide number) who had arrived since 1970. Possibly a fifth of them,roughly, had previously neither identified themselves nor had been seenby FSU authorities as Jews.
MIGRATION AND DEMOGRAPHIC CHANGES
At the start of the recent mass aliya and emigration (1989) the Jewishpopulation of the Russian Federation was the second largest in the Di-aspora, and Ukrainian Jewry was in fourth place. Fifteen years later, theJewish population of the Russian Federation ranked fifth in the Dias-pora, and Ukrainian Jewry was tenth.53 Recent censuses in FSU coun-tries empirically confirmed the previously predicted demographic de-cline of the Jewish communities there.
The data of these censuses by age and religion show erosion of the“core” Jewish population. After the mass emigration of the 1990s thispopulation became less homogeneous in its origin. Of those childrenrecorded as Jews at ages under 5 in the 2002 Russian census, more thantwo-thirds were of mixed ethnic origin. At the same time, data from the2000 Estonian census clearly demonstrate erosion of the “core” Jewishpopulation by apostasy.
The data on age composition show that before the mass emigration ofthe 1990s, Russian and Ukrainian Jewry had already reached the “ter-minal stage” of demographic evolution. The emigration has dramaticallyaccelerated the process of aging of the FSU Jewish populations. Recent
P O S T- S O V I E T J E W I S H D E M O G R A P H Y , 1 9 8 9 – 2 0 0 4 3 0 5
07_366 Ch 13.qxd 7/16/07 6:34 PM Page 305
data on age composition demonstrate that now Belarussian Jewry hasalso reached the “terminal stage” of demographic evolution.
The birth dynamics show that the Jews who emigrated to Israel es-caped the dramatic fertility reduction characteristic of the FSU popula-tion as a whole and Jews in particular. The 1990s mass emigration seri-ously decreased the pool of people eligible for maintaining a Jewishpopulation and the recent emigration from the FSU to all destinationshas decreased. Out-migration of FSU immigrants from Israel is muchlower than that from Western countries.
In 1970 there were about 12.6 million “core” Jews in the world. By2004 this number had reached approximately 13 million.54 In the sameperiod, the number of “core” Jewish population originating in the FSUfell by more than a half million, despite the sizable additions to this“core” Jewish population as a result of the official recognition of Ju-daism/Jewish ethnicity (and self reidentification) of many individuals inIsrael who had previously neither identified themselves or been seen byFSU authorities as Jews. In 1970 the share of Soviet Jews among worldJewry was 17 percent whereas by 2004 we estimate the share of “core”Jewish population originating from the FSU among world Jewry as onlyabout 12 percent. During this period a significant number of these Jewschanged their places of residence and now they are mostly concentratedin Israel.
NOTES
This chapter is part of a broader research project being carried out by the au-
thor at the Division of Jewish Demography and Statistics of the Avraham Har-
man Institute of Contemporary Jewry, the Hebrew University of Jerusalem.
The author expresses his appreciation to Sergio DellaPergola for his general ad-
vice. The author is grateful to Evgeny Andreev, Zvi Eisenbach, Ekaterina
Kvasha, Zinaida Palyan, Rafi Pizov, and Emma Trakhtenberg for providing ma-
terials, information, and suggestions. The author also thanks Judith Even for
editing an earlier draft. Responsibility for the content of the chapter is, of
course, the author’s alone.
1. See Sergio DellaPergola, “Demography,” in Martin Goodman, ed., The
Oxford Handbook of Jewish Studies (Oxford: Oxford University Press, 2002),
3 0 6 M A R K T O L T S
07_366 Ch 13.qxd 7/16/07 6:34 PM Page 306
807–8. The Soviet census data are regarded as “a good example of a large and
empirically measured core Jewish population in the Diaspora.” [Uziel O.
Schmelz and Sergio DellaPergola, “World Jewish Population, 1993,” American
Jewish Year Book 95 (1995): 481].
2. Brian D. Silver, “The Ethnic and Language Dimensions in Russian and So-
viet Censuses,” in Ralph S. Clem, ed., Research Guide to the Russian and Soviet
Censuses (Ithaca and London: Cornell University Press, 1986), 70–97; Ward W.
Kingkade, “Content, Organization, and Methodology in Recent Soviet Popula-
tion Censuses,” Population and Development Review 15, no. 1 (1989): 123–38.
3. See, e.g.: Mordechai Altshuler, Soviet Jewry since the Second World War:
Population and Social Structure (New York: Greenwood, 1987), 21–24; Zvi
Gitelman, “The Reconstruction of Community and Jewish Identity in Russia,”
East European Jewish Affairs 24, no. 2 (1994): 40; cf. Robert J. Brym, with
Rozalina Ryvkina, The Jews of Moscow, Kiev and Minsk: Identity, Antisemitism,
Emigration (New York: New York University Press, 1994), 21–22.
4. See: Sergio DellaPergola, “Demography,” 808.
5. We estimate that in the Russian Federation, the ratio of “enlarged” to
“core” Jewish population was 1.6 to 1 in 1989, and 1.8 to 1 in 1994 [Mark Tolts,
“Jewish Demography of the Former Soviet Union,” in Sergio DellaPergola and
Judith Even, eds., Papers in Jewish Demography 1997 (Jerusalem: The Avra-
ham Harman Institute of Contemporary Jewry, The Hebrew University of
Jerusalem; World Union of Jewish Studies; Association for Jewish Demography
and Statistics, 2001), 112]. The decreasing share of “core” Jews among the re-
maining “enlarged” Jewish population offers a serious challenge to community-
building in the FSU in the future [see Zvi Gitelman, A Century of Ambivalence:
The Jews of Russia and the Soviet Union, 1881 to the Present, 2nd ed. (Bloom-
ington: Indiana University Press, 2001), chaps. 8 and 9; Mikhail Krutikov, “The
Jewish Future in Russia: Trends and Opportunities,” East European Jewish Af-
fairs 32, no. 1 (2002): 1–16].
6. However, the census in each of the FSU states met with political prob-
lems [Dominique Arel, “Demography and Politics in the First Post-Soviet Cen-
suses: Mistrusted State, Contested Identities,” Population (English edition) 57,
no. 6 (2002): 801–28].
7. In 2001, a population census was conducted also in Armenia, but its re-
sults regarding Jews were not available in time to be included in this chapter.
According to the results of the Moldova census of October 2004, there were
only 3,628 Jews. However, this census did not cover Moldovan territory east of
the Dniester River. The 1989 Soviet census counted 65,836 Jews in Moldova as
a whole. Thus, we may assume that in this country intercensal decrease was
very sizable—about 60,000.
P O S T- S O V I E T J E W I S H D E M O G R A P H Y , 1 9 8 9 – 2 0 0 4 3 0 7
07_366 Ch 13.qxd 7/16/07 6:34 PM Page 307
8. This figure did not cover “Tats.” In the 1999 Azerbaidzhan census,
10,900 Tats were enumerated, but according to the last Soviet census of 1989
there were only 10,200 Tats in this republic. We may surmise that some Mus-
lims started to use this ethnic label; this problem should be studied separately.
On Tats in the 2002 Russian census results, see: Mark Tolts, “Demography of
North Caucasian Jewry: A Note on Population Dynamics and Shifting Identity,”
forthcoming in Moshe Gammer, ed., Ethno-Nationalism, Islam and the State in
the Caucasus: Post-Soviet Disorder (London: Routledge, 2007).
9. For detailed analysis of the 2002 Russian census results for Jewish pop-
ulation, see: Mark Tolts, “The Post-Soviet Jewish Population in Russia and the
World,” Jews in Russia and Eastern Europe 52, no. 1 (2004): 37–47.
10. Ibid., 45–46.
11. See: Mark Tolts, “Aliya from the Russian Federation: An Analysis of Re-
cent Data,” Jews in Eastern Europe 47–48, nos. 1–2 (2002): 16–18.
12. Zvi Gitelman, “Recent Demographic and Migratory Trends among So-
viet Jews: Implications for Policy,” Post-Soviet Geography 33, no. 3 (1992): 140.
13. See, e.g.: A. Volkov, “Etnicheski smeshannye sem’i v SSSR: Dinamika i
sostav” [Part 2], Vestnik Statistiki 8 (1989): 8–24; Mark Tolts, “The Balance of
Births and Deaths among Soviet Jewry,” Jews and Jewish Topics in the Soviet
Union and Eastern Europe 19, no. 2 (1992): 21–22.
14. For the period of 1999–2002 their number was estimated at 14,800 [see:
Mark Tolts, “Mass Aliyah and Jewish Emigration from Russia: Dynamics and
Factors,” East European Jewish Affairs 33, no. 2 (2003), 76].
15. Their number for the period between the 1994 Russian microcensus and
the recent 2002 Russian census was tentatively estimated at 3,800 (ibid.).
16. See, e.g.: Robert J. Brym and Rozalina Ryvkina, “Russian Jewry Today:
A Sociological Profile,” Sociological Papers (Bar-Ilan University) 5 (1996):
1–47; Valery Chervyakov, Zvi Gitelman, and Vladimir Shapiro, “E Pluribus
Unum? Post-Soviet Jewish Identities and Their Implications for Communal
Reconstruction,” in Gitelman, ed., Jewish Life After the USSR, 61–75.
17. Judith Deutsch Kornblatt, Doubly Chosen: Jewish Identity, the Soviet
Intelligentsia, and the Russian Orthodox Church (Madison: The University of
Wisconsin Press, 2004), passim.
18. Zvi Gitelman, “Thinking about Being Jewish in Russia and Ukraine,” in
Gitelman, Jewish Life After the USSR, 51.
19. Boris Wiener, “Konstruirovanie sovremennoi ethnokonfessional’noi
identichnosti: ot bezveriia k vere chuzhogo naroda,” Diaspory /Diasporas 6, no.
1 (2004), 196.
20. For comprehensive analysis of census data on age composition of the
Jewish population of the USSR and its republics between 1959 and 1989, see:
3 0 8 M A R K T O L T S
07_366 Ch 13.qxd 7/16/07 6:34 PM Page 308
Mark Tolts, “Shinuyim be-herkev ha-ukhlusiya ha-yehudit be-Brit ha-Moatsot:
Hizdaknut ve-shuk ha-nisuin” (Changes in the Composition of the Jewish Pop-
ulation of the USSR: Aging and the Marriage Market), Yahadut Zemanenu 9
(1994): 243–50; idem., “Demography of the Jews in the Former Soviet Union:
Yesterday and Today,” in Gitelman, Jewish Life After the USSR, 196–97.
21. Mark Tolts, “Trends in Soviet Jewish Demography since the Second
World War,” in Yaacov Ro’i, ed., Jews and Jewish Life in Russia and the Soviet
Union (London: Frank Cass, 1995), 368. The “terminal stage” of demographic
evolution is the situation when the proportion aged under 15 falls to 10 percent
[see: Sergio DellaPergola, “Major Demographic Trends of World Jewry: The
Last Hundred Years,” in Batsheva Bonne-Tamir and Avinoam Adam, eds., Ge-
netic Diversity among Jews (New York: Oxford University Press, 1992), 26].
22. Tolts, “The Post-Soviet Jewish Population in Russia and the World,”49.
23. For detailed analysis of the data for this period, see, e.g.: Mark Tolts,
“Russian Jewish Migration in the Post-Soviet Era,” Revue Européenne des Mi-
grations Internationales 16, no. 3 (2000): 183–99.
24. Tolts, “Mass Aliyah and Jewish Emigration from Russia: Dynamics and
Factors,” 79.
25. See, e.g.: Sergio DellaPergola, “Aliya and Other Jewish Migrations: To-
ward an Integrated Perspective,” in Usiel O. Schmelz and Gad Nathan, eds.,
Studies in the Population of Israel in Honor of Roberto Bachi, Scripta Hi-
erosolymitana 30 (Jerusalem: Magnes Press, 1986), 172–209.
26. Tolts, “Mass Aliyah and Jewish Emigration from Russia: Dynamics and
Factors,” 81–87.
27. These data include also some people who previously emigrated to Israel
from other parts of the FSU.
28. The total fertility rate is the average number of children that a woman
would bear in her lifetime if current age-specific fertility rates remain stable.
29. Statkomitet SNG, Demograficheskii ezhegodnik 1993/ Demographic
Yearbook 1993 (Moscow, 1995), 245.
30. Mark Tolts, “The Jewish Population of Russia, 1989–1995,” Jews in East-
ern Europe 31, no. 3 (1996): 12.
31. See, e.g.: Julie DaVanzo and Clifford Grammich, Dire Demographics:
Population Trends in the Russian Federation (Santa Monica, Calif.: Rand Cor-
poration, 2001), 21–24.
32. E. M. Andreev, L. E. Darsky and T. L. Kharkova, Naselenie Sovetskogo
Soiuza, 1922–1991 (Moscow: Nauka, 1993), 90.
33. See, e.g.: Anatoly Vishnevsky, “Demographic Processes in the Post-Soviet
States,” in Vlada Stanknienò et al., eds., Demographic Development of the
Countries in Transition (Vilnius, 1999), 23–37.
P O S T- S O V I E T J E W I S H D E M O G R A P H Y , 1 9 8 9 – 2 0 0 4 3 0 9
07_366 Ch 13.qxd 7/16/07 6:34 PM Page 309
34. Births to endogamous Jewish couples are the basis of reproduction for
the “core” Jewish population (in Soviet conditions in most of the republics, they
were about the only source). Births to at least one Jewish parent by definition
of course include endogamous births, as well as births to Jewish mothers with
non-Jewish fathers and births to non-Jewish mothers with Jewish fathers; these
are the figures for Jewish fertility as a whole. Only births to Jewish mothers are
considered Jewish according to Jewish religious law (“Halakha”).
35. Corresponding to our estimate that according to the 1989 Soviet census
and the 1994 Russian microcensus approximately twice as many Jewish males
were currently married to non-Jewish females as were Jewish females currently
married to non-Jewish males (see: Mark Tolts, “The Interrelationship between
Emigration and the Socio-demographic Profile of Russian Jewry,” in Russian
Jews on Three Continents (London: Frank Cass, 1997), 154; idem., “The Jew-
ish Population of Russia, 1989–1995,” 19).
36. Sergio DellaPergola, Jewish Demography: Facts, Outlook, Challenges
(Jerusalem: The Jewish People Policy Institute, 2003), 5; P. Polian, “Evreiskaia
emigratsiia iz byvshego SSSR v Germaniiu,” Vestnik Evreiskogo Universiteta
22, no. 4 (2000): 190.
37. Israel CBS, Statistical Abstract of Israel 2005 (Jerusalem, 2005), table
3.14.
38. See: Dov Friedlander, “Fertility in Israel: Is the Transition to Replace-
ment Level in Sight?” in United Nations Secretariat, Division of Economic and
Social Affairs, Population Division, Expert Group Meeting on Completing the
Fertility Transition (New York, 2002), 9.
39. Israel CBS, Statistical Abstract of Israel 2005, table 2.25.
40. See the chapter by Moshe Sicron in this book.
41. See: Mark Tolts, “Demographische Trends unter den Juden der ehema-
ligen Sowjetunion,” Menora: Jahrbuch für deutsch-jüdische Geschichte 2004.
Band 15 (Berlin/Wien: Philo, 2005), 37–38.
42. Tolts, “The Post-Soviet Jewish Population in Russia and the World,”
52–53.
43. Cf. Volkov, “Etnicheski smeshannye sem’i v SSSR: Dinamika i sostav,”
8–24; Tolts, “The Jewish Population of Russia, 1989–1995,” 15.
44. For similar data for immigrants from Ukraine to Israel in 1996–1999, see:
Ilan Riss and Yifat Klopshtock, “Olim miukraina lefi rishum misrad hapnim,
1996–1999” (Immigrants from Ukraine according to the Registry of the Interior
Ministry, 1996–1999), in Ludmila Dymerskaya-Tsigelman, ed., Yehudei brit
hamo‘atsot l’sheavar b’yisrael ub’tfutsot 20–21, no. 5 (2002): 348–50.
45. According to Jewish law (halacha), Jewishness is defined as being born of
Jewish mother or converting to Judaism through a formal religious procedure.
3 1 0 M A R K T O L T S
07_366 Ch 13.qxd 7/16/07 6:34 PM Page 310
46. At the same time, the role of formal conversions to Judaism in Israel was
rather minor: e.g., in 2002 and 2003, only 890 and 918 FSU immigrants, respec-
tively, underwent conversions in Israel (Ha’aretz, November 22, 2004, 1A).
47. Cf. Sergio DellaPergola, “World Jewish Population, 2004,” American
Jewish Year Book 104 (2004): 502.
48. NJPS 2000–2001, “Jews from the Former Soviet Union (FSU): Recon-
ciling Estimates from NJPS and the Hebrew Immigrant Aid Society (HIAS).”
www.ujc.org/content_display.html?ArticleID=84102; for characteristics of
adult ex-Soviet Jews in the USA according to the data of this survey, see:
Jonathon Ament, Jewish Immigrants in the United States (October 2004). www
.ujc.org/content_display.html?ArticleID=118670.
49. Zentralwohlfartsstelle, Statistical Data as of the end of 2003.
50. Estimated by Robert J. Brym; cited in: Tolts, “The Post-Soviet Jewish
Population in Russia and the World,” 57–58. This corresponded fairly closely to
the reported number of Jews in Canada who were born in the FSU (27,790, in-
cluding pre-1970 immigrants) according to the 2001 census (Ron Csillag, “Im-
migration key to growth of Jewish community,” Canadian Jewish News, June
29, 2005. www.cjnews.com/viewarticle.asp?id=6742).
51. Israel CBS, Statistical Abstract of Israel 2004 (Jerusalem, 2004), table
2.25.
52. Israel CBS, Immigration to Israel 1999 (Jerusalem, 2002), table 2.
53. DellaPergola, “World Jewish Population, 2004,” 518.
54. Ibid., 500.
P O S T- S O V I E T J E W I S H D E M O G R A P H Y , 1 9 8 9 – 2 0 0 4 3 1 1
07_366 Ch 13.qxd 7/16/07 6:34 PM Page 311


