Embed Size (px)
Citation preview
23 Sep 2014 © E Goetsch 2000 - 2014 1 | 42
Contemporary Management Skills Development
(for Senior Managers)A structured approach for leading and managing
high-performance teams
22 September 2014Randburg Towers Hotel, Johannesburg
South Africa
Errol Goetsch+27 78 573 5046
[email protected] | www.xe4.org

23 Sep 2014 © E Goetsch 2000 - 2014 2 | 42
Proposal Contract Budget Work plan Capacity Launch
Monitoring Reporting Expenses Delivery Expectation Need
Test
23 Sep 2014 © E Goetsch 2000 - 2014 3 | 42
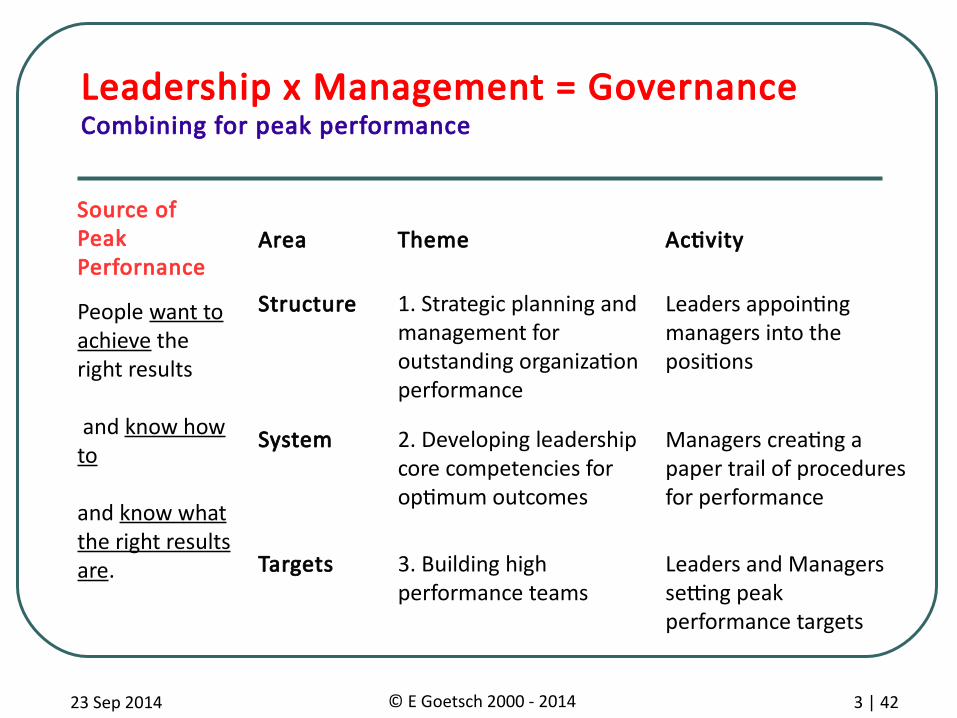
Leadership x Management = GovernanceCombining for peak performance
1. Strategic planning and management for outstanding organization performance
Structure Leaders appointing managers into the positions
2. Developing leadership core competencies for optimum outcomes
System Managers creating a paper trail of procedures for performance
3. Building high performance teams
Targets Leaders and Managers setting peak performance targets
Area ActivitySource of Peak Perfornance
People want to achieve the right results
and know how to
and know what the right results are.
Theme
23 Sep 2014 © E Goetsch 2000 - 2014 4 | 42
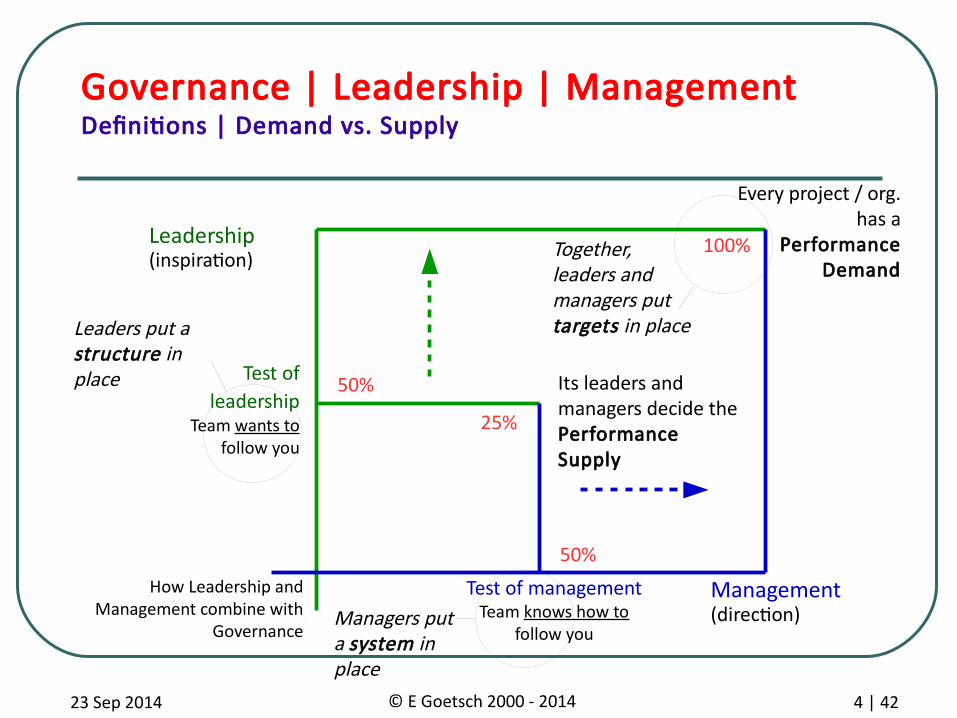
Governance | Leadership | ManagementDefinitions | Demand vs. Supply
Test of leadership
Team wants to follow you
Test of management Team knows how to
follow you
Its leaders and managers decide the Performance Supply
Leadership
Management
Every project / org. has a
Performance Demand
25%
100%(inspiration)
(direction)How Leadership and
Management combine with Governance
Leaders put a structure in place
Managers put a system in place
Together, leaders and managers put targets in place
50%
50%
23 Sep 2014 © E Goetsch 2000 - 2014 5 | 42
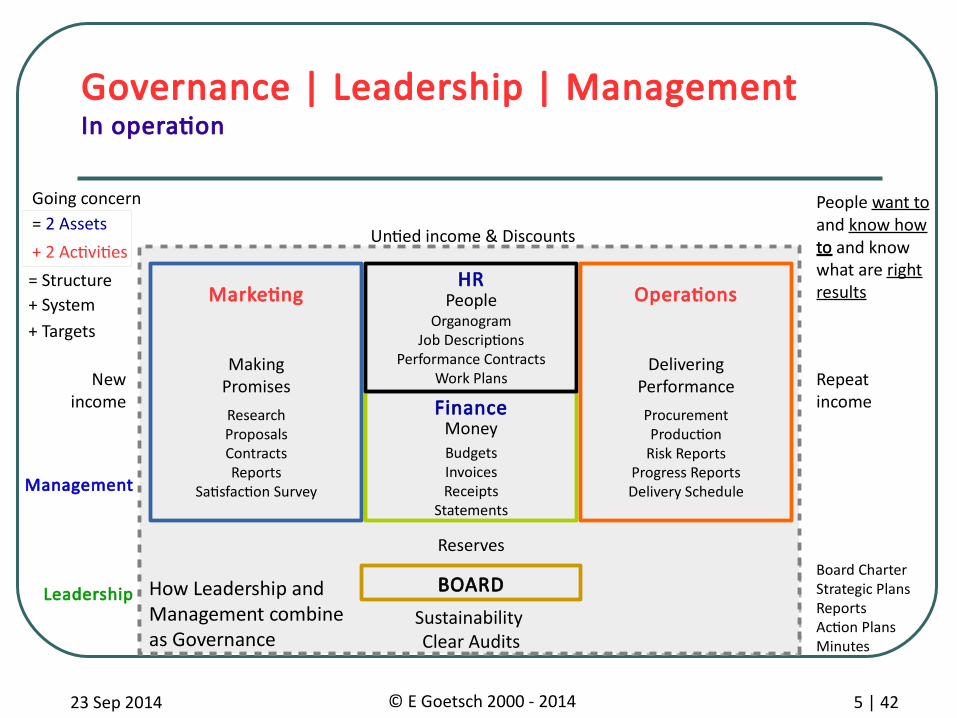
+ System
= 2 AssetsGoing concern
Governance | Leadership | ManagementIn operation
MarketingHR
OperationsPeople
Delivering Performance
ResearchProposalsContractsReports
Satisfaction Survey
OrganogramJob Descriptions
Performance Contracts Work Plans
ProcurementProduction
Risk ReportsProgress ReportsDelivery Schedule
FinanceMoneyBudgetsInvoicesReceipts
Statements
Reserves
BOARD
Sustainability Clear Audits
New income
Repeat income
+ 2 Activities
Board Charter Strategic PlansReportsAction PlansMinutes
Making Promises
+ Targets
= Structure
Leadership
Management
How Leadership and Management combine as Governance
People want to and know how to to and know what are right results
Untied income & Discounts
23 Sep 2014 © E Goetsch 2000 - 2014 6 | 42
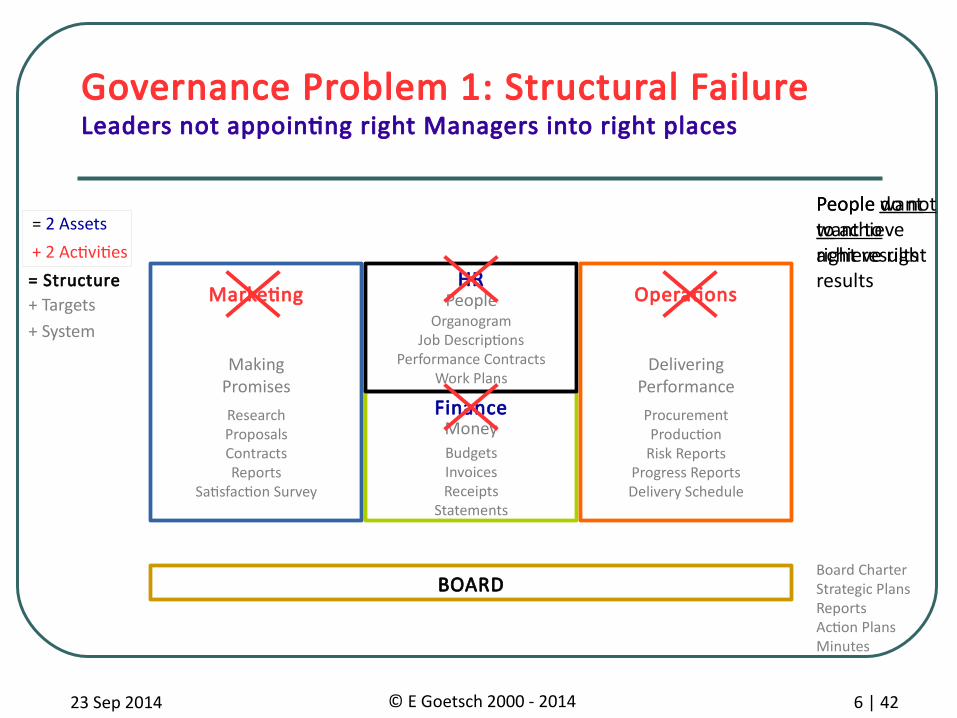
= 2 Assets
Governance Problem 1: Structural FailureLeaders not appointing right Managers into right places
MarketingHR
OperationsPeople
Delivering Performance
ResearchProposalsContractsReports
Satisfaction Survey
OrganogramJob Descriptions
Performance Contracts Work Plans
ProcurementProduction
Risk ReportsProgress ReportsDelivery Schedule
FinanceMoneyBudgetsInvoicesReceipts
Statements
BOARD
+ 2 Activities
Making Promises
+ Targets+ System
= Structure
People do not want to achieve right results
People want to achieve right results
Board Charter Strategic PlansReportsAction PlansMinutes
23 Sep 2014 © E Goetsch 2000 - 2014 7 | 42
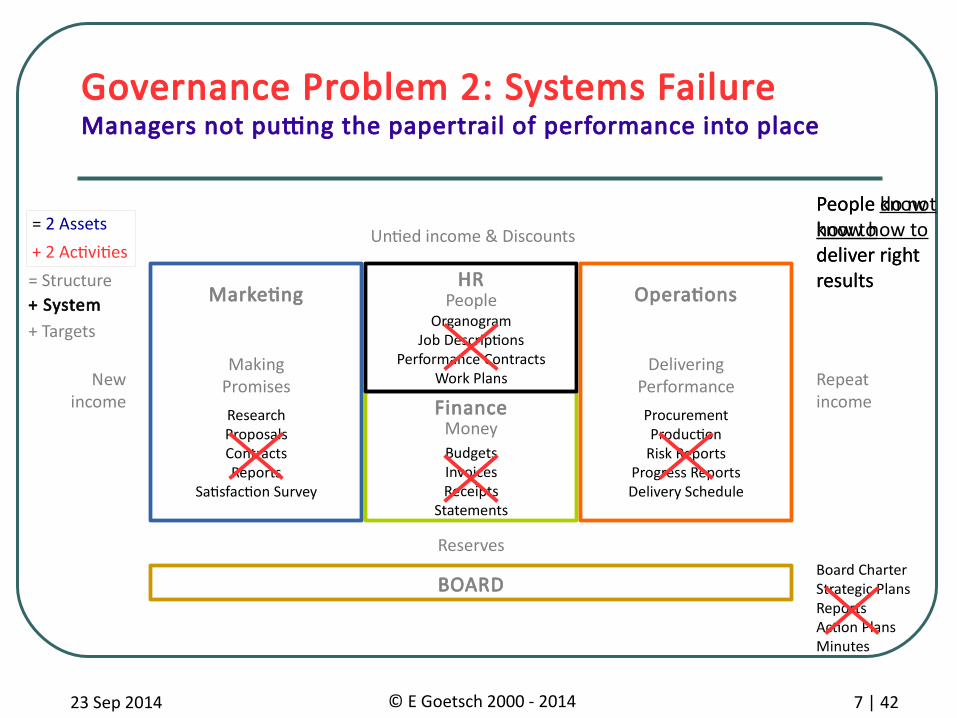
= 2 Assets
Governance Problem 2: Systems FailureManagers not putting the papertrail of performance into place
MarketingHR
OperationsPeople
Delivering Performance
ResearchProposalsContractsReports
Satisfaction Survey
OrganogramJob Descriptions
Performance Contracts Work Plans
ProcurementProduction
Risk ReportsProgress ReportsDelivery Schedule
FinanceMoneyBudgetsInvoicesReceipts
Statements
BOARD
+ 2 Activities
Making Promises
Reserves
+ System+ Targets
= Structure
People do not know how to deliver right results
New income
Repeat income
People know how to deliver right results
Untied income & Discounts
Board Charter Strategic PlansReportsAction PlansMinutes
23 Sep 2014 © E Goetsch 2000 - 2014 8 | 42
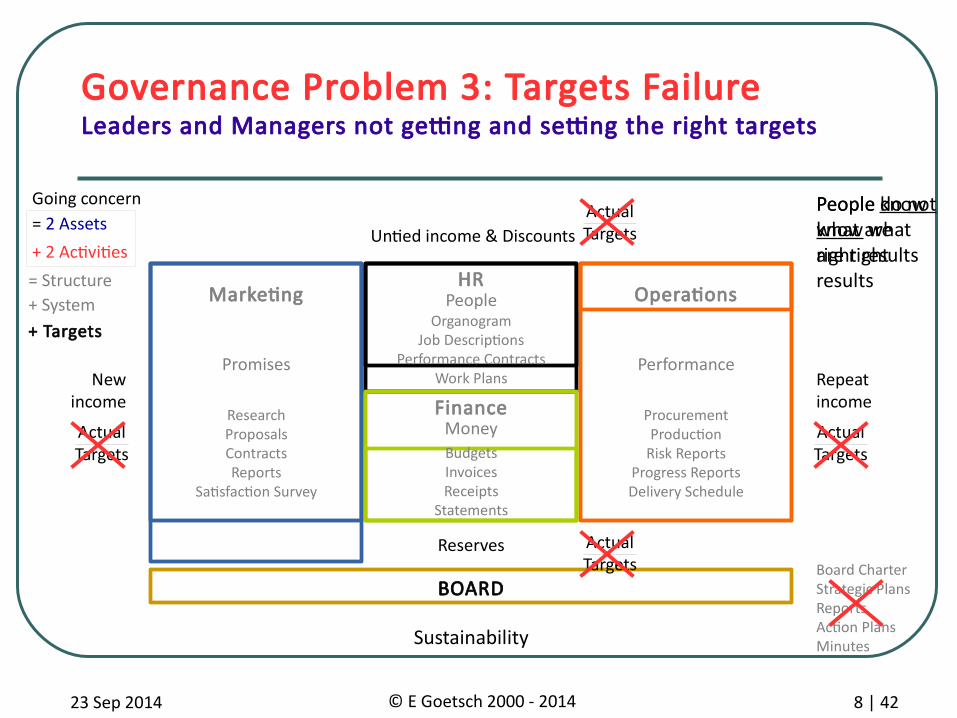
= 2 Assets
Governance Problem 3: Targets FailureLeaders and Managers not getting and setting the right targets
MarketingHR
OperationsPeople
FinanceMoney
BOARD
Sustainability
Going concern
+ 2 Activities
PerformancePromises
Actual Targets
Actual Targets
Actual Targets
Actual Targets
Reserves
+ System+ Targets
= Structure
New income
Repeat income
ResearchProposalsContractsReports
Satisfaction Survey
OrganogramJob Descriptions
Performance Contracts Work Plans
ProcurementProduction
Risk ReportsProgress ReportsDelivery Schedule
BudgetsInvoicesReceipts
Statements
People do not know what are right results
People know what are right results
Untied income & Discounts
Board Charter Strategic PlansReportsAction PlansMinutes
23 Sep 2014 © E Goetsch 2000 - 2014 9 | 42
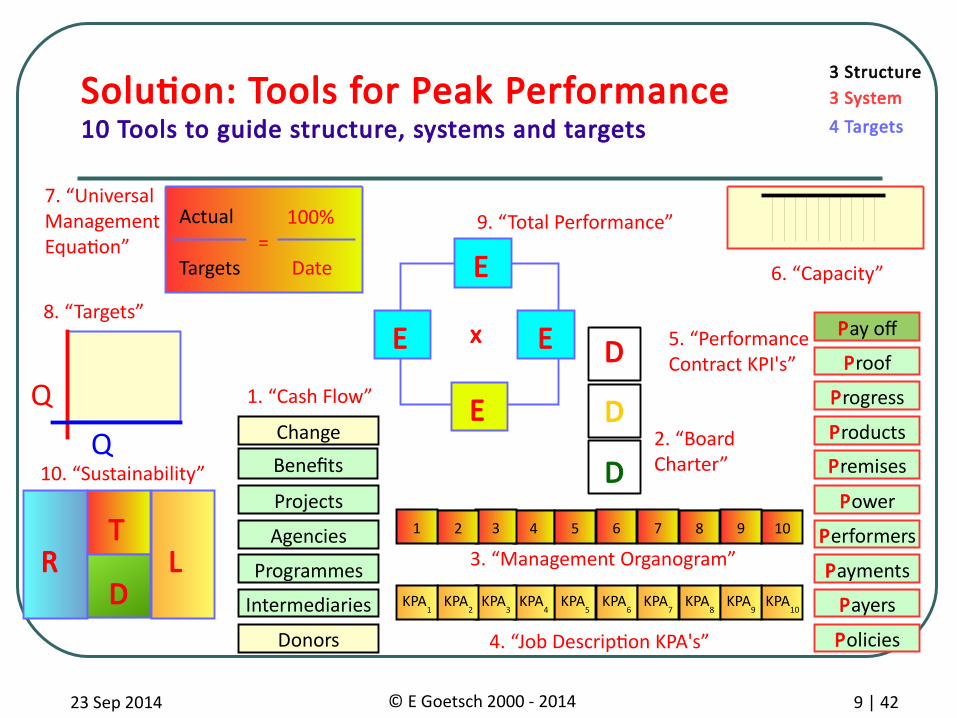
Premises
Power
Products
Policies
Progress
Proof
Pay of
1. “Cash Flow”
5. “Performance Contract KPI's”D
D
D
9. “Total Performance”
Performers
Payments
Payers
7. “Universal Management Equation”
Actual
Targets
100%= Date E
EE
E
x
10. “Sustainability”
R LD
T
Solution: Tools for Peak Performance10 Tools to guide structure, systems and targets
2. “Board Charter”
Q
Q
8. “Targets”
Benefits
Projects
Change
Donors
Agencies
Programmes
Intermediaries
6. “Capacity”
KPA5
KPA6
KPA4
KPA10
KPA3
KPA2
KPA1
KPA7
KPA8
KPA9
3. “Management Organogram”
3 System3 Structure
4 Targets
64 10321 7 8 9
4. “Job Description KPA's”
5
23 Sep 2014 © E Goetsch 2000 - 2014 10 | 42
= 2 Assets
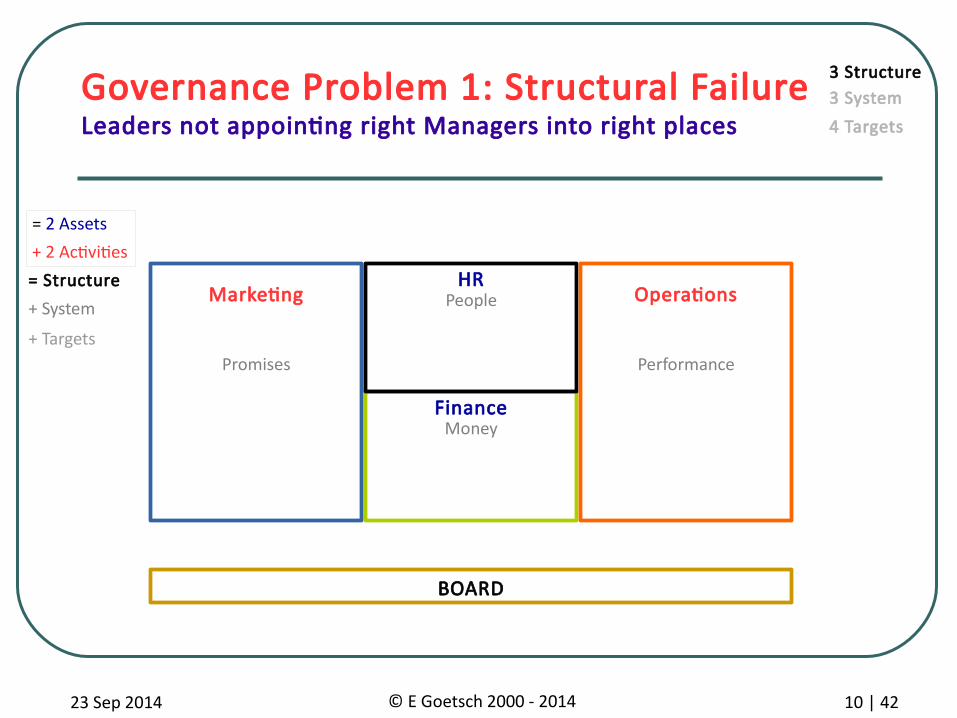
Governance Problem 1: Structural FailureLeaders not appointing right Managers into right places
MarketingHR
OperationsPeople
Performance
FinanceMoney
BOARD
+ 2 Activities
Promises
+ System
= Structure
+ Targets
3 System3 Structure
4 Targets
23 Sep 2014 © E Goetsch 2000 - 2014 11 | 42
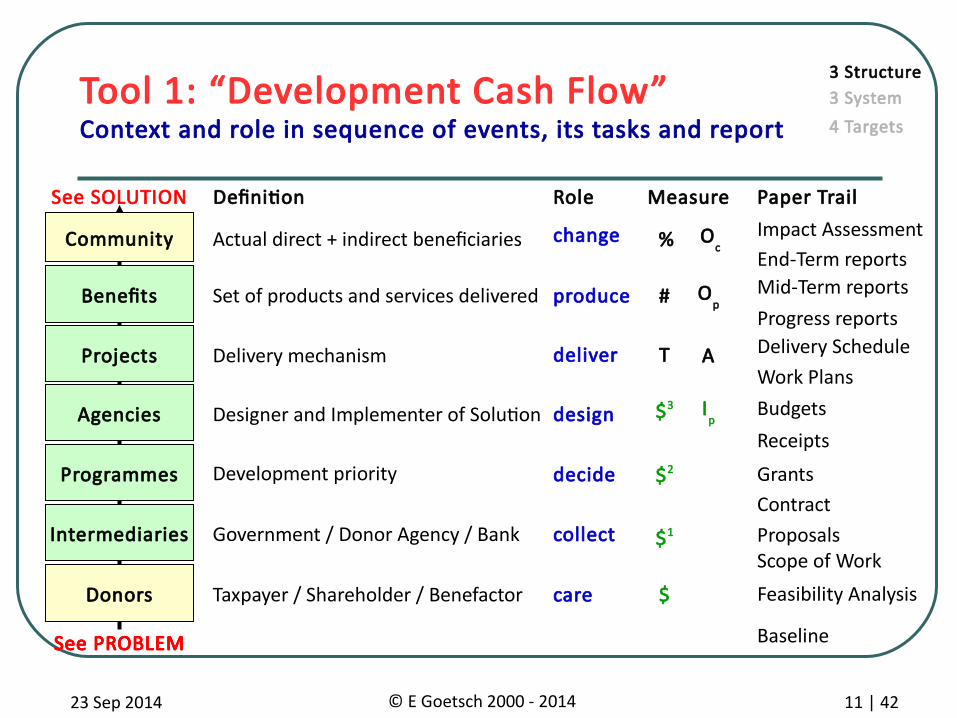
collect
design
decide
produce
deliver
change
$1
T
%
Set of products and services delivered
Delivery mechanism
Designer and Implementer of Solution
Development priority
Government / Donor Agency / Bank
Actual direct + indirect beneficiaries
Taxpayer / Shareholder / Benefactor care
See PROBLEM
See SOLUTION
Benefits
Projects
Agencies
Programmes
Intermediaries
Community
Donors
See PROBLEM
Paper Trail
Tool 1: “Development Cash Flow”Context and role in sequence of events, its tasks and report
#
$3
$2
$
Budgets
Work Plans
Impact Assessment
Baseline
Progress reports
Mid-Term reports
Receipts
End-Term reports
Proposals
Delivery Schedule
Scope of Work
Feasibility Analysis
ContractGrants
3 System3 Structure
4 Targets
A
Oc
Op
Ip
Definition Role Measure
23 Sep 2014 © E Goetsch 2000 - 2014 12 | 42
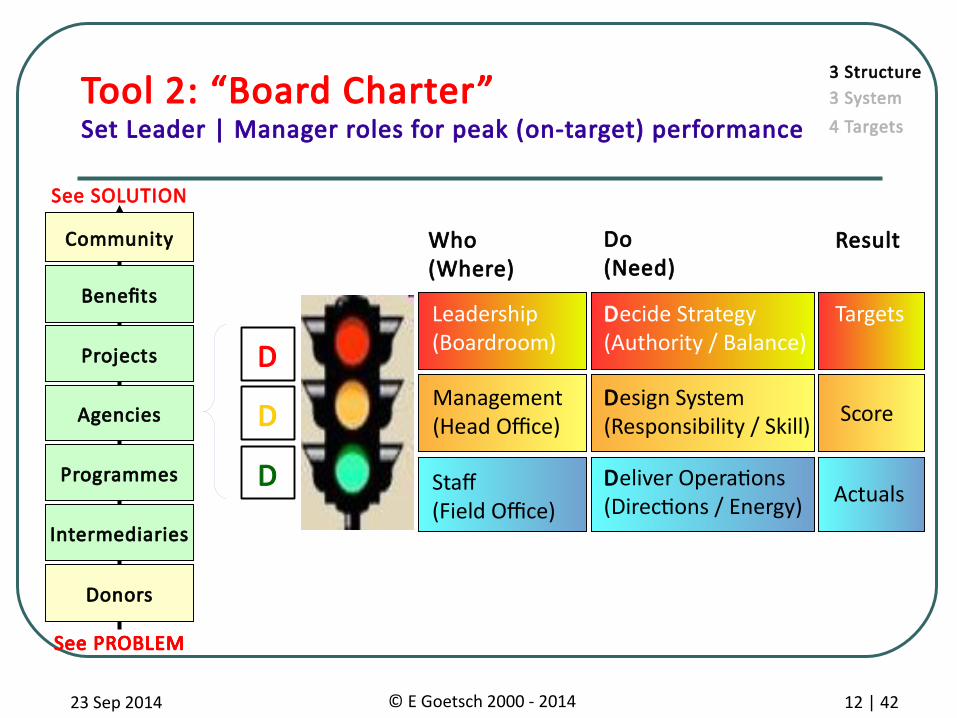
Leadership(Boardroom)
Management(Head Office)
Targets
Score
Decide Strategy (Authority / Balance)
Design System(Responsibility / Skill)
Who (Where)
Do (Need)
Result
Deliver Operations(Directions / Energy) ActualsStaf
(Field Office)
Tool 2: “Board Charter”Set Leader | Manager roles for peak (on-target) performance
3 System3 Structure
4 Targets
See PROBLEM
See SOLUTION
Benefits
Projects
Agencies
Programmes
Intermediaries
Community
Donors
See PROBLEM
D
D
D
23 Sep 2014 © E Goetsch 2000 - 2014 13 | 42
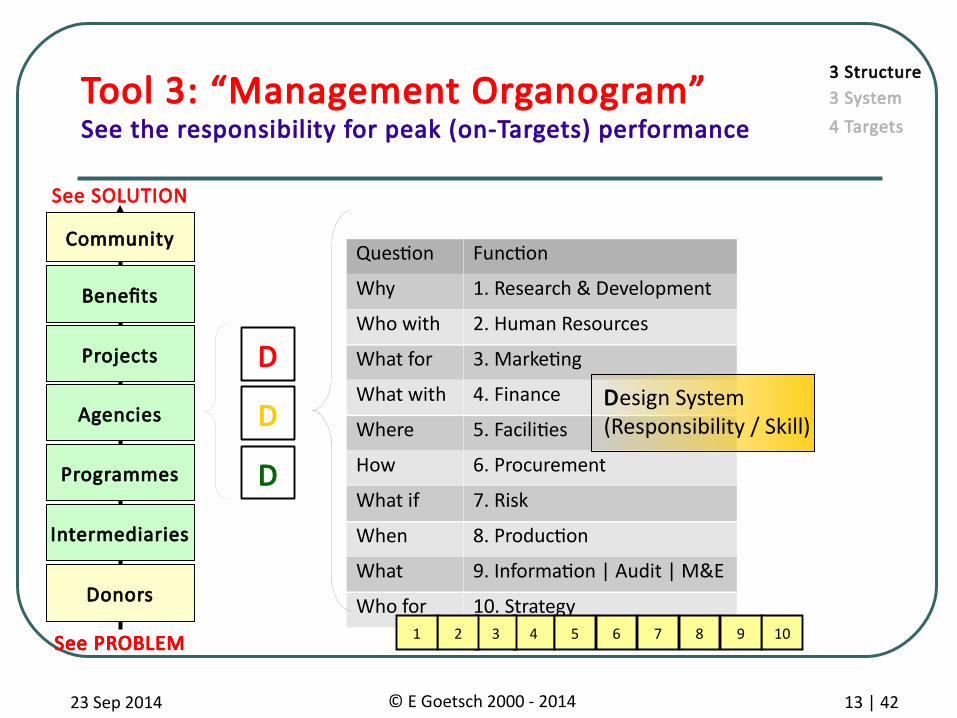
Tool 3: “Management Organogram”See the responsibility for peak (on-Targets) performance
Question Function
Why 1. Research & Development
Who with 2. Human Resources
What for 3. Marketing
What with 4. Finance
Where 5. Facilities
How 6. Procurement
What if 7. Risk
When 8. Production
What 9. Information | Audit | M&E
Who for 10. Strategy
3 System3 Structure
4 Targets
See PROBLEM
See SOLUTION
Benefits
Projects
Agencies
Programmes
Intermediaries
Community
Donors
See PROBLEM
D
D
D
Design System(Responsibility / Skill)
64 10321 7 8 95
23 Sep 2014 © E Goetsch 2000 - 2014 14 | 42
= 2 Assets
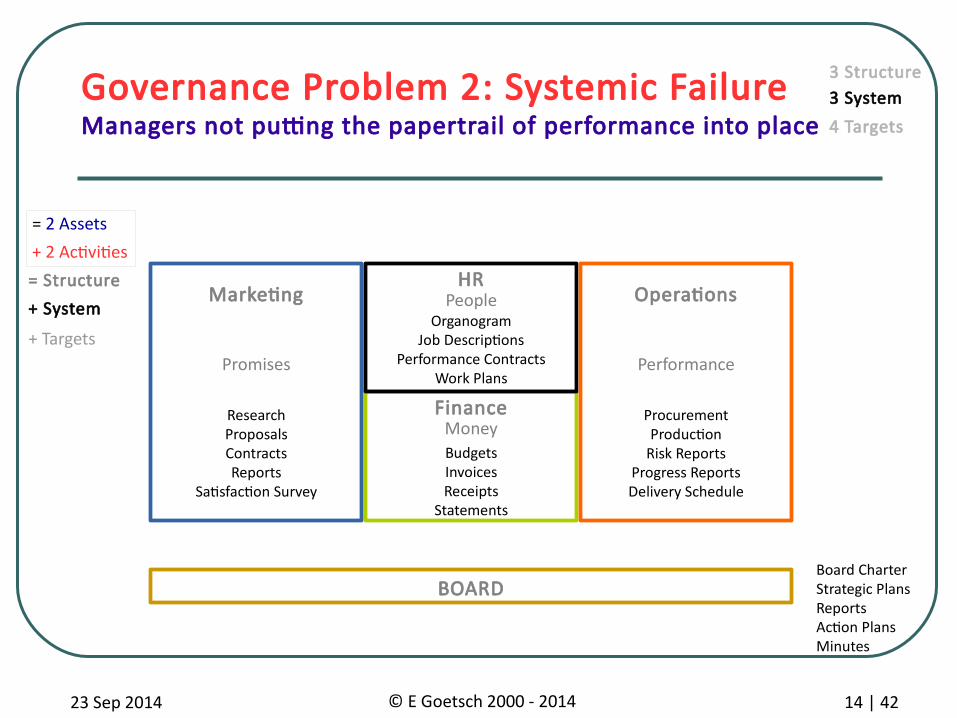
Governance Problem 2: Systemic FailureManagers not putting the papertrail of performance into place
MarketingHR
OperationsPeople
Performance
ResearchProposalsContractsReports
Satisfaction Survey
OrganogramJob Descriptions
Performance Contracts Work Plans
ProcurementProduction
Risk ReportsProgress ReportsDelivery Schedule
FinanceMoneyBudgetsInvoicesReceipts
Statements
BOARD
+ 2 Activities
Promises
+ System
= Structure
+ Targets
3 System3 Structure
4 Targets
Board Charter Strategic PlansReportsAction PlansMinutes
23 Sep 2014 © E Goetsch 2000 - 2014 15 | 42
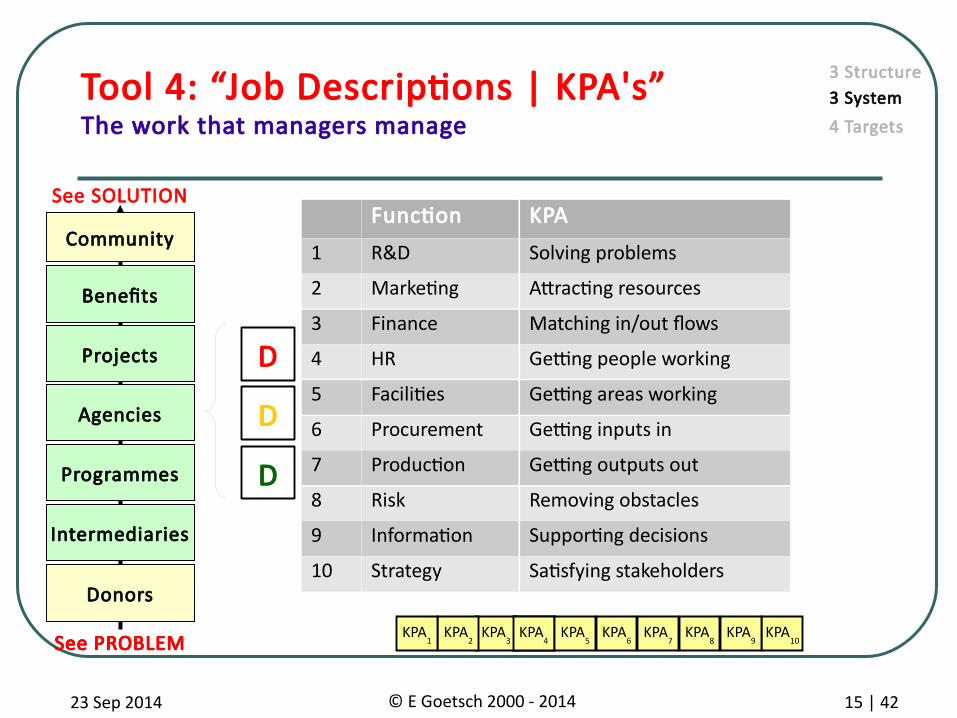
Tool 4: “Job Descriptions | KPA's”The work that managers manage
Function KPA
1 R&D Solving problems
2 Marketing Attracting resources
3 Finance Matching in/out flows
4 HR Getting people working
5 Facilities Getting areas working
6 Procurement Getting inputs in
7 Production Getting outputs out
8 Risk Removing obstacles
9 Information Supporting decisions
10 Strategy Satisfying stakeholders
3 System3 Structure
4 Targets
See PROBLEM
See SOLUTION
Benefits
Projects
Agencies
Programmes
Intermediaries
Community
Donors
See PROBLEM
D
D
D
KPA6
KPA4
KPA10
KPA3
KPA2
KPA1
KPA7
KPA8
KPA9
KPA4
KPA5
23 Sep 2014 © E Goetsch 2000 - 2014 16 | 42
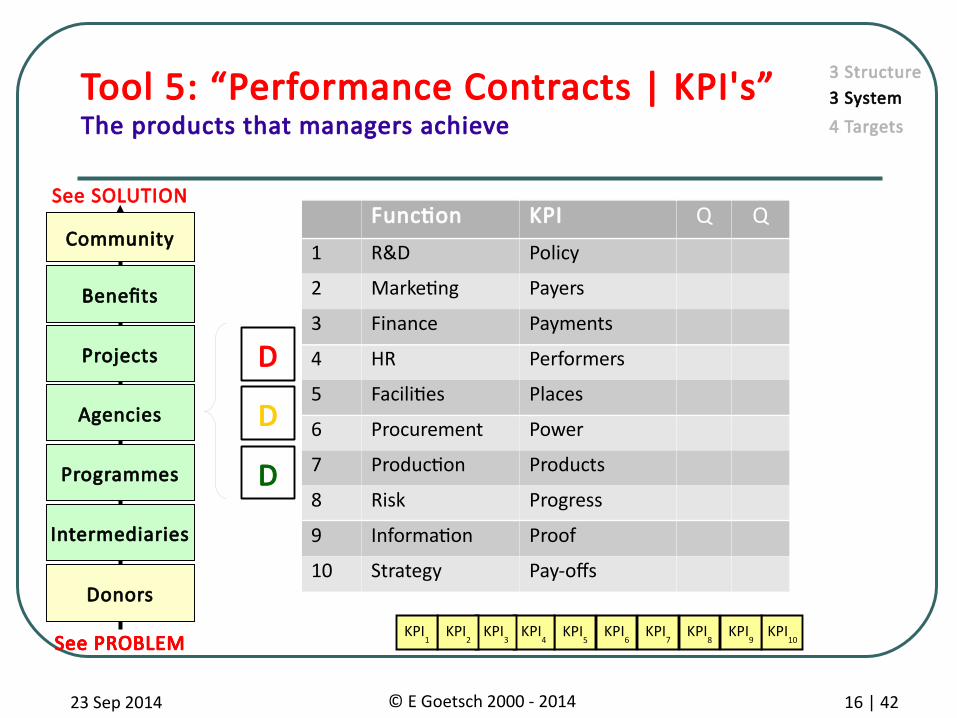
Tool 5: “Performance Contracts | KPI's”The products that managers achieve
3 System3 Structure
4 Targets
See PROBLEM
See SOLUTION
Benefits
Projects
Agencies
Programmes
Intermediaries
Community
Donors
See PROBLEM
D
D
D
Function KPI Q Q
1 R&D Policy
2 Marketing Payers
3 Finance Payments
4 HR Performers
5 Facilities Places
6 Procurement Power
7 Production Products
8 Risk Progress
9 Information Proof
10 Strategy Pay-ofs
KPI5
KPI6
KPI4
KPI10
KPI3
KPI2
KPI1
KPI7
KPI8
KPI9
23 Sep 2014 © E Goetsch 2000 - 2014 17 | 42
Payers Payments Products Proof Pay offPlacesPolicy People Power Progress
Marketing Finance Production StrategyM&EProcurementR&D HR Facilities Risk
What for What with When What Who ForWhereWhy Who with How What If
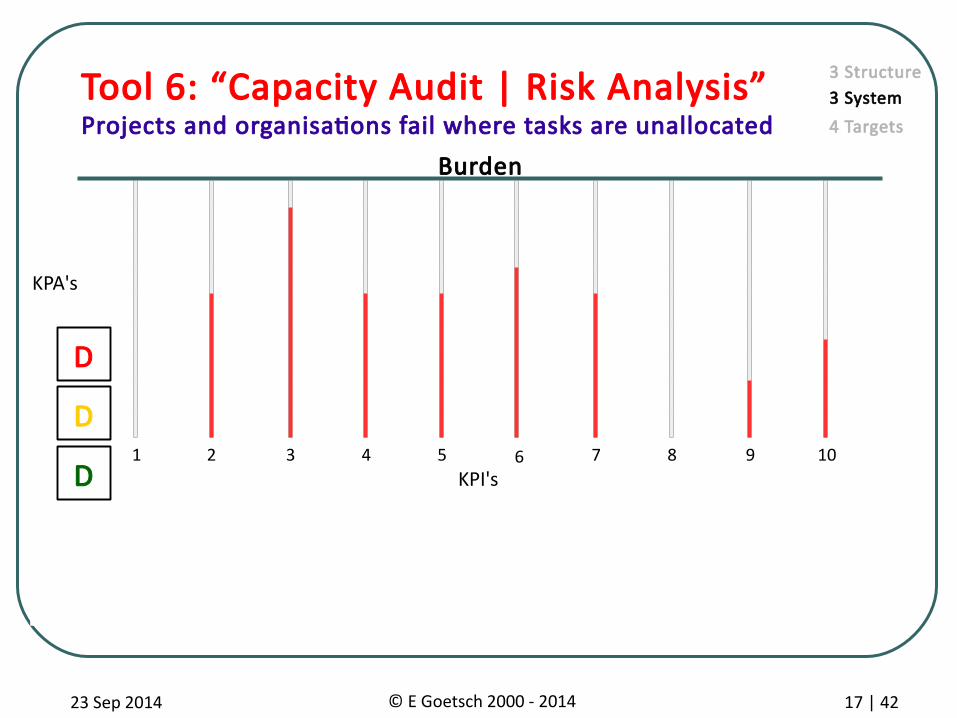
Tool 6: “Capacity Audit | Risk Analysis”Projects and organisations fail where tasks are unallocated
2 3 7 9 1051 4 6 8
Burden
3 System3 Structure
4 Targets
KPA's
KPI's
D
D
D
23 Sep 2014 © E Goetsch 2000 - 2014 18 | 42
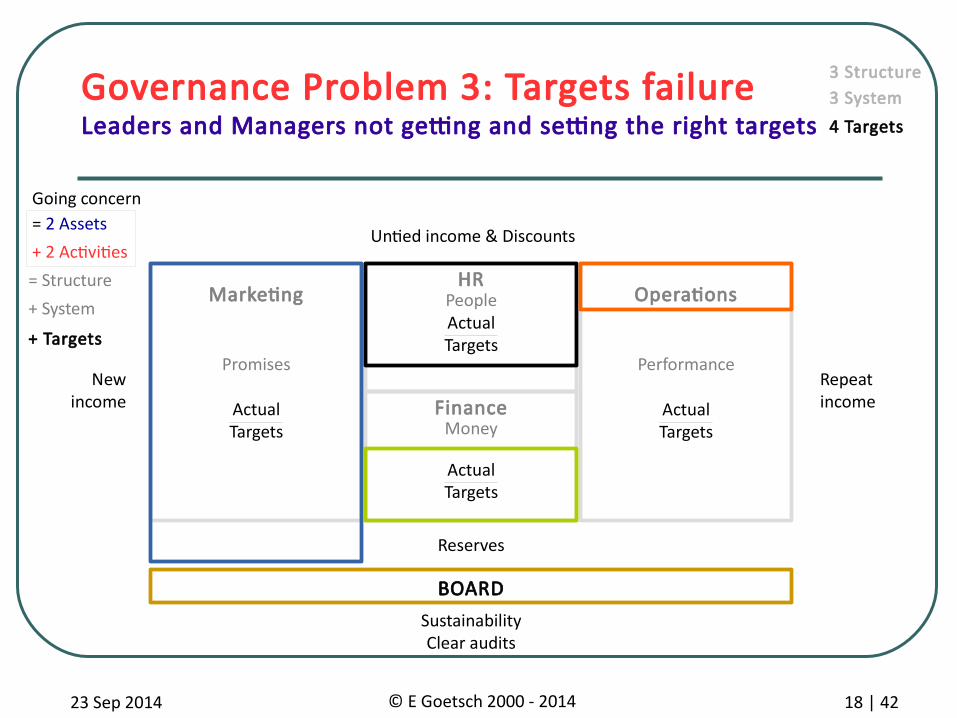
= 2 Assets
Governance Problem 3: Targets failureLeaders and Managers not getting and setting the right targets
MarketingHR
OperationsPeople
FinanceMoney
BOARD
SustainabilityClear audits
Going concern
+ 2 Activities
PerformancePromises
+ System
= Structure
+ Targets
Actual Targets
Actual Targets
Actual Targets
Actual Targets
Reserves
New income
Repeat income
3 System3 Structure
4 Targets
Untied income & Discounts
23 Sep 2014 © E Goetsch 2000 - 2014 19 | 42
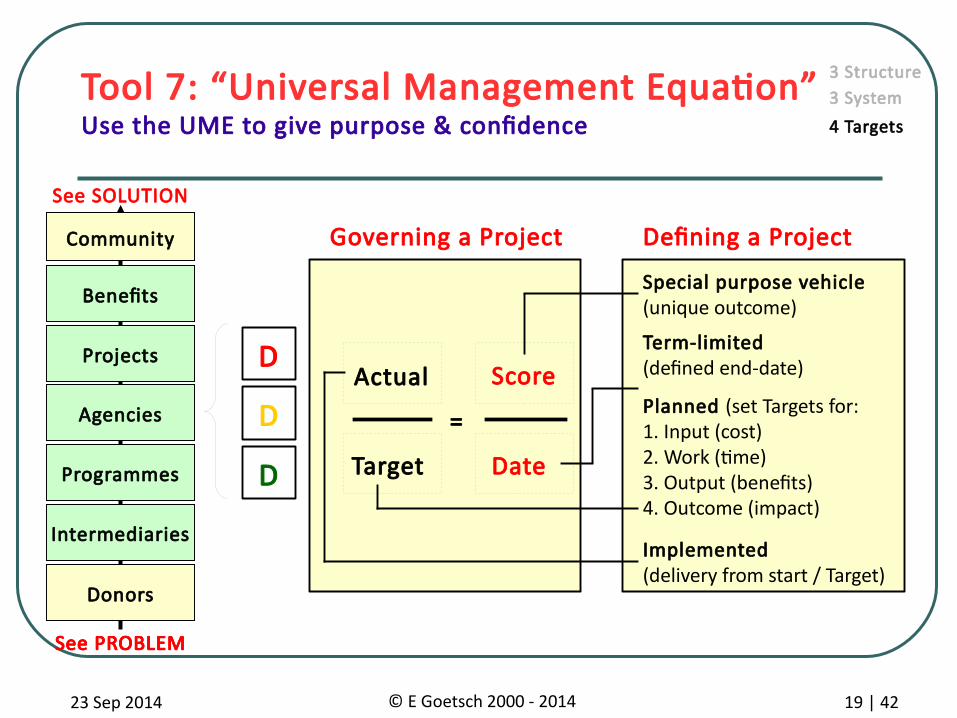
Planned (set Targets for:1. Input (cost)2. Work (time) 3. Output (benefits)4. Outcome (impact)
Actual
Target
Score
Tool 7: “Universal Management Equation”Use the UME to give purpose & confidence
Date
Defining a Project
Special purpose vehicle(unique outcome)
Term-limited(defined end-date)
Implemented(delivery from start / Target)
=
Governing a Project
3 System3 Structure
4 Targets
See PROBLEM
See SOLUTION
Benefits
Projects
Agencies
Programmes
Intermediaries
Community
Donors
See PROBLEM
D
D
D
23 Sep 2014 © E Goetsch 2000 - 2014 20 | 42
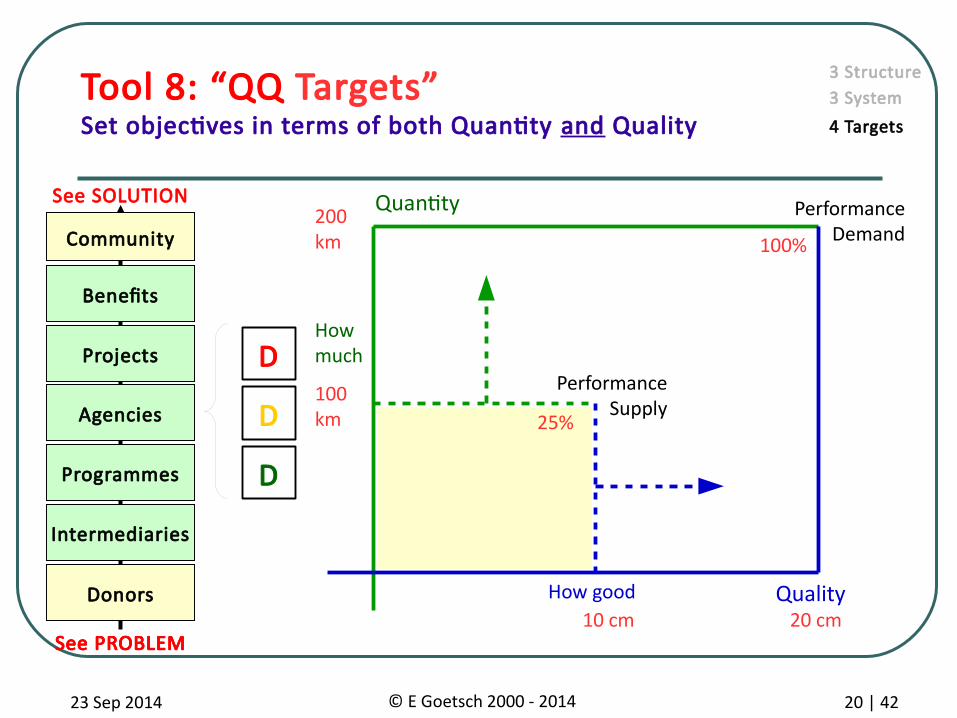
Tool 8: “QQ Targets”Set objectives in terms of both Quantity and Quality
How much
How good
Performance Supply
Quantity
Quality
Performance Demand
25%
100%200 km
100 km
10 cm 20 cm
3 System3 Structure
4 Targets
See PROBLEM
See SOLUTION
Benefits
Projects
Agencies
Programmes
Intermediaries
Community
Donors
See PROBLEM
D
D
D
23 Sep 2014 © E Goetsch 2000 - 2014 21 | 42
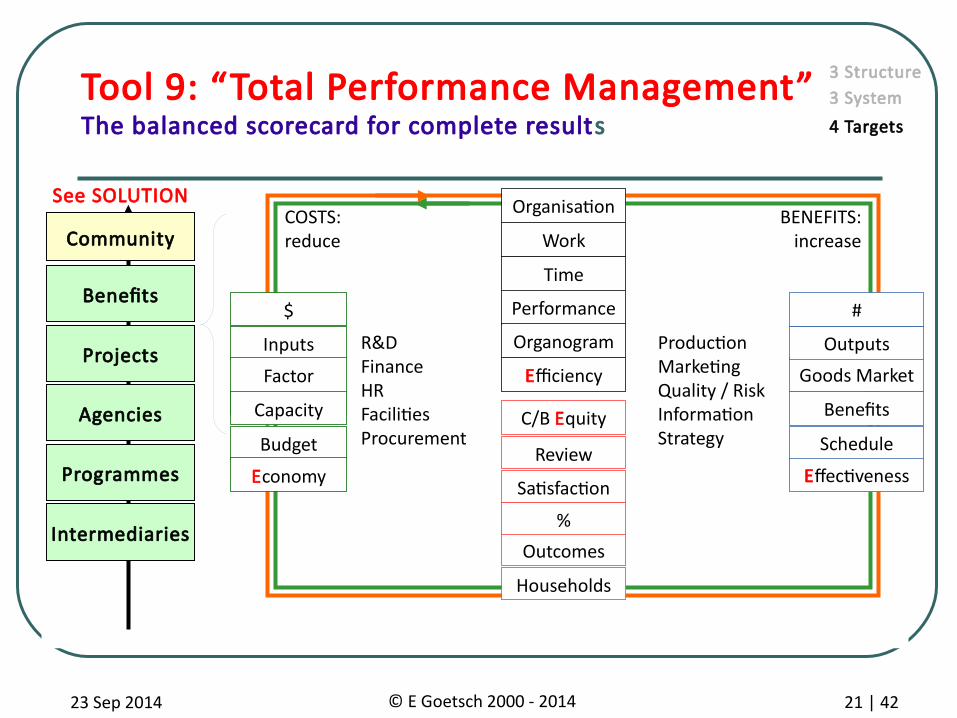
Satisfaction
Outcomes
Inputs
Households
Factor Market
Organisation
Work
Goods Market
Outputs
%
$
Time
#
Capacity
Performance
Benefits
COSTS: reduce
BENEFITS: increase
ProductionMarketingQuality / RiskInformationStrategyBudget
Organogram
Schedule
Tool 9: “Total Performance Management”The balanced scorecard for complete results
C/B Equity
Economy
Efficiency
Efectiveness
R&DFinance HRFacilitiesProcurement
Review
E X E L E N C EC L=X = e4
3 System3 Structure
4 Targets
See SOLUTION
Benefits
Projects
Agencies
Programmes
Intermediaries
Community
23 Sep 2014 © E Goetsch 2000 - 2014 22 | 42
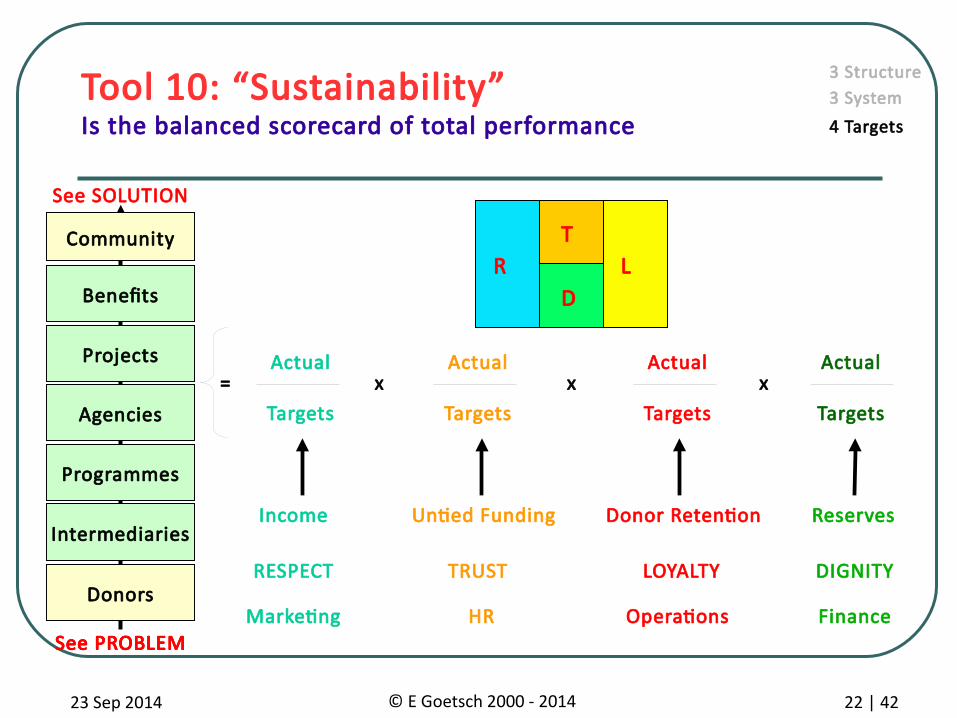
TRUST
Donor RetentionIncome
LOYALTYRESPECT
Untied Funding
Actual
Targetsx
Actual
Targetsx
Actual
Targets
Marketing OperationsHR Finance
Tool 10: “Sustainability”Is the balanced scorecard of total performance
DIGNITY
Reserves
Actual
Targetsx
R LD
T
=
3 System3 Structure
4 Targets
See PROBLEM
See SOLUTION
Benefits
Projects
Agencies
Programmes
Intermediaries
Community
Donors
See PROBLEM
23 Sep 2014 © E Goetsch 2000 - 2014 23 | 42
Contemporary Management Skills Development
(for Senior Managers)A structured approach for leading and managing
high-performance teams
22 September 2014Randburg Towers Hotel, Johannesburg
South AfricaQ U E S T I O N S?
Errol Goetsch+27 78 573 5046
[email protected] | www.xe4.org
23 Sep 2014 © E Goetsch 2000 - 2014 24 | 42
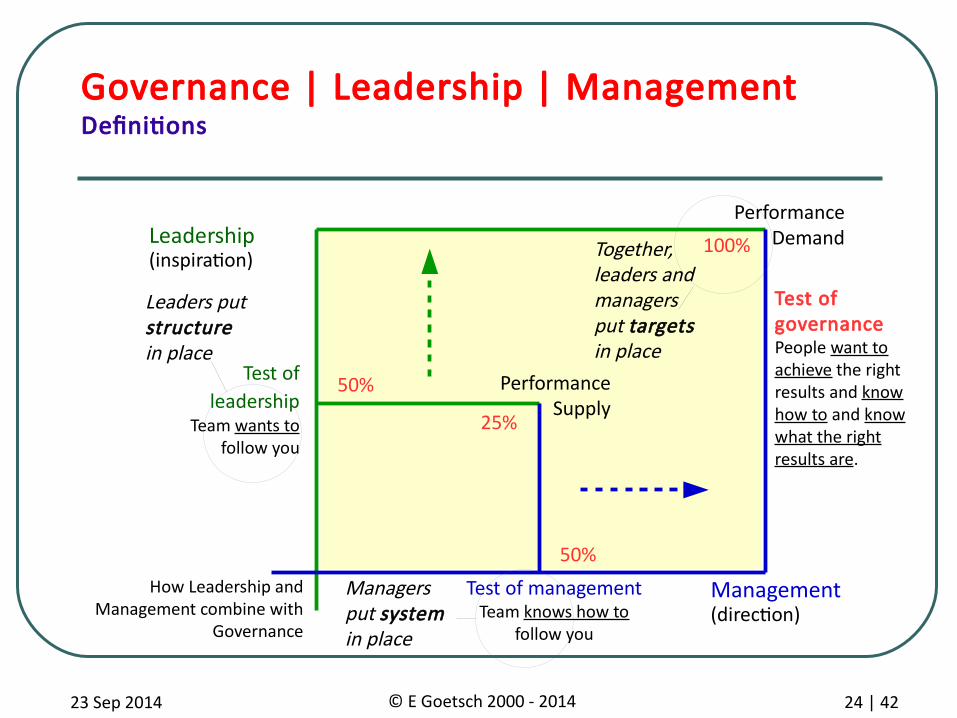
Governance | Leadership | ManagementDefinitions
Test of leadership
Team wants to follow you
Test of management Team knows how to
follow you
Performance Supply
Leadership
Management
Performance Demand
25%
100%(inspiration)
(direction)How Leadership and
Management combine with Governance
Leaders put structure in place
Managers put system in place
Together, leaders and managers put targets in place
50%
50%
Test of governancePeople want to achieve the right results and know how to and know what the right results are.

23 Sep 2014 © E Goetsch 2000 - 2014 25 | 42
+ System
= 2 AssetsGoing concern
Governance | Leadership | ManagementIn operation
MarketingHR
OperationsPeople
Delivering Performance
ResearchProposalsContractsReports
Satisfaction Survey
OrganogramJob Descriptions
Performance Contracts Work Plans
ProcurementProduction
Risk ReportsProgress ReportsDelivery Schedule
FinanceMoneyBudgetsInvoicesReceipts
Statements
Reserves
BOARD
Sustainability Clear Audits
New income
Repeat income
+ 2 Activities
Strategic PlansReportsAction PlansMinutes
Making Promises
+ Targets
= Structure
Leadership
Management
How Leadership and Management combine as Governance
People want to and know how to to and know what are right results
Untied income & Discounts
23 Sep 2014 © E Goetsch 2000 - 2014 26 | 42
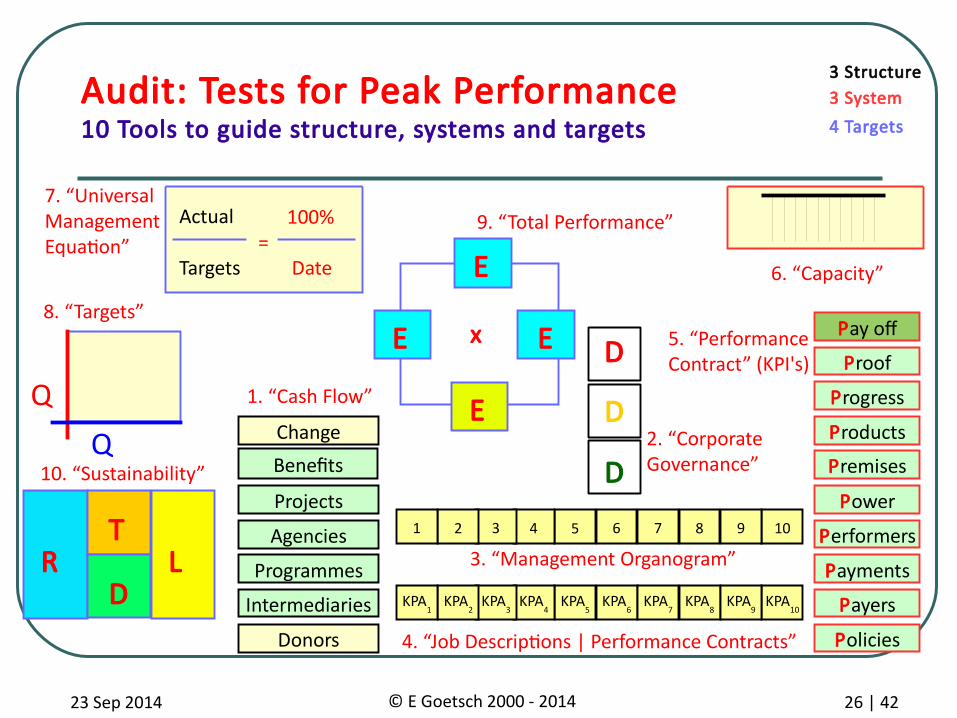
Premises
Power
Products
Policies
Progress
Proof
Pay of
1. “Cash Flow”
5. “Performance Contract” (KPI's)D
D
D
9. “Total Performance”
Performers
Payments
Payers
7. “Universal Management Equation”
Actual
Targets
100%= Date E
EE
E
x
10. “Sustainability”
R LD
T
Audit: Tests for Peak Performance10 Tools to guide structure, systems and targets
2. “Corporate Governance”
Q
Q
8. “Targets”
Benefits
Projects
Change
Donors
Agencies
Programmes
Intermediaries
6. “Capacity”
KPA5
KPA6
KPA4
KPA10
KPA3
KPA2
KPA1
KPA7
KPA8
KPA9
3. “Management Organogram”
3 System3 Structure
4 Targets
5 64 10321 7 8 9
4. “Job Descriptions | Performance Contracts”
23 Sep 2014 © E Goetsch 2000 - 2014 27 | 42
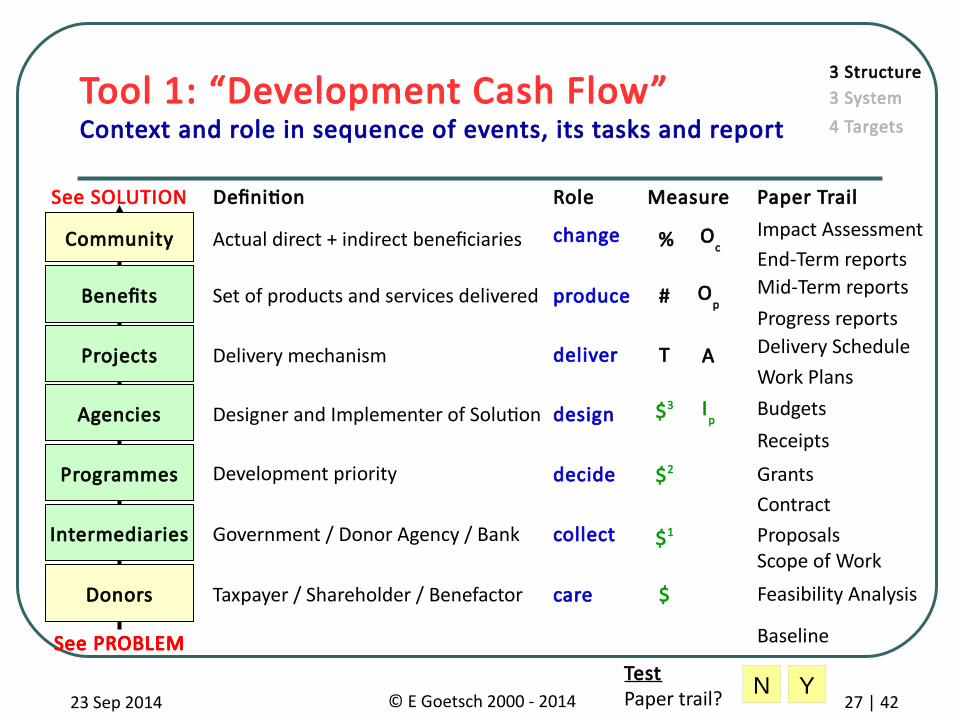
collect
design
decide
produce
deliver
change
$1
T
%
Set of products and services delivered
Delivery mechanism
Designer and Implementer of Solution
Development priority
Government / Donor Agency / Bank
Actual direct + indirect beneficiaries
Taxpayer / Shareholder / Benefactor care
See PROBLEM
See SOLUTION
Benefits
Projects
Agencies
Programmes
Intermediaries
Community
Donors
See PROBLEM
Paper Trail
Tool 1: “Development Cash Flow”Context and role in sequence of events, its tasks and report
#
$3
$2
$
Budgets
Work Plans
Impact Assessment
Baseline
Progress reports
Mid-Term reports
Receipts
End-Term reports
Proposals
Delivery Schedule
Scope of Work
Feasibility Analysis
ContractGrants
3 System3 Structure
4 Targets
A
Oc
Op
Ip
Definition Role Measure
TestPaper trail? N Y
23 Sep 2014 © E Goetsch 2000 - 2014 28 | 42
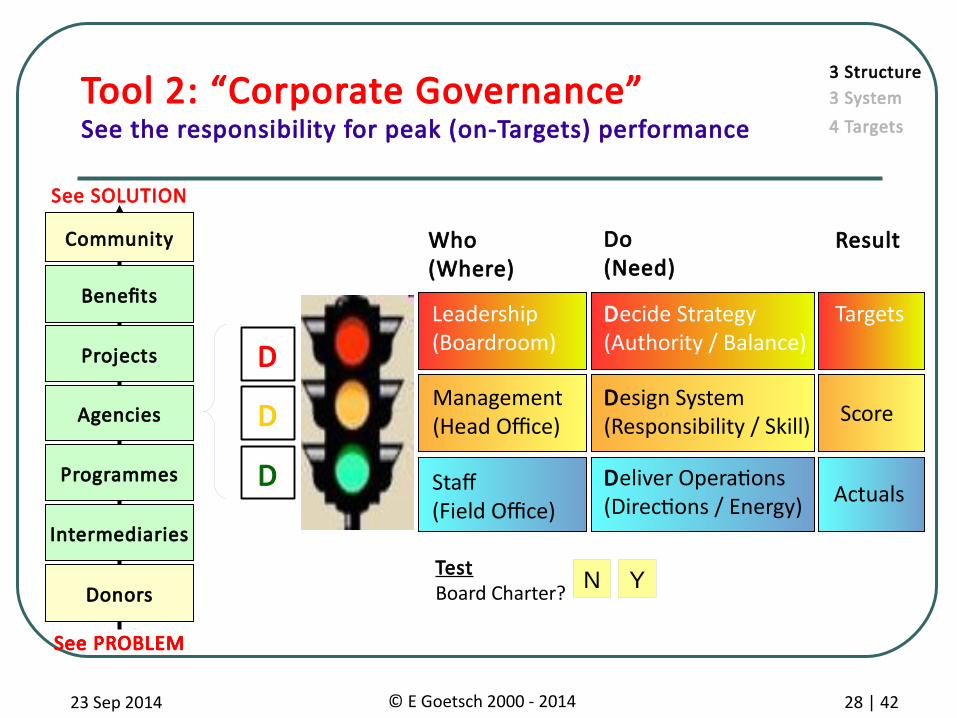
Leadership(Boardroom)
Management(Head Office)
Targets
Score
Decide Strategy (Authority / Balance)
Design System(Responsibility / Skill)
Who (Where)
Do (Need)
Result
Deliver Operations(Directions / Energy) ActualsStaf
(Field Office)
Tool 2: “Corporate Governance”See the responsibility for peak (on-Targets) performance
3 System3 Structure
4 Targets
See PROBLEM
See SOLUTION
Benefits
Projects
Agencies
Programmes
Intermediaries
Community
Donors
See PROBLEM
D
D
D
TestBoard Charter? N Y
23 Sep 2014 © E Goetsch 2000 - 2014 29 | 42
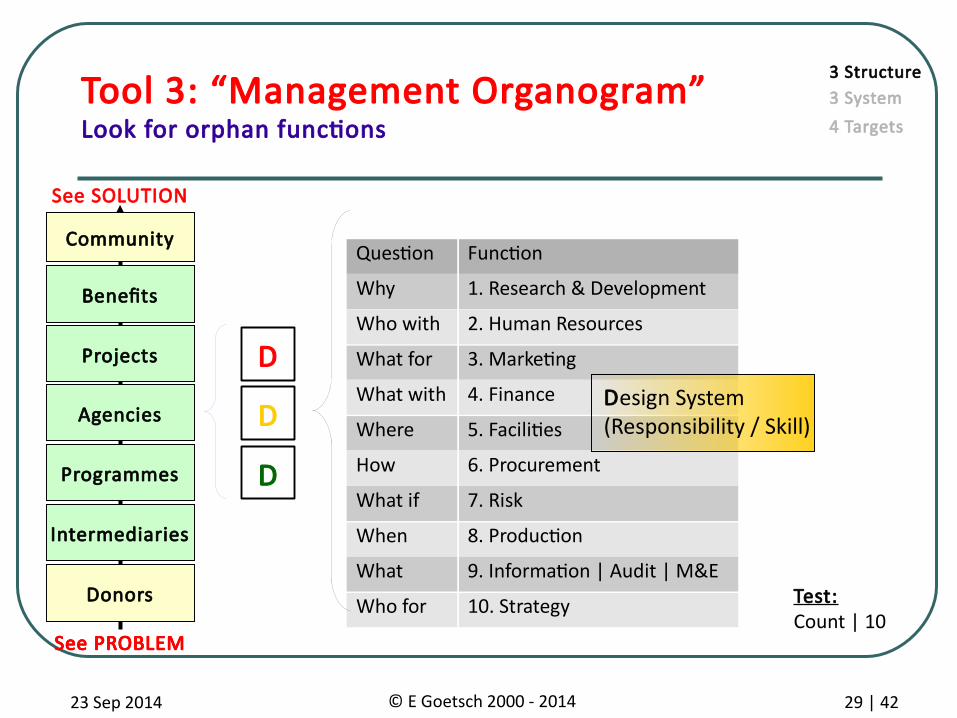
Tool 3: “Management Organogram”Look for orphan functions
Question Function
Why 1. Research & Development
Who with 2. Human Resources
What for 3. Marketing
What with 4. Finance
Where 5. Facilities
How 6. Procurement
What if 7. Risk
When 8. Production
What 9. Information | Audit | M&E
Who for 10. Strategy
3 System3 Structure
4 Targets
See PROBLEM
See SOLUTION
Benefits
Projects
Agencies
Programmes
Intermediaries
Community
Donors
See PROBLEM
D
D
D
Design System(Responsibility / Skill)
Test:Count | 10
23 Sep 2014 © E Goetsch 2000 - 2014 30 | 42
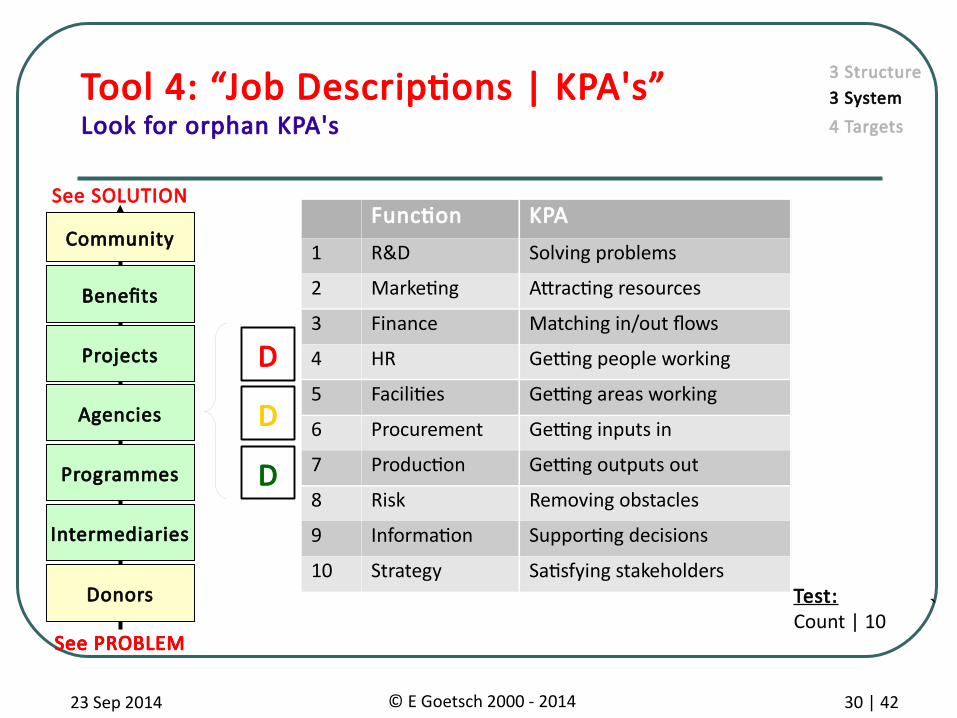
Tool 4: “Job Descriptions | KPA's”Look for orphan KPA's
Function KPA
1 R&D Solving problems
2 Marketing Attracting resources
3 Finance Matching in/out flows
4 HR Getting people working
5 Facilities Getting areas working
6 Procurement Getting inputs in
7 Production Getting outputs out
8 Risk Removing obstacles
9 Information Supporting decisions
10 Strategy Satisfying stakeholders
3 System3 Structure
4 Targets
See PROBLEM
See SOLUTION
Benefits
Projects
Agencies
Programmes
Intermediaries
Community
Donors
See PROBLEM
D
D
D
Test:Count | 10 `
23 Sep 2014 © E Goetsch 2000 - 2014 31 | 42
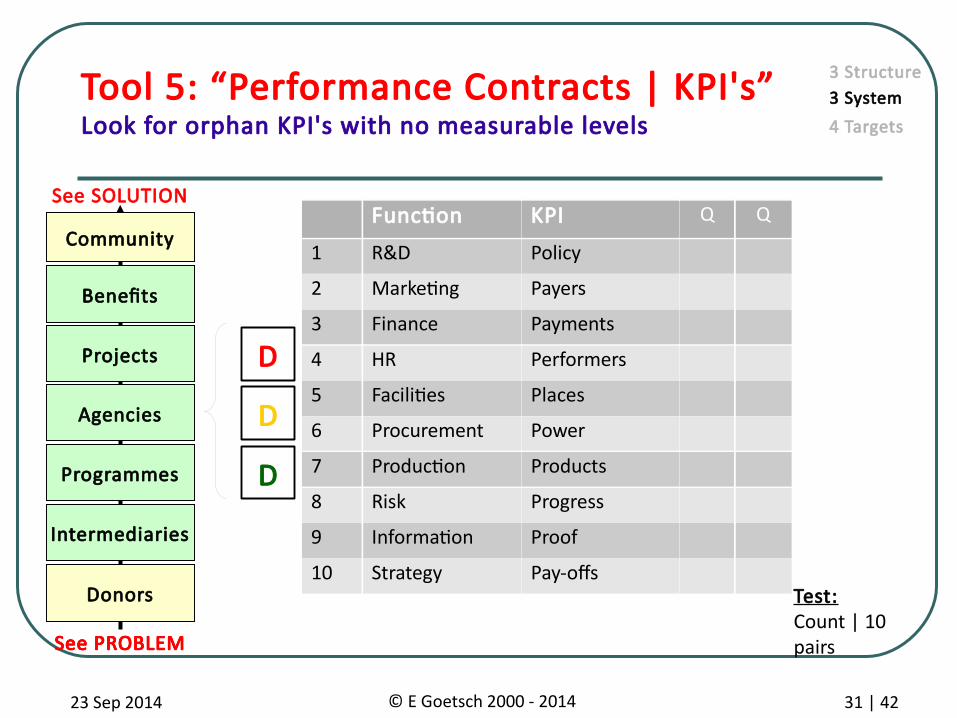
Tool 5: “Performance Contracts | KPI's”Look for orphan KPI's with no measurable levels
3 System3 Structure
4 Targets
See PROBLEM
See SOLUTION
Benefits
Projects
Agencies
Programmes
Intermediaries
Community
Donors
See PROBLEM
D
D
D
Function KPI Q Q
1 R&D Policy
2 Marketing Payers
3 Finance Payments
4 HR Performers
5 Facilities Places
6 Procurement Power
7 Production Products
8 Risk Progress
9 Information Proof
10 Strategy Pay-ofsTest:Count | 10 pairs
23 Sep 2014 © E Goetsch 2000 - 2014 32 | 42
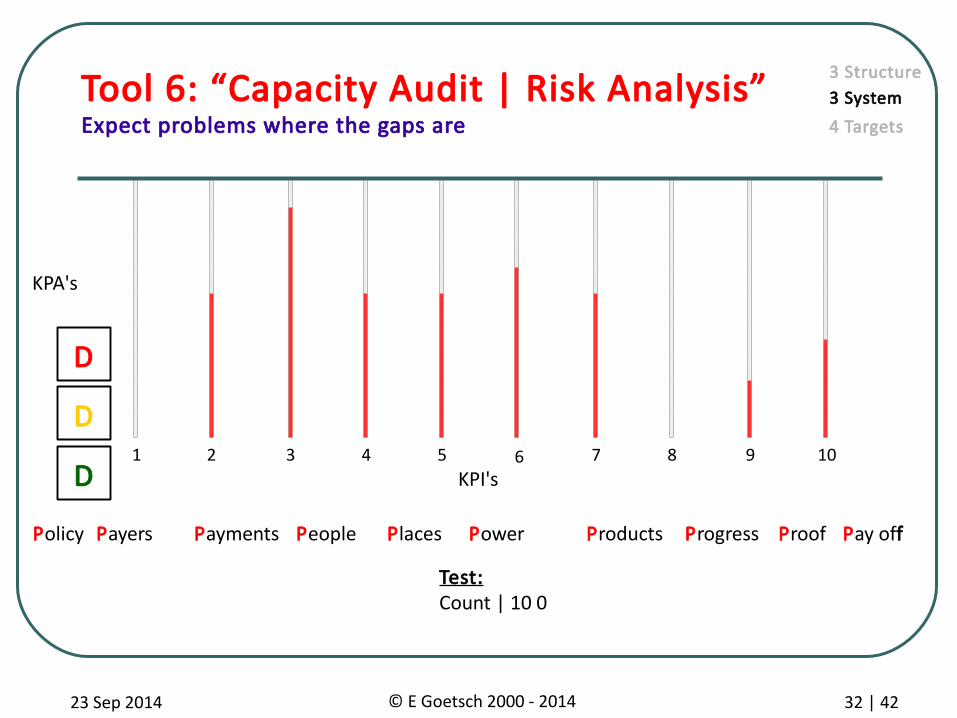
Payers Payments Products Proof Pay offPlacesPolicy People Power Progress
Tool 6: “Capacity Audit | Risk Analysis”Expect problems where the gaps are
2 3 7 9 1051 4 6 8
3 System3 Structure
4 Targets
KPA's
KPI's
D
D
D
Test:Count | 10 0
23 Sep 2014 © E Goetsch 2000 - 2014 33 | 42
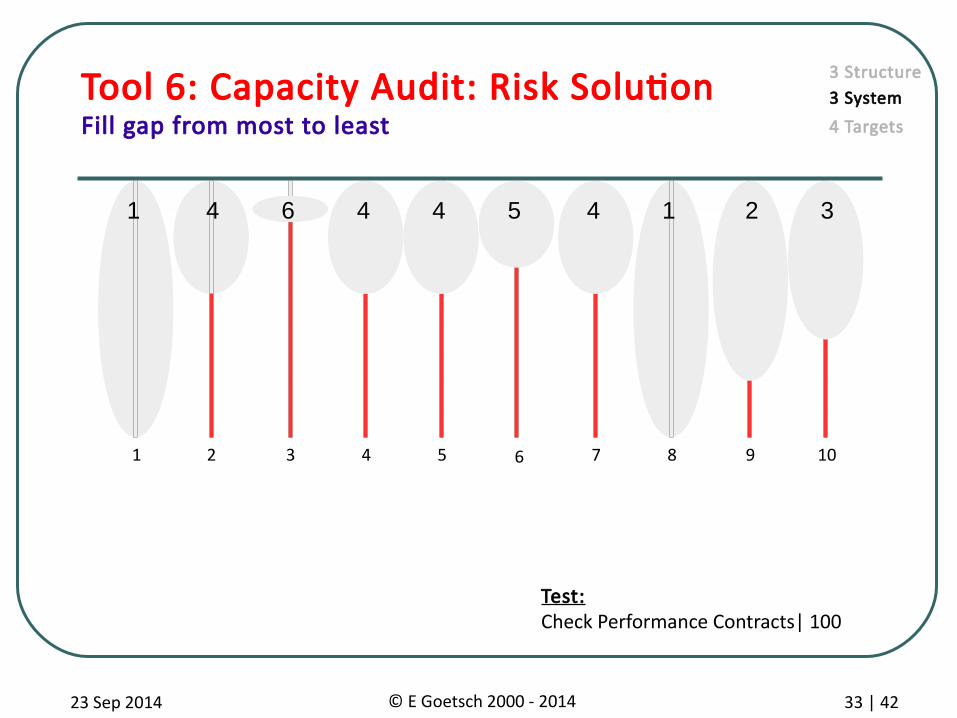
Tool 6: Capacity Audit: Risk SolutionFill gap from most to least
2 3 7 9 1051 4 6 8
1 1 2 34 4 4 456
3 System3 Structure
4 Targets
Test:Check Performance Contracts| 100
23 Sep 2014 © E Goetsch 2000 - 2014 34 | 42
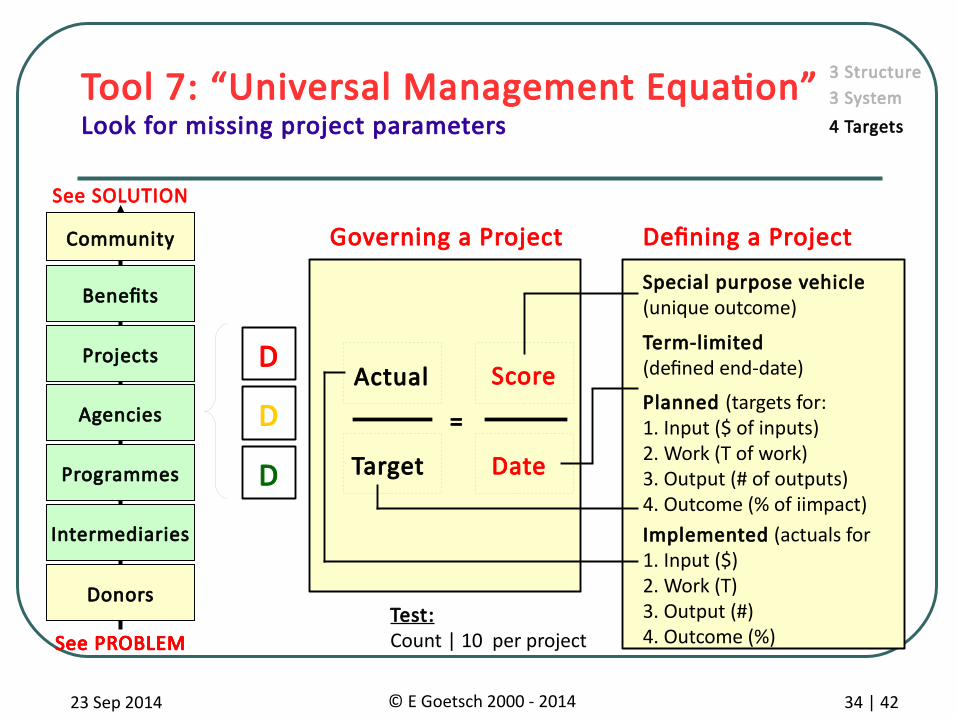
Planned (targets for:1. Input ($ of inputs)2. Work (T of work) 3. Output (# of outputs)4. Outcome (% of iimpact)
Actual
Target
Score
Tool 7: “Universal Management Equation”Look for missing project parameters
Date
Defining a Project
Special purpose vehicle(unique outcome)
Term-limited(defined end-date)
Implemented (actuals for1. Input ($)2. Work (T) 3. Output (#)4. Outcome (%)
=
Governing a Project
3 System3 Structure
4 Targets
See PROBLEM
See SOLUTION
Benefits
Projects
Agencies
Programmes
Intermediaries
Community
Donors
See PROBLEM
D
D
D
Test:Count | 10 per project
23 Sep 2014 © E Goetsch 2000 - 2014 35 | 42
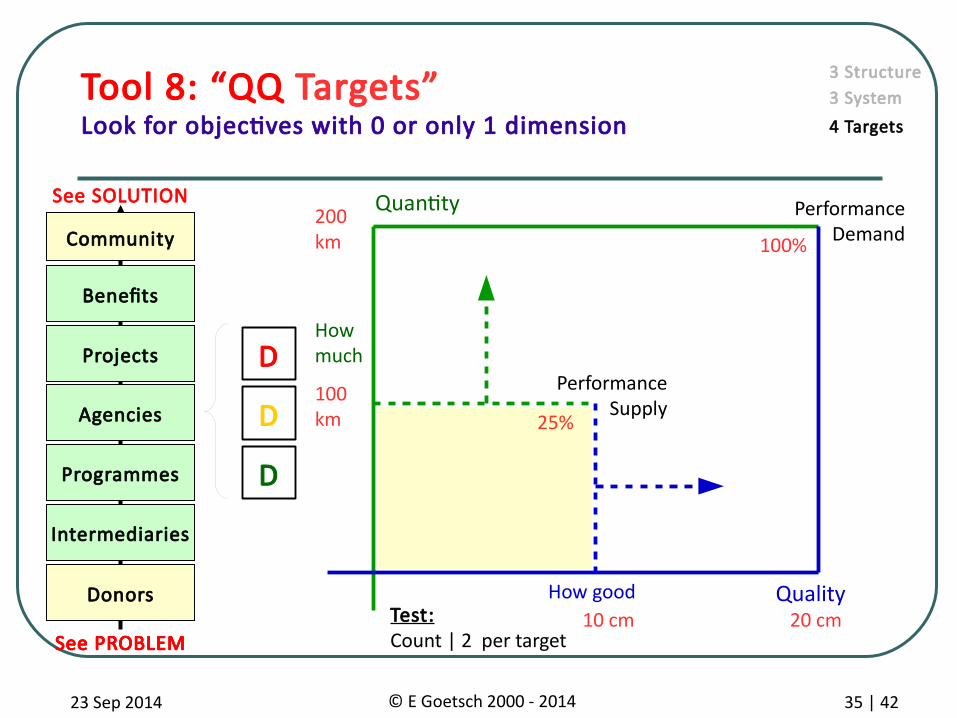
Tool 8: “QQ Targets”Look for objectives with 0 or only 1 dimension
How much
How good
Performance Supply
Quantity
Quality
Performance Demand
25%
100%200 km
100 km
10 cm 20 cm
3 System3 Structure
4 Targets
See PROBLEM
See SOLUTION
Benefits
Projects
Agencies
Programmes
Intermediaries
Community
Donors
See PROBLEM
D
D
D
Test:Count | 2 per target
23 Sep 2014 © E Goetsch 2000 - 2014 36 | 42
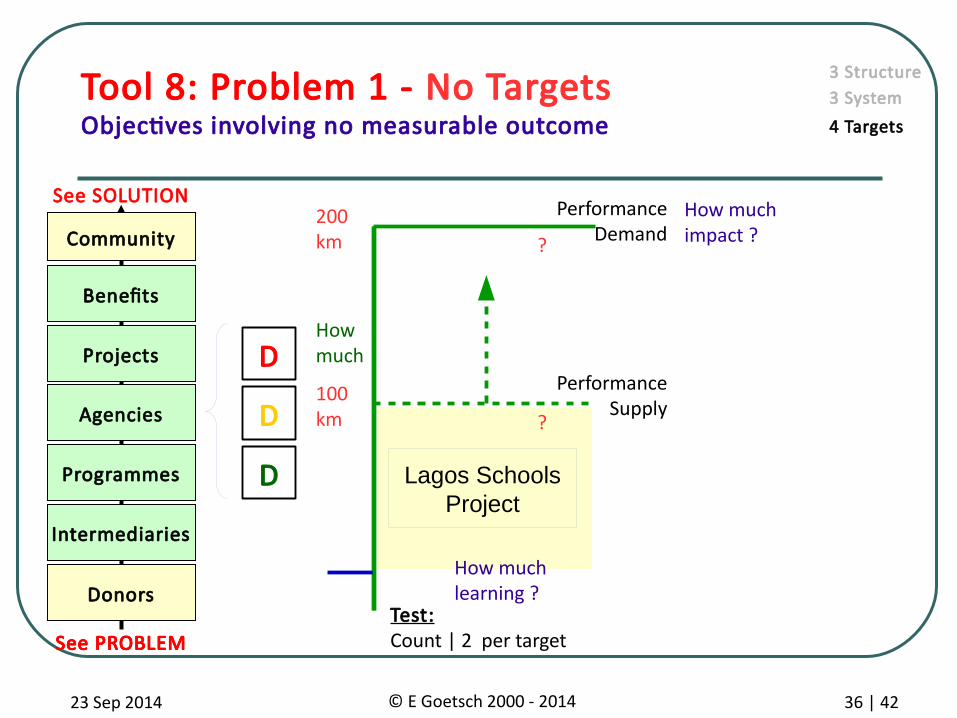
Tool 8: Problem 1 - No TargetsObjectives involving no measurable outcome
Performance Supply
Performance Demand
?
?
Lagos SchoolsProject
How much learning ?
How much impact ?
3 System3 Structure
4 Targets
How much
200 km
100 km
See PROBLEM
See SOLUTION
Benefits
Projects
Agencies
Programmes
Intermediaries
Community
Donors
See PROBLEM
D
D
D
Test:Count | 2 per target
23 Sep 2014 © E Goetsch 2000 - 2014 37 | 42
Satisfaction
Outcomes
Inputs
Households
Factor Market
OrganisationsWork
Goods Market
Outputs
%
$
Time
#
Capacity
Performance
Benefits
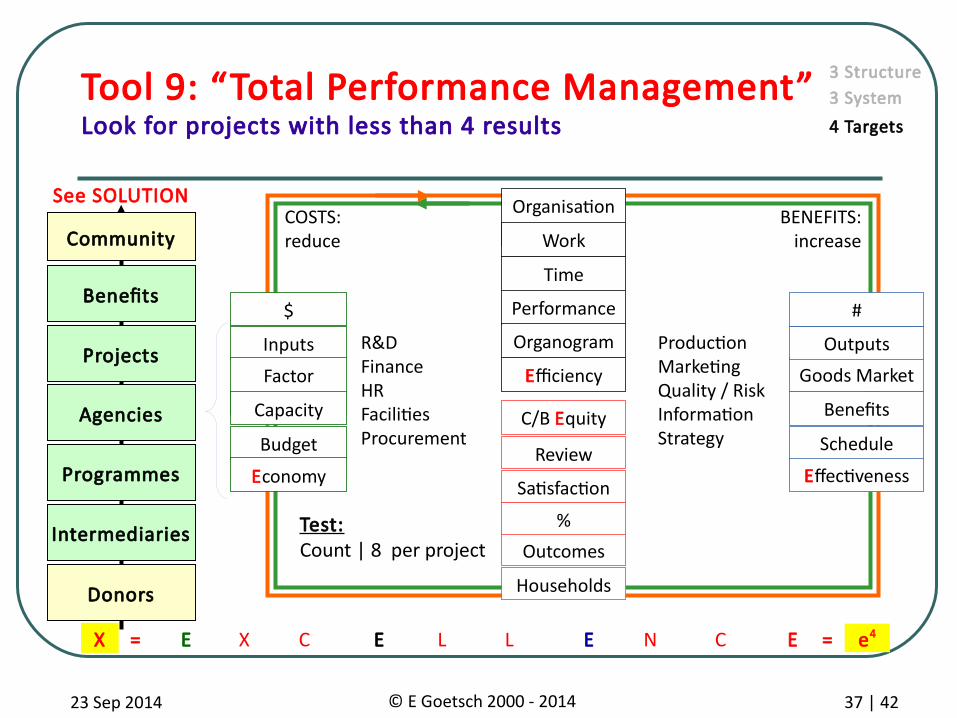
COSTS: reduce
BENEFITS: increase
ProductionMarketingQuality / RiskInformationStrategyBudget
Organogram
Schedule
Tool 9: “Total Performance Management”Look for projects with less than 4 results
C/B Equity
Economy
Efficiency
Efectiveness
R&DFinance HRFacilitiesProcurement
Review
E X E L E N C EC L=X = e4
3 System3 Structure
4 Targets
Test:Count | 8 per project
See SOLUTION
Benefits
Projects
Agencies
Programmes
Intermediaries
Community
Donors
23 Sep 2014 © E Goetsch 2000 - 2014 38 | 42
Satisfaction
Outcomes
Inputs
Households
Factor Market
OrganisationsWork
Goods Market
Outputs
%
$
Time
#
Capacity
Performance
Benefits
COSTS: reduce
BENEFITS: increase
ProductionMarketingQuality / RiskInformationStrategyBudget
Organogram
Schedule
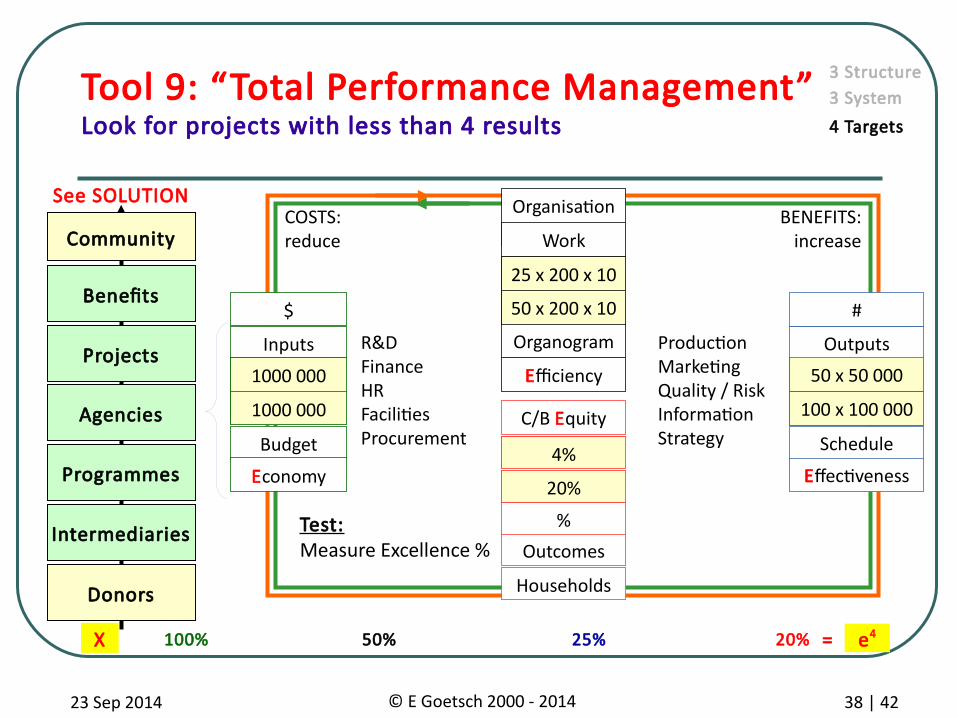
Tool 9: “Total Performance Management”Look for projects with less than 4 results
C/B Equity
Economy
Efficiency
Efectiveness
R&DFinance HRFacilitiesProcurement
Review
100% 50% 25% 20%X = e4
3 System3 Structure
4 Targets
Test:Measure Excellence %
20%
1000 000 50 x 50 000
25 x 200 x 10
1000 000
50 x 200 x 10
100 x 100 000
4%
See SOLUTION
Benefits
Projects
Agencies
Programmes
Intermediaries
Community
Donors
23 Sep 2014 © E Goetsch 2000 - 2014 39 | 42
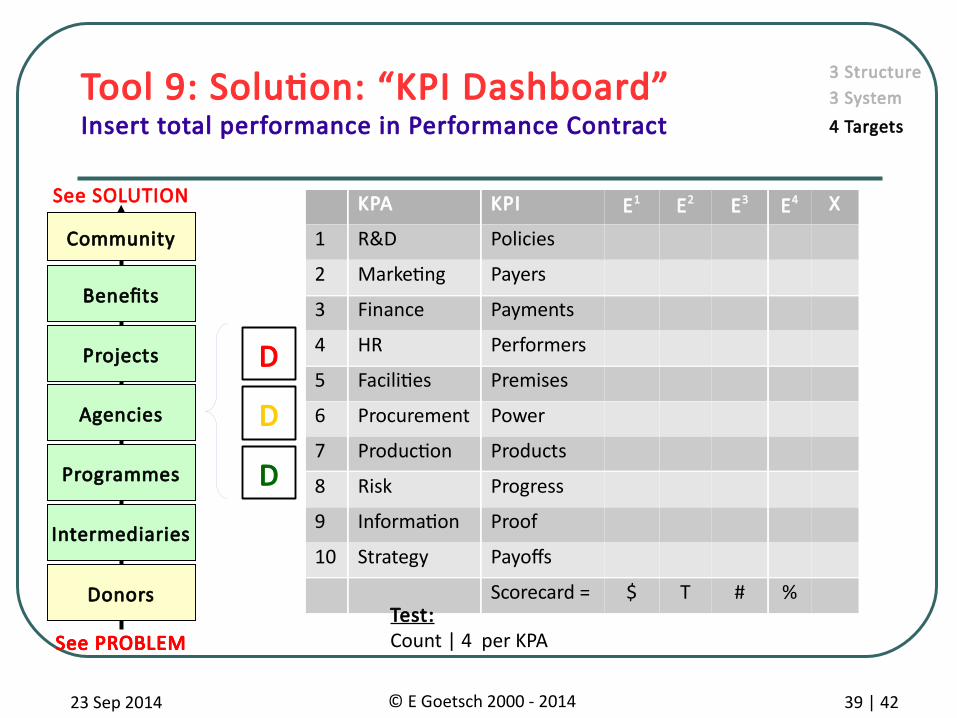
Tool 9: Solution: “KPI Dashboard”Insert total performance in Performance Contract
KPA KPI E1 E2 E3 E4 X
1 R&D Policies
2 Marketing Payers
3 Finance Payments
4 HR Performers
5 Facilities Premises
6 Procurement Power
7 Production Products
8 Risk Progress
9 Information Proof
10 Strategy Payofs
Scorecard = $ T # %
3 System3 Structure
4 Targets
See PROBLEM
See SOLUTION
Benefits
Projects
Agencies
Programmes
Intermediaries
Community
Donors
See PROBLEM
D
D
D
Test:Count | 4 per KPA
23 Sep 2014 © E Goetsch 2000 - 2014 40 | 42
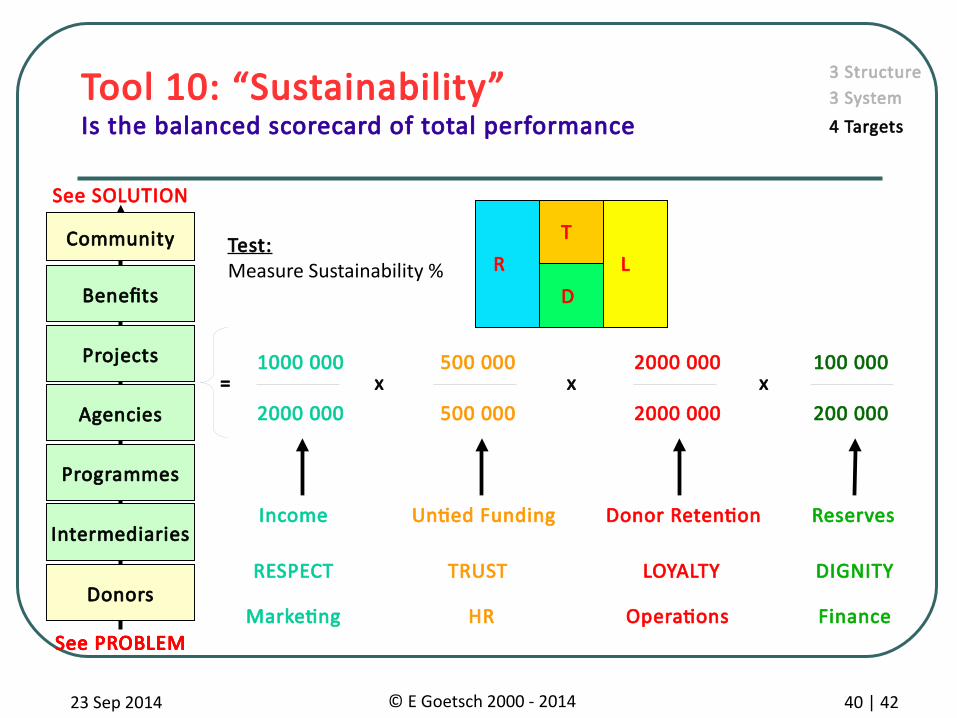
TRUST
Donor RetentionIncome
LOYALTYRESPECT
Untied Funding
1000 000
2000 000x
500 000
500 000x
2000 000
2000 000
Marketing OperationsHR Finance
Tool 10: “Sustainability”Is the balanced scorecard of total performance
DIGNITY
Reserves
100 000
200 000x
R L
D
T
=
3 System3 Structure
4 Targets
See PROBLEM
See SOLUTION
Benefits
Projects
Agencies
Programmes
Intermediaries
Community
Donors
See PROBLEM
Test:Measure Sustainability %
23 Sep 2014 © E Goetsch 2000 - 2014 41 | 42
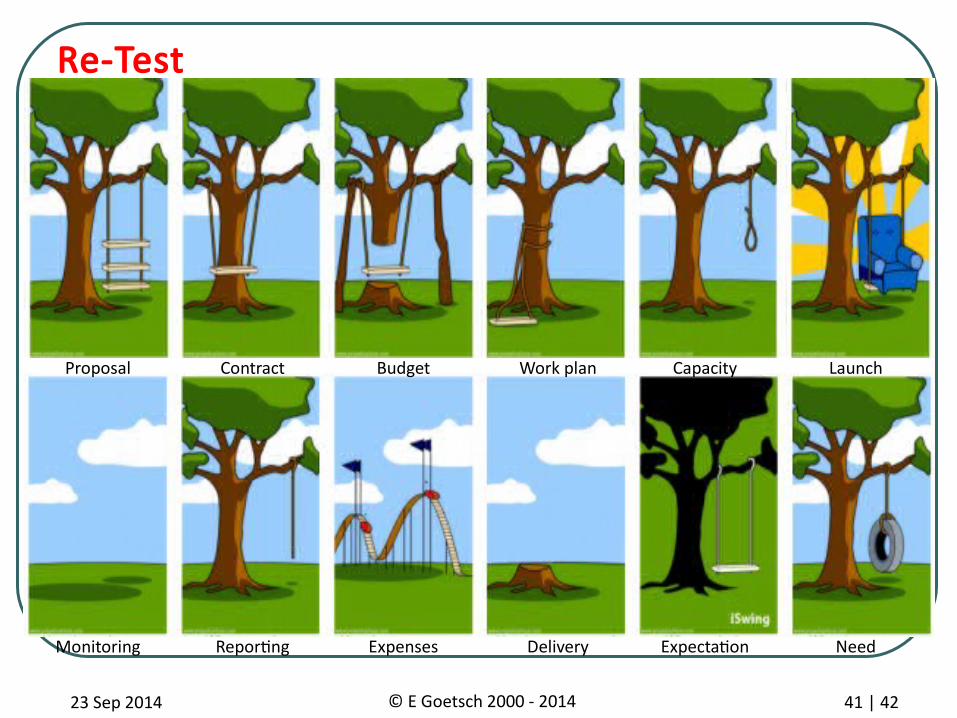
Proposal Contract Budget Work plan Capacity Launch
Monitoring Reporting Expenses Delivery Expectation Need
Re-Test
23 Sep 2014 © E Goetsch 2000 - 2014 42 | 42
Contemporary Management Skills Development
(for Senior Managers)A structured approach for leading and managing
high-performance teams
22 September 2014Randburg Towers Hotel, Johannesburg
South AfricaT H A N K Y O U
Errol Goetsch+27 78 573 5046
[email protected] | www.xe4.org


