Embed Size (px)
Citation preview


Corporate Performance Management

August-Wilhelm ScheerWolfram Jost · Helge HeßAndreas KronzEditors
CorporatePerformanceManagementARIS in Practice
With 145 Figuresand 5 Tables
123

Professor Dr. Dr. h.c. mult. August-Wilhelm ScheerE-Mail: [email protected]
Dr. Wolfram JostE-Mail: [email protected]
Dr. Helge HeßE-Mail: [email protected]
Dr. Andreas KronzE-Mail: [email protected]
IDS Scheer AGPostfach 10 15 3466015 SaarbrückenGermany
Original German edition published by Springer, 2005
Cataloging-in-Publication Data
Library of Congress Control Number: 2005936459
ISBN-10 3-540-30703-6 Springer Berlin Heidelberg New YorkISBN-13 978-3-540-30703-6 Springer Berlin Heidelberg New York
This work is subject to copyright. All rights are reserved, whether the whole or part ofthe material is concerned, specifically the rights of translation, reprinting, reuse ofillustrations, recitation, broadcasting, reproduction on microfilm or in any other way,and storage in data banks. Duplication of this publication or parts thereof is permittedonly under the provisions of the German Copyright Law of September 9, 1965, in its current version, and permission for use must always be obtained from Springer-Verlag.Violations are liable for prosecution under the German Copyright Law.
Springer is a part of Springer Science+Business Mediaspringeronline.com
© Springer-Verlag Berlin Heidelberg 2006Printed in Germany
The use of general descriptive names, registered names, trademarks, etc. in this publication does not imply, even in the absence of a specific statement, that such namesare exempt from the relevant protective laws and regulations and therefore free for general use.
Cover design: design & production GmbHProduction: Helmut PetriPrinting: Strauss Offsetdruck
SPIN 11594000 Printed on acid-free paper – 43/3153 – 5 4 3 2 1 0
Preface
Over the years, the discipline of process management has been discussed in terms
of a wide range of issues and approaches. When the concept was first mentioned
in the media 12 years ago, discussions initially centered on whether sweeping
changes along the lines of Business Reengineering or smaller, incremental steps
would prove more successful, or the optimum form of the notation for document-
ing workflow sequences.
Since these beginnings, Process Management has become an important control in-
strument in many companies, because its practitioners realized that optimizing a
company's capacity to create value in the form of processes has a direct and im-
mediate effect on the bottom line. While process optimization is undoubtedly a
highly effective method of cutting costs, over the last few years much greater sig-
nificance has been attached to the subject of customer orientation.
If you think about the last time you were dissatisfied with your supplier or pro-
vider, and why this was so, you will very probably agree that the reason for your
dissatisfaction had nothing to do with the product itself, but instead was related to
the quality of service or processes: delivery dates that were not met, slow response
times, the need to speak with multiple contacts etc.
The oft-quoted adage "If I can't measure it, I can't optimize it" applies equally to
processes. It is therefore essential for companies to formulate their process objec-
tives for times, costs, and quality in terms of concrete, measurable performance
indicators. Then, the latent synergies in the company can be exploited to the full
with benchmarking and process comparisons, and best practices can be identified.
This understanding has been called "Corporate Performance Management" by the
Gartner Group, and it refers to the use of "Processes, Methodologies, Metrics, and
Technologies" in order to create an inextricable link between corporate strategy,
planning, implementation and controlling. In order to assure a company's agility,
its management must use tools and methods that enable the consequences of deci-
sions to be evaluated quickly, so that the company can respond with flexibility.
Synonyms for "Corporate Performance Management" are "Business Performance
Management" and "Enterprise Performance Management".
Besides its direct use for optimization purposes, the importance of monitoring
processes has also increased as a result of initiatives and statutory regulations re-
garding corporate governance and risk management. For example, the Sarbanes
Oxley Act requires that companies present proof of the effectiveness of their in-
ternal control systems as part of their periodic company reporting programs. This
means that essential process checks and the associated processes must be docu-
mented and the suitability and effectiveness thereof must be tested regularly.
Even the trend towards outsourcing processes is predicated on a clear definition of
what is expected of the service provider in terms of process performance, and ne-

VI Preface
cessitates the implementation of appropriate monitoring measures for testing com-
pliance with service level agreements.
Disproving the old saw that builders' homes are the most in need of repair, IDS
Scheer can demonstrate the remarkable success of implementing this process-
oriented approach in its own house using ARIS Process Platform: among its other
achievements, consistent process-orientation by a committed support team at the
Customer Helpdesk cut enquiry processing time by more than half, and for this the
team was honored with the "Helpdesk Award 2004", awarded by an independent
technical panel at the end of 2004.
But have we reached the point where we can make sense of all these numbers,
alerts and benchmarks and make the right decisions? What good is a whistling ket-
tle if no-one knows how to turn the heat off? Process Mining methods have been
developed and patented to ensure the consistent application of data mining tech-
niques to process data, and which are available as part of the ARIS Controlling
Platform, provide guidance in finding the important cause-and-effect relationships
among millions of discrete items of process information.
Against this background, the trend towards attaching more and more importance
to organizational knowledge and the analysis of organizational relationships, be-
yond pure key performance indicator systems, is entirely logical. In companies
with flat hierarchical structures and knowledge-intensive processes, success de-
pends to an ever increasing degree on ensuring that the right employees – often
separated by time and geography – work together and communicate efficiently.
Rigid supervisory responsibilities and reporting paths are losing their former pri-
macy; adhoc interaction, collaboration and working in communities merge with
well structured workflows.
It is here that exhilarating challenges await today's managers, as they are called
upon to combine new levels of freedom and motivation for the individual with a
results-oriented approach to meet their own expectations for effectiveness and ef-
ficiency.
This volume continues the "ARIS in Practice" series of articles published by the
Springer Verlag. Contributions will focus on the use of the ARIS Controlling Plat-
form in visualizing, evaluating and analyzing "actively lived" business processes
in sectors such as the chemicals industry, telecommunications, energy manage-
ment, logistics, and also banking and insurance. When these tools are combined
with the requisite industry knowledge, they can be used to monitor company per-
formance and set up a program of continuous optimization based on process-
oriented key performance indicators.

Preface VII
The editors wish to express their sincere thanks to all the contributing writers,
without whose technical skills and efforts this book would not have been written.
All contributors are named in alphabetical order at the end of the book.
The editors also wish to thank Mr. Michael Linke, IDS Scheer AG, for his con-
summate management of the compilation of this book, and for his organizational
support.
Saarbrücken, October 2005
August-Wilhelm Scheer Wolfram Jost
Helge Heß Andreas Kronz

Table of Contents
From Process Documentation to
Corporate Performance Management ……….....................................................1
August-Wilhelm Scheer, Institute for Economic Information
Technology, University of the Saarland
Wolfram Jost, IDS Scheer AG
Part 1: Conception and Methodology of Corporate Performance
Management Solutions from IDS Scheer
From Corporate Strategy to Process Performance –
What Comes after Business Intelligence? ...........................................................7
Helge Heß, IDS Scheer AG
Managing of Process Key Performance Indicators
as Part of the ARIS Methodology ..................................................................... 31
Andreas Kronz, IDS Scheer AG
Operational, Tool-Supported Corporate Performance Management
with the ARIS Process Performance Manager……………………………… 45
Markus von den Driesch, IDS Scheer AG
Tobias Blickle, IDS Scheer AG
Part 2: Corporate Performance Management in Practice
Successful Process and Performance Controlling in the
Power Supply Industry at SÜWAG Energie................................................... 65
André Dreißen, IDS Scheer AG
Rainer Heinrichs, Süwag Energie AG
No Business Intelligence Without Process Intelligence.................................... 77
Helmut Kruppke, IDS Scheer AG
Tino Bauer, IDS Scheer AG

X Table of Contents
Monitoring with Key Performance Indicators
at E.ON Bayern AG Sales Service …………………………………………… 99
Robert Reif, E.ON Bayern AG
Andreas Kronz, IDS Scheer AG
Klaus Miksch, IDS Scheer AG
Performance Management Based on ITIL in the
IDS Scheer Customer Interaction Center (CIC) ………………………….. 125
Gregor Loes, IDS Scheer AG
Process Performance Management in Securities Operations
at CREDIT SUISSE ………………………………………………………….. 135
Olaf Klein, Credit Suisse
Dirk Kogelschatz, Credit Suisse
Closing the Cycle – Measuring, Analyzing and Improving
Processes, Performance and Workflows in the Insurance Sector ………… 153
Herbert Oberländer, IDS Scheer AG
Frank Ossig, IDS Scheer AG
Michael Linke, IDS Scheer AG
Performance Management in Power Stations -
with openJET, openBMS and ARIS PPM ………………………………….. 161
Bernd Heselmann, GIS mbH
Peter Stängle, GIS mbH
Andreas Kronz, IDS Scheer AG
Klaus Miksch, IDS Scheer AG
More than Figures – Performance Management of
HR-Processes at Vodafone Greece ………………………………………... 179
Petros Panagiotidis, Vodafone Greece
Phillip Knirck, IDS Scheer AG
Andreas Kronz, IDS Scheer AG
Corporate Performance Management in Logistics
and Procurement - Focused Identification of Weak Points
with Supply Chain Controlling ……………………………………………… 191
Steffen Drawert, IDS Scheer AG

Table of Contents XI
Continuous Measurement and Analysis of Operations
Management Processes – ARIS PPM at E.ON Kernkraft GmbH ………... 203
Karl Ramler, E.ON Kernkraft GmbH
Jürgen Schwarzin, E.ON Kernkraft GmbH
Andreas Kronz, IDS Scheer AG
Klaus Miksch, IDS Scheer AG
Analysis and Optimization of the Credit Application Process
at DaimlerChrysler Bank ……………………………………………………. 219
Lars Müller, DaimlerChrysler Bank
Frank Gahse, IDS Scheer AG
Increasing Customer Satisfaction with Visualized
Root-Cause Analysis – CPM Success in the Mass Market
at British Telecom …….…………………………………….....................…... 233
John Bird, IDS Scheer UK Limited
Monetary Assessment of Performance Management
in the Health Care System – Process Cost Analysis at
Marienhospital Herne …………………………………………………….….. 247
Holger Raphael, Marienhospital Herne
Hendrik Schenk, Marienhospital Herne
Monitoring ITIL Process Performance at DAB Bank …………………….. 263
Simone Sulzmann, iET Solutions GmbH
Annex: The Authors …………………………………………………………. 273

From Process Documentation to
Corporate Performance Management
August-Wilhelm Scheer
Institute for Economic Information Technology, University of the Saarland
Wolfram Jost
IDS Scheer AG
Summary
Since its emergence in the early nineties as an innovative tool for corporate
reorganization, Business Reengineering has evolved considerably, and even now
its tenets are experiencing something of a renaissance. In the last few years,
additional, dynamic methods such as activity-based cost calculation, the process-
based Balanced Scorecard, or Process Mining have been introduced for use
together with static process analysis. In this context, the term Corporate
Performance Management is used to denote all the long-term, process-oriented
modes of action and approach that have been adopted in companies. Specifically
with regard to the ARIS methodology, a number of proven method-based and
software solutions have been developed over the years, which enable perform-
ance-based company controlling.
Keywords
Process documentation, ARIS, EPC, SAP R/3, reference model, ERP, key
performance indicators, metrics, performance management, balanced scorecard,
simulation, process cost analysis, target process, actual process, optimization
measures.

2 A.-W. Scheer, W. Jost
1 The History of Business Process Management
In the early nineteen-nineties, when the notion of the "business process" was first
used in academic circles in connection with BPR (Business Process Reengineer-
ing), no-one could have foreseen that, more than 10 years later, the idea would be
more current than ever before. In the dynamic IT and consulting industry, where
the half-lives of topics and trends shrink daily, this is an exception. The overall
concept of the business process was developed in stages, and Corporate Per-
formance Management represents the most advanced stage of its development.
The approach became the centre of interest in the 1990s, with the publication of
Michael Hammer's book, "Reengineering the Corporation". Central to Hammer's
version of the BPR approach was the idea that companies can increase their
competitiveness by radically restructuring and optimizing the organization of their
business processes. This approach was greeted with enthusiasm in Europe,
although it tended to be interpreted in "softer" form. However, the one element
that was entirely absent from Michael Hammer's approach was method-based and
technology-based support for the BPR concept.
ARIS was the first development and publication ever of a standardized data and
procedural model for business process management (see Figure 1). Shortly after-
wards, IDS Scheer developed the ARIS Toolset, the first tool for (graphic)
modeling of business processes. With the ARIS method and the ARIS Toolset,
companies were now able to document their business processes, and to present
them in comprehensible form to their employees in the technical departments. The
transparency and shared understanding of the processes that this engendered also
gave rise to the first process management usage scenarios.
Fig. 1: Process representation and introductory publication to ARIS

From Process Documentation to Corporate Performance Management 3
2 Business Processes as the Link between IT and
Organization
Soon afterwards, extensive analysis of the collected data was added to the simple
modeling capability. Dynamic process simulation (ARIS Simulation) and process
cost analysis (ARIS PCA) are two variants of process analysis that have lost none
of their currency to this day, and which are still in use in many ongoing projects.
The sustained success of the first large reengineering projects soon gave rise to the
question of linking the process concept to the introduction of modern ERP
systems. SAP identified this development early and decided to document the
process logic encoded in its R/3 System on a business management level. This
documentation (called the R/3 reference model) was based on the ARIS method
and used the ARIS Toolset as its technology platform. SAP consultants and
customers alike used this as the basis for reaching a consensus on the inter-
pretation of business processes that were to be mapped with SAP.
3 Design, Implementation and Controlling as the Basis
for Success
After the ERP wave came the
Internet, which ushered in the era
of e-business. After a brief period
of confusion and missteps re-
garding the "what, how and
when", it soon became plain that
e-Business too would only lead
to success if a fully consistent
consideration of the value added
chain were given due considera-
tion, and a process-oriented ap-
proach were applied to this entire
aspect of business. Ultimately,
the primary aim of e-Business
was to redefine business pro-
cesses throughout the company, as is also attested by the recently coined terms e-
Procurement or Supply Chain Management.
One of the most important lessons of the New Economy hype was that process
orientation cannot continue to be limited to static documentation and analysis, that
even the phases of process implementation, and particularly those of overall, i.e.
"corporate" or "enterprise-wide" controlling must be incorporated to provide a
complete picture of holistic process orientation. IDS Scheer has invested sub-
stantially in the development of new software solutions relating to all aspects of
Fig. 2: Business Process Lifecycle

4 A.-W. Scheer, W. Jost
these three strategic areas (design, implementation and controlling), so that it can
close the "Business Process Lifecycle" loop and offer its customers an end-to-end
range of solutions (see Figure 2).
4 Increased flexibility thanks to service-oriented
architectures
Fresh significance is now being attached to the subject of process-based software
implementation and operation due to the paradigm of service-oriented application
architecture based on interacting Web services. The ERP manufacturers have
realized that their "old", monolithic system architectures are reaching the limits of
their flexibility with regard to the support they can offer individual customer
processes. New architectural approaches – e.g. SAP's "Enterprise Service Archi-
tecture (ESA)" – serve to reinforce thinking in process terms, not only when the IT
system is initially implemented but also when it is in continuous operational use
(see Figure 3).
Fig. 3: ESA concept by SAP

From Process Documentation to Corporate Performance Management 5
5 Process Performance Controlling
Almost a decade after the initial development of the Business Process Manage-
ment approach, the biggest problem in IT and reorganization projects is still the
lack of sustainability in budgeting, planning and implementing process strategies.
To be sure, substantive improvements are attained for a short while, perhaps 6-12
months after the end of the project, but after that, the subsequent stage of
continuous optimization is neglected.
The same is true of the introduction and use of standardized software. Many
customers hope that using the software will enable them to tap new areas of
benefit potential. The oft-cited Return on Investment (ROI) is emblematic of this
hope. Nowadays, this figure is used only too freely as a basis for decision making.
Meanwhile, a test as to whether and to what degree this (theoretical) value –
usually the result of much painstaking research – is actually realized, is often
entirely omitted. In future, companies will not be able to afford not to test in this
fashion, because it will mean losing the ability to act on substantial medium- and
long-term improvement opportunities. Any company that makes a substantial
financial investment in organizational or software projects must also deal with the
question of continuous success monitoring long after the project has been
completed. The "performance" of every process change, whether it is supported
purely in organizational terms or also by the technological infrastructure, must be
tested in terms of its actual effectiveness.
Performance Management and Process Controlling are the watchwords of the
hour. The aim is to ensure that running processes are subject to constant
improvement through continuous and – to the extent possible – automated
measurement and analysis. Process key performance indicators thus serve as the
basis for the sustained success of the project, and Performance Management and
Process Controlling themselves become an important component of company-
wide controlling. In the future, it will no longer be sufficient to use just the
"classic" financial indicators as the basis for directing the company. These figures
are generally backwards-looking and thus they do not lend themselves to rapid
responsiveness. They also do not provide sufficient resolution to enable real
corrections to the operational business to be derived. Legislators have also realized
this. Thus for example the "Sarbanes-Oxley Act" has been passed in the USA.
According to this legislation, all publicly listed companies must now prepare a
report on the quality of business processes that affect financial reporting and
balance sheet figures in addition to the conventional financial report. This report
must be audited by an independent public accounting body. In other words,
legislators are of the opinion that in future a statement of "bald" financial figures
will not be sufficient to provide a true representation of a company's economic
situation. A similar EU Directive is also being debated in Europe. This example is
intended to provide an indication of the importance that will be attached in future

6 A.-W. Scheer, W. Jost
to the measurement and continuous analysis of processes and process key
performance indicators in the realm of corporate governance as well.
6 Flexible Software Platform as Basis for Corporate
Performance Management
As a corporation with a worldwide presence, IDS Scheer implemented Corporate
Performance Management focusing on the review and optimization of business
processes, and has been using it successfully for many years. The ARIS Process
Platform offers tools and method-based support covering all the enormously
diverse aspects of Corporate Performance Management:
ARIS Balanced Scorecard (ARIS BSC) allows a strategic treatment and analysis
of the company from various perspectives, ARIS Process Cost Analyser (ARIS
PCA) enables processes to be evaluated in terms of their costs, and ARIS SOX
Audit Manager supports SOX-compliant auditing of workflows pertinent to
balance sheet preparation. ARIS Process Performance Manager (ARIS PPM)
functions as the core component and enables the actual processes running in a
company to be visualized, analyzed and compared with target processes entirely
automatically. The "buried" treasures and undiscovered potential of the company,
and thus also the key to its future direction, are to be found in the merging of
process models, process key performance indicators and conventional financial
figures. This future direction is also supported efficiently by the tools offered as
part of the ARIS Process Platform suite.

From Corporate Strategy to
Process Performance –
What Comes after Business Intelligence?
Helge Heß
IDS Scheer AG
Summary
If companies are to succeed in today’s markets, it is absolutely essential that their
centralkey processes be designed efficiently. In issues of company analysis,
traditional Business Intelligence projects have often not delivered the results that
are required in order to be able to derive direct optimization measures in terms of
times, costs and quality. The aim of Corporate or Process Performance
Management is to optimize the process sequences at work in the company through
computer-supported analysis of process structures in conjunction with key
performance indicators, so as to organize them more effectively. New approaches
in communication and activity analysis yield optimization options whose effects
are felt far beyond those of conventional Business Intelligence solutions.
Keywords
Process Performance Management, process management, key performance
indicator systems, service level agreements, process mining, right-time
monitoring, organizational analysis

8 H. Heß
1 From Corporate Strategy to Process Management
The primary tasks of the management staff of any company will always be to
organize its business as effectively ("Are we doing the right things?") and
efficiently ("Are we doing things right?") as possible. Effectiveness concerns both
the strategic decisions relating to business segments, products, markets and M&A.
However, the imperative for constant reinvention is not limited to product
developments, it applies most particularly to the company's processes: Amazon,
Dell, Ebay and Ryanair have not achieved their extraordinary success merely by
bringing new products to market, they also revolutionized their order processing
and service processes.
Fig. 1: Derivation of process objectives from success factors
for the business segments
Furthermore, decisions to position the company as an innovation or cost leader in
the market, or to attract and keep customers with high quality of service result in
the creation of entirely different key competencies and processes. Figure 1 shows
how metrics and objectives are assigned to the key processes of any business
segment from the analysis of critical success factors.

What Comes after Business Intelligence? 9
This renders the performance of the processes measurable. It then becomes
possible to derive optimization potential from shortfalls in achieving objectives.
This then leads to the creation of the classic optimization loop: Monitoring and
Analysis – Optimization – Implementation.
Figure 2 shows how the core processes of a business segment can be evaluated
with regard to performance and relevance. The processes in the top right quadrant
are highly significant for the company, but demonstrate low performance (in terms
of costs, quality, times etc.) so that a need for optimization literally becomes
visible. The processes in the left half are candidates for outsourcing.
Fig. 2: Portfolio for evaluating corporate processes
Setting up a key performance indicator system that will assure such an evaluation
effectively is no minor undertaking: to the outside world, the success of a
company is shown by reporting of its profitability and financial indicators. But
these indicators alone are not adequate to enable the company's operations to be
directed truly successfully, because financial success is not generally revealed
until some time after the commercial decisions and optimization measures have
been made. Accordingly, monitoring must be instituted at the point where the
value is actually added and the decisions are having a direct effect on costs,
quality and throughput times. Put another way: "You are only successful in the
long terms if you know why you are successful." (Rupert Lay)

10 H. Heß
2 Monitoring, Analyzing and Optimizing Processes
With the advent of concepts like the Balanced Scorecard, the last few years have
seen a change of perspective towards constant monitoring of all company
activities for the effects of the results, so that they can be manipulate and directed
to specific ends. The intention is to create a system that evaluates its own
performance on a continuous basis, and is able to respond flexibly to changes.
But value is added in the key processes of the company, which means that
commercial success is entirely contingent on efficient process management. This
transcends the purely internal company view, and involves customers and
suppliers as well. To be successful, the pertinent key processes of the company
(depending on the sector of industry, for example product innovation, product
development, sales, order processing, service business, ...) must be designed
efficiently with respect to the criteria of cost, quality and time such that they lead
to high customer satisfaction and opportunities for reducing costs can be exploited
to full advantage.
At the same time, the efficiency of the processes must be monitored constantly
and close to real time, so that problems may be detected and optimizing measures
may be taken as early as possible. To this end, it is indispensable to set up
measurement procedures for the essential key performance indicators, so that the
results can be objectified ("one version of the truth"); the axiom "what cannot be
measured cannot be optimized" remains as true as ever.
2.1 Corporate Performance Management Takes the Place of
Business Intelligence
In the past, typical Business Intelligence - and Data Warehouse – approaches often
concentrated largely on financial analyses. Even though this has changed, a large
number of these projects still do not really satisfy the informational needs of their
users with regard to detecting optimization potential: The highly data-driven
approach of many Business Intelligence projects entails enormous effort to extract
the data and preserve its quality, and often it also fails to deliver information that
can be used to derive optimization measures. The traditional Data Warehouse -
and OLAP tools did not deliver the results that could be used directly for
optimizing business processes or implementing strategy.
It is evident that analyses must be linked more closely with the company's value
creation. Traditional Business Intelligence Systems are being replaced by process-
oriented Performance Management solutions.

What Comes after Business Intelligence? 11
The phrase Corporate Performance Management (CPM) was coined by
Gartner Group to describe the combination of "processes, methodologies, metrics
and technologies to measure, monitor and manage the performance of the
business" (see Buytendijk et al. 2004.).
Fig. 3: Top-down analysis of key performance indicators for actual processes
CPM is thus directed at continuous monitoring of the effectiveness of the results
of all company processes and the constant optimization thereof, i.e. its objective is
a monitoring system that monitors the business performance of all pertinent
business processes all the time, detects and reports weaknesses and problem
situations, ideally even suggests optimization options, and evaluates the success of
improvement measures. Substantive recommendations for action, including their
chances of success, are needed so that better decisions can be made more quickly.
Process Performance Management may be regarded as the heart of CPM.
To the confusion of many users, the abbreviation "BPM" is used for both
"Business Process Management" and "Business Performance Management"
(which is synonymous with Corporate Performance Management and
Enterprise Performance Management).

12 H. Heß
At present, conventional business intelligence companies are competing for the
CPM market with the providers of Business Process Management systems. BI
tools are attempting to refine their traditional, data-oriented approach to
emphasize the association between their analyses and business processes (see
Chamoni, Gluchowski 2004). Upon closer examination, hardly any of these BI
providers can really know anything about the company's business processes –
much less analyze them. When BI providers talk about process orientation, they
are usually thinking about their own analysis process, from the point when the
data is extracted until it is processed in the frontend.
Fig. 4: Cumulative view of actual processes
Some Process Management providers have added monitoring and analysis
components to extend the scope of their tools, which were originally intended for
process modeling and documentation, to support the entire control loop of
Planning – Execution - Monitoring. The most important insight is that pure indi-
cator systems which are not associated with the business processes are inadequate.
Instead, indices with their plan and warning values serve to direct attention to
problem cases, which must then be investigated more closely with a process
analysis. Figure 3 shows how index anomalies are detected at a high level of
abstraction, then the influencing factors are identified, and the structure of the
actual processes is analyzed for the critical combinations.

What Comes after Business Intelligence? 13
An analysis instrument such as ARIS Process Performance Manager (ARIS PPM)
is able to generate the structure of actual processes automatically: process frag-
ments are derived from the operational data that is extracted from the source
systems (ERP, CRM, EAI, Workflow, Helpdesk systems etc.) and are combined to
form a total process (see. Heß 2004). This can be done for single operations
(process instances), but one of the more interesting aspects is that it can be used to
generate a visual view of a set of operations, showing for example the probability
that certain process paths will be passed through or the frequency with which
certain loops are executed (see Fig. 4).
This means that a combination of both performance indicators and process
structures is essential in order to obtain a meaningful analysis.
2.2 Corporate Governance and Corporate Performance Management
Besides questions of optimization, a series of legal requirements have also kept
the subject of process transparency and evaluation under scrutiny:
Both the revised International Capital Framework Agreement (Basel II) and
the Law on Control and Transparency in Companies (KonTraG) require a
near real-time representation of business relationships and the risks associated
therewith in addition to current business figures.
The Sarbanes Oxley Act (SOX, SOA), which was enacted in 2002 in a reaction
to several high-profile stock exchange scandals and cases of fraudulent accounting
practices, also demands the introduction of appropriate risk management and
control systems in the company. This particularly requires that company manage-
ment provide constantly updated information on the effectiveness of its internal
control system as part of the periodic company reporting program. This means that
decisions must be made as to which management, business and support processes
are relevant for financial reporting purposes. For these processes, the pertinent
risks and control activities must be documented and evaluated. In practice, the
control system can only be tested effectively with system support.

14 H. Heß
2.3 Management-oriented Analysis of Process Performance
In many sectors of industry, customers’ requirements regarding the quality of
service provision have risen to the point that satisfying these requirements has
become a key survival issue for companies: for example some logistics providers
promise their customers free transportation and dispatch handling if they do not
meet the agreed delivery date. The effect that this has on costs if serious delivery
delays arise can only be surmised.
Fig. 5: Cockpit interface with management-oriented
processing of business performance
As a result, the managements of very many companies are extremely preoccupied
with the performance of their key processes. Modern cockpit interfaces enable
users to navigate without special knowledge of the system and thus provide an
unprecedented degree of transparency (see Fig. 5).
Moreover, it is critically important for corporate managers to be aware of the link
between the financial indicators and process performance. If financial indicators
show negative trends, it is important to analyze them and adopt corrective
measures (see Fig. 6).

What Comes after Business Intelligence? 15
Fig. 6: Drill-down to key performance indicators along the value creation chain
Example: Failure to reach planned sales volume may trigger the following
analysis chain:
• In the second quarter, sales increased by only 1.8% instead of the planned 4%
compared with the same quarter in the previous year. Why was this?
• Orders received were on target but the number of credit notes rose dramatically.
What was the reason for this?
• Question for SALES: Are we having quality problems?
• If not – question to SALES: Are we having problems meeting delivery
deadlines?
• If yes – question to WAREHOUSING: Are we encountering many out-of-stock
situations?
• If not – question to LOGISTICS: Are we making mistakes with supply or are
there scheduling problems in Shipping?
• If yes – question to MATERIALS MANAGEMENT: Are we having quality
problems with the materials delivered by our suppliers?

16 H. Heß
It becomes evident that financial indicators often reflect symptoms that require
closer analysis of the processes (in the nature of a “root cause analysis”), because
that is where the actual causes lie. The objective is to establish a consistent
connection between financial and non-financial value drivers.
2.4 Six Sigma on the Path to Business Excellence
Six Sigma is a management approach that evolved in a practical environment for
the purpose of drastically reducing process non-conformances (in terms of quality,
times, etc.). "Sigma" is derived from the statistical standard deviation; "Six
Sigma" means allowing only 3.4 errors per million error possibilities, i.e.
executing 99.997% of all processes in compliance with the stated targets and
specifications. The publication of successes by companies like Motorola, General
Electric, Ford etc. has resulted in many other companies engaging in "Business
Excellence" initiatives with Six Sigma (see Kieslich et al. 2004).
Six Sigma establishes a Total Quality philosophy in the company, which places
the focus on the customer and translates the customer's specifications to
measurable quantities. Six Sigma and Process Management are very closely
related, because the familiar DMAIC cycle is ultimately established to achieve
continuous process improvement. Clear process objectives are derived from the
value drivers thus obtained; the degree to which these objectives are attained is
continuously measured, and the reasons for non-conformances are analyzed – this
is very similar to the requirements of a CPM system. Here too: The targets of cost
reduction and quality optimization cannot be attained without measuring the
results of processes.
The high level of attention demanded of managers in companies where Six Sigma
is practiced, and its close association with corporate strategy are particularly
interesting. Organizational implementation is usually carried out by special Six
Sigma teams, which are attached directly to the executive management levels of
the company.

What Comes after Business Intelligence? 17
2.5 Outsourcing and Service Level Agreements
The question of which processes constitute the key processes of a company and
which can be contracted out to external service providers forces companies to deal
with the evaluation of services: cooperation along a shared value creation chain
cannot function efficiently unless the requirements the service provider is ex-
pected to satisfy have been clearly formulated and its services can be con-
tinuously measured and monitored. Particularly with regard to outsourcing
processes, this means that Service Level Agreements must not only be defined, it
must also be possible to monitor them on a continuous basis (see Fig. 7). A new
process for managing outsourcing activities must be set up (see. Scheer 2004).
Fig. 7: Continuous monitoring of Service Level Agreements
2.6 The Path to the Process-oriented Organization
Corporate Performance Management is the foundation stone of permanent com-
pany controlling based on key performance indicators and processes, so that the
process-oriented organization can respond cohesively, rapidly and flexibly to
changed requirements and framework conditions, and can make decisions sooner.
Many companies are currently committed to incorporating a process-oriented
approach in the structural organization as well. It is clear that the responsibility for
processes must remain with the technical departments, but the decision must still
be taken regarding assignment of the task of process management itself.

18 H. Heß
A "Process Management" Competence Center is very often set up for this purpose,
with responsibility for horizontal tasks such as defining documentation
conventions, supplying tools and assuring quality assurance and consolidation of
project results, and fulfilling the roles of multiplier and coach in the company.
Even the role of the CIO is being completely rethought: Whereas this executive's
key tasks were once the supply and operation of hardware and software, the focus
of his duties is shifting more and more to ensuring the efficiency of the process
infrastructure.
However, it must be added that in many companies where IT once served as the
innovation engine and growth driver, IT managers are now most likely to be the
first to be affected by cost-cutting measures. The question of the benefit of IT for
the company has been given only secondary importance. The introduction of a
new IT system was commonly regarded to be successful as long as it was
completed on time and under budget. Other success criteria such as reduced costs,
increased productivity or increased customer and employee satisfaction were often
considered to be unquantifiable and therefore ignored.
Fig. 8: Relationship between the IT infrastructure and process management
All that is now changing: the object is now to control the interface between the
technical area and IT, so that the process optimization achieved with IT solutions
can be measured and the ROI in software can be proven. Business and IT
considerations collide in the question of monitoring: The IT manager, who uses
system management support to measure the performance of his hardware, network
components and applications, must now face the effects that IT problems have on
Lower system performance
or availiability

What Comes after Business Intelligence? 19
running business processes, for example so that he can assign priorities for
escalation and troubleshooting. Conversely, when investigating the root causes of
weaknesses, the process manager is interested in whether IT problems were in-
volved in the cause (see Fig. 8).
This means that monitoring the performance of a company must include a
consideration of strategic aspects combined with process-oriented analyses as well
as IT-related analyses (IT-service management) in order to yield an all-round
view.
Service-oriented Architectures and CPM
In a very small number of cases, it is sufficient to carry out a manual analysis of
business process sequences. Data gathering techniques such as interviews,
workgroups etc. are useful for creating a generalized transparency for the business
processes; but gathering data in this manner is not adequate to meet the
requirements of currency and objectivity. Since most process-relevant data is now
present on IT systems, it must be possible to extract this data from these "source
systems" consistently and automatically, and ultimately to reconstruct the entire
process performance chain, e.g. from customer inquiry to delivery and receipt of
payment, from these individual items of information. This requirement applies
particularly where processes transcend system boundaries (e.g. CRM – ERP –
Legacy System).
In this context, it is evident that all approaches of a Service-Oriented Architecture
(SOA) facilitate the extraction of process-relevant data, since the data then does
not have to be extracted individually from each source system; it can be supplied
by the middleware. As a result, the SOA approaches that are implemented to lend
greater flexibility to business processes also make it considerably easier to
monitor the workflows (see Krafzig, Banke, Slama, 2004).

20 H. Heß
3 Trends in Corporate Performance Management
3.1 Process Mining for Automated Weakpoint Analysis
According to some estimates, the volume of data held by companies is growing at
an average rate of 90% per year. In companies where several hundreds of
thousands of operations are executed every day, the process manager is often not
in a position to detect weak points, because they are lost in the analyses of overall
quantities for example because of data compression and averaging. But from the
customer's point of view, every single delay or complaint is difficult to excuse.
Special analytical techniques must therefore be used on process information in
order to detect such situations.
Data mining techniques are able to provide information and insights, and to
identify relationships from large volumes of data, and are being used more and
more for analyzing process data (process mining). The objective in this case is to
discern combinations of dimensions (e.g. customer groups, products, regions,
sectors, plants, local authorities etc.) that have particular characteristics and
special requirements in terms of optimizing times, costs or quality.
Fig. 9: Intelligent process analysis using process mining

What Comes after Business Intelligence? 21
Figure 9 shows how process mining techniques are used to perform intelligent
process analysis instead of the usual "slicing and dicing" of data: ARIS PPM
leads users directly to those processes and combinations of dimensions that show
the largest deviations from plan values or the most significant anomalies. For
example, the constellations are highlighted in which the largest discrepancies
occur between regions in terms of throughput times, costs or quality key
performance indicators. Then, the reasons why the throughput time is so much
longer in region A than in region B must be investigated – again, this is done by
an analysis of the process structure. Finally, the process mining capabilities can be
used for internal benchmarking.
3.2 Proactive Instead of Reactive: Right Time Monitoring
Data relating to past events must be analyzed so that conclusions regarding
weakpoints and optimization potential can be drawn. However, process managers
need more information than this, because their chief concern is of course to detect
and eliminate problems in ongoing processes. The ex-post perspective becomes an
ex-ante view.
As products lend themselves more and more to comparison, even as the number of
variations multiplies (for example, Daimler-Chrysler offers about 10^27 variants
and builds the same car only about 1.4 times per year), in many industries the time
to respond to customer wishes has become a critical success factor. In the
industrial sector, being able to fulfill customer requirements quickly and
specifically means being able to manufacture in small batches. In service-oriented
sectors, the challenge lies in determining and reducing the activities within the
process that do not add value: The reason for the long throughput time for a life
insurance application is not that the processor in question really needs that long to
complete the processing steps for the application, but usually because of the
complex and often uncoordinated communication paths between the insurance
company and the other parties involved, such as brokers, the healthcare agency
etc.
In both the industrial and the service environments, the need for near real-time
analysis and information grows as throughput times become shorter. “Real-time”
here does not necessarily mean millisecond processing, but rather the
synchronization of the supply of information with the need, so that the term “right-
time” or “true-time” monitoring is perhaps more appropriate: The supply of
essential information to the right consumer at exactly the right time, to provide
those responsible with every resource to obtain current information at all times,
and to institute appropriate escalations and notifications upon the occurrence of all
events that deviate from the process standard. True real-time requirements only
exist in a few sectors, e.g. fraud detection in financial and banking transactions.
Right Time companies are process-oriented, because true time services cannot be
provided unless processes are considered from end to end, i.e. from the customer

22 H. Heß
requirement to completion of the order. Right Time companies are also event-
oriented, because they can respond to external and internal events (triggers”) at
any time: new customer contact, entry into market by a competitor, supplier
reports delivery bottlenecks, complaint from a high-priority customer, etc.
The term Business Activity Monitoring (BAM) describes the ability to detect
such events (events = data from RFID systems, from barcode scanners, process
events from ERP, CRM and SCM applications, etc.) to provide a right-time view
of the business processes. In the previous example, this means for instance that a
delayed delivery of goods is detected, the impact of the delay to the extent that it
threatens the supply deadline for the final product can be assessed, and responses
and notifications can be derived therefrom immediately. The old principle of the
recipient’s duty to look for information is thus turned on its head, and then it
becomes the task of the information system to provide the necessary information
in good time to everyone concerned.
The next step is to be able to look into the future: Predictive models are used to
forecast future trends and identify problems ahead of time, while it is still possible
to intervene and institute countermeasures.
3.2.1 From the Organizational Chart to the Dynamic
Organizational Analysis
An analysis of the efficiency and effectiveness of processes entails more than just
a consideration of the structure of the control flow, i.e. which activities are per-
formed in what order. The following aspects are also particularly interesting for
optimizing the business (see Fig. 10):
• Organizational analysis: Who works with whom, and how?
• Analysis of data and documentation relationships: What data and
documents are used in the process?
• Analysis of system support: Which IT systems are used?
For analysis purposes, this means that the extracted process information is also
used to make statements about these aspects. Just as target processes can be mod-
elled and compared with real actual processes via CPM, this can now also be used
for the organizational, data, document and system side (see Fig 11).

What Comes after Business Intelligence? 23
Fig. 10: Aspects of process analysis
Fig. 11: Extension of process analysis

24 H. Heß
In the following, the analysis of organization and responsibilities will be dealt
with in more detail with reference to an example: Classic organizational charts
provide a static view of the structural organization of a company according to
association with given disciplines. It does not offer a great deal of help in
answering the question of how departments and employees interact in real life,
and where communication can be improved. Meanwhile, transparency of this
nature is becoming more and more important, especially in knowledge-intensive
and cooperative processes, so that networks can be organized more efficiently, and
ultimately to ensure efficient processing.
Questions that are typically asked in this context are for example:
• Which organizational units/positions carry out which activities? (How
often? With what quality? With what throughput times? At what
costs?)
• Which units work together closely? How often do organizational units
O1 and O2 work on the same process instance? How often is work
handed off from organizational unit O1 to O2? Where do friction
losses arise between departments?
• Which employees and positions form the communication bridgeheads
with other departments? Which organizational units / positions are
holding up the efficient flow of the processes?
• Who needs what kind of training? Who is a special knowledge carrier
and specialist?
• At what percentage of its capacity is a department working? How can
personnel costs be reduced?
These activity and communications analyses spotlight the relationships of
organizational units and employees among each other and also make transparent
the link between structural organization and the procedural organization. As with
the analysis of generated actual processes, now the real relationships among the
organizational units can be reviewed. Figures 12 and 13 show what an
organization-centered navigation may look like when it is based on dynamic
relationship networks rather than static organizational charts. For example, the
user can see what relationships the "Sales" organizational unit has with other units,
whereby the nature of the relationship may be one of cooperation, delegation,
information etc. The processes in which this organizational unit participates and
the subsections for which it is responsible are also clearly revealed.

What Comes after Business Intelligence? 25
Fig. 12: Communication between organizational units
Fig. 13: Actual relationships of an organizational unit

26 H. Heß
This visualization is essential for revealing, analyzing and optimizing the real
communication relationships during the execution of a process. Techniques are
used (see Fig. 14) from a variety of disciplines, including statistics (correspond-
ence analysis) and sociology (social network analysis etc., see Cross, Parker 2004;
Kilduff, Tsai 2003).
In many companies, the boundaries between structured, well documented and ad-
hoc processes are also becoming blurred: not infrequently, parts of an entire
process are supported by mail systems and collaboration features, with no
possibility to correlate these activities with the structured data. Examples are the
bid phase of processing an order, schedule and deadline agreements, syn-
chronization of innovation and development processes. This may require even
these communication relationships to be analyzed and visualized, since they are a
part of the workflows that are to be documented.

What Comes after Business Intelligence? 27
4 Integration in Business Process Portals
Business process portals serve to provide the employee with all the information he
needs for the efficient processing of his role-specific workflows and activities.
This is particularly interesting when it is combined with the EAI- or SOA-based
architectures discussed earlier. Process portals offer the capabilities an employee
has by virtue of his role to define process sequences, execute them via a workflow,
and to control or monitor them. Portals can also be used to integrated human
interactions with the automated processing of activities so that they become the
central user interface for all internal and external business processes. Cockpits for
controlling process performance are the central component of process portals (see
Fig. 15).
Fig. 14: Example of a cockpit (ARIS PPM) for controlling and
monitoring business processes
Besides support for structured processes, efficient and effective support for work
sequences and tasks that are not precisely defined also continues to gain
importance. For this, collaboration features are needed that enable employees to
communicate with colleagues, customers and partners. To this end, process portals

28 H. Heß
provide the capability to efficiently use and share data, knowledge and
applications in the manner of a project.
This is where process portals, virtual workspaces and business communities merge
(see Hagel, Armstrong 1997; IDS Scheer [1]; IDS Scheer [2]): synchronous and
asynchronous collaborative tools and services such as e-mail, chatrooms,
discussion forums, blackboards, Instant Messages, Web conferences, combine
manual interactions with collaborative business processes. In particular it is
important to replace the undisciplined use of all these tools with an ordered
integration in the value creation chain. At this point, the circuit is completed by
thus synchronizing the supply and demand of information in the fashion of a right
time company.

What Comes after Business Intelligence? 29
5 Literature
Buytendijk, F., Wood, B., Geishecker, L.: Mapping the Road to Corporate
Performance Management, Gartner Report 30. Januar 2004.
Chamoni, P.; Gluchowski, P.: Integrationstrends bei Business-Intelligence-
Systemen. In: Wirtschaftinformatik, 46 (2004) 2, Page 119-128.
Cross, R.; Parker, A.: The Hidden Power of Social Networks: Understanding
How Work Really Gets Done in Organizations. Boston 2004.
Hagel III, J.; Armstrong, A.G.: Net Gain – Expanding Markets through Virtual
Communities. Boston 1997.
Heß, H.: Marktführerschaft durch Process Performance Management: Konzepte,
Trends und Anwendungsszenarien. In: Scheer, A.-W.; Abolhassan, F.; Kruppke,
H.; Jost, W. (Hrsg.): Innovation durch Geschäftsprozessmanagement. Berlin et al.
2004, Pp. 119 -136.
IDS Scheer [1]: Business Communities – Status Quo und Marktmodelle. June
2001.
IDS Scheer [2]: Virtual Workplaces – Status Quo und Marktmodelle. June 2001.
Kieslich, T.; Lange, D.; Röttgermann, A.: Six Sigma – Methodik zur Business
Excellence. In: Scheer, A.-W.; Abolhassan, F.; Kruppke, H.; Jost, W.: Innovation
durch Geschäftsprozessmanagement. Berlin et al. 2004, Pp. 93 -102.
Kilduff, M.; Tsai, W.: Social Networks and Organizations. SAGE Publications
2003.
Krafzig, D.; Banke, K.; Slama, D.: Enterprise Soa: Service-Oriented
Architecture Best Practices. Prentice Hall 2004.
Scheer, A.-W.: Unsere ARIS Methode öffnet die Tür in die Weltliga. In: Scheer,
A.-W.; Abolhassan, F.; Kruppke, H.; Jost, W. (Hrsg.): Innovation durch
Geschäftsprozessmanagement. Berlin et al. 2004, Pp. 1 -10.

Managing of Process Key Performance Indicators
as Part of the ARIS Methodology
Andreas Kronz
IDS Scheer AG
Summary
Evaluating processes with the aid of key performance indicators continues to gain
acceptance as an integral element of corporate controlling as well as process
management. This article will first describe the tasks associated with process
controlling, which will then be used as a basis for defining the objectives of a
process-oriented key performance indicator management system. In particular, we
will explain how the description of key performance indicators can be integrated
in general process modelling. When KPI management has been assigned its
proper place in the process management loop, roles that are needed to implement
it in real terms will be defined.
Keywords
Process-oriented key performance indicator system, indicator, key performance
indicator (KPI), eEPC, KPI management, business process controlling,
monitoring of business workflows, collection concepts, process instance,
Performance Management, dimensions, calculation rule, measurement points,
functions, ERM attribute, measurement probes, KPI allocation diagram, key
performance indicator tree

32 A. Kronz
1 Introduction
In many companies, the controlling function is being increasingly expanded
beyond its traditional intepretation to include active support for the control and
optimization of company workflows. As a result, it assumes a new role in classic
process management, not only because it occupies the key position of process
monitoring, but also because it integrates workflow monitoring with corporate
controlling. Collecting and analyzing performance-related key performance indi-
cators is the first prerequisite for holistic process management and forms the basis
for consistent and continuous process optimization.
This idea can be put into practice by using powerful tools in different areas of the
company to collect data in a process-oriented manner and present it in the form of
process key performance indicators that apply throughout the company. To this
end, many companies have already selected the ARIS product family as their tool
for the business process management environment in general, and ARIS Process
Performance Manager (ARIS PPM) in particular for Business Process Controlling.
The main objective in installing such a system is to set up an overall view of the
company's core processes and to establish a cycle for continuously improving
process efficiency.
At the same time, the efficiency of the processes must be monitored constantly
and in close to real time, so that weak points may be detected in the nature of an
early warning system and optimizing measures can be taken. Measurements must
serve as the basis for deriving measures that will help to improve the company's
performance. Standardized process descriptions that are applicable throughout the
company represent the linchpin of the system, because they determine what is to
be measured, how it is to be measured, the nature of the measurement and they
serve as the starting point for new arrangements.
The principal tasks of process controlling are as follows:
• Evaluation, analysis and continuous monitoring of business workflows
Monitoring is performed on the basis of manually or automatically
collected data. Evalaution is done with reference to target values, which
are set by management and validated by the technical departments.
• The aim of process controlling is to map the process reality in a task-
oriented manner according to the issue and task. The viewpoint or also
the viewing mode may be shifted in any number of ways, for example if
Sales or Production are considering the same processes.

Managing of Process Key Performance Indicators 33
• The result of process controlling is transparency of the processes, in
structural terms and for purposes of evaluation. Operational and strategic
decisions can be made on the basis of information and process
evaluations that are kept permanently current. This becomes all the more
important as companies strive to keep pace with a volatile environment of
constantly changing business processes and adaptations.
• The results of process controlling can also be used as the basepoint for
process optimizations. In this case, process controlling can provide
insight into weak points and some indication of the improvement poten-
tial. Derived measures are thus quantified in terms of their costs and
benefts at the planning stage. After improvement measures have been
implemented, their effects can be made transparent and the actual situa-
tion thus created can be evaluated with process controlling.
1.1 The Process-oriented Key Performance Indicator System
The basis for all process controlling is a process-oriented key performance
indicator system that links the process perspective to the essential controlling
aspects of the business. The key performance indicators must enable conclusions
to be drawn regarding the effectiveness of the processes (e.g. customer
satisfaction) and their efficiency (e.g. processing time, delivery reliability, process
quality and costs). In addition, a process-oriented key performance indicator
system is configured so that it is possible to make statements about the actual
course of the process.
Since most process-related data is stored on IT systems in the majority of
companies, a computer-supported system can be set up to extract the data from
these "source systems" and to use these individual items of data to reconstruct an
order processing chain, e.g. from the generation of a purchase order to receipt of
the product and transfer of payment. For the parts of the process that are not yet
fully mapped in computerized form, for example customer acquisition and
consulting, the pertinent process information can be gathered by manual methods.
In both cases, it is imperative to establish a clear connection between the process
and its key performance indicators, without which it is practically impossible to
interpret the KPIs or derive any meaningful measures.
By using the various data collection techniques, a global view of processes can be
obtained and a comprehensive system of key performance indicators can be
created.

34 A. Kronz
2. Objectives and Tasks of Process-oriented KPI
Management
KPI management has three distinct objectives, which are reflected later in the
spheres of responsibility of various roles.
The primary objective of KPI Management is to provide a consistent definition of
the KPI system. The content of the KPI system must therefore be synchronized
with a variety of areas (management, proceess manager, software development
etc.) and it must obey unambiguous calculation rules. Besides this definition,
target values and threshold ranges must also have been coordinated.
The KPI system must be documented in unambiguous terms and must be made
accessible to the various groups concerned. It must describe how individual key
performance indicators are calculated, and consequently how they are evaluated,
how KPIs are interrelated, and the nature of their connection to the process. These
essential features of the KPI system must be described unambiguously in the
process models.
KPI Management is also responsible for the processes that trigger a change in the
KPI system itself, and which much ensure that the consistency of the system is
preserved, and that the KPI system documentation is also modified in accordance
with release management for the process description.
A number of factors can trigger changes to the KPI system:
If the strategic alignment and subordinate objectives of the company are changed
by its management, the control instruments and thus also the key performance
indicators must be adapted. This can affect the targets, and also the definitions or
priorities of key performance indicators in the KPI system.
Even a change in the processes themselves due to strategic realignments or
optimization measures, can create a need to adapt the KPI system, for example
because activities that needed to be measured no longer exist.
And not least, a change to the application system landscape can influence the key
performance indicators, because changes are usually made to the IT systems in
order to effect a change in processes, which in turn is intended to affect the KPI
system.
2.1 Terminological Conventions
Several concepts must be defined as they relate to KPI Management, to provide
the basis for a common understanding:

Managing of Process Key Performance Indicators 35
2.2 Measurement point
A measurement point defines a point in the process at which data is collected (by
manual or automated means) for calculating key performance indicators. A
measurement point returns one or more data items (point in time, information
about the object concerned) every time a concrete processe (process instance) is
executed. The measurement point has an equivalent (interface or data extraction)
in an application system under consideration, which is characterized by the
description of the format of the data records that are returned at this measurement
point as a description of the change in status of application objects (creation,
modification, completion, ...).
2.3 Key Performance Indicator (KPI)
The key performance indicator calculates one or more values from the data
returned by the measurement point in accordance with the definition assigned to it.
Fixed target values or target ranges that may apply only to specific products,
services of business transactions can also be defined for the KPI.
2.4 Evaluation or Analyses
The evaluation interprets the key performance indicator with reference to various
criteria – called dimensions – (time period; product; region) and possibly
describes a relationship between the results and the predetermined targets or non-
compliances therewith. The dimensions are also exported from the source systems
in the form of features of individual application system objects, and are transferred
as properties of the process instances. The user evaluates the level of performance
of his business processes by considering the interaction between the KPIs and the
dimensions.
A graphical representation and the representiation medium are also agreed as part
of the analysis in conjunction with the corresponding tools.
3. Description of Key Performance Indicators
For the purposes of process-oriented KPI management, the description of the key
performance indicators must be embedded in the business process modeling in
order to assure optimum support for the objectives of KPI Management. To this
end, the structures of the KPIs and their connections to the processes must be
documented as well as their definitions. Several descriptive techniques are used

36 A. Kronz
within the framework of the ARIS methodology. The following section includes
descriptions of the most important model types.
3.1 Key Performance Indicator tree
The key performance indicator tree structures the KPIs by organizing them in
individual, technically related KPI groups (e.g. Quality, Cost, Time, and also
process-oriented groupings). It should be noted that there may be more than one
key performance indicator tree. It is also possible for KPIs to be assigned to
several KPI trees according to the target group.
Fig. 1: Example of a key performance indicator tree
3.2 KPI Allocation Diagram
The KPI allocation diagram defines the measurement points and the data at the
measurement points that is to be included for the purposes of the KPI. Linking
multiple KPIs to a new KPI is also described in the KPI allocation diagram. This
can be used to map key performance indicator calculation hierarchies. Changes to
the names of KPIs, such as "Number of POs" instead of "Number of processes"
can also be specified in the diagram.
A description of the calculation rule for a KPI is maintained within the KPI to
which it applies. The KPI allocation diagram does not have to provide a
mathematically precise or complete description of the KPI, but it does enable a
technical specification to be made, from which an exact calculation specification
can be derived as part of IT requirements management.

Managing of Process Key Performance Indicators 37
In the example, the key performance indicator is calculated from the Goods
Outward Actual and Goods Outward (planned) measurement points (see Fig. 2).
In order to provide a full description of the KPIs, the point in the process sequence
where the necessary data is collected must be defined. These points in the process
define the measurement points and are used later in the specification of the
interfaces required. Measurement points can return any amount of data simply by
receiving or reading the data in question from the IT system that is involved in the
execution of the function. Thus, measurement points return not only the
specification for the systems from which the data is drawn, but also the time
information regarding when the data relating to the process sequence is collected.
This is especially important for data that is liable to change during the process
sequence.
Fig. 2: Example of a KPI allocation diagram
There is another distinction between measurement points and key performance
indicators. Whereas measurement points return data relating to a single point in
the process, key performance indicators often rely on data from multiple measure-
ment points. For example, when calculating a time period from function A to
function B, the data from the measurement point at function A must be combined
with the data supplied by the measurement point at function B. It is also evident
that the KPI can not be calculated until the process has passed through function B.

38 A. Kronz
Thus the separation of KPI and measurement point also enables measurement
points to use, or reuse, data for multiple KPIs.
3.3 Technical Model Representation in ARIS
An event-driven process chain (EPK) is a model that is used to describe
graphically the chronological-logical sequence of a service provision process. It is
based on the following assumptions:
Every activity (operation, processing step, function) within a process is caused by
a management-relevant change in the status of an infomation object. Every
function can bring about a management-relevant change of status of an
information object. The status of a management-relevant information object is
described graphically by an Event type object. Accordingly, the event is chosed as
the reference point for the measurement point. The information is not available to
the measurement point until the information object's change of status has been
stored in an IT system.
A cross on the event indicates that the event represents a measurement point for
the process controlling system (see Fig. 3).
The measurement point returns one or more values that can be used for calculating
different KPIs, so N-M relationships can be drawn between measurement point
and KPI. The data returned by the measurement probe is represented as ERM
attribute type objects and can therefore be reused from data models and integrated
in other data models. Besides the technical description, information about the
specific URL or the original database table and data type information can also be
stored in the ERM attributes. The EPC can also be elaborated with organizational
units. The organizational unit describes the groups of processors in the company
that perform the function. Organizational units are connected to the respective
function by non-directional connections (informational connection type). Meas-
urement probes can also return information about organizations on the basis of the
information that exists in the IT systems. These are often reflected in the form of
dimensions.

Managing of Process Key Performance Indicators 39
Offer to be
created
Check
Customer
Order
Customer
Order
Created
SYS
Create Offer
Customer
Order to
be created
SYS
Create Customer
Order
Customer
order to be
changed
SYS
Change Customer
Order
Customer
Order
changed
Delivery to be
created
SYS
Create Delivery
Delivery
Created
SYS
Picking Order to be
created
Picking Order
created
SYS
Goods Outward to
be booked
Goods
Outward
booked
SYS
Create Invoive
Invoicce
created
Measuring
Point
Customer
Order
Measuring
Point
Goods
Outwar...
Measuring
Point
Invoice
created
Goods
Outward
(planned),
latest
Measuring
Point
Goods
Outwar...
Auftragsabwicklung
VBEP-WADAT
LIKP_WADAT_IST
Timestamps/Dates extracted from SAP
Timestamps/Dates extracted from SAP
Timestamps/Dates extracted from SAP
Fig. 3: Enhancement to the eEPC
Order processing

40 A. Kronz
4 Integration of KPI Management in the Process
Management Loop
KPI Management intersects with Process Management at many points; it may also
be defined as a component thereof. The KPI Management tasks assigned to the
roles concerned can be derived from this integration.
Fig. 4: Integration in Process Management
The description of key performance indicators must be embedded in Business
Process Design. The definition and structure of the KPIs as well as the relationship
between the KPIs and the processes are described here. Adaptations to the
processes necessarily cause adaptations to the KPI structure.
When processes are strategically realigned or new services are designed (Business
Process Strategy), the KPIs must necessarily be adapted as well, because the re-
flect what management expects of the processes. Changes to the KPIs in turn
mean that measurement points must be redefined or reconfigured, and they must
be submitted to requirements management for the application systems.

Managing of Process Key Performance Indicators 41
In order to ensure efficient, cost-effective controlling, the implementation of
measurement points must be taken into account in the implementation and support
of the processes by IT (Business Process Implementation). Interface management
of the measurement points has the effect of gathering the data in a Business
Process Warehouse, which holds the data in readiness for all process questions
regarding times, quality and costs, also for the purposes of process cost analysis.
The Business Process Warehouse also contains the clearing point and ensures the
consistency of the data from the measurement points. The controlling tools are
integrated as components of the Business Process Warehouse.
Business Process Controlling uses the data from the measurement points for
process-oriented evaluations analyses with ARIS PPM. These analyses are
combined with traditional controlling approaches as necessary to obtain an overall
picture of company performance or to add process auditing to the auditing
function.
The results can be made available in a central access platform so that they can be
prepared in a manner most suitable for the target group. This platform should be
integrated in the company portal so that it can be included in the single sign-on
access and authorization arrangements. The controlling scenario can be
supplemented and rounded out to good effect with special reports for different
user groups.
Besides the purely operational use of process controlling, key performance
indicators can also be accessed by process analysts. In particular, analysts can also
use the functionalities of the process controlling tools (Process Mining, ABC
Analysis etc.) to detect weak points in the process sequence and derive im-
provements. Some of the analyses are carried out in the controlling tools (for view
of just the Actual situation), and process modeling is used as well for Target-
Actual comparisons. The KPIs can also be used as the basis for defining new
target ranges for KPIs.
5 Tasks and Responsibilities as Part of KPI
Management
Besides the tasks associated with KPI Management, responsibilities must also be
defined for the individual activities. This definition results in a series of roles,
which must be integrated as a role concept in the Process Management role
concept (not further described here). Therefore, only the roles of KPI Management
will be described explicitly in the following section.

42 A. Kronz
5.1 Management (Mmgt)
Management is responsible for the targets and the strategic alignment of process
management as part of the KPI Management function. This includes establishing
rough key performance indicators and target values that support the strategy and
enable its implementation to be controlled.
The KPIs are also defined in coordination with the Controlling departments, which
embed them in the overall controlling infrastructure and/or use them for
interdepartmental comparisons and benchmarks.
5.2 KPI-Manager (KPI-Mgr)
KPI Managers are responsible for the routine operation of KPI Management. They
convert the KPI targets received from management to calculable key performance
indicators so that they can be implemented operationally. To this end, they
coordinate with the technical departments and prepare a consistent detailed
specification of the KPIs. Since the KPI Managers also serve as the collection
point for KPI requirements from the operational technical departments, they
reconcile these requirements with the targets supplied from the Management level
in consultation with Process Management.
At the same time, they work with the IT departments to determine available and
required measurement points, from which the required key performance indicators
can be calculated. They also define the criteria and dimensions that are necessary
in order to be able to evaluate the key performance indicators. The consistency of
the dimensions themselves must also be ensured, for example so that
performances for different KPI areas can be evaluated uniformly.
After feasibility testing, the KPI Managers cooperate with IT Requirements
Management to draw up suitable release plans for realizing the measurement
points and adapt them to the release plans for process modeling. With regard to
the KPIs themselves, their implementation is coordinated with the IT managers of
the controlling tools. The KPI-Mgrs also use KPI trees and KPI allocation
diagrams to document the KPIs in process modeling.
Besides the changes to the KPI system due to new targets set by Management, the
KPI Managers determine the effects of the system changes on the key
performance indicator system. Since system changes may be either IT or process
changes, they must be integrated in the corrsponding requirements or change
processes (this is a required input from the respective change manager).

Managing of Process Key Performance Indicators 43
5.3 Process Managers
As part of KPI Management, Process Management has the task of confirming the
respective KPIs for the processes in consultation with Corporate Management.
Process managers receive the decision criteria from the KPI managers, who have
translated the targets into process-compatible KPIs in cooperation with the
technical department. The process managers and corporate management share
joint responsibility for ensuring compliance with the KPI target values.
5.4 Technical Departments
Together with the KPI managers, the technical departments work out the detailed
specification of the key performance indicators and contribute new KPI require-
ments for operations as necessary.
5.5 IT System Managers and Requirements Management
IT system managers work with the KPI managers to harmonize new or changed
measurement points. The requirement for new measurement points must be
included in Requirements Management and synchronized as necessary.
Requirements Management itself must consider measurement points for all new IT
plans, and clarify changes as necessary with the KPI managers.
The IT System Managers are thus reponsible for the stability of the measurement
points, particularly in the event of IT changes, and for the corresponding
information from the KPI Managers.
The IT Managers of the controlling tools implement the key performance
indicators according to the specifications defined by the KPI managers. Depend-
ing on the changes, they may also be required to cooperate in adapting the process
modelling.

44 A. Kronz
5.6 Use of the KPI system
The following table summarizes the possible usage scenarios of the key
performance indicator system for the various roles.
Use
Management • Corporate leadership using highly aggregated
data
• Notifications in the event of significant
deviations
• Control of implementation of the strategic
target values
• Derivation of new strategic alignments
Controlling • Use of the Process KPI system as a module in
overall controlling
• Interdepartmental comparisons and
benchmarks
Process
Management
• Operational control and continuous monitoring
of the managed processes
• Notification in the event of deviations
• Derivation of measures
Process Analysts • Cause tracing, structure analyses and
target/actual comparisons
• Derivation of structural changes from processes
KPI Mgr • Control and support of the KPI system
IT Management • 1st and 2nd level support for KPI tools
(3rd with technical management )
• Continuous monitoring of business
management processes from the technology
perspective
Fig. 5: Use of the KPI system

Operational, Tool-Supported Corporate
Performance Management with the ARIS Process
Performance Manager
Markus von den Driesch
IDS Scheer AG
Tobias Blickle
IDS Scheer AG
Summary
In ARIS Process Platform, and particularly ARIS PPM, users have a professional
tool for Corporate Performance Management. Consistent alignment with process
analysis, combined with the ability to analyse process-external data at the same
time, enables users to detect weak points in the process organization with com-
prehensive and easy-to-use analytical methods (Process Mining, ABC analyses
etc.). Beyond the evaluation of key performance indicators, the graphic vis-
ualization of actual processes is a patented method for identifying patterns in the
execution of processes and pinpointing optimization potential. The system has
been applied successfully, its flexibility and effectiveness proven in widely
differing real-life situations for many customers in vastly different sectors of
industry.
Keywords
Key performance indicators, process mining, process visualization, weak point
analysis, scalability

46 M. von den Driesch, T. Blickle
1. The Path to Corporate Performance Management
A comprehensive Corporate Performance Management (CPM) system is not pos-
sible without the collection and evaluation of objective key performance indicators
for the most diverse aspects of a company's life. Most conventional reporting and
business intelligence applications focus on financial indicators and do not take
adequate account of the company's business processes.
Yet it is precisely an evaluation of the performance and efficiency that yield these
financial indicators which is so important for detecting problems and enabling the
introduction of optimizing measures as early as possible. Only an overall view of
the performance of the processes in the context of other aspects makes it possible
to reveal weak points and define measures for correcting them.
Thus the collection of key performance indicators that enable the quality of the
business processes to be evaluated is essential for Corporate Performance
Management. A one-time "snapshot" for evaluating process performance, e.g. in
the form of a manual collection and analysis, is no longer sufficient, because the
workflow sequences in the company are evolving constantly and are constrained
continuously by external influences.
1.1 Requirements for Process Controlling
Accordingly, a procedure is required that enables process-based key performance
indicators to be evaluated on an ongoing basis. It should be possible to collect the
process-relevant information automatically, techniques and aids should be pro-
vided for weak point analyses, and it should be possible to prepare the information
appropriately for the target group (management, process manager, process partic-
ipant).
The set of key performance indicators to be calculated must be defined flexibly,
and in such a way that it can be expanded to meet changing requirements of the
company's specific processes. Besides calculating key performance indicators, it is
also necessary to be able to visualize the structure of actual processes, since this is
the only way to obtain generalized explanations for their performance behavior.
Since processes very often extend across the boundaries of multiple heterogeneous
systems, it must be possible to analyze workflows "from end to end". Since
processes are very often included that are performed hundreds of thousands of
times a day, the analysis component must be scalable so as to be able to assure
consistently good behavior both when the information is imported and while the
information is being analyzed.

Operational, Tool-Supported Corporate Performance Management 47
2. Process Performance Management with ARIS PPM
With ARIS Process Performance Manager, IDS Scheer offers a software solution
that is purpose-built for controlling and analyzing business processes. As part of
this solution, a patented procedure is used to collect process-relevant data from the
operational IT systems, reconstruct process automatically and calculate key
performance indicators for these processes. An extensive list of options for
analyzing the key performance indicators online and particularly for presenting the
actual process measurements in the form of event-driven process chains (eEPC)
place the system in a class of its own.
2.1 Visualizing the Real Process Structure
Process analysis using ARIS PPM is
based on "process instances", i.e. the
individual, concrete operations that
belong to a process type, e.g. order
processing, purchasing or maintenance.
The chronological-logical sequence of
each individual process instance can be
displayed graphically in the form of an
event-driven process chain. The EPC
representation has now become estab-
lished as the industry standard for
mapping business processes, and is
very easy for users to understand.
Unlike the design components of the
ARIS product family, with which
processes can be modeled by the users
themselves, the process chains and their
graphical presentation are automat-
ically generated by ARIS PPM are the
data has been imported from the
operational system.
The corresponding EPC is created for each individual business transaction and
supplied with the appropriate instance information (i.e. dimensions such as
customer, times of execution, executing person, region, etc.). Since these models
are generated dynamically, the process structure may appear differently for each
individual instance, depending on the sequence of activities that have actually
taken place. In particular, parallel processing operations and processing loops
provide important clues regarding potential optimizations. With this presentation,
Fig. 1: EPC visualization of a process
instance

48 M. von den Driesch, T. Blickle
the precise workflow sequence and structure of the business transaction can be
recorded very quickly. Deviations from the target model can be identified.
An especially interesting analysis option is obtained when several of these actual
workflow sequences are combined and visualized as an EPC model. This
"compressed EPC" represents the average behavior of the underlying process
instances that have actually been passed through. To do this, the selected process
instance models are virtually "superimposed" on each other (see Fig. 2). During
compression, all the objects and connections of the selected process instances are
incorporated in the compressed EPC. Objects (e.g. functions, organizational units,
events) and connections that fulfill specified equivalence criteria are combined to
form one object or connection. The logical workflow sequence is retained by
incorporating connectors ("AND", "OR", and "XOR" branches) in the process
workflow sequence.
Fig. 2: Compressed process model

Operational, Tool-Supported Corporate Performance Management 49
This visualization of the compressed model is highly suitable for performing a
structural analysis of the process, because it clearly shows the user which are the
most important paths and activities in the process. The probabilities of various
paths are expressed graphically by different connection thicknesses. This enables
various behavior patterns in business processes to be evaluated and structural
differences to be analyzed. For example, the user can thus test whether
optimization measures affect the main path, or whether secondary paths that are
traversed less frequently are disruptive and should be eliminated.
The compressed process model thus represents an actual model, which can be
compared to a target model (modeled with ARIS components wherever possible)
to determine structural differences (see Fig. 3): Paths in the target model are not
passed through in reality, probabilities differ from expectations, activities must be
passed through several times, unplanned organizational interruptions occur during
processing because several organizational units are involved, etc.
This information serves as the reference point for continuous optimization of the
process.
Fig. 3: Comparison of a target model with actual models

50 M. von den Driesch, T. Blickle
2.2 Key Performance Indicators and Analyses
Process visualization in the form of aggregated process chains is a primary aid to
explaining and correcting structural disruptions and bottlenecks. Anything that is
considered to be a "bottleneck" or "disruption" in a process is expressed in the
corresponding key performance indicators, e.g. unsatisfactory "delivery relia-
bility". Key performance indicators thus serve to reveal weak points in the huge
number of individual business transactions, while the EPC presentation serves to
explain the weak points.
In general, key performance indicator is understood to mean the interpretation of a
numerical value that is returned by a key performance indicator definition under
specified framework conditions. Let us consider the example of a "Process run-
time for purchasing processes in August 2004" key performance indicator that has
the value "5 days". The key performance indicator definition should be understood
as a key performance indicator for the purposes of ARIS PPM, in this instance for
example "process runtime". Limiting the range to "Purchasing processes in August
2004" serves as a filter for a "dimension". A dimension is a process-relevant var-
iable that is used for catagorizing processes. In the example described, the "point
in time" (= August 2004) and the "process type" (= Purchasing process) are di-
mensions.
Straight way, a comparison of the key performance indicator value (5 days) with a
reference value reveals a weak point. Reference values can be plan values, the
previous year's figures, or even key performance indicators from comparable
processes (e.g. benchmarking between different sales organizations, plants,
regions).
The "Process runtime" key performance indicator can be calculated for each
individual business transaction (process instance). There is a whole range of
generally applicable key performance indicators which can provide useful
information for each process type, such as throughput times, processing times,
frequencies and the number of employees involved. Besides these, key
performance indicators are needed that are only meaningful for certain process
types, or which are based on given structures in the process sequence. For
example, very frequent use is made of key performance indicators that measure
the time period between two given activities in the process (time period key
performance indicators). Another example would be delivery reliability key
performance indicators, which evaluate whether a specified activity is completed
by a desired point in time. These key performance indicators vary from one usage
scenario to the next and must be defined specifically.
ARIS PPM therefore has a flexible rules mechanism which enables key
performance indicators to be defined without any need for programming (see Fig.
4). All key performance indicators are calculation from information that is present
on the process instance. A calculation rule defines which attribute values are to be
used and how the various values are to be related to each other via operators. As

Operational, Tool-Supported Corporate Performance Management 51
well as providing simple arithmetical links, these operators enable complex
condition checks. The user creates the rules mechanism with a graphic editor,
which hides much of the complexity of the calculation rules.
Fig. 4: Example of an individual key performance indicator definition
Like the key performance indicators, dimension values can also be calculated with
these rules so that the process instances can be classified. The key performance
indicators and dimensions calculated in this way are saved in the database for each
individual process instance. The consideration of the key performance indicator
values for individual process instances is used in monitoring scenarios. For
monitoring purposes, the user receives targeted alarms regarding critical con-
ditions in the individual business transactions so that operational counter-measures
can be instituted.
On the other hand, in overall process management a number of process instances
of the same type is used. Here, it is desirable to reveal systematic errors. For this
purpose, the key performance indicator values for a set of process instances are
aggregated. The aggregation type is usually an averaged value (e.g. for time peri-
ods) or a cumulative value (e.g. for quantities, costs).

52 M. von den Driesch, T. Blickle
The aggregated key performance indicator values often need to be calculated in
terms of new key performance indicators. In the example of the rate of returned
goods, the ratio of goods returned to the total number of purchasing operations is
calculated. Returns are often separate business processes. The "return rate" key
performance indicator must then be calculated from the number of returns divided
by the number of purchases, i.e. two aggregated key performance indicator values
are calculated against each other. This subsequent reconciliation is enabled by
ARIS PPM via "user-defined" key performance indicators, which the user can de-
fine directly in the user interface and which are then immediately available for
use.
All the indicators that have been described up to now are based on data which is
present directly on individual process instances. For a complete overview, how-
ever, some information that is not associated with individual workflow sequences
is needed. For example, an evaluation of customer satisfaction is often conducted
with a representative survey of a random sample. The number of people employed
by the company is also independent of individual business transactions. Carrying
out a complete evaluation of processes or the entire company also requires key
performance indicators of this kind. In ARIS PPM, they can be saved as "instance-
independent key performance indicators", which can be analyzed by the same
methods as all other key performance indicators.
2.3 Documentation
To avoid misinterpretations or misunderstandings in the analysis, accurate
documentation and descriptions of the key performance indicators and dimensions
is essential. For this purpose, a description of how the key performance indicators
are obtained is defined at the technical level. The corresponding measurement
points can be modeled in a process chain, for example, using the description
methods that apply throughout the ARIS product family.
Besides the modeled description, the end user can also access a brief description in
layman's terms. In ARIS PPM, the user can view a description of the key per-
formance indicator in a tooltip and can also refer to freely defined HTML docu-
ments with an explanation directly from the application.

Operational, Tool-Supported Corporate Performance Management 53
2.4 Weak Point Analysis
It may seen, therefore that ARIS PPM is able to yield a large quantity of
information (process structures, key performance indicators and dimension) that is
essential for measuring and evaluating the company's performance. The user can
start a simple analysis by querying a single key performance indicator. First
results are shown in the speedometer diagram (see Fig. 5).
Fig. 5: Speedometer presentation
Here, the needle shows the process runtime as an average of a time interval.
Comparison values (warning and alarm values) are also shown, so that the current
value for the process runtime can be evaluated. Plan values can be set for each key
performance indicator. From the simple average for a key performance indicator,
the user can switch to the trend analysis by adding the Time dimension. Iteration
is performed over the Time dimension, i.e. the time is plotted along the X axis of
the diagram (in freely definable increments). With this display, the trend of the
key performance indicator over a period of time can be reviewed, and noteworthy
time intervals can be pinpointed (see Fig. 6).

54 M. von den Driesch, T. Blickle
Fig. 6: Trend analysis
All key performance indicators depending on various dimensions can be visua-
lized in the same way. Noteworthy deviations of the key performance indicators
for specific dimension values can also be identified.

Operational, Tool-Supported Corporate Performance Management 55
Fig. 7: 3D bar chart
The analyses can be represented with a number of different diagram types. For
example, line diagrams lend themselves particularly well to indicating tendencies
and trends. A 3D bar chart (see Fig. 7) presents combinations of the dimensions
clearly for evaluation. Percentage distributions are often displayed with pie charts.
In all cases, the mode of presentation is highly flexible and can be freely defined
to provide the best possible conditioning of the information. It should also be
noted that all data can also be presented in tabular form and exported to Excel.

56 M. von den Driesch, T. Blickle
2.5 Process Mining: Automated Weak Point Analysis
In practical use, 15-20 dimensions and a similar number of key performance
indicators quickly become necessary. In order to be able to determine the signifi-
cance of a key performance indicator for a dimension value here, the combination
of each indicator with each dimension would have to be checked – a very time-
consuming task if it is undertaken manually.
With the Process Mining feature in ARIS PPM, all such tasks can be automated.
The system checks the combinations of key performance indicators and dimen-
sions automatically and returns a list with the most significant noteworthy
features. The "noteworthy feature" is determined from the maximum deviation of
a key performance indicator value from an average in a given iteration step.
The chart on the right in Fig 8 shows the average process runtime for several
facilities. Evidently, all values are fairly similar, the "noteworthy feature" or de-
viation width is correspondingly low at 4%. One may therefore draw the con-
clusion that different facilities have little or no effect on the key performance
indicator - the dimension "Plant" is therefore not a noteworthy feature. Similarly, a
dimension is noteworthy if it has a large fluctuation width (Fig. 8 left). The
process runtime varies very considerably from one customer territory to another,
which indicates that customer behavior also varies between territories.
Fig. 8: ProcessMining by noteworthy features

Operational, Tool-Supported Corporate Performance Management 57
ARIS PPM provides further support for analyzing the data with ABC analysis and
Top-Flop displays. In a top-flow diagram, a specified number of "best" and
"worst" values are presented (see Fig. 9). This enables best practices and
optimization opportunities to be detected very quickly. The ABC analysis is a
method for establishing priorities, separating the critical from the non-critical and
determining the respective cost to benefit ratios in individual areas. For example,
ABC analyses can be used to determine which products and services are the most
important for a company's sales, who are the most important customers, or what
efforts are having a financial effect. The objective of an ABC analysis is to direct
the company's attention more actively towards the important areas and to identify
starting points for targeted measures.
Fig. 9: Top-flop analysis

58 M. von den Driesch, T. Blickle
2.6 Management Views
Management-oriented views in ARIS PPM enable the occasional user to obtain a
quick overview of the critical key performance indicators and the most important
analyses. The content and conditioning can be configured individually without dif-
ficulty (see Fig. 10).
This display is particularly suitable for integration in a company portal, to provide
a large group of recipients with access to current analysis results. A management
view logs into the ARIS PPM server automatically, enabling further, interactive
analysis to be started simply by clicking on one of the displays with the mouse.
Fig. 10: Management view for quick overview of the most important analysis results

Operational, Tool-Supported Corporate Performance Management 59
2.7 Offline Reports
Besides the online analysis described in the preceding, evaluations on paper are
also needed for some user groups. For this purpose, reports can be defined that
generate a PDF document, for example. Report generation can be automated on
the server, so that daily or weekly reports are created automatically at specified in-
tervals.
Fig. 11: Sample report in Adobe Acrobat format (PDF)

60 M. von den Driesch, T. Blickle
3 Technical Aspects
3.1 Process Generation
As has been explained, the calculation of key performance indicators requires data
on individual process instances. A process instance contains information about the
activities performed, the points in time when the activities were carried out, the
processors in the process, and the structural sequence of the activities.
ARIS PPM uses the function, event, links, and organizational unit object types to
map a process instance as an event-driven process chain. Unlike the static ARIS
models, in ARIS PPM these object types represent measured operations at the
instance level or an aggregated level (see Fig. 12).
Fig. 12: Sample EPC from ARIS PPM

Operational, Tool-Supported Corporate Performance Management 61
The information about process sequences must be extracted from the application
systems that support the business processes operationally. Some process-based
systems, for instance workflow systems, can then provide the workflow for a
business transaction directly as an instance EPC. For these systems, ARIS PPM
specifies an XML-based default import format. Each individual process instance is
imported and stored in its entirety, and the configured key performance indicators
are calculated.
However, in most application systems it is not possible to fully extract a complete
process chain, because their operation is document or record-driven. But they
often hold a change history for the documents. ERP systems are typical examples
of such application systems. In these cases, then, a procedure is needed that can
reconstruct the correct process sequences from an enormous number of individual
items of information. ARIS PPM enables this by linking the occurrence of given
event in the source system (e.g. creation of a new record) to a "process fragment".
A process fragment represents a "mini-process" that consists of a function, a start
event and an end event.
All additional information about the event that is stored in the application system
is also exported, e.g. the date and reasons for a change, name of the creator, etc.
The associated process fragments are instantiated while the events are being im-
ported to ARIS PPM, i.e. the objects of the process fragment are supplied with
real data and stored in the database. These process fragments, which are initially
unconnected, are then combined with the aid of rules to form complete process
instances or process chains. This operation is called merging and is a core
functionality of the application (see Fig. 13).
In the first step of merging, all process fragment instances belonging to a given
business transaction are collected. In many cases, this is facilited by a unique
identifier, which can be extracted from the application system for each system
event. This may be an order number or a transaction number, for example. If one
unique identifiier is to be used for all substeps, the directly preceding or following
substep can also be identified. This mechanism enables a gradual compilation of
all the process fragment instances.
At this point in the processing associated process fragments are found as the
import progresses; but they are not yet linked to each other. There are a number of
routines for placing the fragments in the correct order.

62 M. von den Driesch, T. Blickle
Fig. 13: Merging process fragments
The "sort merge" sorts the fragments according to a definable ordering criterion,
e.g. the time of execution. The individual fragments are connected to each other
via the events. The subsequent event in each case is deleted and the function is
then connected directly to the preceding event of the subsequent function. In the
key-based merge, on the other hand, more complex connection rules are possible.
In principle, a rule is defined for the equivalency of events. The events can have
attribute values just as functions do. For example, two events are considered to be
identical if they have the same name in the same process instance. These identical
events are consolidated, that is to say they are fused into a single event, the
connection relationships to the functions are changed accordingly and another link
is added to the process chain.
In real situations, not all fragments of a process instance will be included in an
extraction operation. The mechanisms just described will also function if
associated process instance fragments are imported into ARIS PPM at different
times; this means that a process instance can continue to grow with the passing of
time.
3.2 System Architecture
A system for continuous process measurement must be able to process and store
extremely large volumes of data. For the simplest of processes, data on 10 or more
measurement points is returned so that the system can generate a process instance.
And the process instance data must be available for prolonged periods of time.

Operational, Tool-Supported Corporate Performance Management 63
Depending on the process type, access and analysis capabilities are required for
several months or even several years; as result, the number of process instances to
be managed can quickly grow into the millions.
As a rule, various operational IT systems are integrated for returning data. These
are often located in a computer center and their integration must satisfy certain
security considerations. This is why an application like ARIS PPM is designed
with a client-server architecture (see Fig. 14).
Fig. 14: Client-server architecture
ARIS PPM has a three-tier architecture consisting of the frontend, the server
application, and the relational database. The frontend provides the functionalities
that are needed for analyzing and navigating. This is the presentation layer for the
process data that is supplied by the server application.
Queries are formulated in a special metalanguage by the frontend. During the
analysis operation, the server application converts these queries into SQL retrieval
queries for the database. The application server also provides the extended
analysis functionalities such as Process Mining, ABC analysis etc. Both the
frontend and the application server are programmed in Java, so they are largely
platform-independent.
3.3 Scalability
As was explained previously, very large volumes of data can flow into the
database. But the volume of data has direct implications for the performance of the
system, during both the import and the analysis. To achieve acceptable times, the
computing capability should be configured correspondingly, especially in the case
of the database server. The scaling concept of the ARIS PPM enables the system
to be expanded incrementally. According to this concept, the data can be
distributed among several individual PPM systems or "subservers", each with its
own database. The data is imported directly to these subservers, so the import
operation can be carried out in parallel.
The user only needs to log into a master server, so he is completely unaware as to
whether the data is held on one system or is shared among several (see Fig. 15).

64 M. von den Driesch, T. Blickle
The master server submits the analysis queries to all the subservers in parallel and
consolidates the partial results as a total result, which is presented to the user.
Fig. 15: Scaling concept
This scaling concept enables solutions to be implemented in which additional
computers can be added incrementally as the volume of data grows, while
significantly reducing the cost of the initial investment.

Successful Process and
Performance Controlling in the Power Supply
Industry by SÜWAG Energie
André Dreißen
IDS Scheer AG
Rainer Heinrichs
Süwag Energie AG
Summary
SÜWAG Energie AG took the decision to implement a program continuous
process and system optimization of its business processes based on ARIS Process
Performance Manager. The service processes at four different locations were
selected for Performance Monitoring with a standardized, software-supported
process controlling system. After just two months, the first substantiated analysis
based on SAP IS-U were available, so that process improvement measures could
be initiated.
Keywords
Quality key performance indicators, complaints quota, energy industry, SAP IS-U,
process mining, implausible meter reading results, customer segments, disruption
factor analysis, anomaly analyses, process controlling tool

66 A. Dreißen, R. Heinrichs
1 Introduction
Süwag Energie AG is based in Frankfurt am Main and was founded in mid-2001
as the result of merger of four regional power supply companies. From the outset,
the new company has been keenly aware of the new competitive landscape in the
energy market, and today, in the electricity sector for example, it supplies energy
to more than two million consumers.
The company was faced with the challenging of making the right strategic
decisions to combine the differing corporate elements and cultures. At the same
time, it was important to distill out a series of best practices and introduce them as
standards in the company – without allowing the customer base to experience any
loss of the quality they had come to expect.
Today, the business model has barely changed, but the company's structural and
procedural organizations have both been completely redesigned. Corporate pro-
cesses and IT were examined from the points of view of cost savings, flexibility
and future-proofing.
2 Redesign of Processes and IT
In order to standardize the hitherto highly heterogeneous IT landscape, it was
decided to expand the existing ERP platform (SAP R/3) as part of a new IT
strategy. In the design phase, a business process model was developed around the
SAP solution for the energy supply industry, SAP IS-U (Industry Solution
Utilities), which covers many of Süwag Energie AG's core processes, from
customer contact to meter reading, billing, device management, accounting, and
supply management.
As part of the implementation of the new IT strategy – in addition to various
support systems – the eight billing systems that had been used by the four former
companies (one each for standard and special contract consumers) were replaced
with SAP IS-U, CRM, EDM (Energy Data Management) and BW (Business
Warehouse) in a project that lasted two years.
The most important consideration when introducing the new IT architecture was
to ensure efficient mapping of corporate workflows. Because Süwag employees
are based at four different regional sites, standardized processes are particularly
important for interdepartmental cooperation and to ensure a uniform public face.

Performance Controlling in the Power Supply Industry at SÜWAG Energie 67
All phases of setting up the new company were guided by a professional process
management system, which divides the lifecycle of a business process into three
phases:
• Process design
• Process implementation
• Process controlling
In this context, the development or refinement of a business process is to be
viewed as a closed loop: If needs to adapt the current corporate workflows
(organizational change requirements, optimization potential, etc.) are identified as
part of the process controlling program, procedures for redesigning and
implementing the changed workflow are triggered directly afterwards. Following
on from that, particularly the structure and implementation of the process
controlling program at Süwag Energie AG are analyzed in detail.
2.1 Process Controlling as a Means to Protect Investments
Introducing a highly-integrated IT infrastructure that enables both departmental
and company-wide processes to be executed efficiently is often a highly complex
undertaking, associated with considerable costs. In many cases, the company's
expectations of new IT systems are disappointed despite the high cost in terms of
money and work. The main reasons for this are:
• the specifications from the process design phase are not implemented
consistently
• the overall view is lost in the implementation phase and optimization is
carried out in an unbalanced manner from the point of view of one area
• insufficient account is taken of the fact that the system is dynamic and
continues to evolve
• the integration of the new software in the existing IT landscape is only
partly successful (e.g. because of its complexity or interface problems)
• the decisions made in the design phase are not checked or reviewed.
Accordingly, it is important and wise to protect this investment. This includes a
critical examination of the objectives of a larger conversion process - even after
the software has been installed. One common management error is to concentrate
on planning up until the new software becomes operational (including a brief
phase of operational guidance by the project team). Then the project team "returns
to the ranks", the successful project director is assigned new tasks, future change
requests are managed via a contact person in IT – continuous monitoring of the
application and processes is neglected.

68 A. Dreißen, R. Heinrichs
The negative scenario: In future, the software solution is modified in the areas of
responsibility of the individual technical departments, more or less necessary
additional developments are integrated, modules that are not needed are not
removed, a whole range of new reports is developed. For processes that were once
lean and standardized, variants are created for different sectors, customer
segments, products, locations, etc.
The result: Process and system performance are compromised. The level of
dissatisfaction among users rises. Within a few years, the first reengineering
project is begun. In the worst case, this results in a new, expensive software
solution.
The long-term success of any process and IT landscape is based on three major
factors:
• The ability of the defined processes and selected IT solution to continue
to operate in the future
• The transfer of the project organization for an implementation project to
the structural organization of the company
• Continuous, active review of the workflows and IT
Modifications to processes are being made constantly in the daily business of a
company: A planned process (target design) seldom matches the process as it is
introduced, and this in turn is not the same as the process that is actually running
every day. To actively control the form of the process and to protect the
investment in process and IT architecture, Süwag Energie AG introduced a
modern process controlling program.
The advantages are obvious: After its employees, a company's business processes
are the most important decision-making criteria on the market. Process controlling
is a continuous procedure; regular discussion of their own processes by employees
promotes the culture of process optimization in the company. Besides,
evolutionary changes in small increments have a much better chance of being
accepted in the organization than revolutionary reengineering projects, whose
success is further threatened by political and budgeting resistance.

Performance Controlling in the Power Supply Industry at SÜWAG Energie 69
3 Process Controlling at Süwag Energie AG
3.1 The Objectives of Process Controlling
Besides the overriding objective of investment protection described previously,
process controlling is used at Süwag to pursue a number of specific subordinate
objectives, as illustrated in Fig. 1.
Fig. 1: The objectives of process controlling
Controlling is viewed as a continuous corporate task, in which a standardized
control system ensures transparency by regular process reporting. Transparency is
also assured in the sense that the paper trail of the process performance in daily
business transactions can be verified or disproven with substantiated analytical
data in the technical departments. The analysis tool ARIS PPM (Process
Performance Manager) was introduced as the platform for continuous process and
system optimization.

70 A. Dreißen, R. Heinrichs
Since most midsize and large energy suppliers in Germany now use SAP IS-U,
and this suite has established itself as the de facto industry standard, the analysis
capabilities of ARIS PPM have been tailored specifically to the situation in
energy supply industry. We were therefore able to build a software-supported
process controlling system in a short period of time.
3.2 Project Content
With the introduction of SAP IS-U, particularly the customer-related processes at
Süwag Energie AG were completely restructured. Because of the large number
and multiplicity of processes, and their direct effect on the perception of the
company from the outside, the Customer Service department was chosen as the
department for introduction of the process controlling pilot project. Süwag
customer service employees work on the various customer segments (Private and
Commercial Customers, Industrial, Retail & Services, and Public Sector) at four
different locations. Processes that are essential for carrying out business on a day-
to-day basis are supported in SAP IS-U by a central user interface (the SAP CRM
Customer Interaction Center).
Fig. 2: The SAP CRM central user interface (CIC) in Customer Service
(German version)

Performance Controlling in the Power Supply Industry at SÜWAG Energie 71
Information relating to customers such as addresses, current supply contracts,
open invoices, complaints etc, can be displayed very easily.
Customer-related processes such as contract modifications, moves, changes to
banking data or bill checking, can be carried out as needed. When ARIS PPM had
been installed, the wide variety of single transactions were merged in SAP IS-U to
obtain complete and comparable workflows, prepared for graphical display and
made available for analysis.
Fig. 3: ARIS PPM analysis by process numbers
Here, ARIS PPM functions as a stand-alone software package – with no effect on
the performance of the operational SAP system that represents the direct contact
with the customer. In the design phase of the project, the processes selected for
performance monitoring included these high-volume processes:
• Moves
o Moving in
o Moving out
o Moving post-processing
• Changing bank information
• Changing contract account

72 A. Dreißen, R. Heinrichs
• Recording meter reading
• Changing advance payment plan
• Processing implausible meter reading result
• Changing tariff data
Fig. 4 shows an individual evaluation of the process data analyzed in the ARIS
PPM user interface – in this case the frequency of processes in a given period of
time.
4 Examples of Use
Following the launch of the pilot project in the Customer Service department,
ARIS PPM was installed and key performance indicators were defined. The
success of this kind of process controlling is decided in large part by two factors:
• complete and accurate evaluation of data
• integration of the process controlling task in the organization
With this in mind, all the data and key performance indicators that had been
gathered were tested in the project team and also validated by the technical
department. After just two months, the project team was able to provide the first
substantiated evaluations based on SAP IS-U. The quality of the data and the
results of these first evaluations were so promising that it was possible to release
the application for operational use with a few adjustments. Indications of non-
optimal use of SAP transactions (e.g. Move in/Move out) meant that the first
process improvement measures could be instituted in very short order.
It was also revealed that some processes are associated with high post-processing
effort. Based on these findings, further evaluations can now be made to determine
and correct the reasons for the post-processing needs.
Moreover, regional differences were identified and used in the definition of best
practices to improve the average process performance of the entire company.
To simplify process controlling, adapted evaluations were developed for the
various target groups. The target groups for process controlling (management
board, divisional management, process managers) can receive canned reports
either in hardcopy or electronically via the intranet (HTML format) and email
(PDF format) as necessary. Direct access to ARIS PPM with a browser is possible
from any workstation, provided the user is logged in with the corresponding, user-
specific authorizations.

Performance Controlling in the Power Supply Industry at SÜWAG Energie 73
ARIS PPM has been measuring customer service processes successfully since
early 2004. And now for the first time, substantiated and documented analyses can
be received regularly and automatically from the core IT systems without any
additional effort.
By setting up role-specific information views (called Management Cockpits) the
pertinent data can be combined in such a way that the respective process controller
can call up an overview of the entire area for which he or she is responsible with a
click of the mouse. If the predefined parameters such as process quantity and
throughput time, or the quality key performance indicators such as error rate and
complaints quota within the desired tolerances, the manager can be assured that
performance in this area is satisfactory. If individual values fall below the
benchmark, a value – depending on the significance of the key performance
indicator for that division of the company – can be observed more closely, or a
more thorough analysis can be carried out directly (Process Mining). Fig. 4 shows
a jump from the Management Cockpit used by the head of the Süwag front office.
Fig. 4: Process Performance Cockpit for the moving core process

74 A. Dreißen, R. Heinrichs
The moving core process was selected from manager's entire area of re-
sponsibility. Five different aspects of the business process are combined in a
standardized way in this display. The head of the front office is informed about:
• the average process throughput time for all moves (monthly view)
• the trend by number of processes and throughput time (weekly view)
• the distribution of the individual processes and their throughput times
• the distribution of throughput times by individual customer segments
• the actual progress of the the moves in SAP IS-U
All graphical displays are generated automatically by the Performance
Management software, so that the user can concentrate exclusively on analyzing
the data. The display of the system process workflow (on the right in Fig. 4) is
particularly noteworthy.
Fig. 5: Evaluation – monthly comparison of process numbers and throughput times for the
moving core process

Performance Controlling in the Power Supply Industry at SÜWAG Energie 75
The target workflows developed in the design phase can very easily be compared
with process shown here, as it is actually running in SAP. It can be particularly
interesting to superimpose all the occurrences of a business process for a given
analysis period, as has been done here. This shows the individual variants of the
processes particularly clearly. It often shows that a process is not executed as
"cleanly" as was envisioned in the blueprint, but possesses considerably more
variants or is delayed by more loops or unnecessary wait times than was
anticipated.
If the development of certain aspects of a process is categorized as critical, a
disruption factor analysis is triggered. The extreme versatility of the tool we are
using enables the various views of the process under consideration to be displayed
in more detail simply by marking them.
A concrete example of a process analysis is shown in Fig. 5. Here, the process
number graph (bar) and the process throughput times graph (curve) for the
Moving process are compared with each other by month. Besides the clear fall in
the number of moves in July (due to vacation time) the initial processing time for
Moving as shown here rose significantly, from 6 minutes in April to 9 minutes in
August. This value also peaked at 10 minutes in July. Because of the frequency of
this high-volume process (generally > 2000 moves per month) and the fact that its
performance has worsened by about 50% is would seem that a more thorough
analysis of this point is merited. This analysis does not always lead automatically
to optimization measures, since the figures returned may be singular events or due
to seasonal influences.
Conclusion and Forecast for the Future
Based on our experiences to date, the task of process controlling should not be
restricted to a central unit (except for interdepartmental control), it should be
embedded in the respective technical areas. On the one hand, those affected will
then be directly involved, and on the other, the analysis will be simplified because
the substantive technical expertise will be immediately available.
Following our initial positive experiences with Process Controlling, we have
instituted a coaching and know-how transfer program, led by the technical
consultants of IDS Scheer. In the medium term, the employees of Süwag will
refine processes and the apparatus for controlling them independently. As a result,
the task of process controlling will be appended to the job description for
department heads and process managers.
At Süwag, this new task will also be integrated in the existing meeting structure.
In future, managers will be required to report on compliance with key
performance indicators/benchmarks at the divisional level every 4-6 weeks.
Measures for optimizing the processes will be defined and controlled based on the

76 A. Dreißen, R. Heinrichs
results of the anomaly analyses. Urgent process adaptations will be implemented
in parallel with and independently of these measures.
ARIS PPM is a highly suitable process controlling tool in this context. For all the
automated data conditioning and the high degree of user support, there should be
no mistake but that the success of process controlling is thanks to the employees
who make draw the correct conclusions from the data they receive.

No Business Intelligence Without
Process Intelligence
Helmut Kruppke
IDS Scheer AG
Tino Bauer
IDS Scheer AG
Summary
More and more companies are asking themselves how they can gain demon-
strable, measurable benefits from innovations in communications and IT
technology. By providing information that can be used as the basis for decisions,
Business Intelligence serves as the means. At the moment though, the major hurdle
is that the information needs to be structured before it can be used. This can only
be achieved by management-instituted measures to bring about an improvement in
the way services in the company are performed. These service performance
processes must be designed in such a way, taking into account the internal and
external information base in the company, that the service (process output) results
in an improved competitive position for the company. The link between Business
Intelligence (information supply function) and the competitive service per-
formance processes is the management cycle. This cycle ensures that the available
information is transformed into targetted measures. It further guarantees that the
implementation of these measures also brings about more competitive service
performance processes via the control and monitoring of target achievement.
Keywords
Business Intelligence, controlling, business process management, business process
optimization, management process, management cycle

78 H. Kruppke, T. Bauer
1 The Challenge: Use Information Deliberately to Raise
Operational Performance!
Information management is not just an operational task, it has now become a
strategic tool in setting the company apart from its competitors. The rising level of
electronic support for operational business processes by IT means that the com-
pany can draw on more and more data. As a consequence, pertinent information is
becoming more and more important for generating knowledge. Meanwhile, many
corporate decision makers are drowning in data and starving for information.1
They have data cemeteries, but no information on which to base their decisions, or
to institute an effective decision-making process. When considering the benefit
that flows into the company routine from the existing data stock, the objective
observer is often prompted to wonder about the way of doing business: "Business
as usual or Business Intelligence?"2
In order to generate information from
unstuctured data, companies are turning more and more to Business Intelligence
systems as planning and control tools. But the derivation of concrete measures
leading to a measurable improvement in the company's profitability often does not
happen. In order to make this step, the information obtained must be transformed
in the respective phases of the decision-making and control process – referred to
in the following as the management cycle – into measures that will remain
effective for the long term.3
The fact that this transformation often does not take
place is usually due to two reasons:
1. Nowadays, decision-relevant information is often stored in different
locations, so its results have to be combined in Excel spreadsheets. This
impedes consistent access to information for the analysis of cause-and-
effect relationships between strategic target variables and operational
performance processes.
2. Either the available information is not processed further to obtain
targetted measures with an optimized cost-benefit ratio, or defined meas-
ures "drain into the sand" because there is no institutionalized control of
their implementation to ensure a continuous Target-Actual deviation
analysis.
1
Gentsch, 2000.
2
Grothe, Gentsch, 2000, P. 10.
3
See Wild, 1982, P. 37.

No Business Intelligence Without Process Intelligence 79
The current "second" Business Intelligence wave represents an attempt to counter
the first cause. Unlike the first, primarily technology-oriented wave, this new
wave places "Business" firmly in its focus. And with the objective of achieving
measurable improvements in the factors that contribute to competitiveness.4
This
approach will be presented in the following chapter 2. To combat the second
cause, company decision makers must first define objectives from the "right"
information and then derive measures for achieving those objectives. One way to
transform the information advantage thus gained into measurable, sustained
improvement in the performance of business processes is explained in chapter 3.
Finally, the solution approach is illustrated in a concrete, real-life example in
chapter 4, then future development possibilities in the company's operational life
will be examined in the conclusion in the last chapter.
2 Business Intelligence as a Basis for Providing
Targetted Information
The start of the Business Intelligence movement was represented by the
technological opportunities that arose from the Data Warehouse systems. These
provided the necessary conditions for a standardized, company-wide information
base for evaluation and analysis purposes, despite the various, differing source
systems in the company. But as its name suggests, a Data Warehouse is just a
"storage facility" for consistent information. This is associated with the following
problems:5
1. Transferring data from the operational systems to a Data Warehouse is
extremely labor-intensive and rigid. Any significant organizational
change usually means that the interfaces to the Data Warehouse have to
be reconfigured.
2. The available analysis methods are not capable of handling the enormous
volumes of information that will be available in the future. Most
importantly, the procedures to enable comparisons if changes are made to
the product, customer or organizational structures are not in place.
3. The user interfaces in Data Warehouse systems can usually only be used
by specialists. However, these are not usually the same people as the
decision makers who actually need the information.
4. Methods for "matching" the operational information from the business
processes of a company with the strategic targets are not available. It is
thus not possible to make a success comparison.
4
See Scheer 2004, P. 12.
5
See Kieninger/ Mayer, 2002, P. 234f.

80 H. Kruppke, T. Bauer
Business Intelligence is intended to make up for the shortcomings of classic Data
Warehouse systems. "Business Intelligence" (BI) refers to the analytical process,
that transforms – fragmented – company and competitors' data into action-oriented
knowledge about skills, positions, activities and objectives of the internal or ex-
ternal spheres of activity (actors and processes) under consideration.“6
In order to
ensure the required, consistent supply of information, the Business Intelligence
approach of the future must meet the following requirements: 7
1. Preconfigured, powerful analysis models capable of handling very large
data volumes
2. Central information models (point of reference)
3. Central methods which are also used in the operational systems
(plausibility checks etc.)
4. Configurable generators for transferring data from legacy systems
5. Powerful, customized user interfaces.
Constantly changing data as well as changes to the environment and surroundings
mean that flexible analytical approaches are essential. This necessary adaptation is
enabled by the Business Intelligence process. Three phases must be passed
through so that knowledge can be distilled from base data by identifying asso-
ciations and relationships:8
1. Provision of structured, unstructured or qualitative and/or quantitative
base data
2. Identification of correlations and relationships with or without a
hypothesis
3. Communication of the conditioned results to the corresponding decision
makers.
By expanding the object of analysis, the use of Business Intelligence places much
higher demands on the managerial qualification of the users. Without excellent
methodological knowledge, Business Intelligence solutions cannot be implemen-
ted to any good effect.9
The Business Intelligence approach consists of the fol-
lowing central modules:10
1. Multidimensional models (e.g. data cubes made up of sales regions,
customer segments, product groups and time sequences) are suitable
for mapping structured, quantitative data. A list-oriented data analysis
6
Grothe/ Gensch, 2000, P. 19.
7
See Kieninger/ Mayer, 2002, P. 235.
8
See Grothe/ Gentsch, 2000, P. 19ff.
9
See Klieninger/ Mayer, 2002, P. 234f.
10
See Grothe, 1999, P.7.

No Business Intelligence Without Process Intelligence 81
method does not reflect reality, nor does it serve an explorative
analytical procedure.
2. Expansion of the influence factors is served best by the most com-
prehensive treatment perspectives possible.
3. It is possible to avoid being overwhelmed with data by focussing on the
respective core questions and analyses of the areas under consideration.
Each core analysis must establish a connection between key
performance indicators that are important for the bottom line and
execution processes. This enables you to advance rapidly to the causes
of possible "anomalies". Analysis time is reduced, even as the quality
of the analysis gets better.
Use of new technologies improves the controlling and optimization of all business
processes that are relevant for a company. Because "Information alone does not
equip a person to act."11
Information systems must be assessed primarily according
to whether and how they affect the behavior of people.12
In and of itself, an informa-
tion system does not provide any benefit. Often, an informational competitive
advantage mechanism is assumed implicitly in company practise. In order to be
able to actually convert the consistent supply of information to a raised level of
corporate performance, this information must be used in a directed manner so that
business processes are also improved deliberately as operational drivers of com-
pany performance. Accordingly, one can only really talk about "information
conduct performance" if the information supply system is directed at providing the
correct information in each phase of the decision making and control process.
Fig. 1: Complexity reduction – Evaluation of data13
11
Gabriel, Dittmar, 2001, P.19.
12
See Weber, 2002, P. 97.
13
See Grothe, 1999, P. 3.

82 H. Kruppke, T. Bauer
Management decisions must be made in the face of constantly changing con-
ditions. Expanding the scope of consideration and the accompanying complexity
of the decision situation means that new controlling instruments and methods must
be used so that optimization potential can be identified quickly and objectively.14
As a result, the role of the decision making process is becoming more and more
critical in implementing defined strategies. Optimization decisions can no longer
be made centrally by individual departments on the basis of static, canned
information from standard information systems. Too much important,
decentralized information from the technical departments would be ignored. But
this integration inevitably leads to a greater degree of complexity. In order for the
decision makers to be able to process this plethora of information for the purpose
of achieving their objective, the decision making process must be supported by
information technology. This is the only way to prevent important criteria from
being neglected due to "information overload" or too much attention being paid to
minor problems.15
Handling this task properly requires purpose-built tools and methods, so that
potential can be identified and isolated even in a complex decision making
environment. To this end, IDS Scheer has developed an approach that provides
methodological and technical aids for decision making. Substantiated results or
optimiza-tion potential and the measures required to achieve them can be
developed in the consideration of end-to-end processes, not centrally and top-
down. For this, key players have to be integrated. It is evident that the information
supply function of Business Intelligence must be seen as a precondition for an
objective-oriented decision making and control process. The results of this
management cycle are business processes that are aligned optimally with
corporate objectives.16
The next chapter will deal in more detail with the interplay
between Business Intelligence, the management cycle and business process
optimization.
14
Even in the company-wide consideration of the order processing process, complexity
increases because of the many departments involved.
15
For an approach regarding objectivity failures that occur in the decision making process
and which task areas and the reference points for controlling it yields, see Otto 2003, Pp.
52 to 85.
16
Ultimately from this design of business processes, it is possible to derive configuration
options for the structural organization, IT support and staff development.

No Business Intelligence Without Process Intelligence 83
3 Directed Optimization of Business Processes with
Business Intelligence
With the support of technological development, Business Intelligence offers the
capability to supply all management processes with the decisive information. The
result is a technologically sophisticated and networked method of decision making
and corporate control (Information Supply Chain).17
This Information Supply
Chain supports the entire management cycle, from strategy development and the
corresponding derivation of objectives to the analysis, setup and evaluation of
alternatives, all the way through to monitoring the defined measures. A range of
tools are available in the individual phases of the management cycle, including
data and process mining, agent-supported analyses and automated target-actual
comparisons. The management cycle enables corporate objectives to be realized
by the directed design of business processes and objective achievement to be
monitored continuously.
Fig. 2: Global Business Intelligence approach18
17
See Alff, Bungert 2004, P. 157.
18
See Alff, Bunger, 2004, P. 157.

84 H. Kruppke, T. Bauer
Phases of the Management Cycle
The management literature includes a wide range of phase models to describe the
management cycle. In the abstract, it is possible to talk of the following phases:
planning and decision making, and implementation control. In general, planning is
understood to be "a systematic, future-oriented examination and definition of
objectives, measures, means and routes to achieve an intended objective.19
Besides
the design of the executing processes, this also includes the breakdown of
objectives and the assignment of responsibilities. The purpose of planning is to
design company activities and processes with the aid of specific information and
using special tools. In such a way that corporate processes are aligned with the
achievement of company objectives taking into account changes in the
environment and surroundings (see chapter 2). Implementation control then
includes all the activities that are necessary for implementing the measures
defined in planning. In the next step, the results of realization are compared with
the objectives defined initially. This check yields new knowledge for the next
management cycle. The ongoing realization check enables control results to be fed
back into the current management cycle.20
Fig. 3: Management Cycle (according to Wild 1982, P. 37)
19
See Wild, 1974, P. 13.
20
See Weber, 2002, P. 32f.

No Business Intelligence Without Process Intelligence 85
3.1.1 Information Requirements in the Phases of the Management
Cycle
Different information needs arise for each phase of the management cycle: In the
planning phase – from objective definition to realization of the decision – decision
makers must be supported by interactive control systems. Interactive control
systems are at the heart of the organizational awareness, so that decision makers
pay constant attention to them. In this way, the awareness of Management is
directed to the diagnostic part of the system, which is associated with a
particularly high level of strategic uncertainty.21
In the second part of the
management cycle (control) – which deals with monitoring the implementation of
the defined measures – diagnostic control systems are particularly important.
These control systems provide Management with confidence without requiring
constant attention.
Like a thermostat, ideally the system regulates itself with negative feedback loops
and does not need to be attended to when it is running.22
The task of Management
is to define the execution and thus the business processes to be as efficient and
effective as possible beforehand, as part of the planning phase. This requires a
profound knowledge of the activities involved in the execution (business
processes) and their conditions. This knowledge may be available in various
forms: In the form of quantitative statements (figures), qualitative statements
(technical and layman's terms), which is referred to as explicit knowledge, and in
the form or non-verbal, implicit knowledge.23
The purpose of the Business
Intelligence approach is to supply the management cycle systematically with
information. This means collecting, storing, processing and communicating the
information that is needed in each phase.24
In practice, it has been revealed that
some of these phases are run through relatively often. For this reason the
somewhat more abstract model, the Business Process Lifecycle, has proven useful
and includes all the steps listed previously:
21
See Simons, 1995, P.91ff.
22
See Simons, 1995, P. 59ff.
23
See Weber, 2002, P. 91f.
24
See Weber, 2002, P. 93.

86 H. Kruppke, T. Bauer
Fig. 4: IDS Scheer's Business Process Lifecycle
The next section will deal with each phase of the Business Process Lifecycle and
the IT support for ensuring that all phase-specific information needs are met:
Process Strategy Phase
In this phase, the business sector-specific critical success factors (CSF) relative to
the competition are identified from the corporate objectives and the market and
resource situation. In conjunction with the business sector strategy, the business
processes are determined from these critical success factors and are then used as
operational drivers. The objective is to adapt the executed business processes in
the company to changing economic framework conditions. This necessitates
integrating realtime data in the planning processes. The basis for carrying out the
planning are the business process objectives, which are derived from the business
sector strategy. The primary considerations at this point are the customers' needs
and the question of how they can be met.
To support this process as fully as possible with the appropriate information, the
existing IT systems must be combined in a consistent platform. In many
companies today, this concept is pitted against a situation of data islands, caused
by IT landscapes created to serve individual departments. What is required is a
portal as a "single point of access and contact”.25
The IT realization is made
possible with a global Business Intelligence concept ensuring that all information
25
See Alff, Bungert 2004, P. 157.

No Business Intelligence Without Process Intelligence 87
that is decisive for the management cycle is available from the distributed IT
systems in a closed information flow.
Process Design Phase - Analysis
Since business processes are understood to be the operational drivers of a
company's results, they always end in a measurable performance. This
performance can be measured with respect to one or more process objectives. If a
company wants to research the reasons for not achieving process objectives, the
business processes that are responsible for creating this performance must
inevitably be analyzed. Because this where the causes of the factors that disrupt
the business process are to be found. Disruptive factors are higher-level weak
points in a business process, which prevent a defined process objective from being
achieved. The causes of disruptive factors may extend across several subprocesses
or departments. Therefore, disruptive factors must always be described as relating
to a complete end-to-end process. These causes must ultimately be eliminated
specifically with measures that are optimized in terms of the cost-benefits ratio. In
order to be able to make valid, reliable statements about the causes of a disruptive
factor or the extent of its implications, process-related knowledge is essential
before any action can be taken with regard to the cause.
In Process Performance Management, the efficiency, quality and financial
viability of all pertinent business processes except the process instance level are
measured continuously during ongoing operations, and the information thus
obtained is made available for analytical purposes. This enables disruptive factors
in the business processes to be detected and their effects to be evaluated and
analyzed both qualitatively (location in the process) and quantitatively (additional
commitment in terms of time or expense). Cause tracing is speeded up by a
detailed analysis of the process with automated modeling of the actual process
sequence on the basis of process-related information. This information is obtained
from the company's own in-house IT systems using Process Performance
Management solutions.26
This is where the Business Intelligence modules
described in chapter 2 - multidimensional models and agent-supported analysis
methods – come into play. The it is possible to evaluate the disruptive factors with
concrete costs by quantifying the effect caused. This in turn enables disruptive
factors to be prioritized using an 80/20 analysis, so that attention can be focused
on the important disruptive factors in an end-to-end business process.
26
ARIS PPM reads all the business events to be investigated into a repository from one or
more source systems via application-specific adapters. The process-relevant runtime
information that is thus obtained on the activities performed is used to generate event-
driven process chains (EPCs) automatically (see IDS Scheer White Paper, 2004, P. 24f.).

88 H. Kruppke, T. Bauer
Fig. 5: Prioritization of disruptive factors according to the 80/20 rule
3.1.2 Process Design Phase - Optimization
Based on this, in the next step measures can be determined using creativity
techniques to optimize the business processes affected. At the same time, the
measures to combat the cause are developed to be as wide-ranging as possible.
Measures to minimize the effects are only worked out when there are no more
approach options here. The alternative measures can then be evaluated for their
effect in eliminating a disruptive factor. The effort required to implement them
must all be assessed.
In IT terms, this phase is supported with the evaluation of the optimum cost/bene-
fit ratio in the selection of alternative measures. Them the selected measures can
be refined and combined in bundles of measures. This enables refined
implementation planning and a fairly exact estimate of the Return on Investment
for each bundle of measures.27
As a result, a reliable decision making basis for
implementing the packages of measures is provided, as well as an implementation
project plan for immediate adaptation of the business processes concerned.
27
See Bauer, 2004, P. 226f.

No Business Intelligence Without Process Intelligence 89
Fig. 6: Disruptive factor diagram for analysis and display of
cause-and-effect relationships
Process Realization Phase
In the literature, realization of measures is considered to be an execution action,
not a management action, and falls within the responsibility of the line managers.28
But here too, important and challenging tasks such as physically changing and
adapting the structural organization and process sequences, changing or
introducing IT systems, implementing the defined KPIs in the system, building up
process expertise among employees and all the elements of Change Management
must be mastered. The realization phase and Change Management are each
associated with their own constellations of tasks, which are beyond the scope of
this article. At this point, then, the transition is made to implementation
controlling of the measures.
Process Controlling Phase
The purpose of the Process Controlling Phase is continuous monitoring of the
effectiveness of the measures implemented by means of a permanent process
monitoring system. Whether the target objectives defined in the Process Strategy
Phase are indeed achieved in the Process Realization Phase is monitored
continuously by means of target-actual comparisons referring to the KPIs that
have been set up. IT support enables the efficiency, quality and profitability of all
pertinent value-creating business processes to be measured continuously. At the
28
See Weber 2002, P. 32.
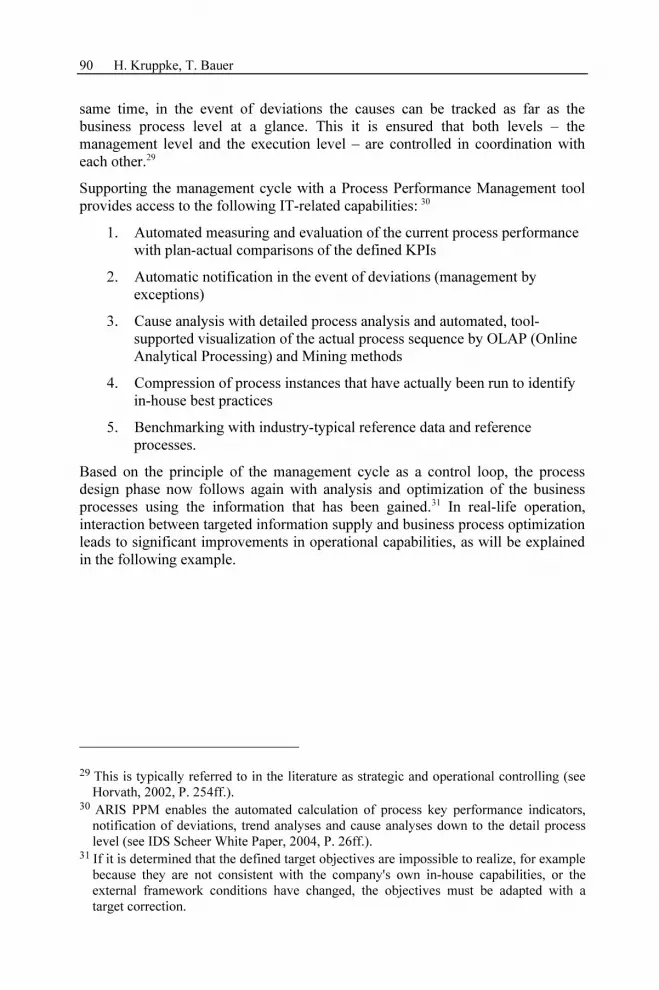
90 H. Kruppke, T. Bauer
same time, in the event of deviations the causes can be tracked as far as the
business process level at a glance. This it is ensured that both levels – the
management level and the execution level – are controlled in coordination with
each other.29
Supporting the management cycle with a Process Performance Management tool
provides access to the following IT-related capabilities:30
1. Automated measuring and evaluation of the current process performance
with plan-actual comparisons of the defined KPIs
2. Automatic notification in the event of deviations (management by
exceptions)
3. Cause analysis with detailed process analysis and automated, tool-
supported visualization of the actual process sequence by OLAP (Online
Analytical Processing) and Mining methods
4. Compression of process instances that have actually been run to identify
in-house best practices
5. Benchmarking with industry-typical reference data and reference
processes.
Based on the principle of the management cycle as a control loop, the process
design phase now follows again with analysis and optimization of the business
processes using the information that has been gained.31
In real-life operation,
interaction between targeted information supply and business process optimization
leads to significant improvements in operational capabilities, as will be explained
in the following example.
29
This is typically referred to in the literature as strategic and operational controlling (see
Horvath, 2002, P. 254ff.).
30
ARIS PPM enables the automated calculation of process key performance indicators,
notification of deviations, trend analyses and cause analyses down to the detail process
level (see IDS Scheer White Paper, 2004, P. 26ff.).
31
If it is determined that the defined target objectives are impossible to realize, for example
because they are not consistent with the company's own in-house capabilities, or the
external framework conditions have changed, the objectives must be adapted with a
target correction.

No Business Intelligence Without Process Intelligence 91
4 Approaches for Solutions to Increasing Operating
Performance Capability with Business Intelligence in
Practise
A SAP R/3 rollout did not lead to any increase in the efficiency of the order
processing process. The result was often more work instead of simpler process
sequences. What was called for was a solution approach that was capable of
dealing with the enormous complexity of order processing at BASF AG: The
company employees about 40,000 employees to fulfil not quite 1 million customer
orders per year. The following functional areas are involved in the order
processing process: Sales (inhouse/field sales), Materials Management Center,
Filling/Production, Warehouse, Scheduling, Shipping/Transportation and
Transport Providers. This alone may provide some idea of the complexity of the
field under investigation. To tackle this complexity, IDS Scheer took over both the
structuring of the management cycle phases in the course of the project and the
supply of information to these phases with its proprietary Business Intelligence
solution for the analysis, measurement, design and continuous controlling of
corporate business processes.32
Among other things, this included ensuring that
the "correct" information was collected as the basis for decision making and the
"correct" methods were used for processing this information.33
In the next section,
the case example will be presented with reference to the phases of the IDS Scheer
Business Process Lifecycle:34
Process Strategy Phase
Besides a demonstrable increase in the efficient and effectiveness of the processes,
the primary objective of the initiative was to ensure that company workflows were
strictly aligned with internal and external customer requirements. In this context,
delivery reliability was to be measurably improved in terms of delivery times,
quantities, quality – for both long-term and 24-hour orders – and thereby lowering
the complaints quota. However, overall order processing costs must also be cut at
the same time. The following preconditions for the progress of the project formed
the design guideline for realizing these objectives:
• Transparency in the order processing process must be preserved with regard
to the individual activities. Moreover, efficiency, complexity, error rate and
throughput speed must be rendered measurable with Key Performance
Indicators (KPIs).
32
See also Approach to rationale-oriented controlling at Weber 2002, P. 48ff.
33
See Seuring/ Bauer 2003, P. 5f.
34
See Bauer 2004, P.224ff.

92 H. Kruppke, T. Bauer
• This transparency should then be used so that potential could be quantified
and evaluated using internal and external benchmarks.
• Potential realization was then enhanced using measures that were optimized
in terms of their cost/benefit ratio.
In the course of realization of these objectives, the following questions were then
answered during the phases of the management cycle:35
• What disruptive factors prevent the interdepartmental workflow of the order
processing process?36
• What costs are caused by these disruptive factors?
• What measures for realizing the optimization potential identified are
suggested by the best cost/benefit ratio?
Process Design Phase – Analysis
Important disruptive factors in the order processing process were identified from a
comprehensive, system-supported analysis. With propriatary Business Intelligence
systems and ARIS Process Performance Manager, the interviewing effort could be
reduced while at the same time increasing the validity and reliability of the results.
In this phase, a calculation was made of the theoretical savings potential
associated with the extra effort when the disruptive factor occurs. For this, the
effects of the 30 disruptive factors were analyzed and quantified. Each disruptive
factor was described with a Key Performance Indicator (KPI). These KPIs could
be integrated in operational processes with the ARIS Process Performance
Manager. ARIS PPM is an IT solution manufactured by IDS Scheer that enables
decision-relevant information to be made available quickly and according to the
situation. In this way, the additional effort that is associated with the occurrence of
a disruptive factor could be quantified with an algorithm and evaluated in terms of
cost and time. Since the development and implementation of measures consumes
resources, only the most significant disruptive factors were pursued further.
These were the disruptive factors that were responsible for 80% of the theoretical
total savings potential. For example, it was revealed that changes to the delivery
date or delivery quantity that were received shortly before the scheduled shipment
caused additional coordination effort totaling up to almost 2.5 hours. The top
disruptive factors could then be investigated in more detail for their causes using
ARIS PPM.
35
See The management cycle according to Wild 1982, P. 37.
36
All potentials identified in a screening phase are clustered and combined as disruptive
factors (DF). DF are cost drivers in that they hinder the normal execution sequence of a
business process. The resulting additional cost can be measured using the effects that
appear after the DF has occurred. The sum of all disruptive factors yields the
theoretically realizable savings potential.

No Business Intelligence Without Process Intelligence 93
For example, it was possible to analyze not only when delivery dates and delivery
quantities had been changed shortly before shipment, but also how often and in
what time period these changes were made. The source of the order to change and
the administrator who made the change could also be identified. This made it
possible to delimit the object of the investigation exactly and define a specific
countermeasure.
Fig. 7: Example of an analysis result from ARIS PPM: Short lead time for changes to
delivery date and quantity and source of the order to change
Process Design Phase - Optimization
Remaining with the example of the order changes at short notice, the measures
developed to counter this included the following: It was determined that the design
of a special process "Change to customer order processing" would assure the
flexibility required to remain competitive and still cut processing time. Both the
organizational implementation with clear rules and responsibilities, and the
computerized implementation so that the change process could be automated were
defined in a measures plan.

94 H. Kruppke, T. Bauer
Fig. 8: Measures definition: Every disruptive factor is in a cause-and-effect relationship,
which must be made transparent
The effects of these measures were predicted to be fewer manual processing steps
and less communication effort. In the end, when the measure plan was
implemented fully, well over 50% savings in processing effort for each short-
notice order change was determined. The prioritized measures were presented to
the steering committee inclusively as part of a business case.
Process Realization Phase
With this approach, BASF AG and IDS Scheer together defined measures that
enabled about 65% of the costs caused by the disruptive factors to be saved. This
was simply by concentrating on a few top disruptive factors and developing
targetted measures to combat them. On the other hand, the costs of implementing
the measures were just a good 10%. With the reduction method, it could be
ensured that the resources were used specifically for eliminating core problems.
This meant that the cost of the measures was significantly reduced. This design
assured the highest possible rationality in the optimization of complex business
processes. BASF now plans to apply the measures developed gradually to other
business units.

No Business Intelligence Without Process Intelligence 95
Process Controlling Phase
Following the successful implementation of the project, BASF continues to use
ARIS PPM so as to be able to monitor the effectiveness of measures subsequently
using target-actual comparisons, identify any deviations and – if necessary –
institute countermeasures as early as possible.37
5 Conclusion
As the example shows, targetted use of all the information available in a company
unlocks access to considerable benefit potential. However, it is essential to carry
out the analysis in a targeted manner, conduct a structured evaluation of the
improvement potential, draw up a definition of highly effective measures that
optimizes benefits, ensure continuous control of the implementation of measures
for changed processes, and to put in place a permanent system of target-actual
comparison of the effectiveness of the measures. Unfortunately, very few
companies are tapping into this potential yet, although the methods and
technologies required are available today. Companies that are able to align their
business processes on the requirements of their environment and surroundings will
not only gain a competitive advantage, they will also be able to manipulate this
alignment better and faster than their competitors. The prequisites for this are the
supply of decision-relevant information and the ability to transform this
information quickly and effectively into sustained measures for the targeted
alignment of business processes.
37
See related discussion 2004, P. 30.

96 H. Kruppke, T. Bauer
6 Literature
Alff, S./ Bungert, W. (2004): Business Intelligence; in: Scheer, A.W. (Ed.):
Innovation durch Geschäftsprozessmanagement, P. 155-167
Bauer, T. (2004): So steigerte die BASF AG mit Supply Chain Controlling und –
optimierung die Effektivität und Effizienz ihrer Auftragsabwicklung – schnell
umsetzbar und toolgestützt; in: Scheer, A.W. (Ed.): Innovation durch
Geschäftsprozessmanagement, P. 219-229
Gabriel, R./ Dittmar, C. (2001): Der Ansatz des Knowledge Managements im
Rahmen des Business Intelligence; in: Business Intelligence, HMD 222, 12/2001
Gentsch, P. (2000): Wie aus Daten Wissen wird; aus der 20. Saarbrückener
Arbeitstagung; www.sapinfo.net/goto/stra/1498/DE, last access: 27.05.2002
Grothe, M. (1999): Aufbau von Business Intelligence; www.competence-
site.de/bisysteme.nsf/46392449EEAEF6FCC12569540059EB71, last access:
29.09.2004
Grothe, M./ Gentsch, P. (2000): Business Intelligence – Aus Informationen
Wettbewerbsvorteile gewinnen, München.
Gentsch, P. (2002): Controlling, Stuttgart
IDS Scheer AG (2004): ARIS Controlling Plattform – Aris PPM – Aris Process
Performance Manager, White Paper, September 2004, http://www.ids-
scheer.com/germany/15097, last access: 29.09.2004
Klieninger, M./ Mayer, T.L. (2002): Informationssysteme für das Controlling
der Zukunft; in: Gleich, R./ Möller, K./ Seidenschwarz, W./ Stoi, R. (2002):
Controlling Fortschritte, Munich, P. 223-243
Related discussion (2004): Kein Process-Management ohne Monitoring; in
Computer Woche, 31. Year, No. 27, July 2004, P. 30
Scheer, A.W. (2004): Intelligentes Business; in: technologie & management,
Issue. 3-4, P. 12-14
Seuring, St./ Bauer, T. (2003): Information Needs in Supply Chain Decisions; in:
Supply Chain Knowledge, Paper for SCM conference 2003 at Cranfield
University, November 2003, www.sck2003.com

No Business Intelligence Without Process Intelligence 97
Simons, R. (1995): Levers of Control, Cambridge, Mass.
Weber, J. (2002): Einführung in das Controlling, Stuttgart
Weber, J. (1974): Grundlagen der Unternehmensplanung, Reinbeck b. Hamburg
Wild, J. (1982): Grundlagen der Unternehmensplanung, Vol 2., Reinbeck b.
Hamburg

Monitoring with Key Performance Indicators
at E.ON Bayern AG Sales Service
Robert Reif
E.ON Bayern AG
Andreas Kronz
IDS Scheer AG
Klaus Miksch
IDS Scheer AG
Summary
Within the space of just seven months E.ON Bayern AG implemented a Corporate
Performance Management System based on ARIS PPM. The aim of the Sales
Service project was to achieve holistic controlling of selected business processes
using source data from SIEBEL CRM and SAP IS-U IT systems. The focus was on
making business processes better and more directly controllable, generating more
transparency in procedures and reliable automation of reporting. The results of
this project contributed in various ways to the consistent identification of weak
points and greater standardization of business processes, and provided significant
support for the optimization of resource planning, deadlines and response times.
Keywords
Energy industry, SAP IS-U, Key Performance Indicator, automatic weak point
analysis, Siebel CRM, XML dataflow, Business Process Management, throughput
time, backlog analysis, ACTUAL processes, complaint processes, resource
planning, response times, factual basis for discussions, insourcing system
knowledge, warning values, frequency distribution

100 R. Reif, A. Kronz, K. Miksch
1. The Need for the Project
1.1 The Company
With annual sales of more than EUR 46 billion and 66,000 employees, E.ON AG
is the world's largest private energy service provider. With its two strong pillars
electricity and gas, E.ON is clearly focused on energy business. Munich-based
E.ON Energie AG is the largest private energy service provider company in
Europe. It supplies some 21 million customers with electricity and gas.
As part of the merger of predecessor companies VEBA und VIAG to form E.ON
AG, and also of PreussenElektra and Bayernwerk to form E.ON Energie AG and
the parallel umbrella brand strategy adopted by the E.ON Group, the autumn of
2001 saw the start of the merger process for five regional Bavarian utilities. This
led to the founding of E.ON Bayern AG as an E.ON Energie AG subsidiary in
November 2001 (see Fig. 1), at which time a key performance indicator-based
Process Monitoring System using ARIS PPM was successfully introduced.
Fig. 1: E.ON AG merger process
E.ON Bayern is the largest regional utility in Germany. Its electricity sales amount
to some 30 billion kilowatt hours (see Fig. 2). Within its territory, Regensburg-
based E.ON Bayern serves approximately 2.2 million customers.

Monitoring with Key Performance Indicators at E.ON Bayern AG 101
Fig. 2: Electricity sales of German regional utilities
E.ON Bayern is particularly active in the fields of distribution (medium and low-
voltage grids) and sales. Sales are differentiated by commercial and industrial
customers, local authorities, private customers, and redistributors. In both
segments, 3,500 employees generated sales of EUR 2.6 billion in 2003, with a
cumulative grid length of more than 175,000 km.
Fig. 3: Company figures E.ON Bayern AG (2002)

102 R. Reif, A. Kronz, K. Miksch
1.2 The Sales Service Mission
With some 2.0 million customers throughout Germany, the "Private Customer"
segment is the largest customer group within E.ON Bayern and is supplied with
professional and friendly service for all aspects of electricity, charges and billing
by an in-house central sales organization, the "Sales Service".
At the beginning of electricity market deregulation, the sales service was
restructured as a centrally managed organizational unit so as to achieve a uniform,
central approach to customer support. Today, all private customers are supported
from a total of four locations, differentiated by products under one disciplinary
responsibility. Unlike with the former, decentralized regional approach to
customer responsibility, this gives customers active in more than one region one
central point of contact.
In order to provide logistical and methodical support for operative front-end units,
horizontal functions that deal with common tasks such as quality management,
process management, project coordination, order management, training, system
support and IT coordination were bundled in Sales Service. Altogether, Sales
Service has a headcount of about 580, making it one of the largest units in E.ON
Bayern.
Sales Service is thus responsible for quality- and cost-optimized processing and
support for E.ON Bayern's private customers (general pricing, product customers
and employees' electricity) and also business and multi-site customers with annual
settlement.
The large number of customers means that this is a typical mass consumer
business. For example, the number of relocations alone amounts to some 200,000
p.a. In addition, there are some 4,400 telephone calls a day and approx. 3,500
items of mail from customers (letters, faxes, emails), at peak times this can rise to
8,000 items per day. A professional mail system geared for efficiency was set up
to achieve fast mail turnover and near real-time processing times for customer
issues.
As in Sales Service as a whole, benchmarking is carried out regularly at the
company and process levels to increase transparency within and across the
Group's regional utility companies. This permits a continuous improvement
process that identifies and eliminates weak points in both structures and processes
and enables units to learn from the best in class. The core element is continuous
monitoring at the business process level, as established at E.ON Bayern with
ARIS PPM.

Monitoring with Key Performance Indicators at E.ON Bayern AG 103
1.3 Situation before Project Start
Over the past few years, the E.ON Bayern organization and the Sales Service have
been consistently improved and optimized. About 3 years ago, a project initiative
was launched to optimize corporate processes on the basis of a wide range of
aspects, with quality- or cost-based goals being set for various projects. The
outcome can be described as an "organized, future-proof, forward-looking and
flexible" organization. Various challenges had to be overcome en route:
SAP IS-U and CRM Rollouts
Even before merging as E.ON Bayern, the five utilities had decided to migrate to
SAP IS-U (R/3). Apart from one company, all had been using the R/2 version of
IS-U. The fifth company had a proprietary system which was to be replaced. All
five were subsidiaries of the former Bayernwerk, so while they did not
immediately function "as one company" they did begin to pool their IT
development work via Bayernwerk's IT subsidiary. This resulted in a joint IS-U
migration plan which envisaged switching the individual predecessor systems to
SAP IS-U (R/3) in 4 – 6 week intervals over a six-month period.
The SAP IS-U (R/3) rollout also led to major changes for the employees involved,
especially the front-end units. Comprehensive training measures for a large
number of employees led to bottlenecks in operating resources. Familiarization
with the new system and the initial technical teething trouble led to longer process
times, in some cases twice as long, as with the old system.
Besides the SAP IS-U rollout, a front-end CRM system from Siebel was intro-
duced for comprehensive contact documentation and thus better customer service.
This necessary action also led to longer process times in the beginning as
additional activities now had to be established in the process. Both systems also
encountered acceptance problems.
The system rollouts, longer processing times, employee problems caused by
migrating to completely new software, and the additional resource stress from
employee training sessions, for example, ultimately led to processing backlogs.

104 R. Reif, A. Kronz, K. Miksch
Centralization of Customer Support
In the wake of market deregulation and the increasing competition, the Group had
to carry out organic consolidation of customer support practically at the same time
as the system rollouts.
Until then, some of the predecessor companies had had their own autarchic, stand-
alone customer support at their own sites or in their regions. In part, the
organization comprised an integrated, general support structure within which the
teams were responsible for a certain number of customers or a given territory and
provided "their customers" with everything from classic 1st
level or front office
services through to highly complex and time-consuming 2nd
level or back office
services. Reminders/debt collection and supply blocks were normally handled by
specialist teams.
Other companies had organized their customer support with specialization and
strict separation of 1st
level / front office und 2nd
level / back office by means of a
typical call center organization, albeit without territory- or customer-specific
assignment. Every employee was responsible for every customer as long as the
customer calling had an issue within his or her field of responsibility.
The differing organizational forms led to differing employee structures and pro-
files in the various units. Whereas the one unit fostered a more generalized
qualification of employees, another preferred to deploy employees with particular
expertise to the pertinent area. As a result of the heterogeneous organizational
structures, the employee structures were just as heterogeneous and differentiated.
Reorganization thus faced a "human" challenge of merging the various organi-
zations and cultures.
Development of Backlogs
Processes that had not yet been fully synchronized, four IS-U migrations and the
rollout of a CRM system very quickly led to a significant extra workload for the
operational units. The resulting bottlenecks in operational processes could not be
offset with efficiency actions during the initial phase and thus resulted in the
buildup of a backlog in dealing with customers' issues. In service areas, backlogs
normally result in increased customer contacts and complaints on all contact paths
as customers assume their issues have not been received by their electricity utility
and so submit more letters or complain. The effect of a rising backlog can
therefore be gauged by the reduction in contactability and TSF (telephone service
factor).

Monitoring with Key Performance Indicators at E.ON Bayern AG 105
Lack of Transparency
Rising backlogs also lead to a rising volume of short-term status information on
individual cases. Results for reports were usually generated manually and were
often challenged so that they needed to be reconfirmed several times. The work-
load for research and clarifications rose out of all proportion because of the mi-
grations and restructuring programs.
Given this complex situation, the need was identified to introduce a Performance
Monitoring System in order to improve processes and make them directly control-
lable, to generate more process transparency and to reliably automate reporting.
2 Project Description
2.1 Project Brief
The ARIS Process Performance Manager (ARIS PPM) project was launched in
mid-January with a planned duration of seven months before the monitoring
system went live. In the run up to the project, E.ON Bayern critically reviewed the
ability of the ARIS Process Performance Manager (ARIS PPM) tool from IDS
Scheer before opting to deploy it. The project contents were, in detail:
Development and Definition of Key Performance Indicators for
Reference Processes
As there was no definitive concept for a Performance Management System at the
start of the project, an incremental approach was agreed for the technical
realization. First of all, all the Sales Service core processes were described in
technical terms and the appropriate key performance indicators defined. Following
this analysis, two reference processes were selected for technical realization as a
first step. The results were then leveraged to draw up a rollout plan based on the
already defined key performance indicators as part of a specification and thus
minimize project risks.
The two "most important" processes were chosen as the reference processes to be
implemented. Importance was defined as "mass critical with a high degree of
standardization", which led to the relocation process with approx. 240,000 runs a
year being chosen.

106 R. Reif, A. Kronz, K. Miksch
On the other hand, the complaint process was chosen as a reference process with a
high degree of complexity and little scope for standardization in order to exploit
the range of the selected system and business of the Sales Service. Technically,
the selection of the reference processes required an interface from ARIS PPM to
both IS-U and Siebel.
Creation of a Specification (Requirements Definition and IT Concept)
and Documentation
The project brief entailed not only implementation but also an intensive know-
how transfer that would enable E.ON Bayern to maintain and develop the Process
Performance Management system itself. The objective was the greatest possible
independence from external service providers; as a result the contents of the
project documents that were created extended from data export and import
procedures within the interfaces, customizing settings for ARIS PPM and the
frontend through to detailed algorithms for calculating the key performance
indicators.
Technical Realization of a Basis System for the Reference Processes
Three different tasks were defined for realizing the basis system:
• Adapting the ARIS PPM Frontend to E.ON Bayern requirements
The aim was to develop a user-friendly, intuitive system because ease of
handling was identified as a driver for acceptance by users. Thus the preferred
approach was to limit the analysis functionality, eliminate what was
unimportant and provide full functionality only when actually required.
• Mapping key performance indicators for the two reference processes
Relocation and Complaints
This involved the precise definition of the key performance indicators and the
evaluation criteria (dimensions such as customer group, team assignment) and
the definition of the processing logic for the data received from the various
interfaces.
• Designing the ARIS PPM connection to SAP IS-U and Siebel
The objective here was not only the functionality but also an interface design
that permits flexible and low-cost expansion for monitoring other processes.

Monitoring with Key Performance Indicators at E.ON Bayern AG 107
Automated, Recipient-Oriented Reporting
As the Sales Service value-added chains involve a large number of employees at a
number of levels, there are differentiated demands on the reports and reporting
system. Top management has different expectations for processing and aggre-
gation of data than middle management or coordinators and process analysts.
Middle management and process managers need the ability to analyze not only
highly aggregated data views but also highly detailed individual views. Therefore,
the reporting system must comprise a mix of predefined, regularly called or
distributed reports and "ad-hoc" analyses generated on demand. The project
attached particular importance to maintenance-free automation wherever possible.
Conducting Training Actions
Without correct and efficient use of the system there is after all no benefit for the
company. Therefore, particular value was attached to training actions at E.ON
Bayern right from the beginning. In the run up to the project, the project team
produced a "user guide" as support material so that attended training could be
reduced to half a day per user. As efficient analysis has a highly individual
character however, individual appointments were agreed with participants where
required so that the most important queries could be discussed individually. The
support team used this to derive standard queries in the system. This resulted in
high integration with the system and the support team.
Institutionalization of Process Management in the Organization
Sustainability is only achieved if operation and use are ensured on a lasting basis
after the end of the project. Thus not only technical but also organizational
implementation of process management is very important for generating benefits
from the project. To this end, the project team carefully selected key personnel to
act as multipliers and opinion shapers in the company and so inject process
thinking into the company. They were established from the project phase on as the
central contact partners in their areas for process-oriented analyses.
Inter-unit reporting for top management was restructured along process-oriented
lines and centralized to ensure data consistency and plausibility. This was used to
modify the intra-unit reporting, which the technical unit produces for its
management with unit-specific data. This is individually designed with respect to
content and appearance following the logic of process-oriented analyses and
queries (favorites).
To handle any problems or questions arising, the ARIS PPM Support was
established as a central contact point for users and so provide support for the
institutionalization of process management. It offers a hotline service for users
with questions about key performance indicator contents and analysis possibilities

108 R. Reif, A. Kronz, K. Miksch
or with improvement suggestions. It also houses the entire technical service for
problems with data delivery, error messages and system problems of a technical
nature.
Intensive Integration of all Technical Departments
As the introduction of a monitoring system is a highly sensitive project, the early
integration of all those involved internally or externally is a critical success factor.
At E.ON Bayern, tasking of service providers for projects with an IT background
is triggered by the CIO Department. Accordingly, a representative from the CIO
Department was integrated even at the project planning stage. Likewise, internal
units such as the works council and data protection representative were involved
from an early stage and informed of the objectives of the project.
As both internal and external service providers were involved, they too were
included in the planning phase. This meant that service providers could plan their
resources in good time and also "signed on" to the project. The outcome is
realizable solution approaches and realistic project plans by all involved with high
planning reliability for all performance packages.
2.2 Phased Approach
The project itself was carried out in several steps:
Conducting Technical Workshops
The technical workshops with the affected departments were primarily designed to
determine the information requirements with respect to the processes. In the
project run up, there was a requirement of communicating 4-6 meaningful core
key performance indicators per process so that the workshops could focus on the
core questions. With regard to the budget, it was also decided that it would be
better to add key performance indicators retrospectively rather than offer
secondary or redundant key performance indicators during the first step.
The workshops were moderated by IDS Scheer. The workshops were run along
strict process-oriented lines, in that the processes were discussed in the order that
they arise and then their technical realization in the IT systems was discussed
before a second step formulated the questions to be asked about the process and
the measuring points and key performance indicator entailed by such questions.
The goal was to structure the workshops as efficiently as possible from the
viewpoint of the technical departments and so avoid the additional workload of a
large number of workshops or interviews. The one-day workshops each discussed
one process in its entirety, which included not only the two reference processes,

Monitoring with Key Performance Indicators at E.ON Bayern AG 109
relocation and complaints, but all Sales Service processes so that the results could
be applied seamlessly for the rollout.
Conducting IT Workshops
The results and requirements generated by the technical workshops were used by
the two service providers involved, IDS Scheer AG and the Group IT subsidiary,
to define the key performance indicators in concrete terms. Both the exact
algorithms (e.g. throughput time without post channels) for the key performance
indicators and the data extraction from the systems were defined.
As the Group IT subsidiary is also responsible for operating all the systems within
the E.ON Group and thus Siebel and IS-U as well, it was responsible for
extracting the data required in ARIS PPM from the upstream systems. Therefore
the IT defined a precisely documented interface between the systems and the
monitoring system, in particular the semantic definition for the data to be
transferred. This enables the impact of data-level changes in the systems on the
monitoring to be estimated. The semantic analysis covered only the two reference
processes.
Development and Initial Customizing of ARIS PPM
Data extraction was conducted differently depending on the system concerned so
that the existing software components and the technology of the source system
could be optimally exploited and hence reduce development costs.
On the SAP side, a configurable software module from IDS Scheer AG was
chosen that permits customizing so that any data can be periodically read out from
the SAP system. This module also permits flexible reading of other data from the
SAP system in future. As the SAP system does not log all the data required for
process monitoring, a decision was taken to implement special routines in SAP IS-
U that record this additional data and save it for subsequent extraction.
Extraction on the Siebel-PKS side was realized directly using the script options
available in the Siebel system so as to permit faster development. All the system
extractions end up in an XML data stream that can be used as input for the ARIS
PPM system. XML technology permits system- and platform-independent data
transfer that can be directly used for further systems or modules.

110 R. Reif, A. Kronz, K. Miksch
Fig. 4: Architecture of the data transfer interfaces
Parallel to the development work, the two service providers updated and expanded
the technical part of the specification in exemplary cooperation so as to provide
complete documentation.
Commissioning of ARIS PPM
A highly iterative process with prompt handling of error logs and usability
experience was chosen for testing and development, whererin the tests were all
conducted by E.ON Bayern employees. During the final test phase, the planned
training sessions with a total of approx. 20 employees were staged so that their
experience could be used as feedback for the final cycle. The employees were
familiarized with the system, its navigation and typical analyses in groups of 3 to
5. Individual favorites were created for each employee in a one-on-one session.
These sessions were also used as personal discussions to foster sustained
conviction and acceptance. All these one-on-one sessions were carried out by
E.ON Bayern support team employees.
Integration of the Systems/Outline Sketch of the System Landscape
E.ON Bayern
The Sales Service has two core systems in addition to the standard office
applications. The main system is SAP IS-U as the billing system in which all the
business transactions from changes to customer master data, billing, metering,

Monitoring with Key Performance Indicators at E.ON Bayern AG 111
reminder/debt collection through to supply blocks are handled by Sales Service
employees. In addition, there is a Siebel CRM system that is used as a
documentation tool for all customer contacts and as a workflow system for the
employees. Both systems interact and are linked by an EAI interface (Enterprise
Application Integration). The typical business transactions workflow is as follows:
Fig. 5: General "Customer support" process model
During case processing, there is a customer-related "jump" from the corresponding
Siebel screens to the IS-U entry screen. Customer master data is periodically
transferred via EAI from IS-U to Siebel.
ARIS PPM monitoring is based on the reconstruction of the actual processes from
the runtime data of the operative systems. As a result, a documented snapshot of
the actual process is created for each business transaction and is saved in the
process database. The process data is then used to calculate the key performance
indicators. This requires time stamps on the process steps that determine the key
performance indicator.
The general process flow shown in Fig. 5 combines the processes from Siebel and
IS-U fragments. The interface concept realized for ARIS PPM enables an actual
process picture to be created with Siebel and IS-U fragments for each business
transaction (see Fig. 6).

112 R. Reif, A. Kronz, K. Miksch
Customer
Contact
Create
Transaction
SIEBEL
Team A
Transaction
Processing
SAP IS-U
Team B
Activity
Processing
SIEBEL
Team B
Activity
Processing
Team A
SIEBEL
Transaction to
be closed
SIEBEL
Team B
Transaction
closed
Fig. 6: General process model with Siebel and IS-U fragments
The ARIS PPM data-technical integration is completely automatic. Every night,
the delta information of the last 24 hours is extracted from the upstream systems
and made available to ARIS PPM as an XML data stream. All the routines are
time-activated and run automatically without manual intervention. This minimizes
operating and maintenance costs and also rules out error sources from manual data
enrichment or even manipulation, which has significantly increased the acceptance
of the system.

Monitoring with Key Performance Indicators at E.ON Bayern AG 113
Interaction of Several Service Providers in the Project
A key and elementary factor of the project was the efficient coordination of the
service providers involved. The Group IT subsidiary operates practically all the IT
systems within the entire E.ON Group, involving hardware and software
(computer center and support) through to IT and process-near consulting services.
The IT subsidiary is the preferred provider so that synergy effects in the group are
optimally exploited. Nevertheless, external service providers can be directly
commissioned in justified cases, e.g. if the Group IT subsidiary does not have the
required experience or references for the service required. This option was used
for the Sales Service project.
In IDS Scheer, a service provider was commission that provides the ARIS PPM
product, ARIS PPM integration know-how and many years of proven experience
in business process management. The IT subsidiary is responsible for operating
the IS-U and Siebel systems and has programming capacities with special know-
ledge of the systems and in particular their configuration. Thus, modifications to
the productive system may be carried out solely by the responsible system opera-
tor.
Accordingly, the performances to be rendered by the service providers and the
expected outcomes for the project were exactly specified and put down in writing.
IDS Scheer took on responsibility for ARIS PPM introduction (ARIS PPM
database and frontend), customizing the frontend, data import of the Siebel and IS-
U files and their processing in ARIS PPM (import interface) and lead-managed the
production of the specification. The Group IT subsidiary was to provide the
necessary data as per the IDS Scheer requirements in an appropriate format from
the upstream systems (export interface) and cooperate in the production of the
specification.

114 R. Reif, A. Kronz, K. Miksch
3 Results and Experiences
The following presents typical ARIS PPM system screens used by E.ON Bayern
and explains how the system is used for the various analysis and report
requirements.
Fig. 7: Speedometer for relocation throughput time
This Management Cockpit for throughput times (DLZ) in the relocation process
presents a speedometer – here as a quarterly comparison – which shows deviations
at glance. The speedometer has three different colours that represent the threshold
values:
Comment Screenshots
In order to preserve the original character of the project, the original screenshots
(German) were only slightly modified for a better understanding. "realistische
Beispieldaten" (German) is translated to "realistic example data".
Green area: Is the ideal area (planned value), from 0 days up to a defined
warning value. In this example, the ideal (goal) throughput time for relocation is a
maximum of one day, not including internal postal channels. In reality, however,
this value is scarcely achievable as an average value.
Yellow area: A target range (planned value), between warning value and a
defined alarm value, here between 1 and 5 working days. No response is required
from management in the yellow area.
Red area: If the actual value in the period under review is above the alarm value
it is in the red area. This shows management that there is a need to take action.

Monitoring with Key Performance Indicators at E.ON Bayern AG 115
Fig. 7 shows how the Q1 2003 DLZ of approx. 10 days (red) was improved in the
subsequent quarters to approx. 4.3 days (Q4).
Fig. 8: Speedometer and line chart for relocation throughput time
The DLZ improvement during the course of 2003 is shown once again in Figure 8.
Here it can be clearly seen that the alarm value, marking the beginning of the red
area, was no longer crossed after Q2 and thus the process is within the tolerance
range.
This insight was used to analyze what specifically led to the increase in DLZ in
the period under review. One cause was a general increase in business transactions
resulting from internal group reorganization which extended the Sales Service's
scope of responsibilities, with the average DLZ rising on the back of unchanged
resource input (see Fig. 9). These analyses are just two examples of the further
tracing of causes that could be carried out.

116 R. Reif, A. Kronz, K. Miksch
Fig. 9: Line chart number of complaints by month and
bar chart number of complaints by area
The frequency distribution was also analyzed. For example, Fig. 10 shows that
more than 95% of all cases were dealt with within the yellow range (DLZ 5 days
or fewer). The problem is then a few to very few extreme anomalies that could not
be completed within 3 months or more, thus increasing the total throughput time.
These anomalies could now be easily displayed and quickly identified in a further
analysis as shown in Fig. 12 (Process list) for clarification and completion by the
relevant units. Internal controlling was then modified so that extreme anomalies
are reported individually but not included in the general analysis so as not to
distort the overall picture.

Monitoring with Key Performance Indicators at E.ON Bayern AG 117
Fig. 10: Frequency distribution by time intervals
Another analysis approach is the controlling of processing backlogs. A Backlog
Analysis Cockpit (see Figure 11) immediately shows the size of the current
backlogs and their distribution across the individual teams. This can be analyzed
further, leading perhaps to the temporary reallocation of staff from teams that are
up to date to those with a particularly high backlog. This provides optimum
support for operational personnel management.
Fig. 11: Column chart of complaints backlog by status and
pie chart of complaint backlogs by team

118 R. Reif, A. Kronz, K. Miksch
The appropriate process list can now be generated, for example so that individual
concrete business transactions can be identified ready for discussion in the units
involved or for further detailed analysis. This results in a list of the ACTUAL
processes that form the basis of the query just executed (see Fig. 12). The
individual processes can then be called up as a diagram in EPC format (see Fig.
13). This option is also available to the operational units.
Fig. 12: Table of process instances
Every row of the table shown in Figure 12 represents an ACTUAL process read
out from the upstream systems. The column diagram in Fig. 11, which displays the
backlog of open complaints (96 complaints) in the left-hand dark blue column, can
be used to drill down to and display the list of these 96 complaint processes (see
Fig. 12). In other words, ARIS PPM always preserves the connection between the
numbers in the analyses and the actual processes.

Monitoring with Key Performance Indicators at E.ON Bayern AG 119
Fig. 13: ACTUAL process in EPC format

120 R. Reif, A. Kronz, K. Miksch
4 Benefits
The many benefits arising for Sales Service from the projects are described below.
Monitoring Deadlines and Reaction Times
The Process Monitoring System can be used to monitor and track deadlines and
response times in handling customer issues. "Overdue" business transactions are
displayed proactively and can be broken down to the data level using drill-down
so that the case can be identified in the upstream system and dealt with.
Corresponding automated reports and evaluations can be selected for these
specific cases.
Support for Resource Planning
Although ARIS PPM itself does not have a forecasting component, it is ideal for
drawing conclusions about team utilization and spotting peaks and excess
capacities. For example, after the mass dispatching of invoices, the figures
generated by ARIS PPM can be used to plan the additional HR requirements
required to handle the higher level of customer queries expected 1-2 days later
with the usual quality and efficiency.
Identification of Weak Points
The process presentations available can be used to analyze processes at the
structural level. This enables questions about the actual status of standardization
efforts, TARGET/ACTUAL deviations, or the degree of task delegations that have
had no effect to be answered. Identifying weak points is thus a key basis for
optimizing structural and process organizations.
Standardizing Business Processes
Even actual processes with a high degree of standardized tend to take on a "life of
their own" and drift away from the target. ARIS PPM can be used to
"superimpose" and compare variants of actual processes. This enables steps to be
taken, which in turn generate more standards.

Monitoring with Key Performance Indicators at E.ON Bayern AG 121
Factual Basis for Discussions through Concrete Figures
When figures are presented by various parties in an unverified manner, this
generally leads to the numbers being challenged rather than a discussion of their
significance. One goal achieved by the project is a reporting system based on a
coordinated data basis that precludes interpretation by its complete automation,
thus adding a new "fact-based" quality to discussions.
5 Lessons Learned
Insourcing System Knowledge
Right from the start, projects with external service providers call for a strategy for
the collecting of the knowledge generated so that the know-how is available in a
defined location for use after the end of the project. With an outsourcing approach,
the knowledge of systems and internal structures remains with the service
provider, who may is only engaged again when needed. This dependency on the
service provider is justified using perceived or apparent cost advantages of
outsourcing, also with respect to the costs for training and providing in-house
resources. Arguments in favor of greater independence include greater control
over the IT system, cost advantages in the event that the system is upgraded, and
the use of IT resources already in place.
E.ON Bayern opted at an early stage for the insourcing solution. Although both
service providers enjoyed full trust, the know-how for interfaces, customizing, key
performance indicator calculation and technical support (hotline) is to be devel-
oped internally.
This does not apply to operating the system, as this is governed by the contracts
with the Group IT subsidiary. Services and remuneration are laid down in
appropriate service level agreements (SLAs).
It was decided to include the appropriate employees in the project from an early
stage so that know-how could be built up continuously. During the transition to
live operation, this enabled employees to take over responsibility from their
experience as project members ("flying" change). This smooth transition to the
operational phase ensured that the project benefits would be retained.
Technical Feasibility Proven
As was indicated earlier, it was decided to adopt a phase-oriented approach so as
to evaluate in a first step the way in which the data is to be extracted from Siebel
and IS-U and compiled in inter-system processes. Then a milestone was defined

122 R. Reif, A. Kronz, K. Miksch
that provided the option to terminate project activities if a discussion showed that
the first step had not produced any usable and reasonable results.
This approach was necessary because although IDS Scheer had comprehensive
experience with data extraction from a very wide range of upstream systems, the
high level of customizing required for the Sales Service's two systems and the
individually developed linkage between the systems entailed a risk that the
required workload might be excessive.
Interface Flexibility
As the interfaces to Siebel and IS-U were developed as configurable software
modules, further measuring points and key performance indicators can be
"docked" with relatively little effort. Despite a slightly increased workload for
developing the interface concept and the interfaces themselves during the first
phase of the project, the costs of developing further interfaces during rollout can
now be minimized.
Data Volumes are "Processable"
Another uncertainty before the project started was the extraction of the data sets
that are processed by Sales Service every day and the resulting performance of the
ARIS PPM system. The proper dimensioning of the hardware and the networks
used combined with appropriate scaling of the system and interfaces ensured
highly effective monitoring. For some 2 years now, about 13,000 process steps
including additional information have been exported and imported at E.ON
Bayern with no performance problems.
6 Key Success Factors
E.ON Bayern regards the ARIS PPM project as a major success because the
expected project benefits have materialized. There follows a summary of the key
success factors for the project. These may also be regarded as a recommendation
for many other projects.

Monitoring with Key Performance Indicators at E.ON Bayern AG 123
6.1 Involvement of all Concerned Right from the Start
Identification of Key Players and Opinion Shapers within the
Company
They can drive the project by forming a positive opinion and proactively avoid
critical situations through open dialog and solution-oriented behavior. Together
with and under the leadership of project management, problems can be tackled
head-on without outside time pressure. For this project, the timely involvement of
the works council and data protection representative was of major importance.
The technical and other departments affected are also of critical importance and
must be intensively involved as they carry the project through their support and
deployment of their employees and ultimately generate its added value.
Integration of the Service Providers Involved
Needless to say there is a defined client-contractor relationship between the pro-
ject management and the external and internal service providers. Nevertheless it is
important to create a climate of open dialog and to obtain and heed where possible
the opinion of these service providers. After all, all those involved in the project
must act as a team in which company boundaries are not apparent. This means
treating and respecting service providers as equally entitled partners. At the same
time the service partners must regard the client as a project partner.
6.2 Interdisciplinary Cooperation
The team staffing is very important for a successful project team. You need the
right people with the right skills. The project had the right mixture of technicians
and managers who complement each other and contribute their own particular
expertise to the project, thus meeting the technical and organizational demands of
a monitoring project of this nature.

124 R. Reif, A. Kronz, K. Miksch
6.3 Exact Task and Role Allocation among Service Providers
A clear and razor-sharp definition of the tasks and roles is an absolute basis on
which service providers can act and cooperate. This avoids time-consuming
discussions during the project itself about the allocation of tasks and budgets. It is
important that this is defined in joint discussions attended by all the service
providers affected – and documented in writing.
6.4 Project Marketing
Project marketing is part of any project. Do good – and talk about it. Or even
better: Do good – and have others talk about it. Project marketing should not be
addressed to the project organization and hierarchies alone. Also decisive is the
marketing beyond the project, e.g. internal sponsors reporting positively on the
project and the project team at higher levels via their network.
6.5 "Pragmatism"
Finally, a healthy portion of pragmatism is called for so that practical relevance is
ensured at all times and to guard against overly ambitious demands that are
demotivating and unrealistic. Here are some often quoted rules that proved to be
invaluable during the project and very much recommended here:
• Projects should be simple so that they can be understood (keep it short and
simple – KISS)
• Identify the project benefits clearly
• Do not overload the project. Better 80 or 60 actually achieved percent than
the envisaged 100%, which is never achieved (80 / 20 rule)
• Pick the low-hanging fruit to generate a positive attitude towards the project
(quick wins)
• Think big, start small

Performance Management Based on ITIL in
IDS Scheer AG Customer Interaction Center (CIC)
Gregor Loes
IDS Scheer AG
Summary
The IDS Scheer Customer Interaction Center (CIC) has significantly boosted cus-
tomer satisfaction by rolling out a Corporate Performance Management system
based on the ARIS Process platform. The ISO 9000 certified Support Helpdesk,
which looks after worldwide support for all ARIS products, used the Process Min-
ing technology of ARIS PPM to carry out a reorganization to the ITIL standard
very rapidly, reducing the processing times of 1st Level Support queries by more
than half, which earned it a "Helpdesk Award 2004" from an independent jury.
Keywords
Service process, service quality, key performance indicator system, process defini-
tion, SLA monitoring, call volume, hotline, solution times, IT helpdesks, problem
management, net processing time

126 G. Loes
1 Environment
Just imagine you were sitting in a restaurant on a Friday evening having just fin-
ished an excellent meal with customers you have invited to celebrate the success-
ful conclusion of a project. When you ask for the bill, you realize that your wallet
has been stolen.
You are in a very embarrassing situation and need help as quickly as possible. As
you work for a very well-known company you agree with the restaurant owner
that the bill will be sent to your company. But all your bank and credit cards were
in your wallet. So you call the Information and ask for the telephone number to
block your cards. The friendly voice on the other end of the line tells you the
numbers you need and puts you through to the call center for blocking your cards.
After a few minor hurdles, which you have to negotiate in the Interactive Voice
Response system, your cards are safely blocked, in other words after a few min-
utes you can be confident that nobody can withdraw any money from your ac-
count.
This situation or one like it is no doubt familiar to many people. As bank custom-
ers, we expect rapid help in such a situation. Immediate blocking of the card and
the assurance that any money withdrawn will be reimbursed by the bank is now
regarded as the absolute minimum level of support that a bank must offer.
Such service levels are also now regarded as absolutely normal in other areas too.
How would you react if you had been told that it was Friday evening and the ser-
vice center cannot block your card until Monday morning and any debits until
then would be at your expense?
Nowadays, impeccably organized service provision is expected from what are
widely known as IT hotlines. That is why issues such as ITIL (IT Infrastructure
Library) have been growing more and more important in the past few years. These
are standards designed to help align IT processes to a company's core business.
This pressure has long been experienced by product hotlines, for example. After
all, customers pay a sizeable annual fee for optimum support. Providing optimum
support in turn calls for optimization of the underlying processes. With more than
1,000 customer contacts per day this is much like a production-line activity. Fast
solutions for customers can only be achieved if each work step is clearly defined,
if there are model solutions and every employee can directly see what the next
steps are. Comparisons with industrial production are thus quite appropriate. For
example, if optimizing process workflows and interfaces reduces the average
processing time per call by only one minute, a typical service hotline can save one
employee, or create scope for new issues that have to be taken on by the service
department without having to recruit new staff.

ITIL-Based Performance Management 127
2 Description of the Problem
As described above, we are talking about the industrialization of service manage-
ment particularly in the service environment. Service processes must be fast and
efficient without impacting the highest possible quality for the customer. Some
70% of all customers change providers because of poor service (Source: Rockefel-
ler Institute). Therefore it is important to establish a detailed key performance in-
dicator system that identifies changes in service quality and helps to implement
actions for improving this in service quality.
In addition, service units must increasingly be able to make their performances
transparent. Not least, to protect themselves from the ever greater cost pressure
they are subjected to. After all, many controllers cannot see why service units
have such a large headcount and in addition the service spectrum is often very
opaque for outsiders.
3 Procedure
The aim of most organizational changes in a company is ultimately to boost prof-
its, i.e. if areas such as service or sales are to be reorganized, the corporate goals
have to be broken down the service level and used to derive a key performance in-
dicator system that provides meaningful support for controlling that area. The key
performance indicators are assigned target values that are continuously measured.
In a service unit, which as mentioned above can be compared with an industrial
production unit, this means providing clear process definitions as a basis for
achieving the target values. These process definitions in turn also help to establish
what target values (e.g. target value for SLA compliance) are possible given the
available resources. These process definitions can also be used as the basis for im-
plementing a helpdesk/CRM system.
A balanced scorecard simplifies the presentation of the objectives and their key
performance indicators and enables users to drill down to the underlying processes
(see Fig. 1 - Balanced Scorecard for Customer Support).

128 G. Loes
Fig. 1: Balanced Scorecard for Customer Support

ITIL-Based Performance Management 129
4 The Solution
For many years now, IDS Scheer has had its service unit certified to ISO 9000 and
later to ISO 9000:2000. Right from the start, a great deal of attention was paid to
process standards, which were also used to implement a CRM system. With more
than 4,000 service agreements, it is absolutely essential to monitor the defined
service level agreements on a continuous basis, with computerized support. ARIS
PPM is used for SLA monitoring. Besides SLA monitoring, it also analyzes work-
load, throughput times and wait times. For example, our analyses in 2003 showed
that our call volume was rising steadily at a rate of about 20%. They also showed
that about 13% of all queries accounted for 46% of our total hotline workload (see
Fig. 2 Workload versus number of complex queries), i.e. a handful of difficult
queries tied up a relatively large amount of resources. This in turn led to longer
throughput times for the "simple" queries.
Fig. 2: Workload versus number of complex queries
Therefore, a decision was taken to launch an internal project that would reorganize
the hotline area in line with ITIL principles. The goal was to reduce throughput
times by faster processing of the much larger volume of "simple" queries and to
assign the more complex queries to a special team formed for that purpose.
The aim was twofold: to reduce solution times and thus also waiting times for cus-
tomers, and at the same time to reduce the number of open questions by direct

130 G. Loes
processing at the 1st
level. Unlike classic IT helpdesks, product support at IDS
Scheer involves specialist support. Most incoming queries are relatively complex.
Hence the 1st
level solution rate cannot be compared with that of an IT hotline.
Following the ITIL definitions, a 1st
level team was formed that tries to pass on
help or solutions to customers as quickly as possible. Starting in Q2, more than
40% of queries on average were to be solved by the 1st
level, rising to about 55%
by Q3. The goals are part of the target definitions for the 1st
Level team. The rede-
fined 2nd
level is responsible for deferrals and testing issues that cannot be clari-
fied at the lower level. As for the 1st
level, the target starting in Q2 was that an av-
erage of 60% of queries reaching the 2nd
level should be solved at that level.
Starting in Q3, the target level was set for 70%.
The remainder of queries are difficult and time-consuming problems that must be
referred to problem management. ARIS PPM is used to continuously monitor the
newly defined targets (see Figs. 3 and 4 Target definitions for 1st
and 2nd
level sup-
port).

ITIL-Based Performance Management 131
Fig. 3: Target definitions for 1st
level support
Fig. 4: Target definitions for 2nd
level support

132 G. Loes
5 The Results
What has the ITIL-based reorganization really achieved?
• The throughput times for 1st
level queries (i.e. technically simple queries)
have been reduced considerably
• Customers' queries are therefore solved faster
• The number of open queries has fallen thanks to the faster throughput times
• The average net processing time per query has been reduced
• The throughput times for 2nd
level queries have also be been reduced
• Here too, net processing times have been shortened
Fig. 5: Developments of throughput times 1st
level queries

ITIL-Based Performance Management 133
As a result, the growing number of queries was successfully mastered without ad-
ditional staff, and the faster processing and throughput times have led to a drop in
costs per query. The 1st
level net processing times rose briefly because the new
team had to be trained in the new tasks. ITIL-based reorganization is useful not
only for IT departments. Wherever a high degree of service is demanded, it is ad-
visable to test the ITIL Best Practice Model for its applicability and deploy it if
this is the case. Post-reorganization analyses revealed that there was a very low
overlap of similar knowledge in 2003 (see Fig. 6: CIC 2003 know-how distribu-
tion). Absences due to illness or vacation were thus a perennial problem for the
unit.
Fig. 6: CIC 2003 know-how distribution
The alignment with ITIL created teams with similar knowledge that covered a
wide range of know-how. Vacation- or illness-related absences were now less dis-
ruptive for daily operations.

134 G. Loes
Fig. 7: Know-how distribution in CIC, 2004
6 Conclusion
For IDS Scheer, alignment to ITIL has paid dividends. Along with the desired cost
reductions, throughput and processing times have been improved, thus leading to
further optimization of support. Our success in endeavoring to improve customer
satisfaction in a sustainable way with our helpdesk services through Corporate
Performance Management was recognized in November 2004: The Helpdesk
Award in the "External Support Service Provider" category awarded each year by
a jury of experts and companies in the field of customer support has confirmed
that IDS Scheer has a leading market position not only in software and consulting
but also in support services.

Process Performance Management in Securities
Operations at CREDIT SUISSE
Olaf Klein
Credit Suisse
Dirk Kogelschatz
Credit Suisse
Summary
Credit Suisse is following an ongoing initiative to implement a complete process
orientation in its securities operations applications. Part of this initiative forms
the monitoring of processes with the intention to obtain more information about
executed process instances and thereby identify opportunities for continuous
process improvement. Therefore, ARIS Process Performance Manager first was
evaluated in a pilot study and subsequently implemented into the existing
application landscape for securities processing. Today, the operations unit
monitors its compliance to the time standards for execution defined in the service
level agreements (SLA) between the different business units. Moreover, loops in
the execution of processes or the cost drivers, like required manual interventions
or delays due to communication with external parties become transparent.
Keywords
Business Process Management (BPM), Business Performance Management,
Process Performance Manager (PPM), Key Performance Indicator (KPI), Service
Level Agreement (SLA)

136 O. Klein, D. Kogelschatz
1 Motivation and Approach
Credit Suisse is one of the leading banks in Switzerland and internationally well-
known for its private and investment banking services. Its securities operations
unit in Switzerland is responsible for the custody and transaction services offered
to Swiss and international clients through the different business units that
represent Credit Suisse in markets all around the globe as well as through external
asset managers who rely on the services.
For retail clients in Switzerland these services are offered by independent retail
banks (Credit Suisse and Neue Aargauer Bank); for private clients world-wide by
the private banks (Bank Leu and Hoffmann, as well as the private banking unit of
Credit Suisse); for pension funds, investment funds, insurance companies and
governments by Credit Suisse Asset Management, which is part of the investment
bank Credit Suisse First Boston. Thus all the services offered by securities
operations are provided for other entities of the Credit Suisse Group.
Around 50% of this business is cross border with more than 400 external
custodians all over the world. This involves more than 50 currencies and roughly
20 million transactions per year.
Securities services include safekeeping and administration of securities (corporate
actions), securities transfers as well as the clearing and settlement of trades. This
wide range of activities is supported by 27 applications/application areas.
In 1997, within a first initiative of modernizing of the existing application
portfolio for securities handling, the idea was born to identify the processes which
were hidden in these applications. The goal was set to break up the monolithic
black box applications and in a new design to separate processes and business
rules from the underlying services providing the actual business functionality (see
figure 3). For the execution and control of process instances a central engine was
needed, hence "Auftragsmanager" (order manager) development was initiated.
Event driven process chains, which are designed in ARIS Toolset and afterwards
imported into the Auftragsmanager via a direct interface, form the basis of this
approach.
In 1998 Auftragsmanager became ready for deployment and two different areas
were chosen for the new application architecture. The booking system for stock
exchange trades was one of them, while the other one was the application which
supports securities transfers inbound and outbound of Credit Suisse. Following
these two first successful implementations a strategic initiative called SEC2000
and aimed at the modernization of the entire securities platform was launched.
Besides process control oriented architecture, emphasis was placed on the closing
of around 450 functional gaps which over the years had come apparent in the
applications. Closing these gaps leads to an increase of the straight-through
processing rate and thus to a decrease of operating costs due to automation.

Process Performance Management in Securities Operations at CREDIT SUISSE 137
Auftragsmanager was declared the central element of the entire SEC2000
philosophy. Its implementation became mandatory for all applications. Thus for
all existing applications an assessment was undertaken to reveal the processes
within them in order to derive a master plan for continued implementation of a
process oriented application architecture. This master plan guides ongoing
activities for rebuilding the securities applications.
Customer Requirements,
Management figures,
Market rules, etc.
Analysis and
Modelling in ARIS
Analysis and
Modelling in ARIS
D
efinition
ProcessData
Process
„Auftragsmanager“
Control / Monitor
AM InterfaceAM Interface
E
xecutio
n
Order Data
MIS Figures
M
easurem
ent
Process Performance
Manager (PPM)
O
ptim
ization
Performance
Measures
Fig. 1: Vision of a closed process control cycle
As explained above with ARIS Toolset the software solution for process design
was found and with the development of Auftragsmanager the engine to actually
execute and control them was built. Still one piece was missing to close the
process control cycle envisioned (see figure 1). Although Auftragsmanager
provides some means to monitor process instances in a quasi real time manner its
ability to serve as a process measurement tool are too limited to exploit the
potential of process optimization. Hence the need for an additional component
became apparent. At the end of 2002 Credit Suisse's contacts with IDS Scheer led
to the evaluation of the Process Performance Manager (ARIS PPM). A pilot study
was started to find out, whether and how ARIS PPM could be connected to the
existing environment. This pilot provided further insights concerning the
prerequisites for a successful implementation of ARIS PPM.

138 O. Klein, D. Kogelschatz
AuftragsmanagerAuftragsmanager
Process-
design
(ARIS)
Process-
design
(ARIS)
Appl.
Service
A
Appl.
Service
A
Appl.
Service
B
Appl.
Service
B
Appl.
Service
C
Appl.
Service
C
. . .. . .
ARIS-
Interface
ARIS-
Interface
PPMPPM
Prozessdata-
warehouse
P90 OE . . .
Datenanreicherung
Process- and order-
related data
Aggregation of
process data with
product specific
informations is
necessary
Fig. 2: Data feed ARIS PPM
Upon the termination of the pilot study the implementation of ARIS PPM into the
process driven architecture was designed. Two essential lessons were learned in
the pilot study. First, in order to obtain the insights for business process
management from ARIS PPM, plain process data need to be enriched by order
details (see figure 2). For instance the path an inbound or an outbound securities
transaction follow through the widely ramified process chains is identical. Only
additional order details permit their distinction. Second, the considerations on the
performance indicators to be defined for a process need to be made in the process
design phase. Otherwise the attachment of the "probe heads" for automated
process measurement may not be possible as precise as necessary because of e.g.
nonexistent granularity of the underlying models. Furthermore, developers at IDS
Scheer were challenged to tune the performance of ARIS PPM, in order to cope
with the daily volumes which are processed on Credit Suisse's securities
processing platform.

Process Performance Management in Securities Operations at CREDIT SUISSE 139
2 Process Control and Modularization of Applications
In order to process control applications now modularized by disintegration into
functional services the processes within the applications needed to be
(re)identified. As it is the case with most legacy systems 15 to 20 years after their
initial implementation, these applications had undergone major changes
implementing more and more functionality into them. This had blurred business'
understanding for the processes captured in the applications and de facto had led
to a situation where understanding and responsibility between business and IT was
entirely split up.
Order
Account
Safe
custody
account
Slip
Program
Controlling
Decisions
Functions
Decisions
Business
Rules
Auftragsmanager
Current Situation
Services
(Function)
Services
(Function)
Services
(Function)
Controlling
Processes
Order
Slip
Account
Target Situation
Safe
custody
account
Fig. 3: Application modularization
By "digging out" the processes out of the applications again and identification of
the interfaces, where users and applications interact, complete control over these
processes was regained. Not to mention the improved communication between
business and IT due to mutually improved understanding of each other. It was this
front-to-end modeling of processes and execution of process instances, which
made it possible to build a business case yielding a net present value and by this
showing a positive return on investment. As important as this business case is,
emphasis has to be placed on the level of collaboration between IT and business
which will prove even more valuable in the long run. Essentially this can be
ascribed to the fact that the process models can serve as the basis for the definition
of future functional requirements.

140 O. Klein, D. Kogelschatz
3 Derivation of a Master Plan through Application
Assessments
Figure 4 presents an overview of an assessment scheme which was followed for
all the applications under investigation. In a kick-off meeting in which all parties
involved were identified the developers for each application were informed about
the new design approach and the goals to be achieved. Structured interviews
followed. The interviews covered the typical questions about volumes processed,
media brakes in the process flow and the interfaces involved. The results were
transformed into a first process to give the stakeholders a first idea what process
modeling actually means. The evolving discussions on these preliminary processes
combined with the information obtained in the interviews then were documented
in a report which included a recommendation.
The combined outcomes of all assessments led to the derivation of the master plan
for the separation of processes from functional services. All together, more than
50 processes were defined. After approval of the master plan implementation
could begin. For every application a concept was written including the final
version of the process and detailed descriptions of the functions within this
process. At the same time business requirements regarding process measurement
were collected followed by the assignment of the necessary measurement points to
the process.
Initialisation
Preinformation
of application-
owners per
Mail with
presentation:
scope and
approach
Coaching by migration-Team
Systemdefinition*) Realisation
Implementation
Kick-off
per
applicati
on
Assessment
Pilot ARIS-
Process
Report
Planing,
Concep
t
Hand-over
of frame-
programs
and
introduction
Test-
Support
*) Per application there is an effort of about 30
man days
team for migration
team for migration and application owners
Fig. 4: Approach to application assessments
Concept
Planning
Kick-off
per
application
Coaching by Migration Team
System definition *)

Process Performance Management in Securities Operations at CREDIT SUISSE 141
Coverage and Volumes Today
Right now about 35% of the 27 applications are controlled by the application
Auftragsmanager. Process controlled order flow covers already the business areas
of securities transfers, part of the process of OTC and stock exchange trade
settlement, parts of corporate actions handling, securities lending and borrowing,
as well as some support processes. Daily volumes of executed process functions
currently vary between 350.000 and 800.000.
Nu
mb
er
of A
ctivities
per D
ay
Fig. 5: Daily volumes
4 Architectural Setup
As mentioned before, ARIS Toolset is the preferred software and the Event-
Process-Chain (EPC) is the method used for the modeling of the processes. All the
processes then are imported into Auftragsmanager. At runtime these processes
facilitate the communication between Auftragsmanager and the individual services
providing the actual business functionality.
Services may be automated process steps, manual activities or online interfaces
where the user interacts with the application (e.g. data entry). A service invoked
by Auftragsmanager must communicate its termination. For automated process
steps this is done by the underlying services, for manual/online steps this
information must be delivered by process participants, i.e. the users. Upon

142 O. Klein, D. Kogelschatz
termination of one step Auftragsmanager knows form the underlying process
models which step to invoke next (see figure 6).
This communication setup assures that Auftragsmanager, as the central engine,
obtains all information related to process execution and stores it in the process log
file. Log data are imported into ARIS PPM every night. Simultaneously the import
data are combined with order details, which are collected from other databases.
START
Service
Service
Service
Service
Monitoring
Exception Handling
Status Log
Timeout Control
Au
ftrag
s-
man
ag
er
Bestellung/ReklamationSteuer-produkte
UmsatzabgabeKontrolle
FrontAuftragserfassung
der BU
Umsatzabgabekontrolliert
Kunde/BUbelastet
Auftragan SecOpserteilt
Kundenreklamationentgegengenommen
Level 2: SteuerdienstleistungLevel 2: Steuerdienstleistung
The Auftragsmanager starts
services and gets back their
execution. The Log will be used
for Process Measurement in PPM.
Qu
eu
e M
an
ag
em
en
t S
ys
te
m
On Timeout
Bestellung/ReklamationSteuer-produkte
UmsatzabgabeKontrolle
FrontAuftragserfassung
der BU
Umsatzabgabekontrolliert
Kunde/BUbelastet
Auftragan SecOpserteilt
Kundenreklamationentgegengenommen
Level 2: SteuerdienstleistungLevel 2: Steuerdienstleistung
Differenzenlisteeingetroffen
Differenzenlistebearbeiten
ausgewiesenenStempelbeträgenvergleichen
Kontrolllistevorhanden
Kontrolllistechecken
KeineweitereDP
enthalten
Kontroll-Listebearbeitet
Kontrolleabschliessen
Umsatzabgabekontrolliert
Level 3: Umsatzabgabe Level 3: Umsatzabgabe
KontrolleKontrolleDifferenzenlisteeingetroffen
Journaleintrag/ Kundenabrechnungkonsultieren
13.2.2.2Journal/Positionkorrigieren
Journal/Positionkorrekt
Prüfung obweitereDifferenzenpositionenenthalten sind
WeitereDifferenzenposition
enthalten
KeineweitereDP
enthalten
Vereinahmte zuausgewiesenenStempelbeträgenvergleichen
Kontrolleabschliessen
Kontrollebeendet
Kundenabrechnungist zukorrigieren
13.2.2.1
Kundenabrechnungkorrigieren
Kundenabrechnungkorrekt
Kundenabrechnungi.O./
Journal/Postitionist zu korrigieren
LevelLevel 4: Differenzliste4: Differenzliste
bearbeitenbearbeiten
Process Design
Processes are loaded into the
controlling database of the
Auftragsmanager
Fig. 6: Architecture and connections
5 Examples and Business Benefits
Securities transfers were the first process controlled orders. These processes had
already been running for some years but processes were not yet measured due to
the lack of an appropriate tool for automated process measurement. With the
commissioning of ARIS PPM time was ready for the formulation of key per-
formance indicators for securities transfers as shown below in figure 7.

Process Performance Management in Securities Operations at CREDIT SUISSE 143
Business Volume Related Measures (per Time Period)
Name Description Business Benefit
number of orders measures the overall number of securities
transfer orders
flexibilisation of reporting cycles; basis for dynamic
allocation of workforce
number of cancel requests measures cancelled orders
(own and on customer request)
volume number not extractable from system until
now
number of orders entered by employee measures employee production allows for differentiation of complexity of order
constellations (pricing)
number of orders controlled by employee measures employee production allows for acknowledgement of secondary tasks
Process Performance Related Measures (per Time Period)
Name Description Business Benefit
percentage of orders fulfilling time related
settlement standards
measures fulfilment of quality standards quantitative quality assurance, allows for analysis of
weaknesses in process setup
number of critical stati occurred in work flow measures orders needing supplementary manual
intervention
accounts for costs for order processing, allows for
analysis of failure prone delivery constellations
number of orders overdue measures orders settling after specified
settlement date
quality check, allows for improvement through
analysis
number of manual interventions measures manual interventions during delivery
process
accounts for costs of order processing, helps to
increase STP rate through analysis
average time between order capture and
settlement
measures time between order completion and
external confirmation
quality check of external custodians
Fig. 7: Selection of KPIs for securities transfers
For these indicators virtual "probe heads" were placed in the process models. For a
volume counter of executed process instances (orders) a single measurement point
may be sufficient as shown in figure 8 by the top probe head. In order to discern
STP instances from those requiring manual intervention two probe heads may
discern the different edges that these instances may follow (probe heads in the
middle). To derive throughput times the time span between two probe heads is
measured (top and bottom probe head). KPIs are represented through appointment
of measurement points and the derivation of formulae based upon them.
Order Data
Order entry
Clearing
Settlement
Booking of:
- cash account
- safekeeping account
Customer statement
Customer receives
statement
customer issues
order
Fig. 8: Mapping of business process into IT processes

144 O. Klein, D. Kogelschatz
For securities transfers the final set comprised around 30 indicators and around 25
dimensions which contain the order specific information needed to identify the
business process in the IT process as shown in illustration 8. With these indicators
dash boards were set up which show relevant process information customized
according to management levels.
Employee
Am
ount
of O
rders
Fig. 9: Captured orders per employee
Figure 9 provides an example of a volume indicator showing the number of orders
captured per employee. On one side this first picture provides an approximate
overview of individual productivity. On the other hand interpretation must be
undertaken with precaution since not all orders have the same complexity.
Information revealing the complexity of the underlying orders may be contained
in the other dimensions that process instances are enriched with or they may not
be available in an automated form. However, reasonable interpretation requires a
well founded understanding of the business.

Process Performance Management in Securities Operations at CREDIT SUISSE 145
Amount of Cancelled Orders per Business Unit
Am
ou
nt
of C
an
ce
l
Business Unit
Fig. 10: Cancelled orders per business unit
Figure 10 shows the number of cancellations of orders per business unit. Until the
introduction of process performance management cancelled orders had not been
known because the volume figures were based on customer statements produced.
If an order was cancelled before the customer statement had been produced this
became not visible.
Cancellation Rate per Time
Time
Cancellation
Rate
Fig. 11: Rate of cancelled orders over time

146 O. Klein, D. Kogelschatz
Figure 11 shows how the rate of cancelled orders evolves over time. The rate and
not the absolute number is chosen because it is normalized by the total number of
orders executed. Cancellations are a common phenomenon in the process of
securities deliveries and may be due to internal or external factors. In any case,
they reflect the quality of internal or external work. Until the implementation of
ARIS PPM business had no means to measure cancellations because the system
did not disclose them. A captured order which is cancelled later causes the same
expenses as a successful order. Therefore they should be priced accordingly.
Through the introduction of ARIS PPM the basis for a fairer allocation of costs
among the different business units of Credit Suisse relying on securities
operations' services becomes now available. For example business units with poor
instruction quality leading to order cancellations could be charged accordingly
giving them an incentive to improve the quality of their instructions through better
training of employees. For securities operations this also new services available
for the responsible managers, in order to provide its internal clients with analysis
revealing the most common instruction errors and thus giving valuable input in
which field of the delivery instructions additional training might be needed in
front units.
Process Duration from Capturing until Booking
Days
Fig. 12: Throughput time from order capturing
until booking of positions
As mentioned before, between the individual business units and securities
operations service level agreements are defined. These SLAs include quality
levels. Of course front units have a vital interest to monitor the service levels that

Process Performance Management in Securities Operations at CREDIT SUISSE 147
they pay for. Process measurement now provides the opportunity to monitor time
related quality indicators. Figure 12 shows the evolvement of throughput times
over time (lowest line). Additionally an arbitrary line has been included in the
chart to show the level of service quality agreed upon (top line). The line in the
middle may serve as a lower threshold value for the process owner who of course
would like to intervene before the upper line is crossed, if for some reason
throughput times should begin to deteriorate.
Fig. 13: Drill down to the individual order
While Figure 12 shows average values for throughput times by application of a
time filter those orders not fulfilling the service level agreement can easily be
separated. With just one mouse click a list of these orders can be generated and
hence delivered to front units which then are informed which client's orders may
not have fulfilled the service quality that Credit Suisse strives for (see figure 13).
Moreover another mouse click reveals the process flow the order has pursued
(depicted in the form of an event driven process chain).
For the safekeeping of securities it is common to work together with external
custodians in the individual markets. If the suspicion arises that the services
quality may be influenced by external factors, like e.g. a specific custodian, it is
now easy to verify with hard facts if this suspicion proves to be true. Again, a
lever for process optimization has become available.

148 O. Klein, D. Kogelschatz
Fig. 14: Aggregated process instances
The column to the left in Figure 14 may also be represented in the form of a
process. But instead of an individual event driven process chain the result will be
an aggregated process model representing all the individual process chains. Such
an empirical process model provides further insight into the process behavior. The
edges represent the model paths which actually occurred. For every edge it is
known how many instances have flown through it. In this dummy example for
instance 30.000 orders were processed STP and 3.000 provoked a manual inter-
vention.

Process Performance Management in Securities Operations at CREDIT SUISSE 149
The manual function in the process is the one to the very right. In addition,
information on the average processing time of all functions is included by the
color depth in this chart. Processing times of individual functions vary form
milliseconds for a simple automated function (top left white function) up to close
to an hour for the online function to the right.
Fig. 15: Processing time of an online function
Figure 14 shows that the processing time for an online function quite naturally is
larger than an automated one. For obvious reasons business is most concerned
with online functions. Figure 15 may serve as an example for an analysis of an
online function. A manager may be interested to know how long it takes until the
reason for a halted order has been found out, corrected and order execution
continued. And he may be interested to see, if different organizational units show
differences in their processing times. The above illustration shows such an
example which depicts in the columns additionally whether a note documenting
the reason for the halt of the order has been captured.
While Figure 15 uses only two classes of processing time (0-2 hours; 2-4 hours)
sometimes the actual distribution of orders over the processing time is of concern.
Figure 16 provides such an example showing how many orders fell in which time
class.

150 O. Klein, D. Kogelschatz
Fig. 16: Distribution of the processing time of an online function
6 Process Mining for Identification of Performance
Shaping Factors
The throughput time of a delivery of securities may be influenced by many
factors. In many cases the performance shaping factors are unknown. For these
cases statistical analysis proves to be a powerful investigation tool. The statistics
features in ARIS PPM are referred to as Process Mining functions.
Process Throughput Times Regarding the Custodian
Custodians of Credit Suisse
Duration(Days)
Fig. 17: Process throughput times in relation to the custodian

Process Performance Management in Securities Operations at CREDIT SUISSE 151
As mentioned before external factors can influence throughput times for securities
transfers. A major performance shaping factor in this are the external custodians.
Process mining allows for an analysis in which for a specified performance
indicator a set of arbitrarily chosen dimensions is tested on its influence on the
performance indicator. According to some boundary conditions chosen for the
analysis ARIS PPM presents the dimensions which show a significant influence
on the indicator. Of course causality has to be explained by business experts.
Figure 17 depicts how external custodians influence the throughput times for
securities transfers. Again the potential of process performance management for
the optimization of business processes is evident.
7 Lessons Learned
The ability to scrutinize process execution down to individual performance
shaping factors leads to a paradigm shift. While in the beginning business was
reluctant to look thoroughly into the sometimes quite complex models for process
execution the transparency brought by performance measurements has changed
this. Now managers are aware of the meaningful performance indicators which
have become available due to the process controlled order execution. Furthermore,
following the path of an individual process instance (order) through the complex
models facilitates people's understanding and internalization of process orien-
tation. Performance of until now self-organizing employees becomes transparent
to the management. Here emphasis is less on the comparison of work done by
individual employees but rather on the performance of the front to end process.
While smart self-organizing employees focus on finding the local optimum of how
to do their work process performance management helps to find the global
optimum of the overall process.
Different products vary in their execution complexity. Again process performance
managements provides further insights. Obvious that these new insights can be
used to identify products which tend to decrease process performance thus
allowing for appropriate provisions for process improvements to be initiated. With
the closing of the process control cycle improvement measures again can be
assessed for their effectiveness as business process management is a perpetual
mission.
The operation of processes inherently has some risks. While risk can not be
measured directly, the measurement of the value of all open transactions, repre-
senting the exposure to risk, may serve as a proxy measure for operational risk.
From the point of view of the financial controller orders cancelled upon customer
request can now be charged. With time a shift away from unit costs to activity
based costing seems now feasible.
From the point of view of the clients of securities operations the quality levels can
now be monitored.

152 O. Klein, D. Kogelschatz
In the process of separation of process from the business functionality of the
applications some lessons had to be learned. For instance the processes contained
in an application are much broader than individual business processes. As an
example an application may serve for several organizational units as the ones in
charge for in- and outbound securities transfers. It is quite obvious that the
underlying application must serve both business processes. That means that
processes on the IT level tend to be quite complex and this makes the mapping of
business processes into them sometimes burdensome.
Process performance management leads to increased transparency. This transpar-
ency might not always be welcome and people investigating process performance,
especially when related to staff, must do this with caution and be aware of the
responsibility they carry.
As it is often the case the benefits of process performance management were not
realized immediately. In the case of Credit Suisse it was the ability to measure the
service level agreements which promoted the idea of process measurement.
Now that process measurement is becoming more and more familiar, all
stakeholders welcome the fact that arguments concerning processes are based on
real measurements delivering hard data.
8 Summary and Outlook
After the first implementations of the closed process control cycle Credit Suisse is
convinced of the approach and propagation is ongoing. For every application
which is modularized the definition of key performance indicators has become a
natural supplementary step during the design phase of the processes. As a conse-
quence the strategic initiative towards process controlled order execution is
continued with another 10 application areas within securities operations.
Plans exist to include more manual steps which until now are not supported by IT
systems. The extension of processes to front applications is another objective
pursued. Once theses front to end processes can be measured continuously the
focus of process optimization will solely be set on Credit Suisse’s customer re-
quirements.

Closing the Cycle – Measuring, Analyzing and
Improving Processes, Performance and
Workflows in the Insurance Sector
Herbert Oberländer
IDS Scheer AG
Frank Ossig
IDS Scheer AG
Michael Linke
IDS Scheer AG
Summary
Since the opening of the markets in the late 1990s, insurance companies have had
to contend with global competition in which the abstract value "insurance protec-
tion" is the tradable commodity. Accordingly, optimizing organizational and IT
processes and structures in this very conservative industry has now taken on
greater priority, a very demanding task due to the highly sensitive data involved.
With ARIS Process Performance Manager, a tool is available that enables reor-
ganization and efficiency improvements, e.g. in application processing, to be
measured and visualized for the first time. In several pan-European projects, it
has led to a significant reduction in throughput times.
Keywords
Combined ratio, insurance industry, process map, legacy applications, business
process analysis, weak points, throughput time, response times, QA phase, data
extraction, process improvement, timestamp, policy drafting

154 H. Oberländer, F. Ossig, M. Linke
1 Project Overview
1.1 The Environment
The golden age of the insurance industry came to an end in the 1990s, and the
global players in this sector are now confronted by equally global problems.
Where once profits could be taken for granted and company success was based on
a handful of products, insurers are now finding life that much harder in the mar-
ketplace. Intense competition and turbulent times on the stock markets have meant
that insurance companies must take concerted action to optimize their true core
businesses (e.g. new products, lowering the combined ratio, leaner structures).This
is one of the main reasons why the insurance industry is coming to grips more and
more with the issue of Business Process & Performance Management. This in-
volves defining the process portfolio within the company and which processes
contribute what to the company's success or how important they are for the cus-
tomer.
Fig. 1: Process map of an insurance company

Improving Processes, Performance and Workflows in the Insurance Sector 155
In 2004 most of these core processes are handled with IT systems. Looking at
these IT-supported processes in detail, it quickly becomes clear that the insurance
industry has a highly heterogeneous and individualized IT landscape. Unlike
manufacturing and retail for example, hardly any standard software (such as SAP)
is used, the central master data and claims systems are mostly systems that have
evolved over the years. These applications have been developed and supported en-
tirely by the in-house IT departments for years, sometimes even decades.
In the recent past, these legacy applications have been augmented with more mod-
ern transaction and interface concepts using Enterprise Architecture (EAI) solu-
tions, but in essence the core of the old systems has not changed and still serves as
the basis for further upgrades.
Fig. 2: Classic EAI infrastructure in the insurance sector

156 H. Oberländer, F. Ossig, M. Linke
1.2 Description of the Problem
In the past, management gathered its knowledge about business activities from
variables such as sales trends, cash flow, profit, earnings contributions etc. In
other words it relied on information rooted in the past. Process-oriented considera-
tion of the company's business was limited to business process analysis, ad-hoc
recording of processing volumes and times noted by employees and retrospective
work volume reports relating to a given term date.
The disadvantages of this approach are evident. A high degree of manual work
falls to the operational employees in recording the data, and to others downstream
in aggregating and analyzing the data. As permanent data collection is not possi-
ble, there is always a specific reason for doing so. This means it is hard to recog-
nize trends, and changes cannot be detected early enough.
A further disadvantage is that whole ranges of questions relating to processes sim-
ply cannot be answered, e.g.:
• Are there new applications that have been delayed or even lost?
• How cost and time efficient are the various sales channels?
• Where are the weak points and bottlenecks in the workflows?
• How high is the average throughput time for a given product and what
were the anomalies?
What was needed then was tool that measures IT-supported business processes.
For example, the timely provision of quantity structures, processing and through-
put times should enable process managers to estimate resource requirements. The
chosen tool should also be able to show very quickly whether a technical/IT modi-
fication to a business process has really had the desired effects. And all this should
entail less effort, not more.
The spectrum of processes considered ranged from new application processing (at
HALLESCHE Private Krankenversicherung, Germany) to loss adjustment (RAS,
Italy).

Improving Processes, Performance and Workflows in the Insurance Sector 157
1.3 The Procedure
As a rule, the underlying projects in the insurance field were preceded by an
approx. 3- to 4-month pilot project. The aim was to establish whether the informa-
tion required could be extracted from the legacy IT systems. The pilot project was
also intended to answer the question as to how much the information generated by
ARIS PPM can support process managers in their work.
Fig. 3: High-level project plan
An appropriate pilot process was identified during the initial workshops, which
were conducted jointly with the technical and application development depart-
ments. This process was then used to draw up the list of critical questions that
needed to be answered with ARIS PPM. In addition, input was provided about the
desired key performance indicators (e.g. processing duration, number of process
steps, response times, throughput times per customer) and dimensions (insurance
type, sales channel, regional allocation, policy status, etc.).
A review of the technical environment and relevant systems frequently revealed
that a certain amount of effort would be required to obtain the necessary source
data in each case. The customer-side application developers produced shell scripts
for the mainframe and legacy systems to extract the required process data, which
was then imported via ARIS PPM import routines into the ProcessWarehouse,
where it was then processed. This was done in XML format, which enabled the

158 H. Oberländer, F. Ossig, M. Linke
IDS Scheer consulting team to develop the import procedure (parsing) for the
mainframe data without an unreasonable amount of work.
Following the successful initial import of the source data, it was now possible to
generate the first graphic reports "ad-hoc" as it were, and to actively analyze the
selected processes. The analysis specifically attempted to determine whether the
important questions could be answered at all with the source data, or whether indi-
cations of possible behavior patterns could be given and so provide process own-
ers with more transparency on the processes for which they were responsible.
It proved to be absolutely necessary to establish a QA phase that carefully checked
for errors in the data delivered. Even minor errors (e.g. a single bit error during
data extraction) can seriously corrupt data extraction and lead to irrecoverable ac-
ceptance problems for ARIS PPM.
The conclusion of the pilot projects was marked by a presentation of lessons
learned and results achieved to the respective decision makers, conducted by the
joint team of customer staff and IDS Scheer consultants.
1.4 The Solution
Even in the pilot projects, ARIS PPM provided the customer with more transpar-
ency regarding the business volume. Near real-time identification of trends was
possible with the weekly updating of data in ARIS PPM. The evaluations that
were conducted and the interpretation of results enabled the companies to analyze,
control and even improve workflows. Now, individual functional units and their
processes can be examined and evaluated so that specific process improvement
measures can be adopted. The following slides are taken from a concrete example
at a German health insurance company. They enable process owners to identify
the weak points in the "New heath insurance application processing" process un-
der review and where the process is carried out particularly quickly. The basis was
formed by some 38,000 process instances from a selected representative period
that were fed into ARIS PPM as an initial load. Specification and coordination
were carried out in close cooperation between the operating organization (OO),
the responsible technical department and the application development department
(AD). As some of the necessary process steps did not have a timestamp (date and
time) in the master data system, it was agreed to use the day as the smallest unit of
time. This did not result in any unacceptable loss of information for the desired
views.

Improving Processes, Performance and Workflows in the Insurance Sector 159
Fig. 4: Drill-down to business types in the "Life" segment
Desired key performance indicators included periods such as between application
date and receipt of mail, customer to customer cycle through to policy drafting,
and also the number of checks within a process and the number of processing
steps. Dimensions such as insurance type, service center, sales unit, sales channel
and policy status were chosen so that these key performance indicators could be
better judged with respect to their origin.
2 Conclusion
Now that the customers have decided to purchase and establish ARIS PPM
throughout the company, the next stage is to identify the suitable processes and
prioritize the corresponding implementation projects. The stated aim of the "Insur-
ance" BU is to advise and continuously coach the customer during these imple-
mentation projects so that they are ultimately able to use the tool relatively inde-
pendently. The customer will also be supported in carrying out a weak point
analysis and making the necessary corrections by the full extent of the business
unit's expertise in the industry, including "best practice" approaches and the
process reference model for insurance companies.

Performance Management in Power Stations -
with openJET, openBMS and ARIS PPM
Bernd Heselmann
Gesellschaft für integrierte Systemplanung mbH
Peter Stängle
Gesellschaft für integrierte Systemplanung mbH
Andreas Kronz
IDS Scheer AG
Klaus Miksch
IDS Scheer AG
Summary
The integration of the ARIS Process Platform in the open product family of GIS
mbH, one of the largest European providers of operations management systems
for nuclear power station facilities, has now made holistic Business Process
Management technically possible in the energy generation sector as well. The
transfer of operations management data for a power station facility from the
widely-used openBMS system to ARIS PPM enables users to identify potential
improvements in times, quality and costs from extracted real data. Use of the same
methodologies and XML structures has led to an integrated Performance Man-
agement solution that permits the design, implementation and controlling of pro-
cess-oriented workflows in the power station environment.
Keywords
Operations management systems, openBMS, openJET, nuclear power station,
malfunction and fault reports, occupational safety measures, facility description
system, maintenance rate, processing duration, reporting obligations, safety
system, indicators, early warning system, process costs, management view,
workflow engine, XML import interface, PPM graph format, process typification,
processwarehouse, workflow logic, UML (Unified Modeling Language, CORBA
(Common Object Request Broker Architecture)

162 B. Heselmann, P. Stängle, A. Kronz, K. Miksch
1 Initial Situation
Operations management systems have been used in nuclear power stations since
the end of the 1980s. One such system is offered by GiS, and can now be found at
many sites in German-speaking countries. The latest version is openBMS. Today
it is more necessary than ever that a company continuously reviews its processes
and so ensure sustained optimization. Of course, this is done for safety reasons,
but also in a context of liberalized and deregulated markets and a depressed
economic climate.
But which processes are running badly, where is there need for action? What
needs to be done so ensure that power station management is supplied with all the
information it needs, and quickly enough for it to institute appropriate measures?
Before these questions are answered, the concept behind an operations man-
agement system merits a few words of explanation.
2 Operations Management
Running a nuclear power station is an extremely complex undertaking in which
several hundred people perform thousands of mission-critical processes with
innumerable individual activities each year in a coordinated, compliant and
quality-assured manner on an interdisciplinary basis in order to maintain the
facility in a defined technical target state at all times. A wide range of regulations,
rules and guidelines have to be complied with to ensure the safety of the plant and
the environment as well as that of the operators.
Keeping track of this immense workload and variety and still economically plan,
execute and document the tasks involved demands an IT panoply that effectively
supports and controls all the related processes.
The openBMS operations management system from GiS is equal to the challenge
of interactively planning all operations management processes in the facility, as
well as monitoring and documenting their proper execution. Conversely, it also
ensures that nobody may carry out any maintenance work in and on the facility
without a written order to do so. The rule is: "No order, no job". The openBMS
occupational safety components efficiently integrate statutory requirements in
business processes, thus minimizing risks for the company.
Violation of these environmental and occupational safety regulations can cause
lasting damage to a company's image. The use of openBMS effectively supports
regulation compliance and thus contributes significantly to achieving company
objectives.

Performance Management in Power Stations 163
The maintenance processes are precisely described in the Maintenance Manual.
Every employee can and must carry out exactly that work for which he or she has
been scheduled and is responsible for, and the operations management system
provides guidance and support so that all the pertinent regulations and guidelines
are complied with. With these features, openBMS represents quality assurance in
the best meaning of the term.
The system is used to process all the planned tasks of preventive maintenance and
also unplanned tasks entered in the form of malfunction and fault reports. This
provides for transparency regarding what is happening on the site at the moment
and also a complete case history of all faults, repairs and maintenance activities
for every component in the facility.
This information forms an ideal basis for damage statistics and analyses.
Moreover, it represents a wealth of operational experience that can be tapped in
repeat or comparable situations. Knowledge of the facility and its history has long
been established as a company asset. Whenever required, a user looks for similar
job orders in the system's memory, copies them, makes changes as necessary, and
has then already completed the entire job planning. This not only saves a
considerable amount of planning effort, it also leverages proven actions and
processing mechanisms and exploits past operating experience. If this approach is
applied consistently, it results in long-term company expertise that leads to
continuous optimization, savings in maintenance costs, enhanced efficiency and
innovation and thus provides the preconditions for sustained corporate success.
Thanks to openBMS, the degree of planning for all the tasks to be carried out is
increased significantly, a enormous variety of site- and release-related tasks is
logically combined, packaged and optimized with respect to resources and time.
Each planned job order is greeted by a query as to what other planned tasks with
the same release, same BOM, same transport media, lifting gear, personnel etc.
can be carried out at the same time. The benefit of this aggregation has is that
there are fewer job orders altogether, with fewer releases and better resource
utilization. openBMS enables a considerably higher degree of planning with no
extra effort for planning activities. This better planning also leads to better and
more reliable work results.
A particular challenge for managers is the annual power station audit. A large
number of jobs have to be carried out at practically the same time with due regard
to all marginal conditions: safety, resources, deadlines, costs. In the days and
weeks of the audit, the operations management system serves as the central
coordinating tool. Every job, every release or standardization, all occupational
safety measures, are effected via openBMS. Although detailed advanced planning
is the foundation for a successful audit, careful attention must still be paid to
change management.

164 B. Heselmann, P. Stängle, A. Kronz, K. Miksch
Timely and extensive advanced planning of all work envisaged has another major
advantage: in the event of a temporary stoppage, pending work that was actually
scheduled for the audit can be brought forward at short notice. A key aspect of
operations management is the facility description system, in which all facility
objects (components) are recorded together with their spatial and technical data
and described together with their procedural relationships to other objects. The
facility description also includes the entire power and control engineering
discipline at the facility. The importance of a consistent facility description for the
operations management system should not be underestimated: the software system
cannot not work effectively without it.
Operations management also means the close synchronization of an enormous
diversity of functions such as document management, materials management or
controlling. With openBMS, a degree of integration is achieved that removes the
boundaries between the various IT systems. As the integration platform, SAP
NetWeaver is particularly important here.
All in all, running German power stations nowadays cannot be imagined without
openBMS. It plans and controls all activities on and in the facility, permits
transparency in daily operations and ensures that QA-sanctioned procedures are
established for the tasks of all participants at every hierarchical level.
3 Process Orientation in Operations Management
Power station operators realized very early on that operations management
processes would have to be given workflow support. Process data and history have
been recorded in the operations management system for years and now constitute
a priceless source of information. For example, this information may relate to job
order, release or fault reporting processes. The procedure for a fault report is
outlined below as a typical example of such processes. Needless to say, these
processes differ slightly from power station to power station:
3.1 Reporting and Recording Fault Reports
In general, all staff are encouraged to report malfunctions and faults as quickly as
possible. In practice, these range from items left in places in violation of safety
regulations to defective lighting and leaks in the controlled area, a very wide range
of reports. The fault report is characterized in the operations management system
by a damage description. Information on the time reported, the person reporting
and his or her organizational unit, when noticed (e.g. housekeeping inspection, by
chance etc.) and the operating state of the unit in question can be entered as codes
to supplement the report. Digital photographs of the damage and documents can
also be attached. Once the originator has entered a fault report, he or she
completes the process with a digital signature and forwards it to the shift manager.

Performance Management in Power Stations 165
3.2 Evaluation by Shift Manager
The shift manager reads incoming fault reports on a current basis and particularly
evaluates their impact on the facility and its target state. The assignment of a
priority and a deadline is obligatory. Where appropriate, immediate action is
initiated as a temporary response to the problem. In this case, a safety release is
normally required. If the shift manager considers a particular technical department
or member of staff to be responsible, this is entered accordingly. Otherwise, re-
sponsibility for rectifying the problem is determined in a discussion with the
power station and departmental managers and passed on to the persons in question
via a workflow system.
3.3 Acceptance by Assigned Employee
Where appropriate, the assigned employee inspects the problem area and initiates
a technical clarification to rectify the situation. This results in a new job order with
corresponding planning, or orders that are already planned may be used to correct
the fault. The job order constitutes a process of its own.
3.4 Closure of Fault Report by Assigned Employee
Once the problem has been rectified, the assigned employee is prompted by the
workflow to describe how the problem was dealt with. Codes can be used in the
report to specify the cause of the malfunction, description of the fault, precautions
and rectification.
Of course, these business transactions can be controlled and monitored by the
workflow system. This guarantees that the right information is processed at the
right time by the right unit or person. However, it is also necessary to critically
assess the process flow on a continuous basis: Is the defined workflow efficient?
Could the work be carried out more cost effectively without any loss of quality?
An example of a new approach to process optimization in operations management
is the integration of openBMS and ARIS PPM.

166 B. Heselmann, P. Stängle, A. Kronz, K. Miksch
4 Process Analysis in ARIS PPM
The operational experience stored in openBMS (see openBMS ARIS PPM
interface) is transferred to ARIS PPM. In other words, the business objects for
maintenance and the corresponding workflow information are made available to
ARIS PPM for analysis. ARIS PPM uses this information to determine essential
indices. For fault reports, these may include for example:
• Number of fault reports relating to the safety system, with high priority for
correction
• Number of fault reports that may need to be reported to public authorities
• Fault-related maintenance rate
• Number of fault reports identified during regular inspections of components
• Number of open fault reports
• Fault-related component downtimes, outages and malfunctions
• Downtimes of components covered by preventive maintenance
• Processing time for fault reports
Besides the continuous monitoring of permanent safety indicators, the benefit for
operations management lies especially in the situational analysis of the process
data. For this, ARIS PPM offers extensive capabilities. Process and maintenance
managers are provided with a wealth of new analysis options:
• Can the process chain, i.e. the sequence of steps in a process, be shortened?
• Is all the information available in good time?
• Was there sufficient planning or did delays arise in job execution?
• Do problems arise more frequently in particular constellations?
• Does the process chain have a structural defect?
• Could steps be carried out more efficiently?
• How high are the process costs?

Performance Management in Power Stations 167
Fig. 1: Process analysis in ARIS PPM
Process optimization in operations management must be seen as a holistic strategy
aimed at achieving the goals of improved safety and quality combined with cost
minimization and is of course an ideal management tool.

168 B. Heselmann, P. Stängle, A. Kronz, K. Miksch
Fig. 2: Management Cockpit in ARIS PPM
Power station senior management defines clear corporate objectives. A failure to
meet the defined targets must be made transparent as early as possible. The role of
ARIS PPM is to aggregate all the relevant facts to key points so that top man-
agement at the power station can make the right decisions as quickly as possible
with due regard for corporate strategy and all other marginal conditions. This
purpose is served by the Management View, a condensed presentation of the rele-
vant information in a type of cockpit display that can be used as an early warning
system (see Fig. 2).
What does successful and feasible process management actually look like, without
overambitious promises of success? What improvement potential can managers
expect from ARIS PPM coupled with openJET?

Performance Management in Power Stations 169
5 Business Process Optimization in openJET
5.1 Architecture of openJET
openJET (JET = Java-based Engineering Tool) is a JAVA-based framework for
the automated production of mission-critical applications. With openJET, mission-
critical applications can be generated directly from the results of the technical
analysis. This integrates the systems development phases from technical design
through to running applications, thus reducing development and maintenance
times.
openJET is based on the 'Model Driven Architecture' (MDA) philosophy. Various
graphical editors are used to produce the platform-independent model (PIM). The
major diagram types are supported by UML (Unified Modeling Language) for
modeling the business logic. A generation process is applied to the PIM to pro-
duce and compile the Java source code and the corresponding Java class files.
More information about MDA can be found at http://www.omg.org/mda/.
Fig. 3: openJET architecture

170 B. Heselmann, P. Stängle, A. Kronz, K. Miksch
openJET provides both the modeling and the runtime environment. Thus openJET
offers a complete framework for developing and executing distributed enterprise
applications. The overall system has been realized as a classic multi-layer
application.
Communication among the various components flows from the servers to the
database via JDBC, communication between the servers and clients and between
the servers themselves is assured by CORBA (Common Object Request Broker
Architecture). The following overview presents the relevant system components:
• openJET modeling client:
The openJET modeling client contains all the tools required to create an
application with openJET.
• openJET application client:
The openJET application client provides the environment for executing the
created applications.
• Security system:
The security system administers the privileges of the openJET modeling
environment users.
• Generator:
The generator automatically creates the necessary .java and .class files needed
to run the application. These are stored in the file system.
• Model server:
The model l- server administers the information on the modeled application in
a relational database. This includes information about the business classes, for
example.
• Application server:
The application server is needed for running the application. It stores the
application data in a relational database. This data includes the instances of
the business classes, for example.
• CORBA NameService:
The CORBA NameService is required so that components can communicate
with each other.
During development, the modeler can concentrate solely on implementing the
technical requirements. The following is a selection of the functionalities that
openJET provides for modelers:
• Transaction service and object administration
(caching, optimistic blocking procedure)
• Distributed calls using CORBA

Performance Management in Power Stations 171
• Object-relational mapping persistence service
• Configuration management layer model
• Workflow engine
5.2 Configuration Management – openJET Layer Model
With openJE, users can customize an existing application. Customizing can be
carried out locally by the customer. So that customer changes are not lost during
application software updates, openJET provides various modeling layers. There
are a total of seven layers in openJET, although the principle will be explained
here with only the three that are most significant for modeling.
The Reference Layer is used to develop the openBMS standard software, which is
customer-independent. During a rollout of the software the specific customer
requirements, especially its business processes, are mapped in the Adaptation
Layer. After delivery of the modified application, the customer can make further
changes locally in the Customizing Layer.
Fig. 4: Example of Layer Model
If a part of the delivered software is changed, a variant of the original is
automatically created in a higher layer. During runtime, the highest variant of the
software component is always applied and used. The variant masks the original, in

172 B. Heselmann, P. Stängle, A. Kronz, K. Miksch
other words removing the variant restores the original state. Of course, new
software components can also be created in a higher layer. Fig. 4 shows an ex-
ample of a variant for a GUI dialog.
Installing a new version of the standard software (Reference Layer) at the
customer's premises does not affect or overwrite the variants in the superior layers.
This guarantees that the customer modifications will still run after a version
change.
5.3 Business Process Modeling in openJET
openJET has a workflow engine that is responsible for carrying out a business
process during runtime. For the purposes of openJET, a business process
represents the sequence in which various business activities (BA) are to be
performed. A BA is a special GUI dialog with which a user can carry out a certain
task, e.g. the entry dialog for a material master record or a dialog for releasing the
material master record.
The workflow engine was designed in conjunction with the University of Erlangen
and implemented using the results from GiS mbH. A business process can be
modeled using the openJET Workflow Editor, a graphic environment for design-
ing a business process.
Fig. 5: Screenshot of the Workflow Editor

Performance Management in Power Stations 173
The following section describes some of the nodes types a developer can use to
model a business process:
Operation Nodes
This is the central node type of a business process. An operation node bundles the
information "what has to be done when and by whom". The "when" is defined by
the position of the operation in the business process. The operation is not due for
processing until all the upstream operations have been completed by a user.
"Who" is defined by the derivation of a responsibility. The operation can be
modeled on a functional, organizational or personal basis. "What" means that an
operation node is assigned to precisely one business activity, which the user must
process. Other settings can be made to the node that determine, for example, the
operation type, whether processing the operation is obligatory or optional.
Decision Nodes
Decision nodes are used to model different paths in the business process, whereby
only one is carried out at runtime. Decision values can be simple Boolean values
or also integers. The path actually taken is determined by specifying a method that
identifies the decision value at runtime.
Program Nodes
With a program node, any program can be executed at a given time in the business
process. For example, after a material master record has been released, the data
can be sent to an SAP system, where a material master record is also created.
Pause Nodes
A pause node can be used to interrupt a business process until a certain condition
has been fulfilled. This means that while the business process is waiting there are
no operations for a user to carry out.
Trigger Nodes
A trigger node can be used to "bring to life" a different business process. The
business process thus prompted is recalculated and all pause conditions are
retested.
Pause and trigger nodes are required to synchronize two or more business
processes with each other. For example a maintenance order cannot be closed out
until all the associated services have been concluded. In this case, the maintenance
order business process waits for the maintenance service business process. Upon

174 B. Heselmann, P. Stängle, A. Kronz, K. Miksch
its completion, the maintenance service business process triggers the order
business process, so that a further check is run to ensure that all services have now
been completed.
5.4 Business Process Execution in openBMS
The user has a task list in the main menu. This list contains all the operations from
various openBMS business processes that the user has to carry out. This means
that the task list is the central entry point for users.
The operations in a user task list are derived from the responsibility modeled on
the operation node. Thus, a user finds in the task list all those operations that have
been assigned to him or her personally or to his or her organizational unit or to one
of his or her functions. If operations are group based (organizational or function-
ally based), these events can be carried out by several users. Once a user starts
processing the operation, it is removed from the task lists of the other group
members. The user confirms that the operation has been processed by entering a
password. Then the business process is recalculated and the task list is populated
with the subsequent operations.
Thus, the Workflow Engine ensures consistent execution of the business process.
While a business process is being carried out, the Workflow Engine administers
all the process-relevant data in a relational database. The data stored for each
completed operation node includes:
• User who completed the operation
• Date and time of execution
• Operation name
• Business object, e.g. material master
• Upstream event
• Downstream event
This data can be used to reproduce the actually completed business process for
each business object. This Workflow Engine and business object data is fed to
ARIS PPM for analysis purposes via the XML interface (see Fig. 6).
5.5 openBMS / ARIS PPM Interface
Basically, ARIS PPM can use two different procedures for extracting process data
from the application systems. Both are based on an XML import interface for
asynchronous importing of data to ARIS PPM.

Performance Management in Power Stations 175
The import interface can handle two different XML formats: PPM graph format
and PPM event format. Fig. 6.1 shows these two import variants.
Fig. 6: ARIS PPM XML import interface
The event format is used for all activity-oriented application systems for which the
process-forming information (sequence logic) cannot be exported. The events or
incidents in the source system are interpreted as process fragments. This is neces-
sary whenever the source system is not workflow based and uses status-based
emulation. The configuration effort within ARIS PPM is greater than with graph
format as the individual process fragments have to be configured for the "Process
merge" step.
PPM graph format is used to import already structured process data from process-
oriented application systems (e.g. workflow systems). The openJET-PPM adapter
generates XML files that describe business transactions, "process instances",
including their workflow logic in PPM graph format. Unlike the PPM event
format, complete process instances can be imported. There is no need to merge
process fragments to form process instances via a business logic.
Within the ARIS PPM system, the graph format is used for universal exchange of
process-oriented data. ARIS PPM uses the transferred process information to build
a "ProcessWarehouse". First it categorizes the transferred process instance to
determine whether it is, for example, a fault report (process typification).

176 B. Heselmann, P. Stängle, A. Kronz, K. Miksch
Then the specific indicators for the fault report, such as duration or costs (key
performance indicator calculation) are determined. The analysis is done online in
the ProcessWarehouse at the evaluation time, for example the number of open
fault reports on certain components.
As process-oriented application systems have been developed with openJET, the
PPM graph format was used for the XML interface. The Workflow Engine is
responsible for executing the business processes. It is independent of the technical
business process and so can be used as the runtime environment for all business
processes within openBMS. This enabled a universal openJET-PPM adapter to be
created that can be used for all business processes modeled in openJET. Thus a
single adapter can be used for exchanging process data on all existing and new
business processes with ARIS PPM. Newly defined business processes can also be
exported to ARIS PPM without additional configuration.
6 Conclusion
Process orientation and optimization are now key factors for operations manage-
ment. The ongoing analysis of business processes and their optimized design are
critical for future corporate success.
The transfer of operations management data from the openBMS system to ARIS
PPM enables users to identify potential improvements in times, quality and costs
on the basis of real data in nuclear power stations.
Fig. 7: Business Process Change Management

Performance Management in Power Stations 177
Business Process Management solutions based on openBMS, ARIS PPM and
openJET thus serve to automate, rationalize and optimize complex operations
management process sequences. The integration of process design, process
execution and process monitoring enables the knowledge generated in the process
to be used and made available for closed loop analysis. This optimizes the overall
solution and its execution. With the openJET modeling component, processes can
again be adapted to individual requirements quickly, simply and cost effectively.
If an operations management process need changing or modifying, this can be
done while openBMS is running.
In addition, the system permits pragmatic mapping of existing processes, as with
the classic procedure using upstream business process analysis.
The ARIS PPM monitoring component permits users to identify the impact of new
processes or changes on the existing processes in good time.
This Business Process Management (BPM) approach is enabling ever more
companies to improve their operating efficiency. Nowadays, many business
processes are mapped in heterogeneous IT systems. The business logic is hard
coded in these systems. They lack the flexibility that is needed to carry out
changes quickly. If the entire potential of BPM is to be exploited, the IT systems
too must meet the demands of Change Management for business processes. With
the combination of openBMS, ARIS PPM and openJET it is now possible to
implement, analyze and optimize a business process-oriented IT system landscape.
As a result, IT systems can be adapted constantly to the evolving experiences and
needs of corporate operational processing organizations.

More than Figures – Performance Management of
HR-Processes at Vodafone Greece
Petros Panagiotidis
Vodafone Greece
Phillip Knirck
IDS Scheer AG
Andreas Kronz
IDS Scheer AG
Summary
Early 2004 the first ARIS Process Performance Manager (ARIS PPM) pilot
project in Greece was launched by Vodafone, with the objective to evaluate how
quickly ARIS PPM can be implemented and what business value ARIS PPM can
provide. Vodafone had lived and experienced the design and implementation
phase of the business process life cycle. As next step Vodafone IT wanted to close
the life cycle by implementing Business Process Controlling as final phase of their
process-oriented IS Development methodology. ARIS PPM was chosen to close
the loop between the realization, GoLive and support stages of the adopted pro-
cess oriented IS development methodology in the context of systems continuous
improvement. The ARIS Process Performance Manager provided Vodafone with a
pilot process specific reporting functionality of recruitment processes. The scoped
processes could be measured and analyzed by combining the configured test KPIs
and dimensions or by analyzing automatically created visualized process patterns,
using test data. The project was successfully conducted in a very short timeframe
in collaboration with Vodafone Greece IT, the local IDS Partner Spirit SA and
ARIS PPM Consultants from the UK and Germany The following pages will share
with you how this opportunity emerged and the lessons learned. It will also show
which approach was taken to achieve these two objectives and how the project
team created added value for all participants.
Keywords
SAP HR, ARIS, recruitment, process extractor, customizing tool kit (CTK), costs
per applicant, process mining, vacancy process, process cycle time, multinational
team, pilot, test data, test KPIs, process oriented IS development

180 P. Panagiotidis, P. Knirck, A. Kronz
1 About Vodafone Greece
VODAFONE Group is one of the largest mobile telecommunication companies in
the world, participating in private telephony networks in many countries amongst
which is Vodafone Greece. In 2004 Vodafone Greece generated almost € 1,5
billion profit with more than 3,5 million customers.
During the eleven years of presence in the Greek market Vodafone has been
established in consumers’ minds as the leader in the field of mobile
communication. Since the beginning of its operation it has traveled a long way,
focusing on the application of the most advanced technology, on the development
of innovative services and products and on substantial investments. Vodafone
boasts the most extended and technologically advanced, durable and reliable
against damage or failure, mobile telephony network in Greece, a fact that allows
it to provide a wide range of coverage and communication of high quality. In
addition to that, acknowledging the fact that its development is interwoven with
the progress of the society in which it operates, Vodafone has offered work of
great importance in fields pertaining to crucial social issues.
Fig. 1: Greek Vodafone Internet Site

Performance Management of HR-Processes at Vodafone Greece 181
1.1 About the IDS Scheer Partner SPIRIT
In the absence of an IDS Scheer subsidiary in Greece, Vodafone is supported by
the Hellenic IDS Scheer Partner SPIRIT SA. SPIRIT offers integrated solutions
and consulting services to address managerial challenges in the area of CPM. As
much an engineering as a management consulting company, SPIRIT S.A.
conceptualizes, develops and implements bottom-line solutions for business and
IT transformation. Its core team has been involved with ARIS products and the
ARIS methodology since 1998 under different company umbrellas. The
company’s core business is Business Process Improvement based on IDS Scheer
products and the solutions designed around these products.
1.2 The History of ARIS at Vodafone
The ARIS PPM Project at Vodafone is the concluding step of a process which
started roughly three years before the project was launched. Over a period of three
years Vodafone Greece integrated different companies and business units into a
new organisational structure, in order to align infrastructures to recent business
needs. As a result the IT was faced with a very heterogeneous systems and
application landscape. These technologies had to be integrated into core platforms
such as the ERP and CRM systems. To counter this challenge a new “Information
System Integration” team under the lead of Dr. Petros Panagiotidis was founded.
Faced with this enormous integration task Panagiotidis was looking for a
structured analysis tool, which supported a business driven approach instead of
one focusing on technical parameters. Petros Panagiotidis, a Ph.D. in Business
Systems Analysis evaluated the ARIS products as the best in class for the
integration objective.
One application to be integrated was the HR system for which the future platform
would be SAP. Around two years after the integration team has been formed the
SAP HR system was alive. It had been blueprinted, designed, implemented and
rolled out by the Integration Team. Now it had successfully passed both the design
and implementation phase of the process life cycle. During the implementation
Vodafone was supported by the Hellenic IDS Scheer Partner SPIRIT SA. How-
ever, Vodafone management through Dr. Panagiotidis ensured that the main focus
was kept on the business issues.
From this business perspective the process life cycle was still in need of the third
and concluding phase. The processes anticipated and designed in ARIS needed to
be monitored and controlled. It was stressed that the process design and the
required “to be processes” had to be linked with Vodafone’s real life operations in
order to serve as the information system for a continuous improvement cycle. The
need to manage and possibly identify any gaps between described processes and
real life operations led to the first ARIS PPM implementation in Greece.

182 P. Panagiotidis, P. Knirck, A. Kronz
Besides the need to measure the HR process, Vodafone wanted to test the ARIS
PPM functionality and to get experience in using ARIS PPM. This would allow
Vodafone to take forward the experience into further projects and IT systems and
in the long run to be able to implement the entire process cycle on their own. As
ARIS PPM was a new subject to Vodafone, it was decided to choose a process
which could be implemented as a pilot, an approach proven successfully by many
ARIS PPM customers before. Due to the sensitivity of HR data, it was agreed that
all data used would be fictitious and therefore the KPI results would not represent
real life operations. Altogether the project posed two objectives:
• Closing the process life cycle of the HR applicant process
• Testing ARIS PPM functionality and learning about ARIS PPM projects
1.3 The Environment
The recruitment process starts when a position is vacant in the company, and a
successor has to be found (either externally or internally). Vacant positions are
published in job advertisements. A job advertisement involves the publishing of
one or more vacancies with the aim of attracting suitable applicants. The Planning
and Recruitment Department checks the received applications in response to the
advertisement and then ranks the employees using a profile match up of the job
requirements and the applicants' qualifications. These applicants then go through a
selection procedure, and a suitable employee is hired. This process is now run
using the SAP HR system. It had been chosen as the pilot process for two reasons:
first and foremost it was a process in need of a reporting and controlling
functionality. Secondly a standard ARIS PPM content for SAP HR is available
from IDS Scheer as an official product. This meant most of the reporting
functionality needed came out of the box.
•Vacancy fulfillment (Recruitment) process
Receipt of
Applications
Record
applicant
data
Check
applications
Hire
applicant
Reject
applicant
•Status of process
•In process•In process
•On hold
•To be
hired
•Rejected
A Subset
Fig. 2: Recruitment process at Vodafone

Performance Management of HR-Processes at Vodafone Greece 183
The Vodafone SAP HR application had been modified in order to adhere to
Vodafone business requirements, this is an approach commonly used by SAP
customers. ARIS PPM uses SAP information and thus had to be adapted to the
SAP changes. This can be done without programming efforts by using the stand-
ard tools that come with ARIS PPM such as the PPM Extractor4MySAP and the
Customizing Tool Kit (CTK).
1.4 The Approach
The general approach for the project consisted of three stages: conceptualisation,
where requirements and measures where identified, implementation, where ARIS
PPM was rolled out and training, where end users were trained and ARIS PPM
explained in detail. The following paragraphs cover this approach in more detail.
The project team was formed by Vodafone’s IT department, ARIS specialists from
Spirit and ARIS PPM consultants from the UK and Germany. Whenever ne-
cessary the team got excellent support by Vodafone’s SAP specialists. All major
project activities were conducted onsite at the customer’s premises in Athens.
Before all project members met for the project kick off, Vodafone had already
worked out, written down and distributed a presentation of their expectations and
project requirements.
Project Matrix
Goal Track and Control the overall time of the Recruitment Process
in order to improve the response time to our customers
Component Labor throughput per Process and per Status
Unit of measure Time (days / hours)
Recruitment Process
Metrics (KPI)
� Average no. of days for applicant processing
� Recruiting process time
� Marketing cost per applicant
� Average no. of days for status “In process”
� Average no. of days for status “On Hold”
� Average no. of days for status “To be hired”
� Average no. of days for status “Rejected”
� Number of CV processed per day per Recruiter
� Time per Decision”
Fig. 3: Overall project objectives and possible process measures as provided by Vodafone

184 P. Panagiotidis, P. Knirck, A. Kronz
As a result all parties involved were well prepared for the workshop, which made
this project stage both effective and efficient. The remaining time was used to
write the project charter and to install ARIS PPM. Using their comprehensive
business and technical knowledge, Vodafone prepared in advance a document
clearly showing their goals and requirements. This made this part of the project
easy and fast. Their preparation was backed up with plenty of examples, one being
a list of KPIs which they wanted to be implemented together with a technical de-
scription of where to find the data for these KPIs.
Description SAP Table Field
Actions P4000-MASSN
Status P4000-APSTA
Advertisement P4001-OFFID
Applicant Group Q4000-APGRP
Family Group P9400-ZEIDIK1
Vacancy P4002-OBJID
Aplplicant Number P4000-PERNR
Personnel Sub area P0001-BTRTL
Personnel Area P0001-WERKS
Layers P0001-ZL2
Advertisement Costs T750B-PCOST
Unsolicited Group P4001-SPAPL
Fig. 4: Relevant fields in the SAP system
One workshop result was a list of measures to be controlled. Vodafone wanted to
fully understand how these can be configured in ARIS PPM. It was therefore
decided to conduct full-scale training at the end of the project. Experiences from
similar projects as well as best practices were also presented and incorporated into
the workshop.
During the workshop new requirements evolved. Some of the KPIs requested were
not covered by the standard SAP HR content from IDS Scheer and had to be
newly configured. Adding to this was the decision to perform the entire ARIS
PPM Training, covering everything from end user application to customization, in
order to give the customer a full understanding of ARIS PPM functionality. These
new requirements were considered and incorporated into a revised project plan.
At the end of this phase all project members returned to their home bases having
created a detailed project charter and performed the first data import into the ARIS
PPM system. This thorough preparation ensured a quick start for the ARIS PPM
roll out during the second get together.

Performance Management of HR-Processes at Vodafone Greece 185
VODAFONE GREECE -16-
Goal Statement
In alignment with the Information Systems Development Strategy aiming at:
• the reduction of the complexity of operations
• the increase in productivity with the use of Information Systems (set
processes in control, make them capable & support the Organization’s
Competitive Advantage with IS)
we aim at the following:
Reduce time Reduce transaction cost
Improve quality for internal
and external customer of HR
Business Case
Goal Statement
Within Human Resources processes, Recruitment was selected for the Pilot
PPM* due to the following reasons:
• high impact on internal & external customers
• high impact on our business
If we improve the recruitment process we:
• increase the possibility of attracting high quality people
• are in line with the corporate policies (e.g. passion for people)
Opportunity Statement
DECISION
PROFILE
MATCUP
APPLICANTSADVERTISEMENTVACANCY
REJECTION
HIRING
DECISION
PROFILE
MATCUP
APPLICANTSADVERTISEMENTVACANCY
REJECTION
HIRING
The recruitment process commences when a position becomes free in the company, and
a successor must be find (either externally or internally). Vacant positions are published in
job advertisements. A job advertisement involves the publishing of one or more vacancies
with the aim of attracting suitable applicants. The Planning and Recruitment Department
check the received applications in response to the advertisement and then rank the
employees using a profile match up of the job requirements and the applicants'
qualifications. These applicants then go through a selection procedure, and a suitable
employee is hired
Recruitment Procedure
Project Scope
Process Performance Management – Project Charter
Project Plan Team Selection
Project Champion: , HR Director
Project Manager : Dr Petros Panagiotidis Black Belt, Business
Systems Integration Manager
Project Manager IDS:Senior ARIS Product Consultant
• Measure the process in real-time
• Provide a dashboard to the management
The success of the project will be based upon the adaptation of the pilot PPM by
the management, as a process optimization & control methodology
• Based on test KPIs and process specification limits we will try to track:
• Average no of days for application processing
• Marketing cost per applicant
• Recruiting process time
in order to optimize and reduce the time and cost and improve quality of the VF
HR internal & external customers
Fig. 5: The Project Charter, a result of the workshop
Before this pilot ARIS PPM had never been used to process Greek information
and was therefore only available in German, French and English. However, some
of the SAP content contained Greek characters. This issue was tackled in two
ways. For the short term solution all Greek information was automatically
transformed into English during import using a standard ARIS PPM functionality.
Following enhancement a new ARIS PPM Version was implemented which fully
supports Greek and any other multi-byte characters (such as Chinese or Japanese).
The second meeting was dedicated to configuring ARIS PPM to fulfil Vodafone’s
requirements and to adapt it to the specifics of Vodafone’s SAP system. Two
major challenges were encountered: Time constraints and access to the SAP
system that was open within set timeslots.
These challenges were resolved through the close collaboration between the
experts of Vodafone, Spirit and IDS Scheer. The project team was given free
access to any SAP specialist, this access was needed to understand the Vodafone
specifics of the SAP system and information structure. Here the technical ex-
pertise of Vodafone proved to be an important key to success again.
The team also worked in parallel. One part focused on data import and ARIS PPM
configuration while the other one created the preconfigured process analyses,
management views and prepared the final presentation.

186 P. Panagiotidis, P. Knirck, A. Kronz
By adopting this approach the client’s requirements were met. All KPIs,
dimensions and requested results were delivered on time. Implementing the
reporting functionality for an entire process within one week is quite an
achievement, and consequently the project team, including Dr. Panagiotidis, was
thrilled.
Some measures have the nature of belonging to several processes. One KPI
Vodafone had required was not tied to the application process alone: marketing
costs per applicant, a measure which is part of the vacancy process. A vacancy can
be advertised and the costs of this advertisement can then be divided through the
number of applicants who applied as a direct result of it. With the selected
applicant process the marketing costs per applicant could only be used in a limited
way, i.e. the KPI could only be combined with a certain set of dimensions. In
order to work comprehensively an additional process, the vacancy process, was
needed.
This scenario was used for the training. Implementing the vacancy process as well
as its KPI & dimensions was supposed to be the exercise for the participants of the
technical and customization training. The participants were to create something
new and provide a real benefit to the project while learning ARIS PPM
customizing at the same time.
A Vodafone-specific training scenario was prepared. This new scenario had an
additional advantage: its process was much simpler than the application process
and therefore would fit a training scenario much better in the sense that it was easy
to comprehend by the participants.
The training was divided in user-specific parts. Business personnel and users
attended the one-day end user training. The customization training was carried out
for users who knew ARIS PPM functionality and were likely to be included into
future ARIS PPM projects. The data import training was attended by users with
SAP knowledge.
The project management was highly involved in the training and received ongoing
summaries. In return its feedback was incorporated into the training. This
management involvement and the customised training plan ensured a thorough
understanding of the ARIS PPM functionality.

Performance Management of HR-Processes at Vodafone Greece 187
2 Achieved Results
As the goal of the project for Vodafone was twofold (to learn about ARIS PPM
and ARIS PPM projects and to close the process cycle of the SAP HR process) the
results have to be looked at from these two angles.
Understanding ARIS PPM functionality was achieved through:
• Intensive training with a custom-made training scenario
• Close collaboration between all participants during the entire project
course
• Management involvement in conducting process analysis and working
together to adhere business values
These measures allowed Vodafone to gain a comprehensive understanding of the
added value ARIS PPM can provide and effective use of its potential.
Fig. 6: Management view with detailed analysis about employees and advertisements
In the training the customer understood the attributes and influencing factors,
which have an impact on the success of an ARIS PPM implementation project.
This knowledge is shared between several persons at Vodafone according to their

188 P. Panagiotidis, P. Knirck, A. Kronz
specialties and background. Project members learned on the job by supporting the
ARIS PPM consultants during customization and roll out.
Gradually more and more work was taken over by the project members from
Spirit and Vodafone. Therefore Vodafone did not just learn but experienced the
work required for ARIS PPM projects.
The management involvement and the accustomed effective training plan as well
as the resulting knowledge and experience will allow Vodafone to evaluate what
business value future ARIS PPM projects can provide as well as how much effort
will be needed to achieve this. In addition to the requirements further benefits
were achieved. The standard customization was extended by more than a dozen
measures and more than half a dozen dimensions. To facilitate process analysis,
favourites were created, allowing instant access of key analyses, many of which
were created by Vodafone and Spirit. The most important views were put into two
management views in the design of Vodafone’s Corporate Identity.
Number of CVs KPI was encountered in order
to quantify Users Productivity
Fig. 7: Quantities and cycle times to analyse performance and productivity

Performance Management of HR-Processes at Vodafone Greece 189
To facilitate process analysis, favourites were created, allowing instant access of
key analyses, many of which were created by Vodafone and Spirit. The most
important views were put into two management views in the design of Vodafone’s
Corporate Identity.
The implemented KPIs can be categorized into these categories:
• Volumes and Quantities
• Process Cycle Times
• Costs
The first group was mainly represented by the number of CVs which enables
Vodafone to analyse how many applications are being processed in combination
with any dimension, e.g. time, employees etc. The number of CVs gives an overall
impression of productivity. It allows Vodafone to see their “champions” in terms
of which employees are processing most of the work at a certain time. Volumes
are also used to understand and explain performance variations in terms of
processing time. They show whether the amount of applications handled
influences the processing time in a positive or negative way.
“Process cycle time” is the category to which most KPIs implemented belong. The
process throughput time as a whole and the duration of parts of the process are
analysed with different KPIs of this category. In conjunction with the overall
process duration, cycle times for all process states were configured. This gives the
opportunity to see overall durations of applications as well as to analyse which
parts of the process take how many resources. For example: it is now possible to
see how long applications are being processed or how long chosen candidates
decide to accept or reject offers. This will help focusing on weak points in the
process chain by monitoring closely and improving.
Costs are measured through the marketing costs per applicant. This measure
shows the effectiveness of job advertisements. Vodafone now knows how many
applicants an advertisement produces and how much it has to pay for each
applicant.
Exactly 29 dimensions have been implemented in total, fifteen of these are project
specific, meaning they are not part of standard HR customization and have been
added by request. Typical examples of dimensions are Recruiter, Processor,
Status, Actions, Training, Contact Medium, Recruitment source etc. These
dimensions provide different angles and perspectives to view and understand the
KPIs performances.

190 P. Panagiotidis, P. Knirck, A. Kronz
3 Resume and Outlook
The experience of the first ARIS PPM project in Greece produced results and
learning experiences in several ways. A complex pilot was executed within a short
period of time, including one week entirely dedicated to training. The project has
also proven that ARIS PPM works abroad and can overcome even critical issues
quickly, as shown by the new multi-byte functionality.
Vodafone’s comprehensive understanding of the added value of business process
controlling as part of business process management was key to the quick success
of the project. From the IDS Scheer perspective, Vodafone’s desire to understand
how object oriented data is being transformed into process-oriented information
was very encouraging. Together with Spirit, Vodafone will now be able to conduct
future projects on its own.
The project showed that establishing process controlling will not require huge
projects, but by focussing on key business areas and using predefined content such
benefits can be realized quite quickly.

Corporate Performance Management in Logistics
and Procurement – Focused Identification of
Weak Points with Supply Chain Controlling
Steffen Drawert
IDS Scheer AG
Summary
The increasing integration of logistics chains within and between companies
offers significant cost advantages, albeit at the expense of higher complexity and
loss of transparency. Supply Chain Controlling based on holistic Corporate
Performance Management is an approach for restoring clarity. Actual relation-
ships with suppliers can be automatically monitored and documented on the basis
of ARIS PPM. A Management Cockpit permits automatic graphic localization and
flagging of weak points in the logistics network for further optimization. Evolving
the in-house reporting system towards end-to-end process benchmarking with a
CPM-based solution approach is then the logical next step to create the basis for
establishing Logistics Process Management. Purchasing and procurement thus
become the "enabler" for the logistics ability of a company.
Keywords
Supply chain controlling, ABC analysis, delivery backlog, material price stability,
delivery reliability, service level agreements (SLA, Supplier Controlling, SLA
controlling, root cause analysis, just-in-time, just-in-sequence

192 S. Drawert
1 Why Does Logistics Need Supply Chain Controlling?
The growing complexity of logistical networks within and between the value-
added chains of different companies, from the Just-In-Time (JIT) approach of the
mid 1990s through to the present Just-In-Sequence (JIS) method, can lead to a
drastic reduction of costs, but it may also reduce the transparency in logistics
networks, e.g. in the automotive industry. Sustained customer loyalty depends
increasingly on market-responsive logistics services from the companies involved.
Optimum logistics service as the outcome of intelligent Supply Chain
Management can only be assured through optimum coordination of the links in the
logistics chain.
Fig. 1: Action fields in inbound logistics
Despite a rapid development in the field of logistics optimization, many issues
relating to efficient planning and controlling of supply chains remain open and
unanswered, such as:
• How productive are material inventories today and tomorrow?
• What are the real causes for poor supply service?
• Do suppliers really deliver as desired?

Corporate Performance Management in Logistics and Procurement 193
This has been borne out in IDS Scheer's many years of experience. Industry
studies reveal that many logistics and purchasing managers complain about a lack
of control options in the integration of logistics partners even as the marketplace
demands swift responses, and also about a lack of performance transparency
within the supply chain, though real-time information could minimize supply
delays.
The major deficit is an effective and needs-oriented system for reporting and
monitoring solutions to provide near real-time status checks of supply chain
processes. Exploiting logistics improvement potential and providing decision
support in strategic and operational action fields demands focused analysis that
delivers answers to the question: "Where can potential be leveraged to create
sustained competitiveness?" This becomes more important than ever when
contemplating cooperation with and integration of logistics partners (e.g.
suppliers).
2 How Do Companies Benefit from a Process-Oriented
Solution Approach?
Effective support for decisions concerning planning and controlling of logistics
transfer relationships can only be achieved with a needs-driven transparency in
intra- and inter-company processes. Action-oriented reporting solutions are
required that enable near real-time management of business processes by not only
providing information efficiently but also by effectively triggering and monitoring
appropriate improvement actions. The aim is to establish solutions that go beyond
the traditional scope of reporting solutions.
This can only be achieved by establishing a direct relationship between the
"process" performance and measurement object and "information" based thereon
in the form of analyses and cockpits. Only this linkage will ensure focused
identification and analysis of relevant deviations (effects) on the basis of possible
process and flow breakdowns, i.e. the actual causes. In logistics management
systems of this kind, such consistent linking ensures efficient performance and
cost measurement and also leads to qualitative and quantitative process
transparency throughout the Supply Chain Management system.
In order to meet all these logistics and procurement management requirements,
IDS Scheer has leveraged ARIS PPM, its proprietary Corporate Performance
Management solution, to create a preconfigured "Logistics" content module for
the procurement side (inbound) of the value-added chain, which for the first time
permits root cause analysis based on the lived ACTUAL processes.

194 S. Drawert
Fig. 2: Logistic Process Warehouse
Starting with the specific action fields and issues at the strategic and operational
levels of purchasing and procurement, relevant information requirements were
derived and examined for reporting purposes. Not only does the solution permit
efficient performance and data management, it also enables the identification and
analysis of improvement potential.

Corporate Performance Management in Logistics and Procurement 195
3 What Does an Effective and Integrated Overall
Solution Look Like?
In order to be able to make the best use of the flexible and adjustable reporting
structures provided by the ARIS Process Performance Manager, it made sense to
augment the patented Process Mining technology with an industry-specific ana-
lysis and reporting solution including a logistics-specific content package.
Fig. 3: Content and function scope of the "ARIS PPM for Logistics – Procurement" -
industry solution
The primary purpose was to establish a state-of-the-art "Logistics Process
Warehouse" with the following outstanding features:

196 S. Drawert
Completely preconfigured ARIS PPM Content Module for
• end-to-end and balanced evaluation of inbound logistics performance,
• practice-related use in procurement and purchasing and
• fast adaptation of an efficient reporting solution.
Comprehensive content coverage of strategic and operational
purchasing issues by means of
• user-specific management cockpits,
• application-compatible evaluation and favorites structures and
• multidimensional key performance indicator analyses.
Completely data-oriented expansion of the extraction scope to
include
• analysis-relevant characteristics fields,
• purchasing-specific process types and
• preconfigured settlement logics.
Expansion of the analysis and functional scope compared with the
standard version to include
• ABC classification/top-flop lists,
• multistage filtering and
• new chart and list types.
For example, Service Level Agreements (SLAs) with suppliers can be controlled
with split-second accuracy and consistently integrated in any legacy reporting
system. Such monitoring of logistics transfer relationships frequently leads to a
higher degree of partner integration and acts as a driver for continuous process
improvements. The provision of relevant key performance indicators such as
supply backlogs, material price stability or delivery reliability as part of
preconfigured analyses accelerates purchasing processes, improves the quality of
planning and optimizes supplier performance for the long term.

Corporate Performance Management in Logistics and Procurement 197
4 What Can CPM for Logistics Offer Companies?
To show the effectiveness of preconfigured process reporting solutions such as
"ARIS PPM for Logistics – Procurement", there follows a discussion of their
practical application.
Fig. 4: Magic controlling square
The process-based measurement of logistics performance in procurement and
suppler management mostly involves four steps. (see Fig. 4), as explained below.
The insight derived should be fed directly into supply chain optimization and drive
a continuous improvement process.
4.1 WHAT – Determination of Purchasing Status
The first step is to determine the quantity and value volumes I order to obtain a
qualitative and quantitative view of the logistics processes under analysis and to
identify action fields and potential. This data pool is formed for example by:
• recording purchasing-related quantity volumes
• identifying logistics-intensive purchasing segments
• clustering in supplier/plant or supplier/material combinations
• detailed analyses according to corporate specification

198 S. Drawert
4.2 WHERE - Measuring Performance Capability
An end-to-end view of procurement based on fully data-based process analyses
creates transparency and permits near real-time identification of logistics potential.
The performance capability and flexibility of suppliers, for example, can be
analyzed both at the time the measurement is taken (snap-shot analysis) and over a
period of time (trend analysis). A meaningful, easily comprehensible visualization
of the real, i.e. "lived", purchasing process supports understanding of the actual
performance (e.g. delivery reliability) of suppliers, so that weak points can be
identified in concrete terms This is demonstrated by the following "ARIS PPM for
Logistics - Management View" as an overview of logistics and procurement
management.
Fig. 5: Magic controlling square

Corporate Performance Management in Logistics and Procurement 199
A Management Cockpit like this places the purchasing, logistics and plant
managers in the position to make analyses with a wide range of relevant pur-
chasing parameters such as:
• Supply backlog and key performance indicator overview for individual plants
• Strategic process and target/actual comparisons
• Special material/supplier combinations in the form of ABC segmenting
4.3 WHY - Verification of Potential
In order to convert this newly achieved transparency into concrete optimization
efforts, the greatest leverage must be brought to bear on the potential concerned In
this context, purchasers received automated support in the form of preconfigured
segmenting and driver analyses that deliver an initial improvement action package
straight away. In addition, flexible target/actual comparisons can be used to
establish an efficient early warning system (e.g. email or SMS messages sent as
soon as a target delivery date is missed) that draws the attention of managers to
the relevant deviations through alert and exception controlling. There is also a
flexible ad-hoc reporting module for identifying specific performance drivers.
Detailed diagnosis of critical purchasing processes with respect to structural or
individual performance drivers permits verification of the improvement potential
in this phase. The following figure shows a typical evaluation of significant
planned/actual delivery time deviations for purchaser groups that enables this need
for action to be addressed directly to the process owner. This sharpens purchasers'
optimization focus, which is assisted in no small measure by the consideration of
various process parameters at interfaces with upstream and downstream activities.

200 S. Drawert
4.4 HOW - Support for Improvements
The focused and – based on ARIS PPM Process Mining technology – completely
automated visualization of the logistics chain as it actually works delivers
methodological and content support for modern purchasing issues such as
optimized integration strategies with suppliers (SMI) and also for operational
process harmonization.
Fig. 6: Favorite (Bookmark) for identifying delivery time potential in purchasing processes
Periodic monitoring of running workflows, processes and procedures enables
logistics managers to spot changes and trends early. This permits end-to-end target
achievement controlling, e.g. for SLAs. This in turn drastically enhances the
performance and visibility of purchasing and also promotes the process-based
integration of logistics partners.

Corporate Performance Management in Logistics and Procurement 201
5 What are the Concrete Benefits to Purchasing of a
CPM System?
The business management and logistics benefits that can be derived from the
results of process-based logistics reporting are many and varied, with regard to the
identification of causes and potential and also as a key to the practical establish-
ment of an improvement system. The following specific improvements, which
have all been proven in real-life projects, can be gained by using a Corporate
Performance Management solution:
• Provision of predefined logistics reporting contents for individual user groups
• Fast adaptation to customer requirements (preconfigured, fast rollout)
• Transparency through full data basis for cause and potential identification
• Action-oriented reporting concept down to operational process/records level
• Use of snap-shot analyses also as a tool for continuous process controlling
• Multidimensional process evaluation and deviation analysis possible
• Efficient early warning system through alert controls
• Support for parameter management through full data and plausibility checks
• Effective and end-to-end target achievement controlling possible
• Improved delivery quality by suppliers thanks to split-second controlling of
SLAs.
The logical next step is then to use a CPM-based solution approach to evolve the
in-house reporting effort into an end-to-end process benchmarking system, and
thus create the basis for establishing Logistics Process Management. Purchasing
and procurement thus become the "enabler" for the logistics ability of a company.

Continuous Measurement and Analysis of
Operations Management Processes –
ARIS PPM at E.ON Kernkraft GmbH
Karl Ramler
Kernkraftwerk Unterweser
E.ON Kernkraft GmbH
Jürgen Schwarzin
Kernkraftwerk Unterweser
E.ON Kernkraft GmbH
Andreas Kronz
IDS Scheer AG
Klaus Miksch
IDS Scheer AG
Summary
The Unterweser Nuclear power station (KKU), owned by E.ON Kernkraft GmbH
decided at an early stage to establish an end-to-end Performance Management
System (PMS). The PMS was realized as an end-to-end control system and set up
on the basis of a clear strategic focus derived from E.ON Kernkraft GmbH target
specifications. The IDS Scheer Corporate Performance solution, which was added
to the deployed SAP BW Business Intelligence solution to include process-oriented
analysis functions, achieved the goal of anchoring and implementing process
management in the company.
Keywords
Nuclear power, energy, KKU operations management system, performance-
related process indicators, SAP BW, Performance Management System (PMS),
cockpit, browser-based, Malfunction and Fault Reports (MFR), deadline
overruns, corporate performance management, operational key performance
indicators, ACTUAL costs, PLANNED costs, main drivers

204 K. Ramler, J. Schwarzin, A. Kronz, K. Miksch
1 Outline Presentation of E.ON Kernkraft –
Unterweser Nuclear Power Station (KKU)
Based in Hannover, E.ON Kernkraft GmbH (EKK) is the operator of or
shareholder in a total of thirteen nuclear power stations in Bavaria, Lower Saxony
and Schleswig-Holstein. This makes it the largest private nuclear power utility in
Europe. The installed net output of all plants including the shares in shared
ownership nuclear power stations is more than 8,500 megawatts (MW).
Fig. 1: Unterweser nuclear power station
EKK is the operator and sole shareholder of Unterweser Nuclear Power Station
(KKU), which is situated ten kilometers south of Nordenham on the lower reaches
of the River Weser. The nuclear power station commenced commercial operation
in September 1979. A pressurized water reactor generates a net output of 1,345
MW, representing a significant contribution to the reliable and environment-
friendly production of electricity for Germany.
By October 2004, the power station had generated more than 230 billion kilowatt
hours. This generation achievement is unequaled by any other nuclear power
station in the world. In 1980, 1981 und 1993, KKU was the generating world
champion. Since coming onstream, Unterweser nuclear power station has
achieved an average availability of some 90%. This places it among the best
pressurized water reactors in the world. Its high availability also serves as proof of
the reliability and operating safety of the power station, as well as the high
technical standard and expertise of its workforce. With its 320 employees,
Unterweser nuclear power station is an important economic factor for the entire
region.

ARIS PPM at E.ON Kernkraft 205
The KKU mission is to generate electricity. It is one of the base load power
stations that are onstream around the clock. Base load is the volume of electricity
that must be available day and night without interruption.
1.1 Technical Data:
Gross output: 1,410 MW
Net output: 1,345 MW
Therm. output: 3,900 MW
Electricity generation 2003 (gross): 9,747,671 MWh
Availability 2003 88.34 %
2 Initial Situation
None of the operational control systems and analysis tools commonly used for
controlling today is capable of promptly and permanently identifying weak points
in business processes. Analysis and optimization projects are normally of a one-
off nature, the data capture and optimization methods chosen are too time-
consuming for permanent use, data is entered manually and usually has no
interfaces to operational systems. The recording and analysis of performance-
related process indicators is a precondition for holistic process management and
forms the basis for end-to-end and continuous process optimization. Process
Performance Management is based on the measuring of operational key
performance indicators which until now could not be captured at all or only with
great effort. Performance-related process indicators are derived from the
operational control systems and presented as user-oriented evaluations. Identifying
key performance indicators for process-oriented controlling of a company
presupposes that a technical concept has been defined that renders the controlling
relevance (meaningfulness) of the key performance indicators transparent and
enables IT-technical implementation.
For the first time with the "ARIS Process Performance Manager (ARIS PPM)"
software tool developed by IDS Scheer, the objective of permanently anchoring
process management in a company and supporting it with credible data can be
achieved.
The following article describes the integration of ARIS PPM in the KKU
operations management system and serves as an example of how the ARIS PPM
analysis capability can be used.

206 K. Ramler, J. Schwarzin, A. Kronz, K. Miksch
3 Integration of the Process Performance Manager
(ARIS PPM)
KKU decided at an early stage to establish an end-to-end Performance
Management System (PMS). The PMS was realized as an end-to-end control
system and set up using a clear strategic focus derived from the EKK target
specifications. Figure 2 illustrates the primary PMS system functions.
Fig. 2: KKU Performance Management System
The role of process performance management within the PMS is to monitor all
important process flows and is thus a key component in the implementation of the
entire control system at KKU. ARIS PPM, manufactured by IDS Scheer AG, is
used for continuous process performance measurement. ARIS PPM was integrated
in the IT system structure and organizationally in the PMS.
3.1 IT Integration
The key performance indicators managed in the PMS are administered in the SAP
Business Warehouse (SAP BW). The SAP BW administers the definitions and the
movement data (target-actual values and traffic-light thresholds) for each key
performance indicator but not the raw data itself. In other words, SAP BW is used
as the display, administration and definition component. The provision and
calculation of the actual values from the operational level depends on whether or
not the process is IT-assisted. Monthly key performance indicators captured

ARIS PPM at E.ON Kernkraft 207
manually or processes without IT support are entered via an intranet entry system
that stores the results directly in SAP BW. For the IT systems used by KKU
• operations management system (OMS),
• document and event management system (DMS / EMS) and
• business management systems (SAP R/3)
Fig. 3: IT system structure
the key performance indicators are recorded with ARIS PPM. This data is
automatically transferred from ARIS PPM to SAP BW via configurable interfaces
so that all the results are available in a uniform manner in SAP BW. New key
performance indicators require only additional configuration of the interface
between SAP BW and ARIS PPM. Users can access HTML evaluations via a
Management Cockpit at the information and presentation level. For further
analysis, they can then jump to the ARIS PPM analysis component. The following
figure is a diagram of a typical IT system structure.
The advantage of this architecture is the fast entry and easy expandability of
processes and the use of comprehensive analysis capabilities in ARIS PPM. The
key difference between ARIS PPM and the DataWarehouse is the deliberate
structuring of the data extracted from the operational systems in predefined
process structures. This enables automated performance measuring of running
business processes and so enables the efficiency of company procedures to be
evaluated on the basis of measured PMS key performance indicators for the
purposes of proactive process controlling.
At the same time, in SAP BW have a globally uniform interface for querying and
viewing basic key performance indicators. Local entry of manual key performance
indicators is possible and also simple to expand.

208 K. Ramler, J. Schwarzin, A. Kronz, K. Miksch
For all the processes carried out with OMS, DMS / EMS and SAP, the data is
generated with ARIS PPM. The following figure shows the processes that have
been implemented.
Fig. 4: Processes implemented in ARIS PPM
Over 100 key performance indicators are already being determined for the seven
realizable processes. Further evaluation options are currently being assessed for
the SAP processes. The process performance indicators obtained form a part of the
input information for management assessment.
3.2 Organizational Integration
The ARIS PPM organizational integration is effected by management assessment.
At KKU, it is done in stages as shown in Figure 5. This self-check is carried out
on a monthly basis by departmental managers. This involves evaluating the target
achievement of the PMS and initiating corrective actions where required. Level 1
management assessment is normally carried out on a quarterly basis by the facility
manager (FM) as part of the status meetings with the departmental managers. The
aim here is to ensure inter-departmental target achievement and effectiveness of
the PMS. Level II management assessment must be carried out annually by the
facility and departmental managers.
This addresses the suitability and appropriateness of the PMS, annual target
achievement and coordination of the following year's target values.

ARIS PPM at E.ON Kernkraft 209
Fig. 5: KKU management assessment
The PMS key performance indicators can be reprioritized and recalculated and are
quickly implementable thanks to the flexibility of the IT system structure.
For all the PMS process performance indicators in which the targets have not been
achieved, managers receive a detailed ARIS PPM evaluation (called the Man-
agement View) in preparation for the management assessment. Below is a typical
example of an ARIS PPM Management View on missed deadlines for malfunction
and fault reports (MFRs).
B EC D FBB EECC D FF
Fig. 6: Detailed evaluation for management assessment
These detailed evaluations help the managers in question to analyze the
deviations. If necessary, they can then call up further analyses for identifying the
causes. Other options provided by ARIS PPM will be explained in the following
example of deadline tracking for malfunction and fault reports.

210 K. Ramler, J. Schwarzin, A. Kronz, K. Miksch
4 Process Analysis with Process Performance Manager
(ARIS PPM)
A favorite is defined in ARIS PPM to map a process performance indicator. A
favorite is a standard evaluation comparable to using a browser bookmark for an
analysis that has been saved and can be called repeatedly at any time. Favorites
are the starting point for evaluations and can be refined with selection criteria
(dimensions), filter settings etc. The options available in ARIS PPM are demon-
strated in the following example.
4.1 Analyzing "Deadline Tracking of Malfunction and Fault Reports
(MFRs)"
As mentioned above, analysis starts from a favorite. The following figure shows
the favorite "MFR_04.1 Proportion of missed deadlines" for the MFR process.
The y-axis in the data window shows the number of processes as a percentage and
the x-axis whether the processing deadline was exceeded or not.
Fig. 7: Proportion of missed MFR deadlines
In 2004, 90.7% of the malfunction and fault reports (MFRs) were completed on
time and 9.3% were late. The next question is then by how much.

ARIS PPM at E.ON Kernkraft 211
The analysis shows that the missed deadlines were in a range from 1 to a
maximum of 14 days. A more detailed analysis (see Figure 7) shows that of the
9.3% late MFRs (see Figure 8) about 83% were less than 3 days late. 16.2% were
between 3 and 7 days late and only 0.7% were more than 7 days late.
Fig. 8: Detailed evaluation of the duration of missed deadlines
Every malfunction and fault report has a lead organizational unit that is
responsible for the MFR and its rectification. This then raises the question whether
there are organizational differences in carrying out MFR processes and whether
there are lead organizational units (OU) that cause more missed deadlines than
others.
Analysis (see Figure 9) shows differences in the distribution and a buildup of
missed deadlines at OU F. The reasons for this can now be examined, especially
for purposes of comparison with OU G, so that best practices can be copied or a
better distribution of MFRs for a more even workload. The greatest potential for
optimization seems at to be at OU F with 47%.
This means that improvements can be introduced at the right place. After
completion of the analysis for this organizational unit, the causes can be identified
and presented at the next management assessment.

212 K. Ramler, J. Schwarzin, A. Kronz, K. Miksch
Fig. 9: Organizational units causing MFRs
It is very important that the resources responsible be addressed with objective
figures. In this way the resources primarily responsible for missed deadlines can
be convinced to examine the deviations in detail and work on a solution to the
problem.
A further consideration for the analysis is which process-technical systems (see
Figure 10) are affected by the missed MFR deadlines. KKU process-technical
systems are designated by facility identifiers (FI) and aggregated over several
levels in components and component groups.

ARIS PPM at E.ON Kernkraft 213
Fig. 10: Systems affected
An analysis is thus normally refined across the systems' various hierarchy levels.
Figure 10 shows a predominance of MFRs with missed deadlines in systems T and
Y (30.4%).
What is the distribution in System T?
Fig. 11: Distribution System T, TH System Part 1

214 K. Ramler, J. Schwarzin, A. Kronz, K. Miksch
Fig. 12: Distribution System T, TH System Part 2
As can be seen from Figures 11 and 12, the peak is in System TH (approx. 43%).
Within System TH, this can be broken down to subsystem TH25 with approx.
15% and TH26 with approx. 11%. The next step is to clarify the problems that led
to the deadlines being missed. One possible cause might be a lack of spare parts
for these components.
Appropriate modification of inventory strategy could then rectify this deadline
problem. This example clearly demonstrates how the analysis can be used to
systematically eradicate individual weak points.
4.2 Analyzing the Urgency of Malfunction and Fault Reports
An urgency is stipulated for dealing with MFRs. The urgency of an MFR can be
adjusted if the situation at the facility permits this. This then influences the
specified deadlines for the MFR and thus the missed deadline key performance
indicator.
In fact, there are situations in which it is necessary to change the urgency of an
MFR. However, changing the urgency comes at the expense of impacting process
efficiency. The following figure shows how often urgencies were changed in
2004. The urgency of about 14% of MFRs was changed.

ARIS PPM at E.ON Kernkraft 215
Fig. 13: Frequency of urgency changes
As with missed deadlines, the next step is to analyze the distribution of changes
according to the organizational units that trigger them. The approximately 14%
urgency deviations were caused by the organizational units as shown in Figure 14.
Fig. 14: Distribution of urgency changes by organizational unit

216 K. Ramler, J. Schwarzin, A. Kronz, K. Miksch
4.3 Analyzing Open Malfunction and Fault Reports
Another important aspect relating to missed deadlines is the number of open
MFRs. The number of open MFRs must not be allowed to become too large,
otherwise this could impact facility availability.
At the time the analysis was run, 173 MFRs were still open across the lead
organizational units, as shown in Figure 15:
Fig. 15: Distribution across organizational units
Again, organizational unit F seems to be resource primarily responsible. Despite
the high rate of urgency changes, OU F still has the largest number of open MFRs.
If deadline reliability in the processing of MFRs is to be maintained, it is
absolutely essential to rectify the causes of F's missing deadlines in a permanent
manner.
Key performance indicators should never be considered in isolation, as they
mostly reflect just one aspect of a process without horizontal relationships and
dependencies. For example, controlling MFRs should look at both missed
deadlines and also the number of urgency changes key performance indicator.
Only by considering these key performance indicators together and the way they
affect each other it is possible to achieve a corporate optimum defined on the basis
of the target specifications.

ARIS PPM at E.ON Kernkraft 217
Following the rollout of ARIS PPM, the processing of MFRs was tracked on a
regular basis. From 2002, there was a steady downward trend. The quota of
missed deadlines fell from a maximum of about 37% in 2001 to its current level of
approx. 10%. 98.4% of MFRs are completed within a tolerance of three days.
The rigorous analysis of the causes for missed MFR deadlines led to a
considerable reduction in the number of missed deadlines.
The tracking of malfunction and fault reports example impressively shows that the
use of ARIS PPM has materially improved punctuality in MFR processing. This
translates to better quality and improved efficiency.
Fig. 16: Trend from 2000 to 2004
5 Summary
With the PMS control system, KKU has created an efficient tool for continuously
evaluating and optimizing the operational management of its plant. One of the
most important elements is the analysis of business processes, realized with ARIS
PPM and integrated in the PMS. Now that the system has been in live operation
for some time, the integration and use of ARIS PPM in the KKU control system
has been deemed a great success. Further processes have been integrated in the
PMS without any problems. The benefits of ARIS PPM were clearly demonstra-
ted.

218 K. Ramler, J. Schwarzin, A. Kronz, K. Miksch
ARIS PPM is a flexible tool for mapping process performance indicators without a
high level of effort. Transparency for managers regarding process performance
and the identification of process weak points has been significantly improved. The
technical departments are now in a position to conduct detailed analysis of their
processes using real data from the operational systems without extensive work or
calling on the IT department.
The options provided by ARIS PPM for identifying weak points or root causes of
problems in processes from the key performance indicator are shown in the
following figure.
Fig. 17: Capabilities of ARIS PPM
The consideration of trends, influencing factors and distributions enables the
causes for deviations in a given key performance indicator to be determined. ARIS
PPM provides the basis for deriving corrective and improvement measures and
thus contributes significantly to improving process quality and efficiency.

Analysis and Optimization of the Credit
Application Process at DaimlerChrysler Bank
Lars Müller
Daimler Chrysler Bank
Frank Gahse
IDS Scheer AG
Summary
DaimlerChrysler Bank is one of the leading German auto-banks and for years has
been expanding at a rate well above the sector average. Fast and fault-free
business processes with low process costs are a key success factor for long-term
retention of satisfied customers through new profitable financial services. A year
ago, DaimlerChrysler Bank decided to implement ARIS Process Performance
Manager. This article discusses the procedure and the experiences gained during
the rollout of process measurement for the credit application process. It ends with
a look at future uses for the tool.
Keywords
Process performance management, measuring and analyzing process performance
indicators, process automation, service level management, customers' business
processes, return on investment in IT

220 L. Müller, F. Gahse
1 Presentation of DaimlerChrysler Bank
With a balance sheet total of EUR 14.2 billion, DaimlerChrysler Bank is
Germany's second largest auto-bank.
Its product line includes financing, leasing, insurance and fleet management for
Mercedes Benz, smart, Chrysler, Jeep and Setra vehicles. In Germany,
DaimlerChrysler Bank gets more than 40 percent of all new DaimlerChrysler cars
and 50 percent of utility vehicles rolling. Since mid 2002, the bank has also been
offering overnight money accounts, fixed-interest-rate deposits, savings plans,
investment funds and credit cards for private customers. DaimlerChrysler Bank
services more than 900,000 customers, half of whom with leasing and financing
transactions with a contract value of over EUR 13 billion.
2003
No of Customers 845.080
No of Employees 1.488
2003 2002 2001
Balance Sheet Total According to US-GAAP Mio € 14.213 12.173 10.781
TurnoverAccording to US-GAAP Mio € 3.697 3.420 3.079
Leasing and Financing
Accounts Units 655.346 613.468 570.078
Contract Asset Mio € 13.222 12.192 11.298
Deposits
Accounts Units 147.166 43.429* -*
Deposit Volume Mio € 3.138 768* -*
Funds
Subscription volume Mio € 90** -** -**
Credit Cards
Units 248.351 12.974 -*
* Launch deposites and cards 01.07.2002 ** Launch funds am 01.07.2003
Fig. 1: Development of DaimlerChrysler Bank in figures

Optimization of the Credit Application Process at DaimlerChrysler Bank 221
2 Process Performance Management at
DaimlerChrysler Bank
2.1 Initial Situation
In the past, company management and thus controlling was highly profit-oriented.
Financial metrics such as interest revenue, costs, operating profit or return rate on
equity were used by senior management to assess the overall business situation.
Growing and more diverse customer wishes, tougher competition and not least the
rising importance of information technology have all led to sharply increased
demands facing company management over the past few years.
As part of its strategic focus, the aim of DaimlerChrysler Bank is to be the best
financial service partner for customers and dealers in close cooperation with the
DaimlerChrysler brands. In order to reflect the shifting demands on the company's
objective system, 2003 saw the launch of a project to develop a detailed balanced
scorecard (BSC). Along with the financial metrics, BSC also measures goal
achievement in the customer, process and potential perspectives.
DaimlerChrysler Bank customers expect their mobility requirements to be met and
their financial flexibility ensured. Excellent service and high quality are the keys
to success. Customers and dealers need a fast response to credit applications. In
particular those business processes with direct customer contact must be designed
in a way that ensures fast and reliable processing. Optimal processes can only be
provided, however, if they are continuously monitored. That is why, in the autumn
of 2003, DaimlerChrysler Bank decided to add process performance to its
controlling approach by including the ARIS PPM software solution from IDS
Scheer.
2.2 The Objectives
The underlying objectives of DaimlerChrysler Bank in the process-oriented
development of its controlling system were:
• Ensuring high-quality and efficient business processes
• Creating transparency on actual processes
• Identifying optimization potential in process flows
• Visualizing the impact of process changes over time
• Meeting the demands on the balanced scorecard

222 L. Müller, F. Gahse
• Replacing or consolidating decentralized reporting
• Organized distribution of process know-how
3 Implementation with ARIS PPM – easyline Pilot
Process
Before deciding on ARIS PPM, a test installation using the credit application
process as an example was carried out to determine the suitability of this tool. An
initial prototype with real data was available within a short space of time. With
relatively little effort, the selected process data (status information, timestamp,
evaluation dimensions) were imported from the operational systems to the PPM
database.
The initial results were so convincing for all those involved in the project that a
decision was taken to acquire the appropriate PPM licenses and to use the test
installation as the basis for implementing a pilot project to measure the
performance of the easyline process.
3.1 Process Description
The easyline process is part of the credit application process in DaimlerChrysler
Bank's leasing/financing product area. In general, car dealers can submit a credit
application in two different ways: either by fax or the "submit button" in their
proposal/costing program. The latter case involves the easyline process.
The "happy path" in the easyline process is as follows: A customer in the dealer's
showroom has chosen a car, e.g. a Mercedes-Benz CLK. But the dealer can only
complete the order when the financing has been arranged. To do this, he or she
records the customer's data and sends the financing application to DaimlerChrysler
Bank using the submit button. This results in automatic prechecking before the
application is stored in the agreement management system. Then a suitable
scorecard based on the customer and agreement data is used for an automatic
credit check (point evaluation) and confirmation. The positive credit decision is
sent back to the dealer via the feedback interface. The dealer has had to wait less
than a minute for this positive credit decision. The prospective customer feels that
he or she has been well advised and signs the contract for the dream car.
In reality, the process often does not follow the optimum path for any number of
reasons. On the one hand, the dealer might have overlooked some data, so that the
application is returned for completion. Or the data is complete but does not meet
all the criteria for automatic processing. For example, individual repayment is to
be agreed. Even if easyline has been able to create the application, the credit check
may fail or require manual checking – e.g. if the scoring system ranks the

Optimization of the Credit Application Process at DaimlerChrysler Bank 223
customer as not or not fully creditworthy or the response from the automatically
consulted credit agency has not been received. In such cases, DaimlerChrysler
Bank may require further information from the dealer or the customer, or the case
is sent to the support center for manual checking. Or the customer may want an
alternative financing plan or even put off signing the contract until later.
The actual performance of the easyline process is to be continuously measured
with ARIS PPM. A technical process model with specific measurement points was
defined in a technical requirements workshop. The process to be measured
comprises four functions or subprocesses that can produce a wide range of events.
Along with the timestamp, the individual events also contain the information as to
whether a function was completed automatically or whether manual processing
was necessary.
Fig. 2: easyline credit application process with defined measurement points
3.2 Technical Architecture
ARIS PPM uses probes to extract the information from the individual easyline
process instances. The extracted information must contain all the attributes
required for calculating and presenting the defined measurement variables. The
event timestamp is the key information for ARIS PPM so that it can understand
the sequence of the individual steps in an end-to-end process instance. This is how

224 L. Müller, F. Gahse
ARIS PPM converts unstructured information into business processes. The
standard extraction format is XML. The process instances are stored in a database
known as the ProcessWarehouse.
OLAP technologies are used to query the ProcessWarehouse. The results can be
illustrated in more than 30 different business graphics. The probes are normally
applied to critical processes, such as transitions in the organization or system
interfaces. In the DaimlerChrysler Bank case, data extraction was relatively easy.
This was thanks to the use of EAI (Enterprise Application Integration), a process
automation technology. The company opted for BusinessWare from Vitria for the
process automation level. BusinessWare collects the business process information
from the individual operational systems and controls the operational flow. All the
relevant process information is transferred from the EAI layer to ARIS PPM. The
advantage of this is that only one interface for PPM needs to be implemented and
maintained for the easyline process.
Fig. 3: Integration of ARIS PPM in the DaimlerChrysler Bank system architecture
3.3 Measurement Variables and Dimensions
A number of measurement variables were defined for the ARIS PPM pilot that
express various process performance criteria (time, quantity, quality, efficiency).
Cost-related measurement variables have not been analyzed so far, though this is
possible with ARIS PPM.
The measurement variables are generally broken down by process and function
levels. For example, whereas there is only one possible occurrence for each of the
considered measurement variables for a credit application at the process level (e.g.
Daily batch job

Optimization of the Credit Application Process at DaimlerChrysler Bank 225
number of manual interruptions), the same measurement variable can have several
occurrences at the functional level – depending on which function is being
considered.
The following tables show the measurement variables implemented:
KPI Type Business content / explanation
Number of processes Quantity Absolute number of request processes. Multiple display of the same
request on a repeated cycle
Manual break Quality Average number of manual breaks in the easyline-process. Every
event which results in a manual intervention is counted as a break
(e.g. manual customer classification)
Automation Level Efficiency, Quality Percentage of requests which ran through the whole process without
being manually broken
Cycle Time Time Total cycle time of a process from the first to the last event. The cycle
time changes as long as the whole process is not finished. Thus the
use of this category makes only sense if the analysis is limited to
finished processes. The basis for the ‘KE-quota’ KPI
KE-quota Time,
Service level
Percentage of those credit checks that were reported back to the
seller within 15 minutes for easyline-processes in consumer business.
(Processes with a cycle to of <= 15 minutes in relation to all
processes)
Table 1: Measurement variables at the process level
KPI Type Business content / explanation
Function Cycle Time Time Total cycle time of a process from the first to the last (current) event.
The cycle time changes as long as the observed function is not
finished. Thus the use of this category makes only sense if the
analysis is limited to finished functions.
Processing frequency Efficiency, Quality Average number of process steps per function. Tells how often a
function is ran through at average (hint to loops)
Manual Breaks Quality Average number of manual breaks per function (see corresponding
measurement category of the same name)
Table 2: Measurement variables at the functional level
Various evaluation dimensions were defined as part of the technical concept so
that process owners can trace the causes of any deviations from planned values.
For example, an increase in the throughput time of the overall process could be
caused by a clearly distinguishable problem in the commercial business process of
a particular dealer. Only this knowledge permits focused process optimization and
fault rectification.

226 L. Müller, F. Gahse
The dimensions too can be categorized by process and functional level. The
following dimensions were defined for measuring the easyline process:
Dimension Explanation / Example
Process type Order processing
Process status Event where the process is currently located
Business area Retail, Fleet
Product License, Financing
Usage of contract Commercial, private
Region North, South
Service center Munich, Hamburg
Dealer organization Car dealer, who made the request (e.g. office in Stuttgart, sales representative Maier)
Car Cars (MB, Chrysler, smart),
Commercial vehicle (HGV, busses, transporters,…)
Time Time of incoming request (scaleable from hour to years)
Contract / order number Search dimension
Table 3: Dimensions at the process level
Dimension Explanation / Example
Function Term for an observed process step
Processing status Events which were passed by a function (very important dimension)
Table 4: Dimensions at the functional level
When selecting the required evaluation dimensions, attention must paid to
ensuring that only those dimensions are defined for ARIS PPM that actually
influence the process flow or are required for qualified cause identification. Here
is an example from the pilot project:
The contractual type of use (private, commercial) depends on the customer's legal
form and is thus an important customer-dependent feature that affects the process
flow. The reason for this is that a commercial customer is subject to different
credit check standards than a private customer. This results in a different
expectation for the throughput time until the credit decision is received. At the
beginning of the pilot, the customer's industry was also defined as an important
evaluation dimension. However, it transpired that this has no influence at all on
the process. Therefore this dimension can remain hidden in the future.
3.4 Project Chronology
Implementing ARIS PPM for the easyline process took less than six months from
start of the technical concept until going live. The technical workload came
primarily at the beginning of the project (producing the technical concept) and at
the end (testing, acceptance).

Optimization of the Credit Application Process at DaimlerChrysler Bank 227
Based on the experience of the DaimlerChrysler Bank project, the duration of an
ARIS PPM project depends greatly on the following factors:
1. Availability of the required process data: do the source systems need
upgrading?
2. Format of the process data: It is better if the data already has a process-
oriented format in the source systems. Here DaimlerChrysler Bank uses
the EAI integration platform.
3. Degree of detailing or process measurement requirements (number of
measurement points/events).
4. Complexity and number of the measurement variables requiring special
calculation: ARIS PPM comes supplied with a set of standard
measurement variables (e.g. total throughput time). If this is insufficient,
additional measurement variables have to implemented via customizing.
5. Where possible, thought should be given in any process/system design
project in the company about the subsequent measurement of the process
under review and so define the optimum measurement points for them.
6. Training/communication: Project participants must receive focused
information about the objectives, procedure and concept at the beginning.
3.5 Organizational Participants
A wide range of DaimlerChrysler Bank departments connected in some manner or
other with the process to be measured were involved in the project. Process
knowledge is frequently highly dispersed in a company. The correct presentation
of the process in ARIS PPM calls for detailed knowledge of the defined and actual
flows. The integration of all the departments affected is a significant factor in the
sustained success of an ARIS PPM rollout, as active participation in the technical
concept and testing ensures identification with the philosophy and the tool and
also the capabilities it offers even before the software goes live.

228 L. Müller, F. Gahse
Department Role
Operations Process responsibility (central)
Sales Process user (local)
Business Process Management Method responsibility for process
management and documentation
Controlling Overall project management, technical
coordination, key performance
indicator development, management
reporting
Information Technology Management Technical process responsibility,
implementation responsibility,
operation
Table 5: Departments involved in the project
Since the productive start, some 10 members of staff in the various departments
have been regular users. The main users are currently the Operations department,
regional service centers (sales), and controlling, whereby the departments have
different requirements with respect to the measuring of the easyline process
performance (see following graphic).
Fig. 4: Current use of ARIS PPM

Optimization of the Credit Application Process at DaimlerChrysler Bank 229
4 Initial Findings and Actions
The several months of "test operation" have led to some valuable findings with
respect to both the handling of the project and also for optimizing the easyline
process.
4.1 Experiences from Working on the Project
There is no standard recipe for implementing an ARIS PPM project or conducting
a pilot introduction. Nevertheless, various success factors are worth mentioning
which from the DaimlerChrysler Bank viewpoint contribute to a successful project
and the avoidance of errors.
Besides the time factors already mentioned in the previous chapter, the inclusion
of the affected departments and IT in the technical concept phase is strongly
recommended and this is a key driver for the quality of the implemented solution.
The process model defined for measurement should be complete but with a focus
on what is important so that the business process is comprehensible for all
employees. In this context, a meaningful limitation of the key performance
indicators and dimensions to the required level is advisable. As the project
managers are entering new territory with ARIS PPM, the slogan "the less the
better" is particularly apt in the early stages. It is quite common for the
significance of further important details to be revealed only after the first process
performance data becomes available, details that were not given suitable
consideration in the technical concept phase. An iterative approach is developed.
Therefore, the project planning must accept right from the start that change
requests are essential. These iterations are all the more necessary in more complex
processes. On the other hand, it tends to be these processes that offer enormous
optimization potential.
The organizational responsibility (roles in process management) should be
clarified before the introduction as far as possible. A side effect of the convincing
actual process data provided is that ARIS PPM often serves as an implementation
driver towards a more process-oriented organization.
4.2 Replacement of Legacy Reports
The introduction of ARIS PPM was by no means DaimlerChrysler Bank's first
encounter with the issue of process optimization. The use of such a solution also
creates efficiencies through the systematic identification of process weaknesses.

230 L. Müller, F. Gahse
The easyline process too had been the subject of intensive analysis by
DaimlerChrysler Bank employees with a view to optimizing the process, even
before the introduction of ARIS PPM. For example, the Saarbrücken customer
service center, which deals with private customer business, kept daily tally lists of
the reasons for interruptions in the easyline process before ARIS PPM was
available. The data was then aggregated in an Excel file as the basis for time series
analysis of the manual interventions in the process.
Today, this analysis is carried out in a matter of seconds using a predefined
standard report (favorites) in ARIS PPM. This enables prompt identification and
initiation of improvement actions. Simple exporting of data to Excel for further
processing is also possible.
4.3 Identification of Optimization Potential
The introduction of ARIS PPM has already led to the identification and
rectification of various weak points in the business procedures analyzed. The
findings are continually leveraged for actions to optimize the process. In some
cases, immediate actions can lead to rapid systematic improvements with
relatively little effort.
Apart from fundamental process weaknesses, specific issues can be addressed, e.g.
regional differences in the degree to which the automated process is used. Dealers
are not obliged to submit a credit application electronically. They can also be
printed out and faxed, which results in manual processing of the credit application
at DaimlerChrysler Bank. Now the "Dealer organization" dimension can be used
by ARIS PPM to analyze which dealers are not yet using the much more cost-
effective easyline process to the desired degree. These dealers can then be
contacted, and perhaps given further encouragement or training.
The key measurement variable in the credit application process is the throughput
time from receipt of application to the credit decision. The shorter the waiting time
for the customer, the higher the probability of a successful signing of a deal with
lasting customer satisfaction. The throughput time depends on the degree of
automation in the process, which in turn is determined by the causes of manual
interruptions and their frequency. Only a systematic and complete analysis of
these causes enables users to understand and optimize the process. These and
other initial findings have led to the initiation of corresponding improvement
measures for a sustainable improvement in throughput times. Regardless of
whether it is an organizational initiative (e.g. training selected car dealers) or
technical process optimization, the success can be measured with ARIS PPM
immediately after implementation.

Optimization of the Credit Application Process at DaimlerChrysler Bank 231
5 Conclusion / Outlook / Next Steps
DaimlerChrysler Bank decided to use ARIS PPM for particular reason that it can
continuously monitor and optimize mission-critical core processes. Reducing
mistakes and minimizing throughput times pay dividends in the form of higher
customer satisfaction and also positively affects the bottom line by ensuring
efficient business processes. The findings to date lead to the conclusion that
investment in setting up the corresponding organizational and technical infra-
structure will amortize itself quite quickly.
DaimlerChrysler Bank intends to consistently expand its process controlling with
the support of ARIS PPM. The further development is already proceeding at top
speed. The Balanced Scorecard project on the one hand and the operational
requirement on the other result in requirements that can in future be met by the
tool. Currently, it is being expanded to include manual applications reaching
DaimlerChrysler Bank by fax rather than the easyline interface. In addition,
continuous screening of the submission quality of the documentation required for
the credit decision is being planned so that the throughput time can be
differentiated and evaluated even better, thus enabling the identification of further
weak points in the process. A follow-up project will take a closer look at the credit
disbursement process.
The selection of suitable processes is primarily determined by their focus on the
mission-critical procedures in the company. There is already a wealth of ideas at
DaimlerChrysler Bank that also seem to be ideal candidates for implementation in
ARIS PPM. The issues have yet to be assessed and prioritized, however.
Examples include CRM processes in customer processing, contract termination
processing, and also support processes such as accounting (throughput times for
records) or receivables management, to name but a few.

232 L. Müller, F. Gahse
Literature
Hagerty, J.: IDS Scheer elevates Importance of Process Performance Manage-
ment. AMR Research Inc., Nov. 2002
Horvath, P.; Mayer, R.: X-Engineering: Neue Potentiale der Prozess Perfor-
mance erschliessen, in Information Management & Consulting, Oct. 2002
IDS Scheer AG (Hrsg.): ARIS Process Performance Manager. White Paper,
Saarbrücken 2004.
Kaplan, R., Norton, D.: The Balanced Scorecard – Measures that drive
Performance. Harvard Business Review on Measuring Corporate Performance, P.
123-145. Harvard Business School Press 1998
Kühl, M.: Geschäftprozesse unter Beobachtung; in Computerwoche no. 10,
March 7, 2003
Kronz, A., Renner, A., Ramler, K.: Prozess Performance Measurement im
Auftragsbearbeitungsprozess; in BWK Das Energie-Fachmagazin; Nr. 11/ 2002,
S. 48-51.
Loes, G.: Prozessorientierte Einführung und Controlling von CRM-Systemen am
Beispiel von Service-Level-Agreements; in A.-W. Scheer, W. Jost (Hrsg.) ARIS
in der Praxis: Gestaltung, Implementierung und Optimierung von Geschäfts-
prozessen, S. 241-265; 2002
Scheer, A.-W., Kirchmer, M.: Business Process Automation – Combining Best
and Next Practices, in Scheer, A.-W., Abolhassan, F., Jost, W., Kirchmer, M.:
Business Process Automation – ARIS in Practice. Berlin, New York, and others
2004, P 1-16
Westermann, P., Gahse, F.: Excellence in Vehicle Financing, in Scheer, A.-W.,
Abolhassan, F., Jost, W., Kirchmer, M.: Business Process Automation – ARIS in
Practice. Berlin, New York, and others 2004, P 83-106

Increasing Customer Satisfaction with Visualized
Root-Cause Analysis – CPM Success in the Mass
Market at British Telecom
John Bird
IDS Scheer UK Limited
Summary
BT implemented a Corporate Performance Solution in order to increase the num-
ber of satisfied customers. In the first step of this strategic project it was necessary
to identify the cause of customer dissatisfaction. Amongst other ARIS Process Per-
formance Manager analysis features, the patented Process Mining Wizard was
used to visualize areas of concern by analyzing data from more than 20 different
BT-specific Helpdesk-Systems.
Keywords
British Telecom, customer satisfaction, root-cause-analysis, helpdesk, customer
service center (CSS), EDCSM (event driven customer satisfaction measures), ora-
cle RDBMS, internal measures, repeated fault calls, estimated repair times, post
faultcalls, revenue generation, early life failure, process performance manage-
ment

234 J. Bird
1 Project Review
1.1 About British Telecom
Generating £13 billion annual revenues and with 21 million customers and 48,000
employees, BT Retail is a major force in the communications market. It has a well
established strategy that puts customers firmly at its heart, vigorously defending
its core business and growing new market opportunities. This strategy is under-
pinned by effective cost transformation and people programmes.
BT Retail have three main customer groups, consumer, business and major busi-
ness or corporate for whom they provide everything from traditional telephony
services, mobile technology, internet access and web-based services, through to
help and advice.
In the consumer market BT Retail have developed and delivered innovative
propositions (BT Talk Together, Entertainment, BT Answer). Their biggest and
most important offering to date however is BT Broadband.
For business customers they offer bespoke solutions and advice on key areas of
business strategy. They also provide a practical understanding of business issues
and comprehensive knowledge of all business communications needs and issues.
In addition to this, Field Service comprising an engineering team of 17,000 is truly
at the forefront of the business providing that crucial interface between the com-
pany and its customers. It plays a key role in bringing to life BT's vision of 'con-
necting your world completely' by delivering a world-class provision and repair
service to all BT's 21 million customers.
Other areas of operation include: BT regions, customer contact centres, products
and enterprises and transformation and technology.
1.2 Project Background
The company BT Retail wanted to increase the usage of the ARIS Toolset within
the organisation, mainly to map their processes and to distribute these to all em-
ployees on the intranet using the ARIS Web Publisher component.
Following initial presentations and acceptance, it was agreed that high-level spon-
sorship was required to ensure the project had a high profile. To this end, a second
presentation and demonstration was made to a senior BT Retail director at which
the entire ARIS product portfolio was outlined.

CPM Success in the Mass Market at British Telecom 235
When ARIS PPM was discussed, the director soon realised the potential of the
product and the probability of a ‘quick-win’ by using ARIS PPM with live data to
model his processes, rather than build them from scratch using the ARIS Toolset.
These processes are very complex and to ensure that ARIS PPM was ‘up to the
job’, it was decided to run a proof of concept based on one business process –
Business Highway.
This proof of concept started on 13 September 2002. The data to be used came
from three separate source systems and covered a four week period. The main
transaction data came from the CSS (Customer Service System) system, Internal
Quality data also came from CSS and finally, a third party input stream relating to
Customer Satisfaction, this data is known as EDCSM (Event Driven Customer
Satisfaction Measures).
As mentioned earlier, the process to be analysed was ‘Business Highway’, this en-
compassed some 9 different process types, 2,800 jobs, 7,000 orders and 53,000 ac-
tivities. There were 6,500 Internal Quality transactions and 80 EDCSM transac-
tions. ARIS PPM was configured with 81 Key Performance Indicators and 23
Dimensions.
2 Project Objective
The project focus was to be in the area of ‘Consumer Repair’ with an emphasis on
identifying the root cause of ‘Customer Dissatisfaction’.
This objective embraced several BT Retail overall objectives of improving levels
of satisfaction and reducing dissatisfaction amongst BT Retail customers by:
• Identifying what causes customer dissatisfaction
• Cross-linking the customer view with the process view – the idea here
was to try to see the problem from the customer’s perspective
• Creating the necessary improvements to the processes and planning the
programmes to implement the changes
• Implement the programmes in the field

236 J. Bird
3 Project Approach
3.1 Project Structure
A preliminary planning meeting was held on 9th
January 2003 to identify the scope
of the project; the team members required; data involved and timescales.
The project was structured around nine ‘Work Packages’ identified in the meeting,
each of these was represented by one or more people on the project team, some
people having a dual role. These ‘Work Packages’ were:
• Project Management
• End to End Root Cause Analysis
• Customer Acceptance Test & Training
• Management Information Solutions
• ARIS PPM Platform
• ARIS PPM Configuration, Administration & Maintenance
• ARIS PPM Consultancy & Technical Support
• Field Engineering
• Call Centres
There was a further person involved who was responsible for project coordination.
In all, the project team consisted of ten people.
3.2 Workshop
Once project funding had been obtained, the majority of the project team assem-
bled at the end of March 2003 to discuss the data in more detail and to define the
processes involved. In total some 22 separate processes were identified within the
‘Consumer Repair’ Process Group. Once these had been decided the KPIs and
Dimensions were determined. The main transaction data was to be extracted from
28 regional CSS databases and to complete the end-to-end transaction details, a
further 8 extract files were generated from CSS and additional application sys-
tems. These contained data covering the Fault details, CSS Internal Measures, Re-
peated Fault Calls, Estimated Repair Times, Post Fault Calls, Revenue Generation
and Early Life Failure. A final data set was assembled from the EDCSM data
which is obtained from a third party organisation that undertakes the surveys to
ensure impartiality.

CPM Success in the Mass Market at British Telecom 237
Nine standard ARIS PPM KPIs were retained and a further 75 identified. Four
standard ARIS PPM Dimensions were retained and a further 52 identified.
During development of the Pilot, a new release of ARIS PPM took place which in-
troduced both Search Dimensions and Process Independent KPIs. As a result of
this, 7 Search Dimensions were identified and 9 Process Independent KPIs were
introduced.
3.3 Project Schedule
A high level project schedule was developed and agreed by all parties. This took
into consideration any possible problem areas and contingency was built in to al-
low for any such events occurring.
Fig. 1: Projectplan
Certain unforeseen circumstances caused us to deviate from the schedule during
the middle of the project, these revolved mainly around hardware specification,
availability and location. This delayed the loading of the data by a couple of
weeks. From IDS Scheer’s perspective, there was a prolonged period of inactivity
during April and May whilst BT Retail ensured that the data could be obtained
from the sources identified. Eventually this proved to be both feasible and practi-
cal and so the ARIS PPM configuration activities began. This work was under-
taken in the IDS Scheer offices as the hardware issues mentioned above had not
yet been resolved.

238 J. Bird
As can be seen from the schedule, Customer Acceptance testing was to be under-
taken throughout June and July but Final User Testing was at the end of October.
This may seem unusual, but the reason for this large gap was to allow both BT Re-
tail and IDS Scheer to make changes to the data and to the ARIS PPM configura-
tion should the first testing phase find any discrepancies.
In actual fact, this was not the case, Customer Acceptance Testing proved that the
data was correct and the ARIS PPM configuration was giving the correct results.
3.4 Hardware
In conjunction with BT Retail IT, a two tier hardware platform was agreed. Two
server machines were made available, one was to act as the Database Server and
the other as both ARIS PPM Server and Web Server.
The ARIS PPM Front-ends were a mixture of PCs running Microsoft Windows
and Internet explorer.
Fig. 2: Server-Architecture
The combined ARIS PPM Server & Web Server had 3 GB RAM,
two Xeon 2.4
GHZ processors and was running Microsoft Windows 2000 server service pack 2
and Microsoft Internet information server 5.0. The Database Server also had 3 GB
RAM, two Xeon 2.4 GHZ processors and 150 GB Raid 1 Disk for data and fault
tolerance. This machine was running Microsoft Windows 2000 server service
pack 2 and Oracle 8I Enterprise Edition. The ARIS PPM Server/Web Server was
linked to the Database Server via a high-speed (100 MBit) network.
PPM front-ends
PPM server
+
Web server
HTTP
RMI
JDBC
Database server
PPM front-ends
PPM server
+
Web server
HTTP
RMI
JDBC
Database server

CPM Success in the Mass Market at British Telecom 239
3.5 Data Retrieval
The responsibility for Data Retrieval lay entirely with BT Retail. IDS Scheer pro-
vided BT Retail with an output specification which detailed the XML formatting
required for the data and BT Retail wrote several Visual Basic programs to extract
the data from their source systems. Several test iterations of the output were read
into ARIS PPM before totally clean data was obtained.
It was intended that data import would be on a weekly basis, unfortunately, this
could not be undertaken at a week-end for various reasons, the major factor being
that a significant amount of data would not be ready for use at that time. All data
would be ready for processing by the Tuesday evening of each week.
Although we had a good idea of the volume of data ARIS PPM needed to handle,
it was only when this phase of the project began that the exact volumes became
known. The main transaction data ranged from 110,000 per week to 185,000 with
an overall average of 130,000 EDCSM data was approximately 800 to 900 trans-
actions per week.
At the time of writing, the system has been operational for some 11 months and
held approximately 17 months data, this means that approximately 10 million re-
cords are available for analysis.
3.6 Training
An intensive Training Programme was devised which included several one-day
ARIS PPM appreciation sessions for line managers, system evaluators and team
leaders who would be involved in the project. These sessions provided the atten-
dees with an overview of ARIS PPM functionality and the application of ARIS
PPM to their own data. It was essential that these people understood the capabili-
ties of ARIS PPM so that the Pilot system could move forward with their support.
Two End-User training courses of two days duration were scheduled, the first was
for those people who would be close to the project, but not actually true ‘End-
Users’ this was to ensure that they had a firm understanding of what ARIS PPM
could do and how it was achieved.
The second course was for the End-Users and this took place on a BT Retail site
just prior to going live. In total some 45 people were trained, 18 of whom were
End-Users.

240 J. Bird
3.7 Testing, Issues and Corrective Action
At an early stage it was recognised that testing needed to be very thorough. The
project schedule was tight and the project could not afford to waste valuable time
reconfiguring ARIS PPM and, more importantly reloading data.
Testing was undertaken in several areas. Firstly data integrity was checked; this
soon highlighted an area which caused us to rethink our approach.
Our chosen approach had been to run the XML import and immediately follow
this with the PPM import. This is standard practice, what we had failed to realise
however was the impact if errors were found on the XML import, in extreme cases
the import would be aborted for the file containing the error. Our XML import
would read all nine weekly files in one pass. Normal errors, such as invalid data
formats were ignored and processing continued, but if invalid characters were
found, the import of the file concerned stops at that point and the next file is read.
Surprisingly these invalid characters were more common than we realised due to
the fact that there were several fields in the BT Retail data which were pure text
entered by end-users and engineers in the field, thus reserved XML characters
such as ampersands, apostrophes, quotes, etc were frequently present. Once these
errors were corrected, the XML import and PPM import could be run again. We
also discovered at this point that our PPM import was taking longer due to the du-
plication of the data which had been accepted in the first XML import.
All this of course wasted valuable time and so the BT Visual Basic programs were
amended to eliminate these reserved XML characters. Furthermore, as a precau-
tionary measure it was decided that we would create a dummy ARIS PPM client
to run the XML import against until all errors were corrected and the data was
clean. At this point we could now run the combined XML and PPM imports.
Additional testing was carried out to ensure that the transaction fragments were
being assembled in the correct sequence to form complete end-to-end process in-
stances (we were using the “sortmerge” functionality for this).
Finally, our testing ensured that the KPIs were being calculated correctly and that
the Dimensions were being populated as expected.
4 Going Live, Issues and Corrective Action
BT Retail did not want to go live with a small amount of data, so it was agreed
that 6 weeks of data must be loaded before the users would begin their ARIS PPM
analysis work.
Approximately four weeks before going live, a new ARIS PPM Release became
available giving us the ability to use Search Dimensions and Process Independent

CPM Success in the Mass Market at British Telecom 241
KPIs. BT quickly recognised the advantages of these new features and requested
that they be included in the Pilot system.
This request coincided with us experiencing performance issues, particularly in
the area of data import. As mentioned earlier, we did not have the luxury of being
able to do the weekly import over a week-end, our SLA was to have this available
each Wednesday morning. The other performance issues related to some of the
more complex queries being run by the end-users which took some time to com-
plete, especially when several weeks worth of data was being queried. This was
having a detrimental effect on user perception, even though by traditional means
these results would have taken far longer too obtain.
We needed to be proactive and acted quickly to address the issues, the pressing
one being query response times. A short term fix was achieved by adjusting the
ORACLE parameters to increase block-buffer sizes.
In conjunction with members of the ARIS PPM development team in Saar-
brucken, we examined the ARIS PPM configuration and determined that several
changes could be made to improve data import times. These involved converting
some of the KPIs into Dimensions (which speeds up data import as less calcula-
tion is needed) and more importantly isolating the more heavily analysed data (the
EDCSM specific transactions). This latter action was achieved using ARIS PPM’s
hierarchy functionality which essentially created a separate process group for the
EDCSM transactions whilst retaining links back to the original transaction data. In
this way queries could be run against the EDCSM data extremely quickly because
of the lower volumes involved.
Also by doing this, we were able to configure ARIS PPM so that the Dimensions
which were EDCSM specific were only available for the EDCSM process group,
this also contributed to speeding up the data import
To save time whilst the BT Retail hardware was being reconfigured, the ARIS
PPM configuration was being modified and installed on an IDS Scheer Server. All
data which had been previously imported on the BT Retail platform was made
available to IDS Scheer and batch jobs created to import these. Once the IDS
Server was fully loaded with the BT Retail data, the ORACLE instance was
backed up and made available to BT Retail.
Over a two day period, one of the BT Retail server machines was reconfigured so
that the ARIS PPM Server, Web Server and Database Server were all on the one
machine, RAM was increased to 6 GB and Windows Advanced Server was in-
stalled this allowed ORACLE to access more RAM. Then the new ARIS PPM
configuration was loaded and the ORACLE backup restored.
From that point onwards, there was an immediate increase in the speed of Data
Import and network traffic was reduced significantly. Queries were also faster as a
result of these changes. Section 5 User Acceptance Criteria contains the results in
detail.

242 J. Bird
Also, because the data import was now taking approximately 9 hours as opposed
to the earlier 12 to 14 hours, it was felt that a second data import could be run dur-
ing the week to load historical weekly data going back to the start of the BT Retail
financial Year.
On a day-to-day basis, BT Retail uses the full range of ARIS PPM functionality to
evaluate the Consumer Repair processes. There are several standard queries run
for regular reporting/statistical requirements, but a large part of the analytical
work is triggered by the EDCSM results each week and therefore is of a random
nature because of the variety of responses obtained.
5 User Acceptance Criteria
As a result of the performance issues identified during Customer Acceptance Test-
ing a series of Benchmark queries were devised as part of the overall User Accep-
tance Criteria. These were to be run each day for a minimum of two weeks the
benchmark queries were stored as Favorites and were run at approximately
7:30am each day, this was a deliberate decision made to avoid higher network
traffic during the course of the day which might have distorted the figures. Addi-
tionally, ARIS PPM caching was turned off thus ensuring that the queries were
run directly on the ARIS PPM database.
• The “System Benchmarks” – comprised three queries run against one, six and
13 weeks data.
• The “User Benchmarks” – consisted of six typical/representative user queries
also run against one, six and 13 weeks.
• Based on the performance experienced and expectations from the system im-
provements, an ‘Ideal Response Time’ was set for each query.
• Each query was run separately and the response time was recorded to enable
assessment of the percentage within target and the distribution of the responses.
These queries were run over a prolonged period and average Response Times cal-
culated. The results are shown in the table below, for completeness the column
headed “Original Response Time” shows the responses experienced before the
hardware and adapter changes were made.
The maximum expected response times for the queries for both types of bench-
mark were agreed and are shown in the table below, along with the responses
achieved:

CPM Success in the Mass Market at British Telecom 243
As can be seen, the “Actual Response Time” far exceeded the “Ideal”. Overall Pi-
lot Acceptance was determined through the following criteria:
• System availability to users - 95% during office hours (08:30 - 16:30)
• Data import delivers consistent overnight performance, i.e. less than 13 hours
for each week loaded (see table below for results)
• Response times are within the maximum agreed for 90% of all benchmark que-
ries using the final system configuration released to users
• System availability enables benchmark testing to be carried out for a minimum
of ten working days
• Two instances of two, four and six concurrent query/flood testing are carried
out by users, each running one of the user benchmark queries, for one six and
13 weeks, and the results recorded
Transactions Import Time
Minimum 108,623 5:25:24
Maximum 185,077 13:06:10
Overall Average 130,111 9:28:35
Fig. 4: Transaction and import times
Weeks Under
Analysis
Original
Response Time
Ideal
Response Time
Actual
Re-
sponse
Time
One Week 22.5 secs 15 secs 6 secs
Six Weeks 2 mins 15 secs 1 min 30 secs 7 secs
13 Weeks 6 mins 4 mins 7 secs
Fig. 3: Computing times

244 J. Bird
5.1 User Testimonials
The Pilot passed all the necessary Acceptance Criteria with ease and resulted in
some very complimentary comments:
“The figures include the results of flood testing carried out …… with a group of
seven users; these were also excellent, with a maximum time of only 23 seconds
for the last query to run in all the tests carried out.” – BT Retail PPM Implemen-
tation Project Manager.
… were very pleased with the performance of ARIS PPM and there was general
appreciation, and more importantly belief, that the newly implemented configura-
tion means that we now have a truly useable system.” - Root Cause Analysis
Manager (Consumer).
“I have no doubt that we have concluded testing with all thumbs up, and that we
will be able to close the action plan and effectively the Pilot of ARIS PPM with
positive sign-off from all of the key project and user representatives.” - Manage-
ment Information Solutions Manager.
“…the benchmarks. All are within target and showing an exceptional perform-
ance against the target set for each of the benchmarks.” – BT Retail PPM Imple-
mentation Project Manager.
“…performance exceeded our expectations. Well done to all concerned.” .” -
Root Cause Analysis Manager (Consumer).
6 Benefits
BT Retail acknowledge that ARIS PPM has contributed to the identification and
some of the key areas of dissatisfaction within the Consumer Repair Process and
pinpoint areas for further detailed analysis.
It has helped them begin to understand the potential of ARIS PPM to chart the
process followed against the process documented, at the individual fault level, and
track a job from the customer’s point of view as well as being able to see the pro-
cess itself. However, the process mapping functionality delivered in Version 3 has
not yet enabled BT to reach its goal of being able to chart the aggregate repair
view. This view is something that BT looks forward to seeing implemented in the
medium term to more accurately chart and monitor deviation from the docu-
mented process and assist in the development of corrective actions.
An added bonus is the ability to monitor dissatisfaction levels over time and
against differing Dimensions and against target levels.

CPM Success in the Mass Market at British Telecom 245
The major overall benefits are
• BT Retail now have a more in-depth view of the customer experience for
the Consumer Repair process, linking the customer view and the process
view enabling them to drill down to root causes.
• The Analysis process has been accelerated; they can identify areas where
Customer Dissatisfaction is high in a fraction of the time it took previ-
ously.
• ARIS PPM has brought a wider scope and provided more versatile tools
and techniques to the Root-Cause Analysis team.

Monetary Assessment of Performance
Management in the Health Care System –
Process Cost Analysis at Marienhospital Herne
Holger Raphael
Marienhospital Herne
Hendrik Schenck
Marienhospital Herne
Summary
Together with IDS Scheer, the Catholic Hospital Foundation Marienhospital
Herne launched a pilot project for the operational intensive care station to meet
the challenges of the flat rate payment system with process cost accounting (PCA),
opting for ARIS Process Platform as IT support so as to ensure the best possible
cost-driver accounting.
Keywords
DRG, Process Cost Analysis, clinical paths, healthcare system, case rates, de-
scriptive QM, performance-amount induced (pai) and performance-amount neu-
tral (pan) processes, Process Cost Accounting, Cost Driver, eEPC, ARIS Process
Platform, Hospital Information System (HIS), InEK raw case costing

248 H. Raphael, H. Schenck
1 Why Process Cost Accounting in Hospitals?
1.1 The Hospital Environment
In response to increasing cost pressures caused by economic and demographic de-
velopments, legislators have produced more reforms for health than for any other
sector of the economy. The reform of the compensation system for inpatient
treatment and its price-like lump sums is designed to reduce healthcare costs, and
hospitals are now being forced to act. Unlike the previous system of compensation
by daily rates, the new DRGs1
offer little incentive for wasting resources.2
There-
fore hospitals must render their services at the lowest possible costs while still
complying with quality standards.3
Cost accounting in particular now plays a much greater role as a management tool
because "the hospital shall maintain cost and performance accounting that permits
operational controlling and an evaluation of its efficiency and effectiveness (...)".4
Hospitals find in general that revenues are capped by the negotiated budget. Thus,
only the costs remain as an object of an assessment5
. One method of fundamental
cost analysis is to evaluate the individual process steps. The focus here should be
on those subprocesses that stand out either for their higher costs (e.g. major HR
expense) or frequency of execution within the process. The cost drivers of the
workflow, i.e. the influencing factors that determine the nature of the cost devel-
opment, have to be identified and analyzed. There follows an explanation of why
process orientation is required, then the principles of process cost accounting will
be introduced. That will be followed by a description of the procedure adopted in
the pilot project for the Catholic Hospital Foundation Marienhospital Herne and
its results. A conclusion rounds off the presentation.
1
Diagnosis Related Group.
2
See Breyer, F. / Zweifel, P. (1999), P. 353 ff.
3
The options for revenue optimization are not dealt with in this article.
4
Hospital Accounting Regulation: Section 8 Cost and Performance Accounting.
5
This assumes that up-coding is not an option for boosting revenues, as it is with DRGs.

Process Cost Analysis at Marienhospital Herne 249
1.2 Process & Performance Orientation in Hospitals
Because of specialization and the wide range of tasks, hospitals are organized
along functional, hierarchical lines.6
As a result, processes are split up across vari-
ous organizational units and tasks are distributed among many task centers, con-
trary to the logical sequence. The economic and efficient treatment of a patient
thus depends greatly on the coordination of the service-providing units in the hos-
pital.
This issue is currently being discussed with respect to the quality of treatment un-
der the heading of Clinical Paths7
. A treatment path is a control instrument. The
clinical path describes the optimum path of a specific patient type with key diag-
nostic and therapeutic services and its chronological sequence.
Interdisciplinary and interprofessional aspects are covered along with elements for
implementation, control and economic evaluation.Process orientation is an impor-
tant tool for ensuring the quality management (QM) required by law. With case
rates, there is a strong incentive to reduce treatment quality below the optimum by
rendering (too) few individual services 8
or not to comply with the minimum stan-
dard (in figurative terms: "discharging bleeding patients"). Therefore, hospitals are
required by Section 137 Social Code V to maintain a documented quality man-
agement system. Looking at quality standards such as ISO, KTQ or EFQM, the
first step concentrates on proof in the form of documenting quality in manuals and
reports. This is followed by the process of continuous improvements to hospital
workflows.
Of course, the more descriptive QM tends to have synergy effects with process
cost accounting which must be exploited. In an optimum situation, the processes
documented in QM can be evaluated using process cost accounting, thus providing
a new source of information for process optimization.
6
Compare this context and below, Scheer et al. (1996), P. 77.
7
Other terms used include clinical pathways, critical pathways, patient path, treatment
path.
8
See Breyer, F. / Zweifel, P. (1999), P. 354

250 H. Raphael, H. Schenck
2 Basis of Process Cost Accounting
Process cost accounting is a term that has recently begun to inform discussions
and the design of cost accounting. Process cost accounting considers the idea "that
even in industry, costs that are demonstrably attributable to production are now
very low compared with the fixed overheads that are attracted as lump-sum pay-
ments in the form of surcharge and settlement rates."9
The main tasks of process
cost accounting include revealing the performance-related links between the use of
production factors, processes and treatment in hospitals in the context of the high
overheads.
At the same time, process cost accounting is not a radically new cost accounting
system; rather, it applies traditional cost category and cost center accounting. The
starting point for process cost accounting is the question as to the main influencing
factors for cost accounting. These variables are called cost drivers.
Process cost accounting can be seen as the basis for a number of use cases. The
main ones are:
• Process management
• Performance costing
• Contribution-based cost accounting
• Target costing10
• Cost management.
In general, a process is a chain of activities directed at rendering a performance
output.
9
S. Schmidt, A. (2001), P. 220; Coenenberg emphasizes the strategic aspect of process
cost accounting with the presence of three effects: the allocation effect, the complexity
effect and economies of scale effect. Cf.. Coenenberg, A. G. (1999), P. 235 ff.
10
Target costing cannot be applied directly to hospitals. Market orientation in the sense of
concentrating on customer wishes must be limited as patients, doctors and health insur-
ance funds are the customers, and in most cases patients do not demand the services vol-
untarily, are seldom able to judge the medical treatment themselves ,and do not pay the
direct price. Thus conjoint analysis can therefore not be applied for calculating the target
price. See Schlüchtermann, J. / Gorschlüter, P. (1996), P. 107.

Process Cost Analysis at Marienhospital Herne 251
A process has the following features11
:
• Quantifiable service provision,
• of a given quality,
• with analyzable throughput or processing times,
• requiring measurable resources to produce it (costs)
• can be traced to certain cost-influencing factors (cost drivers).
As a rule, a multi-layer, a hierarchical process model is assumed.12
At the sub-
process level, a distinction is made between performance amount-induced (pai)
and performance amount neutral (pan) processes.13
In the case of performance
amount induced subprocesses, the time and associated costs are proportional to the
quantity of output. In contrast, performance amount neutral subprocesses represent
the basic cost of the cost center. Experts have yet to come up with a definitive an-
swer as to how pan processes are to be settled.14
The following assumes a broad definition of process cost accounting15
according
to the basic concept of cost-related process evaluation as a pragmatic approach to
project implementation. In this context, process cost accounting is seen as offering
a possibility of tactical/operational planning on a partial cost basis. However, the
term process-oriented accounting is suggested to provide a linguistic distinction
from process cost accounting, which is generally understood to be based on full
cost accounting.
In this article, the presentation of the general situation in German hospitals and the
methodological principles of process cost accounting is followed by a discussion
of the way process cost accounting was implemented at the Catholic Hospital
Foundation Marienhospital Herne.
11
See Horváth, P. / Mayer, R. (1993), P. 16.
12
Presentation differs in the literature. A wide range of terms and differentapproaches are
used concerning the number of process hierarchy levels.
See Reckenfelderbäumer (1994), P. 33.
13
Cf. here and below Mayer, R. (1990), P. 307 f. and Mayer, R. (2002), P. 1623 f.
14
See Götze, U. (1997), P. 167
15
This and other terms are often used as synonyms (see Coenenberg, A. G. / Fischer, M.
(1991), P. 21 f.).
Whereas some authors justify this use of synonyms on the grounds of the identical fun-
damental idea (see the work just quoted as a case in point), other authors make an explicit
distinction between the terms, particularly rejecting any use of the term Activity Based
Costing as a synonym (see for example Mayer, R. (2002), P. 1622 f.).

252 H. Raphael, H. Schenck
3 Marienhospital Process Cost Accounting Pilot Project
3.1 Framework Conditions at Marienhospital
Marienhospital has been using process management with a focus on QM and certi-
fication (DIN EN ISO 9001:2000) since 1999. A strategic decision was taken at an
early stage to use a process-oriented tool as IT-side support. Criteria for selecting
the software included in particular a central data pool for efficient management in
the use phase and the most extensive possible reuse of modeled processes. This
included the direct transfer of processes by Controlling to process cost accounting
and also the option for customizing a workflow-oriented hospital information sys-
tem (HIS).16
Based on the Marienhospital's annual participation in InEK raw case costing17
, a
hospital-specific DRG evaluation on a full-cost basis is already being used for
controlling in the internal reporting system. As InEK costing works with rough
keys in respect of hospitals' performance data, more detailed information about
cost drivers is required.
The Operational Intensive Station (OI)18
was chosen for the process cost account-
ing pilot project for several reasons. On the one hand, considerable costs19
arise
here, the need for information is high. On the other hand, the intensive station
workflows are very complex, so that a positive outcome of the pilot project would
prove the general applicability of the method and the tool.
16
Introducing a workflow-oriented HIS, which was developed with a particular focus on
the requirements in primary performance delivery, i.e. the treatment of patients, involves
enormous adaptation effort and requires the hospital's legacy workflow structures. In the
past, all the HIS systems on the market were originally developed from the billing re-
quirements. A workflow-oriented HIS called Soarian has been announced by Siemens.
17
The hospitals' umbrella associations, Verband der Privaten Krankenversicherung [Private
Health Insurance Association] and the Deutsche Krankenhausgesellschaft [German Hos-
pital Society] founded the Institut für das Entgeltsystem im Krankenhaus [Hospital Com-
pensation System Institute] (InEK GmbH) on May 10, 2001. The Institute provides
member partners with support for self administration and the bodies they formed for the
legally mandated introduction and continuous development of the DRG System based on
Section 17 b Hospital Financing Act (KHG). Further information can be found at
http://www.g-drg.de.
18
Interdisciplinary intensive station for the surgery, vascular surgery, hand surgery, gyne-
cology, pain therapy, urology, and neuro-urology departments.
19
As a result of inadequate mapping after the introduction of DRGs, many hospitals re-
garded their intensive station as a major loss-maker.
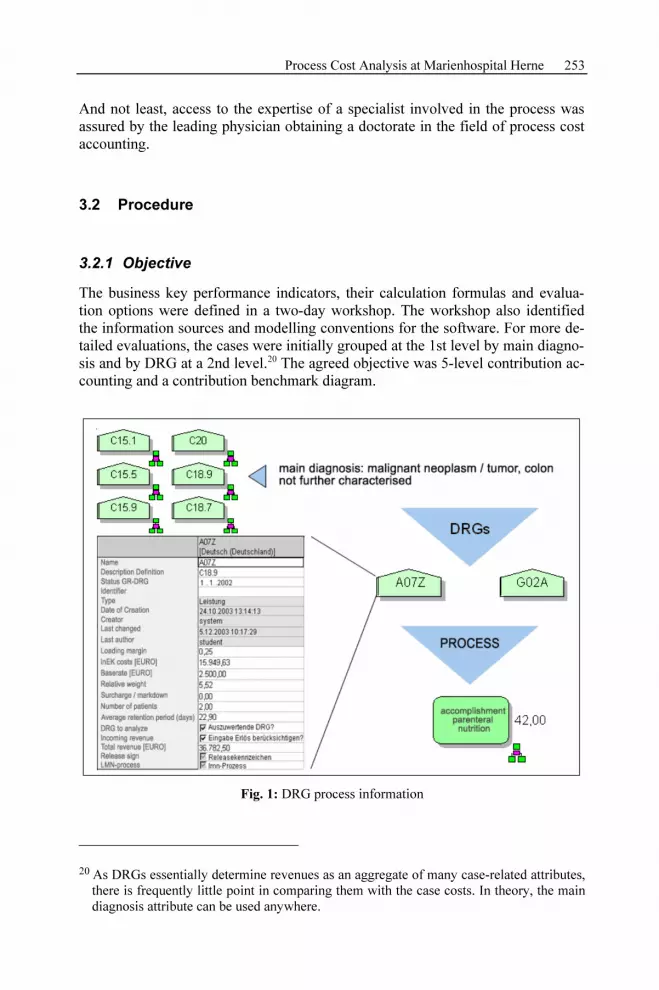
Process Cost Analysis at Marienhospital Herne 253
And not least, access to the expertise of a specialist involved in the process was
assured by the leading physician obtaining a doctorate in the field of process cost
accounting.
3.2 Procedure
3.2.1 Objective
The business key performance indicators, their calculation formulas and evalua-
tion options were defined in a two-day workshop. The workshop also identified
the information sources and modelling conventions for the software. For more de-
tailed evaluations, the cases were initially grouped at the 1st level by main diagno-
sis and by DRG at a 2nd level.20
The agreed objective was 5-level contribution ac-
counting and a contribution benchmark diagram.
Fig. 1: DRG process information
20
As DRGs essentially determine revenues as an aggregate of many case-related attributes,
there is frequently little point in comparing them with the case costs. In theory, the main
diagnosis attribute can be used anywhere.

254 H. Raphael, H. Schenck
Contribution accounting initially takes into consideration the 3 directly attribut-
able cost categories before considering pan costs and the administration overhead.
The pan costs are allocated on the basis of care days. If Contribution Accounting
III is negative, the corresponding DRG is to be avoided in the short term.21
If Con-
tribution IV or V are negative, there is a medium-term need for action.
In the Contribution Benchmark diagram, not only is Contribution V shown but the
identified costs are also compared. The reference value is taken from the InEK
raw case costing.22
The OI (case) costs determined in process cost accounting are
compared with the costs of cost centre group 2 (intensive station) of the corre-
sponding DRG from the InEK costing23
. This diagram allows for the fact that there
are DRGs whose revenues do not fully cover the average costs determined by
InEK. Thus a hospital's cost structure may appear positive compared to that of
other hospitals but it still makes a loss.
21
To the extent that this is permitted under the terms of the treatment mission.
22
Of course, the objection may be raised at this point that InEK costing cannot determine
comparable cost-driver allocated costs owing to the methodology and options available,
and so does not lend itself entirely to benchmarking. The InEK Benchmark Index should
be seen as a rough guide and used only with due allowance for possible variations due to
its methodology. The problem of comparability is intrinsic to benchmarking.
23
As the OI assessment covers only part of a DRG performance delivery, cost center group
2 is used. Evaluating a DRG requires consideration of the complete course of treatment.
Revenues per DRG
./. medical supply costs
= DBI
./. personal costs
= DB II
./. operating costs
= DB III
./. LMN costs
= DB IV
./. loading margin
= DB V

Process Cost Analysis at Marienhospital Herne 255
-6000
-4000
-2000
0
2000
4000
6000
8000
-8000 -6000 -4000 -2000 0 2000 4000 6000
InEK-
Benchmark-
Kennziffer
DB V
DRG_1
DRG_2
DRG_3
DRG_4
DRG_5
DRG_6
DRG_7
DRG_8
Fig. 2: Contribution-based cost accounting benchmark diagram
Apart from these specific key performance indicators, others have also been de-
veloped, e.g. the degree of utilization.
InEK
Benchmark
KPI

256 H. Raphael, H. Schenck
3.3 Software Support from ARIS Process Cost Analyzer
Technically, the realized solution envisages the ARIS PCA24
controlling tool,
which is an ARIS Process Platform component along with ARIS Process Perform-
ance Manager, importing the processes that have been modeled in the ARIS data-
base. Then the desired key performance indicators are calculated on the basis of
freely defined rules via the object attributes maintained in the ARIS database. This
results in transparency of both calculation and costs. In addition, freely defined
analyses can be run beforehand, with the results displayed graphically and ex-
ported for further processing. The advantage of having a separate imported data-
base is that what-if scenarios can be generated by changing the attributes in the
tool itself. The essential structure of the ARIS database, including the Organiza-
tion, Control and Performance views, is obtained. The calculation of the key per-
formance indicators is transparent thanks to the drill-down function in all key per-
formance indicators.
3.3.1 Activity Recording
The detailed analysis of personnel costs required the approval of the staff repre-
sentative committee (SRC) on the anonymized recording of work and time taken.
The QM processes could not be transferred directly because this presentation sets
different priorities and so does not adequately map the origins of costs.
Whereas in the past procedures were modelled top down solely by QM representa-
tives and physicians, this time all ward staff were asked to make a complete list of
their activities. The next step was to group these activities and aggregate them in
workflows. The uniform wording and degree of abstraction demanded detailed
technical and process knowledge. The advantage of this method is that the real ac-
tual state is recorded and not a desirable target one. As a more differentiated allo-
cation was not possible, the only differentiation was between doctors and nursing
staff.
The subprocesses were organized in a way that made them constant with respect
to the cost driver. This enables the treatment expense of a given DRG to be de-
rived by simply multiplying the usage quantity by the evaluated subprocesses.
24
Process Cost Analyzer.

Process Cost Analysis at Marienhospital Herne 257
3.3.2 Personnel Costs
The processing times were determined for the identified activities using a minute-
based multi-moment time recording procedure. The personnel cost rates were de-
termined in ARIS PCA on the basis of salaries, holiday entitlements, overtime and
illness-related absences.
3.3.3 Costs of Medical Needs
As there was no electronic patient-related documentation of the medical needs
available, models and allocation keys were developed so that the actual costs
could be allocated to the individual processes as accurately as possible with re-
spect to the cost drivers. Medical needs encompasses the three subgroups blood,
medication and other medical needs.
3.3.4 Equipment Costs
The calculation of equipment costs includes (imputed) depreciation and also the
identified costs of the medical equipment. In order to minimize the modelling
workload, equipment used together for treatment was aggregated in systems.
3.3.5 Determination of Input Quantities
The input quantities (number of times the treatment modules were carried out)
were determined by analyzing the patient files. The input quantities were entered
in a Microsoft Access database. The automatic transfer of the data to ARIS was
not yet implemented, so parts had to be modelled. In future, usage quantities will
be entered and maintained whilst the patient is in the hospital. This points up the
need for workflow-oriented systems that permit comprehensive, analyzable docu-
mentation of medical services.

258 H. Raphael, H. Schenck
3.4 Modelling in ARIS
The individual DRGs are modelled as services and the associated subprocesses are
assigned to the functions of a product/service tree as eEPCs25
. The usage quantity
of the subprocesses is stored in the functions. The pan processes are modelled par-
allel to this. The attributes for calculating minute cost rates and capacities are
stored in the application system type diagrams for equipment and in organizational
diagrams for personnel. The costs of consumable materials, the average processing
time and the deployment factor of the functions are stored in the individual eEPCs.
Fig. 3: ARIS EPC
25
Extended event-driven process chains.
Accomplishment parenteral nutrition

Process Cost Analysis at Marienhospital Herne 259
4 Results
The first result that must be shown is the modified ARIS PCA. This enables navi-
gation through the various views and display of the corresponding key perform-
ance indicators. If key performance indicators are shown in white, this means that
they have been taken from the ARIS database and can be edited for scenario
analyses. Key performance indicators shown in blue can be used for navigating
through the calculation. Exportable evaluations and graphics have been produced
for the individual hierarchies – main diagnoses, DRGs, processes.
Fig. 4: Modified ARIS PCA
Now the economic aspects not only of individual subprocesses but also of entire26
DRGs can be analyzed for business purposes. The user-definable grouping func-
tion also permits cases to be analyzed for a wide range of determinants through
external processing of the data available in the HIS.
26
The pilot project only dealt with a partial performance of a complete treatment path.

260 H. Raphael, H. Schenck
5 Conclusion
The process cost accounting-appropriate mapping of complex and in some cases
scarcely structurable workflows can be regarded as a success due to the choice of
a high degree of abstraction.27
The greatest limitation lies in the legacy informa-
tion system landscape. This determines the possible accuracy of the patient-related
cost allocation, the effort required to obtain information and thus directly the eco-
nomic success of process cost accounting. This underscores the economic neces-
sity of digital and thus analyzable patient files.28
A critical success factor is close coordination with QM. Early consideration of
process cost accounting in QM reduces the workload and creates greater accep-
tance, as certified processes are available for costing purposes.29
Another area of use where process-oriented costing has proved its worth is in in-
vestment decisions. A major benefit is the intuitive cost transparency that enables
discussions with medical experts.
But process cost accounting also serves as an essential foundation for further
analyses. Besides from the general ability to carry out detailed case costing, it can
provide answers to other questions. A central point is the grouping of case data for
strategic planning and control, because in many cases the case numbers do not al-
low solid statistical conclusions to be drawn. The determination of systematic dif-
ferences between InEK costing and process cost accounting may also be of inter-
est30
.
In conclusion, it may be stated that process cost accounting is an important but
time-consuming cost accounting method whose success depends greatly on the
concrete situation.
27
Owing to the aggregation, the potential for process optimization is lower than for routine
processes with a fixed order of activities.
28
The existing situation in which on the one hand doctors spend a large part of their work-
ing time on documentation which on the other hand is often not in a form that lends itself
to financial analysis, is clearly untenable from a planning and control viewpoint.
29
A possible conflict of goals should be pointed out here. Whereas a complete workflow
overview is desirable for QM, process cost accounting tends more to subprocesses that
are homogenously influenced by cost drivers.
30
This question is necessary for a definitive evaluation of the benchmark approach chosen
here; this definitive answer will probably also influence the future behavior of both hos-
pitals and health insurance funds.

Process Cost Analysis at Marienhospital Herne 261
Literature
Breyer, F. / Zweifel, P (1999): Gesundheitsökonomie, 3rd edition, Berlin and el-
sewhere, 1999.
Coenenberg, A. G. (1999): Kostenrechnung und Kostenanalyse, 4th edition,
Landsberg/Lech 1999.
Coenenberg, A. G. / Fischer, T. M. (1999): Prozesskostenrechnung – Strate-
gische Neuorientierung in der Kostenrechnung, in: DBW, Vol. 1, 1999, pp. 21-40.
Götze, U. (1997): Einsatzmöglichkeiten und Grenzen der Prozeßkostenrechnung,
in: Freidank, C.-C. / Götze, U. / Huch, B. / Weber, J. (Hrsg.): Kostenmanagement:
aktuelle Konzepte und Anwendungen, Berlin and elsewhere 1997, pp.141-174.
Horváth, P. / Mayer, R. (1993): Prozeßkostenrechnung. Konzeption und Ent-
wicklungen, in: krp, Special issue 2, 1993, pp. 15-28.
Mayer, R. (1990): Prozeßkostenrechnung, in: krp, Vol. 5, 1990, pp. 309-312.
Mayer, R. (2002): Prozesskostenrechnung, in: Küpper, H.-U.; Wagenhofer, A.
(Hrsg.): Handwörterbuch Unternehmensrechnung und Controlling, 4th edition,
Stuttgart 2002, pp. 1621-1630.
Reckenfelderbäumer, M. (1994): Entwicklungsstand und Perspektiven der Pro-
zessrechnung, Wiesbaden 1994.
Scheer, A.-W. / Chen, R. / Zimmermann, V. (1996): Prozeßmanagement im
Krankenhaus, in: Adam, D. (Hrsg.): Krankenhausmanagement, Wiesbaden 2004,
pp. 75-96.
Schlüchtermann, J. / Gorschlüter, P. (1996): Ausgewählte Aspekte eines mo-
dernen Kostenmangements im Krankenhaus, in: Adam, D. (Ed.): Krankenhaus-
management, Wiesbaden 2004, pp. 97-111.
Schmidt, A. (2001): Kostenrechnung: Grundlagen der Vollkosten-, Deckungsbei-
trags- und Plankostenrechnung sowie des Kostenmanagements, 3rd edition., Stutt-
gart and elsewhere 2001.

Monitoring ITIL Process Performance at DAB
Bank
Simone Sulzmann
iET Solutions GmbH
Summary
The productivity of a service department depends greatly on the ad hoc ability to
analyze processes in detail and immediately initiate any change actions required.
This closes the loop of operational activities, process and cause analysis and
implementation of suitable optimization measures. DAB Bank has introduced an
ITIL-based process structure in order to boost its service quality. This flexible
analysis of detailed flows is the final logical component for a rounded-off concept.
Keywords
Service process, service quality, key performance indicator system, process
definition, SLA monitoring, call volume, hotline, solution times, IT helpdesks,
problem management, net processing time

264 S. Sulzmann
1 Service Department Work as per ITIL
Today, the management of IT service processes is confronted with two challenges
which at first sight seem to be contradictory: strict cost orientation and a focus on
customer satisfaction. The ITIL guideline shows how both can be achieved. It
supplies the foundation for successful IT Service Management (ITSM). This
entails the process for planning, managing and controlling the quality and quantity
of IT services rendered. The abbreviation ITIL stands for Information Technology
Infrastructure Library. This is a collection of methods for organizing IT. The
guideline comprises a number of modules or disciplines and provides guidance on
how to set up a service-oriented IT department, but without direct instructions.
More than 40 books have since been published containing proven real-life
methods as "Best Practice for IT".
2 Introducing ITIL Processes at DAB Bank
DAB Bank AG supports savers, investors and traders in Germany and Austria.
The largest direct broker in terms of its customers’ securities holdings, DAB
offers a full portfolio of services for wealth building, securities and asset
protection. In corporate-customer business, the bank is a partner to asset
management companies, investment fund brokers, investment advisers and also
commercial and savings banks. Founded in 1994, the Munich-based bank started
with some 10,000 customers; today it manages some EUR 13 billion for more than
462,000 accounts. It regards “1-A quality at the lowest possible costs” as one of its
key strengths in the banking business. The in-house IT department operates its IT
Service Management (ITSM) along the same lines. With the seamless, de-facto
standard ITIL-based ITSM solution from iET Solutions, the bank succeeded in
improving the quality of its IT services noticeably over an implementation period
of 12 weeks.
2.1 Conception
The strategic impulse for adopting ITIL was the initiative in the IT department to
consolidate systems and optimize processes.
The IT initiative requirements for DAB Bank raised the question as to whether the
legacy helpdesk software could cope with the restructuring of the service
organization. It was soon revealed that modifying the legacy system would be too
expensive, an ITIL-compliant application was called for to replace it. For his
bank, explained Marcel Comans, head of IT Service&Support, there were quite
clear decision criteria: scalability, end-to-end ITIL basis, low modification

Monitoring ITIL Process Performance at DAB Bank 265
workload and excellent value for money compared with other vendors simplified
his decision for iET ITSM.
What applies for the entire IT initiative was also used as the yardstick for selecting
the new IT Service Management System (ITSM). The tool had to be the state of
the art and enable IT department staff to influence the application development
themselves. Only then can DAB Bank ensure even at the helpdesk that changes to
processes are immediately implemented in the ITSM application as well. "We just
have a living process to which we make minor adjustments quickly and easily
every week in iET ITSM," is how Comans describes his experience. Because one
of the key objectives was to provide sales units with optimum support, and it is
precisely here that flexible and fast responses are a must.
Fig. 1: ITIL-aligned processes help to provide a cost-oriented structure for the IT Service
The plan was to be turned into reality as quickly as possible. "Once a decision had
been taken for ITIL-compliant IT Service, we were keen to roll out and implement
the changes fast," recalls Marcel Comans, responsible for Incident Management.
Consultants experienced in ITIL helped him to define the flows. Together they
conducted workshops with internal customers from the bank's technical
departments and IT staff. This formed the basis on which the project group
designed the processes. DAB Bank wanted more customer-oriented controlling of
IT services and processes from the new ITIL orientation. Of particular importance
for the bank were:
266 S. Sulzmann
• Standardization of procedures in IT
• Definition of interfaces to other areas
• Measurability of processes
• Documentation of all faults arising
• Conclusion of Service Level Agreements
• Reusability of problem solutions.
2.2 Incident Management – Reporting of Problems and Bottlenecks
Requests to replace a faulty keyboard or a problem with bank systems are
recorded in Incident Management, as are warning or error reports generated in the
Monitoring System. The ticket generated is classified and prioritized using various
service categories; after all, not every incident is equally important and urgent.
The five helpdesk staff are provided with active support by the system. An error in
a particular system category can only be assigned certain priorities. In turn, these
are couple to the service levels. Marcel Comans sees clear advantages in this: "My
helpdesk colleagues find things much easier with iET ITSM and in the event of
escalation we ensure that only relevant cases are presented to management."
Looking back, Marcel Comans is highly satisfied with the outcome: "Everybody
who was affected was involved right from the start; this ensured the high level of
acceptance we have today. Together with our customers, we defined recovery
times that were then agreed in the corresponding service levels and are monitored
with iET ITSM. Our customers are pleased that they now have only one point of
contact." Regardless of whether they report the incident via the telephone hotline,
intranet or email.

Monitoring ITIL Process Performance at DAB Bank 267
If a Service Level Agreement stipulates contacting the customer within 24 hours,
the employee is given a timely reminder. The introduction of ITSM now permits
sending email notifications and escalations to the employees responsible and to
management.
Fig. 2: A clearly designed screen is critical for fast and structured incident entering
The intranet interface is also an innovation much used by internal customers for
standardized messages. "This enabled us to significantly reduce the number of
initial calls to the hotline. With the queries over the intranet we are simply that
much faster," comments Comans on the success. The helpdesk team processes
some 200 incidents a day.

268 S. Sulzmann
2.3 Problem Management – Tracking Down the Causes
IT department customers are more interested in having their problems solved. At
the same time, Problem Management deals with analyzing and deriving solutions
for similar incidents; this means that several incidents can be addressed in one go.
Second-level Support at DAB Bank, IT Operations, is responsible for operating
the systems such as the trading application or the account management system.
The various system owners are the first point of contact when similar incidents
arise. They analyze the incidents affecting their systems for repetitions and
parallels. If they or a helpdesk team member notice a conspicuous frequency of
comparable tickets these are linked to form a problem case.
The product owner draws up a solution along with the appropriate solution
documentation.
This extra effort pays dividends, because the helpdesk team immediately has the
right solution to hand if such an incident occurs again.
Depending on the problem, guidance on how to rectify the incident may suffice –
or detailed tracing of the cause may be called for. In the latter case, the product
owner puts together a team of experts to deal with the problem according to its
urgency and importance. "The product owner ensures that a solution is found and
documented. Normally the solution is communicated to the customer via a central
point of contact at the helpdesk.
In more complex cases, the product owner contacts the customer directly. In this
way we ensure that our customers receive prompt help without communication
breaks," explains Klaus Hintermayr, Head of Problem Management. His team too
is bound by particular recovery times. "Even now, so soon after rollout, we can
say that iET ITSM has improved our service quality," sums up Hintermayr.
"Thanks to the standardized processes, our staff work together extremely
efficiently; everybody knows how valuable good information from colleagues is
and so everybody plays their part."
2.4 Change Management
Solving a problem often entails major changes to systems. Accordingly, third level
support, the "IT Systems Infrastructure" team, is responsible for Change
Management. Under the project control of Alexander Venzke, Head of IT Systems
Infrastructure, the relevant processes are set up as per ITIL. The second area
besides IT Production, IT Solutions, is becoming progressively more involved in
the work. Then, about 20 other employees will be using iET ITSM for their daily
work. Step by step, DAB Bank is establishing a system that provides integrated
mapping of all its individual service processes and is used jointly by all in-house
IT units.

Monitoring ITIL Process Performance at DAB Bank 269
3 Process Performance Management in IT Service
3.1 Key Performance Indicators for Service
As the head of IT Operations, Klaus Hintermayr is responsible not only for the
quality but also the efficiency of his department. Practically with a mouse click in
iET ITSM, he generates reports on incident handling, throughput times and how
long it takes to trace the cause of a problem. Since the rollout of the iET Solutions
software, his colleague Marcel Comans also generates his own reports just as
quickly. The open interface to the database enables him to answer questions
quickly with a few clicks.
So he always has to hand queries about the number of incidents with a given
priority for a given application. The iET ITSM add-on module, iET Process
Analyzer, combines classic reporting with detailed analysis capabilities for tracing
causes at the process level.
For Marcel Comans, this tool provides a clear bonus compared with the old way
of processing data in a spreadsheet: "With iET Process Analyzer I always have
graphic reports straight away. I can use Favorites to save model reports and then
customize them using Drag-and-Drop and a few clicks of the mouse."
It is particularly exciting for him when quality performance indicators are
involved. Questions about the initial solution rate and how many cases could only
be completed with the help of the 2nd or 3rd Level are very helpful indicators.
Also important is the question of compliance with Service Level Agreements.
Here, the iET Process Analyzer comes supplied with comprehensive standard
reports. It compares target and actual times for the processes.
"The evaluation options in the standard report already meet 95% of our
requirements," explains Comans with satisfaction. "We merely augment them with
a few key performance indicators to provide information on the results of our
escalation process."
The quality of Problem Management can be measured with key performance
indicators such as average time taken to solve a problem or the number of
incidents related to a certain problem. Every process step can be linked and shown
with cost rates or prices. Also advantageous is the direct link to the data from the
operational system, iET ITSM. This does away with time-consuming customizing,
mapping or synchronization processes. Ease of use was another reason why DAB
Bank installed iET Process Analyzer. "We simply save so much time. I am faster
with my own reports. And my colleagues who have no knowledge of the database
structure can nevertheless "click together" their own evaluations and no longer
have to rely on me," explains Comans with a smile.

270 S. Sulzmann
Fig. 3: Example of a standard iET Process Analyzer report:
The "outlier" in May/June shows unusually high waiting times.
3.2 Tracing Causes with Process Mining
When it is a matter of rooting out the causes of variances, iET ProcessAnalyzer
really comes into its own. As a rule, the analysis process begins with the time
dimension. The key performance indicators from Incident Management are first
retrieved on an ad-hoc basis and then evaluated for a given period of time and may
be compared with other periods. This might illustrate for example how many calls
were taken per month by how many staff or how high the throughput time was
over the last 6 or 12 months. If "outliers" are found, then the detective work
begins.
If Comans, Hintermayr and their colleagues establish a noticeable variance, they
can immediately "drill-down" to find the underlying reasons. Double-clicking on
the graphic takes them further into the problem and presents a list of the processes
affected. For each individual case, they see a visualized flow of all the steps of the

Monitoring ITIL Process Performance at DAB Bank 271
actual process in an EPC diagram. This makes it easier to pinpoint the special
case. A glance at the attributes shows the corresponding process values.
Fig. 4: EPC detail presentation
Figure 4 and the corresponding attributes show the reasons for the variation. In
this example, the transaction was left unattended for a very long time owing to
resource bottlenecks in the vacation period.
3.3 Ideal Decision and Planning Principles
The retrospective analysis of problems and their causes is extremely important.
The derivation of the right actions for the future is the next key step. Here too,
graphical evaluations help to show the optimization potential. They show where
efficiency in a process can be boosted. Only an integrated cost analysis helps to
draw the right conclusions from the historical data. For example, priority must be
given to tackling those outliers that cause the highest costs. In addition, the
evaluations are an ideal planning tool. For example, the multi-dimensional
analyses help to produce better estimates for future resource requirements on the
basis of the historical values. Marcel Comans at DAB Bank hopes that in future
greater use will be made of iET ProcessAnalyzer to monitor running processes.
"We don't have to wait until we receive a flood of incidents or escalations. Every
IT team leader who regularly looks at iET ProcessAnalyzer can track whether
there are signs of a problem emerging in his or her area. Then early remedial
action can be taken."

272 S. Sulzmann
4 Summary and Outlook
Comprehensive process work has paid off for DAB Bank. "What ITIL promises
has been delivered," concludes Comans with satisfaction. Needless to say there
were initial reservations in the various teams, says the project leader, but now
everybody has been convinced. His colleagues have more breathing space for their
daily work; they can concentrate on providing optimum solutions. At DAB Bank
people are aware that the IT systems provide major support for the bank's strategy.
Thanks to top-quality applications and new processes, the bank is ideally
positioned to undertake future growth with confidence.

Annex: The Authors
Barth, Winfried
Senior Manager
ARIS PPM Product Consulting
IDS Scheer AG
Altenkesseler Straße 17
D-66115 Saarbrücken
Bauer, Tino
Manager
Business Unit Chemie/Pharma
IDS Scheer AG
Lindwurmstraße 23
D-80337 München
Bird, John
Senior Consultant
ARIS PPM Product Consulting
IDS Scheer UK Limited
Vienna House
Starley Way
UK-B37 7HB Birmingham
Blickle, Dr. Tobias
Senior Manager
ARIS PPM Development
IDS Scheer AG
Altenkesseler Straße 17
D-66115 Saarbrücken
Drawert, Steffen
Manager
Core Service Supply
Chain Controlling
IDS Scheer AG
Zimmerstraße 69
D-10117 Berlin
Dreißen, André
Manager
Business Unit Utilities/Telecom
IDS Scheer AG
Heinrichstraße 169A
D-40239 Düsseldorf
Gahse, Frank
Senior Manager
ARIS PPM International
IDS Scheer AG
Altenkesseler Straße 17
D-66115 Saarbrücken
Heinrichs, Rainer
Head of Call/Billing
Süwag Energie AG
Brüningstr. 1
D-65929 Frankfurt
Heselmann, Bernd
Signatory, Head of
Product Development
Gesellschaft für integrierte
Systemplanung mbH
Softwarezentrum
Junkersstr. 2
D-69469 Weinheim
Heß, Dr. Helge
Director
ARIS Business Process Engineering
IDS Scheer AG
Altenkesseler Straße 17
D-66115 Saarbrücken

274 Annex: The Authors
Jost, Dr. Wolfram
Member of the Board
IDS Scheer AG
Altenkesseler Straße 17
D-66115 Saarbrücken
Klein, Dr. Olaf
Ass. Vice-President
Credit Suisse Zürich
Paradeplatz 8
8070 Zürich
Knirck, Phillip
Consultant
ARIS PPM Product Consulting
IDS Scheer AG
Altenkesseler Straße 17
D-66115 Saarbrücken
Kogelschatz, Dirk
Business Project Leader
Credit Suisse Zürich
Paradeplatz 8
CH-8070 Zürich
Kronz, Dr. Andreas
Senior Manager
ARIS PPM Product Consulting
IDS Scheer AG
Altenkesseler Straße 17
D-66115 Saarbrücken
Kruppke, Helmut
Member of the Board,
Spokesman of the Executive Board
IDS Scheer AG
Altenkesseler Straße 17
D-66115 Saarbrücken
Linke, Michael Peter
Product Marketing Manager
ARIS PPM
IDS Scheer AG
Altenkesseler Straße 17
D-66115 Saarbrücken
Loes, Gregor
Senior Manager
Customer Interaction Center (CIC)
IDS Scheer AG
Altenkesseler Straße 17
D-66115 Saarbrücken
Miksch, Klaus
Global Account Manager
IDS Scheer AG
Lindwurmstrasse 23
D-80337 München
Müller, Lars
Head of Process and
Quality Controlling
DaimlerChrysler Bank AG
Siemensstraße 7
D-70469 Stuttgart
Oberländer, Herbert
Director
Business Unit Insurances
IDS Scheer AG
Lindwurmstraße 23
D-80337 München
Ossig, Frank
Senior Consultant,
Core Service Technologies
IDS Scheer AG
Lindwurmstraße 23
D-80337 München

Annex: The Authors 275
Panagiotidis, Dr. Petros
Dr. Petros Panagiotidis
Business Systems Integration
Manager
Vodafone Panafon S.A.
GR-15231 Halandri
Ramler, Karl
Technical Manager
E.ON Kernkraft GmbH
Kernkraftwerk Unterweser
Dedesdorfer Str. 2
D-26935 Stadland
Raphael, Holger
Head of Administration
Stiftung Katholisches Krankenhaus
Marienhospital Herne
Klinikum der Ruhr Universität
Bochum
Hölkeskampring 40
D-44625 Herne
Reif, Robert,
Corporate Management
Sales Control
E.ON Bayern AG
Heinkelstraße 1
D-93049 Regensburg
Scheer, Prof. Dr. Dr. h.c. mult.
August-Wilhelm
Head of the Institute for Econimic
Information Technology, University
of the Saarland; founder and Chair-
man of the Supervisory Board
IDS Scheer AG
Altenkesseler Straße 17
D-66115 Saarbrücken
Schenck, Hendrick
Controlling
Stiftung Katholisches Krankenhaus
Marienhospital Herne
Klinikum der Ruhr Universität
Bochum
Hölkeskampring 40
D-44625 Herne
Schwarzin, Jürgen
Divisional Head
Process Controlling
E.ON Kernkraft GmbH
Kernkraftwerk Unterweser
Dedesdorfer Str. 2
D-26935 Stadland
Stängle, Peter
Head of the Coaching Team
Gesellschaft für integrierte
Systemplanung mbH
Zepplinstr. 11
D-91052 Erlangen
Sulzmann, Simone
Marketing Manager Worldwide
iET Solutions GmbH
Boschetsrieder Str. 67
D-81379 München
von den Driesch, Markus
Senior Manager
ARIS PPM Development
IDS Scheer AG
Altenkesseler Straße 17
D-66115 Saarbrücken


