Embed Size (px)
Citation preview
Growing UpCarter’s
Carter’s, Inc. 2004 Annual ReportCarter’s, Inc. 1170 Peachtree Street NE, Suite 900, Atlanta, Georgia 30309 • 888.782.9548 www.carters.com
If they could just stay little ‘til their Carter’s wear out.
Carter’s, Inc. 2
00
4
Annual R
epo
rt

from Top
Revenue Growth $ in millions
Financial Highlights
1994
$271
2004
$823
Co
ncep
t an
d D
esig
n: w
ww
.cri
ttg
raha
m.c
om
Co
py:
Mim
i Bea
n
Carter’s, Inc. 1
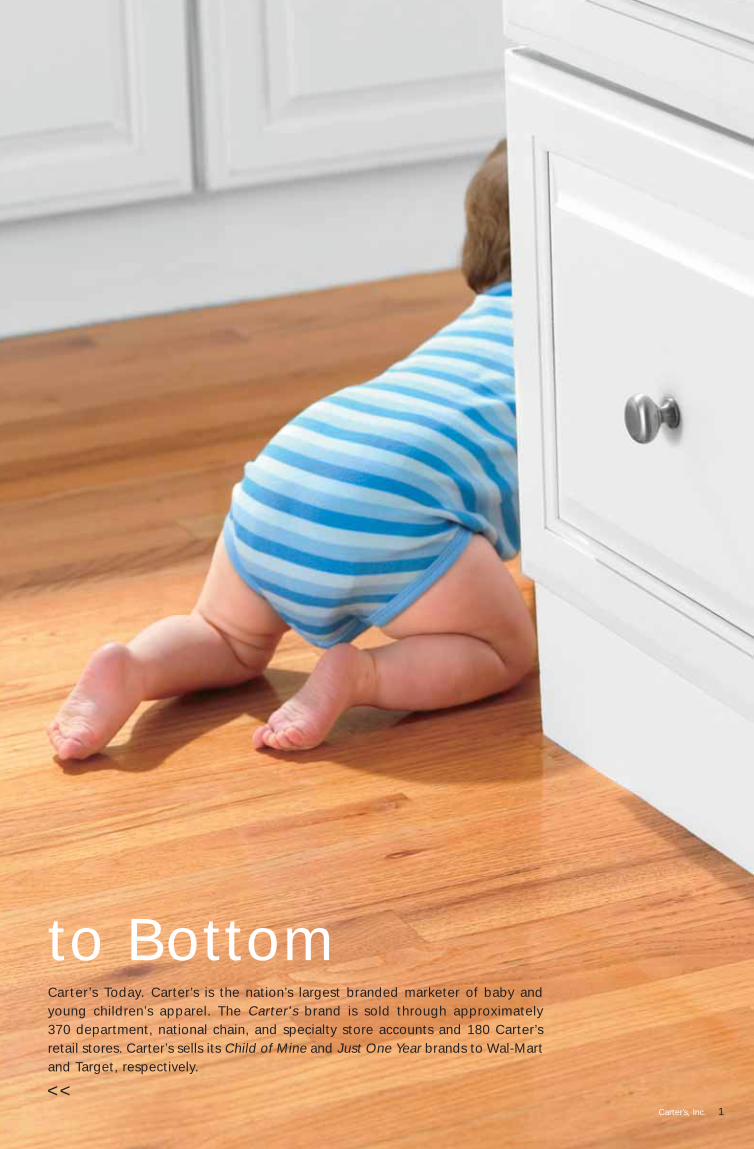
Carter’s Today. Carter’s is the nation’s largest branded marketer of baby andyoung children’s apparel. The Carter's brand is sold through approximately 370 department, national chain, and specialty store accounts and 180 Carter’sretail stores. Carter’s sells its Child of Mine and Just One Year brands to Wal-Martand Target, respectively.
to Bottom
<<2004 Annual Report
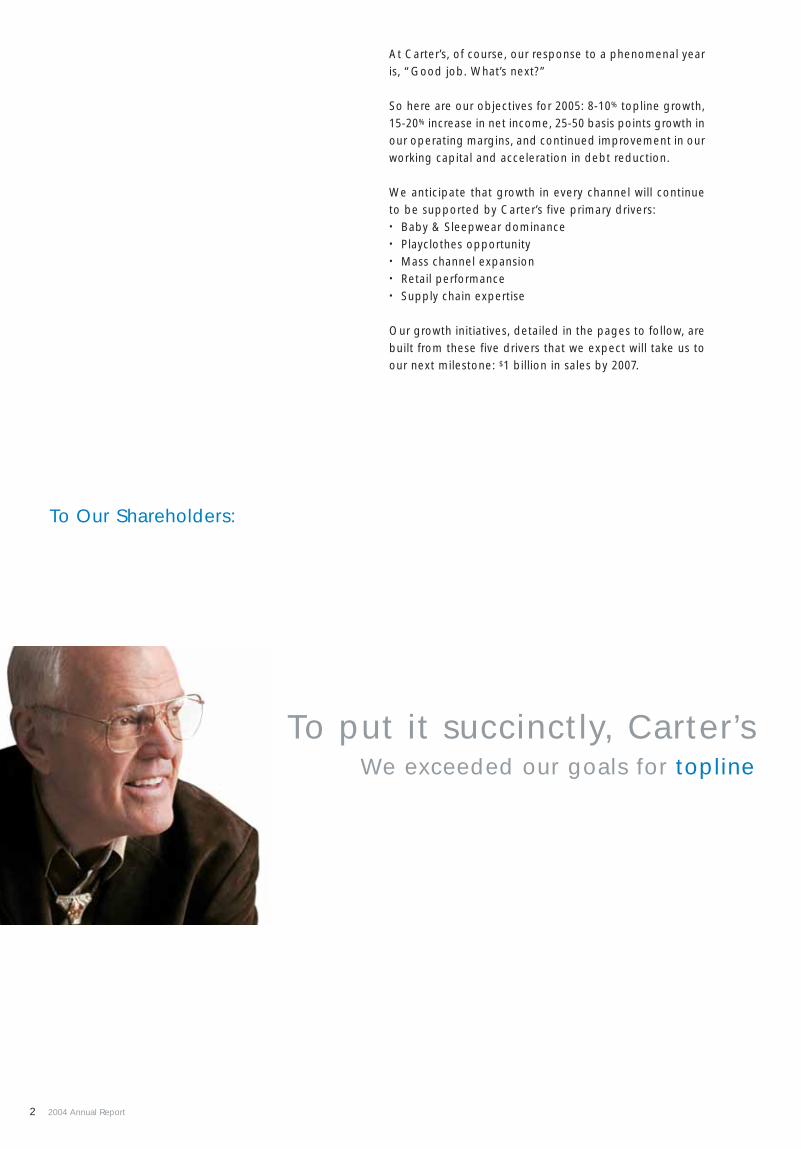
At Carter’s, of course, our response to a phenomenal yearis, “Good job. What’s next?”
So here are our objectives for 2005: 8-10% topline growth,15-20% increase in net income, 25-50 basis points growth inour operating margins, and continued improvement in ourworking capital and acceleration in debt reduction.
We anticipate that growth in every channel will continueto be supported by Carter’s five primary drivers:• Baby & Sleepwear dominance • Playclothes opportunity• Mass channel expansion• Retail performance• Supply chain expertise
Our growth initiatives, detailed in the pages to follow, arebuilt from these five drivers that we expect will take us toour next milestone: $1 billion in sales by 2007.
To Our Shareholders:
We exceeded our goals for topline
To put it succinctly, Carter’s
2

Net sales $823.1 million, up 17%
Net income $49.7 million, up over 100%
Record level of operating cash flow of $42.7 million
Debt reduction of $28.2 million or 13%
Growth in all channels
Growth in all product categories
Wholesale
Retail
Mass
47%
35%
18%
Channel Mix
Product Mix
Baby
Playclothes
Sleepwear
Other
42%
30%
21%
7%
Results
Diversified Revenue Base
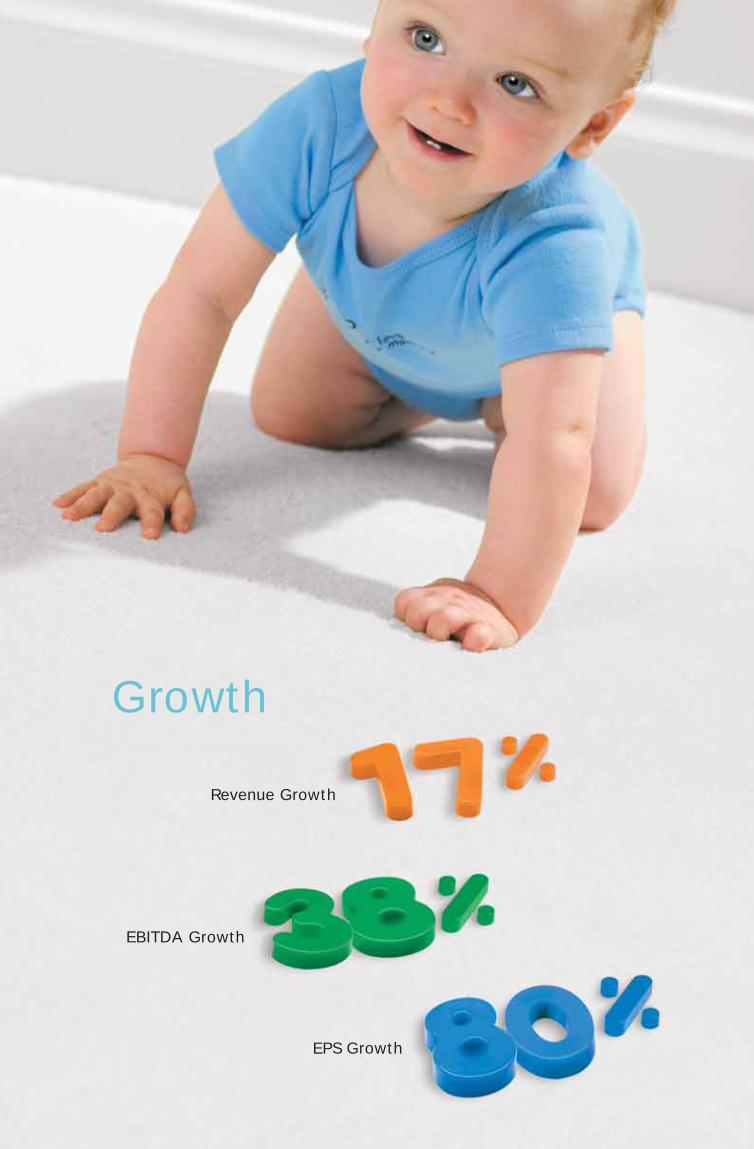
Growth
Revenue Growth
EBITDA Growth
EPS Growth
Net sales $823.1 million, up 17%
Net income $49.7 million, up over 100%
Record level of operating cash flow of $42.7 million
Debt reduction of $28.2 million or 13%
Growth in all channels
Growth in all product categories
Wholesale
Retail
Mass
47%
35%
18%
Channel Mix
Product Mix
Baby
Playclothes
Sleepwear
Other
42%
30%
21%
7%
Results
Diversified Revenue Base
Growth
Revenue Growth
EBITDA Growth
EPS Growth
Carter’s, Inc. 1
Carter’s Today. Carter’s is the nation’s largest branded marketer of baby andyoung children’s apparel. The Carter's brand is sold through approximately 370 department, national chain, and specialty store accounts and 180 Carter’sretail stores. Carter’s sells its Child of Mine and Just One Year brands to Wal-Martand Target, respectively.
to Bottom
<<2004 Annual Report
At Carter’s, of course, our response to a phenomenal yearis, “Good job. What’s next?”
So here are our objectives for 2005: 8-10% topline growth,15-20% increase in net income, 25-50 basis points growth inour operating margins, and continued improvement in ourworking capital and acceleration in debt reduction.
We anticipate that growth in every channel will continueto be supported by Carter’s five primary drivers:• Baby & Sleepwear dominance • Playclothes opportunity• Mass channel expansion• Retail performance• Supply chain expertise
Our growth initiatives, detailed in the pages to follow, arebuilt from these five drivers that we expect will take us toour next milestone: $1 billion in sales by 2007.
To Our Shareholders:
We exceeded our goals for topline
To put it succinctly, Carter’s
2
Carter’s, Inc. 3
In addition to all the good news, I want to mention theseveral ways in which Carter’s is remarkable, each of whichis a sustainable advantage in our industry.
Our greatest asset is the Carter’s brand. This name is trustedyear after year, baby after baby, generation after genera-tion by mothers and grandmothers whose standards areextremely high.
Very often, Carter’s is an expectant mom’s first purchase forher baby. We are the #1 gift choice nationwide for familyand friends who are touched by each new life. Few apparelbrands in this country enjoy anything near our 84% aware-ness. We call it “share of heart,” and it’s priceless.
Another advantage is the core characteristics of the peopleat Carter’s; sterling values that can’t be taught, but mustbe acknowledged. This team is driven, hard-working, andmotivated, and as a result, Carter’s has become a magnetfor talent. Over the past three years, we’ve been able toupgrade every department with outstanding people,including our recent additions in retail management.
Our new executives join a team that is known for its consistent performance, deep bench strength, anddecades-long commitment for growth – and we have thetalent in place to take Carter’s to the next level.
In 2004, our president of marketing, Joe Pacifico, movedinto the position of president of Carter’s, which enabledme to focus on strategy and long-term planning.
Carter’s culture is creative, productive, team-based, disciplined, and focused on serving our brand, our company, and the needs of children. We understandthose needs. We understand the desire to celebrate thebirth of a child. We’re proud of the Carter’s brand andeverything it stands for.
And we’re doing our best, every single day, to make ournext report card as good as this one.
Sincerely,
Frederick J. Rowan, IIChairman of the Board of Directorsand Chief Executive Officer
and bottom line in every channel.
earned “straight A’s” in 2004.
• Baby
• #1 in the $504 million layette market
• 27% share of layette
• 3.8 times larger than the nearest competitor
• Baby Gifts
• #1 in the $1.1 billion baby gift market
• 24% share
• 2.7 times larger than the nearest competitor
• Sleepwear
• #1 in the $784 million sleepwear market
• 27% share
• 75% larger than the nearest competitor
• Newborn Playclothes
• #1 in the $1.2 billion newborn playclothes market
• 19% share
• 50% larger than the nearest competitor

2004 Annual Report4
Brand IdentityCarter’s is a special part of the emotional bond betweenparent and child, because several times every day, Carter’sis part of the care experience. In fact, there are over 10Carter’s Baby products sold for every child born in America.
Our Baby, Sleepwear, and Playclothes products are distin-guished by their consistent quality, attractive colors, andwarm-hearted artwork, and an experienced mother orgrandmother can usually identify a Carter’s gift with onegood look.
Brand StrengthAs the single most powerful baby and young children’sbrand, Carter’s is the first choice for gifts by shoppers.They trust the Carter’s brand as the sign of a gift that’sappropriate, comfortable, safe, and easily cared for, inaddition to being adorable.
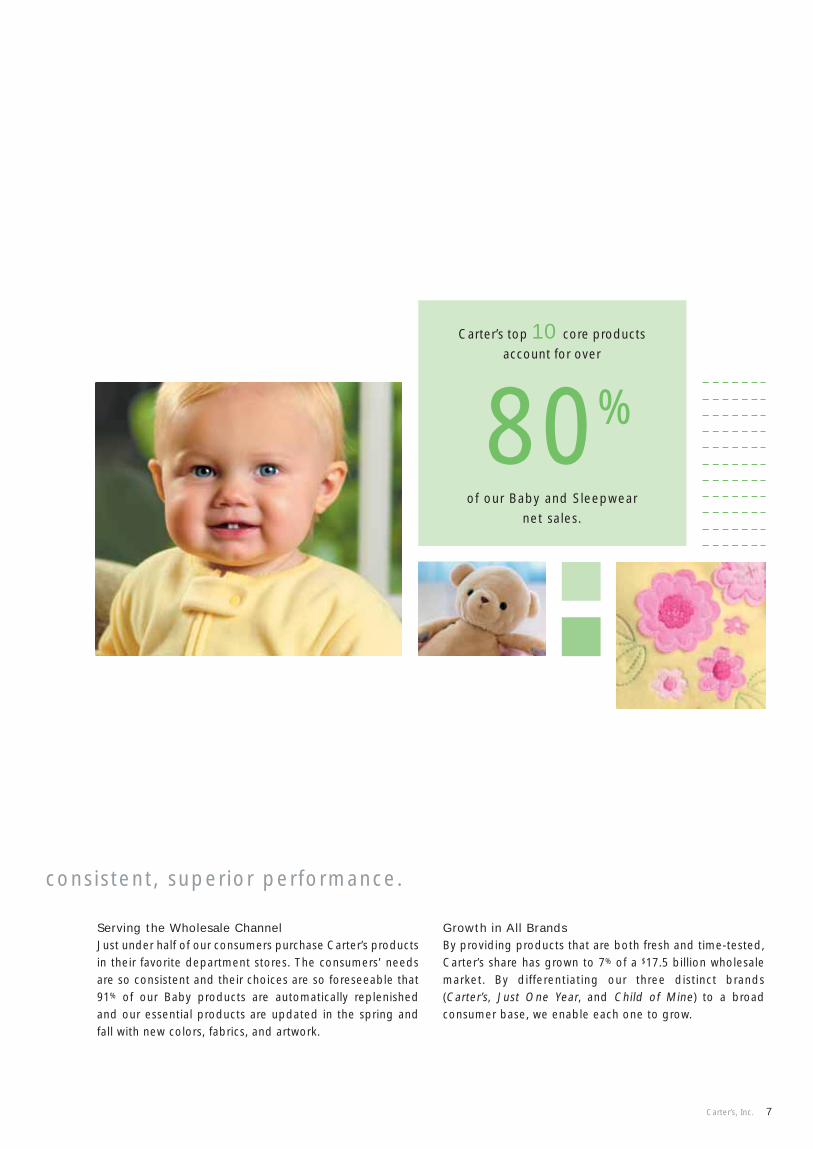
Carter’s understands children’s lives so well that just 10 core products account for over 80% of our Baby andSleepwear net sales. Our bodysuits, blanket sleepers, and other everyday essential products are beautifullydesigned and well constructed, with innovative packagingand pricing that keeps them moving almost as fast as theyoungsters who wear them.
A newCarter’s
customer is born
every8
Build on proven and disciplined
seconds.

Carter’s, Inc. 5
Opportunities for Organic GrowthWe don’t expect to stop growing until people stop havingbabies, and not only are the number of births growingsteadily, but most of today’s parents have more disposableincome to spend on their families. Children’s apparel as anindustry is unique, because in six short years – from birth tobus – a child typically grows through 10 sizes and dozens ofdifferent Baby, Sleepwear, and Playclothes items.
In addition, we round out our offering with select licensedproducts that have grown steadily and should continue togrow, year after year.
Born to Win strategies to drive organic growth in our core products.

2004 Annual Report6
Biggerand Stronger
Dominate Baby and Sleepwear markets by gaining share with key wholesale customers through
Carter’s, Inc. 7
Serving the Wholesale ChannelJust under half of our consumers purchase Carter’s productsin their favorite department stores. The consumers’ needsare so consistent and their choices are so foreseeable that91% of our Baby products are automatically replenishedand our essential products are updated in the spring andfall with new colors, fabrics, and artwork.
Growth in All BrandsBy providing products that are both fresh and time-tested,Carter’s share has grown to 7% of a $17.5 billion wholesalemarket. By differentiating our three distinct brands(Carter’s, Just One Year, and Child of Mine) to a broad consumer base, we enable each one to grow.
80%
of our Baby and Sleepwear net sales.
Carter’s top 10 core productsaccount for over
consistent, superior performance.

2004 Annual Report8
Growing by LeapsLeverage our brand formula in the large and
growing Playclothes market.
Carter’s, Inc. 9
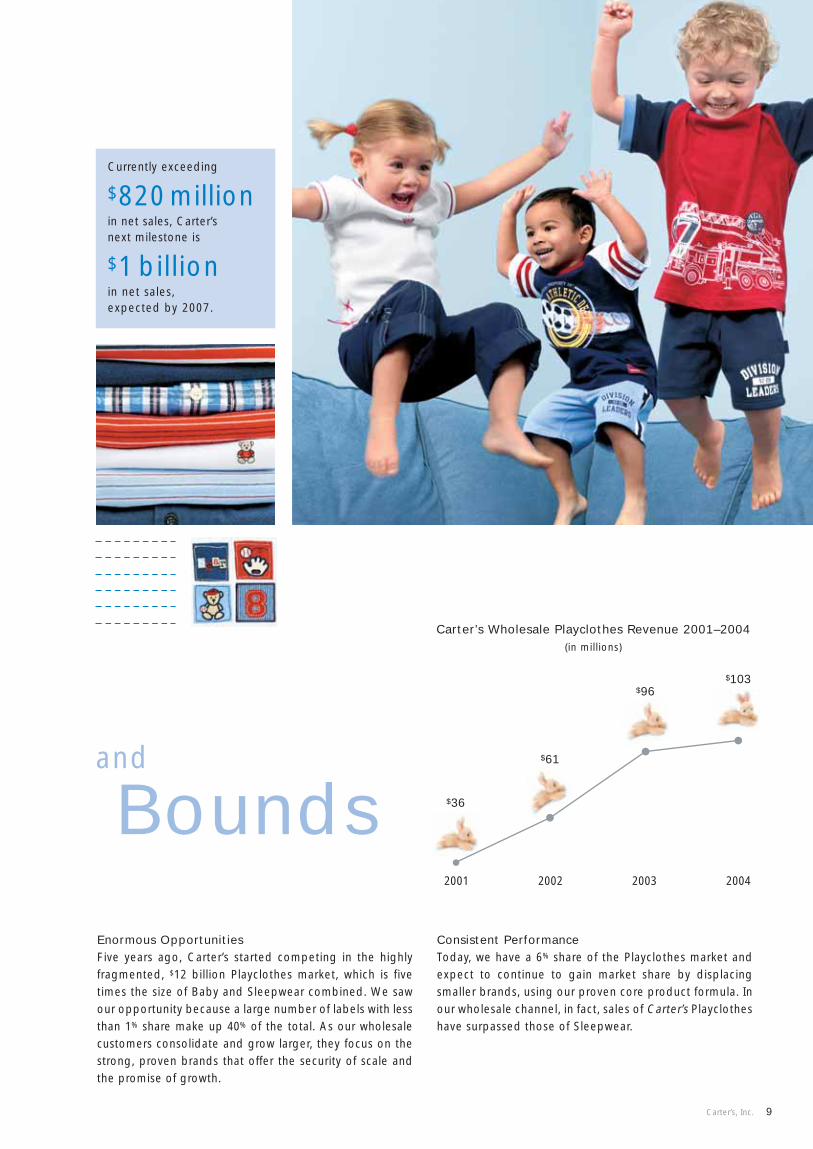
Carter’s Wholesale Playclothes Revenue 2001–2004 (in millions)
Bounds2001 2002 2003 2004
and
Enormous OpportunitiesFive years ago, Carter’s started competing in the highlyfragmented, $12 billion Playclothes market, which is fivetimes the size of Baby and Sleepwear combined. We sawour opportunity because a large number of labels with lessthan 1% share make up 40% of the total. As our wholesalecustomers consolidate and grow larger, they focus on thestrong, proven brands that offer the security of scale andthe promise of growth.
Consistent PerformanceToday, we have a 6% share of the Playclothes market andexpect to continue to gain market share by displacingsmaller brands, using our proven core product formula. Inour wholesale channel, in fact, sales of Carter’s Playclotheshave surpassed those of Sleepwear.
$96$103
Currently exceeding
$820 millionin net sales, Carter’s next milestone is
$1 billionin net sales, expected by 2007.
$36
$61

2004 Annual Report10
Drive comparable store sales and extend

Carter’s, Inc. 11
Reaching
Widening Our LeadAs the #1 children’s outlet retailer, we are a destinationwhich makes Carter’s stores an attractive addition to outlet and strip center malls. In 2004, we added 11 storesfor a total of 180 (with 27 in strip malls), and we expectto open 10-12 new stores each year through 2008.
Touching Our CustomersBy focusing on our strength in Baby products, our successproves once more that babies are irresistible. Last year,we increased comp store growth 6.2% by implementingsome important improvements: we enhanced our product,put Baby products in the front of the store, redesignedour signage to be more emotional and welcoming, madethe aisles wider for shoppers with baby carriages, andbrought in new leadership.
Out
Focusing on how we could improve each shopper’s experience
resulted in comp store growth of 6.2%.
the reach of the Carter’s brand through our retail stores.
2004 Annual Report12
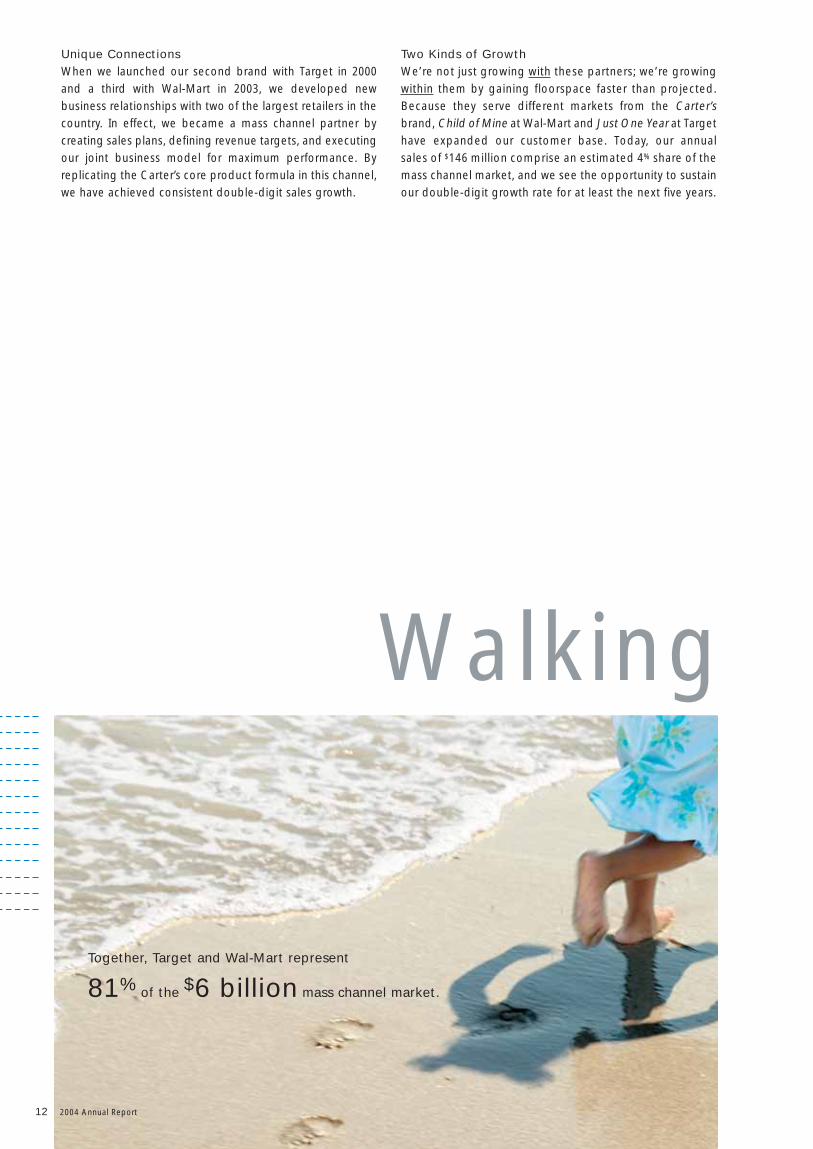
Unique ConnectionsWhen we launched our second brand with Target in 2000and a third with Wal-Mart in 2003, we developed new business relationships with two of the largest retailers in thecountry. In effect, we became a mass channel partner by creating sales plans, defining revenue targets, and executingour joint business model for maximum performance. Byreplicating the Carter’s core product formula in this channel,we have achieved consistent double-digit sales growth.
Two Kinds of GrowthWe’re not just growing with these partners; we’re growingwithin them by gaining floorspace faster than projected.Because they serve different markets from the Carter’sbrand, Child of Mine at Wal-Mart and Just One Year at Targethave expanded our customer base. Today, our annualsales of $146 million comprise an estimated 4% share of themass channel market, and we see the opportunity to sustainour double-digit growth rate for at least the next five years.
Walking
Together, Target and Wal-Mart represent
81% of the $6 billion mass channel market.
Carter’s, Inc. 13
TallExpand mass channel brands by replicating the proven Carter’s formula.
2004 Annual Report14
Gaining Speed
Shorter CyclesBecause Carter’s is a core product business, we don’t haveto reinvent the wheel – or the supply chain – for our newlines each spring and fall. As a result, our new productdevelopment costs are relatively low, which is a distinctadvantage, enabling us to leverage our volume and shortenour cycle times. And shorter cycles mean fewer risks andgreater benefits.
Global RecognitionCarter’s skills and efficiencies add value throughout ourglobal supply chain. We enjoy the security and flexibilityof working in a dozen countries where the best sourcingagents and manufacturers recognize the depth of ourcommitment to social compliance, the value of our productcontinuity, the magnitude of our unit volume, and thestrength of our brand.
Emerging new markets provide new opportunities for efficient and flexible sourcing that meet Carter’s standards for quality.
Carter’s, Inc. 15
Improve our products (topline driver) and lower our costs (bottom line benefit) through supply chain
leverage and logistics efficiencies.

Millions of parents
trust Carter’s, the
people who know
kids in all their
funny, eager, and
curious wonder.
2004 Annual Report16
Financial Review
18 Business and Financial Overview
23 Management’s Discussion and Analysis of
Financial Condition and Results of Operations
35 Management’s Report on Internal Control
over Financial Reporting
36 Report of Independent Registered
Public Accounting Firm
37 Consolidated Balance Sheets
38 Consolidated Statements of Operations
39 Consolidated Statements of Cash Flows
40 Consolidated Statements of Changes
in Stockholders’ Equity
41 Notes to Consolidated Financial Statements
63 Stock Price, Dividend Information, and
Related Stockholder Matters
65 Leadership Team
66 Corporate Information
Business and Financial Overview
18 2004 Annual Report
The following table sets forth selected financial and other data as of and for the five fiscal years ended January 1,2005 (fiscal 2004). On August 15, 2001, investment funds affiliated with Berkshire Partners LLC purchased controlof Carter’s, Inc. from Investcorp S.A. (the “Acquisition”), which had been our controlling stockholder since acquiringus in 1996. Financing for the Acquisition and related transactions totaled $468.2 million and was provided by:$24.0 million in new revolving loan facility borrowings; $125.0 million in new term loan borrowings; $173.7 millionfrom the sale by The William Carter Company (“TWCC”) of senior subordinated notes; and $145.5 million ofcapital invested by investment funds affiliated with Berkshire Partners LLC and other investors, which includedrollover equity by our management of $18.3 million.
The proceeds of the Acquisition and financing were used to purchase our existing equity ($252.5 million), payfor selling stockholders’ transactions expenses ($19.1 million), pay for buyers’ transaction expenses ($4.0 million),pay debt issuance costs ($13.4 million), and to retire all outstanding balances on previously outstanding long-term debt, including accrued interest thereon ($174.8 million). In addition, $4.4 million of proceeds were heldas cash for temporary working capital purposes.
As a result of certain adjustments made in connection with the Acquisition, the results of operations for fiscal2004, 2003, and 2002 and the period from August 15, 2001 through December 29, 2001 (the “Successor” periods)are not comparable to prior periods (the “Predecessor” periods).
As a result of the Acquisition, our assets and liabilities were adjusted to their estimated fair values as of August 15,2001. The seven and one-half month period prior to the Acquisition includes certain Acquisition-related charges,principally sellers’ expenses, such as management bonuses and professional fees, debt extinguishment charges fordebt redemption premiums, and the write-off of deferred debt issuance costs on debt retired as a result of the Acquisition and refinancing. The Predecessor periods include amortization expense on our tradename andgoodwill. The Successor periods reflect increased interest expense, the amortization of licensing agreements,and cessation of amortization on our tradename and goodwill due to the adoption of Statements of FinancialAccounting Standards (“SFAS”) No. 141, “Business Combinations” (“SFAS 141”) and SFAS No. 142, “Goodwilland Other Intangible Assets” (“SFAS 142”). Accordingly, the results of operations for the Predecessor andSuccessor periods are not comparable.
On October 29, 2003, we completed an initial public offering of Carter’s, Inc.’s common stock including the saleof 5,390,625 shares by us and 1,796,875 shares by the selling stockholders, primarily Berkshire Partners LLC andits affiliates. Net proceeds to us from the offering totaled $93.9 million. On November 28, 2003, we used approx-imately $68.7 million of the proceeds to redeem approximately $61.3 million in outstanding senior subordinatednotes and pay a redemption premium of approximately $6.7 million and related accrued interest charges of $0.7 million. We used approximately $2.6 million of the net proceeds to terminate the Berkshire Partners LLCmanagement agreement and used approximately $11.3 million to prepay amounts outstanding under the termloan as required by the senior credit facility. The remaining proceeds were used for working capital and othergeneral corporate purposes.
The selected financial data for the five fiscal years ended January 1, 2005 were derived from our AuditedConsolidated Financial Statements. Our fiscal year ends on the Saturday in December or January nearest to thelast day of December. Consistent with this policy, fiscal 2004 ended on January 1, 2005 and fiscal 2003 endedon January 3, 2004. As a result, fiscal 2004 contained 52 weeks of financial results and fiscal 2003 contained 53 weeks of financial results.

The following table should be read in conjunction with Management’s Discussion and Analysis of FinancialCondition and Results of Operations, the Consolidated Financial Statements, and the accompanying Notes tothe Consolidated Financial Statements.
Successor (a) Predecessor (b) (c)
For the For theperiod from period fromAugust 15, December 31,
2001 2000Fiscal years through through Fiscal year
dollars in thousands, December 29, August 14,except per share data 2004 2003 2002 2001 2001 (d) 2000
Operating Data:Wholesale sales $385,810 $356,888 $301,993 $118,116 $144,779 $244,136Retail sales 291,362 263,206 253,751 108,091 127,088 215,280Mass channel sales 145,949 83,732 23,803 9,573 10,860 3,959
Total net sales 823,121 703,826 579,547 235,780 282,727 463,375Cost of goods sold 525,082 448,540 352,151 149,352 182,863 293,340Gross profit 298,039 255,286 227,396 86,428 99,864 170,035Selling, general, and
administrative expenses 208,756 188,028 174,110 57,987 88,895 135,322Acquisition-related
charges (e) – – – – 11,289 –Write-down of
long-lived assets (f) – – 150 – 3,156 –Closure costs (g) 620 1,041 – (268) 1,116 –Deferred charge write-off (h) – – 923 – – –Management fee
termination (i) – 2,602 – – – –Royalty income (12,362) (11,025) (8,352) (2,624) (4,993) (5,808)Operating income 101,025 74,640 60,565 31,333 401 40,521Interest income (335) (387) (347) (207) (73) (303)Loss on extinguishment
of debt (j) – 9,455 – – 12,525 –Interest expense 18,852 26,646 28,648 11,307 11,803 18,982Income (loss) before income
taxes and cumulativeeffect of change inaccounting principle 82,508 38,926 32,264 20,233 (23,854) 21,842
Provision for (benefit from) income taxes 32,850 15,648 13,011 7,395 (6,857) 8,835
Income (loss) before cumulative effect of changein accounting principle 49,658 23,278 19,253 12,838 (16,997) 13,007
Cumulative effect of change in accounting principle, for revenue recognition, net of income tax benefit of $217 (k) – – – – – 354
Net income (loss) $ 49,658 $ 23,278 $ 19,253 $ 12,838 $ (16,997) $ 12,653
Per Common Share Data (l):Basic net income (loss) $ 1.77 $ 0.99 $ 0.86 $ 0.57 $ (0.44) $ 0.33Diluted net income (loss) $ 1.66 $ 0.92 $ 0.82 $ 0.56 $ (0.44) $ 0.33Dividends – $ 1.10 – – – –Basic weighted
average shares 28,125,584 23,611,372 22,453,088 22,332,136 38,752,744 38,759,508Diluted weighted
average shares 29,927,957 25,187,492 23,544,900 23,086,845 38,752,744 38,759,508
Business and Financial Overview continued
19Carter’s, Inc.

Business and Financial Overview continued
20 2004 Annual Report
Successor (a) Predecessor (b) (c)
For the For theperiod from period fromAugust 15, December 31,
2001 2000Fiscal years through through Fiscal year
December 29, August 14,dollars in thousands 2004 2003 2002 2001 2001 (d) 2000
Balance Sheet Data(end of period):
Working capital (m) $183,694 $150,632 $131,085 $ 111,148 $ 87,862Total assets 672,965 646,102 643,349 604,162 327,545Total debt, including
current maturities 184,502 212,713 297,622 298,742 161,400Stockholders’ equity 327,933 272,536 179,359 158,338 69,596Cash Flow Data:Net cash provided by
operating activities $ 42,676 $ 40,506 $ 27,304 $ 31,113 $ 168 $ 24,197Net cash used in
investing activities (18,577) (16,472) (15,554) (247,459) (9,266) (19,217)Net cash (used in) provided
by financing activities (26,895) (23,535) (880) 240,514 5,925 (4,698)Other Data:EBITDA (n) $120,561 $ 87,401 $ 79,258 $ 38,251 $ 121 $ 57,687Gross margin 36.2% 36.3% 39.2% 36.7% 35.3% 36.7%Depreciation and
amortization $ 19,536 $ 22,216 $ 18,693 $ 6,918 $12,245 $ 17,520Capital expenditures 20,481 17,347 18,009 9,556 9,480 17,179
Notes to Selected Financial Data(a) As a result of the Acquisition, we adjusted our assets and liabilities to their estimated fair values as of August 15, 2001. In addition,
we entered into new financing arrangements and changed our capital structure in connection with the Acquisition. At the time of theAcquisition, we adopted the provisions of SFAS 141 and SFAS 142 which affect the amortization of goodwill and other intangibles.Accordingly, the results as of the end of and for the Successor period from August 15, 2001 through December 29, 2001, theSuccessor fiscal years 2002, 2003, and 2004 are not comparable to prior periods.
(b) On a pro forma basis, assuming SFAS 142 was in effect for all periods presented, pro forma (loss) income before income taxes andcumulative effect of change in accounting principle for revenue recognition would have been $(21.8) million for the Predecessorperiod from December 31, 2000 through August 14, 2001 and $25.1 million for the Predecessor fiscal year 2000. Pro forma net (loss)income would have been $(15.5) million for the Predecessor period from December 31, 2000 through August 14, 2001 and $14.9 million for the Predecessor fiscal year 2000.
(c) The stockholder’s equity of TWCC as of January 1, 2005 equals that of Carter’s, Inc.; however, its components of common stock andadditional paid-in capital accounts are different. Subsequent to the Acquisition described in Note (a) above, there are substantiallyno differences in the statements of operations and cash flows of Carter’s, Inc. and TWCC and substantially no differences in thebalance sheet other than the components of stockholder’s equity. Prior to the Acquisition described in Note (a) above, differencesexisted between Carter’s, Inc. and TWCC that resulted from the treatment of $20.0 million in outstanding 12% senior subordinatednotes on Carter’s, Inc. (formerly Carter Holdings, Inc.). The proceeds of these senior subordinated notes were used by Carter’s, Inc.to purchase all of the outstanding redeemable preferred stock of TWCC. As a result, there were differences in the statements of operations between Carter’s, Inc. and TWCC in interest expense, debt issuance amortization expense, and income tax expense.Differences in the balance sheets between Carter’s, Inc. and TWCC included deferred debt issuance costs, current and deferred taxes,taxes payable, current and long-term debt, and equity. The following provides a reconciliation of the differences in net (loss) incomebetween Carter’s, Inc. and TWCC as of and for the Predecessor period from December 31, 2000 through August 14, 2001 and forthe Predecessor fiscal year ended December 30, 2000 in addition to TWCC’s balance sheet, cash flow, and other data:

Business and Financial Overview continued
21Carter’s, Inc.
Predecessor
For theperiod from
December 31,2000
through Fiscal yearAugust 14,
dollars in thousands 2001 (d) 2000
Carter’s, Inc. net (loss) income $(16,997) $ 12,653Interest expense (net of tax) 992 1,623Debt issuance amortization (net of tax) 107 169Loss on extinguishment of debt (net of tax) 1,470 –TWCC net (loss) income $(14,428) $ 14,445
TWCC Balance Sheet Data:Working capital (m) $ 84,336Total assets 325,988Total debt, including current maturities 141,400Redeemable preferred stock 19,116Common stockholder’s equity 65,397TWCC Cash Flow Data:Net cash provided by operating activities $ 1,375 $ 26,637Net cash used in investing activities (9,266) (19,217)Net cash provided by (used in) financing activities 4,718 (7,138)Other Data:Depreciation and amortization $ 12,245 $ 17,520
(d) In the first quarter of fiscal 2003, we adopted the provisions of SFAS No. 145, “Rescission of FASB Statements No. 4, 44, and 64,Amendment of FASB Statement No. 13, and Technical Corrections” (“SFAS 145”). SFAS 145 rescinds Financial Accounting StandardsBoard (“FASB”) Statement No. 4, which required all gains and losses from extinguishment of debt to be aggregated and, if material,classified as an extraordinary item, net of the related income tax effect. As a result, the criteria in Accounting Principles Board Opinion 30 will now be used to classify those gains and losses. Accordingly, charges related to the extinguishment of debt duringthe Predecessor period from December 31, 2000 through August 14, 2001, as more fully described in note (j) below, have been reclas-sified to conform to the provisions of SFAS 145.
(e) The Acquisition-related charges for the Predecessor period from December 31, 2000 through August 14, 2001 include $4.5 millionin management bonuses and $6.8 million in other seller expenses.
(f) The $3.2 million write-down of long-lived assets for the Predecessor period from December 31, 2000 through August 14, 2001 relatesto the closure of two domestic manufacturing facilities in that period. The $150,000 write-down in the Successor fiscal year 2002relates to a reduction in the carrying value of land and building held for sale located in Barnesville, Georgia that was sold in theSuccessor fiscal year 2003.
(g) The $1.1 million in closure costs for the Predecessor period from December 31, 2000 through August 14, 2001 relate to closure costsassociated with two domestic manufacturing facilities. The $1.0 million in closure costs for the Successor 2003 fiscal year relates tothe closure of our two sewing facilities located in Costa Rica and includes $0.2 million of asset impairment charges, $0.5 million ofseverance, and $0.3 million of other closure costs. The $0.6 million in closure costs for fiscal 2004 relate to closure costs associatedwith the closure of our Costa Rican facilities and our distribution facility in Leola, Pennsylvania.
(h) The deferred charge write-off in the Successor fiscal year 2002 reflects the write-off of $0.9 million of previously deferred costs associated with the filing of a registration statement on Form S-1 in August 2002, to register an initial public offering of Carter’s, Inc.’scommon stock.
(i) The $2.6 million reflects the payment to terminate the Berkshire Partners LLC management agreement upon completion of our initialpublic offering of Carter’s, Inc.’s common stock on October 29, 2003.
Business and Financial Overview continued
22 2004 Annual Report
(j) Debt extinguishment charges for the Predecessor period December 31, 2000 through August 14, 2001 reflect the write-off of debtissuance costs of approximately $4.7 million and a debt redemption premium of approximately $7.8 million. Debt extinguishmentcharges for the Successor 2003 fiscal year reflect the write-off of $2.4 million of debt issuance costs resulting from the redemptionof $61.3 million of our 10.875% senior subordinated notes and the prepayment of $11.3 million in term loan indebtedness, a debtredemption premium of approximately $6.7 million, and a $0.4 million write-off of the related note discount.
(k) In fiscal 2000, we recorded the cumulative effect of a change in accounting principle in order to comply with guidance provided bythe Securities and Exchange Commission Staff Accounting Bulletin No. 101, “Revenue Recognition in Financial Statements.” On apro forma basis, assuming this accounting change for revenue recognition is applied retroactively, net income would have been $13.0 million in fiscal 2000.
(l) As a result of the Acquisition, our capital structure and the number of outstanding shares were changed. Accordingly, earnings pershare in Predecessor periods are not comparable to earnings per share in Successor periods.
(m) Represents total current assets less total current liabilities.
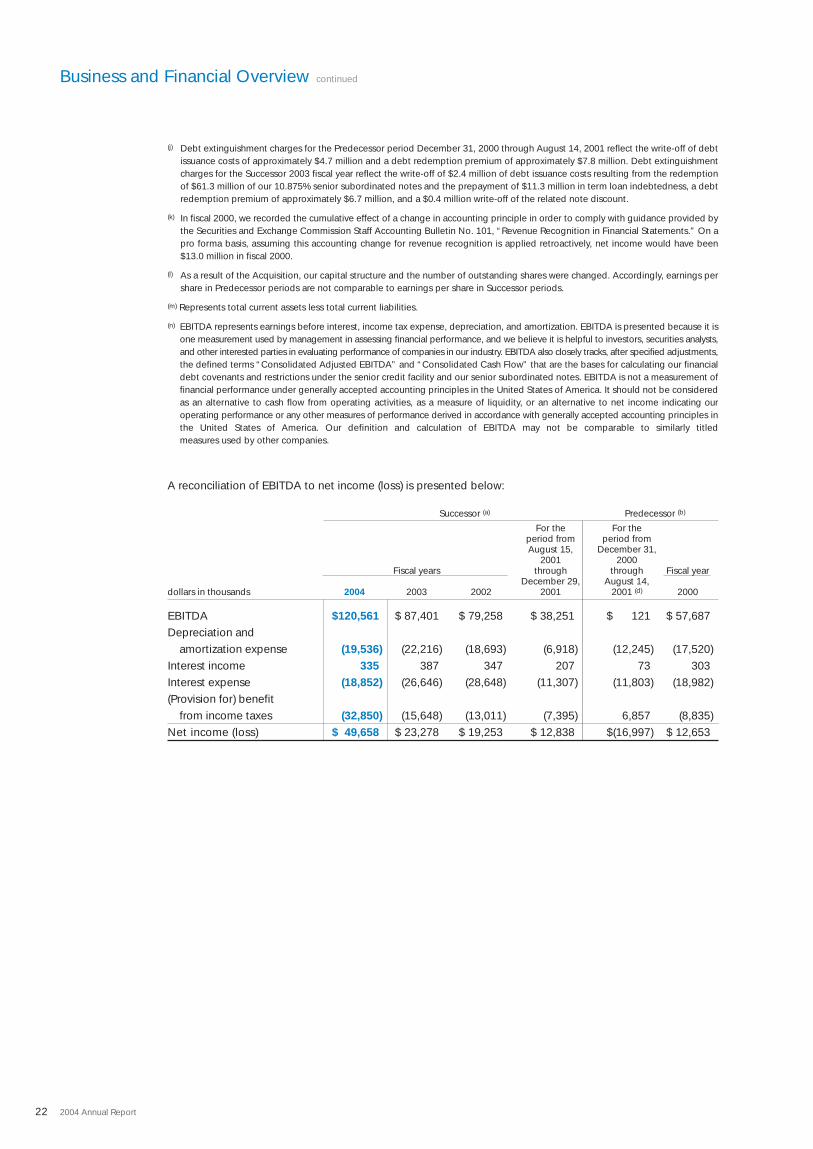
(n) EBITDA represents earnings before interest, income tax expense, depreciation, and amortization. EBITDA is presented because it isone measurement used by management in assessing financial performance, and we believe it is helpful to investors, securities analysts,and other interested parties in evaluating performance of companies in our industry. EBITDA also closely tracks, after specified adjustments,the defined terms “Consolidated Adjusted EBITDA” and “Consolidated Cash Flow” that are the bases for calculating our financialdebt covenants and restrictions under the senior credit facility and our senior subordinated notes. EBITDA is not a measurement offinancial performance under generally accepted accounting principles in the United States of America. It should not be consideredas an alternative to cash flow from operating activities, as a measure of liquidity, or an alternative to net income indicating ouroperating performance or any other measures of performance derived in accordance with generally accepted accounting principles inthe United States of America. Our definition and calculation of EBITDA may not be comparable to similarly titled measures used by other companies.
A reconciliation of EBITDA to net income (loss) is presented below:
Successor (a) Predecessor (b)
For the For theperiod from period fromAugust 15, December 31,
2001 2000Fiscal years through through Fiscal year
December 29, August 14,dollars in thousands 2004 2003 2002 2001 2001 (d) 2000
EBITDA $120,561 $ 87,401 $ 79,258 $ 38,251 $ 121 $ 57,687Depreciation and
amortization expense (19,536) (22,216) (18,693) (6,918) (12,245) (17,520)Interest income 335 387 347 207 73 303Interest expense (18,852) (26,646) (28,648) (11,307) (11,803) (18,982)(Provision for) benefit
from income taxes (32,850) (15,648) (13,011) (7,395) 6,857 (8,835)Net income (loss) $ 49,658 $ 23,278 $ 19,253 $ 12,838 $(16,997) $ 12,653
Management’s Discussion and Analysis ofFinancial Condition and Results of Operations
23Carter’s, Inc.
Overview
The following is a discussion of our results of operations and current financial condition. You should read thisdiscussion in conjunction with our consolidated historical financial statements and notes included elsewhere inthis annual report. Our discussion of our results of operations and financial condition includes various forward-looking statements about our markets, the demand for our products and services, and our future results. Webased these statements on assumptions that we consider reasonable. Actual results may differ materially fromthose suggested by our forward-looking statements for various reasons including those discussed in the “RiskFactors” section of our most recently filed annual report on Form 10-K. Those risk factors expressly qualify allsubsequent oral and written forward-looking statements attributable to us or persons acting on our behalf.Except for any ongoing obligations to disclose material information as required by the federal securities laws,we do not have any intention or obligation to update forward-looking statements after we file this annual report.
We are the largest branded marketer of apparel for babies and young children in the United States with a 2004market share of 6.8%, up from 5.1% in 2003. We sell our products to approximately 370 department store,national chain, and specialty accounts, which together accounted for 47% of our net sales during fiscal 2004.Additionally, we currently operate 180 Carter’s retail stores, which accounted for 35% of our net sales during fiscal 2004. We also sell our products in the mass channel in approximately 1,300 Target stores under our JustOne Year brand, which replaced the Tykes brand name in Target stores beginning in December 2004, and underour Child of Mine brand in approximately 3,100 Wal-Mart stores nationwide. Mass channel revenues accountedfor 18% of our net sales during fiscal 2004.
Consolidated net sales have increased from $463.4 million in fiscal 2000 to $823.1 million in fiscal 2004. Thisrepresents a compound annual growth rate of 15.4%. During this period, wholesale net sales have increased ata compound annual growth rate of 12.1%, from $244.1 million to $385.8 million; net sales at our Carter’s retailstores increased at a compound annual growth rate of 7.9% from $215.3 million to $291.4 million; and sales in themass channel (which began during the fourth quarter of fiscal 2000) increased from $4.0 million to $145.9 million.
Our growth has been driven by the success of our focus on high volume, essential core products. Our product teamsdesign core products with simple and cost-effective construction and creative art. Over the past five fiscal years,we have expanded our design teams in order to improve artistic applications on these core products. This focuson essential, core products reduces the complexity of our inventory, increases our productivity, and creates amore stable and predictable revenue base. We have also hired people with experience in sourcing products fromthird-party manufacturers throughout the world, primarily in the Far East. By increasing our global sourcing capabilities, we have experienced significant improvement in product quality and lower product costs. Ourglobal sourcing network has also enabled us to more competitively price our products, increase market share,and enter the mass channel.
On October 29, 2003, we completed an initial public offering of Carter’s, Inc.’s common stock including the saleof 5,390,625 shares by us and 1,796,875 shares by the selling stockholders, primarily Berkshire Partners LLC andits affiliates. Net proceeds to us from the offering totaled $93.9 million. On November 28, 2003, we used approx-imately $68.7 million of the proceeds to redeem approximately $61.3 million in outstanding senior subordinatednotes and pay a redemption premium of approximately $6.7 million and related accrued interest charges of $0.7 million. We used approximately $2.6 million of the net proceeds to terminate the Berkshire Partners LLCmanagement agreement and used approximately $11.3 million to prepay amounts outstanding under the termloan as required by the senior credit facility. The remaining proceeds were used for working capital and othergeneral corporate purposes.
Our fiscal year ends on the Saturday, in December or January, nearest the last day of December. Consistent withthis policy, fiscal 2004 ended on January 1, 2005 and as a result, contained 52 weeks of financial results. Fiscal 2003ended on January 3, 2004 and contained 53 weeks of financial results. Fiscal 2002 ended on December 28, 2002 andcontained 52 weeks of financial results.
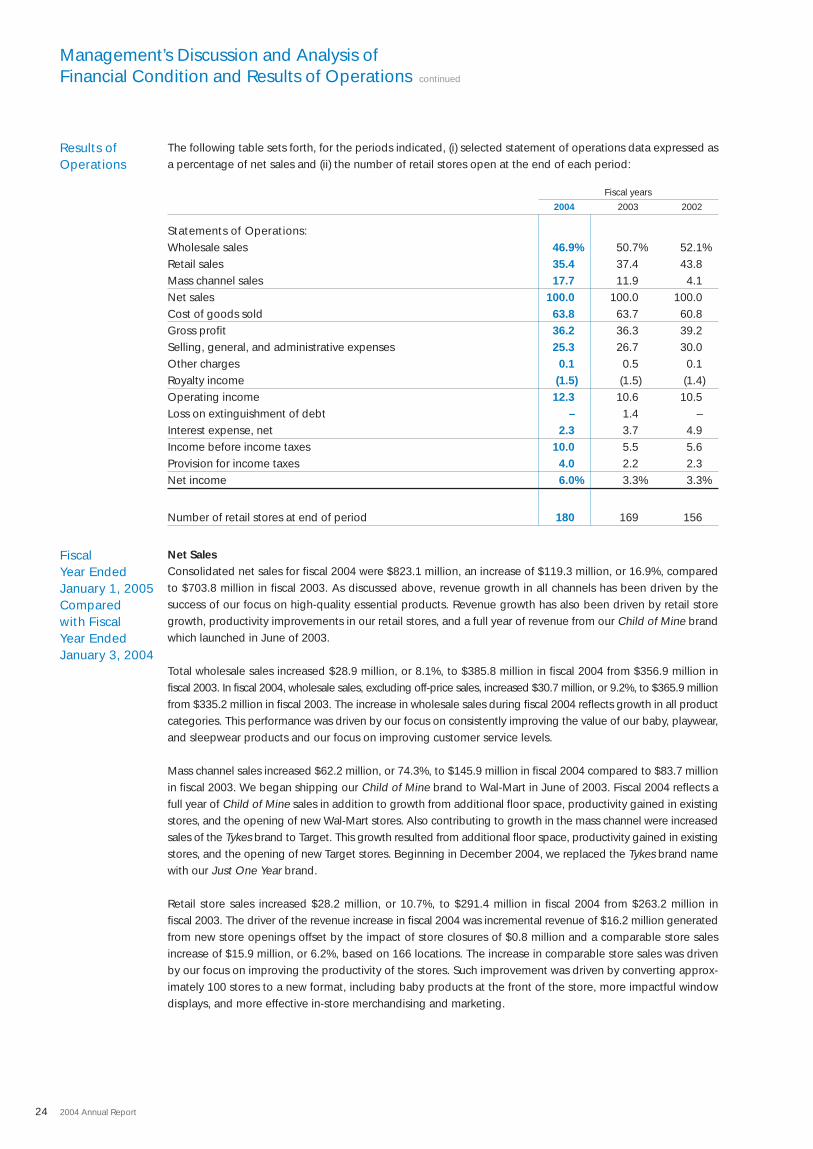
The following table sets forth, for the periods indicated, (i) selected statement of operations data expressed asa percentage of net sales and (ii) the number of retail stores open at the end of each period:
Fiscal years
2004 2003 2002
Statements of Operations:Wholesale sales 46.9% 50.7% 52.1%Retail sales 35.4 37.4 43.8Mass channel sales 17.7 11.9 4.1Net sales 100.0 100.0 100.0Cost of goods sold 63.8 63.7 60.8Gross profit 36.2 36.3 39.2Selling, general, and administrative expenses 25.3 26.7 30.0Other charges 0.1 0.5 0.1Royalty income (1.5) (1.5) (1.4)Operating income 12.3 10.6 10.5Loss on extinguishment of debt – 1.4 –Interest expense, net 2.3 3.7 4.9Income before income taxes 10.0 5.5 5.6Provision for income taxes 4.0 2.2 2.3Net income 6.0% 3.3% 3.3%
Number of retail stores at end of period 180 169 156
Net SalesConsolidated net sales for fiscal 2004 were $823.1 million, an increase of $119.3 million, or 16.9%, comparedto $703.8 million in fiscal 2003. As discussed above, revenue growth in all channels has been driven by thesuccess of our focus on high-quality essential products. Revenue growth has also been driven by retail storegrowth, productivity improvements in our retail stores, and a full year of revenue from our Child of Mine brandwhich launched in June of 2003.
Total wholesale sales increased $28.9 million, or 8.1%, to $385.8 million in fiscal 2004 from $356.9 million in fiscal 2003. In fiscal 2004, wholesale sales, excluding off-price sales, increased $30.7 million, or 9.2%, to $365.9 millionfrom $335.2 million in fiscal 2003. The increase in wholesale sales during fiscal 2004 reflects growth in all productcategories. This performance was driven by our focus on consistently improving the value of our baby, playwear,and sleepwear products and our focus on improving customer service levels.
Mass channel sales increased $62.2 million, or 74.3%, to $145.9 million in fiscal 2004 compared to $83.7 millionin fiscal 2003. We began shipping our Child of Mine brand to Wal-Mart in June of 2003. Fiscal 2004 reflects afull year of Child of Mine sales in addition to growth from additional floor space, productivity gained in existingstores, and the opening of new Wal-Mart stores. Also contributing to growth in the mass channel were increasedsales of the Tykes brand to Target. This growth resulted from additional floor space, productivity gained in existingstores, and the opening of new Target stores. Beginning in December 2004, we replaced the Tykes brand namewith our Just One Year brand.
Retail store sales increased $28.2 million, or 10.7%, to $291.4 million in fiscal 2004 from $263.2 million in fiscal 2003. The driver of the revenue increase in fiscal 2004 was incremental revenue of $16.2 million generatedfrom new store openings offset by the impact of store closures of $0.8 million and a comparable store salesincrease of $15.9 million, or 6.2%, based on 166 locations. The increase in comparable store sales was drivenby our focus on improving the productivity of the stores. Such improvement was driven by converting approx-imately 100 stores to a new format, including baby products at the front of the store, more impactful windowdisplays, and more effective in-store merchandising and marketing.
Results ofOperations
FiscalYear EndedJanuary 1, 2005Comparedwith Fiscal Year EndedJanuary 3, 2004
Management’s Discussion and Analysis ofFinancial Condition and Results of Operations continued
24 2004 Annual Report
Management’s Discussion and Analysis ofFinancial Condition and Results of Operations continued
25Carter’s, Inc.
Gross ProfitIn fiscal 2004, gross profit increased $42.8 million, or 16.7%, to $298.0 million compared to $255.3 million infiscal 2003. Gross profit as a percentage of net sales was 36.2% in fiscal 2004 and 36.3% in fiscal 2003. Theimpact on gross margin from a higher mix of mass channel sales was largely offset by product cost reduction.Results for fiscal 2003 also included approximately $1.3 million in accelerated depreciation related to the closureof our Costa Rican sewing facilities.
Selling, General, and Administrative ExpensesIn fiscal 2004, selling, general, and administrative expenses increased $20.7 million, or 11.0%, to $208.8 million from$188.0 million in fiscal 2003. As a percentage of net sales, these expenses decreased to 25.3% in fiscal 2004 from 26.7% in fiscal 2003. The decrease, relative to sales, reflects the benefit of leveraging operating expenses,most notably in the mass channel, against higher levels of revenue. The decrease, relative to sales, also reflectsthe cessation of the amortization of our licensing agreements as of August 15, 2004. During fiscal 2004, werecorded approximately $3.1 million in amortization related to these agreements as compared to $5.0 millionin fiscal 2003. Results for fiscal 2003 included the payment of a $2.5 million special bonus to vested option holdersin July 2003.
Closure CostsIn June of 2004, we exited our distribution facility in Leola, Pennsylvania in order to consolidate our distributionoperations and reduce costs. We recorded approximately $175,000 of severance and other exit costs related tothis closure during fiscal 2004.
In July of 2003, we decided to exit our Costa Rican sewing facilities, given our ability to obtain lower costs fromthird-party suppliers. During fiscal 2003, we recorded approximately $1,041,000 in severance and other exit costsrelated to these closures. During fiscal 2004, we recorded approximately $74,000 and $371,000 in severance andother exit costs related to these closures.
Management Fee TerminationIn the fourth quarter of 2003, upon completion of our initial public offering on October 29, 2003, we paid $2.6 millionto terminate the Berkshire Partners LLC management agreement. Under the agreement, which was scheduled toexpire in 2005, we paid an annual fee of $1.65 million.
Royalty IncomeWe license the use of the Carter’s, Carter’s Classics, Just One Year, and Child of Mine names and sublicensedthe Tykes name to certain licensees. In fiscal 2004, royalty income increased 12.1% to $12.4 million comparedto $11.0 million in fiscal 2003. This increase primarily reflects increased licensed sales of our Child of Mine brandby our licensee partners who began shipping their products during the third quarter of fiscal 2003.
Operating IncomeOperating income for fiscal 2004 increased $26.4 million, or 35.3%, to $101.0 million compared to $74.6 millionin fiscal 2003. Operating income, as a percentage of net sales, was 12.3% in fiscal 2004 as compared to 10.6% in fiscal 2003. The increase in operating income reflects growth in net sales in all channels, increased gross profit, and the benefit of leveraging operating expenses against higher levels of revenue. Fiscal 2003 resultsincluded $1.0 million in closure costs, $1.3 million in accelerated depreciation, $2.6 million to terminate theBerkshire Partners LLC management agreement, and a $2.5 million special bonus paid to vested option holders in July 2003.
Interest Expense, NetInterest expense in fiscal 2004 decreased $7.7 million, or 29.5%, to $18.5 million from $26.3 million in fiscal 2003.This decrease is attributable to the redemption of approximately $61.3 million of our 10.875% senior subordinatednotes on November 28, 2003, reduced levels of term loan indebtedness, and the additional week of interestexpense in fiscal 2003.

Management’s Discussion and Analysis ofFinancial Condition and Results of Operations continued
26 2004 Annual Report
FiscalYear EndedJanuary 3, 2004Comparedwith Fiscal Year EndedDecember 28,2002
Loss on Extinguishment of DebtOn November 28, 2003, we used the proceeds of the initial public offering to redeem $61.3 million of our10.875% senior subordinated notes. In connection with this redemption, we incurred redemption premiums ofapproximately $6.7 million, wrote-off $2.2 million of deferred debt issuance costs, and expensed $0.4 millionrelated to the note discount. We also prepaid $11.3 million in term loan indebtedness and subsequently wrote-off$0.2 million of deferred debt issuance costs.
Income TaxesOur effective tax rate was 39.8% for fiscal 2004 and 40.2% for fiscal 2003. Our effective tax rates in fiscal 2004and 2003 were higher than the statutory rates due primarily to the impact of certain non-deductible costs. SeeNote 8 to the accompanying consolidated financial statements for the reconciliation of the statutory tax rate toour effective tax rate.
Net IncomeOur fiscal 2004 net income increased to $49.7 million as compared to $23.3 million in fiscal 2003 as a result ofthe factors described above.
Net SalesConsolidated net sales for fiscal 2003 were $703.8 million, an increase of $124.3 million, or 21.4%, comparedto $579.5 million in fiscal 2002. This revenue growth has been driven by strong product performance resultingfrom our focus on improving the value of our core products through the expansion of our global sourcingnetwork, effective merchandising strategies, and revenue from our new Child of Mine brand launched in June 2003,which is now being sold in substantially all Wal-Mart stores in the United States.
Total wholesale sales increased $54.9 million, or 18.2%, to $356.9 million in fiscal 2003 from $302.0 million in fiscal 2002. In fiscal 2003, wholesale sales, excluding off-price sales, increased $49.6 million, or 17.4%, to$335.2 million from $285.5 million in fiscal 2002. The increase in wholesale sales during fiscal 2003 reflects thegrowth of our baby and playclothes product lines offset by lower sleepwear revenue. This performance wasdriven by our focus on improving the value of our high-volume, core products and focus on improving customerservice levels.
Mass channel sales increased $59.9 million to $83.7 million in fiscal 2003 compared to $23.8 million in fiscal 2002.This revenue growth reflects sales of our new Child of Mine brand. Also contributing to this growth wereincreased sales of the Tykes brand to Target. This growth resulted from additional floor space, productivity gainedin existing stores, and the opening of new Target stores.
Retail store sales increased $9.5 million, or 3.7%, to $263.2 million in fiscal 2003 from $253.8 million in fiscal 2002. The driver of the revenue increase in fiscal 2003 was incremental revenue of $20.6 million generatedfrom new store openings offset by the impact of store closures of $6.8 million and a comparable store salesdecline of $4.3 million, or 1.8%, based on 148 locations. During fiscal 2003, we opened 15 stores and closed twostores. There were a total of 169 stores as of January 3, 2004 compared to 156 stores at December 28, 2002.
Gross ProfitIn fiscal 2003, gross profit increased $27.9 million, or 12.3%, to $255.3 million compared to $227.4 million infiscal 2002. Gross profit as a percentage of net sales in fiscal 2003 decreased to 36.3% compared to 39.2% in fiscal 2002. The decrease in gross profit, relative to sales, reflects a higher mix of wholesale and mass channelsales, which yield lower margins than similar products sold through our retail channel. Retail sales were 37% ofconsolidated net sales in 2003 as compared to 44% in 2002. Also contributing to the decline in gross profit, asa percentage of sales, was the impact of accelerated depreciation charges of approximately $1.3 million,recorded in the third and fourth quarters of 2003 relating to the closure of our Costa Rican sewing facilities.
Management’s Discussion and Analysis ofFinancial Condition and Results of Operations continued
27Carter’s, Inc.
Selling, General, and Administrative ExpensesIn fiscal 2003, selling, general, and administrative expenses increased $13.9 million, or 8.0%, to $188.0 million from$174.1 million in fiscal 2002. As a percentage of net sales, these expenses decreased to 26.7% in fiscal 2003 from 30.0% in fiscal 2002. The decrease, relative to sales, was due primarily to our ability to grow revenue at afaster rate than our selling, general, and administrative expenses and a special executive bonus of $5.0 millionpaid in fiscal 2002 that did not recur in fiscal 2003, partially offset by higher distribution costs driven by unitvolume growth and a $2.5 million payment to vested option holders of Carter’s, Inc.’s common stock in July 2003.
Closure CostsIn July of 2003, we decided to exit our Costa Rican sewing facilities given our ability to obtain lower costs fromthird-party suppliers. In addition to the accelerated depreciation charges, described above, we recorded approx-imately $184,000 of asset impairment charges, $483,000 of severance, and $374,000 of other closure costsduring the third and fourth quarters of fiscal 2003.
Management Fee TerminationIn the fourth quarter of fiscal 2003, upon completion of our initial public offering on October 29, 2003, we paid$2.6 million to terminate the Berkshire Partners LLC management agreement. Under the agreement, which wasscheduled to expire in 2005, we paid an annual fee of $1.65 million.
Royalty IncomeWe license the use of the Carter’s, Carter’s Classics, and Child of Mine names and sublicensed the Tykes nameto certain licensees. In fiscal 2003, royalty income increased 32.0% to $11.0 million compared to $8.4 million infiscal 2002. This increase reflects continued expansion of our licensed product placement with our key wholesalecustomers and licensed sales of our new Child of Mine brand by our licensee partners who began shipping theirproducts during the third quarter of 2003.
Operating IncomeOperating income for fiscal 2003 increased $14.1 million to $74.6 million compared to $60.6 million in fiscal 2002. Operating income, as a percentage of net sales, was 10.6% in fiscal 2003 as compared to 10.5% in fiscal 2002. The increase in operating income reflects the benefit from revenue growth, increased gross profit,and leveraging of operating expenses. Fiscal 2003 results included $1.0 million in closure costs, $1.3 million inaccelerated depreciation, $2.6 million to terminate the Berkshire Partners LLC management agreement, and a$2.5 million special bonus paid to vested option holders in July 2003. Fiscal 2002 results included a $5.0 millionspecial executive bonus, which did not recur in 2003.
Interest Expense, NetInterest expense in fiscal 2003 decreased $2.0 million, or 7.2%, to $26.3 million from $28.3 million in fiscal 2002.This decrease is attributable to lower variable interest rates on reduced levels of term loan indebtedness and theredemption of approximately $61.3 million of our 10.875% senior subordinated notes on November 28, 2003,partially offset by an additional week of interest expense.
Loss on Extinguishment of DebtOn November 28, 2003, we used the proceeds of the initial public offering to redeem $61.3 million of our10.875% senior subordinated notes. In connection with this redemption, we incurred redemption premiums ofapproximately $6.7 million, wrote-off $2.2 million of deferred debt issuance costs, and expensed $0.4 millionrelated to the note discount. We also prepaid $11.3 million in term loan indebtedness and subsequently wrote-off$0.2 million of deferred debt issuance costs.
Management’s Discussion and Analysis ofFinancial Condition and Results of Operations continued
28 2004 Annual Report
Liquidity and CapitalResources
Income TaxesOur effective tax rate was 40.2% for fiscal 2003 and 40.3% for fiscal 2002. Our effective tax rates in fiscal 2003and 2002 were higher than the statutory rate due to the impact of certain non-deductible costs. See Note 8 tothe accompanying consolidated financial statements for the reconciliation of the statutory tax rate to our effectivetax rate.
Net IncomeOur fiscal 2003 net income increased 20.9% to $23.3 million as compared to $19.3 million in fiscal 2002 as aresult of the factors described above.
Our primary cash needs are working capital, capital expenditures, and debt service. Historically, we have financedthese needs through operating cash flow and funds borrowed under our senior credit facility. Our primary sourceof liquidity will continue to be cash flow from operations and borrowings under our revolving loan facility, andwe expect that these sources will fund our ongoing requirements for debt service and capital expenditures.These sources of liquidity may be impacted by continued demand for our products and our ability to meet debtcovenants under our credit facility.
Net accounts receivable at January 1, 2005 were $80.4 million compared to $65.3 million at January 3, 2004. Thisincrease primarily reflects higher levels of revenue in the latter part of fiscal 2004 as compared to the latter partof fiscal 2003.
Inventory levels at January 1, 2005 were $120.8 million compared to $104.8 million at January 3, 2004. Increased inventory levels as of January 1, 2005 include inventory required to support forecasted revenue growthin all channels of distribution. Average inventory levels increased 10% to $129.1 million in fiscal 2004 comparedto $117.4 million in fiscal 2003. Average inventory levels are expected to be higher in fiscal 2005 based onincreases in forecasted demand.
Net cash provided by operating activities during fiscal 2004 and fiscal 2003 was $42.7 million and $40.5 million.This increase in net cash flow provided by operating activities in fiscal 2004 as compared to fiscal 2003 was drivenby the growth in earnings and reductions in prepaid expenses, partially offset by increased levels of inventoryto support demand and increased levels of accounts receivable resulting from growth in revenue and the timingof shipments. Net cash provided by our operating activities in fiscal 2002 was approximately $27.3 million. Theincrease in net cash flow provided by operating activities in fiscal 2003 as compared to fiscal 2002 was due tothe decline in inventory levels, our growth in earnings, and fluctuations in accounts receivable, accounts payable,and other liabilities.
We have invested $20.5 million, $17.3 million, and $18.0 million in capital expenditures during fiscal years 2004,2003, and 2002. We plan to invest approximately $25.0 million in capital expenditures in fiscal 2005. Major areasfor investment in fiscal 2004 included our distribution center expansion, retail store openings and remodelings,and fixturing programs for our key wholesale customers.
On October 29, 2003, we completed an initial public offering of Carter’s, Inc.’s common stock including the saleof 5,390,625 shares by us and 1,796,875 shares by the selling stockholders, primarily Berkshire Partners LLC andits affiliates. Net proceeds to us from the offering totaled $93.9 million. On November 28, 2003, we used approx-imately $68.7 million of the proceeds to redeem approximately $61.3 million in outstanding senior subordinatednotes and pay a redemption premium of approximately $6.7 million and related accrued interest charges of $0.7 million. We used approximately $2.6 million of the net proceeds to terminate the Berkshire Partners LLCmanagement agreement and used approximately $11.3 million to prepay amounts outstanding under the termloan as required by the senior credit facility. The remaining proceeds were used for working capital and othergeneral corporate purposes.
Management’s Discussion and Analysis ofFinancial Condition and Results of Operations continued
29Carter’s, Inc.
Effective November 24, 2004, our credit facility was amended to increase our letter of credit sublimit to $60.0 million from $40.0 million and eliminate the requirement to hedge a portion of our variable rate debt.Effective July 29, 2003, our credit facility was amended to, among other things, increase the amount of thecommitments under the revolving loan facility from $60.0 million to $80.0 million, provide for a 75 basis pointreduction in the applicable interest margin by prepaying our existing Tranche B term loan and replacing it witha new Tranche C term loan, and reduce the amount of our mandatory loan prepayment requirement from 50% or 75% of excess cash flow to 25% or 50% of excess cash flow, depending on the applicable leverage ratio.Pursuant to the amendment, we are also permitted to repurchase up to $15.0 million of additional senior subordinated notes, which we may consider from time to time.
Principal borrowings under the term loan are due and payable in quarterly installments of $181,031 from March 31, 2005 through September 30, 2007, and four quarterly payments of approximately $17.3 million from December 31, 2007 through September 30, 2008. Interest on the term loan is payable at the end of interestrate reset periods, which vary in length but in no case exceed six months. The outstanding balance of the revolvingloan facility is payable in full on August 15, 2006. Interest is payable quarterly on base rate borrowings under therevolving loan facility and may be payable more frequently in the event we choose a Eurodollar rate option availableunder the terms of the senior credit facility. No principal payments are required on the senior subordinated notesprior to their scheduled maturity in August 2011. Beginning August 15, 2006, we may redeem all or part of thesenior subordinated notes as further described in Note 5 to the accompanying consolidated financial statements.Interest is payable semi-annually on the senior subordinated notes in February and August of each year. Prior tothe completion of our initial public offering, our semi-annual interest payments on the senior subordinated noteswere $9.5 million. After giving effect to the redemption of $61.3 million of the principal amount of these seniorsubordinated notes in November 2003, our semi-annual interest payment is now approximately $6.2 million.
The senior credit facility, as amended, sets forth mandatory and optional prepayment conditions that may resultin our use of cash to reduce our debt obligations, including payments of: (i) 50% of the net cash proceeds froman equity issuance by Carter’s, Inc., excluding, among other things, any issuance of equity in connection withemployee or director stock plans or a permitted acquisition and (ii) 25% or 50% of consolidated excess cash flow(50% or 75% prior to the July 29, 2003 amendment), depending on the applicable leverage ratio, as both termsare defined in the amended senior credit facility. Accordingly, we made principal prepayments of approximately$2.4 million on March 22, 2004 and $4.8 million on March 26, 2003. No such prepayment is required in fiscal 2005.The lenders will apply such prepayments first to the term loan and, second, to permanently reduce the revolvingloan facility. Subject to certain conditions in the senior credit facility, we may make optional prepayments of ourdebt obligations without premium or penalty. The lenders will apply such optional prepayments according to our instruction.
In December 2004, March 2004, and December 2003, we prepaid an additional $20.0 million, $5.0 million, and$6.5 million in term loan indebtedness. At January 1, 2005, we had approximately $184.5 million of debtoutstanding, consisting of $113.2 million of senior subordinated notes, $71.3 million in term loan borrowings,and no revolver borrowings, exclusive of approximately $6.8 million of outstanding letters of credit. Averageoutstanding letters of credit were $10.9 million in fiscal 2004 compared to $8.9 million in fiscal 2003. At January 1,2005, we had approximately $73.2 million of financing available under our revolver.
As previously provided by a management agreement with Berkshire Partners LLC, we agreed to, among otherthings, pay Berkshire Partners an annual management fee of $1.65 million per year for four years, commencingon the first anniversary of the Acquisition. We paid this fee quarterly, in advance. As described above, uponcompletion of our initial public offering, this management fee agreement was terminated.
On July 31, 2003, we paid a cash dividend of approximately $24.9 million on the outstanding shares of Carter’s, Inc.’scommon stock to the stockholders of record as of July 30, 2003. Concurrently, we paid a special bonus ofapproximately $2.5 million to our vested option holders. These payments were funded using cash on hand aswell as borrowings under our revolving loan facility, as described above. We have no current intention of payingfurther dividends. Our credit facility imposes certain covenants, requirements, and restrictions on actions by us andour subsidiaries that, among other things, restrict the payment of dividends beyond the dividend noted above.
Management’s Discussion and Analysis ofFinancial Condition and Results of Operations continued
30 2004 Annual Report
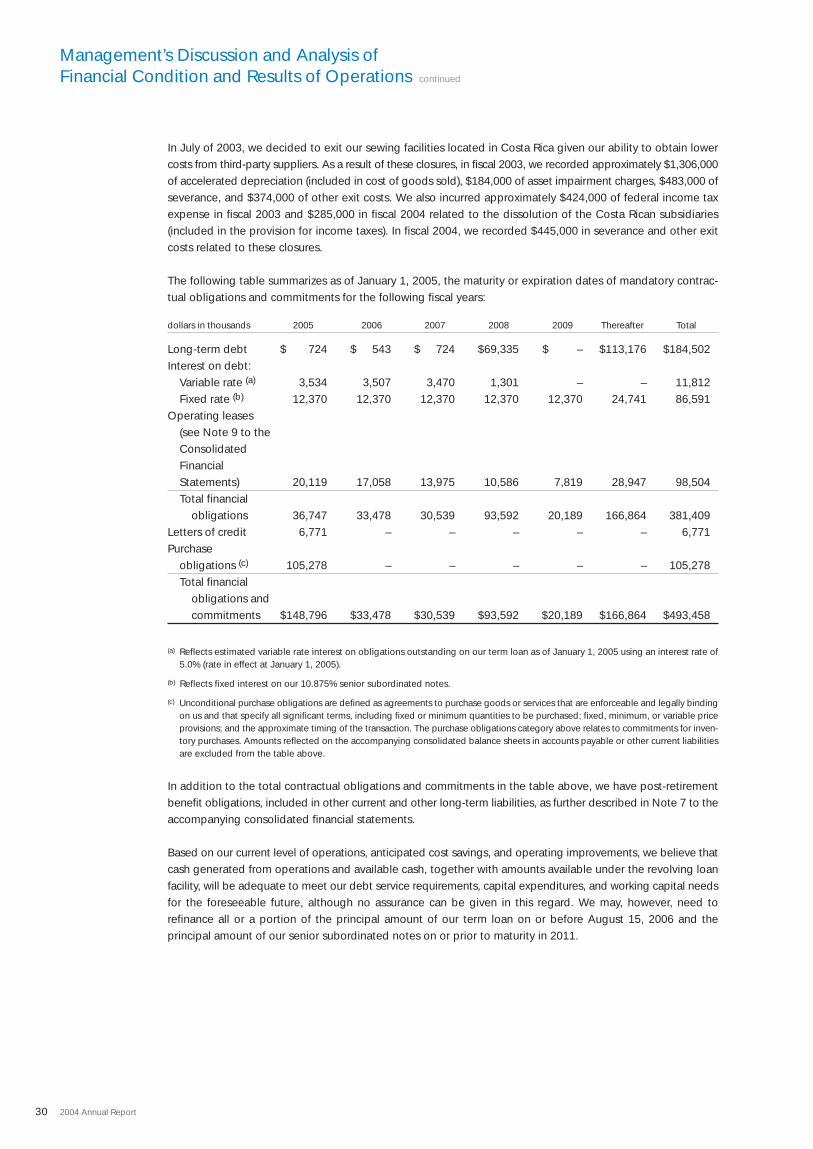
In July of 2003, we decided to exit our sewing facilities located in Costa Rica given our ability to obtain lowercosts from third-party suppliers. As a result of these closures, in fiscal 2003, we recorded approximately $1,306,000of accelerated depreciation (included in cost of goods sold), $184,000 of asset impairment charges, $483,000 ofseverance, and $374,000 of other exit costs. We also incurred approximately $424,000 of federal income taxexpense in fiscal 2003 and $285,000 in fiscal 2004 related to the dissolution of the Costa Rican subsidiaries(included in the provision for income taxes). In fiscal 2004, we recorded $445,000 in severance and other exitcosts related to these closures.
The following table summarizes as of January 1, 2005, the maturity or expiration dates of mandatory contrac-tual obligations and commitments for the following fiscal years:
dollars in thousands 2005 2006 2007 2008 2009 Thereafter Total
Long-term debt $ 724 $ 543 $ 724 $69,335 $ – $113,176 $184,502Interest on debt:
Variable rate (a) 3,534 3,507 3,470 1,301 – – 11,812Fixed rate (b) 12,370 12,370 12,370 12,370 12,370 24,741 86,591
Operating leases (see Note 9 to the Consolidated Financial Statements) 20,119 17,058 13,975 10,586 7,819 28,947 98,504Total financial
obligations 36,747 33,478 30,539 93,592 20,189 166,864 381,409Letters of credit 6,771 – – – – – 6,771Purchase
obligations (c) 105,278 – – – – – 105,278Total financial
obligations and commitments $148,796 $33,478 $30,539 $93,592 $20,189 $166,864 $493,458
(a) Reflects estimated variable rate interest on obligations outstanding on our term loan as of January 1, 2005 using an interest rate of5.0% (rate in effect at January 1, 2005).
(b) Reflects fixed interest on our 10.875% senior subordinated notes.
(c) Unconditional purchase obligations are defined as agreements to purchase goods or services that are enforceable and legally bindingon us and that specify all significant terms, including fixed or minimum quantities to be purchased; fixed, minimum, or variable priceprovisions; and the approximate timing of the transaction. The purchase obligations category above relates to commitments for inven-tory purchases. Amounts reflected on the accompanying consolidated balance sheets in accounts payable or other current liabilitiesare excluded from the table above.
In addition to the total contractual obligations and commitments in the table above, we have post-retirementbenefit obligations, included in other current and other long-term liabilities, as further described in Note 7 to theaccompanying consolidated financial statements.
Based on our current level of operations, anticipated cost savings, and operating improvements, we believe thatcash generated from operations and available cash, together with amounts available under the revolving loanfacility, will be adequate to meet our debt service requirements, capital expenditures, and working capital needsfor the foreseeable future, although no assurance can be given in this regard. We may, however, need to refinance all or a portion of the principal amount of our term loan on or before August 15, 2006 and the principal amount of our senior subordinated notes on or prior to maturity in 2011.
Management’s Discussion and Analysis ofFinancial Condition and Results of Operations continued
31Carter’s, Inc.
Effects ofInflation andDeflation
Seasonality
CriticalAccountingPolicies andEstimates
We are affected by inflation and changing prices primarily through the purchase of raw materials, increased operating costs and expenses, and fluctuations in interest rates. The effects of inflation on our net sales and oper-ations have not been material in recent years. In recent years, there has been deflationary pressure on sellingprices. While we have been successful in offsetting such deflationary pressures through product improvementsand lower costs with the expansion of our global sourcing capabilities, if deflationary price trends outpace ourability to obtain further price reductions from our global suppliers, our profitability may be affected.
We experience seasonal fluctuations in our sales and profitability, with generally lower sales and gross profit inthe first and second quarters of our fiscal year. Over the past five fiscal years, approximately 57% of our consol-idated net sales were generated in the second half of our fiscal year. Accordingly, our results of operations forthe first and second quarters of any year are not indicative of the results we expect for the full year.
As a result of this seasonality, our inventory levels and other working capital requirements generally begin toincrease during the second quarter and into the third quarter of each fiscal year. During these peak periods wehave historically borrowed under the revolving loan facility. Peak borrowings on our revolving loan facility in fiscal2004 were $25.3 million compared to $44.5 million in fiscal 2003.
Our discussion and analysis of our financial condition and results of operations are based upon our consolidatedfinancial statements, which have been prepared in accordance with accounting principles generally accepted inthe United States of America. The preparation of these financial statements requires us to make estimates andjudgments that affect the reported amounts of assets, liabilities, revenues, expenses, and related disclosure ofcontingent assets and liabilities. We base our estimates on historical experience and on various other assumptionsthat we believe are reasonable under the circumstances, the results of which form the basis for making judgmentsabout the carrying values of assets and liabilities that are not readily apparent from other sources. Actual resultsmay differ from these estimates under different assumptions or conditions.
Our significant accounting policies are described in Note 2 to the accompanying consolidated financial statements.The following discussion addresses our critical accounting policies, which are those that require management’smost difficult and subjective judgments, often as a result of the need to make estimates about the effect ofmatters that are inherently uncertain.
Revenue RecognitionWe recognize wholesale and mass channel revenue after shipment of products to customers, when title passes,and when all risks and rewards of ownership have transferred. In certain cases, in which we retain the risk of lossduring shipment, revenue recognition does not occur until the goods have reached the specified customer. Weconsider revenue realized or realizable and earned when the product has been shipped and when all risks andrewards of ownership have transferred, the sales price is fixed or determinable, and collectibility is reasonablyassured. In the normal course of business, we grant certain accommodations and allowances to our wholesaleand mass channel customers. Such amounts are reflected as reductions of net sales. For certain accommodationsrelated to cooperative (“co-op”) advertising for which we can determine the fair value, such amounts are classified as a component of selling, general, and administrative expenses. Retail store revenues are recognizedat the point of sale. We reduce revenue for customer returns and deductions. We also maintain an allowance fordoubtful accounts for estimated losses resulting from the inability of our customers to make payments and otheractual and estimated deductions. If the financial condition of our customers were to deteriorate, resulting in animpairment of their ability to make payments, an additional allowance could be required. Past due balances over90 days are reviewed individually for collectibility. All other balances are reviewed regularly by our credit andcollections department. Account balances are charged off against the allowance when we feel it is probable thereceivable will not be recovered.
Management’s Discussion and Analysis ofFinancial Condition and Results of Operations continued
32 2004 Annual Report
During fiscal 2004, we contracted with a third-party service to provide us with the fair value of co-op advertisingarrangements entered into with certain of our major wholesale and mass channel customers. Such fair value isdetermined based upon, among other factors, comparable market analysis for similar advertisements. In accordancewith Emerging Issues Task Force Issue No. 01-09, “Accounting for Consideration Given by a Vendor to aCustomer/Reseller” (“EITF 01-09”), we have included the fair value of these arrangements of approximately$3,272,000 in fiscal 2004 as a component of selling, general, and administrative expenses in the accompanyingconsolidated statement of operations rather than as a reduction of revenue. Co-op advertising arrangements inprevious fiscal years were treated as a reduction of revenue in accordance with EITF 01-09 as we had determinedthat it was impracticable to obtain the fair value of those arrangements.
InventoryWe provide reserves for slow-moving inventory equal to the difference between the cost of inventory and theestimated market value based upon assumptions about future demand and market conditions. If actual marketconditions are less favorable than those we project, additional write-downs may be required.
Goodwill and TradenameAs of January 1, 2005, we had approximately $360 million in goodwill and tradename assets. The fair value ofthe Carter’s tradename was estimated at the Acquisition to be approximately $220 million using a discountedcash flow analysis, which examined the hypothetical cost savings that accrue as a result of our ownership of thetradename. The cash flows, which incorporated both historical and projected financial performance, werediscounted using a discount rate of ten percent. The tradename was determined to have an indefinite life. Thecarrying value of these assets is subject to annual impairment reviews as of the last day of each fiscal year. Factorsaffecting such impairment reviews include the continued market acceptance of our offered products and thedevelopment of new products. Impairment reviews may also be triggered by any significant events or changesin circumstances. Our impairment review of goodwill is based on the estimated fair values of the underlying businesses. These estimated fair values are based on estimates of the future cash flows of the businesses.
Accrued ExpensesAccrued expenses for health insurance, workers’ compensation, incentive compensation, professional fees, andother outstanding obligations are assessed based on actual commitments, statistical trends, and estimates basedon projections and current expectations, and these estimates are updated periodically as additional informationbecomes available.
Accounting for Income TaxesAs part of the process of preparing our consolidated financial statements, we are required to estimate our actualcurrent tax exposure (state, federal, and foreign), together with assessing permanent and temporary differencesresulting from differing bases and treatment of items for tax and accounting purposes, such as the carrying valueof intangibles, deductibility of expenses, depreciation of property, plant, and equipment, and valuation of inventories. Temporary differences result in deferred tax assets and liabilities, which are included within ourconsolidated balance sheets. We must then assess the likelihood that our deferred tax assets will be recoveredfrom future taxable income. Actual results could differ from this assessment if sufficient taxable income is notgenerated in future periods. To the extent we determine the need to establish a valuation allowance or increasesuch allowance in a period, we must include an expense within the tax provision in the accompanying consolidated statements of operations.

Management’s Discussion and Analysis ofFinancial Condition and Results of Operations continued
33Carter’s, Inc.
RecentAccountingPronouncements
Stock-Based Compensation ArrangementsWe account for stock-based compensation on stock options under the intrinsic value method, whereby we recordcompensation expense equal to the difference between the exercise price of the stock option and the fair marketvalue of the underlying stock at the date of the option grant. For disclosure purposes only, we also estimate theimpact on our net income of applying the fair value method of measuring compensation cost on stock optionswith the fair value, prior to our initial public offering, determined under the minimum value method as providedby SFAS No. 123, “Accounting for Stock-Based Compensation” (“SFAS 123”) as amended by SFAS No. 148,“Accounting for Stock-Based Compensation-Transition and Disclosure” (“SFAS 148”). For stock issued or soldoutright to employees, directors, or third parties, we measure expense as the difference between the price paidby the recipient and the fair market value of the stock on the date of issuance or sale. Prior to our initial publicoffering, in the absence of a public market for Carter’s, Inc.’s common stock, management and the Board ofDirectors estimated the market value of Carter’s, Inc.’s common stock for all option grants and stock issuancesusing an approach that applies a multiple to Adjusted EBITDA. Adjusted EBITDA represents earnings beforeinterest, income tax expense, depreciation and amortization, and also excludes Acquisition-related charges,write-downs of long-lived assets, closure costs, and a deferred charge write-off. Adjusted EBITDA is not a measurement under accounting principles generally accepted in the United States of America.
In December 2004, the FASB issued SFAS No. 123 (revised 2004), “Share-Based Payment” (“SFAS 123R”), whichreplaces SFAS 123, “Accounting for Stock-Based Compensation” and supercedes Accounting Principles BoardOpinion No. 25, “Accounting for Stock Issued to Employees.” SFAS 123R requires all share-based payments toemployees, including grants of employee stock options, to be recognized in the financial statements based ontheir fair values, beginning with the first interim or annual period after June 15, 2005, with early adoption encouraged.We are required to adopt SFAS 123R in our third quarter of fiscal 2005, beginning July 2, 2005. The pro formadisclosures previously permitted under SFAS 123, will no longer be an alternative to financial statement recognition.Additionally, we will use the modified prospective method of adoption, which requires that compensationexpense be recorded for all unvested stock options and restricted stock at the beginning of the first quarter ofadoption of SFAS 123R and for all subsequent stock options granted thereafter. The impact of adoption, basedupon current options outstanding, is estimated to result in an aggregate reduction in third and fourth quarter offiscal 2005 pre-tax earnings of approximately $1.3 million or approximately $0.03 per diluted share.
In November 2004, the FASB issued SFAS No. 151, “Inventory Costs – An Amendment of ARB No. 43, Chapter 4”(“SFAS 151”). SFAS 151 amends the guidance in Accounting Research Bulletins (“ARB”) No. 43, Chapter 4, “InventoryPricing” (“ARB 43”), to clarify the accounting for abnormal amounts of idle facility expense, freight, handlingcosts, and wasted material (spoilage). Among other provisions, the new rule requires that items such as idle facilityexpense, excessive spoilage, double freight, and rehandling costs be recognized as current-period charges regardless of whether they meet the criterion of “so abnormal” as stated in ARB 43. Additionally, SFAS 151 requiresthat the allocation of fixed production overheads to the costs of conversion be based on the normal capacity of the production facilities. SFAS 151 is effective for fiscal years beginning after June 15, 2005 and is requiredto be adopted by us in the first quarter of fiscal 2006, beginning on January 1, 2006. SFAS 151 is not expectedto have a material impact on the Company.
Management’s Discussion and Analysis ofFinancial Condition and Results of Operations continued
34 2004 Annual Report
Forward-LookingStatements
Quantitativeand QualitativeDisclosuresAbout Market Risk
Statements contained herein that relate to our future performance, including, without limitation, statements withrespect to our anticipated results of operations or level of business for fiscal 2005 or any other future period, areforward-looking statements within the meaning of the safe harbor provisions of the Private Securities LitigationReform Act of 1995. Such statements are based on current expectations only, and are subject to certain risks,uncertainties, and assumptions. Should one or more of these risks or uncertainties materialize, or should underlyingassumptions prove incorrect, actual results may vary materially from those anticipated, estimated, or projected.Among the factors that could cause actual results to materially differ include a decrease in sales to or the lossof one or more of our key customers, downward pressure on our prices, disruptions in foreign supply sources,negative publicity, the loss of one or more of our major suppliers for raw materials, increased competition in thebaby and young children’s apparel market, our substantial leverage which increases our exposure to interest raterisk and could require us to dedicate a substantial portion of our cash flow to repay principal, the impact ofgovernmental regulations and environmental risks applicable to our business, and seasonal fluctuations in thechildren’s apparel business. These risks are described under the heading “Risk Factors” in our most recently filedannual report on Form 10-K. We undertake no obligation to publicly update or revise any forward-looking statements, whether as a result of new information, future events, or otherwise.
In the operation of our business, we have market risk exposures including those related to foreign currency riskand interest rates. These risks and our strategies to manage our exposure to them are discussed below.
We contract for production with third parties primarily in the Far East and South and Central America. While thesecontracts are stated in United States dollars, there can be no assurance that the cost for the future productionof our products will not be affected by exchange rate fluctuations between the United States dollar and the localcurrencies of these contractors. Due to the number of currencies involved, we cannot quantify the potentialimpact of future currency fluctuations on net income in future years. In order to manage this risk, we source productsfrom approximately 100 vendors worldwide, providing us with flexibility in our production should significant fluctuations occur between the United States and various local currencies. To date, such exchange fluctuationshave not had a material impact on our financial condition or results of operations. We do not hedge foreigncurrency exchange rate risk.
Our operating results are subject to risk from interest rate fluctuations on our senior credit facility, which carriesvariable interest rates. At January 1, 2005, our outstanding debt aggregated $184.5 million, of which $71.3 millionbore interest at a variable rate, so that an increase of 1% in the applicable rate would increase our annual interestcost by $713,000 and could have an adverse effect on our net income and cash flow.
Management’s Discussion and Analysis ofFinancial Condition and Results of Operations continued
35Carter’s, Inc.
Other Risks There also are other risks in the operation of our business specifically related to raw material pricing and ourglobal sourcing network.
The principal raw materials we use are finished fabrics and trim materials. Prices for these materials are affectedby changes in market demand, and there can be no assurance that prices for these and other raw materials willnot increase in the near future. These materials are available from more than one supplier, which enables us tonegotiate pricing. However, the loss of one or more of these suppliers could temporarily interrupt our supply,which could have an adverse effect on our sales and increase our costs.
We currently source substantially all of our production from our offshore operations and third-party manufacturerslocated in foreign countries. As a result, we may be adversely affected by political instability resulting in thedisruption of trade from foreign countries, the imposition of new regulations relating to imports, duties, taxes,and other charges on imports, any significant decreases in the value of the dollar against foreign currencies, andrestrictions on the transfer of funds. These and other factors could result in the interruption of production inoffshore facilities, delay receipt of the products into the United States, or affect our operating income. Our futureperformance may be subject to such factors, which are beyond our control, and there can be no assurance thatsuch factors would not have a material adverse effect on our financial condition and results of operations. Wecarefully select our sourcing agents, and in an effort to mitigate the possible disruption in product flow, we placeproduction in various countries we believe to be of lower risk.
We continually evaluate opportunities to improve our products and reduce our costs. Our remaining sewing facilities, located in Mexico, continue to provide us with an advantageous cost structure. If we determine in thefuture that we are able to source products currently sewn in Mexico at a significantly lower cost with superiorquality elsewhere, we would develop a plan to exit such facilities and incur closure-related costs.
We enter into various purchase order commitments with full-package suppliers. We can cancel these arrangements,although in some instances, we may be subject to a termination charge reflecting a percentage of workperformed prior to cancellation. Historically, such cancellations and related termination charges have occurredinfrequently and have not had a material impact on our business. However, as we rely more heavily on our full-package global sourcing network, we expect to incur more of these termination charges, which couldincrease our cost of goods sold.
Management’s Report on Internal Control over Financial Reporting
Our management is responsible for establishing and maintaining adequate internal control over financial reporting, as such term is defined in Exchange Act Rule 13a-15(f). Under the supervision and with the participation of our management, including our Chief Executive Officer and Chief Financial Officer, we conductedevaluations of the effectiveness of each of Carter’s, Inc. and The William Carter Company and its subsidiaries’internal control over financial reporting based on the framework in Internal Control – Integrated Frameworkissued by the Committee of Sponsoring Organizations of the Treadway Commission (“COSO”). Based on ourevaluations under the framework in Internal Control – Integrated Framework issued by the COSO, our manage-ment concluded that each of Carter’s, Inc. and The William Carter Company and its subsidiaries’ internal controlover financial reporting was effective as of January 1, 2005.
Because of its inherent limitations, internal control over financial reporting may not prevent or detect misstatements. Also, projections of any evaluation of effectiveness to future periods are subject to the risk thatcontrols may become inadequate because of changes in conditions, or that the degree of compliance with thepolicies or procedures may deteriorate.
Our management’s assessments of the effectiveness of each of Carter’s, Inc. and The William Carter Companyand its subsidiaries’ internal control over financial reporting as of January 1, 2005 have been audited byPricewaterhouseCoopers LLP, an independent registered public accounting firm, as stated in their report whichappears herein.

Report of Independent Registered Public Accounting Firm
36 2004 Annual Report
To the Board of Directors and Stockholders of Carter’s, Inc.:
We have completed an integrated audit of the fiscal 2004 consolidated financial statements and of the internal control over financialreporting as of January 1, 2005 for each of Carter’s, Inc. and The William Carter Company and its subsidiaries and audits of the fiscal 2003 and fiscal 2002 consolidated financial statements of Carter’s, Inc. and The William Carter Company and its subsidiaries inaccordance with the standards of the Public Company Accounting Oversight Board (United States). Our opinions, based on our audits,are presented below.
Consolidated financial statementsIn our opinion, the accompanying consolidated balance sheets and the related consolidated statements of operations, cash flows andchanges in stockholders’ equity present fairly, in all material respects, the financial position of each of Carter’s, Inc. and The William CarterCompany and its subsidiaries at January 1, 2005 and January 3, 2004, and the results of their operations and their cash flows for eachof the three years in the period ended January 1, 2005 in conformity with accounting principles generally accepted in the United Statesof America. These financial statements are the responsibility of Carter’s, Inc. and The William Carter Company and its subsidiaries’management. Our responsibility is to express an opinion on these financial statements based on our audits. We conducted our auditsof these statements in accordance with the standards of the Public Company Accounting Oversight Board (United States). Those stan-dards require that we plan and perform the audit to obtain reasonable assurance about whether the financial statements are free of materialmisstatement. An audit of financial statements includes examining, on a test basis, evidence supporting the amounts and disclosuresin the financial statements, assessing the accounting principles used and significant estimates made by management, and evaluatingthe overall financial statement presentation. We believe that our audits provide a reasonable basis for our opinions.
Internal control over financial reportingAlso, in our opinion, management’s assessments, included in the accompanying Management’s Report on Internal Control OverFinancial Reporting appearing on page 35, that each of Carter’s, Inc. and The William Carter Company and its subsidiaries maintainedeffective internal control over financial reporting as of January 1, 2005 based on criteria established in Internal Control – IntegratedFramework issued by the Committee of Sponsoring Organizations of the Treadway Commission (“COSO”), is fairly stated, in all mate-rial respects, based on those criteria. Furthermore, in our opinion, each of Carter’s, Inc. and The William Carter Company and itssubsidiaries maintained, in all material respects, effective internal control over financial reporting as of January 1, 2005, based on crite-ria established in Internal Control – Integrated Framework issued by the COSO. Carter’s, Inc. and The William Carter Company andits subsidiaries’ management is responsible for maintaining effective internal control over financial reporting and for its assessment ofthe effectiveness of internal control over financial reporting. Our responsibility is to express opinions on management’s assessmentsand on the effectiveness of Carter’s, Inc. and The William Carter Company and its subsidiaries’ internal control over financial report-ing based on our audit. We conducted our audit of internal control over financial reporting in accordance with the standards of thePublic Company Accounting Oversight Board (United States). Those standards require that we plan and perform the audit to obtainreasonable assurance about whether effective internal control over financial reporting was maintained in all material respects. An auditof internal control over financial reporting includes obtaining an understanding of internal control over financial reporting, evaluatingmanagement’s assessments, testing and evaluating the design and operating effectiveness of internal control, and performing suchother procedures as we consider necessary in the circumstances. We believe that our audit provides a reasonable basis for our opinions.
A company’s internal control over financial reporting is a process designed to provide reasonable assurance regarding the reliabilityof financial reporting and the preparation of financial statements for external purposes in accordance with generally accepted accountingprinciples. A company’s internal control over financial reporting includes those policies and procedures that (i) pertain to the maintenance of records that, in reasonable detail, accurately and fairly reflect the transactions and dispositions of the assets of the company; (ii) provide reasonable assurance that transactions are recorded as necessary to permit preparation of financial statementsin accordance with generally accepted accounting principles, and that receipts and expenditures of the company are being made only inaccordance with authorizations of management and directors of the company; and (iii) provide reasonable assurance regarding preventionor timely detection of unauthorized acquisition, use, or disposition of the company’s assets that could have a material effect on thefinancial statements.
Because of its inherent limitations, internal control over financial reporting may not prevent or detect misstatements. Also, projectionsof any evaluation of effectiveness to future periods are subject to the risk that controls may become inadequate because of changesin conditions, or that the degree of compliance with the policies or procedures may deteriorate.
PricewaterhouseCoopers LLPStamford, ConnecticutMarch 16, 2005
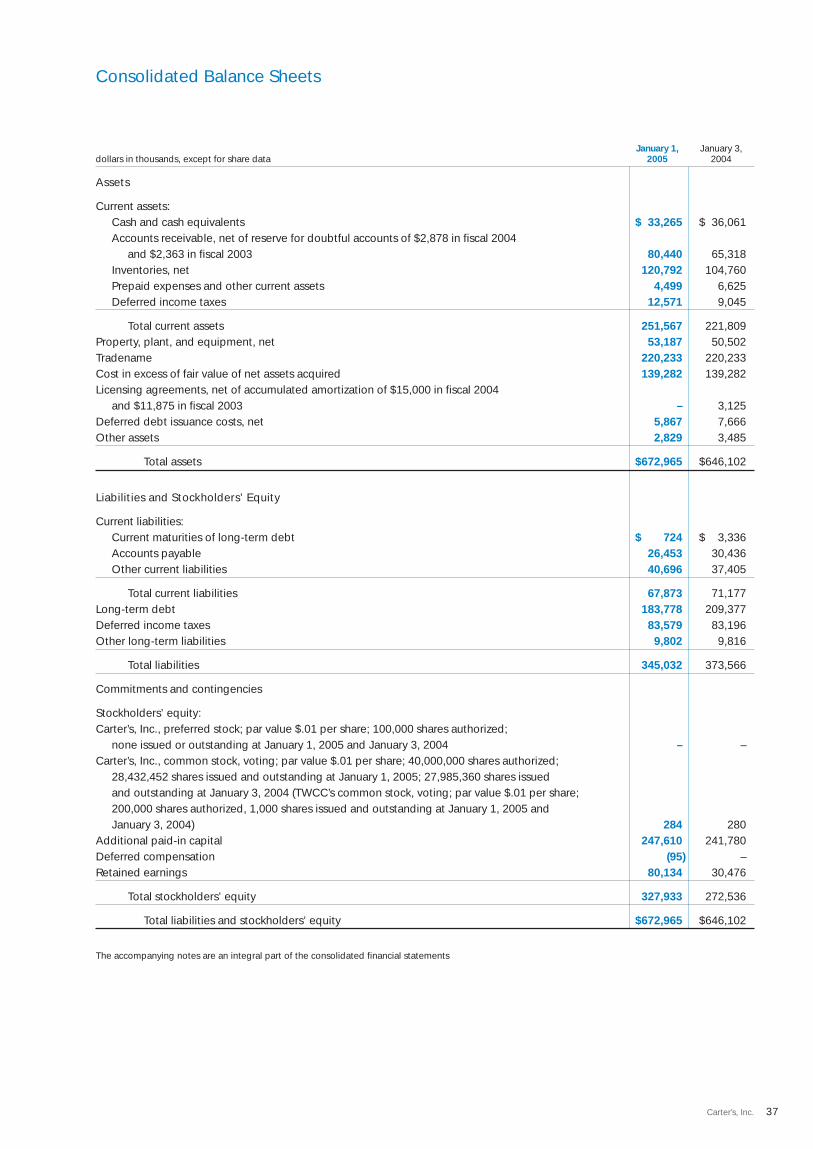
Consolidated Balance Sheets
37Carter’s, Inc.
January 1, January 3,dollars in thousands, except for share data 2005 2004
Assets
Current assets:Cash and cash equivalents $ 33,265 $ 36,061Accounts receivable, net of reserve for doubtful accounts of $2,878 in fiscal 2004
and $2,363 in fiscal 2003 80,440 65,318Inventories, net 120,792 104,760Prepaid expenses and other current assets 4,499 6,625Deferred income taxes 12,571 9,045
Total current assets 251,567 221,809Property, plant, and equipment, net 53,187 50,502Tradename 220,233 220,233Cost in excess of fair value of net assets acquired 139,282 139,282Licensing agreements, net of accumulated amortization of $15,000 in fiscal 2004
and $11,875 in fiscal 2003 – 3,125Deferred debt issuance costs, net 5,867 7,666Other assets 2,829 3,485
Total assets $672,965 $646,102
Liabilities and Stockholders’ Equity
Current liabilities:Current maturities of long-term debt $ 724 $ 3,336Accounts payable 26,453 30,436Other current liabilities 40,696 37,405
Total current liabilities 67,873 71,177Long-term debt 183,778 209,377Deferred income taxes 83,579 83,196Other long-term liabilities 9,802 9,816
Total liabilities 345,032 373,566
Commitments and contingencies
Stockholders’ equity:Carter’s, Inc., preferred stock; par value $.01 per share; 100,000 shares authorized;
none issued or outstanding at January 1, 2005 and January 3, 2004 – –Carter’s, Inc., common stock, voting; par value $.01 per share; 40,000,000 shares authorized;
28,432,452 shares issued and outstanding at January 1, 2005; 27,985,360 shares issued and outstanding at January 3, 2004 (TWCC’s common stock, voting; par value $.01 per share; 200,000 shares authorized, 1,000 shares issued and outstanding at January 1, 2005 and January 3, 2004) 284 280
Additional paid-in capital 247,610 241,780Deferred compensation (95) –Retained earnings 80,134 30,476
Total stockholders’ equity 327,933 272,536
Total liabilities and stockholders’ equity $672,965 $646,102
The accompanying notes are an integral part of the consolidated financial statements
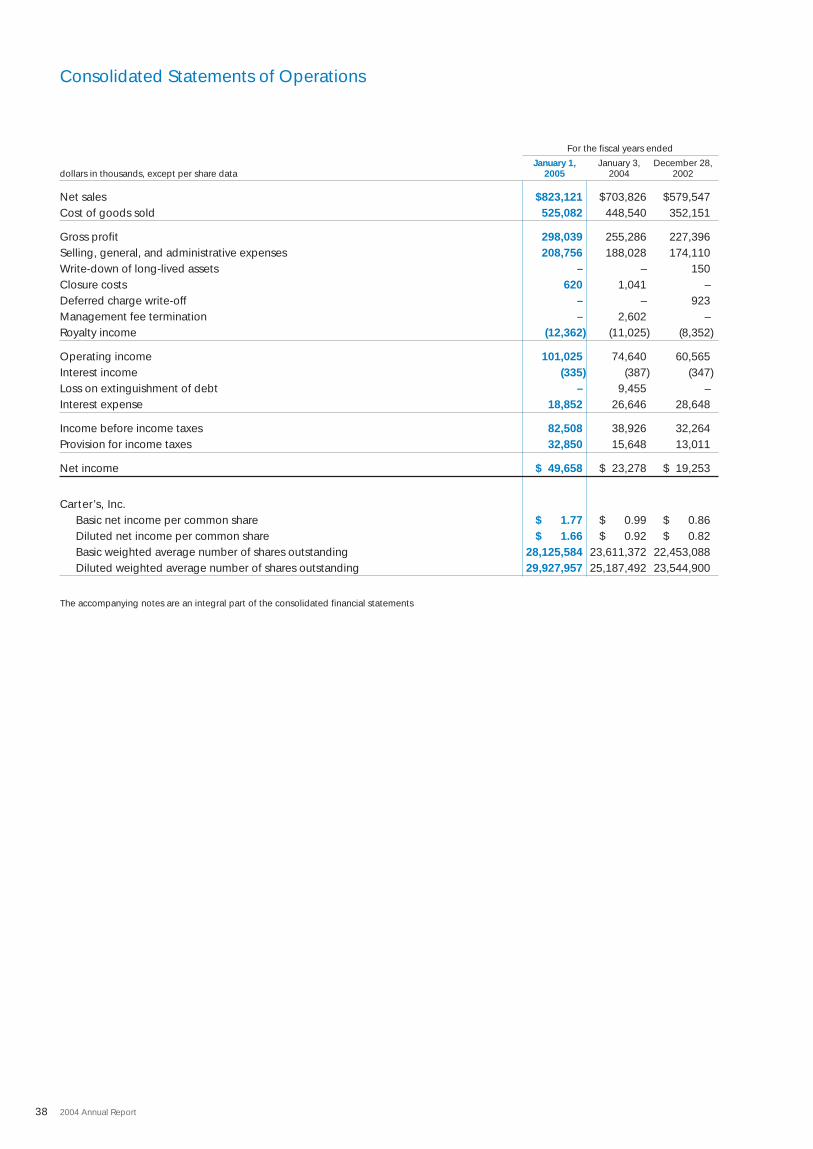
Consolidated Statements of Operations
38 2004 Annual Report
For the fiscal years ended
January 1, January 3, December 28,dollars in thousands, except per share data 2005 2004 2002
Net sales $823,121 $703,826 $579,547Cost of goods sold 525,082 448,540 352,151
Gross profit 298,039 255,286 227,396Selling, general, and administrative expenses 208,756 188,028 174,110Write-down of long-lived assets – – 150Closure costs 620 1,041 –Deferred charge write-off – – 923Management fee termination – 2,602 –Royalty income (12,362) (11,025) (8,352)
Operating income 101,025 74,640 60,565Interest income (335) (387) (347)Loss on extinguishment of debt – 9,455 –Interest expense 18,852 26,646 28,648
Income before income taxes 82,508 38,926 32,264Provision for income taxes 32,850 15,648 13,011
Net income $ 49,658 $ 23,278 $ 19,253
Carter’s, Inc.Basic net income per common share $ 1.77 $ 0.99 $ 0.86Diluted net income per common share $ 1.66 $ 0.92 $ 0.82Basic weighted average number of shares outstanding 28,125,584 23,611,372 22,453,088Diluted weighted average number of shares outstanding 29,927,957 25,187,492 23,544,900
The accompanying notes are an integral part of the consolidated financial statements
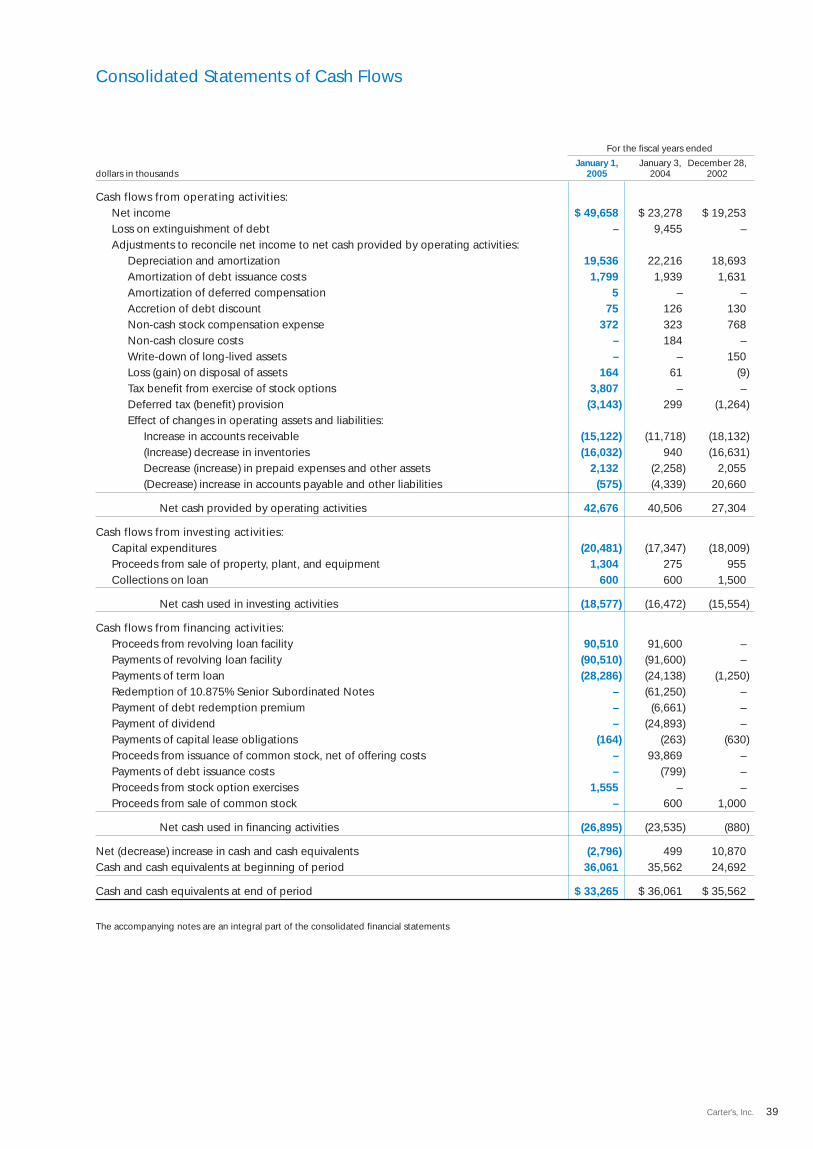
Consolidated Statements of Cash Flows
39Carter’s, Inc.
For the fiscal years ended
January 1, January 3, December 28,dollars in thousands 2005 2004 2002
Cash flows from operating activities:Net income $ 49,658 $ 23,278 $ 19,253Loss on extinguishment of debt – 9,455 –Adjustments to reconcile net income to net cash provided by operating activities:
Depreciation and amortization 19,536 22,216 18,693Amortization of debt issuance costs 1,799 1,939 1,631Amortization of deferred compensation 5 – –Accretion of debt discount 75 126 130Non-cash stock compensation expense 372 323 768Non-cash closure costs – 184 –Write-down of long-lived assets – – 150Loss (gain) on disposal of assets 164 61 (9)Tax benefit from exercise of stock options 3,807 – –Deferred tax (benefit) provision (3,143) 299 (1,264)Effect of changes in operating assets and liabilities:
Increase in accounts receivable (15,122) (11,718) (18,132)(Increase) decrease in inventories (16,032) 940 (16,631)Decrease (increase) in prepaid expenses and other assets 2,132 (2,258) 2,055(Decrease) increase in accounts payable and other liabilities (575) (4,339) 20,660
Net cash provided by operating activities 42,676 40,506 27,304
Cash flows from investing activities:Capital expenditures (20,481) (17,347) (18,009)Proceeds from sale of property, plant, and equipment 1,304 275 955Collections on loan 600 600 1,500
Net cash used in investing activities (18,577) (16,472) (15,554)
Cash flows from financing activities:Proceeds from revolving loan facility 90,510 91,600 –Payments of revolving loan facility (90,510) (91,600) –Payments of term loan (28,286) (24,138) (1,250)Redemption of 10.875% Senior Subordinated Notes – (61,250) –Payment of debt redemption premium – (6,661) –Payment of dividend – (24,893) –Payments of capital lease obligations (164) (263) (630)Proceeds from issuance of common stock, net of offering costs – 93,869 –Payments of debt issuance costs – (799) –Proceeds from stock option exercises 1,555 – –Proceeds from sale of common stock – 600 1,000
Net cash used in financing activities (26,895) (23,535) (880)
Net (decrease) increase in cash and cash equivalents (2,796) 499 10,870Cash and cash equivalents at beginning of period 36,061 35,562 24,692
Cash and cash equivalents at end of period $ 33,265 $ 36,061 $ 35,562
The accompanying notes are an integral part of the consolidated financial statements
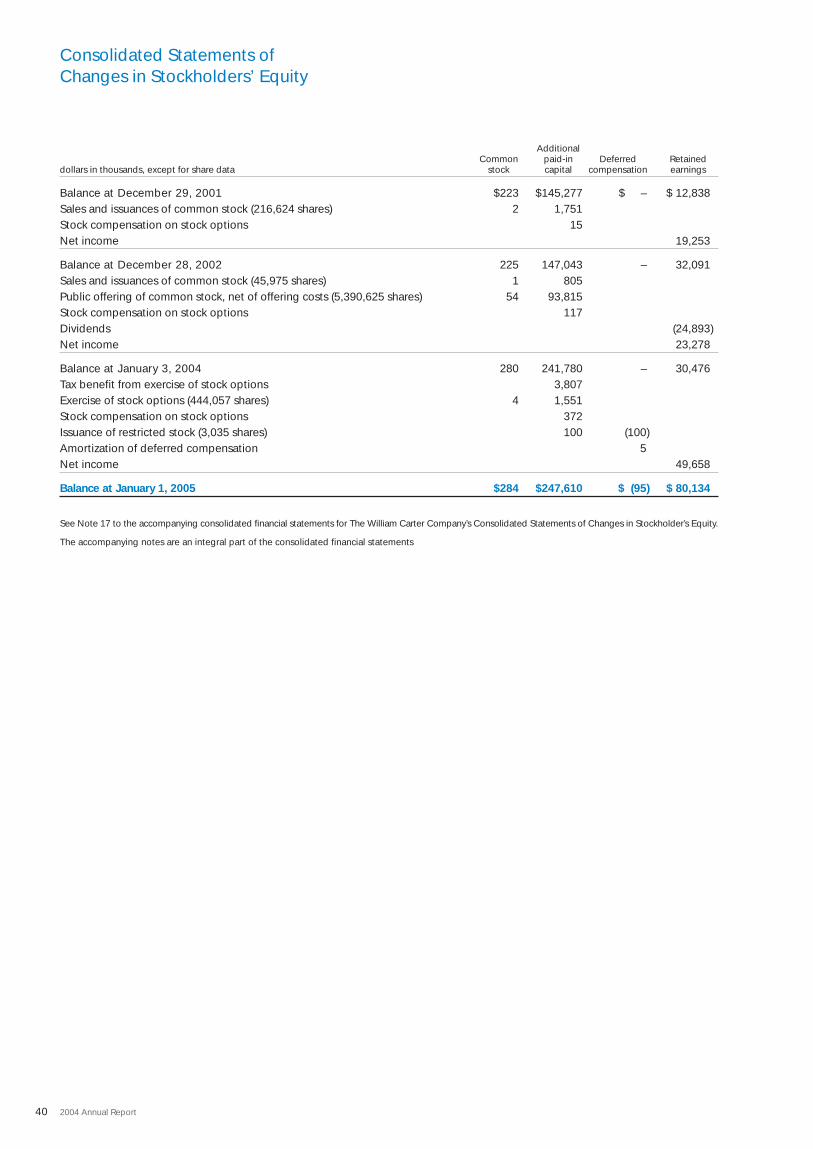
Consolidated Statements of Changes in Stockholders’ Equity
40 2004 Annual Report
AdditionalCommon paid-in Deferred Retained
dollars in thousands, except for share data stock capital compensation earnings
Balance at December 29, 2001 $223 $145,277 $ – $ 12,838Sales and issuances of common stock (216,624 shares) 2 1,751Stock compensation on stock options 15Net income 19,253
Balance at December 28, 2002 225 147,043 – 32,091Sales and issuances of common stock (45,975 shares) 1 805Public offering of common stock, net of offering costs (5,390,625 shares) 54 93,815Stock compensation on stock options 117Dividends (24,893)Net income 23,278
Balance at January 3, 2004 280 241,780 – 30,476Tax benefit from exercise of stock options 3,807Exercise of stock options (444,057 shares) 4 1,551Stock compensation on stock options 372Issuance of restricted stock (3,035 shares) 100 (100)Amortization of deferred compensation 5Net income 49,658
Balance at January 1, 2005 $284 $247,610 $ (95) $ 80,134
See Note 17 to the accompanying consolidated financial statements for The William Carter Company’s Consolidated Statements of Changes in Stockholder’s Equity.
The accompanying notes are an integral part of the consolidated financial statements
Notes to Consolidated Financial Statements
41Carter’s, Inc.
Note 1: The Company
On September 30, 2003, Carter Holdings, Inc., a Massachusetts corporation, re-incorporated in Delaware andchanged its name by forming and subsequently merging with and into its new wholly-owned Delawaresubsidiary. The surviving company is named Carter’s, Inc. In connection with the re-incorporation, Carter’s, Inc.effected a 4-for-1 split of its common stock.
Carter’s, Inc. conducts its operations and derives all of its operating income and cash flow through its wholly-ownedsubsidiary, The William Carter Company (“TWCC”). This is a combined report for Carter’s, Inc. and its wholly-owned subsidiary, TWCC. Both Carter’s, Inc. and TWCC are registrants with the Securities and ExchangeCommission. Carter’s, Inc. is required to register its equity securities under the Securities Act of 1933, asamended, and TWCC is a voluntary filer as required under the terms of the indenture governing its 10.875%senior subordinated notes.
Carter’s, Inc., together with TWCC (collectively “Carter’s,” “we,” “us,” and “our”) design, source, manufacture,and market branded childrenswear under the Carter’s, Carter’s Classics, Child of Mine, and Tykes labels. Wereplaced the Tykes brand name with our Just One Year brand beginning in December 2004. Our products aresourced through contractual arrangements with numerous manufacturers throughout the world and throughproduction at company-managed sewing facilities in Mexico. Our sewing operations in Costa Rica were closedin the fourth quarter of fiscal 2003 (see Note 15 to the consolidated financial statements regarding this closure).Products are manufactured for wholesale distribution to major domestic retailers, including the mass channel,and for our 180 retail stores that market our brand name merchandise and certain products manufactured byother companies.
On September 29, 2004, we completed a secondary offering of 8,687,457 shares of Carter’s, Inc.’s commonstock, including the underwriters’ over-allotment option, which was sold by Berkshire Partners LLC and its affiliates(“Berkshire Partners”) and certain members of management. We did not receive any of the proceeds from thisoffering except for proceeds from the exercise of stock options exercised in connection with this offering. Thesale reduced the beneficial ownership, on a fully-diluted basis, of Berkshire Partners to 36.2% from 66.0% andmanagement’s ownership to 8.9% from 10.1%. We incurred $582,000 of costs related to the offering in fiscal 2004 that are recorded as a component of selling, general, and administrative expenses in the accompa-nying consolidated statement of operations. As of January 1, 2005, the beneficial ownership, on a fully-dilutedbasis, of Berkshire Partners and management was 25.5% and 8.8%.
On October 29, 2003, we completed an initial public offering of Carter’s, Inc.’s common stock (the “offering”)including the sale of 5,390,625 shares by us and 1,796,875 shares by the selling stockholders, primarily BerkshirePartners. Net proceeds to us from the offering totaled $93.9 million. On November 28, 2003, we used approx-imately $68.7 million of the proceeds to redeem approximately $61.3 million in outstanding senior subordinatednotes and pay a redemption premium of approximately $6.7 million and related accrued interest charges of $0.7 million. We used approximately $2.6 million of the net proceeds to terminate the Berkshire Partnersmanagement agreement. We also used approximately $11.3 million to prepay amounts outstanding under theterm loan, as required by the senior credit facility. The remaining proceeds of approximately $11.3 million wereutilized for working capital and other general corporate purposes.
On July 12, 2001, a special purpose entity formed by Berkshire Partners entered into a stock purchase agreementwith Carter’s, Inc. and all of Carter’s, Inc.’s stockholders to acquire substantially all of the stock of Carter’s, Inc.except for some equity interests held by our management (the “Acquisition”). The Acquisition was consummatedon August 15, 2001.
The Acquisition was accounted for under the purchase method of accounting. The purchase price for theAcquisition, including related fees and expenses, was allocated to our tangible and identifiable intangible assetsand liabilities based upon their estimated fair values with the remainder allocated to goodwill.

Notes to Consolidated Financial Statements continued
42 2004 Annual Report
Note 2: Summary of Significant Accounting Policies
Basis of PreparationThe accompanying financial statements comprise the consolidated financial statements of Carter’s, Inc. andTWCC. Carter’s, Inc.’s only asset is its investment in the common stock of TWCC, its wholly-owned subsidiary.As a result, the consolidated financial positions, results of operations, and cash flows of Carter’s, Inc. and TWCCare substantially the same. See Note 17 to the consolidated financial statements for additional information.
ReclassificationsCertain prior year amounts have been reclassified for comparative purposes.
Principles of ConsolidationThe accompanying consolidated financial statements include the accounts of Carter’s, Inc. and those of TWCCand TWCC’s wholly-owned subsidiaries. International subsidiaries represented 100% of our sewing productionfor fiscal years 2004, 2003, and 2002. Total net assets (primarily property, plant, and equipment and inventory)at our international subsidiaries were approximately $4.6 million at January 1, 2005 and $4.5 million at January 3,2004. All intercompany transactions and balances have been eliminated in consolidation.
Fiscal YearOur fiscal year ends on the Saturday in December or January nearest to the last day of December. The accompanying consolidated financial statements reflect our financial position as of January 1, 2005 and January 3,2004 and results of operations for the fiscal years ended January 1, 2005, January 3, 2004, and December 28, 2002.The fiscal year ended January 3, 2004 (fiscal 2003) contains 53 weeks. The fiscal years ended January 1, 2005 (fiscal 2004) and December 28, 2002 (fiscal 2002), each contain 52 weeks.
Cash and Cash EquivalentsWe consider all highly liquid investments that have original maturities of three months or less to be cash equivalents. We had cash deposits, in excess of deposit insurance limits, in three banks at January 1, 2005 andfour banks at January 3, 2004.
Accounts ReceivableApproximately 85% of our gross accounts receivable at January 1, 2005 and 87% at January 3, 2004 were fromour ten largest wholesale and mass channel customers. Of these customers, three have individual receivablebalances in excess of 10% of our gross accounts receivable (but not more than 17%) at January 1, 2005 and January 3, 2004. Sales to these customers represent comparable percentages to total wholesale and masschannel net sales. In fiscal 2004, two customers accounted for 10.0% and 10.7% of our consolidated net sales.
Components of accounts receivable as of January 1, 2005 and January 3, 2004 are as follows:
January 1, January 3,dollars in thousands 2005 2004
Trade receivables, net $76,939 $61,750Royalties receivable 3,056 2,854Other 445 714
Total $80,440 $65,318
InventoriesInventories are stated at the lower of cost (first-in, first-out basis for wholesale and mass channel inventories andretail method for retail inventories) or market. We provide reserves for slow-moving inventory equal to the differencebetween the cost of inventory and the estimated market value based upon assumptions about future demandand market conditions.
Notes to Consolidated Financial Statements continued
43Carter’s, Inc.
Property, Plant, and EquipmentProperty, plant, and equipment are stated at cost, less accumulated depreciation and amortization, whichincludes the amortization of assets recorded under capital leases. When fixed assets are sold or otherwisedisposed, the accounts are relieved of the original costs of the assets, and the related accumulated depreciationand any resulting profit or loss is credited or charged to income. For financial reporting purposes, depreciation andamortization are computed on the straight-line method over the estimated useful lives of the assets as follows:buildings – 15 to 26 years and machinery and equipment – 3 to 10 years. Leasehold improvements and fixedassets purchased under capital leases are amortized over the lesser of the asset life or related lease term. Wecapitalize the cost of our fixtures designed and purchased for use at major wholesale and mass channel accounts.The cost of these fixtures is amortized over a three-year period.
Cost in Excess of Fair Value of Net Assets Acquired and Other Intangible AssetsCost in excess of fair value of net assets acquired (“goodwill”) represents the excess of the cost of the Acquisitionover the fair value of the net assets acquired.
In connection with the Acquisition, we adopted the provisions of Statements of Financial Accounting Standards(“SFAS”) No. 141, “Business Combinations” (“SFAS 141”), and applied the required provisions of SFAS No. 142,“Goodwill and other Intangible Assets” (“SFAS 142”). Accordingly, our tradename and goodwill are deemed tohave indefinite lives and are not being amortized. Our licensing agreements, however, recognized in the allocation of the Acquisition purchase price, were amortized over the average three-year life of such agreements,as it was determined that these agreements have finite lives. Amortization expense on our licensing agreements was$3.1 million for fiscal 2004 and $5.0 million in fiscal 2003 and fiscal 2002. The licensing agreements were fullyamortized as of August 15, 2004.
We adopted the remaining provisions of SFAS 142 as of the beginning of fiscal 2002. In accordance with thisstatement, we identified our reporting units, and have completed the required assessments for impairment ofgoodwill (by comparing the fair values of our reporting units to their respective carrying values, including allocated goodwill) and our tradename and found that there was no impairment of either asset, either at theinitial adoption date or at the most recent assessment performed as of January 1, 2005.
We measure our goodwill and tradename for impairment on at least an annual basis or if events or changes incircumstances so dictate.
Impairment of Other Long-Lived AssetsWe review other long-lived assets, including property, plant, and equipment and licensing agreements, forimpairment whenever events or changes in circumstances indicate that the carrying amount of such an asset maynot be recoverable. Management will determine whether there has been a permanent impairment on such assetsheld for use in the business by comparing anticipated undiscounted future cash flows from the use and eventualdisposition of the asset or asset group to the carrying value of the asset. The amount of any resulting impairmentwill be calculated by comparing the carrying value to fair value, which may be estimated using the present valueof the same cash flows. Long-lived assets that meet the definition of held for sale are valued at the lower of carrying amount or fair value, less costs to sell.
Deferred Debt Issuance CostsDebt issuance costs are deferred and amortized to interest expense using the straight-line method, whichapproximates the effective interest method, over the lives of the related debt. Amortization approximated$1,799,000 for the fiscal year ended January 1, 2005, $1,939,000 for the fiscal year ended January 3, 2004, and $1,631,000 for the fiscal year ended December 28, 2002.

Notes to Consolidated Financial Statements continued
44 2004 Annual Report
Revenue RecognitionRevenues consist of sales to customers, net of returns, accommodations, deductions, and cooperative (“co-op”)advertising. We recognize wholesale and mass channel revenue after shipment of products to customers, whentitle passes, and when all risks and rewards of ownership have transferred. In certain cases, in which we retain therisk of loss during shipment, revenue recognition does not occur until the goods have reached the specifiedcustomer. We consider revenue realized or realizable and earned when the product has been shipped and whenall risks and rewards of ownership have transferred, the sales price is fixed or determinable, and collectibility isreasonably assured. In the normal course of business, we grant certain accommodations and allowances to ourwholesale and mass channel customers. Such amounts are reflected as reductions of net sales. Certain accom-modations related to co-op advertising for which we can determine the fair value are classified as a componentof selling, general, and administrative expenses. Retail store revenues are recognized at the point of sale. Wereduce revenue for customer returns and deductions. We also maintain an allowance for doubtful accounts forestimated losses resulting from the inability of our customers to make payments and other actual and estimateddeductions. If the financial condition of our customers were to deteriorate, resulting in an impairment of theirability to make payments, an additional allowance could be required. Past due balances over 90 days arereviewed individually for collectibility. All other balances are reviewed regularly by our credit and collectionsdepartment. Account balances are charged off against the allowance when we feel it is probable the receivablewill not be recovered.
During fiscal 2004, we contracted with a third-party service to provide us with the fair value of co-op advertisingarrangements entered into with certain of our major wholesale and mass channel customers. Such fair value is determined based upon, among other factors, comparable market analysis for similar advertisements. In accordance with Financial Accounting Standards Board’s Emerging Issues Task Force Issue No. 01-09,“Accounting for Consideration Given by a Vendor to a Customer/Reseller” (“EITF 01-09”), we have included thefair value of these arrangements of approximately $3,272,000 in fiscal 2004 as a component of selling, general,and administrative expenses in the accompanying consolidated statement of operations rather than as a reduction of revenue. Co-op advertising arrangements in fiscal 2003 and fiscal 2002 were treated as a reductionof revenue in accordance with EITF 01-09 as we had determined that it was impracticable to obtain the fair value ofthose arrangements.
Accounting for Shipping and Handling Fees and CostsShipping and handling costs include shipping supplies, related labor costs, third-party shipping costs, and certaindistribution overhead. Such costs are generally absorbed by us and are included in selling, general, and administrative expenses. These costs amounted to approximately $26,955,000 for fiscal 2004, $22,620,000 forfiscal 2003, and $19,514,000 for fiscal 2002.
With respect to the freight component of our shipping and handling costs, certain customers arrange for shipping and pay the related freight costs directly to third parties. However, in the event that we arrange and paythe freight for these customers and bill them for this service, such amounts billed would be included in revenueand the related cost would be charged to cost of goods sold. For fiscal years 2004, 2003, and 2002, no sucharrangements or billings to customers occurred.
Royalties and License FeesWe license the Carter’s, Carter’s Classics, Just One Year, and Child of Mine names to other companies for useon baby and young children’s products, including bedding, outerwear, shoes, socks, room décor, toys, stationery,strollers, hair accessories, and related products. These royalties are recorded as earned, based upon the salesof licensed products by our licensees.
We have licensed the right to use and sublicense the Tykes trademark for use on certain products sold primarilyat Target stores. We have replaced the Tykes brand name in Target stores with our Just One Year brand beginningin December 2004.
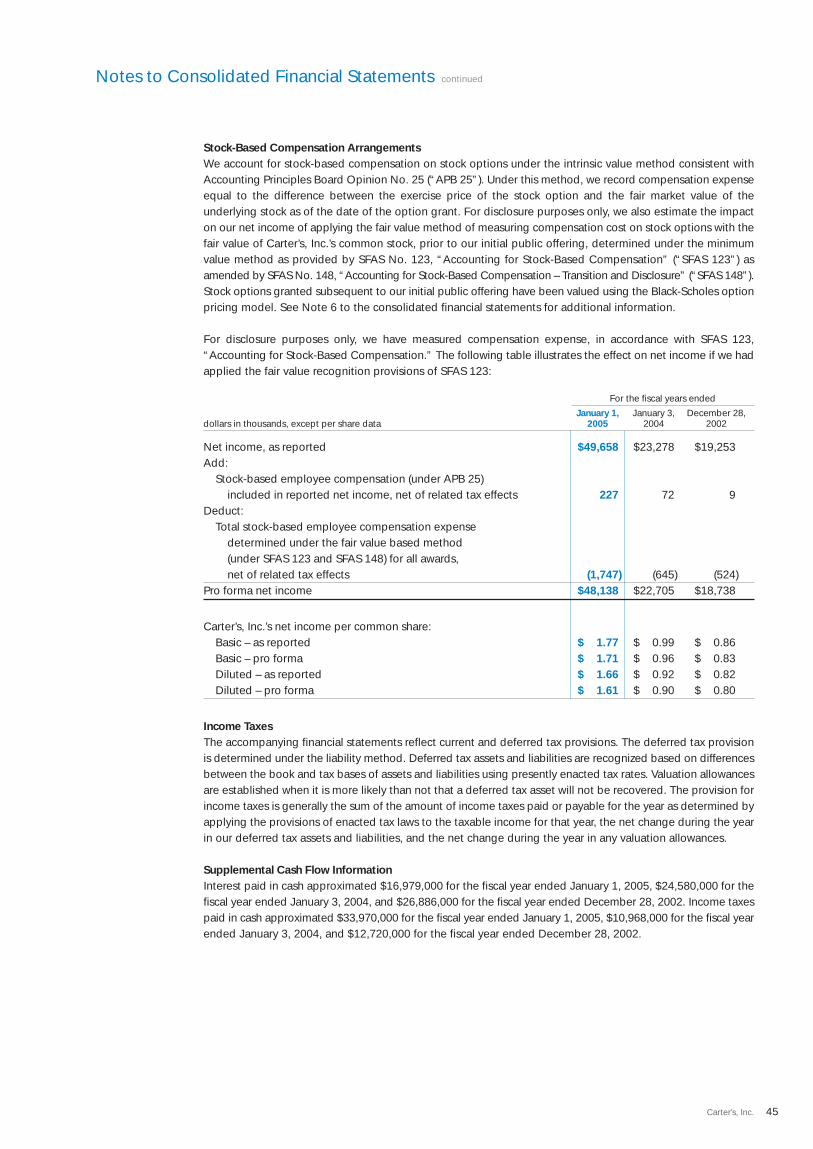
Notes to Consolidated Financial Statements continued
45Carter’s, Inc.
Stock-Based Compensation ArrangementsWe account for stock-based compensation on stock options under the intrinsic value method consistent withAccounting Principles Board Opinion No. 25 (“APB 25”). Under this method, we record compensation expenseequal to the difference between the exercise price of the stock option and the fair market value of the underlying stock as of the date of the option grant. For disclosure purposes only, we also estimate the impacton our net income of applying the fair value method of measuring compensation cost on stock options with thefair value of Carter’s, Inc.’s common stock, prior to our initial public offering, determined under the minimumvalue method as provided by SFAS No. 123, “Accounting for Stock-Based Compensation” (“SFAS 123”) asamended by SFAS No. 148, “Accounting for Stock-Based Compensation – Transition and Disclosure” (“SFAS 148”).Stock options granted subsequent to our initial public offering have been valued using the Black-Scholes optionpricing model. See Note 6 to the consolidated financial statements for additional information.
For disclosure purposes only, we have measured compensation expense, in accordance with SFAS 123,“Accounting for Stock-Based Compensation.” The following table illustrates the effect on net income if we hadapplied the fair value recognition provisions of SFAS 123:
For the fiscal years ended
January 1, January 3, December 28,dollars in thousands, except per share data 2005 2004 2002
Net income, as reported $49,658 $23,278 $19,253Add:
Stock-based employee compensation (under APB 25) included in reported net income, net of related tax effects 227 72 9
Deduct:Total stock-based employee compensation expense
determined under the fair value based method (under SFAS 123 and SFAS 148) for all awards, net of related tax effects (1,747) (645) (524)
Pro forma net income $48,138 $22,705 $18,738
Carter’s, Inc.’s net income per common share:Basic – as reported $ 1.77 $ 0.99 $ 0.86Basic – pro forma $ 1.71 $ 0.96 $ 0.83Diluted – as reported $ 1.66 $ 0.92 $ 0.82Diluted – pro forma $ 1.61 $ 0.90 $ 0.80
Income TaxesThe accompanying financial statements reflect current and deferred tax provisions. The deferred tax provisionis determined under the liability method. Deferred tax assets and liabilities are recognized based on differencesbetween the book and tax bases of assets and liabilities using presently enacted tax rates. Valuation allowancesare established when it is more likely than not that a deferred tax asset will not be recovered. The provision forincome taxes is generally the sum of the amount of income taxes paid or payable for the year as determined byapplying the provisions of enacted tax laws to the taxable income for that year, the net change during the yearin our deferred tax assets and liabilities, and the net change during the year in any valuation allowances.
Supplemental Cash Flow InformationInterest paid in cash approximated $16,979,000 for the fiscal year ended January 1, 2005, $24,580,000 for thefiscal year ended January 3, 2004, and $26,886,000 for the fiscal year ended December 28, 2002. Income taxespaid in cash approximated $33,970,000 for the fiscal year ended January 1, 2005, $10,968,000 for the fiscal yearended January 3, 2004, and $12,720,000 for the fiscal year ended December 28, 2002.
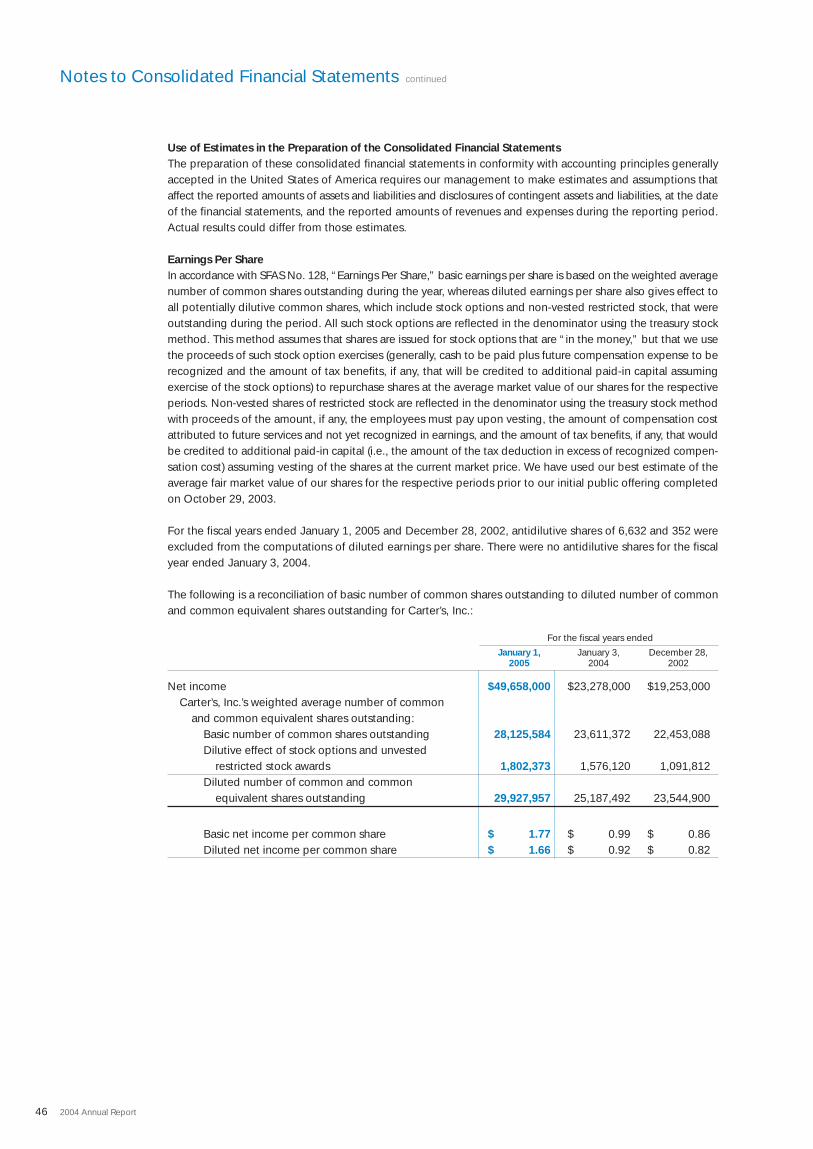
Notes to Consolidated Financial Statements continued
46 2004 Annual Report
Use of Estimates in the Preparation of the Consolidated Financial StatementsThe preparation of these consolidated financial statements in conformity with accounting principles generallyaccepted in the United States of America requires our management to make estimates and assumptions thataffect the reported amounts of assets and liabilities and disclosures of contingent assets and liabilities, at the dateof the financial statements, and the reported amounts of revenues and expenses during the reporting period.Actual results could differ from those estimates.
Earnings Per ShareIn accordance with SFAS No. 128, “Earnings Per Share,” basic earnings per share is based on the weighted averagenumber of common shares outstanding during the year, whereas diluted earnings per share also gives effect toall potentially dilutive common shares, which include stock options and non-vested restricted stock, that wereoutstanding during the period. All such stock options are reflected in the denominator using the treasury stockmethod. This method assumes that shares are issued for stock options that are “in the money,” but that we usethe proceeds of such stock option exercises (generally, cash to be paid plus future compensation expense to berecognized and the amount of tax benefits, if any, that will be credited to additional paid-in capital assumingexercise of the stock options) to repurchase shares at the average market value of our shares for the respectiveperiods. Non-vested shares of restricted stock are reflected in the denominator using the treasury stock methodwith proceeds of the amount, if any, the employees must pay upon vesting, the amount of compensation costattributed to future services and not yet recognized in earnings, and the amount of tax benefits, if any, that wouldbe credited to additional paid-in capital (i.e., the amount of the tax deduction in excess of recognized compen-sation cost) assuming vesting of the shares at the current market price. We have used our best estimate of theaverage fair market value of our shares for the respective periods prior to our initial public offering completedon October 29, 2003.
For the fiscal years ended January 1, 2005 and December 28, 2002, antidilutive shares of 6,632 and 352 wereexcluded from the computations of diluted earnings per share. There were no antidilutive shares for the fiscalyear ended January 3, 2004.
The following is a reconciliation of basic number of common shares outstanding to diluted number of commonand common equivalent shares outstanding for Carter’s, Inc.:
For the fiscal years ended
January 1, January 3, December 28,2005 2004 2002
Net income $49,658,000 $23,278,000 $19,253,000Carter’s, Inc.’s weighted average number of common
and common equivalent shares outstanding:Basic number of common shares outstanding 28,125,584 23,611,372 22,453,088Dilutive effect of stock options and unvested
restricted stock awards 1,802,373 1,576,120 1,091,812Diluted number of common and common
equivalent shares outstanding 29,927,957 25,187,492 23,544,900
Basic net income per common share $ 1.77 $ 0.99 $ 0.86Diluted net income per common share $ 1.66 $ 0.92 $ 0.82
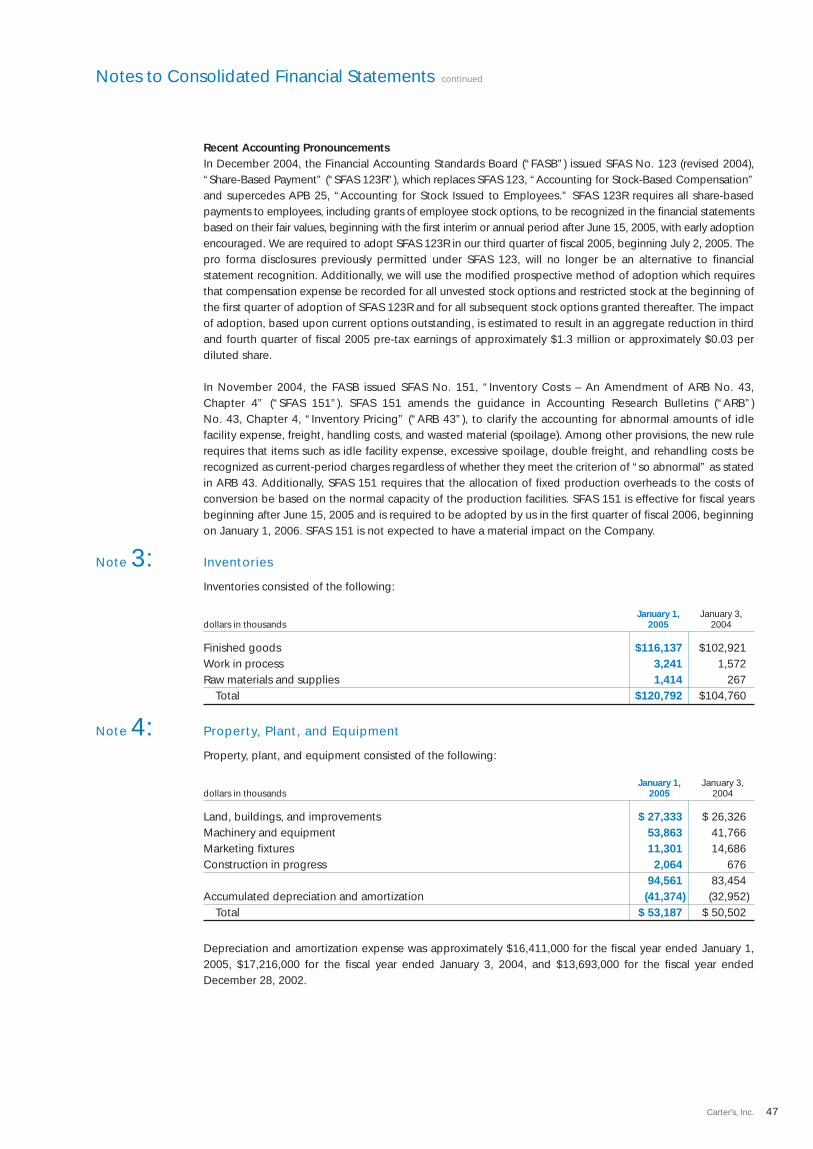
Notes to Consolidated Financial Statements continued
47Carter’s, Inc.
Note 3:
Note 4:
Recent Accounting PronouncementsIn December 2004, the Financial Accounting Standards Board (“FASB”) issued SFAS No. 123 (revised 2004),“Share-Based Payment” (“SFAS 123R”), which replaces SFAS 123, “Accounting for Stock-Based Compensation”and supercedes APB 25, “Accounting for Stock Issued to Employees.” SFAS 123R requires all share-basedpayments to employees, including grants of employee stock options, to be recognized in the financial statementsbased on their fair values, beginning with the first interim or annual period after June 15, 2005, with early adoptionencouraged. We are required to adopt SFAS 123R in our third quarter of fiscal 2005, beginning July 2, 2005. Thepro forma disclosures previously permitted under SFAS 123, will no longer be an alternative to financial statement recognition. Additionally, we will use the modified prospective method of adoption which requires that compensation expense be recorded for all unvested stock options and restricted stock at the beginning ofthe first quarter of adoption of SFAS 123R and for all subsequent stock options granted thereafter. The impactof adoption, based upon current options outstanding, is estimated to result in an aggregate reduction in thirdand fourth quarter of fiscal 2005 pre-tax earnings of approximately $1.3 million or approximately $0.03 perdiluted share.
In November 2004, the FASB issued SFAS No. 151, “Inventory Costs – An Amendment of ARB No. 43,Chapter 4” (“SFAS 151”). SFAS 151 amends the guidance in Accounting Research Bulletins (“ARB”) No. 43, Chapter 4, “Inventory Pricing” (“ARB 43”), to clarify the accounting for abnormal amounts of idle facility expense, freight, handling costs, and wasted material (spoilage). Among other provisions, the new rulerequires that items such as idle facility expense, excessive spoilage, double freight, and rehandling costs berecognized as current-period charges regardless of whether they meet the criterion of “so abnormal” as statedin ARB 43. Additionally, SFAS 151 requires that the allocation of fixed production overheads to the costs ofconversion be based on the normal capacity of the production facilities. SFAS 151 is effective for fiscal yearsbeginning after June 15, 2005 and is required to be adopted by us in the first quarter of fiscal 2006, beginningon January 1, 2006. SFAS 151 is not expected to have a material impact on the Company.
Inventories
Inventories consisted of the following:
January 1, January 3,dollars in thousands 2005 2004
Finished goods $116,137 $102,921Work in process 3,241 1,572Raw materials and supplies 1,414 267
Total $120,792 $104,760
Property, Plant, and Equipment
Property, plant, and equipment consisted of the following:
January 1, January 3,dollars in thousands 2005 2004
Land, buildings, and improvements $ 27,333 $ 26,326Machinery and equipment 53,863 41,766Marketing fixtures 11,301 14,686Construction in progress 2,064 676
94,561 83,454Accumulated depreciation and amortization (41,374) (32,952)
Total $ 53,187 $ 50,502
Depreciation and amortization expense was approximately $16,411,000 for the fiscal year ended January 1,2005, $17,216,000 for the fiscal year ended January 3, 2004, and $13,693,000 for the fiscal year endedDecember 28, 2002.
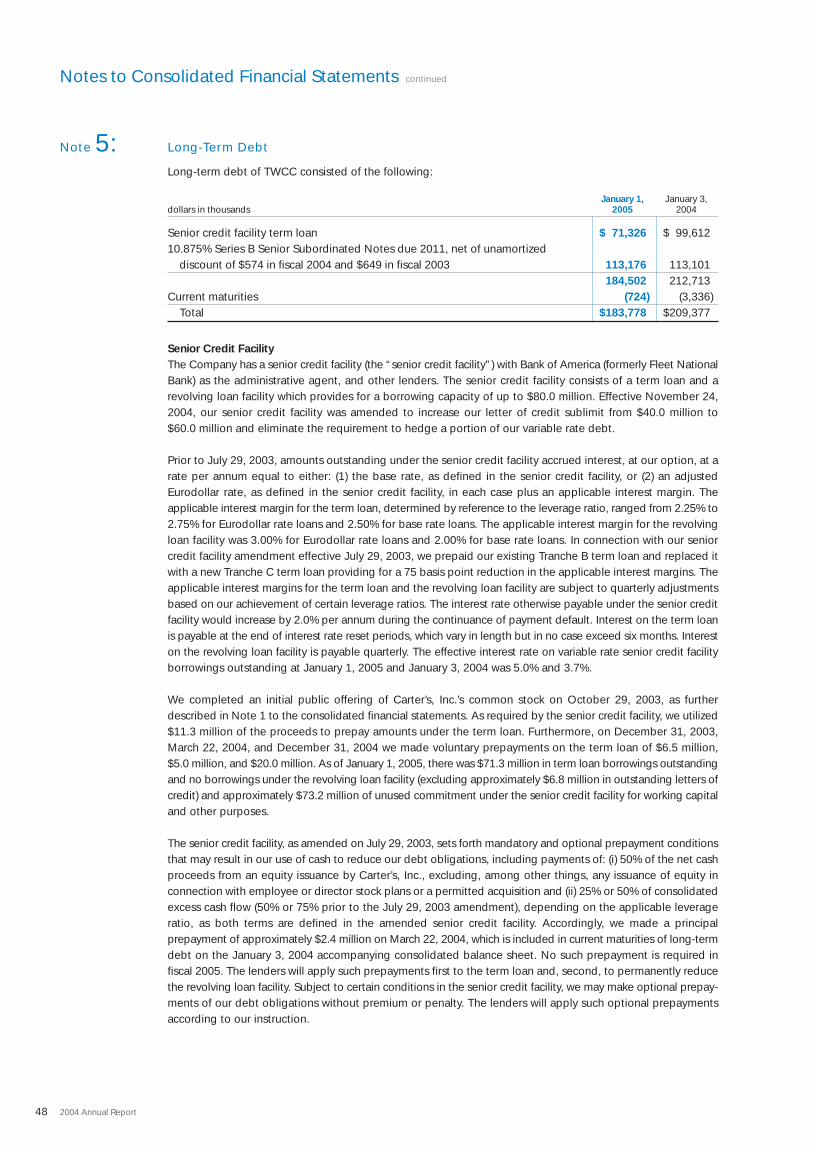
Notes to Consolidated Financial Statements continued
48 2004 Annual Report
Note 5: Long-Term Debt
Long-term debt of TWCC consisted of the following:
January 1, January 3,dollars in thousands 2005 2004
Senior credit facility term loan $ 71,326 $ 99,61210.875% Series B Senior Subordinated Notes due 2011, net of unamortized
discount of $574 in fiscal 2004 and $649 in fiscal 2003 113,176 113,101184,502 212,713
Current maturities (724) (3,336)Total $183,778 $209,377
Senior Credit FacilityThe Company has a senior credit facility (the “senior credit facility”) with Bank of America (formerly Fleet NationalBank) as the administrative agent, and other lenders. The senior credit facility consists of a term loan and arevolving loan facility which provides for a borrowing capacity of up to $80.0 million. Effective November 24,2004, our senior credit facility was amended to increase our letter of credit sublimit from $40.0 million to $60.0 million and eliminate the requirement to hedge a portion of our variable rate debt.
Prior to July 29, 2003, amounts outstanding under the senior credit facility accrued interest, at our option, at arate per annum equal to either: (1) the base rate, as defined in the senior credit facility, or (2) an adjustedEurodollar rate, as defined in the senior credit facility, in each case plus an applicable interest margin. The applicable interest margin for the term loan, determined by reference to the leverage ratio, ranged from 2.25% to2.75% for Eurodollar rate loans and 2.50% for base rate loans. The applicable interest margin for the revolvingloan facility was 3.00% for Eurodollar rate loans and 2.00% for base rate loans. In connection with our seniorcredit facility amendment effective July 29, 2003, we prepaid our existing Tranche B term loan and replaced itwith a new Tranche C term loan providing for a 75 basis point reduction in the applicable interest margins. Theapplicable interest margins for the term loan and the revolving loan facility are subject to quarterly adjustmentsbased on our achievement of certain leverage ratios. The interest rate otherwise payable under the senior creditfacility would increase by 2.0% per annum during the continuance of payment default. Interest on the term loanis payable at the end of interest rate reset periods, which vary in length but in no case exceed six months. Intereston the revolving loan facility is payable quarterly. The effective interest rate on variable rate senior credit facilityborrowings outstanding at January 1, 2005 and January 3, 2004 was 5.0% and 3.7%.
We completed an initial public offering of Carter’s, Inc.’s common stock on October 29, 2003, as furtherdescribed in Note 1 to the consolidated financial statements. As required by the senior credit facility, we utilized$11.3 million of the proceeds to prepay amounts under the term loan. Furthermore, on December 31, 2003,March 22, 2004, and December 31, 2004 we made voluntary prepayments on the term loan of $6.5 million, $5.0 million, and $20.0 million. As of January 1, 2005, there was $71.3 million in term loan borrowings outstandingand no borrowings under the revolving loan facility (excluding approximately $6.8 million in outstanding letters ofcredit) and approximately $73.2 million of unused commitment under the senior credit facility for working capitaland other purposes.
The senior credit facility, as amended on July 29, 2003, sets forth mandatory and optional prepayment conditionsthat may result in our use of cash to reduce our debt obligations, including payments of: (i) 50% of the net cashproceeds from an equity issuance by Carter’s, Inc., excluding, among other things, any issuance of equity inconnection with employee or director stock plans or a permitted acquisition and (ii) 25% or 50% of consolidatedexcess cash flow (50% or 75% prior to the July 29, 2003 amendment), depending on the applicable leverageratio, as both terms are defined in the amended senior credit facility. Accordingly, we made a principal prepayment of approximately $2.4 million on March 22, 2004, which is included in current maturities of long-termdebt on the January 3, 2004 accompanying consolidated balance sheet. No such prepayment is required in fiscal 2005. The lenders will apply such prepayments first to the term loan and, second, to permanently reducethe revolving loan facility. Subject to certain conditions in the senior credit facility, we may make optional prepay-ments of our debt obligations without premium or penalty. The lenders will apply such optional prepaymentsaccording to our instruction.
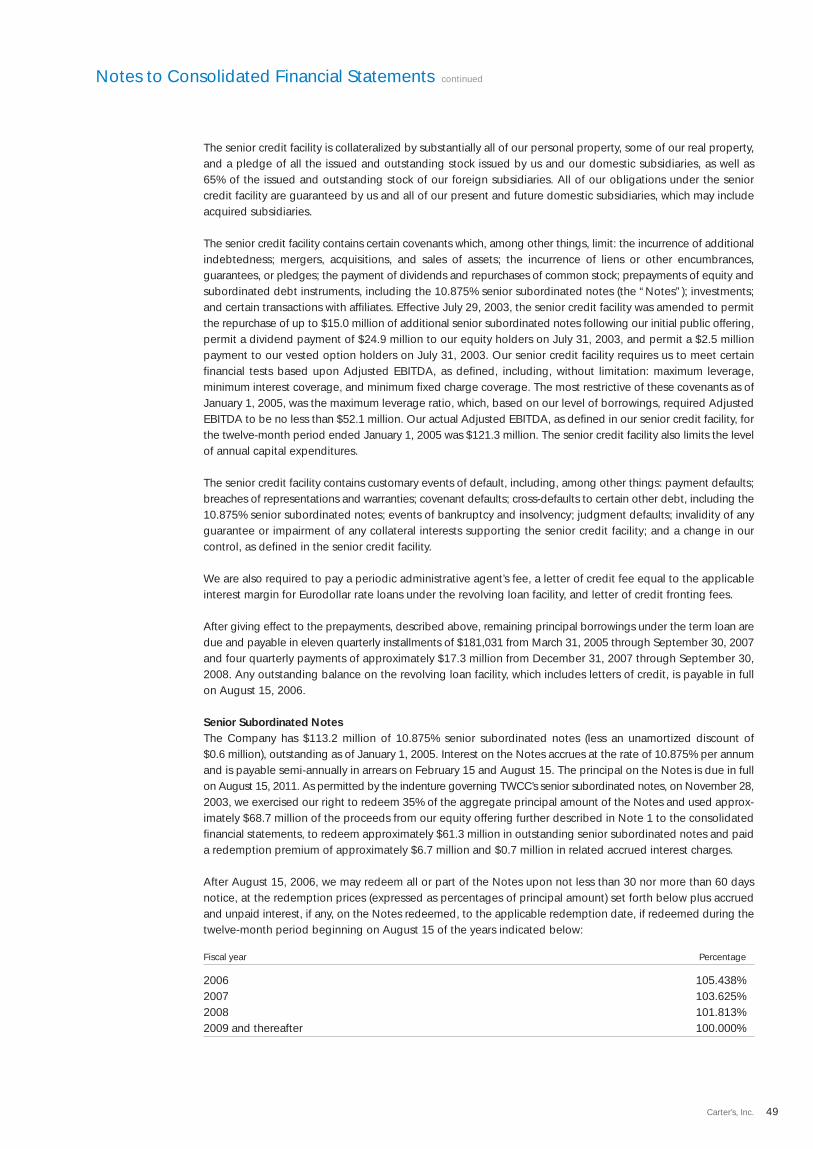
Notes to Consolidated Financial Statements continued
49Carter’s, Inc.
The senior credit facility is collateralized by substantially all of our personal property, some of our real property,and a pledge of all the issued and outstanding stock issued by us and our domestic subsidiaries, as well as 65% of the issued and outstanding stock of our foreign subsidiaries. All of our obligations under the senior credit facility are guaranteed by us and all of our present and future domestic subsidiaries, which may includeacquired subsidiaries.
The senior credit facility contains certain covenants which, among other things, limit: the incurrence of additionalindebtedness; mergers, acquisitions, and sales of assets; the incurrence of liens or other encumbrances, guarantees, or pledges; the payment of dividends and repurchases of common stock; prepayments of equity andsubordinated debt instruments, including the 10.875% senior subordinated notes (the “Notes”); investments;and certain transactions with affiliates. Effective July 29, 2003, the senior credit facility was amended to permitthe repurchase of up to $15.0 million of additional senior subordinated notes following our initial public offering,permit a dividend payment of $24.9 million to our equity holders on July 31, 2003, and permit a $2.5 millionpayment to our vested option holders on July 31, 2003. Our senior credit facility requires us to meet certainfinancial tests based upon Adjusted EBITDA, as defined, including, without limitation: maximum leverage, minimum interest coverage, and minimum fixed charge coverage. The most restrictive of these covenants as ofJanuary 1, 2005, was the maximum leverage ratio, which, based on our level of borrowings, required AdjustedEBITDA to be no less than $52.1 million. Our actual Adjusted EBITDA, as defined in our senior credit facility, forthe twelve-month period ended January 1, 2005 was $121.3 million. The senior credit facility also limits the levelof annual capital expenditures.
The senior credit facility contains customary events of default, including, among other things: payment defaults;breaches of representations and warranties; covenant defaults; cross-defaults to certain other debt, including the10.875% senior subordinated notes; events of bankruptcy and insolvency; judgment defaults; invalidity of anyguarantee or impairment of any collateral interests supporting the senior credit facility; and a change in ourcontrol, as defined in the senior credit facility.
We are also required to pay a periodic administrative agent’s fee, a letter of credit fee equal to the applicableinterest margin for Eurodollar rate loans under the revolving loan facility, and letter of credit fronting fees.
After giving effect to the prepayments, described above, remaining principal borrowings under the term loan aredue and payable in eleven quarterly installments of $181,031 from March 31, 2005 through September 30, 2007and four quarterly payments of approximately $17.3 million from December 31, 2007 through September 30,2008. Any outstanding balance on the revolving loan facility, which includes letters of credit, is payable in full on August 15, 2006.
Senior Subordinated NotesThe Company has $113.2 million of 10.875% senior subordinated notes (less an unamortized discount of $0.6 million), outstanding as of January 1, 2005. Interest on the Notes accrues at the rate of 10.875% per annumand is payable semi-annually in arrears on February 15 and August 15. The principal on the Notes is due in fullon August 15, 2011. As permitted by the indenture governing TWCC’s senior subordinated notes, on November 28,2003, we exercised our right to redeem 35% of the aggregate principal amount of the Notes and used approx-imately $68.7 million of the proceeds from our equity offering further described in Note 1 to the consolidatedfinancial statements, to redeem approximately $61.3 million in outstanding senior subordinated notes and paida redemption premium of approximately $6.7 million and $0.7 million in related accrued interest charges.
After August 15, 2006, we may redeem all or part of the Notes upon not less than 30 nor more than 60 daysnotice, at the redemption prices (expressed as percentages of principal amount) set forth below plus accruedand unpaid interest, if any, on the Notes redeemed, to the applicable redemption date, if redeemed during thetwelve-month period beginning on August 15 of the years indicated below:
Fiscal year Percentage
2006 105.438%2007 103.625%2008 101.813%2009 and thereafter 100.000%
Notes to Consolidated Financial Statements continued
50 2004 Annual Report
Note 6:
The Notes contain provisions and covenants including limitations on other indebtedness, restricted paymentsand distributions, sales of assets, subsidiary stock, liens, and certain other transactions.
The fair value of our senior subordinated notes was approximately $13.7 million greater than the book value asof January 1, 2005 and $17.6 million greater than the book value as of January 3, 2004. The fair values were estimated based on similar issues or on current rates offered to us for debt of the same remaining maturity.
Stockholders’ Equity
In connection with the re-incorporation, as further described in Note 1 to the consolidated financial statements, effective September 30, 2003, the total amount of Carter’s, Inc.’s authorized capital stock consistsof 40,000,000 shares of common stock, $0.01 par value per share, and 100,000 shares of preferred stock, $0.01 par value per share. As of January 1, 2005, Carter’s, Inc. had outstanding 28,432,452 shares of commonstock and no shares of preferred stock.
The issued and outstanding shares of common stock are validly issued, fully paid, and nonassessable. Holdersof Carter’s, Inc.’s common stock are entitled to share equally, share for share, if dividends are declared on Carter’s,Inc.’s common stock, whether payable in cash, property, or our securities. The shares of common stock are notconvertible and the holders thereof have no preemptive or subscription rights to purchase any of our securities.Upon liquidation, dissolution, or winding up of our Company, the holders of common stock are entitled to shareequally, share for share, in our assets which are legally available for distribution, after payment of all debts andother liabilities and subject to the prior rights of any holders of any series of preferred stock then outstanding.Each outstanding share of common stock is entitled to one vote on all matters submitted to a vote of stockholders.There is no cumulative voting. Except as otherwise required by law or the certificate of incorporation, the holders of common stock vote together as a single class on all matters submitted to a vote of stockholders.
Our board of directors may issue preferred stock from time to time. Subject to the provisions of our certificateof incorporation and limitations prescribed by law, the board of directors is expressly authorized to adopt resolutions to issue the shares, to fix the number of shares, and to change the number of shares constituting anyseries and to provide for or change the voting powers, designations, preferences and relative participating,optional or other special rights, qualifications, limitations or restrictions thereof, including dividend rights (includingwhether dividends are cumulative), dividend rates, terms of redemption (including sinking fund provisions),redemption prices, conversion rights, and liquidation preferences of the shares constituting any series of thepreferred stock, in each case without any further action or vote by the shareholders.
Stock Option Plans and Stock IssuancesAt the time of the Acquisition, as further described in Note 1 to the consolidated financial statements, we terminated our existing Management Stock Incentive Plan (the “Former Plan”), which had been formed toprovide incentives to our employees and directors. All outstanding stock options under the Former Plan aresubsequently covered by the basic component of the 2001 Equity Incentive Plan, which was amended andrestated on October 10, 2003 and renamed as our 2003 Equity Incentive Plan (the “Plan”) described below, and expire on August 15, 2011. Stock options awarded under the Former Plan and retained by managementafter the Acquisition (“retained stock options”) entitle recipients to purchase Carter’s, Inc.’s common stock. Theexercise price of all stock options granted under the Former Plan was $1.50 per share, which was deemed to bethe fair market value of the stock at the time the stock options were granted. Accordingly, no compensationexpense was recognized on the stock options granted. All stock options granted under the Former Plan vestedimmediately upon the Acquisition.
Notes to Consolidated Financial Statements continued
51Carter’s, Inc.
At the time of the Acquisition, we adopted the 2001 Equity Incentive Plan in order to provide incentives to ouremployees and directors. Awards under the 2001 Equity Incentive Plan provided recipients with options topurchase shares of Carter’s, Inc.’s common stock. There were 4,344,196 shares, as amended and describedbelow, of Carter’s, Inc.’s common stock made available under the 2001 Equity Incentive Plan. Two types of stock option awards were issued under the Plan – basic stock options and performance stock options. Basic stockoptions vest ratably over a five-year period, but immediately vest upon a change in control, as defined.Performance stock options vest after eight years, but may vest earlier, either all or in part, upon our achievementof certain defined performance objectives as of approximately five years after the grant date or the occurrence ofone of several events, including a change of control, as defined, or termination of employment. Coincident withthe completion of the secondary offering as described in Note 1 to the consolidated financial statements, certain performance objectives have been met and a determination event, as defined, has occurred. Accordingly,performance stock options will now vest ratably over a five-year period from the grant date.
On October 10, 2003, we amended and restated the 2001 Equity Incentive Plan and renamed it the 2003 EquityIncentive Plan. Under the Plan, as amended, the compensation committee of our board of directors may awardincentive stock options (ISOs and non-ISOs), stock appreciation rights (SARs), restricted stock, unrestricted stock,stock deliverable on a deferred basis, performance-based stock awards, and cash payments intended to helpdefray the cost of awards. The amendment and restatement increased the number of shares available to bedelivered under the plan by 400,000. Participation in the amended and restated Plan is limited to those keyemployees and others who are selected by the compensation committee. Under the amended and restated Plan,the maximum number of shares of stock for which stock options or SARs may be awarded to any participant inany year, and the maximum number of shares of stock deliverable to any participant under other awards for anyyear, is in each case 4,000,000. The limit on shares available under the Plan, the individual limits, and other awardterms are subject to adjustment to reflect stock splits or stock dividends, combinations, and certain other events. As of January 1, 2005, there are 224,205 shares available for grant under the Plan. The amended andrestated Plan makes provision for the treatment of awards upon termination of service or in the case of a mergeror similar corporate transaction.
Since the number of shares and the exercise price per share are known at the time of grant, each of the basicstock options, performance stock options, and retained stock options qualify for fixed plan accounting. All stockoptions issued under the Plan expire ten years from the date of grant. The exercise price of the basic andperformance stock options issued at the time of the Acquisition in fiscal 2001 was $6.16 per share, which wasdeemed to be the fair market value of Carter’s, Inc.’s common stock at the time the stock options were granted,based upon the purchase price of common stock in the Acquisition of Carter’s, Inc. as described in Note 1 to theconsolidated financial statements. These were the only stock options granted during fiscal 2001.
In fiscal 2002, we issued 117,000 stock options and recognized approximately $14,500 in compensation expenserelated to these stock option grants based upon the difference in the estimated fair value of Carter’s, Inc.’scommon stock at the time the stock options were granted and the exercise price. During fiscal 2002, we also sold shares of Carter’s, Inc.’s common stock to two of our directors and issued shares of Carter’s, Inc.’s commonstock to a consultant. In connection with these transactions, as well as the stock option grants to certain employees,we recorded compensation expense during fiscal 2002 in the amount of approximately $768,000. Additionally, wereceived cash proceeds of $1.0 million and recorded approximately $1.8 million to our additional paid-in capital.
In fiscal 2003, we issued 398,000 stock options, 321,200 of which were issued at an exercise price that was belowthe fair value. In connection with these issuances, we recognized approximately $116,800 in compensationexpense based upon the difference in the estimated fair value of Carter’s, Inc.’s common stock at the time thestock options were granted and the exercise price. The weighted average exercise price and weighted averagefair value for the stock options issued below fair value were $13.95 and $19.00. For the remaining stock optionsissued during fiscal 2003, for which the exercise price was equal to the fair value, the weighted average exerciseprice and weighted average fair value were $9.88. During fiscal 2003, we also sold shares of Carter’s, Inc.’scommon stock to two of our directors for cash proceeds of $600,000. In connection with these transactions, aswell as the stock option grants to certain employees, we recorded compensation expense of $206,000 and additional paid-in capital in the amount of $600,000.
Notes to Consolidated Financial Statements continued
52 2004 Annual Report
In fiscal 2004, we issued 396,200 stock options to purchase Carter’s, Inc.’s common stock to certain employees.No compensation expense was recorded during fiscal 2004 as a result of stock options granted during thatperiod as the stock options were issued as of the date of grant with an exercise price equal to the fair marketvalue of a share of stock. The weighted average exercise price and weighted average fair value were $29.47.During fiscal 2004, certain employees exercised 444,057 stock options for cash proceeds to Carter’s, Inc. of$1,554,580. None of the options issued during fiscal 2004 were exercisable at January 1, 2005.
In fiscal 2004, we issued 3,035 shares of restricted stock to one of our directors on November 4, 2004 with a fairmarket value of $32.95 on the date of the grant. We received no proceeds from the issuance of restricted stock.In connection with this grant, we recognized $5,000 in compensation expense resulting in $95,000 of deferredcompensation at January 1, 2005 to be amortized over the remainder of the three-year vesting period.
A summary of stock option activity under this Plan (in number of shares that may be purchased) is as follows(including options retained by management, which were all originally issued under the Former Plan):
Weighted Weighted Weightedaverage average average
Basic exercise Performance exercise Retained exercisestock price stock price stock price
options per share options per share options per share
Outstanding, December 29, 2001 772,464 $ 6.16 1,219,348 $ 6.16 1,379,620 $1.50
Granted 39,004 $ 6.68 77,996 $ 6.84 – –Exercised – – – – – –Forfeited – – – – – –Expired – – – – – –Outstanding,
December 28, 2002 811,468 $ 6.18 1,297,344 $ 6.20 1,379,620 $1.50Granted 149,792 $13.16 248,208 $13.16 – –Exercised – – – – – –Forfeited (16,756) $ 6.16 (35,244) $ 6.16 – –Expired – – – – – –Outstanding,
January 3, 2004 944,504 $ 7.29 1,510,308 $ 7.35 1,379,620 $1.50Granted 396,200 $29.47 – – – –Exercised (72,889) $ 6.24 (114,582) $ 6.24 (256,585) $1.50Forfeited (37,570) $ 8.31 (76,107) $ 7.93 – –Expired – – – – – –Outstanding, January 1, 2005 1,230,245 $14.47 1,319,619 $ 7.41 1,123,035 $1.50
Exercisable, January 1, 2005 428,254 $ 6.63 685,688 $ 6.66 1,123,035 $1.50
Retained stock options relate to stock options that were outstanding prior to the Acquisition and became fullyvested in connection with the Acquisition.
Notes to Consolidated Financial Statements continued
53Carter’s, Inc.
A summary of basic stock options outstanding and exercisable at January 1, 2005 is as follows:
Outstanding Exercisable
Weightedaverage Weighted Weighted
Range of remaining average averageexercise prices Number contractual life exercise price Number exercise price
$ 6 - $10 720,722 6.69 years $ 6.30 405,589 $ 6.22$13 - $14 113,323 8.65 years $13.95 22,665 $13.95$27 - $33 396,200 9.37 years $29.47 – –
1,230,245 7.74 years $14.47 428,254 $ 6.63
A summary of performance stock options outstanding and exercisable at January 1, 2005 is as follows:
Outstanding Exercisable
Weightedaverage Weighted Weighted
Range of remaining average averageexercise prices Number contractual life exercise price Number exercise price
$ 6 - $10 1,131,742 6.71 years $ 6.32 648,113 $ 6.24$13 - $14 187,877 8.65 years $13.95 37,575 $13.95
1,319,619 6.98 years $ 7.41 685,688 $ 6.66
There were 1,123,035 retained stock options outstanding and exercisable as of January 1, 2005 with a weightedaverage exercise price of $1.50 and weighted average contractual life of 6.63 years.
The weighted average contractual life for the retained, basic, and performance stock options in aggregate as ofJanuary 1, 2005 is approximately 7.12 years.
For disclosure purposes only, we have measured compensation expense, in accordance with SFAS 123,“Accounting for Stock-Based Compensation.” The following table illustrates the effect on net income if we hadapplied the fair value recognition provisions of SFAS 123:
For the fiscal years ended
January 1, January 3, December 28,dollars in thousands, except per share data 2005 2004 2002
Net income, as reported $49,658 $23,278 $19,253Add:
Stock-based employee compensation (under APB 25) included in reported net income, net of related tax effects 227 72 9
Deduct:Total stock-based employee compensation expense
determined under the fair value based method (under SFAS 123 and SFAS 148) for all awards, net of related tax effects (1,747) (645) (524)
Pro forma net income $48,138 $22,705 $18,738
Carter’s, Inc.’s net income per common share:Basic – as reported $ 1.77 $ 0.99 $ 0.86Basic – pro forma $ 1.71 $ 0.96 $ 0.83Diluted – as reported $ 1.66 $ 0.92 $ 0.82Diluted – pro forma $ 1.61 $ 0.90 $ 0.80
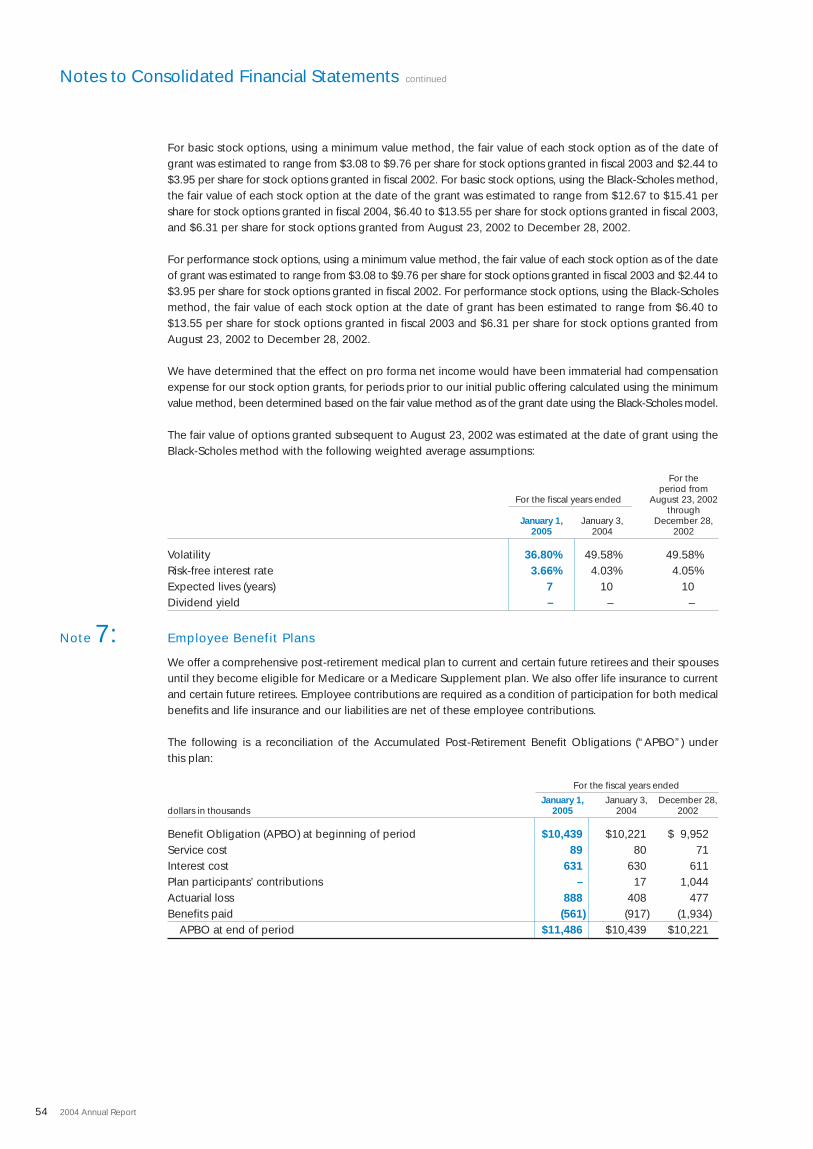
Notes to Consolidated Financial Statements continued
54 2004 Annual Report
Note 7:
For basic stock options, using a minimum value method, the fair value of each stock option as of the date ofgrant was estimated to range from $3.08 to $9.76 per share for stock options granted in fiscal 2003 and $2.44 to$3.95 per share for stock options granted in fiscal 2002. For basic stock options, using the Black-Scholes method,the fair value of each stock option at the date of the grant was estimated to range from $12.67 to $15.41 pershare for stock options granted in fiscal 2004, $6.40 to $13.55 per share for stock options granted in fiscal 2003,and $6.31 per share for stock options granted from August 23, 2002 to December 28, 2002.
For performance stock options, using a minimum value method, the fair value of each stock option as of the dateof grant was estimated to range from $3.08 to $9.76 per share for stock options granted in fiscal 2003 and $2.44 to$3.95 per share for stock options granted in fiscal 2002. For performance stock options, using the Black-Scholesmethod, the fair value of each stock option at the date of grant has been estimated to range from $6.40 to$13.55 per share for stock options granted in fiscal 2003 and $6.31 per share for stock options granted fromAugust 23, 2002 to December 28, 2002.
We have determined that the effect on pro forma net income would have been immaterial had compensationexpense for our stock option grants, for periods prior to our initial public offering calculated using the minimumvalue method, been determined based on the fair value method as of the grant date using the Black-Scholes model.
The fair value of options granted subsequent to August 23, 2002 was estimated at the date of grant using theBlack-Scholes method with the following weighted average assumptions:
For theperiod from
For the fiscal years ended August 23, 2002through
January 1, January 3, December 28,2005 2004 2002
Volatility 36.80% 49.58% 49.58%Risk-free interest rate 3.66% 4.03% 4.05%Expected lives (years) 7 10 10Dividend yield – – –
Employee Benefit Plans
We offer a comprehensive post-retirement medical plan to current and certain future retirees and their spousesuntil they become eligible for Medicare or a Medicare Supplement plan. We also offer life insurance to currentand certain future retirees. Employee contributions are required as a condition of participation for both medicalbenefits and life insurance and our liabilities are net of these employee contributions.
The following is a reconciliation of the Accumulated Post-Retirement Benefit Obligations (“APBO”) under this plan:
For the fiscal years ended
January 1, January 3, December 28,dollars in thousands 2005 2004 2002
Benefit Obligation (APBO) at beginning of period $10,439 $10,221 $ 9,952Service cost 89 80 71Interest cost 631 630 611Plan participants’ contributions – 17 1,044Actuarial loss 888 408 477Benefits paid (561) (917) (1,934)
APBO at end of period $11,486 $10,439 $10,221
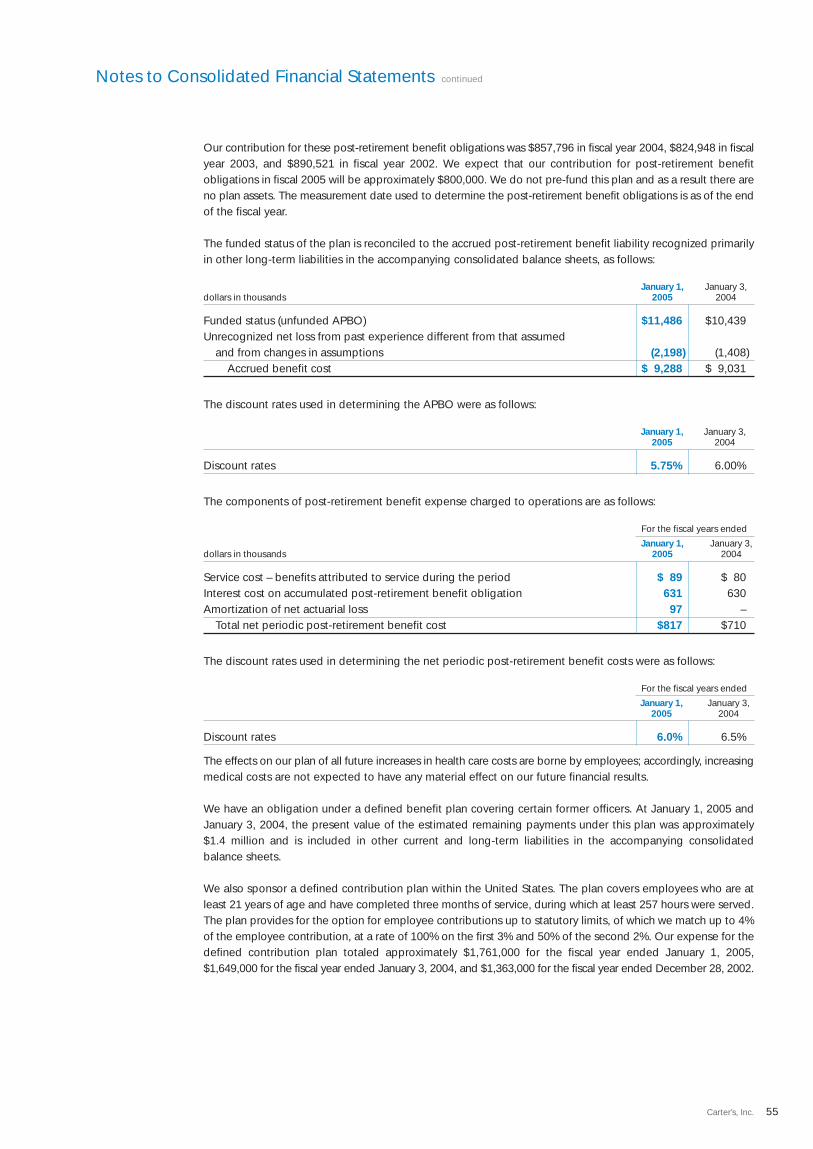
Our contribution for these post-retirement benefit obligations was $857,796 in fiscal year 2004, $824,948 in fiscalyear 2003, and $890,521 in fiscal year 2002. We expect that our contribution for post-retirement benefit obligations in fiscal 2005 will be approximately $800,000. We do not pre-fund this plan and as a result there areno plan assets. The measurement date used to determine the post-retirement benefit obligations is as of the endof the fiscal year.
The funded status of the plan is reconciled to the accrued post-retirement benefit liability recognized primarilyin other long-term liabilities in the accompanying consolidated balance sheets, as follows:
January 1, January 3,dollars in thousands 2005 2004
Funded status (unfunded APBO) $11,486 $10,439Unrecognized net loss from past experience different from that assumed
and from changes in assumptions (2,198) (1,408)Accrued benefit cost $ 9,288 $ 9,031
The discount rates used in determining the APBO were as follows:
January 1, January 3,2005 2004
Discount rates 5.75% 6.00%
The components of post-retirement benefit expense charged to operations are as follows:
For the fiscal years ended
January 1, January 3,dollars in thousands 2005 2004
Service cost – benefits attributed to service during the period $ 89 $ 80Interest cost on accumulated post-retirement benefit obligation 631 630Amortization of net actuarial loss 97 –
Total net periodic post-retirement benefit cost $817 $710
The discount rates used in determining the net periodic post-retirement benefit costs were as follows:
For the fiscal years ended
January 1, January 3,2005 2004
Discount rates 6.0% 6.5%
The effects on our plan of all future increases in health care costs are borne by employees; accordingly, increasingmedical costs are not expected to have any material effect on our future financial results.
We have an obligation under a defined benefit plan covering certain former officers. At January 1, 2005 andJanuary 3, 2004, the present value of the estimated remaining payments under this plan was approximately $1.4 million and is included in other current and long-term liabilities in the accompanying consolidated balance sheets.
We also sponsor a defined contribution plan within the United States. The plan covers employees who are atleast 21 years of age and have completed three months of service, during which at least 257 hours were served.The plan provides for the option for employee contributions up to statutory limits, of which we match up to 4%of the employee contribution, at a rate of 100% on the first 3% and 50% of the second 2%. Our expense for thedefined contribution plan totaled approximately $1,761,000 for the fiscal year ended January 1, 2005,$1,649,000 for the fiscal year ended January 3, 2004, and $1,363,000 for the fiscal year ended December 28, 2002.
Notes to Consolidated Financial Statements continued
55Carter’s, Inc.
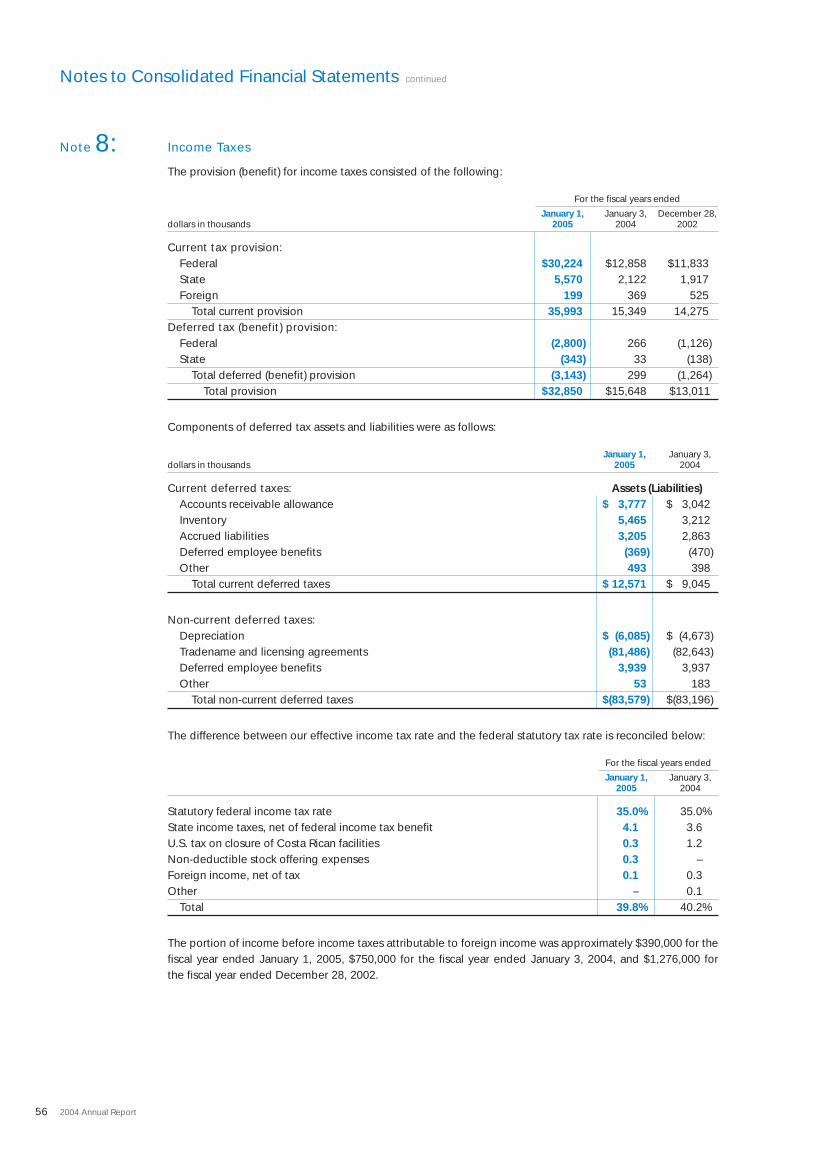
Notes to Consolidated Financial Statements continued
56 2004 Annual Report
Note 8: Income Taxes
The provision (benefit) for income taxes consisted of the following:
For the fiscal years ended
January 1, January 3, December 28,dollars in thousands 2005 2004 2002
Current tax provision:Federal $30,224 $12,858 $11,833State 5,570 2,122 1,917Foreign 199 369 525
Total current provision 35,993 15,349 14,275Deferred tax (benefit) provision:
Federal (2,800) 266 (1,126)State (343) 33 (138)
Total deferred (benefit) provision (3,143) 299 (1,264)Total provision $32,850 $15,648 $13,011
Components of deferred tax assets and liabilities were as follows:
January 1, January 3,dollars in thousands 2005 2004
Current deferred taxes: Assets (Liabilities)Accounts receivable allowance $ 3,777 $ 3,042Inventory 5,465 3,212Accrued liabilities 3,205 2,863Deferred employee benefits (369) (470)Other 493 398
Total current deferred taxes $ 12,571 $ 9,045
Non-current deferred taxes:Depreciation $ (6,085) $ (4,673)Tradename and licensing agreements (81,486) (82,643)Deferred employee benefits 3,939 3,937Other 53 183
Total non-current deferred taxes $(83,579) $(83,196)
The difference between our effective income tax rate and the federal statutory tax rate is reconciled below:
For the fiscal years ended
January 1, January 3,2005 2004
Statutory federal income tax rate 35.0% 35.0%State income taxes, net of federal income tax benefit 4.1 3.6U.S. tax on closure of Costa Rican facilities 0.3 1.2Non-deductible stock offering expenses 0.3 –Foreign income, net of tax 0.1 0.3Other – 0.1
Total 39.8% 40.2%
The portion of income before income taxes attributable to foreign income was approximately $390,000 for thefiscal year ended January 1, 2005, $750,000 for the fiscal year ended January 3, 2004, and $1,276,000 for the fiscal year ended December 28, 2002.

Notes to Consolidated Financial Statements continued
57Carter’s, Inc.
Note 9:
Note 10:
Lease Commitments
Rent expense under operating leases was approximately $24,416,000 for the fiscal year ended January 1, 2005,$22,356,000 for the fiscal year ended January 3, 2004, and $20,584,000 for the fiscal year ended December 28, 2002.
Minimum annual rental commitments under current noncancellable operating leases as of January 1, 2005 wereas follows:
dollars in thousands Buildings, Data Totalprimarily Transportation processing Manufacturing noncancellable
Fiscal year retail stores equipment equipment equipment leases
2005 $18,780 $ 68 $ 997 $274 $20,1192006 16,262 51 589 156 17,0582007 13,522 50 341 62 13,9752008 10,524 28 23 11 10,5862009 7,794 18 7 – 7,819Thereafter 28,945 2 – – 28,947
Total $95,827 $217 $1,957 $503 $98,504
We currently operate 180 leased retail stores located primarily in outlet and strip centers across the UnitedStates, having an average size of approximately 4,900 square feet. Generally, leases have an average term ofapproximately five years with additional five-year renewal options. In February 2001, we entered into a ten-year leaseagreement for our corporate office in Atlanta, Georgia. On December 21, 2004, this lease was amended toinclude an additional floor of the building, effective July 3, 2005 and to extend the lease term until June 30, 2015.This lease has a five-year renewal option. We lease office space in Griffin, Georgia which expires December 2005 witha one-year renewal option. We also lease office space in Shelton, Connecticut which expires December 2006with a five-year renewal option. We also lease office space in New York, New York which expires January 2015, asamended February 1, 2005. In January 2003, we entered into a seven-year lease agreement, with a cancellationoption after four years, for a distribution facility in Stockbridge, Georgia which expires March 2010 with optionsto renew up to 13 years. Internationally, we lease two sewing facilities, one in Linares and one in Montemorelos,Mexico with leases that expire July 2007 and July 2008, each with ten-year renewal options.
In accordance with SFAS No. 13, “Accounting for Leases,” we review all of our leases to determine whether they qualify as operating or capital leases. As of January 1, 2005, all of our leases are classified as operating.Leasehold improvements are amortized over the lesser of the useful life of the asset or current lease term. Weaccount for free rent periods and scheduled rent increases on a straight-line basis over the lease term. Landlordallowances and incentives are recorded as deferred rent and are amortized as a reduction to rent expense overthe lease term.
Commitments and Contingencies
We are subject to various federal, state, and local laws that govern activities or operations that may have adverseenvironmental effects. Noncompliance with these laws and regulations can result in significant liabilities, penalties,and costs. From time to time, our operations have resulted or may result in noncompliance with or liabilitypursuant to environmental laws. Generally, compliance with environmental laws has not had a material impacton our operations, but there can be no assurance that future compliance with such laws will not have a materialadverse effect on our operations.
As of January 1, 2005, we have entered into various purchase order commitments with full-package suppliers for merchandise for resale that approximates $105.3 million. We can cancel these arrangements, although in some instances, we may be subject to a termination charge reflecting a percentage of work performed prior to cancellation.
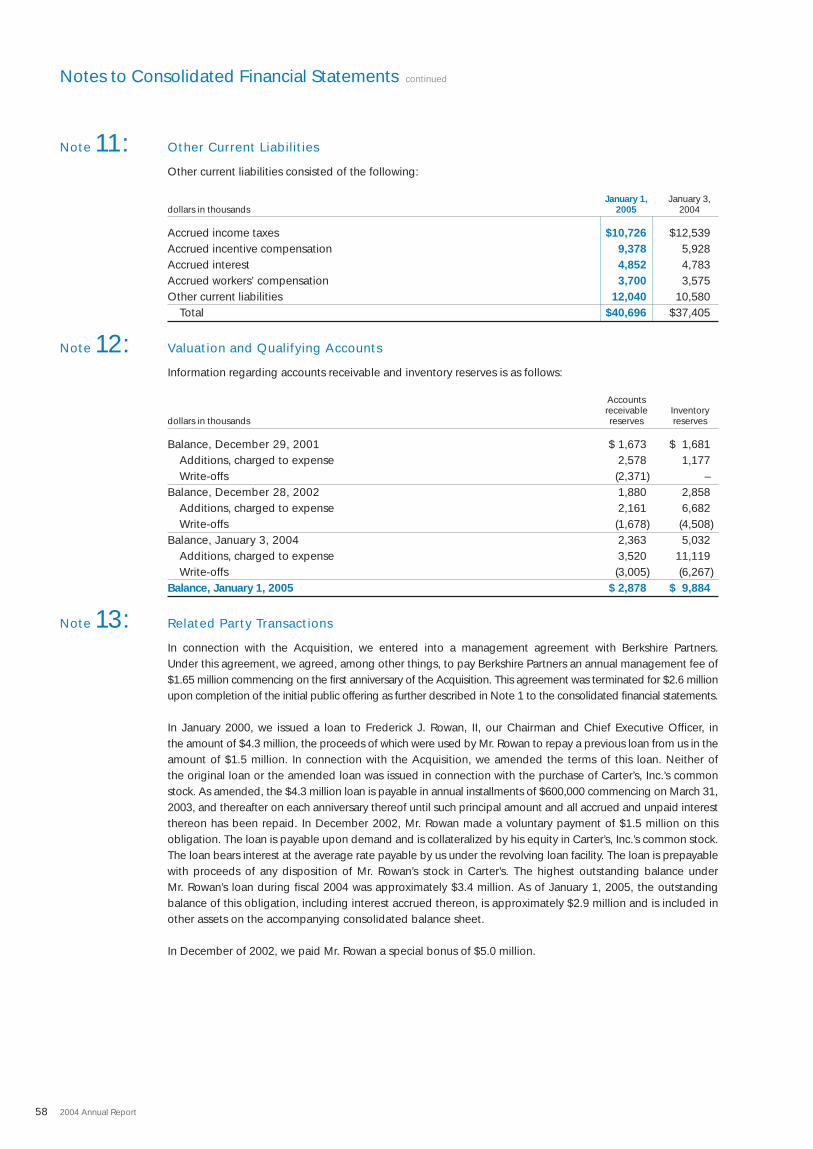
Notes to Consolidated Financial Statements continued
58 2004 Annual Report
Note 11:
Note 12:
Note 13:
Other Current Liabilities
Other current liabilities consisted of the following:
January 1, January 3,dollars in thousands 2005 2004
Accrued income taxes $10,726 $12,539Accrued incentive compensation 9,378 5,928Accrued interest 4,852 4,783Accrued workers’ compensation 3,700 3,575Other current liabilities 12,040 10,580
Total $40,696 $37,405
Valuation and Qualifying Accounts
Information regarding accounts receivable and inventory reserves is as follows:
Accountsreceivable Inventory
dollars in thousands reserves reserves
Balance, December 29, 2001 $ 1,673 $ 1,681Additions, charged to expense 2,578 1,177Write-offs (2,371) –
Balance, December 28, 2002 1,880 2,858Additions, charged to expense 2,161 6,682Write-offs (1,678) (4,508)
Balance, January 3, 2004 2,363 5,032Additions, charged to expense 3,520 11,119Write-offs (3,005) (6,267)
Balance, January 1, 2005 $ 2,878 $ 9,884
Related Party Transactions
In connection with the Acquisition, we entered into a management agreement with Berkshire Partners. Under this agreement, we agreed, among other things, to pay Berkshire Partners an annual management fee of$1.65 million commencing on the first anniversary of the Acquisition. This agreement was terminated for $2.6 millionupon completion of the initial public offering as further described in Note 1 to the consolidated financial statements.
In January 2000, we issued a loan to Frederick J. Rowan, II, our Chairman and Chief Executive Officer, in the amount of $4.3 million, the proceeds of which were used by Mr. Rowan to repay a previous loan from us in theamount of $1.5 million. In connection with the Acquisition, we amended the terms of this loan. Neither of the original loan or the amended loan was issued in connection with the purchase of Carter’s, Inc.’s commonstock. As amended, the $4.3 million loan is payable in annual installments of $600,000 commencing on March 31,2003, and thereafter on each anniversary thereof until such principal amount and all accrued and unpaid interestthereon has been repaid. In December 2002, Mr. Rowan made a voluntary payment of $1.5 million on this obligation. The loan is payable upon demand and is collateralized by his equity in Carter’s, Inc.’s common stock.The loan bears interest at the average rate payable by us under the revolving loan facility. The loan is prepayablewith proceeds of any disposition of Mr. Rowan’s stock in Carter’s. The highest outstanding balance under Mr. Rowan’s loan during fiscal 2004 was approximately $3.4 million. As of January 1, 2005, the outstandingbalance of this obligation, including interest accrued thereon, is approximately $2.9 million and is included inother assets on the accompanying consolidated balance sheet.
In December of 2002, we paid Mr. Rowan a special bonus of $5.0 million.
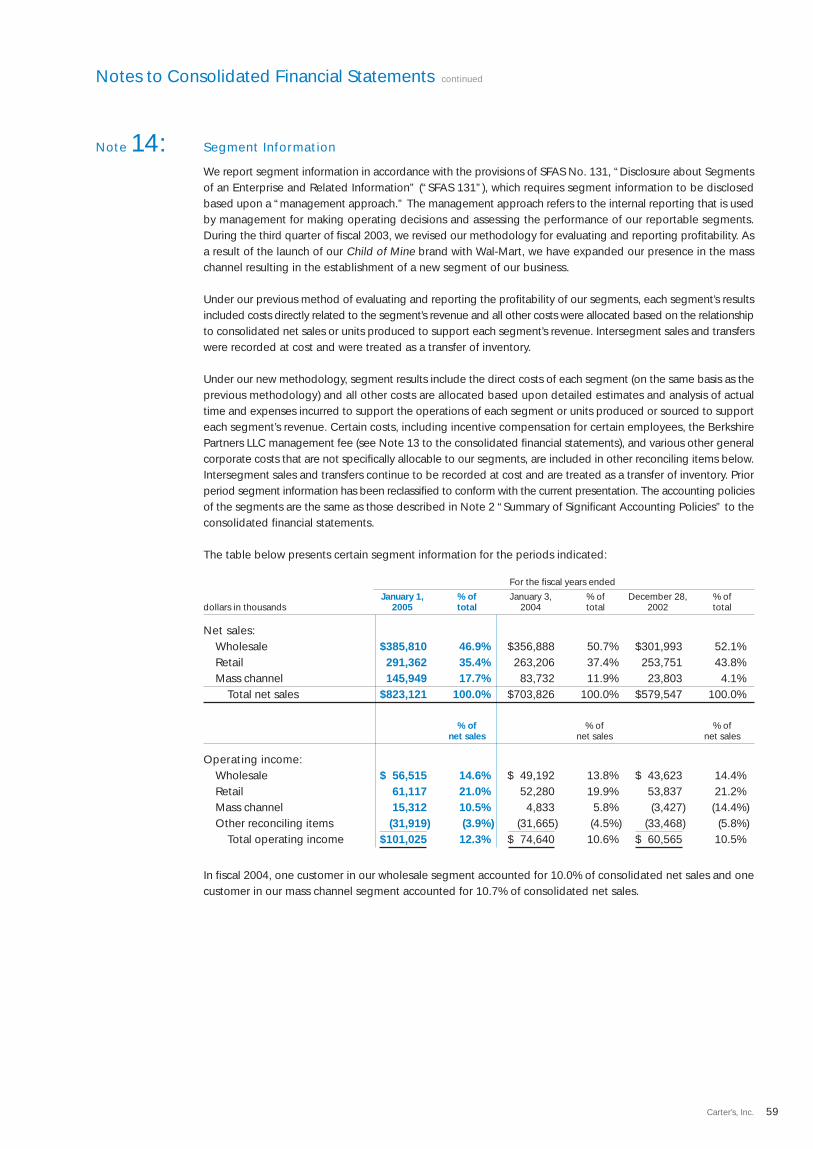
Notes to Consolidated Financial Statements continued
59Carter’s, Inc.
Note 14: Segment Information
We report segment information in accordance with the provisions of SFAS No. 131, “Disclosure about Segmentsof an Enterprise and Related Information” (“SFAS 131”), which requires segment information to be disclosedbased upon a “management approach.” The management approach refers to the internal reporting that is usedby management for making operating decisions and assessing the performance of our reportable segments.During the third quarter of fiscal 2003, we revised our methodology for evaluating and reporting profitability. Asa result of the launch of our Child of Mine brand with Wal-Mart, we have expanded our presence in the masschannel resulting in the establishment of a new segment of our business.
Under our previous method of evaluating and reporting the profitability of our segments, each segment’s resultsincluded costs directly related to the segment’s revenue and all other costs were allocated based on the relationshipto consolidated net sales or units produced to support each segment’s revenue. Intersegment sales and transferswere recorded at cost and were treated as a transfer of inventory.
Under our new methodology, segment results include the direct costs of each segment (on the same basis as theprevious methodology) and all other costs are allocated based upon detailed estimates and analysis of actualtime and expenses incurred to support the operations of each segment or units produced or sourced to supporteach segment’s revenue. Certain costs, including incentive compensation for certain employees, the BerkshirePartners LLC management fee (see Note 13 to the consolidated financial statements), and various other generalcorporate costs that are not specifically allocable to our segments, are included in other reconciling items below.Intersegment sales and transfers continue to be recorded at cost and are treated as a transfer of inventory. Priorperiod segment information has been reclassified to conform with the current presentation. The accounting policiesof the segments are the same as those described in Note 2 “Summary of Significant Accounting Policies” to theconsolidated financial statements.
The table below presents certain segment information for the periods indicated:
For the fiscal years ended
January 1, % of January 3, % of December 28, % ofdollars in thousands 2005 total 2004 total 2002 total
Net sales:Wholesale $385,810 46.9% $356,888 50.7% $301,993 52.1%Retail 291,362 35.4% 263,206 37.4% 253,751 43.8%Mass channel 145,949 17.7% 83,732 11.9% 23,803 4.1%
Total net sales $823,121 100.0% $703,826 100.0% $579,547 100.0%
% of % of % ofnet sales net sales net sales
Operating income:Wholesale $ 56,515 14.6% $ 49,192 13.8% $ 43,623 14.4%Retail 61,117 21.0% 52,280 19.9% 53,837 21.2%Mass channel 15,312 10.5% 4,833 5.8% (3,427) (14.4%)Other reconciling items (31,919) (3.9%) (31,665) (4.5%) (33,468) (5.8%)
Total operating income $101,025 12.3% $ 74,640 10.6% $ 60,565 10.5%
In fiscal 2004, one customer in our wholesale segment accounted for 10.0% of consolidated net sales and onecustomer in our mass channel segment accounted for 10.7% of consolidated net sales.

Notes to Consolidated Financial Statements continued
60 2004 Annual Report
Note 15:
The table below represents inventory by segment:
January 1, January 3,dollars in thousands 2005 2004
Wholesale $ 70,435 $ 62,991Retail 25,116 19,817Mass channel 25,241 21,952
Total $120,792 $104,760
Wholesale inventories include inventory produced and warehoused for the retail segment.
The following represents property, plant, and equipment, net, by geographic area:
January 1, January 3,dollars in thousands 2005 2004
United States $51,055 $47,676International 2,132 2,826
Total $53,187 $50,502
Our international operations consist of sewing facilities and, accordingly, no revenues are recorded at these locations.
The following represents goodwill by segment:
January 1, January 3,dollars in thousands 2005 2004
Wholesale $ 52,843 $ 52,843Retail 83,654 83,654Mass channel 2,785 2,785
Total $139,282 $139,282
Closure Costs
In the fourth quarter of fiscal 2002, we recorded a charge of approximately $150,000 related to a reduction inthe carrying value of the land and building held for sale located in Barnesville, Georgia which was sold in thesecond quarter of fiscal 2003.
On July 3, 2004, we closed our distribution facility located in Leola, Pennsylvania in order to consolidate shippingoperations with our remaining three distribution facilities located in Georgia. This closure was announced toaffected employees on June 1, 2004. Total employees terminated as of January 1, 2005 were 35. As a result ofthis closure, we recorded approximately $175,000 in severance and other exit costs. As of January 1, 2005, wehave approximately $18,000 accrued for additional severance costs included in other current liabilities in theaccompanying balance sheet.
In July of 2003, we decided to exit our sewing facilities located in Costa Rica given our ability to obtain lowercosts from third-party suppliers. Such closures were announced on September 16, 2003 and the facilities wereheld and used for production through the end of November 2003. Total employees terminated as a result ofthese closures were 1,474. As a result of these closures, we recorded approximately $1,306,000 in accelerateddepreciation during the third and fourth quarters of fiscal 2003 (included in cost of goods sold). Additionally, infiscal 2003 we recorded closure costs of $1,041,000 comprised of $184,000 of asset impairment charges,$483,000 of severance, and $374,000 in other exit costs. We also incurred approximately $424,000 in the fourthquarter of fiscal 2003 and $285,000 in fiscal 2004 of federal income tax expense related to the dissolution of theCosta Rican subsidiaries (included in the provision for income taxes). During fiscal 2004, we reversed approxi-mately $136,000 of severance costs and other termination benefits previously accrued for these closures andrecorded approximately $74,000 of severance and $371,000 of other exit costs related to these closures.

Notes to Consolidated Financial Statements continued
61Carter’s, Inc.
Note 16:
Activity associated with the closure cost reserves for our Costa Rican sewing facility and our distribution facilityin Leola, Pennsylvania for the fiscal year ended January 1, 2005 is as follows:
January 3, January 1,2004 2005
reserves Provisions Payments reserves
Severance and other termination benefits $274,000 $172,000 $(428,000) $18,000Other exit costs – 448,000 (448,000) –
Total $274,000 $620,000 $(876,000) $18,000
Unaudited Quarterly Financial Data
Unaudited summarized financial data by quarter for the fiscal years ended January 1, 2005 and January 3, 2004is presented in the table below:
dollars in thousands, except per share data Quarter 1 Quarter 2 Quarter 3 Quarter 4
2004:Net sales $182,720 $156,307 $251,357 $232,737Gross profit 66,270 59,591 87,867 84,311Selling, general, and administrative expenses 47,370 48,024 56,280 57,082Royalty income 3,164 2,504 3,589 3,105Operating income 21,530 14,065 35,127 30,303Net income 10,313 5,917 18,412 15,016Basic EPS 0.37 0.21 0.65 0.53Diluted EPS 0.35 0.20 0.62 0.50
2003:Net sales $165,993 $140,008 $212,135 $185,690Gross profit 60,604 49,855 75,684 69,143Selling, general, and administrative expenses 44,921 41,843 51,896 49,368Royalty income 2,554 1,903 3,692 2,876Operating income 18,237 9,915 27,365 19,123Net income 6,910 2,088 12,655 1,625Basic EPS 0.31 0.09 0.56 0.06Diluted EPS 0.29 0.09 0.52 0.06
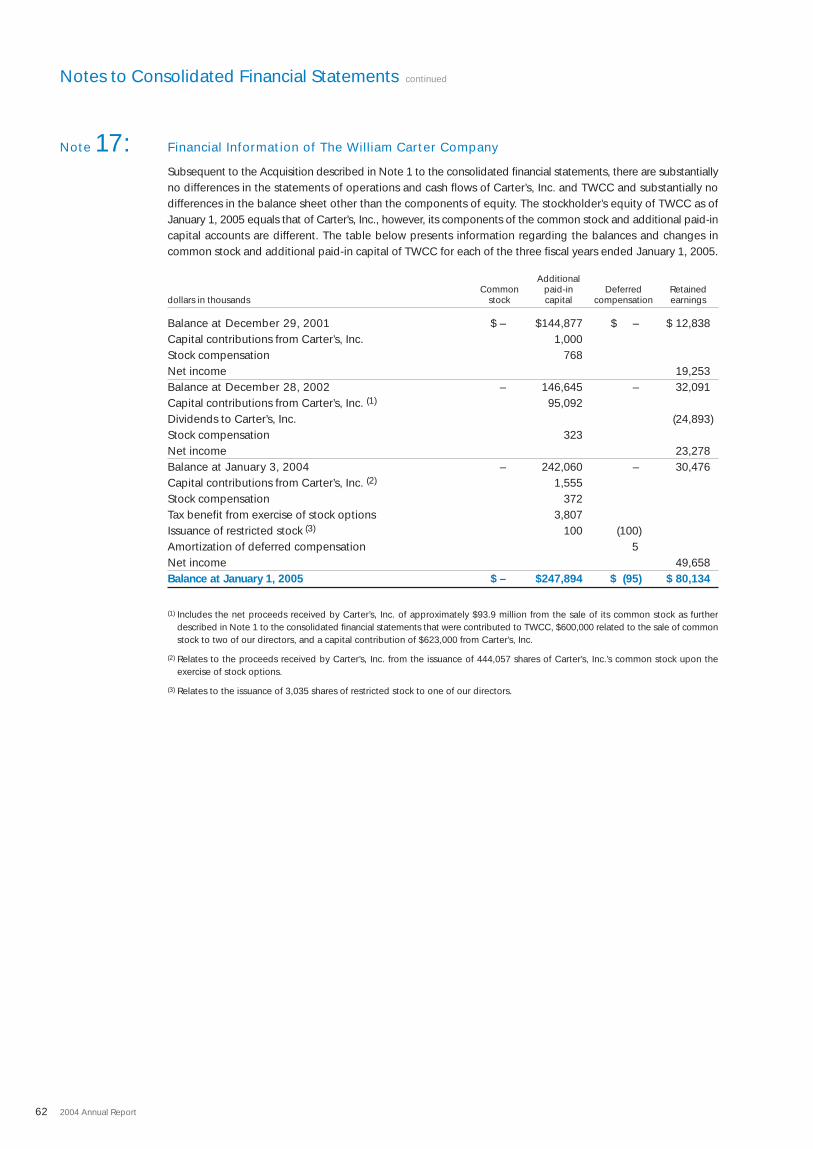
Notes to Consolidated Financial Statements continued
62 2004 Annual Report
Note 17: Financial Information of The William Carter Company
Subsequent to the Acquisition described in Note 1 to the consolidated financial statements, there are substantiallyno differences in the statements of operations and cash flows of Carter’s, Inc. and TWCC and substantially nodifferences in the balance sheet other than the components of equity. The stockholder’s equity of TWCC as ofJanuary 1, 2005 equals that of Carter’s, Inc., however, its components of the common stock and additional paid-incapital accounts are different. The table below presents information regarding the balances and changes incommon stock and additional paid-in capital of TWCC for each of the three fiscal years ended January 1, 2005.
AdditionalCommon paid-in Deferred Retained
dollars in thousands stock capital compensation earnings
Balance at December 29, 2001 $ – $144,877 $ – $ 12,838Capital contributions from Carter’s, Inc. 1,000Stock compensation 768Net income 19,253Balance at December 28, 2002 – 146,645 – 32,091Capital contributions from Carter’s, Inc. (1) 95,092Dividends to Carter’s, Inc. (24,893)Stock compensation 323Net income 23,278Balance at January 3, 2004 – 242,060 – 30,476Capital contributions from Carter’s, Inc. (2) 1,555Stock compensation 372Tax benefit from exercise of stock options 3,807Issuance of restricted stock (3) 100 (100)Amortization of deferred compensation 5Net income 49,658Balance at January 1, 2005 $ – $247,894 $ (95) $ 80,134
(1) Includes the net proceeds received by Carter’s, Inc. of approximately $93.9 million from the sale of its common stock as furtherdescribed in Note 1 to the consolidated financial statements that were contributed to TWCC, $600,000 related to the sale of commonstock to two of our directors, and a capital contribution of $623,000 from Carter’s, Inc.
(2) Relates to the proceeds received by Carter’s, Inc. from the issuance of 444,057 shares of Carter’s, Inc.’s common stock upon the exercise of stock options.
(3) Relates to the issuance of 3,035 shares of restricted stock to one of our directors.
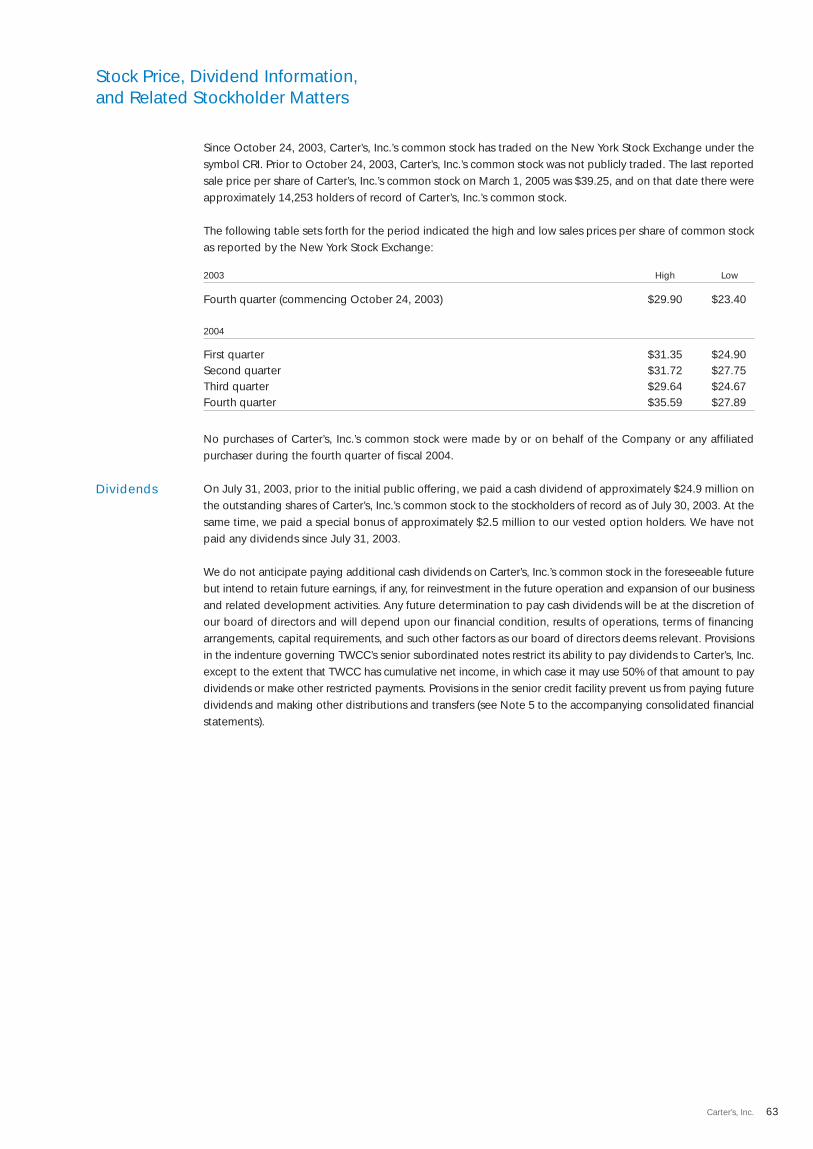
Stock Price, Dividend Information, and Related Stockholder Matters
63Carter’s, Inc.
Dividends
Since October 24, 2003, Carter’s, Inc.’s common stock has traded on the New York Stock Exchange under thesymbol CRI. Prior to October 24, 2003, Carter’s, Inc.’s common stock was not publicly traded. The last reportedsale price per share of Carter’s, Inc.’s common stock on March 1, 2005 was $39.25, and on that date there wereapproximately 14,253 holders of record of Carter’s, Inc.’s common stock.
The following table sets forth for the period indicated the high and low sales prices per share of common stockas reported by the New York Stock Exchange:
2003 High Low
Fourth quarter (commencing October 24, 2003) $29.90 $23.40
2004
First quarter $31.35 $24.90Second quarter $31.72 $27.75Third quarter $29.64 $24.67Fourth quarter $35.59 $27.89
No purchases of Carter’s, Inc.’s common stock were made by or on behalf of the Company or any affiliatedpurchaser during the fourth quarter of fiscal 2004.
On July 31, 2003, prior to the initial public offering, we paid a cash dividend of approximately $24.9 million onthe outstanding shares of Carter’s, Inc.’s common stock to the stockholders of record as of July 30, 2003. At thesame time, we paid a special bonus of approximately $2.5 million to our vested option holders. We have notpaid any dividends since July 31, 2003.
We do not anticipate paying additional cash dividends on Carter’s, Inc.’s common stock in the foreseeable futurebut intend to retain future earnings, if any, for reinvestment in the future operation and expansion of our businessand related development activities. Any future determination to pay cash dividends will be at the discretion ofour board of directors and will depend upon our financial condition, results of operations, terms of financingarrangements, capital requirements, and such other factors as our board of directors deems relevant. Provisionsin the indenture governing TWCC’s senior subordinated notes restrict its ability to pay dividends to Carter’s, Inc.except to the extent that TWCC has cumulative net income, in which case it may use 50% of that amount to paydividends or make other restricted payments. Provisions in the senior credit facility prevent us from paying futuredividends and making other distributions and transfers (see Note 5 to the accompanying consolidated financialstatements).
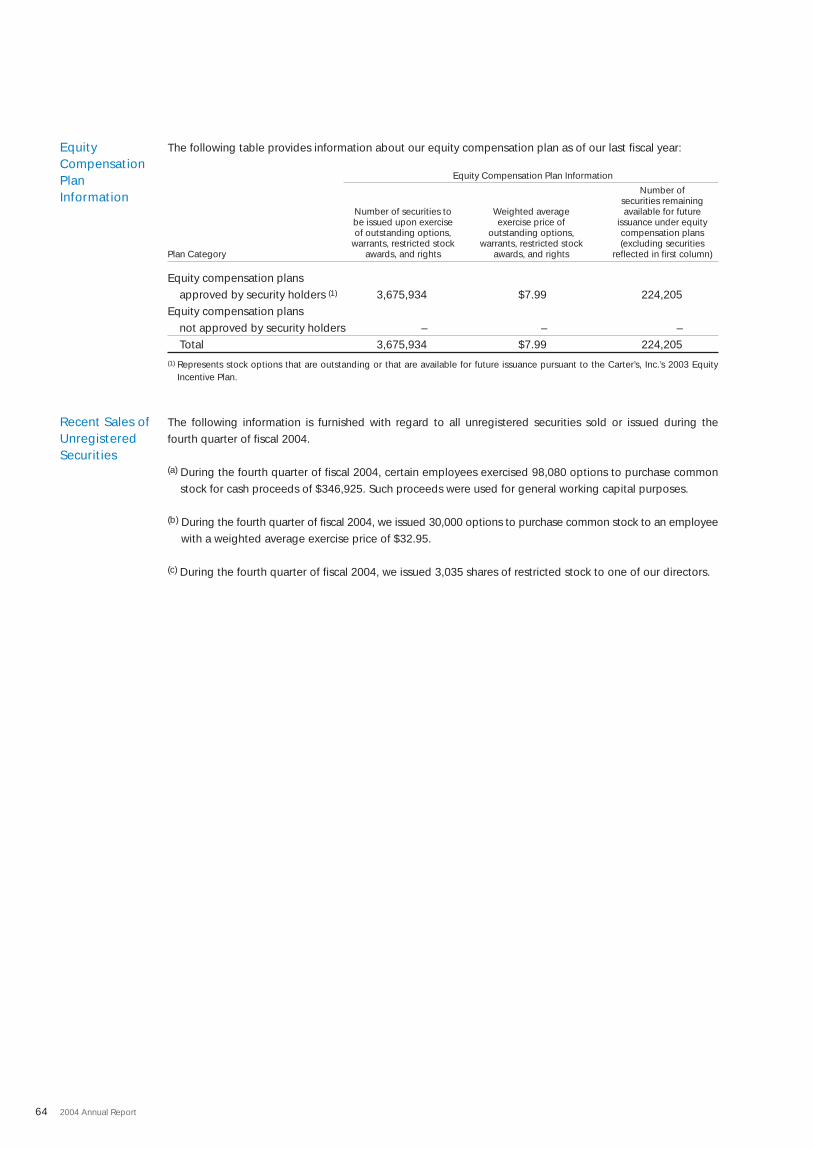
64 2004 Annual Report
EquityCompensationPlanInformation
Recent Sales ofUnregisteredSecurities
The following table provides information about our equity compensation plan as of our last fiscal year:
Equity Compensation Plan Information
Number ofsecurities remaining
Number of securities to Weighted average available for futurebe issued upon exercise exercise price of issuance under equityof outstanding options, outstanding options, compensation plans
warrants, restricted stock warrants, restricted stock (excluding securitiesPlan Category awards, and rights awards, and rights reflected in first column)
Equity compensation plans approved by security holders (1) 3,675,934 $7.99 224,205
Equity compensation plans not approved by security holders – – –Total 3,675,934 $7.99 224,205
(1) Represents stock options that are outstanding or that are available for future issuance pursuant to the Carter’s, Inc.’s 2003 EquityIncentive Plan.
The following information is furnished with regard to all unregistered securities sold or issued during the fourth quarter of fiscal 2004.
(a) During the fourth quarter of fiscal 2004, certain employees exercised 98,080 options to purchase commonstock for cash proceeds of $346,925. Such proceeds were used for general working capital purposes.
(b) During the fourth quarter of fiscal 2004, we issued 30,000 options to purchase common stock to an employeewith a weighted average exercise price of $32.95.
(c) During the fourth quarter of fiscal 2004, we issued 3,035 shares of restricted stock to one of our directors.
Leadership Team
65Carter’s, Inc.
Board of Directors
Frederick J. Rowan, IIChairman of the Board of Directors and Chief Executive Officer, Carter’s Frederick J. Rowan, II joined us in 1992 asPresident and Chief Executive Officer andbecame Chairman of our Board of Directorsin October 1996. Prior to joining us, Mr. Rowan was Group Vice President of VF Corporation, a multi-division apparelcompany and, among other positions, servedas President and Chief Executive Officer ofboth The HD Lee Company Inc. and Bassett-Walker, Inc., divisions of VF Corporation. Mr. Rowan, who has been involved in thetextile and apparel industries for 40 years, hasbeen in senior executive positions for nearly28 of those years. Mr. Rowan began his careerat the DuPont Corporation and later joinedAileen, Inc., a manufacturer of women’sapparel, where he subsequently becamePresident and Chief Operating Officer. OnJune 1, 2004, the Company named JosephPacifico, formerly Carter’s President ofMarketing, as President of Carter’s, Inc. Mr. Rowan continues to serve as ourChairman of the Board of Directors and ChiefExecutive Officer.
Bradley M. Bloom 2
Managing Director, Berkshire Partners LLCBradley M. Bloom became a director inAugust 2001. Mr. Bloom is a ManagingDirector of Berkshire Partners LLC, which heco-founded in 1986. He has been a directorof several of Berkshire Partners’ consumer and retailing companies including STB Beauty,Inc., Acosta, Inc., Gordon Brothers Group,Sterling, Inc., America’s Best Contacts andEyeglasses, L.P., and Miami CruiselineServices Holdings I.B.V.
Paul Fulton 1, 2 (chair)
Non-Executive Chairman of the Board, Bassett Furniture Industries, IncorporatedPaul Fulton became a director in May 2002.Mr. Fulton retired as President of Sara LeeCorp. in 1993, after spending 34 years with thecompany. He is currently non-ExecutiveChairman of the Board of Bassett FurnitureIndustries, Incorporated, where he has been aboard member since August 1993. Mr. Fultonis also a current board member of Bank ofAmerica Corporation, has been a boardmember since October 1989 of SonocoProducts Company, Inc., and has been on theboard of Lowe’s Companies, Inc., sinceDecember 1996.
Ross M. Jones 3 (chair)
Managing Director, Berkshire Partners LLCRoss M. Jones became a director in August2001. Mr. Jones is a Managing Director ofBerkshire Partners LLC, which he joined in1993. He has been a director of several ofBerkshire Partners’ consumer, retailing, manufacturing, and business services com-panies including STB Beauty, Inc., AVW-TelAv, Inc., Sterling Collision Centers, Inc.,and Thomas Built Buses, Inc.
David Pulver 1 (chair)
President, Cornerstone Capital, Inc.David Pulver became a director in January2002. Mr. Pulver has been a private investorfor approximately 22 years, is the President of Cornerstone Capital, Inc., and has been aboard member of Hearst-Argyle Television,Inc. since August of 1997. Mr. Pulver was a founder of The Children’s Place, Inc. andserved as its Chairman and Co-ChiefExecutive Officer until 1982.
Elizabeth A. Smith 2
Executive Vice President and Brand President, Avon Products, Inc.Elizabeth A. Smith became a director inNovember 2004. Effective January 1, 2005,Ms. Smith became Executive Vice Presidentand Brand President of Avon Products, Inc.Ms. Smith was formerly the Group VicePresident for Kraft Foods North America andPresident of Beverage and Grocery Sectors.From 1990 to 2004, she held various man-agement positions at Kraft Foods, Inc. includ-ing President, Beverages, Desserts andCereals where she had responsibility for managing many well known brands.
John R. Welch 3
Former President of Mast Industries (Far East) Ltd.John R. Welch became a director in February2003. Mr. Welch retired as President of MastIndustries (Far East) Ltd. in April 2002 afterspending the previous 18 years with the company. Mr. Welch also served as ExecutiveVice President of Operations at WarnacoKnitwear, a division of Warnaco, Inc. fromAugust 1978 to December 1983. Mr. Welchis currently a board member of BrandotInternational Ltd.
Thomas Whiddon 1, 3
Former Executive Vice President–Logistics and Technology and ChiefFinancial Officer of Lowe’s Companies, Inc.Thomas Whiddon became a director inAugust of 2003. Mr. Whiddon retired asExecutive Vice President–Logistics andTechnology of Lowe’s Companies, Inc. inMarch 2003, a position he held since 2000after serving as the company’s Chief FinancialOfficer from 1996 to 2000. Mr. Whiddon has over 30 years of accounting and financialexperience. Mr. Whiddon is currently a boardmember of STB Beauty, Inc., SonocoProducts Company, Inc., and of Dollar TreeStores, Inc.
Committee Memberships:1 Audit2 Compensation3 Nominating & Corporate Governance
Executive Committee and Management
Frederick J. Rowan, IIChairman of the Board of Directors and Chief Executive Officer
Joseph PacificoPresident
David A. BrownExecutive Vice President, Operations
Suzanne CalkinsSenior Vice President, Strategic Development
Michael D. CaseyExecutive Vice President and Chief Financial Officer
Robin RiceExecutive Vice President, Marketing
Charles E. Whetzel, Jr.Executive Vice President, Global Sourcing
Doug BoyleSenior Vice President, Global Sourcing
Joseph EllesSenior Vice President, Sales
Brendan M. GibbonsVice President, General Counsel
Trevor LangVice President, Finance
Eric M. MartinVice President, Investor Relations
Kevin W. MitchaelVice President, Brand and Consumer Marketing
Andrew B. NorthVice President, Corporate Compliance
Clyde D. StuttsVice President, Human Resources
Mark SyrstadPresident, Retail Stores
Guiding Our Growth
66 2004 Annual Report
Corporate Information
CompanyAddress
Annual Meeting
Stock ExchangeListing
IndependentRegisteredPublicAccounting Firm
Legal Counsel
Transfer Agent
InvestorRelations
Carter’s, Inc.1170 Peachtree Street NE, Suite 900Atlanta, Georgia 30309
Website: www.carters.com
The Annual Meeting of Stockholders is scheduled for 9:00 a.m., Thursday, May 12 at the Atlanta History Center,130 West Paces Ferry Road NW, Atlanta, Georgia 30305.
New York Stock Exchange (Trading Symbol “CRI”)
PricewaterhouseCoopers LLP 300 Atlantic StreetStamford, Connecticut 06901
Ropes & Gray LLPOne International PlaceBoston, Massachusetts 02110
American Stock Transfer and Trust Company59 Maiden LaneNew York, New York 10038
For further information on Carter’s, additional copies of this report, Form 10-K, or other financial information, contact:
Eric M. MartinVice President, Investor Relations1170 Peachtree Street NE, Suite 900Atlanta, Georgia 30309404.745.2700
References to market share in this annual report reflect our estimated share of a market expressed as a percentageof total retail revenues, of such market, derived from NPD Fashionworld’s data issued February 1, 2005. Carter’srevised the NPD’s market definitions to better reflect the nature of the childrenswear business.
The brand awareness claims are based on a 2004 consumer research study, entitled “Carter’s – ConsumerSegmentation.” The brand awareness was derived by Carter’s from a random sample of children’s apparel buyers.

from Top
Revenue Growth $ in millions
Financial Highlights
1994
$271
2004
$823
Co
ncep
t an
d D
esig
n: w
ww
.cri
ttg
raha
m.c
om
Co
py:
Mim
i Bea
n

Growing UpCarter’s
Carter’s, Inc. 2004 Annual ReportCarter’s, Inc. 1170 Peachtree Street NE, Suite 900, Atlanta, Georgia 30309 • 888.782.9548 www.carters.com
If they could just stay little ‘til their Carter’s wear out.
Carter’s, Inc. 2
00
4
Annual R
epo
rt


