Embed Size (px)
Citation preview
Journal of Water Resource and Protection, 2013, 5, 930-940 http://dx.doi.org/10.4236/jwarp.2013.510096 Published Online October 2013 (http://www.scirp.org/journal/jwarp)
Groundwater Quality and Identification of Hydrogeochemical Processes within
University of Lagos, Nigeria
Abiodun Mary Odukoya1, Adetayo Femi Folorunso1,2*, Elijah Adebowale Ayolabi1, Ezekiel Adelere Adeniran3
1Department of Geosciences, University of Lagos, Lagos, Nigeria 2Ocean University of China, College of Marine Geosciences, Qingdao, China
3Department of Works and Physical Planning, University of Lagos, Lagos, Nigeria Email: [email protected], *[email protected], [email protected], [email protected]
Received June 23, 2013; revised July 25, 2013; accepted August 26, 2013
Copyright © 2013 Abiodun Mary Odukoya et al. This is an open access article distributed under the Creative Commons Attribution License, which permits unrestricted use, distribution, and reproduction in any medium, provided the original work is properly cited.
ABSTRACT
Water samples from twenty one boreholes were collected within University of Lagos and analyzed for physical proper- ties, trace elements and cations using inductively coupled plasma optical emission spectrometry (ICP-OES). Physical analysis of the samples shows slight acidity and alkalinity with 78% of the samples exceeded recommended standards. They can be classified as fresh water based on TDS and EC. Chloride concentrations fall within water standards in most samples while Al, Na, Pb and Br exceeded recommended standards in most samples. Gibbs plot, relationship between total cations, Na + K, Ca + Mg and Cl showed that all the groundwater samples fall in the water-rock interaction field which suggests that the weathering of rocks and influence of sea water primarily controls the major chemistry of groundwater in the area. Sodium Absorption Ratio (SAR) for all the water samples was less than 10 and excellent for irrigation purpose. Only 33% of water samples were suitable for irrigation based on Soluble Sodium Percentage (SSP) and Magnesium Adsorption Ratio (MAR), whereas based on Kellys Ratios (KR) all the water samples were not good for irrigation purpose having KR greater than 1. Fifty percent of the water samples showed pollution index (PI) above 1 with highest contribution (37.8%) from lead (Pb). Mn, Al, Ni, Fe and As contributed 29.3%, 19.13%, 8.66%, 4.25% and 0.82% respectively. Keywords: Hydrogeochemical Processes; Groundwater Geochemistry; Weathering; Irrigation; Pollution Index
1. Introduction
Ground water is an important source of water supply in many parts of the world and the most important source of drinking water for 70% of Nigerian population. It is widely distributed under the ground and it is a replenish- able resource unlike other resources of the earth.
One of the most important crises of the twenty-first century is the scarcity of drinking water. Most freshwater bodies of the world over are becoming increasingly pol- luted, thus decreasing the potability of water [1]. The University with population of students and staff totaling fifty thousand (50,000) depends on groundwater for wa- ter supply. This has led to disproportionate sinking of boreholes by all organs of the University community in a bid to meet the water need of their units. In all, about
thirty (30) water boreholes distributed across the campus were located, with at least twenty one (21) of the bore- holes functioning as at the time of the research work.
Chemistry of groundwater is an important factor de- termining its use for domestic, irrigation and industrial purposes. Interaction of groundwater with aquifer miner- als through which it flows greatly controls the ground- water chemistry. Hydrogeochemical processes that are responsible for altering the chemical composition of groundwater vary with respect to space and time. In any area, groundwater has unique chemistry due to several processes like soil/rock-water interaction during recharge and groundwater flow, prolonged storage in the aquifer, dissolution of mineral species, etc. [2].
According to world health organization 40% or more of the disease outbreaks are attributed to polluted ground- water consumption. Thus, it is absolutely necessary to *Corresponding author.
Copyright © 2013 SciRes. JWARP
A. M. ODUKOYA ET AL. 931
ascertain the potability of water before it is used for hu- man consumption. Therefore, in the present study, an attempt is made to determine the chemical characteristics of groundwater within University of Lagos and its suit- ability for both drinking and irrigation purposes.
2. Study Area
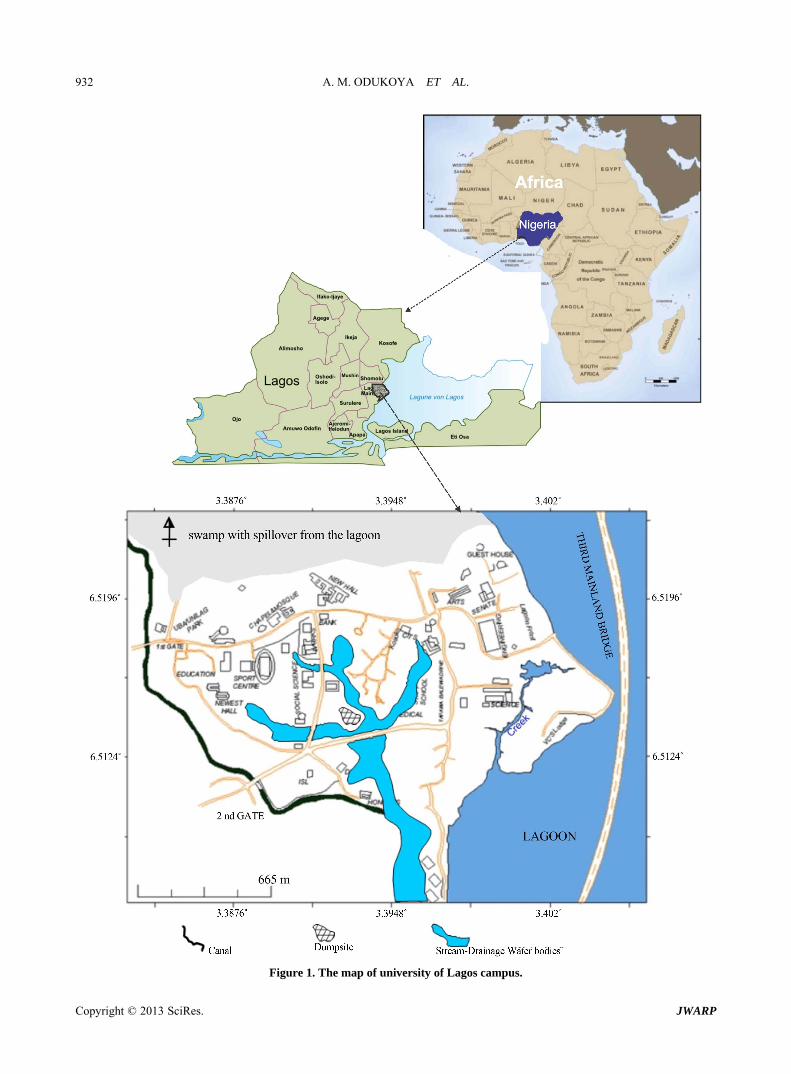
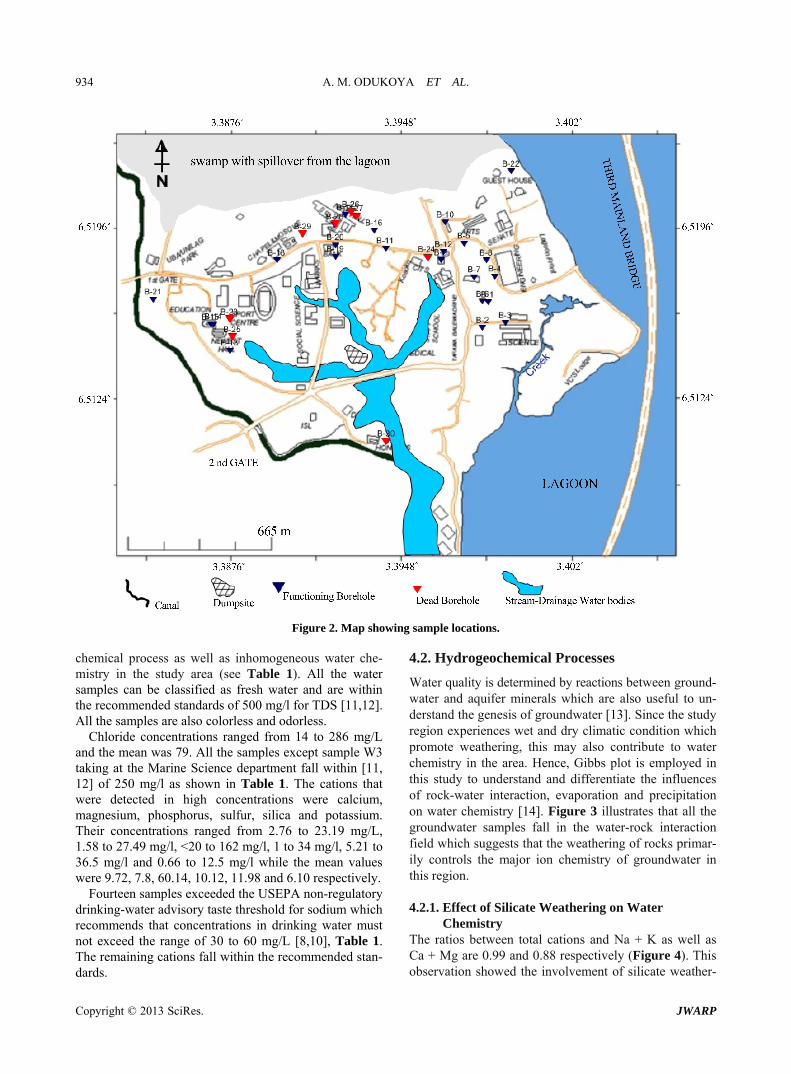
University of Lagos is located within Lagos, Southwest- ern Nigeria. The campus is nearly encompassed by water bodies with Lagos laggon on the east, swamp in the north and canal in the west curving the southward (Figure 1). Topography is generally low and characterized by tor- rential rainfall with a shallow water table (as shallow as 0.5 m around the coast). The geology of the area is char- acterized by two bands of sand separated by silty mud lying within the Dahomey Basin. Dahomey Basin, a combination of inland/coastal/offshore basin that stre- tches from southeastern Ghana through Togo and the Republic of Benin to southwestern Nigeria has been variously described by many workers like [3-6]. Though there has been a nomenclature problem in the stratigra- phy of the Dahomey Basin [6], the age range is from Cretaceous to Tertiary. Lagos mainland is underlain by sediment of Cretaceous through Tertiary to Quaternary. Quaternary sediments are alluvial deposits, covering most part of the Lagos Coastal areas and river valleys.
3. Material and Methods
Twenty one boreholes and one lagoon water were col- lected at several locations within University of Lagos and analyzed for 73 constituents and physical properties. The samples were taken from boreholes located in different part of the University of Lagos (Figure 2). Several sensi- tive parameters of water such as total dissolved solids
(TDS), electrical conductivity, temperature and pH were determined during the on the spot sampling using the appropriate digital meters (e.g. water treatment works (WTW)-conductivity metermodel L/92 and WTW-pH meter model pH/91). Water samples of approximately 125 mL were collected for multi-element analysis; pres- sure filtered through 0.2 mm Nuclepore membranes and 3 mL analytical grade HNO3 was added to bring the wa- ter acid solution to a pH ~ 2. The analysis of trace ele- ments and cations in water were carried out using induc- tively coupled plasma optical emission spectrometry (ICP-OES. All the analyses were carried out at the ACME laboratory, Ontario Canada. To check the accu- racy; activation laboratories (Ontario, Canada) employed two internal standards (each run twice) and found that the errors were consistently minimal. Parameters such as Sodium Adsorption Ratio (SAR), Soluble Sodium Per- centage (SSP), Magnesium Adsorption Ratio (MAR), Kellys Ratio (KR) were also calculated from the result to determine the suitability of the water for irrigation pur- pose using the equation in [7]. Results were further com- pared with recommended standards and pollution index as well as other hydro-geochemical parameters were cal- culated to determine the water geochemistry and its qual- ity for both drinking and irrigation purposes.
4. Results and Discussion
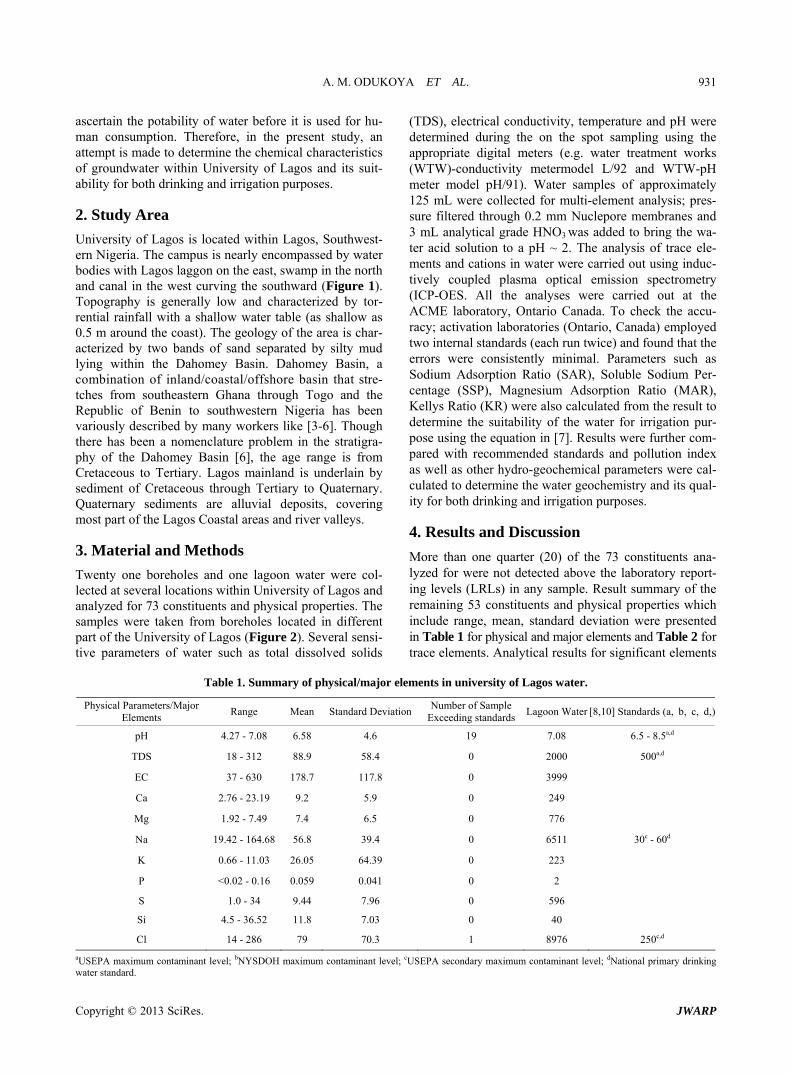
More than one quarter (20) of the 73 constituents ana- lyzed for were not detected above the laboratory report- ing levels (LRLs) in any sample. Result summary of the remaining 53 constituents and physical properties which include range, mean, standard deviation were presented in Table 1 for physical and major elements and Table 2 for trace elements. Analytical results for significant elements
Table 1. Summary of physical/major elements in university of Lagos water.
Physical Parameters/Major Elements
Range Mean Standard DeviationNumber of Sample
Exceeding standardsLagoon Water [8,10] Standards (a, b, c, d,)
pH 4.27 - 7.08 6.58 4.6 19 7.08 6.5 - 8.5a,d
TDS 18 - 312 88.9 58.4 0 2000 500a,d
EC 37 - 630 178.7 117.8 0 3999
Ca 2.76 - 23.19 9.2 5.9 0 249
Mg 1.92 - 7.49 7.4 6.5 0 776
Na 19.42 - 164.68 56.8 39.4 0 6511 30c - 60d
K 0.66 - 11.03 26.05 64.39 0 223
P <0.02 - 0.16 0.059 0.041 0 2
S 1.0 - 34 9.44 7.96 0 596
Si 4.5 - 36.52 11.8 7.03 0 40
Cl 14 - 286 79 70.3 1 8976 250c,d
aUSEPA maximum contaminant level; bNYSDOH maximum contaminant level; cUSEPA secondary maximum contaminant level; dNational primary drinking water standard.
Copyright © 2013 SciRes. JWARP
A. M. ODUKOYA ET AL. 932
Figure 1. The map of university of Lagos campus.
Copyright © 2013 SciRes. JWARP
A. M. ODUKOYA ET AL.
Copyright © 2013 SciRes. JWARP
933
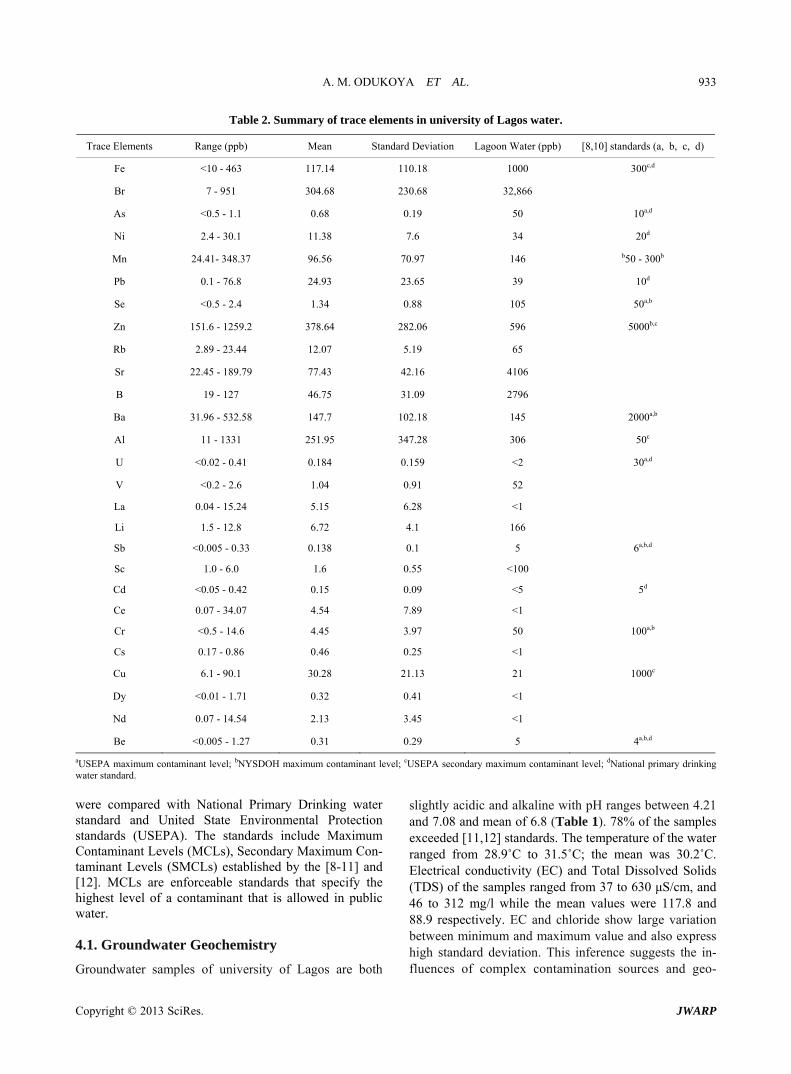
Table 2. Summary of trace elements in university of Lagos water.
Trace Elements Range (ppb) Mean Standard Deviation Lagoon Water (ppb) [8,10] standards (a, b, c, d)
Fe <10 - 463 117.14 110.18 1000 300c,d
Br 7 - 951 304.68 230.68 32,866
As <0.5 - 1.1 0.68 0.19 50 10a,d
Ni 2.4 - 30.1 11.38 7.6 34 20d
Mn 24.41- 348.37 96.56 70.97 146 b50 - 300b
Pb 0.1 - 76.8 24.93 23.65 39 10d
Se <0.5 - 2.4 1.34 0.88 105 50a,b
Zn 151.6 - 1259.2 378.64 282.06 596 5000b,c
Rb 2.89 - 23.44 12.07 5.19 65
Sr 22.45 - 189.79 77.43 42.16 4106
B 19 - 127 46.75 31.09 2796
Ba 31.96 - 532.58 147.7 102.18 145 2000a,b
Al 11 - 1331 251.95 347.28 306 50c
U <0.02 - 0.41 0.184 0.159 <2 30a,d
V <0.2 - 2.6 1.04 0.91 52
La 0.04 - 15.24 5.15 6.28 <1
Li 1.5 - 12.8 6.72 4.1 166
Sb <0.005 - 0.33 0.138 0.1 5 6a,b,d
Sc 1.0 - 6.0 1.6 0.55 <100
Cd <0.05 - 0.42 0.15 0.09 <5 5d
Ce 0.07 - 34.07 4.54 7.89 <1
Cr <0.5 - 14.6 4.45 3.97 50 100a,b
Cs 0.17 - 0.86 0.46 0.25 <1
Cu 6.1 - 90.1 30.28 21.13 21 1000c
Dy <0.01 - 1.71 0.32 0.41 <1
Nd 0.07 - 14.54 2.13 3.45 <1
Be <0.005 - 1.27 0.31 0.29 5 4a,b,d
aUSEPA maximum contaminant level; bNYSDOH maximum contaminant level; cUSEPA secondary maximum contaminant level; dNational primary drinking water standard.
were compared with National Primary Drinking water standard and United State Environmental Protection standards (USEPA). The standards include Maximum Contaminant Levels (MCLs), Secondary Maximum Con- taminant Levels (SMCLs) established by the [8-11] and [12]. MCLs are enforceable standards that specify the highest level of a contaminant that is allowed in public water.
4.1. Groundwater Geochemistry
Groundwater samples of university of Lagos are both
slightly acidic and alkaline with pH ranges between 4.21 and 7.08 and mean of 6.8 (Table 1). 78% of the samples exceeded [11,12] standards. The temperature of the water ranged from 28.9˚C to 31.5˚C; the mean was 30.2˚C. Electrical conductivity (EC) and Total Dissolved Solids (TDS) of the samples ranged from 37 to 630 μS/cm, and 46 to 312 mg/l while the mean values were 117.8 and 88.9 respectively. EC and chloride show large variation between minimum and maximum value and also express high standard deviation. This inference suggests the in- luences of complex contamination sources and geo- f
A. M. ODUKOYA ET AL. 934
Figure 2. Map showing sample locations. chemical process as well as inhomogeneous water che- mistry in the study area (see Table 1). All the water samples can be classified as fresh water and are within the recommended standards of 500 mg/l for TDS [11,12]. All the samples are also colorless and odorless.
Chloride concentrations ranged from 14 to 286 mg/L and the mean was 79. All the samples except sample W3 taking at the Marine Science department fall within [11, 12] of 250 mg/l as shown in Table 1. The cations that were detected in high concentrations were calcium, magnesium, phosphorus, sulfur, silica and potassium. Their concentrations ranged from 2.76 to 23.19 mg/L, 1.58 to 27.49 mg/l, <20 to 162 mg/l, 1 to 34 mg/l, 5.21 to 36.5 mg/l and 0.66 to 12.5 mg/l while the mean values were 9.72, 7.8, 60.14, 10.12, 11.98 and 6.10 respectively.
Fourteen samples exceeded the USEPA non-regulatory drinking-water advisory taste threshold for sodium which recommends that concentrations in drinking water must not exceed the range of 30 to 60 mg/L [8,10], Table 1. The remaining cations fall within the recommended stan- dards.
4.2. Hydrogeochemical Processes
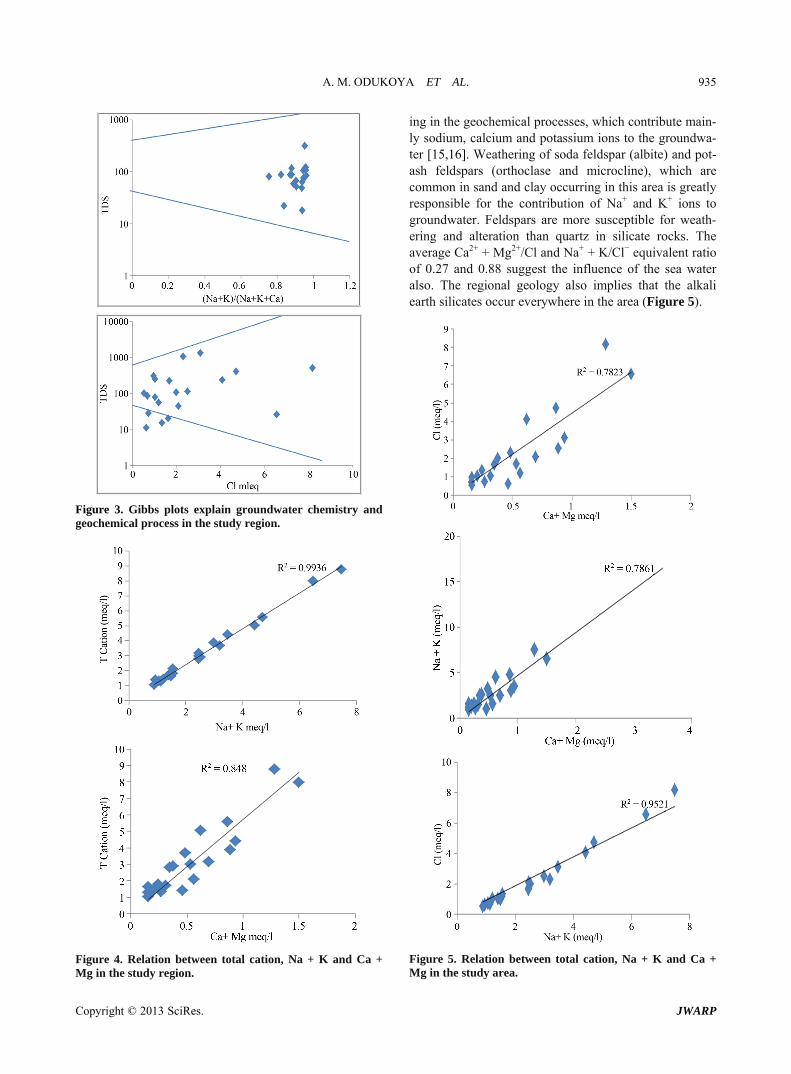
Water quality is determined by reactions between ground- water and aquifer minerals which are also useful to un- derstand the genesis of groundwater [13]. Since the study region experiences wet and dry climatic condition which promote weathering, this may also contribute to water chemistry in the area. Hence, Gibbs plot is employed in this study to understand and differentiate the influences of rock-water interaction, evaporation and precipitation on water chemistry [14]. Figure 3 illustrates that all the groundwater samples fall in the water-rock interaction field which suggests that the weathering of rocks primar- ily controls the major ion chemistry of groundwater in this region.
4.2.1. Effect of Silicate Weathering on Water Chemistry
The ratios between total cations and Na + K as well as Ca + Mg are 0.99 and 0.88 respectively (Figure 4). This observation showed the involvement of silicate weather-
Copyright © 2013 SciRes. JWARP
A. M. ODUKOYA ET AL. 935
Figure 3. Gibbs plots explain groundwater chemistry and geochemical process in the study region.
Figure 4. Relation between total cation, Na + K and Ca + Mg in the study region.
ing in the geochemical processes, which contribute main- ly sodium, calcium and potassium ions to the groundwa- ter [15,16]. Weathering of soda feldspar (albite) and pot- ash feldspars (orthoclase and microcline), which are common in sand and clay occurring in this area is greatly responsible for the contribution of Na+ and K+ ions to groundwater. Feldspars are more susceptible for weath- ering and alteration than quartz in silicate rocks. The average Ca2+ + Mg2+/Cl and Na+ + K/Cl− equivalent ratio of 0.27 and 0.88 suggest the influence of the sea water also. The regional geology also implies that the alkali earth silicates occur everywhere in the area (Figure 5).
Figure 5. Relation between total cation, Na + K and Ca + Mg in the study area.
Copyright © 2013 SciRes. JWARP
A. M. ODUKOYA ET AL. 936
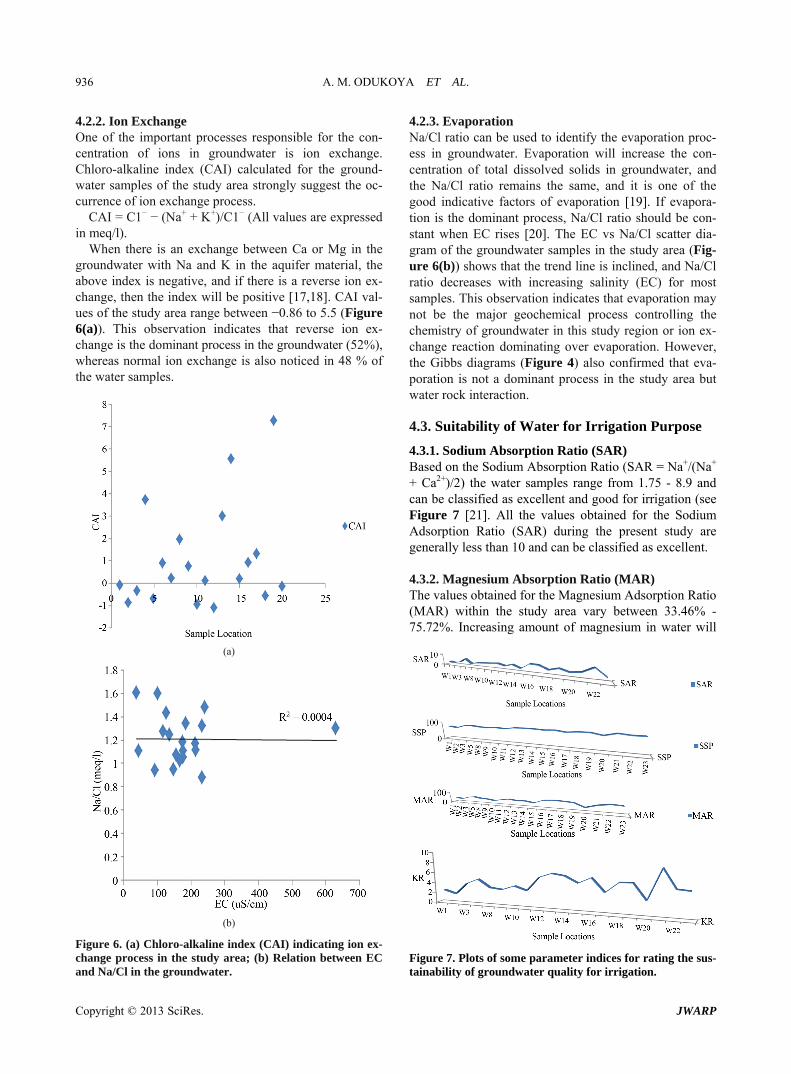
4.2.2. Ion Exchange One of the important processes responsible for the con- centration of ions in groundwater is ion exchange. Chloro-alkaline index (CAI) calculated for the ground- water samples of the study area strongly suggest the oc- currence of ion exchange process.
CAI = C1− − (Na+ + K+)/C1− (All values are expressed in meq/l).
When there is an exchange between Ca or Mg in the groundwater with Na and K in the aquifer material, the above index is negative, and if there is a reverse ion ex- change, then the index will be positive [17,18]. CAI val- ues of the study area range between −0.86 to 5.5 (Figure 6(a)). This observation indicates that reverse ion ex- change is the dominant process in the groundwater (52%), whereas normal ion exchange is also noticed in 48 % of the water samples.
(a)
(b)
Figure 6. (a) Chloro-alkaline index (CAI) indicating ion ex- change process in the study area; (b) Relation between EC and Na/Cl in the groundwater.
4.2.3. Evaporation Na/Cl ratio can be used to identify the evaporation proc- ess in groundwater. Evaporation will increase the con- centration of total dissolved solids in groundwater, and the Na/Cl ratio remains the same, and it is one of the good indicative factors of evaporation [19]. If evapora- tion is the dominant process, Na/Cl ratio should be con- stant when EC rises [20]. The EC vs Na/Cl scatter dia- gram of the groundwater samples in the study area (Fig- ure 6(b)) shows that the trend line is inclined, and Na/Cl ratio decreases with increasing salinity (EC) for most samples. This observation indicates that evaporation may not be the major geochemical process controlling the chemistry of groundwater in this study region or ion ex- change reaction dominating over evaporation. However, the Gibbs diagrams (Figure 4) also confirmed that eva- poration is not a dominant process in the study area but water rock interaction.
4.3. Suitability of Water for Irrigation Purpose
4.3.1. Sodium Absorption Ratio (SAR) Based on the Sodium Absorption Ratio (SAR = Na+/(Na+ + Ca2+)/2) the water samples range from 1.75 - 8.9 and can be classified as excellent and good for irrigation (see Figure 7 [21]. All the values obtained for the Sodium Adsorption Ratio (SAR) during the present study are generally less than 10 and can be classified as excellent.
4.3.2. Magnesium Absorption Ratio (MAR) The values obtained for the Magnesium Adsorption Ratio (MAR) within the study area vary between 33.46% - 75.72%. Increasing amount of magnesium in water will
Figure 7. Plots of some parameter indices for rating the sus- tainability of groundwater quality for irrigation.
Copyright © 2013 SciRes. JWARP
A. M. ODUKOYA ET AL. 937
increase the salinity of the water and therefore decline the crop yield [22]. The values obtained in only 33% of the samples are less than 50% considered suitable with no hazardous effects to the soil according to [23], Figure 7.
4.3.3. Soluble Sodium Percentage (SSP) SSP is frequently used in the determination of the suit- ability of water for irrigation purpose. In this work, the values obtained for the SSP parameter range between 67.3% - 90.43% According to [24] (Figure 7), 33% of the water samples fall within fair classification of 80% and the remaining samples fall within poor (>80%) for the purpose of irrigation. Also, the ranges of values for the Kelly’s Ratio (KR) obtained for the water samples are 1.82 - 9.17 meq/l. The values obtained are higher than the permissible limit of 1.0 recommended by [23] in all the water samples.
4.4. Trace Elements in Water
Al, Fe, Pb, Mn, Br and Ni exceeded recommended stan- dards in 60.87%, 4.35%, 65.2%, 18.78%, 100% and 13.04% of the total samples respectively. Aluminum con- centrations ranged from 11 to 1331 mg/l; the SMCL (50 μg/L) was exceeded in fourteen samples (Table 2). Iron concentrations ranged from <10 (the Laboratory Report- ing Level (LRL)) to 463 mg/l; the Federal SMCL and the New York State MCL for iron was exceeded in one sam- ple W5. Lead concentrations ranged from 0.1 to 76.8 μg/L; the [12] (10 μg/L) was exceeded in fifteen samples (Table 2). Manganese, Bromate and Nickel concentra- tions ranged from 24.41 to 348.87 μg/L, 72 to 95 μg/l, and 2.4 to 30.1 μg/L while the MCLs of 50 μg/L, 10 μg/L and 20 μg/L were exceeded in eighteen, twenty-three and two samples respectively (Table 2).
Some trace elements, Ge, Gd, Ho, Pr,Lu, Tb, Tl and Tm were detected less frequently or at lower concentra- tions (Table 2) than other constituents. The MCLs for antimony (6 μg/L), arsenic (10 μg/L), beryllium (4 μg/L), barium (2000 μg/L), cadmium (5 μg/L), chromium (100 μg/L), selenium (50 μg/L), zinc (5000 μg/L), and ura-nium (30 μg/L), and the SMCL for copper (1000 μg/L), Mercury (2 μg/L ), silver (100 μg/L) and thallium (2 μg/L) were not exceeded in any sample. Co, Li, C, Cs, Dy, Er, Nd, Y, Yb, Zr, Lu, Rb and V were detected, but no MCLs have been established for them while W, Th, Ti, Te, Ag, Au, Ga, Hf, In, Nb, Pd, Re, Rh and Ru were below laboratory detection limit for all the samples.
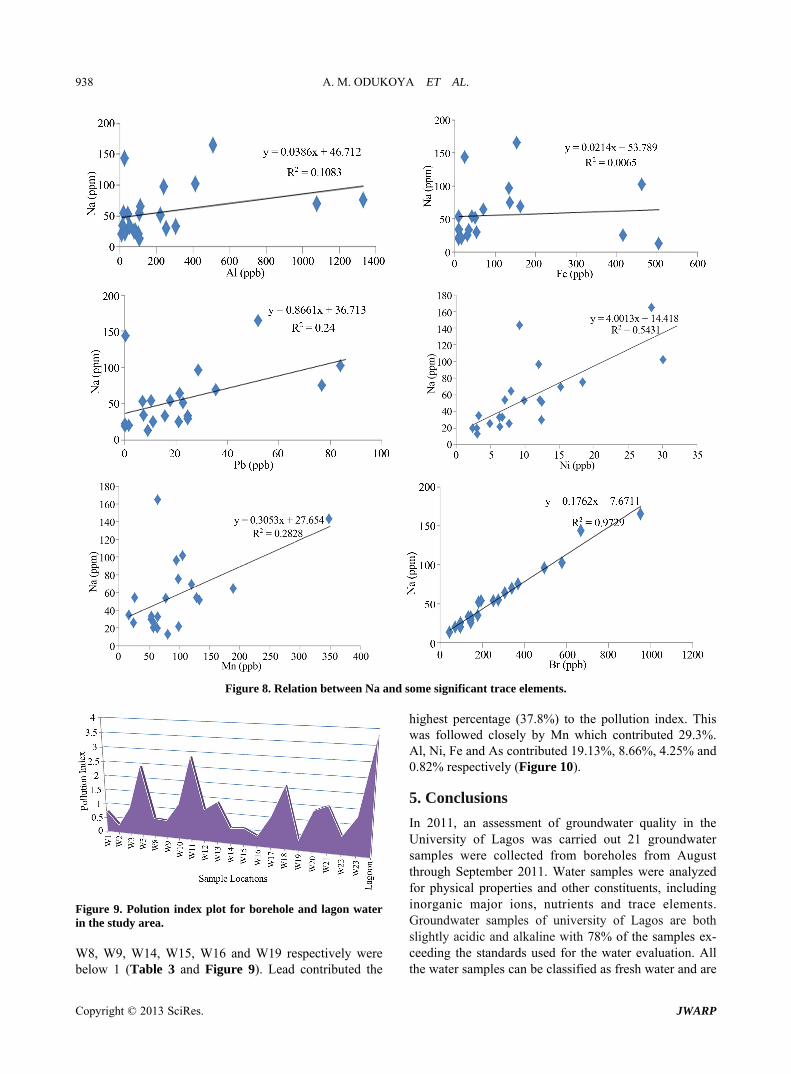
Na showed very weak correlation with Al, Fe, Pb, Ni, Mn and very strong correlation with Br which are sig- nificant trace elements in the water samples (Figure 8). This indicates possible anthropogenic sources for all the significant trace elements except Br which could be geo- genic.
4.5. Pollution Index (PI)
The pollution index was used in this study to evaluate the degree of trace metal contamination in water samples [25-30]. The tolerable level is the element concentration in the water considered safe for human consumption [31,32]. The [10] were used as tolerable level for water and the pollution index can be calculated by the formulae below;
PI = (Heavy metal concentration in water/Tolerable Level)/Number of Heavy metals.
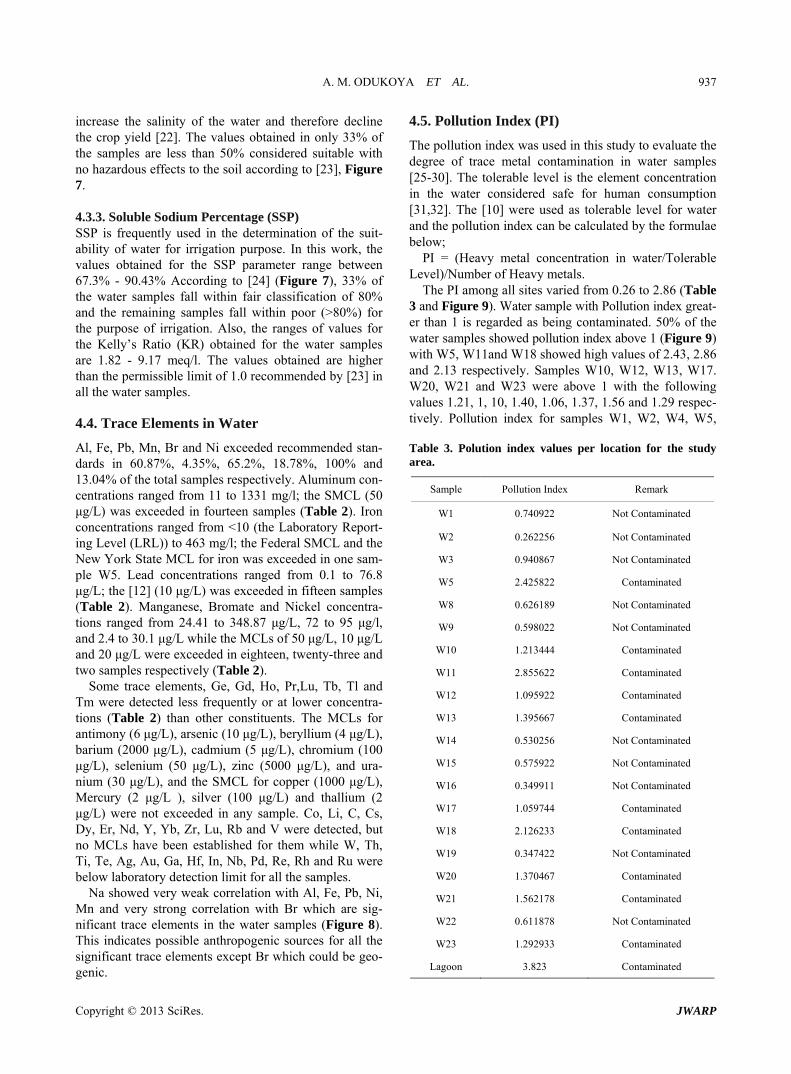
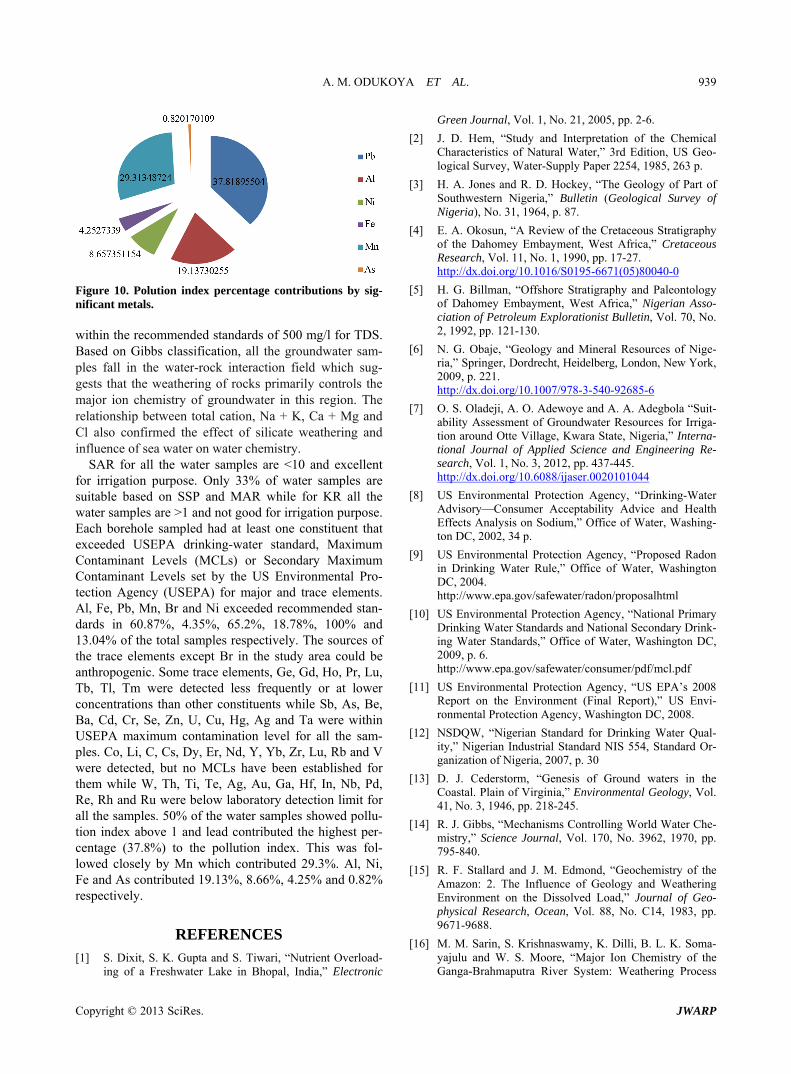
The PI among all sites varied from 0.26 to 2.86 (Table 3 and Figure 9). Water sample with Pollution index great- er than 1 is regarded as being contaminated. 50% of the water samples showed pollution index above 1 (Figure 9) with W5, W11and W18 showed high values of 2.43, 2.86 and 2.13 respectively. Samples W10, W12, W13, W17. W20, W21 and W23 were above 1 with the following values 1.21, 1, 10, 1.40, 1.06, 1.37, 1.56 and 1.29 respec- tively. Pollution index for samples W1, W2, W4, W5, Table 3. Polution index values per location for the study area.
Sample Pollution Index Remark
W1 0.740922 Not Contaminated
W2 0.262256 Not Contaminated
W3 0.940867 Not Contaminated
W5 2.425822 Contaminated
W8 0.626189 Not Contaminated
W9 0.598022 Not Contaminated
W10 1.213444 Contaminated
W11 2.855622 Contaminated
W12 1.095922 Contaminated
W13 1.395667 Contaminated
W14 0.530256 Not Contaminated
W15 0.575922 Not Contaminated
W16 0.349911 Not Contaminated
W17 1.059744 Contaminated
W18 2.126233 Contaminated
W19 0.347422 Not Contaminated
W20 1.370467 Contaminated
W21 1.562178 Contaminated
W22 0.611878 Not Contaminated
W23 1.292933 Contaminated
Lagoon 3.823 Contaminated
Copyright © 2013 SciRes. JWARP
A. M. ODUKOYA ET AL.
Copyright © 2013 SciRes. JWARP
938
Figure 8. Relation between Na and some significant trace elements.
Figure 9. Polution index plot for borehole and lagon water in the study area. W8, W9, W14, W15, W16 and W19 respectively were below 1 (Table 3 and Figure 9). Lead contributed the
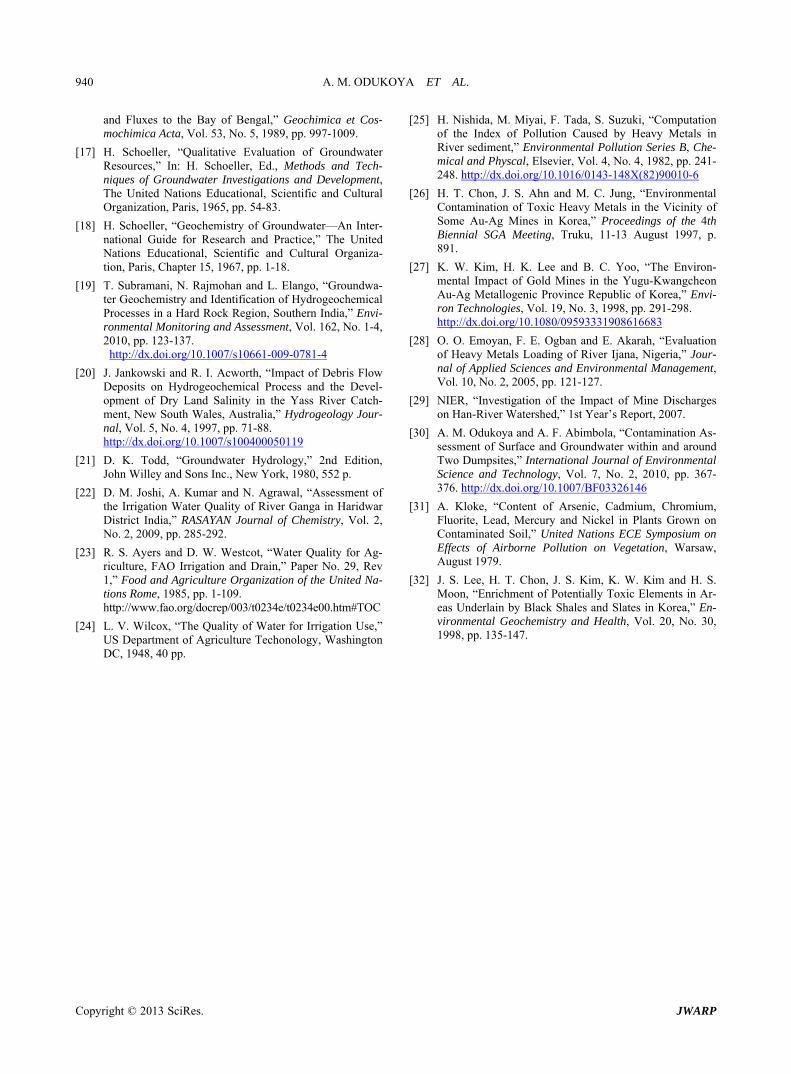
highest percentage (37.8%) to the pollution index. This was followed closely by Mn which contributed 29.3%. Al, Ni, Fe and As contributed 19.13%, 8.66%, 4.25% and 0.82% respectively (Figure 10).
5. Conclusions
In 2011, an assessment of groundwater quality in the University of Lagos was carried out 21 groundwater samples were collected from boreholes from August through September 2011. Water samples were analyzed for physical properties and other constituents, including inorganic major ions, nutrients and trace elements. Groundwater samples of university of Lagos are both slightly acidic and alkaline with 78% of the samples ex- ceeding the standards used for the water evaluation. All the water samples can be classified as fresh water and are
A. M. ODUKOYA ET AL. 939
Figure 10. Polution index percentage contributions by sig- nificant metals. within the recommended standards of 500 mg/l for TDS. Based on Gibbs classification, all the groundwater sam- ples fall in the water-rock interaction field which sug- gests that the weathering of rocks primarily controls the major ion chemistry of groundwater in this region. The relationship between total cation, Na + K, Ca + Mg and Cl also confirmed the effect of silicate weathering and influence of sea water on water chemistry.
SAR for all the water samples are <10 and excellent for irrigation purpose. Only 33% of water samples are suitable based on SSP and MAR while for KR all the water samples are >1 and not good for irrigation purpose. Each borehole sampled had at least one constituent that exceeded USEPA drinking-water standard, Maximum Contaminant Levels (MCLs) or Secondary Maximum Contaminant Levels set by the US Environmental Pro- tection Agency (USEPA) for major and trace elements. Al, Fe, Pb, Mn, Br and Ni exceeded recommended stan- dards in 60.87%, 4.35%, 65.2%, 18.78%, 100% and 13.04% of the total samples respectively. The sources of the trace elements except Br in the study area could be anthropogenic. Some trace elements, Ge, Gd, Ho, Pr, Lu, Tb, Tl, Tm were detected less frequently or at lower concentrations than other constituents while Sb, As, Be, Ba, Cd, Cr, Se, Zn, U, Cu, Hg, Ag and Ta were within USEPA maximum contamination level for all the sam- ples. Co, Li, C, Cs, Dy, Er, Nd, Y, Yb, Zr, Lu, Rb and V were detected, but no MCLs have been established for them while W, Th, Ti, Te, Ag, Au, Ga, Hf, In, Nb, Pd, Re, Rh and Ru were below laboratory detection limit for all the samples. 50% of the water samples showed pollu- tion index above 1 and lead contributed the highest per- centage (37.8%) to the pollution index. This was fol- lowed closely by Mn which contributed 29.3%. Al, Ni, Fe and As contributed 19.13%, 8.66%, 4.25% and 0.82% respectively.
REFERENCES [1] S. Dixit, S. K. Gupta and S. Tiwari, “Nutrient Overload-
ing of a Freshwater Lake in Bhopal, India,” Electronic
Green Journal, Vol. 1, No. 21, 2005, pp. 2-6.
[2] J. D. Hem, “Study and Interpretation of the Chemical Characteristics of Natural Water,” 3rd Edition, US Geo- logical Survey, Water-Supply Paper 2254, 1985, 263 p.
[3] H. A. Jones and R. D. Hockey, “The Geology of Part of Southwestern Nigeria,” Bulletin (Geological Survey of Nigeria), No. 31, 1964, p. 87.
[4] E. A. Okosun, “A Review of the Cretaceous Stratigraphy of the Dahomey Embayment, West Africa,” Cretaceous Research, Vol. 11, No. 1, 1990, pp. 17-27. http://dx.doi.org/10.1016/S0195-6671(05)80040-0
[5] H. G. Billman, “Offshore Stratigraphy and Paleontology of Dahomey Embayment, West Africa,” Nigerian Asso- ciation of Petroleum Explorationist Bulletin, Vol. 70, No. 2, 1992, pp. 121-130.
[6] N. G. Obaje, “Geology and Mineral Resources of Nige- ria,” Springer, Dordrecht, Heidelberg, London, New York, 2009, p. 221. http://dx.doi.org/10.1007/978-3-540-92685-6
[7] O. S. Oladeji, A. O. Adewoye and A. A. Adegbola “Suit- ability Assessment of Groundwater Resources for Irriga- tion around Otte Village, Kwara State, Nigeria,” Interna- tional Journal of Applied Science and Engineering Re- search, Vol. 1, No. 3, 2012, pp. 437-445. http://dx.doi.org/10.6088/ijaser.0020101044
[8] US Environmental Protection Agency, “Drinking-Water Advisory—Consumer Acceptability Advice and Health Effects Analysis on Sodium,” Office of Water, Washing- ton DC, 2002, 34 p.
[9] US Environmental Protection Agency, “Proposed Radon in Drinking Water Rule,” Office of Water, Washington DC, 2004. http://www.epa.gov/safewater/radon/proposalhtml
[10] US Environmental Protection Agency, “National Primary Drinking Water Standards and National Secondary Drink- ing Water Standards,” Office of Water, Washington DC, 2009, p. 6. http://www.epa.gov/safewater/consumer/pdf/mcl.pdf
[11] US Environmental Protection Agency, “US EPA’s 2008 Report on the Environment (Final Report),” US Envi- ronmental Protection Agency, Washington DC, 2008.
[12] NSDQW, “Nigerian Standard for Drinking Water Qual- ity,” Nigerian Industrial Standard NIS 554, Standard Or-ganization of Nigeria, 2007, p. 30
[13] D. J. Cederstorm, “Genesis of Ground waters in the Coastal. Plain of Virginia,” Environmental Geology, Vol. 41, No. 3, 1946, pp. 218-245.
[14] R. J. Gibbs, “Mechanisms Controlling World Water Che- mistry,” Science Journal, Vol. 170, No. 3962, 1970, pp. 795-840.
[15] R. F. Stallard and J. M. Edmond, “Geochemistry of the Amazon: 2. The Influence of Geology and Weathering Environment on the Dissolved Load,” Journal of Geo- physical Research, Ocean, Vol. 88, No. C14, 1983, pp. 9671-9688.
[16] M. M. Sarin, S. Krishnaswamy, K. Dilli, B. L. K. Soma- yajulu and W. S. Moore, “Major Ion Chemistry of the Ganga-Brahmaputra River System: Weathering Process
Copyright © 2013 SciRes. JWARP
A. M. ODUKOYA ET AL.
Copyright © 2013 SciRes. JWARP
940
and Fluxes to the Bay of Bengal,” Geochimica et Cos- mochimica Acta, Vol. 53, No. 5, 1989, pp. 997-1009.
[17] H. Schoeller, “Qualitative Evaluation of Groundwater Resources,” In: H. Schoeller, Ed., Methods and Tech- niques of Groundwater Investigations and Development, The United Nations Educational, Scientific and Cultural Organization, Paris, 1965, pp. 54-83.
[18] H. Schoeller, “Geochemistry of Groundwater—An Inter- national Guide for Research and Practice,” The United Nations Educational, Scientific and Cultural Organiza- tion, Paris, Chapter 15, 1967, pp. 1-18.
[19] T. Subramani, N. Rajmohan and L. Elango, “Groundwa- ter Geochemistry and Identification of Hydrogeochemical Processes in a Hard Rock Region, Southern India,” Envi- ronmental Monitoring and Assessment, Vol. 162, No. 1-4, 2010, pp. 123-137. http://dx.doi.org/10.1007/s10661-009-0781-4
[20] J. Jankowski and R. I. Acworth, “Impact of Debris Flow Deposits on Hydrogeochemical Process and the Devel- opment of Dry Land Salinity in the Yass River Catch- ment, New South Wales, Australia,” Hydrogeology Jour- nal, Vol. 5, No. 4, 1997, pp. 71-88. http://dx.doi.org/10.1007/s100400050119
[21] D. K. Todd, “Groundwater Hydrology,” 2nd Edition, John Willey and Sons Inc., New York, 1980, 552 p.
[22] D. M. Joshi, A. Kumar and N. Agrawal, “Assessment of the Irrigation Water Quality of River Ganga in Haridwar District India,” RASAYAN Journal of Chemistry, Vol. 2, No. 2, 2009, pp. 285-292.
[23] R. S. Ayers and D. W. Westcot, “Water Quality for Ag- riculture, FAO Irrigation and Drain,” Paper No. 29, Rev 1,” Food and Agriculture Organization of the United Na- tions Rome, 1985, pp. 1-109. http://www.fao.org/docrep/003/t0234e/t0234e00.htm#TOC
[24] L. V. Wilcox, “The Quality of Water for Irrigation Use,” US Department of Agriculture Techonology, Washington DC, 1948, 40 pp.
[25] H. Nishida, M. Miyai, F. Tada, S. Suzuki, “Computation of the Index of Pollution Caused by Heavy Metals in River sediment,” Environmental Pollution Series B, Che- mical and Physcal, Elsevier, Vol. 4, No. 4, 1982, pp. 241- 248. http://dx.doi.org/10.1016/0143-148X(82)90010-6
[26] H. T. Chon, J. S. Ahn and M. C. Jung, “Environmental Contamination of Toxic Heavy Metals in the Vicinity of Some Au-Ag Mines in Korea,” Proceedings of the 4th Biennial SGA Meeting, Truku, 11-13 August 1997, p. 891.
[27] K. W. Kim, H. K. Lee and B. C. Yoo, “The Environ- mental Impact of Gold Mines in the Yugu-Kwangcheon Au-Ag Metallogenic Province Republic of Korea,” Envi- ron Technologies, Vol. 19, No. 3, 1998, pp. 291-298. http://dx.doi.org/10.1080/09593331908616683
[28] O. O. Emoyan, F. E. Ogban and E. Akarah, “Evaluation of Heavy Metals Loading of River Ijana, Nigeria,” Jour- nal of Applied Sciences and Environmental Management, Vol. 10, No. 2, 2005, pp. 121-127.
[29] NIER, “Investigation of the Impact of Mine Discharges on Han-River Watershed,” 1st Year’s Report, 2007.
[30] A. M. Odukoya and A. F. Abimbola, “Contamination As- sessment of Surface and Groundwater within and around Two Dumpsites,” International Journal of Environmental Science and Technology, Vol. 7, No. 2, 2010, pp. 367- 376. http://dx.doi.org/10.1007/BF03326146
[31] A. Kloke, “Content of Arsenic, Cadmium, Chromium, Fluorite, Lead, Mercury and Nickel in Plants Grown on Contaminated Soil,” United Nations ECE Symposium on Effects of Airborne Pollution on Vegetation, Warsaw, August 1979.
[32] J. S. Lee, H. T. Chon, J. S. Kim, K. W. Kim and H. S. Moon, “Enrichment of Potentially Toxic Elements in Ar- eas Underlain by Black Shales and Slates in Korea,” En- vironmental Geochemistry and Health, Vol. 20, No. 30, 1998, pp. 135-147.


