Embed Size (px)
Citation preview
LAGOS STATE SCHOOL CENSUS REPORT
Y2014-2015
Ministry of Education
PRODUCED BY
State Education Management Information System (EMIS) Committee
Lagos State School Census Report 2014-2015
ii September 2015
Foreword
This Publication is designed to highlight the distinct features of all the Public and Private, Pre-
Primary, Primary, Junior, Senior Secondary and Technical Schools in the State. It is aimed at
providing information for planning, management and intervention purposes.
The Education Sector has continued to enjoy the support of the technical partner; Education
Sector Support Programme in Nigeria (ESSPIN) in the area of capacity development on the
processing of school data. The Y2014/2015 Annual School Census (ASC) Report is considered
different from the last edition with the inclusion of Private School data.
This report is a practical demonstration of the commitment of the administration to continuous
improvement of the education system. The process of data gathering commenced in March
Y2015 and was ready few months afterwards in preparatory to its being fed into Y2014 Annual
Education Sector Performance Report (AESPR) and Y2016 -2018 Medium Term Sector
Strategy (MTSS).
A major challenge experienced during the exercise was the initial difficulty in securing full
cooperation of Private Schools thereby extending the period required for enumeration. However,
significant achievements were recorded with the full participation of all stakeholders particularly
in the Public Education Sector.
The School Census Report is hereby presented for planning, policy formulation and for the use
of all stakeholders.
Permanent Secretary, Ministry of Education.
September 2015.
Lagos State School Census Report 2014-2015
iii September 2015
Executive Summary
Effective planning of education in Lagos state requires dynamic data for meaningful decision
making process. The need for a continuous collection of quality, timely and reliable data for an
updated education database to generate required Management Information System cannot be
underestimated.
This Report presents main findings from the School Census carried out in the Y2014/2015
Academic Year. Hundred percent (100%) response rate is recorded in the public schools during
the current exercise as in the previous years.
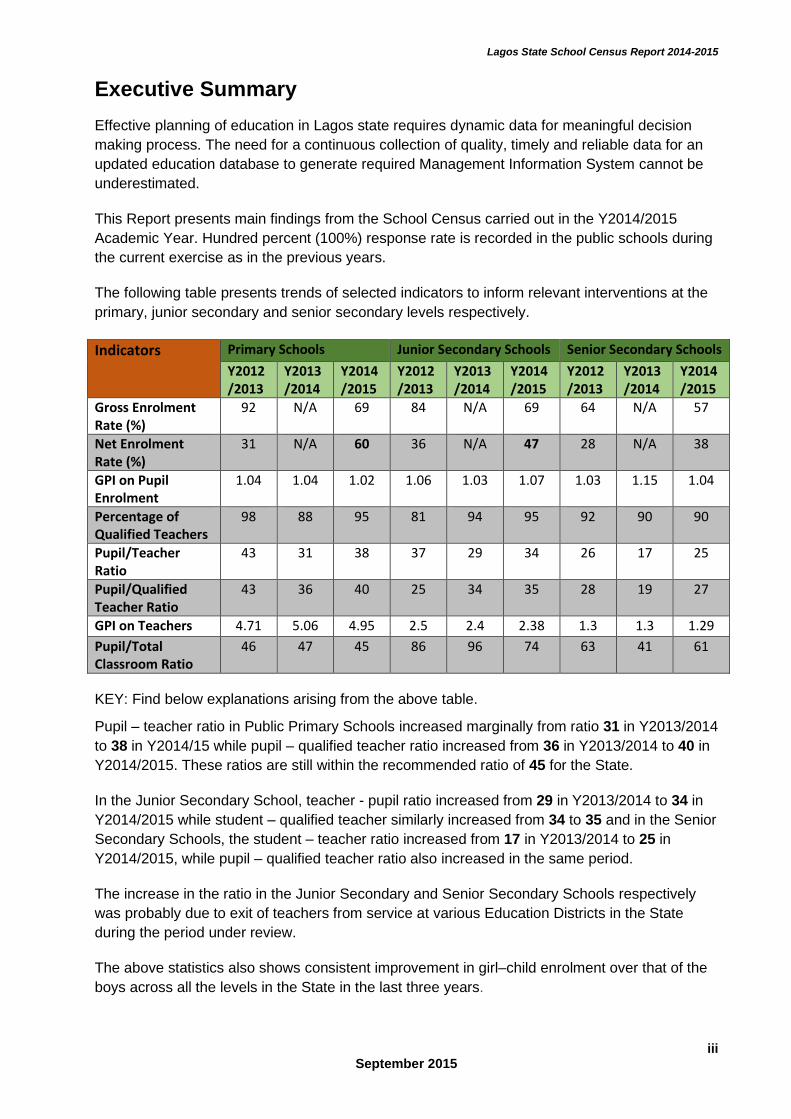
The following table presents trends of selected indicators to inform relevant interventions at the
primary, junior secondary and senior secondary levels respectively.
Indicators Primary Schools Junior Secondary Schools Senior Secondary Schools
Y2012/2013
Y2013/2014
Y2014/2015
Y2012/2013
Y2013/2014
Y2014/2015
Y2012/2013
Y2013/2014
Y2014/2015
Gross Enrolment Rate (%)
92 N/A 69 84 N/A 69 64 N/A 57
Net Enrolment Rate (%)
31 N/A 60 36 N/A 47 28 N/A 38
GPI on Pupil Enrolment
1.04 1.04 1.02 1.06 1.03 1.07 1.03 1.15 1.04
Percentage of Qualified Teachers
98 88 95 81 94 95 92 90 90
Pupil/Teacher Ratio
43 31 38 37 29 34 26 17 25
Pupil/Qualified Teacher Ratio
43 36 40 25 34 35 28 19 27
GPI on Teachers 4.71 5.06 4.95 2.5 2.4 2.38 1.3 1.3 1.29
Pupil/Total Classroom Ratio
46 47 45 86 96 74 63 41 61
KEY: Find below explanations arising from the above table.
Pupil – teacher ratio in Public Primary Schools increased marginally from ratio 31 in Y2013/2014
to 38 in Y2014/15 while pupil – qualified teacher ratio increased from 36 in Y2013/2014 to 40 in
Y2014/2015. These ratios are still within the recommended ratio of 45 for the State.
In the Junior Secondary School, teacher - pupil ratio increased from 29 in Y2013/2014 to 34 in
Y2014/2015 while student – qualified teacher similarly increased from 34 to 35 and in the Senior
Secondary Schools, the student – teacher ratio increased from 17 in Y2013/2014 to 25 in
Y2014/2015, while pupil – qualified teacher ratio also increased in the same period.
The increase in the ratio in the Junior Secondary and Senior Secondary Schools respectively
was probably due to exit of teachers from service at various Education Districts in the State
during the period under review.
The above statistics also shows consistent improvement in girl–child enrolment over that of the
boys across all the levels in the State in the last three years.
Lagos State School Census Report 2014-2015
iv September 2015
Table of Contents
Executive Summary iii
List of Tables v
List of Figures vii
Definitions viii
Abbreviations ix
1. Background 1
2. Schools 2
3. Students 5
4. Teachers 24
5. Facilities 29
6.0 Trend Analysis 38
Annex: Population projections by LGA 46
Lagos State School Census Report 2014-2015
v September 2015
List of Tables
Table 2.1 Number of Public and Private Schools 2
Table 2.2 Number of Private Schools 3
Table 2.3 Number of Schools, Teachers and Enrolment 3
Table 2.4 Selective characteristics of Public Schools 4
Table 2.5 Selective Characteristics of Public Schools by Level 4
Table 3.1 Enrolment in Public Pre-Primary Education by LGA 5
Table 3.2 Enrolment in Private Pre-primary Education by Level, Gender and LGA 6
Table 3.3 Public and private pre-primary school enrolment by gender and LGA 6
Table 3.4a Enrolment in Public Primary School by Level, Gender and LGA (Class 1-3) 8
Table 3.4b Enrolment in Public Primary School by Level, Gender and LGA (Class 4-6) 8
Table 3.5a Enrolment in Private Primary School by Level, Gender and LGA (Primary 1-3) 9
Table 3.5b Enrolment in Private Primary School by Level, Gender and LGA (Primary 4-6) 9
Table 3.6 Summary of Public and Private Primary School Enrolment by Gender and LGA 10
Table 3.7a Public primary school Gross and Net enrolment by Gender and LGA 11
Table 3.7b Private primary school Gross and Net enrolments by Gender and LGA 12
Table 3.7c Total Public and Private primary school Gross and Net enrolment by gender and LGA 12
Table 3.8 Enrolment in Public Junior Secondary School by Level, Gender and LGA 13
Table 3.9 Enrolment in Private Junior Secondary School by Level, Gender and LGA 13
Table 3.10 Summary of Public and Private Junior Secondary School Enrolment by Gender and LGA 14
Table 3.11a Public Junior Secondary School Gross and Net Enrolments by Gender and LGA 15
Table 3.11b Private Junior Secondary School Gross and Net Enrolments by Gender and LGA 15
Table 3.11c Total Public and Private Junior Secondary School Gross and Net Enrolments by Gender and LGA 16
Table 3.12 Enrolment in Public Senior Secondary Schools by Level, Gender, and LGA 17
Table 3.13 Enrolment in Private Senior Secondary School by Level, Gender and LGA 17
Table 3.14 Summary of Public and Private Senior Secondary School Enrolment by Gender and LGA 18
Table 3.15a Public Senior Secondary School Gross and Net Enrolments by Gender and LGA 18
Table 3.15b Private Senior Secondary School Gross and Net Enrolments by Gender and LGA 19
Table 3.15c Total Public and Private Senior Secondary School Gross and Net Enrolment by Gender and LGA 19
Table 3.16 Enrolment of Special needs children in Public Primary Schools 21
Table 3.17 Enrolment of Special needs children in Public Secondary Schools 21
Table 3.18 Repeaters in Public Primary Schools by LGA, Class and Gender 21
Table 3.19 Repeaters in Public JSS and SSS Schools by LGA, Class and Gender 22
Table 3.20 Enrolment in Public Primary with Pre-primary Education, by Gender and LGA 22
Lagos State School Census Report 2014-2015
vi September 2015
Table 3.21 Total Pre-primary School Enrolment by Gender and LGA including Private Schools 23
Table 4.1 Number of Public Pre-primary School Teachers by Gender and LGA 24
Table 4.2 Number of Public Primary School Teachers by gender and LGA 24
Table 4.3 Pupil-Teacher Ratio by LGA, Public Primary 25
Table 4.4 Number of public junior secondary school teachers by gender and LGA 25
Table 4.5 Student-Teacher Ratio by LGA, Public Junior Secondary School 26
Table 4.6 Number of public senior secondary school teachers by gender and LGA 26
Table 4.7 Student-Teacher Ratio by LGA, Public Senior Secondary School 27
Table 4.8 Number of private school teachers by gender and LGA, (All Levels) 27
Table 4.9 Pupil-teacher ratio in private schools by LGA, (All Levels) 28
Table 4.10 Percentage of long-term absent teachers (Public Only) 28
Table 5.1 Number of classrooms by school type and LGA 29
Table 5.2 Pupil/Student-Classroom ratio by School type, sector and LGA 29
Table 5.3 Characteristics of Public Pre-Primary and Primary schools with various needs 30
Table 5.4 Characteristics of Public Junior Secondary Schools with various needs 31
Table 5.5 Characteristics of Public Senior Secondary Schools with various needs 32
Table 5.6 Main source of safe water in Public Primary Schools (Percentage) 33
Table 5.7 Main source of safe water in public Junior Secondary schools (Percentage) 34
Table 5.8: Main source of Safe water in Public Senior Secondary Schools (Percentage) 35
Table 5.9: Toilets in public primary schools 36
Table 5.10: Toilets in public Junior Secondary schools 36
Table 5.11: Toilets in public Senior Secondary schools 37
Table 6.1: Trend Analysis of Schools Enrolment and Teachers Population of Public Pre-Primary and Primary School Pupils in Lagos State. 38
Table 6.2: Trend Analysis of Schools Enrolment and Teachers Population of Public Junior Secondary School Students in Lagos State. 38
Table 6.3: Trend Analysis of Schools Enrolment and Teachers Population in Lagos State Public Senior Secondary Schools 39
Table 6.4: Trend Analysis of Pupils Enrolment (2010/2011 – 2014/2015 Session) in Public Pre- Primary and Primary Schools 39
Table 6.5: Number of Pre Primary and Primary School Teachers from Year 2010/2011 to 2014/2015 Session 40
Table 6.6: Trend Analysis of Pupils Enrolment (2010/2011 – 2013/2014 Session) in Public Junior Secondary Schools 41
Table 6.7: Number of Junior Secondary School Teachers from 2010/2011 to 2014/2015 academic Session 42
Table 6.8: Trend Analysis of Students Enrolment (2010/2011 – 2014/2015 Session) in Public Senior Secondary Schools 42
Table 6.9: Number of Public Senior Secondary School Teachers from 2010/2011 to 2014/2015 academic Session 43
Table 6.10: Trend Analysis of Number of Primary, Junior Secondary and Senior Secondary Schools Y2010/2011 to 2014/2015 Academic Session 44
Lagos State School Census Report 2014-2015
vii September 2015
List of Figures
Figure 2.1a Proportion of Schools by Level 2
Figure 2.1b. Enrolment in Private and Public Schools 3
Figure 3.1: Public and private pre-primary enrolment 7
Figure 3.2: Total public and private pre-primary enrolment 7
Figure 3.3: Public and private primary pupils’ enrolment 11
Figure 3.4: Total public and private primary school enrolment by LGA 11
Figure 3.5: Public and private schools enrolment by LGA 14
Figure 3.6: Total public and private junior secondary schools enrolment 16
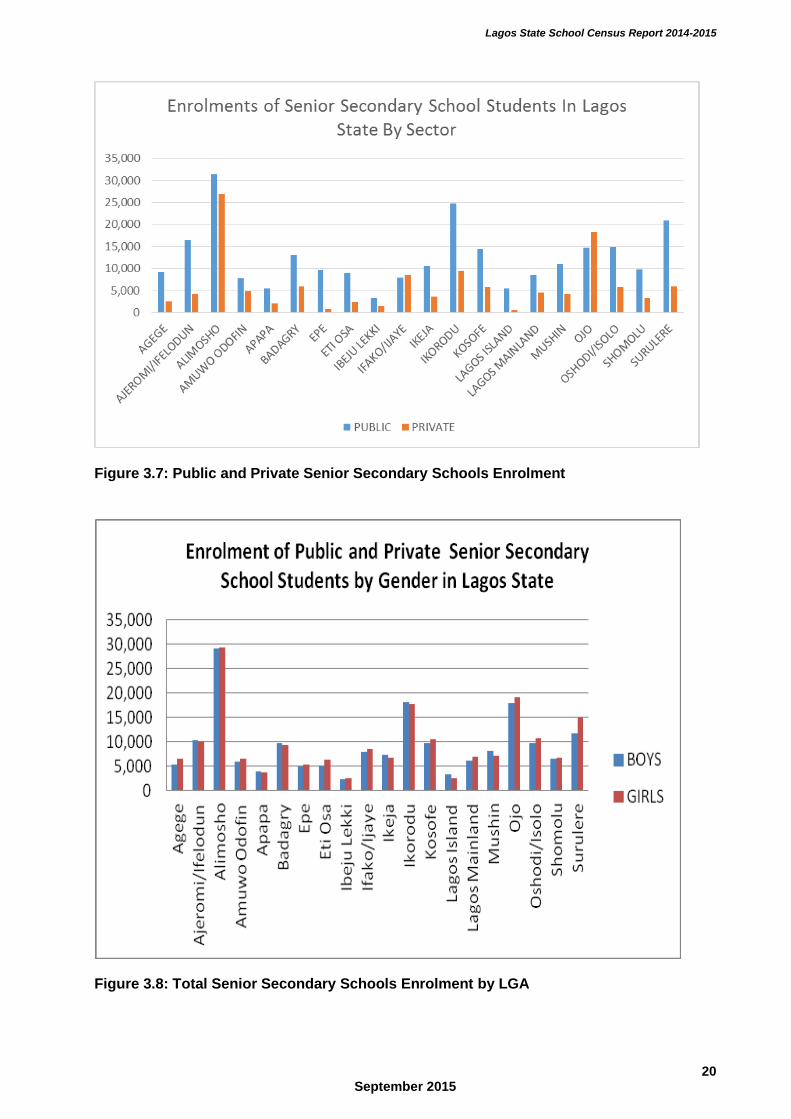
Figure 3.7: Public and private senior secondary schools enrolment 20
Figure 3.8: Total senior secondary schools enrolment by LGA 20
Fig 6.1: Trend Analysis of Pupils Enrolment (2010/2011 – 2014/2015 Session) in Public Pre- Primary and Primary Schools 39
Fig 6.2: Trend Analysis of Teachers (2010/2011 – 2014/2015 Session) in Public Pre- Primary and Primary Schools 40
Fig 6.3: Trend Analysis of JSS Students’ Enrolment rate from Year 2010/2011 to 2013/2014 session 41
Figure 6.4: Public junior secondary schools teacher 42
Figure 6.5: Trend Analysis of SSS Students’ Enrolment from 2010/2011 to 2013/2015 academic session 43
Figure 6.6: Trend Analysis of Number of SSS Teachers’ from Year 2010/2011 to 2014/2015 session 44
Fig 6.7: Trend Analysis of Number of Primary, Junior and Senior Secondary Schools From 2010/2011 to 2013/2014 academic sessions 45
Lagos State School Census Report 2014-2015
viii September 2015
Definitions
Dropout rate by grade: Proportion of pupils from a cohort enrolled in a given grade in a given school year who are no longer enrolled in the following school year. This indicator is used to measure the phenomenon of pupils from a cohort leaving school without completion, and its effect on the internal efficiency of educational systems. In addition, it is one of the key indicators for analysing and projecting pupil flows from grade to grade within the educational cycle. Gross enrolment rate: Total enrolment in primary education, regardless of age, expressed as a percentage of the eligible official school-age population (6-11 years in Nigeria). This shows the general level of participation in primary education. It also indicates the capacity of the education system to enrol students of that age group. It can also be a complementary indicator to net enrolment rate by indicating the extent of over-aged and under-aged enrolment. Gross intake rate: Total number of new entrants in the first grade of primary education, regardless of age, expressed as a percentage of the population at the official primary school-entrance age (6 years in Nigeria).This indicates the general level of access to primary education. It also indicates the capacity of the education system to provide access to grade 1 for the official school-entrance age population. Gender Parity Index (GPI): Is the socio economic index usually designed to measure the relative access to education of males and females. It is calculated as the quotient of the number of females by the number of males enrolled in given stage of education. Net enrolment rate: Enrolment of the official age group for primary education (6-11 years in Nigeria) expressed as a percentage of the corresponding population. This shows the extent of coverage in a given level of education for children and youths belonging to the official school age group. Pupil-teacher ratio: Average number of pupils (students) per teacher at a specific level of education in a given school year. This indicator is used to measure the level of human resources input in terms of the number of teachers in relation to the pupil population. The results can be compared with established national norms on the number of pupils per teacher. Repetition rate by grade: Proportion of pupils from a cohort enrolled in a given grade at given school years who study in the same grade in the following school year. This measures the rate at which pupils from a cohort repeat a grade, and its effect on the internal efficiency of educational systems. In addition, it is one of the key indicators for analysing and projecting pupil flows from grade to grade within the educational cycle. Source: UNESCO Institute of Statistics, Education Indicators, Technical Guidelines, November 2009
Lagos State School Census Report 2014-2015
ix September 2015
Abbreviations
ASC Annual School Census
EMIS Education Management Information System
GER Gross Enrolment Rate
GIR Gross Intake Ratio
GPI Gender Parity Index
ISD Integrated School Development
NER Net Enrolment Rate
SBMC School-Based Management Committee
SMOE State Ministry of Education
SUBEB State Universal Basic Education Board
PQTR Pupil Qualified Teacher Ratio
PTR Pupil Teacher Ratio
PCR Pupil Classroom Ratio
Lagos State School Census Report 2014-2015
1 September 2015
1. Background
The National Educational Management Information System (NEMIS) Policy, which was approved by the 54th National Council on Education meeting in Katsina in December 2007, envisaged the decentralisation of the system in 2009: “different states are now required to set up, staff and furnish Education Management Information Systems for their respective States”. The Policy document determines some coordination principles (in terms of organisation, operations and the transition period). These are further explained in the Implementation Guidelines for the NEMIS Policy that was disseminated in August 2009.
The National EMIS Committee convened in August 2009, approved the Annual School Census (ASC) Operational Manual, which is based on a census cycle that runs yearly from August to July. The Operational Manual includes guidance for every ASC phase and a timeline. Additionally, the National EMIS Committee also approved a simplified 8 - page ASC questionnaire for the public schools and an even shorter form for private schools. It was approved that the Education Sector Support Programme in Nigeria (ESSPIN) would provide new, simple and easy-to-use data entry software designed for the newly adopted questionnaires, which would be made available to ESSPIN supported States, and lastly, November of every year was selected as commencement of data collection.
This national meeting was followed up by the Lagos State EMIS Committee meeting, during which the Committee decided on major changes in the process of conducting the next Lagos State School Census. In Y2009, and subsequent school censuses, trained enumerators were used to fill in the forms in the presence of school Head Teachers, who supplied all the data and information needed. Field coordinators were trained to organise and oversee the work of enumerators, and ensure that forms were correctly and completely filled before being returned to the State Ministry of Education (SMoE) and State Universal Basic Education Board (SUBEB). Additionally, a Core EMIS Committee was instituted in the State, which was responsible for planning the census; meeting several times in the months leading up to the data collection. Members were also responsible for ensuring that enumerators and field coordinators carried out their duties.
Forms were returned on time to SMoE and SUBEB. Data Entry Officers in the EMIS Unit of the two Agencies were trained, data entry commenced and followed by data cleansing/ analysis. The effect of these was that the capacity of data entry officers and analysts has improved with the support of ESSPIN. However, there is still need for more of such capacity development exercises during the next ASC cycle. As a result of these efforts, State officers were able to accurately generate the tables in this report. The content of these tables were checked to ensure accuracy.
Essentially, this report presents an overview of Lagos State public school system in terms of socio-economic data. This is with the intention that the information will be used in planning across the education sector, and minimizes the need for collection of data by individual MDAs in the Sector. This report is reliable and is presented as a pride of Lagos State.
Lagos State School Census Report 2014-2015
2 September 2015
2. Schools
The Census commenced with the determination to get quality data that captured the true situation of variables in both Public and Private Schools. Every measure was adopted to ensure validity and reliability of the data presented. Table 2.1 Number of Public and Private Schools
Original school list
Public
Pre Primary and Primary *
Junior Secondary
Sci & Tech Schools
Senior Secondary
Private
1A. Responded 1,007 348 5 316
6,007
1B. Did not respond ** 0 0 0 0
6,091
1. Total 1,007 348 5 316
12,098
Response rate, original school list % 100% 100% 100% 100%
50%
New schools
2. Total 7 1
3
5,814
All schools
1A+2. Responded 1,014 349 5 319
11,820
1B. Did not respond ** - - - -
182
1A+1B+2. Total 1,014 349 5 319
12,002
Response rate, all schools (%) 100% 100% 100% 100%
66%
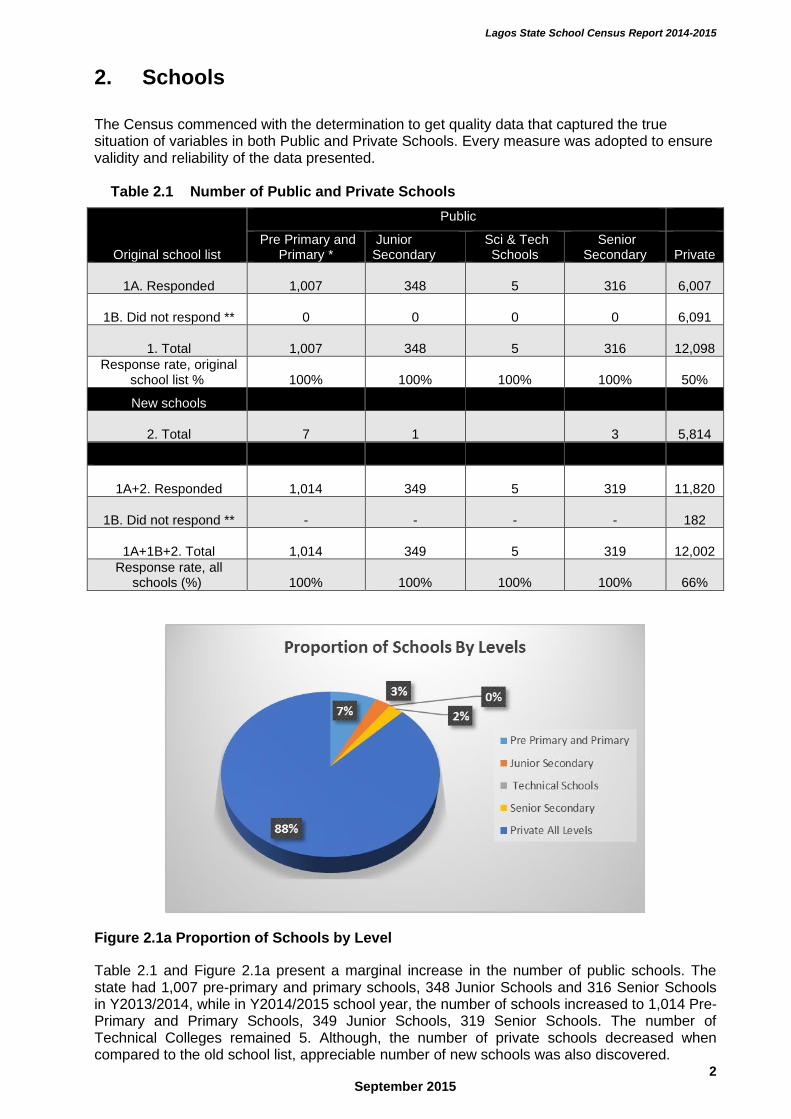
Figure 2.1a Proportion of Schools by Level
Table 2.1 and Figure 2.1a present a marginal increase in the number of public schools. The state had 1,007 pre-primary and primary schools, 348 Junior Schools and 316 Senior Schools in Y2013/2014, while in Y2014/2015 school year, the number of schools increased to 1,014 Pre-Primary and Primary Schools, 349 Junior Schools, 319 Senior Schools. The number of Technical Colleges remained 5. Although, the number of private schools decreased when compared to the old school list, appreciable number of new schools was also discovered.
Lagos State School Census Report 2014-2015
3 September 2015
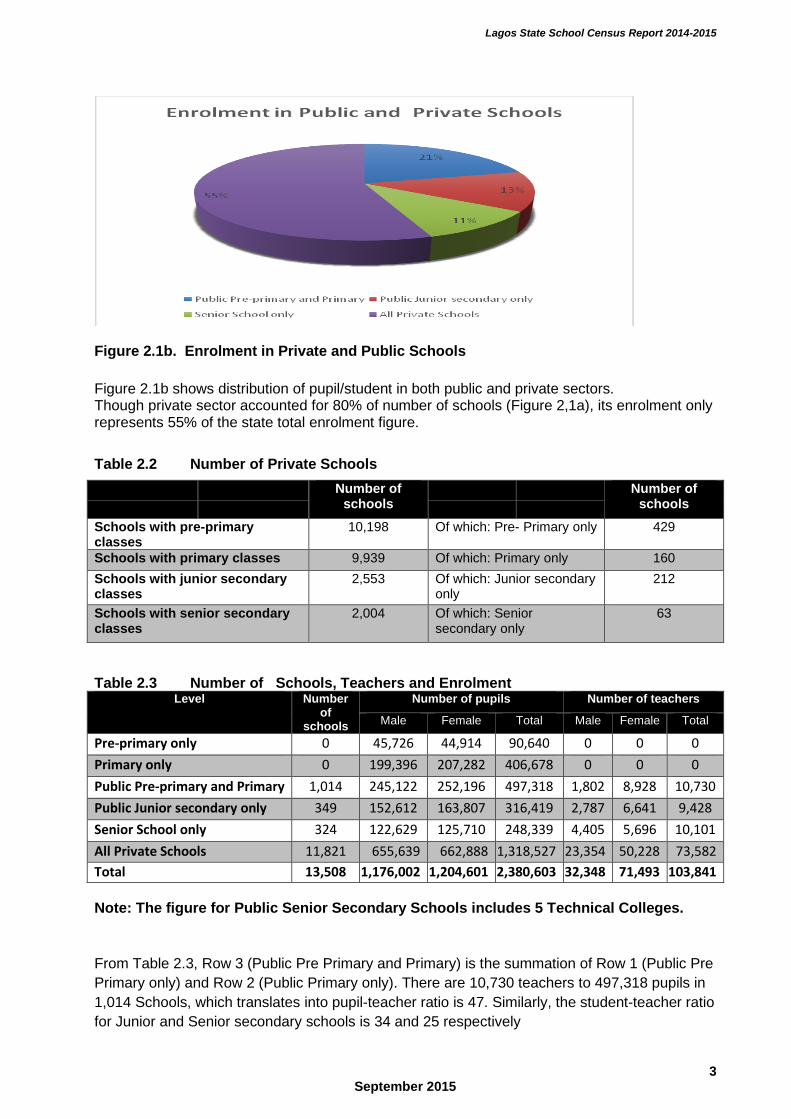
Figure 2.1b. Enrolment in Private and Public Schools
Figure 2.1b shows distribution of pupil/student in both public and private sectors. Though private sector accounted for 80% of number of schools (Figure 2,1a), its enrolment only represents 55% of the state total enrolment figure.
Table 2.2 Number of Private Schools
Number of schools
Number of
schools
Schools with pre-primary classes
10,198 Of which: Pre- Primary only 429
Schools with primary classes 9,939 Of which: Primary only 160
Schools with junior secondary classes
2,553 Of which: Junior secondary only
212
Schools with senior secondary classes
2,004 Of which: Senior secondary only
63
Table 2.3 Number of Schools, Teachers and Enrolment Level Number
of schools
Number of pupils Number of teachers
Male Female Total Male Female Total
Pre-primary only 0 45,726 44,914 90,640 0 0 0
Primary only 0 199,396 207,282 406,678 0 0 0
Public Pre-primary and Primary 1,014 245,122 252,196 497,318 1,802 8,928 10,730
Public Junior secondary only 349 152,612 163,807 316,419 2,787 6,641 9,428
Senior School only 324 122,629 125,710 248,339 4,405 5,696 10,101
All Private Schools 11,821 655,639 662,888 1,318,527 23,354 50,228 73,582
Total 13,508 1,176,002 1,204,601 2,380,603 32,348 71,493 103,841
Note: The figure for Public Senior Secondary Schools includes 5 Technical Colleges.
From Table 2.3, Row 3 (Public Pre Primary and Primary) is the summation of Row 1 (Public Pre
Primary only) and Row 2 (Public Primary only). There are 10,730 teachers to 497,318 pupils in
1,014 Schools, which translates into pupil-teacher ratio is 47. Similarly, the student-teacher ratio
for Junior and Senior secondary schools is 34 and 25 respectively
Lagos State School Census Report 2014-2015
4 September 2015
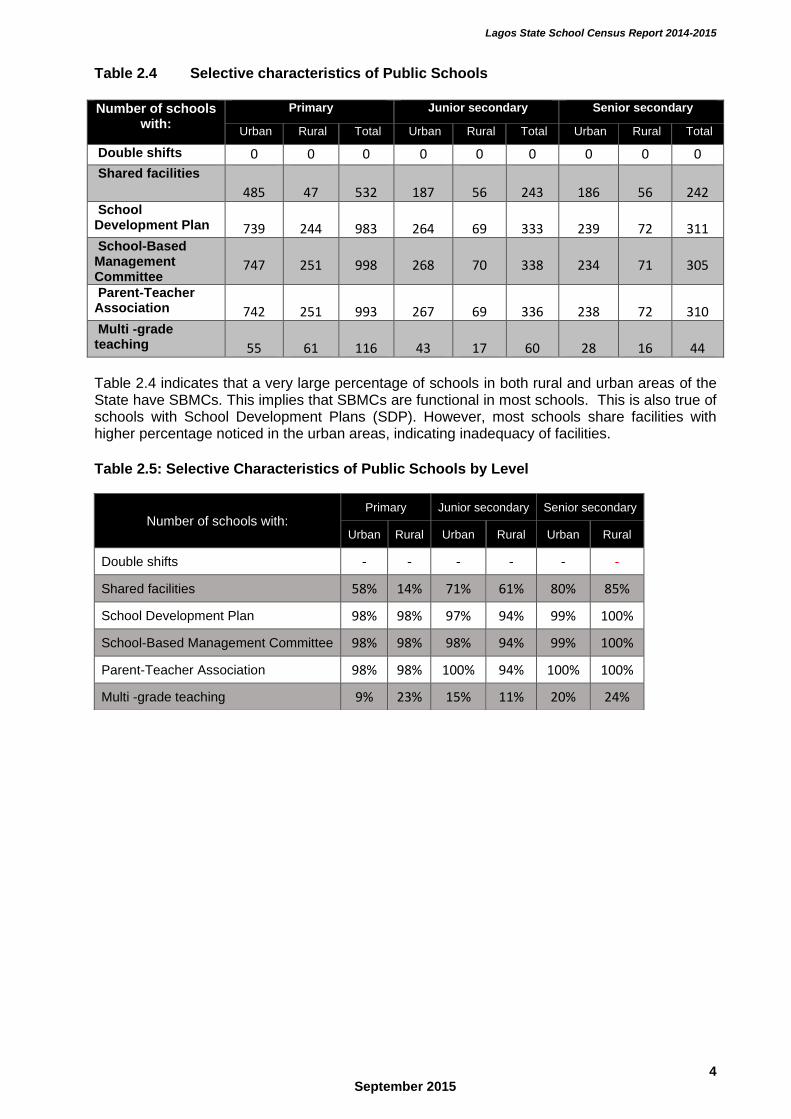
Table 2.4 Selective characteristics of Public Schools
Number of schools with:
Primary Junior secondary Senior secondary
Urban Rural Total Urban Rural Total Urban Rural Total
Double shifts 0 0 0 0 0 0 0 0 0
Shared facilities 485
47
532
187
56
243
186
56
242
School Development Plan
739
244
983
264
69
333
239
72
311
School-Based Management Committee
747
251
998
268
70
338
234
71
305
Parent-Teacher Association
742
251
993
267
69
336
238
72
310
Multi -grade teaching
55
61
116
43
17
60
28
16
44
Table 2.4 indicates that a very large percentage of schools in both rural and urban areas of the State have SBMCs. This implies that SBMCs are functional in most schools. This is also true of schools with School Development Plans (SDP). However, most schools share facilities with higher percentage noticed in the urban areas, indicating inadequacy of facilities.
Table 2.5: Selective Characteristics of Public Schools by Level
Number of schools with: Primary Junior secondary Senior secondary
Urban Rural Urban Rural Urban Rural
Double shifts - - - - - -
Shared facilities 58% 14% 71% 61% 80% 85%
School Development Plan 98% 98% 97% 94% 99% 100%
School-Based Management Committee 98% 98% 98% 94% 99% 100%
Parent-Teacher Association 98% 98% 100% 94% 100% 100%
Multi -grade teaching 9% 23% 15% 11% 20% 24%
Lagos State School Census Report 2014-2015
5 September 2015
3. Students
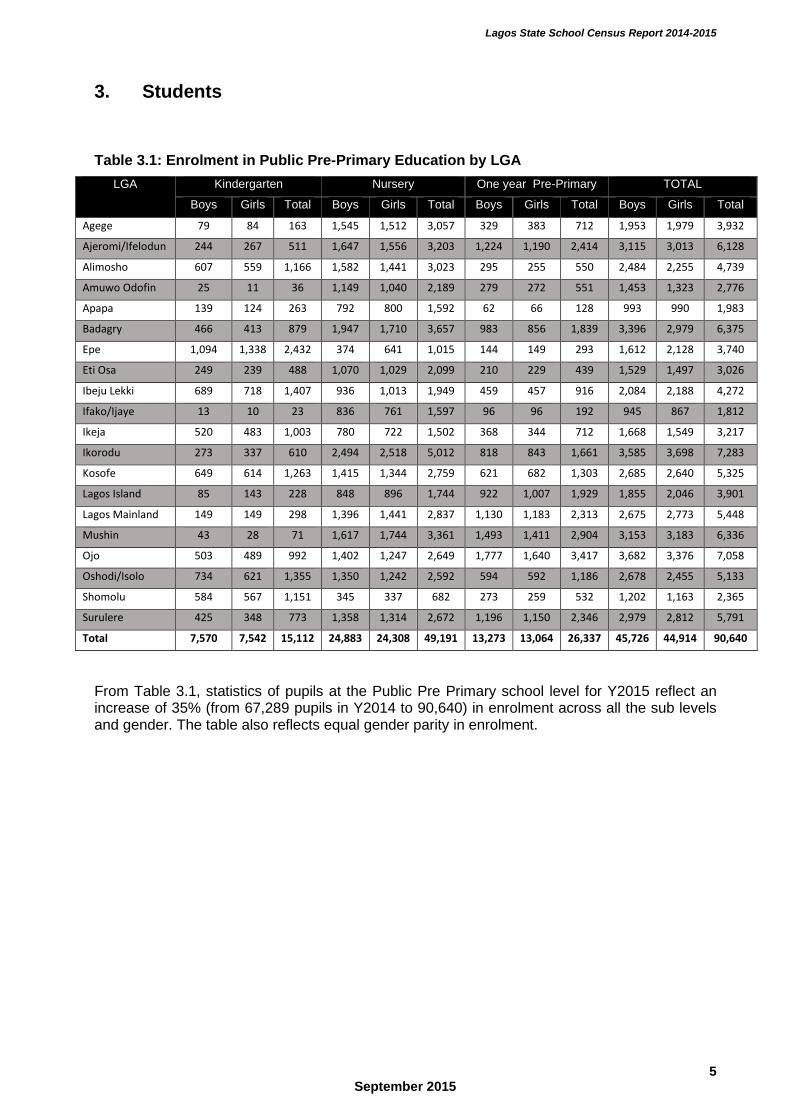
Table 3.1: Enrolment in Public Pre-Primary Education by LGA
LGA Kindergarten Nursery One year Pre-Primary TOTAL
Boys Girls Total Boys Girls Total Boys Girls Total Boys Girls Total
Agege 79 84 163 1,545 1,512 3,057 329 383 712 1,953 1,979 3,932
Ajeromi/Ifelodun 244 267 511 1,647 1,556 3,203 1,224 1,190 2,414 3,115 3,013 6,128
Alimosho 607 559 1,166 1,582 1,441 3,023 295 255 550 2,484 2,255 4,739
Amuwo Odofin 25 11 36 1,149 1,040 2,189 279 272 551 1,453 1,323 2,776
Apapa 139 124 263 792 800 1,592 62 66 128 993 990 1,983
Badagry 466 413 879 1,947 1,710 3,657 983 856 1,839 3,396 2,979 6,375
Epe 1,094 1,338 2,432 374 641 1,015 144 149 293 1,612 2,128 3,740
Eti Osa 249 239 488 1,070 1,029 2,099 210 229 439 1,529 1,497 3,026
Ibeju Lekki 689 718 1,407 936 1,013 1,949 459 457 916 2,084 2,188 4,272
Ifako/Ijaye 13 10 23 836 761 1,597 96 96 192 945 867 1,812
Ikeja 520 483 1,003 780 722 1,502 368 344 712 1,668 1,549 3,217
Ikorodu 273 337 610 2,494 2,518 5,012 818 843 1,661 3,585 3,698 7,283
Kosofe 649 614 1,263 1,415 1,344 2,759 621 682 1,303 2,685 2,640 5,325
Lagos Island 85 143 228 848 896 1,744 922 1,007 1,929 1,855 2,046 3,901
Lagos Mainland 149 149 298 1,396 1,441 2,837 1,130 1,183 2,313 2,675 2,773 5,448
Mushin 43 28 71 1,617 1,744 3,361 1,493 1,411 2,904 3,153 3,183 6,336
Ojo 503 489 992 1,402 1,247 2,649 1,777 1,640 3,417 3,682 3,376 7,058
Oshodi/Isolo 734 621 1,355 1,350 1,242 2,592 594 592 1,186 2,678 2,455 5,133
Shomolu 584 567 1,151 345 337 682 273 259 532 1,202 1,163 2,365
Surulere 425 348 773 1,358 1,314 2,672 1,196 1,150 2,346 2,979 2,812 5,791
Total 7,570 7,542 15,112 24,883 24,308 49,191 13,273 13,064 26,337 45,726 44,914 90,640
From Table 3.1, statistics of pupils at the Public Pre Primary school level for Y2015 reflect an increase of 35% (from 67,289 pupils in Y2014 to 90,640) in enrolment across all the sub levels and gender. The table also reflects equal gender parity in enrolment.
Lagos State School Census Report 2014-2015
6 September 2015
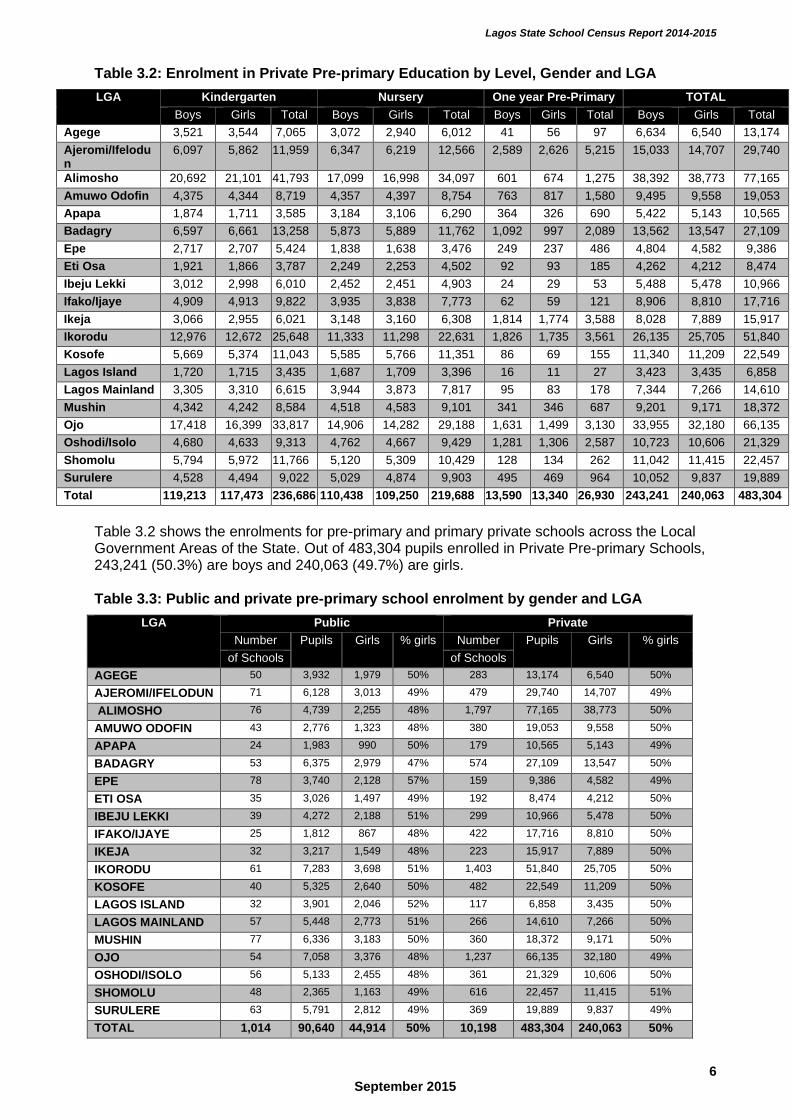
Table 3.2: Enrolment in Private Pre-primary Education by Level, Gender and LGA
LGA Kindergarten Nursery One year Pre-Primary TOTAL
Boys Girls Total Boys Girls Total Boys Girls Total Boys Girls Total
Agege 3,521 3,544 7,065 3,072 2,940 6,012 41 56 97 6,634 6,540 13,174
Ajeromi/Ifelodun
6,097 5,862 11,959 6,347 6,219 12,566 2,589 2,626 5,215 15,033 14,707 29,740
Alimosho 20,692 21,101 41,793 17,099 16,998 34,097 601 674 1,275 38,392 38,773 77,165
Amuwo Odofin 4,375 4,344 8,719 4,357 4,397 8,754 763 817 1,580 9,495 9,558 19,053
Apapa 1,874 1,711 3,585 3,184 3,106 6,290 364 326 690 5,422 5,143 10,565
Badagry 6,597 6,661 13,258 5,873 5,889 11,762 1,092 997 2,089 13,562 13,547 27,109
Epe 2,717 2,707 5,424 1,838 1,638 3,476 249 237 486 4,804 4,582 9,386
Eti Osa 1,921 1,866 3,787 2,249 2,253 4,502 92 93 185 4,262 4,212 8,474
Ibeju Lekki 3,012 2,998 6,010 2,452 2,451 4,903 24 29 53 5,488 5,478 10,966
Ifako/Ijaye 4,909 4,913 9,822 3,935 3,838 7,773 62 59 121 8,906 8,810 17,716
Ikeja 3,066 2,955 6,021 3,148 3,160 6,308 1,814 1,774 3,588 8,028 7,889 15,917
Ikorodu 12,976 12,672 25,648 11,333 11,298 22,631 1,826 1,735 3,561 26,135 25,705 51,840
Kosofe 5,669 5,374 11,043 5,585 5,766 11,351 86 69 155 11,340 11,209 22,549
Lagos Island 1,720 1,715 3,435 1,687 1,709 3,396 16 11 27 3,423 3,435 6,858
Lagos Mainland 3,305 3,310 6,615 3,944 3,873 7,817 95 83 178 7,344 7,266 14,610
Mushin 4,342 4,242 8,584 4,518 4,583 9,101 341 346 687 9,201 9,171 18,372
Ojo 17,418 16,399 33,817 14,906 14,282 29,188 1,631 1,499 3,130 33,955 32,180 66,135
Oshodi/Isolo 4,680 4,633 9,313 4,762 4,667 9,429 1,281 1,306 2,587 10,723 10,606 21,329
Shomolu 5,794 5,972 11,766 5,120 5,309 10,429 128 134 262 11,042 11,415 22,457
Surulere 4,528 4,494 9,022 5,029 4,874 9,903 495 469 964 10,052 9,837 19,889
Total 119,213 117,473 236,686 110,438 109,250 219,688 13,590 13,340 26,930 243,241 240,063 483,304
Table 3.2 shows the enrolments for pre-primary and primary private schools across the Local Government Areas of the State. Out of 483,304 pupils enrolled in Private Pre-primary Schools, 243,241 (50.3%) are boys and 240,063 (49.7%) are girls. Table 3.3: Public and private pre-primary school enrolment by gender and LGA
LGA Public Private
Number Pupils Girls % girls Number Pupils Girls % girls
of Schools of Schools
AGEGE 50 3,932 1,979 50% 283 13,174 6,540 50%
AJEROMI/IFELODUN 71 6,128 3,013 49% 479 29,740 14,707 49%
ALIMOSHO 76 4,739 2,255 48% 1,797 77,165 38,773 50%
AMUWO ODOFIN 43 2,776 1,323 48% 380 19,053 9,558 50%
APAPA 24 1,983 990 50% 179 10,565 5,143 49%
BADAGRY 53 6,375 2,979 47% 574 27,109 13,547 50%
EPE 78 3,740 2,128 57% 159 9,386 4,582 49%
ETI OSA 35 3,026 1,497 49% 192 8,474 4,212 50%
IBEJU LEKKI 39 4,272 2,188 51% 299 10,966 5,478 50%
IFAKO/IJAYE 25 1,812 867 48% 422 17,716 8,810 50%
IKEJA 32 3,217 1,549 48% 223 15,917 7,889 50%
IKORODU 61 7,283 3,698 51% 1,403 51,840 25,705 50%
KOSOFE 40 5,325 2,640 50% 482 22,549 11,209 50%
LAGOS ISLAND 32 3,901 2,046 52% 117 6,858 3,435 50%
LAGOS MAINLAND 57 5,448 2,773 51% 266 14,610 7,266 50%
MUSHIN 77 6,336 3,183 50% 360 18,372 9,171 50%
OJO 54 7,058 3,376 48% 1,237 66,135 32,180 49%
OSHODI/ISOLO 56 5,133 2,455 48% 361 21,329 10,606 50%
SHOMOLU 48 2,365 1,163 49% 616 22,457 11,415 51%
SURULERE 63 5,791 2,812 49% 369 19,889 9,837 49%
TOTAL 1,014 90,640 44,914 50% 10,198 483,304 240,063 50%
Lagos State School Census Report 2014-2015
7 September 2015
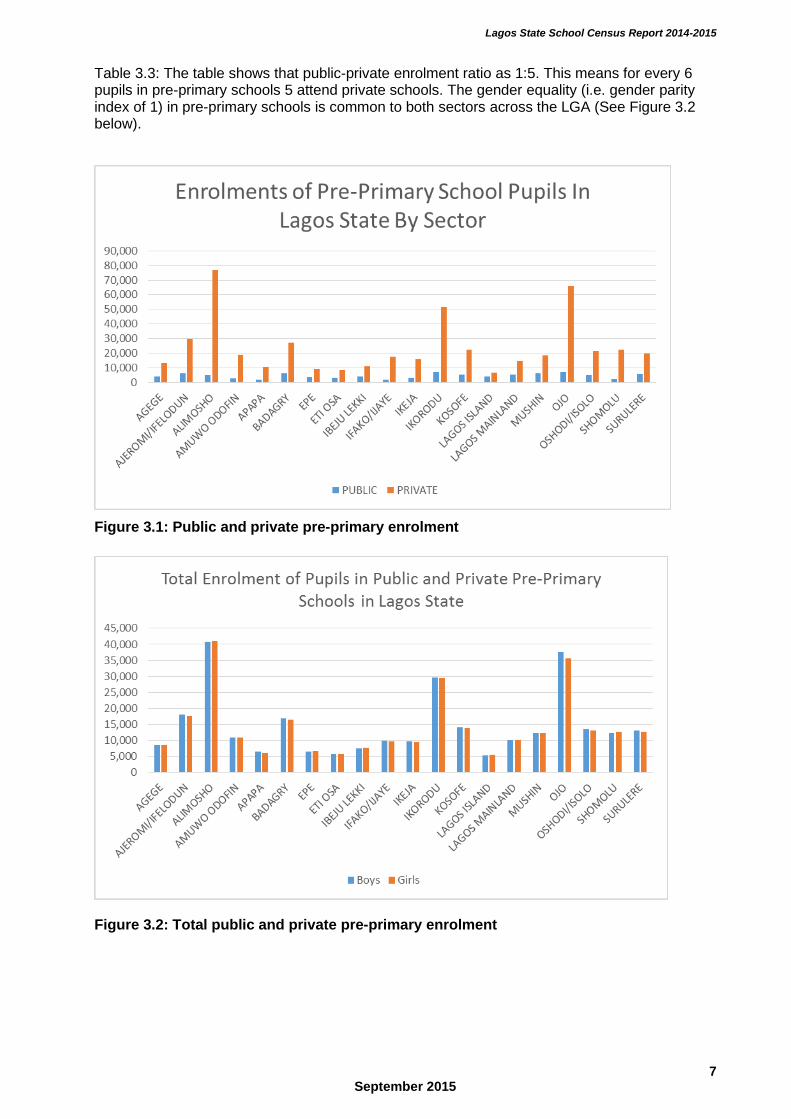
Table 3.3: The table shows that public-private enrolment ratio as 1:5. This means for every 6 pupils in pre-primary schools 5 attend private schools. The gender equality (i.e. gender parity index of 1) in pre-primary schools is common to both sectors across the LGA (See Figure 3.2 below).
Figure 3.1: Public and private pre-primary enrolment
Figure 3.2: Total public and private pre-primary enrolment
Lagos State School Census Report 2014-2015
8 September 2015
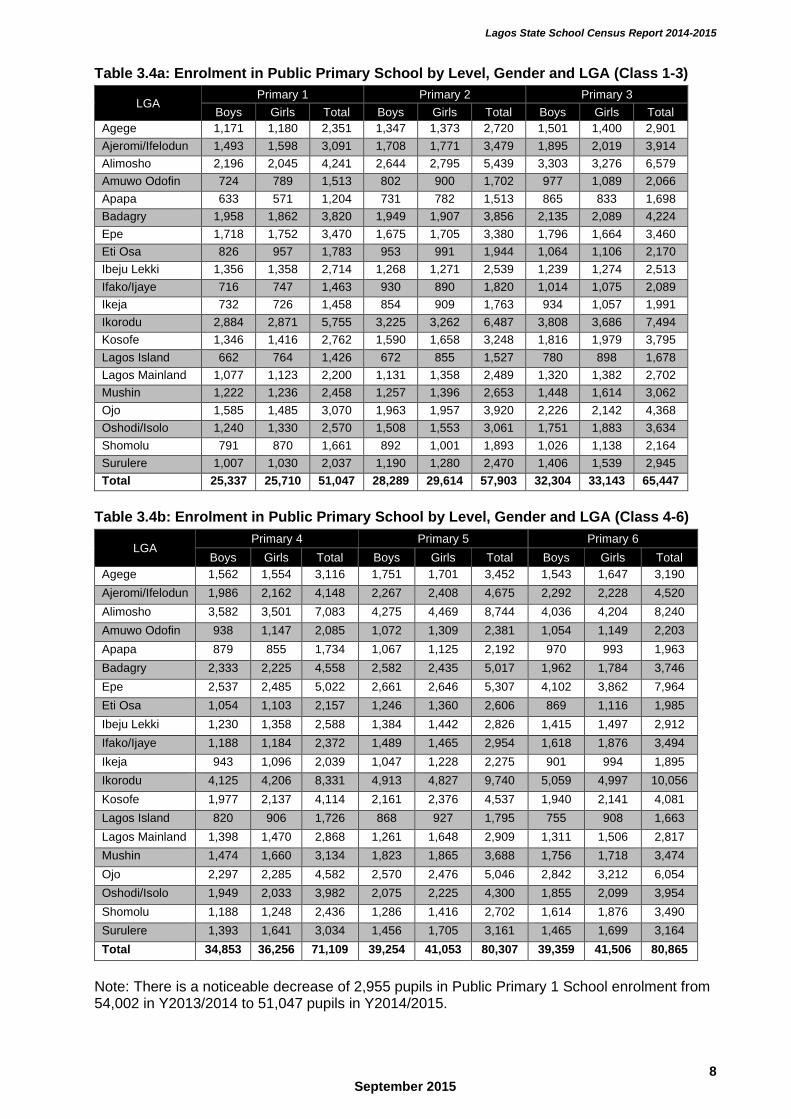
Table 3.4a: Enrolment in Public Primary School by Level, Gender and LGA (Class 1-3)
LGA Primary 1 Primary 2 Primary 3
Boys Girls Total Boys Girls Total Boys Girls Total
Agege 1,171 1,180 2,351 1,347 1,373 2,720 1,501 1,400 2,901
Ajeromi/Ifelodun 1,493 1,598 3,091 1,708 1,771 3,479 1,895 2,019 3,914
Alimosho 2,196 2,045 4,241 2,644 2,795 5,439 3,303 3,276 6,579
Amuwo Odofin 724 789 1,513 802 900 1,702 977 1,089 2,066
Apapa 633 571 1,204 731 782 1,513 865 833 1,698
Badagry 1,958 1,862 3,820 1,949 1,907 3,856 2,135 2,089 4,224
Epe 1,718 1,752 3,470 1,675 1,705 3,380 1,796 1,664 3,460
Eti Osa 826 957 1,783 953 991 1,944 1,064 1,106 2,170
Ibeju Lekki 1,356 1,358 2,714 1,268 1,271 2,539 1,239 1,274 2,513
Ifako/Ijaye 716 747 1,463 930 890 1,820 1,014 1,075 2,089
Ikeja 732 726 1,458 854 909 1,763 934 1,057 1,991
Ikorodu 2,884 2,871 5,755 3,225 3,262 6,487 3,808 3,686 7,494
Kosofe 1,346 1,416 2,762 1,590 1,658 3,248 1,816 1,979 3,795
Lagos Island 662 764 1,426 672 855 1,527 780 898 1,678
Lagos Mainland 1,077 1,123 2,200 1,131 1,358 2,489 1,320 1,382 2,702
Mushin 1,222 1,236 2,458 1,257 1,396 2,653 1,448 1,614 3,062
Ojo 1,585 1,485 3,070 1,963 1,957 3,920 2,226 2,142 4,368
Oshodi/Isolo 1,240 1,330 2,570 1,508 1,553 3,061 1,751 1,883 3,634
Shomolu 791 870 1,661 892 1,001 1,893 1,026 1,138 2,164
Surulere 1,007 1,030 2,037 1,190 1,280 2,470 1,406 1,539 2,945
Total 25,337 25,710 51,047 28,289 29,614 57,903 32,304 33,143 65,447
Table 3.4b: Enrolment in Public Primary School by Level, Gender and LGA (Class 4-6)
LGA Primary 4 Primary 5 Primary 6
Boys Girls Total Boys Girls Total Boys Girls Total
Agege 1,562 1,554 3,116 1,751 1,701 3,452 1,543 1,647 3,190
Ajeromi/Ifelodun 1,986 2,162 4,148 2,267 2,408 4,675 2,292 2,228 4,520
Alimosho 3,582 3,501 7,083 4,275 4,469 8,744 4,036 4,204 8,240
Amuwo Odofin 938 1,147 2,085 1,072 1,309 2,381 1,054 1,149 2,203
Apapa 879 855 1,734 1,067 1,125 2,192 970 993 1,963
Badagry 2,333 2,225 4,558 2,582 2,435 5,017 1,962 1,784 3,746
Epe 2,537 2,485 5,022 2,661 2,646 5,307 4,102 3,862 7,964
Eti Osa 1,054 1,103 2,157 1,246 1,360 2,606 869 1,116 1,985
Ibeju Lekki 1,230 1,358 2,588 1,384 1,442 2,826 1,415 1,497 2,912
Ifako/Ijaye 1,188 1,184 2,372 1,489 1,465 2,954 1,618 1,876 3,494
Ikeja 943 1,096 2,039 1,047 1,228 2,275 901 994 1,895
Ikorodu 4,125 4,206 8,331 4,913 4,827 9,740 5,059 4,997 10,056
Kosofe 1,977 2,137 4,114 2,161 2,376 4,537 1,940 2,141 4,081
Lagos Island 820 906 1,726 868 927 1,795 755 908 1,663
Lagos Mainland 1,398 1,470 2,868 1,261 1,648 2,909 1,311 1,506 2,817
Mushin 1,474 1,660 3,134 1,823 1,865 3,688 1,756 1,718 3,474
Ojo 2,297 2,285 4,582 2,570 2,476 5,046 2,842 3,212 6,054
Oshodi/Isolo 1,949 2,033 3,982 2,075 2,225 4,300 1,855 2,099 3,954
Shomolu 1,188 1,248 2,436 1,286 1,416 2,702 1,614 1,876 3,490
Surulere 1,393 1,641 3,034 1,456 1,705 3,161 1,465 1,699 3,164
Total 34,853 36,256 71,109 39,254 41,053 80,307 39,359 41,506 80,865
Note: There is a noticeable decrease of 2,955 pupils in Public Primary 1 School enrolment from 54,002 in Y2013/2014 to 51,047 pupils in Y2014/2015.
Lagos State School Census Report 2014-2015
9 September 2015
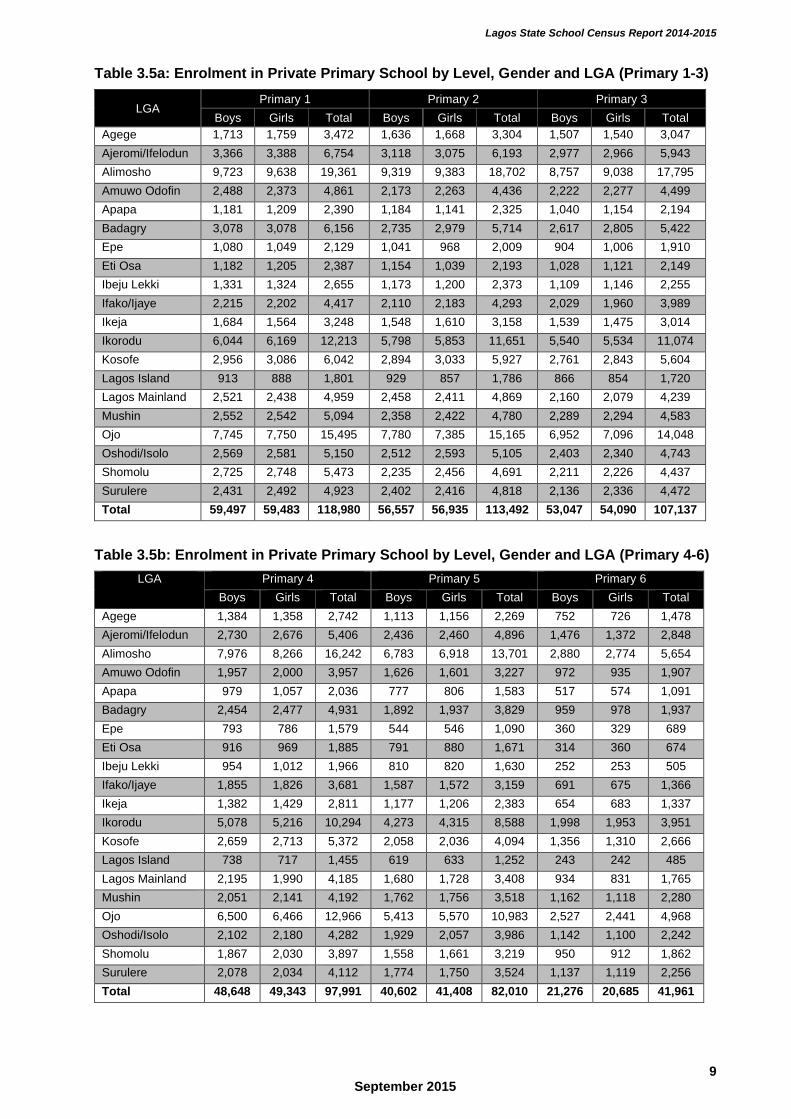
Table 3.5a: Enrolment in Private Primary School by Level, Gender and LGA (Primary 1-3)
LGA Primary 1 Primary 2 Primary 3
Boys Girls Total Boys Girls Total Boys Girls Total
Agege 1,713 1,759 3,472 1,636 1,668 3,304 1,507 1,540 3,047
Ajeromi/Ifelodun 3,366 3,388 6,754 3,118 3,075 6,193 2,977 2,966 5,943
Alimosho 9,723 9,638 19,361 9,319 9,383 18,702 8,757 9,038 17,795
Amuwo Odofin 2,488 2,373 4,861 2,173 2,263 4,436 2,222 2,277 4,499
Apapa 1,181 1,209 2,390 1,184 1,141 2,325 1,040 1,154 2,194
Badagry 3,078 3,078 6,156 2,735 2,979 5,714 2,617 2,805 5,422
Epe 1,080 1,049 2,129 1,041 968 2,009 904 1,006 1,910
Eti Osa 1,182 1,205 2,387 1,154 1,039 2,193 1,028 1,121 2,149
Ibeju Lekki 1,331 1,324 2,655 1,173 1,200 2,373 1,109 1,146 2,255
Ifako/Ijaye 2,215 2,202 4,417 2,110 2,183 4,293 2,029 1,960 3,989
Ikeja 1,684 1,564 3,248 1,548 1,610 3,158 1,539 1,475 3,014
Ikorodu 6,044 6,169 12,213 5,798 5,853 11,651 5,540 5,534 11,074
Kosofe 2,956 3,086 6,042 2,894 3,033 5,927 2,761 2,843 5,604
Lagos Island 913 888 1,801 929 857 1,786 866 854 1,720
Lagos Mainland 2,521 2,438 4,959 2,458 2,411 4,869 2,160 2,079 4,239
Mushin 2,552 2,542 5,094 2,358 2,422 4,780 2,289 2,294 4,583
Ojo 7,745 7,750 15,495 7,780 7,385 15,165 6,952 7,096 14,048
Oshodi/Isolo 2,569 2,581 5,150 2,512 2,593 5,105 2,403 2,340 4,743
Shomolu 2,725 2,748 5,473 2,235 2,456 4,691 2,211 2,226 4,437
Surulere 2,431 2,492 4,923 2,402 2,416 4,818 2,136 2,336 4,472
Total 59,497 59,483 118,980 56,557 56,935 113,492 53,047 54,090 107,137
Table 3.5b: Enrolment in Private Primary School by Level, Gender and LGA (Primary 4-6)
LGA Primary 4 Primary 5 Primary 6
Boys Girls Total Boys Girls Total Boys Girls Total
Agege 1,384 1,358 2,742 1,113 1,156 2,269 752 726 1,478
Ajeromi/Ifelodun 2,730 2,676 5,406 2,436 2,460 4,896 1,476 1,372 2,848
Alimosho 7,976 8,266 16,242 6,783 6,918 13,701 2,880 2,774 5,654
Amuwo Odofin 1,957 2,000 3,957 1,626 1,601 3,227 972 935 1,907
Apapa 979 1,057 2,036 777 806 1,583 517 574 1,091
Badagry 2,454 2,477 4,931 1,892 1,937 3,829 959 978 1,937
Epe 793 786 1,579 544 546 1,090 360 329 689
Eti Osa 916 969 1,885 791 880 1,671 314 360 674
Ibeju Lekki 954 1,012 1,966 810 820 1,630 252 253 505
Ifako/Ijaye 1,855 1,826 3,681 1,587 1,572 3,159 691 675 1,366
Ikeja 1,382 1,429 2,811 1,177 1,206 2,383 654 683 1,337
Ikorodu 5,078 5,216 10,294 4,273 4,315 8,588 1,998 1,953 3,951
Kosofe 2,659 2,713 5,372 2,058 2,036 4,094 1,356 1,310 2,666
Lagos Island 738 717 1,455 619 633 1,252 243 242 485
Lagos Mainland 2,195 1,990 4,185 1,680 1,728 3,408 934 831 1,765
Mushin 2,051 2,141 4,192 1,762 1,756 3,518 1,162 1,118 2,280
Ojo 6,500 6,466 12,966 5,413 5,570 10,983 2,527 2,441 4,968
Oshodi/Isolo 2,102 2,180 4,282 1,929 2,057 3,986 1,142 1,100 2,242
Shomolu 1,867 2,030 3,897 1,558 1,661 3,219 950 912 1,862
Surulere 2,078 2,034 4,112 1,774 1,750 3,524 1,137 1,119 2,256
Total 48,648 49,343 97,991 40,602 41,408 82,010 21,276 20,685 41,961
Lagos State School Census Report 2014-2015
10 September 2015
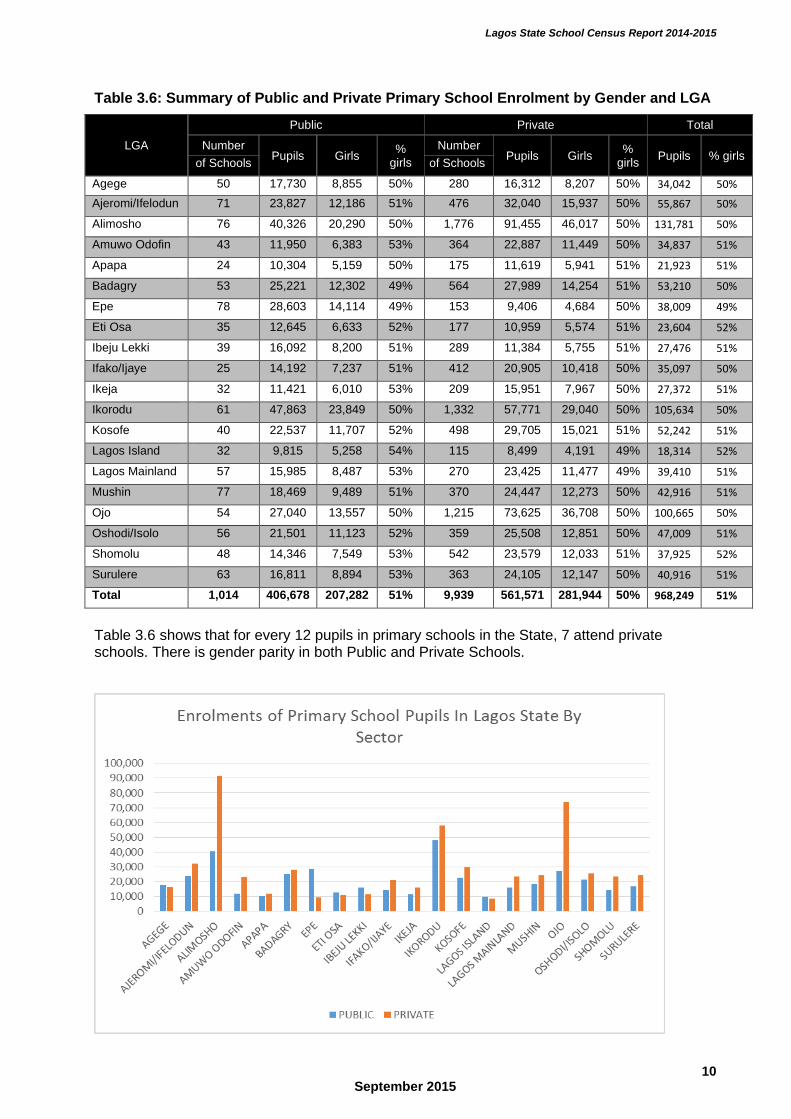
Table 3.6: Summary of Public and Private Primary School Enrolment by Gender and LGA
LGA
Public Private Total
Number Pupils Girls
% girls
Number Pupils Girls
% girls
Pupils % girls of Schools of Schools
Agege 50 17,730 8,855 50% 280 16,312 8,207 50% 34,042 50%
Ajeromi/Ifelodun 71 23,827 12,186 51% 476 32,040 15,937 50% 55,867 50%
Alimosho 76 40,326 20,290 50% 1,776 91,455 46,017 50% 131,781 50%
Amuwo Odofin 43 11,950 6,383 53% 364 22,887 11,449 50% 34,837 51%
Apapa 24 10,304 5,159 50% 175 11,619 5,941 51% 21,923 51%
Badagry 53 25,221 12,302 49% 564 27,989 14,254 51% 53,210 50%
Epe 78 28,603 14,114 49% 153 9,406 4,684 50% 38,009 49%
Eti Osa 35 12,645 6,633 52% 177 10,959 5,574 51% 23,604 52%
Ibeju Lekki 39 16,092 8,200 51% 289 11,384 5,755 51% 27,476 51%
Ifako/Ijaye 25 14,192 7,237 51% 412 20,905 10,418 50% 35,097 50%
Ikeja 32 11,421 6,010 53% 209 15,951 7,967 50% 27,372 51%
Ikorodu 61 47,863 23,849 50% 1,332 57,771 29,040 50% 105,634 50%
Kosofe 40 22,537 11,707 52% 498 29,705 15,021 51% 52,242 51%
Lagos Island 32 9,815 5,258 54% 115 8,499 4,191 49% 18,314 52%
Lagos Mainland 57 15,985 8,487 53% 270 23,425 11,477 49% 39,410 51%
Mushin 77 18,469 9,489 51% 370 24,447 12,273 50% 42,916 51%
Ojo 54 27,040 13,557 50% 1,215 73,625 36,708 50% 100,665 50%
Oshodi/Isolo 56 21,501 11,123 52% 359 25,508 12,851 50% 47,009 51%
Shomolu 48 14,346 7,549 53% 542 23,579 12,033 51% 37,925 52%
Surulere 63 16,811 8,894 53% 363 24,105 12,147 50% 40,916 51%
Total 1,014 406,678 207,282 51% 9,939 561,571 281,944 50% 968,249 51%
Table 3.6 shows that for every 12 pupils in primary schools in the State, 7 attend private schools. There is gender parity in both Public and Private Schools.
Lagos State School Census Report 2014-2015
11 September 2015
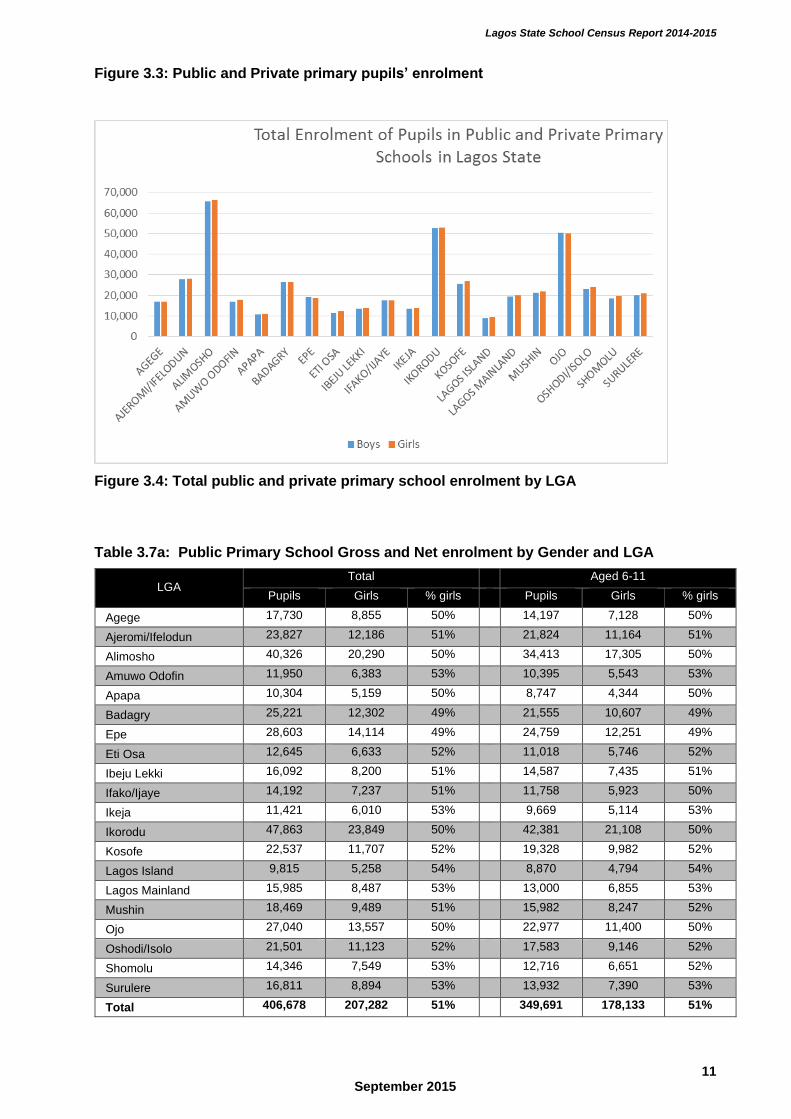
Figure 3.3: Public and Private primary pupils’ enrolment
Figure 3.4: Total public and private primary school enrolment by LGA
Table 3.7a: Public Primary School Gross and Net enrolment by Gender and LGA
LGA
Total Aged 6-11
Pupils Girls % girls Pupils Girls % girls
Agege 17,730 8,855 50% 14,197 7,128 50%
Ajeromi/Ifelodun 23,827 12,186 51% 21,824 11,164 51%
Alimosho 40,326 20,290 50% 34,413 17,305 50%
Amuwo Odofin 11,950 6,383 53% 10,395 5,543 53%
Apapa 10,304 5,159 50% 8,747 4,344 50%
Badagry 25,221 12,302 49% 21,555 10,607 49%
Epe 28,603 14,114 49% 24,759 12,251 49%
Eti Osa 12,645 6,633 52% 11,018 5,746 52%
Ibeju Lekki 16,092 8,200 51% 14,587 7,435 51%
Ifako/Ijaye 14,192 7,237 51% 11,758 5,923 50%
Ikeja 11,421 6,010 53% 9,669 5,114 53%
Ikorodu 47,863 23,849 50% 42,381 21,108 50%
Kosofe 22,537 11,707 52% 19,328 9,982 52%
Lagos Island 9,815 5,258 54% 8,870 4,794 54%
Lagos Mainland 15,985 8,487 53% 13,000 6,855 53%
Mushin 18,469 9,489 51% 15,982 8,247 52%
Ojo 27,040 13,557 50% 22,977 11,400 50%
Oshodi/Isolo 21,501 11,123 52% 17,583 9,146 52%
Shomolu 14,346 7,549 53% 12,716 6,651 52%
Surulere 16,811 8,894 53% 13,932 7,390 53%
Total 406,678 207,282 51% 349,691 178,133 51%
Lagos State School Census Report 2014-2015
12 September 2015
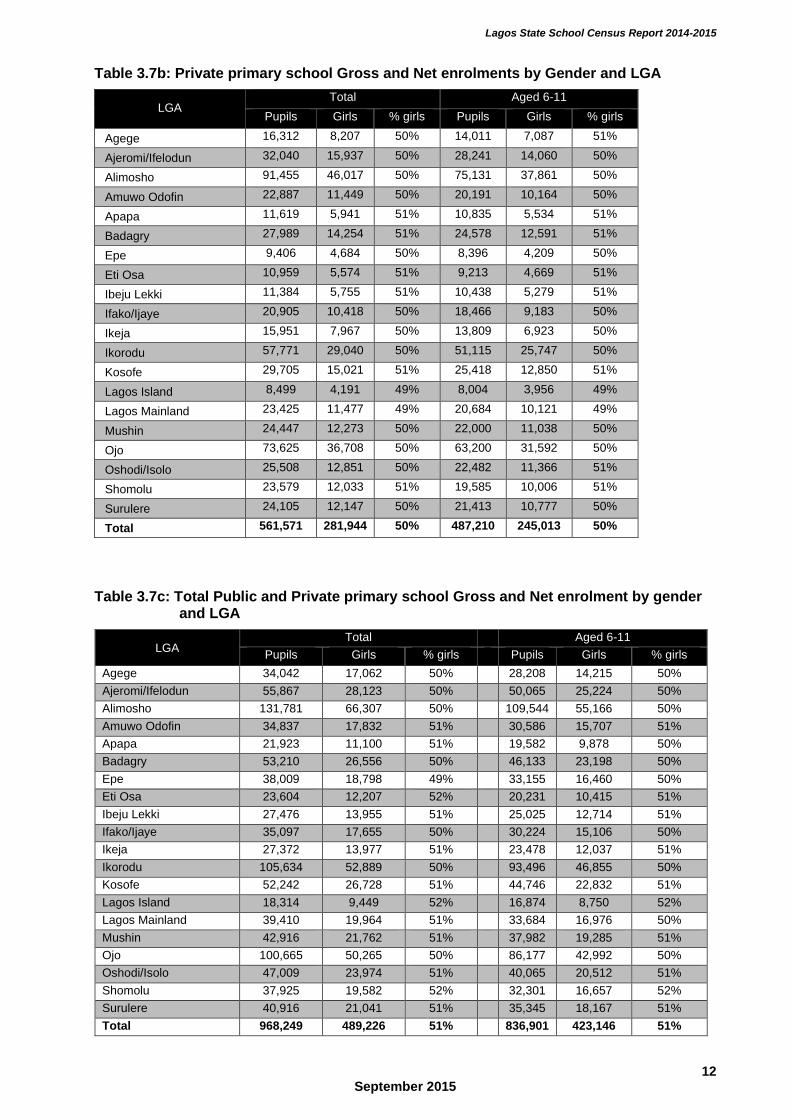
Table 3.7b: Private primary school Gross and Net enrolments by Gender and LGA
LGA
Total Aged 6-11
Pupils Girls % girls Pupils Girls % girls
Agege 16,312 8,207 50% 14,011 7,087 51%
Ajeromi/Ifelodun 32,040 15,937 50% 28,241 14,060 50%
Alimosho 91,455 46,017 50% 75,131 37,861 50%
Amuwo Odofin 22,887 11,449 50% 20,191 10,164 50%
Apapa 11,619 5,941 51% 10,835 5,534 51%
Badagry 27,989 14,254 51% 24,578 12,591 51%
Epe 9,406 4,684 50% 8,396 4,209 50%
Eti Osa 10,959 5,574 51% 9,213 4,669 51%
Ibeju Lekki 11,384 5,755 51% 10,438 5,279 51%
Ifako/Ijaye 20,905 10,418 50% 18,466 9,183 50%
Ikeja 15,951 7,967 50% 13,809 6,923 50%
Ikorodu 57,771 29,040 50% 51,115 25,747 50%
Kosofe 29,705 15,021 51% 25,418 12,850 51%
Lagos Island 8,499 4,191 49% 8,004 3,956 49%
Lagos Mainland 23,425 11,477 49% 20,684 10,121 49%
Mushin 24,447 12,273 50% 22,000 11,038 50%
Ojo 73,625 36,708 50% 63,200 31,592 50%
Oshodi/Isolo 25,508 12,851 50% 22,482 11,366 51%
Shomolu 23,579 12,033 51% 19,585 10,006 51%
Surulere 24,105 12,147 50% 21,413 10,777 50%
Total 561,571 281,944 50% 487,210 245,013 50%
Table 3.7c: Total Public and Private primary school Gross and Net enrolment by gender and LGA
LGA Total Aged 6-11
Pupils Girls % girls Pupils Girls % girls
Agege 34,042 17,062 50% 28,208 14,215 50%
Ajeromi/Ifelodun 55,867 28,123 50% 50,065 25,224 50%
Alimosho 131,781 66,307 50% 109,544 55,166 50%
Amuwo Odofin 34,837 17,832 51% 30,586 15,707 51%
Apapa 21,923 11,100 51% 19,582 9,878 50%
Badagry 53,210 26,556 50% 46,133 23,198 50%
Epe 38,009 18,798 49% 33,155 16,460 50%
Eti Osa 23,604 12,207 52% 20,231 10,415 51%
Ibeju Lekki 27,476 13,955 51% 25,025 12,714 51%
Ifako/Ijaye 35,097 17,655 50% 30,224 15,106 50%
Ikeja 27,372 13,977 51% 23,478 12,037 51%
Ikorodu 105,634 52,889 50% 93,496 46,855 50%
Kosofe 52,242 26,728 51% 44,746 22,832 51%
Lagos Island 18,314 9,449 52% 16,874 8,750 52%
Lagos Mainland 39,410 19,964 51% 33,684 16,976 50%
Mushin 42,916 21,762 51% 37,982 19,285 51%
Ojo 100,665 50,265 50% 86,177 42,992 50%
Oshodi/Isolo 47,009 23,974 51% 40,065 20,512 51%
Shomolu 37,925 19,582 52% 32,301 16,657 52%
Surulere 40,916 21,041 51% 35,345 18,167 51%
Total 968,249 489,226 51% 836,901 423,146 51%
Lagos State School Census Report 2014-2015
13 September 2015
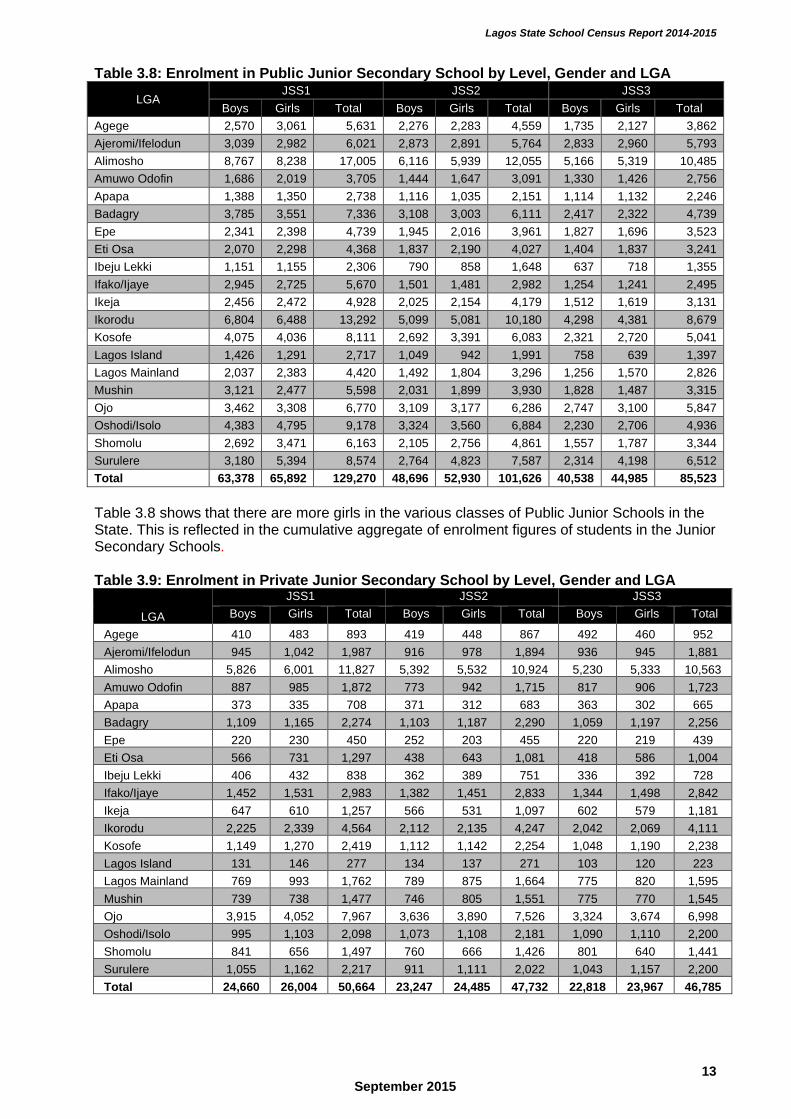
Table 3.8: Enrolment in Public Junior Secondary School by Level, Gender and LGA
LGA JSS1 JSS2 JSS3
Boys Girls Total Boys Girls Total Boys Girls Total
Agege 2,570 3,061 5,631 2,276 2,283 4,559 1,735 2,127 3,862
Ajeromi/Ifelodun 3,039 2,982 6,021 2,873 2,891 5,764 2,833 2,960 5,793
Alimosho 8,767 8,238 17,005 6,116 5,939 12,055 5,166 5,319 10,485
Amuwo Odofin 1,686 2,019 3,705 1,444 1,647 3,091 1,330 1,426 2,756
Apapa 1,388 1,350 2,738 1,116 1,035 2,151 1,114 1,132 2,246
Badagry 3,785 3,551 7,336 3,108 3,003 6,111 2,417 2,322 4,739
Epe 2,341 2,398 4,739 1,945 2,016 3,961 1,827 1,696 3,523
Eti Osa 2,070 2,298 4,368 1,837 2,190 4,027 1,404 1,837 3,241
Ibeju Lekki 1,151 1,155 2,306 790 858 1,648 637 718 1,355
Ifako/Ijaye 2,945 2,725 5,670 1,501 1,481 2,982 1,254 1,241 2,495
Ikeja 2,456 2,472 4,928 2,025 2,154 4,179 1,512 1,619 3,131
Ikorodu 6,804 6,488 13,292 5,099 5,081 10,180 4,298 4,381 8,679
Kosofe 4,075 4,036 8,111 2,692 3,391 6,083 2,321 2,720 5,041
Lagos Island 1,426 1,291 2,717 1,049 942 1,991 758 639 1,397
Lagos Mainland 2,037 2,383 4,420 1,492 1,804 3,296 1,256 1,570 2,826
Mushin 3,121 2,477 5,598 2,031 1,899 3,930 1,828 1,487 3,315
Ojo 3,462 3,308 6,770 3,109 3,177 6,286 2,747 3,100 5,847
Oshodi/Isolo 4,383 4,795 9,178 3,324 3,560 6,884 2,230 2,706 4,936
Shomolu 2,692 3,471 6,163 2,105 2,756 4,861 1,557 1,787 3,344
Surulere 3,180 5,394 8,574 2,764 4,823 7,587 2,314 4,198 6,512
Total 63,378 65,892 129,270 48,696 52,930 101,626 40,538 44,985 85,523
Table 3.8 shows that there are more girls in the various classes of Public Junior Schools in the State. This is reflected in the cumulative aggregate of enrolment figures of students in the Junior Secondary Schools. Table 3.9: Enrolment in Private Junior Secondary School by Level, Gender and LGA
LGA
JSS1 JSS2 JSS3
Boys Girls Total Boys Girls Total Boys Girls Total
Agege 410 483 893 419 448 867 492 460 952
Ajeromi/Ifelodun 945 1,042 1,987 916 978 1,894 936 945 1,881
Alimosho 5,826 6,001 11,827 5,392 5,532 10,924 5,230 5,333 10,563
Amuwo Odofin 887 985 1,872 773 942 1,715 817 906 1,723
Apapa 373 335 708 371 312 683 363 302 665
Badagry 1,109 1,165 2,274 1,103 1,187 2,290 1,059 1,197 2,256
Epe 220 230 450 252 203 455 220 219 439
Eti Osa 566 731 1,297 438 643 1,081 418 586 1,004
Ibeju Lekki 406 432 838 362 389 751 336 392 728
Ifako/Ijaye 1,452 1,531 2,983 1,382 1,451 2,833 1,344 1,498 2,842
Ikeja 647 610 1,257 566 531 1,097 602 579 1,181
Ikorodu 2,225 2,339 4,564 2,112 2,135 4,247 2,042 2,069 4,111
Kosofe 1,149 1,270 2,419 1,112 1,142 2,254 1,048 1,190 2,238
Lagos Island 131 146 277 134 137 271 103 120 223
Lagos Mainland 769 993 1,762 789 875 1,664 775 820 1,595
Mushin 739 738 1,477 746 805 1,551 775 770 1,545
Ojo 3,915 4,052 7,967 3,636 3,890 7,526 3,324 3,674 6,998
Oshodi/Isolo 995 1,103 2,098 1,073 1,108 2,181 1,090 1,110 2,200
Shomolu 841 656 1,497 760 666 1,426 801 640 1,441
Surulere 1,055 1,162 2,217 911 1,111 2,022 1,043 1,157 2,200
Total 24,660 26,004 50,664 23,247 24,485 47,732 22,818 23,967 46,785
Lagos State School Census Report 2014-2015
14 September 2015
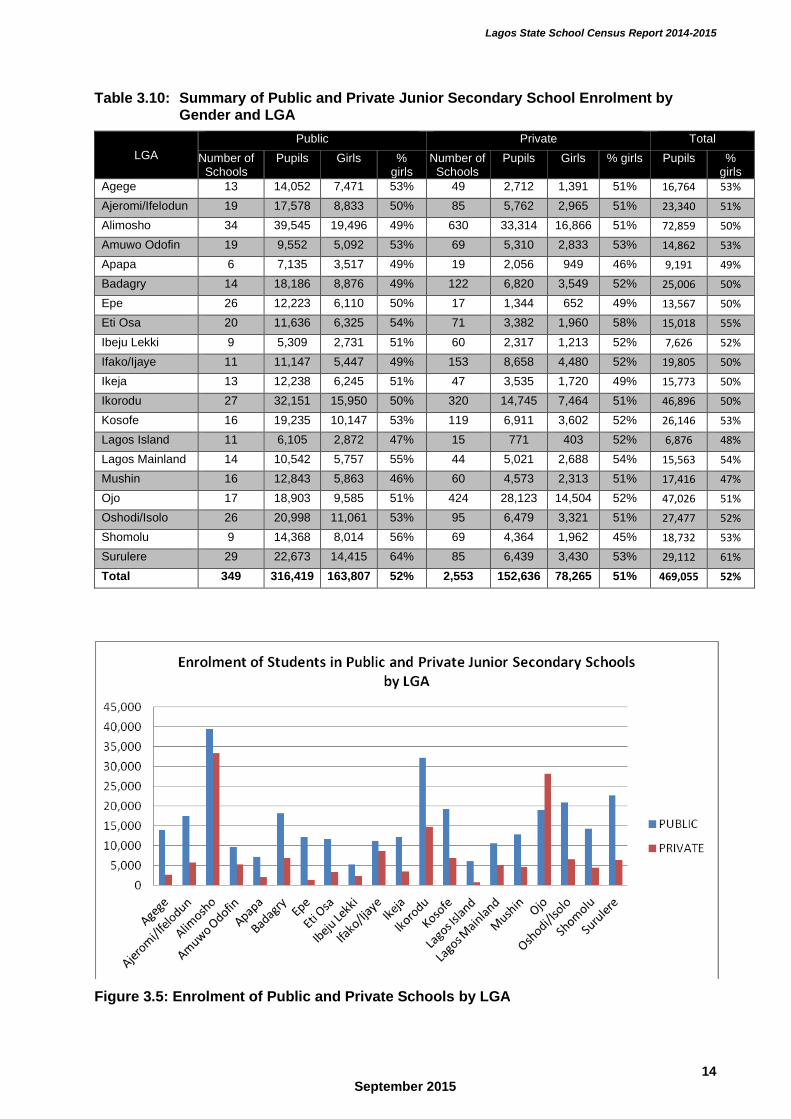
Table 3.10: Summary of Public and Private Junior Secondary School Enrolment by Gender and LGA
LGA
Public Private Total
Number of Schools
Pupils Girls % girls
Number of Schools
Pupils Girls % girls Pupils % girls
Agege 13 14,052 7,471 53% 49 2,712 1,391 51% 16,764 53%
Ajeromi/Ifelodun 19 17,578 8,833 50% 85 5,762 2,965 51% 23,340 51%
Alimosho 34 39,545 19,496 49% 630 33,314 16,866 51% 72,859 50%
Amuwo Odofin 19 9,552 5,092 53% 69 5,310 2,833 53% 14,862 53%
Apapa 6 7,135 3,517 49% 19 2,056 949 46% 9,191 49%
Badagry 14 18,186 8,876 49% 122 6,820 3,549 52% 25,006 50%
Epe 26 12,223 6,110 50% 17 1,344 652 49% 13,567 50%
Eti Osa 20 11,636 6,325 54% 71 3,382 1,960 58% 15,018 55%
Ibeju Lekki 9 5,309 2,731 51% 60 2,317 1,213 52% 7,626 52%
Ifako/Ijaye 11 11,147 5,447 49% 153 8,658 4,480 52% 19,805 50%
Ikeja 13 12,238 6,245 51% 47 3,535 1,720 49% 15,773 50%
Ikorodu 27 32,151 15,950 50% 320 14,745 7,464 51% 46,896 50%
Kosofe 16 19,235 10,147 53% 119 6,911 3,602 52% 26,146 53%
Lagos Island 11 6,105 2,872 47% 15 771 403 52% 6,876 48%
Lagos Mainland 14 10,542 5,757 55% 44 5,021 2,688 54% 15,563 54%
Mushin 16 12,843 5,863 46% 60 4,573 2,313 51% 17,416 47%
Ojo 17 18,903 9,585 51% 424 28,123 14,504 52% 47,026 51%
Oshodi/Isolo 26 20,998 11,061 53% 95 6,479 3,321 51% 27,477 52%
Shomolu 9 14,368 8,014 56% 69 4,364 1,962 45% 18,732 53%
Surulere 29 22,673 14,415 64% 85 6,439 3,430 53% 29,112 61%
Total 349 316,419 163,807 52% 2,553 152,636 78,265 51% 469,055 52%
Figure 3.5: Enrolment of Public and Private Schools by LGA
Lagos State School Census Report 2014-2015
15 September 2015
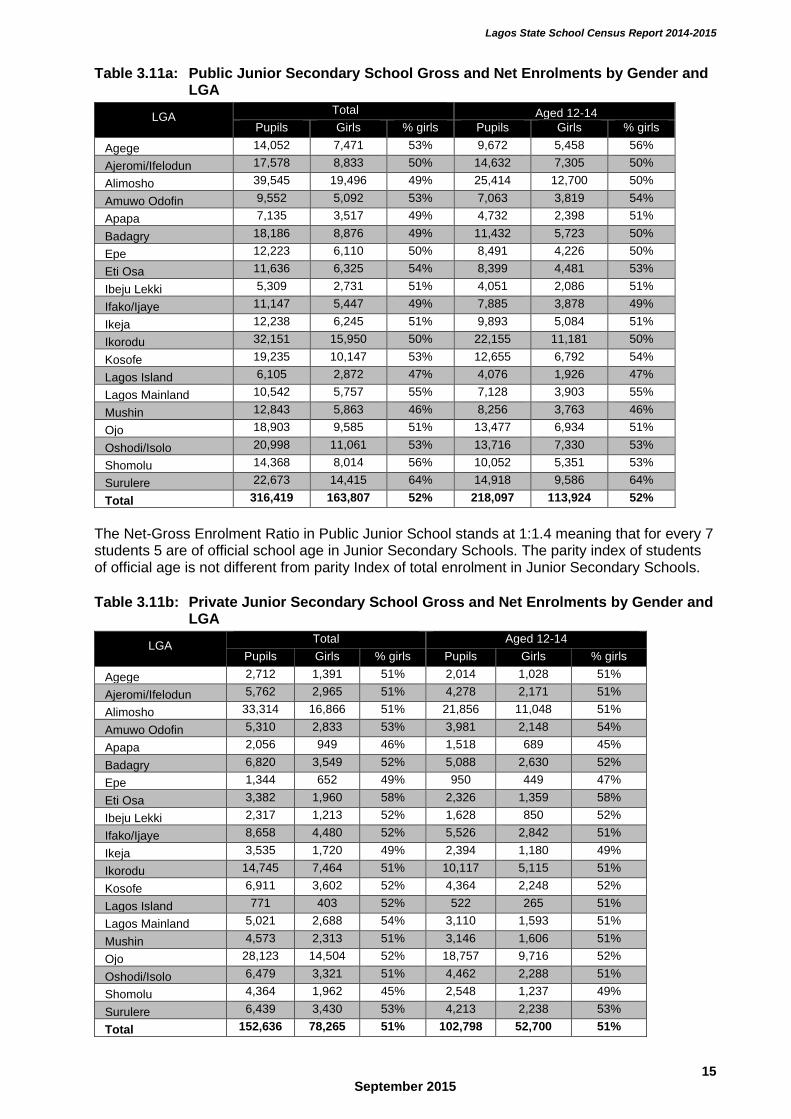
Table 3.11a: Public Junior Secondary School Gross and Net Enrolments by Gender and LGA
LGA
Total Aged 12-14
Pupils Girls % girls Pupils Girls % girls
Agege 14,052 7,471 53% 9,672 5,458 56%
Ajeromi/Ifelodun 17,578 8,833 50% 14,632 7,305 50%
Alimosho 39,545 19,496 49% 25,414 12,700 50%
Amuwo Odofin 9,552 5,092 53% 7,063 3,819 54%
Apapa 7,135 3,517 49% 4,732 2,398 51%
Badagry 18,186 8,876 49% 11,432 5,723 50%
Epe 12,223 6,110 50% 8,491 4,226 50%
Eti Osa 11,636 6,325 54% 8,399 4,481 53%
Ibeju Lekki 5,309 2,731 51% 4,051 2,086 51%
Ifako/Ijaye 11,147 5,447 49% 7,885 3,878 49%
Ikeja 12,238 6,245 51% 9,893 5,084 51%
Ikorodu 32,151 15,950 50% 22,155 11,181 50%
Kosofe 19,235 10,147 53% 12,655 6,792 54%
Lagos Island 6,105 2,872 47% 4,076 1,926 47%
Lagos Mainland 10,542 5,757 55% 7,128 3,903 55%
Mushin 12,843 5,863 46% 8,256 3,763 46%
Ojo 18,903 9,585 51% 13,477 6,934 51%
Oshodi/Isolo 20,998 11,061 53% 13,716 7,330 53%
Shomolu 14,368 8,014 56% 10,052 5,351 53%
Surulere 22,673 14,415 64% 14,918 9,586 64%
Total 316,419 163,807 52% 218,097 113,924 52%
The Net-Gross Enrolment Ratio in Public Junior School stands at 1:1.4 meaning that for every 7 students 5 are of official school age in Junior Secondary Schools. The parity index of students of official age is not different from parity Index of total enrolment in Junior Secondary Schools. Table 3.11b: Private Junior Secondary School Gross and Net Enrolments by Gender and
LGA
LGA
Total Aged 12-14
Pupils Girls % girls Pupils Girls % girls
Agege 2,712 1,391 51% 2,014 1,028 51%
Ajeromi/Ifelodun 5,762 2,965 51% 4,278 2,171 51%
Alimosho 33,314 16,866 51% 21,856 11,048 51%
Amuwo Odofin 5,310 2,833 53% 3,981 2,148 54%
Apapa 2,056 949 46% 1,518 689 45%
Badagry 6,820 3,549 52% 5,088 2,630 52%
Epe 1,344 652 49% 950 449 47%
Eti Osa 3,382 1,960 58% 2,326 1,359 58%
Ibeju Lekki 2,317 1,213 52% 1,628 850 52%
Ifako/Ijaye 8,658 4,480 52% 5,526 2,842 51%
Ikeja 3,535 1,720 49% 2,394 1,180 49%
Ikorodu 14,745 7,464 51% 10,117 5,115 51%
Kosofe 6,911 3,602 52% 4,364 2,248 52%
Lagos Island 771 403 52% 522 265 51%
Lagos Mainland 5,021 2,688 54% 3,110 1,593 51%
Mushin 4,573 2,313 51% 3,146 1,606 51%
Ojo 28,123 14,504 52% 18,757 9,716 52%
Oshodi/Isolo 6,479 3,321 51% 4,462 2,288 51%
Shomolu 4,364 1,962 45% 2,548 1,237 49%
Surulere 6,439 3,430 53% 4,213 2,238 53%
Total 152,636 78,265 51% 102,798 52,700 51%
Lagos State School Census Report 2014-2015
16 September 2015
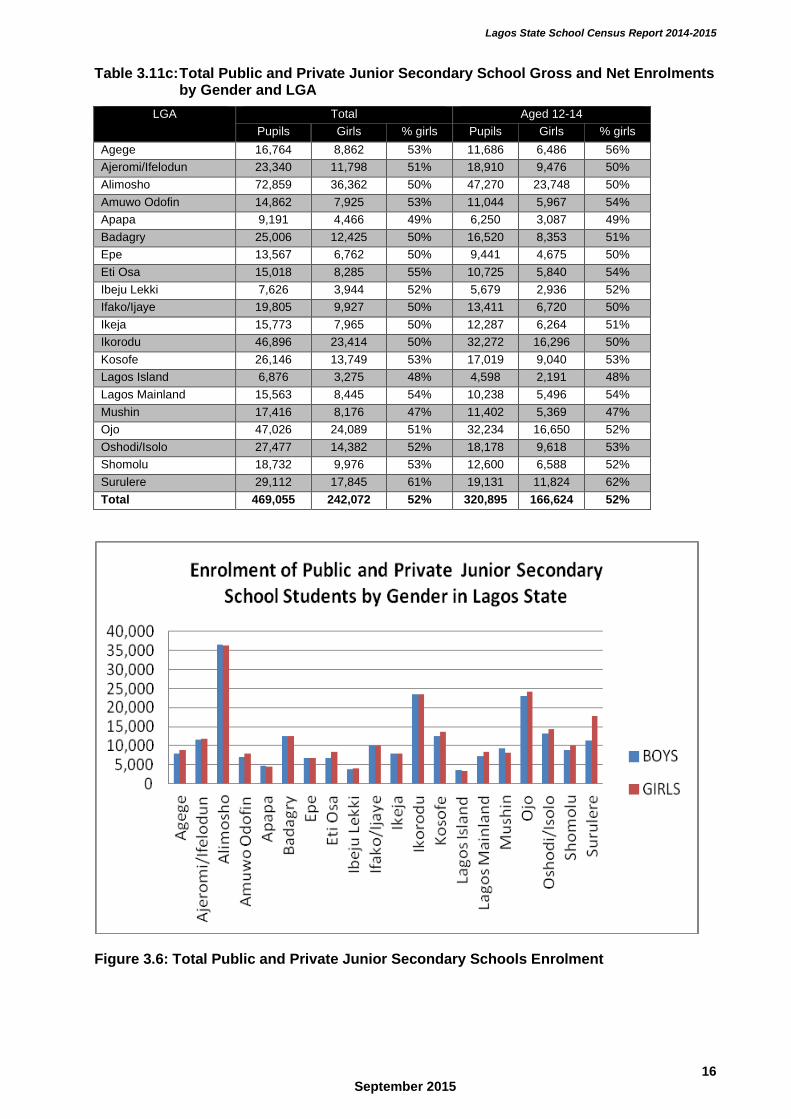
Table 3.11c: Total Public and Private Junior Secondary School Gross and Net Enrolments by Gender and LGA
LGA Total Aged 12-14
Pupils Girls % girls Pupils Girls % girls
Agege 16,764 8,862 53% 11,686 6,486 56%
Ajeromi/Ifelodun 23,340 11,798 51% 18,910 9,476 50%
Alimosho 72,859 36,362 50% 47,270 23,748 50%
Amuwo Odofin 14,862 7,925 53% 11,044 5,967 54%
Apapa 9,191 4,466 49% 6,250 3,087 49%
Badagry 25,006 12,425 50% 16,520 8,353 51%
Epe 13,567 6,762 50% 9,441 4,675 50%
Eti Osa 15,018 8,285 55% 10,725 5,840 54%
Ibeju Lekki 7,626 3,944 52% 5,679 2,936 52%
Ifako/Ijaye 19,805 9,927 50% 13,411 6,720 50%
Ikeja 15,773 7,965 50% 12,287 6,264 51%
Ikorodu 46,896 23,414 50% 32,272 16,296 50%
Kosofe 26,146 13,749 53% 17,019 9,040 53%
Lagos Island 6,876 3,275 48% 4,598 2,191 48%
Lagos Mainland 15,563 8,445 54% 10,238 5,496 54%
Mushin 17,416 8,176 47% 11,402 5,369 47%
Ojo 47,026 24,089 51% 32,234 16,650 52%
Oshodi/Isolo 27,477 14,382 52% 18,178 9,618 53%
Shomolu 18,732 9,976 53% 12,600 6,588 52%
Surulere 29,112 17,845 61% 19,131 11,824 62%
Total 469,055 242,072 52% 320,895 166,624 52%
Figure 3.6: Total Public and Private Junior Secondary Schools Enrolment
Lagos State School Census Report 2014-2015
17 September 2015
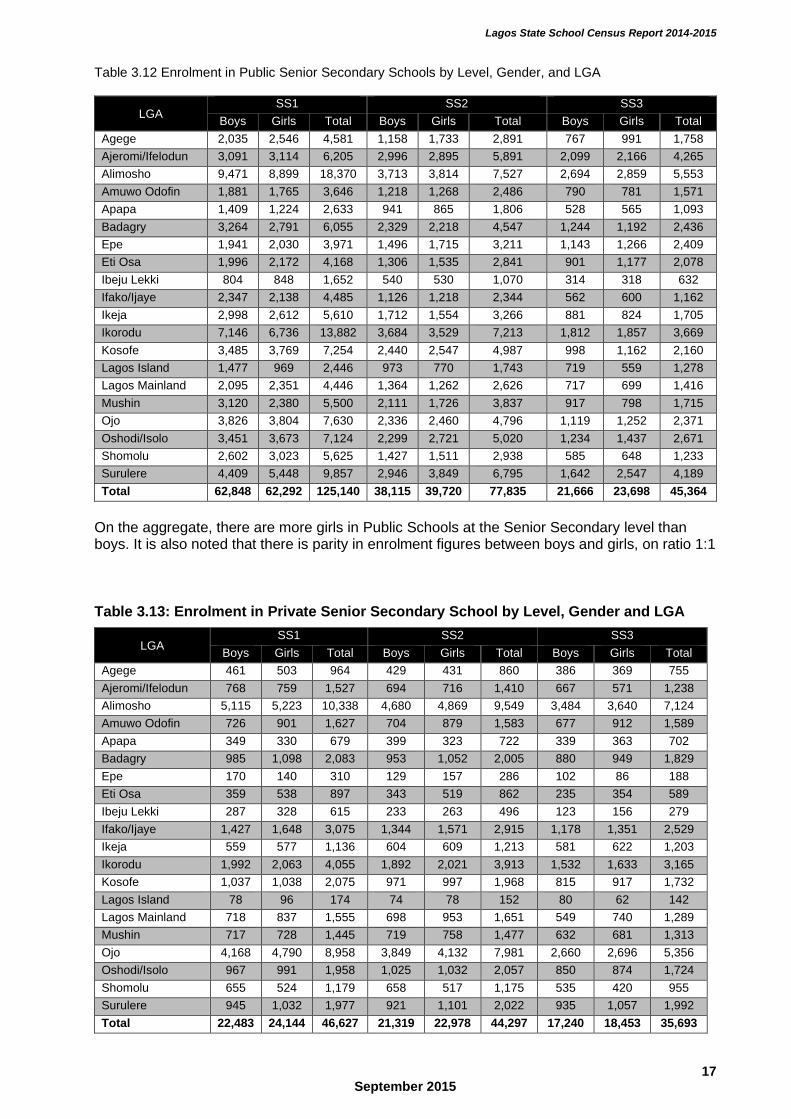
Table 3.12 Enrolment in Public Senior Secondary Schools by Level, Gender, and LGA
LGA SS1 SS2 SS3
Boys Girls Total Boys Girls Total Boys Girls Total
Agege 2,035 2,546 4,581 1,158 1,733 2,891 767 991 1,758
Ajeromi/Ifelodun 3,091 3,114 6,205 2,996 2,895 5,891 2,099 2,166 4,265
Alimosho 9,471 8,899 18,370 3,713 3,814 7,527 2,694 2,859 5,553
Amuwo Odofin 1,881 1,765 3,646 1,218 1,268 2,486 790 781 1,571
Apapa 1,409 1,224 2,633 941 865 1,806 528 565 1,093
Badagry 3,264 2,791 6,055 2,329 2,218 4,547 1,244 1,192 2,436
Epe 1,941 2,030 3,971 1,496 1,715 3,211 1,143 1,266 2,409
Eti Osa 1,996 2,172 4,168 1,306 1,535 2,841 901 1,177 2,078
Ibeju Lekki 804 848 1,652 540 530 1,070 314 318 632
Ifako/Ijaye 2,347 2,138 4,485 1,126 1,218 2,344 562 600 1,162
Ikeja 2,998 2,612 5,610 1,712 1,554 3,266 881 824 1,705
Ikorodu 7,146 6,736 13,882 3,684 3,529 7,213 1,812 1,857 3,669
Kosofe 3,485 3,769 7,254 2,440 2,547 4,987 998 1,162 2,160
Lagos Island 1,477 969 2,446 973 770 1,743 719 559 1,278
Lagos Mainland 2,095 2,351 4,446 1,364 1,262 2,626 717 699 1,416
Mushin 3,120 2,380 5,500 2,111 1,726 3,837 917 798 1,715
Ojo 3,826 3,804 7,630 2,336 2,460 4,796 1,119 1,252 2,371
Oshodi/Isolo 3,451 3,673 7,124 2,299 2,721 5,020 1,234 1,437 2,671
Shomolu 2,602 3,023 5,625 1,427 1,511 2,938 585 648 1,233
Surulere 4,409 5,448 9,857 2,946 3,849 6,795 1,642 2,547 4,189
Total 62,848 62,292 125,140 38,115 39,720 77,835 21,666 23,698 45,364
On the aggregate, there are more girls in Public Schools at the Senior Secondary level than boys. It is also noted that there is parity in enrolment figures between boys and girls, on ratio 1:1 Table 3.13: Enrolment in Private Senior Secondary School by Level, Gender and LGA
LGA SS1 SS2 SS3
Boys Girls Total Boys Girls Total Boys Girls Total
Agege 461 503 964 429 431 860 386 369 755
Ajeromi/Ifelodun 768 759 1,527 694 716 1,410 667 571 1,238
Alimosho 5,115 5,223 10,338 4,680 4,869 9,549 3,484 3,640 7,124
Amuwo Odofin 726 901 1,627 704 879 1,583 677 912 1,589
Apapa 349 330 679 399 323 722 339 363 702
Badagry 985 1,098 2,083 953 1,052 2,005 880 949 1,829
Epe 170 140 310 129 157 286 102 86 188
Eti Osa 359 538 897 343 519 862 235 354 589
Ibeju Lekki 287 328 615 233 263 496 123 156 279
Ifako/Ijaye 1,427 1,648 3,075 1,344 1,571 2,915 1,178 1,351 2,529
Ikeja 559 577 1,136 604 609 1,213 581 622 1,203
Ikorodu 1,992 2,063 4,055 1,892 2,021 3,913 1,532 1,633 3,165
Kosofe 1,037 1,038 2,075 971 997 1,968 815 917 1,732
Lagos Island 78 96 174 74 78 152 80 62 142
Lagos Mainland 718 837 1,555 698 953 1,651 549 740 1,289
Mushin 717 728 1,445 719 758 1,477 632 681 1,313
Ojo 4,168 4,790 8,958 3,849 4,132 7,981 2,660 2,696 5,356
Oshodi/Isolo 967 991 1,958 1,025 1,032 2,057 850 874 1,724
Shomolu 655 524 1,179 658 517 1,175 535 420 955
Surulere 945 1,032 1,977 921 1,101 2,022 935 1,057 1,992
Total 22,483 24,144 46,627 21,319 22,978 44,297 17,240 18,453 35,693
Lagos State School Census Report 2014-2015
18 September 2015
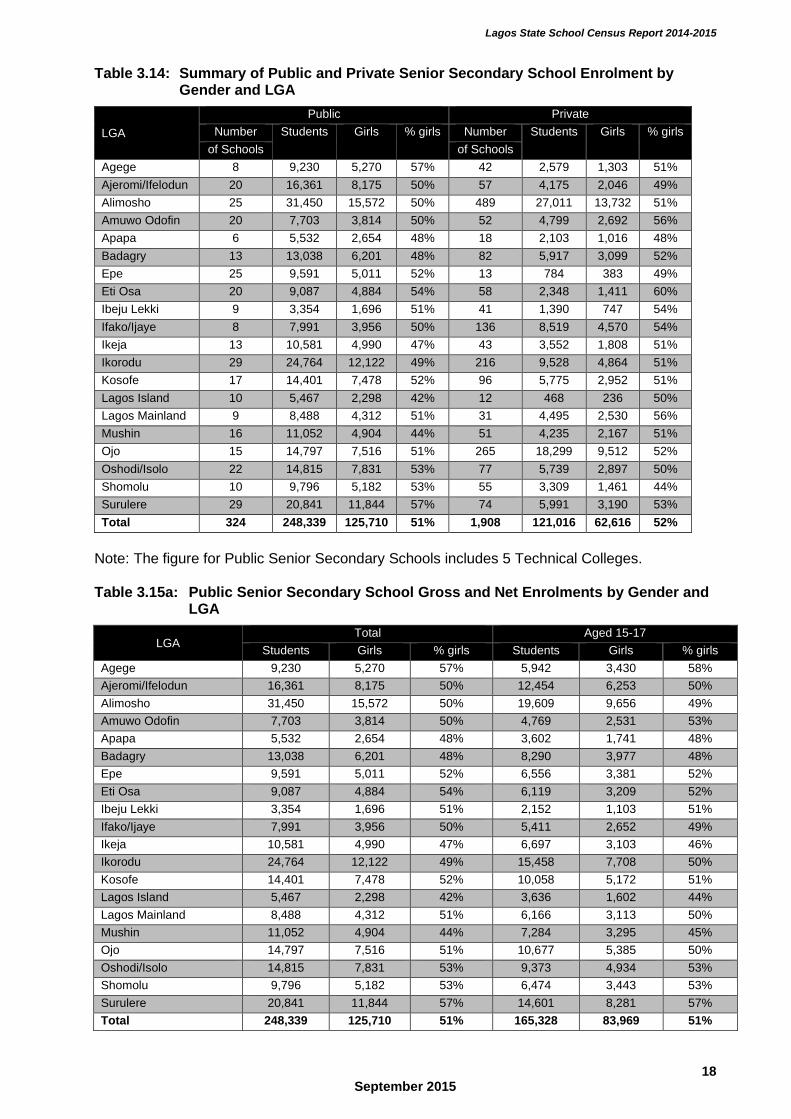
Table 3.14: Summary of Public and Private Senior Secondary School Enrolment by Gender and LGA
LGA
Public Private
Number Students Girls % girls Number Students Girls % girls
of Schools of Schools
Agege 8 9,230 5,270 57% 42 2,579 1,303 51%
Ajeromi/Ifelodun 20 16,361 8,175 50% 57 4,175 2,046 49%
Alimosho 25 31,450 15,572 50% 489 27,011 13,732 51%
Amuwo Odofin 20 7,703 3,814 50% 52 4,799 2,692 56%
Apapa 6 5,532 2,654 48% 18 2,103 1,016 48%
Badagry 13 13,038 6,201 48% 82 5,917 3,099 52%
Epe 25 9,591 5,011 52% 13 784 383 49%
Eti Osa 20 9,087 4,884 54% 58 2,348 1,411 60%
Ibeju Lekki 9 3,354 1,696 51% 41 1,390 747 54%
Ifako/Ijaye 8 7,991 3,956 50% 136 8,519 4,570 54%
Ikeja 13 10,581 4,990 47% 43 3,552 1,808 51%
Ikorodu 29 24,764 12,122 49% 216 9,528 4,864 51%
Kosofe 17 14,401 7,478 52% 96 5,775 2,952 51%
Lagos Island 10 5,467 2,298 42% 12 468 236 50%
Lagos Mainland 9 8,488 4,312 51% 31 4,495 2,530 56%
Mushin 16 11,052 4,904 44% 51 4,235 2,167 51%
Ojo 15 14,797 7,516 51% 265 18,299 9,512 52%
Oshodi/Isolo 22 14,815 7,831 53% 77 5,739 2,897 50%
Shomolu 10 9,796 5,182 53% 55 3,309 1,461 44%
Surulere 29 20,841 11,844 57% 74 5,991 3,190 53%
Total 324 248,339 125,710 51% 1,908 121,016 62,616 52%
Note: The figure for Public Senior Secondary Schools includes 5 Technical Colleges. Table 3.15a: Public Senior Secondary School Gross and Net Enrolments by Gender and
LGA
LGA Total Aged 15-17
Students Girls % girls Students Girls % girls
Agege 9,230 5,270 57% 5,942 3,430 58%
Ajeromi/Ifelodun 16,361 8,175 50% 12,454 6,253 50%
Alimosho 31,450 15,572 50% 19,609 9,656 49%
Amuwo Odofin 7,703 3,814 50% 4,769 2,531 53%
Apapa 5,532 2,654 48% 3,602 1,741 48%
Badagry 13,038 6,201 48% 8,290 3,977 48%
Epe 9,591 5,011 52% 6,556 3,381 52%
Eti Osa 9,087 4,884 54% 6,119 3,209 52%
Ibeju Lekki 3,354 1,696 51% 2,152 1,103 51%
Ifako/Ijaye 7,991 3,956 50% 5,411 2,652 49%
Ikeja 10,581 4,990 47% 6,697 3,103 46%
Ikorodu 24,764 12,122 49% 15,458 7,708 50%
Kosofe 14,401 7,478 52% 10,058 5,172 51%
Lagos Island 5,467 2,298 42% 3,636 1,602 44%
Lagos Mainland 8,488 4,312 51% 6,166 3,113 50%
Mushin 11,052 4,904 44% 7,284 3,295 45%
Ojo 14,797 7,516 51% 10,677 5,385 50%
Oshodi/Isolo 14,815 7,831 53% 9,373 4,934 53%
Shomolu 9,796 5,182 53% 6,474 3,443 53%
Surulere 20,841 11,844 57% 14,601 8,281 57%
Total 248,339 125,710 51% 165,328 83,969 51%
Lagos State School Census Report 2014-2015
19 September 2015
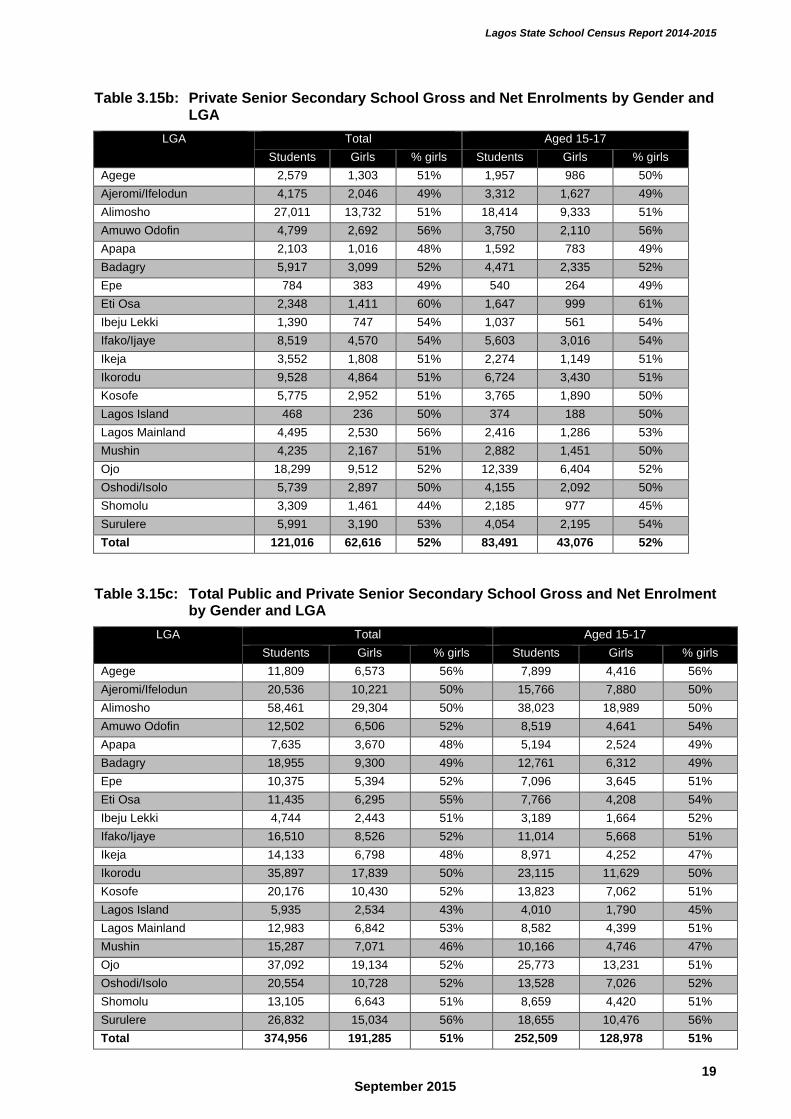
Table 3.15b: Private Senior Secondary School Gross and Net Enrolments by Gender and LGA
LGA Total Aged 15-17
Students Girls % girls Students Girls % girls
Agege 2,579 1,303 51% 1,957 986 50%
Ajeromi/Ifelodun 4,175 2,046 49% 3,312 1,627 49%
Alimosho 27,011 13,732 51% 18,414 9,333 51%
Amuwo Odofin 4,799 2,692 56% 3,750 2,110 56%
Apapa 2,103 1,016 48% 1,592 783 49%
Badagry 5,917 3,099 52% 4,471 2,335 52%
Epe 784 383 49% 540 264 49%
Eti Osa 2,348 1,411 60% 1,647 999 61%
Ibeju Lekki 1,390 747 54% 1,037 561 54%
Ifako/Ijaye 8,519 4,570 54% 5,603 3,016 54%
Ikeja 3,552 1,808 51% 2,274 1,149 51%
Ikorodu 9,528 4,864 51% 6,724 3,430 51%
Kosofe 5,775 2,952 51% 3,765 1,890 50%
Lagos Island 468 236 50% 374 188 50%
Lagos Mainland 4,495 2,530 56% 2,416 1,286 53%
Mushin 4,235 2,167 51% 2,882 1,451 50%
Ojo 18,299 9,512 52% 12,339 6,404 52%
Oshodi/Isolo 5,739 2,897 50% 4,155 2,092 50%
Shomolu 3,309 1,461 44% 2,185 977 45%
Surulere 5,991 3,190 53% 4,054 2,195 54%
Total 121,016 62,616 52% 83,491 43,076 52%
Table 3.15c: Total Public and Private Senior Secondary School Gross and Net Enrolment by Gender and LGA
LGA Total Aged 15-17
Students Girls % girls Students Girls % girls
Agege 11,809 6,573 56% 7,899 4,416 56%
Ajeromi/Ifelodun 20,536 10,221 50% 15,766 7,880 50%
Alimosho 58,461 29,304 50% 38,023 18,989 50%
Amuwo Odofin 12,502 6,506 52% 8,519 4,641 54%
Apapa 7,635 3,670 48% 5,194 2,524 49%
Badagry 18,955 9,300 49% 12,761 6,312 49%
Epe 10,375 5,394 52% 7,096 3,645 51%
Eti Osa 11,435 6,295 55% 7,766 4,208 54%
Ibeju Lekki 4,744 2,443 51% 3,189 1,664 52%
Ifako/Ijaye 16,510 8,526 52% 11,014 5,668 51%
Ikeja 14,133 6,798 48% 8,971 4,252 47%
Ikorodu 35,897 17,839 50% 23,115 11,629 50%
Kosofe 20,176 10,430 52% 13,823 7,062 51%
Lagos Island 5,935 2,534 43% 4,010 1,790 45%
Lagos Mainland 12,983 6,842 53% 8,582 4,399 51%
Mushin 15,287 7,071 46% 10,166 4,746 47%
Ojo 37,092 19,134 52% 25,773 13,231 51%
Oshodi/Isolo 20,554 10,728 52% 13,528 7,026 52%
Shomolu 13,105 6,643 51% 8,659 4,420 51%
Surulere 26,832 15,034 56% 18,655 10,476 56%
Total 374,956 191,285 51% 252,509 128,978 51%
Lagos State School Census Report 2014-2015
20 September 2015
Figure 3.7: Public and Private Senior Secondary Schools Enrolment
Figure 3.8: Total Senior Secondary Schools Enrolment by LGA
Lagos State School Census Report 2014-2015
21 September 2015
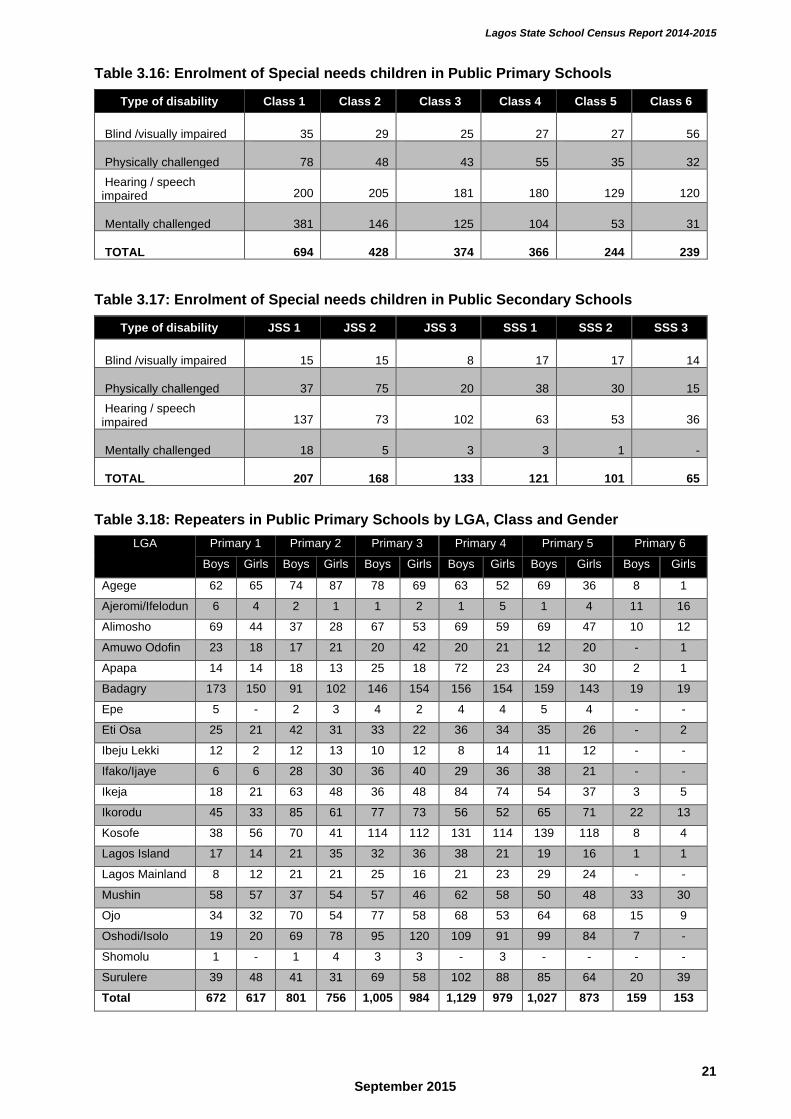
Table 3.16: Enrolment of Special needs children in Public Primary Schools
Type of disability Class 1 Class 2 Class 3 Class 4 Class 5 Class 6
Blind /visually impaired
35
29
25
27
27
56
Physically challenged
78
48
43
55
35
32
Hearing / speech impaired
200
205
181
180
129
120
Mentally challenged
381
146
125
104
53
31
TOTAL
694
428
374
366
244
239
Table 3.17: Enrolment of Special needs children in Public Secondary Schools
Type of disability JSS 1 JSS 2 JSS 3 SSS 1 SSS 2 SSS 3
Blind /visually impaired
15
15
8
17
17
14
Physically challenged
37
75
20
38
30
15
Hearing / speech impaired
137
73
102
63
53
36
Mentally challenged
18
5
3
3
1
-
TOTAL
207
168
133
121
101
65
Table 3.18: Repeaters in Public Primary Schools by LGA, Class and Gender
LGA Primary 1 Primary 2 Primary 3 Primary 4 Primary 5 Primary 6
Boys Girls Boys Girls Boys Girls Boys Girls Boys Girls Boys Girls
Agege 62 65 74 87 78 69 63 52 69 36 8 1
Ajeromi/Ifelodun 6 4 2 1 1 2 1 5 1 4 11 16
Alimosho 69 44 37 28 67 53 69 59 69 47 10 12
Amuwo Odofin 23 18 17 21 20 42 20 21 12 20 - 1
Apapa 14 14 18 13 25 18 72 23 24 30 2 1
Badagry 173 150 91 102 146 154 156 154 159 143 19 19
Epe 5 - 2 3 4 2 4 4 5 4 - -
Eti Osa 25 21 42 31 33 22 36 34 35 26 - 2
Ibeju Lekki 12 2 12 13 10 12 8 14 11 12 - -
Ifako/Ijaye 6 6 28 30 36 40 29 36 38 21 - -
Ikeja 18 21 63 48 36 48 84 74 54 37 3 5
Ikorodu 45 33 85 61 77 73 56 52 65 71 22 13
Kosofe 38 56 70 41 114 112 131 114 139 118 8 4
Lagos Island 17 14 21 35 32 36 38 21 19 16 1 1
Lagos Mainland 8 12 21 21 25 16 21 23 29 24 - -
Mushin 58 57 37 54 57 46 62 58 50 48 33 30
Ojo 34 32 70 54 77 58 68 53 64 68 15 9
Oshodi/Isolo 19 20 69 78 95 120 109 91 99 84 7 -
Shomolu 1 - 1 4 3 3 - 3 - - - -
Surulere 39 48 41 31 69 58 102 88 85 64 20 39
Total 672 617 801 756 1,005 984 1,129 979 1,027 873 159 153
Lagos State School Census Report 2014-2015
22 September 2015
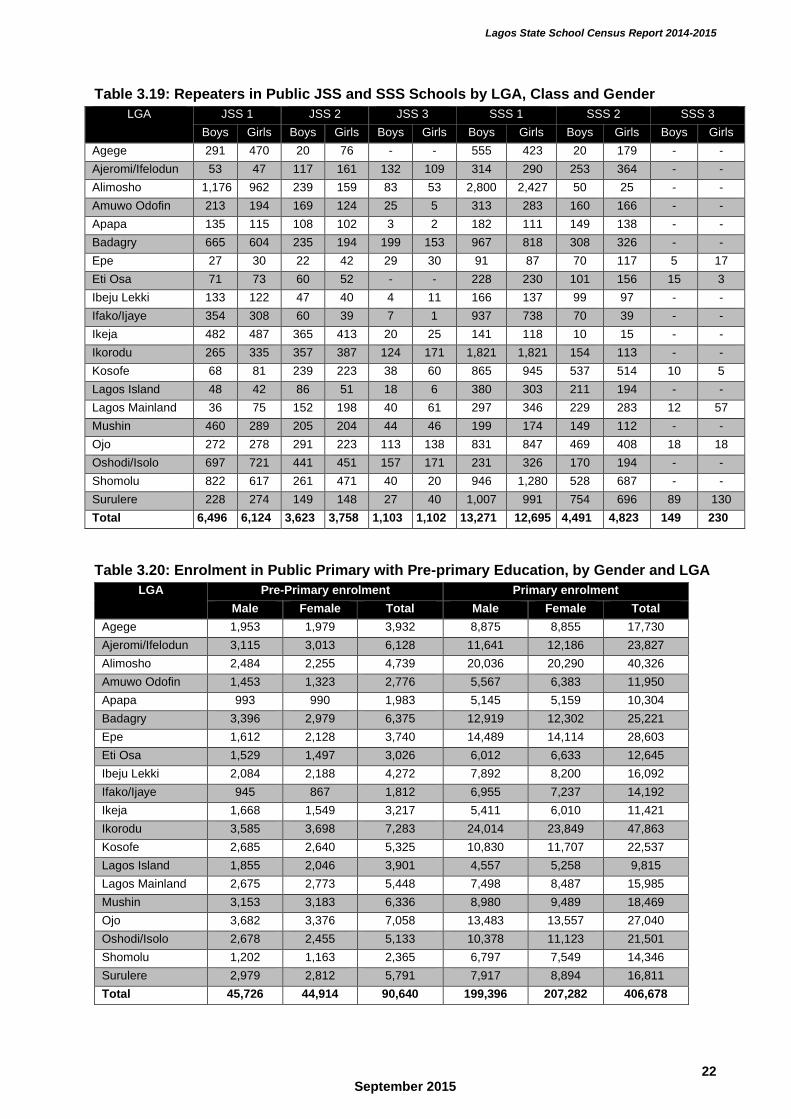
Table 3.19: Repeaters in Public JSS and SSS Schools by LGA, Class and Gender
LGA JSS 1 JSS 2 JSS 3 SSS 1 SSS 2 SSS 3
Boys Girls Boys Girls Boys Girls Boys Girls Boys Girls Boys Girls
Agege 291 470 20 76 - - 555 423 20 179 - -
Ajeromi/Ifelodun 53 47 117 161 132 109 314 290 253 364 - -
Alimosho 1,176 962 239 159 83 53 2,800 2,427 50 25 - -
Amuwo Odofin 213 194 169 124 25 5 313 283 160 166 - -
Apapa 135 115 108 102 3 2 182 111 149 138 - -
Badagry 665 604 235 194 199 153 967 818 308 326 - -
Epe 27 30 22 42 29 30 91 87 70 117 5 17
Eti Osa 71 73 60 52 - - 228 230 101 156 15 3
Ibeju Lekki 133 122 47 40 4 11 166 137 99 97 - -
Ifako/Ijaye 354 308 60 39 7 1 937 738 70 39 - -
Ikeja 482 487 365 413 20 25 141 118 10 15 - -
Ikorodu 265 335 357 387 124 171 1,821 1,821 154 113 - -
Kosofe 68 81 239 223 38 60 865 945 537 514 10 5
Lagos Island 48 42 86 51 18 6 380 303 211 194 - -
Lagos Mainland 36 75 152 198 40 61 297 346 229 283 12 57
Mushin 460 289 205 204 44 46 199 174 149 112 - -
Ojo 272 278 291 223 113 138 831 847 469 408 18 18
Oshodi/Isolo 697 721 441 451 157 171 231 326 170 194 - -
Shomolu 822 617 261 471 40 20 946 1,280 528 687 - -
Surulere 228 274 149 148 27 40 1,007 991 754 696 89 130
Total 6,496 6,124 3,623 3,758 1,103 1,102 13,271 12,695 4,491 4,823 149 230
Table 3.20: Enrolment in Public Primary with Pre-primary Education, by Gender and LGA
LGA Pre-Primary enrolment Primary enrolment
Male Female Total Male Female Total
Agege 1,953 1,979 3,932 8,875 8,855 17,730
Ajeromi/Ifelodun 3,115 3,013 6,128 11,641 12,186 23,827
Alimosho 2,484 2,255 4,739 20,036 20,290 40,326
Amuwo Odofin 1,453 1,323 2,776 5,567 6,383 11,950
Apapa 993 990 1,983 5,145 5,159 10,304
Badagry 3,396 2,979 6,375 12,919 12,302 25,221
Epe 1,612 2,128 3,740 14,489 14,114 28,603
Eti Osa 1,529 1,497 3,026 6,012 6,633 12,645
Ibeju Lekki 2,084 2,188 4,272 7,892 8,200 16,092
Ifako/Ijaye 945 867 1,812 6,955 7,237 14,192
Ikeja 1,668 1,549 3,217 5,411 6,010 11,421
Ikorodu 3,585 3,698 7,283 24,014 23,849 47,863
Kosofe 2,685 2,640 5,325 10,830 11,707 22,537
Lagos Island 1,855 2,046 3,901 4,557 5,258 9,815
Lagos Mainland 2,675 2,773 5,448 7,498 8,487 15,985
Mushin 3,153 3,183 6,336 8,980 9,489 18,469
Ojo 3,682 3,376 7,058 13,483 13,557 27,040
Oshodi/Isolo 2,678 2,455 5,133 10,378 11,123 21,501
Shomolu 1,202 1,163 2,365 6,797 7,549 14,346
Surulere 2,979 2,812 5,791 7,917 8,894 16,811
Total 45,726 44,914 90,640 199,396 207,282 406,678
Lagos State School Census Report 2014-2015
23 September 2015
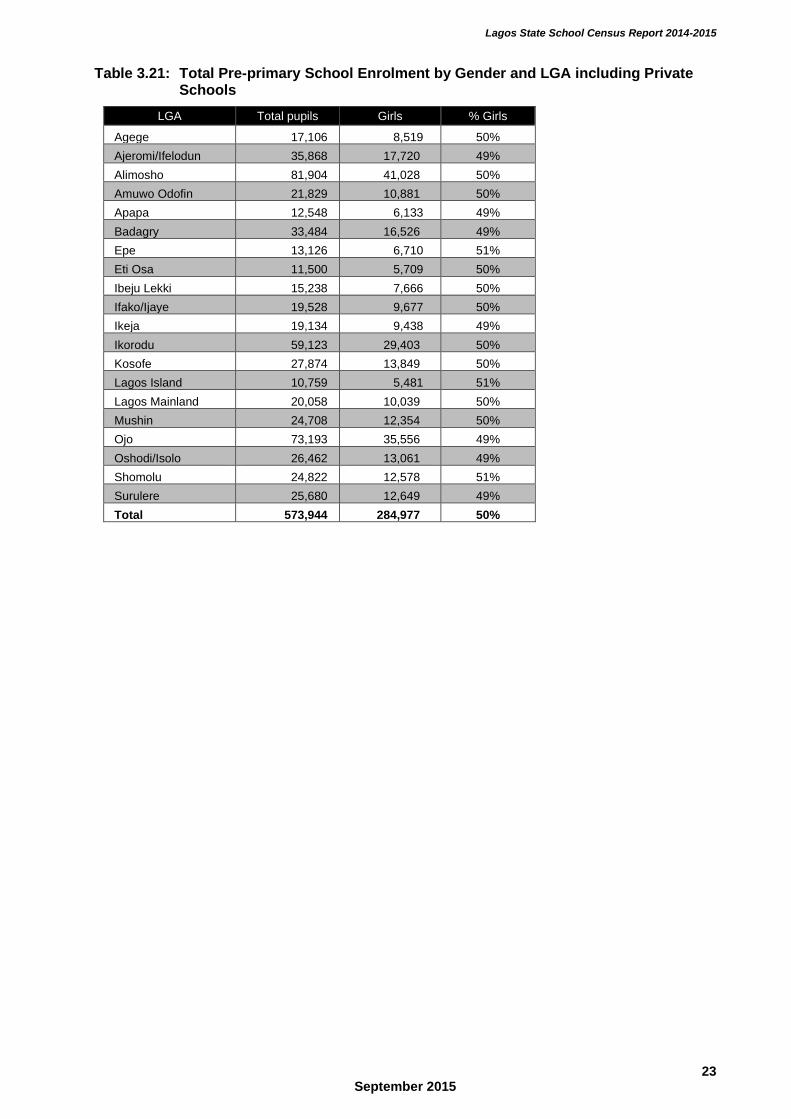
Table 3.21: Total Pre-primary School Enrolment by Gender and LGA including Private Schools
LGA Total pupils Girls % Girls
Agege 17,106 8,519 50%
Ajeromi/Ifelodun 35,868 17,720 49%
Alimosho 81,904 41,028 50%
Amuwo Odofin 21,829 10,881 50%
Apapa 12,548 6,133 49%
Badagry 33,484 16,526 49%
Epe 13,126 6,710 51%
Eti Osa 11,500 5,709 50%
Ibeju Lekki 15,238 7,666 50%
Ifako/Ijaye 19,528 9,677 50%
Ikeja 19,134 9,438 49%
Ikorodu 59,123 29,403 50%
Kosofe 27,874 13,849 50%
Lagos Island 10,759 5,481 51%
Lagos Mainland 20,058 10,039 50%
Mushin 24,708 12,354 50%
Ojo 73,193 35,556 49%
Oshodi/Isolo 26,462 13,061 49%
Shomolu 24,822 12,578 51%
Surulere 25,680 12,649 49%
Total 573,944 284,977 50%
Lagos State School Census Report 2014-2015
24 September 2015
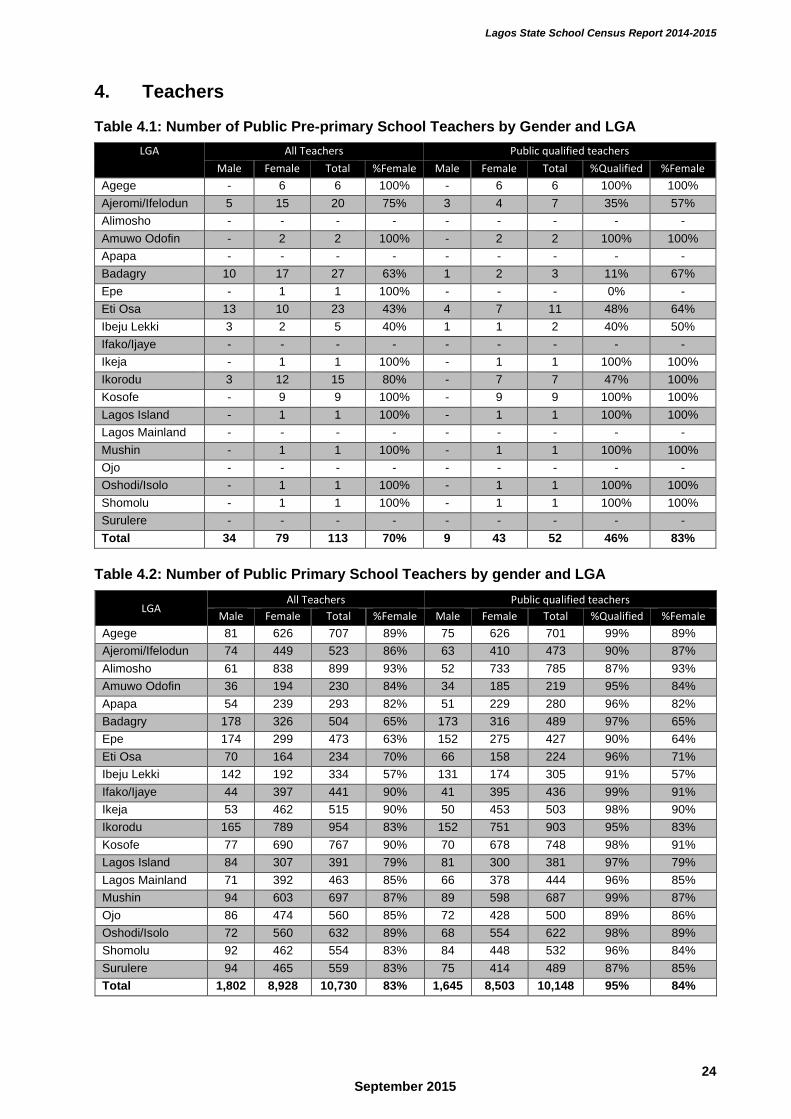
4. Teachers
Table 4.1: Number of Public Pre-primary School Teachers by Gender and LGA
LGA All Teachers Public qualified teachers
Male Female Total %Female Male Female Total %Qualified %Female
Agege - 6 6 100% - 6 6 100% 100%
Ajeromi/Ifelodun 5 15 20 75% 3 4 7 35% 57%
Alimosho - - - - - - - - -
Amuwo Odofin - 2 2 100% - 2 2 100% 100%
Apapa - - - - - - - - -
Badagry 10 17 27 63% 1 2 3 11% 67%
Epe - 1 1 100% - - - 0% -
Eti Osa 13 10 23 43% 4 7 11 48% 64%
Ibeju Lekki 3 2 5 40% 1 1 2 40% 50%
Ifako/Ijaye - - - - - - - - -
Ikeja - 1 1 100% - 1 1 100% 100%
Ikorodu 3 12 15 80% - 7 7 47% 100%
Kosofe - 9 9 100% - 9 9 100% 100%
Lagos Island - 1 1 100% - 1 1 100% 100%
Lagos Mainland - - - - - - - - -
Mushin - 1 1 100% - 1 1 100% 100%
Ojo - - - - - - - - -
Oshodi/Isolo - 1 1 100% - 1 1 100% 100%
Shomolu - 1 1 100% - 1 1 100% 100%
Surulere - - - - - - - - -
Total 34 79 113 70% 9 43 52 46% 83%
Table 4.2: Number of Public Primary School Teachers by gender and LGA
LGA All Teachers Public qualified teachers
Male Female Total %Female Male Female Total %Qualified %Female
Agege 81 626 707 89% 75 626 701 99% 89%
Ajeromi/Ifelodun 74 449 523 86% 63 410 473 90% 87%
Alimosho 61 838 899 93% 52 733 785 87% 93%
Amuwo Odofin 36 194 230 84% 34 185 219 95% 84%
Apapa 54 239 293 82% 51 229 280 96% 82%
Badagry 178 326 504 65% 173 316 489 97% 65%
Epe 174 299 473 63% 152 275 427 90% 64%
Eti Osa 70 164 234 70% 66 158 224 96% 71%
Ibeju Lekki 142 192 334 57% 131 174 305 91% 57%
Ifako/Ijaye 44 397 441 90% 41 395 436 99% 91%
Ikeja 53 462 515 90% 50 453 503 98% 90%
Ikorodu 165 789 954 83% 152 751 903 95% 83%
Kosofe 77 690 767 90% 70 678 748 98% 91%
Lagos Island 84 307 391 79% 81 300 381 97% 79%
Lagos Mainland 71 392 463 85% 66 378 444 96% 85%
Mushin 94 603 697 87% 89 598 687 99% 87%
Ojo 86 474 560 85% 72 428 500 89% 86%
Oshodi/Isolo 72 560 632 89% 68 554 622 98% 89%
Shomolu 92 462 554 83% 84 448 532 96% 84%
Surulere 94 465 559 83% 75 414 489 87% 85%
Total 1,802 8,928 10,730 83% 1,645 8,503 10,148 95% 84%
Lagos State School Census Report 2014-2015
25 September 2015
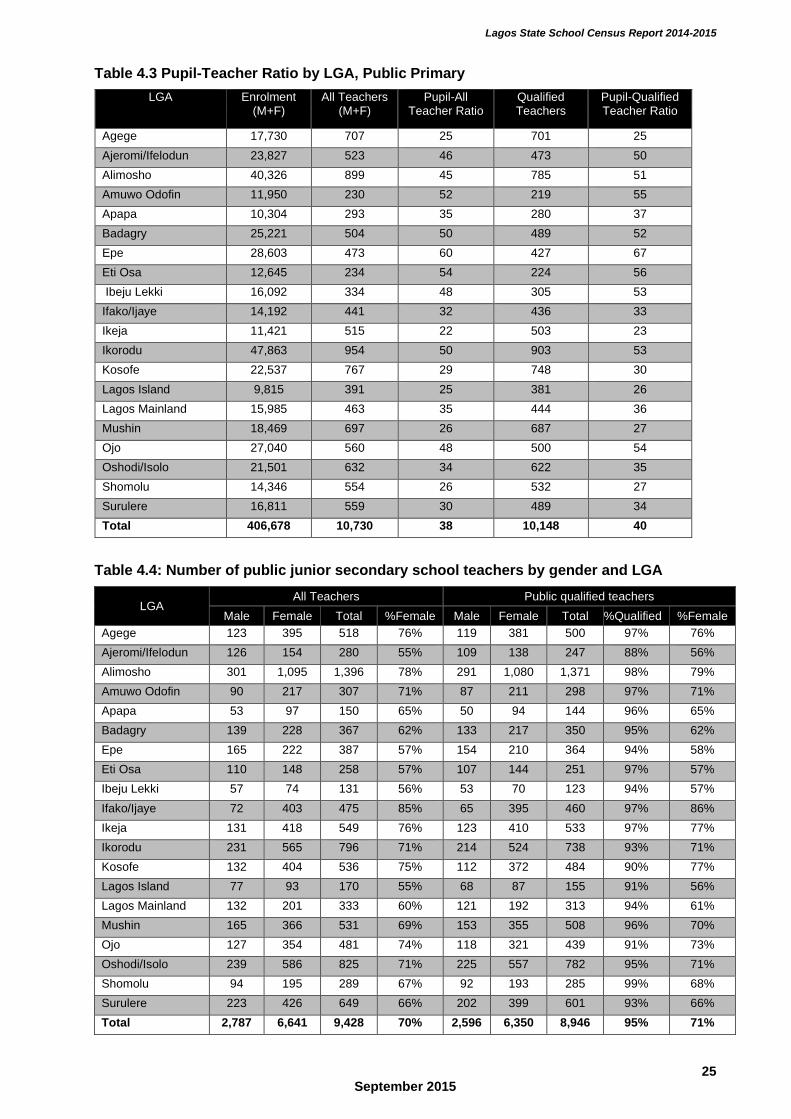
Table 4.3 Pupil-Teacher Ratio by LGA, Public Primary
LGA Enrolment (M+F)
All Teachers (M+F)
Pupil-All Teacher Ratio
Qualified Teachers
Pupil-Qualified Teacher Ratio
Agege 17,730 707 25 701 25
Ajeromi/Ifelodun 23,827 523 46 473 50
Alimosho 40,326 899 45 785 51
Amuwo Odofin 11,950 230 52 219 55
Apapa 10,304 293 35 280 37
Badagry 25,221 504 50 489 52
Epe 28,603 473 60 427 67
Eti Osa 12,645 234 54 224 56
Ibeju Lekki 16,092 334 48 305 53
Ifako/Ijaye 14,192 441 32 436 33
Ikeja 11,421 515 22 503 23
Ikorodu 47,863 954 50 903 53
Kosofe 22,537 767 29 748 30
Lagos Island 9,815 391 25 381 26
Lagos Mainland 15,985 463 35 444 36
Mushin 18,469 697 26 687 27
Ojo 27,040 560 48 500 54
Oshodi/Isolo 21,501 632 34 622 35
Shomolu 14,346 554 26 532 27
Surulere 16,811 559 30 489 34
Total 406,678 10,730 38 10,148 40
Table 4.4: Number of public junior secondary school teachers by gender and LGA
LGA All Teachers Public qualified teachers
Male Female Total %Female Male Female Total %Qualified %Female
Agege 123 395 518 76% 119 381 500 97% 76%
Ajeromi/Ifelodun 126 154 280 55% 109 138 247 88% 56%
Alimosho 301 1,095 1,396 78% 291 1,080 1,371 98% 79%
Amuwo Odofin 90 217 307 71% 87 211 298 97% 71%
Apapa 53 97 150 65% 50 94 144 96% 65%
Badagry 139 228 367 62% 133 217 350 95% 62%
Epe 165 222 387 57% 154 210 364 94% 58%
Eti Osa 110 148 258 57% 107 144 251 97% 57%
Ibeju Lekki 57 74 131 56% 53 70 123 94% 57%
Ifako/Ijaye 72 403 475 85% 65 395 460 97% 86%
Ikeja 131 418 549 76% 123 410 533 97% 77%
Ikorodu 231 565 796 71% 214 524 738 93% 71%
Kosofe 132 404 536 75% 112 372 484 90% 77%
Lagos Island 77 93 170 55% 68 87 155 91% 56%
Lagos Mainland 132 201 333 60% 121 192 313 94% 61%
Mushin 165 366 531 69% 153 355 508 96% 70%
Ojo 127 354 481 74% 118 321 439 91% 73%
Oshodi/Isolo 239 586 825 71% 225 557 782 95% 71%
Shomolu 94 195 289 67% 92 193 285 99% 68%
Surulere 223 426 649 66% 202 399 601 93% 66%
Total 2,787 6,641 9,428 70% 2,596 6,350 8,946 95% 71%
Lagos State School Census Report 2014-2015
26 September 2015
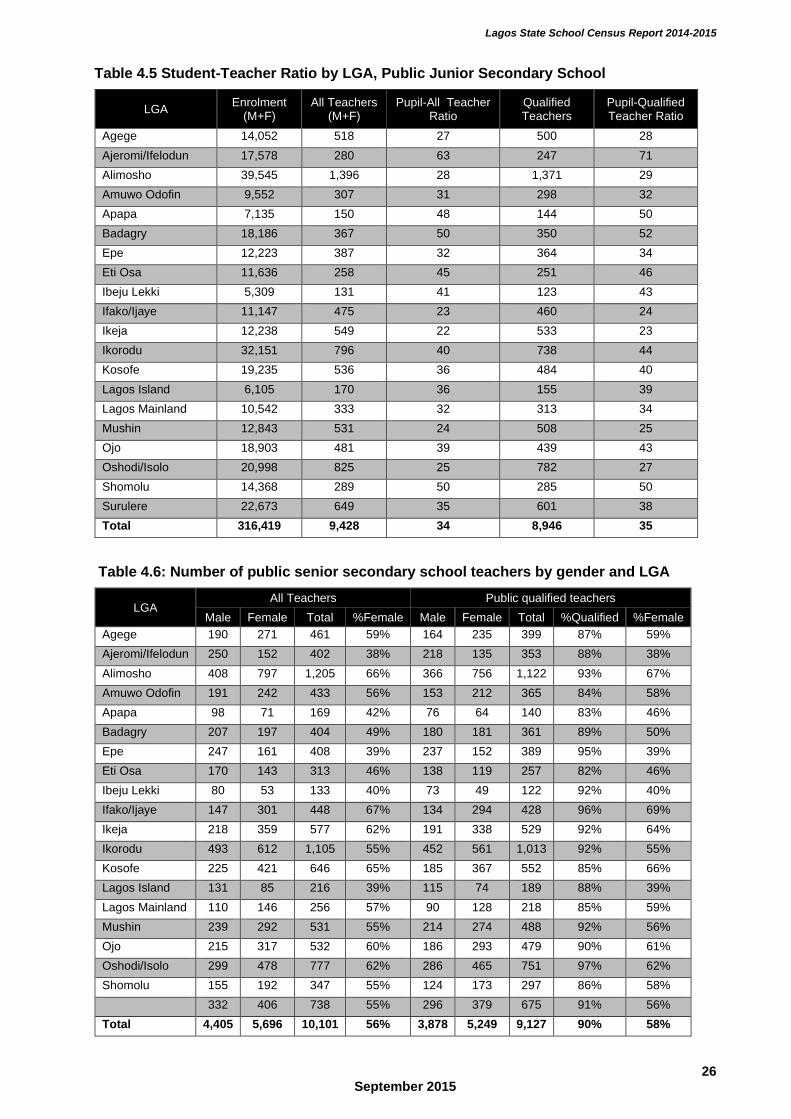
Table 4.5 Student-Teacher Ratio by LGA, Public Junior Secondary School
LGA Enrolment
(M+F) All Teachers
(M+F) Pupil-All Teacher
Ratio Qualified Teachers
Pupil-Qualified Teacher Ratio
Agege 14,052 518 27 500 28
Ajeromi/Ifelodun 17,578 280 63 247 71
Alimosho 39,545 1,396 28 1,371 29
Amuwo Odofin 9,552 307 31 298 32
Apapa 7,135 150 48 144 50
Badagry 18,186 367 50 350 52
Epe 12,223 387 32 364 34
Eti Osa 11,636 258 45 251 46
Ibeju Lekki 5,309 131 41 123 43
Ifako/Ijaye 11,147 475 23 460 24
Ikeja 12,238 549 22 533 23
Ikorodu 32,151 796 40 738 44
Kosofe 19,235 536 36 484 40
Lagos Island 6,105 170 36 155 39
Lagos Mainland 10,542 333 32 313 34
Mushin 12,843 531 24 508 25
Ojo 18,903 481 39 439 43
Oshodi/Isolo 20,998 825 25 782 27
Shomolu 14,368 289 50 285 50
Surulere 22,673 649 35 601 38
Total 316,419 9,428 34 8,946 35
Table 4.6: Number of public senior secondary school teachers by gender and LGA
LGA All Teachers Public qualified teachers
Male Female Total %Female Male Female Total %Qualified %Female
Agege 190 271 461 59% 164 235 399 87% 59%
Ajeromi/Ifelodun 250 152 402 38% 218 135 353 88% 38%
Alimosho 408 797 1,205 66% 366 756 1,122 93% 67%
Amuwo Odofin 191 242 433 56% 153 212 365 84% 58%
Apapa 98 71 169 42% 76 64 140 83% 46%
Badagry 207 197 404 49% 180 181 361 89% 50%
Epe 247 161 408 39% 237 152 389 95% 39%
Eti Osa 170 143 313 46% 138 119 257 82% 46%
Ibeju Lekki 80 53 133 40% 73 49 122 92% 40%
Ifako/Ijaye 147 301 448 67% 134 294 428 96% 69%
Ikeja 218 359 577 62% 191 338 529 92% 64%
Ikorodu 493 612 1,105 55% 452 561 1,013 92% 55%
Kosofe 225 421 646 65% 185 367 552 85% 66%
Lagos Island 131 85 216 39% 115 74 189 88% 39%
Lagos Mainland 110 146 256 57% 90 128 218 85% 59%
Mushin 239 292 531 55% 214 274 488 92% 56%
Ojo 215 317 532 60% 186 293 479 90% 61%
Oshodi/Isolo 299 478 777 62% 286 465 751 97% 62%
Shomolu 155 192 347 55% 124 173 297 86% 58%
332 406 738 55% 296 379 675 91% 56%
Total 4,405 5,696 10,101 56% 3,878 5,249 9,127 90% 58%
Lagos State School Census Report 2014-2015
27 September 2015
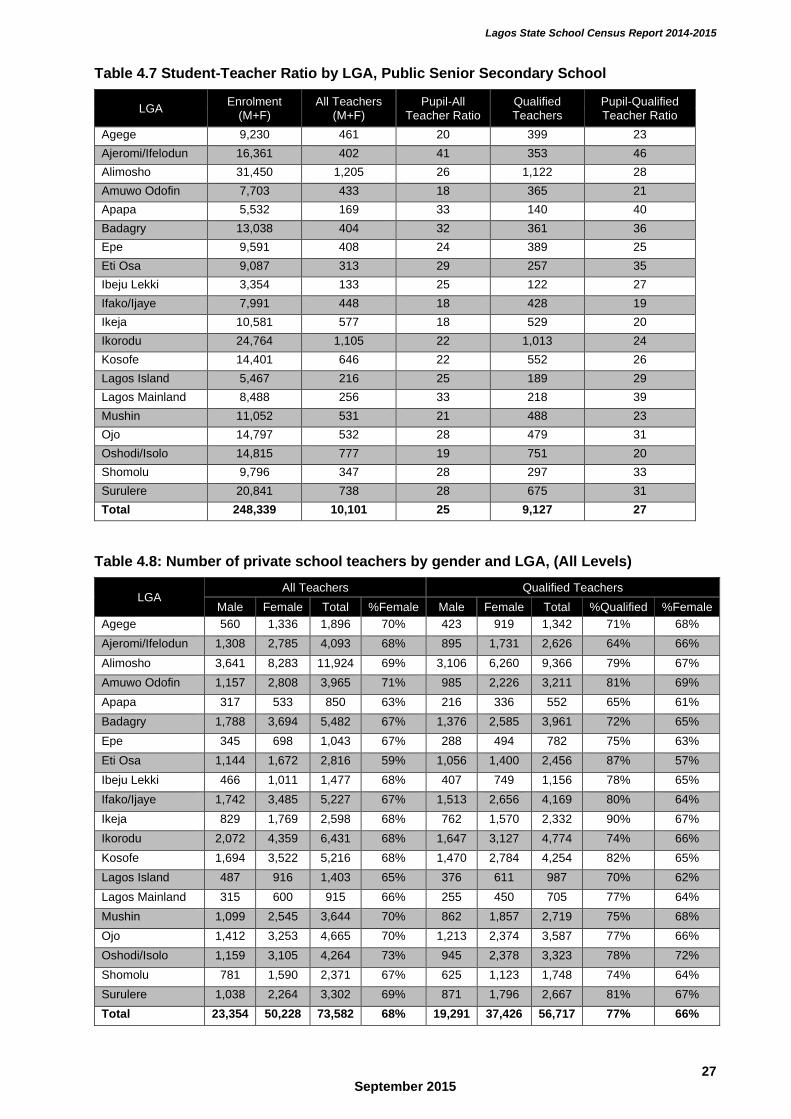
Table 4.7 Student-Teacher Ratio by LGA, Public Senior Secondary School
LGA Enrolment
(M+F) All Teachers
(M+F) Pupil-All
Teacher Ratio Qualified Teachers
Pupil-Qualified Teacher Ratio
Agege 9,230 461 20 399 23
Ajeromi/Ifelodun 16,361 402 41 353 46
Alimosho 31,450 1,205 26 1,122 28
Amuwo Odofin 7,703 433 18 365 21
Apapa 5,532 169 33 140 40
Badagry 13,038 404 32 361 36
Epe 9,591 408 24 389 25
Eti Osa 9,087 313 29 257 35
Ibeju Lekki 3,354 133 25 122 27
Ifako/Ijaye 7,991 448 18 428 19
Ikeja 10,581 577 18 529 20
Ikorodu 24,764 1,105 22 1,013 24
Kosofe 14,401 646 22 552 26
Lagos Island 5,467 216 25 189 29
Lagos Mainland 8,488 256 33 218 39
Mushin 11,052 531 21 488 23
Ojo 14,797 532 28 479 31
Oshodi/Isolo 14,815 777 19 751 20
Shomolu 9,796 347 28 297 33
Surulere 20,841 738 28 675 31
Total 248,339 10,101 25 9,127 27
Table 4.8: Number of private school teachers by gender and LGA, (All Levels)
LGA All Teachers Qualified Teachers
Male Female Total %Female Male Female Total %Qualified %Female
Agege 560 1,336 1,896 70% 423 919 1,342 71% 68%
Ajeromi/Ifelodun 1,308 2,785 4,093 68% 895 1,731 2,626 64% 66%
Alimosho 3,641 8,283 11,924 69% 3,106 6,260 9,366 79% 67%
Amuwo Odofin 1,157 2,808 3,965 71% 985 2,226 3,211 81% 69%
Apapa 317 533 850 63% 216 336 552 65% 61%
Badagry 1,788 3,694 5,482 67% 1,376 2,585 3,961 72% 65%
Epe 345 698 1,043 67% 288 494 782 75% 63%
Eti Osa 1,144 1,672 2,816 59% 1,056 1,400 2,456 87% 57%
Ibeju Lekki 466 1,011 1,477 68% 407 749 1,156 78% 65%
Ifako/Ijaye 1,742 3,485 5,227 67% 1,513 2,656 4,169 80% 64%
Ikeja 829 1,769 2,598 68% 762 1,570 2,332 90% 67%
Ikorodu 2,072 4,359 6,431 68% 1,647 3,127 4,774 74% 66%
Kosofe 1,694 3,522 5,216 68% 1,470 2,784 4,254 82% 65%
Lagos Island 487 916 1,403 65% 376 611 987 70% 62%
Lagos Mainland 315 600 915 66% 255 450 705 77% 64%
Mushin 1,099 2,545 3,644 70% 862 1,857 2,719 75% 68%
Ojo 1,412 3,253 4,665 70% 1,213 2,374 3,587 77% 66%
Oshodi/Isolo 1,159 3,105 4,264 73% 945 2,378 3,323 78% 72%
Shomolu 781 1,590 2,371 67% 625 1,123 1,748 74% 64%
Surulere 1,038 2,264 3,302 69% 871 1,796 2,667 81% 67%
Total 23,354 50,228 73,582 68% 19,291 37,426 56,717 77% 66%
Lagos State School Census Report 2014-2015
28 September 2015
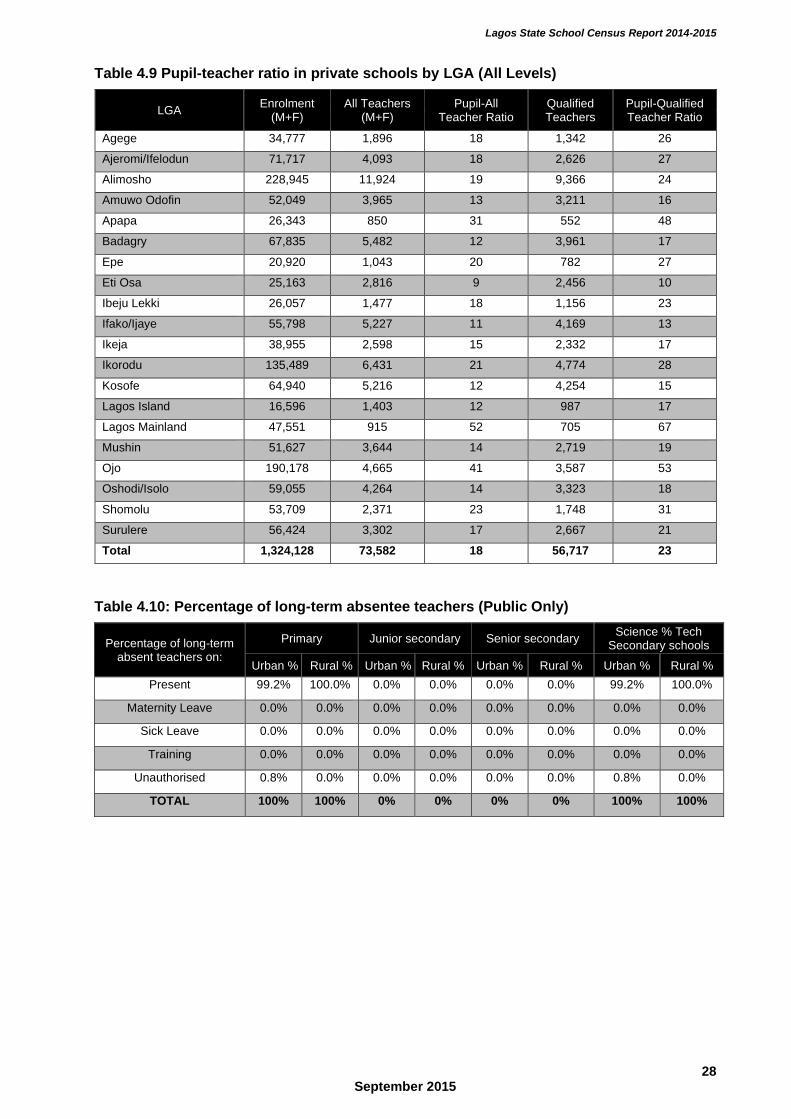
Table 4.9 Pupil-teacher ratio in private schools by LGA (All Levels)
LGA Enrolment
(M+F) All Teachers
(M+F) Pupil-All
Teacher Ratio Qualified Teachers
Pupil-Qualified Teacher Ratio
Agege 34,777 1,896 18 1,342 26
Ajeromi/Ifelodun 71,717 4,093 18 2,626 27
Alimosho 228,945 11,924 19 9,366 24
Amuwo Odofin 52,049 3,965 13 3,211 16
Apapa 26,343 850 31 552 48
Badagry 67,835 5,482 12 3,961 17
Epe 20,920 1,043 20 782 27
Eti Osa 25,163 2,816 9 2,456 10
Ibeju Lekki 26,057 1,477 18 1,156 23
Ifako/Ijaye 55,798 5,227 11 4,169 13
Ikeja 38,955 2,598 15 2,332 17
Ikorodu 135,489 6,431 21 4,774 28
Kosofe 64,940 5,216 12 4,254 15
Lagos Island 16,596 1,403 12 987 17
Lagos Mainland 47,551 915 52 705 67
Mushin 51,627 3,644 14 2,719 19
Ojo 190,178 4,665 41 3,587 53
Oshodi/Isolo 59,055 4,264 14 3,323 18
Shomolu 53,709 2,371 23 1,748 31
Surulere 56,424 3,302 17 2,667 21
Total 1,324,128 73,582 18 56,717 23
Table 4.10: Percentage of long-term absentee teachers (Public Only)
Percentage of long-term absent teachers on:
Primary Junior secondary Senior secondary Science % Tech
Secondary schools
Urban % Rural % Urban % Rural % Urban % Rural % Urban % Rural %
Present 99.2% 100.0% 0.0% 0.0% 0.0% 0.0% 99.2% 100.0%
Maternity Leave 0.0% 0.0% 0.0% 0.0% 0.0% 0.0% 0.0% 0.0%
Sick Leave 0.0% 0.0% 0.0% 0.0% 0.0% 0.0% 0.0% 0.0%
Training 0.0% 0.0% 0.0% 0.0% 0.0% 0.0% 0.0% 0.0%
Unauthorised 0.8% 0.0% 0.0% 0.0% 0.0% 0.0% 0.8% 0.0%
TOTAL 100% 100% 0% 0% 0% 0% 100% 100%
Lagos State School Census Report 2014-2015
29 September 2015
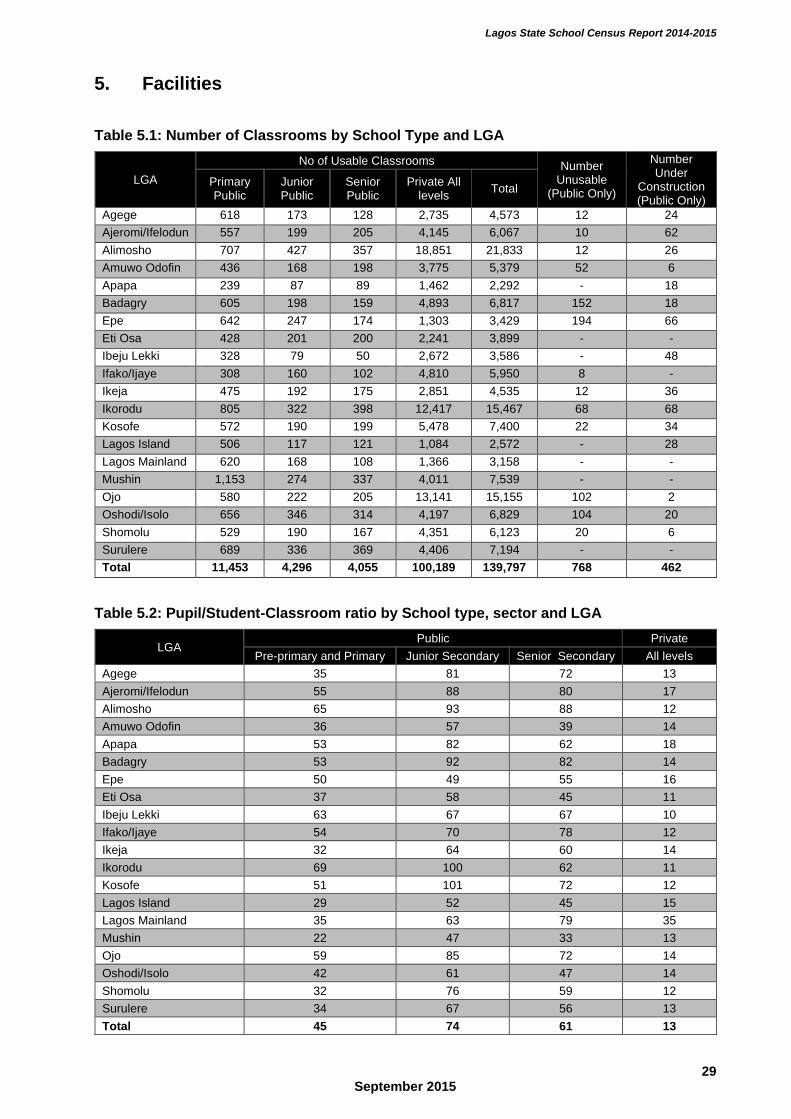
5. Facilities
Table 5.1: Number of Classrooms by School Type and LGA
LGA
No of Usable Classrooms Number Unusable
(Public Only)
Number Under
Construction (Public Only)
Primary Public
Junior Public
Senior Public
Private All levels
Total
Agege 618 173 128 2,735 4,573 12 24
Ajeromi/Ifelodun 557 199 205 4,145 6,067 10 62
Alimosho 707 427 357 18,851 21,833 12 26
Amuwo Odofin 436 168 198 3,775 5,379 52 6
Apapa 239 87 89 1,462 2,292 - 18
Badagry 605 198 159 4,893 6,817 152 18
Epe 642 247 174 1,303 3,429 194 66
Eti Osa 428 201 200 2,241 3,899 - -
Ibeju Lekki 328 79 50 2,672 3,586 - 48
Ifako/Ijaye 308 160 102 4,810 5,950 8 -
Ikeja 475 192 175 2,851 4,535 12 36
Ikorodu 805 322 398 12,417 15,467 68 68
Kosofe 572 190 199 5,478 7,400 22 34
Lagos Island 506 117 121 1,084 2,572 - 28
Lagos Mainland 620 168 108 1,366 3,158 - -
Mushin 1,153 274 337 4,011 7,539 - -
Ojo 580 222 205 13,141 15,155 102 2
Oshodi/Isolo 656 346 314 4,197 6,829 104 20
Shomolu 529 190 167 4,351 6,123 20 6
Surulere 689 336 369 4,406 7,194 - -
Total 11,453 4,296 4,055 100,189 139,797 768 462
Table 5.2: Pupil/Student-Classroom ratio by School type, sector and LGA
LGA Public Private
Pre-primary and Primary Junior Secondary Senior Secondary All levels
Agege 35 81 72 13
Ajeromi/Ifelodun 55 88 80 17
Alimosho 65 93 88 12
Amuwo Odofin 36 57 39 14
Apapa 53 82 62 18
Badagry 53 92 82 14
Epe 50 49 55 16
Eti Osa 37 58 45 11
Ibeju Lekki 63 67 67 10
Ifako/Ijaye 54 70 78 12
Ikeja 32 64 60 14
Ikorodu 69 100 62 11
Kosofe 51 101 72 12
Lagos Island 29 52 45 15
Lagos Mainland 35 63 79 35
Mushin 22 47 33 13
Ojo 59 85 72 14
Oshodi/Isolo 42 61 47 14
Shomolu 32 76 59 12
Surulere 34 67 56 13
Total 45 74 61 13
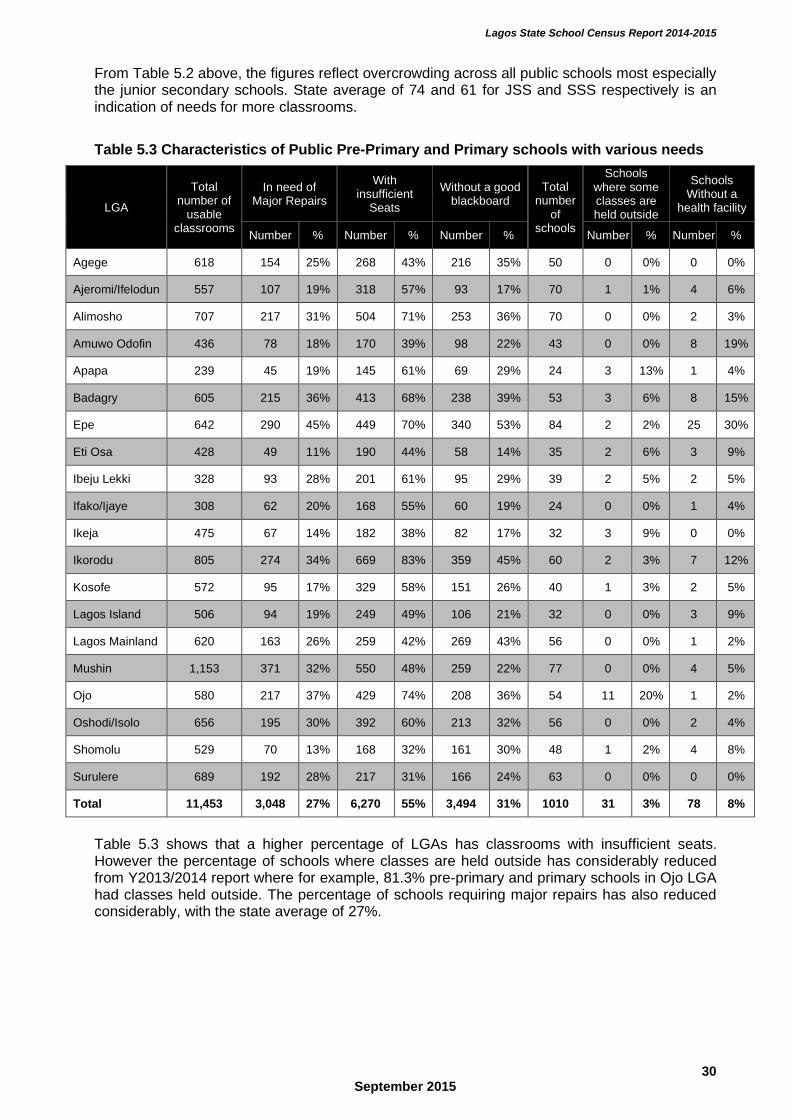
Lagos State School Census Report 2014-2015
30 September 2015
From Table 5.2 above, the figures reflect overcrowding across all public schools most especially the junior secondary schools. State average of 74 and 61 for JSS and SSS respectively is an indication of needs for more classrooms.
Table 5.3 Characteristics of Public Pre-Primary and Primary schools with various needs
LGA
Total number of
usable classrooms
In need of Major Repairs
With insufficient
Seats
Without a good blackboard
Total number
of schools
Schools where some classes are held outside
Schools Without a
health facility
Number % Number % Number % Number % Number %
Agege 618 154 25% 268 43% 216 35% 50 0 0% 0 0%
Ajeromi/Ifelodun 557 107 19% 318 57% 93 17% 70 1 1% 4 6%
Alimosho 707 217 31% 504 71% 253 36% 70 0 0% 2 3%
Amuwo Odofin 436 78 18% 170 39% 98 22% 43 0 0% 8 19%
Apapa 239 45 19% 145 61% 69 29% 24 3 13% 1 4%
Badagry 605 215 36% 413 68% 238 39% 53 3 6% 8 15%
Epe 642 290 45% 449 70% 340 53% 84 2 2% 25 30%
Eti Osa 428 49 11% 190 44% 58 14% 35 2 6% 3 9%
Ibeju Lekki 328 93 28% 201 61% 95 29% 39 2 5% 2 5%
Ifako/Ijaye 308 62 20% 168 55% 60 19% 24 0 0% 1 4%
Ikeja 475 67 14% 182 38% 82 17% 32 3 9% 0 0%
Ikorodu 805 274 34% 669 83% 359 45% 60 2 3% 7 12%
Kosofe 572 95 17% 329 58% 151 26% 40 1 3% 2 5%
Lagos Island 506 94 19% 249 49% 106 21% 32 0 0% 3 9%
Lagos Mainland 620 163 26% 259 42% 269 43% 56 0 0% 1 2%
Mushin 1,153 371 32% 550 48% 259 22% 77 0 0% 4 5%
Ojo 580 217 37% 429 74% 208 36% 54 11 20% 1 2%
Oshodi/Isolo 656 195 30% 392 60% 213 32% 56 0 0% 2 4%
Shomolu 529 70 13% 168 32% 161 30% 48 1 2% 4 8%
Surulere 689 192 28% 217 31% 166 24% 63 0 0% 0 0%
Total 11,453 3,048 27% 6,270 55% 3,494 31% 1010 31 3% 78 8%
Table 5.3 shows that a higher percentage of LGAs has classrooms with insufficient seats. However the percentage of schools where classes are held outside has considerably reduced from Y2013/2014 report where for example, 81.3% pre-primary and primary schools in Ojo LGA had classes held outside. The percentage of schools requiring major repairs has also reduced considerably, with the state average of 27%.
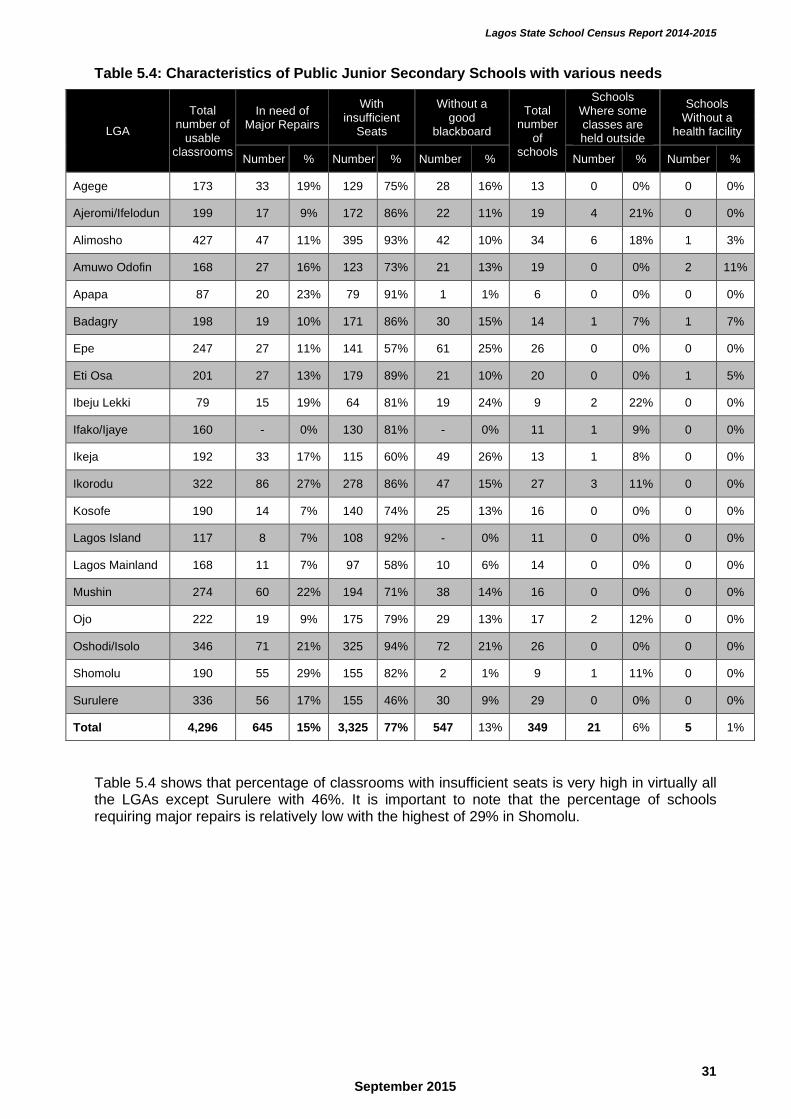
Lagos State School Census Report 2014-2015
31 September 2015
Table 5.4: Characteristics of Public Junior Secondary Schools with various needs
LGA
Total number of
usable classrooms
In need of Major Repairs
With insufficient
Seats
Without a good
blackboard
Total number
of schools
Schools Where some classes are held outside
Schools Without a
health facility
Number % Number % Number % Number % Number %
Agege 173 33 19% 129 75% 28 16% 13 0 0% 0 0%
Ajeromi/Ifelodun 199 17 9% 172 86% 22 11% 19 4 21% 0 0%
Alimosho 427 47 11% 395 93% 42 10% 34 6 18% 1 3%
Amuwo Odofin 168 27 16% 123 73% 21 13% 19 0 0% 2 11%
Apapa 87 20 23% 79 91% 1 1% 6 0 0% 0 0%
Badagry 198 19 10% 171 86% 30 15% 14 1 7% 1 7%
Epe 247 27 11% 141 57% 61 25% 26 0 0% 0 0%
Eti Osa 201 27 13% 179 89% 21 10% 20 0 0% 1 5%
Ibeju Lekki 79 15 19% 64 81% 19 24% 9 2 22% 0 0%
Ifako/Ijaye 160 - 0% 130 81% - 0% 11 1 9% 0 0%
Ikeja 192 33 17% 115 60% 49 26% 13 1 8% 0 0%
Ikorodu 322 86 27% 278 86% 47 15% 27 3 11% 0 0%
Kosofe 190 14 7% 140 74% 25 13% 16 0 0% 0 0%
Lagos Island 117 8 7% 108 92% - 0% 11 0 0% 0 0%
Lagos Mainland 168 11 7% 97 58% 10 6% 14 0 0% 0 0%
Mushin 274 60 22% 194 71% 38 14% 16 0 0% 0 0%
Ojo 222 19 9% 175 79% 29 13% 17 2 12% 0 0%
Oshodi/Isolo 346 71 21% 325 94% 72 21% 26 0 0% 0 0%
Shomolu 190 55 29% 155 82% 2 1% 9 1 11% 0 0%
Surulere 336 56 17% 155 46% 30 9% 29 0 0% 0 0%
Total 4,296 645 15% 3,325 77% 547 13% 349 21 6% 5 1%
Table 5.4 shows that percentage of classrooms with insufficient seats is very high in virtually all the LGAs except Surulere with 46%. It is important to note that the percentage of schools requiring major repairs is relatively low with the highest of 29% in Shomolu.
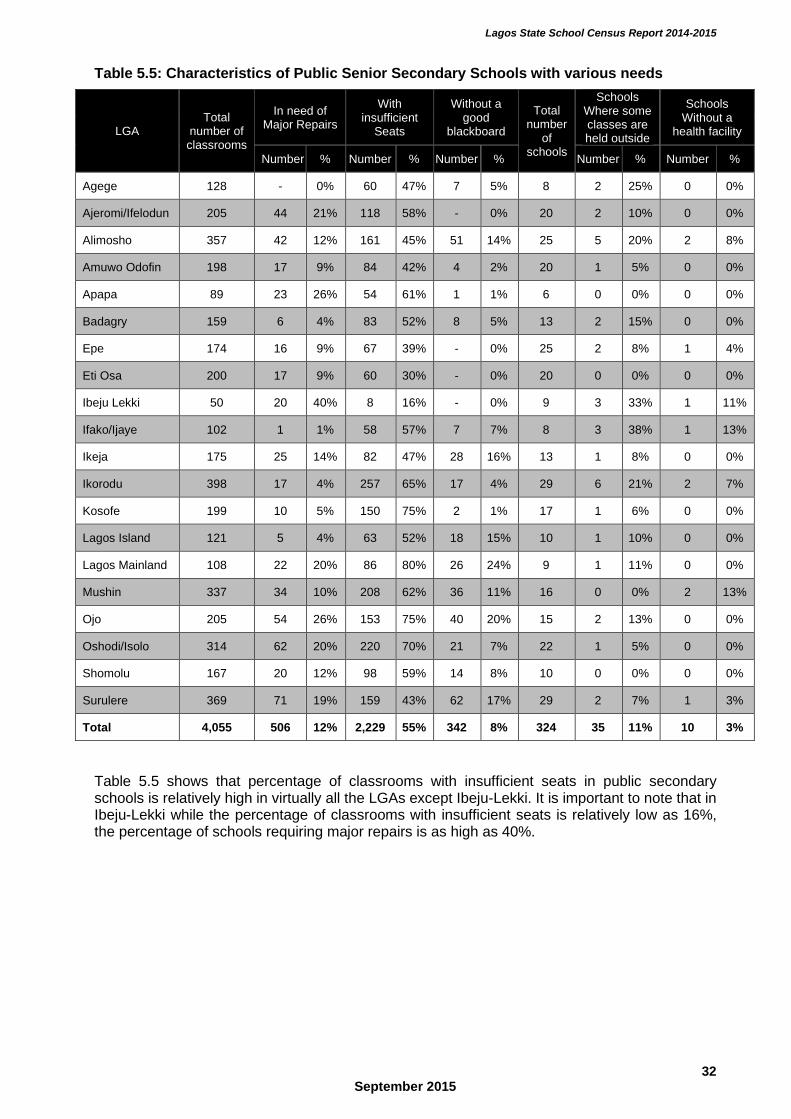
Lagos State School Census Report 2014-2015
32 September 2015
Table 5.5: Characteristics of Public Senior Secondary Schools with various needs
LGA Total
number of classrooms
In need of Major Repairs
With insufficient
Seats
Without a good
blackboard
Total number
of schools
Schools Where some classes are held outside
Schools Without a
health facility
Number % Number % Number % Number % Number %
Agege 128 - 0% 60 47% 7 5% 8 2 25% 0 0%
Ajeromi/Ifelodun 205 44 21% 118 58% - 0% 20 2 10% 0 0%
Alimosho 357 42 12% 161 45% 51 14% 25 5 20% 2 8%
Amuwo Odofin 198 17 9% 84 42% 4 2% 20 1 5% 0 0%
Apapa 89 23 26% 54 61% 1 1% 6 0 0% 0 0%
Badagry 159 6 4% 83 52% 8 5% 13 2 15% 0 0%
Epe 174 16 9% 67 39% - 0% 25 2 8% 1 4%
Eti Osa 200 17 9% 60 30% - 0% 20 0 0% 0 0%
Ibeju Lekki 50 20 40% 8 16% - 0% 9 3 33% 1 11%
Ifako/Ijaye 102 1 1% 58 57% 7 7% 8 3 38% 1 13%
Ikeja 175 25 14% 82 47% 28 16% 13 1 8% 0 0%
Ikorodu 398 17 4% 257 65% 17 4% 29 6 21% 2 7%
Kosofe 199 10 5% 150 75% 2 1% 17 1 6% 0 0%
Lagos Island 121 5 4% 63 52% 18 15% 10 1 10% 0 0%
Lagos Mainland 108 22 20% 86 80% 26 24% 9 1 11% 0 0%
Mushin 337 34 10% 208 62% 36 11% 16 0 0% 2 13%
Ojo 205 54 26% 153 75% 40 20% 15 2 13% 0 0%
Oshodi/Isolo 314 62 20% 220 70% 21 7% 22 1 5% 0 0%
Shomolu 167 20 12% 98 59% 14 8% 10 0 0% 0 0%
Surulere 369 71 19% 159 43% 62 17% 29 2 7% 1 3%
Total 4,055 506 12% 2,229 55% 342 8% 324 35 11% 10 3%
Table 5.5 shows that percentage of classrooms with insufficient seats in public secondary schools is relatively high in virtually all the LGAs except Ibeju-Lekki. It is important to note that in Ibeju-Lekki while the percentage of classrooms with insufficient seats is relatively low as 16%, the percentage of schools requiring major repairs is as high as 40%.
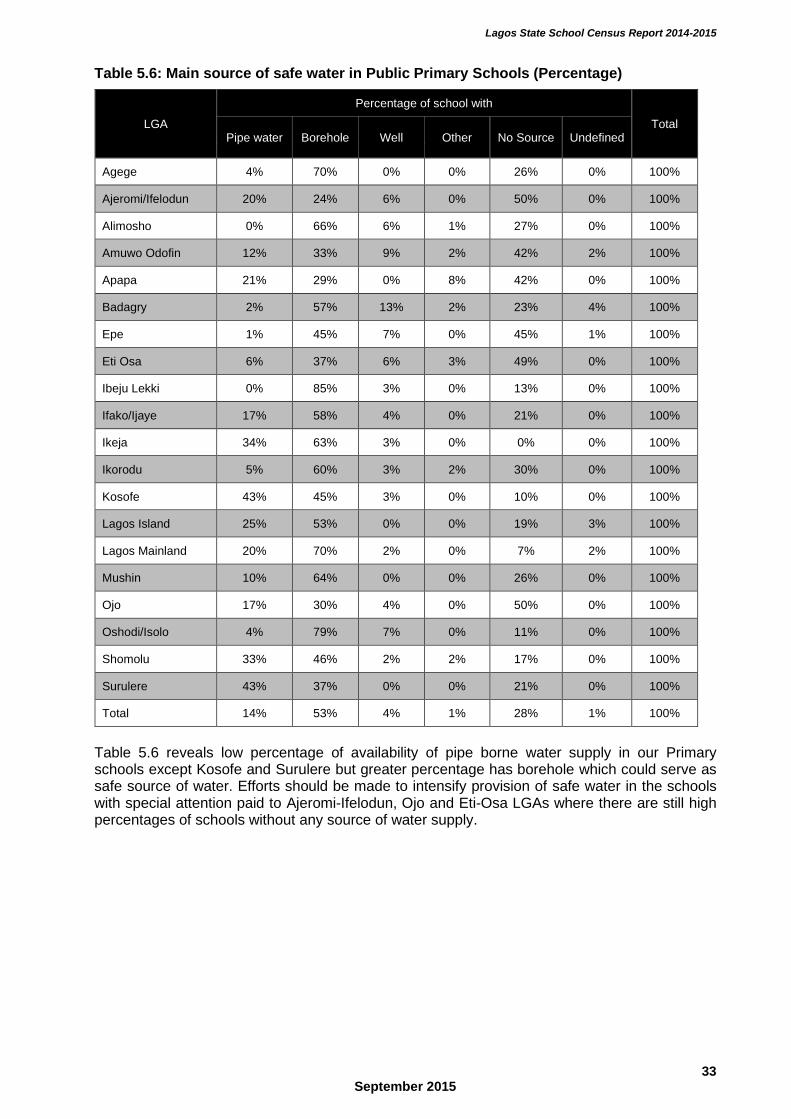
Lagos State School Census Report 2014-2015
33 September 2015
Table 5.6: Main source of safe water in Public Primary Schools (Percentage)
LGA
Percentage of school with
Total Pipe water Borehole Well Other No Source Undefined
Agege 4% 70% 0% 0% 26% 0% 100%
Ajeromi/Ifelodun 20% 24% 6% 0% 50% 0% 100%
Alimosho 0% 66% 6% 1% 27% 0% 100%
Amuwo Odofin 12% 33% 9% 2% 42% 2% 100%
Apapa 21% 29% 0% 8% 42% 0% 100%
Badagry 2% 57% 13% 2% 23% 4% 100%
Epe 1% 45% 7% 0% 45% 1% 100%
Eti Osa 6% 37% 6% 3% 49% 0% 100%
Ibeju Lekki 0% 85% 3% 0% 13% 0% 100%
Ifako/Ijaye 17% 58% 4% 0% 21% 0% 100%
Ikeja 34% 63% 3% 0% 0% 0% 100%
Ikorodu 5% 60% 3% 2% 30% 0% 100%
Kosofe 43% 45% 3% 0% 10% 0% 100%
Lagos Island 25% 53% 0% 0% 19% 3% 100%
Lagos Mainland 20% 70% 2% 0% 7% 2% 100%
Mushin 10% 64% 0% 0% 26% 0% 100%
Ojo 17% 30% 4% 0% 50% 0% 100%
Oshodi/Isolo 4% 79% 7% 0% 11% 0% 100%
Shomolu 33% 46% 2% 2% 17% 0% 100%
Surulere 43% 37% 0% 0% 21% 0% 100%
Total 14% 53% 4% 1% 28% 1% 100%
Table 5.6 reveals low percentage of availability of pipe borne water supply in our Primary schools except Kosofe and Surulere but greater percentage has borehole which could serve as safe source of water. Efforts should be made to intensify provision of safe water in the schools with special attention paid to Ajeromi-Ifelodun, Ojo and Eti-Osa LGAs where there are still high percentages of schools without any source of water supply.
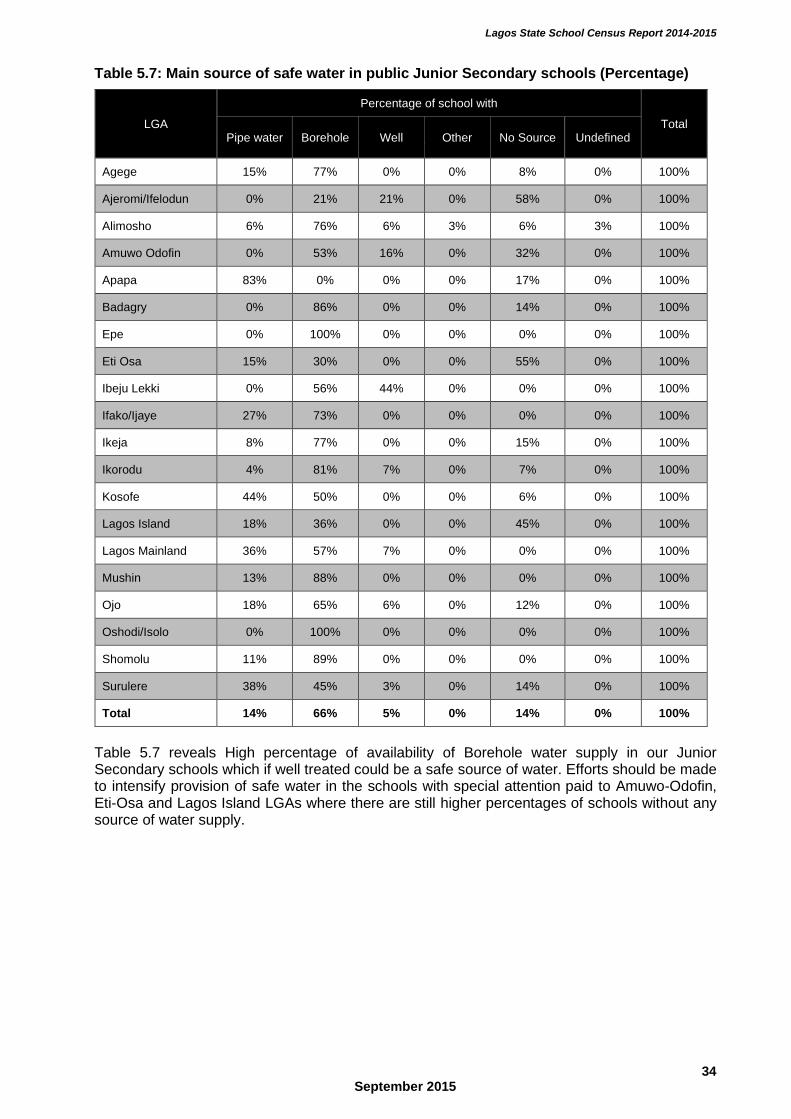
Lagos State School Census Report 2014-2015
34 September 2015
Table 5.7: Main source of safe water in public Junior Secondary schools (Percentage)
LGA
Percentage of school with
Total Pipe water Borehole Well Other No Source Undefined
Agege 15% 77% 0% 0% 8% 0% 100%
Ajeromi/Ifelodun 0% 21% 21% 0% 58% 0% 100%
Alimosho 6% 76% 6% 3% 6% 3% 100%
Amuwo Odofin 0% 53% 16% 0% 32% 0% 100%
Apapa 83% 0% 0% 0% 17% 0% 100%
Badagry 0% 86% 0% 0% 14% 0% 100%
Epe 0% 100% 0% 0% 0% 0% 100%
Eti Osa 15% 30% 0% 0% 55% 0% 100%
Ibeju Lekki 0% 56% 44% 0% 0% 0% 100%
Ifako/Ijaye 27% 73% 0% 0% 0% 0% 100%
Ikeja 8% 77% 0% 0% 15% 0% 100%
Ikorodu 4% 81% 7% 0% 7% 0% 100%
Kosofe 44% 50% 0% 0% 6% 0% 100%
Lagos Island 18% 36% 0% 0% 45% 0% 100%
Lagos Mainland 36% 57% 7% 0% 0% 0% 100%
Mushin 13% 88% 0% 0% 0% 0% 100%
Ojo 18% 65% 6% 0% 12% 0% 100%
Oshodi/Isolo 0% 100% 0% 0% 0% 0% 100%
Shomolu 11% 89% 0% 0% 0% 0% 100%
Surulere 38% 45% 3% 0% 14% 0% 100%
Total 14% 66% 5% 0% 14% 0% 100%
Table 5.7 reveals High percentage of availability of Borehole water supply in our Junior Secondary schools which if well treated could be a safe source of water. Efforts should be made to intensify provision of safe water in the schools with special attention paid to Amuwo-Odofin, Eti-Osa and Lagos Island LGAs where there are still higher percentages of schools without any source of water supply.
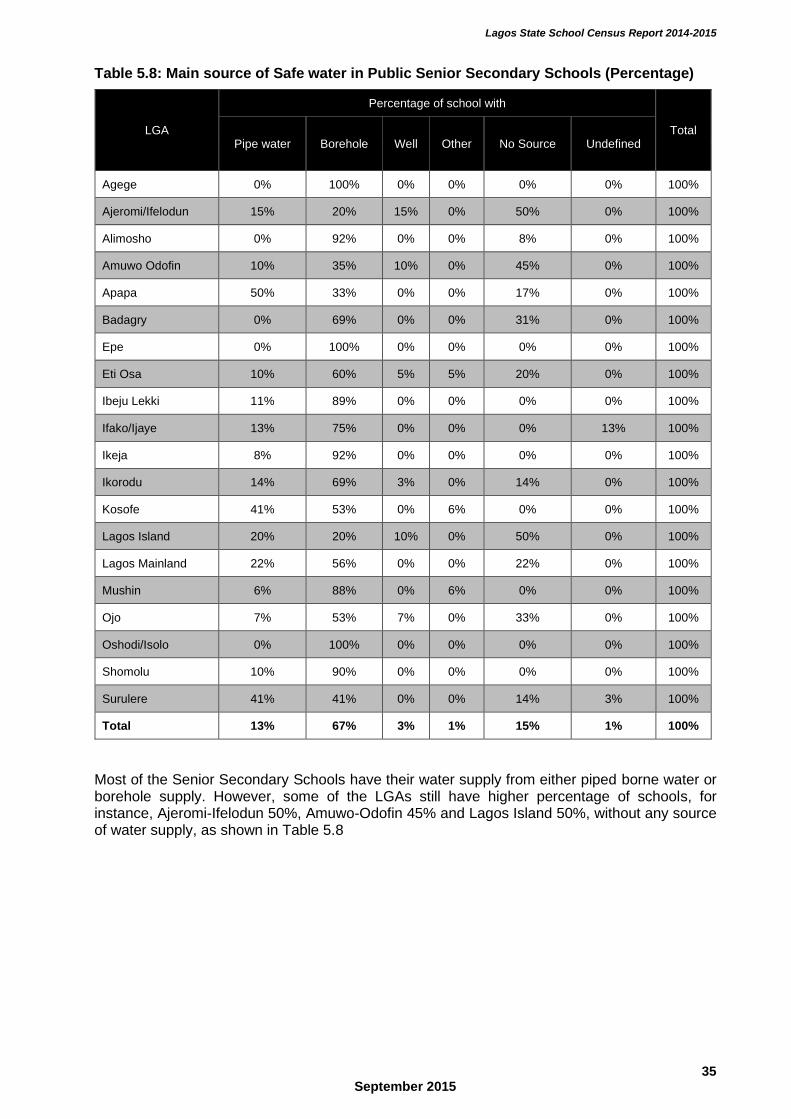
Lagos State School Census Report 2014-2015
35 September 2015
Table 5.8: Main source of Safe water in Public Senior Secondary Schools (Percentage)
LGA
Percentage of school with
Total Pipe water Borehole Well Other No Source Undefined
Agege 0% 100% 0% 0% 0% 0% 100%
Ajeromi/Ifelodun 15% 20% 15% 0% 50% 0% 100%
Alimosho 0% 92% 0% 0% 8% 0% 100%
Amuwo Odofin 10% 35% 10% 0% 45% 0% 100%
Apapa 50% 33% 0% 0% 17% 0% 100%
Badagry 0% 69% 0% 0% 31% 0% 100%
Epe 0% 100% 0% 0% 0% 0% 100%
Eti Osa 10% 60% 5% 5% 20% 0% 100%
Ibeju Lekki 11% 89% 0% 0% 0% 0% 100%
Ifako/Ijaye 13% 75% 0% 0% 0% 13% 100%
Ikeja 8% 92% 0% 0% 0% 0% 100%
Ikorodu 14% 69% 3% 0% 14% 0% 100%
Kosofe 41% 53% 0% 6% 0% 0% 100%
Lagos Island 20% 20% 10% 0% 50% 0% 100%
Lagos Mainland 22% 56% 0% 0% 22% 0% 100%
Mushin 6% 88% 0% 6% 0% 0% 100%
Ojo 7% 53% 7% 0% 33% 0% 100%
Oshodi/Isolo 0% 100% 0% 0% 0% 0% 100%
Shomolu 10% 90% 0% 0% 0% 0% 100%
Surulere 41% 41% 0% 0% 14% 3% 100%
Total 13% 67% 3% 1% 15% 1% 100%
Most of the Senior Secondary Schools have their water supply from either piped borne water or borehole supply. However, some of the LGAs still have higher percentage of schools, for instance, Ajeromi-Ifelodun 50%, Amuwo-Odofin 45% and Lagos Island 50%, without any source of water supply, as shown in Table 5.8
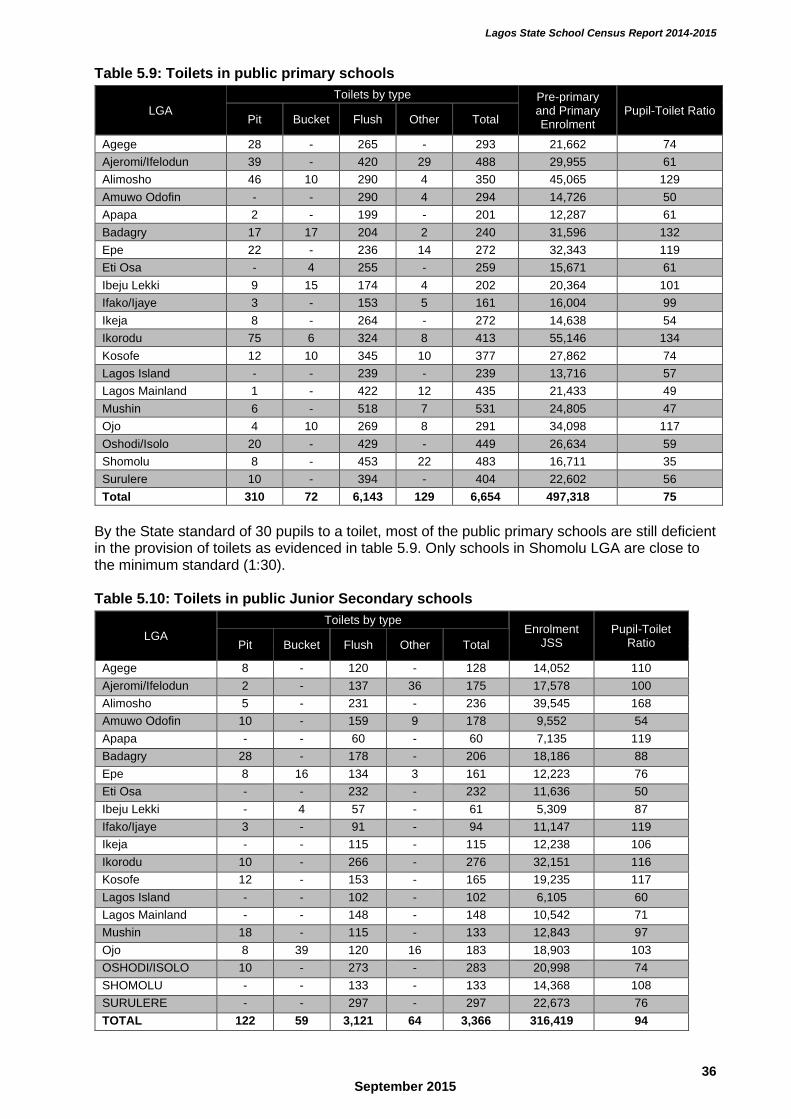
Lagos State School Census Report 2014-2015
36 September 2015
Table 5.9: Toilets in public primary schools
LGA
Toilets by type Pre-primary and Primary Enrolment
Pupil-Toilet Ratio Pit Bucket Flush Other Total
Agege 28 - 265 - 293 21,662 74
Ajeromi/Ifelodun 39 - 420 29 488 29,955 61
Alimosho 46 10 290 4 350 45,065 129
Amuwo Odofin - - 290 4 294 14,726 50
Apapa 2 - 199 - 201 12,287 61
Badagry 17 17 204 2 240 31,596 132
Epe 22 - 236 14 272 32,343 119
Eti Osa - 4 255 - 259 15,671 61
Ibeju Lekki 9 15 174 4 202 20,364 101
Ifako/Ijaye 3 - 153 5 161 16,004 99
Ikeja 8 - 264 - 272 14,638 54
Ikorodu 75 6 324 8 413 55,146 134
Kosofe 12 10 345 10 377 27,862 74
Lagos Island - - 239 - 239 13,716 57
Lagos Mainland 1 - 422 12 435 21,433 49
Mushin 6 - 518 7 531 24,805 47
Ojo 4 10 269 8 291 34,098 117
Oshodi/Isolo 20 - 429 - 449 26,634 59
Shomolu 8 - 453 22 483 16,711 35
Surulere 10 - 394 - 404 22,602 56
Total 310 72 6,143 129 6,654 497,318 75
By the State standard of 30 pupils to a toilet, most of the public primary schools are still deficient in the provision of toilets as evidenced in table 5.9. Only schools in Shomolu LGA are close to the minimum standard (1:30). Table 5.10: Toilets in public Junior Secondary schools
LGA
Toilets by type Enrolment
JSS Pupil-Toilet
Ratio Pit Bucket Flush Other Total
Agege 8 - 120 - 128 14,052 110
Ajeromi/Ifelodun 2 - 137 36 175 17,578 100
Alimosho 5 - 231 - 236 39,545 168
Amuwo Odofin 10 - 159 9 178 9,552 54
Apapa - - 60 - 60 7,135 119
Badagry 28 - 178 - 206 18,186 88
Epe 8 16 134 3 161 12,223 76
Eti Osa - - 232 - 232 11,636 50
Ibeju Lekki - 4 57 - 61 5,309 87
Ifako/Ijaye 3 - 91 - 94 11,147 119
Ikeja - - 115 - 115 12,238 106
Ikorodu 10 - 266 - 276 32,151 116
Kosofe 12 - 153 - 165 19,235 117
Lagos Island - - 102 - 102 6,105 60
Lagos Mainland - - 148 - 148 10,542 71
Mushin 18 - 115 - 133 12,843 97
Ojo 8 39 120 16 183 18,903 103
OSHODI/ISOLO 10 - 273 - 283 20,998 74
SHOMOLU - - 133 - 133 14,368 108
SURULERE - - 297 - 297 22,673 76
TOTAL 122 59 3,121 64 3,366 316,419 94
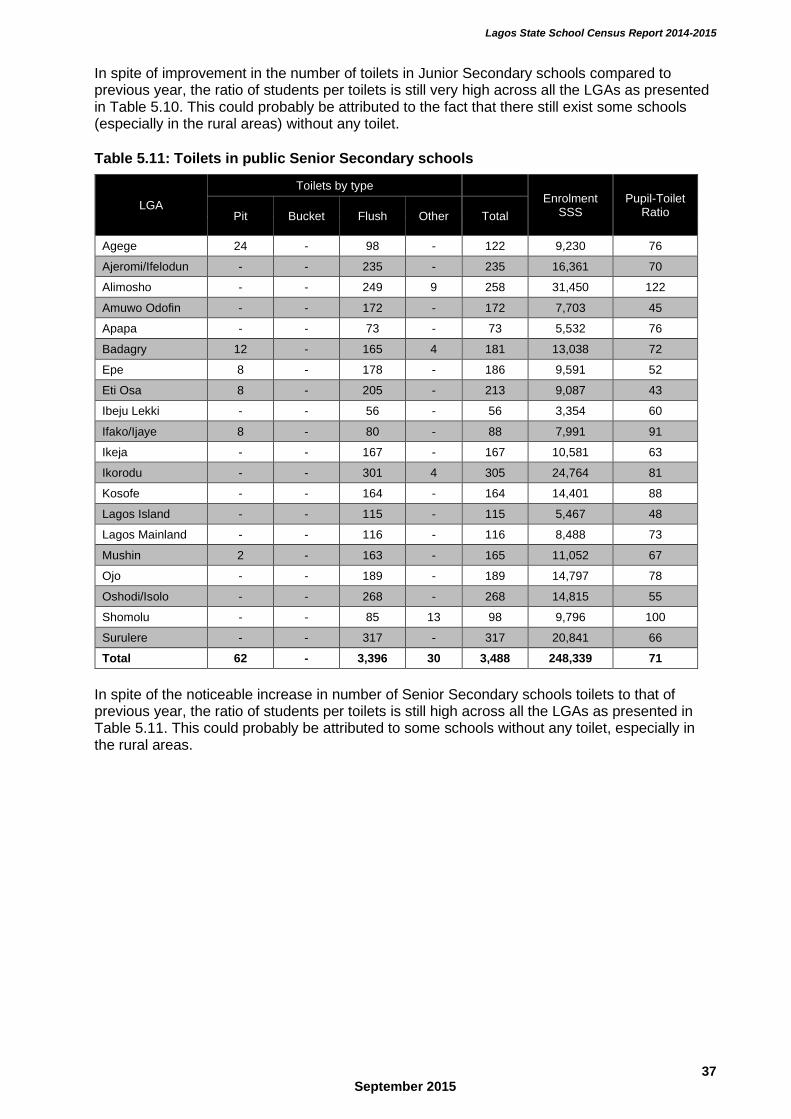
Lagos State School Census Report 2014-2015
37 September 2015
In spite of improvement in the number of toilets in Junior Secondary schools compared to previous year, the ratio of students per toilets is still very high across all the LGAs as presented in Table 5.10. This could probably be attributed to the fact that there still exist some schools (especially in the rural areas) without any toilet. Table 5.11: Toilets in public Senior Secondary schools
LGA
Toilets by type
Enrolment SSS
Pupil-Toilet Ratio Pit Bucket Flush Other Total
Agege 24 - 98 - 122 9,230 76
Ajeromi/Ifelodun - - 235 - 235 16,361 70
Alimosho - - 249 9 258 31,450 122
Amuwo Odofin - - 172 - 172 7,703 45
Apapa - - 73 - 73 5,532 76
Badagry 12 - 165 4 181 13,038 72
Epe 8 - 178 - 186 9,591 52
Eti Osa 8 - 205 - 213 9,087 43
Ibeju Lekki - - 56 - 56 3,354 60
Ifako/Ijaye 8 - 80 - 88 7,991 91
Ikeja - - 167 - 167 10,581 63
Ikorodu - - 301 4 305 24,764 81
Kosofe - - 164 - 164 14,401 88
Lagos Island - - 115 - 115 5,467 48
Lagos Mainland - - 116 - 116 8,488 73
Mushin 2 - 163 - 165 11,052 67
Ojo - - 189 - 189 14,797 78
Oshodi/Isolo - - 268 - 268 14,815 55
Shomolu - - 85 13 98 9,796 100
Surulere - - 317 - 317 20,841 66
Total 62 - 3,396 30 3,488 248,339 71
In spite of the noticeable increase in number of Senior Secondary schools toilets to that of previous year, the ratio of students per toilets is still high across all the LGAs as presented in Table 5.11. This could probably be attributed to some schools without any toilet, especially in the rural areas.
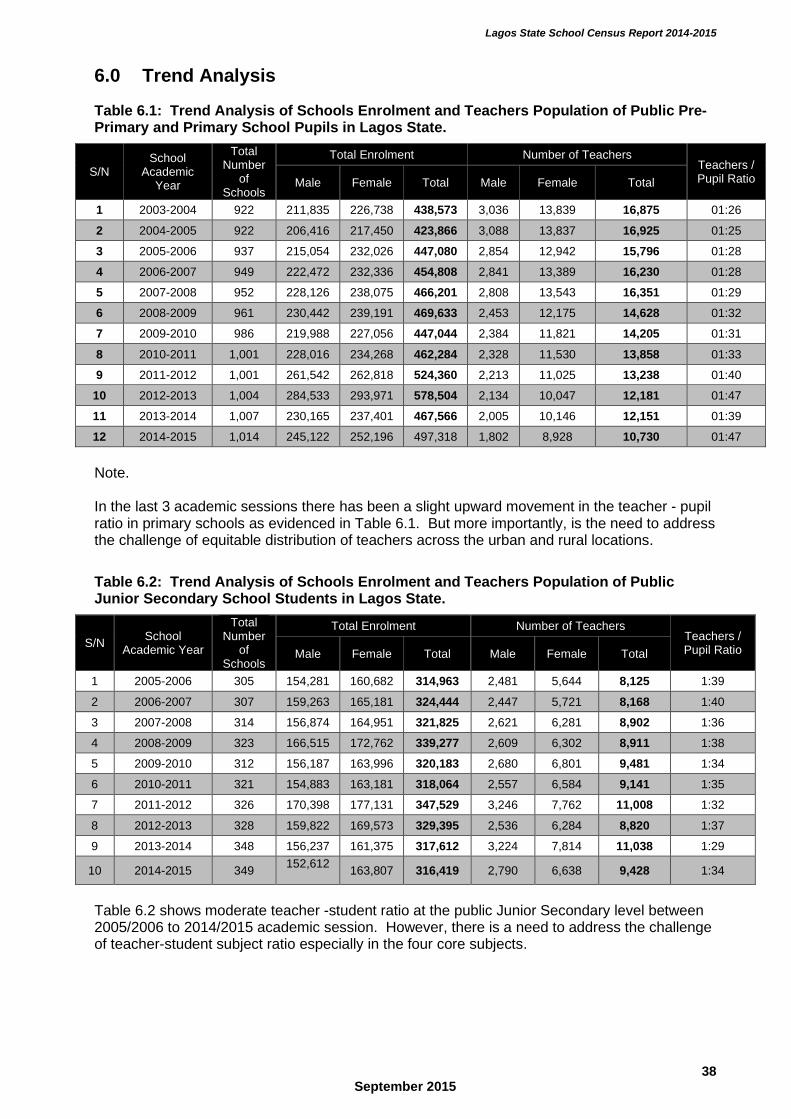
Lagos State School Census Report 2014-2015
38 September 2015
6.0 Trend Analysis
Table 6.1: Trend Analysis of Schools Enrolment and Teachers Population of Public Pre-Primary and Primary School Pupils in Lagos State.
S/N School
Academic Year
Total Number
of Schools
Total Enrolment Number of Teachers Teachers / Pupil Ratio Male Female Total Male Female Total
1 2003-2004 922 211,835 226,738 438,573 3,036 13,839 16,875 01:26
2 2004-2005 922 206,416 217,450 423,866 3,088 13,837 16,925 01:25
3 2005-2006 937 215,054 232,026 447,080 2,854 12,942 15,796 01:28
4 2006-2007 949 222,472 232,336 454,808 2,841 13,389 16,230 01:28
5 2007-2008 952 228,126 238,075 466,201 2,808 13,543 16,351 01:29
6 2008-2009 961 230,442 239,191 469,633 2,453 12,175 14,628 01:32
7 2009-2010 986 219,988 227,056 447,044 2,384 11,821 14,205 01:31
8 2010-2011 1,001 228,016 234,268 462,284 2,328 11,530 13,858 01:33
9 2011-2012 1,001 261,542 262,818 524,360 2,213 11,025 13,238 01:40
10 2012-2013 1,004 284,533 293,971 578,504 2,134 10,047 12,181 01:47
11 2013-2014 1,007 230,165 237,401 467,566 2,005 10,146 12,151 01:39
12 2014-2015 1,014 245,122 252,196 497,318 1,802 8,928 10,730 01:47
Note. In the last 3 academic sessions there has been a slight upward movement in the teacher - pupil ratio in primary schools as evidenced in Table 6.1. But more importantly, is the need to address the challenge of equitable distribution of teachers across the urban and rural locations.
Table 6.2: Trend Analysis of Schools Enrolment and Teachers Population of Public Junior Secondary School Students in Lagos State.
S/N School
Academic Year
Total Number
of Schools
Total Enrolment Number of Teachers Teachers / Pupil Ratio Male Female Total Male Female Total
1 2005-2006 305 154,281 160,682 314,963 2,481 5,644 8,125 1:39
2 2006-2007 307 159,263 165,181 324,444 2,447 5,721 8,168 1:40
3 2007-2008 314 156,874 164,951 321,825 2,621 6,281 8,902 1:36
4 2008-2009 323 166,515 172,762 339,277 2,609 6,302 8,911 1:38
5 2009-2010 312 156,187 163,996 320,183 2,680 6,801 9,481 1:34
6 2010-2011 321 154,883 163,181 318,064 2,557 6,584 9,141 1:35
7 2011-2012 326 170,398 177,131 347,529 3,246 7,762 11,008 1:32
8 2012-2013 328 159,822 169,573 329,395 2,536 6,284 8,820 1:37
9 2013-2014 348 156,237 161,375 317,612 3,224 7,814 11,038 1:29
10 2014-2015 349 152,612
163,807 316,419 2,790 6,638 9,428 1:34
Table 6.2 shows moderate teacher -student ratio at the public Junior Secondary level between 2005/2006 to 2014/2015 academic session. However, there is a need to address the challenge of teacher-student subject ratio especially in the four core subjects.
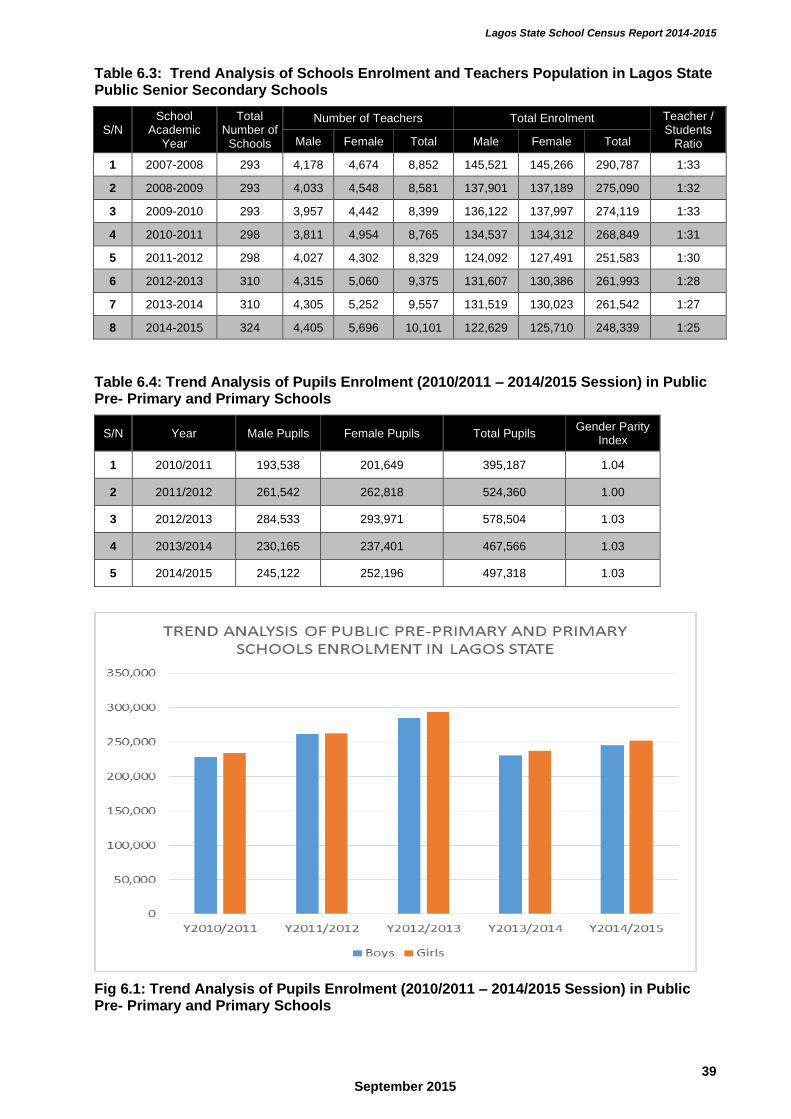
Lagos State School Census Report 2014-2015
39 September 2015
Table 6.3: Trend Analysis of Schools Enrolment and Teachers Population in Lagos State Public Senior Secondary Schools
S/N School
Academic Year
Total Number of
Schools
Number of Teachers Total Enrolment Teacher / Students
Ratio Male Female Total Male Female Total
1 2007-2008 293 4,178 4,674 8,852 145,521 145,266 290,787 1:33
2 2008-2009 293 4,033 4,548 8,581 137,901 137,189 275,090 1:32
3 2009-2010 293 3,957 4,442 8,399 136,122 137,997 274,119 1:33
4 2010-2011 298 3,811 4,954 8,765 134,537 134,312 268,849 1:31
5 2011-2012 298 4,027 4,302 8,329 124,092 127,491 251,583 1:30
6 2012-2013 310 4,315 5,060 9,375 131,607 130,386 261,993 1:28
7 2013-2014 310 4,305 5,252 9,557 131,519 130,023 261,542 1:27
8 2014-2015 324 4,405 5,696 10,101 122,629 125,710 248,339 1:25
Table 6.4: Trend Analysis of Pupils Enrolment (2010/2011 – 2014/2015 Session) in Public Pre- Primary and Primary Schools
S/N Year Male Pupils Female Pupils Total Pupils Gender Parity
Index
1 2010/2011 193,538 201,649 395,187 1.04
2 2011/2012 261,542 262,818 524,360 1.00
3 2012/2013 284,533 293,971 578,504 1.03
4 2013/2014 230,165 237,401 467,566 1.03
5 2014/2015 245,122 252,196 497,318 1.03
Fig 6.1: Trend Analysis of Pupils Enrolment (2010/2011 – 2014/2015 Session) in Public Pre- Primary and Primary Schools
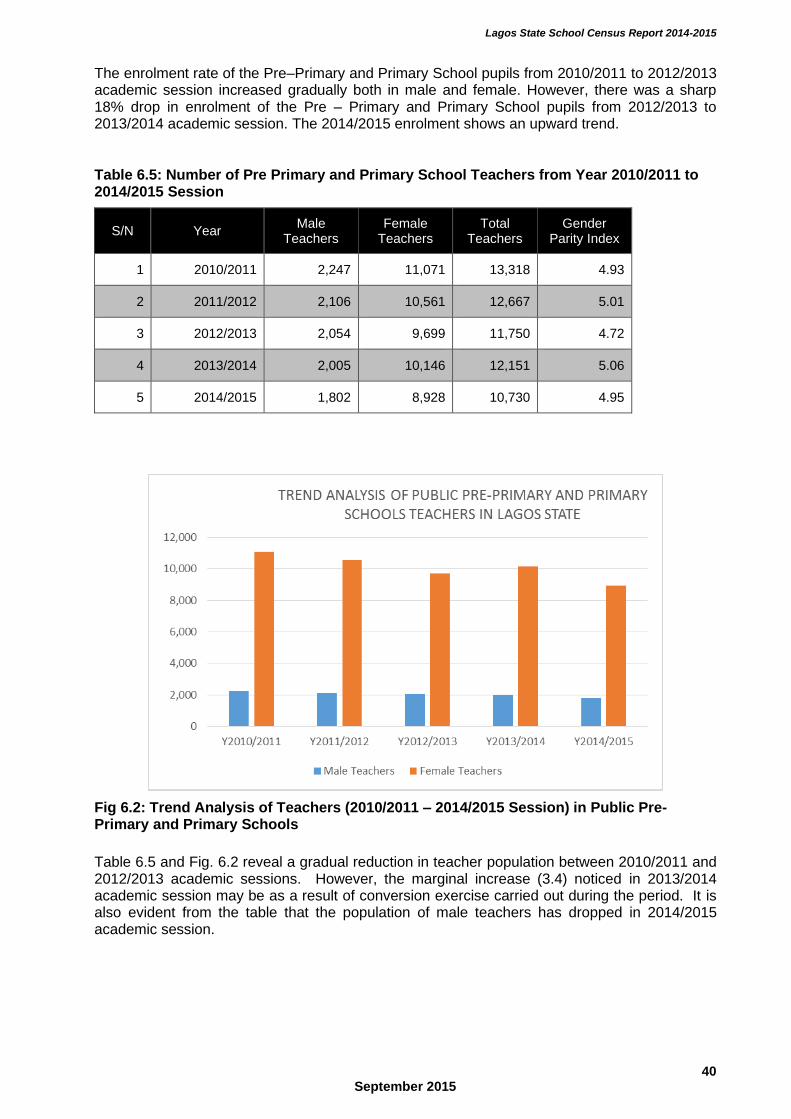
Lagos State School Census Report 2014-2015
40 September 2015
The enrolment rate of the Pre–Primary and Primary School pupils from 2010/2011 to 2012/2013 academic session increased gradually both in male and female. However, there was a sharp 18% drop in enrolment of the Pre – Primary and Primary School pupils from 2012/2013 to 2013/2014 academic session. The 2014/2015 enrolment shows an upward trend.
Table 6.5: Number of Pre Primary and Primary School Teachers from Year 2010/2011 to 2014/2015 Session
S/N Year Male
Teachers Female
Teachers Total
Teachers Gender
Parity Index
1 2010/2011 2,247 11,071 13,318 4.93
2 2011/2012 2,106 10,561 12,667 5.01
3 2012/2013 2,054 9,699 11,750 4.72
4 2013/2014 2,005 10,146 12,151 5.06
5 2014/2015 1,802 8,928 10,730 4.95
Fig 6.2: Trend Analysis of Teachers (2010/2011 – 2014/2015 Session) in Public Pre- Primary and Primary Schools
Table 6.5 and Fig. 6.2 reveal a gradual reduction in teacher population between 2010/2011 and 2012/2013 academic sessions. However, the marginal increase (3.4) noticed in 2013/2014 academic session may be as a result of conversion exercise carried out during the period. It is also evident from the table that the population of male teachers has dropped in 2014/2015 academic session.
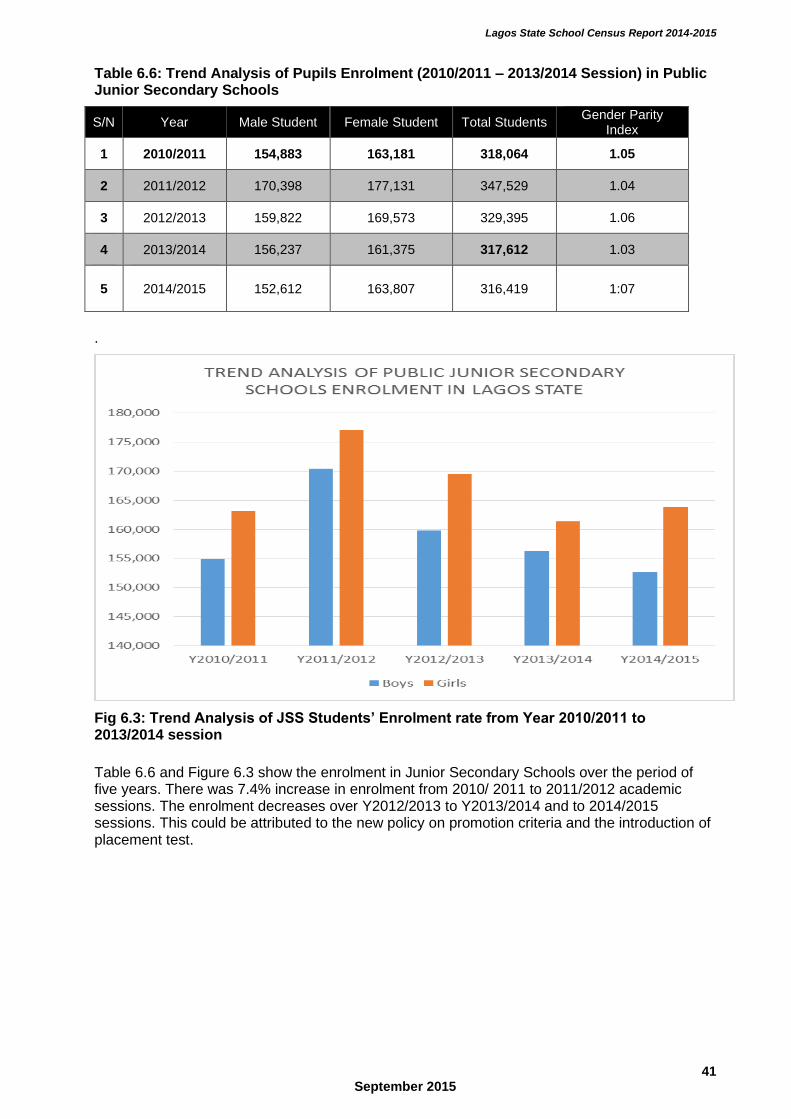
Lagos State School Census Report 2014-2015
41 September 2015
Table 6.6: Trend Analysis of Pupils Enrolment (2010/2011 – 2013/2014 Session) in Public Junior Secondary Schools
S/N Year Male Student Female Student Total Students Gender Parity
Index
1 2010/2011 154,883 163,181 318,064 1.05
2 2011/2012 170,398 177,131 347,529 1.04
3 2012/2013 159,822 169,573 329,395 1.06
4 2013/2014 156,237 161,375 317,612 1.03
5 2014/2015
152,612
163,807 316,419 1:07
.
Fig 6.3: Trend Analysis of JSS Students’ Enrolment rate from Year 2010/2011 to 2013/2014 session
Table 6.6 and Figure 6.3 show the enrolment in Junior Secondary Schools over the period of five years. There was 7.4% increase in enrolment from 2010/ 2011 to 2011/2012 academic sessions. The enrolment decreases over Y2012/2013 to Y2013/2014 and to 2014/2015 sessions. This could be attributed to the new policy on promotion criteria and the introduction of placement test.
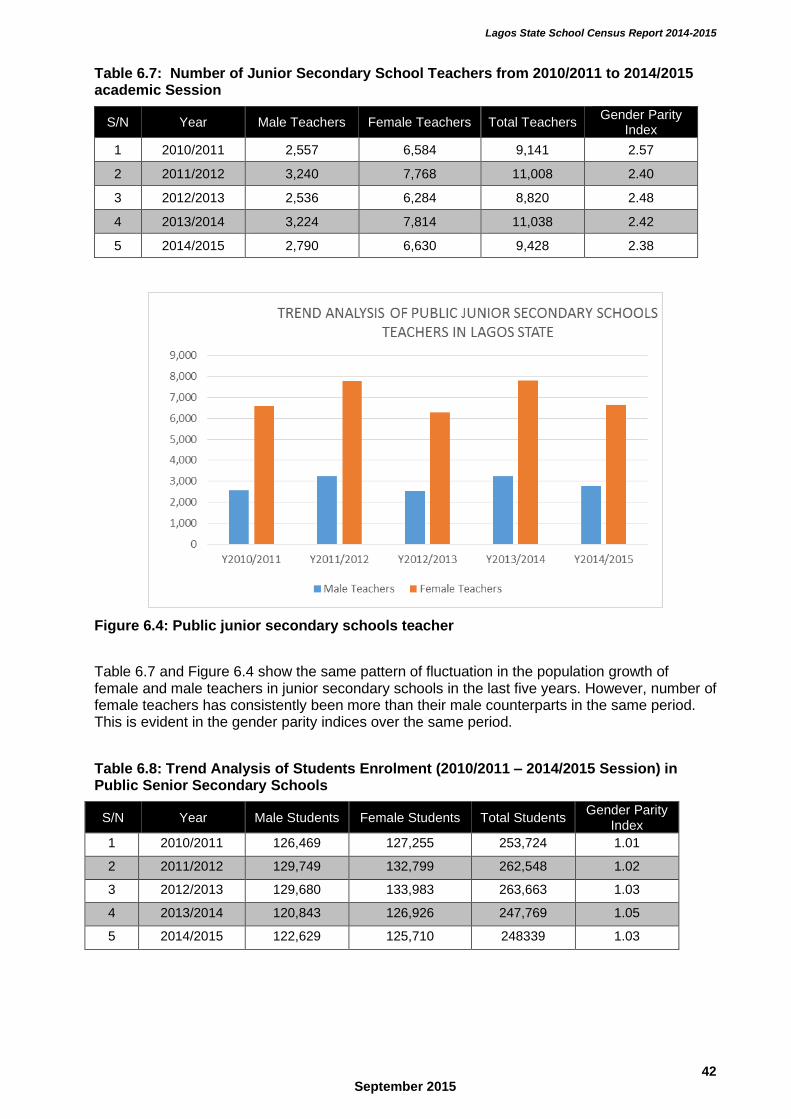
Lagos State School Census Report 2014-2015
42 September 2015
Table 6.7: Number of Junior Secondary School Teachers from 2010/2011 to 2014/2015 academic Session
S/N Year Male Teachers Female Teachers Total Teachers Gender Parity
Index
1 2010/2011 2,557 6,584 9,141 2.57
2 2011/2012 3,240 7,768 11,008 2.40
3 2012/2013 2,536 6,284 8,820 2.48
4 2013/2014 3,224 7,814 11,038 2.42
5 2014/2015 2,790 6,630 9,428 2.38
Figure 6.4: Public junior secondary schools teacher
Table 6.7 and Figure 6.4 show the same pattern of fluctuation in the population growth of female and male teachers in junior secondary schools in the last five years. However, number of female teachers has consistently been more than their male counterparts in the same period. This is evident in the gender parity indices over the same period.
Table 6.8: Trend Analysis of Students Enrolment (2010/2011 – 2014/2015 Session) in Public Senior Secondary Schools
S/N Year Male Students Female Students Total Students Gender Parity
Index
1 2010/2011 126,469 127,255 253,724 1.01
2 2011/2012 129,749 132,799 262,548 1.02
3 2012/2013 129,680 133,983 263,663 1.03
4 2013/2014 120,843 126,926 247,769 1.05
5 2014/2015 122,629 125,710 248339 1.03
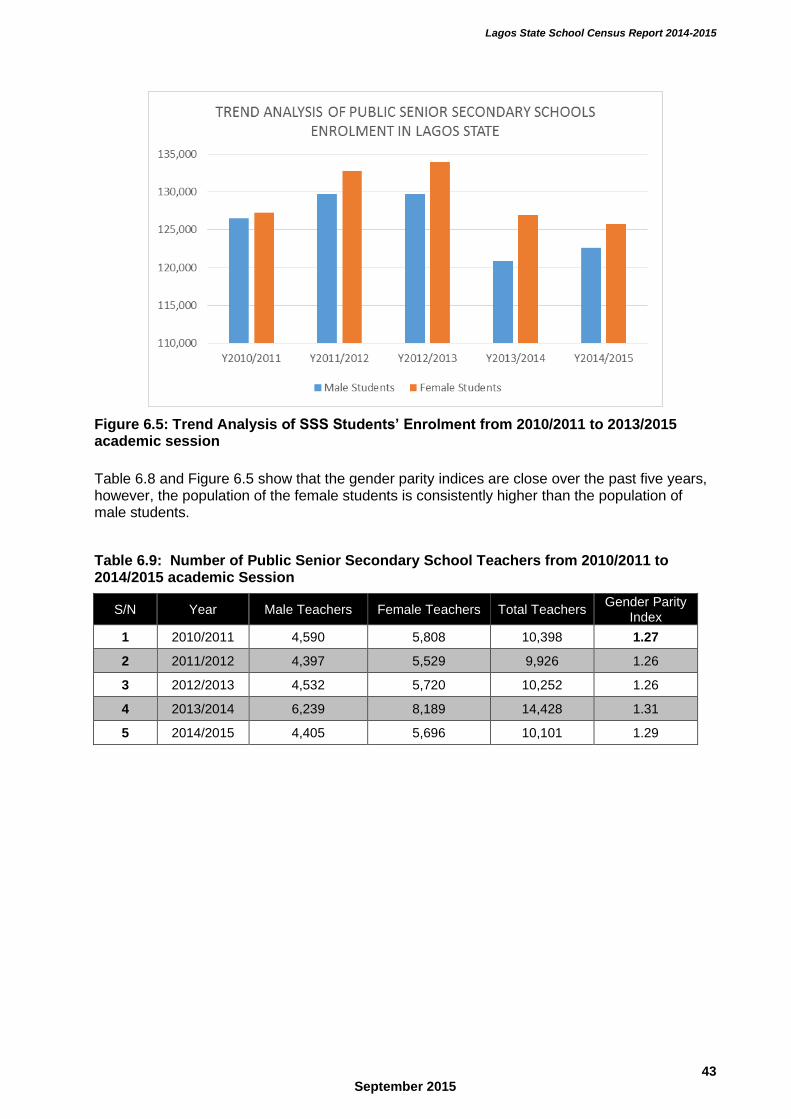
Lagos State School Census Report 2014-2015
43 September 2015
Figure 6.5: Trend Analysis of SSS Students’ Enrolment from 2010/2011 to 2013/2015 academic session
Table 6.8 and Figure 6.5 show that the gender parity indices are close over the past five years, however, the population of the female students is consistently higher than the population of male students.
Table 6.9: Number of Public Senior Secondary School Teachers from 2010/2011 to 2014/2015 academic Session
S/N Year Male Teachers Female Teachers Total Teachers Gender Parity
Index
1 2010/2011 4,590 5,808 10,398 1.27
2 2011/2012 4,397 5,529 9,926 1.26
3 2012/2013 4,532 5,720 10,252 1.26
4 2013/2014 6,239 8,189 14,428 1.31
5 2014/2015 4,405 5,696 10,101 1.29
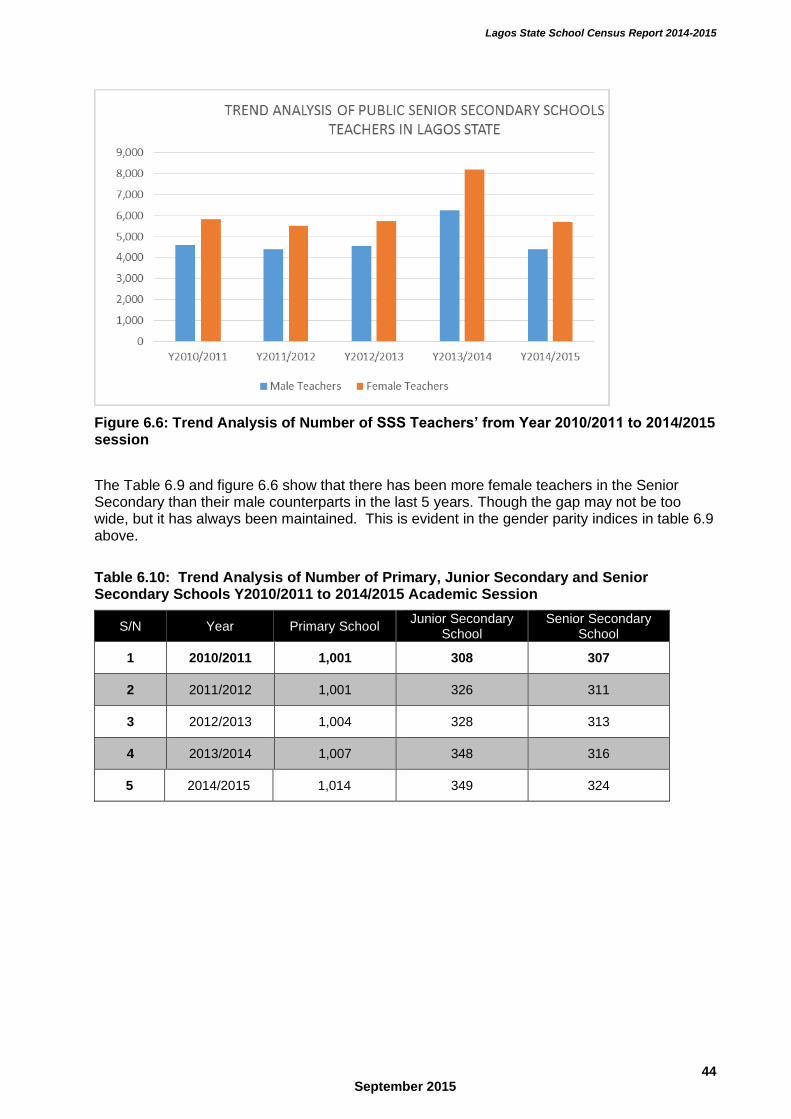
Lagos State School Census Report 2014-2015
44 September 2015
Figure 6.6: Trend Analysis of Number of SSS Teachers’ from Year 2010/2011 to 2014/2015 session
The Table 6.9 and figure 6.6 show that there has been more female teachers in the Senior Secondary than their male counterparts in the last 5 years. Though the gap may not be too wide, but it has always been maintained. This is evident in the gender parity indices in table 6.9 above.
Table 6.10: Trend Analysis of Number of Primary, Junior Secondary and Senior Secondary Schools Y2010/2011 to 2014/2015 Academic Session
S/N Year Primary School Junior Secondary
School Senior Secondary
School
1 2010/2011 1,001 308 307
2 2011/2012 1,001 326 311
3 2012/2013 1,004 328 313
4 2013/2014 1,007 348 316
5 2014/2015 1,014 349 324
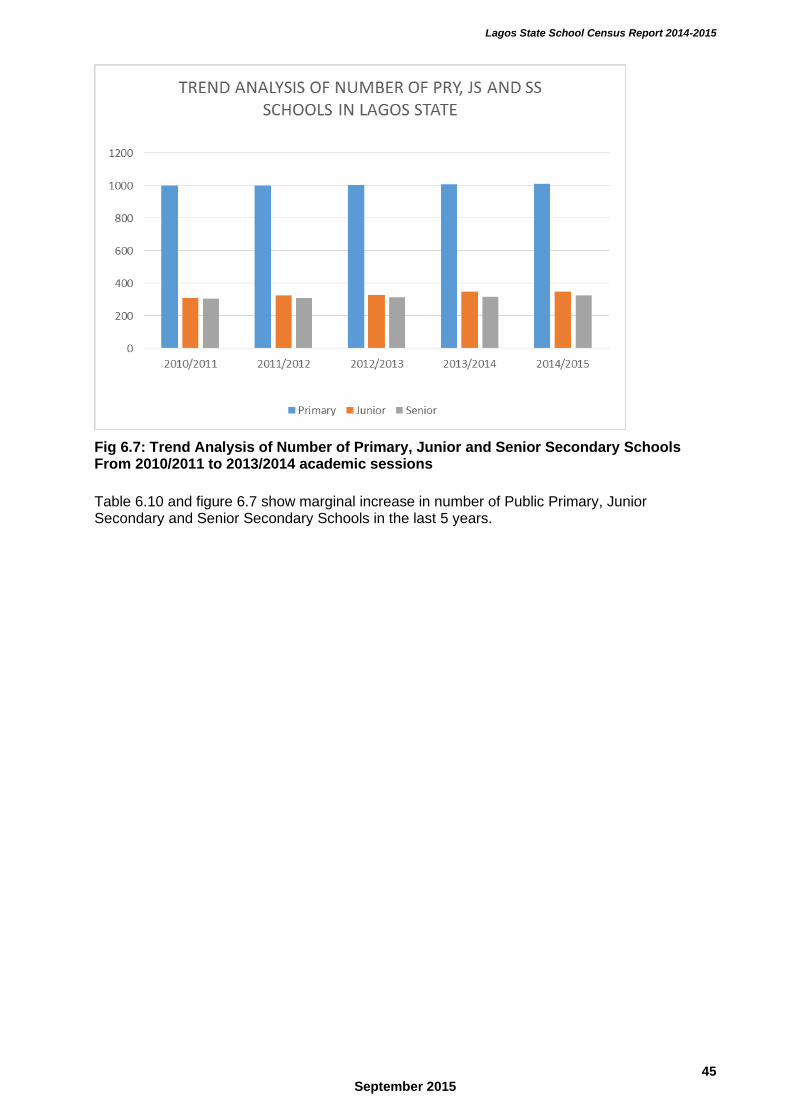
Lagos State School Census Report 2014-2015
45 September 2015
Fig 6.7: Trend Analysis of Number of Primary, Junior and Senior Secondary Schools From 2010/2011 to 2013/2014 academic sessions
Table 6.10 and figure 6.7 show marginal increase in number of Public Primary, Junior Secondary and Senior Secondary Schools in the last 5 years.
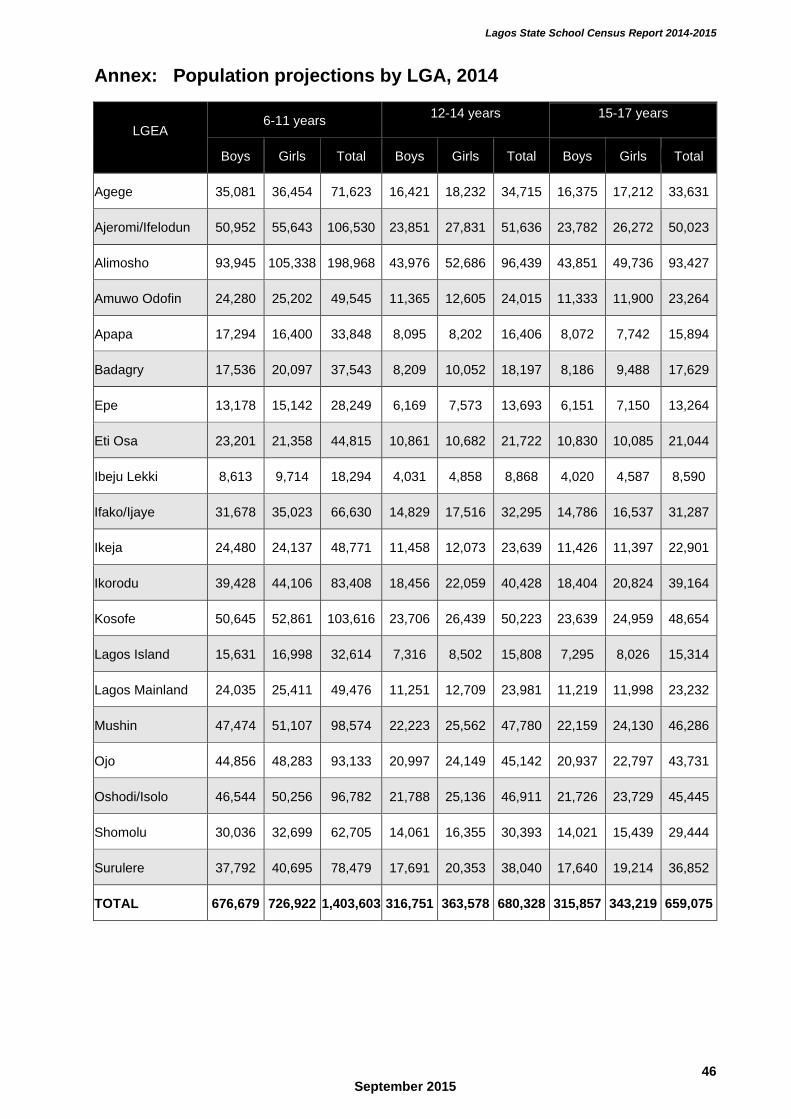
Lagos State School Census Report 2014-2015
46 September 2015
Annex: Population projections by LGA, 2014
LGEA
6-11 years 12-14 years
15-17 years
Boys Girls Total Boys Girls Total Boys Girls Total
Agege 35,081 36,454 71,623 16,421 18,232 34,715 16,375 17,212 33,631
Ajeromi/Ifelodun 50,952 55,643 106,530 23,851 27,831 51,636 23,782 26,272 50,023
Alimosho 93,945 105,338 198,968 43,976 52,686 96,439 43,851 49,736 93,427
Amuwo Odofin 24,280 25,202 49,545 11,365 12,605 24,015 11,333 11,900 23,264
Apapa 17,294 16,400 33,848 8,095 8,202 16,406 8,072 7,742 15,894
Badagry 17,536 20,097 37,543 8,209 10,052 18,197 8,186 9,488 17,629
Epe 13,178 15,142 28,249 6,169 7,573 13,693 6,151 7,150 13,264
Eti Osa 23,201 21,358 44,815 10,861 10,682 21,722 10,830 10,085 21,044
Ibeju Lekki 8,613 9,714 18,294 4,031 4,858 8,868 4,020 4,587 8,590
Ifako/Ijaye 31,678 35,023 66,630 14,829 17,516 32,295 14,786 16,537 31,287
Ikeja 24,480 24,137 48,771 11,458 12,073 23,639 11,426 11,397 22,901
Ikorodu 39,428 44,106 83,408 18,456 22,059 40,428 18,404 20,824 39,164
Kosofe 50,645 52,861 103,616 23,706 26,439 50,223 23,639 24,959 48,654
Lagos Island 15,631 16,998 32,614 7,316 8,502 15,808 7,295 8,026 15,314
Lagos Mainland 24,035 25,411 49,476 11,251 12,709 23,981 11,219 11,998 23,232
Mushin 47,474 51,107 98,574 22,223 25,562 47,780 22,159 24,130 46,286
Ojo 44,856 48,283 93,133 20,997 24,149 45,142 20,937 22,797 43,731
Oshodi/Isolo 46,544 50,256 96,782 21,788 25,136 46,911 21,726 23,729 45,445
Shomolu 30,036 32,699 62,705 14,061 16,355 30,393 14,021 15,439 29,444
Surulere 37,792 40,695 78,479 17,691 20,353 38,040 17,640 19,214 36,852
TOTAL 676,679 726,922 1,403,603 316,751 363,578 680,328 315,857 343,219 659,075


