Embed Size (px)
Citation preview
CENSUS OF INDIA 1991
Dr. M. VIJAYANUNNI of the Indian Administrative Service
Registrar General & Census Commissioner, India
F-ffi
Registrar General of India (In charge of the census of india and vital statistics) t , .
" Office Address: 2A Mansingh Road
New Delhi 110011, India
Telephone: (91-11)3383761 (91-11)3383145 [email protected] http://www.censusindia.ne
Fax: Email: Internet:
Registrar General of India's publlcations can be purchased from the following:
• The Sales Depot (Phone:338 6583) Office of the Registrar General of India 2-A Mansingh Road New Delhi 110011, India
• Directorates of Census Operations in the capitals of all states and union territories in India
• The Controller of Publication Old Secretariat Civil Lines Delhi 110 054
• Kitab Mahal State Emporia Complex, Unit No.21 Baba Kharak Singh Marg New Delhi 110 001
• Sales outlets of the Controller of Publication all over India
Census data available on floppy disks can be purchased from the following:
• Office of the Registrar General, India Data Processing Division 2nd Floor, 'E' Wing Pushpa Bhawan Madangir Road New Delhi 110 062, India
Telephone: (91-11 )698 1558 Fax: (91-11)6980295 Email: [email protected]
© Registrar General of India
The contents of this publication may be quoted citing the source clearly
PREFACE
'To see a world in a grain. of sand And a heaven in a wild flower Hold infinity in the, palm of your hand And eternity irf an hour"
Such as described in the above verse would be the gfaphic outcome of the effort to consolida.te the district-level data relating to all the districts' of a state or the union territories into a single tome as is this volume. Tnis publication is; part of the State and District Profile series of the 1991 census and is brought out in continuation of -the State Profile 1991 India volume, to serve as a handy reference compendium of the districtlevel data from the 19'91 census.
The data in this volume comprises 41 tables arraAgel:i 'in 12 sections and preceded by a map showing the constituent districts. The 12 sections are: General Data, Population Structure, Nuptiality, Fertility and Child Mortality, Literacy and Education, Work Participation, Migration, Religion, Language, Housing and Household Amenities, Urban Agglomerations, Cities and Towns and-an overall Population Scenario of the Past and Present. I
The first se,ction presents the basic administrative da\a like area, number 'of districts', tahsils, development blocks, towns and villages, population, number of households, density, per cent decatfal variation, sex ratio, per'cent of ~rban popufatibn and inhabited villages classified -population size. The second section on pORulation structure gives the distribution of population by age and sex, the ratio of children to women and the dependency ratio of young people of age 0 to 14 years as well" as oid people of age 60 plus to those.in the )Norking age group 15 to 59 years.
j
The third section on nuptiality presents certain selected indicators on female nuptiality, proportion of married females and the ·proportions of married, widowed and divorced or separated among the &ged.
"-The fourth section on fertility and child mortality presents data on the number of
children per woman at the completion of the reproductive period, the crude birth rate, total fertility rate and child mortality rate.
The fifth section on literacy and education gives selected indicators on literacy and education, literacy rates for selected age groups by sex, distribution of literates by educational level, distribution of females in th_e reproductive age group by educational level and the percentages of child workers attending school. \ I
I The sixth section on' work participation contains tables on the main workers and
marginal workers in selected age groups and the percentage distribution of 'main workers by educational level, by industrial category, by industrial and occupational classifications and of non-workers by main activity.
\ . The seventh section on migration presents the district-level data available on
migration viz. in-migrants by place of birth and place of last residence.
The eight!") section on religion gives the data on the six numerically biggest religions in each district.
iii
The ninth section on language contains data on the distribution of population by language as well as the speaker-strengths of the numerically largest languages and mother tongues arranged in descending order. This will give a graphic picture of the language profile of the district which is not easily available anywhere else.
The tenth section on housing and household amenities presents the data on the distribution of households by type of house occupied and the availability of electricity, drinking ~ater atld toilet facilities to hQ,useholds.
The eleventh sectiOI1 gives the details of urban agglomerations, cities and to~ns !.ike their population, sex ra!lo .. literacy rate and work participation ra,tes.
The twelfth selection tops off the tables giving the population scenario' at the district level based on the censuses after independence starting with the 1951 census till 1991, Since the popula,tion projections for the future are not available at the districtieyel, the f)JtlJre population scenario, though available at the national and state levels, could not be given at tile district level. This section gives the district-level data for 1951, 1961, 1971 and 1981 as recast as per the 1991 jurisdiction of the districts. The tables pre,sent the data on population, per cent decadal variation in population, annual exponential growth rate, sex ratio and the urban population for the period 1951-91 ~hich will come in extremely handy for convenient reference at one place.
The District Profile series of which this volume is a part is the fruitful outcome of o)(er two years of intensive and sustained work to cull out and put together all the available, district-level data feasible of presentation here. It is hopea that this will serve as a handy ref~ence source to a wide spectrum of data users like policy planners, .administrators, scholars and researchers.
December 1998 New Delhi
Dr. M. Vijayanunni Registrar General & Census Commissioner of India
iv
Preface
concepts and definitions
Map of Manipur
CONTENTS
LIST OF TABLES
General Data· State and Districts
1. Area, Number of Tahsils, C. D. Blocks, Towns and Villages, 1991
2. Population and Number of households, 1991
3. Density, Per cent decadal variation, Sex ratio and Percentage of urban population, 1991
4. Districts ranked according to Area, Population and Density, 1991
5. Number of inhabited ,<,illages classified by population size, 1991
Population Structure
6. Distribution of Population by Age and Sex, 1991
7. Child-woman ratios, 1991
8. Dependency ratios, 1991
Nuptiallty
9. Selected indicators on Female Nuptiality, 1991
10. Proportion of Married females in selected age groups, .1991
11. Proportions of Married, Widowed and,DivorcedlSeparated among th~ aged by sex, 1~91
Fertility and Child Mortality
12. Number of children ever born and Number of children surviving per ever married woman in tlie age group 45-49 years, 1991
13. Crude Birth Rate and Total Fertility Rate, 1991
14. Child Mortality Indicators, 1991
Literacy and Education
15. Selected indicators on. Literacy and Education, 1991
.16. Literacy rates for selected age groups by ~ex, 1991
17. Distribution of literates by Educational level, 1991
18. Distribution/of females in the age group 15-44 years by Educational Jevel,1991
19. Number of children in the age group 10-14 years and the proportion among them attending school, 1991
Page
iii
vii
xi
2
4
5
7
8
12 14
15
18
19
20
22
23 24
26
28 30
33
34
Work Participation
20. Population and Proportion of Main workers .md Marginal workers in selected age groups\ 1991
21. Distribution (in per cent) of main workers by Educational Level, 1991
22. Distribution (in per cent) of main workers by Industrial category, 1991
.23. Distribution (in per cent) of main workers by National Industrial Classification, 1991
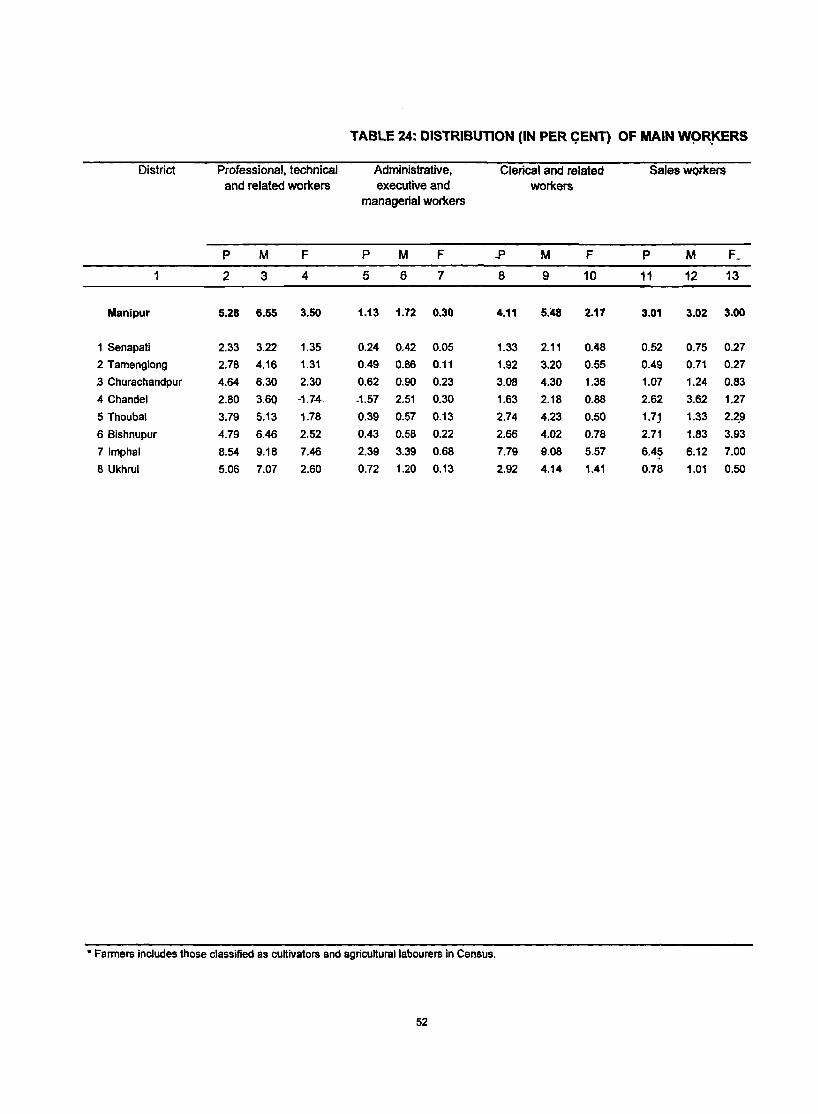
24. Distribution (in per cent) of main workers by Occupational Classification, 1991
25. Distribution (in per cent) of non workers by main activity, 1991
Migration
26. In-migrants by Place of Birth, 1991
27. In-migrants by Place of Last residence with duration of residence 0-9 years, 1991
Religion
28. Six numerically biggest religions arranged in descending order of the number of followers, 1991
Language
29. Distribution of population by Scheduled Languages, 1991
30. Numerically biggest languages arranged in descending order of the number of speakers, 1991
31. Numerically biggest Mother Tongues arranged in descending order of the number of speakers, 1991
Housing and Household Amenities
32. Distribution of households'by Type of House occupied, 1991
33. Availability of ElectriCity, Safe drinking water and Toilet facilities to Households, 1991
Urban Agglomerations, Cities and Towns
34. Urban agglomerations, Cities and Towns and their population, 1991
35. Number of Urban agglomerations, Cities and Towns classified by population size, 1991
36. Sex ratio, literacy rates and work participation rates in Urban Agglomerations, Cities and Towns, 1991
37. Distribution (in per cent) of main workers in Urban Agglomerations, Cities and Towns by industrial category, 1991
Population Scenario - Past and Present
38. Population, 1951-91
39. Per cent decadal variation in population and average annual exponential growth rate, 195f-91
40. Sex ratio (number of females per 1,000 males), 1951-1991
41. Urban population and its proportion to total population, 1951-1991
vi
38
45
48 50
52
54
56
58
62
66 68
73
81
82
85
~
89
90
95
96
97
98
General Data
Village,
Town
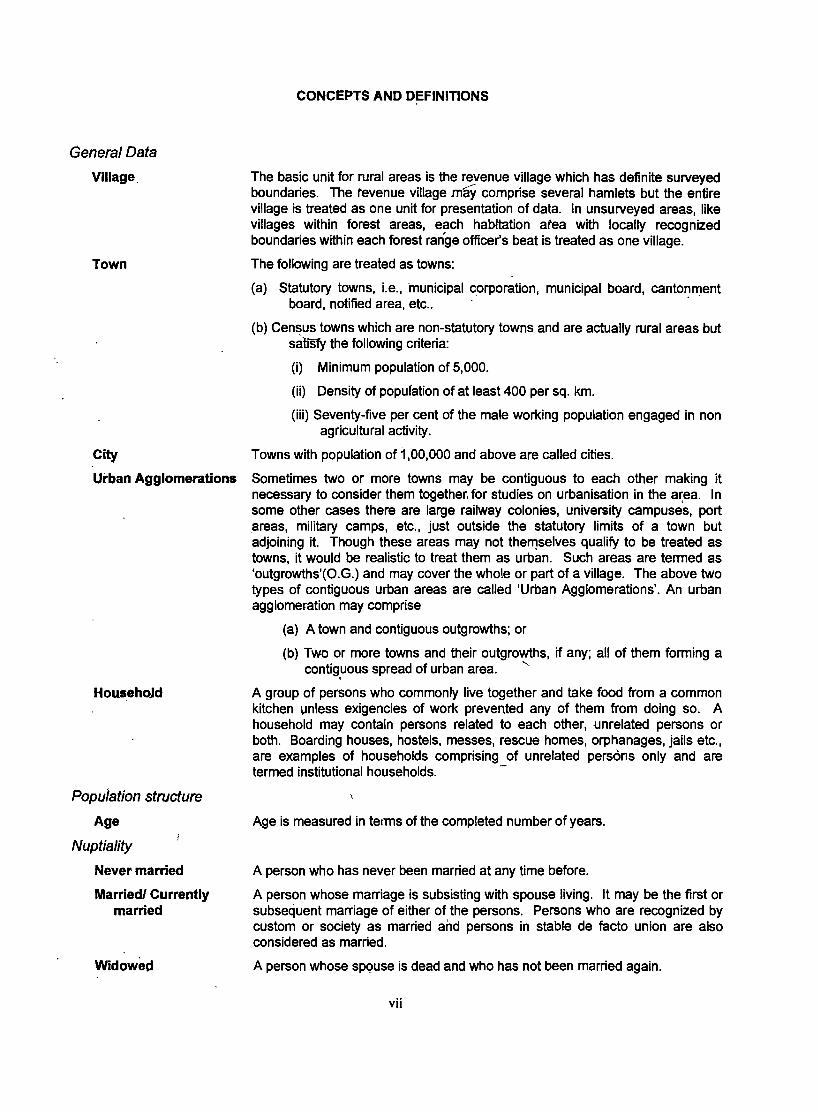
CONCEPTS AND D~FINITIONS
The basic unit for rural areas is the revenue village which has definite surveyed boundaries. The revenue village may comprise several hamlets but the entire village is treated as one unit for presentation of data. In unsurveyed areas, like villages within forest areas, each habitation atea with locally recognized boundaries within each forest range officer's beat is treated as one village.
The following are treated as towns:
(a) Statutory towns, Le., -municipal corporation, municipal board, cantonment board, notified area, etc.. . ' . .
(b) Cen~us towns which are non-statutory towns and are actually rural areas but salisfy the following criteria:
(i) Minimum population of 5,000.
(ii) Density of popuration of at least 400 per sq. km.
(iii) Seventy-five per cent of the male working population engaged in non agricultural activity.
City Towns with population of 1,00,000 and above are called cities.
Urban Agglomerations Sometimes two or more towns may be contiguous to each other making it necessary to consider them together, for studies on urbanisation in the area. In some other cases there are large railway colonies, university campuses, port areas, military camps, etc., just outside the statutory limits of a town but adjoining it. Though these areas may not thell)selves qualify to be treated as towns, it would be realistic to treat them as urban. Such areas are termed as 'outgrowths'(O.G.) and may cover the whole or part of a village. The above two types of contiguous urban areas are called 'Urban Agglomerations'. An urban agglomeration may comprise
HousehQld
Population structure
Age
Nuptiality
Never married
Marriedl Currently married
Widowed
(a) A town and contiguous outgrowths; or
(b) Two or more towns and their outgrowths, if any; all of them forming a contig,uous spread of urban area. "-
A group of persons who commonly live together and take food from a common kitchen I,m less exigencies of work prevented any of them from doing so. A household may contain persons related to each other, unrelated persons or both. Boarding houses, hostels, messes, rescue homes, orphanages, jails etc., are examples of households comprising of unrelated persons only and are termed institutional households. -
Age is measured in terms of the completed number of years.
A person who has never been married at any time before.
A person whose marriage is subsisting with spouse living. It may be the first or subsequent marriage of either of the persons. Persons who are recognized by custom or society as married and persons in stable de facto union are also considered as married.
A person whose spQuse is dead and who has not been married again.
vii
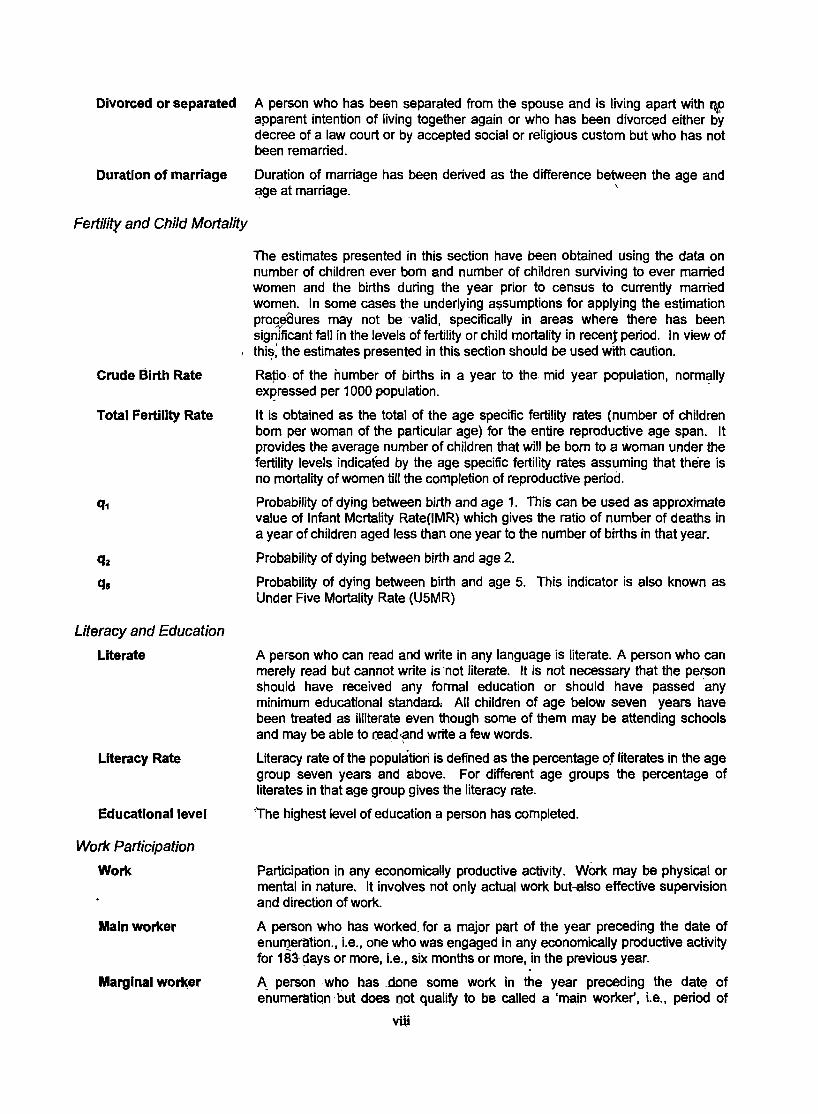
Divorced or separated A person who has been separated from the spouse and is living apart with '¥l apparent intention of living together again or who has been divorced either by decree of a law court or by accepted social or religious custom but who has not been remarried.
Duration of marriage Duration of marriage has been derived as the difference between the age and ~ge at marriage. \
Fertility and Child Mortality
The estimates presented in this section have been obtained using the data on number of children ever born and number of children surviving to ever married women and the births during the year prior to census to currently married women. In some cases the underlying a~sumptions for applying the estimation pro~ures may not be valid, specifically in areas where there has been significant fall in the levels of fertility or child mortality in recent period. In view of
I thi~: the estimates presented in this section should be used with caution.
Crude Birth Rate
Total Fertility Rate
Literacy and Education
Literate
Literacy Rate
Educational level
Work Participation
Work
Main worker
Marginal wo~er
Ratio of the number of births in a year to the mid year population, normally ex~ressed per 1000 population. .
It is obtained as the total of the age specific fertility rates (number of children born per woman of the particular age) for the entire reproductive age span. It provides the average number of children that will be born to a woman under the fertility levels indicated by the age specific fertility rates assuming that there is no mortality of women till the completion of reproductive period.
Probability of dying between birth and age 1. This can be used as approximate value of Infant Mortality Rate(IMR) which gives the ratio of number of deaths in a year of children aged less than one year to the number of births in that year.
Probability of dying between birth and age 2.
Probability of dying between birth and age 5. This indicator is also known as Under Five Mortality Rate (U5MR)
A person who can read and write in any language is literate. A person who can merely read but cannot write is' not literate. It is not necessary that the person should have received any formal education or should have passed any minimum educational standard·; All children of age below seven years have been treated as illiterate even though some of them may be attending schools and may be able to r:ead ·and write a few words . . ,
Literacy rate of the population is defined as the percentage of literates in the age group seven years and above. For different age groups the percentage of literates in that age group gives the literacy rate.
{The highest level of education a person has completed.
Participation in any economically productive activity. Work may be physical or mental in nature. It involves not only actual work but-efso effective supervision and direction of work.
A person who has worked. for a major part of the year preceding the date of enurQeration., i.e., one who was engaged in any economically productive activity for 183-days or more, Le., six months or more, in the previous year.
A_ person . who has .done some work in the year preceding the dat~ of e'numeration but does oot qualify to be called a 'rna.in worker', i.e., period of
viii
Nonworker
Cultivator
Agriculturallabo~rer
Household Industry
Migration
Migrant
Language
Language and
Mother tongue
work is less than 183 days.
A person who has not worked at all in the year preceding the date of enumeration.
A person engf)ged as employer, single worker or family worker in cultivation of undernoted crops on land owned,or held from government or private persons or institutions for payment ilJ/money, kind or share. Cultivation includes supervision or direction of cultivation.
Cultivation includes ploughing, sowing and harvesting and production of cereals and millet crops such as wheat, paddy, jowar, bajra, ragi, etc., and pulses, raw jute and kindred fiber crop, cotton, etc ..
Cultivation does not in-clude growing of fruits and vegetables, keeping orchard or groves or working in plantations like tea, coffee, rubber, cinchona and medicinal plants.
A person who works in another person's land for wages in cash kind or share crop is regarded as an agricultural labourer. Such 'a person has no risk in cultivation but merely works in another person's land for wages and has no right of lease or contract on the land on which he works.
An industry conducted by one or more members of the household at home or within the village in rural areas and within the precincts of the house where the household lives in urban areas. It should be smaller than the scale of a registered factory and should be engaged in manufacturing, processing, servicing and repairs of goods.
/
Data on migrants are available by two different concepts as given below.:
Migrants by place of birth: Persons who were born outside the village or townl urban-agglomeration of enumeration.
Migrants by place of last residence: Persons who were living outside the village or townl urban agglomeration of enumeration.
, As per the census concept, each language is a group of mother tongues. The census questionnaire collects information on the mother tongue of each person and mother tongue is defined as the language spoken in childhood by the person's mother to the person. The mother tongues returned by the respondents in censu$ were classified and grouped under appropriate languages according to their linguistic characteristics. Mother ~ongues with 10,000 or more speakers at all-lndia1evel are presented separately under the relevant language, while those mother tongufjs which returned _less than 10,000 speakers each and which were classified under a particular language are included in "others- under that language. The total number of languages so arrived at is 114, comprising of 18 languages included in the Eighth Schedule to the Constitution of India (Scheduled Languages) and 96 other languages not included in the Eighth Schedule to. the Constitution of India (Non-scheduled Languages). There is a total of 216 identified mother tongues which returned 10,000 or more speakers each at all-India level consisting of 85 mother tongues grouped under the 18 Scheduled Languages and 131 mother tongues grouped under the 96 Non- scheduled Languages.
Housing and Household Amenit{es
'Pennanenthouses Houses in. which both wall and roof are made of permanent materials. Material of wall can be burnt bricks. GI sheets or other metal sheets, stone or cement
ix
Semi- permanent houses
Temporary houses
concrete. Roof may be made of tiles, slate, shingle, corrugated iron, zinc br other metal sheets, asbestos cement sheets, bricks, lime and stone, stone and RBC/RCC or concrete.
Houses in which either wall or roof is made of permanent materials and the other is made of temporary material.
Houses in which both wall and roof are made of materials which have to be replaced frequently. Wall may be made of grass, leaves, reeds, bamboo, mud, un-burnt bricks or wood. Roof may be made from grass, leaves, bamboo, thatch, 'un-burnt bricks or wood.
Serviceable temporary Temporary houses in which wall is made of mud, un-burnt bricks or wood. houses
Non-serviceable Temporary houses in which wall is made of grass, leaves, reeds p.r bamboo. temporary houses
Safe drinking water If the source of drinking water is tap, hand pump or tube well then it has been termed as safe drinking water. It may be n.oted that this definition is not comprehensive.
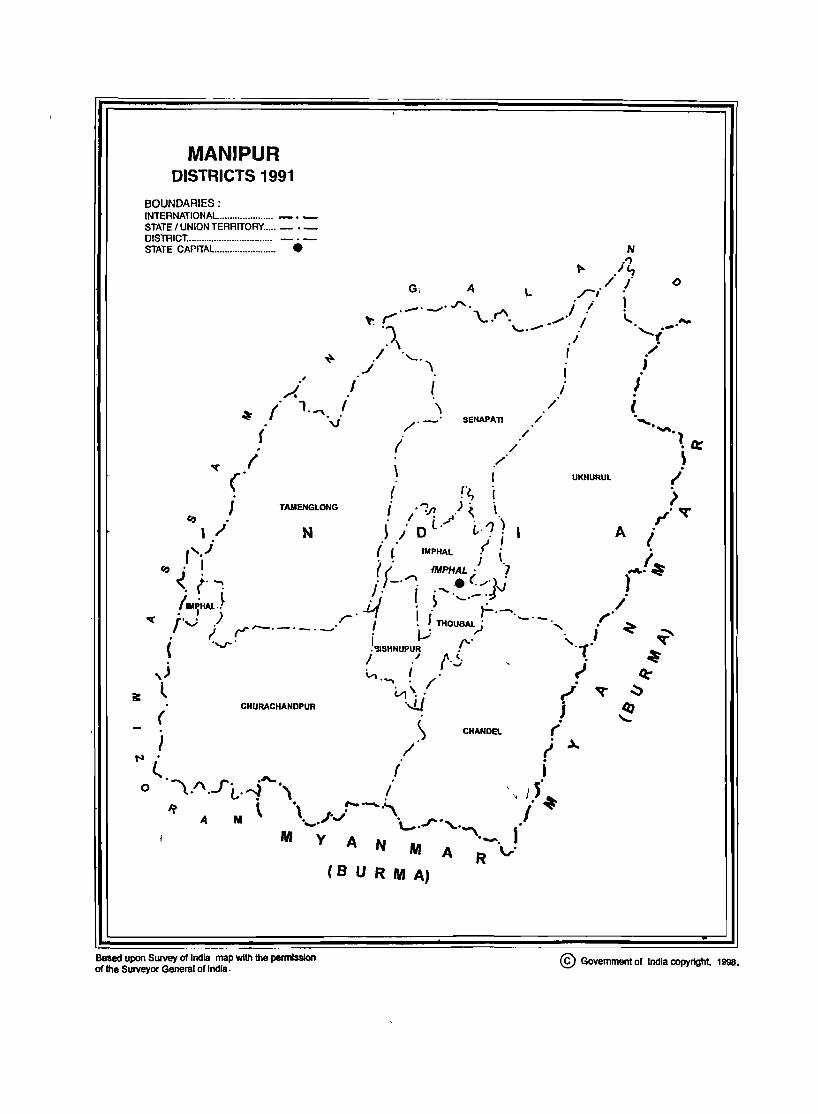
MANIPUR DISTRICTS 1991
BOUNDARIES: INTERNATIONAL ..................... _. _ STATE I UNION TERRITORY ..... - ._ DISTRICT.................................. -'-STATE CAPITAl........................ • N
t- ./1, ./i
L /1' ..... " 1 .-'_'''''' ~ I!· - r" '\.. ., ",,' / " _
.. ; ') . -' '.-' _, . 'f . \ .1".
~ jl ''-', ' i
A
" I I I! /. . ~ I 1.",.' \ / / (
( "\) /. ~. SENAPAll ./ '"'. -"1 I / .~
1/) "t' (' \ I UKHURUL I
(f"l.,1 ) J .) . .
TAMENGLONG I' '7.11 . ~ \ ,./ ~
~ I ./ N .j ,/1 0 t."'" i,·?·1 A I ( t r . . r .. ·.1 " IMPHAL J \ I ~
~ ~ J.: (f-.". lMPH~L(./)J )~ • . \ /. I· ..... · -.~
/IMPHALJ d . ~ "_. ~ / , , ) -Vf I j , ........ ".
"t' _r'-.) i "r,._._._._.r·! ~ THou:~; """-". j ~ . . I, . ""'-i'.'
( ....,... • '3ISHNUPUR « I / {'-!;
J . I I , '-'I ....... ' /'
l v,'.. r' ~
( P . ,I !. CHURACHAND UR '-J..4
( CHANDEL ('
I /) i ..\. '" . l (I . "",..,.. .~. c'
o V'.-' l,..--) '\ ! '" '.' ... I? \" .1"')-'-'\ I
'" M ._. 'L, .J" . ". • ~. I M
Based upon Survey of India map with the permission of the Surveyor General of India.
y A N M
(8 U R M A)
-. A R v'
© Government of India copyright, 1998.


GENERAL DATA -STATE AN'D DISTRICTS
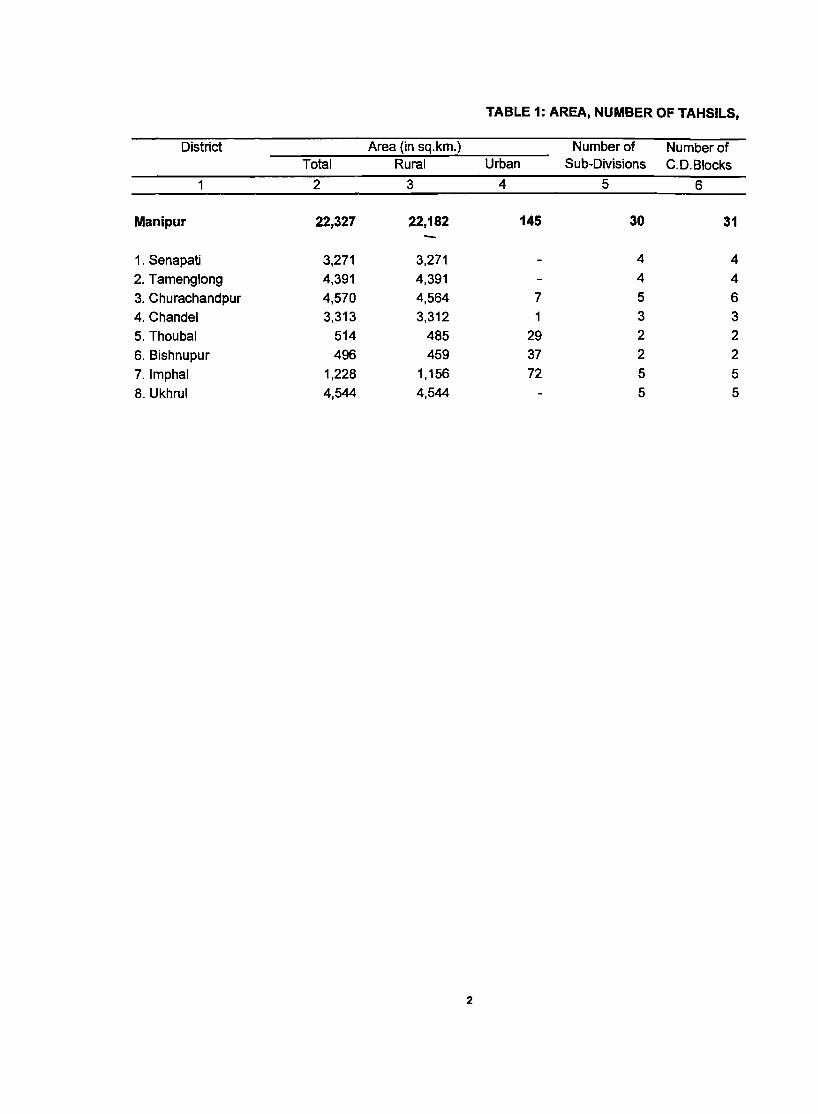
TABLE 1: AREA, NUMBER OF TAHSILS,
District Area (in sq.km.) Number of Number of Total Rural Urban Sub-Divisions C.D.Blocks
1 2 3 4 5 6
Manipur 22,327 22,182 145 30 31
1. Senapati 3,271 3,271 4 4
2. Tamenglong 4,391 4,391 4 4
3. Churachandpur 4,570 4,564 7 5 6
4. Chandel 3,313 3,312 1 3 3 5. Thoubal 514 485 29 2 2
6. Bishnupur 496 459 37 2 2
7.lmphal 1,228 1,156 72 5 5
8. Ukhrul 4,544 4,544 5 5
2
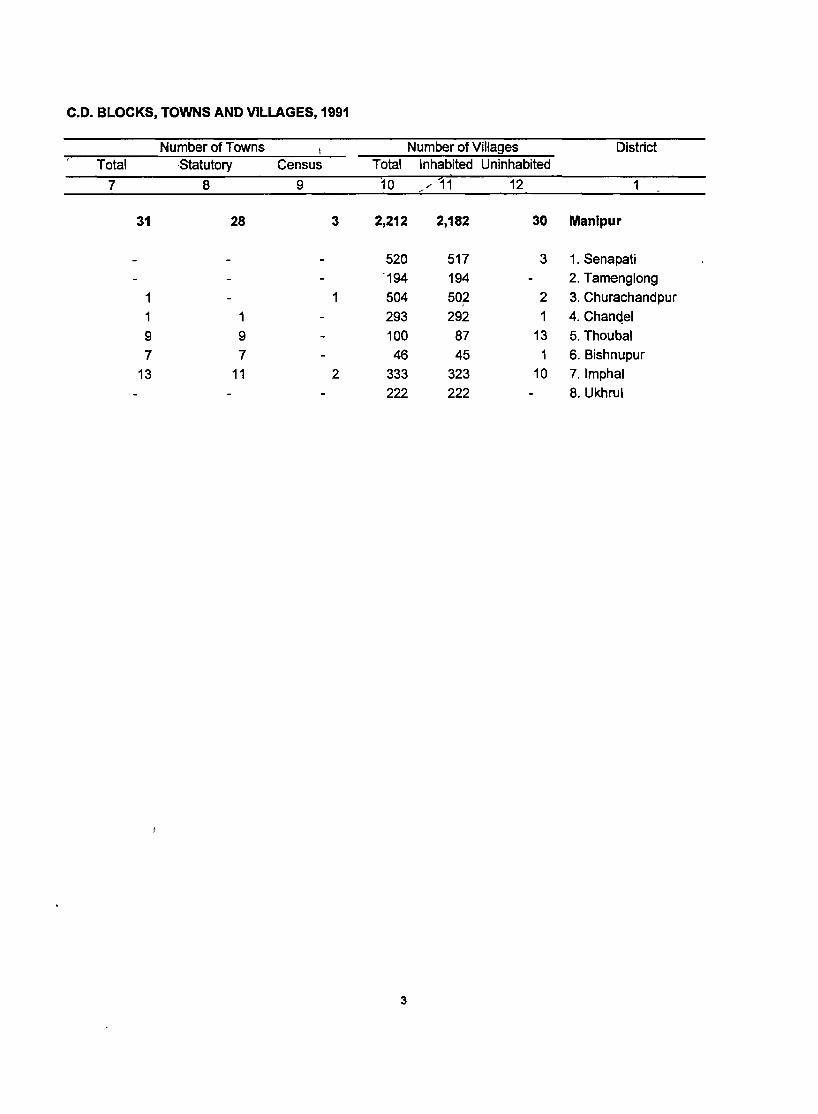
C.D. BLOCKS, TOWNS AND VILLAGES, 1991
Number of Towns I Number of Villages District Total Statutory Census Total Inhabited Uninhabited
7 8 9 '10 " 11 12 1
31 28 3 2,212 2,182 30 Manipur
520 517 3 1. Senapati -194 194 2. Tamenglong
1 1 504 50f 2 3. Churachandpur
1 1 293 292 1 4. Chan(~el
9 9 100 87 13 5. Thoubal
7 7 46 45 1 6. Bishnupur
13 11 2 333 323 10 7.lmphal
222 222 8. Ukhrul
3
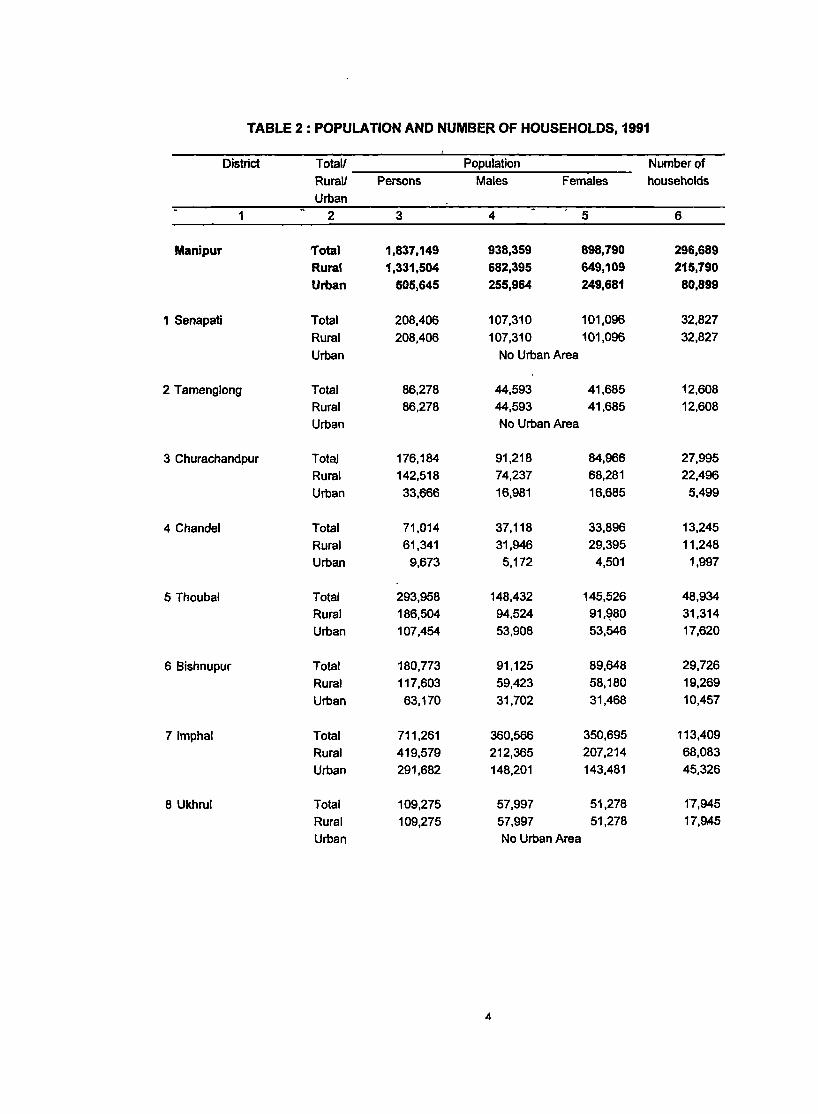
TABLE 2 : POPULATION AND NUMBER OF HOUSEHOLDS, 1991
District Totall Population Number of
RuraU Persons Males Females households
Urban
1 2 3 4 5 6
Manipur Total 1,837,149 938,359 898,790 296,689
Rural 1,331,504 682,395 649,109 215,790
Urban 505,645 255,964 249,681 80,899
1 Senapati Total 208,406 107,310 101,096 32.827
Rural 208,406 107,310 101,096 32,827
Urban No Urban Area
2 Tamenglong Total 86,278 44,593 41,685 12,608
Rural 86,278 44,593 41,685 12,608
Urban No Urban Area
3 Churachandpur Tota] 176,184 91,218 84,966 27,995
Rural 142,518 74,237 68,281 22,496
Urban 33,666 16,981 16,685 5,499
4 Chandel Total 71,014 37,118 33,896 13,245
Rural 61,341 31,946 29,395 11,248
Urban 9,673 5,172 4,501 1,997
5 Thoubal Total 293,958 148,432 145,526 48,934
Rural 186,504 94,524 91,~80 31,314
Urban 107,454 53,908 53,546 17,620
6 Bishnupur Total 180,773 91,125 89,648 29,726
Rural 117,603 59,423 58,180 19,269
Urban 63,170 31,702 31,468 10,457
71mphal Total 711,261 360,566 350,695 113,409
Rural 419,579 212,365 207,214 68,083
Urban 291,682 148,201 143,481 45,326
8 Ukhrul Total 109,275 57,997 51,278 17,945
Rural 109,275 57,997 51,278 17,9A5
Urban No Urban Area
4
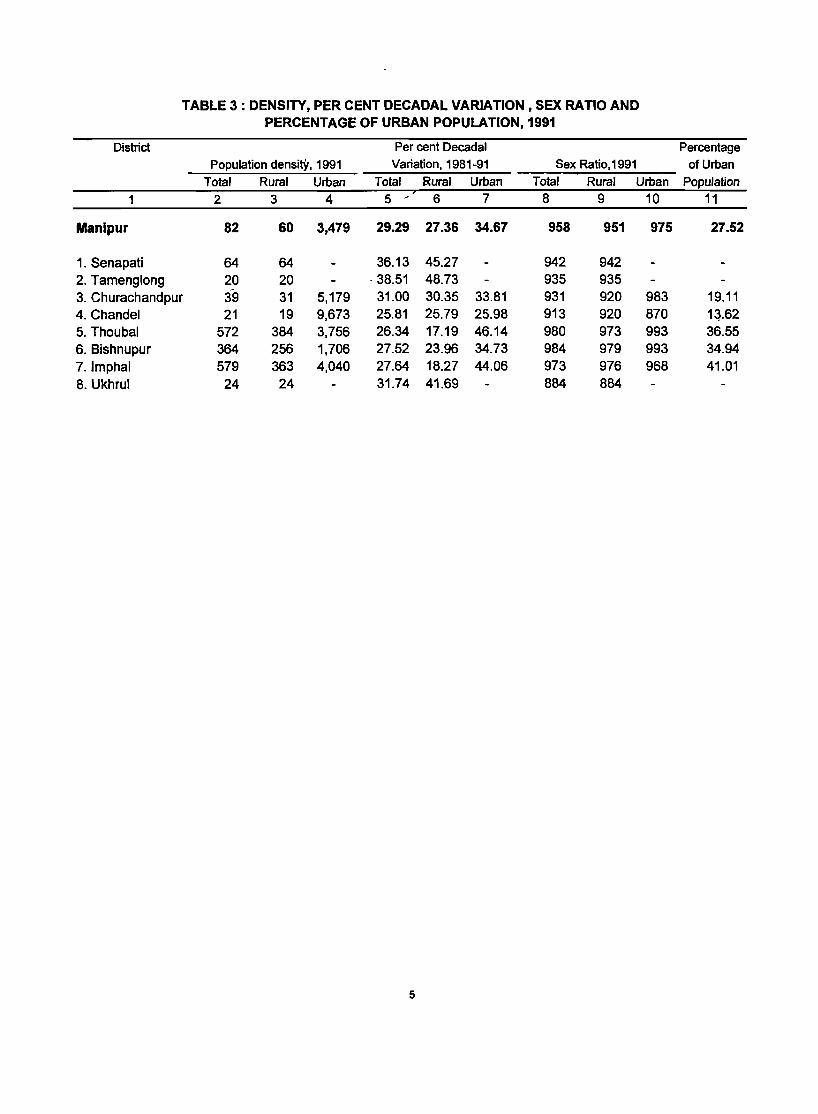
TABLE 3 : DENSITY, PER CENT DECADAL VARIATION, SEX RATIO AND PERCENTAGE OF URBAN POPULATION, 1991
District Per cent Decadal Percentage
Population densitY, 1991 Variation, 1981-91 Sex Ratio,1991 of Urban
Total Rural Urban Total Rural Urban Total Rural Urban Population
1 2 3 4 5 / 6 7 8 9 10 11
Manipur 82 60 3,479 29.29 27.36 34.67 958 951 975 27.52
1. Senapati 64 64 36.13 45.27 942 942 2. Tamenglong 20 20 - 38.51 48.73 935 935 3. Churachandpur 39 31 5,179 31.00 30.35 33.81 931 920 983 19.11 4. Chandel 21 19 9,673 25.81 25.79 25.98 913 920 870 1~.62
5. Thoubal 572 384 3,756 26.34 17.19 46.14 980 973 993 36.55 6. Bishnupur 364 256 1,706 27.52 23.96 34.73 984 979 993 34.94 7.lmphal 579 363 4,040 27.64 18.27 44.06 973 976 968 41.01 8. Ukhrul 24 24 31.74 41.69 884 884
5

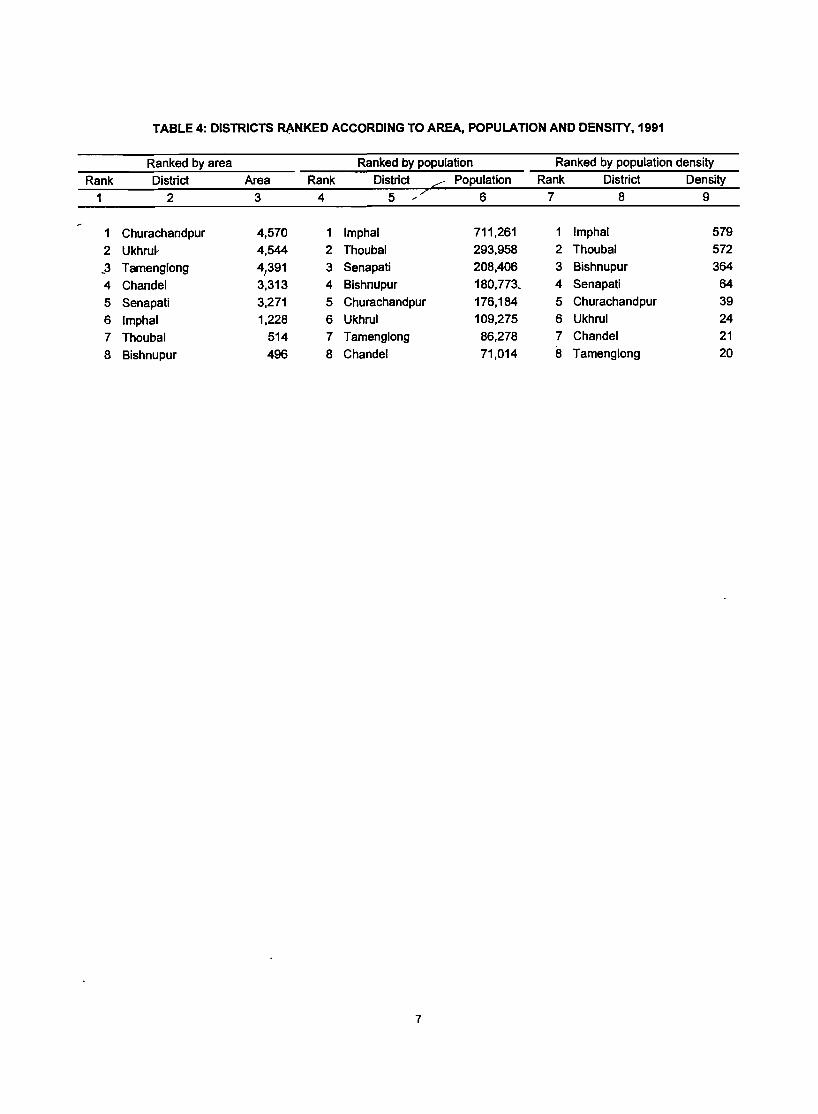
TABLE 4: DISTRICTS ~NKED ACCORDING TO AREA, POPULATION AND DENSITY, 1991
Ranked by area Ranked by population Ranked by population density
Rank District Area Rank District .:;;::: Population Rank District Density
1 2 3 4 5 7 6 7 8 9 .-
1 Churachandpur 4,570 1 Imphal 711,261 1 Imphal 579
2 Ukhru~ 4,544 2 Thoubal 293,958 2 Thoubal 572
~3 Tamenglong 4,391 3 Senapati 208,406 3 Bishnupur 364
4 Chandel 3,313 4 Bishnupur 180,773. 4 Senapati 64
5 Senapati 3,271 5 Churachandpur 176,184 5 Churachandpur 39
6 Imphal 1,228 6 Ukhrul 109,275 6 Ukhrul 24
7 Thoubal 514 7 Tamenglong 86,278 7 Chandel 21
8 Bishnupur 496 8 Chandel 71,014 8 Tamenglong 20
7
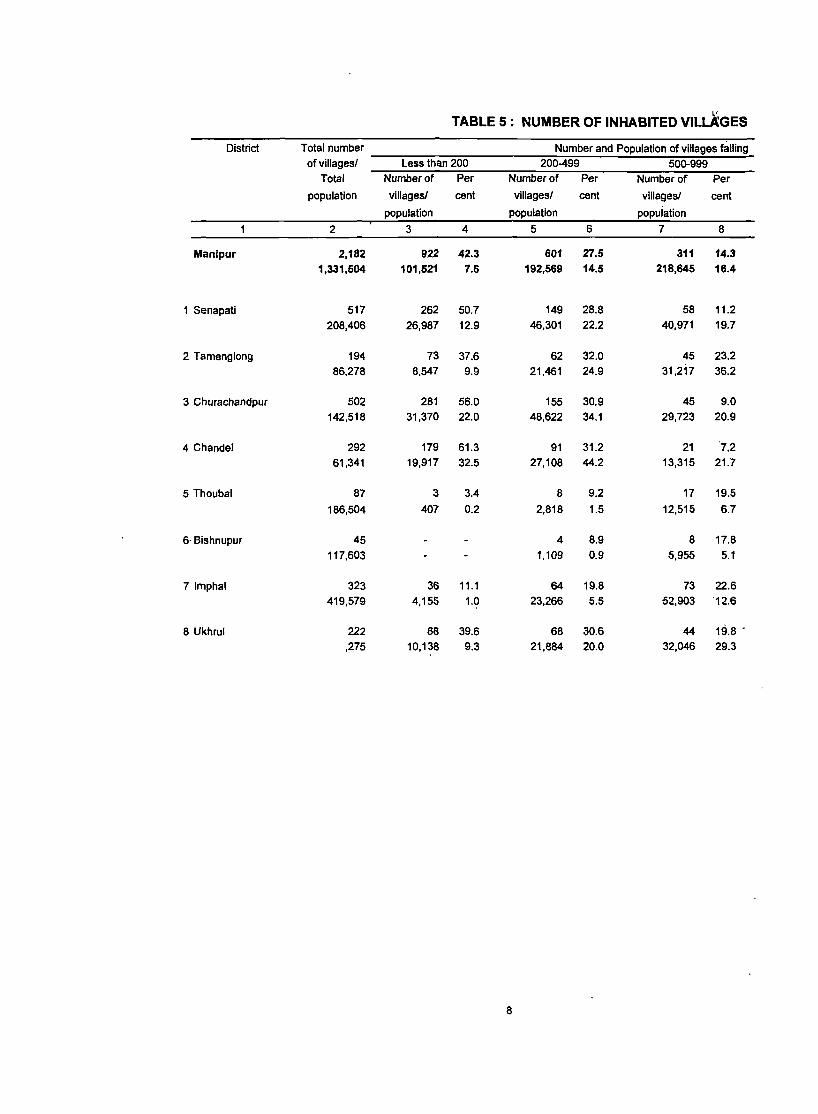
I' TABLE 5: NUMBER OF INHABITED VILLAGES
District Total number Number and Population of villages falling of villages! Less than 200 200-499 500-999
Total Number of Per Number of Per Number of Per
population villages! cent villagesl cent villages! cent
population population population
2 3 4 5 6 7 8
Manipur 2,182 922 42.3 601 27.5 311 14.3 1,331,504 101,521 7.6 192,569 14.5 218,645 16.4
1 Senapati 517 262 50.7 149 28.8 58 11.2
208,406 26,987 12.9 46,301 22.2 40,971 19.7
2 Tamenglong 194 73 37.6 62 32.0 45 23.2
86,278 8,547 9.9 21,461 24.9 31,217 36.2
3 Churachandpur 502 281 56.0 155 30.9 45 9.0
142,518 31,370 22.0 48,622 34.1 29,723 20.9
4 Chandel 292 179 61.3 91 31.2 21 7.2
61,341 19,917 32.5 27,108 44.2 13,315 21.7
5 Thoubal 87 3 3.4 8 9.2 17 19.5
186,504 407 0.2 2,818 1.5 12,515 6.7
6· Bishnupur 45 4 8.9 8 17.8
117,603 1,109 0.9 5,955 5.1
71mphal 323 36 11.1 64 19.8 73 22.6
419,579 4,155 1.0 23,266 5.5 52,903 12.6
8 Ukhrul 222 88 39.6 68 30.6 44 19.8 .
,275 10,138 9.3 21,884 20.0 32,046 29.3
8
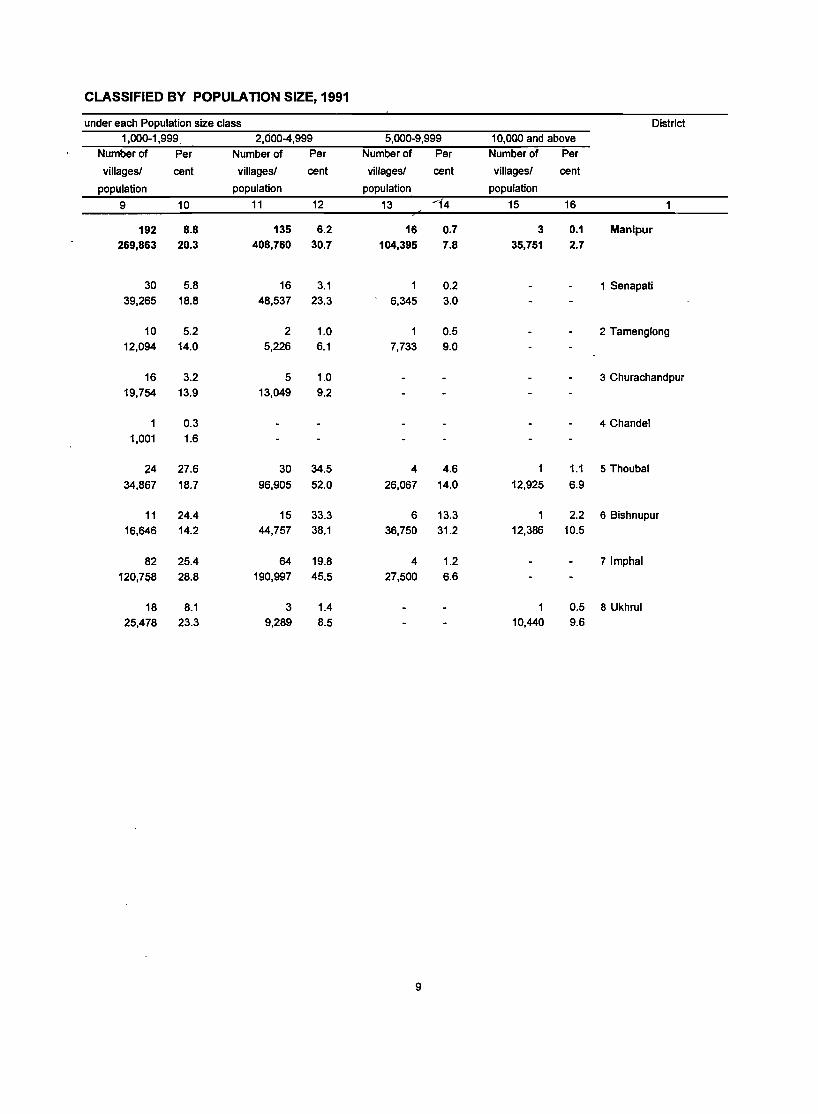
CLASSIFIED BY POPULATION SIZE, 1991
under each Population size class District 1,000-1,999. 2,000-4,999 5,000-9,999 10,000 and above
Number of Per Number of Per Number of Per Number of Per
villagesl cent villages! cent villagesl cent villages! cent
population population population population
9 10 11 12 13 ---14 15 16
192 8.8 135 6.2 16 0.7 3 0.1 Manipur
269,863 20.3 408,760 30.7 104,395 7.8 35,751 2.7
30 5.8 16 3.1 0.2 1 Senapati 39,265 18.8 48,537 23.3 6,345 3.0
10 5.2 2 1.0 0.5 2 Tamenglong 12,094 14.0 5,226 6.1 7,733 9.0
16 3.2 5 1.0 3 Churachandpur
19,754 13.9 13,049 9.2
0.3 4 Chandel
1,001 1.6
;14 27.6 30 34.5 4 4.6 1.1 5 Thoubal
34,867 18.7 96,905 52.0 26,067 14.0 12,925 6.9
11 24.4 15 33.3 6 13.3 2.2 6 Bishnupur
16,646 14.2 44,757 38.1 36,750 31.2 12,386 10.5
82 25.4 64 19.8 4 1.2 71mphal
120,758 28.8 190,997 45.5 27,500 6.6
18 8.1 3 1.4 0.5 8 Ukhrul
25,478 23.3 9,289 8.5 10,440 9.6
9

POPULATION STRUCTURE
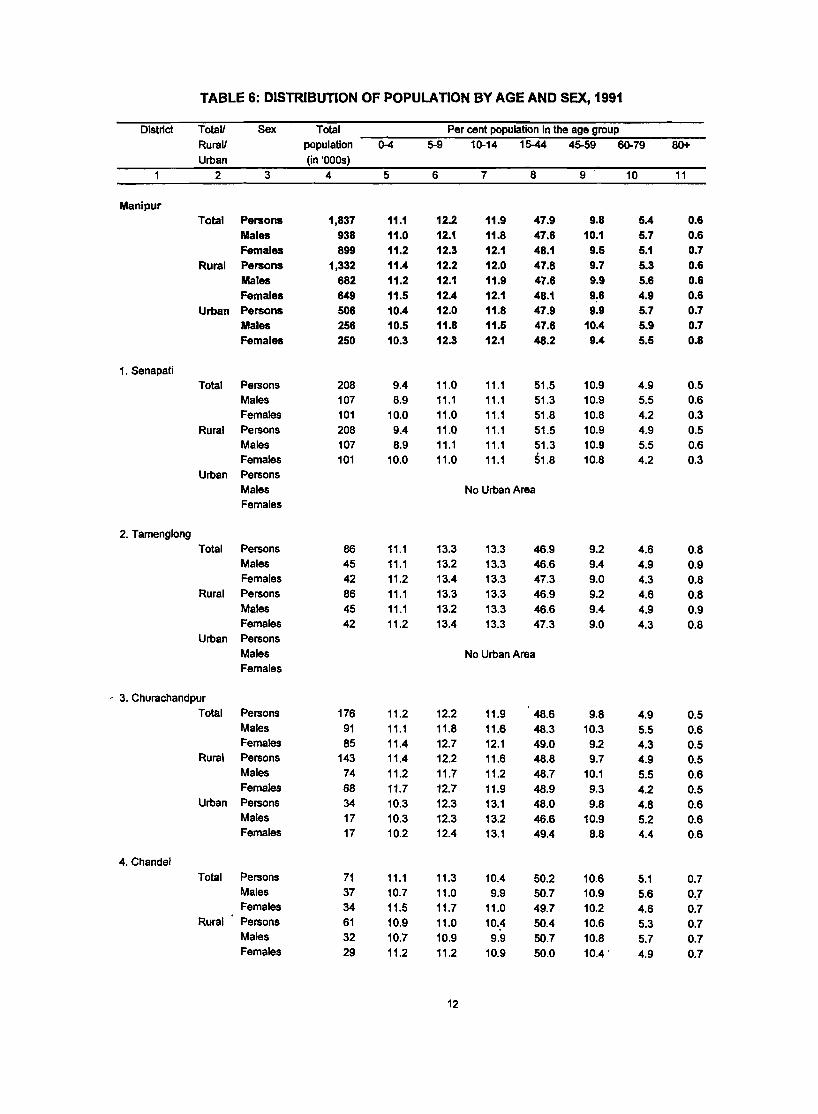
TABLE 6: DISTRIBUTION OF POPULATION BY AGE AND SEX, 1991
District
Manipur
1. Senapati
2. Tamenglong
Totall RuraV
Urban 2
Sex
3
Total Persons Males Females
Rural Persons Males Females
Urban Persons Males Females
Total Persons Males Females
Rural Persons Males Females
Urban Persons Males Females
Total Persons Males Females
Rural Persons Males Females
Urban Persons Males Females
, 3. Churachandpur
Total Persons Males Females Persons Males Females Persons Males Females
4. Chandel
Rural
Urban
Total Persons Males Females
Rural Persons Males Females
Total population (in 'OOOs)
4
1,837 938 899
1,332 682 649 506 256 250
208 107 101 208 107 101
86 45 42 86 45 42
176 91 85
143 74 68 34 17 17
71 37 34 61 32 29
5
11.1 11.0 11.2 11.4 11.2 11.5 10.4 10.5 10.3
9.4 8.9
10.0 9.4 8.9
10.0
11.1 11.1 11.2 11.1 11.1 11.2
11.2 11.1 11.4 11.4 11.2 11.7 10.3 10.3 10.2
11.1 10.7 11.5 10.9 10.7 11.2
Per cent population in the age group 5-9 10-14 15-44 45-59 60-79
6
12.2 12.1 12.3 12.2 12.1 12.4 12.0 11.8 12.3
11.0 11.1 11.0 11.0 11.1 11.0
13.3 13.2 13.4 13.3 13.2 13.4
12.2 11.8 12.7 12.2 11.7 12.7 12.3 12.3 12.4
11.3 11.0 11.7 11.0 10.9 11.2
12
7
11.9 11.8 12.1 12.0 11.9 12.1 11.8 11.5 12.1
11.1 11.1 11.1 11.1 11.1 11.1
8
47.9 47.6 48.1 47.8 47.6 48.1 47.9 47.6 48.2
51.5 51.3 51.8 51.5 51.3 51.8
No Urban Area
13.3 13.3 13.3 13.3 13.3 13.3
46.9 46.6 47.3 46.9 46.6 47.3
No Urban Area
11.9 11.6 12.1 11.6 11.2 11.9 13.1 13.2 13.1
10.4 9.9
11.0 10.4 9.9
10.9
48.6 48.3 49.0 48.8 48.7 48.9 48.0 46.6 49.4
50.2 50.7 49.7 50.4 SO.7 50.0
9
9.8 10.1
9.5 9.7 9.9 9.6 9.9
10.4 9.4
10.9 10.9 10.8 10.9 10.9 10.8
9.2 9.4 9.0 9.2 9.4 9.0
9.8 10.3 9.2 9.7
10.1 9.3 9.8
10.9 8.8
10.6 10.9 10.2 10.6 10.8 10.4·
10
5.4 5.7 5.1 5.3 5.6 4.9 5.7 5.9 5.5
4.9 5.5 4.2 4.9 5.5 4.2
4.6 4.9 4.3 4.6 4.9 4.3
4.9 5.5 4.3 4.9 5.5 4.2 4.8 5.2 4.4
5.1 5.6 4.6 5.3 5.7 4.9
80+
11
0.6 0.6 0.7 0.6 0.6 0.6 0.7 0.7 0.8
0.5 0.6 0.3 0.5 0.6 0.3
0.8 0.9 0.8 0.8 0.9 0.8
0.5 0.6 0.5 0.5 0.6 0.5 0.6 0.6 0.6
0.7 0.7 0.7 0.7 0.7 0.7
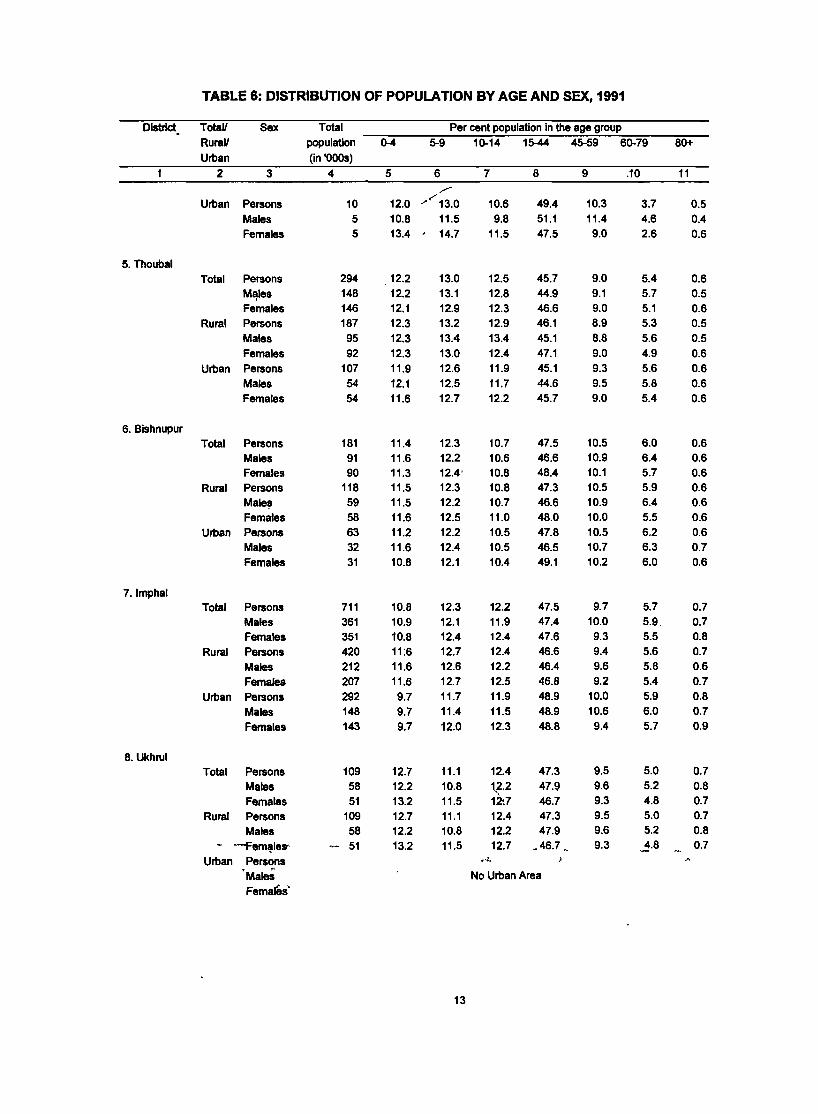
TABLE 6: DISTRIBUTJON OF POPULATION BY AGE AND SEX, 1991
District. T olalt Ruralt Urban
Sex
5. Thoubal
6. Bishnupur
7.lmphal
8.lJt(hrul
2 3
Urban Persons Males Females
Total Persons M~les
Females Rural Persons
Males Females
Urban Persons Males Females
Total Persons Males Females
Rural Persons Males Females
Urban Persons Males Females
Total Persons Males Females
Rural Persons Males Females
Urban Persons Males Females
Total Persons Males Females
Rural Persons Males
- --Fe'm~lesUrban Persons
'Males
Fema's'
Total population (in 'Ooos)
4
10 5 5
294 148 146 187 95 92
107 54 54
181 91 90
118 59 58 63 32 31
711 361 351 420 212 207 292 148 143
109 58 51
109 58
-- 51
Per cent population in the age group 5-9 10-14 15-44 45-59 60-79
5 6 7 8 /
12.0 /<" 13.0 10.6 9.8
11.5
49.4 51.1 47.5
10.8 11.5 13.4 A 14.7
12.2 12.2 12.1 12.3 12.3 12.3 11.9 12.1 11.6
11.4 11.6 11.3 11.5 11.5 11.6 11.2 11.6 10.8
10.8 10.9 10.8 11:6 11.6 11.6 9.7 9.7 9.7
12.7 12.2 13.2 12.7 12.2 13.2
13.0 13.1 12.9 13.2 13.4 13.0 12.6 12.5 12.7
12.3 12.2 12.4' 12.3 12.2 12.5 12.2 12.4 12.1
12.3 12.1 12.4 12.7 12.6 12.7 11.7 11.4 12.0
12.5 12.8 12.3 12.9 13.4 12.4 11.9 11.7 12.2
10.7 10.6 10.8 10.8 10.7 11.0 10.5 10.5 10.4
12.2 11.9 12.4 12.4 12.2 12.5 11.9 11.5 12.3
45.7 44.9 46.6 46.1 45.1 47.1 45.1 44.6 45.7
47.5 46.6 48.4 47.3 46.6 48.0 47.8 46.5 49.1
47.5 47.4 47.6 46.6 46.4 46.8 48.9 48.9 48.8
11.1 12.4 47.3 10.8 tf.2 47.9 11.5 12:7 46.7 11.1 12.4 47.3 10.8 12.2 47.9 11.5 12.7 ~46.7 ~ ....
No Urban Area
13
9
10.3 11.4 9.0
9.0 9.1 9.0 8.9 8.8 9.0 9.3 9.5 9.0
10.5 10.9 10.1 10.5 10.9 10.0 10.5 10.7 10.2
9.7 10.0 9.3 9.4 9.6 9.2
10.0 10.6 9.4
9.5 9.6 9.3 9.5 9.6 9.3
.10
3.7 4.6 2.6
5.4 5.7 5.1 5.3 5.6 4.9 5.6 5.8 5.4
6.0 6.4 5.7 5.9 6.4 5.5 6.2 6.3 6.0
5.7 5.9. 5.5 5.6 5.8 5.4 5.9 6.0 5.7
5.0 5.2 4.8 5.0 5.2
..1.8
80+
11
0.5 0.4 0.6
0.6 0.5 0.6 0.5 0.5 0.6 0.6 0.6 0.6
0.6 0.6 0.6 0.6 0.6 0.6 0.6 0.7 0.6
0.7 0.7 0.8 0.7 0.6 0.7 0.8 0.7 0.9
0.7 0.8 0.7 0.7 0.8 0.7
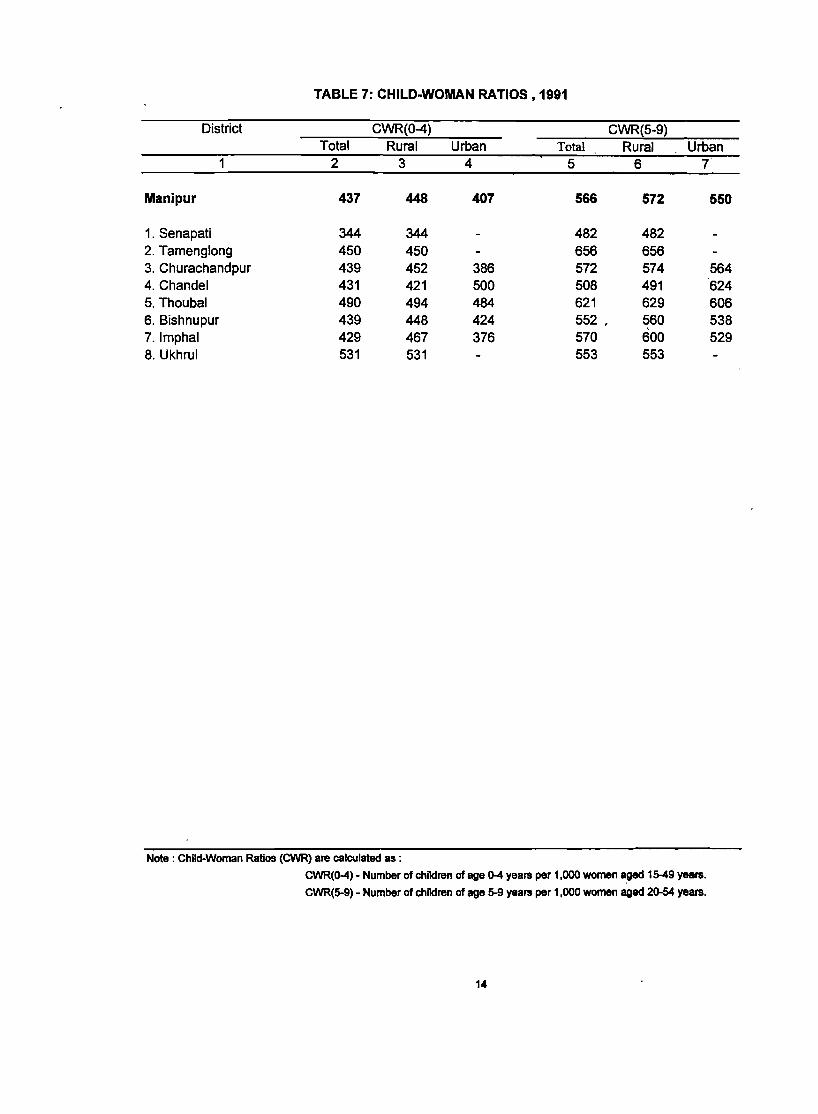
TABLE 7: CHILD-WOMAN RATIOS, 1991
District CWR(O-4) CWR(5-9) Total Rural Urban Total Rural Urban
1 2 3 4 5 6 7
Manipur 437 448 407 566 572 550
1. Senapati 344 344 482 482 2. Tamenglong 450 450 656 656 3. Churachandpur 439 452 386 572 574 564 4. Chandel 431 421 500 508 491 624 5. Thoubal 490 494 484 621 629 606 6. Bishnupur 439 448 424 552 " 560 538 , 7.lmphal 429 467 376 570 600 529 8. Ukhrul 531 531 553 553
Note: Child-Woman Ratios (CWR) are calculated as :
CWR(O-4) - Number of children of age 0-4 years per 1,000 women aged 15-49 years.
CWR(5-9) - Number of children of age 5-9 years per 1,000 women aged 20-54 years.
14
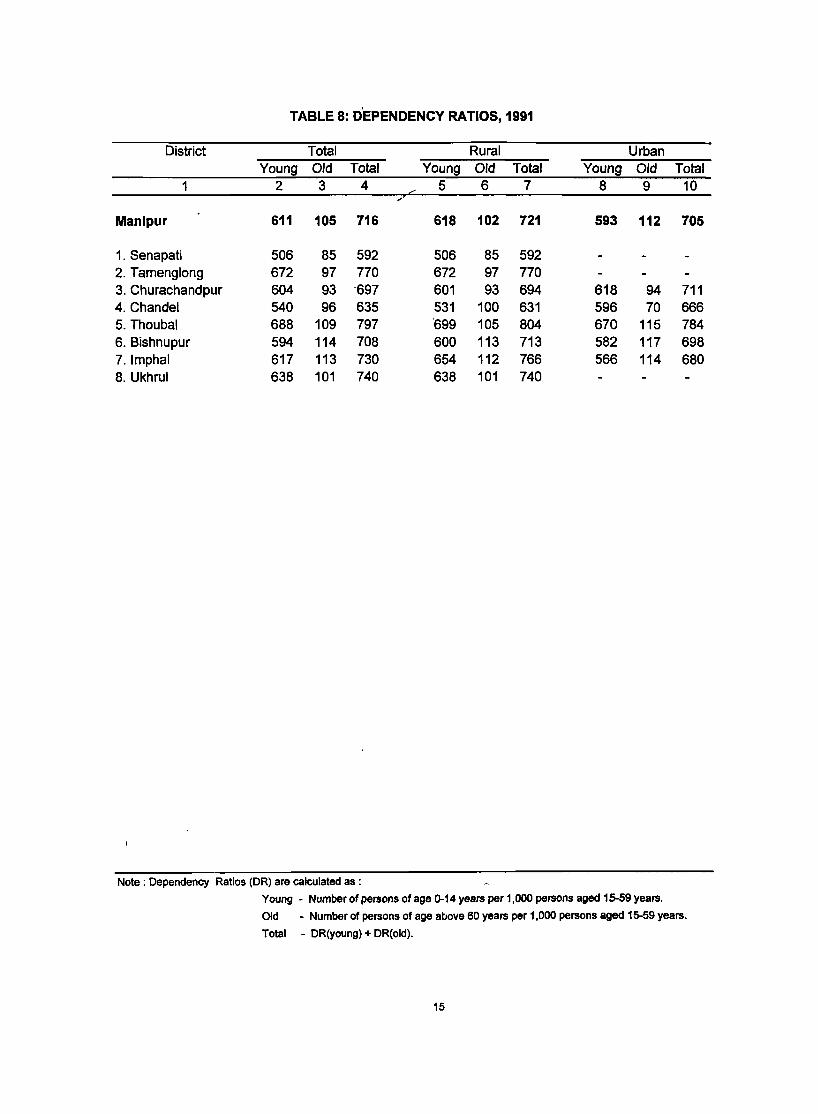
TABLE 8: O'EPENOENCY RATIOS, 1991
District Total Rural Urban Young Old Total Young Old Total Youna Old Total
1 2 3 4 5 6 7 8 9 10
Manipur 611 105 716 618 102 721 593 112 705
1. Senapati 506 85 592 506 85 592 2. Tamenglong 672 97 770 672 97 770 3. Churachandpur 604 93 -697 601 93 694 618 94 711 4. Chandel 540 96 635 531 100 631 596 70 666 5. Thoubal 688 109 797 '699 105 804 670 115 784 6. Bishnupur 594 114 708 600 113 713 582 117 698 7.lmphal 617 113 730 654 112 766 566 114 680 8. Ukhrul 638 101 740 638 101 740
Note: Dependency Ratios (DR) are calculated as :
Young - Number of persons of age 0-14 years per 1,000 persons aged 15-59 years.
Old - Number of persons of age above 60 years per 1,000 persons aged 15-59 years.
Total - DR(young) + DR(old).
15


NUPTIALITY
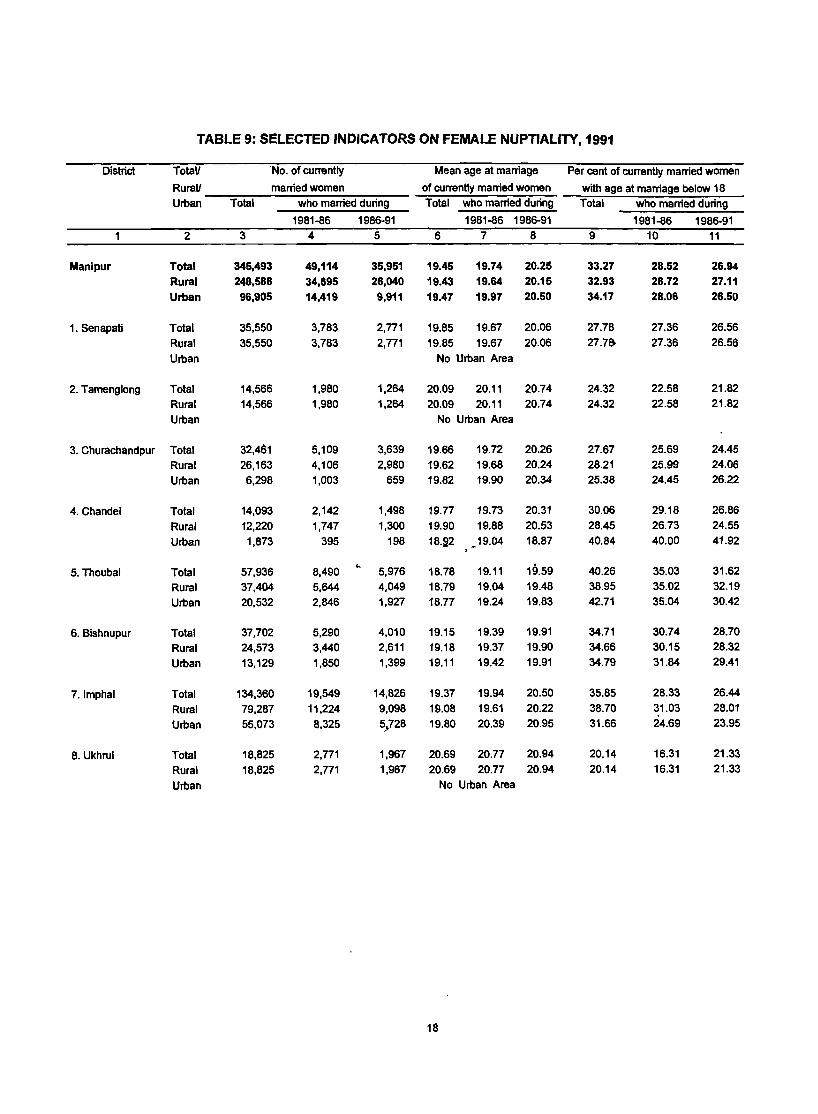
TABLE 9: SELECTED INDICATORS ON FEMALE NUPTIAlITY, 1991
District Total! ·No. of currently Mean age at marriage Per cent of currently married women
Rural! married women of currently married women with age at marriage below 18
Urban Total who married during Total who married during Total who married during
1981-86 1986-91 1981-86 1986-91 1981-86 1986-91
2 3 4 5 6 7 8 9 10 11
Manlpur Total 345,493 49,114 35,951 19.45 19.74 20.25 33.27 28.52 26.94
Rural 248,588 34,695 26,040 19.43 19.64 20.15 32.93 28.72 27.11
Urban 96,905 14,419 9,911 19.47 19.97 20.50 34.17 28.06 26.50
1. Senapati Total 35,550 3,783 2,771 19.85 19.67 20.06 27.78 27.36 26.56
Rural 35,550 3,783 2,771 19.85 19.67 20.06 27.78> 27.36 26.56
Urban No Urban Area
2. Tamenglong Total 14,566 1,980 1,264 20.09 20.11 20.74 24.32 22.58 21.82
Rural 14,566 1,980 1,264 20.09 20.11 20.74 24.32 22.58 21.82
Urban No Urban Area
3. Churachandpur Total 32,461 5,109 3,639 19.66 19.72 20.26 27.67 25.69 24.45
Rural 26,163 4,106 2,980 19.62 19.68 20.24 28.21 25.99 24.06
Urban 6,298 1,003 659 19.82 19.90 20.34 25.38 24.45 26.22
4. Chandel Total 14,093 2,142 1,498 19.77 19.73 20.31 30.06 29.18 26.86
Rural 12,220 1,747 1,300 19.90 19.88 20.53 28.45 26.73 24.55
Urban 1,873 395 198 18.~2 ~
19.04 18.87 40.84 40.00 41.92
5. Thoubal Total 57,936 8,490 ..
5,976 18.78 19.11 19.59 40.26 35.03 31.62
Rural 37,404 5,644 4,049 18.79 19.04 19.48 38.95 35.02 32.19
Urban 20,532 2,846 1,927 18.77 19.24 19.83 42.71 35.04 30.42
6. Bishnupur Total 37,702 5,290 4,010 19.15 19.39 19.91 34.71 30.74 28.70
Rural 24,573 3,440 2,611 19.18 19.37 19.90 34.66 30.15 28.32
Urban 13,129 1,850 1,399 19.11 19.42 19.91 34.79 31.84 29.41
7.lmphal Total 134,360 19,549 14,826 19.37 19.94 20.50 35.85 28.33 26.44
Rural 79,287 11,224 9,098 19.08 19.61 20.22 38.70 31.03 28.01
Urban 55,073 8,325 5}28 19.80 20.39 20.95 31.66 24.69 23.95
8. Ukhrul Total 18,825 2,771 1,967 20.69 20.77 20.94 20.14 16.31 21.33
Rural 18,825 2,771 1,967 20.69 20.77 20.94 20.14 16.31 21.33
Urban No Urban Area
18
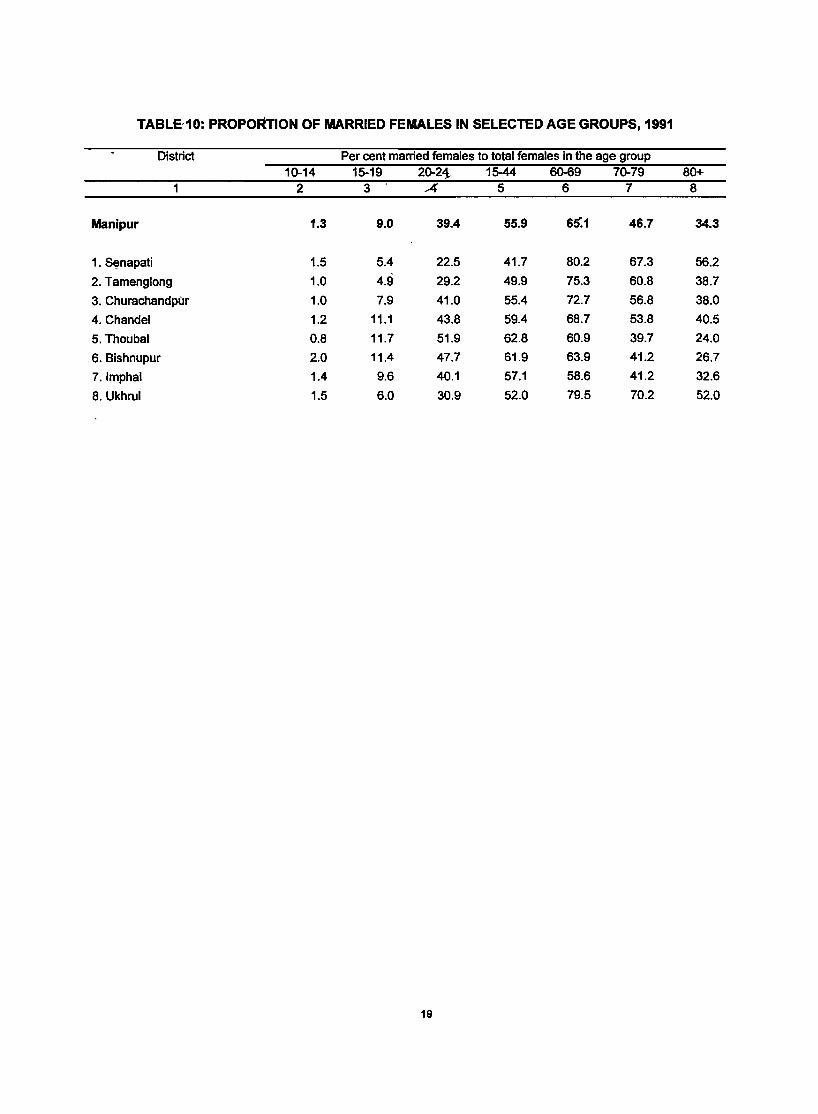
TABLE'10: PROPORTION OF MARRIED FEMALES IN SELECTED AGE GROUPS, 1991
District Per cent married females to total females in the age group 10-14 15-19 20-21- 15-44 60-69 70-79 80+
1 2 3 A 5 6 7 8
Manipur 1.3 9.0 39.4 55.9 60.1 46.7 34.3
1. S~napati 1.5 5.4 22.5 41.7 80.2 67.3 56.2
2. Tamenglong 1.0 4.9 29.2 49.9 75.3 60.8 38.7
3. Churachandpur 1.0 7.9 41.0 55.4 72.7 56.8 38.0
4. Chandel 1.2 11.1 43.8 59.4 68.7 53.8 40.5
5. Thoubal 0.8 11.7 51.9 62.8 60.9 39.7 24.0
6. Bishnupur 2.0 11.4 47.7 61.9 63.9 41.2 26.7
7.lmphal 1.4 9.6 40.1 57.1 58.6 41.2 32.6
8. Ukhrul 1.5 6.0 30.9 52.0 79.5 70.2 52.0
19
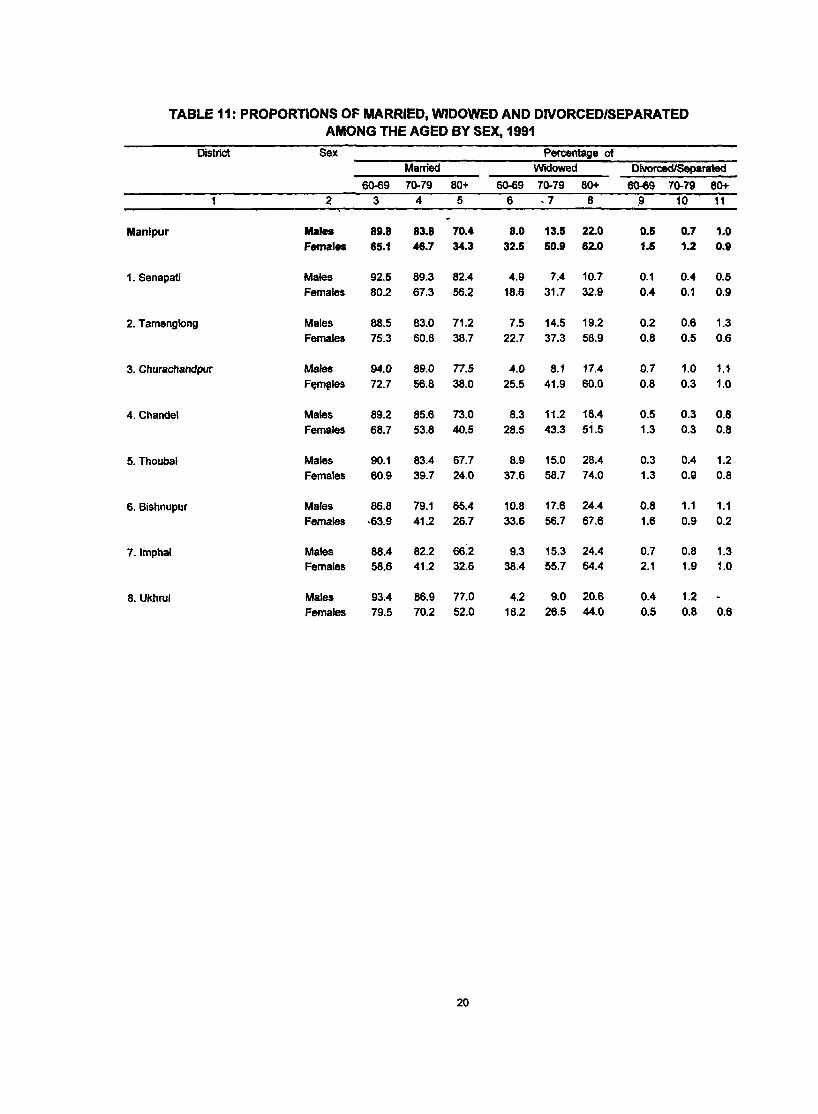
TABLE 11: PROPORTIONS OF MARRIED, WIDOWED AND DIVORCED/SEPARATED AMONG THE AGED BY SEX, 1991
District Sex Percentage of Married Widowed Divorced/Separated
60-69 70-79 80+ 60-69 70-79 80+ 60-69 70-79 80+ 2 3 4 5 6 ,7 8 J1 10 11
Manlpur Males 89.8 83.8 70.4 8.0 13.5 22.0 0.5 0.7 1.0 Females 65.1 46.7 34.3 32.5 50.9 62.0 1.5 1.2 0.9
1. Senapati Males 92.5 89.3 82.4 4.9 7.4 10.7 0.1 0.4 0.5 Females 80.2 67.3 56.2 18.6 31.7 32.9 0.4 0.1 0.9
2. Tamenglong Males 88.5 83.0 71.2 7.5 14.5 19.2 0.2 0.6 1.3 Females 75.3 60.8 38.7 22.7 37.3 58.9 0.8 0.5 0.6
3. Churachandpur Males 94.0 89.0 n.s 4.0 8.1 17.4 0.7 1.0 1.1
F~lll€Iles 72.7 56.8 38.0 25.5 41.9 60.0 0.8 0.3 1.0
4. Charldel Males 89.2 85.6 73.0 8.3 11.2 18.4 0.5 0.3 0.8 Females 68.7 53.8 40.5 28.5 43.3 51.5 1.3 0.3 0.8
5. Thoubal Males 90.1 83.4 67.7 8.9 15.0 28.4 0.3 0.4 1.2 Females 60.9 39.7 24.0 37.6 58.7 74.0 1.3 0.9 0.8
6. Bishnupur Males 86.8 79.1 65.4 10.8 17.6 24.4 0.8 1.1 1.1 Females ·63.9 41.2 26.7 33.6 56.7 67.6 1.6 0.9 0.2
7.lmphal Males 88.4 82.2 66.2 9.3 15.3 24.4 0.7 0.8 1.3 Females 58.6 41.2 32.6 38.4 55.7 64.4 2.1 1.9 1.0
8. Ukhrul Males 93.4 86.9 77.0 4.2 9.0 20.6 0.4 1.2 Females 79.5 70.2 52.0 18.2 26.5 44.0 0.5 0.8 0.6
20
FERTILITY AND CHILD ·MORTALITY
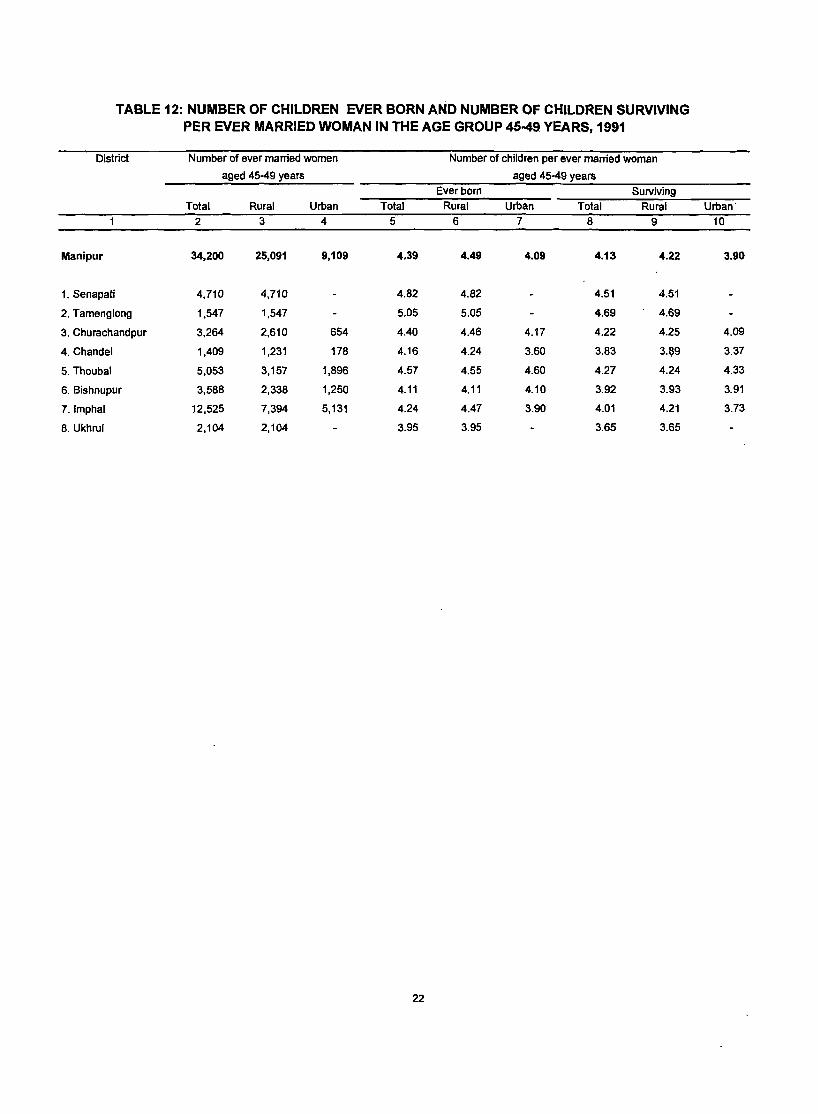
TABLE 12: NUMBER OF CHILDREN EVER BORN AND NUMBER OF CHILDREN SURVIVING PER EVER MARRIED WOMAN IN THE AGE GROUP 45-49. YEARS, 1991
District Number of ever married women Number of children per ever married woman
aged 45-49 years aged 45-49 years
Ever born Surviving
Total Rural Urban Total Rural Urban Total Rural Urban·
2 3 4 5 6 7 8 9 10
Manipur 34,200 25,091 9,109 4.39 4.49 4.09 4.13 4.22 ,3.90
1. Senapati 4,710 4,710 4.82 4.82 4.51 4.51
2. Tamenglong 1,547 1,547 5.05 5.05 4.69 4.69
3. Churachandpur 3,264 2,610 654 4.40 4.46 4.17 4.22 4.25 4.09
4. Chandel 1,409 1,231 178 4.16 4.24 3.60 3.83 3.~9 3.37
5. Thoubal 5,053 3,157 1,896 4.57 4.55 4.60 4.27 4.24 4.33
6. Bishnupur 3,588 2,338 1,250 4.11 4.11 4.10 3.92 3.93 3.91
7.lmphal 12,525 7,394 5,131 4.24 4.47 3.90 4.01 4.21 3.73
8. Ukhrul 2,104 2,104 3.95 3.95 3.65 3.65
22
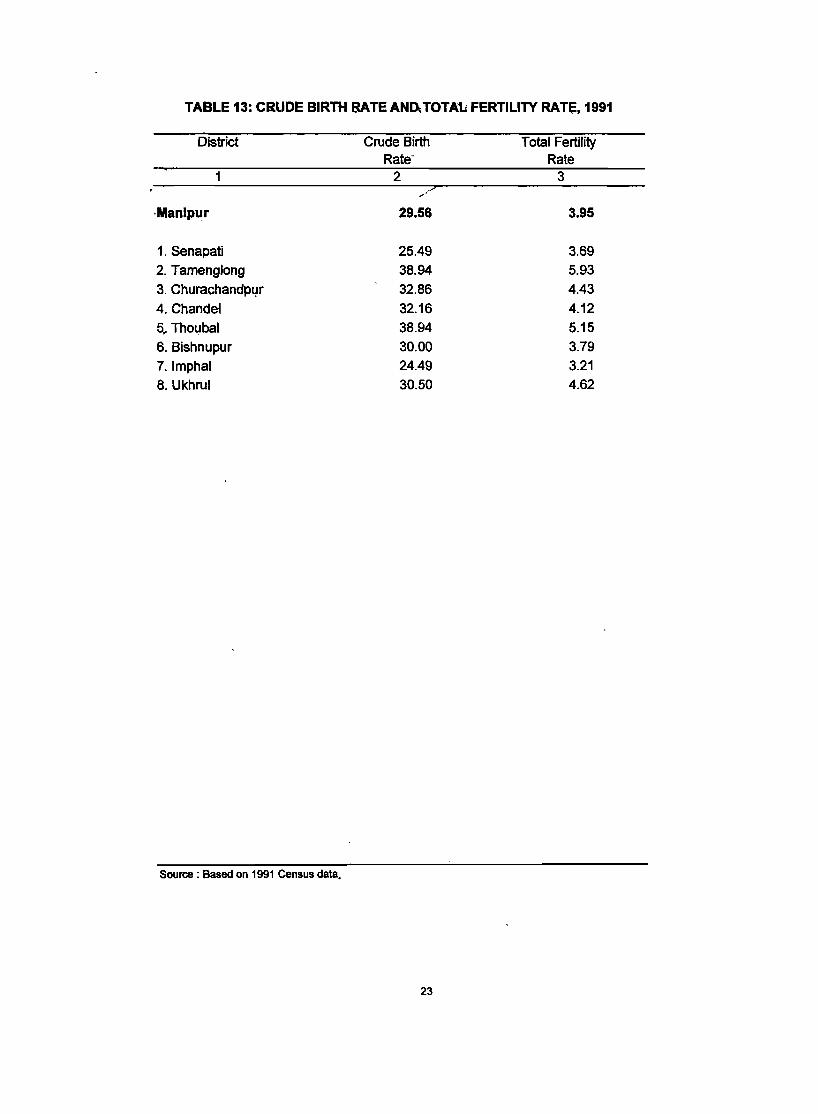
TABLE 13: CRUDE BIRTH BATE ANn, TOTAts FERTILITY RATe. 1991
District Crude Birth Total Fertility Rate- Rate
1 2 3 ,/
·Man.pur 29.56 3.95
1. Senapati 25.49 3.69
2. TamengJong 38.94 5.93
3. Churachandp~r 32.86 4.43
4. Chan del 32.16 4.12
5,. Thoubal 38.94 5.15
6. Bishnupur 30.00 3.79
7.lmphal 24.49 3.21
8. Ukhrul 30.50 4.62
Source: Based on 1991 Census data.
23
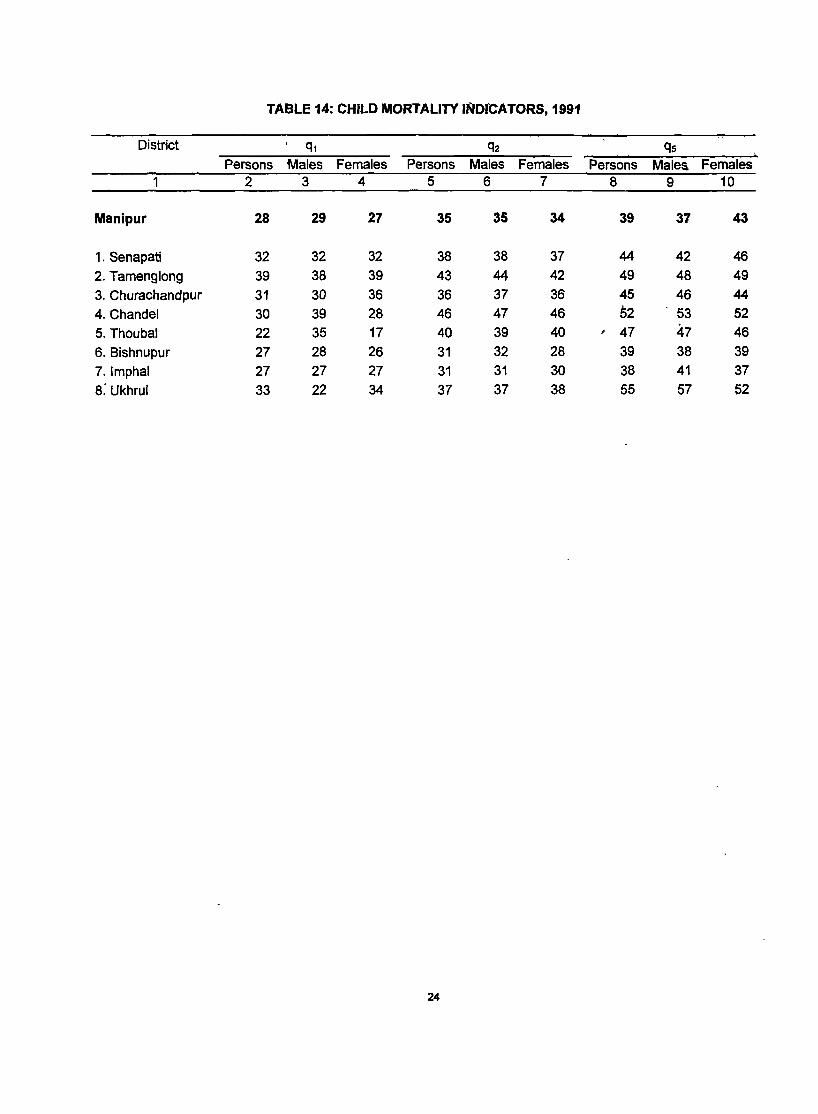
TABLE 14: CHILD MORTALITY INOrCATORS, 1991
District , q1 q2 qs Persons Males Females Persons Males Females Persons Males. Females
1 2 3 4 5 6 7 8 9 10
Manipur 28 29 27 35 35 34 39 37 43
1. Senapati 32 32 32 38 38 37 44 42 46
2. Tamenglong 39 38 39 43 44 42 49 48 49
3. Churachandpur 31 30 36 36 37 36 45 46 44
4. Chandel 30 39 28 46 47 46 52 . 53 52
5. Thoubal 22 35 17 40 39 40 I 47 47 46
6. Bishnupur 27 28 26 31 32 28 39 38 39
7.lmphal 27 27 27 31 31 30 38 41 37
8: Ukhrul 33 22 34 37 37 38 55 57 52
24

LJTERACY AND EDUCATION
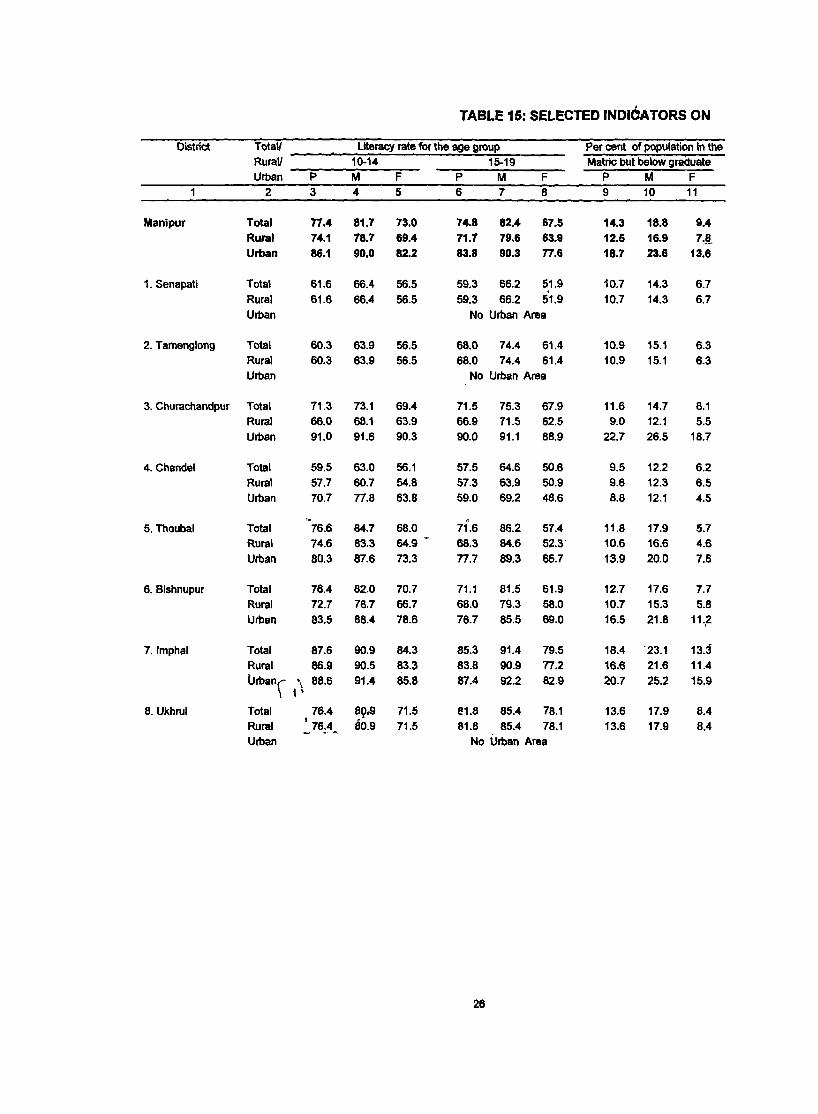
TABLE 15: SELECTED INDIOATORS ON
District Tota" Literacy rate for the age group Per cent of population in the Rural! 10-14 15-19 Matrie but below graduate Urban P M F P M F P M F
2 3 4 5 6 7 8 9 10 11
Manipur Total 71.4 81.7 73.0 74.8 82.4 67.5 14.3 18.8 9.4 Rural 74.1 78.7 69.4 71.7 79.6 63.9 12.5 16.9 7& Urban 86.1 90.0 82.2 83.8 90.3 17.6 18.7 23.6 13.6
1. Senapati Total 61.6 66.4 56.5 59.3 66.2 51.9 10.7 14.3 6.7 Rural 61.6 66,4 56.5 59.3 66.2 51.9 10.7 14.3 6.7 Urban No Urban Area
2. Tamenglong Total 60.3 63.9 56.5 68.0 74.4 61.4 10.9 15.1 6.3 Rural 60.3 63.9 56.5 68.0 74.4 61.4 10.9 15.1 6.3 Urban No Urban Area
3. Churachandpur Total 71.3 73.1 69.4 71.5 75.3 67.9 11.6 14.7 8.1 Rural 66.0 68.1 63.9 66.9 71.5 62.5 9.0 12.1 5.5 Urban 91.0 91.6 90.3 90.0 91.1 8B.9 22.7 26.5 18.7
4. Chandel Total 59.5 63.0 56.1 57.5 64.6 50.6 9.5 12.2 6.2 Rural 57.7 60.7 54.8 57.3 63.9 SO.9 9.6 12.3 6.5 Urban 70.7 17.8 63.8 59.0 69.2 48.6 B.8 12.1 4.5
, 5. Thoubal Total 76.6 84.7 68.0 71.6 86.2 57.4 11.8 17.9 5.7
Rural 74.6 83.3 64.9 - 68.3 84.6 52.3' 10.6 16.6 4.6 Urban 80.3 87.6 73.3 n.7 89.3 66.7 13.9 20.0 7.6
6. Bishnupur Total 76.4 82.0 70.7 71.1 81.5 61.9 12.7 17.6 7.7 Rural 72.7 78.7 66.7 68.0 79.3 58.0 10.7 15.3 5.8 Urban 83.5 88.4 78.6 76.7 85.5 69.0 16.5 21.8 11.~
7.lmphal Total 87.6 90.9 84.3 85.3 91.4 79.5 18.4 '23.1 13.3 Rural 86.9 90.5 83.3 83.8 90.9 n.2 16.6 21.6 11.4
Urban, \ 88.6 91.4 85.8 87.4 92.2 82.9 20.7 25.2 15.9 I •
8. Ukhrul Total 76.4 89,9 71.5 e1.8 85.4 78.1 13.6 17.9 8.4 , 80.9 78.1 Rural _76;4~ 71.5 81.8 85.4 13.6 17.9 8.4
Urban No Urban Area
26
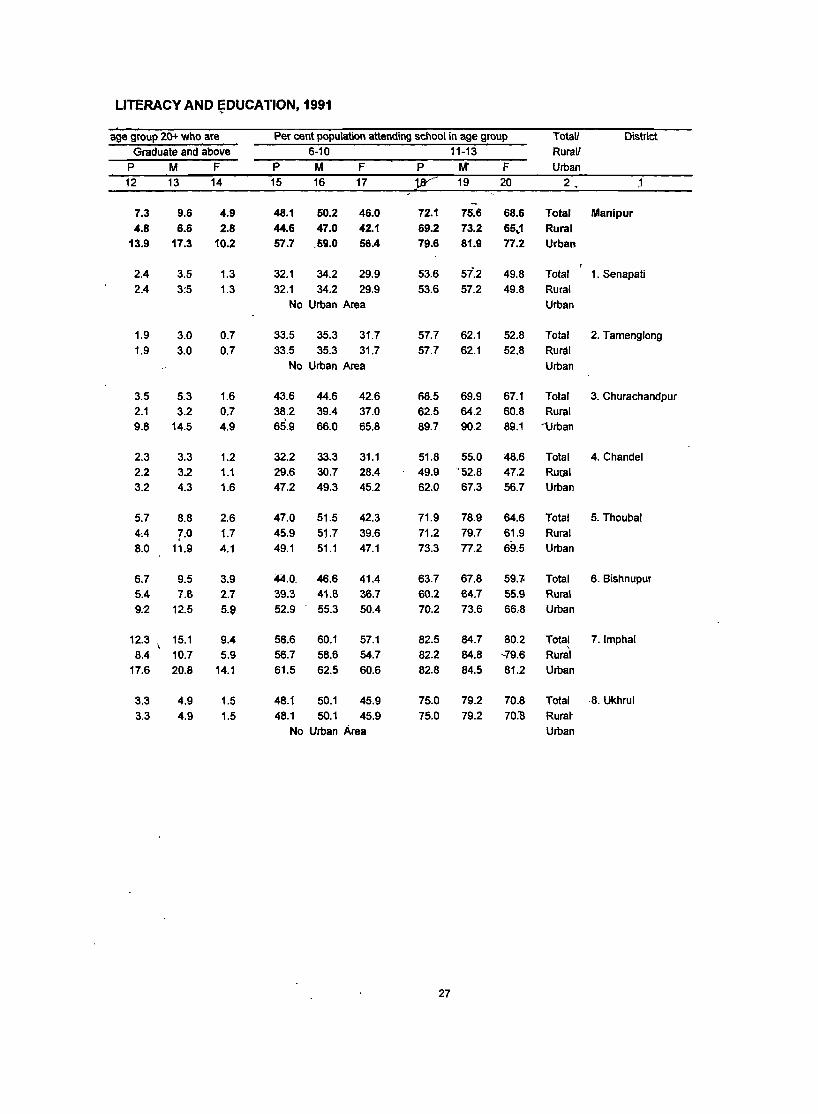
LITERACY AND ;DUCATJON, 1991
age group 20+ who are Per cent population attending school in age group Total/ District Graduate and above 6-10 11-13 Ruralf
p M F P M F P M' F Urban 12 13 14 15 16 17 vv= 19 20 2 • .:1
.. 7.3 9.6 4.9 48.1 50.2 46.0 72.1 75.6 68.6 Total Manipur 4.8 6.6 2.8 44.6 47.0 42.1 69.2 73.2 65 .. 1 Rural
13.9 17.3 10.2 57.7 ,59.0 56.4 79.6 81.9 77.2 Urban
2.4 3.5 1.3 32.1 34.2 29.9 53.6 51'.2 49.8 Total 1. Senapati 2.4 3:5 1.3 32.1 34.2 29.9 53.6 57.2 49.8 Rural
No Urban Area Urban
1.9 3.0 0.7 33.5 35.3 31.7 57.7 62.1 52.8 Total 2. Tamenglong 1.9 3.0 0.7 33.5 35.3 31.7 57.7 62.1 52.8 Rural
No Urban Area Urban
3.5 5.3 1.6 43.6 44.6 42.6 68.5 69.9 67.1 Total 3. Churachandpur 2.1 3.2 0.7 38.2 39.4 37.0 62.5 64.2 60.8 Rural 9.8 14.5 4.9 65.9 66.0 65.8 89.7 90.2 89.1 --Urban
2.3 3.3 1.2 32.2 33.3 31.1 51.8 55.0 48.6 Total 4. Chandel 2.2 3.2 1.1 29.6 30.7 28.4 49.9 '52.8 47.2 Rurpl 3.2 4.3 1.6 47.2 49.3 45.2 62.0 67.3 56.7 Urban
5.7 8.8 2.6 47.0 51.5 42.3 71.9 78.9 64.6 Total 5. Thoubal 4,4 !-O 1.7 45.9 51.7 39.6 71.2 79.7 61.9 Rural 8.0 11.9 4.1 49.1 51.1 47.1 73.3 77.2 69.5 Urban
6.7 9.5 3.9 44.0. 46.6 41.4 63.7 67.8 59.~ Total 6. Bishnupur 5.4 7.S 2.7 39.3 41.S 36.7 60.2 64.7 55.9 Rural 9;2 12.5 5.9 52.9 55.3 50.4 70.2 73.6 66,S Urban
12.3 \ 15.1 9.4 58.6 60.1 57.1 82.5 84.7 80.2 Total 7.lmphal 8.4 10.7 5.9 56.7 58.6 54.7 82.2 84.8 ,79.6 Rural
17.6 20.8 14.1 61.5 62.5 60.6 82.8 84.5 81.2 Urban
3.3 4.9 1.5 48.1 50.1 45.9 75.0 79.2 70.8 Total 8. Ukhrul 3.3 4.9 1.5 48.1 50.1 45.9 75.0 79.2 70.'8 Rural-
No Urban Area Urban
27
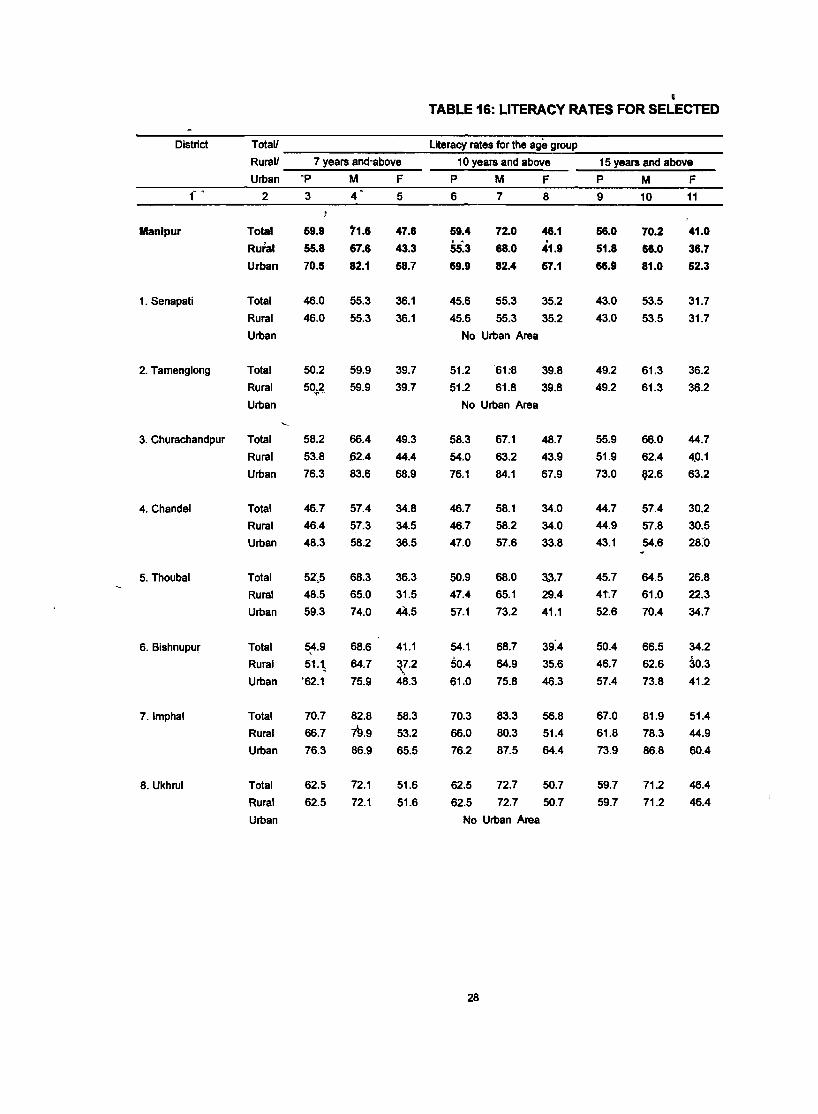
, TABLE 16: LITERACY RATES FOR SELECTED
District Total! Literacy rates for the age group
Rural! 7 years and-above 10 years and above 15 years and above
Urban 'p M F P M F P M F f" 2 3 4 5 6 7 8 9 10 11
Manipur Total 59.9 71.6 47.6 59.4 72.0 46.1 56.0 70.2 41.0
Rural 55.8 67.6 43.3 55:3 68.0 41.9 51.8 68.0 38.7
Urban 70.5 82.1 58.7 69.9 82.4 57.1 66.9 81.0 52.3
1.Senapati Total 46.0 55.3 36.1 45.6 55.3 35.2 43.0 53.5 31.7
Rural 46.0 55.3 36.1 45.6 55.3 35.2 43.0 53.5 31.7
Urban No Urban Area
2. Tamenglong Total 50.2 59.9 39.7 51.2 '61:8 39.8 49.2 61.3 36.2
Rural 50.2 59.9 39.7 51.2 61.8 39.8 49.2 61.3 36.2 '" Urban No Urban Area
...._
3. Churachandpur Total 58.2 66.4 49.3 58.3 67.1 48.7 55.9 66.0 44.7
Rural 53.8 .62.4 44.4 54.0 63.2 43.9 51.9 62.4 4D.1
Urban 76.3 83.6 68.9 76.1 84.1 67.9 73.0 ~2.6 63.2
4. Chandel Total 46.7 57.4 34.8 46.7 58.1 34.0 44.7 57.4 30.2
Rural 46.4 57.3 34.5 46.7 58.2 34.0 44.9 57.8 30.5
Urban 48.3 58.2 36.5 47.0 57.6 33.8 43.1 54.6 28:0
5. Thoubal Total 52',5 68.3 36.3 50.9 68.0 3~.7 45.7 64.5 26.8
Rural 48.5 65.0 31.5 47." 65.1 29.4 4t.7 61.0 22.3
Urban 59.3 74.0 44.5 57.1 73.2 41.1 52.6 70.4 34.7
6. Bishnupur Total 5;4.9 68.6 41.1 54.1 68.7 39:4 50.4 66.5 34.2
Rural 51.\ 64.7 :v.2 50.4 64.9 35.6 46.7 62.6 30.3
Urban '62.1 75.9 48.3 61.0 75.8 46.3 57.4 73.8 41.2
7.lmphal Total 70.7 82.8 58.3 70.3 83.3 56.8 67.0 81.9 51.4
Rural 66.7 79.9 53.2 66.0 80.3 51.4 61.8 78.3 44.9
Urban 76.3 86.9 65.5 76.2 87.5 64.4 73.9 86.8 60.4
8. Ukhrul Total 62.5 72.1 51.6 62.5 72.7 50.7 59.7 71.2 46.4
Rural 62.5 72.1 51.6 62.5 72.7 50.7 59.7 71.2 46.4
Urban No Urban Area
28
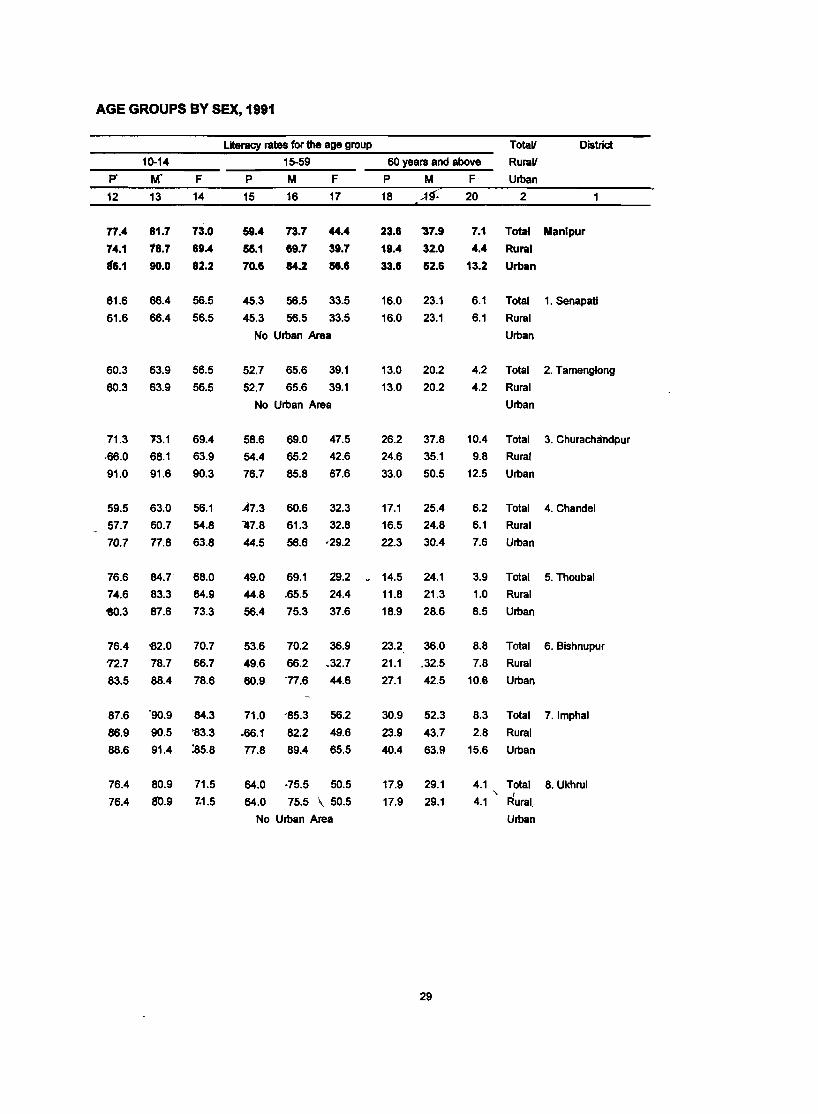
AGE GROUPS BY SEX, 1991
Literacy rates for the age group Total! District
10-14 15-59 60 years and above Rural! p- M' F P M F P M F Urban
12 13 14 15 16 17 18 ~9; 20 2 1
77.4 81.7 73.0 59.4 73.7 44.4 23.6 '37.9 7.1 Total Manlpur
74.1 78.7 69.4 55.1 69.7 39.7 19.4 32.0 4.4 Rural
11'6.1 90.0 82.2 70.6 M.2 56.6 33.6 52.6 13.2 Urban
61.6 66.4 56.5 45.3 56.5 33.5 16.0 23.1 6.1 Total 1. Senapati
61.6 66.4 56.5 45.3 56.5 33.5 16.0 23.1 6.1 Rural
No Urban Area Urban
60.3 63.9 56.5 52.7 65.6 39.1 13.0 20.2 4.2 Total 2. Tamenglong
60.3 63.9 56.5 52.7 65.6 39.1 13.0 20.2 4.2 Rural
No Urban Area Urban
71.3 13.1 69.4 58.6 69.0 47.5 26.2 37.8 10.4 Total 3. Churachanctpur
·66.0 68.1 63.9 54.4 65.2 42.6 24.6 35.1 9.8 Rural
91.0 91.6 90.3 76.7 85.8 67.6 33.0 50.5 12.5 Urban
59.5 63.0 56.1 47.3 60.6 32.3 17.1 25.4 6.2 Total 4. Chandel
57.7 60.7 54.8 "7.8 61.3 32.8 16.5 24.8 6.1 Rural
70.7 77.8 63.8 44.5 56.6 '29.2 22.3 30.4 7.6 Urban
76.6 84.7 68.0 49.0 69.1 29.2 ~ 14.5 24.1 3.9 Total 5. Thoubal
74.6 83.3 64.9 44.8 .65.5 24.4 11.8 21.3 1.0 Rural
'80.3 87.6 73.3 56.4 75.3 37.6 18.9 28.6 8.5 Urban
76.4 -82.0 70.7 53.6 70.2 36.9 23.2 36.0 8.8 Total 6. Bishnupur
72.7 78.7 66.7 49.6 66.2 .32.7 21.1 ,32.5 7.8 Rural
83.5 88.4 78.6 60.9 77.6 44.6 27.1 42.5 10.6 Urban
87.6 °90.9 84.3 71.0 -85.3 56.2 30.9 52.3 8.3 Total 7.lmphal
86.9 90.5 '83.3 .66.1 82.2 49.6 23.9 43.7 2.8 Rural
88.6 91.4 :a5.8 77.8 89.4 65.5 40.4 63.9 15.6 Urban
76.4 80.9 71.5 64.0 -75.5 50.5 17.9 29.1 4.1 Total 8. Ukhrul \. I
76.4 80.9 7.1.5 64.0 75.5 \ 50.5 17.9 29.1 4.1 Rural,
No Urban Area Urban
29
~
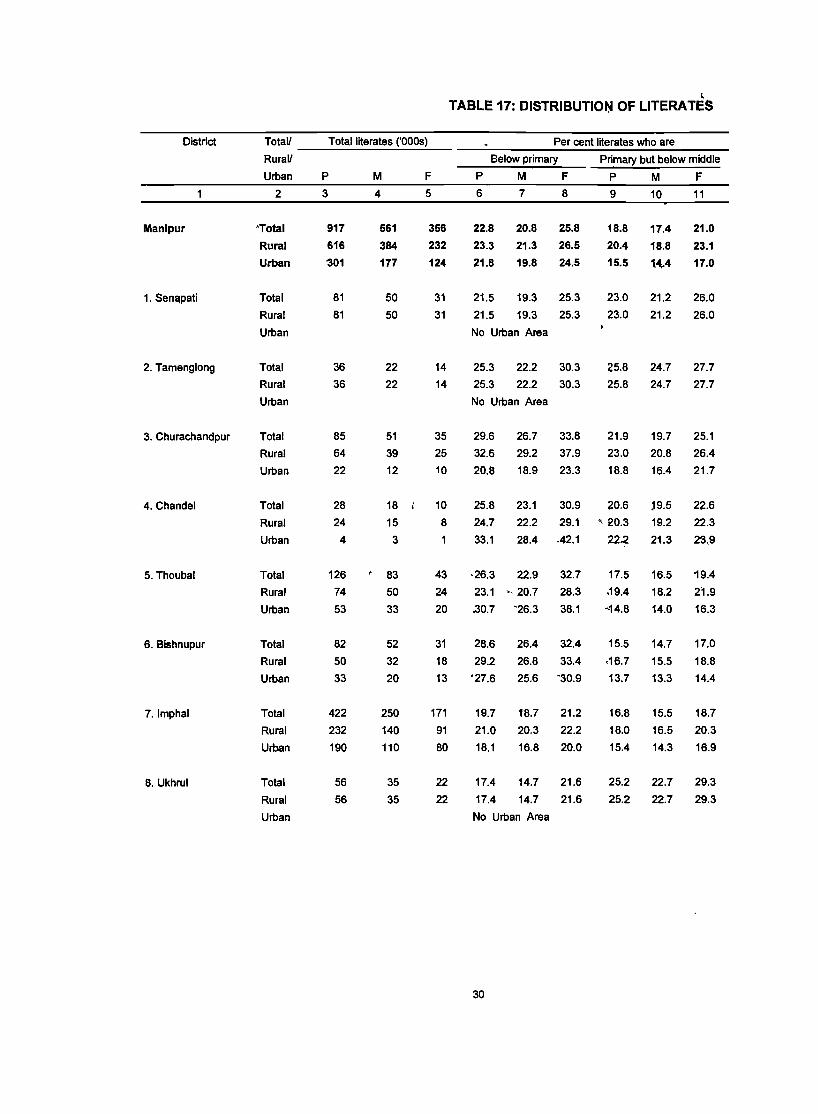
TABLE 17: DISTRIBUTIO~ OF LITERATES
District TotaV Total literates ('OOOs) Per cent literates who are
RuraV Below primary Primary but below middle
Urban P M F P M F P M F
2 3 4 5 6 7 8 9 10 11
Manipur 'Total 917 561 356 22.8 20.8 25.8 18.8 17.4 21.0
Rural 616 384 232 23.3 21.3 26.5 20.4 18.8 23.1
Urban '301 177 124 21.8 19.8 24.5 15.5 1'\.4 17.0
1. Sen~pati Total 81 50 31 21.5 19.3 25.3 23.0 21.2 26.0
Rural 81 50 31 21.5 19.3 25.3 23.0 21.2 26.0
Urban No Urban Area
2. Tamenglong Total 36 22 14 25.3 22.2 30.3 25.8 24.7 27.7
Rural 36 22 14 25.3 22.2 30.3 25.8 24.7 27.7
Urban No Urban Area
3. Churachandpur Total 85 51 35 29.6 26.7 33.8 21.9 19.7 25.1
Rural 64 39 25 32.6 29.2 37.9 23.0 20.8 26.4
Urban 22 12 10 20.8 18.9 23.3 18.8 16.4 21.7
4. Chandel Total 28 18 t 10 25.8 23.1 30.9 20.6 j9.5 22.6
Rural 24 15 8 24.7 22.2 29.1 "120.3 19.2 22.3
Urban 4 3 33.1 28.4 .42.1 22.2 21.3 23.9
5. Thoubal Total 126 . 83 43 -26.3 22.9 32.7 17.5 16.5 19.4
Rural 74 50 24 23.1 ',20.7 28.3 .19.4 18.2 21.9
Urban 53 33 20 .30.7 '26.3 38.1 "'14.8 14.0 16.3
6. Bishnupur Total 82 52 31 28.6 26.4 32.4 15.5 14.7 17.0
Rural 50 32 18 29.2 26.8 33.4 ,16.7 15.5 18.8
Urban 33 20 13 '27.6 25.6 '30.9 13.7 13.3 14.4
7.lmphal Total 422 250 171 19.7 f8.7 21.2 16.8 15.5 18.7
Rural 232 140 91 21.0 20.3 22.2 18.0 16.5 20.3
Urban 190 110 80 18.1 16.8 20.0 15.4 14.3 16.9
8. Ukhrul Total 56 35 22 17.4 14.7 21.6 25.2 22.7 29.3
Rural 56 35 22 17.4 14.7 21.6 25.2 22.7 29.3
Urban No Urban Area
30
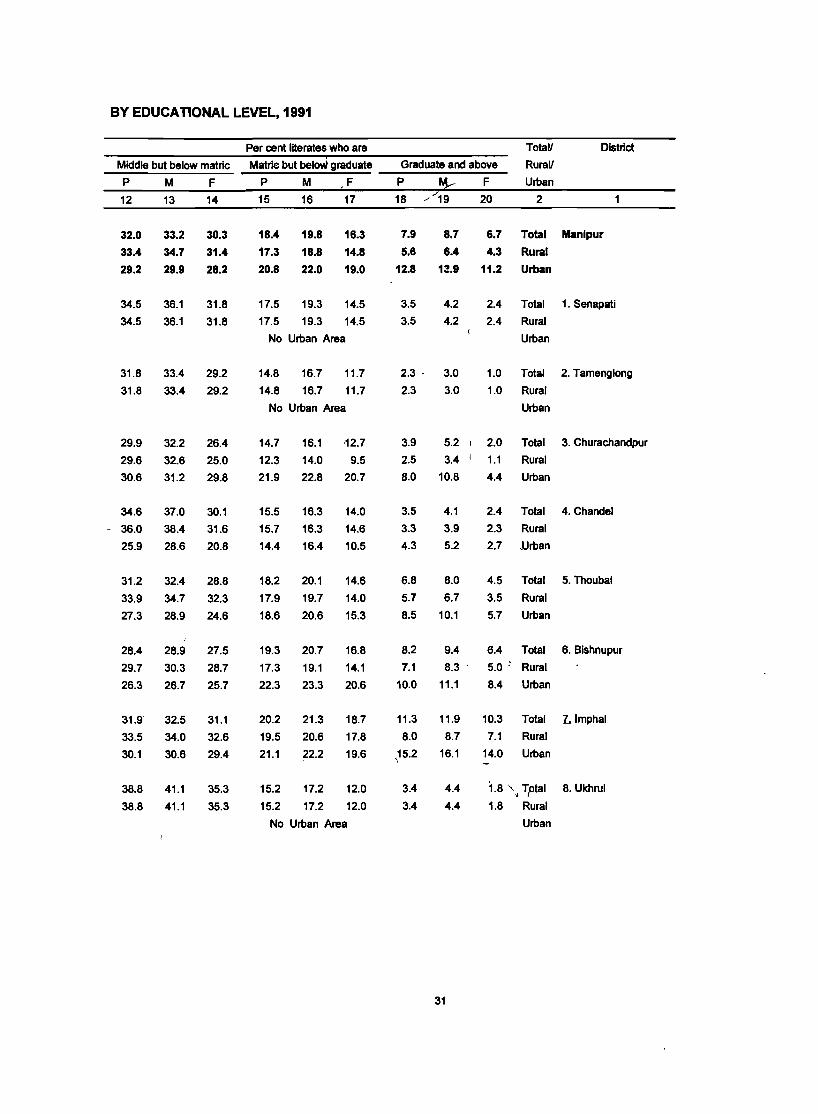
BY EDUCATIONAL LEVEL, 1991
Per cent literates who are Total! District
Middle but below matric Matrlc but beloW graduate Graduate and above Rural!
P M F P M ,F P ~ F Urban
12 13 14 15 16 17 18 />19 20 2
32.0 33.2 30.3 18.4 19.8 16.3 7.9 8.7 6.7 Total Manlpur
33.4 34.7 31.4 17.3 18.8 14.8 5.6 6.4 4.3 Rural
29.2 29.9 28.2 20.8 22.0 19.0 12.8 13.9 11.2 Urban
34.5 36.1 31.8 17.5 19.3 14.5 3.5 4.2 2.4 Total 1. Senapati
34.5 36.1 31.8 17.5 19.3 14.5 3.5 4.2 2.4 Rural
No Urban Area Urban
31.8 33.4 29.2 14.8 16.7 11.7 2.3 . 3.0 1.0 Total 2. Tamenglong
31.8 33.4 29.2 14.8 16.7 11.7 2.3 3.0 1.0 Rural
No Urban Area Urban
29.9 32.2 26.4 14.7 16.1 '12.7 3.9 5.2 I 2.0 Total 3. Churachandpur
29.6 32.6 25.0 12.3 14.0 9.5 2.5 3.4 I 1.1 Rural
30.6 31.2 29.8 21.9 22.8 20.7 8.0 10.8 4.4 Urban
34.6 37.0 30.1 15.5 16.3 14.0 3.5 4.1 2.4 Total 4. Chandel
- 36.0 38.4 31.6 15.7 16.3 14.6 3.3 3.9 2.3 Rural
25.9 28.6 20.8 14.4 16.4 10.5 4.3 5.2 2.7 ,Urban
31.2 32.4 28.8 18.2 20.1 14.6 6.8 8.0 4.5 Total 5. Thoubal
33.9 34.7 32.3 17.9 19.7 14.0 5.7 6.7 3.5 Rural
27.3 28.9 24.6 18.6 20.6 15.3 8.5 10.1 5.7 Urban
28,4 28.9 27.5 19.3 20.7 16.8 8.2 9.4 6.4 Total 6. Bishnupur
29.7 30.3 28.7 17.3 19.1 14.1 7.1 8.3 5.0 ~ Rural
26.3 26.7 25.7 22.3 23.3 20.6 10.0 11.1 8.4 Urban
31.9 32.5 31.1 20.2 21.3 18.7 11.3 11.9 10.3 Total 1..lmphal
33.5 34.0 32.6 19.5 20.6 17.8 8.0 8.7 7.1 Rural
30.1 30.6 29.4 21.1 22.2 19.6 \15.2 16.1 14.0 Urban
38.8 41.1 35.3 15.2 17.2 12.0 3.4 4.4 1.8 '\. Tptal 8. Ukhrul
38.8 41.1 35.3 15.2 17.2 12.0 3.4 4.4 1.8 Rural
No Urban Area Urban
31

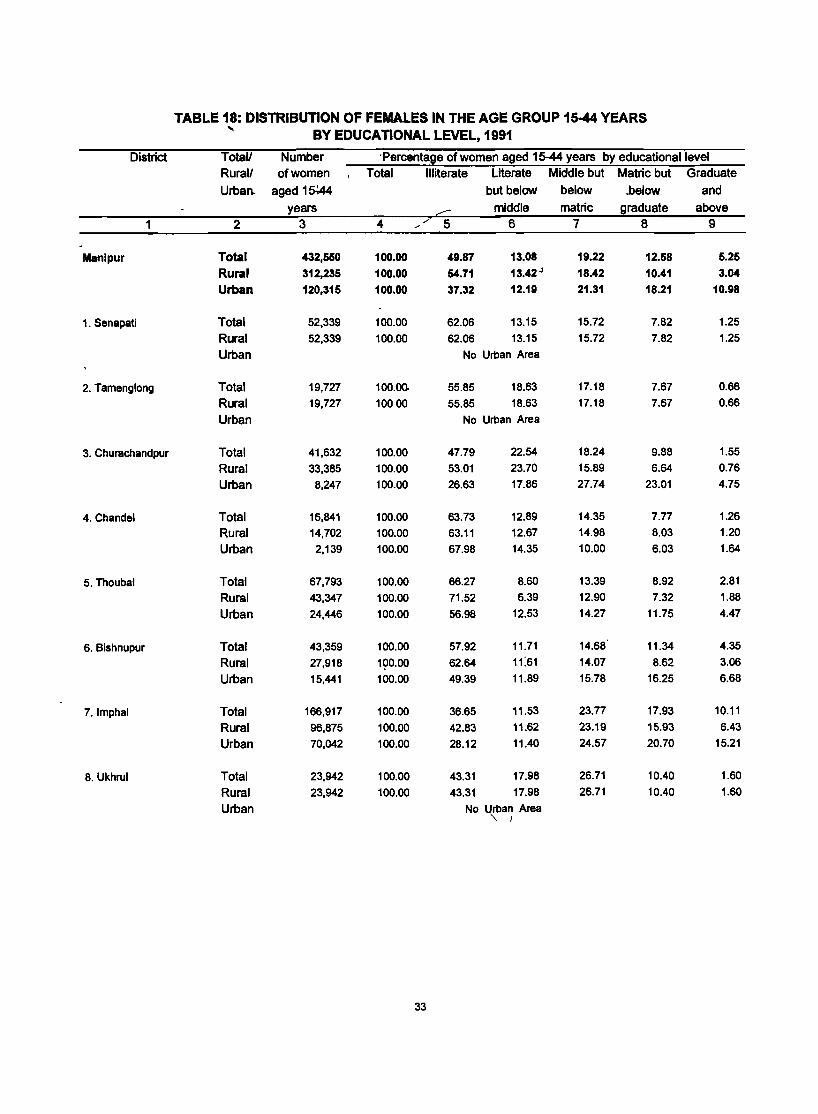
TABLE 18: DISTRIBUTION OF FEMALES IN THE AGE GROUP 15-44 YEARS ... BY EDUCATIONAL LEVEL, 1991
District TotaV Number 'Percentage of women aged 15-44 years by educational level Rural! of women Total Illiterate Literate Middle but Matric but Graduate
Urban. aged 15-:44 but below below .. below and
years .:::::: middle matric graduate above
1 2 3 4 /' 5 6 7 8 9 ./
Manipur Total 432,550 100.00 49.87 13.08 19.22 12.58 5.25
Rural 312,235 100.00 64.71 13.42" 18.42 10.41 3.04
Urban 120,315 100.00 37.32 12.19 21.31 18.21 10.98
1. Senapati Total 52,339 100.00 62.06 13.15 15.72 7.82 1.25
Rural 52,339 100.00 62.06 13.15 15.72 7.82 1.25
Urban No Urban Area
2. Tamenglong Total 19,727 100.00. 55.85 18.63 17.18 7.67 0.66
Rural 19,727 10000 55.85 18.63 17.18 7.67 0.66
Urban No Urban Area
3. Churachandpur Total 41,632 100.00 47.79 22.54 18.24 9.88 1.55
Rural 33,385 100.00 53.01 23.70 15.89 6.64 0.76
Urban 8,247 100.00 26.63 17.86 27.74 23.01 4.75
4. Chandel Total 16,841 100.00 63.73 12.89 14.35 7.77 1.26
Rural 14,702 100.00 63.11 12.67 14.98 8.03 1.20
Urban 2,139 100.00 67.98 14.35 10.00 6.03 1.64
5. Thoubal Total 67,793 100.00 66.27 8.60 13.39 8.92 2.81
Rural 43,347 100.00 71.52 6.39 12.90 7.32 1.88
Urban 24,446 100.00 56.98 12.53 14.27 11.75 4.47
6. Bishnupur Total 43,359 100.00 57.92 11.71 14.68 11.34 4.35
Rural 27,918 190.00 62.64 11:61 14.07 8.62 3.06
Urban 15,441 100.00 49.39 11.89 15.78 16.25 6.68
7.lmphal Total 166,917 100.00 36.65 11.53 23.77 17.93 10.11
Rural 96,875 100.00 42.83 11.62 23.19 15.93 6.43
Urban 70,042 100.00 28.12 11.40 24.57 20.70 15.21
8. Ukhrul Total 23,942 100.00 43.31 17.98 26.71 10.40 1.60
Rural 23,942 100.00 43.31 17.98 26.71 10.40 1.60
Urban No Urban Area "- I
33
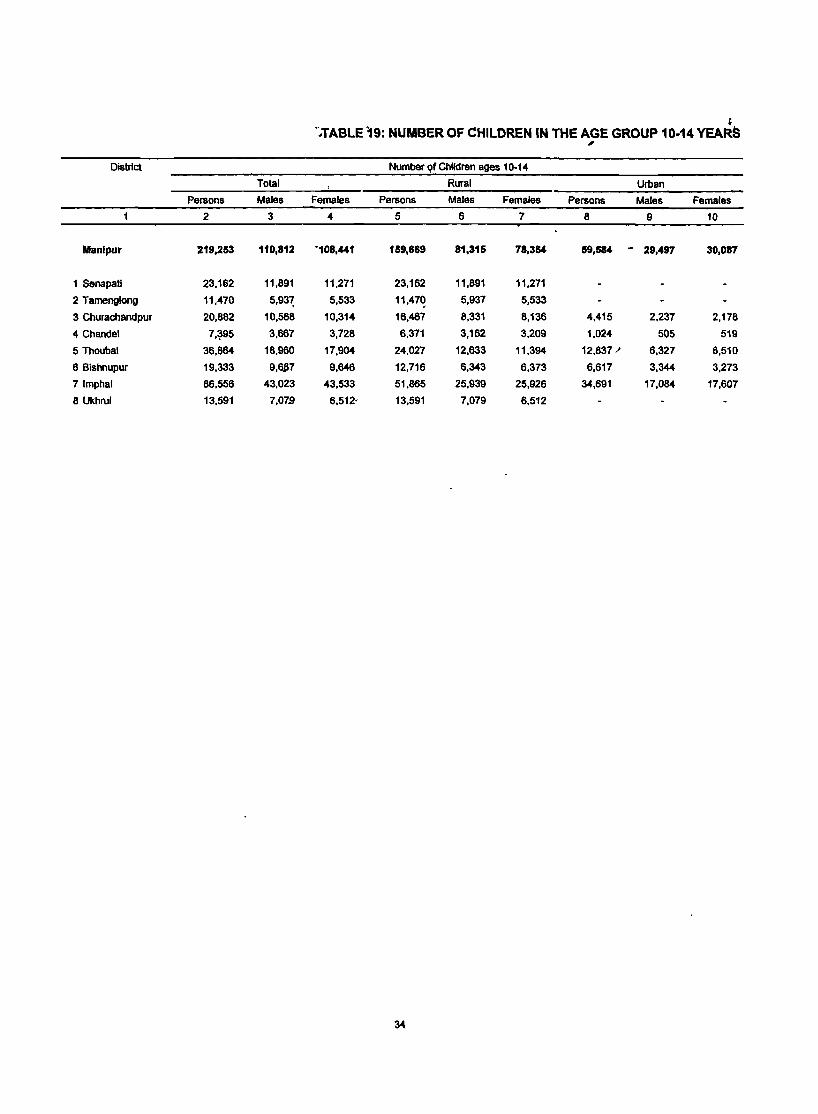
, ··,TABLE ~9: NUMBER OF CHILDREN IN THE AGE GROUP 10-14 YEARS ,
District Number Qf Children ages 10-14
Total Rural Urban
Persons Males Females Persons Males Females Persons Males Females
2 3 4 5 6 7 8 9 10
Manlpur 219,253 110,812 -108,441 159,669 81,315 78,354 59,584 - 29,497 30,087
1 Senapati 23,162 11,891 11,271 23,162 11,891 11,271
2 Tamenglong 11,470 5,93~ 5,533 11,47Q 5,937 5,533
3 Churachandpur 20,882 10,568 10,314 16,467 8,331 8,136 4,415 2,237 2,178
4 Chandel 7,~95 3,667 3,728 6,371 3,162 3,209 1,024 505 519
5 Thoubal 36,864 18,960 17,904 24,027 12,633 11,394 12,837 ,) 6,327 6,510
6 Bishnupur 19,333 9,6$7 9,646 12,716 6,343 6,373 6,617 3,344 3,273
71mphal 86,556 43,023 43,533 51,865 25,939 25,926 34,691 17,084 17,607
8 Ukhrul 13,591 7,07B 6,512' 13,591 7,079 6,512
34
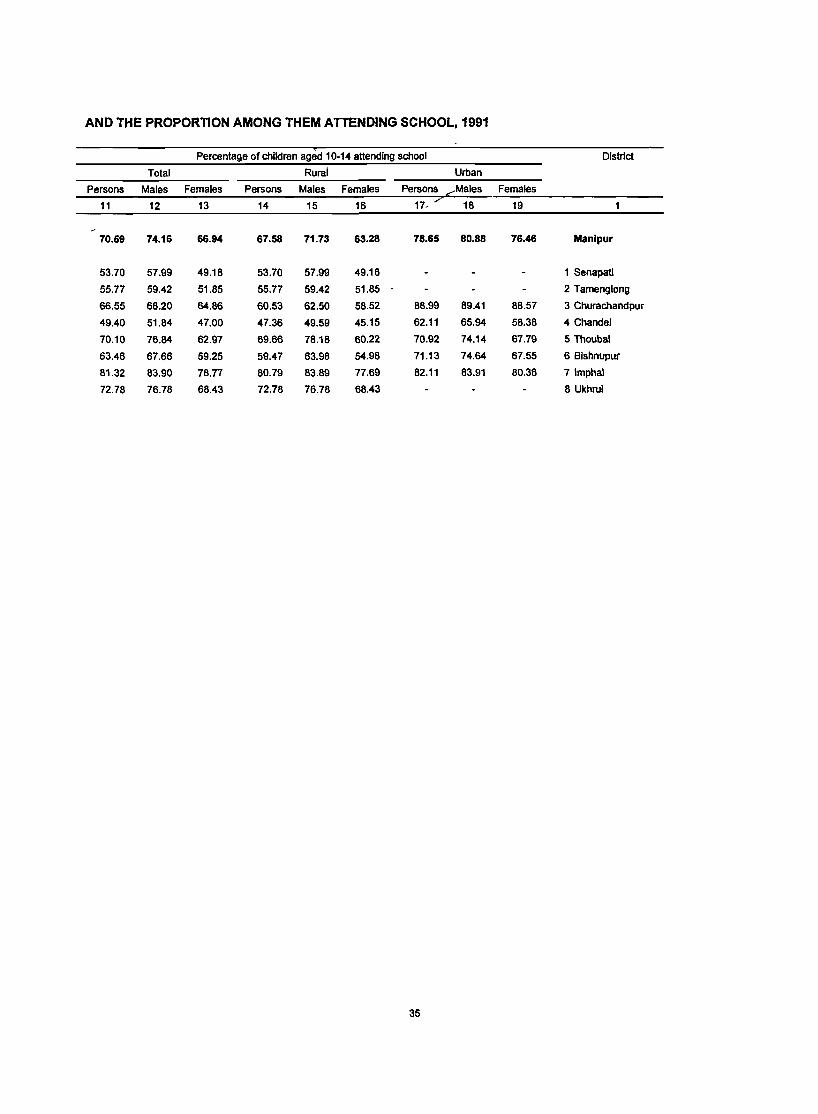
AND THE PROPORTION AMONG THEM ATTENDING SCHOOL, 1991
Percentage of children aged 10-14 attending school District
Total Rural Urban
Persons Males Females Persons Males Females Persons ...... Males Females
11 12 13 14 15 16 17- -- 18 19
70.59 74.16 66.94 67.58 71.73 63.28 78.65 80.88 76.46 Manlpur
53.70 57.99 49.18 53.70 57.99 49.18 1 Senapati
55.77 59.42 51.85 55.77 59.42 51.85 2 Tamenglong
66.55 68.20 64.86 60.53 62.50 58.52 88.99 89.41 88.57 3 Churachandpur
49.40 51.84 47.00 47.36 49.59 45.15 62.11 65.94 58.38 4 Chandel
70.10 76.84 62.97 69.66 78.18 60.22 70.92 74.14 67.79 5 Thoubal
63.46 67.66 59.25 59.47 63.98 54.98 71.13 74.64 67.55 6 Bishnupur
81.32 83.90 78.77 80.79 83.89 77.69 82.11 83.91 80.36 71mphal
72.78 76.78 68.43 72.78 76.78 68.43 8 Ukhrul
35


WORK P~RTICJPATION
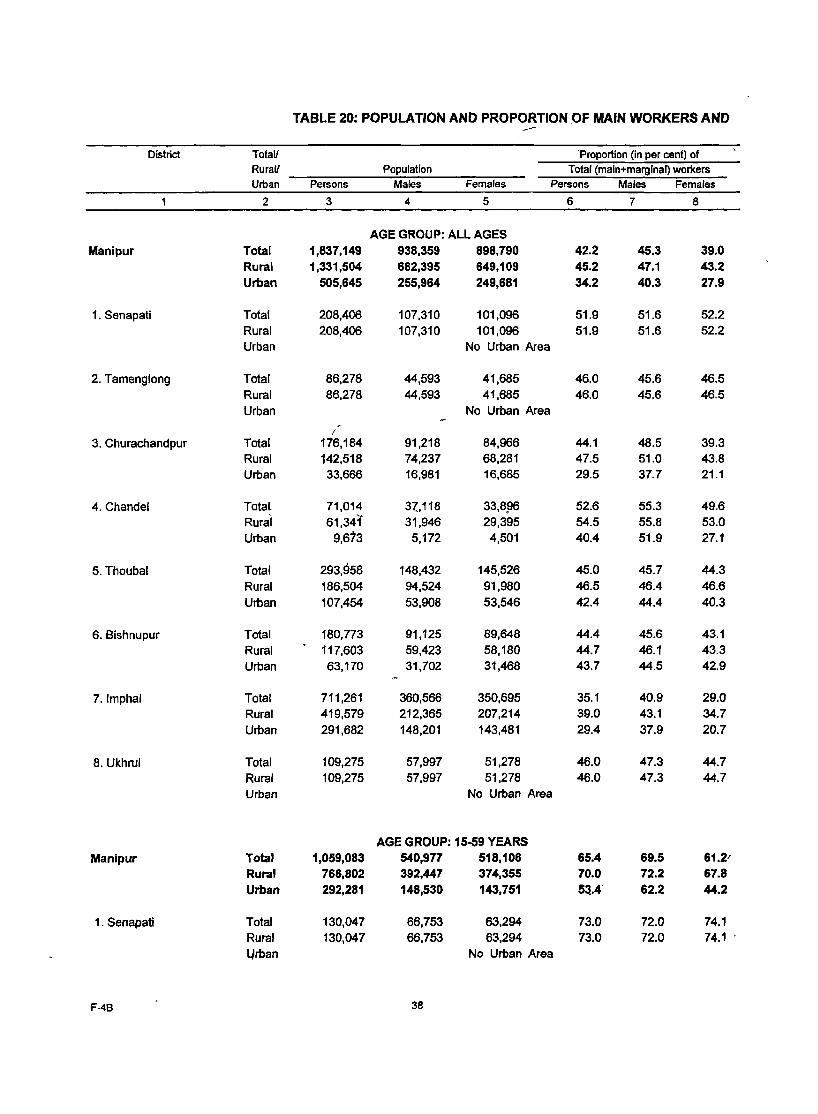
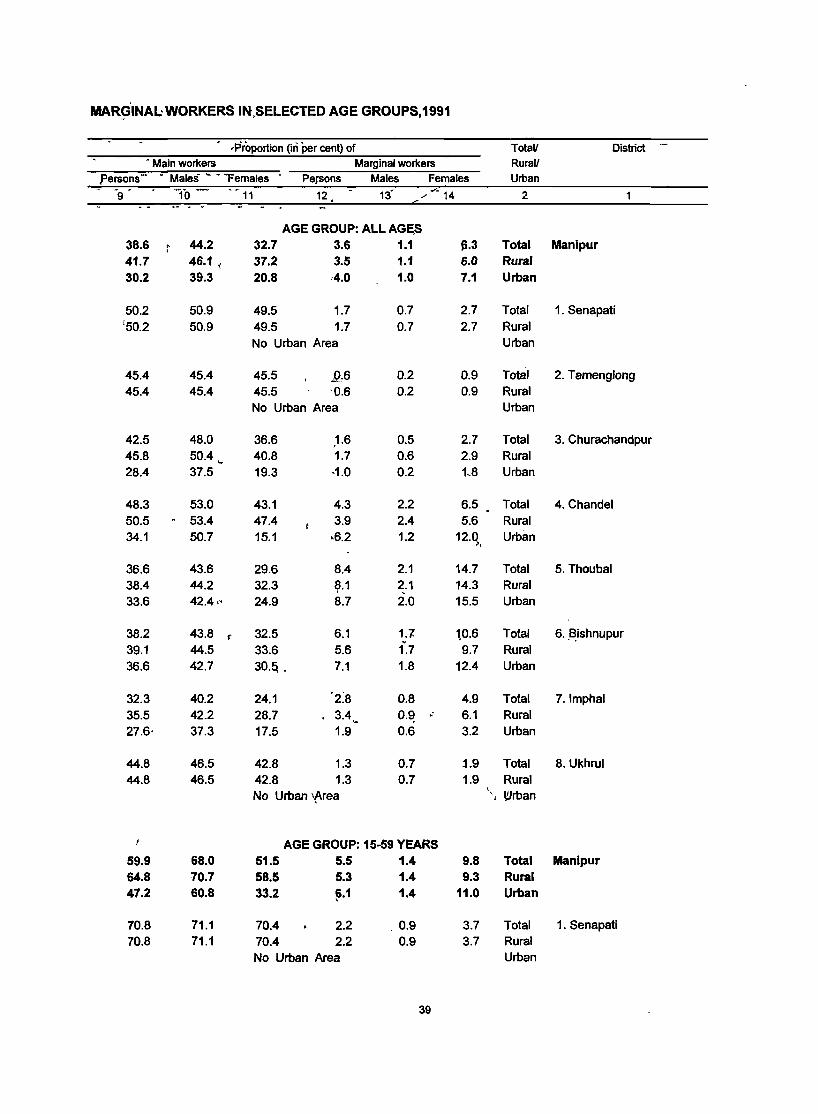
TABLE 20: POPULATION AND PROPORTION .OF MAIN WORKERS AND ---District Total! Proportion (in per cent) of
Rural! Population Total (main+marginal) workers Urban Persons Males Females Persons Males Females
2 3 4 5 6 7 8
AGE GROUP: ALL AGES Manipur Total 1,837,149 938,359 898,790 42.2 45.3 39.0
Rural 1,331,504 682,395 649,109 45.2 47.1 43.2 Urban 505,645 255,964 249,681 34.2 40.3 27.9
1. Senapati Total 208,406 107,310 101,096 51.9 51.6 52.2 Rural 208,406 107,310 101,096 51.9 51.6 52.2 Urban No Urban Area
2. Tamenglong Total 86,278 44,593 41,685 46.0 45.6 46.5 Rural 86,278 44,593 41,685 46.0 45.6 46.5 Urban No Urban Area
I
3. Churachandpur Total 176,184 91,218 84,966 44.1 48.5 39.3 Rural 142,518 74,237 68,281 47.5 51.0 43.8 Urban 33,666 16,981 16,685 29.5 37.7 21.1
4. Chandel Total 71,014 3V18 33,8~6 52.6 55.3 49.6 Rural 61,341' 31,946 29,395 54.5 55.8 53.0 Urban 9,673 5,172 4,501 40.4 51.9 27.1
5. Thoubal Total 293,958 148,432 145,526 45.0 45.7 44.3 Rural 186,504 94,524 91,980 46.5 46.4 46.6
Urban 107,454 53,908 53,546 42.4 44.4 40.3
6. Bishnupur Total 180,773 91,125 89,648 44.4 45.6 43.1 Rural 117,603 59,423 58,180 44.7 46.1 43.3 Urban 63,170 31,702 31,468 43.7 44.5 42.9
7.lmphal Total 711,261 360,566 350,695 35.1 40.9 29.0 Rural 419,579 212,365 207,214 39.0 43.1 34.7
Urban 291,682 148,201 143,481 29.4 37.9 20.7
8. Ukhrul Total 109,275 57,997 51,278 46.0 47.3 44.7 Rural 109,275 57,997 51,278 46.0 47.3 44.7 Urban No Urban Area
AGE GROUP: 15-59 YEARS Manipur Total 1,059,083 540,977 518,106 65.4 69.5 61.2'
Rural 766,802 392,447 374,355 70.0 72.2 67.8 Urban 292,281 148,530 143,751 53.4 62.2 44.2
1. Senapati Total 130,047 66,753 63,294 73.0 72.0 74.1 Rural 130,047 66,753 63,294 73.0 72.0 74.1 Urban No Urban Area
F-4B 38
MAR~'INAL' WORKERS IM,SELECTED AGE GROUPS,1991
. ,Proportion (in per cent) of TotaV District -
- Main workers Marginal workers RuraV
persons .. • Males - • -Females Persons Males Females Urban
- -9 . 10 11 12 13" ". .... ·14 2
AGE GROUP: ALL AGE,S 38.6 ~ 44.2 32.7 3.6 1.1 1i.3 Total Manipur , 41.7 46.1 ( 37.2 3.5 1.1 6.0 Rural 30.2 39.3 20.8 ,4.0 1.0 7.1 Urban
50.2 50.9 49.5 1.7 0.7 2.7 Total 1. Senapati [50.2 50.9 49.5 1.7 0.7 2.7 Rural
No Urban Area Urban
45.4 45.4 45.5 jJ_.6 0.2 0.9 Total 2. Tamenglong 45.4 45.4 45.5 '0.6 0.2 0.9 Rural
No Urban Area Urban
42.5 48.0 36.6 ,1.6 0.5 2.7 Total 3. Churachandpur 45.8 50.4 ... 40.8 1.7 0.6 2.9 Rural 28.4 37.5 19.3 ,1.0 0.2 1,8 Urban
48.3 53.0 43.1 4.3 2.2 6.5 Total 4. Chandel 50.5
_ 53.4 47.4 3.9 2.4 5.6 Rural
34.1 50.7 15.1 .6.2 1.2 12.q, Urban
36.6 43.6 29.6 8.4 2.1 14.7 Total 5. Thoubal 38.4 44.2 32.3 ~.1 2.1 14.3 Rural 33.6 42.4 .... 24.9 8.7 2.0 15.5 Urban
38.2 43.8 t 32.5 6.1 1.1 10.6 Total 6. ~ishnupur 39.1 44.5 33.6 5.6 {7 9.7 Rural 36.6 42.7 30.5, . 7.1 1.8 12.4 Urban
32.3 40.2 24.1 '2:8 0.8 4.9 Total 7.lmphal 35.5 42.2 28.7 3.4
"-O.~
_. 6.1 Rural
27.6· 37.3 17.5 1.9 0.6 3.2 Urban
44.8 46.5 42.8 1.3 0.7 :1.9 Total 8. Ukhrul 44.8 46.5 42.8 1.3 0.7 1.9 Rural
No Urban lf4.rea \ J \!lrban
AGE GROUP: 15-59 YEARS 59.9 68.0 51.5 5.5 1.4 9.8 Total Manipur 64.8 70.7 58.5 5.3 1.4 9.3 Rural 47.2 60.8 33.2 ~.1 1.4 11.0 Urban
70.8 71.1 70.4 2.2 0.9 3.7 Total 1. Senapati 70.8 71.1 70.4 2.2 0.9 3.7 Rural
No Urban Area Urban
39
I
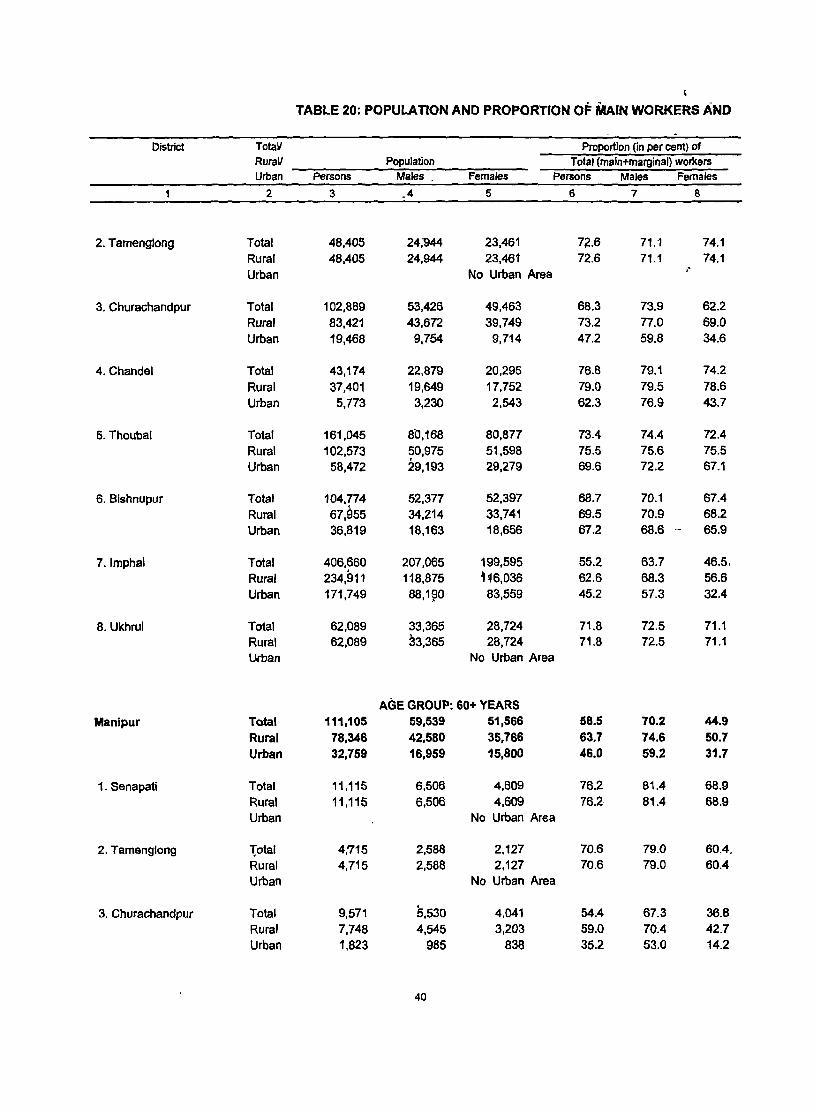
TABLE 20: POPULATION AND PROPORTION OF MAIN WORKERS AND
District Totall Proportion (in per cent) of RuraL' Population Total (main+marginal) workers Urban Persons Males .. Females Persons Males Females
2 3 .4 5 6 7 S
2. Tamenglong Total 48,405 24,lM4 23,461 72.6 71.1 74.1
Rural 48,405 24,944 23,461 72.6 71.1 74.1
Urban No Urban Area "
3. Churachandpur Total 102,889 53,426 49,463 68.3 73.9 62.2
Rural 83,421 43,672 39,749 73.2 77.0 69.0
Urban 19,468 9,754 9,714 47.2 59.8 34.6
4. Chandal Total 43,174 22,879 20,295 76.8 79.1 74.2
Rural 37,401 19,649 17,752 79.0 79.5 78.6
Urban 5,773 3,230 2,543 62.3 76.9 43.7
5. Thoubal Total 161,045 80,168 80,877 73.4 74.4 72.4
Rural 102,573 50,975 51,598 75.5 75.6 75.5
Urban 58,472 29,193 29,279 69.6 72.2 67.1
6. Bishnupur Total 104,774 52,377 52,397 68.7 70.1 67.4
Rural 67,955 34,214 33,741 69.5 70.9 68.2
Urban 36,819 18,163 18,656 67.2 68.6 - 65.9
7.lmphal Total 406.660 207.065 199.595 55.2 63.7 46.5,
Rural 234,911 118,875 ~ 16,036 62.6 68.3 56.6
Urban 171.749 B8,1~0 83,559 45.2 57.3 32.4
8. Ukhrul Total 62,089 33,365 28,724 71.8 72.5 71.1 Rural 62,089 33,365 28,724 71.8 72.5 71.1
Urban No Urban Area
AGE GROUP; 60+ YEARS
Manipur Total 111,105 59,539 51,566 58.5 70.2 44.9 Rural 78,346 42,580 35,766 63.7 74.6 50.7 Urban 32,759 16,959 15,800 46.0 59.2 31.7
1. Senapati Total 11,115 6,506 4,609 76.2 81.4 68.9
Rural 11,115 6,506 4,609 76.2 81.4 68.9 Urban No Urban Area
2. Tamenglong 10tal 4,715 2,588 2.127 70.6 79.0 60.4,
Rural 4,715 2,588 2,127 70.6 79.0 60.4 Urban No Urban Area
3. Churachandpur Total 9,571 5,530 4,041 54.4 67.3 36.8
Rural 7,748 4,545 3,203 59.0 70.4 42.7
Urban 1,823 985 838 35.2 53.0 14.2
40
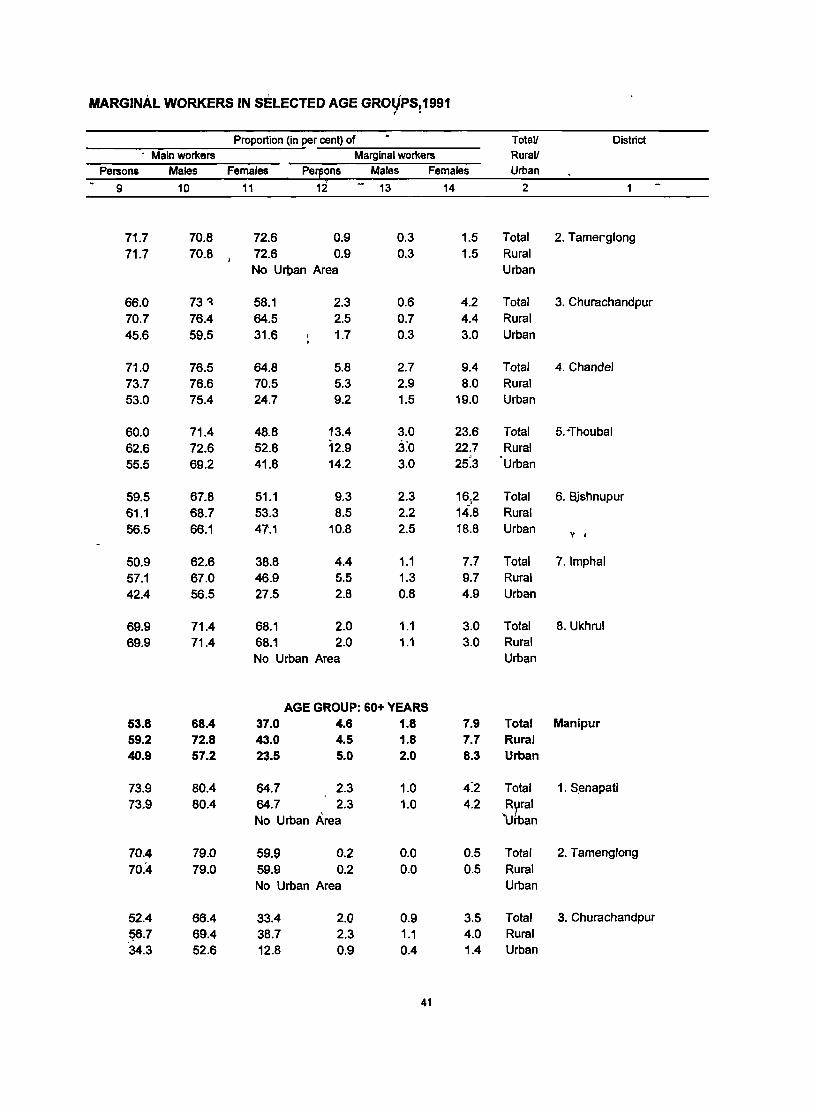
MARGINAL WORKERS IN SELECTED AGE GROYPS!1991
Proportion (in per cent) of TotaU District . Main wofl(ers Marginal wofl(ers RuraU
Persons Males Females Perpons Males Females Urban
9 10 11 12 - 13 14 2
71.7 70.8 72.6 0.9 0.3 1.5 Total 2. Tamerglong 71.7 70.8 12.6 0.9 0.3 1.5 Rural
No Urban Area Urban
66.0 73 ~ 58.1 2.3 0.6 4.2 Total 3. Churachandpur 70.7 76.4 64.5 2.5 0.7 4.4 Rural 45.6 59.5 31.6 1.7 0.3 3.0 Urban
71.0 76.5 64.8 5.8 2.7 9.4 Total 4. Chandel 73.7 76.6 70.5 5.3 2.9 8.0 Rural 53.0 75.4 24.7 9.2 1.5 19.0 Urban
60.0 71.4 48.8 13.4 3.0 23.6 Total 5.~Thoubal
62.6 72.6 52.8 12.9 3:0 22.7 Rural 14.2 3.0 25:3
. Urban 55.5 69.2 41.8
59.5 67.8 51.1 9.3 2.3 16.2 Total 6. 8,ishnupur 61.1 68.7 53.3 8.5 2.2 14:8 Rural 56.5 66.1 47.1 10.8 2.5 18.8 Urban "t i
50.9 62.6 38.8 4.4 1.1 7.7 Total 7.lmphal 57.1 67.0 46.9 5.5 1.3 9.7 Rural 42.4 56.5 27.5 2.8 0.8 4.9 Urban
69.9 71.4 68.1 2.0 1.1 3.0 Total 8. Ukhrul 69.9 71.4 68.1 2.0 1.1 3.0 Rural
No Urban Area Urban
AGE GROUP: 60+ YEARS 53.8 68.4 37.0 4.6 1.8 7.9 Total Manipur 59.2 72.8 43.0 4.5 1.8 7.7 Rural 40.9 57.2 23.5 5.0 2.0 8.3 Urban
73.9 BO.4 64.7 2.3 1.0 4:2 Total 1. S.enapati 73.9 80.4 64.7 2.3 1.0 4.2 R~ral
No Urban Area "urban
70.4 79.0 59.9 0.2 0.0 0.5 Total 2. Tamenglong 70.4 79.0 59.9 0.2 0.0 0.5 Rural
No Urban Area Urban
52.4 66.4 33.4 2.0 0.9 3.5 Total 3. Churachandpur
~.7 69.4 38.7 2.3 1.1 4.0 Rural 34.3 52.6 12.B 0.9 0.4 1.4 Urban
41
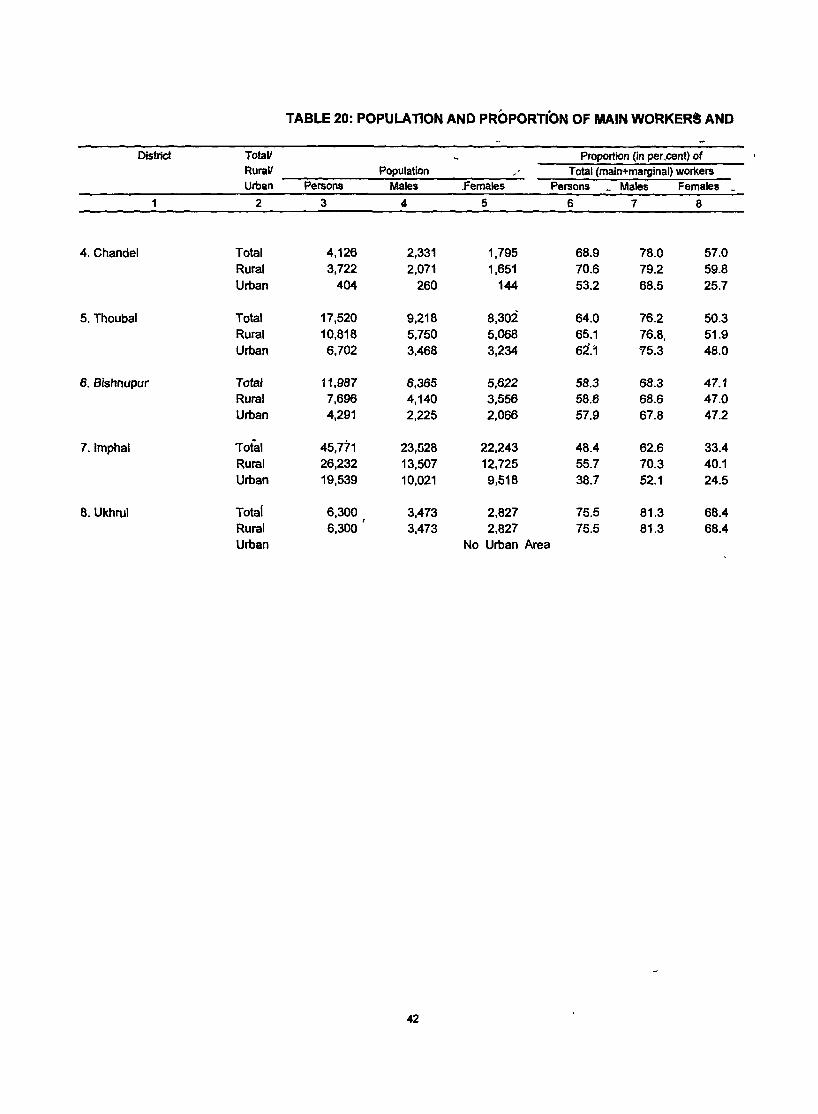
TABLE 20: POPULATION AND PROPORTION OF MAIN WORKERS AND
District TotaL' Proportion (in per.cent) of RuraL' Population , , Total (main+marginal) workers Urban Persons Males .females Persons _ Males Females -
2 3 4 5 6 7 8
4. Chandel Total 4,126 2,331 1,795 68.9 78.0 57.0 Rural 3,722 2,071 1,651 70.6 79.2 59.8 Urban 404 260 144 53.2 68.5 25.7
5. Thoubal Total 17,520 9,218 8,302 64.0 76.2 50.3 Rural 10,818 5,750 5,068 65.1 76.8, 51.9 Urban 6,702 3,468 3,234 6i.~ '75.3 48.0
6. Bishnupur Total 11,987 6,365 5,622 58.3 68.3 47.1 Rural 7,696 4,140 3,556 58.6 68.6 47.0 Urban 4,291 2,225 2,066 57.9 67.8 47.2
7.lmphal Total 45,771 23,528 22,243 48.4 62.6 33.4 Rural 26,232 13,507 12,725 55.7 70.3 40.1 Urban 19,539 10,021 9,518 38.7 52.1 24.5
8. Ukhrul Total 6,300 3,473 2,827 75.5 81.3 68.4 Rural 6,300 3,473 2,827 75.5 81.3 68.4 Urban No Urban Area
42
MARGINAL WORKERS IN SELECTED AGE GROUPS,1991
Proportion (in per cent) of Total! District
Main workers Marglnal workers Rural!
Persons Males Females Persons Males Females Urban
9 10 11 12 13 14 2
".. ,
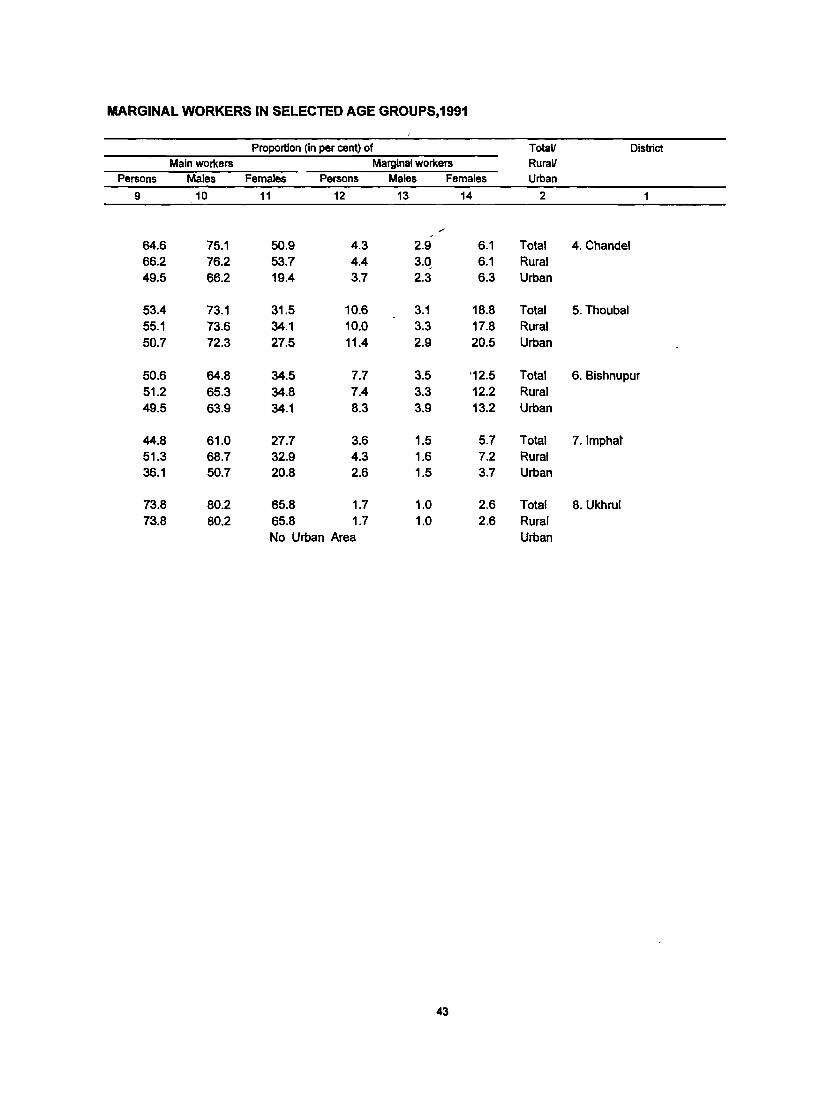
64.6 75.1 50.9 4.3 2.9 6.1 Total 4. Chandel 66.2 76.2 53.7 4.4 3.~ 6.1 Rural 49.5 66.2 19.4 3.7 2.3 6.3 Urban
53.4 73.1 31.5 10.6 3.1 18.8 Total 5. Thoubal 55.1 73.6 34.1 10.0 3.3 17.8 Rural 50.7 72.3 27.5 11.4 2.9 20.5 Urban
50.6 64.8 34.5 7.7 3.5 '12.5 Total 6. Bishnupur 51.2 65.3 34.8 7.4 3.3 12.2 Rural 49.5 63.9 34.1 8.3 3.9 13.2 Urban
44.8 61.0 27.7 3.6 1.5 5.7 Total 7.lmphat 51.3 68.7 32.9 4.3 1.6 7.2 Rural 36.1 50.7 20.8 2.6 1.5 3.7 Urban
73.8 80.2 65.8 1.7 1.0 2.6 Total 8. Ukhru[ 73.8 80.2 65.8 1.7 1.0 2.6 Rural
No Urban Area Urban
43

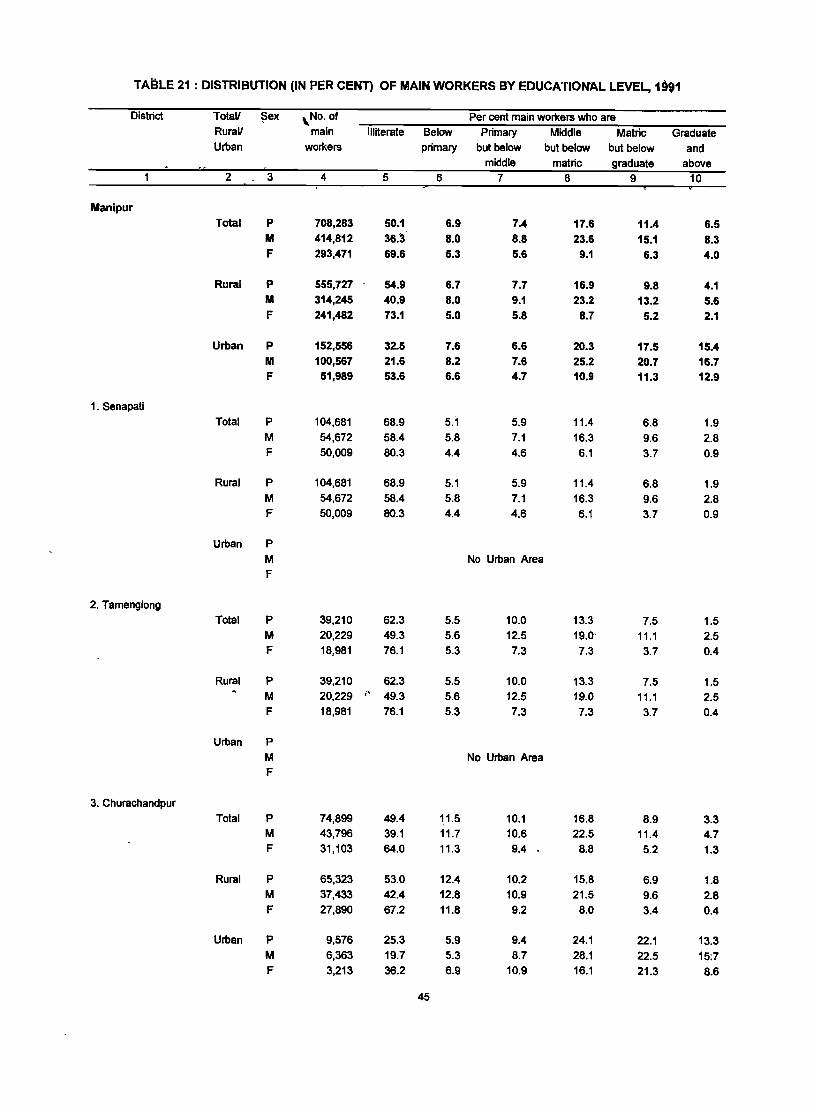
TABLE 21 : DISTRIBUTION (IN PER CENT) OF MAIN WORKERS BY EDUCATIONAL LEVEL, 1991
District TotaV ~e)( \No. of Per cent main workers who are RuraV main Illiterate Below Primary Middle Matrie Graduate Urban workers primary but below but below but below and
middle matrie graduate above 2 - 3 4 5 6 7 8 9 10
Manipur Total P 708,283 50.1 6.9 7.4 17.6 11.4 6.5
M 414,812 36.3 8.0 8.8 23.6 15.1 8.3 F 293,471 69.6 5.3 5.6 9.1 6.3 4.0
Rural P 555,727 54.9 6.7 7.7 16.9 9.8 4.1 M 314,245 40.9 8.0 9.1 23.2 13.2 5.6 F 241,482 73.1 5.0 5.8 8.7 5.2 2.1
Urban P 152,556 32.5 7.6 6.6 20.3 17.5 15.4 M 100,567 21.6 8.2 7.6 25.2 20.7 16.7 F 51,989 53.6 6.6 4.7 10.9 11.3 12.9
1. Senapati Total P 104,681 68.9 5.1 5.9 11.4 6.8 1.9
M 54,672 58.4 5.8 7.1 16.3 9.6 2.8 F 50,009 80.3 4.4 4.6 6.1 3.7 0.9
Rural P 104,681 68.9 5.1 5.9 11.4 6.8 1.9 M 54,672 58.4 5.8 7.1 16.3 9.6 2.8 F 50,009 80.3 4.4 4.6 6.1 3.7 0.9
Urban P M No Urban Area F
2. Tamenglong Total P 39,210 62.3 5.5 10.0 13.3 7.5 1.5
M 20,229 49.3 5.6 12.5 19.0- 11.1 2.5 F 18,981 76.1 5.3 7.3 7.3 3.7 0.4
Rural P 39,210 62.3 5.5 10.0 13.3 7.5 1.5 M 20,229 ,~ 49.3 5.6 12.5 19.0 11.1 2.5 F 18,981 76.1 5.3 7.3 7.3 3.7 0.4
Urban P M No Urban Area F
3. Churachandpur Total P 74,899 49.4 11.5 10.1 16.8 8.9 3.3
M 43,796 39.1 11.7 10.6 22.5 11.4 4.7 F 31,103 64.0 11.3 9.4 8.8 5.2 1.3
Rural P 65,323 53.0 12.4 10.2 15.8 6.9 1.8 M 37,433 42.4 12.8 10.9 21.5 9.6 2.8 F 27,890 67.2 11.8 9.2 8.0 3.4 0.4
Urban P 9,576 25.3 5.9 9.4 24.1 22.1 13.3 M 6,363 19.7 5.3 8.7 28.1 22.5 15:7 F 3,213 36.2 6.9 10.9 16.1 21.3 8.6
45
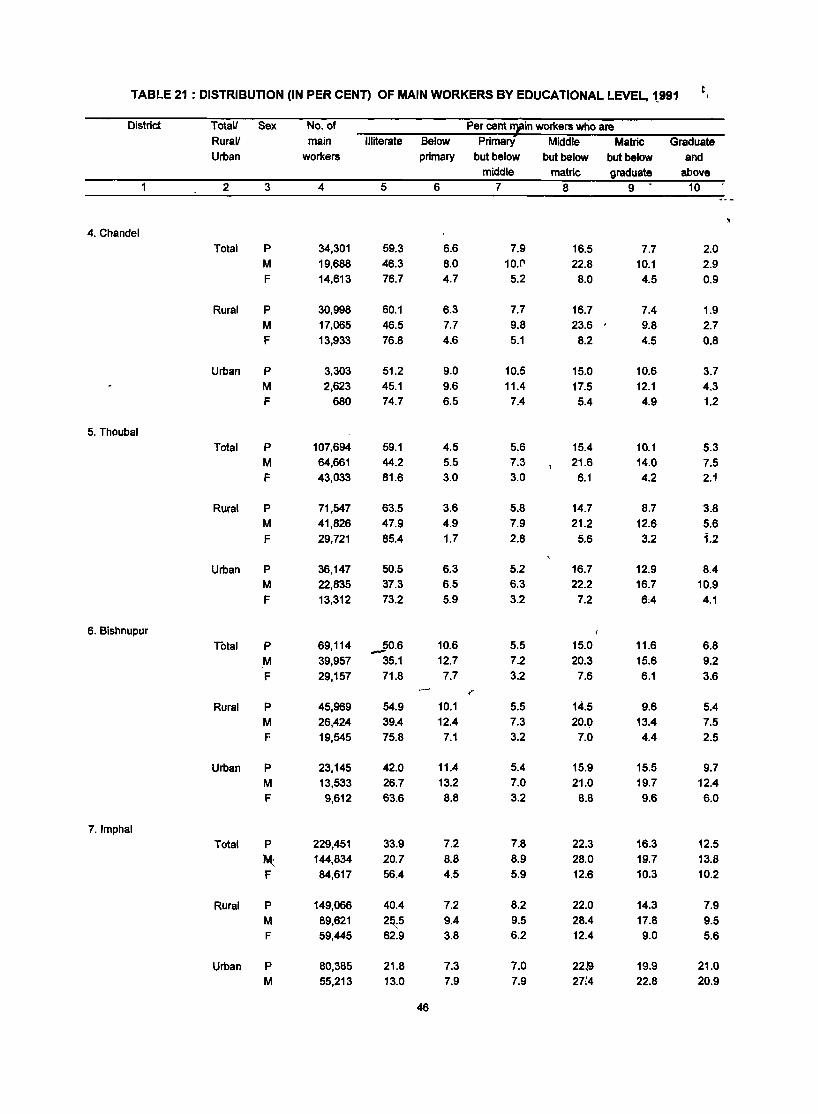
TABLE 21: DISTRIBUTION (IN PER CENn OF MAIN WORKERS BY EDUCATIONAL LEVEL, 1.991 C I
District
4. Chandel
5. Thoubal
6. Bishnupur
7.lmphal
Total! RuraV Urban
2
Sex
3
Total P M F
Rural P M F
Urban P M F
Total P M F
Rural P M F
Urban P
lotal
M F
P M F
Rural P M F
Urban P M F
Total P
M; F
Rural P M F
Urban P M
No. of
main workers
4
34,301 19,688 14,613
30,998 17,065 13,933
3,303 2,623
680
107,694 64,661 43,033
71,547 41,826 29,721
36,147 22,835 13,312
Illiterate
5
59.3 46.3 76.7
60.1 46.5 76.8
51.2 45.1 74.7
59.1 44.2 81.6
63.5 47.9 85.4
50.5 37.3 73.2
69,114 -,0.6 39,957 35.1 29,157 71.8
45,969 26,424 19,545
23,145 13,533 9,612
229,451 144,834 84,617
149,066 89,621 59,445
80,385 55,213
54.9 39.4 75.8
42.0 26.7 63.6
33.9 20.7 56.4
21.8 13.0
Below primary
46
6
6.6 8.0 4.7
6.3 7.7 4.6
9.0 9.6 6.5
4.5 5.5 3.0
3.6 4.9 1.7
6.3 6.5 5.9
10.6 12.7 7.7
10.1 12.4
7.1
11.4 13.2 8.8
7.2 8.8 4.5
7.2 9.4 3.8
7.3 7.9
Per cent ~in workers who are Primary Middle Matric
but below but below but below middle
7
7.9 10.(1 5.2
7.7 9.8 5.1
10.5 11.4 7.4
5.6 7.3 3.0
5.8 7.9 2.8
5.2 6.3 3.2
5.5 7.2 3.2
5.5 7.3 3.2
5.4 7.0 3.2
7.8 8.9 5.9
8.2 9.5 6.2
7.0 7.9
matrie 8
16.5 22.8
8.0
16.7 23.6 8.2
15.0 17.5 5.4
15.4 21.6
6.1
14.7 21.2
5.6
16.7 22.2
7.2
15.0 20.3 7.6
14.5 20.0
7.0
15.9 21.0
8.8
22.3 28.0 12.6
22.0 28.4 12.4
22,9 27(4
graduate 9 •
7.7 10.1 4.5
7.4 9.8 4.5
10.6 12.1 4.9
10.1 14.0 4.2
8.7 12.6 3.2
12.9 16.7 6:4
11.6 15.6 6.1
9.6 13.4 4.4
15.5 19.7 9.6
16.3 19.7 10.3
14.3 17.8 9.0
19.9 22.8
Graduate and
above 10
2.0 2.9 0.9
1.9 2.7 0.8
3.7 4.3 1.2
5.3 7.5 2.1
3.8 5.6 1.2
8.4 10.9 4.1
6.8 9.2 3.6
5.4 7.5 2.5
9.7 12.4 6.0
12.5 13.8 10.2
7.9 9.5 5.6
21.0 20.9
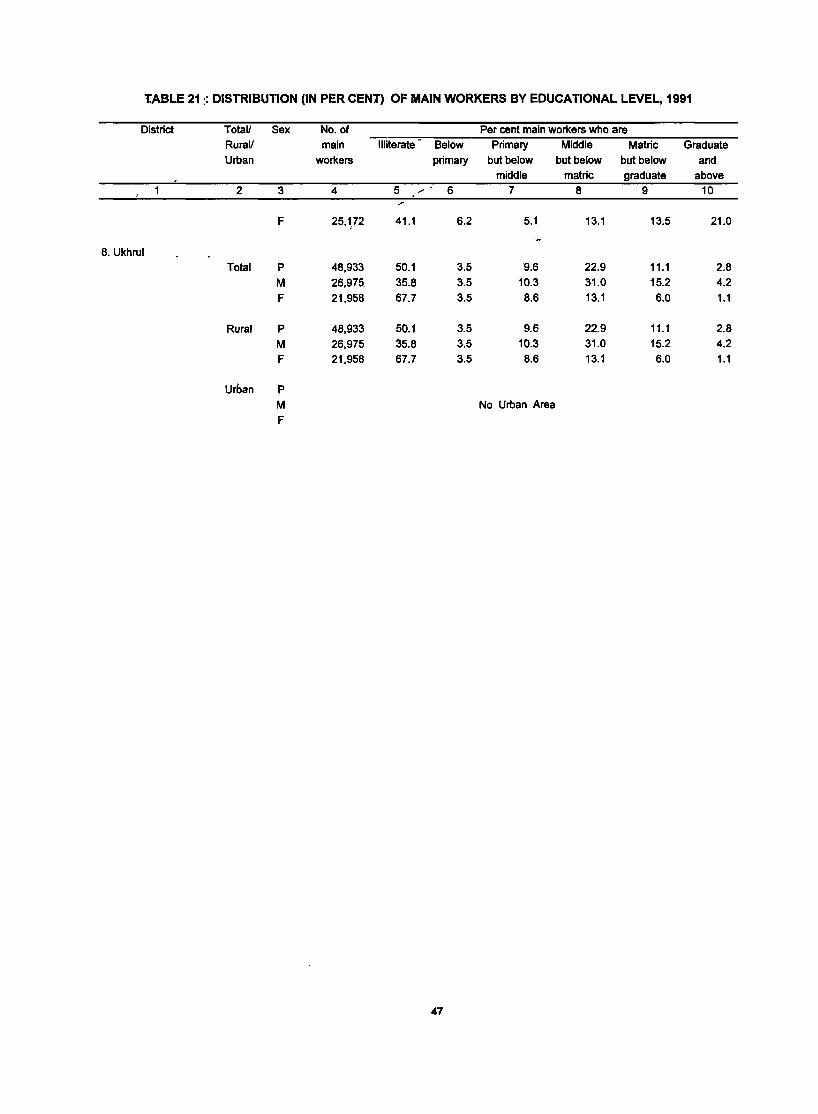
tABLE 211: DISTRIBUTION (IN PER CEN1) OF MAIN WORKERS BY EDUCATIONAL LEVEL, 1991
District Total! Sex No. of Per cent main workers who are Rural! main Illiterate - Below Primary Middle Matric Graduate
Urban workers primary but below but below but below and middle matric graduate above
2 3 4 5 6 7 8 9 10 /'
F 25,1,72 41.1 6.2 5.1 13.1 13.5 21.0
8. Ukhrul Total P 48,933 50.1 3.5 "9.6 22.9 11.1 2.8
M 26,975 35.8 3.5 10.3 31.0 15.2 4.2
F 21,958 67.7 3.5 8.6 13.1 6.0 1.1
Rural P 48,933 50.1 3.5 9.6 22.9 11.1 2.8
M 26,975 35.8 3.5 10.3 31.0 15.2 4.2
F 21,958 67.7 3.5 8.6 13.1 6.0 1.1
Urban P
M No Urban Area
F
47
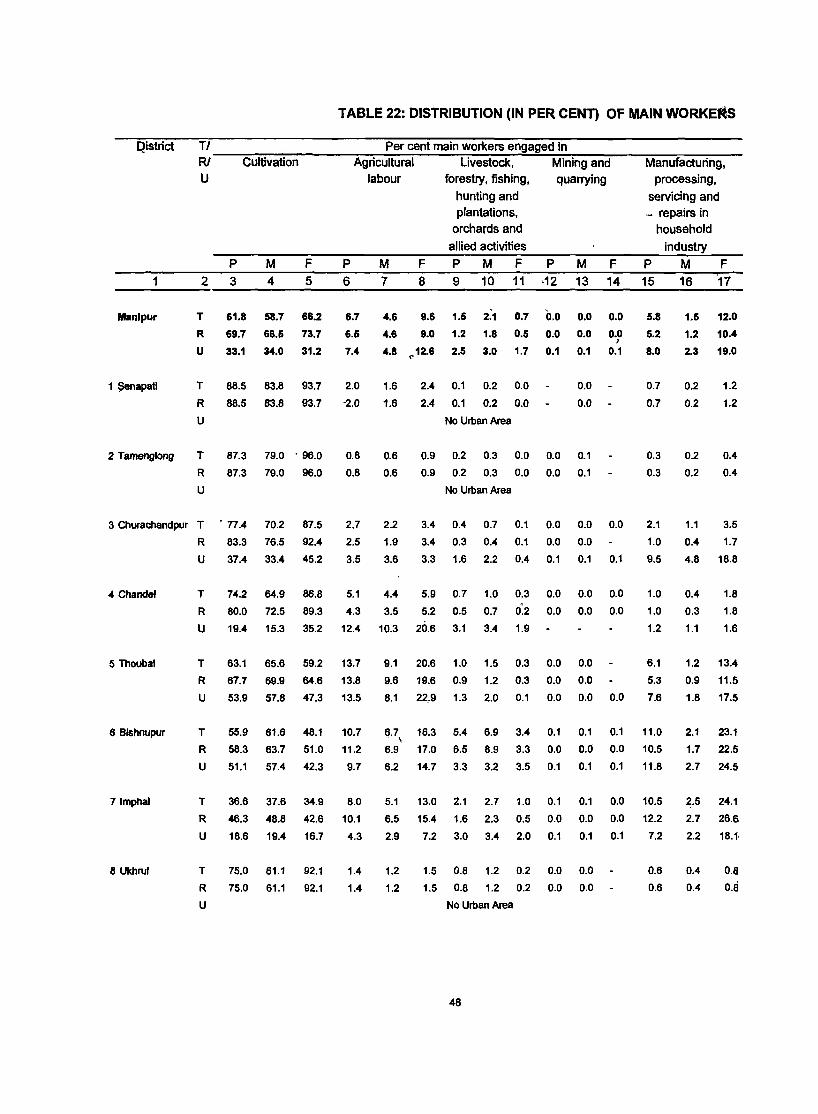
TABLE 22: DISTRIBUTION (IN PER CENT) OF MAIN WORKE'-S
Qistrict TI Per cent main workers engaged in RI----~C-u~ltiv~a~t~io-n------~A~g-ri~c-ul~tu-~~I----~L~iv-e-s~tock~-,~~~M~i~ni~n-g-a-n-d----~M~a-n-u~m~ct--un~·n-g-,--
U labour forestry, fishing, quarrying processing,
P M F 1 2 3 4 5 -------
Manlpur
1 ~apati
2 Tamengiong
T
R
U
T
R
U
61.8
69.7
33.1
58.7
66.5
34.0
66.2
73.7
31.2
88.5 83.8 93.7
88.5 83.8 93.7
T 87.3 79.0' 96.0
R 87.3 79.0 96.0
U
3 Churachandpur T
R
U
. 77.4
83.3
37.4
70.2
76.5
33.4
87.5
92.4
45.2
4 Chandel
5 Thoubal
6 Bishnupur
71mphal
8 Ukhrul
T
R
U
T
R
U
T
R
U
T
R
U
74.2
80.0
19.4
63.1
67.7
53.9
55.9
58.3
51.1
36.6
46.3
18.6
64.9
72.5
15.3
65.6
69.9
57.8
61.6
63.7
57.4
37.6
48.8
19.4
86.8
89.3
35.2
59.2
64.6
47.3
48.1
51.0
42.3
34.9
42.6
16.7
T 75.0 61.1 92.1
R 75.0 61.1 92.1
U
P 6
6.7
6.5
7.4
2.0
-2.0
0.8
0.8
2.7
2.5
3.5
5.1
4.3
12.4
13.7
13.8
13.5
10.7
11.2
9.7
8.0
10.1
4.3
1.4
1.4
hunting and servicing and plantations, .. repairs in
orchards and household allied activities industry
M F PM F PM F PM F 7 8 9 10 11 ·12 13 14
4.6 9.6
4.6 9.0
4.8 ,,12.6
1.5
1.2
2.5
1.6
1.6
2.4 0.1
2.4 0.1
2.1
1.8
3.0
0.7 0.0 0.5 0.0
1.7 0.1
0.2 0.0
0.2 0.0
No Urban Area
0.0
0.0
0.1
0.0
0.0
0.0
0.0 ;
0.1
0.6
0.6
0.9 0.2 0.3 0.0 0.0 0.1
0.9 0.2 0.3 0.0 0.0 0.1
2.2
1.9
3.6
3.4
3.4
3.3
No Urban Area
0.4
0.3
1.6
0.7
0.4
2.2
4.4 5.9 0.7 1.0
3.5 5.2 0.5 0.7
10.3 20.6 3.1 3.4
9.1 20.6 1.0 1.5
9.6 19.6 0.9 1.2
8.1 22~9 1.3 2.0
6.7 16.3 5.4 6.9 . \
6.9 17.0 6.5 8.9
6.2 14.7 3.3 3.2
5.1 13.0 2.1 2.7
6.5 15.4 1.6 2.3
2.9 7.2 3.0 3.4
0.1
0.1
0.4
0.0
0.0
0.1
0.3 0.0
0~2 0.0
1.9
0.3 0.0
0.3 0.0
0.1 0.0
3.4 0.1
3.3 0.0
3.5 0.1
1.0 0.1
0.5 0.0
2.0 0.1
0.0
0.0
0.1
0.0
0.1
0.0 0.0
0.0 0.0
0.0
0.0
0.0 0.0
0.1 0.1
0.0 0.0
0.1 0.1
0.1 0.0
0.0 0.0
0.1 0.1
1.2
1.2
1.5 0.8 1.2 0.2 0.0 0.0
1.5 0.8 1.2 0.2 0.0 0.0
No Urban Area
48
15 16 17
5.8
5.2
8.0
0.7
0.7
0.3
0.3
2.1
1.0
9.5
1.0
1.0
1.2
6.1
5.3
7.6
11.0
10.5
11.8
10.5
12.2
7.2
0.6
0.6
1.5
1.2
2.3
0.2
0.2
0.2
0.2
1.1
0.4
4.8
0.4
0.3
1.1
1.2
0.9
1.8
2.1
1.7
2.7
2.5
2.7
2.2
0.4
0.4
12.0
10.4
19.0
1.2
1.2
0.4
0.4
3.5
1.7
18.8
1.8
1.8
1.6
13.4
11.5
17.5
23.1
22.5
24.5
24.1
26.6
18.11
O.B
O.a
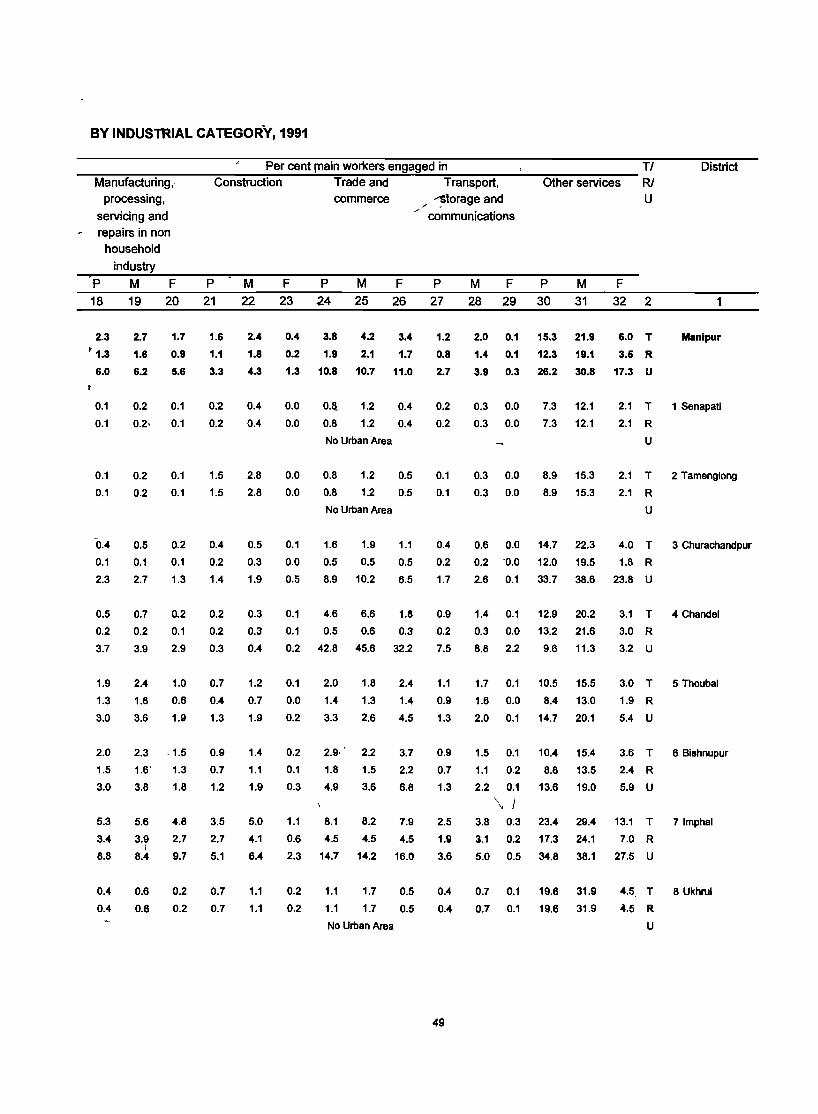
BY INDUSTRIAL CATEGORY, 1991
Per cent fllain workers engaged in TI --~M7a-n-u~fu-ct~u-n~·n-g-,-----c~on-s~t-ru-ct7.i~on--~~~T~r-ad~e~a~nd~~~~T=r-a-n-s-po-rt~,------O~th-e-r-se-N~ic-e-s--~
processing, commerce " -:norage and U seNicing and / communications
~ repairs in non household
industry P M F 18 19 20
2.3
~ 1.3
6.0
0.1
0.1
0.1
0.1
0.4
0.1
2.3
0.5
0.2
3.7
1.9
1.3
3.0
2.0
1.5
3.0
5.3
3.4
8.8
0.4
0.4
2.7
1.6
6.2
0.2
1.7
0.9
5.6
0.1
0.2. 0.1
0.2
0.2
0.1
0.1
0.5 0.2
0.1 0.1
2.7 1.3
0.7 0.2
0.2 0.1
3.9 2.9
2.4 1.0
1.8 0.6
3.6 1.9
2.3 ,1.5
1.6' 1.3
3.8 1.8
5.6
3.~ 8.4
0.6
0.6
4.8
2.7
9.7
0.2
0.2
P 21
1.6
1.1
3.3
0:2
0.2
1.5
1.5
0.4
0.2
1.4
0.2
0.2
0.3
0.7
0.4
1.3
0.9
0.7
1.2
3.5
2.7
5.1
0.7
0.7
M 22
2.4
1.8
4.3
0.4
0.4
2.8
2.8
0.5
0.3
1.9
0.3
0.3
0.4
1.2
0.7
1.9
1.4
1.1
1.9
5.0
4.1
6.4
1.1
1.1
F P M F 23 24 25 26
0.4 3.8 4.2 3.4
0.2 1.9 2.1 1.7
1.3 10.8 10.7 11.0
0.0 O.a. 1.2 0.4
0.0
0.0
0.0
0.8 1.2
No Urban Area
0.8 1.2
0.8 1.2
No Urban Area
0.4
0.5
0.5
0.1 1.6 1.9 1.1
0.0 0.5 0.5 0.5
0.5 8.9 10.2 6.5
0.1 4.6 6.6 US
0.1 0.5 0.6 0.3
0.2 42.8 45.6 32.2
0.1 2.0 1.8 2.4
0.0 1.4 1.3 1.4
0.2 3.3 2.6 4.5
0.2 2.9· 2.2 3.7
0.1 1.8 1.5 2.2
0.3 4.9 3.6 6.8
1.1 8.1 8.2 7.9
0.6 4.5 4.5 4.5
2.3 14.7 14.2 16.0
0.2
0.2
1.1 1.7
1.1 1.7
No Urban Area
0.5
0.5
P 27
1.2
0.8
2.7
0.2
0.2
0.1
0.1
0.4
0.2
1.7
0.9
0.2
7.5
1.1
0.9
1.3
0.9
0.7
1.3
2.5
HI
3.6
0.4
0.4
49
M F P M 28 29 30 31
2.0 0.1 15.3 21.9
1.4 0.1 12.3 19.1
3.9 0.3 26.2 30.8
0.3 0.0 7.3 12.1
0.3 0.0
0.3
0.3
0.0
0.0
0.6 0.0
0.2 -0.0
2.6 0.1
1.4 0.1
0.3 0.0
8.8 2.2
1.7 0.1
1.6 0.0
2.0 0.1
1.5 0.1
1.1 0.2
2.2 0.1
\/
7.3 12.1
8.9
8.9
15.3
15.3
14.7 22.3
12.0 19.5
33.7 38.6
12.9 20.2
13.2 21.6
9.6 11.3
10.5 15.5
8.4 13.0
14.7 20.1
10.4 15.4
8.8 13.5
13.6 19.0
3.8 0.3 23.4 29.4
3.1 0.2 17.3 24.1
5.0 0.5 34.8 38.1
0.7
0.7
0.1
0.1
19.6
19.6
31.9
31.9
F
32 2
6.0 T
3.5 R
17.3 U
2.1 T
2.1 R
U
2.1 T
2.1 R
U
4.0 T
1.8 R
23.8 U
3.1 T
3.0 R
3.2 U
3.0 T
1.9 R
5.4 U
3.6 T
2.4 R
5.9 U
13.1 T
7.0 R
27.5 U
4.5, T
4.5 R
U
District
1
Manipur
1 Senapati
2 Tamenglong
3 Churachandpur
4 Chandel
5 Thoubal
6 Bishnupur
71mphal
8 Ukhrul
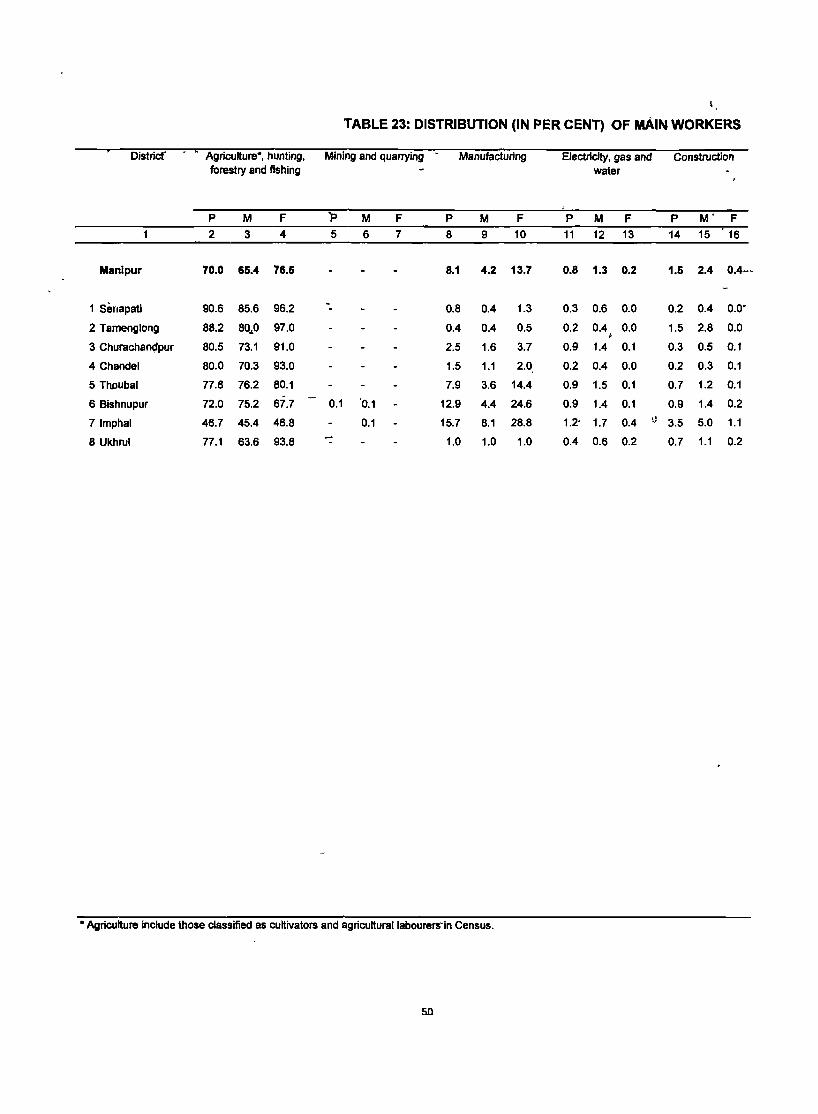
I . TABLE 23: DISTRIBUTION (IN PER CENT) OF MAIM WORKERS
District' Agriculture-, hunting, Mining and quarrying - Manufacturing Electricity, gas and Construction forestry and fishing water
P M F 'p M F P M F P M F P M' F 2 3 4 5 6 7 8 9 10 11 12 13 14 15 16
Manlpur 70,0 65.4 76.5 8.1 4.2 13.7 0.8 1.3 0.2 1.5 2.4 0.4 .. •
1 Senapati 90.6 85.6 96.2 - 0.8 0.4 1.3 0.3 0.6 0.0 0.2 0.4 0.0' -2 Tamenglong 88.2 80,,0 97.0 0.4 0.4 0.5 0.2 0.4 0.0 1.5 2.8 0.0
~
3 Churachanl1pur 80.5 73.1 91.0 2.5 1.6 3.7 0.9 1.4 0.1 0.3 0.5 0.1
4 Chandel 80.0 70.3 93.0 1.5 1.1 2.0 0.2 0.4 0.0 0.2 0.3 0.1
5 Thoubal 77.8 76.2 80.1 7.9 3.6 14.4 0.9 1.5 0.1 0.7 1.2 0.1
6 Bishnupur 72.0 75.2 67.7 0.1 '0.1 12.9 4.4 24.6 0.9 1.4 0.1 0.9 1.4 0.2
71mphal 46.7 45.4 48.8 0.1 15.7 8.1 28.8 1.2' 1.7 0.4 I) 3.5 5.0 1.1
8 Ukhrul 77.1 63.6 93.8 - 1.0 1.0 1.0 0.4 0.6 0.2 0.7 1.1 0.2 -
• Agriculture include those classified as cultivators and agriculturallabourers"in Census.
!ill
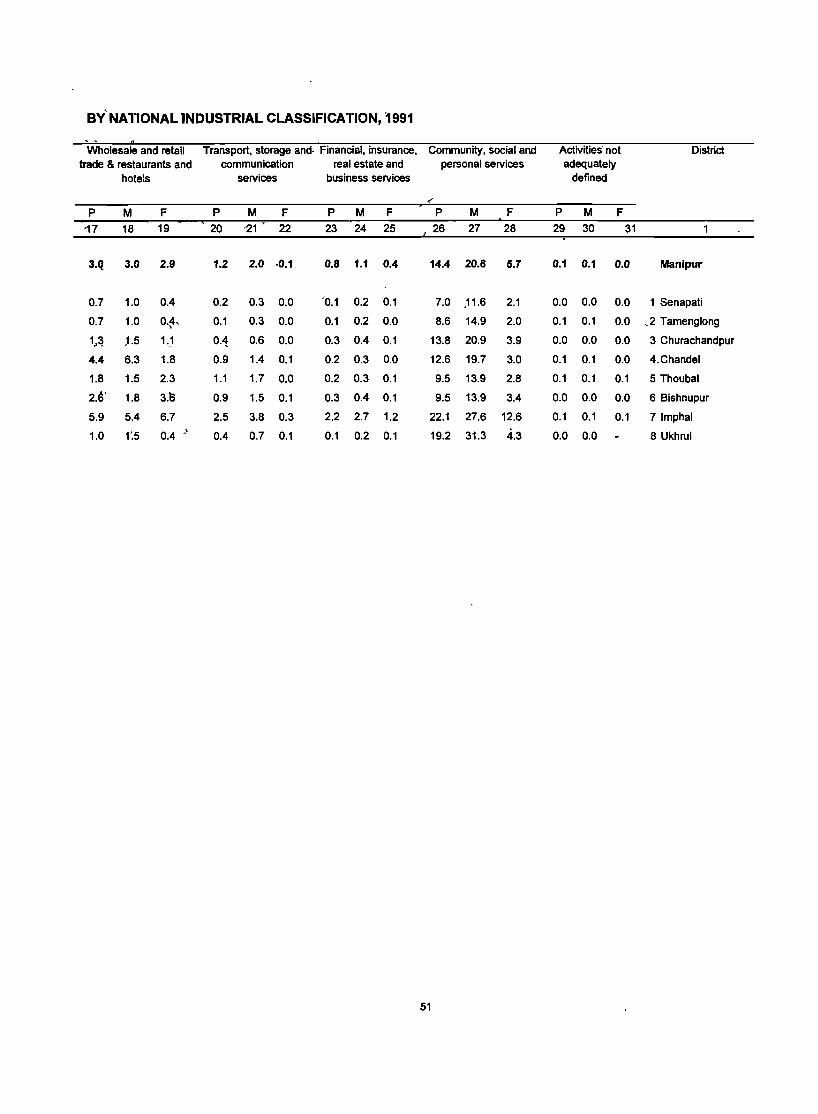
BY' NATIONAL lNDUSTRIAL CLASSIFICATION, ~ 991
. Wholesale and retail Transport, storage and- Financial, insurance, Community, social and Activities' not District
trade & restaurants and communication real estate and personal services adequately hote!s services business services defined
<' p M F P M F P M F P M F P M F
-17 18 19 20 -21 • 22 23 24 25 J 26 27 28 29 30 31
3.q 3.0 2.9 1.2 2.0 ,0.1 0.8 1.1 0.4 14.4 20.6 5.7 0.1 0.1 0.0 Manlpur
0.7 1.0 0.4 0.2 0.3 0.0 '0.1 0.2 0.1 7.0 ,11.6 2.1 0.0 0.0 0.0 1 Senapati
0.7 1.0 O,~, 0.1 0.3 0.0 0.1 0.2 0.0 8.6 14.9 2.0 0.1 0.1 0.0 ,.2 Tamenglong
1~~ ).5 1.) 0·4 0.6 0.0 0.3 0.4 0.1 13.8 20.9 3.9 0.0 0.0 0.0 3 Churachandpur
4.4 6.3 1.8 0.9 1.4 0.1 0.2 0.3 0.0 12.6 19.7 3.0 0.1 0.1 0.0 4.Chandel
1.8 1.5 2.3 1.1 1.7 0.0 0.2 0.3 0.1 9.5 13.9 2.8 0.1 0.1 0.1 5 Thoubal
2J~' 1.8 3.t) 0.9 1.5 0.1 0.3 0.4 0.1 9.5 13.9 3.4 0.0 0.0 0.0 6 Bishnupur
5.9 5.4 6.7 2.5 3.8 0.3 2.2 2.7 1.2 22.1 27.6 12.6 0.1 0.1 0.1 7 Imp hal
1.0 1'.5 0.4 J 0.4 0.7 0.1 0.1 0.2 0.1 19.2 31.3 4.3 0.0 0.0 8 Ukhrul
51
District
1
Manipur
1 Senapati
2 Tamenglong
.3 Churachandpur
4 Chandel
5 Thoubal
6 Bishnupur
71mphal
8 Ukhrul
Professional, technical and related workers
P M F
2 3 4
5.28 6.55 3.50
2.33 3.22 1.35
2.78 4.16 1.31
4.64 6.30 2.30
2.80 3.6Q -1.14-
3.79 5.13 1.78
4.79 6.46 2.52
8.54 9.18 7.46
5.06 7.07 2.60
TABLE 24: DISTRIBUTION (IN PER (fENT) OF MAIN WPI\KERS
Administrative, executive and
managerial workers
P M F
5 6 7
1.13 1.72 0.30
0.24 0.42 0.05
0.49 0.86 0.11
0.62 0.90 0.23
.1.57 2.51 0.30
0.39 0.57 0.13
0.43 0.58 0.22
2.39 3.39 0.68
0.72 1.20 0.13
Clerical and related workers
.P M F
8 9 10
4.11 5.48 2.17
1.33 2.11 0.48
1.92 3.20 0.55
3.08 4.30 1.36
1.63 2.18 0.88
2.74 4.23 0.50
2.66 4.02 0.78
7.79 9.08 5.57
2.92 4.14 1.41
Sales wQrkel'$
P M F_
11 12 13
3.01 3.02 3.00
0.52 0.75 0.27
0.49 0.71 0.27
1.07 1.24 0.83
2.62 3.62 1.27
1.7~ 1.33 2.~9
2.71 1.83 3.93
6.45 6.12 7.00
0.78 1.01 0.50
* Farmers includes those classified as cultivators and agricultural labourers in Census.
52
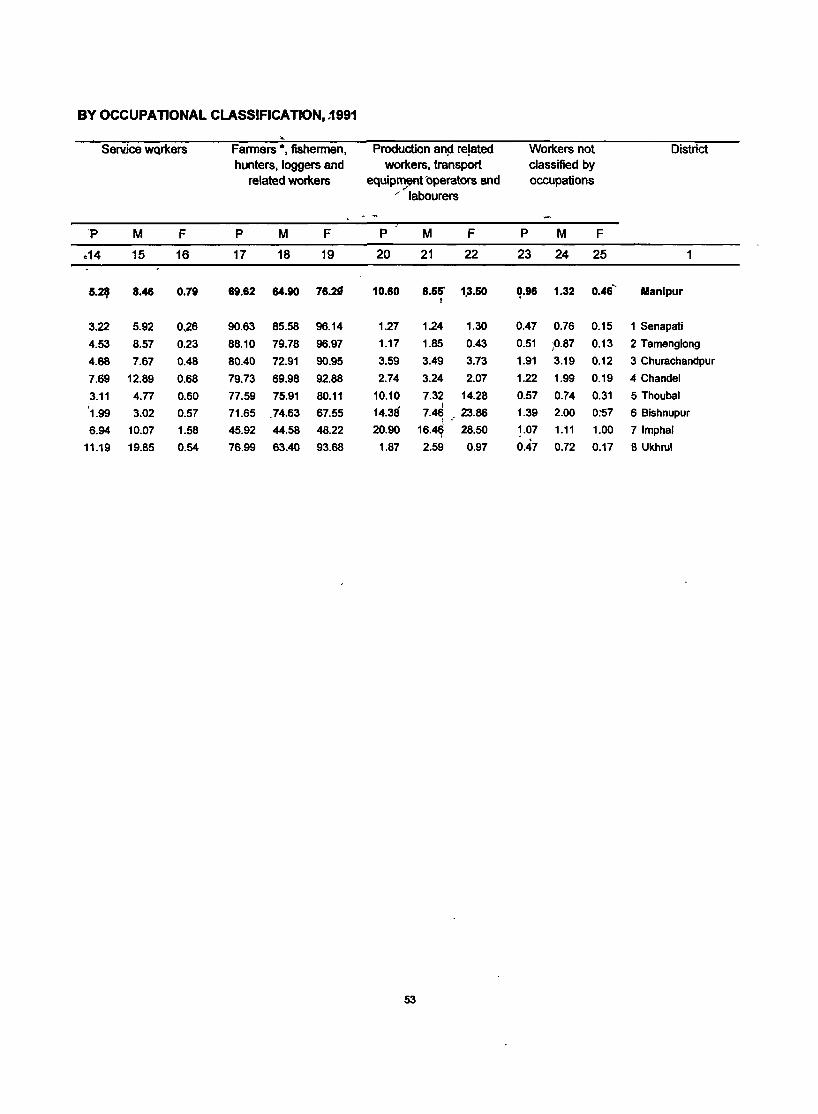
BY OCCUPATIONAL CLASSIFICA nON, .1991 ~
SeNiee wQrkers Farmers *, fisherrnen, Production an51 re!ated Workers not District hunters, loggers and workers, transport classified by
related workers equip~ent operators and occupations /' labourers
'P M F P M F P M F P M F
.14 15 16 17 18 19 20 21 22 23 24 25 1
5.2, 8.46 0.79 69.62 64.90 7Ug 10.60 8.55' 1,3.50 q.96 1.32 0.46" Manlpur I
3.22 5.92 0,26 90.63 85.58 96.14 1.27 1.24 1,30 0.47 0.76 0.15 1 Senapati
4.53 8.57 0.23 88.10 79.78 96.97 1.17 1.85 0.43 0.51 -p.87 0.13 2 Tamenglong
4.68 7.67 0.48 80.40 72.91 90.95 3.59 3.49 3.73 1.91 3.19 0.12 3 Churachandpur
7.69 12.89 0.68 79.73 69.98 92.88 2.74 3.24 2.07 1.22 1.99 0.19 4 Chandel
3.11 4.n 0.60 77.59 75.91 80.11 10.10 7.32 14.28 0.57 0.74 0.31 5 Thoubal
'1.99 14.38 t
3.02 0.57 71.65 .. 74.63 67.55 7.46 23.86 1.39 2.00 0:57 6 Bishnupur
6.94 10.07 1.58 45.92 44.58 48.22 20.90 16.44 " 28.50 1.07 1.11 1.00 71mphal
11.19 19.85 0.54 76.99 63.40 93.68 1.87 2.59 0.97 0.47 0.72 0.17 8 Ukhrul
53
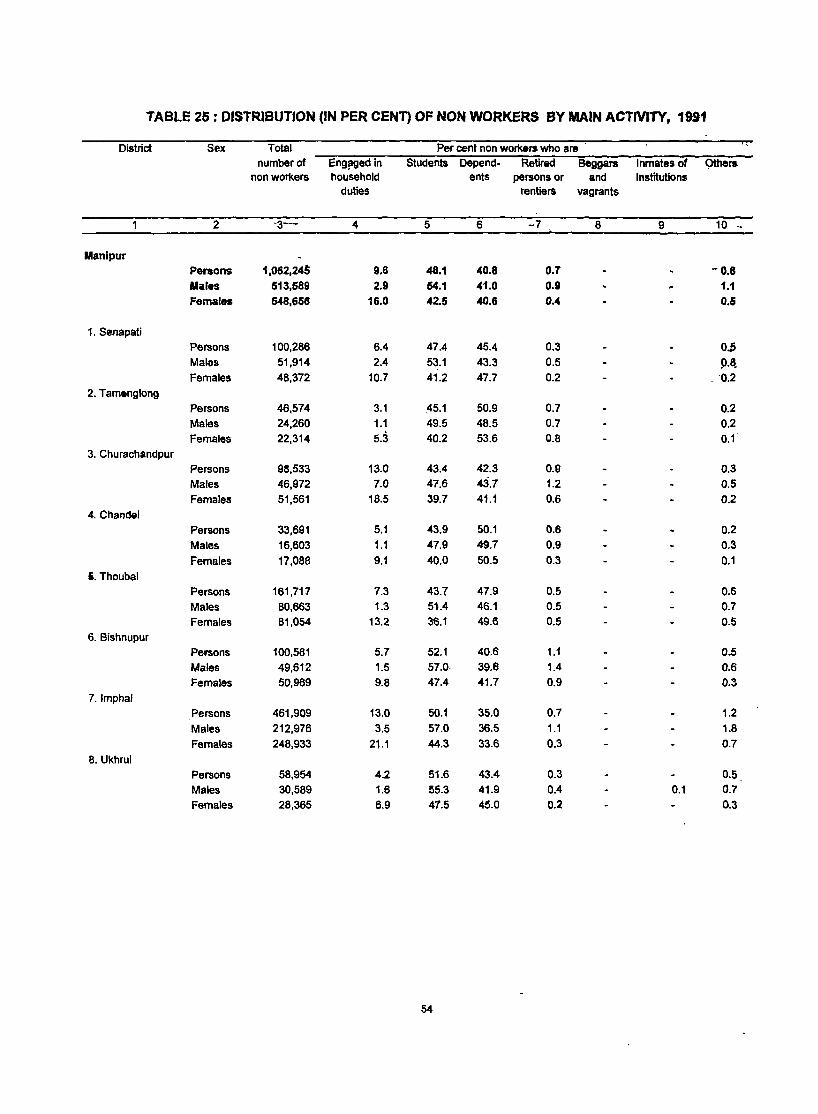
TABLE 25 : DISTRIBUTION (IN PER CENT) OF NON WORKERS BY MAIN ACTIVITY, 1991
District Sex Total Per cent non wor1<ers who are number of Eng!igedin Students Depend- Retired Beggars Inmates of Others
non wor1<ers household ents persons or and Institutions duties rentiers vagrants
2 '3-- 4 5 6 -7 8 9 10 ~
Manipur Persons 1,062,24$ 9.6 48.1 40.8 0.7 -0.8 Males 513,589 2.9 54.1 41.0 0.9 1.1 Females 548,656 16.0 42.5 40.6 0.4 0.5
1. Senapati
Persons 100,286 6.4 47.4 45.4 0.3 0':; Malos 51,914 2.4 53.1 43.3 0.5 9.8. Females 48,372 10.7 41.2 47.7 0.2 0.2
2. Tam.nglong Persons 48,574 3.1 .45.1 50.9 0.7 0.2 Males 24,260 1.1 49.5 48.5 0.7 0.2 Females 22,314 5.3 40.2 53.6 0.8 0.1
3. Churachandpur
Persons 98,533 13.0 43.4 42.3 0.9 0.3 Males 46,972 7.0 47.6 43.7 1.2 0.5 Females 51,561 18.5 39.7 41.1 0.6 0.2
4. Chandel
Persons 33,691 5.1 43.9 SO.1 0.6 0.2 Males 16,603 1.1 47.9 49.7 0.9 0.3. Females 17,088 9.1 40.0 50.5 0.3 0.1
i. Thoubal Persons 161,717 7.3 43.7 47.9 0.5 0.6 Males 80,663 1.3 51.4 46.1 0.5 0.7 Females 81,054 13.2 3S.1 49.6 0.5 0.5
6. Bishnupur Persons 100,581 5.7 52.1 40.6 1.1 0.5 Males 49,612 1.5 57.0· 39.6 1.4 0.6 Females 50,969 9.8 47.4 41.7 0.9 0.3
7.lmphal
Persons 461,909 13.0 SO. 1 35.0 0.7 1.2 Males 212,976 3.5 57.0 36.5 1.1 1.8 Females 248,933 21.1 44.3 33.6 0.3 0.7
8. Ukhrul
Persons 58,954 4.2 51.6 43.4 0.3 0.5 Males 30,589 1.6 !55.3 41.9 0.4 0.1 0.7 Females 28,365 6.9 47.5 4M 0.2 0.3
54

MIGRATION
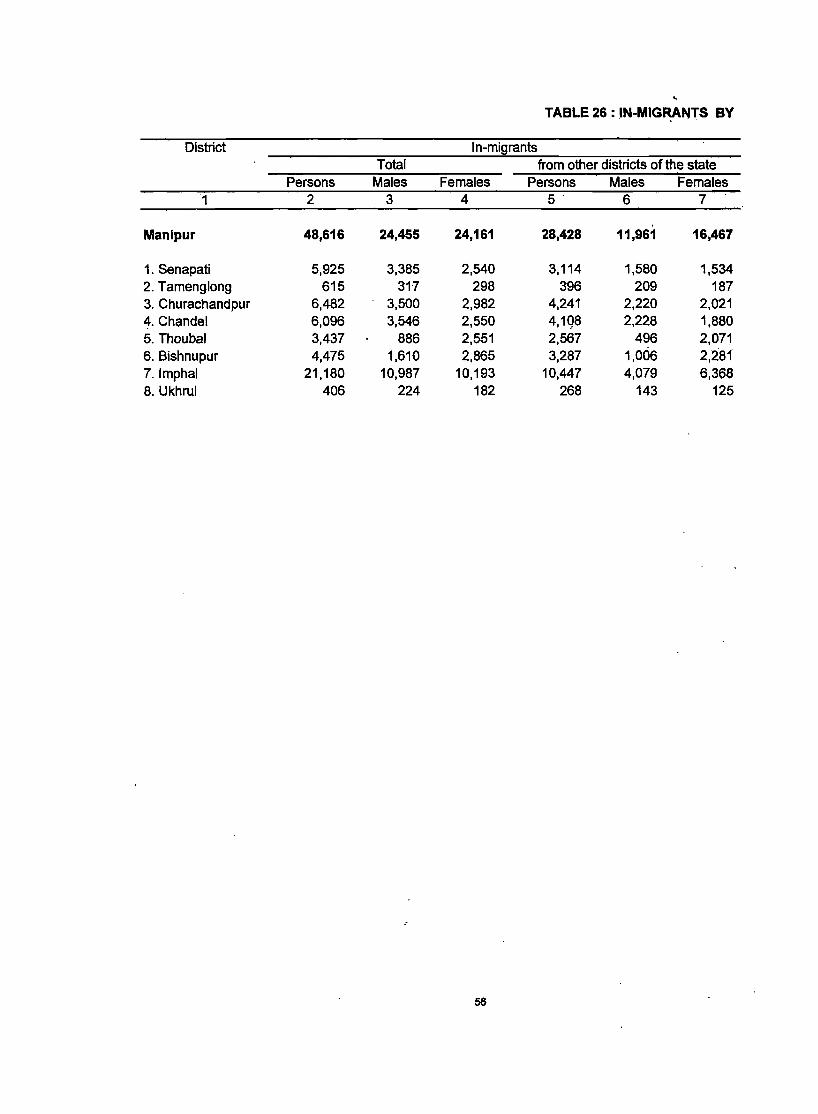
~
TABLE 26 : IN-MIG~NTS BY
District In-migrants Total from other districts of the state
Persons Males Females Persons Males Females 1 2 3 4 5· 6 7
Manipur 48,616 24,455 24,161 28,428 11,961 16,467
1. Senapati 5,925 3,385 2,540 3,114 1,580 1,534 2. Tamenglong 615 31-7 298 396 209 187 3. Churachandpur 6,482 3,500 2,982 4,241 2,220 2,021 4. Chandel 6,096 3,546 2,550 4,1Q8 2,228 1,880 5. Thoubal 3,437 886 2,551 2,567 496 2,071 6. Bishnupur 4,475 1,610 2,865 3,287 1,006 2,281 7.lmphal 21,180 10,987 10,193 10,447 4,079 6,368 8. Ukhrul 406 224 182 268 143 125
56
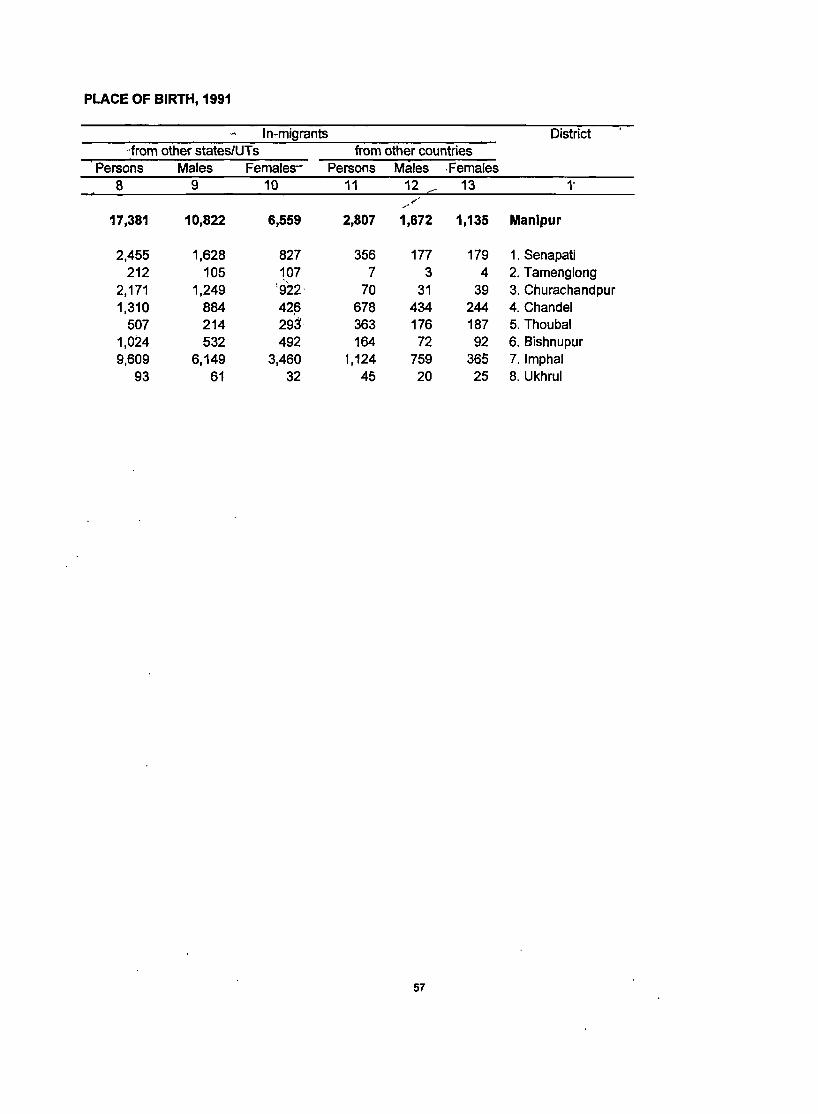
PLACE OF BIRTH, 1991
In-migrants District 'from other states/UTs from other countries
Persons Males Females" Persons Males ·Females 8 9 10 11 12 13 1"
..- "" 17,381 10,822 6,559 2,807 1,672 1,135 Manipur
2,455 1,628 827 356 177 179 1. Senapati 212 105 107 7 3 4 2. Tamenglong
2,171 1,249 '922' 70 31 39 3. Churachandpur 1,310 884 42~ 678 434 244 4. Chandel
507 214 293 363 176 187 5. Thoubal 1,024 532 492 164 72 92 6. Bishnupur 9,609 6,149 3,460 1,124 759 365 7.lmphal
93 61 32 45 20 25 8. Ukhrul
57
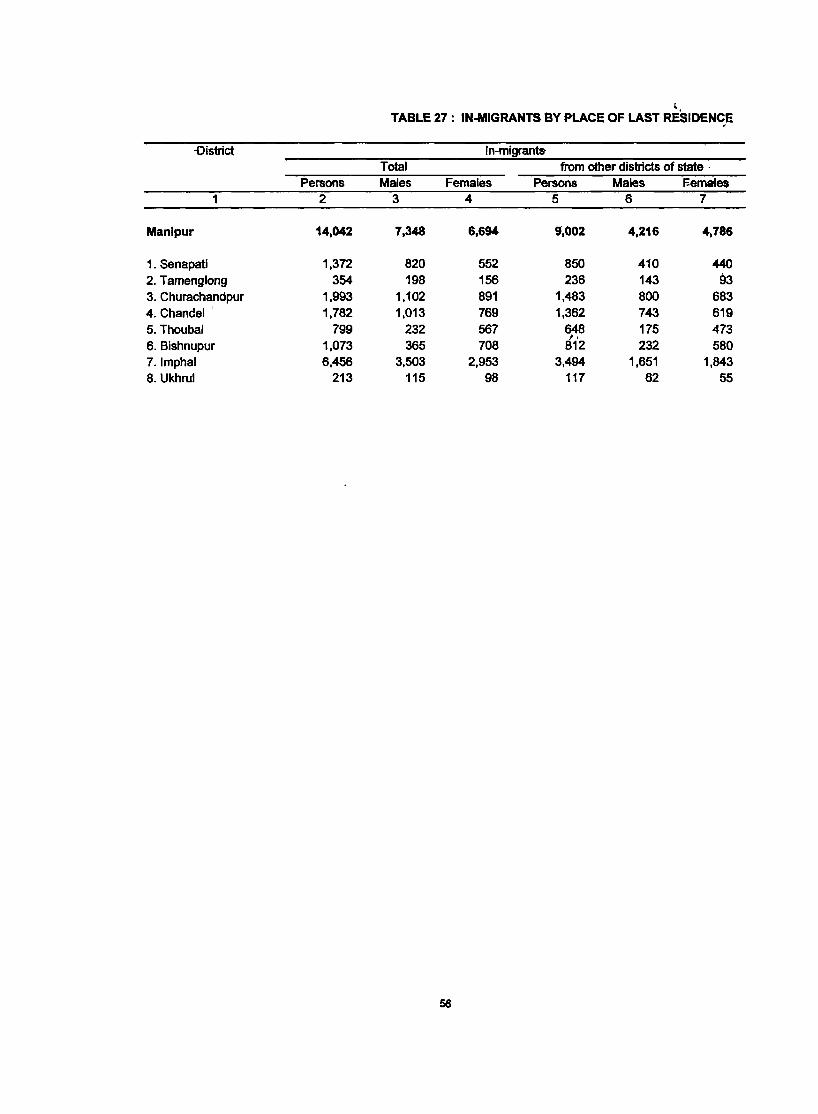
I
TABLE 27: IN-MIGRANTS BY PLACE OF LAST RESIDENCE
-District In-migrants Total from other districts of state .
Persons Males Females Persons Males F-emales 1 2 3 4 5 6 7
Manipur 14,042 7,348 6,694 9',002 4,216 4,786
1. Senapati 1,372 820 552 850 410 440 2. Tamenglong 354 198 156 236 143 93 3. Churachandpur 1,993 1,102 891 1,483 800 683 4.Chandel' 1,782 1,013 769 1,362 743 619 5. Thoubal 799 232 567 648 175 473 6. Bishnupur 1,073 365 708
/' 812 232 580
7.lmphaJ 6,456 3,503 2,953 3,494 1,651 1,843 8. Ukhrul 213 115 98 117 62 55
58
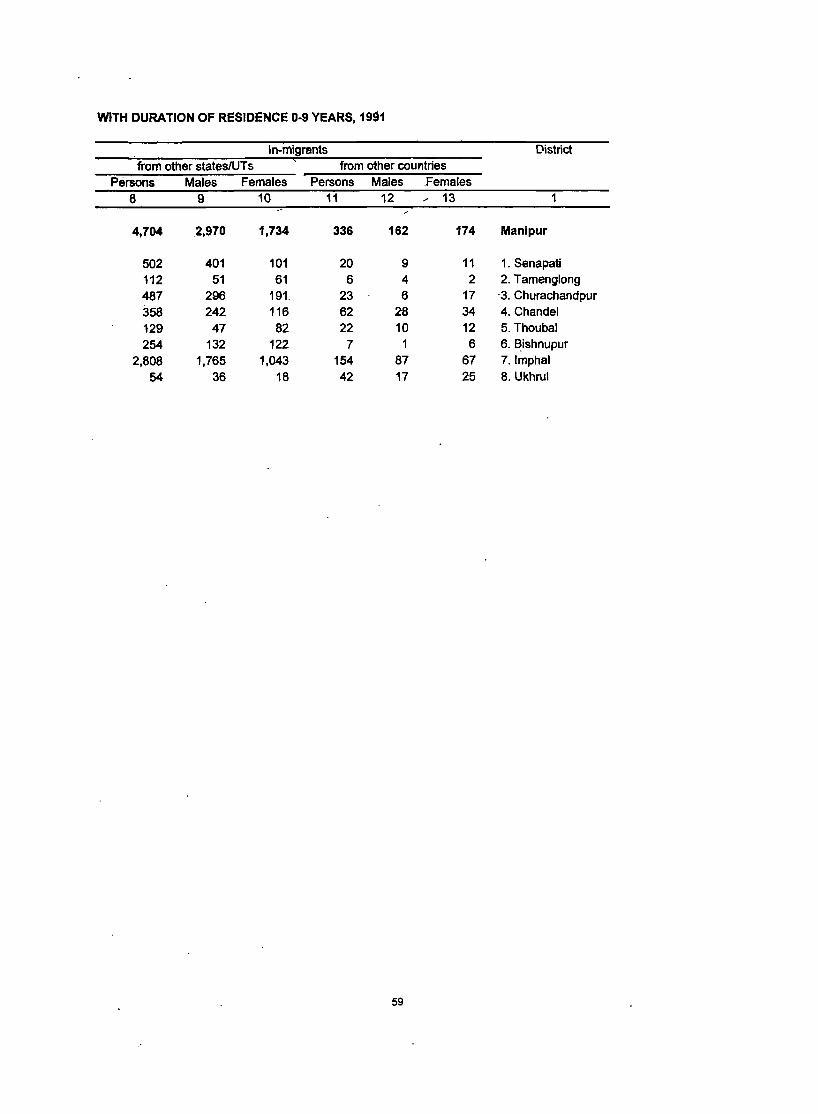
WITH DURATION OF RESIDENCE 0-9 YEARS, 19S1
In-migrants District from other statesJUTs from other countries
Persons Males Females Persons Males Females
8 9 10 11 12 ..- 13 1
4,704 2,970 1,734 336 162 174 Manipur
502 401 101 20 9 11 1. Senapati 112 51 61 6 4 2 2. Tamenglong 487 296 191. 23 6 17 '3. Churachandpur 358 242 116 62 28 34 4. Chandel
129 47 82 22 10 12 5. Thoubal 254 132 122 7 1 6 6. ~ishnupur
2,808 1,765 1,043 154 87 67 7.lmphal
54 36 18 42 17 25 8. Ukhrul
59


RELIGION'
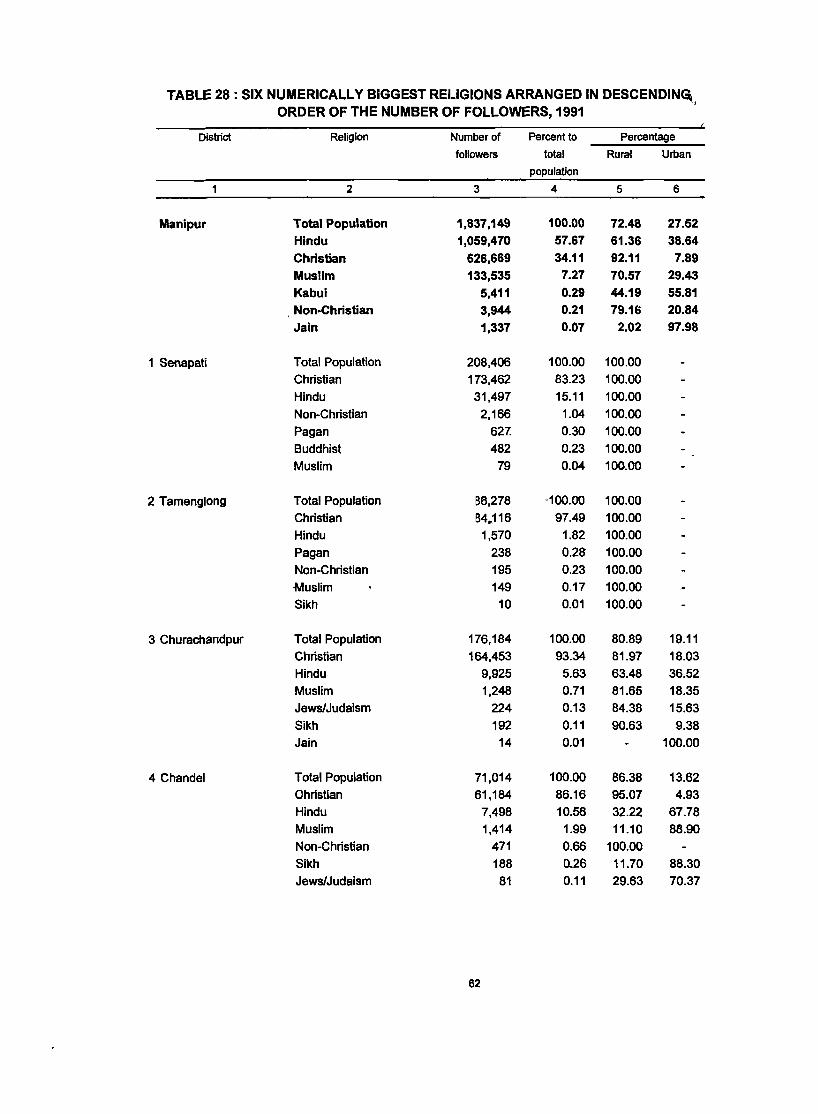
TABLE 28 : SIX NUMERICALLY BIGGEST RELIGIONS ARRANGED IN DESCENDIN~'I ORDER OF THE NUMBER OF FOLLOWERS, 1991
District Religion Number of Percent to Percentage
foHowers total Rural Urban
population
2 3 4 5 6
Manipur Total Population 1,837,149 100.00 72.48 27.52
Hindu 1,059,470 57.67 61.36 38.64
Christian 626,669 34.11 92.11 7.89
Muslim 133,535 7.27 70.57 29.43
Kabui 5,411 0.29 44.19 55.81
Non-Christian 3,944 0.21 79.16 20.84
Jain 1,337 0.07 2.02 97.98
1 Senapati Total Population 208,406 100.00 100.00 Christian 173,462 83.23 100.00 Hindu 31,497 15.11 100.00 Non-Christian 2,166 1.04 100.00 Pagan 62? 0.30 100.00 Buddhist 482 0.23 100.00 Muslim 79 0.04 100.00
2 Tamenglong Total Population 66,278 <100.00 100.00 Christian 64,,116 97.49 100.00 Hindu 1,570 1.82 100.00 Pagan 238 0.28 100.00 Non-Christian 195 0.23 100.00 Muslim 149 0.17 100.00 Sikh 10 0.01 100.00
3 Churachandpur Total Population 176,184 100.00 80.89 19.11 Christian 164,453 93.34 81.97 18.03 Hindu 9,925 5.63 63.48 36.52 Muslim 1,248 0.71 81.65 18.35 Jews/Judaism 224 0.13 84.38 15.63 Sikh 192 0.11 90.63 9.38 Jain 14 0.01 100.00
4 Chandel Total Population 71,014 100.00 86.38 13.62 Ohristian 61,184 86.16 95.07 4.93 Hindu 7,498 10.56 32.22 67.78 Muslim 1,414 1.99 11.10 88.90 Non-Christian 471 0.66 100.00 Sikh 188 0..26 11.70 88.30 Jews/Judaism 81 0.11 29.63 70.37
62
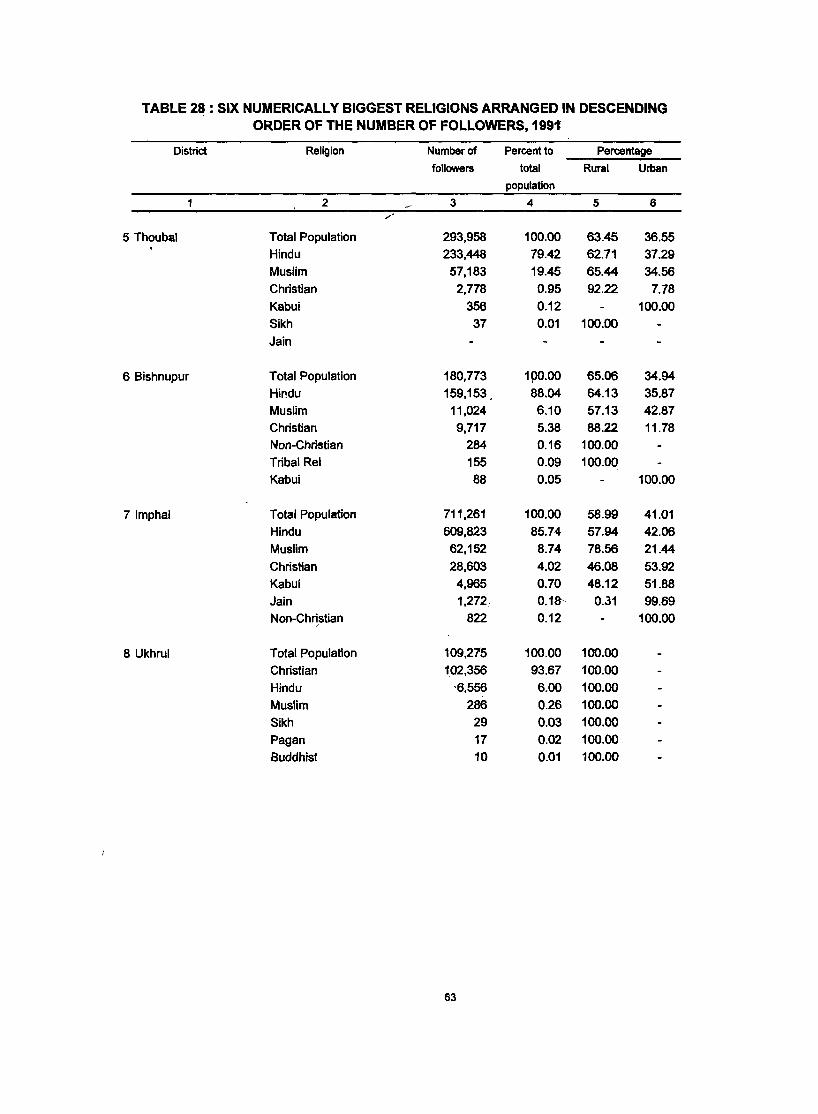
TABLE 2~ : SIX NUMERICALLY BIGGEST RELIGIONS ARRANGED IN DESCENDING ORDER OF THE NUMBER OF FOLLOWERS, 1991
District Religion Number of Percent to Percentage
followers total Rural Urban
population
2 3 4 5 6 ,/
5 Thoubal Total Population 293.958 100.00 63.45 36.55
Hindu 233,448 79.42 62.71 37.29
Muslim 57,183 19.45 65.44 34.56
Christian 2,778 0.95 92.22 7.78
Kabui 356 0.12 100.00
Sikh 37 0.01 100.00
Jain
6 Bishnupur Total Population 180,773 190.00 65.06 34.94
Hindu 159,153. 88.04 64.13 35.87
Muslim 11,024 6.10 57.13 42.87
Christian 9,717 5.38 88.22 11.78
Non-Christian 284 0.16 100.00
Tribal Rei 155 0.09 100.00
Kabui 88 0.05 100.00
71mphal Total Population 711,261 100.00 58.99 41.01
Hindu 609,823 85.74 57.94 42.06
Muslim 62,152 8.74 78.56 21.44
Christian 28,603 4.02 46.08 53.92
Kabui 4,965 0.70 48.12 51.88
Jain 1,272; 0.1B- 0.31 99.69
Non-Chr~stian 822 0.12 100.00
8 Ukhrul Total Population 109,215 100.00 100.00
Christian 102,356 93.67 100.00
Hindu '6,556 6.00 100.00
Muslim 286 0.26 100.00
Sikh 29 0.03 100.00
Pagan 17 0.02 100.00
Buddhist 10 0.01 100.00
63

LANGUAGE
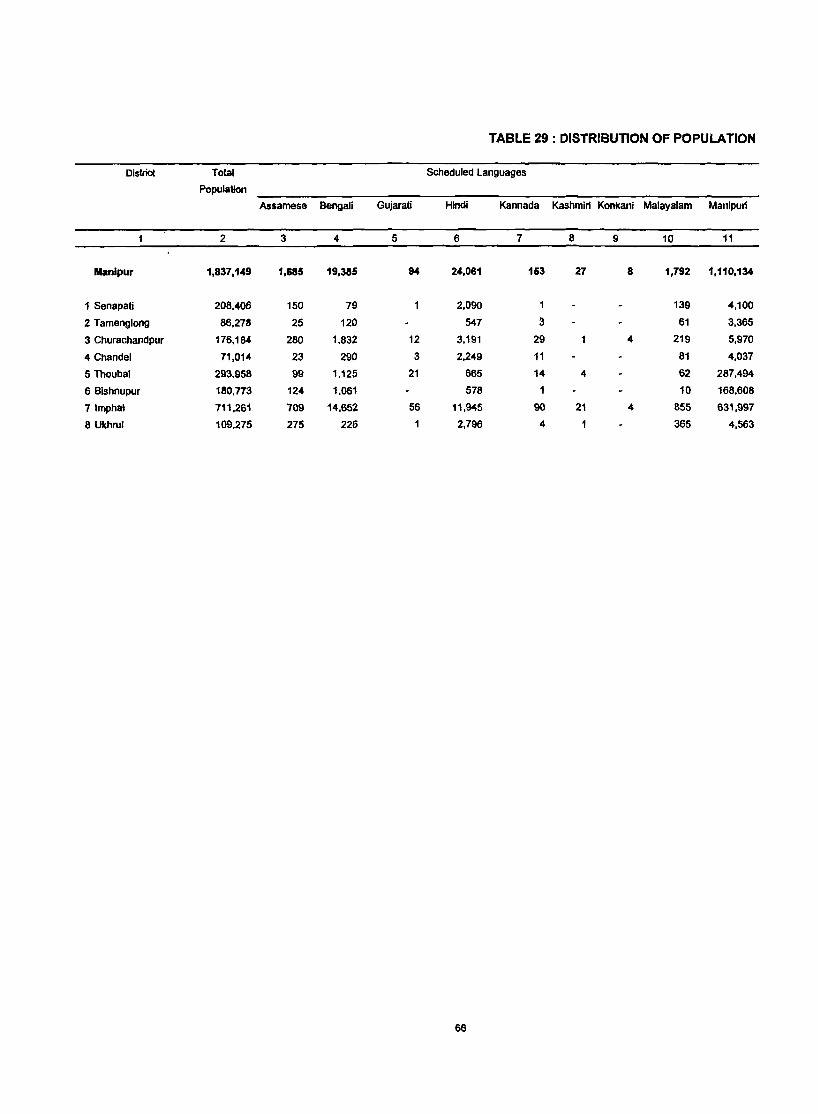
TABLE 29: DISTRIBUTION OF POPULATION
District Total Scheduled languages
Population
Assamese Bengali Gujarati Hindi Kannada Kashmiri Kookani Malayalam Manipuri
2 3 4 5 6 7 8 9 10 11
Manlpur 1,837,149 1,685 19,385 94 24,061 153 27 8 1,792 1,110,134
1 Senapati 208,406 150 79 2,090 1 139 4,100
2 Tamenglong 86,278 25 120 547 3 61 3,365
3 Churachandpur 176,184 280 1,832 12 3,191 29 4 219 5,970
4 Chandel 71,014 23 290 3 2,249 11 81 4,037
5 Thoubal 293,958 99 1,125 21 665 14 4 62 287,494
6 Bishnupur 180,n3 124 1,061 578 1 10 168,608
71mphal 711,261 709 14,652 56 11,945 90 21 4 855 631,997
8 Ukhrul 109,275 275 226 2,796 4 365 4,563
66
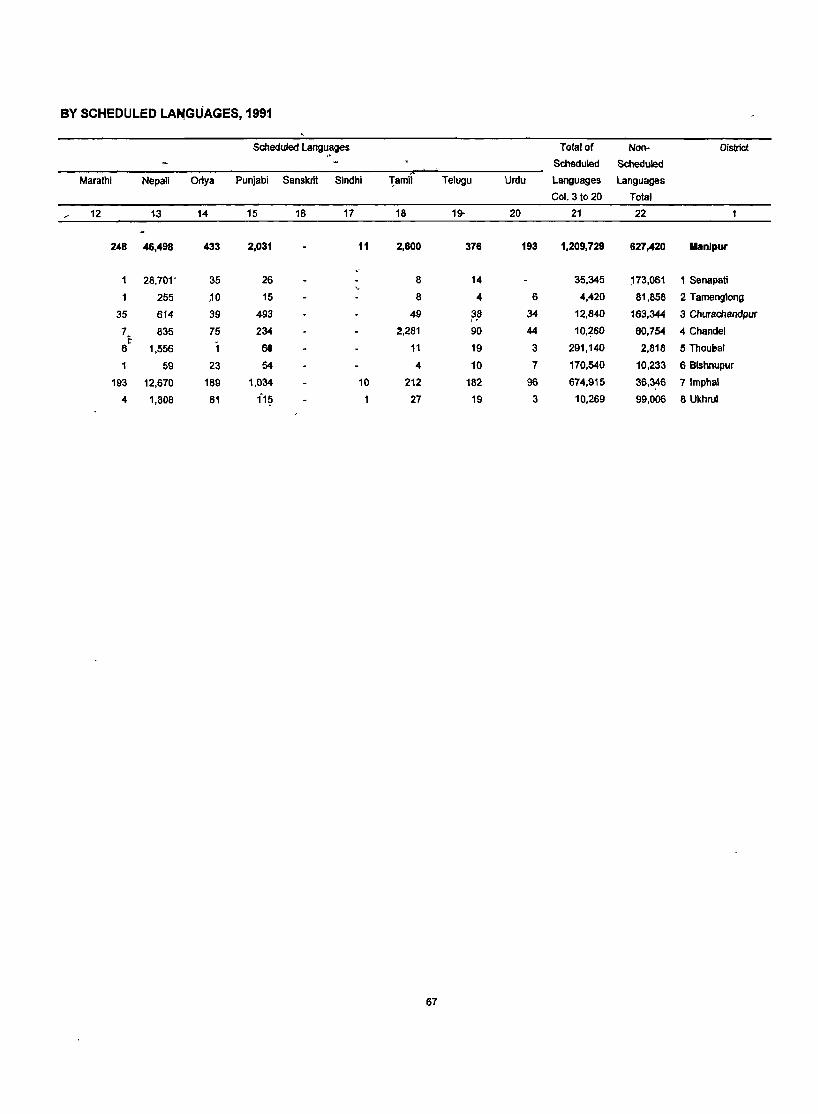
BY SCHEDULED LA~GUAGES.1991
Scheduled lang~?ges Tolal af Non- District
Scheduled Scheduled
Marathi Nepali Oriya Punjabi Sanskrit Sindhi 1amil Telugu Urdu Languages languages
Col. 3to 20 Total
12 13 14 15 16 17 18 19- 20 21 22
248 46,498 433 2,031 11 2,600 376 193 1,209,729 627,420 Manlpur
28,701' 35 26 8 14 35,345 '73,061 1 Senapati '_
255 ,10 15 8 4 6 4,420 81,858 2 Tamenglong
35 614 39 493 49 38 34 , . 12,840 163,344 3 Churachandpur
7 835 75 234 2,281 90 44 10,260 60,754 4 Chandel t-
6 1,556 6t 11 19 3 291,140 2.818 15 Thoueal
59 23 54 4 10 7 170,540 10,233 6 BiShnupur
193 12,670 189 1,034 10 212 182 96 674,915 36.~6 71mphal
4 1,808 61 11? 27 19 3 10,269 99,006 8 Ukhrul
67
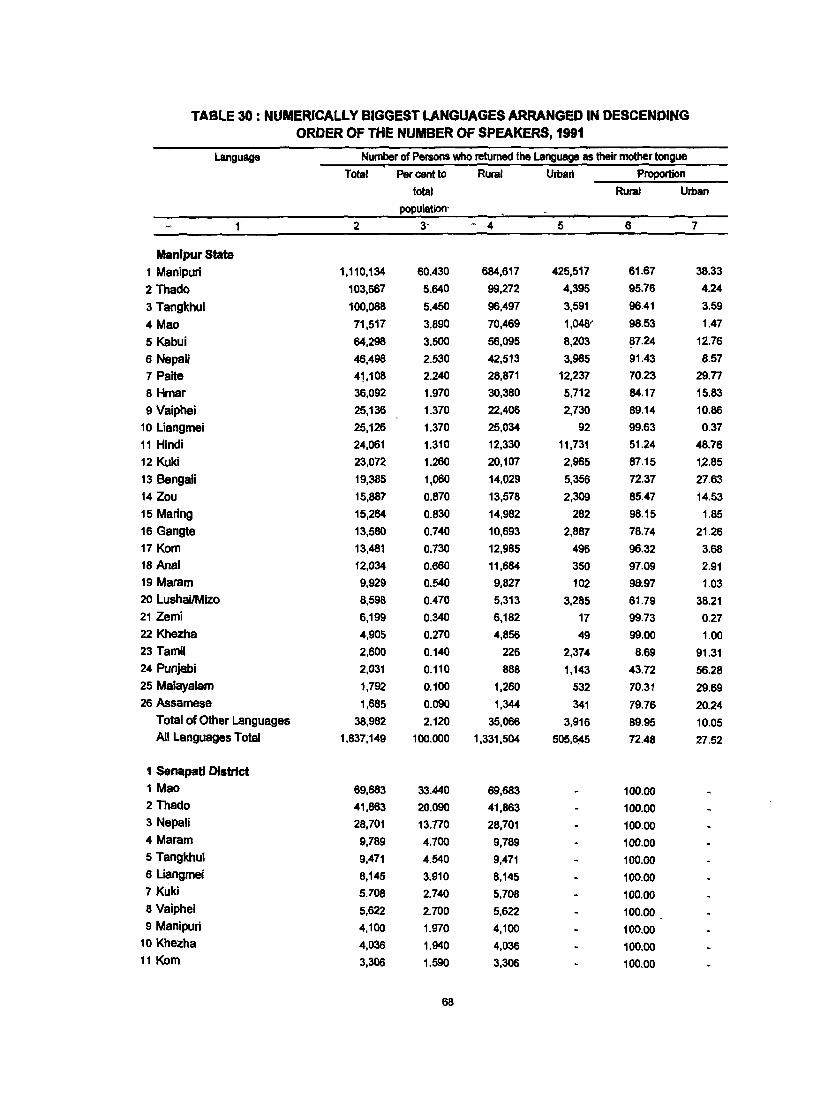
TABLE 30 : NUMERICALLY BIGGEST LANGUAGES ARRANGED IN DESCENDING ORDER OF THE NUMBER OF SPEAKERS, 1991
Language Number of Persons who returned the Language as their mother tongue
Total Percent to Rural Urban Proportion
total Rural Urban
populatiOn'
1 2 3- .~ 4 5 6 7
Manipur Slate 1 Manipuri 1,110,134 60.430 684,617 425,517 61.67 38.33
2 Thado 103,667 5.640 99,272 4,395 95.76 4.24
3 Tangkhul 100,088 5.450 96,497 3,591 96.41 3.59
4 Mao 71,517 3.890 70,469 1,048' 98.53 1.47
5 Kabui 64,298 3.500 56,095 8,203 87.24 12.76
6 Nepali 46,498 2.530 42,513 3,985 91.43 8.57
7 Paite 41,108 2.240 28,871 12,237 70.23 29.n
8 Hmar 36,092 1.970 30,380 5,712 84.17 15.83
9 Vaiphei 25,136 1.370 22,406 2,730 89.14 10.86
10 Liangmei 25,126 1.370 25,034 92 99.63 0.37
11 Hindi 24,061 1.310 12,330 11,731 51.24 48.76
12 Kuki 23,072 1.260 20,107 2,965 87.15 1~.85
13 Bengali 19,385 1,060 14,029 5,356 72.37 27.63
14 Zou 15,887 0.870 13,578 2,309 85.47 14.53
15 Maring 15,264 0.830 14,982 282 98.15 1.85
16 Gangte 13,580 0.740 10,693 2,887 78.74 21.26
17 Kom 13,481 0.730 12,985 496 96.32 3.68
18 Anal 12,034 0.660 11,684 350 97.09 2.91
19 Maram 9,929 0.540 9,827 102 9&.97 1.03
20 LushailMizo 8,598 0.476 5,313 3,285 61.79 38.21
21 Zemi 6,199 0.340 6,182 17 99.73 0.27
22 Khezha 4,905 0.270 4,856 49 99.00 1.00
23 Tamil 2,600 0.140 226 2,374 8.69 91.31
24 Punjabi 2,031 0.110 888 1,143 43.72 56.28
25 MalayaJam 1,792 0.100 1,260 532 70.31 29.69
26 Assamese 1,685 0.090 1,344 341 79.76 20.24 Total of Other Languages 38;982 2.120 35,066 3,916 89.95 10.05 All Languages Total 1,837;149 100.000 1,331,504 505,6:45 72.48 27.52
1 Senapati District 1 Mao 69,683 33.440 69,683 100.00 2 Thado 41,863 20.090 41,863 100.00 3 Nepali 28,701 13.770 28,701 100.00 4 Maram 9,789 4.700 9,789 100.00 5 Tangkhul 9,471 4.540 9,471 100.00 6 Liangmei 8,145 3.910 8,145 100.00 7 Kuki 5.708 2.740 5,708 100.00 8 Vaiphei 5,622 2.700 5,622 100.00 9 Manipuri 4,100 1.970 4,100 100.00
10 Khezha 4,036 1.940 4,036 100.00 11 Kom 3,306 1.590 3,306 100.00
68
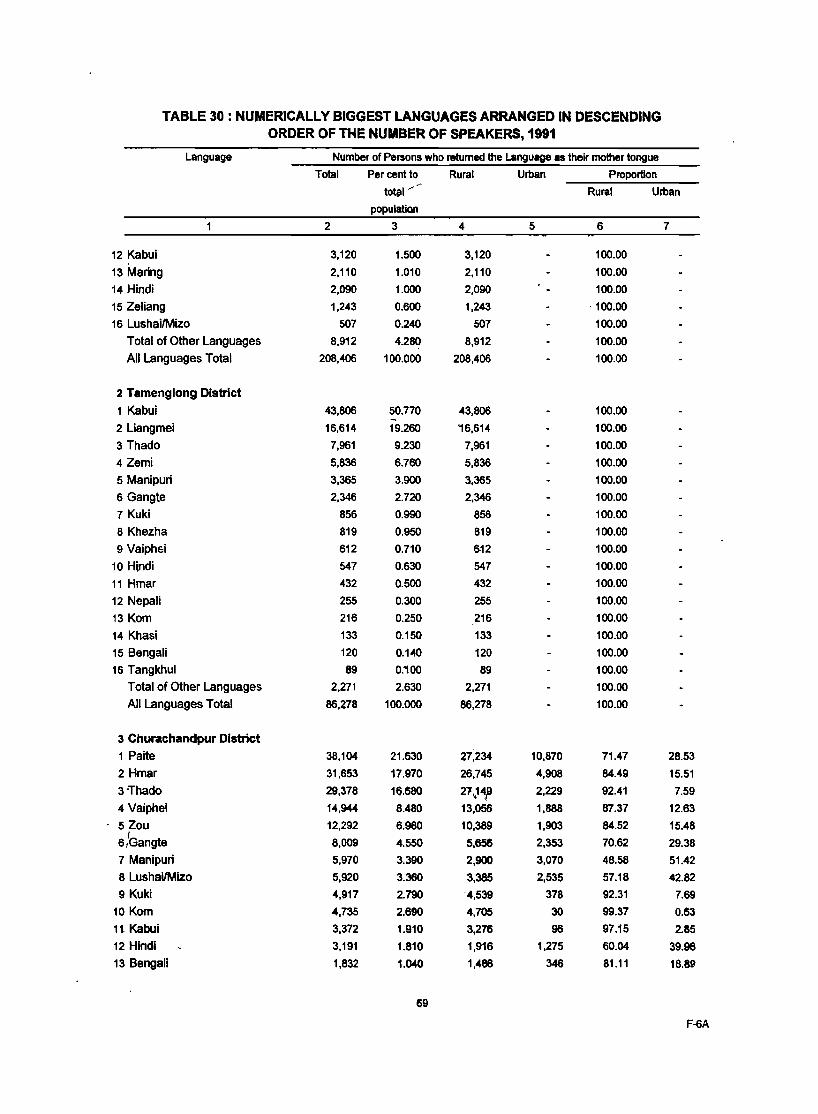
TABLE 30 : NUMERICALLY BIGGEST LANGUAGES ARRANGED IN DESCENDING ORDER OF THE NUMBER OF SPEAKERS, 1991
Language Number of Persons who returned the Language as their mother tongue
Total Per cent to Rural Urban Proportion
totill " Rur:al Urban
population
2 3 4 5 6 7
12 Kabui 3,120 1.500 3,120 100.00
13 Maring 2,110 1.010 2,110 100.00
14 Hindi 2,096 1.000 2,090 100.00
15 Zeliang 1,243 0.600 1,243 ·100.00
16 LushaiIMizo 507 0.240 507 100.00
Total of Other Languages 8,912 4.280 8,912 100.00
All Languages Total 208,406 100.000 208,406 100.00
2 Tamenglong District
1 Kabui 43,806 50.770 43,806 100.00 -2 Liangmei 16,614 19.260 '16,614 100.00
3 Thado 7,961 9.230 7,961 100.00
4Zemi 5,836 6.760 5,836 100.00
5 Manipuri 3,365 3.900 3,365 100.00
6 Gangte 2,346 2.720 2,346 100.00
7 Kukl 856 0.990 856 100.00
8 Khezha 819 0.950 819 100.00
9 Vaiphei 612 0.710 6-12 100.00
10 Hindi 547 0.630 547 100.00
11 Hmar 432 0.500 432 100.00
12 Nepali 255 0.300 255 100.00
13 Kom 216 0.250 216 100.00
14 Khasi 133 0.150 133 100.00
15 Bengali 120 0.140 120 100.00
16 Tangkhul 89 0.'00 89 100.00
Total of Other Languages 2,271 2.630 2,271 100.00
All Languages Total 86,278 100.000 86,278 100.00
3 Churachandpur District
1 Paite 38,104 21.630 27,234 10,870 71.47 28.53
2 Hmar 31,653 17.970 26,745 4,908 84.49 15.51
3'Thado 29,378 16.680 27~14p 2,229 92.41 7.59
4 Vaiphei 14,944 8.480 13,056 1,888 87.37 12.63
5Z0U 12,292 6.980 10,389 1,903 84.52 15.48 I
61Gangte 8,009 4.550 5,656 2,353 70.62 29.38
7 Manipuri 5,970 3.390 2,900 3,070 48.58 51.42
8 LushaVMizo 5,920 3.360 3,385 2,535 57.18 42.82
9 Kuki 4,917 2.790 4,539 378 92.31 7.69
10 Kom 4,735 2.690 4,705 30 99.37 0.63
1t Kabui 3,372 1.910 3,276 96 97.15 2.85
12 Hindi 3,191 1.810 1,916 1,275 60.04 39.96
13 Bengali 1,832 1.040 1,486 346 81.11 18.89
69
F-6A
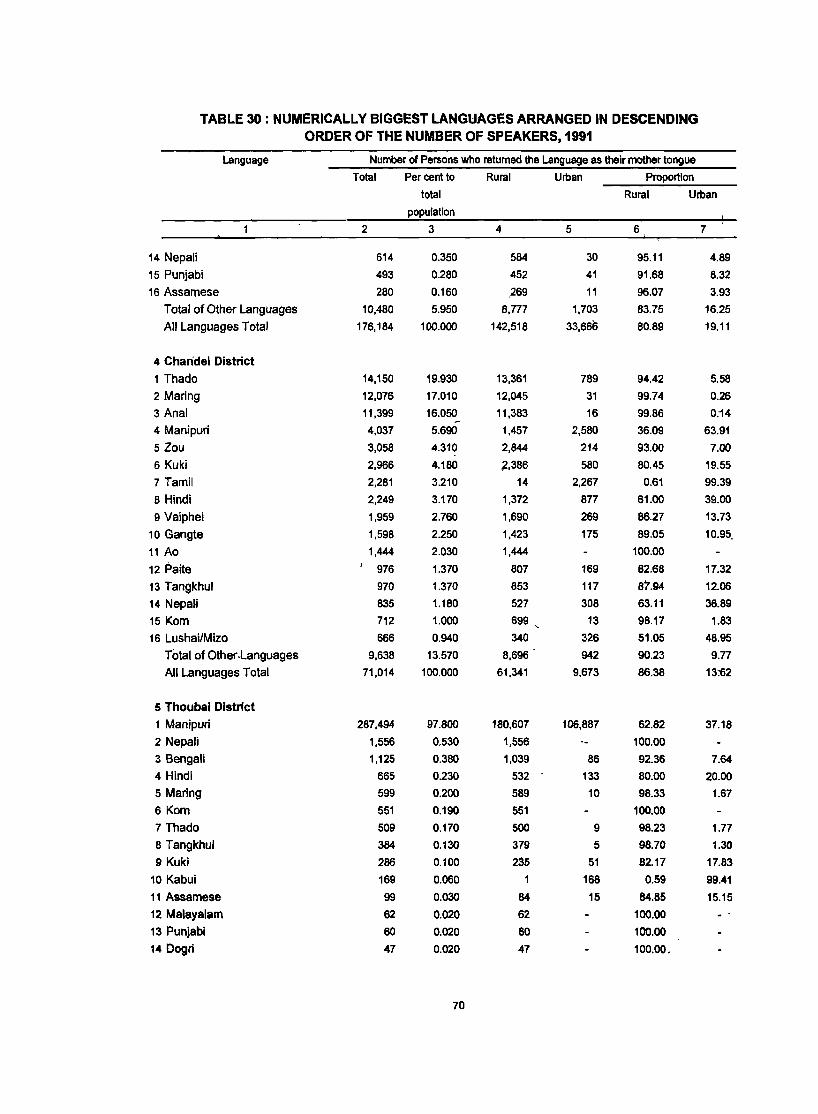
TABLE 30 : NUMERICALLY BIGGEST LANGUAGES ARRANGED IN DESCENDING ORDER OF THE NUMBER OF SPEAKERS, 1991
Language Number of Persons who retumed the Language as their mother tongue Total Per cent to Rural Urban Proportion
total Rural Urban population
2 3 4 5 6 7
14 Nepali 614 0.350 584 30 95.11 4.89
15 Punjabi 493 0.280 452 41 91.68 8.32
16 Assamese 280 0.160 .269 11 96.07 3.93
Total of Other Languages 10,480 5.950 8,777 1,703 83.75 16.25
All Languages Total 176,184 100.000 142,518 33,666 80.89 19.11
4 Chandel District 1 Thada 14,150 19.930 13,361 789 94.42 5.58
2 Maring 12,076 17.010 12,045 31 99.74 0.26
3 Anal 11,399 16.050 11,383 16 99.86 0.14 -4 Manipuri 4,037 5.690 1,457 2,580 36.09 63.91
5 Zou 3,058 4.310 2,844 214 93.00 7.00
6 Kuki 2,966 4.180 ,2,386 580 80.45 19.55
7 Tamil 2,281 3.210 14 2,267 0.61 99.39
8 Hindi 2,249 3.170 1,372 877 61.00 39.00
9 Vaiphei 1,959 2.760 1,690 269 86.27 13.73
10 Gangte 1,598 2.250 1,423 175 89.05 10.95"
11 Ao 1,444 2.030 1,444 100.00
12 Paite I 976 1.370 807 169 B2.68 17.32
13 Tangkhul 970 1.370 853 117 87.94 12.06
14 Nepali 835 1.1BO 527 308 63.11 36.89
15 Korn 712 1.000 699 13 98.17 1.83
16 Lushai/Mizo 666 0.940 340 326 51.05 48.95
Total of Other ,Languages 9,638 13.570 8,696 942 90.23 9.77
All Languages Total 71,014 100.000 61,341 9,673 86.38 13:62
5 Thoubal District 1 Manipuri 287,494 97.800 180,607 106,887 62.82 37.18
2 Nepali 1,556 0.530 1,556 100.00
3 Bengali 1,125 0.380 1,039 86 92.36 7.64
4 Hindi 665 0.230 532 133 80.00 20.00
5 Maring 599 0.200 589 10 98.33 1.67
6 Korn 551 0.190 551 100.00
7 Thada 509 0.170 500 9 98.23 1.77
8 Tangkhul 384 0.130 379 5 98.70 1.30
9 Kuki 286 0.100 235 51 82.17 17.83
10 Kabui 169 0.060 168 0.59 99.41
11 Assarnese 99 0.030 84 15 84.85 15.15
12 Malayalam 62 0.020 62 100.00
13 Punjabi 60 0.020 60 100.00
14 Dogri 47 0.020 47 100.00.
70
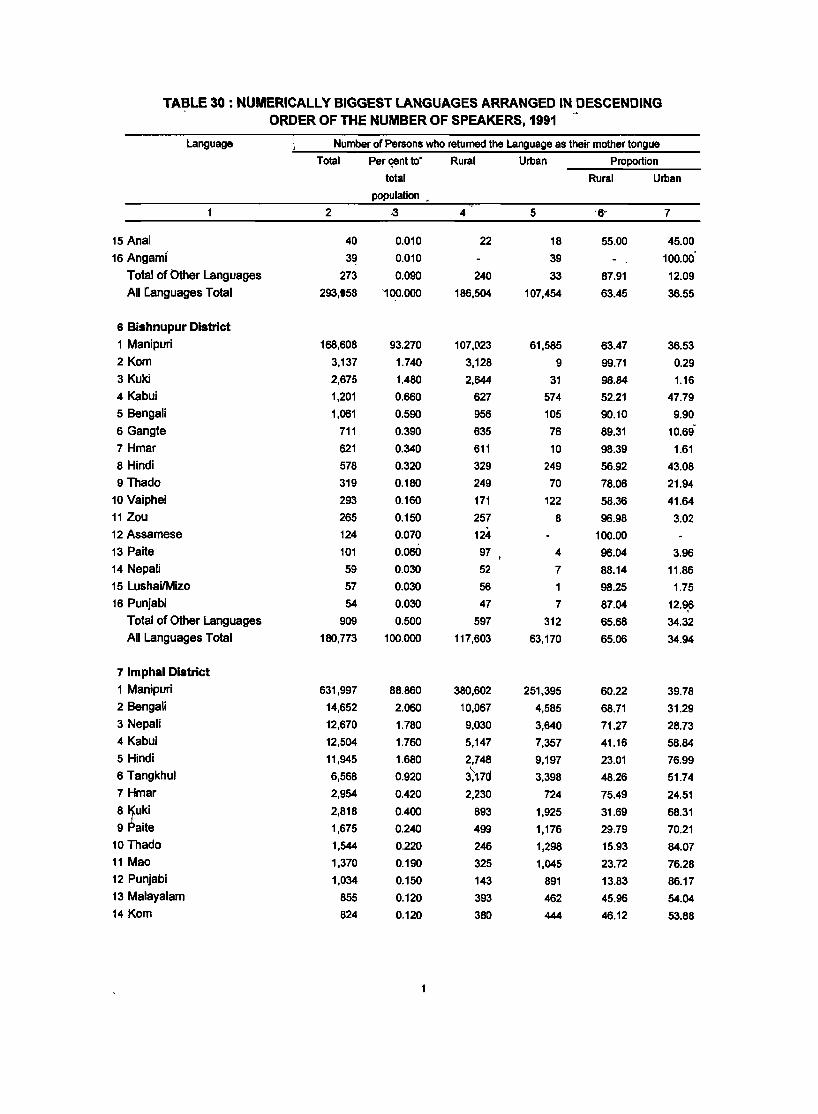
TABLE 30 : NLJMERICALL Y BIGGEST LANGUAGES ARRANGED IN DESCENDING ~
ORDER OF THE NUMBER OF SPEAKERS, 1991
Language Number of Persons who returned the Language as their mother tongue
Total Per ~nt to"' Rural Urban Proportion
total Rural Urban
population ,
2 .3 4 5 '6- 7
15 Anal 40 0.010 22 18 55.00 45.00
16 Angaml 39 0.010 39 100.00'
Total of bther Languages 273 0.090 240 33 87.91 12.09
All tanguages Total 293,158 100.000 186,504 107,454 63.45 36.55
6 Bishnupur District
1 Manipuri 168,608 93.270 107,023 61,585 63.47 36.53
2 Kom 3,137 1.740 3,128 9 99.71 0.29
3 Kuki 2,675 1.480 2,644 31 98.84 1.16
4 Kabui 1,201 0.660 627 574 52.21 47.79
5 Bengali 1,061 0.590 956 105 90.10 9.90
6 Gangte 711 0.390 635 76 89.31 10.69"
7 Hmar 621 0.340 611 10 98.39 1.61
8 Hindi 578 0.320 329 249 56.92 43.08
9 Thado 319 0.180 249 70 78.06 21.94
10 Vaiphei 293 0.160 171 122 58.36 41.64
11 Zou 265 0.150 257 8 96.98 3.02 12 Assamese 124 0.070 124 100.00
13 Paite 101 0.060 97 4 96.04 3.96
14 Nepali 59 0.030 52 7 88.14 11.86
15 LushaiIMizo 57 0.030 56 98.25 1.75
16 Punjabi 54 0.030 47 7 87.04 12.9,6 Total of Other Languages 909 0.500 597 312 65.68 34.32
All Languages Total 180,773 100.000 117,603 63,170 65.06 34.94
7 Imphal District
1 Manipuri 631,997 88.860 380,602 251,395 60.22 39.78 2 Bengali 14,652 2.060 10,067 4,585 68.71 31.29 3 Nepali 12,670 1.780 9,030 3,640 71.27 28.73 4 Kabui 12,504 1.760 5,147 7,357 41.16 58.84 5 Hindi 11,945 1.680 2,748 9,197 23.01 76.99 6 Tangkhul 6,568 0.920 3;170 3,398 48.26 51.74
7 Hmar 2,954 0.420 2,230 724 75.49 24.51
8 ~Uki 2,818 0.400 893 1,925 31.69 68.31 9 aite 1,675 0.240 499 1,176 29.79 70.21
10 Thado 1,544 0.220 246 1,298 15.93 84.07 11 Mao 1,370 0.190 325 1,045 23.72 76.28 12 Punjabi 1,034 0.150 143 891 13.83 86.17 13 Malayalam 855 0.120 393 462 45.96 54.04 14 Kom 824 0.120 380 444 46.12 53.88
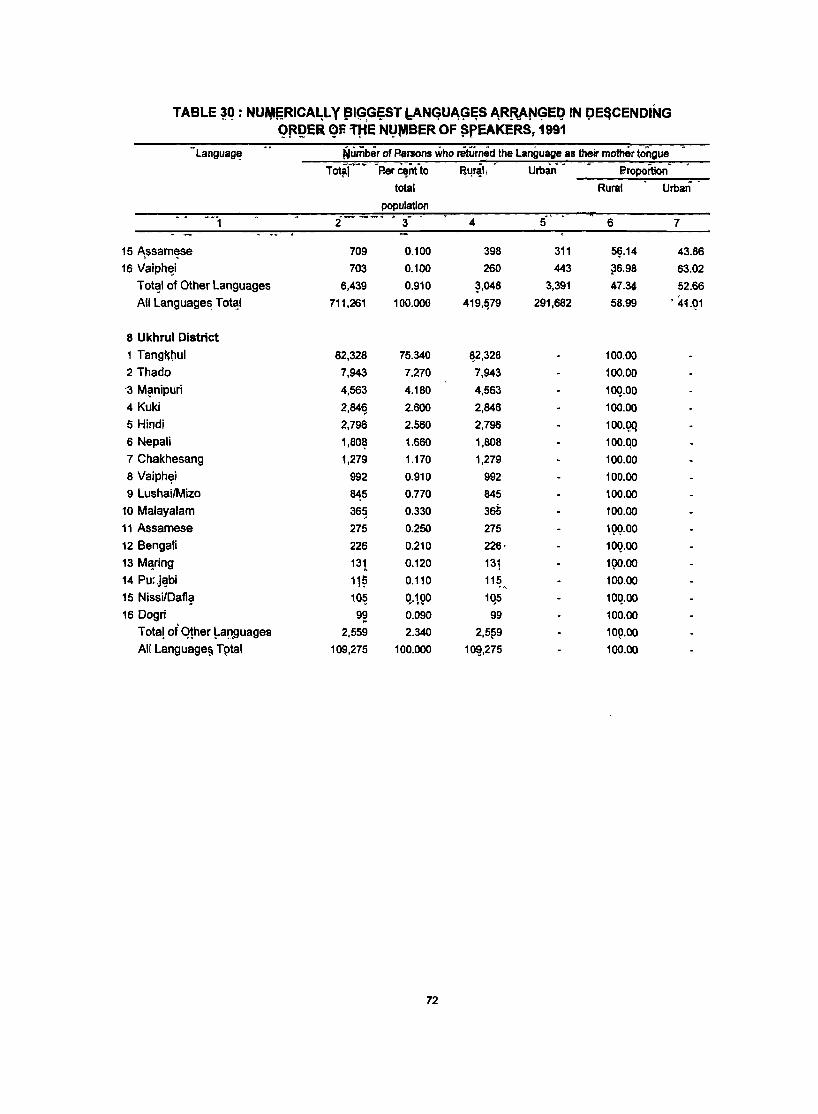
TABLE ~Q : NU'J;RICA~L y PI';;.GI;ST bANGU"~~S "RRt'r-.t<;7EQ IN I;>E!iCENDING Q~~ER ~F. ftiE NlJlIIBER OF ~PEAKERS, 1991
-LanguagE! Numt,er of p,.rsons who returned the Lsoguage as their mottJer longue
TOli, - . p.er~nt"lo ~l!r~l\
. Urban' •
. eroportion
. . total Rural Urban'
population --'1 i . 3- - 4 5"
. 6 7
15 J\ssam~se 709 0.100 398 311 59.14 43.86
16 Vaip~i 703 0.100 260 443 ~6.98 63.02
T ot~1 of Other languages 6,439 0.910 ~,048 3,391 47.34 52.66
Alilanguage~ Tot~1 711,261 100.000 419,~79 291,682 58.99 ' 4~.Q1
8 Ukhrul District 1 Tangl$!lul 82,328 75.340 ~2,328 100.00
2 Thado 7,943 7.270 7,943 100.00
'3 M~nipuri 4,563 4.180 4,563 10Q.00
4 Kuki 2,84~ 2.600 2,846 100.00
5 Hindi 2,796 2.560 2,796 100.QQ
6 Nepali 1,80~ 1.660 1,808 100.QO
7 Chakhesang 1,279 1.170 1,279 100.00
8 Vaiph~i 992 0.910 992 100.00
9 lushailMizo 8-15 0.770 845 100.00
10 Malayalam 36g 0.330 365 100.00
11 Assamese 275 0.250 275 19Q·00
12 Bengali 226 0.210 226, 10Q.00
13 M~ring 131 0.120 131 1(10.00
14 Pu;;j~bi 11~ 0.110 11~ .. 100.00
15 NissilDafltt 10~ q.1QO 1q5 10Q.OO
16 Dogri 9~ 0.090 99 100.00
T ota! of Q!her ~a!1guages 2,559 2.340 2,5?9 10Q.00
Alilanguage§ T9tal 109,275 100.000 1~,275 100.00
72
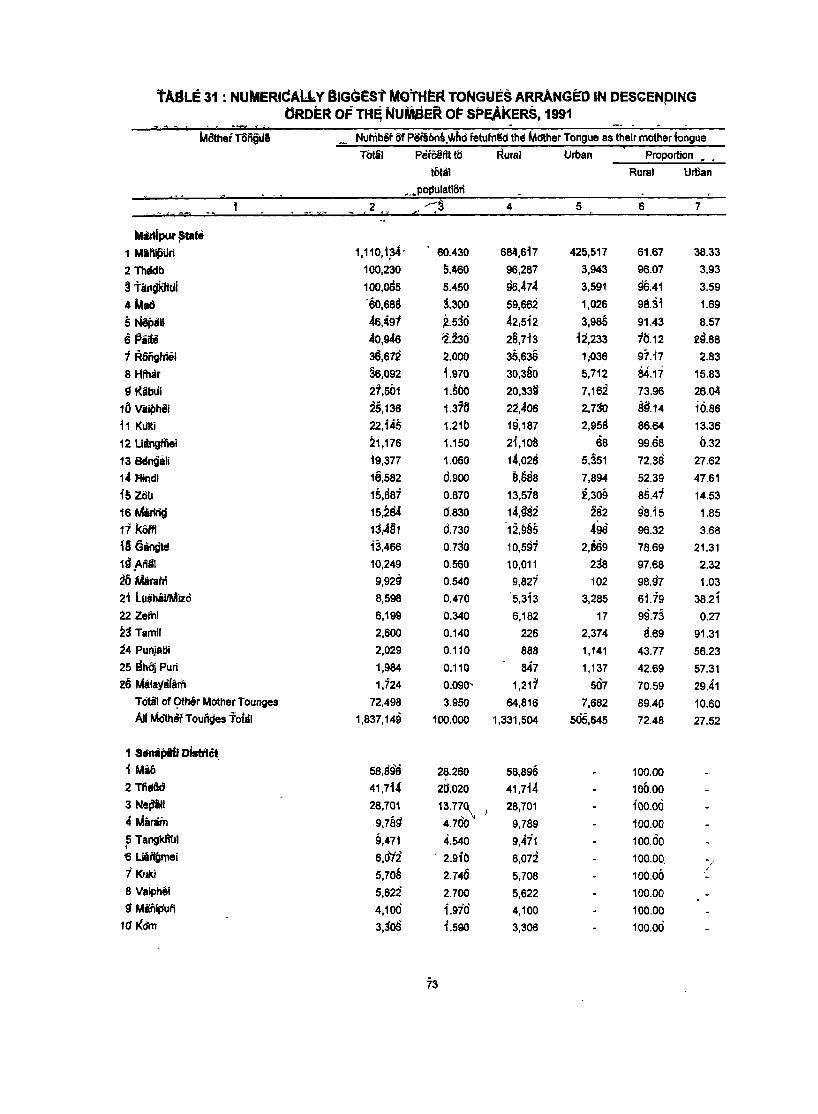
tAdLE 31 : NUMERICALLy alGGEst MOTHER TONGUES ARRANGED IN DES~ENDING tlRDER OF THJ; NUMBER of: spEAkERS, 1991 '
, Mother T6Rgue NuhlMt 6f PI5i'Sbns.whd fetufrtl!d the Mdther Tongue as their mother tongue
ThUll PerC§ilt til Rural Urban Proportion ~ _
tbtdt Rural UrBan _".populati6ri
2 , --:~ 4 5 6 7
teurlipur ~tate 1 Mil'liPilri 1,110,1~' 60.430 684,617 42S,S17 61.67 38.33
2 Thadb 100,230 S.460 96,287 3,943 96.07 3.93
~ Tingk1itli 100,065 5.450 95,.474 3,591 96.41 3.59
.. MatS -60,68~ 3.300 59,662 1,026 98.3f 1.69
5 Nepali 46,491 ~.s3ci .42,S1 2 3,985 91.43 8.57
6 t3.iti 40,9.46 2.230 26,713 12,233 7(j.12 2S.88
7 R6iiglrl8i 36,672 2.000 35,636 1:036 97.17 2.83
8 Hfh8r §S,092 t970 30,380 5,712 84.17 15.83
g Kibul 27,501 1.500 20,33§ 7,162 73.96 26.~
16 ViliPh~i 25,136 1.376 22,406 2,7:ro 89.14 10.86
11 KUlti 22,f45 1.21b 19,187 2,958 86.64 13.36
12 Liingi\'\el 21,176 1.150 2i,1~ Sa 99.68 0.32
13 Blngali 19,377 1.060 14,026 5,351 72.38 27.62
14 Rlndi 16,582 0.900 8,688 7,894 52.39 47.61
1& Zob 15,887 0.870 13,si8 2.309 85.47 14.53
16 Miriii9 15,264 0.830 14,982 282 98.15 1.85
17 kOffl 13r4§1 0.730 12,985 496 96.32 3.68
18 GangU! 13,466 0.730 10,597 2,869 78.69 21.31
1d !,nm 10,249 0.560 10,011 238 97.68 2.32
20 Mirah! 9,929 0.540 9,827 102 98.97 1.03
21 lllshiiIMizd 8,598 0.470 5,313 3,285 6U9 ,
38.21
22 Zefni 6,199 0.340 6,182 17 99.73 0.27
2j Tamil 2,600 0.140 226 2,374 8.69 91.31
i4 Punjatll 2,029 0.110 888 1,141 43.77 56.23
25 ~hlij Purl 1,984 0.110 847 1,137 42.69 57.31
26 Malayalarfi 1,724 0.090'- 1,217 507 70.59 29.41
Tolal of «;>tiler Mother Tounges 72,498 3.950 64,816 7,682 89.40 10.60 M Mother lounges Total 1,837,149 100.000 1,331,504 505,645 72.48 27.52
1 SfnliPiil DistriCt_ i Mio 58,a9S 28.260 58,896 100.00
2 TfiIM 41,714 20'.020 41,714 100.00
3 Nestili 28,701 13.7~' 26,701 100.00
.. Milram 9,7M 4.700 9,789 100.00
P TangkRUI 9,471 4.540 9,471 100.00
'6 Liiitgfllei 6,#2 . 2.910 6,072 100.00. , i KI.rki 5,708 2.7-46 100.00
I
5,708
8 Vaiphei 5,622 2.700 5,622 100.00
g MiniPufi 4,106 1.9i6 4,100 100.00
1fiKdm 3,306 1.590 3,306 100.00
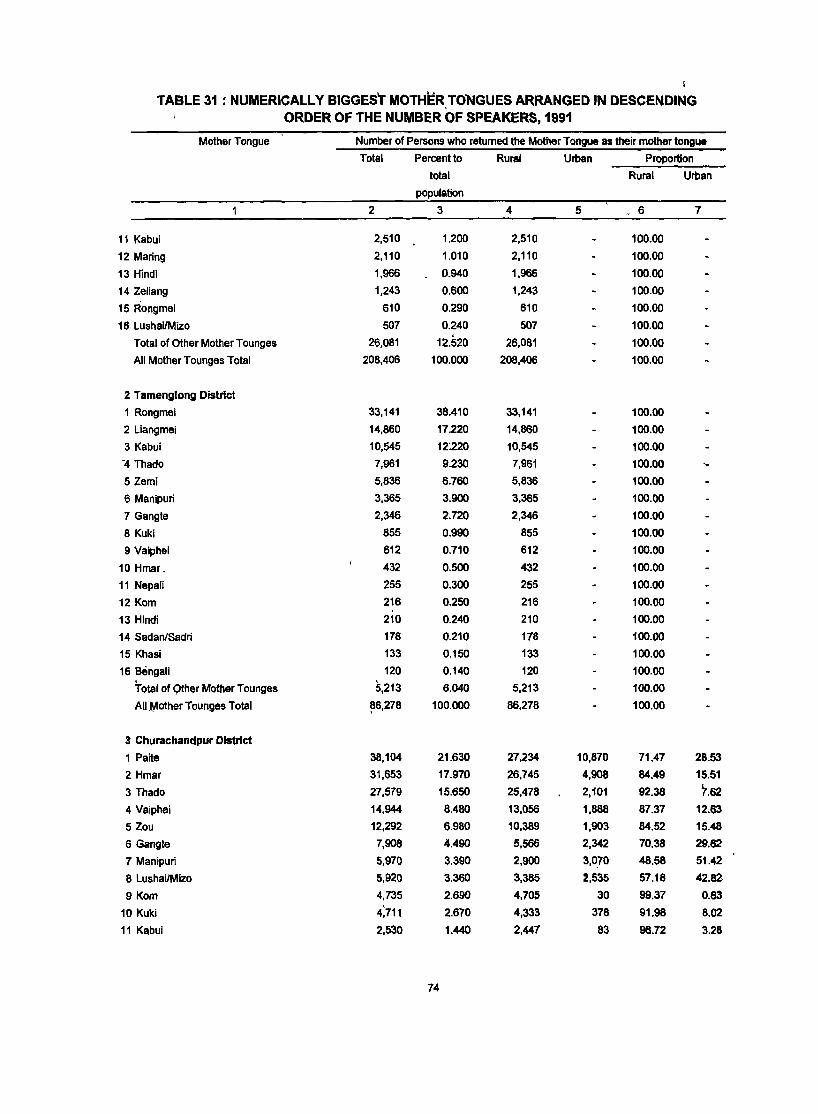
I
TABLE 31 :- NUMERICALLY BIGGEST MOTHER, TONGUES ARRANGED IN DESCENDING ORDER OF THE NUMBER OF SPEAKERS, 1991
Mother Tongue Number of Persons who retumed the Mother Tongue as their mother tongue
Total Percent to Rural Urban Proportion
total Rural Urban
population
2 3 4 5 , 6 7
11 Kabui 2,510 1.200 2,510 100.00
12 Maring 2,110 1.010 2,110 100.00
13 Hindi 1,966 0.940 1,966 100.00
14 Zeliang 1,243 0.600 1,243 100.00
15 Rongmei 610 0.290 610 100.00
16 LushaiIMizo 507 0.240 507 100.00
Total of Other Mother Tounges 26,081 12.520 26,081 100.00
All Mother Tounges Total 208,406 100.000 208,406 100.00
2 Tamenglong District
1 Rongmel 33,141 38.410 33,141 100.00
2 Liangmei 14,860 17.220 14,860 100.00
3 Kabui 10,545 12:220 10,545 100.00
'4 Thado 7,961 9.230 7,961 100.00
5 Zemi 5,836 6.760 5,836 100.00
6 Manipuri 3,365 3.900 3,365 100.00
7 Gangte 2,346 2.720 2,346 100.00
8 Kuki 855 0.990 855 100.00
9 Vaiphei 612 0.710 612 100.00
10 Hmar. 432 0.500 432 100.00
11 Nepali 255 0.300 255 100.00
12 Kom 216 0.250 216 100.00
13 Hindi 210 0.240 210 100.00
14 Sadan/Sadri 178 0.210 178 100.00
15 Khasi 133 0.150 133 100.00
16 Bengali 120 0.140 120 100.00
Total of 9ther Mother Tounges 5,213 6.040 5,213 100.00
AllMother Tounges Total ~6,278 100.000 86,278 100.00
3 Churachandpur District
1 Paite 38,104 21.630 27,234 10,870 71.47 28.53
2 Hmar 31,653 17.970 26,745 4,908 84.49 15.51
3 Thado 27,579 15.650 25,478 2,101 92.38 7.62
4 Vaiphei 14,944 8.480 13,056 1,888 87.37 12.63
5 Zou 12,292 6.980 10,389 1,903 84.52 15.48
6 Gangte 7,908 4.490 5,566 2,342 70.38 29.62
7 Manipuri 5,970 3.390 2,900 3,070 48.58 51.42
8 LushaiIMizo 5,920 3.360 3,385 2,535 57.18 42.82
9 Korn 4,735 2.690 4,705 30 99.37 0.63
10 KUki 4)11 2.670 4,333 378 91.98 8.02
11 Kabui 2,530 1.440 2,447 83 96.72 3.28
74
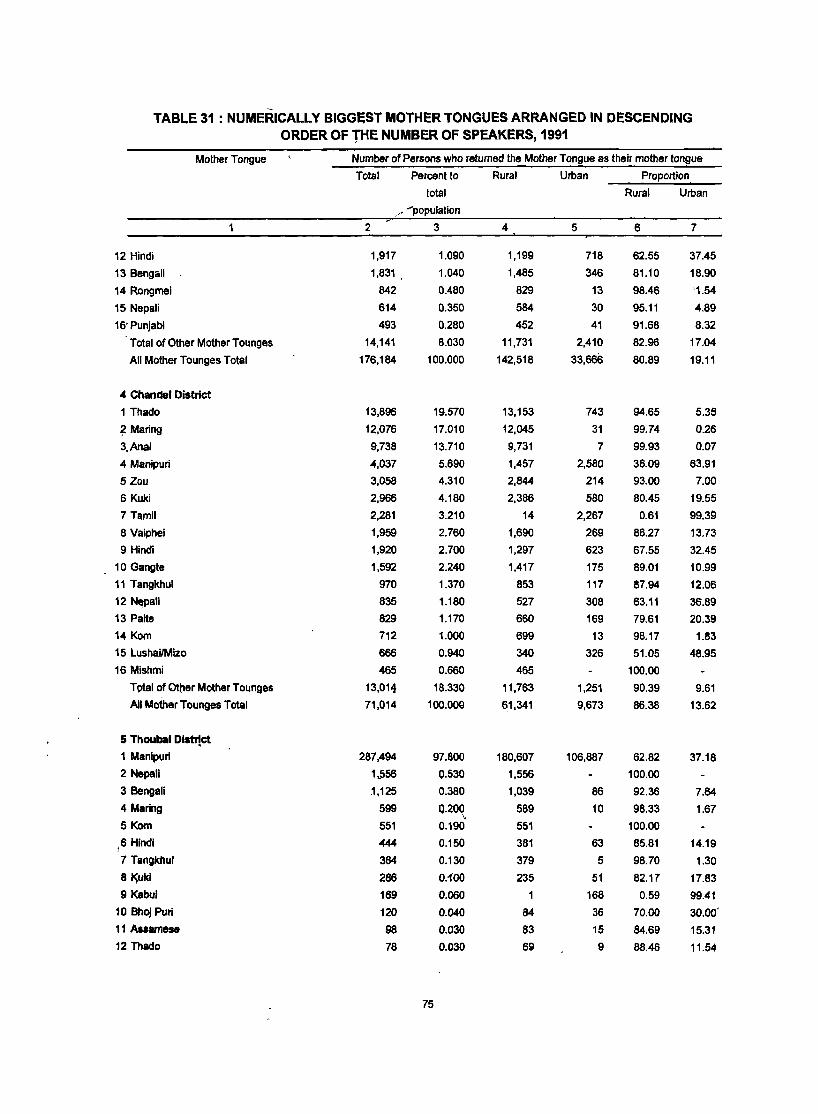
TABLE 31 : NUMERICALLY BIGGEST MOTHER TONGUES ARRANGED IN DESCENDING ORDER OF THE NUMBER OF SPEAKERS, 1991
Molher Tongue Number of Persons who relumed the Mother Tongue as their molher tongue
Total Percent 10 Rural Urban Proportion
lolal Rural Urban
,/ .... population
2 3 4 5 6 7
12 Hindi 1,917 1.090 1,199 718 62.55 37.45
13 Bengali 1,831 1.040 1,485 346 81.10 18.90
14 Rongmei 842 0.480 829 13 98.46 '1.54
15 Nepali 614 0.350 584 30 95.11 4.89
16'Punjabi 493 0.280 452 41 91.68 8.32
Total of Other Mother Tounges 14,141 8.030 11,731 2,410 82.96 17.04
All Mother Tounges Total 176,184 100.000 142,518 33,666 80.89 19.11
" Chandel District
1 Thado 13,896 19.570 13,153 743 94.65 5.35
? Maring 12,076 17.010 12,045 31 99.74 0.26
3. Anal 9,738 13.710 9,731 7 99.93 0.07
4 Manipuri 4,037 5.690 1,457 2,580 36.09 63.91
5 Zou 3,058 4.310 2,844 214 93.00 7.00
6 Kuki 2,966 4.180 2,386 580 80.45 19.55
7 Tamil 2,281 3.210 14 2,267 0.61 99.39
8 Vaiphei 1,959 2.760 1,690 269 86.27 13.73
9 Hindi 1,920 2.700 1,297 623 67.55 32.45
10 Gangte 1,592 2.240 1,417 175 89.01 10.99
11 Tangkhul 970 1.370 853 117 87.94 12.06
12 Nfwali 835 1.180 527 308 63.11 36.89
13 Paite 829 1.170 660 169 79.61 20.39
14 Kom 712 1.000 699 13 98.17 1.83
15 LushaiIMizo 666 0.940 340 326 51.05 48.95
16 Mishmi 465 0.660 465 100.00
Total of Otller Mother Tounges 13,014 18.330 11,763 1,251 90.39 9.61
All Mother Tounges Total 71,014 100.000 61,341 9,673 86.38 13.62
5 Thoubal District
1 Manipuri 287,494 97.800 180,607 106,887 62.82 37.18
2 Nepali 1.556 0.530 1,556 100.00
3 Bengali .1,125 0.380 1,039 86 92.36 7.64
4 Maring 599 0.200 589 10 98.33 1.67 \,
5 Kom 551 0.190 551 100.00
16 Hindi 444 0.150 381 63 85.81 14.19
7 Tangkhul 384 0.130 379 5 98.70 1.30
8 ~uki 286 0.100 235 51 82.17 17.83
9 Kabul 169 0.060 1 168 0.59 99.41
10 Bhoj Puri 120 0.040 84 36 70.00 30.00'
11 Assamese 98 0.030 83 15 84.69 15.31
12 Thado 78 0.030 69 9 88.46 11.54
75
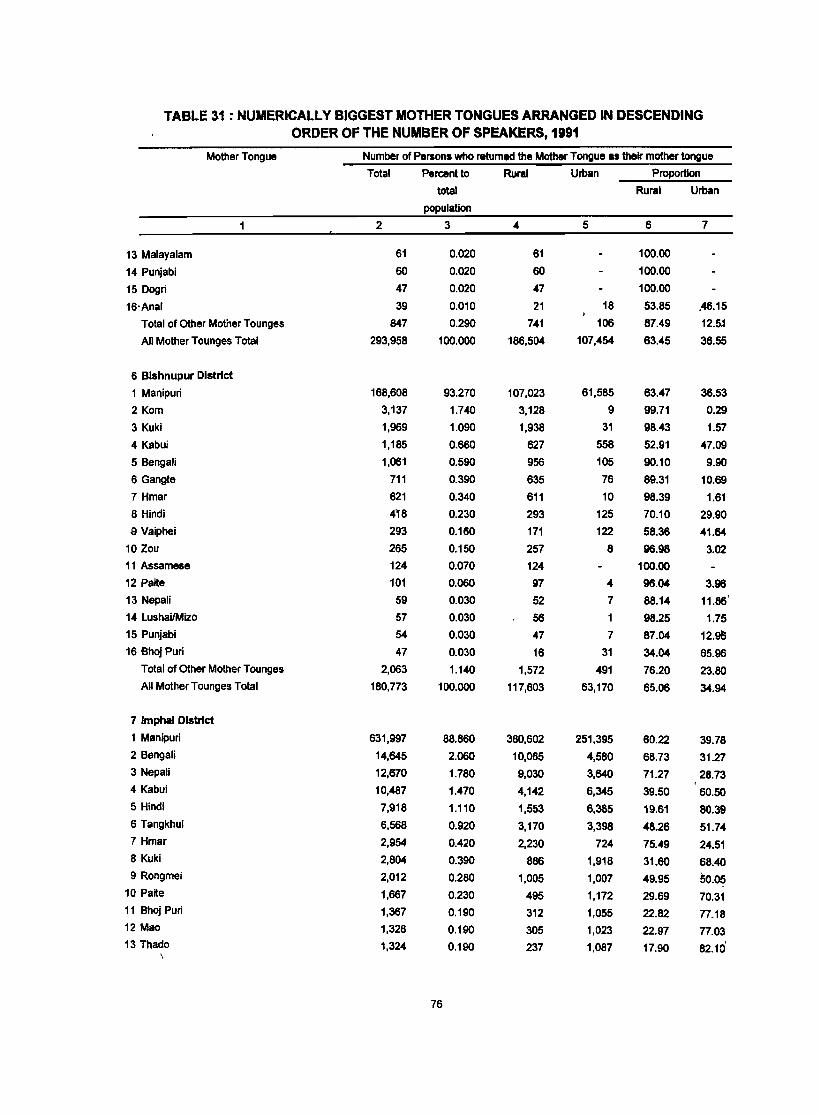
TABLE 31 : NUMERICALLY BIGGEST MOTHER TONGUES ARRANGED IN DESCENDING ORDER OF THE NUMBER OF SPEAKERS, 1991
Mother Tongue Number of Persons who retumed the Mother Tongue as their mother tongue
Total Percent to Rural Urban Proportion
total Rural Urban
population
2 3 4 5 6 7
13 Malayalam 61 0.020 61 100.00
14 Punjabi eo 0.020 60 100.00
15 Dogri 47 0.020 47 100.00
16'Anal 39 0.010 21 18 53.85 ,46.15
Total of Other Mother Tounges 847 0.290 741 106 87.49 12.5:1
All Mother Tounges Total 293,958 100.000 186,504 107,454 63.45 36.55
6 Bishnupur District
1 Manipuri 168,608 93.270 107,023 61,585 63.47 36.53
2 Kom 3,137 1.740 3,128 9 99.71 0.29
3 Kuki 1,969 1.090 1,938 31 98.43 1.57
4 Kabui 1,185 0.660 627 558 52.91 47.09
5 Bengali 1,061 0.590 956 105 90.10 9.90
6 Gangte 711 0.390 635 76 89.31 10.69
7 Hmar 621 0.340 611 10 98.39 1.61
8 Hindi 4'8 0.230 293 125 70.10 29.90
B Vaiphei 293 0.160 171 122 58.36 41.64
10 Zou 265 0.150 257 8 96.98 3.02 11 Assamese 124 0.070 124 100.00
12 Paite f01 0.060 97 4 96.04 3.96 13 Nepali 59 0.030 52 7 88.14 11.86'
14 lushaiIMizo 57 0.030 56 98.25 1.75 15 Punjabi 54 0.030 47 7 87.04 12.9l5 16 Shoj Puri 47 0.030 16 31 34.04 65.96
Total of Other Mother Tounges 2,063 1.140 1,572 491 76.20 23.80 All Mother Tounges Total 180,773 100.000 117,603 63,170 65.06 34.94
7 Imphal District
1 Manipuri 631,997 88.860 380,602 251,395 60.22 39.78 2 Bengali 14,645 2.060 10,065 4,580 68.73 31.27 3 Nepali 12,670 1.780 9,030 3,640 71.27 28.73 4 Kabui 10,487 1.470 4,142 6,345 39.50 60.50 5 Hindi 7,918 1.110 1,553 6,365 19.61 80.39 6 Tangkhul 6,568 0.920 3,170 3,398 48.26 51.74 7 Hmar 2,954 0.420 2,230 724 75.49 24.51 8 Kuki 2,804 0.390 886 1,918 31.60 68.40 9 Rongmei 2,012 0.280 1,005 1,007 49.95 50.05
10 Paite 1,667 0.230 495 1,172 29.69 70.31 11 Bhoj Puri 1,367 0.190 312 1,055 22.82 77.18 12 Mao 1,328 0.190 305 1,023 22.97 77.03 13 Thado 1,324 0.190 237 1,087 17.90 82.10'
76

TABLE 31 : NUMERICALLY BIGGEST MOTHER TONGUES ARRANGED IN DESCENDING ORDER OF THE NUMBER OF SPEAKERS, 1991
Mother Tongue Number of Persons who returned the Mother Tongue as their mother tongue
Total .... Percent to Rural Urban Proportion .. total Rural Urban
population
2 3 4 5 6 7
14 Punjabi 1,032 0.150 143 889 13.86 86.14
15 Malayaillm 834 0.120 390 444 46.76 5~.24
16 Kom 824 0.120 380 444 46.12 53.as -Total of Other Motner Tounges 10,830 1.520 4,634 6,196 42.79 51.21
All Mother Tounges Total 711,261 100.000 419,579 291,682 58.99 41.01
8 Ukhrul District
1'Tangkhul 82,305 75.320 82,305 100.00
2 Thada 7,638 6.990 7,638 100.00
3 Manipuri 4,563 4.180 4,563 100.00
4 Kukl 2,846 2.600 2,846 100.00
5 Nepali 1,807 1.650 1,807 100.00
6 Hindi 1,789 1.640 1,789 100.00
7 Chakhesang 1,279 1.170 1,279 100.00
8 Vaiphei 992 0.910 992 100.00
9 LushaVMilo 845 0.770 845 10$).00
10 Malayalam 359 0.330 359 100.00
11 Kumauni 339 0.310 330 100.00
12 Shoj Puri 254 0.230 254 100.00
13 Garhwali 236 0.220 236 100.00
14 Bengali 226 0.210 226 100.00
15 Assamese 207 0.190 207 100.00
16 Maring 131 0.120 131 100.00
Total of Other Mother Tounges 3,459 3.170 3,459 100.00
All Mother Tounges Total 109,275 100.000 109,275 100.00
77

-
HOUSIN-G AND HOUSEHOLD AMENITIES

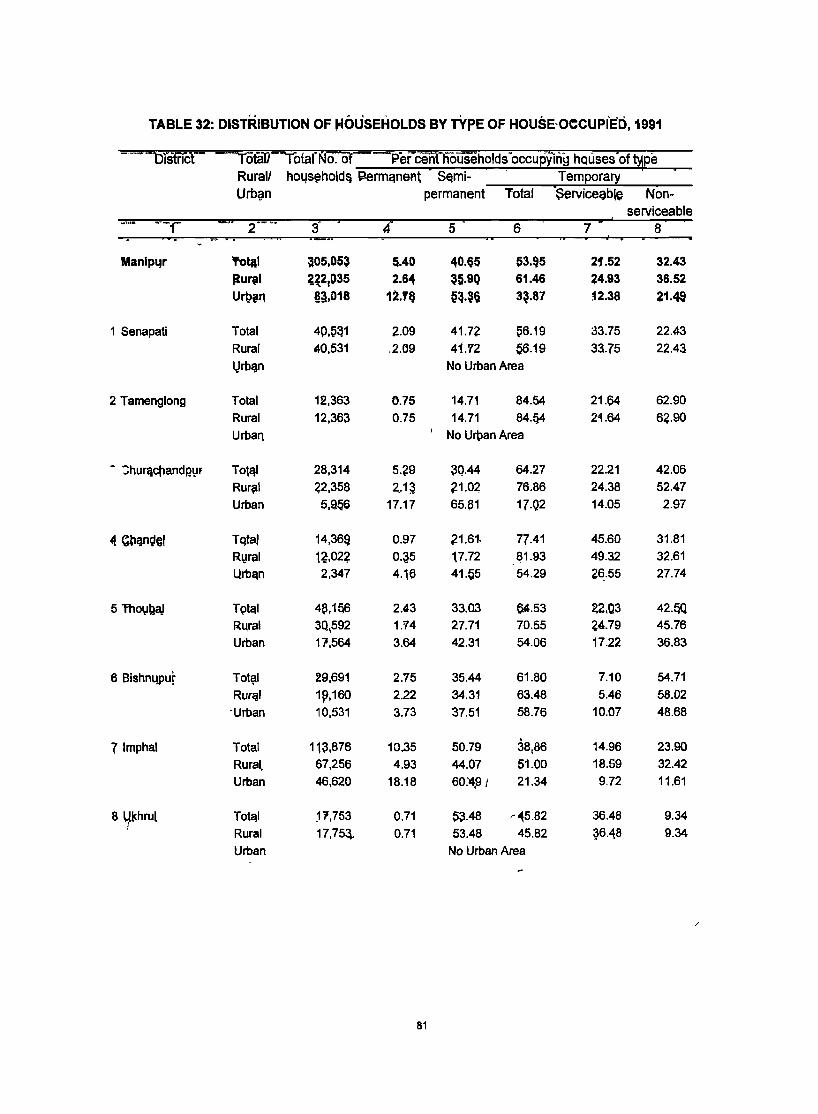
TABLE 32: DISTRIBUTION OF JoIOliSEHOLDS BY TYPE OF HOUSE-OeCUPIED, 1991
= = "'brsfrfc'r- lotarrlofarNO~ ~erCe!1fliouseholdS'OCcupYin~ hQuses'of ~pe Rural! h04sehold~ j;;!ermqnent SElmi- Temporary
Urb~n permanent Total Serviceable Non-
serviceable .. , --, . 2'- " s' "1 5 6 7 8
Manip4r Total a05,05~ !i.40 40.~5 ~3.Q5 2f.52 32.43
~UIllI ~~2!O35 2.64 ~5·9Q 61.46 24.93 36.52
UrQill1 §3,O18 12.1Q :?~.~§ 3~.87 12.38 21.4S
1 Senapati Total 4p,~~1 ~.09 41.7~ ~6.19 33.75 22.43 Rura! ~0,531 .2.09 41.'12 ~.19 33.75 22.43
lJrb~n No Urban Area
2 Tamenglong Tota! 12,363 0.75 14.71 84.54 21.64 62.90 Rura! 12,36~ 0.75 14.71 84·124 21.64 6~.90
Urban j
No Urban Area
- :;hurijellandp.\lF Tot~ 28,314 5.?9 30.44 64.27 22.21 42.06
Rur~1 42,358 2_,1~ ~1.02 76.86 24.38 52.47 Urban 5,a~6 17.17 65.~1 17-Q2 14.05 2.97
• ®~n~e1 Tqtaj 14,36Q 0.97 ~1.6t 77.41 45.60 31.81
Ryri'll 1?,02? 0.~5 17.72 ~1.93 49.32 32.61
UrbEin 2,347 4.16 41.05 54.29 2~.55 27.74
51ho1JbaJ T~tElI 4t3,1~6 2.13 33.03 64·53 22.03 42.SQ R~ral 3Q\592 1.'74 27.71 70.55 24.79 45.76 Urban 11,564 3.64 42.31 54.06 17.22 36.83
6 Bishn4Pur Tot~1 29,691 2.15 35.44 61.80 7.10 54.71
Rur~1 1~,160 2.22 34.31 63.48 5.46 58.02 -Urban 10,531 3.73 37.51 58.76 10.07 48.68
71mphal Tota! 113,876 10.35 50.79 38,86 14.96 23.90
Rural 67,256 4.93 44.07 51.00 18.59 32.42 Urban 46,620 18.18 60~9J 21.34 9.72 11.61
8 U«.hrul TotElI ~i',753 0.71 53.48 ~~5.82 36.48 9.34 I
Rural 17,75a 0.71 53.48 45.82 ~6A8 9.34 Urban No Urban Area
/
81
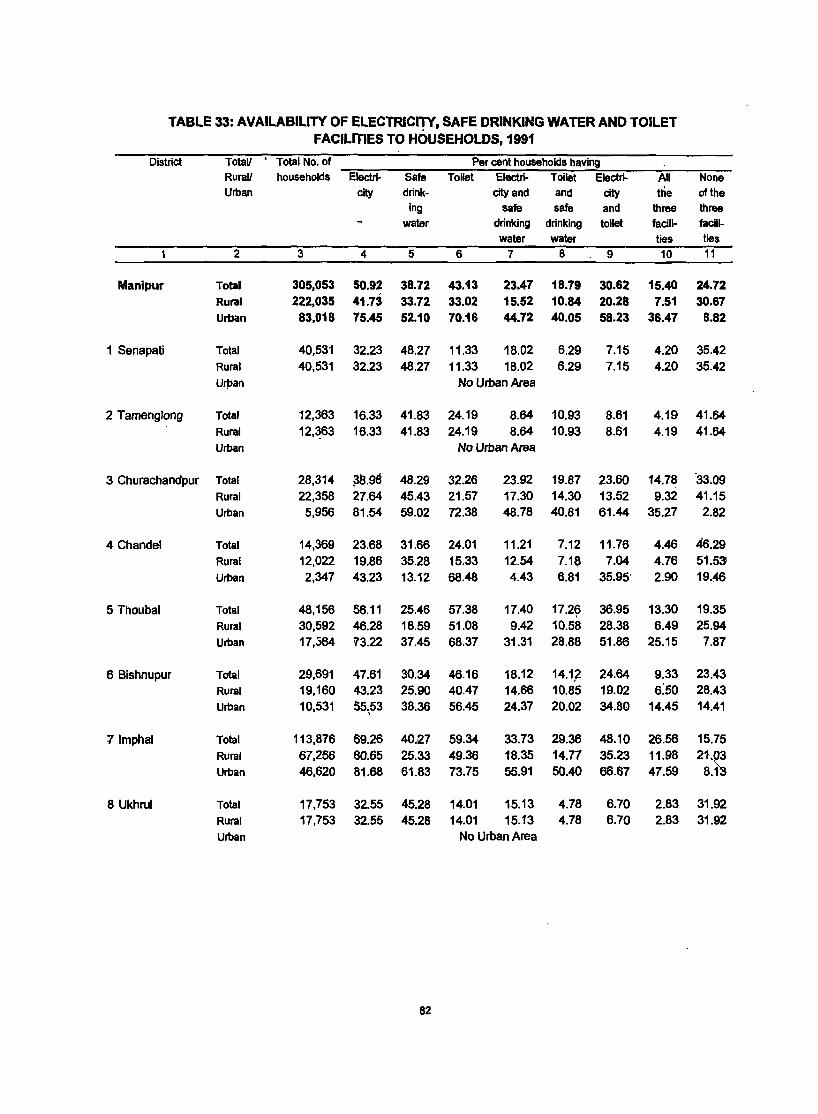
TABLE 33: AVAILABILITY OF ELECTRICITY, SAFE DRINKING WATER AND TOILET FACILITIES TO HOUSEHOLDS, 1991
District Total! Total No. of Per cent households having Rural! households Electri- Safe Toilet EIectri- Toilet Electfi... All None Urban city drink- city and and city the of the
ing safe safe and three three water drinking drinking toilet facili- facHi-
water water ties ties 2 3 4 5 6 7 8 9 10 11
Manipur Total 305,053 50.92 38.72 43.13 23.47 18.79 30.62 15.40 24.72 Rural 222,035 41.73 33.72 33.02 15.52 10.84 20.28 7.51 30.67 Urban 83,018 75.45 52.10 70.16 44.72 40.05 58.23 36.47 8.82
1 Senapati Total 40,531 32.23 48.27 11.33 18.02 6.29 7.15 4.20 35.42 Rural 40,531 32.23 48.27 11.33 18.02 6.29 7.15 4.20 35.42 Urpan No Urban Area
2 Tamenglong Total 12,363 16.33 41.83 24.19 8.64 10.93 8.61 4.19 41.64 Rural 12,~3 16.33 41.83 24.19 8.64 10.93 8.61 4.19 41.64 Urban No Urban Area
3 Churachandpur Total 28,314 ~8.98 48.29 32.26 23.92 19.87 23.60 14.78 '33.09 Rural 22,358 27.64 45.43 21.57 17.30 14.30 13.52 9.32 41.15 Urban 5,956 81.54 59.02 72.38 48.78 40.81 61.44 35.27 2.82
4 Chandel Total 14,369 23.68 31.66 24.01 11.21 7.12 11.76 4.46 46.29 Rural 12,022 19.86 35.28 15.33 12.54 7.1~ 7.04 4.76 51.53 Urban 2,347 43.23 13.12 68.48 4.43 6.81 35.95' 2.90 19.46
5 Thoubal Total 48,156 56.11 25.46 57.38 17.40 17.2~ 36.95 13.30 19.35 Rural 30,592 46.28 18.59 51.08 9.42 10.58 28.38 6.49 25.94 Urban 17,S64 1'3.22 37.45 68.37 31.31 28.88 51.86 25.15 7.87
6 Bishnupur Total 29,691 47.61 30.34 46.16 18.12 14.1~ 24.64 9.33 23.43 Rural 19,160 43.23 25.90 40.47 14.66 10.85 19.02 6:50 28.43 Urban 10,531 55~53 38.36 56.45 24.37 20.02 34.80 14.45 14.41
11mphal Total 113,876 69.26 40,27 59.34 33.73 29.36 48.10 26.56 15.75 Rural 67,256 60.65 25.33 49.36 18.35 14.77 35.23 11.98 2tb Urban 46,620 81.68 61.83 73.75 55.91 50.40 66.67 47.59 8.1
8 Ukhrul Total 17,753 32.55 45.28 14.01 15.13 4.78 6.70 2.83 31.92 Rural 17,753 32.55 45.28 14.01 15.13 4.78 6.70 2.83 31.92 Urban No Urban Area
82
URBAN AGGLOMERATIONS, CITIES AND TOWNS

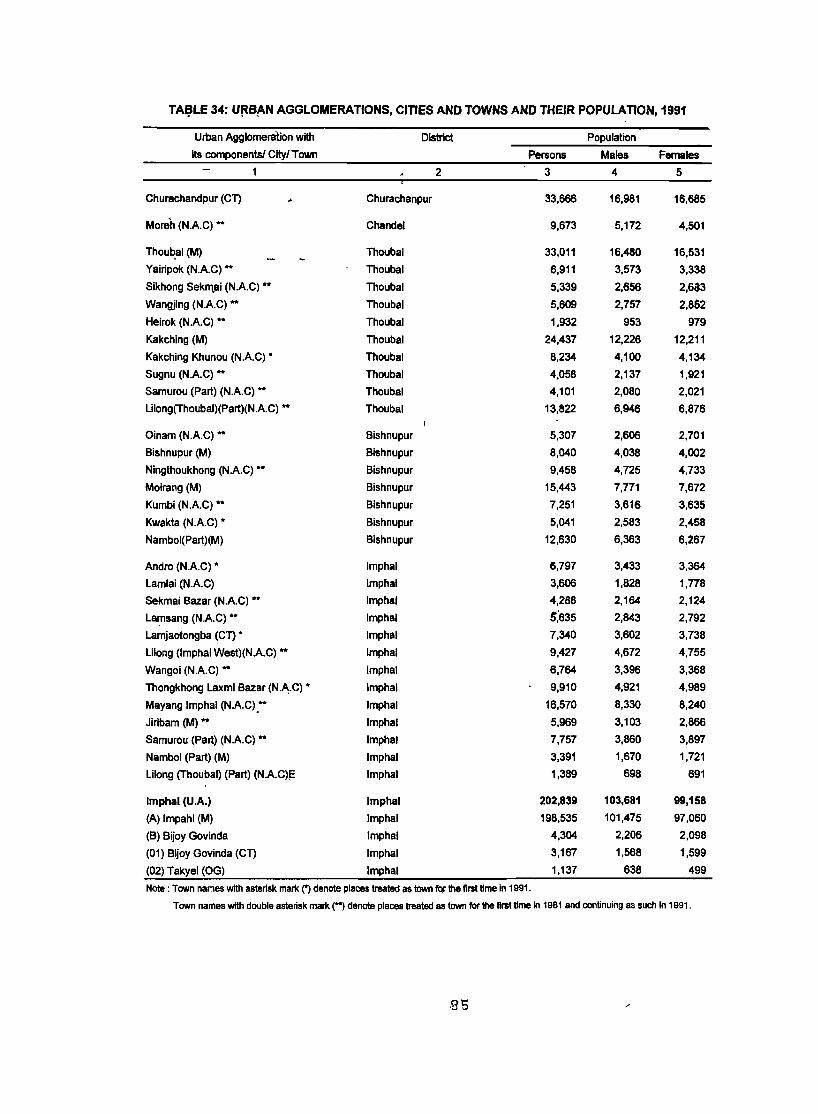
TA~LE 34: U~Bt-N AGGLOMERATIONS, CITIES AND TOWNS AND THEIR POPULATION, 1991
Urban Agglomeration with District Population
its components! City/Town Persons Males Females
1 2 3 4 5
Churachandpur (CT) Churachanpur 33,666 16,981 16,685
More}, (NAC) .. Chandel 9,673 5,172 4,501
Thoub_al (M) Thoubal 33,011 16,480 16,531
Yairipok (NAC) ** Thoubal 6,911 3,573 3,338
Sikhong Sekl1\ai (NAC) ... Thoubal 5,339 2,656 2,6$3
Wangjing (NAC) .. Thoubal 5,609 2,757 2,862
Heirok (NAC)" Thoubal 1,932 953 979
Kakching (M) Thoubal 24,437 12,226 12,211
Kakching Khunou (NAC) * Thoubal 8,234 4,100 4,134
Sugnu (NAC) .. Thoubal 4,058 2,137 1,921
Samurou (Part) (NAC) ... Thoubal 4,101 2,080 2,021
Lilong(Thoubal)(Part)(NAC) .. Thoubal 13,S22 6,946 6,876
Oinam (NAC) .. Bishnupur 5,307 2,606 2,701
Bishnupur (M) Bishnupur 8,040 4,038 4,002
Ningthoukhong (NAC) ... Bishnupur 9,458 4,725 4,733
Moirang (M) Bishnupur 15,443 7,771 7,672
Kumbi (NAC)" Bishnupur 7,251 3,616 3,635
Kwakta (NAC) * Bishnupur 5,041 2,583 2,458
Nambol(Part)(M) Bishnupur 12,630 6,363 6,267
Andro (NAC) * Imphal 6,797 3,433 3,364
Lamlai (NAC) Imphal 3,606 1,828 1,778
Sekmai Bazar (NAC) .. Imphal 4,288 2,164 2,124
Lamsang (NAC) .. Imphal S':635 2,843 2,792
Lamjaotongba (CT) * Imphal 7,340 3,602 3,738
Lilong (Imphal West)(NAC) .. Imphal 9,427 4,672 4,755
Wangoi (NAC) ** Imphal 6,764 3,396 3,368
Thongkhong Laxmi Bazar (N.~.C) • Imphal 9,910 4,921 4,989
Mayang Imphal (NAC) .... Imphal 16,570 8,330 8,240
Jiribam (M) ... Imphal 5,969 3,103 2,866
Samurou (Part) (NAC) ... Imphal 7,757 3,860 3,897
Nambol (Part) (M) Imphal 3,391 1,670 1,721
Lilong (Thoubal) (Part) (NAC)!= Imphal 1,389 698 691
Imphal (U.A.) Imphal 202,839 103,681 99,158
(A) Impahl (M) Imphal 198,535 101,475 97,060
(B) Bijoy Govinda Imphal 4,304 2,206 2,098
(01) Bijoy Govinda (CT) Imphal 3,167 1,568 1.599
(02) Takyel (OG) Imphal 1,137 638 499
Note : Town names with asterisk mark (*) denote places treated as town for the first time in 1991.
Town names with double asterisk mark (**) denote places treated as town forlhe first time in 1981 and continuing as such in 1991.
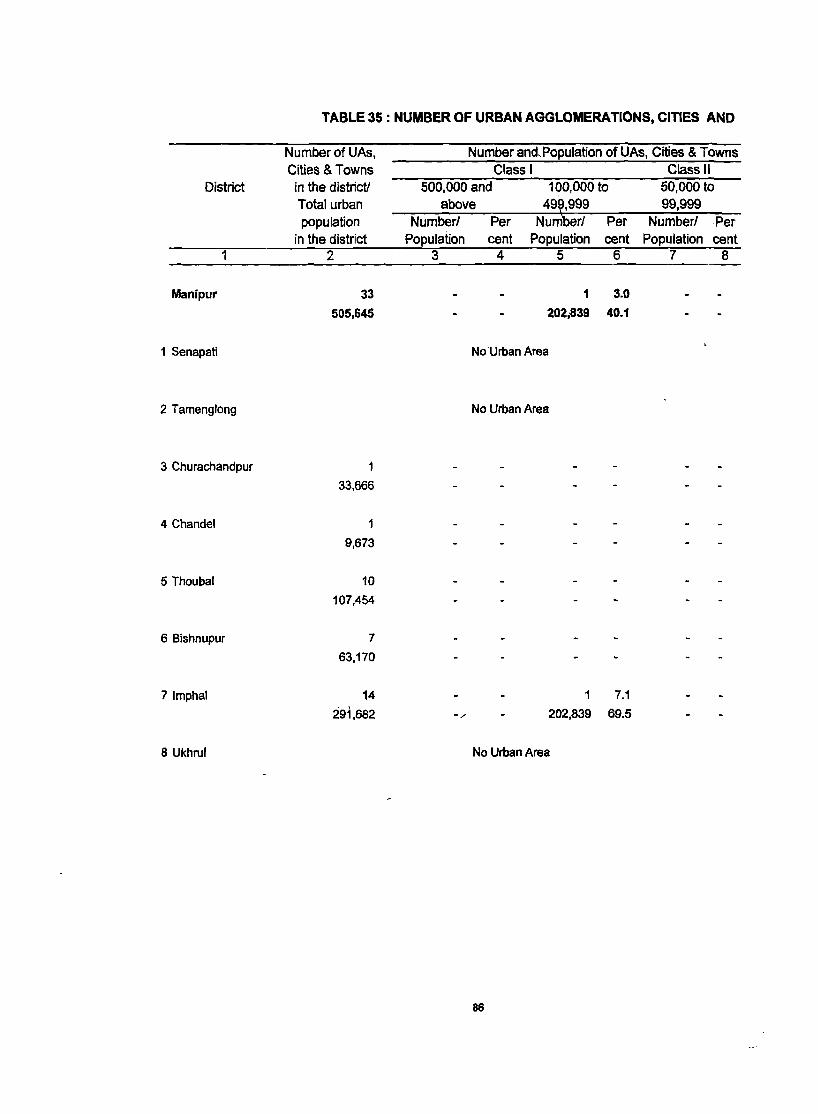
District
1
Manipur
1 Senapati
2 Tamenglong
3 Churachandpur
4 Chandel
5 Thoubal
6 Bishnupur
71mphal
8 Ukhrul
TABLE 35: NUMBER OF URBAN AGGLOMERATIONS, CmES AND
Number of UAs, Cities & Towns in the district! Total urban population
in the district 2
33
505,645
1
33,666
1
9,673
10
107,454
7
63,170
14
291,682
Number and,Population of UAs, Cities & Towns Class I Class II
500,000 and 100,000 to 50,000 to above 49~L999 99,999
Number! Per Number! Per Number! ·Per population cent Population cent Population cent
3 4 5 6 7 8
1 3.0
202;839 40.1
NoUrban Area
No Urban Area
1 7.1
-/ 202,839 69.5
No Urban Area
86
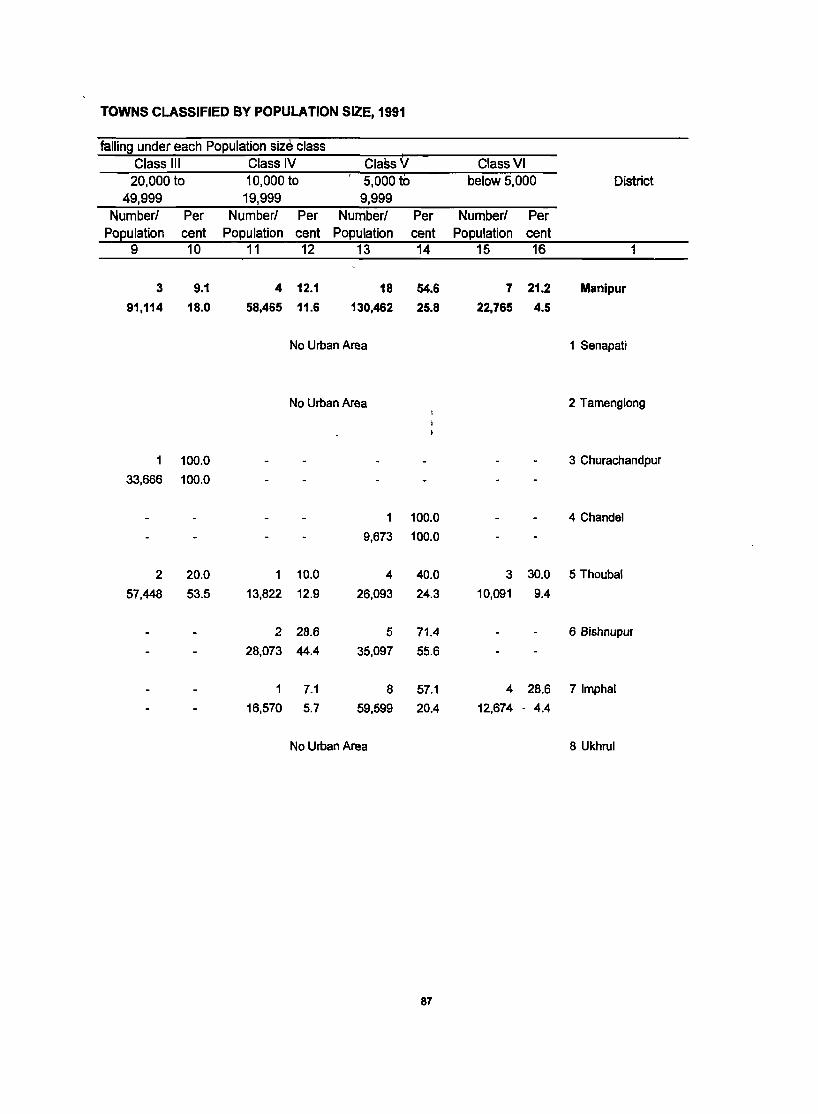
TOWNS CLASSIFIED BY POPULATION SIZE, 1991
falling under each Population size class Class V Class III Class IV Class VI
20,000 to 10,000 to 5,000 to below 5,000 District 49,999 19,999 9,999
Number! Per Number! Per Number! Per Number! Per Population cent Population cent Population cent Population cent
9 10 11 12 13 14 15 16 1
3 9.1 4 12.1 18 54.6 7 21.2 Manipur
91,114 18.0 58,465 11.6 130,462 25.8 22,765 4.5
No Urban Area 1 Senapati
No Urban Area 2 Tamenglong
1 100.0 3 Churachandpur
33,666 100.0
1 100.0 4 Chandel
9,673 100.0
2 20.0 1 10.0 4 40.0 3 30.0 5 Thoubal
57,448 53.5 13,822 12.9 26,093 24.3 10,091 9.4
2 28.6 5 71.4 6 Bishnupur
28,073 44.4 35,097 55.6
1 7.1 8 57.1 4 28.6 71mphal
16,570 5.7 59,599 20.4 12,674 - 4.4
No Urban Area 8 Ukhrul
87

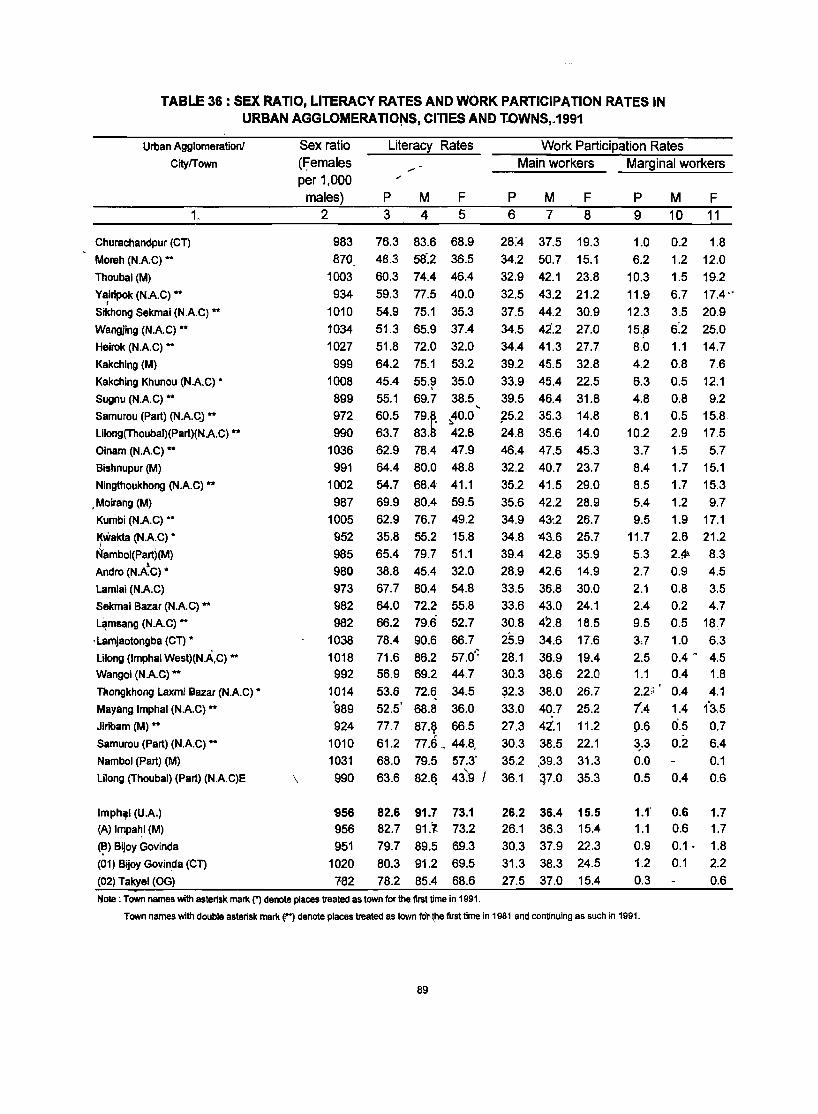
TABLE 36: SEX RATIO, LITERACY RATES AND WORK PARTICIPATION RATES IN URBAN AGGLOMERA TIO",S, CITIES AND T.oWNS,.1991
Urban Agglomeration!
CitylTown
Churachandpur (CT)
Moreh (NAC) ...
Thoubal (M)
Yairipok (NAC)" f
t
Sikhong Sekrnai (NAC) *"
Wangjing (NAC)"
Heirok (NAC) **
Kakching (M)
Kakching Khunou (NAC) *
Sugnu (NAC) **
Samurou (Part) (NAC) ..
Lilong(Thoubal)(Part)(NAC) ..
Oinam (NAC) ..
Bishnupur (M)
Ningthoukhong (NAC) ..
• Moirang (M)
Kumbi (NAC) **
J1.wakta (NAC) *
~ambol(Part)(M) f' Andro (N.A.C) *
Lamlai (NAC)
Sekmai Bazar (NAC) **
L~msang (NAC) ..
. Lamjaotongba (CT) *
Lilong (Imphal West)(N.A,C) *"
Wangoi (NAC) **
l1Iongkhong Laxmi Bazar (NAC) *
Mayang Imphal (NAC) **
Jiribam (M) ** Samurou (Part) (NAC) ..
Nambol (Part) (M)
Lilong (Thoubal) (Part) (NAC)E
Imph.1 (U.A.)
(A) Impa~1 (M)
(~) Bijoy Govinda
(01) Bijoy Govinda (CT)
(02) Takyel (OG)
\
Sex ratio Wemales per 1,000
males) 2
983 870_
1003 934
1010 1034 1027 999
1008 899 972
990
1036 991
1002 987
1005 952 985 980 973 982 982
1038 1018 992
1014 989 924
1010 1031 990
Literacy Rates
P M F 3 4 5
76.3 83.6 68.9 48.3 58.2 36.5 60.3 74.4 46.4 59.3 77.5 40.0 54.9 75.1 35.3 51.3 65.9 37.4 51.8 72.0 32.0 64.2 75.1 53.2 45.4 55.~ 35.0 55.1 69.7 38.5 ... 60.5 79.~. ~O.O
63.7 83.8 42.8 62.9 78.4 47.9 64.4 80.0 48.8 54.7 68.4 41.1 69.9 80.4 59.5 62.9 76.7 49.2 35.8 55.2 15.8 65.4 79.7 51.1 38.8 45.4 32.0 67.7 80.4 54.'8 64.0 722 55.8 66.2 79.6 52.7 78.4 90.6 66.7 71.6 86.2 57.0'~ 56.9 69.2 44.7 53.6 72.6 34.5 52.5' 68.8 36.0 77.7 87.~ 66.5 61.2 77.6 _ 44.8, 68.0 79.5 57.3' 63.6 82.q 43~ J
'956 82.6 91.7 73.1 956 82.7 91.1. 73.2 951 79.7 89.5 69.3
1020 80.3 91.2 69.5 782 78.2 85.4 68.6
Note : Town names with asterisk mark (j denote places treated as town for the first time in 1991.
Work Participation Rates Main workers Marginal workers
P M F 6 7 8
28:4 37.5 19.3 34.2 50.7 15.1 32.9 42.1 23.8 32.5 43.2 21.2 37.5 44.2 30.9 34.5 42.2 27.0 34.4 41.3 27.7 39.2 45.5 32.8 33.9 45.4 22.5 39.5 46.4 31.8 f5.2 35.3 14.B
24.8 35.6 14.0 46.4 47.5 45.3 32.2 40.7 23.7 35.2 41.5 29.0 35.6 42.2 28.9 34.9 43:2 26.7 34.8 43 .. 6 25.7 39.4 42.8 35.9 28.9 42.6 14.9 33.5 36.8 30.0 33.6 43.0 24.1 30.8 4~.8 18.5 25.9 34.6 17.6 28.1 36.9 19.4 30.3 38.6 22.0 32.3 38.0 26.7 33.0 40.7 25.2 27.3 42'.1 11.2 30.3 38.5 22.1 35.2 ,39.3 31.3 36.1 ~7.0 35.3
26.2 36.4 15.5 26.1 36.3 15..4 30.3 37.9 22.3 31.3 38.3 24.5 27.5 37.0 15.4
P 9
1.0 6.2
10.3 11.9 12.3 15.p 8.0 4.2 6.3 4.8 8.1
10.2 3.7 8.4 8.5
M F 10 11
0.2 1.8 1.2 12.0 1.5 19.2 6.7 17.4"" 3.5 20.9 6:2 25.0 1.1 14.7 0.8 7.6 0.5 12.1 O.S 9.2 0.5 15.8 2.9 17.5 1.5 5.7 1.7 15.1 1.7 15.3
5.4 1.2 9.7 9.5 1.9 17.1
11.7 2.6 21.2 5.3 2.4>- 8.3 2.7 0.9 4.5 2.1 0.8 3.5 2.4 0.2 4.7 9.5 0.5 18.7 3.7 1.0 6.3 2.5 0.4 ~ 4.5 1.1 0.4 1.8 2Z," 0.4 4.1 14 1.4 1'3.5 p.6 0.5 0.7 ~.3 0.2 6.4 0.0 0.1 0.5 0,4 0.6
1.1' 0.6 1.7 1.1 0.6 1.7 0.9 0.1· 1.8 1.2 0.1 2.2 0.3 0.6
Town names with double asterisk mark (",l denote places treated as town fot·the first time in 1981 and continuing as such in 1991.
89

TABLE 37: DISTRIBUTION (IN PER CENn OF MAIN WORKE~ INtlRBAN
Uman Agglomeration!
CitylTown
Churachandpur (Cl)
Mereh (NAC) ...
Thoubal (M)
Yairipok (NAC) ••
Sikhong Sekmai (N.A.~) ..
Wangjlng (NAC) ..
Heirok (NAC) ..
Kakching (M)
Kakchlng Khunou (NAC) •
Sug!1u (NAC) *.
Samurou (Part) (NAC) *.
lOong(Thoubal)(Part)(NAC) ..
Oinam (NAC) ..
Bishnupur (M)
Ningthoukhong (NAC) ..
MOirang (M)
Kumbi (NAC) ..
Kwakta (NAC) •
Nambol{Part)(M)
Andro (N.A.C),·
lamiai (NAC)
Sekmai Baza'r (NAC) ..
lamsang (N.A\C) ..
lamjaotongba (CT) •
lilong (Imphal ~t)(N,AC) **
Wangoi'{NAC) ..
Thongkhong Laxmi Bazar (NAC) •
Mayang Imphal (NAG) ..
Jiribam (M)"
Samurou (Part) (NAC) ..
Nambol (Part) (M)
lilong (Thoubal) (Part) (NAC)E
Imphal (U.A.)
(A) 1I11pahi (M)
(8) Bijoy Govinda
(01) Bijoy Govlnda (CT)
(02) Takyel (OG)
Per cent main workers engaged in
Cultivation AgrlcuHural livestock,Forestry Mining and
Labour Fishing, Hunting and Quarrying
Rlantalions,
Orchards and Allied
Activities
P M F M F P M F P M
2 3 4 5 6 7 8 9 10 11 12
37.4 33.4 45.2 3.5 3.6 3.3 1.6 2.2 '0.4 0.1
3.4 1.9 0.0
0.1
0.0
0.0
0.0
0.0
0.1
19.4 15.3 35.2 12.4 10.3 20.6 3.1
59.8 64.8 51.1 4.8 2.9 8.2 1.1 1.5 0.2 0.0
50.5 50.7 50.3 17.2 11.9 28.8 1.2 1.8 0.0 0.0
53.0 61.2 41.3 15.8 12.9 20.1 0.6 0.9 0.1 0.0
72.3 69.0 77.2 1.7 1.2 2.3 0.5 0.9 0.0 0.1
75.6
48.3
64.1
48.4
51.4
34.4
69.7'
37.1
40.6
44.7
62.4
.66.6
52.0
78.7
76.2
59.8
56.0
10.9
28.6
55.6
48.1
63.0
10.2
51.4
67.9
22.5
2.3
2.3
2.5
1.5
5.&
71.6 81.6 7.8
53.8 40.7 20.2
71.2 50.0 13.0
6.6 9.6
9.8 34.6
8.2 22.6
63.6 23.6 27.5 7.4 60.1
55.3 41.7 1.4" 0.5 3.3
31.2 42.6 24.5· 20.0 . 35.9
66.8 72 .. 6 5.1 4.0 6.1
47.1 19.8 11.3 4.9 22.4
51.2 25.4 • 9.7 4.4 17.3
53.1 32.3 10.9
67.3 54.4 1<4.5
71.3 58.3 12.6
57.3 45.6 6.3.
7.7 15.6
8.7 23.9
5.7 25.0
6.0 6.7
88.& '49.2 12.3 3.3 '38.5
72.~ 81.3 0.7
57.9 63.4"1 5.9.
67.6 2&.8 18.1
16.2 0.8 1.(
33.2 20.0 6.8
0.5 0.9
8.1 2.0
3.4 52.8
1.6 1.8
6.7 7.1
63.9 40.8 9.8 8.2 12.6
62.6 27.6 22.5 13.4 35.3
71.8 4B.6
10.0 10.9
47.2 58.5
64.5 72.1
9.5 7.2 13.2
10.~ 11.2 7.1
8.5 7.9 9.5
5.0 0.8 10.2
20.5 24.6 53.6,41.1 66.8
2.8
2:B
3.2
2.3
5.5
1.2 0.8 0.9
1.2 0.8 0.8
1.3 2.5 3.8
0.3. 0.4 0.5
6.5 9.~ 12.3
0.6
0.7
0.2
0.3
0.0
1.1
0.5
1.1
0:8
5.0
4.7
1.9
1.8
1.8
8:9
0.4
0.6
2.0
0.4
0:3
1.8
0.9
4.q 1.0
0.6
1.0
1.3
2.5
2.0
1.8
0.8
1.5 0.4
0.8 0.1
1.5 0.3
1.2 0.0
7.1 0.0
6.5 0.1
3.3 0.4
2.1 1.2
2.2 1.3
7.3 11.3
0.7 0.0
0.8 0.2
1.7 2.4
0.5 0.0
0.6 0.0
2.3 1.0
1.~ 0.2
4.7 2.7
1.6 0.0
1.0 0.0
1.6 0.2
1.4 1.1
3.1 0.3 2.8 0.6
3.2 0.2
1.6 0.0
0.0 0.0
0.1 0.1
0.0 0.0
0.0 0.0
0.0 ·0.0
0;0 0.0
0.0 0.1
0.9 0':6
0.0 0.1
0.0 0.0
0.0 0.0
0.0 0.0
0.0 0.0
0.0 0.0
0.0 0.0'
'0.0 0.0
0.0 0.0
0.2 0.1
0.0 0.0
0.0 0.0
0.0 . 0.0
0.0 0.0-
0.0 0.0
0.0 0.0
0.0 0.0
0.0 0.0
3.8 4.1
3.8 4.1
3.5 3.9
4.2 5.0
1.3 1.3
2.9 0.1
2.9 0.1
2.8 0.0
3.1 0.0
1.3 0.0
0.1
0.1
0.0
0.0
0.0
Note : Town ~ WIIh uteri8k marfI M denOte pfacea tnIaIeCIas town for the fht tine In 1991.
Town name. WIIh double aaterIIk mart (**) denoIe pIIIces treated as town for the fIrIt time in 1981 end c:cntIluing as such In 19111.
90
Manufacturing,
Processing,
Servicing and
Repairs in
Household Industry
F P M F 13 14
0.1 9.5
0.0 1.2
9,0 11.0
0.0 5.4
0.0 12.2
0.0 '5.4
0.0 0.8
0.0 5.5
0.0 5.5
0.0 2.5
0.0 15.2
0.0 5.8
0.0 7.4
1.3 8.5
0.0 18.7
0.0 11.6
0.0 6.B
0.0 5;0
0.0 16.2
0.0 0.9
0.0 3.7
0.0 2.6
0.0 0.9
0.3 20.7
0.0' 14.6
0.0 11.8
0.0 12.7
0.0 7.5
0.0 9.6
0.0 5.7
0.0 3.6
0.0 1.2
0.1
0.1
0.0
0.0
0.0
6:5 6.5
7.9
8.6
5.8
15 16
4.8 18.8
1.1 1.6
1.0 28.7
2.0 12.9
1.7 27.1
2.4 10.0
0.3 1.5
3.9 7.8
0.8 14.8
0.2 6.2
0.0 52.3
1.5 16.9
0.6 14.4
1.1 21.3
4.1 39.4
3.3 23.9
2.4 13.8
1.3 11.6
3.8 31.1 .'
o.~ 3.0
1.0 6.9
1.2 5.3
0.6 1.7
6.7 47.1
3.0 36.2
1.5 30.3
1.2 28.9
1).7 18.7
:7.4 18.9
1.6 12.7
0.3 7,6
0.8 1.6
2.3 1 ...
2.3 16.9
2.3 1&.0
1.& 1&.9
3.4 13.0
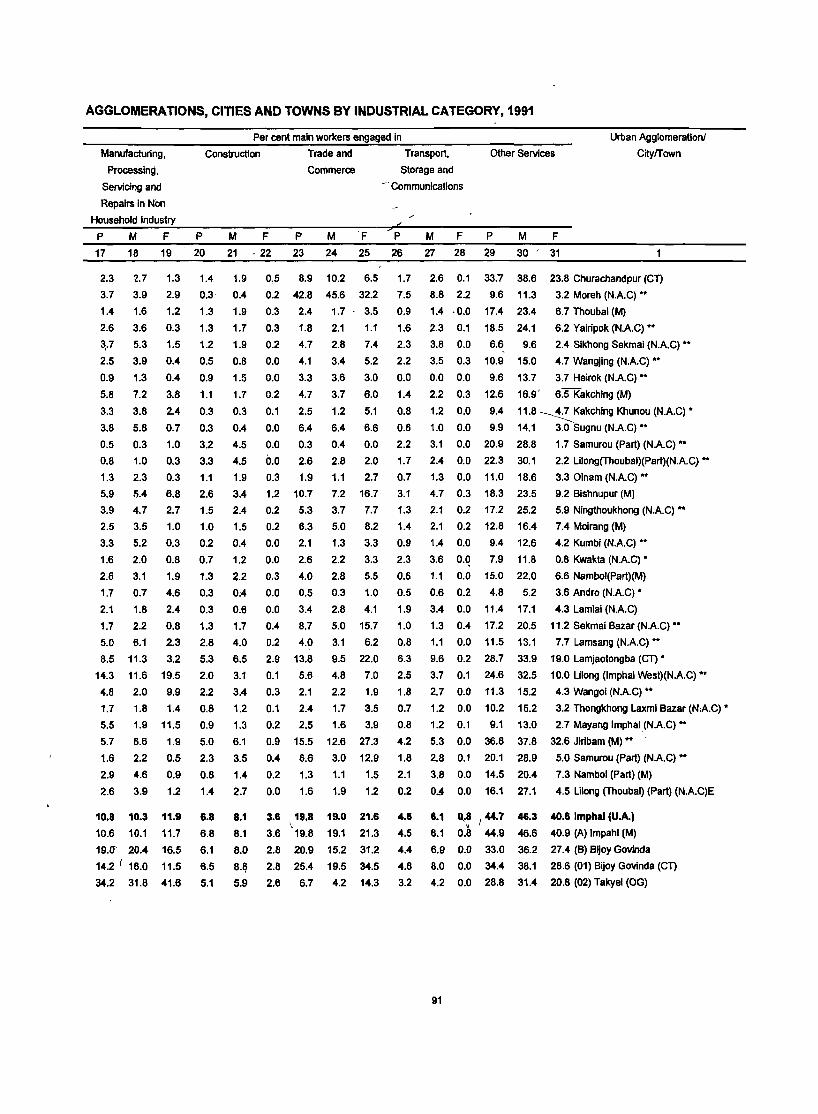
AGGLOMERATIONS, CITIES AND TOWNS BY INDUSTRIAL CATEGORY, 1991
Manufacturing.
Processing.
Servicing and
Repairs in Non
Household Industry
P M F 17
2.3
3.7
1.4
2.6
:p 2.5
0.9
5.8
3.3
3.8
0.5
0.8
1.3
5.9
3.9
2.5
3.3
1.6
2.6
1.7
2.1
1.7
5.0
8.5
14.3
4.8
1.7
5.5
5.7
1.6
2.9
2.6
18 19
'2.7 1.3
3.9 2.9
1.6 1.2
3.6 0.3
5.3 1.5
3.9 0.4
1.3 0.4
7.2 3.8
3.8 2.4
5.8 0.7
0.3 1.0
1.0 0.3
2.3 0.3
5.4 6.8
4.7 2.7
3.5 1.0
5.2 0.3
2.0 0.8
3.1 1.9
0.7 4.6
1.8 2.4
2.2 0.8
6.1 2.3
11.3 3.2
11.6 19.5
2.0 9.9
1.8 1.4
1.9 11.5
6.6 1.9
2.2 0.5
4.6 0.9
3.9 1.2
10.8 10.3 11.9
10.6 10.1 11.7
19.(/ 20.4 16.5
14.2 I 16.0 11.5
34.2 31.8 41.6
Per cent main workers engaged in Urban Agglomeration!
Construction Trade and Transport. Other Services CityfTown
Commerce Storage and
- Communications
P M F P M F P
20 21 ·22 23 24 25 26
1.4 1.9
0.3 0.4
1.3 1.9
1.3 1.7
1.2 1.9
0.5 0.8
0.9 1.5
1.1 1.7
0.3 0.3
0.3 0.4
3.2 4.5
3.3 4.5
1.1 1.9
2.6
1.5
1.0
0.2
0.7
1.3
0.3
0.3
1.3
2.8
5.3
2.0
2.2
0.8
0.9
5.0
2.3
0.8
1.4
3.4
2.4
1.5
0,4
1.2
2.2
0.4
0.6
1.7
4.0
6.5
3.1
3,4
1.2
1.3
6.1
3.5
1.4
2.7
0,5 8.9 10.2 6.5 1.7
0.2 42.8 45.6 32.2 7.5
0.3 2.4 1.7 3.5 0.9
0.3 1.8 2.1 1.1 1.6
0.2 4.7 2.8 7.4 2.3
0.0 4.1 3.4 5.2 2.2
0.0 3.3 3.6 3.0 0.0
0.2 4.7 3.7 6.0 1.4
0.1 2.5 1.2 5.1 0.8
0.0 6.4 6.4 6.6 0.6
0.0 0.3 0.4 0.0 2.2
0.0 2.6 2.8 2.0 1.7
0.3 1.9 1.1 2.7 0.7
1.2 10.7 7.2 16.7
0.2 5.3 3.7 7.7
0.2 6.3 5.0 8.2
0.0 2.1 1.3 3.3
0.0 2.6 2.2 3.3
0.3 4.0 2.8 5.5
0.0 0.5 0.3 1.0
0.0 3,4 2.8 4.1
0.4 8.7 5.0 15.7
0.2 4.0 3.1 6.2
2.9 13.8 9.5 22.0
0.1 5.6 4.8 7.0
0.3 2.1 2.2 1.9
0.1 2.4 1.7 3.5
0.2 2.5 1.6 3.9
0.9 15.5 12.6 27.3
0,4 6.6 3.0 12.9
0.2 1.3 1.1 1.5
0.0 1.6 1.9 1.2
3.1
1.3
1.4
0.9
2.3
0.6
0.5
1.9
1.0
0.8
6.3
2.5
1.8
0.7
0.8
4.2
1.8
2.1
0.2
6.8
6.8
6.1
6.5
5.1
8.1 3.6 19.8 19.0 21.6 4.5 \
8.1 3.6 19.8 19.1 21.3 4.5
8.0 2.8 20.9 15.2 31.2 4.4
8.~ 2.8 25.4 19.5 34.5 4.8
5.9 2.6 6.7 4.2 14.3 3.2
M F P M F
27 28 29 30 31
2.6 0.1
8.8 2.2
1.4 ·0.0
33.7 38.6 23.8 Churachandpur (Cl)
9.6 11.3 3.2 Moreh (NAC)··
17.4 23.4 6.7 Thoubal (M)
2.3 0.1 18.5 24.1
3.8 0.0 6.6 9.6
3.5 0.3 10.9 15.0
0.0 0.0 9.6 13.7
2.2 0.3 12.6 16.9'
6.2 Yairipok (NAC) ••
2.4 Sikhong Sekmai (NAC) ••
4.7 Wangjing (NAC) ••
3.7 Heirok (NAC) ••
6.5 Kakching (M)
1.2 0.0 9.4 11.8 ~7 Kakching Khunou (NAC)·
1.0 0.0 9.9 14.1 3.Osugnu (NAC)··
3.1 0.0 20.9 28.8 1.7 Samurou (Part) (NAC) ••
2.4 0.0 22.3 30.1 2.2 Lilong(Thoubal)(Part)(NAC)-
1.3 0.0 11.0 18.6 3.3 Oinam (NAC)··
4.7 0.3 18.3 23.5
2.1 0.2 17.2 25.2
2.1 0.2 12.8 16.4
1.4 0.0 9.4 12.6
3.6 O.q 7.9 11.8
1.1 0.0 15.0 22.0
0.6 0.2 4.8 5.2
3.4 0.0 11.4 17.1
1.3 0.4 17.2 20.5
1.1 0.0 11.5 13.1
9.6 0.2 28.7 33.9
3.7 0.1 24.6 32.5
2.7 0.0 11.3 15.2
1.2 0.0 10.2 15.2
1.2 0.1 9.1 13.0
5.3 0.0 36.8 37.8
2.8 0.1 20.1 '28.9
3.8 0.0 14.5 20.4
0.1 0.0 16.1 27.1
9.2 Bishnupur (M)
5.9 Ningthoukhong (NAC) -
7.4 Moirang (M)
4.2 Kumbi (NAC) O. 0.8 Kwakta (NAC) •
6.6 Nambol(Part)(M)
3.6 Andro (NAC) •
4.3 Lamlai (NAC)
11.2 Sekmai Bazar (NAC) ..
7.7 Lamsang (NAC)"
19.0 Lamjaotongba (Cl) •
10.0 Lilong (Imphal West)(NAC) O. 4.3 Wangoi (NAC) ••
3.2 Thongkhong Laxmi Bazar (NAC) 0
2.7 Mayang Imphal.(NAC)-
32.6 Jiribam (M) •• .
5.0 Samurou (Part) (NAC) ••
7.3 Nambol (Part) (M)
4.5 Lilong (Thoubal) (Part) (NAClE
6.1 0.,8 I 44.7 46.3 40.5 Imphal IU.A.)
6.1 o.a 44.9 46.6 40.9 (A) Impahl (M)
6.9 0.0 33.0 36.2 27.4 (B) Bijoy Govinda
8.0 0.0 34.4 38.1 28.6 (01) Bijoy Govinda (Cl)
4.2 0.0 28.8 31.4 20.8 (02) Takyel (OG)
91

POPULATION SCENARIO -PAST AND PRESENT


TABLE 38: POPULATION, 1951-1991
District Population .1951. 1961 1971 1981 1991
1 2 3 4 5 6
" Manipur 577,635 ,,"·780,037 1,072,753 1,420,953 1,837,149
1. Senapati 46,608 70,792 102,291 153,091 208,406
2. Tamenglong 33,519 37,667 46,034 62,289 86,278
3. Churachandpur 44,496 66,304 100,418 134,494 176,18<1-
4. Chandel 24,049 27,679 38,723 56,444 71,014
5. Thoubal 99,631 13~,462 182,500 232,675 293,958
6. Bishnupur 57,340 79,005 108,785 141,760 180,773
7.lmphal 230,810 314,53~ 431,773 557,254 711,261
8. Ukhrul 41,182 48,590 62,229 82,946 109,275
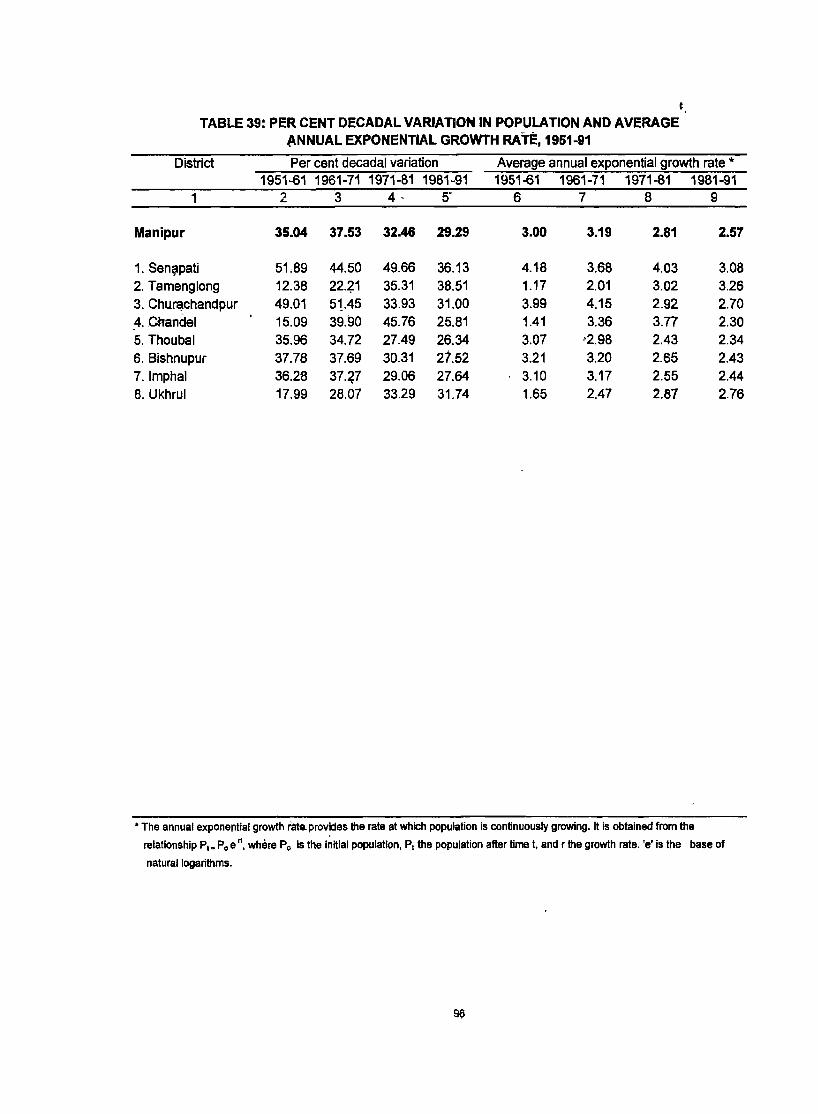
I , TABLE 39: PER CENT OECAOAL VARIATION IN POPULATION AND AVERAGE
ANNUAL EXPONENTIAL GROWTH RATE, 1951-91
District Per cent decadal variation Average annual exponential growth rate * 1951-61 1961-71 1971-81 1981-91 1951-61 1961-71 1971-81 1981-91
1 2 3 4 . 5· 6 7 8 9
Manipur 35.04 37.53 32.46 29.29 3.00 3.19 2.81 2.57
1. Sen~pati 51;89 44.50 49.66 36.13 4 .... 8 3.68 4.03 3.08 2. Tamenglong 12.38 22'41 35.31 38.51 1.17 2.01 3.02 3.26 3. Chu~chandpur 49.01 51.45 33.93 31.00 3.99 4.15 2.92 2.70 4. Chandel 15.09 39.90 45.76 25.81 1.41 3.36 3.77 2.30 5. Thoubal 35.96 34.72 27.49 26.34 3.07 '2.98 2.43 2.34 6. Bishnupur 37.78 37.69 30.31 21.52 3.21 3.20 2.65 2.43 7.lmphal 36.28 37:2} 29.06 27.64 3.10 3.17 2.55 2.44 8. Ukhrul 17.99 28.07 33.29 31.74 1.65 2.47 2.87 2.76
• The annual exponential growth fataprovides the rate at which population is continuously growing. It is obtained from the
relationship PIs Poe 't, where Po is the i~itial population, PI the population after time t. and r the growth rate. 'e' is the base of
natural logarithms.
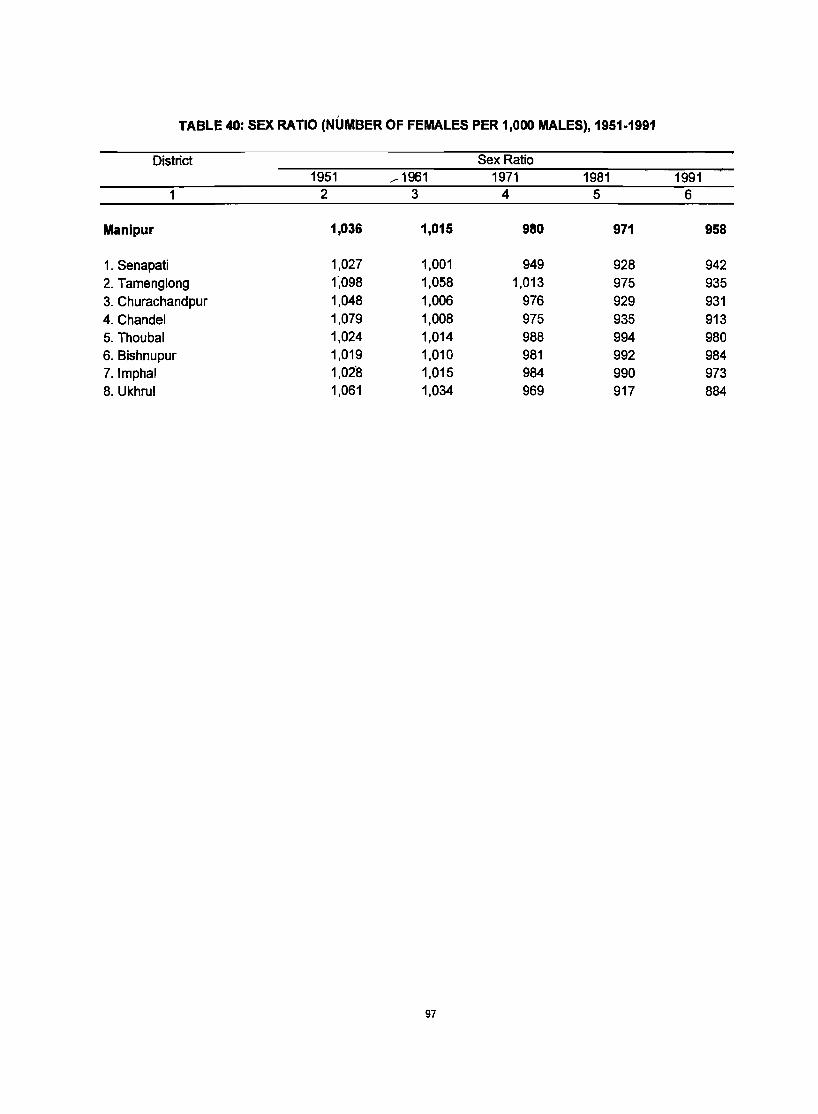
, TABLE 40: SEX RATIO (NUMBER OF FEMALES PER 1,000 MALES), 1951-1991
District Sex Ratio 1951 .-- 1961 1971 1981 1991
1 2 3 4 5 6
Manipur 1,036 1,015 980 971 958
1. Senapati 1,027 1,001 949 928 942
2. Tamenglong 1',098 1,058 1,013 975 935
3. Churachandpur 1,048 1,006 976 929 931
4. Chandel 1,079 1,008 975 935 913
5. Thoubal 1,024 1,014 988 994 980 6. Bishnupur 1,019 1,010 981 992 984
7.lmphal 1,028 1,015 984 990 973
8. Ukhrul 1,061 1,034 969 917 884
97
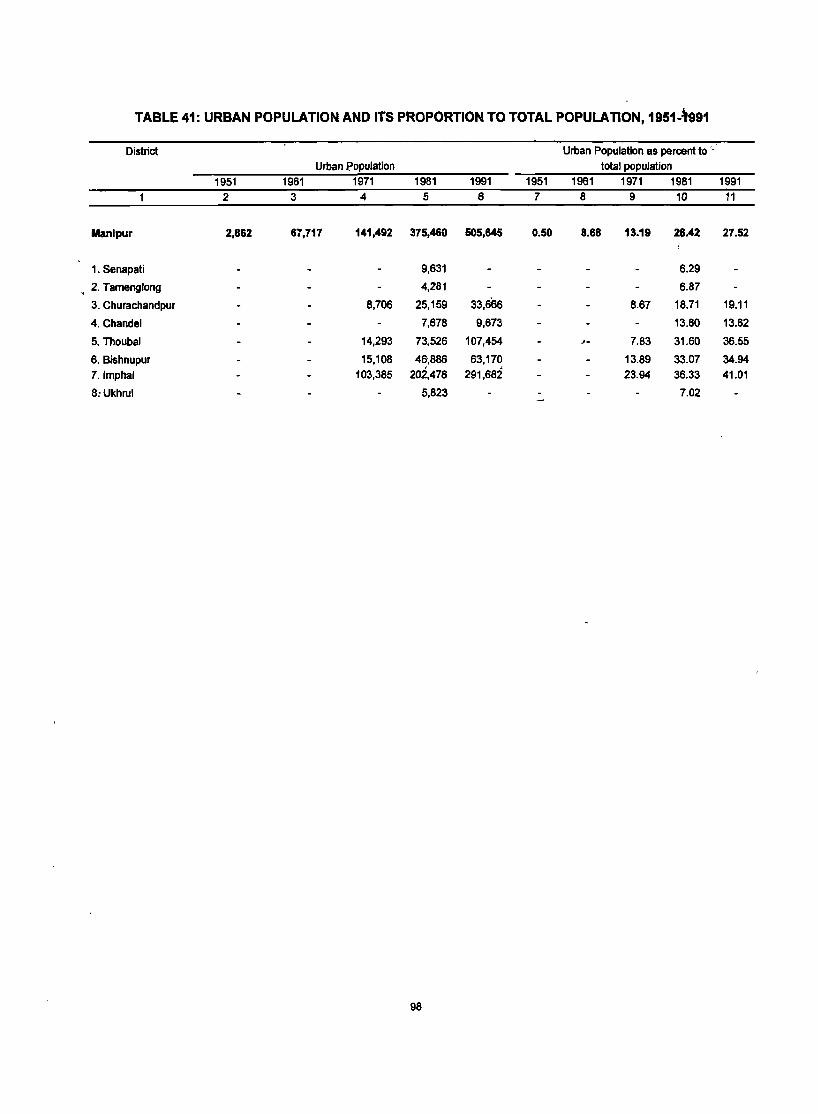
TABLE 41: URBAN POPULATION AND ITS PROPORTION TO TOTAL POPULATION, 1951-~991
District Urban Population as percent to --Urban p,opuJation total population
1951 1961 1971 1981 1991 1951 1961 1971 1981 1991 2 3 4 5 6 7 8 9 10 11
Manipur 2,862 67,717 141,492 375,460 505,645 0.50 8.68 13.19 26.42 27.52
1. Senapati 9,631 6.29
" 2. TamengJong 4,281 6.87
3. Churachandpur 8,706 25,159 33,666 8.67 18.71 19.11
4. Chandel 7,678 9,673 13.60 13.62
5. ThoubaJ 14,293 73,526 107,454 f- 7.83 31.60 36.55
6. Bishnupur 15,108 46,886 63,170 13.89 33.07 34.94 7.lmphal 103,385 202,476 291,682 23.94 36.33 41.01
8:Ukhrul 5,823 7.02
98


