Embed Size (px)
Citation preview
1 23
Environmental Earth Sciences ISSN 1866-6280Volume 65Number 4 Environ Earth Sci (2012) 65:1203-1213DOI 10.1007/s12665-011-1368-2
Influence of hydrogeochemical processes ontemporal changes in groundwater qualityin a part of Nalgonda district, AndhraPradesh, India
R. Rajesh, K. Brindha, R. Murugan &L. Elango

1 23
Your article is protected by copyright and
all rights are held exclusively by Springer-
Verlag. This e-offprint is for personal use only
and shall not be self-archived in electronic
repositories. If you wish to self-archive your
work, please use the accepted author’s
version for posting to your own website or
your institution’s repository. You may further
deposit the accepted author’s version on a
funder’s repository at a funder’s request,
provided it is not made publicly available until
12 months after publication.
ORIGINAL ARTICLE
Influence of hydrogeochemical processes on temporal changesin groundwater quality in a part of Nalgonda district,Andhra Pradesh, India
R. Rajesh • K. Brindha • R. Murugan •
L. Elango
Received: 2 March 2011 / Accepted: 17 September 2011 / Published online: 8 October 2011
� Springer-Verlag 2011
Abstract Geochemical processes that take place in the
aquifer have played a major role in spatial and temporal
variations of groundwater quality. This study was carried out
with an objective of identifying the hydrogeochemical pro-
cesses that controls the groundwater quality in a weathered
hard rock aquifer in a part of Nalgonda district, Andhra Pra-
desh, India. Groundwater samples were collected from 45
wells once every 2 months from March 2008 to September
2009. Chemical parameters of groundwater such as ground-
water level, EC and pH were measured insitu. The major ion
concentrations such as Ca2?, Mg2?, Na?, K?, Cl-, and SO42-
were analyzed using ion chromatograph. CO3- and HCO3
-
concentration was determined by acid–base titration. The
abundance of major cation concentration in groundwater is as
Na? [ Ca2? [ Mg2? [ K? while that of anions is
HCO3- [ SO4
2- [ Cl- [ CO3-. Ca–HCO3, Na–Cl, Ca–
Na–HCO3 and Ca–Mg–Cl are the dominant groundwater
types in this area. Relation between temporal variation in
groundwater level and saturation index of minerals reveals the
evaporation process. The ion-exchange process controls the
concentration of ions such as calcium, magnesium and
sodium. The ionic ratio of Ca/Mg explains the contribution of
calcite and dolomite to groundwater. In general, the geo-
chemical processes and temporal variation of groundwater in
this area are influenced by evaporation processes, ion
exchange and dissolution of minerals.
Keywords Hard rock � Saturation Index � PHREEQC �Evaporation � Dissolution of minerals
Introduction
Groundwater chemistry of a region is generally not homo-
geneous and it is controlled by geochemical processes, flow
and recharge processes, evaporation, evapotranspiration and
possible presence of contamination sources. Identification of
various geochemical processes will help to understand the
causes for changes in water quality due to the interaction with
aquifer material, especially in weathered rock formations.
Hydrogeochemical studies in turn assist in planning man-
agement and remedial measures to protect aquifers that are
contaminated by natural and anthropogenic activities. Thus,
detailed knowledge on geochemical process that control
groundwater chemistry is very essential to understand and
deal with the groundwater related issues. The cause for the
changes in groundwater quality by anthropogenic activity
like agriculture is also an important issue in arid and semiarid
region. The geochemical properties of groundwater depend
on the chemistry of water in the recharge area as well as on
the different geological processes that take place in the
subsurface. The groundwater chemically evolves due to the
interaction with aquifer minerals or by the intermixing
among the different groundwater reservoirs along the flow
path in the subsurface (Domenico 1972; Wallick and Toth
1976). Jalali (2005) reported that the dissolution of carbonate
minerals, cation exchange and weathering of silicates control
the groundwater chemistry in semiarid region of western
Iran. Martinez and Bocanegra (2002) indicated that cation
exchange and calcite equilibrium are the important hydrog-
eochemical processes that control the groundwater compo-
sition. Hydrochemical processes such as dissolution,
weathering of carbonate minerals and ion exchange are
responsible for groundwater quality in Delhi, India (Kumar
et al. 2006). Singh et al. (2008) indicated the impact of
mining allied activities on groundwater quality in the upper
R. Rajesh � K. Brindha � R. Murugan � L. Elango (&)
Department of Geology, Anna University,
Chennai 600025, India
e-mail: [email protected]; [email protected]
123
Environ Earth Sci (2012) 65:1203–1213
DOI 10.1007/s12665-011-1368-2
Author's personal copy
catchment of Damodar River basin, India. Even though there
are several studies on hydrogeochemical processes in the
arid region of alluvial and basaltic terrain no major research
has been carried out in arid regions of granitic terrain.
Implication of irrigation activity, evaporation and geo-
chemical processes of granitic aquifers need to be under-
stood. The granitic terrain of Archean age found in most part
of the central southern India is one such area with arid cli-
mate and irrigation activity. The present study was carried
out in granitic terrain of part of Nalgonda district, Andhra
Pradesh, India. The Nalgonda district in South India is well
known for high concentration of fluoride in groundwater
(Rao 1991). Influence of aquifer materials, availability of
fluoride rich minerals and intense weathering processes have
accentuated the release of fluoride from rocks and soils to
groundwater under the alkaline environment in Wallipalli
watershed, Nalgonda district, Southern India (Reddy et al.
2010). Hydrogeochemical exploration for targeting uncon-
formity related uranium mineralization in Kurnool Group
sediments located southeast of Nalgonda district was carried
out by Singh et al. (2002). Other studies in this area con-
centrated only on fluoride, nitrate (Brindha et al. 2010, 2011)
and bromide (Brindha and Elango 2010) concentration in
groundwater. However, no research had been carried out to
identify the hydrogeochemical processes based on regular
monitoring of groundwater level over space and time. Hence,
the present study was carried out in a part of Nalgonda dis-
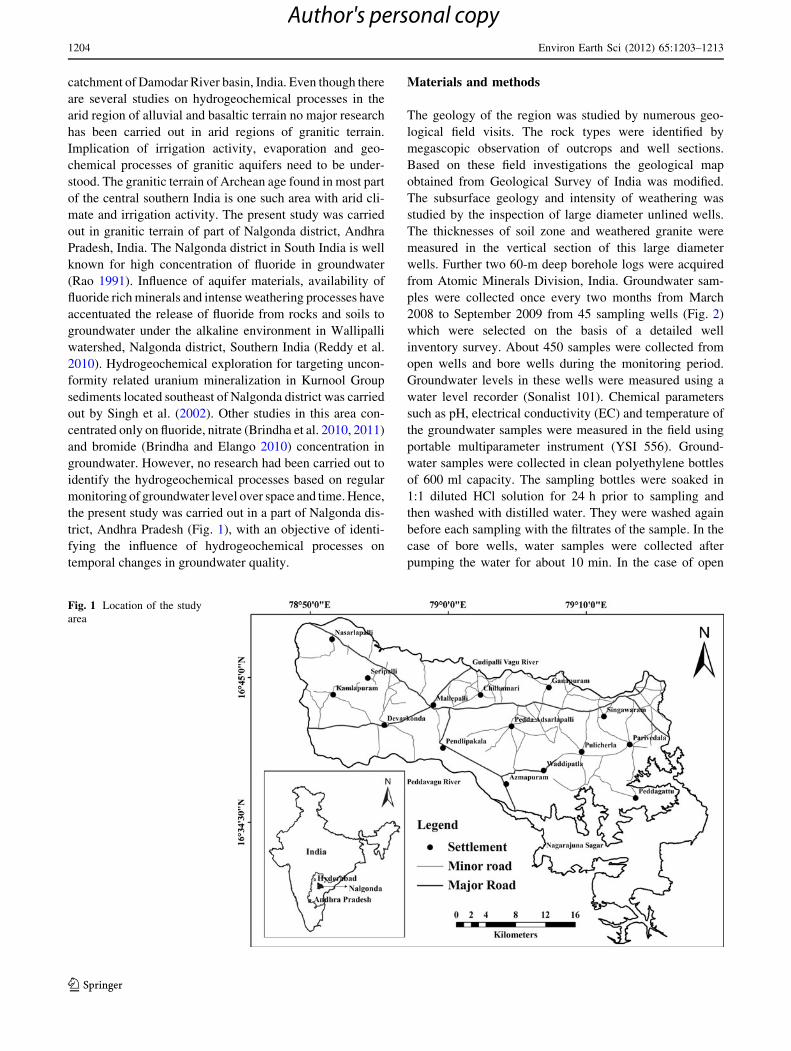
trict, Andhra Pradesh (Fig. 1), with an objective of identi-
fying the influence of hydrogeochemical processes on
temporal changes in groundwater quality.
Materials and methods
The geology of the region was studied by numerous geo-
logical field visits. The rock types were identified by
megascopic observation of outcrops and well sections.
Based on these field investigations the geological map
obtained from Geological Survey of India was modified.
The subsurface geology and intensity of weathering was
studied by the inspection of large diameter unlined wells.
The thicknesses of soil zone and weathered granite were
measured in the vertical section of this large diameter
wells. Further two 60-m deep borehole logs were acquired
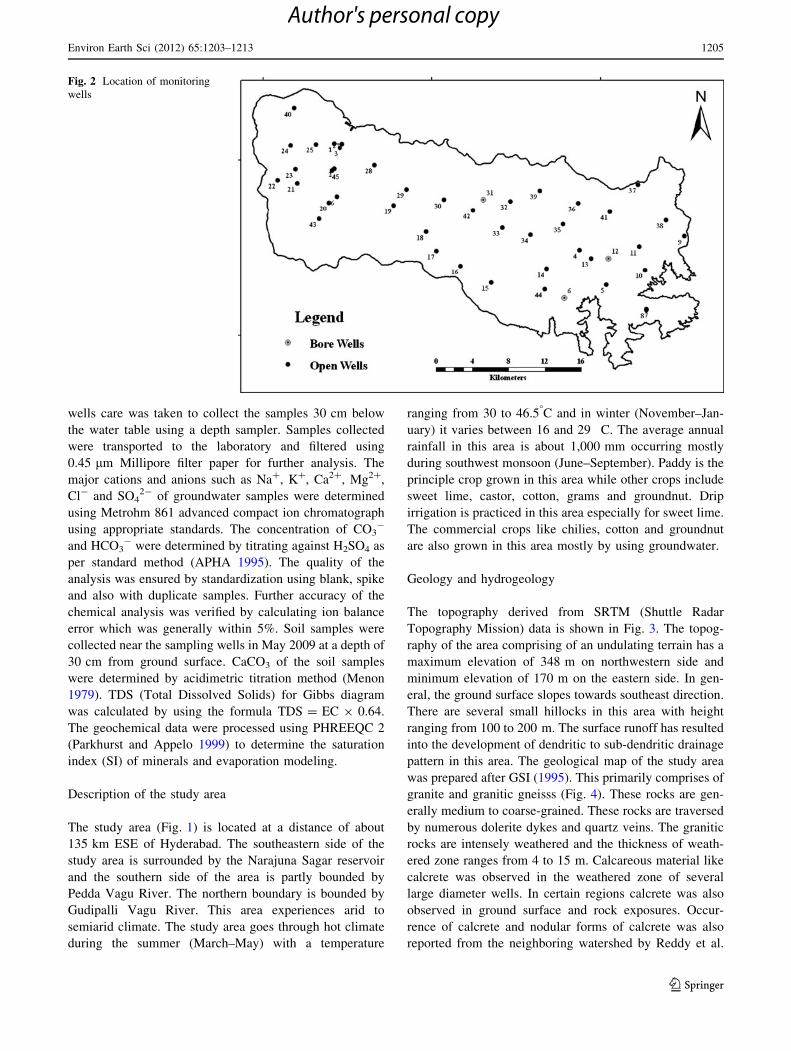
from Atomic Minerals Division, India. Groundwater sam-
ples were collected once every two months from March
2008 to September 2009 from 45 sampling wells (Fig. 2)
which were selected on the basis of a detailed well
inventory survey. About 450 samples were collected from
open wells and bore wells during the monitoring period.
Groundwater levels in these wells were measured using a
water level recorder (Sonalist 101). Chemical parameters
such as pH, electrical conductivity (EC) and temperature of
the groundwater samples were measured in the field using
portable multiparameter instrument (YSI 556). Ground-
water samples were collected in clean polyethylene bottles
of 600 ml capacity. The sampling bottles were soaked in
1:1 diluted HCl solution for 24 h prior to sampling and
then washed with distilled water. They were washed again
before each sampling with the filtrates of the sample. In the
case of bore wells, water samples were collected after
pumping the water for about 10 min. In the case of open
Fig. 1 Location of the study
area
1204 Environ Earth Sci (2012) 65:1203–1213
123
Author's personal copy
wells care was taken to collect the samples 30 cm below
the water table using a depth sampler. Samples collected
were transported to the laboratory and filtered using
0.45 lm Millipore filter paper for further analysis. The
major cations and anions such as Na?, K?, Ca2?, Mg2?,
Cl- and SO42- of groundwater samples were determined
using Metrohm 861 advanced compact ion chromatograph
using appropriate standards. The concentration of CO3-
and HCO3- were determined by titrating against H2SO4 as
per standard method (APHA 1995). The quality of the
analysis was ensured by standardization using blank, spike
and also with duplicate samples. Further accuracy of the
chemical analysis was verified by calculating ion balance
error which was generally within 5%. Soil samples were
collected near the sampling wells in May 2009 at a depth of
30 cm from ground surface. CaCO3 of the soil samples
were determined by acidimetric titration method (Menon
1979). TDS (Total Dissolved Solids) for Gibbs diagram
was calculated by using the formula TDS = EC 9 0.64.
The geochemical data were processed using PHREEQC 2
(Parkhurst and Appelo 1999) to determine the saturation
index (SI) of minerals and evaporation modeling.
Description of the study area
The study area (Fig. 1) is located at a distance of about
135 km ESE of Hyderabad. The southeastern side of the
study area is surrounded by the Narajuna Sagar reservoir
and the southern side of the area is partly bounded by
Pedda Vagu River. The northern boundary is bounded by
Gudipalli Vagu River. This area experiences arid to
semiarid climate. The study area goes through hot climate
during the summer (March–May) with a temperature
ranging from 30 to 46.5�C and in winter (November–Jan-
uary) it varies between 16 and 29 Æ C. The average annual
rainfall in this area is about 1,000 mm occurring mostly
during southwest monsoon (June–September). Paddy is the
principle crop grown in this area while other crops include
sweet lime, castor, cotton, grams and groundnut. Drip
irrigation is practiced in this area especially for sweet lime.
The commercial crops like chilies, cotton and groundnut
are also grown in this area mostly by using groundwater.
Geology and hydrogeology
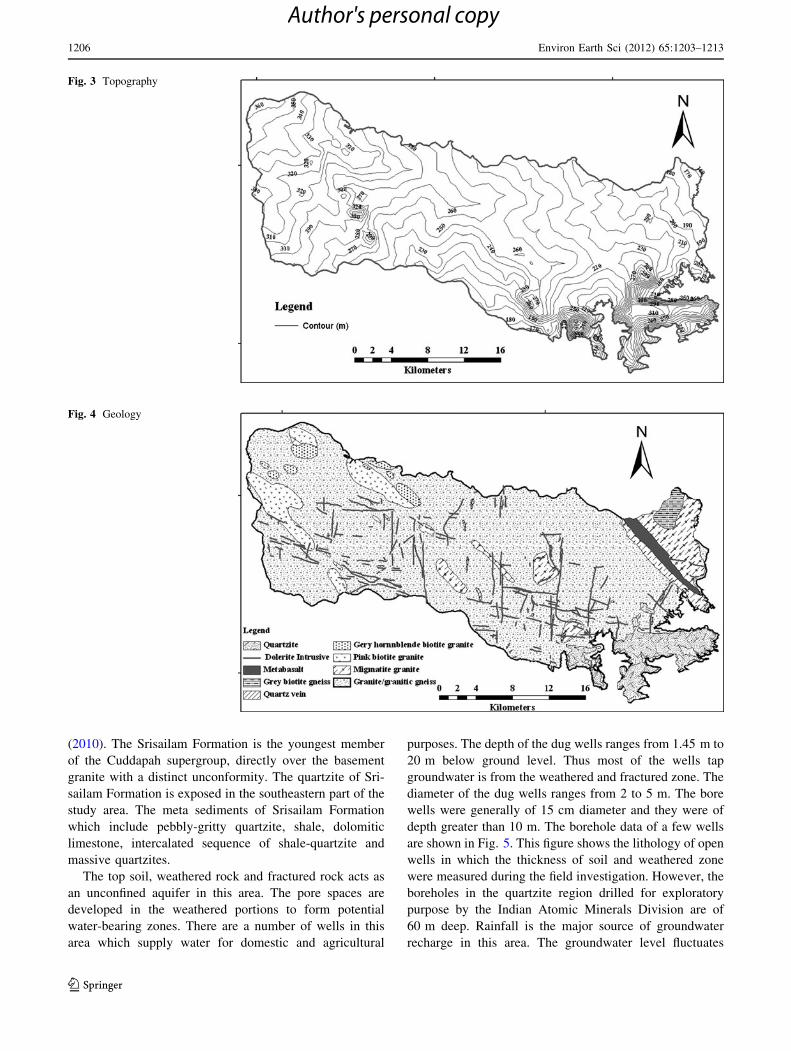
The topography derived from SRTM (Shuttle Radar
Topography Mission) data is shown in Fig. 3. The topog-
raphy of the area comprising of an undulating terrain has a
maximum elevation of 348 m on northwestern side and
minimum elevation of 170 m on the eastern side. In gen-
eral, the ground surface slopes towards southeast direction.
There are several small hillocks in this area with height
ranging from 100 to 200 m. The surface runoff has resulted
into the development of dendritic to sub-dendritic drainage
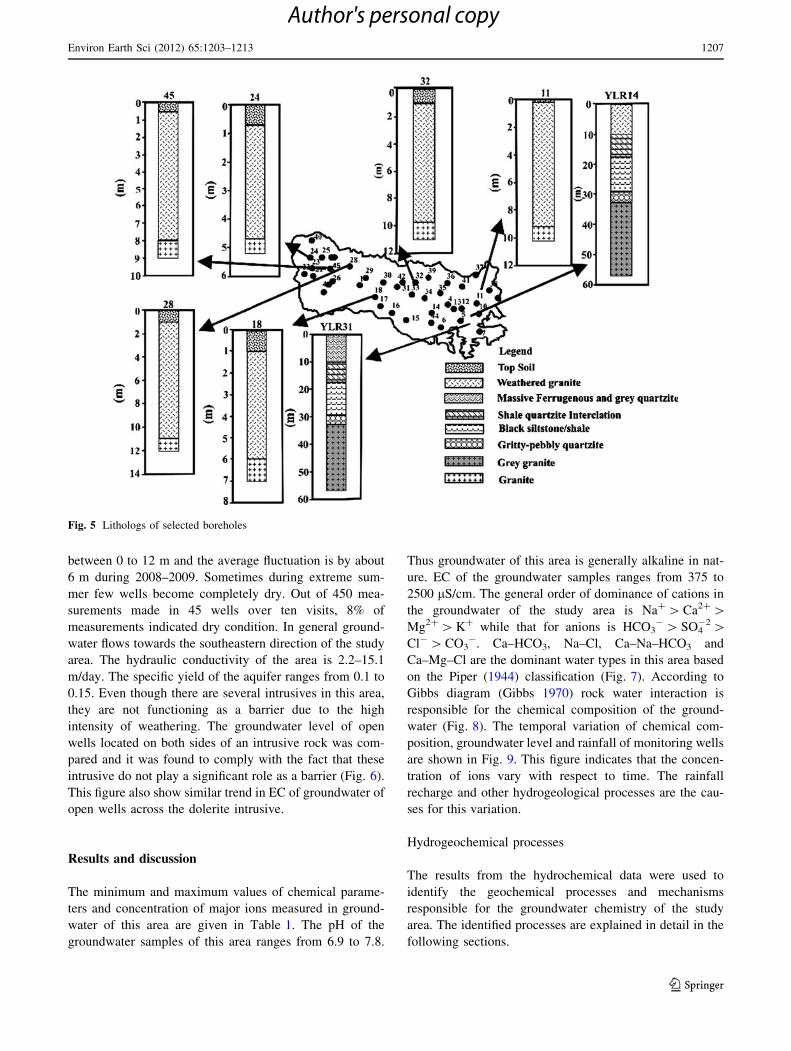
pattern in this area. The geological map of the study area
was prepared after GSI (1995). This primarily comprises of
granite and granitic gneisss (Fig. 4). These rocks are gen-
erally medium to coarse-grained. These rocks are traversed
by numerous dolerite dykes and quartz veins. The granitic
rocks are intensely weathered and the thickness of weath-
ered zone ranges from 4 to 15 m. Calcareous material like
calcrete was observed in the weathered zone of several
large diameter wells. In certain regions calcrete was also
observed in ground surface and rock exposures. Occur-
rence of calcrete and nodular forms of calcrete was also
reported from the neighboring watershed by Reddy et al.
Fig. 2 Location of monitoring
wells
Environ Earth Sci (2012) 65:1203–1213 1205
123
Author's personal copy
(2010). The Srisailam Formation is the youngest member
of the Cuddapah supergroup, directly over the basement
granite with a distinct unconformity. The quartzite of Sri-
sailam Formation is exposed in the southeastern part of the
study area. The meta sediments of Srisailam Formation
which include pebbly-gritty quartzite, shale, dolomitic
limestone, intercalated sequence of shale-quartzite and
massive quartzites.
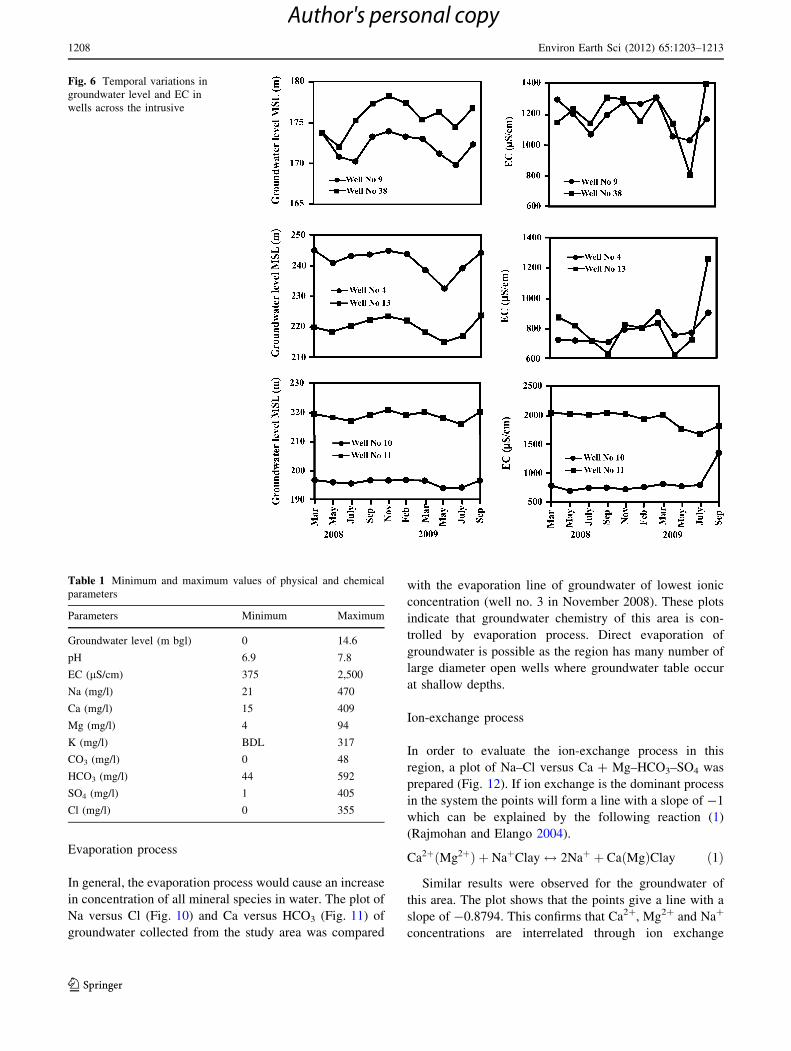
The top soil, weathered rock and fractured rock acts as
an unconfined aquifer in this area. The pore spaces are
developed in the weathered portions to form potential
water-bearing zones. There are a number of wells in this
area which supply water for domestic and agricultural
purposes. The depth of the dug wells ranges from 1.45 m to
20 m below ground level. Thus most of the wells tap
groundwater is from the weathered and fractured zone. The
diameter of the dug wells ranges from 2 to 5 m. The bore
wells were generally of 15 cm diameter and they were of
depth greater than 10 m. The borehole data of a few wells
are shown in Fig. 5. This figure shows the lithology of open
wells in which the thickness of soil and weathered zone
were measured during the field investigation. However, the
boreholes in the quartzite region drilled for exploratory
purpose by the Indian Atomic Minerals Division are of
60 m deep. Rainfall is the major source of groundwater
recharge in this area. The groundwater level fluctuates
Fig. 3 Topography
Fig. 4 Geology
1206 Environ Earth Sci (2012) 65:1203–1213
123
Author's personal copy
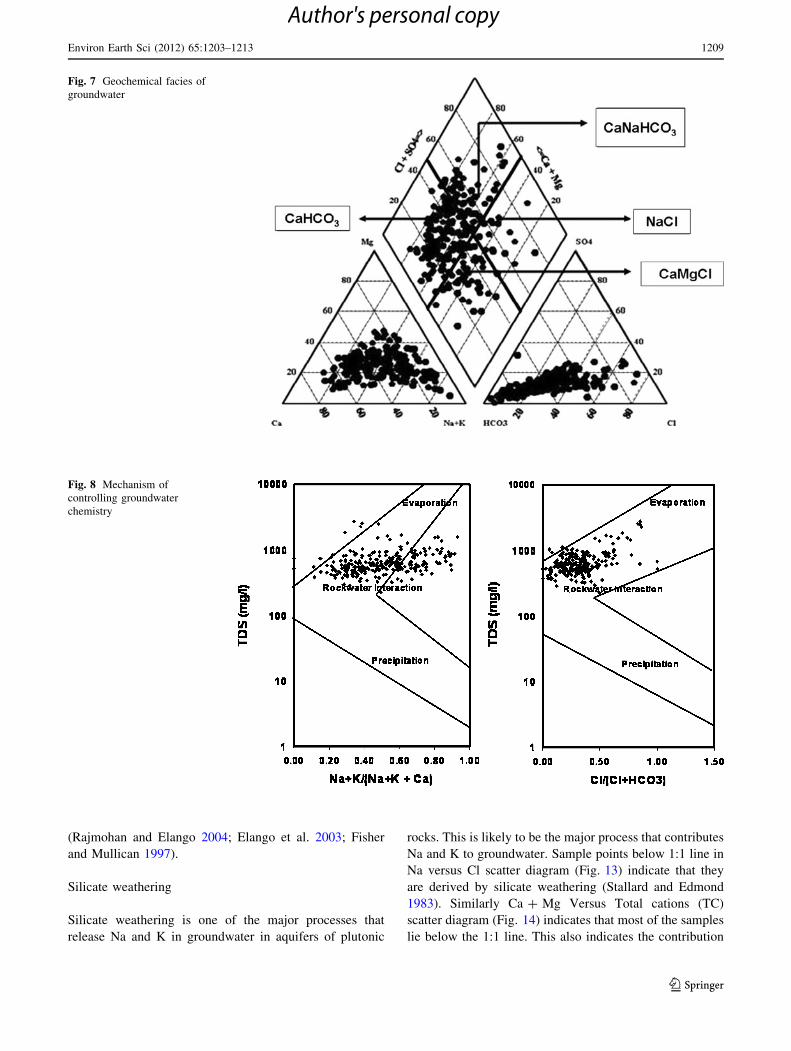
between 0 to 12 m and the average fluctuation is by about
6 m during 2008–2009. Sometimes during extreme sum-
mer few wells become completely dry. Out of 450 mea-
surements made in 45 wells over ten visits, 8% of
measurements indicated dry condition. In general ground-
water flows towards the southeastern direction of the study
area. The hydraulic conductivity of the area is 2.2–15.1
m/day. The specific yield of the aquifer ranges from 0.1 to
0.15. Even though there are several intrusives in this area,
they are not functioning as a barrier due to the high
intensity of weathering. The groundwater level of open
wells located on both sides of an intrusive rock was com-
pared and it was found to comply with the fact that these
intrusive do not play a significant role as a barrier (Fig. 6).
This figure also show similar trend in EC of groundwater of
open wells across the dolerite intrusive.
Results and discussion
The minimum and maximum values of chemical parame-
ters and concentration of major ions measured in ground-
water of this area are given in Table 1. The pH of the
groundwater samples of this area ranges from 6.9 to 7.8.
Thus groundwater of this area is generally alkaline in nat-
ure. EC of the groundwater samples ranges from 375 to
2500 lS/cm. The general order of dominance of cations in
the groundwater of the study area is Na? [ Ca2? [Mg2? [ K? while that for anions is HCO3
- [ SO4-2 [
Cl- [ CO3-. Ca–HCO3, Na–Cl, Ca–Na–HCO3 and
Ca–Mg–Cl are the dominant water types in this area based
on the Piper (1944) classification (Fig. 7). According to
Gibbs diagram (Gibbs 1970) rock water interaction is
responsible for the chemical composition of the ground-
water (Fig. 8). The temporal variation of chemical com-
position, groundwater level and rainfall of monitoring wells
are shown in Fig. 9. This figure indicates that the concen-
tration of ions vary with respect to time. The rainfall
recharge and other hydrogeological processes are the cau-
ses for this variation.
Hydrogeochemical processes
The results from the hydrochemical data were used to
identify the geochemical processes and mechanisms
responsible for the groundwater chemistry of the study
area. The identified processes are explained in detail in the
following sections.
Fig. 5 Lithologs of selected boreholes
Environ Earth Sci (2012) 65:1203–1213 1207
123
Author's personal copy
Evaporation process
In general, the evaporation process would cause an increase
in concentration of all mineral species in water. The plot of
Na versus Cl (Fig. 10) and Ca versus HCO3 (Fig. 11) of
groundwater collected from the study area was compared
with the evaporation line of groundwater of lowest ionic
concentration (well no. 3 in November 2008). These plots
indicate that groundwater chemistry of this area is con-
trolled by evaporation process. Direct evaporation of
groundwater is possible as the region has many number of
large diameter open wells where groundwater table occur
at shallow depths.
Ion-exchange process
In order to evaluate the ion-exchange process in this
region, a plot of Na–Cl versus Ca ? Mg–HCO3–SO4 was
prepared (Fig. 12). If ion exchange is the dominant process
in the system the points will form a line with a slope of -1
which can be explained by the following reaction (1)
(Rajmohan and Elango 2004).
Ca2þðMg2þÞ þ NaþClay$ 2Naþ þ CaðMgÞClay ð1Þ
Similar results were observed for the groundwater of
this area. The plot shows that the points give a line with a
slope of -0.8794. This confirms that Ca2?, Mg2? and Na?
concentrations are interrelated through ion exchange
Fig. 6 Temporal variations in
groundwater level and EC in
wells across the intrusive
Table 1 Minimum and maximum values of physical and chemical
parameters
Parameters Minimum Maximum
Groundwater level (m bgl) 0 14.6
pH 6.9 7.8
EC (lS/cm) 375 2,500
Na (mg/l) 21 470
Ca (mg/l) 15 409
Mg (mg/l) 4 94
K (mg/l) BDL 317
CO3 (mg/l) 0 48
HCO3 (mg/l) 44 592
SO4 (mg/l) 1 405
Cl (mg/l) 0 355
1208 Environ Earth Sci (2012) 65:1203–1213
123
Author's personal copy
(Rajmohan and Elango 2004; Elango et al. 2003; Fisher
and Mullican 1997).
Silicate weathering
Silicate weathering is one of the major processes that
release Na and K in groundwater in aquifers of plutonic
rocks. This is likely to be the major process that contributes
Na and K to groundwater. Sample points below 1:1 line in
Na versus Cl scatter diagram (Fig. 13) indicate that they
are derived by silicate weathering (Stallard and Edmond
1983). Similarly Ca ? Mg Versus Total cations (TC)
scatter diagram (Fig. 14) indicates that most of the samples
lie below the 1:1 line. This also indicates the contribution
Fig. 7 Geochemical facies of
groundwater
Fig. 8 Mechanism of
controlling groundwater
chemistry
Environ Earth Sci (2012) 65:1203–1213 1209
123
Author's personal copy
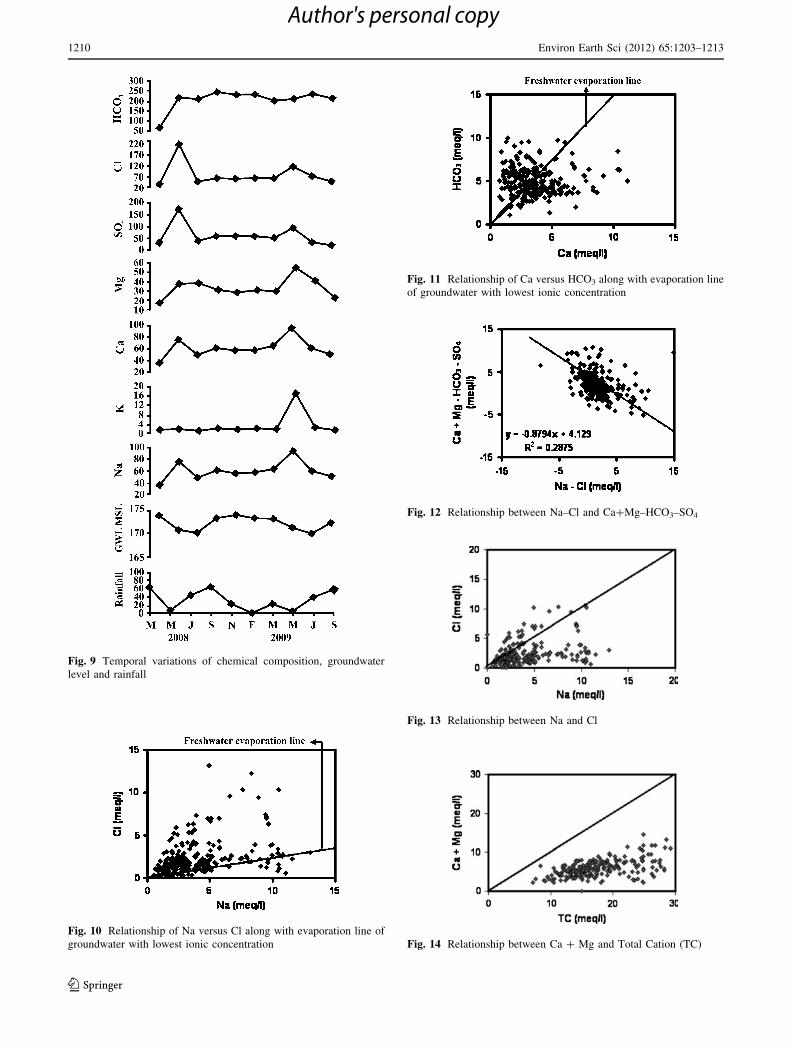
Fig. 9 Temporal variations of chemical composition, groundwater
level and rainfall
Fig. 10 Relationship of Na versus Cl along with evaporation line of
groundwater with lowest ionic concentration
Fig. 11 Relationship of Ca versus HCO3 along with evaporation line
of groundwater with lowest ionic concentration
Fig. 12 Relationship between Na–Cl and Ca?Mg–HCO3–SO4
Fig. 13 Relationship between Na and Cl
Fig. 14 Relationship between Ca ? Mg and Total Cation (TC)
1210 Environ Earth Sci (2012) 65:1203–1213
123
Author's personal copy
of Na and K to groundwater by silicate weathering. This
may be explained by the following weathering reaction (2).
Similar processes of weathering of pyroxene, amphibole
and calcic feldspar minerals, which are common in basic rocks
that are easily weatherable, controlled the concentration of
these ions in groundwater in certain other parts of southern
India and in Himalyan river basin (Jacks 1973; Bartarya
1993).
Dissolution of minerals
Mineral equilibrium calculations for groundwater are use-
ful in predicting the presence of reactive minerals in the
groundwater system and estimating the mineral reactivity
(Deutsch 1997). The SI of mineral is calculated using
SI = (IAP/Ks) (Appelo and Postma 1996), where IAP is
the ion activity product and Ks is the solubility product of
the mineral.
SI of minerals is very helpful for evaluating the
groundwater chemistry and to see if it is controlled by
equilibrium with solid phases (Appelo and Postma 1996).
If SI \ 0, the water is undersaturated, if SI = 0, the water
is in equilibrium with the mineral and if SI [ 0, the water
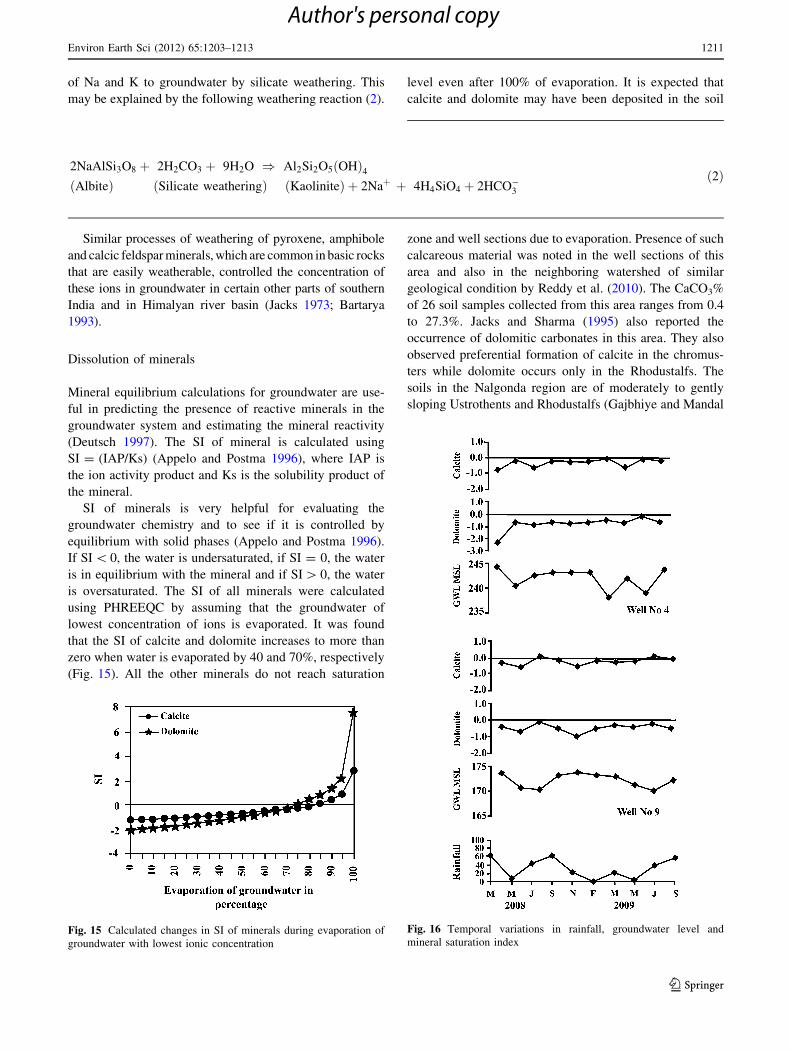
is oversaturated. The SI of all minerals were calculated
using PHREEQC by assuming that the groundwater of
lowest concentration of ions is evaporated. It was found
that the SI of calcite and dolomite increases to more than
zero when water is evaporated by 40 and 70%, respectively
(Fig. 15). All the other minerals do not reach saturation
level even after 100% of evaporation. It is expected that
calcite and dolomite may have been deposited in the soil
zone and well sections due to evaporation. Presence of such
calcareous material was noted in the well sections of this
area and also in the neighboring watershed of similar
geological condition by Reddy et al. (2010). The CaCO3%
of 26 soil samples collected from this area ranges from 0.4
to 27.3%. Jacks and Sharma (1995) also reported the
occurrence of dolomitic carbonates in this area. They also
observed preferential formation of calcite in the chromus-
ters while dolomite occurs only in the Rhodustalfs. The
soils in the Nalgonda region are of moderately to gently
sloping Ustrothents and Rhodustalfs (Gajbhiye and Mandal
Fig. 15 Calculated changes in SI of minerals during evaporation of
groundwater with lowest ionic concentration
Fig. 16 Temporal variations in rainfall, groundwater level and
mineral saturation index
2NaAlSi3O8 þ 2H2CO3 þ 9H2O ) Al2Si2O5 OHð Þ4Albiteð Þ Silicate weatheringð Þ Kaoliniteð Þ þ 2Naþ þ 4H4SiO4 þ 2HCO�3
ð2Þ
Environ Earth Sci (2012) 65:1203–1213 1211
123
Author's personal copy
2000). Hence, it is reasonable to assume that these minerals
are reactive in groundwater environment and they can
control solution concentration. The SI of calcite and
dolomite of groundwater of this area vary with time.
During recharge of rainfall, the groundwater level increases
and SI of calcite and dolomite decreases (Fig. 16). During
dry periods, when the groundwater level decreases, the SI
of these minerals increases which indicates the process of
evaporation. That is, the recharge of rainwater dissolves
these minerals deposited during the preceding dry months
in the soil zone, which increases the SI of minerals in
groundwater. If the rainfall continues for an extended
period, the saturation levels continues for an extended
period, the saturation levels of minerals decrease in
groundwater. Similar observation was made in a few other
regions of south India (Elango and Ramachandran 1991;
Rajmohan and Elango 2004). As it is an arid dry land
where irrigation is practiced with both surface and
groundwater, the water used for irrigation undergoes
evaporation leading to increase in concentration of ions.
This evaporation enriched irrigated water enters the
groundwater zone as recharge, which is pumped again for
irrigation. Thus pumping of groundwater for irrigation and
its evaporation from the irrigated area lead to increase in
concentration of salts especially carbonates in the soils.
Modeling of evaporation processes by PHREEQC also
indicates that water reaches the saturation level only for the
minerals of Calcite and Dolomite (Fig. 16).
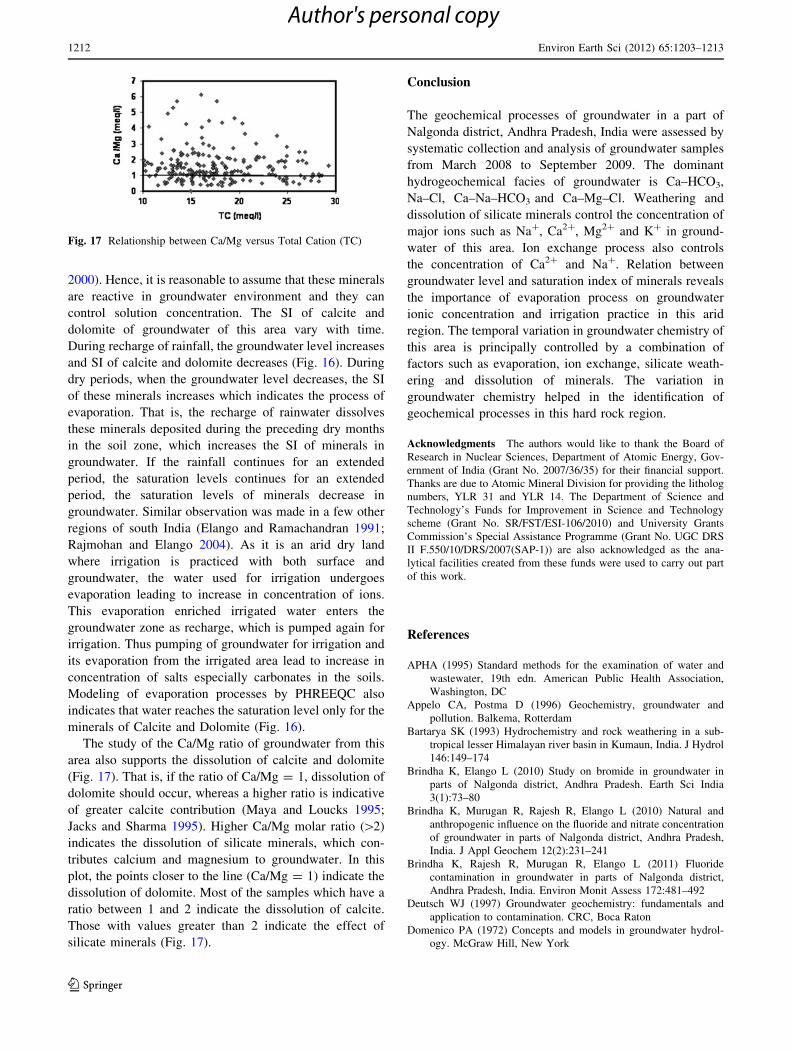
The study of the Ca/Mg ratio of groundwater from this
area also supports the dissolution of calcite and dolomite
(Fig. 17). That is, if the ratio of Ca/Mg = 1, dissolution of
dolomite should occur, whereas a higher ratio is indicative
of greater calcite contribution (Maya and Loucks 1995;
Jacks and Sharma 1995). Higher Ca/Mg molar ratio ([2)
indicates the dissolution of silicate minerals, which con-
tributes calcium and magnesium to groundwater. In this
plot, the points closer to the line (Ca/Mg = 1) indicate the
dissolution of dolomite. Most of the samples which have a
ratio between 1 and 2 indicate the dissolution of calcite.
Those with values greater than 2 indicate the effect of
silicate minerals (Fig. 17).
Conclusion
The geochemical processes of groundwater in a part of
Nalgonda district, Andhra Pradesh, India were assessed by
systematic collection and analysis of groundwater samples
from March 2008 to September 2009. The dominant
hydrogeochemical facies of groundwater is Ca–HCO3,
Na–Cl, Ca–Na–HCO3 and Ca–Mg–Cl. Weathering and
dissolution of silicate minerals control the concentration of
major ions such as Na?, Ca2?, Mg2? and K? in ground-
water of this area. Ion exchange process also controls
the concentration of Ca2? and Na?. Relation between
groundwater level and saturation index of minerals reveals
the importance of evaporation process on groundwater
ionic concentration and irrigation practice in this arid
region. The temporal variation in groundwater chemistry of
this area is principally controlled by a combination of
factors such as evaporation, ion exchange, silicate weath-
ering and dissolution of minerals. The variation in
groundwater chemistry helped in the identification of
geochemical processes in this hard rock region.
Acknowledgments The authors would like to thank the Board of
Research in Nuclear Sciences, Department of Atomic Energy, Gov-
ernment of India (Grant No. 2007/36/35) for their financial support.
Thanks are due to Atomic Mineral Division for providing the litholog
numbers, YLR 31 and YLR 14. The Department of Science and
Technology’s Funds for Improvement in Science and Technology
scheme (Grant No. SR/FST/ESI-106/2010) and University Grants
Commission’s Special Assistance Programme (Grant No. UGC DRS
II F.550/10/DRS/2007(SAP-1)) are also acknowledged as the ana-
lytical facilities created from these funds were used to carry out part
of this work.
References
APHA (1995) Standard methods for the examination of water and
wastewater, 19th edn. American Public Health Association,
Washington, DC
Appelo CA, Postma D (1996) Geochemistry, groundwater and
pollution. Balkema, Rotterdam
Bartarya SK (1993) Hydrochemistry and rock weathering in a sub-
tropical lesser Himalayan river basin in Kumaun, India. J Hydrol
146:149–174
Brindha K, Elango L (2010) Study on bromide in groundwater in
parts of Nalgonda district, Andhra Pradesh. Earth Sci India
3(1):73–80
Brindha K, Murugan R, Rajesh R, Elango L (2010) Natural and
anthropogenic influence on the fluoride and nitrate concentration
of groundwater in parts of Nalgonda district, Andhra Pradesh,
India. J Appl Geochem 12(2):231–241
Brindha K, Rajesh R, Murugan R, Elango L (2011) Fluoride
contamination in groundwater in parts of Nalgonda district,
Andhra Pradesh, India. Environ Monit Assess 172:481–492
Deutsch WJ (1997) Groundwater geochemistry: fundamentals and
application to contamination. CRC, Boca Raton
Domenico PA (1972) Concepts and models in groundwater hydrol-
ogy. McGraw Hill, New York
Fig. 17 Relationship between Ca/Mg versus Total Cation (TC)
1212 Environ Earth Sci (2012) 65:1203–1213
123
Author's personal copy
Elango L, Ramachandran S (1991) Major ion correlations in
groundwater of a coastal aquifer Journal of Indian Water
Resources Society 11:54–57
Elango L, Kannan R, Senthilkumar M (2003) Major ion chemistry
and identification of hydrogeochemical processes of ground
water in a part of Kancheepuram district, Tamil Nadu, India.
Environ Geosci 10(4):157–166
Fisher SR, Mullican WF (1997) Hydrogeochemical evolution of
sodium-sulfate and sodium-chloride groundwater beneath the
northern Chihuahua desert, Trans-Pecos, Texas, USA. J Hydro-
geo 5(2):4–16
Gajbhiye, KS, Mandal C (2000) Agro-Ecological Zones, their Soil
Resource and Cropping Systems, Status of Farm Mechanization
in India, Cropping Systems, Status of Farm Mechanization in
India, pp 1–32
Gibbs RJ (1970) Mechanisms controlling world water chemistry.
Science 170:795–840
GSI (1995) Geological Survey of India’s Geology and minerals map
of Nalgonda district, Andhra Pradesh, India
Jacks G (1973) Chemistry of groundwater in a district in Southern
India. J Hydro 18:185–200
Jacks G, Sharma VP (1995) Geochemistry of calcic horizons in
relation to hillslope processes, southern India. Geoderma
67:203–214
Jalali M (2005) Major ion chemistry of groundwaters in the Bahar
area, Hamadan, Western Iran. J Env Geo 47:763–772
Kumar M, Ramanathan AL, Rao MS, Kumar B (2006) Identification
and evoluation of hydrogeochemical processes in the ground-
water environment of Delhi, India. J Env Geo 50:1025–1039
Martinez DE, Bocanegra EM (2002) Hydrogeochemistry and cation
exchange processes in the coastal aquifer of Mar Del Plata.
Argentina. J Hydrogeo 10:393–408
Maya AL, Loucks MD (1995) Solute and isotopic geochemistry and
groundwater flow in the Central Wasatch Range. UtahJ Hydro
172:31–59
Menon RG(1979) Physical and chemical methods of soil analysis, A
laboratory manual prepared for the use of technicians working in
the soil laboratories of the FAO/UNDP/URT project ‘‘National
Soil Service’’ (English), FAO, Rome (Italy), Agriculture
Department 188
Parkhurst DL, Appelo CAJ (1999) A computer program for speci-
ation, batch-reaction, one-dimensional transport and inverse
geochemical calculations: Water resource investigation, US
Geological Survey, a report, pp 99–4259
Piper AM (1944) A Graphical interpretation of water- analysis. Trans
Am Geophys Union 25:914–928
Rajmohan N, Elango L (2004) Identification and evolution of
hydrogeochemical processes of groundwater environment in an
area of the Palar and Cheyyar River Basins, Southern India.
J Env Geo 46:47–61
Rao NVRM (1991) Hydro-geochemistry and fluoride in Nalgonda
district of Andhra Pradesh, India. International symposium on
applied geochemistry. Osmania University, Hyderabad,
pp 255–261
Reddy DV, Nagabhushanam P, Sukhija BS, Reddy AGS, Smedly PL
(2010) Fluoride dynamics in the granitic aquifer of the Waila-
pally watershed, Nalgonda District, India. J Chem Geo
269:278–289
Singh RV, Sinha RM, Bisht BS, Banerjee DC (2002) Hydrogeo-
chemical exploration for unconformity-related uranium miner-
alization: example from Palanudu sub-basin, Cuddapah Basin,
Andhrapradesh, India. J Geo Exp 76:71–92
Singh AK, Mondal GC, Kumar S, Singh TB, Tewary BK, Sinha A
(2008) Major ion chemistry, weathering processes and water
quality assessment in upper catchement of Damoda River basin,
India. J Env Geo 54:745–758
Stallard RF, Edmond JM (1983) Geochemistry of the Amazon: the
influence of geology and weathering environment on the
dissolved load. J Geophy Res 88:9671–9688
Wallick EI, Toth J (1976) Methods of regional groundwater flow
analysis with suggestions for the use of environmental isotope
and hydrochemical data in groundwater hydrology, pp 37–64
Environ Earth Sci (2012) 65:1203–1213 1213
123
Author's personal copy


