Embed Size (px)
Citation preview
Journal of Food Engineering 108 (2012) 43–50
Contents lists available at ScienceDirect
Journal of Food Engineering
journal homepage: www.elsevier .com/ locate / j foodeng
Glass transition phenomenon on shrinkage of papaya during convective drying
Louise Emy Kurozawa a,c,⇑, Miriam Dupas Hubinger b, Kil Jin Park c
a Department of Food Technology, Rural Federal University of Rio de Janeiro, Seropédica, RJ 23890-000, Brazilb Department of Food Engineering, Faculty of Food Engineering, University of Campinas, Campinas, SP 13083-970, Brazilc Faculty of Agricultural Engineering, University of Campinas, Campinas, SP 13084-971, Brazil
a r t i c l e i n f o a b s t r a c t
Article history:Received 11 June 2011Received in revised form 25 July 2011Accepted 26 July 2011Available online 3 August 2011
Keywords:Desorption isothermPhase transitionModelingEffective diffusivityCubical configurationCoefficient of shrinkage
0260-8774 � 2011 Elsevier Ltd.doi:10.1016/j.jfoodeng.2011.07.033
⇑ Corresponding author at: Department of FoodUniversity of Rio de Janeiro, Seropédica, RJ 23890-01076.
E-mail address: [email protected] (L.E. Kur
Open access under the El
A differential scanning calorimeter was used to determine the Tg of papaya pieces equilibrated with sev-eral water activities. Thermograms revealed the existence of two Tg. The first, which presented lowervalue, is due to the matrix formed by sugar and water. The second one, less visible and less plasticizedby water, probably corresponds to macromolecules. The data of Tg were satisfactory correlated by theGordon–Taylor model. A convective tray dryer was used for the drying experiments, which were carriedout at air temperatures of 40 �C and 70 �C and air velocity of 1.0 m/s. The shrinkage behavior was accom-plished by total area and apparent volume alterations along drying. Samples were photographed duringprocess, and their length and lateral areas were measured using the ImageJ� software. As result, the effectof air temperature on shrinkage was significant and the highest temperature (70 �C) induced higherextent of shrinkage values. At this condition, papaya sample was in a rubbery state, characterized bygreat matrix mobility, and remained so until the end of process, since product temperature (Tp) wasabove the Tg along the process. At lower temperature (40 �C), shrinkage stopped at a critical value ofmoisture content (0.21 g/g, wet basis), which coincided with the point in which the Tg was close to Tp.
� 2011 Elsevier Ltd. Open access under the Elsevier OA license.
1. Introduction
Papaya (Carica papaya L.) is an important fruit crop widelygrown in tropical and subtropical countries, and Brazil is the sec-ond world producer, with a total of 1.890 million t/year in 2008(FAO, 2008). This fruit is nutritive, rich in minerals (calcium, iron,potassium and sodium), vitamin C (ascorbic acid), b-carotene andb-cryptoxanthin (Wall, 2006) and is commonly used to makejuices, pulp, jam, fruit-candies in syrup, crystallized fruit, driedfruit and other products.
Due to their high moisture content, papayas are highly perish-able as deterioration starts soon after harvest; therefore, have beenprocessed to improve their shelf life. Amongst the various methodsemployed for preservation, drying is a process in which the wateractivity of the food is reduced by removal of the water by vaporiza-tion or sublimation, minimizing enzymatic and microbiologicalreactions. Drying is a simultaneous heat and mass transfer process,accompanied by a phase change. The drying rate depends on factorsthat influence the transfer mechanisms, such as the vapor pressureof the material and of the drying air, the temperature and air veloc-ity, water diffusion in the material, the thickness and surface ex-posed for drying (Van Arsdel, 1973; Lewicki and Jakubczyk, 2004).
Technology, Rural Federal00, Brazil. Tel.: +55 19 3521
ozawa).
sevier OA license.
Although air drying offers dehydrated products that can have anextended life of a year, the quality of a conventionally dried prod-uct, which is significantly influenced by changes which occur dur-ing food manufacturing and/or storage, is usually drasticallyreduced from that of the original foodstuff. The changes in thephysical state of the product include shrinkage, fracture, migrationof solids, case hardening and loss of rehydration ability and volatilearoma. Chemical changes (enzymatic reactions, non-enzymaticbrowning and oxidation of lipids, pigments and vitamins) are alsoaffected by physical structure, mainly due to its influence onmolecular mobility, which changes diffusivity of molecular species.An important change in the physical state of the product duringdrying is shrinkage, which affects the quality of the final material,producing large alterations in its volume. Since the material losesmoisture and suffers heating during drying, there are stresses inits cellular structure, leading to volume reduction. This phenome-non during drying may be influenced by glass transition.
Glass transition temperature (Tg) is defined as the temperatureat which an amorphous system changes from the glassy to the rub-bery state. In the glassy state, molecular mobility is extremelyslow, due to the high viscosity of the matrix (about 1012 Pa s). Thusthe Tg can be taken as a reference parameter to characterize prop-erties, quality, stability and safety of food systems (Roos, 1995).
At most drying conditions, a significant amount of the driedproduct remains in the amorphous state, mainly due to insufficienttime for crystallization to occur at the given drying condition. Fruitsamples, like papaya, due to its high moisture content, are in
Nomenclature
a constant of Eq. (5)A sample superficial area (m2)aw water activityb constant of Eq. (5)CGAB constant of Eq. (1)Def effective diffusivity (m2/s)E mean relative deviation modulus (%)k constant of Eq. (2)KGAB constant of Eq. (1)L characteristic length, sample half-thickness (m)n coefficient of shrinkage (Eq. (5))RMSE root means square errort time (s)Tg glass transition temperature (�C)Tp product temperature (�C)V sample volume (m3)
X moisture content (kg water/kg dry solids or kg water/kgsample)
Xm monolayer moisture content (g water/g dry solids or kgwater/kg sample)
w weight fractions (g/g total)Y dimensionless moisture ratio
Subscript0 initial (at t = 0)e equilibriums solidst at instant t
Greek lettersq apparent density (kg/m3)
44 L.E. Kurozawa et al. / Journal of Food Engineering 108 (2012) 43–50
rubbery state at the start of the drying and could remain likewiseas process progresses or suffer change to glassy state. At rubberystate, shrinkage almost entirely compensates for moisture lossand changes in material volume are equal to the volume ofremoved water. If the product becomes glassy, this would let it ri-gid and volume reduction is greatly restricted (Mayor and Sereno,2004; Bhandari and Howes, 1999).
In food systems, shrinkage is rarely negligible, and it is advis-able to take it into account when predicting moisture content pro-files in the material undergoing dehydration. Several authors (Park,1998; Arévalo-Pinedo et al., 2010; Zielinska and Markowski, 2010)verified models to describe mass and heat transfer during drying,with and without assumptions of volume change. The resultsshowed significant differences in effective diffusivity values andthe model with shrinkage fitted better experimental data thanthe model without shrinkage.
The aim of the present work was to evaluate the relationshipbetween the glass transition and shrinkage of papaya cubes duringconvective drying. The specific objectives were: (a) to obtain thewater desorption and glass transition temperature of papaya(C. papaya L.); (b) to model the drying curves by Fick’s model, con-sidering or not volume changes; (c) to model the shrinkage kineticsby Suzuki model.
2. Material and methods
2.1. Material
Papayas ( C. papaya L.) were purchased in a local market(Campinas, SP, Brazil) and were selected in order to obtain samplesof uniform shape, size, and ripening grade, based on skin color(80–90% of yellowness) and soluble solids content (10–12 Brix).The selected papayas were hand-peeled and cut into cubes of(20 � 20 � 20) mm. The main characteristics of the fruit were ob-tained in triplicate according to AOAC (1995). Moisture contentwas gravimetrically measured using a vacuum oven at 70 �C for48 h. Ash content was determined using a muffle furnace at550 �C for 24 h. Fiber content was obtained after acid hydrolysisof sample with hydrochloric acid and sodium hydroxide. Totalreducing sugars were found with Fehling solution.
2.2. Desorption isotherms
Desorption isotherms were determined by gravimetric method.3 g of pieces of fruit were placed into aluminium vials, weighed
and equilibrated over saturated salt solutions (LiCl, CH3COOK,MgCl2, K2CO3, Mg(NO3)2, KI, NaCl and KCl, providing relativehumidities of 11.30 ± 0.27, 22.51 ± 0.32, 32.78 ± 0.16, 43.18 ±0.39, 52.89 ± 0.22, 68.86 ± 0.24, 75.29 ± 0.12 and 84.34 ± 0.26,respectively, according to Greenspan (1977)), in desiccators at25 �C ± 1 �C until equilibrium. The sample was weighed using ananalytical balance with a resolution of 0.0001 g at regular intervalsof time until constant weight. Once equilibrium was reached, theequilibrium moisture content of the sample was measured gravi-metrically by drying in a vacuum oven at 70 �C for at least 48 hto determine the solid mass in the sample.
The isotherm model used to fit the data was GAB model (Vanden Berg and Bruin, 1981):
Xe ¼XmCGABKGABaw
1� KGABawð Þ 1� KGABaw þ CGABKGABawð Þ½ � ð1Þ
where X is moisture content at dry basis (kg water/kg solids).
2.3. Glass transition temperature
About 10 mg of papaya pieces were placed into differentialscanning calorimeter (DSC) aluminum pans (20 ll) and equili-brated over saturated salt solutions in desiccators at 25 �C ± 1 �Cuntil equilibrium was reached. Then samples were hermeticallysealed with lids for analysis and weighed. The mass of each samplepan was matched in advance with the mass empty reference pan towithin ±0.1 mg.
DSC analyses were carried out in a TA-MDSC-2920 (Ta Instru-ments, New Castle, DE, USA). For temperatures below �70 �C,liquid nitrogen was used; otherwise a mechanical refrigerationsystem (RCS-Refrigerated Cooling Accessory) was applied. Equip-ment calibration was performed with indium (Tmelting = 156.6 �C)and verification with azobenzol was done (Tmelting = 68.0 �C). Dryhelium, 25 ml/min, was used as purge gas. After cooling the sampleat 10 �C/min up to �70 �C, measurement of glass transition tem-perature was carried out and thermo–analytical curves obtainedby heating the sample at 10 �C/min up to 80 �C (or other valuesof initial and final temperatures, according to samples). The secondscanning of each sample was performed to reduce the enthalpyrelation of the amorphous product which appears in the first scan.
When a vitrification peak occurred (at aw = 0.834), the samplewas annealed at the vitrification peak temperature (�55 �C) for60 min before the second scan. The glass transition temperature(Tg), vitrification peak temperature (Td) and ice melting tempera-ture (Tm) were determined from thermograms.
L.E. Kurozawa et al. / Journal of Food Engineering 108 (2012) 43–50 45
All analyses were done in triplicate and the data were treatedby the software Universal Analysis 2.6 (TA Instruments, NewCastle, DE, USA).
To describe the plasticizing effect of water on papaya, the glasstransition temperature data were fitted by Gordon–Taylor model(Gordon and Taylor, 1952):
Tg ¼wsTg;s þ kwwTg;w
ws þ kwwð2Þ
The glass transition temperature of the water (Tg,w) was taken at�135 �C (Johary et al., 1987). Tg and Tg,s are glass transition temper-ature of the binary mixture and the dry matter (solids), respectively.Weight fraction of dry matter (solids) and water are indicated by ws
and ww, respectively. The parameter k is a constant of the model.
2.4. Air drying experiments
A convective tray dryer was used in the experiments, whichwere carried out at air temperatures of 40 �C ± 0.3 �C and 70 �C ±0.5 �C and air velocity of 1.0 m/s. The dryer system consisted of avertical airflow through the trays and was arranged as a closedcircuit. For air heating, electric resistances (3000 W) were used,manually set into operation by a digital thermostat. During drying,the sample was weighed using a semi-analytical balance with aresolution of 0.001 g at regular intervals of time until constantweight. The sample moisture contents were gravimetrically deter-mined using a vacuum oven at 70 �C for 48 h. Thermocouples con-nected to a data acquisition (Testor 171 model, TESTO, Lenzkirch,Germany) were placed on tray and inside three papaya cubes toanalyze the evolution of air temperature and temperature intothe product during the experiments.
The drying kinetics was evaluated by moisture ratio versus timecurves. These data were used to obtain effective moisture diffusiv-ity (Def) by non-linear regression. For cube materials, whenassumptions of negligible shrinkage and constant temperatureand effective diffusivity can be considered, the solution of Fick’slaw is written as shown (Crank, 1975):
Y ¼ Xt � Xe
X0 � Xe
� �¼ 8
p2
X1i¼0
1ð2iþ 1Þ exp �ð2iþ 1Þ2 p2Def
4L2 t� �( )3
ð3Þ
where: X is moisture content at dry basis (kg water/kg solids).
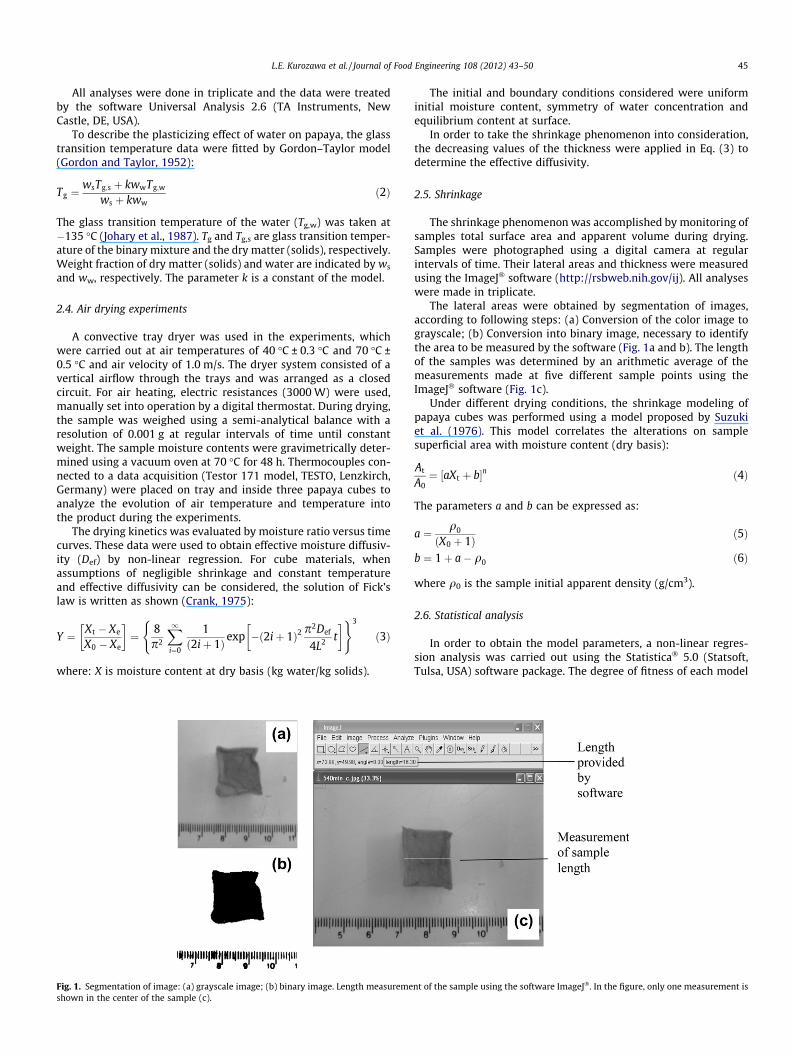
Fig. 1. Segmentation of image: (a) grayscale image; (b) binary image. Length measuremeshown in the center of the sample (c).
The initial and boundary conditions considered were uniforminitial moisture content, symmetry of water concentration andequilibrium content at surface.
In order to take the shrinkage phenomenon into consideration,the decreasing values of the thickness were applied in Eq. (3) todetermine the effective diffusivity.
2.5. Shrinkage
The shrinkage phenomenon was accomplished by monitoring ofsamples total surface area and apparent volume during drying.Samples were photographed using a digital camera at regularintervals of time. Their lateral areas and thickness were measuredusing the ImageJ� software (http://rsbweb.nih.gov/ij). All analyseswere made in triplicate.
The lateral areas were obtained by segmentation of images,according to following steps: (a) Conversion of the color image tograyscale; (b) Conversion into binary image, necessary to identifythe area to be measured by the software (Fig. 1a and b). The lengthof the samples was determined by an arithmetic average of themeasurements made at five different sample points using theImageJ� software (Fig. 1c).
Under different drying conditions, the shrinkage modeling ofpapaya cubes was performed using a model proposed by Suzukiet al. (1976). This model correlates the alterations on samplesuperficial area with moisture content (dry basis):
At
A0¼ ½aXt þ b�n ð4Þ
The parameters a and b can be expressed as:
a ¼ q0
ðX0 þ 1Þ ð5Þ
b ¼ 1þ a� q0 ð6Þ
where q0 is the sample initial apparent density (g/cm3).
2.6. Statistical analysis
In order to obtain the model parameters, a non-linear regres-sion analysis was carried out using the Statistica� 5.0 (Statsoft,Tulsa, USA) software package. The degree of fitness of each model
nt of the sample using the software ImageJ�. In the figure, only one measurement is
46 L.E. Kurozawa et al. / Journal of Food Engineering 108 (2012) 43–50
was evaluated by the determination coefficient (R2), mean relativedeviation modulus E and root means square error (RMSE).
3. Results and discussion
3.1. Material
The main characteristics of the fruit are summarized in Table 1.
3.2. Desorption isotherms
Fig. 2 shows the experimental desorption isotherm for papayaat 25 �C with its respective fitting to the GAB model. Desorptionisotherm shows an increase in equilibrium moisture content withincreasing water activity, at constant temperature. The GAB modelwas tested for adequacy and goodness of fit by determining the
Table 1Chemical composition of the papaya.
Analysis Content (wet basis, %)
Moisture 87.79 ± 0.60Total sugar 7.44 ± 0.15Reducer sugar 5.70 ± 0.05Fibers 3.23 ± 0.42Ash 0.39 ± 0.03
Fig. 2. Water desorption isotherm of papaya piece.
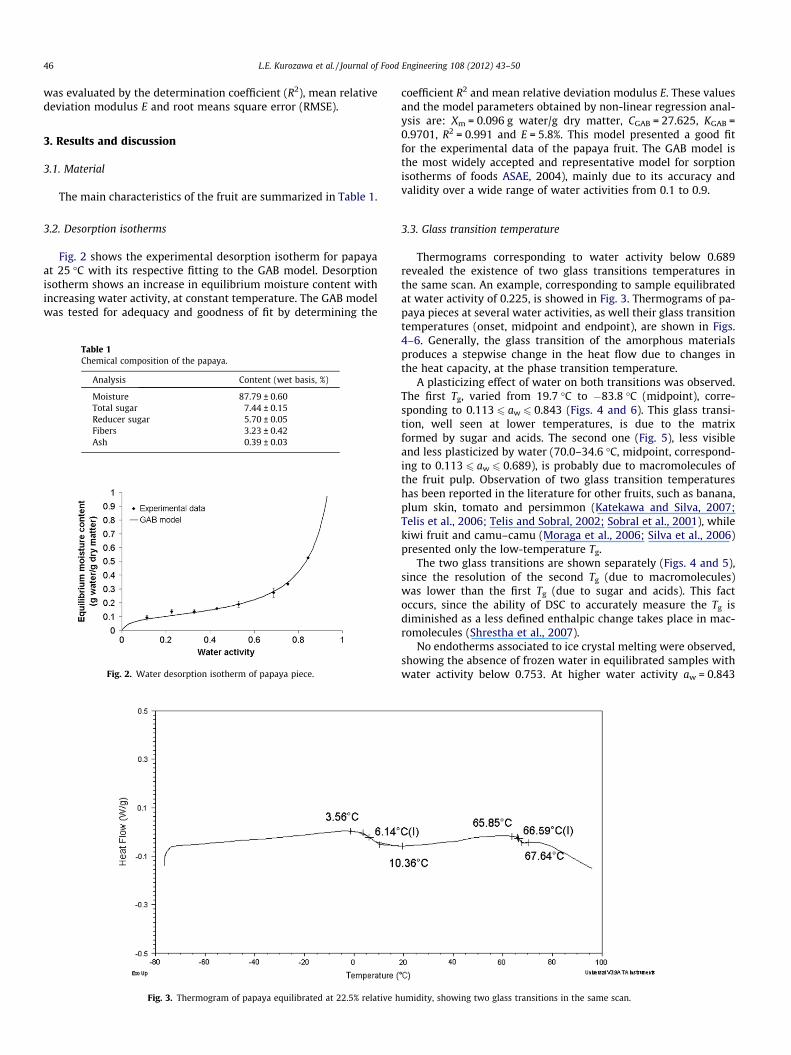
Fig. 3. Thermogram of papaya equilibrated at 22.5% relative h
coefficient R2 and mean relative deviation modulus E. These valuesand the model parameters obtained by non-linear regression anal-ysis are: Xm = 0.096 g water/g dry matter, CGAB = 27.625, KGAB =0.9701, R2 = 0.991 and E = 5.8%. This model presented a good fitfor the experimental data of the papaya fruit. The GAB model isthe most widely accepted and representative model for sorptionisotherms of foods ASAE, 2004), mainly due to its accuracy andvalidity over a wide range of water activities from 0.1 to 0.9.
3.3. Glass transition temperature
Thermograms corresponding to water activity below 0.689revealed the existence of two glass transitions temperatures inthe same scan. An example, corresponding to sample equilibratedat water activity of 0.225, is showed in Fig. 3. Thermograms of pa-paya pieces at several water activities, as well their glass transitiontemperatures (onset, midpoint and endpoint), are shown in Figs.4–6. Generally, the glass transition of the amorphous materialsproduces a stepwise change in the heat flow due to changes inthe heat capacity, at the phase transition temperature.
A plasticizing effect of water on both transitions was observed.The first Tg, varied from 19.7 �C to �83.8 �C (midpoint), corre-sponding to 0.113 6 aw 6 0.843 (Figs. 4 and 6). This glass transi-tion, well seen at lower temperatures, is due to the matrixformed by sugar and acids. The second one (Fig. 5), less visibleand less plasticized by water (70.0–34.6 �C, midpoint, correspond-ing to 0.113 6 aw 6 0.689), is probably due to macromolecules ofthe fruit pulp. Observation of two glass transition temperatureshas been reported in the literature for other fruits, such as banana,plum skin, tomato and persimmon (Katekawa and Silva, 2007;Telis et al., 2006; Telis and Sobral, 2002; Sobral et al., 2001), whilekiwi fruit and camu–camu (Moraga et al., 2006; Silva et al., 2006)presented only the low-temperature Tg.
The two glass transitions are shown separately (Figs. 4 and 5),since the resolution of the second Tg (due to macromolecules)was lower than the first Tg (due to sugar and acids). This factoccurs, since the ability of DSC to accurately measure the Tg isdiminished as a less defined enthalpic change takes place in mac-romolecules (Shrestha et al., 2007).
No endotherms associated to ice crystal melting were observed,showing the absence of frozen water in equilibrated samples withwater activity below 0.753. At higher water activity aw = 0.843
umidity, showing two glass transitions in the same scan.
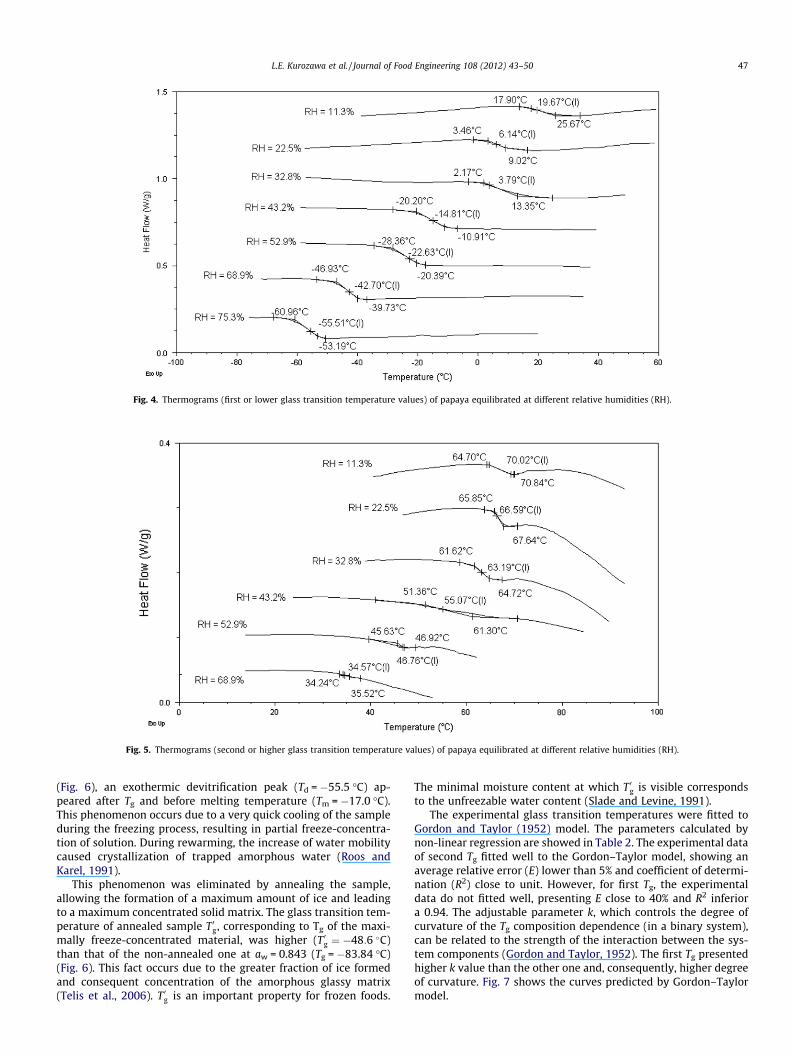
Fig. 4. Thermograms (first or lower glass transition temperature values) of papaya equilibrated at different relative humidities (RH).
Fig. 5. Thermograms (second or higher glass transition temperature values) of papaya equilibrated at different relative humidities (RH).
L.E. Kurozawa et al. / Journal of Food Engineering 108 (2012) 43–50 47
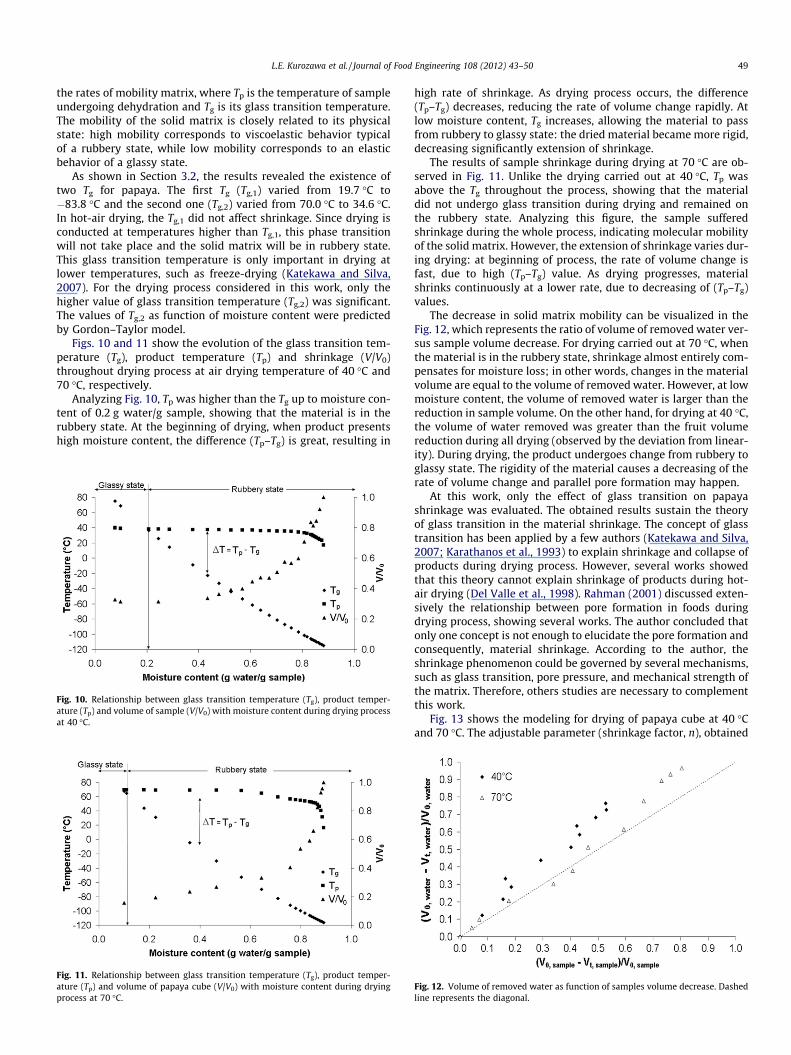
(Fig. 6), an exothermic devitrification peak (Td = �55.5 �C) ap-peared after Tg and before melting temperature (Tm = �17.0 �C).This phenomenon occurs due to a very quick cooling of the sampleduring the freezing process, resulting in partial freeze-concentra-tion of solution. During rewarming, the increase of water mobilitycaused crystallization of trapped amorphous water (Roos andKarel, 1991).
This phenomenon was eliminated by annealing the sample,allowing the formation of a maximum amount of ice and leadingto a maximum concentrated solid matrix. The glass transition tem-perature of annealed sample T 0g, corresponding to Tg of the maxi-mally freeze-concentrated material, was higher (T 0g ¼ �48:6 �C)than that of the non-annealed one at aw = 0.843 (Tg = �83.84 �C)(Fig. 6). This fact occurs due to the greater fraction of ice formedand consequent concentration of the amorphous glassy matrix(Telis et al., 2006). T 0g is an important property for frozen foods.
The minimal moisture content at which T 0g is visible correspondsto the unfreezable water content (Slade and Levine, 1991).
The experimental glass transition temperatures were fitted toGordon and Taylor (1952) model. The parameters calculated bynon-linear regression are showed in Table 2. The experimental dataof second Tg fitted well to the Gordon–Taylor model, showing anaverage relative error (E) lower than 5% and coefficient of determi-nation (R2) close to unit. However, for first Tg, the experimentaldata do not fitted well, presenting E close to 40% and R2 inferiora 0.94. The adjustable parameter k, which controls the degree ofcurvature of the Tg composition dependence (in a binary system),can be related to the strength of the interaction between the sys-tem components (Gordon and Taylor, 1952). The first Tg presentedhigher k value than the other one and, consequently, higher degreeof curvature. Fig. 7 shows the curves predicted by Gordon–Taylormodel.
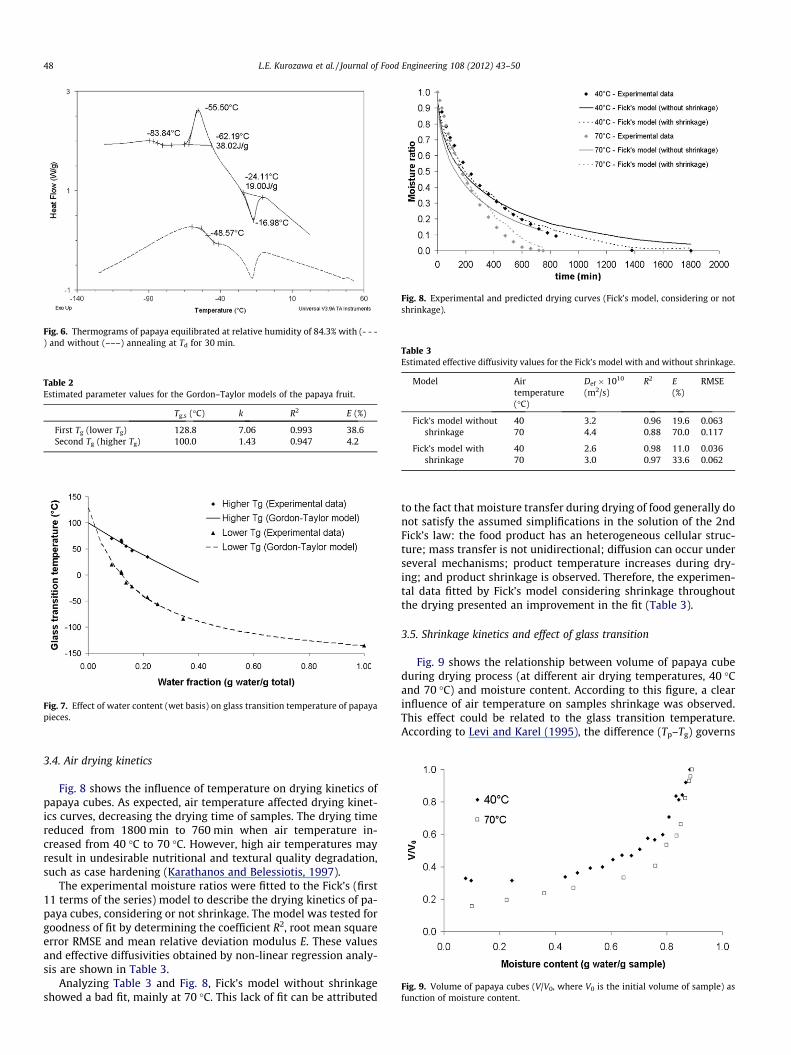
Fig. 6. Thermograms of papaya equilibrated at relative humidity of 84.3% with (- - -) and without (–––) annealing at Td for 30 min.
Table 2Estimated parameter values for the Gordon–Taylor models of the papaya fruit.
Tg,s (�C) k R2 E (%)
First Tg (lower Tg) 128.8 7.06 0.993 38.6Second Tg (higher Tg) 100.0 1.43 0.947 4.2
Fig. 7. Effect of water content (wet basis) on glass transition temperature of papayapieces.
Fig. 8. Experimental and predicted drying curves (Fick’s model, considering or notshrinkage).
Table 3Estimated effective diffusivity values for the Fick’s model with and without shrinkage.
Model Airtemperature(�C)
Def � 1010
(m2/s)R2 E
(%)RMSE
Fick’s model withoutshrinkage
40 3.2 0.96 19.6 0.06370 4.4 0.88 70.0 0.117
Fick’s model withshrinkage
40 2.6 0.98 11.0 0.03670 3.0 0.97 33.6 0.062
Fig. 9. Volume of papaya cubes (V/V0, where V0 is the initial volume of sample) asfunction of moisture content.
48 L.E. Kurozawa et al. / Journal of Food Engineering 108 (2012) 43–50
3.4. Air drying kinetics
Fig. 8 shows the influence of temperature on drying kinetics ofpapaya cubes. As expected, air temperature affected drying kinet-ics curves, decreasing the drying time of samples. The drying timereduced from 1800 min to 760 min when air temperature in-creased from 40 �C to 70 �C. However, high air temperatures mayresult in undesirable nutritional and textural quality degradation,such as case hardening (Karathanos and Belessiotis, 1997).
The experimental moisture ratios were fitted to the Fick’s (first11 terms of the series) model to describe the drying kinetics of pa-paya cubes, considering or not shrinkage. The model was tested forgoodness of fit by determining the coefficient R2, root mean squareerror RMSE and mean relative deviation modulus E. These valuesand effective diffusivities obtained by non-linear regression analy-sis are shown in Table 3.
Analyzing Table 3 and Fig. 8, Fick’s model without shrinkageshowed a bad fit, mainly at 70 �C. This lack of fit can be attributed
to the fact that moisture transfer during drying of food generally donot satisfy the assumed simplifications in the solution of the 2ndFick’s law: the food product has an heterogeneous cellular struc-ture; mass transfer is not unidirectional; diffusion can occur underseveral mechanisms; product temperature increases during dry-ing; and product shrinkage is observed. Therefore, the experimen-tal data fitted by Fick’s model considering shrinkage throughoutthe drying presented an improvement in the fit (Table 3).
3.5. Shrinkage kinetics and effect of glass transition
Fig. 9 shows the relationship between volume of papaya cubeduring drying process (at different air drying temperatures, 40 �Cand 70 �C) and moisture content. According to this figure, a clearinfluence of air temperature on samples shrinkage was observed.This effect could be related to the glass transition temperature.According to Levi and Karel (1995), the difference (Tp–Tg) governs
L.E. Kurozawa et al. / Journal of Food Engineering 108 (2012) 43–50 49
the rates of mobility matrix, where Tp is the temperature of sampleundergoing dehydration and Tg is its glass transition temperature.The mobility of the solid matrix is closely related to its physicalstate: high mobility corresponds to viscoelastic behavior typicalof a rubbery state, while low mobility corresponds to an elasticbehavior of a glassy state.
As shown in Section 3.2, the results revealed the existence oftwo Tg for papaya. The first Tg (Tg,1) varied from 19.7 �C to�83.8 �C and the second one (Tg,2) varied from 70.0 �C to 34.6 �C.In hot-air drying, the Tg,1 did not affect shrinkage. Since drying isconducted at temperatures higher than Tg,1, this phase transitionwill not take place and the solid matrix will be in rubbery state.This glass transition temperature is only important in drying atlower temperatures, such as freeze-drying (Katekawa and Silva,2007). For the drying process considered in this work, only thehigher value of glass transition temperature (Tg,2) was significant.The values of Tg,2 as function of moisture content were predictedby Gordon–Taylor model.
Figs. 10 and 11 show the evolution of the glass transition tem-perature (Tg), product temperature (Tp) and shrinkage (V/V0)throughout drying process at air drying temperature of 40 �C and70 �C, respectively.
Analyzing Fig. 10, Tp was higher than the Tg up to moisture con-tent of 0.2 g water/g sample, showing that the material is in therubbery state. At the beginning of drying, when product presentshigh moisture content, the difference (Tp–Tg) is great, resulting in
Fig. 10. Relationship between glass transition temperature (Tg), product temper-ature (Tp) and volume of sample (V/V0) with moisture content during drying processat 40 �C.
Fig. 11. Relationship between glass transition temperature (Tg), product temper-ature (Tp) and volume of papaya cube (V/V0) with moisture content during dryingprocess at 70 �C.
high rate of shrinkage. As drying process occurs, the difference(Tp–Tg) decreases, reducing the rate of volume change rapidly. Atlow moisture content, Tg increases, allowing the material to passfrom rubbery to glassy state: the dried material became more rigid,decreasing significantly extension of shrinkage.
The results of sample shrinkage during drying at 70 �C are ob-served in Fig. 11. Unlike the drying carried out at 40 �C, Tp wasabove the Tg throughout the process, showing that the materialdid not undergo glass transition during drying and remained onthe rubbery state. Analyzing this figure, the sample sufferedshrinkage during the whole process, indicating molecular mobilityof the solid matrix. However, the extension of shrinkage varies dur-ing drying: at beginning of process, the rate of volume change isfast, due to high (Tp–Tg) value. As drying progresses, materialshrinks continuously at a lower rate, due to decreasing of (Tp–Tg)values.
The decrease in solid matrix mobility can be visualized in theFig. 12, which represents the ratio of volume of removed water ver-sus sample volume decrease. For drying carried out at 70 �C, whenthe material is in the rubbery state, shrinkage almost entirely com-pensates for moisture loss; in other words, changes in the materialvolume are equal to the volume of removed water. However, at lowmoisture content, the volume of removed water is larger than thereduction in sample volume. On the other hand, for drying at 40 �C,the volume of water removed was greater than the fruit volumereduction during all drying (observed by the deviation from linear-ity). During drying, the product undergoes change from rubbery toglassy state. The rigidity of the material causes a decreasing of therate of volume change and parallel pore formation may happen.
At this work, only the effect of glass transition on papayashrinkage was evaluated. The obtained results sustain the theoryof glass transition in the material shrinkage. The concept of glasstransition has been applied by a few authors (Katekawa and Silva,2007; Karathanos et al., 1993) to explain shrinkage and collapse ofproducts during drying process. However, several works showedthat this theory cannot explain shrinkage of products during hot-air drying (Del Valle et al., 1998). Rahman (2001) discussed exten-sively the relationship between pore formation in foods duringdrying process, showing several works. The author concluded thatonly one concept is not enough to elucidate the pore formation andconsequently, material shrinkage. According to the author, theshrinkage phenomenon could be governed by several mechanisms,such as glass transition, pore pressure, and mechanical strength ofthe matrix. Therefore, others studies are necessary to complementthis work.
Fig. 13 shows the modeling for drying of papaya cube at 40 �Cand 70 �C. The adjustable parameter (shrinkage factor, n), obtained
Fig. 12. Volume of removed water as function of samples volume decrease. Dashedline represents the diagonal.
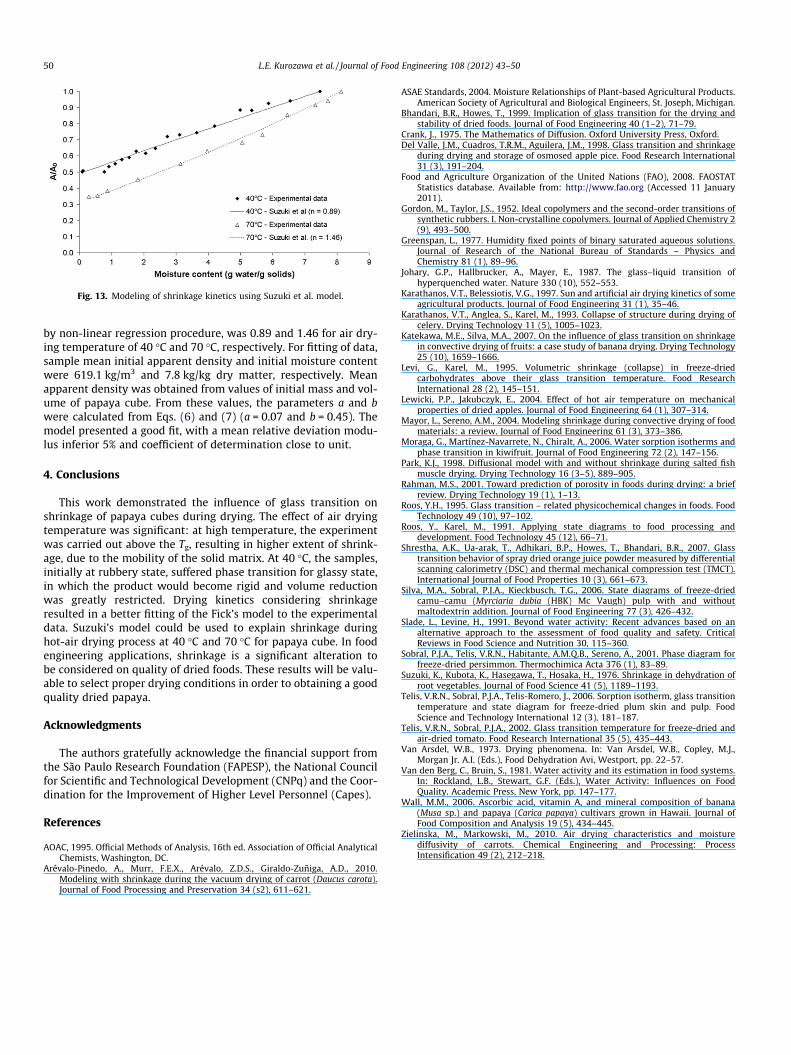
Fig. 13. Modeling of shrinkage kinetics using Suzuki et al. model.
50 L.E. Kurozawa et al. / Journal of Food Engineering 108 (2012) 43–50
by non-linear regression procedure, was 0.89 and 1.46 for air dry-ing temperature of 40 �C and 70 �C, respectively. For fitting of data,sample mean initial apparent density and initial moisture contentwere 619.1 kg/m3 and 7.8 kg/kg dry matter, respectively. Meanapparent density was obtained from values of initial mass and vol-ume of papaya cube. From these values, the parameters a and bwere calculated from Eqs. (6) and (7) (a = 0.07 and b = 0.45). Themodel presented a good fit, with a mean relative deviation modu-lus inferior 5% and coefficient of determination close to unit.
4. Conclusions
This work demonstrated the influence of glass transition onshrinkage of papaya cubes during drying. The effect of air dryingtemperature was significant: at high temperature, the experimentwas carried out above the Tg, resulting in higher extent of shrink-age, due to the mobility of the solid matrix. At 40 �C, the samples,initially at rubbery state, suffered phase transition for glassy state,in which the product would become rigid and volume reductionwas greatly restricted. Drying kinetics considering shrinkageresulted in a better fitting of the Fick’s model to the experimentaldata. Suzuki’s model could be used to explain shrinkage duringhot-air drying process at 40 �C and 70 �C for papaya cube. In foodengineering applications, shrinkage is a significant alteration tobe considered on quality of dried foods. These results will be valu-able to select proper drying conditions in order to obtaining a goodquality dried papaya.
Acknowledgments
The authors gratefully acknowledge the financial support fromthe São Paulo Research Foundation (FAPESP), the National Councilfor Scientific and Technological Development (CNPq) and the Coor-dination for the Improvement of Higher Level Personnel (Capes).
References
AOAC, 1995. Official Methods of Analysis, 16th ed. Association of Official AnalyticalChemists, Washington, DC.
Arévalo-Pinedo, A., Murr, F.E.X., Arévalo, Z.D.S., Giraldo-Zuñiga, A.D., 2010.Modeling with shrinkage during the vacuum drying of carrot (Daucus carota).Journal of Food Processing and Preservation 34 (s2), 611–621.
ASAE Standards, 2004. Moisture Relationships of Plant-based Agricultural Products.American Society of Agricultural and Biological Engineers, St. Joseph, Michigan.
Bhandari, B.R., Howes, T., 1999. Implication of glass transition for the drying andstability of dried foods. Journal of Food Engineering 40 (1–2), 71–79.
Crank, J., 1975. The Mathematics of Diffusion. Oxford University Press, Oxford.Del Valle, J.M., Cuadros, T.R.M., Aguilera, J.M., 1998. Glass transition and shrinkage
during drying and storage of osmosed apple pice. Food Research International31 (3), 191–204.
Food and Agriculture Organization of the United Nations (FAO), 2008. FAOSTATStatistics database. Available from: http://www.fao.org (Accessed 11 January2011).
Gordon, M., Taylor, J.S., 1952. Ideal copolymers and the second-order transitions ofsynthetic rubbers. I. Non-crystalline copolymers. Journal of Applied Chemistry 2(9), 493–500.
Greenspan, L., 1977. Humidity fixed points of binary saturated aqueous solutions.Journal of Research of the National Bureau of Standards – Physics andChemistry 81 (1), 89–96.
Johary, G.P., Hallbrucker, A., Mayer, E., 1987. The glass–liquid transition ofhyperquenched water. Nature 330 (10), 552–553.
Karathanos, V.T., Belessiotis, V.G., 1997. Sun and artificial air drying kinetics of someagricultural products. Journal of Food Engineering 31 (1), 35–46.
Karathanos, V.T., Anglea, S., Karel, M., 1993. Collapse of structure during drying ofcelery. Drying Technology 11 (5), 1005–1023.
Katekawa, M.E., Silva, M.A., 2007. On the influence of glass transition on shrinkagein convective drying of fruits: a case study of banana drying. Drying Technology25 (10), 1659–1666.
Levi, G., Karel, M., 1995. Volumetric shrinkage (collapse) in freeze-driedcarbohydrates above their glass transition temperature. Food ResearchInternational 28 (2), 145–151.
Lewicki, P.P., Jakubczyk, E., 2004. Effect of hot air temperature on mechanicalproperties of dried apples. Journal of Food Engineering 64 (1), 307–314.
Mayor, L., Sereno, A.M., 2004. Modeling shrinkage during convective drying of foodmaterials: a review. Journal of Food Engineering 61 (3), 373–386.
Moraga, G., Martínez-Navarrete, N., Chiralt, A., 2006. Water sorption isotherms andphase transition in kiwifruit. Journal of Food Engineering 72 (2), 147–156.
Park, K.J., 1998. Diffusional model with and without shrinkage during salted fishmuscle drying. Drying Technology 16 (3–5), 889–905.
Rahman, M.S., 2001. Toward prediction of porosity in foods during drying: a briefreview. Drying Technology 19 (1), 1–13.
Roos, Y.H., 1995. Glass transition – related physicochemical changes in foods. FoodTechnology 49 (10), 97–102.
Roos, Y., Karel, M., 1991. Applying state diagrams to food processing anddevelopment. Food Technology 45 (12), 66–71.
Shrestha, A.K., Ua-arak, T., Adhikari, B.P., Howes, T., Bhandari, B.R., 2007. Glasstransition behavior of spray dried orange juice powder measured by differentialscanning calorimetry (DSC) and thermal mechanical compression test (TMCT).International Journal of Food Properties 10 (3), 661–673.
Silva, M.A., Sobral, P.J.A., Kieckbusch, T.G., 2006. State diagrams of freeze-driedcamu–camu (Myrciaria dubia (HBK) Mc Vaugh) pulp with and withoutmaltodextrin addition. Journal of Food Engineering 77 (3), 426–432.
Slade, L., Levine, H., 1991. Beyond water activity: Recent advances based on analternative approach to the assessment of food quality and safety. CriticalReviews in Food Science and Nutrition 30, 115–360.
Sobral, P.J.A., Telis, V.R.N., Habitante, A.M.Q.B., Sereno, A., 2001. Phase diagram forfreeze-dried persimmon. Thermochimica Acta 376 (1), 83–89.
Suzuki, K., Kubota, K., Hasegawa, T., Hosaka, H., 1976. Shrinkage in dehydration ofroot vegetables. Journal of Food Science 41 (5), 1189–1193.
Telis, V.R.N., Sobral, P.J.A., Telis-Romero, J., 2006. Sorption isotherm, glass transitiontemperature and state diagram for freeze-dried plum skin and pulp. FoodScience and Technology International 12 (3), 181–187.
Telis, V.R.N., Sobral, P.J.A., 2002. Glass transition temperature for freeze-dried andair-dried tomato. Food Research International 35 (5), 435–443.
Van Arsdel, W.B., 1973. Drying phenomena. In: Van Arsdel, W.B., Copley, M.J.,Morgan Jr. A.I. (Eds.), Food Dehydration Avi, Westport, pp. 22–57.
Van den Berg, C., Bruin, S., 1981. Water activity and its estimation in food systems.In: Rockland, L.B., Stewart, G.F. (Eds.), Water Activity: Influences on FoodQuality. Academic Press, New York, pp. 147–177.
Wall, M.M., 2006. Ascorbic acid, vitamin A, and mineral composition of banana(Musa sp.) and papaya (Carica papaya) cultivars grown in Hawaii. Journal ofFood Composition and Analysis 19 (5), 434–445.
Zielinska, M., Markowski, M., 2010. Air drying characteristics and moisturediffusivity of carrots. Chemical Engineering and Processing: ProcessIntensification 49 (2), 212–218.


![Regionalization amidst 'State-Shrinkage' [p.p. 5-28]](https://img.dokumen.tips/doc/110x75/631b937b3e8acd9977057dea/regionalization-amidst-state-shrinkage-pp-5-28.jpg)


