Embed Size (px)
Citation preview

© 2007 European Association of Geoscientists & Engineers 417
ABSTRACTIn this paper we present a geophysical survey that was carried out as a research activity during field trips to the Himera archaeological site, where relics of a large Greek settlement are still buried, effected by a joint group of archaeologists and geophysicists during an educational project. Two-dimensional (2D) resistivity and ground-penetrating radar (GPR) surveys were performed to locate buried archaeological structures at this archaeological site. The results of the GPR surveys show some anomalies characterized by semi-hyperbolic shapes. In some restricted areas of the town, two grids of parallel GPR profiles were acquired while time- and depth-slices were calculated to iden-tify the extension of the buried structures. In fact, the shapes of many anomalies recognized in the slices seem to describe the distribution of the relics (i.e. walls, roads, etc.). A 2D electrical resistivity profile showed clear anomalies, which were connected with wall-like relics. This was also obtained by using on-site calibration on partially uncovered structures, while the low background resistivity values were interpreted as representing river deposits having different moisture characteristics. Recommendations were also given to the archaeological site-excavators, following which some of the results were confirmed by subsequent archaeological excavations.
Geophysical investigations at the Himera archaeological site, northern Sicily
P. Capizzi1, P.L. Cosentino1*, G. Fiandaca1, R. Martorana1, P. Messina1 and
S. Vassallo2
1 University of Palermo, C.F.T.A. Department, Geophysical section, Via Archirafi 26, 90123 Palermo, Italy2 Servizio Archeologico, Sovrintendenza BB.CC.AA. di Palermo, Via Ausonia 26, 90144 Palermo, Italy
Received August 2006, revision accepted September 2007
ever planned, would be regarded as a test site rather than exhaus-tive research. Therefore, we had to make a choice from among various pos-sibilities of an educational training project, which ranged between these two extremes:– repeat consolidated acquisition in places previously explored,
to retrieve stable and known results; in this case there would have been no new information, but this would have provided the best formal didactic situation;
– involve the students in the actual research activities so as to obtain the best scientific results, which would have also included changes in methodologies and application tools dur-ing the research; in this case new data and information would have been obtained, and would probably have given the stu-dents an interesting experience in this kind of research, even though the results might have been incomplete.
We decided on this second approach, taking into due considera-tion the fact that even with limited educational funds one can gain information useful to the archaeologist. Furthermore, in this way typical research anxiety and curiosity would have been grasped by the students working together with genuine researchers. The geophysical techniques used at the Himera archaeologi-cal site were the GPR and 2D resistivity tomography. The con-
INTRODUCTION We herein present a geophysical survey that was carried out within the framework of the educational activity included in the didactic project “Sciences for Archaeology”, dedicated to the memory of Giuseppe Nenci (17/4/1924 – 29/12/1999), a great Italian archaeologist. This project, which included seven hundred hours of classroom activity and five hundred hours of field train-ing, aimed at determining what role scientific support could have in archaeological research. The educational programme was organized for twenty young students who had already obtained their bachelor’s degree. As could be expected, only a few study-cases were chosen for the training activities, in fact we concentrated the educational activity on geophysical methodologies, thus making it possible to spend a long time both in the field and on laboratory activities. We considered the Plain of Himera as being a very interesting test site, because it contains the remains of an ancient town (7th
– 5th century B.C.) founded by Greek colonists. Located about 30 km ESE of Palermo, along the northern coast of Sicily, this site is indeed very large and has so far only been very scarcely explored (Fig. 1). Consequently, our geophysical survey, what-
Near Surface Geophysics, 2007, 417-426
P. Capizzi et al.418
© 2007 European Association of Geoscientists & Engineers, Near Surface Geophysics, 2007, 5, 417-426417-426
figurations used were the dipole-dipole and the linear grid appli-cations, and the aim of this study was also to determine the dif-ferences between them. A magnetic survey was excluded, as a busy railway and motorway intersect the area from east to west. Furthermore, the area is crossed over by a number of shallow (more or less buried) iron pipelines used for agriculture. In fact, some preliminary tests showed that magnetic noise is very high, with abrupt time spikes. With a view to improving the educational activity, the results obtained from different methodologies and application proce-dures were compared and assessed for a cost/benefit analysis, taking into account the geophysical methods’ capability of recon-structing site features and optimizing excavation strategies.
GEOLOGICAL OUTLINES AND HISTORICAL NOTESHimera was founded near the mouth of the Northern Imera River in 648 B.C. by a group of Greek colonists of mixed origin. It was composed of a small high area (“Himera alta”), on the southern hill (already unearthed), and a large low area (“Himera bassa”) near the mouth of the river. From a geological point of view, the area of “Himera bassa” is actually on the plain at the mouth of the Northern Imera River, which runs into the sea on the Northern Sicilian coast. The land, generally cultivated to grow crops, is made up of loamy soil covering Pliocene and Pleistocene terraces. From time to time heavy water flows caused the river to spill over and flood the land, spreading fluvial deposits over the area of the mouth. Therefore, after more than 2,000 years, the ruins of the lower town are now covered by 1–2 m of fluvial loamy soils.In 409 B.C. Hannibal, the grandson of Hamilcar, led a large Carthaginian army against Himera. After the cruel battle, the
Greeks were defeated and Himera was destroyed and then com-pletely abandoned. It is believed that the survivors of the battle fled to the area of Termini Imerese. The abandonment of the town is the main reason for its conservation. In fact, the ruins were covered by one of the major floods of the Imera River in the mouth area, while the archaeological relics were completely buried, except some pieces of the so called Victory Temple, close to the Imera River. One of the major problems of the archaeological studies affected in this area is connected to learning more about the impressive urban plan of the town founded during the VI century B.C. In fact, the actual layout of the urban network, obtained on the basis of sporadic elements scattered over an area of about 35 hectares, awaits further confirmation from archaeological excavations. In principle, these excavations should be preceded by various suitable investigations, prevalently geophysical. The depth of the buried ruins, assumed on the basis of pre-liminary excavations, ranges from a few tenths of a centimetre to about 1.5–2 m. Our field work covered the lower part of the town situated on the coastal plain, which is now called Buonfornello (Fig. 1). Previous historical and archaeological studies have shown that the town of Himera had a very regular urban plan (Vassallo 2005). Each block of houses, roughly oriented from north to south, was about 41 m long. These blocks were divided by roads 6 – 6.20 m wide, roughly parallel to each other.
GPR SURVEYS
GPR data acquisitionGPR surveys (Capizzi et al. 2003) included the acquisition of numerous GPR profiles, which were carried out using two GSSI systems (SIR System 2 and SIR 3000) and two 400 MHz anten-nas. These are normal parallel co-polarized antennas in the “broadfire” position (Radzevicius et al. 2000), and we always used them in perpendicular acquisition mode, that is with dipoles perpendicular to the acquisition line. In fact, taking into account both the a priori information about the buried structures – name-ly the general orientation, the typology and the limited noise level – we considered the cost/benefit ratio as being very high when used together with cross-polarized antenna arrays. After numerous calibration tests had been effected, the fol-lowing acquisition setup was fixed: Range = 100 ns (survey depth roughly corresponding to about 3 m), Frequency band pass from 100 to 800 MHz, horizontal stacking = 3 fold, sample/scan = 1024; bits/sample = 16, scans/second = 64. The wavelength, according to the central frequency of the antenna (400 MHz) and to the mean wave propagation velocity in the ground (about 0.06 m/ns, after some calibrations carried out very close to excavated areas), can be estimated as about 15 cm. Profiles were acquired in continuous mode with a velocity of about 0.3 m/s. Figure 1 shows the location of the various areas that were investigated using different investigation densities: in some selected areas, characterized by bad-access (vegetation), we car-
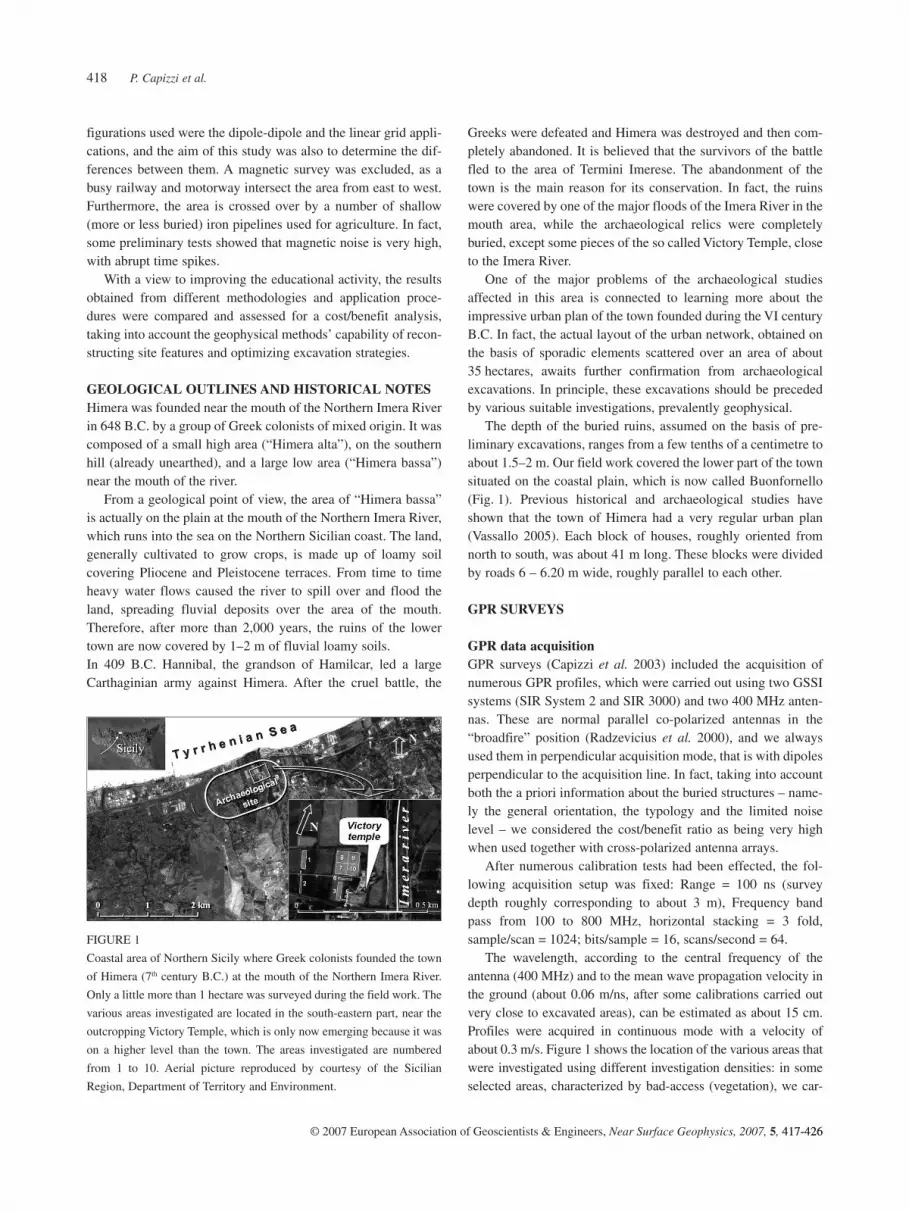
FIGURE 1
Coastal area of Northern Sicily where Greek colonists founded the town
of Himera (7th century B.C.) at the mouth of the Northern Imera River.
Only a little more than 1 hectare was surveyed during the field work. The
various areas investigated are located in the south-eastern part, near the
outcropping Victory Temple, which is only now emerging because it was
on a higher level than the town. The areas investigated are numbered
from 1 to 10. Aerial picture reproduced by courtesy of the Sicilian
Region, Department of Territory and Environment.
Geophysical investigations at the Himera archaeological site, northern Sicily 419
© 2007 European Association of Geoscientists & Engineers, Near Surface Geophysics, 2007, 5, 417-426
ried out quasi-2D investigations (only two parallel profiles) to study particular archaeological problems, while in easy-access areas we acquired data along the lines of a guiding grid positioned and controlled by optical telemetry using referenced points. In view of our intention to plan further geophysical interventions in this archaeological site (35 hectares of land), various grid steps (0.5, 1 and 2 m) were used to compare the results obtained with the various steps in the selected sample areas. In fact, some of the typical acquisition parameters of archaeological research should always be controlled and optimized regarding the geometry (i.e. shape and depth) and the depolarization properties of the buried structures. The areas were selected on the basis of the archaeological plan. In particular, areas 4 and 5, even though they were very small, were investigated with the aim of locating the boundaries of the religious area. Areas 8 and 9 were particularly important because the archaeologists believed that they knew the exact position of the northern limit of the Himera ruins. In fact, about 100m to the northwest of area 8, they had discovered a truncated wall, the missing part of which had probably been washed away by flood-ing of the mouth of the river. The GPR profiles were generally acquired in the following way:– area 1: 19 m × 79 m. This area was covered by 20 profiles placed
in longitudinally (NNW–SSE) and 80 profiles placed transver-sally (ENE–WSW). All the profiles were spaced 1 m apart;
– area 2: 1 m × 62 m. Only 2 profiles, placed longitudinally (NNW–SSE), were located in this area; they were spaced 1 m apart;
– area 3: 28 m × 82 m. In this area data were acquired from 15 profiles placed longitudinally (NNW–SSE) and 42 profiles placed transversally (ENE–WSW). All the profiles were spaced 2 m apart;
– area 4: 1 m × 11 m. Experimental data were acquired from 2 profiles placed transversally (ENE–WSW) and spaced 1 m apart (in this case an alternative range of 50 ns was used);
– area 5: was made up of two areas 3 m × 5 m, separated by a step of about 60 cm in height. We acquired 4 profiles placed longitudinally (NNW–SSE) and 6 profiles placed transver-sally (ENE–WSW); they were spaced 1 m apart;
– area 6: 45 m × 5 m. In this area, 16 profiles, placed longitudi-nally (NNW–SSE) and 5 profiles, placed transversally (ENE–WSW) were investigated; in this way a grid of sliced data with a mesh of 3 m ×1 m was subsequently elaborated;
– area 7: 50 m × 50 m. In this area there were 51 profiles placed longitudinally (NNW–SSE) and 51 profiles placed transver-sally (ENE–WSW), all of which were spaced 1 m apart. A quarter of area 7 was further investigated using a separation of only 0.5 m between contiguous profiles;
– areas 8, 9 and 10: 50 m ×50 m. In each of these areas, 26 pro-
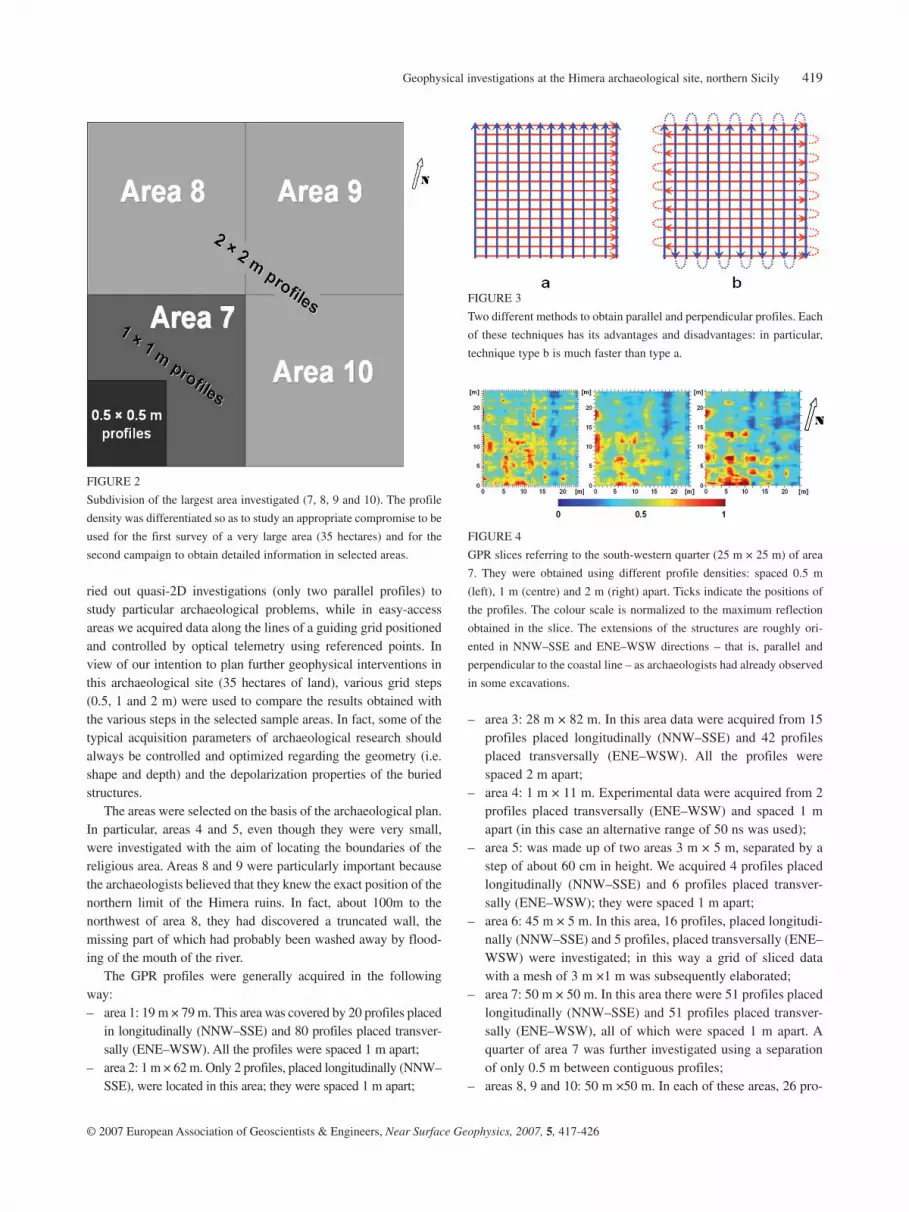
FIGURE 2
Subdivision of the largest area investigated (7, 8, 9 and 10). The profile
density was differentiated so as to study an appropriate compromise to be
used for the first survey of a very large area (35 hectares) and for the
second campaign to obtain detailed information in selected areas.
FIGURE 3
Two different methods to obtain parallel and perpendicular profiles. Each
of these techniques has its advantages and disadvantages: in particular,
technique type b is much faster than type a.
FIGURE 4
GPR slices referring to the south-western quarter (25 m × 25 m) of area
7. They were obtained using different profile densities: spaced 0.5 m
(left), 1 m (centre) and 2 m (right) apart. Ticks indicate the positions of
the profiles. The colour scale is normalized to the maximum reflection
obtained in the slice. The extensions of the structures are roughly ori-
ented in NNW–SSE and ENE–WSW directions – that is, parallel and
perpendicular to the coastal line – as archaeologists had already observed
in some excavations.
P. Capizzi et al.420
© 2007 European Association of Geoscientists & Engineers, Near Surface Geophysics, 2007, 5, 417-426417-426
files placed longitudinally (NNW–SSE) and 26 profiles placed transversally (ENE–WSW) were investigated, all of which were spaced 2 m apart. Therefore, the free land con-taining areas 7, 8, 9 and 10 was subdivided into three areas with three different levels of detail, so that the comparison of the results could achieve the best investigation project in terms of cost/benefit ratio (Fig. 2). Certainly, the 2 m spacing was not enough for detailed archaeological investigations.
It should be pointed out, however, that all the profiles were acquired following directions that were sub-parallel to the two main directions suggested by the knowledge previously acquired by archaeologists concerning the entire area, i.e., sub-parallel and sub-perpendicular to the direction of the coast line. Furthermore, a fast, albeit not always correct, technique was used in the acquisition. In fact, typical acquisition should be made using one side of the rectangle as the starting point and the oppo-site side as the final point (Fig. 3a). In our case, consecutive parallel profiles were acquired in continuity (“zig-zag” profiles, Fig. 3b), always using the final point of the previous profile as the starting point of the next one. Consequently, the direction of the antenna box in comparison with that used for the two adjacent profiles was inverted. This was useful not only in avoiding time-consuming procedures, but also in controlling the variability of the reflections along the flanked profiles and the correct operation of the antenna as well as in calculating averaged planar data. However, in the case of non-symmetrical spreading of the anten-na dipoles and in the presence of damping anisotropy and/or dipping depolarizing surfaces – as in our case – the elaboration processes of controlling and normalizing the adjacent profiles would have been neither simple nor effortless.
Processing and interpretation The acquired data (a total of 21,117 m of GPR profiles) were subsequently processed using a standard procedure included in the ReflexW® software (Sandmeier Scientific Software). In par-ticular, background removal, band pass frequency filter (150–750 MHz, chosen after many tests on the set of acquired data), horizontal and vertical stacking and envelope were applied to the original data. Furthermore, the processed data was used to obtain slice representation. Time slices were obtained at various times (i.e. at various depths, on the rough assumption of homogeneous electromagnetic properties of the subsoil) by calculating 2D amplitude maps of the radar signals, using a specified time win-dow in all parallel and perpendicular radar profiles. Conversion time-depth was made using a permittivity value of 25, corre-sponding to that of the wet loamy soil present in the Himera plain. The calibrations were retrieved from previous and subse-quent excavations, even if for this kind of archaeological research the lack of a precise depth calibration is only a minor problem. However, conversion is always very rough because it is generally made using the very simple assumption that the underground is homogeneous. Furthermore, in these cases, the depths of the rel-ics are generally known from previous studies (sparse excava-tions guided by archaeological evidence), while the major prob-lem is that of locating the main buried structures and retrieving a reliable map that contains this information. On the basis of the previous assumption, the time window was 10 ns, approximately corresponding to a depth of 0.3 m. For each area, 10 slices (spaced at depths 0.3 m apart) were planned. The slices were calculated with the help of a Matlab®-implemented algorithm (Matlab, The MathWorks, Inc. Software): preliminarily, a matrix is calculated from the values of all the signals’ power averaged in the selected time (or depth) window. Subsequently, starting from these very large matrices, a set of points (typically 250 m × 250 m) is selected to apply a spline interpolation, to obtain the graphical representation of the slice.
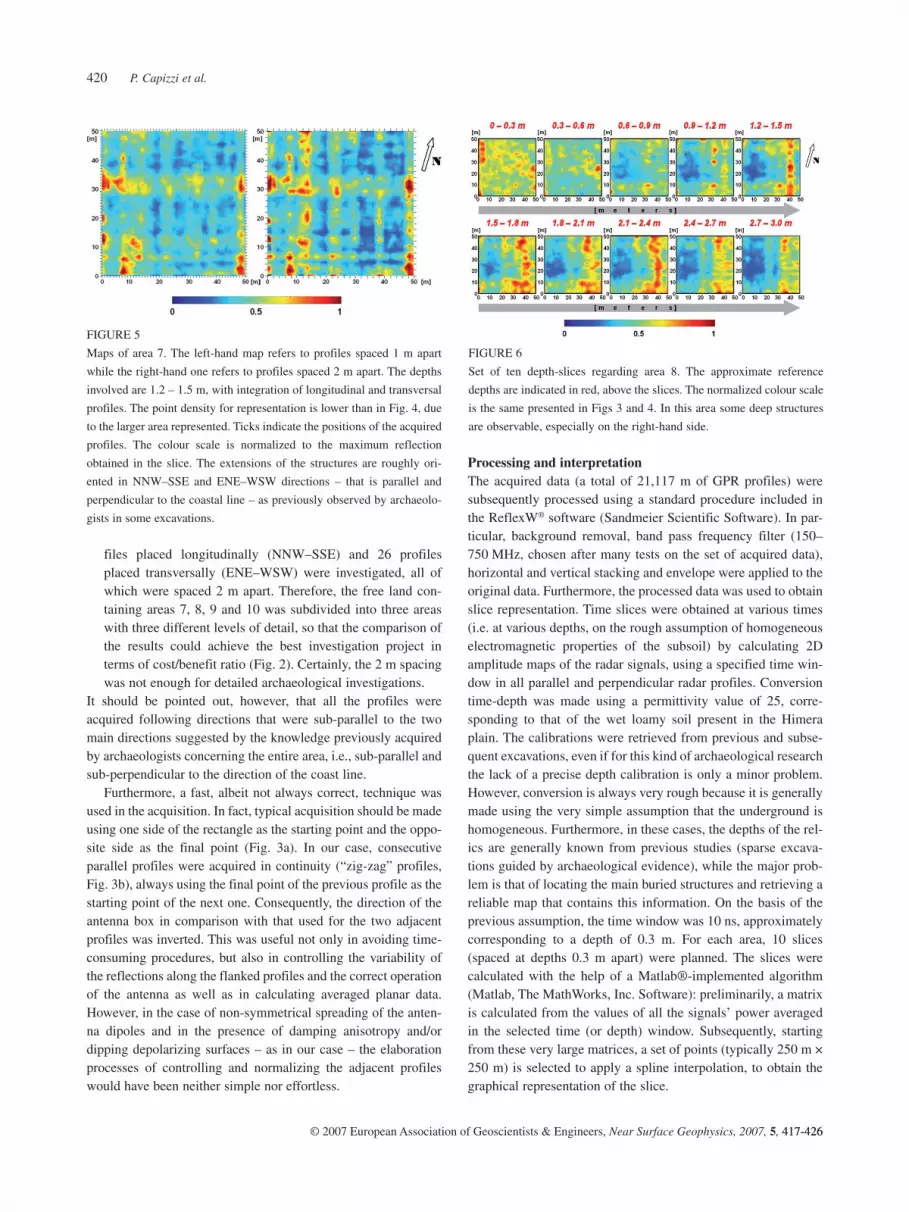
FIGURE 5
Maps of area 7. The left-hand map refers to profiles spaced 1 m apart
while the right-hand one refers to profiles spaced 2 m apart. The depths
involved are 1.2 – 1.5 m, with integration of longitudinal and transversal
profiles. The point density for representation is lower than in Fig. 4, due
to the larger area represented. Ticks indicate the positions of the acquired
profiles. The colour scale is normalized to the maximum reflection
obtained in the slice. The extensions of the structures are roughly ori-
ented in NNW–SSE and ENE–WSW directions – that is parallel and
perpendicular to the coastal line – as previously observed by archaeolo-
gists in some excavations.
FIGURE 6
Set of ten depth-slices regarding area 8. The approximate reference
depths are indicated in red, above the slices. The normalized colour scale
is the same presented in Figs 3 and 4. In this area some deep structures
are observable, especially on the right-hand side.

Geophysical investigations at the Himera archaeological site, northern Sicily 421
© 2007 European Association of Geoscientists & Engineers, Near Surface Geophysics, 2007, 5, 417-426
In spite of possible depolarization effects caused by the irregu-larities of the tops of the hidden structures, this representation allowed us to highlight geometrical forms imputable to buried archaeological structures. In Fig. 4, the slices containing the results obtained from the investigation of the south-west part (25 m × 25 m) of area 7 using three different gridding-values of GPR profiles, i.e. spaced 0.5 m (left), 1 m (centre) and 2 m (right) apart, are presented. In all three slices, the data derived from both the longitudinal and the transversal profiles were integrated. The integration was made after a separate normalization of the two slices (from longitudi-nal and transversal profiles) and a subsequent combination, using the higher value retrieved from the two slices for each pixel. These slices were calculated between 40 and 50 ns, roughly cor-responding to a depth of 1.2–1.5 m. It is easy to recognize shapes and lateral extensions of the various structures and walls in the left-hand map. Going from left to right, the shapes of the recog-nizable structures are progressively affected by distortion and spreading, so that the right-hand map is only good enough to be sure that there are indeed some structures and to roughly locate them with some reliability. As a matter of fact, a well defined structure is very clear in the slide on the left (profiles spaced 0.5 m to each other): it is located between 12 and 15 m (WSW–ENE direction) and between 15 and 20 m (NNW–SSE direction). The
same structure is very blurry in the central slide (profiles spaced 1 m from each other) and practically missing in the right-hand slide (profiles spaced 2 m apart). In Fig. 5, two slices obtained from the entire area 7 are pre-sented. The left-hand slice refers to profiles spaced 1 m apart, while the right-hand one refers to profiles spaced 2 m apart; they both have the same depths given above (1.2–1.5 m) and the same integration of the longitudinal and transversal profiles (however, the point density for representation – always 250 × 250 pixels – is lower than in Fig. 4, due to the large area represented). In this case, we can observe that the comparison gives ambiguous con-clusions, as the left-hand slice seems to be characterized by a better resolving power. It should be pointed out, however, that in principle the visualization of the slices is a combined function of different factors, namely:1. the density and shape of the acquisition (straight or curved)
lines; 2. the density and shape of the anomalies resulting from buried
structures; 3. the algorithms (splines or similar) used for the interpolation
of signals and representation, as well as for smoothing;4. colour digitization. Consequently, when information is acquired with a density appropriate to the geometries of the archaeological structures (Fig. 4, left), items 3 and 4 are minor points; otherwise, they have an ambiguous influence on the appearance and interpretation of the slice. In Fig. 6, an example of the sets of depth-slices is presented regarding area 8. In the right-hand part of this area, precisely from 20 to 50 m of the abscissa, some structures can be located starting from an approximate depth of 1.5 m. A probable inter-pretation is an enlargement of collapsed ruins, situated at a rough
FIGURE 7
This map adds the four slices of areas 7, 8, 9 and 10. It is calculated for a
depth of 1.2 – 1.5 m, which is one of the most representative of the buried
structures. The 100 profiles used for the construction were acquired from
2 m spacing in both the longitudinal and transversal directions. The two
small white rectangles are non-investigated areas. This area is an integra-
tion of four different areas. The normalization of the amplitudes was
performed separately for each area, as the data were collected at different
times and under different weather conditions. Consequently, it is not pos-
sible to compare the relative amplitudes of the four areas.
FIGURE 8
The anomaly showed in the time slice at a depth of 0.6 – 0.9 m of one of
two parts of area 5 (a, top of the figure) the strong reflection on the left-
hand side of the longitudinal profile of area 4 (b, bottom of the figure)
can perhaps be ascribed to the boundary of the religious area of the
Victory temple.
P. Capizzi et al.422
© 2007 European Association of Geoscientists & Engineers, Near Surface Geophysics, 2007, 5, 417-426417-426
depth of 2 m, and the foundations of houses situated at greater depths. Similar depth slices were assembled for all the areas where the data were collected with sufficient detail. The four slices of areas 7, 8, 9 and 10, constructed for the depth of 1.2–1.5 m, were arranged in a single slice, which is presented in Fig. 7. The 100 profiles spaced 2 m apart in both
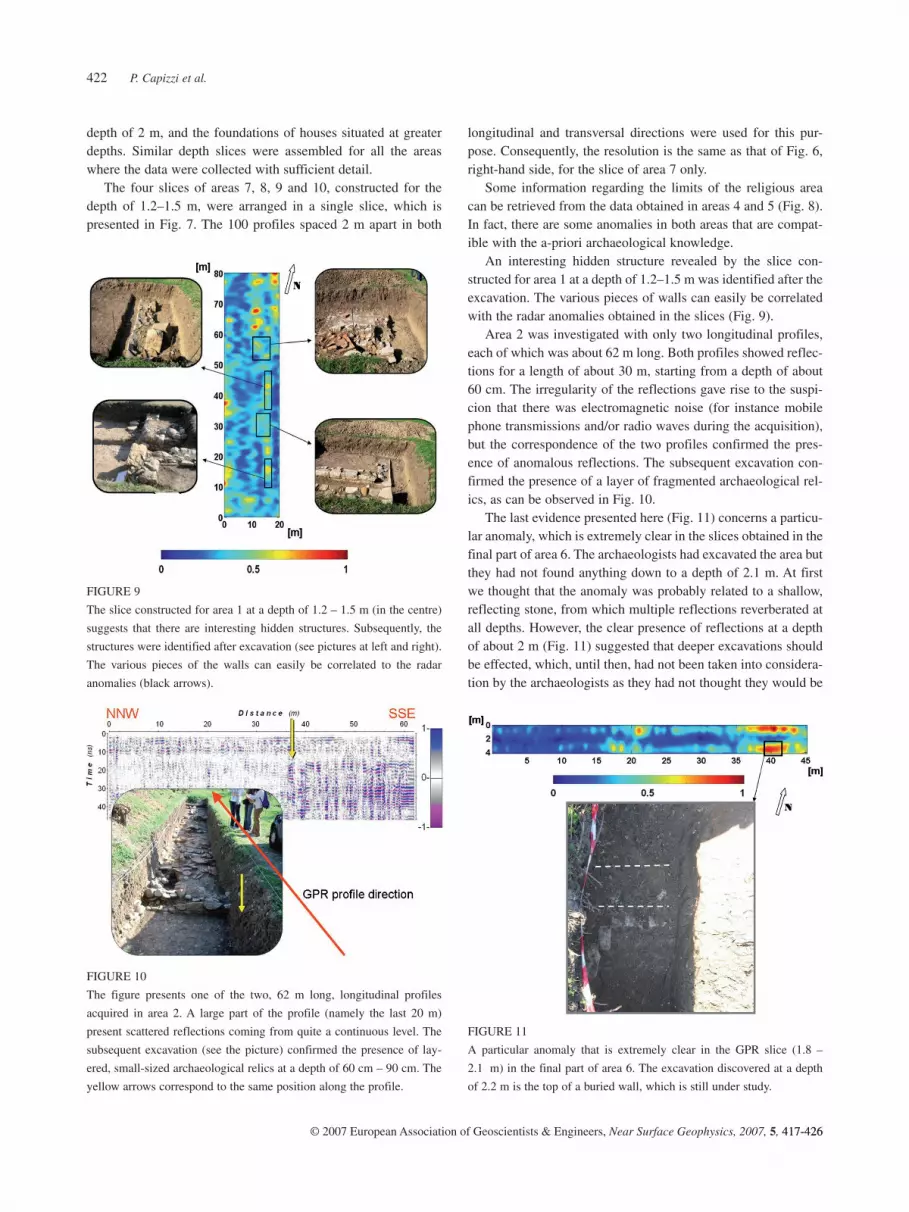
longitudinal and transversal directions were used for this pur-pose. Consequently, the resolution is the same as that of Fig. 6, right-hand side, for the slice of area 7 only. Some information regarding the limits of the religious area can be retrieved from the data obtained in areas 4 and 5 (Fig. 8). In fact, there are some anomalies in both areas that are compat-ible with the a-priori archaeological knowledge. An interesting hidden structure revealed by the slice con-structed for area 1 at a depth of 1.2–1.5 m was identified after the excavation. The various pieces of walls can easily be correlated with the radar anomalies obtained in the slices (Fig. 9). Area 2 was investigated with only two longitudinal profiles, each of which was about 62 m long. Both profiles showed reflec-tions for a length of about 30 m, starting from a depth of about 60 cm. The irregularity of the reflections gave rise to the suspi-cion that there was electromagnetic noise (for instance mobile phone transmissions and/or radio waves during the acquisition), but the correspondence of the two profiles confirmed the pres-ence of anomalous reflections. The subsequent excavation con-firmed the presence of a layer of fragmented archaeological rel-ics, as can be observed in Fig. 10. The last evidence presented here (Fig. 11) concerns a particu-lar anomaly, which is extremely clear in the slices obtained in the final part of area 6. The archaeologists had excavated the area but they had not found anything down to a depth of 2.1 m. At first we thought that the anomaly was probably related to a shallow, reflecting stone, from which multiple reflections reverberated at all depths. However, the clear presence of reflections at a depth of about 2 m (Fig. 11) suggested that deeper excavations should be effected, which, until then, had not been taken into considera-tion by the archaeologists as they had not thought they would be
FIGURE 9
The slice constructed for area 1 at a depth of 1.2 – 1.5 m (in the centre)
suggests that there are interesting hidden structures. Subsequently, the
structures were identified after excavation (see pictures at left and right).
The various pieces of the walls can easily be correlated to the radar
anomalies (black arrows).
FIGURE 10
The figure presents one of the two, 62 m long, longitudinal profiles
acquired in area 2. A large part of the profile (namely the last 20 m)
present scattered reflections coming from quite a continuous level. The
subsequent excavation (see the picture) confirmed the presence of lay-
ered, small-sized archaeological relics at a depth of 60 cm – 90 cm. The
yellow arrows correspond to the same position along the profile.
FIGURE 11
A particular anomaly that is extremely clear in the GPR slice (1.8 –
2.1 m) in the final part of area 6. The excavation discovered at a depth
of 2.2 m is the top of a buried wall, which is still under study.
Geophysical investigations at the Himera archaeological site, northern Sicily 423
© 2007 European Association of Geoscientists & Engineers, Near Surface Geophysics, 2007, 5, 417-426
productive. The outcome of our interpretation was that the top of a buried wall was discovered at a depth of 2.2 m, thereby opening a new research theme for the archaeologists.The excavations, which were scheduled by archaeologists before the GPR survey, also included a test excavation at a point close to area 7 that had not been investigated with geophysical meth-ods. However, this test was unproductive. 2D RESISTIVITY SURVEYAfter the GPR survey and the subsequent excavation campaign, we concluded the educational programme with a short geoelec-trical test carried out with a new geoelectrical array. In particular, we intended to acquire a 2D profile in area 10, where, on the basis of the GPR results, it was highly probable that the excava-tion to be effected would intersect a wall buried at a depth of about 1 m. For investigations effected with the 2D resistivity method, we selected two different arrays: the one most used (Dipole-Dipole) for many purposes requiring high-resolution arrays (Dahlin and Zhou 2004; Sasaki 1992) and a recently developed new array, called “linear grid” (Fiandaca et al. 2005). It was also our aim to compare acquisition procedures and results, in terms of resolu-tion and stability. The area selected to apply these methods is located near an archaeological excavation; it is perpendicular to the direction of the unearthed walls and it is 7 m from the boundary of the excava-tion. This site was selected to verify the continuity of the struc-tures and to validate the resolution power of the ERT investiga-tions in this area, characterized by reliable a priori information.
The linear grid array The linear grid array (Fiandaca et al. 2005) is a linear multi-elec-trode configuration, which is a sort of 2D version of the resistivity grid (Cosentino et al. 1999; Cosentino and Martorana 2003). The
array was developed for use with multi-channel resistivity-meters: in fact for each current dipole, potential measurements are carried out for every adjacent electrode pair of the whole array (and not just for some pairs between the current electrodes). For our field measurements with 64 electrodes, 13 different current dipoles were selected. The choice of number and position of the current dipoles was finalized to obtain a proper sampling density of the investi-gated zone: the profile was subdivided into 3, 4, and 6 equal parts and the current electrodes were located at the ends of each part (Fig. 12). Simulations of 2D resistivity data with few current injections (in our case, 13) showed a resolution power that is comparable to those of standard arrays such as dipole-dipole, Wenner and Wenner-Schlumberger (Martorana et al. 2004; Fiandaca et al. 2005). The use of MRS-256 (GF Instruments, Czech Republic), in place of a “standard” resistivity meter, allowed us to completely separate the current channel of the linear grid array and the poten-tial ones: in fact, the transmitter for the current injections and the receiver for the potential measurements (up to 256 quasi-contem-porary potential measures) are physically distinct, as are the cables and the electrodes for potential measurements and current injection. To summarize, the advantages of the combined use of the linear grid array and the MRS-256 are the following:– only low-potential multi-channel cables are needed; in fact
almost all the electrodes of the array are used for potential measures and not for current injection;
– “intelligent” cables or automatic switches are not required: for each current injection all the potential measurements are made between the same electrodes;
– no electrodes are used for either current injection or potential measurements. Consequently, there are no problems regard-ing electrode polarization (Dahlin 2000);
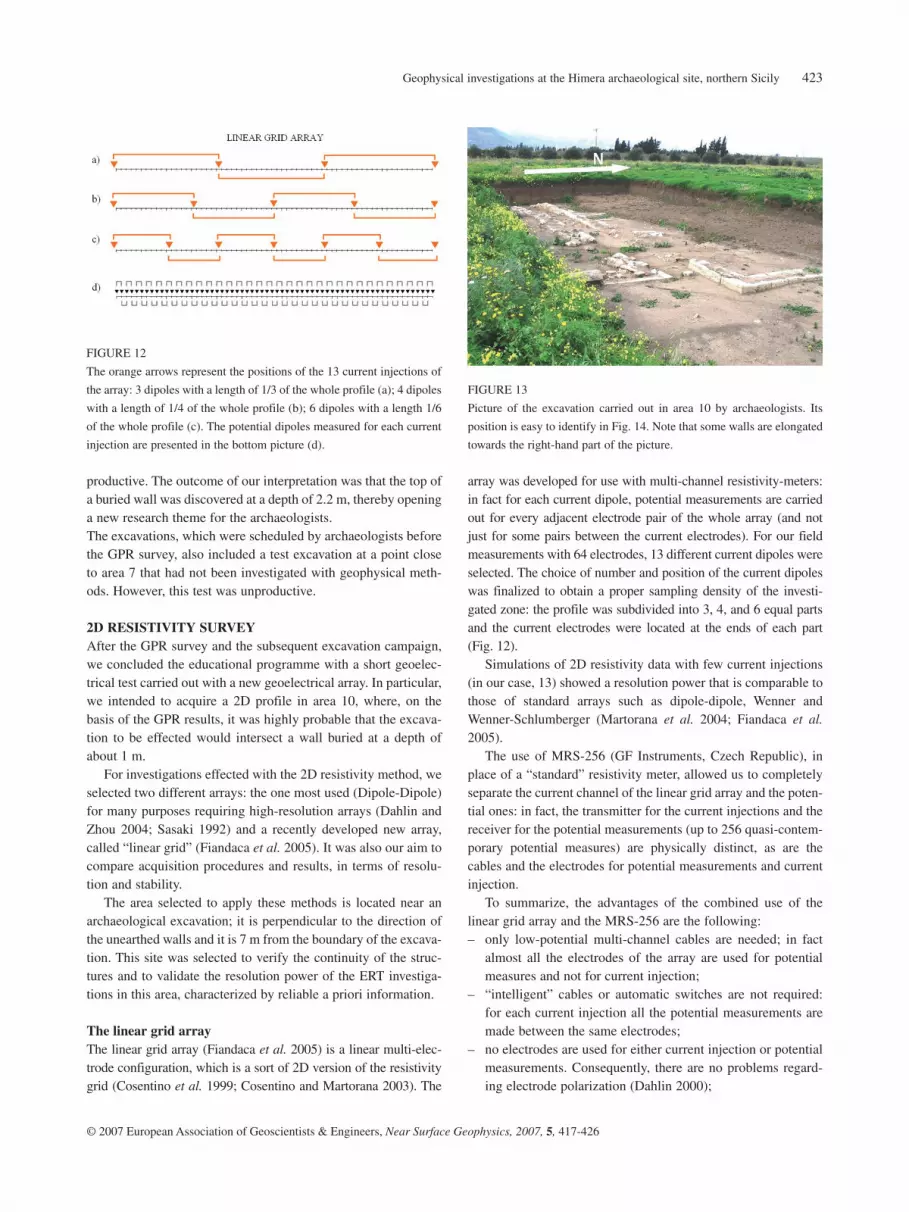
FIGURE 12
The orange arrows represent the positions of the 13 current injections of
the array: 3 dipoles with a length of 1/3 of the whole profile (a); 4 dipoles
with a length of 1/4 of the whole profile (b); 6 dipoles with a length 1/6
of the whole profile (c). The potential dipoles measured for each current
injection are presented in the bottom picture (d).
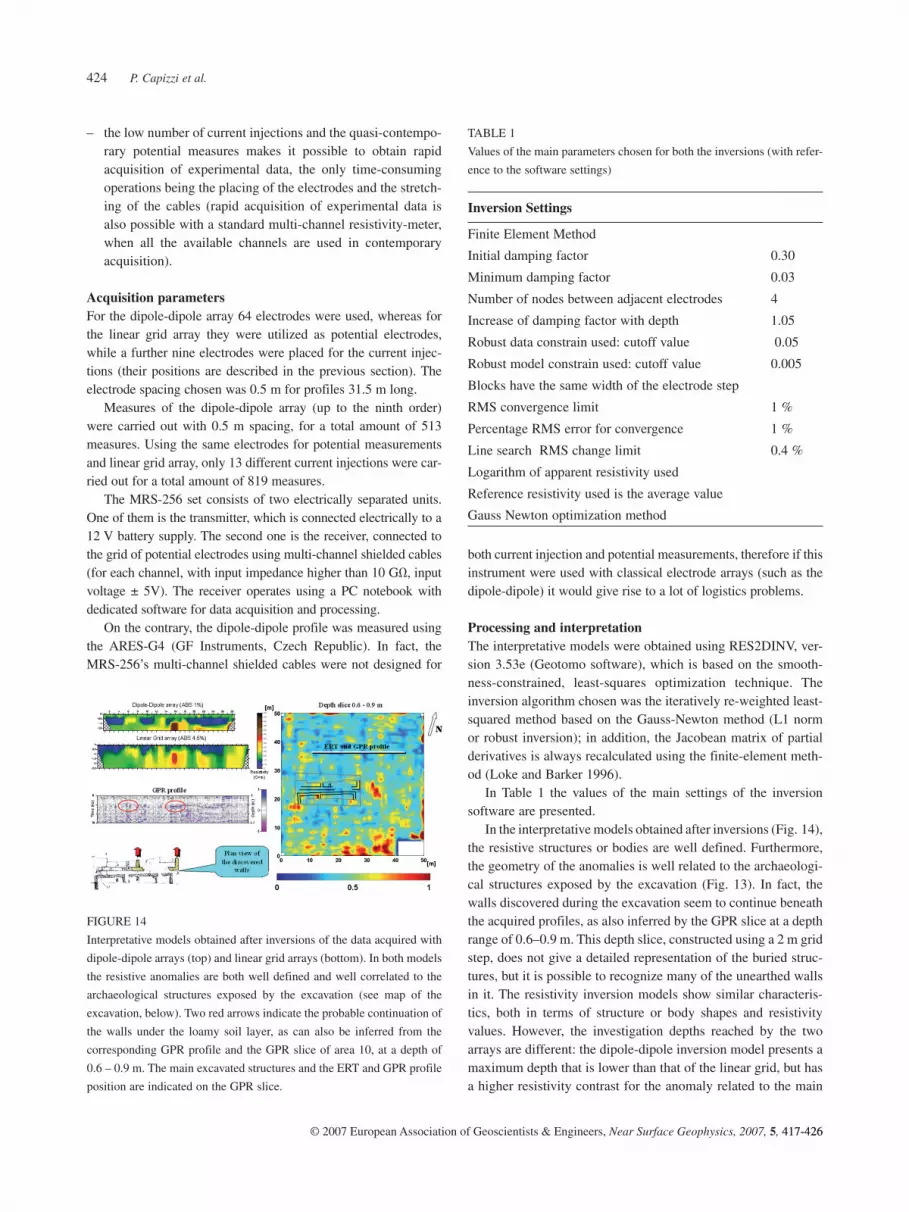
FIGURE 13
Picture of the excavation carried out in area 10 by archaeologists. Its
position is easy to identify in Fig. 14. Note that some walls are elongated
towards the right-hand part of the picture.
P. Capizzi et al.424
© 2007 European Association of Geoscientists & Engineers, Near Surface Geophysics, 2007, 5, 417-426417-426
– the low number of current injections and the quasi-contempo-rary potential measures makes it possible to obtain rapid acquisition of experimental data, the only time-consuming operations being the placing of the electrodes and the stretch-ing of the cables (rapid acquisition of experimental data is also possible with a standard multi-channel resistivity-meter, when all the available channels are used in contemporary acquisition).
Acquisition parameters For the dipole-dipole array 64 electrodes were used, whereas for the linear grid array they were utilized as potential electrodes, while a further nine electrodes were placed for the current injec-tions (their positions are described in the previous section). The electrode spacing chosen was 0.5 m for profiles 31.5 m long. Measures of the dipole-dipole array (up to the ninth order) were carried out with 0.5 m spacing, for a total amount of 513 measures. Using the same electrodes for potential measurements and linear grid array, only 13 different current injections were car-ried out for a total amount of 819 measures. The MRS-256 set consists of two electrically separated units. One of them is the transmitter, which is connected electrically to a 12 V battery supply. The second one is the receiver, connected to the grid of potential electrodes using multi-channel shielded cables (for each channel, with input impedance higher than 10 GΩ, input voltage ± 5V). The receiver operates using a PC notebook with dedicated software for data acquisition and processing. On the contrary, the dipole-dipole profile was measured using the ARES-G4 (GF Instruments, Czech Republic). In fact, the MRS-256’s multi-channel shielded cables were not designed for
both current injection and potential measurements, therefore if this instrument were used with classical electrode arrays (such as the dipole-dipole) it would give rise to a lot of logistics problems.
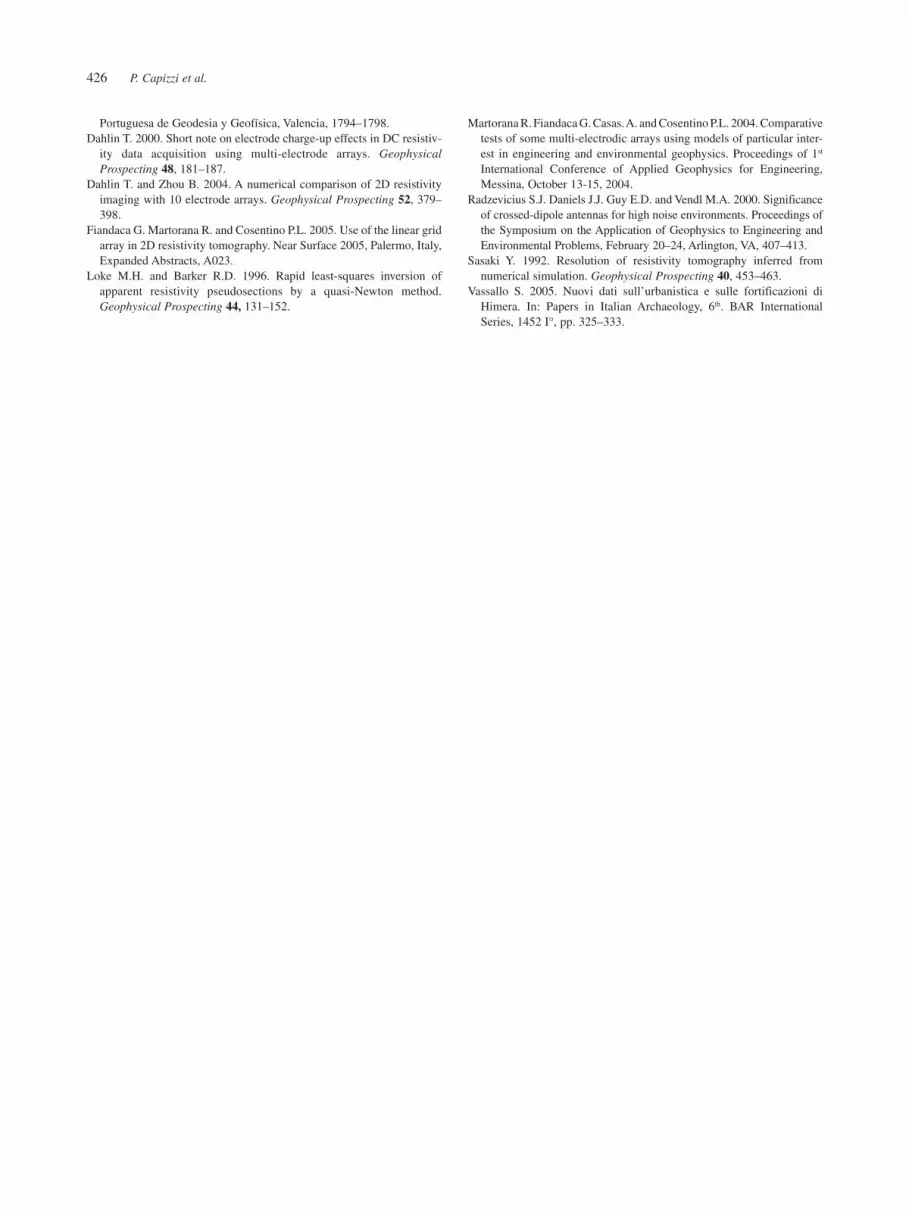
Processing and interpretationThe interpretative models were obtained using RES2DINV, ver-sion 3.53e (Geotomo software), which is based on the smooth-ness-constrained, least-squares optimization technique. The inversion algorithm chosen was the iteratively re-weighted least-squared method based on the Gauss-Newton method (L1 norm or robust inversion); in addition, the Jacobean matrix of partial derivatives is always recalculated using the finite-element meth-od (Loke and Barker 1996). In Table 1 the values of the main settings of the inversion software are presented. In the interpretative models obtained after inversions (Fig. 14), the resistive structures or bodies are well defined. Furthermore, the geometry of the anomalies is well related to the archaeologi-cal structures exposed by the excavation (Fig. 13). In fact, the walls discovered during the excavation seem to continue beneath the acquired profiles, as also inferred by the GPR slice at a depth range of 0.6–0.9 m. This depth slice, constructed using a 2 m grid step, does not give a detailed representation of the buried struc-tures, but it is possible to recognize many of the unearthed walls in it. The resistivity inversion models show similar characteris-tics, both in terms of structure or body shapes and resistivity values. However, the investigation depths reached by the two arrays are different: the dipole-dipole inversion model presents a maximum depth that is lower than that of the linear grid, but has a higher resistivity contrast for the anomaly related to the main
FIGURE 14
Interpretative models obtained after inversions of the data acquired with
dipole-dipole arrays (top) and linear grid arrays (bottom). In both models
the resistive anomalies are both well defined and well correlated to the
archaeological structures exposed by the excavation (see map of the
excavation, below). Two red arrows indicate the probable continuation of
the walls under the loamy soil layer, as can also be inferred from the
corresponding GPR profile and the GPR slice of area 10, at a depth of
0.6 – 0.9 m. The main excavated structures and the ERT and GPR profile
position are indicated on the GPR slice.
Inversion Settings
Finite Element Method
Initial damping factor 0.30
Minimum damping factor 0.03
Number of nodes between adjacent electrodes 4
Increase of damping factor with depth 1.05
Robust data constrain used: cutoff value 0.05
Robust model constrain used: cutoff value 0.005
Blocks have the same width of the electrode step
RMS convergence limit 1 %
Percentage RMS error for convergence 1 %
Line search RMS change limit 0.4 %
Logarithm of apparent resistivity used
Reference resistivity used is the average value
Gauss Newton optimization method
TABLE 1
Values of the main parameters chosen for both the inversions (with refer-
ence to the software settings)

Geophysical investigations at the Himera archaeological site, northern Sicily 425
© 2007 European Association of Geoscientists & Engineers, Near Surface Geophysics, 2007, 5, 417-426
wall. In the inversion model obtained using the data set acquired with the linear grid, it is also possible to recognize the base of the main wall. The results obtained from the geoelectrical surveys appear to confirm the GPR interpretations, and in a few cases give addi-tional information regarding the size and the depth of the bottom of the hidden structures.
DISCUSSION AND CONCLUSIONSObviously, in this paper the results of the geophysical training period of our educational project can only be regarded from a scientific point of view; this includes both the new archaeologi-cal information and the specific geophysical suggestions given regarding the applicability of the methodologies used for such investigations. However, during the educational project the students, who came from a variety of cultural backgrounds ranging from classi-cal to scientific, attended an introductory course in applied geo-physics, following which they effected guided GPR and ERT surveys on the archaeological site of Himera. This allowed them to assist and participate in the acquisition, processing and inter-pretation of the geophysical data. Even though they probably did not acquire enough knowledge to be actually able to apply geo-physics, nevertheless they were more than happy to contribute to this successful campaign and they certainly understood the importance of these geophysical techniques in archaeological research. The archaeological excavation tests showed that the structures were generally very irregular and spread out. In fact, the town itself was abandoned more than twenty four centuries ago and was subsequently flooded by the Himera River numerous times. Obviously, the irregularities of the buried structures caused a lot of noise in the geophysical signals, related to the diffractions of the EM waves as well as to the misfit between the boundaries of each element of the geoelectrical model and the geometry of the archaeological structures. As regards the new archaeological information, it is possible to list the following items:1. the maps of the slices in the investigated areas confirmed the
hypothesis that the structures generally extended along NNW–SSE and WSW–ESE directions; they located the major structures quite well, while also giving some indication regarding the large “empty” areas, where public spaces of the Greek town were possibly positioned;
2. the data (and subsequent excavation) regarding area 6 gave rise to new, possible assumptions regarding hidden archaeo-logical structures;
3. the GPR data obtained in areas 8 and 9 invalidated the archae-ological hypothesis regarding the northern limit of the Himera ruins. In fact, the geophysical results showed buried structures were to be found as far as the northern limits of both these two areas, therefore the above mentioned truncation of the buried wall should be ascribed to a different cause.
As far as the information regarding the geophysical investiga-tions is concerned, we were able to infer the following:1. calcarenite archaeological structures can be easily recognized
in these loamy soils when using GPR and resistivity methods; in areas where relics are located at shallower depths, mag-netic surveys can also be used. In spite of the magnetic noise in the Himera area, some further gradiometric tests will be made in agreement with the Italian Railway Company;
2. the use of GPR should be very useful in the entire Himera area, in fact the comparison between the different densities of the acquired profiles suggests:
– that we cover large areas with 2 m spaced profiles (in both the orthogonal directions), so as to locate the main zones characterized by clustered archaeological relics;
– that we use 0.5 m spaced profiles to obtain details of small areas, where clustering is already known;
3. resistivity, if used in small areas to refine the information, can be very useful in detecting not only the tops of buried struc-tures, but sometimes also the bottoms;
4. archaeological excavations, which allowed us to calibrate the depths of geophysical anomalies, are always very useful for the improvement of the results. However, in cases where the areas to be investigated are very large, geophysics can be used not only to plan excavation strategies but also to obtain “vir-tual” maps of entire sites.
Finally, we wish to emphasize the importance of using special financial support (as well as part of “educational” ones, if neces-sary) to obtain further information regarding the vast archaeo-logical heritage of the Sicilian region that is still buried and often unknown. For such purposes, at least non-invasive geophysical research should be promoted and extended as much as possible, in view of the possible negative interference of urbanization strategies.
ACKNOWLEDGEMENTSM. Daniela Benvenuto, Simona Bracco, Vera Castagnetta, Angelo Castrorao Barba, Claudia Di Gesù, Agata Di Raimondo, Maria Laura Falletta, Simona Guarneri, Fabrizio Ingarsia, Angela Landolina, Antonietta Lo Verde, Valentina Mandalari, Vita Masi, Roberto Miccichè, M. Giovanna Randazzo, Antonino Rizzo, Anna Sala, Maria Sardisco and Cinzia Tocco were the students of the educational project: without their efforts and their enthusiasm this work would not have been accomplished. Many thanks to the referees who advised us to re-elaborate some of the data, thus significantly improving the paper.
REFERENCESCapizzi P. Cosentino P.L. Messina P. Miraglia D. Romano L. and
Vassallo S. 2003. Indagini georadar nel sito archeologico di Himera. Proceedings of 22° Convegno Nazionale GNGTS, Roma.
Cosentino P. Martorana R. and Terranova L.M. 1999. The resistivity grid to optimize tomographic 3D imaging. Proceedings of the 5th Meeting of EAEG, European Section, Budapest, Hungary, Em12.
Cosentino P. and Martorana R. 2003. High-resolution micro-geophysics: Electrical tomography for walls. Proceedings of 3ª Asamblea Hispano-
P. Capizzi et al.426
Portuguesa de Geodesia y Geofísica, Valencia, 1794–1798.Dahlin T. 2000. Short note on electrode charge-up effects in DC resistiv-
ity data acquisition using multi-electrode arrays. Geophysical Prospecting 48, 181–187.
Dahlin T. and Zhou B. 2004. A numerical comparison of 2D resistivity imaging with 10 electrode arrays. Geophysical Prospecting 52, 379–398.
Fiandaca G. Martorana R. and Cosentino P.L. 2005. Use of the linear grid array in 2D resistivity tomography. Near Surface 2005, Palermo, Italy, Expanded Abstracts, A023.
Loke M.H. and Barker R.D. 1996. Rapid least-squares inversion of apparent resistivity pseudosections by a quasi-Newton method. Geophysical Prospecting 44, 131–152.
Martorana R. Fiandaca G. Casas. A. and Cosentino P.L. 2004. Comparative tests of some multi-electrodic arrays using models of particular inter-est in engineering and environmental geophysics. Proceedings of 1st International Conference of Applied Geophysics for Engineering, Messina, October 13-15, 2004.
Radzevicius S.J. Daniels J.J. Guy E.D. and Vendl M.A. 2000. Significance of crossed-dipole antennas for high noise environments. Proceedings of the Symposium on the Application of Geophysics to Engineering and Environmental Problems, February 20–24, Arlington, VA, 407–413.
Sasaki Y. 1992. Resolution of resistivity tomography inferred from numerical simulation. Geophysical Prospecting 40, 453–463.
Vassallo S. 2005. Nuovi dati sull’urbanistica e sulle fortificazioni di Himera. In: Papers in Italian Archaeology, 6th. BAR International Series, 1452 I°, pp. 325–333.


