Embed Size (px)
Citation preview

Akshay Samker, SMKAKS001
Geometric Properties ExperimentLecturer: Matongo Kabani
SAMKER4/16/2014
Summary
The purpose of this experiment is to substantiate the
relationship between bending moments and sectional properties
of symmetrical cross sections, to measure beam displacement
using dial gauges and to process collected data using
statistical methods.
The linear relationship between load and deflection has been
verified and the Young’s Modulus (modulus of elasticity) has
been calculated using the relationship between bending moment
and curvature. A linear chart showing the difference between
theoretical deflection and experimental deflection has also
been computed.
The purposes of this report have been met. The linear
relationship between load and deflection has been proven.
Young’s Modulus has been calculated. There is a 4.4%
difference between the theoretical and experimental
deflection. The principle of virtual work is suited for roof
trusses.
Introduction
In this experiment we hope to substantiate the relationship
between bending moments and section properties of symmetrical
cross sections of Aluminium cantilever beams with the
following arrangement.
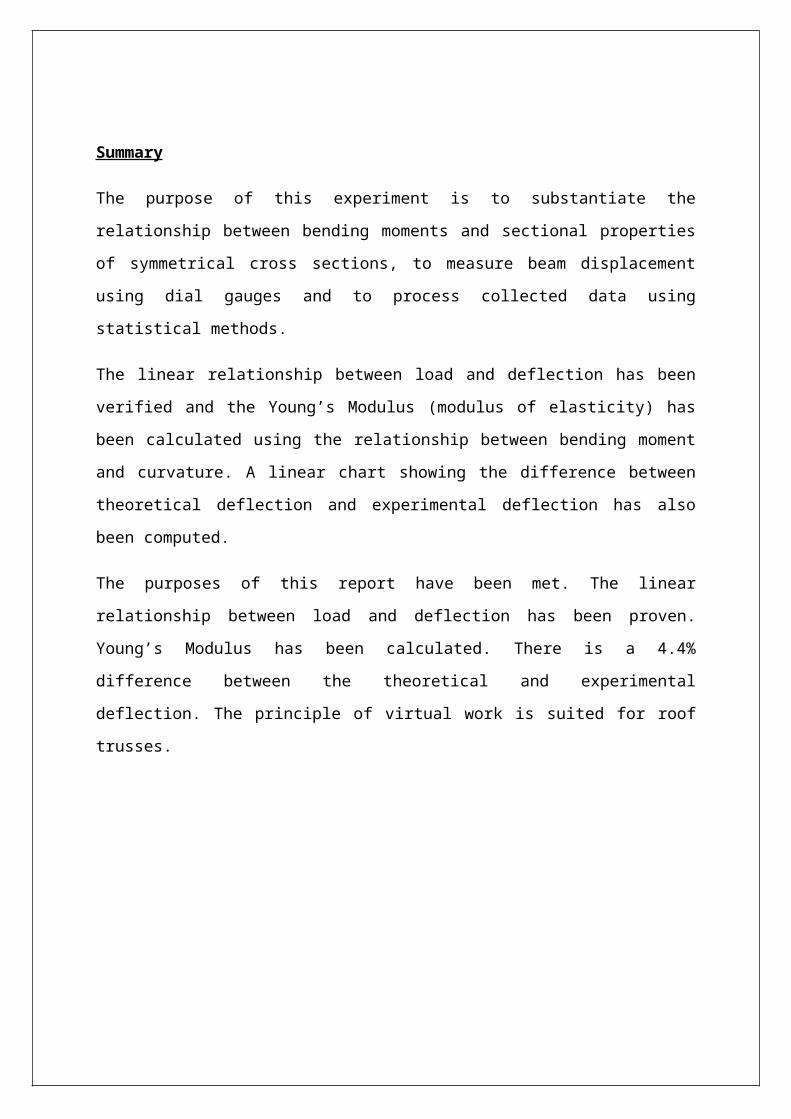
Experiment setup
(Fig. 1)
We define coordinate x across the beam length, y vertically
and z across the beam width. This system sets the top of the
beam to be in tension and the bottom of the beam to be in
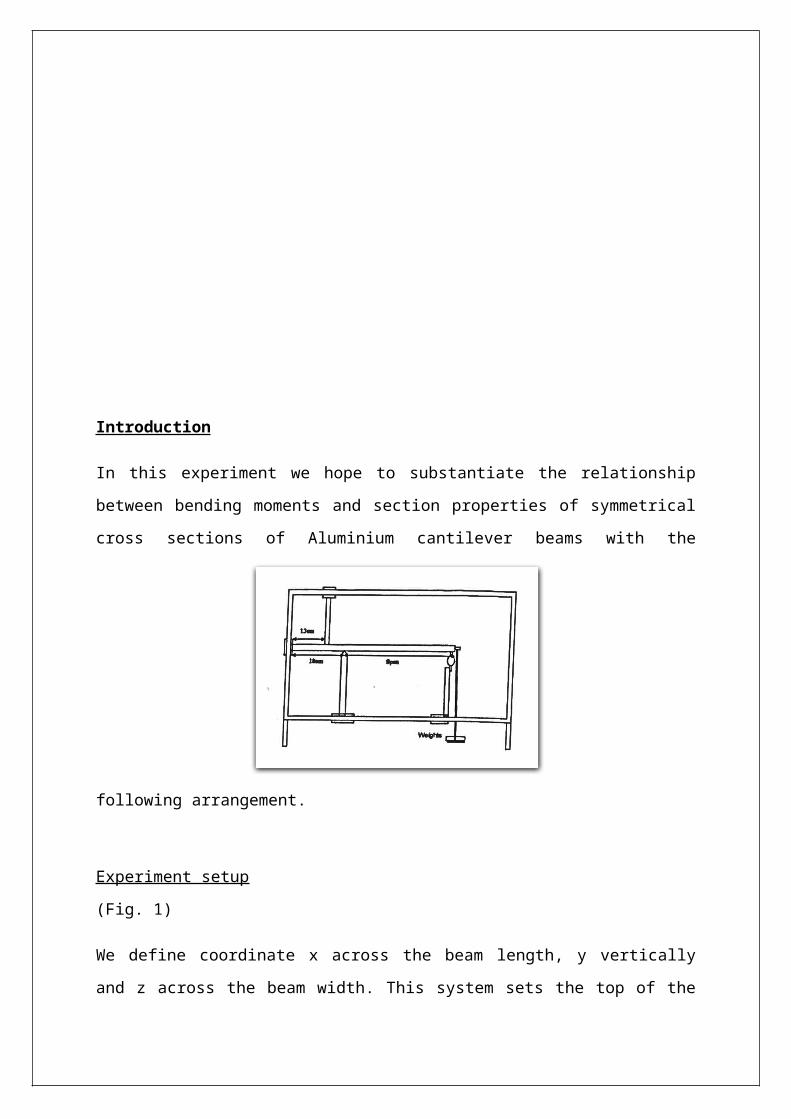
compression. For symmetric cross sections with the line of
action of the force at the centroid of the cross section we
define the bending moment as
Mz=−P (Lx−x )(1)
Where P is the load and L is the span of the beam and x=0 at
the support.
If the beam cross section is symmetrical about the z or y axis
then the bending moment is defined by
Mz=EIzzkz
(2)
Where E is the Modulus of Elasticity and k is the curvature of
the beam.
We will be using 5 systems for this experiment in different
orientations and 3 beam types.
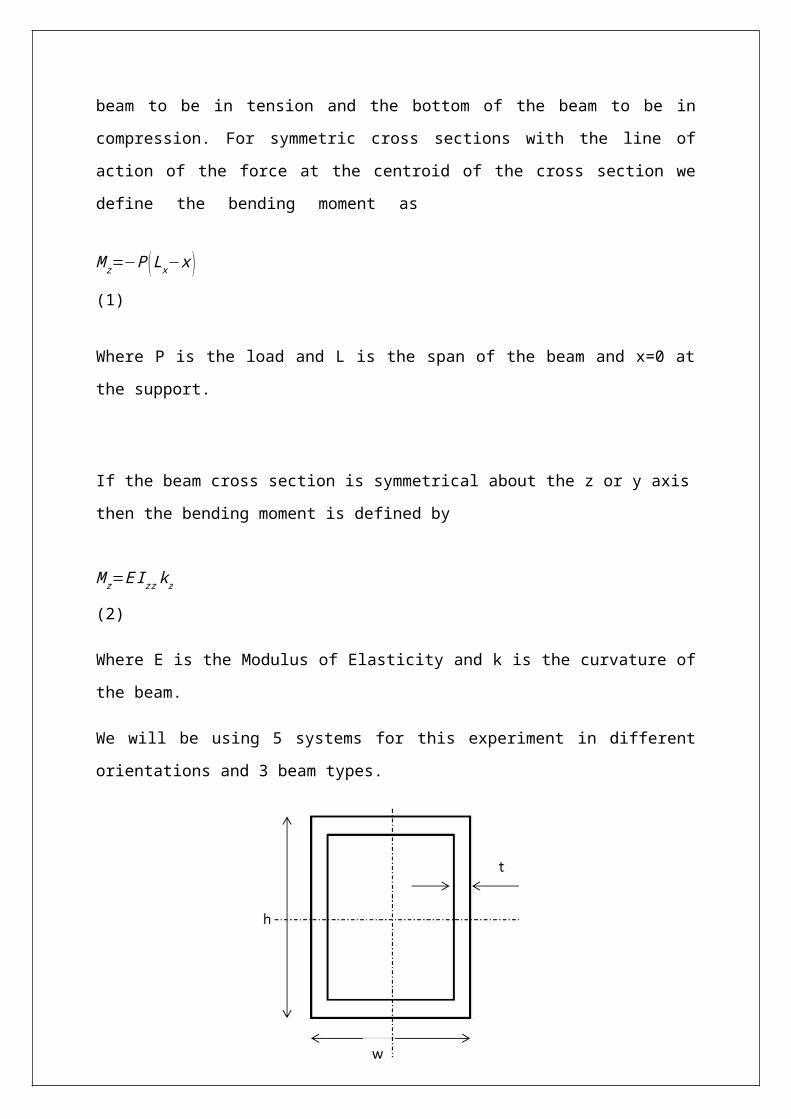
RH
S Major Axis
(Fig. 2)
RHS
Minor Axis
(Fig. 3)
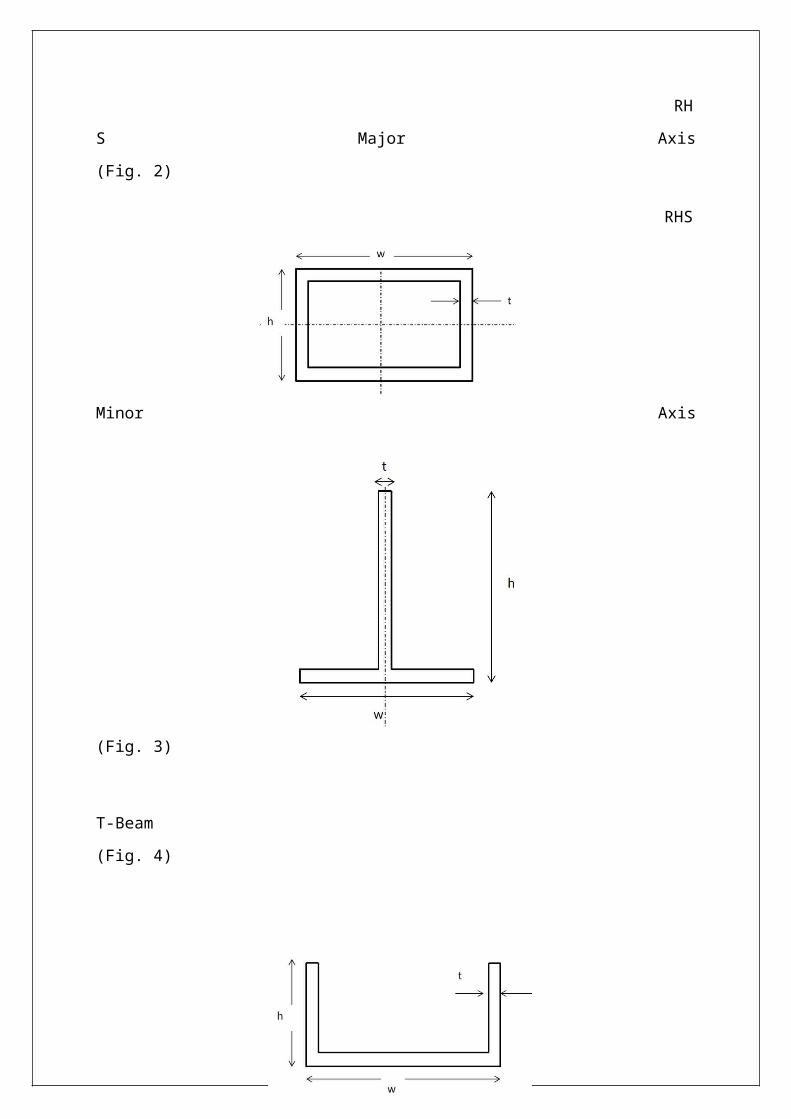
T-Beam
(Fig. 4)
Channel
(Fig. 5)
The theoretical deflection can be calculated using a
manipulated version of the formulas
dt=PL3
3EI(3)
Methodology
Use Vernier callipers to measure the cross sectional
dimensions of each beam and a measuring tape to record the
span of the beam.
For each cantilever:
1. Ensure that it is fixed to the frame and that the beam is
in a horizontal direction.

2. Mount the dial gauges at the tip of the cantilever to
measure vertical deflections.
3. Place the hanger at the tip of the cantilever and zero
the gauge.
4. Place weights on the hanger and record the deflections at
each weight.
5. Remove weights in the same intervals and record the
deflections ant unloading
Results
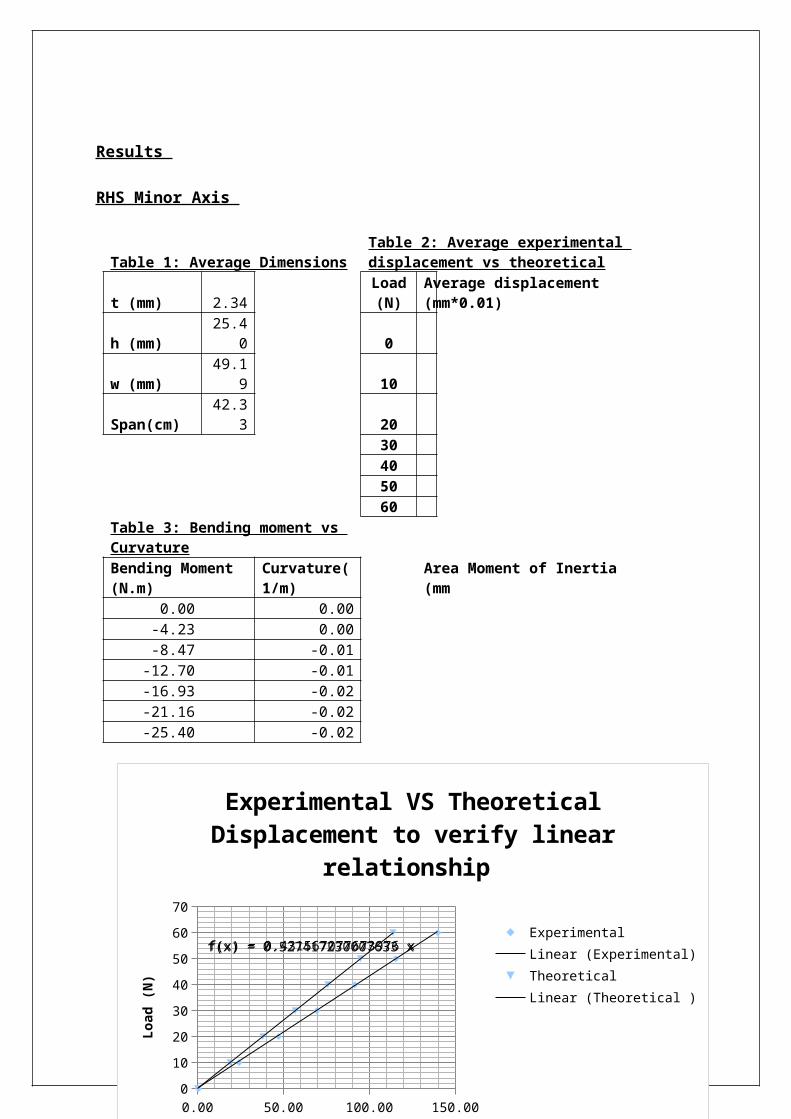
RHS Minor Axis
Table 1: Average DimensionsTable 2: Average experimental displacement vs theoretical
t (mm) 2.34Load(N)
Average displacement (mm*0.01)
h (mm)25.4
0 0
w (mm)49.1
9 10
Span(cm)42.3
3 2030405060
Table 3: Bending moment vs CurvatureBending Moment (N.m)
Curvature(1/m)
Area Moment of Inertia (mm
0.00 0.00-4.23 0.00-8.47 -0.01-12.70 -0.01-16.93 -0.02-21.16 -0.02-25.40 -0.02
0.00 50.00 100.00 150.00010203040506070
f(x) = 0.527417230007633 xf(x) = 0.431567077673976 x
Experimental VS Theoretical Displacement to verify linear
relationship
ExperimentalLinear (Experimental)Theoretical Linear (Theoretical )
Displacement (mm*0.01)
Load (N)
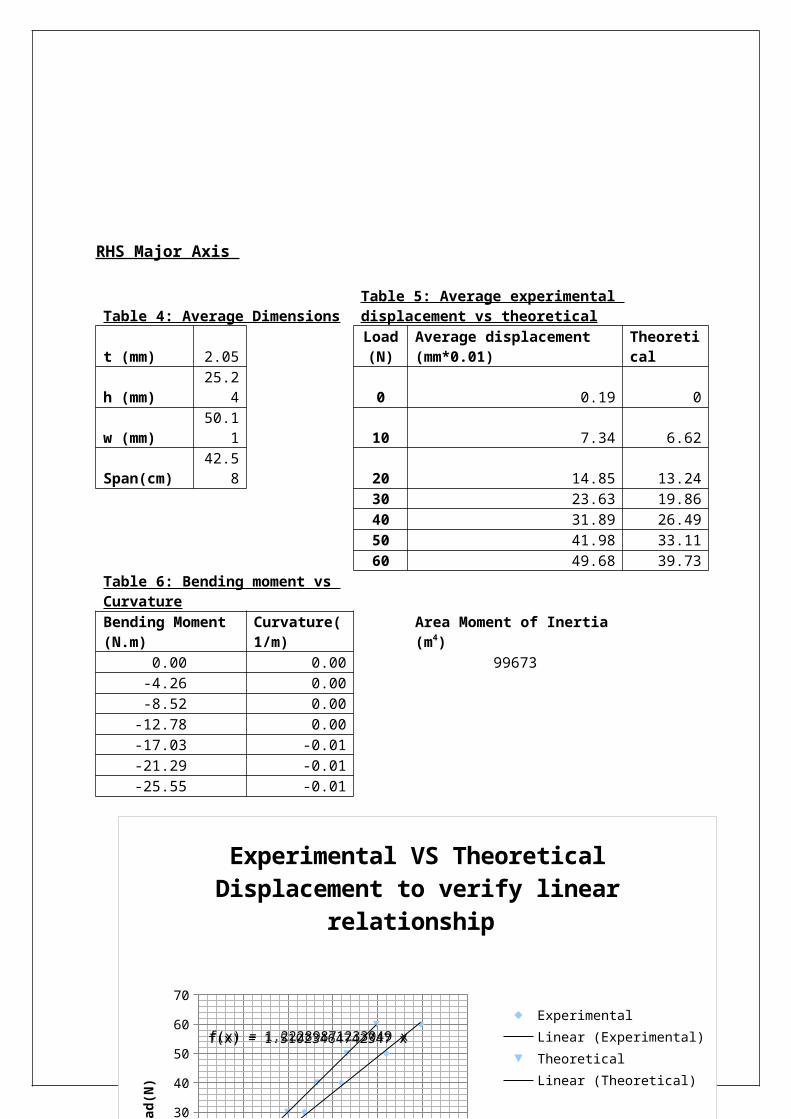
RHS Major Axis
Table 4: Average DimensionsTable 5: Average experimental displacement vs theoretical
t (mm) 2.05Load(N)
Average displacement (mm*0.01)
Theoretical
h (mm)25.2
4 0 0.19 0
w (mm)50.1
1 10 7.34 6.62
Span(cm)42.5
8 20 14.85 13.2430 23.63 19.8640 31.89 26.4950 41.98 33.1160 49.68 39.73
Table 6: Bending moment vs CurvatureBending Moment (N.m)
Curvature(1/m)
Area Moment of Inertia(m4)
0.00 0.00 99673-4.26 0.00-8.52 0.00-12.78 0.00-17.03 -0.01-21.29 -0.01-25.55 -0.01
0.00 50.00 100.00 150.00010203040506070
f(x) = 0.527417230007633 xf(x) = 0.431567077673976 x
Experimental VS Theoretical Displacement to verify linear
relationship
ExperimentalLinear (Experimental)Theoretical Linear (Theoretical )
Displacement (mm*0.01)
Load (N)
0.00 10.00 20.00 30.00 40.00 50.00 60.000
10
20
30
40
50
60
70
f(x) = 1.51023464742347 xf(x) = 1.22289871233049 x
Experimental VS Theoretical Displacement to verify linear
relationship
ExperimentalLinear (Experimental)TheoreticalLinear (Theoretical)
Displacement (mm*0.01)
Load(N)
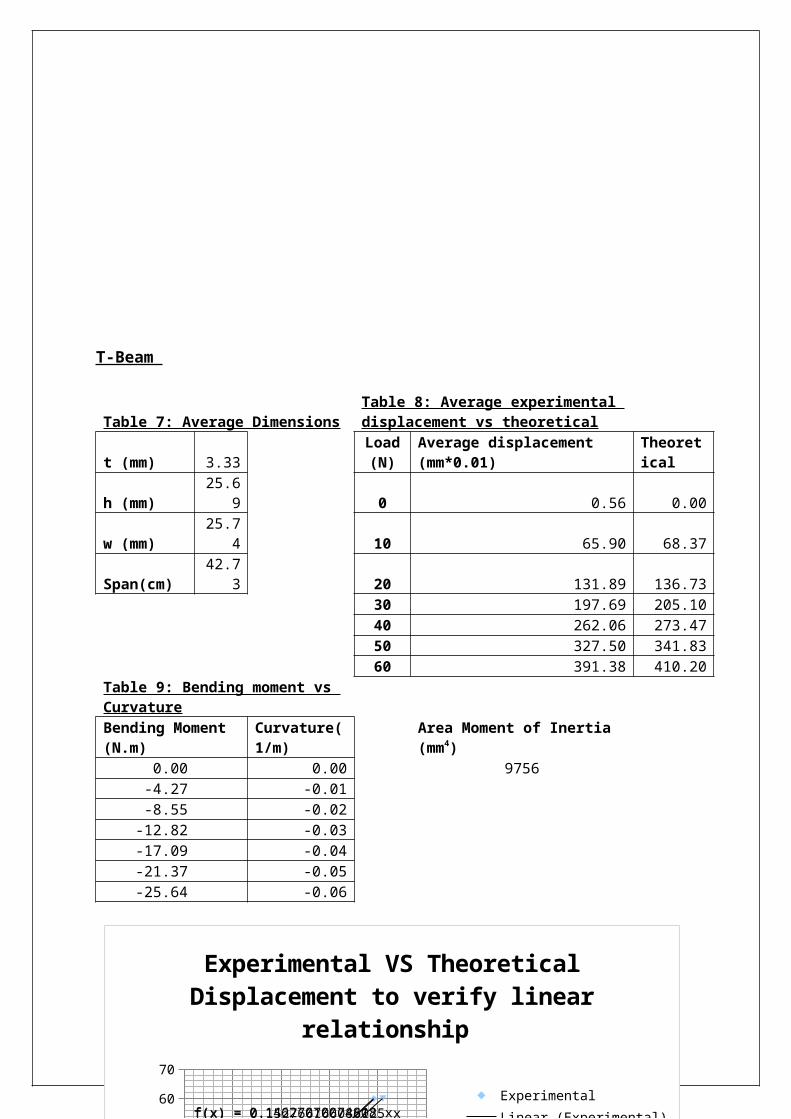
T-Beam
Table 7: Average DimensionsTable 8: Average experimental displacement vs theoretical
t (mm) 3.33Load(N)
Average displacement (mm*0.01)
Theoretical
h (mm)25.6
9 0 0.56 0.00
w (mm)25.7
4 10 65.90 68.37
Span(cm)42.7
3 20 131.89 136.7330 197.69 205.1040 262.06 273.4750 327.50 341.8360 391.38 410.20
Table 9: Bending moment vs CurvatureBending Moment (N.m)
Curvature(1/m)
Area Moment of Inertia (mm4)
0.00 0.00 9756-4.27 -0.01-8.55 -0.02
-12.82 -0.03-17.09 -0.04-21.37 -0.05-25.64 -0.06
0.00 10.00 20.00 30.00 40.00 50.00 60.000
10
20
30
40
50
60
70
f(x) = 1.51023464742347 xf(x) = 1.22289871233049 x
Experimental VS Theoretical Displacement to verify linear
relationship
ExperimentalLinear (Experimental)TheoreticalLinear (Theoretical)
Displacement (mm*0.01)
Load(N)
0.00 100.00200.00300.00400.00500.000
10
20
30
40
50
60
70
f(x) = 0.14627070074808 xf(x) = 0.152766166086125 x
Experimental VS Theoretical Displacement to verify linear
relationship
ExperimentalLinear (Experimental)Linear (Experimental)TheoreticalLinear (Theoretical)
Displacement (mm*0.01)
Load(N)
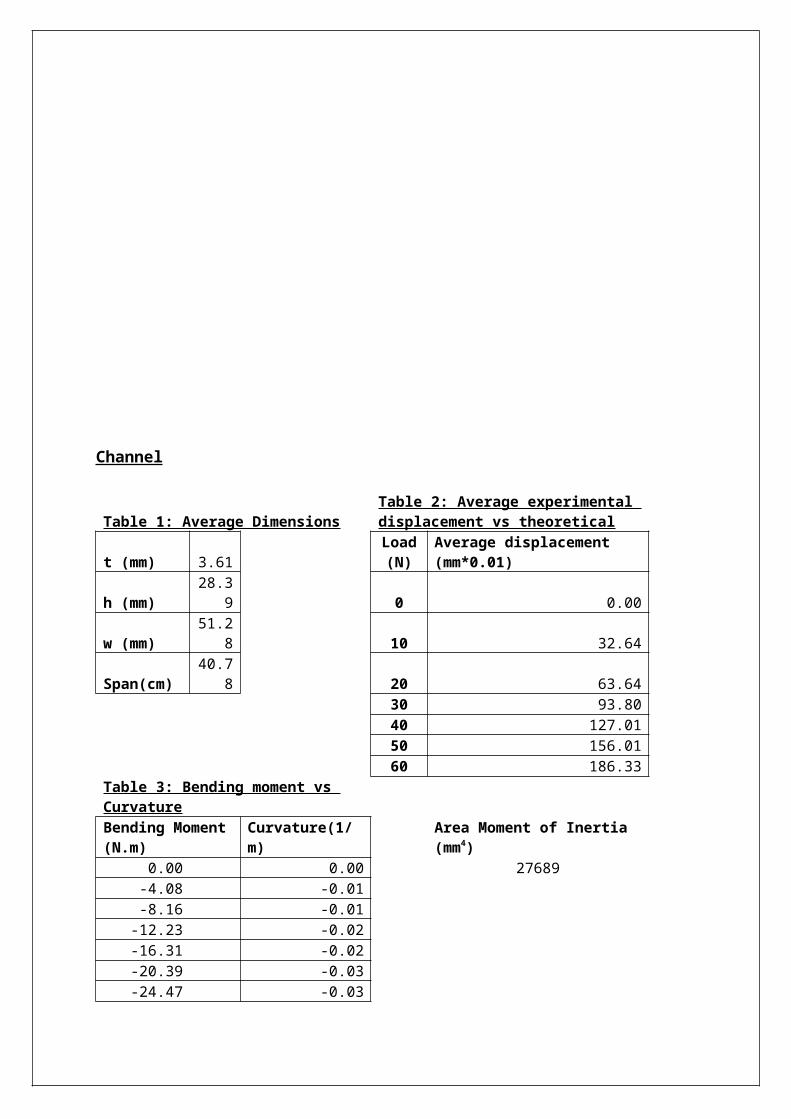
Channel
Table 1: Average DimensionsTable 2: Average experimental displacement vs theoretical
t (mm) 3.61Load(N)
Average displacement (mm*0.01)
h (mm)28.3
9 0 0.00
w (mm)51.2
8 10 32.64
Span(cm)40.7
8 20 63.6430 93.8040 127.0150 156.0160 186.33
Table 3: Bending moment vs CurvatureBending Moment(N.m)
Curvature(1/m)
Area Moment of Inertia (mm4)
0.00 0.00 27689-4.08 -0.01-8.16 -0.01-12.23 -0.02-16.31 -0.02-20.39 -0.03-24.47 -0.03
0.00 100.00200.00300.00400.00500.000
10
20
30
40
50
60
70
f(x) = 0.14627070074808 xf(x) = 0.152766166086125 x
Experimental VS Theoretical Displacement to verify linear
relationship
ExperimentalLinear (Experimental)Linear (Experimental)TheoreticalLinear (Theoretical)
Displacement (mm*0.01)
Load(N)
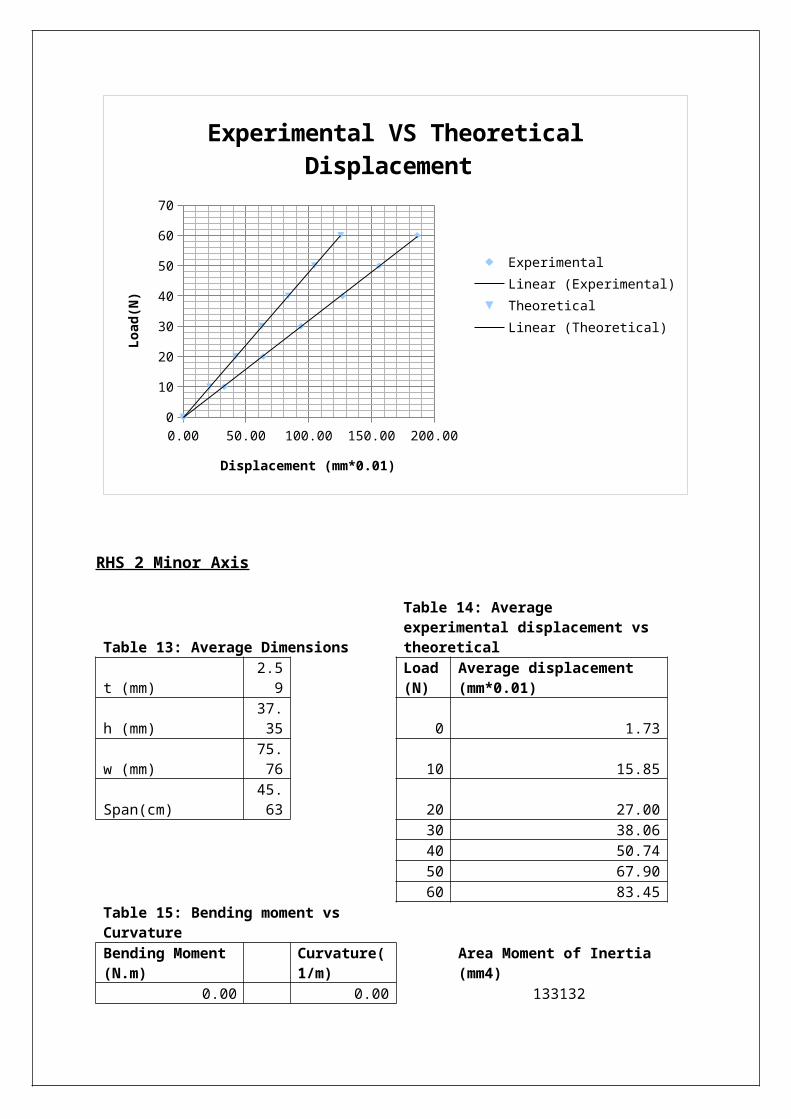
RHS 2 Minor Axis
Table 13: Average Dimensions
Table 14: Average experimental displacement vs theoretical
t (mm)2.59
Load(N)
Average displacement (mm*0.01)
h (mm)37.35 0 1.73
w (mm)75.76 10 15.85
Span(cm)45.63 20 27.00
30 38.0640 50.7450 67.9060 83.45
Table 15: Bending moment vs CurvatureBending Moment (N.m)
Curvature(1/m)
Area Moment of Inertia (mm4)
0.00 0.00 133132
0.00 50.00 100.00 150.00 200.000
10
20
30
40
50
60
70
Experimental VS Theoretical Displacement
ExperimentalLinear (Experimental)TheoreticalLinear (Theoretical)
Displacement (mm*0.01)
Load(N)
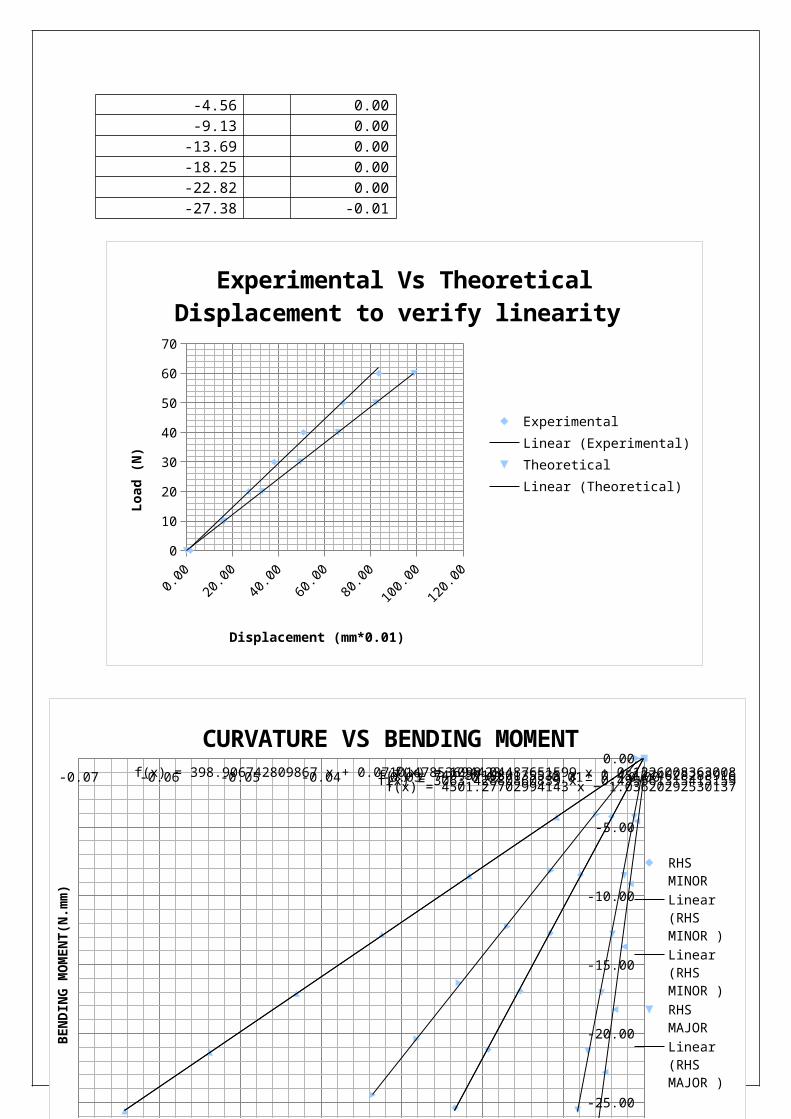
-4.56 0.00-9.13 0.00-13.69 0.00-18.25 0.00-22.82 0.00-27.38 -0.01
0.00
20.00
40.00
60.00
80.00
100.00
120.00
0
10
20
30
40
50
60
70
Experimental Vs Theoretical Displacement to verify linearity
ExperimentalLinear (Experimental)TheoreticalLinear (Theoretical)
Displacement (mm*0.01)
Load (N)
-0.07 -0.06 -0.05 -0.04 -0.03 -0.02 -0.01 0.00
-30.00
-25.00
-20.00
-15.00
-10.00
-5.00
0.00
f(x) = 4501.27702994143 x − 1.03620292530137f(x) = 740.571980135535 x + 0.451274628288916f(x) = 398.906742809867 x + 0.0710147853694423f(x) = 3063.42880860839 x − 0.499661315415159f(x) = 1098.04487651599 x + 0.1226008363008
CURVATURE VS BENDING MOMENT
RHS MINOR Linear (RHS MINOR )Linear (RHS MINOR )RHS MAJOR Linear (RHS MAJOR )
CURVATURE
BENDING MOMENT(N.mm)
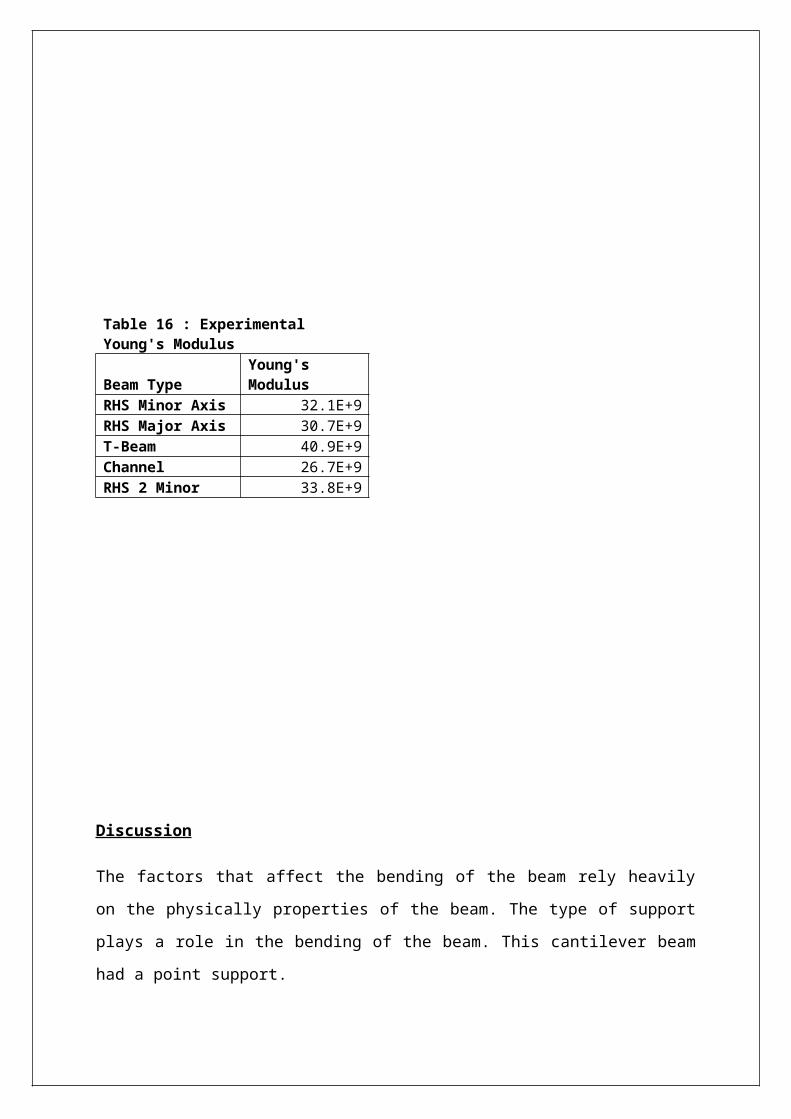
Table 16 : Experimental Young's Modulus
Beam TypeYoung's Modulus
RHS Minor Axis 32.1E+9RHS Major Axis 30.7E+9T-Beam 40.9E+9Channel 26.7E+9RHS 2 Minor 33.8E+9
Discussion
The factors that affect the bending of the beam rely heavily
on the physically properties of the beam. The type of support
plays a role in the bending of the beam. This cantilever beam
had a point support.
-0.07 -0.06 -0.05 -0.04 -0.03 -0.02 -0.01 0.00
-30.00
-25.00
-20.00
-15.00
-10.00
-5.00
0.00
f(x) = 4501.27702994143 x − 1.03620292530137f(x) = 740.571980135535 x + 0.451274628288916f(x) = 398.906742809867 x + 0.0710147853694423f(x) = 3063.42880860839 x − 0.499661315415159f(x) = 1098.04487651599 x + 0.1226008363008
CURVATURE VS BENDING MOMENT
RHS MINOR Linear (RHS MINOR )Linear (RHS MINOR )RHS MAJOR Linear (RHS MAJOR )
CURVATURE BENDING MOMENT(N.mm)
The moment of inertia and the orientation of the beam play a
vital role in the amount of deflection in the beam. The moment
of inertia was computed using the cross sectional area. The
dimensions of the cross section was obtained using a Vernier
calliper, which has an associated uncertainty, using the
uncertainty in the mean of the dimensions and calculating
using the range method, of 0.12mm.
The span of the beam is also factor in the bending moment
which plays a role in the deflection.
The dial gauge calibration and manner of loading and unloading
affect the reading. Gently loading the beam will offer less
“shock” to the gauge and hence give a more accurate reading.
The noise factor in the data is obtained from the initial
reading of the deflection in the beam, i.e.: when no load is
applied. These values need to be subtracted from the
subsequent readings in order to give the correct reading.
According to the dial gauge resolution the uncertainty in the
deflection is 0.05×0.01mm. Using the root sum method the
uncertainty in the vertical deflection is 14.4nmm. The noise
factors and other factors of error are constituent of the
variation in the between the experimental and the theoretical
deflection.
Conclusion
The purposes of this lab have been met. The relationship
between load and vertical displacement is linear and the
Young’s modulus for each type of beam has been calculated
experimentally taking into account the uncertainty with the
given data.
Uncertainty in the measurement of deflections and dimensions
were accounted for using the range method and instrument
resolution. The percentage difference between the theoretical
and experimental deflection in the T-Beam was 4.4% which shows
the most accuracy of all the beams analysed. The Young’s
modulus calculated was 40.9±2.3GPa. 39GPa does fall in thisrange.
The principle of virtual work is suited for estimating the
deflection in roof trusses. The uncertainty is low and hence
accurate estimations can be made, given that the roof truss is
made of an isotropic material.
Recommendations
During this experiment, the readings from the dial gauge were
not clear. The sensitivity of the gauge was not given. A
digital gauge is recommended as the readings would be quicker
to establish and would also be correctly calibrated.
The hollow of the beams were covered making it difficult to
obtain precise readings using the Vernier calliper. A sample
piece of each beam is recommended for the purpose of measuring
dimensions.
The level of friction in the dial gauge has not been given.
This could affect the readings if the gauge is not installed
in a perfectly vertical arrangement. In this case a digital
gauge is recommended.
The use of strain gauges instead of a dial gauge would have
been a quicker method to achieving the objectives of this
experiment, i.e. the use of engineering stress and engineering
strain.
References
1. Kabani,M. CIV2037F Course Notes
2. Gere, J.M.; Timoshenko, S.P. Mechanics of Materials:Forth
edition, Nelson Engineering, (1996),
3. Norris, Charles Head; John Benson Wilbur, Senol Utku,
Elementary Structural Analysis (3rd ed.). McGraw-Hill.
Pp, (1976). 313–326

Appendices
Sample Calculations
Area Moment of Inertia of RHS Minor (all other moment of
inertia is calculated using the same principle)
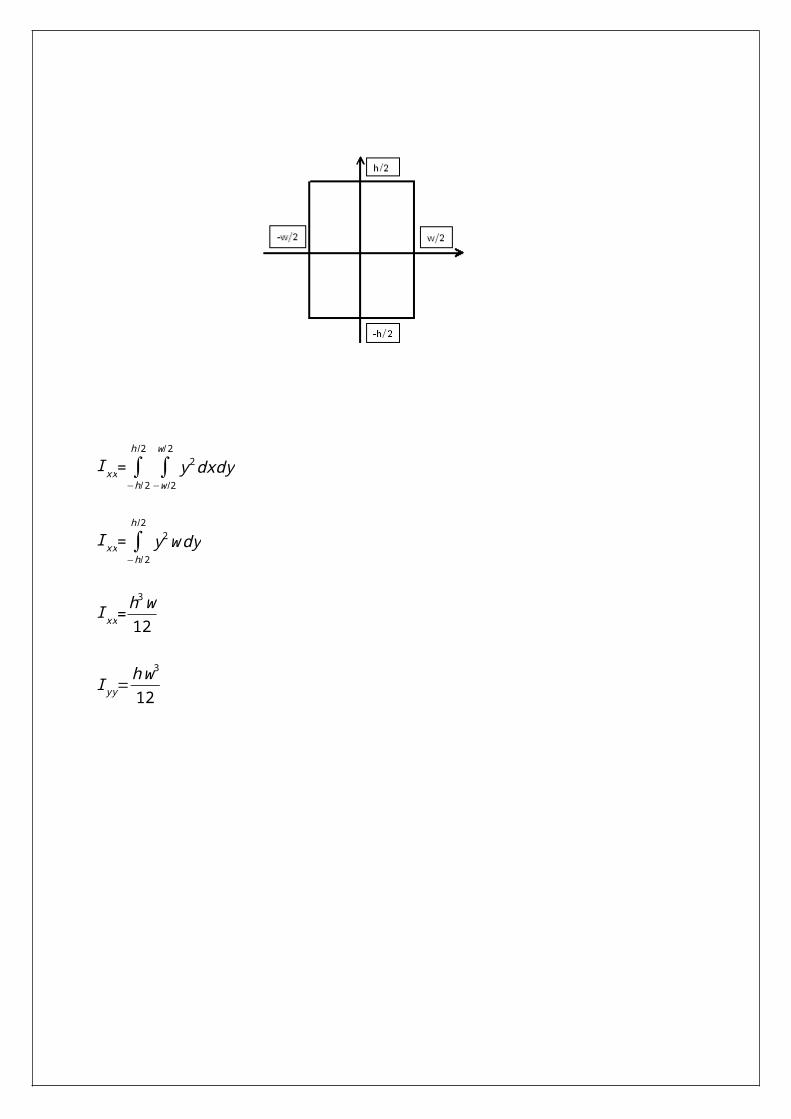
Ixx= ∫−h/2
h /2
∫−w /2
w/2
y2dxdy
Ixx= ∫−h/2
h /2
y2wdy
Ixx=h3w12
Iyy=hw3
12
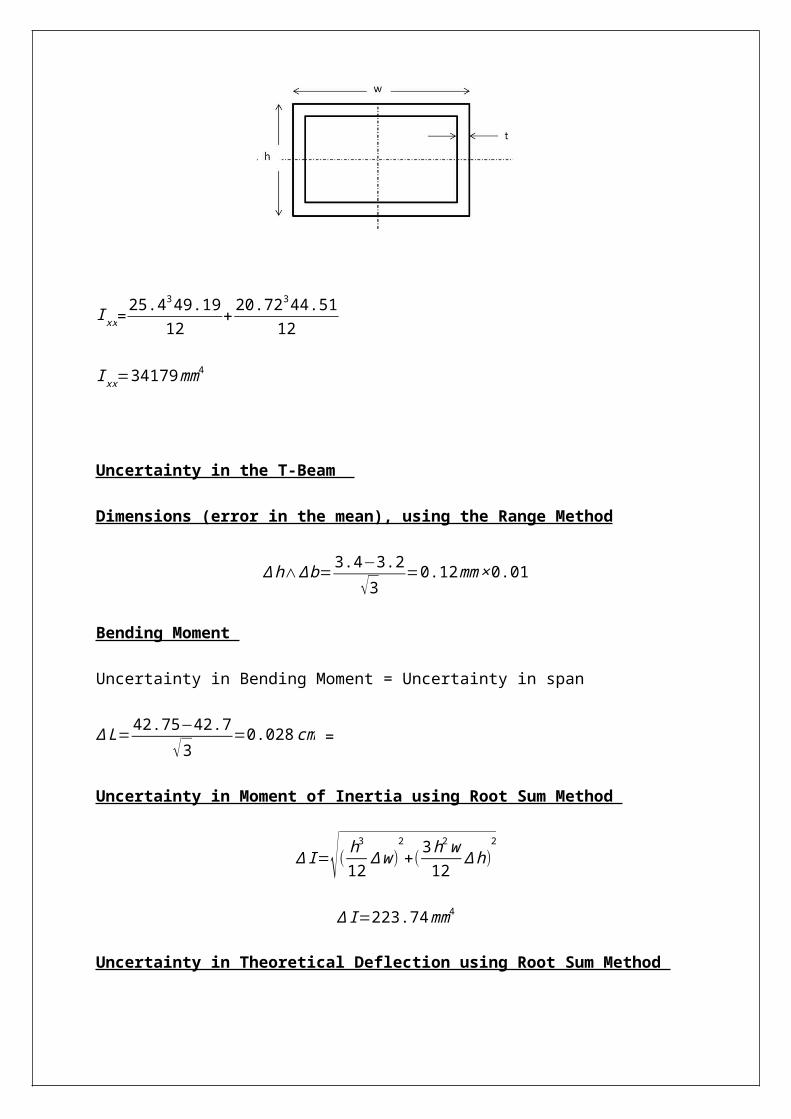
Ixx=25.4349.19
12+20.72344.51
12
Ixx=34179mm4
Uncertainty in the T-Beam
Dimensions (error in the mean), using the Range Method
∆h∧∆b=3.4−3.2
√3=0.12mm×0.01
Bending Moment
Uncertainty in Bending Moment = Uncertainty in span
∆L=42.75−42.7
√3=0.028cm =
Uncertainty in Moment of Inertia using Root Sum Method
∆I=√(h312 ∆w)
2+(3h2w12 ∆h)
2
∆I=223.74mm4
Uncertainty in Theoretical Deflection using Root Sum Method
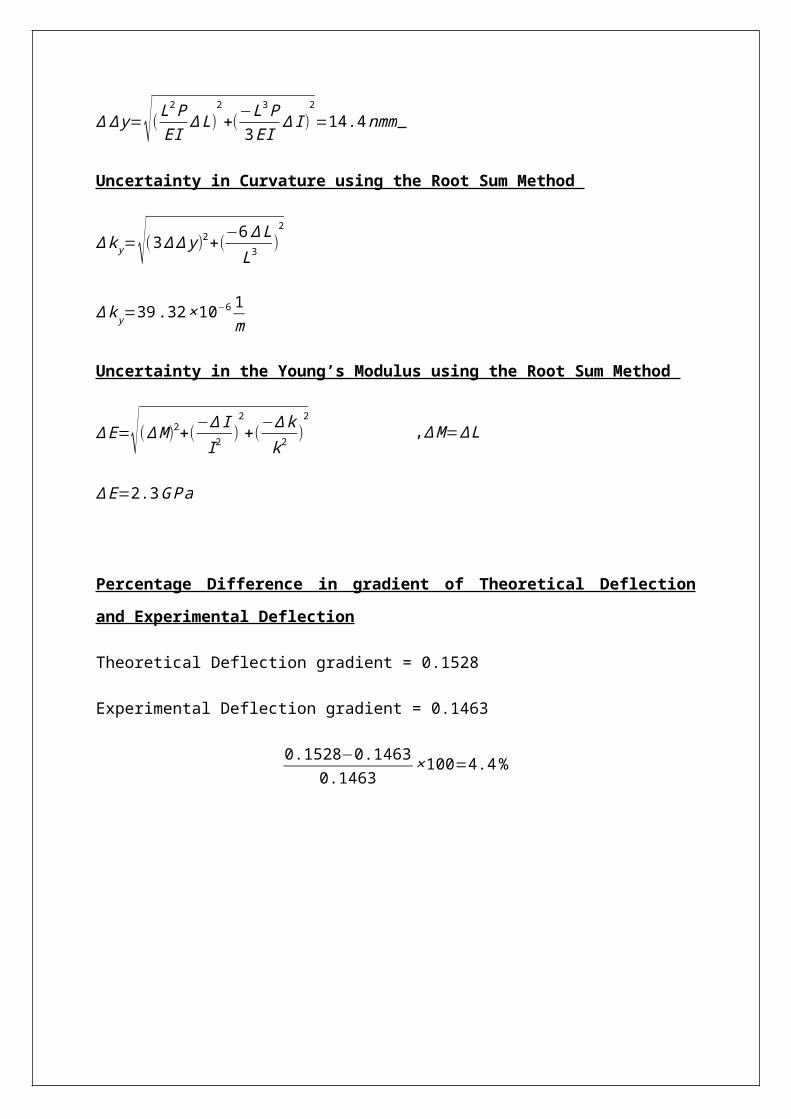
∆ ∆y=√(L2PEI ∆L)
2+(
−L3P3EI ∆I)
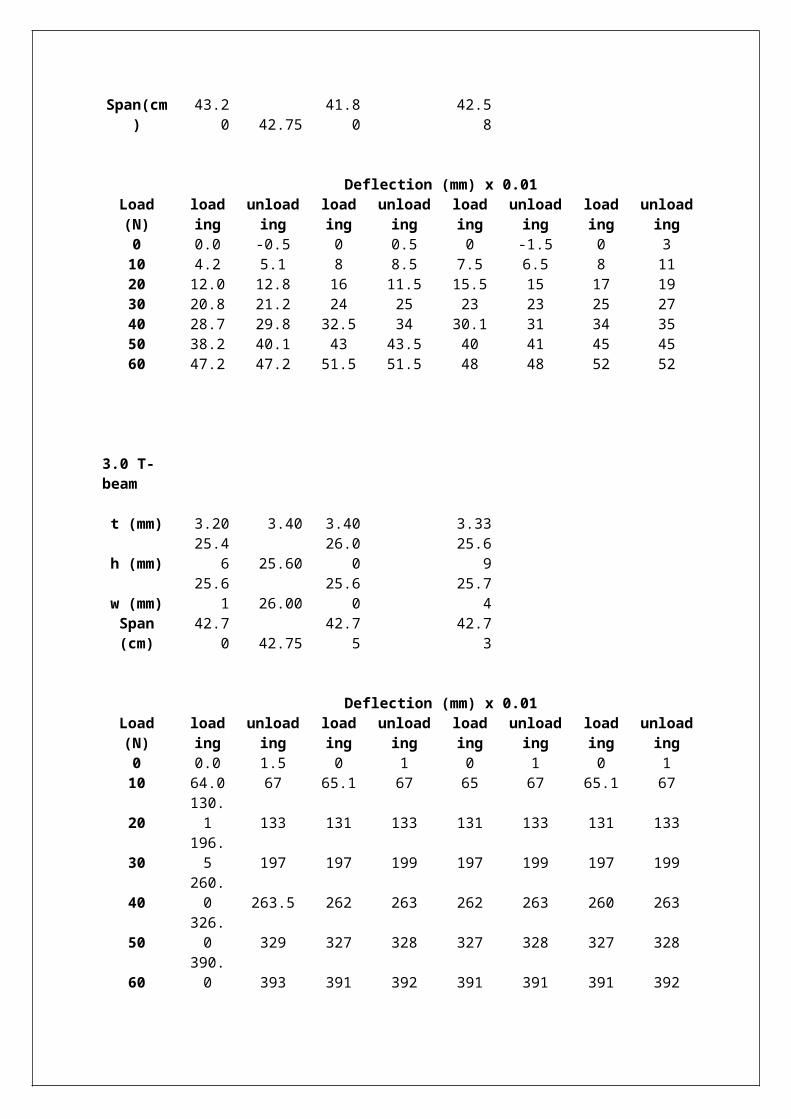
2=14.4nmm
Uncertainty in Curvature using the Root Sum Method
∆ky=√(3∆∆y)2+(−6∆LL3 )
2
∆ky=39.32×10⁻⁶ 1m
Uncertainty in the Young’s Modulus using the Root Sum Method
∆E=√(∆M)2+(−∆II2
)2+(
−∆kk2 )
2 ,∆M=∆L
∆E=2.3GPa
Percentage Difference in gradient of Theoretical Deflection
and Experimental Deflection
Theoretical Deflection gradient = 0.1528
Experimental Deflection gradient = 0.1463
0.1528−0.14630.1463
×100=4.4%

Raw Data
1.0 RHS, minoraxis
t (mm) 2.14 2.26 2.01 2.94 2.34
h (mm)25.0
0 26.2025.1
1 25.28 25.40
w (mm)48.2
0 50.4048.0
3 50.14 49.19Span(cm
)42.8
0 43.2041.5
0 41.80 42.33
Deflection (mm) x 0.01Load(N)
loading
unloading
loading
unloading
loading
unloading
loading
unloading
0 0.0 2 0 1 0 0.1 0 210 20.5 29 20 28 20 28 21 2720 41.1 56 41 53 41 53 42 5030 62.0 81 61 76 61 76 65 7340 85.0 102 85 97 83 97 88 95
50112.5 123 109 118 109 118 114 119
60141.5 143.5 138 138 138 138 141 141
2.0 RHS, majoraxis
t (mm) 2.20 2.00 1.95 2.05
h (mm)25.2
1 25.5424.9
825.2
4
w (mm)50.1
4 50.1850.0
050.1
1
Span(cm)
43.20 42.75
41.80
42.58
Deflection (mm) x 0.01Load(N)
loading
unloading
loading
unloading
loading
unloading
loading
unloading
0 0.0 -0.5 0 0.5 0 -1.5 0 310 4.2 5.1 8 8.5 7.5 6.5 8 1120 12.0 12.8 16 11.5 15.5 15 17 1930 20.8 21.2 24 25 23 23 25 2740 28.7 29.8 32.5 34 30.1 31 34 3550 38.2 40.1 43 43.5 40 41 45 4560 47.2 47.2 51.5 51.5 48 48 52 52
3.0 T-beam
t (mm) 3.20 3.40 3.40 3.33
h (mm)25.4
6 25.6026.0
025.6
9
w (mm)25.6
1 26.0025.6
025.7
4Span(cm)
42.70 42.75
42.75
42.73
Deflection (mm) x 0.01Load(N)
loading
unloading
loading
unloading
loading
unloading
loading
unloading
0 0.0 1.5 0 1 0 1 0 110 64.0 67 65.1 67 65 67 65.1 67
20130.1 133 131 133 131 133 131 133
30196.5 197 197 199 197 199 197 199
40260.0 263.5 262 263 262 263 260 263
50326.0 329 327 328 327 328 327 328
60390.0 393 391 392 391 391 391 392
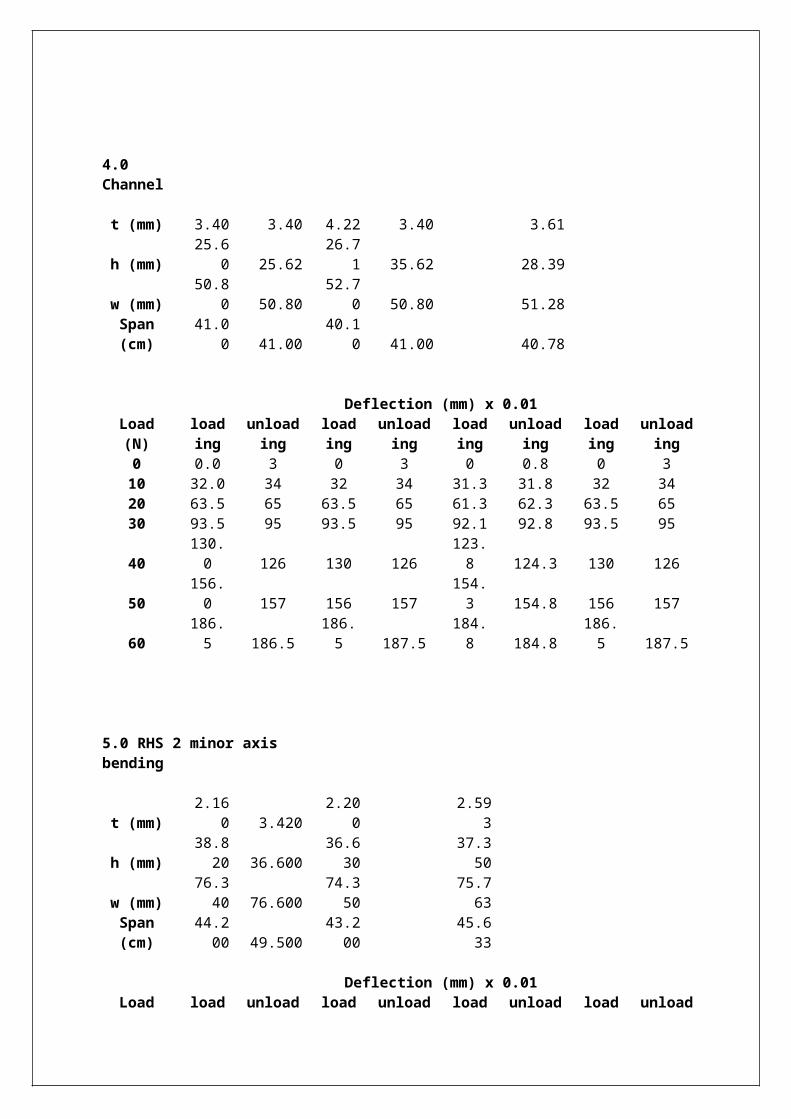
4.0 Channel
t (mm) 3.40 3.40 4.22 3.40 3.61
h (mm)25.6
0 25.6226.7
1 35.62 28.39
w (mm)50.8
0 50.8052.7
0 50.80 51.28Span(cm)
41.00 41.00
40.10 41.00 40.78
Deflection (mm) x 0.01Load(N)
loading
unloading
loading
unloading
loading
unloading
loading
unloading
0 0.0 3 0 3 0 0.8 0 310 32.0 34 32 34 31.3 31.8 32 3420 63.5 65 63.5 65 61.3 62.3 63.5 6530 93.5 95 93.5 95 92.1 92.8 93.5 95
40130.0 126 130 126
123.8 124.3 130 126
50156.0 157 156 157
154.3 154.8 156 157
60186.5 186.5
186.5 187.5
184.8 184.8
186.5 187.5
5.0 RHS 2 minor axis bending
t (mm)2.16
0 3.4202.20
02.59
3
h (mm)38.820 36.600
36.630
37.350
w (mm)76.340 76.600
74.350
75.763
Span(cm)
44.200 49.500
43.200
45.633
Deflection (mm) x 0.01Load load unload load unload load unload load unload

(N) ing ing ing ing ing ing ing ing0 0.0 1.5 0 6 0 4.5 0 1.810 11.2 18 16 26 13.9 21 8 12.720 23.5 29 27 38 24 34.1 17.5 22.930 34.0 40.5 39 49 34.5 45.1 27.1 35.340 48.5 42.5 57 62 50.5 59 39 47.450 65.0 68.5 75 78 66.9 76 54.2 59.660 83.5 83.5 94 94 83 91 69.3 69.3


