Embed Size (px)
Citation preview
DOE/OR/20722-6(DE85003149)
Distribution Category UC-70A
GEOLOGIC REPORT FOR THE
WELDON SPRING RAFFINATE PITS SITE
NOVEMBER 1984
Prepared for
UNITED STATES DEPARTMENT OF ENERGY OAK RIDGE OPERATIONS OFFICE
Under Contract No. DE-AC05-81OR20722
By
Bechtel National, Inc.
Bechtel Job No. 14501 MS'®

PREFACE
This report is one of a series of engineering and environmental reports planned for the U.S. Department of Energy properties at Weldon Spring, Missouri — the Raffinate Pits Site and the Quarry. These reports include, but are not limited to, the following: Engineering Evaluation of Alternatives for theDisposition of the Weldon Spring Raffinate Pits Site, Draft Environmental Impact Statement: Long-Term Management ofExisting Radioactive Material in the Vicinity of Weldon Spring, Missouri, and Radiological Survey Report for the Weldon Spring Raffinate Pits Site. A water balance study of the raffinate pits is in progress. The results of that study are not discussed in this report, but will be the subject of a separate report as soon as data collection and analysis are completed.
This report describes the essential geologic features at the Raffinate Pits Site. It is not intended to be a definitive statement of the engineering methods and designs required to obtain desired performance features for any permanent waste disposal at the site. Such requirements, if developed, will be reported separately.

TABLE OF CONTENTS
Page
1.0 Purpose 1
2.0 Previous Work 2
3.0 Methods of Investigation 4
4.0 Findings 9
5.0 Regional Geology 12
5.1 Stratigraphy and Lithology 125.2 Regional Groundwater and Water Supply 155.3 Regional Structure 16
6.0 Site Geology 18
6.1 Topography and Surface Drainage 186.2 Site Stratigraphy and Lithology 19
6.2.1 Overburden 196.2.2 Bedrock 22
6.3 Geophysical and Geological Relationships 256.3.1 Relationships Outside the Pits 256.3.2 Relationships Inside Pits 3 and 4 28
7.0 Site Hydrogeology 35
7.1 Groundwater Table 357.2 Overburden Groundwater Monitoring 377.3 Hydrogeologic Conditions in the Overburden 37
v
Page
References 44
Tables 47
Figures 97
AppendicesA Trench Logs A-lB Borehole Logs B-lC Observation Well Logs C-lD Hydrographs D-lE Weston Geophysical 1983 Report E-lF Weston Geophysical 1984 Report F-l
vi
LIST OF TABLES
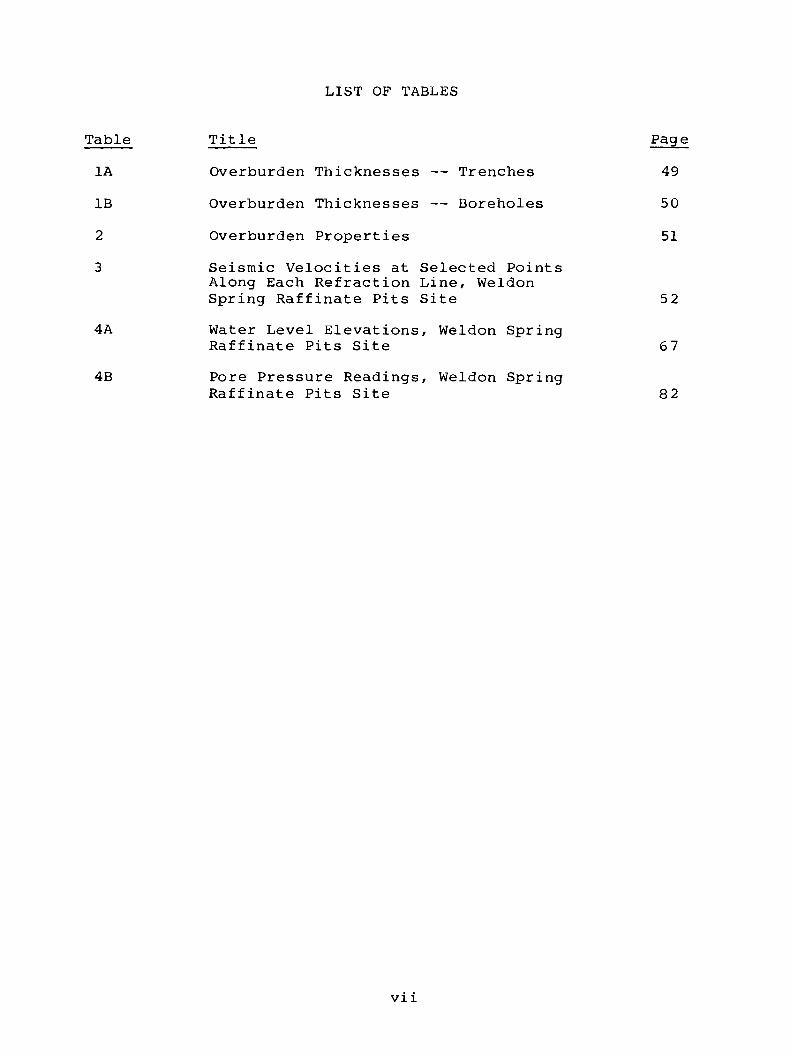
Table1AIB
23
4A
4B
Title
Overburden Thicknesses — Trenches Overburden Thicknesses — Boreholes
Overburden PropertiesSeismic Velocities at Selected Points Along Each Refraction Line, Weldon Spring Raffinate Pits SiteWater Level Elevations, Weldon Spring Raffinate Pits SitePore Pressure Readings, Weldon Spring Raffinate Pits Site
Pa9e4950
51
52
67
82
vi i
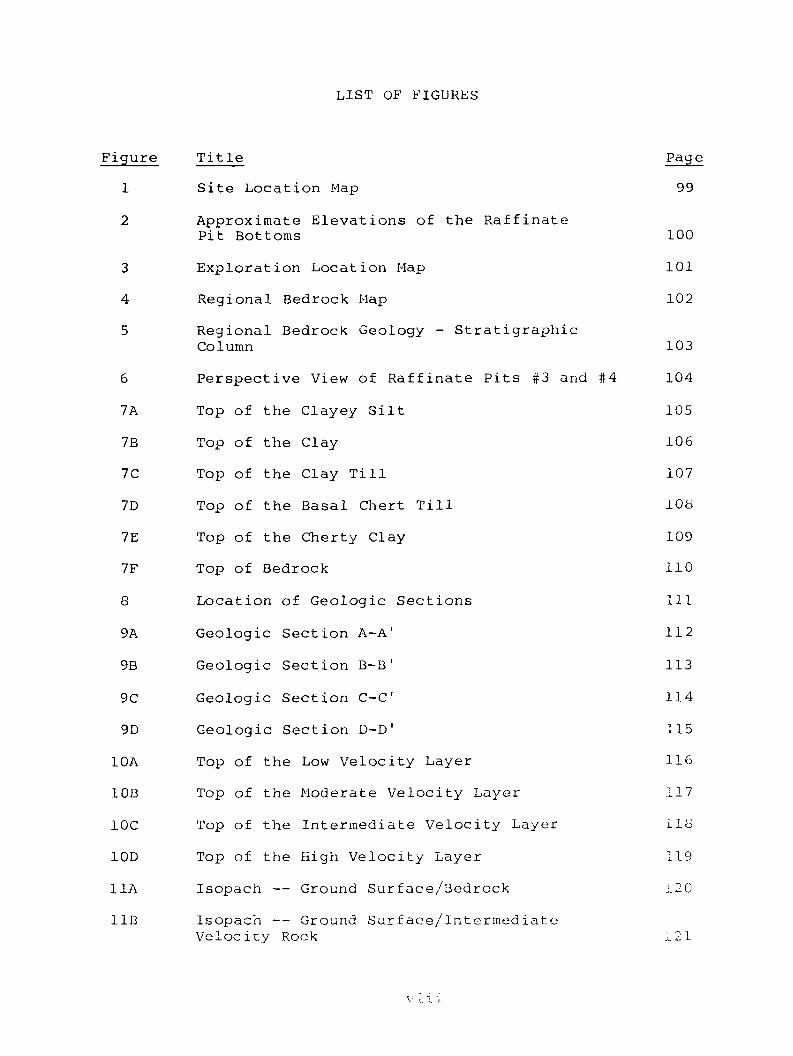
LIST OF FIGURES
Figure Title Page1 Site Location Map 992 Approximate Elevations of the Raffinate
Pit Bottoms 1003 Exploration Location Map 1014 Regional Bedrock Map 1025 Regional Bedrock Geology - Stratigraphic
Column 103
6 Perspective View of Raffinate Pits #3 and #4 104
7 A Top of the Clayey Silt 1057B Top of the Clay 1067 C Top of the Clay Till 107
7D Top of the Basal Chert Till 108
7E Top of the Cherty Clay 1097F Top of Bedrock 110
8 Location of Geologic Sections 111
9A Geologic Section A-A1 112
9B Geologic Section B-B' 113
9C Geologic Section C-C1 114
9D Geologic Section D-D 1 115
10A Top of the Low Velocity Layer 116
10B Top of the Moderate Velocity Layer 117
10C Top of the Intermediate Velocity Layer 118
10D Top of the High Velocity Layer 119
11A Isopach — Ground Surface/Bedrock 120
1 IB Isopacn — Ground Surface/Intermediate Velocity Rock 121
v i.
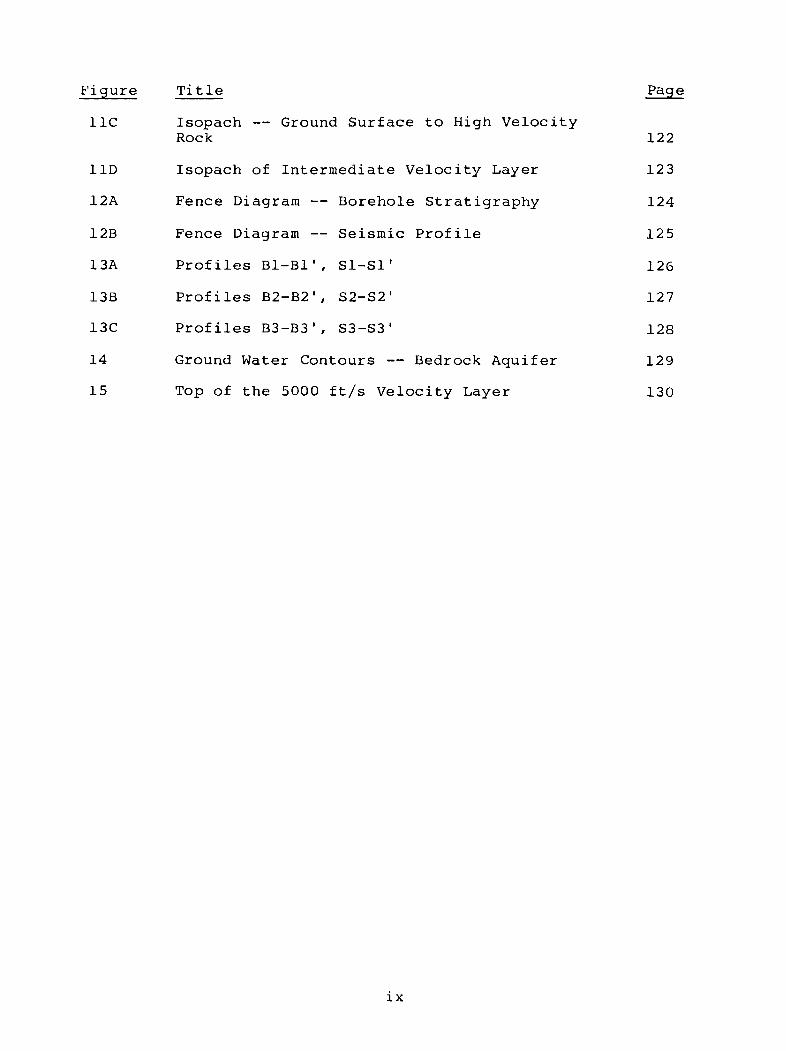
Figure Ti tie Page11C Isopach — Ground Surface to High Velocity
Rock 1221 ID Isopach of Intermediate Velocity Layer 12312A Fence Diagram -- Borehole Stratigraphy 12412B Fence Diagram -- Seismic Profile 12513A Profiles Bl-Bl1, Sl-Sl' 12613B Profiles B2-B21, S2-S21 12713C Profiles B3-B31, S3-S3' 12814 Ground Water Contours — Bedrock Aquifer 12915 Top of the 5000 ft/s Velocity Layer 130
ix
1.0 PURPOSE
A preliminary geologic site characterization study was conducted at the Weldon Spring Raffinate Pits Site, which is part of the Weldon Spring Site, in St. Charles County, Missouri. The Raffinate Pits Site is under the custody of the Department of Energy (DOE). Surrounding properties, including the Weldon Spring chemical plant, are under the control of the Department of the Army (Figure 1). The study determined the following parameters: site stratigraphy, lithology and general conditionsof each stratigraphic unit, and groundwater characteristics and their relation to the geology. These parameters were used to evaluate the potential of the site to adequately store low-level radioactive wastes.
The site investigation included trenching, geophysical surveying, borehole drilling and sampling, and installing observation wells and piezometers to monitor groundwater and pore pressures. The investigation activities were conducted on both DOE and adjacent U.S. Army properties.
1
2.0 PREVIOUS WORK
Several studies designed to characterize and assess the suitability of the Weldon Spring Raffinate Pits Site for long-term storage of low-level radioactive waste have been conducted (Refs. 1, 2, 3, and 4). These studies indicate that the raffinate pits are underlain by 3 to 15 m (10 to 50 ft) of unconsolidated sediments. These sediments have been described as a loess and a silty clay till that rests on a 0.3- to 0.6-m (1- to 2-ft) thick permeable limestone residuum (Refs. 1, 3, and4). In 1964, Henry Reitz conducted a geological engineering study prior to the construction of Pit 4. The study included augering a series of shallow boreholes and conducting some laboratory tests on the earth materials. Borehole logs from the Reitz auger holes indicate that approximately 6 m (20 ft) of overburden consisting of a silty clay underlain by a pebbly clay exists at the site. Auger refusal is logged as being on rock. Many of the Reitz boreholes are located where Pit 4 now exists. In the process of constructing Pit 4, several feet of silty clay were excavated from the pit area for dike construction, which reduced the effective thickness of clay beneath the pits. The Reitz report presents inconsistent data for certain boreholes, such that it is difficult to ascertain from the report the thickness of clay remaining beneath Pit 4. Figure 2 shows the assumed excavation elevations for Raffinate Pits 3 and 4. Contours within the pits were drawn using final design sections for Pit 4 (Ref. 1) and an as-built plan map of Pit 3 (Ref. 5).
In 1980, Lawrence Berkeley Laboratories (LBL) conducted a study that included augering seven holes and completing them as observation well points (Figure 3). All the holes were augered to refusal on what was presumed to be bedrock. The report states that between 6 and 15 m (20 and 50 ft) of relatively impermeable clay exists above bedrock at the site. An isopach of the overburden was constructed by LBL using their data and the Reitz data (Ref. 1). It shows that the overburden
2
thicknesses range from 6 to 11 m (20 to 35 ft) beneath Pit 4 and from 6 to 15 m (20 to 50 ft) beneath Pit 3. A bedrock contour map using LBL and Reitz data shows an elongated trough trending east-west beneath Pits 3 and 4. LBL monitored their observation wells for a month. They were always found to be dry, thus indicating that the overburden was unsaturated at that time.The results of the LBL study have not been verified because the report does not include drill logs or identify the holes by number. Bechtel has renumbered the wells and is monitoring them on a semi-annual basis.
In 1982, T. Lomenick summarized the LBL and Reitz findings and described the regional geology, hydrology, and nature of the bedrock underlying the pits. In particular, the report describes the weathered and pinnacled nature of the bedrock surface, the northeast- and northwest-trending joint sets, and the one degree of regional dip to the northeast. The report indicates that the groundwater gradient is to the north and that groundwater lies approximately 18 m (60 ft) below the site.
Previous studies indicate that overburden is unsaturated, infiltration of precipitation is minimal, and yearly precipitation is usually nearly the same as evaporation so that neither large accumulations nor losses of water in the raffinate pits would be expected. However, no site-specific precipitation-evaporation data were available. With this understanding of the general site conditions, the 1983 Bechtel investigation was formulated.
3
3.0 METHODS OF INVESTIGATION
Site investigations consisted of trenching and geophysical studies, completed between December 13 and December 21, 1982 and subsurface exploratory drilling and sampling, completed between February 13 and April 4, 1983. A geophysical exploration program inside the pits began on December 12, 1983, but was postponed on December 19, 1983, before it was completed, because of adverse weather conditions that caused the raffinate pits to freeze. The geophysical work resumed on March 19, 1984 and was completed April 3, 1984. Figure 3 shows the final locations of all explorations.
The trenching program was originally designed to locate shallowsand lenses within the overburden that might serve ascontaminant migration pathways from the raffinate pits.However, because the near-surface materials are laterally andvertically consistent (none contain sand lenses), the trencheswere dug deeper to more fully investigate the overburden.During the field program, 15 trenches, which averaged about 6 m(20 ft) deep, were excavated by Berra Construction Company using
3 3a backhoe equipped with a 2 m (3 yd ) bucket. The trench logs are presented in Appendix A.
The trenches were distributed throughout the site to gain information about the general site conditions. There was a slight concentration of trenches between the dike of Pit 4 and the northwest side of the DOE property. The trenches were concentrated because previous studies indicate that less than 6 m (20 ft) of overburden are present between the bottom of Pit 4 and weathered bedrock (Refs. 1 and 3). The trench investigation provided subsurface information on the potential seepage from the pit, particularly in this area of reported thin overburden.
4
Because the soil surface is slightly contaminated throughout the site, surface materials were set aside at the start of the trench excavations. When the excavations were backfilled, the surface materials were placed at ground surface and prevented from sliding into the trenches to minimize potential contamination of the subsurface.
Descriptions of the trench materials, to a depth of 1.8 m (6 ft), are based on observation of the undisturbed trench walls. Below this, descriptions are based on bucket grab samples only because potential caving made entering the trenches unsafe. However, trench walls were cohesive and generally did not cave.
The trenching program was done concurrently with the 1982 geophysical survey. The survey consisted of 12 seismic refraction lines, 37 electrical resistivity point tests, and 4 self potential survey lines. The seismic and resistivity surveys were conducted to provide general geophysical profiling of the site; they were located to provide adequate representation of the entire site. The seismic refraction survey delineates seismic velocity interfaces that are related to changes in the density of the earth materials. Similarly, the electrical resistivity survey detects interfaces that are related to the ability of the earth materials to conduct electrical current. These methods are described in detail in Appendices E and F .
Five drilling sites on U.S. Army property were surveyed using electrical resistivity and magnetometer methods prior to drilling. These surveys were made to detect any hazardous buried objects that might affect drilling activities. The geophysical surveys were conducted by Weston Geophysical, Corp. of Westboro, Massachusetts; the data are presented in their report to Bechtel National, Inc. dated March 1983 (Appendix E).
5
A geophysical study of the bottoms of Raffinate Pits 3 and 4 began on December 12, 1983. The program was designed to provide geophysical characterization of conditions inside Pits 3 and 4 and to provide detailed characterization of specific lines, surveyed in 1982, surrounding Pit 3. Severe freezing conditions precluded completing the work in December. The program resumed on March 19, 1984 and was completed on April 3, 1984. Twenty seismic refraction survey lines (Lines 1, 2, 3, and 13 through 29) were run inside Pits 3 and 4 and around Pit 3 (Figure 3). Twelve electrical resistivity point tests (RT 44 through RT 55) were conducted along the seismic lines surrounding the pits.The report of the geophysical investigation is presented in Appendix F.
The drilling and sampling program began on February 13 and continued to March 24, 1983. During that time, 26 boreholes were completed by Boyles Bros. Drilling Co. of Salt Lake City, Utah using Longyear 44, Simco 4000, and Mobile B-56 rotary drill rigs. Borehole logs are presented in Appendix B .
Of these 26 boreholes, 13 were completed as observation wells,10 as piezometers, and 3 were backfilled. Of the 13 observation wells, 8 extend into limestone bedrock (Burlington/Keokuk Formation) below the water table. These eight bedrock wells were installed to measure the groundwater gradient in the limestone. Four (B-21, B-23, B-19A, and B-17) are located on DOE property to determine the elevation of groundwater near the raffinate pits and four (B-9, B-ll, B-3, and B-4) on Army property to determine the elevations of groundwater away from influence of the pits. The boreholes were drilled in two stages to prevent cross-contamination between the overburden and bedrock. Stage 1 included advancing the borehole through the overburden and providing a seal between overburden and the bedrock. Stage 2 consisted of coring the bedrock.
The remaining five observation wells were installed in the overburden to monitor water levels in areas of suspected
6
saturation or where anomalous conditions were encountered during drilling. The observation well logs are presented in Appendix C.
Ten vibrating wire piezometers were installed in the dike surrounding Pit 4 and in the foundation material beneath and surrounding Pits 3 and 4. They were installed to provide more detailed characterization of pore pressures in the clay overburden proximal to the pits. The piezometers are being used because they measure small changes in pore pressure; measure negative pore pressures, which indicate unsaturated conditions; and measure the temperature of the groundwater. They were installed with a conventional sand pack, seal, and grout p l u g .
Boreholes drilled for piezometer and observation wells were sampled in the overburden using a split-spoon assembly through a hollow-stern auger. Continuous, undisturbed Shelby-tube samples were taken to obtain engineering information from four boreholes located on the dikes of Pits 3 and 4 (B-10, B-12, B-13, and B-15). The physical properties of the materials in these samples were tested by McClelland Engineers of St. Louis and are presented in Table 2. The permeability results of the tests are discussed in Subsection 7.3.
Three boreholes (B-13, B-15, and B-19) were backfilled.Boreholes B-13 and B-15 were holes in which continuous, undisturbed samples were taken in the dikes and foundations of Pits 4 and 3, respectively. These holes were backfilled after sampling was completed. Water was detected in Borehole B-15 during sampling and attempts were made to install an observation well to monitor the water level. However, severe caving made installation impossible. Observation Well B-15A replaced Borehole B-15. Borehole B-19 is located in an area where the ground surface was very wet. The overburden was sampled using a track mounted rig. Coring of the rock was to be accomplished using a Longyear 44, but the rig could not be positioned on the hole because of the wet conditions. Borehole B-19 was therefore backfilled and replaced by Observation Well B-19A.
7
Eberline Instrument Corporation personnel under contract to Bechtel monitored the extent of subsurface contamination by taking soil samples from the side walls of the trenches to a depth of approximately 2 m (6 ft); gamma logging all boreholes except where hole collapse was likely to result from such logging, and taking isolated water and soil samples. In no case was any gamma activity above background levels detected (Ref. 6).
Geologists from the Missouri Department of Natural Resources, Division of Geology and Land Survey were cognizant of all stages of the geological program. They reviewed the exploration plan prior to its implementation and suggested adjustments, which were incorporated into the program• They also continually monitored field activities and provided consultation during the investigation.
The Missouri state geologists were concerned about the weathered (residual) limestone reported as overlying competent rock at the Raffinate Pits Site (Section 2). Weathered limestone residuum is exposed off-site in roadcuts and along stream drainages. It is characterized by loose, red, clayey, silty, and sandy, decomposed, leached limestone beds up to 0.3 m (1 ft) thick interbedded with nearly horizontal chert beds. The residuum probably serves as a preferential pathway for groundwater movement. The geologists were concerned that the weathered (residual) limestone on-site may have the same character as the type of residuum observed off-site. If this type of residuum were to exist above bedrock beneath the raffinate pits, it would not only decrease the thickness of the effective barrier between the raffinate pit bottoms and top of permeable rock but would provide a preferential pathway for contaminants should they breach the clay barrier. The Bechtel exploration program addressed these concerns. Missouri state geologists conducted a dye-trace program in an attempt to determine the direction and rate of flow through the residual material. The results of the program are presented in Subsection 6.2.2.
8
4.0 FINDINGS
The following parameters were assessed to determine the suitability of the Weldon Spring Raffinate Pits Site for long-term storage of low-level radioactive wastes:
1. Thickness and geologic characteristics of the overburden2. Geologic characteristics of the bedrock3. Permeability of — and groundwater occurrence in — the
overburden4. Groundwater occurrence, direction, and gradient in the
bedrock
Overburden thicknesses at the Raffinate Pits Site range from 3 to 11.6 m (10 to 38 ft). An overburden thickness of 15 m (50 ft) was found in Borehole B-3, located on Army property.The thicknesses of overburden within Pits 3 and 4 are estimated from isopachs to range from 3 to 7.6 m (10 to 25 ft) (Figure 11A). Outside the pits overburden thicknesses range from 5.2 to11.6 m (17 to 38 ft) (Table 1). The overburden is composed predominantly of silty clays to clayey silts (Table 2). These materials are underlain by coarser cherty silts and clays.
Published studies indicate that fractures within the rock trend northwest and northeast (Ref. 4). The predominant trend of fractures occurring in the stratigraphically lower Kimmswick Formation, some of which are solutioned, is approximately N70°W and N70 °E; minor fracture sets trend approximately N40 °W and N40°E. These fracture trends are similar to those reported by Lomenick for the Burlington/Keokuk Formation (Ref. 4).
Two fracture sets trending N30 to 72E and N30 to 65W have been reported as extending from the Kimmswick up through the Burlington/Keokuk Formation by the U.S. Army (Ref. 7). Again, these are similar to those measured in the Kimmswick by Bechtel. The surface of the limestone has also been
9
differentially weathered, which has led to the formation of pinnacles and depressions in the rock surface. Because of itsfractured and solutioned condition, the bedrock is not considered part of the containment system. It is a basic assumption of this analysis that were contaminants to reach the limestone they would ultimately be transported off-site.
— 9The permeability of the overburden ranges from 1.6 x 10 cm/s(4.5 x 10 6 ft/day) to 3 x 10 6 cm/s (8.5 x 10 3 ft/day)(Table 2); the higher values correspond to siltier materials. Moisture contents ranging from 15 to 30 percent were measured from samples of the dike fill and underlying clays and clay tills.
Seismic velocities and pore pressure readings from the piezometers indicate that the overburden is unsaturated beneath Pit 4 and portions of Pit 3, in areas surrounding Pit 4, and onthe north side of Pit 3 (Tables 3 and 4A-B). A 1,520 m/s(5000 ft/s) velocity layer, generally indicative of saturation, was detected within Pit 3 and along Seismic Lines 1, 2, and 17.There is also evidence of this velocity layer on Seismic Lines 4, 5, 6, 7, and 12. This layer, if saturated, may represent a naturally occurring perched water table with possibly some contribution from Pit 3. Water elevations in Piezometer B-5 and Observation Well B-14 appear to substantiate the presence ofthis layer. The water level in Observation Well B-2, which issealed in the overburden, potentially represents the groundwater table. However, if it does, the water table is anomalously high (Figure 9A). To ascertain whether Pit 4 was contributing any water to Observation Well B-2, field radiation tests on B-2 water samples were performed. The test results did not exceed background levels. Furthermore, the seismic survey did not detect a saturated layer on seismic lines within the pit or around Well B-2. Water contribution from Pit 4 to this borehole, if any, could not be ascertained.
10
The hydrogeologic properties of the bedrock are variable. The permeability depends on the fractured and solutioned character of the rock, and the degree of interconnection of these features.
The groundwater varies in elevation from 177 to 187 m (580 to 615 ft) (Figure 14), about 7.5 to 18 m (25 to 60 ft) below ground surface, and is estimated to be about 5.5 to 6.1 m (18 to 20 ft) below the lowest excavated elevation of Pit 4, as determined from Reitz data (Ref. 1). The groundwater gradient is to the North at approximately 24 m/km (50 ft/mi). Using the water level in Well B-2 and the maximum known excavation depth in Pit 4, a minimum distance of 5.5 to 6.1 m (18 to 20 ft) can be calculated between the stored wastes and groundwater.
The data collected during this geologic investigation indicate that the Raffinate Pits site is a suitable long-term storage area for the Weldon Spring radioactive wastes. The pit bottoms will be further examined in detail during remedial activities and modified if necessary to assure the continuous presence of a clay with thickness shown by a computer model study to retard and prevent passage of a contaminant front for more than 1000 years.
11
5.0 REGIONAL GEOLOGY
5.1 STRATIGRAPHY AND LITHOLOGY
The Ordovician and Mississippian geologic systems in east-central Missouri, particularly in St. Charles County, are exposed in numerous highway cuts and along the cliffs of the Missouri River. During the site investigation, the stratigraphic units within the region were examined. Exposures of the various stratigraphic units in St. Louis and St. Charles Counties were inspected to determine the relationship of the regional geology to the site geology and hydrogeology. Regional bedrock consists of various sandstones, limestones, and dolomites. The following stratigraphic and lithologic descriptions are based on the reconnaissance field survey and published geologic descriptions. A geologic bedrock map of the Weldon Spring area is presented in Figure 4.
The St. Peter Formation, the oldest and stratigraphically lowest unit inspected, is exposed southwest of the town of Matson along Highway 94 (Figure 4). It is an Ordovician, fine- to medium-grained, well-sorted, typically cross-bedded, water-bearing sandstone that serves as a major aquifer and water supply in St. Charles County. It lies approximately 150 m (500 ft) vertically below the Raffinate Pits Site.
The St. Peter Formation is overlain by the Joachim Formation, an Ordovician, yellow-brown, thin-bedded dolomite and limestone unit. The Joachim Formation is exposed along the cliffs of the Missouri River at Matson and in several quarries in the area.The Plattin Formation overlies the Joachim and is exposed along Highway 94 near Defiance, Missouri. The Plattin is a fine-grained, Ordovician limestone that contains a few chert nodules. The weathered rock is characteristically pitted, possibly due to the weathering of fossilized worm burrows (Ref. 8). The Plattin Formation is overlain by the Decorah Formation,
12
an Ordovician, soft, calcareous shale unit that weathers easily and, consequently, is not well exposed. The gentle slopes typical northeast of Defiance represent the surface expression of this soft formation (Ref. 8). The Decorah is overlain by the Kimmswick Formation, an Ordovician, coarse-grained, fossiliferous, generally medium- to thick-bedded limestone containing some nodules and lenses of chert. Bechtel measured the prominent fracture (and joint) sets at an of f-site exposure of the Kimmswick Formation. It was found that the unit is fractured with two dominant fracture sets that have an average trend of approximately N70°E and N70°W and two minor sets that trend approximately N40°E and N40°W. The unit also contains large cavities and voids due to solution activity along fractures and bedding planes. The Kimmswick is extensively quarried for cement because of its high calcium carbonate content.
The Glen Park Formation, an unconformable, oolitic limestone, has been identified in outcrops along Dardenne Creek in St. Charles County (Ref. 9). The formation was not observed during the field survey nor has it been mapped in the vicinity of the site. In west-central St. Charles County the unit varies in thickness from one meter or so to 9 m (30 ft). The Glen Park, which is unassigned Devonian-Mississippian, is overlain by the Bushberg Formation.
The Bushberg Formation (the name has been somewhat indiscriminately applied to sandstone units occurring above the Glen Park) is a sandstone unit that underlies known Mississippian rock units. In St. Charles County, the Bushberg occurs as a greenish unit often containing large [15-cm (6-in.) diameter] sand concretions. It is exposed along Little Femme Osage Creek and in the abandoned Hamburg quarry located on the Missouri River. The age of the formation has not been well established, but is considered Devonian-Mississippian (Ref. 9). It conformably overlies the Glen Park Formation at the
13
Bushberg-type locality in Jefferson County, Missouri, southeast of St. Charles County. The Bushberg is approximately 5 in (15 ft) thick in the vicinity of the Raffinate Pits Site and lies about 70 m (230 ft) below the site. It contains usable quantities of water in localized pockets.
Two Mississippian units, the Chouteau Group (undifferentiated) and the Fern Glen Formation, overlie the Bushberg. Rocks that probably represent these formations are exposed in the Hamburg quarry (Figure 4). These rock units are limestones and dolomite limestones that are massive, fine-grained, and green to tan in color.
The Mississippian Burlington/Keokuk Formation overlies the Chouteau Group. The Burlington/Keokuk Formation consists of two lithologically similar units that are grouped as o n e . This formation comprises the bedrock underlying the Weldon Spring Raffinate Pits Site and is exposed in nearby off-site outcrops. It is characterized as a massively bedded limestone that contains chert lenses up to 0.3 m (1 ft) thick. The limestone is fine- to coarse-grained, fossiliferous, and fractured. The unit contains large cavities and voids along fractures and bedding planes where solution activity has occurred. Fracture sets are reported to trend northwest and northeast (Ref. 4), similar to those measured in the Kimmswick. The U.S. Army reports that fracture sets trend N30 to 72E and N30 to 65W in the Kimmswick through to the Burlington/Keokuk Formation (Ref. 7). Again, this is similar to those measured in the Kimmswick. The Burlington/Keokuk is approximately 46 m (150 ft) thick and lies between 5.2 and 12 m (17 and 40 ft) below the raffinate pi t s .
The bedrock units overlying the Burlington/Keokuk are shaley limestones known as the Warsaw and Salem Formations. These units were not observed by Bechtel in St. Charles County, but have been mapped by others to the northeast of the raffinate
14
pits (Figure 4). A summary of the bedrock stratigraphy is presented in Figure 5.
The above bedrock units are overlain by a sequence of alluvium, aeolian silts, glacial clays, and residuum. The thicknesses of these unconsolidated sediments depend partially on bedrock surface topography (Ref. 10). In the vicinity of Weldon Spring, these deposits range in thickness from a thin veneer to 18 m (60 ft) or more.
5.2 REGIONAL GROUNDWATER AND WATER SUPPLY
According to Miller et al. (Ref. 11) 97 percent of the water used in Jefferson, St. Charles, and St. Louis counties comes from surface water sources, primarily the Missouri and Mississippi Rivers; 2 percent comes from alluvial aquifers; and 1 percent comes from bedrock aquifers. The Mississippi River and Missouri River flood plains are the primary locations of the alluvial aquifers. The aquifers are considered high-yielding sources and are recharged directly from the rivers. Most public supply wells in St. Charles County draw from alluvium (Refs. 11 and 12).
The major bedrock aquifers in the region are the St. Peter Formation and the sandstone and dolomite formations that underlie the St. Peter. Locally, private, small, domestic and stock wells extract water from the less productive formations overlying the St. Peter Formation. In these formations, groundwater comes from fractures, and the degree to which a given well can produce water depends on the degree of the interconnection of the fractures. Generally, the yields from these geologic formations are small.
Recharge of the bedrock aquifers occurs through fractures and solution cavities in the rock units. The majority of recharge occurs where the fractures are exposed to the alluvial gravels
15
beneath the river flood plains. Recharge also occurs where extensively fractured formations are not covered by low permeability overburden, as possibly along the House Springs/Eureka anticline, which is southwest and up dip of the site (Figure 4). Fishel and Williams (Ref. 13) and Roberts and Theis (Ref. 14) report that the groundwater gradient is about 29 m/km (60 ft/mi) to the northeast towards Dardenne Creek.This gradient is similar to that determined during the Bechtel 1983-1984 study and is an indication that the recharge area for bedrock units is southwest of the site. Recharge is greatly restricted in the immediate vicinity of the raffinate pits because of the thick silty clays that comprise the overburden (Ref. 15).
Local surface water commonly flows intermittently through gaining and losing streams. Intermittent spring development and infiltration on the sides of the valleys were noted by Roberts and Theis (Ref. 14) and during Bechtel's 1983 field activities. This phenomenon is characteristic of karst conditions where surface water comes in contact with permeable alluvium overlying rock or with the rock itself.
5.3 REGIONAL STRUCTURE
The Mississippian and Ordovician bedrock units in St. Charles County are estimated to dip about 29 m/km (60 ft/mi) (less than 1 degree) in a N13°E direction (Ref. 13). Estimates are based on water-well logs. Krummel (1956) also states that bedrock dips northeasterly with some minor fluctuations due to structure and cross bedding (Ref. 16).
The only known structural feature that is potentially important to the Weldon Spring Raffinate Pits Site is the House Springs/Eureka anticline, which trends northwest through House Springs and Eureka southeast of the Missouri River, crosses the river, and trends just east of the town of Defiance (Ref. 17). The trace of the anticline is shown in Figure 4. This is a very
16
gentle anticline -- it may actually be a monocline (Ref. 8) -- that is a planar uplifted structure usually associated with mild tectonic activity. Miller et al. believe that fracturing and jointing, possibly associated with anticlines in the area, may create areas of recharge to bedrock aquifers (Ref. 11).
Other features that may have an effect on the Weldon Spring Raffinate Pits Site include active faults and their associated seismic events. A brief, general report entitled Site Seismicity and Design Earthquake Considerations was prepared for the site by Bechtel National, Inc. in 1983 (Ref. 18). The study, which was not fault specific, summarizes the tectonic and seismic setting of this site. The Weldon Spring Raffinate Pits Site is located in the tectonically quiet central stable region bounded about 240 km (150 mi) to the south by the Mississippi Embayment. The New Madrid seismic zone within the embayment is currently the nearest, most seismically active zone. After review and evaluation of published earthquake studies, the Bechtel study estimates a maximum seismic intensity of VII or VIII (Modified Mercalli scale) for the site. These intensities are associated with near-site Richter magnitudes of 5.3 to 5.8.
17
6.0 SITE GEOLOGY
This section describes the geologic units identified at the Weldon Spring Raffinate Pits Site during the 1982-1983 investigations. The descriptions are based on a compilation of data collected by the various exploration techniques referred to in Section 3.0.
Basically, there are six unconsolidated sedimentary units overlying bedrock:
1. Topsoil2. Modified loess (clayey silt)3. Clay (Ferrelview Formation)4. Clay till5. Basal till6. Cherty clay, residual soil
The bedrock beneath these sediments is the Burlington/Keokuk Formation.
6.1 TOPOGRAPHY AND SURFACE DRAINAGE
The Weldon Spring Raffinate Pits Site is located on a ridge that divides the Missouri and Mississippi river valleys (Figure 1). The ridge is drained southward to the Missouri by steep drainages, and northward to the Mississippi (via Dardenne Creek) by low-gradient drainages. The site is located just north of the divide on gentle rolling terrain, and all surface runoff leaving the site flows northward to Dardenne Creek. The raffinate pits are diked so that all precipitation falling onto them stays within the pits and does not leave the site as surface runoff. Figure 6 is a perspective view of Raffinate Pits 3 and 4. It shows the dikes and pit bottom excavation elevations. The figure is computer generated using topographic data and the assumed pit excavation elevations (Figure 2).
18
These elevations are considered ground surface with respect to all discussions concerning the overburden. The basis for the raffinate pit bottom elevations is the 1964 Reitz exploration report, the 1959 Mallinckrodt as-built drawings of Pit 3, and the geophysical study of the pit bottoms. The drawings by Reitz and Mallinckrodt indicate that Pits 3 and 4 are built on existing surface drainages.
6.2 SITE STRATIGRAPHY AND LITHOLOGY
6.2.1 Overburden
The six unconsolidated overburden units outlined above are described briefly here. More detailed descriptions are presented on the trench and borehole logs in Appendices A and B .
ThicknessUnit (Ft)
Topsoil: Sandy clay, blackish-brown, 1/2 to 3-1/2organic-rich.
Modified Clayey silt, mottled gray-dark 2-1/2 to 10Loess: yellowish-orange, becomes dense and
plastic with depth, is manganese stained. The loess is modified in the sense that it contains higher than average clay content for loess and has been leached of primary calcareous components (Ref. 19).
Clay Clay, mottled gray-dark yellowish- Variable(Ferrelview orange, plastic, dense, manganese to 10Formation): stained, contains weathered iron
nodules. (Ferrelview Formation is referenced in Refs. 8 and 10).
Clay Till: Clay, yellowish-brown, plastic, dense, 1 to 37manganese stained, shows blocky fractures, contains sand- to pebblesized quartz, granitic rock, and chert dispersed throughout the clay matrix.
Basal Till: Sandy, clayey silt, yellowish- 1 to 5brown, broken chert nodules abundant, loosely bound by matrix.
19
Cherty Clay: Multicolored brown, red, 3-1/2 to 15orange, and yellow, very dense, clay matrix with tightly bound abundant granule- to cobble-sized chert particles.
Laboratory particle-size analyses where conducted by McClelland Engineers (Ref. 20) and are presented in Table 2. The test results confirm that the samples are primarily clays, silty clays, and very clayey silts.
Thicknesses of overburden and the elevations of bedrock determined by the trenching and drilling are presented in Tables 1A and IB. Contour maps of each layer were drawn by computer using these data. The relationship of the seismic data to the borehole data, especially beneath the pit bottoms will be discussed in detail in Subsection 6.3. The geophysical investigations of the pit bottoms have provided information lacking in the Reitz report (Ref. 1), and have facilitated more definitive contouring beneath the pit bottoms.
The overburden covers rock at the site, but thins out off-site along the flanks of the ridge, as evidenced in stream drainages. Of the unconsolidated units described above, only the cherty clay was found to be discontinuous across the site. This material is prominent in the north and northwest portions of the site, but was not found in all boreholes. It is possible that the clay (Ferrelview Formation) is also discontinuous. However, differentiating between the clayey silt and clay was not always possible because the two units have similar characteristics. In view of this similarity, it is possible that, in certain boreholes, the clay was logged as clayey silt, especially where the clay might have been thin or in those boreholes drilled before the difference between the two units was fully recognized. Table 1 lists the thicknesses of the unconsolidated sediments found in the Bechtel boreholes. The thickness of overburden measured in boreholes that fully penetrated these sediments ranges from 5 to 15 m (17 to 50 ft) at and around the site.
20
The modified loess is a yellowish-orange, plastic clayey silt to silty clay. The upper few feet of the unit are relatively loose due to bioturbation (e.g., roots and burrowing animals), but the material becomes denser with depth. The contact of the clayey silt with the underlying clay is difficult to distinguish because the density of clayey silt approaches that of the clay, and the two units are nearly the same color. A contour map of the top of the clayey silt is shown in Figure 7A. The elevations are based on projection of borehole data beneath the pits. It appears that in some places near the center of Pit 4, the clayey silt has been completely removed.
The clay (Ferrelview Formation) is very dense and plastic. It is occasionally silty and slickensided. These slickensides are primarily the result of consolidation and compaction of the clay particles after they were deposited and do not represent tectonic activity. The clay generally fractures concoidally, although it occasionally has a blocky fracture pattern. Where the blocky fractures occur, they continue down through the underlying clay till, which commonly has a blocky fracture pattern. The surfaces of the blocky fractures are tight and often coated with manganese and calcium, which occurs either as a powdery crust or as small concretions. These fractures are irregular, randomly oriented, and dry. Figure 7B is a contourmap of the top of the clay. Some of the clay has beencompletely removed from the center of Pit 4, exposing the underlying clay till. The clay till is a massive, dense, plastic clay that contains some sand, silt, and small pebbles to granules of chert, granitic material, and quartzite. These inclusions generally occur as isolated clasts surrounded by clay matrix. The till exhibits faint graded bedding and in places has a blocky fracture. Where observed, these fractures were always dry. Figure 7C is a computer drawn contour map of thetop of the clay till. The clay till is underlain by the basalchert till, which is a thin layer containing cobbles of weathered, broken chert in a loose sandy, clayey, silt matrix.A contour map of the top of the basal till is shown on Figure 7D.
21
The cherty clay is exposed in shallow stream beds on the Army property, northwest of the raffinate pits. Its occurrence is accentuated by the fact that stream flows remain constant across the cherty clay. The stream flows are supported by the clay in creek bottoms, which attests to the relatively low permeability of the clay. This is important because in the vicinity of Pit 4, the cherty clay likely fills a bedrock low. This low had been noted by previous researchers and was delineated by the 1983 seismic refraction survey. In general, the cherty clay fills this and other bedrock lows detected by the geophysical surveys and drilling activities. Clay-filled lows are consistent with the clay's initial formation as a Pennsylvanian residual soil (Ref. 8). The cherty clay is the product of in situ weathering of Mississippian rock and the introduction of secondary clay from an unknown source. It was later eroded so that only remnants are left in bedrock lows. Figure 7E is a contour map of the top of the cherty clay. The map should be considered an estimate of actual conditions because of the sparseness of available data points.
6.2.2 Bedrock
The Burlington/Keokuk Formation, a cherty limestone, underlies the unconsolidated sediments at the site. The upper 12 m (40 ft) or so of the limestone are gradationally weathered, and exhibit a consequent irregular rock surface, sometimes called a pinnacled surface. The Bechtel investigation detected one possible pinnacle with about 2.5 m (8 ft) of relief. Pinnacles and depressions were also discussed by Lomenick, who noted that many depressions are clay-filled (Ref. 4). This agrees with the Bechtel findings that the cherty clay is found in bedrock lows (Subsection 6.2.1). The uppermost portion of the limestone forms a 0.3- to 1.5-m (1- to 5-ft) thick zone of highly weathered residual limestone. The zone consists of cobbles and boulders of limestone and chert in a loose, silty, sandy, clay
22
matrix. The limestone clasts often have solution features, such as pitted and rounded upper surfaces, and the chert clasts have weathering rinds. This weathered rock has apparently experienced some degree of lithostatic consolidation and in some locations on the site it occurs at greater depths than previously reported. The permeability of the weathered residual limestone is not known, although drilling water losses were variable (zero to 100 percent). It is likely that the average permeability of the residual limestone is low. However, because the weathered rock is more permeable than the overlying unconsolidated materials, it is not considered to be part of the low permeability materials that comprise the overburden, but rather as part of the permeable bedrock. Figure 7F is a computer drawn contour map of the top of limestone based on borehole data. It shows that the top of rock occurs beneath Raffinate Pits 3 and 4 at elevation 187 to 189 m (615 to 620 ft) m.s.l. The depth to rock, i.e. thickness of overburden, is discussed in Subsection 6.3.2.
The results of the present study indicate that the hydrogeologic characteristics of this residual weathered limestone are different from those of a residuum observed off-site by the Missouri State geologists. The off-site material is characterized by 0.3- to 0.6-m (1- to 2-ft) thick, loosely compacted, decomposed limestone beds undisturbed by lithostatic consolidation (Ref. 8). This residuum occurs at or near the ground surface and has been determined by the State geologists to be permeable elsewhere in Missouri. The residual weathered limestone at the Raffinate Pits Site occurs at a greater depth below ground surface; the beds have only partially disintegrated; and the limestone, chert, and other particles comprising the matrix are more consolidated than is the case in the residuum observed off-site. After comparing the on- and off-site materials, the State geologists concurred with the results of the Bechtel investigation.
23
Several geologic sections were drawn using the borehole data.The location of these lines is shown on Figure 8. The sections (Figures 9A-9D) show the stratigraphic relationship of the overburden units to the bedrock, and the water levels monitored on May 4, 1984 using the observation wells and piezometers.
Drill-water losses occurred in some boreholes when drilling through the weathered limestone. The Missouri State geologists conducted a dye-trace study in an attempt to determine the flow direction of the lost drill water. The study involved injecting dye down exploratory Boreholes B-4 and B-17, two of the wells where water losses occurred at the overburden-limestone contact, and monitoring nearby stream drainages to detect the dye. Two liters (0.5 gal) of Rhodamine WT dye were injected at the 8.2-m (27-ft) level in Borehole B-4, and then several hundred gallons of water were subsequently injected as drilling progressed. One kilogram (2 lb) of fluorescein dye was injected at about the 9-m (29-ft) level in Borehole B-17. The dye was again followed by the injection of several hundred gallons of drill water.Streams and springs near and several miles from the site on either side of the groundwater divide near Highway 94 were monitored for several months. At no time was either Rhodamine WT or fluorescein dye detected. The dye study did not determine the direction of flow or the emergence point of water lost into the weathered bedrock (Ref. 21).
Competent Burlington/Keokuk Formation is a gray, fine- to coarse-grained limestone, locally fractured and solutioned, and fossiliferous. The upper 3 to 6 m (10 to 20 ft) contain abundant chert nodules, the quantity of which decreases with depth. The upper 11 m (35 ft) of competent rock are generally fractured; the fractures are iron-oxide stained due to weathering. The formation also contains numerous clay-filled and open voids.
24
6.3 GEOPHYSICAL AND GEOLOGICAL RELATIONSHIPS
Geophysical exploration completed to date at the site consisted of self potential, seismic refraction, and electrical resistivity surveys. The electrical resistivity and seismic refraction surveys were conducted both outside and within Raffinate Pits 3 and 4. The locations of all survey lines and point tests are shown on Figure 3. The work was done in two phases: the first comprised work done outside the pits and thesecond the work done within Pits 3 and 4. Surveys within the dikes of Pits 3 and 4 were conducted on both the land and water surfaces. Seismic velocity data are presented in Table 3. The methods and instrumentation used are described in detail in Appendices E and F.
6.3.1 Relationships Outside the Pits
The self potential surveys were used in areas of suspected pond seepage (Figure 3). These areas were located on the north side of Raffinate Pits 1 and 2, on the east side of Pit 3 near Boreholes B-5 and B-14, on the north side of Pit 3, and on the west side of Pit 4 near Borehole B-2.
The only location that indicated possible water movement was on the east side of Raffinate Pit 3, where the ground surface has been disturbed (Subsection 7.3). However, the data are difficult to use because the survey lines did not extend far enough beyond the disturbed areas to provide background measurements of the undisturbed materials for comparison.
The electrical resistivity data generally defined a three-layer subsurface profile. The profile consists of a thin surface layer with resistivity values between 48 and 119 ohm-feet, an intermediate layer with remarkably uniform resistivity values between 2 and 40 ohm-feet, and a lower layer with high resistivity values of greater than 1000 ohm-feet. Weston Geophysical has indicated that the consistency of resistivity
25
values from the intermediate layer is unusual in the natural environment. Such consistency is probably due to abundant iron oxide nodules observed in the soil (Appendices A and B ).
The elevation of the upper resistivity layer corresponds well with the elevation of the low velocity layer. The high resistivity layer does not, however, always correspond with the high seismic velocity layer. For example, the high resistivity layer at RT 48 corresponds to high velocity rock, whereas, at RT 47, it corresponds to intermediate velocity rock. Frequently, as at RT 31 and RT 32, the high resistivity layer does not correspond to any particular seismic velocity layer (Appendices E and F ) . This apparent anomaly arises because the geophysical methods measure different properties of the soil and rock and, therefore, the resistivity and seismic velocity data do not always correlate well. Properties of the soil and rock at the site that affect resistivities and velocities include unit thicknesses, densities, chert content, and the matrix composition. It is, therefore, very important to verify the results of the geophysical survey by using borehole data.
The electrical resistivity and seismic refraction data correlate well with the borehole data. Generally, the high resistivity interface marks the contact between the relatively impermeable clays and the basal till. This is likely due to the chert content, which lowers the resistance of the till. However, in some instances, the high resistivity interface occurs in units underlying the basal till, the cherty clay (where it exists), or the weathered bedrock. It is believed that this occurs where the basal till is too thin to be detected or where there is a localized decrease in its chert content. The basal till, cherty clay, and weathered limestone are not always distinguishable from one another electrically because they have similar resistivities. Therefore, it is not always clear which stratigraphic unit corresponds to the high resistivity interface.
26
Thirteen seismic refraction lines (1 through 12 and 17) were surveyed outside the pits. The seismic data collected outside the pits define a 3- to 4-layer velocity profile. The profile consists of a 366 to 549 m/s (1,200 to 1,800 ft/s) low velocity layer underlain by a 610 to 1,463 m/s (2,000 to 4,800 ft/s) moderate velocity layer. The moderate velocity layer is underlain in places by a 2,134 to 2,743 m/s (7,000 to9,000 ft/s) intermediate velocity layer. A 3,048 to 4,267 m/s(10,000 to 14,000 ft/s) high velocity layer underlies the entire site. A generally thin, 1,520 m/s (5,000 ft/s) velocity layer, which was detected on specific lines within the moderate velocity layer, is the only deviation from this profile. The range of values within each unit is attributable to changes in soil/rock density and, in some cases, water content. Thegreater the soil or rock density, the higher the seismic velocity. Dry unconsolidated materials usually have seismic velocity lower than 1,520 m/s (5,000 ft/s). The greater the water content, the closer the seismic velocity approaches1,520 m/s (5,000 ft/s).
Low seismic velocity interfaces are in close agreement with the lower contact of the near-surface clayey silt layer. The depth to bedrock as determined by seismic refraction was consistently greater than the depth determined by drilling, because the weathered bedrock surface does not provide a good refracting layer. The seismic waves were refracted off the more competent bedrock, generally a few feet deeper than the actual top of rock. Where intermediate velocity material was detected [2,134 to 2,743 m/s (7,000 to 9,000 ft/s)], the actual depth to the top of bedrock is even less certain.
Projection of borehole data onto seismic sections reveals that the intermediate velocity material is composed of basal chert till, cherty clay, and the weathered bedrock. These units have sufficiently similar physical characteristics (principally
27
density) that distinguishing the units seismically was not possible. Thicknesses of overburden based on borehole data are known to range from 5.2 to 12.2 m (17 to 38 ft) outside the pits. The seismic data are generally in close agreement with these values. Although total thicknesses outside the pits are somewhat greater, the seismic data (Appendix F) indicated that the minimum thickness of overburden, about 7.5 m (25 ft), occurs at the north end of the site along Lines 10 and 11 (Figure 3). This is substantiated by Borehole B-17 and Trench TR-10 (Appendices A and B).
6.3.2 Relationships Inside Pits 3 and 4
The following paragraphs discuss findings of the geophysical surveys conducted within Pits 3 and 4 and analyzes the findings based on results of exploration activities outside the pits.The purpose of the work within the raffinate pits was to confirm pit excavation data presented by Reitz (Ref. 1) and to determine the relationships of the pit bottoms to the top of rock. The geophysical methods employed included electrical resistivity and seismic refraction. Water depths to the top of sludge were also measured along survey lines and test points.
The geophysical study of the pit bottoms began on December 12, 1983 and, after an interruption, was completed on April 3,1984. It included 21 seismic refraction survey lines (Lines 13 through 29, and detailed profiling of Lines 1, 2, 3, and 17) located around and within Pits 3 and 4 and 12 electrical resistivity test points (RT 44 through RT 55) located within Pits 3 and 4 (Figure 3). The results of the geophysical study are presented in a report to Bechtel by Weston Geophysical Corp., included in this document as Appendix F.
The surface and subsurface conditions inside the dikes were found to hinder data collection and to complicate data interpretation. These conditions included seismic inversion layers, conductive sludges, and the large size of the pits.
28
These conditions were partially overcome by use of long seismic spreads, adjusted resistivity arrays, and large energy sources. However, complications resulting from seismic inversion layers cannot be completely overcome by seismic spread manipulations. This condition, which was found to exist below Pit 3 and possibly below Pit 4, causes uncertainty in layer thicknesses and contacts, masks underlying (slower) seismic velocity layers, and hinders transmission of seismic energy.
The resistivity test points were located along Seismic Lines 13, 16, 17, 25, 27, 28, and 29 (Figure 3). Resistivity Tests RT 47 and RT 48 produced data similar to those obtained in the earlier geophysical survey and consistent with data from their associated Seismic Lines 16 and 13, respectively. Four of the tests (RT 44, RT 45, RT 46, and RT 49), located along the common dike between Pits 3 and 4 produced anomalously deep, low resistivity readings that do not correspond to the associated seismic data. The causes of these anomalies are not understood at this time, but they could be due to any of several factors influencing the electrical properties of the materials, including high total-dissolved-solids concentrations in the groundwater, ionized water from the pits or previous processes at the site, proximal buried pipes, or metal objects.
The seismic velocity data obtained from seismic lines surveyed inside Pit 4 are similar to those obtained outside the p i t , except that they indicate the presence of more abundant intermediate velocity materials. The seismic data collected from Pit 3 also indicate that the west side of the pit is underlain by relatively great thicknesses of intermediate velocity material. Figures 10A-D are contour maps of the top of the low, moderate, intermediate, and high velocity seismic layers, respectively. These maps are drawn from seismic data collected both outside and inside the raffinate pits. The data are presented in Table 3 and represent elevations of the top of each seismic velocity layer at selected points along each refraction line. The data were derived from seismic velocity
29
profiles provided by Weston Geophysical and presented in Appendices E and F.
Some layers are not present within the pits, probably because of excavation during pit construction. The low velocity [366 to 549 m/s (1,200 to 1,800 ft/s)] materials are absent from both Pits 3 and 4 (Figure 10A). The moderate velocity [610 to1,463 m/s (2,000 to 4,800 ft/s)] materials are absent from portions of Pit 3 (Figure 10B). The extent of the intermediate velocity [2,134 to 2,743 m/s (7,000 to 9,000 ft/s)] layer is notcertain. This layer was detected along the western andsouthwestern portions of the site (Seismic Lines 8 and 9), beneath Pit 4, and beneath the western side of Pit 3. Figure 10C, a computer drawn contour map of the intermediate velocity layer, extrapolates the contours in areas where the layer may betoo thin to be detected seismically (as along Line 14).
The contour map of the top of rock shows a very irregular surface with pinnacles and depressions of up to 12 m (40 ft) of relief (Figure 10D). The contours show the elevation of the top of fresh rock. The actual top of the formation is at some higher elevation. As discussed earlier, the actual elevation cannot be determined seismically. The contour map, however, helps to explain the differential weathering that has occurred at the site. Although limestone bedrock is believed to be higher and to occur more uniformly across the site, the seismic survey has differentiated between the more resistant pinnacles and less resistant depression areas within the rock. The latter are probably more fractured and decomposed than the pinnacled areas, and consequently are included as part of the intermediate velocity [2,134 to 2,743 m/s (7,000-9,000 ft/s)] materials.
The total thickness of overburden beneath the pits is difficult to estimate. Since no boreholes with usable logs exist within Pits 3 or 4, the actual components of the intermediate velocity material are uncertain at this time. According to the Reitz report, the bottom of Pit 4 was excavated to not less than 3 m
30
(10 ft) above the refusal elevation (assumed by Reitz to be rock) experienced during the 1964 auger program, which included both power- and hand-driven augers. Bechtel found during the 1982-1983 program that the flight augers generally could not completely penetrate the basal till nor the cherty clay. With the possible exception of Borehole B-19, the augers did not reach the top of weathered rock. It is therefore considered that the 3 m (10 ft) reported by Reitz is a conservative estimate of the thickness of overburden remaining above rock beneath the pits.
Computer generated isopachs of overburden thicknesses were drawn using borehole or seismic refraction data (Figures 11A-D). The borehole data are projected beneath the pit bottoms and the isopach developed from these data represents the difference between ground surface (which includes the excavated pit bottom) and the top of limestone (Figure 11A). The data indicate that overburden thicknesses within Pits 3 and 4 range between 3 and7.6 m (10 and 25 ft). The least thickness of overburden occurs in Pit 4 where the maximum excavation of overburden materials occurred. The maximum thickness of overburden occurs in pit 3. Three isopachs (Figures 11B, 11C, and 11D) were drawn using the seismic data. Thicknesses of materials between the ground surface and top of the intermediate velocity materials, and the ground surface and high velocity materials are shown on Figures 11B and 11C, respectively. The thicknesses of the intermediate velocity material are shown in Figure 11D. Depths from ground surface to the intermediate velocity materials range from 0 to7.6 m (25 ft). Depths from ground surface to high velocity materials range from 7.6 to nearly 30 m (25 to nearly 100 ft). This illustrates that the thicknesses of intermediate velocity materials beneath Pits 3 and 4 ranges from 0 to about 21 m (70 ft) .
Two perspective views of the borehole stratigraphy and seismic layers beneath Pits 3 and 4 are shown as fence diagrams on
31
Figures 12A and 12B, respectively. The profiles that comprise the fence diagrams are shown together on Figures 13A, 13B, and 13C. The figures indicate that the thickness of the intermediate velocity layer varies greatly beneath Pits 3 and 4 and that, for reasons discussed in Subsection 6.3, it is not readily apparent what thicknesses of materials correspond to the layer. In certain areas, as along the south end of Profiles B3 and S3 (Figure 13C), the top of the intermediate velocity layer corresponds to the top of rock as presented on the borehole projections. However, in other areas, as along the north end of Profiles B3 and S3, the top of the intermediate velocity layer occurs at a much higher elevation than the overburden materials as projected beneath the pits from boreholes. Based on these data, correlation of the borehole data with the seismic data is difficult. As discussed earlier, uncertainties exist regarding the accuracy of the data collected inside the pits because of the effect of the complex site conditions on the seismic geophysical survey.
The seismic refraction method is sensitive to the differential weathering of the bedrock surface. This could also account for the variation in the intermediate velocity layer. The cherty clay, basal till, and possibly portions of the clay till, have some of the same physical properties as a weathered rock, and where these units occur in a relatively thick sequence, especially above highly weathered rock, greater thicknesses of intermediate seismic velocity materials may have been detected. Therefore, the projection of the borehole data is thought to give a good representation of actual conditions beneath the pits. The anomalous occurrence of intermediate velocity material in Pit 3 along profiles B3 and S3 may be due to greater chert content within the clay till. This can only be confirmed by further investigation.
32
The profiles of borehole data projected beneath the pits indicate that the basal till and cherty clay are not everywhere present. Because the pits are built on pre-existing surface drainages (Subsection 6.1), the till and clay units may have been eroded, although this cannot be confirmed at this time.The effects of the drainages may also account for the variability in bedrock weathering,
The actual depth to rock beneath the pits is probably close to that calculated from the borehole projections. It is slightly greater than is predicted based on the difference between ground surface and the top of intermediate velocity rock and much less than is predicted based on the difference between ground surface and the top of high velocity rock.
The seismic velocities measured directly beneath the pond of Pit 4 and above intermediate velocity layer range between 1,219 and1,463 m/s (4,000 and 4,800 ft/s). This layer is composed of sludge and underlying overburden materials. The materials beneath the sludge may correspond to the 731 to 1,158 m/s (2,400 to 3,800 ft/s) layer measured both along the inside dikes of Pit 4 and outside Pits 3 and 4. The increased velocity in the overburden measured beneath Pit 4 probably represents a greater degree of saturation, but not total saturation. It is possible that this layer does not extend dov/n to the intermediate velocity layer; if this 1,219 to 1,463 m/s (4,000 to 4,800 ft/s) layer is the top of a velocity inversion, it could mask underlying lower velocity materials. Percent saturation calculations conducted by Environmental Science Engineering Corporation (Ref. 22) for the sludges in Pit 4 indicate that the sludges are saturated or nearly so, which is a verification of the existence of a 1,219 to 1,462 m/s (4000 to 4800 ft/s) velocity layer.
Seismic velocities measured beneath Pit 3 and above the intermediate and high velocity layers range from 1,036 to
1,520 m/s (3,400 to 5,000 ft/s). These values indicate that only portions of the sludge and materials beneath the sludge are saturated. Areas with seismic velocities of 1,520 m/s (5,000 ft/s) are probably saturated. Continuous saturation from the top of sludge to the intermediate velocity layer occurs along Seismic Line 27 in the center of Pit 3. Saturated layers also occur beneath unsaturated 1,036 to 1,097 m/s (3,400 to 3,600 ft/s) materials along the west, east, and south edges of the pit. The hydrogeologic implications of this layer are discussed in Subsection 7.3.
34
7.0 SITE HYDROGEOLOGY
A major goal of the exploration program was to determine the groundwater conditions in the immediate vicinity of the raffinate pits. Section 3.0 describes the types of observation wells and piezometers installed at the site. In summary, eight observation wells in bedrock, five observation wells in overburden, and ten vibrating wire piezometers in overburden were installed. This section summarizes the results of data obtained to date from these wells and piezometers.
7.1 GROUNDWATER TABLE
Groundwater occurs primarily in the bedrock. The groundwater table has been identified by ten observation wells established in 1983: B-2, B-3, B-4, B-9, B-ll, B-16, B-17, B-19A, B-21, andB-23.
The groundwater surface elevations range from 177 to 187 m (580 to 615 ft) m.s.l., a maximum of about 18 m (60 ft) below the ground surface. The water-surface gradient is to the north at about 24 in/km (50 ft/mi) (Figure 14). The elevations and gradient are similar to those reported by Fishel and Williams and Roberts and Theis (Refs. 13 and 14), which indicate that the site lies just north of a groundwater divide located in the vicinity of Highway 94. The Bechtel exploration program did not include installing monitoring wells south of the reported divide. In all cases, the groundwater surface was found to be in the bedrock, except for Well B-2, which approaches but does not encounter residual limestone. Figure 14 presents water table elevations on two dates. The contours suggest that the water table is above the limestone beneath portions of Pit 4. However, the geophysical data indicate that the overburden is not saturated beneath and around Pit 4. That the water level contours in this area may actually represent a piezometric
35
surface (confined conditions) rather than saturated conditions is supported by the fact that no seismic velocities indicative of saturation were detected beneath Pit 4.
Water levels in Observation Well B-2 are anomalously high and do not exactly conform to the groundwater table. It is not clear at this time what the water level in this well represents (water table, piezometric surface perched water, or raffinate pit water). Water levels in Observation Well B-2 are discussed further in Subsection 7.3.
Using the water-level elevation in Observation Well B-2 (which is considered high for the water table) and the maximum excavation depth of Pit 4 (Ref. 1), a minimum of 5.5 to 6.1 m (18 to 20 ft) exists between the bottom of Pit 4 and the groundwater table.
Dri11-water losses were variable. All bedrock boreholes except B-3 lost some drill water. Groundwater flows through the Burlington/Keokuk Formation along fractures and voids. The rate of groundwater flow is dependent on the extent, number, and size of fractures and voids. For example, Borehole B-3 did not encounter any voids, whereas Boreholes B-4, B-9, and B-ll intercepted several. The variations in water flow are indicated by the hydrographs of site wells (Appendix D ) . Water level elevations are presented by date in Table 1. The hydrographs for the observation wells installed in bedrock show that the water table fluctuated several feet from the time of installation (April 1982) to about June 1983. The reason for the relatively rapid changes is not known, but they may have resulted from purging activities (attempts to air lift water out of the wells) that took place during April and May 1983.
After this initial period, water levels monitored by the bedrock wells have generally fluctuated only a few feet over the monitoring period with the exception of Wells B-4 and B-9. Fluctuations in these wells have varied from 1.2 to 6.1 m (4 to
3 6
20 ft). There are several explanations for this behavior. For example, these wells may be connected to more extensive fracture systems. Responses to changes in the groundwater table will occur more readily where the least resistance to flow exists. Also, water flowing in upper bedding plane fractures may be cascading down the walls of the wells, causing a measuring device to indicate a water level higher in the hole than actually exists.
Because of the variation in bedrock permeability, the Bechtel analysis gives no credit to the limestone as a containment medium. Specific pathways of potential contaminant migration are not identified at this time.
7.2 OVERBURDEN GROUNDWATER MONITORING
Fifteen observation wells and piezometers were installed in the overburden: B-l, B-2, B-5, B-6, B-7, B-8, B-10, B-12, B-14, B-15A, B-16, B-18, B-20, B-22, and B-24. Of these, ten are dry. Wells B-2, B-14, B-22, and Piezometer B-5 indicate that local saturated conditions may exist. Observation Well B-16 is located off DOE property and monitors water table conditions in the weathered limestone.
The seven wells installed by LBL during 1980 (Figure 3) are being monitored semi-annually by Bechtel. Of the seven wells, five have always been dry. One well, located on the common dike between Pits 3 and 4, contained water for a short period of time, but has since gone dr y . The remaining well, which has always contained water, is located near Observation Well B-2.
7.3 HYDROGEOLOGIC CONDITIONS IN THE OVERBURDEN
The following discussion addresses the permeability and moisture content of the overburden and the occurrence of groundwater above the bedrock. Laboratory permeability test results for the
37
1983 samples collected from four holes through the dikes of Pits3 and 4 are presented in Table 2. The permeabilities andmoisture contents of both dike fill and the foundation materials
— 9were determined. The permeabilities range from 1.6 x 10 cm/s(4.5 x 10 6 ft/day) to 3 x 10 ^ cm/s (8.5 x 10 ^ ft/day).Permeability values for the siltier clays and clayey silts arethe highest measured. The geometric mean of the permeabilitytest results is 1.3x10 cm/s (3.7 x 10 ^ ft/day). Themoisture contents of the samples that range from 15 to 30 percent(Table 2), indicating that the materials are unsaturated. Thesevalues agree with Rietz1 (Ref. 1) test results, which indicate anaverage moisture content of 20 percent. Three laboratorypermeability tests were conducted on the clay materials taken byReitz from a depth of about 3 m (10 ft). The test results show
_ 8that these materials range in permeability from 1.7 x 10 cm/s (4.82 x 10 5 ft/day) to 6.4 x 10 ^ cm/s (1.81 x 10 ^ ft/day).
The upper few feet of overburden at the site (mostly topsoil) are poorly drained and have a high moisture content. The unsaturated overburden beneath the topsoil and the topsoil itself were classified according to color standards established by the U.S. Department of Agriculture, Soil Conservation Service (Ref. 23). These classifications indicate that the soils around the raffinate pits are poorly drained. Poorly drained materials are normally saturated. Colors in a poorly drained soil will be darker, an indication of reducing conditions, which are due to the lack of dissolved oxygen in the water. These darker colors occur in the topsoil and in saturated areas at the site, as around Borehole B-22, north of Pit 3. Poorly drained soil that experiences constant recharge of meteoric water will be light in color because of the increased dissolved oxygen content of the water. The overburden materials underlying the topsoil at the site are unsaturated and, as a result, more oxygen is present in the pore spaces. The increased oxygen content prompts the formation of oxides, which gives the materials a lighter color.
38
Unsaturated materials coupled with poorly drained conditions are further indications that the overburden materials at the site have low permeability.
As described in Subsection 6.3.2, the geophysical surveys detected seismic velocity layers of 1,520 m/s (5,000 ft/s) within, beneath, and surrounding Pit 3. This velocity, which is the seismic velocity of water, is generally indicative of saturated conditions. The geophysical data indicate that the central portion of Pit 3 is saturated and that the saturation continues beneath unsaturated sludges and overburden materials on the east, west and south sides of Pit 3. A thin, 1.5- to 3-m (5- to 10-ft) thick 1,520 m/s (5,000 ft/s) layer was also detected about 3 m (10 ft) below ground surface along Seismic Lines 1, 2, and 17. Because this layer, if saturated, is an important part of the hydrogeology at the site, Bechtel requested Weston Geophysical to critically review their seismic data collected during the 1982 survey to determine whether potentially saturated layers occur elsewhere on the site. A potential 1,520 m/s (5,000 ft/s) layer was found on Seismic Lines 12, 4, 5, 6, and 7. Although the existence of a saturated layer on these lines cannot be confirmed without the similar detailed refraction work conducted on Lines 1, 2, and 17 during 1984, the implication is that the saturated layer may be a naturally occurring perched water table. This layer possibly represents some horizontal migration from Pit 3. Figure 15 is a contour map of the surface of this 1,520 m/s (5,000 ft/s) layer. Assuming that this layer is a saturated zone, the figure shows at least two hydrogeologic conditions: a mounding effectfrom Pit 3, and, south of the Pit 3, a saturated elevation higher than the p i t , which indicates the existence of the perched water table. Based on the absence of a saturated layer east of Pits 1 and 2 along Seismic Line 3 and the possible existence of an up-gradient, saturated layer still farther south along Seismic Lines 4, 5, 6, and 7, it seems unlikely that Pits 1 and 2 are contributing water to the 1,520 m/s (5,000 ft/s) layer detected south of Pit 3.
39
Immediately adjacent to Pit 3, the top of this saturated layer is within the clayey silt and is a maximum of 3 m (10 ft) above the reported pit excavation. Farther away from the p i t , along Seismic Line 1, the top of the saturated layer occurs in the clayey silt and clay. Precipitation may have infiltrated the silty clay and become perched on the underlying clay layer (Ferrelview). Where the clay has blocky fractures, water may be able to pass through the fractures. The existence of this layer is evidenced primarily by water levels in Piezometer B-5 and Well B-14, which occur within the Weston Geophysical projection of the 1,520 m/s (5,000 ft/s) layer on Seismic Line 1. It should also be noted that these holes are located near a plugged, low-level discharge line from Pit 3 (Ref. 2). It is possible that either the plug or exterior wall of the discharge line may have failed and be allowing water to escape from the p i t . The discharge line that extends eastward from the low-level discharge in Pit 3 was excavated by Bechtel and U.S. Army personnel approximately 40 m (130 ft) east of Pit 3. The line was reportedly not leaking at that location. It is also possible that the saturated conditions are due to a nearby surface drainage that keeps the underlying soils saturated.
The slow seepage of water into Trench TR-5 and Borehole B-6 during excavation and augering may be indicative of a shallow saturated layer. However, at the time of the work the seepage appeared to be coming from the topsoil. The piezometer installed in B-6 is currently monitoring unsaturated conditions.
Borehole B-15 was drilled through the approximate midpoint of the east dike of Pit 3. The borehole encountered water at about 0.6 m (2 ft) below the contact of the dike and the foundation.An Eberline downhole gamma detection probe did not measure gamma radiation above background levels there (Ref. 6).
Attempts were made to install an observation well to measure the level of the encountered water, but severe caving prevented
40
this. The boring was backfilled with a heavy bentonite grout. Once grout settlement and shrinkage ceased, more grout was placed to fill the hole flush with ground surface.
In an effort to learn more about the water found in Borehole B-15, B-15A was drilled on the dike about 3 m (10 ft) south of Borehole B-15. Although the new hole did not encounter water, an observation well was installed to monitor long-term conditions at the dike-foundation contact. To date, the well has remained d r y .
If the water detected in B-15 is evidence of the seismically detected 1,520 m/s (5,000 ft/s) velocity layer, it is surprising that B-15A, only 3 m (10 ft) away, appears to be dry in the zone of this velocity layer. Further, the moisture content of soil samples taken from B-15 indicate that the clay materials are not saturated (Table 2), which is a strong indication that the water detected in B-15 is associated with some discontinuity near the dike/foundation contact and not porous media flow.
Saturated conditions were also encountered in the vicinity of Observation Well B-24 and Piezometer B-22. The well, piezometer, and Trenches TR-11 and TR-12 are located in an area where the ground has been disturbed. Pipes, wood posts, cables, and 208-liter (55-gal) drums were encountered. The soil was dark, wet, and had a strong odor of decomposing organic materials. A comparison of topographic contours between the Mallinckrodt (Ref. 5) and Bechtel maps indicates that dumping and/or landfilling has taken place since the construction of Pit 3. This disturbed ground may account for the saturated conditions. Observation Well B-24 has gone dry and the water level in Piezometer B-22 appears to drop during the winter and rise during the summer (Appendix D ) . The geophysical data do not suggest the presence of a 1,520 m/s (5,000 ft/s) layer near B-24 and B-22 along the north side of Pits 3 and 4.
41
Hydrographs for Piezometers B-l, B-7, B-8, B-10, B-12, B-18, and B-20, shown in Appendix D, are monitoring unsaturated conditions. The hydrographs show that the pore pressures fluctuate with time. Fluctuations are probably due to fluctuations in the barometric pressure, because piezometers are very sensitive to barometric pressure and the hydrograph fluctuations are similar for each piezometer. Since the barometric pressure readings used in the pore pressure calculations are not site-specific [readings used are those measured at Lambert - St. Louis Airport about 24 km (15 mi) away], any deviation in the readings from actual site conditions will result in inaccurate pore pressure calculation results. Preliminary error analysis indicates that the pore pressure would fluctuate about 0.5 feet of water for an approximate0.9 feet of water change in the barometric pressure. Therefore, the barometric pressure is a very important factor in calculating pore pressures.
Pore pressures monitored by Piezometers B-l, B-7, and B-12 have shown a generally increasing trend over the monitored period.It is not known whether this trend reflects a long-term fluctuation or whether the system has yet to reach equilibrium. Pore pressures are presented in Table 4B; all hydrographs are presented in Appendix D.
As discussed in Subsection 7.1, Observation Well B-2 may be monitoring the groundwater table, although the water elevation readings are anomalously high. During augering, the borehole encountered water at about 1.2 m (4 ft), which coincides with the base of the drain that relieves excessive pore pressures at the downstream toe of the Pit 4 dike. The water entering B-2 was from the drain. Although the observation well installed in B-2 is sealed below that contact, drain water may still be percolating into the well as a result of a leaky seal. It is also possible that water may be infiltrating from Pit 4 or from a natural perched water table. However, the seismic refraction survey did not detect a 1,520 m/s (5,000 ft/s) velocity layer
42
along Lines 28 and 29 below Pit 4 or along Line 9 at the western toe of the dike and by Well B-2. The water level in Well B-2 may be reflecting the groundwater table and recharge from the drain, which would produce a groundwater mound above the surrounding groundwater table elevation.
In summary, the overburden is unsaturated beneath Pit 4 and portions of Pit 3 and generally outside the pits, especially in the western half of the site around Pit 4. Seismically detected areas of saturation exist beneath the center of Pit 3 and as thin, shallow layers along Seismic Lines 1, 2, 17, and possibly along Lines 4, 5, 6, 7, and 12. The layer appears to be a naturally occurring perched water table that is possibly receiving some recharge from Pit 3, but there are few data to confirm this. Other areas of saturation, such as around Piezometer B-22, occur where the ground has been disturbed by site activities.
The complexity of site geology is evident from the data collected during the field studies accomplished to date and presented in this report. These studies conclude the preliminary phase of the geologic investigation. The final phase of field investigation will be implemented after a raffinate sludge retention system and location have been selected.
43
REFERENCES
1. Reitz, Henry M. Design Memorandum for 12M Cubic Feet Raffinate Pit, Atomic Energy Commission Plant, Weldon Spring, Missouri, Engineering Project 44-385-005. Mallinckrodt Chemical Works Uranium Division, 1964.
2. National Lead Company of Ohio. Weldon Spring Raffinate Pits Stabilization Project RY-04-02, United States Atomic Energy Commission, Oak Ridge Operations Office, Oak Ridge, TN, 1974.
3. Lawrence Berkeley Laboratory. Preliminary Characterization and Assessment of the Weldon Spring Low-Level Radioactive Waste Disposal Site, Weldon Spring, Missouri, Earth Science Division, University of California, Berkeley, CA, 1980.
4. Lomenick, T. The Utility of Raffinate Pits at WeldonSpring, Missouri for Containment of Radioactive Contaminants, (Draft), Chemical Technology Division, Oak Ridge National Laboratory, Oak Ridge, TN, 1982.
5. Mallinckrodt Chemical Works. As-built plan map ofRaffinate Pit #3, Weldon Spring, Missouri, 1959.
6. Bechtel National, Inc. Radiological Survey Report for theWeldon Spring Raffinate Pits Site, Oak Ridge, TN, August 1984.
7. U.S. Department of the Army. Assessment of Weldon SpringChemical Plant in St. Charles County, Missouri, Office ofDepartment of the Army Project Manager for Chemical Demilitarization and Installation Restoration, Aberdeen Proving Ground, MD, 1976.
44
8. Dean, T.J., Division of Geology and Land Survey, Missouri Department of Natural Resources, personal communication with E. M. Fanelli and P. Mote, Bechtel Civil and Minerals, Inc., 1983.
9. J.W. Koenig (Ed.). The Stratigraphic Succession in Missouri, Vol. XL, Second Series, Missouri Geological Survey, 1961.
10. B . Harris, L. N. Stout, and J. D. Vineyard (Eds.). The Resources of St. Charles County, Missouri, Land, Water and Minerals, Missouri Geological Survey, Dept, of Natural Resources, April 1977.
11. Miller, Don E ., L.F. Emmett, J. Skelton, H.G. Jeffery, J.H. Jeffery, and J.H. Barks. Water Resources of the St. Louis Area, Missouri, Water Resources Report 30, Missouri Geological Survey and Water Resources, 1974.
12. Searcy, J.K., R.C. Baker, and W.H. Durun. Water Resources of the St. Louis Area, Missouri and Illinois, Geological Survey Circular 216, 1952.
13. Fishel, V.C. and C.C. Williams. The Contamination of Ground Waters from Liquid Wastes from the Weldon Spring Ordnance Works, Missouri, U.S. Department of the Interior, Geological Survey, Lawrence, KS, 1944.
14. Roberts, Claude M. and C.V. Theis. Preliminary Investigation of Ground-Water Occurrences in the Weldon Spring Area, St. Charles County, Missouri, U.S. Department of the Interior — Geological Survey, Indianapolis, IN, 1951.
15. National Lead Company of Ohio. Study of Radioactive Waste Storage Area at ERDA-Weldon Spring Site, 1977.
45
16. Krummel, W.J., Jr. Geology of the South Half of the WeldonSpring Quadrangle. Unpublished Masters Thesis, Washington University, 1956.
17. McCracken, Mary H. Structural Features of Missouri, Reportof Investigations #49, Missouri Geological Survey and Water Resources, 1971.
18. Bechtel Civil and Minerals, Inc. Weldon Spring Site Seismicity and Design Earthquake Considerations, San Francisco, CA, July 1983.
19. Pettijohn, F.J. Sedimentary Rocks, Harper and Row, New York, 1975.
20. McClelland Engineers. Laboratory Testing of Soils, Weldon Springs Storage Site, Weldon Springs, Missouri, July 1983.
21. Letter, T. J. Dean, Division of Geology and Land Survey,Missouri Department of Natural Resources, to P. Mote,Bechtel Civil and Minerals, Inc., "Summary of Water Tracing Experiments at Weldon Spring Complex," November 22, 1983.
22. Environmental Science and Engineering, Inc. Materials Test Report, Sludge Sampling and Testing Services, Weldon Spring Storage Site, Missouri, (Draft), St. Louis, MO, August 1983.
23. U.S. Department of Agriculture, Soil Conservation Service. Soil Classification — A Comprehensive System — 7th Approximation, August 1960.
46

TABLES

TABLE 1AOVERBURDEN THICKNESSES — TRENCHES
TrenchNumber
Thickness of Unit (ft) OverburdenThickness
(ft)Topsoil ClayeySilt Clay Till
Cl ay Basal
TR-1 1.4a 14.6 3.00 0. 5d 19.5+TR-2 3.0 8.0 2.00 8.00d 21.0+TR-3 1.0 9.0 10.00 5.70 1. 5d 27.2+TR-4 1.0 6.0 12.00 3.10d 22.1+TR-5 1.5 7.0 11.30 3.00d 22.8+TR-6 2. 7a 3.3 6.80 7.00 1.3d 21.1+TR-7 0.5 5.7 2.30 I4.70b>d 23.2+TR-8 1.0 7.8 0.95 8.25 1.9 19. 9TR-9 1.0 5.0 5.50 5.30 3.5b»d 20.3+TR-10 0.5 5.5 5.20 4.50 2.2 17. 9TR-11 1.5 5.5 4.40 4.60 5.1d 21.1+TR-12 8.4a 1.0 9.60 1.00 1.4d 21.4+TR-13 1.5 6.3 11.70 1.3d 20.8+TR-14 1.0 8.5 11.50b»d 21.0+TR-15 3.7a 5.8 5.5Qc »d 19.0+
NOTES:
a - Gravel fillb - Till interbedded with silt c - Clayey silt interbedded with ash and clayd - Thickness not known; trench was completed before contact was
encountered+ - Trench did not fully penetrate overburden
To convert feet to meters, multiply by 0.3048.
49
TABLE IB
OVERBURDEN THICKNESSES — BOREHOLES
BoreholeNumber
Total Thickness of Unit (ft) OverburdenDepth(ft) Topsoil Clayey Till
Silt Clay Clay BasalChertyClay
Thickness(ft)
B-l 21.5 1.5 7. 5a 12.58 21.5+B-2 29.6 4.0b 4.0 15.0 3.5 3.18 29. 6+B-3 148.6 3.0 2.0 37.0 8.0 50.0B-4 119.6 0. 5b 2.5 5.0 7.0 3.0 18.0B-5 21.5 3.0 4.0 12.0 2.58 21.5+B-6 21.5 1.5 9.5 10.58 0 21. 5+B-7 22.8 1.0 4.5 7.5 9.88 22.8+B-8 33.0 1.0 8.0 12.5 5.5 27.0B-9 84.7 5.0 6. 5a 6.5 3.0 21.0B-10 25.6 25.6C »S —B-ll 106.2 1.0 9. 0a 7.0 17.0B-12 30.0 20.0C 4.0 6.08 10.0+B-l 3 27.0 12.0C 9.0 6.08 15. 0+B-14 21.8 2.0 5.5 11.5e 2.88 21.8+B-15 30.0 16.0C I4.0f>8 14.0+B-15a 37.0 16.0 C 14.0f 7.08 21.0+B-16 28.5 4.0d 15.0 19.0B-17 99.1 2.0 4.0 5.0 13.0 1.0 25.0B-l 8 24.0 2.0 6.0 9.5 6.58 24.0+B-19 21.5 1.0 10.5 5.0 5.0 21.5B-19a 101.0 4. 0b 3.0 5.0 6.0 2.0 8.0 28.0B-20 29.5 1. 5b 13.5 14.58 29.5+B-21 99.4 1.0 4.0 5.0 11.0 2.0 3.5 29.5B-22 15.0 4.0h 11.0a »8 15.0+B-23 90.7 1.0 5.0 4.0 26.5 1.5 38.0B-24 23.5 1.0 6.0 4.0 9.5 3.08 23.5+
NOTES:
a - Unable to determine contact between clayey silt and clay b - Gravel fill c - Dike filld - Mixture of fill and topsoil e - Silty clayf - Mixture of clay and silty clayg - Thickness is not known; hole was completed before contact was encountered h - Mixture of fill and silty clay + - Borehole did not fully penetrate overburden
To convert feet to meters, multiply by 0.3048.
50
TABLE 2
OVERBURDEN PROPERTIES
B oreho leNo.
Depth o f Samp 1e ( f t )
Permeab 1 1 I t y [ f t / d a y (cm /s) J
M o is tu reContent
P ercen t SI I t and Cl ay
(0 .0 7 4 mm)
Pe nc ent Cl ay
(0 .0 0 5 mm)
Mater la 1 Type
10 2-4 3 .9 7 x l0 ~ 5 4^ X o1 00 17.2 73 44 Dl ke f 11l - s 1I t y c lay
10 10 .3-12 .1 3 .9 7 x l0 ~ 4
r-»IoX 17.8 N/A N/A Dl ke f 11l - s 1I t y c 1 ay
10 18.7 2 .0 4 x l0 _3 ( 7 . 2 x l0 ~ 7 ) 15.4 90 44 D ike f i l l - v e r y s i l t y c 1 a
10 19.4 I . 2 2 x l0 ~ 3 (4 .3 x I 0 " 7 ) 20 .0 90 44 D ike f i l l - v e r y s i l t y c 1 a
10 2 0 .0 8. 19k I0” 4 ( 3 . Ix lO - 7 ) 18.7 N/A N/A D ike f i l l - v e r y s i l t y c 1 a
12 5.5 4.54x10 8
CT\1o
2 1 .9 98 46 Dl ke f 11 1 - c 1 ayey s i l t
12 22-24 1.7 6 x I0 ” 3 (6 .2 x I0~7 ) 22.6 N/A N/A Cl ayey s i I t
12 25.5 9 . 64x I 0 " 5 (3 .4 x I0~8 ) 20 .0 92 51 Cl ay t i l l
12 26.0 3.97x I0“ 5 X o1 00 17. 1 N/A N/A Cl ay t i l l
12 3 0 .0 8 .5x I0~3 ( 3 . Ox I0 - 6 ) 14.5 72 38 Cl ay t i l l
13 12.0 1 .96x 10~3 (6 . 9 x I 0 ~ 7 ) 2 9 .9 98 37 O r g a n ic - r i c h c la y e y s i l t
13 26 .0 3.69x I0-3 <1 .3x I0~6 ) 24.2 90 54 SI I t y c 1 ay
15 4-6 2 .5 5 x l0 -5 (0 .9 x I0 ~ 8 ) 20.9 95 47 Dl ke f 11 l - c 1 ayey s i I t
15 17.5 2.64x I0~4 ( 9 . 3 x lO * 8 ) 21 .5 96 45 S I I t y c la y
To c o n v e r t f e e t t o m e te rs , m u l t i p l y by 0.3048.
N/A - Not a n a lyze d .
51
TABLE 3Sri 5 VIC V E L O C I T I E S AT S E L E C T E D P O I N T S AL0N3 EACH R E F R A C T I O N LINE
w E L D O N S P R I N G R A F F I N A T E PITS SITE
S E I S M I C C O O R D I N A T E S E L E V A T I O N V E L O C I T YLINE ( P L A N T G R ID) TCP CF Or L A Y E R
L A Y E R ( = 7) ( F T / S E C )
LI N 9 S 7 8 1 W 5 0 9 2 5 654 180065S 5000650 3500612 13000
N 9 8 5 3 1 4 5 0 9 3 9 663 150 0655 50006 4 7 2 90059 9 1 3 0 C 0
N 9 6 5 81 4 5 0 9 3 5 661 180 06 5 3 5 0 C 06 43 2 9 C C593 13 0 00
N 9 9 0 5 1 W 509 3 9 65c 15C0650 5 0 0 06*1 2900600 1 3 0 0 0
N 9 9131 45 0 339 6 56 1500646 50 0 0640 4 0 0 0605 1 2 0 0 0 - 1 3 000
N 9 9 2 8 1 * 5 0 9 3 9 650 15006 43 2 70 06 33 5000632 40006 06 1 2 0 0 0 - 1 3 0 0 0
N 9 9 3 8 1 4 5 0 9 3 9 647 12006 35 2700631 5000625 3400603 12 0 0 0
N 9 9 4 51 450 939 643 12 0 0633 50006 27 3400601 12 C 0 0
N 9 9 5 5 1 W 509 3 9 639 1200632 5000626 34005 99 1 2 0 0 0
L 2 N 9 9 2 2 5 W 5 0 6 4 1 653 1 2 0 0 - 1 4 0 0643 5000635 3 4 0 0 - 3 7 0 0595 1 2 0 0 0
N 9 9 2 2 5 W 5 0 6 9 1 653 1 2 0 0 - 1 4 0 0643 5000635 3 4 0 0 - 3 7 0 0597 1 2 0 0 0
N 9 9225 W 50741 651 1 2 0 0 - 1 4 0 0643 5000635 3 4 0 0 - 3 7 0 0599 1 2 000
52
7 A 6 L t 5S E I S M I C V E L O C I T I E S AT S E L E C T E D P O I N T S A L O N G F A C n R E F R A C T I O N L I N ?
2 E L D C N S P R I N G R A F F I N A T E P I T S S I T E
S E I S M I C C O O R D I N A T E SL I N E ( P L A N T G R I G )
L 2 c on t N 9 9 2 2 5 V. 5 0 7 9 1
NS 9 225 2 5 0 5 41
N 9 5 2 2 5 k 5 0 o 9 1
N 9 9 2 2 5 2 5 0 9 4 1
L 3 N 9 8 9 2 5 2 5 0 5 9 4
N 9 9 0 2 5 2 5 0 5 9 4
N 9 9 12 5 w 5 0 5 9 4
N 9 5 2 <l 5 2 5 0 5 9 4
N 9 8 3 2 5 2 5 0 5 9 4
N 9 9 4 2 5 2 5 0 5 9 4
N 9 9 5 2 5 2 5 0 5 5 4
L4 N9 a 7 8 3 2 5 C 940
N 9 8 7 4 5 2 5 0 9 7 2
N9 87 0 7 2 5 1 0 0 7
N 9 8 6 6 9 2 5 1 0 3 3
N 9 3 6 3 1 2 5 1 0 6 5
E L E V A T I O N v e l o c i t yT C P CF CF L A Y E R
L A Y E R (F T ) ( F T / S E C )
651 1 2 0 0 - 1 4 C C6 43 5 00 0535 3 4 C 0 - 3 7 0 06 0 0 12 0006 53 12 0 0 - 1 4 0 064 3 500 0655 3 4 0 0 - 3 7 0 0602 1 2 0006 5 3 1 2 Q 0 - 1 4 C C643 5 0 0 0b 3 5 3 4 0 0 - 3 7 0 06 04 1 2 0 0 065 3 1 2 C 0 - 1 4 0 06 4 4 5 00 06 3 7 3 4 0 0 - 3 7 0 06 06 1 2 0 0 06 5 3 17 0 0641 3 4 C G583 1 1 0 0 0 - 1 2 0 0 0653 170 06 4 2 3 4 0 0591 1 IOC 3- 1 2 0 0 06 5 3 1 2 0 0 - 1 7 0 06 4 2 3 4 0 0594 1 1 0 C C - 1 2 C 0 06 53 1 2 C 06 43 3 9 0 0 - 4 3 0 05 97 1 1 0 0 0 - 1 2 0 0 06 5 2 1 2 0 06 44 3 9 0 0 - 4 3 0 05 9 4 110 0 06 51 1 2 0 06 4 6 3 60 0591 1 1 C C 065 0 1 2 0 06 4 3 3 6 0 0589 1 1 0 0 066 3 1 4 C 0655 3 2 0 0 - 3 5 0 06 0 9 1 3 0 0 0663 1 4 C 065 6 3 2 0 0 - 3 5 0 061 2 1 3 0 0 06 6 3 1 4 0 065 7 3 2 0 0 - 3 5 0 0615 1 3 0 0 06 62 1 4 0 06 5 7 3 2 0 0 - 3 5 0 06 1 5 1 3 0 0 065 9 1 4 0 0
53
T A 5 L E 3S E I S M I C V E L O C I T I E S AT S c L E C T E C P O I N T S A L O N G E A C H p F F P A C T I C N
W E L D O N S ? ^ IK 3 K A F C 1 N A T E P I T S 5 I T ES E I S M I C C C C P S l K A T i S E L E V A T I O N V E ^ C C I T Y
L I N E ( P L A N T 3 RI 3 ) TCP C c C F L A Y l PH Y E k ( F T ) ( F T / S E C )
N 9 £ t 3 1 n 5 I C 6 -J o 3 A519
3 2 9 0 - 3 1 3 0 0 0
5 00
N 9 8 5 9 3 W 5 1 1 0 0 5 5 3 1 A0 05 5 2 3 2 0 0-3 5005 2 0 1 3 09 0
N 9 8 5 5 5 W 5 1 i 3 1 6 5 S 1 A 0 0553 3 20 0-3 5006 2 1 3 0 0 0
N 9 a 1 Z 9 W 5 C 7 a 3 557 560 5 1 A
120 0 a 9 C 0
1 2 0 0 0N 9 S 2 1 9 W 3 C 3 3 E a 6A
5 3 5 6 1 7
1 2 0 0 u 3 c C
i. a u u CN ? 8 3 0 9 W 3 0 85 3 6 d 5
55 3 61 d
1 2 0 0 - 2 4 C C 0
1 2 C 0 C
000
N9 5 3 33 V. 5 3 9 0 G 6 5 5 6 5 7 620
2 0 C 3 40 0 0
1 2 0 0 0N 9 6 A 3 5 w 5 0 9 A 6 6 o 2 2 U 0 0
6 3 7 A c 0 0 - A 5 C 06 2 0 1 2 0 C 0
N 9 £ 5 7 5 Vi 5 C 9 9 1 661 1 a 0 0 - 2 0006 58 4 0 0 0-4 5006 13 11 j C 0
N 9 3 6 6 A w 5 1 0 3 5 6 6 A 1 AC C6 5 8 4 0 C C - 4 5 C C618 1 2 0 C 0
N 9 7 9 9 A W j 1 u 1 3 6 5 6 16 0 06 47 4 3 C 0 - 2 0 0 0507 1 2 0 0 0
N 9 8 0 1 6 W 3 9 9 6 6 ' 6 59 1 6 C C6 A 9 a 0 C 0 - 5 0006 C 8 1 2 0 0 0
N 9 5 0 A 1 W 5 0 9 2 2 661 1 2 0 0 - 1 6 0 06 5 2 A 0 C 0 - 5 0 0060 9 12 00 0
N 9 3 C 6 3 W 3 0 6 7 8 66 3 1 2 C 0 - 1 6 CO6 5 A a 3 0 0 - 5 000610 1 2 0 0 0
N 9 S C 3 8 W 3 3 d 3 a 5 6 5 1 2 0 0655 A 0 0 0 - 5 0006 11 1 2 00 0
N 9 £ 11 3 W 5 0 7 9 1 66 7 12 00660 4 C C C - 5 000612 1 2 00 0
N9 51 3 7 W 5 0 7 A 7 6 67 1 2 0 05 60 A 0 0 0 - 5 0 0 C6 1 A 1 2 0 0 0
L I N E
5 4
T A B L E 3S E I S M I C V E L O C I T I E S AT S E L E C T E D P O I N T S A L O N G E A C H R E F R A C T I O N L I N E
W E L D O N SPRI-N3 R A F F I N A T E P I T S S I T ES E I S M I C C O O R D I N A T E S E L E V A T I O N V E L O C I T YLINE (PLANT G R ID ) TOP 0 F CF LA YER
L A Y E R (C T) ( F T / S E C )
N 9 8 9 9 4 w 5 1 0 0 9 657 1600647 3 5 C 0609 12000
N9 6 G 3 4 W 5 1 0 5 6 653 1 6 C 0546 3500611 12000
N9 S 17 2 W5 11 0 0 6 54 16CO649 4 60 0613 12000
N9 8 2 5 9 W 5 114 7 657 1 3 0 0 - 16006 5 0 3 80 0- 4600616 11 5 C 0
N 9 S 3 5 0 k 5 11 9 4 656 13006 4 9 3 300615 115 00
N 9 8 4 3 5 k 5 1 2 4 1 652 1300643 2500620 11500
N 9 8 5 2 6 W 5 1 2 S 7 652 1300S4 7 2 500622 11500
N9 o 5 5 9 k 5 1 3 9 7 647 1800635 3 40 0610 12000
N 9 8 5 7 2 W 5 1 4 9 7 649 18006*0 3400601 8 00 0597 1 2000
N 9 5 5 8 4 W 5 1 5 9 5 649 1200- 1800642 3400 ’610 3 0005 5 4 1 2 0 0 0
N9 6 5 9 7 k 5 1 6 9 5 6 49 1200644 3 80 0615 8000571 1 2 000
N 9 o 6 2 2 k 5 17 9 2 646 1200641 3300505 SOOO5 S 5 1 200 0
N 9 3 64 7 k 5 1 5 6 9 6 46 15006 3 5 3 80 0599 12000
N 9 o 6 7 2 k 3 1 9 6 8 642 1500635 3 50 0612 12000
N9 8672 W 5 1 9 9 1 6 4 2 1200 - 1500634 4 0 C 0613 12000
N 9 5 7 6 3 k 5 2 G 3 0 642 120 0- 150055
T A B L E 3S E I S M I C V E L O C I T I E S AT S E L E C T E D P O I N T S A L O N G E A C H R E F R A C T I O N L I N E
W E L D O N S P R I N G R A F F I N A T E P I T S S I T ES E I S M I C C O O R D I N A T E S E L E V A T I O N V E L O C I T YL INE ( P L A N T GRID ) TOP OF OF L A YE R
L A Y E R (FT) ( F T / S E C )
L 9 c o n t N 9 6 7 6 3 W 5 2 0 3 0 634 4000615 6500606 12000
N 9 6 3 5 3 W 5 2 C 7 0 642 1 2 0 0 - 1 5 0 0634 2 5 0 0 - 3 0 0 0520 6500556 1 2 000
N 9 6 S 4 4 W 5 211 5 640 12 0 0 - 1 500634 2 5 0 0 - 3 0 0 0621 6500590 1 2 0 00
N 9 9 0 44 to 5 2 12 2 538 1 2 0 0 - 1 5 0 06 3 4 2 5 0 0 - 3 0 0 0616 7 0 0 0 - 7 5 0 0589 12000
N 9 9 1 4 4 W 5 2 1 3 1 637 1 2 0 0 - 1 5 0 0634 2000613 7 0 0 0 - 7 5 0 0563 1200 0
N 9 9 2 5 0 to 5 213 6 635 2000614 7 0 0 0 - 7 5 0 059 0 1 20 00
N 9 9 3 3 4 to52156 634 2 0 00505 7 0 0 0 - 7 5 0 05 95 1 3 0 0 0 - 1 4 0 0 0
N 9 9 42 6 to 5 2 2 4 4 63 7 1 30 0634 2500601 1 3 0 0 0 - 1 4 0 0 0
N5 9500 W 5 2 2 9 7 639 1 30 0635 2500612 1 3 0 0 0 - 1 4 0 0 0
L 10 N9 9 566 W 5 2 3 27 643 1200636 2700615 11000
N 9 9 6 5 7 to 5 2 2 97 643 1200637 2700614 110 0 0
N 9 5 7 5 5 W 52 26 6 6-3 1200637 2700b 1 4 110 00
N 9 9 5 5C to 5 2 2 3 4 540 1200536 2 5 0 0 - 2 7 0 0613 1 0 5 0 0 - 1 1 0 0 0
N 5 9 5 2 2 W 5 2 1 5 6 642 1200637 2500612 10500
N9 9567 to5 2 C 5 4 642 1 200639 2500611 10 500
N 1 0 0 0 5 5 k5 20 11 645 120056
T A B L E 3S E I S M I C V E L O C I T I E S AT S E L E C T E D P O I N T S A L ONG EACH R E F R A C T I O N LINE
W E L D O N S P R I N G R A F F I N A T E PITS SITE
S E I S M I C C O O R D I N A T E S E L E V A T I O N V E L O C I T YLINE (PL ANT G R ID) TOP 0- OF L A YE R
l a y e r (FT) ( F T / S E C )
L10 c on t N 1 00 056 W 5 2C 1 1 640 2500610 10 500
LI 1 N1 00031 W 5 2 C A 4 644 1500634 4000608 9000
N 1 0 0 0 6 9 W 519 4 4 644 1 5C0623 40005 04 9 0 0 0
N 1 0 C 0 5 6 W 5 1 8 4 4 641 1500634 4000607 9000
N 10 0 0 4 4 * 5 1 7 4 4 644 1500637 2600615 9000
N 1 0 0 0 3 1 W 51 644 644 1 500536 2600611 1 1 0 0 0 - 1 2 0 0 0
NIOC'019 *5 1544 542 1200535 3500603 1 1 0 0 0 - 1 2 0 0 0
NIOC 0 06 W 5 1 4 4 4 640 1200534 3500595 1 1 0 0 0 - 1 2 0 0 0
N 9 9 9 9 4 W 5 13 4 4 5 4 2 1 2 0 0637 2200624 3500591 1 1 0 0 0 - 1 2 0 0 0
N9 9981 W 512 4 4 641 1200637 2200613 35005 91 110 0 0
N 5 5 S 6 9 W 51144 t> 4 1 1200630 2 50 0601 3500596 110 0 0
N 9 5 3 5 o W 510 44 641 1200631 2500595 1100 0
N 9 3 9 4 5 W 5 0 9 7 5 637 1200631 2500600 11000
L 12 N 9 9 6 4 7 * 5 0 9 7 5 635 1400633 3000601 1100 0
N 9 5 7 4 7 W 5 0 9 7 5 635 1400632 3 00 0502 11000
N9 9347 W 5 0 9 7 5 633 1 4006 3 2 3 0 0 0603 11000
57
T A B L E 3S EI S M C V E L O C I T I E S AT S E L E C T E D P O I N T S A L O N G E A C H R E F R A C T I O N L I N E
W E L D C N S P R I N G R A F F I N A T E P I T S S I T ES E I S M I C C O O R D I N A T E S E L E V A T I O N V E L O C I T YLIN E (PL A NT GRID) TCP OF OF L A YE R
L A Y E R (FT) ( F T / S E C )
L12 c on t N 9 9 9 4 7 W 5 0 9 7 5 6 38 1400632 30CG603 11 000
L 13 N 9 8853 W 51900 552 1600644 2400627 105CC
N 3 8 6 5 1 W 5 1 8 4 9 652 1 60 0645 24006 26 10 5 0 0
N 9 5 8 4 9 W 517 5 9 652 1600645 2400624 10500
N 9 8 8 4 7 W5 1 7 5 C 6 53 1600646 2400622 1 05 00
N 9 8 8 4 6 V 5 1 7 C 0 553 1600543 2400621 10 500
N 9 8 8 4 4 VI 5 1 6 4 9 654 1 600642 2400620 10 500
N S S E 4 2 W 5 1 5 9 9 655 1600641 2400620 10500
L 14 N 9 8 8 0 6 W 5 1 6 0 9 660 16006 A 2 2400620 1 0 5 0 0 - 1 1 0 0 0
N 9 8 3 5 0 W 5 1 5 9 1 654 1600644 2400 _6 21 1 0 5 0 0 - 1 1 0 0 0
N 9 8 3 9 7 W 51 5 7 2 652 1600646 2400619 1 0 5 0 0 - 1 1 0 0 0
N 9 8 9 4 4 VI51 5 5 4 650 1600647 2400616 7 0 0 0 - 8 0 0 0612 1 0 5 0 0 - 1 1 0 0 0
N 9 8 9 9 1 W 515 3 7 651 1 600645 2400615 7 0 0 0 - 8 0 0 0593 1 0 5 0 0 - 1 1 0 0 0
N 9 9 0 3 8 W 5 1 51 9 652 1600643 2400615 7 0 0 0 - 8 0 0 0587 1 0 5 0 0 - 1 1 0 0 0
N 9 9 0 8 4 W 515 0 2 661 1600641 2400615 7 0 0 0 - 8 0 0 0580 1 0 5 0 0 - 1 1 0 0 0
L 15 N 9 9 5 5 9 W 5 1 5 41 652 140058
T A B L E 3S E I S M I C V E L O C I T I E S AT S E L E C T E D P O I N T S A L O N G EACH R E F R A C T I O N L I N E
W E L O G N S P R I N G R A F F I N A T E P I T S S I T ES E I S M I C C C U R QI N A T E S E L E V A T I O N V E L O C I T YLINE (PLA NT GRIG) TOP OF CF LA YER
L A Y E R (FT) ( F T / S E C )
L15 c o n t N 9 9 5 5 9 W 5 1 5 4 1 646 3500614 7000538 1 3 0 C0
N 9 9 6 06 W 5 1 5 4 7 654 1400646 3600619 7 0 C 0555 13 0C 0
N9 9 6 5 8 W 5155 2 6 56 140 0646 3500625 7000582 1 3 000
N 9 9 7 0 3 W 31557 657 1400646 3600630 7000580 13 000
N 9 9 7 5 9 U 5 1 5 6 3 6 56 1400646 3300623 7000578 13 0 00
N 9 9 6 0 9 to 5 1 5 6 9 655 14C0647 3800618 70 005 76 13 000
N 9985 6 W 5 1 5 7 6 655 1400647 35 00611 7000576 1 3 0 00
L 16 N 9 99 50 W 5 1 6 6 6 650 14005 4 3 3 8 0 0621 7000553 13000
N 9 9534 to51 813 650 1400643 3800621 7000557 130 0 0
N9 9 5 1 9 W 5 1 7 7 0 650 1400644 3800621 70005 6 0 13 0 0 0
N 9 9 9 0 3 to 5 17 2 2 651 1400644 3800620 7000563 130 0 0
N 9 9 3 91 W 5 1 6 7 5 652 1400644 3600613 7000567 1 30 00
N 9 9 3 7 5 W 5 1 6 2 8 653 1400645 3800614 7000
59
T A B L E 3S E I S M I C V E L O C I T I E S AT S E L E C T E D P O I N T S A L O N G E A C H R E F R A C T I O N L I N E
W E L D O N S P R I N G R A F F I N A T E P I T S S I T ES E I S M I C C C O R D I N A T E S E L E V A T I O N V E L O C I T YLINE (PLA NT GRID) TCP Or OF LA YER
L AY ER (FT) ( F T / S E C )
LI fc co nt N 9 5 £ 7 5 W 5 1 6 2 5 570 13 00 0N 3 9 S 5 9 W5 1 5 S 0 654 1400
645 3600611 7000573 13000
L 17 N 9 9 C 6 9 W 51506 652 140 0-160 0642 2400617 7 0 0 0 - 3 0 0 0580 1 1 0 0 0 - 1 2 0 0 0
N 9 9 0 6 9 W 5 14 0 b 659 1 4 0 0 - 1 6 0 0652 2400649 5000643 3000629 7 0 0 0 - 8 0 0 0579 1 1 0 0 0 - 1 2 0 0 0
N 9 9 0 6 9 * 5 1 3 0 6 662 1 4 0 0 - 1 6 0 0656 3000618 7 0 0 0 - 8 0 0 0577 1 1 0 0 0 - 1 2 0 0 0
N 9 9 C 6 9 * 5 1 2 06 662 1 4 0 0 - 1 6 0 0653 5000647 3 0 0 0 - 3 5 0 0618 70 0 0-8 0 0 0560 1 2 0 0 0 - 1 3 0 0 0
N 9 5 0 6 9 W 511 0 6 662 1 4 0 0 - 1 6 0 0653 5000647 3500612 7 0 0 0 - 8 0 0 0589 1 2 0 0 0 - 1 3 0 0 0
N 9 9 0 6 9 W 510 0 6 660 1 4 0 0 - 1 6 0 0651 5000646 3 500606 7 0 0 0 - 8 0 0 0598 1 2 0 0 0 - 1 3 0 0 0
N 9 S 0 6 9 W 5 09 06 660 1 4 0 0 - 1 6 0 0652 50006 4 6 3 5 0 0601 1 2 0 0 0 - 1 3 0 0 0
L 16 N 9 91 9 4 W 5 1 4 8 4 659 »W A T E R SUR656 3 4 C 0633 4600623 7 0 0 0 - 8 0 0 0598 11000
N 9 9 1 9 4 W 513 8 4 659 ,W AT E R SUR656 3400651 5000621 7500596 1 2 0 0 0 - 1 3 0 0 0
N 9 9 1 9 4 W 5128 4 65 9 ♦WA T E R SUR656 5000
60
T AS LE 3S E I S M I C V E L O C I T I E S AT S E L E C T E D P OI N T S A L O N G EACH R E F R A C T I O N 1
W E L D C N S P R I N G R A F F I N A T E PITS SITE
S E I S M I C C O O R D I N A T E S E L E V A T I O N v e l o c i t yLINE (PLA NT GRID) TCP CP OF L A YE R
L A Y E R (FT) ( F T / S E C )
L 18 c o n t N 9 9 1 9 4 W 5 1 1 S 4 659 ,W A TER SUR6 56 5000
N 9 9 1 9 4 W 5 1 C 8 4 659 , W A T E R SUR6 56 5000
N 9 9 1 9 4 W51 G 50 659 ,W A TE R SUR6 56 3600650 5000
L 19 N 9 9 2 9 7 W 5 1 4 8 1 659 ,W A T E R SUR656 3400640 5000626 7 0 0 0 - 8 0 0 0593 1 2000
N992 97 W5138 1 659 .WATER SUR656 340 06 4 0 5 0 00622 7500601 125C 0 - 1 3 0 0 0
N 9 9 2 9 7 W512 S1 6 59 .WA TE R SUR656 5000
N 9 9 2 9 7 W 51161 659 ,W AT ER SUR656 5 00 0
N 9 9 2 9 7 W 5 1 0 8 1 6 59 .WATE R SUR6 5 6 36006 4 3 5000
N 9 9 2 9 7 in 5 1 0 4 7 6 5 9 .WATER SUR656 3 600649 5000
L20 N 9 9 3 9 7 W 5 1 4 9 4 659 .WAT ER SUR6 57 3400647 5 000623 70005 94 1 2 5 0 0 - 1 3 0 0 0
N9 9397 W 513 84 659 .WATER SUR657 3400647 500 0613 7 000607 125 0 0 - 1 3 0 0 0
N 9 9 3 9 7 w 51284 6 5 9 .WATER SUR6 5 6 5000
N 9 93 97 W 5 11 S 4 6 5 9 .W AT E R SUR656 5 0 C 0
N 9 9 3 9 7 W 5106 4 659 .WAT ER SUR656 3600650 5000
N 9 9 3 9 7 W 5 1 0 4 S 659 .WATER SUR656 3600650 5000
L 21 N 9 9 5 0 0 W 5 1 4 3 6 659 ♦ W A T ER SUR657 3400640 5000
6 1
T A B L E 3S E I S M I C V E L O C I T I E S AT S E L E C T E D P O I N T S A L O N G E A C H R E F R A C T I O N L I N E
W E L D O N S P R I N G R A F F I N A T E P I T S S I T ES E I S M I CLINE
L21 cont
L 2 2
L 2 3
C O O R D I N A T E S E L E V A T I O N V E L O C I T Y(PL AN T GRID ) TCP OF 0 * L A YE R
L A Y E R (FT) ( F T / S E C )
N 9 9 5 00 W 5 1 5 3 6 659 .WATER SUR656 .WATER EOT
N 9 9 5 0 0 W 5 1 2 9 6 659 .WATER SUR656 , WA TE R BOT
N 9 9 5 0 0 W 5 11 5 o 659 ,WA TER SUR656 .WATER BOT
N 9 9 5 0 0 W 5 1 0 3 6 659 .WATER SUR656 3800650 5000
N 9 9 5 0C w 5 1 0 5 0 659 .WAT ER SUR656 3800650 500 0
N9 960 3 W 5 1 4 8 4 659 .WATER SUR656 3400635 5000613 7000592 1 3 0 C 0
N 9 9 6 C 3 W 5 1 384 659 .WA TER SUR6 5 6 3400649 5000621 7000603 1 3 0 C 0
N9 9603 W 5 1 2 5 4 659 .WATER SUR6 5 6 .WATER BOT
N 9 9 6 0 3 W 5 1 1 S 4 659 .WATER SUR656 .WATER BOT
N 9 9 6 0 3 W 5 1 0 8 4 659 .WATER SUR656 3600651 , 5 C 0 0_
N9 96 0 3 W 51 0 5 6 659 , W A T E* R SUR6 5 6 3600650 , 50 00
N 9 9 7 0 3 W 5 1 4 61 659 .WATER SUR6 5 6 3400637 5 0005 38 1 2 5 0 0 - 1 3000
N 9 9 7 0 3 W 5 1 3 S 1 6 5 9 .WATER SUR6 5 6 3 4 C 0640 5000630 700 0601 1 2 5 0 0 - 1 3 0 0 0
N 9 9 7 0 3 W 5 1 2 8 1 659 .WATER SUR6 5 6 .WATER BOT
N 9 9 7 0 3 *51181 659 , W A T c R SUR656 .WATER BOT
N 9 9 7 0 3 W 5 1 0 8 1 659 .WATER SUR656 5000618 11500
N 9 9 7 03 W 5 1 0 5 0 659 .WATER SUR6 5 6 , WA T ER BOT
62
T A B L E 3S E I S M I C V E L O C I T I E S AT S E L E C T E D P O I N T S A L O N G E A C H R E F R A C T I O N L I N E
W E L D O N S P R I N G R A F F I N A T E P I T S S I T ES E I S M I C C O O R D I N A T E S E L E V A T I O N V E L O C I T YLI N E (PLANT GRID) TOP Or OF L A YE R
LAY ER (FT) ( F T / S E C )
L24 N9 93G3 W 51494
N9 9 7 61 W 5139 5
N 9 9 7 5 9 W 5 1 2 9 7
N 9 9 7 3 3 W 5 11 9 9
N 9 9 7 27 k 5 11 0 1
N 9 9 7 0 3 W 5 1 0 5 0
L 2 5 N9 5 9 S 4 W 5 1 5 3 o
N 9 5 0 9 4 W51 534
N 9 9 1 9 4 W 5 15 3 Z
N 9 9 2 9 4 W 515 3 0
N 9 9 3 9 A U5 1 52 E
N 9 9 4 9 4 W 5 1 5 2 6
N 9 9 5 94 W 51524
L 2 6 N9 9 3 50 k 52069
N 9 S 8 7 5 W 5 2 C 2 5
659 , W A TE R SUR657 3400638 5 00 0659 ♦WA TE R SUR656 5000641 7 00 0602 1 2 5 0 0 - 1 3 0 0 0659 , W A TER SUR6 5 6 500 0641 7 000602 1 2 5 0 0 - 1 3 0 0 0659 ♦WA TE R SUR6 56 ♦WA TE R EOT659 ♦WA TE R SUR656 ♦ WA T E R EOT659 ♦WATE R SUR656 ♦WAT ER 3DT650 16006 4 3 2400615 700 0-3 0 00593 110006 52 160064:5 2AC06 20 7 0 0 0 - 8 0 0 05 93 110 0 06 5 3 1500649 2 4 C 06 2 A 700 0-8 COO602 110006 5 2 1 4 0 0 - 1 6 0 06 4 5 2 4 0 0 - 3 9 0 06 2 8 7 0 0 0 - 8 0 0 0595 1 1 0 0 0 - 1 2 0 0 0654 14006 4 7 2 4 0 0 - 3 8 0 06 26 7 00 05 8 9 1 2 C 0 0 - 1 3 0 0 Q654 140 06 A 7 3800621 7'0C0590 1 2 0 0 0 - 1 5 0 0 06 5 3 1400643 3 5 0 0524 70005 90 1 2 0 0 0 - 1 3 00 0651 1400641 3 800612 700 0647 1400637 3 80 0
6 3
T A B L E 3S E I S M I C V E L O C I T I E S AT S E L E C T E D P O I N T S A L O N G E A C H R E F R A C T I O N L I N E
W E L D O N S P R I N G R A F F I N A T E P I T S S I T ES E I S M I C C O O R D I N A T E S E L E V A T I O N V E L O C I T YLINE (PLANT GRID) TCP CF OF LA YE R
L A Y E R (FT) ( F T / S E C )
L 2 6 c o n t N 9 9 6 7 5 W 5 2 0 2 5 619 7000N 9 9 9 C 0 W 5 1S S 1 647 1400
633 3800626 7 0 C 0
N 9 9 9 2 2 W 5 19 3 8 650 14C0634 3800627 70 00
N 9 9 9 4 6 W 518 9 4 649 1400639 3800622 7000
N 9 9 9 6 3 W 518 5 9 650 1400643 3300619 7000
L 27 N 9 9 1 1 3 W 5 1 3 3 * 659 .wA TE R SUR658 3^0 0647 5000618 7500551 115C0
N 9 9 2 1 3 W 5 1 3 3 5 659 .WATER SUR656 5000621 7500594 11500
N 9 9 3 1 3 W 5 1 3 3 7 659 . W A TE R SUR656 5000616 7500607 1000 0
N 9 9 4 1 3 W 513 2 9 659 .WA T E R SUR656 5000615 10000
N 9 9 5 1 3 W 5 1 3 4 1 659 . W AT ER SUR656 5000633 7000612 1 0 50 0
N 9 9 6 1 3 W 51 3 43 659 .WA TE R SUR656 5000644 7000609 10 500
N 9 9 7 1 3 W 51 3 45 659 .WAT ER SUR656 5 0 C 0643 7000605 1 0 50 0
N 9 9 3 1 3 W 5 1 3 4 6 659 .W A T E R SUR656 5000632 7000600 10 500
N 9 9 8 6 3 W 51 3 4 7 659 5000627 7000598 1 05 00
L 2 8 N 9 88 3 1 W 5 1 7 0 3 649 . W AT E R SUR646 1600
64
T A B L E 3S E I S M I C V E L O C I T I E S AT S E L E C T E D P O I N T S A L O N G E A C H R E F R A C T I O N L I N E
W E L D O N S P R I N G R A F F I N A T E P I T S S I T ES E I S M I C C O O R D I N A T E S E L E V A T I O N V E L O C I T YLINE ( P LA NT G R ID) TOP 0= OF LAYE R
L A Y E R (FT) ( F T / S E C )
L 2 8 con t N 9 S 8 8 1 W 5 1 7 0 3 642 2400619 10500
N 9 6 9 8 1 W 5 1 7 06 649 .WAT ER SUR639 ,W A T E R EOT
N 9 9 0 8 1 W 51707 649 , W A T E R SUR636 4 4 0 0 - 4 8 0 06 20 .NO DATA
N 9 9 1 8 1 W 517 0 9 649 ,W A T ER SUR635 4 2 0 0 - 4 7 0 0617 ,NO DATA
N 9 9 2 3 1 W 5 1 7 1 1 649 ,W A T E R SUR639 4 2 0 0 - 4 7 0 0612 7 0 0 0 - 9 0 0 0597 13 00 0
N 9 9 3 3 1 W 51713 649 ,W A T E R SUR633 4 2 0 0 - 4 7 0 0610 7 0 0 0 - 9 0 0 0598 13 0 00
N 9 9 A 3 0 W 5 1 71 5 649. , W A T E R SUR637 4 2 0 0 - 4 7 0 0613 7 0 0 0 - 9 0 0 0537 13 00 0
N 9 9 5 8 0 W 51 71 6 649 ♦WA T ER SUR639 4 1 0 0 - 4 3 0 0617 7 0 0 0 - 9 0 0 0583 13000
N9 3660 W 5 17 17 649 ,W A T E R SUR6AQ 4 1 0 0 - 4 3 0 0620 7 0 0 0 - 9 0 0 0580 130 0 0 *
N 9 9 7 8 0 W 5 1 7 19 649 ,WA TE R SUR643 3800618 7000571 130 0 0
N 9 9 8 3 3 W 5 1 7 2 0 649 1400645 3300618 70 0 0567 13 00 0
L 2 9 N9 8 89 4 W 5 1 9 0 6 649 4000633 7000621 1 0 50 0
N 9 6 9 9 4 W 519 0 9 649 ,W A T E R SUR638 4 0 0 0 - 4 5 0 0631 7000610 1 05 00
N 9 9 0 9 4 W 5 1 912 649 ♦W A T E R SUR634 4 0 0 0 - 4 5 0 0630 7000599 1 0 5 0 0 - 1 3 0 0 0
N 9 9194 W 5 1 91 6 649 .WATER SUR65
T A B L E 3S E I S M I C V E L O C I T I E S AT S E L E C T E D P O I N T S A L O N G E A C H k E F R A C T I C N L I N E
W E L D O N S P R I N G R A F F I N A T E P I T S S I T ES E I S M I C C O O R D I N A T E S E L E V A T I O N V E L O C I T YLINE (PL A NT GRID) TCP OF Q F L A Y t R
LAYER C^T) ( F T / S E C )
L 2 9 c on t N 9 91 9 4 W 5 1 9 16 634 4 0 CO -4 5 0 06 3 0 7000569 13000
N 9 9 2 9 4 W 5 1 91 9 649 ,WATE R SUR5 36 4 0 0 0 - 4 5 0 06 2 2 70 0 0591 13000
N 9 9 3 9 4 W 5 1 9 2 2 549 ,W A T E R SUR637 4 0 0 0 - 4 5 0 0614 7000593 1300 0
N 9 9 4 9 4 W 5 1 9 2 5 649 .WATER SUR539 4 0 0 0 - 4 5 0 0613 700 0592 1 0 0 0 0 - 1 3 0 0 0
N9 9594 W 519 2 s 549 .WATER SUR639 400 0-4 5 0C612 7 0 0 0 - 1 0 0 0 05 01 10000
N 9 9 6 9 4 W 51 931 64 9 .WA TE R SUR640 4 0 0 0 - 4 5 0 0615 7 0 0 0 - 1 0 0 0 0571 1000 0
N9 9794 W 5 1 9 34 649 .WAT ER S'JR542 4 0 0 0 - 4 5 0 0618 7 0 0 0 - 1 0 0 0 0563 10000
N9 9 854 W 5 1 9 3 8 649 .WATER SUR647 140 0635 3800619 7 0 0 0 - 1 0 0 0 0563 10CC0
66
T A B L E 4 AW A T E R L E V E L E L E V A T I O N S
W E L D O N S P R I N G R A F F I N A T E P I T S S I T EC 3 S . WELL
ID
32
DATE (Y/N/D)
63022 1 6 30 20 3 5 3 0 3 1 1 8 3 0 313 6 3 0 3 2 2 8 2 0 3 2 3 8 3 0 3 2 4 8 3 0 3 2 5 83 03 2 6 8 3 0 4 0 6 8 30 4 1 1 53 04 1 3 8 3 0 4 1 5 8 3 0 419 6 3 0 4 2 2 8 3 0 4 2 7 8 3 0 4 2 9 8 3 0 5 0 55 3 0 51 0 8 3 0 5 1 7 6 3 0 5 2 4 8305 31 6 3 0 6 0 3 8 3 0 6 0 3 6 3 0 6 1 0 3 3 0 6 1 4 8 3 0 6 1 7 3 3 0 6 2 2 6 3 0 6 2 4 630 73 1 6 3 0 7 0 8 6 3 0 7 1 5 6 3 0 7 2 2 8 3 0 7 2 9 6 3 0 9 05 5 3 0 6 1 26 3 0 619 8 3 0 916 830 92 3 63 09 3 0 5 310 0 7 3 31014 83 10 2 1 8 3 1 0 2 3 6 3 1 1 0 4 3 312 0 3 83 12 1 5 8 3 1 2 2 0 8 3 1 2 3 0 S 4 0 1 0 4
E L E V A T I O N GF WA TER (FT.)
6 1 C .65610.756 1 1 . 37612.00 6 1 1 . 1 66 1 1 . 426 1 1 . 4 66 1 1 . 5 4611 .7 16 1 1 . 35611.5 8 612.086 1 1 . 5 26 1 1 . 63611. 656 1 1 . 4 36 1 1 . 88611 .5 16 1 1 . 66611 .6 3611 .5 8612 .3 96 1 2 . 056 1 1 . 9 2611.716 1 1 . 31611 .4 16 11 . 2 5 6 1 1 . 1 66 1 1 . 7 5 611 .0 86 1 1 . 1 66 1 0 . 9 26 1 1 . 9 26 11 . 3 36 1 0 . 7 5610 .7 5 6 1 0 . 0 8610.16 610 .0 8610 .2 5 b 1 C • 3 3610 .4 16 1 0 . 0 86 1 0 . 166 1 1 . 086 1 1 . 2 56 1 1 . 2 56 1 1 . 336 1 1 . 0 8
67
T A B L E 4 AW A T E R L E V E L E L E V A T I O N S
W E L 3 0 N S P R I N G R A F F I N A T 5 P I T S S I T EDBS.
I
a
WELLD2 co nt
DATE ( Y/M / D )
8 4 0111 8 40 1 1 9 840 12 5 5 40 2 0 3 84 02 1 0 84 02 1 7 84 02 2 4 8 40 3 0 9 840 31 3 340 319 840 22 9 8 4 0 4 0 3 84 04 1 9 6 4 04 2 5 3 4 0 5 0 4 340 511 8 4 0 518 8 4 0 5 2 3 8 4 0 5 2 9 840 70 5 8 4 0 7 13 8 4 0 7 17 840 72 7 330311 8 3 0 313 330 32 2 6 3 0323 83 02 2 55 3 0 3 2 9 3 30 3 3 06 3 04Q4 S3 040 5 8 3 0 4 0 8 8 3 0 4 12 8 3 0 413 63 04 1 5 6 3 0 4 2 7 8 3 0 4 2 9 8 30 5 0 4 £305 0 5 5 3 0 510 8 3 0 517 o 3 0 5 2 4 £30531 3 5 0 5 0 3 83050 S 8 3 0 610 5 3 0 514 330 61 7 3 20 6 2 2
E L E V A T I O N OF W A T ER (FT.)
6 1 1 . 2 56 1 1 . 5 06 1 1 . 5 06 1 1 . 5 8611.566 1 1 . 536 1 1 . 5 86 1 1 . 7 56 1 1 . 3 36 1 1 . 7 56 1 1 . 6 66 1 1 . 75612.466 1 1 . 9 2611 .9 2612.25612.166 12 . 4 16 1 2 .3 36 1 2 . 5 86 1 2 . 5 86 1 2 . 4 1612.635 7 5 .7 05 8 0 .6 8 5 3 2.145 6 2 . 1 4582.0 3 5 5 2.31 5 6 2.35 5 6 2.725 8 2 . 5 4 5 6 2.38 5 62.98 5 8 2.93 5 6 3.085 7 5 . 23 5 3 2.41 5 8 2 . 33552. 25 a 3 C. . 4 1 5 3 2.5458 2. 3 5 5 6 0.085 6 0 . 355 32 . 9 4 5 6 0.03 5 8 3.085 79 . 5 0 5 8 2.66
68
T A 2 L E 4AW A T E R L E V E L E L E V A T I O N S
W E L D O N S P R I N G R A F F I N A T E P I T S S I T E0 3 S . WELL
ID
3 2 c o n t
B4
C Y/w/COS 3 0 5 2 4 8 3 G 7 0 1 £3070 8 6 3 0 715 630 72 2 6 3 0 72 9 6 3 0 80 5 S 3 0 S 12 3 3 0 619 3 3 0 5 16 630 92 3 630 93 0 S 31 0 0 7 33 10 1 45 3 1 0 2 1 8310 286 3110 452120 6 63 12 1 5 8 312 2 05 3 12 3 06 4 010 4 b40111 64 01 1 95 0 1 2 5 84 0 2 0 3 340 21 06 4 0 217 8 4 0 2 2 4 54 03 0 9 3 40 2 1 3 64 03 1 9 5 4 0 2 2 9 84 04 0 3 £ 4 0 4 19 3 4 0 4 2 6 £ 4 0 5 0 4 64 05 1 1 8 4 0 515 8 4 0 5 2 3 3 4 0 5 2 9 5 4 0 7 0 5 64 07 1 2 84 0 7 17 64 07 2 7 9 3 0 3 1 6 £2 03 1 9 8 3 0 3 2 2 6333 23 53 03 2 5
UrEL Ev a t i c nWATER (FT.)
56 0 505 8 2 635 3 2 08532 42552 4255 2 3356 2 50592 565 6 2 58582 5058 2 63532 6 65 5 2 25532 665 8 2 66
585 82 665 S 2 6 653 2 50582 505 52 505 8 2 4 25 3 2 425 82 8356 2 6 356 2 75582 6 35 52 755 6 2 755 5 2 63562 835 8 2 9158 2 6 65 3 2 3 35 5 2 55532 535 5 2 755 3 2 75532 915 8 2 915 6 2 915 3 2 7553 2 75532 33582 536 lfc 2 9615 696 1 4 93614 97615 73
69
T A B L E 4AW A T E R L E V E L E L E V A T I O N S
WE L O O N S P R I N G R A F F I N A T E P I T S S I T EG E S . WELL DATE
ID (Y/M/D)
54 cont 3 3 0 3 2 9 5 3 0 5 3 0 8 3 0 4 0 4 5 30 4 0 6 53 04 0 3 830 41 25 3 0 4 1 3 63 04 1 5 £ 3 0 4 1 9 £3 04 2 76 3 0 4 2 9 6 3 0 5 0 4 = 3 0 5 0 5 3 3 0 5 1 0 53 05 1 7 8 30 5 24 530 531 6 3 0 6 0 3 63 06 0 8 6 30 6 1 0 6 3 0 514 6 3 0 617 6 3 0 6 2 28 3 0 6 2 4 S 3 0 7 0 1 5 3 0 7 06 6 3 0 7 1 5 530 72 2 5 3 0 7 2 9 6 3 0 8 05 630 81 2 6 3 0 3 1 9 6 3 0 9 1 5 6 3 0 9 239 3 0 9 3 C 8 3 1 00 7 6 3 1 0 14 8310 21 631 02 8 8 3 1 1 04 5 3 1 2 0 8 8 3 1 2 1 5 6 3 1 2 2 0 8 3 1 2 3 0 8 4 0 1 0 4 640 11 1 8 4 0 1 19 6 4 0 1 25 84 02 0 3 8402 10
E L E V A T I O N OF WATER (FT.)
614.51 6 1 ^ . 6 36 1 4 . 3 86 1 4 . 2 6614.26613.716 1 3 . 5 6613 .4 1 6 1 2 . 116 1 2 . 11610.6 1611 .5 5 60 9. 556 0 9 . 61610.386 09 . 9 16 0 7 . 5 26 1 0 . 3 66 0 9 . 7 460 9. 4 56 09 . 7 4 6 0 9.36 610.86611.116 0 9 . 7 8 6 0 5.36 6 0 8.£66 0 9 . 7 86 0 9 . 6 9 60 8.866 0 8 . 3 6 60 5.696 0 7 .6 9 6 0 7.6960 7. 6 16 0 7 . 786 0 7 . 696 0 7 . 786 07 . 5 36 0 7 . 8 66 0 8 . 0 36 0 8 . 9 46 0 9 . 0 36 0 9 . 0 36 0 7 . 7 86 0 7 . 8 660 8. 4 5 6 0 8.456 0 8 . 6 9 60 8.69
70
T A B L E 4 AW A T E R L E V E L E L E V A T I O N S
W E L D O N S P R I N G R A F F I N A T E P I T S S I T E0 3$ . WELL
1054 co nt
DATE CY/^/3)
64021 7 5 4 0 2 24 6 4 0 3 09 8 4 0 3 1 3 8 4 0 3 19 6 4 0 3 29 54 04 0 3 64 Q4 1 9 6 4 0 4 2 6 640 50 4 840 511 8 4 0 5 18 £ 4 0 5 23 34 05 29 £ 4 0 7 05 8 4 0 7 1 3 8 4 0 7 17 3 4 0 7 27 8 3 0 4 04 830 40 6 63 04 0 3 83 0* 1 1 8 3 0 4 13 630 41 5 330 42 7 8 3 0 4 29 6 3 0 5 0 4 8 3 0 5 0 5 8 3 0 5 1 0 8 3 0 5 1 7 8 3 0 5 2 4 830 53 1 8 3 0 6 0 3 8 3 0 6 0 8 3 3 0 6 1 0 8 3 0 6 1 4 8 3 0 6 17 8 3 0 6 2 2 630 62 4 830 70 1 830 70 S 6 30 7 1 5 830 72 2 83 07 2 9 830 60 5 6 30 8 1 2 8 3 0 6 1 9 8 3 0 9 1 6 8 3 0 9 2 3 8 3 0 9 3 0
E L E V A T I OF W A T E R
608 .6 1 6 0 6.61599 .4 55 9 9.456 0 8 . 7 66 0 3.036 0 9 . 2 86 0 9 . 0 36 0 5 . 5 36 0 3 . 11 604. 116 0 4 . 4 55 0 4.336 0 3.94 6 0 6.78 60 9.36 6 0 8.94 6 0 9.36 5 8 2.02 5 8 2.595 6 2 . 7 7 5 8 3.90 5 8 3.75 5 5 3.385 8 0 . 3 8550 .5 55 8 4 . 9 7 5 3 2.93 5 3 2.15 5 8 3.22 5 8 2. 79575.7 25 7 6 . 7 65 7 6 . 0 75 7 7 . 13 571 .995 7 0 . 5 55 7 0 . 5 55 7 0 . 38570 .1 35 7 0 . 5 55 7 0 . 5 55 7 0 . 5 55 7 0 . 2 25 7 0 . 3 35 6 9 . 9 7570. 055 6 9 . 975 6 9 . 305 6 9 . 8 0
GN(FT.)
7 1
T A B L E 4 AW A T E R L E V E L E L E V A T I O N S
W E L D O N S P R I N G R A F F I N A T E P I T S S I T EDB S . WELL
ID39 cont
511
DATE (Y/N/u)
£31007 5 3 1 0 1 4 831 02 1 5 3 1 0 2 8 6 3 1 1 0 4 8 3 1 2 0 3 6 3 1 2 1 5 5 3 1 2 20 6 312 3 0 £ 4 0 1 04 64011 1 6 4 0 1 1 9 54 01 2 5 8 4 0 2 0 3 6 4 0 2 1 0 6 4 0 2 17 3 4 0 2 24 3403 09 84 03 1 3 8 4 0 3 19 8 4 0 5 2 9 6 4 0 4 0 3 6 4 0 4 19 8 4 0 4 26 6 4 0 5 0 4 64 05 1 1 6 4 0 5 18 64 05 2 3 8 4 0 5 2 9 6 4 0 7 05 8 4 0 7 1 3 6 4 0 7 1 7 8 40 7 2 783 02 2 98 3 0 2 3 0 8 3 0 4 0 4 83 04 0 6 6 3 0 4 0 3 830 41 1 6 3 0 4 1 3 53 04 1 5 8 3 0413 8 3 0 4 27 6 3 0 4 2 9 8 3 0 5 0 4 63 05 0 5 8 30 5 1 0 83 05 1 7 6 3 0 5 2 4 8305 31
E L c V A T I C N OF W A T E R (FT.)
5 6 9 . 63570 .3 85 7 0 . 28 56 9.3 95 6 9 . 97577 .4 75 6 9 . 9 75 6 9 . 9 75 6 9 . 9 7579.3 05 7 7 . 3857 1. 1 35 7 1 . 135 7 5 . 2 25 7 5 . 2 2 5 7 9.385 7 9 . 3 05 7 6 . 3 05 7 6 . 3 05 6 9 . 1 35 9 0 . 225 3 9 . 2 2 5 a 9 . 3 05 8 9 . 5 0 5 6 9.305 6 9 . 305 6 9 . 305 6 9 . 3 0 5 3 9.055 69 . 2 25 6 9 . 7 25 6 9 . 3 95 6 9 . 9 76 0 6 . 3 66 1 4 . 4 06 1 6 . 0 36 1 6 . 5 66 1 6 . 7 46 1 6 . 6 96 1 7 . 2 961 6. 6 96 1 3 . 9 9615.266 1 5 . 0 96 1 5 . 1 86 1 4 . 7 76 1 4 . 4 46 1 4 . 9 76 1 2 . 1 56 1 5 . 6 1
72
T A B L E 4AW A T E R L E V E L E L E V A T I O N S
W E L D O N S P R I N G R A F F I N A T E P I T S S I T ED B S . WELL
ID
B 1 1 cont
DATE C Y / y/ D )
83 06 0 38 3 0 6 0 88 3 0 6 1 08 3 0 6 1 48 3 0 6 1 78 3 0 6 Z 28 3 0 6 2 483 07 0 183 07 0 88 3 0 7 1 58 3 0 7 2 28 3 0 7 2 96 3 0 8 0 56 3 0 8 1 2E 30 £ 1983 0 9 168 3 0 9 2 38 3 0 9 3 083 100 76 3 1 0 1 4631 02 18 3 1 0 2 88 3 1 1 0 45312 088 3 1 2 1 58 3 1 2 2 08 31 2 3 C5 4 0 1 0 48401 118 4 0 1 1 98 4 0 1 2 58 4 0 2 0 38 4 0 2 1 08 4 0 2 17840224'8 4 0 3 0 98 4 0 3 1 38 4 0 3 1 98 4 0 3 2 954 040 38 4 Q 4 1 93 4 0 4 2 66 4 0 5 0 4840 51 18 4 0 5 1 38 4 0 5 2 38 4 0 5 2 93 4 0 7 0 58 4 0 7 1 38 4 0 7 1 7
e l e v a t i o nOF W A T E R (FT.)
6 1 5 . 6 36 15 . 3 16 1 3 . 2 56 1 5 . 2 26 1 5 . 1 86 1 5 . 3 4615 .5 16 1 5 . 1 86 1 5 . 2 66 1 5 . 67 615 .266 1 5 . 2 66 1 5 . 2 6614.92615 .5 16 1 3 . 6 76 1 3 . 7 66 1 3 . 7 66 1 3 . 5 96 1 3 . 6 7613.576 1 3 . 4 26 1 3 . 4 26 1 2 . 6 7613 .5 16 1 3 . 51613.5 16 1 3 . 5 9613.5 96 1 3 . 8 46 1 3 . 8 46 1 3 . 7 76 1 3 . 8 46 1 3 . 6 7613.846 1 3 . 8 46 1 3 . 8 46 1 4 . 8 46 1 5 . 0 1615 .0 1614 .9 2515.016 1 5 . 0 96 1 5 . 0 96 1 5 . 2 66 1 5 . 2 66 1 5 . 2 76 1 5 . 0 16 1 5 . 0 96 1 5 . 18
73
T A B L E 4 AW A T E R L E V E L E L E V A T I O N S
W E L D O N S P R I N G R A F F I N A T E P I T S S I T E0 5 S . WELL
ID
611 cont 614
DATE ( Y/M/ C)
8 40 7 2 7 8 3 0 4 0 4 6 3 0 4 0 6 630 41 1 3 3 0 4 1 3 83 04 1 9 6 3 0 4 2 2 8 30 4 2 7 6 3 0 4 2 9 3 3 0 5 0 4 6 3 0 5 05 8305 10 6 30 5 1 7 830 524 8305 31 6 3 0 6 03 8 3 0 6 0 8 6 3 0 6 1 0 8 3 0 6 1 4 8 3 0 6 17 8 3 0 6 22 8 3 0 6 2 4 63 07 0 1 6 3 0 7 06 3307 15 8 3 0 7 2 2 63 07 2 9 63 08 0 5 8 3 0 8 08 6 3 0 6 1 2 3 3 0 519 8 3 0 9 16 83 09 2 3 830 93 0 6 3 1 0 0 7 8 3 1 0 1 4 631 02 1 8 3 1 0 28 6 3 1 1 0 4 6 3 1 2 08 5 3 1 2 1 5 6 3 1 2 20 8 312 3 0 8 4 0 1 0 4 6 4 0 1 11 6 4 0 1 1 9 6 4 0 1 2 5 8 4 0 2 0 3 6 4 0 2 10 8 4 0 2 1 7
E L E V A T I O N OF W A T E R (FT.)
6 1 5 . 2 66 3 3 . 7 5633 .8 16 3 3 . 7 26 3 3 . 6 76 3 3 . 5 26 3 3 . 7 76 3 3 . 3 66 3 3 . 7 86 3 3 . 8 66 3 3 . 8 26 3 3 . 8 96 3 3 . 8 66 3 3 . 9 86 3 4 . 0 6 6 3 4 . 2 16 3 4 . 0 26 3 4 . 0 76 3 4 . 0 76 3 3 . 0 76 3 3 . 9 96 3 3 . 9 06 3 4 . 4 06 3 4 . 3 2 6 3 4.526 3 4 . 4 0 6 34.406 3 3 . 3 26 3 3 . 7 26 3 4 . 0 76 3 4 . 1 66 3 4 . 496 3 4 . 4 96 3 4 . 5 56 3 4 . 7 46 3 4 . 8 26 3 4 . 8 26 3 4 . 6 56 3 4 . 7 45 3 5 . 7 4 6 3 5 . 825 3 5.826 3 5 . 8 26 3 3 . 9 96 3 3.996 34 . 0 76 3 4 . 0 76 3 4 . 2 46 34 . 2 46 3 4 . 3 2
74
T A B L E 4AW A T E R L E V E L E L E V A T I O N S
W E L D O N S P R I N G R A F F I N A T E P I T S S I T EO S S . WELL
IC314 co nt
316
DATc( Y / M / D )
6 4 0 2 24 840 30 9 6 4 0 3 1 3 8 4 0 319 5* 03 2 9 8 4 0 4 0 3 8 4 0 4 0 3 6* 04 0 3 8 4 0 4 0 35 4 0 4 1 9 8 4 0 4 2 6 6405 04 8* 05 1 1 8 4 0 513 540 52 3 6405 29 0*0 70 5 64 07 1 3 64 07 1 7 5 4 0 7 27 8 3 0 4 0 8 S3 34 12 8 3 0 4 13 3 3 0 4 1 5 5 3 0 4 19 3 3 0 4 2 7 8 3 0 4 2 9 8 3 0 5 0 5 8 3 0 5 10 8 3 0 5 1 7 6 3 0 5 2 4 8305 31 8 3 0 6 0 3 33 06 0 6 830 61 0 3 3 0 6 1 4 8 3 0 6 17 53 06 2 2 330 62 * 83 07 0 1 8 3 0 7 0 8 5307 156 3 0 7 2 2 8 3 0 7 2 3 8 30 5 0 5 6 3 0 5 12 3 3 0 819 6 3 0 916 8309 23 8 3 0 93 C
E L E V A T I O N CF W AT ER (FT.)
6 3 4 . 2 46 3 4 . 2 46 3 4 . 3 26 3 4 . 3 2 6 3 2.996 2 4 . 7 56 3 4 . 7 46 3 4 . 7 4634 .7 56 3 3 . 4 06 3 4 . 07634 .0 76 3 4 . 0 76 2 4 . 1 66 3 4 . 1 66 3 4 . 2 5 6 3 5.246 3 5 . 2 4 6 3 5.246 3 5 . 40 6 0 * . 236 0 3 . 5 36 0 4 . 60 6 04.2 36 0 1 . 5 36 0 1 . 4 36 0 4 . 3 9 6 0 4.51 6 0 * . 3 56 0 4 . 5 56 0 4 . 4 1 6 01.856 0 1 . 8 3 6 0 4.49601.5 96 0 1 . 626 0 1 . 1 8 o 0 3 . 3 5 6 0 3.77 6 0 4.01 6 0 3.43 6 0 3.436 0 3 . 4 36 0 4 . 016 0 1 . 7 76 0 2 . 77602 .3 5 602 . 5 1 6 0 2.356 0 2 . 3 5
75
T A 3 L £ 4AW A T E R L E V E L E L E V A T I O N S
W E L D O N S P R I N G R A F F I N A T E P I T S S I T E03S . WELL
ID
816 cont
817
CATE ( Y/H/ D)
6 310 0 7 8 3 1 0 1 4 33 10 2 1 3 3 1 0 2 6 6 3 1 1 0 4 8 3 1 2 08 8 3 1 2 1 5 6 3 1 2 2 0 8 3 1 2 3 0 6 4 010 4 640 11 1 3 4 0119 34 01 2 5 6 4 0 2 0 3 8 4 0 2 1 0 8 4 0 2 1 7 8 4 0 2 2 4 8 4 0 3 0 9 8 4 0 3 1 3 8 4 0 3 1 9 8 4 0 3 2 9 6 4 0 4 0 3 3 4 0 4 1 9 6 4 0 4 2 6 8 4 0 5 0 4 84 05 1 1 8 4 0 5 13 8 4 0 5 2 3 3 4 0 5 2 9 8 4 0 7 0 5 6 4 0 7 1 3 8 4 0 7 1 7 8 4 0 7 27 6 3 0 4 0 8 8 3 0 4 0 8 63 04 0 8 83 04 0 8 6 3 0 4 0 8 3 3 0 4 1 2 8 3 0 4 1 3 8 3 0 4 1 5 8 3 0 4 1 9 8 3 0 4 2 7 8 3 0 4 2 98 3 0 5 0 48 3 0 5 0 5 6 3 0 5 1 0 3 3 0 5 1 7 8 3 0 5 2 4 6 3 0 5 3 1
e l e v a t i o nOF W A T ER (FT.)
602.266 0 2 . 1 8 6 0 2.186 0 2 . 4 36 0 2 . 1 8 6 0 5 . 26 6 0 3.516 0 3 . 6 06 0 3 . 6 06 0 3 . 356 0 3 . 3 56 0 3 . 4 36 0 3 . 4 36 0 3 . 4 36 0 3 . 4 36 0 3 . 4 36 0 3 . 3 56 0 3 . 9 36 0 3 . 9 36 0 4 . 8 56 04 . 6 86 0 4 . 1 86 0 4 . 6 86 0 5 . 0 16 0 4 . 9 36 0 4 . 9 36 0 4 . 9 36 0 4 . 9 36 0 5 . 0 16 0 4 . 0 16 0 4 . 1 06 0 4 . 016 0 4 . 1 06 0 3 . 6 46 0 3 . 6 46 0 3 . 6 46 0 6 . 4 46 0 6 . 4 46 0 2 . 8 96 0 5 . 6 96 0 2 . 1 46 0 4 . 7 96 0 1 . 7 16 0 1 . 3 66 0 1 . 7 56 0 1 . 6 4 6 01.966 0 1 . 4 46 0 1 . 6 16 0 2 . 0 9
76
T A B L E 4AW A T E R L E V E L E L E V A T I O N S
W E L D O N S P R I N G R A F F I N A T E P I T S S I T ECBS . WELL
ID
B 17 co nt
DATE(Y/M/D)
83 06 0 3 630 60 b 6 30 6 1 0 8 3 0 6 1 4 8 3 0 5 1 7 83 06 2 2 8 30 6 2 4 8 30 7 0 1 830 70 8 83 07 1 5 8 3 0 7 2 2 83 07 2 9 830 805 63 08 1 2 8 30 3 1 9 5 3 0 916 8 3 0 9 2 3 8 3 0 S 3 C 8 3 1 0 0 7 8 31014 63 10 2 1 8 3 1 0 2 5 3 31 1 0 4 8 3 1 2 08 8 3 1 2 1 5 8 31 2 2 0 8 31 2 3 0 8 4 0 1 0 4 8401 11 8 40 1 1 9 840 12 5 8 4 0 2 0 3 6 40 2 1 0 8 40 2 1 7 54 02 2 4 6 4 0 3 0 9 8 4 0 3 1 3 84 03 1 9 64 03 2 9 640 40 3 8 4 0 413 6 4 0 4 2 6 6 4 0 5 0 4 84 05 1 1 8 4 0 5 1 8 8 4 0 5 2 3 8 4 0 5 2 9 840 705 8 4 0 7 1 3 8 4 0 7 1 7
E L E V A T I O N CF W A T E R (FT.)
60 2. 1 1 601. 716 0 1 . 7 75 9 9 . 1 06 0 1 . 7 86 0 1 . 4 4601.1160 1. 6 160 1. 1 96 0 1 . 1 9 6 0 0.566 0 1 . 6 96 0 1 . 6 96 0 0 . 9 46 0 0 . 9 46 0 0 . 5 2 6 0 0.946 00 . 6 1 601 .026 0 0 . 7 86 0 0 . 9 4 6 0 0 . 8 66 0 0 . 3 6 6 01.36 6 0 0.51600 .6 16 0 0 . 6 1 601 .196 0 1 . 1 96 0 1 . 526 0 1 . 6 16 0 1 . 5 26 0 1 . 5 26 0 1 . 5 26 0 1 . 5 26 0 1 . 6 96 0 1 . 6 96 0 1 . 8 66 0 1 . 6 96 0 1 . 7 86 0 1 . 3 66 0 1 . 8 66 0 1 . 8 66 0 2 . 0 26 02 . 1 16 0 2 . 1 96 0 2 . 1 96 0 2 . 0 26 0 2 . 0 26 0 2 . 11
7 7
T A B L E * A WATER L E VtL E L E V A T I O N S
W E L D O N S P R I N G R A F F I N A T E PITS SITE
Q 3 S . WELL ID
BIT co nt 619
DATE E L E V A T I O N( y / y /:) OF W-T E R (FT.)
5*0 727 3 0 2.028 3 0 4 22 6 0 5.2283 04 2 5 6 10 . 1 78 30 4 2 7 6 07 . 5 38 2 0 4 2 9 510 .8 88 30 5 0 4 6 11.11530505 6 1 0 . 56o 3 C 5 1 0 6 1 1 . 568 30 5 1 7 5 10 . 5 05 3 0 5 2 4 6 11.746 3 0 5 31 6 1 2 . 4 58 3 0 6 0 3 612.515 3 0 6 C 5 6 1 2 . 6 28 3 0 61 0 612 .4 35 3 0 6 1* 60 9. 9 08 3 0 6 17 6 05.265 3 0 6 2 2 6 1 2 . 9 55 3 0 6 2 4 6 12 . 5 353 070 1 6 1 2 . 7 0830 70 3 60 5. 5 363 07 1 5 6 1 2 . 528 3 0 7 22 6 12 . 7 35 3 0 72 9 6 1^ . 7 56 3 0 5 0 5 6 05.708 3 0 S 12 6 1 2 . 6 25 3 0 3 19 6 1 2 . 7 08 3 0 9 1 6 6 1 2 . 3 633 09 2 3 61 2. 3 68 30930 o l 2 .5 36 3 1 0 07 6 1 2 .5 36 3 1 0 1 4 6 1 2 .6 283 10 2 1 6 1 2 . 7 06 3 1 C 2 8 61 2. 4 58 3 1 1 0 4 612.7 0831203' 6 1 2 .2 8831 21 5 6 12 . 3 53 3 1 2 2 0 6 1 2 . 3 66 3 1 2 3 0 6 1 2 . 4 58 4 C 1 0 4 612 .2 86 4 C 1 U 6 1 2 . 366 4 0 1 1 9 6 1 2 . 268401 25 6 1 2 . 2 86 4 0 2 0 3 612 .4 56402 10 6 1 2 .4 564 02 1 7 6 1 2 . 3 6E 4 0 2 2 4 612 .4 564 0 3 09 61 2. 4 56 4 0 3 1 3 6 1 2 . 4 58 4 0 3 1 9 6 1 2 . 6 2640 32 9 6 1 2 . 5 3
78
T A B L E AAW A T E R L E V E L E L E V A T I O N S
W E L D O N S P R I N G R A F F I N A T E P I T S S I T EO S S . WELL
ID
3 1 9 c o n t
321
DATE ( Y/M/D )
8 4 0 4 0 3 8 40419 84 04 2 6 8 4 0 5 0 4 8 4 0 5 11 8 40 2 1 8 8 40 5 2 3 840 52 9 84 07 0 5 8 4 0 7 1 3 84 07 1 7 84 07 2 7 8 3 0 4 1 9 8 3 C 4 2 2 6 3 0 4 2 7 83 04 2 9 6 3 0 5 0 4 3 3 0 5 0 5 830510 63 05 1 7 8 3 0 5 2 4 530 531 530603 8 3 0 6 0 8 630 61 0 6 3 0 6 1 45 3 0617 6 3 0 6 2 2 8 3 0 6 2 4 83 07 0 1 6 3 0 7 0 36 3 0 715 630 72 2 3 3 0 7 2 9 830 80 5 3 3 0 8 125 3 0 8 1 9 8 3 0 9 1 6 830 92 3 6 3 0 9 30 53 10 0 7 631 014 83 10 2 1 631 026 6 3 1 1 04 3 312 0 3 531 21 5 6 3 1 2 20 6 3 1 2 306 4 0 1 0 4
E L E V A T I O N OF W A T E R (FT.)
6 1 2 . 5 36 06 . 5 36 0 3 . 6 26 0 9 . 6 26 0 5 . 3 6 6 0 6.566 0 9 . 1 1 60 9.216 0 6 . 9 56 0 8 . 9 56 0 3 . 9 56 0 6 . 9 56 0 5 . 7 1606.01 6 0 6.49 60 5.9 56 0 8 . 9 06 0 7 . 4 56 0 7 . 3 3 6 0 8.096 0 6 . 3 1 6 0 3.44 6 0 6.446 0 8 . 3 16 0 3 . 0 9 6 0 3.246 0 8 . 1 5 60 7.9 96 0 7 . 9 96 0 7 . 9 1 60 7.82607 .9 16 0 7 . 5 76 0 7 . 916 0 8 . 156 0 7 . 9 96 0 7 . 6 5607 .9 1 6 0 7.31 6 0 7.996 0 5 . 0 7 6 0 7.49 6 0 7.40 6 0 7.406 0 7 . 4 06 0 6 . 0 76 0 7 . 8 26 0 7 . 6 26 0 7 . 3 26 0 7 . 6 5
79
T A B L E 4 AW A T E R L E V E L E L E V A T I O N S
W E L D O N S P R I N G R A F F I N A T E P I T S S I T ED B S . WELL
10
321 co nt
523
DATE (Y/N/D)
6 4 0 1 11 8 4 0 1 1 9 8 4 0 1 2 5 84 0 20 3 6 4 0 2 10 3 ^ 0 2 1 7 8 4 0 2 2 4 8 4 0 3 0 9 8 4 0 3 1 3 8 4 0 3 1 9 84 03 2 9 8 4 0 4 0 3 640 41 9 8 4 0 4 26 8 4 0 5 C 4 340 511 84 05 1 8 6 4 0 5 2 3 8 4 0 5 29 54 070 5 S 4 0 7 1 3 640 71 7 8 4 0 7 2 7 8 3 0 4 1 9 83 04 2 7 8 30 42 9 8 2 0 5 0 4 6 3 0 505 8 3 0 5 10 8 3 0 5 17 8 3 0 5 2 4 830531 8306 02 83 060 8 8 30 6 1 0 8 30 6 1 4 6 3 0 6 1 7 3 3 0 6 2 2 8 3 0 6 2 4 63 07 0 1 £30703 8 3 0 7 15 3 3 0 7 22 630 72 9 83 08 0 5 8 3 0 3 12 83 06 1 3 8 30 3 1 6 830 923 8 30 9 3 0
E L E V A T I O N OF W A TE R (FT.)
60 7.656 0 7 . 6 56 0 7 . 7 46 0 7 . 8 26 0 7 . 5 26 0 7 . 3 26 0 7 . 9 96 0 7 . 9 16 0 7 . 9 16 0 3 . 7 4 60 3.6 56 0 8 . 7 4 60 3.626 0 8 . 3 2 6 0 6 . 8 26 0 8 . 3 26 0 5 . 8 26 0 3 . 8 26 0 8 . 8 26 0 7 . 9 96 0 7 . 9 96 0 7 . 9 96 0 7 . 9 96 1 3 . 0 96 1 0 . 5 76 1 7 . 9 96 1 3 . 336 1 2 . 7 26 1 2 . 7 26 1 2 . 6 86 1 2 . 7 46 1 3 . 0 66 1 2 . 9 76 1 2 . 9 26 1 2 . 7 86 1 2 . 9 46 1 3 . 0 16 1 2 . 9 26 1 3 . 0 16 1 2 . 8 46 1 3 . 2 66 1 3 . 0 96 1 2 . 5 16 1 2 . 7 66 1 2 . 3 46 1 2 . 6 76 1 2 . 5 96 1 2 . 5 16 1 2 . 5 96 1 2 . 6 7
80
T A B L E 4AH A T E R L E V E L E L E V A T I O N S
W E L D O N S P R I N G R A F F I N A T E P I T S S I T ED B S . WELL
ID
B23 co nt
DATE ( Y / M / D )
6 3 1 0 0 7 8 3 1 G 1 4 6 3 1 0 21 33 10 2 3 6 3 1 1 0 4 831 20 3 63 12 1 5 8 3 1 2 2 0 3 3 1 2 3 0 8 4 0 1 0 4 8 40 1 1 1 84 01 1 9 64 01 2 5 £ 4 0 2 0 3 6 4 0 2 1 0 8 4 0 2 1 7 8 4 0 2 2 4 84 03 0 9 84 03 1 3 6 4 0 3 1 9 8 40 3 2 5 8 40 4 0 3 8 40 4 1 9 6 40 4 2 6 6 4 0 5 0 4 6 4 0 511 6 4 0 516 6 4 0 5 2 3 8 4 0 5 2 5 8 4 0 7 05 8 40 7 1 3 8 4 0 7 1 7 6 4 0 7 27 330 41 5 8 3 0 4 1 9 6 3 0 4 2 2 6 3 0 4 2 7 3 3 0 4 29 6 3 0 5 0 4 8 3 0 5 0 5 8 3 0 5 10 S 3 0 5 1 7 6 3 0 5 2 4 33 05 3 1 8 3 0 6 0 3 3 3 0 6 0 6 3 3 0 6 1 0
E L c V A T I Q N OF W A TE R (FT.)
612.59612 .9 26 1 2 . 9 26 1 2 . 8 4612 .9 26 1 2 . 2 66 1 2 . 4 36 12 . 5 1612 .5 16 1 2 . 6 76 1 2 . 8 46 1 2 . 8 46 1 2 . 8 46 1 3 . 0 96 1 3 . 0 961 3. 0 56 1 3 . 0 961 2. 7 66 1 2 . 3 46 1 3 . 5 9613.34 6 1 2 . 3 46 1 3 . 4 36 1 2 . 9 26 12 . 9 2612.926 1 2 . 9 26 1 2 . 926 1 2 . 9 26 1 3 . 7 661 3. 9 26 1 3 . 5 96 1 3 . 7 6 620 . 3 7626. 826 2 6 . 7 96 2 7 . 5 5 6 2 6.74 b 2 6 . 7 56 2 6 . 7 66 2 6 . 7 5 6 2 7 . 1 86 2 6 . 6 06 2 6 . 6 262 6. 6 2 62 6 . 566 2 6 . 5 3
81
T A B L E 4 3P O R E P R E S S U R E R E A D I N G S
W E L D u N S P R I N G R A F F I N A T E P I T S S I T EP I E Z O M E T E R CATE PORE P R E S S U R E
( Y/M / D ) FT. CF w
6302 15 - 0 . 0 3S30221 - 0 . 1 95 3 0 313 -0.516 3 0 3 21 - 0 . 6 55 3 0 3 2 2 - 0 . 5 o63032 3 - 0 . 4 753 0 3 24 - 0 . 4 36 3 0 3 2 5 — 0.468 3 0 3 2 8 -0 .703 3 0 3 29 - 0 . 4 96 3 0 3 3 0 - 0 . 4 28 3 0 4 0 4 - 0 . 5 96 3 0 4 0 6 - 0 . 6 763 04 0 5 -0.53330 411 - 0 . 4 58 3 0 4 1 3 - 0 . 6 98 3 0 4 1 5 - 0. 62330 42 9 - 0 . 6 083 05 0 5 - 0 . 8 7830 510 - 0. 658 3 0 5 17 - 0 . 6 483 05 2 4 - 1 . 5 7330531 - 0 . 9 883 06 0 3 - 0 . 7053061 0 - 0 . 7333 06 1 4 - 0 . 8 083061 7 - 0 . 7263 06 2 2 - 0 . 6 98 3 0 6 2 4 - 0 . 9483 07 0 1 - 0 . 9 933 07 0 8 - 0 . 4 483 07 1 5 - 0 . 7 833 07 2 2 0 . 2 0
83 07 2 9 - 0. 958 3 0 8 0 5 - 0. 968 3 0 8 12 0.1683 03 1 9 0.148 3 0 9 1 6 0.058 3 0 9 2 3 - 0 . 1 3830 93 0 - 0 . 0 233 10 0 6 0.178 3 1 0 1 4 - 0 . 1 68 3 1 C 2 1 0.7683 10 2 8 0.04631 10 4 - 0 . 0 68 312 0 3 - 0 . 2 2831 215 - 0 . 1 383 12 2 0 - 0 . 1 68 3 1 2 3 0 - 0 . 1 664 01 0 4 0.57
32
IDv n
noDr>
o n a > On a > a > Ou CX: o n on ID O ) Cr ex. o n a . a> On c u cx> c u o n cx> o o a 1 <x> 0 ‘ Of) O f o u CU ( V Ou 0 0 OO 0 0 a » c n o n a * OU a / m O r a - cr> CO CO 0 0 (XI aV i U l U J V J V I V> U l U J Uu U l UJ V I U J U J V I V ; U l U J V I V I t v UJ U J t v U J U J t v 4 4 4 4 4 4 4 4 4 4 4 " 4 4 4 4 " 4 4 4 4 4 4 ' 4O o O o o o O o o O o O o o o o o o o o o O o o o o O o o o o O o O O O O O o C ' o O O O O O o o o oo o O a * o o V I V i V I U l V i 4 4 4 4 4 4 t v t v I V V J UJ ( V V IV U> -V -V ~ 4 U l UT t n i n t n 4 4 4 t v V I t v UJ r v fx> r v r i k » k “» Mr v r v k-* i-> k-* o u > IXj M k * o fs j I—1 «-* k-» o o o V I M f v IX) rx> r v M rx> k-* r v k * M o fX i r v k * k-» o |X> k * o r o k * k-» o rx> k-» k * o rx> k » k-»
f v - 4 4 o V I k * 4 - 4 o V I V I U l k-» o ° . ON 4 o 4> tr> V I 4 t v IX) k-» CO • 4 - 4 I V U i vO U l (V k - 4 eh V I UJ 4 J 4 . ' U J \L' 4 - 4 o V V I s4>
00U>
I I I I-V -V -4 -4 0U -4 CO 'V —4 Ci • a/ <v CO a> Ou (JO cn un CO Cn 00 o> on U» -4 in o o o o O o O o O o o O Ci O o O o C"> o O o o o
• • • • • • • • • • • • • e • • • • • • • • • • • • •o oo CO V) <v VI M IX) <U rx> tu 4 o tn i n tv ■'V rv o O o o o o ll> rv IX) Ul < u 4 k* k* k* 4 vn vn 4 4 4 tn 1>J C7> o IX) 4 O vn k* k*0D Ul **4 oo 00 k» ou -4 a* UJ rxi •4 UJ CXI ut CO 0u 4 UJ o Ou UJ VJ M o UU a* VI O rv -4 UJ -4 o -4 Ui Vr k-» O -4 rv k* O' u> VJ l-i (> Oj U> IXi
T>► HrnM*~i D O .5 r r
mx>
-< oX 1'_X —4 X rn t ’ o
TJ* n o—I X ) • rn
O u ~n xi i n $: ut > (Z l -H C r n x ? xd r n
TABLE 4B
? G R £ PR E SSURc
READINGS WELCGN
SPRING RAFFINATE
PITS SITE
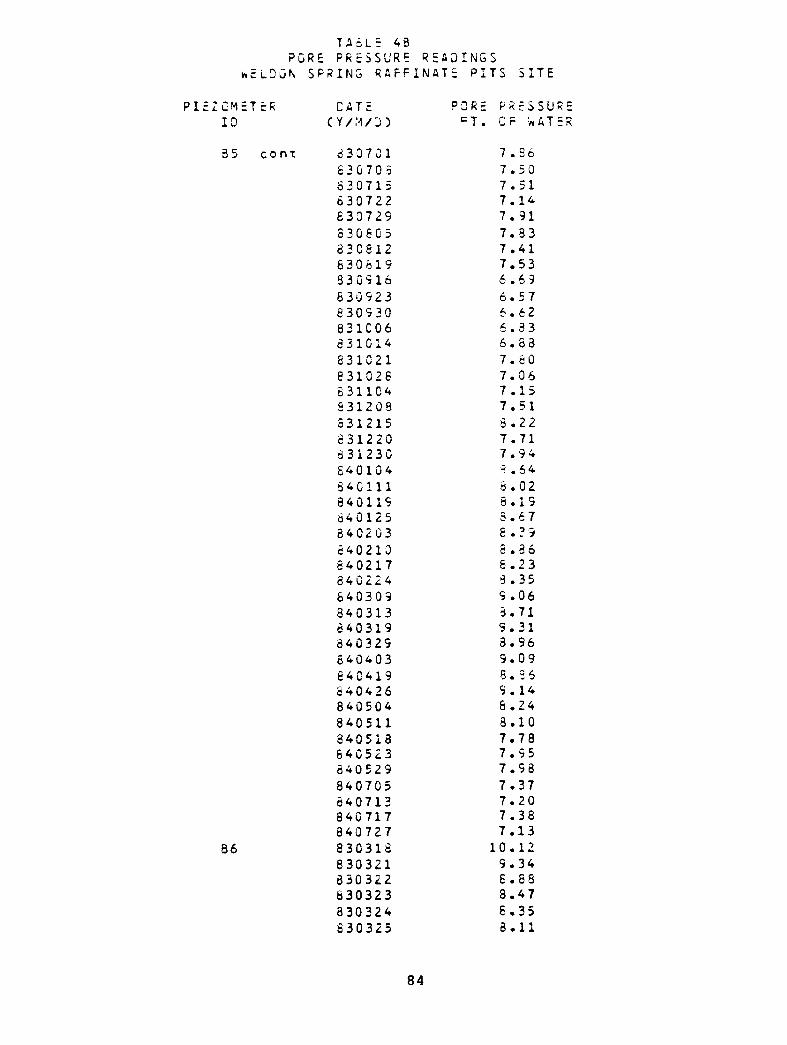
T A B L E 4BP O R E P R E S S U R E R E A D I N G S
he L O O N S P R I N G R A F F I N A T E P I T S S I T EP I E ZCMET BR
ID
3 5 c o m
86
CATE PORE P R E S S U R E(Y / M / D ) c T . CF WATER
8307 01 7 . 8 6
63070 5 7.506 3 0 7 15 7 .516 3 0 7 2 2 7.146 3 0 7 2 9 7 .91630 60 5 7.336 3 0 6 12 7.416 3 0 6 1 9 7.538 3 0 9 1 6 6 . 6 96 3 0 9 2 3 6.5753 09 3 0 6.628 3 1 C 0 6 6.333 3 1 0 1 4 6 . 6 8
8310 21 7.60831 02 6 7.066 3 1 1 0 4 7.15S 31 2 0 8 7.516 31 2 1 5 5.226 31 2 2 0 7.713 31 2 3 0 7.946 40 1 0 4 3.648 4 0 1 1 1 6 . 0 28 40 1 1 9 8.19640 12 5 S . 6 78 4 0 2 03 8.39640 210 6.366 4 0 2 1 7 8.238 4 0 2 2 4 3.356 4 0 3 0 9 9.068 4 0 3 1 3 3.716 4 0 3 1 9 9.318 4 0 3 2 9 3.966 4 0 4 03 9.096 40 4 1 9 8 . 8 68 4 04 2 6 9 . 148 4 0 5 0 4 6.248 4 0 51 1 3.108 4 0 5 13 7.786 4 0 5 2 3 7.956 4 0 5 2 9 7.988 4 0 7 0 5 7.376 4 0 71 3 7.208 4 0 7 1 7 7.388 4 0 7 2 7 7.138 3 0 3 1 6 1 0 . 1 2
8 3 0 3 21 9.348 3 0 3 2 2 6 . 6 68 3 0 3 2 3 8.478 3 0 3 2 4 6.356 3 0 3 2 5 6 . 1 1
84
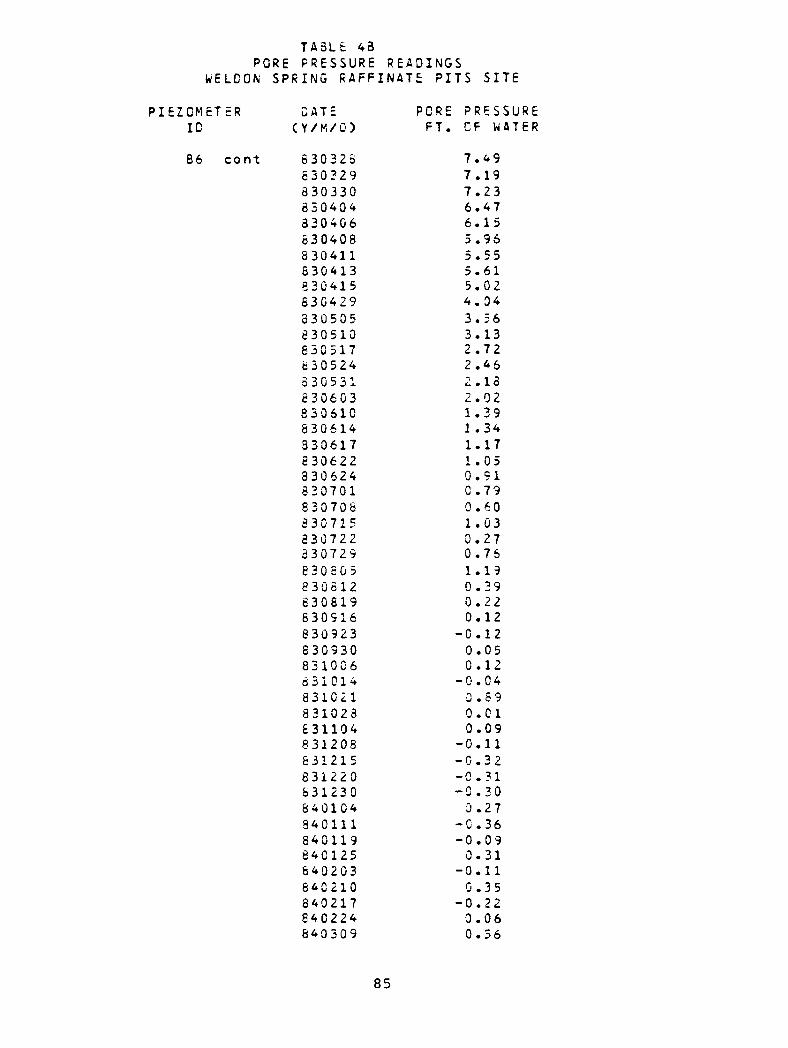
T A 3 L 6 43P O R E P R E S S U R E R E A D I N G S
W E L D O N S P R I N G R A F F I N A T E P I T S S I T EP I E Z O M E T
ID66
ER DATE(Y/M/O)
co nt 63 03 2 35 3 0 3 2 9 6 3 0 33 0 65 04 0 4 8 3 0 4 0 6 63 04 0 8 8 3 0 4 11 8 3 0 4 13 83 04 1 5 6 3 0 4 2 9 3 3 0 5 0 5 53 05 1 0 6 3 C 51 7 6 3 0 5 24 3 3 0 5 31 6 3 0 6 03 8 3 0 610 8 3 0 6 1 4 3 3 0 6 1 7 6 3 0 6 2 2 8 3 0 6 2 4 8307 01 83 07 0 8 5 3 0 7 1 5 83 07 2 2 3 3 0 7 29 630 50 5 8 3 0 6 1 2 6 3 0 8 1 9 8 3 0 9 1 6 8 30 9 2 3 63 09 3 0 8 310 0 6 8 3 1 0 1 4 6310 21 83 10 2 3 6 3 1 1 0 4 8 3 1 2 08 631 21 5 8 3 1 2 2 0 83123 0 6 4 0 1 0 4 3 4 0111 64 01 1 9 8 40 1 2 5 6 40 2 0 3 6 4C 2 1 0 8 40 2 1 7 8 4 0 2 2 4 8 4 0 3 0 9
PCRE P R E S S U R E FT. CF WA TE R
7. 497.197 .236.476.155.965.55 5.615.024. 0 43.563.132.72 2.462.132.02 1.39 1 .34 1.171.05 0.91 C .79 0.60 1 .03 0.27 0.761.19 0.39 0 . 2 2 0.12
- 0.12 0.05 0 . 1 2
- 0 . 0 4 0.8 9 0.01 0.09
- 0 . 1 1 - 0 . 3 2 -0.3 1 - 0 . 3 0 0.27
- C . 3 6 - 0 . 0 9 0.31
- 0 . 1 1 0.35
- 0 . 2 2 0 .06 0.56
8 5
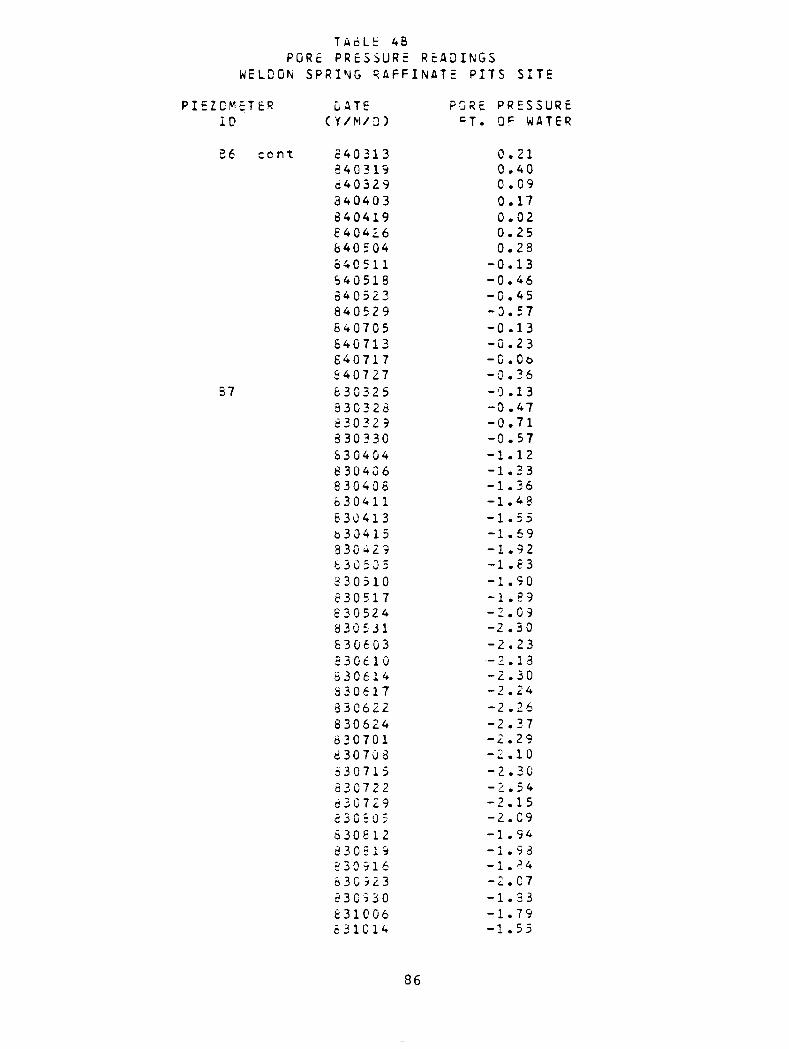
7 A 6 L E 4BPORE P R E S S U R E R E A D I N G S
W E L D O N S P R I N G R A F F I N A T E PITS SITE
P I E Z O M E T E R DATE PGRE P R E S S U R EID ( Y/M / D ) C T. O p WATER
36 cent 5 AO 313 0.213 4 0 3 19 0.403 4 0 3 2 9 0.093 4 0 4 0 3 0.176 4 0 4 1 9 0.026 4 0 4 2 6 0.256 4 0 5 0 4 0.236 40 5 1 1 - 0 .1 38 4 0 5 1 3 - 0 . 4 66 4 0 5 2 3 - 0 . 4 58 4 0 5 2 9 - 0 . 5 76 4 0 7 0 5 - 0 . 1 35 4 0 7 1 3 - 0 . 2 36 4 0 7 1 7 - 0 . 0 6S 4 0 7 2 7 -0 . 36
37 6 3 0 3 2 5 - 0 .138 3 0 3 2 6 - 0 . 4 763032 9 - 0 .7 133 03 3 0 - 0 . 5 7S 3 04 04 -1 . 128 3 0 4 0 6 - 1 .3 38 3 0 4 0 5 - 1 . 3 66 3 0 4 1 1 -1 .4 863 04 1 3 - 1 . 5 56 3 0 4 1 5 - 1 .5933042 9 - 1 . 9 26 3 0 5 0 5 - 1 .6 33 3 0 5 1 0 - 1 .9 05 3 0 5 1 7 - 1 .5 96 3 0 5 2 4 - 2 . 0 98 3 0 531 -2 .3 06 3 0 6 0 3 - 2 . 2 35 3 0 6 1 0 - 2 . 135 3 0 6 1 4 - 2 .3 0830 61 7 - 2 . 243 3 0 6 2 2 - 2 .2 68 3 0 6 2 4 - 2 .3 7630 70 1 - 2 .2 96 3 0 7 0 6 - 2 . 1 05 3 0 7 15 - 2 . 30630 72 2 - 2 . 5 46 3 0 7 2 9 - 2 . 1 55 3 0 5 0 5 -2.0 96 3 0 8 1 2 - 1 . 9 46 3 0 5 19 - 1 . 9 35 3 0 916 - 1 . 8 4630 523 - 2 .076 3 0 3 3 0 - 1 .3 36 310 0 6 - 1. 796 31 01 4 - 1 .55
86
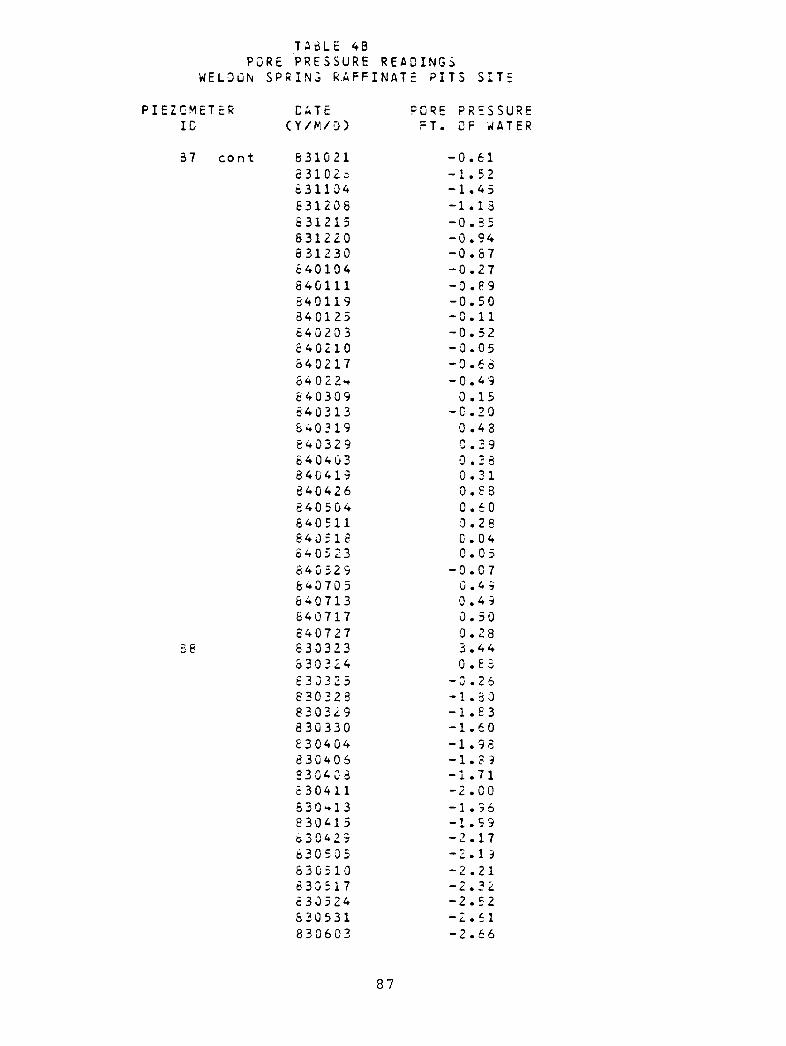
T A B L E 4BP O R E P R E S S U R E R E A D I N G S
W E L D O N S P R I N G R A F F I N A T E P I T S S I T EP I E Z C M E T
ID37
ER CATE PORE P R E S S U R E(Y / M / D ) FT. OF WATER
cont 631 02 1 -0 .6 163 1 0 26 - 1 . 5 26 3 1 1 0 4 - 1 . 4 563 12 0 6 - 1 .1 3531 21 5 -0 .8 56 3 1 2 2 0 - 0 .9 46 3 1 2 3 0 - 0 .6 76 4 0 1 0 4 - 0 . 2 73 4 0 1 1 1 - 0 . 6 95 4 0 1 1 9 -0 .5 05 40 1 2 5 - 0 .1 16 4 0 2 0 3 - 0 .5 284 0210 - 0 . 058 4 0 2 1 7 - 0 .6 86 4 0 2 2 4 - 0 . 4 98 4 0 3 0 9 0.156 40 3 1 3 - 0 . 2 06 4 0 3 1 9 0.4 36 4 0 3 2 9 C.296 40 4 0 3 0.388 4 0 4 1 9 0.313 4 0 4 2 6 0.S36 4 0 5 0 4 0.6064 05 1 1 0.286 4 0 5 1 3 0.0 46 4 0 5 2 3 0.056 4 0 5 2 9 - 0 . C 76 40 7 0 5 0.496 4 0 7 1 3 0.496 40 7 1 7 0.503 40 7 2 7 0.2863 03 2 3 3.448 3 0 3 2 4 0.85£ 30 3 2 5 - 0 . 2 68 3 0 3 2 3 - 1 . 3 08 3 0 3 2 9 - 1 . 8 38 3 0 3 3 0 - 1 . 6 0E 3 04 04 -1 . 956 3 0 4 0 6 - 1 . 3 98 3 04 03 - 1. 71£30 41 1 -2.005 3 0 4 13 — 1.968 3 0 4 1 5 -1 . 59b 3 0 4 2 5 -2 . 176 30 5 0 5 - 2 . 1 58 3 0 5 1 0 -2.2163 05 1 7 - 2 .3 26 3 0 5 2 4 - 2 . 5 283 05 3 1 -2 .618 3 0 6 0 3 - 2 . 6 6
8 7
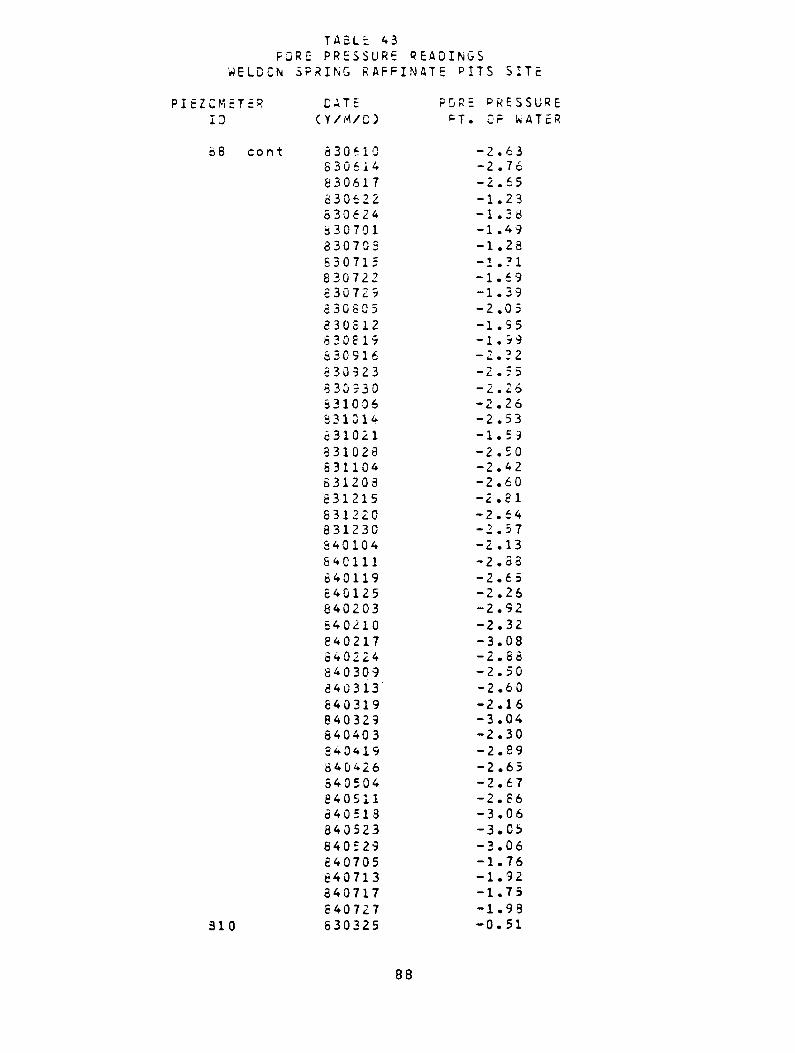
T A B L E A3F O R E P R E S S U R E R E A D I N G S
W E L D CN S P R I N G R A F F I N A T E P I T S S I T EP I E Z O M E T E R CATE PORE P R E S S U R E
ID
B 8 cont
3 1 0
( Y/M / C ) FT. OF W
63 06 1 0 - 2 . 6 3S 3 0 6 i 4 - 2 . 7 683 06 1 7 - 2 . 656 3 0 6 2 2 - 1. 235 3 0 6 2 4 - 1 . 3 663070 1 - 1 . 493 3 0 7 0 5 - 1 . 2 853071 5 - 1 .318 3 0 7 2 2 - 1 . 6 95 3 0 7 2 5 - 1. 393 30605 1 fx> o Ul
3 3 0 5 1 2 - 1 . 956306 15 - 1 . 5 95 3 0 516 - 2 . 3 26 3 0 3 2 3 - 2. 558 3 0 5 3 0 - 2 . 2 663100 6 - 2 . 2 68 3 1 0 1^ -2. 53631 02 1 - 1 . 5 9331 02 3 - 2 . 5 06 3 1 1 0 4 - 2 . 4 2631 20 3 -2. 60831 21 5 - 2. 318 3 1 2 20 - 2 . 6 48 3 1 2 30 - 2 . 5 76 4 0 1 04 - 2 . 1 3840 11 1 -2. 536 4 0 1 19 - 2 . 6 58 4 0 1 25 - 2 . 2 66 4 0 2 0 3 - 2 . 9254 02 1 0 - 2 . 326 4 0 2 1 7 - 3 . 0 85 4 0 2 2 4 - 2 . 5 684 03 0 9 - 2 . 5 0340313' - 2. 606 4 0 3 1 9 - 2 . 1 684 03 2 9 - 3 . 0 48 4 0 4 0 3 - 2 . 3 03 4 04 15 - 2 . 8 95 4 0 4 2 6 - 2 . 6 584 05 0 4 - 2 . 6 784 05 1 1 - 2 . 8 66 4 0 5 1 3 - 3 . 0 68 4 0 5 2 3 - 3 . 0 58 4 0 5 2 9 - 3 . 0 684 07 0 5 - 1 . 7 66 4 0 7 1 3 - 1 . 9 23 4 0 7 1 7 - 1 . 7 564 07 2 7 - 1 . 9 363 03 2 5 - 0 . 5 1
8 8
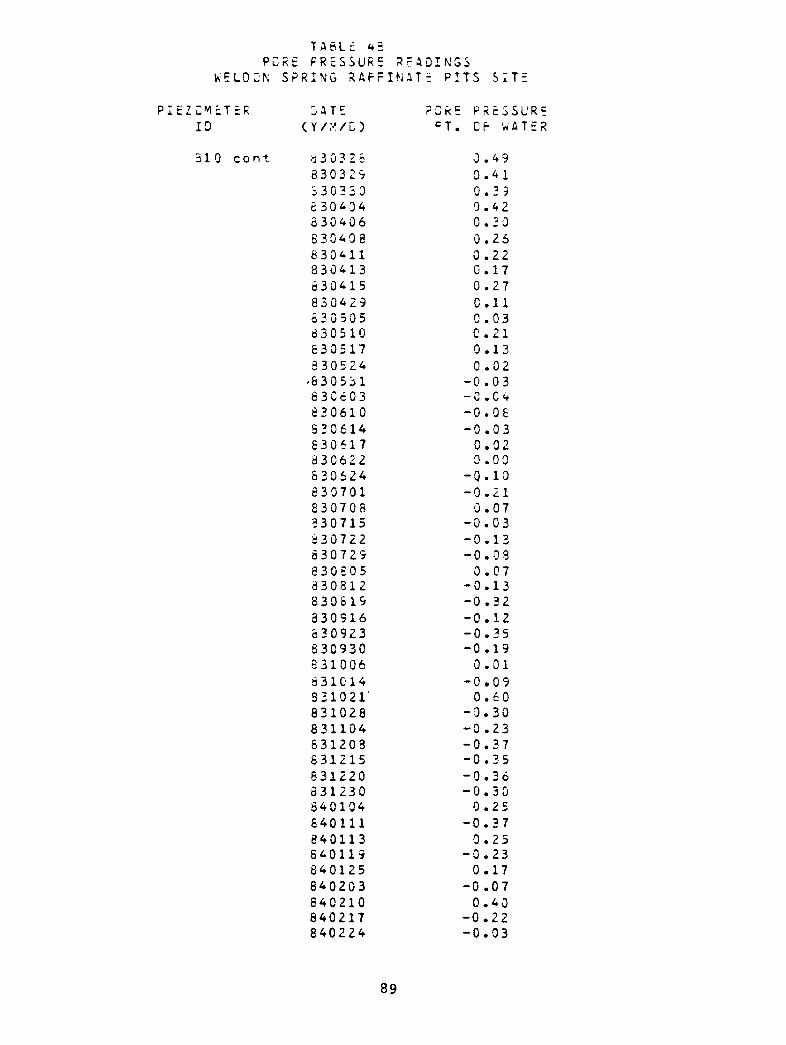
T A B L E 4=P C R E P R E S S U R E R E A D I N G S
W E L Q D N S P R I N G R A F F I N A T E P I T S S I T EP I E Z C N c T
ID310
ER
co nt
GATE PDRE P R E S S U R E( y /,y /C) FT. DP WATE R
a 303 2 8 0.498 3 0 3 2 9 0.4 13 3 0 3 5 0 0.336 3 0 4 0 4 0.428 3 0 4 0 6 0.308 3 0 4 08 0.26830 41 1 0.2283 0 4 13 0.17830 41 5 0.278 3 0 4 29 C.ll6 3 0 5 0 5 0.038305 10 0.21£30 51 7 0.135 3 0 5 2 4 0.02'830531 -0 .038 3 C 6 0 3 - 0 . 0 4630 61 0 -0.0 6S 3 0 6 14 - 0 . 0 3630 61 7 0.02630 62 2 0.008 3 0 5 2 4 - 0 . 1 06307 01 -0. 21S 3 07 0 8 0.0 7330 71 5 - 0 . 0 3630 72 2 - 0 . 1 38 3 0 7 2 9 1 o o oo
8 3 0 5 0 5 0 .07330 81 2 - 0 . 1 38 3 0 8 1 9 - 0 . 3 23 3 0 9 1 6 -0 .128 3 0 9 23 -0.35830 93 0 -0 .1983 1 0 06 0.01631 01 4 - 0 . 0 9331021' 0.6063 1 0 28 - 0 . 3 08 3 1 1 0 4 - 0 . 2 383 1 2 03 - 0 . 3 78 3 1 2 15 - 0 . 3 5831 22 0 - 0 . 3 68 3 1 2 3 0 - 0 . 3 0840 10 4 0.25840 11 1 - 0 . 3 78 4 0 1 13 0.258 4 Q 1 1 9 - 0 . 2 384 01 2 5 0.176 4 0 2 0 3 1 o o
8 4 0 2 1 0 0.408 4 0 2 1 7 - 0 . 2 28 4 0 2 2 4 - 0 . 0 3
89
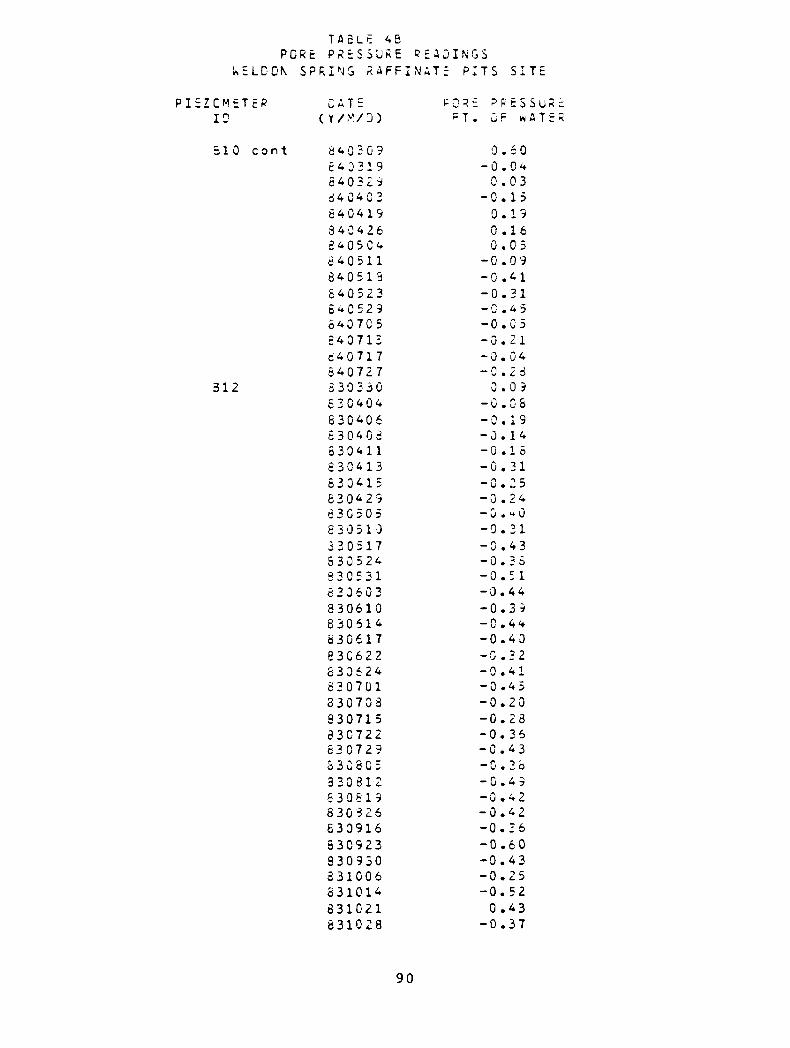
TABLE 48 PCRE P R E S S U R E R E A D I N G S
US LOOK S P R I N G R A F F I N A T E PITS SITE
P I E Z O M E T E R CATE PORE PPESSUR:ID ( Y / M/ D ) f=T. DF wATER
510 cont
31,
( Y/M/D) p T . OF w
84 0 3 0 9 0.60£ 4 0 3 19 - 0 . 0 45 4 0 3 Z 9 0.0384 040 3 - 0 . 1 58 4 0 4 1 9 0.193 4 0 4 2 6 0.168 4 0 5 0 4 0.0584 05 1 1 - 0 . 0 98 40 5 1 3 -0.418 4 0 5 23 - 0. 31£<♦0 529 -0. 4584 0 7 0 5 - 0 • C 5540715 -0 .218 4 0 7 1 7 - 0 . 0 46 40 7 2 7 - 0 . 2 85 3 0 3 3 0 0.0 98 3 0 4 0 4 - 0. 08830406 - 0 . 1 963 040 8 - 0 . 1 45 3 0 4 11 - 0 . 1 583 04 1 3 - 0 . 3 163 041 5 - 0 . 2 583 04 2 3 - 0 . 2 463050 5 - 0 . 4 08 3 0 510 -0.3133 05 1 7 - 0 . 4 353 05 2 4 - 0 . 3 88 3 0 5 31 -0 .5163 0 6 03 -0.4483 06 1 0 - 0 . 3 58 3 0 6 1 4 - 0 . 4 46 3 0 6 17 - 0 . 4 0830 622 - 0. 326 3 0 6 2 4 -0.41630701 -0 .453 3 0 7 0 8 - 0 . 2 0830 71 5 - 0 . 2 8830 72 2 - 0 . 3 66 3 0 7 2 9 - 0 . 4 333030 5 -0.3b33 08 1 2 -0 .435 3 0 619 -0 .428 30 3 26 - 0 . 4 263 0 9 16 - 0 . 3 65 3 0 9 23 - 0 . 6 0830 93 0 - 0 . 4 35 3 1 0 0 6 - 0 . 2 533 1 0 14 - 0 . 5 2631 02 1 0.438 3 1 0 28 - 0 . 3 7
90

T A B L E 4BP C R E P R E S S U R E R E A D I N G S
klELDuN S P R I N G R A F F I N A T E P I T S S I T EP I E Z O M E T E R CATE FORE P R E S S U R E
ID
B12 cont
81 8
( Y/M/D ) FT. CF W
8 3 1 1 0 4 - 0 . 2 9531208 -0. 5653 12 1 5 - 0 . 5 25 3 1 2 2 0 - 0 . 3 9831 23 0 - 0. 3184 01 0 4 C . 2 18401 11 - 0 . 4 28 4 0 1 1 9 - 0 . 1 73 4 0 1 2 5 0.238 4 0 2 0 3 - 0 . 2 084 02 1 0 0.338 4 0 2 17 - 0 . 3 58 4 Q 2 2 4 - 0 . 1 5540 30 9 0.4 76403 13 0.13840 31 9 0.0784 03 2 9 0 . 0 08 4 0 4 0 3 — 3.068 * 0 4 1 9 -0. 088 4 0 4 26 0 . 2 06 4 0 5 04 0 . 1 28405 11 1 O o8 4 0 5 18 - 0 . 3 46 4 0 5 23 - 0 . 2 73 4 0 5 2 9 -0.4 1S 4 0 7 u 5 -0.198 4 0 7 1 3 -0.23840 71 7 - 0 . 2 48 4 0 7 27 - 0 . 4 063041 1 1 o o o
8 3041 3 - 0 . 7 *8 3 0 4 1 5 0.068 3 0 4 2 9 - 3. 666 3 0 5 0 5 — 1.09530 51 0 - 1. 158 3 0 5 1 7 - 1 . 2 96 3 0 5 2 4 - 1. 596305 31 -1 .476 3 0 6 0 3 -1.458 3 0 6 1 0 - 1 . 8 3830 61 4 - 1 . 706 3 0617 - 1 . 7 3630 62 2 - 1 . 8 4630 62 4 - 1 . 9 46307 01 - 1 . 9 683 07 0 8 - 1 . 93630 71 5 - 1 . 3 7830 72 2 - 2 . 1 23 3 0 7 2 9 -1.51630 80 5 - 1. 85
9 1
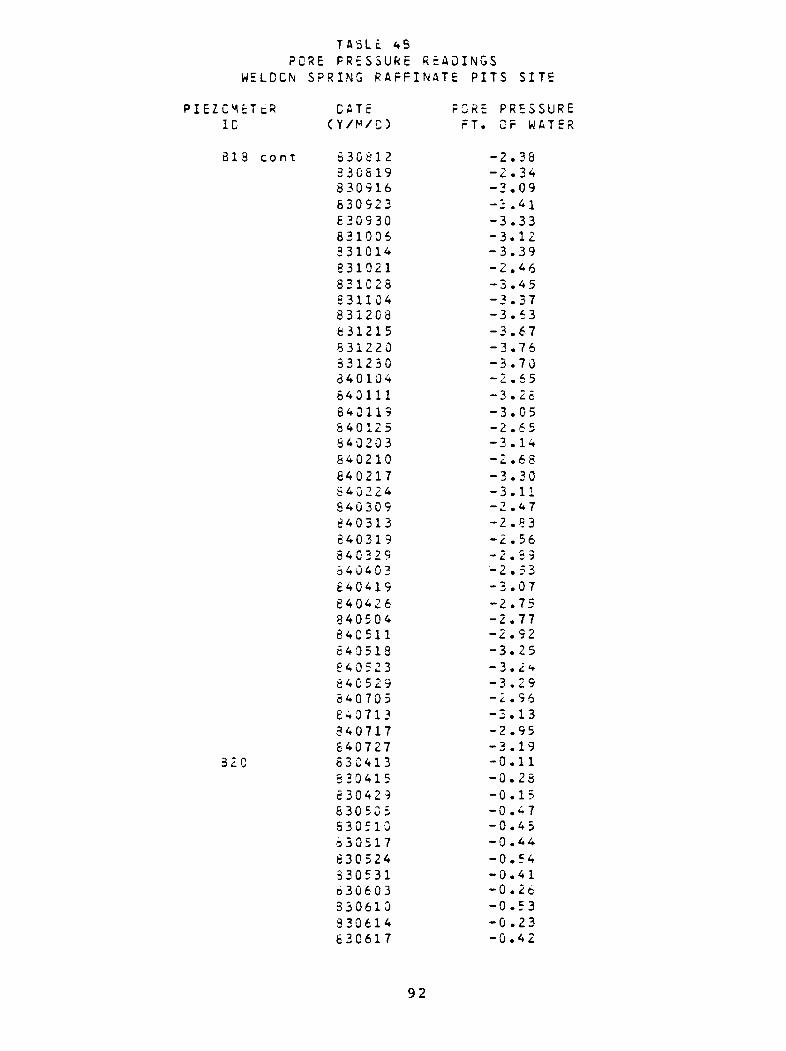
T AB LE 45 PORE P R E S S U R E R E A D I N G S
W E L D C N S P R I N G R A F F I N A T E PITS SITE
P I E Z C M E10
B 1 3
3 2 C
TER
co nt
CATE FORE P R E S S U R E( Y / M /C ) FT. OF W A T E R
8 3 G 8 1 2 3 3 0 5 19 8 3 0 9 1 6 63 09 2 3 £30930 6 3 1 0 06 3 3 1 0 14 831021 8 3 1 C 2 8 £ 31 1 0 4 8 312 0 8 6 3 1 2 15 8 3 1 2 2 0 S31 230 3 4 0 1 0 4 6401 11 64 01 1 9 8 4 0 1 25 3 4Q203 6 4 0 2 1 0 6 4 0 2 17 6 4 0 2 2 4 8 4 0 3 0 9 £4 03 1 3 6 40 3 1 9 S4C 32 9 3 4 0 4 0 3 £ 4 0 4 1 9 £ 4 0 4 26 8 4 0 5 0 4 6 4 C 5 11 6 4 0 5 18 £40523 8 4 0 5 2 9 640 70 5 £40713 3 4 0 7 1 7 £4 07 2 7 830 41 3 33 04 1 5 £ 3 0 4 29 63 05 0 5 S 3 0 5 1 0 6 5 0 5 1 7 630 52 4 8 3 0 5 31 o 3 0 6 0 3 330 61 0 3 3 0 6 14 6 3 0 6 1 7
- 2 .38- 2 .34_ 2 .09-3 .41-3 .33-3 . 1 2-3 .39- 2 .46- 3 .45_ 2 .37-3 .63-3 .67- 3 .76-3 .70~ L .65-3 • 26-3 .05- 2 . 6 5-3 .14” L. . 6 8_ 3 .30-3 . 1 1- ? .47- 2 .83- 2 .56- 2 .59- 2 • 53-3 .07- 2 .75- 2 .77- 2 .92-3 .25-3 . 2 «*-3 .29- 2 .96- 2 .13- 2 .95_ 'a.19- 0 . 1 1- 0 .28- 0 .15- 0 .47- 0 .45- 0 .44- 0 .54- 0 .41- 0 .26- 0 .53- 0 .23- 0 .42
92
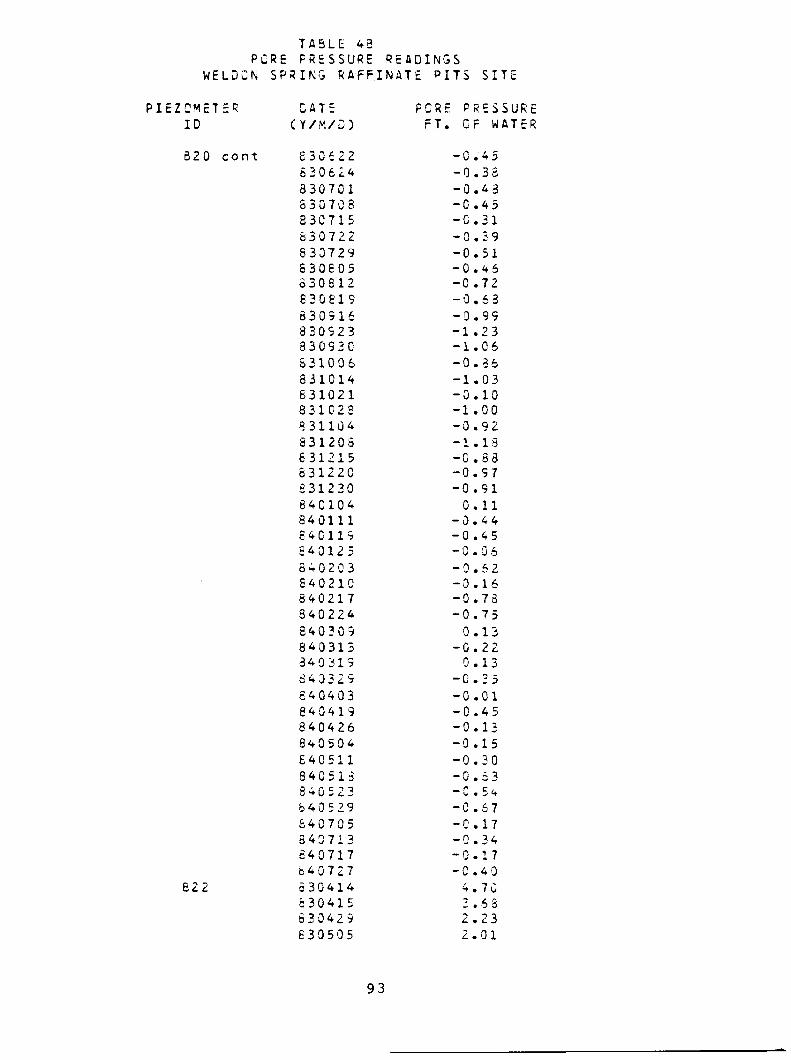
T A B L E 43 PORE FRE SSURE R E A D I N G S
W E L D C N S P R I N G R A FF I NATE PITS SITE
P I E Z G M E TID3 2 0
6 2 2
ER CATE(Y/M/D )
con t 6 3 0 6 2 26 3 0 6 2 4 83070 1 S 3 0 7 C 8 8 3 0 7 1 5 8 3 0 7 2 2 6 3 0 7 2 9 6 3 0 6 0 5 6 3 0 6 1 2 8 3 0 6 1 9 6 3 0 9 16 8 3 0 523 3 3 0 9 2 05 310 0 6 6 3 1 0 1 4 6 3 1 0 2 1 8 310 2 3 9 3 1 1 0 46 3120 S 6 3 1 2 1 5 6 3 1 2 2 0 6 31 2 3 0 6 4 C 10 4 8 40 1 1 1 £40119 £40125 6 4 0 2 0 3 6 4 0 210 8 4 0 2 1 7 3 4 0 2 2 4 8 4 0 3 0 5 8 4 0 3 1 3 3 4 0 3 1 9 8 4 3 3 2 9 £ 4 0 4 0 3 8 4 0 4 1 9 8 4 0 4 2 6 8 4 0 5 0 4 6 40 5 1 1 8 4 0 5 13 34 05 2 3 6 4 0 5 2 9 6 4 0 7 0 5 3 4 3 7 1 3 3 4 0 7 1 7 6 4 0 7 2 76 3 0 4 1 46 3 0 4 1 5 8 3 0 4 2 9 6 3 0 5 0 5
FORE P R E S S U R E FT. GF WA TER
- 0 . 45- 0. 33- 0 . 4 3- 0 . 45- C. 31- 0. 39- 0 . 51— 0.45 - 0. 72 - 0 . 6 3 - 0 . 9 5 - 1 . 2 3 - 1 . 0 6— 0.36 - 1. 03 - 0.10 - 1.00 - 0 . 92 - 1 . 13 - 0 . 83 -0. 57 -0. 910.11
- 0 . 4 4- 0 . 4 5- 0 . 0 6- 0 . 6 2- 0 . 16-0.7 8- 0 . 7 50.13
-C.220.13
- C . 25- 0.01- 0 . 4 5- 0. 13- 0 . 1 5- 0 . 30- 0. 63- C . 5 4 - 0 . 6 7 - 0. 17 - 0. 34 - 0 . 1 7- 0 . 4 0 4.703.532.23 2.01
9 3
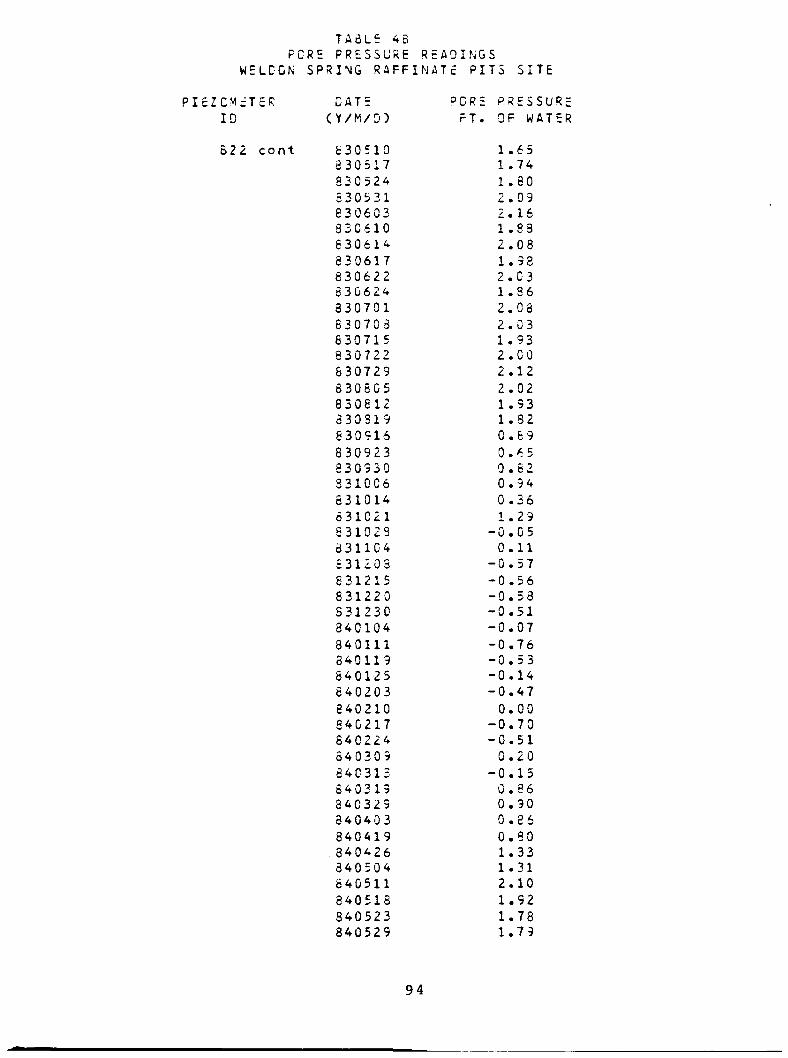
T A B L E 43 FGR5 P R E S S U R E R E A D I N G S
WELC-ON S P R I N G R A F F I N A T E PITS SITE
P I E Z O M E T E RID
B22 cont
CATE ° 0 R E P R E S S U R( Y/M / D) FT. OF WATE
630 51 0 1.658 3 0 5 1 7 1.748 3 0 5 2 4 1.80530531 2.0983060 3 2.168 3 G 61 0 1.836 3 0 6 1 4 2.088 3 0 6 1 7 1.988 3 0 6 22 2.0 383G 62 4 1.36330 70 1 2.086 3 0 7 03 2.036 3 0 7 15 1 . 938 3 0 7 22 2 . 0 06 3 0 7 29 2 . 1 2
6 3 0 8 C 5 2 . 0 28 3 0 6 12 1 .933 30 5 1 9 1 .826 30 9 1 6 0.698 3 0 9 23 0.65830 93 0 0.623 3 10 C 6 0.946 3 1 0 1 4 0 .3663 10 2 1 1.2 9831 028 - 0. 053 3 1 1 0 4 0 . 1 1£ 31 2 0 3 - 0 . 5 78 31215 - 0 . 5 68 3 1 2 2 0 -0 .53S 31 2 3 0 -0.518 40 1 0 4 - 0. 078 4 0 1 11 - 0 . 7 63 40 1 1 9 - 0 . 5 38 4 0 1 2 5 - 0 . 1 46 4 0 2 0 3 - 0 . 4 7640210 0 . 0 08 40 2 1 7 - 0 . 7 03 4 0 2 2 4 - 0 . 5 1S 4 0 3 0 9 0 . 2 03 4C 3 1 3 - 0 . 1 56 4 0 3 19 0 . 8 68 4 0 3 29 0.908 4 0 4 0 3 0 . 8 68 40 4 1 9 0.803 4 0 4 2 6 1.333 4 0 5 0 4 1.31840 51 1 2 . 1 03 4 0 5 1 3 1.928 40 5 2 3 1.788 4 0 5 2 9 1.79
9 4

T A 3 L E 4BP C R E P R E S S U R E R E A D I N G S
WE LG ON S P R I N G R A P F I N A T 5 P I T S S I T EP I E Z G V E T E R D A T E ^ G R E P R E S S U R E
ID ( Y / v / C ) F T . C F W A T E R32 2 c o n t 5 4 0 7 0 5 ^ > 6
3 4 0 713 2.40840 71 7 2.57640727 2.34
9 5


FIGURES

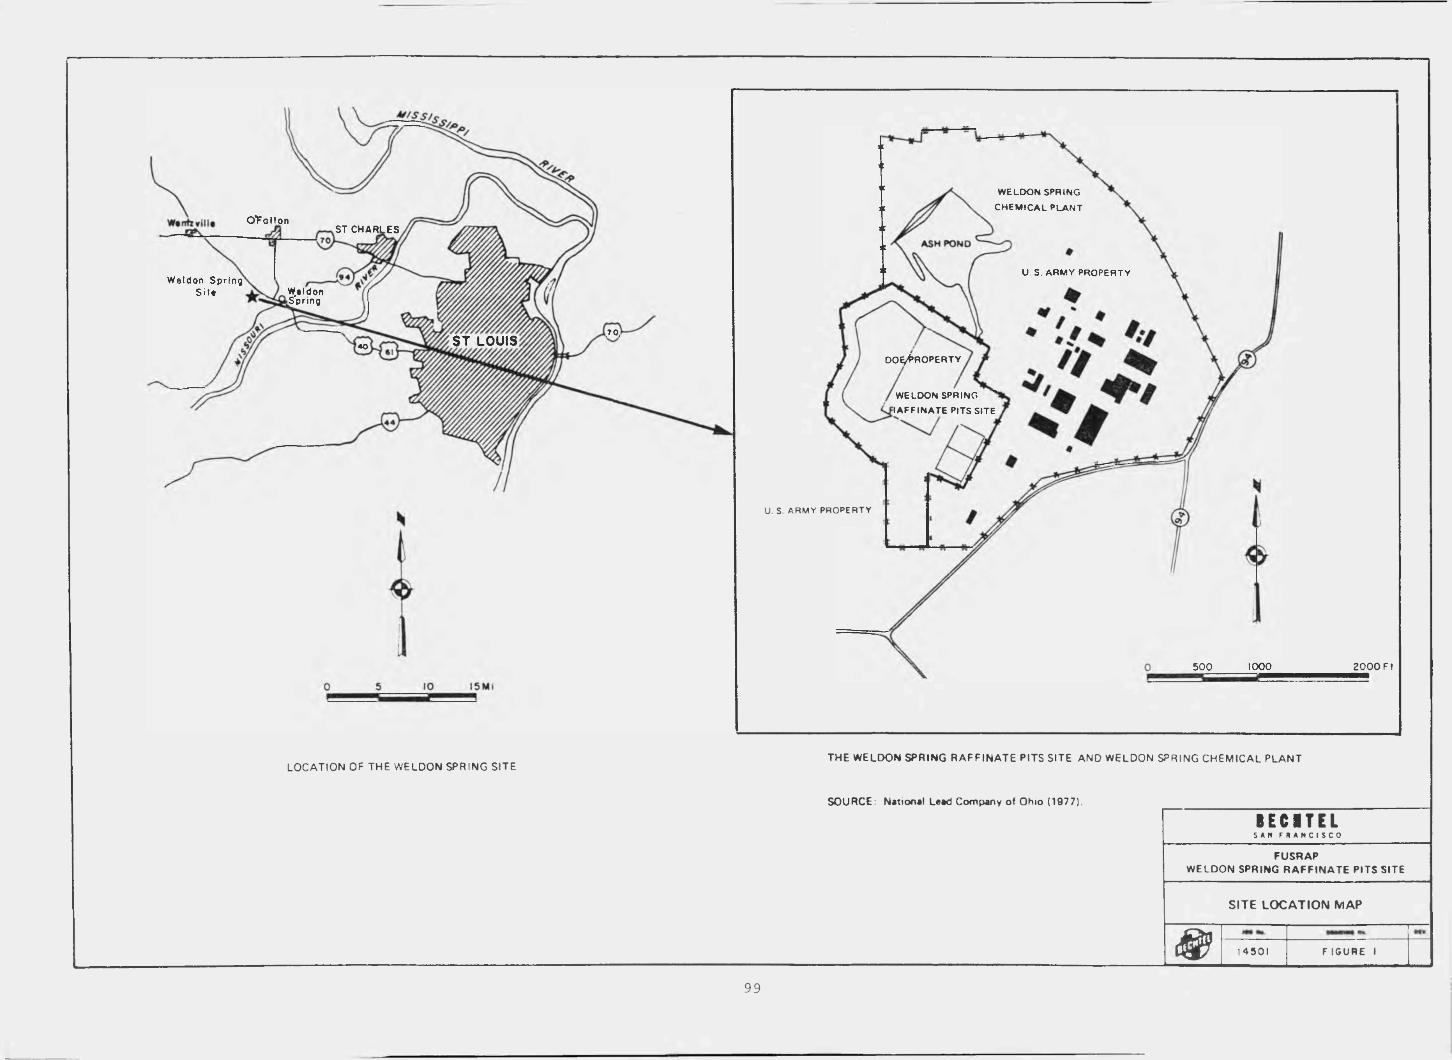
* " S S / S
Wenhrille OTallon & ST CHARLES
W eldon SpringSit' * Weldon
Sprin g
ST LOUIS
U S A R M Y PROPERTY
WELDON SPRING
CHEMICAL PLANT
ASH POND
U. S. A R M Y PROPERTY
d o ^ r o p e r t y
W EL DO N SPRING
A F F IN A T E /
2 0 0 0 Ft
LOCATION OF THE WELDON SPRING SITETHE WELDON SPRING R A F F IN A T E PITS SITE AND WELDON SPRING CHEMICAL PLANT
SOURCE: National Lead Company of Ohio (1977).
B E C I T E LS A It F R A N C I S C O
FUSRAPWELDON SPRING R A F F IN A T E PITS SITE
SITE LOCATION MAP
& 14301 F IG U R E I
99
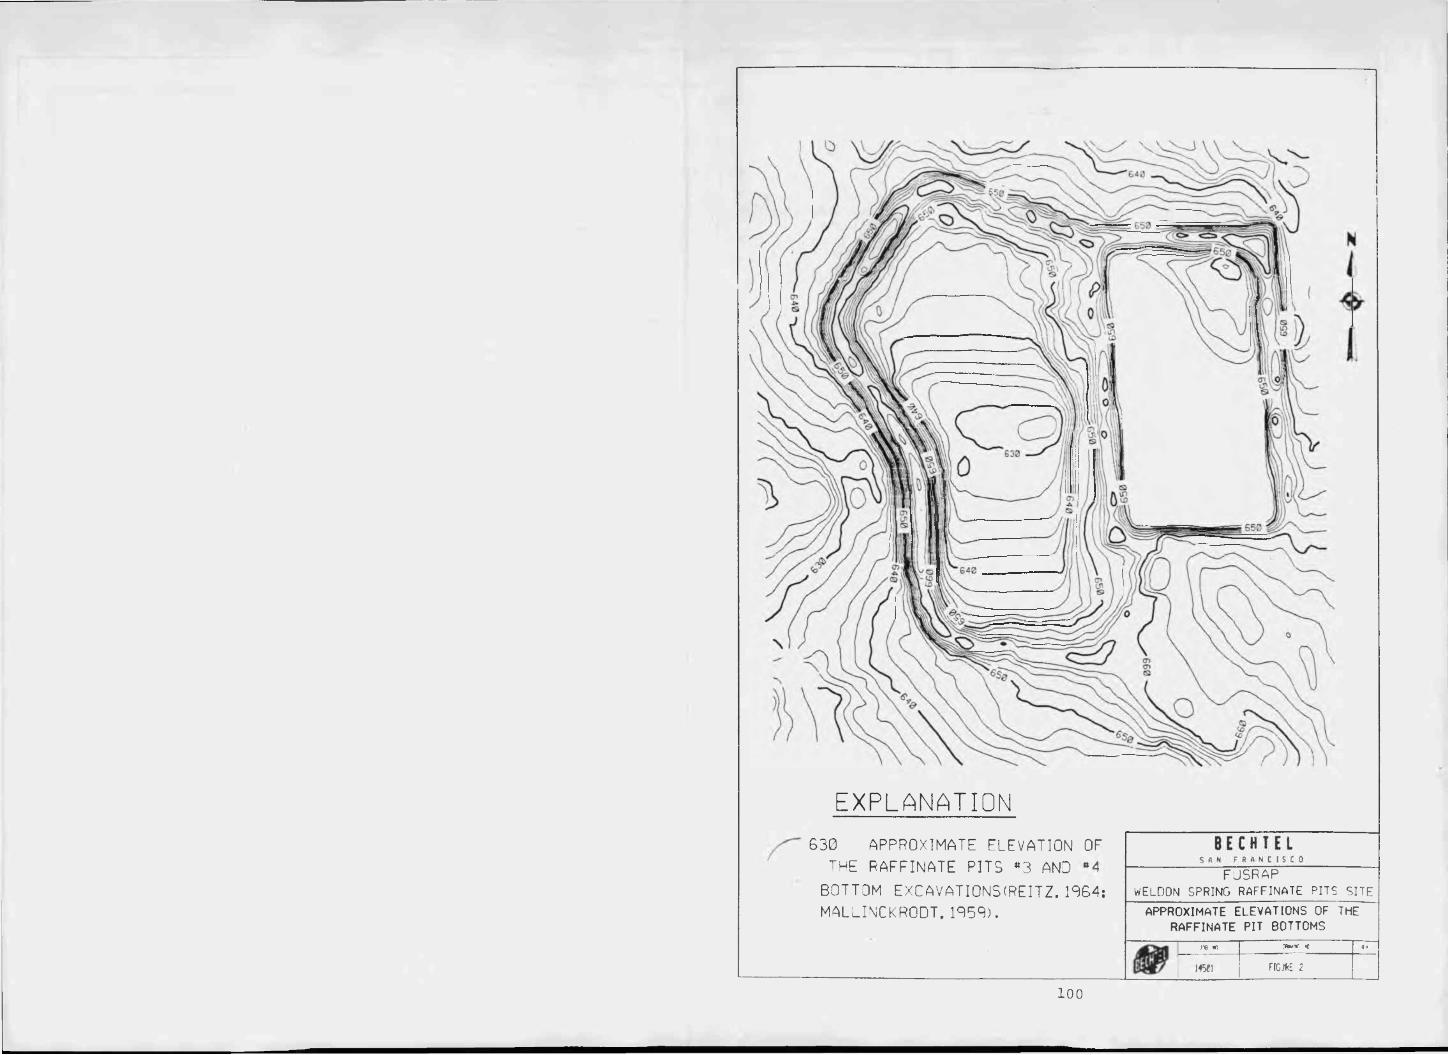
EXPLANATION630 APPROXIMATE ELEVATION OF
THE RAFFINATE PITS «3 AND "4 BOTTOM EXCAVATIONS(REITZ. 1064; MALLINCKRODT. 1059).
FUSRAPWELDON SPRING RAFFINATE PITS SITEAPPROXIMATE ELEVATIONS OF THE
RAFFINATE PIT BOTTOMSy* m. CRvnr, * 4*
145*1 FIGJttE 2
1 0 0
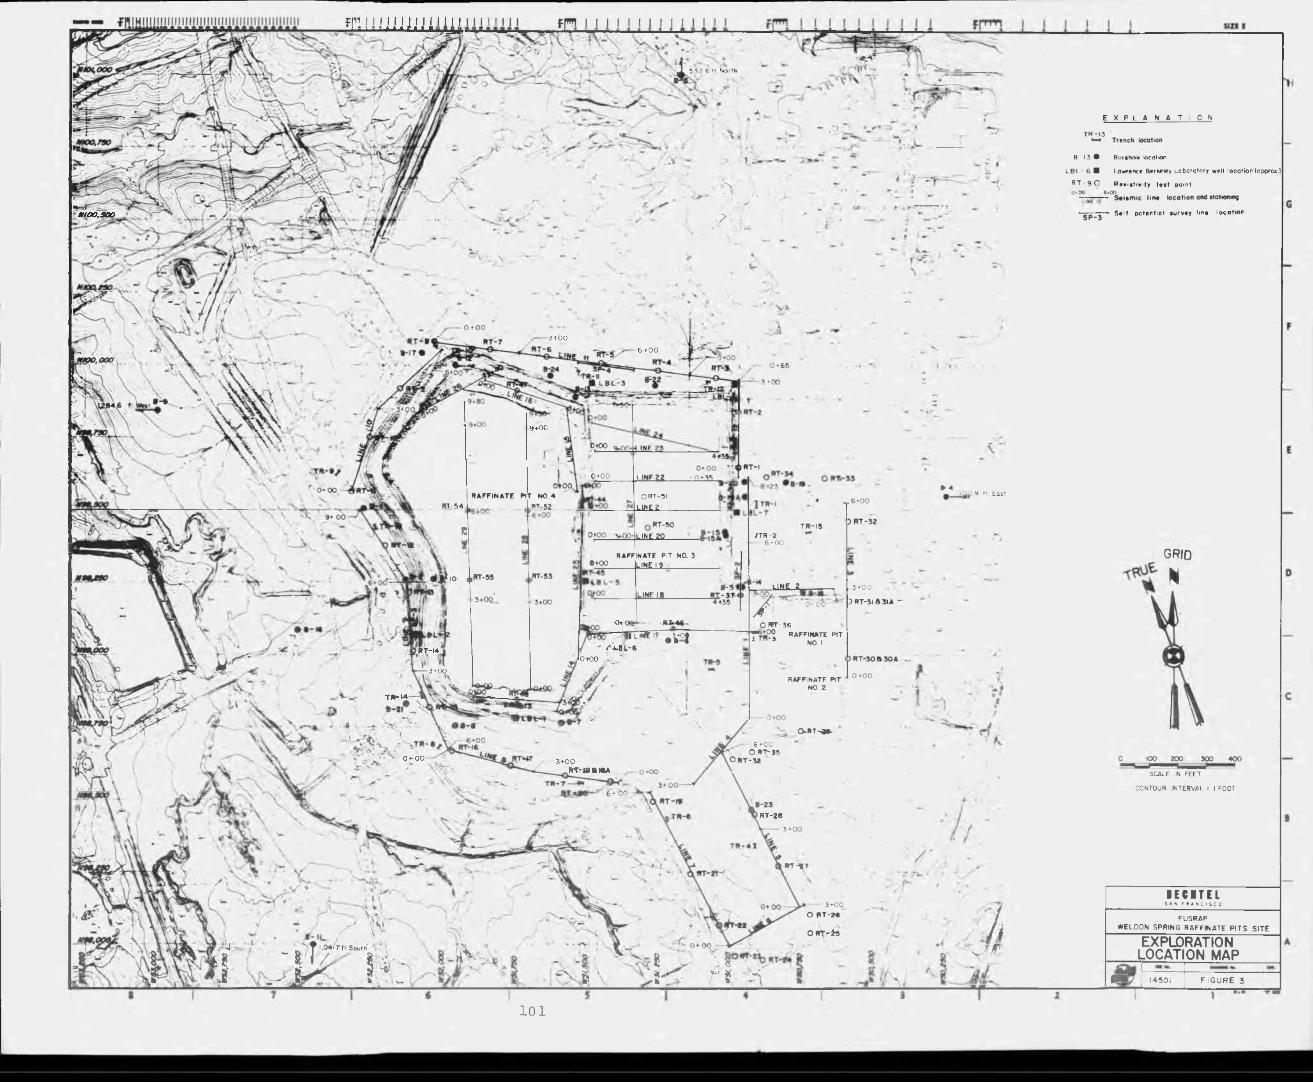
f PI 1J J
Nfcit
7 - V A /\ > V x \ / A '
R~ xX_xc'. ■ \L_ -X.. *-oV’ -~C" - •• -• - i s” 6"N°rM
f ,D
..1 1K
■?
‘ y:. v
!KnfceA v *" \ '»• • \r.
W.»-» .<\
R T-54,f
8
» r - * \ *v \ M . \ u\ X \ , '
* 4T
_ t | £ i o <i
0+00RAFFINATE PIT NO. 4
.RT-52
, * K L
0 R T -5 I
Llfl£2l
UNE 20RAFFINATE PIT NO. 3
LINE >9__________
0-3
iLiHtiT #yo|
( -
B-4^ /~gp 9 ft. East
f T R - 26 + 00
JUNE 2,
/ 01C.3 + 0 0
Z>RT~3t63tA "■
OFTT-36RAFFINATE PIT
1 3 NO. I
RAFFINATE PIT NO 2
O.RT-4*— 6+00 ORT-JS
O R T -3 8
!■ I
A
\ll _vx
I ’ i / \’X j S T 1,0417 ft SajlhX " ‘B w 8' J / sI -j> fe rX
rtV -
> 4 ,* RT-tT
3 + 0 0 O R T -z e
ORt 9
- -v8w.' 6 1 ^ 4 - - X 1
E X P L A N A T I O N
B-13 • Borehole loca tion
L B L -6 ■ Lawrence Berkeley L a b o ra to ry well location (appro* )
R T - 9 O R esistiv ity te s t point
S elf potential survey line location
g r id
HI
0 100 200 300 400
SCALE IN FEET
CONTOUR IN T E R V A L = I FOOT
IECITELSAN F R A N C I S C O
/ FUSRAP
/ Ji WELDON SPRING RAFFINATE P ITS SITE |
' TF EXPLORATIONV fT LOCATI ON MAP
— --------------- :----- tWyl 14501 F IG U R E 3~
1 0 1
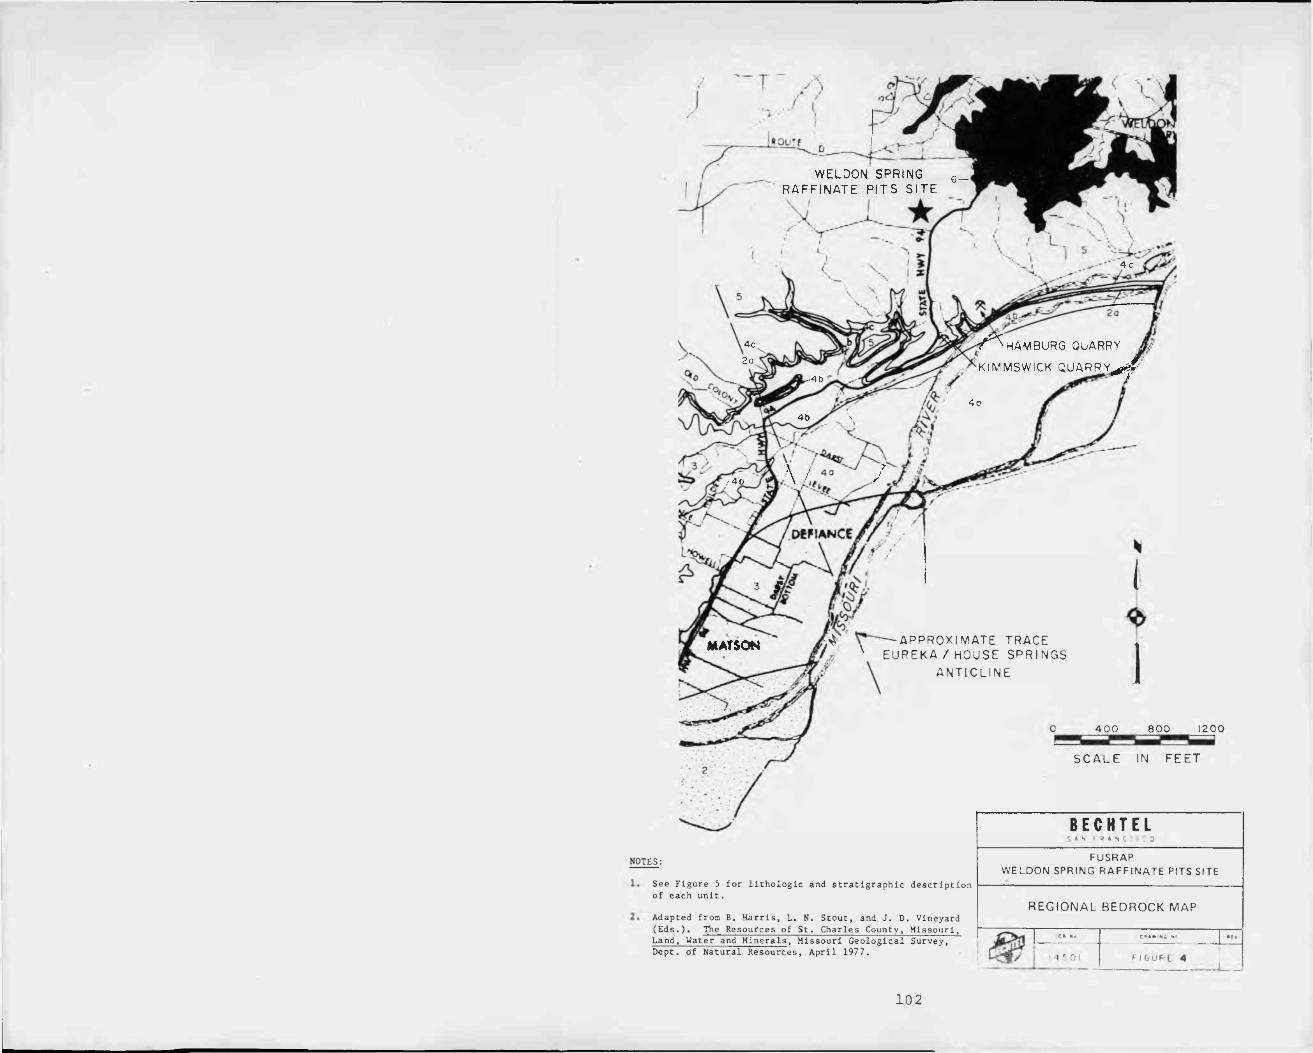
» OL ' • f
WELDON SPRI NGR A F F I N A T E P I T S S I T E
jL ★
\HAMBURG QUARRY
K I M M S W I C K Q U AR R Y
V A \ } ’} \ / « v / / /
DEFIANCE
MATSON ^ A P P R O X I M A T E T R A C E' X E U R E K A / H O U S E S P R I N G S
A N T I C L I N E
I]
4 0 0 8 0 0 1 2 0 0
S C A L E IN F E E T
rES:
See Figure 5 for lithologic and stratigraphic description of each u n i t .
A dapted from B. Harris, L. N. Stout, and J. D. Vineyard (E d s .). The Resources of St. Charles County, Missouri, Land, Water and M i n e r a l s , Missouri Geological Survey,D e p t . of Natural R e s ources, April 197 7.
B E C H T E Ls « n « a « •« c i s : o
FUSRAPWELDON SPRING R A F FIN A T E PITS SITE
REG IO NA L BEDROCK MAP
C l He C M W ' N S «• • l v
< 4 5 0 1 F I G UPE 4_______
1 0 2
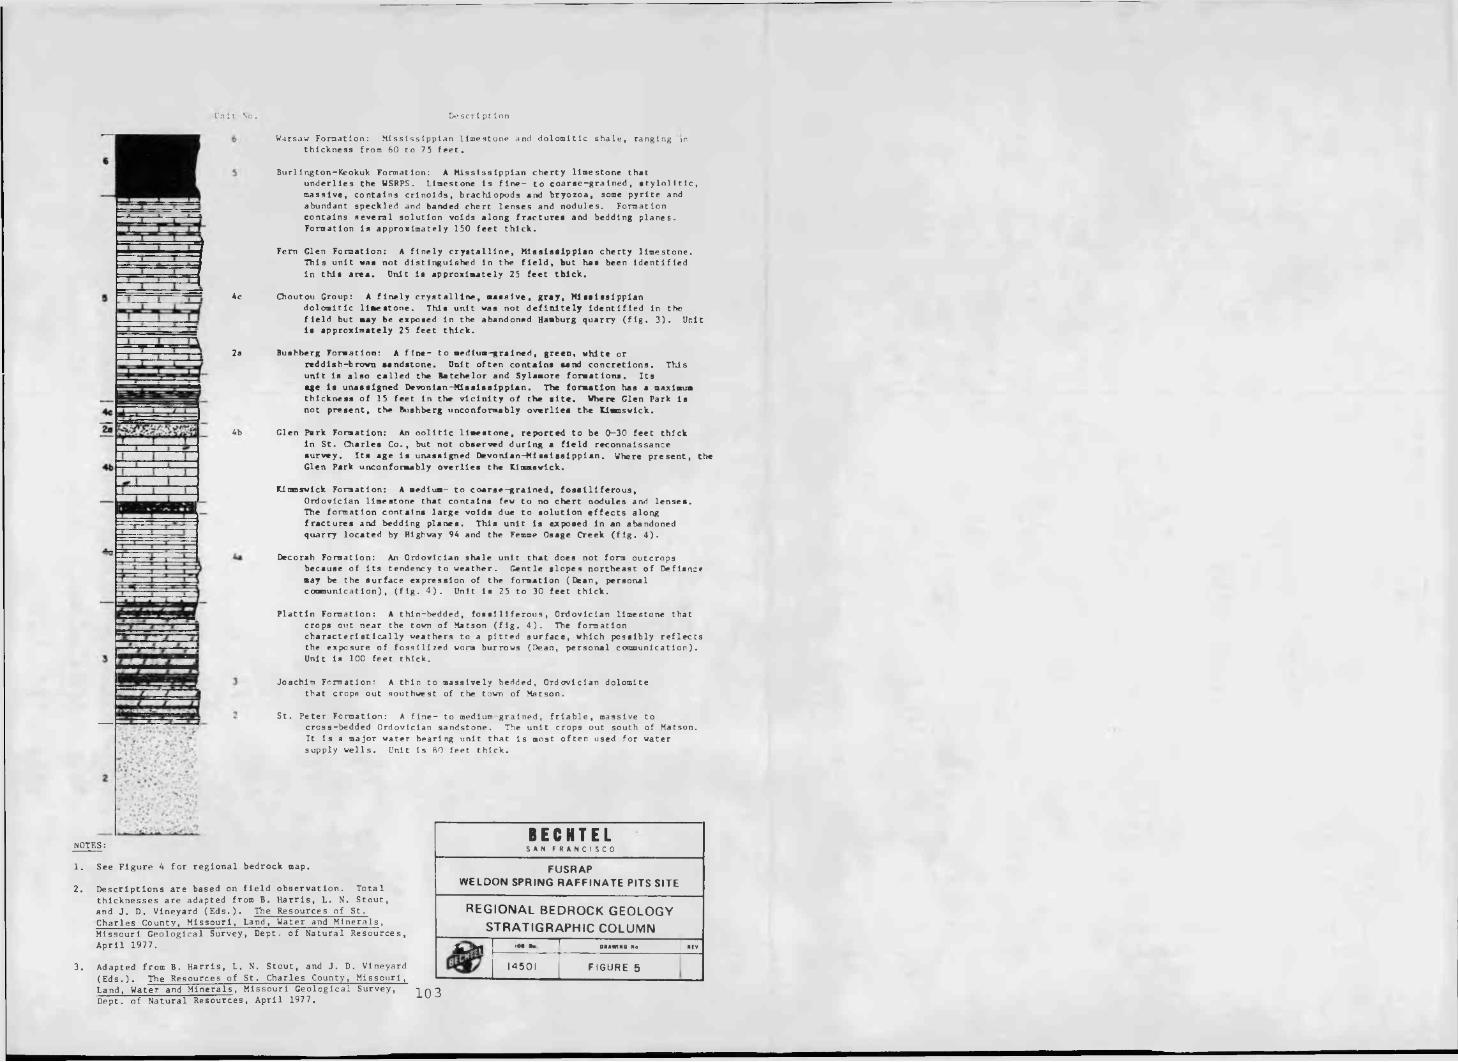
Unit So. D«? scrl pt ion
Ac
2a
Ab
Warsaw Formation: Mississippian limestone and dolomitic shale, ranging in thickness from 60 to 75 feet.
Burlington-Keokuk Formation: A Mlssisslppian cherty limestone thatunderlies the W S R P S . Limestone is fine- to coarse-grained, stylolitic, massive, contains crinoids, brachlopods and b r y o z o a , some pyrite and abundant speckled and banded chert lenses and nodules. Formation contains several solution voids along fractures and bedding planes. Formation is approximately 150 feet thick.
Fern Glen Formation: A finely crystalline, Mlssisslppian cherty limestone.This unit was not distinguished in the f i e l d , but has been identified in this area. Unit is approximately 25 feet thick.
Choutou Croup: A finely crystalline, m a s s i v e , gray, Mlssisslppiandolomitic limestone. This unit was not definitely identified in the field but may be exposed in the abandoned Hamburg quarry (fig. 3). Unitis approximately 25 feet thick.
Bushberg Formation: A fine- to medium-grained, green, white orreddish-brown sandstone. Unit often contains sand concretions. This unit is also called the Batchelor and Sylamore formations. Its age Is unas signed Devonian-Mlssisslppian. The formation has a maximum thickness of 15 feet in the vicinity of the site. Where Glen Park is not present, the Bushberg unconformably overlies the tinmsvlck.
Glen Park Formation: An oolitic li m e s t o n e , reported to be 0-30 feet thickin St. Charles Co., but not observed during a field reconnaissance survey. Its age is unassigned Devonian-Missiseippian. Where present, the Glen Park unconformably overlies the Kimasvick.
Klmosvlck Formation: A medium- to coarse-grained, fosstliferous,Ordovician limestone that contains few to no chert nodules and lenses.The formation contains large voids due to solution effects alongfractures and bedding planes. This unit is exposed in an abandoned quarry located by Highway 9A and the Femme Osage Creek (fig. 4).
Decorah Formation: An Ordovician shale unit that does not form outcropsbecause of its tendency to weather. Gentle slopes northeast of Defiance may be the surface expression of the formation ( Dean, personal coosBunlcation), (fig. 4). Unit is 25 to 30 feet thick.
Plat tin Formation: A thin-bedded, fosslllferous, Ordovician limestone thatcrops out near the town of Matson (fig. 4). The formation characteristically weathers to a pitted surface, which possibly reflects the exposure of fossilized worm burrows (Dean, personal communication). Unit is 100 feet thick.
Joachim Formation: A thin to massively b e d d e d , Ordovician dolomitethat crops out southwest of the town of Matson.
St. Peter Fo r m a t i o n : A fine- to medium-grained, friable, massive tocross-bedded Ordovician s a n dstone. The unit crops out south of Matson.It is a major water bearing unit that Is most often used for water supply wells. Unit is 60 feet thick.
NOTES:
1. See Figure 4 for regional bedrock map.
2. Descriptions are based on field observation. Totalthicknesses are adapted from B . Harris, L. N. Stout, and J. D . Vineyard (Eds.). The Resources of St.Charles County, Missouri, Land, Water and M i n e r a l s , Missouri Geological Survey, Dept, of Natural Resources, April 1977.
3. Adapted from B. Harris, L. N. Stout, and J. D. Vineyard(E d s .). The Resources of St. Charles County, Missouri,Land, Water and M i n e r a l s , Missouri Geological Survey, Dept, of Natural Resources, April 1977.
B E C H T E LS A N F R A N C I S C O
FUSRAPWELDON SPRING R A F F IN A T E PITS SITE
REGIONAL BEDROCK GEOLOGYSTRATIGRAPHIC COLUMN
Au<hi I M »• DSAWtNfi No. | NEV.
14501 FIGURE 5
103
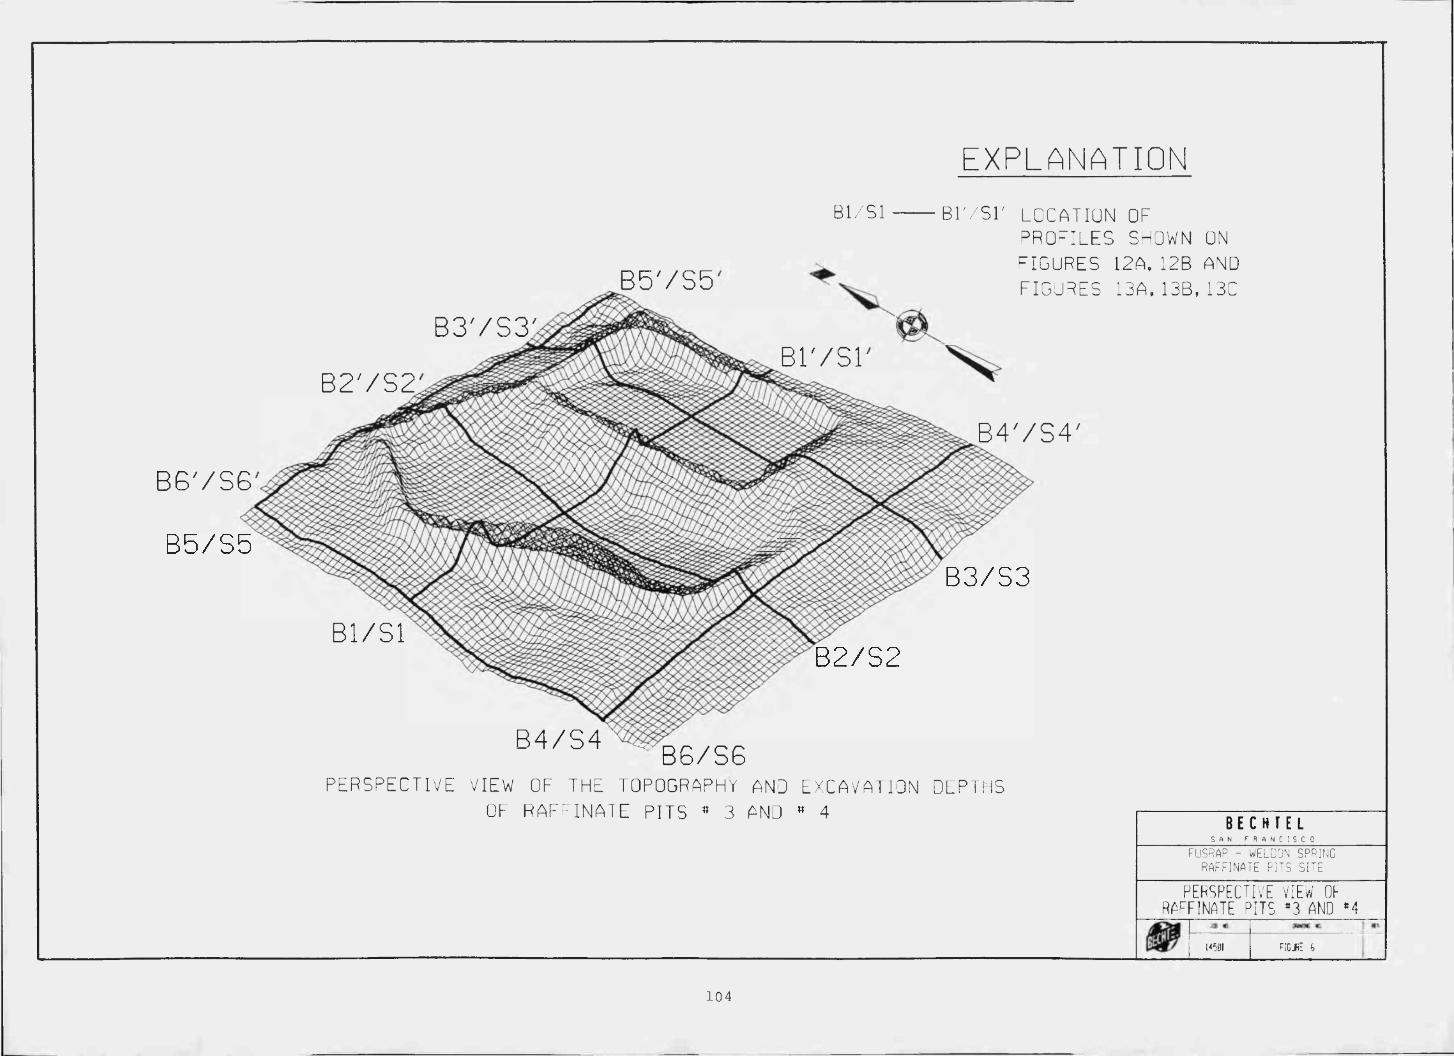
EXPLANATION
B5VS5'B3VS3'.
B l /S l
Bl'/SLB2VS2:
B4VS4'B6VS6'
B l ' / S r LOCATION OFPROFILES SHOWN ON FIGURES 12A, 12B AND FIGURES 1 3 A ,1 3 B ,130
Bl/Sl
R4/S4 ^ B6/S6PERSPECTIVE VIEW OF THE TOPOGRAPHY AND EXCAVATION DEPTHS
OF RAFFINATE PITS * 3 AND » 4 B E C H T E LS A N F R A N C I S C O
FUSRAP - WELDON SPRING RAFFINATE PITS SITE
PERSPECTIVE VIEW OF RACFINATE PITS *3 AND M
14501 FiCJi: 6
104
E X P L A N A T I O NCONTOUR SHOwING THE APPRO/ IRATE
ELEVATION OF "RE CLAYEY SILT
APPROXIMATE AREA WHERE ThE CLAYEY
SILT HAS BEEN COMPLETELY EXCAVATED
FROM PIT «4
\ w\ \\\ i m630
200100 3 0 0
SCALE IN FEETCONTOUR INTERVAL « 5 FEET
B E C H T E LFUSRAP
WELDON SPRING RAFFINATE PITS SITE
TOP OF THE CLAYEY SILT
105
CLAYf e r r e l V I E w ;
/
E X P L A N A T I O N... : CONTOUR SHOWING THE APPROXIMATE/' ELEVATION OF THE TOP OF THE CLAY
ZAPPROXIMATE AREA WHERE THE CLAY
HAS BEEN EXCAVATED FROM PIT *4
0 100 2 0 0 30 0 40 0
SCALE IN FEET
CONTOUR INTERVAL • 5 FEET
B E C H T E LS A N F R A N C I S C O
FUSRAPWELDON SPRING RAFFINATE PITS SITE
TOP OF T t£ CLAYxe to NO. Rfw
14581 FIGURE m
1 0 6
. V CONTOUR SHOWING THE APPROXlMATEyELEVATION OF THE CLAY TILL
APPROXIMATE AREA WHERE CLAY TILL
IS EXPOSED IN THE BOTTOM OF PIT *4
XX
100 2 0 0 3 0 0
SCALE W FEET
CONTOUR INTERVAL • 5 FEET
FUSRAPWELDON SPRING RAFFINATE PITS SITE
TOP OF THE CLAY TILLCLAY Tiu »
Ficure 7t14511
107
CONTOUR SHOWING THE APPROXIMATEo"'ELEVATION OF THE BASAL CHERT TILL
100 200 3 0 0 4 0 0
SCftE m FEET,630CONTOUR INTERVAL ■ 5 FEET
FUSRAPWELDON SPRING RAFFINATE PITS SITE
BA TOP OF TIC BASAL CTCRT TILL
1 0 8
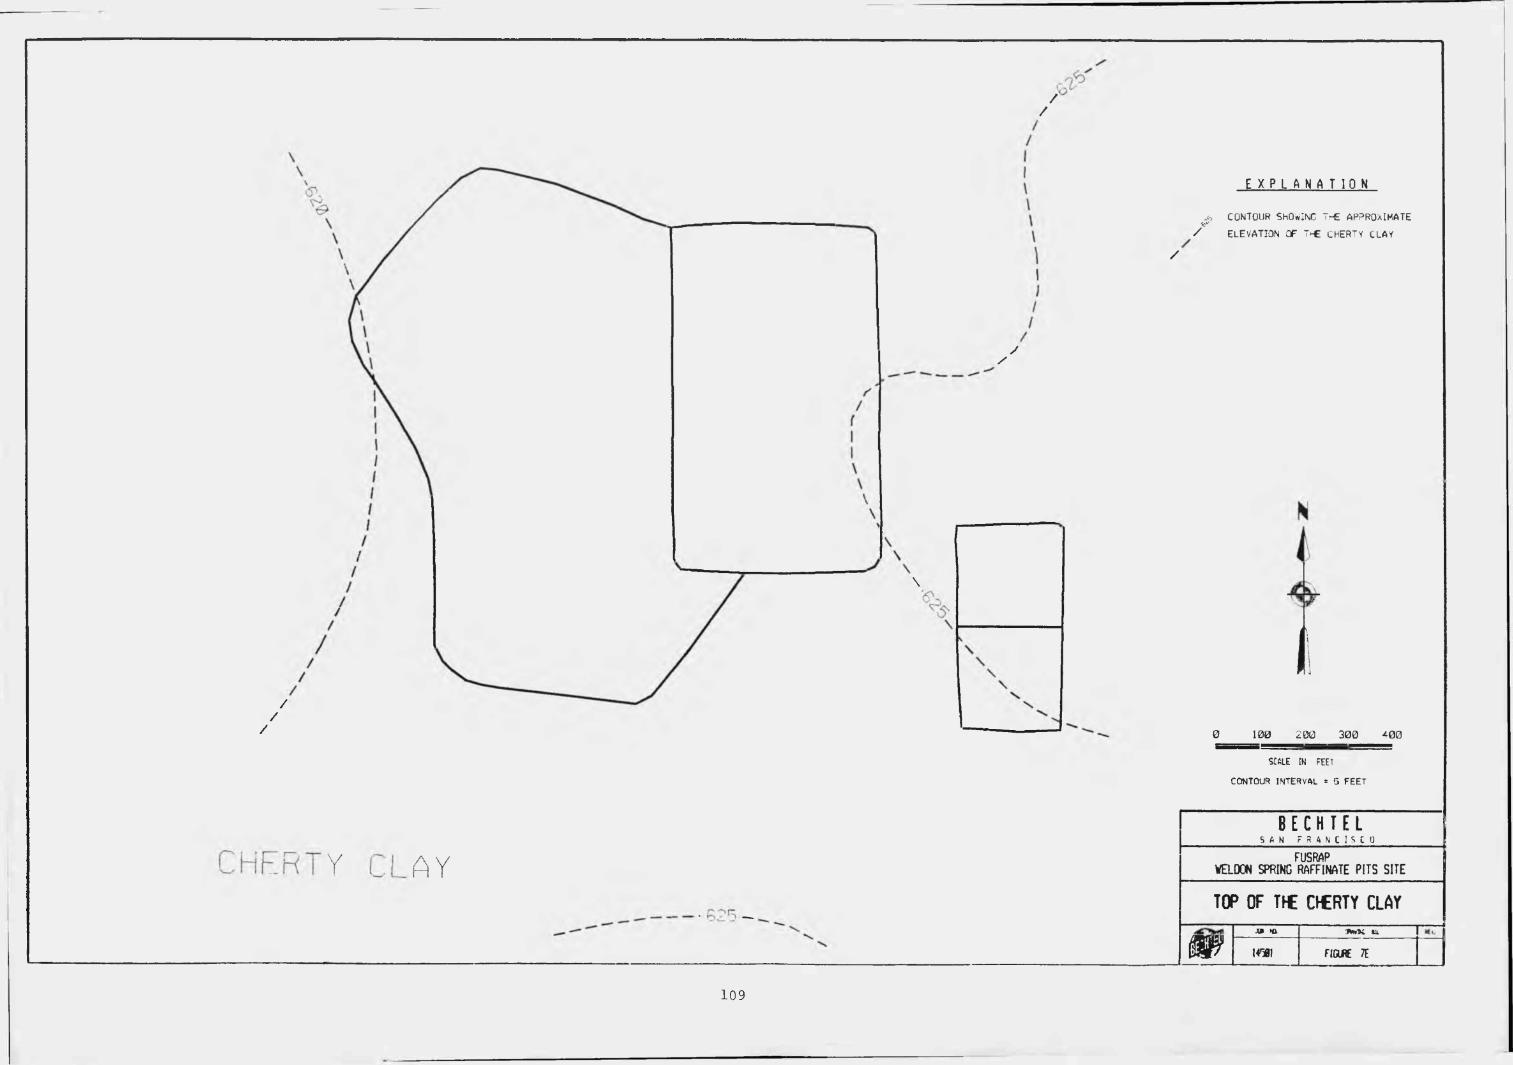
E X P L A N A T I O N
CONTOUR SHOWING T r£ APPROXIMATE
ELEVATION OF T^E CHERTY CLAY
\
//
100 3 0 0 <00SI6LE IN FEET
CONTOUR INTERVAL = 5 FEET
B E C H T E LCHERTY CLAY FUSRAP
WELDON SPRING RAFFINATE PITS SITE
TOP OF TTC 0 € R T Y CLAYJ* Hi
109
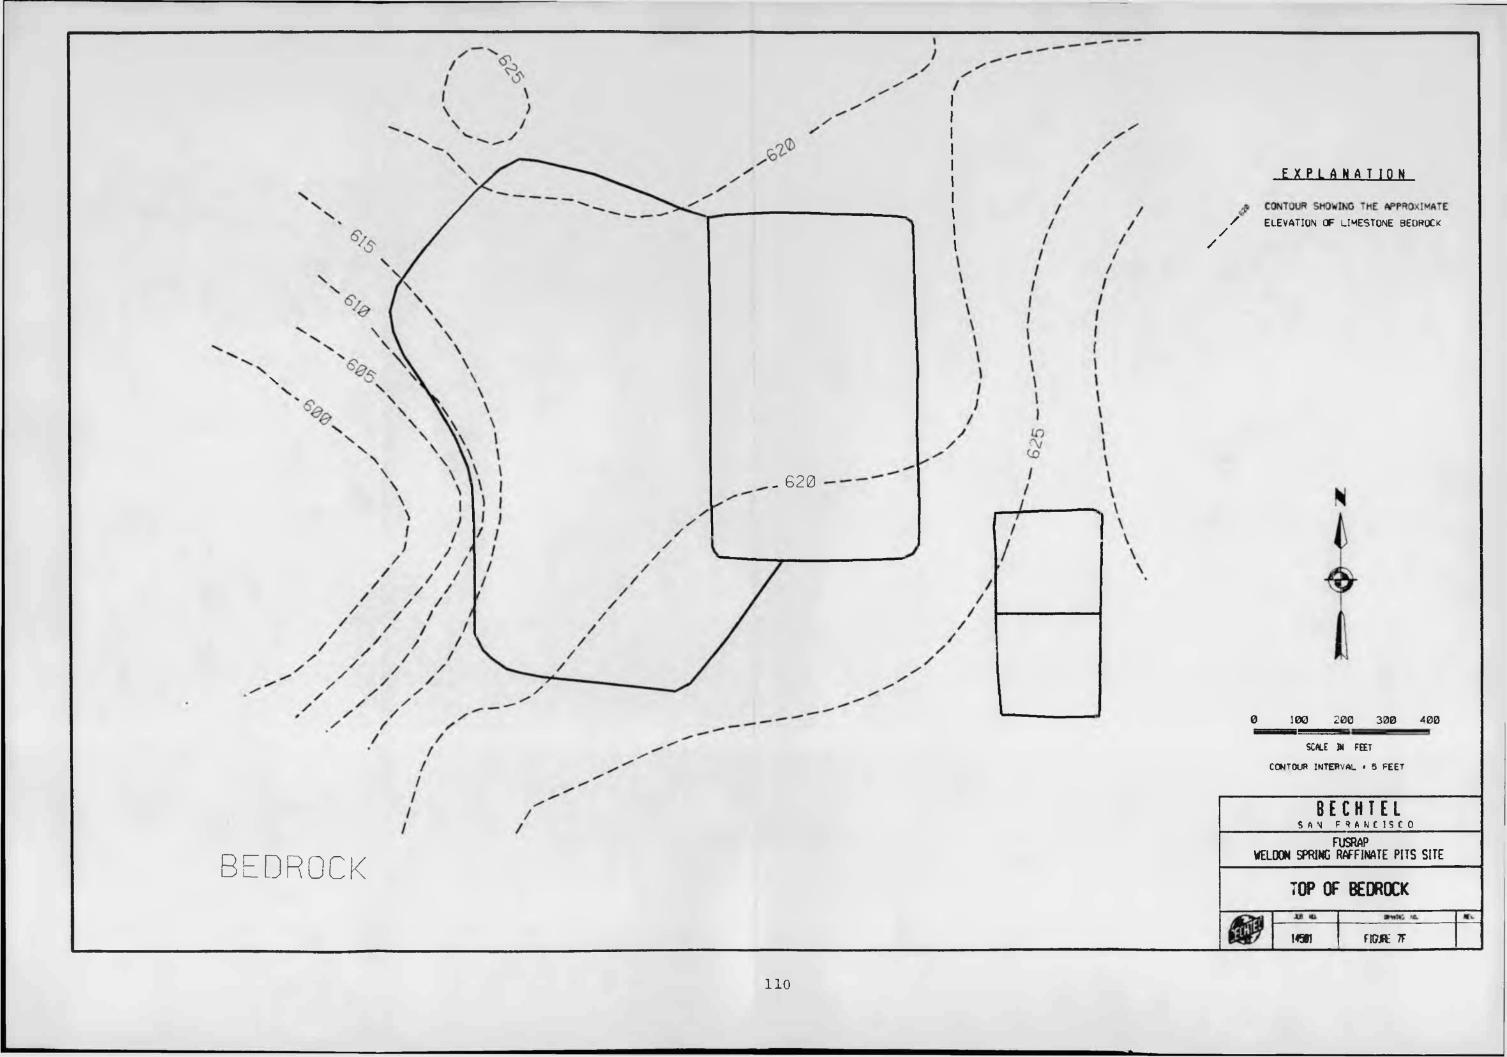
E X P L A N A T I O NCONTOUR SHOWING THE APPROXIMATE
ELEVATION OF LIMESTONE BEDROCK
\
620
100 200 4 0 03 0 0
SCALE N FEET
CONTOUR INTERVAL • 5 FEET
FUSRAPWELDON SPRING RAFFINATE PITS SITE
BEDROCKTOP OF BEDROCKA * H i
1 1 0
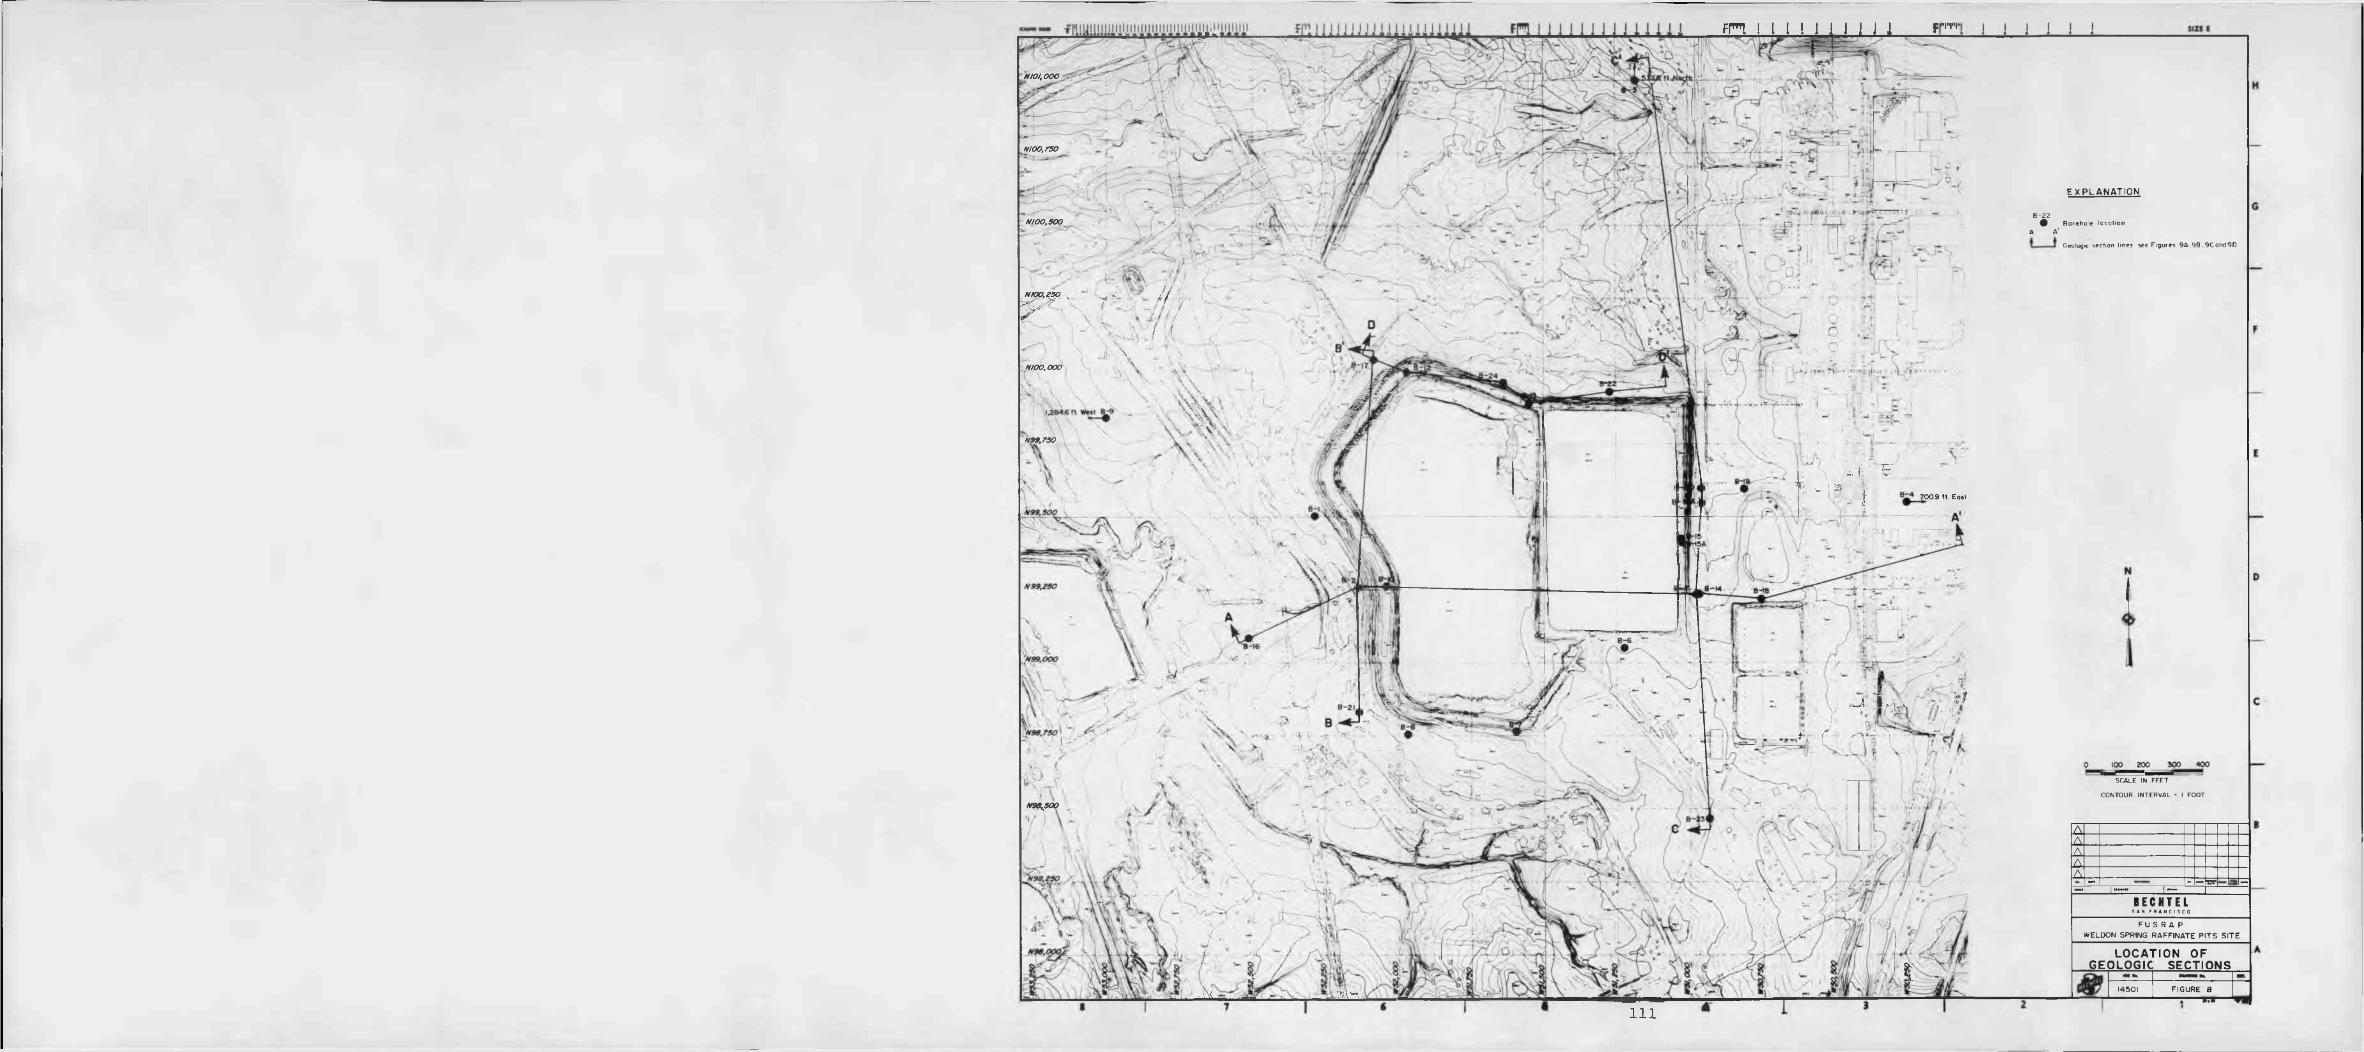
, T O ij j i m i n n ii
N100,750
N/00,500
NfOO, 250
N100,000
EXPLANATION
B-220 Borehole locotion
A A’
Geologic section lines see Figures 9A.9B ,9Cond9D
SCALE IN FEET
CONTOUR INTERVAL * I FOOT
BECHTELS AN F R A N C IS C O
F U S R A P WELDON SPRING RAFFINATE P IT S S IT E
LOCATION OF GEOLOGIC SECTIONS
14501 FIGURE 8
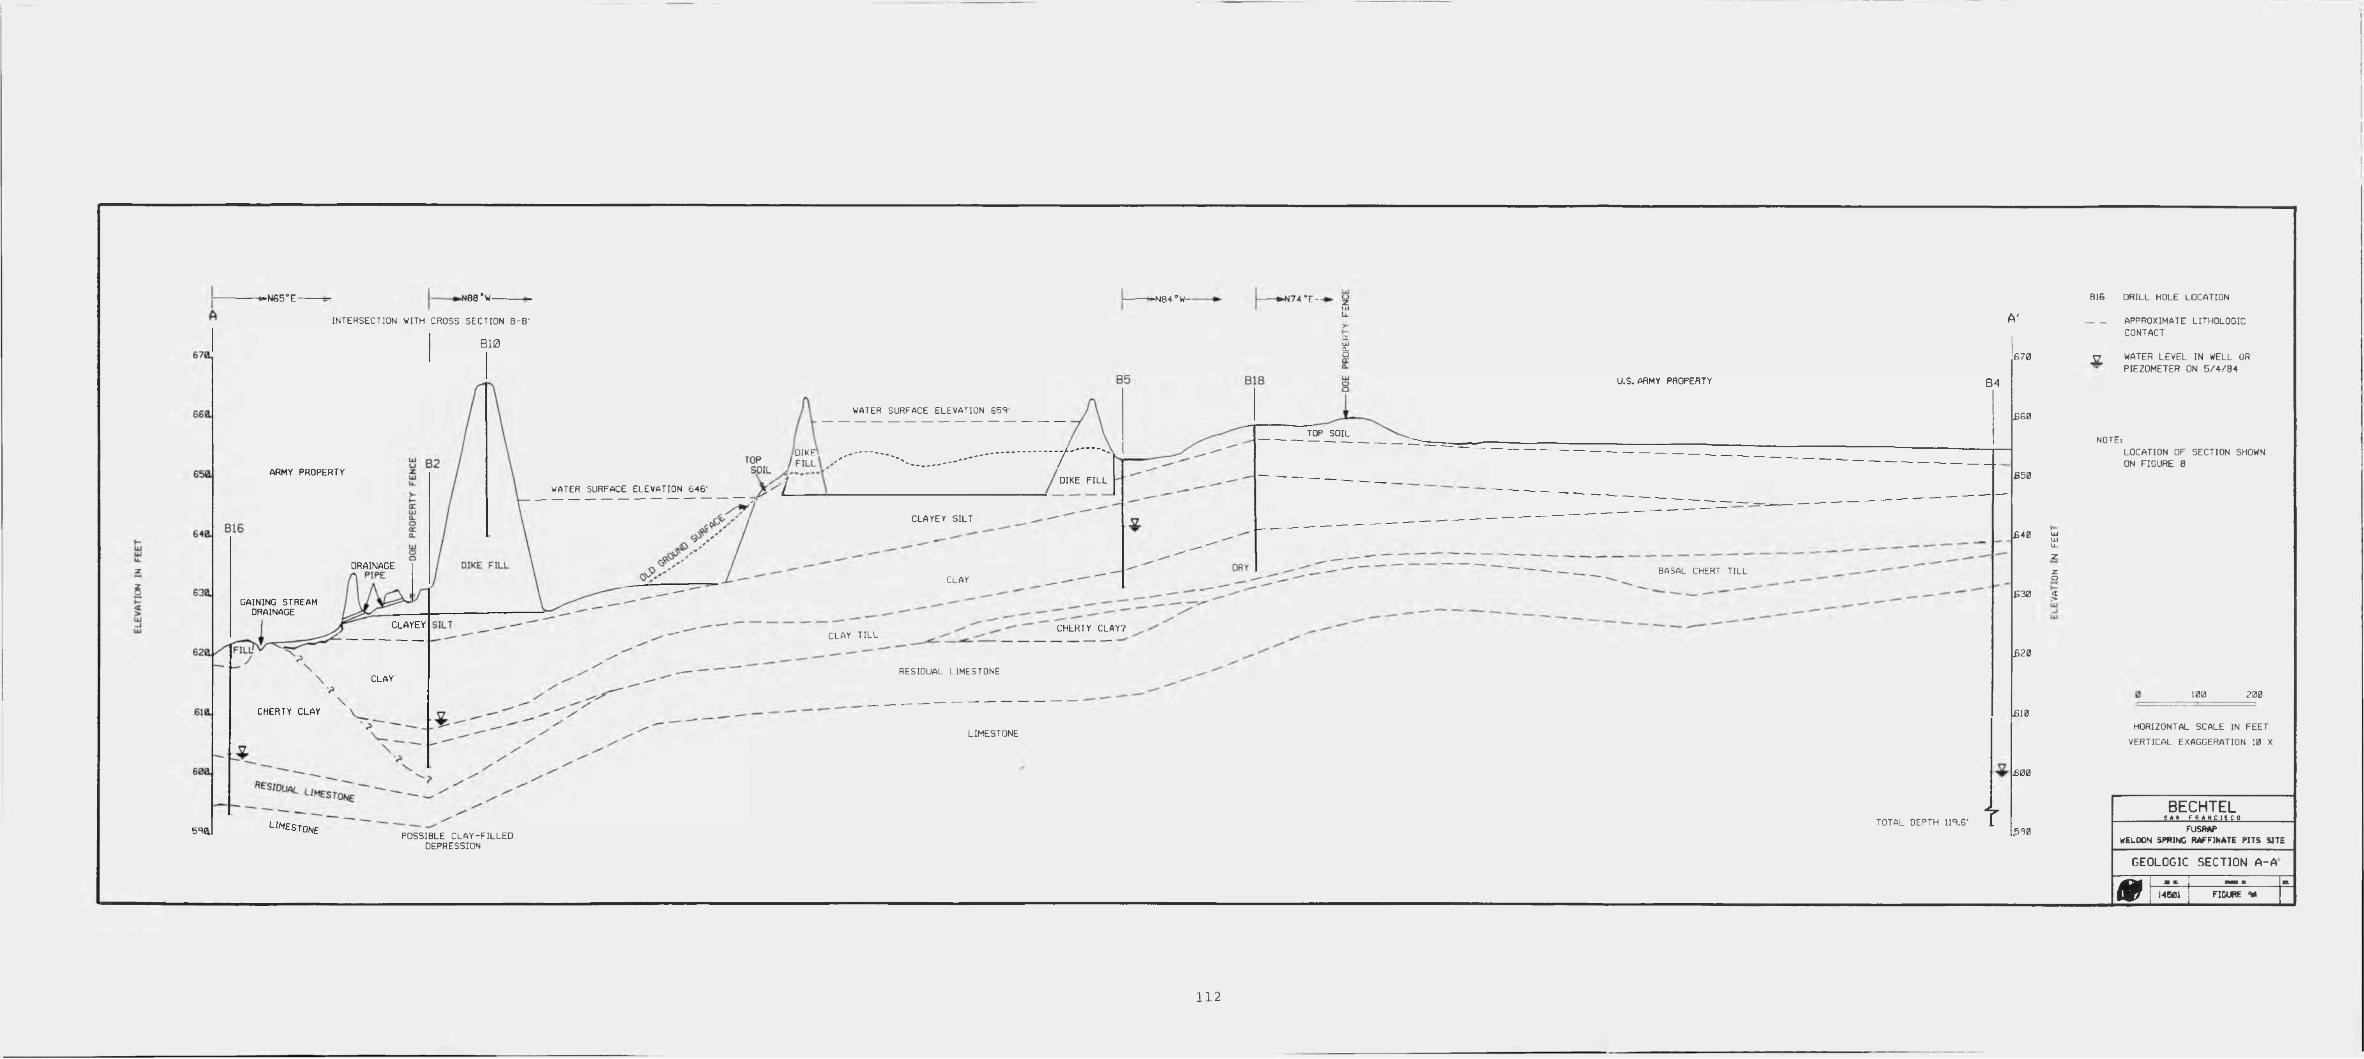
23
-i-N G B 'E - N88 "W- — -N84”W- °E—INTERSECTION WITH CROSS SECTION B-B'
B10A'
DIKE .
WATER SURFACE ELEVATION 646' jARMY PROPERTY
DRAINAGE PIPE
GAINING STREAM DRAINAGE
CLAYEY
CLAY
CHERTY CLAY
S/DL/AL
U ” £ S T O N £
auia.aB
WATER SURFACE ELEVATION 658
CLAYEY SILT
CLAY
U.S. ARMY PROPERTY
TOP SOIL
DIKE FILL
BASAL CHERT TILL
CLAY TILLCHERTY CLAY?
RESIDUAL LIMESTONE
LIMESTONE
ssa TOTAL DEPTH 118,,e- iPOSSIBLE CLAY-FILLED
DEPRESSION
670
£60
£50
£40 y u_ zzo
£30 c
£20
£10
£00
.530
BIG DRILL HOLE LOCATION
APPROXIMATE LITHOLOGICCONTACT
V WATER LEVEL IN WELL OR PIEZOMETER ON 5 /4 /8 4
NOTE:LOCATION OF SECTION SHOWN ON FIGURE 8
100 200HORIZONTAL SCALE IN FEET
VERTICAL EXAGGERATION 10 X
BECHTELSAN FAANCiflCOFUSRAP
WELDON SPRING RAFFINATE PITS SITE
GEOLOGIC SECTION A-AMM M B HM » na9 14601 FIGURE *
112
►N7°W 4"E -
B INTERSECTION WITH CROSS SECTION O-O' B'G70
INTERSECTION WITH CROSS SECTION A-A'
DIKE
FILLDIKEFILL
821G5E OLD/GROUND SURFACEWA^ER SURFACE ELEVATION 6 *6 'TOP SOIL-i
B2 540
OLD GROUND SURFACE-
2 530 z636zo
LU_JUl320
sit
POSSIBLE CLAY-BILLED DEPRESSION
680TOTAL DEPTH SR.l' .TOTAL DEPTH 9A.4
817 DRILL HOLE LOCATION
APPROXIMATE LITHOLOGICCONTACT
U WATER LEVEL IN WELL ORPIEZOMETER ON 5 /4 /8 4
NOTE:LOCATION OF SECTION SHOWN ON FIGURE 8
100 200
HORIZONTAL SCALE IN FEET
VERTICAL EXAGGERATION 10 X
BECHTELS A N F R A N C I S C O
FUSRAPWELDON SPRING RAFFINATE PITS SITE
GEOLOGIC SECTION B-B'
0 14561 FIGURE SB
113
ELEV
ATIO
N IN
FEET
-N3°W~ *N4°E- 4 4 ►N6 W—
670,
6 6 0
650
640
6 3 0
6 2 0
6 1 0
600
5 9 0 1
8 2 3FIELD OFFICE LOCATION
L M TS OF RAFFINATE PIT NO. 3
CLAYEY SILT
DIKE FILL
: lay t il l
---------------------BASAL CHERT TILL
CHERTY CLAY RESIDUAL SOIL
- MESTONE
TOTAL DEPTH 90.7
,£70 B20 DRILL HOLE LOCATION
APPROXIMATE LITHOLOGICCONTACT
U.S. ARMY PROPERTY
_TOP SOIL____
CLAYEY SILT
NO TOPOGRAPHIC DATA AVAILABLE
B3
CLAY
CLAY TILL
Tiu
c^ERTY CLAY?
TOTAL DEPTH 101
£60
£50
£40
£30 zz oc > l i i£20 fl
£10
£00
£90
TOTAL DEPTH 150.5' T
T7 WATER LEVEL IN WELL ORPIEZOMETER ON 5 /4 /8 4
NOTE:
1. LOCATION OF SECTION SHOWN ON FIGURE 8
2. ELEVATION OF THE WATER 63 WAS 582.8 FEET ON 5 /4 /8 4
0 100 200
HORIZONTAL SCALE IN FEET VERTICAL EXAGGERATION 10 X
BECHTELS»N F m c i s n
weldcnFUSRAP
SPRING RAFFINATE PITS SITE
GEOLOGIC SECTION C-C'I a b mm b B
m 14601 FIGURE AC
114
■N70 W-H - ►N82°V b N48°W- - N81 F -N84°E----►
INTERSECTION WITH CROSS SECTION B-B '
B13B12
160624
DIKEFILL B22 TR12B17
DIKE FILL652 350
LAND FILLCLAYEY SILT642 340uj
CLAYu_z
DRYzot-<33UJ
CLAY TILL 330
UJ •DRY
BASAL
622 320CHERTY CLAY RESIDUAL SOIL <?!RESIDUAL LIMESTONE
LIMESTONE
603 300
TOTAL DEPTH RS.l
z
z
TR12 TRENCH LOCATION
B24 DRILL HOLE LOCATION
APPRCXIMATE LITHOLOGIC CONTACT
V WATER LEVEL IN WELL ORPIEZOMETER ON 5 /4 /8 4
NOTE:
LOCATION OF SECTION SHOWN ON FIGURE 8
100 200HORIZONTAL SCALE IN FEET
VERTICAL EXAGGERATION 10 X
BECHTELS a 1 F R A N C I S C O
FUSRAPWELDON SPRING RAFFINATE PITS SITE
GEOLOGIC SECTION D-D'
ma b MM « t t
14501 FIGURE AD
1 1 5
LOW VELOCITY LAYER I 2 O0 - 1000 F T / S E C
E X P L A N A T I O N
^ t> CONTOUR SHOWING THE APPROXIMATE
/ ELEVATION OF THE TOP OF THE LOW
/ ' VELOCITY LAYER. QUERIED WHERE
INFERRED.
Z
AREA WHERE LOW VELOCITY MATERIALS DO NOT EXIST
f4
I
100 2 0 0 3 0 0 4 0 0
SCALE IN FEET
CONTOUR INTERVAL = 5 FEET
B E C H T E LS A N F R A N C I S C O
FUSRAPWELDON SPRING RAFFINATE PITS SITE
TOP OF TT£ LOW VELOCITY LAYER
l#5» FIOFE m
1 1 6
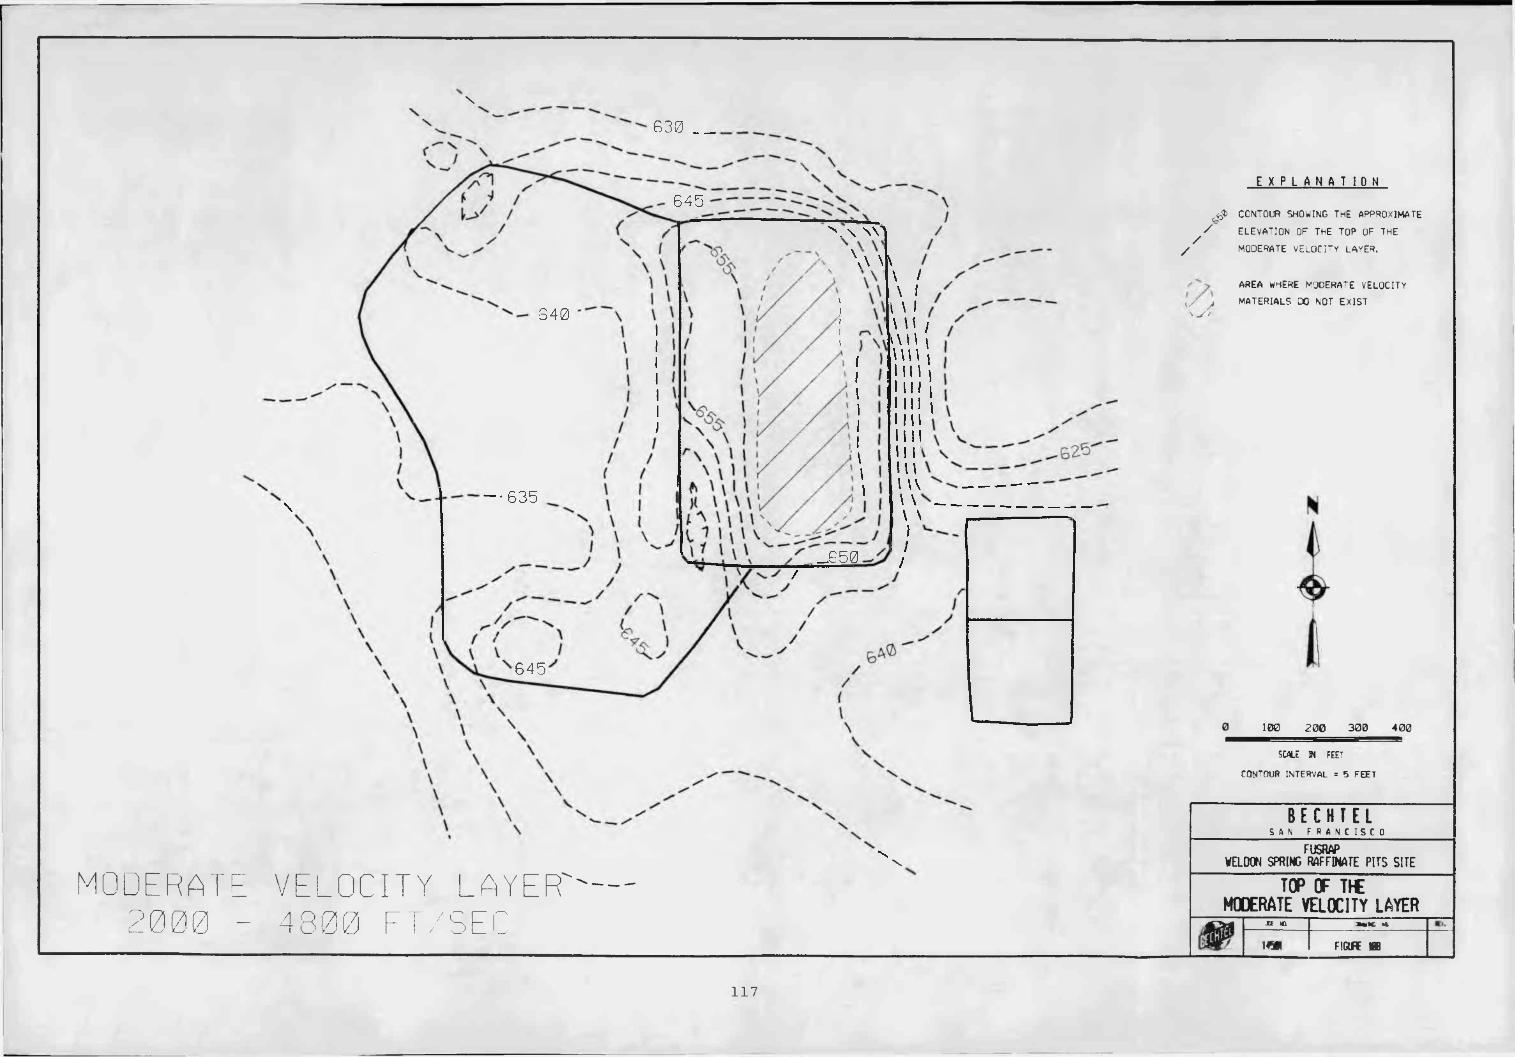
X
630 _ _
645
\
540 \\1 , l\lli \Ul . u n i 1111 imi iMil im i xII ix - in x 1 w v\ \ n _- • 6 3 5
.650
\
MODERATE VELOCITY LAYER"------2 0 0 0 - 4 8 0 0 F T / SEC
x
/ Zz
E X P L A N f t T I 0 N
^ CONTOUR SHOWING THE APPROXIMATE ELEVATION OF THE TOP OF THE MODERATE VELOCITY LAYER.
'/ zw /AREA WHERE MODERATE VELOCITY MATERIALS DO NOT EXIST
100 2 0 0 3 0 0 4 0 0
SCALE W FEET
CONTOUR INTERVAL = 5 FEET
B E C H T E LBAN FRANCISCOFUSRAP
WELDON SPRING RAFFDWIE PITS SITE
TOP OF TT€ MODERATE VELOCITY LAYER
C M jo to AbtC 4\*M F10FE »
1 1 7
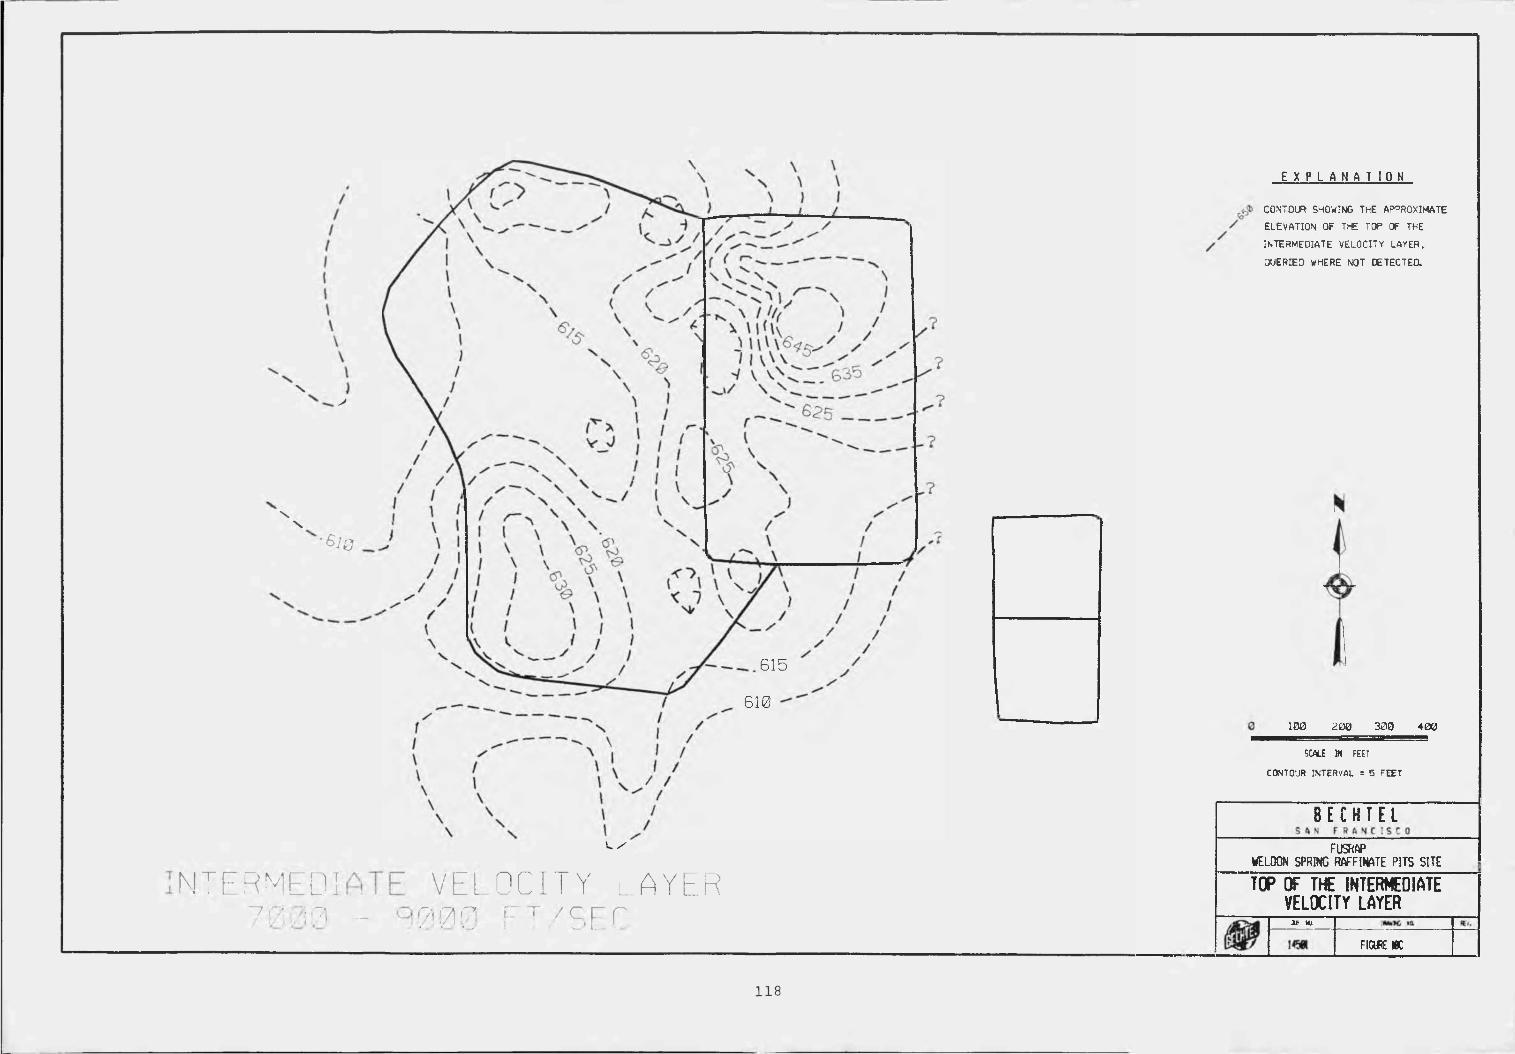
\V
\ \6lQ
J 1 \' \/ I V \
L /
NTERMEDI7 17ii7!i71 -
VELOCITY l AYER 0 0 0 F T / S E C
«-<fc CONTOUR SHOWING ThE APPROXIMATEoELEVATION OF ThE TOP OF THE
INTERMEDIATE VELOCITY LAYER.
QUERIED WHERE NOT DETECTEa
330200 4 0 0
SCALE W FEET
CONTOUR INTERVAL = 5 FEET
B E C H T E LFUSfttf
WELDON SPRING RAFFINATE PITS SITE
TOP OF THE INTERMEDIATE VELXITY LAYER
H i
1 1 8
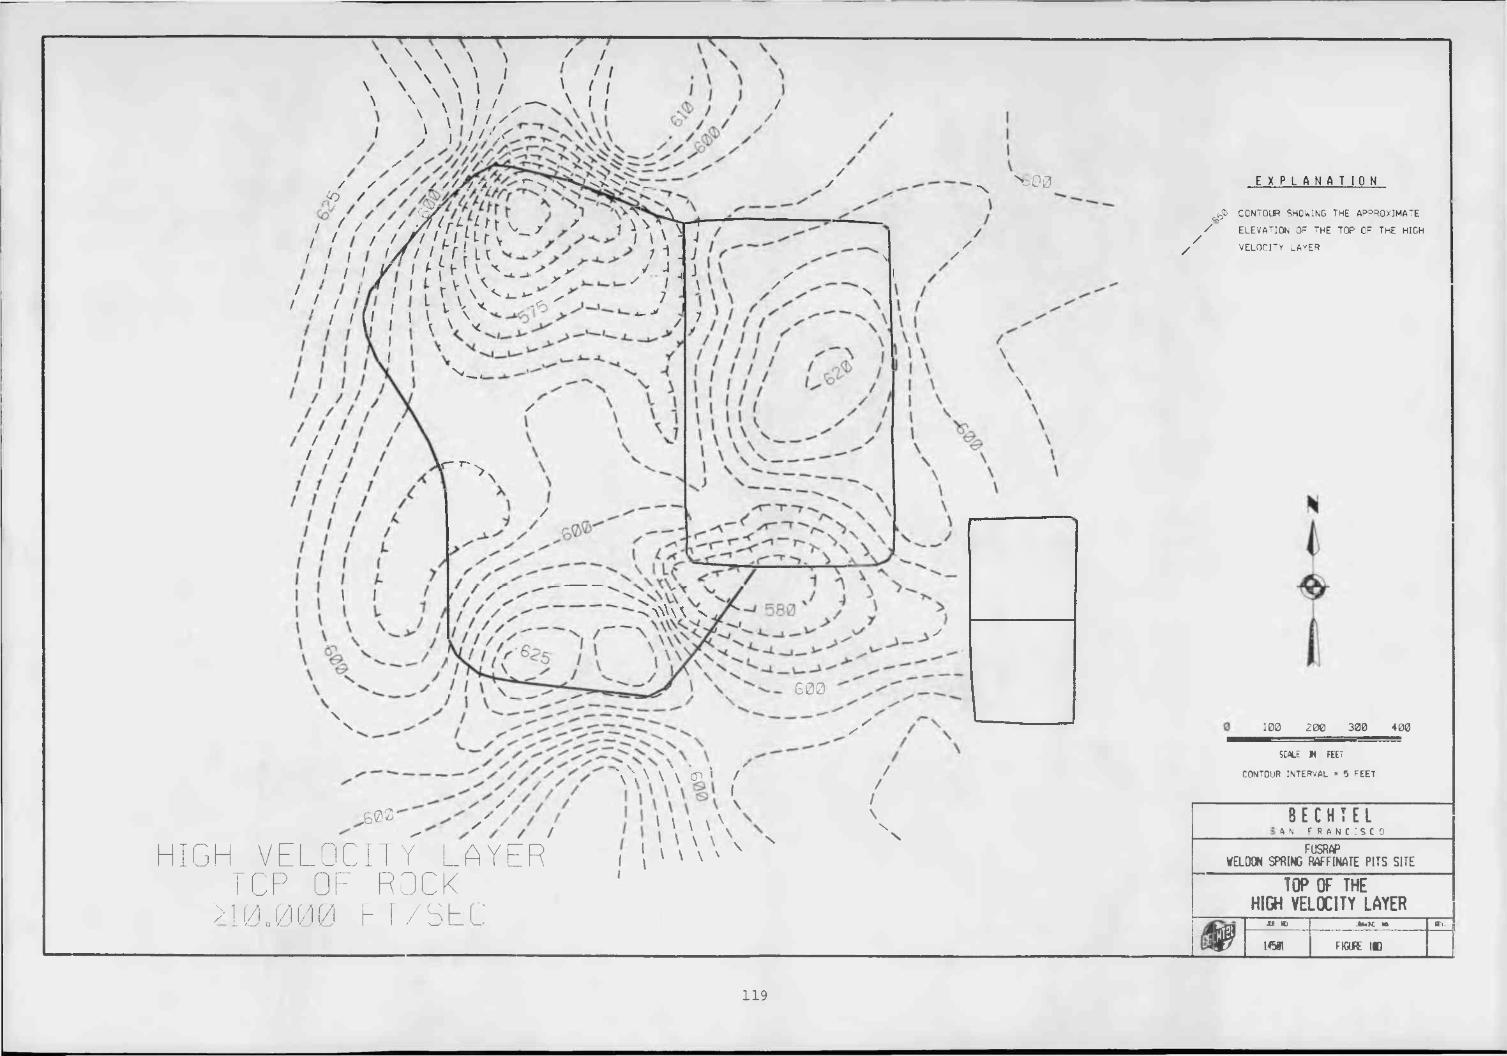
\ V l / y
' * , / / & */ // / / / / /S/ 7 , n , 1 \VJ w N i ■ V , ______________
/ / / / / f f t r L \ L r f x, 7 z i T v ^ n r */ / I ' / < h \irv - i i V Jz ' I / / / ifr u ; i . j
! ' 1 / X M ' < x — ' r ' / - I - ' '/ ' I 1 / I 1 r v \ < < ' 'z / z III, Iv rv \,\ --X y J
1 '(! 1 \ X \ “ / /
y x >B00
\y / X
yy/ yy
E X P L A N A T I O N
^ CONTOUR SHOWING THE APPROXIMATE
y ELEVATION OF THE TOP OF THE HIGH
v e l o c it y l a y e r
N z _ ,
y/ / / / \c" r>> \
I I
/
- -
600
y
x \ / /
,603 '
HIGH VELOCITY LAYER TCP OF ROCK
> 1 0 . O f O 0 F I / S '
V \ ' * * /\ \ \ \ \ <p I /
\ \ wI 1 ' ' \ '
N
\
100 2 0 0 3 0 0 4 0 0
SCALE W FEET
CONTOUR INTERVAL = 5 FEET
B E C H T E LAN F R A N C I S C O
FUSRAPWELDON SPRING RAFFINATE PITS SITE
TOP OF THE HIGH VELXITY LAYER
Jte m J M K W. to.F 145« FIGURE IB
119
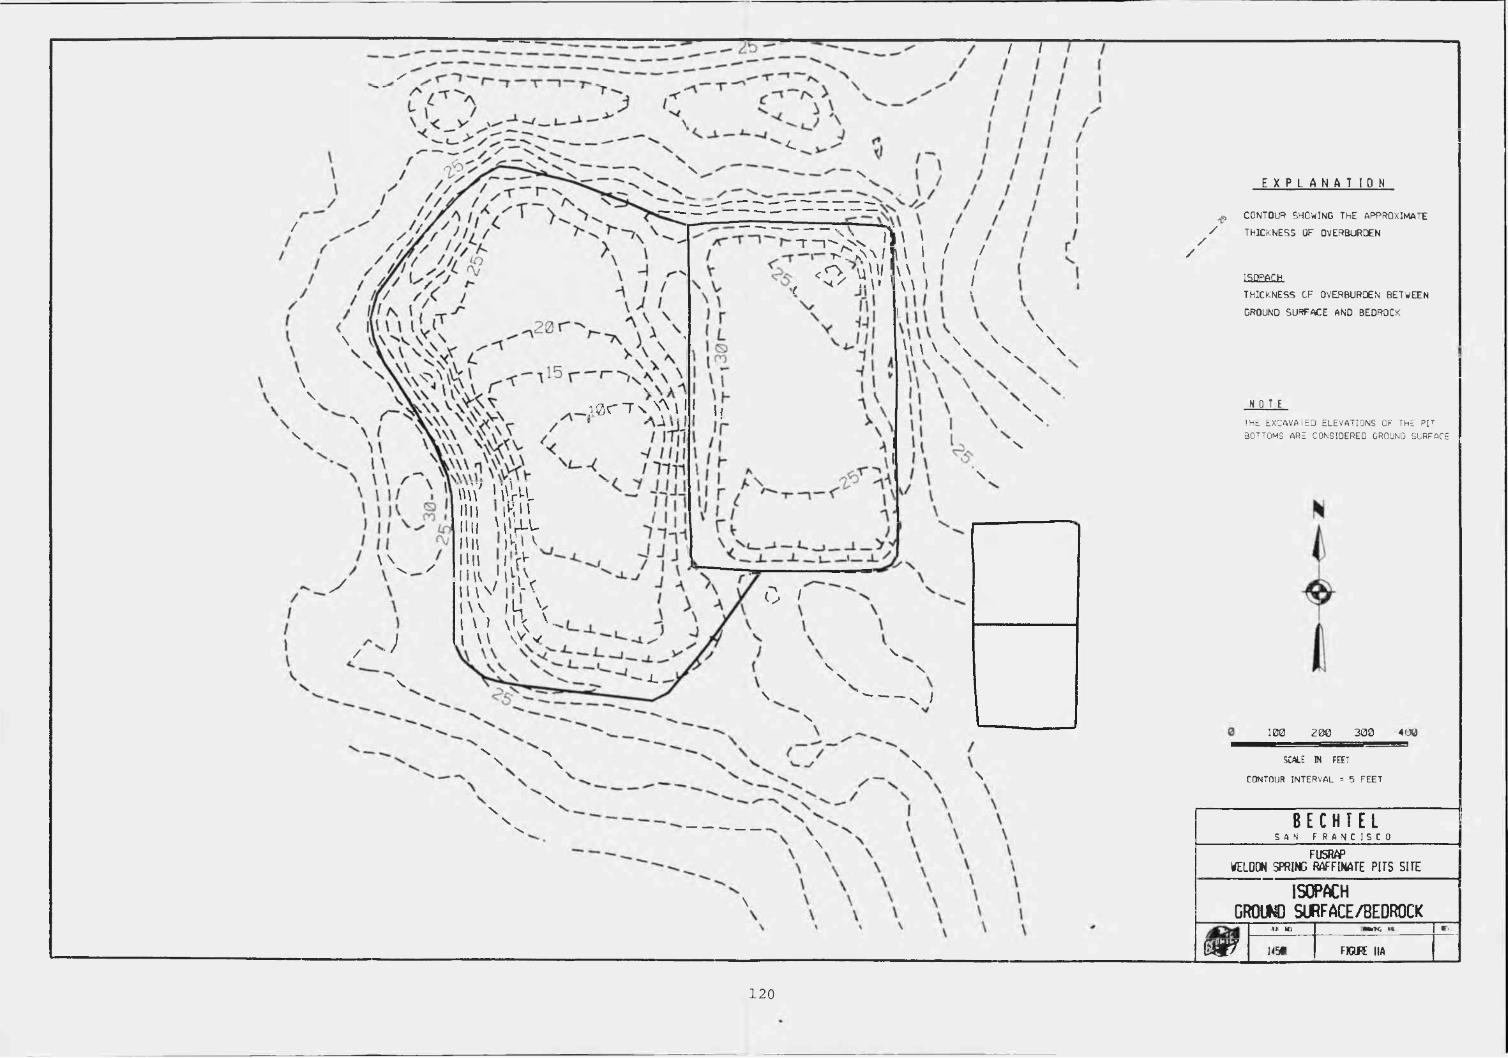
I T
/'
/
\
\\
X
•CX X
V ^ x T T * ' ' /t-Xxn I f I I I / < 0 \iH I 1\ \ I 1 /, N / V.v i v i /
‘ X l a r T s ^ i i ; „
\\ X zy
/ .)
mY 1 i' V'-Lnii fin llll 'l 4-L MU iHI t lilt I ft-H W ' lV»V m V I f .n\ iK Vi t i \ i \ v1 t t \ V V
i; i \ \ x\ \
\ X
XX
X
X
0 I
XX
X JL XX
XX
X X XX
'■--------------- X I
XX
XX
XX
X
\
zzz
E X P L A N A T I O N
CONTOUR SHOWING THE APPROXIMATE
THICKNESS OF OVERBURDEN
ISCPACHTHICKNESS OF OVERBURDEN BETWEEN
GROUND SURFACE AND BEDROCK
NOTETHE EXCAVATED ELEVATIONS OF THE PIT BOTTOMS ARE CONSIDERED GROUND SURFACE
100 2 0 0 3 0 0 4 0 0
SCALE IN FEET
CONTOUR INTERVAL = 5 FEET
B E C H T E LS A N F R A N C I S C O
FUSRAPWELDON SPRING RAFFINATE PITS SITE
ISOPACH GROUND SURFACE/BEDROCK
te u IMK II C-.m 14561 rtm iia
1 2 0
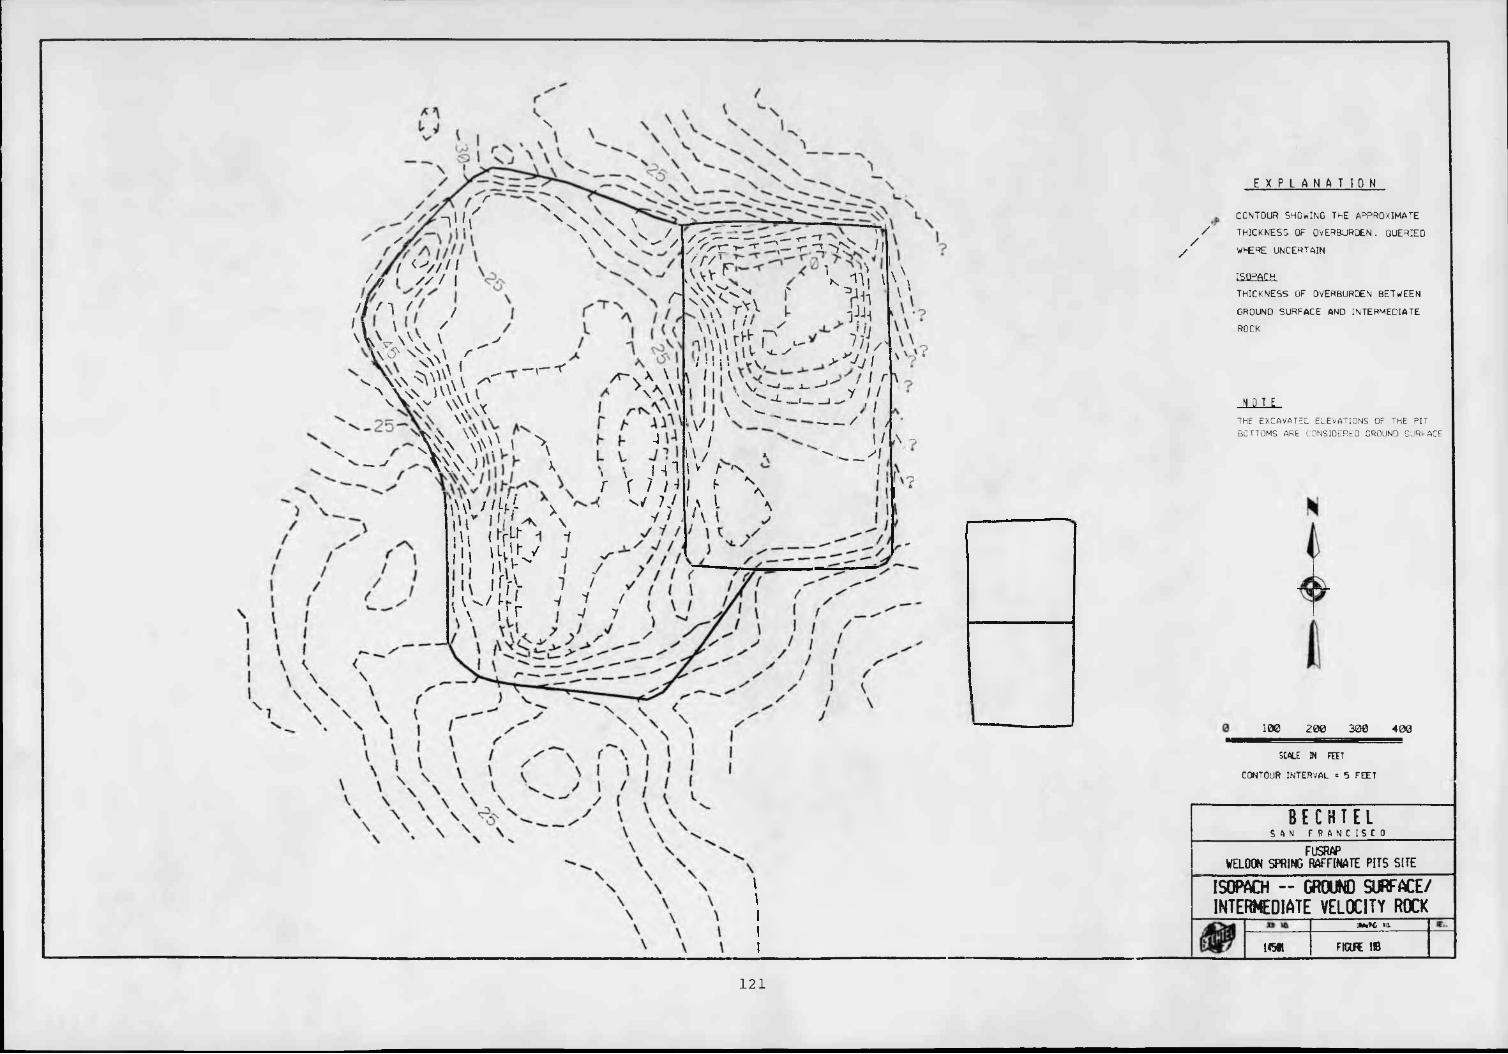
x
r
i!(i/ X X
X' x N - V \
/ i
/ '// I n f /1 \ V ' z\ V V \ X \ \ ^
^ xt x x\ {x \\\ V\\\ \ Z'" \\\\ l<X\v V
x V V VV\X xX '
x \ N X / N. \ \ ^ /
r
' r/'rTA w xx ^ v r\\\ r)\ \.
-i— r
X V
4 * v \ ' x\ i x \ n ;
> > ? t \A V / ' k - x x / ,;> ' A I x W r i ’H ' K s f J i i W v
'/S & & & Z . ? 5 x x T i i/V 11* i \
— r f t 'w \ \ i // v
f k f i y ' J i r
\ \ \ \ ^ t ^ nV I ‘ — / I >\ I I /L\ ~\ / A X y /
I V A ' X |
,\r \i\j (Ifp" -1 i
111 1 J">/ J vi i ' 1: / yI I f f - 7 /i s / t v V z
\ x t! r i v 7
///
E X P L A N A T I O N
CONTOUR SHOWING THE APPROXIMATE
THICKNESS OF OVERBURDEN. QUERIED
WHERE UNCERTAIN
ISQpftCH.
THICKNESS OF OVERBURDEN BETWEEN
GROUND SURFACE AND INTERMEDIATE
ROCK
NOTE
THE EXCAVATED ELEVATIONS OF THE PIT BOTTOMS ARE CONSIDERED GROUND SURFACE
100 2 0 0 3 0 0 4 0 0
SCALE IN FEET
CONTOUR INTERVAL = 5 FEET
B E C H T E LS A N F R A N C I S C O
FUSRAPWELDON SPRING RAFFINATE PITS SITE
ISOPACH - GROUND SURFACE/ INTERMEDIATE VELOCITY ROCK
145K
hum, iiFIGUE IB
1 2 1
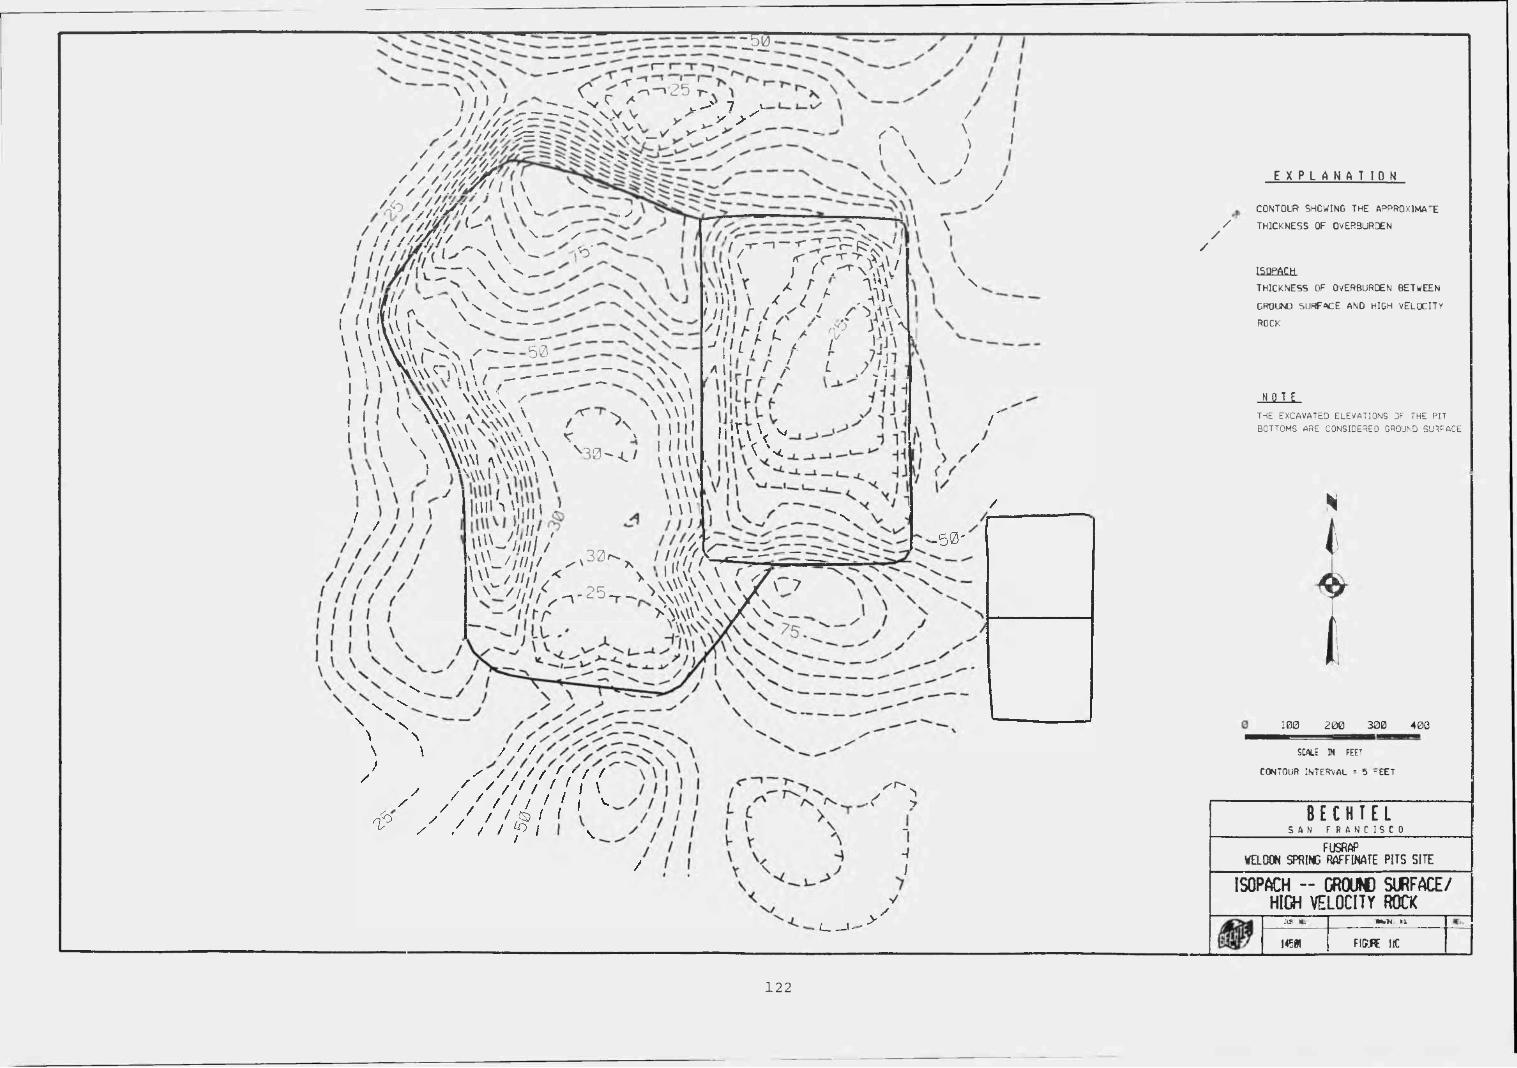
X* 1 • ■ I
'Y, / V r V '- '25 ^I / i,7 — — 'V ' <*, / / / — ^ \ V Vy V / / / / — \ v J v y >-J/ / /y//Z^= X — ✓ ^ ^
'''''7/4'^/ / / / S W ' i i \
/ a '/ / / m s ' v X ./ /y/zyfv \ \ x
\ V - \X:-f U F C ^ " -I ' l l \ V i < ^ - ---------
\ V ^ (V ~ - - 5b
\
. y/
/
r \
A '
\
/\
\/
I
I
\ .y
/y
i ', vXx\\n\\'w- r - r -! i i' vv\\ X\XV\ -r "- i t x w s ^ v r x
l ' { l l r B i V
' ' 'I t W . \ \ I ■ M 1 *
x x > \
xX v \ '\ \ W
r \ I U H' 3 0 ~ V KHl
' \ \ W\ WIllH Vj'jji ’ \\\
^ y l i i i ;
' / / ■ — i - - r ^ 3 r p R X v , '\ ( f f & M i
X r ;o'Y/ <; / . Y i
• Z Y V \L N
'Mi' \ < / / . i'M' i i r i ✓ X c A>in \s i U ' r f / < p A'VJ 'l i- ,L / ? i i i 11 * / / 7 nxi / yy i A 1
\
N
V V - / ; / / / ■ / ^ 3 0 ' - > . '(({ifty
\ V ^ n.25_ \ ^ ^ o- i rr >.W'VN.\X XN-
' ' / I l l' / '/d
y ^ 3
"I
- /
/V
< i- > y
y
E X P L A N A T I 0 N
CONTOUR SHOWING THE APPROXIMATE
y THICKNESS OF OVERBURDEN
yISOPACH
THICKNESS OF OVERBURDEN BETWEEN
GROUND SURFACE AND HIGH VELOCITY
ROCK
NOTE
THE EXCAVATED ELEVATIONS OF THE PIT BOTTOMS ARE CONSIDERED GROUND SURFACE
Nt
- % >
1
100 2 0 0 3 0 0 4 0 0
SCALE IN FEET
CONTOUR INTERVAL = 5 -EET
B E C H T E LS A N F R A N C I S C O
FUSRAPWELDON SPRING RAFFINATE PITS SITE
ISOPACH - GROUND SURFACE/ HIGH VELOCITY ROCK
JIB * . * * N , WDl
14501 1 FIGURE 1IC
1 2 2
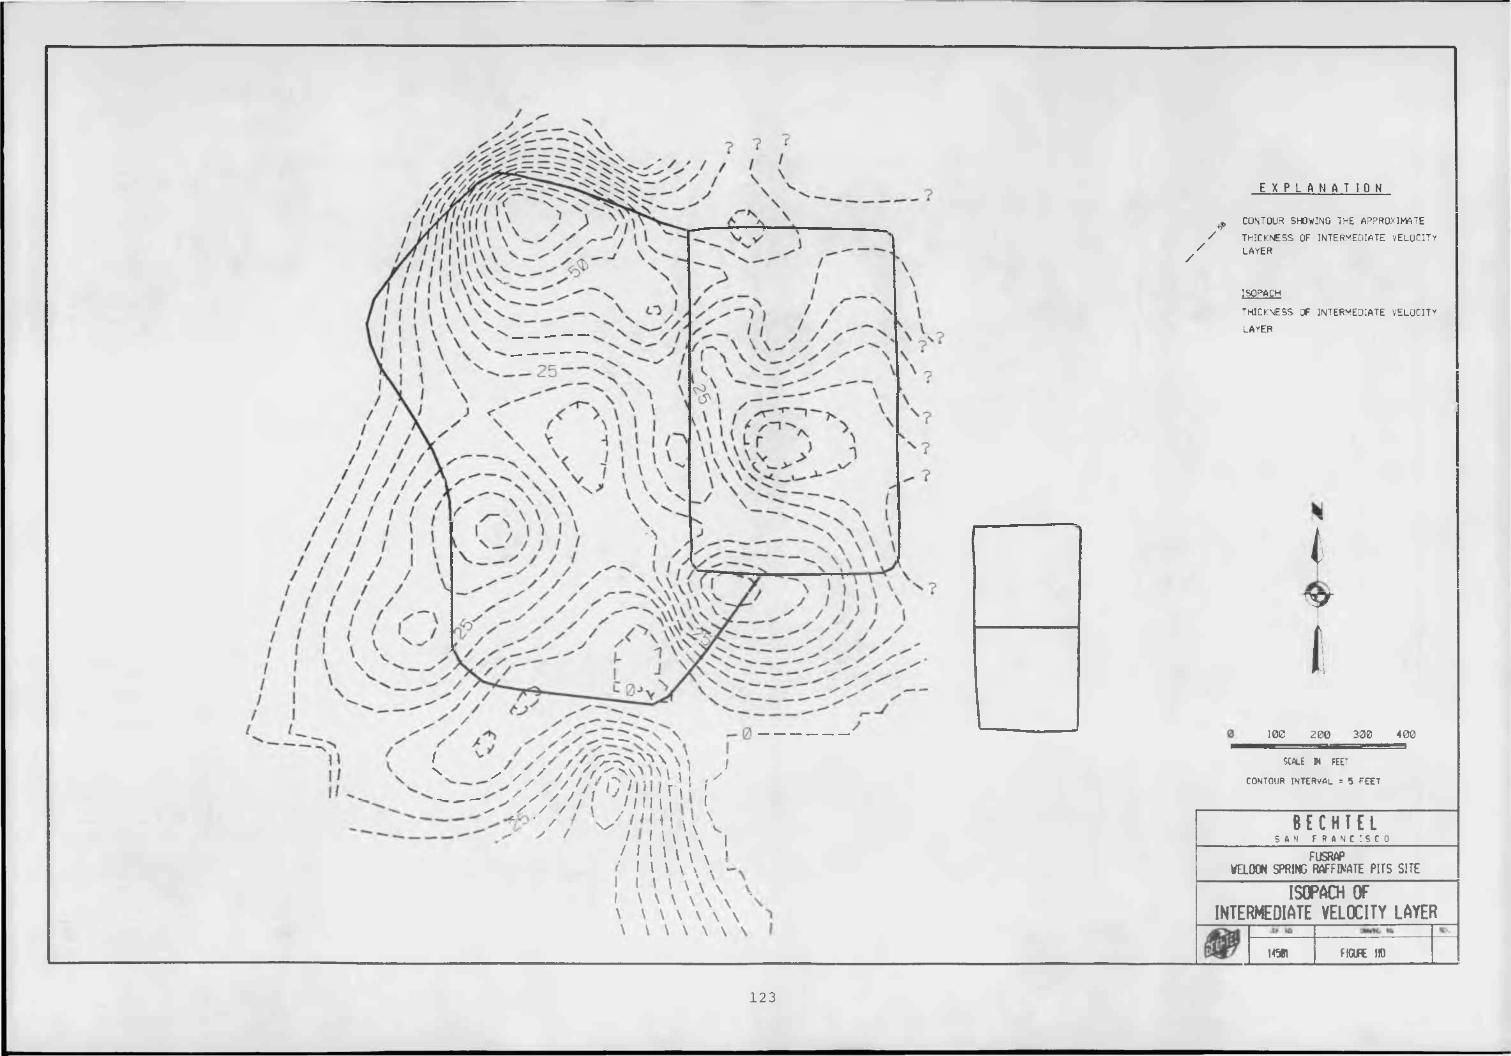
- ® 1 '
' V \ \ \ \ C w > - V /
v V X V T r r r x
ZZ C s \|
/ y / / / / Z ^ > x . X t I : . y V / / / / i ly r» I 'Z/// /'II11 I^ • z / V ^ 1 '! Vx X' ' ' 1 1 l M \ l/ M 1 ! \ \
/ i i \ x X X ;I I M \ \ \' \ V \ \ \ \ ’
v \ \ \ \ \ \X X \ \ \ \ \
/ z
E X P L A N A T 1 0 NCONTOUR SHOWING THE APPROXIMATE
/ THICKNESS OF INTERMEDIATE VELOCITY LAYER
ISOPACH
THICKNESS OF INTERMEDIATE VELOCITY
LAYER
I
YI100 2 0 0 3 0 0 4 0 0
SCALE W FEET
CONTOUR INTERVAL = 5 FEET
B E C H T E LS A N F R A N C I S C O
FUSRAPWELDON SPRING RAFFINATE PITS SITE
ISOPACH OF INTERMEDIATE VELKITY LAYER
14581 F K M t 110
1 2 3
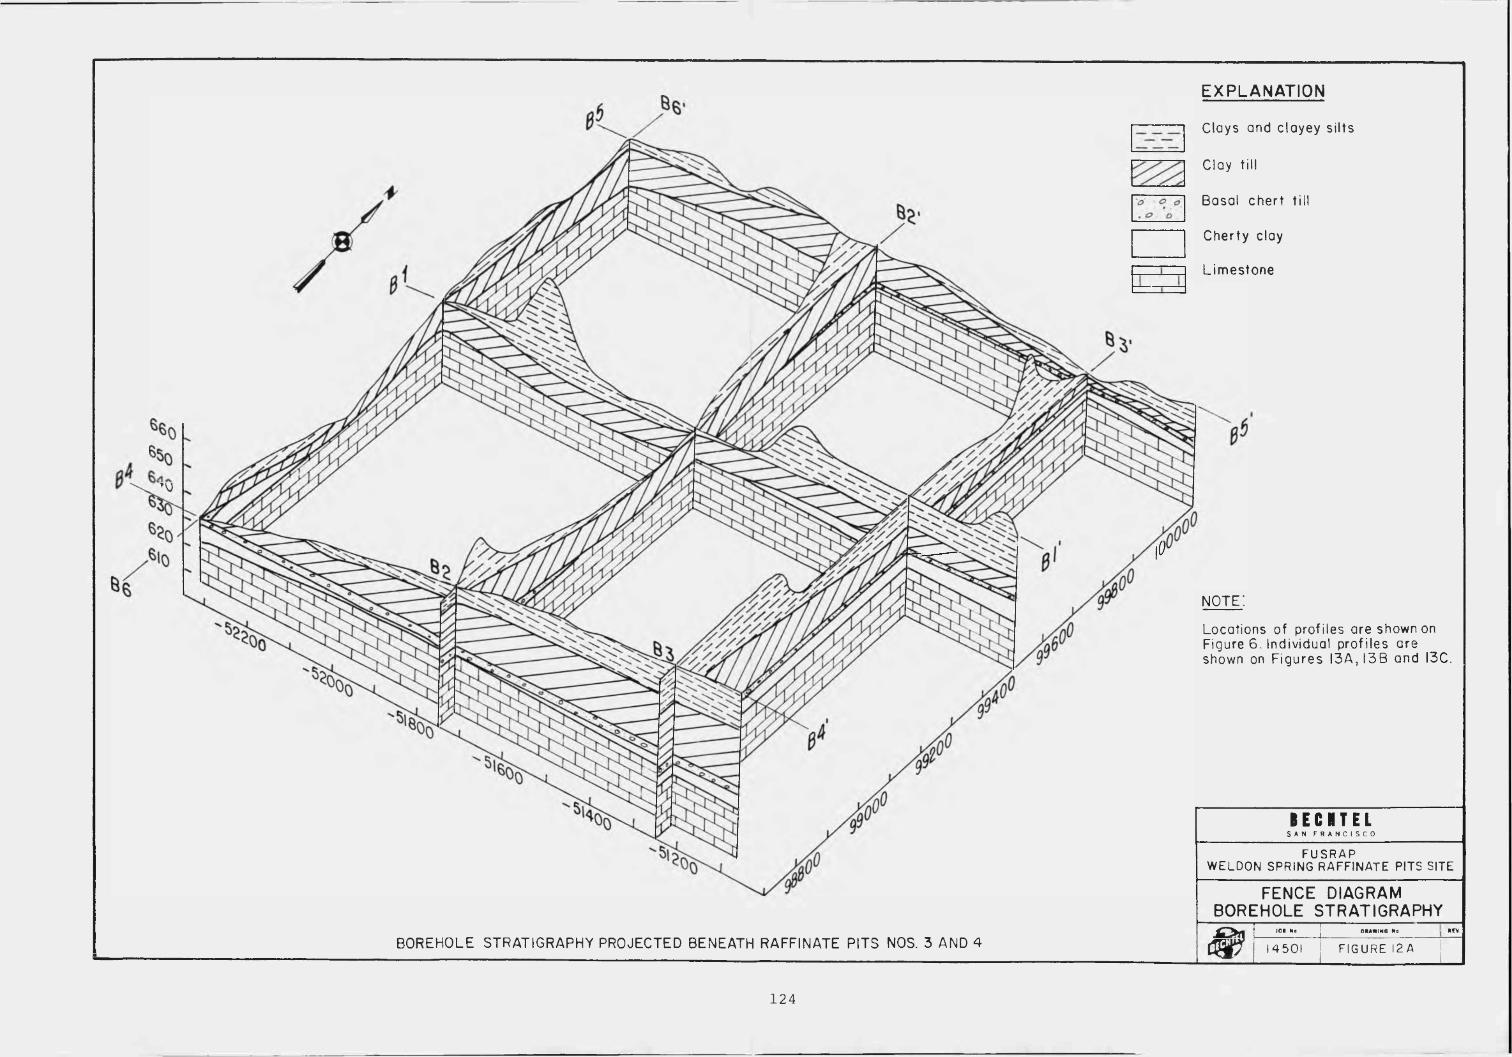
X -
EXPLANATION
Clays and clayey silts
Clay till
Basal chert till
Cherty clay
Limestone
n o t e :
Locations of profiles are shown on Figure 6. Individual profiles are shown on Figures 13A , 13 B and I3C.
BOREHOLE STRATIGRAPHY PROJECTED BENEATH RAFFINATE PITS NOS. 3 AND 4
B E C H T E LS A N F R A N C I S C O
F U S R A PW E L D O N SPRING R A F F I N A T E PITS SITE
FENCE DIAGRAMBOREHOLE STRATIGRAPHY£>ty JOS No. DRAWING NO. * r v
< w 1 4 50 1 F IG U R E 12 A
1 2 4
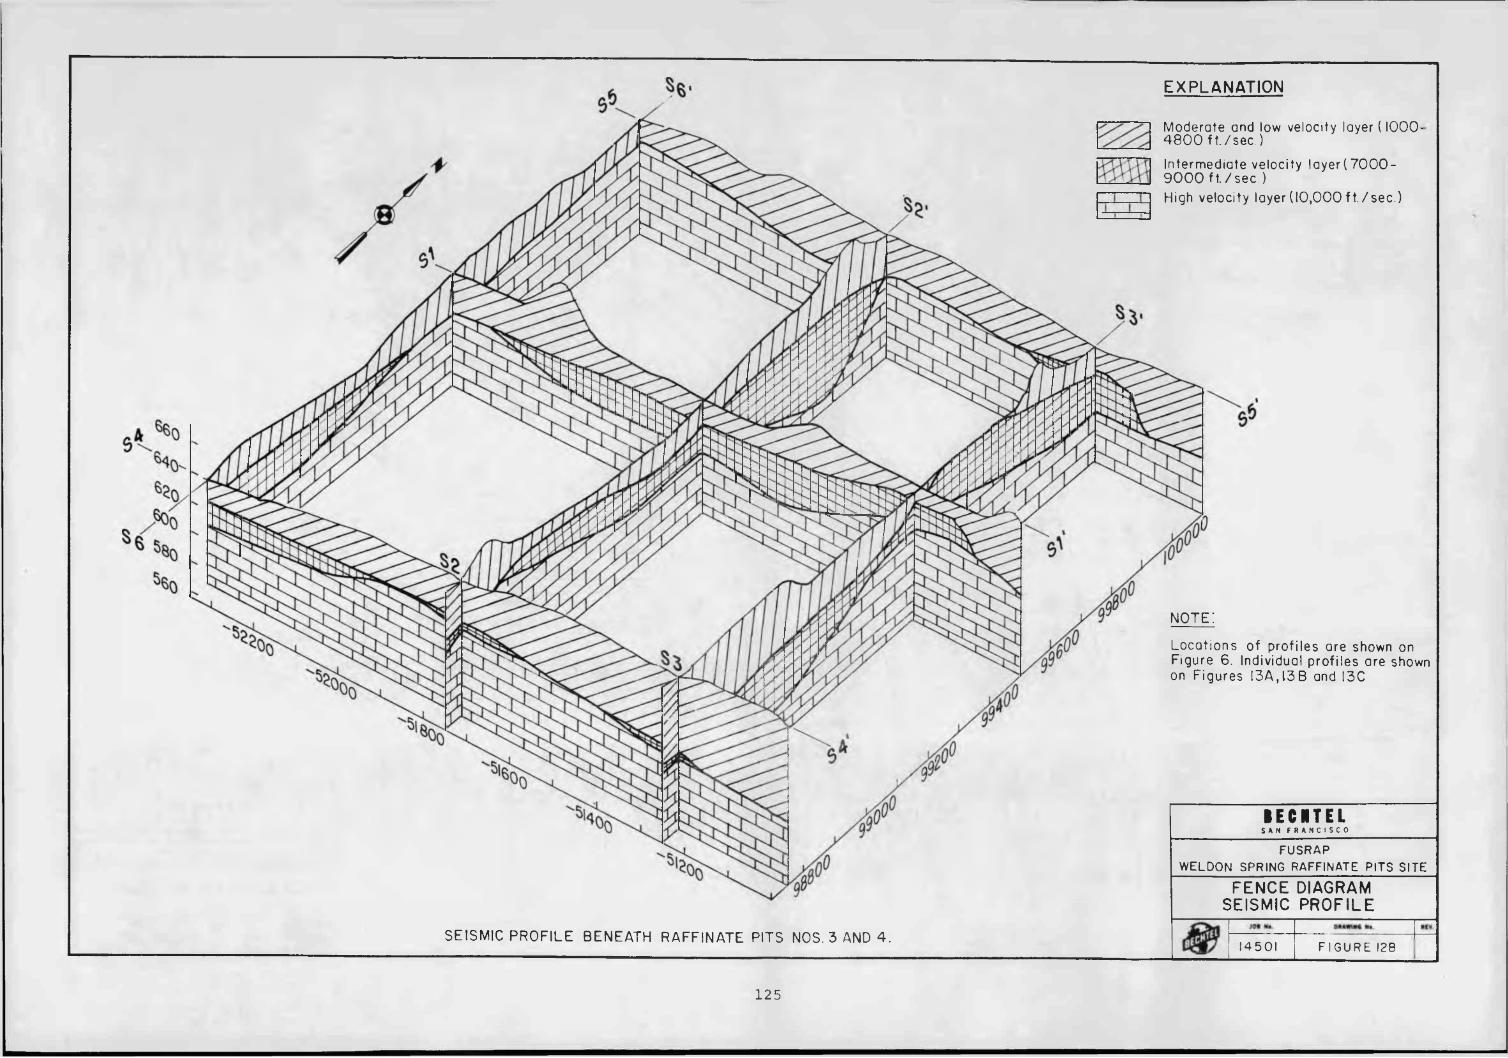
X.V
EXPLANATION
Moderate and low velocity layer ( IOOO- 4 8 0 0 f t . /sec . )
Intermediate velocity l a y e r (7 0 0 0 - 9 0 0 0 f t . /s ec . )High velocity layer(1 0 ,0 0 0 ft ./sec.)
n o t e :
Locations of profiles are shown on Figure 6. Individual profiles are shown on Figures I3A.13B and I3C
SEISMIC PROFILE BENEATH RAFFINATE PITS NOS. 3 AND 4.
B E C H T E LS A N F R A N C I S C O
F US RA PW ELD ON SPRING RAFFINATE P ITS SITE
FENCE DIAGRAM SEISMIC PROFILE
1 4 5 0 1 F I G U R E 128
125
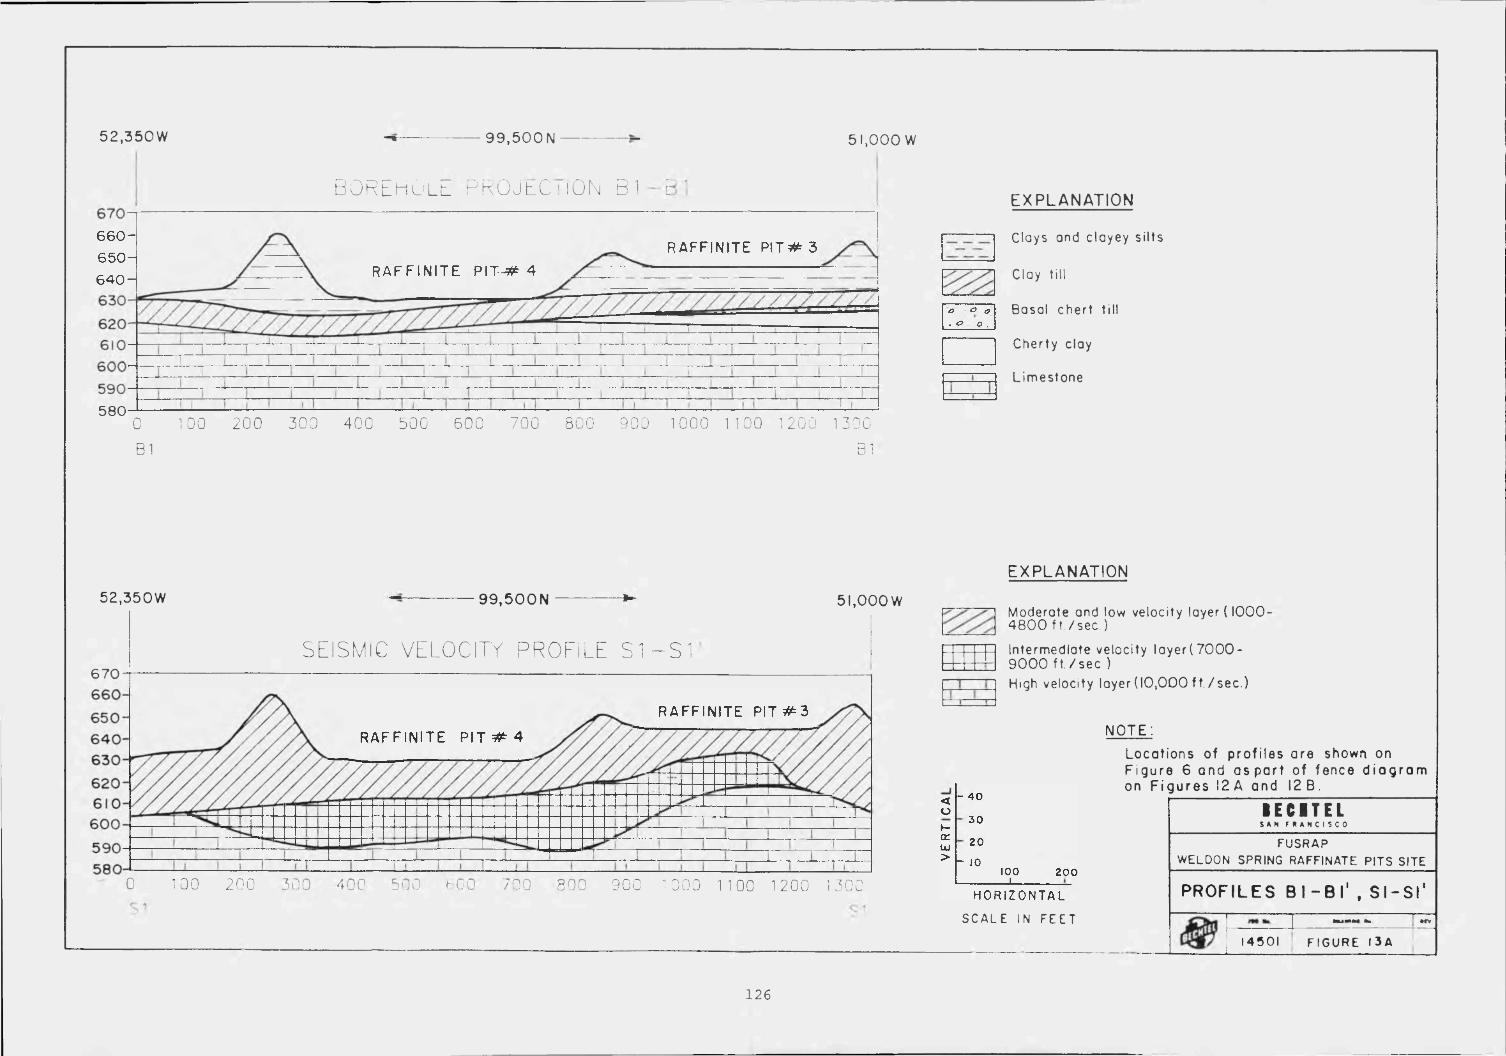
5 2 , 3 5 0 W ■» 9 9 , 5 0 0 N 5 1 , 0 0 0 W
5 8 0
B O R E h G l l P R O J l C I lON B 1 — E
6 6 0 -R AF F I N I T E P I T * 3
6 5 0 -RAF F I N I T E P I T - * 46 4 0 -
6 3 0 -
0 100 200 300 400 500 600 700 800 900 1000 1 100 1200 1300
B 1 B 1
EXPLANATION
Clays and clayey silts
Clay till
Basal chert till
Cherty clay
Limestone
EXPLANATION
Moderate and low velocity layer (1 0 0 0 - 4 8 0 0 ft. /sec.)
Intermediate velocity layer( 7 0 0 0 - 9 0 0 0 ft. /se c )High velocity layer (10 ,000 ft . /sec.)
- 4 0
- 3 0
or- 20
> _100 200
H O R I Z O N T A L
S C A L E IN F E E T
NOTE:
Locations of profi les are shown on Figure 6 and as part of fence d ia g r a m on F ig u re s 12 A and 12 B .
B E C I T E LS A N F R A N C I S C O
FU S R A PWE LDON SPRING RAFFINATE P ITS SITE
P R O F I L E S BI-BI' , Sl-Sl'» M » * N • » M Y
1 4 5 0 1 F I G U R E 1 3 A
R A F F I N I T E PIT * 3
R A F F I N I T E P I T * 4
5 2 . 3 5 0 W 9 9 . 5 0 0 N ----------------- * - 5 I . 0 0 0 W
SEISMIC VELOCITY PROFILE S 1 - S 16 7 0 -]--------------------------------------------------------------------------------------------------------------------------------------------------------------------------------i
0 100 200 300 400 500 600 700 800 900 1300 1100 1200 1300
1 2 6
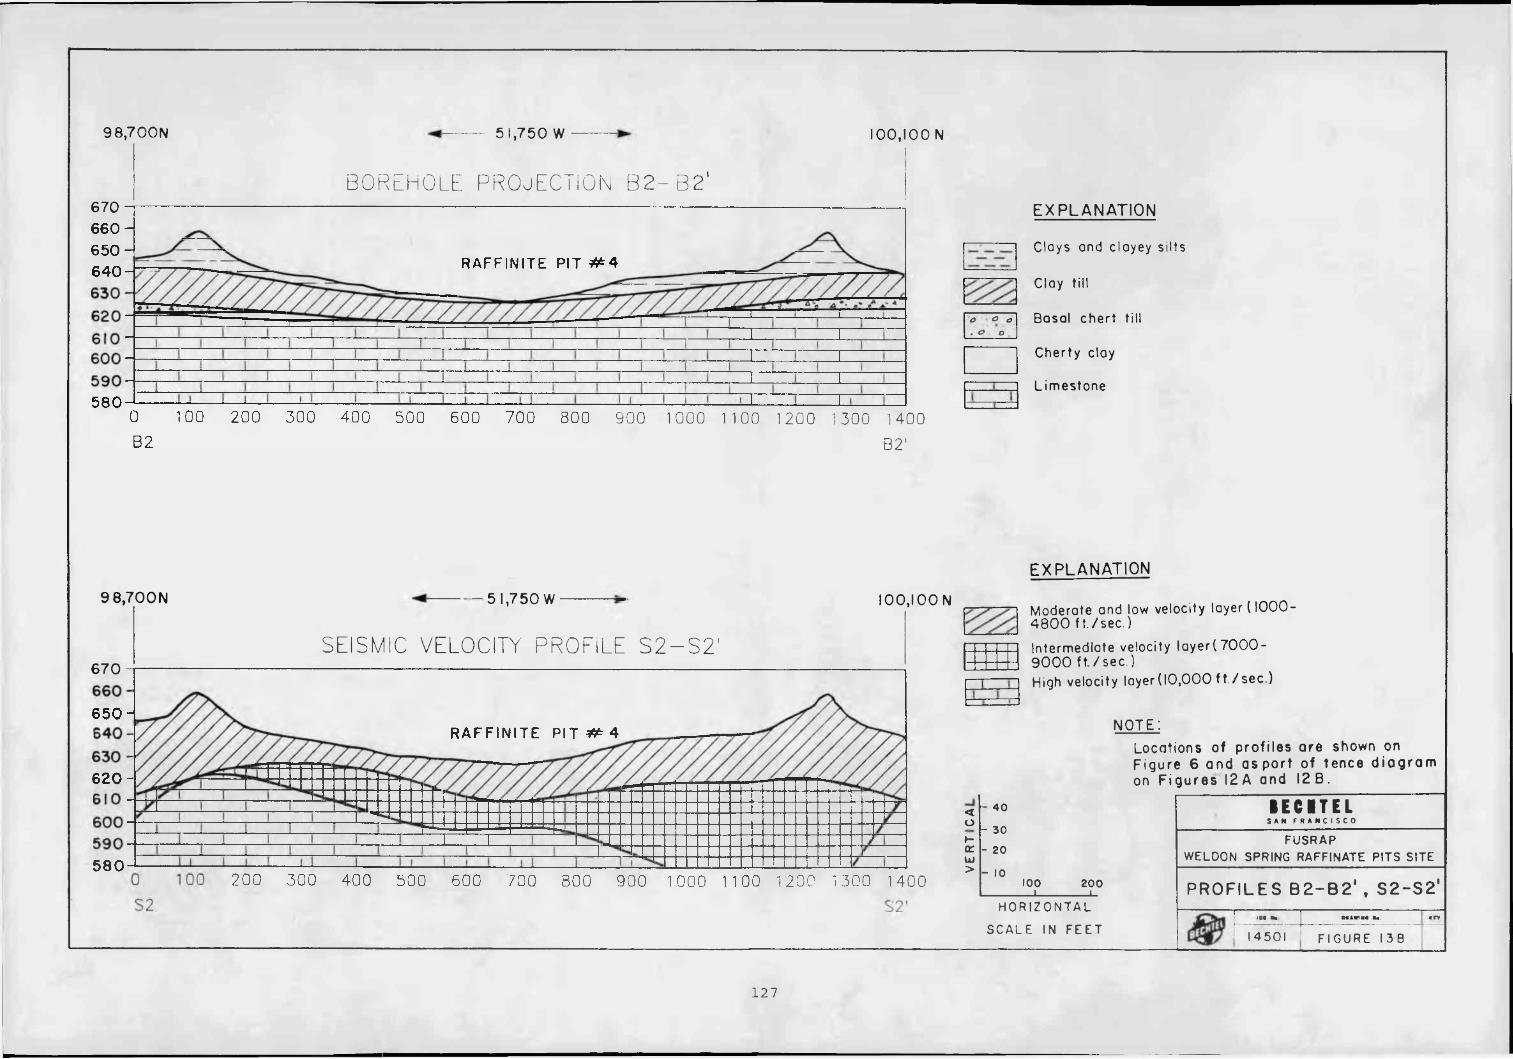
9 8 ,7 0 0 N 5 1 , 7 5 0 W
BO RE H O LE PROJECTION B 2 - B 2 '
1 0 0 ,1 0 0 N
6 7 06 6 0 -
6 5 0 -R A F F IN IT E PIT * * 4
O o o
. c> o
900 1000 1100 1200 1300 1400
B2'
9 8 , 7 0 0 N
6 7 0
- - 5 1,750 W 1 0 0 ,1 0 0 N
SEISMIC VELOCITY PROFILE S 2 - S 2 '
6 6 0 -
6 5 0 -5 4 0 - R A F F I N I T E P IT 4
6 3 0 -
6 2 0 -
1 3001000 1100 1400
<oH£CU J>
- 4 0
- 30
- 20 - 10
EXPLANATION
Cloys and clayey silts
Clay till
Basal chert till
Cherty clay
Limestone
EXPLANATION
Moderate and low velocity layer ( 1 0 0 0 - 4 8 0 0 ft . /sec.)
Intermediate velocity l a y e r ( 7 0 0 0 - 9 0 0 0 ft . /sec .)High velocity layerOO.OOO ft . /sec.)
NOTE:Locations of profi les are shown on Figure 6 and as port of fence d i a g r a m on F ig u re s 12 A and 12 B .
100 i— 200 L_
H O R I Z O N T A L
S C A L E IN F E E T
1 E C I T E LS A N F R A N C I S C O
F U S R A PWELD ON SPRING RAFFINATE P ITS S ITE
PROFILES B 2 - B 2 ' , S 2 -S 2 'i ce « • H t w t N I We. ■r>
1 4 5 0 1 F I G U R E 1 3 8
1 2 7
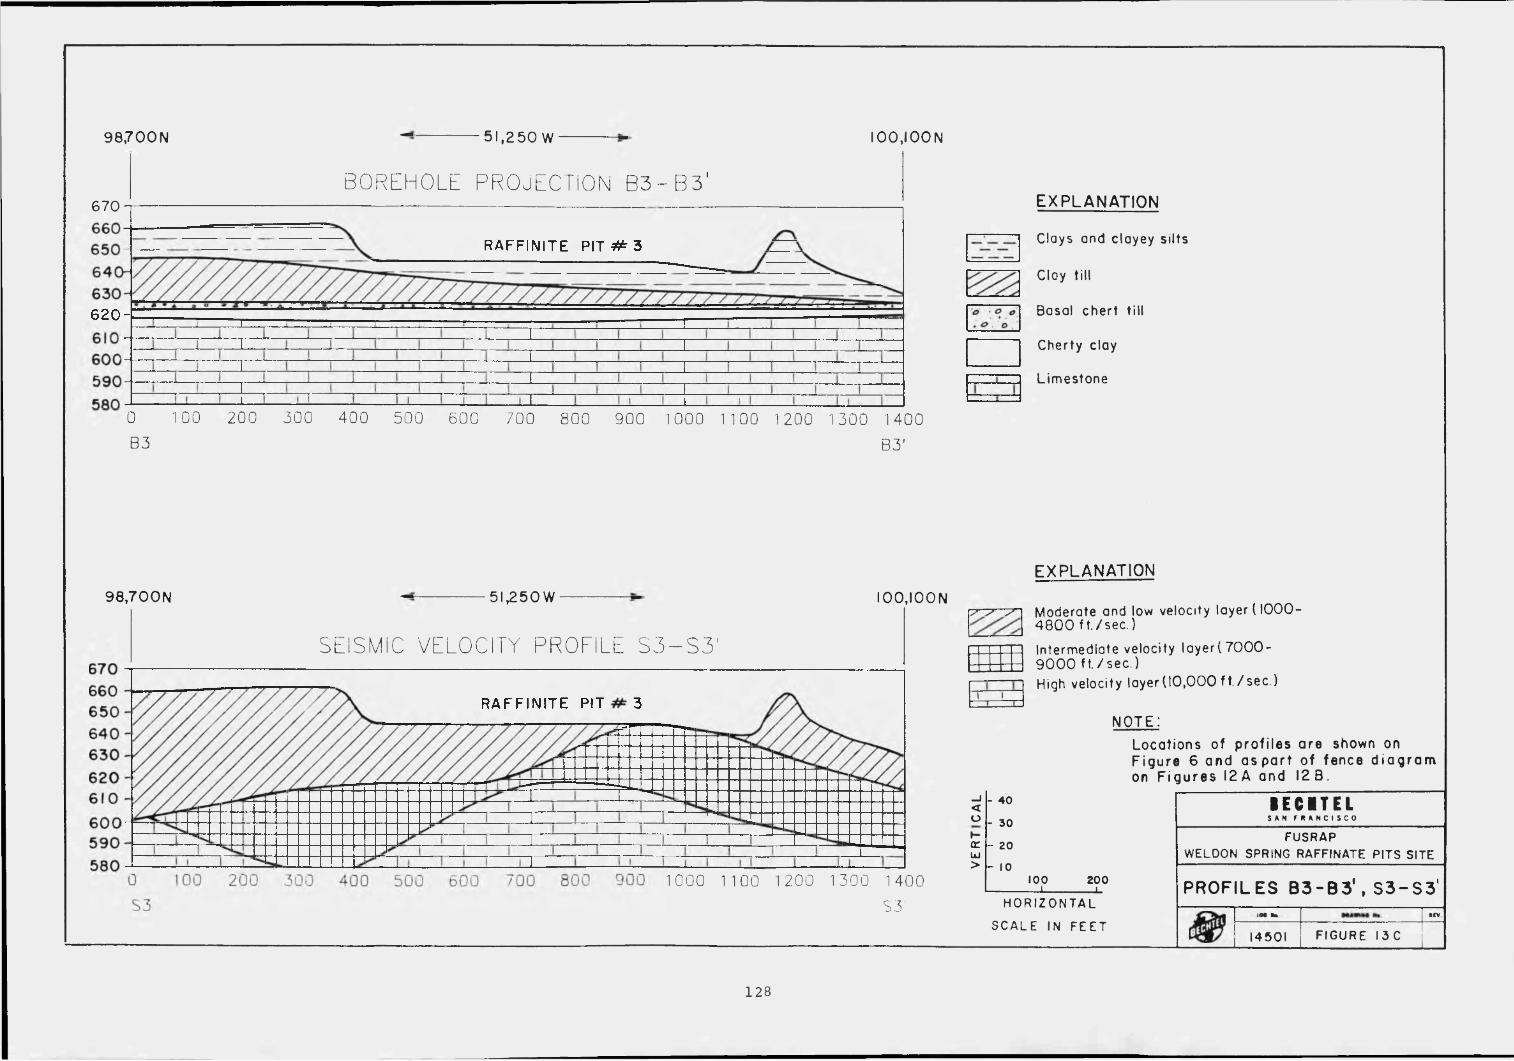
9 8 , 7 0 0 N 5 1 , 2 5 0 W -------------- I 0 0 . I 0 0 N
B O R E H O L L PROJECTION B 3 - B 3 '6 7 0
B3 B3'
EXPLANATION
Clays and clayey silts
Cloy till
Basal chert till
Cherty clay
Limestone
9 8 . 7 0 0 N 5 1,2 5 0 W IOO.IOON
SEISMIC VELOCITY PROFILE S 3 - S 3 '
R A F F IN IT E
7
5 9 0 -
TOOO 1 100 I 200 1300 1400
S3'
EXPLANATION
Moderate and low velocity layer ( 1 0 0 0 -vr > y~\ Moderate and It 4 8 0 0 ft . /sec.)
I__ L
Intermediate velocity layer( 7 0 0 0 - 9 0 0 0 ft . /sec .)High velocity layerOO.OOO ft . /sec.)
NOTE:Locations of profiles are shown on Figure 6 and as part of fence d i a g r a m on F ig u re s 12 A and 12 B .
— 1 - 40<o - 30
oc - 20UJ> - 10
100 L _
200 LH O R I Z O N T A L
S C A L E IN F E E T
B E C I T E LS A N F R A N C I S C O
F U S R A PWELD ON SPRING RAFFINATE P ITS SITE
PROFILES B 3 - B 3 ' , S 3 - S 3 'iee •» •(V
1 4 5 0 1 F I G U R E I 3 C
R A F F IN IT E PIT & 3
0 100 200 300 400 500 600 "700 800 900 1000 1100 1200 1300 1400
1 2 8
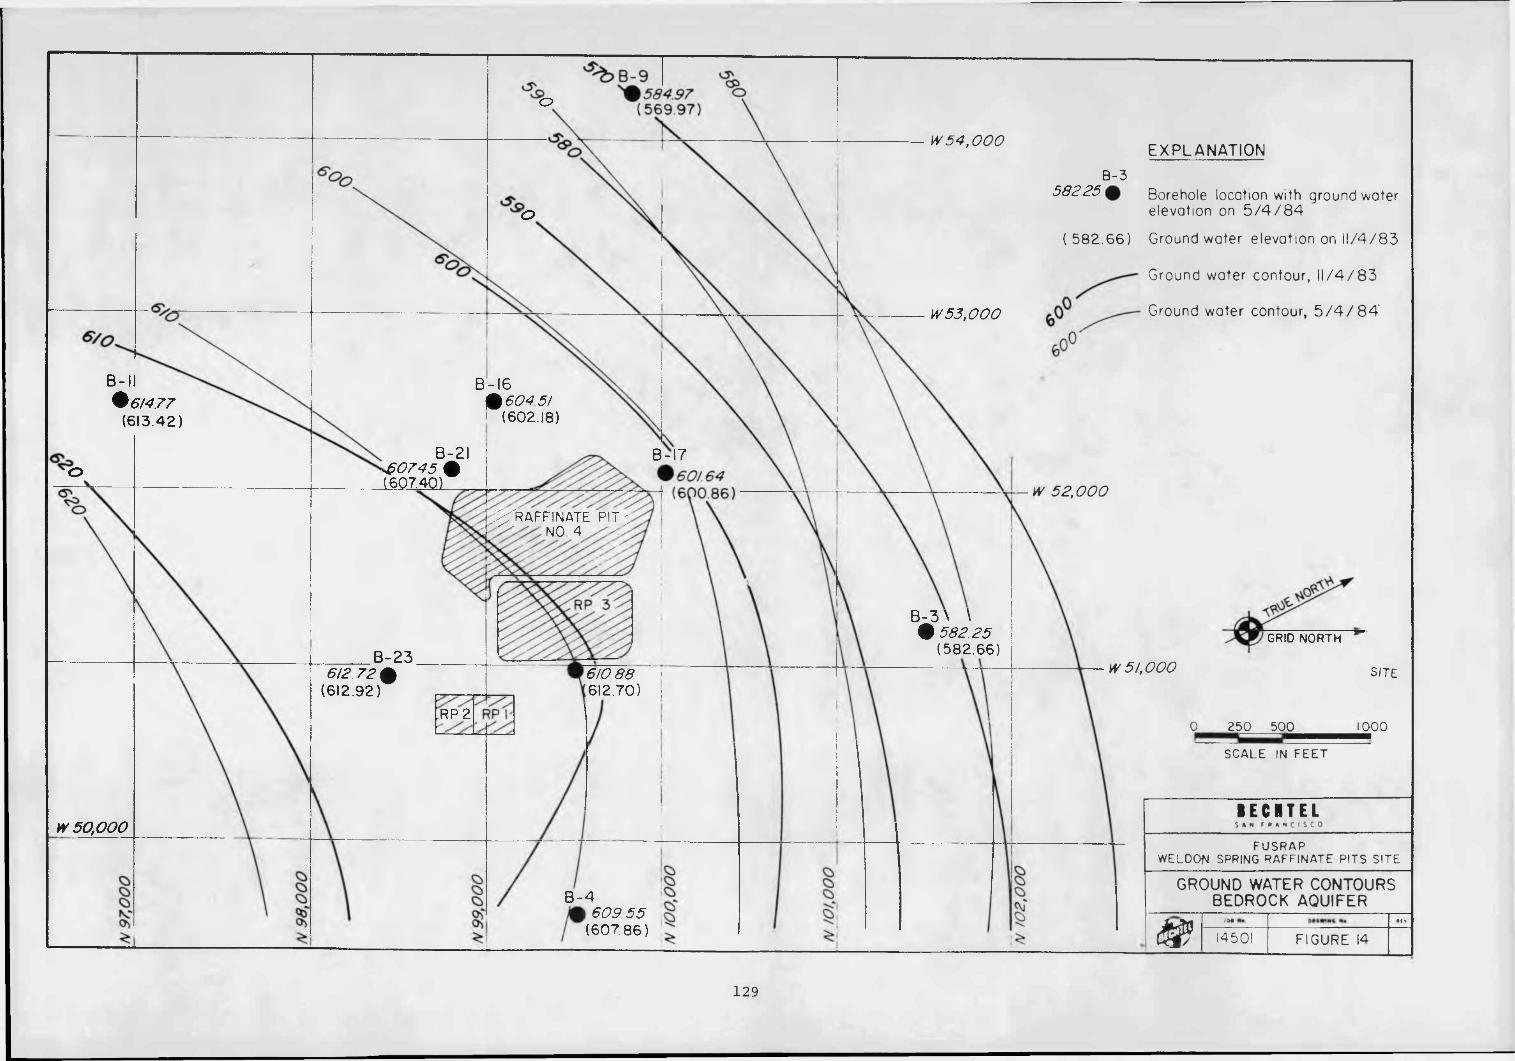
W 54,000
B-3
*58497( 5 6 9 97 )
V
B - 16*604 5/I (602.18)
B-21 0745
( -60740)
R A F F I N A T E P I T N O 4 / /
B - 3 \ \*582.25
(5 8 2 .6 6 )
6/2 72 (612.92)
6/088612.70)
/
W 50,000
B-4* 609 55 I (607 86)
EXPLANATION
Borehole location with ground water elevation on 5 / 4 / 8 4
( 5 8 2 . 6 6 ) Ground water elevation on 1 1 /4 /8 3
Ground water contour, 1 1 / 4 / 8 3
Ground water contour, 5 / 4 / 8 4 '
W 52,000
NORTH
W 51,000 SITE
0 2 5 0 5 0 0 1 0 0 0
SCALE IN F E E T
B E C H T E LS A N F R A N C I S C O
F U S R A PWELDON SPRING RA FFINATE PITS SITE
GROUND WATER CONTOURSBEDROCK AQUIFER
4 ®
I N ef«
1 4 5 0 1 FIGURE 14
1 2 9
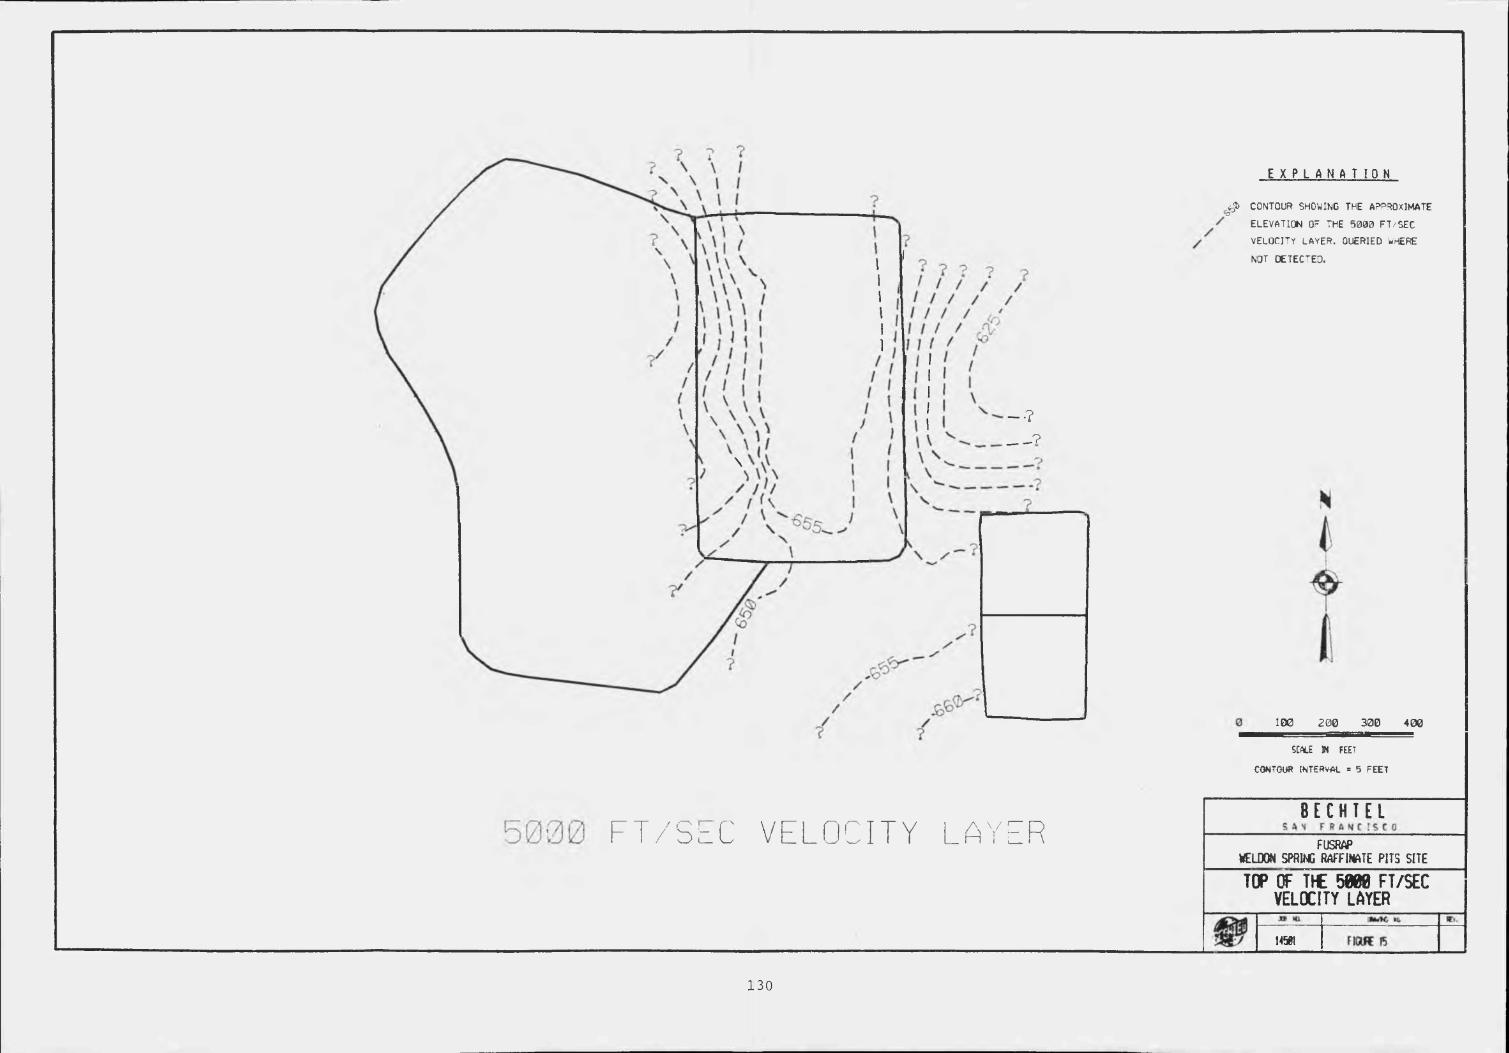
.<$> CONTOUR SHOWING THE APPROXIMATE
ELEVATION OF THE 5000 FT/SEC
VELOCITY LAYER. QUERIED WHERE
NOT DETECTED.
-•? ?
\ V W 7
100 3 0 0200 4 0 0
SCW.E W FEETCONTOUR INTERVAL = 5 FEET
B E C H T E L5 0 3 0 F T / S E C VELOCITY FUSRAP
WELDON SPRING RAFFINATE PITS SITE
TOP OF T*£ 5000 FT/SEC VELOCITY LAYER
14581 FIGIFE 15
1 3 0
APPENDIX A WELDON SPRING GEOLOGIC TRENCH LOGS
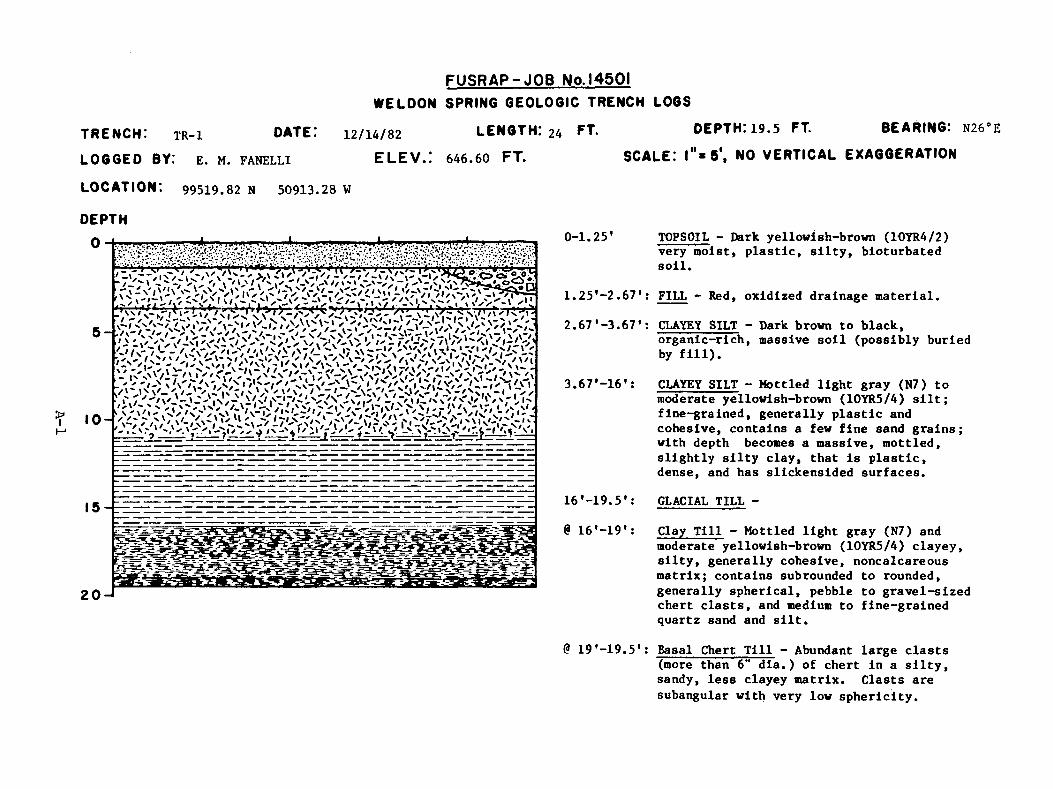
A—1
F U S R A P -J O B No. 14501
TRENCH: tr-i
WELDON SPRING GEOLOGIC TRENCH LOGS DATE: 12/14/82 LENGTH! 24 FT. DEPTH: 19.5 FT. BEARING: N26°E
LOGGED BY: E. M. FANELLI ELEV..* 646.60 FT.LOCATION: 99519.82 N 50913.28 W
DEPTH
20 ^
0-1.25'
s c a l e : i"« s', n o v e r t i c a l EXAGGERATION
TOPSOIL - Dark yellowish-brown (10YR4/2) very moist, plastic, silty, bloturbated soil.
1.25'-2.67': FILL - Red, oxidized drainage material.
2.67'-3.67': CLAYEY SILT - Dark brown to black,organic-rich, massive soil (possibly buried by fill).
3.67'-16': CLAYEY SILT - Mottled light gray (N7) tomoderate yellowish-brown (10YR5/4) silt; fine-grained, generally plastic and cohesive, contains a few fine sand grains; with depth becomes a massive, mottled, slightly silty clay, that is plastic, dense, and has slickensided surfaces.
16'-19.5': GLACIAL TILL -
@ 16'-19': Clay Till - Mottled light gray (N7) andmoderate yellowish-brown (10YR5/4) clayey, silty, generally cohesive, noncalcareous matrix; contains subrounded to rounded, generally spherical, pebble to gravel-sized chert clasts, and medium to fine-grained quartz sand and silt.
@ 19'-19.5': Basal Chert Till - Abundant large clasts (more than 6" dia.) of chert in a silty, sandy, less clayey matrix. Clasts are subangular with very low sphericity.
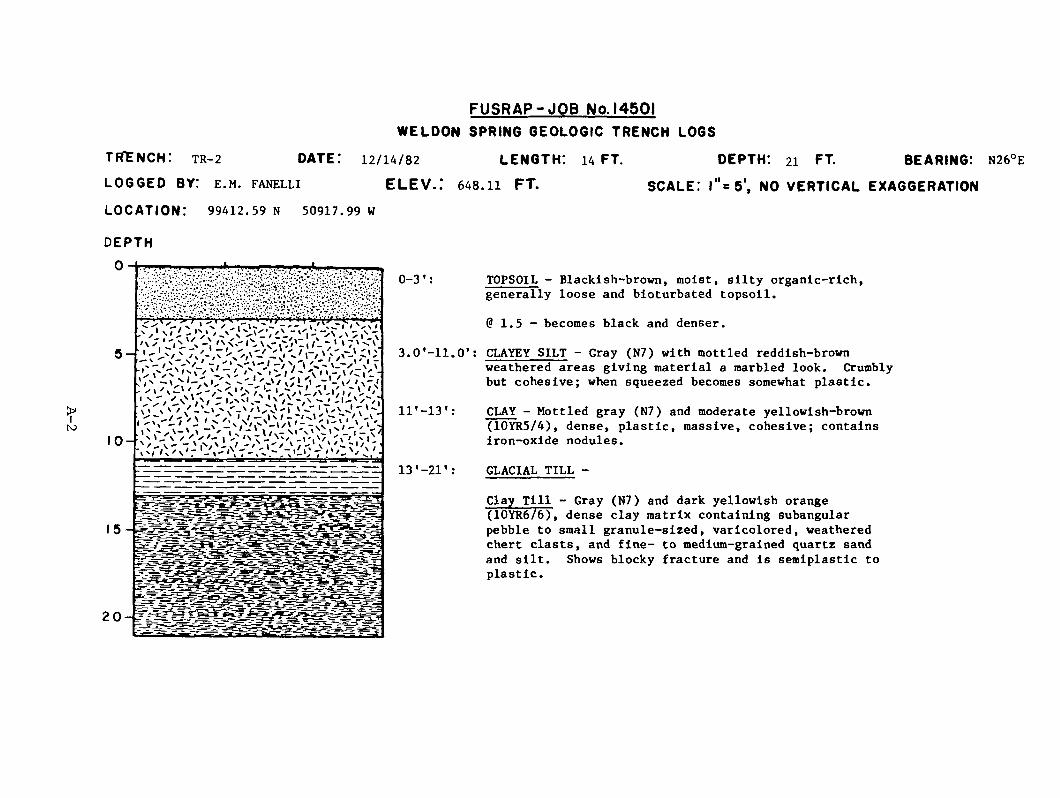
A-2
F U S R A P -J O B No. 14501WELDON SPRING GEOLOGIC TRENCH LOGS
tr te n c h : tr-2 d a t e : 12/14/82 l e n g t h : 14 f t . d e p th : 21 f t . b e a r in g :
LOGGED by: E.M. FANELLI E L E V . : 648.11 FT. SCALE: l " = 5 \ NO VERTICAL EXAGGERATION
LOCATION: 99412.59 N 50917.99 W
DEPTH
TOPSOIL - Blackish-brown, moist, silty organic-rich, generally loose and bioturbated topsoil.
@ 1 . 5 - becomes black and denser.
CLAYEY SILT - Gray (N7) with mottled reddish-brown weathered areas giving material a marbled look. Crumbly but cohesive; when squeezed becomes somewhat plastic.
CLAY - Mottled gray (N7) and moderate yellowish-brown (10YR5/4), dense, plastic, massive, cohesive; contains iron-oxide nodules.
GLACIAL TILL -
Clay Till - Gray (N7) and dark yellowish orange T T 0 Y R 6 7 6 T , dense clay matrix containing subangular pebble to small granule-sized, varicolored, weathered chert clasts, and fine- to medium-grained quartz sand and silt. Shows blocky fracture and is semiplastic to plastic.
N26°E
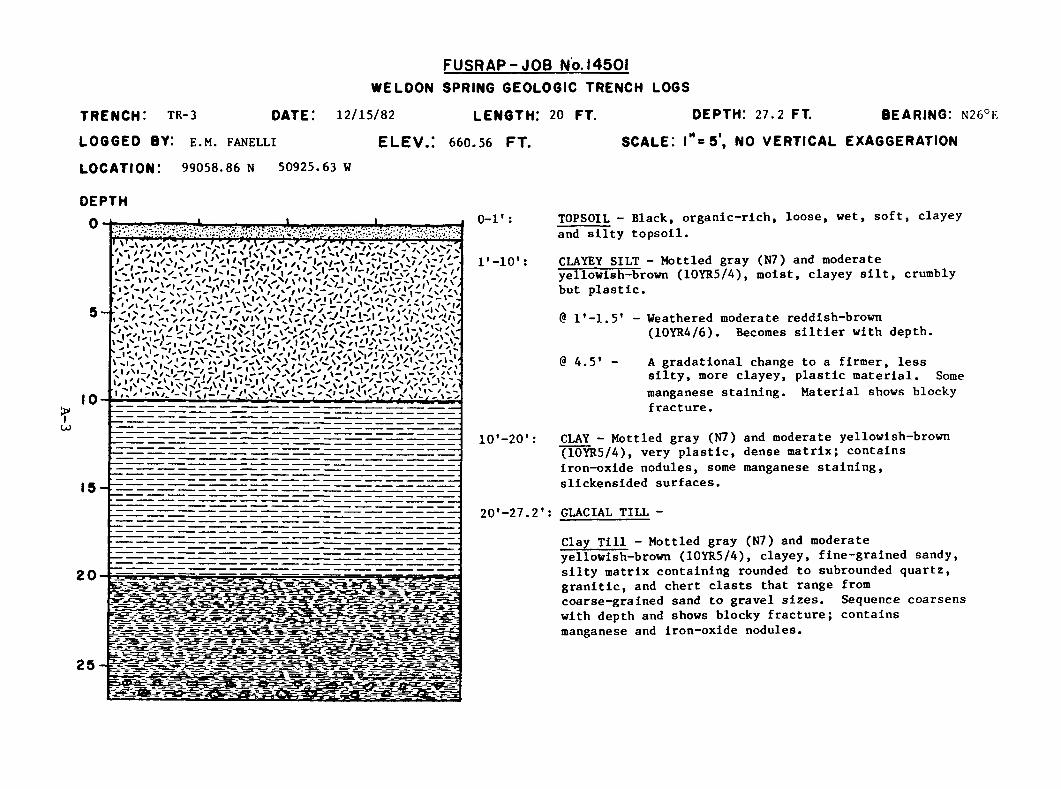
F U S R A P -J O B No. 14501WELDON SPRING GEOLOGIC TRENCH LOGS
t r e n c h : tr-3 d a te : 12/15/82 l e n g t h : 20 f t . d e p th : 27.2 f t . b e a r in g : n26°f.LOGGED by: e .M. FANELLI E L E V .: 660.56 FT. SCALE: l " = 5 \ NO VERTICAL EXAGGERATION
LOCATION: 99058.86 N 50925.63 W
DEPTH0- 1':
l'-lO :
... , r'x_''0 r '-x “V->
15
20
25
10* -20':
TOPSOIL - Black, organic-rich, loose, wet, soft, clayey and silty topsoil.
CLAYEY SILT - Mottled gray (N7) and moderate yellowish-brown (10YR5/4), moist, clayey silt, crumbly but plastic.
@ l'-1.5* - Weathered moderate reddish-brown(10YR4/6). Becomes siltier with depth.
@ 4.5' - A gradational change to a firmer, lesssilty, more clayey, plastic material. Some manganese staining. Material shows blocky fracture.
CLAY - Mottled gray (N7) and moderate yellowish-brown (10YR5/4), very plastic, dense matrix; contains iron-oxide nodules, some manganese staining, slickensided surfaces.
20'-27.2': GLACIAL TILL -
Clay Till - Mottled gray (N7) and moderate yellowish-brown (10YR5/4), clayey, fine-grained sandy, silty matrix containing rounded to subrounded quartz, granitic, and chert clasts that range from coarse-grained sand to gravel sizes. Sequence coarsens with depth and shows blocky fracture; contains manganese and iron-oxide nodules.
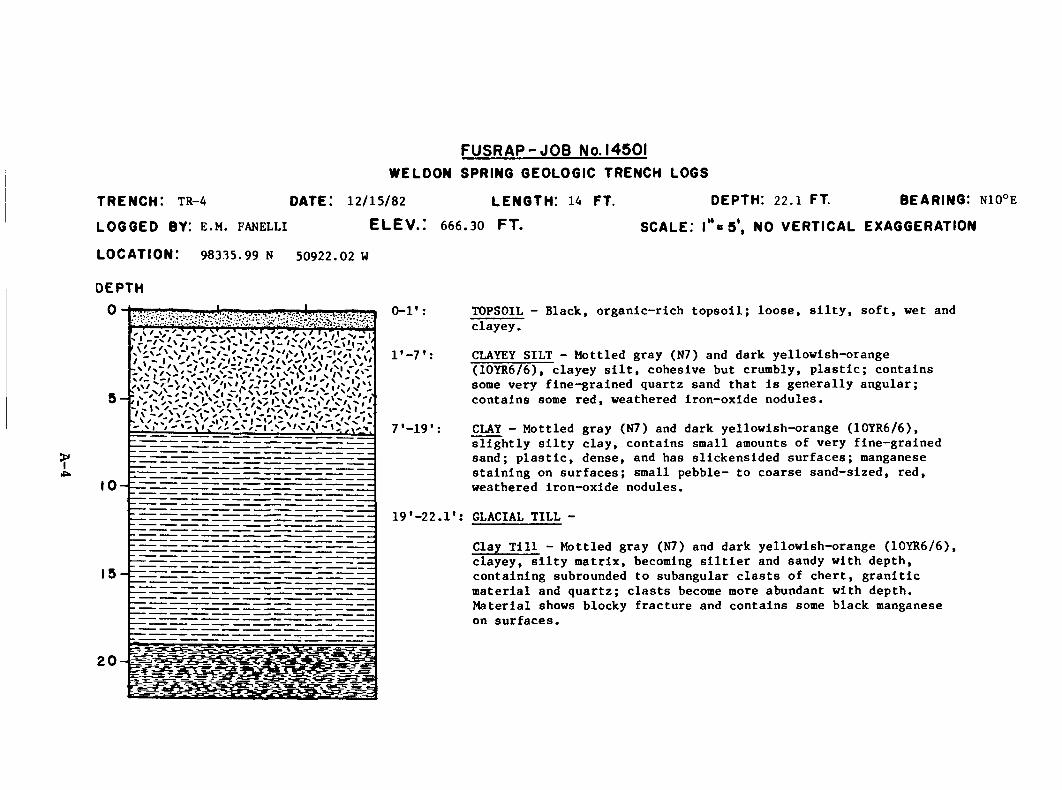
A-4
F U S R A P -J O B No. 14501WELDON SPRING GEOLOGIC TRENCH LOGS
t r e n c h : tr-4 d a t e : 12/15/82 l e n g t h : 14 f t . d e p t h : 22.1 f t . b e a r i n g :
LOGGED b y: E.M. FANELLI E L E V . : 666.30 F T . SCALE: 1*'= 5*. NO V E R T IC A L EXAGGERATION
L O C A T IO N : 98335.99 N 50922.02 W
DEPTH
10-
15-
0-1': TOPSOIL - Black, organic-rich topsoil; loose, silty, soft, wet andclayey.
1 *-7': CLAYEY SILT - Mottled gray (N7) and dark yellowish-orange(10YR6/6), clayey silt, cohesive but crumbly, plastic; contains some very fine-grained quartz sand that is generally angular; contains some red, weathered iron-oxide nodules.
7 '-19': CLAY - Mottled gray (N7) and dark yellowish-orange (10YR6/6),slightly silty clay, contains small amounts of very fine-grained sand; plastic, dense, and has slickensided surfaces; manganese staining on surfaces; small pebble- to coarse sand-sized, red, weathered iron-oxide nodules.
19 *-22.1’S GLACIAL TILL -
Clay Till - Mottled gray (N7) and dark yellowish-orange (10YR6/6), clayey, silty matrix, becoming slitter and sandy with depth, containing subrounded to subangular clasts of chert, granitic material and quartz; clasts become more abundant with depth. Material shows blocky fracture and contains some black manganese on surfaces.
N10°E
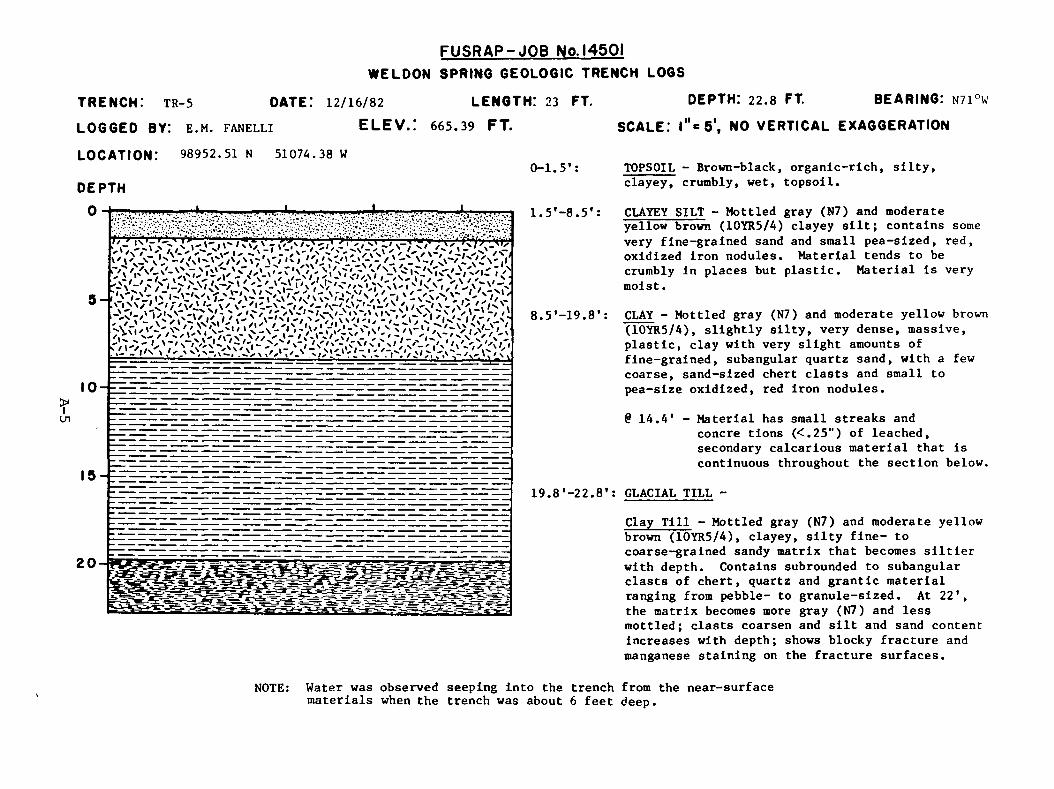
A-5
F U S R A P -J O B No. 14501WELDON SPRING GEOLOGIC TRENCH LOGS
t r e n c h : tr-5 d a t e :LOGGED BY: e.m. fanelli
LOCATION: 98952.51 N 51074.38 W
12/16/82ELEV.:
l e n g t h : 23 FT.665.39 FT.
0-1.5':DEPTH
10
15
1.5'—8.5 *:
8.5'-19.8':
DEPTH: 22.8 FT. BEARING: N71°wSCALE.1 l"=5‘, NO VERTICAL EXAGGERATION
TOPSOIL - Brown-black, organic-rich, silty, clayey, crumbly, wet, topsoil.
CLAYEY SILT - Mottled gray (N7) and moderate yellow brown (10YR5/4) clayey silt; contains some very fine-grained sand and small pea-sized, red, oxidized iron nodules. Material tends to be crumbly in places but plastic. Material is very moist.
CLAY - Mottled gray (N7) and moderate yellow brown (10YR5/4), slightly silty, very dense, massive, plastic, clay with very slight amounts of fine-grained, subangular quartz sand, with a few coarse, sand-sized chert clasts and small to pea-size oxidized, red iron nodules.
@ 14.4* - Material has small streaks andconere tions (<.25”) of leached, secondary calcarious material that is continuous throughout the section below.
19.8'-22.8': GLACIAL TILL -
Clay Till - Mottled gray (N7) and moderate yellow brown (10YR5/4), clayey, silty fine- to coarse-grained sandy matrix that becomes siltier with depth. Contains subrounded to subangular clasts of chert, quartz and grantic material ranging from pebble- to granule-sized. At 22', the matrix becomes more gray (N7) and less mottled; clasts coarsen and silt and sand content increases with depth; shows blocky fracture and manganese staining on the fracture surfaces.
NOTE: Water was observed seeping into the trench from the near-surface materials when the trench was about 6 feet deep.
A-6
F U S R A P -J O B No. 14501WELDON SPRING GEOLOGIC TRENCH LOGS
t r e n c h : tr-6 d a t e : 12/16/82 l e n g t h :i9.5 f t . d e p t h : 21.1 ft.LOGGED BY: e.m. fanelli ELEV.: 652.55 FT.LOCATION: 98433.51 N 51235.23 W
BEARING: n6°k
DEPTH
IQ-
15
20-
0-2.75':
SCALE: l"=5', n o v e r t i c a l e x a g g e r a t i o nFILL - Large gravel-sized fill material.
6'-12.81:
12.8'-21.1’:
@ 12.8'-19.8'
CLAYEY SILT - (old soil surface) - Black-brown, organic-rich, clayey and silty, crumbly but plastic; contains roots.
CLAYEY SILT - Mottled gray (N7) to dark yellowish-orange (10YR6/6) very clayey silt, crumbly but plastic becomes denser and more plastic with depth. Contains some secondary calcite streaks and concretions, and numerous pea-sized or smaller iron-oxide nodules.
CLAY - Mottled gray (N7) and dark yellowish-orange (10YR6/6) to mainly gray (N7), massive, very dense clay containing abundant iron-oxide nodules, slight amounts o fine-grained quartz sand, and very slight amounts of secondary calcite, and has slickensided surfaces.
GLACIAL TILL-
Clay Till - Mottled gray (N7) and dark yellowish-orange (10YR6/6) very dense, clay matrix containing some medium to fine-grained, subrounded and subspherical quartz, quartzite, granitic, and chert clasts. Matrix becomes sandier and siltier with depth, shows blocky fracture, has manganese-stained and some slickensided surfaces.
@ 19.8'-21.1' - Basal Chert Till - Abundant chert clasts and someLess matrix, than the clay till,
Becomes siltier and looserfossiliferous chert, but cohesive if reworked. with depth; clasts are generally well rounded, spherical to elongate and show weathering rinds.
A-7
F U S R A P -J O B No. 14501WELDON SPRING GEOLOGIC TRENCH LOGS
t r e n c h : tr-7 d a t e : 12/16/82 l e n g t h : 22 f t. d e p t h : 23.2 ft. b e a r i n g : na6 wLOGGED b y : e.M. FANELLI ELEV.! 647.96 FT. SCALE: l"=5', NO VERTICAL EXAGGERATIONLOCATION: 98561.80 N 51526.89 W
DEPTH
-u ' v f v , 1' ' y xi )'>:<, I x v . ' / S ' ; / - ' 1 0 I x v : ;
- - - - - - - - - - - - - - - - - - - - - - - - - - - - - - - - - - - - - - - - - - - - - - - - - - - - - - - - - - - - - - - - - - - - - - - - - - - - - - - - - - - - - - - - - - - - - - - - - - - - - -
-' n M ^ 1T 1 i h T ^ ' T ^ i 1 i 1 11 i 1 i T T v i M ^ ' I * i 1 i 1 i1 P ! ^ 1 1! T 1! i 11 ! ’1 1 111 1 V111 f 1111 * 1 11 • 11 1 . 1 * 111 . 1 1111 11 . 1 1 1 - 1. 1 - 1 11 - 1 - 1 * t -1 * 11 1 -1 - ! 11. t -I 1 1 1 1 1 1 I I I 1 I I ' 1 1 1 1 ! 1 1 ! 1 ! 1 1 1 1 1 1 1 1 1 1 1I I 1 1 1 1 1 1 1 1 1 1 1 1 1 1 1 1 1 1 1 1 1 1 1 1 1 1 1 1 1 1 1 1 1 I I 1 1 1 1 1 1 1 1 1 1 1 1 1 1 1 1 1 1 1 1 1 1 1 1 1 1 1 1 1 1 1 1 1' I 1! 1 ! 1 ! 1 ! 1 ! 1 1 1 1 1 1 1 1 1 1 1 1 1 1 1 1 ' 1 1 1 1 1 1 1 1 1 1 1 111L1.! 1! 1! 1! 1! 1! 1! 1! 1! 111! 1! 1! 111! 1! 111 • 1! 1! 11111111111111111111, 1, 1, 1,
TOPSOIL - Blackish brown, silty, clayey, organic-rich, loose, wet topsoil.
CLAYEY SILT - Mottled gray (N7) and dark yellowish-orange (10YR6/6) to moderate yellowish-brown (10YR5/4), very clayey silt; crumbly but plastic; contains fine-grained sand, abundant iron-oxide nodules which cause a dark reddish-brown stain; some organic material.
CLAY - Mottled gray (N7) and dark yellowish-orange (10YR6/6) plastic, massive, dense clay; contains sparse, angular, fine quartz grains; shows blocky fracture with slickensides.
GLACIAL TILL-
o . j - j - o . j - Clay Till - Mottled gray (N7) andyellowish-orange (10YR6/6) clayey, silty, matrix that becomes sandier with depth. Contains weathered, pea-sized, iron-oxide nodules and clasts of granitic material and chert; surfaces and fractures are manganese stained.
@ 17.1' - Some secondary calcite concretions and streaks.
@ 18.5'-23.2' - Interbedded Silt - Gray (N7), very dry silt included as pockets in a brown (10YR5/4), massive, plastic clay, containing pebble-, granule-, and sand-sized clasts of chert. Also contains pea-sized, weathered, iron-oxide nodules. The dry silt is friable to loose.
0-.51:
. 5'-6.2 5':
6.2 51-8.5':
8.5'-23.2':
A-8
F U S R A P -J O B No. 14501WELDON SPRING GEOLOGIC TRENCH LOGS
t r e n c h : tr-8 d a t e : 12/17/82 l e n g t h : 17 f t . d e p t h : 21.5 f t . b e a r i n g : sso wLOGGED b y : E.M. FANELLI E L E V . . 643.11 FT. SCALE: l " * 5 ' f NO VERTICAL EXAGGERATION
LOCATION: 98684.01 N 52020.09 W
d e p t h
20-
0-1':1'-8.8 ’:
8.8 ’ -9.7 5'
9.75'-19.9 ’i
TOPSOIL - Blacklsh-brown, organic-rich, loose, wet topsoil.
CLAYEY SILT - Mottled gray (N7) and grayish-orange (10YR7/4), very clayey silt. Crumbly but plastic; dense, becoming denser with depth.
@ 1'-1.8' - Weathered moderate reddish-brown (10YR4/6).
CLAY - Mottled gray (N7) and grayish-orange (10YR7/4), dense clay containing pea-sized iron-oxide nodules; has slickensided surfaces.
GLACIAL TILL-
@ 9.75'-18.0' - Clay Till - Mottled gray (N7) and grayish-orange (10YR7/4) clayey matrix, containing few clasts of pebble-sized chert, granitic material and quartzite; has slickensides.
@ 17.5' - Clasts are more abundant and larger; matrix is looser and siltier.
@ 18.0'-19.9'- Basal Chert Till - boulder-sized, angular chert clasts with white weathering rinds in a loose, clayey, silty matrix.
19.9'-21.5': WEATHERED BEDROCK - Boulder-sized, weathered, rounded,fossiliferous limestone with solution features on upward surfaces, and angular, broken, weathered chert clasts in a dark yellowish-orange (10YR6/6) to grayish-orange (10YR7/4) silty, clayey matrix. Matrix becomes siltier and sandier with depth.
A-9
F U S R A P -J O B No. 14501
TRENCH: tr-9
WELDON SPRING GEOLOGIC TRENCH LOGSdate: 12/20/82 length: 19.6 ft. depth: 20.3 ft. BEARING: N65c
LOGGED BY: e.m. fanelli ELEV..* 639.61 FT.LOCATION: 99623.82 N 52374.97 W
DEPTH 0
5-
10
15
2 0 - . . . . . . . . . . . . . . . . 1 , r i7 1 rF i 1 i 11 ' 1 1! 1 1 1! I i_ l ! "
0-1*:
6.0'-11.5':
11.5'-20.3':
s c a l e : l"=5', n o v e r t i c a l e x a g g e r a t i o n
TOPSOIL - Blackish-brown, clayey, silty loose, moist, organic-rich, topsoil.
CLAYEY SILT - Mottled gray (N7) and moderate yellowish-orange (10YR6/6), very clayey silt; crumbly becoming more plastic at 4 1; plastic, moist, contains iron-oxide nodules.
CLAY - Mottled gray (N7) and moderate yellowish-orange (10YR6/6) clay; contains pea-sized, weathered, red-brown iron-oxide nodules, some very fine sand, minor silt; has slickensided surfaces.
GLACIAL TILL -
@ 11.5'-16.8* - Clay Till - Mottled gray (N7) and moderateyellowish-orange (10YR6/6), clayey, silty matrix, plastic, shows blocky fracture, manganese on surfaces; contains some angular to well-rounded, fine- to medium-grained sand and small gravel-sized clasts of granitic material, chert and quartzite. Some clasts have secondary white weathering rinds.
@ 16.8* - Clasts increase in size and abundance, chert has secondary weathering rinds.
@ 19'-20.3* - Interbedded Silt - Gray (N7) clayey silt, dry, crumbly, often mixed with d a y ; becomes more clayey with depth and contains some iron-oxide nodules.
A-10
F U S R A P -J O B No. 14501WELDON SPRING GEOLOGIC TRENCH LOGS
t r e n c h : tr-io d a t e : 12/20/82 l e n g t h : 14 f t .
LOGGED b y : e.m. fanelli E L E V . : 645.85 FT.
LOCATION: 100067.53 N 52035.66 W
DEPTH: 19.5 FT. BEARING:
DEPTH0-. 5'
SCALE: l"= 5', NO VERTICAL EXAGGERATIONTOPSOIL - Blackish-brown, silty, clayey, organic-rich topsoil.
CLAYEY SILT - Mottled gray (N7) and moderate yellow-orange (10YR6/6) clayey silt, contains some iron-oxide nodules that cause a reddish-black stain; crumbly but plastic; very dry.
@ 3.3' - Material becomes more clayey and plastic, less crumbly.
CLAY - Less mottled, mainly brown (5YR4/4) clay that contains weathered, red, iron-oxide nodules; very dense, slickensided with secondary calcite on the surfaces and in concretions.
GLACIAL TILL -
- Clay Till - Mottled gray (N7) and dark yellowish-gray (10YR6/6) clayey matrix, that contains sparse, coarse sand-sized to pebble-sized clasts of chert and granitic material; matrix contains iron-oxide nodules, has slickensided surfaces with manganese staining and some secondary calcite; shows blocky fracture and is plastic.
@ 15.7'-17.9' - Basal Chert Till - Chert clasts increase in abundance and
6 '-11.2':
11.2'-17.9'
20-Jsize, have weathering rinds, and are contained in a silty, clayey matrix with some secondary leached calcite on surfaces and in concretions.
17.9'-19.5': WEATHERED BEDROCK - Boulder-sized limestone and chert clastsin clayey, silty matrix. Limestone is rounded; shows solution features on surfaces; chert is angular, broken and has weathering rinds.
N62°W
F U S R A P -J O B No. 14501WELDON SPRING GEOLOGIC TRENCH LOGS
t r e n c h : tr-ii d a t e : 12/20/82 l e n g t h : u f t . d e p t h : 21.1 f t . b e a r i n g : n
LOGGED BY: E.M. FANELLI ELEV.*. 644.85 FT. SCALE: l"= 5‘, NO VERTICAL EXAGGERATION
LOCATION: 99993.42 N 51537.46 W
DEPTH
10
15-i
2 0 - !
0-1.5*: TOPSOIL - Black-brown, clayey, silty, slightly sandy, moist,crumbly and organic-rich topsoil.
I.5'-7': CLAYEY SILT - Mottled gray (N7) and moderate yellowish-orange (10YR6/6), moist, crumbly, very clayey silt, plastic, becomes denser, less crumbly, more clayey at approximately 5.9* ft.; contains weathered iron oxide nodules and some fine sand.
7'-11.4*: CLAY - Mottled gray (N7) and moderate yellowish-orange (10YR6/6)very dense, slightly silty, slickensided clay; contains weathered iron oxide nodules.
II.4'-21.1': GLACIAL TILL -
@ 11.4'-16* - Clay Till - Mottled gray (N7) and moderate yellowish-orange (10YR6/6) clayey, dense, slickensided matrix containing weathered iron oxide nodules, silt, medium- to coarse-grained sand, pebble to gravel-sized chert and granitic rock, some secondary calcite on surfaces and in concretions.
<? 15.5' - Clasts coarser rounded to broken.
@ 16'-21.1* - Basal Chert Till - Dark yellowish-orange (10YR6/6), and pale reddish-brown (10YR5/4) clay matrix is less mottled and more silty and sandy than above, but plastic. Chert is abundant and weathering rinds are common; clasts are nearly boulder-sized.
NOTE: Unearthed debris in western end of trench. Debris consistedof segments of fiberglass pipe, boards, cable, and metal wire. Water seeped into the trench from the debris.
A-12
FUSRAP - JOB No. 14501WELDON SPRING GEOLOGIC TRENCH LOGS
t r e n c h : tr-12 d a t e : 12/20/82LOGGED BY: e.m. fanelli ELEV.LOCATION: 99947.81 N 51081.09 W
DEPTH 0-1':
10-
o°<?. •«,• C? -i <o
LENGTH.- 14 FT. DEPTH: 21.4 FT. BEARING: N57°w
644.59 FT. SCALE: l"=5\ NO VERTICAL EXAGGERATION
TOPSOIL - Black-brown, organic-rich (containing roots), clayey, silty, slightly sandy, wet topsoil.
1'-9.4': FILL(?) - Black, organic-rich, very sticky, decomposing,odoriferous clayey silt, resembling the clayey silt seen in the other trenches but soft to loose.
9.4'-191: CLAY - Gray (N7), silty clay, becoming siltier with depth,moderately soft.
@ 16.9' - Becomes mottled gray (N7) and dark yellowish-orange (10YR6/6) silty clay, with abundant manganese mineralization.
19.O'-21.4': GLACIAL TILL-
15-
- @ 19’-20’ -
— (3 20'-21.4 ’ -
Clay Till - Mottled gray (N7) and dark yellowish-orange (10YR6/6), dense clay matrix containing medium- to coarse-grained sand and few pebble-sized chert nodules; weathered iron-oxide nodules and manganese staining.
Basal Chert Till - Material is more gravelly and silty than above. It is plastic; chert clasts increase to boulder size and have white to gray weathering rinds.
@ 20.5' - Matrix changes color to brownish (5YR6/6); with abundant chert clasts embedded in a firm clay matrix, with abundant manganese staining.
A-13
F U S R A P -J O B No. 14501WELDON SPRING GEOLOGIC TRENCH LOGS
t r e n c h : tr-13 d a t e : 1 2 /2 1 / 8 2
LOGGED BY: e.m. fanelli ELEV.! 636.13
LOCATION: 99441.50 N 52242.06 W
LENGTH: 22 FT. FT.
0-1.5':
DEPTH 0
5-
10-
15
2 0
1.5'-7.8':
7.8'-20.8':
DEPTH: 20.8 FT. BEARING: nio uSCALE: l"=5\ NO VERTICAL EXAGGERATIONTOPSOIL - Black, brown, organic-rich, moist, silty, clayey, loose topsoil.
CLAYEY SILT - Mottled gray (N7) to dark yellowish-orange (10YR6/6) very clayey silt, becomes more clayey with depth, generally crumbly, contains roots and has a slight decay odor; also contains red iron-oxide nodules.
GLACIAL TILL-
@ 7.8'-19.5' - Clay Till - Mottled gray (N7) and darkyellowish-orange (10YR6/6), dense clay matrix containing small pebble to coarse sand-sized clasts of chert and granitic material; slightly silty, has slickensides; contains approx. 1" pockets of clayey yellowish-orange (10YR7/6), dry, fine-grained sand.
@ 11.5'-16.4' - Discrete small lenses and pockets of brightyellowish-orange fine-grained, dry sand in a very silty, clay matrix; some mixing of sand into clay, less sand with depth.
@ 16.4'-19.5* - Clay Till cont. - Very clayey, dense, siltymatrix, mottled gray and moderate yellowish-orange (10YR6/6), with some pebble-sized clasts of chert and granitic material, coarsens with depth.
@ 18.5' - Color more yellowish-brown (10YR5/4) with darkeryellowish-orange (10YR6/6) staining in fractures and small iron-oxide nodules.
@ 19.5'-20.8' - Basal chert till - Very gravelly to boulder-sized, chert clasts with weathering rinds and angular
edges.
F U S R A P -J O B No. 14501
t r e n c h : tr-14 d a t e :
LOGGED BY: e.m. fanelli
LOCATION: 98860.94 N 52085.39 W
WELDON SPRING GEOLOGIC TRENCH LOGS 12/21/82 LENGTH: 25 FT. DEPTH: 21 FT. BEARING: n o r th
ELEV.; 644.29 FT.
DEPTH
' '".'■/''/'■vv1 / 'I-‘V ('K7, v i
ryr p r ip -1 i i t i i rryr i rn m i r it t+tth t ; t ; i ; itt ;t ;rn ; n n r : i ;i ;r;i i i i i i i i i i i i i i i i i i i i i i i i i i i i i i i i i i i i i i i ii i i i i i i i i i i i i i i i i i i i i i i i i i i i i i i i i i i i i i i ii i i i i i i i i i i i i i i i i i i i i i i i i i i i i i i i i i i i i i i ii i i i i i i i i i i i i i i i i i i i i i i i i i i i i i i i i i i i i i i ii i i i i i i i i i i i i i i i i i i i i i i i i i i i i i i i i i i i i i i ii i i i i i i i i i i i i i i i i i i i i i i i i i i i i i i i i i i i i i i i
i ! i ! l1 i ! i i i l i ! i ! i ! i ! i i i J i ! i ! i ! i ! i ! i ! i ! i ! i ! i ! i ! i ! i ! i ! i ! i l i i i ! i ! i ! l i d i ! i ! i ! i !
s c a l e : l"=5', NO VERTICAL EXAGGERATION
0-1*: TOPSOIL - Black-brown, organic-rich, silty,clayey topsoil.
1'-9.5': CLAYEY SILT - Mottled gray (N7) and darkyellowish-orange (10YR6/6), very clayey silt, crumbly but plastic; contains weathered iron-oxide nodules.
@ 4.5* - Material becomes denser and more plastic; shows faint blocky fracture and some slickensides near base of unit.
9.5'-21': GLACIAL TILL-
@ 9.5*-15* - Clay Till - Gray (N7) and moderateyellowish-brown (10YR5/4) clay matrix with sand to pebble-sized clasts of generally angular chert and granitic material that coarsens with depth; shows manganese staining.
@ 14.5* - Secondary calcite concretions and streaks.
@ 15'-20* - Interbedded Silt Pockets - Gray (N7), dry silt occurring as discrete pockets in the clay till. Clay has slickensides and contains iron-oxide nodules; becomes less silty with depth.
@ 20'-21' - continuation of Clay Till.
F U S R A P -J O B No. 14501W E LD O N SPRING GEOLOGIC TRENCH LOGS
t r e n c h : tr-15 d a t e : 1 2 /2 1 / 8 2 l e n g t h : 1 9 f t. d e p t h : 1 5 ft. b e a r i n g : nso°LOGGED b y : E. M. fanelli ELEV..' 661.86 FT. SCALE: l“=5\ NO VERTICAL EXAGGERATIONLOCATION: 99425.93N 50734.20 W
DEPTH 0-3.75': FILL - Predominantly gravel In a brown, silty matrix.
m m m m
3.75'-4.00': CLAYEY SILT - Blacklsh-brown, possibly original soil materials.
4'-9.5': CLAY - Mottled gray (N7) and moderate yellowish-brown(10YR5/4) clay, contains some pebble-sized rock clasts; material appears reworked.
9.5'-12.5': ASH - Gray to gray green coal ash.
12.5'-15': CLAYEY SILT - Mottled gray (N7) to moderateyellowish-brown (10YR5/4) but predominantly gray. Contains oxide lron-nodules and manganese; generally dry.
G E O L O G I C D R I L L LOG FUSRAP-WELDON SPRING 14501 1 of i I B-l
DOE PROPERTY-RAFFINATE PIT AREA j N 99507.31 W 52283.25
(ANGLE F ROM NOflZ.
1I 90°
|«E ANINO
BEGUN COMFICTID O * M.L MAN! And m o d e l MOLE IIZE jOVEFf UWD EN (FT.) KOCH (FT.) jrOTAL OEFTH
2/15/83 2/16/83 BOYLES BROS./J. WILKENS MOBILE-56 j 8 ’ j 21.5 0 | 21.5'c o n s BOXES SAMFLES EL TOF OF CASING on OUND EL. 1 OEFTH/EL. OnOUNO WATEB loEFTH/ EL. TOF OF NOCK
0 2 641.43 638.89 DRY | UNKNOWN(CASINO I f FT IN HOLS : OIA./LENGTH
150 LBS/30 IN.n
1.000EO «V
E. M. FANELLI
W A T E RP R ESSUR E
TESTS
- I 1O t 1 i iELSVATIOK OEICF I AT ION ANO CLASSIFICATION
NOTES ON: WATIR LEVELS. WATER RITURN, CHARACTIR OF ONILLINO, ETC.
18"
18"
638.89 O.O'-l. 5! : TOPSOIL: BLACKISH-BROWN,'ORGANIC-RICH, MOIST TO WET, CLAYEY SILT.
1.5'-9.O': CLAYEY SILT: MOTTLED GRAY (N7)AND MODERATE YELLOWISH-BROWN (10YR5/4) OR DARK YELLOVTISH- ORANGE (10YR6/6) CLAYEY SILT: NON-PLASTIC TO SLIGHTLY PLASTIC, MODERATELY DENSE WITH DEPTH AND CONTAINS ABUNDANT IRON-OXIDE NODULES.
DRILLED USING 8 ’ DIA. HOLLOW STEM AUGER WITH 3' DIAMETER SPLIT SPOON ASSEMBLY. DESCRIPTIONS ARE BASED ON AUGER SPOILS AND SPLIT SPOON SAMPLES.
629.89
6/ 10/645
15
9.0'-21.5': CLAY TILL: MOTTLED GRAY (N7)AND MODERATE YELLOWISH-BROWN (10YR5/4) TO DARK YELLOWISH- ORANGE (10YR6/6), SILTY, SANDY, DENSE CLAY THAT CONTAINS A FEW PEBBLES OF SUBROUNDED CHERT, QUARTZITE, AND GRANITIC MATERIAL. WHICH GENERALLY COARSEN TO COBBLE SIZES WITH DEPTH. THE MATERIAL HAS MANGANESE-STAINED SURFACES, CONTAINS IRON AND SECONDARY FRIABLE, CALCAREOUS CONCRETIONS, AND SHOWS BLOCKY FRACTURING.
4/6/1250
20 -
BOH @21.5’ COMPLETED AS PIEZOMETER INSTALLATION.
NOTE:
ROCK AND SOIL COLORS ARE INDEXED ON THE ROCK-COLOR CHART PUBLISHED BY THE GEOLOGICAL SOCIETY OF AMERICA.
• wfi. it sfo o n ; e r - im c l
’ OtNMIfON; f - f it c h ■ n ;
H*CF 1 9-|DOE PROPERTY-RAFFINATE PIT AREA
B-l
G E O L O G I C D R I L L LOG FUSRAP-WELDON SPRING 14501 B-2
DOE PROPERTY-RAFFINATE PIT AREACOONOINATII
N 99255.75 W 52139.58 90® VERTICAL
2/16/83
CO M H ITIO
2/18/83 BOYLES BROTHERS c o m b o x e s
0
OWlLL WAKE AND MODEL
MOBILE-56 29.6'
150 LBS/30 IN.
E t* E
► Ee 1E <! 5 1 0 < z• <
18"
18"
18
633.58GROUND EL.
631.04
0TOTAL OEPTN
29.6*
CASING LEFT IN MOLE: OIA./LENGTH
5/7/7100
4/7/9100
6/6/7100
W A T E RPRESSURE
TESTS
III
5/6/5100
1 E
2"/25.8*
ELEVATION
OEFTH/EL. GROUND WATER
22.6/608.44 (2/21/83)
E. M. FANELLI
DESCRIPTION AND CLASSIFICATION
FILL: GRAVEL-SIZED CLASTS OF CHERT AND LIMESTONE.
UNKNOWN
CLAYEY SILT: STIFF, CONTAINS FINEGRAINED SAND, SHOWS BLDCKY FRACTURE;. .UPPER 2' WEATHERED AND BLACK IN COLOR, LOVER PORTION CLAYEY,. BROWN, CONTAINS ANGULAR SAND TO PEBBLE-SIZED GRAINS OF CHERT AND QUARTZITE.
8.0-23.0’: CLAYEY SILT: MOTTLED GRAY (N7)AND MODERATE YELLOWISH-BROWN (10YR5/4) OR DARK YELLOWISH-
10-1::;;,'-H ORANGE (IOYR6/6), CLAYEY SILT:NON-PLASTIC TO SLIGHTLY PLASTIC, MODERATELY DENSE WITH DEPTH AND CONTAINS ABUNDANT IRON- OXIDE NODULES.
23.0'-29.6' :
20- />/o —
- iaJi' @ 26.5*
CLAY TILL: MOTTLED GRAY (N7) AND MODERATE YELLOWISH-BROWN (10YR5/4) OR DARK YELLOWISH- ORANGE (10YR6/6), SILTY, SANDY DENSE CLAY THAT CONTAINS A FEW PEBBLES OF SUBROUNDED CHERT, QUARTZITE, AND GRANITIC MATERIAL, WHICH GENERALLY COARSEN TO COBBLE SIZES WITH DEPTH. THE MATERIAL HAS MANGANESE-STAINED SURFACES, CONTAINS IRON AND SECONDARY FRIABLE CALCAREOUS CONCRETIONS AND SHOWS BLOCKY FRACTURING.
BASAL CHERT TILL: BROWN TO BLACK COBBLE TO BOULDERSIZED, ANGULAR TO SUBANGULAR CHERT CLASTS IN A LOOSE,SANDY, SILTY, CLAYEY MATRIX. THE CHERT COMMONLY HAS WHITE WEATHERING RINDS.
601.44
BOH @29.6’ COMPLETED AS PVC OBSERVATION WELL.
NOTE:ROCK AND SOIL COLORS ARE INDEXED ON THE ROCK-COLOR CHART PUBLISHED BY THE GEOLOGICAL SOCIETY OF AMERICA.
WAVE* LEVELS. WATIH WSTUWN, CMAWACTS* OF OEILLING, ETC.
8' AUGER HOLE DESCRIPTIONS BASED ON AUGER SPOILS AND SPLIT SPOON SAMPLES.
@ 5* WATER FLOWING INTO HOLD-PROBABLY FILL DRAINAGE.
26.5* HEAR GRAVEL HITTING AUGER FLIGHTS
29.5' REFUSAL TRIED TO BAIL HOLE-RETURNED .2 GAL./MIN.
• • • SPLIT SPOON
O • OBNNISON; *
ST - SHELEV TUBE;
■ FITCHEW; O • OTHEW DOE PROPERTY-RAFFINATE PIT AREA
HfcCF I 9-1
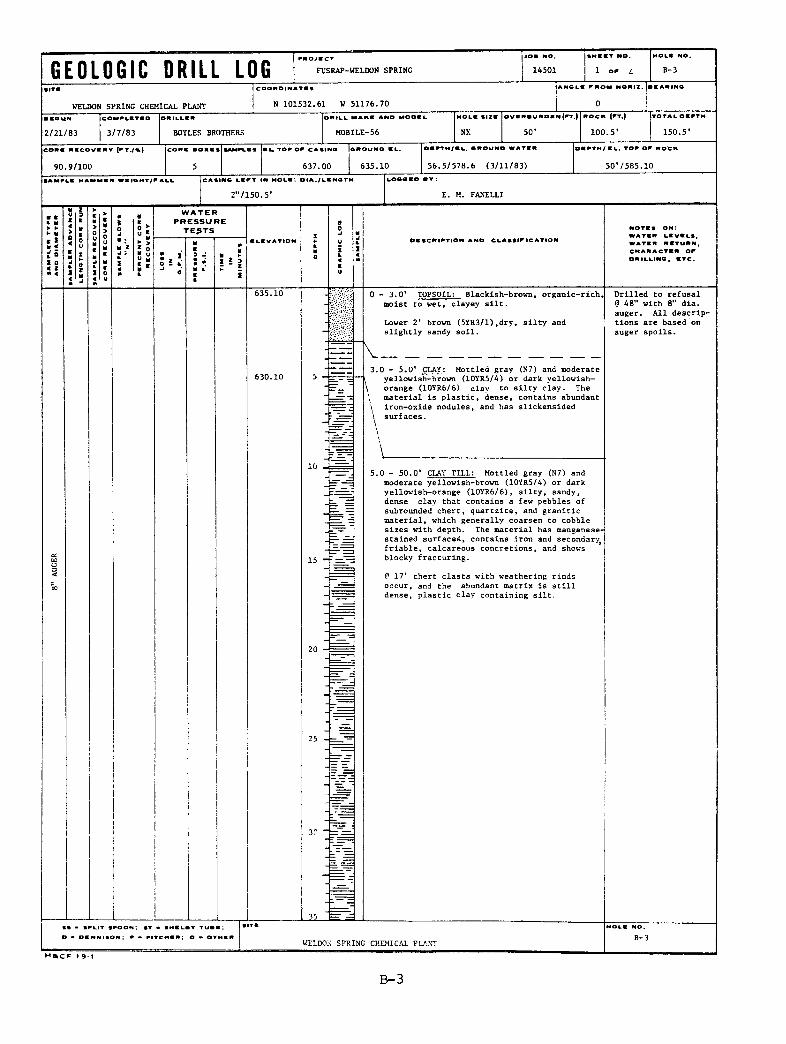
GE O L O G I C D R I L L LOG FUSRAP-WELDON SPRING 14501, m . . t no.
B-3
WELDON SPRING CHEMICAL PLANT
COORDINATES
N 101532.61 W 51176.70 0
BEGUN jcOMFLETED
2/21/83 | 3/7/83 BOYLES BROTHERS
DWILL MAKE AND MODEL
MOBILE-56 NX
o v e r b u n d e n (ft.)
50*
ROCK (FT.)
100.5* 150.5*
c o m m c o v i
90.9/100
t*V (FT./%) CONK SOKES
5
»F CASINO |CNOUNO EL.
637.00 635.10CASINO LEFT IN MOLE: DIA./LENGTH
2"/150.5*
W A T E RPRESSURE
TE ^T SELEVATION
56.5/578.6 (3/11/83)
OSFTM/SL. TOF OF NOCK
50*/585.10
E. M. FANELLI
WATER LEVELS, WATER NCTURN, CHARACTER OF DRILLING, ETC.
0 - 3.0* TOPSOIL: Blackish-brown, organic-rich,moist to wet, clayey silt.
Lower 2 1 brown (5YR3/1),dry, silty and slightly sandy soil.
3.0 - 5.0* CLAY: Mottled gray (N7) and moderateyellowish-brown (10YR5/4) or dark yellowish- orange (10YR6/6) clay to silty clay. The material is plastic, dense, contains abundant
\ iron-oxide nodules, and has slickensided \ surfaces.
5.0 - 50.0' CLAY TILL: Mottled gray (N7) andmoderate yellowish-brown (10YR5/4) or dark yellowish-orange (10YR6/6), silty, sandy, dense clay that contains a few pebbles of subrounded chert, quartzite, and granitic material, which generally coarsen to cobble sizes with depth. The material has manganese- stained surfaces, contains iron and secondary, friable, calcareous concretions, and shows blocky fracturing.
@ 17* chert clasts with weathering rinds occur, and the abundant matrix is still dense, plastic clay containing silt.
30
• • - tR LIT SWOON; ST > SMCLRY t u b e ;
MftCF 1 9-1
35__ ^
WELDON SPRING CHEMICAL PLANT
Drilled to refusal @ 48" with 8" dia. auger. All descriptions are based on auger spoils.
B-3
B-3
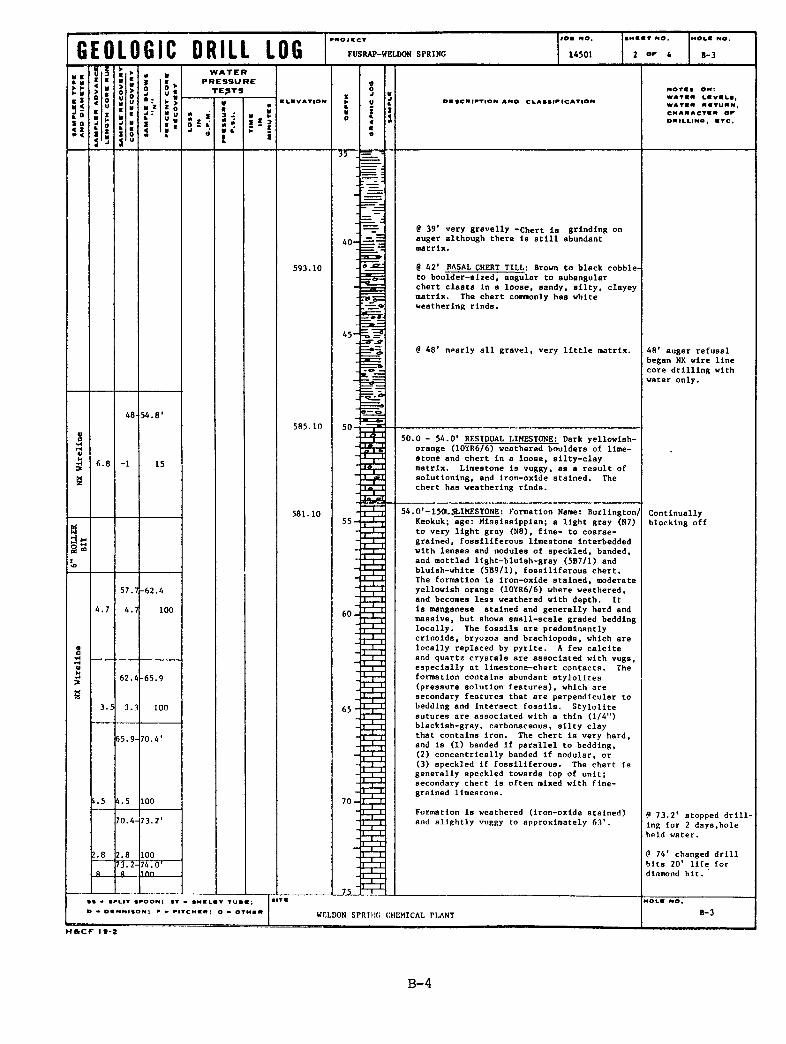
G E O L O G I C D R I L L LOGm
FRO J B C V JOB NO.
FUSRAP-WELDON SPRING 14501 2 o f 4 B-3
£iv «
W A T E RP R E S S U R E
T E ^ T S
i !I LIVATION OESCNIFTION ANO CLASSIFICATION WATE* LEVELS,
WATE* EETUBN, CHARACTER OF ONILLINB, ETC.
35
AO-
593.10
45-_
48-
6.8
54.8 '
15
585.10 50-
581.1055'
4.7
57.7
4.7
-62.4
100 60-
62.4 -65.9
3.5 3.3 100 65
65.9-
4.5
70.4*
70-
70.4
2.8737?
73.2’
10074.0*100.
• S - SFI.IT SFOON; ST - SMELE v TUBE;
O - DENNISON*. F m F|TC HER; O • OTHER
H A C F 19*2
_7J_
WRLDON SPR
@ 39* very gravelly -Chert la grinding on auger although there Is still abundant matrix.
@ 42' BASAL CHERT TILL: Brown to black cobble- to boulder-sized, angular to aubangular chert claeta In a loose, sandy, silty, clayey matrix. The chert commonly has white weathering rinds.
48* nearly all gravel, very little matrix. 48* auger refusal began NX wire line core drilling with water only.
50.0 - 54.0* RESIDUAL LIMESTONE: Dark yellowish- orange (10YR6/6) weathered boulders of limestone and chert in a loose, sllty-clay matrix. Limestone is vuggy, as a result of solutlonlng, and iron-oxide stained. The chert has weathering rinds.
54.0*-15Q.5LIMESTONE: Formation Name: Burlington/ Keokuk; age: Mississippian; a light gray (N7) to very light gray (N8 ), fine- to coarsegrained, fossiliferous limestone interbedded with lenses and nodules of speckled, banded, and mottled light-bluish-gray (5B7/1) and bluish-white (5B9/1), fossiliferous chert.The formation is iron-oxide stained, moderate yellowish orange (10YR6/6) where weathered, and becomes less weathered with depth. It is manganese stained and generally hard and massive, but shows small-scale graded bedding locally. The fossils are predominantly crinoids, bryozoa and brachiopods, which are locally replaced by pyrite. A few calclte and quartz crystals are associated with vugs, especially at limestone-chert contacts. The formation contains abundant stylolites (pressure solution features), which are secondary features that are perpendicular to bedding and Intersect fossils. Stylolite sutures are associated with a thin (1/4") blackish-gray, carbonaceous, silty clay that contains iron. The chert is very hard, and is (1 ) banded if parallel to bedding,(2 ) concentrically banded if nodular, or(3) speckled if fossiliferous. The chert is generally speckled towards top of unit; secondary chert is often mixed with finegrained limestone.
Formation is weathered (iron-oxide stained) and slightly vuggy to approximately 63*.
Continually blocking off
@ 73.2* stopped drilling for 2 days,hole held water.
@ 741 changed drill bits 2 0 * life for diamond bit.
CHEMICAL PLANT B-3
B-4
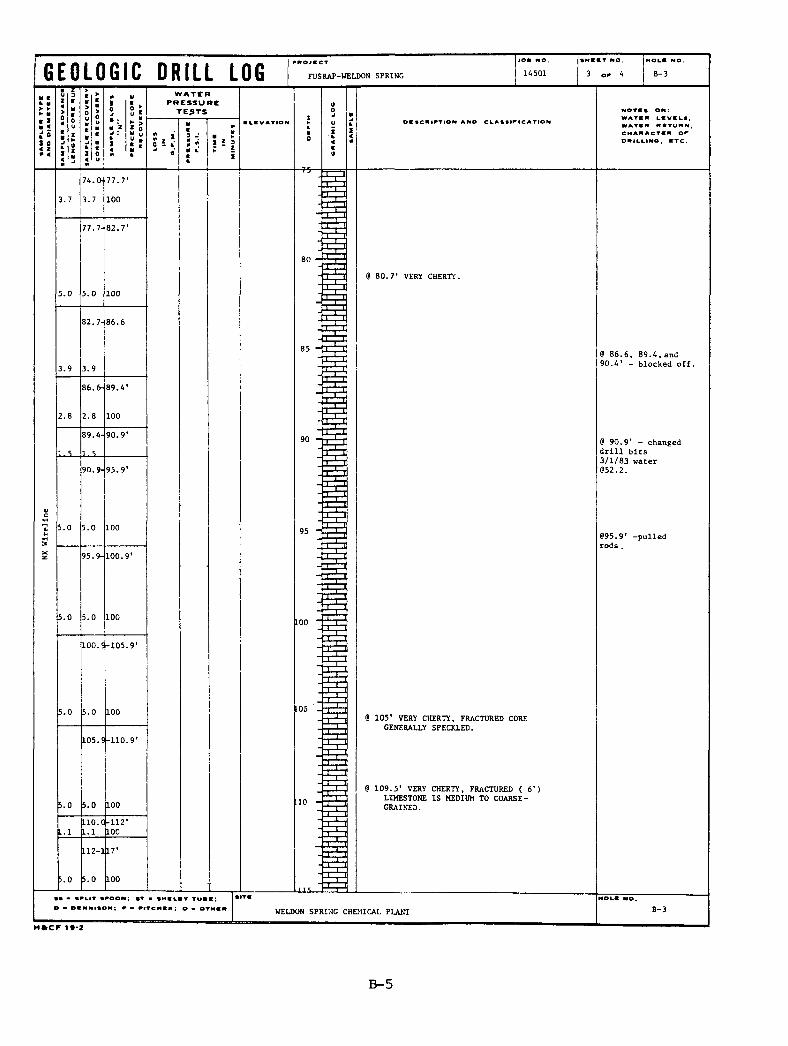
G E O L O G I C D R I L L LOG 14501 1-3FUSRAP-WELDON SPRING
W A T E RPRESSURETESTS
WATCH HITUHN,
100
77.7- 82.7'
80
80.7’ VERY CHERTY
5.0 5.0 100
82.7486.6
85 @ 8 6 .6 , 89.4, and 90.4* - blocked off
86.6-89.4
10089.4-90.9
@ 90.9' - changed drill bits 3/1/83 water @52.2.90.9-95.9
[email protected]* -pulled
95.9-100.9
5.0 100 100100.S-105.9
LOS5.0 100105' VERY CHERTY, FRACTURED CORE
GENERALLY SPECKLED.105.9-110.9
109.5* VERY CHERTY, FRACTURED ( 6 ’) LIMESTONE IS MEDIUM TO COARSEGRAINED.5.0 5.0 1100
112-117
100-LLS.
1-3WELDON SPRING CHEMICAL PLANT
MftCF 1S-2
B -5
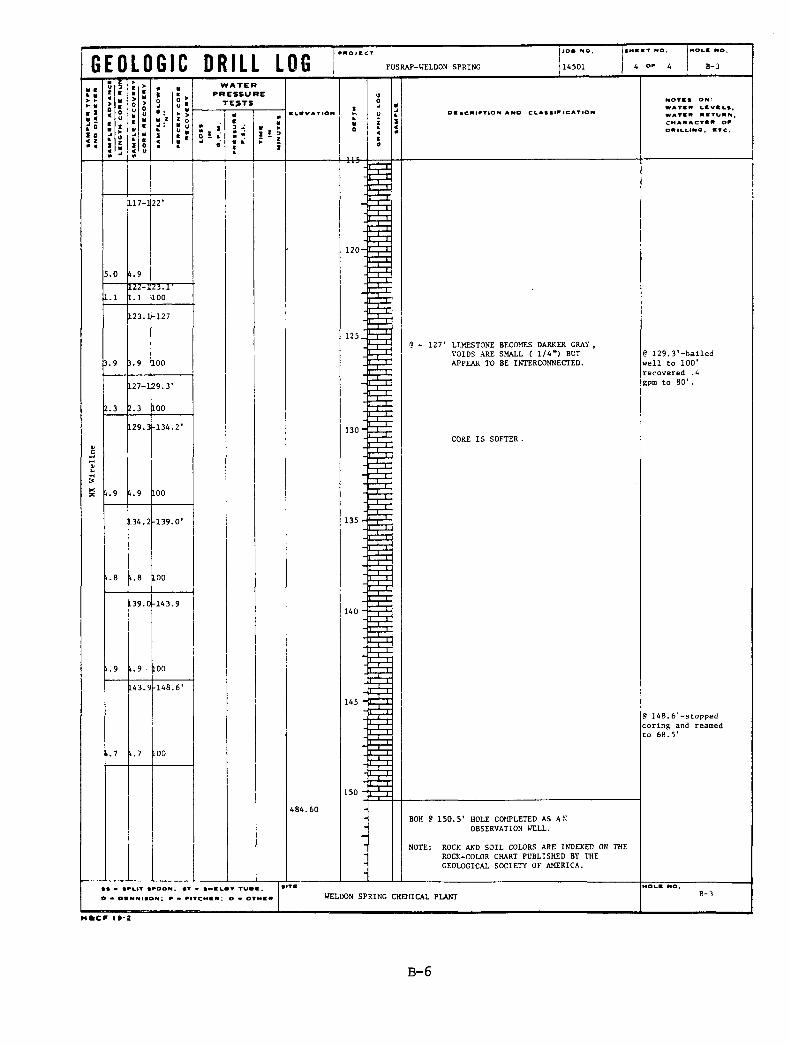
G E O L O G I C D R I L L LOG FUSRAP-WELDON SPRING
c I ■ <I 0
W A T E RPRESSUREte ts
11! 1
■ k lV ATION
JOE NO. MOLE NO.
14501 4 o f 4 B-3
OB»C*IFTION tND CLASSIFICATION
NOTES ON: WATE* LEVELS, WATCH *ETU*N. CHAU ACTE* OF OHILLINQ, BTC.
5.0
117-1
4.97 J 7 T100
123.1
1.9 100127-
2.3
129.3*100
129.3-134.2*
100L34.2
.9
139.0*
L39.0-143.9
100-148.6*
125 _
135
145 -
127* LIMESTONE BECOMES DARKER GRAY VOIDS ARE SMALL ( 1/4") BUT APPEAR TO BE INTERCONNECTED.
<? 129. 3*-bailed well to 1 0 0 * recovered .4 gpm to 80* .
CORE IS SOFTER .
148.6’-stopped coring and reamed to 68.5'
150.5* HOLE COMPLETED AS AN OBSERVATION WELL.
ROCK AND SOIL COLORS ARE INDEXED ON THE ROCK-COLOR CHART PUBLISHED BY THE GEOLOGICAL SOCIETY OF AMERICA.
WELDON SPRING CHEMICAL PLANT
H * C F 1t-2
B -6
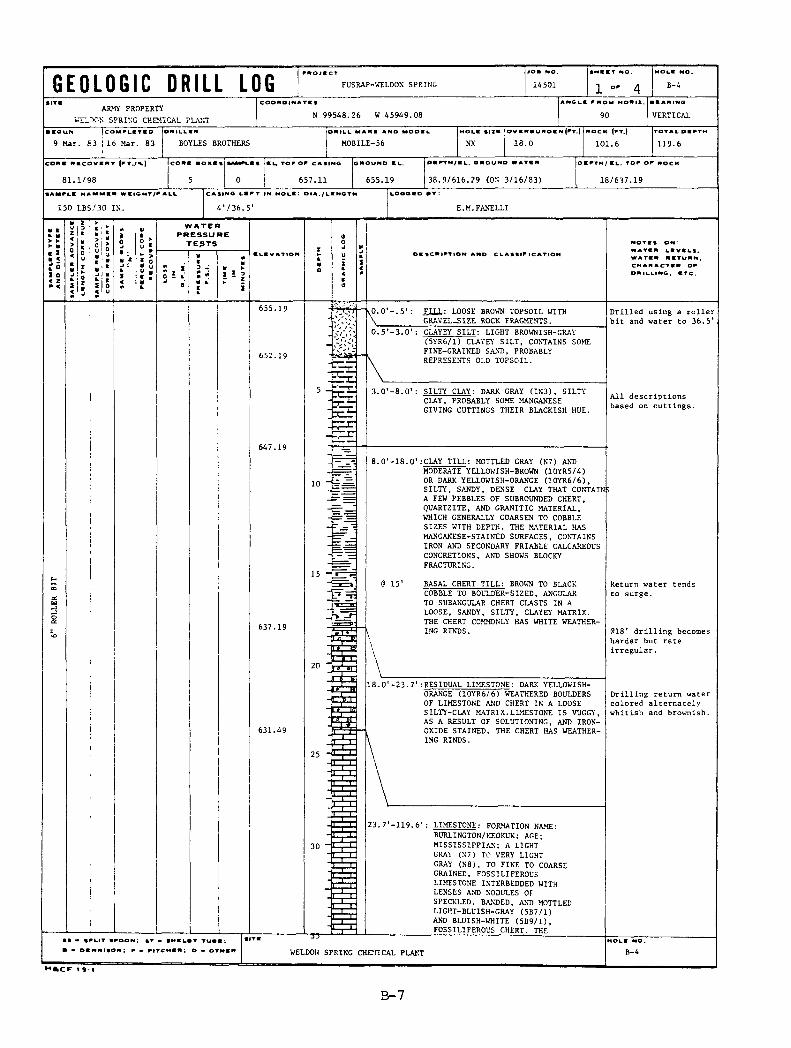
G E O L O G I C D R I L L LOG | f u s r a p-m e l d o n s p r i n g 14501 I i OF 4 B-4
SiTe ARMY PROPERTYVT-DON SPRING CHEMICAL PLANT N 99548.26 W 45949.08 90 j VERTICAL
■ eeuN IcOMFuKTKO9 Mar. 63 | 16 Mar. 83 BOYLES BROTHERS j MOBILE-56 | NX | 18.0 101.6 119.6
81.1/98 657.11 655.19 38.9/616.29 (ON 3/16/83) 18/637.19
150 LBS/30 IN.loooeo » v :
4'/36.5' E.M.FANELLI
W A TE RPRESSUREtests
Cl.KVA.TtOM OCtCMIATION AMO CLASSIFICATION
NOTES ON: WATCH LEVCLS. WATCH HCTUHN, CNAHACTCH OFCHILLING, CTC.
655.19 X1LL: LOOSE BROWN TOPSOIL WITH GRAVEL-SIZE ROCK FRAGMENTS.
Drilled using a roller bit and water to 36.5’
0.5’-3.0' CLAYEY SILT: LIGHT BROWNISH-GRAY(5YR6/1) CLAYEY' SILT, CONTAINS SOME FINE-GRAINED SAND, PROBABLY REPRESENTS OLD TOPSOIL.
3.0’: SILTY CLAY: DARK GRAY (IN3), SILTY CLAY, PROBABLY SOME MANGANESE GIVING CUTTINGS THEIR BLACKISH HUE.
All descriptions based on cuttings.
8.O'-18.O':CLAY TILL: MOTTLED GRAY (N7) AND MODERATE YELLOWISH-BROWN (10YR5/4)OR DARK YELLOWISH-ORANGE (10YR6/6), SILTY, SANDY, DENSE CLAY THAT CONTAIN^ A FEW PEBBLES OF SUBROUNDED CHERT, QUARTZITE, AND GRANITIC MATERIAL,WHICH GENERALLY COARSEN TO COBBLE SIZES WITH DEPTH. THE MATERIAL HAS MANGANESE-STAINED SURFACES, CONTAINS IRON AND SECONDARY FRIABLE CALCAREOUS CONCRETIONS, AND SHOWS BLOCKY FRACTURING.
637.19
<3 15* BASAL CHERT TILL: BROWN TO BLACK COBBLE TO BOULDER-SIZED, ANGULAR TO SUBANGULAR CHERT CLASTS IN A LOOSE, SANDY, SILTY, CLAYEY MATRIX. THE CHERT COMMONLY HAS WHITE WEATHERING RINDS.
18.O'-23.7*:RESIDUAL LIMESTONE: DARK YELLOWISH- ORANGE (10YR6/6) WEATHERED BOULDERS OF LIMESTONE AND CHERT IN A LOOSE SILTY-CLAY MATRIX.LIMESTONE IS VUGGY, AS A RESULT OF SOLUTIONING, AND IRON- OXIDE STAINED. THE CHERT HAS WEATHERING RINDS.
Return water tends to surge.
(318* drilling becomes harder but rate irregular.
Drilling return water colored alternately whitish and brownish.
• • ■ s p lit spoon ;
D - o k m n is o n ; F I
H*CF 1 9 1
s r • IH IL tY TUKK;
PITCMKW; o - OTHKP
23.7'-119.61: LIMESTONE: FORMATION NAME: BURLINGTON/KEOKUK; AGE; MISSISSIPPIAN; A LIGHT GRAY (N7) TO VERY LIGHT GRAY (N8 ), TO FINE TO COARSE GRAINED, FOSSILIFEROUS LIMESTONE INTERBEDDED WITH LENSES AND NODULES OF SPECKLED, BANDED, AND MOTTLED LIGHT-BLUISH-GRAY (5B7/1)AND BLUISH-WHITE (5B9/1), FOSSILIFEROUS CHERT. THE
WELDON SPRING CHEMICAL PLANT B - 4
B -7
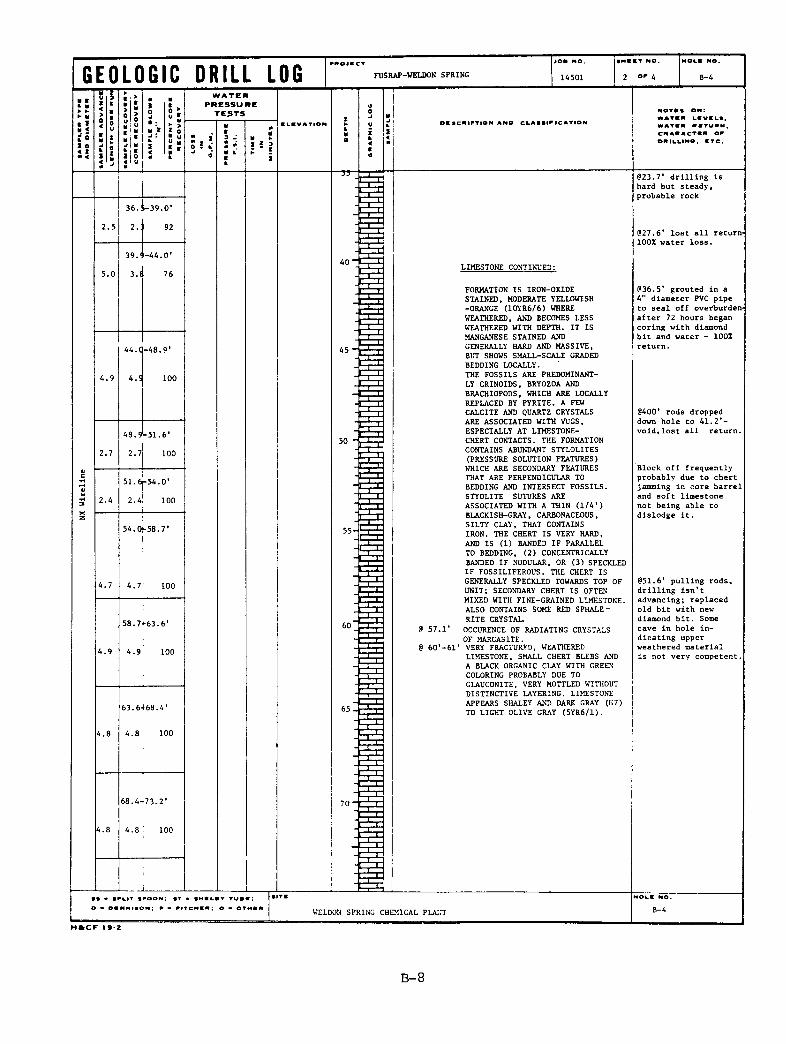
G E O L O G I C D R I L L LOG FUSRAP-WELDON SPRING 14501 2 4 B-4
W A T E RPRESSURE
TESTS
I 5
ELEVATION
-33-
DESCNIPTlON AND CLASSIFICATIONWATEN LEVELS, WATE* aiTURN, CNAWACTEE OF DMILLIMO, ETC.
36
2..i-39.0*
92
39.9-44.0’
3 .i 76
4.9
44.( •48.9’
100
48.9-51.6'
2.750 "100
51.6
2.4
54.0
4.7
58.7
4.9
54.0*
10058.7*
100
63.6468.4'
I4.8 1 100
68.4473.2*
O - DENNISON; » - fITCHC * ; O - I
•IfcCF 19-2
LIMESTONE CONTINUED:
FORMATION IS IRON-OXIDE STAINED, MODERATE YELLOWISH -ORANGE (10YR6/6) WHERE WEATHERED, AND BECOMES LESS WEATHERED WITH DEPTH. IT IS MANGANESE STAINED AND GENERALLY HARD AND MASSIVE,BUT SHOWS SMALL-SCALE GRADED BEDDING LOCALLY.THE FOSSILS ARE PREDOMINANTLY CRINOIDS, BRYOZOA AND BRACHIOPODS, WHICH ARE LOCALLY REPLACED BY PYRITE. A FEW CALCITE AND QUARTZ CRYSTALS ARE ASSOCIATED WITH VUGS, ESPECIALLY AT LIMESTONE- CHERT CONTACTS. THE FORMATION CONTAINS ABUNDANT STYLOLITES (PRESSURE SOLUTION FEATURES)WHICH ARE SECONDARY FEATURES THAT ARE PERPENDICULAR TO BEDDING AND INTERSECT FOSSILS. STYOLITE SUTURES ARE ASSOCIATED WITH A THIN (1/4’) BLACKISH-GRAY, CARBONACEOUS,SILTY CLAY, THAT CONTAINS IRON. THE CHERT IS VERY HARD,AND IS (1) BANDED IF PARALLEL TO BEDDING, (2) CONCENTRICALLY BANDED IF NODULAR, OR (3) SPECKLED IF FOSSILIFEROUS. THE CHERT IS GENERALLY SPECKLED TOWARDS TOP OF UNIT; SECONDARY CHERT IS OFTEN MIXED WITH FINE-GRAINED LIMESTONE. ALSO CONTAINS SOME RED SPHALERITE CRYSTAL.
57.1' OCCURENCE OF RADIATING CRYSTALS OF MARC AS ITE.
60'-61* VERY FRACTURED, WEATHEREDLIMESTONE, SMALL CHERT BLEBS AND A BLACK ORGANIC CLAY WITH GREEN COLORING PROBABLY DUE TO GLAUCONITE, VERY MOTTLED WITHOUT DISTINCTIVE LAYERING. LIMESTONE APPEARS SHALEY AND DARK GRAY (K7) TO LIGHT OLIVE GRAY (5YR6/1).
@23.7* drilling is hard but steady, probable rock
@27.6' lost all return- 1 0 0% water loss.
@36.5' grouted in a 4" diameter PVC pipe to seal off overburden- after 72 hours began coring with diamond bit and water - 1 0 0%
@400* rods dropped down hole to 41.2’- void.lost all return;
Block off frequently probably due to chert jamming in core barrel and soft limestone not being able to dislodge it.
@51.6' pulling rods, drilling isn’t advancing; replaced old bit with new diamond bit. Some cave in hole indicating upper weathered material is not very competent.
WELDON SPRING CHEMICAL PLANT B-4
B -8
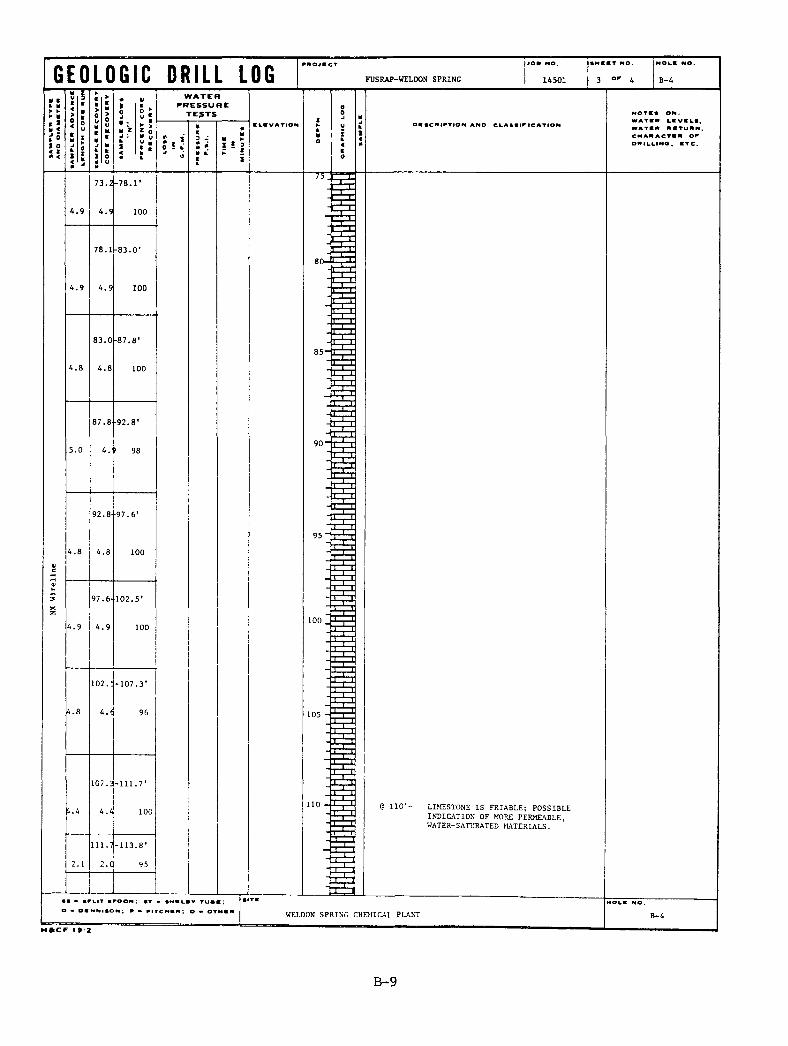
G E O L O G I C D R I L L LOG FUSRAP-WELDON SPRING I 14501 3 of u B-4
j IIS< z
WATERPRESSURE
TE>TS
5 Z *■0 5 4 I $
K i t VATION DESCAIPTION AND CLASSIFICATIONWATE* LEVELS, WATE* * ETU W N , CMAAACTS* OF OWILLING , ETC.
4.9
2.1
73.2-78.1*
4.9
87.8
4.
•83.0'
100
87.8'
92.8*
100
97.6* 102.5'
-107.3*
4. q 96
107.3-111.7'
4.41
111.7-113.8'
2.Q 95
85-
105 -
110 • @ 110'- LIMESTONE IS FRIABLE; POSSIBLE INDICATION OF MORE PERMEABLE, WATER-SATURATED MATERIALS.
SS • SPLIT SPOON; ST - IH IL tY TUEE;
o - o e n n is o n ; p - p i t c h * * ; o ■ o t h i i
1»CF I 9 2WELDON SPRING CHEMICAL PLANT
B -9
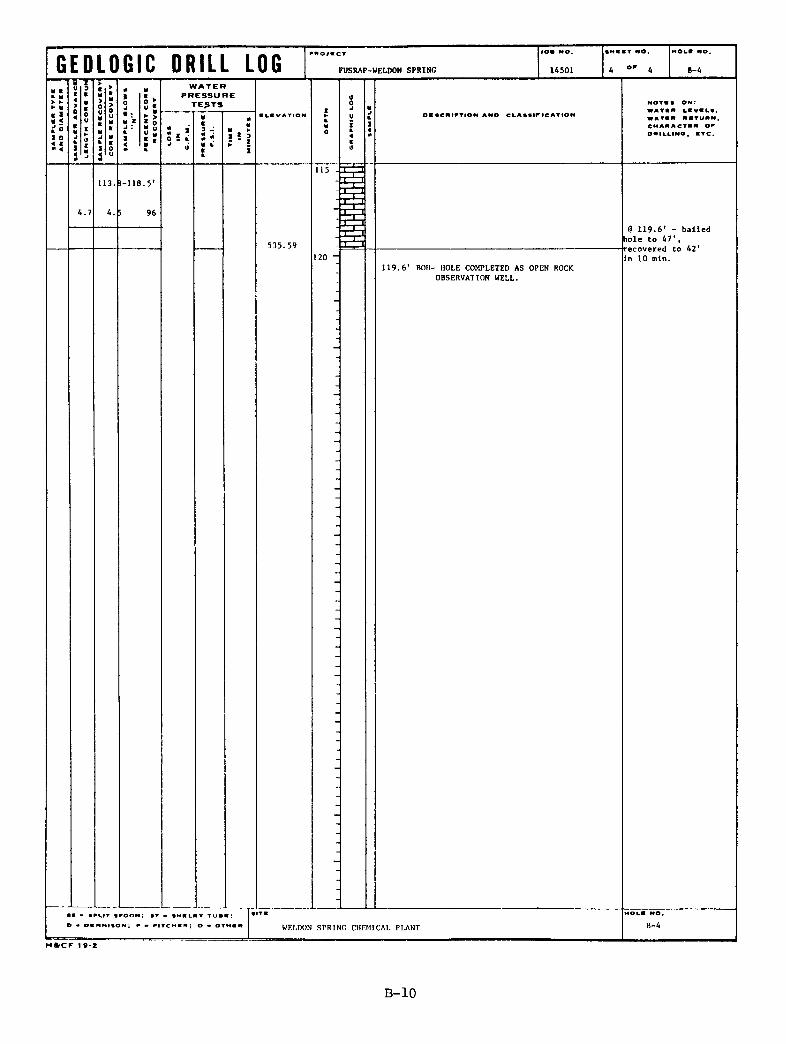
G E O L O G I C D R I L L LOG FUSRAP-WELDON SPRING 14501
j *s>* o V •
W A T E RP R E S S U R E
T E £ T S
I !• O V A T I O N O ltC R IfT IO N AND CLASSIFICATION
NOTES ON? WATS* LEVELS, WATER RITURN, CHARACTIR OF DNILLINO, ETC.
115
113.
4.
1-118.5*
96
535.59 120 “119.6’ BOH- HOLE COMPLETED AS OPEN ROCK
OBSERVATION WELL.
@ 119.6' - balled hole to 47', recovered to 42' in 1 0 mln.
SS - SFl.IT SFOON; ST - SMIL
O • OE NNISON ; F • FITCHEW; WELDON SPRING CHEMICAL PLANT B-4
H A C F 1 9-2
B -1 0
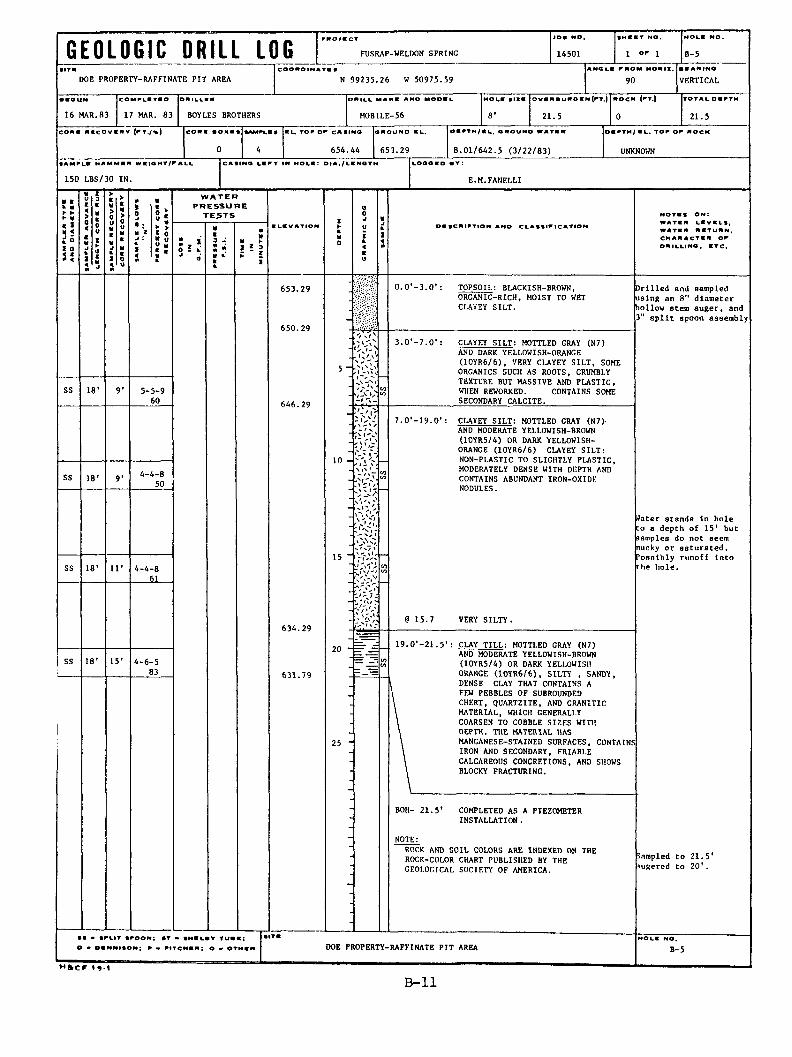
G E O L O G I C D R I L L LOG FUSRAP-WELDON SPRING 14501 1 OF 1 B-5
DOE PROPERTY-RAFFINATE PIT AREA N 99235.26 W 50975.59ANO L E F R O M H O R I I .
90■ a A F I N O
VERTICAL
• EOUN COMFIITBO OFILLBN DNILL MAKE ANO MODEL MOLE SIZE o v b f e u f o b n (ft .) * o c k (ft.J TOTAL OEFTM
16 MAR.83 17 MAR. 83 BOYLES BROTHERS MOBILE-56 8 * 21.5 0 21.5CONE lO X f l t •AMFLE. BU TOF OF CASINO OWOUNO SL.
0 4 654.44 653.29 8.01/642,5 (3/22/83)
OBFTH/EL. TOF OF HOCK
UNKNOWN
150 LBS/30 IN. 7
1 0 0 0 (0 IV
E.M.FAMELLI
W A T E RP R E S S U R E
T E £ T SCLIVATION OESC*|FTION ANO CLASSIFICATION
NOTES o n : WATER LEVELS, WATER RETURN, CHARACTER OF OR ILLINO , ETC.
653.29
650.29
18' 5-5-960 646.29
SS 18' 9 ’ 4-4-850
SS 18’ 11* 4-4-8 GL
IB’ 15’ 4-6-583
634.29
631.79
0.O'-3.O': TOPSOIL: BLACKISH-BROWN,ORGANIC-RICH, MOIST TO WET CLAYEY SILT.
Drilled and sampled using an 8 " diameter hollow stem auger, and 3" split spoon assembly
3.O ’-7.O ’: CLAYEY SILT; MOTTLED GRAY (N7)AND DARK YELLOWISH-ORANGE (10YR6/6), VERY CLAYEY SILT, SOME ORCANICS SUCH AS ROOTS, CRUMBLY TEXTURE BUT MASSIVE AND PLASTIC, WHEN REWORKED. CONTAINS SOME SECONDARY CALCITE. ____
10 -
r StVfo
i-
7.0 ’-19.O’ : CLAYEY SILT: MOTTLED GRAY (N7)-AND MODERATE YELLOWISH-BROWN (10YR5/4) OR DARK YELLOWISH- ORANGE (10YR6/6) CLAYEY SILT: NON-PLASTIC TO SLIGHTLY PLASTIC, MODERATELY DENSE WITH DEPTH AND CONTAINS ABUNDANT IRON-OXIDE NODULES.
15 -VLv
A'.C **
-fater stands In hole to a depth of 15’ but samples do not seem nucky or saturated. Possibly runoff into the hold.
15.7 VERY SILTY.
20
25 -
19.0’-21.5’: CLAY TILL: MOTTLED GRAY (N7)AND MODERATE YELLOWISH-BROWN (10YR5/4) OR DARK YELLOWISH ORANGE (10YR6/6), SILTY , SANDY, DENSE CLAY THAT CONTAINS A FEW PEBBLES OF SUBROUNDED CHERT, QUARTZITE, AND GRANITIC MATERIAL, WHICH GENERALLY COARSEN TO COBBLE SIZES WITH DEPTH. THE MATERIAL HAS MANGANESE-STAINED SURFACES, CONTAINS IRON AND SECONDARY, FRIABLE CALCAREOUS CONCRETIONS, AND SHOWS BLOCKY FRACTURING.
BOH- 21.5*
NOTE:
COMPLETED AS A PIEZOMETER INSTALLATION .
ROCK AND SOIL COLORS ARE INDEXED ON THE ROCK-COLOR CHART PUBLISHED BY THE GEOLOGICAL SOCIETY OF AMERICA.
Sampled to 21.5’ tugered to 2 0 ’.
H *C F 19 1
DOE PROPERTY-RAFFINATE PIT AREA
B-ll
B-5
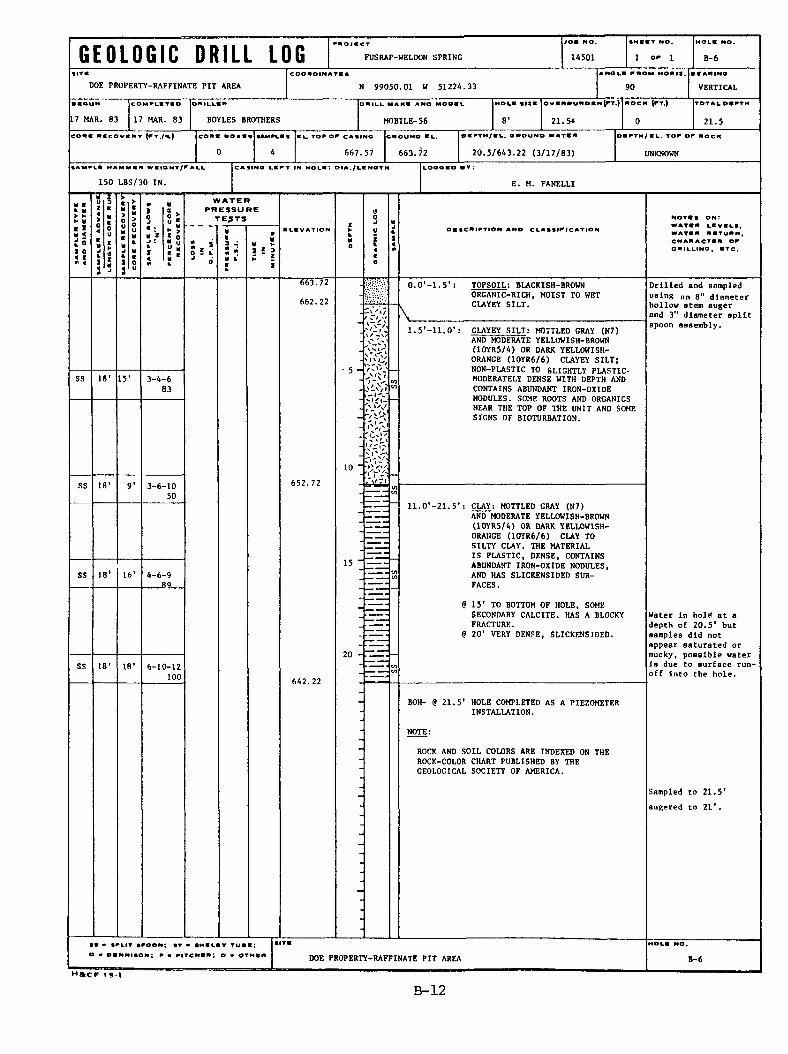
G E O L O G I C D R I L L LOGFHOICCT JOE NO, SHEET NO.
FUSRAP-WELDON SPRING 14501 1 O' 1 B-6
DOE PROPERTY-RAFFINATE PIT AREACOOAOINATES
N 99050.01 W 51224.33tNGLI FROM HORII.
90■ « ANINO
VERTICAL
17 MAR. 83
COMFUITBD OHILLS* O* ILL MANE ANO MODEL MOLE SHE o v s * b u * d b n (ft .) WOCK (FT.)
17 MAR. 83 BOYLES BROTHERS MOBILE-56 8 ’ 2 1 .5+ 0
TOTAL DRRTM
21.5CO*S RICOVIRY c o m i o i i i ia m f i
667.57
6NOUNO EL.
663.72
OE ATM / I L. OROUNO WATE*
20.5/643.22 (3/17/83)
150 LBS/30 IN. T*T1
CASINO LEFT IN MOLE: OIA./LENOTM LOOOEO *T
E. M. FANELLI
W A T E RP R E S S U R E
TESTSELEVATION OSSC*IFTION AND CLASSIFICATION
NOTES o n : WATS* LEVELS, WATE* R ITU *N , CHARACTER OF ORILLINO, BTC.
663.7T
662.22--V'/
O.O'-l.S': TOPSOIL: BLACKISH-BROWNORGANIC-RICH, MOIST TO WET CLAYEY SILT.
V
SS 15' 3-4-683
18' 9 ’ 3-6-1050
652.72
1.5'-11.0*: CLAYEY SILT: MOTTLED GRAY (N7)AND MODERATE YELLOWISH-BROWN (10YR5/4) OR DARK YELLOWISH- ORANGE (10YR6/6) CLAYEY SILT; NON-PLASTIC TO SLIGHTLY PLASTIC* MODERATELY DENSE WITH DEPTH AND CONTAINS ABUNDANT IRON-OXIDE NODULES. SOME ROOTS AND ORGANICS NEAR THE TOP OF THE UNIT AND SOME SIGNS OF BI0TURBATI0N.
Drilled and sampled using on 8 " diameter hollow stem auger and 3" diameter split spoon assembly.
15SS 18‘ 16* 4-6-9
89_
11.0'-21.5*: CLAY: MOTTLED GRAY (N7)AND MODERATE YELLOWISH-BROWN (10YR5/4) OR DARK YELLOWISH- ORANGE (10YR6/6) CLAY TO SILTY CLAY. THE MATERIAL IS PLASTIC, DENSE, CONTAINS ABUNDANT IRON-OXIDE NODULES,AND HAS SLICKENSIDED SURFACES .
@ 15' TO BOTTOM OF HOLE, SOME SECONDARY CALCITE. HAS A BL0CKY FRACTURE.
(3 20’ VERY DENSE, SLICKENSIDED.
20 -18' 18* 6- 10-12100 642.22
Water In hold at a depth of 20.5' but samples did not appear saturated or mucky, possible water Is due to surface runoff into the hole.
BOH- @ 21.5’ HOLE COMPLETED AS A PIEZOMETER INSTALLATION.
NOTE:
ROCK AND SOIL COLORS ARE INDEXED ON THE R0CK-C0L0R CHART PUBLISHED BY THE GEOLOGICAL SOCIETY OF AMERICA.
Sampled to 21.5' augered to 2 1 *.
O • DENNISON; F • FITCHE* ; O - OTME*
H » C F 1 9 1
DOE PROPERTY-RAFFINATE PIT AREA B-6
B -1 2
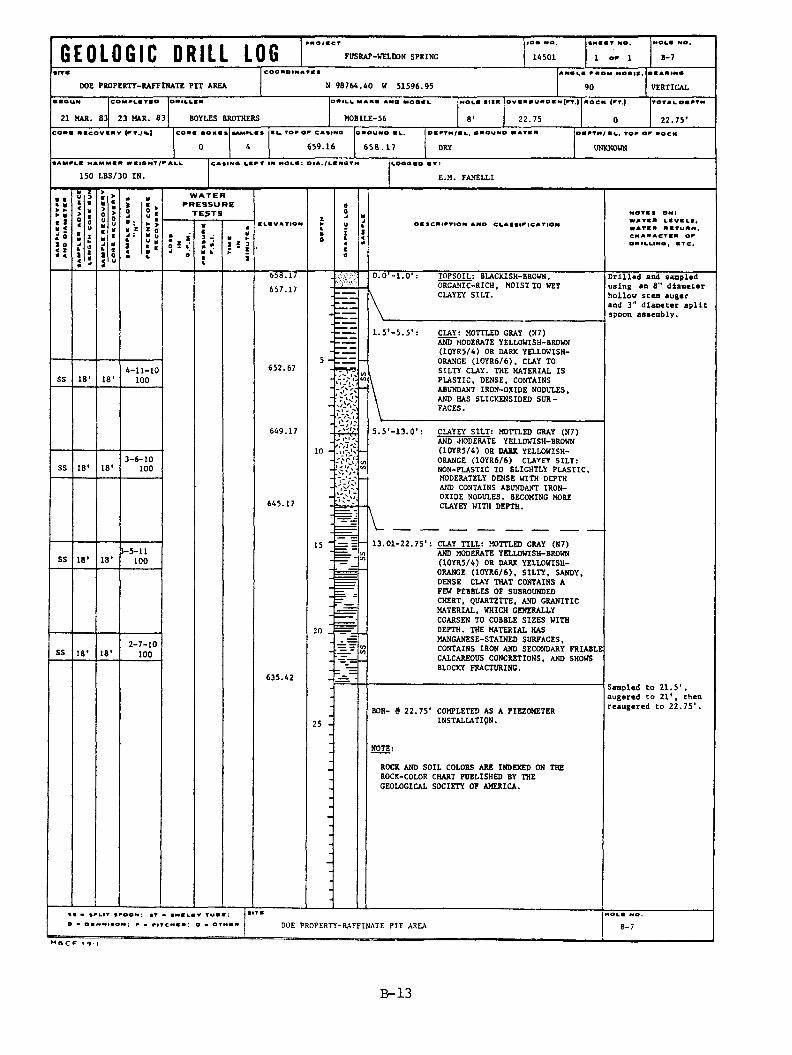
G E O L O G I C D R I L L LOGjoa no.
FUSRAP-WELDON SPRING 14501 1 o f l
DOE PROPERTY-RAFFINATE PIT AREA N 98764.40 W 51596.95 VERTICALCOMFIITBO ON.LLE* OMlLb MARI ANO MODCL NOL* SIZE HOC* (FT.I
21 MAR. 83 23 MAR. 83 BOYLES BROTHERS MOBILE-56 8 * 22.75 0 22.75'cowe NICOVINV (f t ./*) sAwi-i.ee IU TOF OF CASINO OROUNO Ik .
0 4 659.16 658.17 DRY UNKNOWN
150 LBS/30 IN.CAIINa L C F T IN HOLE: OIA./LINOTN
E.M. FANELLI
W A TE RPRES SURE
TE>T S
1 £ELEVATION
no tes o n : WATE* LEVELS, WATS* RETURN, CMAWACTE* OF ONILLINO, ETC.
658.17657.17
O.O'-l.O': TOPSOIL: BLACKISH-BROWN.ORGANIC-RICH, MOIST TO WET
V CLAYEY SILT.
Drilled and sampled using an 8" diameter hollow stem auger and 3" diameter split spoon assembly.
18' 18'4-11-10100 652.67
649.17
5 -
18' 18'3 -6-10100
-7;- io -f'vV;*-
1.5*-5.5': CLAY: MOTTLED GRAY (N7)AND MODERATE YELLOWISH-BROWN (10YR5/4) OR DARK YELLOWISH- ORANGE (10YR6/6), CLAY TO SILTY CLAY. THE MATERIAL IS PLASTIC, DENSE, CONTAINS ABUNDANT IRON-OXIDE NODULES, AND HAS SLICKENSIDED SURFACES.
645.17
5.5'-13.0*: CLAYEY SILT: MOTTLED GRAY (N7)AND MODERATE YELLOWISH-BROWN (10YR5/4) OR DARK YELLOWISH- ORANGE (10YR6/6) CLAYFY SILT: NON-PLASTIC TO SLIGHTLY PLASTIC, MODERATELY DENSE WITH DEPTH AND CONTAINS ABUNDANT IRON- OXIDE NODULES. BECOMING MORE CLAYEY WITH DEPTH.
18' 18'$-5-11 100
15
20 _18' 18'
2-7-10100
13.01-22.75': CLAY TILL: MOTTLED GRAY (N7)AND MODERATE YELLOWISH-BROWN (10YR5/4) OR DARK YELLOWISH- ORANGE (10YR6/6), SILTY, SANDY, DENSE CLAY THAT CONTAINS A FEW PEBBLES OF SUBROUNDED CHERT, QUARTZITE, AND GRANITIC MATERIAL, WHICH GENERALLY COARSEN TO COBBLE SIZES WITH DEPTH. THE MATERIAL HAS MANGANESE-STAINED SURFACES,CONTAINS IRON AND SECONDARY FRIABLE CALCAREOUS CONCRETIONS, AND SHOWS BLOCKY FRACTURING.
635.42
25BOH- 9 22.75' COMPLETED AS A PIEZOMETER
INSTALLATION.
Sampled to 21.5', augered to 2 1 *, then reaugered to 22.75'.
ROCK AND SOIL COLORS ARE INDEXED ON THE ROCK-COLOR CHART PUBLISHED BY THE GEOLOGICAL SOCIETY OF AMERICA.
it • »FkiT s fo o n ; er - (Nicav rues; o - o im n i io n ; f • f iT c m « *; o - O tm in DOE PROPERTY-RAFFINATE PIT AREA B-7
B -1 3
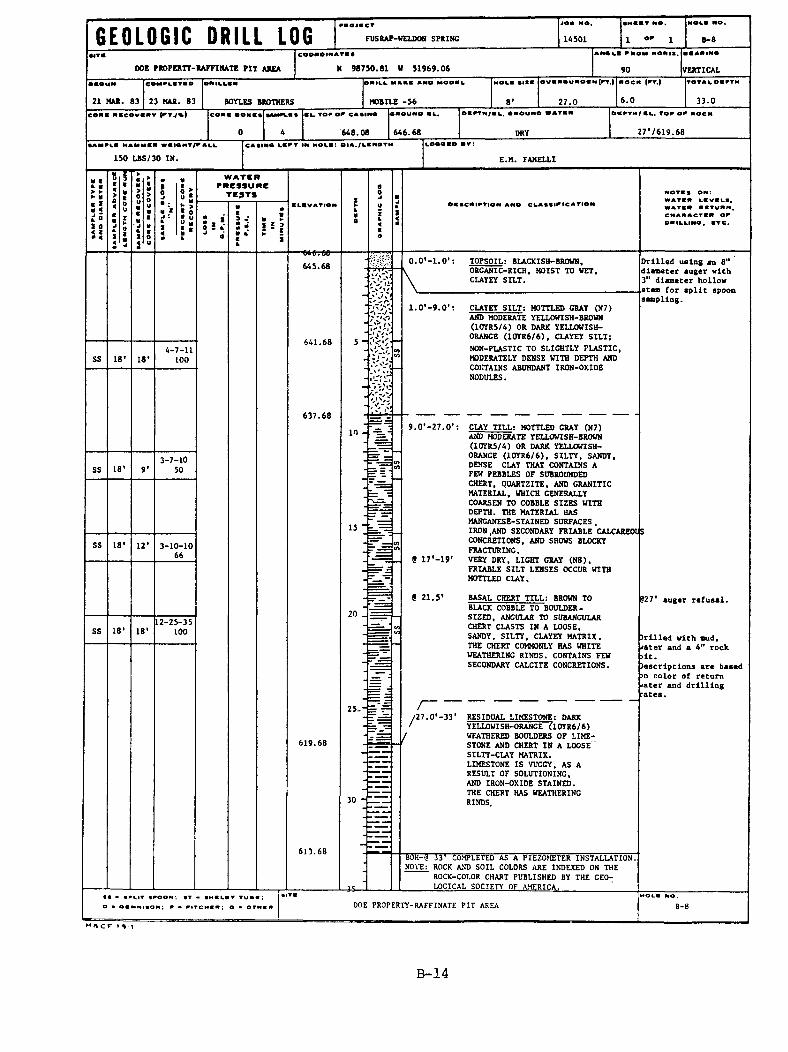
G E O L O G I C D R I L L LOG FUSRAP-VELDON SPRING 14501 6-8
DOE PROPERTY-RAFFINATE PIT AREA N 98750.81 W 51969.06 90 VERTICAL
21 MAR. 83 23 MAR. 83 BOYLES BROTHERS MOBILE -56 27.0 6.0 33.0C O W S I O K I I
0 648.08
SROUNO I I ,
646.68 27V619.68
150 LBS/30 IN. E.M. FANELLI
5 o
W A TE RP R E S S U R E
TE5TS
iil
ILIVATIONWATE* LEVELS, WATE* *ETV*N, CHAWACTE* O* OWILLINO, ETC.
645.68
18' 18*4-7-11
100
641.68
O.O’-l.O': TOPSOIL: BLACKISH-BROWN,ORGANIC-RICH, MOIST TO VET,
\ CLAYEY SILT.
1.0'-9.0': CLAYEY SILT: MOTTLED GRAY (N7)AND MODERATE YELLOWISH-BROWN (10YR5/4) OR DARK YELLOWISH- ORANGE (10YR6/6), CLAYEY SILT; NON-PLASTIC TO SLIGHTLY PLASTIC, MODERATELY DENSE WITH DEPTH AND CONTAINS ABUNDANT IRON-OXIDE NODULES.
Drilled uelng an 8" diameter auger with 3" diameter hollow .stem for split spoon sampling.
637.68
10
18'3-7-10
50
15
18' 12* 3-10-1066
S.O’- Z ? . ^ : CLAY TILL: MOTTLED GRAY (N7)AND MODERATE YELLOWISH-BROWN (10YR5/4) OR DARK YELLOWISH- ORANGE (10YR6/6), SILTY, SANDY,DENSE CLAY THAT CONTAINS A FEW PEBBLES OF SUBROUNDED CHERT, QUARTZITE, AND GRANITIC MATERIAL, WHICH GENERALLY COARSEN TO COBBLE SIZES WITH DEPTH. THE MATERIAL HAS MANGANESE-STAINED SURFACES ,IRON,AND SECONDARY FRIABLE CALCAREOljS CONCRETIONS, AND SHOWS BLOCKY FRACTURING.
9 1 7 1 9 * VERY DRY, LIGHT CRAY (N8 ),FRIABLE SILT LENSES OCCUR WITH MOTTLED CLAY.
8 21.5T
SS 18' 18'12-25-35
100
20
/27.0,-33l
619.68
30 -
BASAL CHERT TILL: BROWN TO BLACK COBBLE TO BOULDERSIZED, ANGULAR TO SUBANCULAR CHERT CLASTS IN A LOOSE,SANDY, SILTY, CLAYEY MATRIX. THE CHERT COMMONLY HAS WHITE WEATHERING RINDS. CONTAINS FEW SECONDARY CALCITE CONCRETIONS.
RESIDUAL LIMESTONE: DARK YELLOWISH-ORANGE (10YR6/6) WEATHERED BOULDERS OF LIMESTONE AND CHERT IN A LOOSE" SILTY-CLAY MATRIX.LIMESTONE IS VUGGY, AS A RESULT OF SOLUTIONING,AND IRON-OXIDE STAINED.THE CHERT HAS WEATHERING RINDS.
327* auger refusal.
drilled with mud,■rater and a 4" rock jit.Descriptions are based jn color of return rater and drilling rates.
613.68
44-
BOH-e 33' COMPLETED AS A PIEZOMETER INSTALLATION. NOTE: ROCK AND SOIL COLORS ARE INDEXED ON THE
ROCK-COLOR CHART PUBLISHED BY THE CEO- ______ LOGICAL SOCIETY OF AMERICA. _______ ~
• • e * viT i p o o m ; » t - « m i l *i • O I M M t l O N ; # • f l T C H I M ; DOE PROPERTY-RAFFINATE PIT AREA B-
B -1 4
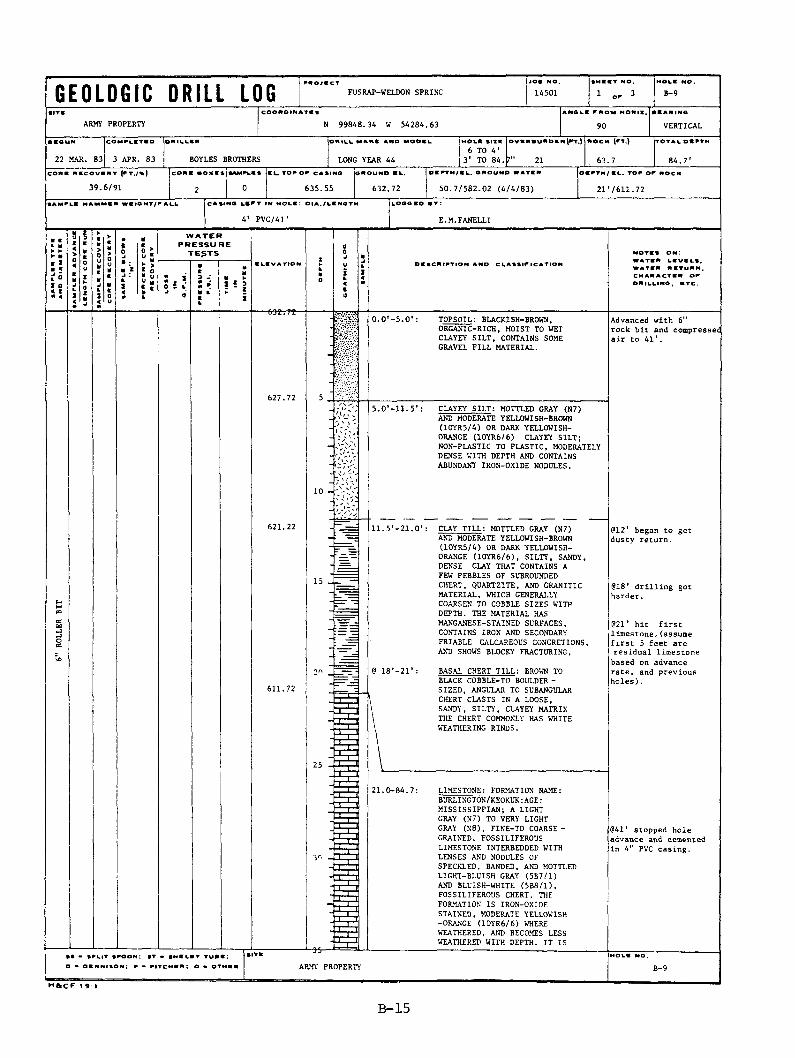
G E O L O G I C D R I L L LOG|>oe no.
FUSRAP-WELDON SPRING | 14501 1 OF 3 B-9
ARMY PROPERTY N 99848.34 W 54284.63 VERTICALCOMILITIO loniLie* ontll M A K C ANO MODIL iHOLt SIT« o v m « u w o in {ft .) «OCH (FT.)
| 6 TO 4'3 APR. 83 BOYLES BROTHERS LONG YEAR 44 |3' TO 84. 7” 21 63.722 MAR. 83
T O T A l f i t r T M
84.7*c o m RICOVIRY (ft./% )
39.6/91c o n s eoxEs|SAMFw«s c u tor or c asino
2 0 635.55
ROUND EC.
632.72
OEFTM/CC. 0ROUNO WATER
50.7/582.02 (4/4/83) 2V/611.72CASINO CEFT IN HOLE: OlA./LENOTN
41 PVC/41'
loooeo :
E.M.FANELLI
W A T E RPRESSURE
TESTS
1 £ D : £ELEVATION
-632.~ 2
OISCNIRTlON AND CLASSIFICATION WATER LEVELS. WATIR RITURN, CHARACTER OF OWILLINO , BTC.
TOPSOIL: BLACKISH-BROWN, ORGANIC-RICH, MOIST TO WET CLAYEY SILT, CONTAINS SOME GRAVEL FILL MATERIAL.
Advanced with 6" rock bit and compressed
627.72
'»/.V 5.0'-11.5’:
10 -
11.5’-21.0'
18*-21’
611.72
CLAYEY SILT: MOTTLED GRAY (N7)AND MODERATE YELLOWISH-BROWN (10YR5/4) OR DARK YELLOWISH- ORANGE (10YR6/6) CLAYEY SILT; NON-PLASTIC TO PLASTIC, MODERATELY DENSE WITH DEPTH AND CONTAINS ABUNDANT IRON-OXIDE NODULES.
CLAY TILL: MOTTLED GRAY (N7)AND MODERATE YELLOWISH-BROWN (10YR5/4) OR DARK YELLOWISH- ORANGE (10YR6/6), SILTY, SANDY, DENSE CLAY THAT CONTAINS A FEW PEBBLES OF SUBROUNDED CHERT, QUARTZITE, AND GRANITIC MATERIAL, WHICH GENERALLY COARSEN TO COBBLE SIZES WITH DEPTH. THE MATERIAL HAS MANGANESE-STAINED SURFACES, CONTAINS IRON AND SECONDARY FRIABLE CALCAREOUS CONCRETIONS, AND SHOWS BLOCKY FRACTURING.
BASAL CHERT TILL: BROWN TO BLACK COBBLE-TO BOULDER - SIZED, ANGULAR TO SUBANGULAR CHERT CLASTS IN A LOOSE,SANDY, SILTY, CLAYEY MATRIX THE CHERT COMMONLY HAS WHITE WEATHERING RINDS.
@1 2 ’ began to get dusty return.
@18 * drilling got harder.
@2 1 1 hit first limestone.(assume first 5 feet are residual limestone based on advance rate, and previous
21.0-84.7: LIMESTONE: FORMATION NAME:BURLINGTON/KEOKUK;AGE:MISS IS SIPPIAN; A LIGHT GRAY (N7) TO VERY LIGHT GRAY (N8 ), FINE-TO COARSEGRAINED, FOSSILIFEROUS LIMESTONE INTERBEDDED WITH LENSES AND NODULES OF SPECKLED, BANDED, AND MOTTLED LIGHT-BLUISH GRAY (5B7/1)AND BLUISH-WHITE (5B8/1), FOSSILIFEROUS CHERT. THE FORMATION IS IRON-OXIDE STAINED, MODERATE YELLOWISH -ORANGE (10YR6/6) WHERE WEATHERED, AND BECOMES LESS WEATHERED WITH DEPTH. IT IS
@411 stopped hole advance and cemented in 4" PVC casing.
D - OINNIION
1»CF 1 9-|
F - FITCMBR; O • OTMBH ARMY PROPERTY
B -1 5
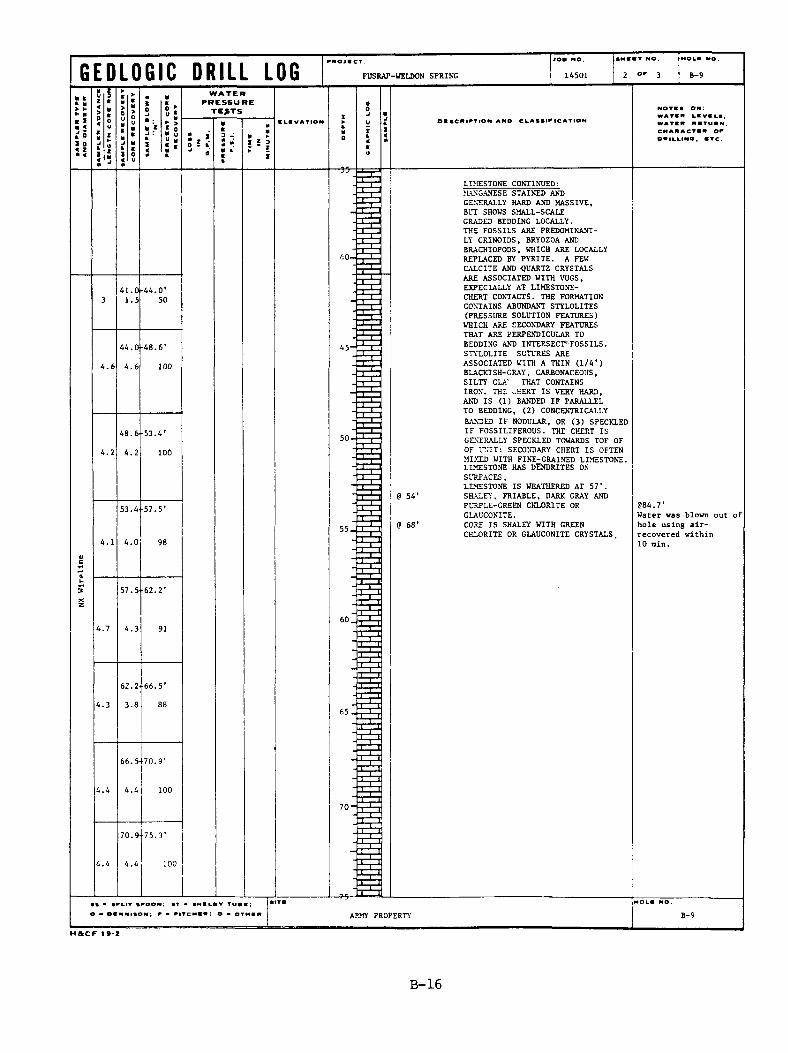
G E O L O G I C D R I L L LOG FUSRAP-WELDON SPRING 14501 2 OF 3 B-9
e ei w► P► ■ t I * < i 5 1 o
WATERPRESSURE
TE>TSELEVATION
- 5 5 -
WATEN LEVELS, WATEW RITUMN, CNAWACTSWOWILLINO, ETC.
41.0-44.0 f1.5
0-44.
4.6
48.6
4.2
53.4
50
48.6*
10045-
53.4*
100
57.5'
4.3
62.2
3.8
57.5'
9855.
60.
65 .
70.9'
4.4 100
75.3'
• • - SPLIT SPOON; ST - SH
O • DENNISON; P - PITCME
@ 54'
9 68'
AP.MY PROPERTY
LIMESTONE CONTINUED:MANGANESE STAINED AND GENERALLY HARD AND MASSIVE,BUT SHOWS SMALL-SCALE GRADED BEDDING LOCALLY.THE FOSSILS ARE PREDOMINANTLY CRIN0IDS, BRY0Z0A AND BRACHI0P0DS, WHICH ARE LOCALLY REPLACED BY PYRITE. A FEW CALCITE AND QUARTZ CRYSTALS ARE ASSOCIATED WITH VUGS, ESPECIALLY AT LIMESTONE- CHERT CONTACTS. THE FORMATION CONTAINS ABUNDANT STYL0LITES (PRESSURE SOLUTION FEATURES)WHICH ARE SECONDARY FEATURES THAT ARE PERPENDICULAR TO BEDDING AND INTERSECT*FOSSILS. STYLOLITE SUTURES ARE ASSOCIATED WITH A THIN (1/4') BLACKISH-GRAY, CARBONACEOUS,SILTY CLA' THAT CONTAINS IRON. THE oHERT IS VERY HARD,AND IS (1) BANDED IF PARALLEL TO BEDDING, (2) CONCENTRICALLY BANDED IF NODULAR, OR (3) SPECKLED IF FOSSILIFEROUS. THE CHERT IS GENERALLY SPECKLED TOWARDS TOF OF OF UNIT: SECONDARY CHERT IS OFTEN MIXED WITH FINE-GRAINED LIMESTONE. LIMESTONE HAS DENDRITES ON SURFACES.LIMESTONE IS WEATHERED AT 57'. SHALEY, FRIABLE, DARK GRAY AND PURPLE-GREEN CHLORITE OR GLAUCONITE.CORE IS SHALEY WITH GREEN CHLORITE OR GLAUCONITE CRYSTALS.
@84.7'Water was blown out of hole using air- recovered within 10 min.
HftCF 1 9-2
B -1 6
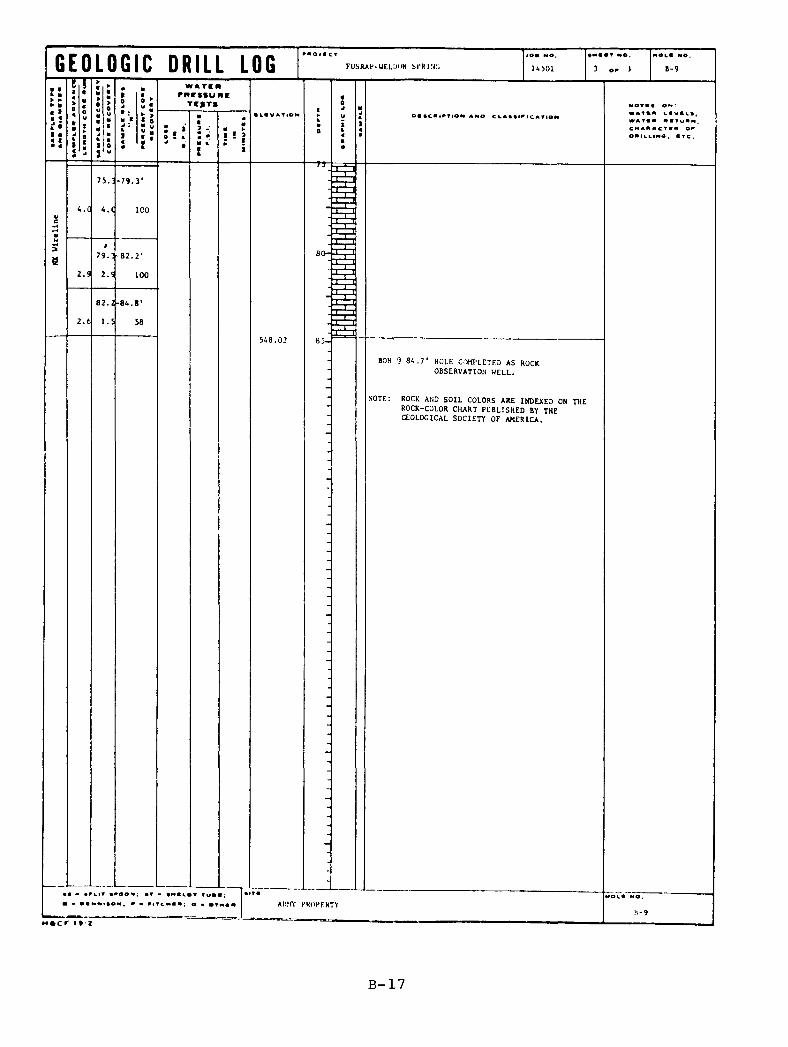
G E O L O G I C D R I L L LOG fusrah-uf.unin bf’RiNr;
75.
79.
2.9
82.2’ 100
82.2
1.5
-84.8*
58
79.3'
ICO
WATE ItFRESEUItE
TE>T»
« * c r is z
• ktVATlOK
-rr
85-
w l« vevs.WATII *«TU*N,CM AA A c o a OAtLLIMO, arc.
BOH o 84.7' HOLE COMPLETED AS ROCKo b s e r v a t i o n w e l l .
NOTE: ROCK AND SOIL COLORS ARE INDEXED ON THEROCK-COLOR CHART PUBLISHED BY THE GEOLOGICAL SOCIETY OF AMERICA.
ARMY PROPERTY R-9
B - 17
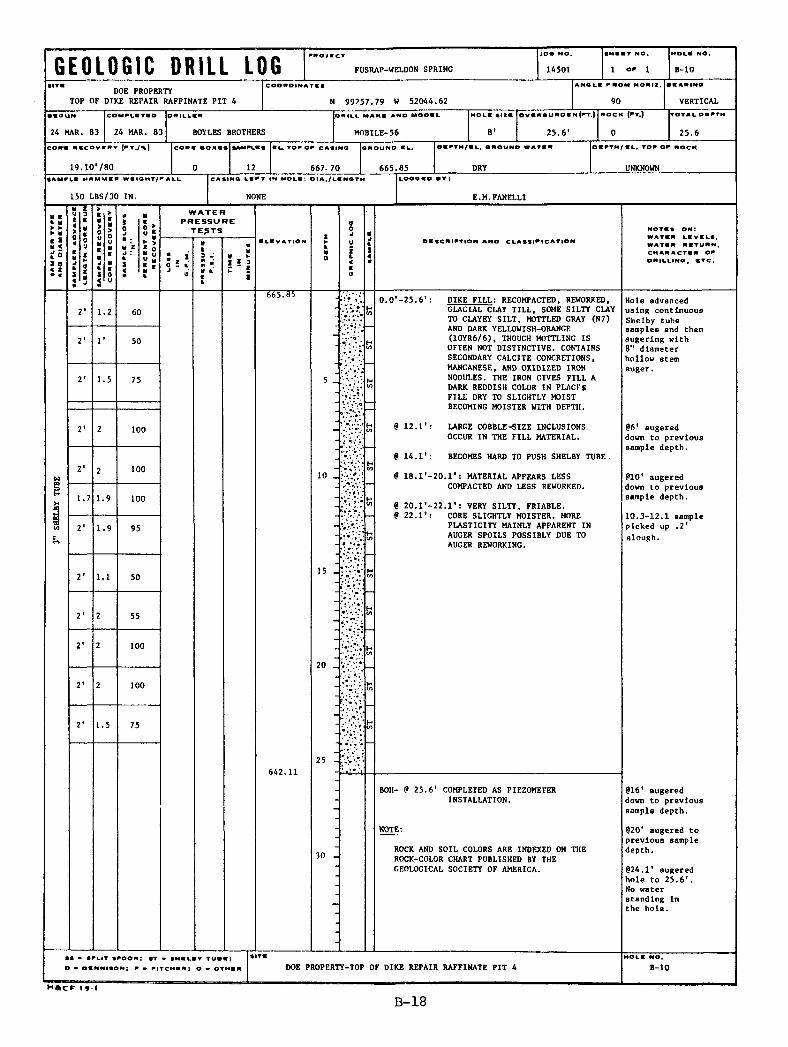
G E O L O G I C D R I L L LOG FUSRAP-WELDON SPRING 14501 1 o f 1 B-10
"ITK DOE PROPERTYTOP OF DIKE REPAIR RAFFINATE PIT 4
C O O H D I N A T I I
N 99257.79 W 52044.62 90 VERTICALCOMPLITtD o h il l e h OHILL MAHI AND MODEL HOLE SIZE ov sh e u ho bn ( ft .) HOCK (ft .) TOTAL DEPTH
24 MAR. 83 BOYLES BROTHERS MOBILE-56 8 ' 25.6’ 0 25.624 MAR. 83
19.10780
COHB HOKES SAMPLES «U TOP OF CASINO OHOVNO EL.
0 12 667. 70 665.85 DRYM M f l l MAMMBH W IIO HT/PAIL
150 LBS/30 IN.
lo o oeo e v :
E.M.FANELLIW A T E R
P R E S S U R ETE^TS
1 IELEVATION
“665.85
DESCRIPTION ANO CLASSIFICATION
NOTES o n ; WATCH LEVELS, WATEH HCTUHN. CMAHACTEH OF OHILLINO, ETC.
1. 2
2*
1.5
2'1.7 1.9
2' 1.9
2' 1.1
1.5
60
75
100
100
10095
0.0,-25.6l: DIKE FILL: RECOMPACTED, REWORKED,GLACIAL CLAY TILL, SOME SILTY CLAY TO CLAYEY SILT, MOTTLED GRAY (N7) AND DARK YELLOWISH-ORANGE (10YR6/6), THOUGH MOTTLING IS OFTEN NOT DISTINCTIVE. CONTAINS SECONDARY CALCITE CONCRETIONS, MANGANESE, AND OXIDIZED IRON NODULES. THE IRON GIVES FILL ADARK REDDISH COLOR IN PLACESFILL DRY TO SLIGHTLY MOIST BECOMING M0ISTER WITH DEPTH.
9 12.1': LARGE COBBLE-SIZE INCLUSIONSOCCUR IN THE FILL MATERIAL.
9 14.1': BECOMES HARD TO PUSH SHELBY TUBE .
9 18.V-20.V: MATERIAL APPEARS LESSCOMPACTED AND LESS REWORKED.
6 20.V-22.1': VERY SILTY, FRIABLE.9 22.1': CORE SLIGHTLY MOISTER. MORE
PLASTICITY MAINLY APPARENT IN AUGER SPOILS POSSIBLY DUE TO AUGER REWORKING.
5015 -
55
100
20
100
75
25 -642.11
30 -
BOH- 9 25.6* COMPLETED AS PIEZOMETER INSTALLATION.
NOTE:
ROCK AND SOIL COLORS ARE INDEXED ON THE ROCK-COLOR CHART PUBLISHED BY THE GEOLOGICAL SOCIETY OF AMERICA.
Hole advanced using continuous Shelby tube samples and then augering with 8" diameter hollow stem
96' augered down to previous sample depth.
910' augered down to previous sample depth.
10.3-12.1 sample picked up .2 ' slough.
916' augered down to previous sample depth.
920* augered to previous sample depth.
924.1' augered hole to 25.6'.No water standing in the hole.
• • • SPLIT SPOON;
O • OCNNItON; P <
• t • ih iw s v ruee;PITCH*H ; O - OTHEH
H * C F I 9 - 1
DOE PROPERTY-TOP OF DIKE REPAIR RAFFINATE PIT 4 B-10
B -1 8
GE OL OGI C D R I L L LOG FUSRAP-WELDON SPRING | 16501
{.MEET NO.
| 1 OF 3 B-ll__ARMY PROPERTY N 96958.31 W 52458.57
190 I
1VERTICAL
■ ■SUN jcOMFlCTKO OAlLLE* OEILL MAKE ANO MODEL HOLE SIZE IOVE*»U*OEn (FT.) j*OCK (FT.) TOTALDEFTM
24 MAR. 83 | 28 MAR. 83 BOYLES BROTHERS LONG YEAR 44 3 to 4' j 17 | 89.2 106.2*COM wecovewv (f t ./%)
54.1/100
|cO*EBOXES
1 3 0
■ L TOF OF CASING
671.841
669.86 1 63.5/606.36 (3/29/86)
OEFTM/EL. TOF OP
17V652.86
a 0
CAStNG V*F T IN HOLIDIA./ttNQT
4*/51*
LOOOEO O V :
E.M.FANELLIW A TE R
PRESSU RE TESTS
E L E V A T I O N OESCEIATION ANO CLASSIFICATIONWATE* LEVELS. WATE* *ETU *N , CMA*ACTE* OF OniLLINO, ETC.
669.866 6 8 . 8 6
659.86
SS • SFLIT SFOON-. ST - tMELSV
O • OBNNISON; F — FITCHE* ; O
M * C F 1 9-1
O.O'-l.O': TOPSOIL: BLACKISH-BROWN,< ORGANIC-RICH, MOIST TO WET,\ CLAYEY SILT.
l.O'-lO.O*: CLAYEY SILT: MOTTLED GRAY (N7)AND MODERATE YELLOWISH-BROWN (10YR5/4) OR DARK YELLOWISH- ORANGE (10YR6/6), CLAYEY SILT; NON-PLASTIC TO PLASTIC, MODERATELY DENSE WITH DEPTH AND CONTAINS ABUNDANT IRON-OXIDE NODULES.
Advanced with 6" rock bit and compressed air to 51' .
Descriptions are based on cuttings, and between 0-23 * on State of Missouri geologists' observations.
10.0’-17 . O’ : CHERTY CLAY: REDDISH-BROWN(5R5/4), IRON-RICH CLAY CONTAINING CHERT NODULES WITH WEATHERING RINDS.
25.
17.O'-23.O': RESIDUAL LIMESTONE: DARK YELLOWISH-ORANGE (10YR6/6) WEATHERED BOULDERS OF LIMESTONE AND CHERT IN A LOOSE SILTY-CLAY MATRIX.LIMESTONE IS VUGGY, AS A RESULT OF SOLUTIONING,AND IRON-OXIDE STAINED.THE CHERT HAS WEATHERING RINDS .
23.O'-106.2*:LIMESTONE: FORMATION NAME: BURLINGTON/KEOKUK;AGE: MISSISSIPPIAN: A LIGHT GRAY (N7) TO VERY LIGHT GRAY (N8 ), FINE TO COARSEGRAINED, FOSSILIFEROUS LIMESTONE INTERBEDDED WITH LENSES AND NODULES OF SPECKLED, BANDED, AND MOTTLED LIGHT BLUISH-GRAY (5B7/1)AND BLUISH-WHITE (5B9/1). FOSSILIFEROUS CHERT. THE FORMATION IS IRON-OXIDE STAINED, MODERATE YELLOWISH -ORANGE (10YR6/6) WHERE WEATHERED. AND BECOMES LESS WEATHERED WITH DEPTH. IT IS MANGANESE STAINED AND GENERALLY HARD AND MASSIVE.
@17’ - first limey return.
ARMY PROPERTY B-ll
B -1 9
G E O L O G I C D R I L L LOG FUSRAP-WELDON SPRING 14501 I 2 B-ll
i;u i ■!
W A T E RP R E S S U R ETESTS
H i V \I
ELEVATION DESCRIPTION ANO CLASSIFICATIONWATER LEVELS, WATER RETURN, CHARACTER OF DRILLING, ETC.
3 5
4 5 .
5 0 -
4 4 1 0 05 5 -
4 . 5 4 . 5 1 0 0
6 0 . 5 - 6 5 . 5 *
5 . 0 5 . 0 1 0 0
6 5 .5 - 1 6 9 . 3 ’
3 . 8 3 . 8 1 0 0
6 9 . 3 - 7 4 . 0 *
4 . 7 4 . 7 1 0 0
. 1 ...
6 0 '
6 5
7 0 -
SS - SPLIT SPOON; ST • SMB LET TUBE;
O • OINNISON; P - PITCHER ; O - OTHER
a
0 3 3 - 3 5 *
L IM E S T O N E C O N T IN U E D :
B U T SHOW S S M A L L - S C A L E
G R A D E D B E D D IN G L O C A L L Y .
T H E F O S S IL S A R E P R E D O M IN A N T
L Y C R I N O I D S , B R Y O Z O A A N D
B R A C H IO P O D S , W H IC H A R E L O C A L L Y
R E P L A C E D B Y P Y R I T E . A FEW
C A L C I T E A N D Q U A R T Z C R Y S T A L S
A R E A S S O C IA T E D W IT H V U G S ,
E X P E C IA L L Y A T L I M E S T O N E -
C H E R T C O N T A C T S . T H E F O R M A T IO N
C O N T A IN S A B U N D A N T S T Y L O l . I ^ E S
(P R E S S U R E S O L U T IO N F E A T U R E S ) .
W H IC H A R E S E C O N D A R Y F E A T U R E c
T H A T A R E P E R P E N D IC U L A R T O
B E D D IN G A N D IN T E R S E C T F O S S I L S .
S T Y L O L IT E S U T U R E S A R E
A S S O C IA T E D W IT H A T H I N ( 1 / 4 * )
B L A C K I S H - G R A Y , C A R B O N A C E O U S ,
S I L T Y C L A Y , T H A T C O N T A IN S
IR O N . T H E C H E R T I S V E R Y H A R D ,
A N D I S ( 1 ) B A N D E D I F P A R A L L E L
T O B E D D IN G , ( 2 ) C O N C E N T R IC A L L Y
B A N D E D I F N O D U L A R , O R ( 3 )
S P E C K L E D I F F O S S IL IF E R O U S . T H E
C H E R T I S G E N E R A L L Y S P E C K L E D
T O W A R D S T O P O F U N I T : S E C O N D A R Y
C H E R T I S O F T E N M IX E D W IT H F I N E
G R A IN E D L IM E S T O N E .
C L A Y - F I L L E D V O ID S
0 4 0 * - S p o r a d i c a l l y
l o s t a i r r e t u r n - t h e n
r e g a i n e d i t .
0 3 9 . 3 - 4 0 . 0 ' - V O ID
0 4 1 - 4 7 . 0 ' - A I R A N D C L A Y F I L L E D .
0 5 1 ' - C e m e n te d i n
4 " P V C c a s i n g .
0 5 2 ' - B e g a n c o r i n g -
d i s c r e p a n c v o f 1 ' .
AR M Y P R O P E R T Y B - l l
H f tC F 1» -2
B-20
G E O L O G I C D R I L L LOG F U S R A P -W E L D O N S P R IN G 1 4 5 0 1 B-llW A T E R
P R E S S U R ETESTS
WATIR RITURN,
7 4 . 0 - 7 7 . 7 '
3 . 6 100
7 7 . 7 - 8 2 . 5
4 . 8 4 . 8 100
8 2 . 5 - 8 6 . 7
8 51009 8 7 ' - w a t e r @ 5 7
i n h o l e .
8 6 . 7 - 9 1 . 3
9 0
100
9 1 . 3 - 9 6 . 2
100
9 6 . 2 -
100100
1 0 6 . 2 - C O R E SHOW S S 0 > E D E G R E E O F
W E A T H E R IN G TH R O U G H O U T
C O R E D S E C T IO N .
- 1 0 6 . 2 7101
100
1 0 5
? 1 0 6 . 2 ' - b l e w w a t e r
3 u t o f h o l e - r e c o v e r e d
? . 3 g a l / m i t o 6 3 ' .BO H @ 1 0 6 . 2 ' H O L E C O M P L E T E D A S R O C K
O B S E R V A T IO N W E L L .
110 N O T E :
R O C K A N D S O I L C O LO R S A R E IN D E X E D O N T H E
R O C K -C O L O R C H A R T P U B L IS H E D B Y T H E
G E O L O G IC A L S O C IE T Y
O F A M E R IC A .
O - DENNISON; PA R M Y PR O P ER TY" 1-11
H * C F 19-2
B-21
G E O L O G I C D R I L L LOG | PROJECT JOB NO. MOLE NO.
i F U S R A P -W E L D O N S P R IN G 1 4 5 0 1 1 o f i B - 1 2
D O E P R O P E R T Y - R A F F IN A T E P I T A R E A N 1 0 0 0 0 3 . 4 2 W 5 1 9 6 8 . 8 8
COMPLETED DRILLER DRILL MANE AND MODEL HOLE SIZE OVERBURDEN (FT.) ROCK (FT.)
2 5 M A R . 8 3 B O Y L E S B R O T H E R S M O B I L E - 5 6 8 ' 3 0 . 0 02 5 M A R . 8 3
TOTAL DEPTH
CORE BOXES SAMPLES EU TOP OF CASING g ro und c l . DEPTH,EL. TOPO
0 1 5 6 6 6 . 7 6 6 3 . 6 D R Y UNKNOW N
1 5 0 L B S / 3 0 I N .
CASINO LEFT IN HOLE: OlA./LENOTN LOOOEO »V
E . M . F A N E L L I
I 0
W A T E RP R E S S U R E
T ESTS
s >!
ELEVATION ;i OESCWIFTION AND CLASSIFICATIONWATIR LEVELS. NATE* *>TURN, CMARACTIN OF DRILLING, ETC.
. 7
1.8
1 . 2 5
1 . 4
1 . 7 5
1.6*
lOl
1.8' 1.8'
3 5
6 3
8 0
_15_
6 3
5 0
100
5 -
D I K E F I L L : C L A Y E Y S I L T , G R A Y 0 : 7 )
T O D A R K Y E L L O W IS H -B R O W N ( 1 0 Y R 5 / 4 )
T O P R E D O M IN A N T L Y BROW N S I L T Y
C L A Y T O C L A Y E Y S I L T . C O N T A IN S SO M E
IR O N N O D U L E S A N D C A L C IT E
C O N C R E T IO N S . M O IS T T O D R Y , S L IG H T L Y
P L A S T I C T O P L A S T I C , A P P E A R S
R E W O R K E D A N D C O M P A C T E D .
10
1 5 -
6 4 3 . 6 2 0
..’IV)
la -
6 3 9 . 6
1 8 * -
M A T E R IA L B E C O M E S V E R Y D R Y , D E N S E
B U T F R I A B L E , P O S S IB L Y U N C O M P A C T E D .
L A R G E C O B B L E S T O G R A N U L E S O F C H E R T
I N S A M P L E S B U T NO S A N D .
' 2 0 . O ' - 2 4 . 0 ^ C L A Y E Y S I L T : G R A Y ( N 7 ) F R I A B L E ,
S L IG H T L Y C L A Y E Y , C O N T A IN S O X I D I Z E D
IR O N N O D U L E S A N D SO M E L A R G E
C H E R T C L A S T S P R O B A B L Y R E P R E S E N T
IN G D IS T U R B E D O L D S O I L S U R F A C E -
T O P O F F O U N D A T IO N .
6 3 3 . 6
fJ=T
2 4 . O ' - 3 0 . O ’ : C L A Y _ T I L L : M O T T L E D C R A Y ( N 7 )
A N D M O D E R A T E Y E L L O W IS H -B R O W N
( 1 0 Y R 5 / 4 ) O R D A R K Y E L L O W IS H -
O R A N G E ( 1 0 Y R 6 / 6 ) . S I L T Y , S A N D Y ,
D E N S E C L A Y T H A T C O N T A IN S A
FEW P E B B L E S O F S U B R O F rD E D
C H E R T , Q U A R T Z IT E . A N D G R A N IT IC
M A T E R IA L , W H IC H G E N E R A L L Y
C O A R S E N T O C O B B L E S I Z E S W IT H
D E P T H . T H E M A T E R IA L H A S
M A N G A N E S E -S T A IN E D S U R F A C E S ,
IR O N , A N D S E C O N D A R Y F R IA B L E
C A L C A R E O U S C O N C R E T IO N S , A N D
SHOW S B L O C K Y F R A C T U R IN G .
• • - •FLIT SPOON; ST - SMILBV TUBE I O - DENNISON; F • PITCHER; O • OTHER
B O H - (3 3 0 . 0 ' C O M P L E T E D A S A P IE Z O M E T E R
IN S T A L L A T IO N S E A L E D I N T H E
D IK E F O U N D A T IO N .
N O T E : R O C K A N D S O I L C O LO R S A R E IN D E X E D ON T H E
R O C K -C O L O R C H A R T P U B L IS H E D B Y T H E
G E O L O G IC A L S O C IE T Y 0 ^ A M E R IC A .
DOE PROPERTY-RAFFINATE PIT AREA
A u g e r h o l e
c o n t i n u o u s l y s a m p le d
w i t h S h e l b y t u b e s ,
p u s h e d t h r o u g h 8 "
h o l l o w s t e m a u g e r .
(3 6 ' - a u g e r e d d o w n
t o s a m p le d e p t h .
@ 1 1 ' - a u g e r e d d o v r .
t o s a m p le d e p t h .
1 8 ' - a u g e r e d d o w n
t o s a m p le d e p t h .
? 2 1 . 8 * - B e n t S h e I " : ; ,
t u b e o n a r o c k .
? 2 4 ' - a u g e r e d d o v e
t o s a m p le d e p t h .
B-12
B-22
G E O L O G I C D R I L L LOGF* O l■ CT I i O * N O .
F U S R A P -W E L D O N S P R IN G I 1 4 5 0 1 1 O F 1 B - 1 3
| COOROINATI1
D O E P R O P E R T Y - R A F F IN A T E P I T A R E A N 9 9 8 9 0 . 2 2 V 5 1 5 4 5 . 6 9 9 0 V E R T I C A L
BIOUN COk
2 3 M A R . 8 3 I 2 8 M A R . 8 3
0 *IL LE * 0*11.1. M AKI AND MODEL MOLE SIZE OVE** V*OEN (FT.)
B O Y L E S B R O T H E R S M O B I L E - 5 6 8 ' 2 7 . 0 '
MOCK (FT.)
0 27.0
ITOTALOEFTM
c o n s n c c o v E * v CONE BOXES samfles ( L TOF OF CASING jc*OUNO *L. DEPTH/ EL. TOF
1 6 . 3 4 / 7 4 0 9 I 6 6 3 . 7 8 N O T D E T E C T E D UNKN OW N
1 5 0 L B S / 3 0 I N .
CASINO LOFT IN MOLE : DIA./LCNOTN
N O N E
IlOooco by :
E . M F A N E L L I
W A T E RP R E S S U R ET ESTS
* !I lC V A TlON OESCMlFTION AND CLASSIFICATION
NOTES o n : WATIR LEVELS. WATER RtTURN, CM Alt ACTE* OF D*ILLINQ , ETC.
1.17
1.67
5 9
100
100
7 5
100
1QQ
100
6 6 3 . 7 8
6 5 1 . 7 8
6 3 8 . 7 8
0.0’-12.0*: D IK E F I L L : M O T T L E D G R A Y ( N 7 ) T O
P R E D O M IN A N T L Y M O D E R A T E Y E L L O W
I S H - B R O W N , M O IS T , V E R Y S I L T Y ,
P L A S T I C , C O M P A C T E D A N D R E W O R K E D ,
D E N S E C L A Y C O N T A IN IN G IR O N O X ID E
N O D U L E S A N D S O M E M A N G A N E S E .
9 ' - l l ' - S A M P L E L O S T O U T S H E L B Y T U B E .
1 2 . 0 * - 1 4 . 0 * : O R IG I N A L S O I L S U R F A C E : B L A C K ,
M O IS T , O R G A N I C - R IC H , SO M E IR O N
O X ID E S , SO M E P E B B L E T O G R A V E L
S I Z E D C L A S T S .
15- 1 4 . 0 ' - 2 1 . O ’ : C L A Y E Y S I L T : M O T T L E D G R A Y ( N 7 )
A N D M O D E R A T E Y E L L O W IS H -B R O W N
( 1 0 Y R 5 / 4 ) O R D A R K Y E L L O W IS H -
O R A N G E ( 1 0 Y R 6 / 6 ) , C L A Y E Y S I L T ;
N O N - P L A S T IC T O P L A S T I C ,
M O D E R A T E L Y D E N S E W IT H D E P T H
A N D C O N T A IN S A B U N D A N T I R 0 N -
0 X I D E N O D U L E S . SO M E B IO T U R B A T IO N
A N D R O O TS T O 1 5 * .
20-
2 5 '
2 1 . 0 ' - 2 7 . 0 ' : C L A Y : M O T T L E D G R A Y ( N 7 )
A N D M O D E R A T E Y E L L O W IS H -B R O W N
( 1 0 Y R 5 / 4 ) O R D A R K Y E L L O W IS H -
O R A N G E ( 1 0 Y R 6 / 6 ) , C L A Y TO
S I L T Y C L A Y . T H E M A T E R IA L
I S P L A S T I C , D E N S E , C O N T A IN S
A B U N D A N T IR O N - O X ID E N O D U L E S ,
A N D H A S S L IC K E N S ID E D S U R
F A C E S .
2 V - 2 3 ’ - S A M P L E L O S T O U T S H E L B Y T U B E .
B O H - @ 2 7 * : H O L E B A C K F IL L E D W IT H C E M E N T /
B E N T O N IT E G R O U T .
R O C K A N D S O I L C O LO R S A R E IN D E X E D ON T H E
R O C K -C O L O R C H A R T P U B L IS H E D B Y T H E
G E O L O G IC A L S O C IE T Y O F A M E R IC A .
F i r s t 5 * o f h o l e
w e r e a u g e r e d , h o l e
w a s c o n t i n u o u s l y
s a m p le d u s i n g S h e l b y
@ 9 * - a u g e r e d t o
s a m p le d e p t h .
@ 1 5 ' - a u g e r e d t o
s a m p le d e p t h .
@ 2 1 ' - a u g e r e d t o
s a m p le d e p t h .
SB • SFI.lT SFOOW; ST • SMtkBV T V ** ;
O - OINNISON; F - F ITC H**: O - OTMC* DOE PROPERTY-RAFFINATE PIT AREA
B-23
G E O L O G I C D R I L L LOG FUSRAP-WELDON SPRING 14501 of 1 B-14
D O E P R O P E R T Y - R A F F IN A T E P I T A R E A N 9 9 2 3 6 . 9 0 W 5 0 9 6 5 . 6 5 | V E R T IC A L
•tOUN COMFLETEO
2 9 M A R . 8 3 2 9 M A R . 8 3
ohillen OWILL MAKE AND MODEL HOLE SIZE 0 < I NOCK (FT.)
B O Y L E S B R O T H E R S M O B I L E - 5 6 8 ’ 2 1 . 8 3 0
TOTAL OEFTM
COES BOXES BAMPL
6 5 5 . 8 2
6ROUNO EL.
6 5 3 . 5 3 2 2 . 1 / 6 3 3 . 7 2 ( 4 / 8 / 8 3 )
1 5 0 L B S / 3 0 I N .nCASINO LEFT IN HOLE: OIA./LENOTH
2 4 ' - 2 ' P V C
LOOOED
E . M . F A N E L L I
W A T E RP R E S S U R ETESTS
1 *ELEVATION OSSCXIFTION AND CLASSIFICATION
WATCH LEVELS, WATIH RETURN, CHARACTER OF ONILLINO, ETC.
6 5 3 . 5 3
N____2 . 0 ' - 7 . 5 '
T O P S O IL : B L A C K IS H -B R O W N ,
O R G A N I C - R IC H , M O IS T T O W E T ,
C L A Y E Y S I L T .
C L A Y E Y S I L T : M O T T L E D G R A Y ( N 7 )
A N D M O D E R A T E Y E L L O W IS H -B R O W N
( 1 0 Y R 5 / 4 ) O R D A R K Y E L L O W IS H -
O R A N G E ( 1 0 Y R 6 / 6 ) , C L A Y E Y S I L T ;
N O N - P L A S T IC T O P L A S T I C , M O D E R A T E L Y
D E N S E W IT H D E P T H A N D C O N T A IN S
A B U N D A N T IR O N - O X ID E N O D U L E S .
D r i l l e d u s i n g a n
8 " d i a m e t e r h o l l o w -
s t e m a u g e r .
D e s c r i p t i o n b a s e d
o n c u t t i n g s a n d
l o g o f B - 5 .
6 4 6 . 0 3
10 -
7 . 5 ' - 1 9 . 0 ' : C L A Y : M O T T L E D G R A Y ( N 7 )
A N D M O D E R A T E Y E L L O W IS H -B R O W N
( 1 0 Y R 5 / 4 ) OR D A R ” Y E L L O W IS H -
O R A N G E ( 1 0 Y R 6 / 6 ) , C L A Y TO
S I L T Y C L A Y . T H E M A T E R IA L I S P L A S T I C , D E N S E , C O N T A IN S
A B U N D A N T IR O N - O X ID E N O D U L E S ,
A N D H A S S L IC K E N S ID E D S U R
F A C E S .
20 -6 3 1 . 7 2
1 9 . 0 ’ - 2 1 . 8 3 * : C L A Y T I L L : M O T T L E D G R A Y ( N 7 )
A N D M O D E R A T E Y E L L O W IS H -B R O W N
( 1 0 Y R 5 / 4 ) O R D A R K Y E L L O W IS H -
O R A N G E ( 1 0 Y R 6 / 6 ) , S I L T Y , S A N D Y ,
D E N S E C L A Y T H A T C O N T A IN S A
F E W P E B B L E S O F S U B R O U N D E D
C H E R T , Q U A R T Z IT E , A N D G R A N IT IC
M A T E R IA L , W H IC H G E N E R A L L Y
C O A R S E N T O C O B B L E S I Z E S W IT H
D E P T H . T H E M A T E R IA L H A S
M A N G A N E S E -S T A IN E D S U R F A C E S ,
C O N T A IN S IR O N A N D S E C O N D A R Y
F R IA B L E C A L C A R E O U S C O N C R E T IO N S ,
A N D SHOW S B L O C K Y F R A C T U R IN G .
B O H - 9 2 1 . 8 3 ’ H O L E C O M P L E T E D A S 2 *
O B S E R V A T IO N W E L L .
1 . R O C K A N D S O IL C O L O R * A R E IN D E X E D ON
T H E R O C K -C O L O R C H A R T P U B L IS H E D B Y T H E
G E O L O G IC A L S O C IE T Y O F A M E R IC A .
2 . H O L E L O C A T E D A P P R O X IM A T E L Y 5 ' FR O M
B - 5 , B U T D O ES N O T L I E W IT H I N N E A R B Y
S U P F * C E D R A IN A G E .
DOE PROPERTY-RAFFINATE PIT AR£A
B - 2 4
G E O L O G I C D R I L L LOG FUSFAP-WELDON SPRING i 14501 OF 1 B-15
D O E P R O P E R T Y - R A F F IN A T E P I T A R r A
COONDINA «N6LI FROM MONIZ.
N 9 9 4 2 0 . 6 5 W 5 1 0 2 5 . 3 89 0 V E R T I C A L
2 9 M A R .
COMFLETEO
1 1 A P R . 8 3
ioWILL MAKE ANO MODEL |hOLE SIZE I O V E * 9 U »D E N (FT.) NOCK (FT.) ItOTALOEFTH
B O Y L E S B R O T H E R S 3 0 . 0 * , 3 0 . 0 *
e0u
N O N E 1 1 0
OROUND E L.
6 6 3 . 9 4D E T E C T E D
M 0 IS T U P E 9 1 9 ' UNKN OW N
1 5 0 L B S / 3 0 I N .
CASINO LIFT IN MOLI: DIA./IENGT LOOOEO ■ V :
E . M . F A N E L L I
P R E S S U R e TESTS
h i I II
E LE V ATtOHWATEN LEVELS, WATEN NCTUNN, CMAAACTEA OF OAILLINC , ETC.
1.29
1.5
1.25
1 . 1 5 5
1.75 1 88
1 . 2 5 1 6 3
0 . 0 ’ - 1 6 '
6 6 3 . 9 4
— @
D I K E F I L L - S I L T Y C L A Y /C L A Y E Y S I L T :
M O T T L E D G R AY ( N 7 ) T O D A R K Y E L L O W IS H -
O R A N G E ( 1 0 Y R 6 / 6 ) T O D A R K R E D D IS H -
BROW N ( 1 0 Y R 3 / 4 ) , D E N S E , M O IS T . S L IG H T !
P L A S T I C T O P L A S T I C . C L A Y A N D S I L T
C O N T A IN S SO M E S A N D A N D P E B B L E S .
A u g e r h o l e c o n t i n u o u s
l y s a m p le d w i t h S h e l b y
@ 6 ' - a u g e r e d t o
s a m p le d e p t h .
<a 12 M A T E R IA L I S D R Y E R . @ 1 2 * - a u g e r e d t o
s a m p le d e p t h .
A P P R O X IM A T E C O N T A C T W IT H F O U N D A T IO N .
16. 0* -25.0'
6 3 3 . 9 4
■ • - SFLIT IFOON; ST - INI
o - OlNNIION; F • FITCMEA
H 4 C F 1 9 - |
C L A Y E Y S I L T : M O T T L E D G R AY ( N 7 )
A N D M O D E R A T E Y E L L O W IS H -B R O W N
( 1 0 Y R 5 / 4 ) OR D A R K Y E L L O W IS H -
O R A N G E ( 1 0 Y R 6 / 6 ) , C L A Y E Y S I L T ;
N O N - P L A S T IC T O P L A S T I C . M O D E R A T E L Y
D E N S E W IT H D E P T H A N D C O N T A IN S
A B U N D A N T I R O N - O X ID E N O D U L E S .
I 2 5 . O ' - 3 0 . 0 * : C L A Y : M O T T L E D G R A Y ( N 7 )
A N D M O D E R A T E Y E L L O W IS H -B R O W N
( 1 0 Y R 5 / 4 ) OR D A R K Y E L L O W IS H -
O R A N G E ( 1 0 Y R 6 / 6 ) , C L A Y TO
S I L T Y C L A Y . P L A S T I C . D E N S E ,
C O N T A IN S A B U N D A N T IR O N - O X ID E
N O D U L E S . A N D * H A S S L IC K E N S ID E D
S U R F A C E S .
<3 2 0 * - m a t e r i a l w a s
v e r y w e t , u n a b l e t o
r e t a i n s a m p le s i n
t u b e s , h o w e v e r n o
s t a n d i n g w a t e r i n
(3 2 0 - 3 0 ' -
d e s c r i p t i o n s b a s e d
o n a u g e r s p o i l s .
B O H - 9 3 0 ' H O L E C O L L A P S E D ON 3 / 3 1 / 8 3 B E LO W 18
W A T E R I N H O L E A T 1 3 ' ON 3 - 3 1 / 8 3 .
H O L E R E P L A C E D B Y 1 5 A L O C A T E D 1 0 '
S O U T H A N D 1 ' E A S T O F B 1 5 . B 1 5
W AS B A C K F IL L E D .
R O C K A N D S O I L C O LO R S A R E IN D E X E D ON T H E
R O C K -C O IO R C H A R I P U B L IS H E D B Y T H E
G E O L O G IC A L c O C IE T Y O F A M E R IC A .
D O E P R O P E R T Y - R A F F IN A T E P I T A R E A
B - 2 5
G E O L O G I C D R I L L LOGFWOJWCT JOW NO.
F U S R A P -W E L D O N S P R IN G 1 4 5 0 1 1 of x B - 1 5 A
D O E P R O P E R T * - R A F F I N A T E P I T A R E A N 9 9 4 1 0 . 4 9 W 5 1 0 2 1 . 6 2 9 0 V E R T I C A L
WIO UP* COM PIITIO OWILLEW OWILL MANS A NO M OBIL h o le e ix * o v iw iu w d in (ft .) WOCK (ft .| TOTAL DEPTH
t l A P R . 8 3 1 1 A P R . 8 3 B O Y L E S B R O T H E R S S T M C O 4 0 0 0 8 * 3 7 . 0 ' 0 3 7 . 0 *
c o m m c o v iR T (f t ./%| c o m eoxEs
6 5 5 . 4 2 6 6 3 . 4 2 D R Y U N KN O W N
1 5 0 L B S / 3 0 I N .rri 2 * / 3 7 * E . M . F A N E L L I
W A T E RP R E S S U R ETESTS
llia
■ LIVATION OltCRtPTlON AND CLA|f|PICATION
N O T II o n : WATIR LIVRLG, WATIA A(TUAN,cmaw Ac r e * of own.l in o , e re .
6 6 3 . 4 2
0 . 0 ' - 1 6 . 0 ' : D I K E F I L L - S I L T Y C L A Y /C L A Y E Y S I L T :
C O M P A C T E D , M O T T L E D G R A Y ( N 7 ) A N D
D A R K Y E L L O W IS H -O R A N G E ( 1 0 Y R 6 / 6 ) ,
D R Y T 0 M O IS T S I L T Y C L A Y T O
C L A Y E Y S I L T , D E N S E , S L I G H T L Y
P L A S T I C , C O N T A IN S IR O N O X ID E
N O D U L E S .
D r i l l e d u s i n g a n
8 " d i a m e t e r h o l l o w
s t e m a u g e r .
D e s c r i p t i o n b a s e d o n
c u t t i n g s a n d l o g
o f h o l e B 1 5 l o c a t e d
1 0 f t . n o ~ t h a n d
1 f t . w e s t o f h o l e
1 5 A .
1 5 -
6 4 7 . 4 2
P4'~j$c & r
’. V -
6 3 8 . 1 22 5
6 3 3 . 4 2 3 0
35
6 2 6 . 4 2
i» - tP tiT s fo o n ; e r - i m i i . i v t u i i i
O - O INN IIO N i F - PITCHIA; O • OTMIW
H f c c r h i
1 6 . 0 ' - 2 5 . 0 ' : C L A Y E Y S I L T : M O T T L E D G R A Y ( N 7 )
A N D M 0 D F P » T E Y E L L O W IS H -B R O W N
( 1 0 Y R 5 / 4 ) O R D A R K Y E L L O W I S H -
O R A N G E ( 1 0 Y R 6 / 6 ) , C L A Y E Y S I L T
N O N - P L A S T IC T O P L A S T I C , M O D E R A T E L Y
D E N S E W IT H D E P T H A N D C O N T A IN S
A B U N D A N T I R O N - O X I D E N O D U L E S .
2 5 . O ' - 3 0 . O ' t C L A Y : M O T T L E D G R A Y ( N 7 )
A N D M O D E R A T E Y E L L O W IS H -B R O W N
( 1 0 Y R 5 / 4 ) O R D A R K Y E L L O W I S H -
O R A N G E ( 1 0 Y R 6 / 6 ) , C L A Y T O
S I L T Y C L A Y . T H E M A T E R IA L
I S P L A S T I C , D E N S E , C O N T A IN S
A B U N D A N T I R O N - O X I D E N O D U L E S ,
A N D H A S S L IC K E N S ID E D S U R
F A C E S .
1 0 . O ' - 3 7 . O ' : C L A Y T I L L : M O T T L E D G R A Y ( N 7 )
A N D M O D E R A T E Y E L L O W IS H -B R O W N
( 1 0 Y R 5 / 4 ) O R D A R K Y E L L O W I S H -
O R A N G E ( 1 0 Y R 6 / 6 ) , S I L T Y , S A N D Y ,
D E N S E C L A Y T H A T C O N T A IN S A
FEW P E B B L E S O F S U B R O U N D E D
C H E R T , Q U A R T Z IT E , A N D G R A N IT IC
M A T E R I A L , W H IC H G E N E R A L L Y
C O A R S E N T O C O B B L E S I Z E S W IT H
D E P T H . T H E M A T E R IA L H A S
M A N G A N E S E - S T A IN E D S U R F A C E S ,
C O N T A IN S IR O N A N D S E C O N D A R Y
F R I A B L E C A L C A R E O U S C O N C R E T IO N S .
A N D SHOW S B L O C K Y F R A C T U R IN G .
B O H - l? 3 7 ' H O L E C O M P L E T E D A S A N O B S E R V A T IO N W E L L .
N O T E : B 1 5 A I S A R E P L A C E M E N T W E L L FO R B - 1 5 .
N O T E : R O C K A N D S O I L C O L O R S A R E IN D E X E D O N T H E
R O C K -C O L O R C H A R T P U B L IS H E D B Y T H E
G E O L O G IC A L S O C IE T Y O F A M E R IC A .
DOE PROPERTY-RAFFINATE PIT AREA B-15A
B-26
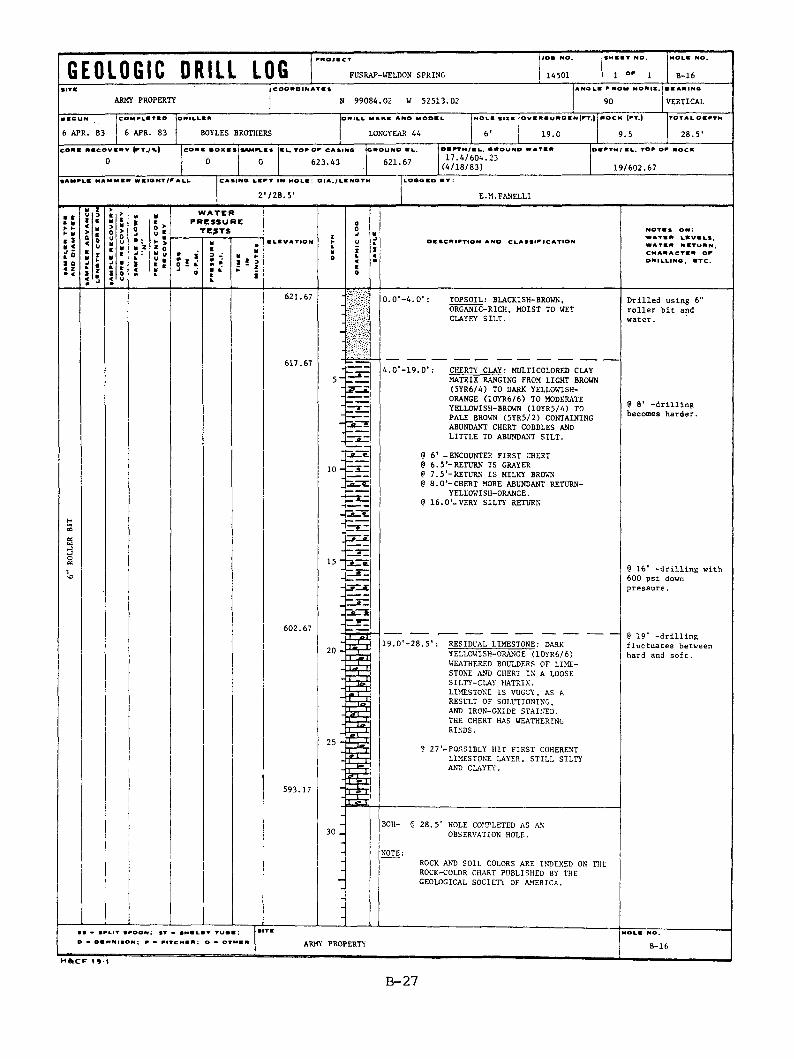
G E O L O G I C D R I L L LOGFNOJECT JOG HO.
F U S R A P -W E L D O N S P R IN G 1 4 5 0 1 1 O P 1
AR M Y P R O P E R T Y
ANGLE FROM HORIZ.
N 9 9 0 8 4 . 0 2 V 5 2 5 1 3 . 0 2 9 0
• CAItlNS
V E R T I C A L
• ■GUN CBM R|.irtD ONILLEW OHILL WAKE ANO MODEL Iho le size OVE • • u h d e n |ft .) ho ck (ft.) TOTALOIFTM
6 A P R . 8 3 6 A P R . 8 3 B O Y L E S B R O T H E R S L O N G Y E A R 4 4 6 * 1 9 . 0 9 . 5 __ 2 8 . 5 '
H E C O V E H V ( F T . /% ) c o m b o x e s S A M n .E S C L T O F O F C A S IN G G H O U N O e l . DK.TM t EL. T O . O .
0 0 0 6 2 3 . 4 3 6 2 1 . 6 71 7 . 4 / 6 0 4 . 2 3
( 4 / 1 8 / 8 3 ) 1 9 / 6 0 2 . 6 7
CASING LEFT IN HOLE : OIA./LENGTH
2'/28.5'LOGGED IV :
E . M . F A N E L L I
W A T E RP R E S S U R ETESTS
: z *o:i x *I ELEVATION DESCHIFTION AND CLASSIFICATION
NOTES o n : WATEN LEVELS, WATEN NETUNN, CHANACTEN OF ONILLING, ETC.
6 2 1 . 6 7
6 1 7 . 6 7
0 . 0 ' - 4 . 0 ' : T O P S O IL : B L A C K IS H -B R O W N ,
O R G A N I C - R IC H , M O IS T T O W ET
C L A Y E Y S I L T .
D r i l l e d u s i n g 6 "
r o l l e r b i t a n d
5 -
5 9 3 . 1 7
I • SFLIT SAOONi ST - SHELNT TUEE;
■ oemnison; f - aitchin; o - othia
H A C F 1 9-1
4 . 0 ' - 1 9 . O ’ : C H E R T Y C L A Y : M U L T IC O L O R E D C L A Y
M A T R IX R A N G IN G FR O M L I G H T BROW N
( 5 Y R 6 / 4 ) T O D A R K Y E L L O W IS H -
O R A N G E ( 1 0 Y R 6 / 6 ) T O M O D E R A T E
Y E L L O W IS H -B R O W N ( 1 0 Y R 5 / 4 ) T O
P A L E BROW N ( 5 Y R 5 / 2 ) C O N T A IN IN G
A B U N D A N T C H E R T C O B B L E S A N D
L I T T L E T O A B U N D A N T S I L T .
6 * - E N C O U N T E R F I R S T C H E R T
6 . 5 ' - R E T U R N I S G R A Y E R
7 . 5 ' - R E T U R N I S M IL K Y BROWN
8 . O ’ - C H E R T M O R E A B U N D A N T R E T U R N -
Y E L L O W IS H -O R A N G E .
1 6 . O ' - V E R Y S I L T Y R E T U R N
t? 8 * - d r i l l i n g
b e c o m e s h a r d e r .
1 5 '
1 9 . 0 ' - 2 8 . 5 ' : R E S ID U A L L IM E S T O N E : D A R K
Y E L L O W IS H -O R A N G E ( 1 0 Y R 6 / 6 )
W E A T H E R E D B O U L D E R S O F L I M E
S T O N E A N D C H E R T I N A L O O S E
S I L T Y - C L A Y M A T R IX .
L IM E S T O N E I S V U G G Y , A S A
R E S U L T O F S O L U T IO N IN G ,
A N D IR O N - O X ID E S T A T E D .
T H E C H E R T H A S W E A T H E R IN G
R IN D S .
0 2 7 ' - P O R S I B L Y H I T F I R S T C O H E R E N T
L IM E S T O N E L A Y E R . S T I L L S I L T Y
A N D C L A Y E Y .
<3 1 6 ' - d r i l l i n g w i t h
6 0 0 p s i d o w n
p r e s s u r e .
” I @ 1 9 ' - d r i l l i n g
f l u c t u a t e s b e t w e e n
h a r d a n d s o f t .
3 0B O H - 0 2 8 . 5 ' H O L E C O M P L E T E D A S AN
O B S E R V A T IO N H O L E .
R O C K A N D S O I L C O LO R S A R E IN D E X E D ON T H E
R O C K -C O L O R C H A R T P U B L IS H E D B Y T H E
G E O L O G IC A L S O C IE T Y O F A M E R IC A .
A R M Y P R O P E R T Y B - 1 6
B-27
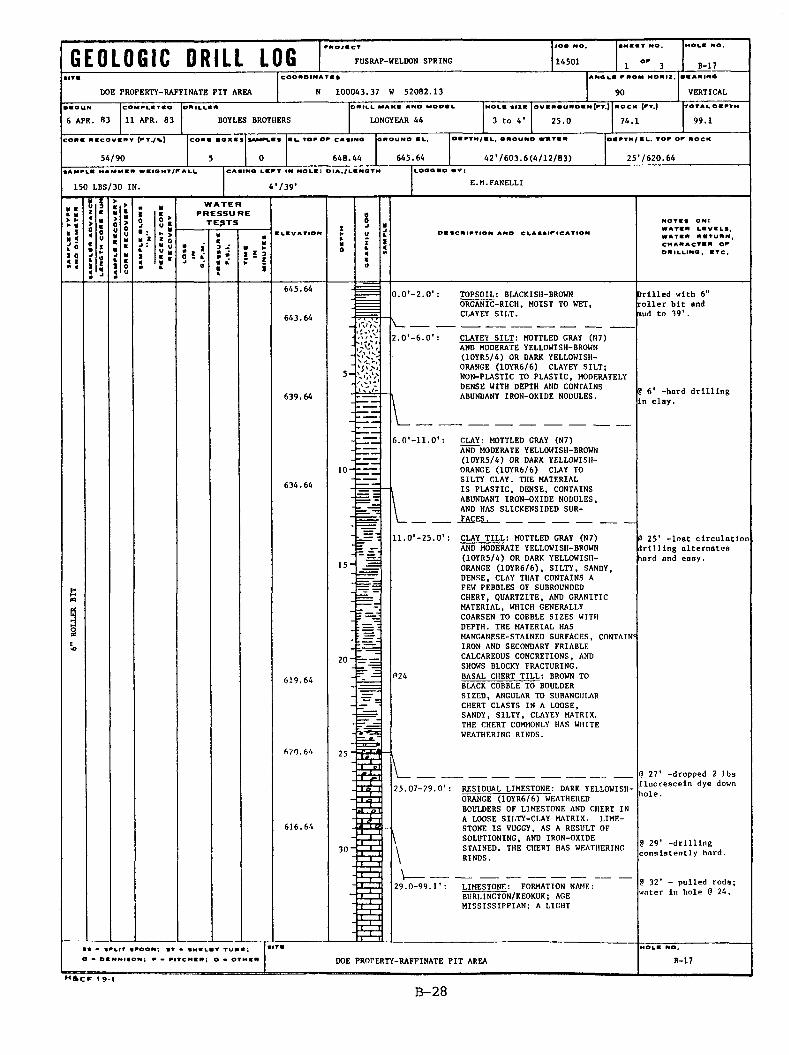
G E O L O G I C D R I L L LOGP IO ItC T JOO NO. •H ««T NO.
F U S R A P -W E L D O N S P R IN G 1 4 5 0 11 ° ' 3 B - 1 7
D O E P R O P E R T Y - R A F F IN A T E P I T A R E A N 1 0 0 0 4 3 . 3 7 W 5 2 0 8 2 . 1 3 90 VERTICAL
6 A P R . 8 3
completed1 1 A P R . 8 3 B O Y L E S B R O T H E R S
5 4 / 9 0
D *tLL MAKE AND MODEL
L O N G Y E A R 4 4 3 t o 4 '
TOTALOEPTN
9 9 . 1
c o * * eoxea «MPL*S • L. TOP OF CASINO OHOUND ■ L. DBFTH/IL. ONOUNO W BT** D *P T N /*L . TOP OF ROCK
5 0 6 4 8 . 4 4 6 4 5 . 6 4 4 2 7 6 0 3 . 6 ( 4 / 1 2 / 8 3 ) 2 5 7 6 2 0 . 6 4
1 5 0 L B S / 3 0 I N .
CASINO LEFT IN HOLE 1 OlA./LENGTH
4 7 39*lo o s e d ev •
E . M . F A N E L L I
T W A T E RP R E S S U R E
T E ^ T SELEVATION OESCEIFTION ANO CLASSIFICATION
WATEN LEVELS, WATEN NETUNN, CMANACTEN OF ON ILLINO , ETC.
6 4 5 . 6 4
6 4 3 . 6 4
6 3 9 . 6 4
0.0*-2.0*z
2.0’-6.0'z
T O P S O I L : B L A C K IS H -B R O W N
O R G A N I C - R I C H , M O IS T T O W E T ,
C L A Y E Y S I L T .
D r i l l e d w i t h 6 "
r o l l e r b i t a n d
m id t o 3 9 * .
C L A Y E Y S I L T z M O T T L E D G R A Y ( N 7 )
A N D M O D E R A T E Y E L L O W IS H -B R O W N
( 1 0 Y R 5 / 4 ) O R D A R K Y E L L O W I S H -
O R A N G E ( 1 0 Y R 6 / 6 ) C L A Y E Y S I L T ;
N O N - P L A S T IC T O P L A S T I C , M O D E R A T E L Y
D E N S E W IT H D E P T H A N D C O N T A IN S
A B U N D A N T IR O N - O X I D E N O D U L E S .9 6 * - h a r d d r i l l i n g
e . o ' - n . o ' z
io- -6 3 4 . 6 4
1 1 . 0 ' - 2 5 . 0 * z
15“
619.64
25 -1
616.64
3 0 “
25.07-29
2 9 . 0 - 9 9
C L A Y ; M O T T L E D G R A Y ( N 7 )
A N D M O D E R A T E Y E L L O W IS H -B R O W N
( 1 0 Y R 5 / 4 ) O R D A R K Y E L L O W I S H -
O R A N G E ( 1 0 Y R 6 / 6 ) C L A Y T O
S I L T Y C L A Y . T H E M A T E R IA L
I S P L A S T I C , D E N S E , C O N T A IN S
A B U N D A N T I R O N - O X I D E N O D U L E S ,
A N D H A S S L IC K E N S ID E D S U R -
F A C E S .___________________________________ ________
C L A Y T I L L ; M O T T L E D G R A Y ( N 7 )
A N D M O D E R A T E Y E L L O W IS H -B R O W N
( 1 0 Y R 5 / 4 ) O R D A R K Y E L L O W I S H -
O R A N G E ( 1 0 Y R 6 / 6 ) , S I L T Y , S A N D Y ,
D E N S E , C L A Y T H A T C O N T A IN S A
F E W P E B B L E S O F S U B R O U N D E D
C H E R T , Q U A R T Z IT E , A N D G R A N IT IC
M A T E R I A L , W H IC H G E N E R A L L Y
C O A R S E N T O C O B B L E S I Z E S W IT H
D E P T H . T H E M A T E R IA L H A S
M A N G A N E S E - S T A IN E D S U R F A C E S , C O N T A IN ?
IR O N A N D S E C O N D A R Y F R I A B L E
C A L C A R E O U S C O N C R E T IO N S , A N D
SHOW S B L O C K Y F R A C T U R IN G .
B A S A L C H E R T T I L L ; BR O W N T O
B L A C K C O B B L E T O B O U L D E R
S I Z E D , A N G U L A R T O S U B A N C U 1 .A R
C H E R T C L A S T S I N A L O O S E ,
S A N D Y , S I L T Y , C L A Y E Y M A T R IX ,
T H E C H E R T C O M M O N L Y H A S W H IT E
W E A T H E R IN G R IN D S .
2 5 * - l o s t c i r c u l a t i o n
d r i l l i n g a l t e r n a t e s
h a r d a n d e a s y .
R E S I D U A L L I M E S T O N E : D A R K Y E L L O W I S H -
O R A N G E ( 1 0 Y R 6 / 6 ) W E A T H E R E D
B O U L D E R S O F L IM E S T O N E A N D C H E R T I N
A L O O S E S I L T Y - C L A Y M A T R I X . L I M E
S T O N E I S V U G G Y , A S A R E S U L T O F
S O L U T IO N IN G , A N D IR O N - O X I D E
S T A I N E D . T H E C H E R T H A S W E A T H E R IN G
R I N D S .
L I M E S T O N E z F O R M A T IO N N A M E :
B U R L IN G T O N /K E O K U K ; A G E
M I S S I S S I P P I A N ; A L I G H T
2 7 * - d r o p p e d 2 l b s
f l u o r e s c e i n d y e d o w n
2 9 * - d r i l l i n g
c o n s i s t e n t l y h a r d .
3 2 * - p u l l e d r o d s ;
w a t e r i n h o l e @ 2 4 .
• • • SPLIT SPOON; ST • SMILOV t u o i ;
o • o in n is o n ; p - p it c h * * ; o - o t m im
H S C F I 9-1DOE PROPERTY-RAFFINATE PIT AREA B-17
B-28
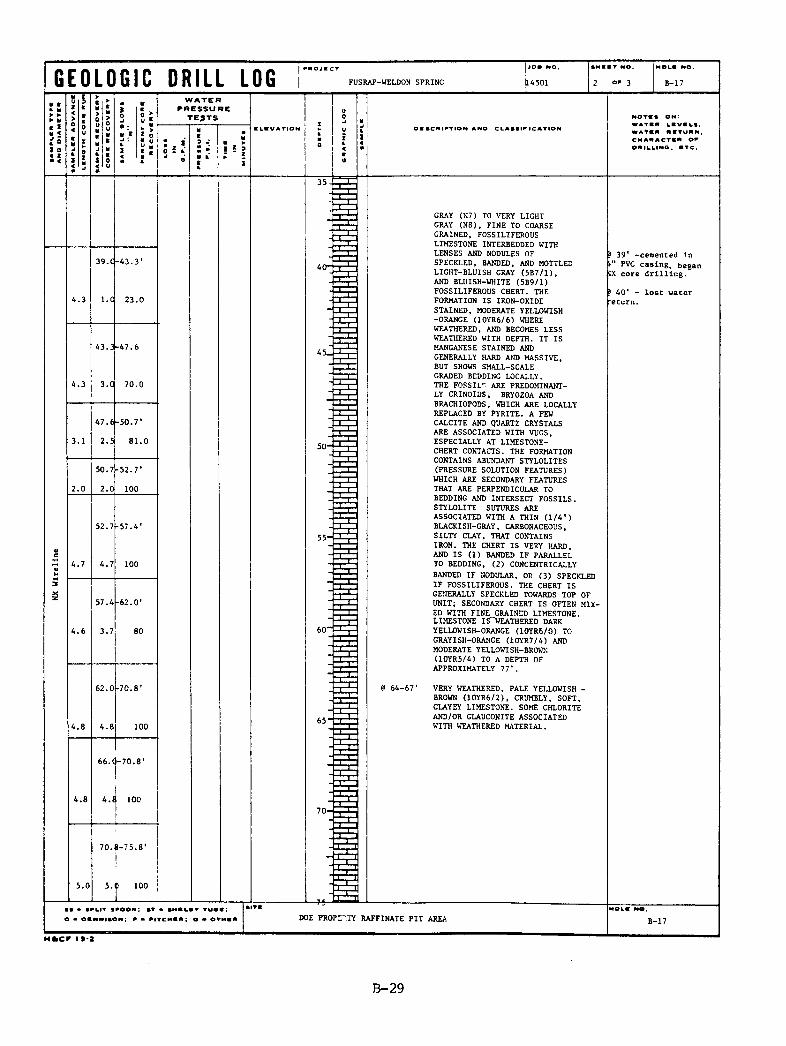
G E O L O G I C D R I L L LOG M O JICT JO. NO.
F U S R A P -W E L D O N S P R IN G L 4 5 0 1 2 OF 3 B - 1 7
K I « <1 0 « z • <
W A T E RP R E S S U R E
T ESTS
h i I ! 9
CLIVATION I OIBCNIPTION ANO CLASSIFICATION
NOTES ON: WATEN LEVELS, WATEN NETUNN, CNANACTSN OF ONILLINO, ETC.
• 4 3 . 3 '
4 3 . 3 - 4 7 . 6
4 . 3 3 . 0 7 0 . 0
3 . 1
4 7 .
2 . 5
5 0 . 7 ’
8 1 . 0
2.0
5 0 . 7
2.05 2 . 7 ’
100
- 5 7 . 4 '
100
5 7 . 4 6 2 . 0 '
8 0
6 2 . 0 • 7 0 . 8 ’
6 6 . ( j - 7 0 . 8
4 . 8
7 0 . 8 - 7 5 . 8 *I
6 0 ’
6 5 *
7 0 -
O - OENNISON; F ■ FITCH8N; O • OTHEN
-**r
6 4 - 6 7 *
G R A Y ( N 7 ) TO V E R Y L I G H T
G R A Y ( N B ) , F I N E T O C O A R S E
G R A IN E D , F 0 S S IL IF E R 0 U S
L IM E S T O N E IN T E R B E D D E D W IT H
L E N S E S A N D N O D U L E S O F
S P E C K L E D , B A N D E D , A N D M O T T L E D
L I G H T - B L U I S H C R A Y ( 5 B 7 / 1 ) ,
A N D B L U IS H - W H IT E ( 5 B 9 / 1 )
F O S S IL IF E R O U S C H E R T . T H E
F O R M A T IO N I S IR O N - O X ID E
S T A IN E D , M O D E R A T E Y E L L O W IS H
-O R A N G E ( 1 0 Y R 6 / 6 ) W HERE
W E A T H E R E D , A N D B E C O M E S L E S S
W E A T H E R E D W IT H D E P T H . I T I S
M A N G A N E S E S T A IN E D A N D
G E N E R A L L Y H A R D A N D M A S S IV E ,
B U T SHOW S S M A L L - S C A L E
G R A D E D B E D D IN G L O C A L L Y .
T H E F O S S I L 1- A R E P R E D O M IN A N T
L Y C R IN O ID S , B R Y O Z O A A N D
B R A C H IO P O D S , W H IC H A R E L O C A L L Y
R E P L A C E D B Y P Y R I T E . A FEW
C A L C I T E A N D Q U A R T Z C R Y S T A L S
A R E A S S O C IA T E D W IT H V U G S ,
E S P E C IA L L Y A T L IM E S T O N E -
C H E R T C O N T A C T S . T H E F O R M A T IO N
C O N T A IN S A B U N D A N T S T Y L O L IT E S
(P R E S S U R E S O L U T IO N F E A T U R E S )
W H IC H A R E S E C O N D A R Y F E A T U R E S
T H A T A R E P E R P E N D IC U L A R T O
B E D D IN G A N D IN T E R S E C T F O S S I L S .
S T Y L O L IT E S U T U R E S A R E
A S S O C IA T E D W IT H A T H I N ( 1 / 4 ’ )
B L A C K I S H - G R A Y , C A R B O N A C E O U S ,
S I L T Y C L A Y , T H A T C O N T A IN S
I R O N . T H E C H E R T I S V E R Y H A R D ,
A N D I S ( 1 ) B A N D E D I F P A R A L L E L
T O B E D D IN G , ( 2 ) C O N C E N T R IC A L L Y
B A N D E D I F N O D U L A R , OR ( 3 ) S P E C K L E D
I F F O S S IL IF E R O U S . T H E C H E R T I S
G E N E R A L L Y S P E C K L E D TO W AR D S T O P O F
U N I T ; S E C O N D A R Y C H E R T I S O F T E N M I X
E D W IT H F I N E G R A IN E D L IM E S T O N E . L IM E S T O N E I S“ W E A T H E R E D D A R K
Y E L L O W IS H -O R A N G E ( 1 0 Y R 6 / 0 ) TO
G R A Y IS H -O R A N G E ( 1 0 Y R 7 / 4 ) A N D
M O D E R A T E Y E L L O W IS H -B R O W N
( 1 0 Y R 5 / 4 ) T O A D E P T H O F
A P P R O X IM A T E L Y 7 7 ' .
V E R Y W E A T H E R E D , P A L E Y E L L O W IS H -
BROW N ( 1 0 Y R 6 / 2 ) , C R U M B L Y , S O F T ,
C L A Y E Y L IM E S T O N E . SO M E C H L O R IT E
A N D /O R G L A U C O N IT E A S S O C IA T E D
W IT H W E A T H E R E D M A T E R IA L .
3 9 * - c e m e n t e d i n
P V C c a s i n g , b e g a n
IX c o r e d r i l l i n g .
4 0 * - l o s t w a t e r
D O E P R O P E R T Y R A F F IN A T E P I T A R E A B - 1 7
M A C F 1 9*2
B-29
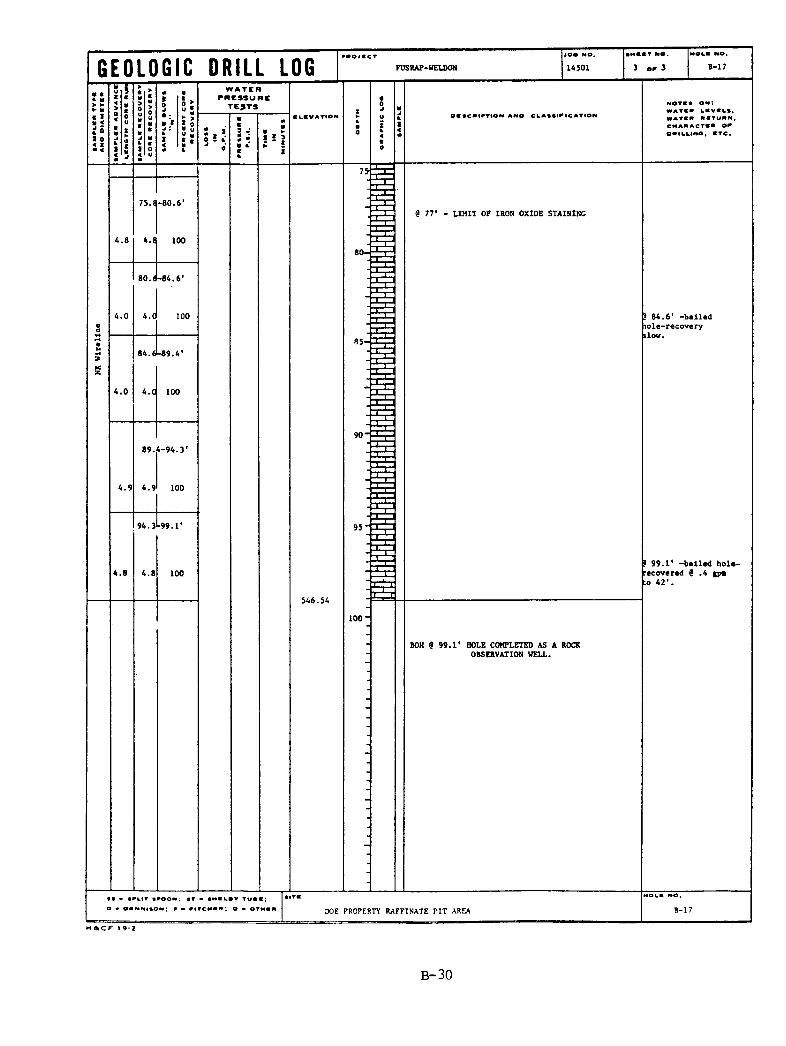
G E O L O G I C D R I L L LOG FUSRAP-WELDON
W A T E RP R E S S U R E
TEJTSCHAWAcree op
75.8-80.6LIMIT OF IRON OXIDE STAINING
10080-
6.0 100 » 8 4 . 6 * - b a i l e d
l o l e - r e c o v e r y
4.0 4.C 100
100
» 99.1' -bailed hole- recovered 9 .4 gpe :o 42'.
4.8 4.8 100
100BOH 9 99.1' HOLE COMPLETED AS A ROCK
OBSERVATION WELL.
B - 1 7D O E P R O P E R T Y R A F F IN A T E P I T A R E A
B-30
G E O L O G I C D R I L L LOGFNOJBCT |JOE NO. | SHEET NO.
F U S R A P -W E L D O N S P R IN G | 1 4 5 0 1 j 1 OF 1 B - 1 8
SITE 1 COONOINATBSD O E P R O P E R T Y - R A F F IN A T E P I T A R E A j N 9 9 2 1 8 . 8 0 W 5 0 7 5 0 . 7 5 9 0 V E R T IC A L
BEGUN | COM*LI TED
6 A P R . 8 3 | 1 1 A P R . 8 3
ONILLEN IOMILL M IME AND MODELi
B O Y L E S B R O T H E R S j S IM C O 4 0 0 0
MOLE Size jovENE vNOEN(FT.)
8 ' | 2 4 . 0 '
a 0 n TOTALOEFTH
2 4 . 0 '
con a n e co ve n v (f t ./%) c o m • o ic s im m l x (b u t o f o f casing c k o u n d b l .
1 2 . 8 / 9 5
OBFTM/«L. TOF OF NOCK
UNKNOW N
1 5 0 L B S / 3 0 I N .
CASINO LEFT IN NOLC: OIA./LENGTH LOGO ED ■ V
E . M . F A N E L L I
W A T E RP R E S S U R ETESTS
1 5ELEVATION
NOTES ON: WATEN LEVELS. WATEN NETUNN, CMANACTEN OFON ILLING , BTC.
6 5 8 . 7 5
6 5 6 . 7 5
0 . 0 ' - 2 . 0 ' : T O P S O I L : B L A C K IS H -B R O W N ,
O R G A N I C - R IC H , M O IS T T O W ET
C L A Y E Y S I L T .
1 . 5
SS
SS 1 . 5
4 - 4 - 6100
2 - 2 - 41005 „
2.0'-8.0':
6 5 0 . 7 55 - 7 - 7100 " \ 9 8 *
10 - _ \3 - 5 - 1 1
1 . 5 I 1 0 0
1 . 5
1 . 5
1 . 5
1 . 5
8 . 0 ' - 1 7 . 5 ' :
4 - 5 - 1 1
100
3 - 4 - 1 0
LO O -
6 4 1 . 2 1
5 - 8 - 2100
5 - 1 5 - 1 7
7 5
20 '
1 1 - 1 9 - 2 0
8 76 3 4 . 7 5
2 5 _
C L A Y E Y S I L T : M O T T L E D G R AY ( N 7 )
A N D M O D E R A T E Y E L L O W IS H -B R O W N
( 1 0 Y R 5 / 4 ) O R D A R K Y E L L O W IS H -
O R A N G E ( 1 0 Y R 6 / 6 ) C L A Y E Y S I L T ;
N O N - P L A S T IC T O P L A S T I C , M O D E R A T E L Y
D E N S E W IT H D E P T H A N D C O N T A IN S
A B U N D A N T IR O N - O X ID E N O D U L E S .
SO M E S E C O N D A R Y C A L C I T E , P L A S T I C
A N D M O D E R A T E L Y S O F T . P R O B A B L Y
O L D F I L L .
V E R Y P E B B L Y B A S E O F F I L L C O N T A IN S
C L A S T S O F F O S S IL IF E R O U S L IM E S T O N E
A N D C H E R T .
C L A Y : M O T T L E D G R A Y ( N 7 )
A N D M O D E R A T E Y E L L O W IS H -B R O W N
( 1 0 Y R 5 / 4 ) O R D A R K Y E L L O W IS H -
O R A N G E ( 1 0 Y R 6 / 6 ) C L A Y T O S I L T Y
C L A Y . T H E M A T E R IA L I S P L A S T I C ,
D E N S E , C O N T A IN S A B U N D A N T IR O N -
O X ID E N O D U L E S , A N D H A S S L IC K E N S ID E D
S U R F A C E S .
1 7 . 5 ' - 2 4 . 0 ' : C L A Y T I L L : M O T T L E D G R A Y ( N 7 )
A N D M O D E R A T E Y E L L O W IS H -B R O W N
( 1 0 Y R 5 / 4 ) O R D A R K Y E L L O W IS H -
O R A N G E ( 1 0 Y R 6 / 6 ) , S I L T Y , S A N D Y ,
D E N S E , C L A Y T H A T C O N T A IN S A
FEW P E B B L E S O F SU R R O U N D E D
C H E R T , O U A R T Z IT E , A N D G R A N IT IC
M A T E R IA L , W H IC H G E N E R A L L Y
C O A R S E N T O C O B B L E S I Z E S W IT H
D E P T H . T H E M A T E R IA L H AS
M A N G A N E S E -S T A IN E D S U R F A C E S ,
C O N T A IN S IR O N A N D S E C O N D A R Y
F R IA B L E C A L C A R E O U S C O N C R E T IO N S ,
A N D SHOW S B L 0 C K Y F R A C T U R IN G .
9 2 2 . 5 ' S M A L L 3 " S A N D L E N S E -D R Y A N D
F R I A B L E .
H o l e d r i l l e d a n d
s a m p le d w i t h 8 "
h o l l o w s t e m a u g e r a n d
s p l i t s p o o n s .
9 8 ' - s e v e r a l c h e r t /
l i m e s t o n e c o b b l e s ,
p r o b a b l y f i l l .
B O H - 9 2 4 ' H O L E C O M P L E T E D A S A P IE Z O M E T E R
IN S T A L L A T IO N .
R O C K A N D S O I L C O LO R S A R E IN D E X E D ON T H E
R O C K -C O L O R C H A R T P U B L IS H E D B Y T H E
G E O L O G IC A L S O C IE T Y ’ O F A M E R IC A .
- sflit sfo o n ; e r - she le v tw e e ;
O - O tNNIION; F - FITCMBN; O • OTMBN DOE PROPERTY-RAFFINATE PIT AREA B-16
B-31
G E O L O G I C D R I L L LOG FUSRAP-WELDON SPRING 14501 o w i B-19
DOE PROPERTY-RAFFINATE PIT AREA N 99596.66 W 50805.60 90• maun ONILL MANE AND MODEL NOCK (FT.)
7 APR. 83 8 APR. 83 BOYLES BROTHERS SIMCO 4000 8 21.5 0 21.5*
C O M B t o m
0 645.37 NOT ENCOUNTERED UNKNOWN
150 LBS/30 IN. E.M.FANELLI
W A T E RP R E S S U R E
T E ^ T S
a i
E L E V A T I O N O E S C N I F T I O N A N D C L A S S I F I C A T I O N
N O T E S O N I W A T E N L E V E L S . W A T E N N f T O M N , C M A N A C T E N O F O M I L L I N O , E T C -
645. 37 644.37
SS 1.5' 1.5'5-7-9100
O.O'-l.O': T0PS0IL: BLACKISH-BROWN,ORGANIC-RICH, MOIST TO WET CLAYEY SILT.
Drilled and sampled using 8" hollow stem auger and split spoons.
l.O'-ll.S' CLAYEY SILT: MOTTLED GRAY (N7)AND MODERATE YELLOWISH-BROWN (10YR5/4) OR DARK YELLOWISH- ORANGE (10YR6/6) CLAYEY SILT; NON-PLASTIC TO PLASTIC, MODERATELY DENSE WITH DEPTH AND CONTAINS ABUNDANT IRON-OXIDE NODULES.
1.5* 1.3'2-3-6
8710'
633.8711.5,-16.5t
15.
SS 1.5*3-7-10
75 628.87
16.5*-21.5’
SS3-7
621.87
<3 21*
CLAY; MOTTLED GRAY (N7)AND MODERATE YELLOWISH-BROWN (10YR5/4) OR DARK YELLOWISH-*- ORANGE (10YR6/6) CLAY TO SILTY CLAY. THE MATERIAL IS PLASTIC, DENSE, CONTAINS ABUNDANT IRON-OXIDE NODULES, AND HAS SLICKENSIDED SURFACES.
CLAY TILL: MOTTLED GRAY (N7)AND MODERATE YELLOWISH-BROWN (10YR5/4) OR DARK YELLOWISH- ORANGE (10YR6/6), SILTY, SANDY, DENSE CLAY THAT CONTAINS A FEW PEBBLES OF SUBROUNDED CHERT, QUARTZITE, AND GRANITIC MATERIAL, WHICH GENERALLY COARSEN TO COBBLE SIZES WITH DEPTH. THE MATERIAL HAS MANGANESE-STAINED SURFACES, CONTAINS IRON AND SECONDARY FRIABLE CALCAREOUS CONCRETIONS, AND SHOWS BLOCKY FRACTURING.CALCAREOUS SAND LAYER IN BASE OF SAMPLE.
@ 21* -split spoon refusal.
@ 21.5* -auger refusal.
BOH-9 2T5HOLE ADVANCED AND BACKFILLED WITH CEMENT. REPLACEMENT HOLE 19A INSTALLED AS ROCK OBSERVATION WELL.
ROCK AND SOIL COLORS ARE INDEXED ON THE ROCK-COLOR CHART PUBLISHED BY THE GEOLOGICAL SOCIETY OF AMERICA.
. . - ..LIT LOOM; .T - .M.L.V TU.E ;
DOE PROPERTY-RAFFINATE PIT AREA
H » c f 191 B-32B-19
G E O L O G I C D R I L L LOGJOE NO. NOUS NO.
F U S R A P -W E L D O N S P R IN G 1 4 5 0 11 OF 3 B - 1 9 A
D O E P R O P E R T Y - R A F F IN A T E P I T A R E A N 9 9 5 4 6 . 4 1 W 5 0 9 5 4 . 2 9 V E R T I C A L
1 9 A P R . 6 3
.co m pleteo
2 2 A P R . 8 3 B O Y L E S B R O T H E R S
0*11.1. WAMI ANO M O O Il
L O N G Y E A R 4 43 T O 4 ' 2 8 . 0
NOCK (FT.)
7 3 101.0 *CONK NKCOVKAV (FT./%) CONK NOKES WFVKS IU TOP OF CASINO CNOUNO Ik . OKPTM/ Kk. SROUND WATEN OKPTH/KL. TOF OF NOCK
4 0 6 4 8 . 2 8 6 4 5 . 1 7 3 5 * / 6 1 0 . 1 7 ( 4 / 2 5 / 8 3 ) 2 8 * / 6 1 7 . 1 7
1 5 0 L B S / 3 0 I N .mCASINO LEFT IN MOLE: OlA./LlNOTM
4 * / 3 9 *
lo ogeo av
E.M.FANELLIW A T E R
P R E S S U R ET ESTS
s !ELEVATION OK SC AI FT ION ANO CLASSIFICATION
WATEN LEVELS, WATEN NETUNN, CHANACTEN OF ONILLINO. ETC.
6 4 5 . 1 7 0 . 0 ' - 4 . 0 * : R O A D F I L L : L IM E S T O N E G R A V E L , SO M E
S I L T , C O M P A C T E D .
5 -
. 0 * - 7 . 0 * : C L A Y E Y S I L T : M O T T L E D G R A Y ( N 7 )
A N D M O D E R A T E Y E L L O W IS H -B R O W N
( 1 0 Y R 5 / 4 ) O R D A R K Y E L L O W IS H -
O R A N G E ( 1 0 Y R 6 / 6 ) C L A Y E Y ' S I L T ;
N O N - P L A S T IC T O P L A S T I C . M O D E R A T E L Y
D E N S E W IT H D E P T H A N D C O N T A IN S
A B U N D A N T IR O N - O X ID E N O D U L E S .
D r i l l e d w i t h 6 "
r o l l e r b i t a n d
m u d t o 3 9 * .
10.
7 . 0 ' - 1 2 . 0 * : C L A Y : M O T T L E D G R A Y ( N 7 )
A N D M O D E R A T E Y E L L O W IS H -B R O W N
( 1 0 Y R 5 / 4 ) O R D A R K - Y E L L O W IS H -
O R A N G E ( 1 0 Y R 6 / 6 ) C L A Y TO
S I L T Y C L A Y . T H E M A T E R IA L
I S P L A S T I C . D E N S E , C O N T A IN S
A B U N D A N T IR O N - O X ID E N O D U L E S .
A N D H A S S L IC K E N S ID E D S U R F A C E S .
6 3 3 . 1 7
12.0*-20.0*:1 5 .
6 2 5 . 1 7
1(318.0 *
2 5 .
C L A Y T I L L :M O T T L E D G R A Y ( N 7 )
A N D M O D E R A T E Y E L L O W IS H -B R O W N
( 1 0 Y R 5 / 4 ) O R D A R K Y E L L O W I S H -
O R A N G E ( 1 0 Y R 6 / 6 ) , S I L T Y , S A N D Y ,
D E N S E C L A Y T H A T C O N T A IN S A
FEW P E B B L E S O F S U B R O U N D E D
C H E R T , Q U A R T Z IT E , A N D G R A N IT IC
M A T E R IA L , W H IC H G E N E R A L L Y
C O A R S E N T O C O B B L E S I Z E S W IT H
D E P T H . T H E M A T E R IA L H A S
M A N G A N E S E -S T A IN E D S U R F A C E S .
C O N T A IN S IR O N A N D S E C O N D A R Y
F R IA B L E C A L C A R E O U S C O N C R E T IO N S ,
A N D SHOW S B L O C K Y F R A C T U R IN G .
■ 2 0 . 0 * : B A S A L C H E R T T I L L : BROW N T O B L A C K
C O B B L E - T O B O U L D E R - S IZ E D , A N G U L A R
T O S U B A N G U L A R C H E R T C L A S T S I N A
L O O S E , S A N D Y , S I L T Y , C L A Y E Y
M A T R IX . T H E C H E R T C O M M O N LY H A S
W H IT E W E A T H E R IN G R IN D S .
L
E53a2 0 . 0 ' - 2 8 . 0 * : " C H E R T Y C L A Y : B R IG H T Y E L L O W IS H -
O R A N G E , T A N , R E D A N D Y E L L O W , D E N S E
C L A Y M A T R IX C O N T A IN IN G A B U N D A N T
C H E R T C L A S T S .
3 0 .
2 8 . 0 - 1 0 1 . 0 ’ : L IM E S T O N E : F O R M A T IO N N A M E :
B U R L IN G T O N /K E O K U K ; A G E :
M I S S I S S I P P I A N ; A L I G H T
G R A Y ( N 7 ) T O V E R Y L I G H T
G R AY ( N 8 ) , F I N E - T O C O A R S E
G R A IN E D , F O S S IL IF E R O U S
L IM E S T O N E IN T E R B E D D E D W IT H
L E N S E S A N D N O D U L E S OF
S P E C K L E D , B A N D E D , A N D M O T T L E D
L I G H T B L U IS H - G R A Y ( 5 B 7 / 1 )
A N D B L U IS H - W H IT E ( 5 B 9 / 1 ) .
F O S S IL IF E R O U S C H E R T .
9 2 8 * - f i r s t l i m e y
9 3 0 ' - d r i l l i n g i s
h a r d a n d s t e a d y ;
9 0 0 p s i d o w n p r e s s u r e
• poom : - i n i
• ON; P • PITCH!*
3 5
D O E P R O P E R T Y - R A F F IN A T E P I T A R E A
B-33
G E O L O G I C D R I L L LOG FUSRAP-WELDON SPRING 14501 2 or 3
► Sl 1 M <1 fi«5
W A T E RP R E S S U R ETE£TS
I I
I IL iVATIO NWATIR LCVlkl, WATIR RITuRN, CHARACTIR OF OWILLINe, *rc.
5.0
39.0|-44.O'
4.9
44.0-
4.7
48. 7'
100
4.8
48.7-
4.8
53.5'
53.54-58.4*4.9 4.9 100
LIMESTONE CONTINUED: THE FORMATION IS IRON-OXIDE STAINED. MODERATE YELLOWISH- ORANGE (10YR6/6) WHERE WEATHERED, AND BECOMES LESS WEATHERED WITH DEPTH. IT IS MANAGANESE STAINED AND GENERALLY HARD AND MASSIVE.BUT SHOWS SMALL-SCALE GRADED BEDDING LOCALLY.THE FOSSILS ARE PREDOMINANTLY CRINOIDS, BRYOZOA AND BRACHIOPODS, WHICH ARE LOCALLY REPLACED BY PYRITE. A FEW CALCITE AND QUARTZ CRYSTALS ARE ASSOCIATED WITH VOIDS, ESPECIALLY AT LIMESTONE- CHERT CONTACTS. THE FORMATION CONTAINS ABUNDANT STYLOLITES (PRESSURE SOLUTION FEATURES), WHICH ARE SECONDARY FEATURES THAT ARE PERPENDICULAR TO BEDDING AND INTERSECT FOSSILS. STYLOLITE SUTURES ARE ASSOCIATED WITH A THIN (1/4”) BLACKISH-GRAY, CARBONACEOUS, SILTY CLAY, THAT CONTAINS IRON. THE CHERT IS VERY HARD, AND IS (1) BANDED IF PARALLEL TO BEDDING, (2) CONCENTRICALLY BANDED IF NODULAR, OR (3) SPECKLED IF FOSSILIFEROUS. THE CHERT IS GENERALLY SPECKLED TOWARD TOP OF UNIT; SECONDARY CHERT IS OFTEN MIXED WITH FINEGRAINED LIMESTONE.
@ 391 -cemented in 4” PVC casing; began NX coring.
S3.5--58.4'
4.9
58.4
4.9
63.4'
98 57-65.5;63-63.4’ ARGILLACEOUS LIMESTONE LAYERS WITH SOME GLAUCONITE/ CHLORITE AND PYRITE.
63.4
4.7
68.1’100
68.1472.9'
4.8 100
70-
75 -]•» • eri.iT erooN; it - tMiiav r uee; o ■ o i n n i i o n ; r p eircMii*; o • o t h i r DOE PROPf.RTY-RAFFINATE PIT AREA B-19A
B-34
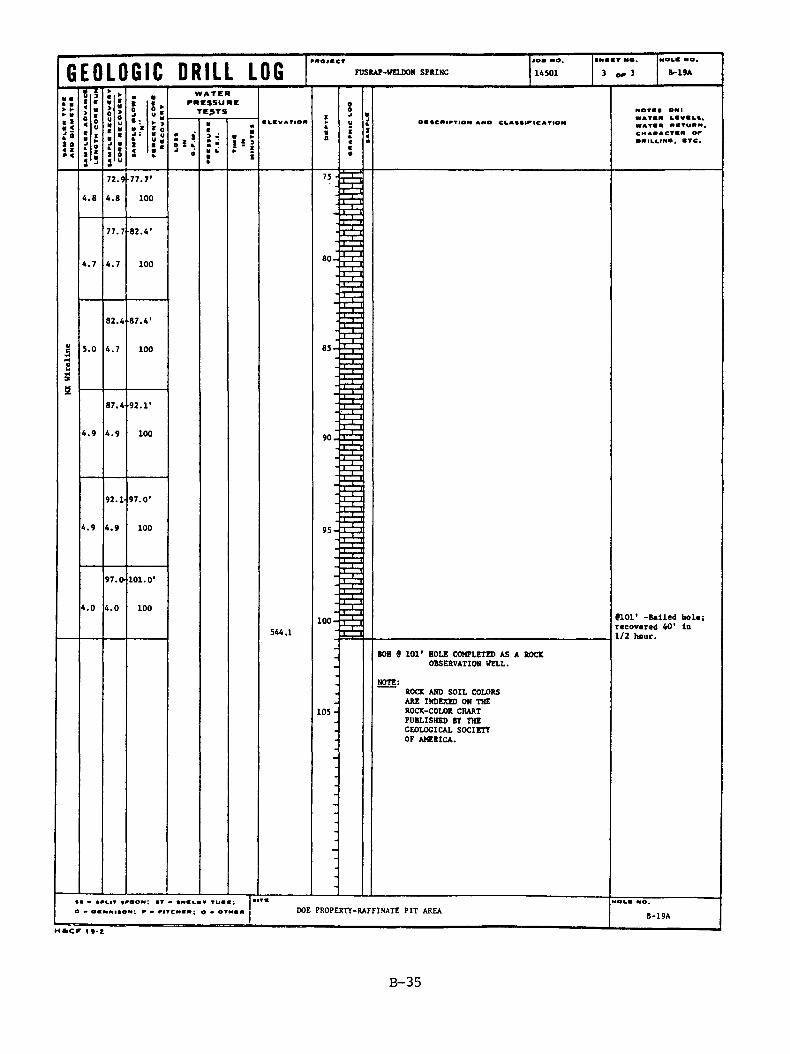
G E O L O G I C D R I L L LOG FUSRAP-WELDON SPRING 14501 B-19A
e tW A T E R
P R E S S U R ETESTS1 $
ELEVATIONWATEN LEVELS, WATEN NETONN, CHANACTSN ON ONILLINO, ETC.
72.9
4.8
1*77.7'
10075 -
4.7
77.7
4.7
82.4'
100 80-
82.4
5.0
87.4'
100 85-
4.9
87.4-
4.9
92.1'
100 90.
4.9
92.1*|97.0
4.9 100 95-
4.0
97.0-
4.0
101.0*
100 100-544.1
8101' -Balled hole; recovered 40' In 1/2 hour.
105-
BOH 9 101' HOLE COMPLETED AS A ROCK OBSERVATION WELL.
ROCK AND SOIL COLORS ARE INDEXED ON THE ROCK-COLOR CHART PUBLISHED BY THE GEOLOGICAL SOCIETY OF AMERICA.
DOE PROPERTY-RAFFINATE PIT AREA
B-35
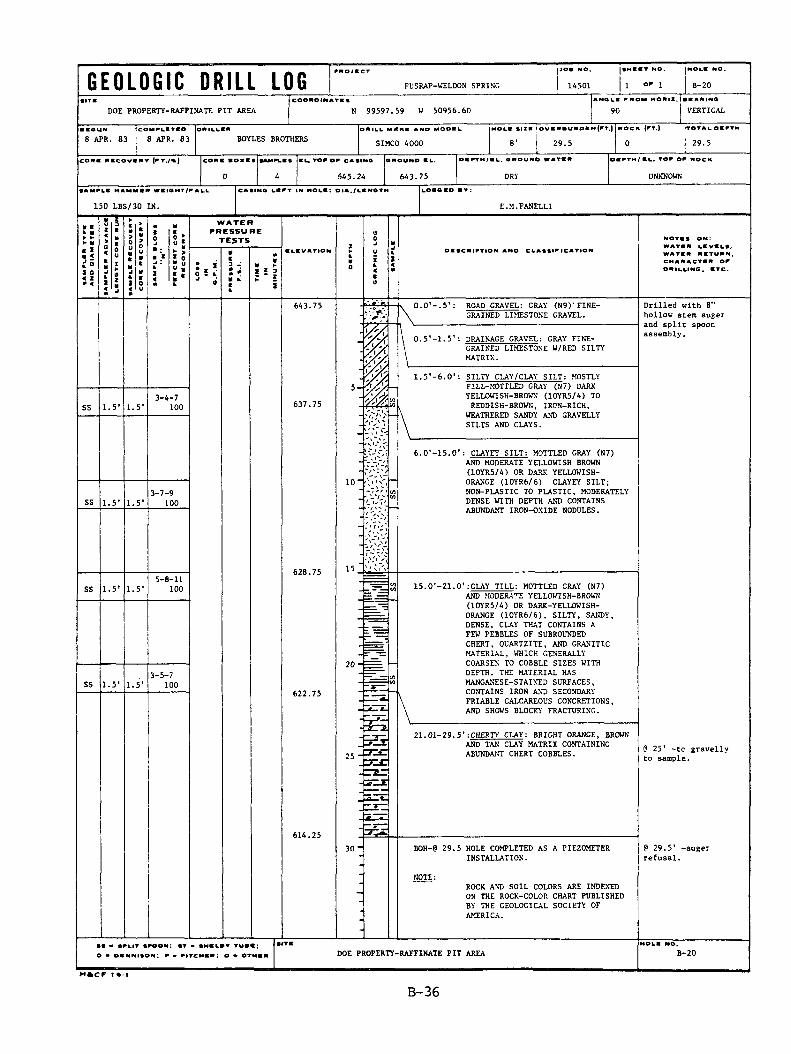
G E O L O G I C D R I L L LOGFWOiECT |JOW NO-
F U S R A P -W E L D O N S P R IN G | 1 4 5 0 1 1 OF ! B - 2 0
D O E P R O P E R T Y - R A F F IN A T E P I T A R E A N 9 9 5 9 7 . 5 9 W 5 0 9 5 6 . 6 0
ANQLl fn o m m o r iz . I I I a n in a
OR ILLS* DRILL ME H I ANO MOOBL HOLE SIZE lOVERaUROIN{FT.| WOC A (ft.) TOTAL OEFTM
8 A P R . 83 | 8 A P R . 83 B O Y L E S B R O T H E R SS IM C O 4 0 0 0 8' j 29.5 0 29.5
CORI 10X11
0 6 4 5 . 2 4
OXOUND I L
6 4 3 . 7 5 UNKNOW N
1 5 0 L B S / 3 0 I N .
*T1CAtlNS LEFT IN HOLE: OIA./LENOTH LOOOBO w v :
E . M . F A N E L L I
W A T E RP R E S S U R ET ESTS
h i X IELEVATION OESCWIFTION ANO CLASSIFICATION
WATEN LEVELS, WATEN NETUNN. CMANACTEN OF ONILLINO . BTC.
1.5'
1 . 5 ' 1.5'
1.5*
6 4 3 . 7 5
3 - 4 - 7100 6 3 7 . 7 5
3 - 7 - 9100
5-8-111006 2 8 . 7 5
S S 1.5'3 - 5 - 7100
6 2 2 . 7 5
614.25
0 . 0 ' - . 5 * : R O A D G R A V E L : G R A Y ( N 9 ) ' F I N E
G R A IN E D L IM E S T O N E G R A V E L .
0 . 5 ' - 1 . 5 ’ : D R A IN A G E G R A V E L : G R A Y F I N E
G R A IN E D L IM E S T O N E W /R E D S I L T Y
M A T R IX .
D r i l l e d w i t h 8 "
h o l l o w s t e m a u g e r
a n d s p l i t s p o o n
a s s e m b l y .
1 . 5 ' - 6 . 0 ' S I L T Y C L A Y /C L A Y S I L T : M O S T L Y
F I L L - M O T T L E D G R A Y ( N 7 ) D A R K
Y E L L O W IS H -B R O W N ( 1 0 Y R 5 / 4 ) T O
R E D D IS H - B R O W N , IR O N - R I C H ,
W E A T H E R E D S A N D Y A N D G R A V E L L Y
S I L T S A N D C L A Y S .
10'6 . 0 ' - 1 5 . 0 ' : C L A Y E Y S I L T : M O T T L E D G R A Y ( N 7 )
A N D M O D E R A T E Y E L L O W IS H BROW N
( 1 0 Y R 5 / 4 ) O R D A R K Y E L L O W IS H -
O R A N G E ( 1 0 Y R 6 / 6 ) C L A Y E Y S I L T ;
N O N - P L A S T IC T O P L A S T I C , M O D E R A T E L Y
D E N S E W IT H D E P T H A N D C O N T A IN S
A B U N D A N T I R O N - O X ID E N O D U L E S .
1 5 . 0 ' - 2 1 . 0 1 : C L A Y T I L L : M O T T L E D G R A Y ( N 7 )
A N D M O D E R A T E Y E L L O W IS H -B R O W N
( 1 0 Y R 5 / 4 ) O R D A R K - Y E L L O W IS H -
O R A N G E ( 1 0 Y R 6 / 6 ) , S I L T Y , S A N D Y ,
D E N S E , C L A Y T H A T C O N T A IN S A
FEW P E B B L E S O F S U B R O U N D E D
C H E R T , O U A R T Z IT E , A N D G R A N IT IC
M A T E R IA L , W H IC H G E N E R A L L Y
C O A R S E N T O C O B B L E S I Z E S W IT H
D E P T H . T H E M A T E R IA L H A S
M A N G A N E S E - S T A IN E D S U R F A C E S ,
C O N T A IN S IR O N A N D S E C O N D A R Y
F R IA B L E C A L C A R E O U S C O N C R E T IO N S ,
A N D SHOW S B L O C K Y F R A C T U R IN G .
2 1 . 0 1 - 2 9 . 5 , : C H E R T Y C L A Y : B R IG H T O R A N G E , BROW N
A N D T A N C L A Y M A T R IX C O N T A IN IN G
A B U N D A N T C H E R T C O B B L E S .@ 2 5 ' - t c g r a v e l l y
t o s a m p l e .
B O H - 0 2 9 . 5 H O L E C O M P L E T E D A S A P IE Z O M E T E R
IN S T A L L A T I O N .
R O C K A N D S O I L C O LO R S A R E IN D E X E D
O N T H E R O C K -C O L O R C H A R T P U B L IS H E D
B Y T H E G E O L O G IC A L S O C IE T Y O F
A M E R IC A .
@ 2 9 . 5 * - a u g e r
r e f u s a l .
e - oehnison; f • fitchew DOE PROPERTY-RAFFINATE PIT AREA
B-36
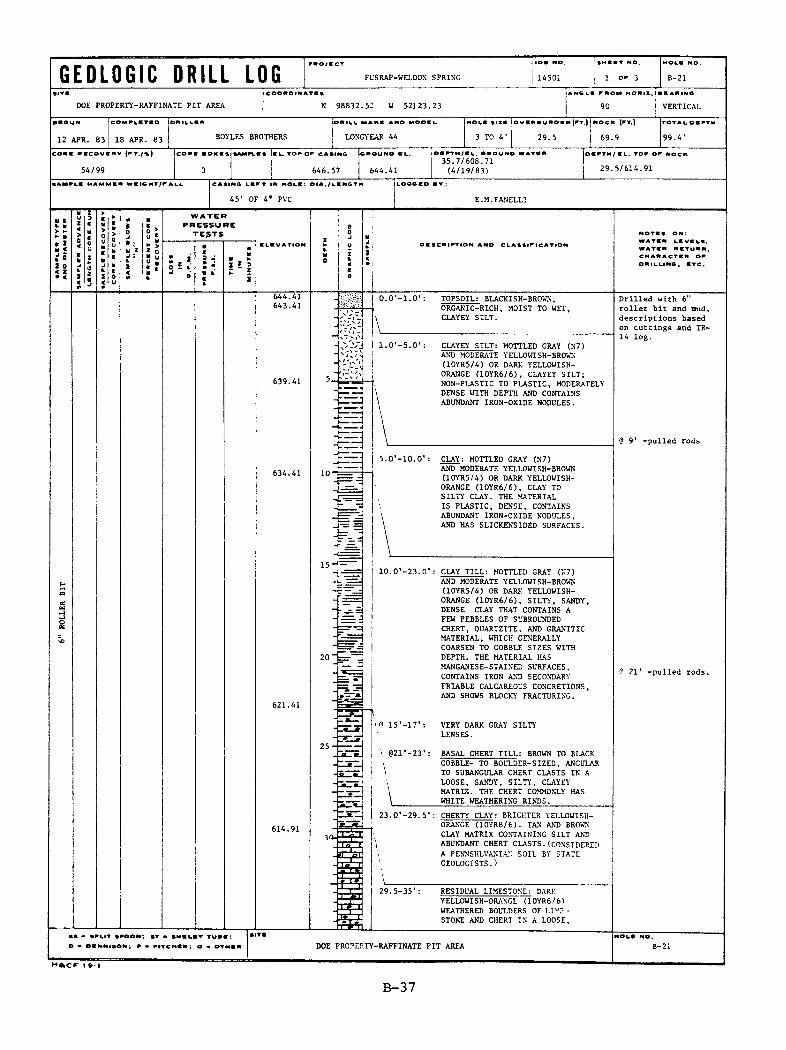
G E O L O G I C D R I L L LOGFROJECT jJOE NO.
F U S R A P -W E L D O N S P R IN G | 1 4 5 0 1 1 OF 3 B - 2 1
D O E P R O P E R T Y - R A F F IN A T E P I T A R E A N 9 8 8 3 2 . 5 2 W 5 2 1 2 3 . 2 3 9 0 V E R T I C A L
• BGUN COMFCITIO d r il l e r O R IL L WAN* ANO MODIL InOLE SIZE i o VSmuMOEN (FT.) 1 NOCK (FT.) t o t a l o eftn
1 2 A P R . 8 3 1 8 A P R . 8 3 B O Y L E S B R O T H E R S L O N G Y E A R 4 4 3 T O 4 ’ | 2 9 . 5 | 6 9 . 9 9 9 . 4 '
co ne K ic o v m v (f t ./%)
5 4 / 9 9
c o m l o x n
3
WFt.ES lEL. TOF OF CASING
6 4 6 . 5 7
Ig * ouno k l
3 5 . 7 / 6 0 8 . 7 1
( 4 / 1 9 / 8 3 )
|OEFTM/EL. TOF OF NOCK
! 2 9 . 5 / 6 1 4 . 9 1
CASING LE
4 5 '
FT IN HOLE: OIA./LENGTH
O F 4 * PV C
LOGGED ET
E . M . F A N E L L I
W A T E RP R E S S U R ET E^TS
5 * 1or* I !
ELEVATION OESCNIFTION ANO CLASSIFICATIONWATEN LEVELS, WATEN NETUNN, CNANACTEN OF ON ILLINO , ETC.
6 4 4 . 4 1
6 4 3 . 4 1
6 3 9 . 4 1
10-
6 1 4 . 9 1
O • DENNISONS F - FITCNBN; O • OTMIN
H & c r i e i
T 0 P S 0 I L ; B L A C K IS H -B R O W N ,
O R G A N I C - R IC H , M O IS T T O W E T ,
C L A Y E Y S I L T .
• x lV 3 ! 1 . 0 ' - 5 . 0 ' : C L A Y E Y S I L T : M O T T L E D G R A Y ( N 7 )
! A N D M O D E R A T E Y E L L O W IS H -B R O W N
( 1 0 Y R 5 / 4 ) O R D A R K Y E L L O W IS H -
O R A N G E ( 1 0 Y R 6 / 6 ) , C L A Y E Y S I L T ;
N O N - P L A S T IC T O P L A S T I C , M O D E R A T E L Y
D E N S E W IT H D E P T H A N D C O N T A IN S
A B U N D A N T I R O N - O X ID E N O D U L E S .
D r i l l e d w i t h 6 "
r o l l e r b i t a n d m u d ,
d e s c r i p t i o n s b a s e d
o n c u t t i n g s a n d T R -
1 4 l o g .
5 9 ' - p u l l e d r o d s
5 . 0 * - 1 0 . 0 ' : C L A Y ; M O T T L E D G R A Y ( N 7 )
A N D M O D E R A T E Y E L L O W IS H -B R O W N
( 1 0 Y R 5 / 4 ) O R D A R K Y E L L O W IS H -
O R A N G E ( 1 0 Y R 6 / 6 ) , C L A Y T O
S I L T Y C L A Y . T H E M A T E R IA L
I S P L A S T I C , D E N S E , C O N T A IN S
\ A B U N D A N T I R O N - O X ID E N O D U L E S ,
\ A N D H A S S L IC K E N S ID E D S U R F A C E S .
1 0 . 0 ’ - 2 3 . O ' : C L A Y T I L L : M O T T L E D G R A Y ( N 7 )
A N D M O D E R A T E Y E L L O W IS H -B R O W N
( 1 0 Y R 5 / 4 ) O R D A R K Y E L L O W IS H -
O R A N G E ( 1 0 Y R 6 / 6 ) , S I L T Y , S A N D Y ,
D E N S E C L A Y T H A T C O N T A IN S A
FEW P E B B L E S O F S U B R O U N D E D
C H E R T , Q U A R T Z IT E , A N D G R A N IT IC
M A T E R IA L , W H IC H G E N E R A L L Y
C O A R S E N T O C O B B L E S I Z E S W IT H
D E P T H . T H E M A T E R IA L H A S
M A N G A N E S E -S T A IN E D S U R F A C E S .
C O N T A IN S IR O N A N D S E C O N D A R Y
F R IA B L E C A L C A R E O U S C O N C R E T IO N S ,
A N D SHOW S B L O C K ):' F R A C T U R IN G .
\ 0 1 5 ' - 1 7 ’ : V E R Y D A R K G R A Y S I L T ) '
L E N S E S .
@ 2 1 ’ - 2 3 ' : B A S A L C H E R T T I L L : BROW N T O B L A C K
C O B B L E - T O B O U L D E R - S IZ E D , A N G U L A R
T O S U B A N G U L A R C H E R T C L A S T S I N A
L O O S E , S A N D Y , S I L T Y . C L A Y E Y
M A T R IX . T H E C H E R T C O M M O N LY H A S
W H IT E W E A T H E R IN G R IN D S .
? 2 1 ' - p u l l e d r o d s .
\
2 3 . 0 ' - 2 9 . 5 * : C H E R T Y C L A Y ; B R IG H T E R Y E L L O W IS H -
O R A N G E ( 1 0 Y R 8 / 6 ) . T A N A N D BROWN
C L A Y M A T R IX C O N T A IN IN G S I L T A N D
A B U N D A N T C H E R T C L A S T S . (C O N S ID E R E D
i A P E N N S H L V A N IA N s o i l b y s t a t e
G E O L O G IS T S . )
2 9 . 5 - 3 5 ' : R E S ID U A L L IM E S T O N E ; D A R K
Y E L L O W IS H -O R A N G E ( 1 0 Y R 6 / 6 )
W E A T H E R E D B O U L D E R S O F L I V T -
S T O N E A N D C H E R T I N A L O O S E ,
DOE PROPERTY-RAFFINATE PIT AREA
B-37
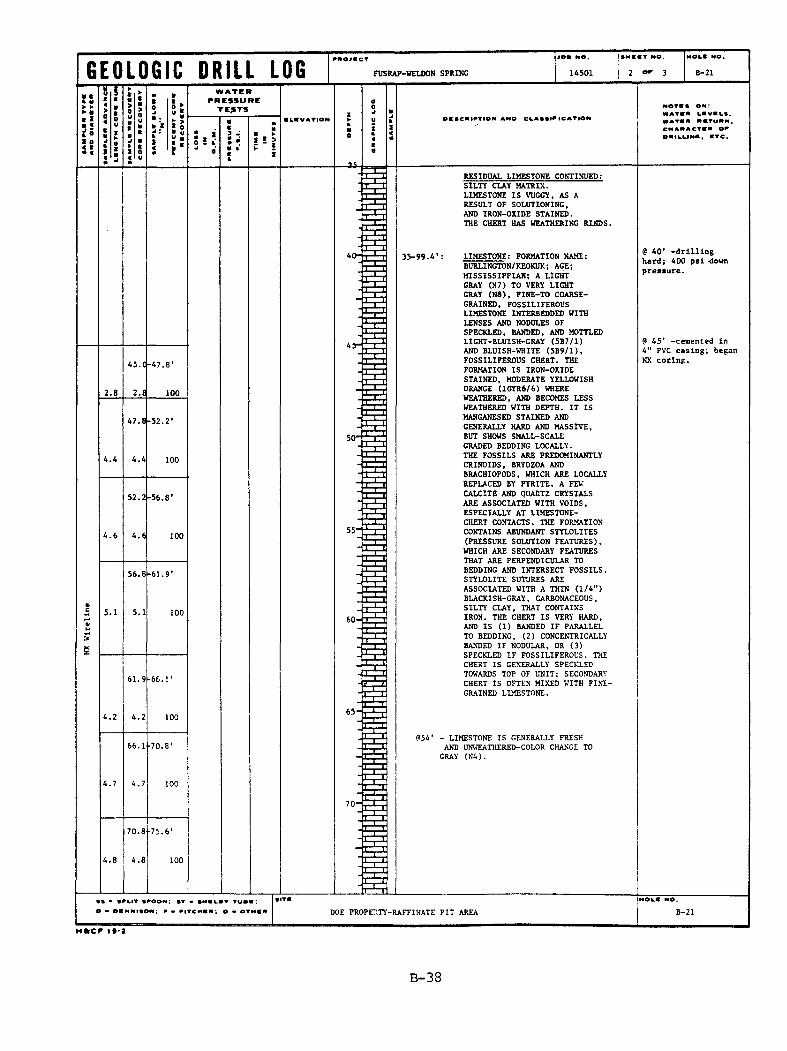
G E O L O G I C D R I L L LOG FUSRAP-WELDON SPRING 14501 2 of 3 B-21
W A T E RP R E S S U R ET ESTS
V IZ
ELEVATION OIICRIFTION ANO CLASSIFICATIONWATEN LEVELS. WATEN NETUNN, CNANACTEN OF ONILLINO, ETC.
4 0 -
2.84 5 . C - 4 7 . 8
2.8 100
4 . 4
4 7 . 8 - 5 2 . 2 '
4 . 4
4 . 6
5 2 . 2
4 . 6
5 6 . 8 '
5 5 1
5 . 1
5 6 . 8
5 . 1
6 1 . 9 '
1006 0 -
-66.1’
4 . 26 5 *
66.1 • 7 0 . 8 '
4 . 7 1007 0 *
4 . 8
7 0 . 8
4 . 8
7 5 . 6 '
R E S ID U A L L IM E S T O N E C O N T IN U E D ;
S I L T Y C L A Y M A T R IX .
L IM E S T O N E I S V U G G Y , A S A
R E S U L T O F S O L U T IO N IN G ,
A N D I R O N - O X ID E S T A IN E D .
T H E C H E R T H A S W E A T H E R IN G R I N D S .
3 5 - 9 9 . 4 * : L IM E S T O N E : F O R M A T IO N N A M E :
B U R L IN G T O N /K E O K U K ; A G E ;
M I S S I S S I P P I A N ; A L I G H T
G R A Y ( N 7 ) T O V E R Y L I G H T
G R A Y ( N 8 ) , F I N E - T 0 C O A R S E
G R A IN E D , F O S S IL IF E R O U S
L IM E S T O N E IN T E R B E D D E D W IT H
L E N S E S A N D N O D U L E S O F
S P E C K L E D , B A N D E D , A N D M O T T L E D
L I G H T - B L U IS H - G R A Y ( 5 B 7 / 1 )
A N D B L U IS H - W H IT E ( 5 B 9 / 1 ) ,
F O S S IL IF E R O U S C H E R T . T H E
F O R M A T IO N I S IR O N - O X ID E
S T A IN E D , M O D E R A T E Y E L L O W IS H
O R A N G E ( 1 0 Y R 6 / 6 ) W H E R E
W E A T H E R E D , A N D B E C O M E S L E S S
W E A T H E R E D W IT H D E P T H . I T I S
M A N G A N E S E D S T A IN E D A N D
G E N E R A L L Y H A R D A N D M A S S IV E ,
B U T SHOW S S M A L L - S C A L E
G R A D E D B E D D IN G L O C A L L Y .
T H E F O S S IL S A R E P R E D O M IN A N T L Y
C R IN O ID S , B R Y O Z O A A N D
B R A C H IO P O D S , W H IC H A R E L O C A L L Y
R E P L A C E D B Y P Y R I T E . A FEW
C A L C I T E A N D Q U A R T Z C R Y S T A L S
A R E A S S O C IA T E D W IT H V O I D S ,
E S P E C IA L L Y A T L IM E S T O N E -
C H E R T C O N T A C T S . T H E F O R M A T IO N
C O N T A IN S A B U N D A N T S T Y L O L IT E S
(P R E S S U R E S O L U T IO N F E A T U R E S ) ,
W H IC H A R E S E C O N D A R Y F E A T U R E S
T H A T A R E P E R P E N D IC U L A R TO
B E D D IN G A N D IN T E R S E C T F O S S I L S .
S T Y L O L IT E S U T U R E S A R E
A S S O C IA T E D W IT H A T H I N ( 1 / 4 ” )
B L A C K I S H - G R A Y , C A R B O N A C E O U S ,
S I L T Y C L A Y , T H A T C O N T A IN S
IR O N . T H E C H E R T I S V E R Y H A R D ,
A N D I S ( 1 ) B A N D E D I F P A R A L L E L
T O B E D D IN G , ( 2 ) C O N C E N T R IC A L L Y
B A N D E D I F N O D U L A R , O R ( 3 )
S P E C K L E D I F F O S S IL IF E R O U S . T H E
C H E R T I S G E N E R A L L Y S P E C K L E D
TO W AR D S T O P O F U N I T ; S E C O N D A R Y
C H E R T I S O F T E N M IX E D W IT H F I N E
G R A IN E D L IM E S T O N E .
@ 5 4 ' - L IM E S T O N E I S G E N E R A L L Y F R E S H
A N D U N W E A T H E R E D -C O L O R C H A N G E TO
G R A Y ( N 4 ) .
@ 4 0 * - d r i l l i n g
h a r d ; 4 0 0 p s i d o w n
p r e s s u r e .
@ 4 5 * - c e m e n t e d i n
4 ” P V C c a s i n g ; b e g a n
N X c o r i n g .
m ow ; F - FITCHEW. O • OTMIft D O E P R O P E R T Y - R A F F IN A T E P I T A R E A
B-38
G E O L O G I C D R I L L LOGn
M S MO. •R H T R O . s o n wo
FUSRAP-WELDON SPRING 14501 3 « * 3 B-21
* •*i«
h
j-s
W A T E RP R E S S U R E
T E S T S
ICIVATION WATIR LEVELS, WAVE* RETURN, CHARACTER OF OWILLINO, ETC.
75.6-80.3' 8 5 6 .-5 6 .9 ' CORE BECOMES SHALEY CONTAINS ABUNDANT PYRITE AND SOME GLAUCONITE AND/OR CHLORITE.
4 .7 100
80.3
4.7
-85.0'
100
8s:s
5 .0
85.0
5 .0
90.0'
100
4 .8
90.0
4 .8
9 4 .8 '
100
95
4 .6
94.8499.4*
4.2 91
545.01
8 95' -drilling very soft.
9 99.4' -bailed well recovered 8 .44 gpe.
BOH 8 9 9 .4 ' HOLE COMPLETED AS A ROCK OBSERVATION WELL.
NOTE:ROCK AND SOIL COLORS ARE INDEXED ON THE ROCK-COLOR CHART PUBLISHED BY THE GEOLOGICAL SOCIETY OF AMERICA.
I I • IRLIT SFOOW; ST ■ IMlkRV TUBE;
o - ocnniion; f - aitchcr; o * otmia DOE PROPERTY-RAFFINATE PIT AREAH & C F t 9-2
B-39
G E O L O G I C D R I L L LOG FUSRAP-WELDON SPRING 14501 B-22
D O E P R O P E R T Y - R A F F IN A T E P I T A R E A N 9 9 9 3 1 . 6 5 W 5 1 2 6 6 . 7 1 9 0 V E R T I C A L
1 3 A P R 8 3
COMPLETED ONIILEM
1 3 A P R . 8 3 B O Y L E S B R O T H E R S
Oftfh.L MAKS AND MODEL
S IM C O 4 0 0 0
(ft .) no c k |rr .) TOTAL DEATH
1 5 . 0 1
COKE 10X11
0 4
I L TOO OK CASINO
6 4 9 . 9 6
OKOVMO EL.
6 4 7 . 3 6
OEPTM/EW. OiOUNO WATEN
9 . 3 3 / 6 3 8 . 0 3
( 4 / 1 5 / 8 3 ) U N KN O W N
1 5 0 L B S / 3 0 I N E . M . F A N E L L I
H Z
P R E S S U R ETESTS
:, *oil 1 i
ELEVATIONWATEN LEVELS, WATEN NKTUNN, CM AN A CTEN ON ONILLINO, ETC.
6 4 7 . 3 6
6 4 5 . 3 6
T 0 P S 0 I L : B L A C K , O R G A N IC - R IC H
C L A Y E Y , S I L T Y , L O O S E , V E R Y M O IS T .
1.5* 1.54 - 3 - 3100
6 4 1 . 3 6
1.5 1.53 - 4 - 7
100
SS3 - 5 - 7
100
2 - 3 - 5
80
6 3 2 . 3 6
2 . 0 , - 6 . 0 ' : F I L L - C L A Y E Y S I L T : M O T T L E D G R A Y ( N 7 )
A N D M O D E R A T E Y E L L O W IS H -B R O W N
( 1 0 Y R 5 / 4 ) O R D A R K Y E L L O W IS H -
O R A N G E ( 1 0 Y R 6 / 6 ) , C L A Y E Y S I L T ;
N O N - P L A S T IC T O P L A S T I C , M O D E R A T E L Y
D E N S E W IT H D E P T H A N D C O N T A IN S
A B U N D A N T IR O N - O X ID E N O D U L E S .
SO M E T R A S H - L I D S O F 5 5 G A L .
\ B A R R E L S I N U P P E R S U R F A C E S .
D r i l l e d a n d s a m p le d
w i t h 8 " h o l l o w s t e m
a u g e r a n d s p l i t
s p o o n .
@ 3 * - S o m e w a t e r
s e e p a g e i n t o h o l e
f r o m f i l l .
6 . 0 ' - 1 5 . ' : C L A Y E Y S I L T / S I L T Y C L A Y : D A R K
G R A Y ( N 3 ) O R G A N IC - R IC H ( R O O T S ,
G R A S S N E A R S U R F A C E S ) ; C L A Y E Y ,
S I L T Y , A N O X IC , S O F T T O M O D E R A T E L Y
D E N S E , P L A S T I C T O S L IG H T L Y P L A S T I C ,
V E R Y M O IS T , C O N T A IN S SO M E IR O N
O X ID E N O D U L E S ; O R IG I N A L C O LO R
F A I N T B U T D IS C E R N A B L E A S
M O T T L E D G R A Y ( N 7 ) A N D D A R K
Y E L L O W IS H -B R O W N T O O R A N G E
( 1 0 Y R 6 / 6 T O 1 0 Y R 4 / 2 ) . M A T E R IA L
C O N T A IN S S O M E P E B B L E S O F C H E R T A N D
G R A N IT IC R O C K . G E N E R A L L Y B E C O M IN G
\ M O R E A B U N D A N T W IT H D E P T H A N D
\ P O S S IB L Y R E P R E S E N T IN G O R IG I N A L
\ T I L L @ 1 1 '
@ 1 5 ' - w a t e r i n
h o l e v e r y m u c k y a n d
f o u l s m e l l i n g ; a u g e r
r e f u s a l .
20 -1 5 ‘ H O L E C O M P L E T E D A S A P IE Z O M E T E R
IN S T A L L A T IO N .
R O C K A N D S O I L C O LO R S A R E IN D E X E D ON
T H E R O C K -C O L O R C H A R T P U B L IS H E D B Y
T H E G E O L O G IC A L S O C IE T Y O F A M E R IC A .
DOE PROPERTY-RAFFINATE PIT AREA B-22
B-40
G E O L O G I C D R I L L LOGj o n no.
F U S R A P -W E L D O N S P R IN G 1 4 5 0 1 1 e F 3 B - 2 3
D O E P R O P E R T Y - R A F F IN A T E P I T A R E A
COO«OINATCI
N 9 8 4 7 1 . 5 2 W 5 0 9 3 6 . 4 2 V E R T I C A L
COMPLETED DRIlLBi
1 3 A P R 8 3 1 9 A P R . 8 3 B O Y L E S B R O T H E R S L O N G Y E A R 4 4 3 T O 4 ' 3 8 . 0
|ft,| rock (ft.)
5 2 . 7 90.7eons recovery (ft./%)
3 7 . 9 ' / 9 9 6 6 7 . 0 9
6ROUNO EL.
6 6 5 . 0 9 5 2 / 6 1 3 . 1 ( 4 / 1 9 / 8 3 )
■ RTM/Sk. TOF OF ROCK
38V627.09
1 5 0 L B S / 3 0 I N .
7 T m4V52.5
LOOSED BY
E . M . F A N E L L I
W A T E RP R E S S U R ETESTS
ELEVATION
6 6 5 . 0 $
6 6 4 . 0 9
WATER LEVELS, WATEN RETURN, CHARACTER OF ONlLLINO, ETC.
6 5 9 . 0 9
6 5 5 . 0 9
O . O ' - l . O ' : T 0 P S 0 I L ; B L A C K -B R O W N .
O R G A N I C - R IC H , M O IS T T O W E T ,
C L A Y E Y S I L T .
D r i l l e d w i t h 6 "
r o l l e r b i t a n d
a m d t o 5 2 . 5 * .
1.0'-6.0' C L A Y E Y S I L T : M O T T L E D G R A Y ( N 7 )
A N D M O D E R A T E Y E L L O W IS H -B R O W N
( 1 0 Y R 5 / 4 ) O R D A R K Y E L L O W IS H -
O R A N G E ( 1 0 Y R 6 / 6 ) , C L A Y E Y S I L T ;
N O N - P L A S T IC T O P L A S T I C , M O D E R A T E L Y
D E N S E W IT H D E P T H A N D C O N T A IN S
A B U N D A N T I R O N - O X ID E N O D U L E S .
6.0'-10.0' C L A Y ; M O T T L E D G R A Y ( N 7 )
A N D M O D E R A T E Y E L L O W IS H -B R O W N
( 1 0 Y R 5 / 4 ) O R D A R K Y E L L O W IS H -
O R A N G E ( 1 0 Y R 6 / 6 ) , C L A Y T O
S I L T Y C L A Y . T H E M A T E R IA L
I S P L A S T I C , D E N S E , C O N T A IN S
A B U N D A N T I R O N - O X ID E N O D U L E S ,
A N D H A S S L IC K E N S ID E D S U R F A C E S .
151 0 . 0 ' - 3 8 . O ' : C L A Y T I L L : M O T T L E D G R A Y ( N 7 )
A N D M O D E R A T E Y E L L O W IS H -B R O W N
( 1 0 Y R 5 / 4 ) OR D A R K - Y E L L O W IS H -
O R A N G E 1 0 Y R 6 / 6 ) , S I L T Y , S A N D Y ,
D E N S E C L A Y T H A T C O N T A IN S A
F E W P E B B L E S O F S U B R O U N D E D
C H E R T , Q U A R T Z IT E , A N D G R A N IT IC
M A T E R IA L , W H IC H G E N E R A L L Y
C O A R S E N T O C O B B L E S I Z E S W IT H
D E P T H . T H E M A T E R IA L H A S
M A N G A N E S E -S T A IN E D S U R F A C E S ,
C O N T A IN S IR O N A N D S E C O N D A R Y
F R IA B L E C A L C A R E O U S C O N C R E T IO N S ,
A N D SHOW S B L O C K Y F R A C T U R IN G .
25
3 0 *
•• • WFk.IT ifoon;
• - ■BNNIIOM; F <
H f tC ? 1 M
•t - •MSk.nv tubs;
' F i T C N B n ; e • o T M s nD O E P R O P E R T Y - R A F F IN A T E P I T A R E A B - 2 3
B-41
*j
G E O L O G I C D R I L L LOG FUSRAP-WELDON SPRING 14501 of 3 I b-23
o J u £iss*
W A T E RP R E S S U R E
T E S T S
ELEVATION OE SCWIFTlON ANO CLASSIFICATIONWATEN LEVELS, WATEN NETUNN, CNANACTEN OF ONILLINO, ETC.
. 2 . 5 7
5 . 0
4 . 9 4 . 9
3 5 -
6 2 8 . 5 9
3 6 . 5 * - 3 8 ’ : B A S A L C H E R T T I L L : BROW N T O B L A C K
C O B B L E T O B O U L D E R - S IZ E D , A N G U L A R
T O S U B A N G U L A R C H E R T C L A S T S I N A
L O O S E , S A N D Y , S I L T Y , C L A Y E Y M A T R IX ,
T H E C H E R T C O M M O NLY H A S W H IT E R IN D S .
45-
5 5 *
9 8
5 7 . 6 - - 6 2 . 5 '
6 0
100
6 2 . 5 - 6 7 . 7
5 . 2 5 . 0
4 . 0
6 7 . 7 - 7 1 , . 7
4 . 0
9 6
1 .6
7 1 . 7 - 1 7 6 . 3 '
4 . 6 1 0 0
3 8 ' - 9 0 . 7 ' : L IM E S T O N E : F O R M A T IO N N A M E :
B U R L IN G T O N /K E O K U K ; A G E ;
M I S S I S S I P P I A N ; A L I G H T
G R A Y ( N 7 ) T O V E R Y L I G H T
G R A Y ( N 8 ) , F I N E - T O C O A R S E
G R A IN E D , F O S S IL IF E R O U S
L IM E S T O N E IN T E R B E D D E D W IT H
L E N S E S A N D N O D U L E S O F
S P E C K L E D , B A N D E D , A N D M O T T L E D
L I G H T B L U IS H - G R A Y ( 5 B 7 / 1 )
A N D B L U IS H - W H IT E ( 5 B 9 / 1 ) ,
F O S S IL IF E R O U S C H E R T . T H E
F O R M A T IO N I S IR O N - O X ID E
S T A IN E D , M O D E R A T E Y E L L O W IS H -
O R A N G E ( 1 0 Y R 6 / 6 ) W HE RE
W E A T H E R E D , A N D B E C O M E S L E S S
W E A T H E R E D W IT H D E P T H . I T I S
M A N G A N E S E D S T A IN E D A N D
G E N E R A L L Y H A R D A N D M A S S IV E ,
B U T SHOW S S M A L L - S C A L E
G R A D E D B E D D IN G L O C A L L Y .
T H E F O S S IL S A R E P R E D O M IN A N T L Y
C R IN O ID S , B R Y 0 Z 0 A A N D
B R A C H IO P O D S , W H IC H A R E L O C A L L Y
R E P L A C E D B Y P Y R I T E . A FEW
C A L C I T E A N D Q U A R T Z C R Y S T A L S
A R E A S S O C IA T E D W IT H V O ID S ,
E S P E C IA L L Y A T L I M E S T O N E -
C H E R T C O N T A C T S . T H E F O R M A T IO N
C O N T A IN S A B U N D A N T S T Y L O L IT E S
(P R E S S U R E S O L U T IO N F E A T U R E S ) ,
W H IC H A R E S E C O N D A R Y F E A T U R E S
T H A T A R E P E R P E N D IC U L A R T O
B E D D IN G A im IN T E R S E C T F O S S IL S .
S T Y L O L IT E S U T U R E S A R E
A S S O C IA T E D W IT H A T H I N ( 1 / 4 " )
B L A C K I S H - G R A Y , C A R B O N A C E O U S ,
S I L T Y C L A Y , T H A T C O N T A IN S
I R O N . T H E C H E R T I S V E R Y H A R D ,
A N D I S ( 1 ) B A N D E D I F P A R A L L E L
T O B E D D IN G ( 2 ) C O N C E N T R IC A L L Y
B A N D E D I F N O D U L A R , O R ( 3 )
S P E C K L E D I F F O S S IL IF E R O U S . T H E
C H E R T I S G E N E R A L L Y S P E C K L E D
TO W AR D S T O P O F U N I T ; S E C O N D A R Y
C H E R T I S O F T E N M IX E D W IT H F I N E
G R A IN E D L IM E S T O N E .
@ 3 6 .5 * - d r i l l i n g
@ 3 8 * - d r i l l i n g
h a r d e r a n d s t e a d y ;
5 0 0 p s i d o w n p r e s s u r e ;
f i r s t l i m e v r e t u r n .
@ 5 2 . 2 * - c e m e n t e d
i n 4 " P V C , b e g a n
N X c o r i n g .
- 7 5 -
DOE '' 0?ERTY - RAFF INATE PIT AREA B-23H f tC F 1 t - 2
B-42
G E O L O G I C D R I L L LOGJON NO.
F U S R A P -W E L D O N S P R IN G L 4 5 0 1 3 o p 3 B - 2 3
v e i * ► ► ► vE X M <i 5 x o< i * <
»0J -Z
X
5 ;85M °!*
W A T E RP R E S S U R E
T E £ T SELEVATION
NOTES ONI WATEN LEVELS, WATEN NETUNN, GHANA CTE N ON ONILLINO, ETC.
4 . 8
7 6 . 3
4 . 8
8 1 . 1 *
1008 0 -
4 . 9
8 1 . 1
4 . 9 100’
8 5 *
4 . 7 4 . 7 100
5 7 4 . 3 99 0 '
7 5
L IM E S T O N E I S W E A T H E R E D D A R K
Y E L L O W IS H -B R O W N ( 1 0 Y R 5 / 4 ) T O
7 5 . 5 ' .
S M A L L S H A L E Y L E N S E S C O N T A IN IN G
S O M E G L A U C O N IT E A N D /O R
C H L O R IT E .
@ 7 7 1 - w h i t e r e t u r n .
@ 9 0 . 7 * - b a l l e d
h o l e t o 7 0 ' r e c o v e r e d
t o 5 2 * @ . 1 6 g p m .
9 0 . 7 * - H O L E C O M P L E T E D A S A R O C K
O B S E R V A T IO N W E L L .
9 5 -N O T E :
R O C K A N D S O I L C O L O R S A R E IN D E X E D
O N T H E R O C K -C O L O R C H A R T P U B L IS H E D
B Y T H E G E O L O G IC A L S O C IE T Y O F
A M E R IC A .
• S - SPLIT SPOON; ST - SHCLNV
O • O INN IIO N ; p - p itc h e n ; o
M fc C F t 9 *2
D O E P R O P E R T Y - R A F F IN A T E P I T A R E A B - 2 3
B-43
G E O L O G I C D R I L L LOG FUSRAPWELDON SPRING 14501
D O E P R O P E R T Y - R A F F IN A T E P I T A R E A
1 4 A P R . 8 3
COM»LITtO
1 4 A P R . 8 3
COONDINATK
N 9 9 9 6 9 . 0 5 W 5 1 6 3 5 . 2 0
B O Y L E S B R O T H E R S
OKILL MAKS AMO MODEL
S IM C O 4 0 0 0
9 0
" ( F T . )
2 3 . 5 0 2 3 . 5 '
r./%> cone i o m i i
0 6 5 2 . 1 8
OHOUNO EL
6 4 9 . 2 2
2 2 . 3 5 / 6 2 6 . 9
( 4 / 1 5 / 8 3 )
1 5 0 L B S / 3 0 I N . 2 V 2 3 / 5
lo o o e o m r
E . M . F A N E L L I
► "► « E 1 H <a o
W A T E RP R E S S U R E
t e s t s
a *
ELEVATIONWATEN LEVELS. WATEN NSTUNN. CMANACTCN ON ONILLIMO, ETC.
W9.226 4 8 . 2 2 T O P S O I L : B L A C K IS H -B R O W N ,
O R G A N I C - R IC H , M O IS T T O V E T ,
C L A Y E Y S I L T .
4 - 5 - 7
7 5
1.5*5 - 6 - 60
1 . 0 - 7 . O ’ : C L A Y E Y S I L T : M O T T L E D G R A Y ( N 7 )
A N D M O D E R A T E Y E L L O W IS H -B R O W N
( 1 0 Y R 5 / 4 ) O R D A R K Y E L L O W IS H -
O R A N G E ( 1 0 Y R 6 / 6 ) , C L A Y E Y S I L T ;
N O N - P L A S T IC T O P L A S T I C , M O D E R A T E L Y
D E N S E W IT H D E P T H A N D C O N T A IN S
A B U N D A N T IR O N - O X ID E N O D U L E S .
D r i l l e d a n d s a m p le d
w i t h 8 " h o l l o w s t e m
a u g e r a n d s p l i t s p o o n
@ 2 . 5 ’ - 5 * - l o s t s a m p le
d u e t o m o i s t u r e , w a t e r
c o m i n g f r o m u p p e r 2
t o 3 f e e t o f h o l e .
6 4 2 . 2 2
LJ lL4 - 6 - 6 an.
3 - 4 - 7
1006 3 8 . 2 2
1.5'
1.5*
1.3'4 - 7 - 1 0
8 7
7 . 0 ' - 1 1 . 0 ’ : C L A Y : M O T T L E D G R A Y ( N 7 )
A N D M O D E R A T E Y E L L O W IS H -B R O W N
( 1 0 Y R 5 / 4 ) O R D A R K Y E L L O W IS H
O R A N G E ( 1 0 Y R 6 / 6 ) , C L A Y T O
S I L T Y C L A Y . T H E M A T E R IA L
I I S P L A S T I C , D E N S E , C O N T A IN S
A B U N D A N T IR O N - O X ID E N O D U L E S ,
\ A N D H A S S L IC K E N S ID E D S U R F A C E S .
1 1 . 0 ' - 2 3 . 5 1 :
1.5'4 - 7 - 1 1
100
4 - 1 8 - 5 0
100.
6 2 5 . 7 2
@ 2 0 . 5 *
C L A Y T I L L : M O T T L E D G R A Y ( N 7 )
A N D M O D E R A T E Y E L L O W IS H -B R O W N
( 1 0 Y R 5 / 4 ) O R D A R K - Y E L L O W IS H -
O R A N G E ( 1 0 Y R 6 / 6 ) , S I L T Y , S A N D Y ,
D E N S E C L A Y T H A T C O N T A IN S A
FEW P E B B L E S O F S U B R O U N D E D
C H E R T , Q U A R T Z IT E , A N D G R A N IT IC
M A T E R IA L , W H IC H G E N E R A L L Y
C O A R S E N T O C O B B L E S I Z E S W IT H
D E P T H . T H E M A T E R IA L H AS
M A N G A N E S E -S T A IN E D S U R F A C E S ,
C O N T A IN S IR O N A N D S E C O N D A R Y
F R IA B L E C A L C A R E O U S C O N C R E T IO N S ,
A N D SHOW S B L O C K Y F E A T U R IN G .
B A S A L C H E R T T I L L : BROW N T O B L A C K
C O B B L E - T O B O U L D E R - S IZ E D , A N G U L A R
T O S U B A N G U L A R C H E R T C L A S T S I N A
L O S S E , S A N D Y , S I L T Y , C L A Y E Y
M A T R IX . T H E C H E R T C O M M O NLY H A S
W H IT E W E A T H E R IN G R IN D S .
9 2 1 . 5 ' -
r e f u s a l .
s a m p le
9 2 3 . 5 * - a u g e r
r e f u s a l .
B O H - 9 2 3 . 5 ' H O L E C O M P L E T E D A S AN
O B S E R V A T IO N W E L L .
R O C K A N D S O I L C O LO R S A R E IN D E X E D
O N T H E R O C K -C O L O R C H A R T P U B L IS H E D
BY T H E G E O L O G IC A L S O C IE T Y O F
A M E R IC A .
DOE PROPERTY-RAFFINATE PIT AREA B-24
M ftC F 1 9-1
B-44

APPENDIX C OBSERVATION WELL AND PIEZOMETER LOGS
PIEZOMETER INSTALLATIONS
OBSERVATION WELLPROJECT
FUSRAP - Weldon Spring WELL NO.B-l(566)
JO I NO.
14501 DOE PROPERTYCOORDINATES
99507.31 N 52283.25 W■EGUN
2/16/8:COMPLETED
32/16/83PREPARED BY
E.M. FANELLIREFERENCE POINT FOR MEASUREMENTS
Elevation of the Piezometer
g e n e ra l iz e d g e o lo g ic lo g ---------m m m m ~
0-1.5': TOPSOIL - Blackish brown, organic-rich soil.
1.5-9.O': Silty clay - Mettled gray/orange plastic, dense clay.
9.0-21.5(B0H) Glacial Till -Clay till - Clay containing sand to gravel size clasts of quartzite, granites and chert, generally coarsens with depth.
ELEV.-TOP OF SURFACE CASING:.641.43
ELEV.-TOP OF RISER CASING:
- GROUND SURFACE
SURFACE CASING
DIA: 6"t y p e : Steel pipe
BOTTOM OF SURFACE CASING
BACKFILL MATERIAL
t y p e : Bentonite/cement grout
RISER CASING
DIA:
t y p e : armored, grease filled cable
TOP OF SEAL
TYPE:
ANNULAR SEAL
1.4' bentonite gravel .5' bentonite powder
TYPE:
TOP OF FILTER PACK
FILTER PACK
clean silica sand fine grained
f -
TOP OF SCREEN
SCREEN:
DIA: 3/4" t y p e : PWS vibratingwire piezomete
agJMMgfcxttBHMcx i b k
• HOLE DIA: .
BOTTOM OF SCREEN
BOTTOM OF SUMP
BOTTOM OF HOLE
8"
DEPTH ELEV.
638.89
2.4 636.49
16.3
17.5
622.59
620.69
18.0 620.89
18.5_
19.5"2175™
620.39619.39 618789
C-l
OBSERVATION WELLPROJECT
FUSRAP - Weldon Springs WELL NOB-2
JOB NO
14501 SITE DOE PROPERTYRAFFINATE PIT AREA
COORDINATES
BEGUN
2/18/82COMPLETED
2/18/83PREPARED BY
E.M. FANELLIREFERENCE POINT FOR MEASUREMENTSTop of Surface Casing
633.58
g e n e r a l iz e d g e o lo g ic log m n s m m
FILL - Coarse0'-4'gravel fill.
4'-8': Clayey Silt - Probably old soil surface - stiff, silty, sandy, clayey soil with some larger clasts of chert and quartzites.
8'-23*: Clayey Silt Clay - Mottled gray and orange-brown, slighty plastic,clayey silt, contains some fine sand and iron oxide nodules.
23'-29.6'(BOH): Glacial Till -23'-26.5* - Clay till containing sand and pebble size quartzite, granitic and chert clasts.
ELEV.-TOP O f SURFACE CASING:
ELEV.-TOP OF RISER CASING:633.08
-GROUND SURFACE
26.5'-29.6' - Basal Cherty till - large gravel-sized chert clasts in fine grained£% silty, sandy, clay matrix.
SURFACE CASING
DIA: 6 "
t y p e : Steel pipe with vented pipe
•OTTOM OF SURFACE CASING
BACKFILL MATERIAL
t y p e : Cement/bentonite grout
TOP OF SEALANNULAR SEAL
t y p e : Bentonite pelletsTOP OF FILTER PACK
FILTER PACK
t y p e : road gravel
DIA: 2"
TOP OF SCREEN
SCREEN:
TYPE: PVC
OPENINGS: w id t h : approximately .04" type: cut with hacksaw
.HOLE DIA: .
BOTTOM OF SCREEN
BOTTOM OF SUMP
BOTTOM OF HOLE
8"
DIA: 2"RISER CASING
TYPE: PVC
Vr
DEPTH
2.21*
17.8*
18.8'
22.8
25.8
26.82i76™
ELEV.
631.04
628.83
613.24
612.24
607.24
605.24
604.24 601744
C-2
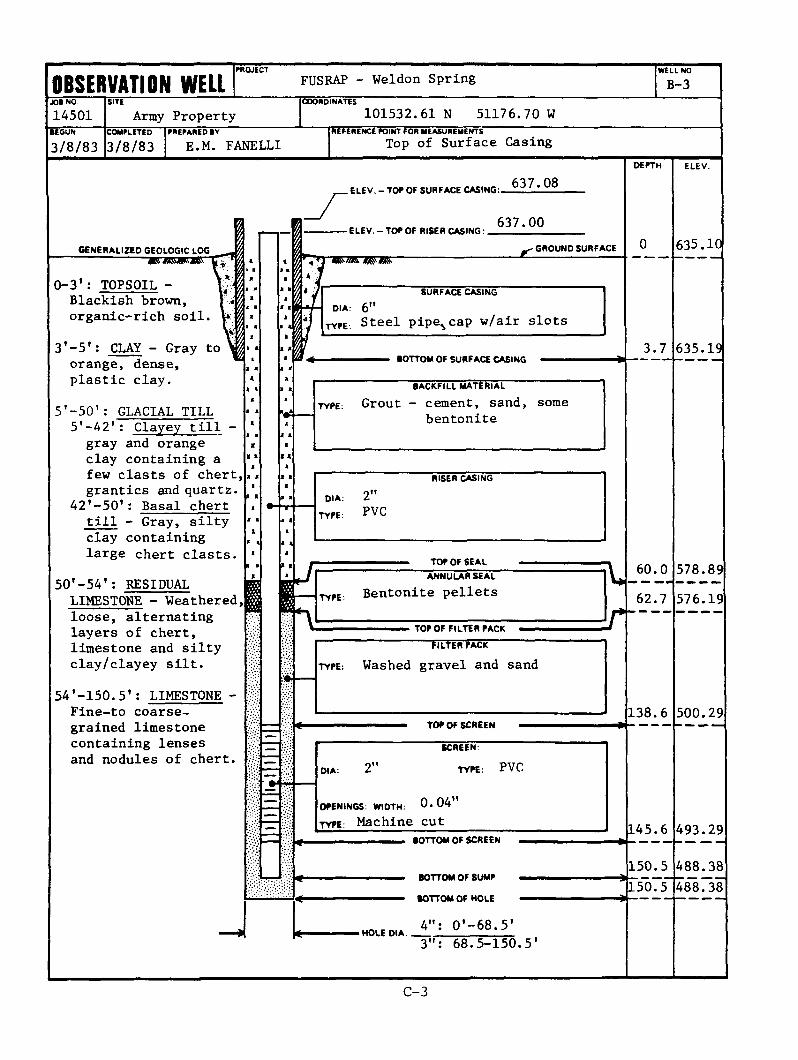
OBSERVATION WELLPROJECT FUSRAP - Weldon Spring w ell no
B-3JOB NO.
14501SITE
Army PropertyCOORDINATES
101532.61 N 51176.70 WBEGUN
3/8/83COMPLETED
3/8/83PREPARED BY
E.M. FANELLIREFERENCE POINT FOR MEASUREMENTSTop of Surface Casing
. ELEV. - TOP OF SURFACE CASING:. 637.08
g e n e r a l iz e d g e o lo g ic LOGmmmMXSy'
0-3': T0PS0IL - Blackish brown, organic-rich soil.
3'-5': CLAY - Gray to orange, dense, plastic clay.
5'-50’: GLACIAL TILL 5*-42*: Clayey till - gray and orange clay containing a few clasts of chert, grantics and quartz
42'-50': Basal chert till - Gray, silty clay containing large chert clasts.
50'-54': RESIDUALLIMESTONE - Weathered, loose, alternating layers of chert, limestone and silty clay/clayey silt.
54'-150.5': LIMESTONE - Fine-to coarsegrained limestone containing lenses and nodules of chert.
-E LE V .-TO P OF RISER CASING:637.00
- GROUND SURFACE
SURFACE CASING
DIA: 6 "TYPE. Steel pipe^cap w/air slots
BOTTOM OF SURFACE CASING
BACKFILL MATERIAL
TypE: Grout - cement, sand, somebentonite
TOP OF SCREEN
DIA: 2"
SCREEN:
TYPE: PVC
OPENINGS: WIDTH: 0.04"t y p e : Machine cut
. HOLE DIA.
BOTTOM OF SCREEN —
BOTTOM OF SUMP — —
BOTTOM OF HOLE —
4": O'-68.5'3": 68.5-150.5'
DIA:
TYPE:
RISER CASING
2"PVC
TYPE:
ANNULAR SEAL
Bentonite pellets
TYPE:
FILTER PACK
Washed gravel and sand
i \ *
r
DEPTH
3.7
60.062.7
138.6
145.6
150.515075"
ELEV.
635.10
635.19
578.89576.19
500.29
493.29
488.38488738
C-3
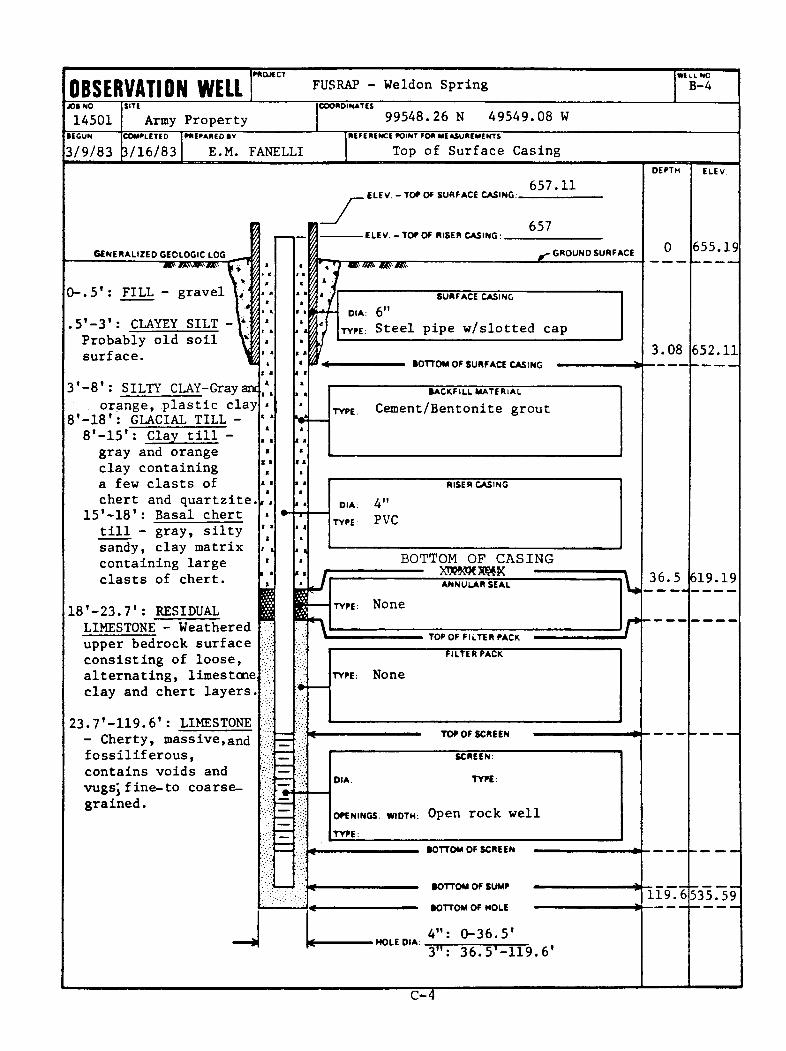
OBSERVATION WELLPftOJtCT FUSRAP - Weldon Spring W i l l NOB-4
JOB NO
14501 Army PropertyCOORDINATES 99548.26 N 49549.08 W
BEGUN
3/9/83COMPLETED
3/16/83PREPARED BV
E.M. FANELLIREFERENCE POINT FOR MEASUREMENTS
Top of Surface Casing
IGENERALIZED geolog ic lo g i
~m m m m "Cl*. *■ %0-. 5* : FILL - gravel vs.
.5*-3*: CLAYEY SILT Probably old soil surface.
3'-8' : SILTY CLAY-Gray anc . orange, plastic clay
8'-18*: GLACIAL TILL - 8*-15*: Clay till - gray and orange clay containing a few clasts of chert and quartzite
15'-18': Basal chert till - gray, silty sandy, clay matrix containing large clasts of chert.
18'-23.7': RESIDUAL LIMESTONE - Weathered upper bedrock surface consisting of loose, alternating, limestone clay and chert layers.
23.7*-119.6': LIMESTONE - Cherty, massive,and fossiliferous, contains voids and vugsjfine-to coarsegrained.
I I%
ELEV.-TO* OF SURFACE CASING:
ELEV. - TOF OF RISER CASING :.
657.11
657-GROUND SURFACE
SURFACE CASING
DIA: 6 "type: Steel pipe w/slotted cap
BOTTOM OF SURFACE CASING
BACKFILL MATERIAL
type: Cement/Bentonite grout
TOP OF SCREEN
J .HOLE DIA:
BOTTOM OF SUMP
BOTTOM OF HOLE — —
4”: 0-36.5*3": 36.5'-119. 6'
RISER CASING
DIA: 4"TYPE PVC
BOTTOM OF CASINGANNULAR SEAL
TYPE: None
FILTER PACK
TYPE: None
r
OPENINGS: w id th : Open rock well
BOTTOM OF SCREEN
DEPTH
3.08
36.5
119.6
ELEV.
655.19
652.11
619.19
535.59
C=7
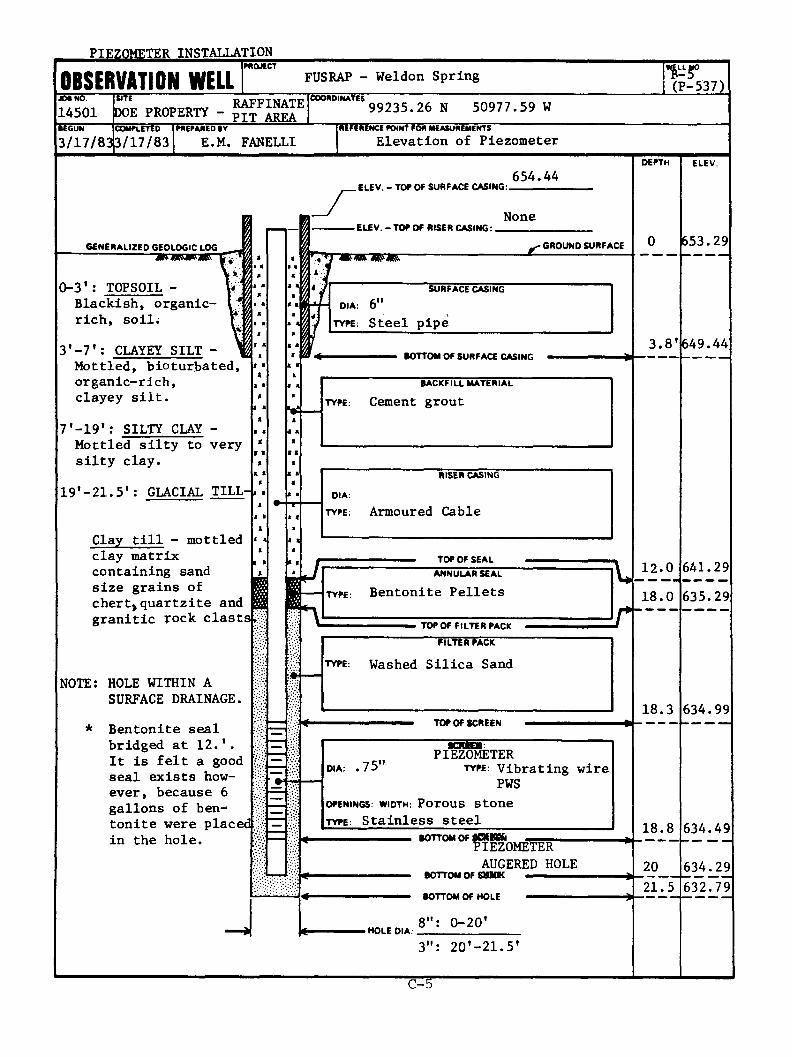
PTK70METER INSTALLATION
OBSERVATION WELLPROJECT FUSRAP - Weldon Spring I CP-537)1
I NO
14501SITE^ RAFFINATEDOE PROPERTY PIT AREA
COORDINATES 99235.26 N 50977.59 WBEGUN
3/17/83(3COMPLETED
/17/83PREPARED BY
E.M. FANELLIREFERENCE POINT FOR MEASUREMENTS
Elevation of Piezometer
g e n e r a l iz e d g e o lo g ic log5EOLOGIC LOG ___%m m m m fpy
0-3': TOPSOIL - y yBlackish, organic- y* rich, soil.
3 * —7 *: CLAYEY SILT - Mottled, bioturbated, organic-rich, clayey silt.
7'-19': SILTY CLAY - Mottled silty to very silty clay.
19'-21.5': GLACIAL TILL-
Clay till - mottled clay matrix containing sand size grains of chertjquartzite and granitic rock clastsL
NOTE: HOLE WITHIN ASURFACE DRAINAGE.
* Bentonite seal bridged at 12.'.It is felt a good seal exists however, because 6 gallons of bentonite were placed in the hole.
ELEV. - TOP O f SURFACE CASING:.654.44
ELEV. - TOP OF RISER CASING:None
-GROUND SURFACE
SURFACE CASING
DIA: 6 "
t y p e : Steel pipe
BOTTOM OF SURFACE CASING
BACKFILL MATERIAL
t y p e : Cement grout
RISER CASING
DIA:
t y p e : Armoured Cable
TOP OF SEAL ANNULAR SEAL
t y p e : Bentonite Pellets
TOP OF FILTER PACK
FILTER PACK
t y p e : Washed Silica Sand
f ~
TOP OF SCREEN
DIA: .75" PIEZOMETERt y p e : Vibrating wire
PWSOPENINGS: WIDTH: PorOUS Stonet y p e . Stainless steel
BOTTOM OF SCKVSfcPIEZOMETER AUGERED HOLE
BOTTOM OF S W K . —
> HOLE DIA:
BOTTOM OF HOLE
8": 0- 20'3": 20'-21.5'
depth ELEV.
653.29
3.8' 649.44
12.018.0
641.29635.29
18.3 634.99
18.8
2 0 ____"21.5
634.49
634^29632.79
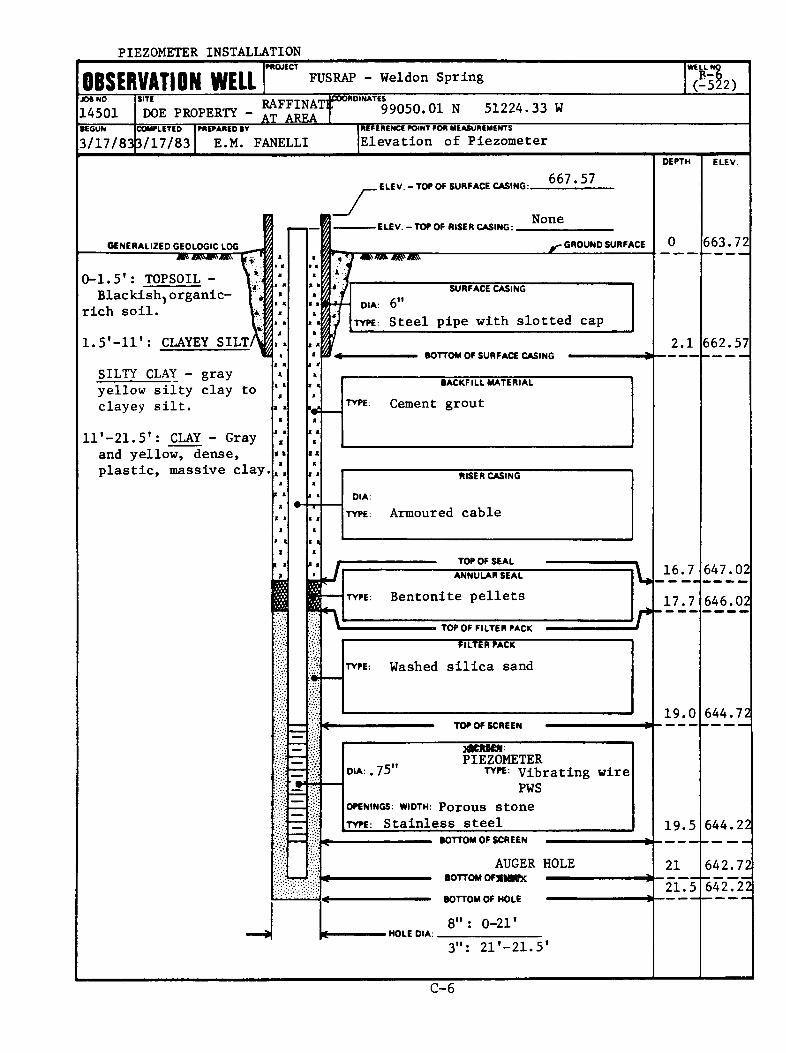
PIEZOMETER INSTALLATION
OBSERVATION WELLPROJECT FUSRAP - Weldon Spring WELL NO
& 1 )JOB NO I SITE T A T - T T M A T I COORDINATES
14501 I DOE PROPERTY - AT AREA ‘ 99050.01 N 51224.33 W8EGUN I COMPLETED
3/17/83(3/17/83PREPARED BV
E.M. FANELLIREFERENCE POINT FOR MEASUREMENTS
Elevation of Piezometer
GENERALIZED GEOLOGIC LOG __J0mmmm\ j0-1.5’: T0PS0IL - \'|
B l a c k i s h ^ o r g a n i c - r i c h s o i l . urn
V/
l.S'-ll': CLAYEY SILT/SILTY CLAY - gray yellow silty clay to clayey silt.
ll'-21.5': CLAY - Gray and yellow, dense, plastic, massive clay.
I i
I I «*
a• t i i aa
j
i \ m m m m
ELEV.-TOP O f SURFACE CASING:667.57
ELEV. - TOP OF RISER CASING: .N o n e
-GROUND SURFACE
SURFACE CASING
DIA: 6 "
type: S t e e l p i p e w i t h s l o t t e d c a p
BOTTOM OF SURFACE CASING
BACKFILL MATERIAL
t y p e : Cement grout
RISER CASING
DIA:
type: Armoured cable
TOP OF SEAL
ANNULAR SEAL
ty p e : B e n t o n i t e p e l l e t s
TOP OF FILTER PACK
FILTER PACK
t y p e : Washed silica sand
r
TOP OF SCREEN
D IA :. 75"tACMCMPIEZOMETER
TYPE: V i b r a t i n g w i r e PWS
OPENINGS: WIDTH: P o r O U S S t o n e
t y p e : Stainless steelBOTTOM OF SCREEN
AUGER HOLEBOTTOM 0 F *|W 6 c —
• HOLE DIA: .
BOTTOM OF HOLE -
8" : 0-21’3": 21’-21.5'
DEPTH
2.1
16.717.7
19.0
19.5
21’2lT5
ELEV.
663.72
662.57
647.02646.02
644.72
644.22
642.72642721
C-6
OBSERVATION WELLPROJECT FUSRAP - Weldon Spring WELL NO
B-24JO® NO. [SITE TtAWTNATF « » "O IN A T tS
14501 (DOE PROPERTY - p n AREA 99969.05 N 51635.20 WBEGUN [COMPLETED
4/14/83J4/14/83PREPARED ®V
E.M. FANELLIREFERENCE POINT FOR MEASUREMENTS
Top of Surface Casing
genera lized geo log ic LOG i---------m m m m CPiI * i
0-1’: T0PS01L -Blackish, organic- l-M rich topsoil.
l'-7': CLAYEY SILT - Gray and orangish- yellow, clayey silt.
7'-ll': CLAY - gray and orangish, dense, plastic clay.
ll'-23.5'(BOH): 6LAC1AL TILLll'-20.5': Clay Till gray and orangish clay containing clast of chert, granitic rock and quartz.20.5’-23.5': Basal Chert Till - grayish, loose, silty, sandy clay matrix containing large clasts of chert.
ELEV. - TOP OF SURFACE CASING:.652.18
ELEV. - TOP OF RISER CASING:.652.14
-GROUND SURFACE
SURFACE CASINGDIA: 6 "
ty p e - . Steel pipe with slotted cap
BOTTOM OF SURFACE CASING
BACKFILL MATERIAL
type: C e m e n t / B e n t o n i t e g r o u t
DIA: 2"RISER CASING
TYPE: PVC
TOP OF SEAL ANNULAR SEAL
type: B e n t o n i t e p e l l e t s
TOP OF FILTER PACKFILTER PACK
type: Sand and gravel
TOP OF SCREEN
SCREEN:
TYPE: PVC
OPENINGS: WIDTH: . 04" type: Machine cut
BOTTOM OF SCREEN
BOTTOM OF SUMP
BOTTOM OF HOLE
8"HOLE DIA: .
r ~
DEPTH
2.0 647.22
18.020.0
20.5
23.0
23 ._5_ 23.5
ELEV.
649.22
631.22629.22
628.72
627.22
626.Jt 626.72
C-7
OBSERVATION WELL FUSRAP - Weldon Spring WELL NO
B-23JOB NO.
14501 SITt RAFFINATEDOE PROPERTY— PIT AREACOORDINATES
98471.52 N 50936.42 WBEGUN
4/13/8c o m ple te d
314/19/83PREPARED BY
E.M. FANELLIREFERENCE POINT FOR MEASUREMENTS
Top of Surface Casing
GENERALIZED GEOLOGIC LOG"mmvmm c*7 i
0-1': TOPSOIL -Blackish, organic- cn rich topsoil.
l'-6': CLAYEY SILT - Gray and yellowish, slighty plastic, clayejy silt.
6'-10': CLAY - Gray and yellowish, plastic, dense clay.
10'-38': GLACIAL TILL10-36.5*: CLAY TILL - gray and orange, plastic, dense clay with a few, small chert and granitic rock clasts.36.5'-38': Basal ChertTill - grayish, loose, silty, sandy clay matrix containing large chert clasts.
38*-90.7*(BOH):LIMESTONE - Gray, fossiliferous limestone.
ELEV. - TOE OF SURFACE CASING:667.09
ELEV.-TOP OF RISER CASING: 667.01jC.GROUND SURFACE
SURFACE CASINGDIA: 6 "
type: Steel pipe with slotted c a p
BOTTOM OF SURFACE CASING
BACKFILL MATERIAL
TYPE: Cement/Bentonite grout
DIA: 4"RISER CASING
TYPE: PVC
BOTTOM OF CASING ■ 3iR£9h«McL ---
TOP OF FILTER PACK
FILTER PACK
type: Open rock well
TOP OF SCREEN
. HOLE DIA:
BOTTOM OF SUMP —
BOTTOM OF HOLE —
4”: 0-52.5*3": 52.5-90.7*
ANNULAR SEAL
TYPE: None r
TYPE:
o p e n in g s , w id t h . Open rock well
BOTTOM OF SCREEN
DEPTH
3.03
90.7
ELEV.
665.09
662.06
52.5 3.2.59
574 .39
C-8
PIEZOMETER INSTALLATION
OBSERVATION WELLPftOJCCT FUSRAP - Weldon Spring mV-?2(P-572)
XX NO.
14501SITE RAFFINATE]DOE PROPERTY — pjj AREA
COORDINATES
99931.65 N 51266.71 WREFERENCE POINT FOX MEASUREMENTS
Elevation of Piezometer•EGUN
4/13/8:COMPLETED
4/13/83RRERAREO SV
E.M. FANELLI
. ELEV. - TOP O f SURFACE CASING:.649.96
g e n e r a l iz e d g e o lo g ic log ---------m M K m m '
0-2*: TOPSOIL -Blackish, organic- y/Ji , rich, topsoil.
2'-6* : FILL/SILTY CLAY -| Gray, wet, loose, decomposing organic soil with trash throughout.
6'-15*(BOH): CLAYEY SILT/SILTY CLAY - Gray, soft, decomposing, material, probably old fill material.
ELEV.-TOPOF RISER CASING:None
- GROUND SURFACE
SURFACE CASING
DIA: 6 "
t y p e : Steel pipe with slotted cap
BOTTOM OF SURFACE CASING
BACKFILL MATERIAL
t y p e : Cement/bentonite grout
RISER CASING
DIA:
t y p e : Armoured cable
to p of s e a l
ANNULAR SEAL
t y p e : Bentonite sealTOP OF FILTER PACK r -
FILTER PACK
t y p e : Washed sand95%< 4 sieve 5% <100 sieve
TOP OF SCREEN
d ia : .75" t y p e : Vibrating wirePWS
OPENINGS: WIDTH: PorOUS StOne t y p e : Stainless steel
• HOLE DIA: .
BOTTOM OF SCREEN
BOTTOM OF SUMP
BOTTOM OF HOLE
8"
DEPTH ELEV.
647.36
2.4 644.96
10.012.0
637.36635.36
12.5' 634.86
13'
15'
634.36
632.36
C-9
OBSERVATION WELLPROJECT FUSRAP - Weldon Spring WELL NO
B-21JOS NO.
14501 srTi RAFFINATq "0INATtsDOE PROPERTY PXT AREA 9 8 8 3 2 . 5 2 N 5 2 1 2 3 . 2 3 W
REFERENCE POINT SON MEASUREMENTS
T o p o f S u r f a c e C a s in gCOMPLETEO
4 / 1 2 / 8 3 1 4 / 1 8 / 8 3
PREPARED SV
E.M. FANELLI
genera lized geo log ic lo g &
0 - 1 * : T O P S O IL -B l a c k i s h , o r g a n i c - E ^
r i c h s o i l . F I
l ' - 5 * : CLAYEY S IL T - G ra y a n d y e l l o w i s h - o r a n g e , s l i g h t l y p l a s t i c , c l a y e y s i l t .
5 * - 1 0 * : CLAY - G r a y a n d o r a n g i s h , p l a s t i c ,
d e n s e c l a y .
1 0 ' - 2 3 ' : G L A C IA L T IL L -
1 0 ' - 2 1 ' : C la y T i l l - g r a y a n d o r a n g e c l a y w i t h a f e w s m a l l c h e r t , q u a r t z a n d g r a n i t i c r o c k c l a s t s .
2 1 * - 2 3 * : B a s a l C h e r t T i l l - g r a y i s h , l o o s e ^ s i l t y , s a n d y m a t r i x c o n t a i n i n g l a r g e c h e r t c l a s t s .
2 6 * - 2 9 . 5 ' : CHERTY CLAY -
L a r g e c h e r t c l a s t s i n a m u l t i h u e d , b ro w n a n d y e l l o w c l a y m a t r i x .
2 9 . 5 ’ - 3 5 ' : R E S ID U A L L IM E S T O N E - W e a th e r e d b r o k e n l im e s t o n e b o u ld e r s a n d c h e r t c l a s t s i n s i l t y c l a y m a t r i x .
3 5 * - 9 9 . 4 ( B O H ) :L IM E S T O N E - G r a y , — * f o s s i l i f e r o u s , l i m e s t o n e .
m m m m
ELEV. - TOP OF SURFACE CASING:. 6 4 6 . 5 7
ELEV.-TOPOF RISER CASING:. 6 4 6 . 5 2
-GROUND SURFACE
SURFACE CASING
DIA: 6 "type: S t e e l p i p e w i t h s l o t t e d c a p
BOTTOM OF SURFACE CASING
BACKFILL MATERIAL
type: Cement/bentonite grout
DIA: 4 "
RISER CASING
TYPE: PVC
BOTTOM OF C A SIN G — T B M K K X K —
TOP OF FILTER PACK
TOP OF SCREEN
> HOLE DIA:
BOTTOM OF SCREEN
BOTTOM OF SUMP
BOTTOM OF HOLE
4 " : 0 - 4 5 *
3 " : 4 5 - 9 9 . 4 *
ANNULAR SEAL
TYPE: N o n e rFILTER PACK
TYPE: N o n e
SCREEN:
DIA: TYPE:
OPENINGS: WIDTH: O p en r o c k w e l l
TYPE:
oepth
2 . 8 4
4 5 *
9 9 . 4
ELEV.
6 4 4 .4 1
6 4 1 .5 7
5 9 9 .4 1
545.01
C-10
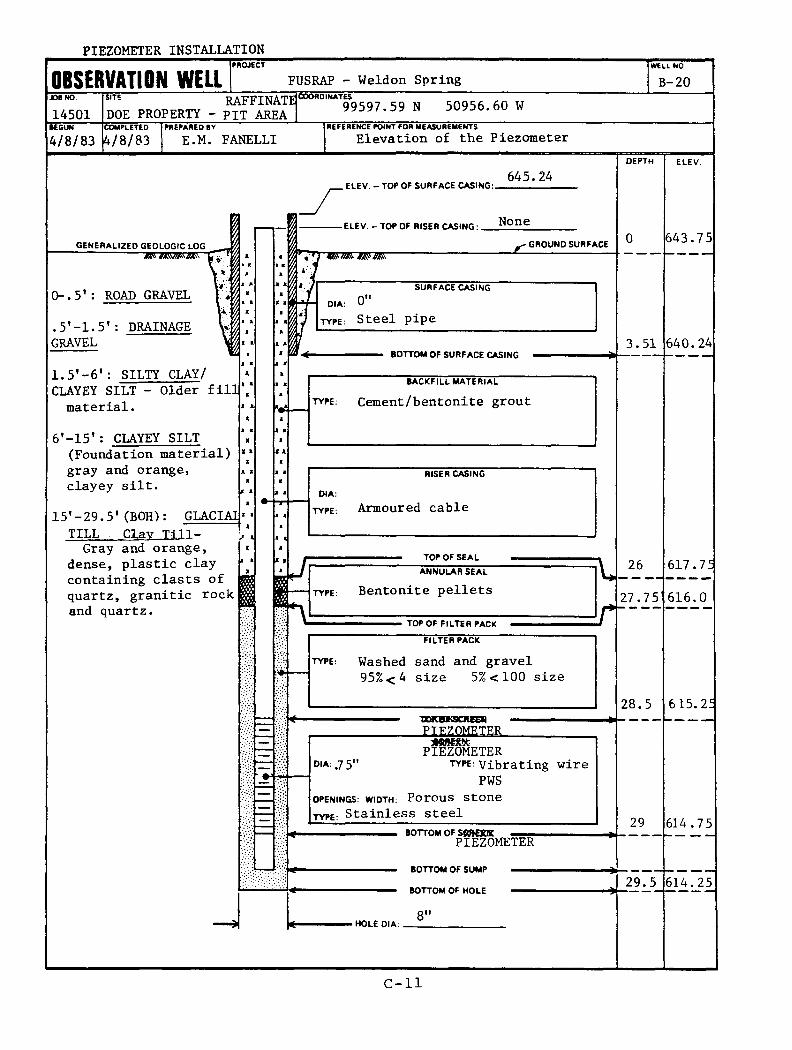
PIEZOMETER INSTALLATION
OBSERVATION WELL FUSRAP - Weldon SpringWELL NO
B-20JOB NO
14501SITE RAFFINATEDOE PROPERTY - PIT AREA
COORDINATES99597.59 N 50956.60 WBEGUN
4/8/83COMPLETED
4/8/83PREPARED BY
E.M. FANELLIREFERENCE POINT FOR MEASUREMENTSElevation of the Piezometer
GENERALIZED GEOLOGIC LOG Vim w i n fj
0-.5*: ROAD GRAVEL DRAINAGE. 5*-l.51
gravel
1.5* — 61: SILTY CLAY/ CLAYEY SILT - Older fill material.
6'-15': CLAYEY SILT (Foundation material) gray and orange, clayey silt.
15'-29.5'(BOH): GLACIAITILL Clav Till-Gray and orange,
dense, plastic clay containing clasts of quartz, granitic rock and quartz.
j »i * i >
t •» l
V
ELEV. - TOP OF SURFACE CASING:.645.24
ELEV. - TOP OF RISER CASING:. None-GROUND SURFACE
m m m m
SURFACE CASING
DIA: 0"TYPE: Steel pipe
BOTTOM OF SURFACE CASING
BACKFILL MATERIAL
t y p e : Cement/bentonite grout
RISER CASING
DIA:
t y p e : Armoured cable
TOP OF SEAL
ANNULAR SEAL
t y p e : Bentonite pelletsTOP OF FILTER PACK
FILTER PACK
ty p e : Washed sand and gravel95%<4 size 5% <100 size
TOKBKSCXBBBPIEZOMETER
DIA: .7 5'PIEZOMETER
ty^ Vibrating wire PWS
OPENINGS: WIDTH: PorOUS Stone type: Stainless steel
BOTTOM OF SRftOOCPIEZOMETER
. HOLE DIA:
BOTTOM OF SUMP
BOTTOM OF HOLE
8"
DEPTH
3.51
26
27.75
28.5
29
29.5
ELEV.
643.75
640.24
617.75
616.0
615.25
614.75
614.25
C-ll
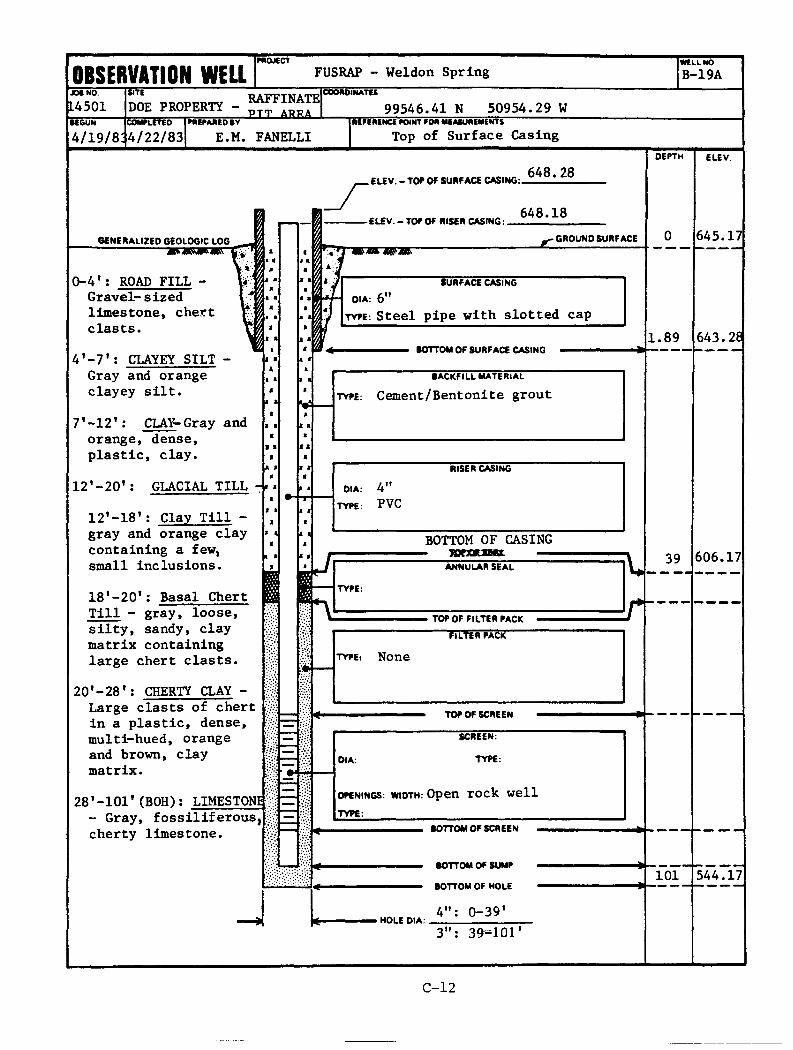
OBSERVATION WELLtrft
FUSRAP - Weldon Spring WELL NO
B -1 9 AJOB NO.
1L4501 DOE PROPERTY - R A F F IN A T EPTT ABF.A
COORDINATES
9 9 5 4 6 . 4 1 N 5 0 9 5 4 . 2 9 WREFERENCE POINT FOR MEASUREMENTS
T o p o f S u r f a c e C a s in gBEGUN
4/19/8:COMFLETEO
4/22/83PREPARED BY
E.M. FANELLI
g e n e ra l iz e d g e o lo g ic lo g ---------------------- * r *
0 - 4 * : ROAD F IL L - G r a v e l - s i z e d l i m e s t o n e , c h e r t c l a s t s .
4 ' - 7 * : CLAYEY S IL T - G r a y a n d o r a n g e c l a y e y s i l t .
7 * - 1 2 * : C L A Y -G r a y a n do r a n g e , d e n s e , p l a s t i c , c l a y .
1 2 ' - 2 0 ' : G L A C IA L T I L L -
1 2 ' - 1 8 ' : C la y T i l l - g r a y a n d o r a n g e c l a y c o n t a i n i n g a fe w , s m a l l i n c l u s i o n s .
1 8 ' - 2 0 ' : B a s a l C h e r t T i l l - g r a y , l o o s e , s i l t y , s a n d y , c l a y m a t r i x c o n t a i n i n g l a r g e c h e r t c l a s t s .
2 0 ' - 2 8 ' : CHERTY CLAY - L a r g e c l a s t s o f c h e r t i n a p l a s t i c , d e n s e , m u l t i - h u e d , o r a n g e a n d b r o w n , c l a y m a t r i x .
2 8 ' - 1 0 1 ' ( B O H ) : L IM E S T O N I- G r a y , f o s s i l i f e r o u s , c h e r t y l i m e s t o n e .
E LE V .-TO E O f SURFACE CASING:6 4 8 . 2 8
J
ELEV. - TOP OF RISER CASING:.6 4 8 . 1 8
-GROUND SURFACE
SURFACE CASING
DIA: 6 "
ty p e : S t e e l p i p e w i t h s l o t t e d c a p
BOTTOM OF SURFACE CASING
BACKFILL MATERIAL
t y p e : Cement/Bentonite grout
DIA: 4 "
RISER CASING
TYPE: PVC
BOTTOM OF C A SIN G X X X K H W t
TOP OF FILTER PACK
TOP OF SCREEN
> HOLE DIA:
BOTTOM OF SUMP
BOTTOM OF HOLE
4 " : 0 - 3 9 '
3 ” : 3 9 - 1 0 1 '
6 0 6 . 1 7ANNULAR SEAL
TYPE:
FILTER PACK
ty p e : N o n e
OPENINGS: WIDTH: O p e n TOCk WellTYPE:
BOTTOM OF SCREEN
DEPTH
1 . 8 9
101
ELEV.
6 4 5 .1 7
6 4 3 .2 8
5 4 4 .1 7
C-12
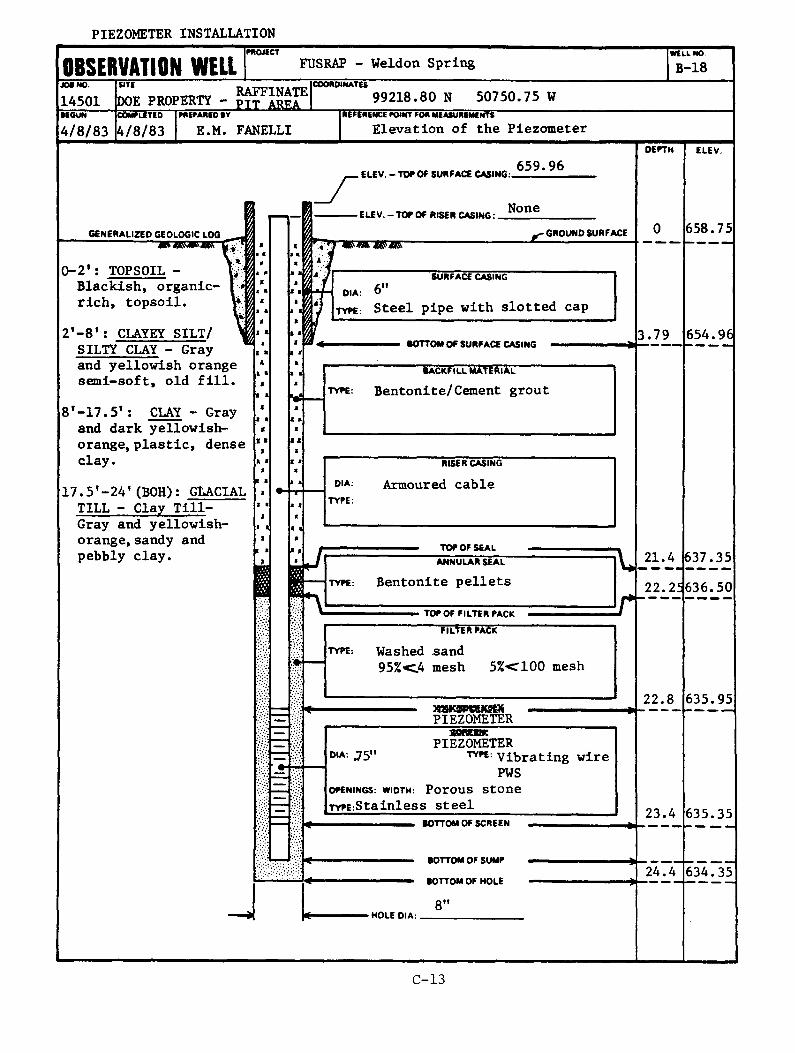
PIEZOMETER INSTALLATION
OBSERVATION WELLPROJECT FUSRAP - Weldon Spring
,*1 ' r a f f i n a t e I '00*0'" *™DOE PROPERTY - P I T a r e a |
WELL WO
B-18JOE NO.
14501 9 9 2 1 8 . 8 0 N 5 0 7 5 0 . 7 5 WBEGUN
4/8/83c o m p le te d
4 / 8 / 8 3
PREPARED EV
E.M. FANELLIREFERENCE POINT FOR MEASUREMENTS
Elevation of the Piezometer
generalized geologic log __---------m m m m ' \
0 - 2 ' : T O P S O IL - B l a c k i s h , o r g a n i c - r i c h , t o p s o i l .
2 ' - 8 ' : CLAYEY S I L T / S IL T Y CLAY - G r a y a n d y e l l o w i s h o r a n g e s e m i - s o f t , o l d f i l l .
8 ' - 1 7 . 5 * : CLAY - G ra ya n d d a r k y e l l o w i s h - o r a n g e , p l a s t i c , d e n s e c l a y .
1 7 . 5 ’ - 2 4 ’ (B O H ):T I L L ~ C la y T i l l - G r a y a n d y e l l o w i s h - o r a n g e , s a n d y a n d p e b b ly c l a y .
Tn-m m
TYPE:
DIA: J 5
ELEV. - TOP OF SURFACE CASING:6 5 9 . 9 6
ELEV. - TOP OF RISER CASING:.N o n e
-GROUNDSURFACE
SURFACE CJkSING
DIA: 6 "
type: S t e e l p i p e w i t h s l o t t e d c a p
BOTTOM OF SURFACE CASING
BACKFILL MATERIAL
t y p e : Bentonite/Cement grout
RISER CASING
A rm o u re d c a b l e
3 . 7 9
TOP OF SEAL ANNULAR SEAL
ty p e : B e n t o n i t e p e l l e t sV
TOP OF FILTER PACK
FILLER PACK
W ash ed s a n d 95% < _4 m esh 5 % < 1 0 0 m esh
WWWKifKPIEZOMETERSMHOKPIEZOMETERTYPt: Vibrating wire
PWSOPENINGS: WIDTH: PorOUS Stone TYPE:Stainless s te e l
HOLE DIA:
BOTTOM OF SCREEN
BOTTOM OF SUMP
BOTTOM OF HOLE
8"
DEPTH
2 1 . 4
2 2 . 2 5
22.8
2 3 . 4
2 4 . 4
ELEV.
6 5 8 . 7 5
6 5 4 . 9 6
6 3 7 . 3 5
6 3 6 . 5 0
6 3 5 . 9 5
6 3 5 . 3 5
6 3 4 . 3 5
C-13
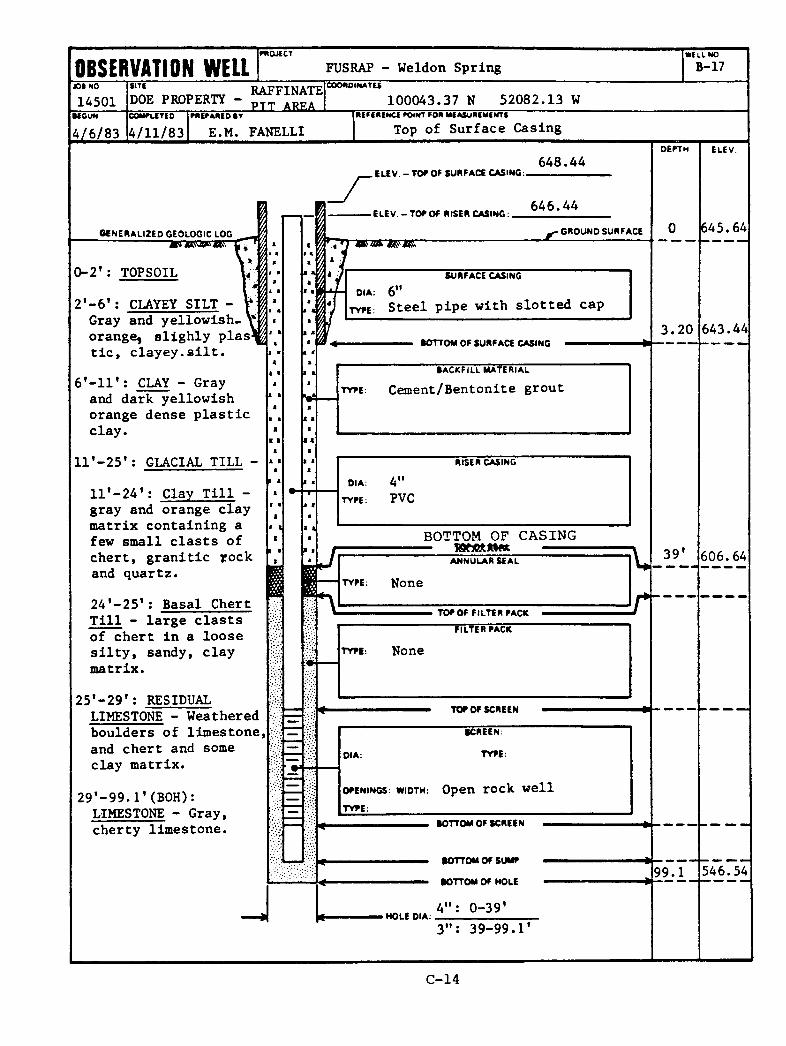
OBSERVATION WELLPROJECT
FUSRAP - Weldon SpringWELL NO
B -1 7
JOI NO
14501SITE
DOE PROPERTY -BEGUN
4/6/83COMPLETED
4/11/83
RAFFINATE P I T AREA
PREPARED BY
E.M. FANELLI
COORDINATES
1 0 0 0 4 3 .3 7 N 5 2 0 8 2 . 1 3 WREFERENCE FOINT FOR MEASUREMENTS
Top of Surface Casing
. ELEV. - TOE or SURFACE CASING:6 4 8 . 4 4
OENERALI2E0 GEOLOGIC LOG
V i\* 'A0 - 2 * : T 0 P S 0 IL 1 ^
2 ' - 6 * : CLAYEY S IL T - G r a y a n d y e l l o w i s h - r i o ra n g e ^ s l i g h l y p l a s t i c , c l a y e y . s i l t .
6 ' - l l ' : CLAY - G r a y a n d d a r k y e l l o w i s h o r a n g e d e n s e p l a s t i c
c l a y .
l l ' - 2 5 ' : G L A C IA L T I L L -
l l ' - 2 4 ' : C la y T i l l - g r a y a n d o r a n g e c l a y m a t r i x c o n t a i n i n g a f e w s m a l l c l a s t s o f c h e r t , g r a n i t i c r o c k a n d q u a r t z .
2 4 ' - 2 5 ' : B a s a l C h e r t T i l l - l a r g e c l a s t s o f c h e r t i n a l o o s e s i l t y , s a n d y , c l a y m a t r i x .
2 5 ' - 2 9 ' : R E S ID U A LL IM E S T O N E - W e a t h e r e d b o u l d e r s o f l i m e s t o n e , a n d c h e r t a n d som e c l a y m a t r i x .
2 9 ’ - 9 9 . 1 ' (B O H ) :L IM E S T O N E - G r a y , c h e r t y l i m e s t o n e .
-ELEV.-TOR OF RISER CASING:6 4 6 . 4 4
y GROUND SURFACE
SURFACE CASING
DIA: 6 "tyre: S t e e l p i p e w i t h s l o t t e d c a p
BOTTOM OF SURFACE CASING
BACKFILL MATERIAL
type: Cement/Bentonite grout
DIA: 4 "
RISER CASING
TYRE: PVC
BOTTOM OF CASING
TOR OF FILTER PACK
DIA:
TOR OF SCREEN
SCREEN:
TYPE:
openings w id th : O p e n r o c k w e l l
> HOLE DIA:
BOTTOM OF SCREEN
BOTTOM OF SUMP
BOTTOM OF HOLE
4 " : 0 - 3 9 *
3 " : 3 9 - 9 9 . 1 ’
ANNULAR SEAL
TYRE: N o n e rFILTER RACK
TYRE: N o n e
DEPTH
3 . 2 0
3 9 *
99.1
ELEV.
6 4 5 .6 4
6 4 3 . 4 4
606.64
5 4 6 . 5 4
C-14
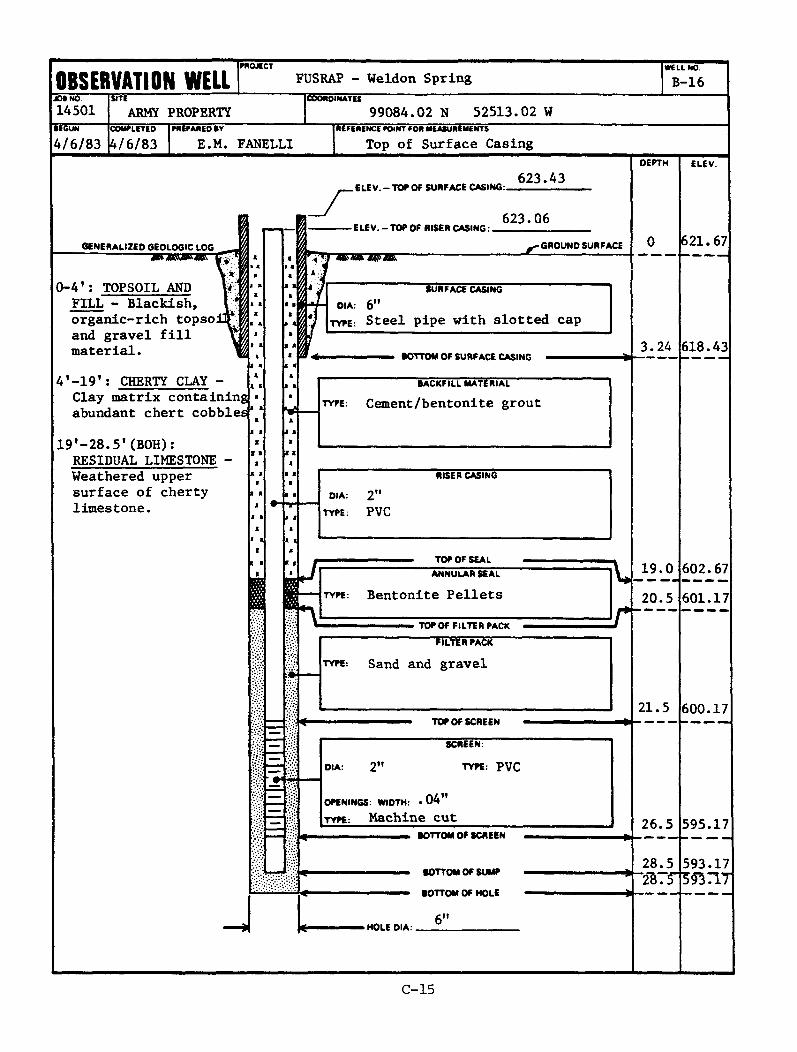
OBSERVATION WELLPROJECT
FUSRAP - W e ld o n S p r i n g
| COORDINATES
WELL NO.
B - 1 6X II NO
1 4 5 0 1IE Gu n
4/6/83
SITE
ARMY PROPERTY 9 9 0 8 4 . 0 2 N 5 2 5 1 3 . 0 2 WCOMPLETED
4/6/83PREPARED »V
E.M. FANELLIREFERENCE FOINT FOR MEASUREMENTS
Top of Surface Casing
g e n e ra l iz e d g e o lo g ic lo g {-------- m m m m (i!0 - 4 * : T O P S O IL ANDF IL L - B l a c k i s h , V? | o r g a n i c - r i c h to p s o iD ^ K
a n d g r a v e l f i l l m a t e r i a l .
4 ’ - 1 9 ' : CHERTY CLAY - C l a y m a t r i x c o n t a i n i n g a b u n d a n t c h e r t c o b b le s
1 9 ' - 2 8 . 5 ' ( B O H ) :R E S ID U A L L IM E S T O N E - W e a t h e r e d u p p e r s u r f a c e o f c h e r t y l i m e s t o n e .
ELEV.-TOR of SURFACE CASING:6 2 3 . 4 3
ELEV. - TOP OF RISER CASING:.6 2 3 . 0 6
-GROUND SURFACE
SURFACE CASING
DIA: 6 "type: S t e e l p i p e w i t h s l o t t e d c a p
BOTTOM OF SURFACE CASING
BACKFILL MATERIAL
ty p e : C e m e n t / b e n t o n i t e g r o u t
TOP OF SEALANNULAR SEAL
ty p e : B e n t o n i t e P e l l e t s
TOP OF FILTER PACK
FILTER PACK
type-. S a n d a n d g r a v e l
DIA: 2"
TOP OF SCREEN
SCREEN:
TYPE: PVC
OPENINGS: WIDTH: . 0 4 "
type : M a c h in e c u tBOTTOM OF SCREEN
BOTTOM OF SUMP
BOTTOM OF HOLE
> HOLE DIA:. 6"
DIA: 2 "
RISER CASING
TYPE: PVC
/ -
DEPTH
3 . 2 4
1 9 . 0
2 0 . 5
2 1 . 5
2 6 . 5
2 8 . 5*257
ELEV.
6 2 1 .6 7
6 1 8 . 4 3
6 0 2 . 6 7
6 0 1 . 1 7
6 0 0 . 1 7
5 9 5 . 1 7
5 9 3 . 1 7S3 717
C-15
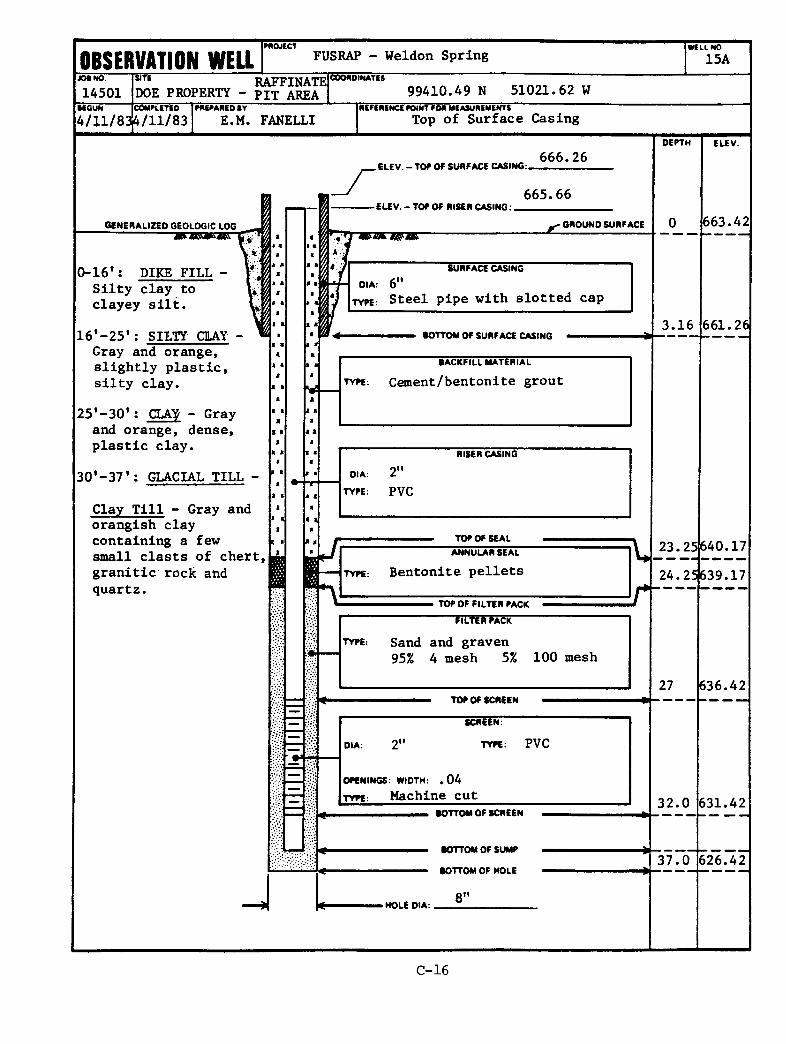
OBSERVATION WELLPROJECT
FUSRAP - W e ld o n S p r in gWELL NO
1 5 A
J0* N° I ™ R A F F IN A T E coo" ° ,NATES . . 1 4 5 0 1 |D 0 E PROPERTY - p I T AREA 9 9 4 1 0 . 4 9 N 5 1 0 2 1 . 6 2 W
BEGUN [COMPLETED
4 / l l / 8 3 | 4 / l l / 8 3PREPARED BY
E .M . F A N E L L IREFERENCE POINT FOR MEASUREMENTS
T o p o f S u r f a c e C a s in g
generalized geologic log)G i
0 - 1 6 ' : D IK E F IL L -S i l t y c l a y t o c l a y e y s i l t .
1 6 ' - 2 5 ' : S IL T Y CLAY - G ra y a n d o r a n g e , s l i g h t l y p l a s t i c , s i l t y c l a y .
2 5 ' - 3 0 ' : CLAY - G r a y a n d o r a n g e , d e n s e , p l a s t i c c l a y .
3 0 ' - 3 7 ' : G L A C IA L T IL L -
C la y T i l l - G r a y a n d o r a n g is h c l a y c o n t a i n i n g a fe w s m a l l c l a s t s o f c h e r t , g r a n i t i c r o c k a n d q u a r t z .
ELEV.-TOPOF SURFACE CASING:.6 6 6 . 2 6
6 6 5 . 6 6ELEV.-TOP OF RISER CASING:.
-GROUND SURFACE
SURFACE CASING DIA: 6 "
type: S t e e l p i p e w i t h s l o t t e d c a p
BOTTOM OF SURFACE CASING
BACKFILL MATERIAL
type: Cement/bentonite grout
TOP OF SEAL ANNULAR SEAL
type: Bentonite pellets
TOP OF FILTER PACK
FILTER PACK
S an d a n d g r a v e n 95% 4 m e s h 5% 1 0 0 m e sh
TOP OF SCREEN
SCREEN:
TYPE: PVC
OPENINGS: WIDTH: . 0 4 type: Machine cut
BOTTOM OF SCREEN
BOTTOM OF SUMP
BOTTOM OF HOLE
HOLE DIA: . 8"
RISER CASING
DIA: 2 "
TYPE: PVC
r
d e p t h
3 . 1 6
2 3 . 2 5
2 4 2 5 6
27
3 2 . 0
3 7 . 0
ELEV.
6 6 3 . 4 2
6 6 1 . 2 6
6 4 0 . 1 7
3 9 . 1 7
6 3 6 . 4 2
6 3 1 . 4 2
6 2 6 . 4 2
C-16
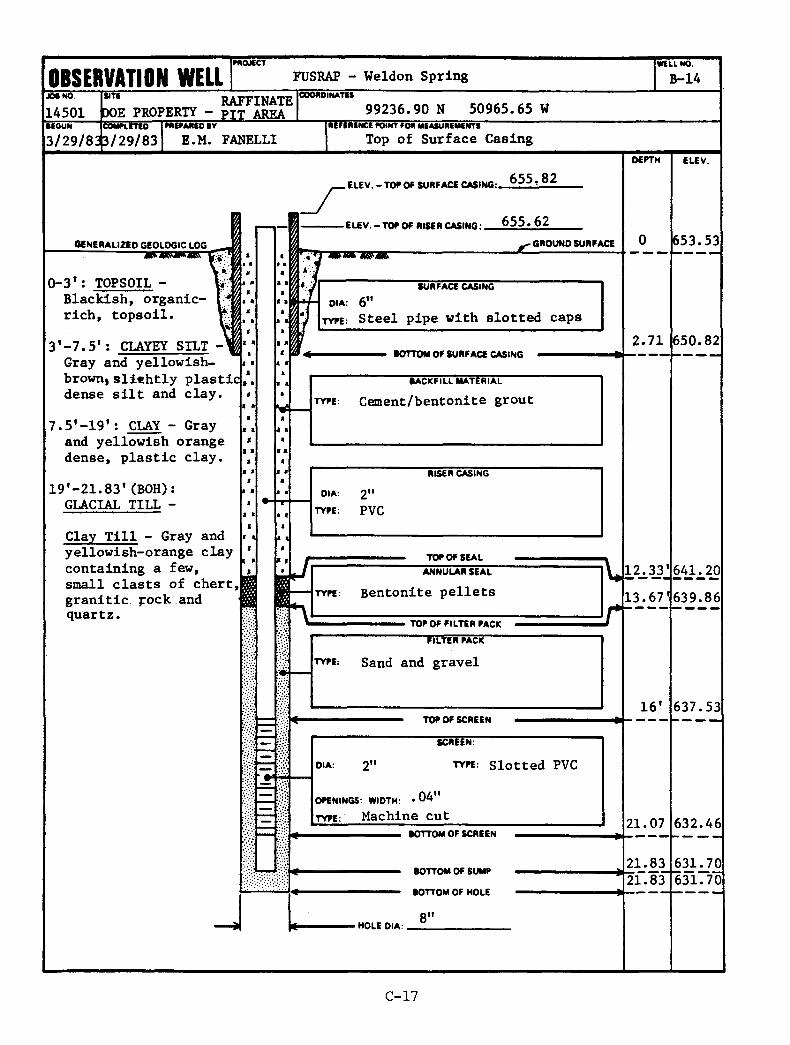
OBSERVATION WELLPROJECT “
FUSRAP - W e ld o n S p r in gWELL NO.
B - 1 4
JOB NO. IN T I p a f f t n a t f coo"oinath
1 4 5 0 1 p O E PROPERTY - p I T AREA 9 9 2 3 6 . 9 0 N 5 0 9 6 5 . 6 5 WBEGUN 1 COMPLETED
3 / 2 9 / 8 3 ( 3 / 2 9 / 8 3PREPARED BY
E .M . F A N E L L IREFERENCE POINT FOR MEASUREMENTS
T o p o f S u r f a c e C a s in g
generalized geologic log
0 - 3 ' : T O P S O IL - L B l a c k i s h , o r g a n i c - • * r i c h , t o p s o i l .
3 ' - 7 . 5 ' : CLAYEY SILT -W.1 G r a y a n d y e l l o w i s h -
b ro w n j s l i t h t l y p l a s t i c | d e n s e s i l t a n d c l a y .
7 . 5 ' - 1 9 ' : CLAY - G r a y a n d y e l l o w i s h o r a n g e d e n s e , p l a s t i c c l a y .
1 9 ' - 2 1 . 8 3 ' ( B O H ) :G L A C IA L T IL L -
C la y T i l l - G r a y a n d y e l l o w i s h - o r a n g e c l a y
c o n t a i n i n g a f e w , s m a l l c l a s t s o f c h e r t , g r a n i t i c p o c k a n d q u a r t z .
ELEV. - TOP O f SURFACE CASING:. 6 5 5 . 8 2
ELEV.-TOPOF RISER CASING- 6 5 5 . 6 2
GROUND SURFACE
SURFACE CASING
DIA: 6 "
type: S t e e l p i p e w i t h s l o t t e d c a p s
BOTTOM OF SURFACE CASING
TOP OF SEAL ANNULAR SEAL
type: Bentonite pellets
TOP OF FILTER PACK
FILTER PACK
type: S a n d a n d g r a v e l
TOP OF SCREEN
DIA: 2"SCREEN:
ty p e : S l o t t e d PVC
OPENINGS: WIDTH: • 0 4 "
Machine cutBOTTOM OF SCREEN
BOTTOM OF SUMP
BOTTOM OF HOLE
■HOLE D IA :.8"
BACKFILL MATERIAL
type: Cement/bentonite grout
DIA: 2"RISER CASING
TYPE: PVC
r
DEPTH
2 . 7 1
1 2 ^ 3 3 ]
1 3 . 6 7 ’
1 6 '
2 1 . 0 7
2 1 . 8 3
2 l" . 8 3
ELEV.
6 5 3 . 5 3
6 5 0 . 8 2
6 4 1 ^ 2 0
6 3 9 . 8 6
6 3 7 . 5 3
6 3 2 . 4 6
6 3 1 ^ 7 06 3 1 .7 *0
C-17
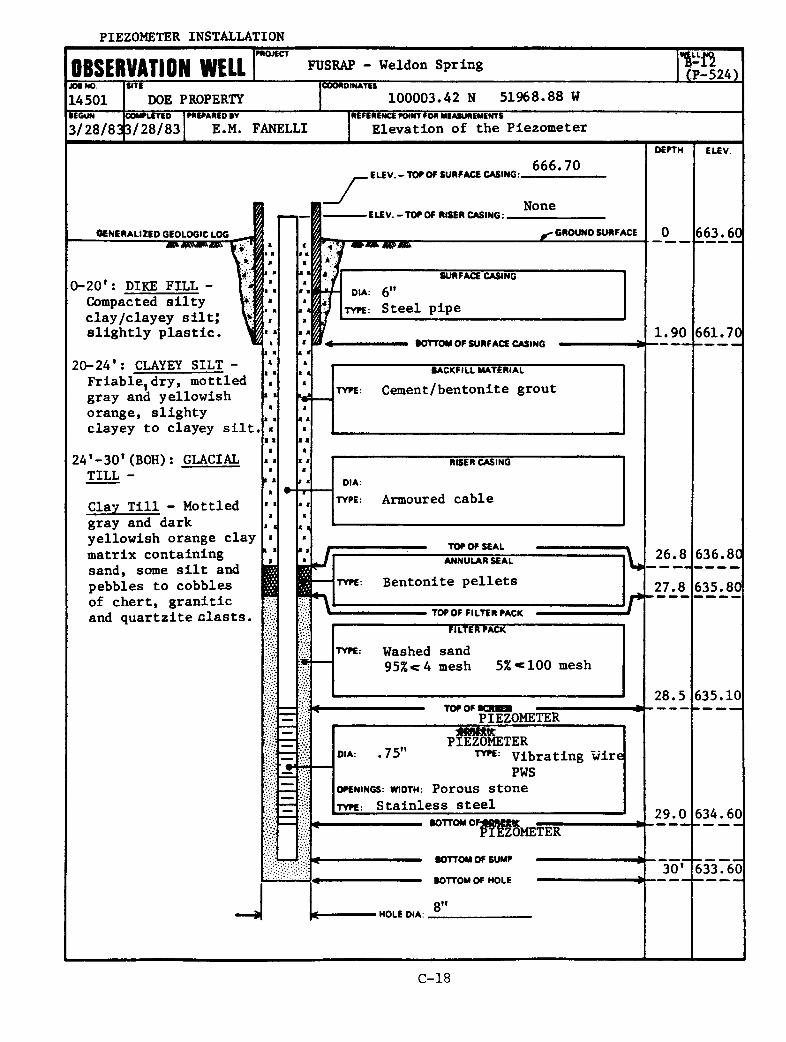
PIEZOMETER INSTALLATION
OBSERVATION WELLPROJECT
FUSRAP - W e ld o n S p r in g "ten( P - 5 2 4 )
JOB NO. IS IT I
1 4 5 0 1 | DOE PROPERTYCOORDINATES
1 0 0 0 0 3 .4 2 N 5 1 9 6 8 . 8 8 WBEGUN 1 COMPLETED
3 / 2 8 / 8 3 ) 3 / 2 8 / 8 3PREPARED BY
E .M . F A N E L L IREFERENCE FOINT FOR MEASUREMENTS
E l e v a t i o n o f t h e P i e z o m e t e r
g e n e r a l iz e d g e o lo g ic lo g
0 - 2 0 * : D IK E F IL L - C o m p a c te d s i l t y c l a y / c l a y e y s i l t ; s l i g h t l y p l a s t i c .
2 0 - 2 4 ' : CLAYEY S IL T - F r i a b l e , d r y , m o t t l e d g r a y a n d y e l l o w i s h o r a n g e , s l i g h t y c l a y e y t o c l a y e y s i l t .
2 4 * - 3 0 ' (B O H ): G L A C IA L T IL L -
C la y T i l l - M o t t l e d g r a y a n d d a r k y e l l o w i s h o r a n g e c l a y m a t r i x c o n t a i n i n g s a n d , som e s i l t a n d p e b b le s t o c o b b le s o f c h e r t , g r a n i t i c a n d q u a r t z i t e c l a s t s .
. ELEV. - TOR O f SURFACE CASING:.
ELEV. - TOR O f RISER CASING: .
TBST
6 6 6 . 7 0
N o n e
- GROUND SURE ACE
SURFACE CASING
DIA: 6 "
TYRE: S t e e l p i p e
BOTTOM OF SURFACE CASING
BACKFILL MATERIAL
t y r e : C e m e n t / b e n t o n i t e g r o u t
RISER CASING
DIA:
ty p e : A rm o u re d c a b l e
TOR OF SEAL ANNULAR SEAL
ty r e : B e n t o n i t e p e l l e t s
TOR OF FILTER RACK rFILTER RACK
t y r e : W ash ed s a n d9 5 % « r4 m esh 5 % « 1 0 0 m e s h
TOR OFP IE Z O M E T E R
P IE Z O M E T E R d ia : . 7 5 " t y r e : v i b r a t i n g w i r e
PWSOPENINGS: WIDTH: PorOUS StOnet y r e : S t a i n l e s s s t e e l _____________________
BOTTOM Om w RBOTTOM OF SUMP
BOTTOM OF HOLE
• HOLE DIA: 8"
DEPTH
1 . 9 0
2 6 . 8
2 7 . 8
2 8 . 5
2 9 . 0
30'
ELEV.
6 6 3 . 6 0
6 6 1 . 7 0
6 3 6 . 8 0
6 3 5 . 8 0
6 3 5 . 1 0
6 3 4 . 6 0
6 3 3 . 6 0
C-18
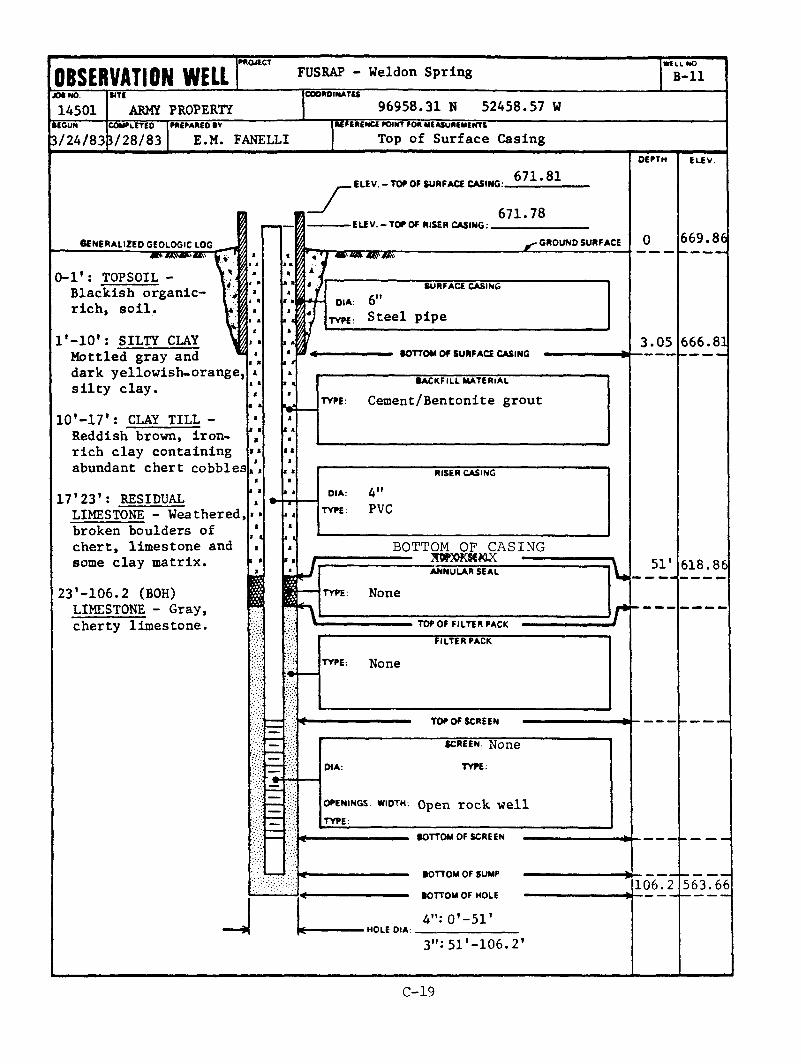
OBSERVATION WELLPROJECT
FUSRAP - W e ld o n S p r in gWELL NO
B - l lJOB NO. ISITE COORDINATES
1 4 5 0 1 1 ARMY PROPERTY 9 6 9 5 8 . 3 1 N 5 2 4 5 8 . 5 7 WBEGUN [COMPLETED
3 / 2 4 / 8 3 ( 3 / 2 8 / 8 3PREPARED BV
E .M . F A N E L L IREFERENCE POINT FOB MEASUREMENTS
T o p o f S u r f a c e C a s in g
. ELEV.-TOPOF SURFACE CASING:.6 7 1 . 8 1
Generalized geologic logTSTOTSIT0 - 1 ' : T O P S O IL -
B l a c k i s h o r g a n i c - r i c h , s o i l .
l ' - l O ' : S IL T Y CLAY M o t t l e d g r a y a n d d a r k y e l l o w i s h - o r a n g e ,
s i l t y c l a y .
1 0 ' - 1 7 ' : CLAY T IL L - R e d d is h b r o w n , i r o n - r i c h c l a y c o n t a i n i n g
a b u n d a n t c h e r t c o b b le s
1 7 ' 2 3 ' : R E S ID U A LL IM E S T O N E - W e a t h e r e d , b r o k e n b o u ld e r s o f c h e r t , l i m e s t o n e a n d som e c l a y m a t r i x .
2 3 ' - 1 0 6 . 2 (B O H ) L IM E S T O N E - G r a y , c h e r t y l i m e s t o n e .
-ELEV.-TOPOF RISER CASING:.6 7 1 . 7 8
-GROUND SURFACEE G V f tSURFACE CASING
OIA. 6 "
type: s t e e l p i p e
BOTTOM OF SURFACE CASING
BOTTOM OF CASING XOHOKOCMX ----
TOP OF FILTER PACK
DIA:
TOP OF SCREEN
screen: N0 n e
TYPE:
OPENINGS w id th . O p e n r o c k w e l l
TYPE:
•HOLE DIA:
BOTTOM OF SCREEN
BOTTOM OF SUMP
BOTTOM OF HOLE
4": 0'~51'3": 51'-106.2'
BACKFILL MATERIAL
type: C e m e n t /B e n t o n i t e g r o u t
DIA: 4"RISER CASING
TYPE: PVC
ANNULAR SEAL
TYPE: N o n e rFILTER PACK
TYPE: N o n e
DEPTH
3 . 0 5
51*
106.2
ELEV.
669.86
6 6 6 .8 1
618.86
563.66
C-19
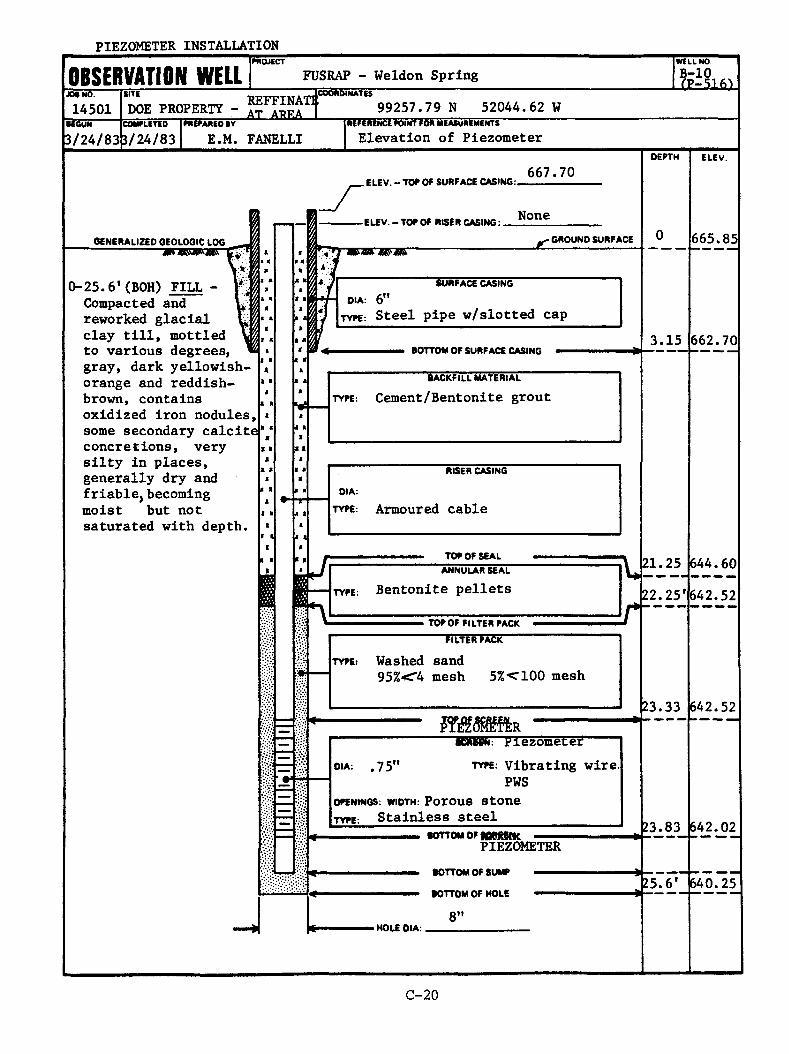
PIEZOMETER INSTALLATION
OBSERVATION WELLPROJECT
FUSRAP - W e ld o n S p r in gWELL NO
B - 1 0f P - 5 1 6 1
jm n o . IS ite RF’F’FTNATI C0<)*BINA™1 4 5 0 1 | DOE PROPERTY - J f J J J IJ 9 9 2 5 7 . 7 9 N 5 2 0 4 4 . 6 2 W
BEGUN (COMPLETED
3 / 2 4 / 8 3 p / 2 4 / 8 3
PREPARED BY
E .M . F A N E L L I
REFERENCE POINT FOR MEASUREMENTS
E l e v a t i o n o f P ie z o m e t e r
GENERALIZED GEOLOGIC LOG
0 - 2 5 . 6 ' (B O H ) F IL L - C o m p a c te d a n d r e w o r k e d g l a c i a l c l a y t i l l , m o t t l e d t o v a r i o u s d e g r e e s , g r a y , d a r k y e l l o w i s h - o r a n g e a n d r e d d i s h - b r o w n , c o n t a i n s o x i d i z e d i r o n n o d u le s , som e s e c o n d a r y c a l c i t e c o n c r e t i o n s , v e r y s i l t y i n p l a c e s , g e n e r a l l y d r y a n d f r i a b l e , b e c o m i n g m o i s t b u t n o t s a t u r a t e d w i t h d e p t h .
RISER CASING
t y r e : A rm o u re d c a b l e
E LE V .-TO R O f SURFACE CASING:.6 6 7 . 7 0
ELEV. - TOR OF RISER CASING: .N o n e
-GROUND SURFACE
SURFACE CASING
DIA: 6 "
t y r e : S t e e l p i p e w / s l o t t e d c a p
BOTTOM OF SURFACE CASING
BACKFILL MATERIAL
t y r e : C e m e n t / B e n t o n i t e g r o u t
TOR OF SEALANNULAR SEAL
ty r e : B e n t o n i t e p e l l e t s
TOR OF FILTER RACK
FILTER RACK
ty r e : W ash ed s a n d95% <T4 m e s h 5 % c l 0 0 m e s h
----------- AGJUWi: P ie z o m e te r------
ty re .- V i b r a t i n g w i r e .
PWS
OPENINGS: WIDTH: PoTOUS StOne t y r e : Stainless steel ___________
HOLE O IA :.
BOTTOM OF J Q M t tk —PIEZOMETERBOTTOM OF SUMP ——
BOTTOM OF HOLE — —
8"
DEPTH
3 . 1 5 6 6 2 . 7 0
2 1 . 2 5
2 2 . 2 5 '
2 3 .3 3
2 3 .8 3
2 5 . 6 '
ELEV.
6 6 5 . 8 5
6 4 4 . 6 0
6 4 2 .5 2
6 4 2 .5 2
6 4 2 .0 2
6 4 0 .2 5
C-20
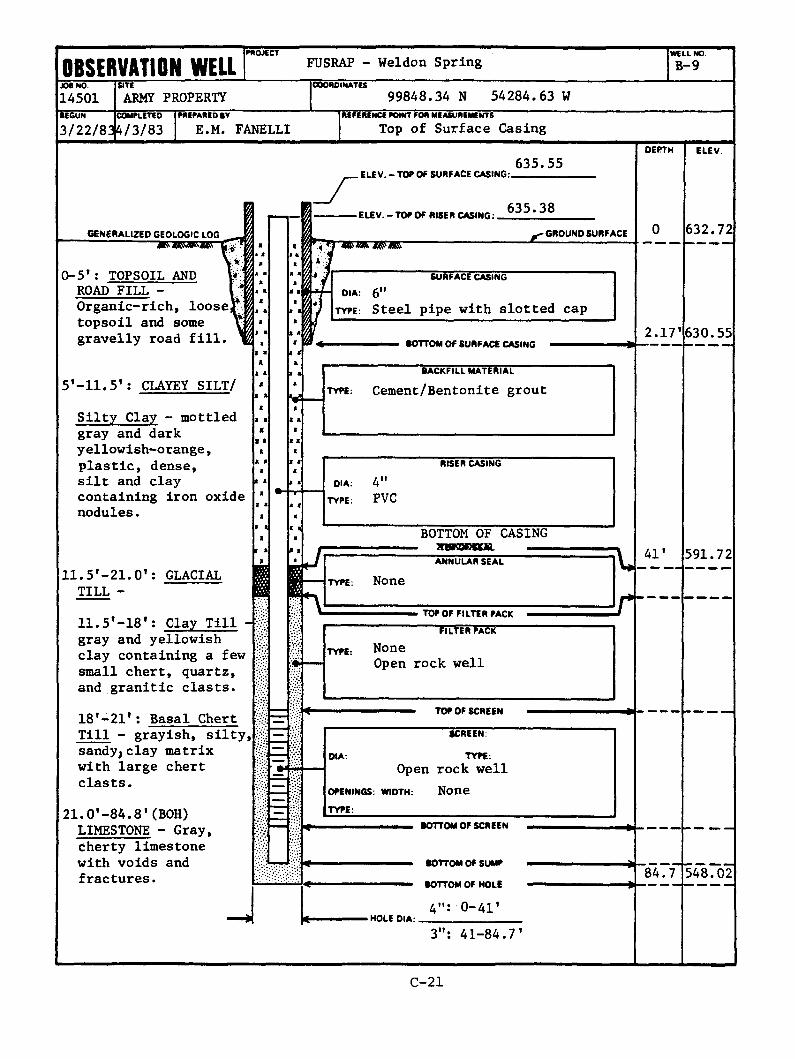
OBSERVATION WELLPROJECT FUSRAP - Weldon Spring
c 6 o r d in a t I s ~
WELL NO.
B-9JOB NO.
14501SITE
ARMY PROPERTY 99848.34 N 54284.63 WBEGUN
3/22/8314c o m p l e t e s
/3/83PREPARED BV
E.M. FANELLIREFERENCE POINT FOR MEASUREMENTS
Top of Surface Casing
GENERALIZED GEOLOGIC LOG
0-5*: TOPSOIL AND ROAD FILL - Organic-rich, looser, j topsoil and some "gravelly road fill.
5'-11.5': CLAYEY SILT/Silty Clay - mottled gray and dark yellowish-orange, plastic, dense, silt and clay containing iron oxide nodules.
11.5'-21.0’: GLACIAL TILL -11.5’-18': Clay Till gray and yellowish clay containing a few small chert, quartz, and granitic clasts.18'-21*: Basal Chert Till - grayish, silty, sandy;clay matrix with large chert clasts.
21.0'-84.8'(BOH) LIMESTONE - Gray, cherty limestone with voids and fractures.
ELEV.-TOPOF SURFACE CASING:.635.55
□
ELEV.-TOPOF RISER CASING:. 635.38-GROUND SURFACE
SURFACE CJLSING
01 A: 6 "
t y p e : Steel pipe with slotted cap
BOTTOM OF SURFACE CASING
BACKFILL MATERIAL
type: Cement/Bentonite grout
DIA. 4”RISER CASING
TYPE: PVC
BOTTOM OF CASING XWOBBOH
TOP OF FILTER PACK
filter pack
type: NoneOpen rock well
TOP OF SCREEN
• HOLE OIA:
BOTTOM OF SCREEN
BOTTOM OF SUMP
BOTTOM OF HOLE
4": 0-41'3": 41-84.7’
ANNULAR SEAL
TYPE: None r
SCREEN:
OIA: TYPE:Open rock well
OPENINGS: WIDTH: NoneTYPE:
DEPTH
2.17*
41'
84.7
ELEV.
632.72
630.55
591.72
548.02
C-21
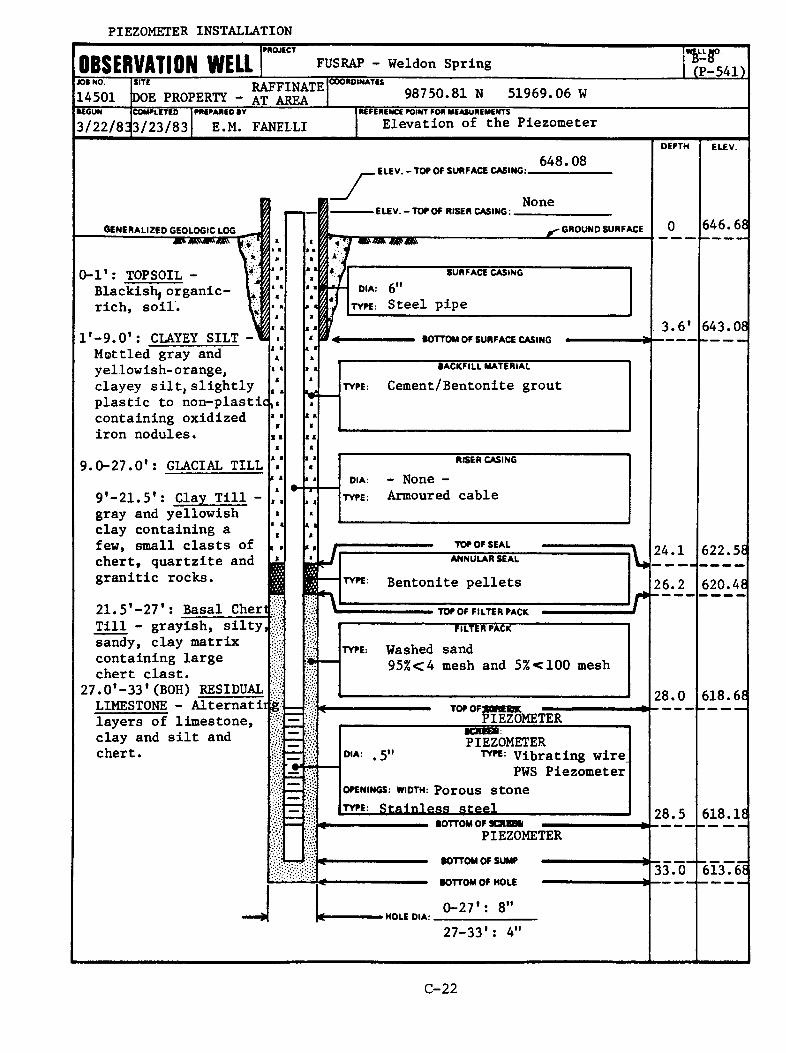
PIEZOMETER INSTALLATION
OBSERVATION WELLPROJECT
FUSRAP - Weldon Spring i wI f f - 5 4 1 ) 1
JOB NO.
14501SITE RAFFINATEDOE PROPERTY - at AREA
COORDINATES 98750.81 N 51969.06 WBEGUN
3/22/82COMPLETED
3/23/83PREPARED BV
E.M. FANELLIREFERENCE FOINT FOR MEASUREMENTSElevation of the Piezometer
DEPTH ELEV.
generalized geologic log
0-1': TOPSOIL - V jBlackish) organic- ^ j rich, soil
l'-9.0': CLAYEY SILT Mottled gray and yellowish-orange, clayey silt, slightly plastic to non-plastic|,« containing oxidized iron nodules.
9.0-27.0*: GLACIAL TILL
9*-21.5*: Clay Till - gray and yellowish clay containing a few, small clasts of chert, quartzite and granitic rocks.21.5*-27*: Basal Chert^
ELEV. - TOP OF SURFACE CASING:648.08
A I I
Till - grayish, silty sandy, clay matrix containing large chert clast.
27.0*-33*(BOH) RESIDUALLIMESTONE - Alternatiijg; layers of limestone, clay and silt and chert.
ELEV.-TOP OF RISER CASING:None
-GROUND SURFACE 646.68m r w m r
SURFACE CASINGDIA: 6 "
type: Steel pipe3.6* 643.08
BOTTOM OF SURFACE CASING
BACKFILL MATERIAL
type: Cement/Bentonite grout
RISER CASING
d ia : - None -type: Armoured cable
TOP OF SEAL ANNULAR SEAL
twe: Bentonite pellets24.1
26.2
622.58
620.48TOP OF FILTER PACK
FILTER PACK
type: Washed sand95%<4 mesh and 5%<100 mesh
28.0 6 1 8 .6 8TOP OFXOMBKPIEZOMETER
DIA: . 5 "
BOttBB:PIEZOMETERTYI>E Vibrating wire
PWS PiezometerOPENINGS: WIDTH: PorOUS Stonetype: Stainless steel
BOTTOM OF28.5
> HOLE DIA: .
PIEZOMETERBOTTOM OF SUMP —
BOTTOM OF HOLE -------
0 - 2 7 ' : 8 "
27-33*: 4"
33.0
6 1 8 .1 8
613.68
C-22
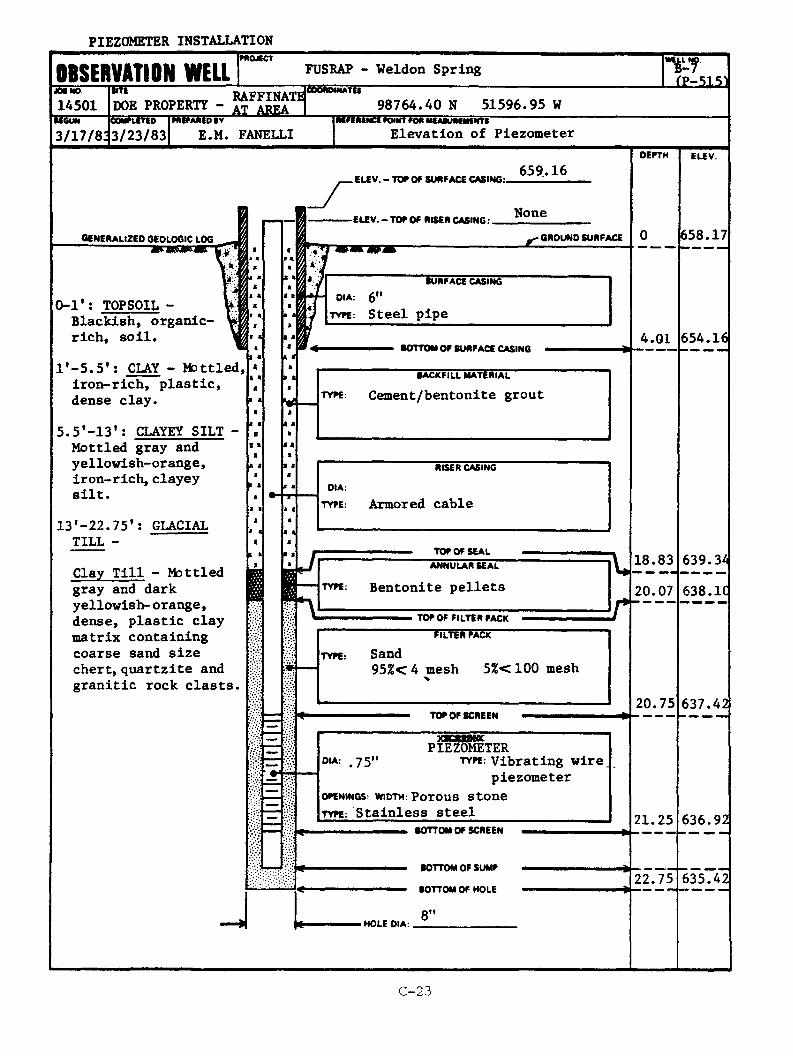
P IE Z O M E T E R IN S T A L L A T IO N
OBSERVATION WELLPROJECT
jt e no
1 4 5 0 1
FUSRAP - Weldon Spring
£ . PROPERTY -
W E L L fyB-£E=51D
llCUN3 / 1 7 / 8 :
55fiH$o3 / 2 3 / 8 3
M W M I D I VE .M . F A N E L L I
9 8 7 6 4 . 4 0 N 5 1 5 9 6 . 9 5 WScFERENtt po in t pop m e m u iih k n t s -
E l e v a t i o n o f P i e z o m e t e r
GENERALIZED GEOLOGIC LOG---------m m
0 - 1 * : T O P S O IL - B l a c k i s h , o r g a n i c - r i c h , s o i l .
l ' - 5 . 5 ' : CLAY - M o t t l e d , i r o n - r i c h , p l a s t i c , d e n s e c l a y .
5 . 5 ’ - 1 3 ’ : CLAYEY S IL T - M o t t l e d g r a y a n d y e l l o w i s h - o r a n g e , i r o n - r i c h , c l a y e y s i l t .
1 3 ' - 2 2 . 7 5 ' : G L A C IA L T IL L -
C la y T i l l - M o t t l e d g r a y a n d d a r k y e l l o w i s h - o r a n g e , d e n s e , p l a s t i c c l a y m a t r i x c o n t a i n i n g c o a r s e s a n d s i z e c h e r t , q u a r t z i t e a n d g r a n i t i c r o c k c l a s t s .
. ELEV.-TOEOF SURFACE CASING:.
ELEV. - TOF OF RISER CASING:.
6 5 9 . 1 6
N o n e
■ GROUND SURFACE
SURFACE CASINGOIA: 6 "
ty fe : S t e e l p i p e
BOTTOM OF SURFACE CASING
SACKFILL MATERIAL
C e m e n t / b e n t o n i t e g r o u t
RISER CASING
DIA:
ty fe : A r m o re d c a b l e
TOF OF SEALANNULAR SEAL
ty fe : B e n t o n i t e p e l l e t s
TOF OF FILTER FACK
I ilVer RACK
f
TYFE: S an d9 5 % < 4 m e sh 5 % < 1 0 0 m e sh
TOF OF SCREEN
OIA: . 7 5 "P IE Z O M E T E R
ty fe : V i b r a t i n g w i r ep ie z o m e t e r
OFENINGS: WIDTH: PorOUS Stonety fe : S t a i n l e s s s t e e l
> HOLE DIA:
BOTTOM OF SCREEN
BOTTOM OF SUMF
BOTTOM OF HOLE
8"
DEPTH
4 . 0 1
1 8 . 8 3
2 0 . 0 7
2 0 . 7 5
2 1 . 2 5
2 2 . 7 5
ELEV.
6 5 8 . 1 7
6 5 4 . 1 6
6 3 9 .3 4
6 3 8 .1 C
637.42
6 3 6 . 9 2
6 3 5 . 4 2
C-23

APPENDIX D HYDROGRAPHS
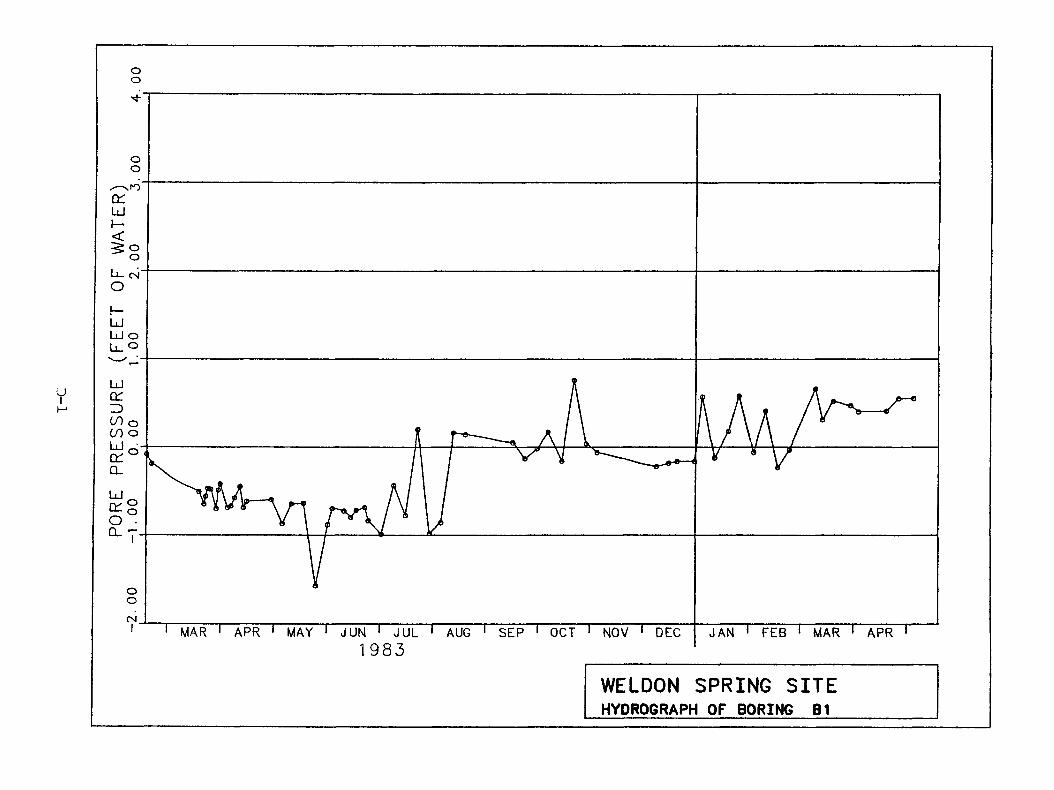
oo
oo
Ld
Ll_ CN
UorCO o CO ob!o
Ld ooCL T
o
1983
WELDON SPRING SITEHYDROGRAPH OF BORING B1
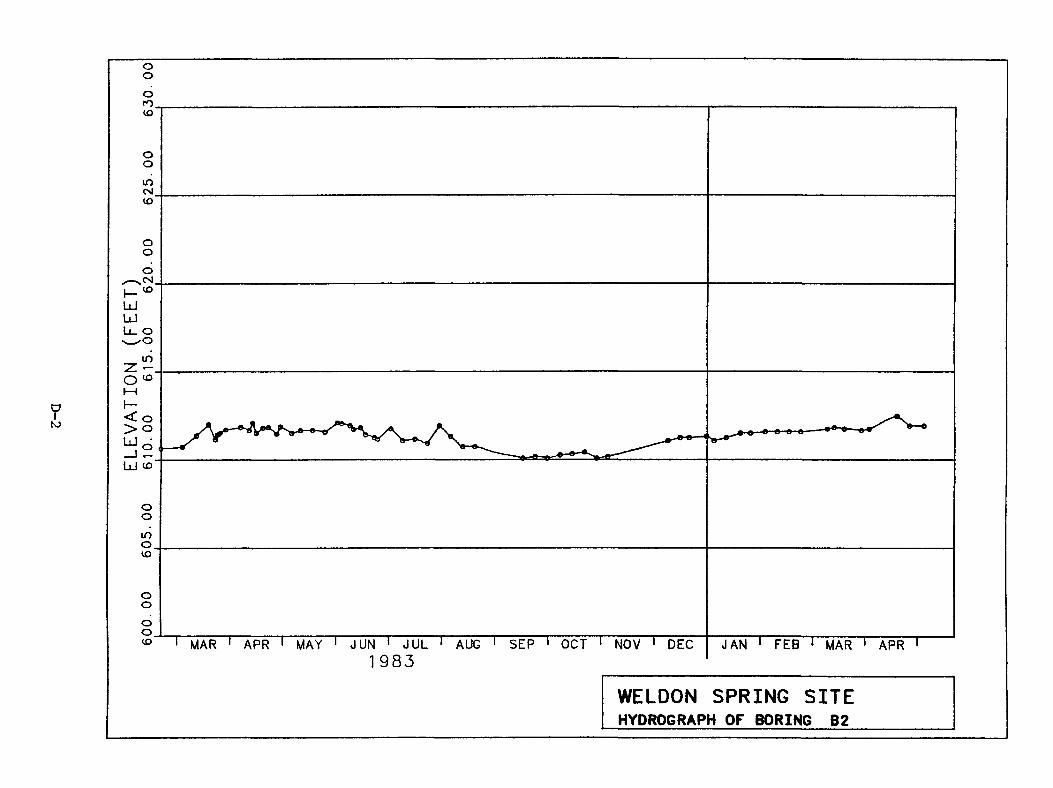
D-2
oooto
o
o/- CslI-"LdLJLi_ o — oin
< o> O
I i I 10
o
ooooto
1983
WELDON SPRING SITEHYDROGRARH OF BORING B2
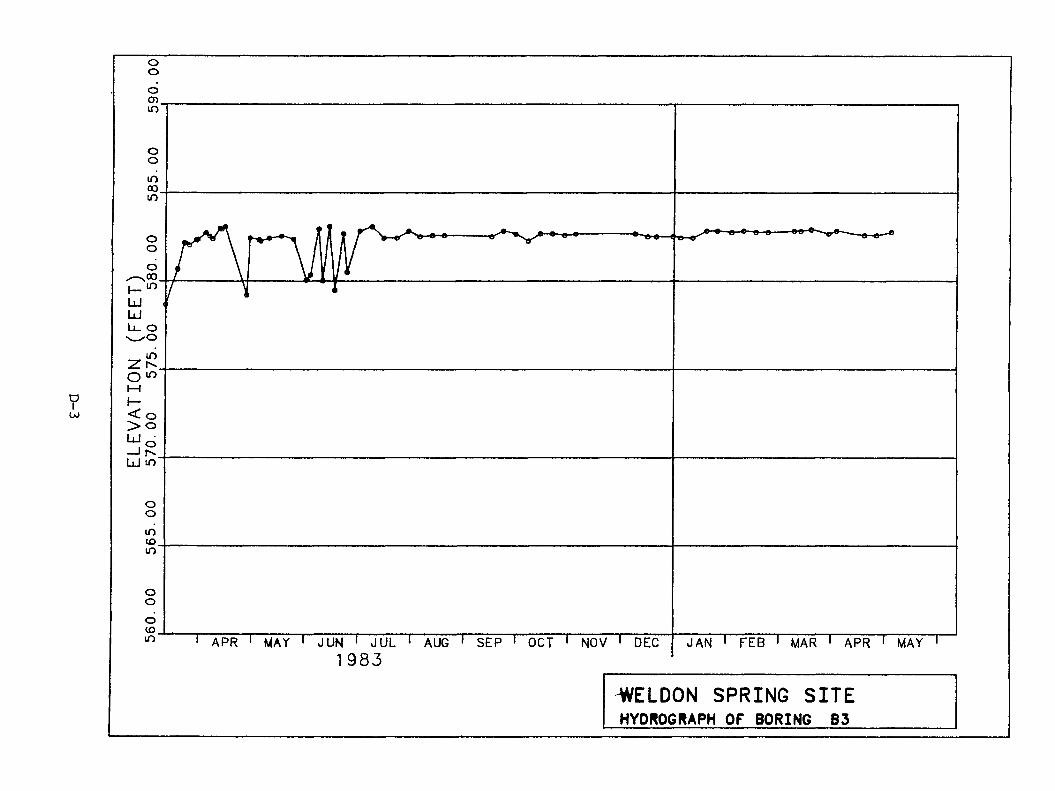
D-3
ooocnin
om0 0in
oo
LJLJLi_ ON-^O
O 10
<C o > o— I r-' LJ m
oomto
o(Dm
1 9 8 3
'WELDON SPRING SITEHYDROGRAPH OF BORING B3
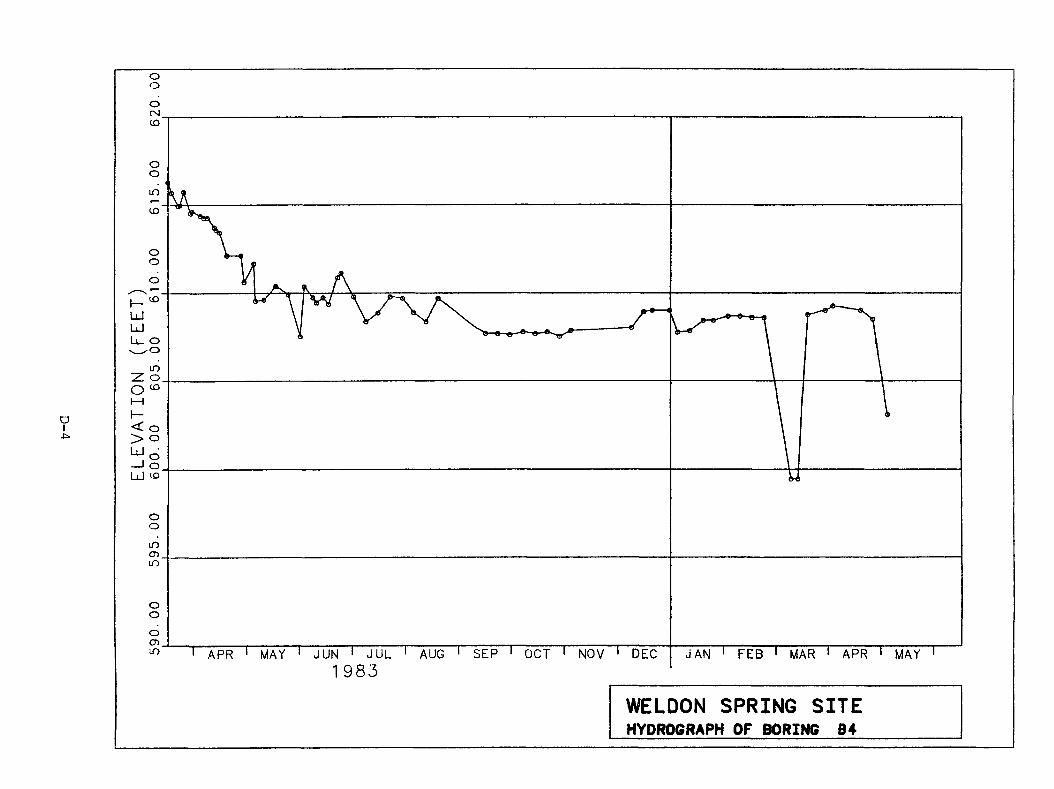
oo
o
ooin
ooo
LlJoo
<C o > O—I oI I I ID
oo
oooCT>m S E P 1 O CT 1 NOV 1 DECJU N J U L AUG
19 8 3
WELDON SPRING SITEHYDR06RAPH OF BORING 84
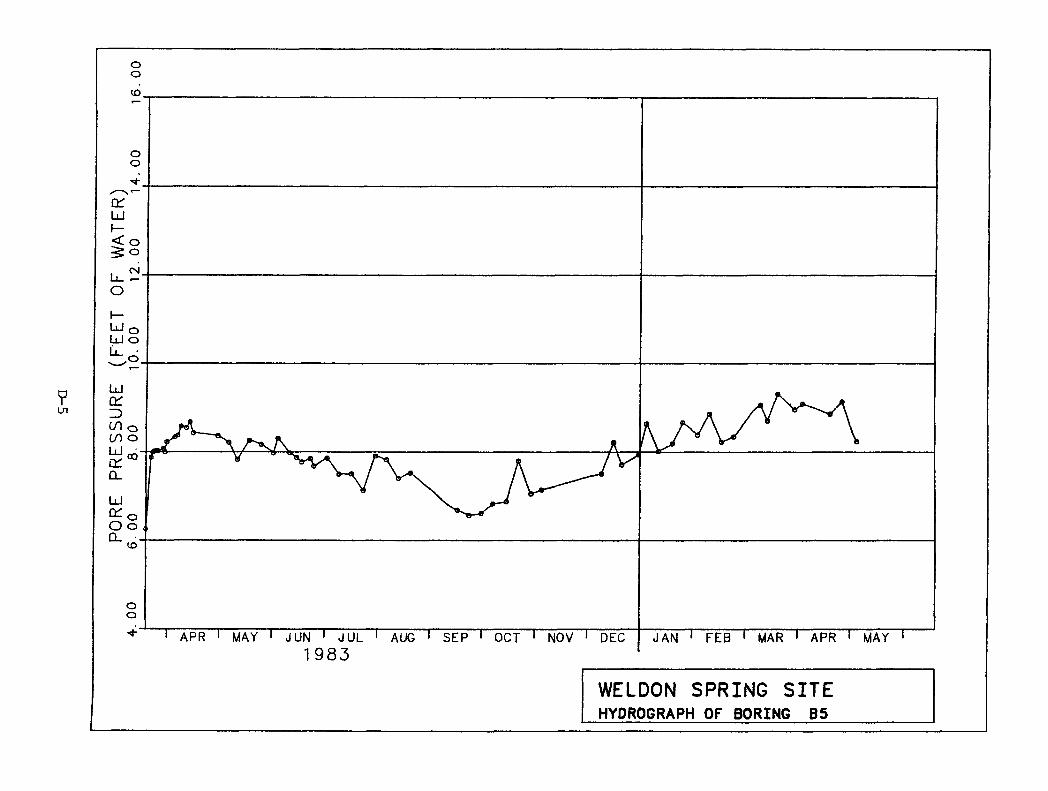
ooCD
Ld
< O5 O<N
LlJ q Ld Oo
Ld
in oin o
id
O o
o
1 9 8 3
WELDON SPRING SITEHYDROGRAPH OF BORING B5
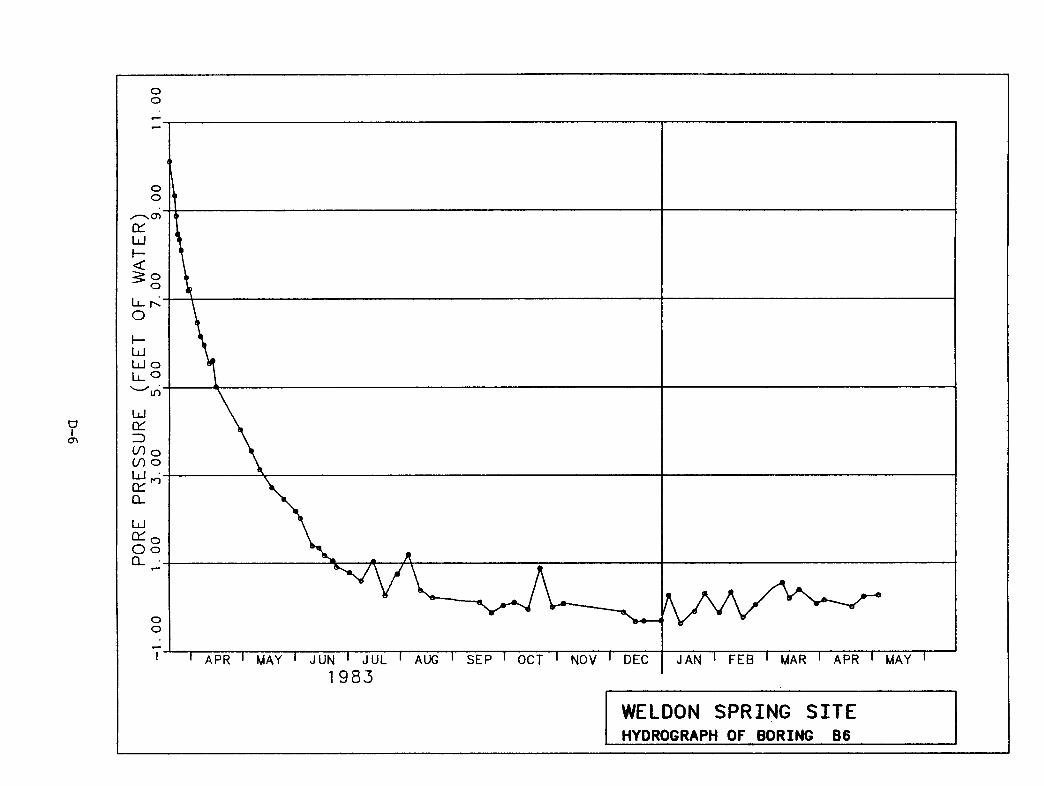
D-6
oo
oa>
Ld
Ll. K
LdLd O L_ o
Ld
CO o CO o
crQ_Ld
O O
o
1983
WELDON SPRING SITEHYDROGRAPH OF BORING B6
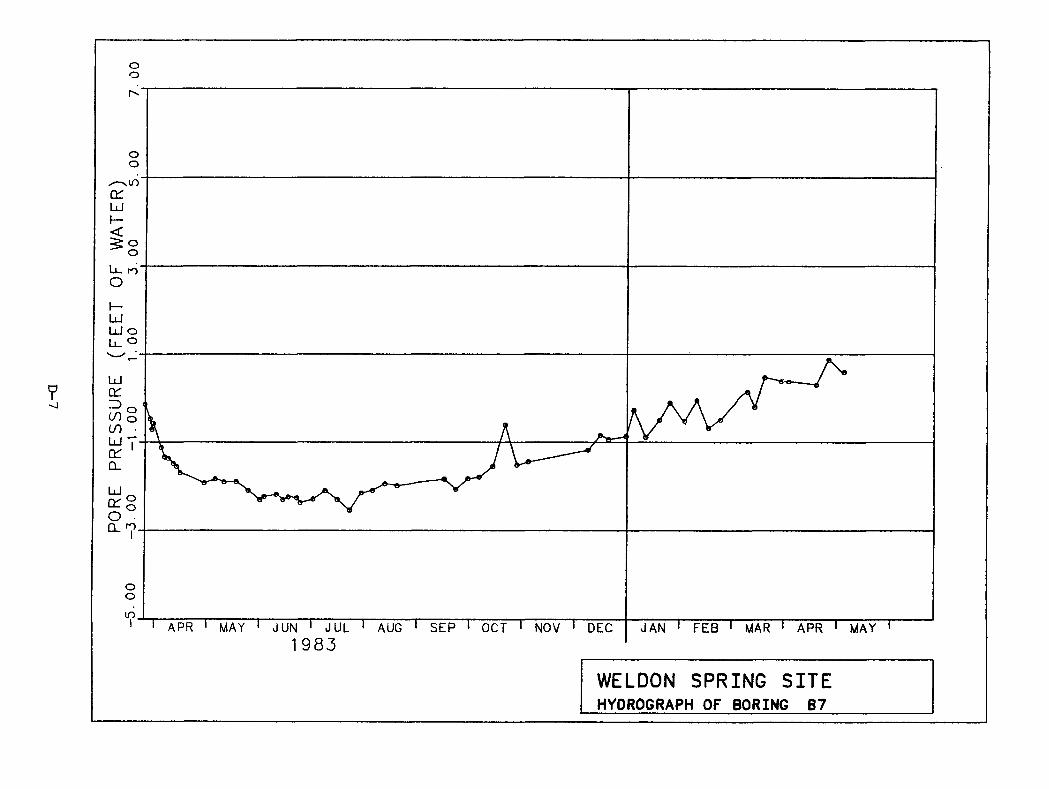
oo
ooinor
Ld
Ld o b_ o
Ld
CO §
Ld T
Ldo
CL 7
ooin
APR MAY JUN1983
WELDON SPRING SITEHYDROGRAPH OF BORING B7
oo
Ld
LdLd O li_°
Ld
CO §in ■Ld T
Ld
Q_ <7
1983
WELDON SPRING SITEHYDROGRAPH OF BORING B8
ELEV
ATIO
N (F
EET)
565. 00
570. 00
575. 00
580. 00
585. 00
590. 00
595. 00
MAY JUN SEP OCT NOV DEC JAN FEBJUL AUG JUN1 983
WELDON SPRING SITEHYDROGRAPH OF BORING B9
oo
o
LJI—
U - CM
UL J o Ij o
LJC T
CO o CO o
ooCM
APR MAY JUN AUG DECJUL1 983
WELDON SPRING SITEHYDROGRAPH OF BORING BIO
D-ll
ooo
o
inCM
oo
^ c o
LdLdLl. ox _ v O
in Z -o 10
< o > o
o
inoID
OO
APR MAY JUN JUL AUG1983
WELDON SPRING SITEHYDROGRAPH OF BORING B11
oo
ooi-o
C dLd
I—LdLd o L . o
LU
(/) o GO o
Ld ooCL V
oCM
19 8 3
WELDON SPRING SITEHYDROGRAPH OF BORING B12
DIt— 1 ui
ooin
o
ooin
I— 10LULUU_ o
< o > o
— I CN I i I ID
Oo
ooin
1983
WELDON SPRING SITEHYDROGRAPH OF BORING 614
D-14
ooo
in
o
LULULl. o
oto
<- o> O
—I o LU to
oin
oatin1983
WELDON SPRING SITEHYDROGRAPH OF BORING B16
oooC MCO
OO
inco
ooo
H co
LULULl. ov _ x O
in Z o O 10
< o> O
— I o LU co
oomCDm
ooocr>m SEP 1 OCTJUL AUG NOV DEC
1 9 8 3
WELDON SPRING SITEHYDROGRAPH OF BORING B17
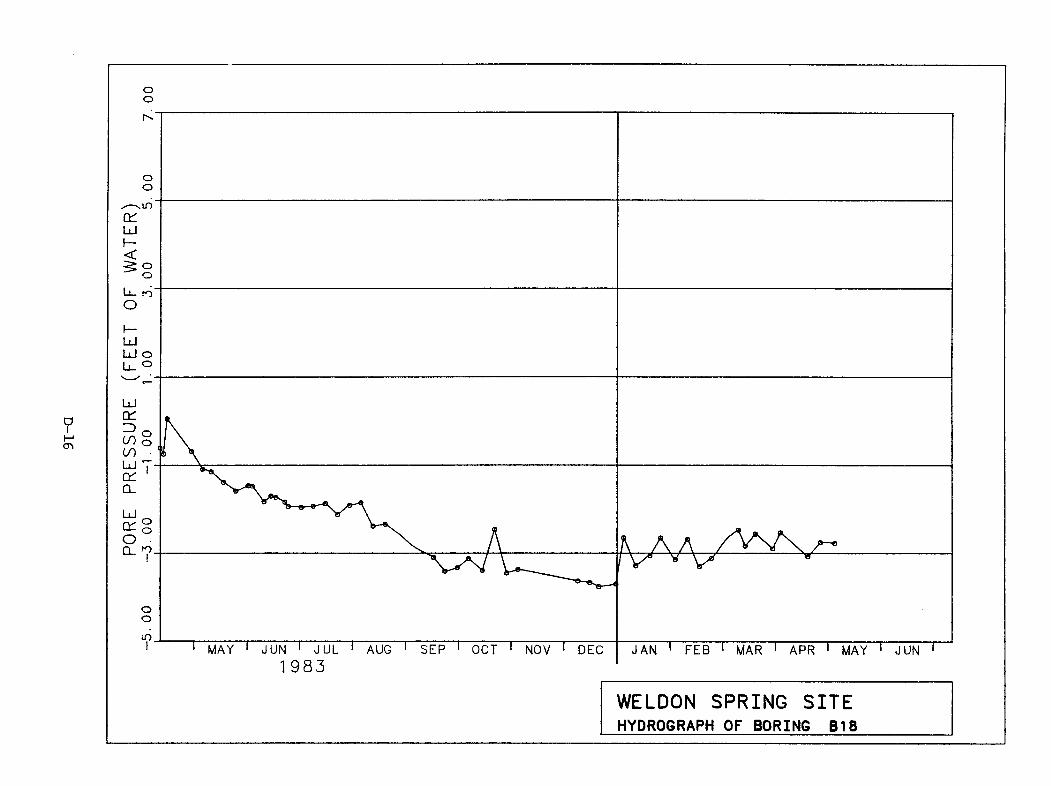
PORE
PRES
SURE
(FE
ET OF
WATE
R).00
-3.00
-1.00
1.00
3.00
5.00
o
mNOV 1 DECMAY JUN JUL
1 98 3
WELDON SPRING SITEHYDROGRAPH OF BORING B18
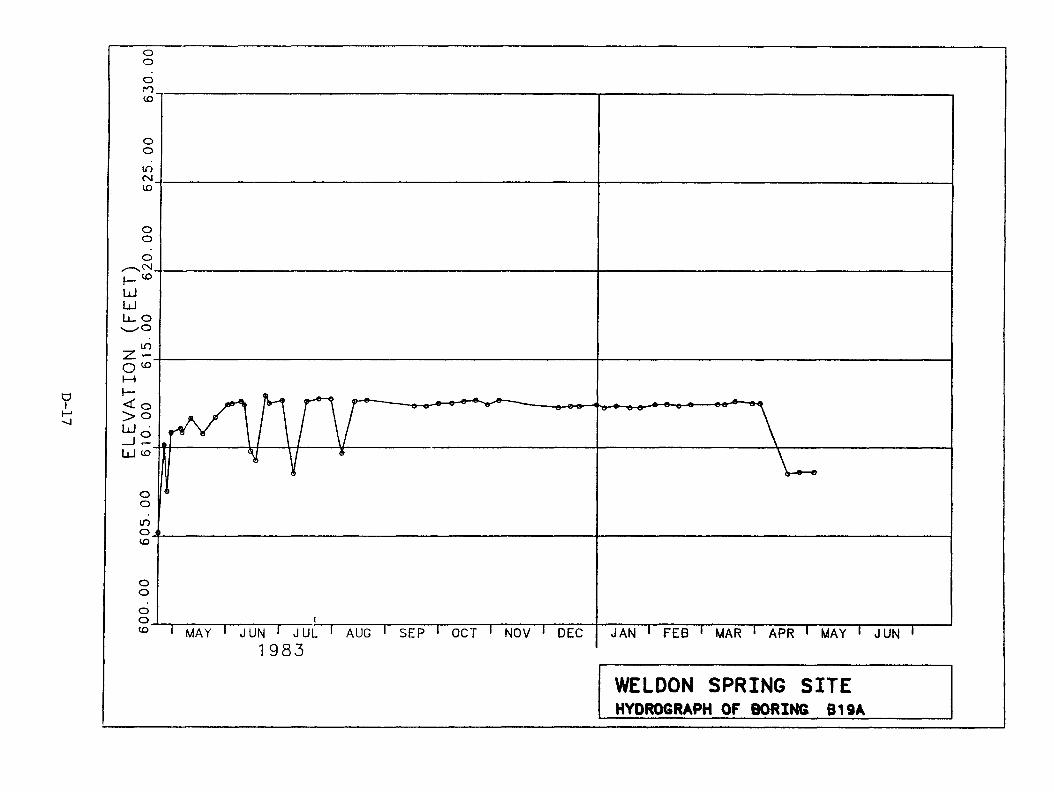
ELEV
ATIO
N (F
EET)
600.00
605.00
610.00
615.00
620.00
625.00
630.
00
1 9 8 3
WELDON SPRING SITEHYDROGRAPH OF BORING B19A
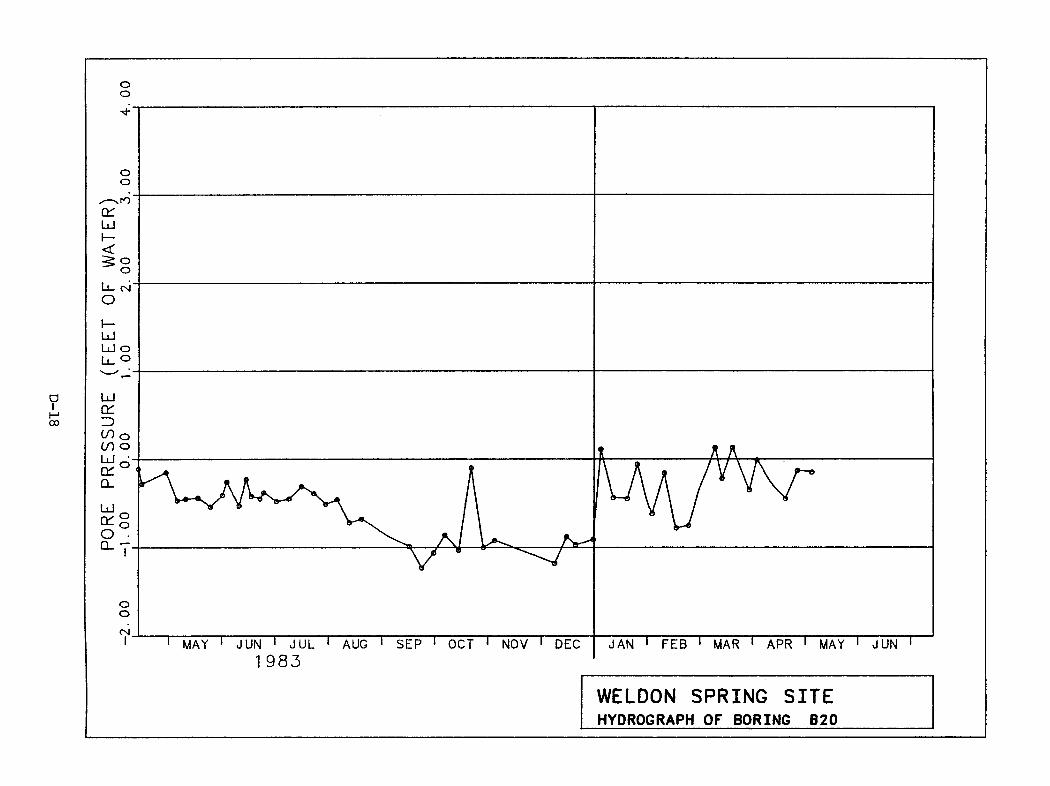
oo
ooC £Ld
U _ (M
LdLd O U-O
Ld
CO O CO oC £
Ldo
oo
19 8 3
WELDON SPRING SITEHYDROGRAPH OF BORING B20
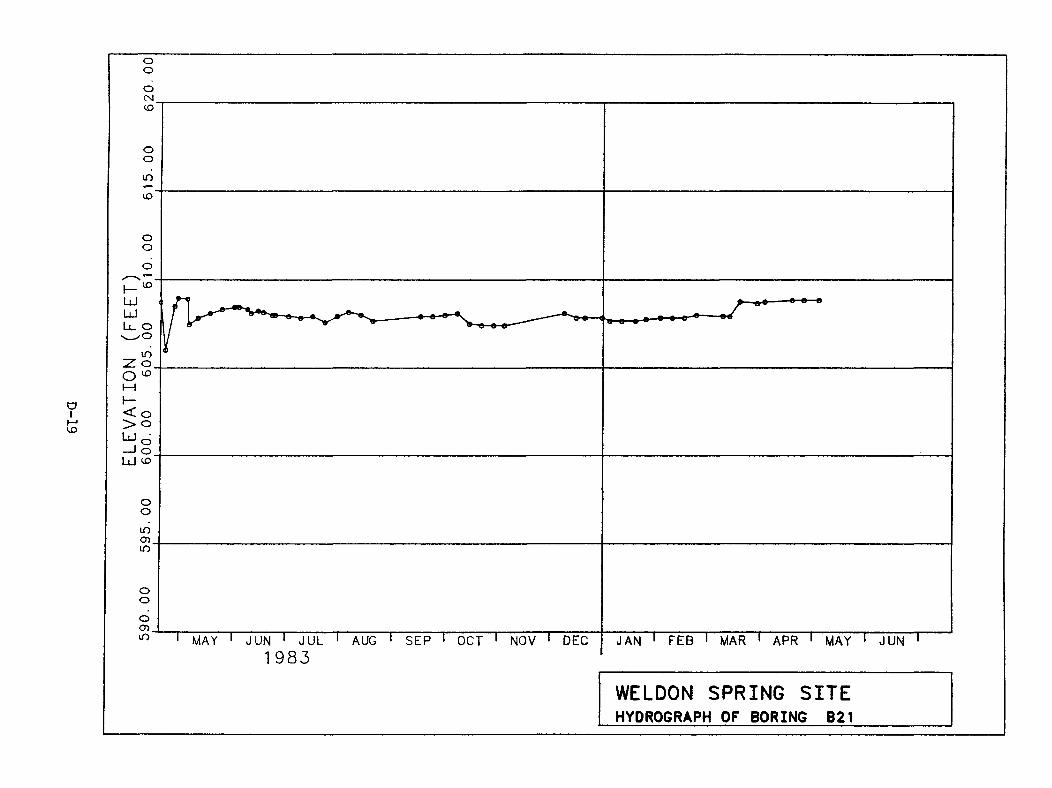
ELEV
ATIO
N (F
EET)
590.00
595.00
600.00
605.00
610.00
615.00
620.
00
MAY JUN AUG JUNJUL1 9 8 3
WELDON SPRING SITEHYDROGRAPH OF BORING B21
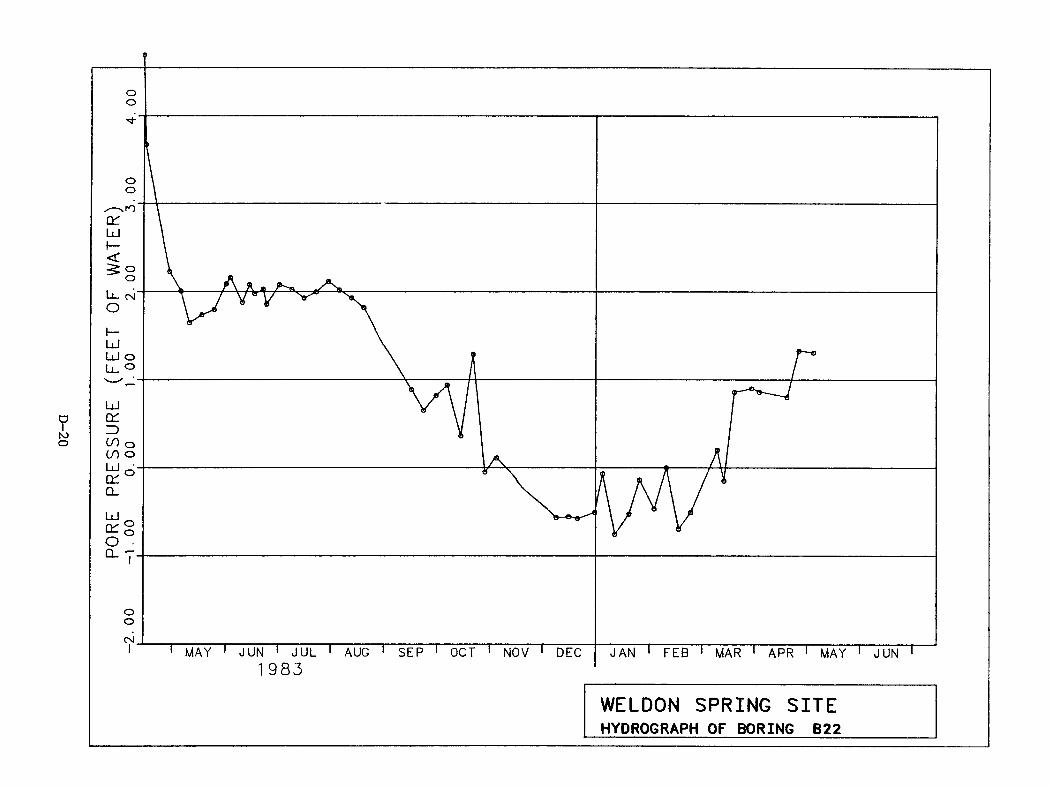
D-20
o
ooC d
Lu cn
LULU o Ll. o
LU
CO o if ) o
LU oo
ooCN
MAY JUN OCTSEP NOV DEC1 983
WELDON SPRING SITEHYDROGRAPH OF BORING B22
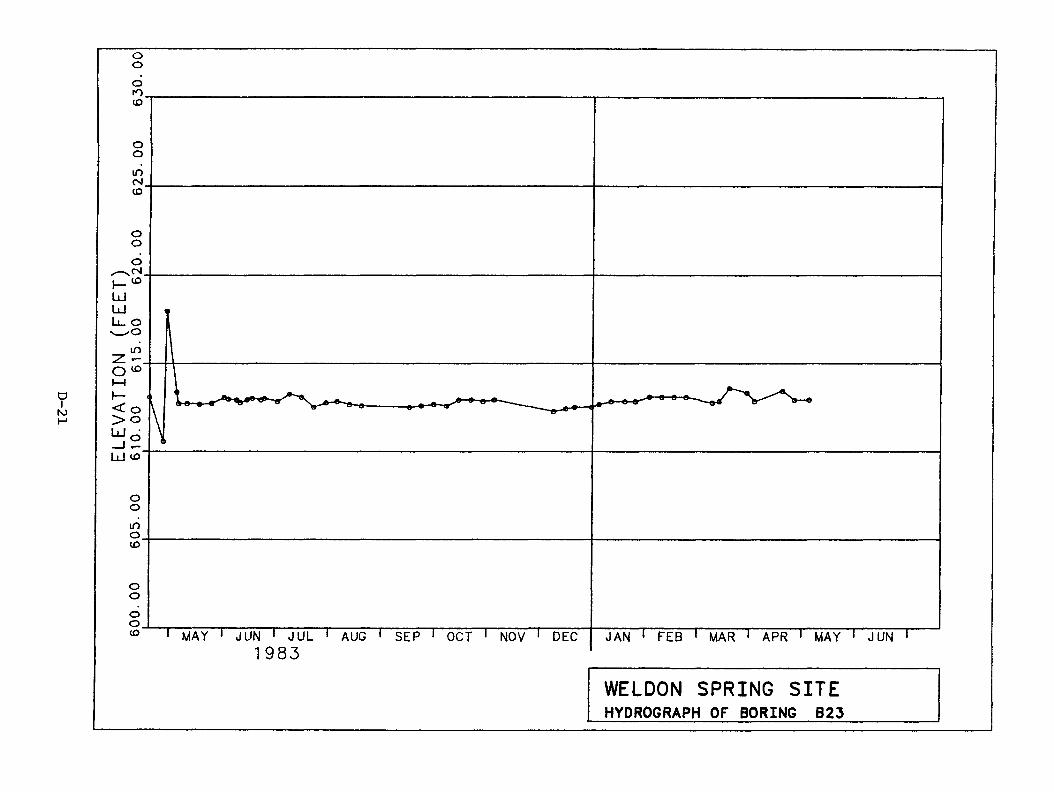
ooo
oin(O
LULULl. Oin
< o> O
LU <O
omoID
oo
1983WELDON SPRING SITEHYDROGRAPH OF BORING B23
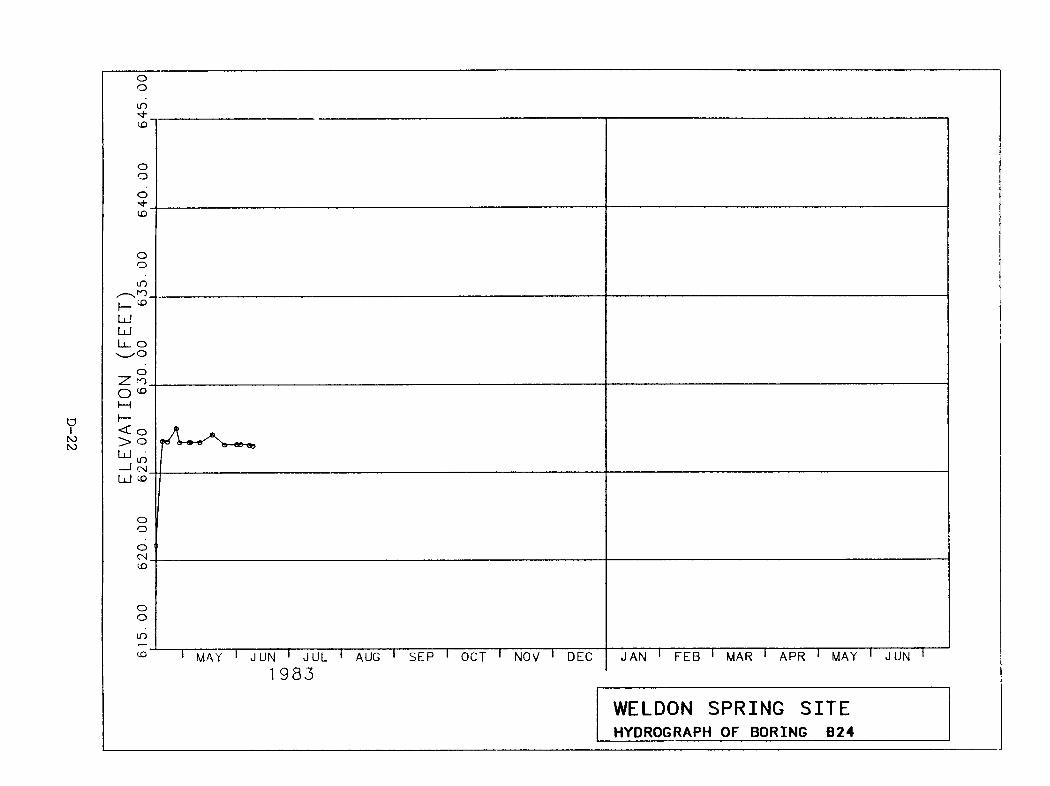
D-22
oom
o
LdLd oo
<L O > O Ld •
1 10 — I CMLd to
ooCNID
OO
inMAR MAY JUNJAN FEB APRJUL AUG
1983
WELDON SPRING SITEHYDROGRAPH OF BORING B24

APPENDIX E WESTON GEOPHYSICAL CORP. 1983 REPORT
GEOPHYSICAL MEASUREMENTS
U.S. DEPARTMENT OF ENERGY (D.O.E.) RAFF1NATE PIT SITE
WELDON SPRING, MISSOURI
Prepared for
BECHTEL NATIONAL. INC.
March 1983
Weston Geophysical■ ' C O R P O R A T I O N
E - l
TABLE OF CONTENTS
Page
LIST OF FIGURES i1.0 INTRODUCTION AND PURPOSE 12.0 LOCATION CONTROL 1
3.0 METHODS OF INVESTIGATION 23.1 Seismic Refraction 2
3.2 Electrical Resistivity 3
3.3 Self Potential 43.4 Magnetometer S
4.0 PRESENTATION OF RESULTS 6
4.1 Raffinate Pit Area 64.2 Summary of Magnetic and Resistivity Data for 6
Tentative Monitoring Well Locations "A"-"E"5.0 DISCUSSION OF RESULTS AND CONCLUSIONS 7
5.1 Raffinate Area 75.2 Summary of Magnetic and Resistivity Data 11
FIGURESAPPENDIX A SEISMIC REFRACTION SURVEY
METHOD OF INVESTIGATIONAPPENDIX B ELECTRICAL RESISTIVITY SURVEY
METHOD OF INVESTIGATIONAPPENDIX C SELF POTENTIAL
METHOD OF INVESTIGATIONAPPENDIX D MAGNETOMETER (TOTAL FIELD) MEASUREMENTS
METHOD OF INVESTIGATION
E-2
1
1
23456789
LIST OF FIGURES
Plan MapPlan Map - Tentative Monitoring Well LocationsSeismic Profiles Lines 1, 2, 3, 4, 5Seismic Profiles Lines 6. 7. 8. 9Seismic Profiles Lines 10. 11, 12Summary of Geophysical Data - Raffinate Pit AreaGeophysical Data Tentative Monitoring Well "AGeophysical Data Tentative Monitoring Well "BGeophysical Data Tentative Monitoring Well "CGeophysical Data Tentative Monitoring Well "DGeophysical Data Tentative Monitoring Well “E
E-3
1.0 INTRODUCTION AND PURPOSEA geophysical survey program was conducted for Bechtel
National. Inc. at the U.S. Department of Energy (DOE) Raffinate Pit Site in Weldon Spring, Missouri during the period of December 13 to 18, 1982.
The survey program consisted of geophysical measurements obtained using seismic refraction, electrical resistivity, self potential and magnetometer survey procedures. The purpose of the survey program was to characterize this site in terms of overburden depths and velocities, depth to groundwater, general foundation characteristics and, in the case of the tentative monitoring well locations. the location of abandoned process lines.2.0 LOCATION AND SURVEY CONTROL
The general location of the survey is shown on the Location Plan which is included on the Plan Map, Figure 1.
The specific locations along or at which measurements were made in the Raffinate pit area are shown on the plan m a p ,Figure 1.
The tentative monitoring well locations "A"-"E" are shown on Figure 1-A. The plan maps were prepared by Weston Geophysical from base maps provided by Bechtel National. Inc.
Horizontal control was established by Weston's field crews
during the course of the fieldwork. Vertical control was approximated by Weston's field crew using field observations of ground topography and available vertical control existing at this site.
E-4
- 2 -
3.0 METHODS OF INVESTIGATIONIn the Raffinate pit area. geophysical measurements were
made using seismic refraction, electrical resistivity and self potential procedures.
At the tentative monitoring well locations, geophysical measurements were made using electrical resistivity and magnetometer procedures.
Appendices A through D are descriptions of the geophysical techniques utilized in this study. Since these descriptions are general in nature, they may not cover all the specific
details of a particular study.3.1 Seismic RefractionSeismic refraction data were obtained utilizing 12-trace.
300-foot spreads.
The seismic system used during this survey consisted of a Universal Seismic Amplifier. Model 780, manufactured by Weston
Geophysical Corporation and a recording oscillograph.
Model PRO-11, manufactured by Southwestern Industrial Electronics Company. The seismic spreads were shot in an end
to end manner resulting in almost continuous coverage around the Raffinate pit area as shown on Figure 1. Due to the confining limits of the site perimeter fence, overlapping spreads were necessary on the high station ends of Lines 1 and 11. Seismic energy was generated with a seisgun at the ends an d . in some cases, at the center of each spread. The
E-5
- 3 -
individual seismic spreads and the shot point locations on each spread are indicated on the plan map. Figure 1 and on the seismic profiles. Figures 2-4. Shot point locations at the ends (E) of each spread, and the center (C) of each spread if utilized are also indicated on Figures 1-4. The measurements made at each shot location were used to determine the compressional (P) wave velocities and evaluate subsurface structure in terms of depth. Shooting at both ends of the seismic spread (reversed shooting) aids in the interpretation of possible apparent velocities as related to dipping interfaces. Center shots were used in areas where additional travel time data was desired. Effective penetration using the 300-foot spreads is in the order of 80 to 120 feet. A discussion of the basic seismic refraction technique and equipment is included as Appendix A to this report.
3.2 Electrical Resistivity
Electrical resistivity measurements were made utilizing vertical electrical sounding procedures. The instrumentation
used in this survey was the Bison Earth Resistivity Meter.
Model 2350, manufactured by Bison Instruments. Inc. This instrument has an accuracy of +2 percent. Vertical electrical sounding measurements called point tests, are made by expanding an electrode array away from a central point. The point tests
were centered at approximately 200-foot intervals around the site perimeter as shown on Figure 1. Measurements were made as
E-6
- 4 -
the electrode array was expanded from a centerpoint to electrode spacings called "a" spacings of 2.5, 5, 7.5, 10, 20, 30 and 50 feet. At point test locations 6A. 18A, 30A and 31A the electrode array was expanded beyond a 100-foot "a" spacing resulting in an overlap with adjacent point test arrays.
The measured resistivity values are apparent since they represent the average resistivity of the various layers within a half-space whose dimensions are defined by the electrode separation. As the electrode or "a" spacing increases the
effective depth of penetration increases. Depths of penetration are greatly affected by the resistances of layers being measured, i.e., a low resistivity (highly conductive)
layer will greatly reduce the depth of penetration The effective depth of penetration for this resistivity survey is estimated to be 100-150 feet for point tests with maximum "a" spacing of 300 feet (the maximum "a" spacing used in this survey) and 25-50 feet for point tests with maximum "a" spacing of 50 feet. The resulting plot of apparent resistivity values
versus electrode spacing therefore indicates the variation of
resistivity with depth. The Wenner electrode configuration was used for point test measurements. A discussion of the electrical resistivity technique is included as Appendix B to this report.
3.3 Self PotentialSelf potential measurements were made utilizing an
electrode array connected to a D.C. Voltmeter. The voltmeter
E-7
- 5 -
used was the Soil Test Strata-meter Receiver, Model R-50. manufactured by Soil Test, Inc. Spontaneous ground potentials are measured as one electrode is moved to successive stations away from a fixed base electrode. The electrode arrays are oriented perpendicular to the suspected feature.
Self potential measurements are surface measurements
related to surface or near-surface conditions. The type of condition detected at this site is a background potential as opposed to mineralization potentials associated with ore bodies. Background potentials include potentials resulting
from fluid streaming, bioelectric activity and variations in
electrolytic concentrations in the overburden water. Depth
penetration is dependent on the magnitude of the anomaly and cannot be directly calculated. A discussion of the self potential technique is included as Appendix C to this report.
3.4 Magnetometer
The magnetometer used during this survey was the Portable
Proton Magnetometer. Model G-816, manufactured by Geometries.
This instrument has an accuracy of +1 gamma. Measurements of total magnetic field intensity were made at tentative monitoring well locations "A"-"E". Data were obtained at each site along two. approximately perpendicular, lines intersecting at the tentative well location. A discussion of magnetometer
technique is included as Appendix D to this report.
E-8
- 6 -
4.0 PRESENTATION OF RESULTS4.1 Raffinate Pit AreaThe results of the seismic refraction survey are presented
as profiles on Figures 2. 3 and 4. Seismic velocity values for the various layers and the approximate elevations of these interfaces are indicated on the profiles. A summary of the seismic data also appears on Figure 5 entitled "Summary of Geophysical Data".
The results of the resistivity and self-potential surveys are also shown on Figure 5. Resistivity values for the materials below the top layer are shown; correlation of resistivity data with seismic data is also indicated. Reduced copies of the resistivity computer models have been included, for illustration, in Appendix B as Figures B-l through B - 8 .
Copies of the SP profiles are included in Appendix C as
Figures C-l through C-4. Reduced copies of these profiles are
shown opposite each test location on Figure 5.4.2 Summary of Magnetic and Resistivity Data for
Tentative Monitoring Well Locations "A"-"E"The results of the magnetometer survey at each tentative
well location are shown as profiles. Figures 6-10. The
interpretation of the magnetometer data for this survey is based on the knowledge that magnetic anomalies, data values which deviate either up or down from a consistent magnetic field condition, would be observed in the presence of magnetic objects in the overburden or above ground surface. Survey
E-9
- 7 -
requirements do not necessitate consideration of topography, magnetic susceptibility, remanent magnetism and diurnal variation. The results of the resistivity survey conducted at each of the individual locations is also indicated on Figures 6-10.5.0 DISCUSSION OF RESULTS AND CONCLUSIONS
5.1 Raffinate AreaThe seismic refraction data shown in profile form on
Figures 2, 3 and 4 is summarized on Figure 5. The velocities of the seismic layers below the near-surface low velocity layer
are shown on Figure 5. Bedrock velocities generally range from
11.000 to 13,000 ft/sec except along the northern edge of the
site where the velocities locally drop to 9,000 and 10.500 ft/sec along portions of lines 10 and 11. This slight velocity decrease is most likely indicative of a slight increase in weathering of the bedrock although a change in lithology could have a similar affect. At some locations along Lines 8 and 9.
an intermediate velocity of 6,500 to 8,000 ft/sec was
measured. This velocity is thought to be indicative of weathered bedrock. The lower velocities measured for rock are
the result of an increase in the number of joints and fractures
and/or chemical weathering. In all cases weathering causes a decrease in bulk density resulting in a lower seismic velocity. The localized slightly lower velocity detected on Line 5. in the vicinity of Station 1+50 is indicative of slight weathering or a depression in the bedrock surface.
E - 10
- 8 -
The seismic velocities of the uppermost layer as shown on Figure 5 shows a wide variation of 2.000 to 5,400 ft/sec. This wide variation in velocity may be due to the degree of saturation of the overburden material or perhaps changes in the physical characteristics of the material either naturally occurring or induced by weathering.
Resistivity values measured around the site are uniformly characterized by a three-layer condition consisting of a thinsurface layer with resistivity values generally between 60 and150 ohm feet, a relatively thick intermediate layer which has uniform resistivity values in the range of 30 to 50 ohm feet except at the eastern end of the site where the values drop to 13 to 25 ohm feet, and a high resistivity layer (greater than1.000 ohm feet) at depth. The surface resistivity layer(generally 60 to 150 ohm feet) correlates with the upper
section of the 1200 to 1800 ft/sec surface layer detected by
the seismic refraction survey. The relatively thick
intermediate resistivity layer correlates with the uppermost seismic layer indicated on Figure 5 which has seismic velocities ranging from 2000 to 5400 ft/sec.
The lower resistivity values (13 to 25 ohm feet) detected at the eastern end of the site may indicate a greater degree of saturation, a change in the mineral or chemical content of the subsurface water or a change in the subsurface material
itself. Seismic refraction and electrical resistivity methods
E— 11
- 9 -
are proven techniques used to determine the presence of groundwater. Totally saturated overburden conditions will usually result in a seismic velocity within the narrow range of
4800-5200 ft/sec. The resistivity technique depends on a change in conductivity due to the physical characteristics of the saturated overburden and water quality (ionic concentrations). A totally saturated overburden condition is not considered the most probable cause for the low resistivity values measured at the eastern end of the site since a 5000
ft/sec seismic velocity, indicative of saturated overburden
conditions, was not measured. Small confined saturated zones
or lenses within the overburden may exist but are undetectable
given the resolution of the seismic technique. However, it should be noted that the seismic velocities generally range from 3400 to 4000 ft/sec in the eastern part of the site.
These velocities are somewhat higher than measured at other locations around the site and may reflect a slight increase in degree of saturation in this area.
The low surface resistivity values measured at RT-36 and RT-37 appear to correlate with surface water observed at these locations. Further correlation with water related conditions
is indicated by the self potential data at locations of SP-1 and SP-2. The data plots for these SP locations show potential
reversals, negative anomalies across wet areas which are characteristic of fluid streaming. These negative anomalies.
E - 12
- 10 -
characteristic of fluid streaming, are the result of the
leaching of ions from the surrounding material and the subsequent concentration of those negative ions in the flowing
water. This can occur on the surface or in subsurface permeable materials. At RT locations 29. 30 and 32 similar low resistivity values are indicated for the subsurface layer. Wet ground surface conditions were observed in the area of RT-29
and RT-30 but not at RT-32. Although a correlation with existing surface water conditions appears likely, it cannot be
stated unequivocally to be the controlling factor. Variation in water chemistry or overburden material could also be a factor. It should be noted that seismic velocities measured in this area are not indicative of a totally saturated overburden material.
At many locations, the top of the high resistivity layer
(greater than 1000 ohm-feet) shows a reasonable correlation with the top of bedrock, that is. the high velocity bedrock determined by the seismic refraction survey. At other locations, such as along lines 8 and 9. the top of the high resistivity layer generally correlates with the top of the
weathered rock layer with a seismic velocity of 6.500 to 8,000
ft/sec, and in a number of other locations, the top of the high
resistivity layer is above the top of the high velocity bedrock as determined by the seismic refraction survey. In these latter locations, it is likely that the resistivity data
E - 13
- 11 -
indicate the top of a weathered rock layer which is too thin to be detected seismically. For example. the resistivity data along Line 6 indicates that the top of the greater than 1000 ohm feet layer is up to 20 feet above the high velocity bedrock determined by the seismic refraction survey. Based on the correlations established along Lines 8 and 9 where 25 to 50 feet of 6.500-8,000 ft/sec was detected, it is interpreted that a weathered rock layer up to 20 feet thick is present above the hard rock layer (velocity of 12,000 ft/sec) on Line 6.
A notable exception to the uniform resistivity layering described above occurs at the locations for point tests RT-36 and RT-37 in the vicinity of Line 1. At these locations, the
resistivity values of a near-surface layer are very low. approximately 16 to 17 ohm feet. Self potential data along lines SP-1 and SP-2 also show some wide variations including negative self-potentials which are indicative of an anomalous condition such as a wet surface condition or possible seepage. The self-potential data along lines SP-3 and SP-4 are generally
uniform and are not indicative of anomalous conditions.
5.2 Summary of Magnetic and Resistivity DataTentative Monitoring Wells "A11- 1 "
"A" The proximity of buildings and fences has adverselyaffected the magnetic data (large gradients) such that no conclusions on subsurface conditions can be made; accordingly no recommendations can be made as to
E - 14
- 12 -
drilling at this tentative well location. Resistivity data at this location indicate a very low resistivity layer/feature which could be due to the presence of a conductive material such as a metal pipe. Due to the anomalous condition at this site an accurate computer model could not be obtained; accordingly the resistivity data for this location, presented in Appendix B on Figure B-l, shows one curve which is a
plot of the field data."B" This tentative well location appears to be located on
the edge of a magnetic anomaly to the Southeast. It
is recommended that the well location be moved to the Northwest where the magnetic field is fairly uniform. No anomalous condition is indicated in the resistivity data at this location. The anomalous condition indicated by the magnetometer data is the result of
the normal magnetic field being disturbed by a magnetic source at some distance from the proposed
boring location. The influence of the magnetic source increases as the source is approached. The resistivity data is essentially a vertical profile
centered at the proposed boring location and is not affected by a metallic magnetic source at some distance from the point test location.
E - 15
- 13 -
"C" This tentative well location is in an area where the magnetic field is uniform. No anomalous condition is indicated in the resistivity data at this location.
"D" This tentative well location appears to be located on the edge of a magnetic anomaly to the north. It is recommended that the well location be moved 20 feet south where the magnetic field is fairly uniform. No anomalous condition is indicated in the resistivity data at this location. The interpretation of the magnetic vs. resistivity conditions at this location
is similar to that at location B. Anomalous magnetic condition indicated at the northwest end of the northwest-southeast profile are probably due to the
steel fence approximately 80 feet northwest of the proposed boring location. The slight decrease in
magnetic values centered at the 40-foot station on the northeast-southeast profile appears to correlate with a wooden platform nailed to a tree only a few feet to the northwest. Although these anomalous magnetic conditions appear to correlate with cultural features described above, interference from subsurface magnetic materials may be involved. The presence of fill and asphalt did not appear to have influenced the magnetometer data at this location.
E - 16
- 14 -
"E" This tentative well location appears to be nearly
centered between magnetic anomalies to the N.W. and S.E. It is recommended that the well location be
moved 15 feet to the east where the magnetic field is fairly uniform. The resistivity data at this location indicates an irregularly layered subsurface
condition. The irregularity in the data may be due to
fill debris buried at this location. Due to the anomalous condition at this site, an accurate computer model of the subsurface condition could not be obtained; accordingly, the resistivity data for this location, presented in Appendix B on Figure B-l. shows
one curve which is a plot of the field data.
E - 17


FIGURES
E-19

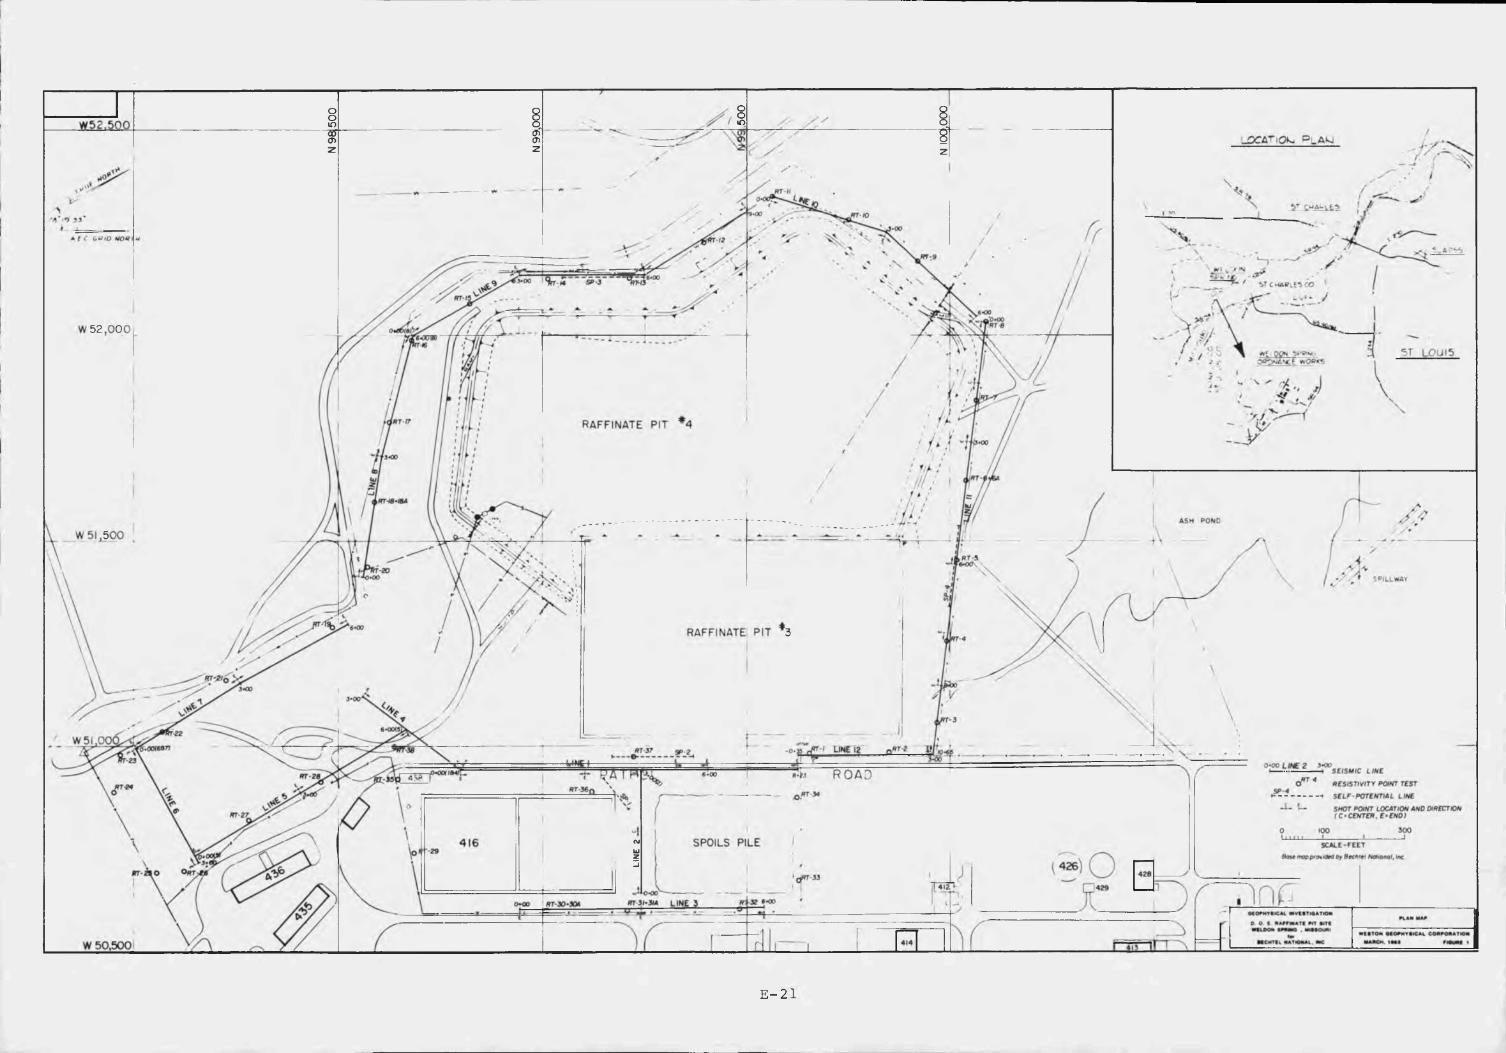
II
I
I
I
moo
J 2 C L T Qk. P . A k j
••to
GV'O ■f?
SP 3
uvt*
W 5 2 ,0 0 0
x y , V >
RAFFINATE PIT1*00
W 5 ,5 0 0
>
RAFFINATE PIT v3
r-22W 51
■Q., ^ L IN C .2t?T 3 7 O---- 9P2
0*00 L I N E 2 3*00S E I S M I C L I N EROADR E S I S T I V I T Y P O I N T T E S T
S E L F P O T E N T I A L L I N E
S N O T P O I N T L O C A T I O N A N D D I R E C T I O N ( C ■C E N T E R , E ' E N D I
300100
SPOILS PILE416 SCALE-FEET
So»emopp#o»idpd Secret No»*onot, »«c29
426
4 1 4W 50.500
E-21
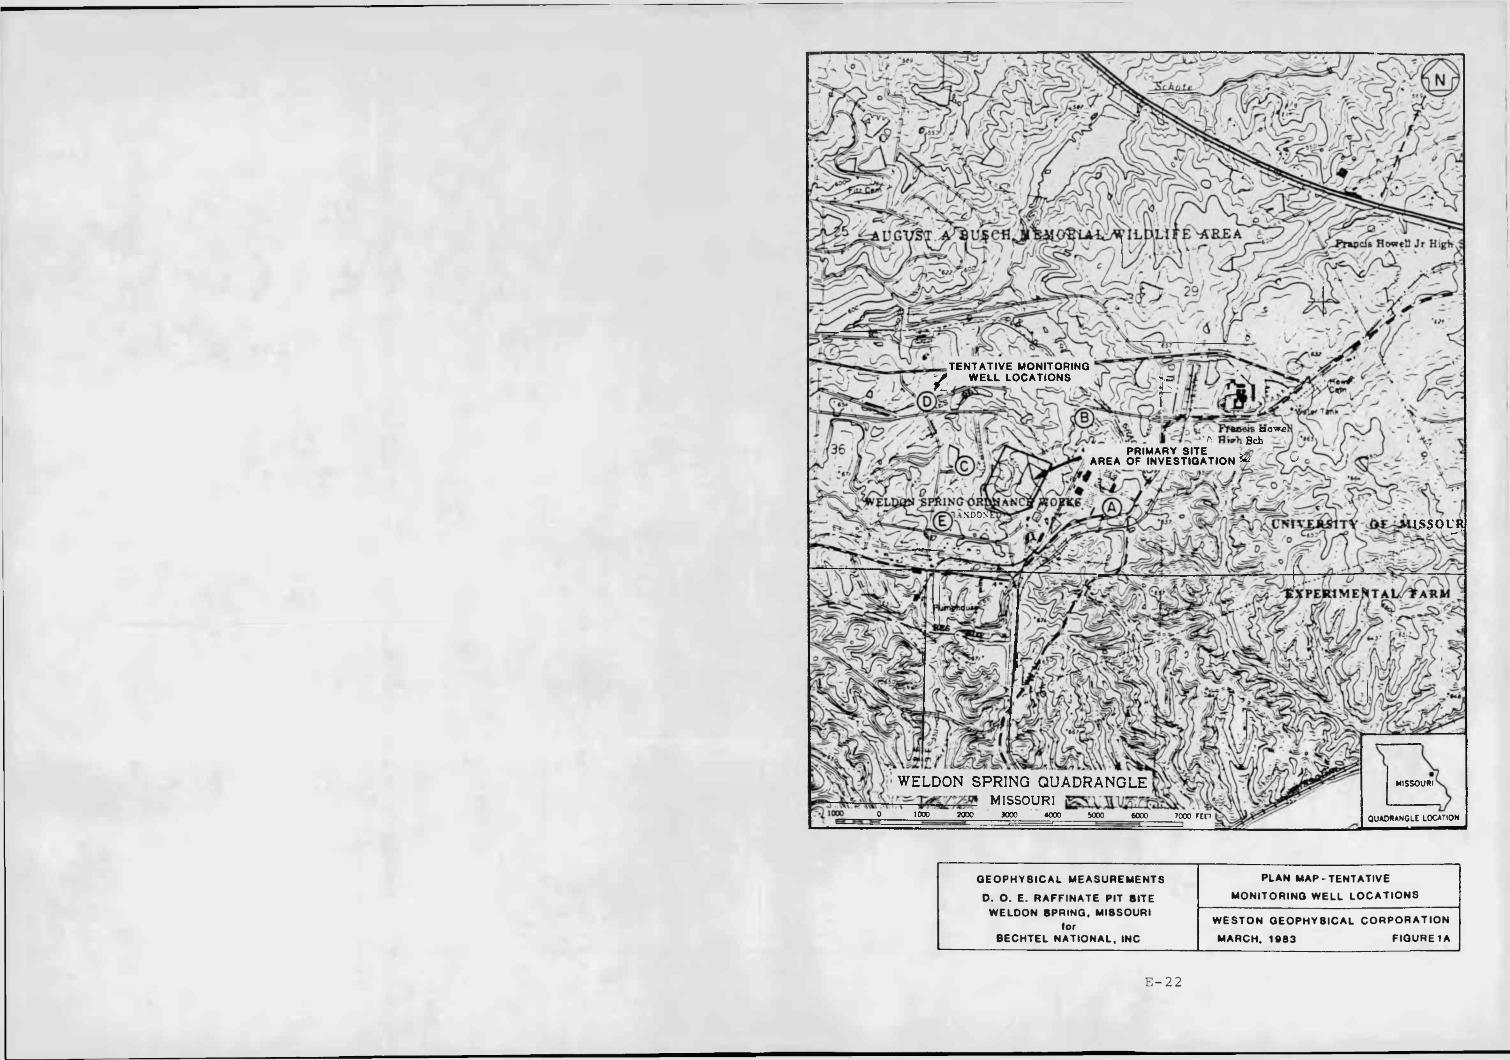
^-Prmpds HowttJ Jr Hig+t i
TENTATIVE MONITORING WELL LOCATIONS
PRIMARY SITE AREA OF INVESTIGATIONt y- i
ClAXDOSlA S O U RU N IV .
\srte / 1WELDON SPRING QUADRANGLEggh
M i s s o u r i
MISSOURI
QUADRANGLE LOCATION
GEOPHYSICAL MEASUREMENTS
D. O. E. RAFFINATE PIT SITE WELDON SPRING. MISSOURI
lorBECHTEL NATIONAL. INC
PLAN MAP-TENTATIVE
MONITORING WELL LOCATIONS
W ESTON GEOPHYSICAL CORPORATION
MARCH. 1083 FIGURE 1A
E- 22
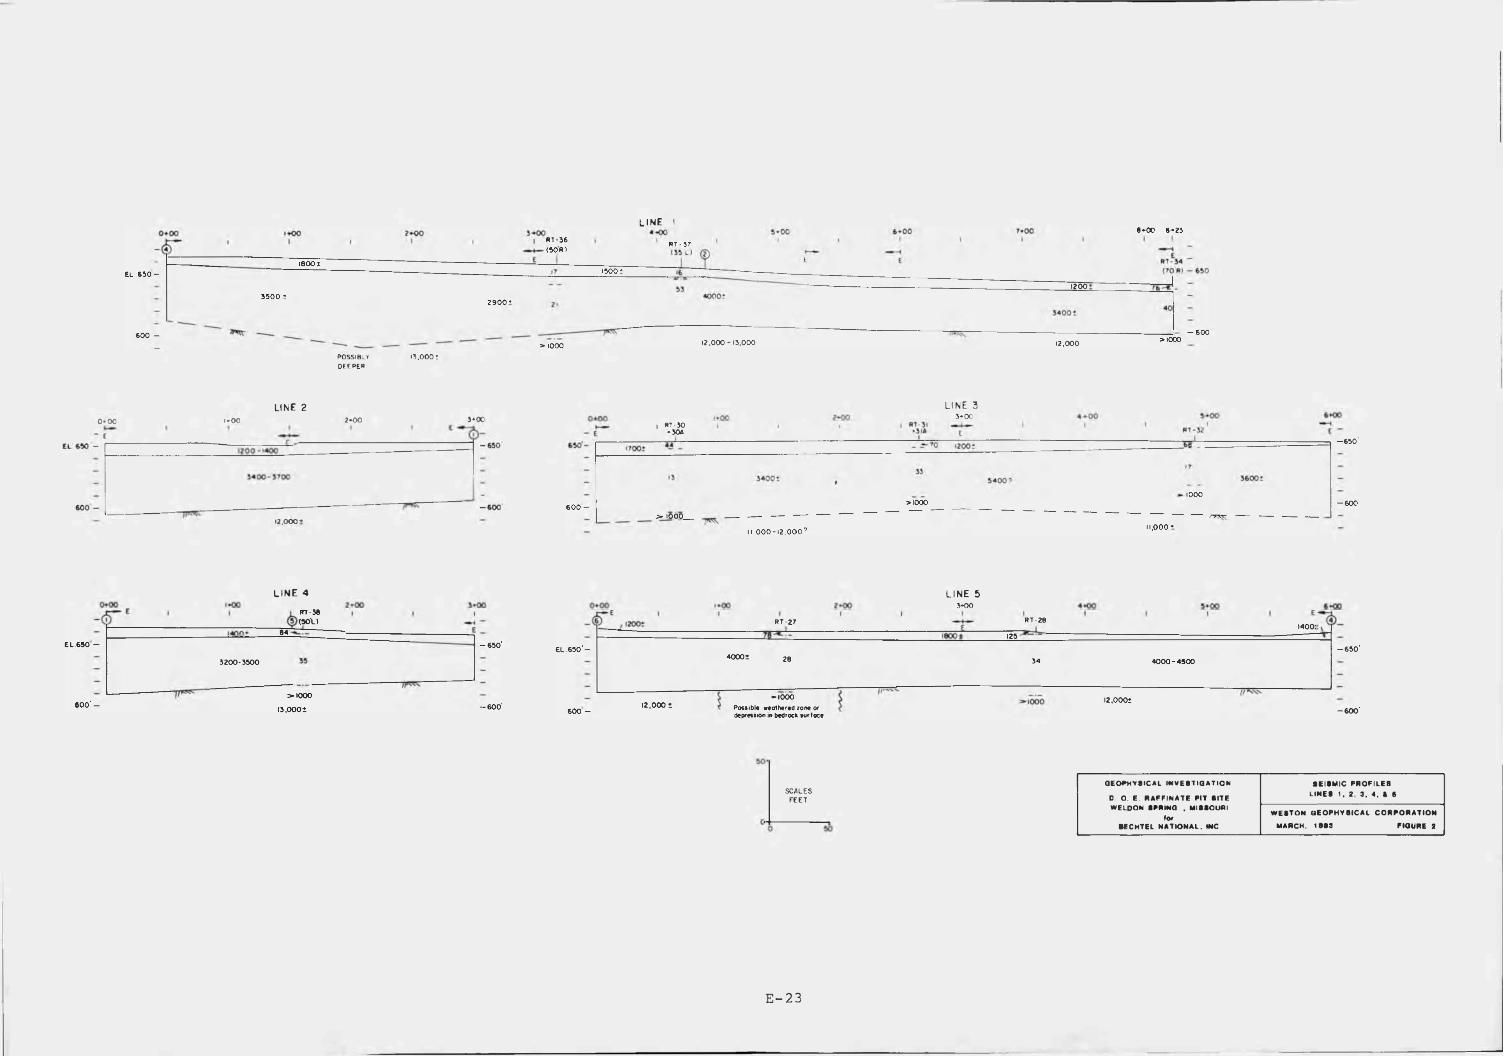
LINE 10*00
-<rR T -5 4 _
(T O * ) - 6 5 018 0 0 1
1500El 6 5 0 -
12003 5 0 0 1
2 9 0 0 * <
- 6 0 06 0 0 - >10001 2 .0 0 0 -1 3 ,0 0 0 12,000> 1000
POSSIBLY 1 3 ,0 0 0 !DEEPER
0*00
• c
LINE 21*00 2*00 >•00
*
12,000 *
LINE 33 * 0 0
- 6 5 0
1000>1000 - 6 0 0
6 0 0 - j6o$_11,000 *II,0 0 0 -12,0 0 0 7
LINE 4
RT-36(SO L)
84
E L 6 5 0 -
3 2 0 0 -3 5 0 0
>10006 0 0 ' - - 6 0 0 '1 3 ,0 0 0 1
LINE 53 *0 0
RT 20R T -2 7
aoc t 125
EL 6 5 0 ' -28 4 0 0 0 - 4 5 0 0
>1000 Possible weoihered zone or depress ton in bedrock svrtoce
12,000112,0001- 6 0 0 '6 0 0 -
SCALESFEET
GEOPHYSICAL INVESTIGATIOND. O. E. RAFFINATE PIT SITE WELDON SPRING , MISSOURI
torBECHTEL NATIONAL. INC
SEISMIC PROFILESLINES 1. 2. 3, 4. 4 6
WESTON GEOPHYSICAL CORPORATION MARCH. 1883 FIGURE 2
E- 23
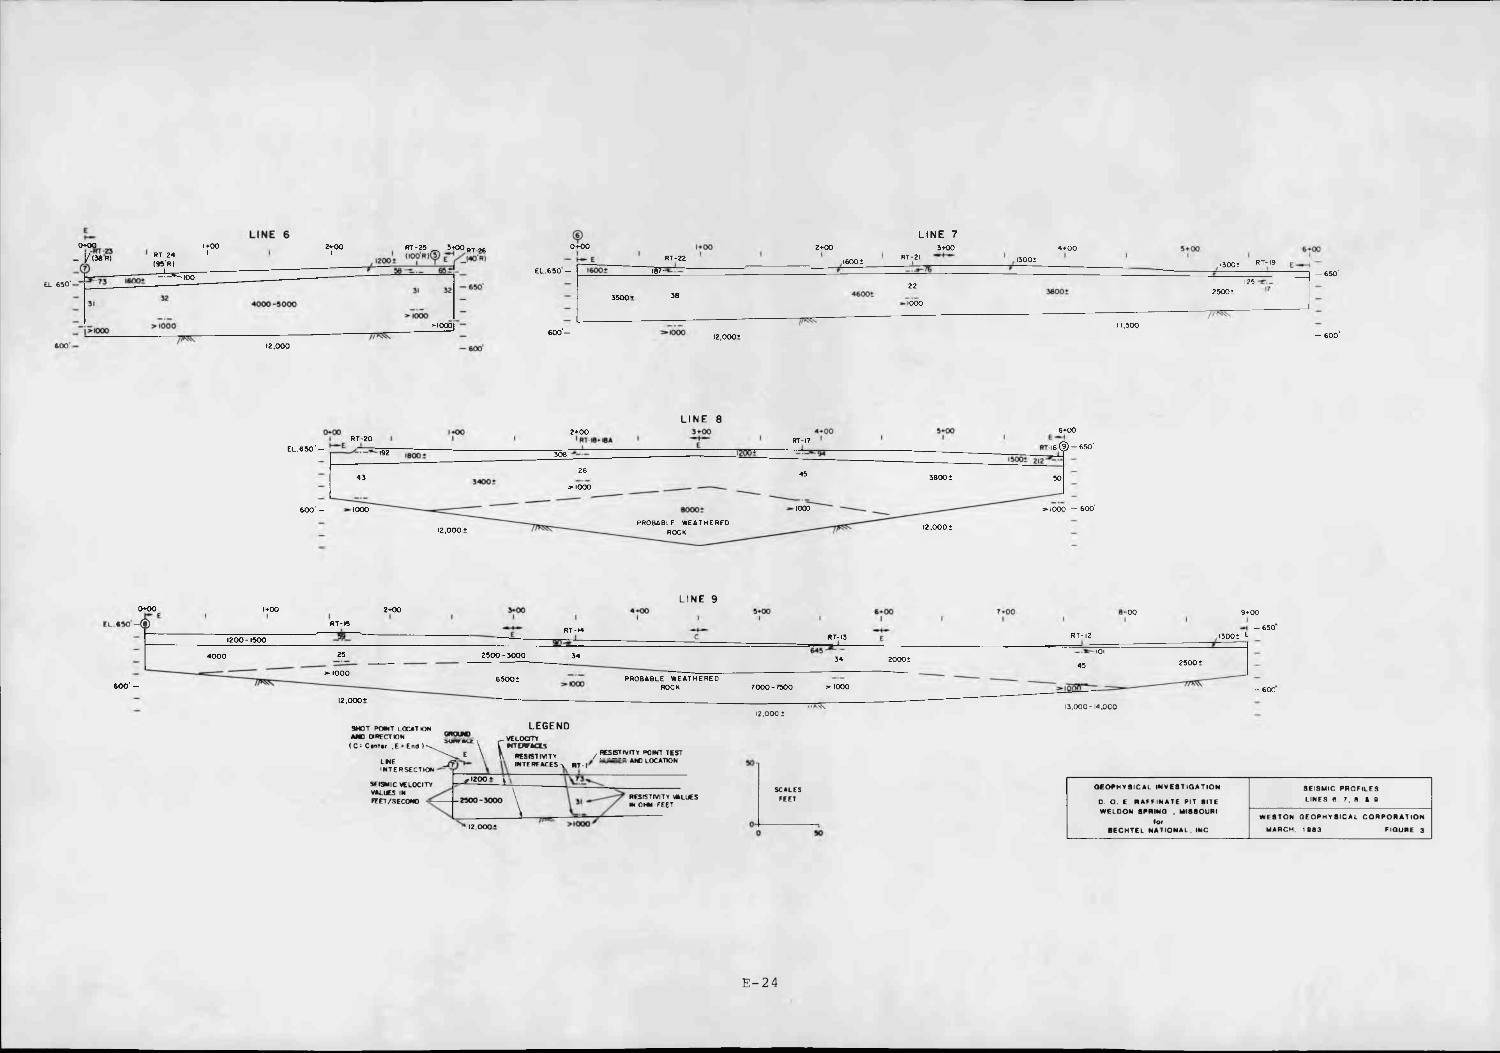
E L.650 '
6 0 0
L IN E 73+ 0 00+00 2+00
RT-21RT-22 130011600+ RT-1913001EL.650' — 187 g - — 650'125 - r _22
383500+1000
11,5006 0 0 - - 600 '
1+00 RT *25 ^ 3+00 p-f 5^"0 0 " I W ? V > c S |RT-24
(95'R) 1200 +100
— 6 5 0 '
4 0 0 0 - 3 0 0 0
10001>•000
12,000 — 600
L I N E 86+00
E — <RT 16 ( 9 ) - 6 5 0 '
4 * 0 00*00 E L . 6 5 0 ' - * 1
R T - 2 0 RT-17
192
26 45 3 8 0 0 + 50
3* (000 — 600'10006 0 0 - 1000
PROBABLE WEATHERED ROCK
12,000 +12,000 +
L IN E 90+00 6*00 7 *0 0 *-oo 9 >00
E L 6 3 0 - ® RT- 15RT - W
13001 ERT-12RT-131 2 0 0 -1 5 0 0
2 5 0 0 - 3 0 0 04 0 0 0 2000
I O O OPROBABLE WEATHERED
ROCK6 5 0 0 1
> 10007 0 0 0 -7 5 0 0
12,0001//A.'N 13,000-14,000
SHOT POINT LOCATION AMO DIRECTION(C* Center ,£»' -*- '
•“ S T Y Vt SECTION
j r i n r i T t - ^ ' 2 0 0 ' L
LH E IN TE R S E C TIO N
SEISMIC WLOCITY VALUES IN FEET/SECOND
LEGENDvELOcmr WTENFACES
RESISTIVITY / L ™ . LOCATIONINTERFACES-v RT*I AW LOCATION
, RES ST IV ITT POINT TEST
\"12,0 0 0 +
RESISTIVITY VALUES IN 0 Hi-FEET
SCALESFEET
G EO PHYSIC AL IN V E S T IG A T IO N
D. O. E. R A FF IN A TE PIT SITE W ELDON SPRING . M ISSOURI
torBECHTEL N A T IO N A L . INC
SEISMIC PROFILES LINES 6, 7. 8. 6 S
W ESTO N G E O P H Y S IC A L C O R P O R A T IO N
MARCH. 188 3 FIGURE 3
E-24
(♦00I
EL,6 5 0 — RT- II
- >41 'gQQ-
2*00I
RT -10 1 _
LINE 103 * 0 0I
4 * 0 0I
1200*- 9 77
5 * 0 0I
36
-10,500 5
/ r ^ -
L I N E II0*00 *00 6*00 9 * 0 0
RT-6*6A - 6 5 0 'RT -7 RT -3RT- 5
79I 5 0 0 t 101 -r _ 1200:30
4 0 0 0 546 3 5 0 0 5 35
>1001>1000 >10006 0 0 '— . - 6 0 0 '
>100011,0 0 0 -12,0009 0 0 0 5 11,0005> 1000
-0*35I
0*00
T J T
LINE 12cooi I
2*00I
3 * 0 0I
t o * " - -- - * 9 0
-
36 3 0 0 0 5 32
6 0 0 - / / * * *11 .0 0 0 2
> 1000
SHOT POINT LOCATION AND DIRECTION
(C = C e n te r ,E = End )
G R O M ) SURFACE x
LWE INTERSECTION
SEISMIC VELOCITYVALUES INFEET/SECOND —
I > - U
LEGENDVELOOTY
^ NTERFACESd c c ic t ixyiTv / RESISTIVITY POINT TESTESSES-,, L0CATK)N
^ \ 2 Q O *
-2 5 0 0 -3 0 0 0 \ RESISTIVITY VALUES IN O H *-FE E T
12.0005
SCALESFEET
G EOPHYSICAL IN V E S T IG A T IO N SEISM IC PRO FILES
D. 0 . E. R A FFIN ATE P IT S ITE LINES 10. 11. S 12
WELDON SPRING . MISSOURIW E S TO N G E O P H Y S IC A L C O R P O R A TIO N
BECHTEL NA T IO N A L. INC MARCH. 1 8 1 3 FIGURE 4
E- 25
W 5 2 .5 0 0* LOCATION PLAkl
A ' ‘O «<">« »
NC** ' STChaRlE*) ''O
W 5 2 .0 0 C
5T LOU 15DONDOOfUANCE WOP<5
RAFFINATE PIT
ASH PONDW 5 1 ,5 0 0
P t L L W A Y
SEISMIC VELOCITY LAYERING BELOW SURFACE LOW VELOCITY LAYER (VELOCITIES IN FT/SEC.)12.000
TOP LAYER (O H M -FEET) SECOND LAYER (O H M -FEET)
RAFFINATE
AGREEMENT OF THIRD LAYER (>1000 OHM-FEET) WITH HIGH VELOCITY ROCK IN TERMS OF DEPTH
AGREEMENT OF THIRD LAYER l> 10 0 0 OHM-FEET) WITH WEATHERED ROCK ( SEISMIC VELOCITY OF 6 5 0 0 - 8 0 0 0 FT /S E C ) IN TERMS OF DEPTH
0*00 2 3*00=FT7rrF ROAD SEISM IC LIN E
RESISTIVITY POINT TEST!f $ 5 5 5s p -«
------------------------ h S E LF-PO TEN TIAL LINE
SHOT POINT LOCATION AND DIRECTION f C mCENTER, E mEND)
SPOILS PILE SCALE-FEET
Sow mop p ro *x M by 8 #ch» f Nahonpl, Inc
R T-3H 3U L IN E 3
W 50 .500
E- 26
TOTAL
FIELD
INTE
NSIT
Y (G
AMMA
S)
TENTATIVE MONITORING WELL LOCATION "a"
55,500
55,000
54,500
54,000
53,500
MAGNETIC PROFILES
N — — S
TENTATIVE LOCATION
50 40 30 20 10 0 10DISTANCE (FT)
20 30T40 50
RESISTIVITY DATA RT*fc 39ANOMALOUS CONDITION Refer to Text
N (T ru e )
f I 018°29lc
/ ^ ill'*
198 c
GEOPHYSICAL MEASUREMENTS
0 . O. E. RAFFINATE PIT SITE WELDON SPRING, MISSOURI
torBECHTEL NATIONAL. INC
GEOPHYSICAL DATA
TENTATIVE LOCATION - W ELL"A ”
WESTON GEOPHYSICAL CORPORATION
MARCH. 1983 FIGURE 6
E- 27
TOTAL
FIELD
INTENSITY
(GAM
MAS)
TENTATIVE MONITORING WELL LOCATION "B"
55,650 MAGNETIC PROFILES
55,600 -NE SW
55,550 -
TENTATIVE 'LOCATION
55,50050 40 30 20 10 0 10 20 40
DISTANCE (FT
RESISTIVITY DATA # 40Ground Surfoce x _____
3.$ 158 ohm-ft23' 32 ohm-ft
>1000 ohm-ft
GEOPHYSICAL MEASUREMENTS
D. O. E. RAFFINATE PIT SITE WELDON SPRING, MISSOURI
lorBECHTEL NATIONAL, INC
GEOPHYSICAL DATA
TENTATIVE LOCATION - W ELL” B "
WESTON GEOPHYSICAL CORPORATION
MARCH, 19B3 FIGURE 7
E- 28
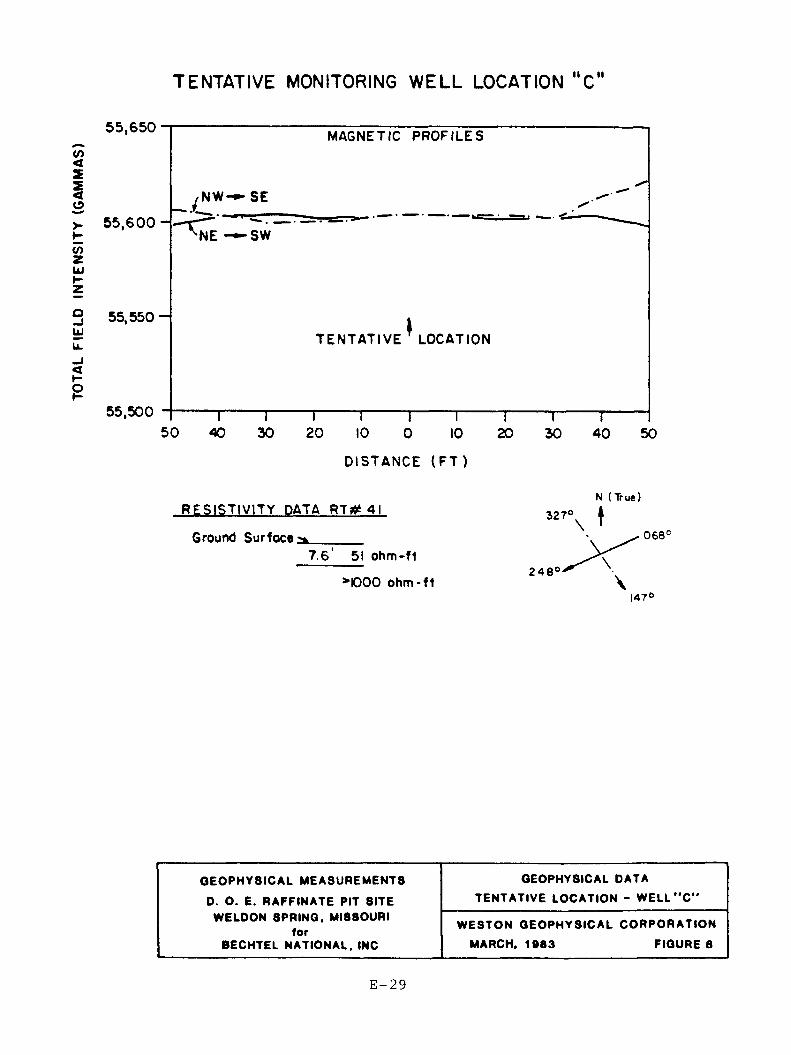
TOTAL
FIELD
INTENSITY
(GAMMAS)
TENTATIVE MONITORING WELL LOCATION "c"
55,650 MAGNETIC PROFILES
55,600 - SWNE
55,550-TENTATIVE LOCATION
55,50050 40 30 20 1 0 0 201 0 5030 40
DISTANCE (FT)
RESISTIVITY DATA RT#4IGround Surfoce;
7.6 51 ohm-ft>000 ohm-ft
N (True)327'
068
2 48
GEOPHYSICAL MEASUREMENTS
D. O. E. RAFFINATE PIT SITE WELDON SPRING. MISSOURI
forBECHTEL NATIONAL. INC
GEOPHYSICAL DATA
TENTATIVE LOCATION - W ELL,,C"
WESTON GEOPHYSICAL CORPORATION
MARCH, 1983 FIGURE 6
E- 29
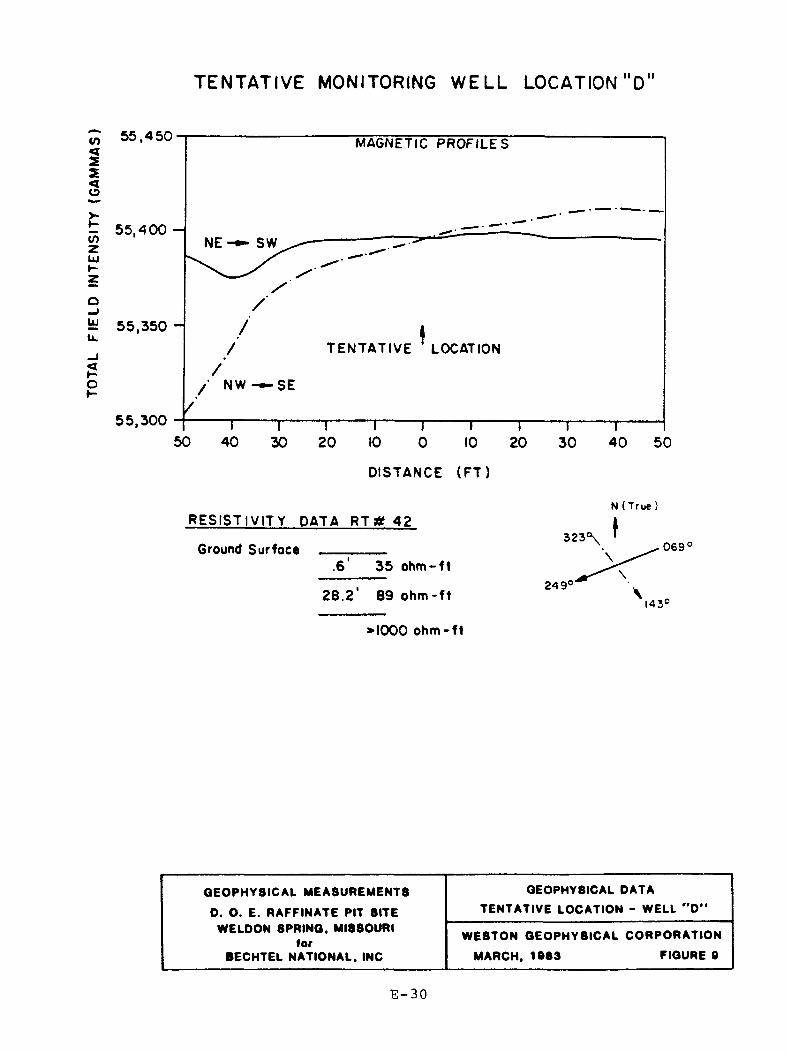
TOTAL
FIELD
INTENSITY
(GAMMAS)
T E N T A T IV E MONITORING W E L L LOCATION "D"
55,4 50 MAGNETIC PROFILES
55,400 - NE SW
55,350 -TENTATIVE LOCATION
SE55,300
50 40 1030 20 0 10 20 30 40 50DISTANCE (FT)
RESISTIVITY DATA RT * 42 Ground Surfoce _______
35 ohm-ft28.2 89 ohm-ft
>1000 ohm-ft
N ( T ru e)
069
2 4 9 0
GEOPHYSICAL MEASUREMENTS
D. O. E. RAFFINATE PIT SITE WELDON SPRING, MISSOURI
torBECHTEL NATIONAL. INC
GEOPHYSICAL DATA
TENTATIVE LOCATION - WELL " D "
WESTON GEOPHYSICAL CORPORATION
MARCH. 1SS3 FIGURE 9
E-30
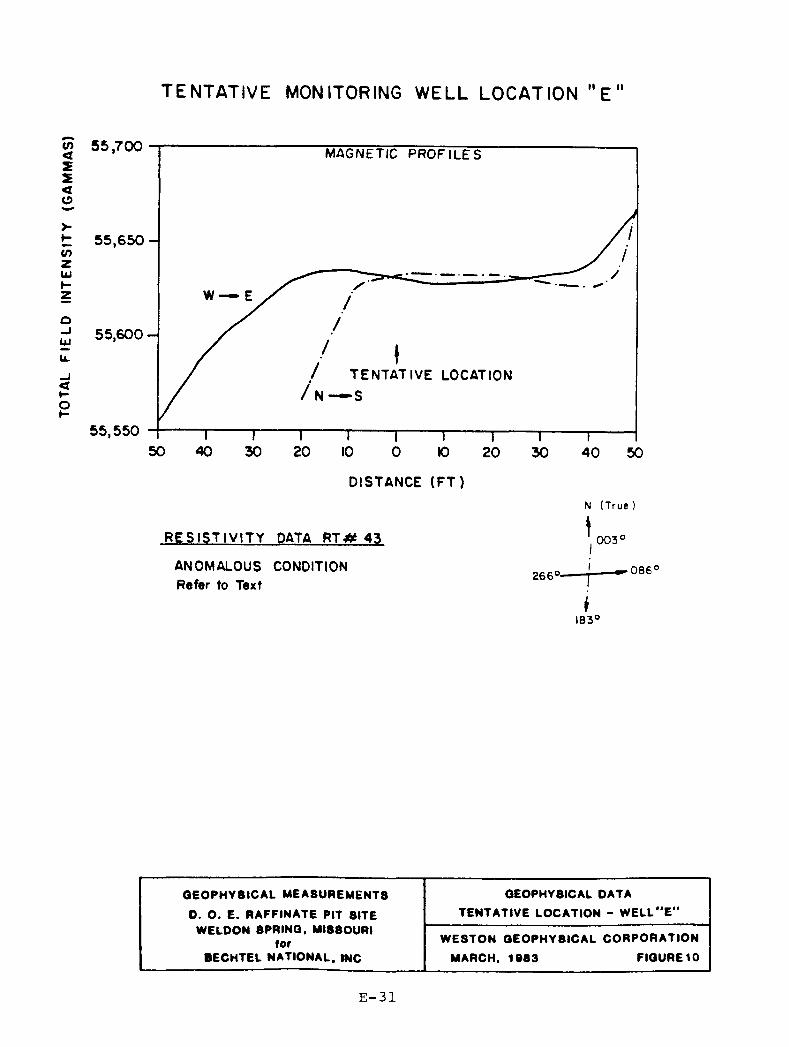
TOTAL
FIELD
INTENSITY
(GAM
MAS)
T E N T A T IV E MONITORING WELL LOCATION " E "
55,700 MAGNETIC PROFILES
55,650 -
55,600-
/ TENTATIVE LOCATION
55,55050 40 2030 1 0 0 10 20 30 40 50
DISTANCE (FT)
RESISTIVITY DATA RT# 43ANOMALOUS CONDITION Refer to Text
N (T r u e )
266
GEOPHYSICAL MEASUREMENTSD. O. E. RAFFINATE PIT SITE
WELDON SPRING, MISSOURI for
BECHTEL NATIONAL. INC
GEOPHYSICAL DATA TENTATIVE LOCATION - W ELL"E ''
WESTON GEOPHYSICAL CORPORATION
MARCH. 1SS3 FIGURE 10
E-31

SEISMICMETHOD
APPENDIX AREFRACTION SURVEY OF INVESTIGATION
E- 33
APPENDIX ASEISMIC REFRACTION SURVEY METHOD OF INVESTIGATION
General ConsiderationsThe seismic refraction method is an indirect means of
determining the depths to a refracting horizon and the thicknesses of major seismic discontinuities overlying the high-velocity refracting horizon.
Interpretations are based on the measurement of the time required for elastic waves, generated at a point source, to travel to a series of vibration-sensitive devices (geophones or
seismometers). These geophones are spaced at known intervals along a straight line on the ground surface. This instrument array is called a seismic spread.
The seismic wave used in a seismic refraction survey for depth calculations and material identifications is called a "P" (compressional) w a v e . This wave is transmitted through earth materials as a series of compressions and rarefactions. As a "P" wavefront passes a point in the earth, the point moves to and fro in the direction of wave propagation, giving rise to its alternate designation of a "longitudinal" wave. The "P" wave is transmitted to subsurface strata, and is refracted back through the uppermost layers to the detectors on the ground surface. If a time-distance plot is constructed for each detector, a computation of the seismic velocity and the depths to the various materials can be made.
E- 34
- A2 -
A composite wave front diagram and travel time graph showing an overburden layer through which the seismic wave will travel with a velocity of 5.000 ft/sec, and bedrock through which the seismic wave will travel at 20,000 ft/sec is shown on page A3 (Diagram A ) . The bedrock surface is assumed to be horizontal and parallel to the ground surface and at an approximate depth of 75 feet.
The wave front digaram shows the positions and shape of the
wave front at various time intervals after the wave has been generated. In ten milliseconds the wave front is spherical and exists only in the overburden. At twenty milliseconds the wave front consists of three segments; the direct wave in overburden, the refracted wave in rock, and the refracted rock wave which is transmitted to the surface. It should be noted that although this wave is travelling in the overburden at the overburden velocity, the tangent to the wave front strikes the ground surface at an angle much smaller than the overburden
waves whose tangent is 90° to the surface of the ground. Accordingly, the time interval at which the refracted wave reaches successive stations on the ground surface is less than
that of the overburden w a v e . The rate at which it arrives at the stations is equal to the velocity of the wave front in bedrock.
The time distance plot for this event results in two lines, the slopes of which are 5,000 ft/sec and 20,000 ft/sec. The intersection of these two lines represents the point on the
E-35
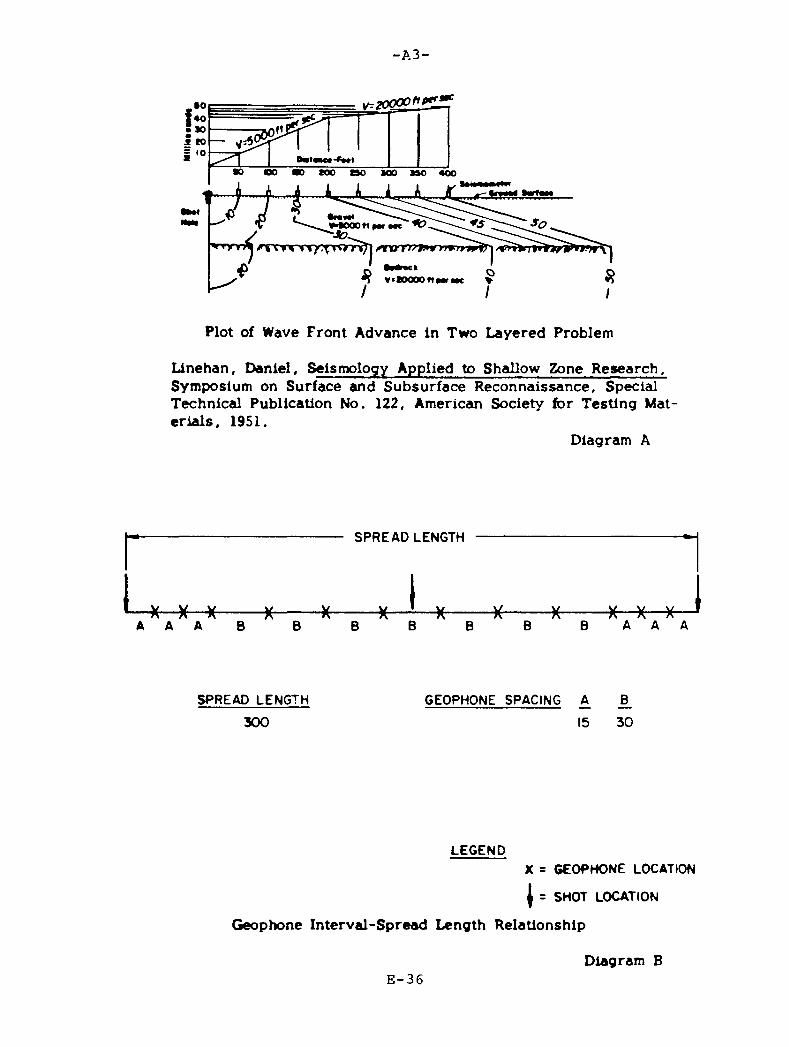
•0 80 ■ H O B O H O H O 400
t )
v n m i <rrv*4
* «inn/yw^v
V»«0000f1per
Plot of Wave Front Advance in Two Layered Problem
Linehan, Daniel, Seismology Applied to Shallow Zone Research. Symposium on Surface and Subsurface Reconnaissance, Special Technical Publication No. 122, American Society for Testing Materials, 1951.
Diagram A
SPREAD LENGTH
•X X X X X XA A A B B B B B B B A A A
SPREAD LENGTH 300
GEOPHONE SPACING ,A B15 30
LEGENDX = GEOPHONE LOCATION| = SHOT LOCATION
Geophone Interval-Spread Length Relationship
Diagram BE-36
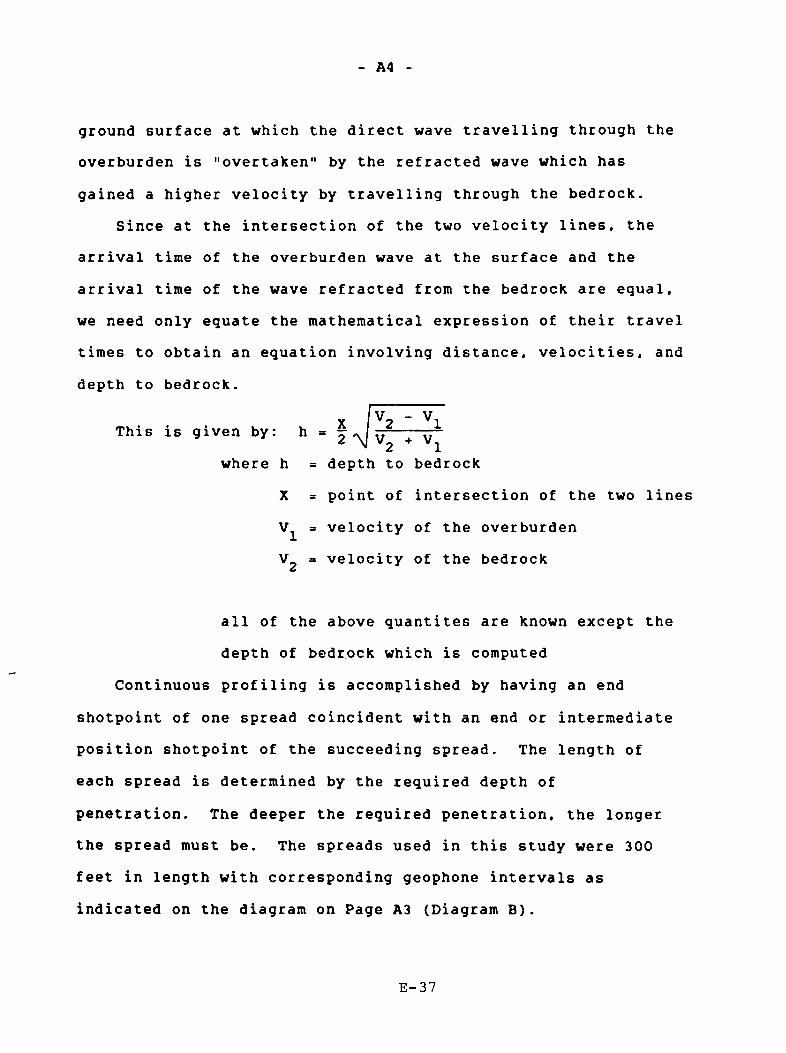
- A4 -
ground surface at which the direct wave travelling through the overburden is "overtaken" by the refracted wave which has
gained a higher velocity by travelling through the bedrock.Since at the intersection of the two velocity lines, the
arrival time of the overburden wave at the surface and the arrival time of the wave refracted from the bedrock are equal, we need only equate the mathematical expression of their travel times to obtain an equation involving distance. velocities, and depth to bedrock.
YThis is given by: h = jwhere h = depth to bedrock
X = point of intersection of the two lines= velocity of the overburden
V 2 = velocity of the bedrock
all of the above quantites are known except the depth of bedrock which is computed
Continuous profiling is accomplished by having an end
shotpoint of one spread coincident with an end or intermediate position shotpoint of the succeeding spread. The length of each spread is determined by the required depth of
penetration. The deeper the required penetration, the longer the spread must be. The spreads used in this study were 300 feet in length with corresponding geophone intervals as indicated on the diagram on Page A3 (Diagram B ) .
E- 37
- A5 -
Field Procedure for Data AcquisitionSeismic cables. which have been fabricated with premeasured
shotpoint and geophone locations, are positioned along the
lines of investigation. Geophones, which have been fitted with a spiked base to provide good ground contact, are emplaced at their measured locations. Seismic energy is generated with small buried charges of explosives. Shotholes are prepared with a driven rod (not excavated) to insure good ground
coupling. The explosives are tightly tamped and the depths andamount of explosives used are noted.
Seismograms are obtained using a portable 24-trace
seismograph system which amplifies and filters the seismic
signal detected by the individual geophones and provides a photographic recording for each of the 24 traces. Refer to
Diagram C for a diagram of the seismic instrumentation. Timing lines are provided across the entire recording at
two-millisecond intervals (instrument accuracy +1%). allowing
direct reading to one millisecond. This system contains a
firing circuit which causes a time break to be displayed on the seismic record; arrival times between the shot and each geophone location are measured in reference to the time break.
The seismograph is equipped so that the background noise level can be observed for all geophones simultaneously, enabling the
instrument operator to determine if the background noise is sufficiently quiet to minimize trace interference.
E-38
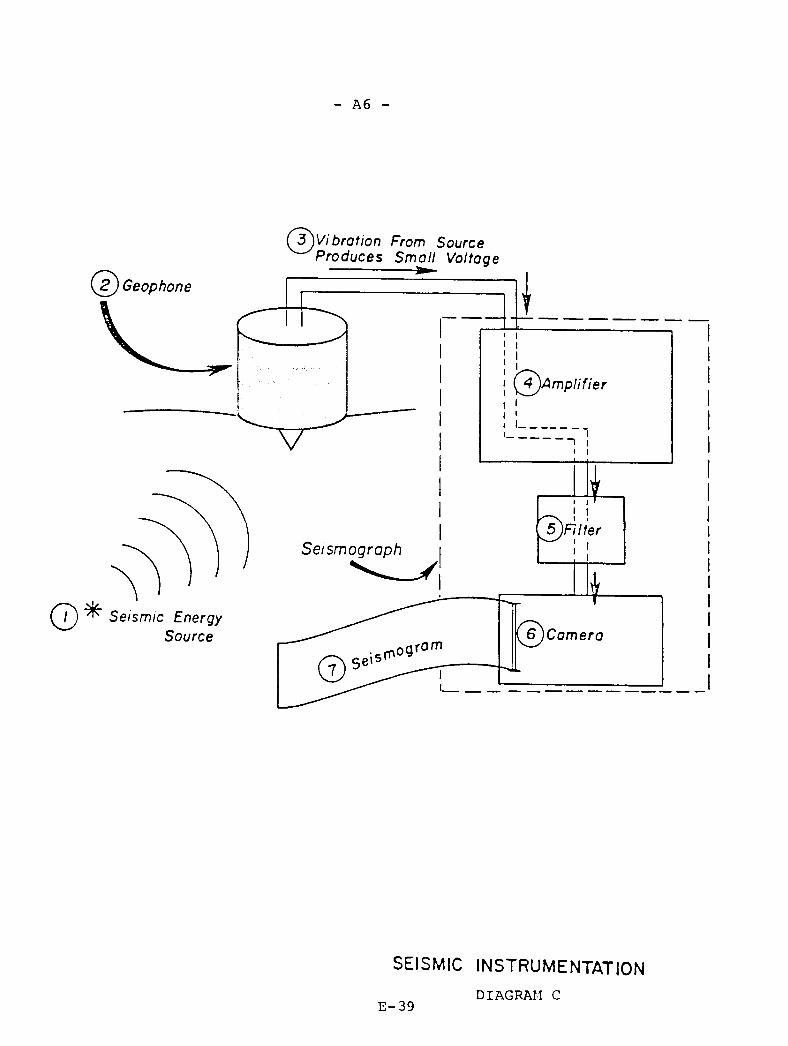
- A6 -
( j ty v ib ra t io n From Source Produces Sm all Voltage
2 ) Geophone
iFilterS e is m o g ra p h
Seismic Energy Source C am era
SEISMIC INSTRUMENTATIONDIAGRAM CE- 39
- A7 -
A recording is obtained for each of the shot locations
indicated on Diagram B, Page A3.Reference
Linehan, Daniel, Seismology Applied to Shallow Zone Research, Symposium on Surface and Subsurface Reconnaissance,Special Technical Publication No. 122, American Society for Testing Materials, 1951.
E- 40
APPENDIX BELECTRICAL RESISTIVITY SURVEY
METHOD OF INVESTIGATION
E-41
APPENDIX BELECTRICAL RESISTIVITY SURVEY
METHOD OF INVESTIGATION
General ConsiderationsThe electrical resistivity survey is a method of obtaining
shallow subsurface information through electric measurements made at the surface of the earth. The basic parameter is the apparent resistivity determined by passing a known electric current between two electrodes and measuring the resulting voltage drop across two other electrodes. Based on the geometric arrangement of the current and potential electrodes. the apparent resistivity may be calculated. The actual resistivity values are then determined from the layer
thicknesses and the corresponding "apparent" resistivity values.
A vertical electric profile can be obtained by increasing the distances between electrodes, thereby providing deeper penetration of the electric current. Since geologic materials have differing electrical characteristics, the apparent resistivity values will be affected by different subsurface conditions.
The relative conductivity (inverse resistivity) of earth materials is proportional to their content of water and dissolved salts or ions. Accordingly, dry sands and gravels, and massive rock formations would have high resistivity values; conversely, moist clays and materials in a saltwater environment would have very low resistivity values.
E-4 2
- B2 -
The interpretation of electrical resistivity data is based
upon the comparison of recorded field measurements of apparent resistivity and electrode separation with theoretically computed cases. Electrical resistivity depth determinations are based on a contrast in resistivity values. If the layering does not have a large contrast (for example, 96 ohm/ft to 120 ohm/ft) then the depth of the layer interface is considered approximate. The higher the resistivity contrast, the more definitive the computer solution.Field Procedures for Data Acquisition
Wenner MethodOne of the most widely used field arrangements of current
and potential electrodes is known as the Wenner configuration. In the Wenner method four electrodes are placed in a straight line and are equally spaced; the two outer electrodes are current electrodes. 1^ and 1^, and the two inner electrodes are the potential electrodes. and P2 (Figure Bl).
A vertical electric profile is obtained by conducting a point test in which the electrode spacing is successively increased about a fixed point after each reading.Data Interpretation
The interpretation of the resistivity data is accomplished by computer analysis of field data curves. The Fortran INVERSE program developes a model of the subsurface condition in terms
E-43
- B3 -
of resistivity value and depth by matching theoretical curves to the field data curve. The INVERSE program accomplishes this by applying Marquardt's algorithm to an initial model, modifying the initial model until an accurate match of the field curve is obtained. The accuracy of match is determined by the RMS error. A limit on the RMS error of 4. considered very accurate, was used as the accuracy criteria in modeling. References
Davis. P. H. 1979. Interpretation of Resistivity Data: Computer Programs for Solutions to the Forward and Inverse Problems. Information Circular 17. Minnesota Geological Survey. University of Minnesota.
Fenn, D . , Cocozza, E .. Isbister. J ., Braids. O . . Yare.B ., and Roux, P., 1980, Procedures Manual for Groundwater Monitoring at Solid Waste Disposal Facilities. SW-611, U.S. Environmental Protection Agency, Office of Solid Waste.
E- 44
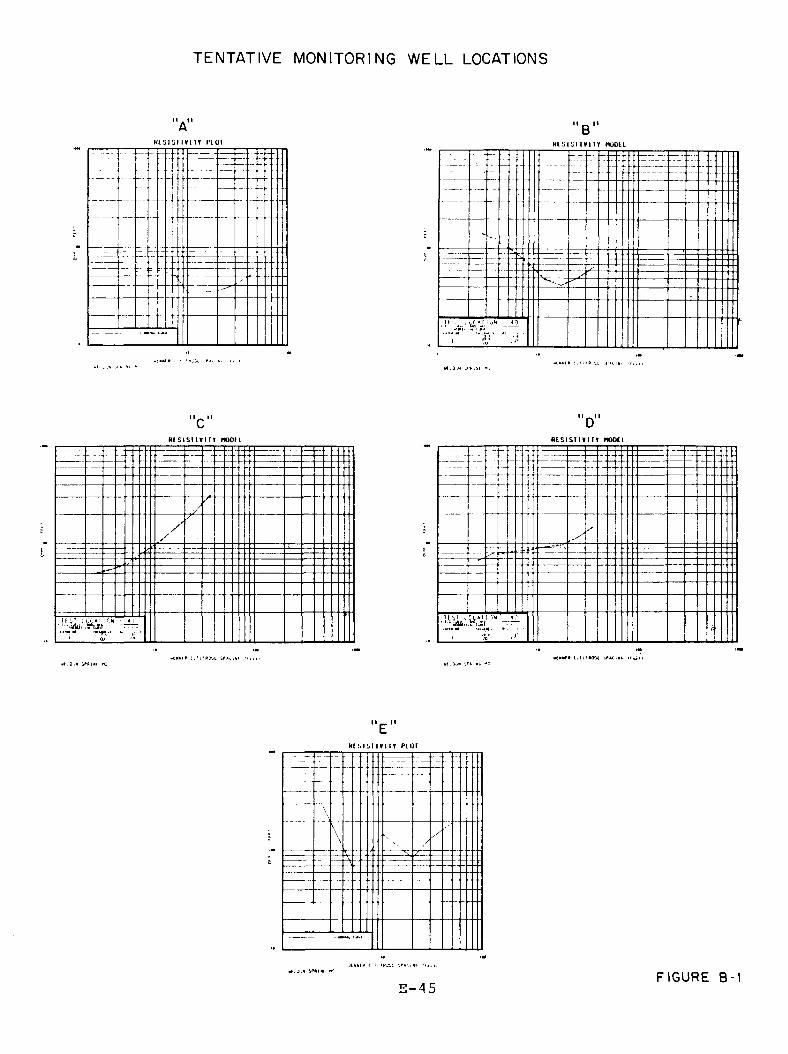
TENTATIVE MONITORING WELL LOCATIONS
K tS lS IIV IT T PI 01_________________ H I ‘->11,1 I VI IT MUOll
--------
—
- -
-
-
_____-
- —
--- r
::-
-
1 1 t
"c" "D"Ri S i SI 1V I IV MODE I R IS IS I IV I IT MODE I
t - - - - — -T —
—yX\
--- .... ■■
---II 'A L■'-.iiia.. !j. --i-
H V i CCAI 11.N ' V *
II II
Kl SI S f I tf 1 IT P io r- - - - - - - — |
—
_ _ ^V ' \ \ / '
E-45 FIGURE B-1
RESISTIVITY COMPUTER MODELSRAF FI NATE P IT AREA
R t s i s r m i f m o w i
i
RCSIS11VI IT MODEL------------
------ ------------—
-
k— — u --
..------------
------------- — -
m
V -
•*, »,«■ y«iw. >«:
m s i s i m i r m o d ii h i s i s r IV I i t h o w l
---
::: --
1 i•--
— — —
---- \- — vr
M ' I JC »T UN7*
—---- . . .
---------- —
------ —
-- ------ — . . . -
M M Lm t
m s i s i m i r m o m i R f s i s n m r n o o n
u -- -
r-
--
:--------- -----
- -
<■.. .
TIM iQCAMON A" sJSt Y .X I...... •■"P" -'\p
E- 46FIGURE B - 2
RESISTIVITY COMPUTER MODELSRAF FI NATE PIT AREA
Rf SISIIflfT MIX* I
M '.T i g t * ! ION r' ' - J S i & J l t
<t . 11 Term -,pa
Rtsisilflif HOttl
TV,1 l GC AT | (JN
•tent* iiii mew sueii
fffSISIIVITT MOOCl
W W ' ~ ‘
wieef e • • < mew '
RESISIIVMT MOOtt
’•VSMAili'0".--'1* "Tl"
*• llM mo* VKIN '
Rf SI SI I f 11T hoou Risisiivirr nowi
---;;- .... : 7 - :- — -
-
— —
— —v
---—--- =
""•ai. j f t i t " '* — -- "71...1
— - - Z —" - - -1 - - -
--- -
-- - -- ... ---
U ' j l lU tfc llO N 1 i• 'Via,, “ i * — r
«)■»)• 11( mr.oi Sf»tn wf wil* ! .11 mnot srecii
E-47FIGURE B - 3
RESISTIVITY COMPUTER MODELSRAF FI NATE PIT AREA
f t i s i s t m t T m o d ii wtsisnwiM hdoci____ _ ___ 1
i
! — z ---------- - -
— - — -. . .
- -
5 - — -~ — -*
—1
" X if lHi ;jn
T
- ------ —
—\
— \
\V ■ - - -
-K
•1’ T l.....TI.D04 SMIHI. *)
id*i '«oot »f*i ii t i n <»ntx '
R f S I S I I V I V V MOOtL R i S I S I I V M V MOOft
- - - __
fj .1
AV'ft’A10’' —i i
*
— -:
...-
-■
'V\
xr
-
'T T ..1 '««(• [,K'I3H ^((IH -f«,i p HI I DOM SM I Hfc *e K M) i.mtooi
R f S I S I I V I l V HOOtl in S I S I I V I IT MOOt l
'•'•.jta.1 '&JM tlN~- ...;r r ...
xhi ■ i, 11 i biiw sr*i 11 I UK IHOOt
E-48FIGURE B - 4
RESISTIVITY COMPUTER MODELSRAF FI NATE P IT AREA
R f S l S H V I I T HO O tl
I
R f S l S H V I I T HOOtl
i
***• UK'tOM UIMMlMM smim* no
R I S I S I I V M T HO O tl
• — - - -: --- - -
- P I" — "IV ■i i "
■twete 11fi mow v»u i m m.,.i*li 3oe sreiet »e
R I S I S 1 I V I 1 1 HO O tl------------- —
-------------- ------- — - - ------------- — -
-— — ----------- —
N X \-
i i r, i l o c i u o i i - ;o
"T!. . . X
vtiwte UN reoot -f*' im,K lOOI '*MFI»t MO
R C S I S I I V I I T HOOtl
„—
~
X \i
...... T . „ T
*■«*■ (lIi '*001 %r«uw <•,.«■MlOOM SMtM *>
R t S I S I I V l I T HOOfl
-■.: -
-:- - 7 V
— - --- -
V
T T ”Xwtwie iiiimot* v'uiikKlPQM iftlK MB
FIGURE B- 5
E- 49
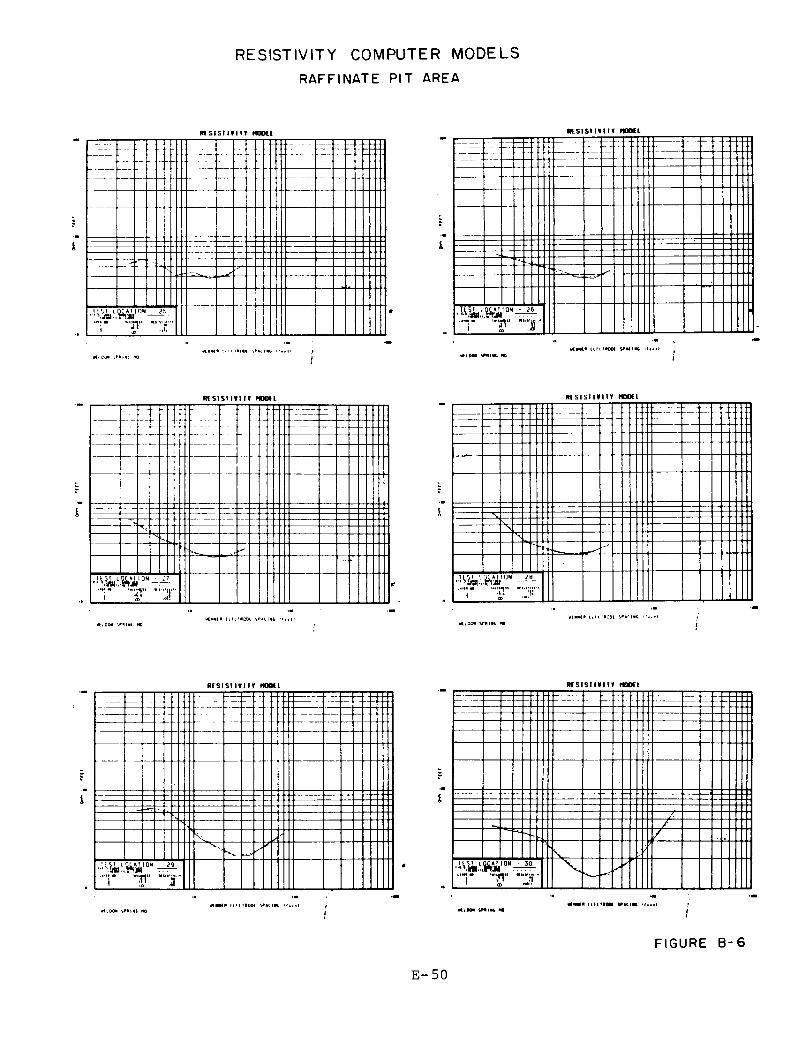
RESISTIVITY COMPUTER MODELSRAF FI NATE PIT AREA
R f S l S H V I I T NDOCl r c s i s i i v i i t h o o e l
:
— —
-
—
- - - - - -- - - - - - -
M '.I I 0 C » 1 I O N ■... . - • • I ; " -
1 * '
r_: i_ _ _ _ _ "
TI S 1 I
i
I O N
7 " ,,v5_
j"v u i k i
tfiOOM smiiet *o
R f S l S H V I I T HOW I R I S I S I I V M T MOW I
- -—
-
--------- j; .:
--------
—
- ■
;_______ ■N.--------- —
■ a i k f t y r - - -
" T " T
— . — ... :
\\
\-•
I I S 1
iW i
I O N"1” r
e(MHte U K ’UCOI tP*ciwt 1viioce y e ie t id
R I S I S I I V M T MOOtL
- - -. . . . .
•—
-------
V . y
/
T " T l ...... T
R I S I S I I V M T MOOtL
i
lOCM '.eeiet no «*MH* IlK'IOM S*»CII e te w i t i K i e q * S f w iK <
FIGURE B - 6
E- 50
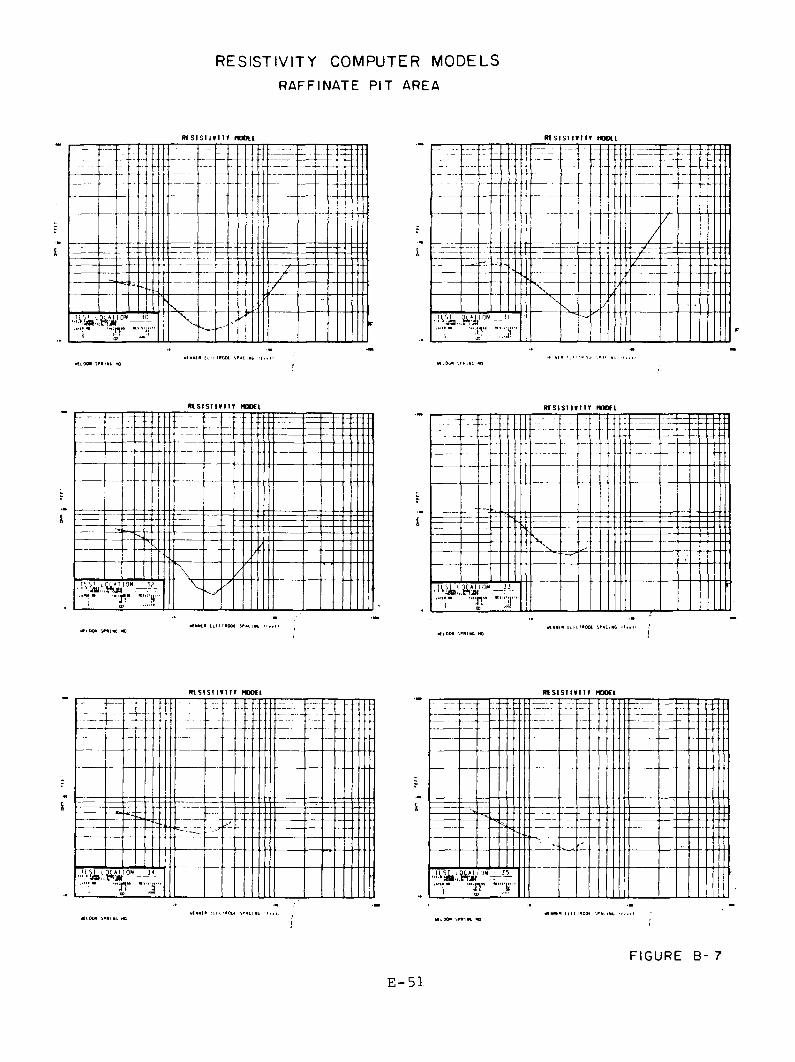
RESISTIVITY COMPUTER MODELSRAF FI NATE
R f S l S H V I I T r u o t i
Mf NNt* 11 K 1*004 ■(..>>vliOOe vent no
R f S l S H V I I T HOOtl
k
P I T AREA
R f S l S H V I I T HOOtl
R f S l S H V I I T HOOtl
- ::1 ---— — -----
- — ■ -s
'i r* ^utiooe rj»eiet no «M(* UH'FOOt tP*UNt
R f S l S H V I I T HOOtl
r T :: y:; - 7:- -
--- — -
...... ..j. ......
•tl 00* iF»l»t MQ • Ie e t* u n " O W ',r«tiefc ■
*■*(• li K'*OM :M tDON >P»I»fc NO
R f S l S H V I I T HOOtl...
.
---------— -----
-<- -------- — -
s — —4, --------- ■ ■
—-
..
"7 ..XNt oo» smmw, ••
E- 51FIGURE B- 7
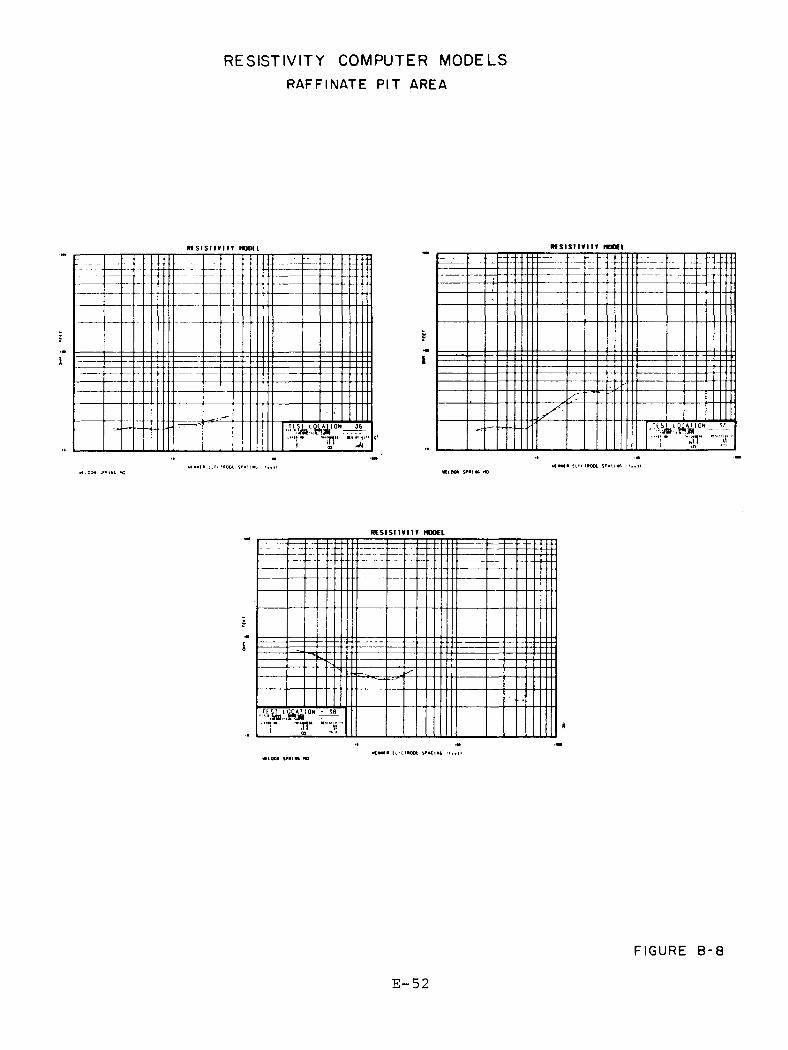
RESISTIVITY COMPUTER MODELSRAF FI NATE P IT AREA
W I S I S i m i T MOW I
. ---- -- —
— -
— --
-
-
i_
II 5
f
a.uPial rrrrrr
T "X
RCSI ST I V 1 1 1 MOOCl
1
el. DO* .P* 1*1. *CM l ’«OOl let ' meet" t i ’ i moot srw.iet
Wiooe s*«iet no
RESI ST 1f 1 1 T MODEL
-----
- -
---- "
■ 1 X
. . . y »iftiOOe tunes *0
E- 52
FIGURE B - 8

APPENDIX CSELF POTENTIAL
METHOD OF INVESTIGATION
E-53
APPENDIX CSELF-POTENTIAL
METHOD OF INVESTIGATION
General ConsiderationsThe self-potential survey is a method of obtaining shallow
subsurface information through electric measurements made at the surface of the earth. The method involves measuring naturally occurring voltage differences (spontaneous ground
potentials) between two electrodes. The equipment used for self-potential measurement consists of a pair of electrodes
connected by wire to a millivoltmeter.Spontaneous ground potentials are created by fluid
streaming, varying electrolytic concentrations in groundwater and other geochemical actions. Spontaneous ground potentials
can vary greatly but generally are less than 100 millivolts and may be either positive or negative. Streaming potentials (fluid streaming) are usually negative.
The interpretation of self-potential data is based upon the
identification of zones of relatively positive or negative
spontaneous ground potentials. The zones are identified by plotting the field measurements as profiles or a contour m a p . Field-Procedure for Data Acquisition
Base stations are established in barren areas if possible,
to minimize the accumulation of potentials on the base station electrode. One electrode is fixed at the base station while
E- 54
- C2 -
the other is moved to successive stations along the line. The advantage of this procedure is that potentials are measured with respect to fixed points.
ReferencesBogoslovsky, V. A., and Ogilvy. A. A., 1973, Deformation
of natural field near drainage structures. Geophysical Prospecting 21, 716-723.
Ogilby, A. A., Ayed, M. A., and Bagoslovsky, V. A., 1969 Geophysical studies of water leakages from reservoirs. Geophysical Prospecting 17. 36-62.
Telford. W. M. . Geldart, L. P.. Sheriff, R . E ., Keys, D. A.. 1978. Applied Geophysics, chapter 6. New York. Cambridge University Press.
E- 55
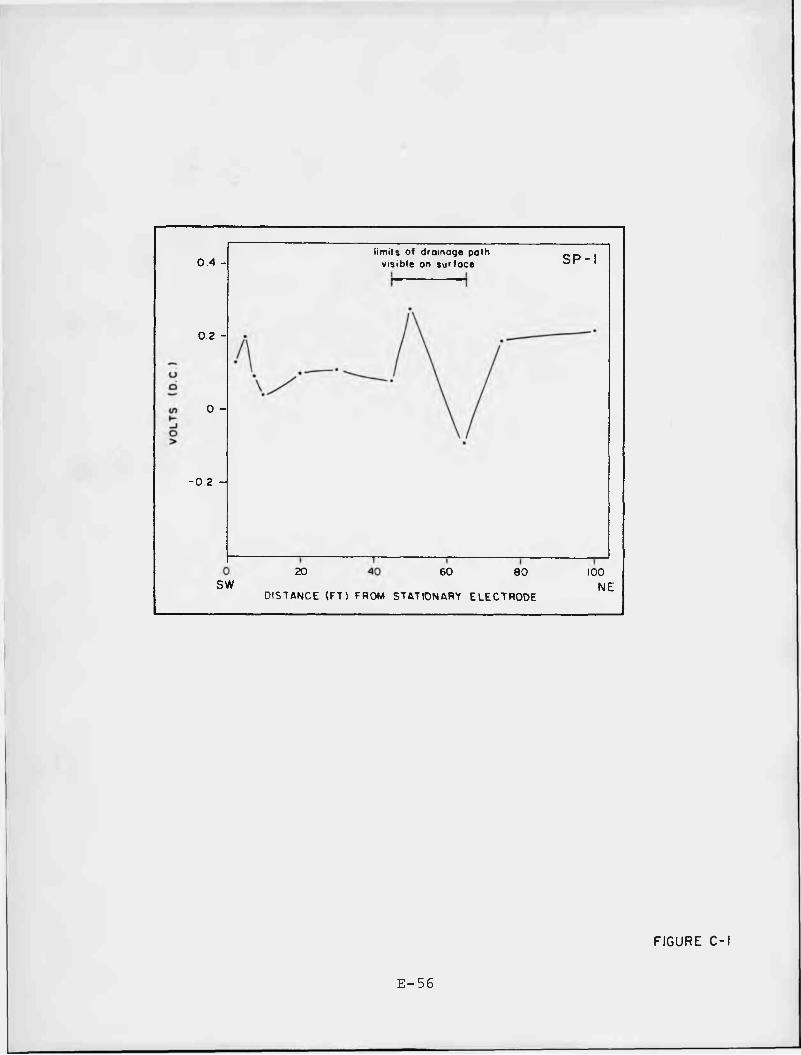
limits of droinoge poth visible on surfoce S P - I0 . 4 -
0.2 -
0 -
20 4 0 6 0 8 0 100sw NEDISTANCE ( FT ) FROM STATIONARY ELECTRODE
E- 56
FIGURE C-l
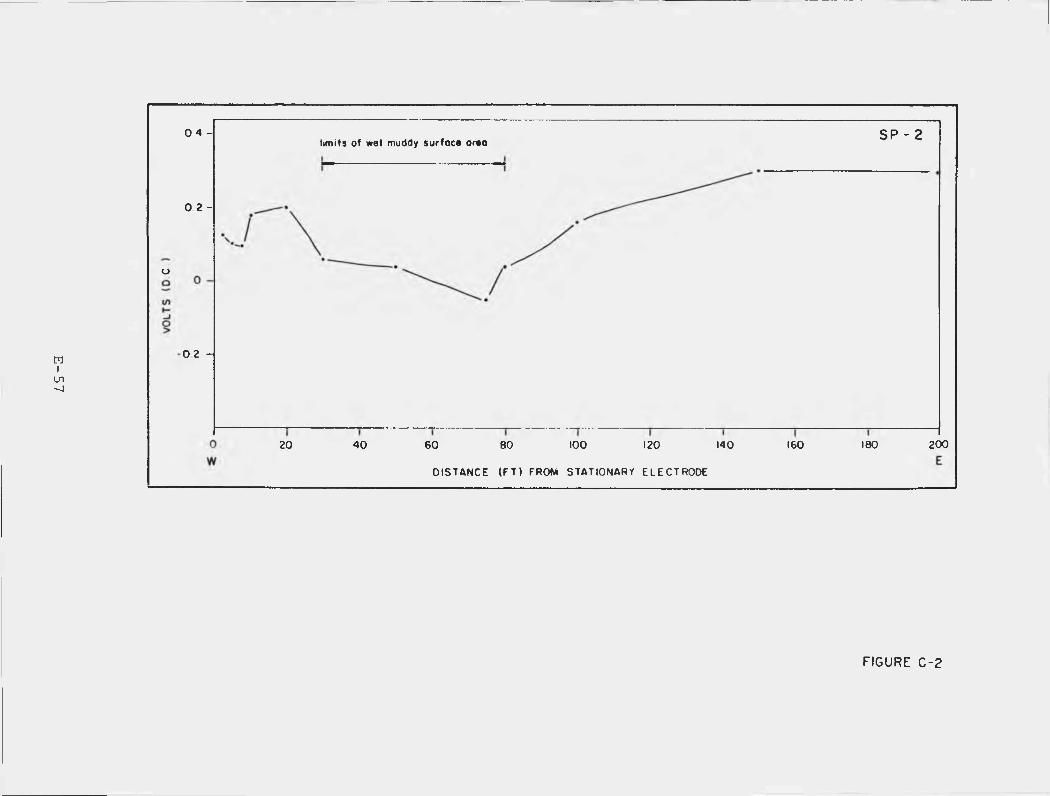
MIUl-J
SP - 2limits of wet muddy surfoce oreo
oizi
20020 4 0 GO 100 140 160 1808 0 120
DISTANCE ( F T ) FROM STATIONARY ELECTRODE
FIGURE C-2
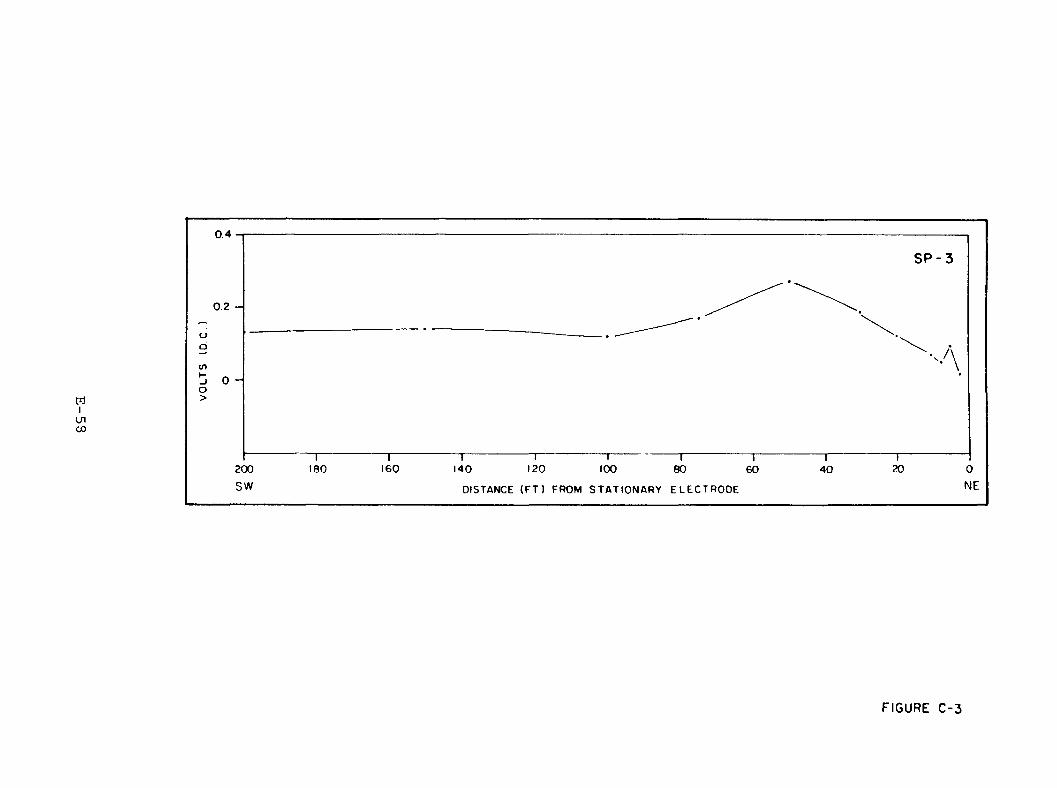
8S
-W
0 4
SP-3
0.2 -
<_>
160 120200SW
180 100 20140 8 0 6 0 4 0
NEDISTANCE ( F T ) FROM ST AT IONARY ELECTRODE
FIGURE C-3
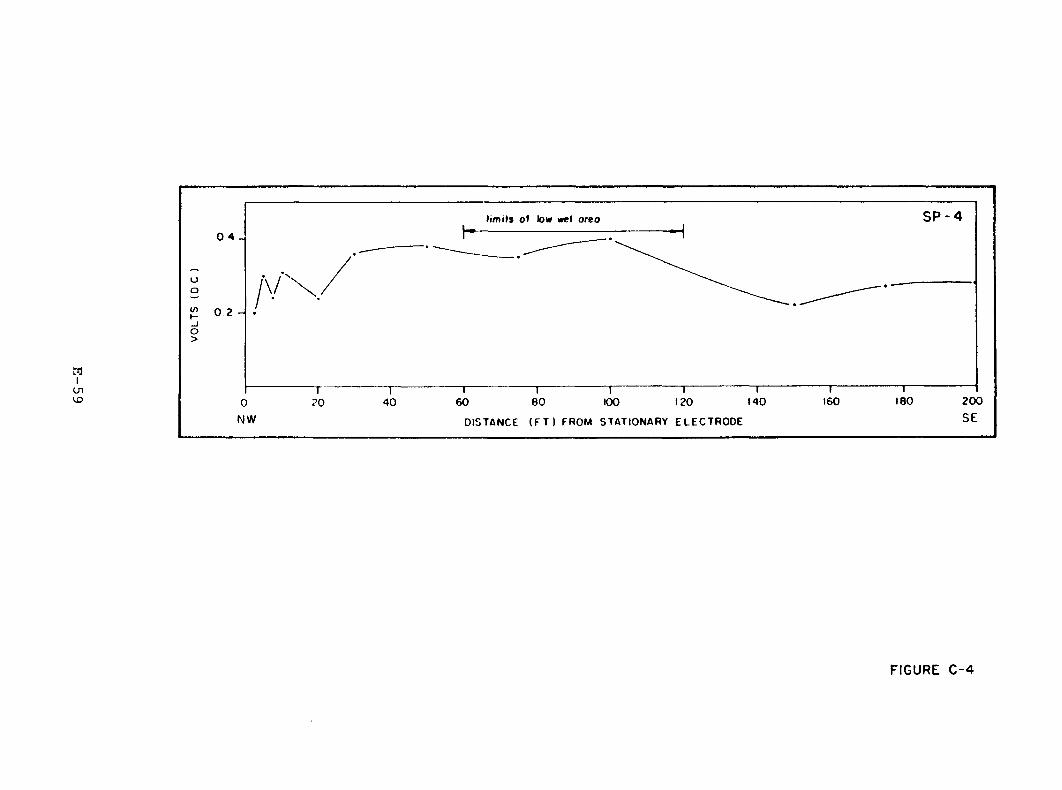
SP-4limits of low wel area
0 4 -
in
_j
180 200SE
1608 0 1 406 0 100 1204 020NW DISTANCE ( F T ) FROM STATIONARY ELECTRODE
FIGURE C - 4

APPENDIX DMAGNETIC (TOTAL FIELD) MEASUREMENTS
METHOD OF INVESTIGATION
E-61
APPENDIX DMAGNETIC (TOTAL FIELD) MEASUREMENTS
METHOD OF INVESTIGATION
IntroductionThe magnetic method is a versatile, relatively inexpensive,
geophysical exploration technique. Magnetic data can be acquired on land, over water, or in the air. Aeromagnetic surveys and deep water marine studies are commonly used as a
reconnaissance tool for tracing large-scale geologic structure,
especially basement depth. Land and coastal water marine data are more useful in tracing smaller, more localized geologic structures, such as mineral and ore deposits, and for detailed
geologic structural modeling. Land and coastal water marine
surveys yield more detail and higher resolution, since the
measurements are taken closer to the anomaly source. Land magnetic data can also be used to locate buried, man-made
structures such as pipelines and tunnels, and for archealogical prospecting.Earth Magnetism
Magnetics, like gravity, is a "potential field" method.For a given magnetic field, the magnetic force in a given
direction is equal to the derivative of the magnetic potential in that direction. The source of the earth's magnetic
potential is its own magnetic field (F) and the inducing effect this field has on magnetic objects or bodies above and below
E-62
- D2 -
the surface. The earth's field is a vector quantity having a unique magnitude and direction at every point on the earth's surface. This magnetic field is defined in three dimensions by angular quantities known as declination and inclination. Declination is defined as the angle between geographic north and magnetic north, and inclination is the angle between the direction of the earth's field and the horizontal. The earth'stotal magnetic field is measured in "gammas" (y) (where 1 gamma
-5= 10 Oersted) and varies from about 25,000 gammas near the equator to 70,000 gammas near the poles.
The earth's magnetic field is not completely stable. It undergoes long-term (secular) variations over centuries; small, daily (diurnal) variations (less than 1% of the total field magnitude); and transient fluctuations called magnetic storms resulting from solar flare phenomena.
The earth's ambient magnetic field can be modified locally by both naturally-occurring and man-made magnetic materials. There are two types of magnetism involved: induced andremanent.
In the case of induced magnetization, the earth's ambient field is enhanced by materials which can behave like a magnet
when an external magnetic field is applied.Crustal rocks become "magnetic" due to the presence of
magnetic particles, usually magnetite or related iron oxide
minerals, in their compositional structure. These particles
E-63
- D3 -
act as small dipoles, which can be uniformly oriented by an external magnetic field, making the host rock "susceptible" to magnetic induction by the earth's field.
These "susceptible" rocks (or any magnetic object) will ethus receive an "induced" magnetic field (H), which represents
a local perturbation in the main earth field. The net field (F^) in the vicinity of this perturbation is simply the vector sum of the induced and earth fields. Although the
induced field is not necessarily parallel to the ambient field, for cases where H £ .25 F , which is generally true for most
geologic applications, the directional difference between the- ynet field (F^). and ambient field (F) is negligible. Thus,
the induced field really serves to enhance the ambient field. The degree to which the ambient field is enhanced is a function
of the "susceptibility" of the material, or its ability to act like a magnet.
Remanent magnetization is produced in materials which have been heated above the Curie point allowing magnetic minerals in the material to become aligned with the earth's field before cooling. The remanent field direction is not always parallel to the earth's present field, and can often be completely reversed. The remanent field combines vectorially with the ambient and induced fifeld components. The contribution of the
remanent components must be considered in magnetic
interpretations.
E-64
- D4 -
InstrumentationAt present. the most widely used magnetometer is the
"proton precession" type. This device utilizes the precession
of spinning protons of the hydrogen atoms in a sample of fluid (kerosene. alchohol. or water) to measure total magnetic field
intensity.Protons spinning in an atomic nucleus behave like tiny
magnetic dipoles, which can be aligned (polarized) by a uniform magnetic field. The protons are initially aligned parallel to the earth's field. A second. much stronger magnetic field is produced approximately perpendicular to the earth's field by introducing current through a coil of wire. The protons become temporarily aligned with this stronger field. When this secondary field is removed, the protons tend to realign themselves parallel to the earth's field direction, causing them to precess about this direction at a frequency of about2.000 hertz. The precessing protons will generate a small
electric signal in the same coil used to polarize them with a frequency proportional to the total magnetic field intensity
and independent of the coil orientation. By measuring the
signal frequency, one can obtain the absolute value of the total earth field intensity to a 1 gamma accuracy. The total magnetic field value measured by the proton precession
magnetometer is the net vector sum of the ambient earth's field and any local induced and/or remanent perturbations.
2 -6 5
- D5 -
The total field proton precession magnetometer is portable
and does not require orientation or leveling, as is required with vertical field instruments. There are a few limitations associated with the precession system, however, the precession signal can be severely degraded in the presence of large field gradients (greater than 200 gammas per foot) and near 60-cycle A/C power lines; also, interpretation of total field data is somewhat more complicated than for vertical field data.Field Techniques
In the field, the operator must avoid any sources of high magnetic gradients and alternating currents, such as power lines, buildings, and any large iron or steel objects. The operator should also avoid carrying any metal articles.
Readings are taken at a predetermined interval which depends on the nature of the survey, the accuracy required, and the
gradients encountered. Base station readings, if required, are usually made several times a day to check for diurnal variations and magnetic storms.
Depending on survey requirements, one should determine the magnetic susceptibility and remanent magnetism for the rock
units in the survey area. If this information is not available, several representative rock samples should be collected and analyzed. One must properly mark the in-situ
orientation of these samples with respect to north direction
and horizontal plane. Susceptibility and remanent field measurements are obtained using standard laboratory techniques.
E-66
- D6 -
InterpretationLateral variations in susceptibility and/or remanent
magnetization in crustal rocks give rise to localized anomalies
in the measured total magnetic field intensity. Geologic structural features (faults, contacts, intrusions, etc.) which correlate with susceptibility and/or remanent magnetization variations will cause magnetic anomalies, which can be measured and interpreted to quantitatively define the geometry of this causative structure.
After diurnal effects and regional gradients have been removed. magnetic anomalies can be studied in detail; derivative operations and frequency filtering can be employed.
Because it is a potential field method, there is an infinite number of possible source configurations for any given magnetic anomaly. There is also an inherent complexity in magnetic dipole behavior. Remanent field effects further add to the complexity. But if the various magnetic field parameters (inclination, declination, and susceptibility) are
well defined, and some reasonable assumptions can be made regarding the nature of the source, an accurate source model
can generally be derived.Magnetic anomalies can be analyzed both qualitatively and
quantitatively. The physical dimensions of an anomaly (slope, wavelength, amplitude, etc.) often reveal enough to draw some general qualitative conclusions regarding the causative source.
E-67
- D7 -
Precise interpretation must be done quantitatively, however, and there are two basic approaches, each ideally requiring prior knowledge of earth and remanent magnetic field parameters. Modeling can be performed by various approximation methods, whereby one reduces the source to a system of poles or dipoles, or assumes it to be one of several simple, geometric forms (vertical prism, horizointal slab, step. etc.). The magnetic properties for this simplified model can be rather easily defined mathematically. Simple formulas can be derived which relate readily measurable anomaly parameters, such as
slope, width, and amplitude ratios, to the general dimensions
of the anomaly source, including depth to top, thickness, dip,
and width normal to strike. Since these methods involve very limiting geometric assumptions, the results can only be treated as good approximations except for very simplified sources.
The second and more accurate quantitative method utilizes
computer iteration techniques to directly calculate the
resultant magnetic anomaly for a two- or three-dimensional geometric model constructed to fit the expected geologic source. This method allows one to develop by trial and error a model whose calculated magnetic field anomaly matches the observed anomaly as closely as possible.
In both two- and three-dimensional computer modeling, the
source body is spatially defined by one or more n-sided polygons. In the two dimensional case, a vertical polygon of infinite length in a direction normal to the magnetic profile
E-68
- D8 -
is used to define the source. Each polygonal segment then
represents the vertical edge of a retangular prism, which is infinitely long in the profile direction. The magnetic effect of each of these prisms is computed and summed with appropriate sign convention to give the net magnetic effect of the body circumscribed by the polygon, and thus, the magnetic anomaly.
In three dimensions, a series of horizontal polygons are stacked vertically to define the source. The net magnetic effect for the total volume is then obtained by computing the effect of each polygon, integrating it over the vertical extent of the body, and summing the results for all of the polygons used. The polygonal geometry allows a great deal of flexibility in defining an anomaly source and can encompass a wide range of geologic forms.Reference
Breiner, S., 1973, Applications Manual for Portable Magnetometers, Geometries.
E-6 9

APPENDIX F WESTON GEOPHYSICAL CORP. 19 8 4 REPORT
GEOPHYSICAL SURVEY VICINITY OF RAFFINATE PITS 3 & 4
U.S. DEPARTMENT OF ENERGY [D.O.E.] RAFFINATE PIT SITE
WELDON SPRING. MISSOURI
Prepared for BECHTEL NATIONAL, INC.
JUNE 1984
Weston Geophysical1 • CORPORATION
F-l
TABLE OF CONTENTS
Page
LIST OF FIGURES i1.0 INTRODUCTION & PURPOSE 12.0 LOCATION & SURVEY CONTROL 13.0 METHODS OF INVESTIGATION 2
3.1 Seismic Refraction 23.2 Electrical Resistivity 5
4.0 PRESENTATION & DISCUSSION OF RESULTS 74.1 General Site Area Subsurface Characteristics 74.2 Raffinate Pit 4 8
4.2.1 Perimeter of Pit 4 84.2.2 Beneath Pit 4 10
4.3 Raffinate Pit 3 124.3.1 Beneath Pit 3 124.3.2 Area Adjacent To Pit 3 14
5.0 SUMMARY OF RESULTS 15FIGURESAPPENDIX A SEISMIC REFRACTION SURVEY
METHOD OF INVESTIGATIONAPPENDIX B ELECTRICAL RESISTIVITY SURVEY
METHOD OF INVESTIGATION
0762R
F-2
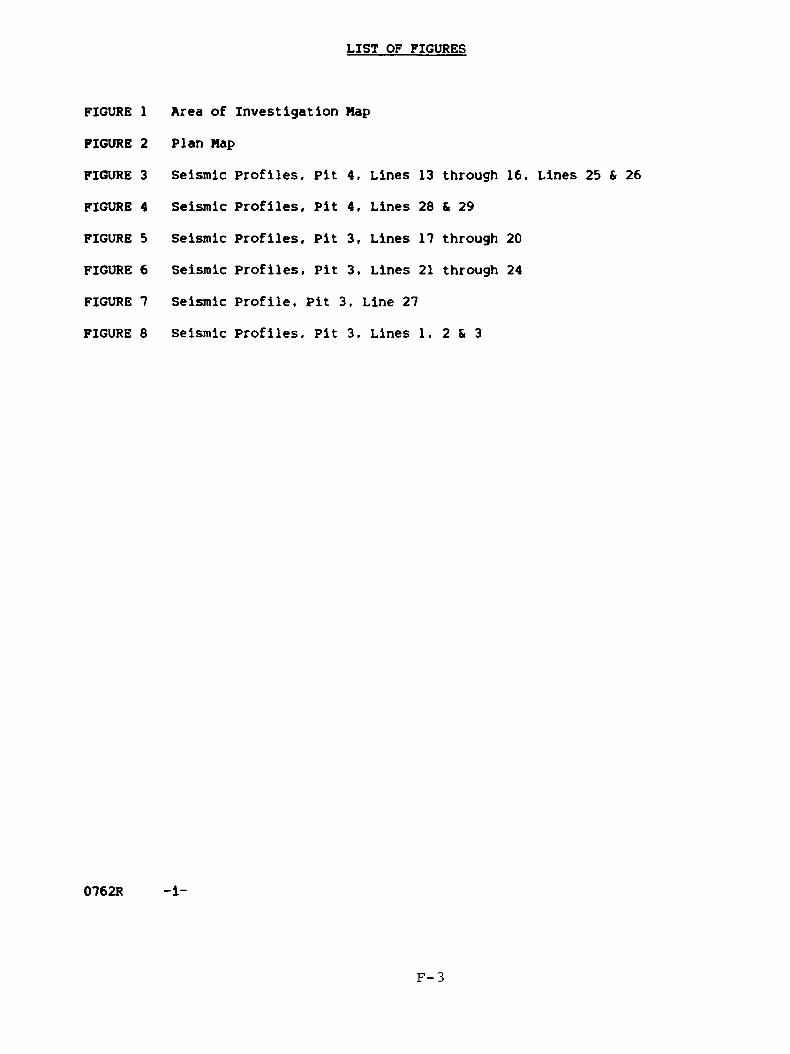
LIST OF FIGURES
FIGURE 1 Area of Investigation MapFIGURE 2 Plan MapFIGURE 3 Seismic Profiles, Pit 4, Lines 13 through 16.FIGURE 4 Seismic Profiles, Pit 4, Lines 28 & 29FIGURE 5 Seismic Profiles, Pit 3, Lines 17 through 20FIGURE 6 Seismic Profiles, Pit 3, Lines 21 through 24FIGURE 7 Seismic Profile, Pit :3. Line 27FIGURE 8 Seismic Profiles, Pit 3. Lines 1. 2 & 3
0762R -1-
F- 3
1.0 INTRODUCTION & PURPOSE
A geophysical survey program was conducted for Bechtel National, Inc. at the U.S. Department of Energy [DOE] Raffinate Pits Site in Weldon Spring, Missouri during the period of December 12 to 19, 1963. The program was temporarily terminated on December 19, 1963 because of freezing of the surface water within the pits, prohibiting the use of waterborne geophysical techniques. Analysis of the data collected during December indicated variations in subsurface conditions within the pits, accordingly the geophysical survey program was slightly modified, reinstated on March 19, 1964, and continued to completion on April 3, 1984.
The geophysical survey program utilized seismic refraction and electrical resistivity procedures. The purpose of the survey was to characterize the immediate area of Raffinate Pits 3 and 4 in terms of overburden thicknesses and velocities, depth to ground-water and general foundation characteristics. Also, the geophysical survey was designed to characterize the materials directly beneath the pits.Previous geophysical measurements were conducted around the RaffinatePit site area by Weston Geophysical In December 1982.
2.0 LOCATION & SURVEY CONTROL
The general location of the survey is shown on the Area of Investigation Map, Figure 1. This map is a section of the USGS Weldon Spring, Missouri, 7-1/2 minute quadrangle map.
The specific locations at which measurements were made in and adjacent to the Raffinate pits are shown on the plan map, Figure 2.
Horizontal control was established by Weston's field crews during the course of the fieldwork by reference to existing boring locations and survey markers. Vertical control for the geophysical profiles was
0762R -1-
F-4
obtained from a 1" = 100 feet scale topographic map supplied by Bechtel National, Inc.
3.0 METHODS OF INVESTIGATION
In the Raffinate pit area, geophysical measurements were made using seismic refraction and electrical resistivity procedures. Generalized descriptions of the geophysical techniques utilized in this study are included as Appendices A and B to this report.
3.1 Seismic Refraction
The individual seismic spreads and the shot point locations are indicated on the plan map, Figure 2 and on the seismic profiles and cross sections, Figures 3-8. Shot point locations at the ends [E] and the center [C] of each spread are also indicated on Figures 3-8. The measurements made at each shot location were used to determine the compressional [P] wave velocities and evaluate subsurface layering in terms of depth. Shooting at both ends of the seismic spread [reversed shooting] aids in the interpretation of apparent velocities resulting from dipping interfaces and lateral discontinuities. Effective penetration using the 300-foot spreads is in the order of 80 to 100 feet. The resolution capability of seismic refraction technique is generally in the range of + 5 to 10 percent of the actual depth to a velocity interface.
Land seismic refraction data were acquired along Lines 13 through 17 and Lines 25 and 26 utilizing 12-trace, 300-foot spreads [see Figure 2]. On Line 26, topographic constraints limited the spread length to 240 feet. Land seismic refraction data were also acquired utilizing 24-trace, 250-foot spreads, over several previously conducted seismic lines [Lines 1 through 3 and Line 17] to obtain higher resolution of the near-surface layering. The seismic spreads on land were shot in an end-to-end manner resulting in continuous coverage of
0762R -2-
F-5
approximately three-quarters of the inside perimeter of Raffinate Pit 4 [see Figure 2]. Seismic energy was generated with a "seisgun" at the ends and center of each spread.
Within the Pit 3 and Pit 4 ponds, seismic data were acquired using a 350-foot marine cable supported at a two foot depth by floats located at each hydrophone. Seismic energy was generated with a "seisgun" at one end of the cable. Also small buried explosive charges located outside the ponds at the ends of each north-south seismic spread were used as energy sources. These shot points were located outside the dike at Pit 3 and just inside the dike at Pit 4 [see Figure 2]. Depths to bottom in the ponds were obtained with a fathometer and/or a weighted sounding line at each point location.
Some of the seismic data within the Pit 3 and Pit 4 ponds were acquired with seismic energy sources located outside the ponds and positioned on land refraction lines that are nearly perpendicular to the lines within the ponds. This allowed for correlation of seismic data collected Inside and outside of the pits. The distance between the source located outside the pond and the first geophone within the pond was large enough such that the first seismic arrivals at each geophone are refracted arrivals from the bedrock. The best fit line through these data points on a time-distance curve has a slope that is the inverse of the velocity for the bedrock because the bedrock is relatively flat in this area. Previous measurements at this site have indicated that the velocity of the bedrock is approximately 13,000+ ft/sec. Arrival times that deviate from this velocity line, that is significantly later or earlier, can be usually attributed to undulations of the bedrock surface or changes in conditions above the bedrock. Changes in the conditions above the bedrock were determined from the interpretations of the data collected using the seismic sources that are within the pond, that is near the geophones.
0762R -3-
F-6
Interpretation of seismic refraction data acquired within the ponds is complex due to the nature of the field conditions and the geophysical characteristics of the subsurface materials. The interpretation is complicated by changes in the velocities of the materials below the pond, most likely due to an increase in the degree of saturation. Totally saturated materials have a seismic velocity equal to the velocity of sound in water, 4800 to 5000 ft/sec.. The same materials partially saturated will have a lower velocity depending upon the degree of saturation. Beneath some areas of the ponds, the bottom materials appear to be saturated [4800 to 5000 ft/sec. velocity] while in other areas the materials are probably nearly saturated [4000 to 4800 ft/sec.] or only partially saturated [3400-3800 ft/sec. velocity]. Lower velocity materials [2000-3000 ft/sec.] encountered around the perimeter of Pit 4 and outside the pits could be present beneath the ponds but cannot be detected because of the shallow, higher velocity materials at the bottom of the Pit 3 and Pit 4 ponds. This condition of higher velocity materials overlying lower velocity materials is known as a “velocity inversion". The velocity inversion layer tends to "trap" seismic energy affecting its vertical propagation. The thicker the velocity inversion layer, the greater the horizontal distance that seismic energy will progagate through the layer, masking arrivals from the underlying lower velocity layer. A near surface velocity inversion of limited thickness was detected outside of Pit 3 along lines 17, 1, and 2. In the case of Lines 17, 1 and 2, the seismic energy propagated in the inversion layer for only a short distance allowing an estimation of layer thickness using velocity and frequency considerations.
The seismic system used during this survey consisted of a Universal Seismic Amplifier, Model 780, manufactured by Weston Geophysical Corporation and a recording oscillograph, Model PRO-11, manufactured by Southwestern Industrial Electronics Company. A discussion of the basic seismic refraction technique and equipment is included as Appendix A to this report.
0762R -4-
F-7
3.2 Electrical Resistivity
Electrical resistivity measurements were made utilizing vertical electrical sounding procedures. The instrumentation used in this survey was the Scintrex Model IPR-10A receiver and TSQ-3 square wave transmitter, manufactured by Scintrex Limited. Vertical electrical sounding measurements, called point tests, are made by expanding an electrode array away from a central point. The measured resistivity values are apparent since they represent the average resistivity of the various layers within a half-space, the dimensions of which are defined by the electrode separation. Conductivity values are the inverse of the resistivity values. As the spacing between electrodes ["a" spacing] increases, the effective depth of penetration increases. Depths of penetration are greatly affected by the resistances of layers being measured, i.e., a low resistivity [highly conductive] layer will somewhat reduce the depth of penetration.
The point tests were centered at 12 locations [RT-44 through RT-55] in the Raffinate pit area as shown on Figure 2. Resistivity measurements around the perimeter of the pits [RT-44 through RT-49] were obtained using “a" spaclngs of 2.5, 5, 7.5, 10, 20, 30, 50, 70, 100, 150 and 200 feet, except in the case of RT-47 and RT-48 which were limited by site constraints to maximum "a" spaclngs of 150 and 130 feet, respectively. The point test data in the ponds [RT-50 through RT-55] were acquired by attaching the electrodes to a floating rope with premarked "a" spacings of 2. 3, 6, 9, 27, 54, 81, 162 and 243 feet.
The effective depth of penetration for this resistivity survey is estimated to be approximately 70 to 100 feet for point tests with maximum “a" spacings of 200 or 243 feet [the maximum “a" spacing used in this survey] and 50 to 80 feet for the point test with maximum "a" spacing of 130 feet. The resulting plot of apparent resistivity values
0762R -5-F-8
versus electrode spacing therefore indicates the variation of resistivity with depth. The Wenner electrode configuration was used for point test measurements.
The interpretation of the resistivity data is accomplished by computer analysis of field data curves. The computer program models the subsurface condition in terms of resistivity value and depth by matching theoretical curves to the field data curve. The program accomplishes this by applying a "fit" to an initial model, and iteratively modifying the model until an accurate match of the field curve is obtained. The resolution of the resistivity data may range from 5 to 30% of the total depth and is dependent on the contrast in resistivity values between adjacent layers. At the Weldon Spring site, high resistivity contrast exists between the predominantly clay type overburden materials [low resistivity] and the bedrock [high resistivity] allowing for good depth resolution, about + 10% of the total depth to a layer interface.
A discussion of the electrical resistivity technique and the computer fit to each of the field curves is included as Appendix B to this report.
0762R - 6 -
F-9
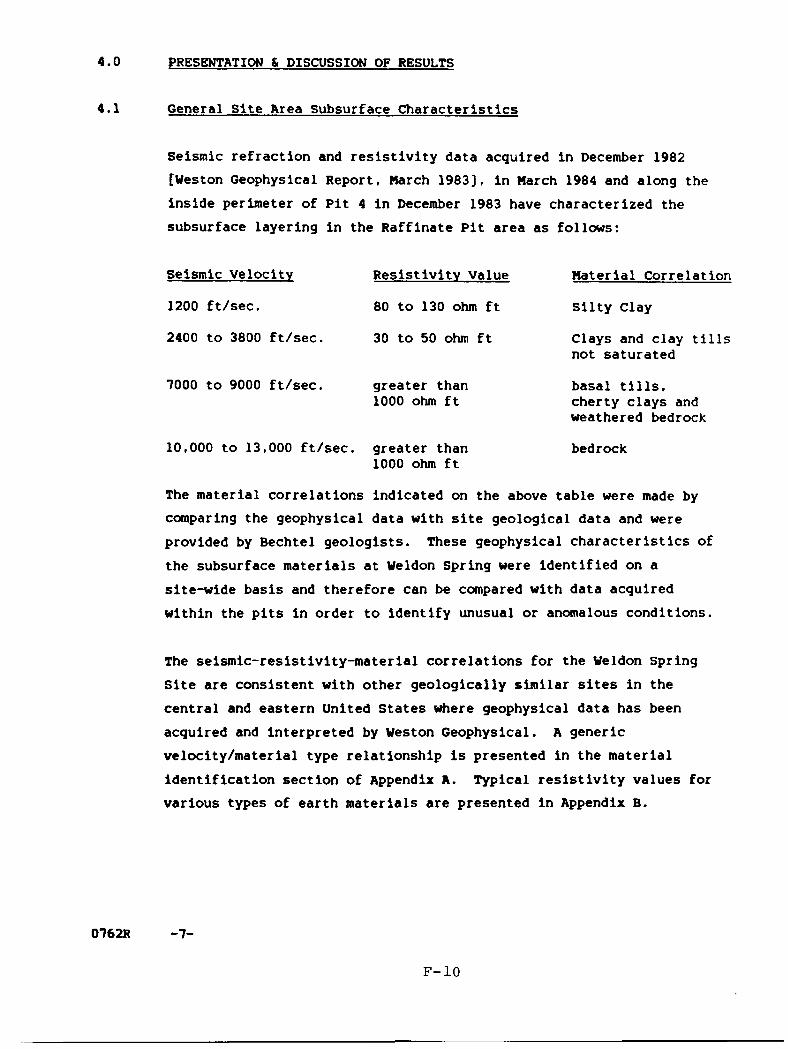
4.0 PRESENTATION & DISCUSSION OF RESULTS
4.1 General Site Area Subsurface Characteristics
Seismic refraction and resistivity data acquired in December 1982 [Weston Geophysical Report, March 1983], in March 1984 and along the inside perimeter of Pit 4 in December 1983 have characterized the subsurface layering in the Raffinate Pit area as follows:
Seismic Velocity 1200 ft/sec.2400 to 3800 ft/sec.
7000 to 9000 ft/sec.
10,000 to 13,000 ft/sec.
Resistivity Value 80 to 130 ohm ft 30 to 50 ohm ft
greater than 1000 ohm ft
greater than 1000 ohm ft
Material CorrelationSilty ClayClays and clay tills not saturatedbasal tills, cherty clays and weathered bedrockbedrock
The material correlations indicated on the above table were made by comparing the geophysical data with site geological data and were provided by Bechtel geologists. These geophysical characteristics of the subsurface materials at Weldon Spring were identified on a site-wide basis and therefore can be compared with data acquired within the pits in order to identify unusual or anomalous conditions.
The seismic-resistivity-material correlations for the Weldon Spring Site are consistent with other geologically similar sites in the central and eastern United States where geophysical data has been acquired and interpreted by Weston Geophysical. A generic velocity/material type relationship is presented in the material identification section of Appendix A. Typical resistivity values for various types of earth materials are presented in Appendix B.
0762R -7-
F-10
Seismic velocity values are related to the overall physical properties of the subsurface materials. Therefore different materials with similar physical properties [elastic moduli and density] will have similar seismic velocities. An increase in the number of joints and fractures and/or weathering in bedrock will cause a decrease in elastic moduli values, evidenced by lower seismic velocity values.[The compressional and shear wave velocities and density are used to calculate Poisson's ratio and the various elastic moduli: Young's.Shear, Bulk.]
4.2 Raffinate Pit 4
Seismic profiles for land refraction Lines 13 through 16, and 25 & 26 and electrical resistivity vertical profiles for Point Tests RT-44,45, and 47 through 49 conducted on land inside the perimeter of the Raffinate Pit 4 dike are presented on Figure 3. Seismic and resistivity profiles for refraction Lines 28 and 29 and Point Tests RT-52 through 55 within the Pit 4 pond are presented on Figure 4.
4.2.1 Perimeter of Pit 4
Bedrock velocities generally range from 10,500 to 13,000 ft/sec. This variation in velocity is most likely indicative of changes in the degree of bedrock weathering, although a change in lithology could have a similar effect. High velocity bedrock was detected along all lines except Line 26, a relatively short 240 foot seismic spread with limited penetration.
Along all refraction lines, except Line 13, an intermediate velocity of 7,000 to 8,000 ft/sec. was measured. This velocity is probably indicative of clay tills, cherty clays and weathered bedrock [correlation table-Section 4.1].
0762R -8-
F-ll
The seismic velocities of the thicker upper layer presented on Figure 3 vary from 2,400 to 3,800 ft/sec. This variation in velocity may be due to the degree of saturation of the overburden material or perhaps changes in the physical characteristics of the material either naturally occurring or induced by weathering [correlation table-Section 4.1].
Resistivity values measured near Raffinate Pit 4 area are generally characterized by a three-layer condition consisting of a thin surface layer with resistivity values generally between 48 and 119 ohm feet, a relatively thick intermediate layer which has uniform resistivity values in the range of 2 to 40 ohm-feet and a high resistivity layer [generally greater than 1,000 ohm feet] at depth [See Section 4.1 for correlations]. The surface resistivity layer correlates with the upper section of the 1,200 to 1,800 ft/sec. surface layer detected by the seismic refraction survey. The intermediate resistivity layer generally correlates with the 2,400 to 3,800 ft/sec. layer and with a clay and clay till layer identified by the test borings. At Point Tests RT-44, 45 and 49, the relatively thick intermediate resistivity layer can be subdivided into two or three sub-layers. These sublayers could be due to variations In subsurface materials such as a localized increase in the percentage of iron oxide nodules observed throughout the site area by Bechtel geologists. Computer solutions to the point tests are included as Figures B-2 to B-13 in Appendix B.
Along the north and south sides of Pit 4. the top of the high resistivity layer [greater than 1000 ohm-feet] correlates with the top of high velocity [10,500 ft/sec.] bedrock at RT-48 and with the top of7,000 to 8,000 ft/sec. layer at RT-47. These correlations are typical for the Weldon Spring site area [see correlation table-Section 4.1]. However, at RT-44 and 45 located on Line 25 along the east side of Pit 4. the top of the high resistivity layer is substantially deeper [more than 35 feet] than the top of high velocity rock.
0762R -9-
F-12
RT-49 was located to further Investigate this anomalous condition not previously observed at the Weldon Spring site. Modeling of the resistivity data for RT-49 yielded similar results.
The significance of the anomalous condition at Resistivity tests RT- 44, 45 and 49 cannot be assessed without additional information. The low resistivity values within the bedrock could possibly be due to mineralized [conductive] groundwater moving through bedrock fractures, or perhaps due to more prevelant clay filled fractures. However, the seismic refraction data are not indicative of any extensive bedrock fracturing as would be evidenced by lower seismic velocities. The conductive nature of the subsurface materials could be related in some way to the subsurface movement of conductive groundwater along an east west drainage system located in this area prior to the construction of Pit 4. The possibility of conductive groundwater draining from the west side of Pit 3 and migrating into the bedrock cannot be excluded from consideration. It is also possible that a pipe or network of pipes buried at depth and oriented parallel with the east side dike in the vicinity of Line 25 could be responsible for the low resistivity readings resulting in the anomalously deep computer modeled solution to the resistivity curves. This latter possibility is considered less likely since the data for RT-44, 45 and 49 including the Lee left and Lee right partitioning data [see Appendix B] do not show lateral variations indicative of cultural affects. Surface metallic debris may also have affected the resistivity data. However, some of the resistivity data for these point tests were obtained beyond the area of metal debris and are consistent with data obtained within the area of debris.
4.2.2 Pit 4 Pond
Two seismic lines [28 and 29) oriented south to north and four resistivity point tests [52, 53, 54 & 55] were acquired within the Raffinate Pit 4 Pond [see Figure 2].
0762R -10-
F-13
The seismic data were collected using sources placed within the pond and on shore at the location of land refraction lines.
The refraction profiles for Lines 28 and 29 and the resistivity point test data for RT-52 through RT-55 are presented on Figure 4. The material at the bottom of the pond has a seismic velocity in the range of 4,000 to 4,800 ft/sec. The thickness of this material varies from 5 to 30 feet and is thinner at the southern end of the pond. This4.000 to 4,800 ft/sec. material probably corresponds to the 2,400 to3,800 ft/sec. material observed outside the pit, except that there is a greater degree of saturation of the materials beneath the pond, it is possible that the less saturated 2,400 to 3,800 ft/sec. material is present beneath the 4,000 to 4,800 ft/sec. material underlying the pond but cannot be detected seismically due to the velocity inversion condition previously described [Section 3.1]. The thickness of the7.000 to 9,000 ft/sec. material is highly variable. The seismic velocities of this material may be locally as high as 10,000 ft/sec. along Line 29. These velocity variations are probably due to locally harder zones, perhaps with more chert, within the basal till/cherty clay/weathered bedrock materials. The high velocity bedrock has similar seismic velocities both Inside and outside the pit. At some locations, the seismic profiles are dashed or discontinuous; locally poor energy coupling and/or energy transmission conditions within and beneath the pond [the velocity inversion] resulted in reduced quality of the seismic refraction data.
The layering as determined from the resistivity point tests [Rt-52 through RT-55] correlate well with the profiles determined by the refraction survey. However, it should be noted that the resistivity values for the 7000-8000 ft/sec. materials beneath the pond are low and similar to the values noted for RT-44, 45 and 49 on the eastern perimeter of the pit. High resistivity values were obtained for the high velocity bedrock. It appears that the anomalous subsurface conditions along the east side of Pit 4 probably extend beneath the Pit 4 pond.
D762R -11-
F-14
4.3 Raffinate Pit 3
The seismic and resistivity profile for Line 17 outside the south edge of the Pit 3 are presented on Figure 3. Seismic profiles for the east-west lines in Pit 3 pond [Lines 18 through 24] are presented on Figures 3 and 4.
The profile for Line 27, the north-south seismic line in the pond, is presented on Figure 5. Profiles for Lines 1,2,3 incorporating the detailed near-surface refraction data obtained during this survey are presented on Figure 6. [Profiles for Lines 1, 2, and 3 were originally presented in the Weston Geophysical report of March, 1983.]
4.3.1 Pit 3 Pond
Eight refraction lines [Lines 18 through 24, and 27] and two resistivity point tests were conducted within the Pit 3 pond. The north-south refraction line within the pit [Line 27] was conducted using seismic sources located within the pond and along other land refraction lines outside the pit. This method of data collection provides information on the overburden materials and bedrock beneath the pond.
Figures 5, 6 and 7 present the interpretation of these data. Seismic data beneath the shot points on Lines 18 through 24 are presented in section form on Figures 5 and 6. Included on these sections are profile information from Lines 15 and 25 adjacent to the west side of Pit 3, and from Lines 12 and 1 [refer to Weston Geophysical site report, March 1983] adjacent to the east side of Pit 3. The seismic profile at the intersection point with Line 27, the north-south profile within the Pit 3 pond, is also shown in the sections. For correlation purposes, the profile for Line 17 is also shown on Figure 5.
0762R -12-
F-15
As shown on the profiles, there is a significant change in the conditions between the east and west sides of the pit. Correlations at the intersections between the east-west lines, the north-south [Line 27] and the land refraction lines were made whenever possible to help define the changes in the near-surface materials. Seismic refraction data obtained along the west and south sides of Pit 3 identified a 5,000 ft/sec. refracting horizon at a depth of 10 to 20 feet below water bottom. The overlying material, mostly sludge, has a velocity of 3,400 ft/sec. If this material were totally saturated, the seismic velocity would approach the velocity of sound in water, approximately 5,000 ft/sec. A 5-to 10-foot thick layer of 3,600 to3,800 ft/sec. material was detected along Lines 18 through 22 on the east side of Pit 3. Based on as-built elevations of Pit 3, this material is sludge. The seismic velocity value of 3600-3800 ft/sec. indicates that this material is not totally saturated. However, materials with velocities in the range of 3,400 to 3,800 ft/sec. were not detected in the center of the pit along Line 27. The seismic velocity measured beneath the pond along Line 27 was 5,000 ft/sec., indicative of a water saturated overburden material.
The relatively poor seismic energy transmission characteristics of the material beneath the Pit 3 pond limited the capability of the seismic refraction technique to resolve layers at depth. This is probably due to the 8 to 16 foot thickness of sludge at the bottom of the pond. Energy transmission was slightly better on the west side of the pit and along Line 27 where some information on seismic layers at depth was obtained [Figure 5 and 6]. Only a few data points on the high velocity bedrock were obtained from the refraction measurements along the east side of the pit. To further complicate the interpretation, the 7,500+ ft/sec. material is highly variable in location and thickness within this pit. This material is present beneath the west side of the pit, but is either very thin or absent beneath the east side. The profile for Line 27 illustrates the variation in the thickness of this material where present.
0762R -13-
F-16
The two resistivity point tests conducted within the pond were likely affected by the sludge. The layering computed with these data indicate very low resistivity values for near surface materials. The low resistivity values are most likely influenced by near surface lateral changes of the conductive sludge within the pit. The very high resistivity layer modeled for RT-51 may be due to a localized zone of air or gas entrapped materials.
4.3.2 Areas Adjacent To Pit 3
The seismic refraction data acquired in December 1983 along Line 17 indicated the presence of a thin layer of 5,000 ft/sec. material near ground surface. The seismic velocity of 5,000 ft/sec. is indicative of a water-saturated overburden material.
In the vicinity of Raffinate Pit 3, additional seismic data were acquired with closer spaced geophones and a 24-trace system in order to detail the 5,000 ft/sec. layer detected on Line 17 and to determine if this layer exists on Lines 1, 2 and 3. The seismic spreads for the reshooting were designed to obtain more detailed information on the near surface layering and were not of sufficient length to penetrate to bedrock. This additional shooting determined that the 5,000 ft/sec. layer exists south and east of Pit 3 along Lines 17, 1 and 2, but apparently does not extend as far east as Line 3. It should be noted that the data obtained along Line 3 may have been affected by buried metal pipes that run parallel to Line 3 and that the localized presence of a thin near surface saturated layer should not be ruled out. A cursory review of the seismic data obtained in the site area in December 1982 indicates that a 5,000 ft/sec. near surface layer could possibly exist along the southern portion of Line 12 adjacent to Line 1 and at some locations along Lines 4, 5, 6, and 7.
The resistivity model at RT-46 is consistent with the seismic refraction data along Line 17 in that the higher resistivity layer at depth corresponds with the top of the 7,000 to 8,000 ft/sec. layer.
0762R -14-F-17
5.0 SUMMARY OF RESULTS
Weldon Spring Site Area
The seismic and resistivity data acquired along the north, east and south perimeters of Pit 4 and along the south side of Pit 3 are quite similar to the data obtained in the December 1982 geophysical survey conducted by Weston Geophysical at the Weldon Spring site outside the immediate pit area. Throughout the site area, the seismic velocities range from 7,000 ft/sec. for basal till/cherty clay/weathered bedrock to 13,000 ft/sec. for intact bedrock, indicative of a wide variation material types and/or in the degree of bedrock weathering. The overlying layer has low resistivity values in the range of 2 to 40 ohm-feet and seismic velocities in the range of 2,400 to 3,800 ft/sec., indicative of the clay layer identified by the test borings. Resistivity values of 1,000 ohm-feet or greater correlate with the top of high velocity rock, weathered rock and/or cherty clay. A correlation table of seismic velocities values, electrical resistivity values and materials typical of the Weldon Spring site area is presented in Section 4.1.
Pit 4
The seismic velocity layering of the overburden materials beneath the Pit 4 pond differs from the typical velocity layering along the edge of the pit and outside of the pit due to presence of water and sludge within the pits. It is likely that the materials beneath the ponds have become nearly water saturated, increasing seismic velocities to 4000 to 4800 ft/sec.. Because of a possible velocity inversion [high velocity material overlying lower velocity material] it cannot be concluded that the less saturated 2,400-3,800 ft/sec. material identified along the edges and outside of Pit 4 underlies the 4,000 to4,800 ft/sec. material beneath the Pit 4 pond.
0762R -15-
F-18
Anomalously low resistivity values for bedrock were measured on the east side of Pit 4 [RT-44, 45 and 49]. The computer solutions for resistivity Point Tests RT-44, 45 and 49 along Line 25 yield anomalously large depths to the high resistivity layer and indicate low resistivity values for the 7,000-9.000 ft/sec. layer and the upper portion of the high velocity rock determined by the seismic refraction survey. This anomalous subsurface condition could be due to changes within the bedrock or the less likely possibility of cultural affects [possible buried pipes or metallic debris]. The depth to the high resistivity layer modeled for point tests RT-52 through 55 located within Pit 4 correlate with the top of high velocity rock; however, low resistivity values are indicated for the cherty clay/weathered rock materials. Preconstruction plans indicate that an east to west drainage pattern existed in the vicinity of these point tests [RT-44, 45, 49, 52 through 55] prior to construction of Pit 4. Additional subsurface information should be obtained in this area to determine the nature of the bedrock and the cause of the low resistivity values within the cherty clay/weathered rock and bedrock materials.
Pit 3 Pond
The results of the geophysical survey indicate that subsurface conditions beneath and in the vicinity of Pit 3 are more complex than the conditions beneath Pit 4. Seismic velocities of 3,400 to 3,800 ft/sec., indicative of partially saturated overburden materials, mostly sludge, were measured within Pit 3 along the east and west sides and to a limited extent along the south side. The underlying material has a velocity of 5,000 ft/sec. indicative of water saturated materials. These partially saturated [3,400-3,800 ft/sec.] materials apparently do not exist in the center of Pit 3 as evidenced by the5,000 ft/sec. velocity measured at the pond bottom on Line 27. These velocity profiles inside the pit differ from typical velocity profiles outside the immediate pit area where the clay like material with a velocity of 2,400 to 3,800 ft/sec. overlies materials with velocities
0762R -16-
F-19
of 1,000 ft/sec. or greater. Materials with velocities of approximately 7,000 to 6000 ft/sec. exist beneath the west side of Pit 3 but are very thin or not present beneath the east side of the pit. The capability of the seismic technique to resolve layering at depth was somewhat adversely affected by relatively poor energy transmission characteristics of the materials beneath Pit 3, mainly the sludge. Closely spaced north-south refraction lines and additional point tests would greatly aid in further characterization of the conditions that apparently exist within this pit.
Areas Adjacent to Pit 3
Seismic velocities of 5,000 ft/sec., indicative of water saturated materials, were measured at relatively shallow depths south of Pit 3on Line 17 during the December 1983 survey. Detailed seismicrefraction data acquired during the spring of 1984 on Lines 17, 1, and2 confirmed the presence of a shallow 5,000 ft/sec. layer of limitedthickness. Seismic data for Lines 17, 1 and 2 indicate that the saturated layer is thin, probably only a few feet thick, and the underlying material is unsaturated as evidenced by the seismic velocity of 3,000 to 3,500 ft/sec. The elevation of the top of the5,000 ft/sec. layer along Lines 17, 1 and 2 is approximately 5 to 10 feet lower than the water elevation in Pit 3.
It is possible that the 5,000 ft/sec. material along Lines 17, 1 and 2 is the result of lateral migration of the water in Pit 3 underneath the dike to the surrounding areas. It is also possible that the 5,000 ft/sec. layer could be due to ponding of groundwater on top of an impermeable clay layer. A review of the seismic data acquired in December 1982, indicates that the 5,000 ft/sec. near surface layer could extend along the southern protion of Line 12 and perhaps along Lines 4, 5, 6, and 7. It should also be noted that there is no evidence of the saturated material on the seismic lines located on the east edge of Pit 4 and on Line 3 to the east of Pits 1 and 2.
0762R -17-
F-20

Additional detailed seismic refraction profiling and electrical surveys [principally EM conductivity and self potential] should be conducted around the Pit 3 area to further investigate the source and the extent of the near surface saturated zone detected on Lines 17, 1 and 2.
0762R -18-F- 21


FIGURES
F-23

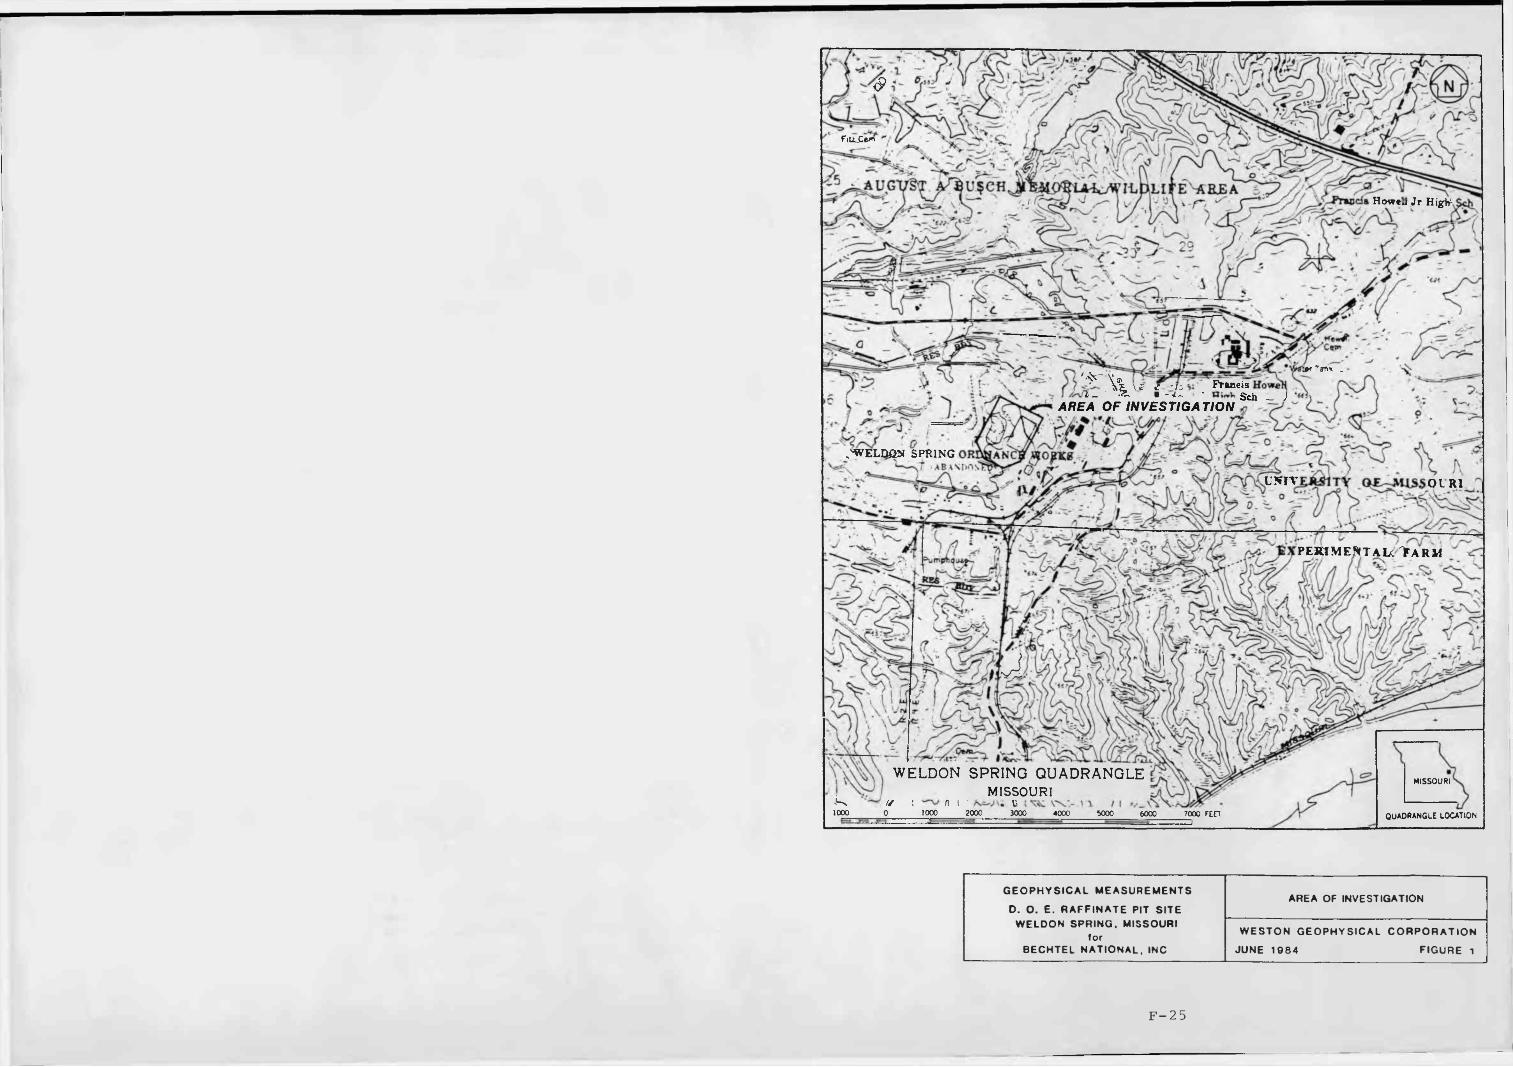
ids Howell Jr Higth
Ffaneis Howeu,,». g . u
A REA O F IN V E S T IG A T IO N
'WELQfiN SPRING OKOMAN
U N I V
S X P E R l M E f t T A L C 1 F A R M " ^J ri;/ 11 iS - • L
■v r ^ 7 / M ;WELDON SPRING QUADRANGLE
MISSOURI" v i —v' n i xw'. l ; vx> 11 i \ v_
MISSOURI
q u a d r a n g l e l o c a t io n
GEOPHYSICAL MEASUREMENTS
D. O. E. RAFFINATE PIT SITE WELDON SPRING. MISSOURI
forBECHTEL NATIONAL. INC
AREA OF INVESTIGATION
WESTON GEOPHYSICAL CORPORATION
JUNE 1984 FIGURE i
F-25
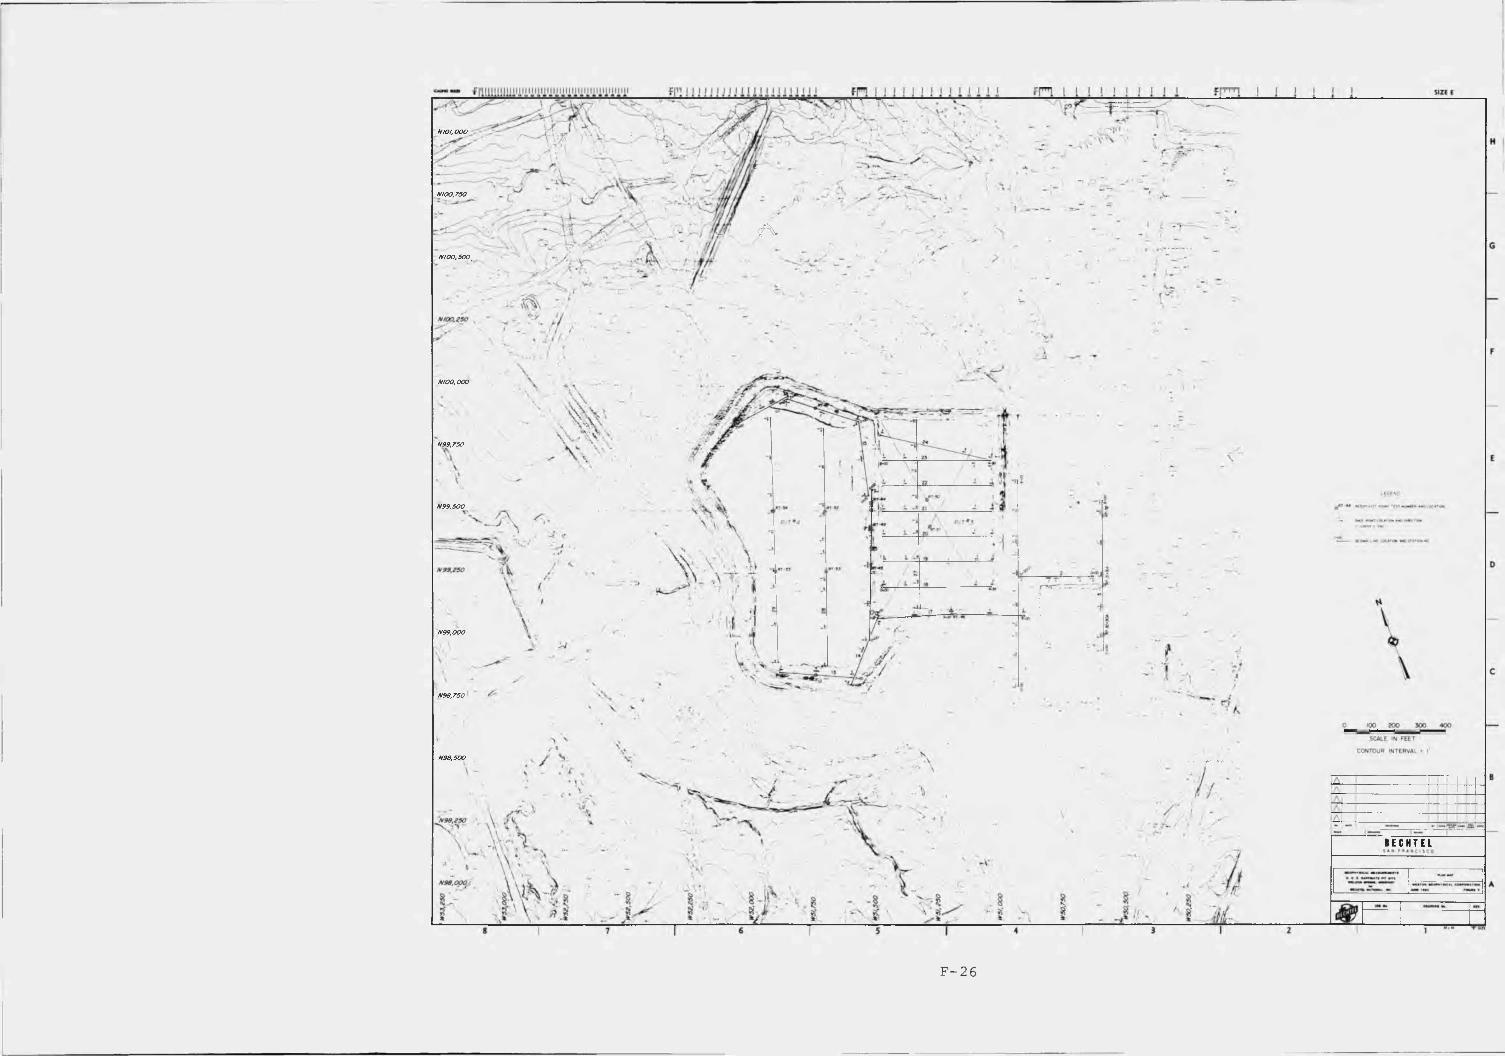
SIZE I
V I -*vN 101,000
N100,500
N100,000
N 99,750
N99,500
N99,000
r t
SOLE IN FTET
CONTOUR INTERVALN98,500
F - 2 6
L IN E 13
23
>1000
sw0-00IiLINE 14
c
N E3+00
- 650EL.650' -
10,500-11,000 7 0 0 0 - 8 0 0 06 0 0 ' - - 6 0 0
s0*00
L IN E 2 5
3 - 0 0
t6+00
E
L I N E 2 62*40J*00
1400 +
3 8 0 03 8 0 0 t
NO HIGH VELOCITY ROCK DETECTED
L INE 16
RT -4 51600- 650'E l -650' -
7 0 0 0 - 8 0 0 0
- 6 0 06 0 0 -32
12,000 - 13,00040
1000
> 1 0 0 0
E3 - 0 0
'«5 N- 6 VCEL.6 5 0 - 67
>1000
- 600'600* - 7 0 0 0 i
13,0001 - 5 5 0 '550' -
L IN E 153 * 0 02 *0 01+000*00
- 6 5 0EL 650' -
3 8 0 0 +3 8 0 0 +
- 600'6 0 0 -
13,000*
SHOT POINT LOCATION AND DIRECTION ( C : C»<V#« . E = End ) —
LNEIN TERSECTIO N
SEISMIC VELOCITY VALUES IN FEET/SECOND —
GmXMO SURFACE s
1200: \
LEGEND- VELOCITY y MTENfACCS v RESISTIVITY
INTERFACES X P T -I\ . 73
, RESISTIVITY POINT TEST / NUNBER A W LOCATION
iRESISTIVITY VALUES IN OWA-FEET
X 12,0001
SCALESFEET
G E O P H Y S IC A L M EASU REM ENTS
O. O. E. R A FF IN A TE PIT SITE WELDON SPRING, MISSOURI
l o rBECHTEL N A T IO N A L , INC
SEISMIC PROFXS6 RAFFINATE PIT NO. 4
LINES 1 8 ,1 4 .1 8 .1 6 .2 6 S 2<
W ESTO N G E O P H Y S IC A L C O R P O R A T IO N
JUNE 198 4 FIGURE 3
F - 2 7
L IN E 2 9
I600T RT-52 RT-536 50 -60 WATER BOTTOM 78-912 4 0 0 1
23
2956 0 0
7 0 0 0L O C A L L Y AS HIGH AS 10,000>1000
>1000
(26) -
1400?
3600?
7000?
L IN E 2 8
W A T E R B O T T O M
10,500
il . OOO?
AND DIRECTION(C * Center , E * End ) -
LMEINTERSECTION
s w S e ,-vtVELOCITYNTERFACCS
RESISTIVITY INTERFACES -i
, RESSTrVTTY POWT TEST T - | / NUAGCR AM) LOCATION
: i t y pSEISMIC VELOCITY VALUES IN FEET/SECOND —-------- - 2 5 0 0 - 3 0 0 0
12,000*\ r—-- *— r---->1000
RESISTIVITY VALUES OHM-FEET
RQU5 I —• = ORIGINAL ELEVATION of PIT BOTTOM
SCALESFEET
GEOPHYSICAL MEASUREMENTS
D. O. E. RAFFINATE PIT SITE WELDON SPRING. MISSOURI
t o rBECHTEL NATIONAL. INC
SEISMIC PftOPR.ES RAFPWATE PIT NO. 4
LBtES IS S 29
WESTON GEOPHYSICAL CORPORATION
1BS4 FIGURE 4
F - 2 8
EL.650 -
6 0 0 ’ -
EL.650'
600'
EL 650' -
6 0 0 -
L IN E 2 0
WATER BOTTOM
14001 - 6502005 0 0 03800' 5 0 0 05 0 0 0
34 0 07 0 0 0 1 7 0 0 0
- 600'12.000
-2.000 13.000
LINE 19
L IN E 18
WATER BOTTOM
- 3 4 0 0 1 ■■ - 6 501200-1500-=____27 0 0 — ^ -----5 0 0 0 ------
4 0 0 0 1
5 0 0 0
50 0 0
7 0 0 0 - 8 0 0 0
•2.000 - - 3 0 0 0 - 6 0 0•2.500-I3XXX)
WATER BOTTOM
- 650'5 0 0 0
5 0 0 05 0 0 0
10,000
- 6 0 012.000-i3 jO O O•1.0001
SHOT POINT LOCATIONAND DIRECTION(C * C en te r , E * End ) .
LWEIN TE R S E C TIO N
SEISMIC VELOCITY VALUES I
FEET/SECOND
SURFACE ^
X)I IN(ECONO --------
LEG ENDVELOOTY WT ERF ACES
RESISTIVITY INTERFACES-,
. RESSTIVfTY POINT TEST ^ y N U W ER A W LOCATION
-■I200t I \ ilZk
^ 12,000? >1000 ROTES I -------------- = ORIGINAL ELEVATION OF P IT BOTTOM
RESISTIVITY VALUES IN O m -FEET
SCALESFEET
L IN E 173tO O
1400 - 1600 TZT650
5 0 0013 0 0 0 12 4 0 0 1
3 5 0 0 1
6 00 - 7 0 0 0 - 8 0 0 0 > 1000
11,000-12,000
E6*00
G E O P H Y S IC A L M E A SU R E M E N TS
D. O . E. R A FF IN A TE P IT S ITE W ELDON SPRING. MISSOURI
t e r■E C H TEL N A T IO N A L . INC
SEISMIC PR OFITSRAFFMATE PIT NO. S LWES 17.1S.1S S 20
W ESTO N G E O P H Y S IC A L C O R P O R A T IO N
FIGURE 6
F-29
LINE 24W A T E R B O T T O M SEE
N O T E»? 1E L 650' -
S EE N O TE*I38 001
7 0 0 0
600' - - 6 0 0 ’11,0001
LINE 2 3W A T E R B O T T O M
E L 6 5 0 ' - 5 0 0 0-■— - 3 4 0 0 1
5 0 0 05 0 0 0 1
7 0 0 0 111,5006 0 0 -
I Z . X X H 3 . 0 0 0
SEENOTE
- 6 5 0
LIN E 2 2W A T E R B O T T O M
EL 650' - \ _______ 3 4 0 0 1 .. - 6 5 0 ’36007 0 0 0 S E E N O T E * I
3 0 0 0 1
600' - 7 0 0 0 1- 6 0 0 '
SHOT POINT LOCATION AND DIRECTION(C = Center , E 1 End ) —»
0*0*0SURFACEL E G E N D
LN EIN TE R S E C TIO N __________________
SEISMIC VELOCITY J — - l? 0 0 -----IXVALUES INFEET/SECOND ----------------- 2 5 0 0 - 3 0 0 0
. VELOCITYHTERFACES
RESISTIVITY INTERFACES
y RES 1STIVITT POINT TEST ^ { / NUMBER AND LOCA-nON
^ 12,C>,0001 > u-NOTES I --------------- ORIGINAL ELEVATION OF PIT BOTTOM
2 SEE WESTON GEOPHYSICAL SITE REPORT, MARCH 1963
RESISTIVITY VALUES IN O H * -FEET
SCALESFEET
W A T E R B O T T O M
1 4 001 3 8 0 0
5 0 0 0 1 120015 0 0 0 15 0 0 0 1
75 0 03*00!
12.000- 13,000GEOPHYSICAL MEASUREMENTS
D. O. E. RAFFINATE PIT BITE WELDON BPRMO. MISSOURI
fo rBECHTEL NATIONAL. INC
SEISMIC PROFILES RAFFBMTE PVT NO. 3 UNES 2 1 .2 2 .tS S 24
WESTON GEOPHYSICAL CORPORATION
A M 1SS4 FIGURE S
F-30
L IN E 2 7
R T - 5 0W A T E R B O T T O M
E L 6 5 0 - 10001 - 6 5 05 4 0 05 0 0 0 1500+
3 5 0 0
600'10,000? - 6 0 0
11,000-12,000
SHOT POINT LOCATIONAND DIRECTION(C - C e n te r , E 8 End ) -
LMEIN TER SEC TIO N
SEISMIC v e l o c it y VALUES IN FEET/SECOND
SURFACE
<
LEG ENDVELOcmrNTERFACIS
M t l t T M T T / "E S S T 'V T T r POINT TE S Tm S S S x „./ •*- ^ W O - >■
12,000?
RESISTIVITY VALUES 0H4-FEET
NOTES I -------------- ORIGINAL ELEVATION O f PIT BOTTOM
SCALESFEET
G E O P H Y S IC A L M EASU REM ENTS
0 . O. E. R A F F IN A T E PIT SITE W ELDO N SPRING, MISSOURI
lo rBECHTEL N A T IO N A L . INC
SEISM IC PROPILES RAFFINATE P IT NO . 3
LINE 27
W ESTO N G E O P H Y S IC A L C O R P O R A T IO N
*J N € 16S4 FIGURE 7
F-31
s L INE I N0*00 ^RT %
1 (30'R>
5 * 0 0 6*00 7 * 0 0 8 * 0 0 8 * 2 3R T - 3 7
1 8 0 0 1 R T - 3 4 ~(70 R) - 6 5 0 'EL 6 5 0 - 5 0 0 0
533 5 0 0 1 5 0 0 0
4 0
6 0 0 - - 6 0 0 '>100012,000-13,000> 1000 12,000
POSSIBLY 13,0001
w3 * 0 0 ! £'
LINE 2 E0*00 s
0+00I RT-30
* 3QAI RT-31
•3 lA
LINE 33 + 0 0 5 + 0 0
RT -32
N6*00
6 5 0 -I2 0 0 '4 0 0 - 650 6 3 0 - I700T ~ " " ■ _ ~ 7 0 12001 — ------------------------ --------------= 1
— 5000 —— ------DATA A F F E C T E D BY B u R i E D P 3 9 0 0 -4 3 0 0
68
3 4 0 0 -3 7 0 0 1334001
33 IT
36002
6 00 - — 600 6 0 0 - >1000— 000
i? j0001 ~ —
li.O O O -12 .OOO7 11,0001
SHOT POINT LO CA TIO N AND D IRECTION
( C - C tm e r , E : End )
L * EIN T E R S E C T IO N "
SEISMIC VELOCITY VALUES IN FEET/SECOND
G P C V C SURFACE ,
LEGENDVELOCITY
V NT ERF ACES\\ RESISTIVITY
INTERFACES x 9
. RESISTIVITY POINT TEST t/ NUABER A K ) LOCATION
1200?
12,0001
1 ->IOOOX
RESISTIVITY v a l u e s IN O H *-FE E T
S C A L E SFEET G E O P H Y S IC A L M EASUREM ENTS
0 . O. E. R A FFIN ATE PIT SITE W ELDON SPRING. M ISSOURI
lo rSECHTEL N A T IO N A L. INC
SEISM IC PROFILES R A FFIN ATE PIT NO. S
LINES 1.2 S 3
W E S TO N G E O P H Y S IC A L C O R P O R A T IO N
JUNE 1 8 8 4 FIGURE S
F-32

APPENDIX ASEISMIC REFRACTION SURVEYMETHOD OF INVESTIGATION
F-33
APPENDIX ASEISMIC REFRACTION SURVEYMETHOD OF INVESTIGATION
General ConsiderationsThe seismic refraction method is an indirect means of
determining the depths to a refracting horizon and the thicknesses of major seismic discontinuities overlying the
high-velocity refracting horizon.Interpretations are based on the measurement of the time
required for elastic waves, generated at a point source, to
travel to a series of vibration-sensitive devices (geophones or
seismometers). These geophones are spaced at known intervals
along a straight line on the ground surface. This instrument array is called a seismic spread.
The seismic wave used in a seismic refraction survey for
depth calculations and material identifications is called a "P" (compressional) wave. This wave is transmitted through earth
materials as a series of compressions and rarefactions. As a ■P" wavefront passes a point in the earth, the point moves to
and fro in the direction of wave propagation, giving rise toits alternate designation of a "longitudinal" wave. The "P"wave is transmitted to subsurface strata, and is refracted back
through the uppermost layers to the detectors on the ground
surface. If a time-distance plot is constructed for each detector. a computation of the seismic velocity and the depths
to the various materials can be made.
F-34
- A2 -
A composite wave front diagram and travel time graph
•bowing an overburden layer through which the seismic wave will
travel with a velocity of 5.000 ft/sec. and bedrock through
which the seismic wave will travel at 20.000 ft/sec is shown on
page A3 (Diagram A). The bedrock surface is assumed to be
horizontal and parallel to the ground surface and at an
approximate depth of 75 feet.The wave front digaram shows the positions and shape of the
wave front at various time intervals after the wave has been generated. In ten milliseconds the wave front is spherical and exists only in the overburden. At twenty milliseconds the wave
front consists of three segments; the direct wave in
overburden, the refracted wave in rock, and the refracted rock wave which is transmitted to the surface. It should be noted
that although this wave is travelling in the overburden at the overburden velocity, the tangent to the wave front strikes the ground surface at an angle much smaller than the overburden
waves whose tangent is 90* to the surface of the ground.
Accordingly, the time interval at which the refracted wave
reaches successive stations on the ground surface is less than
that of the overburden wave. The rate at which it arrives at
the stations is equal to the velocity of the wave front in bedrock.
The time distance plot for this event results in two lines. the slopes of which are 5.000 ft/sec and 20.000 ft/sec. The intersection of these two lines represents the point on the
F-3 5
- A3 -M«0
woo woo ■00
So'tTTTTTjrfWrrf,
Plot of Wave Front Advance In Two Layered Problem
Line ban, Daniel. Seismology Applied to Shallow Zone Research. Symposium on Surface and Subsurface Reconnaissance, Special Technical Publication No. 122, American Society for Testing Materials. 1951.
Diagram A
SPREAD LENGTH
-X - X * -X X- -X — - - X X X X x - x-A A A B B B B A A A
SPREAD LENGTH 900
CEOPHONE SPACING A JB15 30
LEGENDX * GEOPHONE LOCATION | * SHOT LOCATION
Geophone Interval-Spread Length Relationship
Diagram B
F-36
- A4 -
ground surface at which the direct wave travelling through the overburden is "overtaken" by the refracted wave which has
gained a higher velocity by travelling through the bedrock.Since at the intersection of the two velocity lines, the
arrival time of the overburden wave at the surface and the
•rrival time of the wave refracted from the bedrock are equal, we need only equate the mathematical expression of their travel
times to obtain an equation involving distance, velocities, and
depth to bedrock.
where h » depth to bedrock
X • point of intersection of the two lines
- velocity of the overburdenV2 » velocity of the bedrock
all of the above quantites are known except the
depth of bedrock which is computed
Continuous profiling is accomplished by having an end
ehotpoint of one spread coincident with an end or intermediate
position shotpoint of the succeeding spread. The length of
each spread is determined by the required depth of
penetration. The deeper the required penetration, the longer the spread must be. The spreads used in this study were 300
feet in length with corresponding geophone intervals es indicated on the diagram on Page A3 (Diagram B).
This is given by:
F-37
- A5 -
Field Procedure for Data Acquisition
Seismic cables. which have been fabricated with premeasured
•hotpoint and geophone locations, are positioned along the
lines of investigation. Geophones, which have been fitted with
a spiked base to provide good ground contact. are emplaced at their measured locations. Seismic energy is generated with
small buried charges of explosives. Shotholes are prepared
with a driven rod (not excavated) to insure good ground
coupling. The explosives are tightly tamped and the depths andamount of explosives used are noted.
Seismograms are obtained using a portable 24-trace
seismograph system which amplifies and filters the seismic
signal detected by the individual geophones and provides a
photographic recording for each of the 24 traces. Refer to
Diagram C for a diagram of the seismic instrumentation. Timing
lines are provided across the entire recording at
two-millisecond intervals (instrument accuracy ±1\). allowing
direct reading to one millisecond. This system contains a
firing circuit which causes a time break to be displayed on the
seismic record: arrival times between the shot and each
geophone location are measured in reference to the time break.
The seismograph is equipped so that the background noise level can be observed for all geophones simultaneously, enabling the
instrument operator to determine if the background noise is sufficiently quiet to minimize trace interference.
F-33
- A6 -
I Vibration From Source Produces Small Voltage
( 2 ) Geophone
'FilterSeismograph
( T ) Seismic Energy Source Camera
SEISMIC INSTRUMENTATION
DIAGRAM CF- 39
- A 7 -
A recording is obtained for each of the shot locations indicated on Diagram B. Page A3.
Material Identification
Using seismic data alone, materials can be placed into broad classifications based on the velocity of the seismic wave transmitted through them. Each velocity value does not have a unique material correlation, but most bedrock as well as overburden types fall within the restricted velocity ranges given below and shown graphically on Figure D. The relationships between seismic velocity values [both compressional "P" and shear "S" ] and dynamic moduli. assuming typical density values are presented graphically on Figure E.
Overburden
The velocity range of a few hundred to less than 1.000 ft/sec. [fps] is usually indicative of very loose and unsaturated silts, humus, and loose fill materials.
The velocity range of 1,000 to 2,000 fps is indicative of loose, unconsolidated, and unsaturated materials. These materials are often fluvial deposits.
The velocity range of 2.000 to 3.000 fps is usually indicative of an unsaturated overburden material, possibly a coarse gravel or ground moraine-type of glacial till.
Seismic velocity values in the range of 3.000 to 4.500 fps are usually indicative of a compact-type of overburden material such as a relatively dense glacial till.
F-40
- A8 -
Partially saturated clays and silts may also have velocities within this range.
Seismic velocity values of 4.800 to 5.300 fps are commonly indicative of water-saturated fluvial deposits. This velocity range is characteristic of materials which have been developed successfully as municipal groundwater supplies.
The velocity range of 6.000 to 8,000 fps is usually characteristic of dense glacial till.
Bedrock
Depending upon the degree of weathering. bedrock can have seismic velocity values spanning virtually the entire range of values for overburden; at the lower end of this range. however, the bedrock will have the physical characteristic of overburden.
Seismic velocities in the range of 8,000 to 10.000 fps are commonly indicative of slightly to moderately weathered bedrock which may require at least localized drilling and blasting for excavation.
Velocities above 10,000 fps are indicative of bedrock which is generally sound and unweathered. and which will require systematic drilling and blasting for excavation.
Reference
Linehan. Daniel. Seismology Applied to Shallow Zone Research. Symopsium on Surface and Subsurface Reconnaissance.Special Technical Publication No. 122. American Society for Testing Materials. 1951.
F-41
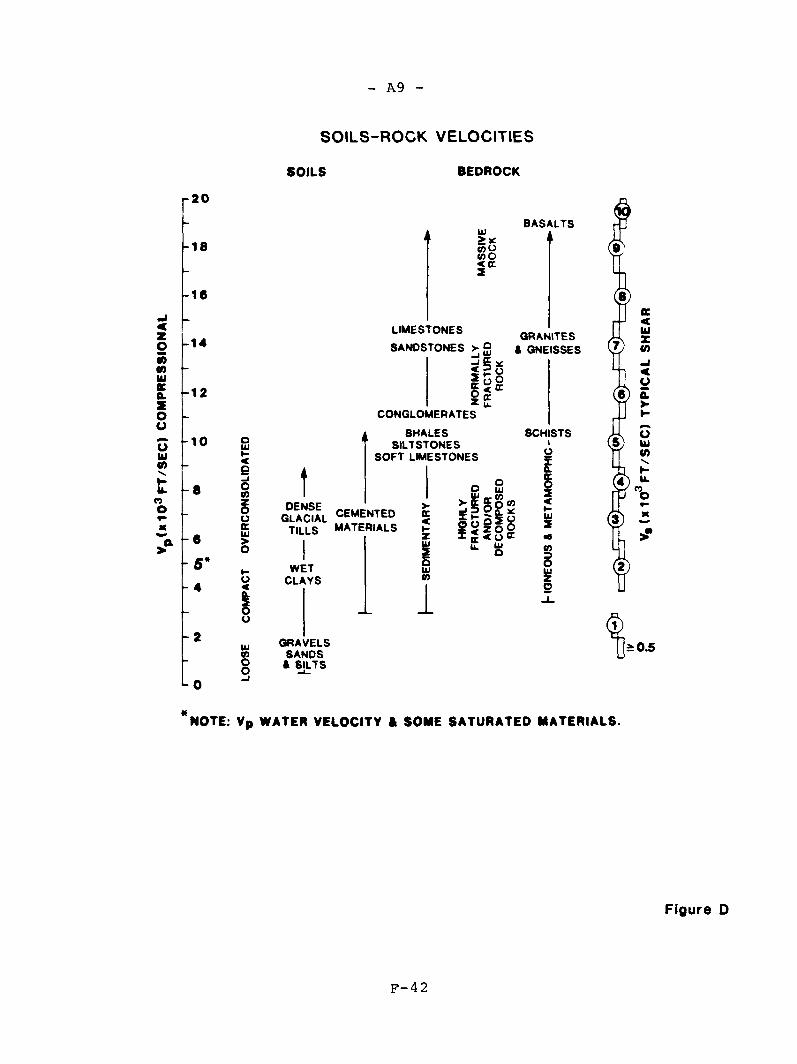
V_(
x103
FT/S
EC
) C
OM
PR
ES
SIO
N*!
.
- A9 -
SOtLS-ROCK VELOCITIES
SOILS BEDROCK
r20
18
16
-14
-1 2
-10
6S'4
<e-jocozooIEUJ>O
ouUJcoOO
ai> xBOco O <cc 2
BASALTS
LIMESTONESSANDSTONES > °
*
!$c
GRANITES * GNEISSES
CONGLOMERATESSHALES
SILT ST ONES SOFT LIMESTONES
DENSE GLACIAL
TILLS MATERIALSCEMENTED
WETCLAYS
GRAVELS SANDS ft SILTS
>ec<in25UJ001
V 2 So. * z 5 < oino
SCHISTSiO$a(0O to
COo$O
I i0 .5
L 0
NOTE: Vp WATER VELOCITY * SOME SATURATED MATERIALS.
Figure D
F-42
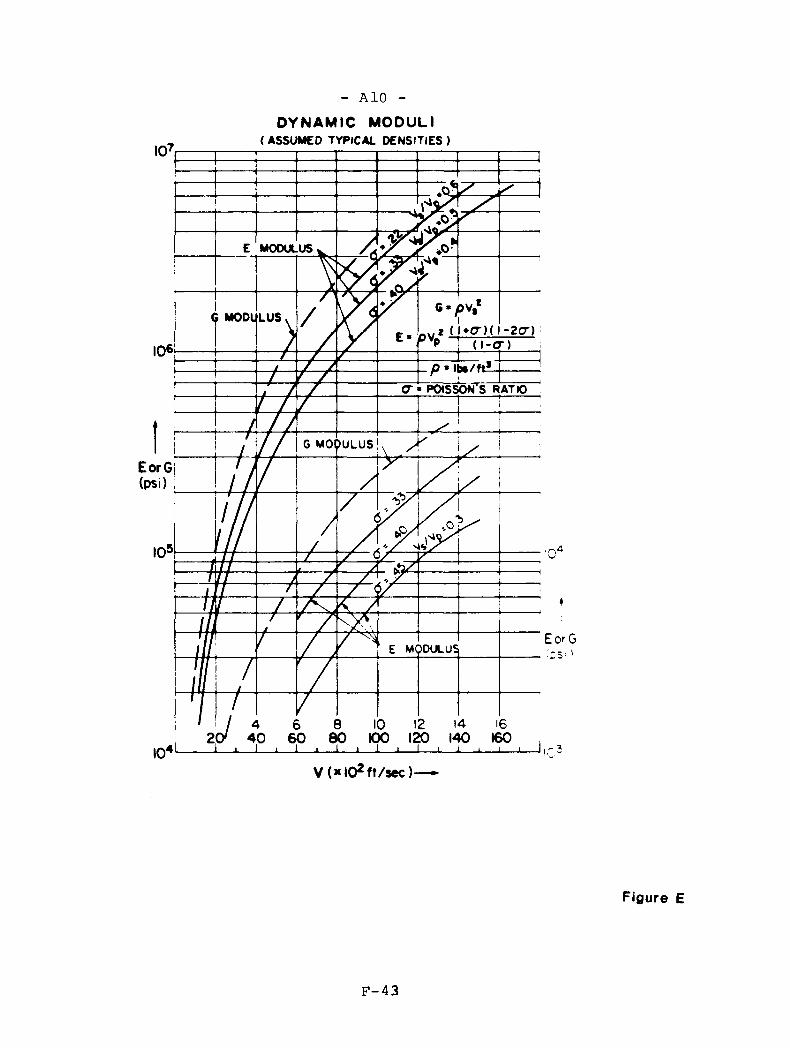
- A10 -DYNAMIC MODULI
( ASSUMED TYPICAL DENSITIES )
7 ^ 4
E MODULUS
6 ■ l,» (i»a)(I-2Q-)MODULUS
p ■ Ibe/fta « POISSON'S RATIO
G MODULUS!EorG(psi)
E MODULUS
40 60
Figure E
F-43

APPENDIX BELECTRICAL RESISTIVITY SURVEY
METHOD OF INVESTIGATION
F-45
APPENDIX BELECTRICAL RESISTIVITY SURVEY
METHOD OP INVESTIGATION
Otntral Considerations
The electrical resistivity survey is a method of obtaining
shallow subsurface information through electric measurements ■ade at the surface of the earth. The basic parameter is the
apparent resistivity determined by passing a known electric current between two electrodes and measuring the resulting voltage drop across two other electrodes. Based on the
geometric arrangement of the current and potential electrodes. the apparent resistivity may be calculated. The actual
resistivity values are then determined from the layer
thicknesses and the corresponding "apparent" resistivity
values.
A vertical electric profile can be obtained by increasing
the distances between electrodes. thereby providing deeper penetration of the electric current. Since geologic materials
have differing electrical characteristics, the apparent
resistivity values will be affected by different subsurface
conditions.
The relative conductivity (inverse resistivity) of earth
materials is proportional to their content of water and
dissolved salts or ions. Accordingly, dry sands and gravels. and massive rock formations would have high resistivity values;
conversely, moist clays and materials in a saltwater environment would have very low resistivity values.
F-46
- B2 -
The interpretation of electrical resistivity data is based upon the comparision of recorded field measurements of apparent resistivity and electrode separation with theoretically computed cases. Electrical resistivity depth determinations are based on a contrast in resistivity values. If the layering does not have a large contrast [for example. 96 ohm/ft to 120 ohm/ft] then the depth of the layer interface is considered approximate. The higher the resistivity contrast, the more definitive the computer solution.
Field Procedures for Data Acquisition
Wenner Method
One of the most widely used field arrangements of current and potential electrodes is known as the Wenner configuration. In the Wenner method four electrodes are placed in a straight line and are equally spaced; the two outer electrodes are current electrodes. 1^ and I2 « and the two inner electrodes are the potential electrodes. and ?2 [Figure Bl]. A third potential electrode is added to the center of the Wenner configuration to create the Lee Partitioning configuration [Figure B-l]. Three measurements of the change in voltage are taken at each positioning of the array; readings are made fromP 1 -p2' Po_Pl and P0_P2' allow*n9 for detection of lateral changes in the subsurface.
A vertical electric profile is obtained by conducting a point test in which the electrode spacing is successively increased about a fixed point after each reading.
Data Interpretation
The interpretation of the resistivity data is accomplished by computer analysis of field data curves. The Fortran INVERSE program develops a model of the subsurface condition in terms
F-47
- B3 -
of resistivity value and depth by Matching theoretical curves to the field data curve. The INVERSE program accomplishes this
by applying Marquardt's algorithm to an initial model,
modifying the initial model until an accurate match of the field curve is obtained. The accuracy of match is determined
by the RMS error. A limit on the RMS error of 4, considered very accurate, was used as the accuracy criteria in modeling.
References
Davis, P. H. 1979, Interpretation of Resistivity Data: Computer Programs for Solutions to the Forward and Inverse Problems. Information Circular 17, Minnesota Geological Survey. University of Minnesota.
Fenn. D.. Cocozza. E.. Isbister, J.. Braids. O.. Yare.B.. and Roux, P.. 1980, Procedures Manual for Groundwater Monitoring at Solid Waste Disposal Facilities. SW-611. U.S. Environmental Protection Agency, Office of Solid Waste.
F-48
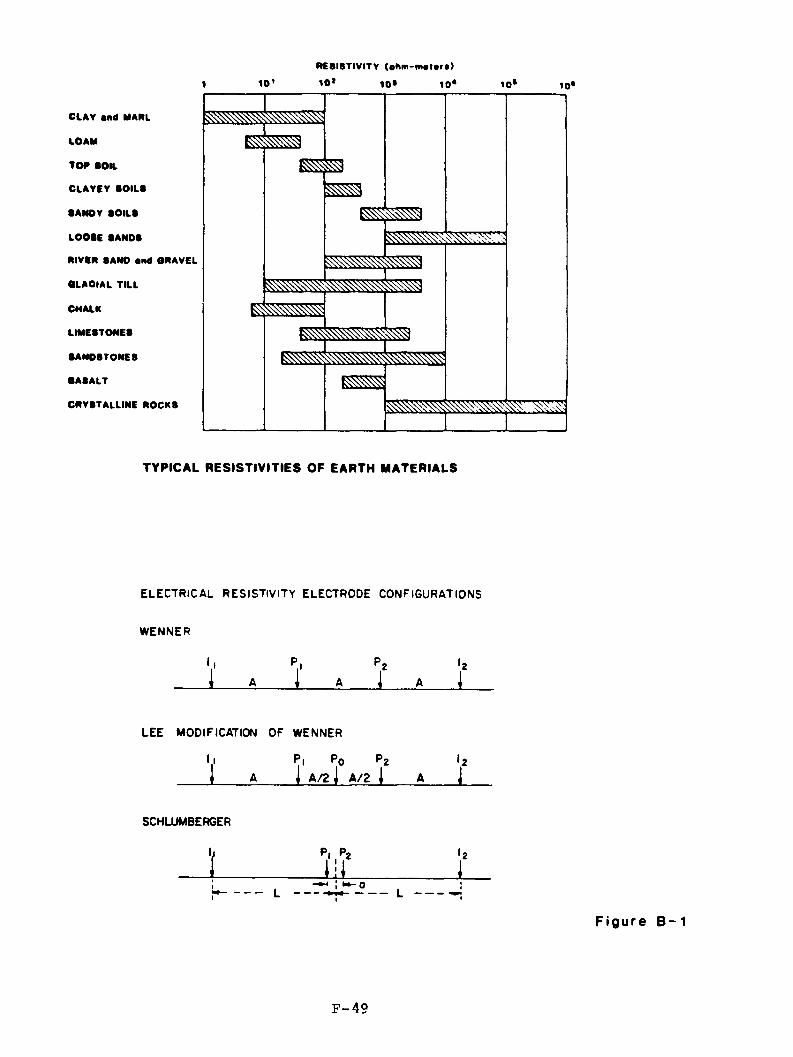
CLAY and MARL
LOAM
TOR SOIL
CLAYEY COILS
•ANDY SOILS
LOOSE SANDS
RIVER SAND and ORAVEL
OLAOIAL TILL
CHALK
LIMESTONES
SANDSTONES
BASALT
CRYSTALLINE ROCKS
R ESISTIVITY (e h m -m a le re )
10’ 10* 10* 10* 1 0 * 1 0 *
TYPICAL RESISTIVITIES OF EARTH MATERIALS
e l e c t r i c a l r e s i s t i v i t y e l e c t r o d e c o n f i g u r a t i o n s
WENNER
l' A i'. A I' A*zI
LEE MODIFICATION OF WENNER
l’ AP. Po Pz \ A/2 j A/2 I A
*2I
SCHLUMBERGER
I . ?!?•zI
Figure B- 1
F-49
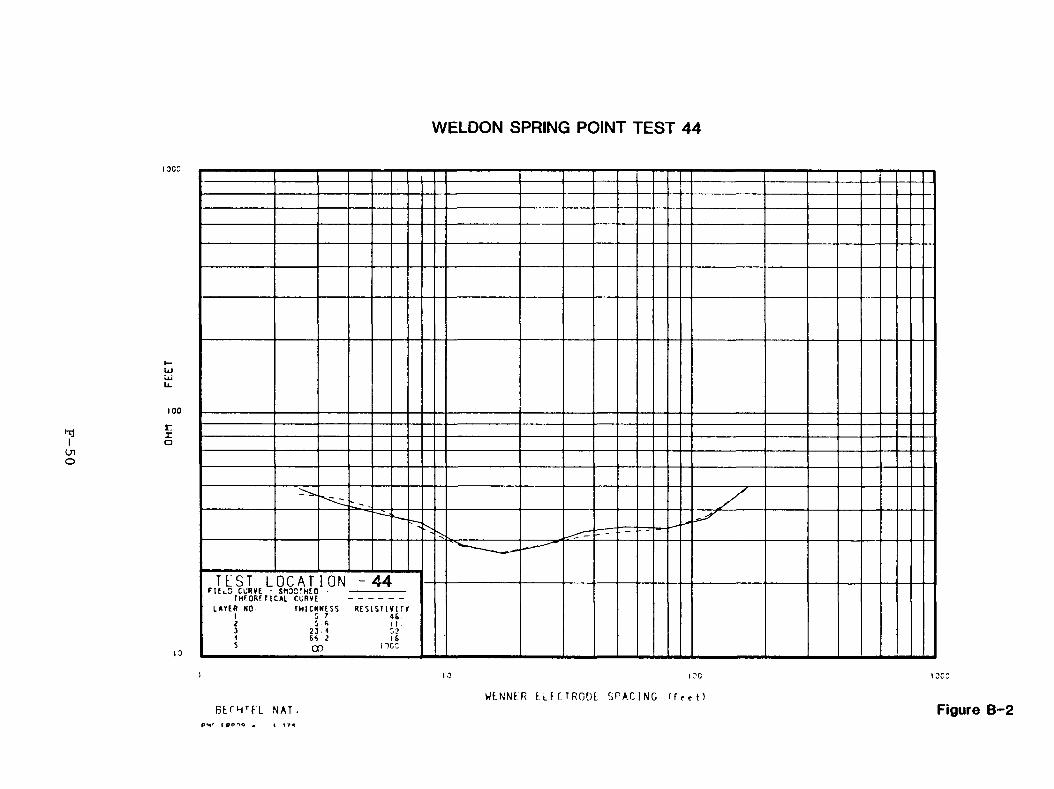
WELDON SPRING POINT TEST 44
TL'ST L O C A T I O N - 44IEiD CURVE - SMOOTHED - - - - - - - -THEORETICAL CURVE - - - - - - - -LATER NO THICKNESS RESIST I VI TV 5 f 46
23 .400
1W LNNt’R L l K T R O D L f>PACING ffec t)
B t f H T f ’ L N A T .
PS' fpp-'p . t X7<Figure B-2
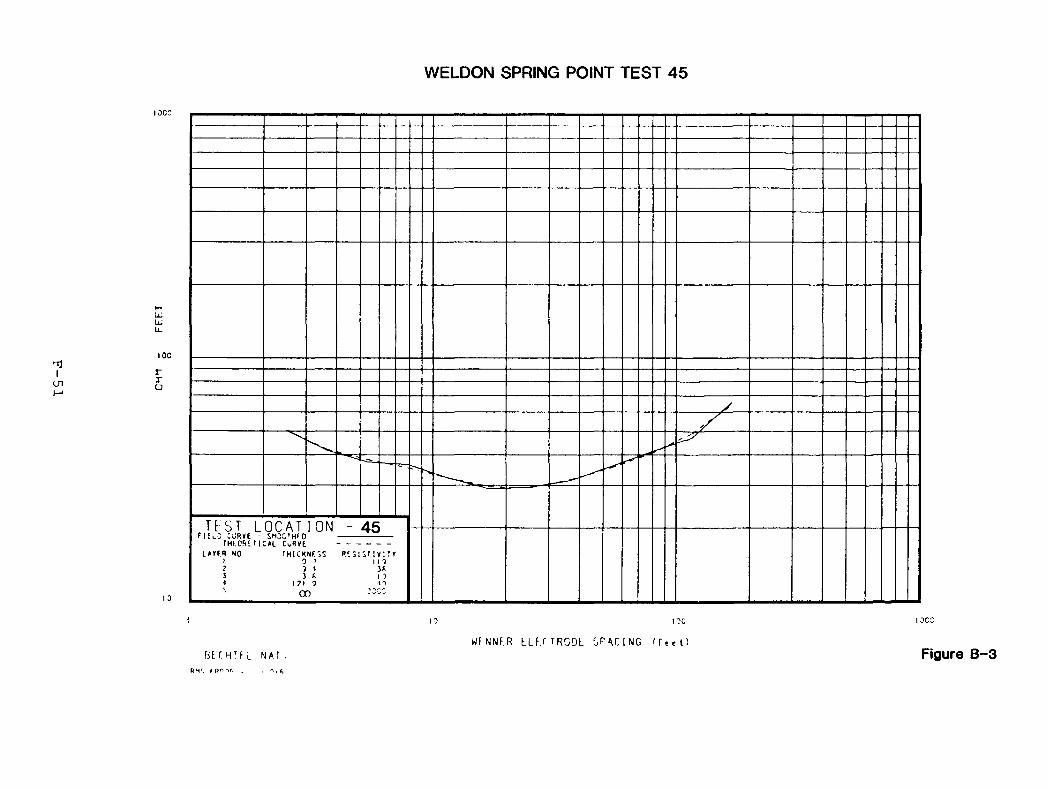
WELDON SPRING POINT TEST 45
IOC:
I O C
T E S T L O C A T I O NF I E l C C U R V E - S h O C T H f 0
T H f . O R i T I C A L C U R V E L A V E R NO
45R E S I S T I V I T Y
12190010
I ?GWtNNLR E. L F: T TRGDL GRACING 'feet)
bethtfl nat . Figure B-3R*1', F pr-->f.
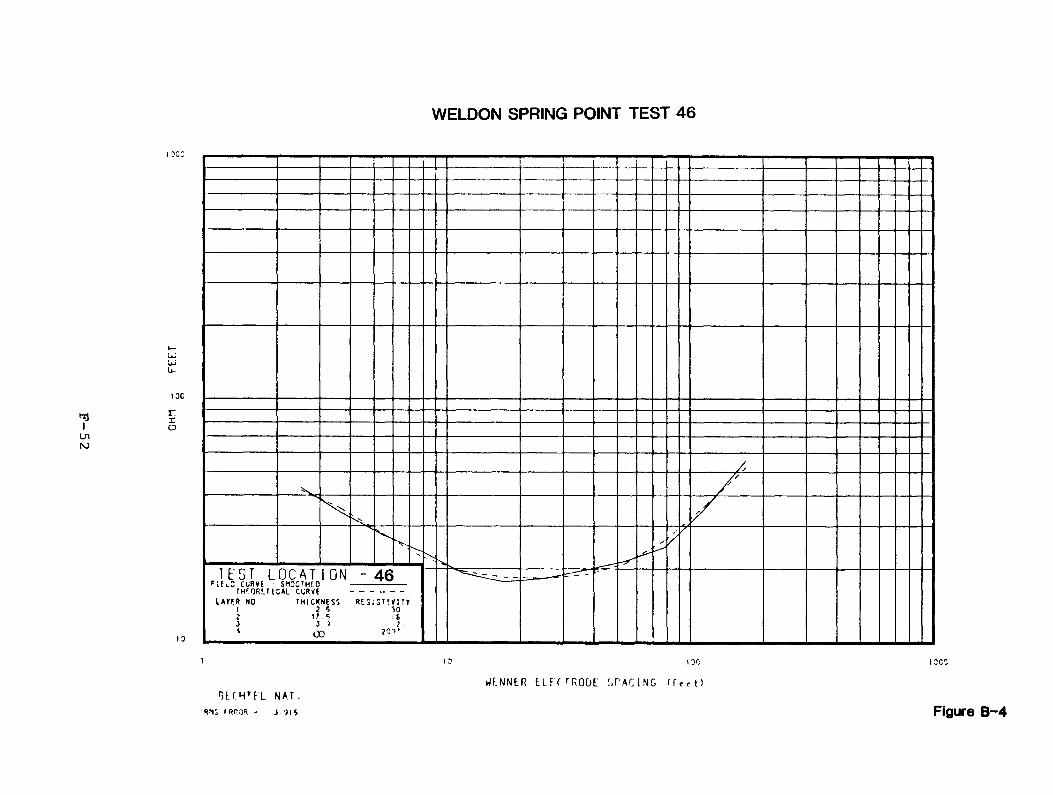
WELDON SPRING POINT TEST 46
Tt'ST L O C A T I O NM U D CURVE - S M 3 C TH E 0
r H C O K V l C A L CURVE L A T E R NO T H I C K N E S S R E S i s M v i r r
1 2 5 SO2 1 2 . 5 , 6 .
46
GO
WF. ' N NER E L E C T R O D E S P A C I N G i f , , t )(5EC H T f L N A T .
RMS I RPOR - J .)! 6 Figure B-4
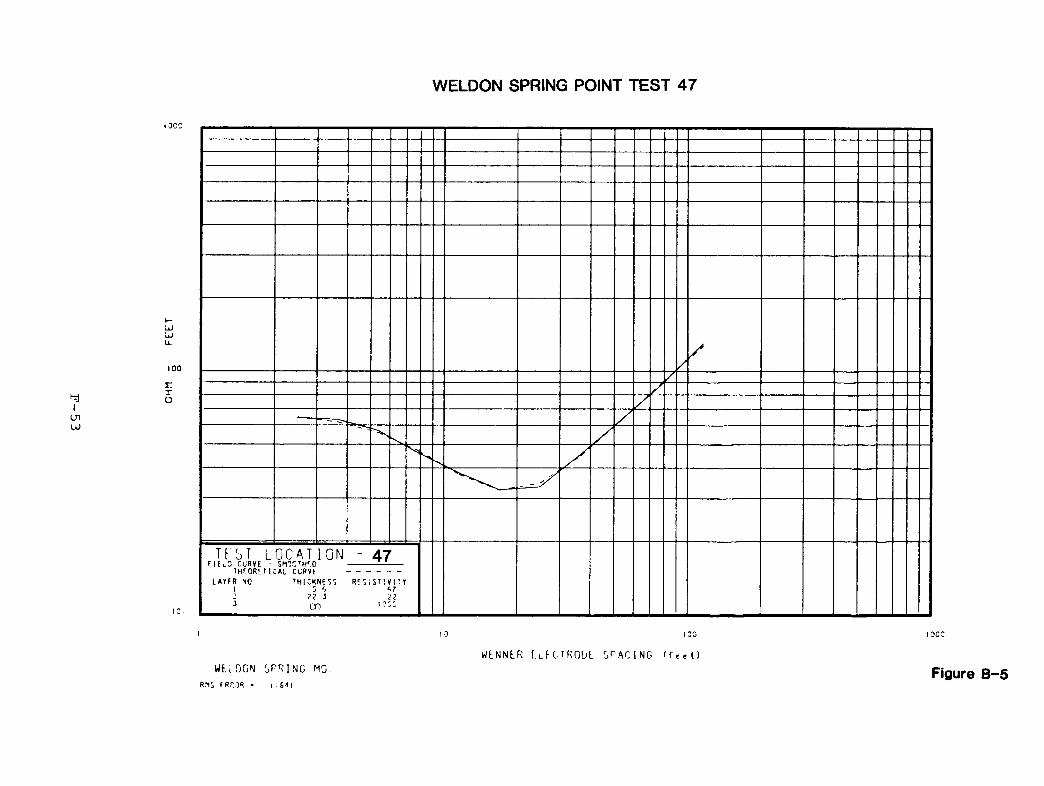
WELDON SPRING POINT TEST 47
TE'bT L O C A T I O NF l U O C U R V E - S M O C T HC O
t H E O R E T I C A L C U RV E L A Y E R NO T H I C K N E S S
47R E S I S T I V I T Y
21on
I 1 0 I 0 0 I O C C
vVLNNLR F.LfCTRODL S P A C I N G ffeet)WtLDGN S P R I NG MO
R MS E R R O R - i 6 1 1Figure B-5
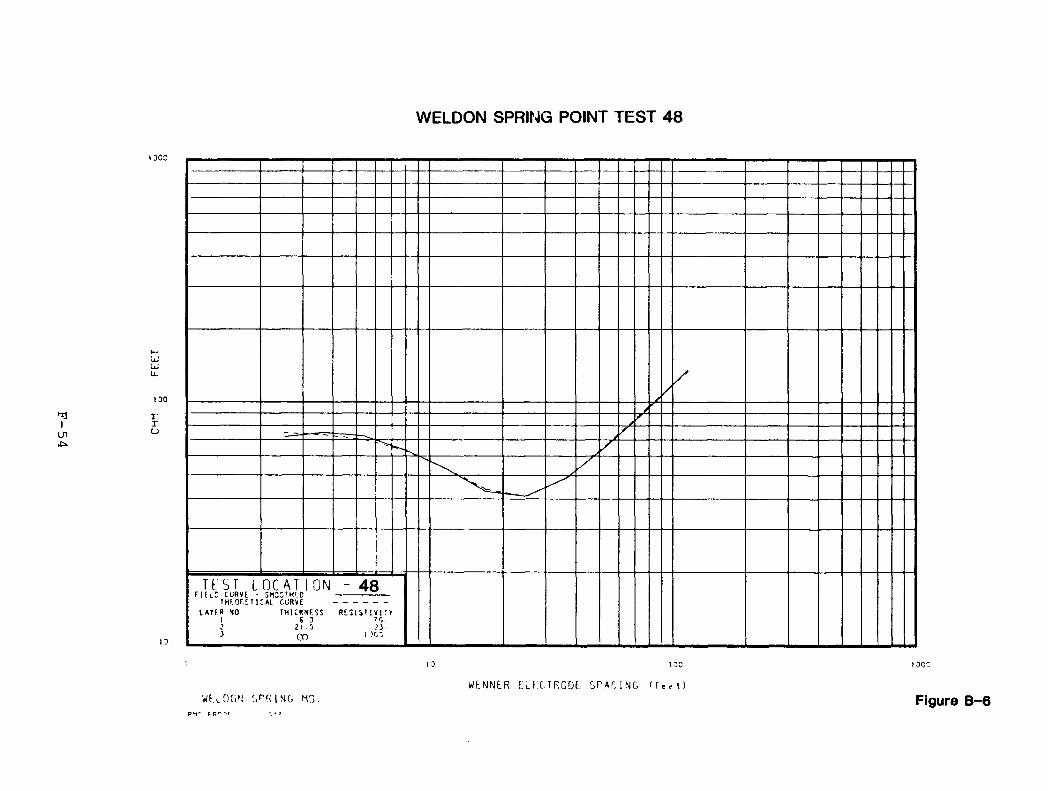
WELDON SPRING POINT TEST 48
O
TL ST L O C A T I ON - 48" ‘ ---------- S r c g ' H ' . O ---------------------
t h i c k n e s s R i s i s n v i :yS 3 7rt21 5 3 300 1
FIE l D c u r v e . ... ...IHFQF;‘ T1CAI CURVE LAVER NO
13 130 1OCC
U F . N N t R L L F : C . T R O D L S P A C I N G ' f e e t )WKlOGN SPRING MG Figure B-6
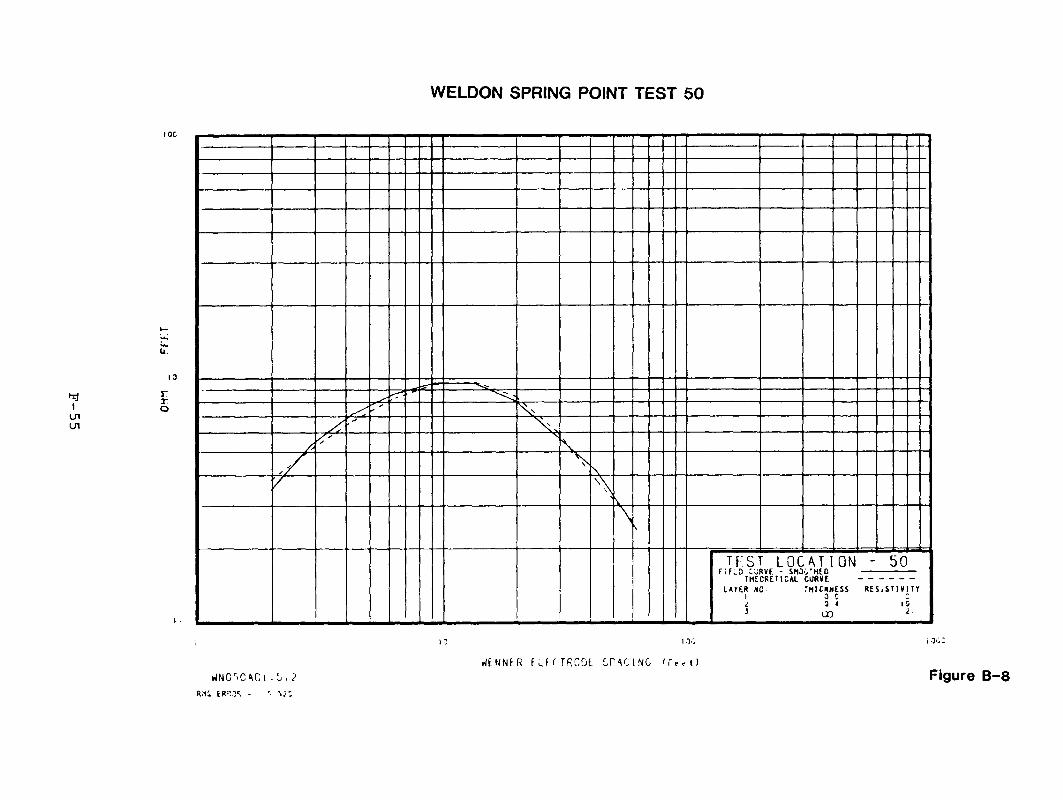
WELDON SPRING POINT TEST 50
IOC
Tf-ST L O C A T I O NF * f .wD CURVE - SM3C- HE0
TNSCRETICAL CURVE LAYER N O THICRWESS R E S I S T I V I T Y
5 0
oo
W N O r- C ^ C i . 0 , 2
r;is er or - '■ \:c
I 3 I 30
W t N N t . R f . L K - T R G O L C r t C I N G f f e r t )
30:
Figure B-8
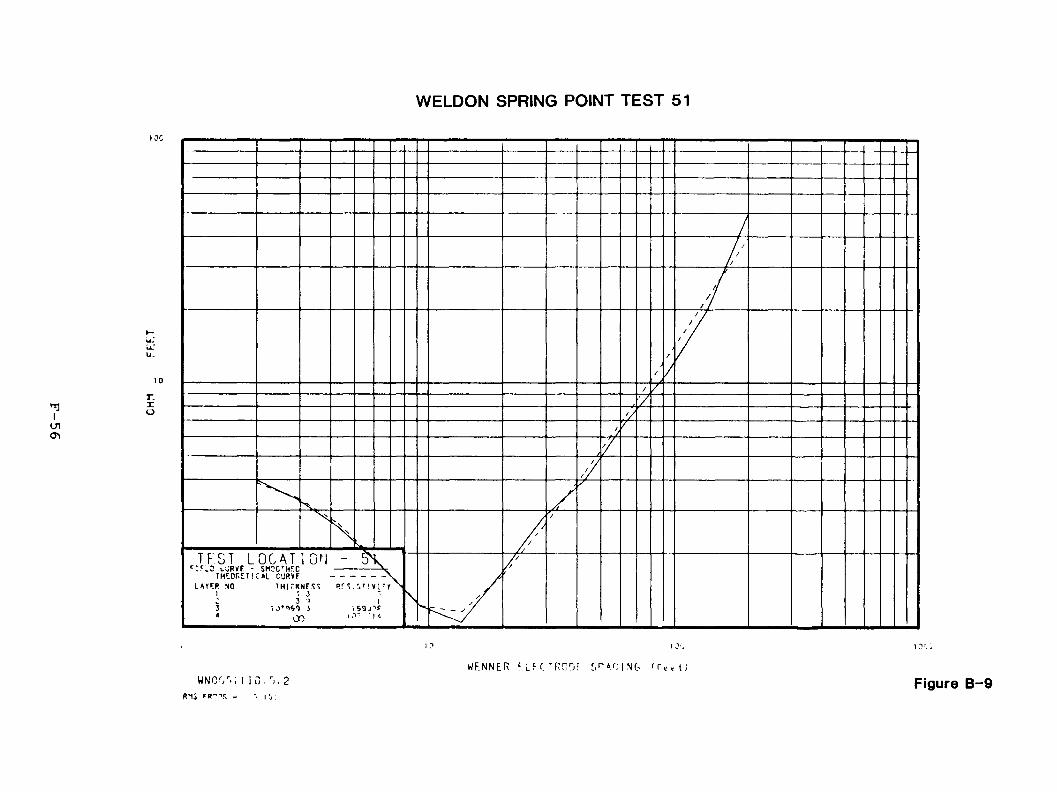
WELDON SPRING POINT TEST 51
IOC
IU1(Tt
r.ro
TF.ST L O C A T I O N!FL3 vURVF. - SMOC'Hf.C TH^Of'ET ! C*L C'JRVFTHICKNESS pr s . c n v i t r
GO1 0 I O'.
W F . N N E R F . L F f . T R G f j f S P A C I N G f f t . t iWNCSSi110.S,2
R% fr - os, * - it , ;
Figure B-9
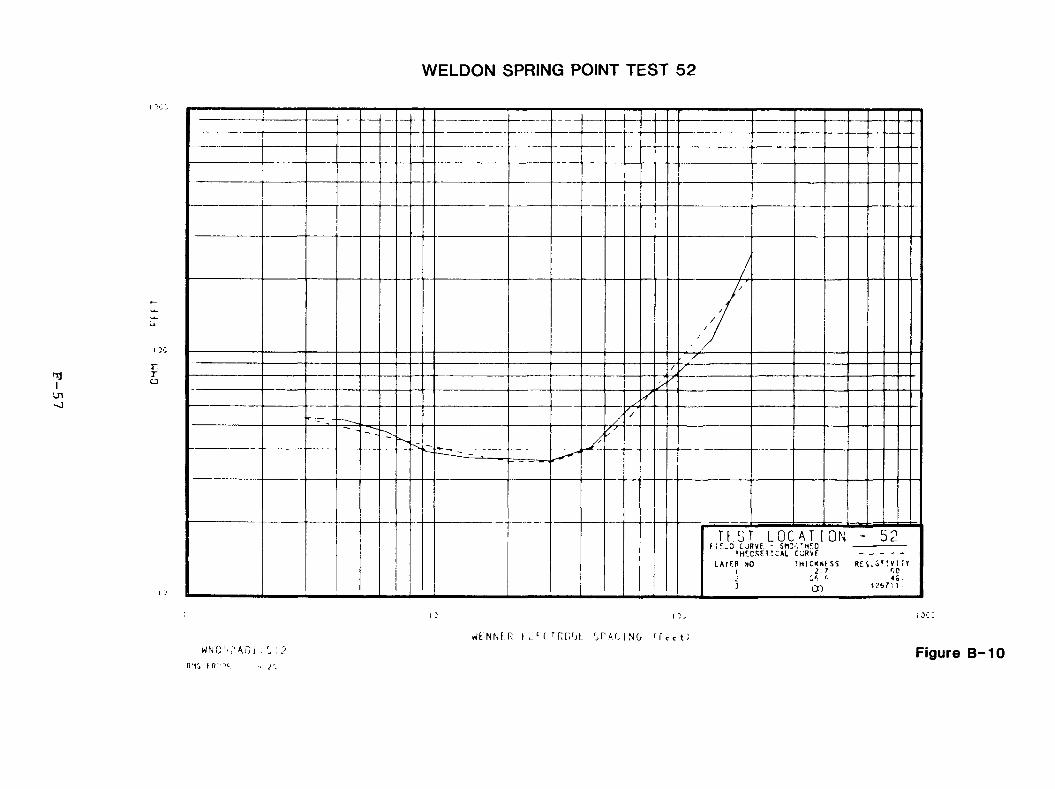
WELDON SPRING POINT TEST 52
Tf'ST L O C A T I O Nf ; f . „ D C J R V f - S h 3 - " Z H f C
T H E C K E T I C A L C U R V f L A f F R NO T H I C K N E S S
00
1 l D 1 iOC"wV t N N t R f uc f TR[;rjL rj P A L i N G
wNC.fAOt .'y,2 Figure B -10R*1S f R ■•■‘C, - . <>:.
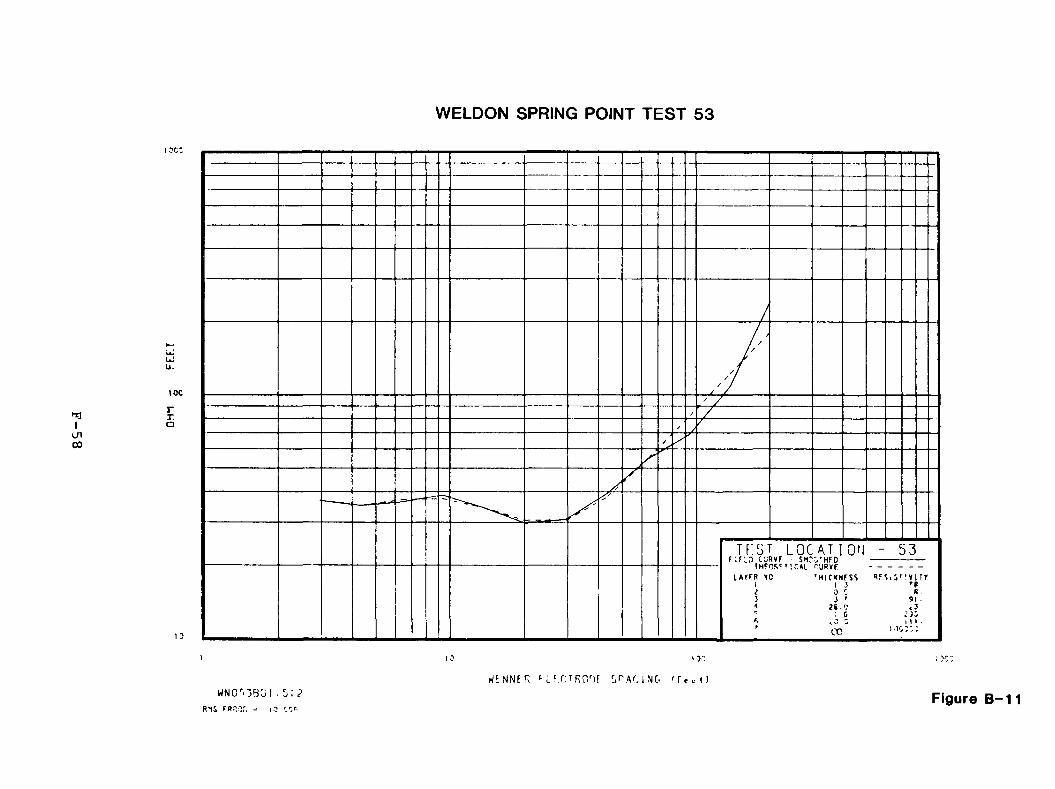
WELDON SPRING POINT TEST 53
Tf'ST L O C A T I O NF i F L O C U R V F S H O O ’ H f D rHfCRETlfAL ruRVF
L A Y F R NO
5 3
HICKHFSS R 5 . S i V ! V l T Y 13 T6
CO
1 10 »ocT E N N E R <■ L c f: T R O rJE E>r A G I N G f r , v t )
WN0p*3B0l ■ jI ?RIG FRROr, - I o w Figure B-11
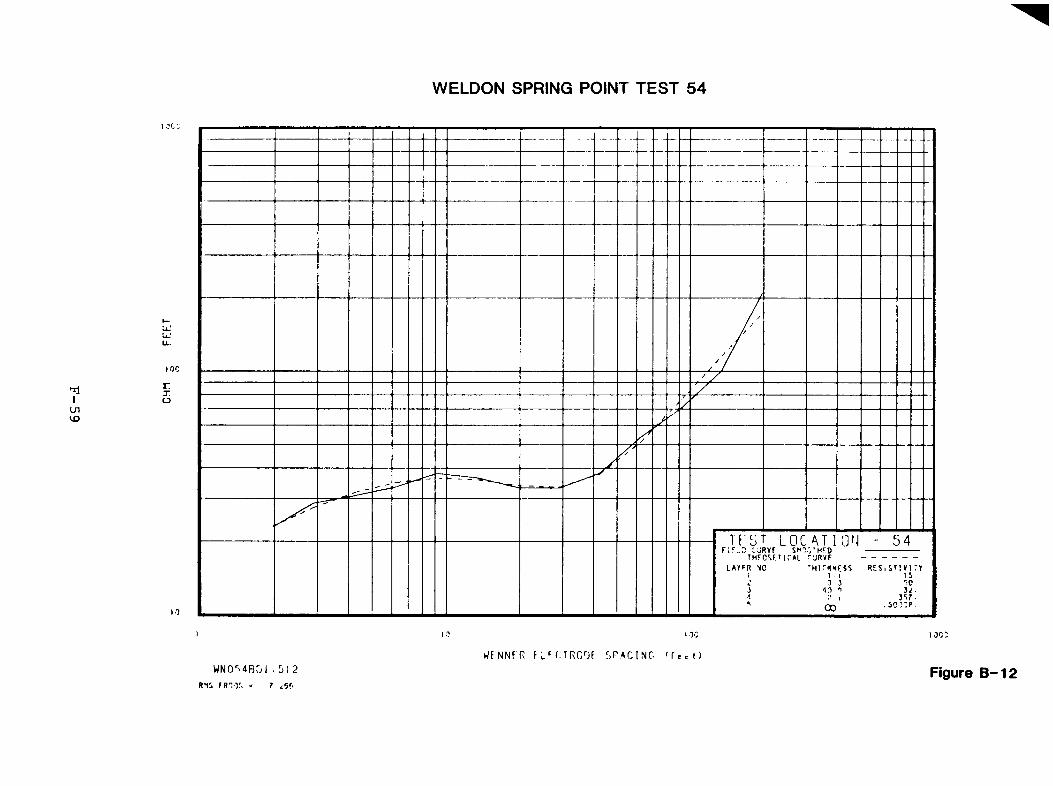
WELDON SPRING POINT TEST 54
Tf'ST L O C A T I O NCURVf - S h^.V H^D
rHf.CSF.TlCAL r ’JRVF LATFR NO
5 4
h i .'u n e s s R t S i i n v i r r
00
I 10 IOC 1OC 0
T E N N E R EuEf:TROOE. [.PACING 'EC c t)WNOMBOI ■ Cl 2
r h tR oor, - r m .Figure B-12
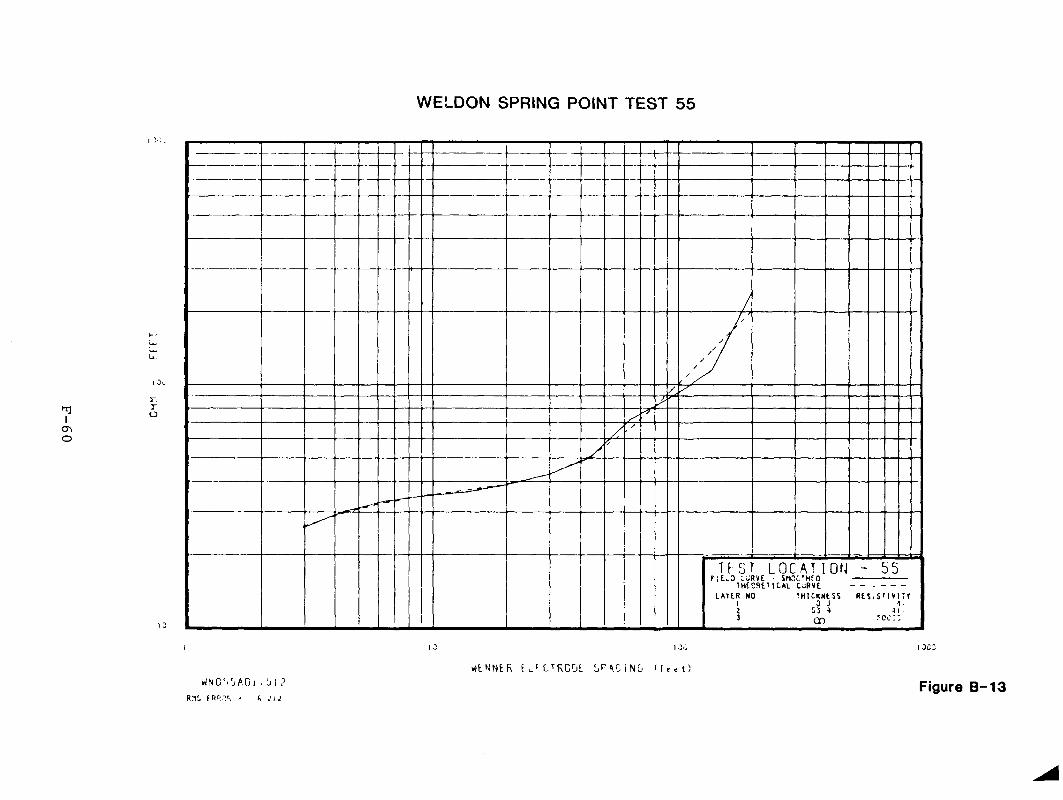
-60
WELDON SPRING POINT TEST 55
- XI
T .TO
T F S T L O C A T I O NF i C U R V E • S M O V H f 0
T H t C R E U C A L C U R V E L A V E R NO T H I C K N E S S R E S . S n v i T Y
5 0 000
WNCf» j AO i • jI ? rx FRt>.y> -• f> m
io c i o c :
WtNNfcR f L ' t - T R C O t LF AC I NO f f e e t )
Figure B-13


