Embed Size (px)
Citation preview

STATE OF CALIF ORNIA RETIREE HEA LTH BENEF ITS PROGRA M
GASB NOS. 43 AND 45 AC TUARIAL VALUATION REPOR T
AS OF JUNE 30 , 201 2
February 21, 2013
The Honorable John Chiang
California State Controller
300 Capitol Mall, Suite 1850
Sacramento, CA 95812
Dear Controller Chiang:
Submitted in this report are the results of our actuarial valuation of the liabilities associated with the
retiree healthcare benefits provided to statewide employees through the programs sponsored by the State
of California as administered by the California Public Employees Retirement System (CalPERS) and the
California Department of Human Resource (CalHR). The valuation was based on census information as
of June 30, 2012, and measures actuarial liabilities as of June 30, 2012. The report includes expense and
financial reporting information applicable to fiscal year end June 30, 2013, and a projection of annual
expense for fiscal year end June 30, 2014. This report was prepared at the request of the State
Controller’s Office (SCO) with the purpose of satisfying the State of California’s financial reporting
requirements.
The actuarial calculations were prepared for purposes of complying with the requirements of Statements
No. 43 and 45 of the Governmental Accounting Standards Board (GASB). The calculations reported
herein have been made on a basis consistent with our understanding of these accounting standards.
Determinations of the liability associated with the benefits described in this report for purposes other than
satisfying the State’s or CalPERS’ financial reporting requirements may produce significantly different
results. This report may be provided to parties other than the SCO only in its entirety and only with the
permission of the SCO.
The valuation was based on information furnished by SCO, CalPERS, and CalHR concerning retiree
healthcare benefits, members’ census and financial data. Data was reviewed for reasonableness and
internal consistency but was not otherwise audited. We are not responsible for the accuracy or
completeness of the information received to produce this valuation. The assumptions and methods used in
this valuation are consistent with the CalPERS Other Postemployment Benefits (OPEB) assumption
model and with the pension assumptions that will be used in the 2012 actuarial valuations of the
CalPERS statewide pension programs. The assumptions and methods were approved by the SCO.
To the best of our knowledge, the information contained in this report is accurate and fairly presents the
actuarial position of the Retiree Healthcare Benefit Program sponsored by State of California as of the
valuation date. All calculations have been made in conformity with generally accepted actuarial principles
and practices, with the Actuarial Standards of Practice issued by the Actuarial Standards Board and with
applicable statutes.
The Honorable John Chiang
California State Controller
Page 2
Future actuarial measurements may differ significantly from the current measurements presented in this
report due to such factors as the following: plan experience differing from that anticipated by the economic
or demographic assumptions; changes in economic or demographic assumptions; increases or decreases
expected as part of the natural operation of the methodology used for these measurements (such as the end
of an amortization period or additional cost or contribution requirements based on the plan’s funded status);
and changes in plan provisions or applicable law.
This report should not be relied on for any purpose other than the purpose stated.
The signing actuaries are independent of the plan sponsor.
The undersigned are members of the American Academy of Actuaries and meet the Qualification
Standards of the American Academy of Actuaries to render the actuarial opinion herein.
Respectfully submitted,
Gabriel, Roeder, Smith & Company
Alex Rivera, FSA, MAAA
Senior Consultant
Randall Dziubek, ASA, EA, MAAA
Senior Consultant
Document1
State of California OPEB Valuation as of June 30, 2012
Table of Contents
Page
Section Number
TRANSMITTAL LETTER
1 EXECUTIVE SUMMARY
A 8
CURRENT OVERVIEW
B
14
19
24
VALUATION RESULTS
Pay-as-You-Go Scenario
Pre-Funding Scenarios
Accounting Information
C 27
SUMMARY OF THE CURRENT SUBSTANTIVE PLAN PROVISIONS
D 46 SUMMARY OF PARTICIPANT DATA
E 57
ACTUARIAL ASSUMPTIONS AND METHODS
F 66 PENSION-RELATED ASSUMPTIONS
Appendix 86 GLOSSARY

EX EC U TIV E S U MMA RY

State of California OPEB Valuation as of June 30, 2012
1
EXECUTIVE SUMMARY
Other Postemployment Benefits
Sponsored by the
State of California
As of June 30, 2012
Introduction
The Governmental Accounting Standards Board (GASB) has issued accounting standards, Statements
No. 43 and 45, relating to Other Postemployment Benefits (OPEB). Under these statements, public
employers sponsoring and subsidizing retiree healthcare benefit programs will need to recognize the
cost of such benefits on an accrual basis.
The State of California provides medical, prescription drug, and dental benefits (healthcare benefits) to
retired statewide employees through a single-employer defined benefit plan.
The State also offers life insurance, long-term care, and vision benefits to retirees; however, because
these benefits are completely paid for by retirees, there is no GASB No. 45 liability to the State on
behalf of such benefits.
The State was required to adopt the provisions of GASB No. 45 for the fiscal year beginning July 1,
2007. This report was prepared in accordance with the requirements of GASB Nos. 43 and 45 and
provides:
1) An actuarial valuation as of June 30, 2012, of the retiree healthcare benefits sponsored
by the State of California for statewide employees based upon the plan and funding
policy provisions in effect as of June 30, 2012;
2) Expense and financial reporting information for fiscal year end June 30, 2013;
3) Projection of expense for fiscal year end June 30, 2014; and
4) Alternative valuation results showing the financial impact of pre-funding retiree
healthcare benefits.
We are not aware of any other OPEB offered to statewide employees that are subsidized by the State of
California, and subject to GASB Nos. 43 and 45.
Background and Key Definitions
Prior to the adoption of GASB No. 45, public sector employers recognized accounting expense for
retiree healthcare benefits on a cash basis, meaning that expense was equal to retiree healthcare claims
expenditures incurred during the year. Because employers paid most of the claims expenditures during
the course of the fiscal year, the accounting or balance sheet liability was relatively low.
GASB No. 45 requires that employers accrue the value of retiree healthcare earned during the
employee’s working lifetime. Changing the expense recognition from a cash to an accrual basis,
requires performing an actuarial valuation and developing the following:
State of California OPEB Valuation as of June 30, 2012
2
1) Present value of future healthcare benefits expected to be paid to current and future
retirees.
2) Actuarial Accrued Liability is the present value of future retiree healthcare benefits
attributable to employee service earned in prior fiscal years.
3) Normal Cost is the present value of future benefits earned by employees during the
current fiscal year.
4) Annual Required Contribution or ARC equals the Normal Cost plus an amortization of
the difference between the Actuarial Accrued Liability and any assets available to pay
benefits.
5) Annual OPEB Cost equals the ARC plus a technical adjustment based on the balance
sheet liability at the beginning of the fiscal year.
6) Net OPEB Obligation or balance sheet liability equals the cumulative difference
between the Annual OPEB Cost and actual employer contributions.
Please note that the Actuarial Accrued Liability impacts the development of the ARC, and is disclosed
in the employer’s notes to the financial statements, but is not a component of the employer’s balance
sheet or accounting liability under the current provisions of GASB No. 45.
The Annual OPEB Cost is the employer’s expense and is not necessarily the same as the employer’s
actual cash contribution. An employer may decide to contribute the minimum amount needed to
sustain the program, commonly referred to as pay-as-you-go funding. In this case, the balance sheet
liability will grow significantly. Other employers may decide to fully fund the value of the retiree
healthcare benefits and contribute the entire ARC into a separate retiree healthcare trust. For such
employers, the balance sheet liability will be zero.
The Actuarial Accrued Liability and ARC were developed using the Individual Entry Age Normal
Actuarial Cost Method as allowed by GASB Nos. 43 and 45. Furthermore, the application of the
Actuarial Cost Method is based on a Closed Group as required by GASB Nos. 43 and 45. Under a
Closed Group Actuarial Cost Method, actuarial present values associated with future entrants are not
considered.
The valuation results are a function of the discount rate assumption used to develop the present value
of future benefits. The discount rate is based on the assets available to pay benefits. Plan sponsors that
finance benefits on a pay-as-you-go basis typically pay retiree healthcare benefits from the general
fund. Because an employer’s general fund is generally invested in short-term securities, a low discount
rate assumption, such as four percent to five percent, is typically used to develop the present value of
future benefits. However, plan sponsors that fully-fund retiree healthcare benefits in a separate trust
may be able to construct a diversified investment portfolio that generates much higher returns such as
seven percent to eight percent. Using a higher discount rate such as eight percent will produce a lower
ARC when compared to a discount rate of four percent. Also, as assets in the trust accumulate,
investment income will also grow thus lowering the overall costs to the employer.
Other key assumptions such as – healthcare inflation, projected healthcare claims, the likelihood an
employee retires, elects healthcare coverage, and survives after retirement – will also impact costs.
State of California OPEB Valuation as of June 30, 2012
3
California Highway Patrol – Pre-Funding
In August of 2009, the State and the California Association of Highway Patrolmen (CAHP) reached an
agreement to support legislation to establish a trust to prefund postemployment healthcare benefits
(OPEB) for certain California Highway Patrol (CHP) officers covered under Bargaining Unit 5. The
key features of the agreement include:
1) The State would make permanent contributions to prefund OPEB in lieu of
increasing CHP members’ compensation effective as of July 1, 2009, and July 1,
2010. The compensation increase rate used to develop OPEB contributions would
not exceed 2.0 percent effective July 1, 2010.
2) CHP members would make permanent contributions of 0.5 percent of base pay to
prefund OPEB.
3) Effective July 1, 2012, the State would make a permanent matching contribution
based on the rates determined in 1) and 2) above.
The State and CHP established an account with the California Employees’ Retiree Benefit Trust
(CERBT) to prefund OPEB. As of January of 2010, the State and CHP members each made
contributions of 0.5 percent of compensation. From July 1, 2011, through June 30, 2012, total
contributions of $1.6 million, in excess of benefits payments, were made to the CHP OPEB account,
and the account balance as of June 30, 2012 is approximately $8.3 million.
An Agreement between the State and CHP Bargaining Unit 5 members was established for the period
July 3, 2010, through July 3, 2013. The parties have agreed to extend the July 3, 2010, through July 3,
2013, agreement to July 3, 2018. The key features of the agreement include:
1) Compensation increases were set to 1.0 percent for the period beginning July 1,
2010.
2) The total contributions to the CHP OPEB account would have equaled 2.0 percent
of compensation effective July 1, 2010; however, the Tentative Agreement redirects
the contributions of 2.0 percent of compensation to the Pension Fund from
September 1, 2010, through June 30, 2013.
3) The matching State contribution to the CHP OPEB account of 2.0 percent of
compensation is deferred from July 1, 2012, to July 1, 2013.
4) As of July 1, 2013, the State is scheduled to make total contributions, including
matching contributions, of 4.0 percent of compensation to the CHP OPEB account.
Contributions of 4.0 percent of compensation represent approximately 20 percent of the full funding
ARC for fiscal year 2010. Given the low level of prefunding and the uncertainty of future
contributions over the 4.0 percent target, the discount rate for CHP members was not increased and
remains at 4.50 percent.
For further information regarding the CHP pre-funding arrangement, please refer to the GASB No. 43
valuation report specific to CHP.
State of California OPEB Valuation as of June 30, 2012
4
Craft and Maintenance-Bargaining Unit 12 (BU-12) – Pre-Funding
In July of 2010, the State and BU-12 reached an agreement for the period July 1, 2010, to July 1, 2012,
extended to July 1, 2013, to prefund postemployment healthcare benefits. The key feature of the
agreement includes:
1) BU-12 members would make permanent contributions of 0.5 percent of base pay to
prefund OPEB effective July 1, 2012.
The State and BU-12 established an account with the CERBT to prefund OPEB. The account balance as
of June 30, 2012, is $0.0.
Given the expected low level of prefunding, the discount rate for BU-12 members was not increased and
remains at 4.50 percent.
Physicians, Dentists and Podiatrists-Bargaining Unit 16 (BU-16) – Pre-Funding
In July of 2010, the State and BU-16 reached an agreement for the period July 1, 2010, to July 1, 2012,
extended to July 1, 2013, to prefund postemployment healthcare benefits. The key feature of the
agreement includes:
1) BU-16 members would make permanent contributions of 0.5 percent of base pay to
prefund OPEB effective July 1, 2012.
The State and BU-16 established an account with the CERBT to prefund OPEB. The account balance as
of June 30, 2012, is $0.0.
Given the expected low level of prefunding, the discount rate for BU-16 members was not increased and
remains at 4.50 percent.
For further information regarding BU-12 and BU-16 pre-funding arrangements, please refer to the
GASB No. 43 valuation reports specific to BU-12 and BU-16.
State of California OPEB Valuation as of June 30, 2012
5
California State Employees – GASB No. 45 Valuation Results
The following section presents the key GASB No. 45 valuation and accounting results for retiree
healthcare benefits offered to California State employees. The Actuarial Accrued Liabilities are
measured as of June 30, 2012, based on census data as of June 30, 2012.
The Annual Required Contribution (ARC) is defined as the Normal Cost plus a 30-year open level-
percent-of-pay amortization of the Unfunded Actuarial Accrued Liability. The Net OPEB Obligation
as of June 30, 2012, is $12.90 billion. The ARC applicable to fiscal year end June 30, 2013, is based on
the results of the actuarial valuation as of June 30, 2011, projected to June 30, 2012, based on an
inflation increase of 3.25 percent.
The valuation was performed assuming three alternative funding options and discount rates:
Under the pay-as-you-go funding scenario, the State is assumed to finance retiree healthcare
benefits from assets available in the general fund. Based on the State’s Pooled Money
Investment Account (PMIA) investment policy and historical returns, an investment return of
4.50 percent can be supported.
Under the full-funding scenario, the State is assumed to fully fund the ARC in a separate trust,
earmarked solely for retiree healthcare benefits, with an investment policy consistent with
Strategy 1 as disclosed in the CalPERS OPEB assumption model for reports based on data
measured after June 15, 2011, and before August 15, 2012, that can support a discount rate of
7.61 percent.
Under the partial funding scenario, the State is assumed to contribute 50 percent of the excess
of the full funding ARC over the pay-as-you-go costs, resulting in a discount rate of 6.055
percent.
Pay-as-you-go funding at 4.50 percent - $63.85 billion Actuarial Accrued Liability
The pay-as-you-go funding scenario produced an actuarial accrued liability of $63.85 billion as of June
30, 2012, an ARC of $4.92 billion for fiscal year end June 30, 2013, estimated employer contributions
of $1.81 billion for fiscal year end June 30, 2013, and an expected Net OPEB Obligation of $16.09
billion at fiscal year end June 30, 2013.
Partial-funding at 6.055 percent - $51.28 billion Actuarial Accrued Liability
The partial-funding scenario produced an actuarial accrued liability of $51.28 billion as of June 30,
2012, an ARC of $4.07 billion for fiscal year end June 30, 2013, estimated employer contributions of
$2.66 billion for fiscal year end June 30, 2013, and an expected Net OPEB Obligation of $14.49 billion
at fiscal year end June 30, 2013.
Full-funding at 7.61 percent - $42.10 billion Actuarial Accrued Liability
The full-funding scenario produced an actuarial accrued liability of $42.10 billion as of June 30, 2012,
an ARC of $3.51 billion for fiscal year end June 30, 2013, estimated employer contributions of $3.51
billion for fiscal year end June 30, 2013, and an expected Net OPEB Obligation of $13.17 billion at
fiscal year end June 30, 2013.
State of California OPEB Valuation as of June 30, 2012
6
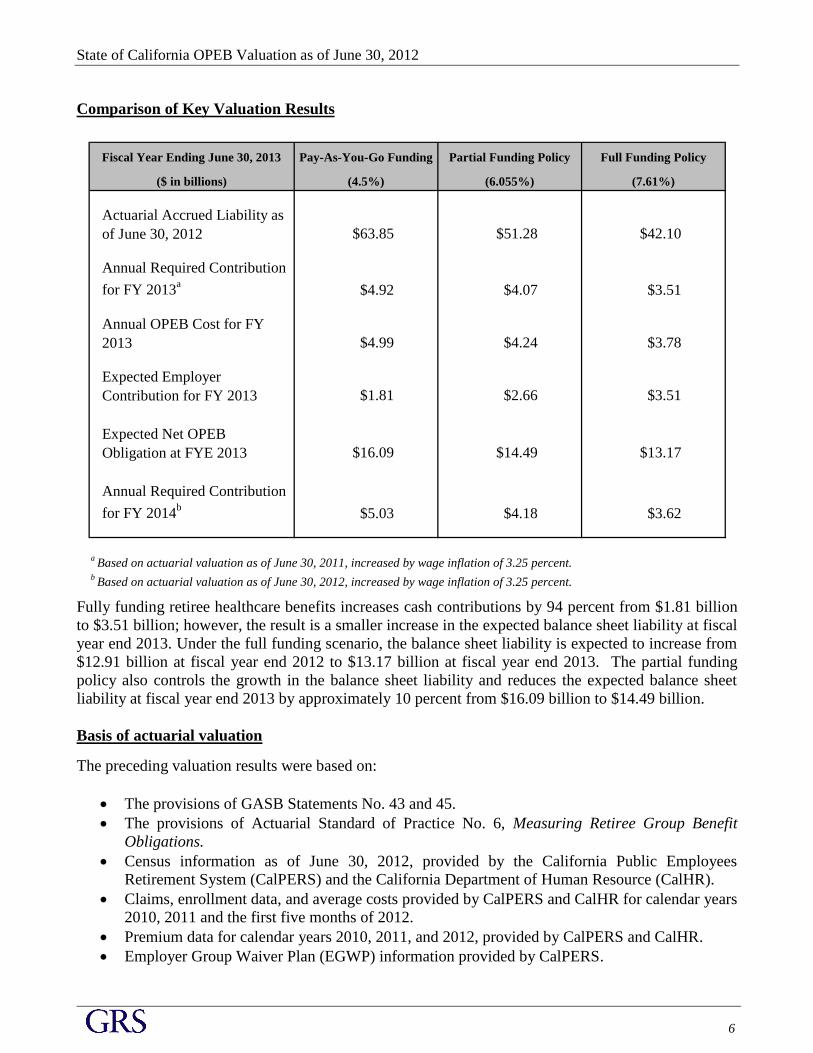
Comparison of Key Valuation Results
Fiscal Year Ending June 30, 2013 Pay-As-You-Go Funding Partial Funding Policy Full Funding Policy
($ in billions) (4.5%) (6.055%) (7.61%)
Actuarial Accrued Liability as
of June 30, 2012 $63.85 $51.28 $42.10
Annual Required Contribution
for FY 2013a
$4.92 $4.07 $3.51
Annual OPEB Cost for FY
2013 $4.99 $4.24 $3.78
Expected Employer
Contribution for FY 2013 $1.81 $2.66 $3.51
Expected Net OPEB
Obligation at FYE 2013 $16.09 $14.49 $13.17
Annual Required Contribution
for FY 2014b
$5.03 $4.18 $3.62
b
Based on actuarial valuation as of June 30, 2012, increased by wage inflation of 3.25 percent.
aBased on actuarial valuation as of June 30, 2011, increased by wage inflation of 3.25 percent.
Fully funding retiree healthcare benefits increases cash contributions by 94 percent from $1.81 billion
to $3.51 billion; however, the result is a smaller increase in the expected balance sheet liability at fiscal
year end 2013. Under the full funding scenario, the balance sheet liability is expected to increase from
$12.91 billion at fiscal year end 2012 to $13.17 billion at fiscal year end 2013. The partial funding
policy also controls the growth in the balance sheet liability and reduces the expected balance sheet
liability at fiscal year end 2013 by approximately 10 percent from $16.09 billion to $14.49 billion.
Basis of actuarial valuation
The preceding valuation results were based on:
The provisions of GASB Statements No. 43 and 45.
The provisions of Actuarial Standard of Practice No. 6, Measuring Retiree Group Benefit
Obligations.
Census information as of June 30, 2012, provided by the California Public Employees
Retirement System (CalPERS) and the California Department of Human Resource (CalHR).
Claims, enrollment data, and average costs provided by CalPERS and CalHR for calendar years
2010, 2011 and the first five months of 2012.
Premium data for calendar years 2010, 2011, and 2012, provided by CalPERS and CalHR.
Employer Group Waiver Plan (EGWP) information provided by CalPERS.

State of California OPEB Valuation as of June 30, 2012
7
Plan information provided by CalPERS and CalHR.
Demographic assumptions consistent with those that will be used in the 2012 actuarial
valuations of the CalPERS statewide pension programs.
Retiree healthcare valuation assumptions and methods consistent with the CalPERS OPEB
assumption model.
Economic and other demographic assumptions such as the discount rate, healthcare inflation,
healthcare claim costs, and healthcare plan participation as recommended by Gabriel, Roeder,
Smith & Company and approved by the SCO.
The latest developments in Federal healthcare reform.
The Net OPEB Obligation as of June 30, 2012, was estimated for each State group using:
o The Net OPEB Obligation as of June 30, 2011;
o Annual OPEB Cost for fiscal year end 2012 as developed in the valuation report as of
June 30, 2011; and
o Actual employer contributions for fiscal year end June 30, 2012, as provided by the
SCO, allocated by the number of retirees disclosed in the valuation report as of June 30,
2011.
The Unfunded Actuarial Accrued Liability (UAAL) is amortized over a 30-year open period as
a level percent of pay. For the Legislative Retirement System, the UAAL is amortized over a
ten-year open period as a level dollar amount.
The valuation was prepared under the supervision of members of the American Academy of Actuaries
who satisfy the Qualification Standards of the American Academy of Actuaries to render an actuarial
opinion on the valuation of retiree healthcare benefits.
The remainder of the report is an integral component of the valuation and includes:
An overview of the current GASB Statements No. 43 and 45 requirements in effect on June 30,
2012.
The basis of the actuarial assumptions and methods used in this valuation.
Valuation results by employer group.
Fiscal year end 2012 financial disclosure information.
Additional details on the census, plan provisions, assumptions, and methods used to prepare the
valuation.

SECTION A
C U R R EN T O VERV IEW

State of California OPEB Valuation as of June 30, 2012
8
CURRENT OVERVIEW
Summary of GASB Accounting Standards
Other Postemployment Benefits
Sponsored by the
State of California
As of June 30, 2012
The Governmental Accounting Standards Board (GASB) has issued Statements No. 43 and 45, relating
to Other Postemployment Benefits (OPEB). We understand the State of California provides subsidized
medical, prescription drug, and dental insurance benefits (healthcare benefits) to eligible retired state
employees, that are subject to GASB Statements No. 43 and 45. Other OPEB offered to retired
employees of the State of California are fully financed by plan members and have not been reflected in
this valuation.
Background
GASB’s issuance of Statements No. 43 and 45 represents the next phase in the movement toward full
accrual accounting for state and local government-wide financial statements and for proprietary or
fiduciary fund financial statements that are prepared in accordance with Generally Accepted
Accounting Principles (GAAP).
In 1994 GASB issued Statements No. 25 and 27, relating to accrual accounting for pensions. These
new GAAP accounting standards, Statements No. 43 and 45 for OPEB, were fashioned very similar to
the pension standards.
One major difference, in practice, between pensions and OPEB is that pension benefits are almost
always pre-funded, whereas OPEB typically are not. Pension plans have accumulated substantial
assets in separate trust funds over the years to pay future pension benefits, whereas retiree healthcare
programs have not. That is, most retiree healthcare programs are financed on a pay-as-you-go basis.
The State of California currently finances retiree healthcare benefits on a pay-as-you-go basis;
however, the California Highway Patrol recently bargained for a modest level of pre-funding. As of
June 30, 2012, there is approximately $8.3 million in assets available to pay future retiree healthcare
benefits currently invested in the CalPERS California Employers' Retiree Benefit Trust. Bargaining
Units 12 and 16 have bargained for a modest level of prefunding which will commence in fiscal year
2013.
Annual OPEB Cost and Net OPEB Obligation
Under GASB No. 45, the Annual OPEB Cost is recorded as an expense and disclosed in the State’s
government-wide financial statement. Similar to the accounting rules for pension plans, the Annual
OPEB Cost represents the actuarially determined annual costs, on an accrual basis, for healthcare
benefits provided to current and future retirees. The Net OPEB Obligation represents the cumulative
difference between the Annual OPEB Costs and actual cash contributions made by the employer, and
is recognized as a balance sheet liability in the Statement of Net Assets.
State of California OPEB Valuation as of June 30, 2012
9
Plan sponsors adopting GASB No. 45 also need to disclose certain information in the Notes to the
Financial Statements and in the Required Supplementary Information section, including:
Development of Annual OPEB Costs for the current fiscal year.
Development of the Net OPEB Obligation at fiscal year end.
Historical Annual OPEB Costs and Employer Contributions.
Historical Actuarial Accrued Liabilities and Assets.
Basis for valuation including brief description of plan benefits, funding policy, and
assumptions and methods.
In addition, the accrual basis of accounting extends to proprietary and fiduciary funds. Their
proportionate share of the total Annual OPEB Cost should be recognized as an OPEB expense and
offset by their share of the amount of employer subsidies provided that year to the current covered
retirees and dependents.
Unfunded Actuarial Accrued Liability for OPEB
Information about the current funded status and the history of funding progress will be presented in the
Notes to the Financial Statements and in the Required Supplementary Information. The amount of the
Actuarial Accrued Liability for OPEB will not be recorded as an expense or a liability on the balance
sheet; however, it will be disclosed in the Notes to Financial Statements. Under a pay-as-you-go
funding policy, no assets accumulate to offset the Actuarial Accrued Liability, and the Unfunded
Actuarial Accrued Liability equals the Actuarial Accrued Liability.
Pre-funding Reduces OPEB Expense and Unfunded Actuarial Accrued Liability
Sponsors financing retiree healthcare benefits on a pay-as-you-go basis will need to measure the
annual OPEB costs using an investment return assumption consistent with the earnings on the assets
backing the retiree healthcare liability. In most cases, this will be the income earned from investments
in the general fund, which may result in an interest rate ranging from four percent to five percent.
When a low assumed investment return is used, the annual OPEB costs could range from three to five
times the pay-as-you-go costs and the balance sheet liability could grow exponentially.
However, if a plan sponsor adopts a well defined and integrated funding, investment, and accounting
policy for retiree healthcare benefits, then assets supporting the OPEB liability could result in a higher
investment return assumption, a lower unfunded liability, lower annual OPEB costs, and reduced or no
balance sheet liability.
State of California OPEB Valuation as of June 30, 2012
10
Assumptions and Methods Impacting the Annual OPEB Costs and Unfunded Actuarial Accrued
Liability
Discount Rate Assumption
The primary assumption influencing Annual OPEB Costs and the Actuarial Accrued Liability is the
assumed rate of return or discount rate on assets supporting the retiree healthcare liability. The State of
California currently finances retiree healthcare benefits on a pay-as-you-go basis from assets in the
general fund, which are invested in short-term fixed income instruments through the Pooled Money
Investment Account (PMIA). According to GASB No. 45, the discount rate must be consistent with
the long-range expected return on such short-term fixed income instruments. Based on PMIA’s
historical returns, investment policy and expected future returns, a discount rate of 4.50 percent was
selected for the pay-as-you-go funding policy.
If a sound pre-funding policy is established and contributions are made to a qualifying trust with an
appropriate investment policy, then:
A higher discount rate, consistent with the funding and investment policies, can be used
and actuarial accrued liabilities would be lower;
Assets would accumulate;
The unfunded liability could be significantly lower when compared to the pay-as-you-
go policy;
Annual OPEB costs would be lower; and
The growth in balance sheet liability could be controlled.
The SCO, on behalf of the State, is reviewing the financial implications of fully or partially funding the
retiree healthcare benefit obligation. At the request of the SCO, we developed valuation results under
two alternative discount rate assumptions, assuming the State makes additional contributions in excess
of pay-as-you-go costs to a qualifying trust, such as a Voluntary Employees' Beneficiary Association
(VEBA) or Internal Revenue Code Section 115 governmental trust. Under the first alternative, the
State is assumed to fully fund the ARC, supporting a discount rate of 7.61 percent, and under the
second alternative, the State is assumed to pre-fund 50 percent of the excess of the fully-funded ARC
over the pay-as-you-go costs, supporting a discount rate of 6.055 percent. The full funding discount
rate of 7.61 percent is consistent with the rate expected to be earned under Strategy 1 as disclosed in
the CalPERS OPEB assumption model for reports based on data measured after June 15, 2011, and
before August 15, 2012.
Healthcare Trend Assumptions
The next key assumption influencing costs is the assumed growth or trend in healthcare costs. The
healthcare trend assumption for OPEB valuations spans over the lifetime of a covered retiree which
could extend to over 30 years. This is in contrast to the short-term healthcare inflation used to develop
premiums for the next fiscal year. This long-term healthcare assumption is by far the most difficult to
set.
Actuaries generally compare the growth in general inflation, wages, healthcare costs, and other goods
and services when setting the healthcare trend assumption. For example, the actuary may compare the
State of California OPEB Valuation as of June 30, 2012
11
historical experience of national healthcare expenditures to the Gross Domestic Product (GDP).
Healthcare inflation may be expressed as general inflation plus a component for healthcare costs.
The long-term healthcare trend is generally lower than the short-term healthcare trend used to update
premiums and expected claims in the following fiscal year because such short-term increases are
generally not sustainable in the long-term. That is, if healthcare benefit costs are assumed to increase
by nine percent per year in the long-term while the cost for other goods and services increase at a rate
less than six percent per year, then in the long run the general economy would include a
disproportionate share of expenditures allocated to healthcare benefits. Consequently, long-term retiree
healthcare actuarial models generally assume that the initial trend rate will eventually grade down to a
more sustainable level. For this valuation, the 2013 trend rates are based on actual premium increases
from calendar 2012 to 2013. The Employer Group Waiver Plan (EGWP), as explained in the following
section, significantly decreased the Medicare premium rates from CY 2012 to CY 2013 (by
approximately 15 percent for the Preferred Provider Organizations (PPO) and 6 percent for the Health
Maintenance Organizations (HMO). The Basic (non- Medicare) premium rates increased by
approximately 15 percent for the PPOs and 8 percent for the HMOs. For 2014 and beyond we assumed
an initial healthcare trend rate of 9.00 percent decreasing each year over the next seven years until the
ultimate rate of 4.50 percent is reached.
Adjustments to Estimate the Potential Impact of the Employer Group Waiver Plan (EGWP)
Effective January 1, 2013, prescription benefits for Medicare eligible members will be provided
through an Employer Group Waiver Plan (EGWP) with a “Wrap” feature. The EGWP design is based
on a federally approved drug formulary and plan design. A sponsor may provide additional benefits
through a supplementary “Wrap” plan that ensures members will receive benefits that are relatively
equal to those of the plan that the sponsor currently offers. In most instances, the current plan benefit
design can be replicated through the combination of an EGWP-Wrap plan at reduced costs. The key
components which are expected to reduce costs include:
1) Fifty percent discount on brand name drugs while member is in the “donut hole” coverage gap.
(Under a standard or model Medicare Part D program, a member is responsible for 100 percent
of the prescription costs from the initial coverage limit ($2,930 for 2012) to the catastrophic
coverage limit ($6,658 for 2012). This coverage gap is also known as the “donut hole.”) The
discount is also applied to the member’s true out of pocket costs which allows federal
catastrophic coverage to be reached sooner.
2) The “donut hole” coverage gap is reduced ratably and completely eliminated by 2020.
3) As the coverage gap diminishes, the sponsor’s “Wrap” supplemental benefits within the “donut
hole” decreases.
4) Federal prescription drug subsidies must be used to reduce the cost of providing benefits to
Medicare eligible members, resulting in lower premium rates. This feature allows the sponsor
to reflect certain EGWP-Wrap savings in the GASB 45 valuation.
The EGWP – Wrap design feature is expected to reduce prescription costs for Medicare eligible
members by approximately 25 percent in the near-term.
However, it is not clear how brand name discounts and federal subsidies will impact the effective trend
rates and overall costs in the future. Consequently, for GASB 45 valuation purposes, we have assumed
that the EGWP – Wrap savings will gradually wear-away by the end of 2020.

State of California OPEB Valuation as of June 30, 2012
12
Adjustments to Estimate the Impact of Excise Tax under Healthcare Reform
Beginning in 2018, the Patient Protection and Affordable Care Act (PPACA) imposes a 40 percent
excise tax on healthcare plan costs over certain statutory limits. The annual statutory limits for 2018
depend on the age and coverage tier as follows:
Age less than 55 or greater than 64 Age greater than 54 or less than 65
Single person coverage $10,200 $11,850
All other coverage types $27,500 $30,950
In 2019 and 2020, the statutory limits are increased by the rate for the Consumer Price Index for all
Urban Consumers (CPI-U) plus one percentage point, and after 2020 the statutory limits are increased
by the CPI-U rate. The statutory limits don’t recognize differences due to region, health status of the
group, or plan design. Healthcare plan costs may be blended among active members, pre-Medicare
retirees, and Medicare retirees if members are covered by the same plan, and similar benefits are
provided. Healthcare plan costs subject to the excise tax include: medical, prescription, and employer
Health Savings Accounts and Health Reimbursement Accounts.
For the valuation as of June 30, 2012, the impact of the excise tax was estimated by:
1) Aggregating average costs by the PPO plans and the HMO plans,
2) Projecting average plan costs based on the assumed valuation trend rate,
3) Projecting the statutory limits assuming a CPI-U rate of 3.0 percent,
4) Estimating the projected excise tax based on the projected average costs and statutory limits,
5) Assuming the plan sponsor would subsidize the excise tax and no additional costs would be
passed to plan members, and
6) Developing an adjusted trend rate, applied to the explicit costs, to approximate the impact of
the additional excise tax costs.
Based on the preceding method, the ultimate trend rate for future retirees was increased by an
additional 0.14 of a percentage point to 4.64 percent on and after 2025.
Participation Assumption
A third key assumption influencing costs is the participation assumption, or the likelihood that an
active member will retire and select healthcare coverage. This assumption generally depends on the
subsidy provided by the employer. That is, the higher the level of employer benefits, and the lower the
level of retiree-paid premium, the higher the likelihood the retired member will select healthcare
coverage. For this valuation, we have defined participation rates that depend on the portion of the total
premium paid by the State. On average, about 90 percent of all eligible retirees elect healthcare
coverage.
Other Demographic Assumptions
Demographic assumptions are used to determine the likelihood an active member will retire, survive,
and receive benefits. Assumptions relating to termination, disability, retirement, and mortality were
based on the same assumptions used by CalPERS to develop costs for pension benefits. We reviewed
the CalPERS assumptions for reasonableness and consistency.

State of California OPEB Valuation as of June 30, 2012
13
Retiree Per Capita Claim Costs and the Implicit Rate Subsidy
A retiree healthcare valuation depends on the retired member’s expected healthcare claim at a given
age indexed for healthcare inflation. Average healthcare costs are generally developed using the
experience of the group, and are adjusted for the retired member’s age based on standard morbidity
tables or group specific morbidity for very large groups.
The employer’s net cost for a given member in a given year equals the expected age-adjusted annual
claims cost less the member’s annual contribution. Retired members not eligible for Medicare who are
charged a premium based on the experience of both active and retired members will be receiving a
subsidy because the average healthcare costs of retired members is generally higher than the blended
average costs of a group comprised of both active and retired members. This subsidy is referred to as
the implicit rate subsidy, and is a major contributor to the OPEB costs. The portion of the blended
average costs paid by the employer is referred to as the explicit rate subsidy, and also directly impacts
OPEB costs.
Community-rated Plans
Certain plan sponsors may be able to participate in a community rated healthcare plan in which:
Healthcare costs for a group of participating employers are pooled through either a fully-
insured program or a self-insured agent multiple employer arrangement;
The same premium rate is charged to all active members and pre-Medicare retirees in the pool;
The individual plan sponsor’s experience or change in demographics does not affect the pooled
premium rate; and
The same premium rate would be charged if the group covered only pre-Medicare retirees.
In such cases, the plan sponsor does not need to recognize an implicit rate subsidy and may determine
costs under GASB Nos. 43 and 45 using unadjusted premiums in the actuarial valuation.
Because State employees and retirees comprise over 60 percent of total covered lives in the healthcare
programs administered by CalPERS, and are rated separately from other participating local
government employers, the State is not eligible for the community rating exception.
Actuarial Cost Method
Actuarial valuation results such as the Actuarial Accrued Liability, Normal Cost, and Annual Required
Contribution, were developed using the Entry Age Normal Actuarial Cost Method as allowed by
GASB Nos. 43 and 45. This method produces an Annual Required Contribution that is level as a
percentage of the member’s pay.
Closed Versus Open Group Valuation
The development of the Annual Required Contribution and the measurement of the Actuarial Accrued
Liability were based on a “closed group” valuation, as required by GASB Nos. 43 and 45. A closed
group valuation produces a snapshot of assets, liabilities and costs for the current fiscal year without
considering how future new hires may influence costs. An open group valuation considers the impact of
future new hires and is a useful tool to evaluate the impact of future potential changes in demographics,
benefit design, assumptions, funding policies or the budgetary effects of the OPEB programs.

SECTION B
VA LU ATIO N R ES U LTS
State of California OPEB Valuation as of June 30, 2012
14
VALUATION RESULTS
Pay-as-you-go Scenario
Other Postemployment Benefits
Sponsored by the
State of California
As of June 30, 2012
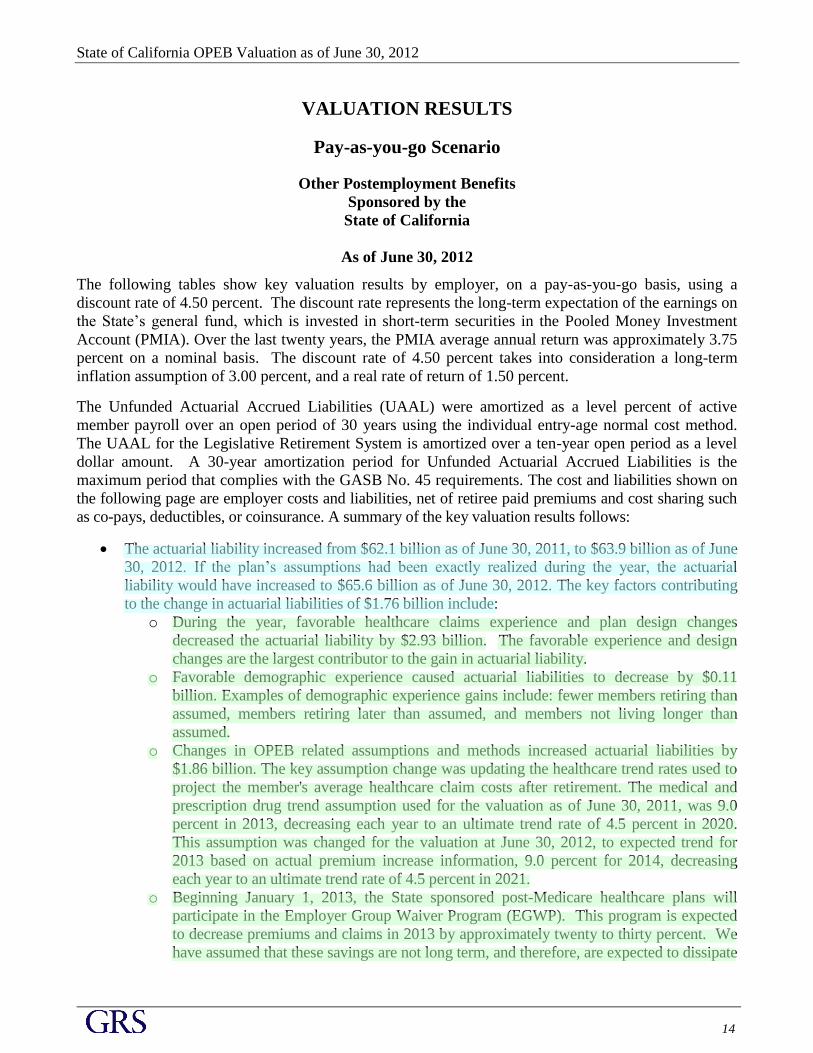
The following tables show key valuation results by employer, on a pay-as-you-go basis, using a
discount rate of 4.50 percent. The discount rate represents the long-term expectation of the earnings on
the State’s general fund, which is invested in short-term securities in the Pooled Money Investment
Account (PMIA). Over the last twenty years, the PMIA average annual return was approximately 3.75
percent on a nominal basis. The discount rate of 4.50 percent takes into consideration a long-term
inflation assumption of 3.00 percent, and a real rate of return of 1.50 percent.
The Unfunded Actuarial Accrued Liabilities (UAAL) were amortized as a level percent of active
member payroll over an open period of 30 years using the individual entry-age normal cost method.
The UAAL for the Legislative Retirement System is amortized over a ten-year open period as a level
dollar amount. A 30-year amortization period for Unfunded Actuarial Accrued Liabilities is the
maximum period that complies with the GASB No. 45 requirements. The cost and liabilities shown on
the following page are employer costs and liabilities, net of retiree paid premiums and cost sharing such
as co-pays, deductibles, or coinsurance. A summary of the key valuation results follows:
The actuarial liability increased from $62.1 billion as of June 30, 2011, to $63.9 billion as of June
30, 2012. If the plan’s assumptions had been exactly realized during the year, the actuarial
liability would have increased to $65.6 billion as of June 30, 2012. The key factors contributing
to the change in actuarial liabilities of $1.76 billion include:
o During the year, favorable healthcare claims experience and plan design changes
decreased the actuarial liability by $2.93 billion. The favorable experience and design
changes are the largest contributor to the gain in actuarial liability.
o Favorable demographic experience caused actuarial liabilities to decrease by $0.11
billion. Examples of demographic experience gains include: fewer members retiring than
assumed, members retiring later than assumed, and members not living longer than
assumed.
o Changes in OPEB related assumptions and methods increased actuarial liabilities by
$1.86 billion. The key assumption change was updating the healthcare trend rates used to
project the member's average healthcare claim costs after retirement. The medical and
prescription drug trend assumption used for the valuation as of June 30, 2011, was 9.0
percent in 2013, decreasing each year to an ultimate trend rate of 4.5 percent in 2020.
This assumption was changed for the valuation at June 30, 2012, to expected trend for
2013 based on actual premium increase information, 9.0 percent for 2014, decreasing
each year to an ultimate trend rate of 4.5 percent in 2021.
o Beginning January 1, 2013, the State sponsored post-Medicare healthcare plans will
participate in the Employer Group Waiver Program (EGWP). This program is expected
to decrease premiums and claims in 2013 by approximately twenty to thirty percent. We
have assumed that these savings are not long term, and therefore, are expected to dissipate
State of California OPEB Valuation as of June 30, 2012
15
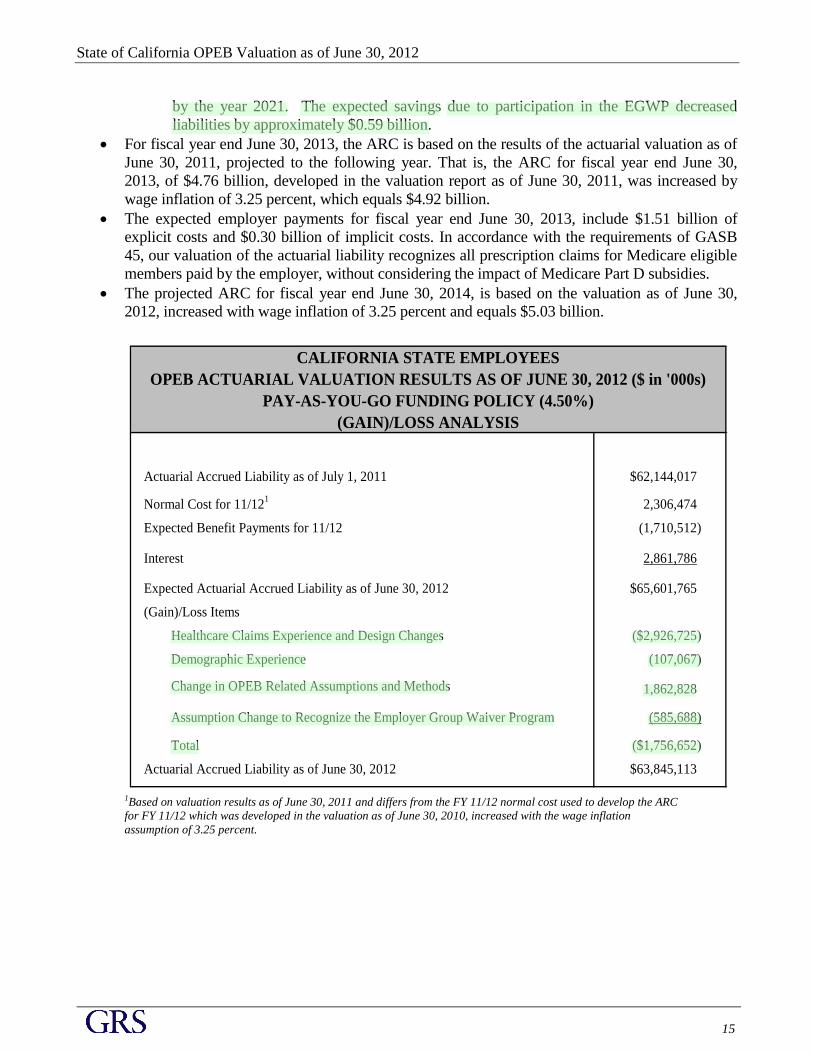
by the year 2021. The expected savings due to participation in the EGWP decreased
liabilities by approximately $0.59 billion.
For fiscal year end June 30, 2013, the ARC is based on the results of the actuarial valuation as of
June 30, 2011, projected to the following year. That is, the ARC for fiscal year end June 30,
2013, of $4.76 billion, developed in the valuation report as of June 30, 2011, was increased by
wage inflation of 3.25 percent, which equals $4.92 billion.
The expected employer payments for fiscal year end June 30, 2013, include $1.51 billion of
explicit costs and $0.30 billion of implicit costs. In accordance with the requirements of GASB
45, our valuation of the actuarial liability recognizes all prescription claims for Medicare eligible
members paid by the employer, without considering the impact of Medicare Part D subsidies.
The projected ARC for fiscal year end June 30, 2014, is based on the valuation as of June 30,
2012, increased with wage inflation of 3.25 percent and equals $5.03 billion.
Actuarial Accrued Liability as of July 1, 2011 $62,144,017
Normal Cost for 11/121
2,306,474
Expected Benefit Payments for 11/12 (1,710,512)
Interest 2,861,786
Expected Actuarial Accrued Liability as of June 30, 2012 $65,601,765
(Gain)/Loss Items
Healthcare Claims Experience and Design Changes ($2,926,725)
Demographic Experience (107,067)
Change in OPEB Related Assumptions and Methods 1,862,828
Assumption Change to Recognize the Employer Group Waiver Program (585,688)
Total ($1,756,652)
Actuarial Accrued Liability as of June 30, 2012 $63,845,113
(GAIN)/LOSS ANALYSIS
CALIFORNIA STATE EMPLOYEES
OPEB ACTUARIAL VALUATION RESULTS AS OF JUNE 30, 2012 ($ in '000s)
PAY-AS-YOU-GO FUNDING POLICY (4.50%)
1Based on valuation results as of June 30, 2011 and differs from the FY 11/12 normal cost used to develop the ARC
for FY 11/12 which was developed in the valuation as of June 30, 2010, increased with the wage inflation
assumption of 3.25 percent.
State of California OPEB Valuation as of June 30, 2012
16
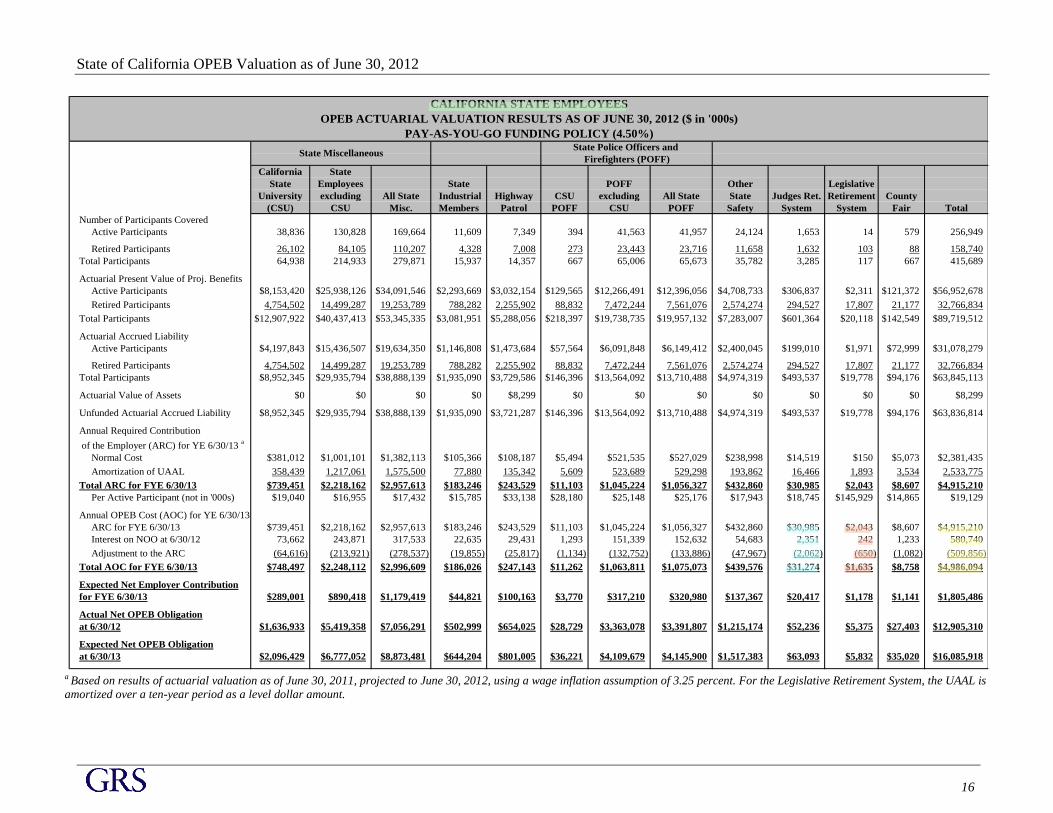
California State
State Employees State POFF Other Legislative
University excluding All State Industrial Highway CSU excluding All State State Judges Ret. Retirement County
(CSU) CSU Misc. Members Patrol POFF CSU POFF Safety System System Fair Total
Number of Participants Covered
Active Participants 38,836 130,828 169,664 11,609 7,349 394 41,563 41,957 24,124 1,653 14 579 256,949
Retired Participants 26,102 84,105 110,207 4,328 7,008 273 23,443 23,716 11,658 1,632 103 88 158,740
Total Participants 64,938 214,933 279,871 15,937 14,357 667 65,006 65,673 35,782 3,285 117 667 415,689
Actuarial Present Value of Proj. Benefits
Active Participants $8,153,420 $25,938,126 $34,091,546 $2,293,669 $3,032,154 $129,565 $12,266,491 $12,396,056 $4,708,733 $306,837 $2,311 $121,372 $56,952,678
Retired Participants 4,754,502 14,499,287 19,253,789 788,282 2,255,902 88,832 7,472,244 7,561,076 2,574,274 294,527 17,807 21,177 32,766,834
Total Participants $12,907,922 $40,437,413 $53,345,335 $3,081,951 $5,288,056 $218,397 $19,738,735 $19,957,132 $7,283,007 $601,364 $20,118 $142,549 $89,719,512
Actuarial Accrued Liability
Active Participants $4,197,843 $15,436,507 $19,634,350 $1,146,808 $1,473,684 $57,564 $6,091,848 $6,149,412 $2,400,045 $199,010 $1,971 $72,999 $31,078,279
Retired Participants 4,754,502 14,499,287 19,253,789 788,282 2,255,902 88,832 7,472,244 7,561,076 2,574,274 294,527 17,807 21,177 32,766,834
Total Participants $8,952,345 $29,935,794 $38,888,139 $1,935,090 $3,729,586 $146,396 $13,564,092 $13,710,488 $4,974,319 $493,537 $19,778 $94,176 $63,845,113
Actuarial Value of Assets $0 $0 $0 $0 $8,299 $0 $0 $0 $0 $0 $0 $0 $8,299
Unfunded Actuarial Accrued Liability $8,952,345 $29,935,794 $38,888,139 $1,935,090 $3,721,287 $146,396 $13,564,092 $13,710,488 $4,974,319 $493,537 $19,778 $94,176 $63,836,814
Annual Required Contribution
of the Employer (ARC) for YE 6/30/13 a
Normal Cost $381,012 $1,001,101 $1,382,113 $105,366 $108,187 $5,494 $521,535 $527,029 $238,998 $14,519 $150 $5,073 $2,381,435
Amortization of UAAL 358,439 1,217,061 1,575,500 77,880 135,342 5,609 523,689 529,298 193,862 16,466 1,893 3,534 2,533,775
Total ARC for FYE 6/30/13 $739,451 $2,218,162 $2,957,613 $183,246 $243,529 $11,103 $1,045,224 $1,056,327 $432,860 $30,985 $2,043 $8,607 $4,915,210
Per Active Participant (not in '000s) $19,040 $16,955 $17,432 $15,785 $33,138 $28,180 $25,148 $25,176 $17,943 $18,745 $145,929 $14,865 $19,129
Annual OPEB Cost (AOC) for YE 6/30/13
ARC for FYE 6/30/13 $739,451 $2,218,162 $2,957,613 $183,246 $243,529 $11,103 $1,045,224 $1,056,327 $432,860 $30,985 $2,043 $8,607 $4,915,210
Interest on NOO at 6/30/12 73,662 243,871 317,533 22,635 29,431 1,293 151,339 152,632 54,683 2,351 242 1,233 580,740
Adjustment to the ARC (64,616) (213,921) (278,537) (19,855) (25,817) (1,134) (132,752) (133,886) (47,967) (2,062) (650) (1,082) (509,856)
Total AOC for FYE 6/30/13 $748,497 $2,248,112 $2,996,609 $186,026 $247,143 $11,262 $1,063,811 $1,075,073 $439,576 $31,274 $1,635 $8,758 $4,986,094
Expected Net Employer Contribution
for FYE 6/30/13 $289,001 $890,418 $1,179,419 $44,821 $100,163 $3,770 $317,210 $320,980 $137,367 $20,417 $1,178 $1,141 $1,805,486
Actual Net OPEB Obligation
at 6/30/12 $1,636,933 $5,419,358 $7,056,291 $502,999 $654,025 $28,729 $3,363,078 $3,391,807 $1,215,174 $52,236 $5,375 $27,403 $12,905,310
Expected Net OPEB Obligation
at 6/30/13 $2,096,429 $6,777,052 $8,873,481 $644,204 $801,005 $36,221 $4,109,679 $4,145,900 $1,517,383 $63,093 $5,832 $35,020 $16,085,918
CALIFORNIA STATE EMPLOYEES
OPEB ACTUARIAL VALUATION RESULTS AS OF JUNE 30, 2012 ($ in '000s)
PAY-AS-YOU-GO FUNDING POLICY (4.50%)State Police Officers and
State MiscellaneousFirefighters (POFF)
a Based on results of actuarial valuation as of June 30, 2011, projected to June 30, 2012, using a wage inflation assumption of 3.25 percent. For the Legislative Retirement System, the UAAL is
amortized over a ten-year period as a level dollar amount.
State of California OPEB Valuation as of June 30, 2012
17
.
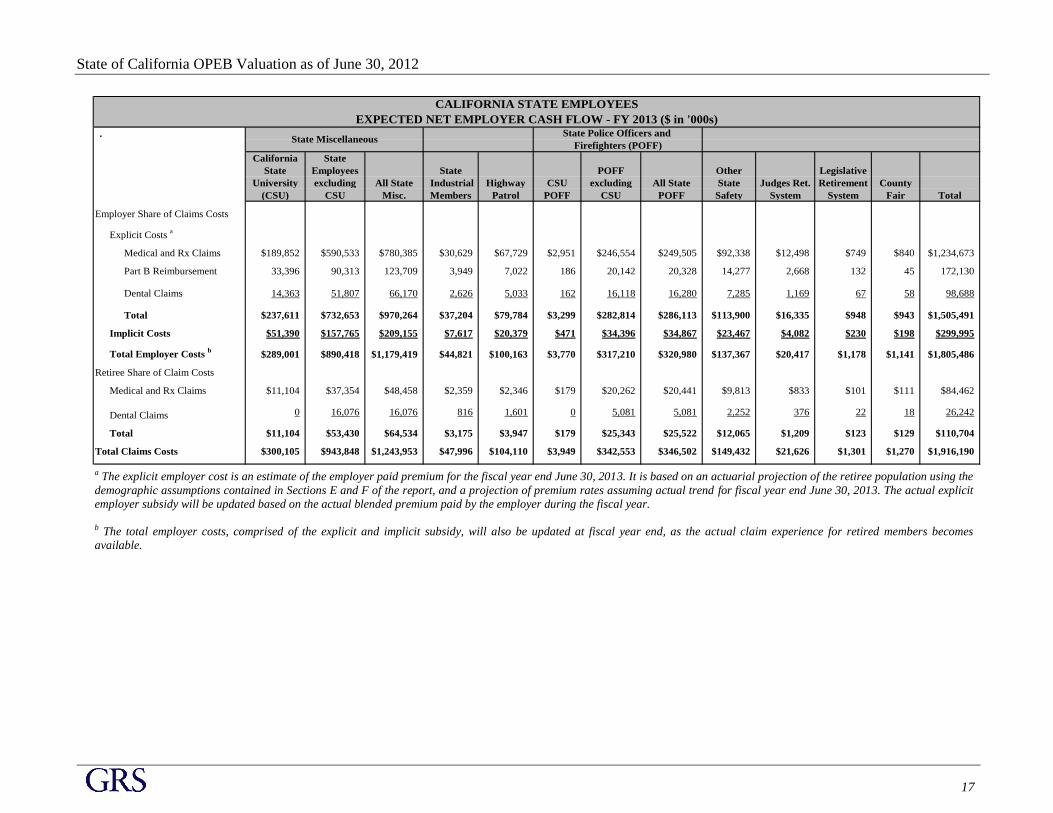
California State
State Employees State POFF Other Legislative
University excluding All State Industrial Highway CSU excluding All State State Judges Ret. Retirement County
(CSU) CSU Misc. Members Patrol POFF CSU POFF Safety System System Fair Total
Employer Share of Claims Costs
Explicit Costs a
Medical and Rx Claims $189,852 $590,533 $780,385 $30,629 $67,729 $2,951 $246,554 $249,505 $92,338 $12,498 $749 $840 $1,234,673
Part B Reimbursement 33,396 90,313 123,709 3,949 7,022 186 20,142 20,328 14,277 2,668 132 45 172,130
Dental Claims 14,363 51,807 66,170 2,626 5,033 162 16,118 16,280 7,285 1,169 67 58 98,688
Total $237,611 $732,653 $970,264 $37,204 $79,784 $3,299 $282,814 $286,113 $113,900 $16,335 $948 $943 $1,505,491
Implicit Costs $51,390 $157,765 $209,155 $7,617 $20,379 $471 $34,396 $34,867 $23,467 $4,082 $230 $198 $299,995
Total Employer Costs b
$289,001 $890,418 $1,179,419 $44,821 $100,163 $3,770 $317,210 $320,980 $137,367 $20,417 $1,178 $1,141 $1,805,486
Retiree Share of Claim Costs
Medical and Rx Claims $11,104 $37,354 $48,458 $2,359 $2,346 $179 $20,262 $20,441 $9,813 $833 $101 $111 $84,462
Dental Claims 0 16,076 16,076 816 1,601 0 5,081 5,081 2,252 376 22 18 26,242
Total $11,104 $53,430 $64,534 $3,175 $3,947 $179 $25,343 $25,522 $12,065 $1,209 $123 $129 $110,704
Total Claims Costs $300,105 $943,848 $1,243,953 $47,996 $104,110 $3,949 $342,553 $346,502 $149,432 $21,626 $1,301 $1,270 $1,916,190
CALIFORNIA STATE EMPLOYEES
EXPECTED NET EMPLOYER CASH FLOW - FY 2013 ($ in '000s)
State MiscellaneousState Police Officers and
Firefighters (POFF)
a The explicit employer cost is an estimate of the employer paid premium for the fiscal year end June 30, 2013. It is based on an actuarial projection of the retiree population using the
demographic assumptions contained in Sections E and F of the report, and a projection of premium rates assuming actual trend for fiscal year end June 30, 2013. The actual explicit
employer subsidy will be updated based on the actual blended premium paid by the employer during the fiscal year.
b The total employer costs, comprised of the explicit and implicit subsidy, will also be updated at fiscal year end, as the actual claim experience for retired members becomes
available.

State of California OPEB Valuation as of June 30, 2012
18
California State
State Employees State POFF Other Legislative
University excluding All State Industrial Highway CSU excluding All State State Judges Ret. Retirement County
(CSU) CSU Misc. Members Patrol POFF CSU POFF Safety System System Fair Total
ARC based on 6/30/12 valuation
Normal Cost $382,391 $984,858 $1,367,249 $97,046 $114,503 $5,638 $511,692 $517,330 $232,436 $13,487 $99 $5,056 $2,347,206
Amortization of UAAL 353,381 1,181,671 1,535,052 76,385 146,892 5,779 535,422 541,201 196,354 19,482 2,392 3,717 2,521,475
Total ARC $735,772 $2,166,529 $2,902,301 $173,431 $261,395 $11,417 $1,047,114 $1,058,531 $428,790 $32,969 $2,491 $8,773 $4,868,681
ARC for YE 6/30/14
Normal Cost $394,819 $1,016,866 $1,411,685 $100,200 $118,224 $5,821 $528,322 $534,143 $239,990 $13,925 $102 $5,220 $2,423,489
Amortization of UAAL 364,866 1,220,075 1,584,941 78,868 151,666 5,967 552,823 558,790 202,736 20,115 2,470 3,838 2,603,424
Total ARC for YE 6/30/14 a
$759,685 $2,236,941 $2,996,626 $179,068 $269,890 $11,788 $1,081,145 $1,092,933 $442,726 $34,040 $2,572 $9,058 $5,026,913
CALIFORNIA STATE EMPLOYEES
OPEB ACTUARIAL VALUATION RESULTS AS OF JUNE 30, 2012 ($ in '000s)
PAY-AS-YOU-GO FUNDING POLICY (4.50%)
State Police Officers and State Miscellaneous
Firefighters (POFF)
DEVELOPMENT OF FYE 2014 ANNUAL REQUIRED CONTRIBUTION
a For fiscal year end June 30, 2014, the ARC will be based on the results of the actuarial valuation as of June 30, 2012, projected to the following year. That is, the ARC will increase by the
wage inflation assumption of 3.25 percent.
State of California OPEB Valuation as of June 30, 2012
19
VALUATION RESULTS
Pre-Funding Scenarios
Other Postemployment Benefits
Sponsored by the
State of California
As of June 30, 2012
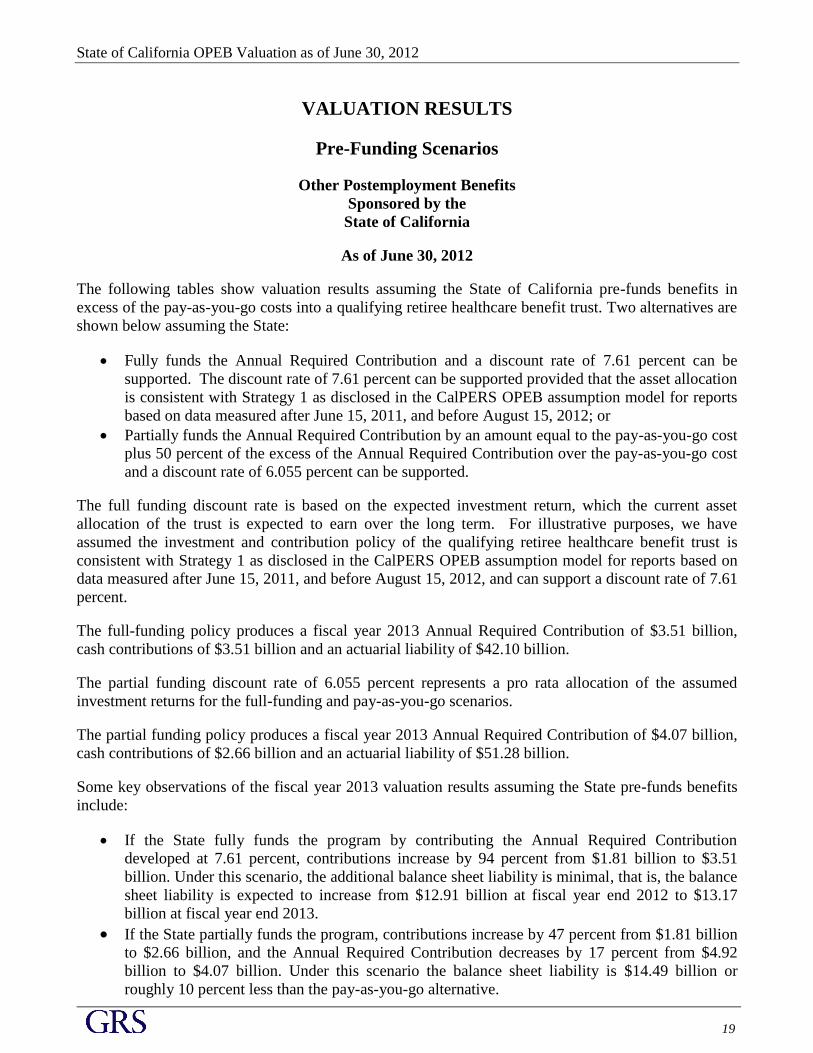
The following tables show valuation results assuming the State of California pre-funds benefits in
excess of the pay-as-you-go costs into a qualifying retiree healthcare benefit trust. Two alternatives are
shown below assuming the State:
Fully funds the Annual Required Contribution and a discount rate of 7.61 percent can be
supported. The discount rate of 7.61 percent can be supported provided that the asset allocation
is consistent with Strategy 1 as disclosed in the CalPERS OPEB assumption model for reports
based on data measured after June 15, 2011, and before August 15, 2012; or
Partially funds the Annual Required Contribution by an amount equal to the pay-as-you-go cost
plus 50 percent of the excess of the Annual Required Contribution over the pay-as-you-go cost
and a discount rate of 6.055 percent can be supported.
The full funding discount rate is based on the expected investment return, which the current asset
allocation of the trust is expected to earn over the long term. For illustrative purposes, we have
assumed the investment and contribution policy of the qualifying retiree healthcare benefit trust is
consistent with Strategy 1 as disclosed in the CalPERS OPEB assumption model for reports based on
data measured after June 15, 2011, and before August 15, 2012, and can support a discount rate of 7.61
percent.
The full-funding policy produces a fiscal year 2013 Annual Required Contribution of $3.51 billion,
cash contributions of $3.51 billion and an actuarial liability of $42.10 billion.
The partial funding discount rate of 6.055 percent represents a pro rata allocation of the assumed
investment returns for the full-funding and pay-as-you-go scenarios.
The partial funding policy produces a fiscal year 2013 Annual Required Contribution of $4.07 billion,
cash contributions of $2.66 billion and an actuarial liability of $51.28 billion.
Some key observations of the fiscal year 2013 valuation results assuming the State pre-funds benefits
include:
If the State fully funds the program by contributing the Annual Required Contribution
developed at 7.61 percent, contributions increase by 94 percent from $1.81 billion to $3.51
billion. Under this scenario, the additional balance sheet liability is minimal, that is, the balance
sheet liability is expected to increase from $12.91 billion at fiscal year end 2012 to $13.17
billion at fiscal year end 2013.
If the State partially funds the program, contributions increase by 47 percent from $1.81 billion
to $2.66 billion, and the Annual Required Contribution decreases by 17 percent from $4.92
billion to $4.07 billion. Under this scenario the balance sheet liability is $14.49 billion or
roughly 10 percent less than the pay-as-you-go alternative.
State of California OPEB Valuation as of June 30, 2012
20
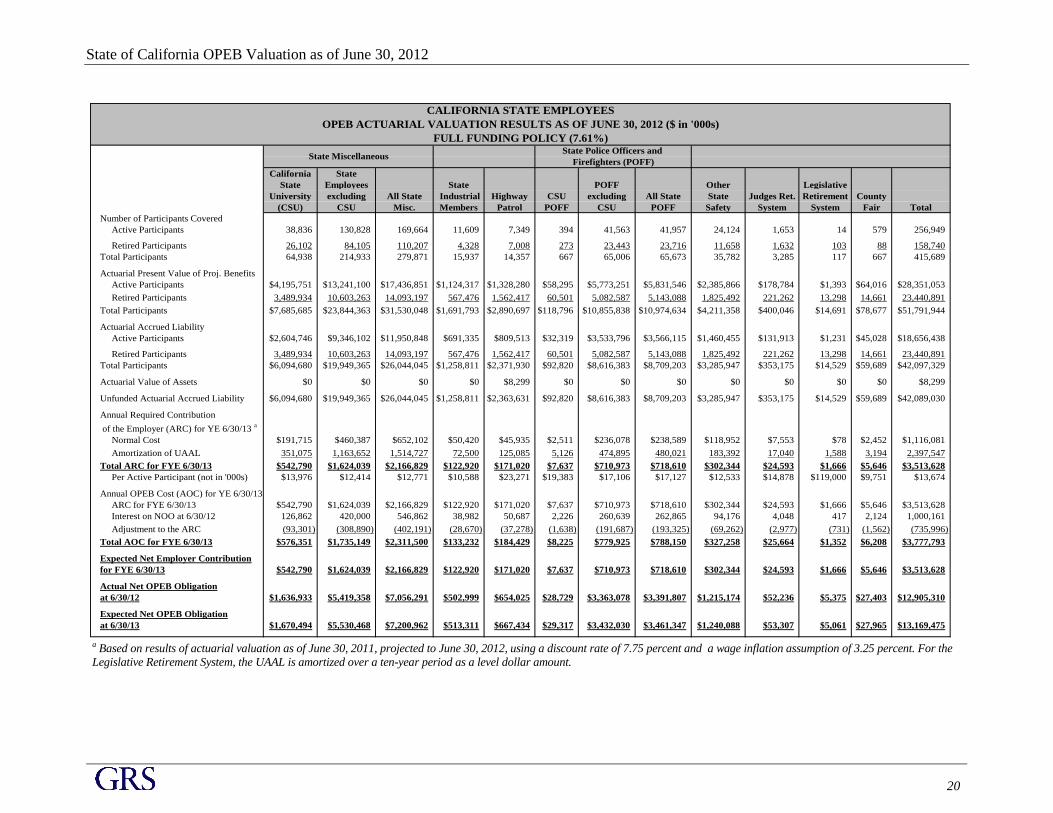
California State
State Employees State POFF Other Legislative
University excluding All State Industrial Highway CSU excluding All State State Judges Ret. Retirement County
(CSU) CSU Misc. Members Patrol POFF CSU POFF Safety System System Fair Total
Number of Participants Covered
Active Participants 38,836 130,828 169,664 11,609 7,349 394 41,563 41,957 24,124 1,653 14 579 256,949
Retired Participants 26,102 84,105 110,207 4,328 7,008 273 23,443 23,716 11,658 1,632 103 88 158,740
Total Participants 64,938 214,933 279,871 15,937 14,357 667 65,006 65,673 35,782 3,285 117 667 415,689
Actuarial Present Value of Proj. Benefits
Active Participants $4,195,751 $13,241,100 $17,436,851 $1,124,317 $1,328,280 $58,295 $5,773,251 $5,831,546 $2,385,866 $178,784 $1,393 $64,016 $28,351,053
Retired Participants 3,489,934 10,603,263 14,093,197 567,476 1,562,417 60,501 5,082,587 5,143,088 1,825,492 221,262 13,298 14,661 23,440,891
Total Participants $7,685,685 $23,844,363 $31,530,048 $1,691,793 $2,890,697 $118,796 $10,855,838 $10,974,634 $4,211,358 $400,046 $14,691 $78,677 $51,791,944
Actuarial Accrued Liability
Active Participants $2,604,746 $9,346,102 $11,950,848 $691,335 $809,513 $32,319 $3,533,796 $3,566,115 $1,460,455 $131,913 $1,231 $45,028 $18,656,438
Retired Participants 3,489,934 10,603,263 14,093,197 567,476 1,562,417 60,501 5,082,587 5,143,088 1,825,492 221,262 13,298 14,661 23,440,891
Total Participants $6,094,680 $19,949,365 $26,044,045 $1,258,811 $2,371,930 $92,820 $8,616,383 $8,709,203 $3,285,947 $353,175 $14,529 $59,689 $42,097,329
Actuarial Value of Assets $0 $0 $0 $0 $8,299 $0 $0 $0 $0 $0 $0 $0 $8,299
Unfunded Actuarial Accrued Liability $6,094,680 $19,949,365 $26,044,045 $1,258,811 $2,363,631 $92,820 $8,616,383 $8,709,203 $3,285,947 $353,175 $14,529 $59,689 $42,089,030
Annual Required Contribution
of the Employer (ARC) for YE 6/30/13 a
Normal Cost $191,715 $460,387 $652,102 $50,420 $45,935 $2,511 $236,078 $238,589 $118,952 $7,553 $78 $2,452 $1,116,081
Amortization of UAAL 351,075 1,163,652 1,514,727 72,500 125,085 5,126 474,895 480,021 183,392 17,040 1,588 3,194 2,397,547
Total ARC for FYE 6/30/13 $542,790 $1,624,039 $2,166,829 $122,920 $171,020 $7,637 $710,973 $718,610 $302,344 $24,593 $1,666 $5,646 $3,513,628
Per Active Participant (not in '000s) $13,976 $12,414 $12,771 $10,588 $23,271 $19,383 $17,106 $17,127 $12,533 $14,878 $119,000 $9,751 $13,674
Annual OPEB Cost (AOC) for YE 6/30/13
ARC for FYE 6/30/13 $542,790 $1,624,039 $2,166,829 $122,920 $171,020 $7,637 $710,973 $718,610 $302,344 $24,593 $1,666 $5,646 $3,513,628
Interest on NOO at 6/30/12 126,862 420,000 546,862 38,982 50,687 2,226 260,639 262,865 94,176 4,048 417 2,124 1,000,161
Adjustment to the ARC (93,301) (308,890) (402,191) (28,670) (37,278) (1,638) (191,687) (193,325) (69,262) (2,977) (731) (1,562) (735,996)
Total AOC for FYE 6/30/13 $576,351 $1,735,149 $2,311,500 $133,232 $184,429 $8,225 $779,925 $788,150 $327,258 $25,664 $1,352 $6,208 $3,777,793
Expected Net Employer Contribution
for FYE 6/30/13 $542,790 $1,624,039 $2,166,829 $122,920 $171,020 $7,637 $710,973 $718,610 $302,344 $24,593 $1,666 $5,646 $3,513,628
Actual Net OPEB Obligation
at 6/30/12 $1,636,933 $5,419,358 $7,056,291 $502,999 $654,025 $28,729 $3,363,078 $3,391,807 $1,215,174 $52,236 $5,375 $27,403 $12,905,310
Expected Net OPEB Obligation
at 6/30/13 $1,670,494 $5,530,468 $7,200,962 $513,311 $667,434 $29,317 $3,432,030 $3,461,347 $1,240,088 $53,307 $5,061 $27,965 $13,169,475
CALIFORNIA STATE EMPLOYEES
OPEB ACTUARIAL VALUATION RESULTS AS OF JUNE 30, 2012 ($ in '000s)
FULL FUNDING POLICY (7.61%)State Police Officers and
State MiscellaneousFirefighters (POFF)
a Based on results of actuarial valuation as of June 30, 2011, projected to June 30, 2012, using a discount rate of 7.75 percent and a wage inflation assumption of 3.25 percent. For the
Legislative Retirement System, the UAAL is amortized over a ten-year period as a level dollar amount.

State of California OPEB Valuation as of June 30, 2012
21
California State
State Employees State POFF Other Legislative
University excluding All State Industrial Highway CSU excluding All State State Judges Ret. Retirement County
(CSU) CSU Misc. Members Patrol POFF CSU POFF Safety System System Fair Total
ARC based on 6/30/12 valuation
Normal Cost $193,462 $457,983 $651,445 $46,836 $48,116 $2,588 $233,736 $236,324 $116,539 $6,879 $51 $2,459 $1,108,649
Amortization of UAAL 347,381 1,137,064 1,484,445 71,749 134,721 5,291 491,112 496,403 187,291 20,130 1,977 3,402 2,400,118
Total ARC $540,843 $1,595,047 $2,135,890 $118,585 $182,837 $7,879 $724,848 $732,727 $303,830 $27,009 $2,028 $5,861 $3,508,767
ARC for YE 6/30/14
Normal Cost $199,750 $472,867 $672,617 $48,358 $49,680 $2,672 $241,332 $244,004 $120,327 $7,103 $53 $2,539 $1,144,681
Amortization of UAAL 358,671 1,174,019 1,532,690 74,081 139,099 5,463 507,073 512,536 193,378 20,784 2,041 3,513 2,478,122
Total ARC for YE 6/30/14 a
$558,421 $1,646,886 $2,205,307 $122,439 $188,779 $8,135 $748,405 $756,540 $313,705 $27,887 $2,094 $6,052 $3,622,803
CALIFORNIA STATE EMPLOYEES
OPEB ACTUARIAL VALUATION RESULTS AS OF JUNE 30, 2012 ($ in '000s)
FULL FUNDING POLICY (7.61%)
State Police Officers and State Miscellaneous
Firefighters (POFF)
DEVELOPMENT OF FYE 2014 ANNUAL REQUIRED CONTRIBUTION
a For fiscal year end June 30, 2014, the ARC will be based on the results of the actuarial valuation as of June 30, 2012, projected to the following year. That is, the ARC will increase
by the wage inflation assumption of 3.25 percent.
State of California OPEB Valuation as of June 30, 2012
22
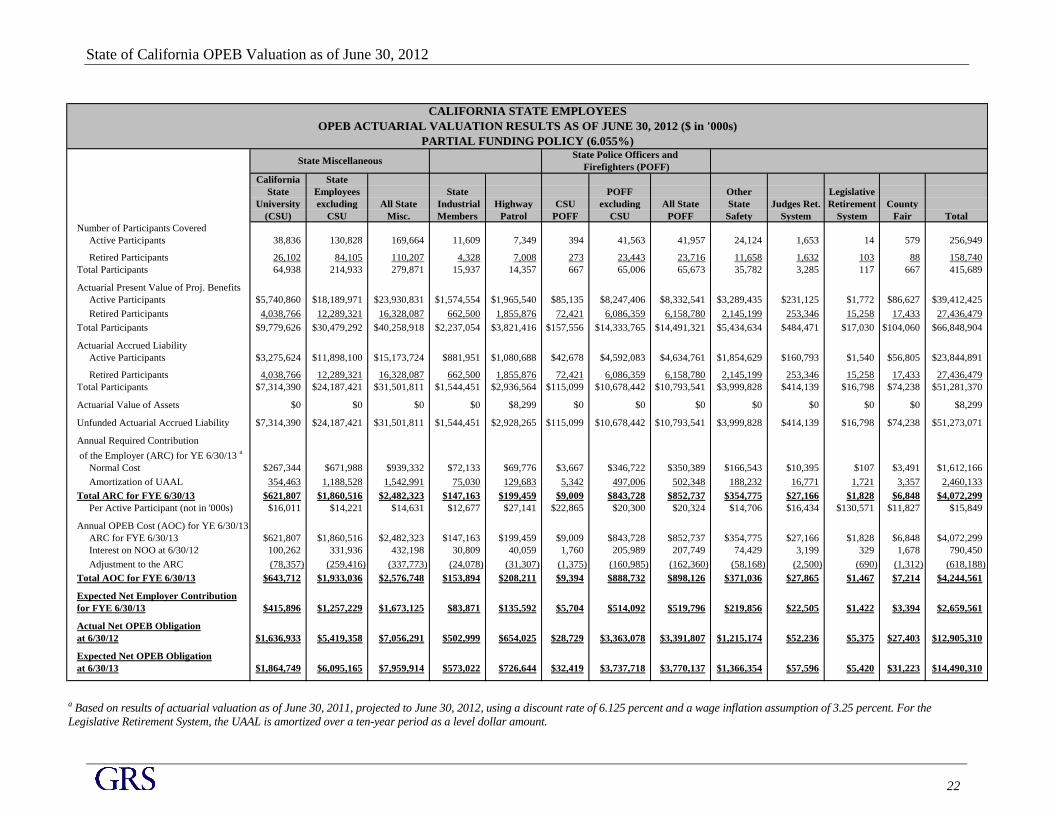
California State
State Employees State POFF Other Legislative
University excluding All State Industrial Highway CSU excluding All State State Judges Ret. Retirement County
(CSU) CSU Misc. Members Patrol POFF CSU POFF Safety System System Fair Total
Number of Participants Covered
Active Participants 38,836 130,828 169,664 11,609 7,349 394 41,563 41,957 24,124 1,653 14 579 256,949
Retired Participants 26,102 84,105 110,207 4,328 7,008 273 23,443 23,716 11,658 1,632 103 88 158,740
Total Participants 64,938 214,933 279,871 15,937 14,357 667 65,006 65,673 35,782 3,285 117 667 415,689
Actuarial Present Value of Proj. Benefits
Active Participants $5,740,860 $18,189,971 $23,930,831 $1,574,554 $1,965,540 $85,135 $8,247,406 $8,332,541 $3,289,435 $231,125 $1,772 $86,627 $39,412,425
Retired Participants 4,038,766 12,289,321 16,328,087 662,500 1,855,876 72,421 6,086,359 6,158,780 2,145,199 253,346 15,258 17,433 27,436,479
Total Participants $9,779,626 $30,479,292 $40,258,918 $2,237,054 $3,821,416 $157,556 $14,333,765 $14,491,321 $5,434,634 $484,471 $17,030 $104,060 $66,848,904
Actuarial Accrued Liability
Active Participants $3,275,624 $11,898,100 $15,173,724 $881,951 $1,080,688 $42,678 $4,592,083 $4,634,761 $1,854,629 $160,793 $1,540 $56,805 $23,844,891
Retired Participants 4,038,766 12,289,321 16,328,087 662,500 1,855,876 72,421 6,086,359 6,158,780 2,145,199 253,346 15,258 17,433 27,436,479
Total Participants $7,314,390 $24,187,421 $31,501,811 $1,544,451 $2,936,564 $115,099 $10,678,442 $10,793,541 $3,999,828 $414,139 $16,798 $74,238 $51,281,370
Actuarial Value of Assets $0 $0 $0 $0 $8,299 $0 $0 $0 $0 $0 $0 $0 $8,299
Unfunded Actuarial Accrued Liability $7,314,390 $24,187,421 $31,501,811 $1,544,451 $2,928,265 $115,099 $10,678,442 $10,793,541 $3,999,828 $414,139 $16,798 $74,238 $51,273,071
Annual Required Contribution
of the Employer (ARC) for YE 6/30/13 a
Normal Cost $267,344 $671,988 $939,332 $72,133 $69,776 $3,667 $346,722 $350,389 $166,543 $10,395 $107 $3,491 $1,612,166
Amortization of UAAL 354,463 1,188,528 1,542,991 75,030 129,683 5,342 497,006 502,348 188,232 16,771 1,721 3,357 2,460,133
Total ARC for FYE 6/30/13 $621,807 $1,860,516 $2,482,323 $147,163 $199,459 $9,009 $843,728 $852,737 $354,775 $27,166 $1,828 $6,848 $4,072,299
Per Active Participant (not in '000s) $16,011 $14,221 $14,631 $12,677 $27,141 $22,865 $20,300 $20,324 $14,706 $16,434 $130,571 $11,827 $15,849
Annual OPEB Cost (AOC) for YE 6/30/13
ARC for FYE 6/30/13 $621,807 $1,860,516 $2,482,323 $147,163 $199,459 $9,009 $843,728 $852,737 $354,775 $27,166 $1,828 $6,848 $4,072,299
Interest on NOO at 6/30/12 100,262 331,936 432,198 30,809 40,059 1,760 205,989 207,749 74,429 3,199 329 1,678 790,450
Adjustment to the ARC (78,357) (259,416) (337,773) (24,078) (31,307) (1,375) (160,985) (162,360) (58,168) (2,500) (690) (1,312) (618,188)
Total AOC for FYE 6/30/13 $643,712 $1,933,036 $2,576,748 $153,894 $208,211 $9,394 $888,732 $898,126 $371,036 $27,865 $1,467 $7,214 $4,244,561
Expected Net Employer Contribution
for FYE 6/30/13 $415,896 $1,257,229 $1,673,125 $83,871 $135,592 $5,704 $514,092 $519,796 $219,856 $22,505 $1,422 $3,394 $2,659,561
Actual Net OPEB Obligation
at 6/30/12 $1,636,933 $5,419,358 $7,056,291 $502,999 $654,025 $28,729 $3,363,078 $3,391,807 $1,215,174 $52,236 $5,375 $27,403 $12,905,310
Expected Net OPEB Obligation
at 6/30/13 $1,864,749 $6,095,165 $7,959,914 $573,022 $726,644 $32,419 $3,737,718 $3,770,137 $1,366,354 $57,596 $5,420 $31,223 $14,490,310
CALIFORNIA STATE EMPLOYEES
OPEB ACTUARIAL VALUATION RESULTS AS OF JUNE 30, 2012 ($ in '000s)
PARTIAL FUNDING POLICY (6.055%)State Police Officers and
State MiscellaneousFirefighters (POFF)
a Based on results of actuarial valuation as of June 30, 2011, projected to June 30, 2012, using a discount rate of 6.125 percent and a wage inflation assumption of 3.25 percent. For the
Legislative Retirement System, the UAAL is amortized over a ten-year period as a level dollar amount.
State of California OPEB Valuation as of June 30, 2012
23
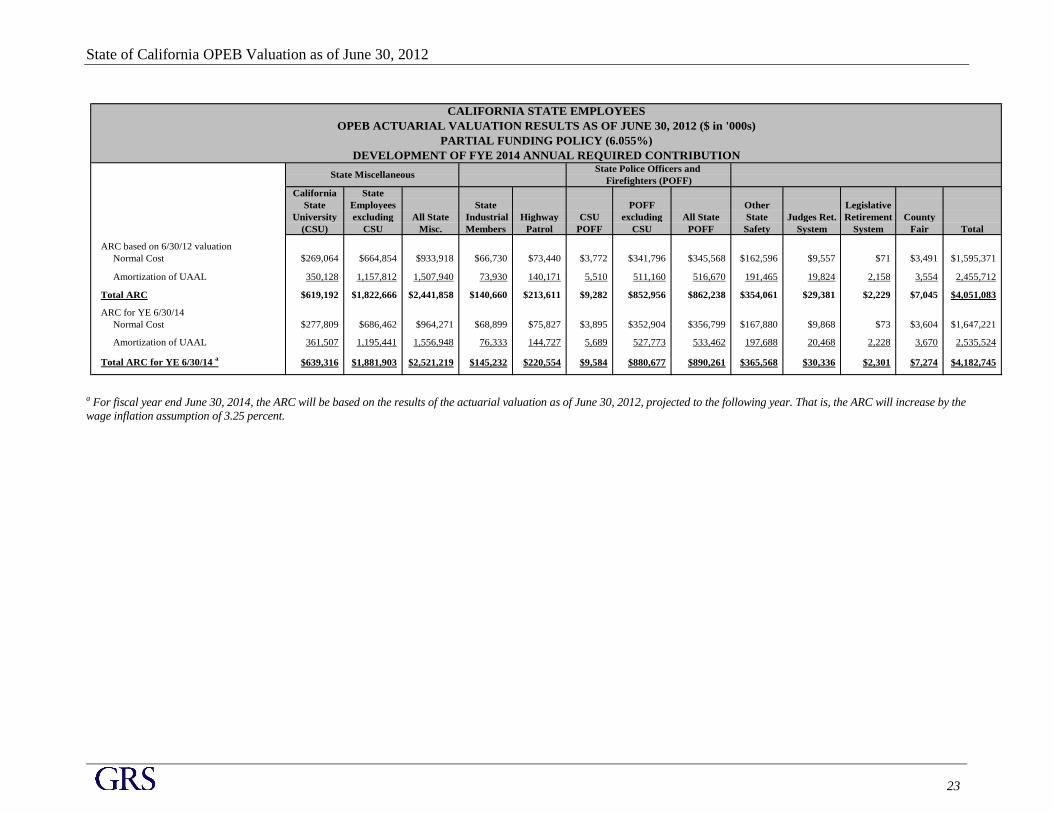
California State
State Employees State POFF Other Legislative
University excluding All State Industrial Highway CSU excluding All State State Judges Ret. Retirement County
(CSU) CSU Misc. Members Patrol POFF CSU POFF Safety System System Fair Total
ARC based on 6/30/12 valuation
Normal Cost $269,064 $664,854 $933,918 $66,730 $73,440 $3,772 $341,796 $345,568 $162,596 $9,557 $71 $3,491 $1,595,371
Amortization of UAAL 350,128 1,157,812 1,507,940 73,930 140,171 5,510 511,160 516,670 191,465 19,824 2,158 3,554 2,455,712
Total ARC $619,192 $1,822,666 $2,441,858 $140,660 $213,611 $9,282 $852,956 $862,238 $354,061 $29,381 $2,229 $7,045 $4,051,083
ARC for YE 6/30/14
Normal Cost $277,809 $686,462 $964,271 $68,899 $75,827 $3,895 $352,904 $356,799 $167,880 $9,868 $73 $3,604 $1,647,221
Amortization of UAAL 361,507 1,195,441 1,556,948 76,333 144,727 5,689 527,773 533,462 197,688 20,468 2,228 3,670 2,535,524
Total ARC for YE 6/30/14 a
$639,316 $1,881,903 $2,521,219 $145,232 $220,554 $9,584 $880,677 $890,261 $365,568 $30,336 $2,301 $7,274 $4,182,745
CALIFORNIA STATE EMPLOYEES
OPEB ACTUARIAL VALUATION RESULTS AS OF JUNE 30, 2012 ($ in '000s)
PARTIAL FUNDING POLICY (6.055%)
State Police Officers and State Miscellaneous
Firefighters (POFF)
DEVELOPMENT OF FYE 2014 ANNUAL REQUIRED CONTRIBUTION
a For fiscal year end June 30, 2014, the ARC will be based on the results of the actuarial valuation as of June 30, 2012, projected to the following year. That is, the ARC will increase by the
wage inflation assumption of 3.25 percent.
State of California OPEB Valuation as of June 30, 2012
24
VALUATION RESULTS
Accounting Information
Other Postemployment Benefits
Sponsored by the
State of California
As of June 30, 2012
The effective date for the GASB OPEB Accounting Standard for the State of California is the fiscal
year beginning July 1, 2007. The following section shows the Required Supplementary information.
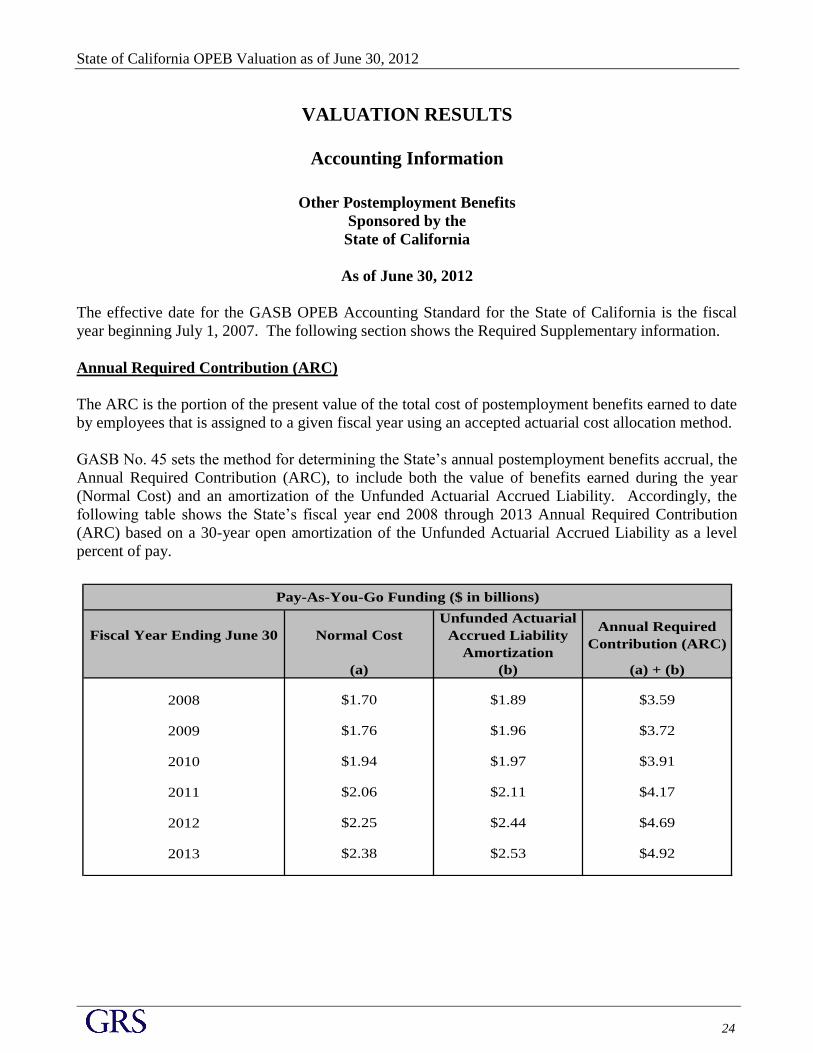
Annual Required Contribution (ARC)
The ARC is the portion of the present value of the total cost of postemployment benefits earned to date
by employees that is assigned to a given fiscal year using an accepted actuarial cost allocation method.
GASB No. 45 sets the method for determining the State’s annual postemployment benefits accrual, the
Annual Required Contribution (ARC), to include both the value of benefits earned during the year
(Normal Cost) and an amortization of the Unfunded Actuarial Accrued Liability. Accordingly, the
following table shows the State’s fiscal year end 2008 through 2013 Annual Required Contribution
(ARC) based on a 30-year open amortization of the Unfunded Actuarial Accrued Liability as a level
percent of pay.
(a) (b) (a) + (b)
2008 $1.70 $1.89 $3.59
2009 $1.76 $1.96 $3.72
2010 $1.94 $1.97 $3.91
2011 $2.06 $2.11 $4.17
2012 $2.25 $2.44 $4.69
2013 $2.38 $2.53 $4.92
Pay-As-You-Go Funding ($ in billions)
Fiscal Year Ending June 30 Normal Cost
Unfunded Actuarial
Accrued Liability
Amortization
Annual Required
Contribution (ARC)

State of California OPEB Valuation as of June 30, 2012
25
Annual OPEB Cost (AOC)
The initial OPEB Obligation was set to zero as of the transition date of July 1, 2007; therefore, the
Annual OPEB Cost equals the Annual Required Contribution for FY 2008. For FY 2009 and beyond,
the annual OPEB Cost will reflect an adjustment for the beginning of year Net OPEB Obligation.
(a) (b) (c) (a) + (b) + (c)
2008 $3.59 $0.00 $0.00 $3.59
2009 $3.72 $0.10 -$0.09 $3.73
2010 $3.91 $0.21 -$0.19 $3.93
2011 $4.17 $0.33 -$0.29 $4.21
2012 $4.69 $0.44 -$0.39 $4.74
2013 $4.92 $0.58 -$0.51 $4.99
Total Annual
OPEB Cost
(AOC)
Pay-As-You-Go Funding ($ in billions)
Fiscal Year Ending June 30
Annual Required
Contribution
(ARC)
Interest on Net
OPEB Obligation
Adjustment to
Annual Required
Contribution
Annual OPEB Cost Summary
2008 $3.59 $1.25 35% $2.34
2009 $3.73 $1.38 37% $4.69
2010 $3.93 $1.37 35% $7.25
2011 $4.21 $1.58 38% $9.88
2012 $4.74 $1.72 36% $12.91
20131
$4.99 $1.81 36% $16.09
Net OPEB
Obligation
Pay-As-You-Go Funding ($ in billions)
Fiscal Year Ending June 30Annual OPEB
Cost
Net Employer
Contribution
Percentage of
Annual OPEB
Cost Contributed
1Net employer contribution and Net OPEB Obligation estimated for fiscal year ending June 30, 2013.
State of California OPEB Valuation as of June 30, 2012
26
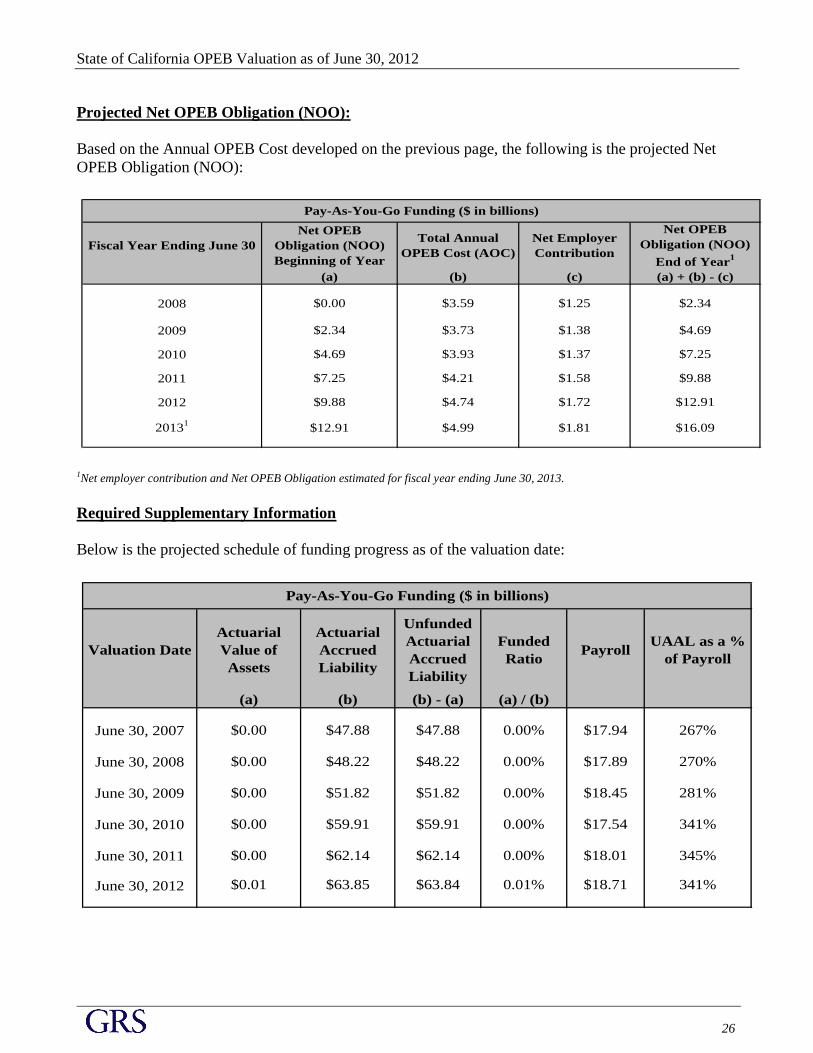
Projected Net OPEB Obligation (NOO):
Based on the Annual OPEB Cost developed on the previous page, the following is the projected Net
OPEB Obligation (NOO):
(a) (b) (c) (a) + (b) - (c)
2008 $0.00 $3.59 $1.25 $2.34
2009 $2.34 $3.73 $1.38 $4.69
2010 $4.69 $3.93 $1.37 $7.25
2011 $7.25 $4.21 $1.58 $9.88
2012 $9.88 $4.74 $1.72 $12.91
20131
$12.91 $4.99 $1.81 $16.09
Pay-As-You-Go Funding ($ in billions)
Fiscal Year Ending June 30
Net OPEB
Obligation (NOO)
Beginning of Year
Total Annual
OPEB Cost (AOC)
Net Employer
Contribution
Net OPEB
Obligation (NOO)
End of Year1
1Net employer contribution and Net OPEB Obligation estimated for fiscal year ending June 30, 2013.
Required Supplementary Information
Below is the projected schedule of funding progress as of the valuation date:
Valuation Date
Actuarial
Value of
Assets
Actuarial
Accrued
Liability
Unfunded
Actuarial
Accrued
Liability
Funded
RatioPayroll
UAAL as a %
of Payroll
(a) (b) (b) - (a) (a) / (b)
June 30, 2007 $0.00 $47.88 $47.88 0.00% $17.94 267%
June 30, 2008 $0.00 $48.22 $48.22 0.00% $17.89 270%
June 30, 2009 $0.00 $51.82 $51.82 0.00% $18.45 281%
June 30, 2010 $0.00 $59.91 $59.91 0.00% $17.54 341%
June 30, 2011 $0.00 $62.14 $62.14 0.00% $18.01 345%
June 30, 2012 $0.01 $63.85 $63.84 0.01% $18.71 341%
Pay-As-You-Go Funding ($ in billions)

SECTION C
S U MMA RY OF TH E C U RRE N T S U B S TAN TIV E P LA N
P R O V IS IO N S
State of California OPEB Valuation as of June 30, 2012
27
SUMMARY OF THE
CURRENT SUBSTANTIVE PLAN PROVISIONS
Other Postemployment Benefits
Sponsored by the
State of California
As of January 1, 2012
Eligibility Requirements
Health Care Coverage
Retired Employees
A member is eligible to enroll in a CalPERS health plan if he or she retires within 120 days of
separation from employment and receives a monthly retirement allowance. If the member meets this
requirement, he or she may continue his or her enrollment at retirement, enroll within 60 days of
retirement, or enroll during any Open Enrollment period. If a member is currently enrolled in a
CalPERS health plan and wants to continue enrollment into retirement, the employer will notify
CalPERS and the member’s coverage will continue into retirement.
Survivors of an Annuitant
If a CalPERS annuitant satisfied the requirement to retire within 120 days of separation, the survivor
may be eligible to enroll within 60 days of the annuitant’s death or during any future Open Enrollment
period. Note: A survivor cannot add any new dependents; only dependents that were enrolled or
eligible to enroll at the time of the member’s death qualify for benefits.
Surviving registered domestic partners who are receiving a monthly annuity as a surviving beneficiary
of a deceased employee or annuitant on or after January 1, 2002, are eligible to continue coverage if
currently enrolled, enroll within 60 days of the domestic partner’s death, or enroll during any future
Open Enrollment period.
Eligibility Exceptions
Certain family members are not eligible for CalPERS health benefits:
Children age 26 or older;
Children who have been married;
Children’s spouses;
Disabled children over age 26 who were never enrolled or who were deleted from coverage;
Former spouses;
Grandparents;
Parents;
Children of former spouses; and
Other relatives.
State of California OPEB Valuation as of June 30, 2012
28
Death of a Member
Upon the death of an employee while in State service, the law requires the State employer to continue
to pay contributions for the survivor’s or registered domestic partner’s health coverage for up to 120
days after the employee’s death. Surviving family members will be eligible for health benefit
coverage, provided they:
Qualify for a monthly survivor check from CalPERS; and
Were an eligible dependent at the time of the member’s death and continue to qualify as
eligible family members.
Surviving family members who do not meet the above qualifications may be eligible for COBRA.
Children of registered domestic partners may have continued eligibility if they were enrolled as family
members at the time of a member’s death.
Coordination with Medicare
CalPERS retired members who qualify for premium-free Part A, either on their own or through a
spouse (current, former, or deceased), must sign up for Part B as soon as they qualify for Part A. A
member must then enroll in a CalPERS sponsored Medicare plan. The CalPERS-sponsored Medicare
plan will pay for costs not paid by Medicare, by coordinating benefits.
Dental Benefits
Retired Employees
Retired State employees are eligible to continue enrollment in the State’s Dental Program if they retire
within 120 days after their date of separation and they receive a retirement allowance from CalPERS.
Retired employees who did not continue dental coverage into retirement may enroll during the annual
dental open enrollment period.
California Highway Patrol employees who retired on or after September 30, 1992, may elect to
continue enrollment in the Union-sponsored indemnity plan or change to a State-sponsored dental plan.
Under the terms of the Memorandum of Understanding between the California Highway Patrol and the
California Department of Human Resource, this is an irrevocable one-time election.
California Correctional Peace Officers Association members who are enrolled in a Union-sponsored
dental plan must change to a State-sponsored dental plan and retire within 120 days after their date of
separation to continue their dental coverage.
Survivors of an Employee or Annuitant
Departments are required to continue paying the State Contributions for a covered employee’s spouse,
domestic partner, and other eligible family members for up to 120 days following an employee’s death.
During this time, CalPERS will determine if the spouse or other family members are eligible for
continuation coverage.
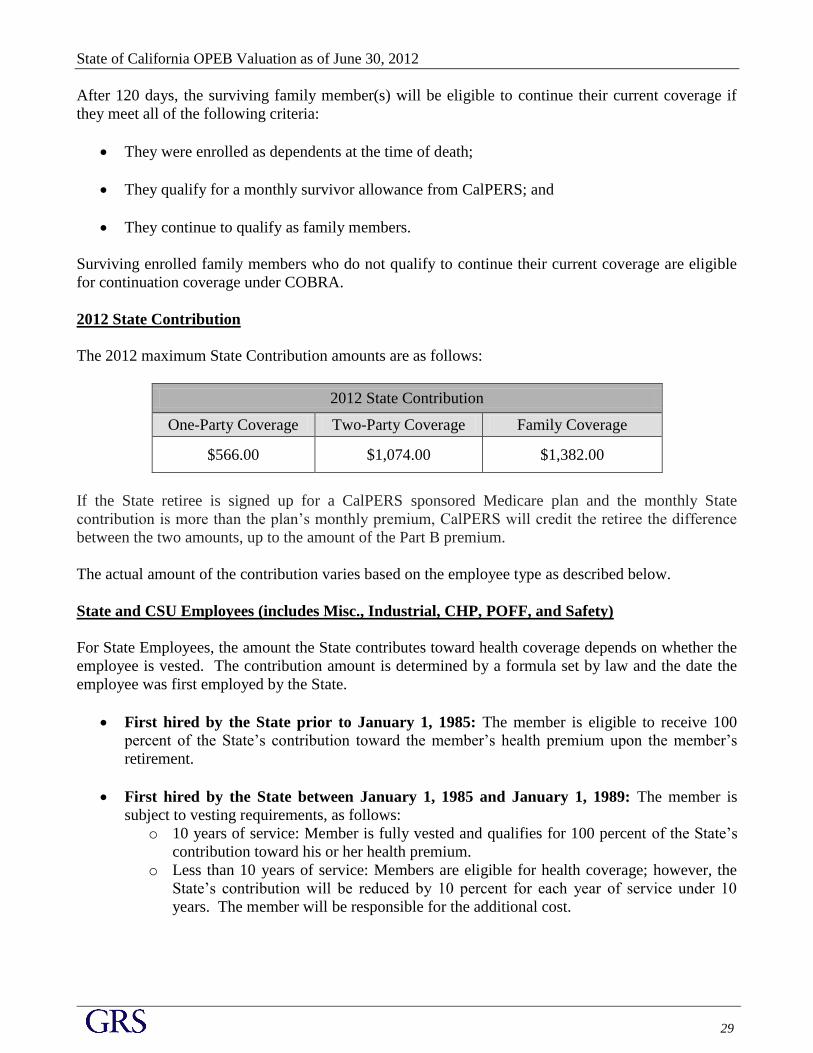
State of California OPEB Valuation as of June 30, 2012
29
After 120 days, the surviving family member(s) will be eligible to continue their current coverage if
they meet all of the following criteria:
They were enrolled as dependents at the time of death;
They qualify for a monthly survivor allowance from CalPERS; and
They continue to qualify as family members.
Surviving enrolled family members who do not qualify to continue their current coverage are eligible
for continuation coverage under COBRA.
2012 State Contribution
The 2012 maximum State Contribution amounts are as follows:
2012 State Contribution
One-Party Coverage Two-Party Coverage Family Coverage
$566.00 $1,074.00 $1,382.00
If the State retiree is signed up for a CalPERS sponsored Medicare plan and the monthly State
contribution is more than the plan’s monthly premium, CalPERS will credit the retiree the difference
between the two amounts, up to the amount of the Part B premium.
The actual amount of the contribution varies based on the employee type as described below.
State and CSU Employees (includes Misc., Industrial, CHP, POFF, and Safety)
For State Employees, the amount the State contributes toward health coverage depends on whether the
employee is vested. The contribution amount is determined by a formula set by law and the date the
employee was first employed by the State.
First hired by the State prior to January 1, 1985: The member is eligible to receive 100
percent of the State’s contribution toward the member’s health premium upon the member’s
retirement.
First hired by the State between January 1, 1985 and January 1, 1989: The member is
subject to vesting requirements, as follows:
o 10 years of service: Member is fully vested and qualifies for 100 percent of the State’s
contribution toward his or her health premium.
o Less than 10 years of service: Members are eligible for health coverage; however, the
State’s contribution will be reduced by 10 percent for each year of service under 10
years. The member will be responsible for the additional cost.

State of California OPEB Valuation as of June 30, 2012
30
First hired by the State after January 1, 1989: The percentage of the State’s contribution is
based on completed years of State credited service as follows:
For California State University Employees and members on disability, the above vesting requirements
do not apply and the employer pays 100 percent of the contribution provided the member is eligible for
healthcare benefits at retirement.
State Contribution – Judge Elected or Appointed Prior to November 9, 1994
State Contributions are based upon the vesting schedule applicable to State Employees.
If a member is eligible for a deferred retirement benefit, the member must pay the full plan premium until
he or she starts receiving benefits in order to have the State's contribution paid once he or she begins
receiving retirement payments.
State Contribution – Judge Elected or Appointed After November 9, 1994
To continue CalPERS health coverage into retirement if the member is under age 65, the member must:
Have at least five years of service credit;
Elect health coverage within 60 days after leaving judicial office; and
Assume the cost of both the member’s share and the employer's share of the monthly premiums -
plus an additional 2 percent of the premium, until age 65.
When the member reaches 65, the member is entitled to have his or her employer's share of the premium.
The State Contribution is determined by the member’s years of service credit:
Years of Service State Contribution
At Least 5 Years 50%
Between 5 to 10 Years Pro-rated between 50% to
100%
10 or More Years 100%
Years of Credited
Service State Contribution
Less than 10 0%
10 50%
10 to 19 50%, plus 5% added for
each year after the 10th year
20 or more 100%
State of California OPEB Valuation as of June 30, 2012
31
State Contribution – Legislator, Constitutional Officer, or Statutory Officer
Members of the CalPERS Health Program can continue coverage into retirement. Members must have at
least eight years of service for health benefits vesting. If the member took office after January 1, 1985, he
or she will need 10 years to receive the full State Contribution towards the monthly premium.
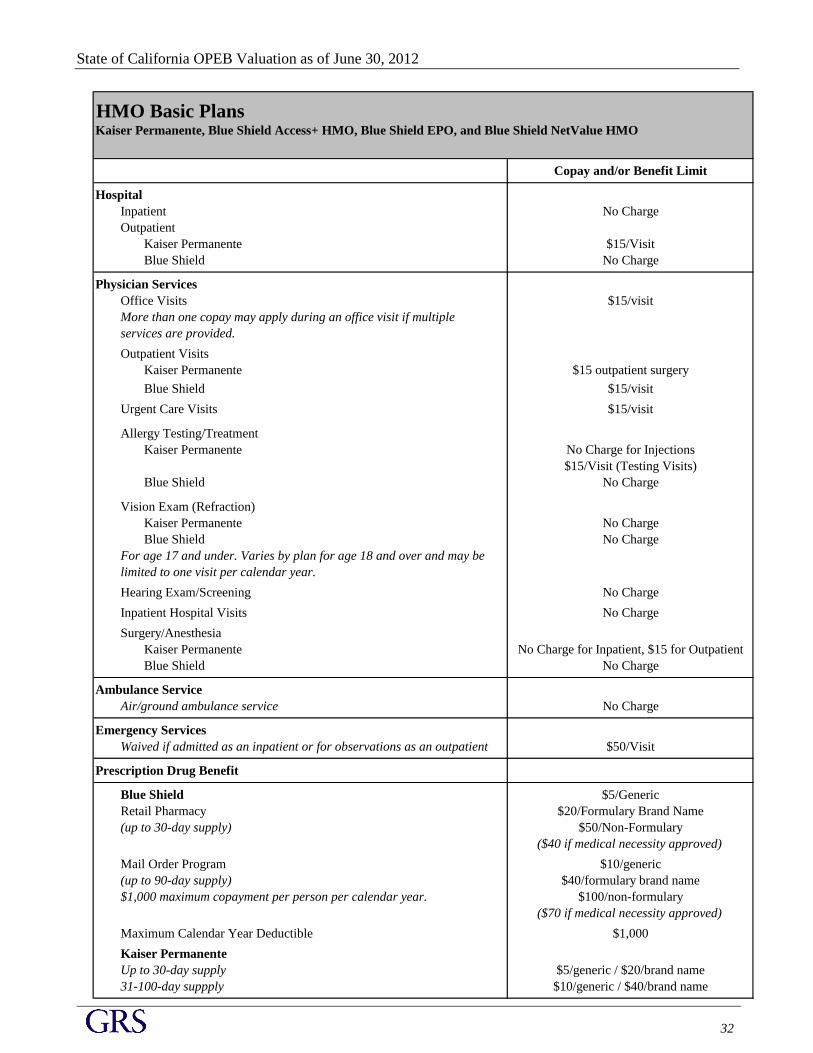
State of California OPEB Valuation as of June 30, 2012
32
HMO Basic PlansKaiser Permanente, Blue Shield Access+ HMO, Blue Shield EPO, and Blue Shield NetValue HMO
Copay and/or Benefit Limit
Hospital
Inpatient No Charge
Outpatient
Kaiser Permanente $15/Visit
Blue Shield No Charge
Physician Services
Office Visits $15/visit
More than one copay may apply during an office visit if multiple
services are provided.
Outpatient Visits
Kaiser Permanente $15 outpatient surgery
Blue Shield $15/visit
Urgent Care Visits $15/visit
Allergy Testing/Treatment
Kaiser Permanente No Charge for Injections
$15/Visit (Testing Visits)
Blue Shield No Charge
Vision Exam (Refraction)
Kaiser Permanente No Charge
Blue Shield No Charge
For age 17 and under. Varies by plan for age 18 and over and may be
limited to one visit per calendar year.
Hearing Exam/Screening No Charge
Inpatient Hospital Visits No Charge
Surgery/Anesthesia
Kaiser Permanente No Charge for Inpatient, $15 for Outpatient
Blue Shield No Charge
Ambulance Service
Air/ground ambulance service No Charge
Emergency Services
Waived if admitted as an inpatient or for observations as an outpatient $50/Visit
Prescription Drug Benefit
Blue Shield $5/Generic
Retail Pharmacy $20/Formulary Brand Name
(up to 30-day supply) $50/Non-Formulary
($40 if medical necessity approved)
Mail Order Program $10/generic
(up to 90-day supply) $40/formulary brand name
$1,000 maximum copayment per person per calendar year. $100/non-formulary
($70 if medical necessity approved)
Maximum Calendar Year Deductible $1,000
Kaiser Permanente
Up to 30-day supply $5/generic / $20/brand name
31-100-day suppply $10/generic / $40/brand name
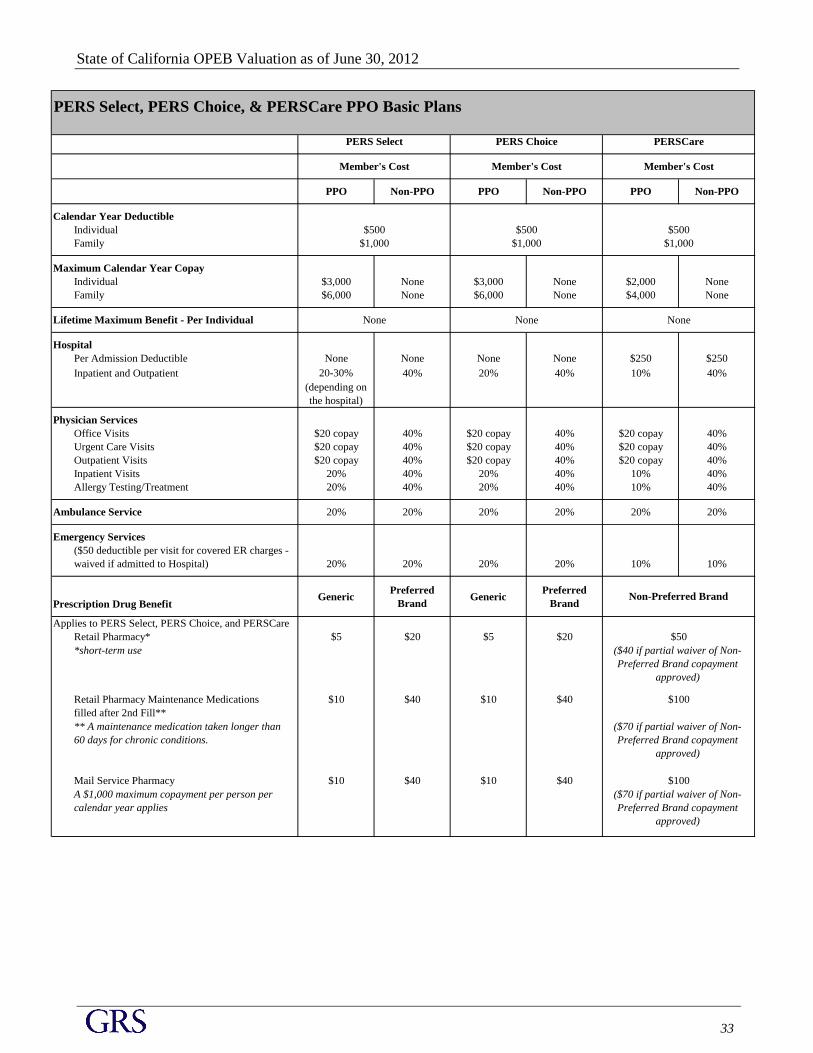
State of California OPEB Valuation as of June 30, 2012
33
PERS Select, PERS Choice, & PERSCare PPO Basic Plans
PPO Non-PPO PPO Non-PPO PPO Non-PPO
Calendar Year Deductible
Individual
Family
Maximum Calendar Year Copay
Individual $3,000 None $3,000 None $2,000 None
Family $6,000 None $6,000 None $4,000 None
Lifetime Maximum Benefit - Per Individual
Hospital
Per Admission Deductible None None None None $250 $250
Inpatient and Outpatient 20-30% 40% 20% 40% 10% 40%
(depending on
the hospital)
Physician Services
Office Visits $20 copay 40% $20 copay 40% $20 copay 40%
Urgent Care Visits $20 copay 40% $20 copay 40% $20 copay 40%
Outpatient Visits $20 copay 40% $20 copay 40% $20 copay 40%
Inpatient Visits 20% 40% 20% 40% 10% 40%
Allergy Testing/Treatment 20% 40% 20% 40% 10% 40%
Ambulance Service 20% 20% 20% 20% 20% 20%
Emergency Services
($50 deductible per visit for covered ER charges -
waived if admitted to Hospital) 20% 20% 20% 20% 10% 10%
Prescription Drug BenefitGeneric
Preferred
BrandGeneric
Preferred
Brand
Applies to PERS Select, PERS Choice, and PERSCare
Retail Pharmacy* $5 $20 $5 $20
*short-term use
Retail Pharmacy Maintenance Medications $10 $40 $10 $40
filled after 2nd Fill**
** A maintenance medication taken longer than
60 days for chronic conditions.
Mail Service Pharmacy $10 $40 $10 $40
A $1,000 maximum copayment per person per
calendar year applies
Member's Cost
$500
$1,000
None
Member's CostMember's Cost
PERS Select
($70 if partial waiver of Non-
Preferred Brand copayment
approved)
None None
$50
Non-Preferred Brand
($70 if partial waiver of Non-
Preferred Brand copayment
approved)
($40 if partial waiver of Non-
Preferred Brand copayment
approved)
$100
$100
PERS Choice
$500
$1,000
PERSCare
$500
$1,000
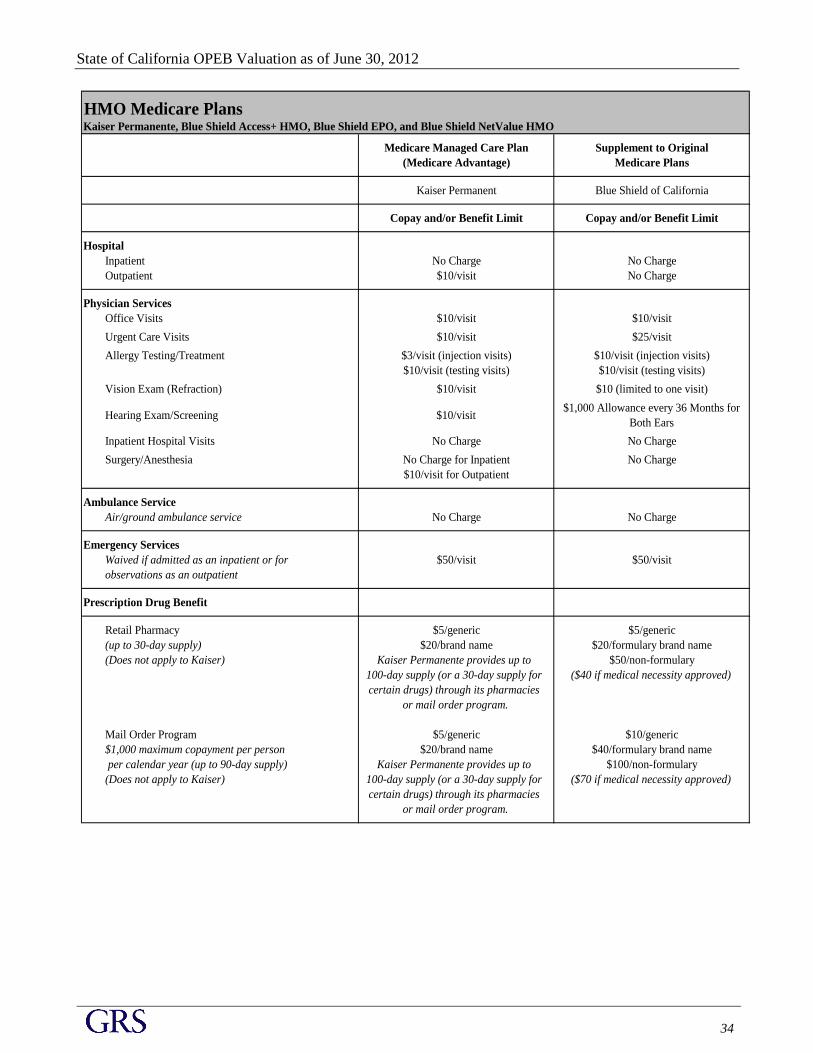
State of California OPEB Valuation as of June 30, 2012
34
HMO Medicare PlansKaiser Permanente, Blue Shield Access+ HMO, Blue Shield EPO, and Blue Shield NetValue HMO
Medicare Managed Care Plan Supplement to Original
(Medicare Advantage) Medicare Plans
Kaiser Permanent Blue Shield of California
Copay and/or Benefit Limit Copay and/or Benefit Limit
Hospital
Inpatient No Charge No Charge
Outpatient $10/visit No Charge
Physician Services
Office Visits $10/visit $10/visit
Urgent Care Visits $10/visit $25/visit
Allergy Testing/Treatment $3/visit (injection visits) $10/visit (injection visits)
$10/visit (testing visits) $10/visit (testing visits)
Vision Exam (Refraction) $10/visit $10 (limited to one visit)
Hearing Exam/Screening $10/visit$1,000 Allowance every 36 Months for
Both Ears
Inpatient Hospital Visits No Charge No Charge
Surgery/Anesthesia No Charge for Inpatient No Charge
$10/visit for Outpatient
Ambulance Service
Air/ground ambulance service No Charge No Charge
Emergency Services
Waived if admitted as an inpatient or for $50/visit $50/visit
observations as an outpatient
Prescription Drug Benefit
Retail Pharmacy $5/generic $5/generic
(up to 30-day supply) $20/brand name $20/formulary brand name
(Does not apply to Kaiser) Kaiser Permanente provides up to $50/non-formulary
100-day supply (or a 30-day supply for ($40 if medical necessity approved)
certain drugs) through its pharmacies
or mail order program.
Mail Order Program $5/generic $10/generic
$1,000 maximum copayment per person $20/brand name $40/formulary brand name
per calendar year (up to 90-day supply) Kaiser Permanente provides up to $100/non-formulary
(Does not apply to Kaiser) 100-day supply (or a 30-day supply for ($70 if medical necessity approved)
certain drugs) through its pharmacies
or mail order program.
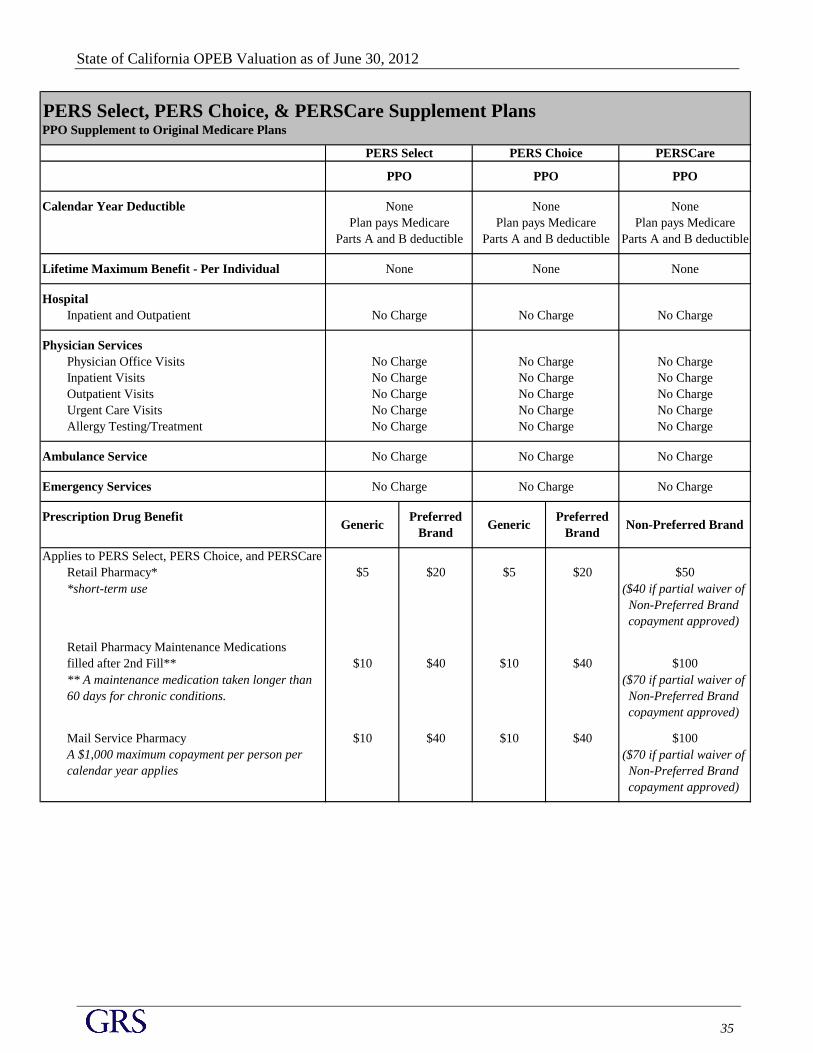
State of California OPEB Valuation as of June 30, 2012
35
PERS Select, PERS Choice, & PERSCare Supplement PlansPPO Supplement to Original Medicare Plans
PERSCare
PPO
Calendar Year Deductible None
Plan pays Medicare
Parts A and B deductible
Lifetime Maximum Benefit - Per Individual None
Hospital
Inpatient and Outpatient No Charge
Physician Services
Physician Office Visits No Charge
Inpatient Visits No Charge
Outpatient Visits No Charge
Urgent Care Visits No Charge
Allergy Testing/Treatment No Charge
Ambulance Service No Charge
Emergency Services No Charge
Prescription Drug Benefit
Applies to PERS Select, PERS Choice, and PERSCare
Retail Pharmacy* $5 $20 $5 $20 $50
*short-term use ($40 if partial waiver of
Non-Preferred Brand
copayment approved)
Retail Pharmacy Maintenance Medications
filled after 2nd Fill** $10 $40 $10 $40 $100
** A maintenance medication taken longer than
60 days for chronic conditions.
($70 if partial waiver of
Non-Preferred Brand
copayment approved)
Mail Service Pharmacy $10 $40 $10 $40 $100
A $1,000 maximum copayment per person per
calendar year applies
GenericPreferred
Brand
No Charge
No Charge
No Charge
No Charge
No Charge
No Charge
No Charge
No Charge
None
None
Plan pays Medicare
Parts A and B deductible
PERS Select
PPO
No Charge
Preferred
Brand
No Charge
No Charge
No Charge
None
($70 if partial waiver of
Non-Preferred Brand
copayment approved)
No Charge
No Charge
No Charge
No Charge
Non-Preferred BrandGeneric
PERS Choice
Plan pays Medicare
Parts A and B deductible
PPO
None
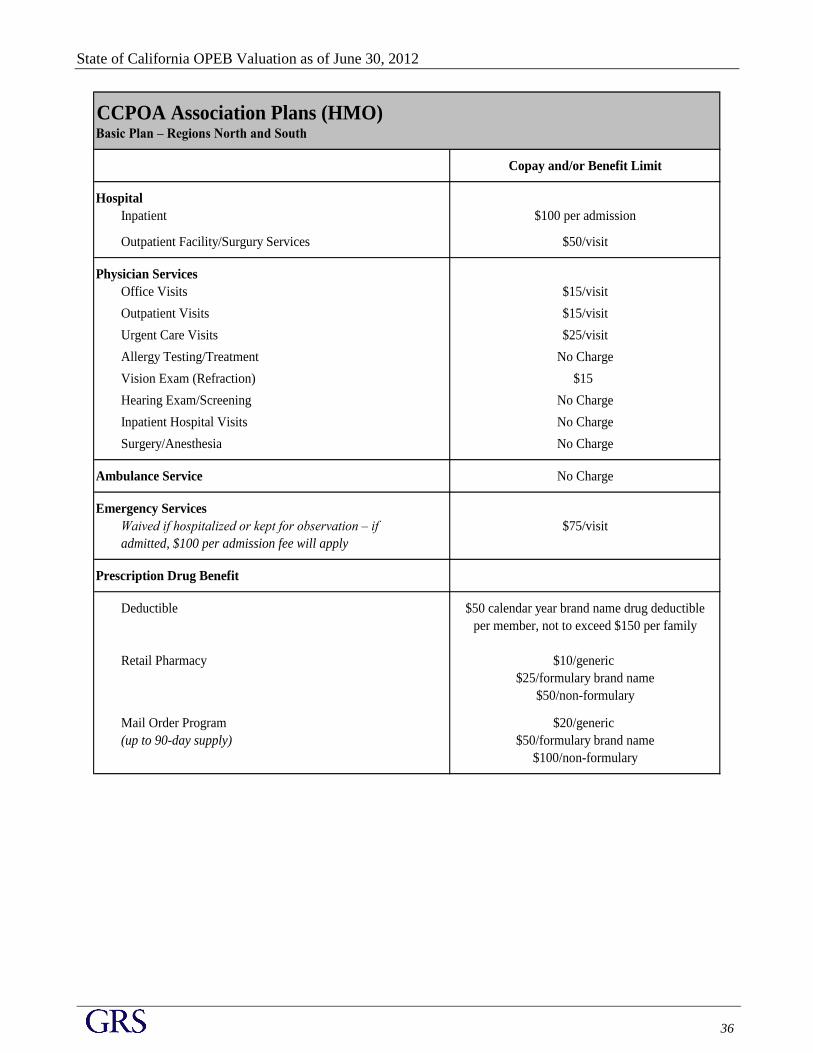
State of California OPEB Valuation as of June 30, 2012
36
CCPOA Association Plans (HMO)Basic Plan – Regions North and South
Copay and/or Benefit Limit
Hospital
Inpatient $100 per admission
Outpatient Facility/Surgury Services $50/visit
Physician Services
Office Visits $15/visit
Outpatient Visits $15/visit
Urgent Care Visits $25/visit
Allergy Testing/Treatment No Charge
Vision Exam (Refraction) $15
Hearing Exam/Screening No Charge
Inpatient Hospital Visits No Charge
Surgery/Anesthesia No Charge
Ambulance Service No Charge
Emergency Services
Waived if hospitalized or kept for observation – if $75/visit
admitted, $100 per admission fee will apply
Prescription Drug Benefit
Deductible $50 calendar year brand name drug deductible
per member, not to exceed $150 per family
Retail Pharmacy $10/generic
$25/formulary brand name
$50/non-formulary
Mail Order Program $20/generic
(up to 90-day supply) $50/formulary brand name
$100/non-formulary

State of California OPEB Valuation as of June 30, 2012
37
CCPOA Association Plans (HMO)Medicare Plan Supplement to Original Medicare
Copay and/or Benefit Limit
Hospital
Inpatient $100 per admission
Outpatient Surgury No Charge
Physician Services
Office Visits $10/visit
Outpatient Visits No Charge
Urgent Care Visits No Charge
Allergy Testing/Treatment No Charge
Vision Exam (Refraction) No Charge
Hearing Exam/Screening No Charge
Inpatient Hospital Visits No Charge
Surgery/Anesthesia No Charge
Ambulance Service No Charge
Emergency Services No Charge
Prescription Drug Benefit
Retail Pharmacy $5/generic
$20/formulary brand name
$35/non-formulary
Mail Order Program $10/generic
(up to 90-day supply) $40/formulary brand name
$70/non-formulary
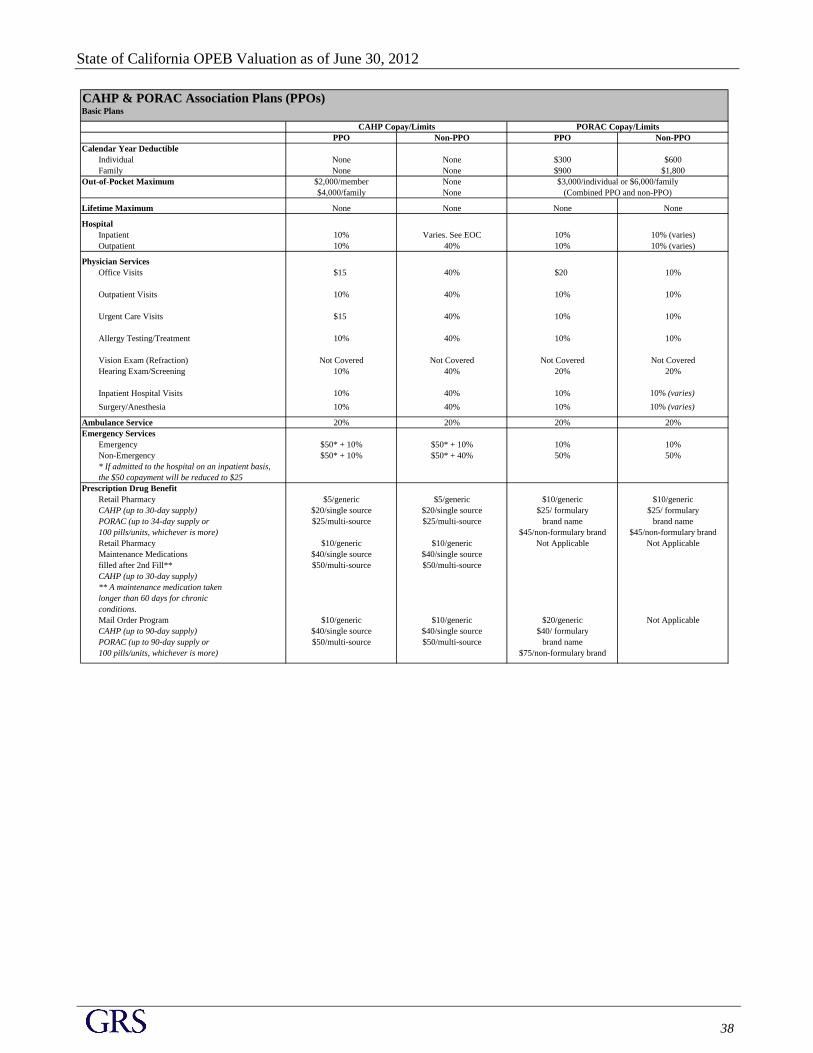
State of California OPEB Valuation as of June 30, 2012
38
CAHP & PORAC Association Plans (PPOs)Basic Plans
PPO Non-PPO PPO Non-PPO
Calendar Year Deductible
Individual None None $300 $600
Family None None $900 $1,800
Out-of-Pocket Maximum $2,000/member None
$4,000/family None
Lifetime Maximum None None None None
Hospital
Inpatient 10% Varies. See EOC 10% 10% (varies)
Outpatient 10% 40% 10% 10% (varies)
Physician Services
Office Visits $15 40% $20 10%
Outpatient Visits 10% 40% 10% 10%
Urgent Care Visits $15 40% 10% 10%
Allergy Testing/Treatment 10% 40% 10% 10%
Vision Exam (Refraction) Not Covered Not Covered Not Covered Not Covered
Hearing Exam/Screening 10% 40% 20% 20%
Inpatient Hospital Visits 10% 40% 10% 10% (varies)
Surgery/Anesthesia 10% 40% 10% 10% (varies)
Ambulance Service 20% 20% 20% 20%
Emergency Services
Emergency $50* + 10% $50* + 10% 10% 10%
Non-Emergency $50* + 10% $50* + 40% 50% 50%
* If admitted to the hospital on an inpatient basis,
the $50 copayment will be reduced to $25
Prescription Drug Benefit
Retail Pharmacy $5/generic $5/generic $10/generic $10/generic
CAHP (up to 30-day supply) $20/single source $20/single source $25/ formulary $25/ formulary
PORAC (up to 34-day supply or $25/multi-source $25/multi-source brand name brand name
100 pills/units, whichever is more) $45/non-formulary brand $45/non-formulary brand
Retail Pharmacy $10/generic $10/generic Not Applicable Not Applicable
Maintenance Medications $40/single source $40/single source
filled after 2nd Fill** $50/multi-source $50/multi-source
CAHP (up to 30-day supply)
** A maintenance medication taken
longer than 60 days for chronic
conditions.
Mail Order Program $10/generic $10/generic $20/generic Not Applicable
CAHP (up to 90-day supply) $40/single source $40/single source $40/ formulary
PORAC (up to 90-day supply or $50/multi-source $50/multi-source brand name
100 pills/units, whichever is more) $75/non-formulary brand
CAHP Copay/Limits PORAC Copay/Limits
$3,000/individual or $6,000/family
(Combined PPO and non-PPO)

State of California OPEB Valuation as of June 30, 2012
39
CAHP & PORAC Association Plans (PPOs)PPO Supplement to Original Medicare
CAHP Copays/Limits PORAC Copays/Limits
Deductibles $100/individual $100/individual
$200/family $200/family
(Major Medical deductible) (Major Medical deductible)
Hospital
Inpatient No Charge No charge. Plan pays after
Medicare benefits are
exhausted. See EOC
Outpatient No Charge No Charge
Physician Services
Office Visits $10/visit No Charge
Outpatient Visits No Charge No Charge
Urgent Care Visits No Charge No Charge
Allergy Testing/Treatment No Charge No Charge
Vision Exam (Refraction) Not Covered 20%; one exam/
calendar year
Hearing Exam/Screening No Charge 20%; $50/exam in connection
with hearing aid purchase
Inpatient Hospital Visits No Charge No Charge
Surgery/Anesthesia No Charge No Charge
Ambulance Service No Charge if Medicare No Charge
approved
20% if not Medicare approved
Emergency Services No Charge if Medicare No Charge
approved
20% if not Medicare approved
Prescription Drug Benefit
Retail Pharmacy $5/generic $10/generic
(up to 30-day supply) $20/single source $25/formulary brand name
CAHP: Diabetic supplies paid under $25/multi-source $45/non-formulary brand name
medical benefit.
PORAC: $50 deductible/member for retail only
Retail Pharmacy Maintenance $10/generic
Medications filled after 2nd fill** $40/single source
CAHP (up to 30-day supply) $50/multi-source
** A maintenance medication taken longer
than 60 days for chronic conditions.
Mail Order Program $10/generic $20/generic
(90-day supply) $40/single source $40/single source
$50/multi-source $75/multi-source
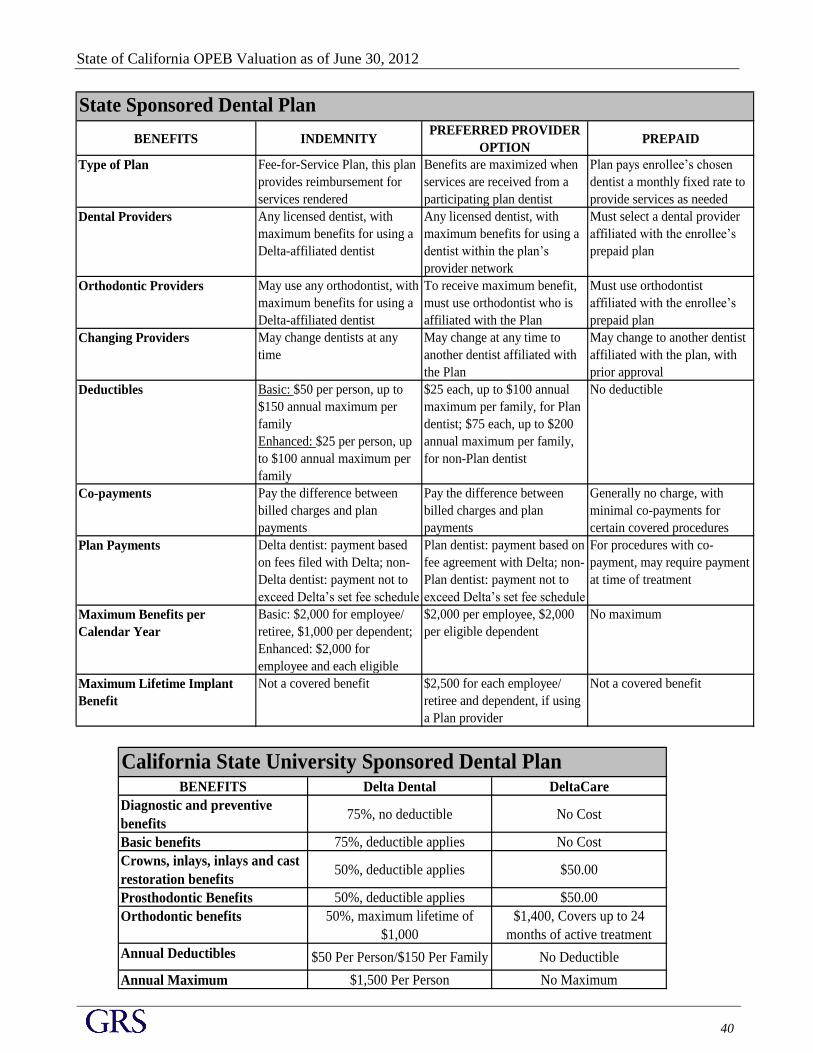
State of California OPEB Valuation as of June 30, 2012
40
BENEFITS INDEMNITYPREFERRED PROVIDER
OPTIONPREPAID
Type of Plan Fee-for-Service Plan, this plan
provides reimbursement for
services rendered
Benefits are maximized when
services are received from a
participating plan dentist
Plan pays enrollee’s chosen
dentist a monthly fixed rate to
provide services as needed
Dental Providers Any licensed dentist, with
maximum benefits for using a
Delta-affiliated dentist
Any licensed dentist, with
maximum benefits for using a
dentist within the plan’s
provider network
Must select a dental provider
affiliated with the enrollee’s
prepaid plan
Orthodontic Providers May use any orthodontist, with
maximum benefits for using a
Delta-affiliated dentist
To receive maximum benefit,
must use orthodontist who is
affiliated with the Plan
Must use orthodontist
affiliated with the enrollee’s
prepaid plan
Changing Providers May change dentists at any
time
May change at any time to
another dentist affiliated with
the Plan
May change to another dentist
affiliated with the plan, with
prior approval
Basic: $50 per person, up to
$150 annual maximum per
family
Enhanced: $25 per person, up
to $100 annual maximum per
family
Co-payments Pay the difference between
billed charges and plan
payments
Pay the difference between
billed charges and plan
payments
Generally no charge, with
minimal co-payments for
certain covered procedures
Plan Payments Delta dentist: payment based
on fees filed with Delta; non-
Delta dentist: payment not to
exceed Delta’s set fee schedule
Plan dentist: payment based on
fee agreement with Delta; non-
Plan dentist: payment not to
exceed Delta’s set fee schedule
For procedures with co-
payment, may require payment
at time of treatment
Basic: $2,000 for employee/
retiree, $1,000 per dependent;
Enhanced: $2,000 for
employee and each eligible
Maximum Lifetime Implant
Benefit
Not a covered benefit $2,500 for each employee/
retiree and dependent, if using
a Plan provider
Not a covered benefit
Maximum Benefits per
Calendar Year
$2,000 per employee, $2,000
per eligible dependent
No maximum
State Sponsored Dental Plan
Deductibles $25 each, up to $100 annual
maximum per family, for Plan
dentist; $75 each, up to $200
annual maximum per family,
for non-Plan dentist
No deductible
California State University Sponsored Dental PlanBENEFITS Delta Dental DeltaCare
Diagnostic and preventive
benefits75%, no deductible No Cost
Basic benefits 75%, deductible applies No Cost
Crowns, inlays, inlays and cast
restoration benefits50%, deductible applies $50.00
Prosthodontic Benefits 50%, deductible applies $50.00
Orthodontic benefits 50%, maximum lifetime of
$1,000
$1,400, Covers up to 24
months of active treatment
Annual Deductibles $50 Per Person/$150 Per Family No Deductible
Annual Maximum $1,500 Per Person No Maximum
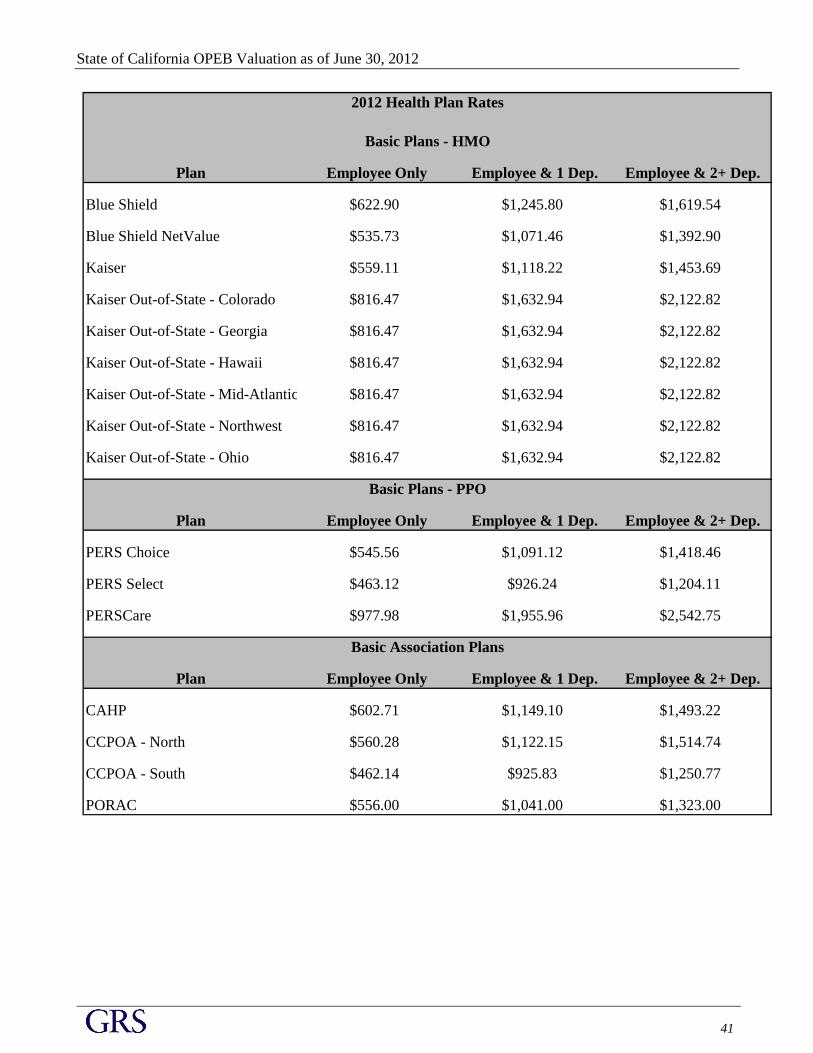
State of California OPEB Valuation as of June 30, 2012
41
Plan Employee Only Employee & 1 Dep. Employee & 2+ Dep.
Blue Shield $622.90 $1,245.80 $1,619.54
Blue Shield NetValue $535.73 $1,071.46 $1,392.90
Kaiser $559.11 $1,118.22 $1,453.69
Kaiser Out-of-State - Colorado $816.47 $1,632.94 $2,122.82
Kaiser Out-of-State - Georgia $816.47 $1,632.94 $2,122.82
Kaiser Out-of-State - Hawaii $816.47 $1,632.94 $2,122.82
Kaiser Out-of-State - Mid-Atlantic $816.47 $1,632.94 $2,122.82
Kaiser Out-of-State - Northwest $816.47 $1,632.94 $2,122.82
Kaiser Out-of-State - Ohio $816.47 $1,632.94 $2,122.82
Plan Employee Only Employee & 1 Dep. Employee & 2+ Dep.
PERS Choice $545.56 $1,091.12 $1,418.46
PERS Select $463.12 $926.24 $1,204.11
PERSCare $977.98 $1,955.96 $2,542.75
Plan Employee Only Employee & 1 Dep. Employee & 2+ Dep.
CAHP $602.71 $1,149.10 $1,493.22
CCPOA - North $560.28 $1,122.15 $1,514.74
CCPOA - South $462.14 $925.83 $1,250.77
PORAC $556.00 $1,041.00 $1,323.00
Basic Plans - HMO
Basic Plans - PPO
Basic Association Plans
2012 Health Plan Rates
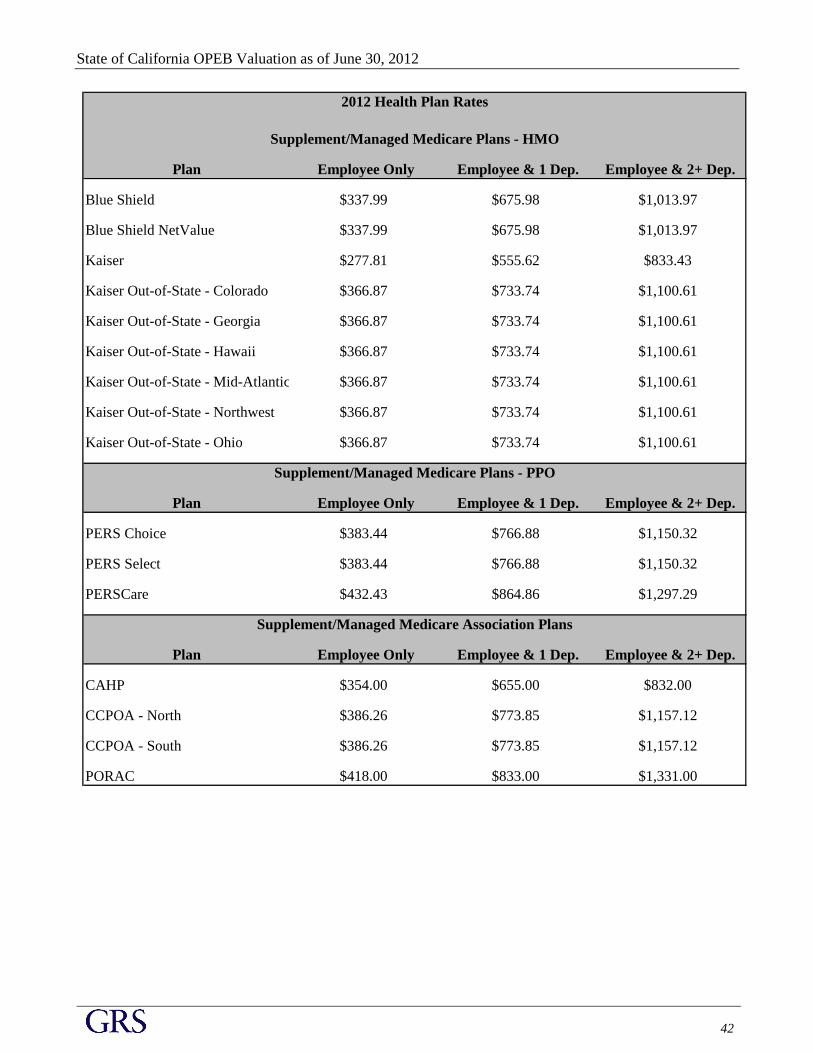
State of California OPEB Valuation as of June 30, 2012
42
Plan Employee Only Employee & 1 Dep. Employee & 2+ Dep.
Blue Shield $337.99 $675.98 $1,013.97
Blue Shield NetValue $337.99 $675.98 $1,013.97
Kaiser $277.81 $555.62 $833.43
Kaiser Out-of-State - Colorado $366.87 $733.74 $1,100.61
Kaiser Out-of-State - Georgia $366.87 $733.74 $1,100.61
Kaiser Out-of-State - Hawaii $366.87 $733.74 $1,100.61
Kaiser Out-of-State - Mid-Atlantic $366.87 $733.74 $1,100.61
Kaiser Out-of-State - Northwest $366.87 $733.74 $1,100.61
Kaiser Out-of-State - Ohio $366.87 $733.74 $1,100.61
Plan Employee Only Employee & 1 Dep. Employee & 2+ Dep.
PERS Choice $383.44 $766.88 $1,150.32
PERS Select $383.44 $766.88 $1,150.32
PERSCare $432.43 $864.86 $1,297.29
Plan Employee Only Employee & 1 Dep. Employee & 2+ Dep.
CAHP $354.00 $655.00 $832.00
CCPOA - North $386.26 $773.85 $1,157.12
CCPOA - South $386.26 $773.85 $1,157.12
PORAC $418.00 $833.00 $1,331.00
Supplement/Managed Medicare Plans - HMO
Supplement/Managed Medicare Plans - PPO
Supplement/Managed Medicare Association Plans
2012 Health Plan Rates
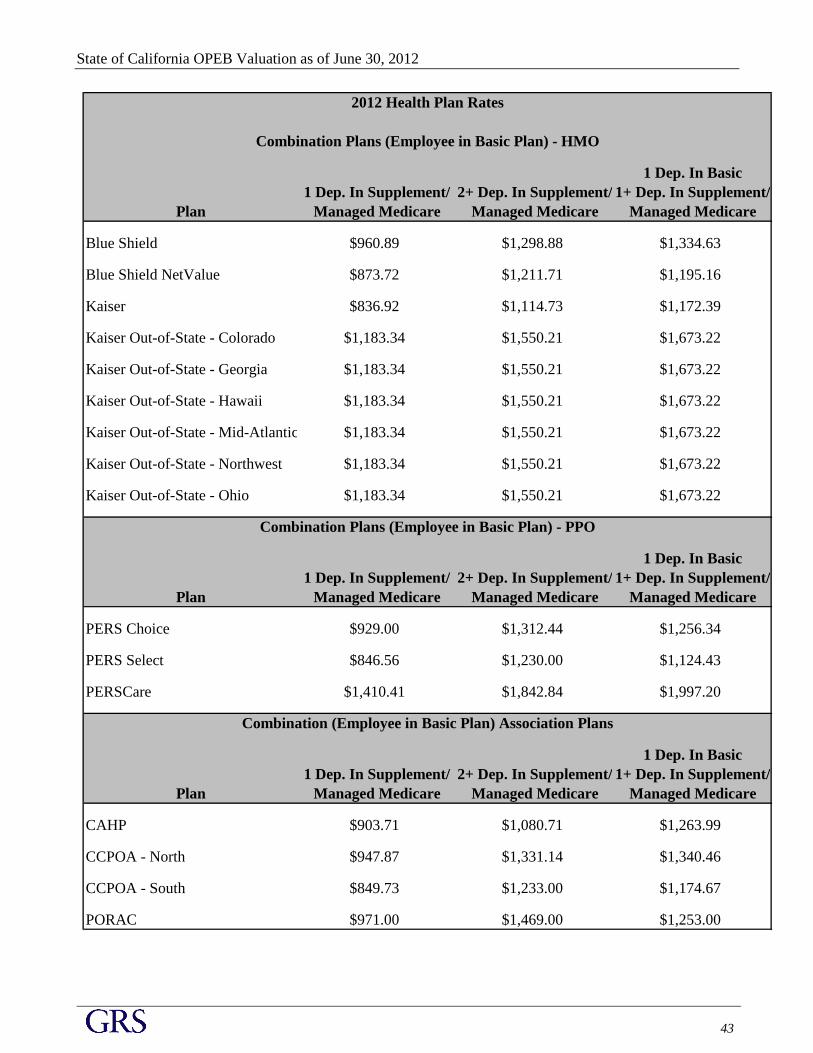
State of California OPEB Valuation as of June 30, 2012
43
1 Dep. In Basic
1 Dep. In Supplement/ 2+ Dep. In Supplement/ 1+ Dep. In Supplement/
Plan Managed Medicare Managed Medicare Managed Medicare
Blue Shield $960.89 $1,298.88 $1,334.63
Blue Shield NetValue $873.72 $1,211.71 $1,195.16
Kaiser $836.92 $1,114.73 $1,172.39
Kaiser Out-of-State - Colorado $1,183.34 $1,550.21 $1,673.22
Kaiser Out-of-State - Georgia $1,183.34 $1,550.21 $1,673.22
Kaiser Out-of-State - Hawaii $1,183.34 $1,550.21 $1,673.22
Kaiser Out-of-State - Mid-Atlantic $1,183.34 $1,550.21 $1,673.22
Kaiser Out-of-State - Northwest $1,183.34 $1,550.21 $1,673.22
Kaiser Out-of-State - Ohio $1,183.34 $1,550.21 $1,673.22
1 Dep. In Basic
1 Dep. In Supplement/ 2+ Dep. In Supplement/ 1+ Dep. In Supplement/
Plan Managed Medicare Managed Medicare Managed Medicare
PERS Choice $929.00 $1,312.44 $1,256.34
PERS Select $846.56 $1,230.00 $1,124.43
PERSCare $1,410.41 $1,842.84 $1,997.20
1 Dep. In Basic
1 Dep. In Supplement/ 2+ Dep. In Supplement/ 1+ Dep. In Supplement/
Plan Managed Medicare Managed Medicare Managed Medicare
CAHP $903.71 $1,080.71 $1,263.99
CCPOA - North $947.87 $1,331.14 $1,340.46
CCPOA - South $849.73 $1,233.00 $1,174.67
PORAC $971.00 $1,469.00 $1,253.00
Combination Plans (Employee in Basic Plan) - HMO
Combination Plans (Employee in Basic Plan) - PPO
Combination (Employee in Basic Plan) Association Plans
2012 Health Plan Rates

State of California OPEB Valuation as of June 30, 2012
44
1 Dep. In Supplement/
Managed Medicare
Plan 1 Dep. In Basic 2+ Dep. In Basic 1+ Dep. In Basic
Blue Shield $960.89 $1,334.63 $1,049.72
Blue Shield NetValue $873.72 $1,195.16 $997.42
Kaiser $836.92 $1,172.39 $891.09
Kaiser Out-of-State - Colorado $1,183.34 $1,673.22 $1,223.62
Kaiser Out-of-State - Georgia $1,183.34 $1,673.22 $1,223.62
Kaiser Out-of-State - Hawaii $1,183.34 $1,673.22 $1,223.62
Kaiser Out-of-State - Mid-Atlantic $1,183.34 $1,673.22 $1,223.62
Kaiser Out-of-State - Northwest $1,183.34 $1,673.22 $1,223.62
Kaiser Out-of-State - Ohio $1,183.34 $1,673.22 $1,223.62
1 Dep. In Supplement/
Managed Medicare
Plan 1 Dep. In Basic 2+ Dep. In Basic 1+ Dep. In Basic
PERS Choice $929.00 $1,256.34 $1,094.22
PERS Select $846.56 $1,124.43 $1,044.75
PERSCare $1,410.41 $1,997.20 $1,451.65
1 Dep. In Supplement/
Managed Medicare
Plan 1 Dep. In Basic 2+ Dep. In Basic 1+ Dep. In Basic
CAHP $921.36 $1,281.64 $1,015.28
CCPOA - North $948.13 $1,340.72 $1,166.44
CCPOA - South $849.95 $1,174.89 $1,098.79
PORAC $903.00 $1,185.00 $1,115.00
Combination Plans (Employee in Supplement/Managed Medicare Plan) - HMO
Combination Plans (Employee in Supplement/Managed Medicare Plan) - PPO
Combination (Employee in Supplement/Managed Medicare Plan) Association Plans
2012 Health Plan Rates

State of California OPEB Valuation as of June 30, 2012
45
Plan Employee Only Employee & 1 Dep. Employee & 2+ Dep.
DeltaPremier1
$54.28 $96.48 $140.48
Delta PPO2
$46.09 $91.39 $138.46
Safeguard SOC Enhanced Plan3
$16.92 $28.63 $35.27
Delta Care USA3
$17.72 $29.07 $40.21
Premier Access3
$16.63 $26.94 $37.73
Western Dental3
$14.72 $24.29 $34.46
1
Employee Share: 1 party - $13.57 / 2 party - $24.12 / 3 or more party - $35.122
Employee Share: 1 party - $11.52 / 2 party - $22.85 / 3 or more party - $34.613
Provided at no cost to the retiree
Plan Employee Only Employee & 1 Dep. Employee & 2+ Dep.
Delta Dental PPO - Basic $31.74 $59.96 $120.40
DeltaCare USA - Basic $19.73 $32.54 $48.11
4Provided at no cost to the retiree
2012 Dental Plan Rates - State Sponsored Plans
2012 Dental Plan Rates - California State University4
SECTION D
S U MA RY O F PA RTIC IPA N T D ATA

State of California OPEB Valuation as of June 30, 2012
46
SUMMARY OF PARTICIPANT DATA
Other Postemployment Benefits
Sponsored by the
State of California
As of June 30, 2012
A. Members Currently in Retired Status
1. Counts of Current Retirees by Medical/Rx Benefit Plan and Valuation Group
2. Counts of Current Retirees by Medical/Rx Benefit Plan and Coverage
3. Distribution of Current Retirees by Medical/Rx Benefit Plan and Coverage Type
4. Distribution of Retiree Medical/Rx Benefit by Age
5. Counts of Current Retirees by Dental Benefit Plan and Valuation Group
6. Counts of Current Retirees by Dental Benefit Plan and Coverage
7. Distribution of Current Retirees by Dental Benefit Plan and Coverage Type
8. Distribution of Retiree Dental Benefit Plan by Age
The members in the schedules referenced above include only those retirees who have
elected to receive health care coverage or dental coverage through the State of California.
B. Members Currently in Active Status
1. Distribution of All Active Members by Age and Service
C. All Members
1. Counts of Current Active Participants and Retirees by Valuation Group
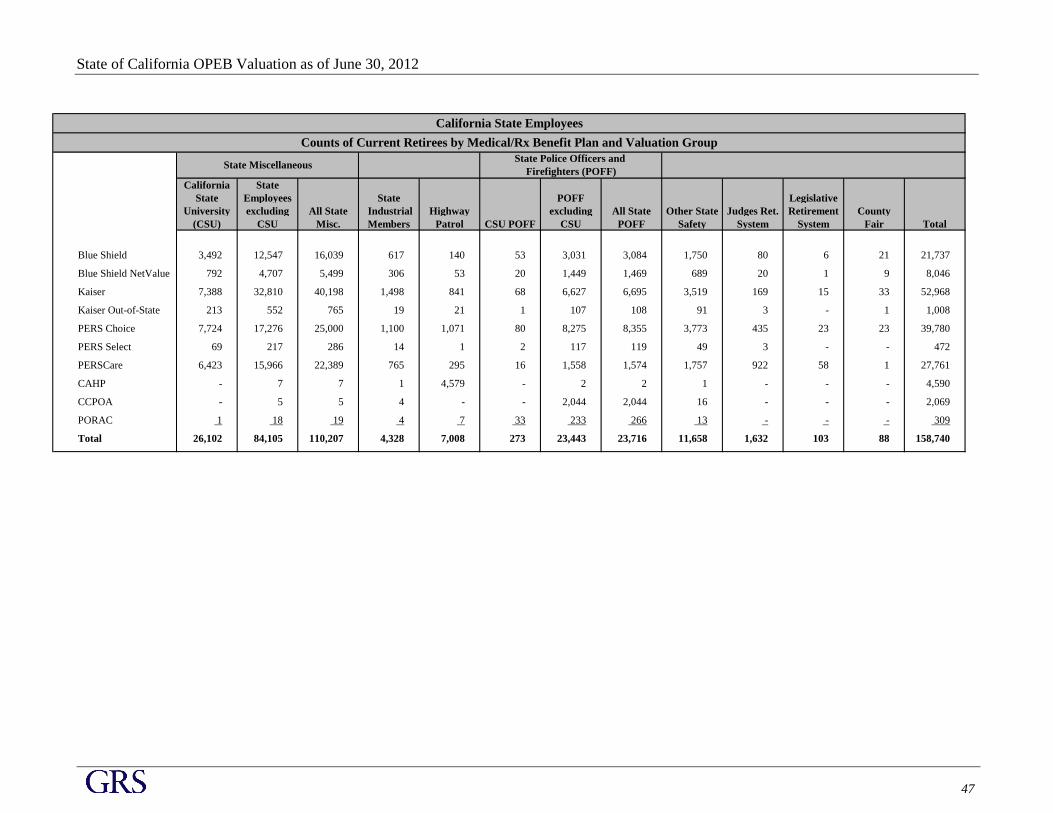
State of California OPEB Valuation as of June 30, 2012
47
California State
State Employees State POFF Legislative
University excluding All State Industrial Highway excluding All State Other State Judges Ret. Retirement County
(CSU) CSU Misc. Members Patrol CSU POFF CSU POFF Safety System System Fair Total
Blue Shield 3,492 12,547 16,039 617 140 53 3,031 3,084 1,750 80 6 21 21,737
Blue Shield NetValue 792 4,707 5,499 306 53 20 1,449 1,469 689 20 1 9 8,046
Kaiser 7,388 32,810 40,198 1,498 841 68 6,627 6,695 3,519 169 15 33 52,968
Kaiser Out-of-State 213 552 765 19 21 1 107 108 91 3 - 1 1,008
PERS Choice 7,724 17,276 25,000 1,100 1,071 80 8,275 8,355 3,773 435 23 23 39,780
PERS Select 69 217 286 14 1 2 117 119 49 3 - - 472
PERSCare 6,423 15,966 22,389 765 295 16 1,558 1,574 1,757 922 58 1 27,761
CAHP - 7 7 1 4,579 - 2 2 1 - - - 4,590
CCPOA - 5 5 4 - - 2,044 2,044 16 - - - 2,069
PORAC 1 18 19 4 7 33 233 266 13 - - - 309
Total 26,102 84,105 110,207 4,328 7,008 273 23,443 23,716 11,658 1,632 103 88 158,740
California State Employees
Counts of Current Retirees by Medical/Rx Benefit Plan and Valuation Group
State MiscellaneousState Police Officers and
Firefighters (POFF)
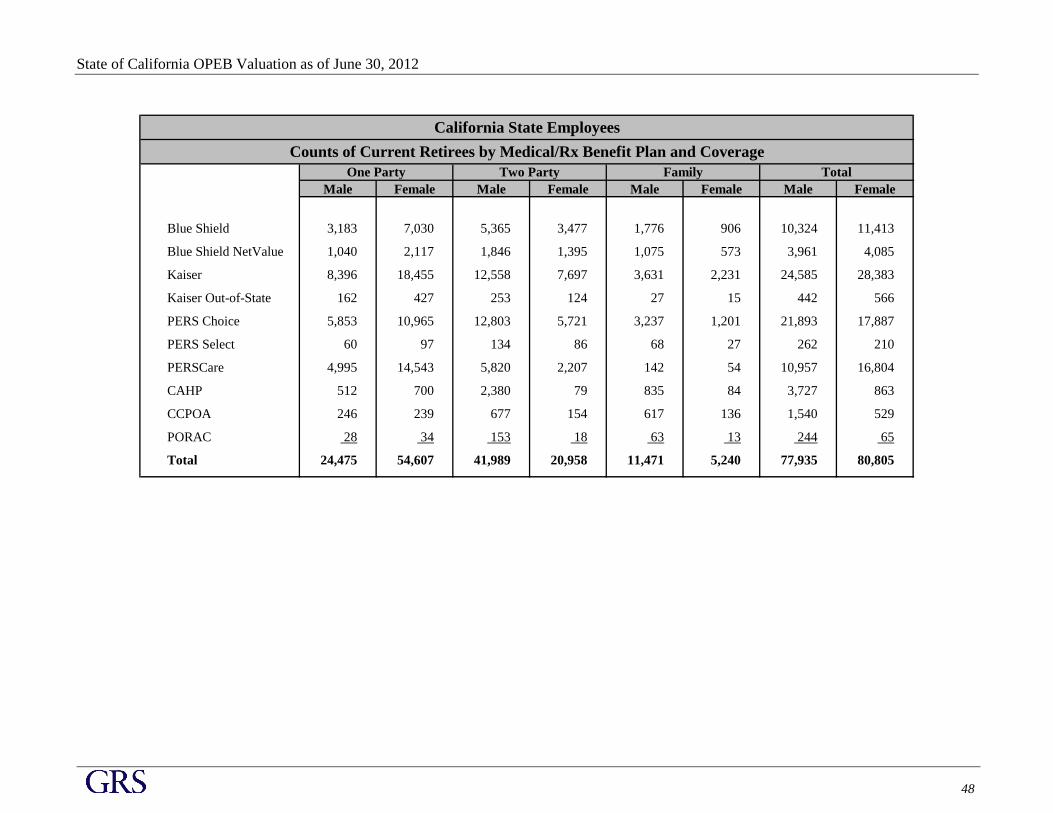
State of California OPEB Valuation as of June 30, 2012
48
Male Female Male Female Male Female Male Female
Blue Shield 3,183 7,030 5,365 3,477 1,776 906 10,324 11,413
Blue Shield NetValue 1,040 2,117 1,846 1,395 1,075 573 3,961 4,085
Kaiser 8,396 18,455 12,558 7,697 3,631 2,231 24,585 28,383
Kaiser Out-of-State 162 427 253 124 27 15 442 566
PERS Choice 5,853 10,965 12,803 5,721 3,237 1,201 21,893 17,887
PERS Select 60 97 134 86 68 27 262 210
PERSCare 4,995 14,543 5,820 2,207 142 54 10,957 16,804
CAHP 512 700 2,380 79 835 84 3,727 863
CCPOA 246 239 677 154 617 136 1,540 529
PORAC 28 34 153 18 63 13 244 65
Total 24,475 54,607 41,989 20,958 11,471 5,240 77,935 80,805
California State Employees
Counts of Current Retirees by Medical/Rx Benefit Plan and Coverage
TotalOne Party Two Party Family

State of California OPEB Valuation as of June 30, 2012
49
Blue Shield 9,376 12,361 21,737
Blue Shield NetValue 5,839 2,207 8,046
Kaiser 19,731 33,237 52,968
Kaiser Out-of-State 253 755 1,008
PERS Choice 16,893 22,887 39,780
PERS Select 333 139 472
PERSCare 1,355 26,406 27,761
CAHP 1,920 2,670 4,590
CCPOA 1,713 356 2,069
PORAC 191 118 309
Total 57,604 101,136 158,740
One Party 22,315 56,767 79,082
Two Party 22,093 40,854 62,947
Family 13,196 3,515 16,711
Total 57,604 101,136 158,740
California State Employees
Distribution of Current Retirees by Medical/Rx Benefit Plan
Distribution of Current Retirees by Coverage Type
Under 65 At Least 65 Total
Under 65 TotalAt Least 65
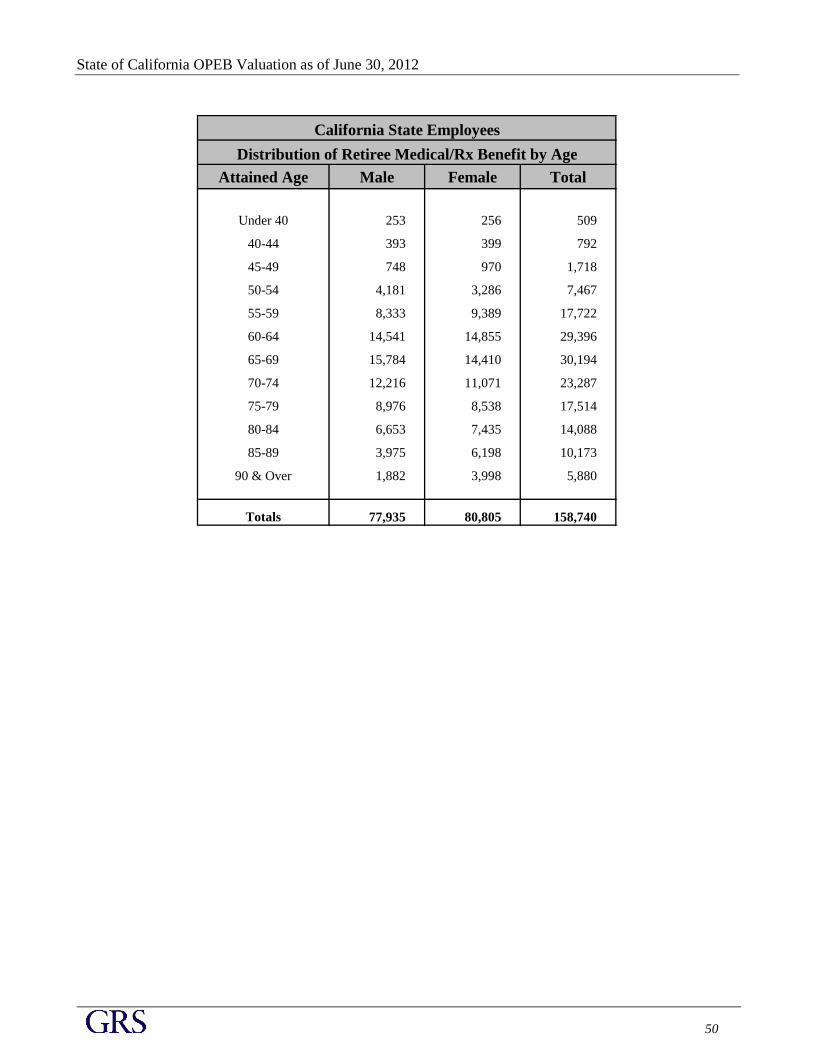
State of California OPEB Valuation as of June 30, 2012
50
Attained Age Male Female Total
Under 40 253 256 509
40-44 393 399 792
45-49 748 970 1,718
50-54 4,181 3,286 7,467
55-59 8,333 9,389 17,722
60-64 14,541 14,855 29,396
65-69 15,784 14,410 30,194
70-74 12,216 11,071 23,287
75-79 8,976 8,538 17,514
80-84 6,653 7,435 14,088
85-89 3,975 6,198 10,173
90 & Over 1,882 3,998 5,880
Totals 77,935 80,805 158,740
California State Employees
Distribution of Retiree Medical/Rx Benefit by Age
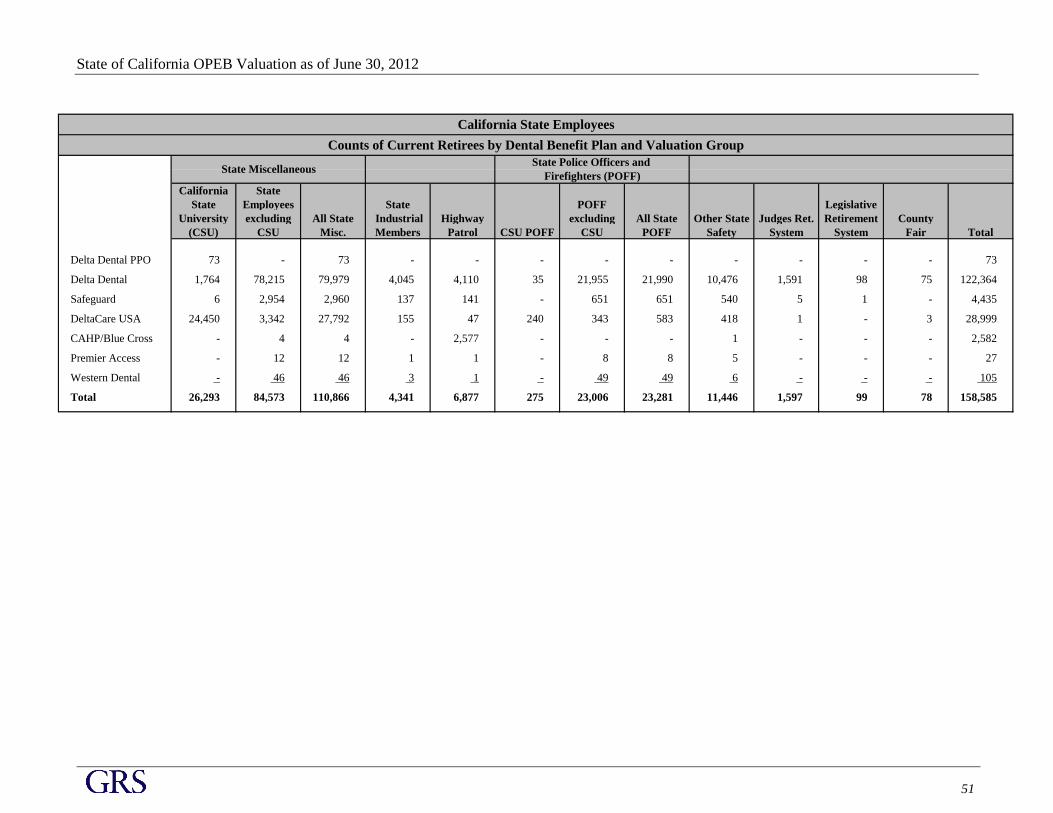
State of California OPEB Valuation as of June 30, 2012
51
California State
State Employees State POFF Legislative
University excluding All State Industrial Highway excluding All State Other State Judges Ret. Retirement County
(CSU) CSU Misc. Members Patrol CSU POFF CSU POFF Safety System System Fair Total
Delta Dental PPO 73 - 73 - - - - - - - - - 73
Delta Dental 1,764 78,215 79,979 4,045 4,110 35 21,955 21,990 10,476 1,591 98 75 122,364
Safeguard 6 2,954 2,960 137 141 - 651 651 540 5 1 - 4,435
DeltaCare USA 24,450 3,342 27,792 155 47 240 343 583 418 1 - 3 28,999
CAHP/Blue Cross - 4 4 - 2,577 - - - 1 - - - 2,582
Premier Access - 12 12 1 1 - 8 8 5 - - - 27
Western Dental - 46 46 3 1 - 49 49 6 - - - 105
Total 26,293 84,573 110,866 4,341 6,877 275 23,006 23,281 11,446 1,597 99 78 158,585
California State Employees
Counts of Current Retirees by Dental Benefit Plan and Valuation Group
State MiscellaneousState Police Officers and
Firefighters (POFF)
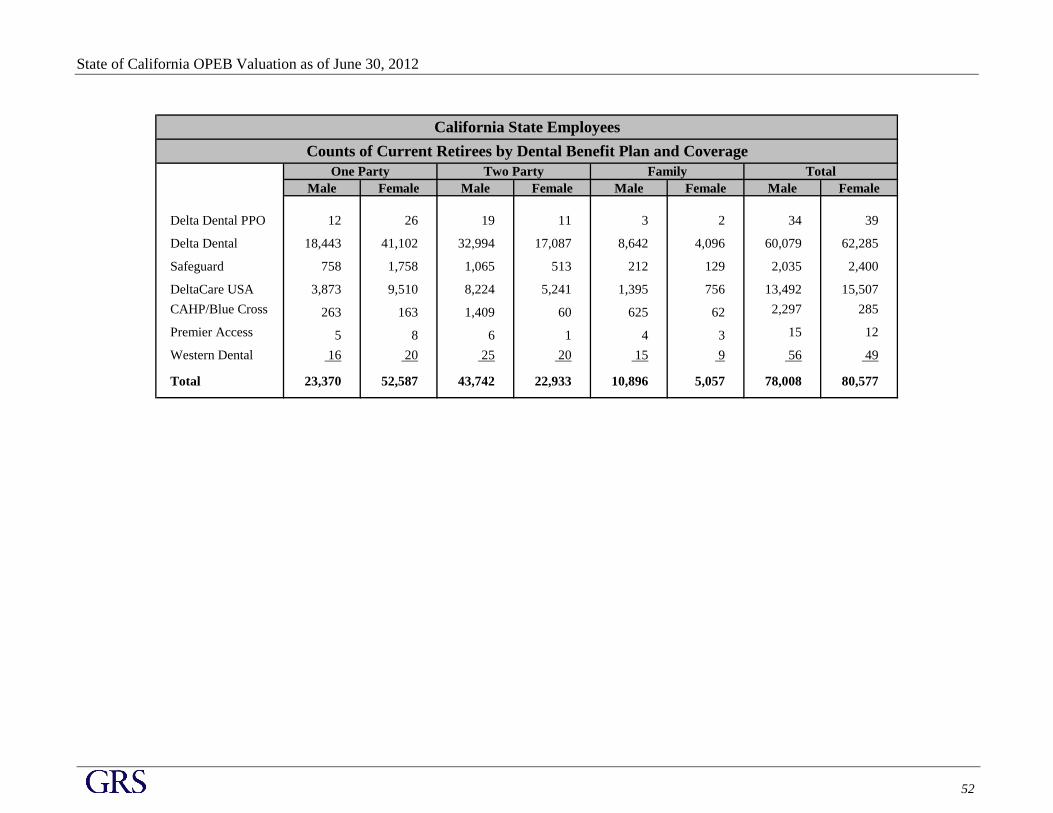
State of California OPEB Valuation as of June 30, 2012
52
Male Female Male Female Male Female Male Female
Delta Dental PPO 12 26 19 11 3 2 34 39
Delta Dental 18,443 41,102 32,994 17,087 8,642 4,096 60,079 62,285
Safeguard 758 1,758 1,065 513 212 129 2,035 2,400
DeltaCare USA 3,873 9,510 8,224 5,241 1,395 756 13,492 15,507
CAHP/Blue Cross 263 163 1,409 60 625 62 2,297 285
Premier Access 5 8 6 1 4 3 15 12
Western Dental 16 20 25 20 15 9 56 49
Total 23,370 52,587 43,742 22,933 10,896 5,057 78,008 80,577
California State Employees
Counts of Current Retirees by Dental Benefit Plan and Coverage
TotalOne Party Two Party Family
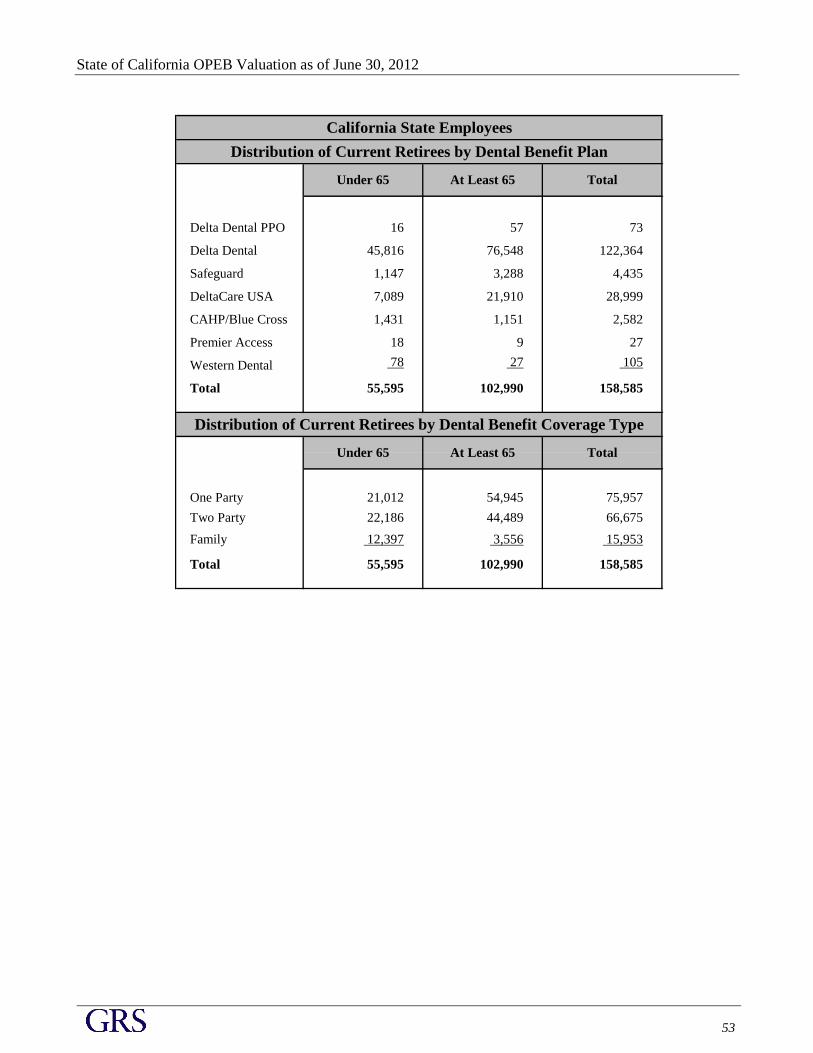
State of California OPEB Valuation as of June 30, 2012
53
Delta Dental PPO 16 57 73
Delta Dental 45,816 76,548 122,364
Safeguard 1,147 3,288 4,435
DeltaCare USA 7,089 21,910 28,999
CAHP/Blue Cross 1,431 1,151 2,582
Premier Access 18 9 27
Western Dental 78 27 105
Total 55,595 102,990 158,585
One Party 21,012 54,945 75,957
Two Party 22,186 44,489 66,675
Family 12,397 3,556 15,953
Total 55,595 102,990 158,585
California State Employees
Distribution of Current Retirees by Dental Benefit Plan
Distribution of Current Retirees by Dental Benefit Coverage Type
Under 65 At Least 65 Total
Under 65 TotalAt Least 65
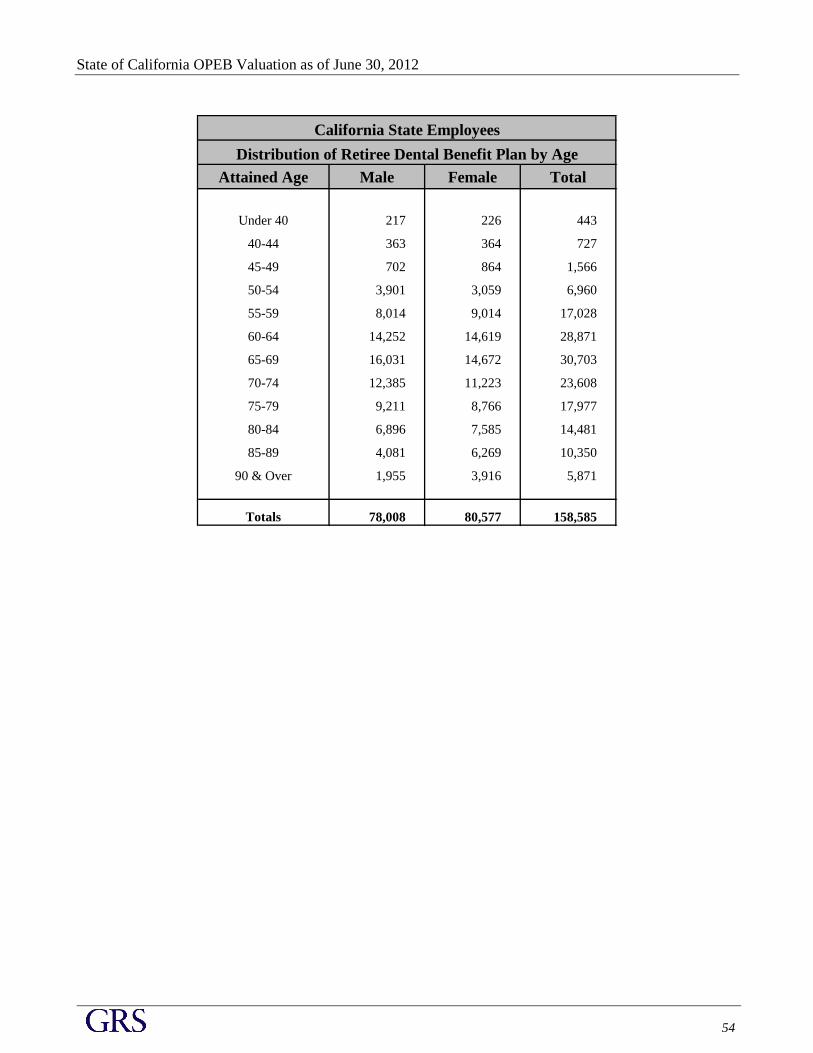
State of California OPEB Valuation as of June 30, 2012
54
Attained Age Male Female Total
Under 40 217 226 443
40-44 363 364 727
45-49 702 864 1,566
50-54 3,901 3,059 6,960
55-59 8,014 9,014 17,028
60-64 14,252 14,619 28,871
65-69 16,031 14,672 30,703
70-74 12,385 11,223 23,608
75-79 9,211 8,766 17,977
80-84 6,896 7,585 14,481
85-89 4,081 6,269 10,350
90 & Over 1,955 3,916 5,871
Totals 78,008 80,577 158,585
California State Employees
Distribution of Retiree Dental Benefit Plan by Age

State of California OPEB Valuation as of June 30, 2012
55
Totals
0 - 4 5 - 9 10 - 14 15 - 19 20 - 24 25 - 29 30 Plus No.
Under 20 10 - - - - - - 10
20-24 2,715 76 - - - - - 2,791
25-29 11,403 4,348 33 - - - - 15,784
30-34 10,516 11,521 2,871 13 - - - 24,921
35-39 7,889 10,185 9,447 1,617 21 - - 29,159
40-44 6,644 9,170 10,777 7,091 2,014 40 - 35,736
45-49 5,671 7,511 9,029 7,209 7,529 2,489 75 39,513
50-54 5,034 6,687 8,413 6,183 7,583 5,673 2,548 42,121
55-59 4,203 5,549 6,871 4,743 5,615 4,220 4,690 35,891
60-64 2,611 3,630 4,288 2,941 3,240 2,186 2,533 21,429
65 & Over 1,287 1,857 2,243 1,311 1,216 744 936 9,594
Totals 57,983 60,534 53,972 31,108 27,218 15,352 10,782 256,949
Years of Service to Valuation Date
California State Employees
Distribution of All Active Members by Age and Service
Attained Age
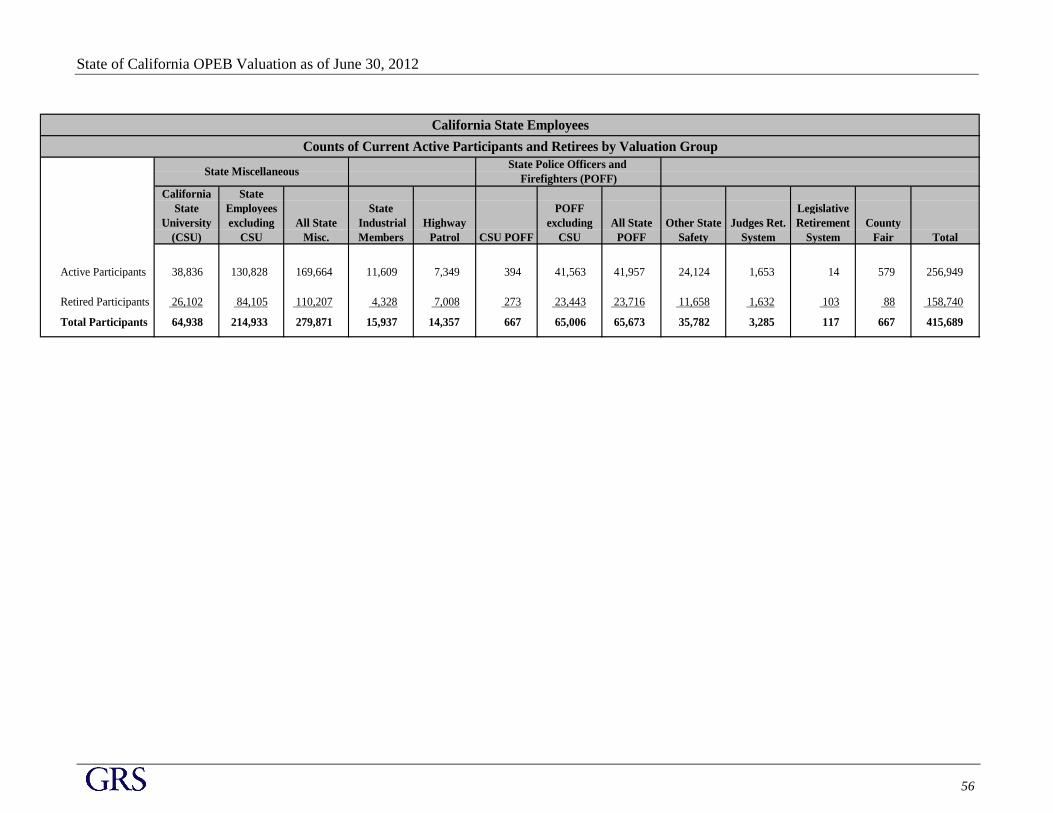
State of California OPEB Valuation as of June 30, 2012
56
California State
State Employees State POFF Legislative
University excluding All State Industrial Highway excluding All State Other State Judges Ret. Retirement County
(CSU) CSU Misc. Members Patrol CSU POFF CSU POFF Safety System System Fair Total
Active Participants 38,836 130,828 169,664 11,609 7,349 394 41,563 41,957 24,124 1,653 14 579 256,949
Retired Participants 26,102 84,105 110,207 4,328 7,008 273 23,443 23,716 11,658 1,632 103 88 158,740
Total Participants 64,938 214,933 279,871 15,937 14,357 667 65,006 65,673 35,782 3,285 117 667 415,689
Firefighters (POFF)
California State Employees
Counts of Current Active Participants and Retirees by Valuation Group
State MiscellaneousState Police Officers and

SECTION E
A C TU A R IA L A S S U MP TIO N S A N D METH O D S

State of California OPEB Valuation as of June 30, 2012
57
SUMMARY OF ACTUARIAL ASSUMPTIONS AND METHODS
Other Postemployment Benefits
Sponsored by the
State of California
As of June 30, 2012
The actuarial assumptions used in the valuation are shown in this Section. Assumptions that are
specific to certain groups (i.e., State Miscellaneous, State Industrial, CHP, POFF, State Safety, JRS,
and LRS) are discussed under the Demographic and Certain Economic Assumptions subsection and
were based on the most recent pension valuation reports produced by CalPERS. Assumptions that are
common to all types of members and unique to the OPEB valuation are shown in the Healthcare and
Other Economic Assumptions subsection. The pension related assumptions were recently updated by
CalPERS, and are recognized in the OPEB valuation as of June 30, 2012.
Actuarial Assumptions and Methods
An actuarial valuation measures the program’s funded status and annual funding or accounting costs
based on the assumptions and methods selected. The funded status compares assets to actuarial
accrued liabilities, and the annual cost represents the normal cost plus an amortization of the unfunded
actuarial accrued liability.
In the valuation process, certain economic and demographic assumptions are made relating to the
projection of benefits, and the timing and duration of benefits. The stream of expected projected
benefits is discounted to a present value as of the valuation date. The present value is then spread over
past service (actuarial accrued liability), and service for the current year (normal cost) based on the
chosen cost method.
The Actuarial Valuation of the State’s OPEB is similar to the Actuarial Valuations performed for the
State’s pension plans. The demographic assumptions (rates of retirement, termination, disability and
mortality etc.) used in this OPEB Valuation were identical to those used in the most recent CalPERS
Valuations for the following pension plans and are disclosed in Section F of this report:
State Plan of the California Public Employees’ Retirement System
Judges’ Retirement System
Judges’ Retirement System II
Legislators’ Retirement System
In addition, the cost method (entry-age normal) is identical to the one used in the most recent CalPERS
Valuation for the State Plan of the California Public Employees’ Retirement System.
The discount rate selected was 4.50 percent for the pay-as-you-go policy, 6.055 percent for the
partially funded policy, and 7.61 percent for the fully funded policy. A discount rate of 7.61 percent
can be supported provided the investment and contribution policy of the qualifying retiree healthcare
benefit trust is consistent with Strategy 1 as disclosed in the CalPERS OPEB assumption model for
State of California OPEB Valuation as of June 30, 2012
58
reports based on data measured after June 15, 2011, and before August 15, 2012. Other assumptions
and methods unique to OPEB valuations are consistent with CalPERS OPEB assumption parameters,
with the exception of the dental trend rates, as follows:
Healthcare trend – Select and ultimate healthcare trend rates were developed separately for the
PPO, prescription drug, HMO and dental plans. For the medical and drug plans, the select and
ultimate trend rates were set at actual increases for 2013 and 9.00 percent in 2014 graded down
over a seven year period until an ultimate trend rate of 4.50 percent is reached in 2021.
Beginning in the year 2025 for Future Retirees, the ultimate trend rate on the Employer's
explicit contribution includes an additional 0.14 percent to account for the Excise Tax under
Federal Healthcare Reform. For the dental plans, select and ultimate trend rates were set at
(0.83) percent for 2013 and 4.50 percent for 2014 and beyond. The trend rates are net of any
increases due to the potential dissipation of the EGWP-Wrap design savings in 2021. Effective
trend for the Post-Medicare plans affected by the EGWP-Wrap design would be higher until
the year 2021. These higher effective trend rates eliminate the approximately 25 percent
savings due to the EGWP-Wrap plan design. The dental trend rate assumption deviated
slightly from the CalPERS OPEB assumption parameters in the sense that trend was not
assumed to be flat.
Per capita claim costs – Claims costs were developed separately for the PPO, prescription
drug, HMO and dental plans. Costs were developed for pre-Medicare and post-Medicare
coverage at each respective age and gender, using overall average costs adjusted for morbidity.
Other healthcare assumptions – The proportion of members selecting a particular plan and
coverage at retirement was based on the most current census and enrollment data.
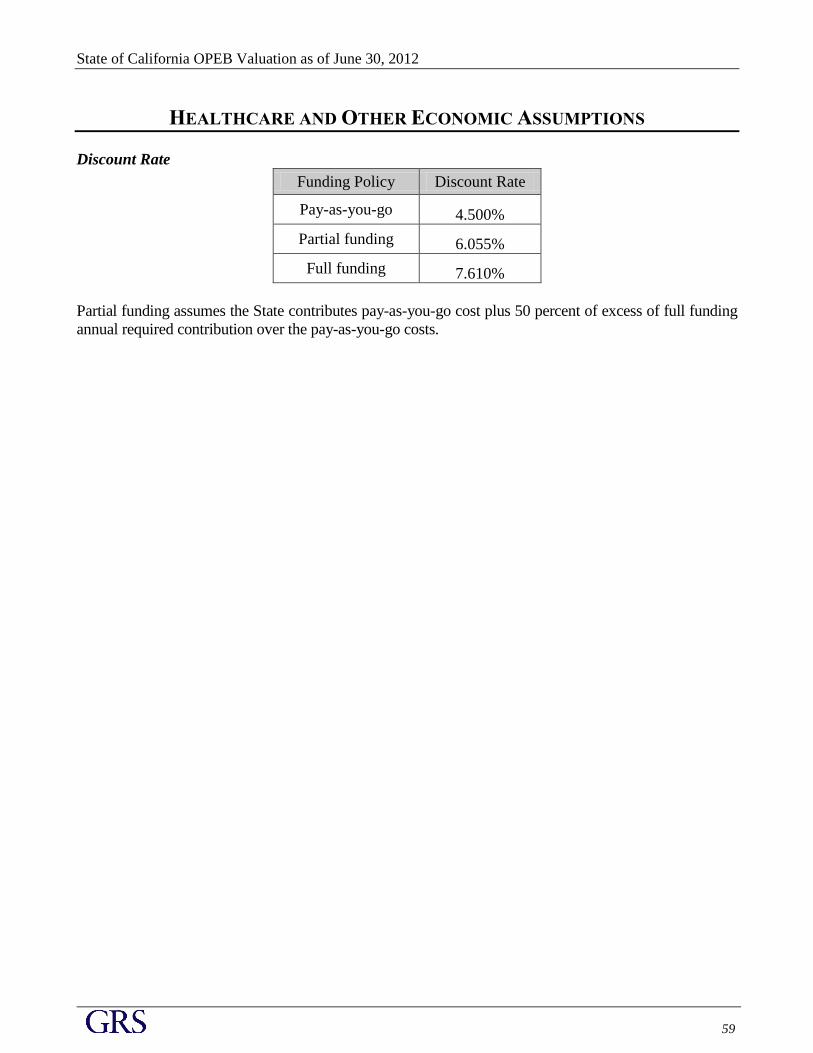
State of California OPEB Valuation as of June 30, 2012
59
HEALTHCARE AND OTHER ECONOMIC ASSUMPTIONS
Discount Rate
Funding Policy Discount Rate
Pay-as-you-go 4.500%
Partial funding 6.055%
Full funding 7.610%
Partial funding assumes the State contributes pay-as-you-go cost plus 50 percent of excess of full funding
annual required contribution over the pay-as-you-go costs.

State of California OPEB Valuation as of June 30, 2012
60
Health Cost and Premium Increases – See table below
Pre-Medicare Post-Medicare
Year Medical Rx Medical Rx Medical/Rx Medical/Rx Dental
2013 9.50% 9.50% 9.50% 9.50% 8.72%* -5.58%* -0.83%*
2014 9.00% 9.00% 9.00% 9.00% 9.00% 9.00% 4.50%
2015 8.50% 8.50% 8.50% 8.50% 8.50% 8.50% 4.50%
2016 8.00% 8.00% 8.00% 8.00% 8.00% 8.00% 4.50%
2017 7.50% 7.50% 7.50% 7.50% 7.50% 7.50% 4.50%
2018 7.00% 7.00% 7.00% 7.00% 7.00% 7.00% 4.50%
2019 6.50% 6.50% 6.50% 6.50% 6.50% 6.50% 4.50%
2020 5.50% 5.50% 5.50% 5.50% 5.50% 5.50% 4.50%
2021 4.50% 4.50% 4.50% 4.50% 4.50% 4.50% 4.50%
2022 4.50% 4.50% 4.50% 4.50% 4.50% 4.50% 4.50%
2023 4.50% 4.50% 4.50% 4.50% 4.50% 4.50% 4.50%
2024 4.50% 4.50% 4.50% 4.50% 4.50% 4.50% 4.50%
2025 and
Beyond4.50% 4.50% 4.50% 4.50% 4.50% 4.50% 4.50%
Pre-Medicare Post-Medicare Pre-Medicare Post-Medicare Statutory
Year Medical/Rx Medical/Rx Medical/Rx Medical/Rx Dental Part B Cap
2013 14.89%* -14.68%* 8.72%* -5.58%* -0.83%* 4.50% 9.89%*
2014 9.00% 9.00% 9.00% 9.00% 4.50% 4.50% 9.00%
2015 8.50% 8.50% 8.50% 8.50% 4.50% 4.50% 8.50%
2016 8.00% 8.00% 8.00% 8.00% 4.50% 4.50% 8.00%
2017 7.50% 7.50% 7.50% 7.50% 4.50% 4.50% 7.50%
2018 7.00% 7.00% 7.00% 7.00% 4.50% 4.50% 7.00%
2019 6.50% 6.50% 6.50% 6.50% 4.50% 4.50% 6.50%
2020 5.50% 5.50% 5.50% 5.50% 4.50% 4.50% 5.50%
2021 4.50% 4.50% 4.50% 4.50% 4.50% 4.50% 4.50%
2022 4.50% 4.50% 4.50% 4.50% 4.50% 4.50% 4.50%
2023 4.50% 4.50% 4.50% 4.50% 4.50% 4.50% 4.50%
2024 4.50% 4.50% 4.50% 4.50% 4.50% 4.50% 4.50%
2025 and
Beyond4.50% 4.50% 4.50% 4.50% 4.50% 4.50% 4.50%**
**For Future Retirees, the ultimate trend rate on the Employer's explicit contribution includes an additional 0.14 percent to account for the Excise Tax
under Federal Healthcare Reform.
*Based on actual increases
HMO PlansPPO Plans
Trend Assumption - Per Capita Costs
Trend Assumption - Premiums and Statutory Cap
PPO Plans
Pre-Medicare Post-Medicare
HMO Plans
All increases are assumed to occur 1/1 of each year beginning 1/1/2013.
The trend rates shown are net of any increases due to the potential dissipation of the EGWP-Wrap design changes in 2021. Effective
trend for the Post-Medicare plans affected by the EGWP-Wrap design changes would be higher until the year 2021. These higher
effective trend rates eliminate the approximately 25 percent savings due to the EGWP-Wrap plan design changes.
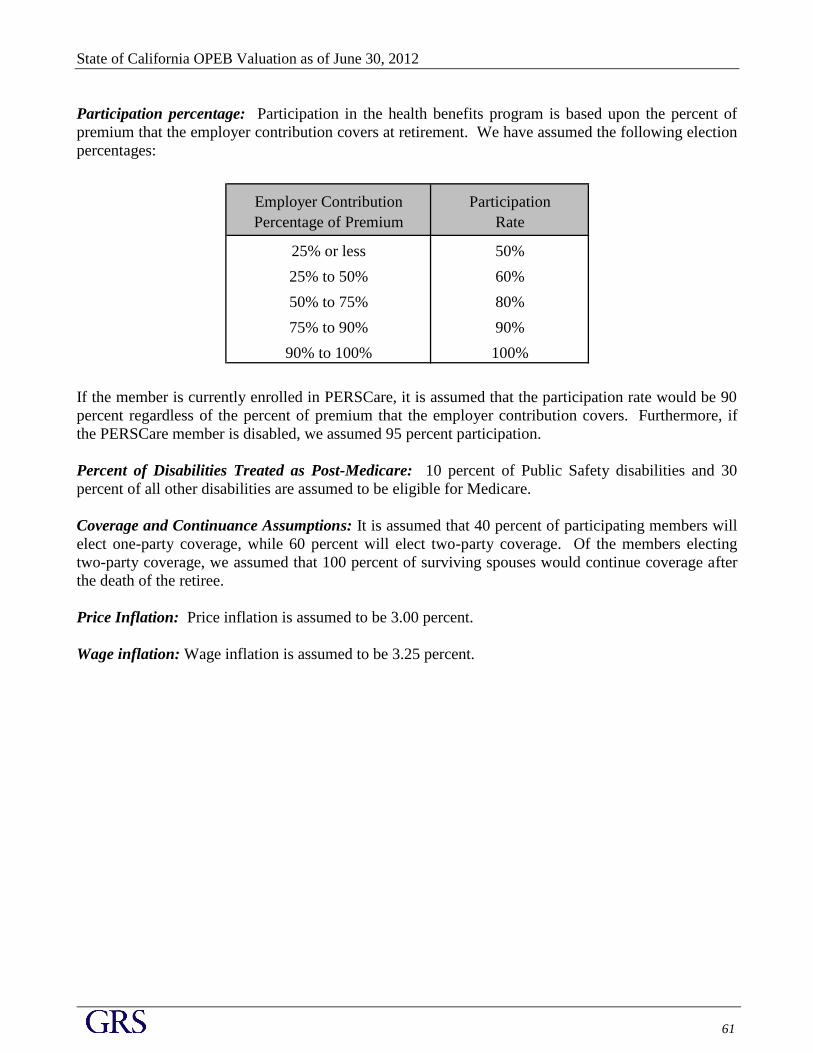
State of California OPEB Valuation as of June 30, 2012
61
Participation percentage: Participation in the health benefits program is based upon the percent of
premium that the employer contribution covers at retirement. We have assumed the following election
percentages:
Employer Contribution Participation
Percentage of Premium Rate
25% or less 50%
25% to 50% 60%
50% to 75% 80%
75% to 90% 90%
90% to 100% 100%
If the member is currently enrolled in PERSCare, it is assumed that the participation rate would be 90
percent regardless of the percent of premium that the employer contribution covers. Furthermore, if
the PERSCare member is disabled, we assumed 95 percent participation.
Percent of Disabilities Treated as Post-Medicare: 10 percent of Public Safety disabilities and 30
percent of all other disabilities are assumed to be eligible for Medicare.
Coverage and Continuance Assumptions: It is assumed that 40 percent of participating members will
elect one-party coverage, while 60 percent will elect two-party coverage. Of the members electing
two-party coverage, we assumed that 100 percent of surviving spouses would continue coverage after
the death of the retiree.
Price Inflation: Price inflation is assumed to be 3.00 percent.
Wage inflation: Wage inflation is assumed to be 3.25 percent.
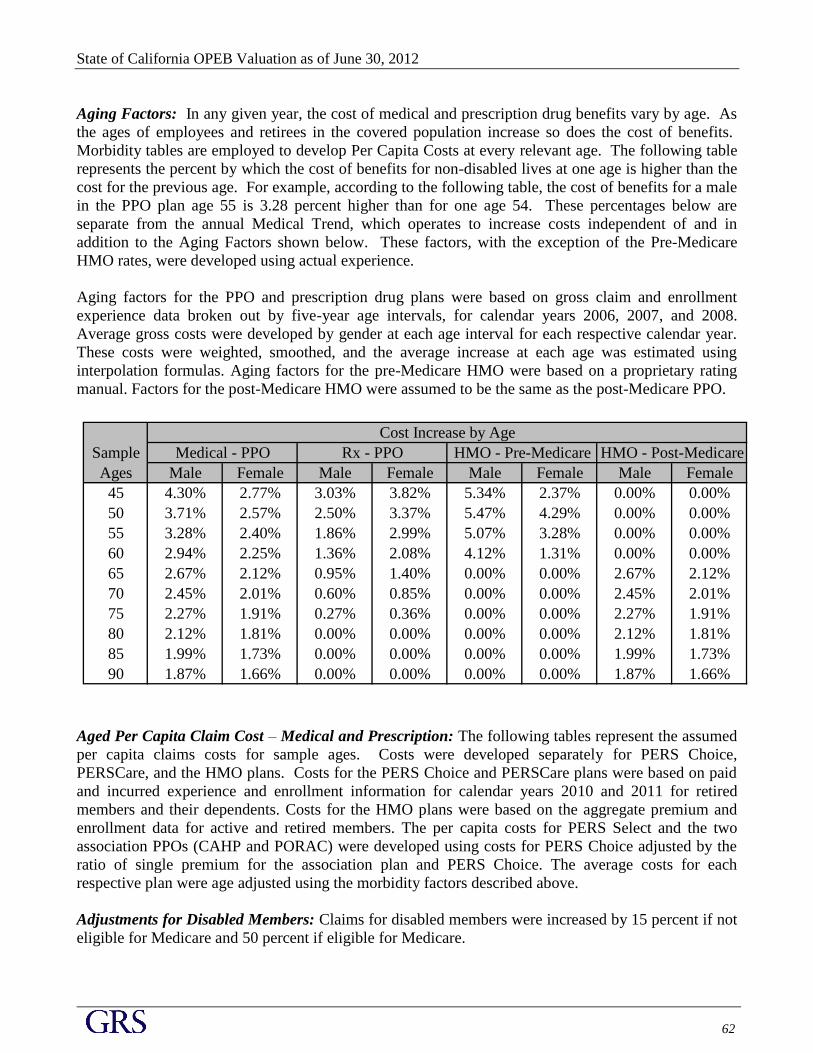
State of California OPEB Valuation as of June 30, 2012
62
Aging Factors: In any given year, the cost of medical and prescription drug benefits vary by age. As
the ages of employees and retirees in the covered population increase so does the cost of benefits.
Morbidity tables are employed to develop Per Capita Costs at every relevant age. The following table
represents the percent by which the cost of benefits for non-disabled lives at one age is higher than the
cost for the previous age. For example, according to the following table, the cost of benefits for a male
in the PPO plan age 55 is 3.28 percent higher than for one age 54. These percentages below are
separate from the annual Medical Trend, which operates to increase costs independent of and in
addition to the Aging Factors shown below. These factors, with the exception of the Pre-Medicare
HMO rates, were developed using actual experience.
Aging factors for the PPO and prescription drug plans were based on gross claim and enrollment
experience data broken out by five-year age intervals, for calendar years 2006, 2007, and 2008.
Average gross costs were developed by gender at each age interval for each respective calendar year.
These costs were weighted, smoothed, and the average increase at each age was estimated using
interpolation formulas. Aging factors for the pre-Medicare HMO were based on a proprietary rating
manual. Factors for the post-Medicare HMO were assumed to be the same as the post-Medicare PPO.
Sample
Ages Male Female Male Female Male Female Male Female
45 4.30% 2.77% 3.03% 3.82% 5.34% 2.37% 0.00% 0.00%
50 3.71% 2.57% 2.50% 3.37% 5.47% 4.29% 0.00% 0.00%
55 3.28% 2.40% 1.86% 2.99% 5.07% 3.28% 0.00% 0.00%
60 2.94% 2.25% 1.36% 2.08% 4.12% 1.31% 0.00% 0.00%
65 2.67% 2.12% 0.95% 1.40% 0.00% 0.00% 2.67% 2.12%
70 2.45% 2.01% 0.60% 0.85% 0.00% 0.00% 2.45% 2.01%
75 2.27% 1.91% 0.27% 0.36% 0.00% 0.00% 2.27% 1.91%
80 2.12% 1.81% 0.00% 0.00% 0.00% 0.00% 2.12% 1.81%
85 1.99% 1.73% 0.00% 0.00% 0.00% 0.00% 1.99% 1.73%
90 1.87% 1.66% 0.00% 0.00% 0.00% 0.00% 1.87% 1.66%
Medical - PPO
Cost Increase by Age
Rx - PPO HMO - Pre-Medicare HMO - Post-Medicare
Aged Per Capita Claim Cost – Medical and Prescription: The following tables represent the assumed
per capita claims costs for sample ages. Costs were developed separately for PERS Choice,
PERSCare, and the HMO plans. Costs for the PERS Choice and PERSCare plans were based on paid
and incurred experience and enrollment information for calendar years 2010 and 2011 for retired
members and their dependents. Costs for the HMO plans were based on the aggregate premium and
enrollment data for active and retired members. The per capita costs for PERS Select and the two
association PPOs (CAHP and PORAC) were developed using costs for PERS Choice adjusted by the
ratio of single premium for the association plan and PERS Choice. The average costs for each
respective plan were age adjusted using the morbidity factors described above.
Adjustments for Disabled Members: Claims for disabled members were increased by 15 percent if not
eligible for Medicare and 50 percent if eligible for Medicare.
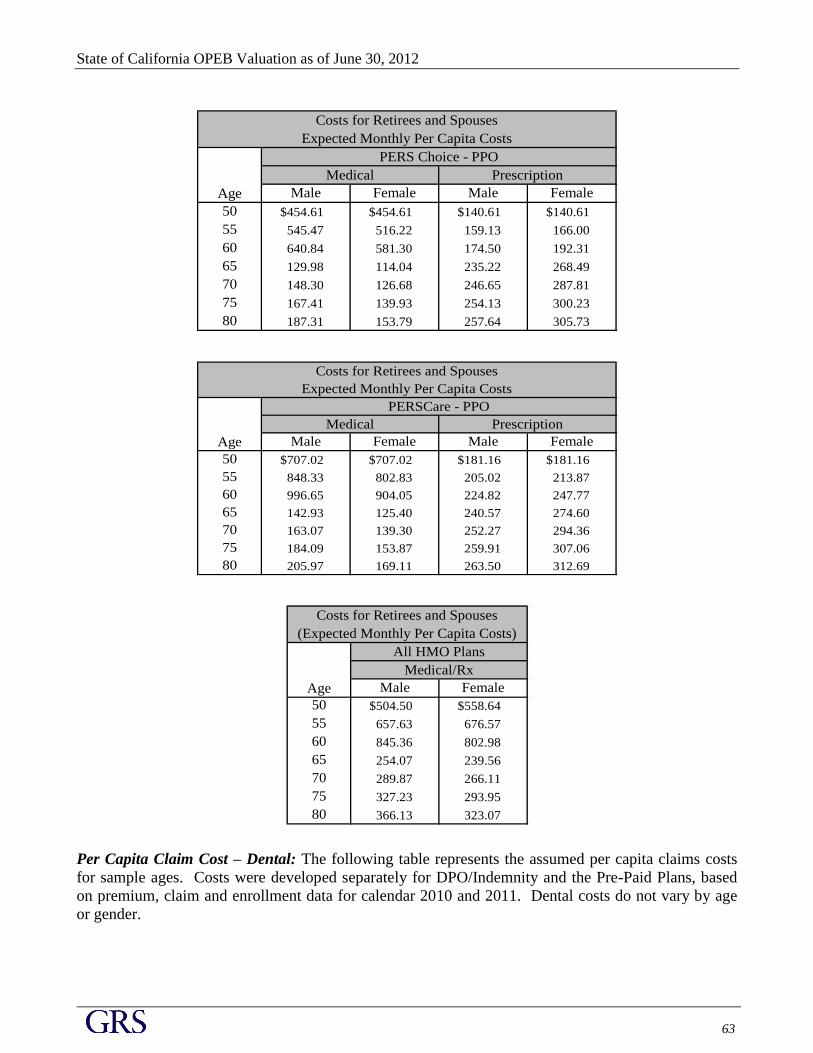
State of California OPEB Valuation as of June 30, 2012
63
Male Female Male Female
50 $454.61 $454.61 $140.61 $140.61
55 545.47 516.22 159.13 166.00
60 640.84 581.30 174.50 192.31
65 129.98 114.04 235.22 268.49
70 148.30 126.68 246.65 287.81
75 167.41 139.93 254.13 300.23
80 187.31 153.79 257.64 305.73
Costs for Retirees and Spouses
Expected Monthly Per Capita Costs
Medical Prescription
Age
PERS Choice - PPO
Male Female Male Female
50 $707.02 $707.02 $181.16 $181.16
55 848.33 802.83 205.02 213.87
60 996.65 904.05 224.82 247.77
65 142.93 125.40 240.57 274.60
70 163.07 139.30 252.27 294.36
75 184.09 153.87 259.91 307.06
80 205.97 169.11 263.50 312.69
Age
Costs for Retirees and Spouses
Expected Monthly Per Capita Costs
PrescriptionMedical
PERSCare - PPO
Male Female
50 $504.50 $558.64
55 657.63 676.57
60 845.36 802.98
65 254.07 239.56
70 289.87 266.11
75 327.23 293.95
80 366.13 323.07
Costs for Retirees and Spouses
(Expected Monthly Per Capita Costs)
All HMO Plans
Medical/Rx
Age
Per Capita Claim Cost – Dental: The following table represents the assumed per capita claims costs
for sample ages. Costs were developed separately for DPO/Indemnity and the Pre-Paid Plans, based
on premium, claim and enrollment data for calendar 2010 and 2011. Dental costs do not vary by age
or gender.
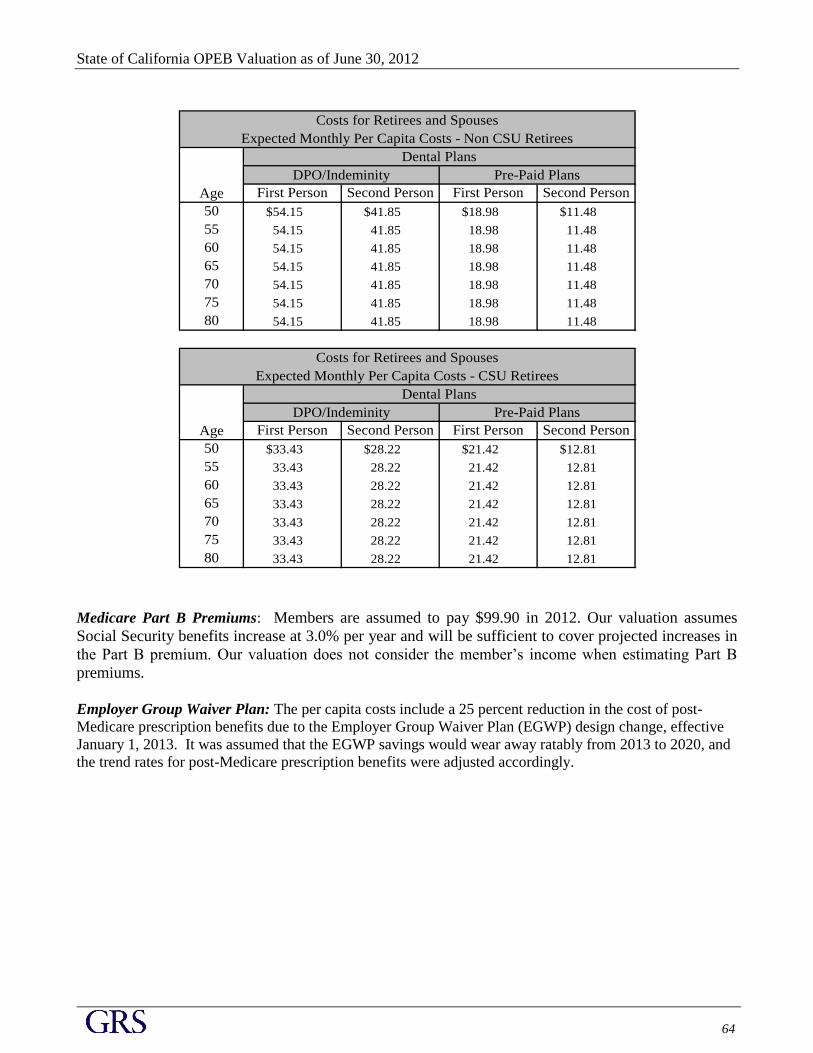
State of California OPEB Valuation as of June 30, 2012
64
First Person Second Person First Person Second Person
50 $54.15 $41.85 $18.98 $11.48
55 54.15 41.85 18.98 11.48
60 54.15 41.85 18.98 11.48
65 54.15 41.85 18.98 11.48
70 54.15 41.85 18.98 11.48
75 54.15 41.85 18.98 11.48
80 54.15 41.85 18.98 11.48
First Person Second Person First Person Second Person
50 $33.43 $28.22 $21.42 $12.81
55 33.43 28.22 21.42 12.81
60 33.43 28.22 21.42 12.81
65 33.43 28.22 21.42 12.81
70 33.43 28.22 21.42 12.81
75 33.43 28.22 21.42 12.81
80 33.43 28.22 21.42 12.81
Costs for Retirees and Spouses
Expected Monthly Per Capita Costs - Non CSU Retirees
Age
Dental Plans
DPO/Indeminity Pre-Paid Plans
Costs for Retirees and Spouses
Expected Monthly Per Capita Costs - CSU Retirees
Age
Dental Plans
DPO/Indeminity Pre-Paid Plans
Medicare Part B Premiums: Members are assumed to pay $99.90 in 2012. Our valuation assumes
Social Security benefits increase at 3.0% per year and will be sufficient to cover projected increases in
the Part B premium. Our valuation does not consider the member’s income when estimating Part B
premiums.
Employer Group Waiver Plan: The per capita costs include a 25 percent reduction in the cost of post-
Medicare prescription benefits due to the Employer Group Waiver Plan (EGWP) design change, effective
January 1, 2013. It was assumed that the EGWP savings would wear away ratably from 2013 to 2020, and
the trend rates for post-Medicare prescription benefits were adjusted accordingly.
State of California OPEB Valuation as of June 30, 2012
65
ACTUARIAL METHODS
The individual entry-age normal actuarial cost method of valuation was used in determining
liabilities and normal cost. Differences between assumed experience and actual experience (“actuarial
gains and/or losses”) become part of actuarial accrued liabilities.
In performing the valuation using the Entry Age Normal (EAN) method, the same salary scale was
used in this valuation as was used in the pension valuations for these groups. This results in normal
cost dollars that increase at the same rate as the normal cost dollars in the pension valuation for this
same group of people. Normal cost for actives hired after the valuation date was not included in this
valuation and was not factored into the Annual Required Contribution (ARC).
Unfunded actuarial accrued liabilities are amortized to produce payments (principal & interest), which
are a level percent of payroll, over a 30-year period. For the Legislative Retirement System, unfunded
actuarial accrued liabilities are amortized to produce level-dollar payments (principal & interest), over
a 10-year period because it is a closed group.
Data Processing: The following data processing methods were required for the June 30, 2012
valuation:
An assumption for active dental plan participation was made. Active members hired before July
1, 2011, were assumed to elect the same dental plan they elected as of the June 30, 2011,
valuation. Members hired on or after July 1, 2011, were assumed to participate in the Delta
Dental DPO.
Participation in JRS I or JRS II was based upon date of hire.

SECTION F
P EN S IO N - R ELATED A S S U MP TIO N S
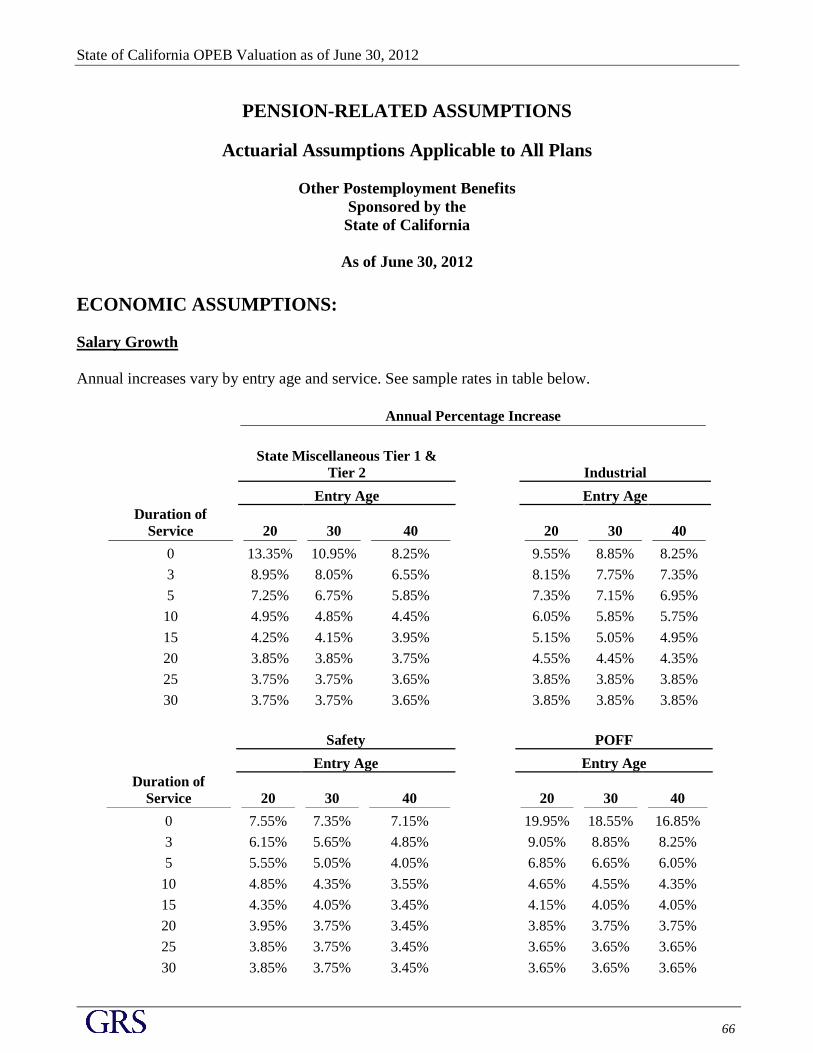
State of California OPEB Valuation as of June 30, 2012
66
PENSION-RELATED ASSUMPTIONS
Actuarial Assumptions Applicable to All Plans
Other Postemployment Benefits
Sponsored by the
State of California
As of June 30, 2012
ECONOMIC ASSUMPTIONS:
Salary Growth
Annual increases vary by entry age and service. See sample rates in table below.
Annual Percentage Increase
State Miscellaneous Tier 1 &
Tier 2 Industrial
Entry Age Entry Age
Duration of
Service 20 30 40 20 30 40
0 13.35% 10.95% 8.25% 9.55% 8.85% 8.25%
3 8.95% 8.05% 6.55% 8.15% 7.75% 7.35%
5 7.25% 6.75% 5.85% 7.35% 7.15% 6.95%
10 4.95% 4.85% 4.45% 6.05% 5.85% 5.75%
15 4.25% 4.15% 3.95% 5.15% 5.05% 4.95%
20 3.85% 3.85% 3.75% 4.55% 4.45% 4.35%
25 3.75% 3.75% 3.65% 3.85% 3.85% 3.85%
30 3.75% 3.75% 3.65% 3.85% 3.85% 3.85%
Safety POFF
Entry Age Entry Age
Duration of
Service 20 30 40 20 30 40
0 7.55% 7.35% 7.15% 19.95% 18.55% 16.85%
3 6.15% 5.65% 4.85% 9.05% 8.85% 8.25%
5 5.55% 5.05% 4.05% 6.85% 6.65% 6.05%
10 4.85% 4.35% 3.55% 4.65% 4.55% 4.35%
15 4.35% 4.05% 3.45% 4.15% 4.05% 4.05%
20 3.95% 3.75% 3.45% 3.85% 3.75% 3.75%
25 3.85% 3.75% 3.45% 3.65% 3.65% 3.65%
30 3.85% 3.75% 3.45% 3.65% 3.65% 3.65%

State of California OPEB Valuation as of June 30, 2012
67
CHP
Entry Age
Duration of
Service 20 30 40
0 9.05% 9.05% 9.05%
3 6.25% 6.25% 6.25%
5 5.15% 5.15% 5.15%
10 3.95% 3.95% 3.95%
15 3.75% 3.75% 3.75%
20 3.65% 3.65% 3.65%
25 3.65% 3.65% 3.65%
30 3.65% 3.65% 3.65%
Annual increases for members of JRS I, JRS II, and LRS are assumed to be 3.25% for all years of
service and ages.
Overall Payroll Growth
3.25% compounded annually (used in projecting the payroll over which the unfunded liability is
amortized). For the State Miscellaneous plan, the payroll of the Second Tier members is assumed to
decrease in accordance with actuarial assumptions based on the assumption that all new entrants will
elect the State Miscellaneous First Tier. The payroll of the First Tier members is assumed to grow at
the rate necessary for the overall payroll of the State Miscellaneous plan to grow annually at a rate of
3.25%.
Inflation
3% compounded annually.
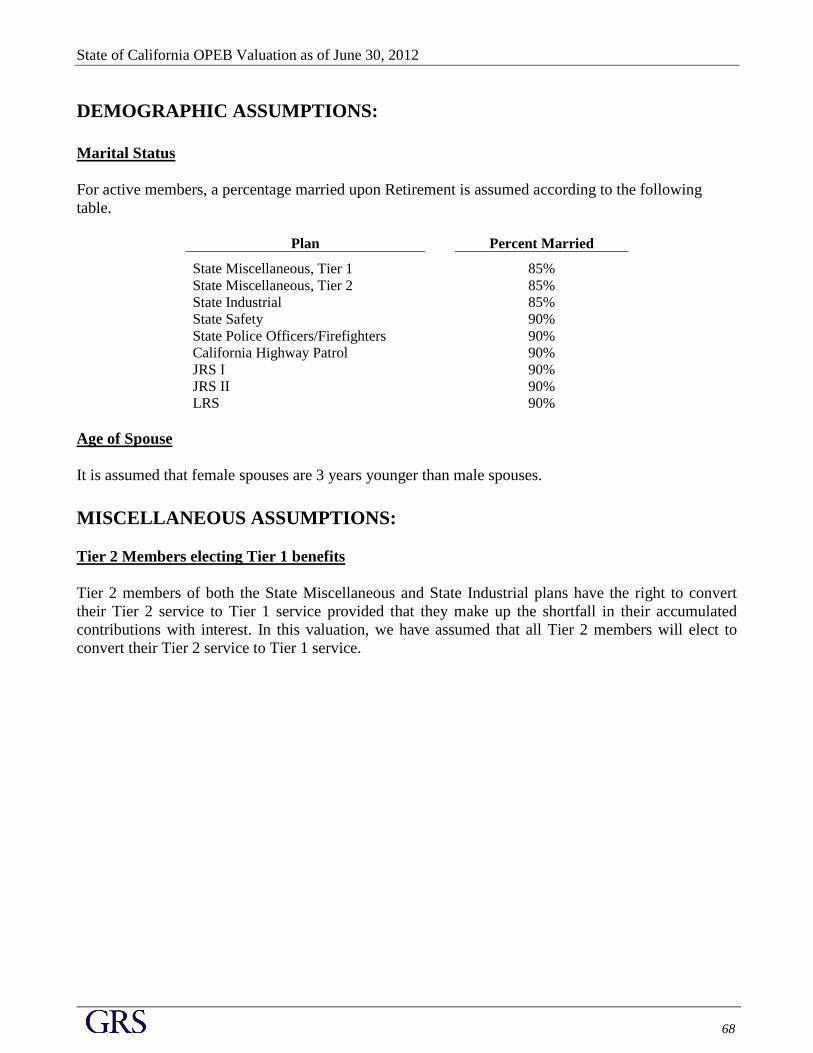
State of California OPEB Valuation as of June 30, 2012
68
DEMOGRAPHIC ASSUMPTIONS:
Marital Status
For active members, a percentage married upon Retirement is assumed according to the following
table.
Plan Percent Married
State Miscellaneous, Tier 1 85%
State Miscellaneous, Tier 2 85%
State Industrial 85%
State Safety 90%
State Police Officers/Firefighters 90%
California Highway Patrol 90%
JRS I 90%
JRS II 90%
LRS 90%
Age of Spouse
It is assumed that female spouses are 3 years younger than male spouses.
MISCELLANEOUS ASSUMPTIONS:
Tier 2 Members electing Tier 1 benefits
Tier 2 members of both the State Miscellaneous and State Industrial plans have the right to convert
their Tier 2 service to Tier 1 service provided that they make up the shortfall in their accumulated
contributions with interest. In this valuation, we have assumed that all Tier 2 members will elect to
convert their Tier 2 service to Tier 1 service.
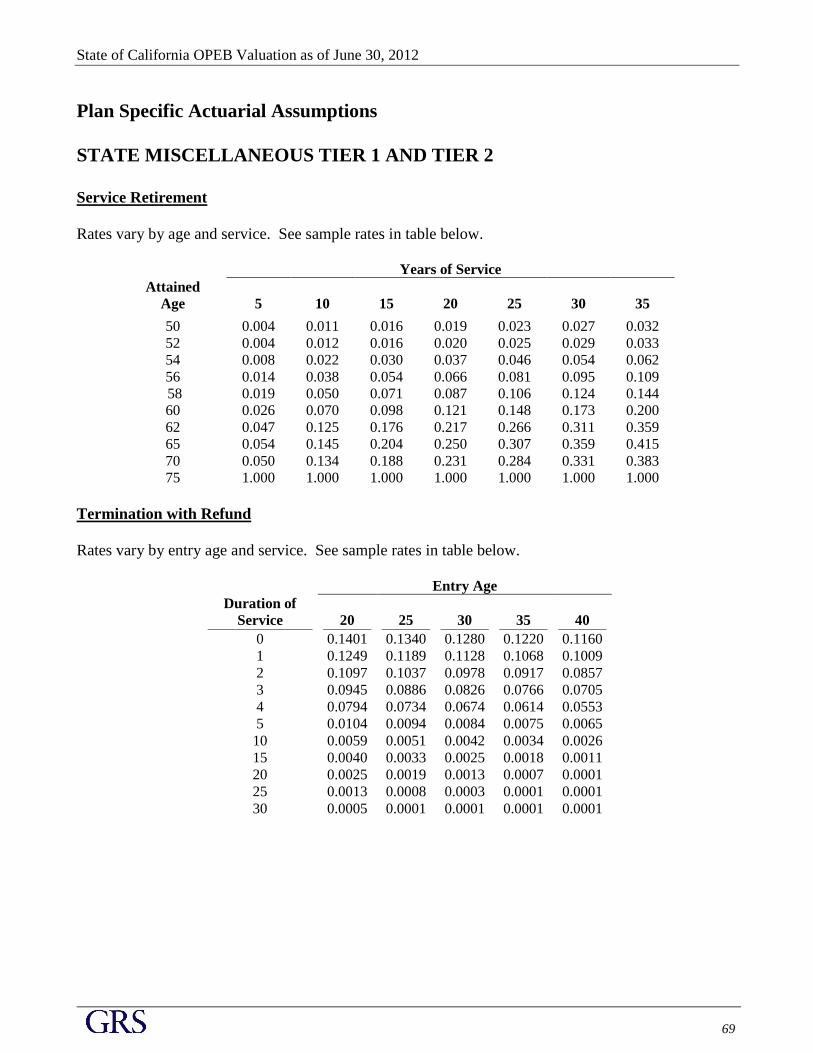
State of California OPEB Valuation as of June 30, 2012
69
Plan Specific Actuarial Assumptions
STATE MISCELLANEOUS TIER 1 AND TIER 2
Service Retirement
Rates vary by age and service. See sample rates in table below.
Years of Service
Attained
Age
5 10 15 20 25 30 35
50 0.004 0.011 0.016 0.019 0.023 0.027 0.032
52 0.004 0.012 0.016 0.020 0.025 0.029 0.033
54 0.008 0.022 0.030 0.037 0.046 0.054 0.062
56 0.014 0.038 0.054 0.066 0.081 0.095 0.109
58 0.019 0.050 0.071 0.087 0.106 0.124 0.144
60 0.026 0.070 0.098 0.121 0.148 0.173 0.200
62 0.047 0.125 0.176 0.217 0.266 0.311 0.359
65 0.054 0.145 0.204 0.250 0.307 0.359 0.415
70 0.050 0.134 0.188 0.231 0.284 0.331 0.383
75 1.000 1.000 1.000 1.000 1.000 1.000 1.000
Termination with Refund
Rates vary by entry age and service. See sample rates in table below.
Entry Age
Duration of
Service 20 25 30 35 40
0 0.1401 0.1340 0.1280 0.1220 0.1160
1 0.1249 0.1189 0.1128 0.1068 0.1009
2 0.1097 0.1037 0.0978 0.0917 0.0857
3 0.0945 0.0886 0.0826 0.0766 0.0705
4 0.0794 0.0734 0.0674 0.0614 0.0553
5 0.0104 0.0094 0.0084 0.0075 0.0065
10 0.0059 0.0051 0.0042 0.0034 0.0026
15 0.0040 0.0033 0.0025 0.0018 0.0011
20 0.0025 0.0019 0.0013 0.0007 0.0001
25 0.0013 0.0008 0.0003 0.0001 0.0001
30 0.0005 0.0001 0.0001 0.0001 0.0001
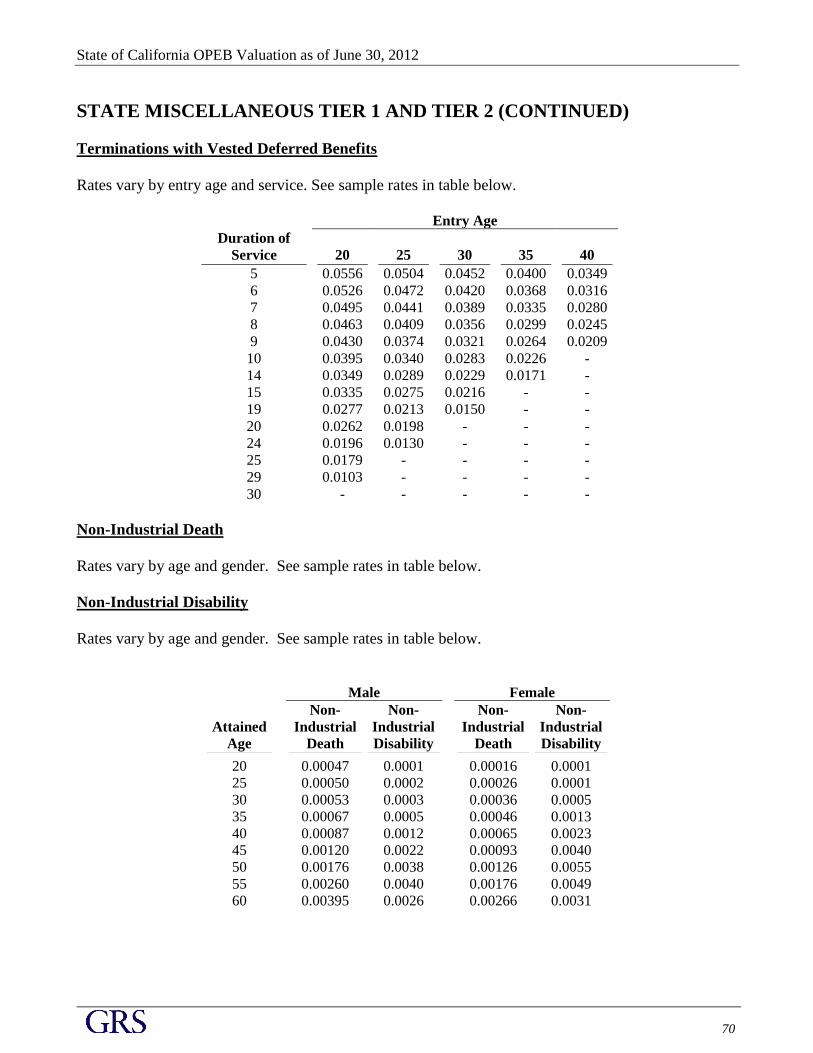
State of California OPEB Valuation as of June 30, 2012
70
STATE MISCELLANEOUS TIER 1 AND TIER 2 (CONTINUED)
Terminations with Vested Deferred Benefits
Rates vary by entry age and service. See sample rates in table below.
Entry Age
Duration of
Service 20 25 30 35 40
5 0.0556 0.0504 0.0452 0.0400 0.0349
6 0.0526 0.0472 0.0420 0.0368 0.0316
7 0.0495 0.0441 0.0389 0.0335 0.0280
8 0.0463 0.0409 0.0356 0.0299 0.0245
9 0.0430 0.0374 0.0321 0.0264 0.0209
10 0.0395 0.0340 0.0283 0.0226 -
14 0.0349 0.0289 0.0229 0.0171 -
15 0.0335 0.0275 0.0216 - -
19 0.0277 0.0213 0.0150 - -
20 0.0262 0.0198 - - -
24 0.0196 0.0130 - - -
25 0.0179 - - - -
29 0.0103 - - - -
30 - - - - -
Non-Industrial Death
Rates vary by age and gender. See sample rates in table below.
Non-Industrial Disability
Rates vary by age and gender. See sample rates in table below.
Male Female
Attained
Age
Non-
Industrial
Death
Non-
Industrial
Disability
Non-
Industrial
Death
Non-
Industrial
Disability
20 0.00047 0.0001 0.00016 0.0001
25 0.00050 0.0002 0.00026 0.0001
30 0.00053 0.0003 0.00036 0.0005
35 0.00067 0.0005 0.00046 0.0013
40 0.00087 0.0012 0.00065 0.0023
45 0.00120 0.0022 0.00093 0.0040
50 0.00176 0.0038 0.00126 0.0055
55 0.00260 0.0040 0.00176 0.0049
60 0.00395 0.0026 0.00266 0.0031

State of California OPEB Valuation as of June 30, 2012
71
STATE MISCELLANEOUS TIER 1 AND TIER 2 (CONTINUED)
Postretirement Mortality
Rates vary by age and gender for healthy benefit recipients, for non-industrially disabled (disability not
job related) retirees and for retirees who are industrially disabled (disability is job-related). See sample
rates in table below.
Healthy Recipients
Non-Industrially Disabled
(Not Job-Related)
Industrially Disabled
(Job-Related)
Age Male Female Male Female Male Female
50 0.00239 0.00125 0.01632 0.01245 0.00443 0.00356
55 0.00474 0.00243 0.01936 0.01580 0.00563 0.00546
60 0.00720 0.00431 0.02293 0.01628 0.00777 0.00798
65 0.01069 0.00775 0.03174 0.01969 0.01388 0.01184
70 0.01675 0.01244 0.03870 0.03019 0.02236 0.01716
75 0.03080 0.02071 0.06001 0.03915 0.03585 0.02665
80 0.05270 0.03749 0.08388 0.05555 0.06926 0.04528
85 0.09775 0.07005 0.14035 0.09577 0.11799 0.08017
90 0.16747 0.12404 0.21554 0.14949 0.16575 0.13775
95 0.25659 0.21556 0.31025 0.23055 0.26108 0.23331
100 0.34551 0.31876 0.45905 0.37662 0.40918 0.35165
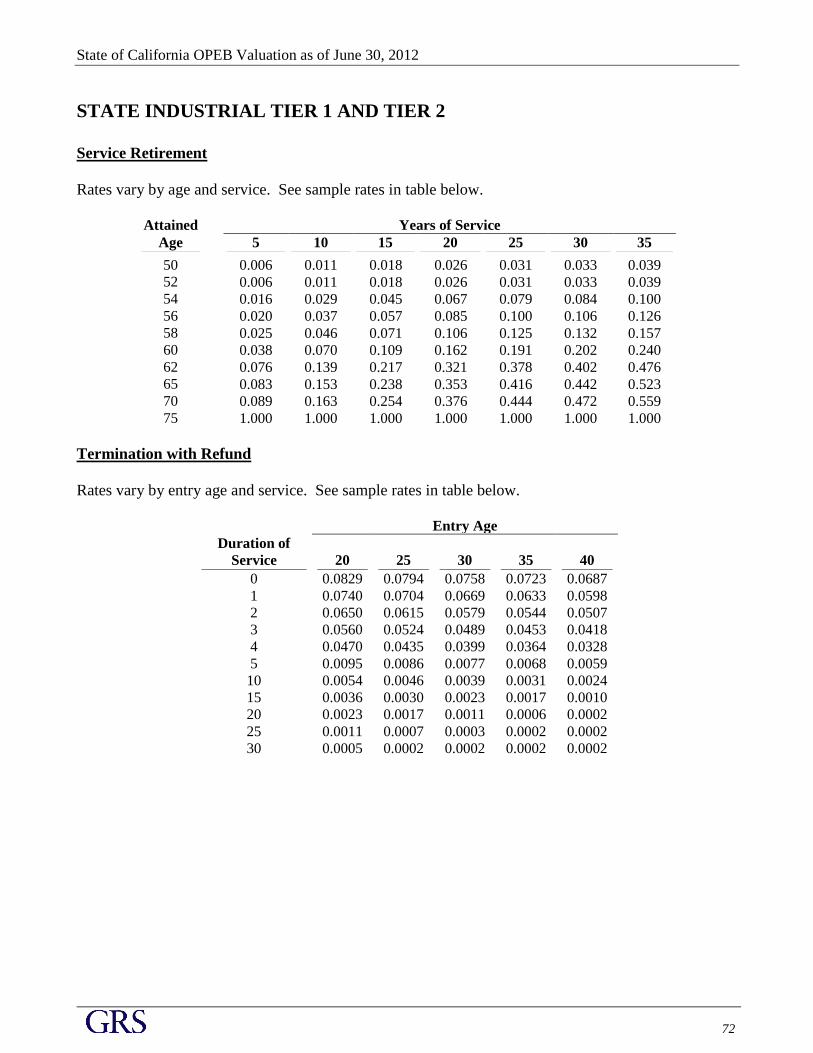
State of California OPEB Valuation as of June 30, 2012
72
STATE INDUSTRIAL TIER 1 AND TIER 2
Service Retirement
Rates vary by age and service. See sample rates in table below.
Attained Years of Service
Age 5 10 15 20 25 30 35
50 0.006 0.011 0.018 0.026 0.031 0.033 0.039
52 0.006 0.011 0.018 0.026 0.031 0.033 0.039
54 0.016 0.029 0.045 0.067 0.079 0.084 0.100
56 0.020 0.037 0.057 0.085 0.100 0.106 0.126
58 0.025 0.046 0.071 0.106 0.125 0.132 0.157
60 0.038 0.070 0.109 0.162 0.191 0.202 0.240
62 0.076 0.139 0.217 0.321 0.378 0.402 0.476
65 0.083 0.153 0.238 0.353 0.416 0.442 0.523
70 0.089 0.163 0.254 0.376 0.444 0.472 0.559
75 1.000 1.000 1.000 1.000 1.000 1.000 1.000
Termination with Refund
Rates vary by entry age and service. See sample rates in table below.
Entry Age
Duration of
Service 20 25 30 35 40
0 0.0829 0.0794 0.0758 0.0723 0.0687
1 0.0740 0.0704 0.0669 0.0633 0.0598
2 0.0650 0.0615 0.0579 0.0544 0.0507
3 0.0560 0.0524 0.0489 0.0453 0.0418
4 0.0470 0.0435 0.0399 0.0364 0.0328
5 0.0095 0.0086 0.0077 0.0068 0.0059
10 0.0054 0.0046 0.0039 0.0031 0.0024
15 0.0036 0.0030 0.0023 0.0017 0.0010
20 0.0023 0.0017 0.0011 0.0006 0.0002
25 0.0011 0.0007 0.0003 0.0002 0.0002
30 0.0005 0.0002 0.0002 0.0002 0.0002

State of California OPEB Valuation as of June 30, 2012
73
STATE INDUSTRIAL TIER 1 AND TIER 2 (Continued)
Terminations with Vested Deferred Benefits
Rates vary by entry age and service. See sample rates in table below.
Entry Age
Duration of
Service 20 25 30 35 40
5 0.0496 0.0449 0.0405 0.0356 0.0311
6 0.0470 0.0421 0.0377 0.0328 0.0281
7 0.0442 0.0393 0.0346 0.0297 0.0250
8 0.0414 0.0365 0.0316 0.0267 0.0220
9 0.0384 0.0335 0.0285 0.0234 0.0187
10 0.0353 0.0302 0.0253 0.0201 -
14 0.0311 0.0257 0.0206 0.0152 -
15 0.0302 0.0246 0.0194 - -
19 0.0248 0.0190 0.0136 - -
20 0.0232 0.0176 - - -
24 0.0173 0.0115 - - -
25 0.0159 - - - -
29 0.0091 - - - -
30 - - - - -
Non-Industrial Death
Rates vary by age and gender. See sample rates in table below.
Industrial Disability, Non-Industrial Disability & Industrial Death
Rates vary by age. See sample rates in table below.
Non-Industrial
Death
Non-
Industrial
Disability
Industrial
Disability
Industrial
Death
Attained Age Male Female
Male and
Female
Male and
Female
Male and
Female
20 0.00047 0.00016 0.0004 0.0002 0.00003
25 0.00050 0.00026 0.0009 0.0002 0.00007
30 0.00053 0.00036 0.0014 0.0002 0.00010
35 0.00067 0.00046 0.0020 0.0003 0.00012
40 0.00087 0.00065 0.0032 0.0003 0.00013
45 0.00120 0.00093 0.0047 0.0004 0.00014
50 0.00176 0.00126 0.0062 0.0004 0.00015
55 0.00260 0.00176 0.0079 0.0006 0.00016
60 0.00395 0.00266 0.0092 0.0006 0.00017
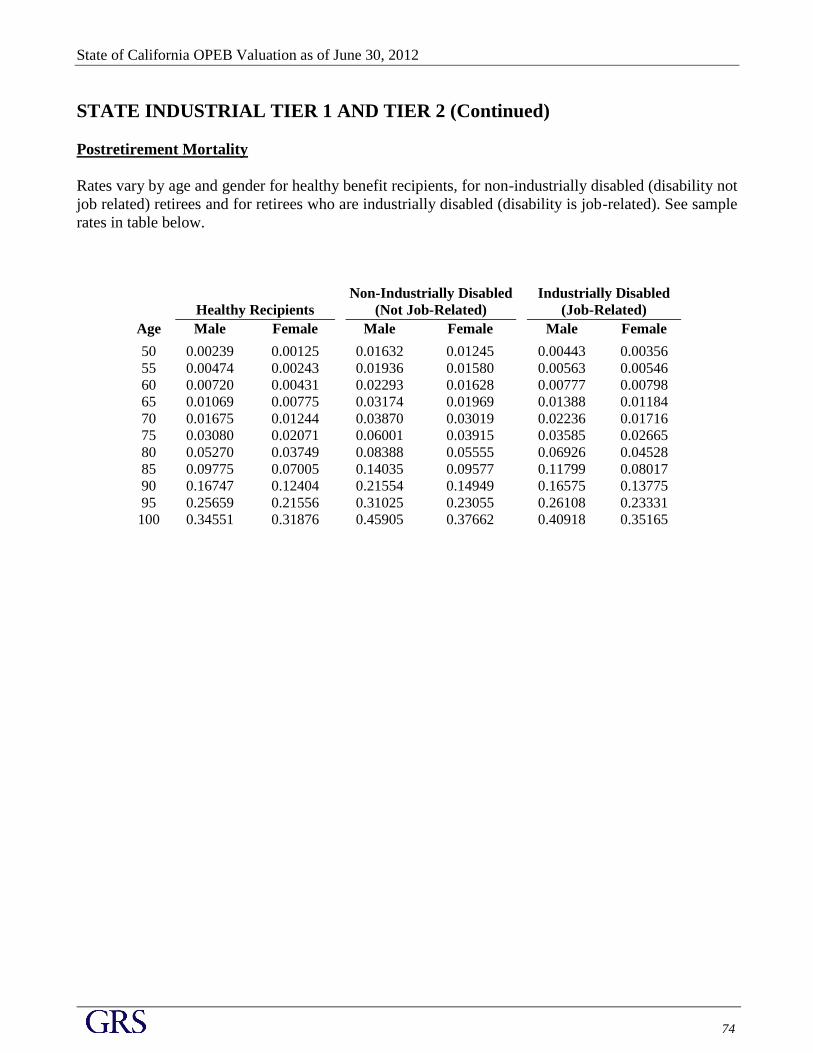
State of California OPEB Valuation as of June 30, 2012
74
STATE INDUSTRIAL TIER 1 AND TIER 2 (Continued)
Postretirement Mortality
Rates vary by age and gender for healthy benefit recipients, for non-industrially disabled (disability not
job related) retirees and for retirees who are industrially disabled (disability is job-related). See sample
rates in table below.
Healthy Recipients
Non-Industrially Disabled
(Not Job-Related)
Industrially Disabled
(Job-Related)
Age Male Female Male Female Male Female
50 0.00239 0.00125 0.01632 0.01245 0.00443 0.00356
55 0.00474 0.00243 0.01936 0.01580 0.00563 0.00546
60 0.00720 0.00431 0.02293 0.01628 0.00777 0.00798
65 0.01069 0.00775 0.03174 0.01969 0.01388 0.01184
70 0.01675 0.01244 0.03870 0.03019 0.02236 0.01716
75 0.03080 0.02071 0.06001 0.03915 0.03585 0.02665
80 0.05270 0.03749 0.08388 0.05555 0.06926 0.04528
85 0.09775 0.07005 0.14035 0.09577 0.11799 0.08017
90 0.16747 0.12404 0.21554 0.14949 0.16575 0.13775
95 0.25659 0.21556 0.31025 0.23055 0.26108 0.23331
100 0.34551 0.31876 0.45905 0.37662 0.40918 0.35165

State of California OPEB Valuation as of June 30, 2012
75
STATE SAFETY
Service Retirement
Rates vary by age and service. See sample rates in table below.
Attained Years of Service
Age 5 10 15 20 25 30 35
50 0.012 0.021 0.028 0.033 0.037 0.048 0.057
52 0.008 0.014 0.019 0.023 0.025 0.033 0.039
54 0.024 0.041 0.055 0.064 0.072 0.093 0.111
56 0.038 0.064 0.086 0.101 0.113 0.146 0.174
58 0.040 0.068 0.092 0.107 0.120 0.155 0.184
60 0.043 0.072 0.098 0.115 0.128 0.166 0.197
62 0.070 0.117 0.159 0.186 0.208 0.270 0.320
65 0.095 0.160 0.217 0.254 0.284 0.369 0.437
70 0.086 0.144 0.195 0.229 0.255 0.331 0.393
75 1.000 1.000 1.000 1.000 1.000 1.000 1.000
Termination with Refund
Rates vary by service. See sample rates in table below.
Service
__0__ __1__ __2__ __3__ __4__ __5__ __10_ __15__ __20__ __25__ __30__
0.1313 0.0967 0.0622 0.0461 0.0374 0.0080 0.0058 0.0039 0.0025 0.0013 0.0009
Terminations with Vested Deferred Benefits
Rates vary by entry age and service. See sample rates in table below.
Entry Age
Duration of
Service 20 25 30 35 40
5 0.0369 0.0369 0.0369 0.0369 0.0369
6 0.0363 0.0363 0.0363 0.0363 0.0363
7 0.0357 0.0357 0.0357 0.0357 0.0357
8 0.0349 0.0349 0.0349 0.0349 0.0349
9 0.0341 0.0341 0.0341 0.0341 0.0341
10 0.0333 0.0333 0.0333 0.0333 -
14 0.0296 0.0296 0.0296 0.0296 -
15 0.0286 0.0286 0.0286 - -
19 0.0239 0.0239 0.0239 - -
20 0.0226 0.0226 - - -
24 0.0173 0.0173 - - -
25 0.0159 - - - -
29 0.0131 - - - -
30 0.0131 - - - -
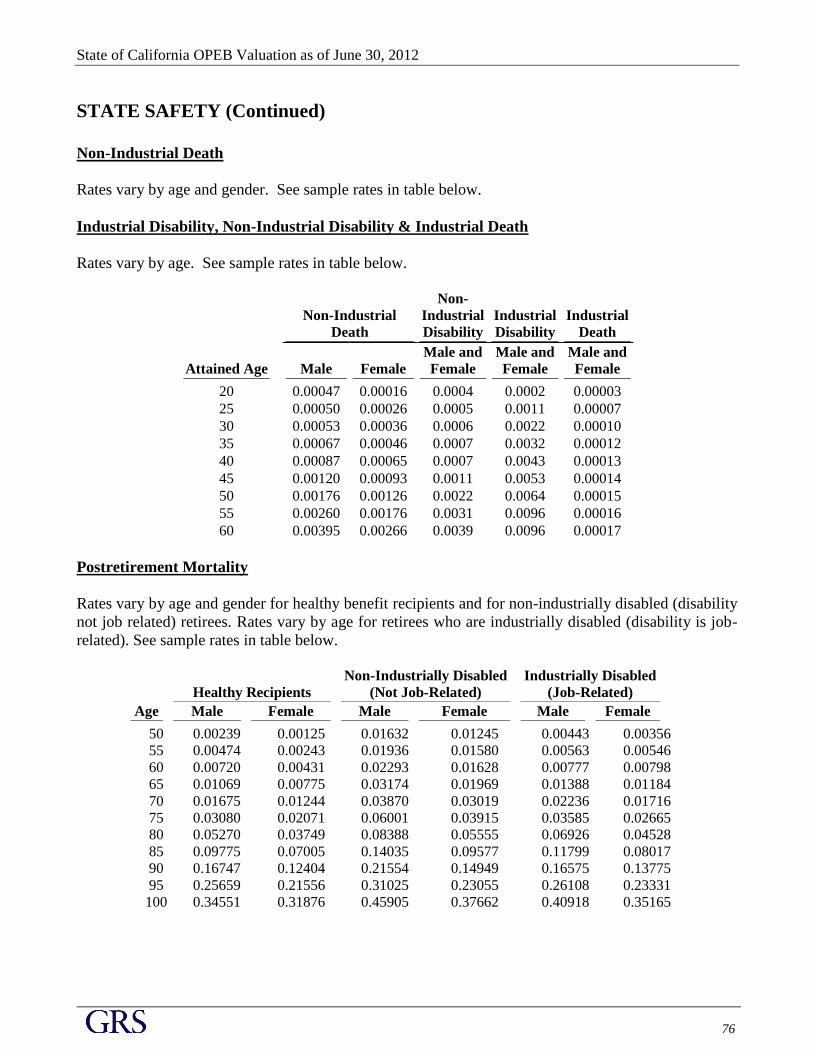
State of California OPEB Valuation as of June 30, 2012
76
STATE SAFETY (Continued)
Non-Industrial Death
Rates vary by age and gender. See sample rates in table below.
Industrial Disability, Non-Industrial Disability & Industrial Death
Rates vary by age. See sample rates in table below.
Non-Industrial
Death
Non-
Industrial
Disability
Industrial
Disability
Industrial
Death
Attained Age Male Female
Male and
Female
Male and
Female
Male and
Female
20 0.00047 0.00016 0.0004 0.0002 0.00003
25 0.00050 0.00026 0.0005 0.0011 0.00007
30 0.00053 0.00036 0.0006 0.0022 0.00010
35 0.00067 0.00046 0.0007 0.0032 0.00012
40 0.00087 0.00065 0.0007 0.0043 0.00013
45 0.00120 0.00093 0.0011 0.0053 0.00014
50 0.00176 0.00126 0.0022 0.0064 0.00015
55 0.00260 0.00176 0.0031 0.0096 0.00016
60 0.00395 0.00266 0.0039 0.0096 0.00017
Postretirement Mortality
Rates vary by age and gender for healthy benefit recipients and for non-industrially disabled (disability
not job related) retirees. Rates vary by age for retirees who are industrially disabled (disability is job-
related). See sample rates in table below.
Healthy Recipients
Non-Industrially Disabled
(Not Job-Related)
Industrially Disabled
(Job-Related)
Age Male Female Male Female Male Female
50 0.00239 0.00125 0.01632 0.01245 0.00443 0.00356
55 0.00474 0.00243 0.01936 0.01580 0.00563 0.00546
60 0.00720 0.00431 0.02293 0.01628 0.00777 0.00798
65 0.01069 0.00775 0.03174 0.01969 0.01388 0.01184
70 0.01675 0.01244 0.03870 0.03019 0.02236 0.01716
75 0.03080 0.02071 0.06001 0.03915 0.03585 0.02665
80 0.05270 0.03749 0.08388 0.05555 0.06926 0.04528
85 0.09775 0.07005 0.14035 0.09577 0.11799 0.08017
90 0.16747 0.12404 0.21554 0.14949 0.16575 0.13775
95 0.25659 0.21556 0.31025 0.23055 0.26108 0.23331
100 0.34551 0.31876 0.45905 0.37662 0.40918 0.35165

State of California OPEB Valuation as of June 30, 2012
77
STATE PEACE OFFICERS AND FIREFIGHTERS
Service Retirement
Rates vary by age and service. See sample rates in table below.
Attained Years of Service
Age 5 10 15 20 25 30 35
50 0.006 0.020 0.027 0.031 0.052 0.082 0.095
52 0.008 0.026 0.035 0.041 0.067 0.106 0.123
54 0.016 0.054 0.073 0.084 0.139 0.219 0.254
56 0.021 0.070 0.094 0.109 0.181 0.284 0.330
58 0.020 0.066 0.089 0.103 0.170 0.267 0.310
60 0.020 0.067 0.091 0.105 0.174 0.273 0.317
62 0.035 0.116 0.157 0.181 0.301 0.472 0.549
65 0.039 0.132 0.178 0.206 0.341 0.536 0.623
70 1.000 1.000 1.000 1.000 1.000 1.000 1.000
Termination with Refund
Rates vary by service. See sample rates in table below.
Service
__0__ __1__ __2__ __3__ __4__ __5__ __10_ __15__ __20__ __25__ __30__
0.1217 0.0779 0.0431 0.0353 0.0275 0.0056 0.0039 0.0025 0.0015 0.0006 0.0003
Terminations with Vested Deferred Benefits
Rates vary by entry age and service. See sample rates in table below.
Entry Age
Duration of
Service 20 25 30 35 40
5 0.0173 0.0173 0.0173 0.0173 0.0173
6 0.0168 0.0168 0.0168 0.0168 0.0168
7 0.0164 0.0164 0.0164 0.0164 0.0164
8 0.0159 0.0159 0.0159 0.0159 0.0159
9 0.0155 0.0155 0.0155 0.0155 0.0155
10 0.0149 0.0149 0.0149 0.0149 -
14 0.0127 0.0127 0.0127 0.0127 -
15 0.0120 0.0120 0.0120 - -
19 0.0093 0.0093 0.0093 - -
20 0.0086 0.0086 - - -
24 0.0055 0.0055 - - -
25 0.0046 - - - -
29 0.0030 - - - -
30 0.0030 - - - -
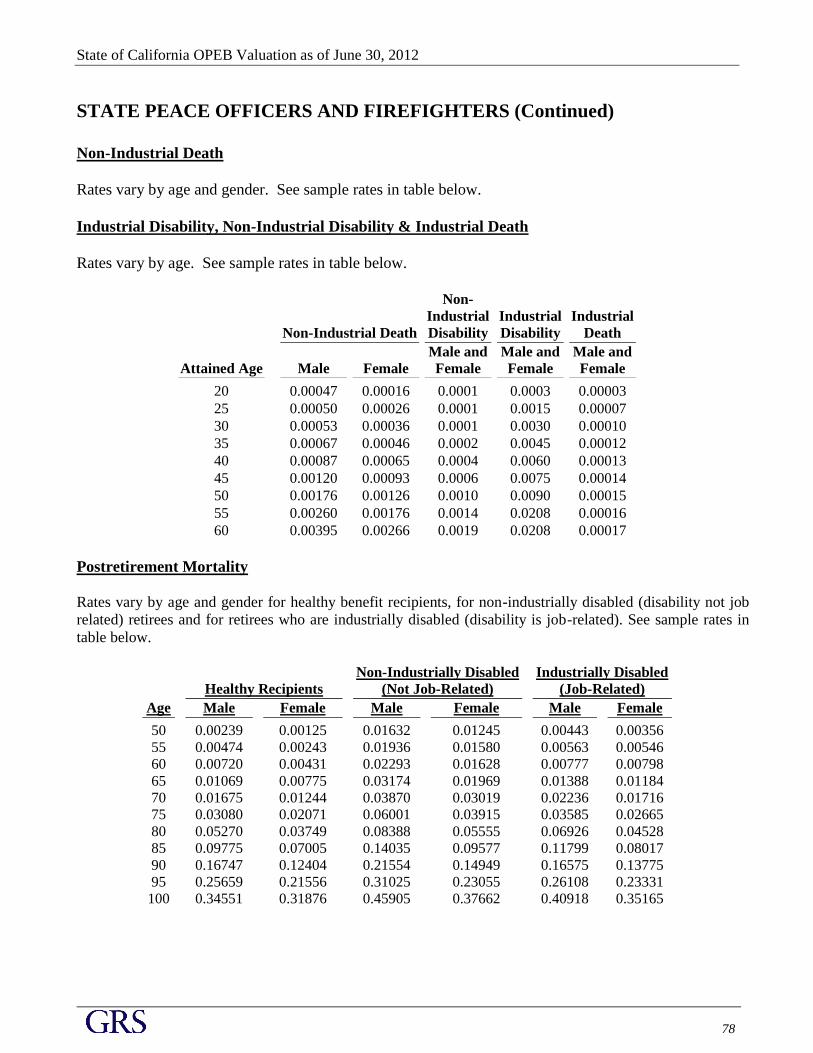
State of California OPEB Valuation as of June 30, 2012
78
STATE PEACE OFFICERS AND FIREFIGHTERS (Continued)
Non-Industrial Death
Rates vary by age and gender. See sample rates in table below.
Industrial Disability, Non-Industrial Disability & Industrial Death
Rates vary by age. See sample rates in table below.
Non-Industrial Death
Non-
Industrial
Disability
Industrial
Disability
Industrial
Death
Attained Age Male Female
Male and
Female
Male and
Female
Male and
Female
20 0.00047 0.00016 0.0001 0.0003 0.00003
25 0.00050 0.00026 0.0001 0.0015 0.00007
30 0.00053 0.00036 0.0001 0.0030 0.00010
35 0.00067 0.00046 0.0002 0.0045 0.00012
40 0.00087 0.00065 0.0004 0.0060 0.00013
45 0.00120 0.00093 0.0006 0.0075 0.00014
50 0.00176 0.00126 0.0010 0.0090 0.00015
55 0.00260 0.00176 0.0014 0.0208 0.00016
60 0.00395 0.00266 0.0019 0.0208 0.00017
Postretirement Mortality
Rates vary by age and gender for healthy benefit recipients, for non-industrially disabled (disability not job
related) retirees and for retirees who are industrially disabled (disability is job-related). See sample rates in
table below.
Healthy Recipients
Non-Industrially Disabled
(Not Job-Related)
Industrially Disabled
(Job-Related)
Age Male Female Male Female Male Female
50 0.00239 0.00125 0.01632 0.01245 0.00443 0.00356
55 0.00474 0.00243 0.01936 0.01580 0.00563 0.00546
60 0.00720 0.00431 0.02293 0.01628 0.00777 0.00798
65 0.01069 0.00775 0.03174 0.01969 0.01388 0.01184
70 0.01675 0.01244 0.03870 0.03019 0.02236 0.01716
75 0.03080 0.02071 0.06001 0.03915 0.03585 0.02665
80 0.05270 0.03749 0.08388 0.05555 0.06926 0.04528
85 0.09775 0.07005 0.14035 0.09577 0.11799 0.08017
90 0.16747 0.12404 0.21554 0.14949 0.16575 0.13775
95 0.25659 0.21556 0.31025 0.23055 0.26108 0.23331
100 0.34551 0.31876 0.45905 0.37662 0.40918 0.35165

State of California OPEB Valuation as of June 30, 2012
79
CALIFORNIA HIGHWAY PATROL
Service Retirement
Rates vary by age and service. See sample rates in table below.
Attained Years of Service
Age 5 10 15 20 25 30 35
50 0.0044 0.0044 0.0044 0.0044 0.0132 0.0250 0.0288
52 0.0145 0.0145 0.0145 0.0145 0.0435 0.0825 0.0950
54 0.0303 0.0303 0.0303 0.0303 0.0909 0.1725 0.1988
56 0.0271 0.0271 0.0271 0.0271 0.0813 0.1542 0.1777
58 0.0229 0.0229 0.0229 0.0229 0.0686 0.1301 0.1499
60 1.0000 1.0000 1.0000 1.0000 1.0000 1.0000 1.0000
Termination with Refund
Rates vary by service. See sample rates in table below.
Service
0 1 2 3 4 5 10 15 20 25 30
0.0129 0.0124 0.0121 0.0116 0.0113 0.0040 0.0029 0.0019 0.0011 0.0006 0.0003
Terminations with Vested Deferred Benefits
Rates vary by entry age and service. See sample rates in table below.
Entry Age
Duration of
Service 20 25 30 35 40
5 0.0093 0.0093 0.0093 0.0093 0.0093
6 0.0091 0.0091 0.0091 0.0091 0.0091
7 0.0090 0.0090 0.0090 0.0090 0.0090
8 0.0087 0.0087 0.0087 0.0087 0.0087
9 0.0085 0.0085 0.0085 0.0085 0.0085
10 0.0082 0.0082 0.0082 0.0082 -
14 0.0071 0.0071 0.0071 0.0071 -
15 0.0070 0.0070 0.0070 - -
19 0.0056 0.0056 0.0056 - -
20 0.0053 0.0053 - - -
24 0.0038 0.0038 - - -
25 0.0033 - - - -
29 0.0026 - - - -
30 0.0026 - - - -
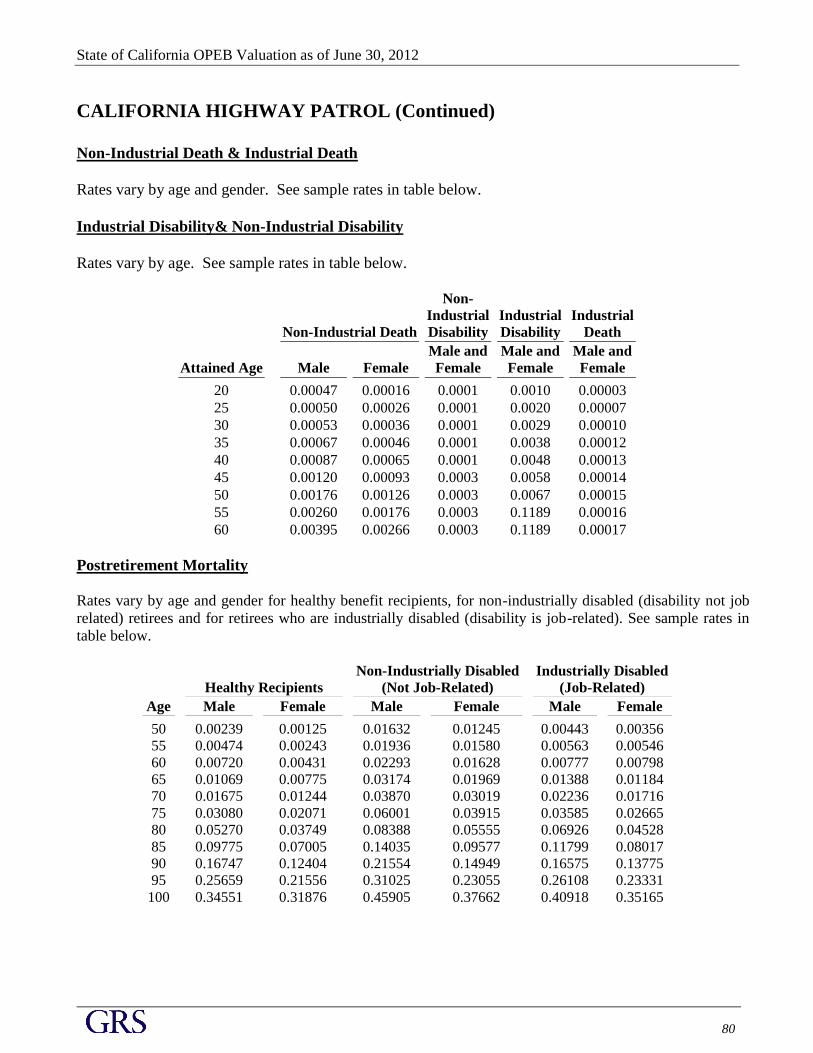
State of California OPEB Valuation as of June 30, 2012
80
CALIFORNIA HIGHWAY PATROL (Continued)
Non-Industrial Death & Industrial Death
Rates vary by age and gender. See sample rates in table below.
Industrial Disability& Non-Industrial Disability
Rates vary by age. See sample rates in table below.
Non-Industrial Death
Non-
Industrial
Disability
Industrial
Disability
Industrial
Death
Attained Age Male Female
Male and
Female
Male and
Female
Male and
Female
20 0.00047 0.00016 0.0001 0.0010 0.00003
25 0.00050 0.00026 0.0001 0.0020 0.00007
30 0.00053 0.00036 0.0001 0.0029 0.00010
35 0.00067 0.00046 0.0001 0.0038 0.00012
40 0.00087 0.00065 0.0001 0.0048 0.00013
45 0.00120 0.00093 0.0003 0.0058 0.00014
50 0.00176 0.00126 0.0003 0.0067 0.00015
55 0.00260 0.00176 0.0003 0.1189 0.00016
60 0.00395 0.00266 0.0003 0.1189 0.00017
Postretirement Mortality
Rates vary by age and gender for healthy benefit recipients, for non-industrially disabled (disability not job
related) retirees and for retirees who are industrially disabled (disability is job-related). See sample rates in
table below.
Healthy Recipients
Non-Industrially Disabled
(Not Job-Related)
Industrially Disabled
(Job-Related)
Age Male Female Male Female Male Female
50 0.00239 0.00125 0.01632 0.01245 0.00443 0.00356
55 0.00474 0.00243 0.01936 0.01580 0.00563 0.00546
60 0.00720 0.00431 0.02293 0.01628 0.00777 0.00798
65 0.01069 0.00775 0.03174 0.01969 0.01388 0.01184
70 0.01675 0.01244 0.03870 0.03019 0.02236 0.01716
75 0.03080 0.02071 0.06001 0.03915 0.03585 0.02665
80 0.05270 0.03749 0.08388 0.05555 0.06926 0.04528
85 0.09775 0.07005 0.14035 0.09577 0.11799 0.08017
90 0.16747 0.12404 0.21554 0.14949 0.16575 0.13775
95 0.25659 0.21556 0.31025 0.23055 0.26108 0.23331
100 0.34551 0.31876 0.45905 0.37662 0.40918 0.35165
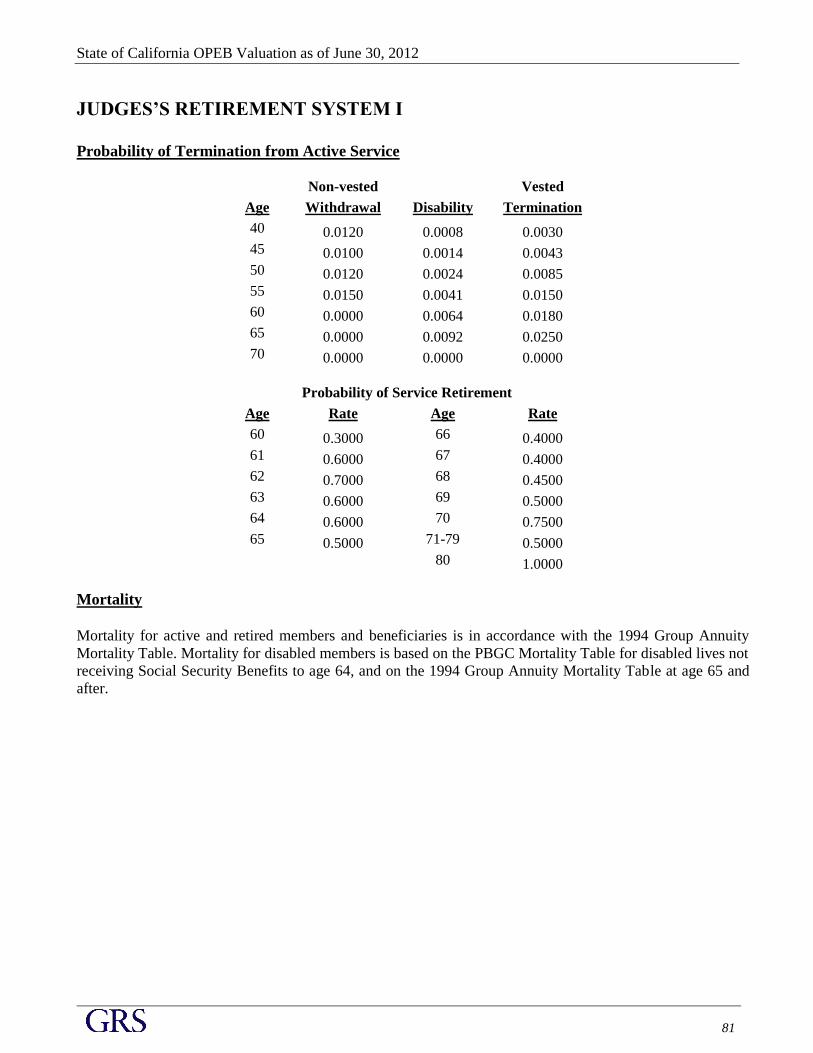
State of California OPEB Valuation as of June 30, 2012
81
JUDGES’S RETIREMENT SYSTEM I
Probability of Termination from Active Service
Non-vested Vested
Age Withdrawal Disability Termination
40 0.0120 0.0008 0.0030
45 0.0100 0.0014 0.0043
50 0.0120 0.0024 0.0085
55 0.0150 0.0041 0.0150
60 0.0000 0.0064 0.0180
65 0.0000 0.0092 0.0250
70 0.0000 0.0000 0.0000
Probability of Service Retirement
Age Rate Age Rate
60 0.3000 66 0.4000
61 0.6000 67 0.4000
62 0.7000 68 0.4500
63 0.6000 69 0.5000
64 0.6000 70 0.7500
65 0.5000 71-79 0.5000
80 1.0000
Mortality
Mortality for active and retired members and beneficiaries is in accordance with the 1994 Group Annuity
Mortality Table. Mortality for disabled members is based on the PBGC Mortality Table for disabled lives not
receiving Social Security Benefits to age 64, and on the 1994 Group Annuity Mortality Table at age 65 and
after.

State of California OPEB Valuation as of June 30, 2012
82
JUDGES’S RETIREMENT SYSTEM II
Service Retirement
Rates vary by age and service.
Service Greater than 20 years Age Rate
Below 65 0.0000
65 0.7500
66 0.4000
67 0.3000
68 0.3500
69 0.5000
70* 1.0000
* For Judges age 70 and older with 5 or more years of service the probability of retirement is 100%.
Withdrawal
Rates vary by age and service.
Entry Age 0-1 1-2 2-3 3-4 4-5 5 or
more
35 0.0053 0.0053 0.0053 0.0053 0.0053 0.0023
40 0.0045 0.0045 0.0045 0.0045 0.0045 0.0038
45 0.0038 0.0038 0.0038 0.0038 0.0038 0.0075
50 0.0038 0.0038 0.0038 0.0038 0.0038 0.0090
55 0.0000 0.0000 0.0000 0.0000 0.0000 0.0083
60 0.0000 0.0000 0.0000 0.0000 0.0000 0.0075
Pre-Retirement Non-Industrial Mortality
Rates vary by age.

State of California OPEB Valuation as of June 30, 2012
83
JUDGES’S RETIREMENT SYSTEM II (Continued)
Non-Industrial Disability
Rates vary by age.
Pre- Non-
Attained Retirement Industrial
Age Mortality Disability
35 0.0008 0.0000
40 0.0012 0.0010
45 0.0016 0.0019
50 0.0026 0.0032
55 0.0037 0.0054
60 0.0058 0.0085
65 0.0106 0.0122
70 0.0000 0.0000
Industrial Mortality
Rates are zero.
Industrial Disability
Rates are zero.
Post-Retirement Mortality: 1994 GAM no setback
Rates vary by age and sex.
Non- Non-
Healthy Healthy Industrial Healthy Healthy Industrial
Age Male Female Disability Age Male Female Disability
35 0.0009 0.0005 0.0200 75 0.0372 0.0227 0.0910
40 0.0011 0.0007 0.0248 80 0.0620 0.0394 0.1135
45 0.0016 0.0010 0.0293 85 0.0972 0.0677 0.1535
50 0.0026 0.0014 0.0360 90 0.1529 0.1163 0.2135
55 0.0044 0.0023 0.0452 95 0.2336 0.1862 0.2937
60 0.0080 0.0044 0.0578 100 0.3172 0.2764 0.3977
65 0.0145 0.0086 0.0691 105 0.4072 0.3836 0.8000
70 0.0237 0.0137 0.0786 110 0.4868 0.4823 1.0000

State of California OPEB Valuation as of June 30, 2012
84
Legislators’ Retirement System
Probabilities of Decrement for Active Participants
Vested Withdrawal – Sample vested withdrawal rates are shown in the following table.
Death – 1994 Group Annuity Mortality Table for Males and Females, published and recorded in the
Transactions of the Society of Actuaries.
Disability – Sample disability rates are shown in the following table.
Non-vested Withdrawal – Sample rates for non-vested withdrawal are shown in the following table.
For each 1,000 active participants at the age shown, the following number will leave within a year on
account of: Vested Non-Vested
Age Withdrawal Disability Withdrawal
30 50.0 0.1 25.0
35 50.0 0.2 25.0
40 50.0 0.7 20.0
41 50.0 0.8 15.0
42 40.0 0.9 15.0
43 40.0 1.0 15.0
44 40.0 1.1 15.0
45 40.0 1.2 15.0
46 40.0 1.3 15.0
47 40.0 1.5 15.0
48 40.0 1.7 15.0
49 40.0 1.9 15.0
50 40.0 2.2 15.0
51 40.0 2.5 5.0
52 40.0 3.0 0.0
53 40.0 3.6 0.0
54 40.0 4.3 0.0
55 40.0 5.0 0.0
56 40.0 5.8 0.0
57 40.0 6.7 0.0
58 40.0 7.5 0.0
59 40.0 8.4 0.0
60 40.0 9.5 0.0

State of California OPEB Valuation as of June 30, 2012
85
Legislators’ Retirement System (Continued)
Mortality Rates After Leaving Active Participation
For healthy lives and disabled lives – 1994 Group Annuity Mortality Table, published and recorded in
the Transactions of the Society of Actuaries.

APPENDIX
G LO S S A RY
State of California OPEB Valuation as of June 30, 2012
86
GLOSSARY
Other Postemployment Benefits
Sponsored by the
State of California
As of June 30, 2012
Accrued Service. The service credited under the plan, which was rendered before the date of the
actuarial valuation.
Actuarial Accrued Liability (AAL). The difference between (i) the actuarial present value of future plan
benefits; and (ii) the actuarial present value of future normal cost, which is sometimes referred to as
"accrued liability" or "past service liability."
Actuarial Assumptions. Estimates of future plan experience with respect to rates of mortality, disability,
turnover, retirement, rate or rates of investment income and salary increases. Demographic assumptions
(rates of mortality, disability, turnover, and retirement) are generally based on past experience, often
modified for projected changes in conditions. Economic assumptions (salary increases and investment
income) consist of an underlying rate in an inflation-free environment plus a provision for a long-term
average rate of inflation.
Actuarial Cost Method. A mathematical budgeting procedure for allocating the dollar amount of the
"actuarial present value of future plan benefits" between the actuarial present value of future normal cost
and the actuarial accrued liability. Sometimes referred to as the "actuarial funding method."
Actuarial Equivalent. A single amount or series of amounts of equal value to another single amount or
series of amounts, computed on the basis of the rate(s) of interest and mortality tables used by the plan.
Actuarial Present Value. The amount of funds presently required to provide a payment or series of
payments in the future. It is determined by discounting the future payments at a predetermined rate of
interest, taking into account the probability of payment.
Actuarial Value of Assets. The value of cash, investments, and other property belonging to a pension or
OPEB plan, as used by the actuary for the purpose of an actuarial valuation.
Amortization. Paying off an interest-bearing liability by means of periodic payments of interest and
principal, as opposed to paying it off with a lump sum payment.
Annual OPEB Cost (AOC). An accrual-basis measure of the periodic cost of an employer’s
participation in a defined OPEB plan.
Annual Required Contribution (ARC). The ARC is the normal cost plus the portion of the unfunded
actuarial accrued liability to be amortized in the current period. The ARC is an amount that is actuarially
determined in accordance with the requirements so that, if paid on an ongoing basis, it would be expected
to provide sufficient resources to fund both the normal cost for each year and the amortized unfunded
liability.
State of California OPEB Valuation as of June 30, 2012
87
Discount Rate. The rate used to adjust a series of future payments to reflect the time value of money.
Expected Net Employer Contributions. The difference between the age-adjusted premium or expected
retiree healthcare claims and retired member’s share of the premium. This amount is used to offset the
Annual OPEB Cost during the fiscal year.
Entry-Age Normal Cost Actuarial Method. A method under which the actuarial present value of
projected benefits of each individual included in the actuarial valuation is allocated on a level basis over
the earnings or service of the individual between entry age and assumed exit age(s). The portion of this
actuarial present value allocated to a valuation year is called the normal cost.
Governmental Accounting Standards Board (GASB). GASB is the private, nonpartisan, nonprofit
organization that works to create and improve the rules U.S. state and local governments follow when
accounting for their finances and reporting them to the public.
Implicit Rate Subsidy. The de facto subsidy of retirees by permitting them to pay lower than age-
adjusted premiums through the use of a single common or blended premium for both retirees and active
employees.
Explicit Rate Subsidy. The portion of the premium paid by the employer. The premium may be based
on the experience of active and retired members or retired members only.
Medical Trend Rate (Health Inflation). The increase in the plan’s cost over time. Trend includes all
elements that may influence a plan’s cost, assuming those enrollments and the plan benefits do not
change. Trend includes such elements as pure price inflation, changes in utilization, advances in medical
technology, and cost shifting.
Net OPEB Obligation (NOO). An accounting liability when an employer doesn’t fully fund the ARC.
Normal Cost. The annual cost assigned, under the actuarial funding method, to current and subsequent
plan years. Sometimes referred to as "current service cost." Any payment toward the unfunded actuarial
accrued liability is not part of the normal cost.
Other Postemployment Benefits (OPEB). OPEB are postemployment benefits other than pensions.
OPEB generally takes the form of health insurance and dental, vision, prescription drugs or other
healthcare benefits.
Pay-As-You-Go Funding. A method of financing benefits by making required benefit payments only as
they come due.
Plan Member. A plan’s membership includes active service employees, terminated employees who are
eligible to receive benefits but are not receiving them, and retired employees and beneficiaries currently
receiving benefits.
Pooled Money Investment Account (PMIA). An account administered by the Pooled Money Investment
Board in the State of California that is limited to investments in the following categories: U.S. government
State of California OPEB Valuation as of June 30, 2012
88
securities, securities of federally-sponsored agencies, domestic corporate bonds, interest-bearing time
deposits in California banks, savings and loan associations and credit unions, prime-rated commercial
paper, repurchase and reverse repurchase agreements, security loans, banker's acceptances, negotiable
certificates of deposit and loans to various bond funds.
Pre-Funding. A method of financing benefits by placing resources in trust as employees earn benefits so
that the resources thus accumulated, along with related earnings, can be used to make benefit payments as
they become due.
Present Value of all Projected Benefits. The present value of the cost to finance benefits payable in the
future, discounted to reflect the expected effects of the time value of money and the probabilities of
payment.
Qualified Plan. A qualified plan is an employer-sponsored retirement plan that qualifies for special tax
treatment under Section 401(a) of the Internal Revenue Code.
Reserve Account. An account used to indicate that funds have been set-aside for a specific purpose and
are not generally available for other uses.
State Plan of the California Public Employees’ Retirement System. Consists of, all State
Miscellaneous employees (including CSU), State Industrial Members, Highway Patrol, State Police
Officers and Firefighters (including CSU), and Other State Safety Employees.
Unfunded Actuarial Accrued Liability (UAAL). The difference between the actuarial accrued liability
and valuation assets. Sometimes referred to as "unfunded accrued liability."
Valuation Assets. The value of current plan assets recognized for valuation purposes.