Embed Size (px)
Citation preview
Freight in
America A New national picture
Bureau of Transportation Statistics
U.S. Department of TransportationResearch and Innovative Technology Administration

Freight in
America A New national picture
January 2006
Bureau of Transportation Statistics
U.S. Department of Transportation
Research and Innovative Technology Administration
To obtain Freight in America and other BTS publications:Phone: 202-366-DATAFax: 202-366-3197Internet: www.bts.govMail: Product Orders Research and Innovative Technology Administration Bureau of Transportation Statistics U.S. Department of Transportation 400 Seventh Street, SW, Room 3430 Washington, DC 20590
Information ServiceEmail: [email protected]: 1-800-853-1351
Recommended citationU.S. Department of TransportationResearch and Innovative Technology AdministrationBureau of Transportation StatisticsFreight in America, January 2006Washington, DC: 2006
U.S. Department of Transportation
Norman Y. MinetaSecretary
Maria CinoDeputy Secretary
Research and Innovative Technology Administration
Ashok G. Kaveeshwar Administrator
Eric C. PetersonDeputy Administrator
Bureau of Transportation Statistics
Mary J. HutzlerActing Deputy Director
Produced under the direction of:Michael P. Cohen Assistant Director for Survey Programs
Wendell FletcherAssistant Director forTransportation Analysis
Program ManagerDeborah D. Johnson
AuthorFelix Ammah-Tagoe
EditorWilliam Moore
Design and LayoutDorinda Edmondson
Cover Design and GraphicsAlpha Glass
Major ContributorsMichael MargretaMichael SprungAdhi DipoShana RetherfordScott DennisCharlie Han
Other ContributorsSteve BeningoRon DuychAlan JeevesPaula RobinsonNeil RussellJoy SharpGetachew MekonnenFahim MohamedSakina Saulath
Special AcknowledgmentSpecial thanks to Rolf Schmitt and Tianjia Tang of the Federal Highway Administration, Offi ce of Freight Management and Operations, for their collaboration in producing the new national estimates used in this report and in the Freight Analysis Framework II data program.
Acknowledgments

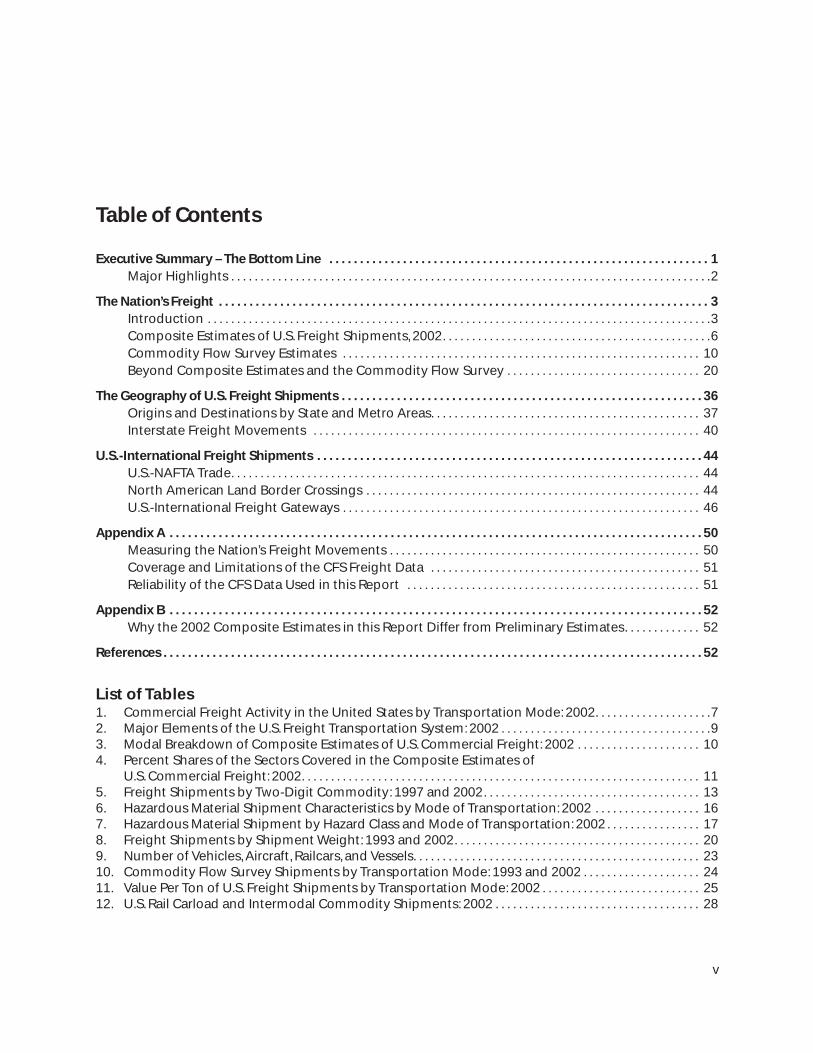
Table of Contents
Executive Summary – The Bottom Line . . . . . . . . . . . . . . . . . . . . . . . . . . . . . . . . . . . . . . . . . . . . . . . . . . . . . . . . . . . . . . 1Major Highlights . . . . . . . . . . . . . . . . . . . . . . . . . . . . . . . . . . . . . . . . . . . . . . . . . . . . . . . . . . . . . . . . . . . . . . . . . . . . . . . . . .2
The Nation’s Freight . . . . . . . . . . . . . . . . . . . . . . . . . . . . . . . . . . . . . . . . . . . . . . . . . . . . . . . . . . . . . . . . . . . . . . . . . . . . . . . . 3Introduction . . . . . . . . . . . . . . . . . . . . . . . . . . . . . . . . . . . . . . . . . . . . . . . . . . . . . . . . . . . . . . . . . . . . . . . . . . . . . . . . . . . . . .3Composite Estimates of U.S. Freight Shipments, 2002 . . . . . . . . . . . . . . . . . . . . . . . . . . . . . . . . . . . . . . . . . . . . . .6Commodity Flow Survey Estimates . . . . . . . . . . . . . . . . . . . . . . . . . . . . . . . . . . . . . . . . . . . . . . . . . . . . . . . . . . . . . 10Beyond Composite Estimates and the Commodity Flow Survey . . . . . . . . . . . . . . . . . . . . . . . . . . . . . . . . . 20
The Geography of U.S. Freight Shipments . . . . . . . . . . . . . . . . . . . . . . . . . . . . . . . . . . . . . . . . . . . . . . . . . . . . . . . . . . . 36Origins and Destinations by State and Metro Areas. . . . . . . . . . . . . . . . . . . . . . . . . . . . . . . . . . . . . . . . . . . . . . 37Interstate Freight Movements . . . . . . . . . . . . . . . . . . . . . . . . . . . . . . . . . . . . . . . . . . . . . . . . . . . . . . . . . . . . . . . . . . 40
U.S.-International Freight Shipments . . . . . . . . . . . . . . . . . . . . . . . . . . . . . . . . . . . . . . . . . . . . . . . . . . . . . . . . . . . . . . . 44U.S.-NAFTA Trade. . . . . . . . . . . . . . . . . . . . . . . . . . . . . . . . . . . . . . . . . . . . . . . . . . . . . . . . . . . . . . . . . . . . . . . . . . . . . . . . 44North American Land Border Crossings . . . . . . . . . . . . . . . . . . . . . . . . . . . . . . . . . . . . . . . . . . . . . . . . . . . . . . . . . 44U.S.-International Freight Gateways . . . . . . . . . . . . . . . . . . . . . . . . . . . . . . . . . . . . . . . . . . . . . . . . . . . . . . . . . . . . . 46
Appendix A . . . . . . . . . . . . . . . . . . . . . . . . . . . . . . . . . . . . . . . . . . . . . . . . . . . . . . . . . . . . . . . . . . . . . . . . . . . . . . . . . . . . . . . 50Measuring the Nation’s Freight Movements . . . . . . . . . . . . . . . . . . . . . . . . . . . . . . . . . . . . . . . . . . . . . . . . . . . . . 50Coverage and Limitations of the CFS Freight Data . . . . . . . . . . . . . . . . . . . . . . . . . . . . . . . . . . . . . . . . . . . . . . 51Reliability of the CFS Data Used in this Report . . . . . . . . . . . . . . . . . . . . . . . . . . . . . . . . . . . . . . . . . . . . . . . . . . 51
Appendix B . . . . . . . . . . . . . . . . . . . . . . . . . . . . . . . . . . . . . . . . . . . . . . . . . . . . . . . . . . . . . . . . . . . . . . . . . . . . . . . . . . . . . . . 52Why the 2002 Composite Estimates in this Report Differ from Preliminary Estimates . . . . . . . . . . . . . 52
References . . . . . . . . . . . . . . . . . . . . . . . . . . . . . . . . . . . . . . . . . . . . . . . . . . . . . . . . . . . . . . . . . . . . . . . . . . . . . . . . . . . . . . . . 52
List of Tables1. Commercial Freight Activity in the United States by Transportation Mode: 2002 . . . . . . . . . . . . . . . . . . . .72. Major Elements of the U.S. Freight Transportation System: 2002 . . . . . . . . . . . . . . . . . . . . . . . . . . . . . . . . . . . .93. Modal Breakdown of Composite Estimates of U.S. Commercial Freight: 2002 . . . . . . . . . . . . . . . . . . . . . 104. Percent Shares of the Sectors Covered in the Composite Estimates of U.S. Commercial Freight: 2002 . . . . . . . . . . . . . . . . . . . . . . . . . . . . . . . . . . . . . . . . . . . . . . . . . . . . . . . . . . . . . . . . . . . . 115. Freight Shipments by Two-Digit Commodity: 1997 and 2002 . . . . . . . . . . . . . . . . . . . . . . . . . . . . . . . . . . . . . 136. Hazardous Material Shipment Characteristics by Mode of Transportation: 2002 . . . . . . . . . . . . . . . . . . 167. Hazardous Material Shipment by Hazard Class and Mode of Transportation: 2002 . . . . . . . . . . . . . . . . 178. Freight Shipments by Shipment Weight: 1993 and 2002 . . . . . . . . . . . . . . . . . . . . . . . . . . . . . . . . . . . . . . . . . . 209. Number of Vehicles, Aircraft, Railcars, and Vessels. . . . . . . . . . . . . . . . . . . . . . . . . . . . . . . . . . . . . . . . . . . . . . . . . 2310. Commodity Flow Survey Shipments by Transportation Mode: 1993 and 2002 . . . . . . . . . . . . . . . . . . . . 2411. Value Per Ton of U.S. Freight Shipments by Transportation Mode: 2002 . . . . . . . . . . . . . . . . . . . . . . . . . . . 2512. U.S. Rail Carload and Intermodal Commodity Shipments: 2002 . . . . . . . . . . . . . . . . . . . . . . . . . . . . . . . . . . . 28
v
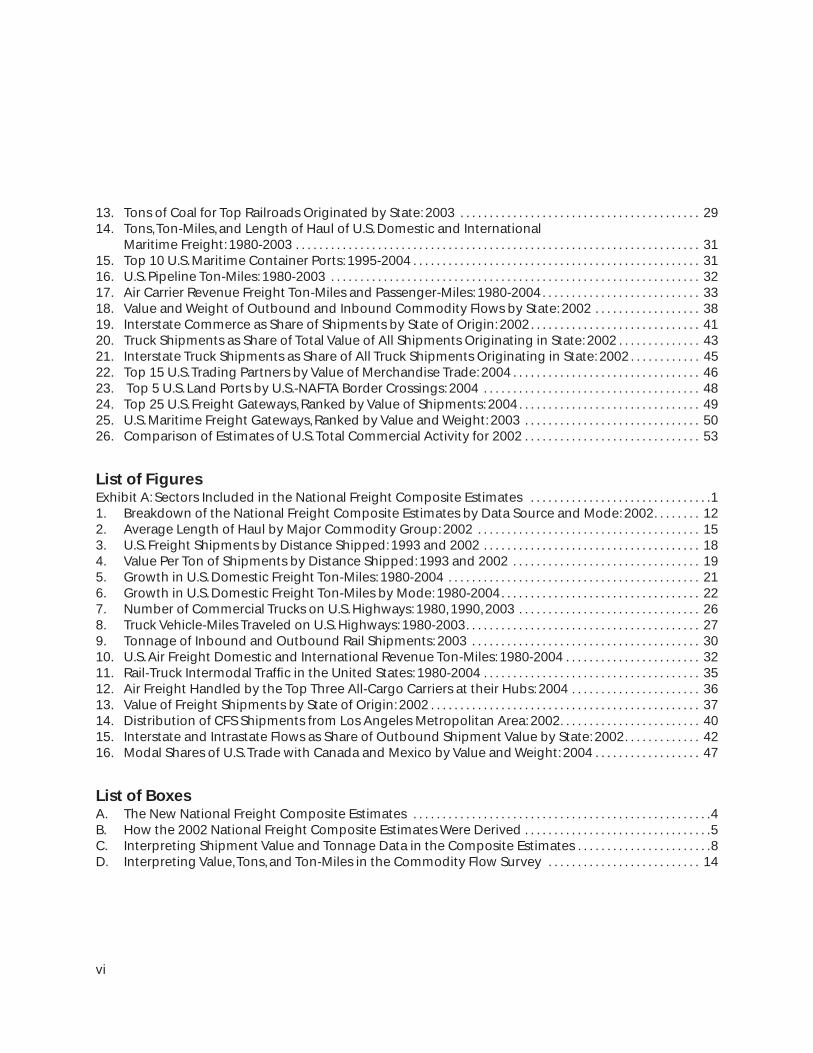
13. Tons of Coal for Top Railroads Originated by State: 2003 . . . . . . . . . . . . . . . . . . . . . . . . . . . . . . . . . . . . . . . . . 2914. Tons, Ton-Miles, and Length of Haul of U.S. Domestic and International Maritime Freight: 1980-2003 . . . . . . . . . . . . . . . . . . . . . . . . . . . . . . . . . . . . . . . . . . . . . . . . . . . . . . . . . . . . . . . . . . . . . 3115. Top 10 U.S. Maritime Container Ports: 1995-2004 . . . . . . . . . . . . . . . . . . . . . . . . . . . . . . . . . . . . . . . . . . . . . . . . . 3116. U.S. Pipeline Ton-Miles: 1980-2003 . . . . . . . . . . . . . . . . . . . . . . . . . . . . . . . . . . . . . . . . . . . . . . . . . . . . . . . . . . . . . . . 3217. Air Carrier Revenue Freight Ton-Miles and Passenger-Miles: 1980-2004 . . . . . . . . . . . . . . . . . . . . . . . . . . . 3318. Value and Weight of Outbound and Inbound Commodity Flows by State: 2002 . . . . . . . . . . . . . . . . . . 3819. Interstate Commerce as Share of Shipments by State of Origin: 2002 . . . . . . . . . . . . . . . . . . . . . . . . . . . . . 4120. Truck Shipments as Share of Total Value of All Shipments Originating in State: 2002 . . . . . . . . . . . . . . 4321. Interstate Truck Shipments as Share of All Truck Shipments Originating in State: 2002 . . . . . . . . . . . . 4522. Top 15 U.S. Trading Partners by Value of Merchandise Trade: 2004 . . . . . . . . . . . . . . . . . . . . . . . . . . . . . . . . 4623. Top 5 U.S. Land Ports by U.S.-NAFTA Border Crossings: 2004 . . . . . . . . . . . . . . . . . . . . . . . . . . . . . . . . . . . . . 4824. Top 25 U.S. Freight Gateways, Ranked by Value of Shipments: 2004 . . . . . . . . . . . . . . . . . . . . . . . . . . . . . . . 4925. U.S. Maritime Freight Gateways, Ranked by Value and Weight: 2003 . . . . . . . . . . . . . . . . . . . . . . . . . . . . . . 5026. Comparison of Estimates of U.S. Total Commercial Activity for 2002 . . . . . . . . . . . . . . . . . . . . . . . . . . . . . . 53
List of FiguresExhibit A: Sectors Included in the National Freight Composite Estimates . . . . . . . . . . . . . . . . . . . . . . . . . . . . . . .11. Breakdown of the National Freight Composite Estimates by Data Source and Mode: 2002 . . . . . . . . 122. Average Length of Haul by Major Commodity Group: 2002 . . . . . . . . . . . . . . . . . . . . . . . . . . . . . . . . . . . . . . 153. U.S. Freight Shipments by Distance Shipped: 1993 and 2002 . . . . . . . . . . . . . . . . . . . . . . . . . . . . . . . . . . . . . 184. Value Per Ton of Shipments by Distance Shipped: 1993 and 2002 . . . . . . . . . . . . . . . . . . . . . . . . . . . . . . . . 195. Growth in U.S. Domestic Freight Ton-Miles: 1980-2004 . . . . . . . . . . . . . . . . . . . . . . . . . . . . . . . . . . . . . . . . . . . 216. Growth in U.S. Domestic Freight Ton-Miles by Mode: 1980-2004 . . . . . . . . . . . . . . . . . . . . . . . . . . . . . . . . . . 227. Number of Commercial Trucks on U.S. Highways: 1980, 1990, 2003 . . . . . . . . . . . . . . . . . . . . . . . . . . . . . . . 268. Truck Vehicle-Miles Traveled on U.S. Highways: 1980-2003 . . . . . . . . . . . . . . . . . . . . . . . . . . . . . . . . . . . . . . . . 279. Tonnage of Inbound and Outbound Rail Shipments: 2003 . . . . . . . . . . . . . . . . . . . . . . . . . . . . . . . . . . . . . . . 3010. U.S. Air Freight Domestic and International Revenue Ton-Miles: 1980-2004 . . . . . . . . . . . . . . . . . . . . . . . 3211. Rail-Truck Intermodal Traffi c in the United States: 1980-2004 . . . . . . . . . . . . . . . . . . . . . . . . . . . . . . . . . . . . . 3512. Air Freight Handled by the Top Three All-Cargo Carriers at their Hubs: 2004 . . . . . . . . . . . . . . . . . . . . . . 3613. Value of Freight Shipments by State of Origin: 2002 . . . . . . . . . . . . . . . . . . . . . . . . . . . . . . . . . . . . . . . . . . . . . . 3714. Distribution of CFS Shipments from Los Angeles Metropolitan Area: 2002 . . . . . . . . . . . . . . . . . . . . . . . . 4015. Interstate and Intrastate Flows as Share of Outbound Shipment Value by State: 2002 . . . . . . . . . . . . . 4216. Modal Shares of U.S. Trade with Canada and Mexico by Value and Weight: 2004 . . . . . . . . . . . . . . . . . . 47
List of BoxesA. The New National Freight Composite Estimates . . . . . . . . . . . . . . . . . . . . . . . . . . . . . . . . . . . . . . . . . . . . . . . . . . .4B. How the 2002 National Freight Composite Estimates Were Derived . . . . . . . . . . . . . . . . . . . . . . . . . . . . . . . .5C. Interpreting Shipment Value and Tonnage Data in the Composite Estimates . . . . . . . . . . . . . . . . . . . . . . .8D. Interpreting Value, Tons, and Ton-Miles in the Commodity Flow Survey . . . . . . . . . . . . . . . . . . . . . . . . . . 14
vi
1
EXECUTIVE SUMMARY—THE BOTTOM LINE
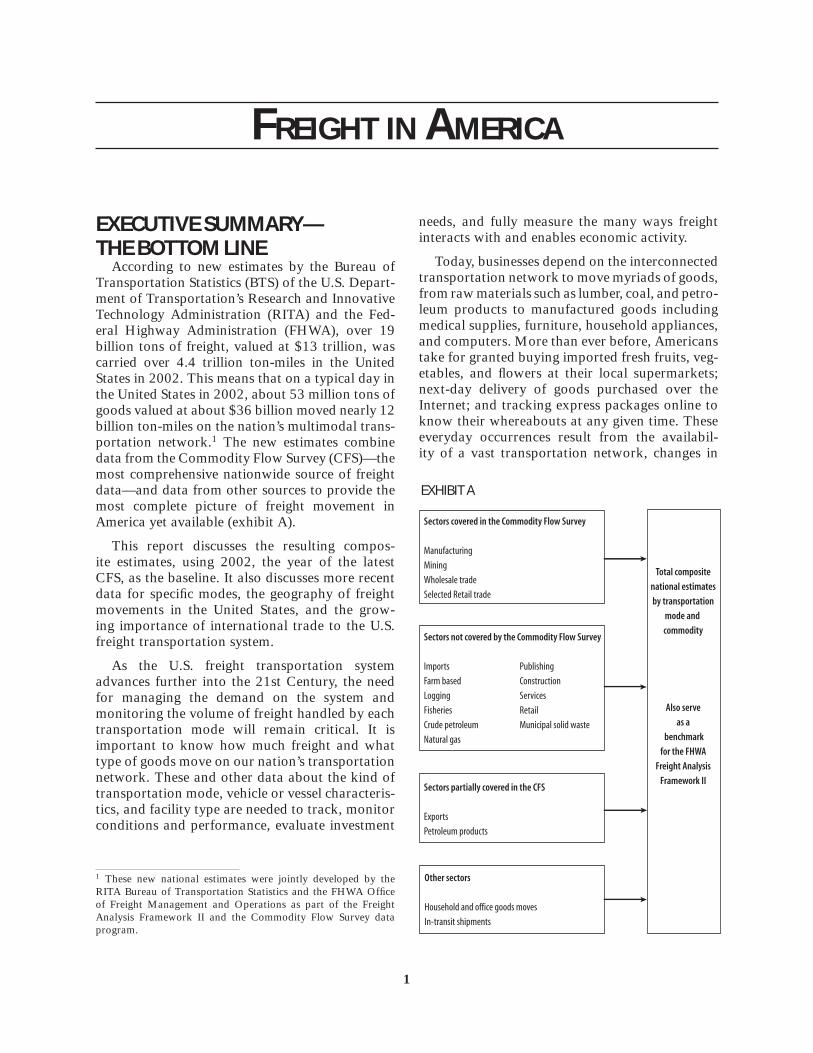
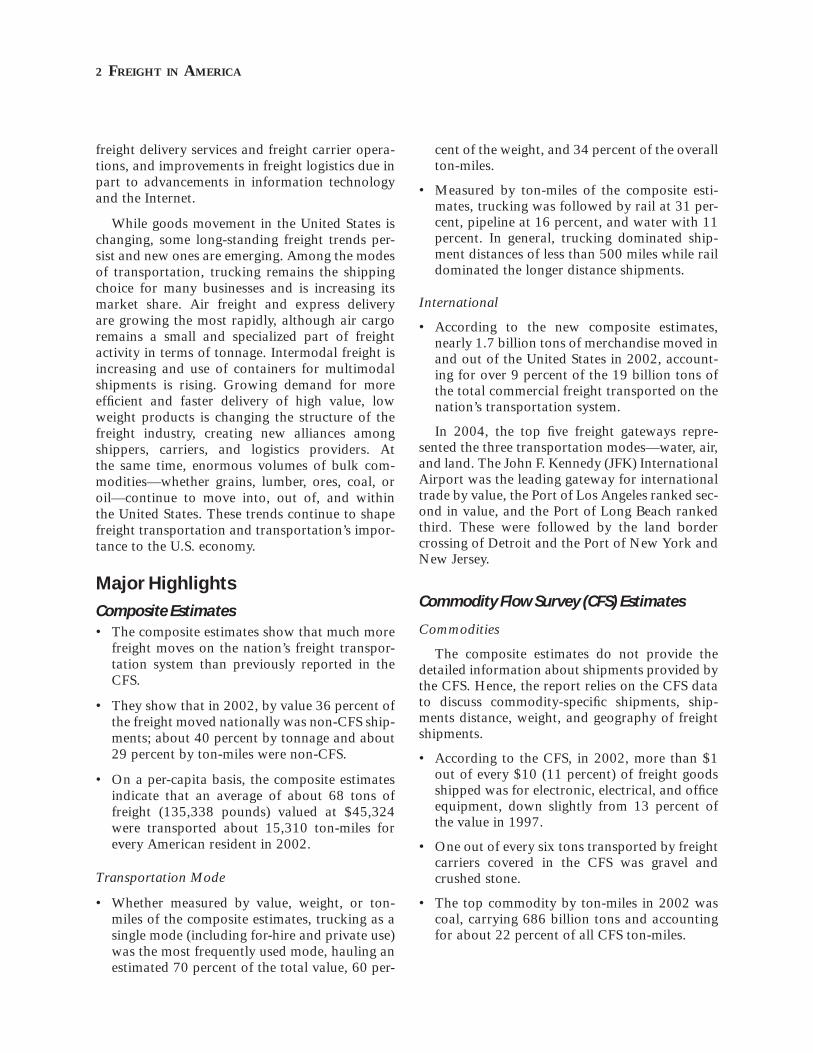
According to new estimates by the Bureau of Transportation Statistics (BTS) of the U.S. Depart-ment of Transportation’s Research and Innovative Technology Administration (RITA) and the Fed-eral Highway Administration (FHWA), over 19 billion tons of freight, valued at $13 trillion, was carried over 4.4 trillion ton-miles in the United States in 2002. This means that on a typical day in the United States in 2002, about 53 million tons of goods valued at about $36 billion moved nearly 12 billion ton-miles on the nation’s multimodal trans-portation network.1 The new estimates combine data from the Commodity Flow Survey (CFS)—the most comprehensive nationwide source of freight data—and data from other sources to provide the most complete picture of freight movement in America yet available (exhibit A).
This report discusses the resulting compos-ite estimates, using 2002, the year of the latest CFS, as the baseline. It also discusses more recent data for specifi c modes, the geography of freight movements in the United States, and the grow-ing importance of international trade to the U.S. freight transportation system.
As the U.S. freight transportation system advances further into the 21st Century, the need for managing the demand on the system and monitoring the volume of freight handled by each transportation mode will remain critical. It is important to know how much freight and what type of goods move on our nation’s transportation network. These and other data about the kind of transportation mode, vehicle or vessel characteris-tics, and facility type are needed to track, monitor conditions and performance, evaluate investment
1 These new national estimates were jointly developed by the RITA Bureau of Transportation Statistics and the FHWA Offi ce of Freight Management and Operations as part of the Freight Analysis Framework II and the Commodity Flow Survey data program.
needs, and fully measure the many ways freight interacts with and enables economic activity.
Today, businesses depend on the interconnected transportation network to move myriads of goods, from raw materials such as lumber, coal, and petro-leum products to manufactured goods including medical supplies, furniture, household appliances, and computers. More than ever before, Americans take for granted buying imported fresh fruits, veg-etables, and fl owers at their local supermarkets; next-day delivery of goods purchased over the Internet; and tracking express packages online to know their whereabouts at any given time. These everyday occurrences result from the availabil-ity of a vast transportation network, changes in
Sectors covered in the Commodity Flow Survey
Manufacturing
Mining
Wholesale trade
Selected Retail trade
Sectors not covered by the Commodity Flow Survey
Imports Publishing
Farm based Construction
Logging Services
Fisheries Retail
Crude petroleum Municipal solid waste
Natural gas
Sectors partially covered in the CFS
Exports
Petroleum products
Other sectors
Household and office goods moves
In-transit shipments
Total composite
national estimates
by transportation
mode and
commodity
Also serve
as a
benchmark
for the FHWA
Freight Analysis
Framework II
EXHIBIT A
FREIGHT IN AMERICA
2 FREIGHT IN AMERICA
freight delivery services and freight carrier opera-tions, and improvements in freight logistics due in part to advancements in information technology and the Internet.
While goods movement in the United States is changing, some long-standing freight trends per-sist and new ones are emerging. Among the modes of transportation, trucking remains the shipping choice for many businesses and is increasing its market share. Air freight and express delivery are growing the most rapidly, although air cargo remains a small and specialized part of freight activity in terms of tonnage. Intermodal freight is increasing and use of containers for multimodal shipments is rising. Growing demand for more effi cient and faster delivery of high value, low weight products is changing the structure of the freight industry, creating new alliances among shippers, carriers, and logistics providers. At the same time, enormous volumes of bulk com-modities—whether grains, lumber, ores, coal, or oil—continue to move into, out of, and within the United States. These trends continue to shape freight transportation and transportation’s impor-tance to the U.S. economy.
Major Highlights
Composite Estimates• The composite estimates show that much more
freight moves on the nation’s freight transpor-tation system than previously reported in the CFS.
• They show that in 2002, by value 36 percent of the freight moved nationally was non-CFS ship-ments; about 40 percent by tonnage and about 29 percent by ton-miles were non-CFS.
• On a per-capita basis, the composite estimates indicate that an average of about 68 tons of freight (135,338 pounds) valued at $45,324 were transported about 15,310 ton-miles for every American resident in 2002.
Transportation Mode
• Whether measured by value, weight, or ton-miles of the composite estimates, trucking as a single mode (including for-hire and private use) was the most frequently used mode, hauling an estimated 70 percent of the total value, 60 per-
cent of the weight, and 34 percent of the overall ton-miles.
• Measured by ton-miles of the composite esti-mates, trucking was followed by rail at 31 per-cent, pipeline at 16 percent, and water with 11 percent. In general, trucking dominated ship-ment distances of less than 500 miles while rail dominated the longer distance shipments.
International
• According to the new composite estimates, nearly 1.7 billion tons of merchandise moved in and out of the United States in 2002, account-ing for over 9 percent of the 19 billion tons of the total commercial freight transported on the nation’s transportation system.
In 2004, the top fi ve freight gateways repre-sented the three transportation modes—water, air, and land. The John F. Kennedy (JFK) International Airport was the leading gateway for international trade by value, the Port of Los Angeles ranked sec-ond in value, and the Port of Long Beach ranked third. These were followed by the land border crossing of Detroit and the Port of New York and New Jersey.
Commodity Flow Survey (CFS) Estimates
Commodities
The composite estimates do not provide the detailed information about shipments provided by the CFS. Hence, the report relies on the CFS data to discuss commodity-specifi c shipments, ship-ments distance, weight, and geography of freight shipments.
• According to the CFS, in 2002, more than $1 out of every $10 (11 percent) of freight goods shipped was for electronic, electrical, and offi ce equipment, down slightly from 13 percent of the value in 1997.
• One out of every six tons transported by freight carriers covered in the CFS was gravel and crushed stone.
• The top commodity by ton-miles in 2002 was coal, carrying 686 billion tons and accounting for about 22 percent of all CFS ton-miles.
FREIGHT IN AMERICA 3
Distance
• In 2002, more than three-quarters (77 per-cent) of the weight (9 billion tons) of all CFS shipments and over half the value ($4.6 tril-lion), moved in local and short haul shipments, within 250 miles from origin. However, long-haul shipments—more than 250 miles—carried 82 percent of the ton-miles.
Size
• Smaller sized shipments (less than 500 pounds) accounted for about 25 percent of the value of CFS shipments. Of these shipments, those weighing less than 100 pounds grew even faster by value between 1993 and 2002—65 percent by value.
Geography
• By value, the leading state of origin for CFS shipments was California with 11 percent ($924 billion) of the value of total CFS ship-ments, followed by Texas with 7 percent of the value. Other leading states of origin by value include Ohio and Illinois.
• By weight, the leading states of origin for out-bound CFS shipments include Texas, Califor-nia, and Illinois.
• By value, the Los Angeles-Long Beach-River-side metro area was the lead for outbound CFS shipments originating in metropolitan areas.
• By weight, the leading metropolitan areas were: Houston-Baytown-Huntsville, Texas; Chicago-Naperville-Michigan City (Illinois part); and Los Angeles-Long Beach-Riverside.
• Nationally, nearly 60 percent of the value of CFS freight shipments by all modes, worth $4.9 trillion, crossed state lines in interstate com-merce. By weight 34 percent of the shipments, over 4 billion tons was interstate.
Each transportation mode continues to play an important role in the movement of freight, whether hauling large quantities of bulk commodities or perishables over great distances, carrying smaller packages to the main streets and back roads of America, or fl ying high-value merchandise to and from our trading partners abroad. Growth in the U.S. economy, increases in wholesale and retail trade, and changes in our overseas trading part-
ners will continue to affect the level of U.S. freight shipments and the demand for freight transporta-tion services. By 2020 the nation’s freight tonnage is projected to increase nearly 70 percent (USDOT FHWA 2003).2 With this expected growth, the need to better track changes in how freight moves and monitor the possible impacts on system capac-ity, congestion, safety, and the environment will be of major importance.
THE NATION’S FREIGHTIntroduction
As the data in this report show, the U.S. freight transportation system carries enormous quantities of goods and raw materials to support economic and industrial activities all across the nation and to meet consumer demands. The system also han-dles large volumes of goods traded internationally and transported to and from the United States and places throughout the world. Freight transportation touches every aspect of American economic life. Goods movement is increasingly part of a complex logistical system that serves an increasingly global-ized economy. Transportation’s vital importance to the U.S. economy is underscored by the fact that more than $1 out of every $10 produced in the U.S. gross domestic product (GDP) is related to trans-portation activity (USDOT BTS 2005).3
Freight in America presents new estimates of freight movements in the United States that are more comprehensive than the Commodity Flow Survey (CFS) and covers domestic shipments from all the major economic sectors as well as exports and imports. It uses fi nal data from the 2002 CFS and composite estimates compiled from many sources to fi ll gaps in CFS coverage by industry, commodity, and transportation mode (boxes A and B).4 The new estimates include a large quan-
2 This projection is based on the 1998 benchmark reported by the Federal Highway Administration’s Freight Analysis Framework.3 This includes all aspects of transportation, including the move-ment of goods and the purchase of all transportation-related products and services as well as the movement of people.4 This report is more complete than the April 2004 Freight Ship-ments in America preliminary highlights report that was based on the preliminary 2002 CFS data. In this report estimates of the nation’s freight shipments differ from the initial estimates. For instance, CFS’ share of total shipments in this report are lower than the preliminary estimates due to the addition of estimates for previously uncovered sectors, such as construction, retail, ser-vices, and municipal solid waste.
4 FREIGHT IN AMERICA
tity of material often not counted in domestic freight surveys, such as municipal solid waste, goods handled by the service sector, and house-hold and offi ce relocations.5 Each mode carries more freight and uses more of the freight infra-structure than previously documented.
The 2002 CFS fi nal national data were released in December 2004 by the Research and Innova-
5 As explained in box A, the CFS covers most but not all com-mercial freight activity in the United States. BTS and Federal Highway Administration supplemented the CFS data with other data sources to create a detailed picture of the nation’s commer-cial freight fl ows.
tive Technology Administration’s (RITA) Bureau of Transportation Statistics (BTS) and the U.S. Census Bureau. Composite estimates in this report were subsequently developed by BTS and the Fed-eral Highway Administration from multiple data sources to complement the CFS data and provide a better picture of commercial freight movements—both domestic and U.S.-international.
This report presents snapshots of changes in freight movements that occurred between 1993 and 2002, highlighting major trends during this period where the data allow such comparisons. Freight in America discusses recent trends in freight charac-
The largest single data source for estimating U.S. freight activity is the Commodity Flow Survey (CFS). This survey covers a large proportion of the nation’s domestic and export freight movements associated with manufacturing, mining, and wholesale trade. However, it does not capture all of the freight that moves on the U.S. freight system because many economic activities are not covered. In order to report on the current state of freight shipments in America and to describe the major changes that are taking place in U.S. freight transportation, this report makes use of several other data sources to provide a more complete snapshot of the nation’s freight activi-ties in 2002 (the year of the most recent CFS). Where 2003 and 2004 data are available, such as goods imports and exports and overall ton-miles, this report also uses these data to describe recent freight activity.
The composite estimates presented in this report are the result of a joint effort by the Research and Innovative Technology Administration (RITA), Bureau of Transpor-tation Statistics (BTS) and the Federal Highway Admin-istration (FHWA), Offi ce of Freight Management and Operations, to develop a more complete picture of the nation’s commercial freight shipments, including all eco-nomic sectors that handle freight in one way or another (see exhibit A). This fuller composite picture draws on the CFS data and non-CFS freight data from several sources for economic sectors not covered in the CFS, such as retail, services, construction, and households goods movements – that traditionally are not perceived as freight “produc-ers” but that do handle freight in their daily operations. It also includes shipments of agricultural products from farms to processing plants, logs and rough wood, fi shery products, crude petroleum, and municipal solid waste. The new composite estimate is different and larger than the BTS estimates published in the Freight Shipments in America report, which used preliminary 2002 CFS data, not the fi nal data used here, and does not include the non-CFS shipments discussed above.
Some data gaps still exist in the national freight pic-ture. The new estimates do not include transshipments, such as shipments from Canada that are transported on U.S. highways to Mexico but do not offi cially enter into the U.S. economy. With the exception of munici-pal solid waste, the estimates do not include government shipments. The composite estimates, using the current methods, were developed for 2002 only. Because the additional complementary data have not been assembled for 1993 and 1997, the other CFS years, the report uses only the CFS data when discussing changes in freight movements by type of transportation modes used in moving the nation’s freight, the kinds of commodities moved, and the distances traveled.
In order to make comparisons by mode, commod-ity, and other freight characteristics and determine, for example, which commodities are shipped the most, BTS performed statistical signifi cance testing on CFS data for freight value, weight, and ton-miles.1 It was not practi-cal to do this testing for the non-CFS estimates because they were drawn from different sources and some of the estimates are modeled data with many assumptions that cannot be tested statistically.
Throughout this report, a statistically signifi cant dif-ference between two different entities in the CFS (num-bers, groups, classifi cations, categories, etc. developed from a sample) is measured at the 10 percent level. This provides a 90 percent level of certainty about CFS esti-mates. That is, if we were to repeatedly make new esti-mates using exactly the same procedure (by drawing a new sample, conducting new interviews, calculating new estimates and new confi dence intervals), the confi dence intervals would contain the average of all the estimates 90 percent of the time.
1 The BTS Offi ce of Survey Programs performed the statisti-cal signifi cance testing for this report, using statistical reliability methods based on Raj and Chandhok 1998.
BOX AThe New National Freight Composite Estimates
FREIGHT IN AMERICA 5
BOX BHow the 2002 National Freight Composite Estimates Were Derived
The composite estimates include data from the Commodity Flow Survey (CFS) and data from sectors not covered in the CFS. The estimates were derived for each mode of transportation and at the 2-digit Standard Classifi cation of Transported Goods (SCTG) level. Below is a brief description of the coverage, methods, and sources for these data:
Component Coverage, methods, and sources
COMMODITY FLOW SURVEY DATA
In-scope sectors Covers domestic and export shipments by manufacturing, mining, wholesale trade, and selected retail sectors. Based on published results of the 2002 CFS as reported by the Bureau of Transportation Statistics and the U.S. Census Bureau.
NONCOMMODITY FLOW SURVEY DATA INCLUDED IN THE COMPOSITE ESTIMATES
(a) Out-of-scope: sectors in the North American Industry Classifi cation System (NAICS) not covered in the 2002 CFS
Imports Covers offi cial U.S. merchandise imports trade by mode and commodity. Value and weight information derived from trade data. Ton-miles derived as a sum of tonnage mul-tiplied by estimated shipment travel distance for each mode.
Farm-based Covers farm-based agricultural shipments that occur prior to storage in off farm facilities (e.g., grain elevators) or processing plants (e.g., fruit and live stock distribution centers). Estimates based on the 2002 Census of Agriculture and the U.S. Department of Agricul-ture’s 2004 Agricultural Statistics.
Fisheries Covers fi shery shipments that go from fi shing vessels to processing/distribution centers, excluding farm-raised fi sh which is covered by the CFS. Based on tonnage data from the 2002 Fisheries of the United States by the National Marine Fisheries Service and vehicle mileage data from the Vehicle Inventory and Use Survey (VIUS).
Crude petroleum Covers crude petroleum shipments by oil and gas extraction industries. Based on data from the Energy Information Administration (EIA) Petroleum Supply Annual 2002, the Federal Energy Regulatory Commission, and Shifts in Petroleum Transportation pub-lished by the Association of Oil Pipelines.
Natural gas Covers natural gas shipments by oil and gas extraction industries. Based on data from EIA’s Natural Gas Annual and the information from the Federal Energy Regulatory Commission.
Municipal solid waste Covers waste collected by municipalities, such as household trash, cardboard boxes, consumer appliances, newspapers, and yard trimmings. Excludes wastes such as sludge, agricultural wastes, and industrial wastes. Based on data from various state and munici-pal agencies and information from the BioCycle Journal of Composting and Organics Recycling.
Logging Logging is out of scope for the 2002 CFS because of the change from the Standard Indus-trial Classifi cation (SIC) to the North American Industry Classifi cation System (NAICS). Estimates based on data from the U.S. Department of Agriculture’s Agricultural Statistics, the Rail Waybill Sample, and the Waterborne Commerce of United States.
Publishing In 2002, publishing became out of scope because of the change from the Standard Indus-tryial Classifi cation (SIC) to the North American Industry Classifi cation System (NAICS). Estimates based on data from the Economic Census and average miles per shipment information from the 1997 CFS.
Construction Covers shipments of companies engaged in construction of residential and commercial buildings, utility systems, road and bridge construction, and specialty trade contractors. Estimates based on the Vehicle Inventory and Use Survey (VIUS), the Economic Census, and average miles per shipment information by commodity from the 1997 CFS.
Services Covers shipments from service sector companies engaged in, for example, accommoda-tion and food, rental and leasing, repair and maintenance, and scientifi c and technical services. Estimates based on the VIUS, the Economic Census, and average miles per ship-ment information by commodity from the 1997 CFS.
(continued on next page)
6 FREIGHT IN AMERICA
teristics, such as length of haul, shipment size, and commodities shipped. The report also highlights the geography of freight movements, including freight movements at the state, regional, and met-ropolitan area levels; interstate freight shipments; and U.S.-international freight movements.
Composite Estimates of U.S. Freight Shipments, 2002
What the Estimates ShowThe composite estimates show that American
businesses transported over 19 billion tons of raw materials and fi nished goods in 2002 from the covered freight generating economic sectors (table 1).6 The value of these freight shipments in 2002, including domestic commodity movements and domestic transportation of exports and imports, was $13 trillion. These large quantities of freight shipments are diverse and include manufactured goods, electronic equipment, grain moved along
6 2002 is the most recent year for which comprehensive nation-wide freight estimates are available for all modes of transportation and for local, intercity, interstate, and U.S.-international freight shipments. See boxes A and B for additional information.
the Mississippi River to Gulf Coast ports, fur-niture and fi xtures from household and offi ce relocations, and farm products as well as crude petroleum and natural gas shipments (see boxes B and C).
Whether transported from farms, factories, or seaports and moved by trucks, trains, ves-sels, pipelines, or airplanes, the freight moved in 2002 generated more than 4.4 trillion ton-miles over the nation’s freight transportation system. The shipments moved over an extensive freight transportation system supported by sophisticated information technology and operated, managed, and maintained by a large number of establish-ments employing a large labor force (table 2).
Comparison of the 2002 CFS and the Composite Estimates
As a proportion of the composite estimates, the 2002 CFS accounted for:
• 65 percent of the $13 trillion in total shipment value,
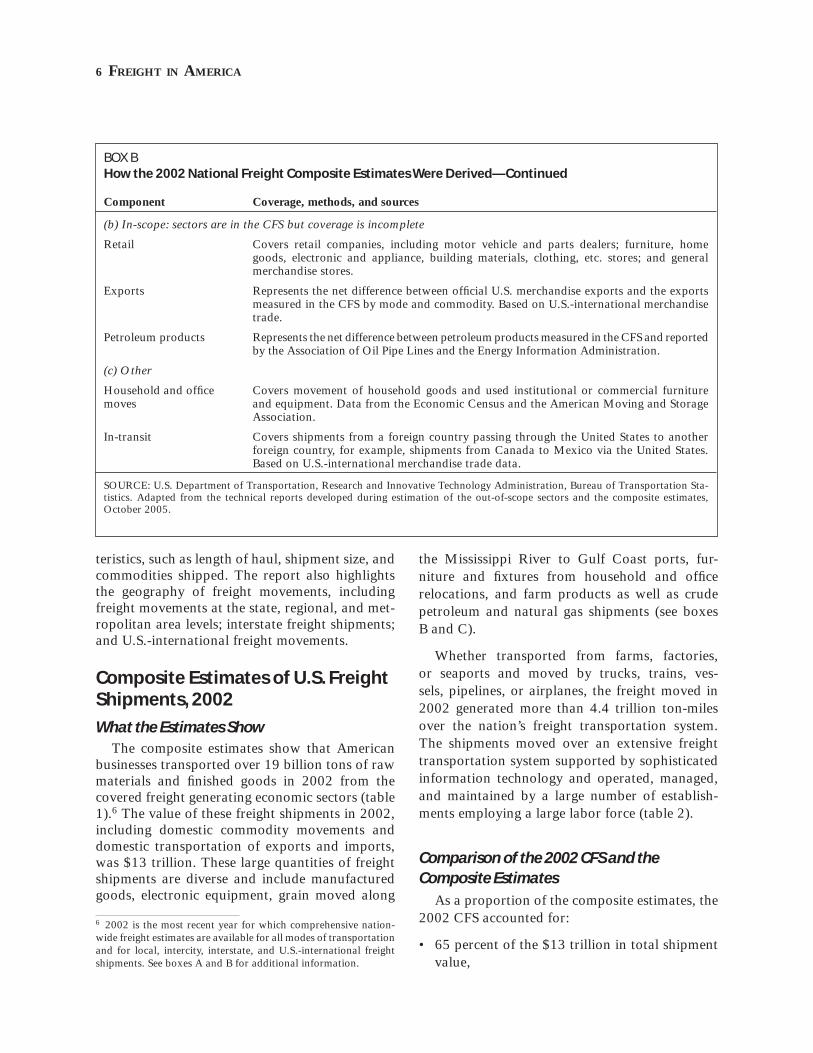
BOX BHow the 2002 National Freight Composite Estimates Were Derived—Continued
Component Coverage, methods, and sources
(b) In-scope: sectors are in the CFS but coverage is incomplete
Retail Covers retail companies, including motor vehicle and parts dealers; furniture, home goods, electronic and appliance, building materials, clothing, etc. stores; and general merchandise stores.
Exports Represents the net difference between offi cial U.S. merchandise exports and the exports measured in the CFS by mode and commodity. Based on U.S.-international merchandise trade.
Petroleum products Represents the net difference between petroleum products measured in the CFS and reported by the Association of Oil Pipe Lines and the Energy Information Administration.
(c) Other
Household and offi ce moves
Covers movement of household goods and used institutional or commercial furniture and equipment. Data from the Economic Census and the American Moving and Storage Association.
In-transit Covers shipments from a foreign country passing through the United States to another foreign country, for example, shipments from Canada to Mexico via the United States. Based on U.S.-international merchandise trade data.
SOURCE: U.S. Department of Transportation, Research and Innovative Technology Administration, Bureau of Transportation Sta-tistics. Adapted from the technical reports developed during estimation of the out-of-scope sectors and the composite estimates, October 2005.
FREIGHT IN AMERICA 7
• 60 percent of the 19 billion tons of total ship-ments, and
• 71 percent of the 4.4 trillion ton-miles of esti-mated total commercial freight movement.
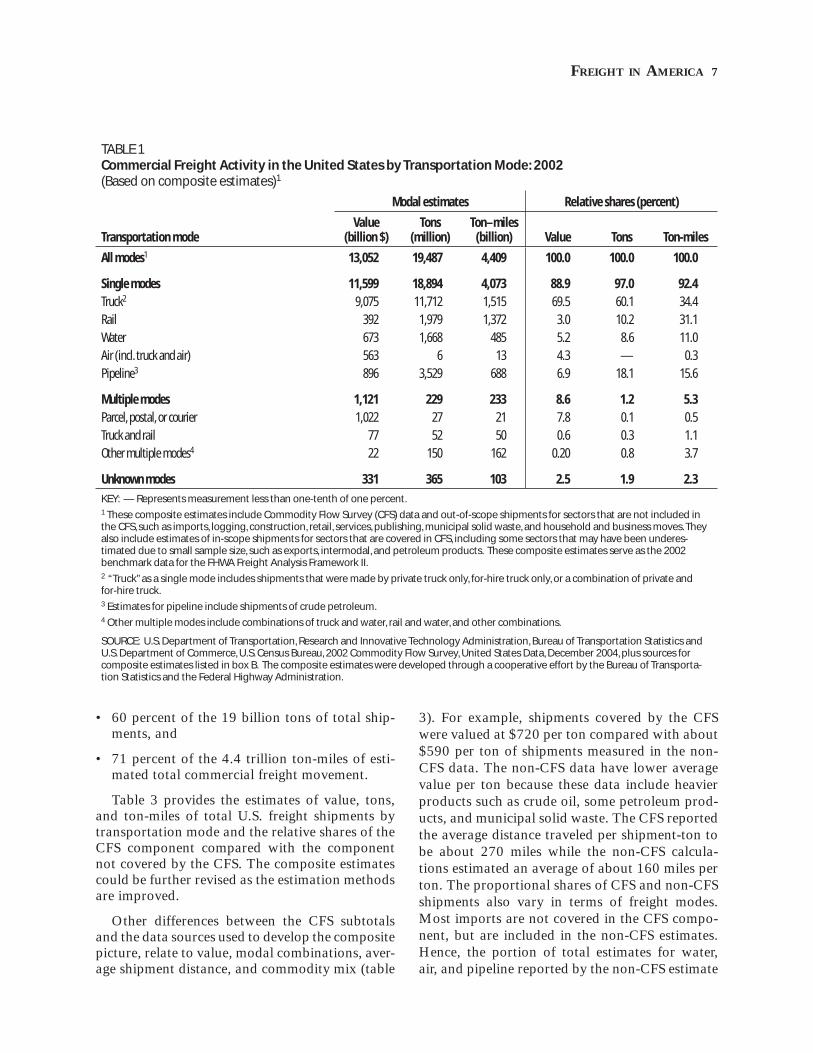
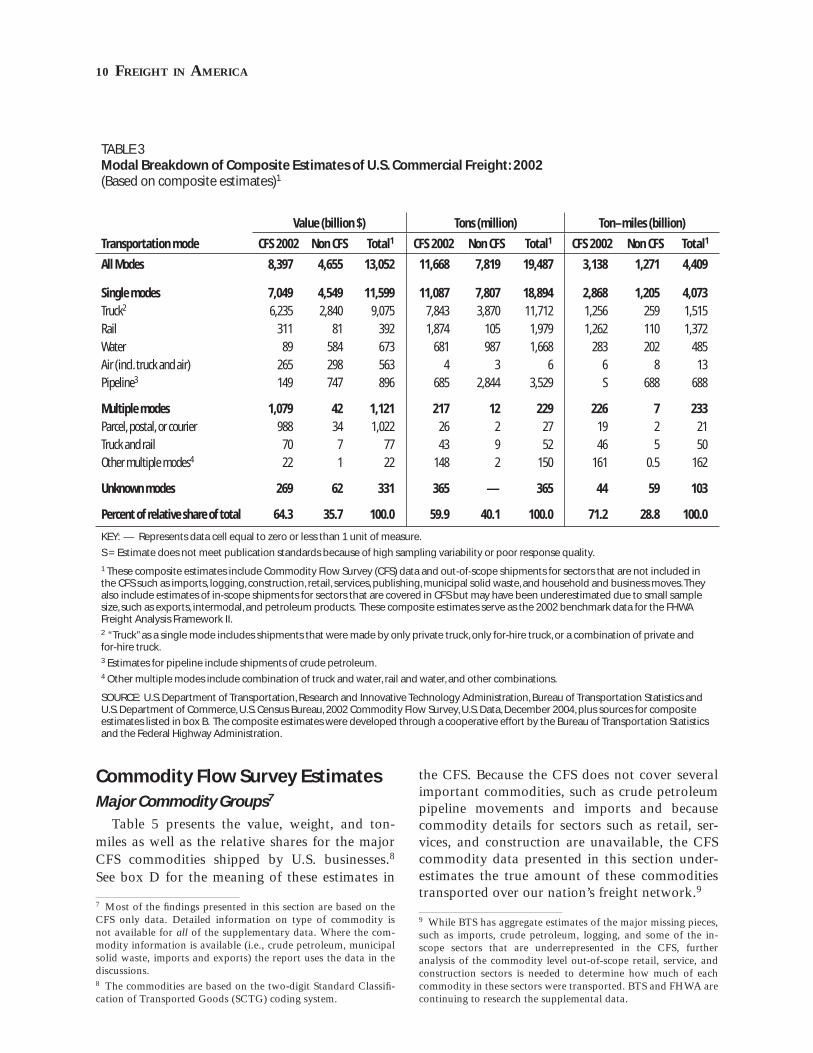
Table 3 provides the estimates of value, tons, and ton-miles of total U.S. freight shipments by transportation mode and the relative shares of the CFS component compared with the component not covered by the CFS. The composite estimates could be further revised as the estimation methods are improved.
Other differences between the CFS subtotals and the data sources used to develop the composite picture, relate to value, modal combinations, aver-age shipment distance, and commodity mix (table
3). For example, shipments covered by the CFS were valued at $720 per ton compared with about $590 per ton of shipments measured in the non-CFS data. The non-CFS data have lower average value per ton because these data include heavier products such as crude oil, some petroleum prod-ucts, and municipal solid waste. The CFS reported the average distance traveled per shipment-ton to be about 270 miles while the non-CFS calcula-tions estimated an average of about 160 miles per ton. The proportional shares of CFS and non-CFS shipments also vary in terms of freight modes. Most imports are not covered in the CFS compo-nent, but are included in the non-CFS estimates. Hence, the portion of total estimates for water, air, and pipeline reported by the non-CFS estimate
TABLE 1Commercial Freight Activity in the United States by Transportation Mode: 2002(Based on composite estimates)1
Transportation mode
Modal estimates Relative shares (percent)
Value (billion $)
Tons (million)
Ton–miles (billion) Value Tons Ton-miles
All modes1 13,052 19,487 4,409 100.0 100.0 100.0
Single modes 11,599 18,894 4,073 88.9 97.0 92.4 Truck2 9,075 11,712 1,515 69.5 60.1 34.4
Rail 392 1,979 1,372 3.0 10.2 31.1
Water 673 1,668 485 5.2 8.6 11.0
Air (incl. truck and air) 563 6 13 4.3 — 0.3
Pipeline3 896 3,529 688 6.9 18.1 15.6
Multiple modes 1,121 229 233 8.6 1.2 5.3 Parcel, postal, or courier 1,022 27 21 7.8 0.1 0.5
Truck and rail 77 52 50 0.6 0.3 1.1
Other multiple modes4 22 150 162 0.20 0.8 3.7
Unknown modes 331 365 103 2.5 1.9 2.3
KEY: — Represents measurement less than one-tenth of one percent.1 These composite estimates include Commodity Flow Survey (CFS) data and out-of-scope shipments for sectors that are not included in the CFS, such as imports, logging, construction, retail, services, publishing, municipal solid waste, and household and business moves. They also include estimates of in-scope shipments for sectors that are covered in CFS, including some sectors that may have been underes-timated due to small sample size, such as exports, intermodal, and petroleum products. These composite estimates serve as the 2002 benchmark data for the FHWA Freight Analysis Framework II.2 “Truck” as a single mode includes shipments that were made by private truck only, for-hire truck only, or a combination of private and for-hire truck.3 Estimates for pipeline include shipments of crude petroleum.4 Other multiple modes include combinations of truck and water, rail and water, and other combinations.
SOURCE: U.S. Department of Transportation, Research and Innovative Technology Administration, Bureau of Transportation Statistics and U.S. Department of Commerce, U.S. Census Bureau, 2002 Commodity Flow Survey, United States Data, December 2004, plus sources for composite estimates listed in box B. The composite estimates were developed through a cooperative effort by the Bureau of Transporta-tion Statistics and the Federal Highway Administration.
8 FREIGHT IN AMERICA
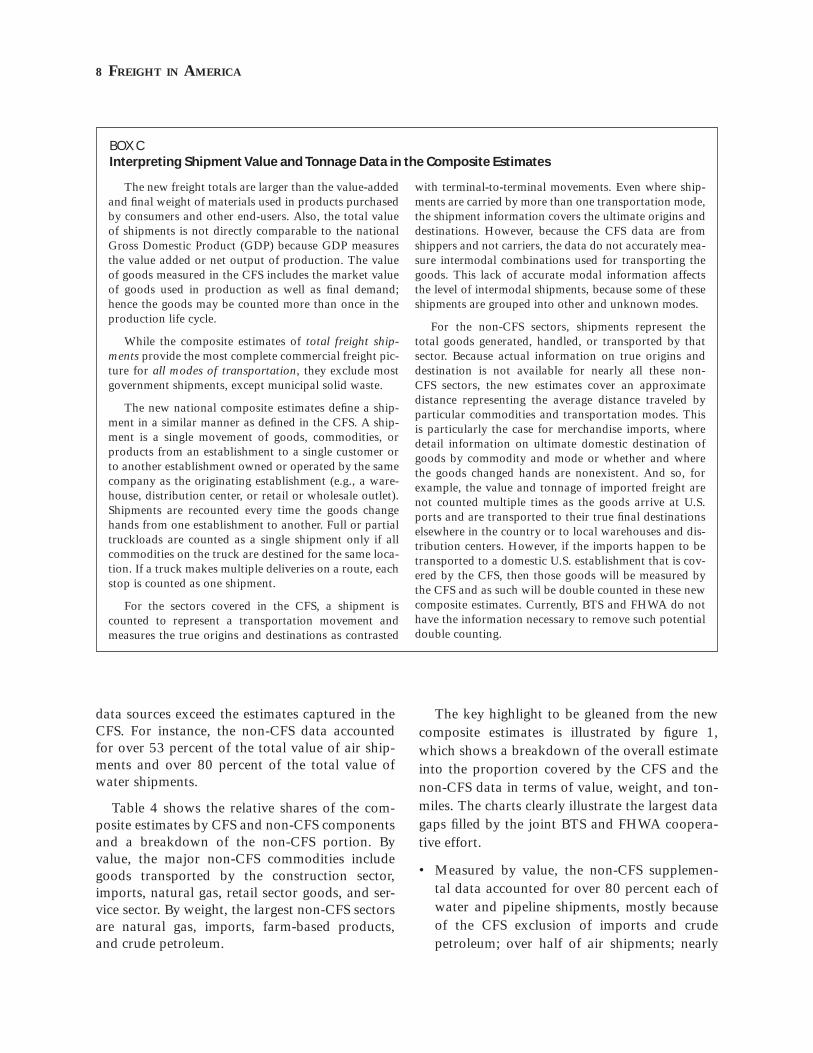
data sources exceed the estimates captured in the CFS. For instance, the non-CFS data accounted for over 53 percent of the total value of air ship-ments and over 80 percent of the total value of water shipments.
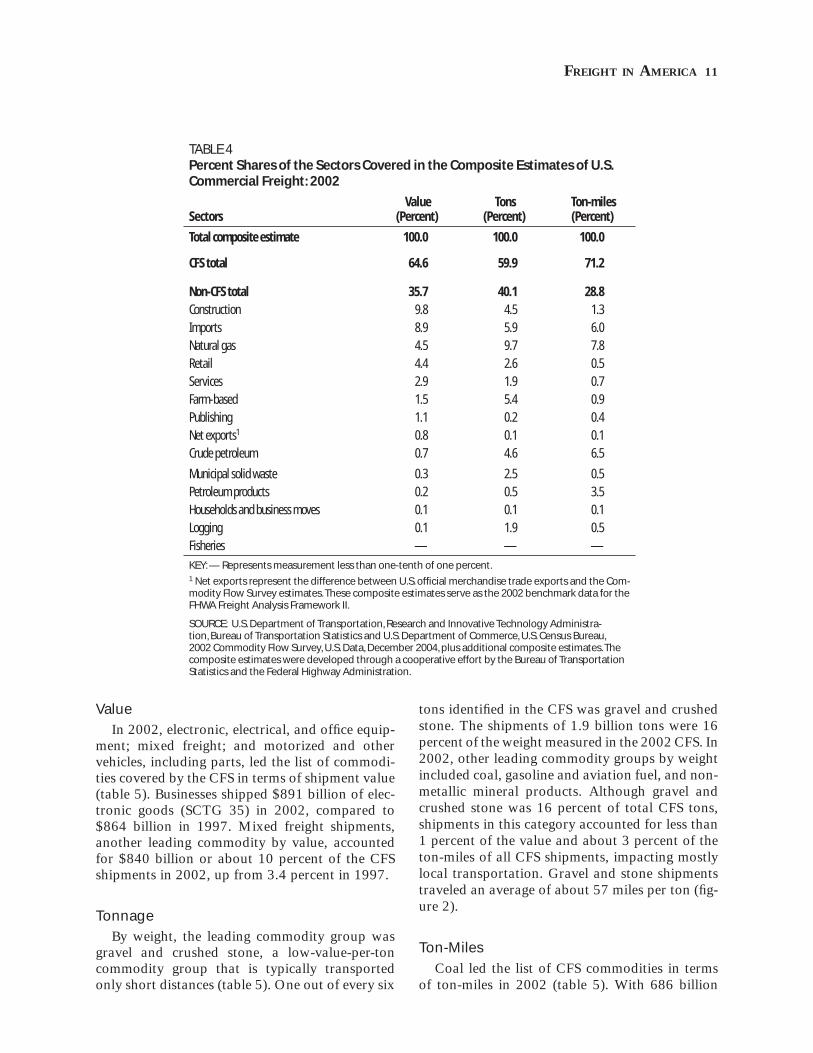
Table 4 shows the relative shares of the com-posite estimates by CFS and non-CFS components and a breakdown of the non-CFS portion. By value, the major non-CFS commodities include goods transported by the construction sector, imports, natural gas, retail sector goods, and ser-vice sector. By weight, the largest non-CFS sectors are natural gas, imports, farm-based products, and crude petroleum.
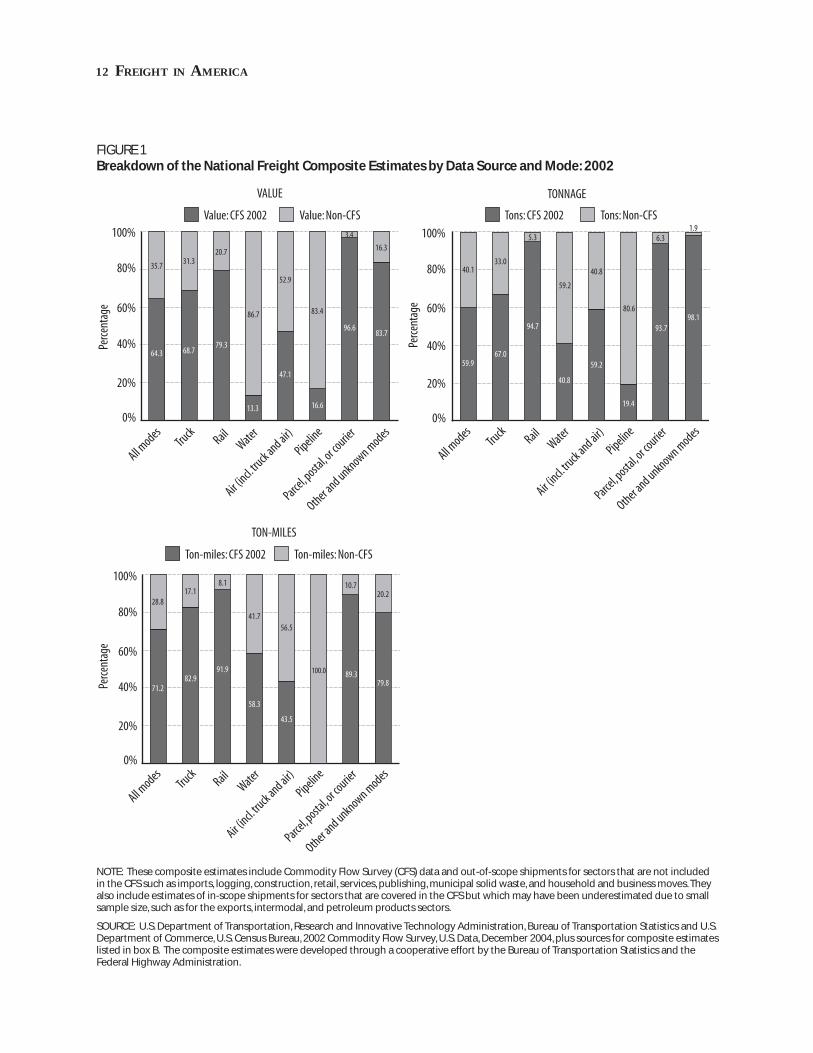
The key highlight to be gleaned from the new composite estimates is illustrated by fi gure 1, which shows a breakdown of the overall estimate into the proportion covered by the CFS and the non-CFS data in terms of value, weight, and ton-miles. The charts clearly illustrate the largest data gaps fi lled by the joint BTS and FHWA coopera-tive effort.
• Measured by value, the non-CFS supplemen-tal data accounted for over 80 percent each of water and pipeline shipments, mostly because of the CFS exclusion of imports and crude petroleum; over half of air shipments; nearly
The new freight totals are larger than the value-added and fi nal weight of materials used in products purchased by consumers and other end-users. Also, the total value of shipments is not directly comparable to the national Gross Domestic Product (GDP) because GDP measures the value added or net output of production. The value of goods measured in the CFS includes the market value of goods used in production as well as fi nal demand; hence the goods may be counted more than once in the production life cycle.
While the composite estimates of total freight ship-ments provide the most complete commercial freight pic-ture for all modes of transportation, they exclude most government shipments, except municipal solid waste.
The new national composite estimates defi ne a ship-ment in a similar manner as defi ned in the CFS. A ship-ment is a single movement of goods, commodities, or products from an establishment to a single customer or to another establishment owned or operated by the same company as the originating establishment (e.g., a ware-house, distribution center, or retail or wholesale outlet). Shipments are recounted every time the goods change hands from one establishment to another. Full or partial truckloads are counted as a single shipment only if all commodities on the truck are destined for the same loca-tion. If a truck makes multiple deliveries on a route, each stop is counted as one shipment.
For the sectors covered in the CFS, a shipment is counted to represent a transportation movement and measures the true origins and destinations as contrasted
with terminal-to-terminal movements. Even where ship-ments are carried by more than one transportation mode, the shipment information covers the ultimate origins and destinations. However, because the CFS data are from shippers and not carriers, the data do not accurately mea-sure intermodal combinations used for transporting the goods. This lack of accurate modal information affects the level of intermodal shipments, because some of these shipments are grouped into other and unknown modes.
For the non-CFS sectors, shipments represent the total goods generated, handled, or transported by that sector. Because actual information on true origins and destination is not available for nearly all these non-CFS sectors, the new estimates cover an approximate distance representing the average distance traveled by particular commodities and transportation modes. This is particularly the case for merchandise imports, where detail information on ultimate domestic destination of goods by commodity and mode or whether and where the goods changed hands are nonexistent. And so, for example, the value and tonnage of imported freight are not counted multiple times as the goods arrive at U.S. ports and are transported to their true fi nal destinations elsewhere in the country or to local warehouses and dis-tribution centers. However, if the imports happen to be transported to a domestic U.S. establishment that is cov-ered by the CFS, then those goods will be measured by the CFS and as such will be double counted in these new composite estimates. Currently, BTS and FHWA do not have the information necessary to remove such potential double counting.
BOX CInterpreting Shipment Value and Tonnage Data in the Composite Estimates
FREIGHT IN AMERICA 9
one-third of truck shipments; and about one-fi fth of rail shipments.
• The picture changes when measured by weight, with the non-CFS data accounting for 80 per-cent of the pipeline tonnage, 59 percent of the water shipments, 40 percent of the air ship-ments, one-third of truck shipments and, about 5 percent of rail mode shipments.
• By ton-miles, the non-CFS data accounted for nearly all of the pipeline shipments because the 2002 CFS did not cover crude petroleum and natural gas movements. These supplemental data accounted for about 42 percent of water ton-miles, 17 percent of the truck ton-miles and about 8 percent of the rail ton-miles.
TABLE 2Major Elements of the U.S. Freight Transportation System: 2002
Mode System extent
Highway Public roads46,769 miles of Interstate highway
115,032 miles of other National Highway System roads
3,828,046 miles of other roads
Air Public-use airports5,286 airports
Rail Miles of railroad operated98,944 miles by Class I freight railroads in the United States1
15,648 miles by regional freight railroads
26,347 miles by local freight railroads
Water 26,000 miles of navigable waterways
Commercial waterway facilitiesGreat Lakes: 600 miles deep-draft
Great Lakes: 154 miles shallow-draft
Inland: 2,361 miles shallow-draft
Ocean: 4,284 miles deep-draft
Ocean: 1,765 miles shallow-draft
Locks: 275 miles
Pipeline OilCrude lines: 64,336 miles of pipe
Product lines: 75,565 miles of pipe
GasTransmission: 309,503 miles of pipe
Distribution: 1,079,565 miles of pipe
1 Includes 570 miles of railroad owned by Canada.
SOURCE: Various sources, as cited in USDOT, Bureau of Transportation Statistics (BTS), National Transporta-tion Statistics, available at http:// www.bts.gov; Association of American Railroads, Railroad Facts, 2003 (Washington, DC: 2004); USDOT, Federal Highway Administration, Highway Statistics 2003 (Washington, DC: 2004), table HM-18; Oil & Gas Journal, Aug. 23, 2004; USDOT, Federal Transit Administration, 2002 National Transit Summaries and Trends, table 18 and appendix, available at www.ntdprogram.com; USDOT, BTS, “Airport Activity Statistics of Certifi cated Air Carriers, Summary Tables, 12 Months Ending Dec. 31, 2002,” 2004; U.S. Army Corps of Engineers, Institute for Water Resources, Navigation Data Center, The U.S. Water-way System Facts, December 2003 (Alexandria, VA: 2003).
10 FREIGHT IN AMERICA
Commodity Flow Survey EstimatesMajor Commodity Groups7
Table 5 presents the value, weight, and ton-miles as well as the relative shares for the major CFS commodities shipped by U.S. businesses.8 See box D for the meaning of these estimates in
7 Most of the fi ndings presented in this section are based on the CFS only data. Detailed information on type of commodity is not available for all of the supplementary data. Where the com-modity information is available (i.e., crude petroleum, municipal solid waste, imports and exports) the report uses the data in the discussions.8 The commodities are based on the two-digit Standard Classifi -cation of Transported Goods (SCTG) coding system.
the CFS. Because the CFS does not cover several important commodities, such as crude petroleum pipeline movements and imports and because commodity details for sectors such as retail, ser-vices, and construction are unavailable, the CFS commodity data presented in this section under-estimates the true amount of these commodities transported over our nation’s freight network.9
9 While BTS has aggregate estimates of the major missing pieces, such as imports, crude petroleum, logging, and some of the in-scope sectors that are underrepresented in the CFS, further analysis of the commodity level out-of-scope retail, service, and construction sectors is needed to determine how much of each commodity in these sectors were transported. BTS and FHWA are continuing to research the supplemental data.
TABLE 3Modal Breakdown of Composite Estimates of U.S. Commercial Freight: 2002(Based on composite estimates)1
Transportation mode
Value (billion $) Tons (million) Ton–miles (billion)
CFS 2002 Non CFS Total1 CFS 2002 Non CFS Total1 CFS 2002 Non CFS Total1
All Modes 8,397 4,655 13,052 11,668 7,819 19,487 3,138 1,271 4,409
Single modes 7,049 4,549 11,599 11,087 7,807 18,894 2,868 1,205 4,073 Truck2 6,235 2,840 9,075 7,843 3,870 11,712 1,256 259 1,515
Rail 311 81 392 1,874 105 1,979 1,262 110 1,372
Water 89 584 673 681 987 1,668 283 202 485
Air (incl. truck and air) 265 298 563 4 3 6 6 8 13
Pipeline3 149 747 896 685 2,844 3,529 S 688 688
Multiple modes 1,079 42 1,121 217 12 229 226 7 233 Parcel, postal, or courier 988 34 1,022 26 2 27 19 2 21
Truck and rail 70 7 77 43 9 52 46 5 50
Other multiple modes4 22 1 22 148 2 150 161 0.5 162
Unknown modes 269 62 331 365 — 365 44 59 103
Percent of relative share of total 64.3 35.7 100.0 59.9 40.1 100.0 71.2 28.8 100.0
KEY: — Represents data cell equal to zero or less than 1 unit of measure.
S = Estimate does not meet publication standards because of high sampling variability or poor response quality.
1 These composite estimates include Commodity Flow Survey (CFS) data and out-of-scope shipments for sectors that are not included in the CFS such as imports, logging, construction, retail, services, publishing, municipal solid waste, and household and business moves. They also include estimates of in-scope shipments for sectors that are covered in CFS but may have been underestimated due to small sample size, such as exports, intermodal, and petroleum products. These composite estimates serve as the 2002 benchmark data for the FHWA Freight Analysis Framework II.2 “Truck” as a single mode includes shipments that were made by only private truck, only for-hire truck, or a combination of private and for-hire truck.3 Estimates for pipeline include shipments of crude petroleum.4 Other multiple modes include combination of truck and water, rail and water, and other combinations.
SOURCE: U.S. Department of Transportation, Research and Innovative Technology Administration, Bureau of Transportation Statistics and U.S. Department of Commerce, U.S. Census Bureau, 2002 Commodity Flow Survey, U.S. Data, December 2004, plus sources for composite estimates listed in box B. The composite estimates were developed through a cooperative effort by the Bureau of Transportation Statistics and the Federal Highway Administration.
FREIGHT IN AMERICA 11
Value
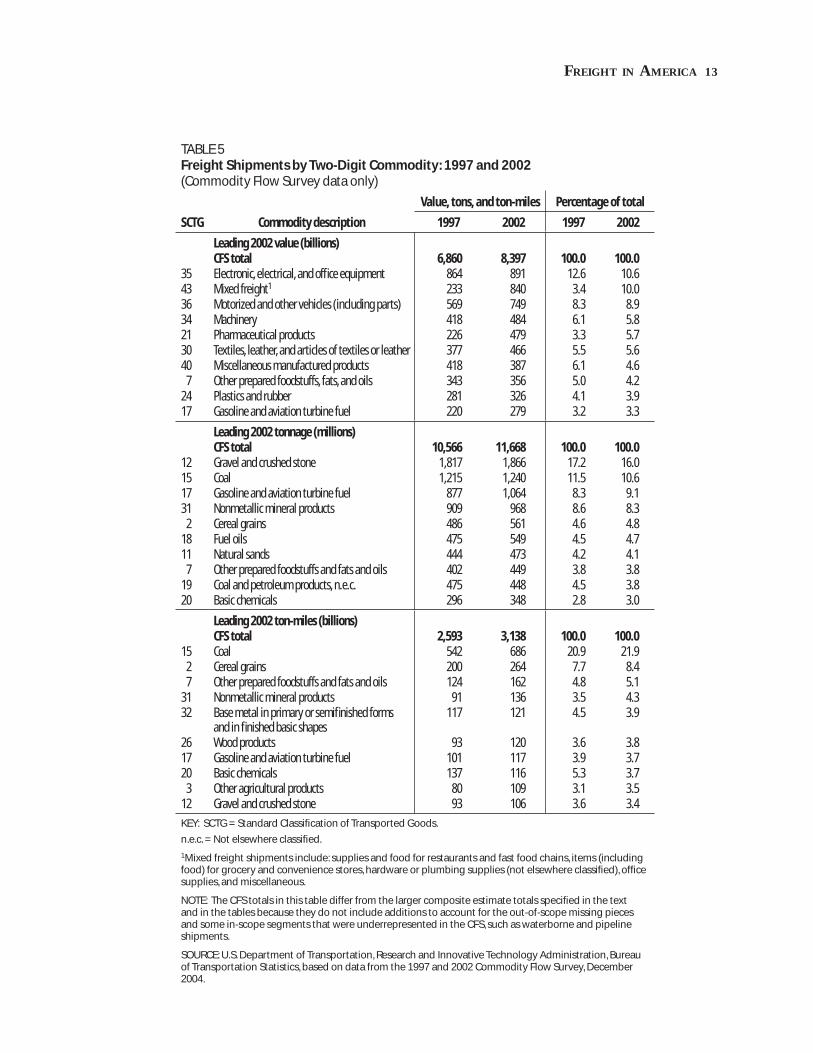
In 2002, electronic, electrical, and offi ce equip-ment; mixed freight; and motorized and other vehicles, including parts, led the list of commodi-ties covered by the CFS in terms of shipment value (table 5). Businesses shipped $891 billion of elec-tronic goods (SCTG 35) in 2002, compared to $864 billion in 1997. Mixed freight shipments, another leading commodity by value, accounted for $840 billion or about 10 percent of the CFS shipments in 2002, up from 3.4 percent in 1997.
Tonnage
By weight, the leading commodity group was gravel and crushed stone, a low-value-per-ton commodity group that is typically transported only short distances (table 5). One out of every six
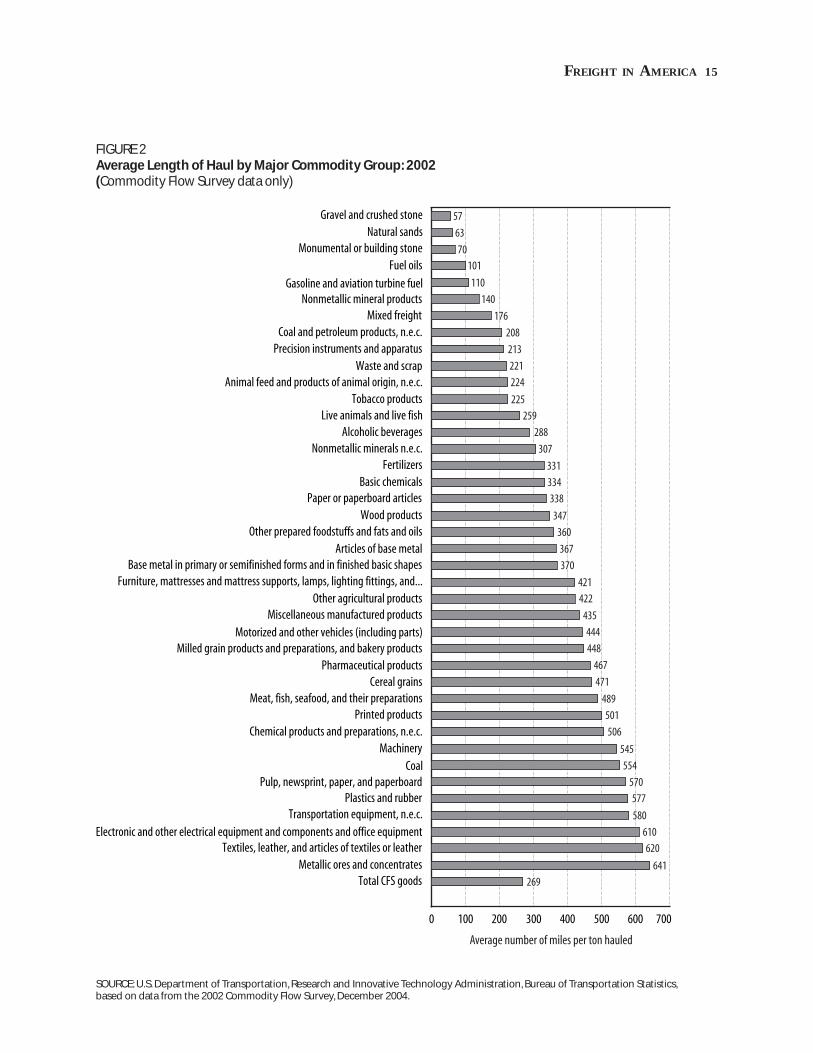
tons identifi ed in the CFS was gravel and crushed stone. The shipments of 1.9 billion tons were 16 percent of the weight measured in the 2002 CFS. In 2002, other leading commodity groups by weight included coal, gasoline and aviation fuel, and non-metallic mineral products. Although gravel and crushed stone was 16 percent of total CFS tons, shipments in this category accounted for less than 1 percent of the value and about 3 percent of the ton-miles of all CFS shipments, impacting mostly local transportation. Gravel and stone shipments traveled an average of about 57 miles per ton (fi g-ure 2).
Ton-Miles
Coal led the list of CFS commodities in terms of ton-miles in 2002 (table 5). With 686 billion
TABLE 4Percent Shares of the Sectors Covered in the Composite Estimates of U.S. Commercial Freight: 2002
Sectors Value
(Percent) Tons
(Percent) Ton-miles (Percent)
Total composite estimate 100.0 100.0 100.0
CFS total 64.6 59.9 71.2
Non-CFS total 35.7 40.1 28.8 Construction 9.8 4.5 1.3
Imports 8.9 5.9 6.0
Natural gas 4.5 9.7 7.8
Retail 4.4 2.6 0.5
Services 2.9 1.9 0.7
Farm-based 1.5 5.4 0.9
Publishing 1.1 0.2 0.4
Net exports1 0.8 0.1 0.1
Crude petroleum 0.7 4.6 6.5
Municipal solid waste 0.3 2.5 0.5
Petroleum products 0.2 0.5 3.5
Households and business moves 0.1 0.1 0.1
Logging 0.1 1.9 0.5
Fisheries — — —
KEY: — Represents measurement less than one-tenth of one percent.1 Net exports represent the difference between U.S. offi cial merchandise trade exports and the Com-modity Flow Survey estimates. These composite estimates serve as the 2002 benchmark data for the FHWA Freight Analysis Framework II.
SOURCE: U.S. Department of Transportation, Research and Innovative Technology Administra-tion, Bureau of Transportation Statistics and U.S. Department of Commerce, U.S. Census Bureau, 2002 Commodity Flow Survey, U.S. Data, December 2004, plus additional composite estimates. The composite estimates were developed through a cooperative effort by the Bureau of Transportation Statistics and the Federal Highway Administration.
12 FREIGHT IN AMERICA
FIGURE 1Breakdown of the National Freight Composite Estimates by Data Source and Mode: 2002
100%
80%
60%
40%
20%
0%
35.7
64.3
31.3
68.7
20.7
79.3
86.7
13.3
52.9
47.1
83.4
16.6
3.4
96.6
16.3
83.7
All modes
Truck Rail
Water
Air (incl.
truck and air)
Pipeline
Parcel, p
ostal, o
r courie
r
Other and unknown m
odes
Perce
ntag
e
VALUE
Value: CFS 2002 Value: Non-CFS
100%
80%
60%
40%
20%
0%
All modes
Truck Rail
Water
Air (incl.
truck and air)
Pipeline
Parcel, p
ostal, o
r courie
r
Other and unknown m
odesPe
rcent
age
40.1
59.9
33.0
67.0
5.3
94.7
59.2
40.8
40.8
59.2
80.6
19.4
6.3
93.7
1.9
98.1
TONNAGE
Tons: CFS 2002 Tons: Non-CFS
100%
80%
60%
40%
20%
0%
All modes
Truck Rail
Water
Air (incl.
truck and air)
Pipeline
Parcel, p
ostal, o
r courie
r
Other and unknown m
odes
Perce
ntag
e
TON-MILES
Ton-miles: CFS 2002 Ton-miles: Non-CFS
28.8
71.2
17.1
82.9
8.1
91.9
41.7
58.3
56.5
43.5
100.0
10.7
89.3
20.2
79.8
NOTE: These composite estimates include Commodity Flow Survey (CFS) data and out-of-scope shipments for sectors that are not included in the CFS such as imports, logging, construction, retail, services, publishing, municipal solid waste, and household and business moves. They also include estimates of in-scope shipments for sectors that are covered in the CFS but which may have been underestimated due to small sample size, such as for the exports, intermodal, and petroleum products sectors.
SOURCE: U.S. Department of Transportation, Research and Innovative Technology Administration, Bureau of Transportation Statistics and U.S. Department of Commerce, U.S. Census Bureau, 2002 Commodity Flow Survey, U.S. Data, December 2004, plus sources for composite estimates listed in box B. The composite estimates were developed through a cooperative effort by the Bureau of Transportation Statistics and the Federal Highway Administration.
FREIGHT IN AMERICA 13
TABLE 5Freight Shipments by Two-Digit Commodity: 1997 and 2002 (Commodity Flow Survey data only)
SCTG Commodity description
Value, tons, and ton-miles Percentage of total
1997 2002 1997 2002
Leading 2002 value (billions)CFS total 6,860 8,397 100.0 100.0
35 Electronic, electrical, and offi ce equipment 864 891 12.6 10.6 43 Mixed freight1 233 840 3.4 10.0 36 Motorized and other vehicles (including parts) 569 749 8.3 8.9 34 Machinery 418 484 6.1 5.8 21 Pharmaceutical products 226 479 3.3 5.7 30 Textiles, leather, and articles of textiles or leather 377 466 5.5 5.6 40 Miscellaneous manufactured products 418 387 6.1 4.6 7 Other prepared foodstuffs, fats, and oils 343 356 5.0 4.2 24 Plastics and rubber 281 326 4.1 3.9 17 Gasoline and aviation turbine fuel 220 279 3.2 3.3
Leading 2002 tonnage (millions)CFS total 10,566 11,668 100.0 100.0
12 Gravel and crushed stone 1,817 1,866 17.2 16.0 15 Coal 1,215 1,240 11.5 10.6 17 Gasoline and aviation turbine fuel 877 1,064 8.3 9.1 31 Nonmetallic mineral products 909 968 8.6 8.3 2 Cereal grains 486 561 4.6 4.8 18 Fuel oils 475 549 4.5 4.7 11 Natural sands 444 473 4.2 4.1 7 Other prepared foodstuffs and fats and oils 402 449 3.8 3.8 19 Coal and petroleum products, n.e.c. 475 448 4.5 3.8 20 Basic chemicals 296 348 2.8 3.0
Leading 2002 ton-miles (billions)CFS total 2,593 3,138 100.0 100.0
15 Coal 542 686 20.9 21.9 2 Cereal grains 200 264 7.7 8.4 7 Other prepared foodstuffs and fats and oils 124 162 4.8 5.1 31 Nonmetallic mineral products 91 136 3.5 4.3 32 Base metal in primary or semifi nished forms
and in fi nished basic shapes 117 121 4.5 3.9
26 Wood products 93 120 3.6 3.8 17 Gasoline and aviation turbine fuel 101 117 3.9 3.7 20 Basic chemicals 137 116 5.3 3.7 3 Other agricultural products 80 109 3.1 3.5 12 Gravel and crushed stone 93 106 3.6 3.4
KEY: SCTG = Standard Classifi cation of Transported Goods.
n.e.c. = Not elsewhere classifi ed.
1Mixed freight shipments include: supplies and food for restaurants and fast food chains, items (including food) for grocery and convenience stores, hardware or plumbing supplies (not elsewhere classifi ed), offi ce supplies, and miscellaneous.
NOTE: The CFS totals in this table differ from the larger composite estimate totals specifi ed in the text and in the tables because they do not include additions to account for the out-of-scope missing pieces and some in-scope segments that were underrepresented in the CFS, such as waterborne and pipeline shipments.
SOURCE: U.S. Department of Transportation, Research and Innovative Technology Administration, Bureau of Transportation Statistics, based on data from the 1997 and 2002 Commodity Flow Survey, December 2004.
14 FREIGHT IN AMERICA
ton-miles in 2002, coal accounted for about 22 percent of all CFS ton-miles and more than twice the ton-miles of cereal grains, the second leading commodity group (table 5). Coal and cereal grains were followed by prepared foodstuffs, nonmetallic mineral and products, and base metals. Coal gen-erated the most ton-miles because, unlike gravel and stone which tends to be produced and used in the same locale, coal production is concentrated in relatively few areas and is often shipped long distances. For example, coal mined in Wyoming is transported nationwide, to coal-fi red power plants in particular states, and to export loca-tions.10 In 2002, a ton of coal was shipped 554
10 Coal from Kentucky, Pennsylvania, and West Virginia is con-sumed almost entirely east of the Mississippi River.
miles on average, far above the 269 average miles per ton for all commodities (fi gure 2).
Hazardous Materials ShipmentsHazardous materials shipments move by truck,
train, vessel, and airplane in quantities rang-ing from several ounces to thousands of tons. In the United States, the U.S. Department of Trans-portation’s (USDOT’s) Pipeline and Hazardous Materials Safety Administration (PHMSA) has responsibility for the safe transportation of haz-ardous materials to industry and consumers by all transportation modes, including the nation’s pipelines. Hazardous materials are essential to the U.S. and global economy. They include fossil fuels used in cars, trucks, power plants, and heating and cooling homes and offi ces, as well as petrochemi-
BOX DInterpreting Value, Tons, and Ton-Miles in the Commodity Flow Survey
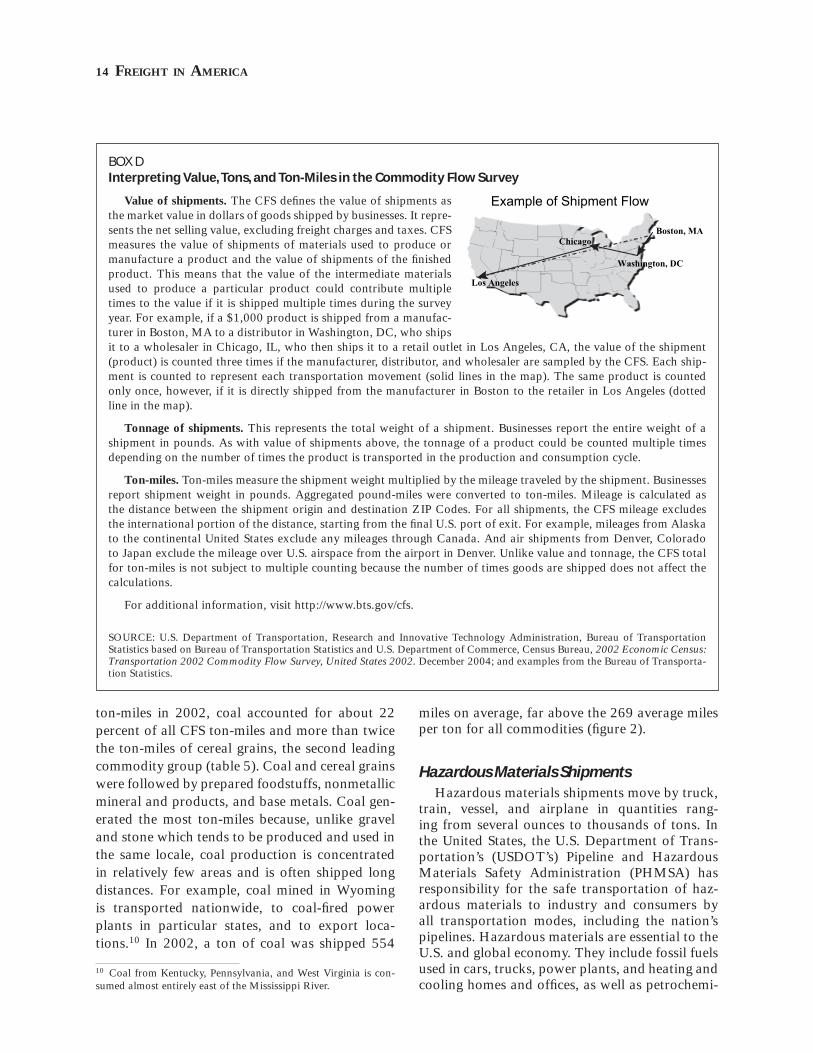
Value of shipments. The CFS defi nes the value of shipments as the market value in dollars of goods shipped by businesses. It repre-sents the net selling value, excluding freight charges and taxes. CFS measures the value of shipments of materials used to produce or manufacture a product and the value of shipments of the fi nished product. This means that the value of the intermediate materials used to produce a particular product could contribute multiple times to the value if it is shipped multiple times during the survey year. For example, if a $1,000 product is shipped from a manufac-turer in Boston, MA to a distributor in Washington, DC, who ships it to a wholesaler in Chicago, IL, who then ships it to a retail outlet in Los Angeles, CA, the value of the shipment (product) is counted three times if the manufacturer, distributor, and wholesaler are sampled by the CFS. Each ship-ment is counted to represent each transportation movement (solid lines in the map). The same product is counted only once, however, if it is directly shipped from the manufacturer in Boston to the retailer in Los Angeles (dotted line in the map).
Tonnage of shipments. This represents the total weight of a shipment. Businesses report the entire weight of a shipment in pounds. As with value of shipments above, the tonnage of a product could be counted multiple times depending on the number of times the product is transported in the production and consumption cycle.
Ton-miles. Ton-miles measure the shipment weight multiplied by the mileage traveled by the shipment. Businesses report shipment weight in pounds. Aggregated pound-miles were converted to ton-miles. Mileage is calculated as the distance between the shipment origin and destination ZIP Codes. For all shipments, the CFS mileage excludes the international portion of the distance, starting from the fi nal U.S. port of exit. For example, mileages from Alaska to the continental United States exclude any mileages through Canada. And air shipments from Denver, Colorado to Japan exclude the mileage over U.S. airspace from the airport in Denver. Unlike value and tonnage, the CFS total for ton-miles is not subject to multiple counting because the number of times goods are shipped does not affect the calculations.
For additional information, visit http://www.bts.gov/cfs.
SOURCE: U.S. Department of Transportation, Research and Innovative Technology Administration, Bureau of Transportation Statistics based on Bureau of Transportation Statistics and U.S. Department of Commerce, Census Bureau, 2002 Economic Census: Transportation 2002 Commodity Flow Survey, United States 2002. December 2004; and examples from the Bureau of Transporta-tion Statistics.
Boston, MA
Example of Shipment Flow
Los Angeles
Chicago
Washington, DC
FREIGHT IN AMERICA 15
FIGURE 2Average Length of Haul by Major Commodity Group: 2002(Commodity Flow Survey data only)
Total CFS goodsMetallic ores and concentrates
Textiles, leather, and articles of textiles or leatherElectronic and other electrical equipment and components and office equipment
Transportation equipment, n.e.c.Plastics and rubber
Pulp, newsprint, paper, and paperboardCoal
MachineryChemical products and preparations, n.e.c.
Printed productsMeat, fish, seafood, and their preparations
Cereal grainsPharmaceutical products
Milled grain products and preparations, and bakery productsMotorized and other vehicles (including parts)
Miscellaneous manufactured productsOther agricultural products
Furniture, mattresses and mattress supports, lamps, lighting fittings, and...Base metal in primary or semifinished forms and in finished basic shapes
Articles of base metalOther prepared foodstuffs and fats and oils
Wood productsPaper or paperboard articles
Basic chemicalsFertilizers
Nonmetallic minerals n.e.c.Alcoholic beverages
Live animals and live fishTobacco products
Animal feed and products of animal origin, n.e.c.Waste and scrap
Precision instruments and apparatusCoal and petroleum products, n.e.c.
Mixed freightNonmetallic mineral products
Gasoline and aviation turbine fuel
Fuel oilsMonumental or building stone
Natural sandsGravel and crushed stone
0 100 200 300 400 500 600 700
Average number of miles per ton hauled
57
63
70101
110
140
176
208
213
221
224
225
259
288
307
331
334
338
347
360
367
370
421
422
435
444
448
467
471
489
501
506
545
554
570
577
580
610
620
641
269
SOURCE: U.S. Department of Transportation, Research and Innovative Technology Administration, Bureau of Transportation Statistics, based on data from the 2002 Commodity Flow Survey, December 2004.
16 FREIGHT IN AMERICA
cal feedstock. And they are also used for farming and medical applications and in manufacturing, mining, and other industrial processes.
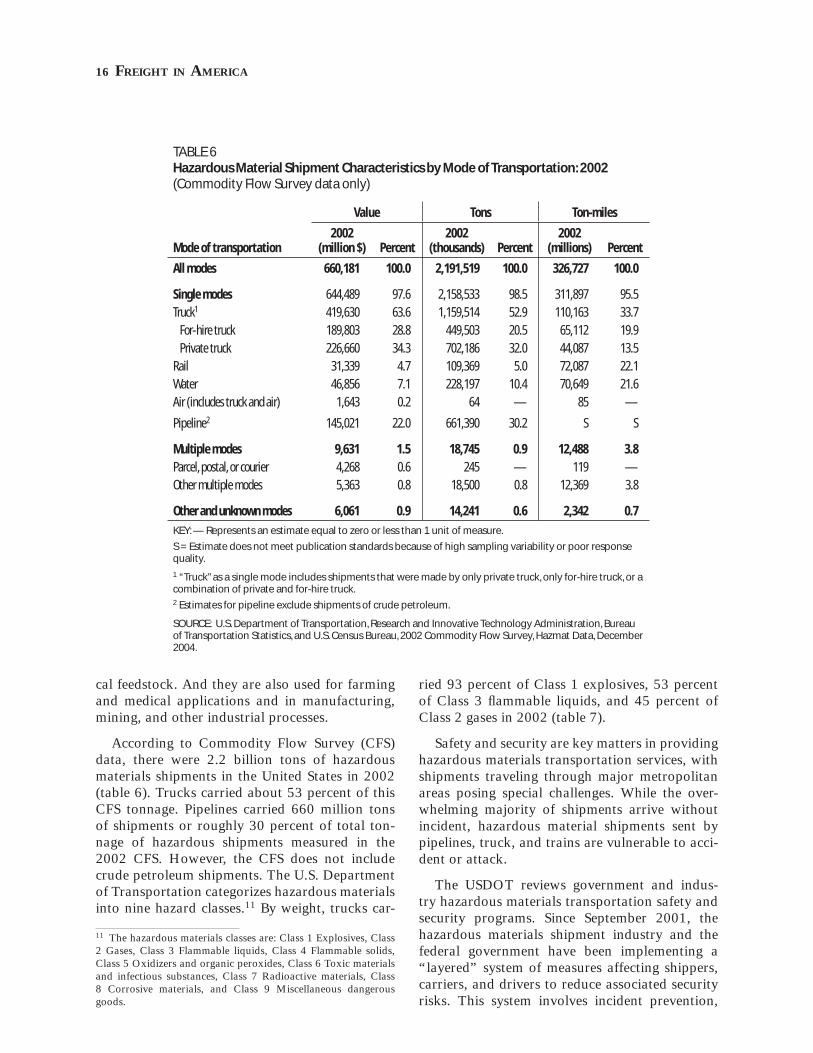
According to Commodity Flow Survey (CFS) data, there were 2.2 billion tons of hazardous materials shipments in the United States in 2002 (table 6). Trucks carried about 53 percent of this CFS tonnage. Pipelines carried 660 million tons of shipments or roughly 30 percent of total ton-nage of hazardous shipments measured in the 2002 CFS. However, the CFS does not include crude petroleum shipments. The U.S. Department of Transportation categorizes hazardous materials into nine hazard classes.11 By weight, trucks car-
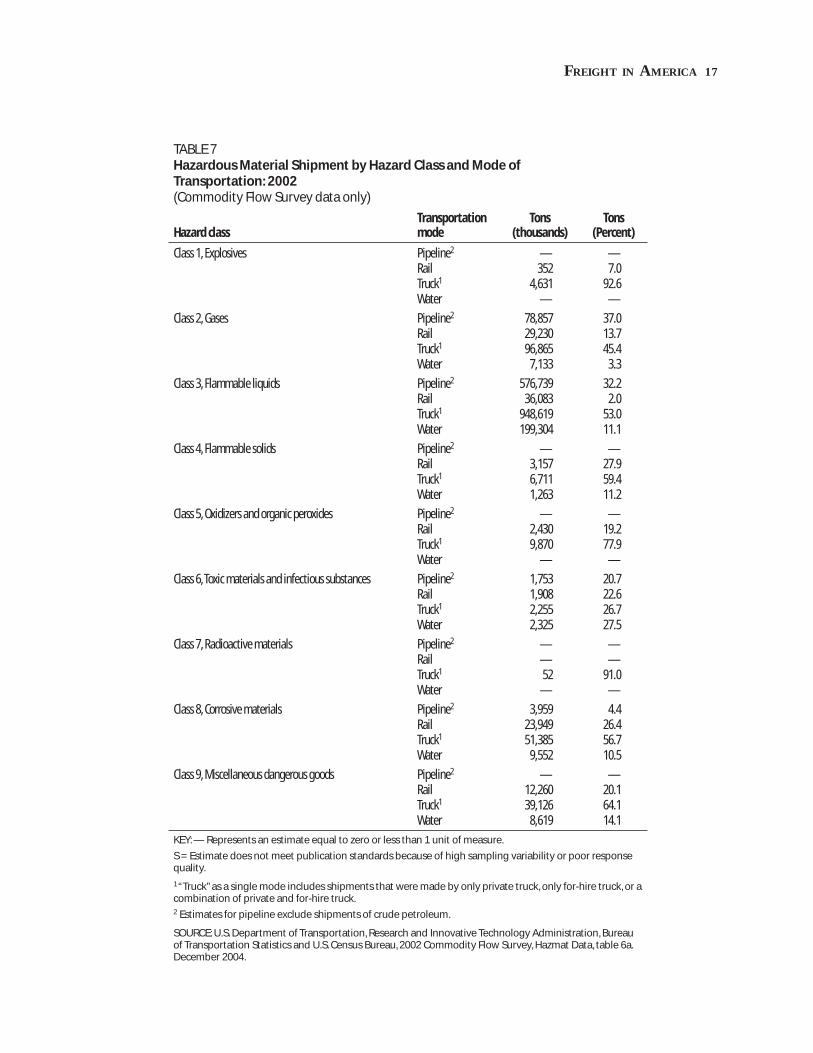
11 The hazardous materials classes are: Class 1 Explosives, Class 2 Gases, Class 3 Flammable liquids, Class 4 Flammable solids, Class 5 Oxidizers and organic peroxides, Class 6 Toxic materials and infectious substances, Class 7 Radioactive materials, Class 8 Corrosive materials, and Class 9 Miscellaneous dangerous goods.
ried 93 percent of Class 1 explosives, 53 percent of Class 3 fl ammable liquids, and 45 percent of Class 2 gases in 2002 (table 7).
Safety and security are key matters in providing hazardous materials transportation services, with shipments traveling through major metropolitan areas posing special challenges. While the over-whelming majority of shipments arrive without incident, hazardous material shipments sent by pipelines, truck, and trains are vulnerable to acci-dent or attack.
The USDOT reviews government and indus-try hazardous materials transportation safety and security programs. Since September 2001, the hazardous materials shipment industry and the federal government have been implementing a “layered” system of measures affecting shippers, carriers, and drivers to reduce associated security risks. This system involves incident prevention,
TABLE 6Hazardous Material Shipment Characteristics by Mode of Transportation: 2002(Commodity Flow Survey data only)
Mode of transportation
Value Tons Ton-miles
2002 (million $) Percent
2002 (thousands) Percent
2002 (millions) Percent
All modes 660,181 100.0 2,191,519 100.0 326,727 100.0
Single modes 644,489 97.6 2,158,533 98.5 311,897 95.5
Truck1 419,630 63.6 1,159,514 52.9 110,163 33.7
For-hire truck 189,803 28.8 449,503 20.5 65,112 19.9
Private truck 226,660 34.3 702,186 32.0 44,087 13.5
Rail 31,339 4.7 109,369 5.0 72,087 22.1
Water 46,856 7.1 228,197 10.4 70,649 21.6
Air (includes truck and air) 1,643 0.2 64 — 85 —
Pipeline2 145,021 22.0 661,390 30.2 S S
Multiple modes 9,631 1.5 18,745 0.9 12,488 3.8 Parcel, postal, or courier 4,268 0.6 245 — 119 —
Other multiple modes 5,363 0.8 18,500 0.8 12,369 3.8
Other and unknown modes 6,061 0.9 14,241 0.6 2,342 0.7
KEY: — Represents an estimate equal to zero or less than 1 unit of measure.
S = Estimate does not meet publication standards because of high sampling variability or poor response quality.
1 “Truck” as a single mode includes shipments that were made by only private truck, only for-hire truck, or a combination of private and for-hire truck. 2 Estimates for pipeline exclude shipments of crude petroleum.
SOURCE: U.S. Department of Transportation, Research and Innovative Technology Administration, Bureau of Transportation Statistics, and U.S. Census Bureau, 2002 Commodity Flow Survey, Hazmat Data, December 2004.
FREIGHT IN AMERICA 17
TABLE 7Hazardous Material Shipment by Hazard Class and Mode ofTransportation: 2002(Commodity Flow Survey data only)
Hazard classTransportation mode
Tons (thousands)
Tons (Percent)
Class 1, Explosives Pipeline2 — — Rail 352 7.0 Truck1 4,631 92.6 Water — —
Class 2, Gases Pipeline2 78,857 37.0 Rail 29,230 13.7 Truck1 96,865 45.4 Water 7,133 3.3
Class 3, Flammable liquids Pipeline2 576,739 32.2 Rail 36,083 2.0 Truck1 948,619 53.0 Water 199,304 11.1
Class 4, Flammable solids Pipeline2 — — Rail 3,157 27.9 Truck1 6,711 59.4 Water 1,263 11.2
Class 5, Oxidizers and organic peroxides Pipeline2 — — Rail 2,430 19.2 Truck1 9,870 77.9 Water — —
Class 6, Toxic materials and infectious substances Pipeline2 1,753 20.7 Rail 1,908 22.6 Truck1 2,255 26.7 Water 2,325 27.5
Class 7, Radioactive materials Pipeline2 — — Rail — — Truck1 52 91.0 Water — —
Class 8, Corrosive materials Pipeline2 3,959 4.4 Rail 23,949 26.4 Truck1 51,385 56.7 Water 9,552 10.5
Class 9, Miscellaneous dangerous goods Pipeline2 — — Rail 12,260 20.1 Truck1 39,126 64.1 Water 8,619 14.1
KEY: — Represents an estimate equal to zero or less than 1 unit of measure.
S = Estimate does not meet publication standards because of high sampling variability or poor response quality.
1 “Truck” as a single mode includes shipments that were made by only private truck, only for-hire truck, or a combination of private and for-hire truck. 2 Estimates for pipeline exclude shipments of crude petroleum.
SOURCE: U.S. Department of Transportation, Research and Innovative Technology Administration, Bureau of Transportation Statistics and U.S. Census Bureau, 2002 Commodity Flow Survey, Hazmat Data, table 6a. December 2004.
18 FREIGHT IN AMERICA
preparedness, and response. The USDOT and Department of Homeland Security have taken steps to enhance the security of hazardous mate-rials transportation.12 For example, the USDOT requires shippers and carriers to implement secu-rity plans regarding specifi ed hazardous materi-als transportation. The USDOT grants encourage state and some local governmental personnel to conduct hazmat inspections and to plan and train for spills of these materials.
Distance Traveled13 Most U.S. freight shipments by value and ton-
nage move less than 250 miles. In 2002, more
12 Congressional Research Service, the Library of Congress. Transportation Security: Issues 109th Congress. http://www.mipt.org/pdf/CRS_IB10135.pdf13 These fi ndings are based on the CFS only data. Distance of shipment information is not available for the non-CFS data.
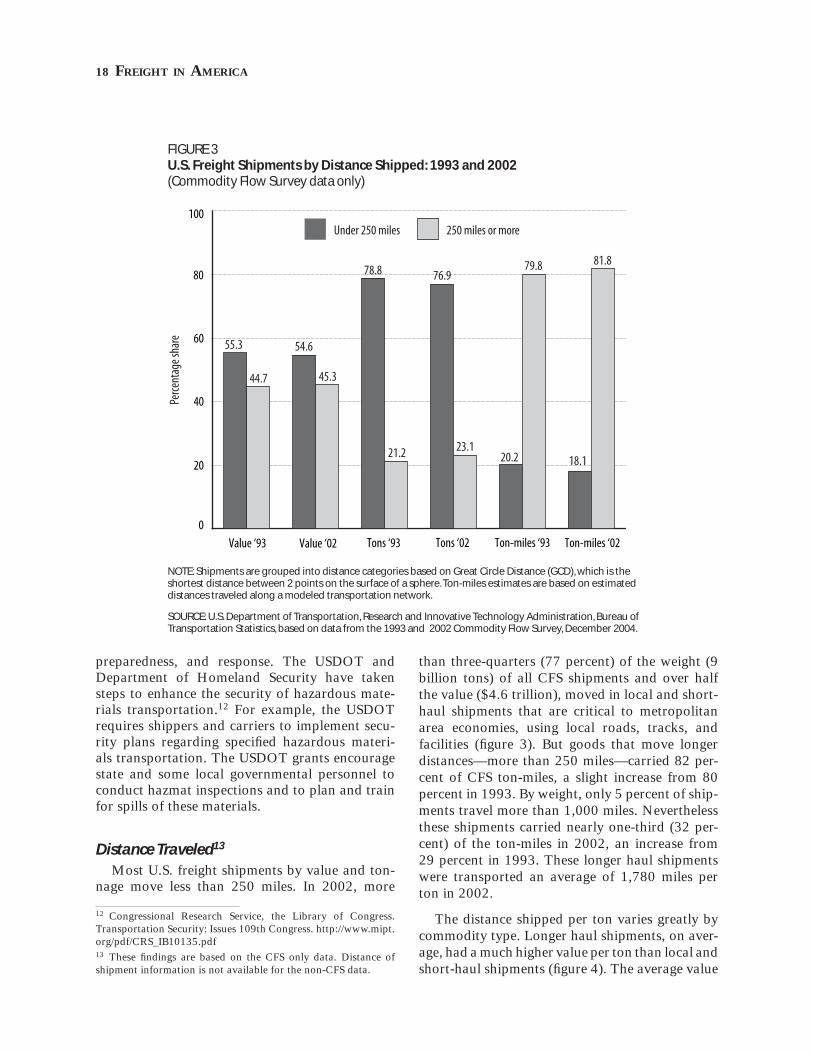
than three-quarters (77 percent) of the weight (9 billion tons) of all CFS shipments and over half the value ($4.6 trillion), moved in local and short-haul shipments that are critical to metropolitan area economies, using local roads, tracks, and facilities (fi gure 3). But goods that move longer distances—more than 250 miles—carried 82 per-cent of CFS ton-miles, a slight increase from 80 percent in 1993. By weight, only 5 percent of ship-ments travel more than 1,000 miles. Nevertheless these shipments carried nearly one-third (32 per-cent) of the ton-miles in 2002, an increase from 29 percent in 1993. These longer haul shipments were transported an average of 1,780 miles per ton in 2002.
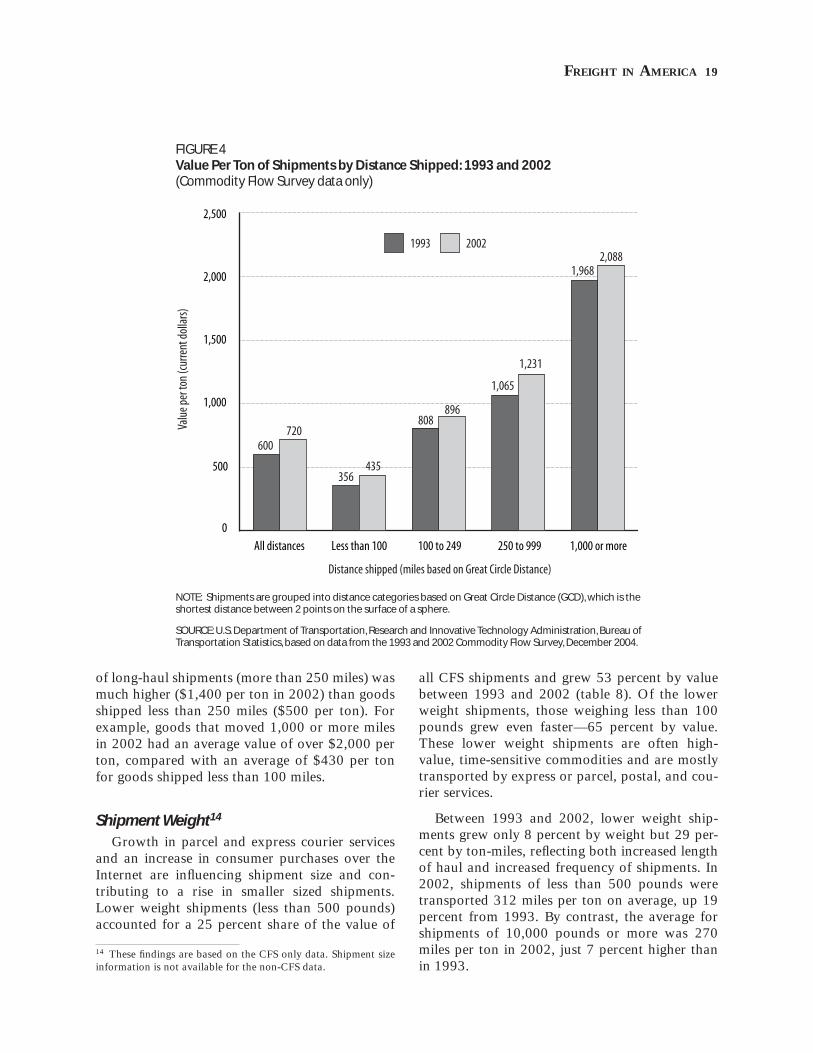
The distance shipped per ton varies greatly by commodity type. Longer haul shipments, on aver-age, had a much higher value per ton than local and short-haul shipments (fi gure 4). The average value
FIGURE 3U.S. Freight Shipments by Distance Shipped: 1993 and 2002(Commodity Flow Survey data only)
Value ‘93 Value ‘02 Tons ‘93 Tons ‘02 Ton-miles ‘93 Ton-miles ‘020
20
40
60
80
100
Perce
ntag
e sha
re
Under 250 miles 250 miles or more
55.3
44.7
54.6
45.3
78.8
21.2
76.9
23.120.2
79.8
18.1
81.8
NOTE: Shipments are grouped into distance categories based on Great Circle Distance (GCD), which is the shortest distance between 2 points on the surface of a sphere. Ton-miles estimates are based on estimated distances traveled along a modeled transportation network.
SOURCE: U.S. Department of Transportation, Research and Innovative Technology Administration, Bureau of Transportation Statistics, based on data from the 1993 and 2002 Commodity Flow Survey, December 2004.
FREIGHT IN AMERICA 19
of long-haul shipments (more than 250 miles) was much higher ($1,400 per ton in 2002) than goods shipped less than 250 miles ($500 per ton). For example, goods that moved 1,000 or more miles in 2002 had an average value of over $2,000 per ton, compared with an average of $430 per ton for goods shipped less than 100 miles.
Shipment Weight14 Growth in parcel and express courier services
and an increase in consumer purchases over the Internet are infl uencing shipment size and con-tributing to a rise in smaller sized shipments. Lower weight shipments (less than 500 pounds) accounted for a 25 percent share of the value of
14 These fi ndings are based on the CFS only data. Shipment size information is not available for the non-CFS data.
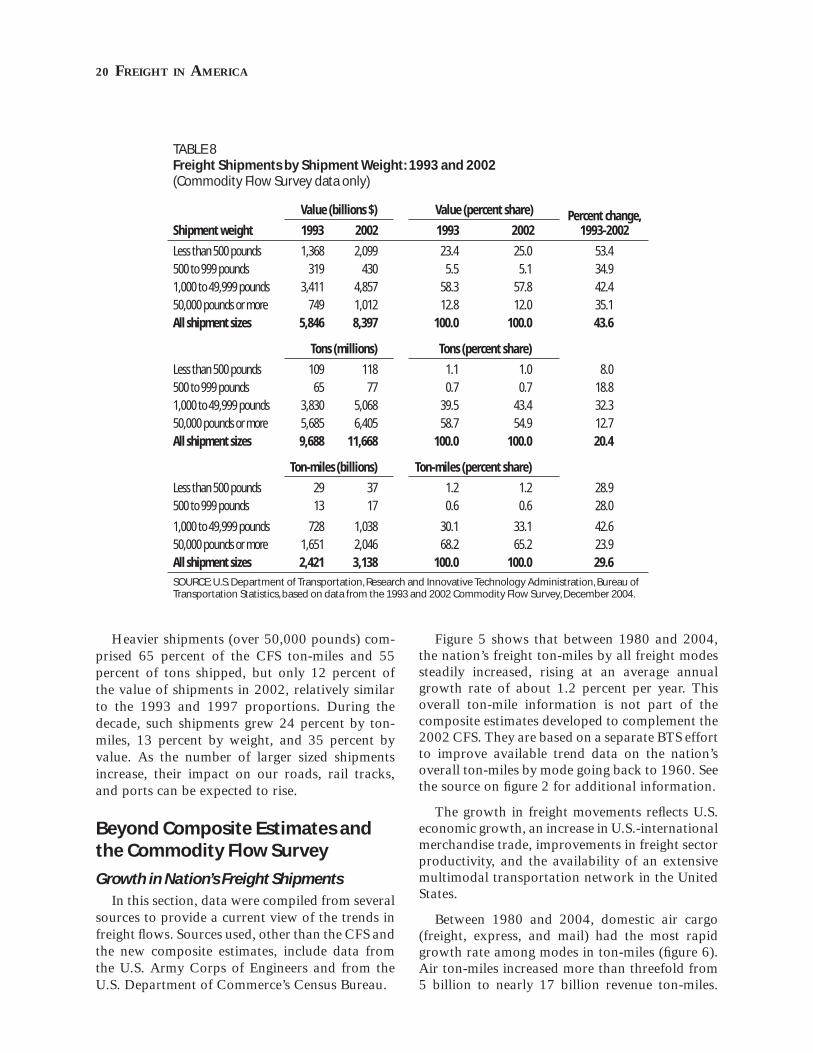
all CFS shipments and grew 53 percent by value between 1993 and 2002 (table 8). Of the lower weight shipments, those weighing less than 100 pounds grew even faster—65 percent by value. These lower weight shipments are often high-value, time-sensitive commodities and are mostly transported by express or parcel, postal, and cou-rier services.
Between 1993 and 2002, lower weight ship-ments grew only 8 percent by weight but 29 per-cent by ton-miles, refl ecting both increased length of haul and increased frequency of shipments. In 2002, shipments of less than 500 pounds were transported 312 miles per ton on average, up 19 percent from 1993. By contrast, the average for shipments of 10,000 pounds or more was 270 miles per ton in 2002, just 7 percent higher than in 1993.
FIGURE 4Value Per Ton of Shipments by Distance Shipped: 1993 and 2002(Commodity Flow Survey data only)
All distances Less than 100 100 to 249 250 to 999 1,000 or more
0
500
1,000
1,500
2,000
2,500
1993 2002
Valu
e per
ton
(cur
rent
dol
lars)
Distance shipped (miles based on Great Circle Distance)
600720
356435
808896
1,065
1,231
1,9682,088
NOTE: Shipments are grouped into distance categories based on Great Circle Distance (GCD), which is the shortest distance between 2 points on the surface of a sphere.
SOURCE: U.S. Department of Transportation, Research and Innovative Technology Administration, Bureau of Transportation Statistics, based on data from the 1993 and 2002 Commodity Flow Survey, December 2004.
20 FREIGHT IN AMERICA
Heavier shipments (over 50,000 pounds) com-prised 65 percent of the CFS ton-miles and 55 percent of tons shipped, but only 12 percent of the value of shipments in 2002, relatively similar to the 1993 and 1997 proportions. During the decade, such shipments grew 24 percent by ton-miles, 13 percent by weight, and 35 percent by value. As the number of larger sized shipments increase, their impact on our roads, rail tracks, and ports can be expected to rise.
Beyond Composite Estimates and the Commodity Flow Survey
Growth in Nation’s Freight Shipments In this section, data were compiled from several
sources to provide a current view of the trends in freight fl ows. Sources used, other than the CFS and the new composite estimates, include data from the U.S. Army Corps of Engineers and from the U.S. Department of Commerce’s Census Bureau.
Figure 5 shows that between 1980 and 2004, the nation’s freight ton-miles by all freight modes steadily increased, rising at an average annual growth rate of about 1.2 percent per year. This overall ton-mile information is not part of the composite estimates developed to complement the 2002 CFS. They are based on a separate BTS effort to improve available trend data on the nation’s overall ton-miles by mode going back to 1960. See the source on fi gure 2 for additional information.
The growth in freight movements refl ects U.S. economic growth, an increase in U.S.-international merchandise trade, improvements in freight sector productivity, and the availability of an extensive multimodal transportation network in the United States.
Between 1980 and 2004, domestic air cargo (freight, express, and mail) had the most rapid growth rate among modes in ton-miles (fi gure 6). Air ton-miles increased more than threefold from 5 billion to nearly 17 billion revenue ton-miles.
TABLE 8Freight Shipments by Shipment Weight: 1993 and 2002(Commodity Flow Survey data only)
Shipment weight
Value (billions $) Value (percent share) Percent change, 1993-20021993 2002 1993 2002
Less than 500 pounds 1,368 2,099 23.4 25.0 53.4
500 to 999 pounds 319 430 5.5 5.1 34.9
1,000 to 49,999 pounds 3,411 4,857 58.3 57.8 42.4
50,000 pounds or more 749 1,012 12.8 12.0 35.1
All shipment sizes 5,846 8,397 100.0 100.0 43.6
Tons (millions) Tons (percent share)
Less than 500 pounds 109 118 1.1 1.0 8.0
500 to 999 pounds 65 77 0.7 0.7 18.8
1,000 to 49,999 pounds 3,830 5,068 39.5 43.4 32.3
50,000 pounds or more 5,685 6,405 58.7 54.9 12.7
All shipment sizes 9,688 11,668 100.0 100.0 20.4
Ton-miles (billions) Ton-miles (percent share)
Less than 500 pounds 29 37 1.2 1.2 28.9
500 to 999 pounds 13 17 0.6 0.6 28.0
1,000 to 49,999 pounds 728 1,038 30.1 33.1 42.6
50,000 pounds or more 1,651 2,046 68.2 65.2 23.9
All shipment sizes 2,421 3,138 100.0 100.0 29.6
SOURCE: U.S. Department of Transportation, Research and Innovative Technology Administration, Bureau of Transportation Statistics, based on data from the 1993 and 2002 Commodity Flow Survey, December 2004.
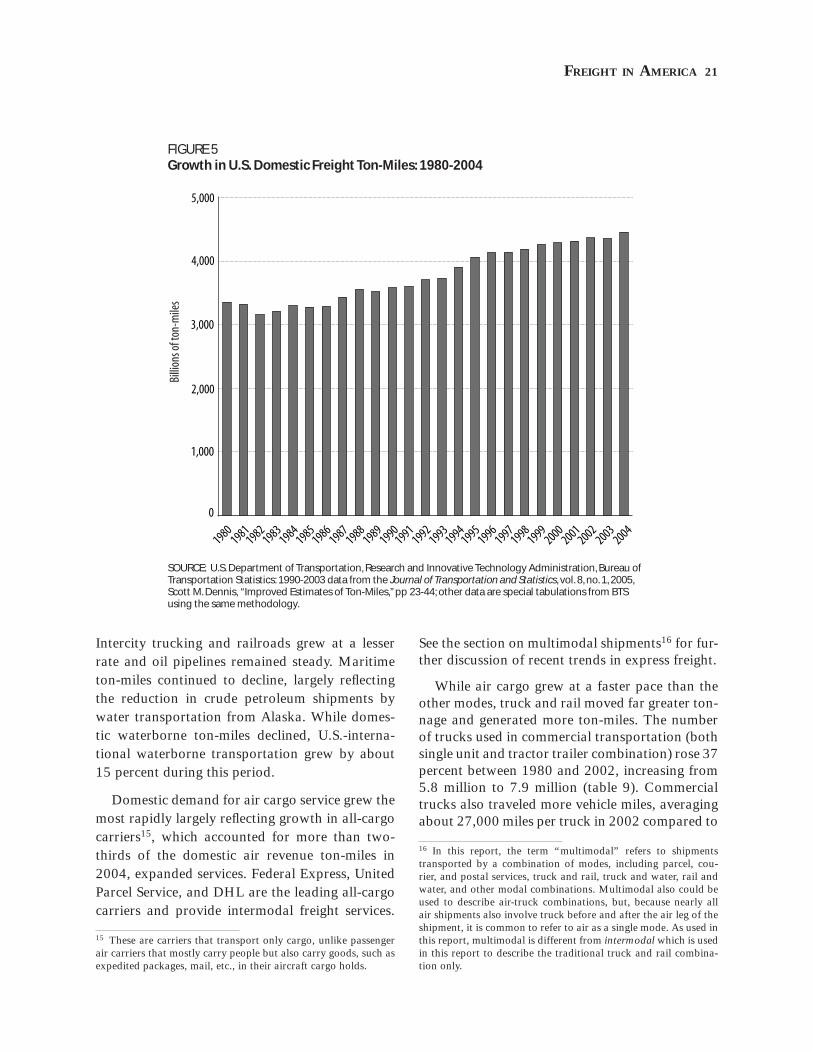
FREIGHT IN AMERICA 21
Intercity trucking and railroads grew at a lesser rate and oil pipelines remained steady. Maritime ton-miles continued to decline, largely refl ecting the reduction in crude petroleum shipments by water transportation from Alaska. While domes-tic waterborne ton-miles declined, U.S.-interna-tional waterborne transportation grew by about 15 percent during this period.
Domestic demand for air cargo service grew the most rapidly largely refl ecting growth in all-cargo carriers15, which accounted for more than two-thirds of the domestic air revenue ton-miles in 2004, expanded services. Federal Express, United Parcel Service, and DHL are the leading all-cargo carriers and provide intermodal freight services.
15 These are carriers that transport only cargo, unlike passenger air carriers that mostly carry people but also carry goods, such as expedited packages, mail, etc., in their aircraft cargo holds.
See the section on multimodal shipments16 for fur-ther discussion of recent trends in express freight.
While air cargo grew at a faster pace than the other modes, truck and rail moved far greater ton-nage and generated more ton-miles. The number of trucks used in commercial transportation (both single unit and tractor trailer combination) rose 37 percent between 1980 and 2002, increasing from 5.8 million to 7.9 million (table 9). Commercial trucks also traveled more vehicle miles, averaging about 27,000 miles per truck in 2002 compared to
16 In this report, the term “multimodal” refers to shipments transported by a combination of modes, including parcel, cou-rier, and postal services, truck and rail, truck and water, rail and water, and other modal combinations. Multimodal also could be used to describe air-truck combinations, but, because nearly all air shipments also involve truck before and after the air leg of the shipment, it is common to refer to air as a single mode. As used in this report, multimodal is different from intermodal which is used in this report to describe the traditional truck and rail combina-tion only.
FIGURE 5Growth in U.S. Domestic Freight Ton-Miles: 1980-2004
19801981
19821983
19841985
19861987
19881989
19901991
19921993
19941995
19961997
19981999
20002001
20022003
20040
1,000
2,000
3,000
4,000
5,000
Billi
ons o
f ton
-mile
s
SOURCE: U.S. Department of Transportation, Research and Innovative Technology Administration, Bureau of Transportation Statistics: 1990-2003 data from the Journal of Transportation and Statistics, vol. 8, no. 1, 2005, Scott M. Dennis, “Improved Estimates of Ton-Miles,” pp 23-44; other data are special tabulations from BTS using the same methodology.
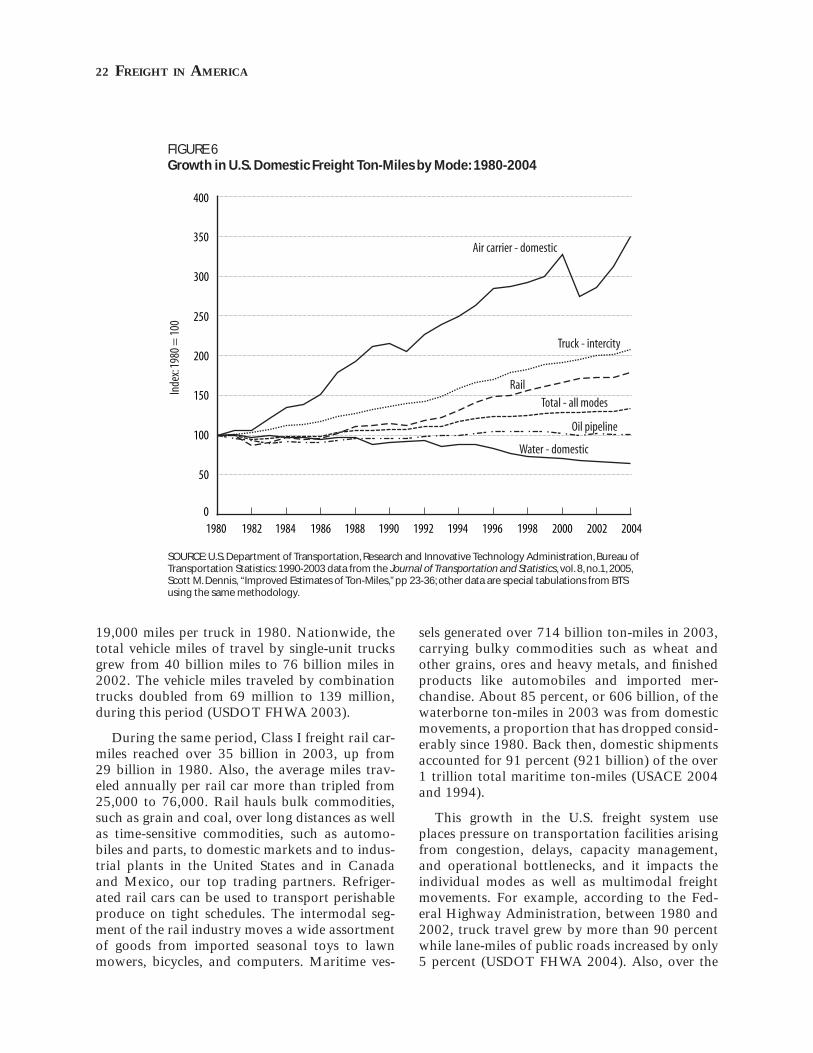
22 FREIGHT IN AMERICA
19,000 miles per truck in 1980. Nationwide, the total vehicle miles of travel by single-unit trucks grew from 40 billion miles to 76 billion miles in 2002. The vehicle miles traveled by combination trucks doubled from 69 million to 139 million, during this period (USDOT FHWA 2003).
During the same period, Class I freight rail car-miles reached over 35 billion in 2003, up from 29 billion in 1980. Also, the average miles trav-eled annually per rail car more than tripled from 25,000 to 76,000. Rail hauls bulk commodities, such as grain and coal, over long distances as well as time-sensitive commodities, such as automo-biles and parts, to domestic markets and to indus-trial plants in the United States and in Canada and Mexico, our top trading partners. Refriger-ated rail cars can be used to transport perishable produce on tight schedules. The intermodal seg-ment of the rail industry moves a wide assortment of goods from imported seasonal toys to lawn mowers, bicycles, and computers. Maritime ves-
sels generated over 714 billion ton-miles in 2003, carrying bulky commodities such as wheat and other grains, ores and heavy metals, and fi nished products like automobiles and imported mer-chandise. About 85 percent, or 606 billion, of the waterborne ton-miles in 2003 was from domestic movements, a proportion that has dropped consid-erably since 1980. Back then, domestic shipments accounted for 91 percent (921 billion) of the over 1 trillion total maritime ton-miles (USACE 2004 and 1994).
This growth in the U.S. freight system use places pressure on transportation facilities arising from congestion, delays, capacity management, and operational bottlenecks, and it impacts the individual modes as well as multimodal freight movements. For example, according to the Fed-eral Highway Administration, between 1980 and 2002, truck travel grew by more than 90 percent while lane-miles of public roads increased by only 5 percent (USDOT FHWA 2004). Also, over the
FIGURE 6Growth in U.S. Domestic Freight Ton-Miles by Mode: 1980-2004
1980 1982 1984 1986 1988 1990 1992 1994 1996 1998 2000 2002 20040
50
100
150
200
250
300
350
400
Inde
x: 19
80 =
100
Air carrier - domestic
Truck - intercity
Rail
Total - all modes
Oil pipeline
Water - domestic
SOURCE: U.S. Department of Transportation, Research and Innovative Technology Administration, Bureau of Transportation Statistics: 1990-2003 data from the Journal of Transportation and Statistics, vol. 8, no.1, 2005, Scott M. Dennis, “Improved Estimates of Ton-Miles,” pp 23-36; other data are special tabulations from BTS using the same methodology.
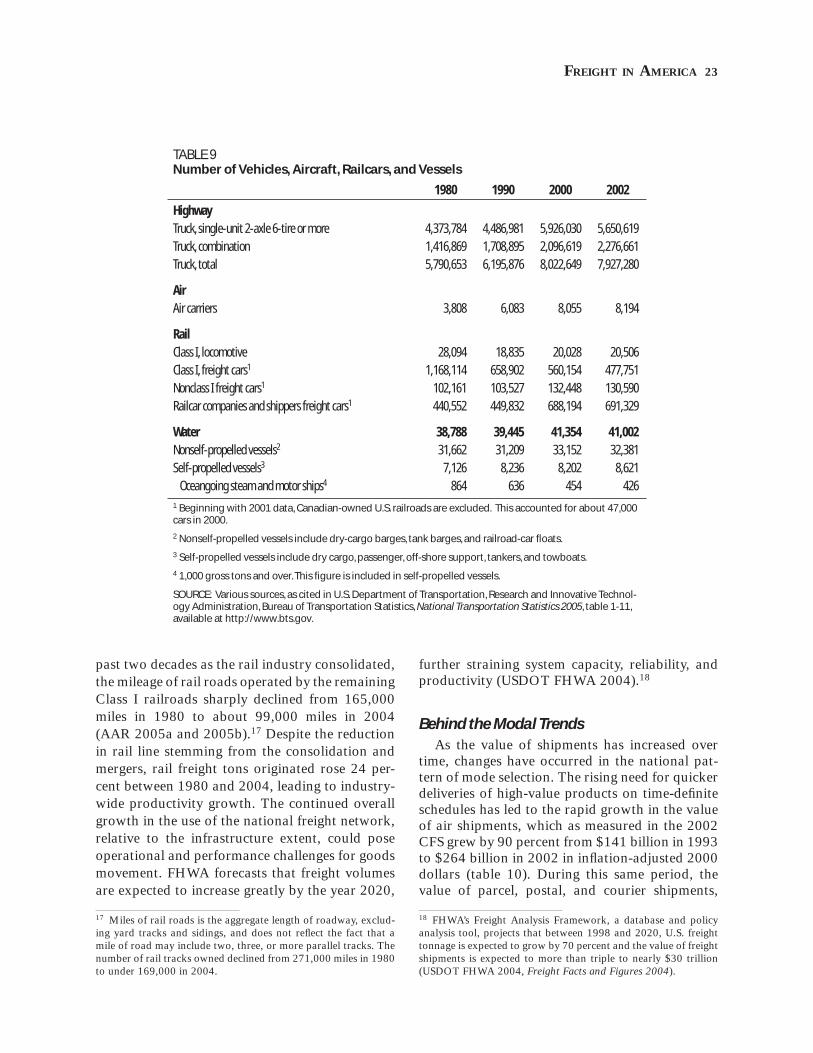
FREIGHT IN AMERICA 23
past two decades as the rail industry consolidated, the mileage of rail roads operated by the remaining Class I railroads sharply declined from 165,000 miles in 1980 to about 99,000 miles in 2004 (AAR 2005a and 2005b).17 Despite the reduction in rail line stemming from the consolidation and mergers, rail freight tons originated rose 24 per-cent between 1980 and 2004, leading to industry-wide productivity growth. The continued overall growth in the use of the national freight network, relative to the infrastructure extent, could pose operational and performance challenges for goods movement. FHWA forecasts that freight volumes are expected to increase greatly by the year 2020,
17 Miles of rail roads is the aggregate length of roadway, exclud-ing yard tracks and sidings, and does not refl ect the fact that a mile of road may include two, three, or more parallel tracks. The number of rail tracks owned declined from 271,000 miles in 1980 to under 169,000 in 2004.
further straining system capacity, reliability, and productivity (USDOT FHWA 2004).18
Behind the Modal Trends As the value of shipments has increased over
time, changes have occurred in the national pat-tern of mode selection. The rising need for quicker deliveries of high-value products on time-defi nite schedules has led to the rapid growth in the value of air shipments, which as measured in the 2002 CFS grew by 90 percent from $141 billion in 1993 to $264 billion in 2002 in infl ation-adjusted 2000 dollars (table 10). During this same period, the value of parcel, postal, and courier shipments,
18 FHWA’s Freight Analysis Framework, a database and policy analysis tool, projects that between 1998 and 2020, U.S. freight tonnage is expected to grow by 70 percent and the value of freight shipments is expected to more than triple to nearly $30 trillion (USDOT FHWA 2004, Freight Facts and Figures 2004).
TABLE 9Number of Vehicles, Aircraft, Railcars, and Vessels
1980 1990 2000 2002
HighwayTruck, single-unit 2-axle 6-tire or more 4,373,784 4,486,981 5,926,030 5,650,619
Truck, combination 1,416,869 1,708,895 2,096,619 2,276,661
Truck, total 5,790,653 6,195,876 8,022,649 7,927,280
AirAir carriers 3,808 6,083 8,055 8,194
RailClass I, locomotive 28,094 18,835 20,028 20,506
Class I, freight cars1 1,168,114 658,902 560,154 477,751
Nonclass I freight cars1 102,161 103,527 132,448 130,590
Railcar companies and shippers freight cars1 440,552 449,832 688,194 691,329
Water 38,788 39,445 41,354 41,002Nonself-propelled vessels2 31,662 31,209 33,152 32,381
Self-propelled vessels3 7,126 8,236 8,202 8,621
Oceangoing steam and motor ships4 864 636 454 4261 Beginning with 2001 data, Canadian-owned U.S. railroads are excluded. This accounted for about 47,000 cars in 2000.
2 Nonself-propelled vessels include dry-cargo barges, tank barges, and railroad-car fl oats.
3 Self-propelled vessels include dry cargo, passenger, off-shore support, tankers, and towboats.
4 1,000 gross tons and over. This fi gure is included in self-propelled vessels.
SOURCE: Various sources, as cited in U.S. Department of Transportation, Research and Innovative Technol-ogy Administration, Bureau of Transportation Statistics, National Transportation Statistics 2005, table 1-11, available at http://www.bts.gov.
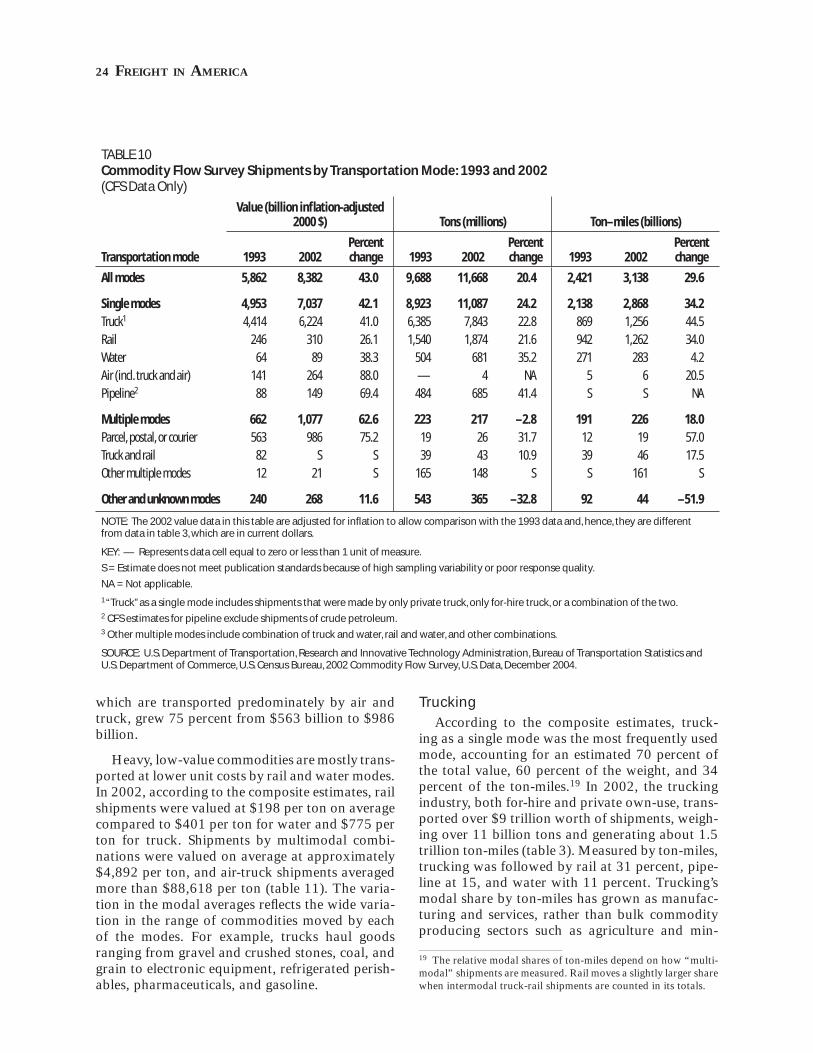
24 FREIGHT IN AMERICA
which are transported predominately by air and truck, grew 75 percent from $563 billion to $986 billion.
Heavy, low-value commodities are mostly trans-ported at lower unit costs by rail and water modes. In 2002, according to the composite estimates, rail shipments were valued at $198 per ton on average compared to $401 per ton for water and $775 per ton for truck. Shipments by multimodal combi-nations were valued on average at approximately $4,892 per ton, and air-truck shipments averaged more than $88,618 per ton (table 11). The varia-tion in the modal averages refl ects the wide varia-tion in the range of commodities moved by each of the modes. For example, trucks haul goods ranging from gravel and crushed stones, coal, and grain to electronic equipment, refrigerated perish-ables, pharmaceuticals, and gasoline.
Trucking
According to the composite estimates, truck-ing as a single mode was the most frequently used mode, accounting for an estimated 70 percent of the total value, 60 percent of the weight, and 34 percent of the ton-miles.19 In 2002, the trucking industry, both for-hire and private own-use, trans-ported over $9 trillion worth of shipments, weigh-ing over 11 billion tons and generating about 1.5 trillion ton-miles (table 3). Measured by ton-miles, trucking was followed by rail at 31 percent, pipe-line at 15, and water with 11 percent. Trucking’s modal share by ton-miles has grown as manufac-turing and services, rather than bulk commodity producing sectors such as agriculture and min-
19 The relative modal shares of ton-miles depend on how “multi-modal” shipments are measured. Rail moves a slightly larger share when intermodal truck-rail shipments are counted in its totals.
TABLE 10Commodity Flow Survey Shipments by Transportation Mode: 1993 and 2002(CFS Data Only)
Transportation mode
Value (billion infl ation-adjusted 2000 $) Tons (millions) Ton–miles (billions)
1993 2002Percent change 1993 2002
Percent change 1993 2002
Percent change
All modes 5,862 8,382 43.0 9,688 11,668 20.4 2,421 3,138 29.6
Single modes 4,953 7,037 42.1 8,923 11,087 24.2 2,138 2,868 34.2Truck1 4,414 6,224 41.0 6,385 7,843 22.8 869 1,256 44.5
Rail 246 310 26.1 1,540 1,874 21.6 942 1,262 34.0
Water 64 89 38.3 504 681 35.2 271 283 4.2
Air (incl. truck and air) 141 264 88.0 — 4 NA 5 6 20.5
Pipeline2 88 149 69.4 484 685 41.4 S S NA
Multiple modes 662 1,077 62.6 223 217 –2.8 191 226 18.0Parcel, postal, or courier 563 986 75.2 19 26 31.7 12 19 57.0
Truck and rail 82 S S 39 43 10.9 39 46 17.5
Other multiple modes 12 21 S 165 148 S S 161 S
Other and unknown modes 240 268 11.6 543 365 –32.8 92 44 –51.9
NOTE: The 2002 value data in this table are adjusted for infl ation to allow comparison with the 1993 data and, hence, they are different from data in table 3, which are in current dollars.
KEY: — Represents data cell equal to zero or less than 1 unit of measure.
S = Estimate does not meet publication standards because of high sampling variability or poor response quality.
NA = Not applicable.
1 “Truck” as a single mode includes shipments that were made by only private truck, only for-hire truck, or a combination of the two.2 CFS estimates for pipeline exclude shipments of crude petroleum.3 Other multiple modes include combination of truck and water, rail and water, and other combinations.
SOURCE: U.S. Department of Transportation, Research and Innovative Technology Administration, Bureau of Transportation Statistics and U.S. Department of Commerce, U.S. Census Bureau, 2002 Commodity Flow Survey, U.S. Data, December 2004.
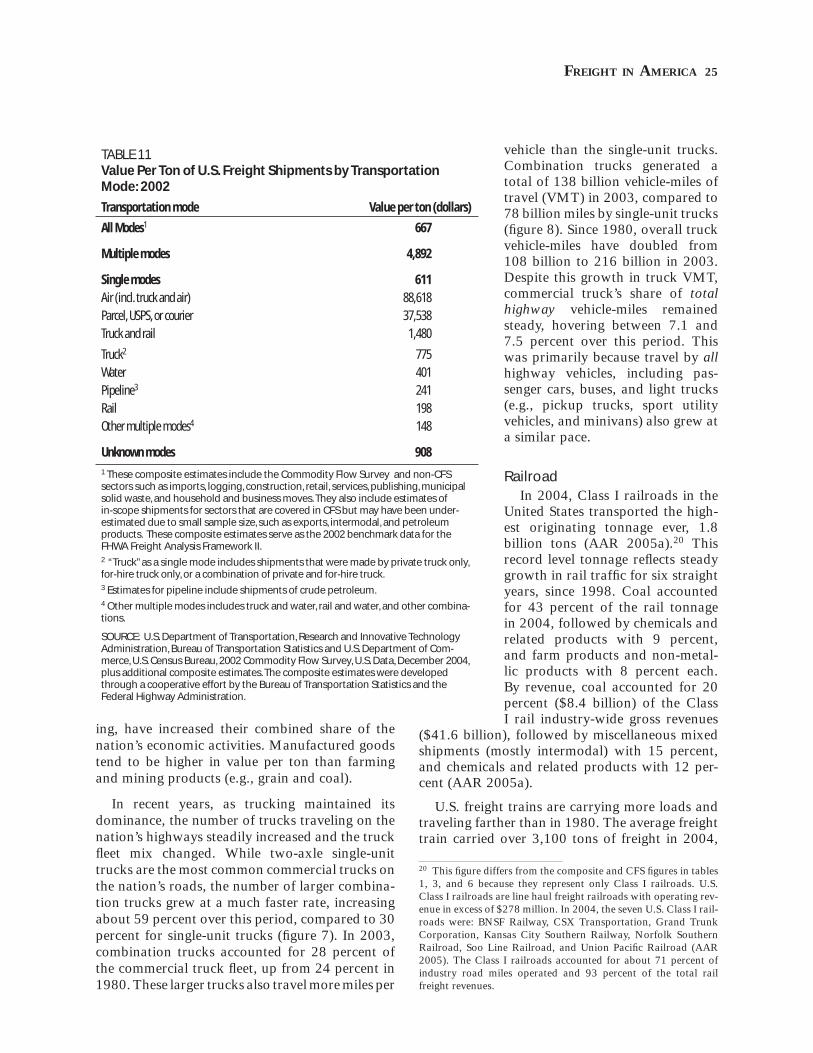
FREIGHT IN AMERICA 25
ing, have increased their combined share of the nation’s economic activities. Manufactured goods tend to be higher in value per ton than farming and mining products (e.g., grain and coal).
In recent years, as trucking maintained its dominance, the number of trucks traveling on the nation’s highways steadily increased and the truck fl eet mix changed. While two-axle single-unit trucks are the most common commercial trucks on the nation’s roads, the number of larger combina-tion trucks grew at a much faster rate, increasing about 59 percent over this period, compared to 30 percent for single-unit trucks (fi gure 7). In 2003, combination trucks accounted for 28 percent of the commercial truck fl eet, up from 24 percent in 1980. These larger trucks also travel more miles per
vehicle than the single-unit trucks. Combination trucks generated a total of 138 billion vehicle-miles of travel (VMT) in 2003, compared to 78 billion miles by single-unit trucks (fi gure 8). Since 1980, overall truck vehicle-miles have doubled from 108 billion to 216 billion in 2003. Despite this growth in truck VMT, commercial truck’s share of total highway vehicle-miles remained steady, hovering between 7.1 and 7.5 percent over this period. This was primarily because travel by all highway vehicles, including pas-senger cars, buses, and light trucks (e.g., pickup trucks, sport utility vehicles, and minivans) also grew at a similar pace.
RailroadIn 2004, Class I railroads in the
United States transported the high-est originating tonnage ever, 1.8 billion tons (AAR 2005a).20 This record level tonnage refl ects steady growth in rail traffi c for six straight years, since 1998. Coal accounted for 43 percent of the rail tonnage in 2004, followed by chemicals and related products with 9 percent, and farm products and non-metal-lic products with 8 percent each. By revenue, coal accounted for 20 percent ($8.4 billion) of the Class I rail industry-wide gross revenues
($41.6 billion), followed by miscellaneous mixed shipments (mostly intermodal) with 15 percent, and chemicals and related products with 12 per-cent (AAR 2005a).
U.S. freight trains are carrying more loads and traveling farther than in 1980. The average freight train carried over 3,100 tons of freight in 2004,
20 This fi gure differs from the composite and CFS fi gures in tables 1, 3, and 6 because they represent only Class I railroads. U.S. Class I railroads are line haul freight railroads with operating rev-enue in excess of $278 million. In 2004, the seven U.S. Class I rail-roads were: BNSF Railway, CSX Transportation, Grand Trunk Corporation, Kansas City Southern Railway, Norfolk Southern Railroad, Soo Line Railroad, and Union Pacifi c Railroad (AAR 2005). The Class I railroads accounted for about 71 percent of industry road miles operated and 93 percent of the total rail freight revenues.
TABLE 11Value Per Ton of U.S. Freight Shipments by Transportation Mode: 2002
Transportation mode Value per ton (dollars)
All Modes1 667
Multiple modes 4,892
Single modes 611 Air (incl. truck and air) 88,618
Parcel, USPS, or courier 37,538
Truck and rail 1,480
Truck2 775
Water 401
Pipeline3 241
Rail 198
Other multiple modes4 148
Unknown modes 908 1 These composite estimates include the Commodity Flow Survey and non-CFS sectors such as imports, logging, construction, retail, services, publishing, municipal solid waste, and household and business moves. They also include estimates of in-scope shipments for sectors that are covered in CFS but may have been under-estimated due to small sample size, such as exports, intermodal, and petroleum products. These composite estimates serve as the 2002 benchmark data for the FHWA Freight Analysis Framework II.2 “Truck” as a single mode includes shipments that were made by private truck only, for-hire truck only, or a combination of private and for-hire truck.3 Estimates for pipeline include shipments of crude petroleum.4 Other multiple modes includes truck and water, rail and water, and other combina-tions.
SOURCE: U.S. Department of Transportation, Research and Innovative Technology Administration, Bureau of Transportation Statistics and U.S. Department of Com-merce, U.S. Census Bureau, 2002 Commodity Flow Survey, U.S. Data, December 2004, plus additional composite estimates. The composite estimates were developed through a cooperative effort by the Bureau of Transportation Statistics and the Federal Highway Administration.
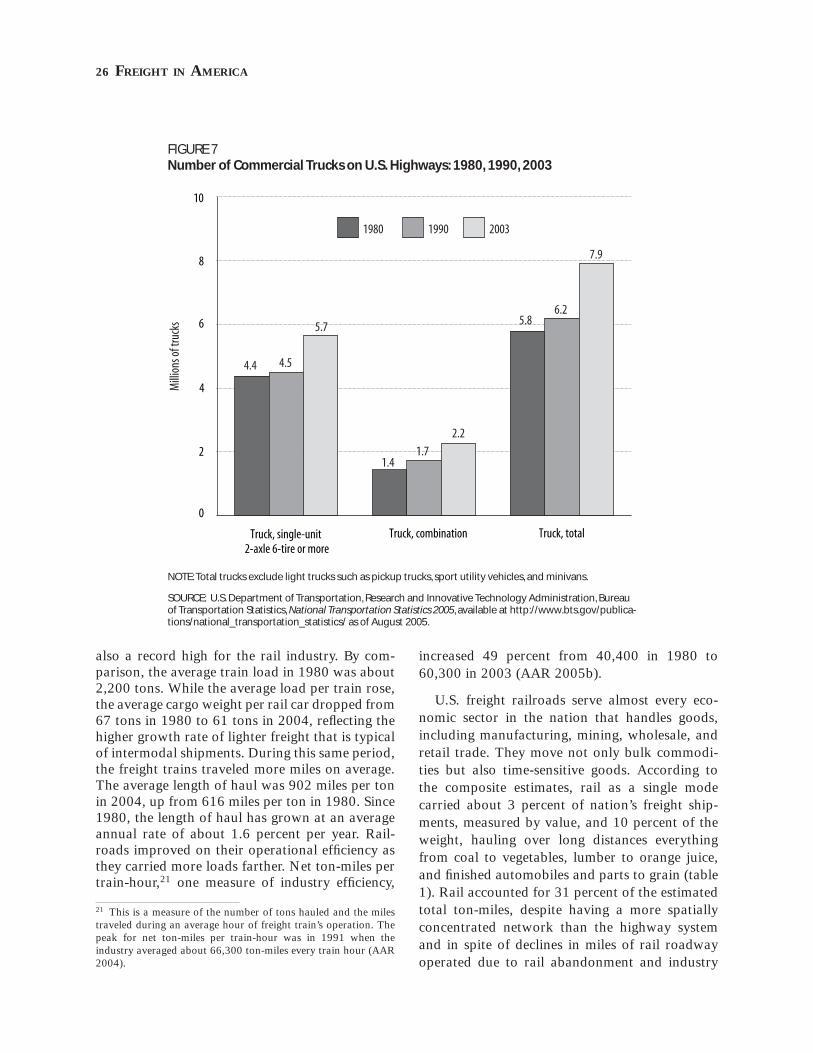
26 FREIGHT IN AMERICA
also a record high for the rail industry. By com-parison, the average train load in 1980 was about 2,200 tons. While the average load per train rose, the average cargo weight per rail car dropped from 67 tons in 1980 to 61 tons in 2004, refl ecting the higher growth rate of lighter freight that is typical of intermodal shipments. During this same period, the freight trains traveled more miles on average. The average length of haul was 902 miles per ton in 2004, up from 616 miles per ton in 1980. Since 1980, the length of haul has grown at an average annual rate of about 1.6 percent per year. Rail-roads improved on their operational effi ciency as they carried more loads farther. Net ton-miles per train-hour,21 one measure of industry effi ciency,
21 This is a measure of the number of tons hauled and the miles traveled during an average hour of freight train’s operation. The peak for net ton-miles per train-hour was in 1991 when the industry averaged about 66,300 ton-miles every train hour (AAR 2004).
increased 49 percent from 40,400 in 1980 to 60,300 in 2003 (AAR 2005b).
U.S. freight railroads serve almost every eco-nomic sector in the nation that handles goods, including manufacturing, mining, wholesale, and retail trade. They move not only bulk commodi-ties but also time-sensitive goods. According to the composite estimates, rail as a single mode carried about 3 percent of nation’s freight ship-ments, measured by value, and 10 percent of the weight, hauling over long distances everything from coal to vegetables, lumber to orange juice, and fi nished automobiles and parts to grain (table 1). Rail accounted for 31 percent of the estimated total ton-miles, despite having a more spatially concentrated network than the highway system and in spite of declines in miles of rail roadway operated due to rail abandonment and industry
FIGURE 7Number of Commercial Trucks on U.S. Highways: 1980, 1990, 2003
Truck, single-unit 2-axle 6-tire or more
Truck, combination Truck, total
0
2
4
6
8
10
1980 1990 2003
Mill
ions
of t
ruck
s
4.4 4.5
5.7
1.41.7
2.2
5.86.2
7.9
NOTE: Total trucks exclude light trucks such as pickup trucks, sport utility vehicles, and minivans.
SOURCE: U.S. Department of Transportation, Research and Innovative Technology Administration, Bureau of Transportation Statistics, National Transportation Statistics 2005, available at http://www.bts.gov/publica-tions/national_transportation_statistics/ as of August 2005.
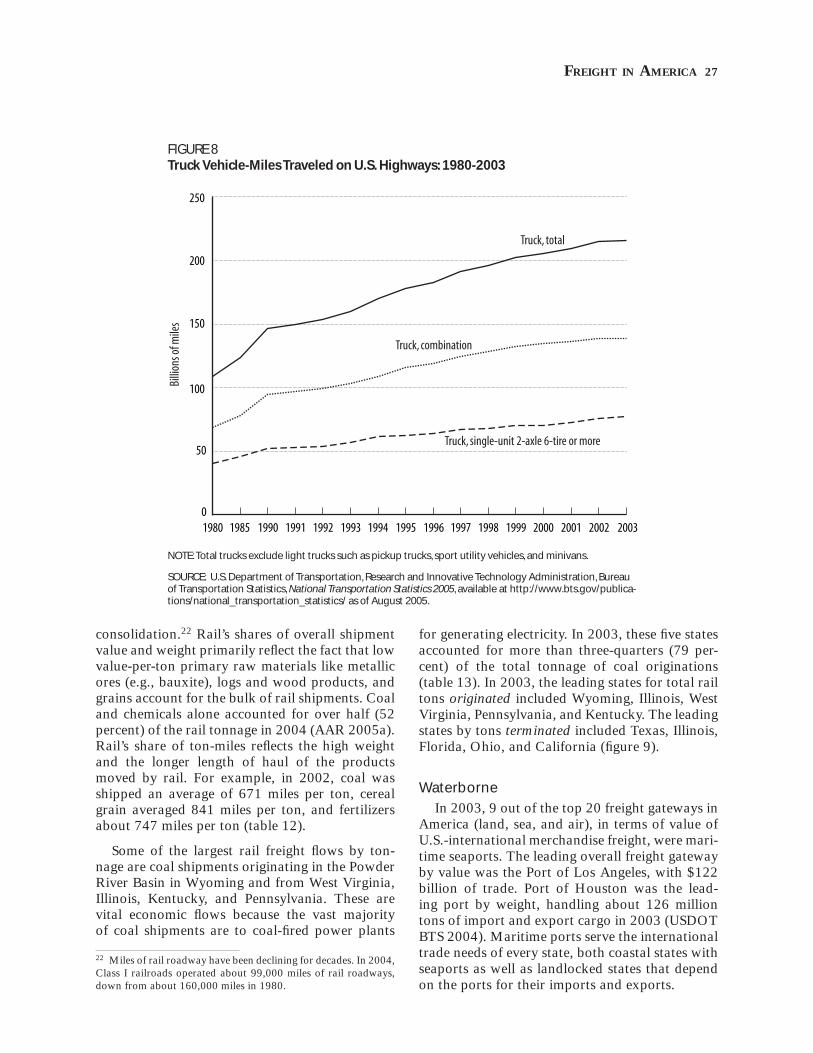
FREIGHT IN AMERICA 27
consolidation.22 Rail’s shares of overall shipment value and weight primarily refl ect the fact that low value-per-ton primary raw materials like metallic ores (e.g., bauxite), logs and wood products, and grains account for the bulk of rail shipments. Coal and chemicals alone accounted for over half (52 percent) of the rail tonnage in 2004 (AAR 2005a). Rail’s share of ton-miles refl ects the high weight and the longer length of haul of the products moved by rail. For example, in 2002, coal was shipped an average of 671 miles per ton, cereal grain averaged 841 miles per ton, and fertilizers about 747 miles per ton (table 12).
Some of the largest rail freight fl ows by ton-nage are coal shipments originating in the Powder River Basin in Wyoming and from West Virginia, Illinois, Kentucky, and Pennsylvania. These are vital economic fl ows because the vast majority of coal shipments are to coal-fi red power plants
22 Miles of rail roadway have been declining for decades. In 2004, Class I railroads operated about 99,000 miles of rail roadways, down from about 160,000 miles in 1980.
for generating electricity. In 2003, these fi ve states accounted for more than three-quarters (79 per-cent) of the total tonnage of coal originations (table 13). In 2003, the leading states for total rail tons originated included Wyoming, Illinois, West Virginia, Pennsylvania, and Kentucky. The leading states by tons terminated included Texas, Illinois, Florida, Ohio, and California (fi gure 9).
Waterborne
In 2003, 9 out of the top 20 freight gateways in America (land, sea, and air), in terms of value of U.S.-international merchandise freight, were mari-time seaports. The leading overall freight gateway by value was the Port of Los Angeles, with $122 billion of trade. Port of Houston was the lead-ing port by weight, handling about 126 million tons of import and export cargo in 2003 (USDOT BTS 2004). Maritime ports serve the international trade needs of every state, both coastal states with seaports as well as landlocked states that depend on the ports for their imports and exports.
FIGURE 8Truck Vehicle-Miles Traveled on U.S. Highways: 1980-2003
1980 1985 1990 1991 1992 1993 1994 1995 1996 1997 1998 1999 2000 2001 2002 20030
50
100
150
200
250
Truck, total
Truck, combination
Truck, single-unit 2-axle 6-tire or more
Bill
ions
of m
iles
NOTE: Total trucks exclude light trucks such as pickup trucks, sport utility vehicles, and minivans.
SOURCE: U.S. Department of Transportation, Research and Innovative Technology Administration, Bureau of Transportation Statistics, National Transportation Statistics 2005, available at http://www.bts.gov/publica-tions/national_transportation_statistics/ as of August 2005.
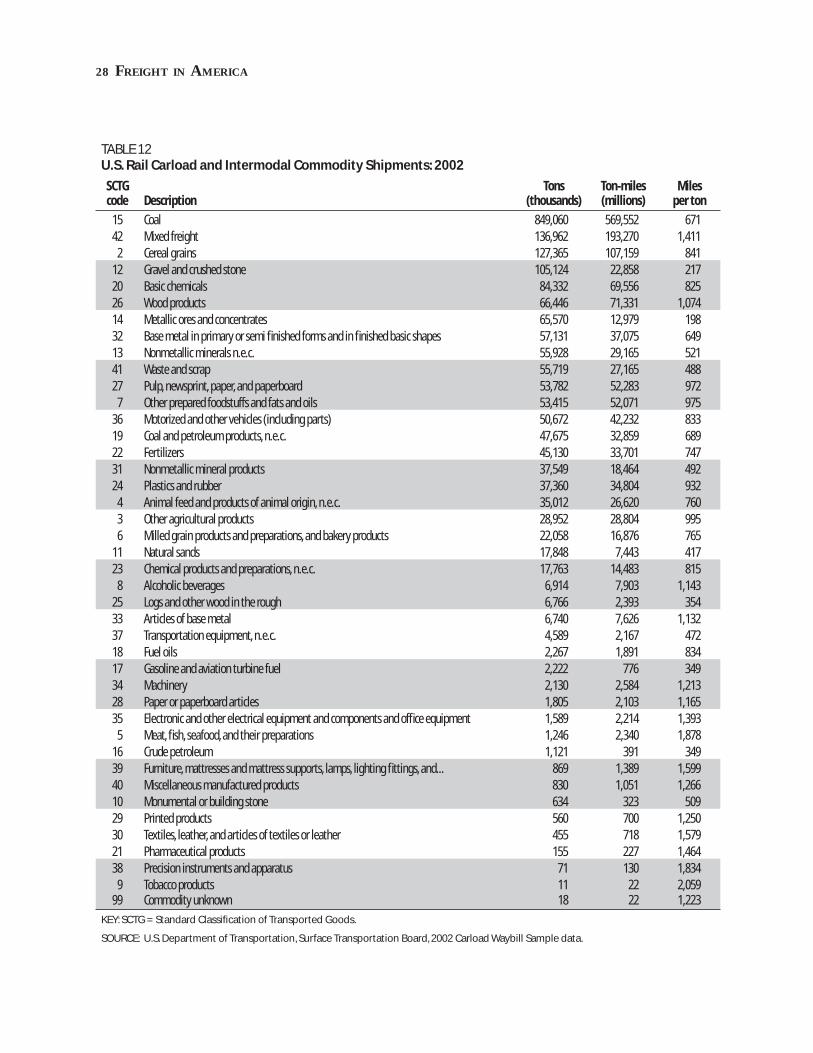
28 FREIGHT IN AMERICA
TABLE 12U.S. Rail Carload and Intermodal Commodity Shipments: 2002
SCTG code Description
Tons (thousands)
Ton-miles (millions)
Miles per ton
15 Coal 849,060 569,552 67142 Mixed freight 136,962 193,270 1,411 2 Cereal grains 127,365 107,159 84112 Gravel and crushed stone 105,124 22,858 21720 Basic chemicals 84,332 69,556 82526 Wood products 66,446 71,331 1,07414 Metallic ores and concentrates 65,570 12,979 19832 Base metal in primary or semi fi nished forms and in fi nished basic shapes 57,131 37,075 64913 Nonmetallic minerals n.e.c. 55,928 29,165 52141 Waste and scrap 55,719 27,165 48827 Pulp, newsprint, paper, and paperboard 53,782 52,283 972 7 Other prepared foodstuffs and fats and oils 53,415 52,071 97536 Motorized and other vehicles (including parts) 50,672 42,232 83319 Coal and petroleum products, n.e.c. 47,675 32,859 68922 Fertilizers 45,130 33,701 74731 Nonmetallic mineral products 37,549 18,464 49224 Plastics and rubber 37,360 34,804 932 4 Animal feed and products of animal origin, n.e.c. 35,012 26,620 760 3 Other agricultural products 28,952 28,804 995 6 Milled grain products and preparations, and bakery products 22,058 16,876 76511 Natural sands 17,848 7,443 41723 Chemical products and preparations, n.e.c. 17,763 14,483 815 8 Alcoholic beverages 6,914 7,903 1,14325 Logs and other wood in the rough 6,766 2,393 35433 Articles of base metal 6,740 7,626 1,13237 Transportation equipment, n.e.c. 4,589 2,167 47218 Fuel oils 2,267 1,891 83417 Gasoline and aviation turbine fuel 2,222 776 34934 Machinery 2,130 2,584 1,21328 Paper or paperboard articles 1,805 2,103 1,16535 Electronic and other electrical equipment and components and offi ce equipment 1,589 2,214 1,393 5 Meat, fi sh, seafood, and their preparations 1,246 2,340 1,87816 Crude petroleum 1,121 391 34939 Furniture, mattresses and mattress supports, lamps, lighting fi ttings, and... 869 1,389 1,59940 Miscellaneous manufactured products 830 1,051 1,26610 Monumental or building stone 634 323 50929 Printed products 560 700 1,25030 Textiles, leather, and articles of textiles or leather 455 718 1,57921 Pharmaceutical products 155 227 1,46438 Precision instruments and apparatus 71 130 1,834 9 Tobacco products 11 22 2,05999 Commodity unknown 18 22 1,223
KEY: SCTG = Standard Classifi cation of Transported Goods.
SOURCE: U.S. Department of Transportation, Surface Transportation Board, 2002 Carload Waybill Sample data.
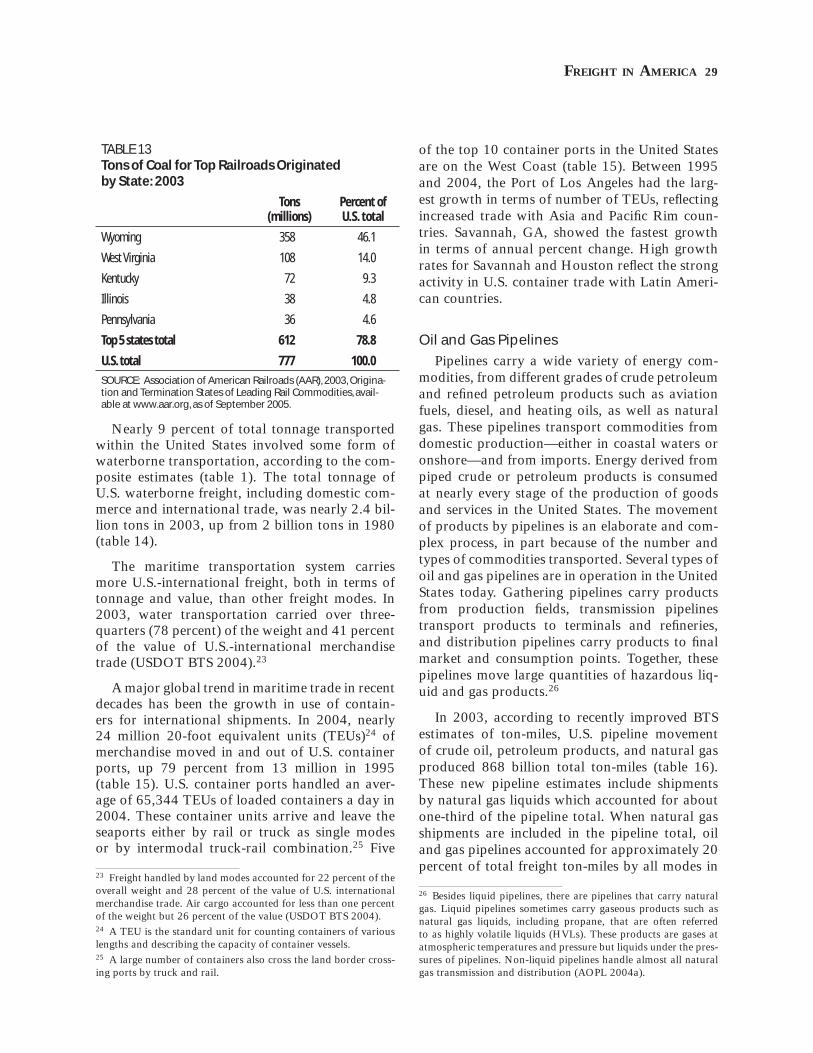
FREIGHT IN AMERICA 29
Nearly 9 percent of total tonnage transported within the United States involved some form of waterborne transportation, according to the com-posite estimates (table 1). The total tonnage of U.S. waterborne freight, including domestic com-merce and international trade, was nearly 2.4 bil-lion tons in 2003, up from 2 billion tons in 1980 (table 14).
The maritime transportation system carries more U.S.-international freight, both in terms of tonnage and value, than other freight modes. In 2003, water transportation carried over three-quarters (78 percent) of the weight and 41 percent of the value of U.S.-international merchandise trade (USDOT BTS 2004).23
A major global trend in maritime trade in recent decades has been the growth in use of contain-ers for international shipments. In 2004, nearly 24 million 20-foot equivalent units (TEUs)24 of merchandise moved in and out of U.S. container ports, up 79 percent from 13 million in 1995 (table 15). U.S. container ports handled an aver-age of 65,344 TEUs of loaded containers a day in 2004. These container units arrive and leave the seaports either by rail or truck as single modes or by intermodal truck-rail combination.25 Five
23 Freight handled by land modes accounted for 22 percent of the overall weight and 28 percent of the value of U.S. international merchandise trade. Air cargo accounted for less than one percent of the weight but 26 percent of the value (USDOT BTS 2004).24 A TEU is the standard unit for counting containers of various lengths and describing the capacity of container vessels.25 A large number of containers also cross the land border cross-ing ports by truck and rail.
of the top 10 container ports in the United States are on the West Coast (table 15). Between 1995 and 2004, the Port of Los Angeles had the larg-est growth in terms of number of TEUs, refl ecting increased trade with Asia and Pacifi c Rim coun-tries. Savannah, GA, showed the fastest growth in terms of annual percent change. High growth rates for Savannah and Houston refl ect the strong activity in U.S. container trade with Latin Ameri-can countries.
Oil and Gas Pipelines
Pipelines carry a wide variety of energy com-modities, from different grades of crude petroleum and refi ned petroleum products such as aviation fuels, diesel, and heating oils, as well as natural gas. These pipelines transport commodities from domestic production—either in coastal waters or onshore—and from imports. Energy derived from piped crude or petroleum products is consumed at nearly every stage of the production of goods and services in the United States. The movement of products by pipelines is an elaborate and com-plex process, in part because of the number and types of commodities transported. Several types of oil and gas pipelines are in operation in the United States today. Gathering pipelines carry products from production fi elds, transmission pipelines transport products to terminals and refi neries, and distribution pipelines carry products to fi nal market and consumption points. Together, these pipelines move large quantities of hazardous liq-uid and gas products.26
In 2003, according to recently improved BTS estimates of ton-miles, U.S. pipeline movement of crude oil, petroleum products, and natural gas produced 868 billion total ton-miles (table 16). These new pipeline estimates include shipments by natural gas liquids which accounted for about one-third of the pipeline total. When natural gas shipments are included in the pipeline total, oil and gas pipelines accounted for approximately 20 percent of total freight ton-miles by all modes in
26 Besides liquid pipelines, there are pipelines that carry natural gas. Liquid pipelines sometimes carry gaseous products such as natural gas liquids, including propane, that are often referred to as highly volatile liquids (HVLs). These products are gases at atmospheric temperatures and pressure but liquids under the pres-sures of pipelines. Non-liquid pipelines handle almost all natural gas transmission and distribution (AOPL 2004a).
TABLE 13Tons of Coal for Top Railroads Originated by State: 2003
Tons (millions)
Percent of U.S. total
Wyoming 358 46.1
West Virginia 108 14.0
Kentucky 72 9.3
Illinois 38 4.8
Pennsylvania 36 4.6
Top 5 states total 612 78.8
U.S. total 777 100.0
SOURCE: Association of American Railroads (AAR), 2003, Origina-tion and Termination States of Leading Rail Commodities, avail-able at www.aar.org, as of September 2005.
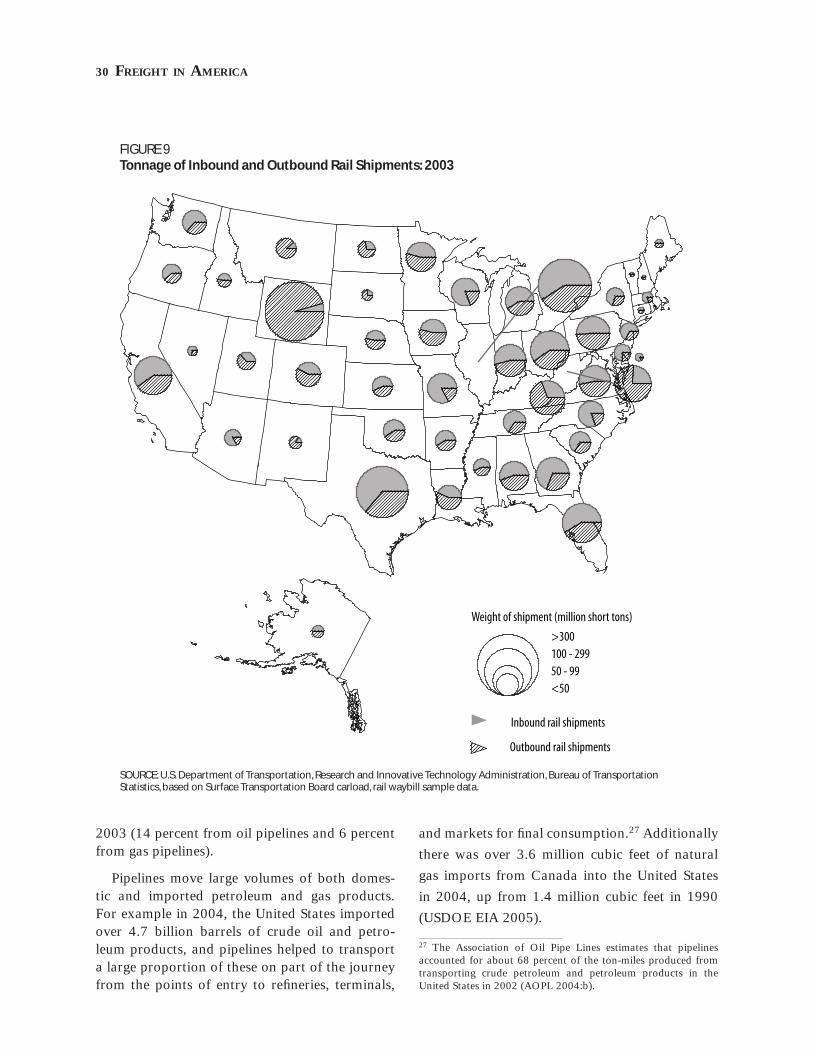
30 FREIGHT IN AMERICA
2003 (14 percent from oil pipelines and 6 percent from gas pipelines).
Pipelines move large volumes of both domes-tic and imported petroleum and gas products. For example in 2004, the United States imported over 4.7 billion barrels of crude oil and petro-leum products, and pipelines helped to transport a large proportion of these on part of the journey from the points of entry to refi neries, terminals,
and markets for fi nal consumption.27 Additionally
there was over 3.6 million cubic feet of natural
gas imports from Canada into the United States
in 2004, up from 1.4 million cubic feet in 1990
(USDOE EIA 2005).
27 The Association of Oil Pipe Lines estimates that pipelines accounted for about 68 percent of the ton-miles produced from transporting crude petroleum and petroleum products in the United States in 2002 (AOPL 2004:b).
FIGURE 9Tonnage of Inbound and Outbound Rail Shipments: 2003
Weight of shipment (million short tons)
>300100 - 29950 - 99<50
Inbound rail shipments
Outbound rail shipments
SOURCE: U.S. Department of Transportation, Research and Innovative Technology Administration, Bureau of Transportation Statistics, based on Surface Transportation Board carload, rail waybill sample data.
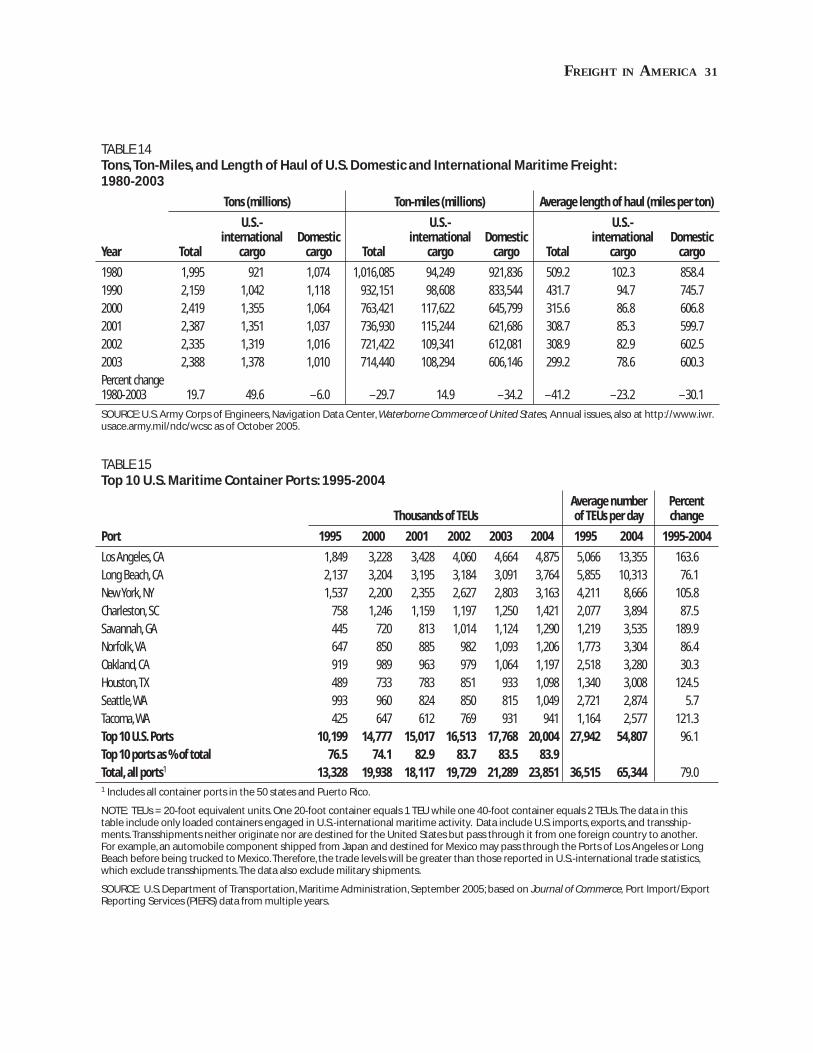
FREIGHT IN AMERICA 31
TABLE 14Tons, Ton-Miles, and Length of Haul of U.S. Domestic and International Maritime Freight: 1980-2003
Tons (millions) Ton-miles (millions) Average length of haul (miles per ton)
Year Total
U.S.-international
cargoDomestic
cargo Total
U.S.-international
cargoDomestic
cargo Total
U.S.-international
cargoDomestic
cargo
1980 1,995 921 1,074 1,016,085 94,249 921,836 509.2 102.3 858.4
1990 2,159 1,042 1,118 932,151 98,608 833,544 431.7 94.7 745.7
2000 2,419 1,355 1,064 763,421 117,622 645,799 315.6 86.8 606.8
2001 2,387 1,351 1,037 736,930 115,244 621,686 308.7 85.3 599.7
2002 2,335 1,319 1,016 721,422 109,341 612,081 308.9 82.9 602.5
2003 2,388 1,378 1,010 714,440 108,294 606,146 299.2 78.6 600.3
Percent change 1980-2003 19.7 49.6 –6.0 –29.7 14.9 –34.2 –41.2 –23.2 –30.1
SOURCE: U.S. Army Corps of Engineers, Navigation Data Center, Waterborne Commerce of United States, Annual issues, also at http://www.iwr.usace.army.mil/ndc/wcsc as of October 2005.
TABLE 15Top 10 U.S. Maritime Container Ports: 1995-2004
Thousands of TEUsAverage number of TEUs per day
Percent change
Port 1995 2000 2001 2002 2003 2004 1995 2004 1995-2004
Los Angeles, CA 1,849 3,228 3,428 4,060 4,664 4,875 5,066 13,355 163.6
Long Beach, CA 2,137 3,204 3,195 3,184 3,091 3,764 5,855 10,313 76.1
New York, NY 1,537 2,200 2,355 2,627 2,803 3,163 4,211 8,666 105.8
Charleston, SC 758 1,246 1,159 1,197 1,250 1,421 2,077 3,894 87.5
Savannah, GA 445 720 813 1,014 1,124 1,290 1,219 3,535 189.9
Norfolk, VA 647 850 885 982 1,093 1,206 1,773 3,304 86.4
Oakland, CA 919 989 963 979 1,064 1,197 2,518 3,280 30.3
Houston, TX 489 733 783 851 933 1,098 1,340 3,008 124.5
Seattle, WA 993 960 824 850 815 1,049 2,721 2,874 5.7
Tacoma, WA 425 647 612 769 931 941 1,164 2,577 121.3
Top 10 U.S. Ports 10,199 14,777 15,017 16,513 17,768 20,004 27,942 54,807 96.1
Top 10 ports as % of total 76.5 74.1 82.9 83.7 83.5 83.9 Total, all ports1 13,328 19,938 18,117 19,729 21,289 23,851 36,515 65,344 79.0 1 Includes all container ports in the 50 states and Puerto Rico.
NOTE: TEUs = 20-foot equivalent units. One 20-foot container equals 1 TEU while one 40-foot container equals 2 TEUs. The data in this table include only loaded containers engaged in U.S.-international maritime activity. Data include U.S. imports, exports, and transship-ments. Transshipments neither originate nor are destined for the United States but pass through it from one foreign country to another. For example, an automobile component shipped from Japan and destined for Mexico may pass through the Ports of Los Angeles or Long Beach before being trucked to Mexico. Therefore, the trade levels will be greater than those reported in U.S.-international trade statistics, which exclude transshipments. The data also exclude military shipments.
SOURCE: U.S. Department of Transportation, Maritime Administration, September 2005; based on Journal of Commerce, Port Import/Export Reporting Services (PIERS) data from multiple years.
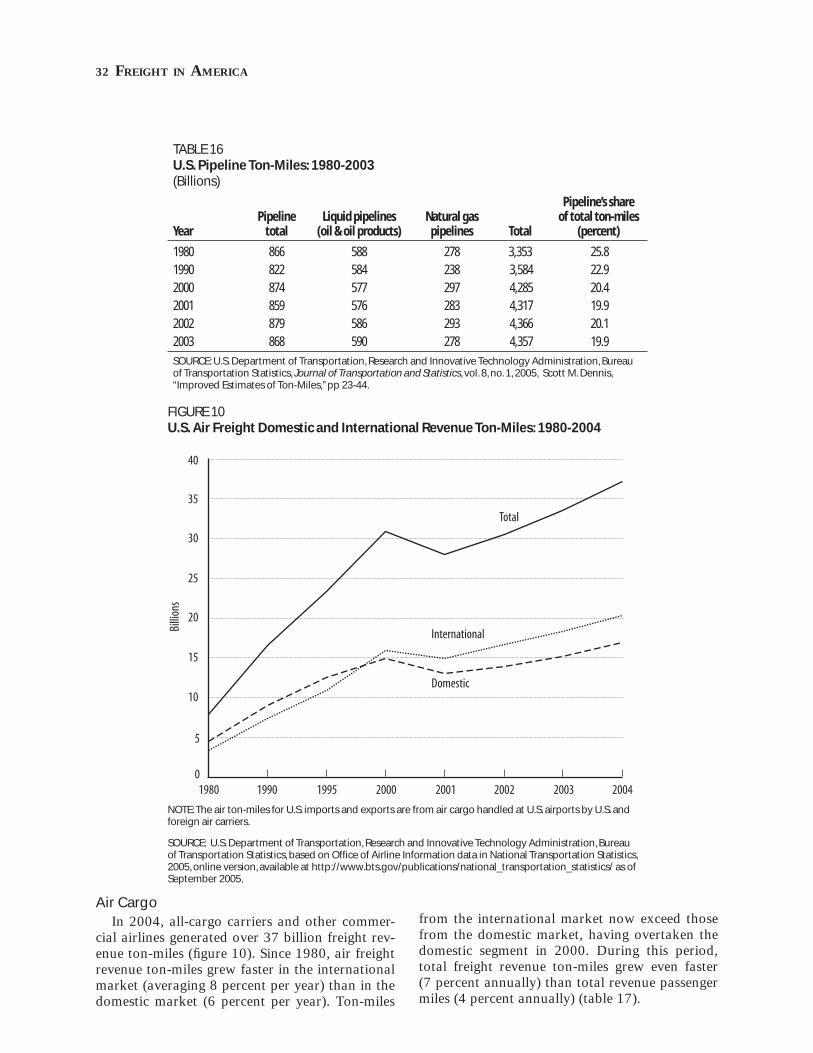
32 FREIGHT IN AMERICA
Air CargoIn 2004, all-cargo carriers and other commer-
cial airlines generated over 37 billion freight rev-enue ton-miles (fi gure 10). Since 1980, air freight revenue ton-miles grew faster in the international market (averaging 8 percent per year) than in the domestic market (6 percent per year). Ton-miles
from the international market now exceed those from the domestic market, having overtaken the domestic segment in 2000. During this period, total freight revenue ton-miles grew even faster (7 percent annually) than total revenue passenger miles (4 percent annually) (table 17).
TABLE 16U.S. Pipeline Ton-Miles: 1980-2003(Billions)
YearPipeline
totalLiquid pipelines
(oil & oil products)Natural gas
pipelines Total
Pipeline’s share of total ton-miles
(percent)
1980 866 588 278 3,353 25.8
1990 822 584 238 3,584 22.9
2000 874 577 297 4,285 20.4
2001 859 576 283 4,317 19.9
2002 879 586 293 4,366 20.1
2003 868 590 278 4,357 19.9
SOURCE: U.S. Department of Transportation, Research and Innovative Technology Administration, Bureau of Transportation Statistics, Journal of Transportation and Statistics, vol. 8, no. 1, 2005, Scott M. Dennis, “Improved Estimates of Ton-Miles,” pp 23-44.
FIGURE 10U.S. Air Freight Domestic and International Revenue Ton-Miles: 1980-2004
1980 1990 1995 2000 2001 2002 2003 2004 0
5
10
15
20
25
30
35
40
Billi
ons
Total
International
Domestic
NOTE: The air ton-miles for U.S. imports and exports are from air cargo handled at U.S. airports by U.S. and foreign air carriers.
SOURCE: U.S. Department of Transportation, Research and Innovative Technology Administration, Bureau of Transportation Statistics, based on Offi ce of Airline Information data in National Transportation Statistics, 2005, online version, available at http://www.bts.gov/publications/national_transportation_statistics/ as of September 2005.
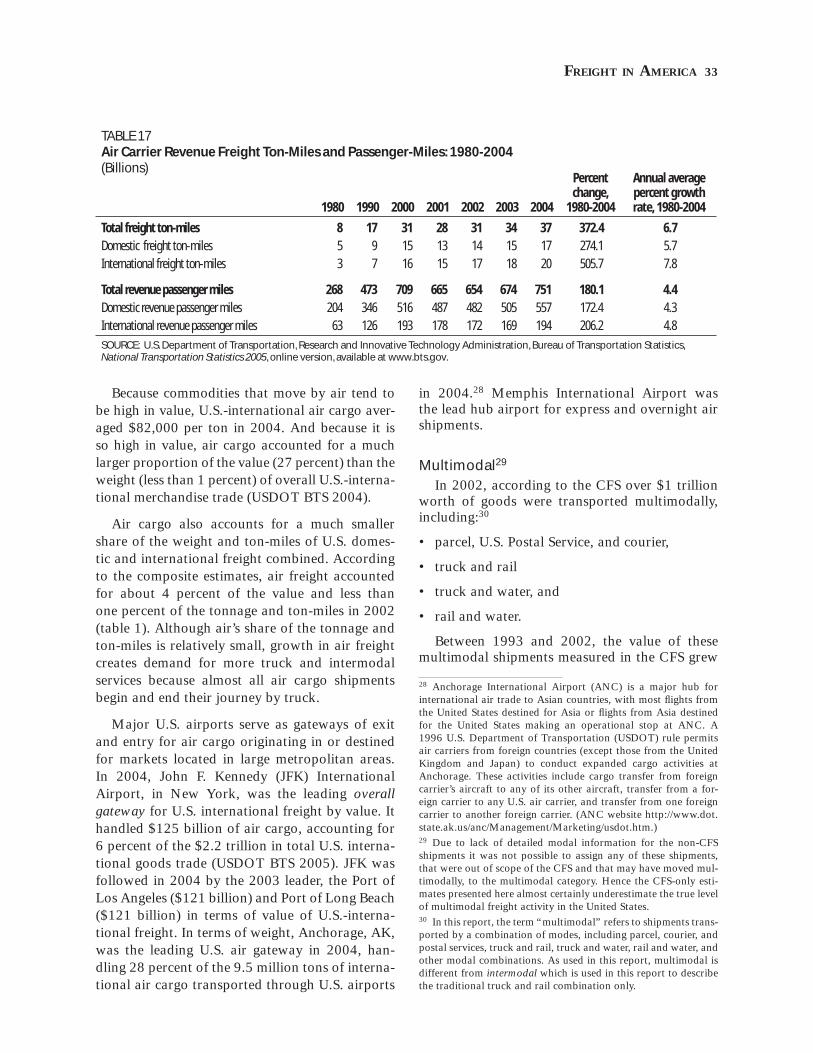
FREIGHT IN AMERICA 33
Because commodities that move by air tend to be high in value, U.S.-international air cargo aver-aged $82,000 per ton in 2004. And because it is so high in value, air cargo accounted for a much larger proportion of the value (27 percent) than the weight (less than 1 percent) of overall U.S.-interna-tional merchandise trade (USDOT BTS 2004).
Air cargo also accounts for a much smaller share of the weight and ton-miles of U.S. domes-tic and international freight combined. According to the composite estimates, air freight accounted for about 4 percent of the value and less than one percent of the tonnage and ton-miles in 2002 (table 1). Although air’s share of the tonnage and ton-miles is relatively small, growth in air freight creates demand for more truck and intermodal services because almost all air cargo shipments begin and end their journey by truck.
Major U.S. airports serve as gateways of exit and entry for air cargo originating in or destined for markets located in large metropolitan areas. In 2004, John F. Kennedy (JFK) International Airport, in New York, was the leading overall gateway for U.S. international freight by value. It handled $125 billion of air cargo, accounting for 6 percent of the $2.2 trillion in total U.S. interna-tional goods trade (USDOT BTS 2005). JFK was followed in 2004 by the 2003 leader, the Port of Los Angeles ($121 billion) and Port of Long Beach ($121 billion) in terms of value of U.S.-interna-tional freight. In terms of weight, Anchorage, AK, was the leading U.S. air gateway in 2004, han-dling 28 percent of the 9.5 million tons of interna-tional air cargo transported through U.S. airports
in 2004.28 Memphis International Airport was the lead hub airport for express and overnight air shipments.
Multimodal29 In 2002, according to the CFS over $1 trillion
worth of goods were transported multimodally, including:30
• parcel, U.S. Postal Service, and courier,
• truck and rail
• truck and water, and
• rail and water.
Between 1993 and 2002, the value of these multimodal shipments measured in the CFS grew
28 Anchorage International Airport (ANC) is a major hub for international air trade to Asian countries, with most fl ights from the United States destined for Asia or fl ights from Asia destined for the United States making an operational stop at ANC. A 1996 U.S. Department of Transportation (USDOT) rule permits air carriers from foreign countries (except those from the United Kingdom and Japan) to conduct expanded cargo activities at Anchorage. These activities include cargo transfer from foreign carrier’s aircraft to any of its other aircraft, transfer from a for-eign carrier to any U.S. air carrier, and transfer from one foreign carrier to another foreign carrier. (ANC website http://www.dot.state.ak.us/anc/Management/Marketing/usdot.htm.)29 Due to lack of detailed modal information for the non-CFS shipments it was not possible to assign any of these shipments, that were out of scope of the CFS and that may have moved mul-timodally, to the multimodal category. Hence the CFS-only esti-mates presented here almost certainly underestimate the true level of multimodal freight activity in the United States.30 In this report, the term “multimodal” refers to shipments trans-ported by a combination of modes, including parcel, courier, and postal services, truck and rail, truck and water, rail and water, and other modal combinations. As used in this report, multimodal is different from intermodal which is used in this report to describe the traditional truck and rail combination only.
TABLE 17Air Carrier Revenue Freight Ton-Miles and Passenger-Miles: 1980-2004(Billions)
1980 1990 2000 2001 2002 2003 2004
Percent change,
1980-2004
Annual average percent growth rate, 1980-2004
Total freight ton-miles 8 17 31 28 31 34 37 372.4 6.7 Domestic freight ton-miles 5 9 15 13 14 15 17 274.1 5.7
International freight ton-miles 3 7 16 15 17 18 20 505.7 7.8
Total revenue passenger miles 268 473 709 665 654 674 751 180.1 4.4 Domestic revenue passenger miles 204 346 516 487 482 505 557 172.4 4.3
International revenue passenger miles 63 126 193 178 172 169 194 206.2 4.8
SOURCE: U.S. Department of Transportation, Research and Innovative Technology Administration, Bureau of Transportation Statistics, National Transportation Statistics 2005, online version, available at www.bts.gov.
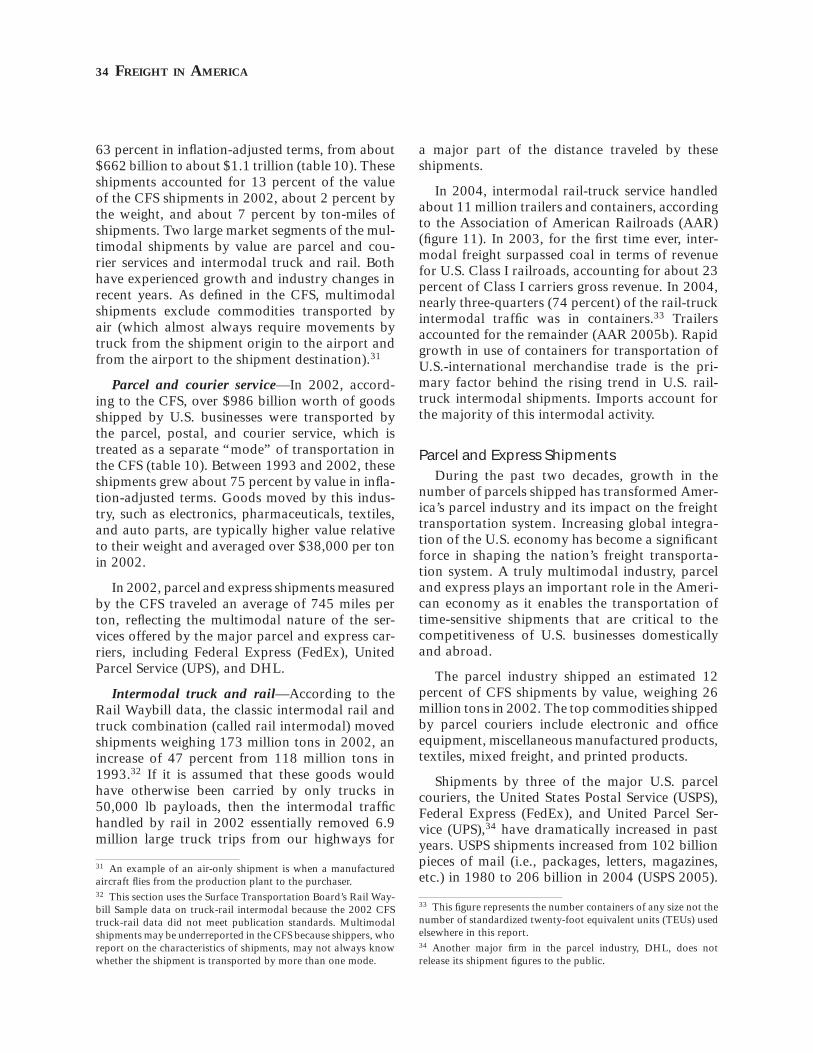
34 FREIGHT IN AMERICA
63 percent in infl ation-adjusted terms, from about $662 billion to about $1.1 trillion (table 10). These shipments accounted for 13 percent of the value of the CFS shipments in 2002, about 2 percent by the weight, and about 7 percent by ton-miles of shipments. Two large market segments of the mul-timodal shipments by value are parcel and cou-rier services and intermodal truck and rail. Both have experienced growth and industry changes in recent years. As defi ned in the CFS, multimodal shipments exclude commodities transported by air (which almost always require movements by truck from the shipment origin to the airport and from the airport to the shipment destination).31
Parcel and courier service—In 2002, accord-ing to the CFS, over $986 billion worth of goods shipped by U.S. businesses were transported by the parcel, postal, and courier service, which is treated as a separate “mode” of transportation in the CFS (table 10). Between 1993 and 2002, these shipments grew about 75 percent by value in infl a-tion-adjusted terms. Goods moved by this indus-try, such as electronics, pharmaceuticals, textiles, and auto parts, are typically higher value relative to their weight and averaged over $38,000 per ton in 2002.
In 2002, parcel and express shipments measured by the CFS traveled an average of 745 miles per ton, refl ecting the multimodal nature of the ser-vices offered by the major parcel and express car-riers, including Federal Express (FedEx), United Parcel Service (UPS), and DHL.
Intermodal truck and rail—According to the Rail Waybill data, the classic intermodal rail and truck combination (called rail intermodal) moved shipments weighing 173 million tons in 2002, an increase of 47 percent from 118 million tons in 1993.32 If it is assumed that these goods would have otherwise been carried by only trucks in 50,000 lb payloads, then the intermodal traffi c handled by rail in 2002 essentially removed 6.9 million large truck trips from our highways for
31 An example of an air-only shipment is when a manufactured aircraft fl ies from the production plant to the purchaser. 32 This section uses the Surface Transportation Board’s Rail Way-bill Sample data on truck-rail intermodal because the 2002 CFS truck-rail data did not meet publication standards. Multimodal shipments may be underreported in the CFS because shippers, who report on the characteristics of shipments, may not always know whether the shipment is transported by more than one mode.
a major part of the distance traveled by these shipments.
In 2004, intermodal rail-truck service handled about 11 million trailers and containers, according to the Association of American Railroads (AAR) (fi gure 11). In 2003, for the fi rst time ever, inter-modal freight surpassed coal in terms of revenue for U.S. Class I railroads, accounting for about 23 percent of Class I carriers gross revenue. In 2004, nearly three-quarters (74 percent) of the rail-truck intermodal traffi c was in containers.33 Trailers accounted for the remainder (AAR 2005b). Rapid growth in use of containers for transportation of U.S.-international merchandise trade is the pri-mary factor behind the rising trend in U.S. rail-truck intermodal shipments. Imports account for the majority of this intermodal activity.
Parcel and Express Shipments
During the past two decades, growth in the number of parcels shipped has transformed Amer-ica’s parcel industry and its impact on the freight transportation system. Increasing global integra-tion of the U.S. economy has become a signifi cant force in shaping the nation’s freight transporta-tion system. A truly multimodal industry, parcel and express plays an important role in the Ameri-can economy as it enables the transportation of time-sensitive shipments that are critical to the competitiveness of U.S. businesses domestically and abroad.
The parcel industry shipped an estimated 12 percent of CFS shipments by value, weighing 26 million tons in 2002. The top commodities shipped by parcel couriers include electronic and offi ce equipment, miscellaneous manufactured products, textiles, mixed freight, and printed products.
Shipments by three of the major U.S. parcel couriers, the United States Postal Service (USPS), Federal Express (FedEx), and United Parcel Ser-vice (UPS),34 have dramatically increased in past years. USPS shipments increased from 102 billion pieces of mail (i.e., packages, letters, magazines, etc.) in 1980 to 206 billion in 2004 (USPS 2005).
33 This fi gure represents the number containers of any size not the number of standardized twenty-foot equivalent units (TEUs) used elsewhere in this report.34 Another major fi rm in the parcel industry, DHL, does not release its shipment fi gures to the public.
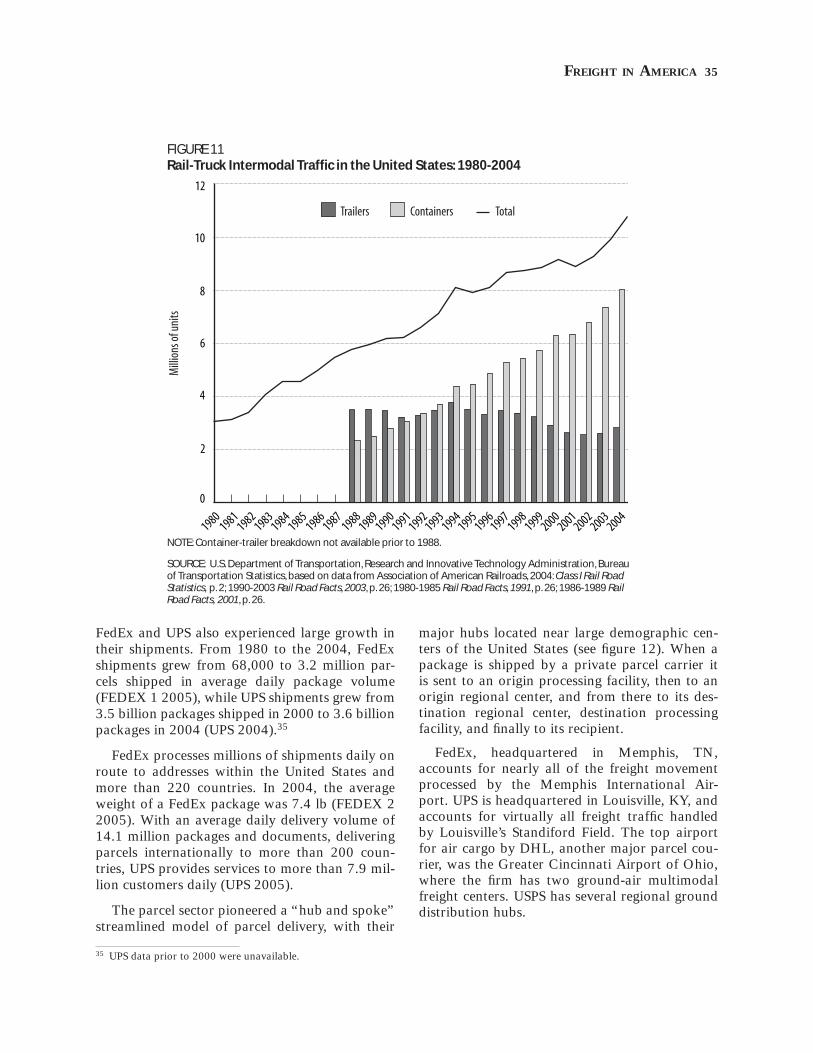
FREIGHT IN AMERICA 35
FedEx and UPS also experienced large growth in their shipments. From 1980 to the 2004, FedEx shipments grew from 68,000 to 3.2 million par-cels shipped in average daily package volume (FEDEX 1 2005), while UPS shipments grew from 3.5 billion packages shipped in 2000 to 3.6 billion packages in 2004 (UPS 2004).35
FedEx processes millions of shipments daily on route to addresses within the United States and more than 220 countries. In 2004, the average weight of a FedEx package was 7.4 lb (FEDEX 2 2005). With an average daily delivery volume of 14.1 million packages and documents, delivering parcels internationally to more than 200 coun-tries, UPS provides services to more than 7.9 mil-lion customers daily (UPS 2005).
The parcel sector pioneered a “hub and spoke” streamlined model of parcel delivery, with their
35 UPS data prior to 2000 were unavailable.
major hubs located near large demographic cen-ters of the United States (see fi gure 12). When a package is shipped by a private parcel carrier it is sent to an origin processing facility, then to an origin regional center, and from there to its des-tination regional center, destination processing facility, and fi nally to its recipient.
FedEx, headquartered in Memphis, TN, accounts for nearly all of the freight movement processed by the Memphis International Air-port. UPS is headquartered in Louisville, KY, and accounts for virtually all freight traffi c handled by Louisville’s Standiford Field. The top airport for air cargo by DHL, another major parcel cou-rier, was the Greater Cincinnati Airport of Ohio, where the fi rm has two ground-air multimodal freight centers. USPS has several regional ground distribution hubs.
FIGURE 11Rail-Truck Intermodal Traffi c in the United States: 1980-2004
19801981
19821983
19841985
19861987
19881989
19901991
19921993
19941995
19961997
19981999
20002001
20022003
2004
0
2
4
6
8
10
12M
illio
ns o
f uni
ts
Trailers Containers Total
NOTE: Container-trailer breakdown not available prior to 1988.
SOURCE: U.S. Department of Transportation, Research and Innovative Technology Administration, Bureau of Transportation Statistics, based on data from Association of American Railroads, 2004: Class I Rail Road Statistics, p. 2; 1990-2003 Rail Road Facts, 2003, p. 26; 1980-1985 Rail Road Facts, 1991, p. 26; 1986-1989 Rail Road Facts, 2001, p. 26.
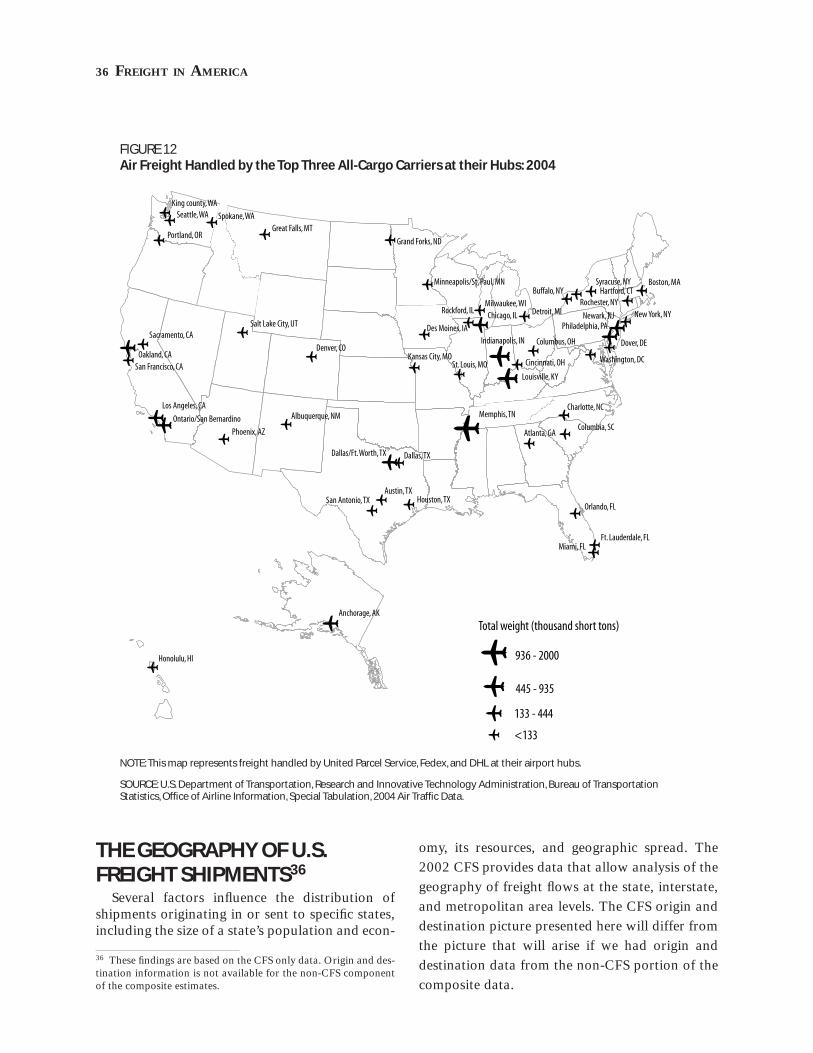
36 FREIGHT IN AMERICA
THE GEOGRAPHY OF U.S. FREIGHT SHIPMENTS36
Several factors infl uence the distribution of shipments originating in or sent to specifi c states, including the size of a state’s population and econ-
36 These fi ndings are based on the CFS only data. Origin and des-tination information is not available for the non-CFS component of the composite estimates.
omy, its resources, and geographic spread. The 2002 CFS provides data that allow analysis of the geography of freight fl ows at the state, interstate, and metropolitan area levels. The CFS origin and destination picture presented here will differ from the picture that will arise if we had origin and destination data from the non-CFS portion of the composite data.
FIGURE 12Air Freight Handled by the Top Three All-Cargo Carriers at their Hubs: 2004
o
o o o
o
o
o
o
o o
o
o
o
o
o
o
o
o
o
o
o
o
o
o o
o
o
o
o
o
o
o
o
o o
o
o
o
o
o
o
o
o
o
o
o
o
o
o
,
oo o o o
Total weight (thousand short tons)
936 - 2000
445 - 935
133 - 444
<133
King county, WA Seattle, WA
Portland, OR
Spokane, WA Great Falls, MT
Grand Forks, ND
Minneapolis/St. Paul, MN
Des Moines, IA
Rockford, IL Milwaukee, WI Chicago, IL Detroit, MI
Buffalo, NY Boston, MA Syracuse, NY
Hartford, CT Rochester, NY
New York, NY Newark, NJ Philadelphia, PA
Dover, DE
Washington, DC
Columbus, OH
Cincinnati, OH
Louisville, KY
Indianapolis, IN
Charlotte, NC
Columbia, SC Atlanta, GA
Memphis, TN
Orlando, FL
Ft. Lauderdale, FL Miami, FL
Houston, TX Austin, TX
San Antonio, TX
Dallas/Ft. Worth, TX Dallas, TX
Kansas City, MO St. Louis, MO
Salt Lake City, UT
Denver, CO
Albuquerque, NM
Sacramento, CA
Oakland, CA San Francisco, CA
Los Angeles, CA
Ontario/San Bernardino
Phoenix, AZ
Honolulu, HI
oAnchorage, AK
NOTE: This map represents freight handled by United Parcel Service, Fedex, and DHL at their airport hubs.
SOURCE: U.S. Department of Transportation, Research and Innovative Technology Administration, Bureau of Transportation Statistics, Offi ce of Airline Information, Special Tabulation, 2004 Air Traffi c Data.
FREIGHT IN AMERICA 37
Origins and Destinations by State and Metro Areas
In 2002, more than one-quarter (29 percent) of CFS shipments by value originated in states with large manufacturing sectors and populations—California, Texas, Ohio, and Illinois (fi gure 13 map). These four large states were also the desti-nation for nearly one-third of shipments by value. The amount of freight shipped to and from these states stems in part from their large domestic mar-
kets and their importance to manufacturing and assembling parts produced in other states. Also these states have major freight gateways and bor-der crossing ports or have large intermodal termi-nals (e.g., Chicago in Illinois). Therefore a good proportion of the freight destined for these states involves international trade. Table 18 shows the value and weight of both outbound and inbound freight shipments by state in 2002. Key highlights on state origins and destinations include:
FIGURE 13Value of Freight Shipments by State of Origin: 2002(Commodity Flow Survey data only; covers all modes)
Value of Shipments (billion $)>600
400 - 600
250 - 399
50 - 249
<50
SOURCE: U.S. Department of Transportation, Research and Innovative Technology Administration, Bureau of Transportation Statis-tics, 2002 Commodity Flow Survey data.
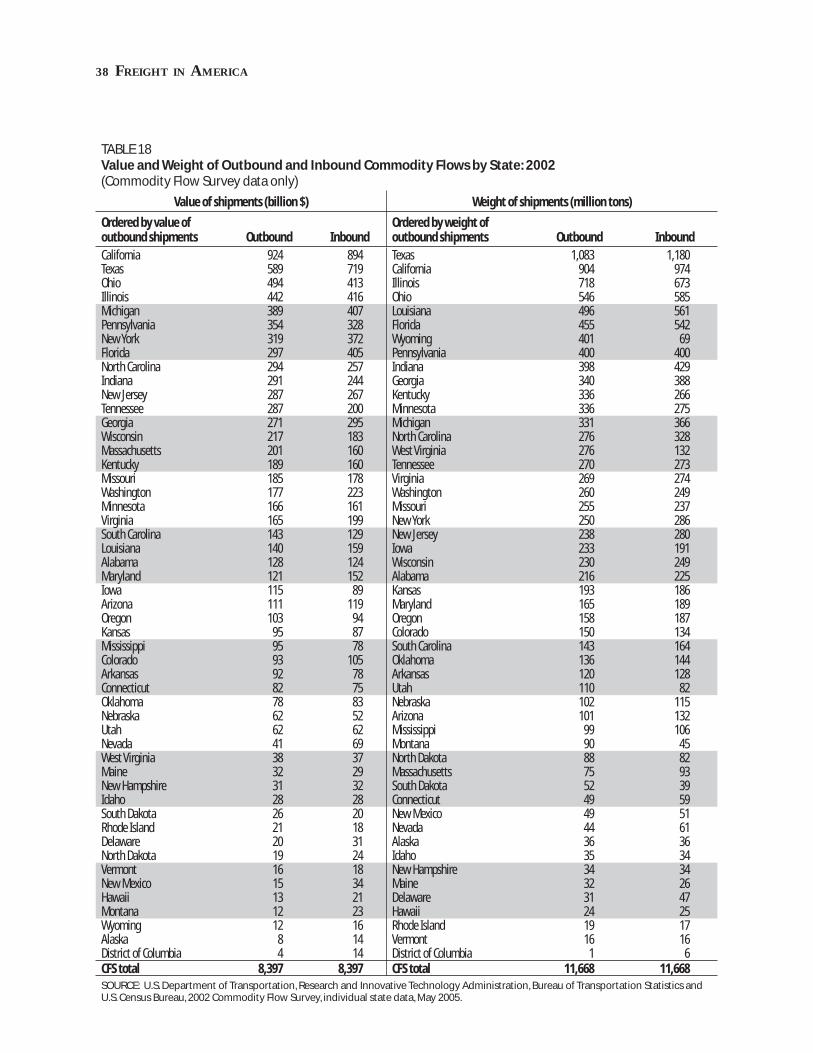
38 FREIGHT IN AMERICA
TABLE 18Value and Weight of Outbound and Inbound Commodity Flows by State: 2002(Commodity Flow Survey data only)
Value of shipments (billion $) Weight of shipments (million tons)
Ordered by value of outbound shipments Outbound Inbound
Ordered by weight of outbound shipments Outbound Inbound
California 924 894 Texas 1,083 1,180 Texas 589 719 California 904 974 Ohio 494 413 Illinois 718 673 Illinois 442 416 Ohio 546 585 Michigan 389 407 Louisiana 496 561 Pennsylvania 354 328 Florida 455 542 New York 319 372 Wyoming 401 69 Florida 297 405 Pennsylvania 400 400 North Carolina 294 257 Indiana 398 429 Indiana 291 244 Georgia 340 388 New Jersey 287 267 Kentucky 336 266 Tennessee 287 200 Minnesota 336 275 Georgia 271 295 Michigan 331 366 Wisconsin 217 183 North Carolina 276 328 Massachusetts 201 160 West Virginia 276 132 Kentucky 189 160 Tennessee 270 273 Missouri 185 178 Virginia 269 274 Washington 177 223 Washington 260 249 Minnesota 166 161 Missouri 255 237 Virginia 165 199 New York 250 286 South Carolina 143 129 New Jersey 238 280 Louisiana 140 159 Iowa 233 191 Alabama 128 124 Wisconsin 230 249 Maryland 121 152 Alabama 216 225 Iowa 115 89 Kansas 193 186 Arizona 111 119 Maryland 165 189 Oregon 103 94 Oregon 158 187 Kansas 95 87 Colorado 150 134 Mississippi 95 78 South Carolina 143 164 Colorado 93 105 Oklahoma 136 144 Arkansas 92 78 Arkansas 120 128 Connecticut 82 75 Utah 110 82 Oklahoma 78 83 Nebraska 102 115 Nebraska 62 52 Arizona 101 132 Utah 62 62 Mississippi 99 106 Nevada 41 69 Montana 90 45 West Virginia 38 37 North Dakota 88 82 Maine 32 29 Massachusetts 75 93 New Hampshire 31 32 South Dakota 52 39 Idaho 28 28 Connecticut 49 59 South Dakota 26 20 New Mexico 49 51 Rhode Island 21 18 Nevada 44 61 Delaware 20 31 Alaska 36 36 North Dakota 19 24 Idaho 35 34 Vermont 16 18 New Hampshire 34 34 New Mexico 15 34 Maine 32 26 Hawaii 13 21 Delaware 31 47 Montana 12 23 Hawaii 24 25 Wyoming 12 16 Rhode Island 19 17 Alaska 8 14 Vermont 16 16 District of Columbia 4 14 District of Columbia 1 6 CFS total 8,397 8,397 CFS total 11,668 11,668 SOURCE: U.S. Department of Transportation, Research and Innovative Technology Administration, Bureau of Transportation Statistics and U.S. Census Bureau, 2002 Commodity Flow Survey, individual state data, May 2005.
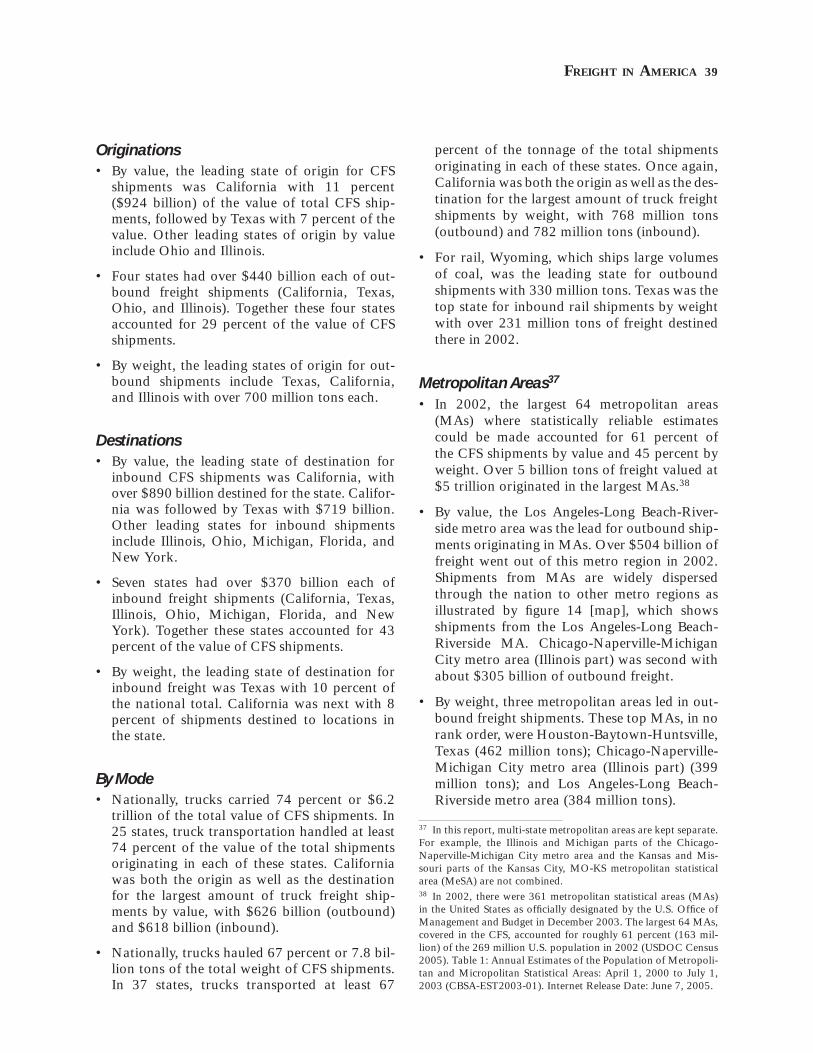
FREIGHT IN AMERICA 39
Originations• By value, the leading state of origin for CFS
shipments was California with 11 percent ($924 billion) of the value of total CFS ship-ments, followed by Texas with 7 percent of the value. Other leading states of origin by value include Ohio and Illinois.
• Four states had over $440 billion each of out-bound freight shipments (California, Texas, Ohio, and Illinois). Together these four states accounted for 29 percent of the value of CFS shipments.
• By weight, the leading states of origin for out-bound shipments include Texas, California, and Illinois with over 700 million tons each.
Destinations • By value, the leading state of destination for
inbound CFS shipments was California, with over $890 billion destined for the state. Califor-nia was followed by Texas with $719 billion. Other leading states for inbound shipments include Illinois, Ohio, Michigan, Florida, and New York.
• Seven states had over $370 billion each of inbound freight shipments (California, Texas, Illinois, Ohio, Michigan, Florida, and New York). Together these states accounted for 43 percent of the value of CFS shipments.
• By weight, the leading state of destination for inbound freight was Texas with 10 percent of the national total. California was next with 8 percent of shipments destined to locations in the state.
By Mode• Nationally, trucks carried 74 percent or $6.2
trillion of the total value of CFS shipments. In 25 states, truck transportation handled at least 74 percent of the value of the total shipments originating in each of these states. California was both the origin as well as the destination for the largest amount of truck freight ship-ments by value, with $626 billion (outbound) and $618 billion (inbound).
• Nationally, trucks hauled 67 percent or 7.8 bil-lion tons of the total weight of CFS shipments. In 37 states, trucks transported at least 67
percent of the tonnage of the total shipments originating in each of these states. Once again, California was both the origin as well as the des-tination for the largest amount of truck freight shipments by weight, with 768 million tons (outbound) and 782 million tons (inbound).
• For rail, Wyoming, which ships large volumes of coal, was the leading state for outbound shipments with 330 million tons. Texas was the top state for inbound rail shipments by weight with over 231 million tons of freight destined there in 2002.
Metropolitan Areas37
• In 2002, the largest 64 metropolitan areas (MAs) where statistically reliable estimates could be made accounted for 61 percent of the CFS shipments by value and 45 percent by weight. Over 5 billion tons of freight valued at $5 trillion originated in the largest MAs.38
• By value, the Los Angeles-Long Beach-River-side metro area was the lead for outbound ship-ments originating in MAs. Over $504 billion of freight went out of this metro region in 2002. Shipments from MAs are widely dispersed through the nation to other metro regions as illustrated by fi gure 14 [map], which shows shipments from the Los Angeles-Long Beach-Riverside MA. Chicago-Naperville-Michigan City metro area (Illinois part) was second with about $305 billion of outbound freight.
• By weight, three metropolitan areas led in out-bound freight shipments. These top MAs, in no rank order, were Houston-Baytown-Huntsville, Texas (462 million tons); Chicago-Naperville-Michigan City metro area (Illinois part) (399 million tons); and Los Angeles-Long Beach-Riverside metro area (384 million tons).
37 In this report, multi-state metropolitan areas are kept separate. For example, the Illinois and Michigan parts of the Chicago-Naperville-Michigan City metro area and the Kansas and Mis-souri parts of the Kansas City, MO-KS metropolitan statistical area (MeSA) are not combined. 38 In 2002, there were 361 metropolitan statistical areas (MAs) in the United States as offi cially designated by the U.S. Offi ce of Management and Budget in December 2003. The largest 64 MAs, covered in the CFS, accounted for roughly 61 percent (163 mil-lion) of the 269 million U.S. population in 2002 (USDOC Census 2005). Table 1: Annual Estimates of the Population of Metropoli-tan and Micropolitan Statistical Areas: April 1, 2000 to July 1, 2003 (CBSA-EST2003-01). Internet Release Date: June 7, 2005.
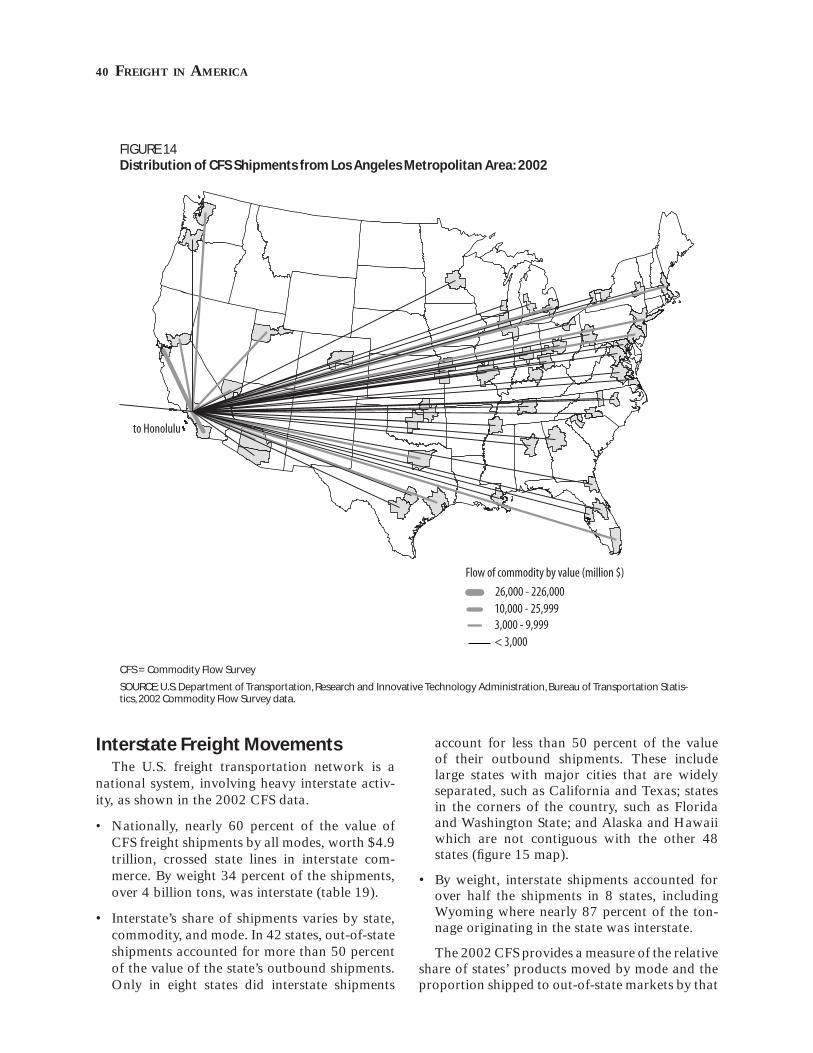
40 FREIGHT IN AMERICA
Interstate Freight MovementsThe U.S. freight transportation network is a
national system, involving heavy interstate activ-ity, as shown in the 2002 CFS data.
• Nationally, nearly 60 percent of the value of CFS freight shipments by all modes, worth $4.9 trillion, crossed state lines in interstate com-merce. By weight 34 percent of the shipments, over 4 billion tons, was interstate (table 19).
• Interstate’s share of shipments varies by state, commodity, and mode. In 42 states, out-of-state shipments accounted for more than 50 percent of the value of the state’s outbound shipments. Only in eight states did interstate shipments
account for less than 50 percent of the value of their outbound shipments. These include large states with major cities that are widely separated, such as California and Texas; states in the corners of the country, such as Florida and Washington State; and Alaska and Hawaii which are not contiguous with the other 48 states (fi gure 15 map).
• By weight, interstate shipments accounted for over half the shipments in 8 states, including Wyoming where nearly 87 percent of the ton-nage originating in the state was interstate.
The 2002 CFS provides a measure of the relative share of states’ products moved by mode and the proportion shipped to out-of-state markets by that
FIGURE 14Distribution of CFS Shipments from Los Angeles Metropolitan Area: 2002
to Honolulu
Flow of commodity by value (million $)
< 3,0003,000 - 9,99910,000 - 25,99926,000 - 226,000
CFS = Commodity Flow Survey
SOURCE: U.S. Department of Transportation, Research and Innovative Technology Administration, Bureau of Transportation Statis-tics, 2002 Commodity Flow Survey data.
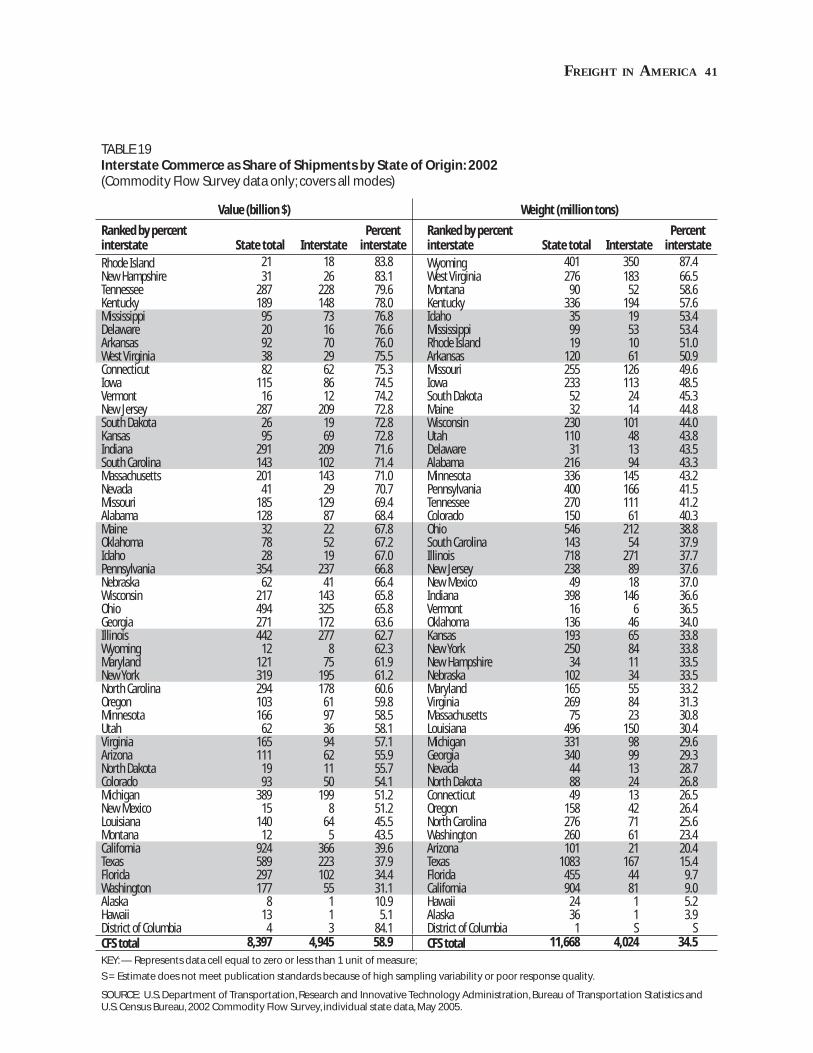
FREIGHT IN AMERICA 41
TABLE 19Interstate Commerce as Share of Shipments by State of Origin: 2002(Commodity Flow Survey data only; covers all modes)
Value (billion $) Weight (million tons)
Ranked by percent interstate State total Interstate
Percent interstate
Ranked by percent interstate State total Interstate
Percent interstate
Rhode Island 21 18 83.8 Wyoming 401 350 87.4 New Hampshire 31 26 83.1 West Virginia 276 183 66.5 Tennessee 287 228 79.6 Montana 90 52 58.6 Kentucky 189 148 78.0 Kentucky 336 194 57.6 Mississippi 95 73 76.8 Idaho 35 19 53.4 Delaware 20 16 76.6 Mississippi 99 53 53.4 Arkansas 92 70 76.0 Rhode Island 19 10 51.0 West Virginia 38 29 75.5 Arkansas 120 61 50.9 Connecticut 82 62 75.3 Missouri 255 126 49.6 Iowa 115 86 74.5 Iowa 233 113 48.5 Vermont 16 12 74.2 South Dakota 52 24 45.3 New Jersey 287 209 72.8 Maine 32 14 44.8 South Dakota 26 19 72.8 Wisconsin 230 101 44.0 Kansas 95 69 72.8 Utah 110 48 43.8 Indiana 291 209 71.6 Delaware 31 13 43.5 South Carolina 143 102 71.4 Alabama 216 94 43.3 Massachusetts 201 143 71.0 Minnesota 336 145 43.2 Nevada 41 29 70.7 Pennsylvania 400 166 41.5 Missouri 185 129 69.4 Tennessee 270 111 41.2 Alabama 128 87 68.4 Colorado 150 61 40.3 Maine 32 22 67.8 Ohio 546 212 38.8 Oklahoma 78 52 67.2 South Carolina 143 54 37.9 Idaho 28 19 67.0 Illinois 718 271 37.7 Pennsylvania 354 237 66.8 New Jersey 238 89 37.6 Nebraska 62 41 66.4 New Mexico 49 18 37.0 Wisconsin 217 143 65.8 Indiana 398 146 36.6 Ohio 494 325 65.8 Vermont 16 6 36.5 Georgia 271 172 63.6 Oklahoma 136 46 34.0 Illinois 442 277 62.7 Kansas 193 65 33.8 Wyoming 12 8 62.3 New York 250 84 33.8 Maryland 121 75 61.9 New Hampshire 34 11 33.5 New York 319 195 61.2 Nebraska 102 34 33.5 North Carolina 294 178 60.6 Maryland 165 55 33.2 Oregon 103 61 59.8 Virginia 269 84 31.3 Minnesota 166 97 58.5 Massachusetts 75 23 30.8 Utah 62 36 58.1 Louisiana 496 150 30.4 Virginia 165 94 57.1 Michigan 331 98 29.6 Arizona 111 62 55.9 Georgia 340 99 29.3 North Dakota 19 11 55.7 Nevada 44 13 28.7 Colorado 93 50 54.1 North Dakota 88 24 26.8 Michigan 389 199 51.2 Connecticut 49 13 26.5 New Mexico 15 8 51.2 Oregon 158 42 26.4 Louisiana 140 64 45.5 North Carolina 276 71 25.6 Montana 12 5 43.5 Washington 260 61 23.4 California 924 366 39.6 Arizona 101 21 20.4 Texas 589 223 37.9 Texas 1083 167 15.4 Florida 297 102 34.4 Florida 455 44 9.7 Washington 177 55 31.1 California 904 81 9.0 Alaska 8 1 10.9 Hawaii 24 1 5.2 Hawaii 13 1 5.1 Alaska 36 1 3.9 District of Columbia 4 3 84.1 District of Columbia 1 S SCFS total 8,397 4,945 58.9 CFS total 11,668 4,024 34.5 KEY: — Represents data cell equal to zero or less than 1 unit of measure;
S = Estimate does not meet publication standards because of high sampling variability or poor response quality.
SOURCE: U.S. Department of Transportation, Research and Innovative Technology Administration, Bureau of Transportation Statistics and U.S. Census Bureau, 2002 Commodity Flow Survey, individual state data, May 2005.
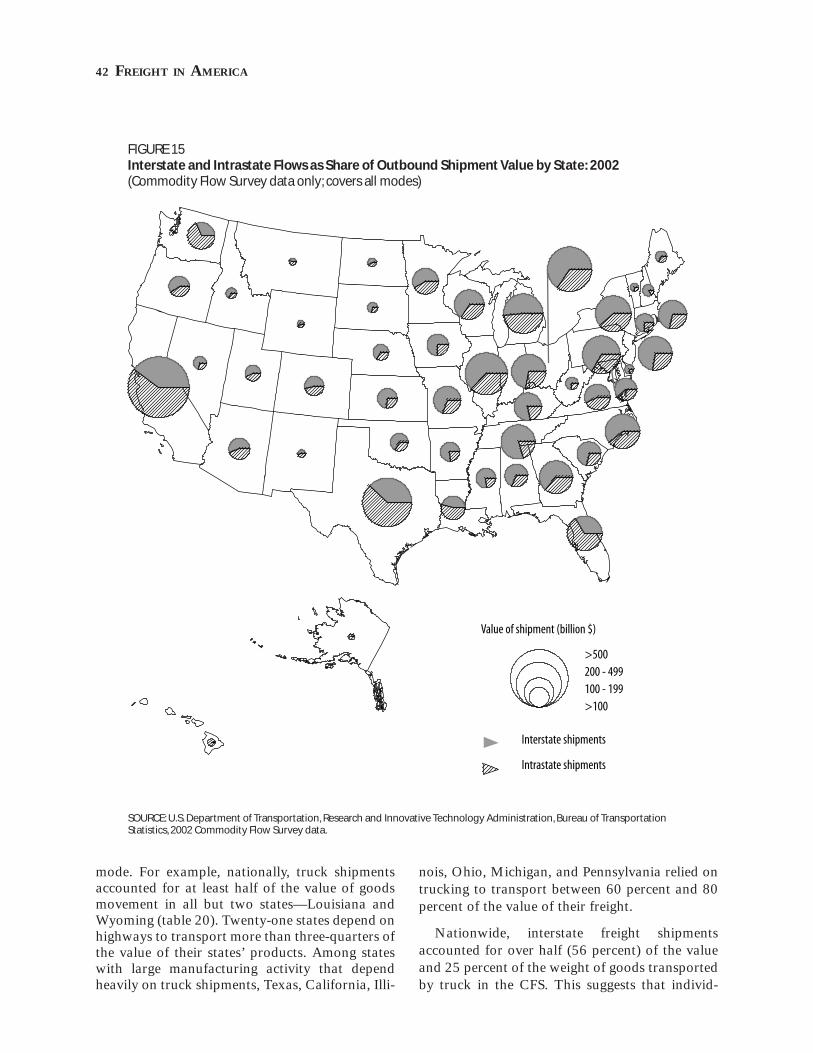
42 FREIGHT IN AMERICA
mode. For example, nationally, truck shipments accounted for at least half of the value of goods movement in all but two states—Louisiana and Wyoming (table 20). Twenty-one states depend on highways to transport more than three-quarters of the value of their states’ products. Among states with large manufacturing activity that depend heavily on truck shipments, Texas, California, Illi-
nois, Ohio, Michigan, and Pennsylvania relied on trucking to transport between 60 percent and 80 percent of the value of their freight.
Nationwide, interstate freight shipments accounted for over half (56 percent) of the value and 25 percent of the weight of goods transported by truck in the CFS. This suggests that individ-
FIGURE 15Interstate and Intrastate Flows as Share of Outbound Shipment Value by State: 2002(Commodity Flow Survey data only; covers all modes)
Value of shipment (billion $)
>500200 - 499100 - 199>100
Interstate shipments
Intrastate shipments
SOURCE: U.S. Department of Transportation, Research and Innovative Technology Administration, Bureau of Transportation Statistics, 2002 Commodity Flow Survey data.
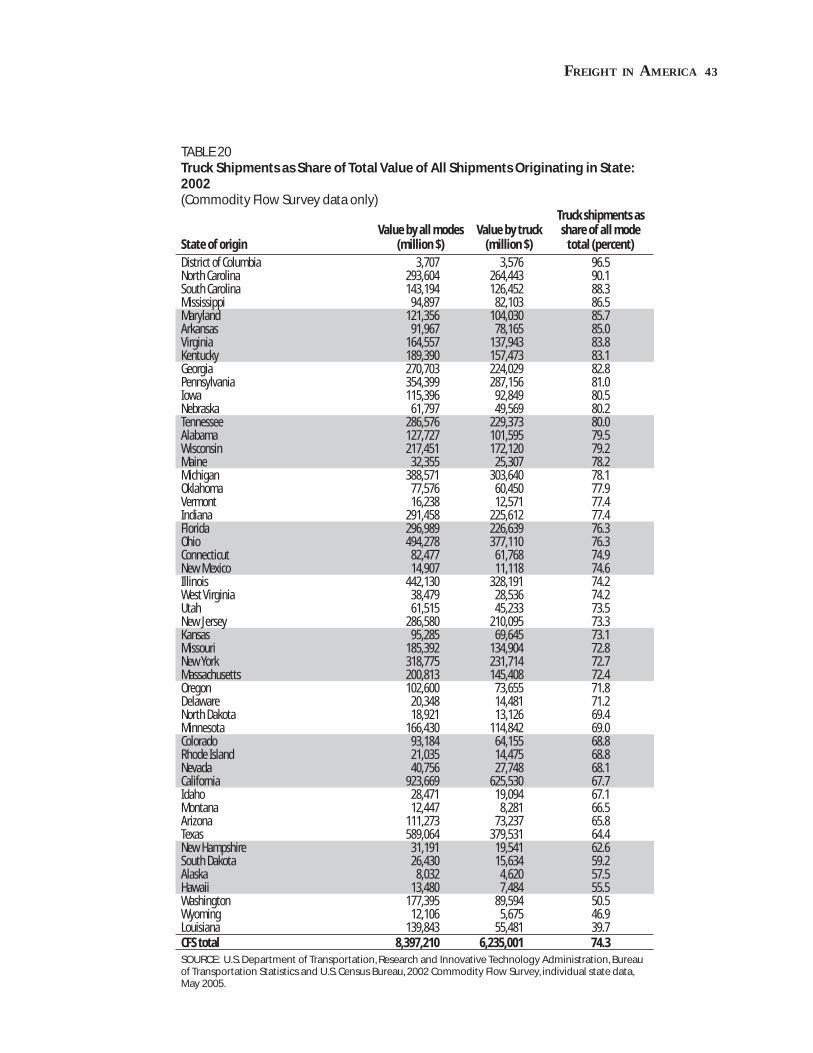
FREIGHT IN AMERICA 43
TABLE 20Truck Shipments as Share of Total Value of All Shipments Originating in State: 2002(Commodity Flow Survey data only)
State of originValue by all modes
(million $)Value by truck
(million $)
Truck shipments as share of all mode
total (percent)District of Columbia 3,707 3,576 96.5North Carolina 293,604 264,443 90.1South Carolina 143,194 126,452 88.3Mississippi 94,897 82,103 86.5Maryland 121,356 104,030 85.7Arkansas 91,967 78,165 85.0Virginia 164,557 137,943 83.8Kentucky 189,390 157,473 83.1Georgia 270,703 224,029 82.8Pennsylvania 354,399 287,156 81.0Iowa 115,396 92,849 80.5Nebraska 61,797 49,569 80.2Tennessee 286,576 229,373 80.0Alabama 127,727 101,595 79.5Wisconsin 217,451 172,120 79.2Maine 32,355 25,307 78.2Michigan 388,571 303,640 78.1Oklahoma 77,576 60,450 77.9Vermont 16,238 12,571 77.4Indiana 291,458 225,612 77.4Florida 296,989 226,639 76.3Ohio 494,278 377,110 76.3Connecticut 82,477 61,768 74.9New Mexico 14,907 11,118 74.6Illinois 442,130 328,191 74.2West Virginia 38,479 28,536 74.2Utah 61,515 45,233 73.5New Jersey 286,580 210,095 73.3Kansas 95,285 69,645 73.1Missouri 185,392 134,904 72.8New York 318,775 231,714 72.7Massachusetts 200,813 145,408 72.4Oregon 102,600 73,655 71.8Delaware 20,348 14,481 71.2North Dakota 18,921 13,126 69.4Minnesota 166,430 114,842 69.0Colorado 93,184 64,155 68.8Rhode Island 21,035 14,475 68.8Nevada 40,756 27,748 68.1California 923,669 625,530 67.7Idaho 28,471 19,094 67.1Montana 12,447 8,281 66.5Arizona 111,273 73,237 65.8Texas 589,064 379,531 64.4New Hampshire 31,191 19,541 62.6South Dakota 26,430 15,634 59.2Alaska 8,032 4,620 57.5Hawaii 13,480 7,484 55.5Washington 177,395 89,594 50.5Wyoming 12,106 5,675 46.9Louisiana 139,843 55,481 39.7CFS total 8,397,210 6,235,001 74.3SOURCE: U.S. Department of Transportation, Research and Innovative Technology Administration, Bureau of Transportation Statistics and U.S. Census Bureau, 2002 Commodity Flow Survey, individual state data, May 2005.
44 FREIGHT IN AMERICA
ual state economies rely on other states’ highway networks and the national highway systems to transport nearly 2 billion tons of goods to their ultimate destinations. In the CFS data, interstate shipments accounted for over 50 percent of the value of truck shipments in 36 states (table 21).
U.S.-INTERNATIONAL FREIGHT SHIPMENTS39
According to the composite estimates, nearly 1.7 billion tons of merchandise moved in and out of the United States in 2002. This means that approximately 9 percent of the 19 billion tons of total commercial freight transported on the nation’s transportation system were imported goods or goods destined for exports. Maritime vessels carried 76 percent of the total weight and 39 percent of the total value of the imports and exports in 2002. Trucks carried 11 percent of the weight and 21 percent of the value, while air carried less than 1 percent of the weight but 27 percent of the value. Rail and pipeline carried the remainder.
According to U.S.-foreign trade statistics, in 2004, the U.S. freight transportation network car-ried merchandise exports and imports worth over $2.2 trillion, an increase of 168 percent from $822 billion in 1990 (both in infl ation-adjusted 2000 dollars).40 Between 1990 and 2004, the ratio of the value of U.S. goods produced for exports and goods imported into the United States to GDP increased from 12 percent to 21 percent, also in infl ation-adjusted terms.
Most U.S.-international merchandise trade is with relatively few countries, although the United States trades with most countries worldwide. In 2004, three-quarters (75 percent) of the value of U.S. merchandise trade was with 15 countries, and just fi ve countries—Canada, Mexico, China, Japan, and Germany—accounted for over half (54
39 The U.S. international data presented in this section are based on offi cial U.S. merchandise trade data and are not from the CFS. Summarized imports and export trade data are incorporated into the composite estimates and described in box B. 40 Infl ation-adjusted chained 2000 dollars data on U.S.-inter-national goods trade are not available from the Bureau of Eco-nomic Analysis for 1980 on the National Income and Products Accounts (NIPA) basis. The NIPA basis data for goods refl ects adjustments for statistical differences and balance of payments. See Table 4.2.6 at http://www.bea.gov/bea/dn/nipaweb/SelectTa-ble.asp?Selected=N#S4, available as of September 2005.
percent) of the value of U.S. goods imports and exports (table 22).
U.S.-NAFTA TradeNearly one-third of U.S. merchandise trade was
with Canada and Mexico, the U.S.-North Ameri-can Free Trade Agreement (NAFTA) trade part-ners. In 2004, land modes of transportation (truck, rail, pipeline) carried the majority (89 percent) of U.S. goods trade with Canada and Mexico, a pro-portion that has remained stable since 1990.
The modal shares of overall U.S.-NAFTA freight vary depending on the value or weight of the traded goods. In terms of value, trucks trans-ported nearly two-thirds (64 percent) of the goods in U.S.-NAFTA trade in 2004 (fi gure 16). Trucks moved $453 billion ($215 billion of exports and $238 billion of imports) of this trade. Trucking was followed by rail, water, pipeline, and air. Trucks are more dominant in U.S. trade with Mexico, accounting for 69 percent of the value, than in U.S. trade with Canada, accounting for 60 percent of the value.
The relative modal roles in U.S.-NAFTA trade vary by weight (fi gure 16). In 2004, water trans-portation carried more of this trade in terms of tonnage than any other mode. About 246 million tons of U.S.-NAFTA trade traveled over water, accounting for about 39 percent of the weight. Water transportation was followed in descend-ing order by truck, rail, pipeline, and air. Water is more dominant in terms of weight because of its role in transporting heavy bulk products (e.g., grains and crude petroleum), while higher value-per-ton commodities (e.g., fresh fl owers, electron-ics, and offi ce equipment) are more often moved by air, truck, and rail. Trucks moved an estimated 176 million tons of traded goods with Canada and Mexico, accounting for about 28 percent of the weight of U.S.-NAFTA trade. Modal shares by weight vary by imports and exports. In 2004, trucks moved 21 percent of import tonnage and an estimated 45 percent of export tonnage.
North American Land Border Crossings
Along the U.S. land borders with Canada and Mexico are over 100 land ports where freight crosses between the countries; 80 of these are along the Canadian border and 24 are along the
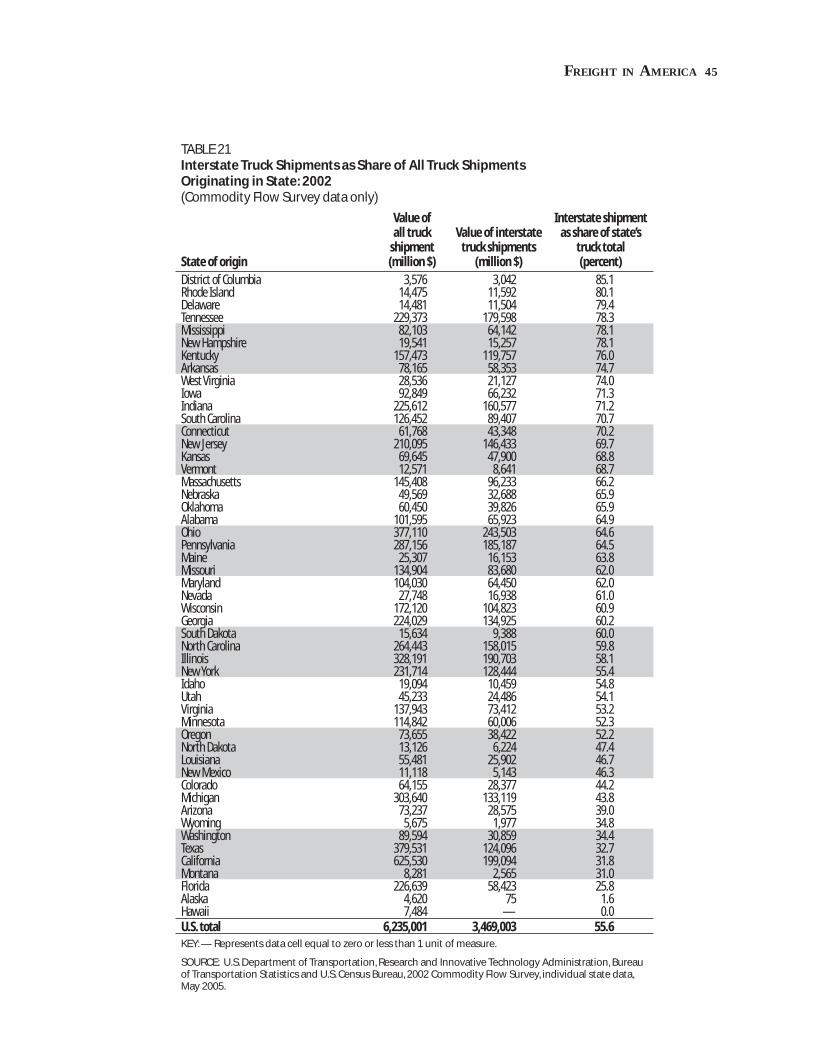
FREIGHT IN AMERICA 45
TABLE 21Interstate Truck Shipments as Share of All Truck Shipments Originating in State: 2002(Commodity Flow Survey data only)
State of origin
Value of all truck
shipment(million $)
Value of interstate truck shipments
(million $)
Interstate shipment as share of state’s
truck total(percent)
District of Columbia 3,576 3,042 85.1Rhode Island 14,475 11,592 80.1Delaware 14,481 11,504 79.4Tennessee 229,373 179,598 78.3Mississippi 82,103 64,142 78.1New Hampshire 19,541 15,257 78.1Kentucky 157,473 119,757 76.0Arkansas 78,165 58,353 74.7West Virginia 28,536 21,127 74.0Iowa 92,849 66,232 71.3Indiana 225,612 160,577 71.2South Carolina 126,452 89,407 70.7Connecticut 61,768 43,348 70.2New Jersey 210,095 146,433 69.7Kansas 69,645 47,900 68.8Vermont 12,571 8,641 68.7Massachusetts 145,408 96,233 66.2Nebraska 49,569 32,688 65.9Oklahoma 60,450 39,826 65.9Alabama 101,595 65,923 64.9Ohio 377,110 243,503 64.6Pennsylvania 287,156 185,187 64.5Maine 25,307 16,153 63.8Missouri 134,904 83,680 62.0Maryland 104,030 64,450 62.0Nevada 27,748 16,938 61.0Wisconsin 172,120 104,823 60.9Georgia 224,029 134,925 60.2South Dakota 15,634 9,388 60.0North Carolina 264,443 158,015 59.8Illinois 328,191 190,703 58.1New York 231,714 128,444 55.4Idaho 19,094 10,459 54.8Utah 45,233 24,486 54.1Virginia 137,943 73,412 53.2Minnesota 114,842 60,006 52.3Oregon 73,655 38,422 52.2North Dakota 13,126 6,224 47.4Louisiana 55,481 25,902 46.7New Mexico 11,118 5,143 46.3Colorado 64,155 28,377 44.2Michigan 303,640 133,119 43.8Arizona 73,237 28,575 39.0Wyoming 5,675 1,977 34.8Washington 89,594 30,859 34.4Texas 379,531 124,096 32.7California 625,530 199,094 31.8Montana 8,281 2,565 31.0Florida 226,639 58,423 25.8Alaska 4,620 75 1.6Hawaii 7,484 — 0.0U.S. total 6,235,001 3,469,003 55.6KEY: — Represents data cell equal to zero or less than 1 unit of measure.
SOURCE: U.S. Department of Transportation, Research and Innovative Technology Administration, Bureau of Transportation Statistics and U.S. Census Bureau, 2002 Commodity Flow Survey, individual state data, May 2005.
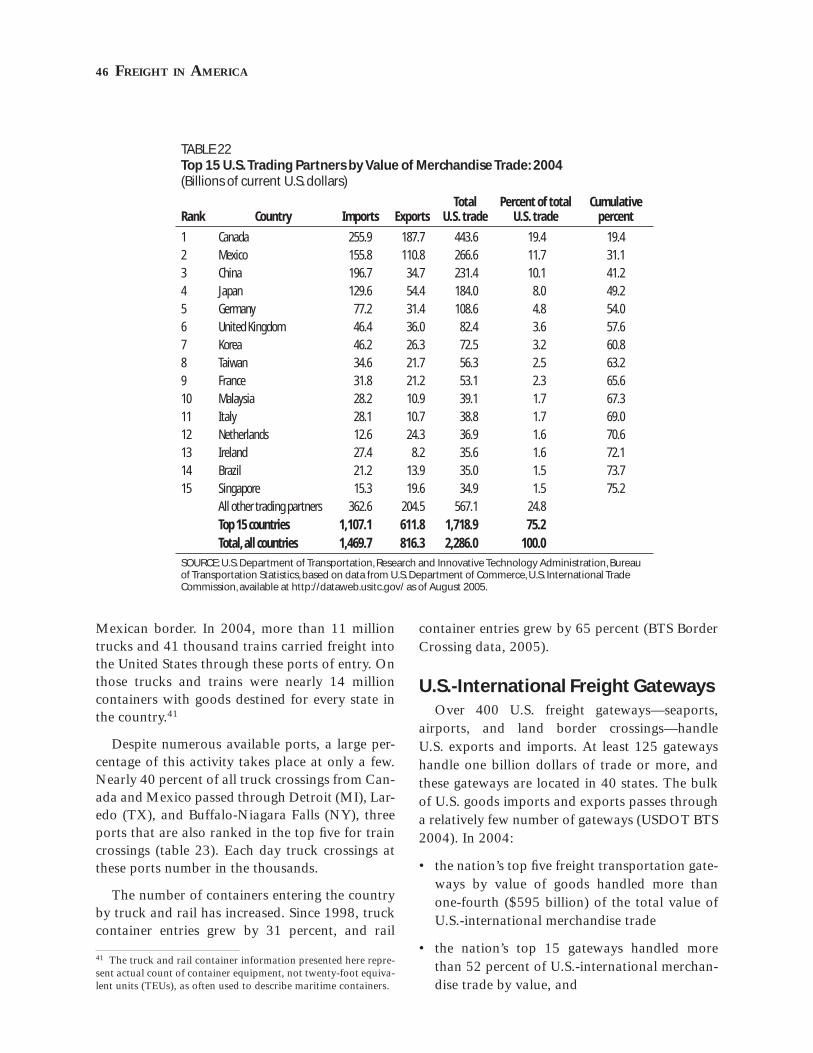
46 FREIGHT IN AMERICA
Mexican border. In 2004, more than 11 million trucks and 41 thousand trains carried freight into the United States through these ports of entry. On those trucks and trains were nearly 14 million containers with goods destined for every state in the country.41
Despite numerous available ports, a large per-centage of this activity takes place at only a few. Nearly 40 percent of all truck crossings from Can-ada and Mexico passed through Detroit (MI), Lar-edo (TX), and Buffalo-Niagara Falls (NY), three ports that are also ranked in the top fi ve for train crossings (table 23). Each day truck crossings at these ports number in the thousands.
The number of containers entering the country by truck and rail has increased. Since 1998, truck container entries grew by 31 percent, and rail
41 The truck and rail container information presented here repre-sent actual count of container equipment, not twenty-foot equiva-lent units (TEUs), as often used to describe maritime containers.
container entries grew by 65 percent (BTS Border Crossing data, 2005).
U.S.-International Freight GatewaysOver 400 U.S. freight gateways—seaports,
airports, and land border crossings—handle U.S. exports and imports. At least 125 gateways handle one billion dollars of trade or more, and these gateways are located in 40 states. The bulk of U.S. goods imports and exports passes through a relatively few number of gateways (USDOT BTS 2004). In 2004:
• the nation’s top fi ve freight transportation gate-ways by value of goods handled more than one-fourth ($595 billion) of the total value of U.S.-international merchandise trade
• the nation’s top 15 gateways handled more than 52 percent of U.S.-international merchan-dise trade by value, and
TABLE 22Top 15 U.S. Trading Partners by Value of Merchandise Trade: 2004(Billions of current U.S. dollars)
Rank Country Imports ExportsTotal
U.S. tradePercent of total
U.S. tradeCumulative
percent
1 Canada 255.9 187.7 443.6 19.4 19.4
2 Mexico 155.8 110.8 266.6 11.7 31.1
3 China 196.7 34.7 231.4 10.1 41.2
4 Japan 129.6 54.4 184.0 8.0 49.2
5 Germany 77.2 31.4 108.6 4.8 54.0
6 United Kingdom 46.4 36.0 82.4 3.6 57.6
7 Korea 46.2 26.3 72.5 3.2 60.8
8 Taiwan 34.6 21.7 56.3 2.5 63.2
9 France 31.8 21.2 53.1 2.3 65.6
10 Malaysia 28.2 10.9 39.1 1.7 67.3
11 Italy 28.1 10.7 38.8 1.7 69.0
12 Netherlands 12.6 24.3 36.9 1.6 70.6
13 Ireland 27.4 8.2 35.6 1.6 72.1
14 Brazil 21.2 13.9 35.0 1.5 73.7
15 Singapore 15.3 19.6 34.9 1.5 75.2
All other trading partners 362.6 204.5 567.1 24.8
Top 15 countries 1,107.1 611.8 1,718.9 75.2Total, all countries 1,469.7 816.3 2,286.0 100.0
SOURCE: U.S. Department of Transportation, Research and Innovative Technology Administration, Bureau of Transportation Statistics, based on data from U.S. Department of Commerce, U.S. International Trade Commission, available at http://dataweb.usitc.gov/ as of August 2005.
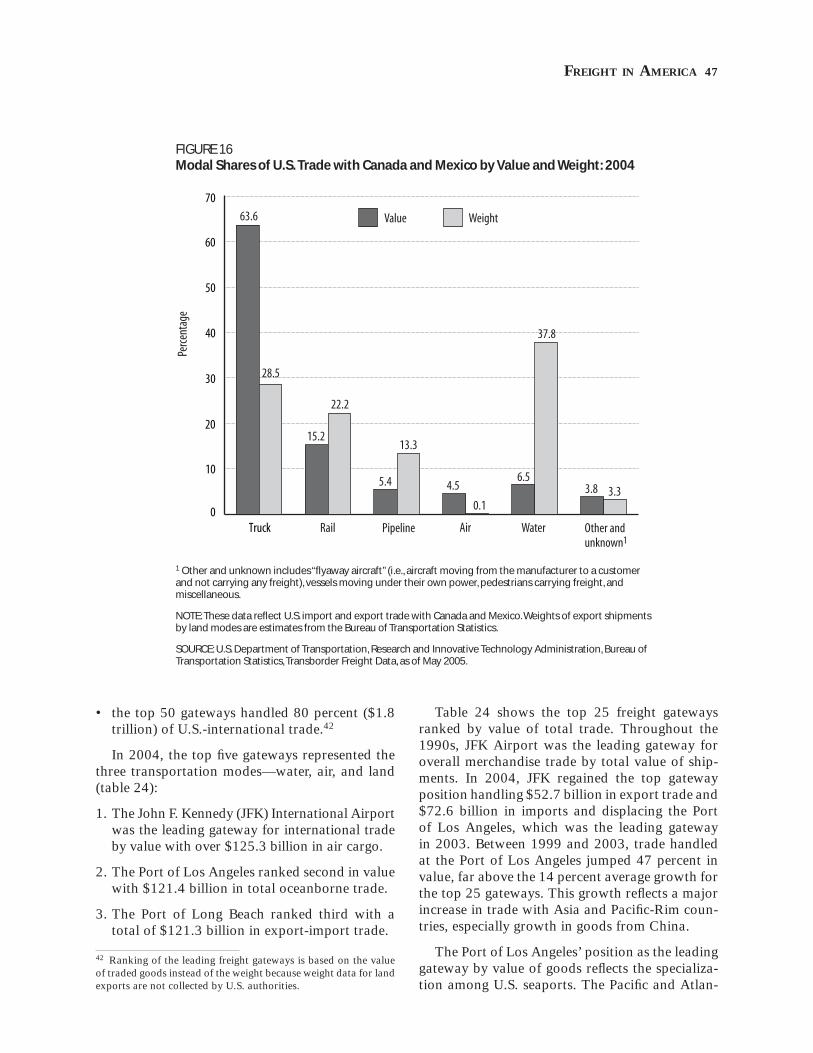
FREIGHT IN AMERICA 47
• the top 50 gateways handled 80 percent ($1.8 trillion) of U.S.-international trade.42
In 2004, the top fi ve gateways represented the three transportation modes—water, air, and land (table 24):
1. The John F. Kennedy (JFK) International Airport was the leading gateway for international trade by value with over $125.3 billion in air cargo.
2. The Port of Los Angeles ranked second in value with $121.4 billion in total oceanborne trade.
3. The Port of Long Beach ranked third with a total of $121.3 billion in export-import trade.
42 Ranking of the leading freight gateways is based on the value of traded goods instead of the weight because weight data for land exports are not collected by U.S. authorities.
Table 24 shows the top 25 freight gateways ranked by value of total trade. Throughout the 1990s, JFK Airport was the leading gateway for overall merchandise trade by total value of ship-ments. In 2004, JFK regained the top gateway position handling $52.7 billion in export trade and $72.6 billion in imports and displacing the Port of Los Angeles, which was the leading gateway in 2003. Between 1999 and 2003, trade handled at the Port of Los Angeles jumped 47 percent in value, far above the 14 percent average growth for the top 25 gateways. This growth refl ects a major increase in trade with Asia and Pacifi c-Rim coun-tries, especially growth in goods from China.
The Port of Los Angeles’ position as the leading gateway by value of goods refl ects the specializa-tion among U.S. seaports. The Pacifi c and Atlan-
FIGURE 16Modal Shares of U.S. Trade with Canada and Mexico by Value and Weight: 2004
Truck0
10
20
30
40
50
60
70
Rail Pipeline Air Water Other and unknown
Value Weight
Perce
ntag
e
63.6
28.5
15.2
22.2
5.4
13.3
4.5
0.1
6.5
37.8
3.8 3.3
1
1 Other and unknown includes “fl yaway aircraft” (i.e., aircraft moving from the manufacturer to a customer and not carrying any freight), vessels moving under their own power, pedestrians carrying freight, and miscellaneous.
NOTE: These data refl ect U.S. import and export trade with Canada and Mexico. Weights of export shipments by land modes are estimates from the Bureau of Transportation Statistics.
SOURCE: U.S. Department of Transportation, Research and Innovative Technology Administration, Bureau of Transportation Statistics, Transborder Freight Data, as of May 2005.
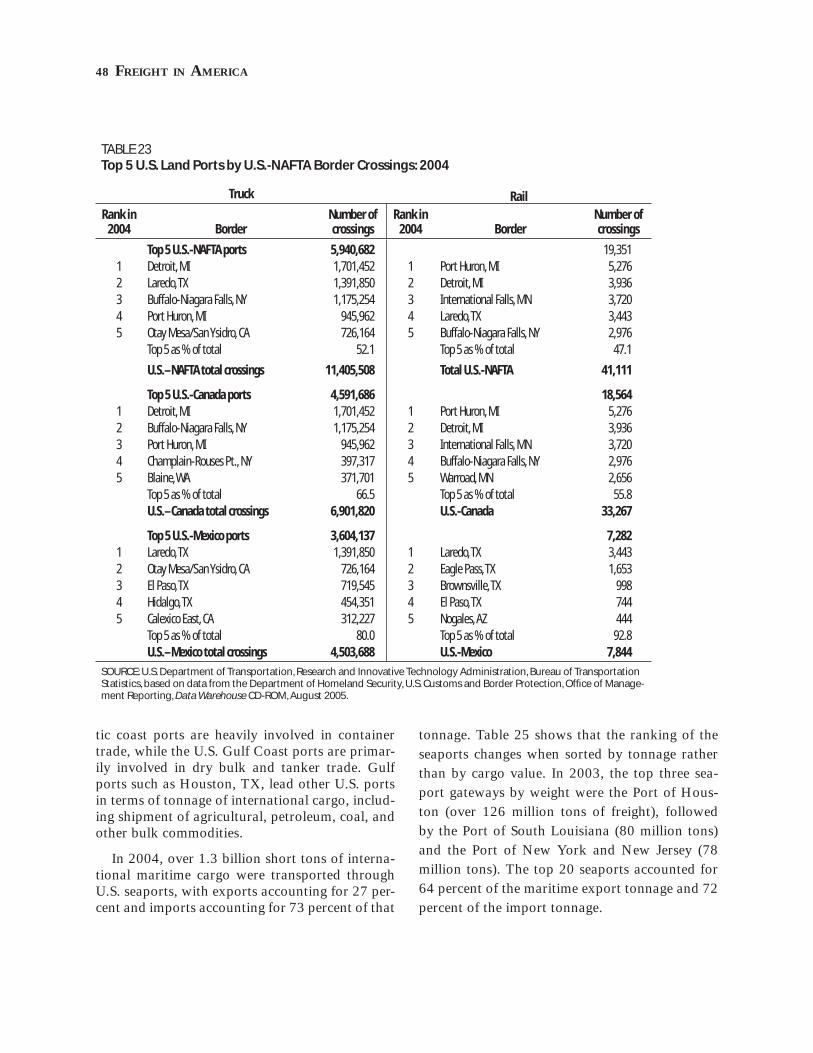
48 FREIGHT IN AMERICA
tic coast ports are heavily involved in container trade, while the U.S. Gulf Coast ports are primar-ily involved in dry bulk and tanker trade. Gulf ports such as Houston, TX, lead other U.S. ports in terms of tonnage of international cargo, includ-ing shipment of agricultural, petroleum, coal, and other bulk commodities.
In 2004, over 1.3 billion short tons of interna-tional maritime cargo were transported through U.S. seaports, with exports accounting for 27 per-cent and imports accounting for 73 percent of that
tonnage. Table 25 shows that the ranking of the seaports changes when sorted by tonnage rather than by cargo value. In 2003, the top three sea-port gateways by weight were the Port of Hous-ton (over 126 million tons of freight), followed by the Port of South Louisiana (80 million tons) and the Port of New York and New Jersey (78 million tons). The top 20 seaports accounted for 64 percent of the maritime export tonnage and 72 percent of the import tonnage.
TABLE 23Top 5 U.S. Land Ports by U.S.-NAFTA Border Crossings: 2004
Truck RailRank in
2004 BorderNumber of crossings
Rank in 2004 Border
Number of crossings
Top 5 U.S.-NAFTA ports 5,940,682 19,3511 Detroit, MI 1,701,452 1 Port Huron, MI 5,2762 Laredo, TX 1,391,850 2 Detroit, MI 3,9363 Buffalo-Niagara Falls, NY 1,175,254 3 International Falls, MN 3,7204 Port Huron, MI 945,962 4 Laredo, TX 3,4435 Otay Mesa/San Ysidro, CA 726,164 5 Buffalo-Niagara Falls, NY 2,976
Top 5 as % of total 52.1 Top 5 as % of total 47.1
U.S.–NAFTA total crossings 11,405,508 Total U.S.-NAFTA 41,111
Top 5 U.S.-Canada ports 4,591,686 18,5641 Detroit, MI 1,701,452 1 Port Huron, MI 5,2762 Buffalo-Niagara Falls, NY 1,175,254 2 Detroit, MI 3,9363 Port Huron, MI 945,962 3 International Falls, MN 3,7204 Champlain-Rouses Pt., NY 397,317 4 Buffalo-Niagara Falls, NY 2,9765 Blaine, WA 371,701 5 Warroad, MN 2,656
Top 5 as % of total 66.5 Top 5 as % of total 55.8U.S.–Canada total crossings 6,901,820 U.S.-Canada 33,267
Top 5 U.S.-Mexico ports 3,604,137 7,2821 Laredo, TX 1,391,850 1 Laredo, TX 3,4432 Otay Mesa/San Ysidro, CA 726,164 2 Eagle Pass, TX 1,6533 El Paso, TX 719,545 3 Brownsville, TX 9984 Hidalgo, TX 454,351 4 El Paso, TX 7445 Calexico East, CA 312,227 5 Nogales, AZ 444
Top 5 as % of total 80.0 Top 5 as % of total 92.8U.S.–Mexico total crossings 4,503,688 U.S.-Mexico 7,844
SOURCE: U.S. Department of Transportation, Research and Innovative Technology Administration, Bureau of Transportation Statistics, based on data from the Department of Homeland Security, U.S. Customs and Border Protection, Offi ce of Manage-ment Reporting, Data Warehouse CD-ROM, August 2005.
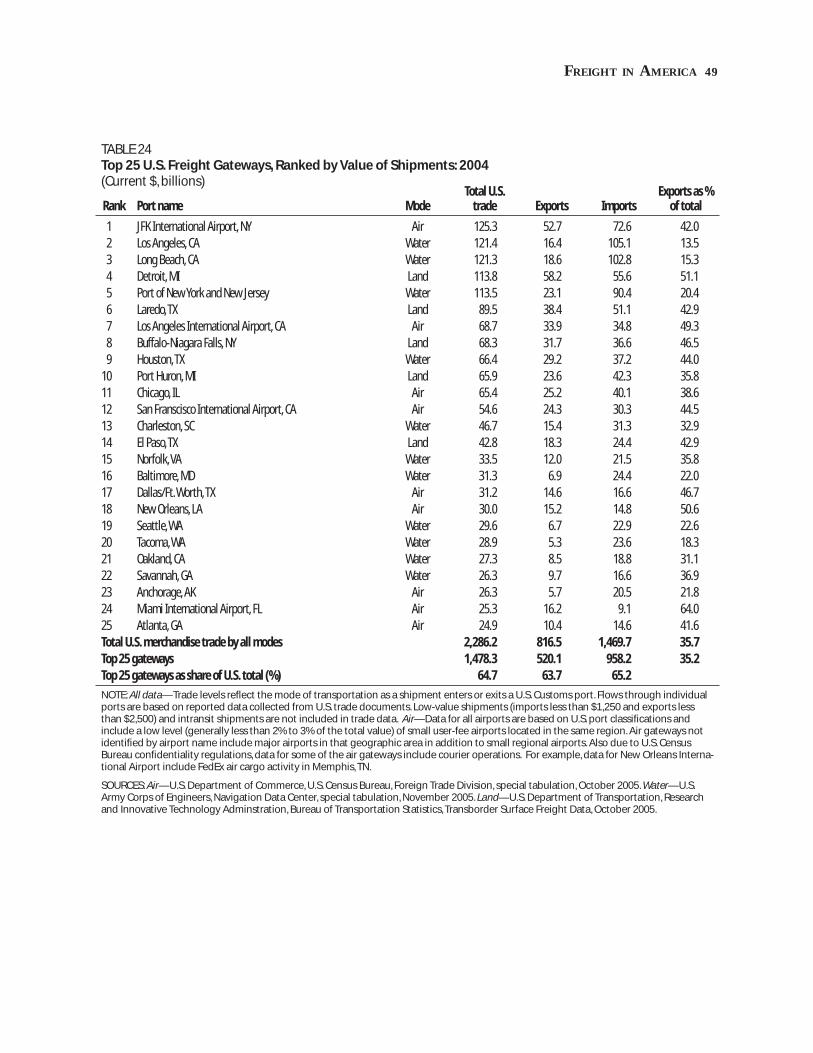
FREIGHT IN AMERICA 49
TABLE 24Top 25 U.S. Freight Gateways, Ranked by Value of Shipments: 2004(Current $, billions)
Rank Port name ModeTotal U.S.
trade Exports ImportsExports as %
of total
1 JFK International Airport, NY Air 125.3 52.7 72.6 42.0 2 Los Angeles, CA Water 121.4 16.4 105.1 13.5 3 Long Beach, CA Water 121.3 18.6 102.8 15.3 4 Detroit, MI Land 113.8 58.2 55.6 51.1 5 Port of New York and New Jersey Water 113.5 23.1 90.4 20.4 6 Laredo, TX Land 89.5 38.4 51.1 42.9 7 Los Angeles International Airport, CA Air 68.7 33.9 34.8 49.3 8 Buffalo-Niagara Falls, NY Land 68.3 31.7 36.6 46.5 9 Houston, TX Water 66.4 29.2 37.2 44.0 10 Port Huron, MI Land 65.9 23.6 42.3 35.8 11 Chicago, IL Air 65.4 25.2 40.1 38.6 12 San Franscisco International Airport, CA Air 54.6 24.3 30.3 44.5 13 Charleston, SC Water 46.7 15.4 31.3 32.9 14 El Paso, TX Land 42.8 18.3 24.4 42.9 15 Norfolk, VA Water 33.5 12.0 21.5 35.8 16 Baltimore, MD Water 31.3 6.9 24.4 22.0 17 Dallas/Ft. Worth, TX Air 31.2 14.6 16.6 46.7 18 New Orleans, LA Air 30.0 15.2 14.8 50.6 19 Seattle, WA Water 29.6 6.7 22.9 22.6 20 Tacoma, WA Water 28.9 5.3 23.6 18.3 21 Oakland, CA Water 27.3 8.5 18.8 31.1 22 Savannah, GA Water 26.3 9.7 16.6 36.9 23 Anchorage, AK Air 26.3 5.7 20.5 21.8 24 Miami International Airport, FL Air 25.3 16.2 9.1 64.0 25 Atlanta, GA Air 24.9 10.4 14.6 41.6 Total U.S. merchandise trade by all modes 2,286.2 816.5 1,469.7 35.7 Top 25 gateways 1,478.3 520.1 958.2 35.2 Top 25 gateways as share of U.S. total (%) 64.7 63.7 65.2
NOTE: All data—Trade levels refl ect the mode of transportation as a shipment enters or exits a U.S. Customs port. Flows through individual ports are based on reported data collected from U.S. trade documents. Low-value shipments (imports less than $1,250 and exports less than $2,500) and intransit shipments are not included in trade data. Air—Data for all airports are based on U.S. port classifi cations and include a low level (generally less than 2% to 3% of the total value) of small user-fee airports located in the same region. Air gateways not identifi ed by airport name include major airports in that geographic area in addition to small regional airports. Also due to U.S. Census Bureau confi dentiality regulations, data for some of the air gateways include courier operations. For example, data for New Orleans Interna-tional Airport include FedEx air cargo activity in Memphis, TN.
SOURCES: Air—U.S. Department of Commerce, U.S. Census Bureau, Foreign Trade Division, special tabulation, October 2005. Water—U.S. Army Corps of Engineers, Navigation Data Center, special tabulation, November 2005. Land—U.S. Department of Transportation, Research and Innovative Technology Adminstration, Bureau of Transportation Statistics, Transborder Surface Freight Data, October 2005.
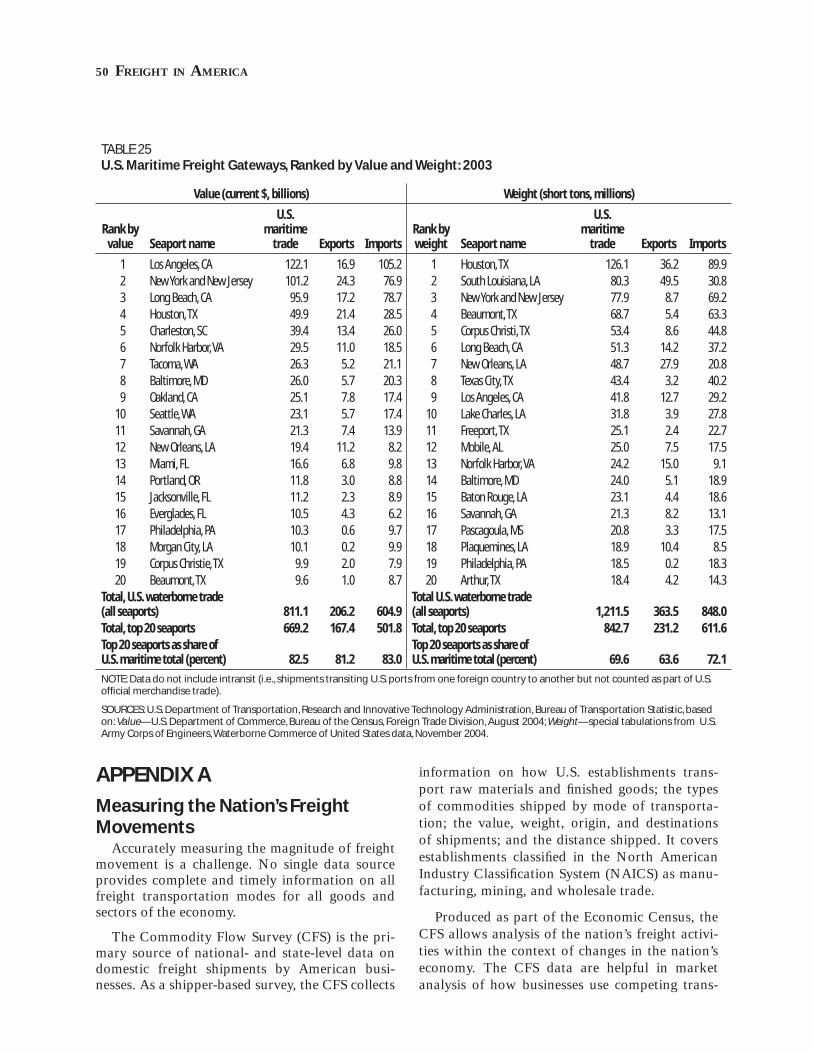
50 FREIGHT IN AMERICA
APPENDIX A
Measuring the Nation’s Freight Movements
Accurately measuring the magnitude of freight movement is a challenge. No single data source provides complete and timely information on all freight transportation modes for all goods and sectors of the economy.
The Commodity Flow Survey (CFS) is the pri-mary source of national- and state-level data on domestic freight shipments by American busi-nesses. As a shipper-based survey, the CFS collects
information on how U.S. establishments trans-port raw materials and fi nished goods; the types of commodities shipped by mode of transporta-tion; the value, weight, origin, and destinations of shipments; and the distance shipped. It covers establishments classifi ed in the North American Industry Classifi cation System (NAICS) as manu-facturing, mining, and wholesale trade.
Produced as part of the Economic Census, the CFS allows analysis of the nation’s freight activi-ties within the context of changes in the nation’s economy. The CFS data are helpful in market analysis of how businesses use competing trans-
TABLE 25U.S. Maritime Freight Gateways, Ranked by Value and Weight: 2003
Value (current $, billions) Weight (short tons, millions)
Rank by value Seaport name
U.S. maritime
trade Exports ImportsRank by weight Seaport name
U.S. maritime
trade Exports Imports
1 Los Angeles, CA 122.1 16.9 105.2 1 Houston, TX 126.1 36.2 89.9 2 New York and New Jersey 101.2 24.3 76.9 2 South Louisiana, LA 80.3 49.5 30.8 3 Long Beach, CA 95.9 17.2 78.7 3 New York and New Jersey 77.9 8.7 69.2 4 Houston, TX 49.9 21.4 28.5 4 Beaumont, TX 68.7 5.4 63.3 5 Charleston, SC 39.4 13.4 26.0 5 Corpus Christi, TX 53.4 8.6 44.8 6 Norfolk Harbor, VA 29.5 11.0 18.5 6 Long Beach, CA 51.3 14.2 37.2 7 Tacoma, WA 26.3 5.2 21.1 7 New Orleans, LA 48.7 27.9 20.8 8 Baltimore, MD 26.0 5.7 20.3 8 Texas City, TX 43.4 3.2 40.2 9 Oakland, CA 25.1 7.8 17.4 9 Los Angeles, CA 41.8 12.7 29.2 10 Seattle, WA 23.1 5.7 17.4 10 Lake Charles, LA 31.8 3.9 27.8 11 Savannah, GA 21.3 7.4 13.9 11 Freeport, TX 25.1 2.4 22.7 12 New Orleans, LA 19.4 11.2 8.2 12 Mobile, AL 25.0 7.5 17.5 13 Miami, FL 16.6 6.8 9.8 13 Norfolk Harbor, VA 24.2 15.0 9.1 14 Portland, OR 11.8 3.0 8.8 14 Baltimore, MD 24.0 5.1 18.9 15 Jacksonville, FL 11.2 2.3 8.9 15 Baton Rouge, LA 23.1 4.4 18.6 16 Everglades, FL 10.5 4.3 6.2 16 Savannah, GA 21.3 8.2 13.1 17 Philadelphia, PA 10.3 0.6 9.7 17 Pascagoula, MS 20.8 3.3 17.5 18 Morgan City, LA 10.1 0.2 9.9 18 Plaquemines, LA 18.9 10.4 8.5 19 Corpus Christie, TX 9.9 2.0 7.9 19 Philadelphia, PA 18.5 0.2 18.3 20 Beaumont, TX 9.6 1.0 8.7 20 Arthur, TX 18.4 4.2 14.3
Total, U.S. waterborne trade (all seaports) 811.1 206.2 604.9
Total U.S. waterborne trade (all seaports) 1,211.5 363.5 848.0
Total, top 20 seaports 669.2 167.4 501.8 Total, top 20 seaports 842.7 231.2 611.6 Top 20 seaports as share of U.S. maritime total (percent) 82.5 81.2 83.0
Top 20 seaports as share of U.S. maritime total (percent) 69.6 63.6 72.1
NOTE: Data do not include intransit (i.e., shipments transiting U.S. ports from one foreign country to another but not counted as part of U.S. offi cial merchandise trade).
SOURCES: U.S. Department of Transportation, Research and Innovative Technology Administration, Bureau of Transportation Statistic, based on: Value—U.S. Department of Commerce, Bureau of the Census, Foreign Trade Division, August 2004; Weight—special tabulations from U.S. Army Corps of Engineers, Waterborne Commerce of United States data, November 2004.
FREIGHT IN AMERICA 51
portation modes to move freight and facilitate production and trade activities. Although the CFS is the most comprehensive data source on nation-wide freight movements, there are important data gaps in the coverage of certain industries and commodities and in the domestic movements of imports. Additional data must be used to fi ll gaps in CFS coverage.
To present a more complete national estimate of the overall freight moved on the nation’s transpor-tation system in 2002, Bureau of Transportation Statistics (BTS) and the Federal Highway Admin-istration (FHWA), Offi ce of Freight Management and Operations have supplemented the CFS data with estimates from other sources on freight ship-ments that are not fully measured in the CFS. These additional estimates cover farm shipments to processing plants, crude petroleum pipeline ship-ments, waterborne imports and exports, and logs and wood in the rough. They also cover shipments by the service, retail, and construction sectors as well as municipal solid waste. The new composite national estimates provide the benchmark data for the FHWA Freight Analysis Framework II. Infor-mation on the methods and data sources used in developing these composite estimates will be avail-able by summer 2006 at the agencies’ websites www.bts.gov and www.fhwa.dot.gov.
This report compares the fi nal data from the 2002 CFS with data from the 1997 and 1993 CFS to show changes in modal shares, distance shipped, shipment sizes, and ton-miles gener-ated on the national transportation network. It is important to note that most of the 1993 and 1997 freight data presented in this report are revised from those published in earlier BTS publications. They were adjusted to account for changes in industry coverage as a result of the transition to the NAICS code.
Coverage and Limitations of the CFS Freight Data
The 2002 CFS is the most recent nationwide shipper survey of commodities shipped in the United States. It follows the 1993 and 1997 CFS and its predecessor, the 1977 Commodity Trans-portation Survey. The Bureau of Transportation Statistics and the Census Bureau cosponsor the CFS as part of the quinquennial (every 5 years) Economic Census (BTS and Census 2003). The Census Bureau collects CFS data from a sample
of manufacturing, mining, and wholesale trade industries in the United States. The survey excludes shipments by establishments classifi ed in the North American Industry Classifi cation System (NAICS) as farms, forestry, fi shing, government agencies, construction, transportation, and most retail and service industries. The 2002 survey did not cap-ture most shipments from logging establishments because under NAICS, the classifi cation of this industry moved from manufacturing (in-scope for the CFS) to agriculture (out-of-scope for the CFS). Further, because the CFS is a survey of domestic establishments and measures shipments leaving an establishment’s facility, it includes exports but not imports (unless the imported goods are received by an in-scope domestic business at the port of entry and reshipped by that business). Although the initial 1993 CFS design included establishments from the oil and gas extraction industry, all three surveys exclude shipments of crude petroleum by this industry because of the way these companies record and report “shipment” information.
Reliability of the CFS Data Used in this Report
The CFS data presented in this report are derived from a sample survey and may differ from the actual, unknown values for the entire population of businesses they represent. Statisticians defi ne this difference as the total error of the estimate. When describing the accuracy of survey results, it is convenient to discuss total error as the sum of sampling error and nonsampling error. Sampling error is the average difference between the estimate and the result that would be obtained from a com-plete enumeration of the sampling frame conducted under the same survey conditions. Nonsampling error encompasses all other factors that contribute to the total error of a sample survey estimate.
The sampling error of the estimates reported in the CFS can be estimated from the selected sample because the sample was selected using probability sampling. Common measures related to sampling error are the sampling variance, the standard error, and the coeffi cient of variation (CV). The sampling variance is the squared difference, averaged over all possible samples of the same size and design, between the estimator and its average value. The standard error is the square root of the sampling variance. The CV expresses the standard error as a percentage of the estimate to which it refers.
52 FREIGHT IN AMERICA
Nonsampling errors are diffi cult to measure and can be introduced through inadequacies in the questionnaire, nonresponse, inaccurate reporting by respondents, errors in the applica-tion of survey procedures, incorrect recording of answers, and errors in data entry and processing. Data users should take into account both the mea-sures of sampling error and the potential effects of nonsampling error when using the CFS estimates. See the CFS source cited below for detailed discus-sion of reliability of the CFS data and estimates of standard errors. Additional information on (1) comparability of 2002 CFS with the 1993 and 1997 CFS, (2) reliability of the CFS estimates, and (3) sample design, data collection, and estimation is available at http://www.bts.gov/cfs/prod.html.
SOURCE: U.S. Department of Transportation, Research and Innovative Technology Administra-tion, Bureau of Transportation Statistics and U.S. Department of Commerce, U.S. Census Bureau, “2002 Economic Census: Transportation Com-modity Flow Survey, Final Report,” December 2003, EC02TCF-US.
APPENDIX B
Why the 2002 Composite Estimates in this Report Differ from Preliminary Estimates
The 2002 composite estimates in this report were jointly developed by the Research and Innovative Technology Administration’s Bureau of Transpor-tation Statistics (BTS) and the Federal Highway Administration’s (FHWA’s) Offi ce of Freight Man-agement and Operations.43 An earlier BTS report, Freight Shipments in America, issued in 2004, also presents composite estimates for 2002, but the numbers were preliminary and are not the same.
The table below compares the estimates in this report for value, tons, and ton-miles with those in Freight Shipments in America. BTS considers the jointly developed composite estimates to be more reliable and complete than earlier estimates because of improvements in estimation methods and expanded industry-commodity coverage. As the
43 The performing organizations for this project were MacroSys Research and Technology and the Oak Ridge National Labora-tory, who worked under the management supervision of BTS and FHWA.
table shows, the new estimates for total value and total tonnage are larger than the preliminary esti-mates in the earlier report. This is largely because the new estimates include previously uncovered sectors, such as construction, retail, services, and municipal solid waste. However, the new estimate for total ton-miles is about 2.1 percent (or 97 bil-lion ton-miles) less than the BTS preliminary esti-mate. This difference is primarily due to revisions between the preliminary and fi nal 2002 Commod-ity Flow Survey data. The fi nal CFS ton-miles were 67 billion tons less than the preliminary CFS data. The remaining difference of 30 billion ton-miles was due to improvements in methodology, i.e., the use of a more disaggregated method of estimating the distance traveled per shipment. While the new composite estimates were derived at the commod-ity, industry, and mode of transportation levels, the former estimates were derived mostly at the modal level. The new estimates for water transportation are lower than the preliminary estimates because in the new method some shipments of crude oil and petroleum products were correctly reassigned to pipelines to avoid double counting.
In a separate effort to improve on the estimate of overall ton-miles (see fi gure 5 and its source), BTS reported 4,366 billion as the total national ton-miles for 2002, a number that is fairly compa-rable to the new composite estimates. The differ-ence of 43 billion ton-miles between that estimate and the jointly developed composite estimate in the above table is less than one percentage point. This difference is due mainly to different method-ologies and defi nitions.
REFERENCESAssociation of American Railroads (AAR). 2005a.
Class I Railroad Statistics. Page 2. Available online at: www.aar.org, as of July 2005. Washington, DC: July 2005.
Association of American Railroads (AAR). 2005b. Railroad Facts 2004. Page 38. Washington, DC: October 2004.
Association of American Railroads (AAR). 2005c. Rail Intermodal Transportation. Page 1. Available online at: www.aar.org, as of July 2005. Washington, DC: June 2005b.
Association of Oil Pipe Lines (AOPL). 2004a. The Liq-uid Pipeline Industry in the United States: Where It’s Been. Where It’s Going. Washington, DC: April 2004.
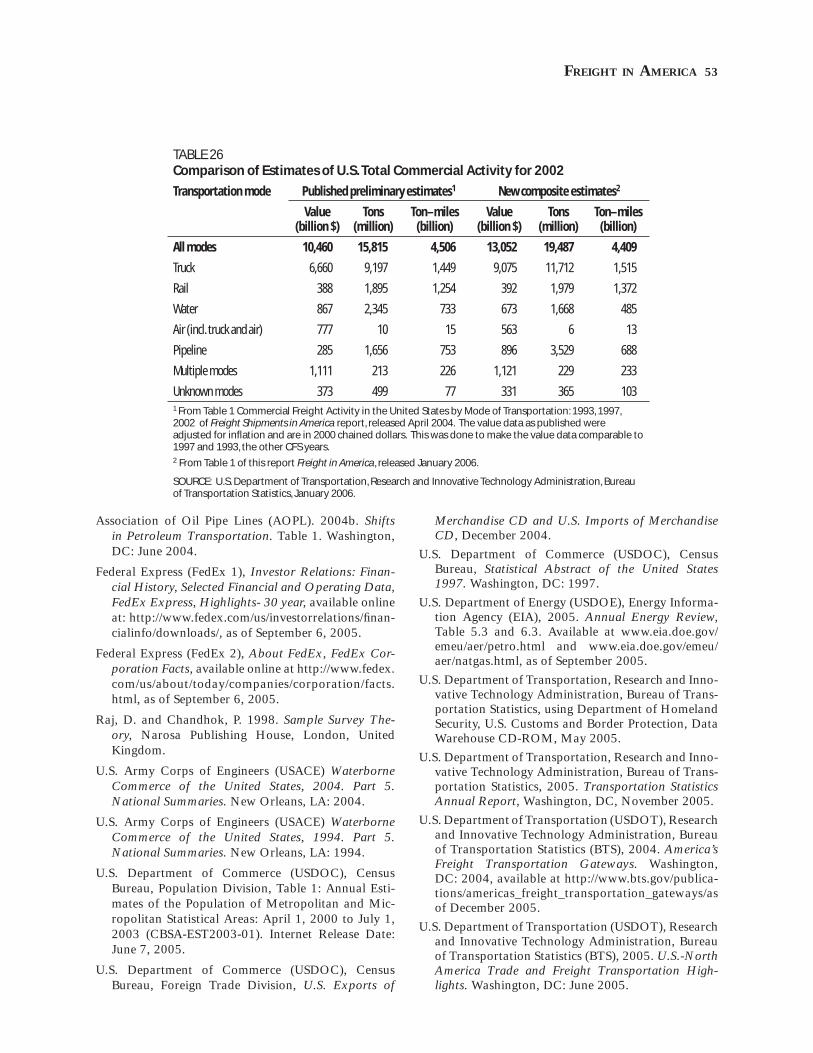
FREIGHT IN AMERICA 53
Association of Oil Pipe Lines (AOPL). 2004b. Shifts in Petroleum Transportation. Table 1. Washington, DC: June 2004.
Federal Express (FedEx 1), Investor Relations: Finan-cial History, Selected Financial and Operating Data, FedEx Express, Highlights- 30 year, available online at: http://www.fedex.com/us/investorrelations/fi nan-cialinfo/downloads/, as of September 6, 2005.
Federal Express (FedEx 2), About FedEx, FedEx Cor-poration Facts, available online at http://www.fedex.com/us/about/today/companies/corporation/facts.html, as of September 6, 2005.
Raj, D. and Chandhok, P. 1998. Sample Survey The-ory, Narosa Publishing House, London, United Kingdom.
U.S. Army Corps of Engineers (USACE) Waterborne Commerce of the United States, 2004. Part 5. National Summaries. New Orleans, LA: 2004.
U.S. Army Corps of Engineers (USACE) Waterborne Commerce of the United States, 1994. Part 5. National Summaries. New Orleans, LA: 1994.
U.S. Department of Commerce (USDOC), Census Bureau, Population Division, Table 1: Annual Esti-mates of the Population of Metropolitan and Mic-ropolitan Statistical Areas: April 1, 2000 to July 1, 2003 (CBSA-EST2003-01). Internet Release Date: June 7, 2005.
U.S. Department of Commerce (USDOC), Census Bureau, Foreign Trade Division, U.S. Exports of
Merchandise CD and U.S. Imports of Merchandise CD, December 2004.
U.S. Department of Commerce (USDOC), Census Bureau, Statistical Abstract of the United States 1997. Washington, DC: 1997.
U.S. Department of Energy (USDOE), Energy Informa-tion Agency (EIA), 2005. Annual Energy Review, Table 5.3 and 6.3. Available at www.eia.doe.gov/emeu/aer/petro.html and www.eia.doe.gov/emeu/aer/natgas.html, as of September 2005.
U.S. Department of Transportation, Research and Inno-vative Technology Administration, Bureau of Trans-portation Statistics, using Department of Homeland Security, U.S. Customs and Border Protection, Data Warehouse CD-ROM, May 2005.
U.S. Department of Transportation, Research and Inno-vative Technology Administration, Bureau of Trans-portation Statistics, 2005. Transportation Statistics Annual Report, Washington, DC, November 2005.
U.S. Department of Transportation (USDOT), Research and Innovative Technology Administration, Bureau of Transportation Statistics (BTS), 2004. America’s Freight Transportation Gateways. Washington, DC: 2004, available at http://www.bts.gov/publica-tions/americas_freight_transportation_gateways/as of December 2005.
U.S. Department of Transportation (USDOT), Research and Innovative Technology Administration, Bureau of Transportation Statistics (BTS), 2005. U.S.-North America Trade and Freight Transportation High-lights. Washington, DC: June 2005.
TABLE 26Comparison of Estimates of U.S. Total Commercial Activity for 2002
Transportation mode Published preliminary estimates1 New composite estimates2
Value (billion $)
Tons (million)
Ton–miles (billion)
Value (billion $)
Tons (million)
Ton–miles (billion)
All modes 10,460 15,815 4,506 13,052 19,487 4,409
Truck 6,660 9,197 1,449 9,075 11,712 1,515
Rail 388 1,895 1,254 392 1,979 1,372
Water 867 2,345 733 673 1,668 485
Air (incl. truck and air) 777 10 15 563 6 13
Pipeline 285 1,656 753 896 3,529 688
Multiple modes 1,111 213 226 1,121 229 233
Unknown modes 373 499 77 331 365 103 1 From Table 1 Commercial Freight Activity in the United States by Mode of Transportation: 1993, 1997, 2002 of Freight Shipments in America report, released April 2004. The value data as published were adjusted for infl ation and are in 2000 chained dollars. This was done to make the value data comparable to 1997 and 1993, the other CFS years.2 From Table 1 of this report Freight in America, released January 2006.
SOURCE: U.S. Department of Transportation, Research and Innovative Technology Administration, Bureau of Transportation Statistics, January 2006.
54 FREIGHT IN AMERICA
U.S. Department of Transportation (USDOT), Federal Highway Administration (FHWA), 2004. Freight Transportation: Improvements and the Economy. Washington, DC: June 2004.
U.S. Department of Transportation (USDOT), Federal Highway Administration (FHWA), 2004. Freight Facts and Figures 2004. Washington, DC: Novem-ber 2004.
U.S. Department of Transportation (USDOT), Federal Highway Administration (FHWA), 2003 Highway Statistics, table VM-1, (Washington, DC: Annual issues), and Internet site http://www.fhwa.dot.gov/policy/ohpi/index.htm.
U.S. Postal Service (USPS 1), Annual Report Operat-ing Statistics: 1970-2004, personal communication, June and July 2005.
United Parcel Service (UPS), UPS Pressroom, Media kits, UPS Fact Sheet, available online at, http://www.press-room.ups.com/mediakits/factsheet/0,2305,866,00.html, as of September 6, 2005.
United Parcel Service (UPS), 2004 Annual Report, avail-able online at, http://www.shareholder.com/ups/, as of September 6, 2005.