Embed Size (px)
Citation preview
J Comput Neurosci (2006) 20: 61–76DOI 10.1007/s10827-006-5216-4
Frame of reference transformations in motion perception duringsmooth pursuit eye movementsJan L. Souman · Ignace Th. C. Hooge ·Alexander H. Wertheim
Received: 6 January 2005 / Revised: 4 July 2005 / Accepted: 27 September 2005 / Published online: 20 February 2006C© Springer Science + Business Media, Inc. 2006
Abstract Smooth pursuit eye movements change the reti-nal image velocity of objects in the visual field. In orderto change from a retinocentric frame of reference into ahead-centric one, the visual system has to take the eyemovements into account. Studies on motion perception dur-ing smooth pursuit eye movements have measured eitherperceived speed or perceived direction during smooth pur-suit to investigate this frame of reference transformation,but never both at the same time. We devised a new ve-locity matching task, in which participants matched bothperceived speed and direction during fixation to that dur-ing pursuit. In Experiment 1, the velocity matches weredetermined for a range of stimulus directions, with thehead-centric stimulus speed kept constant. In Experiment 2,the retinal stimulus speed was kept approximately constant,with the same range of stimulus directions. In both exper-iments, the velocity matches for all directions were shiftedagainst the pursuit direction, suggesting an incomplete trans-formation of the frame of reference. The degree of compen-sation was approximately constant across stimulus direction.We fitted the classical linear model, the model of Turano andMassof (2001) and that of Freeman (2001) to the velocitymatches. The model of Turano and Massof fitted the veloc-
Action Editor: Bruno A. Olshausen
J. L. Souman (�) · I. T. C. Hooge · A. H. WertheimHelmholtz Institute, Department of Psychonomics, UtrechtUniversity,The Netherlandse-mail: [email protected]
J. L. SoumanMax Planck Institutefor Biological Cybernetics,Spemannstrasse 38,72076 Tubingen, Germany
ity matches best, but the differences between de model fitswere quite small. Evaluation of the models and comparisonto a few alternatives suggests that further specification of thepotential effect of retinal image characteristics on the eyemovement signal is needed.
Keywords motion perception . smooth pursuit eyemovements . efference copy . eye movement signal . frameof reference
1. Introduction
Eye movements change the retinal image motion of objectsin the visual field. For instance, in the case of smooth pur-suit eye movements at a constant angular velocity, a constantvelocity is added to the retinal motion. The retinal imageof a stationary object will move across the retinae with thevelocity at which the eyes are moving and the image of anobject that moves at the same velocity as the eyes will be ap-proximately stationary on the retinae. To arrive at a veridicalestimate of the motion of the objects in the outside world in ageocentric frame of reference, the visual system has to applymultiple coordinate system transformations (Swanston et al.,1987; Wade and Swanston, 1996). The images of both eyeshave to be combined into a single binocular representation.Moreover, eye movement information has to be incorporatedto produce an ego-centric (or head-centric) representation.Finally, a geocentric representation can be produced by tak-ing object-distance information and self-motion informationinto account.
In this paper we will focus on the second step in themodel of Wade and Swanston: The transformation from aretinocentric representation into a head-centric one. We willrestrict ourselves to the perception of motion during smooth
Springer
62 J Comput Neurosci (2006) 20: 61–76
pursuit eye movements, with the head kept still. Also, wewill concern ourselves with the perception of a single mo-tion stimulus during pursuit, not with the perception of onestimulus relative to others (termed non-uniform motion byWade and Swanston, 1987, and requiring a pattern-centricframe of reference according to Wade and Swanston, 1996).By doing so we limit ourselves to the simplest case of coor-dinate system transformation with one motion stimulus andone frame of reference transformation, making it easier tospecify the characteristics of this transformation.
Most studies on motion perception during smoothpursuit eye movements have only looked at collinearstimulus motion (i.e., with a stimulus moving alongthe line of pursuit, horizontally in most cases). Inthese studies perceived speed is used as the depen-dent variable to quantify the degree to which the trans-formation from a retinal frame of reference into ahead-centric one is complete (see e.g., Freeman andBanks, 1998; Mack and Herman, 1973; Turano andHeidenreich 1999; Wertheim, 1987). Other studies havefocused on the perception of non-collinear motion duringsmooth pursuit (i.e., moving at an angle other than 0◦ or 180◦
relative to the pursuit direction). In these cases perceived mo-tion direction is used to quantify the degree of compensationfor the effects of the eye movements (Becklen et al., 1984;Festinger and Easton, 1974; Festinger et al., 1976; Hansen,1979; Holtzman et al., 1978; Souman et al., 2005a; Soumanet al., 2005b; Swanston and Wade, 1988; Swanston et al.,1992). Consequently, two different paradigms (measuringeither perceived speed or perceived motion direction) havebeen used to study the transformation of a retinocentric frameof reference into a head-centric one, making it hard to com-pare their results. The matter is complicated even more byother differences between the studies, such as the use of asingle dot stimulus vs. random dot patterns, constant angu-lar velocity vs. sinusoidal motion and different pursuit andstimulus speeds. It is therefore unclear whether perceivedmotion direction is affected by smooth pursuit eye move-ments in the same way as perceived speed is, or whetherthe effect of smooth pursuit eye movements is the same fordifferent stimulus directions.
It is far from trivial to measure experimentally both per-ceived speed and perceived direction and to know that theybelong to the same percept. Since both perceived speed andperceived direction as indicated by an observer vary fromtrial to trial, first determining the perceived direction and thanthe accompanying perceived speed, or vice versa, will not do.Ideally, perceived direction and perceived speed should bemeasured at the same time. We developed a new matchingtask to do exactly that. Participants were presented with twostimulus intervals. In the first one, they viewed the motionstimulus (a moving random dot pattern) during ocular pursuitof a moving target and in the second interval during fixation
of a stationary target. In the second interval, the participantcould adjust both the speed and the motion direction of therandom dots on-line (i.e., in real time) by means of a trackball. The direction in which the track ball was scrolled de-termined the motion direction of the dots and their speedwas determined by the degree to which it was scrolled. Thisallowed participants to simultaneously adjust the velocity ofthe stimulus in two dimensions, in an intuitive way. Theirtask was to adjust the velocity of the random dot pattern inthe fixation interval to match the perceived velocity in thepursuit interval. We conducted two experiments in which theparticipants were presented with stimulus motion in variousdirections. Our aim was to study whether smooth pursuiteye movements have the same effects on perceived veloc-ity for stimuli moving in different directions. Furthermore,we tested which of the existing models of motion perceptionduring smooth pursuit eye movements described the velocitymatches in our experiments best.
2. Models of motion perception duringsmooth pursuit
Historically, the transformation of a retinocentric coordinatesystem into a head-centric one has mainly been viewed as thesum of retinal image velocity and eye velocity (Von Holst,1954; Von Holst and Mittelstaedt, 1950). Because motionperception during smooth pursuit eye movements is not al-ways veridical, two gain terms were introduced (see Freemanand Banks, 1998), making the perceived head-centric stimu-lus h velocity a linear combination of retinal image velocityr and eye velocity e:
h = ρr + εe (1)
where h, r, and e denote 2D motion vectors and ρ and ε rep-resent the gains of the retinal and the eye movement signal,respectively. The two terms ρr and εe describe respectivelythe retinal image velocity r and the eye velocity e as estimatedby the visual system. In the context of this linear model, clas-sical illusions of motion perception during smooth pursuit,such as the Filehne illusion (Filehne, 1922 : A stationary ob-ject is perceived to move in the opposite direction to the eyemovement) and the Aubert-Fleischl phenomenon (Aubert,1886, 1887; Von Fleischl, 1882: A moving object appears tomove slower when tracked with the eyes than during fixa-tion) are explained by a retinal signal gain that is higher thanthe eye movement signal gain (ε/ρ<1). This gain ratio is thesingle free parameter of the linear model.1
1 In many studies the retinal signal gain ρ is tacitly assumed to be unityand, consequently, the Filehne illusion and the Aubert-Fleischl phe-
Springer

J Comput Neurosci (2006) 20: 61–76 63
Recently, some alternatives to the classical linear modelhave been proposed. According to Wertheim (1994), the esti-mate of the eye velocity in the linear model (e = εe) shouldbe extended to include visual and vestibular information.His argument for this extension was that the retinal imagevelocity of objects in the visual field is not only affected byeye movements, but also by head and body movements. Asparticipants kept their head still in our experiments, we willassume that the contribution of the vestibular signals wasminimal. Our stimulus did, however, generate an optic flowpattern, which according to Wertheim (1994) might affectthe eye movement signal. As our stimulus had a constant ro-tational velocity throughout each trial, its optic flow wouldsignal an eye movement in the opposite direction to the reti-nal image motion. Hence, an implementation of Wertheim’sidea specifically targeted at our experiments wouldbe:
h = ρr + (εe − γ r) (2)
where γ denotes the gain of the visual component in the eyemovement signal. However, this equation can also be writtenas:
h = (ρ − γ )r + εe (3)
implying that, without further specification of how ρ andγ depend on the retinal input, this extended model cannotbe discriminated from the classical linear model Eq. (1).Consequently, this particular implementation of Wertheimmodel makes the same predictions as the classical linearmodel.
In the model by Turano and Massof (2001) too the es-timate of the eye velocity is affected by both retinal andextraretinal input. In their model, however, the relationshipbetween input velocities and the estimated velocities is non-linear. The perceived head-centric velocity equals the sumof this estimated eye velocity
e = R′max
(1
1 + e−εe−αr− 1
2
)(4)
and the estimated retinal velocity
r = Rmax
(1
1 + e−ρr− 1
2
)(5)
where Rmax andR′max determine the asymptotic values of the
functions, and ε, α and ρ determine the contributions of the
nomenon are attributed to an eye movement signal that underestimatesthe actual eye velocity (ε < 1). Freeman and Banks (1998) were thefirst to stress the existence of this assumption explicitly.
eye movement velocity e and the retinal image velocity r.We extended Turano and Massof’s model to two dimensionsby applying Eqs. (4) and (5) separately to the horizontal andvertical components of the velocities involved in our experi-ments and then combining those in one velocity vector. Themodel has four free parameters (ε, ρ, α and h = Rmax/R′
max).Freeman (2001) too suggested that the estimates of the
retinal image motion and the eye velocity by the visual sys-tem might be non-linearly related to the actual velocities.Contrary to Turano and Massof (2001) model, however, theeye velocity estimate in his model is independent of the reti-nal image velocity. As in the linear model, the perceivedhead-centric velocity is the sum of the estimated retinal im-age velocity r and the estimated eye velocity e. Like theother models, this model was formulated in one-dimensionalterms, but it is easily extended to more dimensions. The trans-ducers of retinal velocity and eye velocity that provide thevisual system with their estimates have the form:
vout = [(||vin|| + 1)p − 1
] vin
||vin|| (6)
where vin and vout are the input and output velocities of thetransducers and p is the power coefficient. Basically, thistransducer changes the speed by applying a power function,but leaves the direction unchanged. The power coefficientsfor the two inputs (retinal image velocity and eye velocity)are the two free parameters of the model.
The model of Goltz et al. (2003), finally, describes theperceived head-centric velocity in terms of an interactionbetween local illumination gradients at various retinal loca-tions and the eye velocity:
h =(
dl
dx
)+ (dl
dt+ dl
dx· e
)(7)
where x denotes retinal position, l is the local retinal illu-mination and (v)+ is the Moore-Penrose pseudoinverse ofa vector v. Since their model is primarily directed at stim-uli with a certain orientation, such as gratings, is does notseem to be applicable to our data. Moreover, their modeldoes not contain gain terms and hence cannot describe thepartial compensation for the effects of the eye movementsin for instance the Filehne illusion and the Aubert-Fleischlphenomenon. It would be easy to extend their model with aneye movement signal gain, by premultiplying the eye veloc-ity vector e with a gain factor, but it does not seem feasibleto incorporate a retinal signal gain. For these reasons we didnot fit the model of Goltz et al. (2003) to our data.
The mathematical details of the fitting procedures used tofit the linear model, the model of Turano and Massof (2001)and the model of Freeman (2001) to the data of Experiments1 and 2 are given in the Appendix. The goodness of fit of the
Springer
64 J Comput Neurosci (2006) 20: 61–76
models was expressed in the root-mean-squared-error (rmse)of the model predictions. As a measure of the errors we usedthe geometric (or Euclidean) distance between the empiricalvelocity matches and the corresponding model predictionsin 2D velocity space.
3. Experiment 1
3.1. Methods
3.1.1. Participants.
Three students (two male, one female) from Utrecht Uni-versity and the first author participated in the experiment.The students gave their written informed consent and werepaid for their participation. All participants had normal orcorrected-to-normal vision. The age of the participants was19, 20, 23 and 34 years, respectively.
3.1.2. Apparatus and stimuli.
The stimuli were presented on a 19′′ monitor (Iiyama Vi-sion Master Pro 450; resolution 1152 × 864 pixels; refreshrate 100 Hz). Stimulus presentation and response collectionwere controlled by custom written software, running on apc with a Pentium III processor (933 MHz). OpenGL wasused to display the stimuli. Eye movements were measuredfrom both eyes with an infrared video-based tracking system,sampling at 250 Hz (EyeLink, SMI Sensomotoric Systems,Teltow, Germany). Head movements were minimized by achinrest and a short blunt bar against which the participantskept the tip of their nose. Viewing was binocular, with aviewing distance of 60 cm.
A small grey dot (6 × 6 pixels, anti-aliased usingOpenGL’s anti-aliasing function) served as pursuit target(in pursuit intervals) or fixation target (in fixation intervals).It’s luminance was kept low (0.84 cd/m2) to minimize afterglowing effects.2 The motion stimulus that had to be judgedby the participants consisted of a moving random dot pat-tern, presented in a stationary circular aperture (radius 14◦).The luminance of dots in the outer 2◦ of the aperture de-creased monotonically to that of the black background (lum.< 0.01 cd/m2) towards the outer edge of the aperture to min-imize motion cues from the appearance and disappearanceof dots. Similarly, the luminance of dots within a radius of2◦ to 3◦ from the pursuit/fixation target decreased to that ofthe background in the direction of the pursuit/fixation target.Within a radius of 2◦ around the pursuit/fixation target theluminance of the stimulus dots equalled that of the back-
2 The luminance was measured from a 10 × 10 cm patch with the samegray level as the dot, using a Minolta CS-100a luminance meter.
ground; hence no dots were presented in the area around thepursuit/fixation target. This dark area moved with the pursuittarget in pursuit intervals. Dots that moved out of the aperturewere wrapped around and entered the aperture at the oppo-site side. The random dot pattern consisted of dots of 5 × 5pixels, again anti-aliased, with a luminance of 0.36 cd/m2.Its density was about 1 dot per squared degree of visual field.
The aperture within which the random dot pattern wasdisplayed was stationary on the screen, rather than movingwith the pursuit target. In the latter case, participants mightbe biased to judge the velocity of the dot pattern relative tothe edge of the aperture, rather than relative to their head asinstructed. This would be equivalent to judging the retinalimage motion of the dot pattern (assuming accurate pursuit)and produce a low degree of compensation for the effect ofthe eye movements on the retinal image motion. Therefore,we chose to use an aperture that was stationary on the screen(we’ll return to this issue in the General Discussion). Be-cause the retinal image of a stationary contour moves duringsmooth pursuit, we made the aperture as large as our screenpermitted, thereby ensuring that its edge always was periph-eral (at least 11.5◦ from the pursuit target). Also, this wasanother reason why we applied a luminance gradient at theedge of the aperture, to diminish the saliency of the edge (seeabove).
3.1.3. Design and procedure.
Perceived velocity of the random dot pattern was measuredin two conditions: Pursuit and fixation. The pursuit condi-tion was the condition of interest for our research questions,while the fixation condition served as a control, to see howwell participants were able to perform the velocity match-ing task. In both conditions, we had participants match thevelocities for 10 different stimulus directions (from 180◦,or leftward, to 360◦, or rightward, in steps of 20◦). Eachdirection was presented during both leftward and rightwardpursuit and replicated 10 times, resulting in 20 trials per di-rection. The two conditions were measured in two separatesessions, with two participants first doing the fixation con-dition and the other two first doing the pursuit condition.Within a session, trials were divided into 10 blocks of 20trials, with the order of trials randomized. Each block tookabout 8 min. The two sessions were performed on differentdays.
In the first interval of each trial, the random dot patternmoved at a speed of 8◦/s, with its direction depending onthe condition tested. In the second interval, the directionand speed of the random dot pattern were determined bythe participant. Scrolling the track ball in a certain directioncaused the dots to move in that direction and the further thetrack ball was scrolled in that direction, the faster the dotsmoved. Each trial could be repeated as often as the partic-
Springer

J Comput Neurosci (2006) 20: 61–76 65
ipant wanted, although participants typically used only twoor three repetitions. The direction and speed of the randomdot pattern in the second interval were randomly chosenin the first presentation of each trial (speed between 0 and10◦/s), and started at the last setting made by the participantin all subsequent repetitions. To repeat a trial, the participantpressed the right track ball button; to proceed to the next trialthe left button was used.
The experimental procedure is illustrated in Fig. 1. Inpursuit trials, the pursuit target appeared on the left or rightside of the screen (10◦ from the centre), depending on thepursuit direction. It remained stationary for 1000 ms, afterwhich it accelerated linearly in 500 ms to 10◦/s. The pursuittarget then moved at this speed, until it had covered 20◦ ofvisual angle, after which it disappeared. The pursuit targetmoved horizontally, at eye height, with its path verticallycentred on the screen. The random dot pattern was presented250 ms before the pursuit target reached the centre of thescreen and disappeared 500 ms later. Immediately after thepursuit target disappeared, the fixation target for the fixa-tion interval appeared at the centre of the screen and 500 mslater the random dot pattern was presented again. The dotpattern remained visible until the participant pressed one ofthe track ball buttons. In fixation trials, a stationary fixationtarget appeared at the center of the screen in the first interval.After 2000 ms (the same time as in the pursuit intervals) therandom dot pattern appeared and was presented for 500 ms.The random dot pattern then disappeared and only the fix-ation target was visible for 1250 ms; then the dot patternreappeared and could now be adjusted by the participant.This ensured that the onset times of the random dot patternin the fixation trials equalled those in the pursuit trials.
The participants first received a training block, to practiceocular pursuit and the matching task. The experiment wasperformed in a totally dark room, with the pursuit or fixationtarget and the random dot pattern being the only things visibleto the participant. Between blocks the lights in the room wereswitched on for about 1 min, to minimize dark adaptation.
3.1.4. Eye movement data analysis.
The eye movement data were analysed off-line to removetrials with inaccurate pursuit or fixation. First, the measuredeye positions were averaged across both eyes, after whichthey were low-pass filtered using a seven-point running av-erage. A trial was discarded if the eye position data from thepursuit interval contained saccades or showed a very high(>1.2) or low (<0.8) pursuit gain. Since saccades are knownto affect motion perception and localization (Mateeff, 1978;Matin et al., 1969; Matin et al., 1970; Park et al., 2001),it would be unclear in saccadic trials whether any poten-tial deviation of the matched velocity from the physical onewas caused by incomplete compensation for the effects of
the pursuit eye movement or by the presence of saccades.Trials were discarded as saccadic when the eye veloc-ity (horizontal and vertical components simultaneously)exceeded 50◦/s. This criterion was applied both to pur-suit intervals and fixation intervals. In the second in-terval of each trial, which was always a fixation inter-val, eye blinks were allowed, since this interval couldlast several seconds, depending on the time the partici-pant used for adjusting the velocity of the random dotpattern. The eye movements in the final 500 ms of this in-terval were not analysed, because participants often startedto move their eyes just before pressing the track ball button.Since a trial could be repeated as often as the participantwanted, a trial was discarded if the above mentioned crite-ria were not met on at least one of the repetitions, makingsure only trials with accurate pursuit and fixation in all rep-etitions remained. The pursuit gain in pursuit intervals wasdetermined by computing the linear regression coefficientfor the horizontal eye positions during stimulus presentationas a function of time and dividing this regression coefficientby the pursuit target speed. The average eye velocity duringthe fixation intervals was computed by averaging the hori-zontal and vertical eye speed components separately for eachfixation interval, after which the square root of the sum ofsquares of the mean horizontal and vertical speed was taken.
3.2. Results
Because we used rather strict eye movement criteria for in-clusion of trials in further analysis, a large percentage oftrials was discarded (20% in fixation condition and 42% inpursuit condition). All analyses reported here concern thetrials that complied with the criteria. Subsequent analysisshowed that the results without discarding trials on the basisof the eye movement analysis were similar.
Figure 2 shows the pursuit gains for the four partici-pants. For three of them, the pursuit gain was about 1 forall stimulus directions. Participant CP, however, showedmuch more variability in pursuit gain. As this also wasthe participant with the largest proportion of discarded tri-als, he probably had difficulty maintaining accurate pursuit.Partly, the higher variability in his pursuit gain data is alsodue to the smaller number of valid trials that remained af-ter the eye movement analysis. None of the participantsshowed a systematic effect of stimulus direction on pur-suit gain. The fact that the pursuit gains were about unitysuggests that the participants did follow the pursuit targetand not the random dot pattern. This was confirmed byanalysis of the vertical component of the eye movements.All four participants showed a very low vertical eye move-ment velocity (average 0.63◦/s), which did not depend onstimulus direction. Figure 3 shows the average eye velocity(horizontal and vertical speed combined) during the fixation
Springer
66 J Comput Neurosci (2006) 20: 61–76
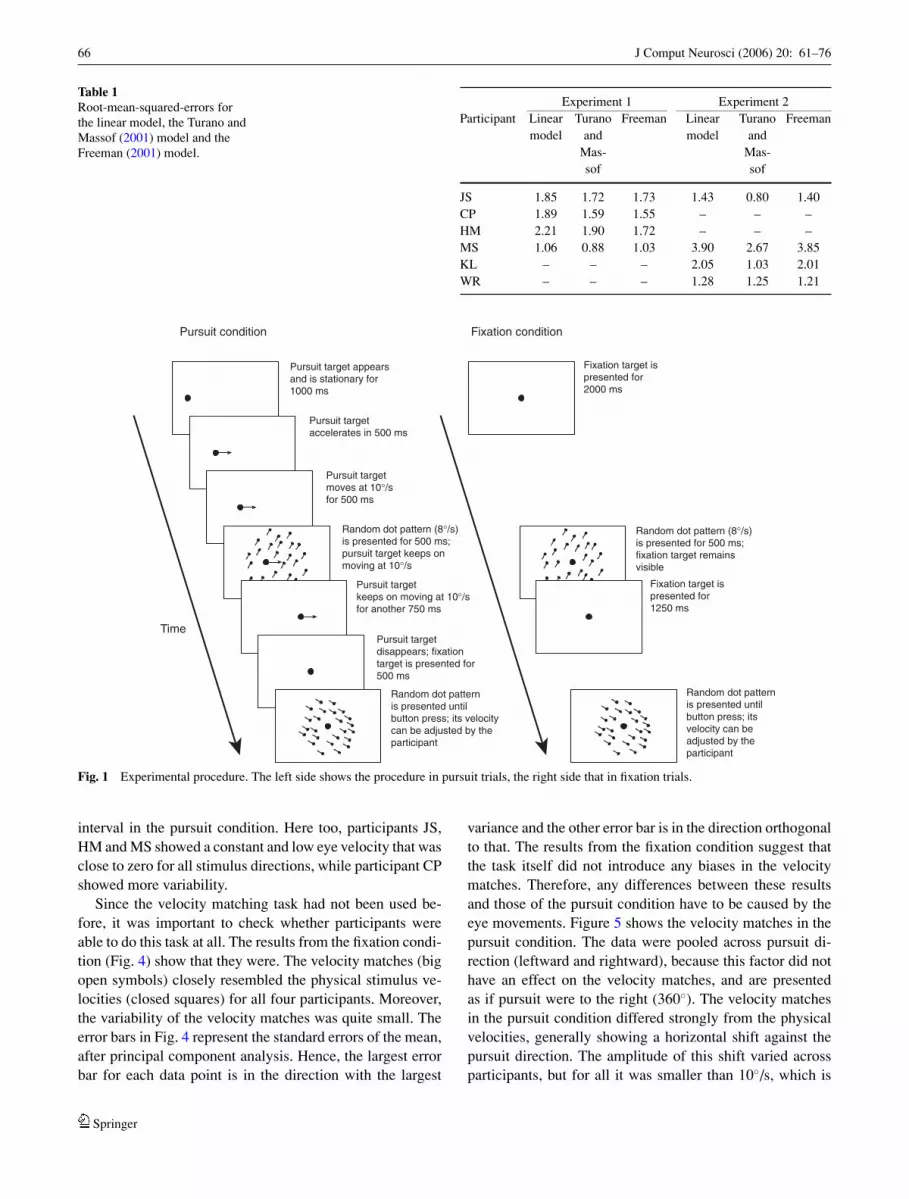
Table 1Root-mean-squared-errors forthe linear model, the Turano andMassof (2001) model and theFreeman (2001) model.
Experiment 1 Experiment 2Participant Linear
modelTurano
andMas-sof
Freeman Linearmodel
Turanoand
Mas-sof
Freeman
JS 1.85 1.72 1.73 1.43 0.80 1.40CP 1.89 1.59 1.55 – – –HM 2.21 1.90 1.72 – – –MS 1.06 0.88 1.03 3.90 2.67 3.85KL – – – 2.05 1.03 2.01WR – – – 1.28 1.25 1.21
Pursuit condition Fixation condition
Time
Pursuit target appearsand is stationary for1000 ms
Pursuit targetaccelerates in 500 ms
Pursuit targetmoves at 10°/sfor 500 ms
Random dot pattern (8°/s)is presented for 500 ms;pursuit target keeps onmoving at 10°/s
Pursuit targetkeeps on moving at 10°/sfor another 750 ms
Pursuit targetdisappears; fixationtarget is presented for500 ms
Random dot patternis presented untilbutton press; its velocitycan be adjusted by theparticipant
Fixation target ispresented for 2000 ms
Random dot pattern (8°/s)is presented for 500 ms;fixation target remainsvisible
Fixation target ispresented for 1250 ms
Random dot patternis presented untilbutton press; itsvelocity can beadjusted by theparticipant
Fig. 1 Experimental procedure. The left side shows the procedure in pursuit trials, the right side that in fixation trials.
interval in the pursuit condition. Here too, participants JS,HM and MS showed a constant and low eye velocity that wasclose to zero for all stimulus directions, while participant CPshowed more variability.
Since the velocity matching task had not been used be-fore, it was important to check whether participants wereable to do this task at all. The results from the fixation condi-tion (Fig. 4) show that they were. The velocity matches (bigopen symbols) closely resembled the physical stimulus ve-locities (closed squares) for all four participants. Moreover,the variability of the velocity matches was quite small. Theerror bars in Fig. 4 represent the standard errors of the mean,after principal component analysis. Hence, the largest errorbar for each data point is in the direction with the largest
variance and the other error bar is in the direction orthogonalto that. The results from the fixation condition suggest thatthe task itself did not introduce any biases in the velocitymatches. Therefore, any differences between these resultsand those of the pursuit condition have to be caused by theeye movements. Figure 5 shows the velocity matches in thepursuit condition. The data were pooled across pursuit di-rection (leftward and rightward), because this factor did nothave an effect on the velocity matches, and are presentedas if pursuit were to the right (360◦). The velocity matchesin the pursuit condition differed strongly from the physicalvelocities, generally showing a horizontal shift against thepursuit direction. The amplitude of this shift varied acrossparticipants, but for all it was smaller than 10◦/s, which is
Springer

J Comput Neurosci (2006) 20: 61–76 67
180 225 270 315 3600.8
0.9
1
1.1
1.2
Pur
suit
gain
180 225 270 315 3600.8
0.9
1
1.1
1.2
180 225 270 315 3600.8
0.9
1
1.1
1.2
Stimulus direction (°)
Pur
suit
gain
180 225 270 315 3600.8
0.9
1
1.1
1.2
Stimulus direction (°)
JS CP
HM MS
Fig. 2 Average pursuit gain forthe four participants inExperiment 1. The error barsrepresent the standard errors ofthe mean.
180 225 270 315 3600
1
2
3
4
5
Mea
n ey
e ve
loci
ty (
°/s)
180 225 270 315 3600
1
2
3
4
5
180 225 270 315 3600
1
2
3
4
5
Stimulus direction (°)
Mea
n ey
e ve
loci
ty (
°/s)
180 225 270 315 3600
1
2
3
4
5
Stimulus direction (°)
JS CP
HM MS
Fig. 3 Average eye velocity forthe four participants in thefixation interval of the pursuittrials in Experiment 1. The errorbars represent the standarderrors of the mean.
the shift that one would expect if participants had reportedthe retinal image velocities. Hence, the effects of the eyemovements on the retinal image velocity were compensatedfor to a certain degree, but not completely.
The linear model (Eq. 1), Turano and Massof (2001)model and Freeman (2001) model were fitted to the velocitymatches in the pursuit condition (see the Appendix for themathematical details of the fitting procedures). The continu-ous red lines in Fig. 5 represent the best fitting model curvesfor the linear model, the dashed blue lines those for the Tu-
rano and Massof model and the dotted green lines show theFreeman model.
All models clearly capture the shift against the pursuitdirection. Although both non-linear models provide betterfits, the differences between the model fits are quite small.To quantify the goodness of fit of the models, the rmse’sof the predictions were computed. These are shown inTable 1. The rmse essentially is the standard deviation of theerrors in the model predictions. Consequently, lower rmse’sindicate a better fit. The errors for both non-linear models
Springer

68 J Comput Neurosci (2006) 20: 61–76
-5 0 5-10
-5
0
Ver
tical
spe
ed (
°/s)
Ver
tical
spe
ed (
°/s)
-5 0 5
-10
-5
0
-5 0 5-10
-5
0
Horizontal speed (°/s)-5 0 5
-10
-5
0
Horizontal speed (°/s)
JS CP
HM MS
Fig. 4 Velocity matches in thefixation condition for the fourparticipants in Experiment 1.Squared symbols represent thephysical velocity of the randomdot pattern. Open symbolsrepresent the average velocitymatch set by the participants,with the error bars representingthe standard error of the mean intwo dimensions (see text fordetails). Different coloursrepresent different stimulusmotion directions (180 to 360◦).
-10 -5 0 5
-10
-5
0
Ver
tical
spe
ed (
°/s)
-10 -5 0 5
-10
-5
0
-10 -5 0 5
-10
-5
0
Horizontal speed (°/s)
Ver
tical
spe
ed (
°/s)
-15 -10 -5 0 5
-10
-5
0
5
Horizontal speed (°/s)
Linear modelTurano & MassofFreeman
JS CP
HM MS
Fig. 5 Velocity matches andmodel fits in the pursuitcondition for the fourparticipants in Experiment 1.Symbols and error bars are as inFig. 4. The continuous red linesgive the best fitting modelcurves for the linear model Eq.(1), the dashed blue linesrepresent the non-linear modelof Turano and Massof (2001)and the dotted green lines showthe predictions of Freeman(2001) model.
were smaller than those for the linear model, but, despite thehigher number of free parameters, the Turano and Massofmodel did not provide a better fit than the Freeman model.
3.3. Discussion
The results from the fixation condition show that our newmethod to measure velocity matches for speed and directionsimultaneously did not introduce any biases. Therefore,this task seems very useful to assess the effects of eyemovements on perceived speed and direction. The results
from the pursuit condition in both experiments show muchmore variability (both within and between participants)then those from the fixation condition, but they neverthelessshow a consistent pattern.
Generally, the effects of the smooth pursuit eye move-ments can be described as a shift of the velocity matchesagainst the pursuit direction. This suggests incomplete com-pensation for the effects of the eye movements on theretinal image motion. The amplitude of the shift variedacross participants. It seems to be captured well by the lin-ear model Eq. (1), although the speed component of the
Springer
J Comput Neurosci (2006) 20: 61–76 69
model predictions (i.e., their radius) was smaller than thatof the actual velocity matches for three of the participants(JS, CP, HM). Both non-linear models fitted the data bet-ter, but this is not surprising, given their higher numberof free parameters. If we use the gain ratio of the lin-ear model as an estimate for the overall degree of trans-formation from a retinocentric frame of reference into ahead-centric one, this gives values of 69, 83, 65, and 40% forthe four participants, respectively. This quantification of thedegree of compensation for the effects of the eye movementson motion perception is essentially equivalent to the one pro-posed by Mateeff et al. (1991), except that their measure canonly be used with non-collinear motion.
In Experiment 1, the retinal image speed of the stimuluscovaried with the stimulus direction from ∼2◦/s (at 360◦)to ∼18◦/s (at 180◦, with rightward pursuit). Since both di-rection discrimination and speed discrimination depend onstimulus velocity (De Bruyn and Orban, 1988) and perceivedspeed is non-linearly related to retinal image speed (McKeeand Nakayama, 1984), this may have affected the velocitymatches in Experiment 1. Moreover, the head-centric stimu-lus speed in Experiment 1 was lower than the pursuit targetspeed, producing retinal image speeds with a horizontal com-ponent that was always opposite to the pursuit direction. Wetherefore repeated Experiment 1 with an approximately con-stant retinal speed that was higher than the pursuit targetspeed.
4. Experiment 2
4.1. Methods
4.1.1. Participants.
Three students (all female) from Utrecht University andthe first author participated in the experiment. The studentswere paid for their participation. They gave their writteninformed consent for participation. All participants had nor-mal or corrected-to-normal vision. The age of the partici-pants was 19, 23, 26 and 34 years, respectively. The first au-thor and one of the students had also participated in Experi-ment 1 (participants JS and MS).
4.1.2. Apparatus and Stimuli.
Same as in Experiment 1.
4.1.3. Design and Procedure.
In Experiment 2 only velocity matches in the pursuit con-dition were measured. This was done in one session. The
stimulus direction again varied from 180◦ to 360◦ in stepsof 20◦. The stimulus speed on the screen was computed toproduce a constant retinal speed of 7◦/s with perfect pursuit.Hence, the actual speed of the random dots on the screen var-ied with stimulus direction. The speed of the pursuit targetwas reduced from 10◦/s in Experiment 1 to 5◦/s in Experi-ment 2, in order to be able to let the retinal image motionspan the entire direction range of 180◦ to 360◦, while keepingthe head-centric stimulus speed in a range in which partici-pants would be able to match the stimulus velocity reliablyfor all stimulus directions. In all other respects the procedurein Experiment 2 was the same as in Experiment 1.
4.2. Results
An even larger percentage of trials was discarded because ofinaccurate pursuit or fixation than in Experiment 1 (52%).But again, this hardly affected the results. Figure 6 shows theaverage pursuit gain for the four participants. As in Experi-ment 1, the pursuit gain was about 1 for most participants andthe vertical eye movement velocity was close to zero (0.63◦/son average). Participant KL showed a large variability in herpursuit gain. This resulted in the loss of a high percentage oftrials (72%) and consequently in larger standard errors of themean. As can been seen from Fig. 7, the average eye veloc-ity in the fixation intervals was low and constant, except forparticipant WR, who showed much more variability in eyevelocity. For this participant too, a high percentage of trialswas discarded (76%).
Figure 8 shows the velocity matches for all four partici-pants, again with both pursuit directions pooled together andplotted as if pursuit were to the right (360◦). As in Experi-ment 1, the velocity matches were shifted against the pursuitdirection relative to the physical velocities for all partici-pants. The data of participant MS show a strange velocitymatch for the 360◦ stimulus direction (orange point). It hasbeen shifted to the left much more than the other points. In-spection of the individual trials showed that this is becausethe participant indicated a velocity of ∼6◦/s in the 360◦ direc-tion as the velocity match in two of the trials and a velocityof ∼6◦/s in the opposite direction in the 13 other trials. Wedon’t have an explanation for this behaviour. In Experiment1, in which she also participated, this participant did notshow this (see Fig. 5). Some of the data points of participantKL have big error bars. This is due to the small number oftrials that remained after the eye movement analysis. Hervelocity matches are probably noisier than those of the otherparticipants for the same reason.
We fitted the linear model, Turano and Massof (2001)model and Freeman (2001) model to the data. The best fit-ting model curves are shown in Fig. 8 (continuous red lines,dashed blue lines and dotted green lines, respectively) andthe accompanying rmse values are given in Table 1. The
Springer

70 J Comput Neurosci (2006) 20: 61–76
180 225 270 315 3600.8
0.9
1
1.1
1.2
Pur
suit
gain
180 225 270 315 3600.8
0.9
1
1.1
1.2
180 225 270 315 3600.8
0.9
1
1.1
1.2
Stimulus direction (°)
Pur
suit
gain
180 225 270 315 3600.8
0.9
1
1.1
1.2
Stimulus direction (°)
JS MS
KL WR
Fig. 6 Average pursuit gain forthe four participants inExperiment 2. The error barsrepresent the standard errors ofthe mean.
180 225 270 315 3600
1
2
3
4
5
Mea
n ey
e ve
loci
ty (
°/s)
180 225 270 315 3600
1
2
3
4
5
180 225 270 315 3600
1
2
3
4
5
Stimulus direction (°)
Mea
n ey
e ve
loci
ty (
°/s)
180 225 270 315 3600
1
2
3
4
5
Stimulus direction (°)
JS MS
KL WR
Fig. 7 Average eye velocity forthe four participants in thefixation interval in Experiment2. The error bars represent thestandard errors of the mean.
fits of the linear model and the Freeman model are virtuallyindistinguishable, while the Turano and Massof model pro-vided better fits for three of the participants (JS, MS, andKL). The model parameter values for the linear model andFreeman’s model did not differ much from those found inExperiment 1 for participant JS (gain ratio’s of 0.69 and 0.64,in Experiments 1 and 2 for the linear model; power ratio’s of0.90 and 0.83 for Freeman’s model), while those for partici-pant MS were very different because of the abovementionedstrange data point at 360◦. Fitting the model without this datapoint produced parameter values comparable to those in Ex-
periment 1 (gain ratio’s 0.40 and 0.34; power ratio’s 0.71and 0.68). The parameter values for the Turano and Massofmodel deviated much more from those obtained in Experi-ment 1. The gain ratio’s of the linear model for participantsKL and WR were 0.56 and 0.36, suggesting fairly low de-grees of compensation for the effects of the eye movements.
4.3. Discussion
As in Experiment 1, the velocity matches were shifted againstthe pursuit direction, indicating incomplete compensation
Springer

J Comput Neurosci (2006) 20: 61–76 71
0 5 10-10
-8
-6
-4
-2
0
Ver
tical
spe
ed (
°/s)
-5 0 5 10-10
-5
0
-5 0 5 10-10
-5
0
Horizontal speed (°/s)
Ver
tical
spe
ed (
°/s)
-5 0 5 10
-10
-5
0
Horizontal speed (°/s)
Linear modelTurano & MassofFreeman
JS MS
KL WR
Fig. 8 Velocity matches andmodel fits for the fourparticipants in Experiment 2.Symbols and error bars are as inFig. 5.
for the effects of the eye movements. The general pattern ofresults resembled that in Experiment 1, indicating that theconfounding of retinal speed and stimulus direction and therestricted retinal direction range did not affect the results inthe first experiment. However, the velocity matches lookednoisier than those in Experiment 1. This may have been partlycaused by the fact that the stimulus speed on the screenvaried with stimulus direction in Experiment 2, making itmore unpredictable.
Surprisingly, the linear model and Freeman (2001) modelproduced virtually identical fits. Analysis of Eq. 17 (Ap-pendix) shows that when the retinal speed ||r1|| and the eyemovement speed||e1|| are constant, this equation describes asemicircle. Hence, by keeping the retinal speed constant inExperiment 2, we effectively limited the degrees of freedomfor Freeman model to fit the data. It could only produce a shiftalong the line of the eye movement (like the linear model)and a change in the radius of the semicircle on which thevelocity matches should lie. This explains why this modelproduced the same fits to the velocity matches in Experiment2 as the linear model.
The Turano and Massof model provided better fits to thedata for three of the four participants. However, this might bea case of overfitting (see Pitt and Myung, 2002). Possibly, themodel picks up random noise in the velocity matches, makingthe model predictions very specific to the data set at hand. TheTurano and Massof model is more susceptible to this prob-lem, because it has a higher number of free parameters thanthe other two models. To test for this possibility, we cross-validated all three models by means of the split-half method.For every stimulus direction, the velocity matches were
randomly divided into two halves and the average velocitymatches were computed for both halves. The models werethen fitted to the average velocity matches of the first half (thetraining or calibration set) and the resulting parameter valueswere used to compute the goodness-of-fit of the models,expressed in the rmse, to the second half (the test set)of the velocity matches. If a model overfits the data,the parameter values will be very specific to the train-ing set and provide a much worse fit to the test set. Hence,we would expect the better fit of the Turano and Massofmodel to disappear when the models are applied to the testset with the parameter values obtained from the training set.The cross-validation procedure was repeated 100 times andthe average rmse-values were computed for all three models.This was done for the results of both Experiment 1 and 2.The resulting rmse’s are given in Table 2. In Experiment1, the differences between the model fits remained small,while the Turano and Massof model still produced thebest fit for three of the four participants in Experiment 2.Consequently, this model does not appear to fit the velocitymatches better at the cost of generalizability.
An alternative way to assess the importance of thenumber of free parameters is to try to reduce it andevaluate the impact on the goodness-of-fit of the model.We tried to limit the number of free parameters in theTurano and Massof model. First we assumed that the twoasymptotic values in Eqs. (4) and (5), Rmax and R′
max areequal, setting h = 1. This hardly affected the model fits,implying that the asymptotic values for the retinal velocityand the eye movement velocity as estimated by the visualsystem are equal. Next, instead of assuming h = 1, we as-
Springer
72 J Comput Neurosci (2006) 20: 61–76
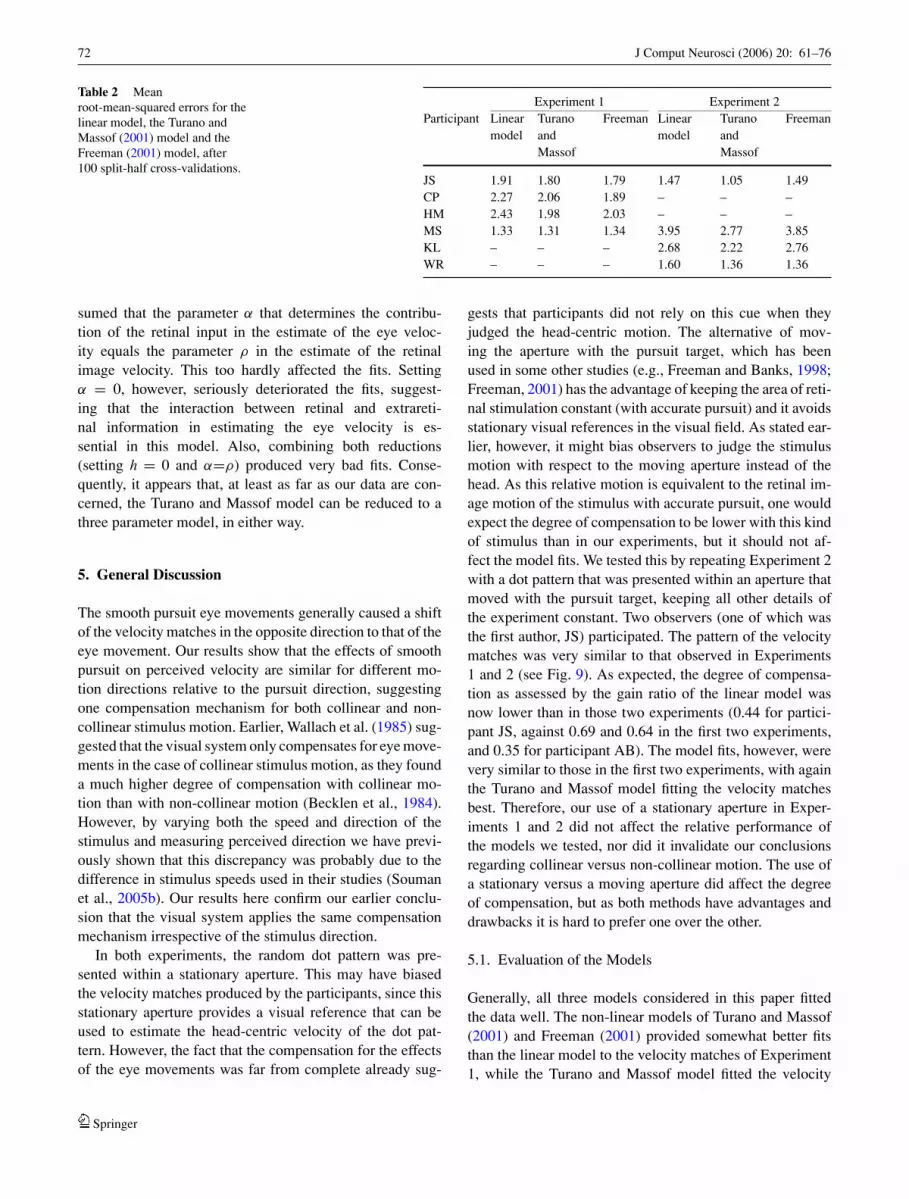
Table 2 Meanroot-mean-squared errors for thelinear model, the Turano andMassof (2001) model and theFreeman (2001) model, after100 split-half cross-validations.
Experiment 1 Experiment 2Participant Linear
modelTuranoandMassof
Freeman Linearmodel
TuranoandMassof
Freeman
JS 1.91 1.80 1.79 1.47 1.05 1.49CP 2.27 2.06 1.89 – – –HM 2.43 1.98 2.03 – – –MS 1.33 1.31 1.34 3.95 2.77 3.85KL – – – 2.68 2.22 2.76WR – – – 1.60 1.36 1.36
sumed that the parameter α that determines the contribu-tion of the retinal input in the estimate of the eye veloc-ity equals the parameter ρ in the estimate of the retinalimage velocity. This too hardly affected the fits. Settingα = 0, however, seriously deteriorated the fits, suggest-ing that the interaction between retinal and extrareti-nal information in estimating the eye velocity is es-sential in this model. Also, combining both reductions(setting h = 0 and α=ρ) produced very bad fits. Conse-quently, it appears that, at least as far as our data are con-cerned, the Turano and Massof model can be reduced to athree parameter model, in either way.
5. General Discussion
The smooth pursuit eye movements generally caused a shiftof the velocity matches in the opposite direction to that of theeye movement. Our results show that the effects of smoothpursuit on perceived velocity are similar for different mo-tion directions relative to the pursuit direction, suggestingone compensation mechanism for both collinear and non-collinear stimulus motion. Earlier, Wallach et al. (1985) sug-gested that the visual system only compensates for eye move-ments in the case of collinear stimulus motion, as they founda much higher degree of compensation with collinear mo-tion than with non-collinear motion (Becklen et al., 1984).However, by varying both the speed and direction of thestimulus and measuring perceived direction we have previ-ously shown that this discrepancy was probably due to thedifference in stimulus speeds used in their studies (Soumanet al., 2005b). Our results here confirm our earlier conclu-sion that the visual system applies the same compensationmechanism irrespective of the stimulus direction.
In both experiments, the random dot pattern was pre-sented within a stationary aperture. This may have biasedthe velocity matches produced by the participants, since thisstationary aperture provides a visual reference that can beused to estimate the head-centric velocity of the dot pat-tern. However, the fact that the compensation for the effectsof the eye movements was far from complete already sug-
gests that participants did not rely on this cue when theyjudged the head-centric motion. The alternative of mov-ing the aperture with the pursuit target, which has beenused in some other studies (e.g., Freeman and Banks, 1998;Freeman, 2001) has the advantage of keeping the area of reti-nal stimulation constant (with accurate pursuit) and it avoidsstationary visual references in the visual field. As stated ear-lier, however, it might bias observers to judge the stimulusmotion with respect to the moving aperture instead of thehead. As this relative motion is equivalent to the retinal im-age motion of the stimulus with accurate pursuit, one wouldexpect the degree of compensation to be lower with this kindof stimulus than in our experiments, but it should not af-fect the model fits. We tested this by repeating Experiment 2with a dot pattern that was presented within an aperture thatmoved with the pursuit target, keeping all other details ofthe experiment constant. Two observers (one of which wasthe first author, JS) participated. The pattern of the velocitymatches was very similar to that observed in Experiments1 and 2 (see Fig. 9). As expected, the degree of compensa-tion as assessed by the gain ratio of the linear model wasnow lower than in those two experiments (0.44 for partici-pant JS, against 0.69 and 0.64 in the first two experiments,and 0.35 for participant AB). The model fits, however, werevery similar to those in the first two experiments, with againthe Turano and Massof model fitting the velocity matchesbest. Therefore, our use of a stationary aperture in Exper-iments 1 and 2 did not affect the relative performance ofthe models we tested, nor did it invalidate our conclusionsregarding collinear versus non-collinear motion. The use ofa stationary versus a moving aperture did affect the degreeof compensation, but as both methods have advantages anddrawbacks it is hard to prefer one over the other.
5.1. Evaluation of the Models
Generally, all three models considered in this paper fittedthe data well. The non-linear models of Turano and Massof(2001) and Freeman (2001) provided somewhat better fitsthan the linear model to the velocity matches of Experiment1, while the Turano and Massof model fitted the velocity
Springer

J Comput Neurosci (2006) 20: 61–76 73
Linear modelTurano & MassofFreeman
-5 0 5 10-10
-8
-6
-4
-2
0
2
Horizontal speed (°/s)
Ver
tical
spe
ed (
°/s)
-5 0 5 10-10
-8
-6
-4
-2
0
2
Horizontal speed (°/s)
JS AB
Fig. 9 Velocity matches andmodel fits for the twoparticipants in the controlexperiment. Symbols and errorbars are as in Fig. 5.
matches of Experiment 2 best. Partly, the differencesmay have been due to the different numbers of freeparameters. As the differences in model fits were also quitesmall, it is hard to choose between these models. In thisrespect our results are very similar to the general velocitymatching experiments of Turano and Massof (2001) andFreeman (2001). In those studies the differences betweenthe linear model and the respective non-linear models werequite small too. The better fits of the model of Turanoand Massof suggest that the eye movement signal that isused by the visual system to estimate the eye velocity maybe partly determined by visual information. The retinalsignal and the eye movement signal may therefore not becompletely independent, as assumed in the linear model andthe model of Freeman. The Turano and Massof model doesnot, however, specify how the effect of the retinal imagevelocity on the estimated eye velocity arises. In this respect,it might be augmented or combined with alternative modelsthat assume an interaction between visual information andthe eye movement signal (see below).
The differences between the fits of the linear and the non-linear models in our experiments cannot be attributed to thefact that we assumed perfect fixation in the fixation intervalfor the non-linear models, whereas we used the actual eyevelocity during the fixation interval when fitting the linearmodel (see the Appendix). The average eye velocity duringthe fixation interval was close to zero (Figs. 3 and 7). More-over, refitting the linear model with perfect fixation assumedproduced the same results as those reported above, in bothexperiments. The maximum difference in the best fitting val-ues for the gain ratio ε/ρ was 0.01.
All three models, at least in the way we extended themto two dimensions in the frontoparallel plane, assume thatthe retinal motion direction and the eye movement directionare estimated veridically by the visual system. Although themodels describe the velocity matches well under this as-sumption, it is not necessarily a valid one. There is, however,as far as we can see no way to determine the estimated reti-nal direction or eye movement direction absolutely, as onealways needs some kind of matching task or comparison task
to measure them. Possibly, errors in the encoded directionswould predict a different pattern of variation in the veloc-ity matches. In order to test this, however, we need a lessnoisy response measure than the one we used in the presentexperiments.
5.2. Alternative Models
As stated in the Introduction, we did not fit the models ofWertheim (1994) and Goltz et al. (2003) to our data. Yet,these models contain some interesting properties. They bothfocus on the importance of retinal image characteristicsin the compensation for the effects of smooth pursuit eyemovements. In this respect they are reminiscent of the oldermodel of Post and Leibowitz (1985), which emphasized theeffect of retinal image characteristics on the activity of ahypothesized reflexive eye movement system. Although thatmodel was falsified by studies that showed that, contraryto its predictions, retinal image motion is required toexperience vection (Mergner and Becker, 1990; Mergneret al., 2000; also see Wertheim, 1990) and that changing thespatial frequency of a stimulus that is tracked with the eyesdoes not affect its perceived velocity (Sumnall et al., (2003),its emphasis on retinal image characteristics deserves furtherelaboration. For example, it is presently unclear whether theeffect of the spatial frequency of a visual stimulus duringsmooth pursuit is due to its effects on the retinal imagevelocity estimate (Freeman and Banks, 1998) or on the eyevelocity estimate (Wertheim, 1987). Further specificationof the possible interactions between retinal image motionand eye velocity in the abovementioned models mightenable them to make more specific, testable, predictions ofthe spatial frequency effect, making it possible to decidebetween the models. The same is true for such factors asthe size (Turano and Heidenreich, 1999) and presentationduration (De Graaf and Wertheim, 1988; Mack and Herman,1978; Souman et al., 2005a) of the motion stimulus.
Another interesting model of motion perception duringsmooth pursuit is that by Pack et al. (2001), which describesboth oculomotor behaviour and motion perception during
Springer
74 J Comput Neurosci (2006) 20: 61–76
smooth pursuit eye movements. Their model is based onneurophysiological evidence that in primates eye movementsignals and retinal motion signals are integrated in area MST(Barton et al., 1996; Bradley et al., 1996; Ilg and Thier,2003; Newsome et al., 1988; Shenoy et al., 1999). As aneural network model, it describes the combination of retinalmotion signals and eye movement signals at a much lowerlevel than the other models discussed in this study. It would beinteresting to connect both types of models by showing howthe effects of experimental factors on the model parametersof the high-level models (the gain ratio of the linear model,or the power coefficients of Freeman (2001) and Turano andMassof (2001) models) derive from the network propertiesin the model of Pack et al. (2001).
6. Conclusions
Our new task, in which participants judged both perceivedspeed and perceived motion direction at the same time, en-abled us to make a direct comparison of the perception ofcollinear and non-collinear during smooth pursuit eye move-ments. The results of Experiments 1 and 2 show that the effectof smooth pursuit eye movements on velocity matches canmainly be described as a shift in the opposite direction to theeye movements. This suggests that the compensation mech-anism is the same, regardless of the stimulus direction orthe retinal image motion direction. Generally, the non-linearmodel of Turano and Massof (2001) provided better fits tothe velocity matches than the linear model and the model ofFreeman (2001), though at the cost of a higher number offree parameters. However, any non-linear effects were notvery strong, as the difference between the model fits overallwas quite small. Evaluation of these models and a few al-ternatives suggests that further specification of the effect ofretinal image motion characteristics on the compensation foreye movements is necessary.
Acknowledgements The authors would like to thank Dr. Tom CAFreeman, Dr. Kathleen A. Turano and Dr. Robert W. Massof for clar-ifying the fitting procedures in their respective papers. A preliminaryaccount of the experiments in this paper was presented at the EuropeanConference on Visual Perception in Budapest (Souman et al., 2004).
Appendix: Mathematical details
6.1. The Linear Model
The linear model is described by Eq. (1), which we repeathere for convenience:
h = ρr + εe (8)
In our experiments, the velocity in the second intervalhad to be adjusted to match the perceived velocity in the firstinterval. Hence, at the velocity match the perceived head-centric velocity h1 in interval 1 equalled that in interval 2(h2). Using equation 8 this gives:
ρr1 + εe1 = ρr2 + εe2 (9)
where the subscripts refer to the interval. Since the retinalvelocity r equals the head-centric stimulus velocity h minusthe eye velocity e, we can also write:
ρ(h1 − e1) + εe1 = ρ(h2 − e2) + εe2 (10)
Rearranging terms and dividing by ρ gives:
(ε
ρ− 1
)(e1 − e2) = h2 − h1 (11)
The vectors h and e have two components, one for horizon-tal speed and one for vertical speed. Hence, Eq. 11 equals asystem of two equations, one for the horizontal speed com-ponents and one for the vertical ones. This equation basi-cally describes a linear regression model with zero intercept.The gain ratio ε/ρ can be estimated by forming the errormatrix:
D =(
ε
ρ− 1
)(E1 − E2) − H2 + H1 (12)
with H and E denoting the matrices formed by all obser-vations on the vectors h and e, and minimizing the traceof the sum of squares and cross products matrix D′D.
Differentiating the trace of D′D with respect to(
ερ
− 1)
,
setting the derivative equal to zero and solving for ε/ρgives:
ε
ρ= 1 + tr([E1 − E2]T [H2 − H1])
tr([E1 − E2]T [E1 − E2])(13)
where tr(A) is the trace of matrix A.
6.2. The Turano and Massof (2001) Model
Applying Eqs. (4) and (5) to the velocity matches gives:
h
1 + e−ρr1+ 1
1 + e−εe−αr1= h
1 + e−ρr2+ 1
1 + e−αr2(14)
where ri denotes the retinal image velocity in interval i and his the ratioRmax/R′
max. This equation cannot be solved for r2
algebraically. Turano and Massof approximated the solution
Springer
J Comput Neurosci (2006) 20: 61–76 75
by means of a series expansion (Turano and Massof, Personalcommunication) and we used their result:
r2 = − 1
ρln
(2h
11+e−εe1−0.5αr1
− 0.5 + 2h1+e−0.5ρr1
− 1
)(15)
To apply this equation to the velocity matches in Experiments1 and 2, we had to assume accurate fixation (e2 = 0), whichseemed a reasonable assumption (see Figs. 3 and 7). Weapplied the equation separately to the horizontal and thevertical components of the velocity matches, with one setof parameters (ε, ρ, α, and h). The best fitting parametervalues were determined by minimizing the trace of the sumof squares and cross products matrix D′D, with
D = H2 − H2 (16)
where H2 is the matrix of velocity matches in the fixationinterval as predicted by the model and H2 is the matrix ofthe actual velocity matches. The trace of D′D was minimizedwith MatLab’s fminsearch function, which implements a un-constrained non-linear optimization procedure.
6.3. Freeman (2001) Model
To fit Freeman’s non-linear model to our data, equa-tion 6 had to be applied to the retinal image veloc-ity and the eye velocity in both intervals. We again as-sumed that fixation in the fixation interval was accurate(e2 = 0), which greatly simplified the fitting procedure. Atthe velocity match (h1 = h2), the equation becomes:
[(||h1 − e1|| + 1)ρ − 1
] h1 − e1
||h1 − e1|| (17)
+[(||e1|| + 1)ε − 1]e1
||e1|| = [(||h2|| + 1)ρ − 1]h2
||h2||
The direction of the velocity match h2 equals that of the lefthand side of the equation and can therefore be computed onthe basis of the (known) vectors e1 and h1. The amplitude ofh2 equals:
||h2|| =(
1 +∥∥∥∥[
(||h1 − e|| + 1)ρ − 1] h1 − e||h1 − e||
+[(||e|| + 1)ε − 1
] e||e||
−[(||e2|| + 1)ε − 1
] e2
||e2||∥∥∥∥) 1
ρ
− 1 (18)
The best fitting model parameters, ρ and ε, werefound by minimizing the trace of the sum of squares
and cross-products matrix D′D, with D defined as inEq. (16). This was done with MatLab’s fminsearch function.
References
Aubert H (1886) Die Bewegungsemp findung. Pflugers Archiv 39:347–370.
Aubert H (1887) Die Bewegungsemp findung, zweite Mitteilung.Pflugers Archiv 40: 459–480.
Barton JJS, Simpson T, Kiriakopoulos E, Stewart C, Crawly A, GuthrieB, et al. (1996). Functional MRI of lateral occipitotemporal cortexduring pursuit and motion perception. Annals of Neurology 40:387–398.
Becklen R, Wallach H, Nitzberg D (1984) A limitation of position con-stancy. Journal of Experimental Psychology: Human Perceptionand Performance 10: 713–723.
Bradley DC, Maxwell M, Andersen RA, Banks MS,Shenoy KV (1996) Mechanisms of heading perception inprimate visual cortex. Science 273: 1544–1547.
De Bruyn B, Orban GA (1988) Human velocity and direction discrim-ination measured with random dot patterns. Vision Research 28:1323–1335.
De Graaf B, Wertheim AH (1988) The perception of object-motionduring smooth-pursuit eye movements: Adjacency is not a factorcontributing to the Filehne illusion. Vision Research 28: 497–502.
Festinger L, Easton AM (1974) Inferences about the efferent systembased on a perceptual illusion produced by eye movements. Psy-chological Review 81(1): 44–58.
Festinger L, Sedgwick HA, Holtzman JD (1976) Visual perceptionduring smooth pursuit eye movements. Vision Research 16: 1377–1386.
Filehne W (1922) Uber das optische Wahrnehmen von Bewegungen.Zeitschrift fur Sinnesphysiologie 53: 134–144.
Freeman TCA (2001) Transducer models of head-centred motion per-ception. Vision Research 41: 2741–2755.
Freeman TCA, Banks MS (1998) Perceived head-centric speed is af-fected by both extra-retinal and retinal errors. Vision Research 38:941–945.
Goltz HC, DeSouza JFX, Menon RS, Tweed DB, Vilis T (2003) In-teraction of retinal image and eye velocity in motion perception.Neuron 39: 569–576.
Hansen RM (1979) Spatial localization during pursuit eye movements.Vision Research 19: 1213–1221.
Holtzman JD, Sedgwick H A, Festinger L (1978) Interaction of per-ceptually monitored and unmonitored efferent commands forsmooth pursuit eye movements. Vision Research 18: 1545–1555.
Ilg U J, Thier P (2003) Visual tracking neurons in primate area MSTare activated by smooth-pursuit eye movements of an “imaginarytarget”. Journal of Neurophysiology 90: 1489–1502.
Mack A, Herman E (1973) Position constancy during pursuit eye move-ment: An investigation of the Filehne illusion. Quarterly Journalof Experimental Psychology 25: 71–84.
Mack A, Herman E (1978) The loss of position constancy during pursuiteye movements. Vision Research 18: 55–62.
Mateeff S (1978) Saccadic eye movements and localization of visualstimuli. Perception and Psychophysics 24: 215–224.
Mateeff S, Yakimoff N, Hohnsbein J, Ehrenstein WH (1991) Percep-tual constancy during ocular pursuit: A quantitative estimationprocedure. Perception and Psychophysics 49: 390–392.
Matin L, Matin E, Pearce DG (1969) Visual perception of directionwhen voluntary saccades occur. I. Relation of visual direction
Springer
76 J Comput Neurosci (2006) 20: 61–76
of a fixation target extinguished before a saccade to a flash pre-sented during the saccade. Perception and Psychophysics 5: 65–80.
Matin L, Matin E, Pola J (1970) Visual perception of direction whenvoluntary saccades occur: II. Relation of visual direction of afixation target extinguished before a saccade to a subsequent testflash presented before the saccade. Perception and Psychophysics8: 9–14.
McKee SP, Nakayama K (1984) The detection of motion in the periph-eral visual field. Vision Research 24: 25–32.
Mergner T, Becker W (1990) Perception of horizontal self-rotation:Multisensory and cognitive aspects. In: R Warren and AHWertheim (eds.), Perception and control of self-motion. Erlbaum,Hillsdale, NJ, pp. 219–263.
Mergner T, Wertheim AH, Rumberger A (2000) Which retinal andextra-retinal information is crucial for circular vection? ArchivesItaliennes de Biologie 138: 123–138.
Newsome WT, Wurtz RH, Komatsu H (1988) Relation of cortical areasMT and MST to pursuit eye movements. II. Differentiation ofretinal from extraretinal inputs. Journal of Neurophysiology 60:604–620.
Pack C, Grossberg S, Mingolla E (2001) A neural model of smooth pur-suit control and motion perception by cortical area MST. Journalof Cognitive Neuroscience 13: 102–120.
Park J. Lee J, Lee C (2001) Non-veridical visual motion percep-tion immediately after saccades. Vision Research 41: 3751–3761.
Pitt MA, Myung IJ (2002) When a good fit can be bad. Trends inCognitive Sciences 6: 421–425.
Post RB, Leibowitz HW (1985) A revised analysis of the role of effer-ence in motion perception. Perception 14: 631–643.
Shenoy KV, Bradley DC, Andersen RA (1999) Influence of gaze rota-tion on the visual response of primate MSTd neurons. Journal ofNeurophysiology 81: 2764–2786.
Souman JL, Hooge ITC, Wertheim AH (2004) How smooth pursuit eyemovements affect the perceived direction and speed of movingobjects. Perception, 33(Supplement): 3a.
Souman JL, Hooge ITC, Wertheim AH (2005a) Vertical object motionduring horizontal ocular pursuit: Compensation for eye move-ments increases with presentation duration. Vision Research 45:845–853.
Souman JL, Hooge ITC, Wertheim AH (2005b) Perceived motion di-rection during smooth pursuit eye movements. Experimental BrainResearch 164: 376–386.
Sumnall JH, Freeman TCA, Snowden RJ (2003) Optokinetic potentialand the perception of head-centred speed. Vision Research 43:1709–1718.
Swanston MT, Wade NJ (1988) The perception of visual motion dur-ing movements of the eyes and of the head. Perception and Psy-chophysics 43: 559–566.
Swanston MT, Wade NJ, Day RH (1987) The representation of uniformmotion in vision. Perception 16: 143–159.
Swanston MT, Wade NJ, Ono H, Shibuta K (1992) The interactionof perceived distance with the perceived direction of visual mo-tion during movements of the eyes and the head. Perception andPsychophysics 52: 705–713.
Turano KA, Heidenreich SM (1999) Eye movements affect theperceived speed of visual motion. Vision Research 39: 1177–1187.
Turano KA, Massof RW (2001) Nonlinear contribution of eyevelocity to motion perception. Vision Research 41: 385–395.
Von Fleischl E (1882) Physiologisch-optische Notizen. Sitzungs-berichte der Akademie der Wissenschaften in Wien 3(86): 7–25.
Von Holst E (1954) Relations between the central nervous system andthe peripheral organs. British Journal of Animal Behavior 2: 89–94.
Von Holst E, Mittelstaedt H (1950) Das Reafferenzprinzip(Wechselwirkungen zwischen Zentralnervensystem und Periph-erie). Die Naturwissenschaften 37: 464–476.
Wade NJ, Swanston MT (1987) The representation of nonuniform mo-tion: Induced movement. Perception 16: 555–571.
Wade NJ, Swanston MT (1996) A general model for the perception ofspace and motion. Perception 25: 187–194.
Wallach H, Becklen R, Nitzberg D (1985) The perception of motionduring colinear eye movements. Perception and Psychophysics 38:18–22.
Wertheim AH (1987) Retinal and extraretinal information in movementperception: How to invert the Filehne illusion. Perception 16: 299–308.
Wertheim AH (1990) Visual, vestibular, and oculomotor interactions inthe perception of object motion during egomotion. In: R Warrenand AH Wertheim (eds.), Perception and control of self-motion.Erlbaum, Hillsdale, NJ, pp. 171–217.
Wertheim AH (1994) Motion perception during self-motion: The di-rect versus inferential controversy revisited. Behavioral and BrainSciences 17: 293–355.
Springer


