Embed Size (px)
Citation preview

Fracture and Ductile vs. Brittle Behavior—
Theory, Modelling and Experiment
I<ft<f0f*7t>2'('
DISTRIBUTION STATEMENT A Approved for Public Release
Distribution Unlimited

MATERIALS RESEARCH SOCIETY SYMPOSIUM PROCEEDINGS VOLUME 539
Fracture and Ductile vs. Brittle Behavior—
Theory, Modelling and Experiment
Symposium held November 30-December 3,1998, Boston, Massachusetts, U.S.A.
EDITORS:
Glenn E. Beltz University of California
Santa Barbara, California, U.S.A.
Robin L. Blumberg Selinger Catholic University
Washington, DC, U.S.A.
Kyung-Suk Kim Brown University
Providence, Rhode Island, U.S.A.
Michael P. Marder University of Texas, Austin
Austin, Texas, U.S.A.
iMlRJSl Materials Research Society
Warrendale, Pennsylvania
Effort sponsored by the Air Force Office of Scientific Research, Air Force Material Command, USAF, under F49620-99-1-0041. The U.S. Government is authorized to reproduce and distribute reprints for Governmental purposes notwithstanding any copyright notation thereon. The views and conclusions herein are those of the authors and should not be interpreted as necessarily representing the official policies or endorsements, either expressed or implied, of the Air Force Office of Scientific Research or the U.S. Government.
This work was supported in part by the Army Research Office under Grant number DAAG55-98- 1-0478. The views, opinions, and/or findings contained in this report are those of the author(s) and should not be construed as an official Department of the Army position, policy, or decision, unless so designated by other documentation.
This work was supported in part by the national Institute of Standards and Technology under Grant Number 43NAMB907543. The views, opinions, and/or findings contained in this report are those of the author(s) and should not be construed as an official MIST position, policy, or decision, unless so designated by other documentation.
This work relates to Department of navy Grant nOOO14-99-1-0243 issued by the Office of naval Research. The United States Government has a royalty-free license throughout the world in all copyrightable material contained herein.
Single article reprints from this publication are available through University Microfilms Inc., 300 north Zeeb Road, Ann Arbor, Michigan 48106
CODEn: MRSFDH
Copyright 1999 by Materials Research Society. All rights reserved.
This book has been registered with Copyright Clearance Center, Inc. For further information, please contact the Copyright Clearance Center, Salem, Massachusetts.
Published by:
Materials Research Society 506 Keystone Drive Warrendale, FA 15086 Telephone (724) 779-3003 Fax (724) 779-8313 Website: http://www.mrs.org/
Library of Congress Cataloging in Publication Data
Fracture and ductile vs. brittle behavior—theory, modelling and experiment : symposium held november 30-December 3, 1998, Boston, Massachusetts, U.S.A. / editors, Glenn E. Beltz, Robin L. Blumberg Selinger, Kyung-Suk Kim, Michael P. Marder
p.cm.—(Materials Research Society symposium proceedings, ISSH 0272-9172 ,- v. 539) Includes bibliographical references and index. ISBn 1-55899-445-9 1. Fracture mechanics—Congresses. 2. Brittleness—Congresses. 3. Ductility—
Congresses. I. Beltz, Glenn E. II. Blumberg Selinger, Robin L. III. Kim, Kyung-Suk IV. Marder, Michael P. V. Series: Materials Research Society symposium proceedings ; v. 539.
TA409.F698 1999 99-18998 620.1'126—dc21 CIP
Manufactured in the United States of America

CONTENTS
Preface ix
Materials Research Society Symposium Proceedings x
PART I: DUCTILE VS. BRITTLE BEHAVIOR OF STEELS AND STRUCTURAL METALLIC ALLOYS
•Scanning Force Microscopy as a Tool for Fracture Studies 3 F. Thome, M. Oöhen, M. Große Oehling, and li. Vehoff
"The Charge Redistribution Accompanying Slip and Cleavage: Electronic Structure Calculations in Alloy Design 13
M.E. Eberhart, C. Woodward, and A.F. Qiamei
Metallurgical Control of the Ductile-Brittle Transition in High-Strength Structural Steels 23
J. W. Morris, Jr.
In Situ Examination of Moving Crack Tips in Ordered Intermetallics 29
J.K. Heuer, N.Q. Lam, P.R. Okamoto, and J.F. Stubbins
The Influence of Microstructure on the Fracture and Tensile Properties of Die Cast and Thixomolded Magnesium Alloys 35
P.E. Thoma, C. Hays, and A. Baik
Embrittlement of Fe-Cr-AI Alloys 41 J.H. Lange, M. Brede, B. Fischer, S. Spindler, H. Wagner, R. Wittmann, D. Oerthsen, A. Broska, and J. Wolff
PART II: CONTINUUM DISLOCATION. CONTACT. AND COHESIVE ZONE MODELS
"Effect of Crack Blunting on the Ductile-Brittle Response of Crystalline Materials 49
D.M. Lipkin, O.E. Beltz, and L.L. Fischer
Effect of Crack Geometry on Dislocation Nucleation and Cleavage Thresholds 57
L.L. Fischer and O.E. Beltz
Dislocation Emission from a Thin-Film-Covered Crack 63 T-Y. Zhang, OF. Qian, T. Wang, and P. Tong
Mobility of Non-Planar Screw Dislocations Ahead of a Mode-Ill Crack Tip 69
A.tl.W. rigan and fi.F. Zhang
Invited Paper
Mode-Ill Fracture Propagation in a Two-Dimensional Continuum Model With Frictional Dissipation 75
E.S.C. Chingand tl. riakanishi
"Transitions of Shear Resistance in a Single-Asperity Contact 81 J.A. Hurtado and K-S. Kim
'Making, Breaking and Sliding of Nanometer-Scale Contacts 93 R.W. Carpick, M. Enachescu, D.F. Ogletree, and M. Salmeron
PART III: FRACTURE AND DEFORMATION OF NONMETALS
On the Triggering of Shear Faults During Brittle Compressive Failure: A New Mechanism 107
E.M. Schulson, D. Iliescu, and C.E. Renshaw
Behavior of Crack Growth Resistance in Toughened Silicon Nitride Ceramics 113
H. Kawamoto, K. Hiramatsu, Y. Takigawa, A. Okada, and H. Usami
Molecular Dynamics Simulations of Nanoindentation of Silicon Nitride 119
P. Walsh, A. Omeltchenko, H. Kikuchi, R.K. Kalia, A. Nakano, and P. Vashishta
Creep Cavitation Enhanced by Glass Pocket Formation in a Tetragonal Zirconia Doped With 0.3 wt% Pure Silica 125
K. Morita, K. Hiraga, and Y. Sakka
Plastic Dynamics and Brittle vs. Ductile Failure in 131 Noncrystalline Solids
M.L. Falk
Effect of Transition Temperature, Structure and Anisotropy on the Deformation and Failure of Polymers 137
K.J. Samuels
Athermal Fracture of Covalent Bonds 145 J.J. Oilman
Fiber Debonding Along a Crack Front in Paper 153 H. Kettunen and K.J. Mskanen
PART IV: FRACTURE AND DEFORMATION OF SILICON
Temperature-Dependent Onset of Yielding in Dislocation- Free Silicon: Evidence of a Brittle-to-Ductile Transition 161
R.fi. Folk II, M. Khantha, D.P. Pope, and V. Vitek
*lnvited Paper
VI

Cross-Sectional and Plan-View Observation of Cracks Introduced in Si at the Ductile-Brittle Transition Temperature 169
Suprijadi and H. Saka
Unstable Stacking Fault Free Energies in Silicon Through Empirical Modelling 175
M. de Körting, A. Antonelli, M.Z. Bazant, E. Kaxiras, and J.F. Justo
Dynamic Crack Propagation in Single-Crystalline Silicon 181 T. Cramer, A. Wanner, and P. Qumbsch
PART V: FRACTALS. SCALING, AND HETEROGENEOUS MEDIA
Cracks in Nano-Ceramic Thin Layers Produced by Laser Treatments 189
J.Th.M. de Hosson and D.tl.J. Teeuw
The Fracture of Composite Materials: A Chaotic Approach 195 R. Tonelli, F. Meloni, and F. Aymerich
Long Distance Roughness of Fracture Surfaces in Heterogeneous Materials 203
M. Hinojosa, E. Bouchaud, and B. Hghiem
Molecular Dynamics Studies of Interracial Crack Propagation in Heterogeneous Media 209
J.M. Corbett and R.L.B. Selinger
Studies of Crack Pattern in Two-Dimensional Media as Resulting From Ion Beam Like or Freezing Destruction 215
M. Ausloos, n. Vandewalle, and R. D'Hulst
PART VI: CRYSTAL PLASTICITY AND MESOSCALE DISLOCATION MODELLING
'Analysis of Compression Behavior of a (011) Ta Single Crystal With Orientation Imaging Microscopy and Crystal Plasticity 221
A.J. Schwartz, J.S. Stölken, W.E. Hing, Q.ti. Campbell, D.H. Lassila, J.Y. Shu, S. Sun, and B.L. Adams
*Mesoscopic Simulation of Dislocation Activity at Crack Tips 233 A. Hartmaier and P. Qumbsch
Molecular Dynamics Study of Copper and Aluminum Under Mechanical Strain 245
P. tieino, H. Häkkinen, L. Perondi, and K. Kaski
Experimental Analysis of Deformation Induced Microstucture Near a Crack Tip in a Hardened Copper Crystal 251
A-F. Bastawros and K-S. Kim
*lnvited Paper
VII

Simulation of Void Growth at High Strain-Rate 257 J. Belak and R. Minich
The Mechanism of Ductile Fracture in Constrained Thin Films 263 M.E. Kassner, T.C. Kennedy, and U.K. Schrems
Finite Element Analysis of Thermal-Mechanical Stress Induced Failure in Interconnects 269
X. Yu and K. Weide
PART VII: INTERFACIAL AND GRAIN-BOUNDARY FRACTURE
•Quantitative Modelling and Measurement of Copper Thin Film Adhesion 277
A.A. Volinsky, ri.l. Tymiak, M.D. Kriese, W.W. Qerberich, and J. W. Hutchinson
"Mechanisms of Intergranular Fracture 291 D. Parkas
'Experiments and Simulations of Directionally Dependent Fracture Along Copper/Sapphire Interfaces 299
J. W. Kysar
Quasi-Static Brittle Fracture 313 J.A. Pfaendtner, R.C. Muthiah, and C.J. McMahon, Jr.
Atomistic Modelling of Grain Boundary Fracture in Diamond 319 O.A. Shenderova, D. W. Brenner, A. Omeltchenko, X. Su, and L. Yang
Minimum Surface Formation Energy for Three-Dimensional Intergranular Fracture 325
E.A. Holm and G.N. McOovney
Author Index 331
Subject Index 333
Invited Paper
VIII

PREFACE
This volume contains papers presented at the 1998 MRS Fall Meeting in Boston, Massachusetts, in Symposium M, entitled "Fracture and Ductile vs. Brittle Behavior—Theory, Modelling and Experiment." The symposium brought together the many communities that investigate the fundamentals of fracture, with special emphasis on the ductile/brittle transition across a broad spectrum of material classes, fracture at interfaces, and modelling fracture over various length scales. Theoretical techniques discussed ranged from first-principles electronic structure theory to atomistic simulation to mesoscale and continuum theories, along with studies of fractals and scaling in fracture. Experimental and theoretical talks were interspersed throughout all sessions, rather than being segregated.
The contributions to this volume generally follow the topical outline upon which the symposium was organized. The first part, dealing with ductile vs. brittle behavior in metals, concerns itself with investigations of high-strength steel, magnesium alloys, ordered intermetallics, and Fe-Cr-Al alloys. The development of analytical methods based on micromechanical models, such as dislocation mechanics and cohesive/contact zone models, are covered in a follow-up section. Monmetals, including silicon, are considered in Parts III and IV. Fractals, chaos, and scaling theories are taken up in Part V, with a special emphasis on fracture in heterogeneous solids. Modelling based on large populations of dislocations has substantially progressed during the past three years; hence, a section devoted to crystal plasticity and mesoscale dislocation modelling appears next. Finally, the technologically significant area of interfacial fracture, with applications to composites and intergranular fracture, is taken up in Part VII.
We hope that this volume will serve as a useful reference, and will help to incite new ideas in fracture research not only for those engineers, theoreticians, and experimentalists who have been working in the field, but also for those who are new to the field.
Thanks are due to Peter Qumbsch, who assisted in the preliminary planning of the symposium; to Christine Townsley, who provided invaluable administrative support at UCSB; to Margherita Chang and Lisa Fischer, who assembled the table of contents and indices; to the MRS staff, who offered excellent logistical support; and to the 1998 MRS Fall Meeting Chairs, Clyde L. Briant, Eric H. Chason, Howard E. Katz, and Yuh Shiohara.
The symposium was generously supported by the Office of naval Research, the Army Research Office, the Air Force Office of Scientific Research, and the Center for Theoretical/Computational Materials Science at the national Institute of Standards and Technology. The organizers would like to offer our personal thanks to Dr. Brian Sanders and Dr. Ozden Ochoa of AFOSR; Dr. Peter Reynolds of OHR; and Dr. Sharon Glotzer and Dr. Jim Warren of CTCMS/NIST for their role in encouraging excellence in fracture research.
Glenn E. Beltz Robin L. Blumberg Selinger Kyung-Suk Kim Michael P. Marder
January 1999

MATERIALS RESEARCH SOCIETY SYMPOSIUM PROCEEDINGS
Volume 507— Amorphous and Microcrystalline Silicon Technology—1998, R. Schropp, H.M. Branz, M. Hack, 1. Shimizu, S. Wagner, 1999, ISBN: 1-55899-413-0
Volume 508— Flat-Panel Display Materials—1998, G. Parsons, C-C. Tsai, T.S. Fahlen, C. Seager, 1998, ISBN: 1-55899-414-9
Volume 509— Materials Issues in Vacuum Microelectronics, W. Zhu, L.S. Pan, T.E. Felter, C. Holland, 1998, ISBN: 1-55899-415-7
Volume 510— Defect and Impurity Engineered Semiconductors and Devices II, S. Ashok, J. Chevallier, K. Sumino, B.L. Sopori, W. Götz, 1998, ISBN: 1-55899-416-5
Volume 511— Low-Dielectric Constant Materials IV, C. Chiang, P.S. Ho, T-M. Lu, J.T. Wetzel, 1998, ISBN: 1-55899-417-3
Volume 512— Wide-Bandgap Semiconductors for High Power, High Frequency and High Temperature, S. DenBaars, J. Palmour, M.S. Shur, M. Spencer, 1998, ISBN: 1-55899-418-1
Volume 513— Hydrogen in Semiconductors and Metals, N.H. Nickel, W.B. Jackson, R.C. Bowman, R.Q. Leisure, 1998, ISBN: 1-55899-419-X
Volume 514— Advanced Interconnects and Contact Materials and Processes for Future Integrated Circuits, S.P. Murarka, M. Eizenberg, D.B. Fräser, R. Madar, R. Tung, 1998, ISBN: 1-55899-420-3
Volume 515— Electronic Packaging Materials Science X, D.J. Belton, M. Qaynes, E.Q. Jacobs, R. Pearson, T. Wu, 1998, ISBN: 1-55899-421-1
Volume 516— Materials Reliability in Microelectronics VIII, J.C. Bravman, T.N. Marieb, J.R. Lloyd, M.A. Korhonen, 1998, ISBN: 1-55899-422-X
Volume 517— High-Density Magnetic Recording and Integrated Magneto-Optics: Materials and Devices, J. Bain, M. Levy, J. Lorenzo, T. Nolan, Y. Okamura, K. Rubin, B. Stadler, R. Wolfe, 1998, ISBN: 1-55899-423-8
Volume 518— Microelectromechanical Structures for Materials Research, S. Brown, J. Gilbert, H. Quckel, R. Howe, G. Johnston, P. Krulevitch, C. Mühlstein, 1998, ISBN: 1-55899-424-6
Volume 519— Organic/Inorganic Hybrid Materials, R.M. Laine, C. Sanchez, C.J. Brinker, E. Giannelis, 1998, ISBN: 1-55899-425-4
Volume 520— Nanostructured Powders and Their Industrial Application, G. Beaucage, J.E. Mark, G.T. Burns, D-W. Hua, 1998, ISBN: 1-55899-426-2
Volume 521— Porous and Cellular Materials for Structural Applications, D.S. Schwartz, D.S. Shih, A.G. Evans, H.N.G. Wadley, 1998, ISBN: 1-55899-427-0
Volume 522— Fundamentals of Nanoindentation and Nanotribology, N.R. Moody, W.W. Gerberich, N. Burnham, S.P. Baker, 1998, ISBN: 1-55899-428-9
Volume 523— Electron Microscopy of Semiconducting Materials and ULSI Devices, C. Hayzelden, C. Hetherington, F. Ross, 1998, ISBN: 1-55899-429-7
Volume 524— Applications of Synchrotron Radiation Techniques to Materials Science IV, S.M. Mini, S.R. Stock, D.L. Perry, L.J. Terminello, 1998, ISBN: 1-55899-430-0
Volume 525— Rapid Thermal and Integrated Processing VII, M.C. Öztürk, F. Roozeboom, P.J. Timans, S.H. Pas, 1998, ISBN: 1-55899-431-9
Volume 526— Advances in Laser Ablation of Materials, R.K. Singh, D.H. Lowndes, D.B. Chrisey, E. Fogarassy, J. Narayan, 1998, ISBN: 1-55899-432-7
Volume 527— Diffusion Mechanisms in Crystalline Materials, Y. Mishin, G. Vogl, N. Cowern, R. Catlow, D. Farkas, 1998, ISBN: 1-55899-433-5
Volume 528— Mechanisms and Principles of Epitaxial Growth in Metallic Systems, L.T. Wille, C.P. Burmester, K. Terakura, G. Comsa, E.D. Williams, 1998, ISBN: 1-55899-434-3
Volume 529— Computational and Mathematical Models of Microstructural Evolution, J.W. Bullard, L-Q. Chen, R.K. Kalia, A.M. Stoneham, 1998, ISBN: 1-55899-435-1
Volume 530— Biomaterials Regulating Cell Function and Tissue Development, R.C. Thomson, D.J. Mooney, K.E. Healy, Y. Ikada, A.G. Mikos, 1998, ISBN: 1-55899-436-X
Volume 531— Reliability of Photonics Materials and Structures, E. Suhir, M. Fukuda, C.R. Kurkjian, 1998, ISBN: 1-55899-437-8
MATERIALS RESEARCH SOCIETY SYMPOSIUM PROCEEDINGS
Volume 532— Silicon Front-End Technology—Materials Processing and Modelling, N.E.B. Cowern, D.C. Jacobson, F.B. Qriffin, P.A. Packan, R.P. Webb, 1998, ISBN: 1-55899-438-6
Volume 533— Epitaxy and Applications of Si-Based Heterostructures, E.A. Fitzgerald, D.C. Houghton, P.M. Mooney, 1998, ISBN: 1-55899-439-4
Volume 535— III-V and IV-IV Materials and Processing Challenges for Highly Integrated Microelectonics and Optoelectronics, S.A. Ringel, E.A. Fitzgerald, I. Adesida, D. Houghton, 1999, ISBN: 1-55899-441-6
Volume 536— Macrocrystalline and Nanocrystalline Semiconductors—1998, L.T. Canham, M.J. Sailor, K. Tanaka, C-C. Tsai, 1999, ISBN: 1-55899-442-4
Volume 537— QaN and Related Alloys, S.J. Pearton, C. Kuo, T. Uenoyama, A.F. Wright, 1999, ISBN: 1-55899-443-2
Volume 538— Multiscale Modelling of Materials, V.V. Bulatov, T. Diaz de la Rubia, R. Phillips, E. Kaxiras, N. Qhoniem, 1999, ISBN: 1-55899-444-0
Volume 539— Fracture and Ductile vs. Brittle Behavior—Theory, Modelling and Experiment, O.E. Beltz, R.L. Blumberg Selinger, K-S. Kim, M.P. Marder, 1999, ISBN: 1-55899-445-9
Volume 540— Microstructural Processes in Irradiated Materials, S.J. Zinkle, Q. Lucas, R. Ewing, J. Williams, 1999, ISBN: 1-55899-446-7
Volume 541— Ferroelectric Thin Films VII, R.E. Jones, R.W. Schwartz, S. Summerfeit, I.K. Yoo, 1999, ISBN: 1-55899-447-5
Volume 542— Solid Freeform and Additive Fabrication, D. Dimos, S.C. Danforth, M.J. Cima, 1999, ISBN: 1-55899-448-3
Volume 543— Dynamics in Small Confining Systems IV, J.M. Drake, Q.S. Qrest, J. Klafter, R. Kopelman, 1999, ISBN: 1-55899-449-1
Volume 544— Plasma Deposition and Treatment of Polymers, W.W. Lee, R. d'Agostino, M.R. Wertheimer, B.D. Ratner, 1999, ISBN: 1-55899-450-5
Volume 545— Thermoelectric Materials 1998—The Next Generation Materials for Small-Scale Refrigeration and Power Generation Applications, T.M. Tritt, M.G. Kanatzidis, G.D. Mahan, H.B. Lyon, Jr., 1999, ISBN: 1-55899-451-3
Volume 546— Materials Science of Microelectromechanical Systems (MEMS) Devices, A.H. Heuer, S.J. Jacobs, 1999, ISBN: 1-55899-452-1
Volume 547— Solid-State Chemistry of Inorganic Materials II, S.M. Kauzlarich, E.M. McCarron III, A.W. Sleight, H-C. zur Loye, 1999, ISBN: 1-55899-453-X
Volume 548— Solid-State Ionics V, Q-A. Nazri, C. Julien, A. Rougier, 1999, ISBN: 1-55899-454-8
Volume 549— Advanced Catalytic Materials—1998, P.W. Lednor, D.A. Nagaki, L.T. Thompson, 1999, ISBN: 1-55899-455-6
Volume 550— Biomedical Materials—Drug Delivery, Implants and Tissue Engineering, T. Neenan, M. Marcolongo, R.F. Valentini, 1999, ISBN: 1-55899-456-4
Volume 551— Materials in Space—Science, Technology and Exploration, A.F. Hepp, J.M. Prahl, T.G. Keith, S.G. Bailey, J.R. Fowler, 1999, ISBN: 1-55899-457-2
Volume 552— High-Temperature Ordered Intermetallic Alloys VIII, E.P. George, M. Yamaguchi, M.J. Mills, 1999, ISBN: 1-55899-458-0
Volume 553— Quasicrystals, J-M. Dubois, P.A. Thiel, A-P. Tsai, K. Urban, 1999, ISBN: 1-55899-459-9
Volume 554— Bulk Metallic Glasses, W.L. Johnson, C.T. Liu, A. Inoue, 1999, ISBN: 1-55899-460-2
Volume 555— Properties and Processing of Vapor-Deposited Coatings, M. Pickering, B.W. Sheldon, W.Y. Lee, R.N. Johnson, 1999, ISBN: 1-55899-461-0
Volume 556— Scientific Basis for Nuclear Waste Management XXII, D.J. Wronkiewicz, J.H. Lee, 1999, ISBN: 1-55899-462-9
Prior Materials Research Society Symposium Proceedings available by contacting Materials Research Society
Part I
Ductile vs. Brittle Behavior of Steels and Structural Metallic Alloys

SCANNING FORCE MICROSCOPY AS A TOOL FOR FRACTURE STUDIES
F. Thome, M. Göken, M. Große Gehling, H. Vehoff Institute of Materials Science and Methods, Universität des Saarlandes, FB 15 Materials Science and Process Technology, Mail box 15 11 50, 66041 Saarbrücken, Germany
ABSTRACT
Dynamic simulations of the fracture toughness as a function of the orientation and tem- perature were carried out and compared with experimental results obtained by in-situ loading pre-cracked NiAl single crystals inside a scanning force microscope (SFM). In order to compare the simulations with the experiments the problem of the short crack with dislocations was solved for general loading and arbitrary slip line directions. The stress and strain field obtained could be directly connected to FEM calculations which allowed the examination of the stability of micro cracks at notches. The effect of different fracture conditions for biaxial loading were studied in detail.
The dynamic simulation yielded predictions of Kic, slip line length and dislocation distri- butions as a function of loading rate, temperature and orientation. These predictions were tested by in-situ loading NiAl single crystals inside a SFM at various temperatures. The local COD, slip line length and apparent dislocation distribution at the surface were measured as a function of the applied load and the temperature. The experiments clearly demonstrated that dislocations emit from the crack tip before unstable crack jumps occur. The local COD could be directly related to the number of dislocations emitted from the crack tip. With increasing temperature the number of dislocations and the local COD increased before unstable crack jumps or final fracture oc- curred.
INTRODUCTION
Fracture processes in complicated alloys are influenced by the material properties at differ- ent size scales. To establish the boundary condition for a fracture problem constitutive equations combined with FEM calculations are needed. This is the macroscopic size scale. However, in order to understand the influence of microstructure on crack nucleation and growth the local stresses which result from the incompatibility stresses of grains and grain boundaries must be known. These stresses act on dislocations which either nucleate cracks (by piling up at inter- faces) or blunt and shield cracks from the applied load, this nowadays is called the mesoscopic scale. Last but not least the local fracture stress as well as the interactions and reactions between dislocations must be understood in order to predict the behavior of different materials, this is the microscopic scale. This paper addresses experimentally as well as theoretically open questions connected with the meso-macro connection. Special experiments are described from which quantitative data of the deformation processes at a crack tip can be obtained at the mesoscopic scale.
The detailed processes at crack tips in quasi brittle materials are still an open issue. There- fore we designed an experiment that gives us the quantitative data directly which are needed in mesoscopic dislocation models.
In the first part the model which lead us to the experiments is briefly described. Based on the simple concept of a dynamically loaded crack shielded by the emission of dislocations [1] we will consider a microcrack embedded in an elastic-plastic stress field near a notch. The second part will focus on the experimental set up and on the results in detail.
3
Mat. Res. Soc. Symp. Proc. Vol. 539 ° 1999 Materials Research Society

In principle we have to measure the dislocation distribution at a crack tip as a function of the applied load, loading rate and temperature and this quantitatively. This seems to be ambi- tious, however, a scanning force microscope (SFM) allows to measure deformations, at least perpendicular to surfaces, extremely precise. Therefore a special tensile stage for in situ loading at various temperatures was designed which fits under a SFM.
But not only the instrument, the specimens as well have to fulfil several conditions: a) they must have a brittle to ductile transition near room temperature since the scanner of a SFM oper- ates only in a limited temperature range and b) it must be possible to relate the deformations measured at the surface to the deformation in the center of the specimen. For this, single crystals with special orientations are needed.
For the tests, NiAl single crystals were used with Burgers vectors parallel to the surface in order to ensure plane deformation. To connect internal properties with the properties measured on the surface, fracture toughness tests with large and small specimens were conducted. The re- sults were compared with the predictions obtained from the measured elastic deformation field at the crack tip, the local COD and the displacement field within the slip bands at the crack tip. The last three can only be obtained with an SFM combined with an in situ loading device.
THE MESO-MACRO CONNECTION
In order to study the behavior of small cracks in polycrystalline specimens computer simulations of the dynamic crack-tip shielding process were combined with a Finite Element Analysis. The simulation of the stability of a crack which emits dislocations is based in principle on the mesoscopic model of Hirsch et al. [1]. However, instead of a semi-infinite crack loaded in mode III, a crack of finite length loaded in mode I and in mixed mode I/II is considered here. The tractions acting on the crack are obtained from the macroscopic FEM-model by a procedure fully described elsewhere [2]. The idea of the new model is sketched in Fig. 1.
t- t- t_ t t t
Ur/~ / '- /
2a \ J
1 -1
(a) (b)
4. i * 4. 1 4.
(c)
r-,
*-* *-. t--,
Fig. 1: Meso-macro connection, a)specimen, b) enlarged FEM net, c) boundary stresses for the simulation
A macroscopic specimen (a) is supposed to contain small cracks. Because of the three- axial stress state the notch area is of primary concern (b). Assuming a microstructure within one finite element (Fig. lc), a crack of length 2a is generally loaded in mixed mode (c). The stability of this micro crack can be calculated using the mesoscopic simulation model [3] with the local boundary conditions. The external load is increased linearly with a constant rate. For each load- ing step the boundary conditions for the mesoscopic model were obtained from the elastic-plastic

FEM model. The elastic plastic model can be considered as a first approximation to incorporate work hardening into the mesoscopic model.
Instead of the well known equations for the semi-infinite crack [4] we therefore need the far field solution of the finite crack which is loaded with a constant rate and with dislocations on slip planes which are not symmetrical to the crack tip. The far field solution is needed in order to use the boundary tractions from the FE element chosen for the micro crack location [5].
The stress fields of the loaded crack and the surrounding dislocations can be obtained by applying the technique of Muskhelishvili [6]. The procedure for evaluating a crack of finite length with arbitrary orientation and loading conditions is briefly described below. The model and results obtained by this model are given in detail elsewhere [2]. Solving the following sys- tem of equations individually for the loaded crack without dislocations and for the crack with dislocations but without external load, respectively, yields the complete stress field by superpo- sition.
c11+o12=2[q>,(z)-|V(zj]> (1)
CT22-iCT12=(p,(z) + co,(z) + (z-z)9"(z), (2)
2uu = K(p(z)-(z-z)(p,(z)-cö(z), (3)
co(z) = z(p'(z)+V(z). (4) u = ui +iu2 (5)
[3-4v, O-33=V(<TU+O-22), (EDZ)
For constant applied loads CT,'f p^ ,<*& the analytic function <p'(z) is given by Rice [7]. From this co'(z) and the stresses can be obtained in a straightforward manner. To obtain the com-
plete stress field the applied loads off .«Ji'f >CT22f must De added afterwards. For a linearly increasing load used in the simulation cp'(z) can De calculated in an analo-
gous manner:
^.-(«f-to&rp/^5-.» 2n4z2-a2 J '-*
7 (7) ^- (°22 - to^) p(VV-f2),
„2 J t- 2n4, '-dt
The nonanalytic function oc>'(z) and the stresses are than obtained easily. Dislocations exert stresses on the crack, too. The procedure to derive dislocation stress
fields is slightly different and analogous to the method described by Lin and Thomson [4]. The complete stress field is again given by the complex functions
q>'=q>o' + <Pi'. (8) a' =<Do' + <Bi', (9)
with <po'(z) and ö>o'(z) given in [4] and (p'i is given below,

<Pi'(z) = 2Wz Vz
{ac2k4j~? ) 2A Va^ J t-C t-z + Jt -; t-z
dt
+ "jzZKzSA^^Zdtl -a (t-;r t-z
(10)
with Aj = • Hb 2ni(K + 1)
and «i' can be calculated easily. This set of equations was used to calculate the momentary stress field on a microcrack in front of a notch. The load was taken from the stress at the FEM element which contains the micro crack. The algebraic sums obtained for the stresses and forces are complicated and handled by an algebraic program like mathematica [5, 2].
From the resulting stress field the various interaction forces between crack and dislocations can now be calculated for different crack and slip plane orientations applying the Peach-Koehler equation. The results of dynamic simulations depend strongly on the assumptions used for the emission criterion, the velocity law and the dislocation interactions considered. This is discussed elsewhere [8]. Here, as an example, only the effect of the loading mode is shown (Fig. 2).
El
• criterion I ■ criterion II •
m •
•
■
* • , «—,
2 3
K, [MPam1'2]
Fig. 2: Dynamic simulation of Kic as a function of the Kn/Ki-ratio
Ki and Kn represent the applied load that cause a mode I crack-tip field and a mode II crack-tip field, respectively. For a crack length of 100 |im and a temperature of 500 K the influ- ence of increasing Kn ratio is investigated. In this case the fracture criterion can be given either from macroscopic energy considerations at notches by
(ki,i„cai)2 + (kn,iocai)2 = kGr
2 (criterion II) (11) or by kijocai = kGr ( criterion I) where the second criterion seems to be more reasonable for
a micro crack. With increasing Kn-loading, the crack behaves either more and more ductile as expected
from experiments on single crystals or more brittle if a process zone is considered. This is not trivial because in a dynamic model not only the normal stress decreases but, in parallel, the stress on the dislocations increases and causes shielding as well as higher dislocation velocities. Hence

for the same external loading conditions a micro crack can behave either ductile or brittle de- pending where the crack initiates in the micro structure of the notch.
However, as mentioned above, the results of the simulation depend strongly on the as- sumptions. Therefore experiments, which yield information of the local dislocation distribution at the crack tip as a function of the orientation and applied loading conditions are needed. First results obtained on single crystals loaded in four point bending are given below for uniaxial loading. But the bending device can easily be modified for biaxial loading.
EXPERIMENT
Specimens Large NiAl single crystals were grown by the Bridgman technique. From the crystal plates
4-point-bend specimens were cut with dimensions of roughly 3x2x15 mm3 and 3x2x25 mm3
(Fig. 3). Two orientations were examined: the soft orientation with a <110> loading axis and the hard orientation with a <100> loading axis given in detail in Fig. 4. The surface was mechani- cally polished with diamond paste of V* um grain size which produced the fine markings on the surface used for the slip offset evaluation.
Sharp cracks were initiated either by a razor blade pressed under load into the bottom of the notch (soft orientation) or by cyclic loading in compression-compression fatigue [9].
13,5 mm
~^7l
3 mm
7 / A
2 mm
3 mm
A i ,«» &■
4 inoi
z\ ,<*
-13 mm-
jlOO} &<. 110»
-e-illOl <1 oo>
Fig. 3: 4-point-bending specimen for the AFM Fig. 4: Specimen orientation
Tensile Machine Important design criteria for the loading device are: the loading device must fit under an
SFM, the construction must be rigid and compact in order to allow the examination of quasi sta- ble crack growth. A photograph of the loading device is given in Fig. 5. The load must be con- trolled exactly to avoid discontinuities. Displacement and load must be continuously monitored in order to compare the external data with the microscopic data.
For loading a piezo stack (black cylinder in Fig. 5) with a maximum elongation of 39,5 um and a loading range of up to 200 N is used. The piezo stack is controlled by a DMS bridge to correct for hysteresis effects (especially for the loading at higher temperatures). The load and strain are measured with a calibrated bar.
The four point bending rig is designed for point loading to avoid moments from imprecise machined specimens. The specimen can be moved in the x-y-direction to position the crack tip within the scanning range of the piezo scanner.

^iiiijr -j
hm^M.'i. "r*\
Fig. 5: Loading device constructed by us for in-situ testing in a SFM
SFM
For in-situ loading a SFM with scanning tip design is needed allowing for arbitrary speci- men sizes. The nanoscope II used has a scanning range of 100 urn with a vertical resolution of better than 1/10 nm and a lateral resolution of approximately 1 nm (depending on the tip radii). To suppress the mechanical vibrations the loading device and the SFM are damped by a spring suspension system.
Heating system
For the tests at higher temperatures longer specimens are used to fix a resistance heater to the ends. The main problem for measuring at higher temperatures is the drift of the piezo system hence of the loading and of the scanning device. The drift of the loading piezos is controlled by strain gages, the drift of the scanner by calibration at every temperature. This limits the tem- perature to 400 K.
EXPERIMENTAL RESULTS
"Soft Orientation"
Fig. 6 shows a typical mode I crack under load. The crack propagated in micro pop-ins. But before every pop-in blunting by dislocation emission was observed. For the small specimens used the crack front was <100>,and the crack plane {110}, hence <100>{100}-slip can be as- sumed.
12 3 4 5
distance from the crack tip [nm]
Fig. 6: Crack tip of the soft orientation Fig. 7: Offset of the polishing traces

The two slip planes emanating from the former crack tip are clearly visible. The Burgers vector lies in the surface since nearly no deformation perpendicular to the surface could be de- tected. The surface displacement could be only measured from the slip offset of the polishing traces. From these offsets the dislocation distribution near the crack tip can be estimated. Sur- prisingly a constant offset of approximately 150 nm was measured up to 4 um from the crack tip shown in Fig. 7. This offset remained even after unloading. The offset corresponded directly to the measured COD, hence a dislocation free zone of the principal dislocations (the dislocations responsible for the COD) must be assumed at the surface. For the example given approximately 520 dislocations were emitted before a pop in occurred.
Hard Orientation For the hard orientation the deformation at the surface is much more complicated, since
several slip planes were activated with displacements perpendicular to the surface. A typical crack tip is shown in Fig. 8. However, in contrast to other techniques the SFM is extremely sen- sitive to deformations in the z-direction which can be measured easily.
11.7 N
f 50-
3 40- S
\% DFZ
» 30-
|20- • \
heig
ht
o
o
0 2 4 6 8 10 12
distance from the crack tip Fjjm]
Fig. 8: Slip lines at a crack tip (hard orienta- tion)
Fig. 9: Slip step height distribution as a func- tion of the distance of the crack tip.
The number of slip bands activated increased with rising load. Again a zone of constant offset was observed (Fig. 9). However, the deformation at the crack tip had also in plane compo- nents. Therefore the number and type of dislocations responsible for the COD could not be esti- mated from the deformation field.
Soft Orientation (400 IP In order to measure the effect of temperature on the deformation at the crack tip, the
specimens were heated inside the SFM up to 400 K and continuously deformed. Fig. 10 shows a low magnification of a crack tip for two different temperatures, taken at approximately the same COD.

Fig. 11 shows the corresponding higher magnification. At room temperature again unstable crack growth was observed, at 400 K however, the specimens deformed heavily before final fracture was observed.
Fig. 11: Higher magnification of Fig. 10 The slip band length increased from 20-40 um to approximately 90 urn, the local COD in-
creased as well as Kic. For the small specimens used in the SFM, the BDT lay 200 K below the temperature measured with large specimens. But again unstable crack growth was observed after excessive blunting. However, it must be kept in mind that the local COD's are in the range of nanometers.
DISCUSSION
The brittle to ductile transition of metals has a long standing discussion in the literature. Theoretically, it was assumed that a material can be either ductile or brittle. Emission of disloca- tions before fracture was the critical event. But the ideas of Thomson [10] and Weertman [11], that dislocations can shield a crack from the applied load brought further progress. Roberts and Hirsch [1] following ideas of St. John [12] combined the picture of dislocation emission with dislocations which moved in the field of the crack. From their model evolved a model which for
10

the first time gave a physical picture of the BDT. However, the model is based on many simplifi- cations and assumptions. Particularly, only a small number of dislocations is needed to shield the crack resulting in much smaller plastic zones as measured experimentally.
Therefore we used the SFM to compare the theoretical predictions with experimental re- sults. The model used is two-dimensional. A direct quantitative prediction cannot be expected. Therefore the effects of loading rate, loading mode, temperature, orientation and interfaces were examined theoretically and compared with the experimental data. Qualitative agreement between experiment and model was found to be excellent. The BDT of NiAl could be simulated and the influence of the specimen orientation and of interfaces [8] on the BDT were predicted correctly [13].
However, the model predicts slip line lengths and dislocation distributions which result in unstable fracture as a function of temperature. These predictions can be proven directly with the SFM, at least at the surface for suitably oriented specimens (plane strain deformation). For the measured Kic-values, the slip lines were a factor often longer than predicted by the model. On the other hand, the simulation predicts larger Kic-values with increasing shear stresses and slip band length when fracture criterion I is used (Fig. 2). This corresponds directly to the measure- ments. Hence, for micro cracks and cracks in single crystals, criterion I is more appropriate.
In the simulation, the dislocation free zone depends on the emission criterion used, but it was an order of magnitude smaller than the experimental values given in Figures 7 and 9 for all emission criteria tested. The pictures taken in the SFM are equilibrium pictures since it takes several seconds to obtain a picture. In addition, the COD did not change when the crack was un- loaded. In the simulation, however, it is difficult to reach an equilibrium because for high rates very small time steps are needed and dislocations move backwards when the crack is unloaded in the computer. In an analytic calculation, the dislocation free zone and the dislocation distribution cannot be obtained independently [14]. For a given Kic and a given dislocation free zone a corre- sponding dislocation density distribution can always be found. Since all three variables can be measured with the SFM it can be used to test appropriate equilibrium calculations. Measure- ments and calculations of this kind are under way. In addition, the surface preparation must be improved to obtain a better resolution and more data at different stresses, rates and temperatures are needed for detailed comparisons.
SUMMARY AND CONCLUSIONS
Dynamic simulations of the fracture toughness as a function of the orientation and tem- perature were carried out and compared with experimental results obtained by in-situ loading pre-cracked NiAl single crystals inside a SFM.
Since in general, a micro crack in a structure is loaded by biaxial stresses and the orienta- tion of a grain which contains a micro crack varies from grain to grain, the problem of the short crack with dislocations was solved for general loading and arbitrary slip line directions. The stress and strain field obtained could be directly connected to FEM calculations which allowed the examination of the stability of micro cracks at notches. The effect of different fracture condi- tions for biaxial loading were studied in detail.
The dynamic simulation yields predictions of Kic, slip line length and dislocation distribu- tions as a function of loading rate, temperature and orientation. These predictions were tested by in-situ loading experiments inside a SFM. The local COD, slip line length and apparent disloca- tion distribution at the surface were measured as a function of the applied load and the tempera- ture. The experiments clearly demonstrate that dislocations emit from the crack tip before unstable crack jumps occur. The local COD could be directly related to the number of disloca- tions emitted from the crack tip. With increasing temperature the number of dislocations and the local COD increased before unstable crack jumps or final fracture occurred.

These findings are in excellent agreement with the theoretical predictions. However, even if the temperature dependence of Kic is predicted quite well, the prediction of the dislocation distribution and the slip line length is much worse. This is not surprising since the model is two dimensional and neither blunting nor the exact velocity law is incorporated in the model.
ACKNOWLEDGEMENTS
The financial support by the DFG and by the VW foundation is greatly acknowledged.
REFERENCES 1. P.B. Hirsch, S.G. Roberts, Phil. Mag. A, 64, 55, (1991) 2. M. Große Gehling, H. Vehoff, The behavior of microcracks in NiAl polycrystals, to be pub-
lished in Mat. Sei. & Eng., A, 3. P. Ochmann, H. Vehoff, Mat. Sei. & Eng., A 192, 364 (1995) 4.1.H. Lin, R. Thomson, Acta Metall., 34, No. 2, 187, (1986) 5. M. Große Gehling, Ph.D. thesis, Universität des Saarlandes, (1999) 6. N.I. Muskhelishvili, Some basic problems in the mathematical theory of elasticity, Noordhoff,
Groningen, Holland 7. J. Rice, mFracture, II 3, (ed. by H. Liebowitz), Academic Press, New York, 191, (1968) 8. H. Vehoff, P. Ochmann, M. Göken, M. Große Gehling, Mat. Sei. & Eng., A 239-249, 378,
(1997) 9 G. Bergmann, H. Vehoff, Scr. Metall. Mater. 30, 969, (1994) 10 R. Thomson, in Physical Metallurgy III (eds. R.W. Cahn, P. Haasen), North Holland 1996,
2207 11 J. Weertmann, Acta Met. 26, 1731, (1978) 12 C. St. John, Phil. Mag. A, 1193, (1975) 13 M. Göken, M., Maßmann, F. Thome, and H. Vehoff, H., Structural Intermetallics 1997, 641-
648, Eds. M. V. Nathal et al., The Minerals, Metals & Material Society (1997) 14 S.-J. Chang, S.M. Ohr, J. Appl. Phys., 52, 7174, (1981)
12

THE CHARGE REDISTRIBUTON ACCOMPANYING SLIP AND CLEAVAGE:
ELECTRONIC STRUCTURE CALCULATIONS IN ALLOY DESIGN
M.E. EBERHART*, C. WOODWARD**, AND A.F. GIAMElt *Department of Chemistry and Geochemistry, Colorado School of Mines, Golden, Co 80401, [email protected]; "Materials Research Division, UES Inc., Dayton, OH 45432; tUnited Technologies Research Center, East Hartford, CT 06108
ABSTRACT
Extracting full information from electronic structure calculations requires the ability to compare differences in bonding between two molecules or solids. Often these comparisons use qualitative models of the chemical bond in an unsuccessful attempt to account for subtle variations in molecular properties. Correlating electronic structure with properties requires an unambiguous and quantifiable description of the chemical bond. Here, we show that such a description is contained within the geometric properties of the charge density, which can be obtained from quantum mechanical calculations. This description is used to rationalize the previously unexplained variation in the mechanical properties of a scries of ordered intermetallic alloys. The ease with which this description of chemical bonding can be applied to problems, which have defied simple bonding explanations, suggests that it may be useful in accounting for the properties of any molecular system which arise from the making, breaking, or rearrangement of bonds.
INTRODUCTION
As part of an attempt to accelerate the pace at which new metallic alloys are developed, increasing attention has been directed toward providing a more fundamental understanding of the mechanisms responsible for brittle versus ductile fracture1-9. While both of these processes are forms of materials failure, they are distinguished by the scale of slip, or plastic deformation, observed before fracture. Fracture, without prior deformation, is termed brittle, while fracture following deformation is termed ductile. The consequences of ductile failure are often less catastrophic than those of brittle failure, accounting for the strong preference to design structural components with ductile materials. Despite this preference, there is no existing framework that allows the alloy designer to systematically alter, through alloy chemistry, the failure mechanism of a brittle material. Because the introduction of improved alloys is, in part, dependent on such a framework, many aspects of alloy design still proceed solely through empiricism, slowing the development of new
13 Mat. Res. Soc. Symp. Proc. Vol. 539 e 1999 Materials Research Society

technologies dependent on metallic materials. Substituting theory for empiricism requires a new, more versatile, description of the chemical bond.
A case in point is provided by the transition metal aluminides with the B2 structure. Of these, NiAl is of greatest interest as a potential high temperature material. However, because it is characterized by brittle failure mechanisms, this alloy has yet to realize this potential. In an effort to understand and then augment the failure properties of NiAl, theorists have first sought an explanation for the variations in the mechanical properties of neighboring aluminides, in particular, FeAl and CoAl. These alloys have different me- chanical behaviors: FeAl is more ductile than NiAl, which is more ductile than CoAl. This variation is thought to be controlled by the potential surface at the tip of an atomically sharp crack. For a few points on this surface, quantum mechanics permits one to calculate the corresponding potential. Using these techniques researchers have investigated the vari- ation in failure modes of these alloys. For the most part, the results of these calculations are rationalized in terms of features of the bonding of the bulk crystal as inferred from the charge density7-9. While a great deal can be learned through the study of alloy charge den- sity, these studies remain qualitative and subject to multiple interpretations. For example, using full-potential linear-APW methods Hong and Freeman7 suggested that directional bonding is responsible for the brittle; fracture of NiAl. While, using the same method, Fu8 concluded that the brittle behavior of NiAl was due to reduced directional bonding. Such conflicting results motivated the systematic theoretical investigation of Schultz and Davenport , where the bonding of FeAl, CoAl, and NiAl were compared. Schultz et al. used a full potential LASTO approach to compare charge densities through this series. It was reasoned that because the transition between ductile and brittle behavior occurs most dramatically between FeAl and CoAl, there should also be a corresponding change in the character of the charge density between these two alloys. However, Schultz et al. concluded that there was no discernible difference in the bonding, which could account for the trends in mechanical properties. The bonding of CoAl was judged to be intermediate to that of FeAl and NiAl.
In much of the current theoretical work, the character of the bonding is gauged in terms of qualitative and semi-quantitative features of the charge density of the bulk crystal. However, flow and fracture arc dynamic properties, reflecting the character and evolution of crystal bonding as a function of strain. Attempts to correlate the static, crystalline bonding with deformation and fracture properties do not capture the relevant details of bond evolution. For example, thcrmodynamic rationale accounting for the competition between slip and fracture are based on energy differences of atomic configurations along the deformation path 10. Similarly, to describe the electronic origins of fracture and slip a dynamic description of the bonding as it evolves through the deformation or fracture is
14

required.
In what follows wc briefly review a quantifiable description of the bonding based on the total self-consistent charge density. This description is used to compare the evolution of the bonding accompanying slip and fracture through the series FeAl, CoAl, and NiAl. It will be shown that this description provides for a consistent explanation for the observed variations in the mechanical behaviors of these alloys.
BONDS AND BOND BREAKING
Structure in the Charge Density
Our model of bonding builds on that of Bader11-16, which in turn, draws part of its validity from Morse theory , allowing for the assignment of a topology to every scalar field. As the charge density, p{f), is a scalar field, it must have a topology. By incorporating the topology of the initial and final lattice structures, this model provides rules as to which pathways are available for plastic deformation and the flow of charge expected along that path.
The topology of a scalar field is determined by the position and type of its critical points, which arc the zeroes of the gradient of this scalar field. Following Bader, there are four kinds of critical points in a three dimensional space: a local minimum, a local maximum, and two kinds of saddle points. These critical points (cps) are denoted by an index which is the number of positive curvatures minus the number of negative curvatures; for example, a minimum cp has positive curvature in the three orthogonal directions, therefore it is called a (3, 3) cp, where the first number is simply the number of dimensions of the space, and the second number is the net number of positive curvatures. A maximum would be denoted by (3, -3), since all three curvatures are negative. A saddle point with two of the three curvatures negative is denoted (3, -1), while the other saddle point is a (3, 1) cp.
For every scalar field, one can construct a system of space filling polyhedra such that there is a homeomorphism between the critical points of this field and the corners, edges, and faces of the packed polyhedra. Under this homeomorphism (3, -3) cps are mapped one- to-one onto polyhedral corners, the path connecting two (3, -3) cps which is a maximum with respect to every neighboring path must pass through a (3, -1) cp and maps one-to- one onto polyhedral edges, the smallest ring of such paths originating and returning to the same (3, -3) cp must necessarily define a surface which contains a (3, 1) cp. These critical points map one-to-one onto polyhedral faces. Finally, the smallest volumes which can be constructed from the union of the (3, 1) defined surfaces must contain a (3, 3) cp.
15

These can be placed in one-to-one correspondence with the polyhedra filling space. The scalar field and the system of packed polyhedra arc topologically equivalent under this homeomorphisrn.
Bader proposed that the topology of p(r), describes much of what is considered chem- ical structure and bonding. The corners of the packed polyhedra arc the locations of atoms. The bonds between these atoms correspond to the edges of the polyhedra. The "bond path" then becomes the ridge of maximum charge density connecting two nuclei and passing through a (3, -1) cp. Because a (3, -1) cp is both a necessary and sufficient condition for the existence of a bond path, this critical point is sometimes referred to as a bond critical point. Other types of critical points must correlate with other features of molecular structure. A (3, 1) cp is required at the center of ring structures like benzene. Accordingly, this critical point has been designated as a ring critical point. Cage structures are always characterized by a single (3, 3) cp somewhere within the cage and again have been given the descriptive name of cage critical points. Finally, maxima in the charge density, (3,-3) cps, are known as atom or pseudo-atom critical points
Both fracture and deformation are processes that involve the breaking of bonds, and hence, changes in topology; as such, the model of Bader is ideally suited to describe the changes accompanying these processes. For example, fracture must be accompanied by a topological change including the disappearance of polyhedral edges and the appearance of ring cps. We recognize this process as bond breaking and surface formation. In terms of the charge density, it must be associated with the disappearance of (3, -1) cps. However, topology only constrains the type of transformation allowed, it says nothing about how susceptible a particular bond is to breaking, i.e. how near a (3, -1) cp is to instability. This can only be ascertained by providing a metric which measures the "distance" between two
charge densities.
Quantifying the Charge Redistribution
We have constructed such a metric which is discussed in detail elsewhere18-20. Briefly, the magnitude of the charge density at a cage critical point must be less than that at a ring cp of this cage. In turn, the charge density at this ring cp must be less than that at a bond cp of this ring, which must be less than that at an atom or pseudo atom cp at the ends of the bond path. Hence, a topological transformation, which must involve changes in the character of critical points, will be accompanied by a predictable redistribution of charge, with some critical points gaining charge density and some losing density. The charge density metric allows one to estimate the distance between two charge densities by providing information regarding the amount of charge that must be lost or gained in order
16

to change the character of a critical point. This distance then is related to the magnitude of the perturbation necessary to produce the specified change in the charge density.
The distance between two charge densities is given in terms of the quantities that determine the geometric properties of the charge density in the neighborhood of a critical point. Note that the character of a critical point is determined only by the real space curvatures of the charge density at the critical point. This is written as the Hessian of the
charge density, Ti^pif) = ^ pi'/ . This tensor has the same transformation properties as the coefficients of a quadratic polynomial, often referred to as the representation quadric. When expressed in a diagonal basis, the representation quadrics can be described by the equation
P\\A. + P22x\ + P33Z3 = * C1)
where x\, xi and .T3 are the eigenvectors and p\\, pii-, and P33 arc the curvatures of the charge density in these directions; these are the eigenvalues or principal curvatures of the charge density.
The type of critical point described by equation (1) is determined only by the signs of the principal curvatures. At a cage critical point, for example, all of the eigenvalues of Hijp(r) are positive. Therefore, its quadric corresponds to an ellipsoid. The quadric of a ring critical point (two positive and one negative eigenvalue) is an hypcrboloid of one sheet with the axis of the hyperboloid normal to the ring. The quadric of a bond critical point corresponds to an hyperboloid of two sheets. Here the axis of the quadric is parallel to the bond path. Finally the representation quadric for a maximum, a (3, 3) cp (an atom or pseudo-atom), corresponds to a negative ellipsoid, which has the same geometric properties as an ellipsoid.
The shape of the quadric can be specified to within a scale factor by the ratios of the principal curvatures. Therefore, a function of these ratios can serve as a charge density metric. We have found that the charge density at a critical point times the square root of the ratio of the appropriate principal curvatures correlates well with the amount of charge redistribution required to produce a specified change in the character of a critical point.18 An intuitive understanding as to why this particular function should correlate with charge redistribution is seen in its geometrical significance. At a bond critical point, the square root of the ratio of one of the eigenvalues perpendicular to the bond path, to the eigenvalue parallel to the bond path, is the tangent of the angle between the perpendicular eigenvector and the asymptotic surface (an elliptic cone) which bounds the representation quadric (Figure 1). The directions of zero curvature through the critical point lie in this cone. As charge is removed from this critical point, the cone becomes more obtuse, finally becoming a disk when the perpendicular eigenvalues vanish. The perpendicular eigenvector
17

is then contained in the cone of zero curvature. Thus, the inherent stability of a bond can be visualized in terms of the angles between the directions of principal curvature and asymptotic elliptic cone defining the directions of zero curvature. Likewise, the stability of other critical points is related to the angles which define the shape of the corresponding
representation quadric .
Slip Versus Fracture in the B2 Aluminides
With a knowledge of the crystalline charge density and a way to access the distance between two densities, it becomes possible to compare the amount of charge redistribution associated with deformation or fracture for different alloys with the same topology. Us- ing a full potential Linear Augmented Slater-type Orbital (LASTO) electronic structure code,21,22 the charge density of B2 FeAl, CoAl, and NiAl have been determined. The B2 structure is a simple cubic structure with basis atoms at the origin and at the body center. In this paper, we will consider the transition metal as being located at the origin (cube corners) and the aluminum atom as being located at the body center. All of these aluminides share the same topology, with bond critical points located between each pair of first neighbor aluminum-transition metal atoms, not surprisingly indicating that these atoms are bound. However, there arc also bond critical points centered on the cube edges, indicative of second neighbor transition metal-transition metal bonds. In the center of each cube face, the charge density achieves a minimum, giving rise to cage critical points at these locations. The cage critical points characterize the polyhedra whose corners are represented by four transition metal atoms and two aluminum atoms. There are of course ring critical points in each of the eight faces of these polyhedra.
Figure 1 shows the bonding polyhedra, which characterize all of the aluminides dis- cussed in this paper. Additionally, the representation quadrics of the aluminum-transition metal bond, and the cage critical point arc shown with the angles needed to compare the charge redistribution of the three aluminides designated. Wc will consider the evolution of the charge density accompanying (111) slip in an attempt to account for: i) the extreme brittle behavior of CoAl, ii) the existence of (111) slip in FeAl and its absence in CoAl and
NiAl, and iii) the (110) cleavage plane of CoAl.
It has been argued10 that slip, to good approximation, can be modeled by the rigid displacement of one semi-infinite crystal relative to another. This process is shown schemat- ically in Figure 2. During (111) slip the (110) slab containing the atoms designated 3, 4, and a will shift along (111) directions relative to the plane containing atoms 1, 2, and ß, so in Figure 2, the upper slab moves rigidly with respect to the lower slab such that atom a moves to the position of atom 4 creating an antiphase boundary (APB). During (111)
18

Figure 1. The bonding polyhedral for the B2 aluminides with aluminum atoms at the apex of the polyhedron and the transition metal atoms sitting in the equitorial plane. Also shown are the representation quadrics of the cage critical point as well as the bond critical points between aluminum and transition metal atoms. The disappearance of the angles marked will result in various kinds of topological instabilities discussed in the text.
•-/ v\
Figure 2. The designations given to the atoms, helping to explain the bond breaking and formation which will occur during <111> slip. Only first neighbor bonds across the slip plane for one bonding polyhedra are shown. A) The bonding of the perfect crystal. B) The bonding as the slip proceeds with the aluminum-to-transition-metal bonds shown as breaking as the aluminum-to aluminum bond forms. C) The bonding across the slip plane for the APB. The formation of the bond between the aluminum atoms will act to lower the Peierls energy.
19
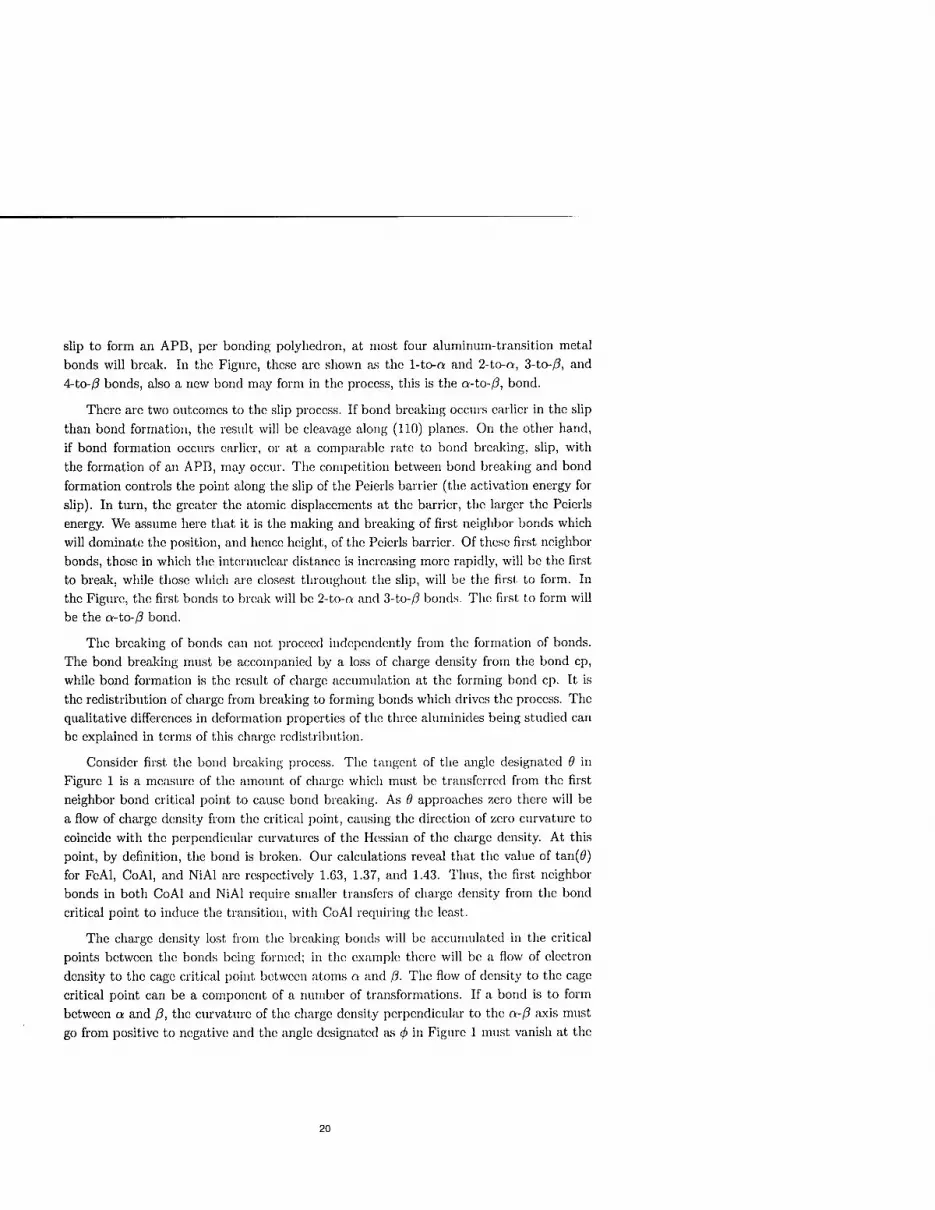
slip to form an APB, per bonding polyhedron, at most four aluminum-transition metal bonds will break. In the Figure, these arc shown as the 1-to-a and 2-to-a, 3-to-/?, and 4-to-/? bonds, also a new bond may form in the process, this is the a-to-ß, bond.
There arc two outcomes to the slip process. If bond breaking occurs earlier in the slip than bond formation, the result will be cleavage along (110) planes. On the other hand, if bond formation occurs earlier, or at a comparable rate to bond breaking, slip, with the formation of an APB, may occur. The competition between bond breaking and bond formation controls the point along the slip of the Peierls barrier (the activation energy for slip). In turn, the greater the atomic displacements at the barrier, the larger the Peierls energy. We assume here that it is the making and breaking of first neighbor bonds which will dominate the position, and hence height, of the Peierls barrier. Of these first neighbor bonds, those in which the internuclcar distance is increasing more rapidly, will be the first to break, while those which are closest throughout the slip, will be the first to form. In the Figure, the first bonds to break will be 2-to-a and 3-to-/? bonds. The first to form will be the a-to-/? bond.
The breaking of bonds can not proceed independently from the formation of bonds. The bond breaking must be accompanied by a loss of charge density from the bond cp, while bond formation is the result of charge accumulation at the forming bond cp. It is the redistribution of charge from breaking to forming bonds which drives the process. The qualitative differences in deformation properties of the three aluminides being studied can be explained in terms of this charge redistribution.
Consider first the bond breaking process. The tangent of the angle designated 9 in Figure 1 is a measure of the amount of charge which must be transferred from the first neighbor bond critical point to cause bond breaking. As 6 approaches zero there will be a flow of charge density from the critical point, causing the direction of zero curvature to coincide with the perpendicular curvatures of the Hessian of the charge density. At this point, by definition, the bond is broken. Our calculations reveal that the value of tan(ö) for FcAl, CoAl, and NiAl are respectively 1.63, 1.37, and 1.43. Thus, the first neighbor bonds in both CoAl and NiAl require smaller transfers of charge density from the bond critical point to induce the transition, with CoAl requiring the least.
The charge density lost from the breaking bonds will be accumulated in the critical points between the bonds being formed; in the example there will be a flow of electron density to the cage critical point between atoms a and ß. The flow of density to the cage critical point can be a component of a number of transformations. If a bond is to form between a and /?, the curvature of the charge density perpendicular to the a-ß axis must go from positive to negative and the angle designated as 4> in Figure 1 must vanish at the
20

transition point. On the other hand, a topological transition will result if the curvature along the a-ß axis, vanishes resulting in a ring cp. In this case, the angle designated ip in Figure 1 will vanish. The loss of a cage critical point without the formation of a bond is topological allowed through the formation of a free surface, i.e. fracture. The values of tan(</>) for FeAl, CoAl, and NiAl are respectively 0.50, 0.68, and 0.51. While the values of tan(V>) for FeAl, CoAl, and NiAl are respectively 1.97, 1.47 and 1.96.
It can be seen that FeAl and CoAl are extremes in terms of the charge redistribution necessary to induce topological transformations. FeAl requires the greatest charge redis- tribution to break the Fc-Al bond while requiring the least to form an Al-Al bond. FeAl also requires the greatest charge redistribution to form a free surface. One can conclude that during (111) slip, bonds will be formed early, resulting in an early Peierls barrier with a concomitant low energy. The competing process of free surface formation can not be realized, as the charge redistribution necessary for this process is accommodated in the forming bonds. CoAl, on the other hand, requires the least charge redistribution to break the Co-Al bond, the greatest to form Al-Al bonds, and the least to form a free surface. During (111) slip bond formation would happen very late in the slip, leading to a large Peierls energy. However, before bond formation occurs, the charge lost from the bond crit- ical points across the (110) planes is accumulated in the cage critical point transforming it to a ring critical point, inducing a topological transformation resulting in free surface. In short, the amount of charge, which must be redistributed in CoAl to produce free surface, is less than required to produce an APB. In FeAl, the opposite is the case. Consistent with all observations, NiAl has charge redistribution properties intermediate to FeAl and CoAl.
SUMMARY
The competition between fracture and slip are controlled by the relative redistribution of charge density accompanying these processes. In general, the process requiring the lessor charge redistribution will dominate. The theory of Bador can be extended, allowing one to compare the charge flow accompanying any allowed topological transformation, thus permitting accurate predictions as to whether fracture or flow are more likely to occur. Altering properties now becomes a mater of choosing alloying elements that will direct charge density to desired locations within the crystal lattice.
ACKNOWLEDGMENTS
Eberhart wishes to acknowledge United Technologies Research Center, the Air Force Office of Scientific Research and the Materials Laboratory at Wright Patterson Air Force Base for their partial support of this research.
21

REFERENCES
1. R.P. Messmer and C.L. Briant, Ada Metall 30, 457 (1982).
2. M.E. Eberhart and D.D. Vvcwdcnsky, Phys. Rev. Lett., 58, 61 (1987).
3. G.S. Painter and F.W. Avrill, Phys. Rev. Lett, 58, 234 (1987).
4. R. Wu, A.J. Freeman, and G.D. Olson, Science, 265, 376 (1994).
5. S.N. Sun, N. Kioussis, and M. Ciftan, Phys. Rev. B, xx, xxx (1996)
6. D. Iotova, N. Kioussis, and S.P. Lim, Phys. Rev. D, xx, xxx (1996).
7. T. Hong and A.J. Freeman, Phys. Rev. B, 43 6446 (1991).
8. M.H. Yoo and C.L. Fu, Scripta Metall, 39, 669 (1991).
9. P.A. Schultz and J.W. Davenport, J. of Alloys and Compounds, 197, 229 (1993).
10. J. Rice, J. Mech. Phys. Solids, 40, 239 (1992).
11. R.F.W. Bader and H.J.T. Preston, Int. J. Quantum Chemistry,3, 327 (1969).
12. R.F.W. Bader, P.M. Bcddall and J. Peslak, Jr., ,7. Chem. Phys., 28, 557 (1973).
13. G.R. Runte, R.F.W. Bader and R.R. Messer, Can. J. Chem., 55, 3040 (1977).
14. R.F.W. Bader, T.T. Nguyen-Dang and Y. Tal, Rep. Prog. Phys., 44, 893 (1981).
15. R.F.W. Bader and P.J. MacDougall, J. Am. Chem. Soc, 107, 6788 (1985).
16. P.F Zou, and R.F.W. Bader, Acta Crystallographica A, 50, (1994)
17. M. Morse, Am. Math. Monthly, 49, 358 (1942).
18. M.E. Eberhart, Acta. Meter., 44, 2495 (1996).
19. M.E. Eberhart, Phil. Mag. A, (1996)
20. M.E. Eberhart and A. Giamei, J. Mat. Eng. to be published
21. J.W. Davenport, Phys. Rev. B29, 2896 (1984).
22. G.W. Fernando, J.W. Davenport, R.E. Watson, and M. Weinert, Phys. Rev. B40, 2757 (1989).
22

METALLURGICAL CONTROL OF THE DUCTILE -BRITTLE TRANSITION IN HIGH-STRENGTH STRUCTURAL STEELS
J.W. MORRIS, JR. Center for Advanced Materials, Lawrence Berkeley Laboratory, and Dept. of Materials Science, University of California, Berkeley, California 94720
ABSTRACT
The models that have been successfully used to control the ductile-brittle transition in high strength structural steels are qualitative in nature, and address the microstructural control of fie mechanisms of brittle fracture. The basic idea is incorporated in the "Yoffee diagram", which dates from the 1920's and attributes the ductile-brittle transition to the competition between deformation and fracture; the more difficult brittle fracture becomes, the lower the temperature at which ductile processes dominate. There are two important brittle fracture modes: intergranular separation and transgranular cleavage. The intergranular mode is usually due to chemical contamination, and is addressed by eliminating or gettering the contaminating species. There are also examples of brittle fracture that is due to inherent grain boundary weakness. In this case the failure mode is overcome by adding beneficial species (glue) to the grain boundary. Transgranular cleavage is made more difficult by refining the effective grain size. In high strength steel this is done by refining the prior austenite grain size, by interspersing islands of metastable austenite that transform martensitically under plastic strain, or by disrupting the crystallographic alignment of ferrite grains or martensite laths. The latter mechanism offers intriguing possibilities for future steels with exceptional tough- ness.
INTRODUCTION
The main technological motivation for interest in the ductile-brittle transition of structural steels has shifted considerably over the thirty (or so) years that the present author has been in- volved with the problem. In the late 60's and early 70's most of the relevant research was motivated by the need for low alloy steels for arctic service, and for cryogenic steels that might be used for the handling and storage of liquefied natural gas. In the 80's the research interest shifted to steels that remained tough at 1-4K for the severely loaded structures of high-field supercon- ducting magnets. More recently the emphasis has returned to applications near ambient temperature, including high-strength, low-alloy steels and weldments for use in general structural applications, and ultrahigh strength steels for use in specialty applications such as high strength bolts, cables and aircraft landing gear. To further these objectives, both Japan and Korea have es- tablished national "supersteel" research programs (Japan, in fact, has two).
At least since the mid-1970's, the bulk of this research has been based on a rough consen- sus regarding the basic approach needed to control the ductile-brittle transition: the grain boundaries are cleaned or modified to eliminate intergranular fracture, and the effective grain size is refined to control transgranular fracture. The precise manner in which this is done"differs, de- pending on the alloy, the geometry of the product, and the processing that can be tolerated.
METALLURGICAL OBJECTIVES
The notion that the ductile-brittle transition is associated with the competition between plas- tic deformation and brittle fracture goes back at least to the 1920's and the "Yoffee diagram", which is illustrated in Fig. 1. Yoffee noted the characteristic temperature dependence of the yield stress and reasoned that brittle fracture would intrude when decreasing temperature caused the yield stress to rise above the stress required for brittle fracture. While modern theories have refined the meaning of "yield stress" in this context, the basic idea holds. The Yoffee diagram sets the frame- work for the metallurgical control of the ductile-brittle transition. Since one would like the strength to be as high as possible, the principle focus of the relevant metallurgical research is to increase the brittle fracture stress.
23 Mat. Res. Soc. Symp. Proc. Vol. 539 ® 1999 Materials Research Society

The first-order determinant of the fracture stress is the fracture mode. There are two basic brittle fracture modes: intergranular separation and transgranular cleavage. The ductile-brittle tran- sition is governed by the easier of the two. This is the dominant brittle mode, and can be identified from fractographic observations on samples fractured below TB- The transition temperature (Tg) decreases as the critical stress for the dominant brittle mode is raised.
Brillle-
Temperature -r TB
TB T
Fig. 1. Illustration of the change in fracture mode at the ductile-brittle transition, and its qualitative representation by the Yoffee diagram.
Of the two possible modes, intergranular fracture is "extrinsic" in that it is strongly affected by chemical adsorption on the grain boundaries. The causes and cures for intergranular fracture are now sufficiently well known that it is rarely a problem in well-controlled alloys. Intergranular fracture of high strength steels is ordinarily caused by metalloid impurities, such as sulfur and phosphorous, that adsorb on grain boundaries and induce embrittlement. When this is the prob- lem, there are several possible solutions: alloy purification to minimize harmful impurities, "gettering" by species that react with harmful impurities to form relatively innocuous precipitates, and thermal treatments that avoid the intermediate temperatures at which impurity segregation is most pronounced. On the other hand, there are alloys, such as high-Mn steels, that fracture in what appears to be an inherent intergranular mode. Their weakness can be addressed by adding chemical species that segregate to grain boundaries and strengthen them. Boron is spectacularly successful in this regard, decreasing the TB of 12Mn steel by more than 200 °C [1]. Small con- centrations of C and Si are also useful.
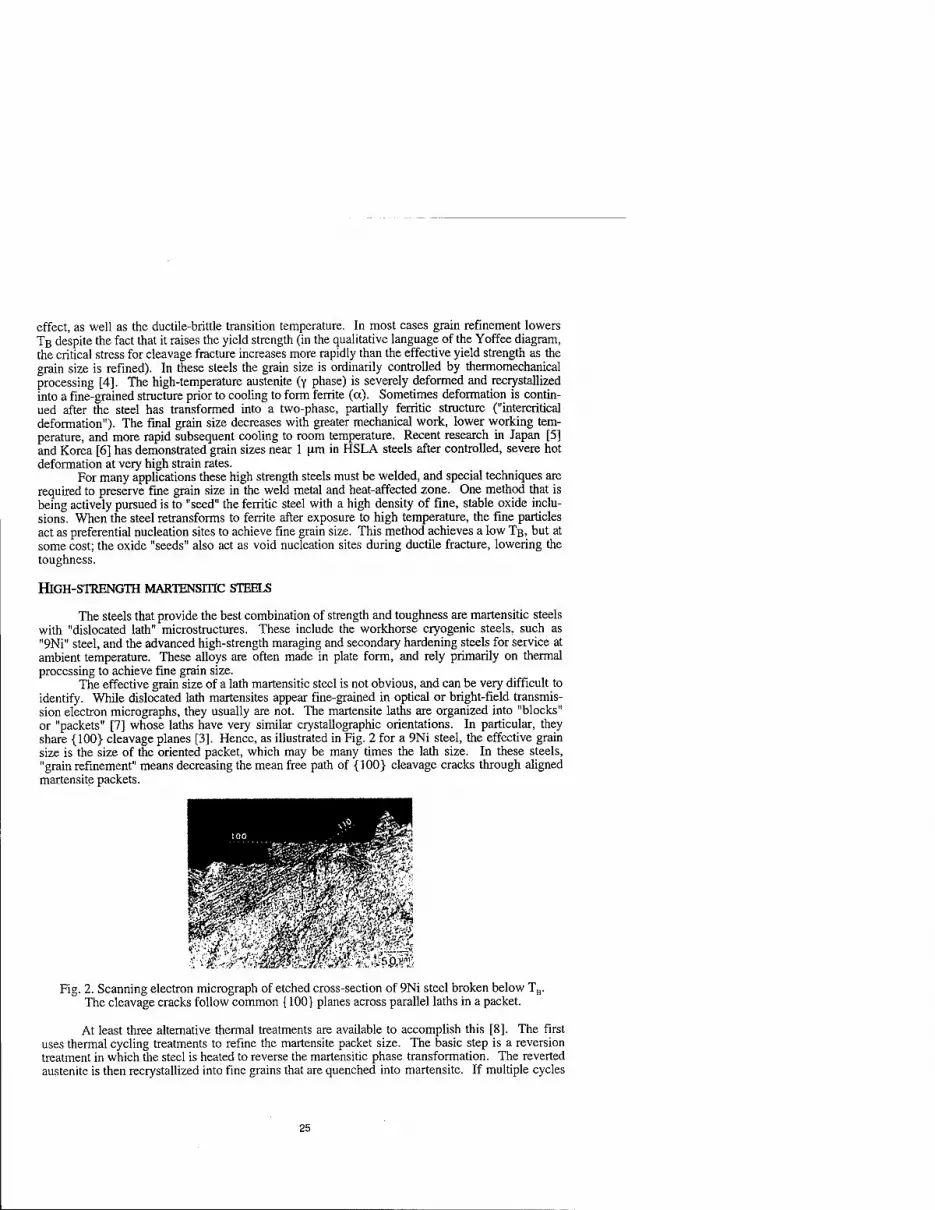
When intergranular fracture is not dominant, the brittle mode is transgranular cleavage; this is the problem that must be overcome in modern high-strength steels. As was made clear by the successful development of relatively low-alloy, high-toughness steels in the 1970's, the effective transgranular cleavage stress in a high strength steel depends much more strongly on its micro- structure than on its composition (though composition can have an important influence on microstructure, as nickel promotes the formation of dislocated martensites with favorable fracture properties). The pertinent characteristic of the microstructure is the effective grain size, which de- termines the mean free path of a cleavage crack [2,3]. While there is still no quantitative theoretical treatment known to this author, the experimental data is clear: grain refinement raises the cleavage fracture stress and lowers Tß. Consequently, the achievement of an ultrafine grain size is the ob- jective of virtually all metallurgical research toward ductile high-strength steels.
HIGH-STRENGTH, LOW-ALLOY STEELS
The nature of the "effective grain size" and the methods that are successful in refining the grain size change with the composition of the steel and the geometry in which it is produced. The simplest case to describe is that of high-strength, low-alloy (HSLA) steels with basically ferritic microstructures. In the reference case the microstructure consists of individual grains of BCC iron separated by high-angle grain boundaries. The grain size controls the strength, via the Hall-Petch
24
effect, as well as the ductile-brittle transition temperature. In most cases grain refinement lowers TB despite the fact that it raises the yield strength (in the qualitative language of the Yoffee diagram, the critical stress for cleavage fracture increases more rapidly than the effective yield strength as the grain size is refined). In these steels the grain size is ordinarily controlled by thermomechanical processing [4]. The high-temperature austenite (v phase) is severely deformed and recrystallized into a fine-grained structure prior to cooling to form ferrite (a). Sometimes deformation is contin- ued after the steel has transformed into a two-phase, partially ferritic structure ("intercritical deformation")- The final grain size decreases with greater mechanical work, lower working tem- perature, and more rapid subsequent cooling to room temperature. Recent research in Japan [5] and Korea [6] has demonstrated grain sizes near 1 [im in HSLA steels after controlled, severe hot deformation at very high strain rates.
For many applications these high strength steels must be welded, and special techniques are required to preserve fine grain size in the weld metal and heat-affected zone. One method that is being actively pursued is to "seed" the ferritic steel with a high density of fine, stable oxide inclu- sions. When the steel retransforms to ferrite after exposure to high temperature, the fine particles act as preferential nucleation sites to achieve fine grain size. This method achieves a low TB, but at some cost; the oxide "seeds" also act as void nucleation sites during ductile fracture, lowering the toughness.
HIGH-STRENGTH MARTENSITIC STEELS
The steels that provide the best combination of strength and toughness are martensitic steels with "dislocated lath" microstructures. These include the workhorse cryogenic steels, such as "9Ni" steel, and the advanced high-strength maraging and secondary hardening steels for service at ambient temperature. These alloys are often made in plate form, and rely primarily on thermal processing to achieve fine grain size.
The effective grain size of a lath martensitic steel is not obvious, and can be very difficult to identify. While dislocated lath martensites appear fine-grained in optical or bright-field transmis- sion electron micrographs, they usually are not. The martensite laths are organized into "blocks" or "packets" [7] whose laths have very similar crystallographic orientations. In particular, they share {100} cleavage planes [3]. Hence, as illustrated in Fig. 2 for a 9Ni steel, the effective grain size is the size of the oriented packet, which may be many times the lath size. In these steels, "grain refinement" means decreasing the mean free path of {100} cleavage cracks through aligned martensite packets.
x msmmksMmsm Fig. 2. Scanning electron micrograph of etched cross-section of 9Ni steel broken below TB.
The cleavage cracks follow common {100} planes across parallel laths in a packet.
At least three alternative thermal treatments are available to accomplish this [8]. The first uses thermal cycling treatments to refine the martensite packet size. The basic step is a reversion treatment in which the steel is heated to reverse the martensitic phase transformation. The reverted austenite is then recrystallized into fine grains that are quenched into martensite. If multiple cycles
25

are used in a systematic way, it is possible to achieve very fine grain sizes, and ductile-brittle tran- sition temperatures below 4K [9].
Fig. 3. (a) Bright-field transmission electron micrograph of lath martensitic steel after intercritical tempering, (b) Companion dark-field image; precipitated austenite appears bright.
The second method uses an "intercritical temper" to create a dense distribution of stable, retained austenite phase along the lath boundaries, effectively breaking up the alignment of laths within a packet (Fig. 3). To use this mechanism, it is critically important that the retained austenite be stable with respect to thermal transformations on cooling to test temperature and to small me- chanical loads during the test [10]. If the austenite retransforms on cooling or under small loads it transforms into the dominant crystallographic variant of the packet and does not refine the grain size. In 9Ni steel the alloy content is sufficiently rich that a dense distribution of stable austenite is created by a single tempering treatment in the low-temperature part of the two-phase (ct+y) region of the Fe-Ni phase diagram. It is possible to form a similarly beneficial distribution of stable austenite in steels of much lower Ni content, or with Mn in place of Ni, but more complicated thermal treatments are needed to achieve the dual requirements that the austenite distribution be dense and stable.
Zone//(311] "-1
Fig. 4. Transmission electron micrograph of the interior of a packet in AerMet 100 showing crystallographic misalignment between adjacent laths.
The third method uses a rapid cyclic reversion to the high-temperature y-phase to disrupt the crystallographic alignment of laths within a packet ("packet refinement"). When this method is successful it leads to an exceptionally fine grain size. Interestingly, this approach was first applied to weldments. It is possible use ferritic weld metal to weld 9Ni steel for cryogenic service if one uses a multipass TIG process in which each pass imposes a rapid thermal cycle on the heat-affected
26

materiell beneath it [11,12]. The resulting weldment has a refined microstructrue and a very low TB; we once made up a plate entirely of weld metal with TB<4K. Recent research in Japan sug- gests that cyclic reversion can be used to achieve packet refinement in relatively thick plates of high-strength maraging steel [13]. In this case the alloy is doped with boron to suppress austenite «crystallization, and permit packet refinement with the relatively slow heating rates that are achiev- able in plates. The developers of this technique report very high toughness at the 2.5 GPa strength level.
We [14] have recently found a fascinating third example of packet refinement in AerMet 100, an HNi-13Co-3Cr-l.2Mo-0.23C secondary hardening steel developed by Carpenter Tech- nology [15], which has fracture toughness of 1.1 GPaVm or higher at yield strengths over 1.7 GPa. (UTS > 1.9 GPa). This alloy naturally develops a highly refined packet structure after the cyclic reversion heat treatment that is applied to relatively thick plates in commercial practice (Fig. 4). In keeping with its refined microstructure, the alloy is exceptionally resistant to brittle fracture by transgranular cleavage. At least some examples remain ductile to below 77K at the 2.5 GPa strength level. The metallurgical source of packet refinement in this alloy is not yet clear.
Fig. 5: Scanning electron fractograph of a sample of AerMet 100 broken in impact at 77K. The fracture mode is ductile.
ACKNOWLEDGMENT
This work was supported by the Director, Office of Energy Research. Office of Basic Energy Sci- ences, Materials Science Division of the U. S. Department of Energy under Contract No. DE- AC03-76SFO0098.
REFERENCES
1. S. K. Hwang and J.W. Morris, Jr., Met. Trans., 11A, p. 1197 (1980) 2. J.I. Kim, C.K. Syn and J.W. Morris, Jr., Met. Trans., 14A, p. 93 (1983) 3. T. Maki, in ICOMAT '89, B.C. Muddle, ed., Trans Tech. Pub., Switzerland, p. 157 (1990) 4. A.J. DeArdo, in Understanding Microstructure, ASM, Metals Park, OH, p. 51 (1997) 5. K. Nagai, Nat. Res. Inst. Met., Tsukuba, Japan, private communication (1998) 6. C. Wung-Yong, POSCO, Pohang, Korea, private communication (1998) 7. T. Maki, K. Tsuzaki and I. Tamura, Trans. ISIJ, 20, p. 209 (1980) 8. H.J. Kim, Y.H. Kim and J.W. Morris, Jr., 38, p. 812 (1998) 9. S. Jin, J. W. Morris, Jr. and V. F. Zackay, Met. Trans., 6A, p. 129 (1975) 10. J. I. Kim and J. W. Morris, Jr., Met. Trans., 12A, p. 1285(1982) 11. Kobe Steel, Ltd., Technical Report No. RDPD-7902, Oct., 1979 12. H. J. Kim and J. W. Morris. Jr., Welding J., 62, p. 210 (1983) 13. T. Yasuno, S. Suzuki, K. Kuribayashi and R. Horiuchi, Tetsu-to-Hagane, 83, p.671 (1997) 14. K. Sato and J.W. Morris, Jr., unpublished research 15. P.M. Novotny, in Fundamentals of Aging and Tempering in Bainitic and Martensitic Steel
Products, Iron and Steel Soc, Warrendale, Pa., p. 215 (1992)
27

IN SITU EXAMINATION OF MOVING CRACK TIPS IN ORDERED INTERMETALLICS
J.K. Heuer (a,b), N.Q. Lam (b), P.R. Okamoto (b), J.F. Stubbins (a) (a) Department of Nuclear Engineering, University of Illinois, Urbana, IL 61801 (b) Materials Science Division, Argonne National Laboratory, Argonne, IL 60439
ABSTRACT
Recent studies have shown that high stress concentrations at moving crack tips in the intermetallic compound NiTi can induce a crystalline-to-amorphous (C-A) transformation of the crack tip region. This stress-induced C-A transformation has a temperature dependence and crystallization behavior similar to those of ion irradiation-induced C-A transformation of NiTi. The present study examines if these similarities between stress- and irradiation-induced amorphization hold true for two other intermetallic compounds, CuTi and Ni3Ti. In situ straining was performed in an intermediate-voltage transmission electron microscope. The presence or absence of an amorphous phase was determined by dark field imaging and selected area diffraction of crack tip regions. Crack tips in both CuTi and Ni3Ti were found to remain crystalline upon fracture. The observed absence of stress-induced amorphization in Ni3Ti is consistent with its known absence during irradiation, but the absence in CuTi differs from its known irradiation-induced amorphization behavior. Reasons for the similarity and difference are discussed.
INTRODUCTION
A fundamental understanding of fracture is of considerable technological importance. While it is known that the stress concentration at a crack tip is the primary driving force for fracture, the mechanism of strain energy release is not well understood. In this study, we investigate the possibility whether this release can occur via local melting of the crack tip.
This possibility is illustrated in Figure 1 which shows the free energy curves of an unstressed perfect crystal, two stressed crystals, and the liquid. Also shown are the ideal glass [1], the glass that has the same entropy as a perfect crystal, and two unrelaxed glasses associated with cooling rates such that Tgi > T^; Tgi represents the respective glass transition temperatures, and TK is the ideal glass transition temperature as defined by Kauzmann [1]. Figure 1 illustrates how heat-induced (ordinary) melting of a perfect crystal occurs when its free energy drops to a level equal to that of the liquid; the temperature at this point (T°) is defined as the melting temperature. However, the free energy curve for the stressed crystal intersects that of the liquid at a temperature T£ below that for melting of the unstressed crystal. This stress-induced reduction in the melting temperature can also occur locally at regions of high stress concentrations such as at crack tips.
Further evidence supporting the possibility of stress-induced melting of the crack tip comes from Monte Carlo (MC) simulations of fracture [2]. In these simulations, fee elemental crystals, subjected to uniaxial tension, were observed to melt prior to failure at temperatures as low as 0.35 T°. These MC simulations also indicate that the melted regions (which cannot sustain a tensile load) immediately recrystallize leaving behind no trace that melting has occurred. This nearly instantaneous recrystallization indicates that the detection of stress-induced melting may not be possible for elemental crystals. However for intermetallic compounds, stress- induced melting may be detectable at low temperatures as a stress-induced crystal-to-amorphous
29 Mat. Res. Soc. Symp. Proc. Vol. 539 ° 1999 Materials Research Society

(C-A) transformation. This is illustrated in Figure 1 which shows that the C-A transformation can be induced by raising the free energy of a crystal to the level of the ideal glass (which is the glassy state with the lowest free energy). For example, C-A transformations in intermetallics such as NiTi can be readily induced by particle irradiation. However, direct observation of a stress-induced C-A transformation at crack tips has been reported only recently [3]. In situ TEM studies of fracture in NiTi (Figure 2a) have revealed that this stress-induced C-A transformation has a similar temperature dependence as ion irradiation-induced C-A transformation of NiTi. In addition, the isothermal crystallization temperature of the resulting glass was found to be identical to that predicted for the ideal glass, providing strong support for the stress-induced melting concept.
In this paper, we report the results of our recent examinations of crack tips for signs of stress-induced amorphization in two other compounds: CuTi, which undergoes an electron irradiation-induced C-A transformation, and Ni3Ti, which does not [4,5]. Cracks in these compounds propagate during straining inside an intermediate-voltage (300 kV) electron microscope and are observed in situ using dark-field imaging and selected area diffraction.
EXPERIMENT
Miniature tensile TEM specimens were prepared from alloy buttons by diamond sectioning and subsequent polishing to a 200 ^m thickness. Disks 3.0 mm in diameter were cut from the thinned material with a core drill, and two parallel ends were truncated with a wire saw to produce modified disk specimens 2.5 mm wide necessary to fit on stainless steel straining bases. Modified disks were then annealed at 900°C for 1 hour to remove any mechanical damage before electropolishing to electron transparency. Prior to straining (24 hours), the disks were attached to the straining bases using a vacuum epoxy.
In situ straining was performed in a Hitachi 9000 TEM using a single tilt heating-straining stage. Crack tips and edges that propagated during straining at room temperature were examined. The presence or absence of amorphization was determined by selected area diffraction (SAD) from these regions using a 10 micron selected area aperture. Cracks in both electron-transparent and electron-opaque regions were examined since the previous NiTi studies indicated amorphous halos were easier to detect in thicker regions due to the greater sampled diffracting volume.
RESULTS
The result of fracture in CuTi is discussed first. CuTi specimens had large-grain microstructures so that crack propagation occurred mainly through single crystalline regions rather than along grain boundaries. Upon application of tensile stress, crack propagation occurred very quickly. In fact, propagation could not be captured by the 30 frame/second recording speed of the video cassette recorder used to monitor the in situ experiments. Dislocation bands were observed to form ahead of crack tips during propagation. Examination of crack tips and edges for signs of amorphization was done by analyzing SAD patterns from 35 different regions in CuTi. In all of these patterns, no diffuse intensity halos typical of an amorphous structure were detected. Instead, crack tips and edges either remained crystalline or became polycrystalline. Figure 2b shows a typical crack that propagated in CuTi along with its associated polycrystalline diffraction pattern. The strong complete ring comes from CuTi (110) reflections; the other weaker rings can be indexed to additional CuTi reflections. Such polycrystalline rings were detectable only in thick regions of the specimen where the diffracting volume was sufficient to produce ring patterns.
30

<L> c
u u
X) Ü
glasses
ideal glass — „ * «. * >
perfect crystal
stressed crystals
Temperature
Figure 1. Thermodynamic basis for stress-induced melting criterion.
31
Like CuTi, the Ni3Ti specimens had a large-grain microstructure, and subsequent crack propagation was through single crystalline regions. As in the case of CuTi, dislocation bands were detected extending far ahead of crack tips after propagation. Examination for amorphization was performed by analyzing SAD patterns from 32 crack tips and edges, and like CuTi, no diffuse intensity halos were detected which revealed that crack tip regions remained single crystalline or became polycrystalline. However, in this case, the majority of crack tips and edges were not polycrystalline. Figure 2c shows a typical crack that propagated in Ni3Ti. Its associated SAD pattern has the same single crystalline structure as the matrix away from the crack regions. Polycrystalline rings were detected in only 2 of the 32 regions examined.
These results indicate that neither CuTi nor Ni3Ti undergo a stress-induced C-A transformation. The absence of this transformation in Ni3Ti was expected since it does not become amorphous during particle irradiation. However, the absence of a stress-induced C-A transformation in CuTi was surprising since it is highly susceptible to electron-induced amorphization. The unexpected behavior of CuTi can be examined in terms of the driving force for the C-A transformation. In order for such a transformation to occur, the free energy of the perfect crystal must be raised to the level of the ideal glass. In the case of particle irradiation, antisite defects (chemical disorder) are known to provide the primary driving force for amorphization of CuTi. The process of chemically disordering a crystal lattice allows strain energy (and hence free energy) to accumulate to the point where a C-A transformation is possible. However, the driving force mechanisms for stress-induced amorphization are still unclear. For NiTi, the evidence suggests the involvement of chemical disorder. The majority (20 of 25) of SAD patterns from partially amorphized crack tips that propagated below 300°C in NiTi showed no superlattice reflections indicating the absence of chemical long-range order. However, NiTi superlattice reflections were present in the majority (15 of 22) of SAD patterns taken from cracks that propagated above 300°C where thermal recovery was possible.
In contrast to the behavior of NiTi, the majority (7 of 10) of SAD patterns from crack tips and edges in CuTi revealed that superlattice reflections were present. This absence of chemical disorder provides an explanation why CuTi is not amorphized by stress at crack tips while it is amorphized by particle irradiation. These results suggest that chemical disorder is an important driving force for stress-induced amorphization and that either the excess free energy associated with chemical disordering at crack tips in CuTi has not reached the point necessary to drive the C-A transformation or that the strain energy must have been released by another mechanism during fracture. The nature of this alternate process is unclear, but the observation of dislocation bands ahead of crack tips suggests that some strain energy is dissipated by dislocation emission. Figure 3 shows a band of dislocation segments and loops extending horizontally from a typical crack tip. They are superimposed on long dislocations (at a 45° inclination) that were present before fracture. Analysis of the dislocations indicates that they move along (001) slip planes. This identification is based on both TEM analysis and atomistic simulations. TEM analysis indicates that the dislocations appear edge-on when the (001) planes are tilted perpendicular to the viewing direction; in addition, atomistic simulations [6] indicate that vacancy migration energies are very low along these planes. The fact that dislocations move along these slip planes so far ahead of cracks indicates that strain energy from the tips can be dissipated over this entire distance.
CONCLUSIONS
Crack tips were examined in both CuTi and Ni3Ti for signs of a stress-induced C-A transformation. Such a transformation was not detected in either material. This is consistent
32

Figure 2. Typical cracks that propagated in (a) NiTi. (b) CuTi, and (c) Ni ,Ti at ambient temperature and the selected area diffraction (SAD) patterns from their tips.
S."\*"\.^
Figure 3. Dislocation band observed ahead of typical crack tip. Imaging conditions are such that the (001) planes arc inclined at (a) 61°. (b) 79°. and (c) 90° to observation direction.
33

with the irradiation behavior of hfyTi, but the absence of stress-induced amorphization in CuTi differs from its known irradiation-induced amorphization behavior. This difference in behavior of CuTi is attributed to the absence of chemical disorder at crack tips necessary to drive a C-A transformation whereas in the case of particle irradiation, chemical disorder provides most of the driving force for amorphization. Also in CuTi, the long bands of dislocations extending from crack tips suggest that dislocation emission is an important energy release mechanism.
ACKNOWLEDGMENTS
This work was supported by the U.S. Department of Energy, Basic Energy Sciences- Materials Sciences, under contract W-31-109-Eng-38. Special thanks are extended to B. Kestel for aid with specimen preparation and E. Ryan and S. Ockers of the Argonne HVEM-Tandem Accelerator Facility for assistance with in situ straining experiments.
REFERENCES
1. W. Kauzmann, Chem. Rev. 43 (1948) 219.
2. R.M. Lynden-Bell, J. Phys.: Condens. Matter 7 (1995) 4603.
3. P.R. Okamoto, J.K. Heuer, N.Q. Lam, S. Ohnuki, Y. Matsukawa, K. Tozawa, and J.F. Stubbins, Appl. Phys. Lett. 73 (1998) 473.
4. P.R. Okamoto and M. Meshii, "Solid-State Amorphization-Particle Irradiation," Science of Advanced Materials, edited by H. Weidersich and M. Meshii (1988) 33.
5. J. Delage, 0. Popoola, J.P. Villain, and P. Moine, Mater. Sei. and Engin. A115 (1989) 133.
6. J.R. Shoemaker, R.T. Lutton, D. Wesley, W.R. Wharton, M.L. Oehrli, M.S. Herte, M.J. Sabochick, and N.Q. Lam, J. Mater. Res. 6 (1991) 473.
34

THE INFLUENCE OF MICROSTRUCTURE ON THE FRACTURE AND TENSILE PROPERTIES OF DIE CAST AND
THIXOMOLDED MAGNESIUM ALLOYS
Paul E. Thoma, Colleen Hays, and Aekyung Baik Johnson Controls, Inc., Corporate Technology, P.O. Box 591, Milwaukee, WI 53201-0591 USA
ABSTRACT
In this investigation, the fracture and tensile properties of die cast and thixomolded magnesium alloys are compared and shown to be dependent on the microstructure of the test specimens. The principal features of a die cast structure that inhibit crack propagation and contribute to high ductility are the presence of highly structured primary a-magnesium dendrites and a continuous network of the a-magnesium phase. The lower tensile properties of thixomolded magnesium alloys are attributed to the presence of nodular a-magnesium dendrites. Cracks propagate around the nodular dendrites through the divorced eutectic that surrounds the nodular a-magnesium dendrites. In the thixomolded alloys, there is also a less developed continuous network of the a-magnesium phase.
INTRODUCTION
Die casting and thixomolding are two methods used to make near net shape magnesium alloy components. In die casting, molten alloy is forced under pressure into a closed cavity mold. The microstructure of a die cast magnesium alloy consists of primary a-magnesium dendrites in a matrix consisting of a-magnesium phase and ß-phase (MgnAlw). A typical die cast AZ91 magnesium alloy microstructure is shown in Figure 1. In thixomolding [1], a semisolid alloy, that is at a temperature between its liquidus and solidus, is forced under pressure into a closed cavity mold. By controlling the temperature of the alloy between its liquidus and solidus, the amount of solid phase and liquid phase is controlled. Because of a shearing action on the thixotropic semisolid magnesium alloy (caused by rotation of a screw within a barrel), the a-magnesium dendrites become nodular in shape. The microstructure of a thixomolded magnesium alloy consists of nodular a-magnesium dendrites in a matrix consisting of a-magnesium phase and p-phase (MgnAln). A typical thixomolded AZ91 magnesium alloy microstructure is shown in Figure 2.
In this investigation, the influence of microstructure on the fracture and tensile properties of two magnesium alloys (AM60 and AZ91) is discussed. Different microstructures are obtained by making die cast and thixomolded test specimens (Figures 1 and 2).
Mg Dendrites|^p|_100a__|I Nodular a-Mg Dendrites I
Figure 1. Die cast AZ91 magnesium alloy. Figure 2. Thixomolded AZ91 magnesium alloy.
MATERIALS AND TEST METHODS
Two magnesium alloys, AM60 and AZ91, are evaluated in this investigation. AM60 is a magnesium alloy that contains 6 wgt.% aluminum and a minimum of 0.25 wgt.% manganese. The magnesium alloy, AZ91, contains 9 wgt.% aluminum, 0.7 wgt.% zinc, and a minimum of 0.15
35 Mat. Res. Soc. Symp. Proc. Vol. 539 e 1999 Materials Research Society

wgt.% manganese. Die casting and thixomolding are used to make tensile bars of these magnesium alloys. Die cast AM60 and AZ91 tensile bars are from Spartan Aluminum Products, Inc., Gibbs Die Casting Aluminum Corporation, and Dow Chemical Company. Thixomolded AM60 and AZ91 tensile bars and a thixomolded AM60 component having >50% a-magnesium nodules, from which tensile bars are machined, are from Thixomat, Inc. The compositions of the magnesium alloy tensile bars are listed in Table I. The aluminum and zinc contents of the tensile bars are within the ASTM composition limits for a specific magnesium alloy (ASTM Standard B 94-93).
Table I. Source and Composition of Die Cast and Thixomolded Tensile Bars.
Magnesium Alloy Process
Source of Tensile Bars
Number of Samples
Aluminum ppm
Manganese ppm
Zinc ppm
AM60 Die Cast Spartan Aluminum Products, Inc.
10 59882 3667 111
AM60 Die Cast Gibbs Die Casting Aluminum Corp. 10 62378 2922 466
AM60 Thixomolded Thixomat, Inc. 10 64181 3694 <5
AM60 Thixomolded Component from Thixomat, Inc. 6 64330 3103 2016
AZ91 Die Cast Spartan Aluminum Products, Inc. 8 89153 1875 7958
AZ91 Die Cast Dow Chemical Company 10 90380 995 7552
AZ91 Thixomolded Thixomat, Inc. 10 89669 2744 8362
The die cast tensile bars of AZ91 and AM60 from Spartan Aluminum Products, Inc. and the tensile bars of AM60 machined from a thixomolded component having >50% a-magnesium nodules have a gage length of 1.00 inch. The die cast tensile bars of AM60 from Gibbs Die Casting Aluminum Corporation and of AZ91 from Dow Chemical Company have a gage length of 2.00 inches. The thixomolded tensile bars of AM60 and AZ91 from Thixomat, Inc. have a gage length of 2.00 inches. An Instron Mechanical Tester is used to determine the tensile properties of the test bars using a strain rate of 0.01 inch/inch/minute. The elongation of the tensile bars within the gage section is measured with an extensometer.
The porosity of the tensile bars is determined by the Archimedes' method. The formula used is:
% Porosity = 100 (pMg Alloy - pTensile Bar) / pMg Alloy (1)
where pMg Alloy is the density of the magnesium alloy (pAZ9i is 1.81 grams/cm3 and pAMeo is 1.79 grams/cm3). pTensile Bar is the measured density of the tensile bar. The location of macro porosity in the tensile bars is determined from real time X-ray images taken by the Institute of Magnesium Technology.
To examine the microstructure of the magnesium alloys, polished metallographic specimens are etched with a glycol etch - ASTM No. 118 consisting of 75 vol.% ethylene glycol, 24 vol.% deionized water, and 1 vol.% concentrated nitric acid. The images of the magnesium alloy microstructures are obtained with an Olympus PMG-3 metallograph.
TEST RESULTS
The microstructure of die cast AZ91 and AM60 magnesium alloys consists of structured primary a-magnesium dendrites, fragments of dendrites, and a divorced eutectic consisting of the a-magnesium phase and the intermetallic compound, MgnAli2 (see Figure 1). The thixomolded AZ91 and AM60 magnesium alloy tensile bars have a microstructure composed of approximately
36

20 to 25% a-magnesium nodules dispersed in a matrix consisting of a-magnesium particles and a divorced eutectic of the a-magnesium phase and MgnAln (see Figure 2). Tensile bars, which are machined from an AM60 thixomolded component, have a microstructure with >50% a-magnesium nodules that are closely packed in a matrix rich in eutectic structure.
The tensile properties of die cast and thixomolded AZ91 and AM60 magnesium alloys are listed in Table II. For a given magnesium alloy, the thixomolded magnesium alloy has tensile properties (stress at fracture and strain at fracture) that are less than the die cast magnesium alloy. For example, the thixomolded AZ91 alloy has an average stress at fracture of 31,180 psi and an average strain at fracture of 3.07%. The die cast AZ91 magnesium alloy specimens from Spartan Aluminum Products, Inc. and Dow Chemical Company have an average stress at fracture of 37,990 psi and 35,270 psi respectively and have an average strain at fracture of 7.61% and 6.00% respectively. The same trend is also observed for the thixomolded and die cast AM60 magnesium alloy. The die cast AM60 magnesium alloy specimens from Spartan Aluminum Products, Inc. and Gibbs Die Casting Aluminum Corp. have an average stress at fracture of 38,220 psi and 36,990 psi respectively and have an average strain at fracture of 21.94% and 16.00% respectively. The thixomolded AM60 magnesium alloy specimens have tensile properties that are less than the die cast AM60 specimens. The thixomolded AM60 alloy with approximately 20 to 25% a-magnesium nodules has an average stress at fracture of 32,310 psi and an average strain at fracture of 10.31%. The thixomolded AM60 alloy with >50% a-magnesium nodules has an average stress at fracture of 19,360 psi and an average strain at fracture of 2.46%.
The porosity of the die cast and thixomolded magnesium alloy tensile bars ranges from 1.06% for the die cast AM60 tensile bars from Gibbs Die Casting Aluminum Corporation to 2.56% for the thixomolded AM60 tensile bars from Thixomat, Inc. The porosity of the tensile bars machined from the thixomolded component of AM60 alloy is 0.50%, which is less than the porosity of the die cast and thixomolded tensile bars. Most of the porosity, however, in the thixomolded and die cast tensile bars (determined by real time X-ray images) occurs in the grip sections of the bars, not in the gage section.
Table II. Tensile Properties and Porosity of Die Cast and Thixomolded Magnesium Alloys.
Magnesium Alloy Process Source of
Tensile Bars
Number of
Samples
Average Porosity,
%
Average Stress at
Fracture, psi
Average Strain at
Fracture, %
AM60 Die Cast Spartan Aluminum Products, Inc.
10 1.43 38,220 21.94
AM60 Die Cast Gibbs Die Casting Aluminum Corp. 10 1.06 36,990 16.00
AM60 Thixomolded Thixomat, Inc. 10 2.56 32,310 10.31
AM60 Thixomolded Component from Thixomat, Inc.
6 0.50 19,360 2.46
AZ91 Die Cast Spartan Aluminum Products, Inc.
8 1.21 37,990 7.61
AZ91 Die Cast Dow Chemical Company 10 1.88 35,270 6.00
AZ91 Thixomolded Thixomat, Inc. 10 1.48 31,180 3.07
DISCUSSION OF RESULTS
The die cast AZ91 and AM60 magnesium alloys have greater stress and strain at fracture than the thixomolded AZ91 and AM60 alloys. There are a number of factors that may contribute to this behavior and include the following: 1) microstructure, 2) matrix enrichment with alloying elements, and 3) porosity.
37

Microstructure
Die cast magnesium alloys have a-magnesium dendrites that are highly structured. In the die cast tensile bars, the structured a-magnesium dendrites, dendrite fragments, and a-magnesium phase from the divorced eutectic form a continuous network. Cross sections of fractured AZ91 and AM60 die cast tensile bars are shown in Figures 3 and 4 respectively. Fracture occurs primarily through the divorced eutectic matrix. The multi-armed structured dendrites and continuous network of a-magnesium phase hinder crack propagation by providing dead end and torturous pathways for crack propagation. The continuous network of a-magnesium phase also provides a high ductility framework to the structure.
Thixomolded magnesium alloys have large nodular dendrites that are more or less spherical in shape (see Figure 2). Cross sections of fractured AZ91 and AM60 thixomolded tensile bars are shown in Figures 5 and 6 respectively. Fracture occurs predominantly through the divorced eutectic matrix and around the nodular a-magnesium dendrites. The portion of the fracture around the nodular dendrites occurs through the divorced eutectic structure that surrounds the nodules. Figure 7 shows the MgnAli2 phase surrounding a nodular dendrite. An enlarged cross section of a fracture surface is shown in Figure 8. It shows the bare surface of a nodular dendrite where fracture occurred. Fracture probably occurs at the interface between the a-magnesium phase and the MgnAl 12 phase of the divorced eutectic. The nodular dendrites do not contribute significantly to the development of a continuous network of the a-magnesium phase since they are almost completely surrounded by the MgnAl 12 phase of the divorced eutectic. There are also fewer dead end and torturous pathways to inhibit crack propagation in the thixomolded magnesium alloy structure. This difference in structure, when compared to the die cast structure, is considered a major factor contributing to the lower tensile properties of the thixomolded magnesium alloys.
Matrix Enrichment with Alloying Elements
The AZ91 and AM60 magnesium alloys have compositions that impart a melting temperature range in these alloys. As a consequence, constituent segregation occurs during solidification. The degree and nature of segregation are influenced by cooling rate during solidification and holding time at a temperature between the liquidus and solidus temperature. In die casting, the cooling rate is very rapid after injection into a mold, and there is minimal constituent segregation in the die cast structure. In thixomolding, however, the magnesium alloy is held in the barrel of the thixomolder at a temperature between its liquidus and solidus temperature. The alloy is in a semisolid state. The a-magnesium dendrites form in the barrel of the thixomolder and become nodular in shape due to rotation of the screw in the barrel of the thixomolder. The number, size, and composition of nodular dendrites formed are dependent on the temperature of the alloy and length of time within the barrel. The lower the temperature is, the greater the number of nodular dendrites and the more enriched the remaining liquid becomes with alloying elements, especially aluminum. The microstructure of the thixomolded AZ91 alloy (Figures 2, 5, 7, and 8), which has 20 to 25% nodular a-magnesium dendrites, is obtained with a barrel temperature of 585°C. This structure has more constituent segregation than the die cast structure, due to the formation of large a-magnesium nodular dendrites. The remaining liquid, which surrounds the nodular dendrites, is enriched with aluminum, and when it has solidified, there is a greater amount of eutectic structure (a-magnesium phase and MgnAl 12) in the space between the nodular dendrites. When the barrel temperature is even lower, the AM60 alloy microstructure, shown in Figures 9 and 10, is obtained. The nodular a-magnesium dendrites make up most of the microstructure. The liquid alloy that is present in the space between the nodular dendrites is very enriched in aluminum. As a consequence, a large amount of MgnAlw phase (component of the eutectic) forms in the limited space between the nodular dendrites during solidification of the remaining liquid. Fracture occurs through the eutectic structure between the nodular dendrites. The tensile properties of tensile bars with this structure are very low (average stress at fracture is 19,360 psi and average strain at fracture is 2.46%). Figure 9 shows crack propagation through the eutectic matrix. Figure 10 shows the eutectic structure between the nodular dendrites. The low tensile properties are attributed to aluminum enrichment and resulting increased amount of eutectic structure in the space between the nodular dendrites. There is also very little development of a continuous a-magnesium network to inhibit crack propagation and provide a high ductility framework.
38

$u ,1"ÄJI -Hj io v V f111 actured Surface B mmm:
Figure 3. Cross section of fractured die cast AZ91 tensile bar.
Figure 4. Cross section of fractured die cast AM60 tensile bar.
Figure 5. Cross section of fractured thixomolded AZ91 tensile bar.
Figure 6. Cross section of fractured thixomolded AM60 tensile bar.
20u J %fe~i-, Micro flft <THPorositv*<
j Nodular a-Mg Dendrite
JMgl7All2 I I ™»J
Figure 7. MgnAln phase around a-magnesium nodule in thixomolded AZ91 tensile bar.
Figure 8. Fracture around a-magnesium nodule in thixomolded AZ91 tensile bar.
mlKf • Nodular a-Mg Dendrites,£v ,- '
Figure 9. Fractured thixomolded AM60 tensile bar with >50% a-magnesium nodules.
Figure 10. Thixomolded AM60 tensile bar with MgnAl« phase between a-magnesium nodules.
39

Porosity
The porosity of the die cast magnesium alloy tensile bars ranges from 1.06% to 1.88%, and the porosity of the AZ91 and AM60 thixomolded tensile bars is 1.48% and 2.56% respectively (see Table II). Real time X-ray images indicate that macro porosity is present in the grip sections of the die cast and thixomolded tensile bars. Macro porosity is not seen in the gage section of the tensile bars and does not influence the fracture and tensile properties. Micro shrinkage porosity, however, is seen at the surface of a nodular a-magnesium dendrite in the thixomolded AZ91 microstructure shown in Figure 7. Micro porosity cannot be ruled out as a contributing factor to the lower tensile properties of the thixomolded tensile bars.
CONCLUSIONS
The nature of the tensile fracture and the tensile properties of magnesium alloys are dependent on microstructure and matrix enrichment with alloying elements. The features of a die cast structure that inhibit crack propagation and contribute to high ductility are the presence of structured primary a-magnesium dendrites and the formation of a continuous network of the a-magnesium phase. The lower ductility of thixomolded magnesium alloys, which have nodular a-magnesium dendrites in their microstructure, is due to the lack of dead end and torturous pathways to inhibit crack propagation. In the thixomolded alloys, cracks propagate around the nodular a-magnesium dendrites through the divorced eutectic structure that surrounds the nodular dendrites. For thixomolded tensile bars made with an enrichment of aluminum in the matrix between the nodular dendrites, the tensile properties are very low and cracks propagate through the eutectic structure in the limited space between the a-magnesium nodular dendrites. In the thixomolded magnesium alloys, a continuous a-magnesium supporting network is not as well developed as in the die cast structures.
ACKNOWLEDGMENTS
The authors are grateful for the generous supply of magnesium alloy tensile bars provided by Spartan Aluminum Products, Inc., Gibbs Die Casting Aluminum Corporation, Dow Chemical Company, and Thixomat, Inc.
REFERENCE
1. R.F. Decker, R.D. Carnahan, R.O. Newman, N.L. Bradley, P.S. Frederick, W.J. Schäfer, J.L. Mihelich, R. Kilbert, L.G. Thompson, G.T. Spalding, D.C. Dawson, and J.C. Jones, "Thixomolding™", 47th Annual World Magnesium Conference in Cannes, France (May 29-30, 1990). International Magnesium Association, pp. 106-116.
40

EMBRITTLEMENT OF FE-CR-AL-ALLOYS
J. H. LANGE, M. BREDE *, B. FISCHER, S. SPINDLER, H. WAGNER, R. WITTMANN, D. GERTHSEN **, A. BROSKA, J. WOLFF *** *Fraunhofer Institut für Angewandte Materialforschung IFAM, Bremen, Germany **Laboratorium für Elektronenmikroskopie LEM der Universität Karlsruhe, Germany ***Institut für Materialphysik der Universität Göttingen, Germany
ABSTRACT
The mechanical behavior of Fe-Cr-Al-alloys was investigated at different temperatures and after several heat-treatments in order to determine critical conditions for the ductility of the material. It was found that a significant embrittlement takes place during deformation at higher temperatures around 400 °C as well as after heat-treatments at temperatures above 1000 °C in combination with very high or very low cooling rates. Possible reasons for this behavior are discussed with respect to the results of transmission electron microscopy (TEM), Auger spectroscopy (AES), positron annihilation spectroscopy (PAS) and measurements of the electrical resistivity.
INTRODUCTION
Fe-Cr-Al alloys show a marked resistance to oxidation and sulfidation even at high temperature and a high electrical resistivity, which makes them special candidates for high temperature applications like industrial furnaces or automotive exhaust systems as well as for heat conducting elements [1]. Processing of Fe-Cr-Al alloys, however, is complicated by their poor cold workability and by the formation of hot cracks during casting. For this reason, the composition range of conventionally processed alloys is restricted to about 25.0 wt.% Cr and 5.5 wt.% Al. The existence of ordered phases is frequently discussed as one possible reason for the embrittlement of Fe-Cr-Al-alloys, but until today, neither the reasons for the tendency to brittle behavior nor the conditions which favor embrittlement, especially concerning composition and heat treatment, have been clarified satisfactorily. This paper presents results of a research program which was carried out to determine the microstructural background responsible for the embrittlement of commercial Fe-Cr-Al alloys. In the beginning, extensive work on mechanical testing was necessary to find out critical heat treatments concerning the deformability of the material. Subsequently, the microstructure of embrittled specimens was examined carefully by transmission electron microscopy (TEM) and Auger spectroscopy (AES). Electrical resistivity measurements were carried out to monitor phase transformations within the material. Finally, the importance of point defects on phase changes was evaluated by positron annihilation spectroscopy (PAS).
EXPERIMENT
The results presented in this study are restricted to a commercial Fe-Cr-Al alloy (FeCr20A15) with a composition of 20.5 % Cr and 5.3 % Al (wt.%). Further additions include Si (0.44 wt.%), Mn (0.23 wt.%) and Ni (0.15 wt.%). The C- and N-content was defined to 0.002 wt.% and 0.005 wt.%. The experiments were carried out on polycrystalline specimens in order to ensure the transferability of the results to the industrial fabrication process. After being machined from
41
Mat. Res. Soc. Symp. Proc. Vol. 539 ®1999 Materials Research Society

hot rolled and cold rolled strips, the specimens were heat treated at 1000 °C for 3 min and afterwards air cooled to room temperature (RT).
RESULTS AND DISCUSSION
As a result of quasi-static tensile tests at different temperatures between RT and 800 °C, Figure 1 shows the tensile elongation, the 0.2% yield strength and the ultimate tensile strength of FeCr20A15 as a function of testing temperature. While the material shows a good ductility at RT (total elongation -20 %), the total elongation is reduced in the temperature range around 400 °C to -14 %. Specimens which were deformed to fracture in this temperature range show the presence of transgranular cleavage cracks within the grains (Figure 2a). The fracture surface is characterized by small cleavage areas which are embedded in a dimpled structure (Figure 2b). This mixed appearance is typical for specimens which have been deformed at temperatures between 325 °C and 450 °C. Tensile tests were also carried out at RT on specimens which had been aged at 400 °C for 2d. In this special state, no reduction of elongation could be found with respect to the original condition. This result indicates that the underlying mechanism, which is responsible for the embrittlement, can take place only in combination with plastic deformation around 400 °C.
dt/dt = 0.000024/s; FeCr20AI5
0 100 200 300 400 500 600 700 800 900
Testing temperature [°C]
Figure 1: Effect of testing temperature on tensile properties of FeCr20A15
Impact bending tests at RT on specimens which had been heat treated at temperatures between 900 °C and 1200 °C for 10 min show strongly varying impact strength values. The impact strength depends to a high degree on the cooling rate between annealing temperature and RT. Figure 3 clearly indicates that the highest values of the impact strength are reached after air cooling, while those specimens which have been cooled at low rates (furnace cooling, 50 °C/h) and high rates (water quenching) show small values, especially for high annealing temperatures. These results can be interpreted only by assuming that two different mechanisms are responsible for the reduced ductility after high temperature heat treatments. In contrast to the results of the impact bending test, which had been carried out on specimens machined from hot rolled strips, tensile tests at RT on recrystallized cold rolled specimens
42

■r!!i*J A -4,:i'*0
Figure 2: Etched cross-section (a) and fracture surface (b) of a tensile specimen deformed to fracture at a temperature of 425 °C (FeCr20A15)
T = RT; FeCr20AI5 (Annealing time: 10 min)
160 -■ ■ Water quenching (Q) ■ Air cooling (AC) • Furnace cooling (FC, 50 DC/h) IS (J/cm>]
1000
T[°C] "00
900 1000 1100 1200
Annealing temperature T [°C]
Figure 3: Impact strength at RT as a function of annealing temperature and cooling rate (FeCr20A15)
showed no loss in ductility after high temperature heat treatments in combination with high cooling rates. The embrittling effect after low cooling rates, however, could be confirmed. The results concerning the total elongation and the ultimate tensile strength given in Figure 4 represent tensile tests on specimens which were furnace cooled (50 °C/h) from 1100 °C (1 h) and subsequently water quenched at different temperatures between 600 CC and 1000 °C. As it can be taken from Figure 4, a steep decrease in total elongation can be found between 900 °C (state I) and 800 °C (state H), which indicates clearly that the embrittling mechanism during slow cooling takes place within this temperature range. A cross-cut through the fracture region shows a highly deformed microstructure in state I (Figure 5a), while transgranular cleavage and a highly twinned microstructure can be recognized in state n. Further experiments, which are not described here, showed, that the embrittled state could be removed by an additional heat treatment at temperatures above 900 °C in connection with rapid cooling to RT. Efforts to produce the embrittled state only by annealing the specimens within the temperature range between 900 °C
43

and 800 °C failed. Thus the conclusion was drawn that the mechanism responsible for the loss in ductility only takes place during continuous cooling.
de/dt = 0.000024/s; T = RT; FeCr20AI5
50 100500 600 700 800 900 1000 1100 1200
Quenching temperature [°C]
Figure 4: Tensile elongation and ultimate tensile strength at RT after slow cooling from 1100 °C (1 h) and subsequent water quenching at the given temperature (FeCr20A15)
|1.0.4mny..c
af'"''
• • -V-.L,,-«,,
ÖAmrr)
b)
Figure 5: Etched cross section through the fracture region of tensile specimens after slow cooling from 1100 °C (1 h) and subsequent water quenching at (a) 900 °C (ductile state) and (b) 800 °C (embrittled state) (FeCr20A15)
To summarize the mechanical results, three important aspects have to be emphasized: Fe-Cr-Al- alloys undergo significant embrittlement during plastic deformation in the temperature range of 400 °C as well as as a result of cooling from high annealing temperatures at very low or very high cooling rates. In the following section, possible reasons for this behavior will be discussed in the view of some additional observations. Careful metallographic examinations did not yield direct information about microstructural reasons for the evolution of transgranular microcracks during deformation around 400 °C. The development of ordering was excluded by TEM diffraction patterns in the case of FeCr20A15. By electrical resistivity measurements, the formation of the so-called K-state [2] could be observed
44

following aging up to 300 °C. This temperature, however, is too low to explain the loss of ductility around 400 °C. During aging at 400 °C, the electrical resistivity of FeCr20A15 decreases continuously even after aging times above 140 h. In agreement with [3,4] it is assumed that the underlying aging process is the precipitation of a Cr-rich alpha'-phase which stems from the binary alloy system FeCr due to the existence of a wide miscibility gap. This process leads to the formation of a very fine-scaled microstructure which affects the mechanical behavior to a high degree, but develops extremely slow. It is reported that the size of the Cr-rich zones is around 22 nm after aging for 34.000 h at 475 °C [5]. The reason why this aging process can lead to embrittlement in the short time during deformation at 400 °C is considered to be the formation of excess vacancies by dislocation climb and intersection [6] which enhance the diffusion process. A verification of this could be found by PAS. During a very slow heating process, the positron lifetime increases in the temperature range between 400 °C and 550 °C and decreases sharply around 600 °C, followed by a second increase due to the formation of thermal vacancies. The first increase is an unexpected result, which can only be interpreted by the demixing process. It could be shown within this study, that the first increase in positron lifetime depends strongly on the concentration of excess vacancies in the original state, which was controlled by cold work. With higher concentrations of vacancies, the increase begins at lower temperature and the maximum value is increased significantly, which gives direct evidence that the demixing process is enhanced by excess vacancies. A TEM study showed that a specimen deformed at 400 °C shows a planar dislocation structure and a high density of dislocation pile-ups, while specimens deformed at RT and 520 °C are characterized by a more cell-like dislocation structure. This observation indicates that dislocation reactions are enabled at RT and 520 °C, but nearly disabled at 400 °C, which can also be explained by the short range clustering process. Corresponding to the work of Gerold and Karnthaler [7], planar slip is favored in alloys which show short range ordering or short range clustering. This is due to the cutting of favorable bonds on glide planes done by the leading dislocations. For the following dislocations, the resistivity on activated glide planes is smaller than on undisturbed ones, which is the reason for the local concentration of dislocations on special glide planes typical for planar dislocation structures. During slow cooling from high annealing temperatures, Fe-Cr-Al alloys undergo a significant loss in ductility in the temperature range between 900 °C and 800 °C. TEM examinations of the embrittled state did not yield any information about the origins of this behavior, e.g. ordering processes. AES analyses, however, showed the formation of Cr-depleted areas (Cr-content -14 wt.%) around the grain boundaries within this temperature range (Figure 6). This could be due to the formation of Cr-rich precipitates at the grain boundaries which, however, could not be experimentally detected. While the reason for the development of Cr-depleted areas in the case of FeCr20A15 is still not clarified, this observation gives a possible explanation for the embrittlement occurring between 900 °C and 800 °C. According to Demo [8], the Cr-depleted zones can undergo a local oc-y phase transformation which may cause large localized stress concentrations. By this mechanism, the grain boundaries should represent barriers to dislocation motion and therefore should explain the evolution of high internal stresses leading to the formation of microcracks. The observed embrittlement after rapid cooling from high annealing temperatures is attributed to the presence of interstitial C+N atoms which have a great influence on the deformation behavior of bcc alloys [9], Literature shows that carbides and nitrides dissolve at temperatures above 950 °C, therefore quenching in water should produce a highly supersaturated solid solution. A significant reduction of the dislocation mobility should enhance the formation of localized stress concentrations and the formation of microcracks on the one hand. The growth of those
45

microcracks should be unlimited if the dislocation mobility is too small to cause blunting and screening of the crack tip and to reduce the stress concentrations on the other hand.
Figure 6: Polished cross-section (a) and Cr-map (b) of a specimen after slow cooling from 1100 °C (1 h) and subsequent water quenching at 800 °C (FeCr20A15)
CONCLUSIONS
Fe-Cr-Al alloys show a good ductility which may be reduced to a high degree under critical conditions. Those conditions are reached during plastic deformation in the temperature range of 400 °C (I) as well as after cooling from high annealing temperatures at very low (II) or very high (HI) cooling rates. As reasons for this behavior, an acceleration of a demixing process in the temperature range of 400 CC by excess vacancies (I), the formation of Cr-depleted zones around the grain boundaries in correlation with a local oc-y phase transformation (II) and the production of a supersaturated solid solution with interstitial C+N atoms (III) are discussed.
ACKNOWLEDGMENTS
The financial support by the 'Bundesministerium für Bildung, Wissenschaft, Forschung und Technologie' is gratefully acknowledged.
REFERENCES
[1] J. Klöwer, A. Kolb-Telieps, M. Brede, in Metal Supported Automotive Catalytic Converters, edited by H. Bode (Werkstoffinformationsgesellschaft, Oberursel, 1998), p. 33
[2] H. Thomas, Z. Metallkde. 41, 185 (1950). [3] W. S. Spear, D. H. Polonis, Metall, and Mat. Trans. A 25, 1135 (1994). [4] R. O. Williams, H. W. Paxton, J. Iron Steel Inst. 185, 358 (1957). [5] R. M. Fisher, E. J. Dulis, K. G. Carroll, J. Metals 5, 690 (1953). [6] F. R. N. Nabarro, Theory of Crystal Dislocations (Dover Publications, New York, 1987),
p. 381. [7] V. Gerold, H. P. Karnthaler, Acta Metall. 37, 2177 (1989). [8] J. J. Demo, Corrosion 27, 531 (1971). [9] B. Sestäk, A. Seeger, Z. Metallkde. 69, 355 (1978).
46

Part II
Continuum Dislocation, Contact, and Cohesive Zone Models

EFFECT OF CRACK BLUNTING ON THE DUCTILE-BRITTLE RESPONSE
OF CRYSTALLINE MATERIALS
D.M.LIPKIN,* G.E.BELTZ," and L.L.FISCHER" 'Physical Metallurgy Laboratory, GE Research & Development Center, Niskayuna, NY 12309 "Department of Mechanical and Environmental Engineering, University of California, Santa Barbara, CA 93106-5070
ABSTRACT
We propose a self-consistent criterion for crack propagation versus dislocation emission, taking into account the effects of crack-tip blunting. Continuum concepts are used to evaluate the evolving competition between crack advance and dislocation nucleation as a function of crack- tip curvature. This framework is used to classify crystals as intrinsically ductile or brittle in terms of the unstable stacking energy, the surface energy, and the peak cohesive stresses achieved during opening and shear of the atomic planes. We find that ductile-brittle criteria based on the assumption that the crack is ideally sharp capture only two of the four possible fracture regimes. One implication of the present analysis is that a crack may initially emit dislocations, only to reinitiate cleavage upon reaching a sufficiently blunted crack-tip geometry.
INTRODUCTION
Ductile versus brittle behavior of crystalline materials is among the least understood of the fundamental mechanical phenomena in materials science. The conventional procedure for applying continuum-based theories to predict the mechanical response of cracked bodies is to assume that the crack is atomically sharp, then to analyze how the body responds to an applied load. Rice and Thomson [1] instituted this approach by comparing the load required to propagate the crack with the load necessary to emit a dislocation on a slip plane inclined to the crack plane and intersecting the crack front (see Figure 1). If dislocation emission occurs at a load lower than that required for crack propagation, then the material is said to be "intrinsically" ductile; otherwise, it is said to be "intrinsically" brittle. This type of physical modeling has evolved considerably over the years to account for factors such as nonlinear defect core structures, realistic slip systems, and three-dimensional dislocation configurations [2]; however, the role of crack blunting when dislocation emission initially occurs has received extremely limited attention [3-7]. Atomistic studies [4,5] agree on one major point: the favorability of crack advance versus dislocation emission can change when the crack tip blunts. Therefore, a crystal should not be classified as intrinsically ductile or brittle based on the emission of the first dislocation.
Presently, we consider the ongoing competition between crack propagation and subsequent dislocation nucleation as the crack-tip curvature evolves toward steady state. We identify the key material parameters that govern the outcome of this competition, allowing a reassessment of the fundamental ductile-brittle response of crystalline materials.
49 Mat. Res. Soc. Symp. Proc. Vol. 539 ® 1999 Materials Research Society

J1'
crack plane
(a)
(b) (c)
Fig.l Dlustration of the competition between dislocation emission and cleavage decohesion at an initially sharp crack tip with an intersecting slip plane, (a) The starting crack configuration leads to either (b) crack-tip bond rupture or (c) dislocation emission and consequent crack-tip blunting.
MODEL
We first consider crack propagation. According to the Griffith theory [8], a sharp crack will advance when the applied energy release rate, b, attains 2ys, the energy per unit area required to create two free surfaces. Formally, b is the rate of decrease of stored elastic energy in the system per unit area of crack advance, b scales directly with the intensity of loads applied to the body and is related to the stress intensity factor, K, by the Irwin relation [9]
A (1)
(I-V2)K
2
where E is Young's modulus and v is Poisson's ratio. For illustration, we consider pure mode I loading, wherein the symmetry of the applied load is such that the crack faces tend to open rather than shear against one another (the formalism can readily be extended to mixed-mode loading). The material parameter 2ys is graphically depicted in Figure 2 as the area under the stress versus displacement curve for the atomic planes undergoing separation during the fracture process. In the Griffith theory, the critical applied load for fracture does not depend on Op, the maximum of the stress vs. separation curve, but only on the area underneath it. This lack of dependence on cp is also borne out by cohesive zone models [10].
We envision a crack that is capable of blunting on the atomic scale in response to the applied load. The crack-tip blunting can represent either purely elastic deformation or dislocation emission on slip planes intersecting the crack front. A slender elliptical slit is used to approximate the blunting crack (Figure 2). The approximation of the crack as an ellipse not
50

Fig.2 The blunted crack configuration is approximated as an elliptical slit having a major axis of length 2a and a minor axis of length 2b. The crack-tip curvature is p=b2/a. On the crack plane, the opening displacement, Aopen. adheres to a traction-separation law, c(Aopen). schematically illustrated in (a). Along the slip plane inclined by an angle 0 to the crack plane, the slip displacement, ASIJP, adheres to the Peierls-like relationship, T(ASI;P),
illustrated in (b). 2ys and yus correspond to the areas under the opening and shear traction curves, respectively.
only makes our calculations tractable, but it also introduces a length scale, p (radius of curvature of the tip), into the analysis. The elliptical crack-tip profile represents a drastic departure from the sharp corner (and its associated stress singularity) that would result, from a continuum viewpoint, when dislocations emit along a single slip plane (e.g., Figure lc). The angled crack tip (which does retain a sharp corner) has received some attention in the literature, notably from Schi0tz et al. [4]. However, atomistic simulations by Gumbsch [5] suggest that, at the atomic scale, it makes little sense to exploit a shape that contains a stress singularity in the continuum description.
We now consider an infinite, two-dimensional, solid containing an elliptical cut-out having a major axis of length 2a and a minor axis of length 2b (Figure 2). A remote tensile stress of magnitude o. is applied perpendicular to the major axis. The radius of curvature at the

2 tip, p, is equal to b /a. The elasticity solution for this problem, given by Inglis [11] and Muskhelishvili [12], predicts that the stress at the crack tip is
( °tip=cUl + y l = o„ (2)
Assuming the crack is not sharp (and thereby departing from the Griffith theory), we impose the condition that the crack propagates in a brittle fashion when the local stress given by Equation (2) achieves the cohesive strength of the solid, op. To a remote observer who sees the cut-out simply as a finite crack, the stress intensity factor is Kj = c^Vita [13]. Combining Equations (1) and (2) and solving for the critical energy release rate leads to
nop rcgpP ■"cleave- , Nj ~ 4g, (3) /
E' Vä 7p.
where E' = E/(l-v2) for plane strain. We have used the approximation in Equation (3) that p«a, i.e., the crack is of some macroscopic, "laboratory" dimension, while p is of atomic dimension. Although Equation (3) is linear in p, it is expected to break down as p approaches zero. In order to maintain a finite toughness in the ideally sharp crack limit, the Griffith theory must prevail as p becomes vanishingly small. For p approaching zero, the applied energy release rate for crack advance must approach the Griffith limit, 2ys. For larger values of p, ^cleave should asymptotically approach the straight line given by Equation (3). This is indicated schematically in Figure 3. The transition zone between the two limits has been assumed to be smooth. However, detailed mechanical analyses of the exact form of Acieavc(p)> using realistic relations to represent the stress vs. separation curves of Figure 2, are in progress, and initial results confirm the basic behavior indicated in Figure 3 [14].
The crossover curvature, below which blunting effects are superseded by the Griffith
limit, is 87sE'/7tOp. This crossover appears to be consistent with atomistic results given by
Schi0tz et al. [4] and Gumbsch [5], who found that only moderate increases in crack initiation load above the Griffith limit are noted for slight excursions from an ideally sharp crack tip. In the latter study, more significant increases in the failure thresholds were noted for significantly blunter cracks.
Dislocation nucleation follows an analogous treatment to that presented for cleavage. Recently, Rice and coworkers [15,16] provided an analysis of the threshold load for dislocation nucleation. They considered a slip plane intersecting a sharp crack. The slip plane was taken to obey an interplanar potential associated with rigid block sliding in a homogeneous lattice (Figure 2). The principal result is that the critical applied b (the prevailing energy release rate if the crack were to move as a classical singular crack, without a shear or decohesion zone at its tip) associated with dislocation nucleation is
52

Adisl=n 8YoT- 2 =sfß)yw (4) (l +cos 9) sure
where 6 is the inclination of the slip plane with respect to the crack plane. Equation (4) assumes the Burgers vector lies completely within the plane of Figure 2 (i.e. has no component parallel to the crack front) and overestimates Adisi for 9 > 0 because it ignores shear-tension coupling (i.e., the effects of tension normal to the slip plane) and uses an approximate stress solution on inclined slip planes [15-17]. The crack-tip shear stress, a,6, along the inclined slip plane is given approximately by
~o sin 9 cos 6 (5)
which is essentially Equation (2) scaled by the appropriate Schmidt Factor. Equation (5) is valid for slip plane inclination angles up to about 70°, beyond which the equation breaks down because the maximum shear stress does not occur directly at the crack tip. Equating (5) with the peak shear stress, tp, and solving for the critical applied energy release rate for dislocation nucleation gives
TtTpP " disl ~ T T~ (6)
4E'sin29cos29
Although Adisi scales linearly with p, the relation must not be interpreted physically for p
approaching zero, whereupon the dislocation nucleation criterion is given by Equation (4). The transition in Adisi from Equation (4) to Equation (6) is again assumed to be smooth, as shown in
Figure 3. The crossover crack-tip curvature is approximately 32y usE'cos 9 / TIT2
, (1 + cos9).
DISCUSSION
Based upon the threshold criteria derived above, we can now differentiate between an intrinsically ductile and an intrinsically brittle crystal. Imagine a material with an initially sharp crack. Knowing the parameters 2ys, yus, Gp, and xp (and elastic moduli), plots of j&disi and Acleave vs. p can be constructed, which can follow one of only four possibilities, as indicated in Figure 3:
Case (i): As depicted in Figure 3(a), 2ys is less than g(6)yus, and c?p is less than Tp/sin9cos9. When the material is loaded, the crack advances by crack-tip cleavage. Because the condition for dislocation nucleation is never satisfied, no blunting (aside from the elastic relaxation, pei) occurs, and we classify this material as intrinsically brittle. Many ceramics below their ductile-to-brittle transition temperature and glasses below their glass transition temperature would be expected to fall under this category.
Case(ii): As depicted in Figure 3(b), 2ys is less than g(9)yus, but ap is greater than Tp/cos9sin9, giving rise to a crossover between Adisl(p) and Acieave(p)- However, cleavage is
53

favored over dislocation nucleation, and an initially sharp crack remains sharp. This material is intrinsically brittle; however, it is evident that a pre-existing, sufficiently blunt crack could sustain ductile behavior and continue to blunt. The latter behavior is, however, metastable, as a perturbation in the local crack-tip curvature could cause it to spontaneously sharpen and proceed to extend via cleavage.
b\ i , "disl ideal
cleavage •
• • "^cleave
g(6)Yus — ••■' f, *
2ys 1 ►
Pel
bl i h ' ^cleave ideal cleavage
,•' ^^^
\,
)Yus
2y. -••••' persistent blunting
i —► Pel
(a) (b)
b> k .' b # ^cleave persistent
blunting
2Ys
(6)Yus
• • •'' "^
►
2Ys g(6)Y„s
blunt-tip cleavage
Pc
..••' k,
(c) (d)
Fig.3 Four possible fracture regimes are anticipated by the present model, (a) Ideal cleavage, characterized by a Griffith fracture criterion and near-zero tip curvature, occurs when 27s<g(9)Yus and ap<Tp/sin9cose. (b) Ideal cleavage with a metastable blunting regime occurs when 2ys<g(0)yus and a-p>Tp/sin6cos6. The metastable regime is marked by the ability of a pre-blunted crack to continue blunting by persistent dislocation emission although sharp-tip cleavage is the more stable configuration, (c) Persistent blunting, characterized by repeated dislocation emission and consequent crack-tip blunting, occurs when 2Ys>g(6)Yus and rjp>Tp/sin6cos9. (d) Blunt-tip cleavage, characterized by the cleavage of a finite-blunted crack, occurs when 2ys>g(9)Yus and ap<Tp/sin9cos0.
54
Case(iii): As depicted in Figure 3(c), g(9)Yus is less than 2ys and Tp/sin9cos6 is less than dp. Now, dislocation nucleation is the preferred response to applied load. As the crack blunts and p continues to increase, Adisi remains less than Acieave, and persistent dislocation nucleation remains the preferred mode. Therefore, the material is classified as intrinsically ductile. Most fee metals at room temperature are expected to fall under this regime.
Case(iv): As in the previous case, g(6)yus is less than 2ys, and initial dislocation nucleation is preferred. However, Tp/sin9cos8 is greater than 0p and crossover occurs at a critical value of p, as shown in Figure 3(d). Therefore, when the crack tip blunts to a critical radius of curvature, cleavage becomes energetically more favorable than dislocation nucleation and the crack advances. This behavior is representative of what is believed to occur in some bec metals and at certain metal-ceramic interfaces.
Although the present model extends our ability to predict the competition between cleavage and blunting beyond the first dislocation emission event, a number of issues remain to be resolved. The motion of surrounding dislocations in the crystal is not accounted for in this treatment, nor are three-dimensional aspects associated with dislocation nucleation on "oblique" slip planes that intersect the crack tip at a point rather than along a line. For the cases described above, in which dislocations are emitted from the crack tip, the applied energy release rates should rigorously be interpreted as those based on the local, or screened, crack-tip field, which can differ from the macroscopic field due to other dislocations, crystalline anisotropy, and various other local heterogeneities. Although emitted dislocations are assumed to be swept sufficiently far away that we may ignore these shielding effects, the importance of external dislocations and plastic dissipation on the ductile versus brittle competition have been shown to play a critical role in the actual applied loads necessary to maintain the "local" loads described in this paper [18-22]. This notion can be exploited to predict the macroscopic fracture toughness, as well as to explain the large dependence of ductile vs. brittle fracture energies on temperature, for example in [22].
Much work has been done on correlating Yus and 2ys with observed fracture processes, especially in the area of numerical simulations of fracture. The present model highlights the relevance of the traction law parameters op and xp. The determination of peak tensile stresses (e.g., in the spirit of Rose et al. [23]) and peak shear stresses (e.g,. as in the work by Cleri et al. [17]) and their role in the ductile versus brittle behavior of crystals should be assessed in future simulations and experiments on fracture.
REFERENCES
1. J. R. Rice and R. Thomson, Philos. Mag. 29, 73 (1974).
2. G. Xu, A. S. Argon, and M. Ortiz, Philos. Mag. A 75, 341 (1997).
3. G. J. Dienes and A. Paskin, J. Phys. Chem. Solids 48, 1015 (1987).
4. J. Schi0tz, L. M. Canel, and A. E. Carlsson, Phys. Rev. B 55, 6211 (1997).
55

5. P. Gumbsch, J. Mater. Res. 10, 2897 (1995).
6. G. E. Beltz and L. L. Fischer, Philos. Mag. A, in press (1998).
7. J. Weertman, in High Cycle Fatigue of Structural Materials, edited by W. O. Soboyejo and T. S. Srivatsan (The Minerals, Metals, and Materials Society, 1997) pp. 41-48.
8. A. A. Griffith, Philos. Trans. R. Soc. London A 221, 163 (1920).
9. G. R. Irwin, J. Appl. Mech. 24, 361 (1957).
10. J. R. Rice and J.-S. Wang, Mater. Sei. Eng. A 107, 23 (1989).
11. C. E. Inglis, Trans. Institution of Naval Architects 55, 219 (1913).
12. N. I. Muskhelishvili, Some Basic Problems on the Mathematical Theory of Elasticity: Fundamental Equations, Plane Theory of Elasticity, Torsion and Bending (Noordhoff, 1975).
13. H. Tada, P. C. Paris, and G. R. Irwin, The Stress Analysis of Cracks Handbook (Del Research Corporation, St. Louis, 1985).
14. G. E. Beltz, D. M. Lipkin, and L. L. Fischer, Appl. Phys. Lett, in press (1999).
15. J. R. Rice, J. Mech. Phys. Solids 40, 239 (1992).
16. Y. Sun, G. E. Beltz, and J. R. Rice, Mater. Sei. Eng. A 170, 67 (1993).
17. F. Cleri, S. Yip, D. Wolf, and S. R. Phillpot, Phys. Rev. Lett. 79, 1309 (1997).
18. J. Weertman, Ada Metall. 26, 1731 (1978).
19. R. Thomson, J. Mater. Sei. 13, 128 (1978).
20. G. E. Beltz, J. R. Rice, C. F. Shih, and L. Xia, Ada Materiala 44, 3943 (1996).
21. D. M. Lipkin and G. E Beltz, Ada Materiala 44, 1287 (1996).
22. D. M. Lipkin, D. R. Clarke, and G. E. Beltz, Ada Materiala 44, 4051 (1996).
23. J. H. Rose, J. R. Smith, and J. Ferrante, Phys. Rev. B 28, 1835 (1983).
56

EFFECT OF CRACK GEOMETRY ON DISLOCATION NUCLEATION AND CLEAVAGE THRESHOLDS
L.L. FISCHER and G.E. BELTZ Department of Mechanical and Environmental Engineering, University of California, Santa Barbara, CA 93106
ABSTRACT
A continuum model based upon the Peierls-Nabarro description of a dislocation ahead of a crack is used to evaluate the critical mode I loading for dislocation nucleation at the tip of a finite, pre-blunted crack. A similar approach is used to evaluate the critical mode I loading for atomic decohesion. Results are presented for various crack tip root radii (a measure of bluntness), for several crack lengths. It is shown that increasing the crack length increases the critical energy release rate for both material behaviors. Increasing the bluntness of a crack tip always increases the required loading for atomic decohesion but nucleation thresholds are initially decreased by very small increases in crack tip bluntness. Nucleation thresholds are later increased after reaching significant crack tip blunting. Implications for ductile versus brittle competition are discussed by comparing the ongoing competition between these two different material behaviors.
INTRODUCTION
In 1974, Rice and Thomson [1] presented their well-known continuum model for quantifying the competition between dislocation nucleation and atomic decohesion. The basic approach was to evaluate the critical energy release rate of cleavage, given by the Griffith criterion, and to evaluate the critical energy release rate for the emission of a dislocation on a slip plane intersecting the crack tip [2]. The event possessing the lowest critical energy release rate was predicted to be the dominant outcome. Emission of a dislocation implied that the material would continue to emit dislocations thus shielding the stress singularity and preventing further brittle fracture. In contrast, if cleavage was predicted, brittle fracture would persist. The major grievances with the Rice-Thomson model are that it generally only provides a qualitative prediction of the material behavior, it does not address the actual nucleation event but instead calculates the energy to move a well developed dislocation, it uses a vaguely defined core cut-off parameter as the equilibrium formation position, and the model always assumes a perfectly sharp crack.
Rice [3] addressed several of these problems when he presented a model that utilized a Peierls-Nabarro [4,5] dislocation description. Assuming a periodic relationship between the shear stress and slip displacement along a slip plane intersecting the crack tip, this model solves for a distribution of infinitesimal slip displacement that results from far field loading using a nonlinear integral equilibrium equation. Eventually, an instability is reached and the integral equation can no longer be solved for increased applied loading. This instability marks the nucleation of a dislocation from the crack tip. The efforts of many groups have continued to build upon and improve methods for evaluating the critical energy release rate of dislocation nucleation [6,7], but the sharp crack assumption is still universally adopted as the incipient dislocation forms.
Results from various groups in the atomistic community suggest that crack tip geometry can have a substantial quantitative effect on the energies of nucleation and cleavage [8,9,10,11]. Physically speaking, an atomically sharp crack is rare, and this is motivation enough to study the effects of crack geometry using continuum analyses. This paper examines the effects of crack tip blunting and crack length on the critical mode I loading for edge dislocation nucleation and atomic decohesion at the tip of a pre-blunted crack.
THEORY
To study the effect of crack geometry, an elliptically shaped crack is used as shown in Figure 1. Prescribing the major and minor axes of the ellipse defines a crack length and a crack tip root radius of curvature, p=d2/a, at the tip of the ellipse thereby approximating a blunt crack configuration.
57 Mat. Res. Soc. Symp. Proc. Vol. 539 • 1999 Materials Research Society

Figure 1. Elliptical crack geometry with crack front and slip plane.
For dislocation nucleation, the elliptical crack is subjected to mode I loading and the equilibrium integral equation is solved for the slip distribution along the slip plane inclined at angle 0.
i[6(r)] = oIo(r)-iJ"o^f(r,S)gds (1)
The first term in the integral equation represents the periodic relationship between shear stress and slip displacement which is for the sake of simplicity given by the Frenkel sinusoidal function [12],
where x is the shear stress, A is the relative atomic displacement between two atomic planes, h is the interplanar spacing of those two planes, and b is the Burgers vector. A term known as the unstable stacking energy, ym, is given by H.b2/27t2h. To obtain the slip displacement occurring on the slip plane as opposed to that occurring between the two atomic planes we use a technique developed by Rice [3]. The extrapolation of A to an imaginary cut halfway between the slipping planes is given by
o(r) = A(r)-Ä (3)
The remaining terms of Equation (1), a^, the applied shear stress along the slip plane, and 0"r6
self, the dislocation self shear stress must be solved for the elliptical crack geometry. In order to solve for the shear stress along the slip plane due to mode I loading a conformal mapping is used where the ellipse of the z plane will be mapped to a unit circle in the £ plane:
a + dV fa-dM I „ m %+ VHv = RK+ 2 r \ 2 K v u (4)
where R=(a+d)/2 and m=(a-d)/(a+d). First consider a plane with no crack or hole subject to tensile loading a in the vertical direction. For this case, the principal axes stress components are Oyy=G, and 0^=0=0. Assume the complex potentials are of the form:
<3>(z) = (a + iß)z, 4/(z) = (y + i5)z (5)
where i=V-T and a, ß ,y , and 8 are real. Employing the relationship between the complex potentials and the principal axes stress components:
Gxx + °yy = 2(*'(z) + *'(z)) = a = 2(a + iß + a - iß) = 4a (6)
ayy - CTXX + i2axy = 2(z*"(z) + 4"(z)) = a = 2(y + i5) = 2y + i28. (7)
58

From Equations 6 and 7, oc=cj/4, we may arbitrarily set ß=0, Y=O"/2 and 8=0. To solve for the image terms due to the elliptical hole, the potentials for no hole are transformed to the £ plane and substituted into the following Cauchy integrals where the contour, K, lies on the unit circle of the £ plane [13,14]. These integrals arise from the traction free boundary conditions at the elliptical surface, combined with subsequent analytic continuation arguments.
^® = i{k+F7t3^) + ^) C(l-mC2) ■d?
1
'l + mi;2)
C^-^H *;m(0
(8)
(9)
Using the method of residues and evaluating for the pole at £=0 solves for the complex potential image terms. The final complex potentials for a plane with an elliptical hole are given by the sum of the original complex potentials and the image terms. The derivatives of the complex potentials with respect to z are found using the chain rule and these values are then used as in Equations 6 and 7 to find the stress field. The stress field can then be rotated to solve for the resolved shear stress along the activated slip plane.
Once the stress field for a mode I loaded elliptical hole has been solved, the values can be compared for asymptotic convergence to well known solutions for sharp cracks [15] and circular holes [16]. To compare the atomically sharp crack solution to an extremely sharp elliptical solution we must choose a crack length (the major axis) and a crack tip curvature. For this case we will use a/b=10,000 and p/b=0.01 which translates to a minor axis of 2d/b=20. Figure 2a compares the shear stress values for a sharp crack and a sharp ellipse along a slip plane inclined at 6=60°. Similarly, Figure 2b compares the cre component for slip along 6=60° for a circular hole and a nearly circular ellipse, using a/b=10 and p/b=9.99.
o „ Applied Comparison 6 = 60° O" Applied Comparison 0 = 60°
0 0.02 0.04 0.06 0.08 0.1 r/b
0 0.1 0.2 0.3 0.4 0.5 r/b
Figure 2 (a) Sharp crack and slender ellipse shear stress comparison, (b) Circular hole and nearly circular ellipse shear stress comparison.
In both cases, the elliptical solutions match the asymptotic solutions very well with the expected exception of the stress singularity at the sharp crack tip. Elliptical solutions will always produce finite stress values at the crack tip.
Solving for the dislocation self stress is done following the exact same steps as used to solve for the applied stress solutions. Of course, there is a different set of original complex potentials for a dislocation in a continuum [13] but finding the image terms and the resolved shear stress is done using exactly the same procedures. The dislocation self stress was also checked for asymptotic convergence to the sharp crack [17] and circular hole [18] solutions and proved once again to make excellent matches. Now that each term in the equilibrium equation has been verified,
59

the integral equation itself must be solved for incrementally increasing slip distribution due to incrementally increasing applied loads. The nonlinear integral equation (Equation 1) is rewritten as a summation using a Guass-Chebyshev substitution and is then solved using a numerical procedure similar to that of Beltz [17].
RESULTS
As previously described, an instability is reached while solving for an incrementally increasing distribution of slip displacement along the slip plane. The stress at which the instability occurs is taken as the critical energy release rate of dislocation nucleation. Figure 3 shows the critical energy release rates for varying values of crack length and crack tip root radius for a slip plane inclined at 9=60°. The energy release rates have been normalized by the product |xb, and the crack lengths and curvatures are normalized by the Burgers vector.
Critical Energy Release Rate of Nucleation 0 = 60°
Figure 3. Critical energy release rates of dislocation nucleation for varying a/b and p/b.
The results clearly show that increasing the bluntness of crack tip at very small radii of curvature decreases the threshold for dislocation nucleation, but at larger radii of curvature, the threshold increases. It is also clear that increasing the crack length increases the threshold for dislocation nucleation.
Solving for the critical energy release rate of atomic decohesion can be done completely by analogy to the dislocation nucleation solution procedure, by assuming an infinitesimal distribution of opening displacement running along the elliptical crack front develops under applied loading. The applied stress and dislocation self stress solutions are now the vertical tensile components of the stress solutions. The opening stress vs. opening displacement relationship is given by
, zM a[A(r)] = ^A(r)e L (10)
where ys is the surface energy and L is the opening displacement at the peak of the stress- displacement relationship. This formula must also be expressed in terms of 5, the displacement occurring at the plane of the crack front in order to solve the integral equilibrium equation expression. Varying the crack length and crack tip root radius demonstrates the effect of the two crack tip geometry parameters on the critical energy release rate of atomic decohesion (Figure 4).
60

0.9
0.8
0.7
0.6
G/u.b 0.5
0.4
0.3
0.2
0.1
Critical Energy Release Rate of Decohesion
-p/b = 0.001 -p/b = 0.1 -p/b= 1 -p/b = 3 -p/b = 5 -p/b = 10
Figure 4. Critical energy release rate of atomic decohesion for varying a/b and p/b.
The results show that increasing the crack tip root radius increases the threshold for atomic decohesion and increasing the crack length increases the threshold for atomic decohesion.
The results of these two calculations have implications for the theoretical study of ductile vs. brittle material behavior. The results of nucleation and decohesion calculations can be compared on the same plot for a given long crack length. Several material property parameters can be varied to observe different energetic favorabilities. In this case we have used a major axis or crack length of 20,000 Burgers vectors. Comparing the critical energy release rates for varying crack tip curvatures reveals the energetic favorability of the two processes.
Energy Release Rate Comparison 6 = 60°, L/b = 0.3, Y /2y =0.15 7 ' 'ns 's
G/u.b
Energy Release Rate Comparison 0 = 40°, L/b = 0.3, y /2y = 0.4
G/p,b
0 20 5 10 15 20 0 5 10 p/b p/b
Figure 5. A comparison of dislocation nucleation and atomic decohesion for a long crack length (a/b=10,000). (a) Intrinsically ductile (b) Quasi-brittle
In Figure 5a the ratio of the unstable stacking energy to the surface energy is fairly low which is indicative of ductile materials. Furthermore, the slip plane is inclined at 9=60° which is an energetically favorable inclination for dislocation nucleation under mode I loading. Accordingly,
61

the graph shows that dislocation nucleation is always favorable to atomic decohesion for all values of crack tip root radius resulting in intrinsically ductile material behavior. In Figure 5b the ratio of the unstable stacking energy to the surface energy has been increased to simulate a more brittle material and the inclination of the slip plane has been decreased to 0=40° which is not as conducive to dislocation nucleation for extremely sharp cracks. This combination results in a quasi-brittle material behavior. That is, a fairly sharp crack (p/b<4) will continue to be sharp but initially blunt crack configurations may blunt further by dislocation nucleation along the activated slip plane.
CONCLUSIONS
A continuum model based upon the Peierls-Nabarro description of a dislocation ahead of a crack has shown that crack geometry may have a significant effect on the material fracture behavior. Increasing the length of a crack will increase the thresholds for dislocation nucleation and atomic decohesion while increasing the bluntness of a crack will increase the threshold for decohesion but may decrease or increase the threshold for dislocation nucleation depending on the magnitude of initial blunting of the crack tip. Furthermore, the results for dislocation nucleation and atomic decohesion may be directly compared to ascertain the favorability of the two behaviors for varying crack lengths and crack tip root radii. This observation provides a means of studying ductile versus brittle competition with consideration of crack tip geometry.
ACKNOWLEDGMENTS
This research was supported by the National Science Foundation under award number CMS- 9634647 and INT-9707863.
REFERENCES
1. J. R. Rice and R. Thomson, Phil. Mag. 29, p. 73 (1974). 2. D.D. Mason, Phil. Mag. 39, p. 455 (1979). 3. J. R. Rice, J. Mech. Phys. Solids 40, p. 239 (1992). 4. R. E. Peierls, Proc. phys. Soc. 52, p. 23 (1940). 5. F. R. N. Nabarro, Proc. phys. Soc. 59, p. 256 (1947). 6. J. R. Rice, G. E. Beltz, and Y. Sun, "Peierls Framework for Dislocation Nucleation from a Crack tip," in Topics on Fracture and Fatigue ed. A. S. Argon (New York: Springer-Verlag, 1992), p. 1. 7. G. Xu, A. S. Argon, and M. Ortiz, Phil. Mag. A 72, p. 415 (1995). 8. P. Gumbsch, J. Mater. Res. 10, p. 2897 (1995). 9. P. Gumbsch and G. E. Beltz, Modelling Simul. Mater. Sei. Eng. 3, p. 597 (1995). 10. J. Schi0tz, A. E. Carlsson, L. M. Canel, and R. Thomson, Mat. Res. Soc. Symp. Proc. 409, p. 95 (1996). 11. J. Schi0tz, L. M. Canel, and A. E. Carlsson, Phys. Rev. B 55, p. 6211 (1997). 12. J. Frenkel, Z. Phys 37, p. 572 (1929). 13. V. Vitek, J. Mech. Phys. Solids, 24, p. 67 (1975). 14. N.I. Muskhelishvili, Some Basic Problems on the Mathematical Theory of Elasticity: Fundamental Equations, Plane Theory of Elasticity, Torsion and Bending (Noordhoff, 1975), p. 347. 15. H. Tada, P. C. Paris, and G. R. Irwin, The stress Analysis of Cracks Handbook (Del Research Corporation: St. Louis, 1985), p. 1.4b. 16. S. P. Timoshenko and J. N. Goodier, Theory of Elasticity (McGraw-Hill, Inc.: New York, 1987), p. 90. 17. G. E. Beltz, Ph.D. Thesis, Division of Applied Sciences, Harvard University, Cambridge, Massachusetts, (1992). 18. J. Dundurs and T. Mura, J. Mech. Phys. Solids 12, p. 177 (1964).
62

DISLOCATION EMISSION FROM A THIN-FILM-COVERED CRACK
Tong-Yi Zhang *, Cai-Fu Qian, Tianhong Wang and Pin Tong Department of Mechanical Engineering, Hong Kong University of Science and Technology, Clear Water Bay, Kowloon, Hong Kong, P.R. China. * mezhangt@,ust.hk
ABSTRACT
The present work investigates the effects of a passive film formed during stress corrosion cracking on ductile/brittle fracture behavior, considering the interaction of a dislocation with a thin- film-covered crack under an applied remote load. The dislocation emission from the thin-film- covered crack tip is analyzed, on the basis of the two-dimensional Rice-Thomson model, for screw and edge dislocations. The results show that the nominally critical stress intensity factor for dislocation emission is related to the thin film thickness, the properties of the film and the loading conditions. For a given loading mode and a given crack length, there exists a critical value of the film thickness at which the film does not influence the dislocation emission. When the film thickness is smaller than the critical value, a harder thin film makes the dislocation emission easier and a softer film makes the dislocation emission more difficult. The opposite is also true if the film thickness is larger than the critical value.
INTRODUCTION
Stress corrosion cracking (SCC) occurs in metals with a static stress in the presence of specific environmental conditions. A passive surface film under oxidizing conditions must be present in SCC, and corrosion rates are consequently quite low. All SCC failures have in common a macroscopic appearance of brittleness, in the engineering sense that the ductility of the material is impaired. However, how the macroscopic ductility is diminished at microscopic levels still remains unclear. Many different mechanisms have been proposed to explain the synergistic stress-corrosion interactions that occur at a crack tip, and there are several processes that can contribute to SCC, including anodic dissolution, film growth and cracking, and hydrogen-induced cracking [1-4].
Sieradzki [5], and Sieradzki and Newman [6, 7] proposed a mechanism of film-induced cleavage for SCC based on dislocation-crack interactions. The dislocation emission from a crack tip may become difficult if a thin film with the thickness of several hundred nanometers is formed around the crack tip owing to an anodic process. Also, a thin ductile film may initiate cleavage if the interface between the film and the substrate is coherent and appropriate mismatch strains exist. The model of film-induced cleavage has successfully interpreted their experimental observations [5-7]. In order to put the model of film-induced cleavage on a solid theoretical basis, Zhang and Qian [8, 9] modeled SCC with a thin-film-covered crack under anti-plane deformation by studying analytically the interaction between a screw dislocation and the thin-film-covered crack. Their results [8, 9] indicate that the crack stress field due to the applied load is enhanced by a harder film or abated by a softer film. If the film thickness is much smaller than the crack length, then the stress intensity factor can be simply expressed as the product of the nominal stress intensity factor and the shear modulus ratio. Both the critical stress intensity factors for screw dislocation emission from the crack tip and screw dislocation dipole emission from the interface are greatly influenced by the film stiffness and thickness. Dislocation emission from the crack tip occurs prior to dislocation dipole emission from the interface. Qian et al. adopted the same modeling [8, 9] and studied the interaction of an edge dislocation with a thin-film-covered crack [10]. The results for edge dislocations are similar to those for screw dislocations. The present work focuses on the critical stress intensity
63 Mat. Res. Soc. Symp. Proc. Vol. 539 ° 1999 Materials Research Society

factor for dislocation emission from the thin-film-covered crack tip, studying in more detail the effects of the film thickness in comparison with the crack length on the critical stress intensity factor for dislocation emission.
ANALYSIS AND RESULTS
Fig. 1 Schematic illustration of a thin-film-covered crack under remote loads.
The present study adopts two- dimensional linear fracture mechanics. The thin-film-covered crack is modeled as that the film has an elliptical shape of xf la2 +x]lh2 = 1. Inside the film, there is a crack extending from -c to c along the xx axis with c2 = a2 -h2 [8]. The crack and the film are embedded in an infinite medium under remote loadings, as shown in Fig. 1. The stress fields induced by the applied loads, an edge and a screw dislocation located inside the film are analyzed using conformal mapping [8, 11]. Analytic solutions are obtained for a screw dislocation interacting with a thin-film- cdvered mode IH crack [8], whereas the
solutions are semi-analytic for an edge dislocation interacting with a thin-film-covered mode I and II crack [11], The critical stress intensity factor in the two-dimensional Rice-Thomson model is calculated from the balance between the driving force and the image force at a certain distance from the crack tip [12, 13]. This distance is usually taken to be the size of the dislocation core cut-off, r0.
In this study, we take r0=l b and b is the magnitude of the Burgers vector. Note that both the slip image force and the slip driving force are related to the polar angle of a slip plane. In this study, we discuss two special cases. A pure mode II or III loading drives the dislocation emission along the crack plane (0=0°) and a pure mode I loading may emit dislocation along the 70°-slip plane. If the stress intensity factors are calculated on the assumption of a homogeneous medium, as one'does during SCC testing, they are named nominally critical stress intensity factors (NCSIFs). The following results will concentrate on the NCSIFs for dislocation emission from the thin-film- covered crack tip.
Since the solutions for mode III cracks are analytic, we are able to express the explicit normalized NCSIF by
Km.JKM.e -
l + r + /«(l-r) -yj2frcr"
2 \ R/jh h
KW.e - ' nb
V" r-i T(\-m") + l + m"
(1)
64

0 10 20 30 40
Film thickness ahead of the crack tip a-c(b)
Fig. 2 The normalized NCSIF as a function of the film thickness for mode IE emission.
where u, is the shear modulus of the matrix, T is the ratio of the shear modulus of the film to that of the substrate, m=(a-h)/(a+h), and R=(a+h)/2.
Fig. 2 illustrates the variation of the normalized NCSIFs with the film thickness, a-c, for the shear modulus ratios of r=0.2, 0.5, 2.0 and 5.0. When the normalized NCSIF equals unity, the film has no influence on the dislocation emission. For a small film thickness, e.g., a-c=5b, as can be seen in Fig. 2, the larger the shear modulus ratio (i.e., the harder the film), the smaller the NCSIF. This means that a harder film makes the dislocation emission easier when the film thickness is small, while a soft film makes it more difficult. For a large film thickness, e.g., a- c=50 b, however, the conclusion is just converse to that for a small thickness. There exists a critical film thickness at which the normalized NCSIF equals unity. When the film thickness is less than the critical one, the dislocation emission is easier for a hard film (IM), but more difficult for a soft film (r<l). The opposite is also true when the film thickness is larger than the critical value. Fig. 3 shows the critical film thickness as a function of the shear modulus ratio for the half-crack lengths of c=19,900 b and c=199,000 b. When T=l, there is no solution for the critical thickness. As can be seen in Fig. 3, the critical thickness decreases with increasing T and the critical thickness for c=199,000 b is much larger than that for c=19,900 b at a given shear modulus ratio. This means that if the film is softer than the substrate and the crack is longer, the critical thickness will be larger.
Fig. 3 The critical thickness as a function of the shear modulus ratio for mode HI emission.
Figs. 4(a) and 4(b) illustrate that the NCSIFs increase with the film thickness for T=2, while decreasing with the film thickness for r=0.5. The variation of the NCSIFs with the film thickness is greatly affected by the crack length. For T=2, the NCSIFs for either mode I or mode II emission are higher for the short crack than those for the long crack, and the opposite is also true for r=0.5. The normalized NCSIF for mode I or II emission is larger than unity if T=2 and the film is thicker than a critical value of about 3 b for c=l,000,000 b or about 5 b for c=l,000 b, as respectively shown in Figs. 4(a) and 4(b). The opposite is true, however, when IM). 5. The results indicate that a harder
65

1.5
1.4
1.3
1.2
o°-1.0
0 5 10 15 20 25 30 35
Film thickness ahead of the crack tip a-c(b)
Fig. 4(a) The normalized NCSEF as function of the film thickness for mode I emission.
. . o- O" ""r=2.a'c=i ooo{b)
• #..6
d .&•' f=2.0, r„=Kb)
;=1000000(b) v=v* = 0.3
' .*' ■ A^
. ^ r=0.5, c=1000000(b)
• r=o.5
i. ■ 11
, c=1000(b) ~*
,,,., ........ i ....... .
1.4
1.3
1.2
-1.1 ii ".
fl.0 °« -a
V = v' = 0.3 r0=1(b) r=2.0,c=1000(b)o..
r=0.5,c=1000(b)
0 5 10 15 20 25 30 35 '
Film thickness ahead of the crack tip a-c(b)
Fig. 4(b) The normalized NCSIF as function of the film thickness for mode D emission.
film will make the dislocation emission more difficult, while a softer film will promote dislocation emission, if the film thickness is larger than the critical value. On the other hand, a harder film will facilitate dislocation emission and a softer film will retard it when the film thickness is smaller than the critical thickness. This critical film thickness depends on the loading mode and the crack length. A long crack yields a large critical film thickness. For example, the critical thickness for the mode II loading is about 5 b for the crack length c=l,000 b, while it is over 40 b for c= 1,000,000 b, as shown in Fig. 4(b). For a given crack length, e.g., c=l,000,000 b, the critical thickness for
the mode I loading is about 3 b, much smaller than that of over 40 b for the mode II loading, as indicated in Figs. 4(a) and 4(b). If the crack is short, e.g., c=l,000 b, the critical film thickness must be smaller than 2 b for the mode I loading. Since the dislocation core is taken to be 1 b in the present study, it will be very difficult and meaningless to conduct the numerical calculation if a film thickness is smaller than 2 b. Therefore, the critical film thickness cannot be explicitly illustrated in Fig. 4(a). The critical film thickness stems from the fact that the exact stress intensity factor decreases (or increases) with increasing the film thickness for a ratio of shear moduli being larger (or smaller) than unity.
Fig. 5 illustrates the NCSEFs for dislocation emission, under the mode I or mode II loading, as functions of the ratio of shear moduli. Two film thicknesses, a-c=5 b and a-c=10 b, are used in plotting Fig. 5. Since both the film thicknesses are larger than the critical film thickness for the mode I emission, as expected, the NCSIFs are enhanced by the ratio of shear moduli for both the film thicknesses. However, a-c=5 b is slightly smaller than, and a-c=10 b is larger than, the critical film thickness for the mode II emission. Fig. 5 shows that the NCSIFs increase with increasing the ratio of shear moduli if the film thickness is larger than the critical one. The opposite is also true. If the film thickness is smaller than the critical one, the NCSIFs decrease with increasing the ratio of shear moduli.
Fig. 6 shows the NCSIFs for dislocation emission under the mode I or mode II loading as functions of the Poisson's ratio of the film, where the Poisson's ratio of the substrate is taken to be 0.3. Again, the two film thicknesses, a-c=5 b and a-c=10 b, are used in plotting Fig 6. As can be
66

seen in Fig. 6, a large Poisson's ratio of the film makes the NCSIFs increase for the mode II emission but decrease for the mode I emission.
Ktt. for e = 0\ a-c = 5(b)
"KS., for6 = 0\ a-c = 10(b)
1.00 1.25 1.50
Ratio of shear moduli T
1.05
{,£ 1.00
° .90
K°„.«fOT e = 0',a-c = 5(b)
■■« °-":"" _ c = 10CW c=1000(b)
Fig .5 The NCSIF as a function of the shear Fig. 6 The NCSIF as a function of the Poisson's modulus ratio. ratio of the film.
CONCLUDING REMARKS
SCC is a complicated process, in which chemical reaction and stress action may dramatically change material properties and then damage the material. The present study takes a linear fracture mechanics approach. In addition, the thin-film-covered crack is modeled to have a special shape. This modeling provides us with analytic solutions for the interaction between a screw dislocation and the thin-film-covered mode HI crack. Consequently, we are able to study the effects of passive thin films on SCC and hence deepen our understanding of these effects. In investigating the interaction between an edge dislocation and the thin-film-covered mode I and/or mode II crack, we used the complex potentials, superposition, Cauchy integration, specially constructed functions, and series expansion, such that the solutions are as analytic as possible. Our focus is on the effects of the film thickness, the shear modulus and Poisson's ratio of the thin film on the dislocation emission from the film-covered crack tip. In general, brittle fracture occurs when no dislocations are emitted from the crack tip. If dislocation emission from a crack tip becomes difficult, the fracture will have the tendency to be in a brittle manner. The critical stress intensity factor for dislocation emission from the thin-film-covered crack tip is calculated in the present work based on the Rice-Thomson model. It is of interest that there exists a critical film thickness for a given crack length and loading mode. When the film is thinner than the critical thickness, a harder film makes the dislocation emission easier, while a softer film makes the emission more difficult.
ACNOWLEDGEMENTS
The work is supported by a grant (RGC Grant, HKUST 819/96 E) from the Research Grants Council of the Hong Kong Special Administrative Region, China. The second author, CFQ, acknowledges also the Foundation for Returned Oversea Scholars sponsored by the Education Ministry, China.
67
REFERENCES
1. R.N. Parkins, JOM, December issue, pp. 12-19 (1992). 2. R.H. Jones and R.E. Ricker, in "Stress-Corrosion Cracking" ed. R.H. Jones, ASM International
(1992) pp. 1-40. 3. D.A. Jones, Principles and Prevention of Corrosion, Second Edition, Prentice-Hall, Upper
Saddle River, NJ 07458, 1996. 4. Th. Magnin, Advances in Corrosion-Deformation Interactions, Trans Tech Publications Ltd,
Lebanon, USA, 1996. 5. K. Sieradzki, ActaMetall. 30, pp. 973-982 (1982). 6. K. Sieradzki and R.C. Newman, Phil. Mag. A51, pp. 95-132 (1985). 7. K. Sieradzki and R.C. Newman, J. Phys. Chem. Solids, 48, pp. 1101-1113 (1987). 8. T.-Y. Zhang and C.-R Qian, ActaMater. 44, pp. 4513-4520 (1996). 9. T.-Y. Zhang and C.-F. Q\an,Mech. Mater. 24, pp. 159-173 (1996). 10. C.-F. Qian, T.-Y. Zhang and P. Tong, Key Eng. Mater. 145-149, pp. 161-166 (1998). 11. T.-Y. Zhang, C.-F. Qian, T. Wang and P. Tong, Interaction of an edge dislocation with a thin-
film-covered crack, submitted to Int. J. Solids Structures. 12. J.R. Rice and R. Thomson, Phil. Mag. 29, pp. 73-97 (1974). 13.1.H. Lin and R. Thomson, Acta Metall. 34, pp. 187-206 (1986).
68

MOBILITY OF NON-PLANAR SCREW DISLOCATIONS AHEAD OF A MODE III CRACK TIP
A.H.W. NGAN, H.F. ZHANG* Department of Mechanical Engineering, The University of Hong Kong, Pokfulam Road, Hong Kong, P.R. China 'Permanent Address: Department of Advanced Materials, Central Iron and Steel Research Institute, Beijing 100081, P.R. China
ABSTRACT
The generalised Peierls-Nabarro model is used to study the transformation of screw dislocation cores from the three-fold, non-planar state to the planar, glissile state ahead of a mode in crack tip.
INTRODUCTION
A necessary though not sufficient condition for brittle-to-ductile transition (BDT) to occur is that dislocations can emanate from the crack tip. The problem of dislocation emission from a crack tip has been studied by a number of authors [1-3] who have considered in detail the force required to gradually form a dislocation from zero to unit Burgers vector content and the competition between such mode of dislocation nucleation and crack cleavage. In the incipient process considered by these authors, the dislocation is assumed to have a planar cors, and no lattice friction is assumed to exist once the dislocation is fully formed and begins to move away from the crack tip. The omission of friction stress during the incipient process is perhaps not important for close-packed slip systems because the lattice friction can be supposed to be small. However, for the bcc structure for which BDT is particularly important, screw dislocation cores are non-planar and so lattice friction should not be neglected a priori in a satisfactory treatment on crack-tip emission.
The present work is therefore an attempt to remedy this deficiency. The dislocation model that we use is the generalised Peierls-Nabarro model [4,5], which is an extended version of the original Peierls-Nabarro model generalised to take into account non-planar core dissociation. In what follows, we will consider the interaction between a mode in crack tip and a three-fold dissociated screw dislocation, which resembles a V4<111> screw dislocation in the bcc lattice. We assume the entire content of the dislocation to emerge from the crack-tip in a fashion similar to what has been considered in ref. [1-3], and we consider in detail here the three-fold dissociation of the dislocation core after its full content has been established but when it is still situated very close to the crack tip. When the dislocation is situated at a distance comparable to its core size from the crack tip, the image effects of the crack should modify significantly the core configuration, and the mobility of the dislocation should be greatly affected.
THEORY
In the generalised Peierls-Nabarro model [4,5], a three-fold screw dislocation is composed by joining together three 120° elastic wedges along surfaces parallel to the dislocation line as shown in Fig. 1. The three wedges are strained into such a way that the long-range field of the dislocation is established at large radial distances from the centre. At small radial distances, the field deviates from the Volterra singular field because of the misfit taken place at the three cut planes. The force law ){<t>) governing the misfit * between adjacent points across the cut plane is non-linear and for specific materials, it can be calculated as the y-surface using atomistic simulation.
We consider placing a mode JE crack tip at a distance x from the dislocation centre so that the crack plane coincides with one of its slip planes, say the 112 plane, as shown in Fig. 1. For a given dislocation core configuration, the energy of the dislocation-crack system is composed of three parts, namely i) the strain energy stored in creating the dislocation ahead of the slit opening of the unloaded crack, ii) the work done against the stress field of the loaded crack-tip as the
69
Mat. Res. Soc. Symp. Proc. Vol. 539 ® 1999 Materials Research Society

r. distance along cut plane measured from dislocation
crack tip at x from dislocation centre
cut plane 311
Fig. 1 -Three-fold screw dislocation situated ahead of a mode III crack tip.
dislocation is created, and iii) the misfit energy which comes from integrating y(Q>) along the three cut planes with $ treated as a varying function along each cut. The strain energy term is simply the elastic energy stored in the strained wedges, and can be evaluated from the prescribed boundary displacements of the wedges using standard methods in anti-plane strain elastostatics [6]. The full expression of the dislocation-crack energy E,0, per unit length is given by:
+ 3/2 _ £3/2 [«2t' (4)"J+ (1) + «2-' (£)»2- (l)]l drid^ + 2 J y[3> = A* - u3_ (r) - «2, (O) dr (1)
+ Jy[<J> = (l-2A)A-2u2_(r)]«V - 2 Jrc(r)[Hj_(r) + «2,(r)]</r + 2 J V2/T(r +JT)
u2_(r)dr
where /z is the shear modulus, £ the Burgers vector, ^m the applied stress intensity factor, 1*0 = ATi„ cos(ii//2+n/3)/Jty, p = 4rr+xT^n: and i»/ = tan"'[V3r/(2x-r)] (0<y£tf). In eqn. (1), the double integral term is the strain energy, the terms involving y the misfit energy and that involving Km the work done against the crack-tip field. ui±(r) represents the displacement function of the boundary marked by + or - of wedge i relative to the wedge tip position (see Fig. 1). A is the fractional Burgers vector content of the cut 213 or 311, and can be used as a parameter specifying the degree of recombination of the core into the planar state. In the absence of the crack, the core configuration should be symmetrically three-fold, and A will assume the value 1/3. When the core is totally constricted into the planar state, A will become 0. To find the stable configuration of the dislocation core under a specific Km, E,„, should then be minimised with respect to A, «3., «2+ and 112-. The long-range limits of the boundary displacements should match the Volterra solution
u(r,8): JJteJT-
70

where A=^r2+2rxcose+xl, which requires that as rlx -> oo, u(r,ff) -> -b/2 for all 6. Hence, the free variables in eqn. (1) are subject to the following end conditions
u3.(0) = 0, K3„(OO) = b/2, «2-(0) = 0, «2.(oo) = (l/2-A)b, w2+(0) = 0, K2+(°°) = (A-1/2)Z>. (2)
The variational problems expressed in eqn. (1) and (2) can be solved approximately by the Rayleigh-Ritz method with the following trial functions satisfying the end conditions (2):
u, (*) =-tan-'(V). «2_W = (l-2A)-tan-'(V). n2t(x) = (24-l)-tan-'(«:1*)- 11 71 71
Here it, (i = 1,2,3) and A are free parameters which are adjusted to obtain minimum values for Ewl
in eqn. (1).
RESULTS AND DISCUSSION
Dislocation Mobility Ahead of Crack-Tip
As an illustration, we present here the results obtained by assuming the following Frenkel sinusoidal y-force law:
Y~4K
2 l-co^—J (3)
Fig. 2 shows the relation between the fractional Burgers vector A and the applied Km when the dislocation is situated at three different distances x ahead of a loaded crack tip. It can be seen that when Km is zero, the values of A are all greater than the three-fold symmetric value 1/3, and with decreasing x, the value of A increases. This is due to the image force of the crack surface, which tries to pull the dislocation configuration towards the V-shape. As Km increases from zero, A decreases steadily as shown in Fig. 2. However, as soon as A decreases to ~ 0.25, the core transforms instantaneously into planar as shown in Fig. 2. It was also found that if the core is stressed to any configuration with A a 0.25, the configuration will return to the stress-free stable configuration upon removal of stress. However, if the core is stressed to beyond the A » 0.25 point so that it has become planar, the core will remain in the planar configuration with A « 0 upon the removal of stress. The condition A reaches 0.25 therefore marks an instability point, and the planar state is a metastable state protected by an energy barrier at A = 0.25. The instability at A = 0.25 can be easily understood from the /force law expressed in eqn. (3), which shows that the misfit energy attains a maximum when $ equals 0.5b. Thus as soon as the opening of 112 branch exceeds 0.5b, there is a net force causing the branch to open further.
The observed instability at A = 0.25 is a characteristic behaviour ahead of a crack tip, and no such stability is found to exist in the motion of a dislocation without the presence of the crack. The reason is that the tendency to open up the 112 branch after A = 0.25 is resisted by the rigidity of the material, and with the presence of the crack, the material trailing the 112 branch is slit open and will become much less rigid. The induced strain energy rise as a result of the change in core configuration as branch 112 opens up after A = 0.25 is therefore too small to offset the associated large drop in misfit energy. The observed instability at A = 0.25 is analogous to the conclusion reached by Rice when considering dislocation generation from a mode II crack tip [3]. Rice concluded that as the crack-tip opening reaches 0.5b, the energy resistance to crack propagation would pass through a maximum value equal to the unstable stacking fault energy. Rice's treatment, however, is based on a /-integral calculation and so it assumes that the field undergoes rigid translation as the dislocation moves out from the crack tip. In our present model, the core configuration changes as the dislocation recombines and so the /-integral method is not valid.
The above results can be compared with predictions obtained by assuming that the dislocation has a Volterra, empty-core field. In Fig. 2, there exists at each value of x a critical Km,
71

Fig. 2 Relation between equilibrium A and applied stress intensity factor Km. *in units of b's.
denoted as Km, at which the core becomes planar and hence mobile. Let us consider the alternative picture in which the dislocation has a Volterra field and possesses a Peierls stress rp. %„ is the homogeneous stress required to convert the core into the planar configuration without the presence of the crack, and using a variational approach similar to the above, it is found to be 0.04/* [6]. In the Volterra model, K„, is the value of Am needed to move the dislocation against ip and the image stress, and this is given by
Jini Mt 4KX
(4)
Fig. 3 shows the variation between Km and x as predicted from eqn. (4) as well as the Peierls- Nabarro model. It can be seen that if the crack-free value of 0.04/; is assumed for tp in eqn. (4), the deviation between the Volterra model and the Peierls-Nabarro model is very large. Eqn. (4) will be a good estimate of the Peierls-Nabarro results only when T„ is decreased to ~ 0.005/i as shown in Fig. 3. Thus, a Peierls-Nabarro dislocation situated in front of a crack tip will experience an effective Peierls stress one order of magnitude lower than if it is situated in a perfect crystal. The crack obviously enhances the mobility of the dislocation by reducing the mechanical rigidity of the material ahead of it.
Fig. 3 - Critical stress intensity factor required to move a dislocation Km. Solid line - Volterra model with TP = 0.04 ß. Dotted line - ditto with T„ = 0.005/i. Crosses - generalised Peierls- Nabarro model.
72

Crack-tip Shielding
We next consider the shielding at the crack-tip caused by the dislocation field. For the Volterra dislocation, the shielding stress intensity factor Ks is ßb/^(27Vc). For the Peierls-Nabarro dislocation, Ks is given by
*.-*i£J *3+<f u,_\£,)d£,
where «3. is the equilibrium boundary displacement, with or without stress, of wedge 3 obtained by minimising the energy functional in eqn. (1) [6]. Fig. 4 shows the variation between K„ and x of the Volterra and the Peierls-Nabarro dislocation when Km = 0. It can be seen that at x s 5b, the Volterra and the Peierls-Nabarro model converge, confirming that at large dislocation distances, the details of the core configuration do not matter. At small dislocation distances, the spreading of the Peierls-Nabarro core reduces the induced crack-tip field as compared with the Volterra core, and so the Peierls-Nabarro Ks is smaller than the Volterra value as shown in Fig. 4 for x <, 5b.
Fig. 4 - Dislocation shielding stress intensity factor Ks. Curve - Volterra model Crosses - generalised Peierls- Nabarro model with Km = 0.
Implications for Brittle/Ductile Behaviour
From Fig. 2, a dislocation situated closer to the crack tip would require a larger Km (= Km) to mobilise it. This is due to the image stress, which would tend to retract the spreading on the slip plane co-planar with the crack plane, and to widen the spreading on slip planes inclining to the crack plane. An applied Km = Km is required to overcome the image stress to make the core planar for motion. It is evident from Fig. 2 that Km tends to ~ 0.12 /j.sjb as x approaches zero. Thus, if Km is larger than - 0.12 n^jb, all dislocations ahead of the crack tip including the one that has been freshly emitted from the crack tip would be planar. The limiting Km ~ 0.12 ß-Jb therefore represents a critical stress intensity factor Kmc such that if the applied Km is higher than or equal to this value, then all dislocations ahead of the crack tip would be mobile. If the applied Km is lower than Kmc, then a non-planar zone would exist ahead of the crack tip, the size of which would increase as the difference (Kmc - Km) increases. A dislocation situated outside this non-planar zone would have planar core and is mobile, but a dislocation existing within the zone would have non-planar core and would require thermal activation before it can move away from the crack tip.
The next question to be asked concerns the competition between dislocation mobility, nucleation and cleavage. Rice [3] has concluded that the critical Km for dislocation nucleation
73

directly from crack tip is Ke = V(2/iyUI) where yus is the unstable stacking fault energy. Taking yus to be the maximum value of the y-force law in eqn. (3), yus = itbl(27?), and so Ke «s 0.3 ßjb for a mode HI crack. Ke is therefore of similar magnitude but higher than ATmc for motion, implying that nucleation from crack-tip would be slightly more difficult than subsequent motion. Thus, if dislocations can be nucleated from the crack-tip, they can move away from it and so crack-tip emission is nucleation rather than mobility controlled. Because nucleation must precede motion, whether the material is brittle or ductile still depends on the competition between nucleation and cleavage as Rice has suggested, and mobility is not a concern. It should be noted, however, that this is quite a fortuitous result, and only comes about because of the enhancement in mobility offered by the crack opening. If the intrinsic value T„ = 0.04^f were to be believed for motion ahead of the crack-tip, Fig. 3 shows that Km at x « b is roughly 0.3 fi^/b, implying that mobility would have been considered as difficult as nucleation.
Future Work
In the bcc lattice, motion of non-screw dislocations presents no problems and so one has a valid reason to focus on screw dislocations. The present analysis assumes that the crack plane is parallel to a slip plane and the crack front is parallel to the <111> Burgers vector direction. This is a rather exceptional situation and as future work one may attempt to investigate the more general condition in which the crack plane is inclined with respect to the glide plane. Insofar as the crack front is parallel to the Burgers vector, the problem is still anti-plane strain as only the mode HI component will interact with the screw dislocation. If the crack front is not parallel to the Burgers vector, the core recombination problem is a three dimensional one and analytical formulation becomes very difficult.
CONCLUSIONS
The core dissociation of a three-fold screw dislocation ahead of a mode III crack tip has been studied within the framework of the generalised Peierls-Nabarro model. The image effects of the crack cause extensive dissociation of the dislocation core on slip planes that are inclined with respect to the crack plane. Core spreading reduces the degree of overshielding at the crack tip by the dislocation field when the dislocation is situated near the crack tip. The presence of the crack also enhances significantly the mobility of the dislocation. The presence of the crack slit opening reduces the rigidity of the material ahead of the crack tip, thus makes recombination of the dislocation core into the planar, mobile configuration by stress much easier. Emission of dislocations from crack-tip is therefore nucleation rather than mobility controlled.
ACKNOWLEDGMENT
This research was carried out under financial support from the Hong Kong Research Grants Council (Project no. HKU 572/96E).
REFERENCES
1. J. Weertman, Phil. Mag. A, 43, 1103 (1981).
2. G. Schoeck, Phil. Mag. A, 63, 111 (1991).
3. J.R. Rice, J. Mech. Phys. Solids, 40, 239 (1992).
4. A.H.W. Ngan, Phil. Mag. Lett., 72, 207 (1995).
5. A.H.W. Ngan, J. Mech. Phys. Solids, 45, 903 (1997).
6. A.H.W. Ngan and H.F. Zhang, to appear in Mech. Mater.
74

MODE-III FRACTURE PROPAGATION IN A TWO-DIMENSIONAL CONTINUUM MODEL WITH FRICTIONAL DISSIPATION
Emily S.C. CHING*, Hiizu NAKANISHI" •Department of Physics, The Chinese University of Hong Kong, Shatin, Hong Kong,
ching@phy. cuhk. edu .hk "Department of Physics, Kyushu University 33, Fukuoka 812-81, Japan
ABSTRACT
Mode-Ill fracture propagation in a two-dimensional continuum model is studied the- oretically. The material is assumed to be isotropic and linearly elastic with a frictional dissipation, and the crack-tip region is modeled by a cohesive zone. As the externally ap- plied load increases, the steady-state crack speed increases to a maximum value which can be substantially smaller than the sound speed when the dissipation is large. The fracture energy also becomes dependent on the velocity.
INTRODUCTION
Both experiments [1] and numerical simulations [2] show that straight crack propagation is unstable when the speed of propagation goes beyond a certain critical value. In an attempt to understand such observations, Ching, Langer and Nakanishi [3] (CLN) performed a lin- ear stability analysis of mode-I fracture against bending deformations in a two-dimensional system. The system was taken to be isotropic and linearly elastic except for the crack-tip region where they used a cohesive-zone model of the kind introduced by Barenblatt [4] and Dugdale [5]. The inclusion of a cohesive zone ensures that the stresses at the crack tip are nonsingular. They computed the linear response of the system, i.e. the first-order change in the crack trajectory, to a small, static and spatially oscillatory shear stress and concluded that, for cohesive-zone models that do not include any dissipative forces, steady-state straight crack propagation is unstable against the perturbation at all nonzero speeds.
It is natural to extend the CLN analysis to models that include some dissipative mech- anisms. Langer and Lobkovsky [6] (LL) have examined models in which the cohesive force contains a dissipative element. Unexpectedly, they discovered that for some models with seemingly reasonable choices of cohesive force, there is no unique solution for the linear re- sponse. This is also the case for the dissipationless version — the linear response CLN found was only one solution among a family of solutions. In cases that there is unique solution, LL found that the results depend sensitively on details that ought to be physically unim- portant. Because of these findings, LL concluded that cohesive-zone models with no or local dissipation is unsatisfactory for use in dynamical studies of fracture.
To understand how general their result is, it would be helpful to study cohesive-zone models with bulk dissipation, i.e., dissipation not confined within the cohesive zone but act- ing throughout the whole system. We shall study one such model with frictional dissipation — dissipation that is proportional to the speed of propagation. As a first step, our present work focuses on steady-state mode-Ill fracture propagation. The problem of mode-Ill frac- ture is simpler as only the antiplane displacement is involved. Thus, this study is not only interesting on its own but can also serve as a useful reference for the mathematically more
75
Mat. Res. Soc. Symp. Proc. Vol. 539 ® 1999 Materials Research Society

difficult problem of mode-I fracture.
MODEL
Mode-Ill crack propagation in a two-dimensional model in which the stress along the open fracture surfaces contains a frictional dissipative term has been studied by one of us [7]. Here, we consider a frictional dissipation that acts in the bulk of the material. The two-dimensional material lies on the x-y plane and the crack runs along the .x-axis. Due to the symmetry of the problem, we need to consider only half of the plane, say the upper-half plane: y > 0. The material is assumed to be isotropic and linearly elastic with a dissipation proportional to the speed of propagation. The antiplane displacement u(x,y,t), which is along the z direction, satisfies the following equation of motion
u(x, y, t) = V2u{x, y, t) - ^[u{x, y, t) - A] - 2au{x, y, t) (1)
where A is an applied displacement imposed on the system and a is the coefficient of the frictional dissipation. We have scaled our units such that the sound speed is unity. The second last term in the right hand side represents an external loading that drives the crack. In the limit when W being large, which is the case we are interested in, this loading is similar to the familiar situation of a strip of elastic sheet with half-width W being displaced at the edges by an amount A.
We focus on steady-state fracture propagation at speed v in the —x direction and look for solutions that depend on x and t only in the form of x + vt. We first transform (1) into a reference frame (x' = x + vt, y) that moves with the crack. The crack tip is thus always at x' = 0. For simplicity, we redefine x' —> x. The transformed equations are
2d2u{x,y) . d2u{x,y) 1 du(x,y)
ß^x^~ + ^y^-W->{x'y)-A]-2aV^x~ = ° (2)
where ß2 = 1 - v2 (3)
The displacement along the x axis is
, „, f 0 x < 0 u(x'V = V = {u(x) x>0 (4)
where U(x) is half of the crack-opening displacement. The stress, up to an elastic modulus, along the x axis is given by
du =fE(.r) x<0
dy y=0 \Xc(x) *>o (b)
where E(x) is the stress ahead of the crack tip, and £c(.r) is a cohesive stress, with a finite range 6, that acts between the open fracture surfaces in the crack-tip region. For explicit results, we follow CLN to use a simple square-law form for Ec:
s.e>-w» = {?' tllr6 m where E0 is the yield stress. The length of the cohesive zone (. is defined by
U(£) = 5 (7)
76

WIENER-HOPF CALCULATIONS AND RESULTS
The general solution of (2) can be written as
u(x, y) = A (l - c-*) + j ^ tfM(jfe) c'te-*<*)»
with
K{k) = \l^ + ß2k2 + i2avk
(8)
(9)
Here, [A+' (A;) denotes the Fourier transform of f/(z). As U(x) is nonzero only on the positive x-axis, U^(k) has singularities only in the upper half /c-plane, which is indicated by the superscript (+). Similarly, the superscript (-) indicates functions that have singularities only in the lower half fc-plane. Equation (5) then leads to the Wiener-Hopf equation:
E<+)(fc) + &-1(k) = 2-K=^5{k) - K(k)ÜM{k)
The kernel K{k) can be factorized into k^+\k)K^~\k) where
Ä-W(fc) = (pi + ikfl2; £(">(*) = ß{p2 - ik)1'2
(10)
(11)
and _ / 1 a
Pl'2 ~ \W2ß2 + V\1/2 aWv
(12)
The formal solutions for (10) are thus
ikÜ^lk) = „ l V ' K(+)(k) . A-(-)(0) .
(13)
ik&-\k) = -k^-\k) -^ -HkAH(fc) K(-)(0) c y '
(14)
where 1 SM(fc')
n.M 7 2iri k' -k±it K(-\k')
and S<+'(A:) is the Fourier transform of Y,c(x). To ensure that the stress is nonsingular at the crack tip, we have the Barenblatt condition
W y'J 2ixK(-){k)
ft fe dy .-*.» v P2 f dy _ V n Jo ,/y
Using (16) in (13), we can compute U(x):
2Sn TTl \ 2^0 fX A U(x) = —— / dyi ftp Jmax(0,x~e)
-P2(y-x+l) y y - x + £
(16)
(17)
(18)
77

where we have used pi —> 0 in the large W limit. U(x) goes like x3/2 for x < £ and shows the conventional -y/x behavior for W 2> x 3> £.
The length of the cohesive zone is obtained by putting x = I in (18) which gives
(l - e-"1) _ rcßS
P2 ~ 2E0
With (17) and (19), the externally applied load A is evaluated as a function of v. As v ■ A tends to the Griffith threshold AG = y/2T,05W which is independent of a. We have
(19)
(20)
In the limit a -¥ 0, A -> Ac thus steady-state propagation is possible at any speed v and only at the Griffith threshold. On the other hand when there is dissipation, steady-state fracture propagation occurs at different speed v for different values of A/AG.
In (19), p2ß increases with v [see (12)] but 1 - e~P2t has a maximum value. As a result, there is a maximally allowed crack speed vmax whose value is given by
\ i-w (21)
and is smaller than 1 (the sound speed) for a ^ 0. At v = vmax, £ diverges and A/W = E0 [see (17)] Thus, the physical origin of a maximally allowed speed of crack propagation is the limitation of the applied stress by the yield stress. When the applied stress is greater than the yield stress, the material will break everywhere making it impossible to have only one propagating crack. This result is the same as that found previously in the model with surface friction [7].
When there is dissipation, the fracture energy, that is the energy consumed per unit length of crack extension, consists of two parts: the energy expended in overcoming the cohesive stress and the energy dissipated by friction. The former is given by
Tc„h = £ dxXc[V(x)]^ (22)
= S05 (23)
and is a constant independent of the dynamics of the crack because the cohesive stress Ec
is a function of U(x) only but not U'(x) [see (6)]. For steady-state crack propagation, the fracture energy is exactly equal to the elastic energy stored initially per unit length of the strip which is given by (1/2)A2/VF. Thus the fracture energy is:
r/rttC = r0(A)2 (24)
where
r0 = lim rfrac = rcoh (25)
In the limit of no dissipation, r/rac = Tcoh and is independent of v. For finite a, as A increases with a, Y;rac > Tcoh and the difference is the energy dissipated by friction per unit length of crack extension.
78

NUMERICAL ANALYSIS
We first study the maximally allowed steady-state crack speed vmax for various values of E0W/S and aW. From (21), we see that vmax increases with E0W/6 for fixed aW, and decreases with aW for fixed E0W/5. These features are verified in Fig. 1. Moreover, it can be seen that vmax can be substantially smaller than 1, the sound speed, when aW is large.
20 30 aW
Figure 1: The maximally allowed steady-state speed of crack propagation vmax. 100, (b) E0W/5 = 200, and (c) Z0W/5 = 1000
(a) E0W/5 =
Figure 2 shows the velocity dependence of the fracture energy Tfrac for v ranging from 0 to vmax. At v = vmax, r/rac/r0 = T,0W/(2S). For small aW, T}rac has a slight dependence on v except for the sharp increase to the maximum value when v « vmax. For large aW, T/roc/ro increases steadily with v and is much larger than 1 even for moderate values of v.
60
50
40
C 30
\, 20 10
0
•fc,
-10
I ' I ' I \
-
■ «y -
// vy -
s' ^^^~
(a) -
■
i , i
0.0 0.2 0.4 0.6 V
0.8 1.0
Figure 2: The fracture energy as a function of the steady-state crack speed. T,0W/S = 100. (a) aW = 0.1, (b) aW = 5 and (c) aW = 20
In Fig. 3, we plot the dependence of v on the externally applied load A. We see that v generally increases from 0 to vmax as A is increased from AG to E0W. For small aW, the increase occurs sharply whereas for large aW, the change in v is much more gradual.
79

1.0 (a i i ■ i ■ i ■ ■ i ■
f 0.8 (by / - 0.6
/ {CV 0.4 / /
0.2
n n 1,1,1,1, , i ,
0 1 3 4 A/A,
5 6 7 8
Figure 3: The dependence of the steady-state speed of crack propagation on the externally applied load. T,0W/6 = 100. (a) aW = 0.1, (b) aW = 5 and (c) aW = 20
CONCLUSIONS
We have studied steady-state mode-Ill fracture propagation in a two-dimensional model with bulk frictional dissipation. With frictional dissipation, the maximum steady-state crack speed allowed is smaller than the sound speed. We note that this feature is not observed in models with viscous dissipation. Moreover, the fracture energy becomes velocity-dependent. For large dissipation, this maximally allowed crack speed is substantially smaller than the sound speed (or the Rayleigh wave speed in modc-I fracture). This result may shed light on why experimentally observed maximum crack speeds are much lower than the Rayleigh wave speed. We are now working on the corresponding calculations for mode-I fracture and the stability analysis of mode-Ill fracture.
ACKNOWLEDGEMENTS
This work is supported by the Hong Kong Research Grants Council (Grant no. 316/96P).
REFERENCES
[1] J. Fineberg, S.P. Gross, M. Marder, and H.L. Swinney, Phys. Rev. Lett. 67, 457, (1991); Phys. Rev. B 45, 5146 (1992). S.P. Gross, J. Fineberg, M. Marder, W.D. McCormick, and H. Swinney, Phys. Rev. Lett. 71, 3162 (1993).
[2] F. Abraham, D. Brodbeck, R.A. Rafey, and W.E. Rudge, Phys. Rev. Lett. 74 272 (1994). See also B.L. Holian and R. Ravelo, Phys. Rev. B 51, 275 (1995).
[3] E.S.C. Ching, J.S. Langer, and H. Nakanishi, Phys. Rev. E 53, 2864 (1996).
[4] G.I. Barenblatt, Adv. Appl. Mech. 7, 56 (1962).
[5] D.S. Dugdale, J. Mech. Phys. Solids 8, 100 (1960).
[6] J.S. Langer and A.E. Lobkovsky, preprint (1998).
[7] H. Nakanishi, Phys. Rev. E 49, 5412 (1994).
80

TRANSITIONS OF SHEAR RESISTANCE IN A SINGLE-ASPERITY CONTACT
J. A. HURTADO, K.-S. KIM Division of Engineering, Brown University, Providence, RI-02912
ABSTRACT
The shear force required to emit circular dislocation loops from the edge of a circular adhesive-contact zone is calculated analytically as a function of contact-zone radii. The emission condition is based on the balance of the configurational force and the Peierls force on a dislocation loop initiated at the edge of the adhesive contact zone. The analysis suggests that there is a transition, for a nanometer-scale single-asperity contact, from concurrent (mobile- dislocation-free) slip to single-dislocation-assisted (SDA) slip. The nanometer-scale friction stress (shear force required for slip/contact area), which experimentally is observed independent of normal loading and contact-zone size, is believed to be the stress required for concurrent slip. The analysis also predicts a second transition from SDA slip to multiple-dislocation-cooperated (MDC) slip at the scale of tens of micrometers in contact size. The friction stress at this large length scale has also been observed experimentally to be independent of normal loading and contact size; however, the friction stress at the nanometer scale is about 30 times that at the scale of tens of micrometers. The analysis is consistent with these experimental observations.
INTRODUCTION
The relationship between the frictional force and the real area of contact remains as one of the fundamental questions in tribology. It was first postulated by Bowden and Tabor that the frictional force 7) necessary to slide across two contacting surfaces is proportional to the real area of contact Ac, i.e.
Tf = TfAc (1)
Here y is the friction stress, or shear resistance, of the interface and it is considered independent of the contact area Ac. Equation (1) is the cornerstone of most friction theories nowadays. However, this relationship was never verified experimentally at the level of a single asperity contact until the development of the atomic force microscope (AFM) and the surface force apparatus (SFA) made it possible in recent years2"7. Both the AFM and the SFA are designed to measure simultaneously the normal and tangential (or frictional) forces between two molecularly-smooth contacting surfaces. The region of contact is circular, of radius a and area^c
= na2. Typical values of Ac for dry adhesive contact in the AFM are in the range of 30-600 nm2
whereas in the SFA, Ac is usually in the range of 5xl09-2xlOn nm2. The lower limit is due to pull-off, which is caused by interface adhesion and takes place before Ac becomes zero. The upper limit is related to the onset of damage and wear at the interface. The radius a is a characteristic measure of the size of the contact. It is within the nanometer scale, a « 3-14 nm, in typical AFM experiments, and within the tens of microns scale, a « 40-250 urn, in SFA experiments. We believe that this large difference between the size of the contact observed in the AFM and the SFA plays an important role in the mechanical behavior of friction, as discussed later in this paper.
Experimental measurements in the SFA2 and the AFM3"7 reveal that the frictional force 7} required to slide across a single asperity contact is, in the respective test range of contact sizes,
81
Mat. Res. Soc. Symp. Proc. Vol. 539 ® 1999 Materials Research Society

proportional to the area of adhesive contact, in agreement with (1). Some of the reported values of Tj for various interfaces are listed in Table I. The ratio of the friction stress to the effective shear modulus of the interface /4#-is particularly meaningful. (Here, the effective modulus /4#-of the interface between two materials, 1 and 2, is defined as /4^= 2fi\fJil(jj\+/Ji), where /iiand /£ are the bulk moduli of each material. Since the analysis is limited to isotropic materials, the shear modulus fj is estimated as £7(2(1+v)), where E is the elastic modulus for the uniaxial stress state normal to the interface and vis the lateral Poisson's ratio. This shear modulus is different from the average in-plane shear modulus of general anisotropy.) It is interesting that, with the exception of the interface between a hydrogen-terminated diamond (111) plane and a tungsten carbide tip6, the ratio t//^// measured in the AFM is about 30 times larger than that measured in the SFA. This seems to be in contradiction with (1), where z/is a constant for all values of Ac, provided that the interface remains undamaged.
Table I. Reported values of the friction stress tj for different interfaces, and estimated values of the nucleation parameter rj (for r,, = 0 and r„ = 6/4).
Interface Technique'5 (environment) Tf (MPa) or/=(r//A^)'1 Tjlb
mica/mica SFA2 (dry air) 20 1286 —
Pt coated tip/mica AFM3 (UHV) 840-910 43-40 1.71-1.6
SiN tip/mica AFM4 (air, 55% RH) 680 33 1.34
Si tip/NbSe2 AFM5 (UHV) 600 43 1.71
WCtip/Diamond(Hl)* AFM6 (UHV) 238 1577 49.47
Si tip/NaCl terraces / steps AFM' (dry N2) 145/478 240 / 48 8.49/1.90 * hydrogen terminated
We believe that the large contrast in the ratio z/ Iß-ß can be significantly attributed to the difference between the contact sizes in the AFM and the SFA. The friction stress Zf must decrease as the size of the contact increases from the nanometer scale (AFM) to the tens of microns scale (SFA). Thus, Z/-should be a function of the contact area. The particular form of this function is unknown to date because no experimental measurements exist for the full range of contact sizes between typical AFM and SFA sizes. This fact has urged the authors to propose a micro-mechanical dislocation model of frictional slip between asperities which provides a size dependent friction stress and explains the transition from the high value found in nanometer scale contacts to the low value in the tens of microns scale8. A description of this model follows.
DESCRIPTION OF THE MODEL
Single-asperity dry contact friction is modeled as two elastic spherical particles pushed together in adhesive contact by a normal force P, and subsequently loaded by a tangential force T which makes the particles slide past each other. It is understood that an external moment is applied to each particle in order to prevent rotation. The geometry of the problem is sketched in Figure 1(a). The contact region is a circle of radius a. A Cartesian coordinate system (x\, xj, xj) is considered with the origin at the center of contact. In these coordinates, the contact region is on the *3=0 plane and the force T is applied parallel to the xi-direction. For simplicity, the case considered is that in which the two particles have the same elastic constants: shear modulus n and Poisson's ratio v. Also, it will be assumed that the contact area is determined uniquely by
82

the applied loads, and that the radius a is much smaller than the sphere radii, i.e. P is small. This latter assumption allows us to model the geometry of the contact as an external circular crack.
edge of the contact
Figure 1: (a) Geometry of the problem, (b) Configuration of pileup of circular dislocation loops in the contact region (x3=0 plane).
The force T is increased quasi-statically until slip across the total area of contact is activated, which occurs when T= 7). The friction stress, ty= Tflira2, depends on the nature of the adhesive bonding between interacting atoms along the interface. However, it also depends on the mechanism of slip that takes place. The authors have proposed8 a mechanism of slip controlled by nucleation and cooperative gliding of dislocation loops in the contact region. The most general situation is illustrated in Figure 1(b). The contact region contains a pileup of N concentric dislocation loops of radii Rj (;'=1,2,...,JV ) and of same Burgers vector b, parallel to T (x[-direction). The dislocations are allowed to glide, driven by the external loads; however, the dislocation loops are constrained to remain circular and concentric as they glide through the interface. As a consequence of this kinematic constraint, the values of T/ calculated from this model will be an upper bound. The shaded areas in the figure represent the region of partial slip that dislocations leave behind as they glide towards the center of the contact. At each location, the displacement jump [u{\ equals b times the number of dislocations that swept through that point. Complete slip across the interface occurs only if the first dislocation (of radius R\) reaches the center of the contact region and collapses.
The average outward configurational force on each dislocation in the pileup, per unit length of dislocation, is
Gt = -1
2nRk
' dU~ = Gk°+G'k ■G/+ZG«*" >k = l>2>
a.T,P,Rj*Rt
,N (2)
Here U is the potential energy of the system, and Gk°, G'k, Gk and G'k"' are, respectively, the self,
applied, image and interaction force components. The expressions for these forces are given in
the Appendix. The self-force Gk° is a function of the dislocation cut-off radius r0. Hirth and
Lothe9 give some estimated values: for ionic crystals r0» 6/3, for crystals with covalent bonding r0 » b/4, and for metals r0 » b/2-2b.
83

Under favorable conditions (determined by a nucleation criterion) dislocations are nucleated along the periphery of the contact. Nucleated dislocations are then driven towards the center by the total configurational force. The internal resistance of the interface to dislocation glide is characterized by an average Peierls force GP = rP b. The effective Peierls stress of the interface Tp can be expressed as zP=filaP, where aP is usually in the range 102—104 for most crystals.
If the contact is loaded monotonically with a tangential force T, dislocations will glide towards the center of the contact and always in equilibrium with the Peierls force. The equations of static equilibrium for each dislocation take the form:
Gk{Rl,...,Rk,...,RN;a;T) + GP =0 ; k = U,...,N (3)
These relations provide a system of N equations for the dislocation positions Rk, contact size a, and load T.
So far, it has been assumed that a pileup of N dislocations already exists in the contact region. The conditions for the nucleation of these N dislocations are yet to be discussed. Also to be discussed are the conditions for complete slip of the interface, i.e. when the first dislocation is destabilized and collapses. Of particular interest is the case when only a single dislocation (N=\) assists the slip process, since this mechanism is predicted8 to prevail for a large range of contact sizes. We will refer to this mechanism as single-dislocation-assisted (SDA) slip. In contrast, the mechanism of slip cooperated by dislocation pileups will be referred to as multiple-dislocation- cooperated (MDC) slip. We will consider each mechanism separately next.
SINGLE DISLOCATION ASSISTED (SDA) SLIP
The total configurational force on a single dislocation (R=R\) in the contact is given by (2) without the interaction term. The dislocation is in static equilibrium if Gt+Gp = 0. We adopt a criterion for the nucleation of the dislocation loop similar to the one proposed by Rice and Thompson10 for the nucleation of a dislocation at the tip of a straight crack front. The nucleation criterion is stated as follows: A dislocation loop is nucleated spontaneously if the equilibrium equationG] + GP = 0 is satisfied (condition 1) when the dislocation is at some micro-structurally significant distance ?]from the periphery of the contact, i.e. when R = a- rj (condition 2).
In addition to conditions 1 and 2, we propose that the micro-structural length n should be sufficiently small to be located in the region where {8t]lda)T< 0 (condition 3). This third condition prevents us from using large values of t] that result in physically unrealistic behavior of the nucleation process due to the configurational axial-symmetry of the problem. Further discussions about this nucleation criterion are reported in ref [8]. For given contact size {alb), length rj, and cut-off radius r„, the nucleation criterion gives the stress level zj„„ required to nucleate a dislocation.
If the Peierls force is zero, a nucleated dislocation is always driven towards the center of the contact and collapses, thus inducing SDA slip of the interface. When the Peierls force is non- zero, however, a nucleated dislocation can be stabilized within the contact region, causing only partial slip of the interface. This situation usually occurs for large contact sizes, i.e. large {alb). In this case, slip is no longer completed by the nucleation of the dislocation; the dislocation must be destabilized. The instability stress r„„ above which a nucleated dislocation is always unstable is determined by solving simultaneously the equilibrium equation with the condition
(5G| ldRl) = 0and (-d2G, /5Ä,2) > 0. The criterion for slip instability is. therefore, that r> rlh,.
84

The condition for SDA slip is a) that a dislocation loop is nucleated and b) that it collapses. The friction stress is thus given as T/= max{r,„,,,%„}.
Solutions to the nucleation criterion are shown as a family of n\ curves for different values of 7] in Figure 2. On the n\ curves T=Tm(a). For these calculations the values r0 = b/4, v= 0.2 and ap=T286, were used. The experimental measurements of tjin the AFM for Pt/mica (Carpick et. al.3) and the SFA for mica/mica (Homola et. al.2) are also plotted in the figure. (It has been assumed that b is approximately 0.5 nm to properly scale the size of the contact.) The function Tim)(a) reaches its maximum at (a , r) for each TJ. The locus of the points (a , t) is represented by the line l\ in the figure. The instability stress r{il)(a), which is ^-independent, is shown by the curve i\. The lines l\ and i\ meet at the point (a c, rc). Both lines depend on the Peierls stress level Tp. In Figure 2 the lines correspond to a value of Tp equal to the SFA-friction stress for mica/mica (i.e. ap= 0^=1286, Table I). If the Peierls stress level is varied, the point (a c, TC) will move along a trajectory h, as shown in Figure 3.
a in meters ( b = 0.5 nm )
10-9 10-8 io-7 10-» 10-5 10-« 10-3 10-'
T/ JU
10-3-
SDA slip (r /ft)
*. AFM (Carpick et. al.3)
__T_ SFA (Homola et. al.*)
SDA-slip region
Concurrent-slip region\
(<■>.')
Partial-slip region
10-3
10 102 103 io<
a/b
10= 10» 10?
Figure 2: Family of dislocation nucleation lines nt for different values of r\: portions of SDA slip (solid lines) and partial slip (dashed lines). The l\ and ;'[ lines delineate the SDA-slip region. (r„ = b/4, v= 0.2, aP= 1286)
The line l\ represents the boundary of the region, on the r-o plane, in which the third condition of the nucleation criterion is satisfied. The condition demands that the maximum allowed value of rj is that corresponding to the critical point (a c, T C). In the example of Figure2, l(a c, rc)=299 b. Also, if the contact size a < a c, rj must be smaller than 77(0 , r). For a given value of 77 and r0, the contact size a is the minimum size at which a dislocation can be nucleated.
The instability line i\ represents the level of stress above which the instability criterion is satisfied. For each level of Tp, the instability line is bounded to the left by the h line, as shown in Figure 3. A nucleated dislocation in a contact of radius a always collapses if a < a < a c, or when T0I) (a) < r(„,) (a) for a c < a- Once the nucleation line n\ intersects with the instability line i\, a nucleated dislocation will stabilize within the contact region, resulting in partial slip of the interface. The region where slip is completed after the nucleation of a single dislocation loop (SDA-slip region) is delineated, in the z-a plane, by the lines l\ and i\. The portions of the
85

nucleation lines in the SDA-slip region are plotted with solid lines. Along these lines r= T/. The other portions, which correspond to partial slip, are plotted with dashed lines.
The experimental AFM data, in Table I, are observed to lie to the left of l\, outside of the SDA-slip region, where dislocations cannot be nucleated. The model therefore predicts that mobile dislocations do not assist the mechanism of slip in the reported AFM experiments. Instead, the surfaces slide past each other via a collective motion of the atoms on each side (concurrent slip). This mechanism is similar to the ideal slip of two atomic planes in a perfect dislocation-free crystal, which requires a shear stress equal to the theoretical shear strength of the material r,/,. Thus, the frictional stress of nano-scale contacts should be constant and of the order of magnitude of r,A. Typically T,I, « ///30 for a bulk material. This is in good agreement with most of the experimental AFM results in Table I (with the exception of the results for the interface between a hydrogen-terminated diamond (111) plane and a tungsten carbide tip6), where T/~ /4#740. This AFM value of T/ could be considered as an effective theoretical shear strength T ,/, of the interface. The transition from concurrent slip to SDA slip occurs along the line /i. Our nucleation criterion provides that this transition is smooth because the initial slope of the nucleation line is zero (Fig. 2). In particular, the level of the frictional shear stress measured for the Pt/mica interface3 in the AFM connects smoothly with the SDA-slip curve for rj «1.75 b (when r0 = b/4 and a/> = 1286).
Beyond the point (a , T ), the slope of the SDA-slip curve progressively changes from zero to -1/2 due to the self-force of the dislocation, which is very large when the size of the contact is small. The influence of the self-force on the nucleation condition becomes negligible as a increases. The micrometer scale regions of the nucleation curves in the log-log plot of Figure 2 are approximately straight lines on which T/I/J cc(a/b)'1'2. The slope can be predicted from a fracture mechanical model in which the dislocation is nucleated when the stress intensity factor reaches a critical value, K = Kc. In the example of Fig. 2, Kc = 0.0686 ß (2n:b)m.
There are three micro-mechanical parameters in the SDA-slip model, namely rj, tP and /•„. The parameter rj is associated with a micro-structural length representative of the extent of the nucleation process zone at the contact edge. A cohesive zone model of a contact1' provides an estimate of the process zone size, r] X b (r,/,///)"' for rj « a. Our model predicts that, along the /, line, j] » 0.051 b (T//J)'
09M for tp = 0 and r0= b/4, in good agreement with the cohesive zone
model. A small value of TJ typifies contact of strong adhesion (large /,/,) between compliant (low fj) asperities. Conversely, contact of weak adhesion between stiff particles is characterized by a large r/. Some estimates of rj are given in the last column of Table I for different interfaces, assuming that r,/, =T/(AFM) » z>. It is observed that for typical adhesive contacts rj is of the order of the Burgers vector b. The hydrogen-terminated diamond (111)/ tungsten carbide6 single asperity contact, however, is a clear example of very large value of rj (a=506). Diamond and tungsten carbide are very stiff materials. In addition, the adhesive forces at the interface are small due to the hydrogen passivation of the diamond surface. This is the reason why Tf/fJcj/is so small for this contact.
The influence of the Peierls stress tP in the SDA-slip model is illustrated in Figure 3. The main effect of z> is on the i\ line delimiting the SDA-slip region, which is displaced upwards as Tp increases. Similarly, the critical point (a c, rc), intersection of/i and ;'i, moves upwards along the li line. The extent of the region of SDA slip therefore decreases as Tp increases.
The cut-off radius r0 represents the configurational line tension of a dislocation. Influence of this parameter on the driving force arises only when the dislocation is curved. It mainly affects the SDA-slip curve when the contact area is small. As r0 is increased, the strength of line tension
86

decreases. Consequently the self-force becomes weaker for larger r0, which results in the increase of r and decrease of a for the nucleation curves.
Figure 3: Effect of Peierls stress Tp = n laF
on SDA-slip region. As tP increases, the instability ;'i line is displaced upwards and so is the SDA-slip region. The critical point (a c, r'c) moves along the /2 line.
10-1
a in meters ( b = 0.5 nm )
10-9 10-» 10-? 10-6 10-5 10-4 10-3
102 103 10"
alb
105 106
In the region of partial slip a nucleated dislocation will stabilize within the contact zone. Destabilization of the dislocation demands further increase in the applied load. For sufficiently large contact sizes a, the stress rim) (a) required to nucleate a dislocation can be much smaller than that required to destabilize the dislocation, %„ (a). In the process of increasing the stress over r{m), the conditions for nucleation of a second, third, or greater numbers of dislocations may be satisfied before the first dislocation is destabilized. This leads to the formation of dislocation pileups and results in a second transition in the slip mechanism: from SDA slip to MDC slip.
MULTIPLE DISLOCATION COOPERATED (MDC) SLIP
Let's assume that a pileup of N-\ circular dislocation loops exists in the contact region. The condition for the nucleation of a new dislocation, the N-th dislocation, is formulated as a simple modification of the nucleation criterion in the previous section: The N-th dislocation is nucleated spontaneously if the N equilibrium equations (3) are simultaneously satisfied when the new dislocation is placed at a micro-structural distance r/ from the periphery of the contact. The equilibrium equations (3) and the condition RN= a-r\ provide a system of N+\ equations for the N+2 variables (Ri,..., RN ; a; T), for fixed r0, t] and TP. The solution to the system of equations yields, as a function of a, the equilibrium positions of the dislocations Rk and the nucleation stress t(nN) required to nucleate the JV-th dislocation of the pileup, (T= T/nzi2). These equations provide a family of nucleation lines n$ on which r=rim (a), as shown in Figure 4(a).
Complete slip instability of the interface is achieved only if the first dislocation (R = R{) of the pileup collapses, Figure 1(b). The stress level ^required for the destabilization of the first dislocation can be obtained, as a function of a, by solving the equilibrium equations (3) with the condition (3G, /dR]) = 0 . These equations provide a family of instability lines iN on which r=
rm (a), also shown in Figure 4(a). The condition for MDC slip with N dislocations is a) that a pileup of N dislocations is
nucleated and b) that the first dislocation collapses. Friction with TV dislocations requires the stress level TN = max{r(nA, r,,»,}. In a monotonically loaded contact the slip instability will occur when the minimum value of tN is reached, thus Tf= minr^ , (N=\,2,...). The MDC condition is
87

illustrated in Fig. 4(a). Consider two example cases of contact sizes {alb)\ and {a!b)i as depicted in Fig. 4(a). At points on the loading path of the contact of size {alb)\, the nucleation condition for N-\ dislocations is satisfied. Since the stress level at A is lower than that corresponding to the instability line /AM, the pileup of N-\ dislocations is stable. At point B one more dislocation is nucleated, thus N dislocations in the pileup. However, since B is above the is line, the nucleation of the 7V-th dislocation is automatically followed by the destabilization of the first dislocation of the pileup which, in turn, causes complete slip of the interface. For the contact of size {alb)i we find the following. At point A' the situation is similar to A. At B', all N dislocations in the pileup are stable because the stress level is lower than rliX). When point C" is reached, r=r„A1, the first dislocation is destabilized and, therefore, it collapses. Note that MDC slip is cooperated by N dislocations in both situations, B and C. However, while in B slip is triggered by the nucleation of a new dislocation, in C it is controlled by the instability condition for the first dislocation. This results in the serrated (zigzagged) profile of the MDC-slip curve shown in Fig. 4(a), which alternates between nucleation and instability lines.
*r/M
Figure 4: Instability /«and nucleation nN curves, (a) Slip instability for two contacts of sizes (a/b), and (alb)i occurs at point B and C respectively. The curve of MDC slip has a serrated profile (solid line), (b) Numerical results for pileups with up to 10 dislocations, (rj =1.75 b, r = b/4, v = 0.2 and a,. = 1286).
Figure 4(b) shows the first ten nucleation and instability lines obtained numerically for the case when n = 1.75 b, r„ = b/4, v= 0.2 and ar = 1286. (The n\ and i\ lines in this figure are the same as those shown in Figure 2.) The instability lines are more spread out than the nucleation lines. This means that slip instability along the serrated MDC-slip curve is, in most cases, triggered by the dislocation nucleation condition. As the number of dislocations in the pileup increases, the slope of the nucleation lines also increases from the initial value of-1/2 for rt\. It will be shown below that the slope reaches an asymptotic value of 0 for an infinite number of dislocations, which corresponds to a value of the friction stress equal to the Peierls stress of the interface.
The angular-averaged shear traction r(r) on the contact plane, for a pileup of JV=10 dislocations, is plotted in Figure 5 with solid lines. Near the dislocations the stress is singular. However, at the dislocation positions T(Rk) = z>, (k = 1,...,N), because all dislocations are in equilibrium with the Peierls stress, as indicated by the open circles in the figure. The dashed lines in the figure represent the shear stress between every other dislocation when the middle dislocation is removed. On these lines, the solid circles correspond to the environmental stress

level at each dislocation position. The environmental stress is the stress that the dislocation experiences due to the applied stress field and the field of all other dislocations. The difference between the Peierls stress and the environmental stress (open and solid circles respectively) at each dislocation position, corresponds to the sum of the self and image forces of the dislocation in consideration. There are two dislocation-free zones within the contact interface: an inner zone within the first dislocation loop (0<r<Ri), and an outer zone between the last stabilized dislocation and the contact edge (RN<r <a). The inner zone is related to the area swept by a destabilized dislocation, whereas the outer zone represents the area swept by a nucleated dislocation until it stabilizes. As N increases, the environmental stress becomes nearly uniform everywhere in the contact region except for the outer dislocation-free zone, where the stress field is always characterized by the square-root singularity, l/(a-r)' , at the contact edge. It is this singular field that controls the dislocation nucleation process.
Figure 5: Shear traction r(r) on the contact plane for a pileup of JV=10 dislocations (solid lines). The shear traction is singular near the dislocations, and it is equal to TP at the dislocation positions (shown with open circles). The solid circles represent the environmental stress level at each dislocation position.
(N = 10, alb = 47000, average shear stress rlß= 9.83xl0"4, v= 0.2 and aP = 1286)
........ 1 ■ ■ ■ 1 ' ' ,.,..... 1.4x10⁻³- /: 1.2x10⁻³- , 1 \ - 1.0X10⁻³- i 1 •
/■■!/:
8.0x10⁻⁴- T If .1 ^...^..o,i-oi-o/7.j|g'L Imlff i 6.0x10<- /'' Y '' '' : 4.0x10-«-
. :
2.0x10«- : 0.0 r- ^x :
0.0 0.1 0.2 0.3 0.4 0.5 0.6
r / a
0.7 0.8 0.9 1.0
Asymptotic solution
In the limit when 7V-»a), discrete dislocation loops in the contact region can be approximated by a continuous distribution of smeared out dislocations. In that case the shear traction on the interface should be uniform and equal to Tp, because all dislocation must be in equilibrium with the Peierls force. Thus Tf -+tp when JV—»<x>. In the asymptotic problem, with a continuous distribution of dislocations, the shear stress and displacement jump on the interface are given „„8.11,12 as
r(r) = TP; and [«i(>)] = nn -{7c/2-E(r/a)l r<a(v = 0) (4)
where E represents the elliptic integral of the second kind. The asymptotic equation for the displacement jump provides an estimate of the number of
dislocations in the contact region, which is found to be proportional to the contact size:
^kWl=W(,/2-l) naP
(5)
89

The number N « 280 for an example of a contact of radius (a/6)=10 and «p=1286. This is a prohibitively large number if a numerical solution of the problem is attempted. Considering that there are computational limitations in the number of dislocation that can be handled numerically, we have proposed an approximate solution of the problem based on the following asymptotic expansion of the shear traction in the contact plane (for large N)
T(T-) = Kr
■^2n{a-r)
1 + r,,+^[C2+C3(/7a)] (6)
Here a, C2 and C3 are fitting constants; Kc is the critical stress intensity factor for the nucleation of a dislocation; Kc = 0.0686 /u(27ib)m in our calculations; and A is the extent of the outer dislocation-free zone, i.e. A = a-Rn , which is shown as a function of a in Figure 6(a). The first term in (6) accounts for the singular stress field that controls the nucleation process in the outer dislocation-free zone; it decays exponentially. Other terms in (6) correspond to the first order asymptotic expansion of the non-singular component of the shear traction. For a contact of infinite size eq. (6) gives t{r) = tp, in agreement with the asymptotic solution (4). Equation (6) is compared with the environmental traction (Fig. 5) in Figure 6(b), showing good agreement.
O B O 9
, ° 10
0 25 50 75 100 125 150 175 200 225 250
(a) b I a (10')
(b)
0.0 0.1 0.2 0.3 0.4 0.5 0.6 0.7 0.8 0.9 1.0
rla
Figure 6: (a) Extent of the dislocation free zone . (b) Comparison of environmental shear traction of Fig. 5 and r(r) in equation (6), with a=0.368, C2 = -5.5, C3= 5.25.
The friction stress is given as the average stress on the interface, i.e.
1 r Tr = r- 27irt(r)dr 1 vn2 *
(7)
The friction stress calculated from (6) and (7) is shown in Figure 7(a), with open circles. The serrated MDC-slip curve for the first ten dislocations, Fig. 4(b), is also plotted in Figure 7(a). The approximate solution matches well the exact (serrated) curve even for relatively small number of dislocations. In our calculations, the value of the Peierls stress was set equal to the friction stress measured experimentally for the mica/mica interface in the SFA (also plotted in
90

the figure). Thus, the MDC-slip curve gradually approaches the experimental SFA value, as expected. Furthermore, in the range of contact sizes of the SFA the friction stress predicted by the model is within 10% of the experimental value. Finally, the combined SDA and MDC-slip curve is shown in Figure 7(b) for a large range of contact sizes, from \0b to 10 b.
a in meters (b = 0.5 nm)
10-9 10-8 10-7 10-s 10-5 10-" 10-3
-2.90 -,
-2.92:
-2.94:
\N=\
V \3
A4
\V
\ uo
■I
1.1 r -'v !■
1'
015
.%
MDCslip :
o Slip (asymp. expansion):
—y— SFA(Homolaet. at.2) '■ 10-2-
10-3-
10-4-
isition
Model
—A— AFIvP
—T—SFA2 -
MDCslip
-2.96:
-2.98-
^ -3.00-
^-3.02-
j? -3.04^
Concurrent slip
latra
\ SDA slip
-3.06-
-3.08-
-3.10-
V
2nd tra
n
-3.12-
(a)
4.4 4.6 4.8 5.0 5.2 5.4 5.6 5.8 6.0
log (a I b) 1 10 102 103 10" 105 106 107
(b) a I b
Figure 7: (a) Approximate solution for large number of dislocations N based on an asymptotic expansion of the shear tractions, (b) Friction stress predicted by the model and transitions in the slip mechanism (77 =1.75 b, r„ = b/4, v= 0.2 and aP = 1286).
CONCLUSIONS
The micro-mechanical dislocation model of frictional slip establishes the friction stress tj as a varying function of contact size a, as illustrated in Figure 7(b). The model predicts that the mechanism of slip is also size dependent. It is characterized by two transitions. The first transition, from concurrent slip to SDA slip, accords to the minimum contact size (typically about 10 nm) for the nucleation of a single dislocation loop. The second transition, from SDA slip to MDC slip, corresponds to the contact size (typically about 10 \im) at which a nucleated dislocation is stabilized within the contact region. The nanometer-scale friction stress measured in the AFM — independent of normal loading and contact-zone size — is believed to be the stress required for concurrent slip; it can be considered as the effective shear strength of the interface. On the other hand, the friction stress measured in the SFA seems to correspond to the effective Peierls stress of the interface. It is reached asymptotically through the mechanism of MDC slip, Figure 7(a). A remarkable result is that the mechanism of SDA slip prevails for a wide range of contact sizes, typically from 10 nm to 10 urn, as shown in Figure 7(b).
In the analysis, the size dependence of the friction stress arises exclusively from mechanical considerations of the behavior of mobile dislocations that cause long-range-stress-field interactions. Other possible contributions, such as chemical or electro-magnetic effects, have not been accounted for. We emphasize that experimental measurements for the whole range of contact sizes are needed in order to assess the model and properly understand the mechanisms of friction at different scales.
91

ACKNOWLEDGMENTS
This work was primarily supported by the MRSEC Program of the National Science Foundation under Award Number DMR-9632524, and by the Institute of Materials Research & Engineering in Singapore.
APPENDIX
The expressions for the components of the configurational force are8
(l-2v) ^._ yb'{2-v) \u I(R„,r0)
8*0 -y)h
F, Mb2(2-v)\l Ok=-
R 4(l-v)(2-v)
-+-Uffl-^ 2n(\-v) [a 2{a2-Rl) 4Rk {a + R,
G' =
ßb\2-v)\F{Rk,R,)
27t{\-v) I 2Rk
-Tb
{V1^ p^R, a Ja
Jr<2-a2
(r'2-Rl) F(r',R,)dr'
2na^a1 R
I(R,r0) = -\\ F(r,R)dr-\ F(r,R)dr\;F(r,R) = -J—K(k) ^—E(Jfc)
In these equations K(&) and E(k) are elliptic integrals of the first and second kind respectively, and k = 2-JrR /(r + R).
REFERENCES
1. F.P. Bowden and D. Tabor, The Friction and Lubrication of Solids, Clarendon Press, Oxford, England, 1950.
2. A.M. Homola, J.N. Israelachvili, P.M. McGuiggan and M.L. Gee, Wear 136, p. 65 (1990). 3. R.W. Carpick, N. Agrait, D.F. Ogletree and M. Salmeron, J. Vac. Sei. Technol. B 14, p. 1289
(1996); Langmuir 12, p.3334 (1996). 4. R.W. Carpick, D.F. Ogletree and M. Salmeron, Appl. Phys. Lett. 70, p. 1548 (1997). 5. M.A. Lantz, S.J. O'Shea, M.E. Weiland and KL. Johnson, Phys. Rev. B 55, p.10776 (1997). 6. M. Enachescu, R.J.A. van den Oetelaar, R.W. Carpick, D.F. Ogletree, C.F.J. Flipse and M.
Salmeron, Phys. Rev. Lett. 81, p. 1877 (1998).
7. E. Meyer, R. Liithi, L. Howald, M. Bammerlin, M. Guggisberg and H.-J. Güntherodt, J. Vac. Sei. Technol. B 14, p. 1285 (1996).
8. J.A. Hurtado and K.-S. Kim, Proc. R. Soc. Lond., submitted. 9. J. Hirth and J. Lothe, Theory of Dislocations, second edition, John Wiley & Sons, 1982. 10. J.R. Rice and R.Thomson, Phil. Mag. 29, p.73 (1973). 11. A.R. Savkoor, Dry adhesive contact of elastomers, M. Engng dissertation, Tech. University
Delft, The Netherlands (1987). 12. K.-S. Kim, R.M. McMeeking and KL Johnson, J. Mech. Phys. Solids 46, p.243 (1998).
92

MAKING, BREAKING AND SLIDING OF NANOMETER-SCALE CONTACTS
R.W. CARPICK*, M. ENACHESCU, D.F. OGLETREE, M. SALMERON Materials Sciences Division, Lawrence Berkeley National Laboratory, Berkeley, CA 94720. * present address: Sandia National Laboratories, MS1413, Albuquerque, NM 87185-1413, [email protected]
ABSTRACT The contact between an atomic force microscope tip and a sample surface can form an ideal
single asperity of nanometer dimensions, where the interaction forces can be measured with sub- nanoNewton force resolution. Studies of contact, adhesion and friction for these nano-asperities have been carried out for a variety of tips and single crystal sample surfaces. The major result is the observation of proportionality between friction and true contact area for a variety of systems, and an impressive agreement with continuum mechanics models for contact area even at the nanometer scale. The relevant continuum models can in fact be understood in the framework of fracture mechanics.
INTRODUCTION As devices shrink in size, the increased surface-to-volume ratio of the component materials
ensures that interfacial forces such as friction and adhesion can play dominant roles. This fact is painfully appreciated by the designers of microelectromechanical systems (MEMS) who often observe catastrophic failure of MEMS devices due to adhesion, friction and resultant wear. Understanding these interfacial forces should allow such problems to be remedied, and furthermore, the relative strength of these forces could potentially be exploited for specific micro- and nano-scale device applications.
There is currently no fundamental theory that explains or predicts friction in general. At the macroscopic level, it is almost universally observed that the friction force (Fß is linearly proportional to the normal force or load (I):
Ff=li-L (1)
which defines the friction coefficient /u. Eq. (1) is often referred to as Amonton's Law. Macroscopic studies are generally hindered by the inevitable roughness of typical surfaces (fig. 1). A complex multitude of contact points at the interface ensures that the true contact area is much smaller than the apparent contact area, and is nearly impossible to determine. Other factors, such as wear, third-bodies and tribochemistry further complicate the matter.
The atomic force microscope (AFM) is an ideal tool with which to study contact and friction in a fundamental way[l]. A tip, with typically 10-100 nm radius of curvature, is attached to a compliant cantilever spring. At low applied loads, the tip can form a nanometer-scale single contact point (an "asperity") with a variety of sample surfaces, thus providing a well-defined interface (fig. 1). The cantilever deflections are recorded using, most commonly, a reflected optical beam. These deflections are converted to forces by using Hooke's Law. In principle, the normal and lateral forces can be measured with sub-nanoNewton precision, with sub-Angstrom displacement precision. This tip is rastered over the surface using piezoelectric scanning tubes. In practice, numerous issues such as cantilever calibration, non-linear piezoelectric scanning components, thermal drift, and coupling of bending modes put limits on the accuracy of these
93
Mat. Res. Soc. Symp. Proc. Vol. 539 ® 1999 Materials Research Society

i Macroscopic PContact
measurements. These issues have been discussed previously[2] and will only be briefly mentioned in this paper.
Single Asperity Ff=???
Fig. 1. The typical surface roughness of macroscopic interfaces ensures a complex multitude of contact points (asperities). A scanning probe instrument provides a well-defined single asperity contact (the tip) where interaction forces can be precisely measured with nanometer/atomic resolution. At this scale, macroscopic physical laws no longer apply. For example, the friction force (FA is no longer linearly proportional to the applied load (£).
EXPERIMENT The atomic force microscope used in these
experiments is described elsewhere[3]. It operates in ultrahigh vacuum (UHV) to ensure surface cleanliness. Chamber pressures were in the 10"10 Torr regime or better. Experiments were performed at room temperature. Microfabricated cantilevers from commercial vendors were used. Scanning electron microscopy measurements of cantilever dimensions were combined with continuum elasticity theory calculations to estimate the normal force spring constants. Lateral forces were calibrated with respect to the normal forces using the "wedge calibration technique"[2]. Briefly, the relative lateral-to- normal force sensitivity ratio is experimentally determined by observing the cantilever's bending response on a tilted surface, i.e. by imposing a
geometrically determined lateral force. The tip geometry was experimentally determined using "inverse imaging". By scanning the
tip in contact with a much sharper feature on the sample, the tip's profile can be determined. This is accomplished by scanning the tip over the atomically-sharp facets of a SrTiC>3(305) faceted surface[4,5], providing a tip cross-section. Unless otherwise noted, the tip was determined to be paraboloidal. The influence of tip geometry is discussed in the next section.
A variety of interfaces were examined with this apparatus: (1) A platinum-coated tip and a muscovite mica(OOOl) sample[4,6]. The 100 nm Pt coating
was deposited by sputtering onto a plasma-cleaned silicon nitride cantilever. Continuity of the Pt coating was determined by measuring substantial contact conductance between the tip and a conducting sample. Muscovite mica was cleaved inside the vacuum chamber just prior to the experiment, producing large step-free regions for measurement.
(2) A silicon nitride tip and a muscovite mica(OOOl) sample. The tip and cantilever are fabricated from low-stress LPCVD silicon nitride which is non-stoichiometric. These SiNx
cantilevers were used as-received from the vendor (Park Scientific Instruments, Sunnyvale CA). Scanning Auger electron spectroscopy measurements indicate that the surface terminates in a layer with appreciable oxygen content along with Si and N.
(3) A tungsten-carbide (WC) tip and a hydrogen-terminated diamond(lll) single-crystal sample[7]. The cantilever was fabricated from Si and coated with ~20nm of WC (NT-MDT, Moscow, Russia). Auger depth profiles indicated that the WC coating also contains oxygen. The sample was a type II B diamond(l 11) single crystal (boron doped), saturated with hydrogen in a plasma. Vacuum annealing was used to clean the sample, as described in detail elsewhere[8]. Topographic AFM imaging revealed that the diamond sample consists of flat islands ~150-250 Ä
94

lateral displacement (nm)
Fig. 2. (a) 7.5 x 7.5 nm2 lateral force image of the mica(OOOl) surface. The fast scan direction is from left to right. The black dots represent the repeat units of the mica lattice, whose periodicity coincides with the lateral forces, (b) Line trace of the section indicated in (a). The lateral force exhibits "stick-slip" behavior, where the lateral force builds up to some well-defined maximum value, and then quickly relaxes (first arrow). During the relaxation, the tip slips by one unit cell. This behavior repeats itself with the lattice periodicity.
in diameter. A very sharp (1 x 1) LEED pattern was observed, indicating that the islands consist of ordered diamond, which was also verified by previous AFM lattice-resolved imaging[8]. All measurements were performed on these atomically flat islands. The hydrogen termination produces an unreconstructed, passivated (non-reactive) surface.
RESULTS Atomic-Scale Stick-Slip
Frequently, when an AFM tip is placed in contact with a crystalline sample and scanned across it to generate a force map, atomic-scale periodicity is observed (fig. 2a)[9]. Lateral and normal forces are observed to vary with the periodicity of the sample's lattice. This behavior has been observed for a wide variety of tips and samples, and a wide range of experimental conditions (liquid, ambient, controlled atmosphere, vacuum)[l]. When examined in detail (fig 2b), this behavior is seen to result from discontinuous motion of the tip along the surface. As the lever is continuously rastered across the sample, the tip traces out the sample's lattice through a regular series of stick-slip events. Theories to explain this phenomena are under development and are not the focus of this paper. We point out that, as seen in fig. 2b, there is a reproducible critical lateral force at which the slip occurs. We are interested in understanding what physical parameters determine this atomic-scale static friction force, Ff. To do this, we measure the average value of this friction force at a given load, change the load slightly, then measure the friction again, and so on. Typically we measure half of the difference between the average friction force obtained scanning left-to-right and right-to-left, which greatly reduces signal offsets due to coupling of bending modes and optical misalignment. Atomic-scale stick-slip was observed for both the Pt/mica and SiNx/mica experiments. It was not observed for the WC/diamond experiment, but this may have been due to the low friction forces for this interface, thus leaving the stick-slip variation within the noise of the measurement.
95

S 200
Pt/Mica Interface: Friction vs. Load Fig. 3 shows the variation of friction
(circles) with load for the Pt/mica interface, measured with decreasing load. Friction is clearly a non-linear function of load, in contradiction with the macroscopic law of Amonton [eq. (1)]. A substantial negative load (called the pull-off force) must be applied to separate the tip and sample, at which point finite friction persists. This is an example of the significant role that interfacial forces play in small-scale contacts. In fig. 3, the friction data is well fit by the Johnson-Kendall-Roberts (JKR)[10] model (solid line) for the contact area between adhesive elastic spheres, which is equivalent to the contact geometry between a paraboloidal tip and a flat plane.
The JKR model essentially balances the elastic strain energy with the adhesive interfacial energy to determine the contact area. This model can be derived using fracture mechanics concepts[ 11,12]. The contact is viewed as an external circular crack in an otherwise infinite medium. The contact edge represents the crack front. Loading and unloading the contact is viewed as propagating this crack (advancing or receding) in mode I (normal separation). Griffith's concept of brittle fracture is used to balance strain energy and interfacial energy to solve for the contact area as a function of load, as summarized elsewhere[l 1]. The end result is a fairly simple, analytic equation:
J 3R f3r i : ^n2/3
Fig. 3. Friction (circles) vs. externally applied load for a Pt-coated tip in contact with mica in UHV. The tip is initially loaded to -210 nN, then friction is measured as the load is decreased. At —140 nN, the tip pulls out of contact with the sample. The solid line is the JKR prediction for the contact area vs. load, scaled to fit the friction data.
A = K - \4E"
( L + 3iqR + ^dTVyRL + (37tyR)2 (2)
where A is the contact area, R is the tip radius, y is the interfacial energy per unit area (also known as the work of adhesion). £* is the reduced Young's modulus of the tip and sample materials, given by
E = 1-V , l-v2
2^ -1 (3)
where E2, E2 are the Young's moduli of the tip and sample respectively, and V], V2 the respective Poisson's ratios. The JKR relation requires that the tip is paraboloidal. Inverse imaging, described above, verifies that the tip is paraboloidal with a curvature radius of-140 tun.
Since the JKR contact area varies with load in almost exact proportion to the measured friction, we postulate that
rf ■ T-A (4) where r is the interfacial shear strength. Eq. (4) thus represents the essential relation governing friction for an elastic single asperity.
We further tested the validity of the JKR approach by deliberately altering the tip shape through application of an extremely high load while sliding. A blunt, flat tip was produced in this fashion, as verified by inverse imaging. The JKR prediction for contact area will obviously
96

Table 1
interface 7
(mJ/m2) T
(MPa) contact radius @ Z=0 (nm)
Pt/mica 404 910 13.7
SiNx/mica 24 52 8.4
WC/Diamond 10 238 1.1
depend upon the tip geometry. We confirmed that the observed friction-load data was well fit by a modified JKR model derived using an appropriately flat tip profile[4].
By using bulk values for the elastic constants (Emjca = 56.5 GPa, vmjca = 0.098[13], Ept = 111 GPa, Vpt = 0.39[14]), we can solve for the contact radius at zero load, listed in Table 1. We see that indeed the contact is of nanometer dimensions. Smaller contacts can be formed with smaller tips and less strongly adhering materials. The JKR analysis also allows us to determine both the interfacial energy (y) and the shear strength (T) for this interface (Table 1). The values quoted are for the maximum shear strength and adhesion energy observed for this system; a gradual decrease of both of these ensued due to contact-induced changes in the tip chemistry, as described elsewhere[6]. The adhesion energy (derived from the pull-off force) is relatively strong, surpassing the van der Waals' energy by an order of magnitude. Likewise, the shear strength is extremely large. The theoretical prediction for the shear strength of a crystalline material in the absence of dislocations is given by ~G/30[15] where G is the shear modulus. We can define an "effective" interfacial shear modulus Geff = 2GmicaGPt/(Gmica +GPt) = 22.3 GPa. This gives,
for Pt/mica, t~Geff/25. The shear strength of this system is thus comparable to the ideal
material shear strength[16,17]. This surprising result remains to be fully explained. Recent theoretical modeling by Hurtado
and Kim[16,17] using dislocation mechanics suggests that below a critical contact size (in the nm range), strongly adhered contacts should exhibit such ideal shear strengths. The strong attractive forces may create a substantial degree of commensurability of the interfacial atoms, thus producing an interface that is resistant to shear, as in a crystalline material. At this scale, according to the theory, the contact is too small to allow the nucleation of even a single dislocation at the contact edge. Dislocation nucleation is predicted to reduce the shear strength substantially at larger scales. Experiments that test this model more thoroughly are desirable.
Limitations in Applying the JKR Theory Although the JKR fits to the friction data presented above are convincing, our approach
contained the implicit assumption that the shear strength T was not dependent upon load. In fact, load-dependent shear strengths have been observed, although only at larger scales and for different materials[18,19]. It would therefore be desirable to determine whether or not the shear strength varies with load.
Furthermore, the JKR model is not a unique prediction for the behavior of a single asperity[20]. The JKR model assumes that the interfacial attraction has zero spatial range; i.e. the system gains energy only when the materials are in direct contact. This approach is reasonable only for relatively compliant, strongly adhering materials exhibiting short-range attraction. Finite range forces have been modeled by others[21,22], with the extreme opposite limit for stiff,
97

weakly adhering materials with long-range forces described by the Derjaguin-Mtiller-Toporov (DMT) theory[23]. Intermediate cases are treated by Maugis[22] using a Dugdale crack model. Again, using a mode I fracture mechanics approach, this time with a constant adhesive stress acting over a finite distance, Maugis provides an analytic solution that predicts the contact area for the JKR and DMT limits, and for cases in between. Maugis' equations are relatively complicated; a simplified form of the solution has been derived which facilitates fitting this model to experimental data[24]. In any event, for these cases, the contact area varies with load in a significantly different fashion compared with the JKR solution.
Finally, the JKR model assumes only normal loading, thus neglecting any possible effect that the substantial applied lateral force has upon the contact area. Johnsonfll] has combined the Dugdale model of Maugis with interacting mode I, II and III fracture mechanics. This theory thus includes the influence of the lateral force upon the contact area, and allows the interaction forces to have a finite range. Using this finite range mixed-mode fracture approach, Johnson predicts that the contact area can be reduced appreciably by partial slip at the contact edge which is induced by the applied lateral force. According to this model, the shape of the area-load relation still resembles the JKR curve, but with different (smaller) absolute values. The model also predicts that the lateral force causes pull-off to occur at a smaller load compared to the direct pull-off force (measured without sliding). This model can be tested with AFM by comparing the direct and sliding pull-off forces. A statistical analysis was conducted for the Pt/mica system, revealing an average reduction of the pull-off force by a factor of 0.89 due to sliding. Using this result, the data presented in fig. 3 can be fit by this modified theory, resulting in an increase of the shear strength by about 20% compared with the JKR fit. While the observed pull-off reduction supports Johnson's model, it is not a direct verification that the contact area itself changes due to sliding.
The above considerations make it clearly desirable to measure the contact area directly. Two different methods to accomplish this are described in the following two sections.
SiNx/Mica Interface: Lateral Stiffness Measurements Contact stiffness is defined as the amount of force per unit displacement required to
compress an elastic contact in a particular direction, has the units of N/m, and is essentially the "spring constant" of the contact. Contact stiffness applies both for normal and lateral displacements. The lateral contact stiffness of an axi-symmetric contact, kconlact, is in fact directly proportional to the contact radius a, given by[25]:
kcontact=s-G a (5)
where G*=[(2-Vj)/G;+(2-V2)/G2]"l. Here G\ and G2 are the tip and sample shear moduli, respectively. This convenient relationship holds for the JKR, DMT or intermediate regimes. It requires that no interfacial slip occurs, thus low lateral forces must be used for the measurement.
In an AFM experiment, the contact stiffness resides in series with the lateral cantilever stiffness. The typical lateral stiffness of commercial AFM cantilevers, kiever, is around 50-200 N/m[2], which is of the same order as the lateral contact stiffness, kcoMach at the nanometer scale. Thus, typical cantilevers can accurately measure variations in the lateral stiffness of nanometer- sized contacts, i.e.
-i-l dFlateml ,
dx ~ Ktot 1 1
. lever ^contact
(6)
98

cn -JE
c: !£ 30
25
20
£. a 0.003 -
■2 «fc
-40 -20 0 20 40 60 Load (nN)
Fig. 4. Crosses: lateral stiffness (ktot) VJ. load data for a SiNx tip on mica in UHV. Triangles: Ff vs. load, acquired shortly after the stiffness measurement. Solid lines: fits of the JKR model to both measurements.
Fig. 5. Ff/ k\0„,ac, vs. load for the S13N4 tip on mica in UHV, calculated from the stiffness and friction data in fig. 4.
where F/atera/ is the lateral force (cantilever torsion), and x is the lateral displacement.
The slope of the initial "sticking" portion of the tip-sample interaction during lateral sliding
(fig. 2b) corresponds to dFiaterai/dx=kt0(, the total lateral stiffness. To measure this slope
accurately, the relative lateral position between the cantilever base and the sample is sinusoidally modulated with an amplitude of a few Ä which avoids slip even at low loads. A lock-in amplifier is used to measure the amplitude of the lateral force response over a range of loads. The in-phase response amplitude {dFiaterai) divided by the amplitude of relative displacement (dx, determined
by accurately knowing the piezo response calibration) corresponds to the total lateral stiffness of
the system, ktot, eq. (6). Since kever is constant, kcontact can be determined from this
measurement. We have measured the variation of ktot with load for a SiNx cantilever and a mica sample in
UHV (fig. 4 - crosses). Indeed, a substantial variation with load is observed, due to the change in contact area. The solid line shows that the JKR model, combined with eq. (5), describes this variation quite accurately. Friction can also be measured as a function of load as described previously (fig. 4 - triangles). Again, the JKR model fits the data very well. The shear strength and adhesion energy for the interface, derived from the JKR fit, are listed in Table 1. For these
calculations, we used ESiN = 155 GPa, vSiN = 0.27[26]. A rather blunt paraboloidal tip of-260
nm radius was used for this experiment, as measured using inverse imaging. We can verify that the shear strength is load-independent without relying on the JKR
analysis. We simply divide the friction measurement at each load by the square of the corresponding contact stiffness measurement (which is proportional to the contact area). Using
eqs. (4) and (5), we find Ff(L) _ K.T{L)
"■contact (L) 64 («r = T(L) (7)
This quantity is plotted vs. load in fig. 5, where we see that indeed the shear strength is load-
independent over this range. Combined lateral stiffness and friction measurements can therefore
determine in detail the mechanical behavior of nanometer-scale interfaces.
WC/Diamond Interface: Contact Conductance Measurements
99

14
12
10
i
<p -
DMT ritJ> —•—4V
-•-3.5 V j£^^ - —»-3.0V
<^\*^ -
- JKR fity^^oV,«« ^^B^^^DMT fit ■
:
-0.5 0 0.5 1 1.5 2 Load [|JN]
Fig. 6. The current measured through the tip-sample contact vs. load, at three different constant voltages. Note the accurate fit of the current to the DMT continuum mechanics model, which is proportional to the contact area.
Load [nN]
Fig. 7. Friction vs. load follows the same dependence as that of contact conductance vs. load, and therefore the same dependence as that of the DMT model, showing that friction is proportional to the contact area. The inset shows a typical force-distance curve with the pull-off force in very good agreement with the value obtained from the DMT fit.
Diamond and tungsten-carbide are important tribological materials. Both materials generally exhibit very low friction. Diamond and diamond-like films are important coating materials used in a wide variety of tools, hard disks, micro-machines and aerospace applications. Similarly, tungsten-carbide plays an important role in several types of hard coatings. Diamond and tungsten-carbide are two of the hardest, stiffest materials known, while the adhesive forces at the interface are small due to the hydrogen passivation of the diamond surface and to the fact that carbides are generally quite inert. These properties make the system under study an excellent candidate to exhibit a DMT-like behavior for contact area versus load. The DMT solution for contact area is given by[22]:
A = J™S?ß' .{L + 2KRY)2I\ (8)
The lateral stiffness technique described previously is not expected to work well for these materials, due to the expected low friction and high stiffness of the materials. Low friction allows slip to take place during the lateral stiffness measurement, thus underestimating the lateral stiffness response. Large elastic moduli lead to large values of kcontact which, as is apparent from eq. (6), cannot be sensitively measured. Since the diamond sample is boron-doped and tungsten- carbide is conductive, local contact conductance measurements can instead be performed as a function of applied load to obtain independent information about the contact area. The nanometer scale of the contact radius in AFM experiments means the total system conductance is limited by the contact and not by the bulk conductance of tip or sample. In this limit, the contact conductance becomes directly proportional to the contact area A. However, the proportionality constant is difficult to determine, preventing absolute determination of A with this technique. Nevertheless, at a fixed voltage, the current is always proportional to A for any current transport mechanism[27]. Thus, it is possible to equate the variation in current at a constant voltage to the variation in A; this relation is used in this work.
Using a sensitive current preamplifier, the load dependence of the current at several voltages applied to the sample was measured using an 88 N/m cantilever (fig. 6). Current-voltage curves revealed consistent semiconductor-like conductance at all loads, which indicates that the
100

conductance mechanism was not affected by the applied stress. For all bias voltages, the current vs. load data can be fit by the DMT model (solid lines). The DMT model provides an excellent fit to the measured data and the pull-off force deduced from the fits is identical to 0.1 uN independently measured from the force-distance curves with the same lever. It is significant that the fits at all voltages have the same pull-off force, which confirms that current is proportional to contact area. These results show unambiguously that the load dependence of the contact area for this single asperity interface can indeed be described by the DMT model. As seen in fig. 6, the JKR model provides a poor fit to this data.
Friction measurements were performed using a 0.23 N/m cantilever to enhance the sensitivity to frictional forces. The radius of curvature of the paraboloidal tip was found to be ~110 nm using inverse imaging, measured before and after tip-sample contact, thus no evidence of wear was observed. Fig. 7 shows the results of frictional force measurements as a function of applied load, which were reproducible at different locations on the sample. The data in fig. 7 were obtained by decreasing the load from 12 nN to negative loads (unloading). Experiments when the load was increased (loading) exhibited the same behavior as shown in fig. 7, indicating that the deformation of the contact is elastic for the range of loads investigated. The data in fig. 7 can be fit by the DMT model (solid line), treating both /and Tas free parameters, demonstrating that friction is proportional to A. The yand Twere determined using Ediamond= ' 164 GPa, Vdiamond =
0.08[28], Ewc= 714 GPa and vwc= 0.24[29]. As summarized in Table 1, the DMT fit results in a pull-off force of-7.3 nN, an adhesion energy of 10 mJ/m2, and a shear strength of 238 MPa. The contact radius is 1.1 nm at zero applied load. No friction data for loads smaller than -2 nN could be obtained due to a premature pull-off of the tip at negative loads. Premature pull-off is frequently promoted by the tip-sample movement during scanning. Force-distance curves involve less lateral movement and therefore provide a direct determination of the pull-off force. The typical, reproducible result is shown in the inset of fig. 4, and the measured pull-off force of -7.3 nN is in excellent agreement with the value obtained from the DMT fit. Attempts to fit the JKR model to our friction vs. load measurements produced strongly inconsistent fits.
For the WC/diamond interface, Geff~ 380 GPa, so t~ Geß/\600. Thus, the shear strength is relatively small in this case, especially in comparison to the Pt/mica interface. An ideal shear strength in the range of G/30 requires a "crystalline" or commensurate interface. This suggests that there may be very little commensurability for the WC/diamond interface, which is plausible considering the high stiffness and weak adhesion of these materials. Further work is required to verify this hypothesis.
We do not attribute the premature pull-off described above to the partial slip phenomenon predicted by Johnson[ll], as this effect is only significant for strongly adhered interfaces, van den Oetelaar has measured strong adhesion and friction between a Si tip and the clean diamond(l 11) surface[30], and observed that partial slip occurs with high lateral force. This was evident by a reduction of the lateral stiffness just prior to full slip.
CONCLUSIONS Atomic force microscopy can accurately measure load, friction, contact area, stiffness,
conductance, adhesion energies, and shear strengths for nanometer-scale contacts. While careful attention must be paid to instrumental issues such as calibration, tip shape, experimental conditions and other instrumental artifacts, methods to address these issues have been developed to quite reasonable extents. Using this instrumentation, we have verified that friction at the
101

nanometer scale, for an elastic, single asperity contact, is directly proportional to the true contact area. In other words, there appears to be a constant friction force per interfacial atom (the shear strength). The constant shear strength indicates that the mechanism of energy dissipation for these systems does not change in this range. Thus, the increase in friction with load is attributable to the increase in contact area. This may not be so surprising given that the nominal stress is only increasingly roughly as L,/3 (from the continuum models). New modes of energy dissipation, resulting from inelastic processes, may activate at higher stressesfl]. For example, evidence of tip-induced atomic-scale wear has been reported for alkali halide materials[31]. Pressure-activated modes of energy dissipation are reported in organic thin films due to progressive molecular deformation[32]. These examples represent stress-dependent increases in the number of energy dissipation channels and are therefore manifested in increases in the shear strength compared with purely elastic, wearless friction.
Fracture mechanics can be successfully utilized to derive continuum models that describe the contact area (as well as stress distribution, contact profile etc.). Impressive agreement with these continuum models is found, even at the nanometer scale. New continuum approaches to account for the effect of lateral forces on a loaded contact (using mixed-mode fracture) and the mechanism of slip (using dislocation mechanics) have been recently developed. In the AFM experiments, different relations between contact area and load are observed for different pairs of materials. The differences may also be correlated with the relative magnitude of the interfacial shear strength. Shear strengths equivalent to the ideal material strength are observed in some cases (e.g. Pt/mica). Nano-technology applications will require interfaces that either resist or facilitate shear, depending on the specific application. Further understanding through studies such as these could eventually allow control of these shear properties at the nanometer scale.
ACKNOWLEDGEMENTS We acknowledge useful discussions with K.L. Johnson, K.-S. Kim, and J. Hurtado. The
Pt/mica experiments were performed and analyzed with the assistance of N. Agrai't. The WC/diamond experiments were performed and analyzed with the assistance of R.J.A. van den Oetelaar and C.F.J. Flipse. R. W. C. acknowledges the support of the Natural Sciences and Engineering Research Council of Canada. This work was supported by the Director, Office of Energy Research, Basic Energy Sciences, Materials Division of the US Department of Energy under contract number DE-AC03-76SF00098.
REFERENCES 1. R.W. Carpick and M. Salmeron, Chem. Rev. 97,1163 (1997). 2. D.F. Ogletree, R.W. Carpick, and M. Salmeron, Rev. Sei. Instrum. 67, 3298 (1996). 3. Q. Dai, R. Vollmer, R.W. Carpick, D.F. Ogletree, and M. Salmeron, Rev. Sei. Instrum. 66, 5266 (1995). 4. R.W. Carpick, N. Agrait, D.F. Ogletree, and M. Salmeron, J. Vac. Sei. Technol. B 14, 1289 (1996). 5. S.S. Sheiko, M. Möller, E.M.C.M. Reuvekamp, and H.W. Zandbergen, Phys. Rev. B 48, 5675 (1993). 6. R.W. Carpick, N. Agrait, D.F. Ogletree, and M. Salmeron, Langmuir 12, 3334 (1996). 7. M. Enachescu, R.J.A. van den Oetelaar, R.W. Carpick, D.F. Ogletree, C.F.J. Flipse, and M. Salmeron, Phys. Rev. Lett. 81,1877 (1998).
102

8. R. van den Oetelaar and C. Flipse, Surf. Sei. 384, L828 (1997). 9. S. Morita, S. Fujisawa, and Y. Sugawara, Surf. Sei. Rep. 23,3 (1996). 10. K.L. Johnson, K. Kendall, and A.D. Roberts, Proc. Roy. Soc. London A 324, 301 (1971). 11. K.L. Johnson, Proc. Roy. Soc. London A 453,163 (1997). 12. D. Maugis and M. Barquins, J. Phys. D. (Appl. Phys.) 11,1989 (1978). 13. L.E. McNeil and M. Grimsditch, J. Phys: Condens. Matter 5,1681 (1992). 14. Metals Handbook, 10th ed. American Society for Metals, Metals Park, Ohio, 1990. 15. A.H. Cottrell, Introduction to the Modern Theory of Metals, Institute of Metals, London Brookfield, VT, USA, 1988. 16. J. Hurtado and K.-S. Kim, Proc. Roy. Soc. A under review (1999). 17. J. Hurtado and K.-S. Kim, Fracture and Ductile vs. Brittle Behavior - Theory, Modeling and Experiment; Proceedings of MRS Fall Meeting Symposium M, December 1998, Boston, MA. this volume (1999). 18. B.J. Briscoe and D.C.B. Evans, Proc. Roy. Soc. London A 380, 389 (1982). 19.1.L. Singer, R.N. Bolster, J. Wegand, S. Fayeulle, and B.C. Stupp, Appl. Phys. Lett. 57, 995 (1990). 20. K.L. Johnson, Langmuir 12,4510 (1996). 21. JA. Greenwood, Proc. Roy. Soc. London A 453,1277 (1997). 22. D. Maugis, J. Colloid Interface Sei. 150,243 (1992). 23. B.V. Derjaguin, V.M. Muller, and Y.P. Toporov, J. Colloid Interface Sei. 53, 314 (1975). 24. R.W. Carpick, D.F. Ogletree, and M. Salmeron, J. Colloid Interface Sei. under review (1998). 25. K.L. Johnson, Contact Mechanics, University Press, Cambridge, 1987. 26. Dr. M. Tortonese, Park Scientific Instruments Inc., Sunnyvale, CA (personal communication). 27. S.M. Sze, Physics of Semiconductor Devices, 2nd ed. Wiley, New York, 1981. 28. CA. Klein, Materials Research Bulletin 27,1407 (1992). 29. J.F. Shackelford, W. Alexander, and J.S. Park, CRC Materials Science and Engineering Handbook, 2nd ed. CRC Press, Boca Raton, 1994. 30. R.J.A. van den Oetelaar, Ph.D. Thesis, Eindhoven University of Technology, 1998. 31. R.W. Carpick, Q. Dai, D.F. Ogletree, and M. Salmeron, Trib. Lett. 5,91 (1998). 32. E. Barrena-Villas, S. Kopta, D.F. Ogletree, D.H. Charych, and M. Salmeron, Phys. Rev. Lett. under review (1998).
103

Part III
Fracture and Deformation of Nonmetals

ON THE TRIGGERING OF SHEAR FAULTS DURING BRITTLE COMPRESSIVE FAILURE: A NEW MECHANISM
E. M. Schulson*, D. Iliescu* and C. E. Renshaw** *Thayer School of Engineering, Dartmouth College, Hanover, NH 03755, [email protected] **Dept. of Earth Sciences, Dartmouth College, Hanover, NH 03755.
ABSTRACT
Direct observations are presented of the micromechanical events that contribute to the localization of deformation within brittle compressive shear faults. The observations were made on ice and show that faults are composed of both wing cracks and splay cracks. The latter features initiate from one side of inclined parent cracks and create sets of slender microcolumns fixed on one end and free on the other. It is proposed that the fault-triggering mechanism is the breaking of near-surface microcolumns owing to frictional sliding across their free ends. A lower-bound estimate of the compressive strength of ice is found to be in order of magnitude agreement with experiment.
INTRODUCTION
Failure of brittle materials under confined compressive loading generally occurs through the formation of one or more macroscopic shear faults. The faults develop quickly, are accompanied by bursts of acoustical energy, and are marked by bands of localized damage inclined by about 30° to the direction of the most compressive stress. In the laboratory they form near the peak of the stress-strain curve, implying that they initiate from deformation-induced instabilities. The question is: what triggers them?
To investigate this point we performed a series of experiments on fresh-water columnar ice Ih (h=hexagonal). We used this material because it is optically transparent, single phase, coarsely grained (10 mm) and possesses a growth texture (termed S2 because the crystallographic c-axes are perpendicular to long axis of the columnar-shaped grains). The transparency and large grains allow cracks to be directly detected by eye; the absence of additional phases reduces complications in interpretation; the growth texture imparts plane strain inelastic deformation to specimens loaded across the columns under moderate across-column confinement. Ice is also a material of considerable practical interest [1]. A complete account of this work is given elsewhere [2].
EXPERIMENTAL CONDITIONS
The ice was grown in the laboratory and then biaxially compressed across the columns under proportional loading at -10°C at a strain rate (along the principal strain direction) of 4.8xl0"3s"', using a true multiaxial loading system housed within a cold room. The minor stress C22=0-löl 1
where an is the major stress. Figure 1 is a sketch of the loading arrangement. Further details are given in reference [2].
107
Mat. Res. Soc. Symp. Proc. Vol. 539 ® 1999 Materials Research Society

S2 COLUMNAR GRAIN
FIGURE 1 Schematic sketch of the loading arrangement.
RESULTS AND OBSERVATIONS
Figure 2a shows a typical terminal shear fault and Figure 2b shows a thin-section of the same fault. The following points are noteworthy: (i) The fault is a zone of intense damage about 2-3 grain diameters wide, inclined by 9 = 26° to the maximum principal stress (vertical). (ii) Wing-cracks (examples arrowed) are distributed across the overall field of damage. They stem from the tips of intergranular parent cracks, which are inclined by about 45° to the direction (xi) of maximum principal stress, and tend to be aligned with this direction, (iii) The fault has zigzag edges, implying that wing cracks are part of its structure, (iv) Milky features (e.g., A and B, Fig. 2a) stem from one side of some parent inclined cracks. These features are actually sets of closely spaced secondary cracks whose length is about one- half the grain diameter, evident from the thin sections (Fig. 2b). We term them "splay cracks" in recognition of the term used to describe similar features in faulted rock [3,4].
108

CM
I
•a
Ü
i^^ra
G
O J3
J3
o o
J3 OH
109

DISCUSSION
Wing cracks develop from frictional sliding across parent cracks, as described e.g. by Ashby and Hallam[5] and observed in ice by Schulson et al.[6]. Splay cracks initiate, we suggest, under sliding stresses on cracked grain boundaries, and then grow, as suggested by Martel and Pollard [4] and by Cooke [7], under tensile stresses arising from non-uniform sliding. Both features contribute to the development of the fault.
Splay cracks, we believe, are key to faulting. Upon forming, they create sets of closely spaced microcolumns fixed on one end and free on the other. The free ends contact the parent sliding crack and this induces a moment which causes the columns to bend and break, like the teeth in a comb under a sliding thumb. Near-surface (external or internal) microcolumns probably break first, initiating the fault. Growth follows, along a band of reduced shear resistance which is composed of both pre-fault damage plus fresh damage created ahead of the fault in a Reches and Lockner [8] kind of "process zone". Figure 3 is a schematic sketch of the development, as we imagine it.
JbX X, A X X .. ..,.kAT.A,Jv.Av..l, M,\ ,K ,."., ,\ ,K ..
! ! Pi II
Wf£&. a •A« b
7"\- ?■■''v 's-' "•«-'i ' i .,•'■'•.,•' ■•■'■af.,-x-,. : i I is JL X k \\ T FT T '
ir/T i ! ! i c d
FIGURE 3 Schematic sketch of the development of a shear fault.
On the assumption that the fault is initiated when microcolumns begin to break, the initiation stress can be estimated as follows: Imagine the "comb crack" illustrated in Figure 4a: M is the moment per unit depth and P is the axial force per unit depth. The crack tip material near the end of the column is under mixed mode loading. If we assume the situation is similar to the growth of an edge crack in a brittle plate, then from the analysis of Thouless et al. [9] it can be shown that in the long-crack limit the stress to trigger the fault may be given by [2]:
110

a = - 2K,
(3ahf(l-ß) (1)
for n<l where Kjc (0.1 MPamO-5) is the fracture toughness, m (0.58) is the friction coefficient, h
is the column length ( found to be about grain size/2) and a is the slenderness ratio (found to be 5.3+2). This gives an initiation stress of 1.0±0.5 MPa under uniaxial loading. Fault initiation by Euler buckling of microcolumns of the same length and slenderness ratio and fixed on both ends, created say between adjacent wing cracks, Figure 4b, occurs under stresses given by:
K2Ed2
" 3h2 (2)
where E is Young's modulus (=10 GPa) and h/d=a. This gives a failure stress between 600 and 3000MPa. The actual terminal failure stress under uniaxial loading is about 2.5 MPa. The new mechanism shown in fig. 4a, and described by eqn. 1 thus affords the more realistic estimate.
FIGURE4 a,b Schematic sketches (a) of the frictional moment-loading of fixed-free microcolumns created by
splay cracks and (b) of the axial loading of microcolumns created by adjacent wing cracks.
Although the observations reported here were made only on ice in the lab, wing-like cracks have also been seen [10] in the Arctic sea ice cover. Also, wing cracks [11,12,13], splay cracks [3,11,14,15] and zigzag shear faults [16] have been seen in rock, on scales large and small. This suggests that the fault triggering mechanism is independent of both material and scale.
111

SUMMARY
1. Frictional crack sliding and splay cracking are elements in the formation of brittle compressive shear faults, at least in ice in the lab. 2. Splay cracks are the critical features. They stem from one side of parent sliding cracks and create sets of fixed-free microcolumns. The microcolumns experience a bending moment induced by frictional sliding at their free end. Eventually they break, triggering the fault. 3. A first-order calculation shows that the applied stress to break the fixed-free columns is of the same order of magnitude as the measured strength.
ACKNOWLEDGEMENTS
This work was supported by Army Research Office, contract no. DAAG 55-97-1-0138 and Office of Naval Research, contract no. N00014-97-1-0211.
REFERENCES
1. E.M. Schulson, The structure and mechanical behavior of ice, J.O.M. (1998 in press). 2. E.M. Schulson, D. Iliescu and C.E. Renshaw, On the initiation of shear faults during brittle compressive failure: A new mechanism, J. Geophys. Res. (1998 in press). 3. T.-F. Wong, Micromechanics of faulting in Westerly granite, Int. J. Rock Meek Min. Sei. & Geomech. Abstr., 19,49-64(1982). 4. S.J. Martel and D.D. Pollard, Mechanics of slip and fracture along small faults and simple strike-slip fault zones in granitic rock, J. Geophy. Res., 94, 9417-9428 (1989). 5. M.F. Ashby and S.D. Hallam, The failure of brittle solids containing small cracks under compressive stress states, Acta. metall, 34, 497-510 (1986). 6. E.M. Schulson, G.A. Kuehn, D.E. Jones and D.A. Fifolt, The growth of wing cracks and the brittle compressive fracture of ice, Acta metall. mater., 39, 2651-2655 (1991). 7. M.L. Cooke, Fracture localization along faults with spatially varying friction, J. Geophys. Res., 102, BIO, 24,425-22,434 (1997). 8. Z. Reches and D.A. Lockner, Nucleation and growth of faults in brittle rocks, J. Geophys. Res., 99, B9,18,159-18,173 (1994). 9. M.D. Thouless, A.G. Evans, M.F. Ashby and J.W. Hutchinson, The edge cracking and spalling of brittle plates, Acta metall, 35, 1333-1341 (1987). 10. E.M. Schulson, E.M. and W.D. Hibler, III, The fracture of ice on scales large and small: arctic leads and wing cracks, Journal ofGlaciology, 37, 319-322 (1991). 11. R.R. Gottschalk, A.K. Kronenberg, J.E. Rüssel, and J. Handin, Mechanical anisotropy of gniess: Failure criterion and textural sources of directional behavior, J. Geophys. Res., 95, 613- 21,634(1990). 12. P. Segall and D.D. Pollard, Nucleation and growth of strike-slip faults in granite, J. Geophys. Res., 88, 555-568 (1983). 13. Z.M. Cruikshank, G. Zhao, et al., Analysis of minor fractures associated with joints and faulted joints, J. Struct. Geol, 13, 865-886 (1991). 14. R.E. Conrad, II and M. Friedman, Microscopic feather fractures in the faulting process, Tectonophysics, 33, 187-198 (1976). 15. R.K. Davies and D.D. Pollard, Relations between left-lateral strike-slip faults and right- lateral kink bands in granodiorite, Mt. Abbot Quadrangle, Sierra Nevada, California, Pure & Appl. Geophys., 124, 177-201 (1986). 16. D.E. Moore and D.A. Lockner, The role of microcracking in shear-fracture propagation in granite, J. Struct. Geol., 17, 95-114 (1995).
112

BEHAVIOR OF CRACK GROWTH RESISTANCE IN TOUGHENED SILICON NITRIDE CERAMICS
H. Kawamoto*, K. Hiramatsu*, Y. Takigawa*, A. Okada**, and H. Usami*** * R&D Laboratory, Japan Fine Ceramics Center, Nagoya, 456-8587 Japan ** Scientific Research Laboratory, Nissan Motor Co., Ltd., Yokosuga, 237-8523 Japan *** Meijo University, Nagoya, 468-8502 Japan
ABSTRACT
Testing methods for crack-growth resistance-curve (R-curve) behavior were investigated and developed to analyze the toughened mechanism in poly cry stalline ceramics. These methods are a biaxial-flexure method for small-scale disc-shaped specimens with micro-indentation cracks and a single-edged notched beam flexural method with crack stabilizers. In both methods, the growing crack length is measured directly as afunction of applied stress, using the system that consist of a microscope and a CCD camera. Applying these testing methods, R-curve behavior of a toughened silicon nitride with a preferred orientation of elongated grains was evaluated to characterize the toughened mechanism, comparing with the behavior in a commercially available silicon nitride. The behavior having these rising R-curves is discussed with emphasis on the effects of microstructure such as grain-growth and grain-orientation, and resultant grain-bridgings behind the crack-tip.
INTRODUCTION
Strength testing methods for the microscopic fracture behavior have been needed in order to develop more toughened structural ceramics, because the microscopic region dominates the macroscopic fracture behavior. The analysis on crack propagation in microscopic material structure is very useful for ceramic material design to increase the fracture resistance [1]. The shape of R-curve influences strength and damage tolerance of ceramic materials and components. Therefore, it is important to quantify such effects with regard to the role of microstructure, the initial crack size and the initial crack shape. Accordingly, the damage tolerance capability is the most important for practical uses of structural ceramics, because of the low fracture toughness and the sensitivity to defect size. R-curve behavior brings out vital information about the mechanism in microstructure for microscopic fracture behavior, such as crack-tip shielding by bridging grains behind the crack-tip. This behavior can be different from each other in those that are measured with long through-thickness cracks and small semi-elliptical surface flaws, particularly with regard to the initiation resistance and the initial slope.
In the present work, in-situ measurement methods for R-curve behavior in poly cry stalline ceramics were investigated and developed applying biaxial-flexure for small-scale disc-shaped specimens with Vickers indentation cracks and single-edged notched beam (SENB) flexure with crack stabilizers. R-curve behavior of a commercially available silicon nitride and a toughened silicon nitride was evaluated using these methods. The improved flaw tolerance mechanism with the rising R-curve behavior was assessed in view of the microstructure sources on grain-bridgings behind the crack-tip.
EXPERIMENTAL PROCEDURE
Two kinds of silicon nitrides were chosen in this study. These properties and processing are shown in Table 1. SN-1 is a commercially available silicon nitride as a standard material distributed by Japan Fine Ceramics Center. SN-sy is a toughened silicon nitride with a preferred orientation of large elongated grains, and was fabricated by tape casting of raw powder slurries seeded with ß -Si3N4 particles and by a gas pressure sintering [2].
Small-crack R-curves were measured for small surface cracks using disc-shaped specimens with cracks by Vickers indentation. Fig 1 shows the testing system and the conditions. Assuming median or radial crack by Vickers indentation load, crack growth resistance KR for
113 Mat. Res. Soc. Symp. Proc. Vol. 539 ®1999 Materials Research Society

stable crack growth is given by
KR=flwafc[n+frejPc (1)
where of is applied flexural stress, c is surface crack size, P is indentation load, d is crack shape parameter, and x is residual stress factor. j£ and/„ are ellipticity correction factors for applied flexural stress and residual stress, respectively [3], [4]. Biaxial tangential tensile stress in ring-on- ring testings is calculated by
-r=^{l + V)ln{ri/r2) + {l-V)(r:-r2yr!} (2)
where W is applied load, v is Poisson's ratio (0.28). rh r2, rs and / are dimensions of disk- shaped specimen and the testing fixture [5]. Parameters and factors in Equation (1) are given by
y/=1.29
ff = (l.7l(a/c)-0.138 (a /cM (l +1.464 (a /c)'
Table 1. Properties and processing of silicon nitrides
Designated name Referceram SN-1 SN-sy
Density 3.21g/cm3(Bulk) 99.3% (Relative)
Fracture toughness 7.0 11.1 (SEPB, MPami'2)
Flexural strength (4-point, MPa) 900 1100
Young's modulus (GPa) 260 — Processing Forming Unidirectional press, CIP Tape casting, CIP
Sintering Pressureless sintering Gas pressure sintering (1780°C,1h) (1850°C,6h, N2/1MPa)
Additives 3wt%MgO,4wt%CeO,1wt%SrC03 5wt%Y203, 2wt%Al203
Microstrucrure (grain size) {(im) Mean dia. 0.49 (Aspect ratio 3.0) Mean dia. 0.47 (Aspect ratio 4.2)
Specimen configuration (mm) Disc (15 in dia., 2 in thickness) Rectangular bar 4X3X20
Ceramic Ball Piston
Lower ring Guide way
Optical microscope with CCD camera
Load W Cross head Speed 0.005 mm/ min Screw driven load
Specimen with indentation cracks load span h = 6.0, T2 = 1.2 mm
Indentation load 49,98, 196, 490N
Fig. 1 In-situ biaxial-flexure R-curve testing system and the conditions for disc-shaped specimens with Vickers indentation cracks
114

/rev = 0.196 +1.48 (a / c ) - 0.685 (a / c)'
where a is crack depth, and y is evaluated from a plot of a f c2 vs. c2'3 at any fixed P. Long-crack R-curve measurement system shown in Fig. 2 was developed for single-edged
notched beam (SENB) flexure method with crack stabilizers. R-curve evaluation employing crack stabilizers that allow stable crack growth could be made by the crack stability analysis followed by modification of testing fixtures [6]. To stabilize the crack growth, the total potential energy, consisting of elastic energy and work done for generating new crack surfaces, must increase as the crack propagates. Reduction in machine compliance leads to expansion of stable crack growth area in relation between the crack length and the machine compliance. The conditions of specimen compliance and machine compliance were appropriately chosen for the stable crack growth. Micro-scale notches were introduced in flexural specimens by sharp blades with diamond pastes. In the testing fixture, a microscope and a CCD camera are located to perform in situ measurement of stable growing crack length as a function of applied stress. Crack growth resistance KR in the direction of notch-depth is given by
KR = (WLl(BwB;n))f(c/Bd) (3)
where W is applied load, L is load span, c is crack length, Bw andSrfare width and height of specimen, respectively,/fc/S^ is a function on c/Bd [7].
^-Upper Anvil (Screw drive)
Load-cell
Crack stabilizer
Specimen
Optical microscope with CCD camera Displacement translator Base anvil
A "i w* -B«
„4* -. ■
m l;.:"
♦, L i
Notch shape
Bd=4 B»=3 l_= 16 mm
SENB flexure method
Fig. 2 In-situ R-curve measurement system for SENB flexure method with crack stabilizers
RESULTS AND DISCUSSION
Fig. 3 shows R-curve behavior of SN-1 by in-situ biaxial flexure method with indentation cracks and SENB flexure method with crack stabilizers, and SEM photographs of the small-crack and long-crack paths. Both R-curves for small-crack and long-crack exhibit the rising behavior with increasing of the crack length. As the small-crack and long-crack p aths of SN-1 are shown in Fig. 3 (b), grain-bridgjngs along the crack paths can be seen clearly. Microcrack propagation between grain-boundaries causes grain-bridgings. The rising behavior of R-curve should be attributed to these bridgings. Small-crack R-curves by indentation method exhibit the steeply rising behavior in the crack extension region under about 200// m, compared with long-crack R- curves by SENB method. Especially, small-crack KR increases rapidly under the crack extension of 100.« m. It is generally known that when the area containing bridging grains increases, the crack growth resistance increases also according to the stable crack extension. Although it is
115

considered that the bridgings in the indentation crack extension area is larger than those in the straight through-thickness crack area, this rapidly ascending behavior of KR might be controlled by other mechanisms. In the ordinate of Fig 3 (a) for small-cracks, the corrected stress intensity factor for elliptic-crack model is used considering the geometry of indentation crack and the residual stress due to microscopic indentation plastic-zone [3], [4]. There is a possibility that the ellipticity correction is not sufficient for the residual stress field of indentation crack area. The starting values of KR for small-crack R-curves are smaller than the values for long-crack R-curves. It is assumed that these differences in the R-curve behavior are caused by the grain- bridgings behind crack-tip [8], the initial crack-tip shape and the microstructure interaction due to microcracks in the zone before crack-tip. In KR for small-crack, the rate of elliptical wake-area change containing grain-bridgings with crack growth is larger than that of through-thickness crack [9].
„ 9
8
7
6
5
4
t
1 1 1 I 1 1 1 1 1 1 1 ■ i • i i I i i i i I i i i i a> o c
SENB flexure with crack stabilizers •■▲
Jrac
k g
row
th r
esis
ta
KR
( M
Pam
i/2 )
*
*.\** \*
: D
^ cPDD
Biaxial-flexure Indentation load 049N D98N A196N O490N
X =0.0132 for 49—196N • X =0.0252 for 490N
w ■, i ■ ■ .1
0 200 400 600 Crack extension, Ac (urn)
Small-crack path
**\up**,,
1.2//m
Long-crack path
(a) (b)
Fig 3 (a) R-curve behavior of SN-1 by in-situ biaxial flexure method with indentation cracks and SENB flexure method with crack stabilizers using straight through-thickness crack, and (b) SEM photographs of the small-crack and long-crack paths
The apparent fracture toughness values for small-cracks are important in practical situations of ceramic materials and components where small-scale cracks limit the performances in service conditions. These small-scale cracks are generated in many cases of localized contact damages between materials and components. These damages result in wear or erosion, foreign object damage, and processing damages such as machining and grinding. The regions including these small cracks have almost residual stresses. Therefore, the analysis on crack growth resistance is useful for materials and components having these small-scale cracks.
Fig. 4 shows the deflecting crack propagation process in SN-sy by in-situ SENB flexure method with crack stabilizers and the crack paths in microstructure. The macroscopic rotation angle of crack plane in the early stage of crack growth is about 60 degrees to the through- thickness plane in the direction of notch-depth. A crack in the microstructure of SN-sy grew along the grain boundaries, as shown in Fig. 4 (b). Many steps in the crack paths were observed between lateral cracks parallel to tensile stress component by flexure moment. This crack propagation area should be assumed as a kind of wake area. It is considered that these step wise crack-surfaces fill a major role similar to grain-bridgings.
Fig. 5 is an apparent R-curve behavior of SN-sy by in-situ SENB flexure method with crack stabilizers. The value in ordinate means the resistance KRX for crack extension component in the
116

direction perpendicular to tensile stress, just as in the direction of notch-depth. The value of KRX seems to increase rapidly in the crack extension region under about 300^/ m. KRX starts from 6.5 MPam"2 and reaches about 10 MPam"2. This saturated value is nearly equal to that by SEPB testing method, shown in Table 1. The value of KRX when the crack growth begins is almost agreement with the value for long-crack in SN-1. However, the crack propagates easily in the direction parallel to tensile stress component.
50 u m 0 ™" * I-,-'" '"'?L -.;-!„• •• ..•••*.■-:,S*i■ •'
■■ _ i ^^JIUM S^ortl _ ^aM
(a)
■2[x m
(b)
Fig. 4 (a) Deflecting crack propagation process in SN-sy by in-situ SENB flexure with crack stabilizers, and (b) the crack paths in microstructure
200 400 600 700 Crack extension, Ac (um)
Fig. 5 Apparent R-curve behavior of SN-sy for crack extension component in the direction of notch-depth by in-situ SENB flexure method with crack stabilizers
117

It is supposed that the crack deviating from the notch plane tends to grow in the direction of shear stress generated by applied flexural loading Since KRX means the component of crack growth resistance in the direction of notch-depth, there is a possibility to overestimate the crack growth resistance along the crack path. Consequently, the crack growth resistance along crack paths should be evaluated applying fracture mechanics on mixed-mode stress-intensity factors of mode I and mode II [10].
CONCLUSIONS
(1) In-situ testing methods for R-curve of toughened poly crystalline ceramics were investigated and developed applying a biaxial-flexure method for small-scale disc-shaped specimens with Vickers indentation cracks and a SENB flexure method with crack stabilizers. (2) R-curve behavior of a commercially available silicon nitride was investigated for small-cracks by the indentation method and straight through-thickness long-cracks by the SENB method. Small-crack R-curves exhibited the steeply rising behavior compared with long-crack R-curves. The differences in R-curve behavior were discussed in view of microstructure sources such as the grain bridgings behind the crack-tip, the initial crack-tip shape and microcracks before crack-tip. (3) R-curve behavior of a toughened silicon nitride with a preferred orientation of elongated grains was evaluated to characterize the toughened mechanism. Cracks grew along the grain boundaries, deviating from the direction of notch-depth. Many steps in the crack paths were observed between lateral cracks to the direction of tensile stress component. It was considered that these stepwise crack-surfaces filled a role similar to grain bridgings, and resulted in steeply rising R- curve behavior. Because this apparent crack growth resistance means that in the direction of notch-depth, the mixed-mode fracture mechanics on mode I and mode II should be applied to the deflecting crack paths.
ACKNOWLEDGMENTS
This research was supported by NEDO as part of the Synergy Ceramics Project under the Industrial Science and Technology Frontier Program promoted by AIST, MITI, Japan. The authors would like to thank Dr. M. Toriyama in National Industrial Research Institute of Nagoya for providing samples of a silicon nitride SN-sy.
REFERENCES
1. H. Kawamoto, Ceramic Transactions Volume 49, Am. Ceram. Soc, 173 (1995).
2. K. Hirao, M. Ohashi, M. E. Brito, and S. Kanzaki, J. Am. Ceram. Soc, 78 [6], 1687 (1995).
3. S. M. Smith and R. O. Scattergood, J. Am. Ceram. Soc, 79 [1], 129 (1996).
4. S. M. Smith and R. O. Scattergood, J. Am. Ceram. Soc, 75 [2], 305 (1992).
5. D. B. Marshall, Am. Ceram. Soc. Bull., 59 [5], 551 (1980).
6. A. Okada, K. Hiramatsu, and H. Usami, 6th Int. Sym. on Ceramic Materials and Components for Engines, (Japan Fine Ceramics Association, Tokyo, 1997), p.770.
7. J. E. Srawly, Int. J. Fract. Mech., 12, 475 (1976).
8. C. J. Gilbert, J. J. Cao, L. C. De Jonghe, and O. Ritchie, J. Am. Ceram. Soc, 80 [9], 2253 (1997).
9. R. W. Rice, J. Am. Ceram. Soc, 77 [9], 2479 (1994).
10. B. Lawn, Fracture of brittle solids, 2nd ed. (Cambridge Univ. Press, Cambridge, 1993), p.44.

MOLECULAR DYNAMICS SIMULATIONS OF NANOINDENTATION OF SILICON NITRIDE
PHILLIP WALSH, ANDREY OMELTCHENKO, HIDEAKIKIKUCHI, RAJIV K. KALIA, AIICHIRO NAKANO, and PRIYA VASHISHTA
Concurrent Computing Laboratory for Materials Simulation, Department of Physics & Astronomy and Department of Computer Science, Louisiana State University, Baton Rouge, LA, 70803-4001
ABSTRACT
This is a report of work in progress on 10 million atom Molecular Dynamics (MD) simulations of nanoindentation of crystalline and amorphous silicon nitride (Si3N4). Nanoindentation is used to determine mechanical properties of extremely thin films such as hardness and elastic moduli. We report load-displacement curves for several Si3N4 configurations using an idealized non-deformable indenter and analyze the local stress distributions in the vicinity of the indenter tip. Preliminary results for surface adhesion using Si3N4 for both tip and substrate are also reported.
INTRODUCTION
Nanoindentation is an experimental method used for determining properties of extremely small samples such as film coatings of just a few nanometers thick. Nanoindentation is defined as indentation where the size of the indent is too small to be resolved optically [1]. One way to perform these tests is with a modified atomic force microscope [2]. In these experiments, a tip attached to a cantilever is brought into contact with a surface. The force between the tip and sample is determined by measuring the deflection of the cantilever arm using a scanning tunneling microscope. If the elastic modulus of the tip is much larger than mat of the sample, the tip can be driven into the surface to create an indent, and mechanical properties of the sample such as hardness and moduli can be measured [2]. Alternatively, the tip can be used to explore the surface forces and surface adhesion between the tip and sample [2,3].
MD simulations of silicon nitride having dimensions of hundreds of angstroms have been performed in the past [4], and since silicon nitride is an important engineering material, we believe that simulations of nanoindentation of this material are both practical and useful. Though MD simulations of nanoindentation have been performed on metals [3,5] and on diamond [6], we believe this to be the first simulation of this type on a ceramic of such a large scale. Our simulations include configurations of amorphous and crystalline Si3N4 having sizes of (approximately) 75,000, 1 million, and 10 million atoms.
THEORY
Molecular Dynamics
The MD method of simulation consists of dividing time into discrete intervals and solving Newton's equations iteratively for N particles (r,, ..., rN) under the influence of a potential V^, ..., rN):
m.d2ri(t)=_ dV 1.
dt2 ar,
The iterative solution to this problem is called an integration algorithm. The basic idea is that an initial set of positions and velocities are adjusted iteratively according to the integration
119 Mat. Res. Soc. Symp. Proc. Vol. 539 ° 1999 Materials Research Society

algorithm for each time step, thus tracing out a path in phase space with time. A time step in our simulations is typically 1-3 femto seconds (10 s). These simulations use the time-reversible algorithm of Tuckerman, et. al. [7].
The core of the MD method is the choice of potential. The potential developed by Vashishta, et. al. for Si02 and Si3N4 includes two body (central) contributions from steric repulsion, screened Coulomb, and charge-dipole interactions [8-10]. The Stillinger-Weber type three body interaction accounts for bond-bending and bond-stretching effects. Potential cutoffs are employed for both two and three body terms.
Initial Configuration
The simulation consists of a rectangular slab of Si3N4 positioned below a rigid silicon (Si) or Si3N4 indenter. The attractive interactions between the Si in the indenter and the nitrogen in the substrate were turned off for the Si indenter simulations to avoid the complication of tip- substrate adhesion. The interactions between the Si3N4 indenter and substrate were not restricted. Simulations were run for three different substrate sizes. 1) 75,803 total atoms, with dimensions 121.21Ä X 116.64Ä in the plane normal to the indentation, and 55.61 Ä thick. 2) 1,061,528 total atoms with 282.83Ä X 279.93Ä normal dimensions and 139.02 Ä thick. 3) 10,614,240 total atoms with 606.07Ä X 606.52Ä normal dimensions and 300.29 Ä thick. For the crystalline configurations, the indented surface was a (0001) surface of a-Si3N4. Periodic boundary conditions were applied in the other two directions which are parallel to the Q 210) and (1 010) crystallographic planes. The amorphous systems were prepared by heating the crystalline substrates in bulk (all boundaries periodic) to 6000 K and thermalizing for 15,000 time steps, each time step corresponding to 1 fs, and then gradually cooling to 0 K. Structure factor and pair correlations were calculated and are characteristic of amorphous Si3N4.
In case 1, a conical Si3N4 indenter with tip radius 5 A was shaped from the a-Si3N4 crystal with its c axis parallel to the indent direction. In the second and third cases, a square- based, pyramidal Si indenter was used. Its size was chosen so that its height corresponds to a maximum indentation depth of about one-third of the substrate thickness.
Simulation Procedure
Langevin dynamics were used to control the temperature during the simulation. In this method, a simulated viscous force dissipates excess kinetic energy out of the system at a rate determined by a time constant, x. During periods of heavy temperature control, such as quenching or gradual heating, a low x is used. During the main part of the simulation when we want to interfere with the natural dynamics of the system as little as possible, a high x is used. Each system was damped at 0 K for 100 time steps with a step size of 3 fs. Then the system was gradually heated over 500 steps to 300 K, using a step size of 2 fs. The indenter was then moved toward the surface at a rate of 200 m/s, or 4 Ä every 1000 time steps, with a step size of 2 fs. The indenter and the lowest layer of atoms in the substrate were held rigid throughout the simulation. The total load on the indenter and the total energy of the system were monitored throughout the indentation process.
RESULTS
Rigid Silicon Indenter
The 10 million atom crystalline and 1 million atom crystalline and amorphous simulations were carried out using a rigid Si indenter with no attractive interaction between the indenter and substrate. The load-displacement curves for the 1 million atom simulations are shown in figure 1. Hardness is usually defined as the maximum load divided by the projected area of the indent. From the figure one can see that the hardness is lower in the amorphous system. However, a decaying of the load with time is apparent in figure 1, most obviously at the end of the indent before the unloading part of the curves (The diverging slope at 42 Ä displacement). The time constant for this decay is on the order of 1 ps. A better simulation schedule would indent slowly enough to allow this decay to take place, or better still, we would
120

z z
10 20 30 40 Displacement (Ä)
1.6
1.4
1.2
1
0.8
0.6
0.4
0.2
0 10 20 30 40
Displacement (Ä) 50
Figure 1. Load-displacement curves for (a) a-Si3N4 and (b) amorphous Si3N4.
like to indent in small increments, each increment followed by a long thermalization, and report the resulting averaged load for each small displacement of the indenter. This should remove the ambiguity apparent in figure 1. For now this has not been practical and we have approximated the hardness measurement by using the lowest value of load occurring at maximum displacement. Then, using the methods described by Pollock [1], we obtained the Young's modulus from the initial slope of the unloading curve. These values are 380 GPa for the crystalline case and 290 GPa for the amorphous case. These compare well with values computed previously for this potential of 420 GPa for a-Si3N4 and 280 GPa for amorphous Si3N4[ll].
The local stress tensor was computed for several configurations of the 10 million atom a-Si3N4 simulation. Such large simulations should make it possible to compare local stress calculations with stress distributions calculated from elasticity theory. The local pressure (trace of the stress tensor) is shown in figure 2 for several of our configurations. The figures show a hemispherical region of high compressive pressure directly under the indenter, which is associated with permanent deformation. Also visible is compressive pressure of much smaller magnitude that has been transmitted to regions of the film far below the indenter. This region is elastically deformed, and the recovery of this deformation on unloading is the reason for the finite slope of the unloading curves in figure 1, making the determination of the Young's modulus possible [1]. Finally, we note that in ct-Si3N4, there are residual tensile pressures left over after the unloading cycle in regions that were never touched by the indenter. One assumption usually made for indentation experiments is that the plastic deformation is determined by the indent size, which is probably approximately true for larger scale microindentation experiments. On this scale for a-Si3N4, however, plastic deformation is not limited to the area of the actual indent.
Rigid Silicon Nitride Indenter
The 75,000 atom system was used to study surface adhesion and small indent displacements. A small section of the configuration along with the initial part of the loading curve is shown in figure 3. There is now a small negative dip in the load curve before contact due to the attractive interaction between the indenter and substrate surface. The displacement zero was set to where the force returns to zero. The positive indenter load beyond this corresponds to indentation of the surface. There is a sudden relaxation in the load with increasing displacement just beyond 2 Ä indent due to the onset of plastic, or irreversible,
121

a
compressive
Figure 2. Local pressure for a) half slice and b) directly below the indenter 50Ä beneath the surface. The figures show (from top to bottom) before loading, indenter displacement of 80 Ä, and after loading. Lighter colors are compressive pressures while darker are tensile.
deformation. A similar feature appears in the figure 1 curves, but is small compared to the overall scale of those curves. We will analyze each of these new features in turn.
The load-displacement curves for approach to the surface are shown in figure 4. The first figure shows no hysteresis in the loading and unloading cycle, indicating a reversible process. As the tip moved to approximately 0.5 Ä, we see the onset of a hysteresis in the load- displacement curve, as the attractive trough reaches its minimum. Bond coordination analysis has shown that 3-coordinated Si atoms in the tip begin to participate in 4-coordinated tetrahedral units with nitrogen atoms in the surface, which is the usual configuration for bulk Si3N4. The breaking of these bonds on unloading leads to hysteresis in the load-displacement curve for the cycle, even though there is no plastic deformation.
Load-displacement curves for small indents are shown in figure 5. For a maximum load occurring before the first peak in figure 3, the process is purely elastic (left graph in figure 5). Plastic deformation as indicated by hysteresis in the load-unload cycle appears as the maximum displacement is increased beyond the first peak (right graph in figure 5). Close inspection of the surface after this last indentation shows that some nitrogen atoms have been pulled from their lattice positions. No permanent damage occurred for smaller indents. In general, ceramics exhibit elastic-plastic behavior during indentation, characterized by small elastic displacements followed by plastic rearrangement of the material under the indenter. All of our load- displacement curves show steady increases of the load with displacement followed by brief
122

-10 -8-6-4-20246 Displacement (A)
Figure 3. Initial configuration for the rigid Si3N4 indenter showing only a small part of the surface. Also shown is the load portion of the load-displacement curve for an indent of approximately 6 Ä.
0.14
0.12
0.1 \ \ \ ....
f 0.06
3 0.04
002 - f f
-0.02 HYI
-10 -8 -6-4-2 0 2 4 Displacement (A)
-10 -8 -6-4-2 0 2 4 Displacement (A)
Figure 4. Load/unload cycles for maximum displacements near the load minimum. The graph on the right shows hysteresis due to the formation and breaking of tip- surface bonds during the load/unload cycle.
-6 -4 -2 0 Displacement (A)
4 -10 -8-6-4-2 0 2 Displacement (A)
Figure 5. Load/unload cycles for displacements near the first load relaxation. As the peak is traversed, hysteresis in the right graph indicates the onset of plastic deformation. Just before the peak (left graph), the indent is purely elastic.
123

relaxations, even at indents beyond the first peak in the curve. These further instances of relaxation in the load could have a similar interpretation as the one just presented.
CONCLUSION
75 thousand, 1 million, and 10 million atom simulations of both amorphous and crystalline Si3N4 have been presented. The load displacement curves for the 1 million atom systems show relaxation effects that should be accommodated in a modified simulation schedule. Still, the main features of these curves are valid and show a-Si3N4 to be harder than amorphous Si3N4. Further, the elastic moduli estimated from these curves are in good agreement with the bulk values known for this potential. Local pressure distributions for the 10 million atom system showed that the elastic deformation extends to a considerable distance from the indent area. Additionally, residual stresses beyond the area of the indent after unloading suggests plastic deformation at significant distances from the immediate indent area. Finally, by using a Si3N4 indenter we modeled attractive interactions between the indenter tip and substrate surface. We found that the formation and breaking of tip-surface bonds determines the onset of hysteresis in the load/unload cycle. On indentation of the surface, we have found that plastic deformation begins at a depth that can be predicted from the first peak of the load curve where the load relaxes slightly with increasing displacement, which is a manifestation of the elastic- plastic nature of the material.
ACKNOWLEDGMENTS
The authors wish to thank the following organizations for providing funding and computing resources in support of this research. AFOSR, DOE, NSF, USC-LSU MURI grants from DARPA, and the Louisiana Education Quality Fund.
REFERENCES
1. H.M. Pollock, in Friction Lubrication, and Wear Technology, edited by P.J. Blau (ASM Metals Handbook 18, 1992), p. 419.
2. N.A. Burnham and R.J. Colton, J. Vac. Sei. Technol. A 7(4), p. 2906 (1989). 3. Uzi Landman and W.D. Luedtke, J. Vac. Sei. Technol. B 9(2), p. 414 (1990). 4. Andrey Omeltchenko, Aiichiro Nakano, Kenji Tsuruta, Rajiv K. Kalia, and Priya
Vashishta, Advances in Metal and Semiconductor Clusters 4, p. 263 (1998). 5. Uzi Landman, W.D. Luedtke, Nancy A. Burnham, Richard J. Colton, Science 248, p
454 (1990). 6. J.A. Harrison, C.T. White, R.J. Colton, and D.W. Brenner, Surface Science 271, p
57(1992). F
7. M. Tuckerman and B.J. Berne, J. Chem. Phys. 97(3): p. 1990 (1992) 8. P. Vashishta, R.K. Kalia, J.P. Rino, and I. Ebbsjö, Phys. Rev. B 41(17), p. 12197
(1990) F
9. P. Vashishta, R.K. Kalia, and Ingvar Ebbsjö, Phys. Rev. Lett. 75(5), p. 858 (1995) 10 C.K. Loong, P. Vashishta, R.K. Kalia, and I. Ebbsjö, Europhys. Lett. 31(4), p. 201
(1995) F
11. A. Omeltchenko, A. Nakano, R.K. Kalia, and P. Vashishta, Europhys. Lett. 3 3(9), p.667(1996).
124

CREEP CAVITATION ENHANCED BY GLASS POCKET FORMATION IN A TETRAGONAL ZIRCONIA DOPED WITH 0.3 WT% PURE SILICA
K. MORITA, K. HIRAGA and Y. SAKKA National Research Institute for Metals, 1-2-1, Sengen, Tsukuba-shi, Ibaraki 305-0047, Japan
ABSTRACT
The relationship between intergranular microstructures and cavitation is examined in a yttria-stabilized tetragonal zirconia doped with 0.2-0.4 wt% Si02 under constant stress loading in tension. An increase in the initial grain size for a constant Si02-addition or an increase in Si02-addition for a constant grain size enhances the precipitation of a glass phase at the multiple grain junctions during deformation. Simultaneously with the enhanced glass phase precipitation, intergranular cavitation is also enhanced. This is because the precipitated glass phase act as the site of cavity formation.
INTRODUCTION
Small amount of Si02-addition is known to strongly affect the high temperature deformation of yttria-stabilized tetragonal zirconia (Y-TZP) with a grain size of about 0.3 fim [1]. Although the addition of pure Si02 simply decreases the flow stress, the tensile ductility of Y-TZP is steeply decreased by a Si02-addition of 0.3 wt%. The decrease in ductility is caused from the occurrence of crack-like cavities growing quickly in the direction perpendicular to the stress axis [1]. A recent study on the Y-TZP doped with 0.3 wt% Si02 [2] has suggested that the crack-like cavitation correlates to a glass phase, which is absent before deformation, precipitated at the multiple grain junctions. The study has also suggested that the precipitation of the glass phase results from grain growth during deformation. If these suggestions are correct, the precipitation of glass phase and hence the cavitation should be enhanced with increasing initial grain size for a constant Si02-addition or with increasing Si02-addition for a given initial grain size. To examine this point closely, we investigated the creep-deformed microstructures of Si02-doped 3Y-TZP as a function of initial grain size and the amount of Si02-addition.
EXPERIMENTAL PROCEDURE
High purity 3Y-TZP (containing 3 mol% yttria, Al2O3<50, SiO2=50, Fe2O3<50, Na2O=220 in wt ppm, Tosoh Co., Japan) doped with 0.2-0.4wt% Si02 was sintered at 1573-1623 K for 2 h to adjust the grain sizes in a range between 0.2 and 0.4 fim. Dog-bone-shaped tensile specimens with a gage length of 10 mm were machined from the materials [1]. Tensile creep tests at a constant stress of 20 MPa were performed at 1673 K in vacuum of 2X10³. The grain size defined as 1.56L, where L is the average intercept length of grains, was measured from SEM micrograph. For microstructural observations with a JEOL JEM-2000EX, specimens were cut from the deformed gage section, mechanically polished to a thickness of 100 /urn and thinned by the Ar ion-milling machine.
125
Mat. Res. Soc. Symp. Proc. Vol. 539 ° 1999 Materials Research Society

RESULTS
1. Effects of initial grain size on creep behavior
Figure 1 shows creep curves for 0.3-wt%-SiO2-doped materials with initial grain sizes among 0.22 and 0.4 /im. Although the strain rate differs from each other owing to the difference in the initial grain size, each creep curve exhibits three distinctive regions. These are the primary-like region where strain rate decreases with strain, the quasi-steady state region where decrease in strain rate saturates and the tertiary region where strain rate increases with strain. As indicated with arrows, the tertiary region is brought forward with an increase in the initial grain size. Since the tertiary region starts with the occurrence of the crack-like cavitation [2], the figure indicates that the cavitation is also advanced with the increasing initial grain size. In accordance with this, severer cavitation appeared in materials having coarser grain sizes at a given creep strain in the tertiary region. Figures. 2(a) and (b) are the typical example of this situation: both axial lengths of crack-like cavities and total cavity density increases with an increase in the initial grain size from 0.27 to 0.4 fim.
2. Effect of Si02-addition on creep behavior
Figure 3 shows the change in creep behavior resulting from an increase in Si02-addition for a constant initial grain size of 0.27 fim. The figure clearly indicates that the increasing Si02-addition also brings forward the onset of the tertiary region and hence the crack-like cavitation. More enhanced cavitation at a given strain in the tertiary region also appeared with the increased Si02-addition. These aspects bear a close resemblance to those caused from the increased grain size for the constant Si02-addition.
+-»
a '3 -4->
10"
10 .-4
[ ! 0.3wt%SiO2, a = 20 MPa, T = 1673 K ; ; ;
i 1
1 , t
-~ s- 1 T 4 ^S^-'fcw '
.v^^j^ i / i 0.22/im
---- -Jj^^^~Q.21 u.m- -
V^^_i"" ig* "!- 0-35/xm
—^-~ZZL" ■ —-^S^Z^^ 0.4/im 1 1 ' UT^TT i I I
1 1 -^-^ 1 [ +
< 1 1 1 1 1
1 1 1 1 1 1
0 0.2 0.4 0.6 0.8 1.0 1.2 1.4 True Strain, e
Fig. 1 Effects of initial grain size on creep behavior in 0.3 wt% Si02-doped 3Y-TZP.
126

(a)
-"*
"«I''""*'
50Qum Fig. 2 Optical micrographs of cavity morphologies in 0.3 wt% Si02-doped 3Y- TZP deformed to failure. Initial grain sizes were (a) 0.27 and (b) 0.4 fim.
0 0.2 0.4 0.6 0.8 1.0 1.2 1.4 True Strain, £
Fig. 3 Effects of Si02-addition on creep behavior in 3Y-TZP with an initial grain size of 0.27 |tm.
127

3. Undeformed and deformed microstructure
Figures 4(a) and (b) are bright field TEM micrographs of the 0.3-wt%-SiO2-doped materials with initial grain sizes of 0.27 and 0.4 fim, respectively. The undeformed materials consisted of equiaxed grains with faceted boundaries and no intergranular glass phase was observed along grain boundaries. For the materials doped with 0.3 wt% Si02, some nanometer-sized glass pockets were found at multiple grain junctions for grain sizes of 0.35-0.40 fim (Fig. 4(b)), but not for grain sizes of 0.22-0.27 fim (Fig. 4(a)). For the constant grain size of 0.27 fim, the glass pockets were observed in the material doped with 0.4 wt% Si02.
After deformation to failure, many glass pockets appeared in materials where such pockets had been absent before deformation (Fig. 4(a)). For materials where the nanometer-sized glass pockets had preexisted, the number and size of the grass pockets were found to increase after deformation (Fig. 4(d)). The important feature is that small cavities coexisted in such glass pockets (Figs. 4(c) and (d)). In addition, detailed observation revealed that some of the glass pockets included cavity nuclei as typically shown in Fig. 4 (e). These features indicate that the cavities formed in the precipitating and/or growing glass pockets during deformation.
DISCUSSION
The first point of the present results is the precipitation of a glass phase at the multiple grain junctions. Earlier studies on the grain boundary microstructures [2, 3] and grain boundary electric conductivities [4] of Si02-dopcd 3Y-TZP have indicated that for a given average grain size, a critical Si02-addition exists for the precipitation of a glass phase at multiple grain junctions. A previous study [3] has also shown that more than 95% of the phase consists of Si02 and the critical Si02-addition per unit boundary area is about 27 pmol/mm2 [3]. For an average grain size of 0.27 fim in the present study, 0.3 wt% Si02 corresponds to the critical addition. For Si02-additions less than the critical value, Si02 can be assumed to segregate along grain boundaries as reported for a 5-wt%-Si02-doped Y-TZP [5].
In this situation, the increasing grain size from 0.27 fim for 0.3 wt% Si02 or the increasing Si02-addition from 0.3 wt% for the grain size of 0.27 fim should lead to the precipitation of glass phase. Indeed, such a relationship between grain size and Si02-addition holds in the undeformed materials as typically shown in Figs. 4 (a) and (b). For deformed materials, the occurrence of glass pockets in materials doped with Si02 up to the critical value (Fig. 4(c)) or less can be attributed to grain growth during creep deformation. This is because grain growth during deformation reduces grain boundary area per unit volume and thus the Si02-concentration exceeds the critical value. The increased size and density of glass pockets in materials with higher Si02-concentrations (Fig. 4(d)) can be also attributed the reduction in grain boundary area due to grain growth.
The next point is the relationship between the glass phase and cavitation. The occurrence of cavities in the glass pockets (Figs. 4 (c)-(e)) clearly indicates that the precipitating and/or growing glass pockets act as the site of cavity formation. It follows that when the precipitation of glass phase is enhanced by heightened Si02-concentrations, cavity formation should be also enhanced. This is just the case in the present results shown in Figs. 1 through 3.
128

■ ■:. fe' <V 'V%^:;i
50nm! Fig. 4 Bright field TEM micrographs of the 0.3-wt%-SiO2-doped 3Y-TZP with initial grain sizes of 0.27 and 0.4 fim. (a) and (b) are undeformed, and (c) through (e) are deformed to failure. Nanometer-sized glass pockets are indicated with arrows, (e) also shows a cavity nucleus in the precipitated glass phase.
129

According to the cavitation mechanism proposed for glass-doped ceramics [6, 7], cavities can nucleate in a glass phase by hydrostatic tension induced by grain boundary sliding and they grow by viscous flow of the glass phase [6, 7] or by a solution-precipitation mechanism [7]. The occurrence of cavities in the glass pockets (Figs. 4 (c)-(e)) strongly suggests that such a cavitation mechanism works in the present Si02-doped 3Y-TZP. Although the detailed mechanism of the crack-like cavity growth (Fig 2) is still not clear, the present results indicates that the precipitation of glass pockets at multiple grain junction plays a central role in the enhanced cavitation in 3Y-TZP doped with small amounts of Si02.
SUMMARY
With an increase in the initial grain size from 0.22 to 0.4 ^m for a constant SiOz-addition of 0.3 wt% or with an increase in Si02-addition from 0.2 to 0.4 wt% for a constant grain size of 0.3 urn, the precipitation of a glass phase is enhanced at the multiple grain junctions in a 3Y-TZP. Simultaneously with the enhanced glass phase precipitation, intergranular cavitation is enhanced and the onset of tertiary creep region was advanced. Such microstructural observation that cavities occur in the glass phase at the multiple grain junctions indicates that the precipitated glass phase acts as the site of cavitation.
REFERENCES
1. H. Y. Yasuda and K. Hiraga, Mater. Sei. Eng. A234-236, p.343 (1997).
2. K. Morita, Y. Sakka and K. Hiraga, Mater. Sei. Forum, in press.
3. K. Hiraga, H. Y. Yasuda and Y. Sakka, Mater. Sei. Eng. A234-236, p. 1026 (1997).
4. T. Uchikoshi, H. Y. Yasuda and K. Hiraga, J. Electroceramics, in press.
5. Y. Ikuhara, P. Thavorniti and T. Sakuma, Acta metall. mater., 45(1997), 5275.
6. R. L. Tsai and R. Raj, Acta metall. 30, p.1043 (1982).
7. J. E. Marion, A. G. Evans, M. D. Drory and D. R. Clarke, Acta metall. 31, p.1445 (1983).
130

PLASTIC DYNAMICS AND BRITTLE VS. DUCTILE FAILURE IN NONCRYSTALLINE SOLIDS
M.L. FALK* Department of Physics, University of California, Santa Barbara, CA 93106
ABSTRACT We simulate fracture in two amorphous solids with different inter-particle potentials.
These small changes in potential result in significant changes in dissipation near the crack tip. While one might expect these effects to arise from a change in flow stress, measurements reveal this is not the case. To understand why, we consider the relationship between crack dynamics, rate-dependent plasticity, and molecular-level structures in the glassy solid. In particular we discuss the macro-scale continuum theory of dynamic brittle fracture in a viscoplastic solid developed by Freund and Hutchinson and the meso-scale theory of viscoplasticity proposed by Falk and Langer. We further consider a simplified model on the molecular scale as a first-step toward the construction of first-principles models of dynamic plasticity and the brittle ductile transition in noncrystalline materials.
INTRODUCTION
The concepts of brittleness and ductility are central to any understanding of failure in solids. Understanding what makes a material brittle or ductile under particular loading conditions at a given temperature requires linking the molecular phenomena which un- derlie plastic flow to the mechanics of the larger scale on which the crack is loaded. This paper attempts to present how one may connect continuum models of fracture to meso- scale models of viscoplasticity and molecular-level models of "defect" regions to begin to develop a theory of brittle and ductile fracture in non-crystalline solids akin to those developed for crystalline materials [1].
The starting point of this analysis will be results from molecular-dynamics (MD) simulations performed in simple 2D analogs of noncrystalline solids, but the theoretical considerations may be applicable to a more general set of practically important materials systems. The simulated system is similar in some ways to metallic glasses which have been observed to undergo transitions between ductile and brittle behavior as a function of temperature and due to small amounts of dilute crystallization. [2] Similar transitions are critical to the processing of colloidal ceramic systems which undergo brittle-ductile transitions due to changes in salt content, i.e. changes in inter-particle interactions.[3]
SIMULATIONS
This section briefly describes the results of a pair of MD simulations of fracture in a simple, 2D amorphous solid. While these simulations are examples of brittle and ductile behavior our point here is not simply to differentiate between brittle behavior and ductile behavior, but rather to establish a connection between a particular change in the under- lying inter-particle potential and a change in fracture behavior which is measurable as the observed fracture toughness. The details of these simulations will be published elsewhere [4] and only the results relevant to the present line of analysis will be presented here.
•Present address: DEAS, Harvard University, Cambridge, MA 02138
131
Mat. Res. Soc. Symp. Proc.Vol. 539 * 1999 Materials Research Society

LJ Potential
o c
Ed
c o o
CLJ Potential
! ■//^" -0.5 1 1/
Interparticlc Distance
Figure 1: The LJ and CLJ potentials. Energy is in units of e, distance is in units of r0.
The simulated systems consisted of 90,000 particles in 2D interacting via a two-body potential. In order to avoid problems of crystallization, we simulated a poly-disperse collection of particles composed of eight species in equal proportion with radii from ap- proximately 0.34 to 0.67 units. The radius of each species was 10% larger than the next smallest, and the total volume of the collection was the same as if the particles were all of radius 0.5. The system is comparable to a single component system in which the rest spacing between two molecules is r0 = 1. The masses of all particles were taken to be 1.
The inter-particle potential was different in the two simulations. In the simulation which displayed ductile behavior a Lennard-Jones(LJ) potential was used
U%(r)=e fra + rß\
a 2fra + rß\l
(1)
where r is the inter-particle distance, ra and rß are the radii of the two particles, and e is scaled to be 1. In the simulation which displayed brittle behavior a different potential was used. We will refer to this potential as a Compressed Lennard-Jones(CLJ) potential because it is the standard LJ potential rescaled around the center of the potential well,
U%J(r) = ULJ{\ r + (1 - A)(rn + rß)). (2)
The parameter A was chosen to be 1.5. This means that width of the potential well was smaller by 33%, and, consequently, the effective range of interaction was also shortened compared to the standard LJ interaction. For the sake of comparison Fig. 1 shows both potentials. In both cases interactions were cut off at a range of rc w 2.2r0. The elastic constants of the two samples were measured: the LJ solid was observed to have Young's and shear modulii of 34e/r% and lOe/r^ respectively; the CLJ solid 39e/r£ and 12e/r£ respectively. The simulations were performed at very low temperature, kT « 0.1% — 1% e.
By measuring the elastic constants of our simulated samples and the stress at which each crack begins to propagate we can calculate G, the energy release rate, for each fracture simulation. We find GLJ = 4.1e/r0 and GCu = 2Äe/r0. G can be considered to arise from a surface energy and a dissipation per unit crack extension, G = 2y + Gdiss- The value of 7 is measured to be 0.94e/r0 in the LJ system and 1.04e/r0 in the CLJ system. This means that for the LJ case the ratio of energy dissipated to the energy expended creating surface Gnssj1^ = 1.19, while for the CLJ case this ratio is 0.14.
132

DISCUSSION AND CONCLUSIONS
Macroscopic: brittle-ductile behavior Why does this change in inter-particle potential lead to a change from ductile to brittle
behavior? We begin by considering the theory of high strain-rate crack growth developed by Freund and Hutchinson[5]. In this theory the plastic strain rate is considered negligible below some shear stress er/iou> and above this stress the strain rate if rises linearly.
e? = £o(ffs -0fiow)ln (3)
Here ß is the shear modulus; as is the applied shear stress. The energy release rate of the brittle crack is found to diverge at both high and low velocity. Between these two diverging limits there exists a velocity at which the energy release rate of the crack is a minimum. The crack cannot propagate when driven at less than this minimum energy release rate which depends on the specifics of the plastic response described in Eq. (3).
(<W^)«l + Ceo/*?ta». (4)
where Gctip is the bare fracture toughness near the tip, and C is a proportionality constant
which depends on the shear modulus, density and G\ir
In the context of this theory we can ask what would cause one material to propagate a brittle crack while another admits only ductile failure. Since a given mode of failure can only result if a propagating solution exists, we can conjecture that the ductile failure mode results when the propagating brittle solution becomes inaccessible. This implies that the minimum energy release rate for brittle fracture is inaccessible in the ductile material and not in the brittle material. For brittle behavior to have resulted from the CLJ potential then, the minimum energy release rate should have decreased when the potential well width was narrowed. This further implies that the narrowing of the potential either caused a decrease in e0i the sensitivity of the strain rate to a change in applied stress, or an increase in afiom, the critical stress for appreciable plastic flow.
We might at first suspect that we have changed the potential in such a way as to raise the critical stress for plastic flow and this has caused the material to become brittle. This is not the case. Using our MD procedure we can directly measure the stress above which the material begins to flow. Bulk measurements of 0fiow obtained by simulating the two systems in periodic boundary conditions with zero applied pressure and a constant applied shear strain rate reveal cTfi0W = OAe/rl for both systems.
Having eliminated <T/;01„ as the responsible parameter for the change in the mode of failure, we must consider the parameter £o- This parameter corresponds to the sensitivity of the strain rate to an applied stress above the flow stress.
i0 = n (di?/do.\ + (5)
Mesoscopic: viscoplasticity in amorphous solids We will discuss the plastic response in the context of one particular theory of viscoplas-
ticity in amorphous solids[6]. In this model the plastic flow arises from a population of oriented two-state regions called "shear transformation zones" (STZ). These STZ's are par- ticularly susceptible to deformation under one sense of shear and when an STZ undergoes a transition it becomes susceptible to an opposite applied shear.
133

The rate of plastic strain is related to the rate at which STZ's flip states,
if = Vz Ae [R+ n+ - Ä_ n_], (6)
where Vz is the typical volume of a region, Ae is the increment of local strain due to an individual flip, n± are the population densities of STZ's in each of the states, and R± are functions of the stress describing the rate at which transitions occur.
The specifics of the R± are the most important aspect for determining the time de- pendence of the plastic flow. In [6] the transition rates are written as volume activated processes. That is, the rates are written in the form R± = RQ exp[-AV*/vf] where, for the purpose of this analysis, we will assume RQ to be a constant attempt frequency, vj is a free volume per particle, and AV* is a free volume needed to activate a transition. AV* is a function of the applied shear stress which we chose to have the simplest one parameter functional form for which the volume is assured to be non-negative.
AV*(as) = VS exp(-ojfi) (7)
where V0* is the free volume needed to activate a transition at zero stress, and ß is a modulus characterizing the sensitivity of the activation volume to the applied stress. In general, VJ > Vf, and since we are interested in as « +a/(om, we are in a regime where R+ > fl_.
Taking this formulation of the transition rates into account, we can consider the rate of deformation described by Eq. (6) in the the steady-state flow regime.
e? » VzAsR+n+ tx R+[aJtl
ow - a;1} (8)
So, we can evaluate e0 in Eq. (5) using Eq. (8) to be
e0 oc (Rofi/a}law) exp[-{V0*/v}) exp{-aflow/ß)] (9)
This last equation provides a first clue as to which aspect of the microscopic behavior is responsible for our observed change from ductile to brittle failure. Neglecting the prefactors to the exponential, we note that the ratio VQ/VJ, which we already noted is a large number, is expected to depend primarily on the relative sizes of the particles which are the same in both systems. Since we have already eliminated a substantial change in o'/ioiui the only remaining parameter in this expression is ß. We can see that the double exponential causes i0 to be suppressed by a factor of exp(-V0*/i;/) when ß becomes large.
Saying that £o is highly sensitive to changes in ß is another way of saying that the sensitivity of the material flow rate to a change in applied shear stress is highly dependent on the sensitivity of the deformable regions (STZ's) in the solid. Relating this to Freund and Hutchinson's fracture model we can state in more prosaic terms that the observed change from ductile to brittle failure seems to be due to a corresponding change from "floppier" to "stiffer" weak regions in the solid.
Microscopic: simplified model of a two-state region We are now left with the problem of how to calculate AV*(as) in Eq. (7), and extract
a value of ß from microscopic considerations. We conjecture that since the simulations are carried out at very low temperature, we are concerned with driven transitions and must
134

Figure 2: Diagram of four identical interacting particles making a transition between stable configurations; (b) is the saddle-point configuration.
ask: For our model two-state system, constrained by its surroundings to a certain area, what is the maximum shear that it can support before being driven into a different state? If we can answer this question we can also, given some applied shear stress, determine what free area (volume) a region must have to become unstable.
We begin by considering four molecules interacting via a two-body inter-particle po- tential as in Figure 2. Since this unit is embedded in our solid it is constrained from undergoing translation or rotation. For particular choices of the inter-particle potential this four-molecule unit is inherently a two-state system. That is to say that for the LJ or similar potential the energy is minimized by having as many bonds near the equilibrium bond length as possible. In this system there are two degenerate ground states, illustrated in Figs. 2(a) and 2(c), in which five of the six bonds are of this length.
We can parameterize the energy of the four-particle system by only two parameters, its x and y dimensions, if we constrain it from rotating, translating or deforming asym- metrically.
U(x, y) = U(x) + U(y) + 4[/[(l/2) (x2 + y2)1/2} (10)
Here U can be any two-particle potential, but we will concern ourselves with ULJ and UCLJ described above in reference to our simulations. Furthermore we can consider the case when the area (two-dimensional volume) of the system remains constant by imposing the constraint A = xy. We can also define a local equivalent shear stress
Es(z, y) = (l/2A)[x (dU/dx) - y (8U/dy)]. (11)
At this point it is possible to understand why such two-state STZ's have been visible as "r-defects," the regions of anamolously high shear stress in simulations carried out by Srolovitz, et. al. [7] Consider the condition for the lowest energy of the configuration,
(dU/ds) = [x2 + y2]-1/2[x (dU/dx) + y(dU/dy)} = 0, (12)
where we have traversed the path of constraint by a unit speed curve parameterized by s such that ds2 = dx2 + dy2. We immediately note that the condition for equilibrium is not the same as the condition for zero shear stress. In general these two conditions are not simultaneously satisfiable. It is important to note that an exception to this, i.e. a case in which the lowest energy configuration has no shear stress, is the case where the molecules interact only via nearest neighbor interactions. This is particularly interesting in light of the simulations since the limit where A > 1 in Eq. (2) is the limit of solely nearest neighbor interactions. Therefore, we expect that the CLJ potential (A = 1.5),
135

which led to brittle fracture in our simulations, should show lower levels of internal shear stresses and fewer "r-defects" than the LJ potential (A = 1) which in the simulation produced ductile fracture. Thus, the microscopic model strongly suggests that the range of the inter-particle potential is crucial in determining whether these STZ's are visible as "r-defects.".
We return now to the question of when our two-state STZ will become unstable to an externally applied shear stress. The condition for instability can be written
(dZs/ds) = [x2 + y2Yll2[x (dXJdx) - y {dL./dy)] = 0 (13)
where we have again traversed the path of constraint by a unit speed curve. We can now define the equivalent of a free volume in our system, Af = A — A0. Here A0 is the equilibrium area of the four-body system at zero applied shear stress « \/3 (rg). We can now calculate the value of Af(^s)/Af(0) at which instability sets in for values of the shear stress Es. In fact, the functional form of Af is similar to what we had guessed in Eq.(7). In order to relate this suppression of the activation volume to values for fi in our viscoplasticity model, we note that the activation area at Es = 0Ae/r%, a stress comparable to the stresses in our fracture samples, is 58% of its value at zero in the LJ case and 74% in the CLJ case. This would correspond to ßLJ = 0.73 and ficu = 1-3. Thus, longer range inter-particle potentials correspond to a solid with "floppier" two- state regions. As we expected from our previous analysis, the toy model with the CLJ potential has a higher value of ß and, therefore, corresponds to a solid with "stiffer" two- state regions. This is in keeping with our expectations since "stiffer" two-state regions should also correspond to a lower value of e0 and, therefore, by Freund and Hutchinson's model to a lower minimum energy release rate for brittle fracture from Eq. (4).
ACKNOWLEDGMENTS I would like to acknowledge J.S. Langer for his guidance, and A.S. Argon, A. Lobkovsky,
M. Marder and R.L.B. Selinger for helpful discussions. This work was supported by the DOE Computational Sciences Graduate Fellowship Program and DOE Grant DE-FG03- 84ER45108, National Science Foundation grant CDA96-01954, and Silicon Graphics Inc.
REFERENCES
1. J.R. Rice and R. Thomson, Phil. Mag, 29, 73 (1974); J.R. Rice, J. Mech. Phys. Solids, 40, 239 (1992); S.J. Zhou, A.E. Carlsson, and R. Thomson, Phys. Rev. Lett., 72, 852 (1994).
2. C.J. Gilbert, RO. Ritchie, and W.L. Johnson, App. Phys. Lett., 71, 476 (1997); T.-W. Wu and F. Spaepen, Phil. Mag. B, 61,739 (1990).
3. G.V. Franks and F.F. Lange, J. Am. Ceramic Soc, 79, 3161 (1996).
4. M.L. Falk, cond-mat/9803058, (unpublished).
5. L.B. Freund and J.W. Hutchinson, J. Mech. Phys. Solids, 33, 169 (1985).
6. M.L. Falk and J.S. Langer, Phys. Rev. E, 57, 7192 (1998).
7. D. Srolovitz, K. Maeda, V. Vitek, and T. Egami, Phil. Mag. A, 44,847 (1981); D. Srolovitz, V. Vitek, and T. Egami, Acta metall., 31, 335 (1983).
136

EFFECT OF TRANSITION TEMPERATURE, STRUCTURE AND ANISOTROPY ON THE DEFORMATION AND FAILURE OF POLYMERS
Robert J. Samuels School of Chemical Engineering, Georgia Institute of Technology, Atlanta, Georgia 30332 - 0100
ABSTRACT The yield strength, the failure strength and strain behavior of Isotactic Polypropylene are
all a function of the molecular orientation in the polymer. Further, although Isotactic Polypropylene and PMDA-ODA polyimide are very different polymers, they behave similarly when the strain rate is slow enough for the polymer to be at the low strain rate limit of its failure envelope. A master True Stress-Total True Strain curve is obtained for both polymers.
INTRODUCTION Understanding the governing deformation and failure behavior of polymers can be daunting when one considers the wide range of fabrication and testing, rates and temperatures that may be used to produce and test a single polymer. Comparison of the behavior of very different polymers seems more difficult but must be addressed if general governing conditions for the deformation and failure behavior of polymers are to be developed. This paper addresses the problem.
EXPERIMENTAL
Isotactic Polypropylene Film grade Isotactic Polypropylene was cast on a film line. The resulting films were
spherulitic. The films were then drawn on a film line to different extension ratio's to produce two drawn film series. The fabrication draw temperature was 110 C for the Series 1 films and 125C for the F Series films. The stress-strain curves of the differently oriented Series 1 films were then measured over a wide range of rates and temperatures [1]. The stress-strain curves of the F Series films were measured at room temperature while simultaneously measuring the molecular orientaion in real-time using polarized infrared measurements [2]. PMDA-ODA POLYTMIDE
This film series was produced from cast films of PMDA-ODA polyimide (Kapton HA) that were drawn at room temperature to different extension ratio's and allowed to relax. The molecular orientation of the resulting nematic liquid crystalline films was then determined be x- ray diffraction [3]. The stress-strain curves of the fabricated oriented films was then measured at a rate of 1.25 %/minute at room temperature.
RESULTS AND DISCUSSION
Ductile- Brittle Transition When a polymer undergoes yielding it is called ductile. When it fractures before yielding,
it is called brittle. In this study all the Series 1 Isotactic Polypropylene that had a spherulitic structure showed both upper and lower yield point at all strain rates and temperatures examined. Thus these samples were ductile under all experimental conditions. The films having a
137
Mat. Res. Soc. Symp. Proc. Vol. 539 ° 1999 Materials Research Society

microfibrillar structure, on the other hand, were brittle. Thus, for the samples studied, there is a ductile- brittle transition in going from a spherulitic structure (ductile) to a microfibrillar structure (brittle).
The effect of orientation on the general concept of a ductile-brittle transition temperature is also significant. The fracture and yield stresses of Isotactic Polypropylene have been reported as a function of temperature [4]. Above about -IOC the failure was reported as ductile (yielding occurs before fracture), whereas below -IOC the failure was brittle (no yield). The point at which the brittle failure stress versus temperature line intersected the yield stress versus temperature line was called the brittle-ductile transition temperature. The structural state of the sample that was studied was not reported.
The yield stress for the spherulitic Series 1 films of Isotactic Polypropylene, deformed at a strain rate of 100 %/minute at different temperatures, is shown in Figure 1 [1].Since all of the samples yielded at all of the temperatures, there is no ductile-brittle transition down to -196C, and the yield stress is a linear function of the temperature. Thus the concept of a ductile-brittle transition temperature is not fruitful in this study, since the transition behavior seems to be structure and not temperature dependent.
True Stress and True Strain Failure Envelopes Extensive studies of Isotactic Polyproplene tensile failure [1,5] have shown that at a fixed
deformation temperature a failure envelope can be observed between low and high strain rate limits. Figure 2 shows the True-Stress failure envelope for the Series 1 films measured at room temperature and different rates of extension as a function of the noncrystalline orientation in the films. At low rates of deformation the polymer chains have time to rearrange before failure, a complete stress-strain curve is achieved, and the final structure at failure is the same for all samples irrespective of the starting orientation of the sample. As the deformation rate is increased the more highly oriented samples break prematurely as a consequence of the inability of the molecules to respond fast enough to the deformation rate. Finally, at a very high strain rate none of the molecules have time to respond before failure and the sample failure strength is directly proportional to its starting orientation.
Figure 2 also shows the Total True-Strain (TTS) failure envelope for the Series 1 films measured at room temperature and different rates of extension as a function of the noncrystalline orientation in the films [5]. This illustrates that at low strain rates (100%/min and below) the sum of the fabrication strain and the test strain to failure is independant of the initial noncrystalline orientation of the film before testing. Above this strain rate the TTS varies until at the highest rate the TTS is a linear function of the noncrystalline orientation of the film before testing.
Thus, as with yield strength, the failure strength and strain behavior are a function of the molecular orientation in the polymer. Analysis has shown further (1,2,5-7) that: [a] A single phase, the noncrystalline region, controls IPP deformation. [b] The final failure structure is controlled by the draw temperature at low strain rates (100%/minute or below at room temperature for IPP). [c] The true stress and true strain must be used for quantitative correlations with structure. [d] The true fabrication strain is a linear function of the noncrystalline orientation function [fnc]. [e] At low test strain rates the true stress at failure is independent of the initial fabricated orientation.
138

Figure 1. Effect of average orientation and temperature on the yield stress of isotactic polypropylene film.
»••-a
».< -9.1
' iwi/.nw » i
"VX X*
.»t^
•/it«
MTC MM»
D II2 M
V M S
D I»1 U
A It* M
• II« H
.1 -i.t *.t t.l t.i a.j I.« t.i •.< t.j t.l «.t
Figure 2. True Stress Failure Envelope and Total True Strain as a function of noncrystalline orientation and rate of testing for isotactic polypropylene films.
139

[fj At low test strain rates the sum of the true fabrication strain and the true tensile strain to break is a constant. [g] At low test strain rates a master true stress - total true strain curve is obtained.
Comparison of Isotactic Polypropylene with PMDA-ODA Polvimide
In this section the effect of anisotropic structure on the room temperature (23oC) deformation and failure behavior of two distinctly different polymers is examined. One a single phase nematic polymer, PMDA-ODA polyimide [PI] (Tg@400oC); the other is the anisotropic two phase molecular polymer composite, Isotactic Polypropylene [IPP] (Tg@14oC). Here the F Series of IPP films are used for the low strain rate real-time structure-stress-strain measurements (2,6,7).
Figure 3 shows the engineering stress-strain curves to failure for the fabricated PI and IPP oriented films and reveals several features. First, as the orientation of the film before stretching increases, the engineering stress to failure increases. Further, as the orientation of the film before stretching increases, the engineering strain to break decreases. A maximum engineering strain of 65% is obtained for the original PI before failure, while that for IPP was 625% strain.
Figure 4 shows the same force-elongation data used to calculate the engineering stress- strain curves in Figure 3 plotted as true stress - true strain curves. Notice that in Figure 4 all of the failure true stresses have essentially the same value irrespective of the films starting orientation. This is in stark contrast to the increasing engineering failure stresses with increasing orientation in Figure 3. The engineering stress defines the force at failure with respect to the original cross-sectional area of the sample before extension. This is not the cross-sectional area the sample sees at break and thus the definition is unrealistic from a physical point of view. The true stress at break defines the force at break with respect to the actual cross-sectional area at break, a physically realistic description of the failure phenomenon. What the results indicate is that at their rate of deformation, all of the PI and IPP films, irrespective of their starting orientation are breaking at the same failure structure. This conclusion is reinforced by the observed behavior of the Total True strain of both PI and IPP with molecular orientation in Figure 5.
Figures 4 and 5 suggest there is one master true stress - true strain curve, the one observed for the unoriented film. The orientation induced by the fabrication simply shifts the starting point of the deformation curve of that film. Thus the initial portion of the oriented films deformation curve will represent that required to get the orientation back on to the original true stress - true strain curve of the unoriented film so it can continue to the final failure deformation state. Figure 6 shows just such a shift for the the anisotropic PI and IPP films. As can be seen from the figures, a shift proportional to the fabrication true strain of the film, when added to the original test true strain (see Figure 4), brings the films deformation curve back onto the original true stress - true strain curve of the unoriented film. Thus by considering the fabrication and testing of the anisotropic film series as a single fabrication process, from an initial undeformed polymer film to a desired broken final fabricated product, it is possible to obtain a master true stress - total true strain curve.
140

350
300
250
200
150
100
SO
0 1 2 3 4 5 6
Draw Ratio,*
ISOTACTIC POLYPROPYLENE
f i
£& ■ F4 .
P y n
R -
■ . .
T > r 0 20 40 60 80 ENGINEERING STRAIN (%)
PMDA-ODA POLYIMIDE
Figure 3. Effect of using Engineering Stress on the deformation curves of both isotactic polypropylene and PMDA-ODA polyimide films.
3 4 Draw Ratio, x
ISOTACTIC POLYPROPYLENE
i ■ i—■—i—■—i— 0.1 0.2 0.3 0.4
TRUE STRAIN
PMDA-ODA POLYIMIDE
0.5
Figure 4. Effect of using True Stress on the deformation curves of both isotactic polypropylene and PMDA-ODA polyimide films.
141

»ff
1
8 8H
y o r
tr-rr-
OJO 02 OA M Hemnra Nonarymllnt OrtonWion nnoUon
Taut
as- * D D D >>
z 0.4'
< E as- u 3
P 0.2 •
o, v^ Tru« Fabrication Strain
0.1-
-O . i 0.1 0.2 0.3 0.4 05 0.6
ORIENTATION FUNCTION (X-RAY)
ISOTACTIC POLYPROPYLENE PMDA-ODA POLYIMIDE
Figure 5. Relation between the True Fabrication strain, the Total True strain and the orientation function of both the isotactic polypropylene and PMDA-ODA polyimide films.
500
400
S. 300
I 200
100
o n a FS A F4 O F5
FSertes
0^- 0.0
600
0.5 1.0 1.5 2.0 2.5
Total True Strain Qog(AM*%H))
0.0 0.1 0.2 0.3 0.4 0.5 TOTAL TRUE STRAIN
ISOTACTIC POLYPROPYLENE PMDA-ODA POLYIMIDE
Figure 6. Relation between the True Stress and the Total True Strain for both the isotactic polypropylene and PMDA-ODA polyimide films.
142
CONCLUSIONS
The yield strength, the failure strength and strain behavior of IPP are all a function of the molecular orientation in the polymer. Further on examination, although PI and IPP are very different polymers, they behave similarly (conditions [c] through [g] above) when the strain rate is slow enough for the polymer to be at the low strain rate limit of its failure envelope. A master True Stress-Total True Strain curve is obtained for both polymers.
REFERENCES
1. R.J. Samuels. Structured Polymer Properties. John Wiley, New York (1974). 2. R.E. Pepper and R. J. Samuels, SPEANTEC. 36, 553(1990). 3. C.Y. Cha, PhD Thesis, Georgia Institute of Technology, 1995. 4. P.I. Vincent, Plastics (London), 26, 141 (1961). 5. RJ. Samuels.Polvm.Eng.Sci..l9. 66 (1979). 6. RE. Pepper and R.J. Samuels, SPE ANTEC. 40, 1416 (1994). 7. RE. Pepper and R.J. Samuels, SPE ANTEC. 43(2),1681(1997).
143

ATHERMAL FRACTURE OF COVALENT BONDS
J. J. GILMAN Materials Science and Engineering, UCLA, Los Angeles, CA 90095
ABSTRACT
Most fracture is athermal. Either because it occurs at low temperatures; or because it occurs too fast for thermal activation to be effective. Thus it must be directly activated by applied stresses. This can occur via quantum tunneling when the chemical bonding of a solid resides in localized (covalent) bonds. Then applied stresses can cause the bonding electrons to become delocalized (anti-bonded) through quantum tunneling. That is, the bonds become broken. The process is related to the Zener tunneling process that is thought to be responsible for dielectric breakdown in semiconductors. Under a driving force, bonding electrons tunnel at constant energy from their bonding states into anti-bonding states through the forbidden gap in the bonding energy spectrum.
INTRODUCTION
The theory of quantum tunneling leads to a characteristic rate law in which the tunneling probability is a function of the virtual work of fracture instead of being a function of the thermal energy as in thermal reaction-rate theory. And, the attempt frequency is determined by the density of Zener-Bloch states rather than being determined by thermal vibration frequencies. Through these parameters experimental results can be compared with the theory. This will be done here for a variety of crystals, glasses, and polymers.
In addition to being related to the theory of dielectric breakdown, this theory of fracture is also related to the Fowler-Nordheim theory of the field emission of elec- trons. The only essential difference is that the bonding electrons are emitted into a vacumn in field emission, whereas they are emitted into surface states during fracture.
The localized fracture of bonds occurs in a stressed specimen prior to the time when the Griffith energy criterion is satisfied, so that general failure occurs. This localized fracture can be detected by observing the presence of the free-radicals that the broken bonds become. This approach to low temperature fracture has been discussed previously [1], It is revisited here because Doremus has reported that the rate equation derived from it agrees with experimental results better than other theories [2]. Also, recent data for Kevlar agree with the theory.
FRACTURE VIA TUNNELING
The situation at the tip of a sub-critical crack is shown schematically in Figure 1. The crack tip does not move concertedly (as a rigid line). It moves in discrete jumps as bond after bond becomes broken until the crack length reaches the Griffith critical value. In the super-critical regime, the rate of crack growth is limited
145 Mat. Res. Soc. Symp. Proc. Vol. 539 ® 1999 Materials Research Society

Anübonding
Figure 1 - Schematic kink on the tip of a crack.
Figure 2 - Schematic bonding and anti- bonding Morse potentials.
principally by the inertia of medium so it accelerates until it reaches a velocity of about v, / 3 where v, is the speed of a longitudinal sound wave, and v,2 = Y / p; with Y = Young's modulus, and p = the mass density.
In the sub-critical regime, the net crack velocity, vc, results from the sum of the velocities of the individual kinks along the crack tip, vk, and the concentration of kinks (fraction of occupied sites), ck, so that vc = ck vk. The cross-sectional area of each kink is ab where b is the distance between bonds along the tangent of the crack tip, and a is the distance between bonds perpendicular to the crack tip. Then, if the bond length is c, the relaxation volume associated with a unit of motion, b, of the crack kink is abc, and the kink velocity is vk = db/dt.
Let the local Cartesian coordinates be x|a, y||b, and z||c. Also, let the principal applied stress be aa so the local stress at the kink is oc = Cozz where C is the stress concentration factor. Then, the strain energy, Uk, of the kink region is approximately:
Uk = (oc'/2Y)abc (1) where Y is Young's modulus. This is the chemical potential of the kink. The force tending to move the kink in the direction that extends the crack is:
3Uk / 3y = (abc / Y) Ooe / ay) oc = U (2) This is a generalized force. Since the hypothetical fracture mechanism begins with the promotion of a bonding electron into an anti-bonding state, it is equivalent to the electrical force needed to do that. The electrical force, fe, on an electron of charge, q, is Eq, where E is an electric field. Therefore: f. = f„,and:
Eq = aco * Cb o (3) where b is the bond length. This expression indicates that there is a simple connec- tion between a stress field and an electric field; allowing theoretical results from the quantum mechanics of electrons to be applied to mechanical problems.
When a valence (bonding) electron undergoes a transition to an anti-bonding state, the local potential changes from attractive to repulsive. A simple, and approxi-mately
146

correct, way to represent this is by means of a bonding Morse potential, together with its conjugate anti-bonding potential [3]. One is obtained from the other simply by changing the sign of one of the two terms. This is illustrated in Figure 2. The Morse potential can be written as the sum of two terms (multiplied by the dissociation energy, D): A = exchange attraction = 2f; and R = overlap repulsion = f2. The function, f(r) where r is the interatomic distance, is:
f(r) = e"""*' where ß is a constant and b is the bond length (equilibrium value of r). Then the bonding potential energy, Ub(r) is:
Ub = D(f2 - 20 and the anti-bonding potential energy is:
Ua = D(f2 + 2f) At equilibrium, when r = b, f = 1, so Ub = - D, and Ua = + 3D. Then: Ali = 4D, and the force tending to separate the atoms is: - (dUa / dr),. b. This can be related to the curvature of Ub at r = b (the bulk modulus, B) using relationships given by Keyes [3], If it is expressed as a pressure by dividing the force by b2, the answer is that the dissociation pressure, Pdlssoo = * - B. This is of the order of megabars. Thus, if a bond is put into an anti-bonding state, a very large pressure tends to break it. This is a quantum mechanical effect caused by the large kinetic energy of a nearly-free electron in an antibonding state.
ZENER TUNNEUNG
In order to account for the dielectric breakdown of solids when they are subjected to very large electric fields, Zener proposed that breakdown avalanches could start with the tunneling of electrons from the valence band where they are immobile to the conduction band where they become mobile so the applied field accelerates them to high enough velocities to cause breakdown [4],
Similarly, Gilman and Tong [1] proposed that this kind of band-to-band tunneling can cause fracture by breaking covalent bonds; the difference in this case being that the stress field is the driving force instead of an electric field.
There are three factors to consider: the electronic attempt frequency, ve, the tunneling probability, p, and the acoustic attempt frequency, va (which may be much slower than the electronic frequency). In one dimension, the electronic frequency is associated with Zener-Bloch oscillations, Figure 3, and is given by [5]:
ve=(abc)a0/h (4) with h being Planck's constant, and using Equation (3).
The acoustic attempt frequency is determined by the sound speed; vs ~~ V(C„/p).
and the bond length, b: va = vs / b (5)
This may be an order of magnitude smaller than ve in which case it determines the overall rate. The range of attempt frequencies is about 1013 - 1014 / sec.
Next, the tunneling probability needs to be considered. This depends very sensitively on the height of the barrier to be penetrated, and on the magnitude of the applied stress, but is relatively insensitive to the shape of the barrier [6]. Therefore,
147

AntibondJD| Baod
Gap
No electric field With electric field
Figure 3 - Schematic diagram of Zener band-to-band tunneling.
1.3 1.4 1.5 1.6 1.7 Reciprocal Tensile Stress (1/GPa)
Figure 4 - Rate of free radical formation in stressed Capron fibers. The straight line conforms with Equation (7). Data of Zhurkov and Tomashevskii [7],
the shape will not be considered further. The barrier is simply taken to be the energy gap in the bonding energy spectrum (the band gap, or the LUMO-HOMO gap). In the absence of an applied stress the energy diagram is shown on the left in Figure 3 where the coordinates are U (energy), and x (reaction path). The effect of an applied stress on the total energy is shown in Figure 3 on the right. It may be seen that an electron can now transfer from the top of the valence band to the bottom of the conduction band (or from the HOMO level to the LUMO level) at constant total energy. However, to do this, it must tunnel through the forbidden gap. This is the problem that Zener addressed. Transposing his result from the electric to the stress field case gives the tunneling probability:
Pl = exp-{(7iE /h)2/boc} (6) = exp - (F/oc)
and, the expression for the fracture kink velocity, vw , is: vk( = c«,[exp - (F/oc)] (7)
Thus, the velocity of a fracture kink ranges from zero to approximately the velocity of sound. Note that the stress in the function of Equation (7) plays the same role as temperature in the usual Arrhenius rate function. Therefore, plots of fracture rates vs. reciprocal applied stress should yield straight lines that intercept the ordinate at approximately the speed of sound.
CONFORMANCE OF DATA WITH TUNNEUNG EQUATION
There are at least four types of data that can be compared with the tunneling theory: (1) rates of free radical production; (2) sub-critical crack velocities; (3) static
148

fatigue; and (4) dynamic (impact) fatigue. Also, various materials meet the
■
../
•
• f m
/ 1 ' ' ■
Figure 5 - Rate of crack propagation in soda-lime glass for two humidity conditions. Wiederhorn's dsata [8].
£120 CO ■o o N
S 80
S 40 S Q. O o
0 2 4 6 8 log [# of impacts]
Figure 6 - Impact fatigue of cellulose acetate fibers. The normalized stress is the applied stress (psi.) divided by the Youngs modulus (= 1.95 x 10⁵ psi.) The logarithm is base 10.
assumption of relatively independent "bond-breaking". These include polymeric fibers such as cellulose acetate and Kevlar, as well as various inorganic glasses including fused silica. Some of the data have been reviewed previously [1], but new data have appeared in the meantime, and Doremus [2] has reported systematic studies of the equations that have been used in the literature to describe the fracture of glass. He concludes that Equation (7) gives the best description of the available data.
When a polymer molecule breaks, the electron-pair bond, becomes two free radicals on the broken ends. These can be detected by a spin resonance spectro- meter. In a stressed polymer fiber, prior to the formation of a crack of critical size, individual molecules break. The rate at which they break depends on the magnitude of the applied stress. This breakage rate can be observed as the rate of free-radical formation. Data for this effect, reported by Zhurkov and Tomashevskii [7] are shown in Figure 4 plotted to conform with Equation (7). That is, the logarithm of the rate versusXhe reciprocal stress. It may be seen that the conformance is quite good over more than four orders of magnitude in the rate.
Cracks that are put into small plates of glass and then subjected to stresses somewhat less than the critical stresses needed to make them propagate rapidly are observed to propagate slowly. Their velocities depend sensitively on the applied stress as expected by Equation (7). Data, obtained by Wiederhorn [8] for two examples are given in Figure 5. These data, as well as data reported previously [1] agree with the form of the equation. Note that in Figure 5, the velocity data extend over five orders of magnitude.
Two types of data exist for fatigue tests: static in which constant (nominal) stresses are applied and the time-to-failure is recorded; and dynamic in which
149

^ 0 36-
• ^
(0 0)
V) • u 2 0 32 o
1 ■ ■ ■ ■
.... log foüum Hm«
-5-3-113579 In [time to fracture (hrs.)]
Figure 7 - Static fatigue data of Burke, Figure 8 - Static fatigue of PPTA (Kevlar) Doremus, Hillig and Turkalo for spec- at 21C. Data from Crist [12]. mens of soda-lime glass. SN is the short time breaking stress at 78K.
repeated light impacts are applied and the number of impacts (time) to failure is recorded. Figure 6 shows impact fatigue data (obtained by Findley and Mintz) for cellulose acetate fibers as reported by Taylor [9].
The most extensive data in the literature are those of static fatigue for various glasses, ceramics such as porcelain, and environmental conditions. A considerable set of theses data follow the Preston-Haward law [10], and it was pointed out previously [1] that rearrangement of this law yields Equation (7). More recent data of Pavelchek and Doremus [11] for soda-lime glass is shown in Figure 7. Doremus' book presents other examples such as fused silica, and borosilicate glass, all of which behave consistently with Equation (7). Also, the book states that Equation (7) is consistently better than other proposed equations in describing the data.
Another polymeric material that behaves as expected by the present theory is Kevlar. Figure 8 illustrates this.
SUMMARY
A case is presented that covalently bonded materials fracture as a result of stress- induced quantum-mechanical tunneling of electrons from bonding states into anti- bonding states (Zener tunneling). It is shown that the resulting rate equation is consistent with a large variety of experimental data; and that its fit to the data is superior to those given by equations based on thermal activation.
150

REFERENCES
1. J. J. Gilman and H. S. Tong, Quantum Tunneling as an Elementary Fracture Process, J. Appl. Phys., 42, 3479 (1971).
2. R. H. Doremus, Glass Science, Second Edition, p. 178-182, John Wiley & Sons, New York (1994).
3. R. W. Keyes, Bonding and Antibonding Potentials in Group-IV Semiconductors, Phys. Rev. Lett., 34, 1334 (1975)
4. C. Zener, A Theory of the Electrical Breakdown of Solid Dielectrics, Proc. Roy. Soc. (London), 145, 523 (1934).
5. R. K. Ridley, Quantum Processes in Semiconductors, p.50, Clarendon Press, Oxford (1982).
6. R. P. Bell, The Tunnel Effect in Chemistry, Chapman and Hall, London (1980).
7. S. N. Zhurkov and E. E. Tomashevskii, in Physical Basis of Yield and Fracture, Institute of Physics, Conf. Series #1, p. 200, Oxford (1966).
8. S. M. Wiederhorn, J. Am. Ceram. Soc, 53, 543 (1970).
9. N. W. Taylor, J. Appl. Phys., 18, 943 (1947).
10. J. L. Glathart and F. W. Preston, J. Appl. Phys., 17,189 (1946); also, T. C. Baker and F. W. Preston, J. Appl. Phys., 17, 170 (1946).
11. E. K. Pavelchekand R. H. Doremus, J. Non-Cryst. Solids, 20, 305 (1976)
12. B. Crist, Annu. Rev. Mater. Sei., 25, 295 (1995).
151

FIBER DEBONDING ALONG A CRACK FRONT IN PAPER
H. KETTUNEN1'2, K. J. NISKANEN1
'Paper Science Centre, KCL, P.O. Box 70, FIN-02151 Espoo, Finland 2Lab. Paper Tech., Helsinki University of Technology, P.O. Box 6300, FIN-02015 HUT, Finland
ABSTRACT
We follow the accumulation of microscopic damage ahead the crack tip in paper. The fiber debonding process varies even within each specimen because of large variation in fiber and bond properties. In general, stiff and weakly bonded fibers tend to debond as a rigid body while ductile or well bonded fibers pull out gradually in a process that propagates from the crack line to the fiber ends. Particularly in the latter case the network ruptures coherently rather than through debonding of single fibers. Experimental analysis and simulations show that fracture energy correlates closely with the size of the fracture process zone (FPZ) irrespective the nature of the debonding process. Only the cases of low bonding and stiff fibers seem to make an exception in that FPZ can grow in size without a corresponding increase in fracture energy.
INTRODUCTION
Our objective is to study experimentally the underlying micro-mechanism that determine the fracture energy of paper. We observe various fiber debonding processes and relate them to the geometry-independent plastic deformation zone and fracture energy. Similarly, in ordinary short fiber composites different rupture processes are seen to affect the size of the plastic deformation zone that relates to fracture energy. E.g. Sato et al. [1] observed that in glass fiber reinforced polyamide, debonding starts from fiber ends. The subsequent damage propagates towards the center of fibers and a band of local yielding forms. This agrees with the shear-lag model of Cox [2]. In contrast, Lindhagen and Berglund [3] found that at large fiber contents damage starts from transverse fibers and fiber bundles. The initial microcracks merge to form the final crack. The size of the process zone depends on fiber length.
Paper differs from ordinary composites becaue the cellulosic fibers are held together by inter- fiber bonds and not by a matrix material. The plastic deformation zone can be divided into the fracture process zone FPZ and the outer plastic zone OPZ [4]. The fracture work contribution from FPZ does not depend on specimen geometry whereas the OPZ contribution does.
EXPERIMENT
Mechanical testing
We studied single-edge-notched specimens using tensile test (SENT) and in-plane tear test (IPT) at 23°C, RH 50%. The former test is common in materials testing but the latter is not. The IPT specimen has to be flexible because it is bent between the clamps. The notched edge is tight and the other edge is slack. This gives stable crack propagation [5]. The SENT specimens were 35 mm wide, the notch length was 10 mm and span length 55 mm. The displacement rate was 0.4 mm/min to provide imaging time. The IPT specimens had a 55-mm ligament and 45-mm initial span length. Tearing angle was 10—12° and elongation rate 20 mm/min.
153 Mat. Res. Soc. Symp. Proc. Vol. 539 e 1999 Materials Research Society

Detection of damage
The microscopic damage was made visible using impregnation with General Electric RTV 615 silicone rubber that does not significantly alter the mechanical properties of paper. The silicone fills almost all the voids in paper. Paper becomes translucent because light scattering surface is reduced. This enhance the optical contrast of any free surface that is created when paper is subsequently elongated. The free surface shows where fibers debond or other damage occurs [6]. Damage accumulation during the tests was recorded with a digital camera. The minimum pixel size was 10 p.m. After IPT, damage patterns were also recorded with a desktop scanner (1200 dpi). In both cases images were taken in reflected light with a black background. Damaged areas correspond to light shades of gray and undamaged areas to dark gray.
The size of FPZ was measured from the scanned images from IPT. Two parameters, the pull- out width and damage width, were determined using image analysis. The first one gives the length of fiber ends sticking out of the crack line. The second measures how far from the crack line damage occurs [7]. These parameters relate to the fracture energy.
Sample material
We used handsheets (SCAN M5:76) of pure mechanical pulp (PGW) and mixtures of PGW and a chemical pulp (softwood kraft). The two pulps differ in stiffness and perhaps bonding ability. Kraft fibers are ductile and well-bonding, PGW fibers are stiff. Kraft fibers were dyed with chlorazole black. In the IPT damage analysis we used mixtures of PGW with kraft, sulphite (low fiber strength), and viscose (low bonding ability) [8], as well as pure kraft pulp at different beating levels [9] and machine-made commercial paper grades (magazine, newsprint, LWC and sack paper) [5]. Beating influences the bonding ability and perhaps ductility of the kraft fibers.
RESULTS
Damage accumulation during the test
Figure 1 shows SENT and IPT damage zones in a kraft specimen in the beginning of crack propagation. Even though rather homogeneous damage is seen in the entire FPZ, single fibers are
Figure 1. Damage shown with the light shades of gray at the notch tip of a softwood kraft specimen in SENT (a) and IPT (b).
154

Figure 2. Damage accumulation sequence in a PGW specimen in SENT with the crack propagating from left to right in (a)—(c). In (c), the fiber 1m (dotted outline) debonds in a systematic sequence, fiber 2m (dashed outline) as a rigid body, and 3m (dash-dotted outline) starting from the fiber end.
also visible. Damage extent is different in the two tests. SENT gives rise to a large outer plastic zone of low damage intensity. In IPT the small but nonzero tearing angle confines damage into the FPZ [7, 8]. The damage zone in IPT resembles the highest intensity part of the SENT damage zone. The IPT fracture work should therefore equal the essential work of fracture (EWF).
Figure 2 shows images of a PGW specimen under increasing load in SENT. The longest fibers (usually also the thickest and stiffest) bridge the crack. Damage spreads along these fibers long way into the intact paper. Some debonding occurs even well behind the crack tip. This broadens the otherwise narrow damage zone and increases the fracture work. Figure 2c illustrates three fiber debonding processes. The first fiber type (lm) becomes visible in a systematic sequence where bond ruptures proceed along the fiber from the crack line to both fiber ends. The second fiber type (2m) debonds more like a rigid body. Especially in the beginning (Fig. 2a), damage grows simultaneously all along the fiber. In the third case, a fiber end debonds first (3m), in accordance with the shear-lag theory. Sometimes these fibers exhibit no other bond failures.
Figure 3 shows a case where presumably stiff and long PGW fiber (or shive), labeled 2m, debonds as a rigid body simultaneously all along its length, even though only the end of the fiber crosses the crack line. The fibers depicted in Fig. 2 bridged the crack line rather symmetrically.
Figure 4 shows crack lines in mixtures of PGW and kraft. Long PGW fibers seem to debond much in the same manner as in the pure PGW sheets (Figs. 2 and 3) so that all the three process
Figure 3. Damage accumulation sequence in a PGW specimen in SENT. The fiber 2m (marked with dashed outline) debonds as a rigid body even though only its end crosses the crack line.
155
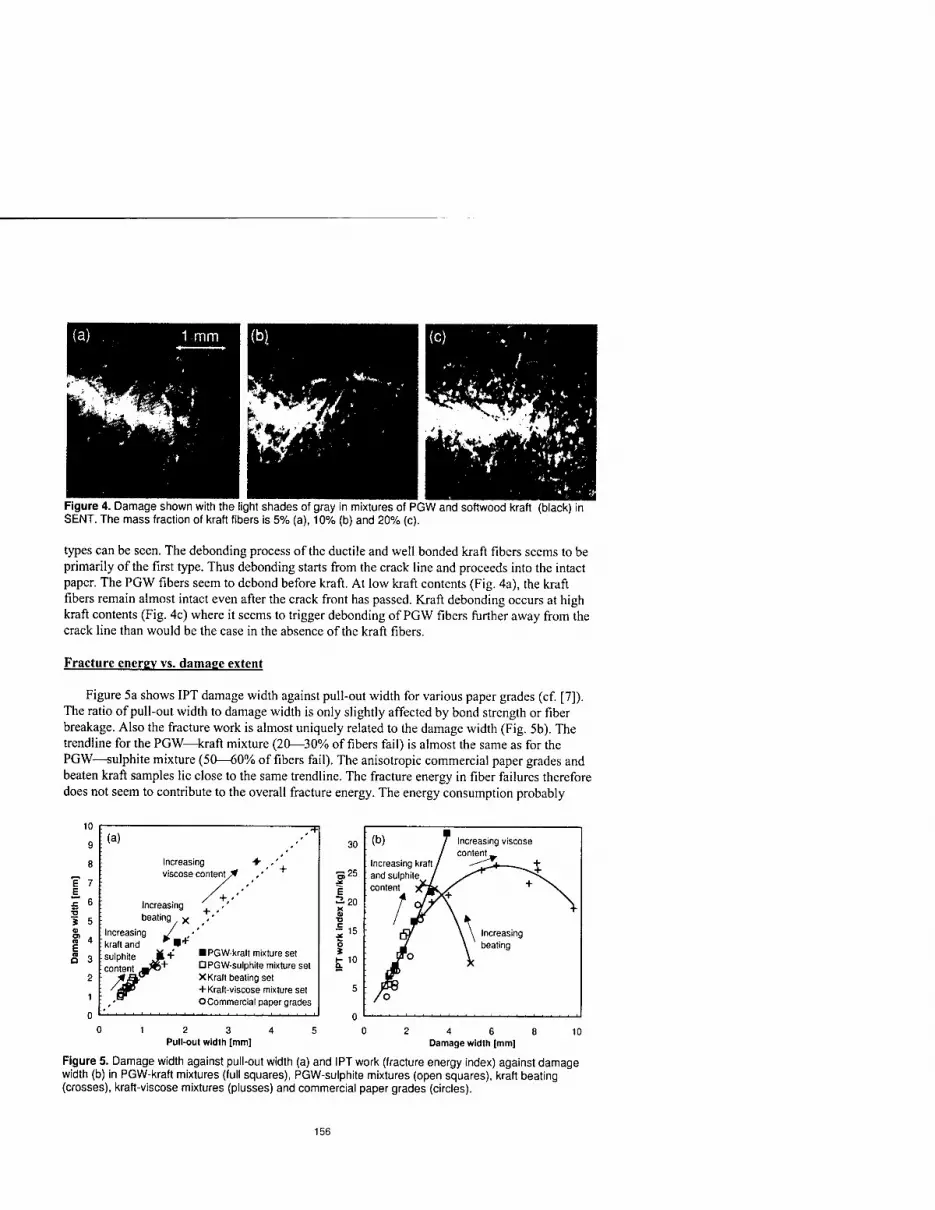
Figure 4. Damage shown with the light shades of gray in mixtures of PGW and softwood kraft (black) in SENT. The mass fraction of kraft fibers is 5% (a), 10% (b) and 20% (c).
types can be seen. The debonding process of the ductile and well bonded kraft fibers seems to be primarily of the first type. Thus debonding starts from the crack line and proceeds into the intact paper. The PGW fibers seem to debond before kraft. At low kraft contents (Fig. 4a), the kraft fibers remain almost intact even after the crack front has passed. Kraft debonding occurs at high kraft contents (Fig. 4c) where it seems to trigger debonding of PGW fibers further away from the crack line than would be the case in the absence of the kraft fibers.
Fracture energy vs. damage extent
Figure 5a shows IPT damage width against pull-out width for various paper grades (cf. [7]). The ratio of pull-out width to damage width is only slightly affected by bond strength or fiber breakage. Also the fracture work is almost uniquely related to the damage width (Fig. 5b). The trendline for the PGW—kraft mixture (20—30% of fibers fail) is almost the same as for the PGW—sulphite mixture (50—60% of fibers fail). The anisotropic commercial paper grades and beaten kraft samples lie close to the same trendline. The fracture energy in fiber failures therefore does not seem to contribute to the overall fracture energy. The energy consumption probably
* 5
(a)
Increasing ♦ viscose content;
Increasing beating x
Increasing J , • kraft and * ■* sulphite content ß ■ PGW-kratt mixture set
□ PGW-sulphite mixture set X Kraft beating set +Kraft-viscose mixture set O Commercial paper grades
30
S25
E ^■20
S fc- 10
(b) Increasing viscose
: Increasing kraft / : and sulphite / content ytrmi
t 4/ *x
content
Ijr WO
\ \ Increasing \ beating
/o
2 3 Pull-out width [mm]
4 6 Damage width [mm]
10
Figure 5. Damage width against pull-out width (a) and IPT work (fracture energy index) against damage width (b) in PGW-kraft mixtures (full squares), PGW-sulphite mixtures (open squares), kraft beating (crosses), kraft-viscose mixtures (plusses) and commercial paper grades (circles).
156

arises from the plastic elongation of fibers and perhaps the concurrent bond ruptures. Fibers with poor bonding capacity provide the only exceptions to the general correlation
between fracture work and damage width. Both the unbeaten kraft and viscose fibers have low ductility and poor bonding capacity and therefore give lower fracture work than damage width alone would predict (Fig. 5b). Given their high stiffness, these fibers may pull out from the surrounding fiber network as a rigid body similar to the PGW fibers illustrated in Fig. 3. Visual inspection of the IPT specimens suggests that the combination of low bonding and high fiber stiffness gives rise to a very irregular and diffuse crack line. This contributes to the exceptionally large damage width values of these fibers in Fig. 5. Another factor with the viscose fibers is the very high fiber length, 6 mm instead of the 2—3 mm of the other pulps.
Simulation of fiber debonding
We did also Monte Carlo simulations to find out if simple single fiber debonding mechanism could explain the experimental results. We compared three processes in fibers that randomly cross a crack line. In the first case bonds were opened in a systematic sequence starting from the crack line and ending to the fiber end first encountered. The second case was a "rigid body" process, where all bonds along the fiber could open with equal probability. The last case was a combination of the other two so that two "process windows", each covering 20% of the fiber length, proceeded systematically towards the fiber ends but the bond opening within the windows was random. The FPZ size was varied with the probability of the fiber failing instead of a bond.
Figure 6 shows the simulation results. None of the debonding models agrees perfectly with the experimentally observed linear relationship between damage width and pull-out width (Fig. 5a). Yet damage width is larger than pull-out width in every model, as in the experiments. Measured fiber lengths and damage widths suggest that the absolute values given by the rigid body process or combination process are closest to reality. However, the large proportion of broken fibers in the rigid body process is not reasonable. It is plausible that the actual debonding mechanism depends on the fiber failure probability.
1.6
1.4
g 1.2
§ 1-° «0.8 s S)0.6 m E g0.4
0.2
0.0
(a)
A Systematic sequence O Rigid body D Combination
0.2 0.4 0.6 0.8 Pull-out width/fiber length
1.0 1.2 0.0 0.2 0.4 0.6 0.8 1.0 1.2 1.4 Damage width/fiber length
Figure 6. Simulated damage width against pull-out width (a) and fracture energy against damage width (b) for the three fiber debonding models, systematic sequence (triangles), rigid body (diamonds) and moving process window (squares). Dashed lines are guides to the eye and numbers in (a) show the fraction of broken fibers.
157

The simulated fracture energy (proportional to the number of opened bonds) falls approximately on a single curve, irrespective the assumed debonding mechanism. The only variation comes from damage width. The slightly nonlinear shape agrees with the experimental results in Fig. 5b. The shape arises from the mathematical algorithm that we use to evaluate damage width both in experiments and simulations.
CONCLUSIONS
The microscopic damage in well bonded sheets made of ductile kraft fibers (Fig. 1) show that in general the network fails in a coherent manner, with most fibers in the FPZ debonding simultaneously. When the network contains stiff fibers (Figs. 2—4), some of them debond individually and extend damage from the crack line. These fibers are parallel to the external load. In mixtures, stiff fibers debond first and ductile fibers later. Different single fiber debonding processes are observed. In few cases the fiber ends debond first, as the shear-lag theory predicts. Some stiff fibers debond as a rigid body, with all their bonds opening simultaneously. On the average, however, debonding starts from the crack line and propagates into the intact paper.
In most of our paper samples, fracture energy depends only on the damage width, the size of the area where debonding occurs. In these cases, fiber failures or details of the debonding process do not affect the slightly nonlinear relationship between fracture energy and damage width. The simulation study confirmed this conclusion. The fracture energy thus arises entirely from the plastic deformation of fibers and related opening of bonds.
Papers with poor bonding and stiff fibers deviate from the general trend in that the damage area is large and yet fracture energy is low. The experimental observations suggest that these fibers may debond predominantly as rigid bodies so that bonds along the entire fiber length undergo rupture process simultaneously. The rigid body behavior means, among other things, that fracture energy is consumed in bond openings, not in the plastic elongation of fibers.
ACKNOWLEDGEMENTS
We acknowledge with great gratitude the financial support from Jenny and Antti Wihuri fund and the Technology Development Centre of Finland. We also thank Mr. Y. Yu for the viscose experiments.
REFERENCES
1. N. Sato, T. Kurauchi, S. Sato, O. Kamigaito, J. Mat. Sei., 26, 3891-3898 (1991). 2. L. Cox, Br. J. Appl. Phys., 3, 72-79 (1952). 3. J. Lindhagen, L. Berglund, J. Appl. Polym. Sei., 69, 1319-1327 (1998). 4. R.J. Seth, Tappi J., 78,177-183 (1995). 5. H. Kettunen, K.J. Niskanen, J. Doussot, PSC Communications 106, KCL, 1997. 6. M.J. Korteoja, K.J. Niskanen, M.T. Kortschot, K.K. Kaski, Paperi ja Puu 80, 364-372 (1998). 7. H. Kettunen, K.J. Niskanen, PSC Communications 110, KCL , 1998. 8. Y. Yu, H. Kettunen, K.J. Niskanen, presented at 1998 Progress in Paper Physics: A Seminar,
Vancouver, Canada; submitted to J. Pulp Paper Sei. 9. H. Kettunen, Y. Yu, K.J. Niskanen, PSC Communications 118, KCL, 1998.
158

Part IV
Fracture and Deformation of Silicon

TEMPERATURE-DEPENDENT ONSET OF YIELDING IN DISLOCATION-FREE SILICON: EVIDENCE OF A BRITTLE-TO-DUCTILE TRANSITION
R. H. Folk II, M. Khantha, D. P. Pope, and V. Vitek Dept. of Materials Science and Eng., University of Pennsylvania, Phila. Pa., 19072
ABSTRACT
An investigation of the brittle-to-ductile transition (BDT) in silicon has been conducted on essentially dislocation-free silicon test specimens made by photolithography. No pre-cracks or additional dislocation sources were introduced into the samples. Three-point bending tests of the samples reveals a well defined transition from brittle fracture of the specimens to complete yielding near 732°C at a crosshead displacement rate of 0.1 mm/min. Limited plasticity is observed below 732°C but is insufficient to prevent crack propagation suggesting that yielding is not dislocation mobility limited. Instead the transition may be controlled by the nucleation of a sufficient density of dislocations. Further support comes from the results of experiments conducted at temperatures below 732°C in which samples were rapidly pre-loaded within the linearly elastic regime, then immediately retested. This rapid pre-loading results in a lower transition temperature. This would not be expected if dislocation mobility controlled the BDT. Instead, it is believed that the transition only occurs when a sufficient density of dislocations has nucleated within the sample. In these experiments, the pre-loading event may increase the dislocation nucleation rate. The source of the dislocations in these defect free samples is still under investigation.
INTRODUCTION
The brittle-to-ductile transition (BDT) has traditionally been attributed to a tightly coupled interaction between dislocation sources and a crack tip [1-3]: if the dislocations are capable of multiplying and moving at a rate greater than the crack velocity, then the crack tip will be blunted and the material will deform ductily. Conversely, if the crack front advances at a rate greater than the rate of dislocation motion, the material will fracture in a brittle manner. In both instances, the motion of the dislocations relative to the crack front is governed by the applied stress, the test temperature, the strain-rate, and the particular dislocation geometry in the vicinity of the crack front.
We propose that the BDT is a more general material phenomenon that is not dependent on a particular crack tip-dislocation geometry and that the presence of a crack is not even a precondition for the transition. Evidence for this viewpoint can be found in research conducted in the 1950's on whiskers of various materials. Pearson, Read, and Feldmann [4], loaded silicon whiskers at various temperatures until failure or yielding of the whiskers occurred. A transition from brittle fracture to general yielding was observed between 600°C and 650°C. Within this temperature range some whiskers exhibited a small degree of plastic deformation prior to fracture. However above 650°C all of the test specimens displayed ductile behavior. Upon yielding, each of these specimens displayed a large load drop until a point was
161
Mat. Res. Soc. Symp. Proc. Vol. 539 ° 1999 Materials Research Society

reached where flow occurred at approximately constant load. Similar results were reported by Brenner [5, 6] on room temperature tensile tests conducted on iron, silver, and copper whiskers. The iron whiskers fractured after reaching elastic strains in excess of 3.5 percent. In contrast, at similar stresses, the silver and copper whiskers yielded suddenly and displayed load drops which were as great as 80-to-l in the case of the copper whiskers. Brenner also noted that the plastic deformation was highly concentrated in narrow slip bands. The results are not limited to whiskers, however. Bulk silicon and germanium samples were tensile tested by Patel and Chaudhuri [7] at elevated temperatures. Unlike more recent BDT experiments conducted on pre-cracked samples, these samples were polished and etched prior to testing to minimize the nucleation of dislocations at surface defects such as micro cracks. Patel and Chaudhuri found that for samples tested in tension at elevated temperatures, large load drops occurred upon yielding. In addition, it was found that the magnitude of the load drop for a given sample was related to the density of grown-in dislocations, with the largest load drop occurring in samples that were initially dislocation-free. Although Patel and Chaudhuri were unable to conclusively identify the dislocation sources, they did report that dislocations were nucleated in the linear elastic portion of the loading curve.
The research presented here represents a preliminary investigation into the brittle-to-ductile transition in bulk silicon in the absence of a crack tip or other stress concentrator. We believe that a brittle-to-ductile transition occurs in a material when a critical combination of stress and temperature results in the generation of mobile dislocations with a sufficient density to permit general yielding (see the paper by M. Khantha, et. al. in this volume). The factors contributing to the generation of the dislocations in the initially dislocation-free samples have been examined, however an explicit characterization of what can be considered a 'sufficient' density of dislocations is not treated at this time. In addition, since there is evidence that preexisting dislocations influence the BDT, several pre-loading experiments have been conducted.
EXPERIMENT
Small silicon beams produced from <100> semiconductor grade silicon wafers using photolithography were tested in three-point bending. The surface of each wafer was patterned with an array of beams that were then etched out of the wafer using KOH. The preferential nature of the KOH etchant produces a trapezoidal cross-section with mirror polished surfaces. The dimensions of the beams are: a top face width of 1 mm, a base width of approximately 1.35 mm, and a length of 10 mm. The thickness of the samples varies with each wafer but is on average 0.25 mm. The trapezoidal cross section has two advantages: it increases the tensile stress (when the narrow face of the beam is placed opposite the applied load) and reduces the contact stress under the load on the top surface of the beam.
The samples were tested in air, at temperatures ranging from 25°C to 816°C with an Instron 4206 at a constant crosshead displacement rate of 0.1 mm/min. In the first set of experiments, the samples were loaded at temperature until either fracture occurred or until a state of constant flow was reached. The results were used to develop a representative stress-temperature map of the BDT.
162

The second set of experiments involved a two-step load cycle. A pre-load was rapidly applied to a preset load within the linear elastic portion of the loading curve, then unloaded, and then immediately reloaded at a reduced crosshead displacement rate. All but one of the samples were pre-loaded at a crosshead displacement rate of 1.0 mm/min. The remaining sample was pre-loaded at a rate of 5.0 mm/min. The reload rate was the same for all samples, 0.1 mm/min. The test temperature and the pre-load level were varied for each sample tested. The effect of the pre-load on the brittle-to-ductile transition temperature (BDTT) was observed.
RESULTS
Fracture/Yield Behavior
The three types of mechanical behavior observed during the loading of the silicon beams are displayed in Figure 1. Figure la is representative of experiments conducted at room temperature, 325°C, and 675°C in which the samples failed by brittle fracture with no apparent plastic deformation. Samples tested above 675°C but below 732°C show some level of plastic deformation prior to fracture. Within this temperature interval, the transition from totally brittle fracture to limited yielding does not appear to be well defined. For example, the sample tested at 713°C shows only a small degree of non-linearity in the loading curve prior to fracture. Samples tested slightly above 713°C show a small load drop followed by brittle
1000
800
<« 600
I I I I I I I I I I I I I I I I I I I I I I I I I I
100Q""""i"m""l' """"i 1000 """"l" nimm'»
a.
♦+>»HMlllJ.lllimiMHHIII Q +***l*MUU"H"»l«
b.
111111 llt-ll 1111H 11II 111111 "ÖT
c.
0.5 1
Deflection (mm)
1.5
_j ■ ■ ' ■
a. T = 675°C, Fracture b. T = 729°C, Yield/Frac. c. T = 732°C, Yield
1.5
Figure 1: Characteristic mechanical behavior of silicon test specimens
163

fracture (Fig. lb). Samples tested at 732°C and above exhibit general yielding and large load drops and deform into a distinct vee-shape. Inspection under a light optical microscope reveals intense slip bands directly under the point of load application. Further work is necessary to characterize the extent of the plastic zone and the magnitude of the dislocation activity in the plastic zone. A comparison between Figures lb and lc illustrates the narrowness of the transition from brittle fracture to complete ductility. A summary of the fracture and yield behavior of the samples tested is presented in Figure 2. The figure inset highlights the mechanical behavior of samples tested in the temperature interval from just below to just above the presumed BDT.
The sharp transition from incomplete yielding to complete ductility at 732°C is characteristic of a brittle-to-ductile transition. Tests at or near 732°C were repeated several times and in all cases the transition remained fixed. Although it could be argued that the difference in behavior displayed above and just below the transition is due to a variation in dislocation mobility, the pre-loading experiments discussed below cast doubt on that hypothesis.
100C
800
600
a CO
£P 400 .5 T3 c
pa
200
X Fracture Stress (MPa) D Yield Stress (MPa) 0 Flow Stress (MPa)
60CT
50C:
1 "|'l I I I | I I I > | I
BDT y\
Intermediate Behavior
Yield
40CT
■ 30C:
20Cr
ifv iiiiiiiiiiiiiiiiini ■ . ■ .T A
' 1U710 715 720 725 730 735 740
200 800 1000 400 600
Temperature (°C)
Figure 2: Stress-Temperature map of the brittle-to-ductile transition.
Pre-loading experiments
The pre-loading experiments were conducted at several temperatures below 732°C. Figures 3 - 8 are a series of loading curves from experiments conducted at 686CC that are characteristic of the type of behavior observed during these tests. Figures 3, 5, and 7 are the pre-loading curves for three different samples. The maximum pre-load stress increases in the series. The resulting behavior of the
164

samples upon reloading is recorded in Figures 4, 6, and 8. The yield behavior shown in Figures 4 and 6 is the same as the yield behavior observed as the test temperature approached the BDT in the first set of experiments. Complete ductility is only observed in the sample subjected to the highest pre-load stress as shown in Figure 8. The magnitude of the load drop in this sample is similar to that observed for samples tested above 732°C without the application of a pre-load. This change in behavior with increasing pre-load may indicate that the application of a pre-load to the samples is equivalent to raising the test temperature.
incf 1''''''* w ,I''■■<'»"''•,»"i'i"<"»"i1 HI"I'l locrr—
0 0.5 1 1.5
Deflection (mm)
Figure 3: Crosshead disp. rate = 1.0 mm/min; T = 686°C
0.5 1 Deflection (mm)
1.5
Figure 4: Crosshead disp. rate = 0.1 mm/min; T = 686°C
■infBTI-TTTTTTT-fTTTTT-rri^-rTTl-TTT-rTT
4« I I I I I I I I I I I I I I I I I t I I I I I I I I I
1 nfW""1"1"'"'"'"''!''1' ''■''"i'' M ■' 111 i'i i
0 0.5 1 1.5
Deflection (mm)
Figure 5: Crosshead disp. rate = 1.0 mm/min; T = 686°C
I I I I I I I I I I I I I I I I III I I I I I I
0 0.5 1 1.5 Deflection (mm)
Figure 6: Crosshead disp. rate = 0.1 mm/min; T = 686°C
165

looa
yd I I I I I I I il I I I I I I I I. j-
Deflection (mm)
Figure 7: Crosshead disp. rate = 5.0 mm/min; T = 686°C
Deflection (mm)
Figure 8: Crosshead disp. rate = 0.1 mm/min; T = 686°C
The pre-loading reduced the BDTT by approximately 46°C. This would not be expected if the transition observed at 732°C is governed by a mechanism that is very sensitive to the velocity of the mobile dislocations. Instead we believe that the BDT results from the nucleation of a sufficient density of mobile dislocations in the sample. Because the initial dislocation density of the samples is on the order of 100- 200 lines/cm2 and the samples are not notched, it is unlikely that the dislocations responsible for the massive plasticity observed above the BDT result from conventional sources. These dislocations may be produced by a homogeneous nucleation process that results from an instability in the material. In addition, this instability may be very sensitive to preexisting dislocations in the material. This would explain the lowering of the BDT in the pre-loaded samples. This would also explain why the sample has to be pre-loaded to a certain minimum stress level before a BDT occurs upon reloading. This description of the nucleation event is but one hypothesis, additional experiments need to be conducted to examine the change in dislocation density above and below the BDT. We are also in the process of investigating the change in dislocation density during the pre-loading phase.
CONCLUSIONS
An investigation into the yield behavior of essentially dislocation-free and crack-free silicon samples has been conducted. Experiments carried out at elevated temperatures indicate that for a constant crosshead displacement rate of 0.1 mm/min, a brittle-to-ductile transition occurs at or near 732°C. Some degree of plasticity is observed prior to the transition but the level of dislocation activity is not sufficient to prevent the brittle fracture of a test specimen. Above the transition temperature complete yielding occurs, characterized by a large drop in the measured load followed by a period of flow. An investigation into the role of dislocation mobility in governing the transition was conducted by pre-loading the samples prior to determining the fracture/yield stress. It was found that pre-loading the samples lowers the BDT by at least 46°C. This would not be expected if the transition was sensitive to and governed by the velocity of the mobile dislocations. Instead, we believe that the BDT occurs when a sufficient density of mobile dislocations nucleates by some process in the material. Because the transition is very sharp and
166

reproducible, it is unlikely that this nucleation process is thermally activated. Instead, the nucleation of the dislocations may result from an instability in the material that manifests itself at a critical combination of stress and temperature. This instability may also be sensitive to the density of preexisting dislocations in the material. This would explain the lowering of the BDT with the application of a pre- load to the samples. To confirm this hypothesis, experiments need to be conducted that carefully measure the change in the dislocation density as a function of stress and temperature.
ACKNOWLEDGMENTS
This research was supported by the U.S. Air Force Office of Scientific Research grant 95-1-0143.
REFERENCES
1. P. B. Hirsch, F. R. S., S. G. Roberts, and J. Samuels, Proc. R. Soc. Lond. A421, pp. 25-53 (1989).
2. M. Brede, Acta Metall. Mater. 41, No. 1, pp. 211-228 (1993).
3. V. R. Nitzsche and K. J. Hsia, Mat. Sei. and Eng. A176, pp. 155-164 (1994).
4. G. L. Pearson, W. T. Read Jr., and W. L. Feldmann, Acta Met. 5, pp. 181-191 (1957).
5. S. S. Brenner, J. Applied Phy., 27, No. 12, pp. 1484-1491 (1956).
6. S. S. Brenner, J. Applied Phy., 28, No. 9, pp. 1023-1026 (1957).
7. J. R. Patel and A. R. Chaudhuri, J. Applied Phy., 34, No. 9, pp. 2788-2799 (1963).
167

CROSS-SECTIONAL AND PLAN-VIEW OBSERVATION OF CRACKS INTRODUCED IN Si AT THE DUCTILE-BRITTLE TRANSITION TEMPERATURE
Suprijadi* r and H.Saka* * Department of Quantum Engg, Nagoya University,Nagoya,Japan,[email protected] r Permanent address: Department of Physics, Institute of Technology Bandung, JL.Ganesha 10,
Bandung 40132,Indonesia
ABSTRACT Mode I cracks introduced in Si at the ductile-brittle transition temperature (DBTT) have
been examined extensively using transmission electron microscopy. Cross-sectional as well as plane-view specimens suitable for the observation were prepared using a focused ion beam technique. Many small dislocation loops nucleate at the fracture surface of a mode I crack during the propagation at DBTT.
INTRODUCTION
The ductile-brittle transition (DBT) in Si single crystals has gathered much attention. It is well accepted that the DBT is a result of the competition between two processes, i.e., a cleavage crack and the thermal activation of dislocation motions [1,2,3]. The emission of dislocations near the tip of a crack in Si deformed at high temperatures has been observed by several workers by transmission electron microscopy (TEM)[4,5,6,7]. In many cases a dislocation wake has been observed frequently in a variety of materials[8,9].
From the viewpoint that the DBT behaviour is considered as a result of the competition between propagtion of a cleavage crack and thermal activation of dislocations, the dislocation wake may be considered as a debris of those dislocations which have lost the competition against the propagation of a cleavage crack. Thus, it appears worthwhile to characterize the dislocation wake in detail. The present paper decribes results obtained, by means of TEM, on the nature of the dislocation wake along a crack surface introduced at the DBTT in Si.
EXPERIMENTAL PROCEDURES
A dislocation-free single crystal of Si was used. Pre-cracks were introduced by Vickers indentation with 50 g on a (001) surface of a parallelopiped crystal (3.5 mm x 11 mm x 0.6 mm) at room temperature[6,7]. Two diagonal half-penny {110} cracks were introduced (fig. 1(a)). The specimen was then deformed to 80% of the fracture stress at 873K by three-point bending in an argon atmosphere in such a way that one set of the {110} pre-cracks, say the (110) crack, was coincident to the axis of the bending, so that the (110) crack grew during the deformation (fig. 1(b)). Two types of foil specimen were prepared using a FIB technique. In one, i.e., cross-sectional specimen, the (110) crack was end-on, while in the other, i.e., plan-view specimen, one of the two broad surfaces of the foil specimen coincides with the (110) fracture surface. The specimens were examined in a Hitachi HU-1000D and a Hitachi H-1250ST microscope at an accelerating voltage of 1000 kV.
169
Mat. Res. Soc. Symp. Proc.Vol. 539 ° 1999 Materials Research Society

[0011 (110) prwrack 010) pre-«™*
[110]
[110]
Figure 1 Geometery of specimen, (a) Introduction of pre-cracks by means of Vickers indentation at room temperature, (b) Three-point bending at DBTT.
Figure 2 Cross-sectional electron micrograph of a crack in a specimen bent to 80% of the fracture stress at 873K. The micrograph is divided into (a) and (b).
170

RESULTS
Figure 2 shows a low-magnification electron micrograph of a cross-sectional specimen where an end-on crack P-C-Xi -X2 -X3 -Yi -Y2 -Y3 -Y4 -Ys -Z is observed. The crack is so long that the micrograph is divided into two parts, namely, (a) and (b). Part from P to C of this crack is a pre-crack (a half-penny crack) at room temperature. The rest of the crack, i.e., from C down to Z must have propagated during the deformation at the DBTT, i.e., 873K (hereinafter the crack C-Z will be called DBTT crack).
Many dislocations such as Di, D2 and D3 have glided out of the severely damaged region just beneath the indentation I over an area which is much wider than that where dislocations can be observed in the as-indented specimen(without further deformation at DBTT(See for example fig. 3 in [6])). Apparently there are many differences in morphology between the pre-crack P-C and the DBTT crack C-Z. First of all, the pre-crack P-C is very straight along [110], while the DBTT crack C-Z is zigzagged and deviates from the exact (110) plane. Secondly, there is no evidence of a dislocation wake along the pre-crack P-C, while a dislocation wake is clearly observed along the DBTT crack C-Z.
Figure 3 shows defect structure near Y4 at a higher magnification in the weak-beam mode. The followings are evident. 1) The fracture surface of the DBTT crack has steps at various places such as Xi, X2, X3, Yi, Y2, Y3, Y4 and Y5. The surface orientation of these steps is approximately <111>. 2) The fracture surface of the DBTT crack is decorated with many small dislocation loops. 3) Dislocation loops are emitted from the fracture surface (for example, p, q, r, s, t and v) and from the corner of a step of the fracture surface(for example, t). These dislocations are believed to be glissile dislocations. 4) In addition to the aforementioned dislocation loops many smaller dislocation loops such as those indicated by arrows in Fig.3 are observed.
Figure 4 shows a plan-view micrograph of a crack which propagated at DBTT. In this case, those crystals that had existed, before deformation at DBTT, at both sides of the pre-crack lying parallel to the foil surface were separated completely into two, and no miore fringes are observed where the pre-crack lay. This makes it rather difficult to identify the crack tip, but dislocation structure connecting d2 -d3 -d4 looks like the tip of a half-penny crack. We believe that dislocations near d2 -cb -d4 nucleated at the tip of a pre-crack. Since it is well
Figure 3 Defect structure near Y4 imaged in the weak-beam mode.
171

172

173
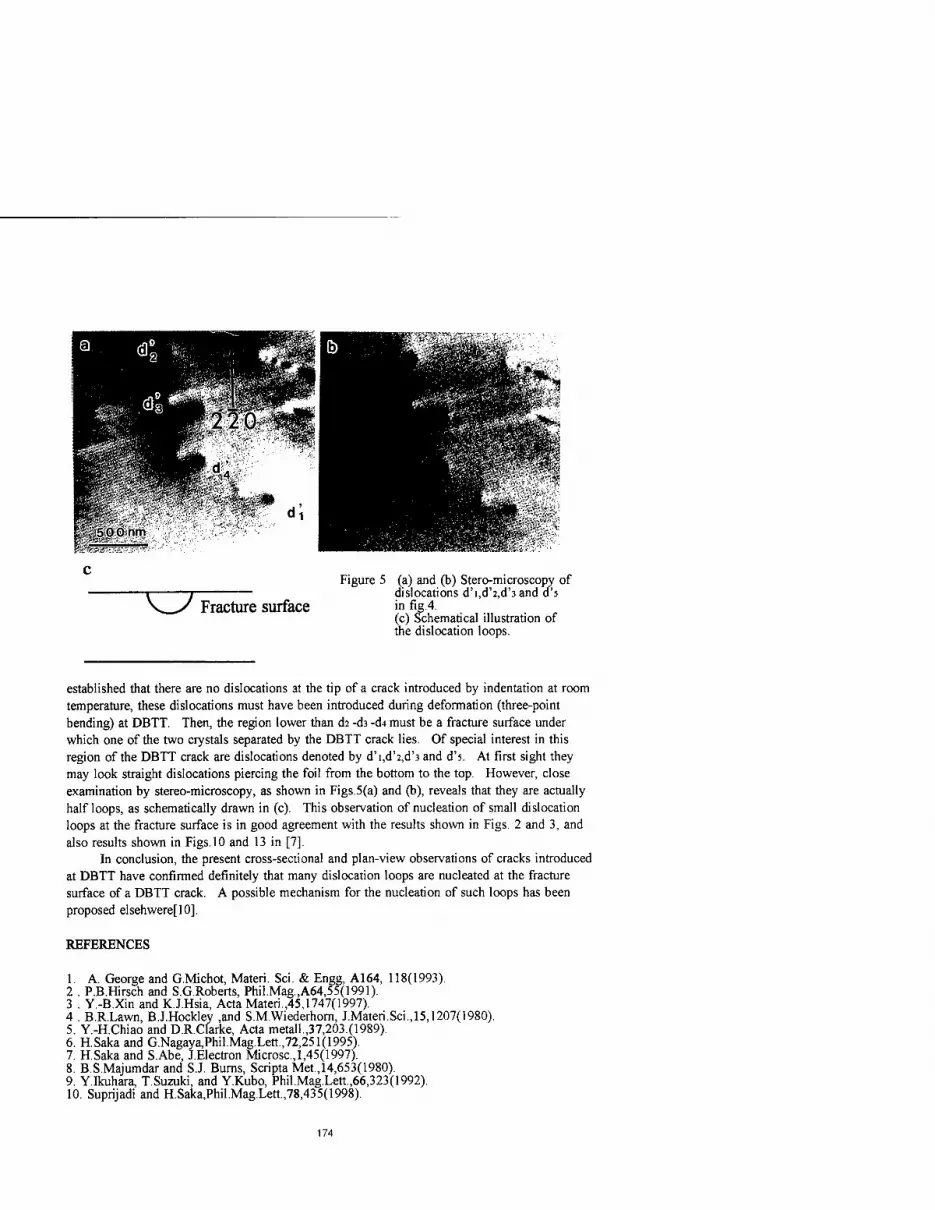
\^s Fracture surface
Figure 5 (a) and (b) Stero-microscopy of dislocations d'i,d'2,d'3and d's in fig.4. (c) Schematical illustration of the dislocation loops.
established that there are no dislocations at the tip of a crack introduced by indentation at room temperature, these dislocations must have been introduced during deformation (three-point bending) at DBTT. Then, the region lower than d2 -d3 -d4 must be a fracture surface under which one of the two crystals separated by the DBTT crack lies. Of special interest in this region of the DBTT crack are dislocations denoted by d'i,d'2,d'3 and d's. At first sight they may look straight dislocations piercing the foil from the bottom to the top. However, close examination by stereo-microscopy, as shown in Figs.5(a) and (b), reveals that they are actually half loops, as schematically drawn in (c). This observation of nucleation of small dislocation loops at the fracture surface is in good agreement with the results shown in Figs. 2 and 3, and also results shown in Figs. 10 and 13 in [7].
In conclusion, the present cross-sectional and plan-view observations of cracks introduced at DBTT have confirmed definitely that many dislocation loops are nucleated at the fracture surface of a DBTT crack. A possible mechanism for the nucleation of such loops has been proposed elsehwere[10],
REFERENCES
1. A. George and G.Michot, Materi. Sei. & Engg, A164, 118(1993) 2 . P.B.Hirsch and S.G.Roberts, Phil.Mag.,A64,55(1991). 3 . Y.-B.Xin and K.J.Hsia, Acta Materi.,45,1747(1997). 4 . B.R.Lawn, B.J.Hockley ,and S.M.Wiederhorn, J.Materi.Sei.,15,1207(1980). 5. Y.-H.Chiao and D.R.Clarke, Acta metall,37,203.(1989). 6. HSaka and G.Nagaya,Phil.Mag.Lett.,72,251(1995). 7. HSaka and S.Abe, J.Electron Microsc, 1,45(1997). 8. B.S.Majumdar and S.J. Burns, Scripta Met,14,653(1980). 9. Y.Ikuhara, T.Suzuki, and Y.Kubo, Phil.Mag.Lett.,66,323(1992). 10. Suprijadi and H.Saka,Phil.Mag.Lett.,78,435(1998).
174

UNSTABLE STACKING FAULT FREE ENERGIES IN SILICON THROUGH EMPIRICAL MODELING
M. DE KONINGW, A. ANTONELLI«2), MARTIN Z. BAZANT'3', EFTHIMIOS KAXIRASW, and J.F. JUSTO'5' '^Department of Nuclear Engineering, Massachusetts Institute of Technology,Cambridge, Massachusetts, 02139 P'lnstituto de Fisica Gleb Wataghin, Universidade Estadual de Campinas,Unicamp, 13083- 970 Campinas, Säo Paulo, Brazil ^'Department of Mathematics, Massachusetts Institute of Technology, Cambridge, Mas- sachusetts, 02139 ^'Department of Physics and Division of Engineering and Applied Sciences, Harvard Uni- versity, Cambridge, Massachusetts 02138 (5)Instituto de Fisica da Universidade de Säo Paulo, CP 66318, CEP 05315-970 Säo Paulo, Säo Paulo, Brazil
ABSTRACT
The temperature dependence of unstable stacking fault free energies on glide and shuffle {111} planes in silicon is investigated using a finite temperature molecular dynamics ap- proach which includes a full treatment of anharmonic vibrational effects. The results are compared to earlier zero temperature ab initio calculations in which finite temperature ef- fects were estimated using a harmonic approximation to transition state theory (TST). The unstable stacking free energies are interpreted within the framework of Rice's dislocation nucleation criterium to characterize a possible change from shuffle to glide plane dominance in the context of dislocation nucleation processes at a sharp crack tip. Such a change may be related to the abrupt brittle-ductile transition observed in silicon.
INTRODUCTION
The understanding of the microscopic properties of extended defects and their relation to the macroscopic mechanical behavior of materials is an issue of fundamental interest to materials science and technology. An interesting example of macroscopic mechanical behavior which is believed to have a direct relation with the properties of dislocations on the microscopic level is the brittle-ductile transition (BDT). This transition, which is characterized by a change in which a brittle, easily fractured material transforms into a tough substance that can easily undergo plastic deformation, is particularly remarkable in silicon. For this material the transition is observed to occur in a narrow temperature interval of a few degrees at a critical temperature near 873 K [1, 2].
On the microscopic level the intrinsic brittleness or ductility of a material is closely related to the behavior of a sharp crack tip under external loading. While brittleness is typically associated with easy crack propagation, ductility is characterized by crack tip blunting through dislocation emission. Although a detailed understanding of the complex atomic mechanisms involved in dislocation nucleation and motion is necessary for a satis- factory quantitative description, the characteristic abruptness of the BDT in silicon may
175
Mat. Res. Soc. Symp. Proc. Vol. 539 ° 1999 Materials Research Society

be related to certain general geometrical features of dislocations in the diamond lattice structure.
The diamond lattice structure consists of two interpenetrating fee lattices giving rise to two distinct sets of close-packed {111} planes: the so-called shuffle and glide planes [3]. While dislocations nucleated on the widely spaced shuffle planes are relatively narrow and experience a relatively high resistance to motion (Peierls stress) [3], dislocations on the narrowly spaced glide planes tend to split into two partial dislocations which lowers the Peierls stresses and enhances mobility. In this sense the BDT in silicon may be related to a sudden change of dominance of one set over the other with respect to dislocation nucleation at a sharp crack tip.
Within this picture, the recent theoretical work by Rice and collaborators [4-6] is par- ticularly interesting. They developed a model for dislocation nucleation at a crack tip based on a continuum elasticity approach and the Peierls stress concept. This study has led to the identification of a simple solid state parameter measuring the resistance to dislocation nucleation at a crack tip (which we will refer to as the dislocation nucleation criterion): the unstable stacking fault (USF) energy 7„s. The USF energy is defined as the lowest barrier that needs to be crossed when one half of a perfect crystal slips, on the dislocation nucle- ation plane of interest, relative to the other half, completing a total displacement equal to one lattice repeat vector.
Kaxiras and Duesbery and Juan and Kaxiras [7, 8] used ab initio total energy calcula- tions based on a local density approximation scheme to density functional theory (DFT- LDA) to calculate accurate zero temperature values for 7„s on the glide and shuffle sets in silicon. The effects of finite temperature and pressure conditions were estimated using a harmonic approximation scheme to transition state theory (TST)[9]. While the results of this work illustrate the idea of an abrupt change in dominance of one set over the other with respect to dislocation nucleation, finite temperature effects related to the motion of the atoms on either side of the slip plane were neglected. In this work we include such effects using finite temperature molecular dynamics (MD) techniques to calculate the USF free energies on the shuffle and glide sets in silicon as a function of temperature. The results are compared to the earlier DFT-LDA work.
COMPUTATIONAL METHOD
The basis for our MD simulations is provided by the new environment-dependent in- teratomic potential (EDIP) for silicon [10, 11]. As opposed to other empirical models, EDIP captures with adequate realism several important stable, metastable, and saddle point configurations, including the energetics of dislocation cores. The free energies have been calculated using the adiabatic switching MD method [12, 13] which is based on the simulation of thermodynamically reversible processes and enables accurate and efficient determination of thermal properties including all anharmonic effects.
In order to represent the structure of the USF configurations on the shuffle and glide sets in the simulations we utilized cells with edges parallel to the [111], [101], and [121] crystallographic directions. The slip displacement vectors associated with the glide and shuffle USF configurations (^[121] a0 and ±[10l]a0 respectively[7]) are implemented by addition to the standard periodic boundary condition repeat vector in the [111] direction.
During the MD simulations the motion of the atoms immediately adjacent to the slip plane was restricted to the [111] direction (perpendicular to the slip plane) to prevent re-
176

Table 1: Static (0 K) unstable stacking energy jus for the {111} shuffle and glide set in silicon at various levels of relaxation. All values are in Jm-2. The DFT results were taken from Ref. 8.
Shuffle set Glide set No relaxation
DFT-LDA 1.84 2.51 EDIP 1.98 3.28
Atomic relaxation DFT-LDA 1.81 2.02
EDIP 1.28 1.89 Atomic+volume relaxation
DFT-LDA 1.67 1.91 EDIP 1.04 1.86
laxation of shear stresses and maintain the system on the saddle point configuration. The size of the cells was chosen as to minimize the interaction between the periodic images of the USF configurations. For this purpose we utilized cells containing 648 atoms divided in 36 (111) planes.
RESULTS
In order to study the volume relaxation perpendicular to the slip planes, the jU3 were evaluated at several volumes below and above the ideal volume of bulk silicon at zero temperature. For the glide set, the minimum value of yus was found for a perpendicular expansion Azgiide = 0.35 A, while the shuffle set USF configuration showed a contraction &-zshuffie = —0.22 A. Table 1 shows several 0 K jus values characterized by different levels of relaxation, as obtained with EDIP and DFT-LDA[8]. EDIP successfully captures the qualitative trends in the effects of relaxation on jus as obtained with DFT-LDA. Both approaches predict the influence of atomic relaxation to be larger on the glide set, and the volume relaxation to be more pronounced on the shuffle set. However, despite this qualitative agreement, there are significant quantitative discrepancies between EDIP and DFT-LDA for the shuffle set. While the differences between EDIP and DFT-LDA on the glide set are fairly small when volume and/or atomic relaxation are allowed, they are much larger for the shuffle set. The consequences of these discrepancies will be discussed further below.
Figure 1 shows the Helmholtz free energies of the shuffle and glide USF configurations as a function of temperature. Although the free energy of the USF glide configuration is higher over the entire temperature range, the difference between both curves decreases with increasing temperature due to the higher entropy of the glide USF configuration. At this point we interpret these results within the framework of Rice's theory on dislocation nucleation. So far, the calculations have ignored the possible influence of finite pressure conditions. These effects should be taken into account in order to obtain a more realistic picture of the energetics involved in the dislocation nucleation criterion. To this end the
177

2.0
1.9 ^ E
1.8
O c u
1.7
1.6
c 1.5
o B *S1
1.4
£ 1.3 •s 1.2
1.1
1.0
-i—'—i—'—i—'—i—'—i—>—i—'—i—■—r
• Glide * Shuffle
_i i i i i i i i i i i_
0 200 400 600 800 1000 1200 1400 1600 1800
T(K)
Figure 1: USF Helmholtz free energies as a function of temperature, for the glide and shuffle sets in silicon at zero pressure.
introduction of the Gibbs free energy per unit area is appropriate:
G{P, T) = F(T) + PAz. (1)
Here F(T) is the Helmholtz free energy per unit area and Az represents the volume relaxation perpendicular to the slip plane under consideration. According to the dislocation nucleation criterion, the condition that the preferred slip plane changes from shuffle to glide is given by Gshuffie(P,T) = Ggnde(P,T), which describes the (P,T) coexistence curve separating the two dislocation nucleation regimes in the phase diagram.
Before embarking on the construction of the EDIP phase diagram, the question related to the quantitative 7US discrepancy mentioned earlier should be addressed. According to Table 1, EDIP overestimates the difference between the glide and shuffle values of ju, at zero temperature (including atomic and volume relaxation) by more than a factor three. Since this discrepancy is reflected in the finite temperature values of 7„s, it strongly affects the free energies and distorts the corresponding EDIP phase diagram. In order to eliminate this effect, the EDIP Helmholtz free energy differences were corrected in such a manner that the zero temperature value equals the corresponding DFT-LDA value. This correction is most conveniently accomplished by means of a simple rigid energy shift imposed for all temperatures. Such a shift only modifies the static energy scales while it leaves unaltered the vibrational entropic properties.
Figure 2 shows a comparison between the corrected EDIP phase diagram (continuous line) and the DFT-LDA results[8] (dotted line). For (P,T) values below (above) these curves, the glide (shuffle) set USF configuration has lower free energy. Both coexistence
178

20 SHUFFLE
—'—i—i—p—■—i—
- corrected EDIP DFT-LDA
- Exp. brittle fracture stress
GLIDE
400 600 800 1000 1200 1400 1600
T(K)
Figure 2: Phase diagram: Coexistence curves separating the preferable nucleation of dis- locations on shuffle planes versus glide set. The full line represents the results obtained with the EDIP potential after correction for the overestimated difference in jU3. The dot- ted line represents the DFT-LDA calculations (Ref. 8). The dashed line represents the experimental brittle fracture stress.
curves agree fairly well, with derivatives dP/dT of the same order of magnitude over the entire temperature range. Furthermore, the curves intersect near 1100 K with nearly equal slopes. The most significant difference between both curves is the inflection point which appears in the EDIP phase diagram and originates from the specific behavior of the glide-shuffle entropy difference as a function of temperature (negative first derivative and positive second derivative). However, despite this discrepancy, both phase diagrams show no pronounced differences. This suggests that the exact treatment of temperature dependent vibrational effects in the present simulations does not significantly alter the qualitative picture provided by the approximate DFT-LDA calculations.
DISCUSSION
The phase diagrams in Figure 2 illustrate the basic idea of an abrupt transition from shuffle to glide set dominance under specific temperature and pressure conditions. Such a transition may be related to the sharp BDT transition observed in silicon. Although dislocations nucleate more easily on shuffle planes, the splitted Shockley partials on the glide set are more mobile. In this sense, the transition from brittle to ductile behavior might be directly related to the abrupt transition from shuffle to glide set dominance. Within such an interpretation, the EDIP and DFT-LDA phase diagrams might indicate a transition temperature at the intersection points of the coexistence curves with the experimental
179

brittle fracture stress. In this manner both EDIP and DFT-LDA would indicate a critical temperature near 1100 K which is not unreasonably far from the experimental value of 873 K. This agreement and the qualitative similarity between both phase diagrams, suggests that temperature dependent vibrational effects included in the present simulations do not significantly alter the qualitative picture provided by the earlier DFT-LDA calculations.
However, for several reasons these results should not be taken literally. First, impor- tant factors such as electronic entropy contributions, surface free energies and dislocation core reconstruction effects have been neglected in the present approach. Furthermore, the microscopic mechanisms involved in the BDT phenomenon may involve subtleties which are not included in the approach adopted in this work. For instance, dislocation mobil- ity mechanisms mediated by kink formation and motion might play an important role in this issue. Therefore, a direct quantitative interpretation of the results in terms of the dislocation nucleation criterion would represent an oversimplification. Nevertheless, we feel that the qualitative picture provided by the present approach can be useful in the further development of quantitative BDT models in silicon.
ACKNOWLEDGEMENTS
M.K. and A.A. acknowledge financial support from FAPESP, CAPES, FAEP, and CNPq, and J.F.J. acknowledges support from FAPESP, all of them Brazilian funding agen- cies. M.B. and E.K. acknowledge support by the Harvard MRSEC and J.F.J. acknowledges support by the MIT MRSEC, both of which are funded through NSF.
REFERENCES
[1] J. Samuels and S.G. Roberts, Proc. R. Soc. London A 421, 1 (1989).
[2] P.B. Hirsch, S.G. Roberts and J. Samuels, Proc. R. Soc. London A 421, 25 (1989).
[3] J.P. Hirth and J. Lothe, Theory of dislocations (Wiley, New York, 1982).
[4] J.R. Rice, J. Mech. Phys. Solids 40, 239 (1992).
[5] J.R. Rice and G.E. Beltz, J. Mech. Phys. Solids 42, 333 (1994).
[6] Y. Sun, G.E. Beltz, Mater. Sei. Eng. A170, 67 (1993).
[7] E. Kaxiras and M.S. Ducsbery, Phys. Rev. Lett. 70, 3752 (1993).
[8] Y-M Juan and E. Kaxiras, Phil. Mag. A 74, 1367 (1996).
[9] G.H. Vineyard, J. Phys. Chem. Solids 3 121 (1957).
[10] M. Z. Bazant, E. Kaxiras and J.F. Justo, Phys. Rev. B 56, 8542 (1997).
[11] J.F. Justo, M. Z. Bazant, E. Kaxiras, V. Bulatov and S. Yip, Phys. Rev. B 58, 2539 (1998).
[12] M. de Koning and A. Antonelli, Phys. Rev. E 53, 465 (1996).
[13] M. de Koning and A. Antonelli, Phys. Rev. B 55, 735 (1997).
180

Dynamic Crack Propagation in Single-Crystalline Silicon T. Cramerf*), A. Wanner (**), P. Gumbsch (*) (*) Max-Planck-Institut für Metallforschung, Seestr. 92, 70174 Stuttgart, Germany (**) Institut für Metallkunde, Univ. Stuttgart, Seestr. 71, 70174 Stuttgart, Germany
Abstract
Tensile tests on notched plates of single-crystalline silicon were carried out at high overloads. Cracks were forced to propagate on {110} planes in a < 110 > direction. The dynamics of the fracture process was measured using the potential drop technique and correlated with the fracture surface morphology. Crack propagation velocity did not exceed a terminal velocity of vr= 3800 m/s, which corresponds to 83% of the Rayleigh wave velocity vR. Specimens fractured at low stresses exhibited crystallographic cleavage whereas a transition from mirror-like smooth regions to rougher hackle zones was observed in case of the specimens fractured at high stresses. Inspection of the mirror zone at high magnification revealed a deviation of the {110} plane onto {111} crystallographic facets.
Introduction
Continuum-mechanical analysis of the dynamic fracture of a brittle solid shows that a crack extends on a straight crack path and accelerates to a limiting crack velocity, which is expected to be the Rayleigh wave velocity vR [1]. However, recent experiments on amorphous materials have revealed that cracks propagate only at about 0.4-0.6 of the Rayleigh wave velocity vR [2,3]. Moreover, these investigations have shown that an initially smooth and mirror-like fracture surface evolves into a rough, hackled region if the crack exceeds a critical crack velocity vr [2-4]. In contrast to the fracture of amorphous solids, the fracture process in a crystal is believed to be governed by cleavage along preferred crystallographic planes, formation of cleavage steps, or the emission of dislocations from the crack tip. Molecular dynamics (MD) simulations of dynamically running cracks have shown that the lower than expected terminal velocity is due to the non-linearity of the atomic interaction [5]. A significantly higher crack velocity of about 0.9 vR has been found in an MD simulation where the crack was forced in a particularly "stiff direction [6], The dynamics of fast fracture in brittle single-crystalline materials has so far been addressed experimentally only in very few studies. The terminal crack velocity in LiF has been reported to be less than 0.5 vR [7], whereas a considerably higher terminal velocity has been observed in tungsten (0.8 v/,) [8]. The terminal crack velocities in sapphire, diamond and tungsten were found to be roughly in the range between 0.7 and 0.85 vR [9]. Preliminary experiments on silicon single crystals gave crack velocities of 0.83 vR [10,11], These observations indicate that cracks can propagate faster in brittle crystals than in brittle amorphous materials. To address these issues, fracture experiments were carried out on single-crystalline silicon plates (wafers) in the present study. The crack length was measured as a function of time using the potential drop technique. Furthermore, the fracture surface morphology was analyzed quantitatively and correlated with the dynamics of the crack propagation.
Experimental
The specimens used in the fracture experiments were manufactured from single-crystalline boron- doped silicon wafers (from SILCHEM, Freiberg, Germany) with a <100> surface normal and a
181
Mat. Res. Soc. Symp. Proc. Vol. 539 ° 1999 Materials Research Society

diameter of 200 mm. These specimens had a rectangular shape with a horizontal dimension of L = 100 mm (parallel to the crack propagation direction or "JC" direction), a vertical dimension of H= 150 mm (parallel to the direction of the applied stress or "y" direction) and a thickness of 750 |im. The crystallographic orientation was such that both the direction of uniaxial tensile loading and the direction of crack propagation were of the <110> type. This orientation activates the (110)[110] cleavage system which is the easiest cleavage system in silicon and in which nearly perfectly flat fracture surfaces are produced [12]. The Rayleigh wave velocity for a surface wave traveling along a (110) plane in [110]direction was calculated from the elastic constants to be v„ = 4480 m/s [13]. Crack propagation was initiated at a notch at one side of the sample. The far-field stress at which fracture occurred changed from specimen to specimen because of variations in root radius and length of the notch. Fracture stresses in the range from 4.7 to 15.5 MPa were obtained in this way. The corresponding energy release rates are in the range of 11 to 106 J/m2, which is about 4 to 35 times the Griffith energy G0= 3 J/m2 [14]. Using FEM-calculations we could ensure that the energy release rate is almost constant for crack lengths between 0.4L and £[11]. Stress was applied via two beams of steel with a slit in which the specimen was glued at the top and bottom (Fig. 1). The grips were mounted in a screw driven tensile machine by two cardanic joints to produce a homogeneous stress field in the sample. The specimen was loaded to fracture at constant crosshead velocity. During the test the load was measured continuously by a load cell and digitized at a sampling rate of 10 Hz.
chromium film: 100 nm
4 channel storage _t oscilloscope
Fig. 1: Schematic diagram of the crack velocity measurement technique and the fixture used for the tensile tests on the rectangular, notched plates. The plates were glued into beams of steel provided with a slit. The crack velocity is measured via resistance change of a thin chromium film on one side of the sample.
The crack tip position /(f) was monitored continuously as a function of time using the potential drop technique. This technique is based on measuring the electric resistance of a thin layer of a brittle conductor (100 nm thick chromium film) sputter deposited on one side of the specimen (Fig. 1). The layer is well bonded to the specimen and fractures at the same time. The resistance of the film is directly related to the crack length. Resistance measurements with a high time resolution were accomplished using a Wheatstone bridge. The output signal of the bridge Us was monitored by a 4-channel-storage-oscilloscope (Tektronix TDS 420 B) at a sampling rate of 50 MHz and an amplitude resolution of 10 bit (high resolution mode). The velocity measurement was calibrated in-situ with a set of conductor lines, which were deposited on the back face of the specimen. This method is described in detail in Ref. [11].
182

Results and discussion
Correlation of crack velocity and fracture surface morphology
Fig. 2 shows the crack velocities as a function of the crack length obtained at two different far- field fracture stresses. The curves are smoothened to reduce fluctuations arising from bit-noise. In both experiments the crack velocity first increases and then stays at an approximately constant level. This level correlates with the far-field fracture stress and the corresponding energy release rate G.
«lMfmN*i*1k
Fracture Stress: G = 4.7 MPa
1 2 3
Crack length [cm]
Fracture Stress: a = 7.4 MPa
1 2 3
Crack length [cm]
Fig. 2: Crack velocity as a function of the crack length for two specimens which were fractured on a (110)[110]
cleavage system. After an initial acceleration period the crack propagates at a steady velocity which depends on the applied far-field fracture stress.
In Fig. 3 the average crack velocity is plotted as a function of the far-field stress at fracture and the energy release rate for all experiments. The average velocity was calculated from the duration of the fracture process and the length of the crack path L-lc, where lc is the length of the initial notch.
G [J/m2] 20 40 60 80 100
40001 1 1 1 1 1-
3500
3000
2500
°0
Regime A mirror
Regime B hackle
= 0.83v, R
14 16 6 8 10 12 Fracture stress o [MPa]
Fig.3: Average crack velocity for the (110)[110] crack system as a function of the far-field stress at the onset of
fracture. An increase of the velocity at lower stresses is followed by a regime where the velocity curve saturates. The generated fracture surface is smooth and mirror-like over the whole crack path (open circles) for the lower stresses. At high stresses a transition from mirror to hackle zones is observed along the crack propagation direction (solid circles).
At low stresses (regime A) the velocity increases with increasing stress and the corresponding morphology of the fracture surface is smooth and mirror-like (open circles in Fig. 3). At higher
183

Stresses (regime B) the velocity reaches a saturation level. This is accompanied by a transition from the mirror-like to rougher hackle zones on the fracture surface (solid circles in Fig. 3). The maximum value of the crack velocity was found to be v, = 3800 m/s. which is 0.83 of the Rayleigh wave velocity vR. This value is denoted as the terminal velocity. As mentioned above, we found a clear correlation between the onset of hackle regions and the far- field stress at the onset of fracture. The transition from mirror to hackle zones is schematically shown in Fig. 4 (left). The hackle and mirror zones can very clearly be distinguished. The transition between the zones is rather abrupt. The hackle region appears to start from the specimen sides (sec a and /; in Fig. 4, left) and extends gradually into the interior. Therefore, there exists an extended transition region where mirror and hackle zones coexist.
G [J/m2] 20 40 60 80 100
4000
[110]
[001] &
_b^
Mirror a
x-position
4 6 8 10 12
Fracture Stress [MPa] Fig. 4: Left: Schematic diagram showing the fracture features obtained from the specimens tested at high fracture stresses. The hackle region initiates from the specimen sides and extends to the center. Right: Variation of the .im- positions a (open squares) and /) (solid squares) as a function of the applied fracture stress. On the 100 mm long specimens no hackle occurred below a fracture stress of 9 MPa. Also included are the crack velocities (gray circles).
In Fig. 4 (right) the x-positions of the onset of the hackle zone a and b (open and solid squares) are plotted as a function of the fracture stress. In addition the corresponding average velocities are shown in the same diagram. For fracture stresses ranging from 0-9 MPa no hackle zone appeared on the 100 mm long specimens. At fracture stresses between 9-12 MPa the onset position decreases with increasing fracture stress. At high fracture stresses (12 to 15 MPa) the onset position is almost constant. This indicates that the dynamic fracture process is governed by two different mechanisms in the mirror and hackle zones. In the case of low fracture stresses and energy release rates an increasing energy flux into the crack tip results in an increase of the average crack velocity. If the energy release rate exceeds about 50 J/m2 no further energy is transformed into kinetic energy, which leads to the saturation of the crack velocity. Further increasing energy flux into the tip is then dissipated by the formation of additional free surface, resulting in the formation of the rougher hackle zones. The terminal crack velocity of vr= 3800 m/s (0.83 \R) for the (110)[110] cleavage system is significant higher than the terminal velocity reported for amorphous materials (0.4 - 0.6 vÄ) [2,3]. Another major difference in the dynamic fracture behavior of amorphous materials and the single- crystalline silicon is the change in the roughening of the fracture surface with the crack velocity. The present results on single-crystalline silicon show an abrupt onset of significant roughening in the formation of hackle zones when the crack velocities saturate at the terminal velocity. This is in
184

contrast to the observations on amorphous materials, where an increase in the crack velocity is accompanied by a continuous increase in surface roughness [2,3] and/or an increase in the length of micro-branches [4]. Such a disparity could be attributed to the long range atomic order of the single crystals. Further investigations using different crystallographic orientations are in progress. They are aimed at a correlation of the crystallography and the characteristics of dynamic crack propagation.
Micro-morphology of mirror and hackle zones
The fracture surface was studied using atomic-force microscopy (AFM) to characterize the mirror zone on smaller length scales. Profiles of the fracture surface topography were taken in the mirror zones of several specimens and at different x-positions along the crack path. Specimens fractured at the lowest fracture stresses exhibit a featureless and flat fracture surface on length scales larger than 5 nm. Specimens which were fractured at the highest stresses reveal significant features in the mirror zone as illustrated in Fig. 5 (left). These hills and valleys are extended in the direction of crack propagation. The wave length and height of the features slightly increases with crack propagation distance. In order to characterize these structures further, cross-sections of the fracture surface were prepared by a focused ion-beam microscope (FIB). An FIB cut surface tilted by 55° is shown in Fig. 5 (right). At this particular location on the fracture surface the features are unusually large. The FIB image clearly reveals that the surface structures are roof-like and correspond to (111) crystallographic facets.
5000 nm
Onm
2500 nm
Onm
5000 nm
Fig. 5: Left: AFM image of the mirror region of a specimen fractured a high fracture far-field stress. Significant surface features are apparent with a large extension along the crack propagation direction. Right: FIB cut cross- section of the mirror-zone tilted by 55° obtained in a region of particularly high features. They correspond to (111) crystallographic facets. Crack propagation was from top to bottom of the images.
Since the surface features exhibit only little morphological variation along the crack propagation direction, it can be assumed that the front of the propagating crack was sharp and dynamically stable. At low fracture stresses the crack front seems to travel along the (110) cleavage plane and to produce an almost perfect fracture surface. At the highest stresses the crack front deviates from the initial (110) cleavage plane onto (111) crystallographic facets. Further investigations are needed to study the conditions under which such a deviation occurs. The hackle regions were examined in detail using laser scanning microscopy (LSM, Fig. 6). These observations reveal that the fracture surface does not show any crystallographic characteristics on length scales larger than 1 um. The fracture surface is characterized by curved and wavy structures.
185

Further quantitative measurements of the topography of these regions using mechanical and optical profilometers show that the depth of the hackles vary in the range of 10-100 um. This is about three orders of magnitude more than the structure size typically observed in the mirror regions.
Fig. 6: LSM image of the hackle zone. Wavy structures arc apparent, crystallography does not play any significant role in this region.
Conclusions
The dynamics of crack propagation in silicon along a [110] direction on a (110) plane was investigated experimentally. The terminal crack velocity was determined to be vr = 3800 m/s, which is 0.83 of the Rayleigh wave velocity vK. This is a significantly higher relative velocity than found in amorphous materials, for which the terminal velocity never exceeds 0.6 y>. The average crack velocity as well as the onset position of the hackle zone on the fracture surface could be correlated with the far-field stress at the onset of fracture. At low fracture stresses the crack front propagates along the (110) plane as intended by the loading geometry. A deviation from the initial (110) cleavage plane onto (111) crystallographic facets occurs at higher stresses.
References
[I] L.B. Freund, Dynamic Fracture Mechanics (Cambridge University Press, New York, 1990) [2] B. Cotterell, Appl. Mat. Res. 4, 227 (1965) [3] J. Fineberg, M. Marder, H.L. Swinney, Phys. Rev. Lett.67(4), 457 (1991) [4] E. Sharon, S.P. Gross, J. Fineberg, Phys. Rev. Lett. 74 (25), 5096 (1995) [5] P. Gumbsch, Z. Metallkd.87, 341 (1996) [6] F.F. Abraham, D. Brodbeck, W.E. Rudge, X. Xu. J. Mech. Phys. Solids 45(9), 1595 (1997) [7] J.J. Gilman, C. Knudsen, W.P. Walsh, J. Appl. Phys.29(4), 601 (1958) [8] D. Hull, P. Beardmore, Int. J. Fract. Mech. 2,468 (1966) [9] J. E. Field, Contemp. Phys. 12(1), 1 (1971). [10] T. Cramer, A. Wanner, P. Gumbsch, Phys. stat. sol. (a), 164, R5 (1997) [II] T. Cramer, P. Gumbsch, A. Wanner, Dynamic Crack Velocity Measurements in Single
Crystalline Silicon, edited by W. Muster, J. Zieps. R. Link (Proc.Werkstoffwoche'98 10. München, MATINFO, 1998)
[12] G. Michot, (private communication) [13] A.N. Darinskii, Wave Motion 25, 35 (1996) [14] J.C.H. Spence, Y.M. Huang, O. Sankey, Act. Met. Mat. 41, 2815 (1993)

Part V
Fractals, Scaling, and Heterogeneous Media

CRACKS IN NANO-CERAMIC THIN LAYERS PRODUCED BY LASER TREATMENTS
J.Th.M. DE HOSSON AND D.H.J. TEEUW Department of Applied Physics, Materials Science Center, Netherlands Institute for Metals Research, University of Groningen, Nijenborgh 4,9747 AG, Groningen, the Netherlands
ABSTRACT
Sol-gel derived thin nano-ceramic layers of Ti02 and A1203 are studied using scanning electron microscopy to reveal the microstructure and morphologies of the layers. The low-voltage scanning electron microscope with a field emission gun is equipped with an especially designed lens, where the specimen is placed at the location where the magnetic field is the largest. In such a way a maximum resolving power could be attained of 1.5 ran at 3kV accelerating voltage. The melt-spun layers were treated differently afterwards, i.e. by furnace and by laser curing. These heat treatments appeared to dictate the final morphologies of the layers to a large extent. Grain growth is observed for the furnace as well as the laser cured layers. The activation energy for grain growth of these layers is determined. Homogeneous dense layers may be obtained if the parameters in the curing process are selected adequately. If the parameters are chosen incorrectly, severely debonded layers may be obtained. Pre-heating the layers resulted in less blister formation. The mechanisms which may cause the layers to fail were examined in more detail.
INTRODUCTION
The sol-gel method allows ceramic films to be made with almost any composition and degree of porosity. In our work the sol-gel concept is combined the laser treatment of surfaces so as to obtain ceramic coatings in an efficient way[l-5]. The research presented in this paper focuses on the various crack patterns that appear after densification of sol gel derived thin films by laser radiation and by furnace treatments. The coating liquids investigated are mainly Si02 A1203, Ti02 and a minor part is constituted by Zr02 films. The sol-gel coatings are deposited on the substrate, which may exist for example of monocrystalline silicon, polycrystalline alumina or quartz. Deposition may take place by means of spin or dip coating [6-8] . After spinning and evaporation, the layers are densified in a furnace or laser treatment. During furnace densification, the sample is placed in a furnace and cured in air at temperature T for a time t. The densification of sol-gel layers takes place by mass transport from particles to the interconnecting points between these particles, hereby reducing total porosity. The mass transport may take place through diffusion processes or viscous flow. The driving force results from minimization of the surface energy. In the examination of the morphology a scanning electron microscope (SEM) is commonly used. However in this work a very special lens system is introduced in the high resolution SEM (HRSEM) the reason of which some attention is paid to its operating conditions. If the energy of the primary electrons of the SEM is high enough, they produce electrons, excited from the conduction band, which can escape from the surface. These electrons, also called secondary electrons, are low energy electrons. Due to the low energy, they have short mean free paths, of the order of nanometers. Therefore, only secondary electrons coming from the point of incidence of the primary beam can be detected by the detector, making these secondary electrons of importance for topographical studies. The lateral resolution, using secondary electrons, of the scanning electron microscope is of the order of nanometers. Primary electrons which enter the specimen are scattered elastically or inelastically by the atoms near the surface layer. The primary electrons current is approximately 10"s to 10"7A. The penetration depth of the high energy electrons will cause the electrons to be trapped in the
189
Mat. Res. Soc. Symp. Proc. Vol. 539 ° 1999 Materials Research Society

material. When studying conducting materials, the electrons will be transported away from the point of incidence. If the specimen is a non-conducting material, the excess electrons will cause charging of the surface. The electrostatic charge on the surface deflects the incoming electrons, giving rise to distortion of the image. In order to reduce surface charging effects, a conducting layer of metal, with typical thicknesses 5-10nm, can be sputtered onto the surface. This layer will transport the excess electrons, reducing the negative charging effects. A negative effect of the sputtered layers is that it may diminish the resolving power of the microscope, since topographical information is no longer gained from the surface of the material, but from the sputtered layer. Another way to minimize charging effects is to balance the incoming and emitted electron current [9-10].
EXPERIMENTS
The microscopes used to produce the micrographs in this section are a Philips XL30-FEG SEM and a Philips XL30S-FEG SEM. Both microscopes produce primary electrons using a field emission gun. The latter is equipped with an especially designed lens, where the specimen is placed at the location where the magnetic field is the largest.
Ti02 thin films
This class of thin films examined using HRSEM consists of similar substrate/layer systems. The substrate is fused silica. The layer is made from a tetraethylorthotitanate precursor, Ti(OC2H5)4
or TEOTi. This precursor will result in a layer of Ti02 after spinning [11]. The expected thickness of the films is of the order of -200-500 nm. After spinning, the specimens are dried to remove excess liquids, left after spinning, from the layers. A set of specimens is cured using a Nabertherm tube-furnace. The specimens are directly cured in air at temperatures ranging from 300°C to 1200°C. An alternative way to densify as-spun thin films, is to cure them in a laser treatment. This process consists of radiating the thin films with a 80W CW-CO., laser (RS80), using a wavelength of 10.6 urn. Since the area of interest of this class of samples is the thin top layer, the operating settings of the microscope are chosen in such a way, that the secondary electron image is mainly generated by the layer. In figure 1 a micrograph is depicted of a TEOTi sample which is heat treated in the furnace at 300°C for 30 minutes. The figure depicts the morphology of the thin layer. There are no grains or particles distinguishable, although overall some sort of texture may be observed, indicating nanopores or very small grains. The transition from amorphous films to the crystalline anatase phase depends on the synthesis conditions of the sol and depending on those conditions crystallization starts at temperatures in the order of ~300°C [12,13]. Cracking of the layer, as depicted in figure lb, is observed on a global scale. The cracks are sub-micron sized, and are assumed to be formed in the drying process already.A micrograph of a sample furnace treated at 700°C is depicted in figure 2. This sample is similar to the one depicted in figure 1 for the 300°C sample, the only difference is the heat treatment it has experienced. The initial film properties, film thickness, sub-micron cracks, grain and pore size distributions are however similar. The sample is heat treated at 700°C for 30 minutes. From the micrograph it is apparent that an evolution in grain size has taken place. In figure 1 no separate grains are distinguishable whereas in figure 2 grains are clearly visible. A second remarkable feature is that the observed sub-micron cracks in the 300°C heat treated sample are less frequently observed in the 700CC heat treated sample. Increasing the curing temperature for the samples to 900°C, results in a further evolution in grain growth for the Ti02 layers up to a radius of 50 nm . At 1200°C further grain growth is observed up to a radius of the grains of the order of ~90 nm. Sub-micron cracks in the layer, occurring for samples which have experienced a heat treatment at lower temperatures, disappeared. The activation energy for
190

Figure 1: (left): Micrograph of a 300°C furnace cured Ti02layer, Figure 2: (right): Micrograph of a 700°C furnace cured Ti02 layer. The average grain radius determined is r=18.2 nm.
grain growth in the thin Ti02 layers is determined to be AC =11.4 kj/mol. Subsequently, the laser cured thin Ti02 are studied using scanning electron microscopy. The morphology of the laser cured layers show a remarkable resemblance with the furnace cured layers. The laser cure parameters for the layers considered are listed in table 1
TABLE 1: laser cure parameters
sample power density (Js'm-2) interaction time (s)
7.5 109
10 109
HO"3
110"3
Laser densified Al203 thin films
These samples receive a pre-treatment before laser curing takes place. The aim of this pre-treatment is to remove excess fluids from the layers. The procedure consists of curing the samples in a furnace at moderated temperatures for a short period of time. Subsequently, the samples are laser cured. The curing is performed using several laser parameters, as listed in table 2. A sample with code 2b is, as defined in the table, a sample which is dried at 400°C and during the laser curing the power density P is set to LS-lO^s"1™ Hvith an interaction time T of 1.910'5s. In figure 3 several micrographs are depicted of layers which have had dissimilar pre-treatments and curing conditions. Micrograph 3a is a cross-sectional picture of a 2a layer. Separate grains may be observed with an average grain size of the order of -25-40 nm. The layer appears to be relatively dense, although voids and cracks may be observed. At the right-hand side debonding of the layer and substrate has taken place. Micrograph 3b also depicts a 2a layer. The debonding effect as seen in micrograph 3a is worsened and is severe. The layer is detached from the substrate and has formed a dome. A planar view of this sample, micrograph 3c, illustrates the formation of blisters in the layer. The blister formation may find its origin in two processes. The first effect may be due to the dissimilar thermal linear expansion coefficients of the layer and the substrate [14,15]. Since the expansion coefficient of the layer is higher than the expansion coefficient of the substrate, the layer will expand more upon heating of the layer/substrate system. This will cause compressive stresses in the layer to build up. Whenever the difference in expansion between layer and substrate, and thus the compressive stress in the layer, is large enough, the layer may fail in a buckling process and debonding between the layer and substrate will take place.
191

TABLE 2: laser curing parameters
pre-treatment parameters code temperature (°C) time (min.)
1 2
3
200
400
600
5 5
5 laser parameters
code power density (}sJm2) interaction time (s) a b
1.3 1010
1.3 1010 2.710"5
1.9 10"5
A second origin for the blister formation may be excess liquids trapped in enclosed pores [6] . During gelation of the layers, particles tend to aggregate and some fluid may be entrapped in pores. Upon heating of the layers this liquid becomes gaseous and expands drastically, building up pressure in the layer. Since the permeability of the layers is low, due to the small pores, the pressure can not leave and will cause the layer to blister. After the laser curing process, the layer is consolidated in its blistered form. To investigate whether the blisters may be caused by entrapped fluids in the layers before laser curing, samples are dried at higher temperatures. Micrograph 3d depicts a 3b sample, pre-treated at 600°C. This sample still exhibits blister forming, though the effect is less severe than for samples pre-heat treated at 400°C. Micrograph 3e displays a region of the layer which is perfectly bonded and where densification is homogeneous. The effect that blister formation is less for layers which have had more intense pre-drying processes, suggests that the blister formation is due to entrapped fluid that expands upon heating. The pre-heating on the other hand causes the layer to density before the laser curing. As a result of this pre-densification a tensile stress state may occur which will lower the compressive stress state in the layer due to the thermal expansion mismatch, lowering the possibility for the film to buckle.
DISCUSSION AND CONCLUSIONS
During the curing process of sol-gel derived thin Ti02 layers, the ceramic material exhibits large changes in morphology. For the furnace cured samples, the changes involve mainly a pronounced evolution in grain sizes. It is seen that the curing temperature is influencing the final grain sizes in the layer. From the dependence of the grain size upon the curing temperature, an activation energy for grain growth is derived. Furthermore, the sub-micron sized cracks disappeared upon increasing the curing temperature. The cracks, as observed for the 300°C samples, are expected to be induced during the drying process of the layers. In this process, large tensile stresses evolve as a result of capillary pressures in the pores of the solid network. Laser curing the A1203 layers not necessarily results in homogeneous, dense layers, as may be observed from figure 3. The various laser treatments result in very different structures of the layers. Cracking, debonding and blister formation may be the result of the laser treatment. The thickness of thin sol-gel derived layers is limited. Exceeding the critical film thickness will result in delamination of the layer. In literature, empirical film thicknesses for spun or dipped layers are of the order of -500-1000 nm [16,17]. Layers with larger thicknesses turn opaque, due to severe cracking in the layers, or delaminate. High thickness layers may be obtained by repetitive deposition of films of low thickness. Post heat treatment of the layers after each deposition increases the final thickness of crack free layers. The effective Young's
192

Figure 3
Micrographs of laser cured A1203 layers.a)micrograph of a 2a specimen.b)micrograph of a 2a specimen, exhibiting catastrophical debonding between layer and substrate. The debonding
may find its origin in two processes, namely buckling due to compressive thernal stresses upon curing, or degassing of entrapped liquids in the layer.c)topview micrograph of a 2a specimen, illustrating the blisters in the layer.d)micrograph of a 3b specimen, indicating that intensifying
the pre-heat treatment reduces blister formation.e) micrograph a 3b specimen, illustrating a homogeneous, well bonded and densified layer.
modulus is of great importance for the final behavior of the thin films. Using an approach [1] in which not the porosity of the material [18,19] but the effective surface for bonding governs the elastic behavior of the material, an estimate is derived for the effective strain energy release and the effective elastic modulus for nanosized materials of high porosity. Using the effective elasticity modulus, for the A1203 layers, three regimes in layer thicknesses can be predicted, for layers with thicknesses below -0.2 (im only surface cracking is expected in the layers. Increasing the thickness will result in channelling cracks in the layers, and the critical thickness for these layers is of the order of -0.4 |xm. Exceeding this critical thickness will result in delamination of the layers. Sol-gel layers containing entrapped liquids in closed pores are expected to build up high hydrostatic pressures as a result of the laser curing process, of the order of -500 MPa. These large hydrostatic pressures has to be sustained by the solid network. Any pressure building up in the layers is hard to relax by degassing, due to the low permeability of the layers, therefore, formation of blisters is a mechanism for the pores under pressure to relax. An alternative mechanism by which the blisters in the layers may be formed is the evolution of compressive stresses in the layers. Due to a misfit in thermal linear expansion coefficients of both substrate and layer, the substrate and layer will expand dissimilar upon temperature
193

changes. As a result of the misfit in expansion, thermally induced stresses are expected to arise in the layer and substrate. Whenever these stresses exceed a critical stress level, the layer will fail in a buckling process. This critical stress is determined for the layers of interest. The critical stress level is determined by, amongst others, the thickness of the layer and the size of flaws present initially. For the system with a layer thickness of the order of -500 nm the size of the flaws is estimated from figure 3c. A critical buckling stress of ~1 GPa is determined for this system. An evaluation of the expected thermally induced stress as a result of the laser curing process indicates that these stresses do not exceed -100 MPa. This low stress value is attributed to the low effective Young's modulus of the layer. For layers to buckle at this stress level, initial flaws of the order of -5 urn are required. However, blisters of this size were not observed. From calculations and the observed layer morphologies as depicted in figure 3, it was concluded that the blisters are not likely to be introduced by compressive stresses in the layer. The stresses evolving in the layer are too small for the layer to fail in a buckling process, regarding the size of the initial flaws at the interface between layer and substrate. The reduction in blister formation as a result of the pre-curing process, prior to the laser curing, indicates that the blisters are caused rather by the evaporation of entrapped liquids in the layers.Choosing the right pre-processing treatment before laser curing the samples, results in a homogeneous, dense layer, as observed in figure 3e.
REFERENCES
1 J.Th.M. De Hosson, D.H.J. Teeuw, in: Lasers in Surface Engineering, Ed. N. B. Dahotre, ASM International, Ohio, USA, chapter 6,1998,pp 205-255.
2 D.J. Taylor, B.D. Faber, J. Non-Crystalline Solids, 147&148,457 (1992). 3 D.J.Shaw, T.A. King, D.J. Taylor SPIE Sol-Gel Optics, 1328,474 (1992).
4 N.Arfsten,B.Linrner,M.Heming,O.Anderson,C.R.Ottermann, Mat. Res.Soc. Symp. Proc. 33,449 (1992).
5 B.D. Fabes, B.J.J. Zelinsky, D.J. Taulor, L. Wiesenbach,S. Boggavarapu, D.Z.Dent, SPIE Sol-Gel Optics II, 1758,227 (1992).
6 C.J.Brinker ,G.W. Scherrer, Sol-Gel Science, 1990, Academic Press, San Diego. 7 L.E. Scriven, Mat. Res. Soc. Symp. Proc, 121, 717 (19988). 8 D.Meyerhofer, J. Appl. Phys., 49, 3993 (1978). 9 J.H.Butler, D.C. Joy, G.F. Bradley, S.J. Krause, Polymer, 36,1781 (1995).
10 J.I.Goldstein, D.E.Newbury, P. Echlin, D.C. Joy, C. Fiori, E. Lifshin,E., Scanning Electron Microscopy and X-ray Microanalysis, 1981, Plenum, New York, 44.
11 Y. Ohya, H. Saiki, T. Tanaka, Y. Takahashi, /. Am. Ceram. Soc, 79, 825 (1996).
12 K.Terabe, K. Kato, H. Miyazaki, S. Yamaguchi, A. Imai, Y. Iguchi, J. Mater. Sc, 29, 1617 (1994).
13 I. Manzini, G. Antonioli, P.P. Lottici, G. Gnappi, A. Montenero, Physica B, 208, 607 (1995).
14 A.G. Evans, J.W. Hutchinson, Int. J. Solids Structures, 20,455 (1984). 15 E. Madence, H. Balkan, M. Quan, Int.. J. Solids. Structures, 32, 3465 (1995). 16 I. Strawbridge, P.F. James, J. Non-Cryst. Solids, 86,381 (1986).
17 S. Sakka, K. Kamiya, K. Makita, Y. Yamamoto, J. Non-Cryst. Solids, 63,223 (1984). 18 P. Krestic, U. Erb, G. Palumbo, Scripta Metall. Mater., 29, 1501 (1993). 19 N. Ramakrishan, V.S. Arunachalam, J. Am. Ceram. Soc, 76, 2745 (1993).
194

THE FRACTURE OF COMPOSITE MATERIALS: A CHAOTIC APPROACH
R. TONELLI*, F. MELONP and F. AYMERICH**
* INFM-Physics Department ** Department of Mechanical Engineering University of Cagliari - 09042 Cagliari, Italy.
ABSTRACT
In the present work, we analyze the behaviour of graphite-reinforced composite mate- rials under periodic loading. We reconstruct the phase space of these physical systems by means of the tools of nonlinear system theory. Experimental measurements are used to calculate chaotic parameters as fractal and embedding dimensions. We use these quantities to characterize differences in the physical samples and modifications in their internal structure. This analysis can provide useful indications about the fracture process.
INTRODUCTION
The problem of the analysis of data from physical systems with non-linear behaviour has been well addressed only in the last few years [1]. By sampling the time evolution of a single scalar variable it is possible to obtain information on the dynamics of the physical system producing the observable. In this kind of analysis reconstruction of the phase space is the key problem. The goal is to reconstruct the time evolution of the system's trajectories in a d-dimensional space in which the coordinates are determined by measurement of the time variation of a single scalar quantity [2]. In such a phase space it is possible to characterize the physical system in terms of embedding and fractal dimensions [1]. These features are not revealed by classical analysis methods devoted to real space and to the more traditional Fourier expansion. This method of analysis can be helpful in the problem of the non-linear response of materials to an external solicitation. In particular, the fracture of graphite-reinforced fibre when subjected to axial periodic force has been investigated in recent years [3] [4]. In these systems there is a transition to a plastic non-linear regime for critical values of the external charge. Samples under periodic loading undergo a fracture after an unpredictable time. This effect does not show any evident macroscopic signal and constitutes a problem in the practical use of this kind of composites.
In the present work, we analyze the behaviour of such materials by means of the tools of non-linear systems theory [1]. We studied modifications in their physical structure by analysing the properties of system trajectories in the reconstructed phase space. We try to indicate a difference in specimen behaviour before the fracture by- determining some physical quantities which allow the distinguishing of the critical factors leading to the system breakdown.
195 Mat. Res. Soc. Symp. Proc. Vol. 539 ° 1999 Materials Research Society

THE EXPERIMENT
A graphite-fibre reinforced bar is axially stressed by external sinusoidal loading. Specimens are polyethererketone laminate materials, built by reinforcing a single layer of polymeric laminates by means of a parallel set of carbon fibres and putting one layer on top of another. The angle formed by the carbon fibres with respect to the axial direction of the externally applied load may vary layer by layer in a periodic sequence. Values are indicated as [0, /02]ns, where ns accounts for the period (fig. 1). The analysis was performed on different samples in order to analyse and numerically characterize different possible behaviours during load and before the fracture.
Tests were carried out in a servohydraulic ± 250 kN MTS machine under load control. Fatigue loading was a sinusoidal tension-tension with R = om^o =0.1. A low pass filter with a cutoff frequency of 10 Hz was applied in this series of tests. A low pass filter with a cutoff frequency of 10 Hz was applied in this series of tests. During the test, the load cell and the longitudinal strain signals, on a basis of a 50 mm length, were continuously monitored by means of an extensometer and a 13-bit digital voltmeter, and processed to give the hysteresis cycle area. In general we can distinguish two kinds of states for such composite materials [5]. Specimens with a fibre angle of less than 30 degrees have a linear strength-deformation diagram. The others undergo a transition to a plastic regime where stiffness is determined by the polymeric matrix, and have non-linear behaviour (Fig. 2).
Specimens considered for the numerical analysis consisted of four angle-ply laminates with 16 layers. The first one had fibres oriented along the directions of 35° and -35° with respect to the load application axis. The other two had angles of 45° and -45° and the last one had fibres at 45°, but with a different fibre structure. In each single layer of polymer the fibres are interlaced at +45° and -45°. The corresponding notations are [35/-35]2s [45/- 45]2s and [45/-45]ls, hereafter indicated as 35, 45A-45B and 45C. The dimensions of all samples were 200x20x2.2 mm3. We measured the time variation of specimen total length as the only variable needed to reconstruct the system's dynamics in the phase space [2]. Sampling rate was 51 points/sec for 35 and 90 points/sec for 45A-45B and load frequency was 3 Hz. In the case of 45C we performed a slightly different kind of experiment. We varied external maximum load and frequency during fatigue. This allowed us to investigate the behaviour of the same sample under different external conditions and to analyse how the modifications of its internal structure are reflected in the reconstructed phase space. The load frequencies were integers varying from 2 to 9 Hz. Sampling rate was 100 points/sec at low frequency and 200 points/sec for frequencies equal to or larger than 6 Hz. The maximum load was increased in time from the initial 0.2 GPa just at the fracture load of material.
Figs. 3 and 4 show the time evolutions of the lengths.
PHASE SPACE RECONSTRUCTION
The measured values of sample lengths constitute a scalar temporal series s(n) that allows the reconstruction of the trajectories in order to represent the system dynamics [2]. We used the lagged variables s(n+T) = s(t0 + (n+T)ts) to create a vector in d dimensions,
y(n) = [s(n), s(n + T), s(n+ 2T), . . ., s(n + (d- \)T)] (1)
196

which provides the phase space coordinates. s(n) is the sample length at time n, T is the time lag and it is an integer number and d is the embedding dimension. This method is a standard procedure in the analysis of experimental data generated by non-linear systems [1].
To determine T we calculated the first minimum of the average mutual information [6] between measurements at time t and t+T defined by:
I{T) = Y,P{s{n),s{n + T))x log, P{s{n),s{n + T))
P{s{n))x P{s{n + T)) (2)
In this relation P(s) is the probability of measurement s, while P(s,s') is the joint probability of measurements s and s'. We found T=5, T=13, T=10 for 35, 45A, 45B. To determine the embedding dimension we used the method of false nearest neigh- bours [7]. We must construct d-dimensional vectors y(n) = [s(n),s(n+T)r . .,s(n+(d- 1)T)] and calculate the number of points nearest neighbors (NN) of a fixed point y(n) for increasing values of d. When there are no false NN remaining, we have reached the required dimension. This analysis in the case 45C allowed us to identify some special characteristics. We found no dependence of d on the external load and frequency. However, in some cases the changes in the load were followed by a more marked increase in the sample length. In these situations we found smaller values of the embedding dimension. These values were always under d = 5 in this series of measurements . In the other cases, in which the sample length was almost stationary, the values of d were larger than 6 (fig 5). We calculated the embedding dimension in different ranges of a single temporal series in which load and frequency were main- tained constant. We found differences between the ranges in which the length was stationary and the ones in which the length increased in time. The first ones were responsible for the higher values of d. Lesser rates of increase in the total length corresponded to larger values of d. Sample length increased in time also in the cases of 35A, 45A and 45B and we found a low value for the embedding dimension (fig.
/ _ [+15] 1.t> [±25]
— [±35] 1.0
/ — [±45]
o.s . / ■"
0 0 " 0.0 40 80 120 160 200
£ [mm/m]
Figure 1: Scheme of the poly- meric matrix: the fibres are in- clined with respect to the direc- tion of load.
Figure 2: Strength-deformation diagram for different fibre incli- nations. The samples with fibre's angulation of 35 and 45 degrees have non-linear behaviour.
197

CALCULATION OF FRACTAL DIMENSION
We used the value of fractal dimension to classify both the general physical character- istics of the different samples and their behaviour in proximity to their fracture. By- using the Grassberger-Procaccia method [8] we calculated the correlation dimension D2 defined by:
r-H> log(r) v '
where C2 is the correlation integral:
N
C2(r) = N{N_1)ZB(r-\\y(i)-yV)\\) (4)
where N is the total points number and 9 is the step function. Fig. 7 shows the results of the scaling of the correlation integral. We eliminated
the initial transient of time from calculations before transition to the plastic regime. The dimensions of samples 45A-45B are D2 = 1.85 and that of sample 35 is D2 = 1.51.
In the case of 45C we calculated D2 only for the pieces of temporal series having low embedding dimensions. In the case with external frequency of 3 Hz we found D2
= 1.78, a value comparable to the ones of 45A and 45B. In the case with external frequency of 4 Hz and the same loading D2 = 1.15 (fig 8).
Thus the results obtained with the procedure of Phase Space reconstruction and fractal dimension calculation show analogies between samples having the same phys- ical structure under similar external solicitations. Conversely, there are differencies when the physical samples or the external conditions are different.
In reality our results are related to the response of devices to the external force, which is essentially determined by the fibre's inclination which govern the stiffness and resistence of such composites. So we use the parameters from numerical calcu- lation to characterize the different samples.
By considering that there is a modification of the devices internal structure before breakdown and a corresponding variation in their dynamical response caused by the progressive increase of the internal damage that drives the materials to fracture, we applied the same method of analysis to the final part of the temporal series of 35, 45A and 45B. We considered roughly the final twenty percent of each temporal series and we divided each of such "reduced series" into three parts. For 35 and 45B each part has 15000 points, for 45A 5000 points. We repeated the calculation of the fractal dimension for the three parts of each " reduced series". For sample 45C we calculated the fractal dimension in the case in which loading is at the fracture value. We calculated D2 for the total temporal series and for its 5000 final points in this case as well.
Figs 9,10, 11 show that the value of D2 in each piece is almost the same as the one calculated for the total temporal series of the corresponding sample. But in all cases we found an increase in the value of fractal dimension at the end of the temporal series. We found the same behaviour in the case of 45C as well (fig 12).

CONCLUSIONS
We reconstructed the phase space and calculated the fractal and embedding dimen- sions in order to characterize different behaviours of the composite materials anal- ysed. We found that these tools allow us to classify the physical systems numerically. In particular, our approach reveals a modification of D2 in the final steps of the frac- ture process. In principle this fact can be used to enhance the imminent breakdown. In short, the method provides useful indications in studying the physical properties of such graphite-fibre peek laminates in the dynamic state before macroscopic fracture.
45A-45B
0.0 200000 400000 Number of points
45C
0.8
0.6
0.4
0.2
0.0
<M>« VI ■
♦-•32 >\ ■HIM \$ S-35 ■ £•£11 N
A-412 MM
■^'^ »—« i
0 12 3 4 5 6
Embedding dimension
Figure 3: Sample lengths (arbi- trary units) vs. time (number of experimental points) for the samcles 35. 45A, 45B.
45 C JZ s.o OJ 5.0 c
_0J 4.0 jB 3.0 g- 2.0
tf> 0.0
■32J34 \2. 30 f\
sL A
0.0 500C00 1000C00 Number of points
Figure 4: Sample length (arbi- trary units) vs. time (number of experimental points) for the sample 45C. The various num- bers correspond to different load and frequency.
Figure 5: Percentage of false nearest neighbours vs. embed- ding dimension for various pieces of the sample 45C. The numbers in the figure correspond to the different parts in the fig. 4.
35-4SA-45B
£ 0 12 3 4 5 6 Embedding dimension
Figure 6: Percentage of false nearest neighbours vs. embed- ding dimension for samples 35. 45A and 45B. When the percent- age is under 3 % we have reached the right embedding dimension. We found respectively 4,3,4 for the embedding dimension.
199

2.0 -1.0 0.0 Log(r)
3.0 -2.5
Log(r)
Figure 7: Scaling of the corre- lation integral vs. r. The frac- tal dimension is the slope of the function. We found respectively D2 = 1.51. 1.S5. 1.85 for 35. 45A. 45B.
Figure 9: Calculation of the frac- tal dimension for the three final parts of the 35 sample temporal series. We found a larger value of D'j in the final par' iai.
3g}l
0 0 -£T J * JA •
o -1.0 3* i* : m y M* ~ S i a
-2.0 »* jr -^32 [
-3.0 -2.0 -1.0 0.0 1. Log(rj
c -.;■
45A
// ^~
Loc(r)
Figure 8: Fractal dimension for some pieces of the sample 45 C. Each piece corresponds to dif- ferent frequency and load condi- tions. The numbers correspond to the pieces in fig 4. We found respectively Do = 1.78, 1.15.1.95 for pieces 6, 7, 32.
Figure 10: Calculation of "he fractal dimension for the three fi- nal parts of the 45A temporal se- ries. We found a larger value of D'j in the final part (a).
200

45B 45C
, , -1.5 *^*
CM -1.9 JT
( ) w^ •—• a -2 3 co ^ e—a b
u _] -2.7 y ~c
-3.8-3.6-3.4-3.2-3.0 Log(r)
-2.0 -1.0
Log(r)
Figure 11: Calculation of the fractal dimension for the three fi- nal parts of the 45B temporal se- ries. We found a larger value of D-j in the final part (a).
Figure 12: Calculation of the fractal dimension for the final 5000 points (b) of the 45C tem- poral series compared to the to- tal series (a). We found a larger value of D') in the final part (b)..
References
[1] Abarbanel H. I. , R. Brown, J.J. Sidorowich L. S. Tsimring (1993) "The analysis of observed chaotic data in physical sys- tems'' Rev. of mod. Phys. 65 1331.
[2] Packard N". H. .1. P. Crutchfield, .1. D. Farmer and R. S. Shaw, (1980) Phys. Rev. Lett. 45, 712.
[3] Meloni F., Serra M., DePascale T. M., Varone A., Ginesu F., "Order-Disorder transition in Composite Materials", in MRS Symposia Proceedings, vol. 272 (1992), p. 135.
[4j P. Priolo. M. Sanna, F. Bertolino, "Fatigue life of graphite- peeks laminates" Thermoplastic Comp. Techn. Seminar, Cagliari (1990).
[5] F. Aymerich, F. Ginesu, P. Priolo , ''Analisi del danneggia- mento in provini di graphite-peek" XIX convegno nazionale AIAS, Meccanica dei materiali innovativi. Pisa 1991.
[6] Fräser A. M. Swinney H. L. (1986) Phys. Rev. A 33 1134.
[7] Kennel M. B., Brown and H. D. I. Abarbanel (1992) Phys. Rev. A 45 3403.
[8] Grassberger P. and I Procaccia, (1983b) PhysicaD 9 ,189.
201

LONG DISTANCE ROUGHNESS OF FRACTURE SURFACES IN HETEROGENEOUS MATERIALS
M. Hinojosa , E. Bouchaud* and B. Nghiem*** *Universidad Autönoma de Nuevo Leon, A.P. 149-F, S. Nicolas de los Garza, 66451 Mexico. **Offlce Nationale D'Etudes et de Recherches Aerospatiales (DMMP/MS), 29 Av. de la Division Leclerc, B.P. 72, F-92322 Chdtillon Cedex, France. ***Laboratoire CNRS/Saint Gobain, B.P. 135. 93303 Aubervilliers Cedex, France
ABSTRACT
The long distance roughness of fatigue fracture surfaces of a nickel-based superalloy is reported for two samples of different grain size. Statistical analysis over a wide range of length scales, from a few nanometers to a few millimeters, using scanning electron microscopy and atomic force microscopy allows to obtain accurately the self-affine correlation length. Long distance fracture profiles of 14,000 points were obtained and digitized from overlapping electron micrographs at a resolution of 0.22 micrometers/point. We have also analyzed the long distance roughness of the mirror zone on a soda-lime glass using atomic force microscopy. In the case of the nickel superalloy, correlation lengths are found to correspond well to the grain size. This result gives information about the mechanism of crack propagation in heterogeneous materials and shows that the correlation length of fracture surfaces is of the order of the largest microstructural heterogeneity.
INTRODUCTION
In 1984, Mandelbrot1 et al established the fractal character of metal fracture surfaces. Their results suggested a correlation of the fractal dimension with the fracture toughness of steels. These results encouraged many workers2 around the world to apply fractal analysis to the study of fracture surfaces and crack propagation. These first results were questioned under the light of results obtained on many different materials analyzed using various experimental techniques, and treated with refined statistical and spectral methods applied to sets of data spanning over several decades of length scales. It is now well established that fracture surfaces are anisotropic natural fractals, they are self-affine objects characterized by the roughness exponent C,. There is abundant accumulated evidence to support the idea, first advanced by Bouchaud3 et al, that there exists a self-affine regime common to many materials, with the universal value Q » 0.8. This regime is valid for sufficiently high enough crack propagation speeds and/or long enough length scales. For very low propagation speeds and/or small enough (sub-micrometric) length scales, another self-affine regime is observed, with a roughness exponent C, * 0.5. For adequate kinetic conditions4, the two regimes can be observed in the same fracture surface, separated at a cut-off length £,c that seems to be strongly correlated with the microstructure. This lead us to a question that remains open: What is the role of the microstructural parameters in the process of crack propagation?
A self-affine surface is fractal up to distances of the order of a characteristic length called the correlation length £, beyond this length scale the surface can be considered to be flat. It is almost intuitive to think that the correlation length must be of the order of the size of the largest heterogeneities in the material. Recent experiments4'5 using atomic force microscopy and SEM observations had permitted to perform self-affinity analysis of fracture surfaces over
203 Mat. Res. Soc. Symp. Proc. Vol. 539 ° 1999 Materials Research Society

five decades of length scales. However, it is not always easy to determine this parameter. In this work we present the results obtained in the determination of the correlation length of fracture surfaces of a nickel superalloy for two samples with very different grain size. Our aim was to determine if E, is correlated to the grain size, assumed to be the largest heterogeneity in the material. For this purpose we analyzed the long distance roughness on profiles of up to 3 millimeters in length. For the self-affinity analysis we used mainly the variable bandwidth method2'6, the use of the 3-millimeter long profiles thus allowed windows sizes at least one decade larger than the grain size. For purposes of comparison, we have also obtained the correlation length in a sample of soda-lime glass.
EXPERIMENT
The material used in this work was N18 nickel superalloy, a soda-lime glass was also analyzed for comparison. The N18 alloy is produced7 by powder metallurgy and specifically designed for high-temperature turbine disk applications. Typical chemical composition of this alloy is as follows (% wt): C:0.015, Co:15.7, Ni: balance, Cr:11.5, Mo:6.5, Al:4.35, Ti:4.35, B:0.015, Hf:0.45, Zr:0.03, O: less than 0.010 (100 ppm), N : less than 0.005(50 ppm). Alloy N18 has an austenitic matrix structure. High temperature strengthening is produced by the precipitation of the ordered intermetallic y' phase, Ni3(Al,Ti), and by solid solution hardening principally by molybdenum. Typical heat treatment comprises partial dissolution slightly below the gamma prime solvus temperature (~ 1195 °C), followed by rapid cooling and subsequent aging, in order to control the size and distribution of the y' precipitates.
The typical microstructure8 of this alloy in the fully heat-treated condition ("sub-solvus" treatment) consists of austenitic grains of- lOum, together with three sizes of y'. The largest, 3-5 urn in diameter, termed primary, forms during forging. The secondary, 0.15-0.30 urn, forms during cooling. The finest, ~ 0.02 urn, that forms during aging, and termed tertiary, appears to control the mechanical properties. The three forms of gamma prime possess a different chemistry and lattice parameters. In the solubilized condition, the microstructure consists mainly in coarse austenitic grains.
For this work we took two samples of this material, one in the fully treated condition, with austenitic grain size of-10 urn, the other was in the solubilized condition with grain size of-100 urn. We had then the same material in different condition with a difference of grain size of one order of magnitude. Figure 1 shows the microstructures of the samples.
la) lb) Figure 1: Microstructure of the two samples analyzed, la) Coarse grain sample lb) Fine grain sample.
204

In order to generate the fracture surfaces, fatigue tests were performed over single-edge- notched plate specimens. We used a servo-hydraulic tension machine operating under load control. Tests were performed in air with a stress ratio R = 0.1 at a frequency of 30 Hz. Figure 2 shows the fracture surfaces obtained. The fractographic observations for the N18 show a mixed intergranular and transgranular mode of propagation for both grain sizes.
Figure 2: Fracture surfaces of coarse-grained (left) and fine-grained (right) specimens
The fracture surfaces were analyzed both by SEM and atomic force microscopy. For the SEM observations fracture surfaces were sectioned and polished in a plane perpendicular to the direction of crack propagation. Cuts were made at locations with crack velocities in the Paris regime of about 0.1 |xm/s for both samples. The profiles obtained were observed by SEM at 200X, digital images were captured at 1024 pixels long with a resolution of 0.22 nm/pixel. Slightly overlapping adjacent fields were registered in order to analyze a long distance continuos profile with a total length of ~ 3 mm. The single 1024-pixels profiles were extracted by image analysis, converted to arrays of x,y coordinates, and then carefully joined together to obtain a single data set of more than 14,000 points. Figure 3 shows the profiles obtained for both the coarse-grained and the fine-grained samples.
2000 3000
Figure 3: Heigth profiles obtained for the N18 samples, each one consists of more than 14,000 points with a resolution of 0.22 pm/pixel. The inset shows one single SEM profile, 14 of these images were needed to obtain the long distance 3-mm profiles shown.
205

For AFM analysis of the N18 samples, ten height profiles of length lOum were recorded perpendicularly to the direction of crack propagation.
With purpose of comparison, we have also analyzed the fracture surface of a soda-lime glass. For the glass sample, we recorded 10 AFM height profiles of length 1 urn, these observations were made over the mirror zone of the fracture surface.
Self-affinity analysis was performed using the variable bandwidth method2'6, we calculated the quantities Zmax(r) and the second moment w(r) of the height distribution. The best results in the determination of the correlation length were obtained using the second moment method, thus we only present the results obtained with this method
RESULTS
Figure 4 shows the results of the self-affinity analysis for the N18 samples. Results of the AFM and SEM observations were completely compatible, as previously reported by Daguier5 et cd, so we were able to construct a single curve spanning over more than six decades of length scales. The curves obtained allowed us to observe the whole domain of the self-affinity regime, together with its upper limit, or correlation length, (;. We can clearly see that this fracture surfaces are no longer self-affine for length scales of the order of 10 um and 100 um for the fine-grained and the coarse-grained samples, respectively, these correlation lengths correspond very well to the grain size of the samples. This results confirms the idea that the correlation length of a fracture surface is of the order of the size of the largest heterogeneities. This fact suggest that the front line interacts with the heterogeneities as it advances through the material, but it "sees" nothing above this correlation length, leaving thus behind a fracture surface which is flat for length scales above this limit.
As far as the self-affinity regime of the N18 alloy is concerned, we have found the same behavior for the two samples, with a roughness exponent C, » 0.8, result in agreement with the ubiquitous universal exponent reported for similar kinetic conditions.
10- ""' - v. „T
1-; -
If 3o.1- // fine grain
■
¥ :
0.01 ■: - //? = 0.8
4= 10 urn £= 100 ^m ,
1E-3- I r-r-r
r(nm)
Figure 4: Self-affinity curves for the N18 samples, results of the AFM and long distance SEM profiles are shown spanning over more than six decades, the limits of the self-affine regimes are estimated at values of 10 /jm and 100 fjm, which correspond to the grain size of the samples. In both cases, the roughness exponent has the universal value £<z0.8.
206

In the case of the glass sample, figure 5 shows that the 10 um AFM profiles are the equivalent of the long distance SEM profiles for the N18 alloy. One clearly sees the limit of the self-affine regime, with a correlation length ^ » 100 nm. Above this value the fracture surface is flat and below this value it is self-affine, thus implying that the front line "sees" a completely homogeneous materials for length scales above this correlation length. In the self-affine domain, the roughness exponent has the universal value C, * 0.8.
E c
0.01
I I I I I III
'$ = 0.8
■"1—
10
5= 100 nm
100
r (nm)
10000
Figure 5: Self-affinity curve for the mirror zone of the fracture surface of the silica glass. The correlation length is clearly determined at 100 nm.
CONCLUSIONS
The use of long distance profiles allowed us to estimate with good accuracy the correlation length for the fatigue fracture surfaces of the N18 samples. This limit of the self- affine domain was found to correspond to the grain size of the material. Our results show that the correlation length of the fracture surfaces of these heterogeneous materials is of the order of the size of the largest microstructural heterogeneities. The simultaneous use of AFM and SEM allowed us to perform the self-affinity analysis over more than six decades of length scales with results that are quantitatively compatible. In the case of the glass fracture surface analyzed, we also were able to determine the correlation length with high precision. We obtained the universal value of the roughness exponent Q » 0.8 for both materials. These results should help to improve the available crack propagation theoretical models.
ACKNOWLEDGMENTS The invaluable help of G. Marcon, J-L. Raviart and S. Naveos is gratefully
acknowledged. M. Hinojosa thanks Universidad Autönoma de Nuevo Leon and ONERA for financial support, he also wants to express his gratitude to P. Daguier for all his help.
207

REFERENCES
1. B.B. Mandelbrot, D.E. Passoja and A.J. Paullay, "Fracture Character of Fracture Surfaces of Metals", Nature, 308, pp 721-722 (1984).
2. See the review article "Scaling Properties of Cracks", E. Bouchaud, J. Phys.:Condens. Matter 9 (1997) 4319-4344 and the abundant references therein
3. E. Bouchaud, G. Lapasset and J. Planes, Europhys Lett., 13, pp 73 (1990). 4. P. Daguier, B. Nghiem, E. Bouchaud and F. Creuzet, "Pinning and Depinning of Crack
Fronts in Heterogeneous Materials", Phys. Rev Lett., 78, pp 1062 (1997). 5. P. Daguier, S. Henaux, E. Bouchaud, and F. Creuzet, "Quantitative Analysis of a Fracture
Surface by Atomic Force Microscopy", Phys. Rev. E, 53, 5637 (1996). 6. J. Schmittbuhl, J.P. Villote. S. Roux, "Reliability of self-affine measurements", Phys. Rev.
E, 51 131 (1995). 7. J.Y. Guedou, J.C. Lautridou and Y. Honnorat, " N18, P M Superalloy for Disks:
Development and Applications"., in Superalloys 1992, Edited by S.D. Antolovich, R.W. Sturutsu, R.A. MacKay, D.L. Anton. T. Khan, R.D. Kissinger, and D.L. Klarstrom, The Minerals, Metals & Materials Society, 1992, pp 267-276.
8. S.T. Wlodek, M. Kelly and D. Alden, "The Structure of N18", in Superalloys 1992, Edited by S.D. Antolovich, R.W. Sturutsu, R.A. MacKay, D.L. Anton. T. Khan, R.D. Kissinger, and D.L. Klarstrom, The Minerals, Metals & Materials Society, 1992, pp 467-476.
208

MOLECULAR DYNAMICS STUDIES OF INTERFACIAL CRACK PROPAGATION IN HETEROGENEOUS MEDIA
John M. Corbett* ** and Robin L. B. Selinger** *Naval Surface Warfare Center Indian Head Division, Indian Head, Maryland ** Catholic University, Washington, DC [email protected]
ABSTRACT
We use molecular dynamics simulation to investigate the evolution of a crack front in interfacial fracture in three dimensions. We find that when a crack passes through a localized region of heterogeneous toughness, crack front waves are initiated and propagate laterally. We also investigate the development of roughness of the crack front when the crack propagates in a region of heterogeneous toughness. We find that in steady state the mean square width W of the front scales with system size L as W~ L035, in agreement with recent theoretical predictions.
INTRODUCTION
When a crack propagates through a solid, the rough fracture surface left behind may display self-similarity over a wide range of length scales [1]. As a first step toward understanding the mechanisms that drive formation of self-similar structure, we study a simpler problem: the evolution of roughness of a crack front as it propagates along a planar interface in a three-dimensional solid. In this case, the fracture surface itself is smooth, but the crack front will roughen if the fracture toughness of the planar interface is heterogeneous. This problem has been studied via continuum methods in the quasi- static case [2] and in the dynamic case [3]. Molecular dynamics methods have been applied to a simplified model which is not fully three dimensional in character [4]. In the present work we report on preliminary results for a fully three dimensional simulation.
We model a crack running along a flat planar interface in a three dimensional crystal. The crystal has the structure of a simple cubic lattice of point masses with linear elastic bonds between nearest neighbors and along the body diagonals of each unit cell. The crack plane is modeled as a weak interface; bonds along the crack plane fail when they reach a threshold strain. Heterogeneity in the fracture toughness is introduced by varying the elastic modulus of bonds along the crack plane.
We use a moving boundary condition developed by Marder et al [5] in which a layer of clean crystal is periodically added ahead of the crack and a layer of broken crystal is removed behind the crack so that the crack remains in the same position in the simulation cell. The simulation is run under conditions of applied strain, so the stress intensity factor driving the crack is roughly constant throughout the simulation. Periodic boundary conditions are used in the y direction (see Figure 1), so there are four free surfaces. Damping is applied in the region near all free surfaces to minimize the effects of reflected acoustic waves. Since only bonds across the crack plane can break, dislocation nucleation
209 Mat. Res. Soc. Symp. Proc. Vol. 539 @ 1999 Materials Research Society

is suppressed so that crack propagation is purely brittle. Under these conditions we expect the crack to propagate at close to the Rayleigh wave speed with no inherent instability.
Figure 1: Geometry of the simulation. A crack propagates along a planar interface between two identical linear elastic solids. The crack surface is smooth, but the crack front roughens if the fracture toughness of the interface is heterogeneous.
CRACK-FRONT WAVES
When a crack moving at steady-state velocity in a homogeneous region of the crystal encounters a small region of heterogeneous toughness, waves are nucleated on the crack-front and propagate laterally as the crack moves forward.
sorted Itf. 9 CB
"' Wlidl J v 1 1 ' ,o - jjg&JAIll r j iJ
■-lll.il J I' 30 40 SO 60 70 60 30 100 110 120
Figure 2: Sequence of crack-front profiles. An initially straight crack propagates into a region of heterogeneous toughness, then back into a homogeneous region. Crack-front waves propagate laterally and persist without observed reduction in amplitude.
210
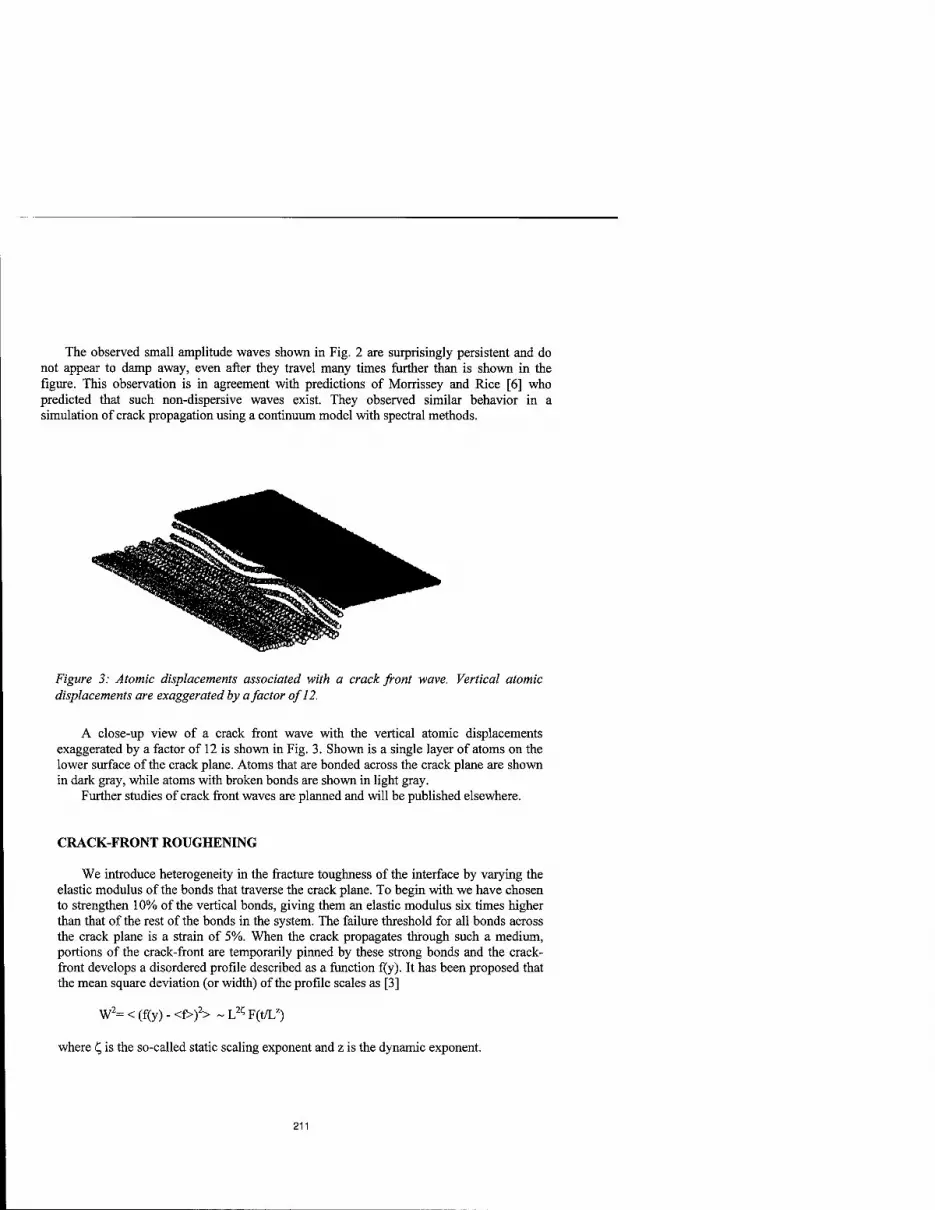
The observed small amplitude waves shown in Fig. 2 are surprisingly persistent and do not appear to damp away, even after they travel many times further than is shown in the figure. This observation is in agreement with predictions of Morrissey and Rice [6] who predicted that such non-dispersive waves exist. They observed similar behavior in a simulation of crack propagation using a continuum model with spectral methods.
Figure 3: Atomic displacements associated with a crack front -wave. Vertical atomic displacements are exaggerated by a factor of 12.
A close-up view of a crack front wave with the vertical atomic displacements exaggerated by a factor of 12 is shown in Fig. 3. Shown is a single layer of atoms on the lower surface of the crack plane. Atoms that are bonded across the crack plane are shown in dark gray, while atoms with broken bonds are shown in light gray.
Further studies of crack front waves are planned and will be published elsewhere.
CRACK-FRONT ROUGHENING
We introduce heterogeneity in the fracture toughness of the interface by varying the elastic modulus of the bonds that traverse the crack plane. To begin with we have chosen to strengthen 10% of the vertical bonds, giving them an elastic modulus six times higher than that of the rest of the bonds in the system. The failure threshold for all bonds across the crack plane is a strain of 5%. When the crack propagates through such a medium, portions of the crack-front are temporarily pinned by these strong bonds and the crack- front develops a disordered profile described as a function f(y). It has been proposed that the mean square deviation (or width) of the profile scales as [3]
W2= < (f(y) - <f>)2> ~ l5 F(t/Lz)
where L, is the so-called static scaling exponent and z is the dynamic exponent.
211

We have attempted to measure the scaling exponents by running an initially stationary, unrelaxed crack into a region of heterogeneous toughness. The applied strain of 3% was well in excess of the critical strain (2.1%) for crack propagation. We performed multiple runs for systems of size 60xLx40, where L=50 (19 runs), L=100 (10 runs), and L=200 (16 runs). A suitably scaled plot of the mean square width vs. time shows a fairly good data collapse with static exponent C, = 0.35 ±0.02 and dynamic exponent z = 0.2.
The static exponent is in agreement with the prediction of Ramanathan and Fisher and seems like a reasonable result. The evaluation of the dynamic exponent was perhaps complicated by the fact that the initial crack was not in elastic equilibrium and that its equilibration was slowed significantly by the damping in the region near the free surface. We plan to repeat these simulations with a different initial condition to see if the dynamic scaling exponent is affected.
jlpr.a-0 35. z-0 2, for size 50.100.200
W2/L2(;
HI! II •Kcaled50dar —
'icaledlOOdar —- I , 'sated2C0 dar
. W ™^Ä$f ilm
-
200 250 300 350
Time / Lz
Figure 4: Mean square width vs. time, suitably scaled, for system sizes L=50, 100, and 200, plotted for £=0.35 andz=0.2.
An experimental estimate of the static scaling exponent is ^ = 0.55 + 0.05, for a planar crack propagating on weak interface in a transparent polymer material [7]. One possibility is that the dissipative elastic-plastic behavior of the polymer gives rise to different roughening behavior. In future work we plan to introduce dissipate elastic- plastic bonds into our simulation to see if that would significantly change the roughening behavior. We also plan to complete our study of roughening and also investigate the scaling behavior of crack velocity at loads just above the threshold value.
Acknowledgments: This work is supported by U. S. Navy NSWCIHD TIP-99-16 and by NSF DMR-59702234.
212
REFERENCES
[1] See, e.g. P. Daguier, B. Nghiem, E. Bouchaud, and F. Creuzet, Phys. Rev. Lett 78, 1062 (1997).
[2] J. Schmittbuhl, S. Roux, J.-P. Vilotte, and K. J. Mäleiy, Phys. Rev. Lett 74,1787 (1995).
[3] S. Ramanathan and D. S. Fisher, Phys. Rev. Lett. 79, 877 (1997); Phys. Rev. E 58, 6026 (1998).
[4] T. Fukuhara and H. Nakanishi, "Dynamical stability of the crack front line" preprint, posted at http://xxx.lanl.gov as cond-mat/9807227.
[5] D. Holland and M. Marder, Phys. Rev. Lett. 80, 746 (1998).
[6] J. W. Morrissey and J. R. Rice, J. Mech. Phys. Sol. 46, 467 (1998).
[7] J. Schmittbuhl and K. J. Mäkiy, Phys Rev. Lett. 78, 3888 (1997).
213

STUDIES OF CRACK PATTERN IN TWO DIMENSIONAL MEDIA AS RESULTING FROM ION BEAM LIKE OR FREEZING DESTRUCTION
M. AUSLOOS*, N. VANDEWALLE* and R.D'HULST**, *SUPRAS, Institut de Physique B5, Universite de Liege, B-4000 Liege, Belgium ** Dept. Mathematics and Statistics, Brunei University, Uxbridge, Middlesex UB8 3PH, UK
ABSTRACT
We have numerically studied various models for crack formation in the slow dynamical regime. Two different aspects are presented herein: (i) sputtering with reconstruction and (ii) internal destruction of a porous medium through the invasion of a secondary phase.
INTRODUCTION
Fracture phenomena [1] in materials arise from various different external causes: mechanical stresses (most commonly studied), thermal stresses (crystal growth), sputtering, second phase injection (internal load), drying (sand), ageing, corrosion, etc... These various processes take place at different velocity scales. Indeed, while mechanical stresses lead to fast developping crack patterns (v = 1 cm s1). the drying of wet sand lead to a slow cracking formation (v = ICH cm s1). Ageing can also lead to slower fracture phenomena with v = 108 cm s1! Fast crack formation is well studied [1] while slow cracking processes are less often discussed. Realistic models are even a little bit lacking.
In this paper, we present simple stochastic models which lead to very slow fracture dynamics as well as particular behaviors like healing and self-avoiding crack patterns. As we will see, these investigations are relevant for respectively sputtering and freezing phenomena. For conciseness we will mainly emphasize the sturcture of cracks in a fractal/percolation geometry sense.
SPUTTERING
Two stochastic models (I and II) have been developped in successive works [2,3]. Each model is constrained to be the most simple one as possible for the intended purpose. Both models are defined on a two-dimensional square lattice of size LxL. The lattice represents a "target" on which the supttering process takes place. Each site can contain either a particle (atom) or a hole. At each step of the simulation, an occupied site of the target is chosen randomly as well as one of the four main directions of the lattice. The particle of this site is then assumed to be ejected along a straigth line in the selected direction. In model I, the particle is assumed to be ejected outside the target and does not participate to the subsequent process thereafter [2]. In model II, the particle is assumed to stop at the first available unoccupied site on the lattice if any [3]. Both fracture processes are illustrated in Figure 1.
Of course, model I is equivalent to a percolation phenomenon [4] and indeed the first percolation threshold is reached after t^^^SL2 time steps. One should notice that we can also consider the second percolation threshold defined when the fracture (cluster of connected holes) reaches the four borders of the target. The second percolation threshold was found in [2] to occur after tc2=0.65L2 time steps in model I.
In model II, the situation is quite different, no percolation threshold is ever reached when the target size increases (tcl->+~ and tc2->+°= when L->+°°). In fact, we have obtained the power laws : tcl~tC2~L3"> through many simulations. This effect is due to some "healing" of the target. Indeed, motion of particles on the target allows for a reconstruction of the lattice. This regime is probably close to plasticity dynamical regimes. This leads also to a destruction of the fracture such that multiple percolation thresholds are observed. An interesting numerical result is the observation of the number N of first percolation thresholds before reaching a second percolation threshold, i.e. the number of fractures observed between tcl and tc2. This number scales as a
215 Mat. Res. Soc. Symp. Proc. Vol. 539 e 1999 Materials Research Society

power law N~L07 as shown in Figure 2. That means that the rearrangements (healing) is critical (scaleless) during very long periods for large systems.
In both models, the crack patterns are found to be fractal with a fractal dimension of about 1.9, i.e. close to the percolation value 91/48.
model I model II
Figure 1 - Typical snapshots of the lattice (target) at the first percolation threshold tc] for both model I and model II. The black squares represent holes (unoccupied sites) on the lattice. Ejected particles are represented outside the target.
Figure 2 - The number N of first percolation thresholds observed between t,, and t^ as a function ofL.
FLUID INVASION AND FREEZING OF POROUS MEDIA
When porous media like cementeous or brick materials are in contact with a fluid, the latter invades pores through capillary forces. The physics of this phenomenon has been well described by percolation-like models. Our motivation was to observe the freezing and subsequent destruction of the porous medium. A simple stochastic model [5] has been developped. The model is again a two-dimensional one, with a random number (taken from a
216

uniform distribution between 0 and 1) attached to each site of a square lattice. The number is some elementary representation of a pore size. From one side, the fluid invades the "materials", invading the pores with the smallest "size" first, then the nearest neighborhing pore(s) with the smallest size, up to the "time" the fluid reaches the opposite extremity of the lattice with respect to its first invasion. The fluid is next frozen at once. The size of each invaded pore, thus belonging to the percolation cluster, is increased by a random number such that each new pore size is less than unity. This pore dilation represents some cracking at the pore scale. The fluid then sublimates, for a new invasion to take place, and so on. Figure 3 illustrates the rule of the above invasion/freezing model.
Figure 4 presents the successive clusters of invading fluid after n=l,2,3,4,5 and 6 cycles. After a few cycles, notice that a self-avoiding phenomenon occurs between successive invasions. Indeed, after a few cycles, the cluster invades new parts of the medium. Thus, the destruction of the porous medium occurs anywhere! The fractal dimension of the successive percolation clusters decreases towards unity. The distribution history of pore sizes has been discussed in [6].
0.78 0.99 0.58 0.-15 0.91
0.19 0.67 0.81 0.12 0.70
0.8-1 0.7S 0.62 0.98 0.72
0.35 0.83 0.50 0.09 0.36
0.60 0.81 0.77 0.16 0.91
0.78 0.99 0.58 EU 0.91 HE_I
10^91 0.67 0.81 loTao^ol ■<■■
0.84 0.7510^210.98 llBa H6| t^Ki]
^p0.83 IBBil SHE] rflEH E E H
liiail GEH a a
ma RJE SKH a o D
0.78 0.99 0.58 0.86 0.91
0.31 0.67 0.81 0.27 0.94
0.84 0.75 0.89 0.98 0.78
0.46 0.83 0.87 0.39 0.72
0.84 0.95 0.80 0.51 0.99
Porous media Water invasion Freezing and Thawing
Figure 3 - Illustration of the invasion-freezing process: (i) a 5x5 lattice representing the porous material, (ii the invasion of the porous material by a fluid (represented in dark), the labels give the evolution of this invasion, and (iii) the porous structure after the freezing process.
n=2 n=3
n=5 n=6
Figure 4 - Successive percolating clusters observed on a 200x200 lattice after n=l,2,3,4,5 and 6 iterations.
217

CONCLUSION
Through two simple models we have attempted to capture the essential features observed in microstructure of random media subjected to slow cracking. Many questions remain, in particular the difference between two and three dimensional systems should be noted. In two dimensions, a percolation cluster completely separates the system into two parts, and an irremediable crack is supposed to exist, - except if no percolation is ever obtained, as in model II here above, where some healing is allowed. This reconstruction process could also be introduced in the random medium invasion and cracking model. In three dimensions though the percolation cluster is defined when one point (site) is reach on the opposite extremity of the invasion side. Therefore there is no complete separation of the material parts. However clusters might be detached from the sample. Other conditional probabilities and energetic conditions might be interestingly imposed.
ACKNOWLEDGEMENTS
This work was supported through the ARC (94-99/174) contract of the University of Liege. NV is financially supported by the FNRS. (Brussels, Belgium).
REFERENCES
1. P.Daguier, S.Henaux, E.Bouchaud, and F.Creuzet, Phys. Rev E 53, 5637 (1996)
2. M.Ausloos and J.M.Kowalski, Phys. Rev. B 45, 12830 (1992)
3. R.D'hulst, N.Vandewalle and M.Ausloos, Phys. Rev. E 55, 189 (1997)
4. D.Stauffer and A.Aharony, Introduction to Percolation Theory, (Taylor & Francis, London, 1994) 2nd printing
5. E.Salmon, M.Ausloos and N.Vandewalle, Phys. Rev. E 55, R6348 (1997)
6. E.Salmon, M.Ausloos and N.Vandewalle, Cement and Concrete Res., in press (1998)
218

Part VI
Crystal Plasticity and Mesoscale Dislocation Modelling

ANALYSIS OF COMPRESSION BEHAVIOR OF A [Oil] TA SINGLE CRYSTAL WITH ORIENTATION IMAGING MICROSCOPY AND CRYSTAL PLASTICITY
AJ. SCHWARTZ, J.S. STÖLKEN, W.E. KING, G.H. CAMPBELL, D.H. LASSILA, J.Y. SHU, S. SUN*, AND B.L. ADAMS* Lawrence Livermore National Laboratory, Materials Science and Technology Division, Livermore, CA 94550, [email protected] * Materials Science and Engineering Department, Carnegie Mellon University, Pittsburgh, PA 15213
ABSTRACT
High-purity tantalum single crystal cylinders oriented with [Oil] parallel to the cylinder axis were deformed 10, 20, and 30 percent in compression. The engineering stress-strain curve exhibited an up-turn at strains greater than -20% while the samples took on an ellipsoidal shape during testing, elongated along the [100] direction with almost no dimensional change along foil]. Two orthogonal planes were selected for characterization using Orientation Imaging Microscopy (OIM): one plane containing [100] and [011] (longitudinal) and the other in the plane containing foil] and [011] (transverse). OIM revealed patterns of alternating crystal rotations that develop as a function of strain and exhibit evolving length scales. The spacing and magnitude of these alternating misorientations increases in number density and decreases in spacing with increasing strain. Classical crystal plasticity calculations were performed to simulate the effects of compression deformation with and without the presence of friction. The calculated stress- strain response, local lattice reorientations, and specimen shape are compared with experiment.
INTRODUCTION
Ideally, any stress-strain behavior during constitutive testing should be solely a function of the applied (macroscopic) deformation, sample history, orientation, temperature, and strain-rate. In compression tests, "extrinsic" factors such as sample alignment and platen friction augment the "intrinsic" factors [1]. Although the use of tensile specimens largely mitigates the "extrinsic" factors, the convenience and utility of compression specimens can outweigh the disadvantages. This is particularly true for latent hardening tests, in which a sequential set of single slip tests quantifies the constitutive response of a previously inactive slip system as a function of prior slip on another system. The combined intrinsic and extrinsic factors manifest themselves in the evolution of the crystal orientation with strain, which is ideally studied using Orientation Imaging Microscopy (OIM).
OIM is a SEM-based technique that has been primarily applied for characterization of the microtexture of polycrystalline materials [2]. In this method, orientation data at resolutions = 1 urn can be acquired as a function of position on a planar-section. In this investigation, OIM is applied to study the evolution of crystal rotations occurring during compression testing of Ta single crystals and to correlate these results with measured constitutive response. These data provide insight into deformation mechanisms as well as a means to assess the influence of sample geometry and testing conditions on the measured constitutive response. For example, the inhomogeneous stress state in compression specimens arising from platen friction was reported by Cook and Larke to cause anomalous stress-strain behavior [3].
The compression specimens characterized in this work using OM are of a configuration similar to the second-stage of a latent hardening experiment using typical engineering practice: ~ 1:1 aspect ratio (diameter/height), polished diameter, lapped end-surfaces, and specimen end- surfaces lubricated with a single application of directional polytetrafluoroethylene (PTFE) tape [4]. Tests under these conditions establish a baseline for comparison with the results of more sophisticated, and expensive, experimental techniques such as renewing the solid lubricant at regular intervals during the test and optimizing the type and thickness of lubricant. Ultimately,
221
Mat. Res. Soc. Symp. Proc. Vol. 539 ®1999 Materials Research Society

the minimization of frictional effects will increase the accuracy of extrapolation methods as described by Ray and Mallik [5] and Singh and Padmanabhan [6] for end-effect correction and decrease the effort in their application.
A unique feature of deformation along the <011> axis of BCC metals is the stable, essentially plain-strain condition that persists to large strains. Compression along the [Oil] direction results in extension along the longitudinal [100] direction and very small elongation (<1%) along the transverse [oil] direction. Cylindrical samples take on an ovoid shape within the (Oil) plane. Hosford [7] has observed similar deformations in the study of drawn BCC polycrystalline <011> textured wires that were first studied in the early 1960's. The origin of this planar deformation mode in single crystals is associated with the fact that the slip directions of all the potentially active {110} and {112} slip planes are contained in a single {110} plane. For the [Oil] loading direction, the potentially active {110} and {112} slip planes occur in symmetric pairs; each pair contains both [ill] and [111] slip directions. This limits the plastic deformation for [011] loading
to the (Oil) plane.
The two-dimensional nature of the plastic deformation is an important consideration in assessing the influence of platen friction on the measured stress-strain response. Simple estimates to account for friction during compression testing have been available for over 70 years [3,8]; however, most of these have assumed axisymmetric deformation. Only since the 1960's have both the necessary experimental methods [9] and theoretical analysis [10,11] been available to examine the influence of friction associated with more complex deformation. These simple analytical methods provide valuable insight and serve as a point of departure for finite-element modeling. A finite-element, crystal-plasticity [12] simulation using a Coulomb friction model of the sample/platen interface is used to study the effects of friction on the nominally homogeneous deformation.
This paper describes the details of crystal growth, purification, specimen preparation, and mechanical testing. The OM results, discussion of the finite element modeling, and overall conclusions are then given.
EXPERIMENT
Single Crystal Preparation
The single crystal of Ta was grown at the Institute for Solid State Physics in Chernogolovka, Russia, from high-purity stock material provided by Cabot Corporation. The stock Ta was further purified by zone refining in high vacuum. The molten zone was formed by electron beam heating from an annular electrode and five passes through the crystal were taken, with the last pass seeded for growth along [013]. The resultant crystal was 18 mm in diameter and approximately 200-mm in length. Each slice for compression testing was oriented using Laue back-reflection x-ray diffraction. After alignment on the Laue camera, the sample and mounting fixture were transferred as a single unit for sectioning slices approximately 5.1 mm thick by wire electrical discharge machining (WEDM). Compression cylinders approximately 5.47 mm diameter by 4.65 mm length were cut by WEDM from the single crystal disks, then machine turned to near final length and diameter. The diameters were polished with 1200 grit SiC paper followed by Super Blau metallputz paste. The ends were lapped flat and parallel using 1200-grit paper to within 0.01 mm.
Purification Treatment of Mechanical Test Specimens
Impurities in BCC metals are known to have a strong effect on mechanical properties. In Ta, the effects of both substitutional [13] and interstitial impurities [14] have been well characterized. The zone refining steps prior to the single crystal growth allow impurities to volatilize into the vacuum or be swept to one end of the boule. Chemical analysis by glow discharge mass spectrometry shows this method was effective in reducing the concentration of substitutional impurities. A typical analysis reveals Nb and W to be the impurities with highest concentration,
222

125 and 45 ppmw, respectively. The other impurities include Mo and Re, both at approximately 2 ppmw, while all other substitutional impurities are well below 1 ppmw. These levels of substitutional impurities are not expected to exert a significant effect on the mechanical behavior.
The relevant interstitial impurities in Ta are H, C, N, and O. At levels of a few tens of ppmw, these impurities cause significant increases in both the yield and flow stresses. However, Smialek and Mitchell [14] have demonstrated that these impurities can be removed to below this level by applying an appropriate heat treatment. As the last step in the preparation of mechanical- test specimens, the samples were introduced into an ultra-high vacuum chamber as shown in Figure 1 (a base pressure of <1 x 10"10 torr in the main chamber, but approximately a decade higher at the specimen position). The samples were suspended with a wire of Ta-10%W and were heated by inductive coupling to an external RF coil. The samples were first heated to 1800°C during which most of the dissolved H outgassed from the specimen and was pumped away. Oxygen was then introduced to the chamber to achieve a pressure of 2 x 10'6 torr in order to react with C at the surface of the sample and remove it as CO. The sample was held in this condition for 8 h, after which the oxygen flow was stopped and the temperature of the sample was raised to 2600CC. The high temperature treatment removed O and N from the sample as observed in the vacuum by residual gas analysis. Two of the mechanical test specimens were held for 8 h while a third one was held for 18 h. At the end of the longer time at high temperature, the vacuum in the chamber fully recovered to its base pressure level. Upon removal of the specimens from the vacuum chamber, they were immediately placed into a dewar of liquid nitrogen in order to slow the kinetics of re-introduction of any impurities. The purity of the specimens was characterized by measuring their electrical resistivity at room temperature and at slightly above the Ta superconducting transition temperature at 4.5K. The residual resistivity ratios achieved are in the range of 700 for the short-time anneal and 1500 for the longer time. Prior to mechanical testing the samples are warmed to room temperature in ethyl alcohol.
>2 Variable Leak Valve
Quartz Water Jacket
RFCoil
} Water Out
Figure 1. Schematic of purification apparatus.
Mechanical Testing
A series of mechanical tests aimed at understanding the deformation behavior of high-purity tantalum single crystals was undertaken. Quasistatic compression tests were performed in a subpress with tungsten carbide platens using an Instron 1127 short frame test machine and an MTS 7.6-mm extensometer was used to measure the relative motion of the platens. Teflon tape
223

was pre-loaded to 2045 kg for use as a lubricant. All of the results described here pertain to samples tested at room temperature at a strain rate of 10"3 s'1.
The engineering stress - engineering strain response of three [011] single crystal compression samples is shown in Figure 2. These purified specimens exhibit a minor yield drop, followed by a nearly linear region of hardening. At approximately 20% engineering strain, the stress - strain response begins to turn up. This is due to a combination of the non-linearity of engineering strain and the effects of platen friction.
250
200- (0 Q. E 150
in
8 100 (/)
.' ' ' ' I ' ' i ! i i i i ! i i i i , i 1 > . | 1 , 1 > | 1 ! 1 , _
: y
engr stress-strain,. ̂
■zf^ stress-strain true
' nl.i.ililii!. Mlll.lllllll'
50
0.00 0.05 0.10 0.15 0.20 Strain
0.25 0.30 0.35
Figure 2. Room temperature stress-strain response of high-purity Ta [011] single crystals at a strain rate of 10~V.
Orientation Imaging Microscopy
The objective of the OIM analysis was to explore the variations in local lattice rotations as a function of position in the sample for several strains. The ovoid samples were sectioned along the plane containing [011] and [100] to reveal the longitudinal view. The unused half was sectioned again to reveal the transverse plane, which contains [01 ll and [011]. These specimens were mounted in conductive epoxy and prepared for OIM examination using standard lapping procedures.
The OIM technique is based on automatic indexing of the backscatter Kikuchi diffraction patterns within a scanning electron microscope. Individual orientation measurements are made at discrete points on the sample, defined on a grid. At each point during the scan, the orientation is recorded along with coordinates describing the position. Images (or maps) can be generated by mapping the crystal orientation (or misorientation) onto a color or grayscale and shading each point on the grid according to some aspect of the crystal orientation. Up to five individual OIM scans were required to cover the longitudinal section and two for the transverse section. Each individual scan was analyzed separately and plotted in terms of in-plane and out-of-plane rotation angles. These overlapping maps were then aligned to assemble an overall collage.
To examine local lattice rotations, the Euler angles relative to a reference orientation at the section center are decomposed to their in-plane and out-of-plane components. The in-plane and out-of-plane crystal-rotation maps for all three compression tests reveal inhomogeneous deformation everywhere and particularly large lattice rotations in the corners of the longitudinal section.
224

RESULTS
Figure 3 illustrates the measured lattice rotations of the [Oil] specimen compressed 10% with a misorientation scale of 0 to 5 degrees. These three scans have step sizes between 13 and 15 microns. The existence of features in the crystal rotation field with sizes on the order of the step size will be observed as single points in the OM scan, however, their morphology will not be resolved. In the longitudinal plane, rather sharp changes in crystal orientation (-1°) are observed that appear to be geometric in nature and emanate at approximately 45° from the top and bottom corners. These features, which do not appear to correspond to the traces of either the {110} or {112} slip planes, or <111> slip directions, appear early in deformation and persist throughout. A second type of contrast feature lying roughly perpendicular to the above features is observed which is characterized by relatively smaller changes in orientation (-0.5°). Of particular interest are the alternating orientation changes observed upon crossing several of these features. This suggests the existence of networks of dislocations with net alternating sign that are required to accommodate the observed rotations. Essentially all of the rotations measured with OM are about the [OT1] axis, i.e. no significant lattice rotations occur out of the (oil) plane. This is consistent with the Burgers vectors being contained in the observed section. These common features are observed in all of the specimens studied.
Crystal Rotation (degrees)
m 2.5
Figure 3. Misorientation collage of the 10% compressed sample, longitudinal view. Rather sharp changes in crystal orientation (-1°) are observed that appear to be geometric in nature and emanate at 45° from the top and bottom corners.
Figure 4 represents a collage of the four scans required to cover the 20% compressed specimen plotted on the misorientation scale from 0 to 10 degrees. The rotations are all about the [OT 1] axis with the largest lattice rotations occurring in the corners and prominent misorientation features emanating from the corners. The finer-scale contrast features normal to these are more pronounced than the 10% compressed specimen. In addition, the spacing of these alternating misorientations is smaller.
Figure 5 reveals the longitudinal section of all but the 300 micron wide region on the right side of the specimen compressed 30%. This image spans a misorientation scale from 0 to 15 degrees. Rotations greater than 15 degree occur in the corners as well as at the ends of the horizontal midplane. Abrupt orientation changes are observed throughout this figure. Of particular interest is the approximately 5 degree alternating misorientations with width on the
225

order of 70 microns. The spacing, magnitude, and angles of the alternating misorientations are observed to increase in number density and decrease in spacing with strain. Specifically, at 10% compression, the angle between primary bands is approximately 95 degrees. This decreases to 85 then 80 degrees as the specimen is compressed to 20% and 30% deformation, respectively [15]. Observed rotations are about the [011] axis.
Crystal Rotation (degrees)
■■I -• • ■ .*• : ai 2.5 5.0 7.5 10
Figure 4. Misorientation collage of the 20% compressed sample, longitudinal view. The rotations are all about the [Ol 1] axis with the largest lattice rotations occurring in the corners and prominent misorientation features emanating from the corners.
*& Crystal Rotation "X'*! (degrees)
7.5 15
Figure 5. Misorientation collage of the 30% compressed sample, longitudinal view. Greater than 15 degree rotations occur in the corners as well as at the ends of the horizontal midplane. Severe orientation changes are observed throughout this figure. Of particular interest is the approximately 5 degree alternating misorientations with width on the order of 70 microns. Observed rotations are about the [Ol 1] axis.
Figure 6 is a higher resolution OIM image of the specimen compressed 20% and suggests that the bands discussed above are discrete ~2 to 5 urn wide regions of relatively large rotations. These bands are aligned approximately 85° with respect to each other but do not lie along the traces of the slip planes. Rotations as large as 5° are observed within the bands while the intersection causes a displacement across the band.
226

Rotation maps from the transverse section shown in Figure 7 are distinctly different in appearance from those in the longitudinal plane. Figure 7(a) is a low-resolution scan with step size equal 16 urn and scans one-half of the transverse section from the top to the bottom. Figure
7 (b) reveals the out-of-plane rotations with 1 urn step size resolution. The features of these out- of-plane rotation maps are neither as sharp nor as straight as those observed in the longitudinal section. The rotation maps confirm that the rotations observed are about the [Oil] axis suggesting the importance of slip on the {112}<111> slip systems. Alternating orientation changes are also observed on this section. Features likely corresponding to the 2 to 5 um wide bands of Fig. 6 are observed in Fig. 7b.
Crystal Rotation (degrees)
-5.0 -2.5 0.0 2.5 5.0 anti- clockwise clockwise
Figure 6. High magnification OM image of the specimen compressed 20%. Orthogonal lines in the center show that the bands intersect at an angle < 90°. Oblique lines at the top right are the traces of the {110} and {112} slip planes in the longitudinal section.
DISCUSSION
The upturn in the stress-strain diagram above 20% strain is similar to that seen by numerous other investigators [1,3-6] during compression testing; however, the effect seems particularly acute. The magnitude of the upturn and its occurrence at relatively low strain suggests that factors other than friction may be significant. A two-step approach shall be used to assess the impact of platen friction on the deformation. First, using simple analytical models, the frictional contribution to the flow stress shall be estimated. The resulting parameters shall then be used as input to a finite element simulation to gage the effect of friction on lattice rotations.
One of the first published estimates of the influence of platen friction on the measured flow stress during compression testing is due to Siebel [8]:
üobs/Ofiow = 1 + C (d/h), (1)
where a0bs is the observed flow stress, <Jfl0W is the true flow stress measured under uniform deformation, d is the sample diameter, h is the sample height, and C is a constant.
227

Crystal Rotation (degrees)
b Crystal Rotation (degrees)
-5.0 -
Figure 7. Misorientation maps of the 30% compressed sample, transverse view. The features of these out-of-plane rotation maps are neither sharp nor straight. The rotation maps confirm that the rotations observed are about the [Oil] axis suggesting the importance of slip on the {112}<111> slip systems. Alternating orientation changes are also observed on this section, (a) low resolution, 16.0 |0.m step size scan, (b) high resolution, 2.0 (Xm step size scan.
Using the Tresca yield criterion and flow rule, the value of C is \i/3, where u is Coulomb's coefficient of friction equal to the tangent friction force divided by the normal force. Although Eqn. 1 is predicated on small values of C, its applicability is quite broad since it was shown by Avitzur [16] to be identical to the upper-bound solution for the compression of a cylinder between two rigid dies. In both cases the deformation is considered to be axisymmetric. Using a generalized Galerkin method, Hill [10] considered the compression of an arbitrary cross-section for both two- and three-dimensional deformations, obtaining:
C = u/3 (in 3D) C = u72 (in 2D)
(2) (3)
These relations were later rederived by Collins [11] using an upper-bounds technique. Thus for a given (d/h), factional effects under 2D deformation are 50% greater than those in the 3D case, at least to first order in (i. This is consistent with the enhanced upturn observed during the essentially plane-strain compression of the [011] oriented single crystal.
The earlier occurrence of the upturn during plain-strain deformation, as compared to the axisymmetric deformations cited in the literature, may be reconciled by considering the
228

relationships between the applied strain and the sample aspect ratio in both two and three dimensions. For isochoric deformations in 2D it is easily shown that the aspect ratio r (r=d/h) may be written as the following function of the engineering strain (e):
r = r0(l-e)-2 (in 2D) (4)
while in 3D:
r = r0(l-e)-3/2 (in 3D) (5)
For samples with the same initial aspect ratio (r0), at any given compressive strain (e) the
aspect ratio of a sample deforming in 2D is (l-e)_1/2 times greater than that of the 3D case. For an applied strain of 30%, this difference amounts to a 20% increase. For an applied strain of 40%, the change in aspect ratio is 29% greater in 2D than in 3D. The net effect of the larger friction factor (increased C) in 2D coupled with the greater change in aspect ratio for a given strain significantly enhances the influence of friction in 2D deformation as compared to 3D. For an applied strain of 30% the combined increase is 80%, while at 40% strain the overall enhancement of the factional effect is over 93%.
A simple estimate of the friction coefficient may be derived by assuming a linear hardening relation:
Ow = °0 + He (6)
where oflow is the true flow stress, oo is the initial yield stress, H is the hardening rate, and e is the true strain. This is substituted into Eqn. 1 and solved for the friction factor (C). Assuming that the initial friction is small (u=0.04) for small strains (<10%), the values of ao and H is obtained:
O0=115MPa, H = 28MPa (7)
Using these values, the friction factor is calculated for larger values of strains. In doing so it is observed that the value of C varies monotonically from 0.02 at 10% strain to 0.1 at 30% strain. It should be emphasized that these values of C are highly dependent upon the chosen hardening model, since the measured response is a convolution of friction and hardening. The goal here is two-fold: to show that the apparent rapid hardening rate can be attributed to friction when accounting for the two-dimensional nature of the deformation and to provide a point of departure for finite-element modeling of the deformation. In this spirit, the evolution of friction with deformation is modeled using a simple one-parameter model describing a linear rise in the friction factor with aspect ratio. The corresponding value of |J, varies linearly from 0.04 at 0% strain to 0.20 at 30%. These values are consistent with nearly perfect lubrication initially to that typical of lubricated metals [17] at 30% strain. The stress-strain behavior predicted by this model along with the experimental data is shown in Figure 8. A curve showing the behavior in the absence of friction is also shown. Using reasonable values for the model parameters results in an acceptable fit to the experimental data considering this simple model.
The evolution of friction stresses at the sample/platen interface is in general extremely complicated, dependent upon both the material response and lubrication conditions at the interface. This will be investigated in detail in a later series of experiments and simulations; however, the present focus shall be on the initial stages of deformation (<10% strain) where friction is considered constant. In this regime it is of interest to examine the role that friction plays in altering the nominally homogeneous deformation and making comparisons with the OIM observations.
A finite-element simulation of the compression sample was performed using Coulomb friction to model the sample/platen interface and a crystal plasticity [12] constitutive relation to model the specimen. The platens were modeled using isotropic elasticity. A crystal plasticity model similar to that of Kothari and Anand [18] has been implemented in the implicit finite element code Nike3D [19]. The material parameters are chosen to be those used by Kothari and Anand, with the following exceptions. The initial flow stress and hardening rate were selected to be consistent with the above values of oo and H for the [011] orientation and linear hardening was assumed.
229

Independent hardening of the slip systems is used, since extensive latent hardening data are unavailable. Slip on both the {112} and the {110} slip-planes is considered. The coefficient of friction at the sample/platen interface is taken as 0.08, consistent with the above observations. Using these parameters, models of both the entire sample and one-eighth the sample were constructed using 243 and 162 elements, respectively. Since the simulation of the entire specimen essentially duplicated the plane-strain deformation observed in the experiments, we shall focus on the one-eighth of the specimen modeled with 162 elements and three symmetry planes.
250
(0 Q.
(0 W 0)
Ui
c
<D Q) C
"5> c
LU
200
150
100
Experimental Data High Friction Model Low Friction Model
0.00 0.05 0.10 0.15 0.20 0.25 0.30 0.35 Engineering Strain
Figure 8. Comparison of the experimental and simulated stress-strain response of the [011] Ta single crystals. Calculations were performed with both low and high friction models and revealed the strong influence of friction on the measured constitutive behavior.
An elementary crystal plasticity calculation [20] indicates that uniaxial compression in BCC metals along the [011] axis in the absence of friction should result in homogenous compression and an associated elongation along the [100] axis. The deformation is contained within the (oil) plane and the lattice rotation is zero. The presence of frictional forces alters this picture, resulting in inhomogeneous deformation and associated crystal rotations.
This can be seen in the finite element simulation shown in Figure 9. For an applied strain of 6%, the lattice rotation in the corner regions is almost two degrees, while the central region of the sample is essentially unrotated. The axis of rotation is parallel to the normal of the plane of the deformation. The deformation and rotations are essentially two-dimensional, even though this is a full three-dimensional calculation. The overall deformation pattern and the magnitude of the lattice rotations are in good agreement with the OM observations; however, the details of the lattice rotations are not. To explore this further, higher resolution simulations were performed.
In order to reduce the large computational burden of three-dimensional calculations, the two- dimensional nature of the deformation was exploited. A slice of the sample parallel to the longitudinal section was modeled assuming that it deformed in plane strain. This appears to be a good approximation in light of the above experimental observations. In doing so, finely meshed finite-element simulations could be performed in a few days. The mesh size in the corners corresponds to 10 um, with over 400 elements in the entire model. All other features (constitutive parameters, friction coefficient, etc.) of the model are identical to the previous three- dimensional case. The results of this simulation are shown in Figure 10. The maximum rotation has increased to -2.3 degrees and the deformation pattern in the corners has become sharper and
230

Figure 9. One-eighth section of full three-dimensional finite element simulation of crystal rotations caused by compression deformation with platen friction. Maximum rotations of 1.6 degrees occur in the upper-right corner, while the center remains unrotated. Applied strain: 6%.
Crystal Rotation (degrees)
Figure 10. High resolution, finely meshed, plane-strain finite element simulation of crystal rotations caused by compression deformation with platen friction. Maximum rotations of 2.3 degrees occur in the upper-right corner, while the center remains unrotated. Applied strain: 6%.
231

more well defined. Experimentation with different mesh sizes and the number of elements leads to the conclusion that the finite element solution exhibits the well-known size effect of classical computational plasticity[21], i.e., without a length scale in the plasticity model, the finite element solution is dependent upon the size of the mesh used in the calculation. It is for this reason that higher resolution calculations with even finer meshes have not been employed to examine the rotations observed by OHVl at the smallest scale.
CONCLUSIONS
Friction exerts a significant effect in the compression deformation of the [Oil] single crystals giving rise to an enhancement of the apparent flow stress at strains in excess of 20%. The two dimensional nature of the deformation exacerbates the effects of platen friction. To first order, the enhancement can be explained by frictional effects without invoking crystal plasticity. The macroscopic lattice rotations at small strains (<10%) predicted by finite-element calculations using a Coulomb friction model are in reasonable agreement with OM observations. Higher order deviations of the experimental results from simple model calculations are likely the consequence of crystal plasticity. Frictional effects drive lattice rotations at the sample corners which likely spawn inhomogeneous bands of deformation throughout the sample. The bands, which are ~2 to 5 |xm in width and bounded by low angle boundaries, evolve with strain. The resolution of these fine-scale lattice rotations awaits the implementation of a scale-dependent crystal plasticity formalism needed to remove the mesh dependence of the finite element solution.
The authors thank Mr. Robert K. Kershaw for performing the metallography, and Ms. Mary M. LeBlanc for mechanical testing. This work is performed under the auspices of U.S. Department of Energy and Lawrence Livermore National Laboratory under contract No. W-7405-Eng-48.
REFERENCES
1. T.C. Hsü, Materials Research and Standards, 9, No. 12, p. 20 (1969). 2. T.A. Mason and B.L. Adams, Journal Of Metals, 46, No. 10, p. 43 (1994). 3. M. Cook, and E.C. Larke, Journal Inst. Metals, 71,p. 371, 1945. 4. J.S. Gunsekera, J. Havranek, and M.H. Littlejohn, Journal of Engineering Materials and Technology, 104, p. 275 (1982). 5. K.K. Ray and A.K. Mallik, Trans. Met. Soc. of AIME, 14A, p. 155 (1983). 6. A.P. Singh and K.A. Padmanabhan, Journal of Materials Science, 26, p. 5481 (1991). 7. W.F. Hosford, Jr., Trans. Met. Soc. of AIME, 230, p. 12 (1964). 8. E. Siebel, and A. Pomp, Kaiser-Wilhelm Inst. EisenForsch, 9, p. 157 (1927). 9. A.T. Male, and M.G. Cockcroft, Journal Inst. Metals, 93, p. 38 (1964-65). 10. R. Hill, J. Mechanics and Physics of Solids, 11, p. 305, (1963). 11. I.F. Collins, J. Mechanics and Physics of Solids, 17, p. 323, (1969). 12. R.J. Asaro, Advances in Mechanics, 23, p. 1, (1983). 13. PL. Raffo, and T.E. Mitchell, Trans. Met. Soc. of AIME, 242, p. 907 (1968). 14. R.L. Smialek and T.E. Mitchell, Phil. Mag., 22, p. 1105 (1970). 15. A.J. Schwartz, W. E. King, G. H. Campbell, J. S. Stölken, D. H. Lassila, S. Sun , and B. L. Adams, Accepted, Journal of Engineering Materials and Technology (1998). 16. B. Avitzur, Metal Forming, Processes and Analysis, p. 78, McGraw-Hill, NY, (1968). 17. H.H. Ryffel, Ed., Machinery's Handbook, 22nd Ed, Industrial Press, NY p. 436 (1984). 18. M. Kothari and L. Anand, J. Mechanics and Physics of Solids, 46, No 1, p. 51, (1998). 19. B.N. Maker, Nike3D: A nonlinear, implicit, three-dimensional finite element code for solid and structural mechanics - user's manual, LLNL, UCRL-MA-105268 Rev 1, (1995). 20. G.Y. Chin, R.N. Thurston, and E.A. Nesbitt, Trans. Metal. AIME, 236, p. 69 (1966). 21. A. Acharya, and G. Shawki, J. Mech. and Physics of Solids, 43, No. 11, p. 1751 (1995).
232

MESOSCOPIC SIMULATION OF DISLOCATION ACTIVITY AT CRACK TIPS
A. HARTMAIER AND P. GUMBSCH Max-Planck-Institut für Metallforschung, Stuttgart ([email protected])
ABSTRACT
Discrete dislocation dynamics simulations have been performed to study dislocation activ- ity in the vicinity of a crack tip and to get a better understanding of the decisive mechanisms of the brittle-to-ductile transition (BDT). The comparison of these simulations with fracture experiments on tungsten single crystals leads to a preliminary model for the BDT of this material. Many features predicted by this model are also found in other materials. Disloca- tion nucleation and the availability of active sources are shown to be limiting plasticity at low temperatures and partly in the semi-brittle regime. At elevated temperatures disloca- tion nucleation occurs easily, such that plasticity in this regime and the BDT itself, must be viewed as a thermally activated processes, which are controlled by dislocation mobility.
INTRODUCTION
Materials performance in structural applications is often limited by a transition from ductile response to brittle fracture with decreasing temperature. This transition is commonly regarded as a competition between brittle cleavage, and blunting and shielding of the crack tip by plastic deformation. However, the question which mechanisms cause or prevent plastic deformation at the different temperatures has not yet been satisfactorily answered. Several groups postulate that dislocation nucleation is the limiting and thus decisive mechanism [1,2], whereas others view the BDT as a thermally activated process, which is controlled by dislocation mobility [3-7].
In this work, different models are implemented into a two-dimensional (2D) simulation scheme, which solves the dynamics of many dislocations around the crack tip. With the help of this computer simulation the influence of dislocation mobility on the one hand, and dislocation nucleation on the other hand, is investigated separately. The comparison of the numerical results with experimental data allows us to determine the limiting processes at various temperatures.
The homogeneous nucleation of dislocations along the crack front seems possible for metals with face centered cubic (fee) crystal structure [1,8], whereas the activation energy for homogeneous nucleation is too high for metals with body centered cubic (bec) structure [1,9]. Therefore, dislocation nucleation in bec metals occurs preferentially at imperfections in the crack front [10,11]. The conditions under which such sources become active are not yet completely understood, but some mechanisms by which discrete nucleation sites along the crack front operate can be investigated in more detail by three-dimensional (3D) discrete dislocation simulations. In this work, it is shown that the assumption of a temperature dependent density of sources along the crack front leads to a good agreement of simulation and experiment.
233
Mat. Res. Soc. Symp. Proc. Vol. 539 e 1999 Materials Research Society

MODEL
A simple two-dimensional (2D) numerical model, which has already been used and de- scribed earlier [5,6,12], is employed to study the dislocation activity in the vicinity of a crack tip. The elastic interaction of many dislocations emanating from the crack-tip region is described by isotropic elasticity, taking into account all self-interactions and all image effects due to the free crack surfaces [12,13]. The crack is loaded in the opening mode to an applied stress intensity A'/ = K. In-plane and out of plane shear components arc set to zero, i.e. A'// = A'/;/ = 0. The dislocations are of perfect edge character with their line direction parallel to the crack front. Only the slip plane with the highest resolved shear stress is considered. This slip plane is inclined by an angle of 72° to the crack plane.
The total force flol acting on each dislocation is expressed by
/tot = / Kd + /dd + /dd' + /fric (1 )
where /Kd is the force caused by the applied stress intensity, /dd is the image force due to the presence of the free crack surfaces, and /dd/ is the interaction force with every other dis- location, which also includes the interaction transmitted by the free surfaces. The quantity /{,.ic is the lattice friction force, which is always opposite to the direction of motion. This lattice friction force is set to zero unless stated otherwise. The image force is always directed towards the crack tip, whereas the applied force /Kd can be attractive or repulsive depending on the Burgers vector and the line direction of the dislocation. Shielding (crack-closing) dis- locations are repelled from the crack tip, whereas anti-shielding (crack-opening) dislocations are attracted towards the crack tip. An explicit formulation of these terms is given in [12].
The simulations are started at zero applied stress intensity and without pre-existing dislocations. The stress intensity is raised at a constant rate. A constant temperature is assumed during each simulation. At each time step a dislocation nucleation criterion, which is described in detail below, is evaluated to decide whether or not a new dislocation is nucleated. Dislocations of anti-shielding character arc absorbed by the crack tip within short times. These dislocations are not explicitly included in the simulation. The absorption of anti-shielding dislocations, just like the nucleation of shielding dislocations at the crack-tip, results in a blunting of the crack. For the sake of simplicity, such a blunting of the crack tip is neglected. The nucleation of shielding dislocations effectively reduces the local stress intensity at the crack tip, such that further dislocation nucleation is impeded. If the emitted dislocation has moved sufficiently far away from the crack tip, the nucleation of a second dislocation becomes possible. After several dislocations are nucleated, an inverse dislocation pile-up develops on the slip plane. In the time step immediately before a new dislocation is nucleated, the local stress intensity is at its maximum. This maximum increases steadily in magnitude as the applied stress intensity is raised. Finally, the local stress intensity kj at the crack tip exceeds the critical value for fracture, which is taken from experiments (kylt = 2MPam''2 [14]). The applied stress intensity at this stage defines the fracture toughness A'crjt.
The mobility of edge dislocations is described by an Arrhenius-type empirical law of the
form [15]
,cdsc(r,r) = ^(£fexp(-^p), (2) where the dislocation velocity ucdgc depends on the resolved shear stress r, the stress exponent m, the temperature T, and the activation energy Qcdgn- The parameter A is a pre-exponential
234

Table I: Parameters describing dislocation mobility of edge dislocations in tungsten single crystals as determined in [18]. The various quantities are defined in the text.
A/(m/s) m(77K) m(298K) <3edge/eV 0.32 • 10~8 4.8 10.5 0.32
factor with the units of a velocity, To = 1 MPa simply fixes the units of the stress. The Boltzmann constant is denoted with k. For semiconductors, stress exponents close to m = 1 are found [16,17], while in transition metals the stress exponent is usually one order of magnitude higher and may even show a temperature dependence [18,19]. For this study, the parameters are set to values for edge dislocations in tungsten [18] (see Table I). The temperature dependence of the stress exponent is assumed to be of the form [19] m(T) = a + ß/T, with the two fit parameters a and ß, determined from the stress exponents given in Table I.
The mobility law expressed in Equ. (2) is valid only for edge dislocations. In metals with bcc crystal structure, screw dislocations are subject to a high Peierls barrier. Moreover, the activation energy for screw dislocation motion is about one order of magnitude higher than that for edge dislocations [20,21]. Therefore, the mobility of screw dislocations is much smaller than that of edge dislocations [22] up to elevated temperatures where dislocation motion becomes athermal. In tungsten this occurs at about 600K [21,23]). The BDT in tungsten usually occurs below this temperature (cf. Fig. 6 and [7]), which provides a first indication of the importance of edge dislocations for the BDT.
Dislocation nucleation
In a first step, dislocation nucleation is assumed to occur easily, and the consistency of this assumption with the experimental data is tested. The following procedure models homogeneous nucleation of dislocations, where the only barriers that must be overcome are the image force due to the free crack surfaces and the repulsion of the previously emitted dislocations: At each time step a "virtual" dislocation of shielding character is introduced on the glide plane at a distance r = 30fe from the crack tip. This virtual dislocation interacts only passively in the sense that it is subject to the applied stress, the image stress, and the stress due to all other dislocations, whereas its own stress field is disregarded. If the net force on the virtual dislocation is positive (pointing away from the crack tip), the nucleation is accepted. Beginning with the following time step, the nucleated dislocation interacts and moves normally.
It is seen below that the assumption of homogeneous dislocation nucleation along the crack front is rather unrealistic at low temperatures. Due to the inherent geometrical con- straints of the 2D model it is impossible to directly model discrete nucleation sites (sources) along the crack front. However, some consequences of such discrete nucleation sites can be captured even in the simplified geometry.
It has been shown [10,11] that dislocation nucleation occurs preferentially at imperfec- tions in the crack front like ledges or kinks. The primary slip plane of the dislocations nucleated at such imperfections does not contain the crack front (see Fig. 1). The shielding of these dislocations is therefore rather localized [24]. Good shielding of the whole crack front
235

Figure 1: Dislocations that are emitted from a ledge (1) in the crack front may cross-slip onto slip planes containing the crack front (2). The Burgers vector 6 is indicated by an arrow.
is achieved, if a part of the dislocation cross-slips onto a plane containing the crack front (Fig. 1). It is always possible to find imperfections for which the part of the dislocation that is attached to the crack front is of screw character. Irrespective of the high Peierls barrier the screw dislocation moves along the crack front with a comparatively velocity, because of the high stress in this region. The dislocation line is thus torn out along the crack front, until it encounters an obstacle or a dislocation of opposite character. In the latter case, the dislocations that are connected to the crack front annihilate, leaving behind a bulk disloca- tion (Fig. 2). This dislocation is mainly of edge character and therefore relatively mobile. At this stage, the system can again be described within the 2D model. The only difficulty is to capture the details of the nucleation process in the dislocation nucleation criterion.
Figure 2: Dislocations moving on a glide plane containing the crack front, join between the sites where they were emitted. The resulting dislo- cation is a well-shielding, mobile dislocation of mainly edge character. The arrow indicates the direction of motion.
Following [5], a situation is considered where two dislocation nucleation sites are separated by a distance A along the crack front (Fig. 2). For the sake of simplicity, the geometry of dislocations emitted from a ledge in the crack front is reduced to the shape of half-loops of radius r on the slip plane containing the crack front. When the first dislocations arc nucleated, the crack is shielded only in the region contained within the half-loops. Until the dislocations from two neighboring sources meet, the dislocation segments parallel to the crack front have moved a distance 8 away from their nucleation position. Only then can the crack front be considered as being completely shielded by the dislocation.
This description is used to modify the nucleation criterion of the 2D simulation. The dislocations are still nucleated at distance r from the crack front, but their shielding is not taken into account until they have moved a distance 5 away from their nucleation site (Fig. 2). This distance 8 is a function of the loading rate K, the spacing A of active sources, and the dislocation mobility. The two latter quantities are themselves functions of the temperature and the applied stress. A detailed, three-dimensional study of these dependences is in progress and will be published elsewhere. Here, it is assumed that the source spacing decreases linearly with increasing temperature, which yields
A(T) = A1-(A2-A,)J^-, (3)
236

with the constants Ai = 5^m, A2 = 0.1 /im, Tx = 77 K, and T2 = 300 K. These parameters are taken from etch-pit studies on fracture surfaces (see [7,25]). The distance S is assumed to be proportional to the source spacing. In two special cases a larger value for \(RT) was chosen, as will be mentioned.
Predeformation
Homogeneous predeformation increases the density of dislocations throughout the mate- rial. This work hardening reduces the overall dislocation mobility, which is accounted for by introducing a finite lattice friction stress rfric in the simulation [Equ. (1)]. In the crack tip region, the additional dislocation can act as dislocation sources, either by dislocation multi- plication or by changing the morphology of the crack front. In either case, predeformation increases the number of active sources and decreases the spacing between them. Homoge- neous dislocation nucleation is therefore assumed in addition to the finite lattice friction when modeling the fracture toughness of predeformed specimen.
RESULTS
The fracture toughness as a function of temperature and loading rate—determined nu- merically and experimentally—is displayed in Fig. 3. The experimental data result from three-point-bending tests on high-purity [26] tungsten single crystals. The crack system specified by the nominal crack plane and the crack front direction was {110}(110). Each crystal was precracked at 77K to obtain a sharp crack front. The tests were performed with a constant loading rate, which translates into an almost constant stress intensity rate K. More details of the experimental procedure and of the results are given in [7,14,25].
s 10 6
J 5 -TBDT~
200 r(K)
300
B
■
A k =o.i ■ K = 0.4 • k = l.o
/ \
■
rr^K
200 400 T(K)
600
40
20
10
Figure 3: Fracture toughness K^ as a function of temperature T for different loading rates K (MPa^/m/s). Numerical results (A) as obtained for homogeneous nucleation are shown in comparison with experimental data (B). Open symbols are stresses at failure normalized by the crack length a (right axis). In part A the BDT is assumed to occur at a constant fracture toughness, which allows one to define a BDT temperature TBDT- Note the different scales of the figures.
The BDT temperature is taken to be the temperature at which the maximum in fracture
237

toughness is measured experimentally. Since the simple numerical model employed here is not expected to show a transition to general yielding, the BDT temperature is defined as the temperature at which A"c,.it reaches a fixed value A'crjt|BDT- Using this definition an apparent activation energy C/BDT is calculated from the loading rate dependence of the numerically determined BDT temperature TBDT assuming an Arrhenius-like relation
■ exp - t^BDT
&7BDT/ ̂
It is found that the actual choice of the fracture toughness A cntlBDT
(4)
for the definition of the BDT in the 2D model severely changes the value of TBDT- However, it has only very little influence on the calculated activation energy for the BDT. Regardless of the exact value of A'critlßDT the activation energy proves to he equal to the activation energy Qcdgc for the glide of edge dislocations [cf. Equ. (1)]. Furthermore, the activation energy for the BDT is independent of the stress exponent m, even if m is a function of temperature [6].
While the scaling behavior of the numerical results with temperature and loading rate provides valuable information on the activation energy of the BDT, it is seen in Fig. 3 that the dependence of fracture toughness on temperature differs significantly between experiment and simulation. The simulations that use the homogeneous nucleation criterion give a low- temperature fracture toughness higher than the experimental data, and a far too moderate increase of fracture toughness with temperature. In contrast, the simulations using the modified nucleation criterion that accounts for discrete nucleation sites correctly give fracture toughnesses in the range of the experimental data for temperatures up to room temperature. Beyond room temperature, the density of sources is high enough to give a quasi-homogeneous nucleation, and the results are the same for both nucleation criteria.
100 200 300 r(K)
a. s
O experimental data ö_^ O homogeneous
~~o- \o A discrete sources
A \J~~~~o
A' A A
0.10 1.00
K (MPam"!/s)
Figure 4: Fracture toughness A*crit as a func- tion of temperature T for the same loading rates K (MPayin/s) as in Fig. 3A, but under the as- sumption of discrete nucleation sites.
Figure 5: Fracture toughness A"crit as a func- tion of loading rate K (MPaVm/s) at. room temperature. To get a larger effect a source spacing is increased to \(RT) = 1.9/im, com- pared to the usual value \{RT) = 0.1 ftm.
The loading rate dependence of experiment and simulation at room temperature is com- pared in Fig. 5. It is seen that the two simulations give qualitatively the same dependence. Quantitatively, the dependence on the loading rate is underestimated as compared with
238

the experiments. The assumption of discrete nucleation sites gives a lower overall fracture toughness, but only a very small change in the loading rate dependence at this temperature.
Experiments conducted at liquid nitrogen temperature do not reveal a significant load- ing rate dependence of the fracture toughness, whereas the numerical simulations under the assumption of homogeneous nucleation predict such an - albeit small - dependence. The loading rate dependence of the fracture toughness virtually vanishes at liquid nitrogen temperature if nucleation at discrete sites is considered (Fig. 4A).
Figure 6: Number N of dislocations emitted at different temperatures T as function of loading rate K. Dislocation nucleation at discrete sites is considered. The source spacing was set to the higher value X(RT) = 2/im, which is higher than the usual value.
. \ A A T=400K
O-O r=300K X. XA,
C^> r=200K
0
"'A-..
~-o— __> 0.10 1.00 K (MPam"*/s)
The number of dislocations that are emitted is strongly dependent on loading rate and temperature (Fig. 6). It is seen that the number of emitted dislocations decreases rapidly with the logarithm of the loading rate, while the decrease of the fracture toughness is only linear (Fig. 5). The time to fracture is approximately inversely proportional to the loading rate.
A ,-o
,<r' 1 £>" I
/ jry—\ ■L-o—o—0__°
^^ ...A'' \k = 0 MPa
,A" OO homogeneous A A A discrete sources
O-O Xm = 500 MPa ,
200 300 7"(K)
S 40 6
▲ reference • predeformed
200 400 T(K)
Figure 7: (A) Fracture toughness A'cr;t as a function of temperature T for a finite lattice friction stress rfr;c and the assumption of quasi-homogeneous dislocation nucleation at all temperatures. The results without lattice friction and both nucleation modes are shown for comparison. (B) Experimental data for a predeformed specimen in comparison with the reference values.
Additional information on the importance of dislocation nucleation and mobility for the fracture toughness and the BDT is obtained from experiments with specimens that have been predeformed in compression to 10% plastic strain at 400°C (Fig. 7B) [7]. As discussed
239

above, this predeformation is modeled by introducing a lattice friction stress and by assum- ing quasi-homogeneous dislocation nucleation at all temperatures (Fig. 7A). The reduced dislocation mobility leads to a lower fracture toughness at all temperatures if compared with the simulation with homogeneous dislocation nucleation. For the model of predeformed specimens, the increase in fracture toughness with temperature is smaller than in the ab- sence of lattice friction. Compared with the results obtained for discrete nucleation sites, a higher fracture toughness at low temperatures is obtained with the model for prcdeformed- specimens. At higher temperatures, when dislocation nucleation occurs more easily, the two curves intersect. These results compare well with the experimental observation (Fig. 7B), of an increased low-temperature fracture toughness and a shallow increase in fracture toughness with temperature for predeformed specimens.
DISCUSSION
Dislocation nucleation
Homogeneous predeformation increases the density of dislocations throughout the mate- rial. If the dislocation population around the crack tip were regarded simply as a polarizable medium, one would expect a lower fracture toughness with increased dislocation density (po- larizability), because the beneficial shielding dislocations would move away from the crack tip while the fracture-promoting dislocations would move closer to the crack tip [27]. Additional energy dissipation by dislocation motion is insignificant compared with crack-tip shielding at low temperatures. Consequently, the increase of the measured low-temperature fracture toughness with predeformation (Fig. 7B) cannot simply be explained by increased plastic flow. An increase in the low-temperature fracture toughness for predeformed specimens is also found in silicon [28]. NiAl is reported to also show an increase in the low-temperature fracture toughness and in the BDT temperature with predeformation [29].
The only reasonable explanation for the increased low temperature fracture toughness of predeformed specimens is that the preexisting dislocations in the highly stressed region around the crack tip act as additional dislocation sources, and that the dislocations emitted from these sources provide more efficient shielding. This behavior is reproduced very well, if the undeformed crystal, which has a low dislocation density, is described with the dis- crete nucleation model, while the predeformed crystal, which has a much higher dislocation density, is described with the homogeneous nucleation criterion. In contrast, the numerical simulations with the homogeneous nucleation criterion for both cases do not account for such additional sources, and accordingly cannot predict this effect (Fig. 7A).
At intermediate temperatures the experiments show that the beneficial effect of the pre- deformation vanishes and the fracture toughness of the predeformed specimens is lower than that of the reference specimens. This is attributed to the increased yield strength and lower dislocation mobility due to work hardening. Reduced dislocation mobility is introduced into the model simply as a finite lattice friction stress, which decreases the fracture toughness from intermediate up to elevated temperatures. The fracture toughness at these tempera- tures therefore appears to be controlled by dislocation mobility.
The importance of dislocation nucleation at low temperatures becomes obvious also from the dependence on loading rate. Simulations assuming homogeneous dislocation nucleation do not reproduce the experimental observation of a vanishing loading rate dependence at
240

low temperatures. Instead, the model where dislocation nucleation occurs at discrete sites and the dislocations have to cross the gap between these sites before the crack is shielded, reproduces the experimental results rather well. With increasing temperature this model yields a steeply increasing nucleation rate until the nucleation sites become dense along the crack front. At this stage, dislocation nucleation occurs quasi-homogeneously. The increase in fracture toughness with temperature then becomes shallower again which results in a "shoulder" in the toughness versus temperature curve at the temperature where dislocation nucleation ceases to be limiting. Such a "shoulder" is also seen in the experimental fracture toughness curves (Fig. 3B), and in the data obtained from other crystallographic orientations of the tungsten single-crystal specimens [7]. A similar behavior is found in 7-TiAl single crystals [30], as well as in NiAl polycrystals [31]. One concludes that the scarcity of active sources is limiting plasticity near the crack tip and hence is limiting fracture toughness at low temperatures. As a consequence, the fracture toughness does not depend on the loading rate at low temperatures.
When the temperature is sufficiently high to activate a large number of sources, dislo- cation mobility assumes control of the nucleation rate and the fracture toughness becomes rate dependent.1 This rate dependence is investigated experimentally and also with the 2D simulation. Both sets of data show a decrease in fracture toughness as the loading rate increases (Fig. 5). This observation is consistent with the numerically determined number of the emitted dislocations, which increases rapidly with decreasing loading rate (Fig. 6). This is explained by the shorter times to fracture at higher loading rates, which reduces the distance that the dislocations can move away from the crack tip. While dislocations close to the crack tip are quite efficiently shielding on the one hand, they also suppress the nucleation of new dislocations on the other hand.
Experimentally as well as numerically, the decrease in fracture toughness is found to be proportional to the logarithm of the loading rate. However, the simulation gives a more moderate decrease. Two important contributions, which increase the strain rate dependence at a given temperature, are not included into the present 2D model. First, the blunting of the crack tip, which is proportional to the number of dislocations emitted, and second, the loading rate dependence of the additional length S, which the dislocations have to overcome before their shielding is accounted for. Both of them tend to increase the dependence of fracture toughness on loading rate and would therefore bring the simulation in even better agreement with experiments.
Activation energy
It is not clear a priori whether a constant loading rate on a precracked sample is trans- lated to the near-tip region as a strain rate or as a rate of stress increase. In view of equation (1) this could result in effective activation energies for dislocation motion of either Q or Q/m. The simple 2D model employed here shows, that the activation energies for BDT and that for dislocation motion are equal [4,6].
In the whole temperature regime of the present investigation, bulk plasticity in tungsten is believed to be controlled by the mobility of screw dislocations (see for example [22]). The activation energy for the glide of these dislocations is Qscrew = 2eV [20,21]. The
1We note here that in materials like dislocation-free silicon dislocation nucleation can be suppressed up to the BDT temperature [32].
241

activation energy for the BDT C/BDT = 0.2eV (derived from Fig. 3B) is much closer to the activation energy for the glide of non-screw (edge) dislocations, Qoge = 0.2 — 0.5eV [18,20]. Consequently, the development of a plastic zone at the crack tip does not appear to be limited by the same mechanisms as bulk plasticity. The difference in the apparent activation energies is also found in NiAl single crystals [29], but seems to be restricted to bcc or CsCl- (B2)-structures, where large differences in the mobility of edge and screw dislocations are found. In materials as silicon [16] and germanium [17] the activation energies for BDT and dislocation motion are found to be equal.
The high activation barrier for screw dislocation motion can only be overcome in the highly stressed region around the crack tip. As discussed above, a dislocation - either one that is nucleated at the crack tip or a pre-existing one - moving "athermally" in the high stress field along the crack tip will generate dislocation segments of non-screw character parallel to the crack tip. These non-screw (edge) dislocations are mobile and are expected to provide efficient shielding. However, the restriction of this mechanism to the highly stressed crack-tip region implies that the low apparent activation energy for the BDT results from processes near the crack tip, whereas bulk dislocation multiplication cannot be limiting the BDT. The details of these crack-tip sources need to be studied further in order to better understand their mechanisms of operation. Specifically dislocation multiplication processes near the crack tip and whether they can provide sufficiently many edge dislocations to induce the transition to ductile behavior need further investigation.
Brittle-to-ductile transition
The comparison of experimental and numerical results shows the importance of disloca- tion nucleation for the low temperature fracture toughness. It also becomes evident that any physical model for the BDT must necessarily include dislocation mobility, and cannot be based on dislocation nucleation exclusively. However, the physical origin of the steep increase in fracture toughness shortly below the BDT temperature remains yet unidentified. This process is strongly dependent on the state of predeformation (see Fig. 7B and [28,29]) and, moreover, strongly rate dependent.
The model proposed by Khanta, Vitek, and Pope [2] of a sudden increase in the dislo- cation density caused by a Kosterlitz-Thouless-type instability, predicts such a very steep increase in fracture toughness. However, in the form in which it is published, the model can neither explain the experimentally observed rate dependence of the BDT, nor the increase in the BDT temperature with predeformation.
On the other hand, the model proposed by Nitzsche and Hsia [4] predicts a rather sharp and, moreover, rate dependent BDT from a continuum model by employing rate dependent plastic (bulk) deformation. The apparent activation energy for the BDT obtained from this model is the same as that for bulk plasticity. This seems to exclude this model as a possible explanation for the steep increase in fracture toughness below the BDT temperature. How- ever, if the crack tip region were injecting a large number of edge dislocations into the bulk, a limited amount of (micro)-plasticity would be possible without dislocation multiplication in the bulk. The implementation of this feature into the Nitzsche-Hsia model could explain the experimental observations.
An important feature which has been neglected so far in our model is the blunting of the crack tip. Since a blunted crack cannot propagate through the crystal, an atomically
242

sharp crack has to be re-initiated to permit crack advance [33]. For a radius of curvature of the blunted crack tip is below a few Burgers vectors the critical stress intensity for re- initiation increases only marginally [33], but re-initiation becomes increasingly difficult for larger amounts of blunting. The blunting of the crack tip is proportional to the number of dislocations, and therefore, it is also rate dependent (c/. Fig. 6). Additional investigations are necessary to determine quantitatively how large amounts of blunting impede crack advance. Additionally, the blunting of the crack tip could also affect the dislocation nucleation in its vicinity.
CONCLUSIONS
The results presented here clearly show that the fracture toughness in the semi-brittle regime is strongly dependent on the availability and activity of dislocation sources. A model assuming easy (homogeneous) dislocation nucleation cannot satisfactorily explain the exper- imental observations. Instead, if dislocation nucleation from discrete nucleation sites along the crack front is introduced, the model predicts multiple features that are found experi- mentally, as for example the increased fracture toughness for predeformed specimens at low temperatures and the vanishing loading rate dependence at low temperatures. With rising temperature dislocation nucleation becomes easier and eventually can be seen as occurring quasi-homogeneously. At this stage the fracture toughness becomes rate dependent, which indicates that dislocation mobility is now the limiting factor.
Immediately below the BDT temperature, the fracture toughness rises steeply. The process that causes this steep rise remains unidentified. However, the dependence of the BDT temperature on loading rate and the state of predeformation indicates that this process is controlled by dislocation mobility. Dislocation nucleation at the crack tip can be excluded as controlling mechanism because it already ceases to control fracture toughness at significantly lower temperatures. The apparent activation energy for the BDT, which is significantly lower than that for bulk deformation, suggests that the BDT originates from processes taking place in the highly stressed region close to the crack tip.
ACKNOWLEDGMENTS
The authors gratefully acknowledge financial support from the Deutsche Forschungsge- meinschaft under contract Gu 367/1. AH further gratefully acknowledges travel grants from the Deutscher Akademischer Austauschdienst.
REFERENCES
1. J. R. Rice and R. Thomson, Phil. Mag. A 29, 73 (1974).
2. M. Khantha, V. Vitek, and D. P. Pope, Key Eng. Mat. 103, 227 (1995).
3. P. B. Hirsch, S. G. Roberts, and J. Samuels, Proc. R. Soc. Lond. A421, 25 (1989).
4. V. R. Nitzsche and K. J. Hsia, Mat. Sei. and Eng. A176, 155 (1994).
5. S. G. Roberts, in Computer Simulations in Materials Science, edited by H. 0. Kirchner, L. P. Kubin, and V. Pontikis (Kluwer Academic Publishers, Dordrecht, 1996), 308, pp 409-433.
243

6. A. Hartmaier and P. Gumbsch, phys. stat. sol. (b) 202 Rl (1997).
7. P. Gumbsch, J. Riedle, A. Hartmaier, and H. F. Fischmeister, Science 282 1293 (1998).
8. F. F. Abraham, D. Schneider, B. Land, D. Lifka, J. Skovira, J. Gerner, and M. Rosendrantz, J. Mech. Phys. Solids 45 1461 (1997).
9. G. Schoeck, Phil. Mag. A 63 111 (1991).
10. S. J. Zhou and R. Thomson, J. Mater. Res. 6 639 (1991).
11. G. Xu, A. S. Argon, and M. Ortiz, Phil. Mag. A 72 415 (1995).
12. I.-H. Lin and R. Thomson, Acta metall. 34 187 (1986).
13. R. Thomson, in Solid State Physics, edited by H. Ehrenreich and D. Turnbull, (Academic Press, New York, 1986) 39, pp. 1-129.
14. J. Riedle, P. Gumbsch, and H. F. Fischmeister, Phys. Rev. Lett. 76 3594 (1996).
15. U. F. Kocks, A. S. Argon, and M. F. Ashby, in Progress in Materials Science, edited by B. Chalmers, J. W. Christian, and T. B. Massalski (Pergammon Press Ltd., Oxford, England, 1975) 19, chap. 3.
16. J. Samuels and S. G. Roberts, Proc. R. Soc. Lond. A 421 1 (1989).
17. F. C. Serbena and S. G. Roberts, Acta metall. mater. 42 2505 (1994).
18. H. W. Schadler, Acta metall. 12 861 (1964).
19. H. L. Prekel, A. Lawly, and H. Conrad, Acta metall. 16 337 (1968).
20. U. Ziebart, PhD thesis, Universität Stuttgart, 1986.
21. Brunner, D., presented at the UHPM-98, Sevrier Annecy Lake, France, 1998 (unpub- lished).
22. A. S. Argon, and S. R. Maloof, Acta metall. 14 1449 (1966).
23. M. Bucki, V. Novak, Y. M. Savitsky, G. S. Burkhanov, and V. M. Kirillova, in Strength of Metals and Alloys, 1, pp. 145-150, 1979.
24. B. Devincre, and S. G. Roberts, Acta mater. 44 2891 (1996).
25. Riedle, J., PhD thesis, Universität Stuttgart, 1995.
26. J. Riedle, P. Gumbsch, H. F. Fischmeister, V. G. Glebovsky, and V. N. Semenov, Mat. Letters 20 311 (1994).
27. S. J. Zhou, and R. Thomson, J. Mater. Res. 6 1763 (1991).
28. P. D. Warren, Scripta metall. 23 637 (1989).
29. F. Ebrahimi and S. Shrivastava, Acta mater. 46 1493 (1998).
30. A. S. Booth and S. G. Roberts, Acta mater. 45 1045 (1997).
31. G. Bergmann and H. Vehoff, Mat. Sei. and Eng. A192/193 309 (1995).
32. G. Michot, presented at the 2do Congresso Internacional de Technologia Metalurgica e de Materials (ABM), Sao Paulo, Brasil, 1997 (unpublished).
33. P. Gumbsch, J. Mat. Sei. 10 2897 (1995).
244

Molecular Dynamics Study of Copper and Aluminum under Mechanical Strain
P. Heinof, H. Häkkinen J, L. Perondif and K. Kaskif t Helsinki University of Technology, Laboratory of Computational Engineering, Miestentie 3, P.O.Box 9400, FIN-02015 Espoo, Finland t University of Jyväskylä, Department of Physics, P.O. Box 35, FIN-40351 Jyvaskylä, Finland
Abstract Mechanical properties of copper and aluminum have been studied using finite temper- ature molecular dynamics simulations. Atomic interactions have been described by a many-atom effective medium potential, which takes into account interactions up to third neighbors. The computed elastic constants showed good agreement with experimental data. Encouraged by these results the model was applied to study fracture in copper. Systems with a grain boundary and an initial cut serving as a crack seed have been stud- ied. In the first case, crack nucleation and propagation took place exclusively at the grain boundary. In the second case, dislocation propagation was observed in one of the <110> directions, with a speed of about 60% of the longitudinal speed of sound. For thin systems crack propagation occurred through micro-void coalescence with a speed of about 30% of the Rayleigh wave speed in copper.
Introduction There has been considerable interest in the dynamics of fracture. From the physics point of view fracture in solid materials involves processes on a wide range of length and time scales. The different scales may be treated theoretically by using macroscopic continuum models [1], mesoscopic spring models [2] or by truly microscopic models with an inter- atomic potential. In this paper we focus on the atomistic modeling.
Earlier, due to the lack of realistic potentials, approximate pair-potentials, e.g. Morse [3], Lennard-Jones [4] or Johnson [3] potentials, have often been used. However, since these pair-potentials favor brittle behavior [4], recently many-body potentials have been proposed as better descriptions of ductile materials, such as metals.
In this work we study mechanical properties of copper and aluminum using a realistic many-atom potential with a strong ab initio character. Unlike the simulations by Zhou et al. [5], at zero temperature, we have undertaken an investigation for low and high temperatures. First, we investigate how accurately the many-atom potential describes the elastic behavior of copper and aluminum. We compute the elastic constants and compare them with experimental values. We also investigate how the results depend on system size and temperature. Then we study crack and dislocation propagation in systems with a grain boundary or an initial cut.
245
Mat. Res. Soc. Symp. Proc. Vol. 539 * 1999 Materials Research Society

Model
In our model the interactions between atoms have been described with the effective- medium theory model potential (EMT) [6]. EMT has been shown to be a powerful scheme for describing several bulk and surface properties of metals. The many-atom nature of metallic cohesion is crucial in most of these problems, and the EMT shows a clear advantage over the classical pair potentials. Compared to other many-atom potentials for metals, EMT has the strongest ab initio nature, since, in principle, all the parameters needed in the total-energy expression can be calculated using the jellium model and density-functional theory with the local-density approximation [7]. In the present work an extended version of the original EMT scheme is used, which takes into account atomic interactions up to third nearest neighbors and is known to improve molecular dynamics results for several thermodynamic quantities and defect energies [8].
We have simulated both tensile and shear loading tests using the Molecular Dynamics (MD) approach. Newton's equations of motion are numerically integrated with the ve- locity Verlet algorithm [9]. Initially, atoms are placed in the sites of an ideal fee lattice. A small Gaussian random noise is added to the coordinates and the velocities are se- lected from a finite temperature (T = 293K and T = WK) Maxwell distribution. During the course of the simulations the temperature is controlled by keeping the system only partially in contact with a thermostat, leaving the middle region (zone in which fracture occurs) intact. We used a Nose-Hoover thermostat in decaying contact with the upper and lower thirds of the system [10]. The external loading was applied such that in the tensile test the atoms at opposite boundaries were moved apart vertically and in the shear test they were moved horizontally in opposite directions. In an attempt to minimize border effects the system was strained in a smooth way, as described in Ref. [10] in detail.
Elastic constants of copper and aluminum In order to study elastic properties of copper and aluminum, MD simulations of tensile and shear tests were done in samples of cubic shape. Three different orientations, with the faces of the cube given by ([100],[010],[001]), ([011],[011],[100]) and ([Ü2],[lll],[110]), were considered. In each of these three cases the elastic modulus (Y^m) was calculated in the d = [010], [Oil] and [111] direction, and for tensile or shear modes, m =|| or m —±, respectively, from the smoothed stress (a) vs. strain (e) curves [10] using Yditn = §7! _ ■ The system size dependence of these moduli was studied in systems with 104 to 3 x 10⁵
atoms, showing no size dependence for systems with more than 105 atoms. It can be shown that these moduli Y^m can be related to the elastic constants, Cy, as follows [11]:
^[010], || = cn ^[OIO],J. = C44
Y[ou],\\ = 5C11 + |ci2 + c44 Y[0U],i = 5C11 - \c\2 (1) Y[in],\\ = 3C11 + 5c12 + 5C44 yjm],i = jCn - |c12 + \cu-
For comparison purposes in Table 1 we have collected the experimental and simulation results for both copper and aluminum, at low and high temperatures. For copper the differences in all cases range from 1 to 13% while for aluminum the differences are larger, ranging from 9 to 23%. Thus we conclude that EMT describes very well and reasonably
246

Copper Aluminum Cii C12 C44 Cu C12 C44
Experimental (300K) MD (293K) Difference (%)
168.4 121.4 75.4 176.9 132.8 73.7 5.0 9.3 2.3
106.8 60.7 28.2 85.1 66.0 33.6 20.3 8.7 19.1
Experimental (OK) MD (10K) Difference (%)
176.2 124.9 81.8 193.1 140.4 82.7 9.6 12.4 1.1
114.3 61.9 31.6 97.4 73.1 38.8 14.8 18.1 22.8
Table 1: Experimental [12] and simulated (MD) elastic constants of copper and aluminum (GNm-2).
well the elastic properties of copper and aluminum, respectively.
Fracture in copper Next we present MD studies of crack propagation in copper with two types of defects. The first type of defect is a grain boundary and we study how it affects crack nucleation and propagation. The other defect is an initial cut which acts as a seed for crack propagation.
A model system with a 45 degree tilt grain boundary was generated. The tilt axis coincides with one of the main axis of the fee lattice. From the previous study, the elastic moduli of the two parts of the system are known. By computing the elastic moduli of the composite system it is then possible to assess the effect of the grain boundary on the elastic properties. Two geometries were studied as shown in Fig. 1.
Figure 1: The system with 45 degree tilted grain boundary where the vertical boundaries are periodic (a) or free (b). Tensile loading was applied in the vertical direction.
The geometry in Fig. la, with two boundaries, enables the use of periodic boundary conditions in the plane perpendicular to the tensile loading direction. The simulations for the two geometries were carried out in a similar way: initially the system was allowed to thermalize at T = 10A"; subsequently strain was applied at a prescribed rate (~ 10~7s-1). In Fig. 2 we show a sequence of snapshots displaying the time behavior of the first test geometry.
247

(a) (b) (c)
Figure 2: Atomic configuration of the system for strain values (a) 7.1, (b) 8.0, (c) 8.7, (d) 9.2, (e) 16.0 and (f) 24 %. The crack propagates along the grain boundary through coalescing micro-voids.
It is seen, as expected, that a crack nucleates at the apex of the grain boundary, where the stress concentration factor is maximum. The crack then proceeds along the boundary. In a final stage, before total breaking, sliding of two of the differently oriented edges is observed. The elastic modulus of the composite system was found to be 210 GPa. This value should be com- pared with the elastic moduli of the two isolated crystallites, which are 194 and 244 GPa for crystallites (i) and (ii) in Fig. 1, respectively. In Fig. 3 we show a sequence of snapshots for the second test geometry. It is seen that in this case no crack evolves and the final failure occurs in the form of the two grains sliding along the grain boundary.
(a) (b) (c)
Figure 3: Tensile test with free boundaries for strain values (a) 3.3, (b) 5.9 and (c) 15 %. The grains slide along the grain boundary, shown as a line in (a).
As a second type of defect we studied how an initial seed for the crack affects otherwise perfect systems. In a bulk system with free boundaries a crack was not seen to propagate even for large elongation. Beyond the elastic region, plastic deformation occurred in the form of dis- location emission. Dislocation propagation may be seen as a result of the fact that the potential
248

energy near a dislocation is larger than that in ordered bulk. In the simulations the dislocations were found to propagate in the [101] crystal orientation with the speed of 3150m/s, which is roughly 60 % of longitudinal elastic wave speed in copper.
Unlike in a bulk system with free boundaries, in a very thin system (only 3 lattice constants in z direction) crack propagation was seen both with free and periodic boundaries. When this system was elongated in the [Oil] crystal orientation (y direction) at T=10K, crack propagation in the [011 ] orientation (x direction) was seen. Prior to local rupture the process region became thinner and crack propagation was seen as a result of coalescing micro-voids, see Fig. 4. Through this mechanism the crack was seen to propagate with a small velocity of approximately 630m/s. When the loading is applied along y=[010] (with x=[100]) the crack seemed to propa- gate in [ 110] and [110] orientations giving evidence that the < 110> orientations are somehow preferred for crack propagation. On the other hand, when y=[l 11] (with x= [ 112]) the crack was seen to grow in the directions ±( 2y - x) = ±[330], giving once again evidence of the same preferred orientation. This fact was originally observed by Abraham [13], who argued that a crack tends to favor the maximum surface energy path.
Figure 4: Snapshots of crack propagation in a thin system (of 3 atomic layers with the total of 200 000 atoms) at lOKJLoading is along the [011] crystal orientation and the crack propagates along the [011] orientation through micro-void generation and coal- escence with the crack. The total strain is (a) 9.8, (b) 12.0 and (d) 17 %.
Conclusions
In this paper we have studied mechanical properties of copper and aluminum using finite temperature molecular dynamics method and the effective-medium theory potential. First we checked the accuracy of the model by comparing the values of elastic constants from simula- tions with the experimentally measured ones. This comparison was very encouraging for using the model for studying fracture behavior. This was done for copper by introducing two types of defects: a grain boundary and a large void to serve as a seed for crack propagation.
In a system with a grain boundary and periodic boundary condition a crack was seen to in- itiate at the point, where strain concentration due to the difference of the modulus of the grain boundary and the modulus of the ordered bulk was largest. After initiation, the crack propagated along the grain boundary. These findings agree with what have been observed experimentally in copper.
249

In bulk systems with free boundaries and an initial cut serving as a crack seed were studied for {111} slip plane and crack propagation. Dislocations were seen to propagate in one of the <110> directions with a speed of about 60% of the longitudinal speed of sound. In thin systems, with free boundaries and an initial side cut, crack propagation was observed. For all initial conditions the crack propagated in a <110> crystal orientation by micro-void coalescence, with the speed of only about 30% of the Rayleigh wave speed in copper.
Finally we conclude that EMT molecular dynamics simulations serve as a realistic tool for studying complicated mechanical processes in fee metals.
Acknowledgment s
This work has been financially supported by the Academy of Finland.
References
[1] S. J. D. Cox and L. Paterson, Phys. Rev. B 40 4690 (1989).
[2] T. T. Rautiainen, M. J. Alava and K. Kaski, Phys. Rev. E 51 R2727 (1995).
[3] B. deCelis, A. S. Argon and S. Yip, J. Appl. Phys. 54 4864 (1983).
[4] B. L. Holian, A. F. Voter, N. J. Wagner, R. J. Ravelo, S. P. Chen, W. G. Hoover, C. G. Hoover, J. E. Hammerberg and T. D. Dontje, Phys. Rev. A 43 2655 (1991).
[5] S. J. Zhou, D. M. Beazley, P. S. Lomdahl and B. L. Holian, Phys. Rev. Lett. 78 479 (1997).
[6] K. W. Jacobsen, J. K. N0rskov and M. J. Puska, Phys. Rev. B 35 7423 (1987).
[7] M. J. Puska, R. M. Nieminen and M. J. Manninen, Phys. Rev. B 24 3037 (1981).
[8] H. Häkkinen and M. Manninen, J. Phys. Condens. Matter 1 9765 (1989).
[9] M. P. Allen and D. J. Tildesley, Computer Simulation of Liquids, Oxford University Press (1987).
[10] P. Heino, H. Häkkinen and K. Kaski, Europhys. Lett. 41 3 273 (1998); P. Heino, H. Häkkinen and K. Kaski, Phys. Rev. B 58, 641 (1998).
[11] H. B. Huntington, The Elastic Constants of Crystals, Academic Press (1958).
[12] C. Kittel, Introduction to Solid State Physics, 3rd ed., John Wiley & Sons, (1967). C. Kittel in Phonons, ed. R.W.H. Stevenson, Oliver & Boyd, Edinburgh (1966).
[13] F. F. Abraham, Phys. Rev. Lett. 77 869 (1996).
250

EXPERIMENTAL ANALYSIS OF DEFORMATION INDUCED MICROSTRUCTURE NEAR A CRACK TIP IN A HARDENED COPPER CRYSTAL
A.-F. BASTAWROS*, K.-S. KM** *Division of Engineering and Applied Sciences, Harvard University, Cambridge, MA02138 **Division of Engineering, Brown University, Providence, RI02912
ABSTARCT
The incremental in-plane Green-Lagrange strain tensor was measured near a stationary crack tip in a cyclically work-hardened copper single crystal. Measurements were made on the surface of a four-point bend specimen, using a finite-deformation laser moire interferometer. The measurement showed the existence of a narrow asymptotic field beyond a distance of 300 |xm from the crack tip. The inner boundary of the asymptotic zone was almost fixed at a characteristic distance ahead of the crack tip. This length scale is thought to arise from a microstructural evolution near the crack tip. The inhomogeneous hardening due to glide-band clustering and patchy slip in a small volume near the crack tip triggered such an evolution. The outer boundary of the asymptotic zone radially grew with the increasing load. The deformation field was found to be very sensitive to additional mode II loading.
INTRODUCTION
Understanding the deformation and fracture processes at the single crystal level provides better understanding of the operative mechanisms in polycrystalline aggregates, that induce crack propagation or blunting, crack and void nucleation at grain boundaries, and deformation-induced microstructure evolution which may cause size dependent toughness. This work focuses on the measurement of the near-crack-tip plastic flow and deformation field in a cyclically work- hardened copper single crystal and the evolution of microstructures caused by inhomogeneous large deformation. The deformation field was measured with a finite-deformation laser-moire interferometer at a length scale resolving the deformation within individual sectors around the crack tip. From such measurements, the in-plane Green-Lagrange strain components were derived and compared with those of plane-strain analytical and finite element analyses, to check the limit of homogenized continuum description of the crack-tip field. The measurements were carried out on an incrementally loaded four-point-bending specimen (4PBS).
Homogenized continuum aspects of the elasto-plastic near-crack-tip field have been studied extensively by many researchers and were shown to be influenced by various material and geometric factors. The material factors are typically yielding and hardening behaviors. The geometric factors stand for crack-tip bluntness, and both specimen and loading geometries. These issues have been studied in ductile single crystals either analytically [1-3] or numerically [4-6]. In a single crystal, the general plane-strain crack-tip asymptotic field was shown to have a sector-type structure, due to the activation of pairs of planar slip systems [1]. For perfect plastic flow, the stress state is uniform within each sector and corresponds to one of the in-plane yield surface vertices. The orientation of the sector boundaries correspond to either slip plane traces (shear mode) or their normals (kink mode). The sector boundaries experience jump in stress state, that corresponds to moving from one vertex to its adjacent one, as well as a slip displacement discontinuity due to concentrated plastic shearing. The near crack tip field was further shown to have HRR-type singularity if the crystal is assumed to follow Taylor power-law hardening [2]. Other hardening rules has also been implemented [3].
251
Mat. Res. Soc. Symp. Proc. Vol. 539 ®1999 Materials Research Society

Limited experimental observations have been reported for measuring the in-plane deformation field around the crack tip in single crystals using geometrical moire [7] etch pit [8] and high resolution moir6 [9]. These measurements were made at the elastic-plastic transition field, where the plastic strain has the same order of the yield strain. They bear some resemblance to the angular sectors of HRR asymptotic solution [2].
In this work, we were interested in experimentally examining the homogenized treatments of crystal plasticity and the use of continuum mean-field constitutive relations. The limitation of the homogenized approach will be determined by examining the measured domain of validity of the HRR-type asymptotic field. This approach requires a well known hardening characteristics. Therefore, a cyclically work hardened copper crystal was selected in order to exhibit an approximate Taylor power law hardening behavior. Furthermore, a large deformation laser moire interferometer [10] was used to measure the large heterogeneous deformation near the crack-tip, where the HRR-type asymptotic field is prevailing. Lagrangian formulation was implemented to allow the same material point to be traced through the deformation history [11, 12].
EXPERIMENT
Copper Single Crystal Preparation: The copper crystal was grown from an oriented seed in a graphite mold under argon environment, using the Bridgeman technique. The oriented crystal (Fig. 1-a) was cut using a wire cutting electro-discharge machine (EDM). Two brass extensions were silver brazed to the single crystal section to form an extended beam (Fig. 1-c). The extended beam is cyclically hardened along the axis in a fully reversed tension-compression using reported procedure [13] to avoid formation of slip bands and cell boundaries. This hardening technique insures a degree of macroscopic matrix structural homogeneity (veins or loop patches of dislocation network). The compression test of the hardened crystal exhibited power law hardening with hardening exponent n=8 and a yield strength of a„ =120 MPa in the [100]. Details of the hardening process are given in [11, 12]. An EDM notch of 2.06mm length and front notch radius of 55um was introduced. A fatigue crack was grown from the notch under a 50um plastic zone to a length of 0.49mm and radius r0 < 2|im. The specimen has a rectangular cross section of width ui=6.33mm, thickness S=4.77mm and a total crack to width ratio a/w=0.41 (Fig. 1-c). The specimen surface is lapped for flatness and polished to a mirror like surface. A positive photo resist coating (Shieply 304) is spun over the surface and a cross grating of 5000 1/in is printed with standard lithography methods through mask printing. The corresponding FCC planar yield surface is shown in Fig. 1- b with the corresponding slip traces marked relative to the shown crack direction.
Testing The specimen was loaded in a 4-point bending jig by a computer controlled Instron machine in a displacement control mode. The crack root opening displacement, 8r, was recorded via a clip gauge over the crack mouth. The load, F vs. 8r curve is shown in Fig. 1-c. Moire fringes were recorded at the indicated positions on Fig. 1-c. A nominal 7-value is evaluated from the area under the F-8r curve [14]. The 7-value is used to set a size scale J/a0. The experimentally estimated size scale is used for comparison with theoretical and finite element predictions.
Strain Measurements The implemented large deformation laser moire interferometry [10] has a variable-reference- grating to increase the dynamic range of the strain measurement (0.1 %< e < 10%). This technique also minimizes the measurement error caused by the deformation-induced surface
252

roughness. After each loading increment the surface of the specimen was interrogated by two virtual reference gratings, the reciprocal grating vector of which is g", a = 1,2. Two moire
patterns with a fringe number variation d/a(x)were digitally recorded. The number of fringes
within a distance dx on the deformed configuration is given by the moire equation [10]
df=gad\-GadX a = 1,2 (1)
Here X represents a point on the specimen surface over the undeformed configuration and x is its image over the deformed configuration, and G is the effective specimen surface grating [10]. By taking the material derivative of (1), we get [11, 12]
FT-(ga-Vr) = G" a = 1,2 (2)
from which the deformation gradient tensor F can be obtained. The components of the Green- Lagrange strain tensor are ready to be evaluated over the undeformed configuration from
E = |(FT-F-I) (3)
Integration of (1) from a reference point X0 to any general point X, for g=const, provides the mapping function between the deformed and undeformed configuration [11,12]
r-/:=ga-(x-x0)-G"-(x-x0) (4)
Once the strain field was mapped onto the undeformed configuration, an effective crack-tip position has been allocated at each loading increment from the near-crack-tip strain field [11,12].
[010] i crack plane
(a) t / (c)
(in)
[001]
(b)
(111)[121] \[2]
3000
2500 -
2000
z 'S 1500 TO
1000
500
0 0.0
4^. 5
: 2^,
3
:
\^^r
" / 2' • •
' 63 > / an ■ 1« S7S
• [010] /
/. . . . . . . . i . . -i_L . . . .1 \ . . . . 0.1 0.2 0.3 0.4
Crack root opening Displacement, 8f (mm) 0.5
Fig. 1. (a) Crack orientation. (b) The Corresponding Planar yield surface. (c)Load vs. crack root opening displacement curve with analysis positions marked.
253

RESULTS
Crack-Tip Field
Typical moire fringes are shown in Fig. 2, for the deformation at position 3 in Fig. 1. The third insert corresponds to the maximum in-plane shear strain distribution,
(7max = ^(ea~eyy)2 + 4e]y )• Triis stram distribution shows the deformation clustering and the
sector type behavior around the crack-tip. The strain field inherited some asymmetry due to the slight degree of mode mixity.
1000 500 -500 -1000 Jim
iax at position 3 Fig. 2. The vertical fy and horizontal fx moire fringes and the corresponding yn
onFig.l,(fc/(7/CT„) = 15).
Asymptotic Field
The experimentally measured strain field has been examined for the existence of an asymptotic field of the HRR-type for the angular and radial strain dependence [1-3]. The angular strain dependence was determined by following the direction of the incremental strain trajectories on the reduced Mohr strain plane, and employing the normality rule to identify the stress state [11- 12]. The surface textures around the crack-tip within 800|im and the corresponding active slip system from moire measurements and the HRR-type asymptotic field [2] are presented in Fig. 3. The radial strain distribution was examined at each loading increment to allocate the annular region, if any, within which the strain has a radial dependence of the type e - r~n/"+1 with the hardening exponent n. By averaging the inner and outer radii of this asymptotic zone at each loading step, Fig. 4 is constructed to show the validity of the asymptotic field at each loading step. On this plot, the horizontal axis represents a size scale, set by the external loading as the applied /-value normalized by ao. The vertical axis is the distance from the crack tip.
The theoretical /-level scaling of the asymptotic field limits are also summarized on Fig. 4. The initial blunted notch radius, r0 and the finite deformation zone influence the inner bound of the asymptotic field. At an early stage of loading, the effect of r0 extends to a distance of r/ro ^4 [1]. It is represented on Fig. 4 by a horizontal line, which is a non-evolving structural factor. Once the plastic zone grows, the influence of the original notch geometry is lost and the finite deformation zone starts growing to a limit of r/(J/oo) = 1.0 (for a/w=0.5 and n=10) [15]. It is represented by a radial line emanating from the origin with a conservative estimate of its slope of r/(J/o0) = 1.25. The outer bound of the asymptotic zone is initially limited to small scale yielding results, [-10% of the plastic zone radius, 0ARp =0.l(E/2nao)(J/(jo)}. At large
strains and fully plastic conditions, the specimen finite dimensions influence the asymptotic field outer bound { 3 J/a0 and extends to 0.12 b (for a/w=0.9 and b/( J/ao) = 25) [ 16, 17]}. On Fig. 4, the outer bound is set approximately to 0.2 b to account for differences in the a/w ratio.
254

[12] [2] 00J(12)(1)
Average limit of finite dimension of the specimen (t>4
*<^-°i
-<0'^ j ^ 41
_.^^l1-25 i Notch sensitivity zone I
J/a0 dim)
Fig. 3. Surface texture (inner) and slip activity Fig. 4. Domain of validity of various from moire (intermediate, "( )") and HRR- constraints, type asymptotic solution [2] (outer, "[ ]"), within 800 mm from the crack tip. Numbers correspond to active slip systems on Fig. 1-b.
The constructed asymptotic limit map shows that the inner bound was almost independent of the applied loading and was set at 300 |Xm for an extended range of J/oo < 250 ^m. However, at higher loadings it started to expand, evolving with deformation and followed the finite deformation limiting bound. The outer boundary evolved with deformation and varied from 5 Jfco at b/(J/a0) = 42 to 1.75 J/ao at b/(J/ao) = 10.3. Other tested samples of the hardened copper crystals showed the same asymptotic field limits, [12].
DISCUSSION AND CONCLUSION
The incremental surface measurements of the in-plane components of the Green Lagrange strain tensor on a fatigue precracked 4-point bend specimen has revealed several distinctive features of the crack-tip field in cyclically work hardened copper single crystals. The surface-measured in- plane deviatoric strain components are similar to those calculated for plane-strain and supported by etch pit experiments along the specimen thickness [8] and the 3D finite element simulation [3]. The deformation field is sensitive to additional mode II loading as ascertained by finite element simulation [5, 12]. Moreover, a limited region of continuum asymptotic field has been observed at a distance > 250 urn from the crack-tip. This trend suggests an early evolution of a deformation-induced microstructural size scale. This size scale sets the nature of hardening characteristics close to the crack-tip.
The observed microstructure size scale dependence is similar in nature to the Hall-Petch effect which states that the yield strength of pure metals increases with diminishing grain size [18, 19]. Likewise, the average width of the angular sectors of constant stresses at 300|im is approximately 30-50 um. Therefore, when the sector size around the crack tip diminishes to certain length scale, the near tip field experiences an inhomogeneous hardening. In such circumstances where the constitutive behavior becomes highly non-local, the conventional
255

homogenized crystal plasticity theory becomes invalid, since it possesses no internal length scale.
Two main factors may give rise to this behavior; namely the strain gradient field near the crack- tip or the patchy slip and glide band clustering within a small volume. The gradient effect is checked using the analysis of the crack-tip field in a solid characterized by strain-gradient plasticity [20]. For the measured plastic zone size, the strain-gradient was found to have no significant influence on the crack tip field. Moreover, the current measurements are not adequate to discriminate the effects of the strain gradient field from the fluctuation effect of the slip clustering close to the crack-tip.
ACKNOWLEDGEMENTS
This research was conducted during A. -F. Bastawros Ph.D. dissertation at Brown University and supported by NSF (DMR-9223683) and ONR (N00014-90-J-1295).
REFERNCES
1. J.R. Rice, J. Appl. Mech. 35, 379-386 (1968); Mech. Mater. 6, 317-335 (1987).
2. M. Saeedvafa and J.R. Rice, J. Mech. Phys. Solids, 37, 673-691 (1989).
3. A.M. Cuitino and M. Ortiz, Modeling Simul. Mater. Sei. Engng., 1, 225-263 (1992); J. Mech. Phys. Solids, 44, 863-904 (1996).
4. J.R. Rice, D.E. Hawk, R.J. Asaro, Int. J. Fracture, 42, 301 (1990).
5. R. Mohan, M. Ortiz, C.F. Shih, J. Mech. Phys. Solids 40, 315 (1992); 40, 1907 (1992).
6. M. Saeedvafa, Mech. Mater. 19, 73-88 (1994).
7. R. Nikolic, PhD Thesis, Harvard University, 1989.
8. J.W. Cho, and J.Yu, Phil. Mag. Letters, 64, 175-182 (1991).
9. X.M. Li, F.P. Chiang, J. Wu, and M. Duddley, Engng. Fracture Mech.43, 171-184 (1992).
10. T.W. Shield and K.-S. Kim, Exp. Mech. 31, 126-134 (1991).
11. A.-F. Bastawros and K.-S. Kim, to be submitted to J. Mech. Phys. Solids (1998).
12. A.-F. Bastawros, PhD thesis, Brown University, 1997.
13. B. Yan, A. Hunsche, P Neumann, and C. Laird, Mater. Sei. Engng. 79, 9-14 (1986).
14. J.R. Rice, P.C. Paris, and J.G. Merkle, ASTM STP 536, 231-245, (1973).
15. N.P. O'Dowd and C.F. Shih, J. Mech. Phys. Solids 39, 989-1015 (1991); 40, 939-963 (1992).
16. R.M. McMeeking and D.M.Parks, ASTM STP 668, 175-194 (1979).
17 . C.F. Shih and M.D. German, Int. J. Fracture 17, 27-43 (1981).
18. E. O. Hall, Proc. Phys. Soc. Lond., B, 64,747 (1951).
19. N.J. Petch, J. Iron Steel Inst., London, 174, 25 (1953).
20. Y. Wei and J. Hutchinson, J. Mech. Phys. Solids 45, 1253-1273 (1997).
256

SIMULATION OF VOID GROWTH AT HIGH STRAIN-RATE
J. BELAK and R. MINICH University of California, Lawrence Livermore National Laboratory, Livermore, CA 95440
ABSTRACT
The dynamic fracture (spallation) of ductile metals is known to initiate through the nucle- ation and growth of microscopic voids. Here, we apply atomistic molecular dynamics modeling to the early growth of nanoscale (2nm radius) voids in face centered cubic metals using embedded atom potential models. The voids grow through anisotropic dislocation nucleation and emission into a cuboidal shape in agreement with experiment. The mechanism of this nucleation process is presented. The resulting viscous growth exponent at late times is about three times larger than expected from experiment for microscale voids, suggesting either a length scale dependence or a inadequacy of the molecular dynamics model such as the perfect crystal surrounding the void.
INTRODUCTION
The growth of microscopic voids is fundamental to the ductile fracture of metals [1]. Under low strain-rate creep conditions growth is determined by the behavior of vacancies and diffusive processes. An understanding is central to technological problems such as the failure of intercon- nect lines of microelectronic circuits [2] and the radiation damage of materials in nuclear reactors [3]. At high strain-rates, as occur during shock loading, there is insufficient time for diffusive pro- cesses and void growth occurs by plasticity mechanisms. The rich history of experiment [4] and of continuum plasticity models of void growth [1,5-8] has resulted in a highly successful contin- uum computer code model of failure based on the nucleation and growth of voids [9-11]. How- ever, there remains many unanswered questions concerning the microscopic mechanisms of void nucleation and plastic growth.
In this paper we examine some of these microscopic mechanisms using atomistic molecular dynamics (MD) modeling of the growth of a nanoscale (radius = 2nm) void in copper under high strain-rate isotropic tension.
Figure 1. Isotropic tension is simulated by expanding the simulation cell in all directions at a con- stant rate. A nanoscale void of size R = 2nm = /cen/10 is cut from the center of the cell.
257
Mat. Res. Soc. Symp. Proc. Vol. 539 ° 1999 Materials Research Society

METHODS
A cubic simulation cell containing N=864000 atoms was created by replicating 60 FCC unit cells along each of the cubic axes. The embedded-atom method [12,13] is used to model copper. The equations of motion are integrated using a Verlet leap-frog algorithm with a time step of 6fs and periodic boundary conditions [14]. The system was simulated at T=300K and P=0 to an equi- librium cell length of /cen = 21.7nm. A void of radius 2nm was then cut from the center of the sim- ulation cell as shown schematically in Figure 1, resulting in a system containing N=860396 atoms. A strain-rate is simulated by rescaling the positions of every atom in the simulation cell as is commonly done in constant pressure MD simulations [15]: x = Hs, where sc[0, 1] and
H = {a, b, q) is a matrix composed of the simulation cell vectors. An isotropic constant strain-
rate is simulated by specifying a constant time derivative of H. After equilibrium, the thermostat is turned off and expansion is simulated under adiabatic conditions.
RESULTS and DISCUSSION
The resulting stress averaged over the entire simulation cell is shown in Figure 2 as a func-
tion of volume for a strain-rate of e=10V. The tension (negative stress) increases monotonically to about 6 GPa after which it turns around and decreases with further expansion. This growth threshold stress agrees well with our previous simulation using comparable voids but smaller overall system sizes [16]. In general larger voids display a smaller growth threshold stress. We stop the simulation when the expanding network of dislocations crosses the periodic boundary.
In a seminal paper on dynamic fracture, Barbee et.al [9] measured the growth rate of microscale voids in copper. They observed a viscous growth law of the form:
V= V0e
3(c-OL„) ;—' 411
Oe
0.72 0.74 0.76 0.78 0.8 Volume / N (r.**3)
2.6 7-
2.4 Plastic i
-
G 2.2 0 > £ 2
1 Dislocation / Nucleation /
-
1.8 - ■ Elastic yS ■
1.6 11;
0.01 0.02 0.03 0.04 time (ns)
Figure 2. Stress as a function of volume per atom (re = 2.54 A) for isotropic adiabatic
expansion of an R=2nm void at £=10 s"1.
Figure 3. The natural log of the void vol- ume as a function of time for growth of an R=2nm void. The lines are drawn as a guide to the eye.
258

where V is the void volume, a is the applied stress, 0go = 0.005 GPa is the growth threshold stress, and r| = 0.2 Pas is the material viscosity. At an applied stress of 6 GPa (well outside the
experimental data), this model predicts a growth exponent of a = 2.2xl010s~1. Comparison with the MD data requires a metric of the void volume within the MD simula-
tion. A void is where the atoms are not. Thus, we define a background grid and compute the sum of unoccupied grid zones. A grid spacing smaller than an atom size leads to spurious results. We find Lrid = 0.36nm gives reproducible results consistent with the known initial void radius (2nm). This void volume metric introduces an error which scales as 1/R. We estimate the error to be no more than a few percent for R = 2nm. The resulting volume is shown in Figure 3 as a function of
1 | i i i | i i i [ i i i | i i i |
0.8
0.6
0.4
0.2
|||Ptf
'■■■'.Hi'-'
« » i t • » t ■ * > t « « « t
0.8 I
0.6
0.4
0.2
"'""I-"»™'"'»*'« il ■ i i I , ■ ■ I I I I I I I I
0 0.2 0.4 0.6 0.8 1 0 0.2 0.4 0.6 0.8 1 (a) (b)
Figure 4. A projection of a thin slice through the center of the simulation cell onto the x-y plane for (a) t=0.024ns and (b) t=0.030ns. The atomic positions are in the unit cube.
Figure 5. The defect structure at (a) t=0.024ns and (b) t=0.030ns as revealed by the atoms with potential energy 1% above the bulk potential energy at T = IK.
259

Simulation time. Three distinct, nearly linear regions are observed on the log plot, suggesting exponential growth. Void growth at early time is elastic, displaying no change when normalized by the total system volume. At late time, the growth is fully plastic with a surrounding network of dislocations moving into the material. As shown below, dislocations first emerge from the void surface at f=0.025ns and the nature of the intermediate region is not clear. From the slope of the
curve at late time we estimate the growth exponent in the simulation to be a = 6.2xl0,0s_1. The factor of three higher exponent than expected from experiment is most likely due either to the vast difference in length scale between the simulation and experiment or to the surrounding perfect crystal in the MD simulation.
Two methods of visualizing the nucleating dislocations were considered. First, a thin cross- section through the center of the simulation cell was projected onto the x-y plane. The result is shown in Figure 4 at times t = 0.024ns and t = 0.030ns. The presence of dislocations is observed through their effect on the strain field. At t = 0.024ns no apparent dislocations have entered the materials though the strain field near the void surface is highly non-linear. This nonlinearity may be the reason for the behavior observed in the intermediate region in the volume curve. At t = 0.030ns several dislocations are evident in the surrounding material. The resulting cuboidal shape has been observed experimentally [17].
The second method has proved extremely useful in visualizing dislocation emission during ductile crack growth [18,19]. The total potential energy is divided into contributions from each atom. Atoms with energy above a threshold are considered to be near a defect. Only these atoms are visualized. A naive application of this idea to the data presented here yielded noise. The ther- mal fluctuations at T = 300K are sufficiently large to wash out the difference between atomic sites in the bulk crystal and near a defect. As a result, the configuration was rapidly quenched to T = IK at constant volume, hopefully not changing the defect structure significantly. The quenched struc- tures at t=0.024ns and at t=0.030ns, shown in Figure 5, give the following picture of dislocation nucleation during void growth. At t=0.024ns, protrusions emerge from the void along the six cubic axes and leading Shockley partial dislocations can be seen wrapping around the void and terminating on neighboring protrusions. The same image at t=0.021ns shows only the void surface atoms. At t=0.030ns, the dislocation structure is far richer. For example, towards the bottom of the image a pair of edge dislocations with both leading and trailing Shockley partials have formed a junction. This junction, presumable created at the above mentioned protrusions, moves with the dislocation pair away from the void. The process repeats as additional dislocations emerge from the void surface and form even richer microstructures.
ACKNOWLEDGMENTS
Work performed under the auspices of the U.S. Department of Energy by the Lawrence Liv- ermore National Laboratory under contract No. W-7405-ENG-48.
REFERENCES
1. A.S Argon ed., Topics in Fracture and Fatigue, Springer-Verlag, New York, 1992. 2. A.F. Bower and D. Craft, Fatigue and Fracture on Eng. Mater, and Struct. 21, 611 (1998). 3. D.R. Olander, Fundamental Aspects of Nuclear Reactor Fuel Elements, ERDA (DOE) Technical Information Center, Oak Ridge, 1976. 4. J.S. Rinehart and J. Pearson, Behavior of Metals Under Impulsive Loads, ASME, Cleveland,
1954 (reprinted by Dover, New York, 1965). 5. F.A. McClintok, J. Appl. Mech. 35, 363 (1968).
260

6. J.R. Rice and D.M. Tracy, /. Mech. Phys. Solids 17, 201 (1969). 7. A. Needleman, J. Appl. Mech. 39, 964 (1972). 8. A.L. Gurson, J. Eng. Mater. Tech. 99, 2 (1977). 9. T.W. Barbee, Jr., L. Seaman, R. Crewdson, and D. Curran, J. Materials 7, 393 (1972). 10. D.R. Curan, L. Seaman, and D.A. Shockey, Phys. Rep. 147, 253 (1987). 11. M.A. Meyers and C.T. Aimone, Prog. Mater. Sei. 28, 1 (1983). 12. M.S. Daw and M.I. Baskes, Phys. Rev. B 29, 6443 (1984). 13. D.J. Oh and R.A. Johnson, in Atomistic Simulation of Materials: Beyond Pair Potentials,
V. Vitek and DJ. Srolovitz eds., Plenum, New York, 1989, p233. 14. M.P. Allen and D.J. Tildesley, Computer Simulation of Liquids, Clarendon Press, Oxford,
1987. 15. M. Parrinello and A. Rahman, J. Appl. Phys 52,7182 (1981). 16. J. Belak, to appear in J. Computer-Aided Mater. Design (1998). 17. A.L. Stevens, L. Davison, and W.E. Warren, J. Appl. Phys. 43, 4922 (1972). 18. S.J. Zhou, D.M. Beazley, P.S. Lomdahl, and B.L. Holian, Phys. Rev. Lett. 78, 479 (1997). 19. V. Bulatov, F.F. Abraham, L. Kubin, B. Devincre, and S. Yip, Nature 391, 669 (1998).
261

THE MECHANISM OF DUCTILE FRACTURE IN CONSTRAINED THIN FILMS
M.E. KASSNER, T.C KENNEDY, K.K. SCHREMS Department of Mechanical Engineering, Oregon State University, Corvallis, OR 97331 USA
ABSTRACT
The mechanism of low macroscopic-plastic-strain, ductile fractures under various high triaxial stresses in constrained thin silver films was investigated. Particular emphasis was placed on investigating ductile fracture by unstable cavity growth. The various multi-axial loads to failure were experimentally measured. FEA analysis was used to determine the corresponding high triaxial stress-states within the interlayer, also considering cavity-cavity interaction, residual stresses and elastic incompatibility stresses across interfaces. These were compared to the stresses required for cavity instability. Ductile fracture under high triaxial stresses, associated with low macroscopic strains, appears to be explained by unstable cavity growth, where cavity growth may occur without large macroscopic (e.g., < 0.05) plastic strains..
INTRODUCTION
Fracture in thin, constrained films was studied using tensile/torsion specimens consisting of two cylindrical maraging steel specimens, 5.1 mm in diameter, joined by a thin silver interlayer. The thickness of the silver (150 urn) to diameter of the elastic maraging steel, t/d, is only about 0.024. The interlayer bonds were prepared by combinations of physical vapor deposition and solid-state bonding. This creates a nearly axisymmetric, high-triaxial, stress-state at the maximum possible applied uniaxial loads (i.e., the ultimate tensile stress of the interlayer bond), where the ratio of the radial or hoop stress (o2 ^ c3) to the normal stress o^ is about 0.82. (This stress ratio does not change significantly as the t/d ratio decreases.) Fracture, particularly under uniaxial loading of relatively soft, thin constrained silver interlayer specimens, appeared to occur at high stresses and in a ductile manner by "microvoid coalescence" but, interestingly, with small (e.g. less than 1%) macroscopic plastic strains within the constrained silver interlayer. The test specimens were also used for biaxial tests where specimens were both uniaxially loaded and loaded by a torque. This allowed manipulation of the triaxial stress state to help determine the mechanism of ductile fracture. Similar ductile fractures with very low macroscopic strains were observed.
The high fracture stress but, especially, the low plastic strain to failure is difficult to rationalize. The fracture process appeared to consist of cavity nucleation and expansion. Forero and Koss [1] showed, experimentally, that for unconstrained ductile metals deformed by uniaxial tension, a simple doubling of the cavity size requires a substantial strain of about 0.5, apparently also consistent with the early theory of Rice and Tracey [2]. The Rice and Tracey models still require substantially more macroscopic or far-field plastic strain than experimentally observed under the various high triaxial stresses [3]. Huang, Hutchinson and Tvergaard [4,5] (FfflT), more recently, introduced the concept of unstable cavity growth in materials under high triaxial stresses. Basically, it was suggested that under certain triaxial stress states [e.g., axisymmetric where a2l°i > 0-75 and c„/ay typically - 4 (for v = 0.3, and cy/E= 0.003)] cavities would expand, unstably, without further increases in stress, where onl is the mean or hydrostatic stress and ay is the yield stress. The precise values for ajay for unstable cavity growth depended on the strain hardening exponent, n. Apparently, unstable cavity growth would not occur for a2/c5, < 0.75 [4]. They did not determine
263 Mat. Res. Soc. Symp. Proc. Vol. 539 e 1999 Materials Research Society

the macroscopic or far-field plasticity associated with failure. Other mechanisms of ductile fracture were also considered, including stable cavity expansion [1,2], direct void interaction without a growth stage and the cavity-nucleation-interlinkage (CNI) failure mechanism [1].
RESULTS AND DISCUSSION
Electron Microscopy Analysis of the Deforming/Fracturing Interlayers
It was observed that the interlayers undergo long-term or delayed failure at a fixed load below the ultimate tensile strength. This is by an identical mechanism as the ultimate tensile strength or short term (less than a few seconds with continually increasing load) tests just described [3,5], Thus, creep or delayed failure at ambient temperature is a means of "slowing" the ductile fracture process in these interlayers so that the ductile fracture sequence can be conveniently examined. The interlayer specimens uniaxially loaded to high triaxial stresses at 552 MPa (triaxial stress state similar to uniaxial loading to failure) were unloaded at various fractions of the expected rupture time, and the cavitation process leading to fracture was sequentially observed. An SEM with a field emission gun was used in this study to examine cavitated specimens that were argon ion etched. This allowed a resolution of cavities to about 20 nm. Figure 1 illustrates cavities 30-50 nm in diameter in a constrained silver interlayer undergoing ductile fracture by delayed failure. Cavities
bondline
Table I. Interrupted Delayed Failure Tests at 552 Mpa
Figure 1. Small cavities observed in the SEM from silver interlayer specimens loaded at 552 MPa to 10% of the expected time to rupture, tr. The cavities (from top to bottom) are about 140 and 60, nm, respectively.
%tr
(expected) Separation Ratio
(L/D)
0 105
1 32
10 77
25 9
50 11
99 8
264

tended to be observed at least very close to the high angle boundary or bond line, usually in areas where the bond line separates recrystallized and unrecrystallized (columnar grains) silver. Cavities usually appeared within the recrystallized grains.
It is observed that the cavity spacing in the "as-bonded" interlayer is fairly wide with an L/D (ratio of cavity separation to the diameter of the larger cavity) of about 105. As discussed elsewhere [3], the observed cavities are not expected to initially (first 10% of the expected time to rupture, %) interact and the stress operating on the cavity is approximately that of the macroscopic stress within the interlayer, as predicted by FEA. Beyond the first 10% oft,, additional cavities are observed, interaction occurs, and the actual stress experienced by cavities is affected by the decreased cavity separation. Thus, at least for the highest level of triaxiality, uniaxial loading cavity- cavity interaction does not appear relevant to the fracture process. This conclusion will be shown to be consistent with the observed fracture stresses and strains.
Study of Unstable Cavity Growth Using Improved FEA (Finite Element Analysis) that Included Analysis of the Far-Field Plastic Strain. Planar Arrays of Cavities, and Also Cases Where a^/ts, < 0.75
A comprehensive FEA of uniaxially and biaxially loaded (uniaxial loading plus torque) constrained interlayers was performed. The FEA analysis predicted the stresses that can cause a cavity to grow unstably (i.e., increase in cavity radius without the necessity for an increase in stress). As an extension of the Huang et al. analysis, we predicted the far-field plastic strains associated with instability and interacting planar-arrays of cavities. Table II shows the calculations of the stress states for uniaxial loading, as well as the "80-20" and "50-50" multiaxial loading cases (described as a ratio of uniaxial load divided by area and the equivalent uniaxial stress at the surface resulting from the torque). The mean stress, cm, and effective (or von Mises) stress, oeff) are also indicated.
The next important task was to determine whether the observed loads and torque (and corresponding principal stress states) in the ductile fracture tests of Fig. 2 are sufficient to produce an instability and also whether the observed plastic strains to failure correspond to the predicted plastic strains at instability.
800-
£/<..-/ =<0.002
Qjui =185 MPa
£/«,■; =<0.002 \
äiaii =169 MPa^\^ 'S
Figure 2. The fracture loci for specimens uniaxially loaded (abscissa, load divided by area) and twisted under a torque (ordinate, reported an effective uniaxial-stress at the surface) (from [4]). The equivalent uniaxial- strain and effective stress to failure are reported.
0 100 200 300 400 500 600 700 800
Sz (=L2/A0), MPa
265

Table II. The "Observed" Stress State (MPa) in the Silver Interlayers at Failure in Figure 2
sz (axial load/area) / ccfr (from torque) °i «2 °3 o. Ocff
o2 ^( c2+o3]
°i [ 2oi , 100-0 935 790 750 825 169 0.82
80-20 745 598 537 627 185 0.76
50-50 461 299 150 303 269 0.49
As expected, FEA showed that eventually the cavities grow without a further increase in strain and applied stress for c2/a, > 0.75. Interestingly, however, we find that instability also occurs for 0.60 < a2/c, < 0.75. However, there appears to be larger far-field plastic strains associated with instabilities where a-Jvy < 0.75. Modeling unstable cavity growth for o-2/
ci < 0.65 was found to be very difficult due to severe mesh distortion associated with the very large strains. Our FEA calculations were compared with the predictions of Rice and Tracey for a wide range of axisymmetric triaxial stress states. The latter model suggests that isolated cavities under identical triaxial stresses do not experience an instability but, instead, require significant and increasing far- field strain (and stress) for growth.
Figure 3 illustrates csit the maximum principal stress, versus the corresponding c2/c, at which an isolated cavity will grow without further increases in far-field stress (predicted "instability") as determined by FEA in this study. The minor stress (a2) is the average of the two smallest principal stresses for non-axisymmetric stress states. The portion of the curves for a2lci\ < 0.65 was estimated by an extrapolation procedure. We find that the effective stress approaches the saturation stress (or steady-state stress, oss) of silver for o2l<3\ < 0.7. Thus, we assumed that the effective stress [= (ar02) for axisymmetric stress-states] required for unstable cavity growth is nearly equal to the saturation stress for CT2/0[ < 0.65. This relationship determined the extrapolated (dashed) portion of the curve in Fig. 3. Figure 3 also includes data (observed "instability") from the three multi-axial loading tests of Table II. The agreement between the FEA predicted stresses and strains for instability are in reasonable agreement with the observed values.
EXTRAPOLATED RESULTS
• EXPERIMENTAL FAILURE STRESS -
0.6 0.7 0.8 STRESS RATIO, aja,
Figure 3. The FEA predicted maximum principal stress for failure versus o2h\ based on unstable expansion of isolated cavities (solid line). The predicted plastic strains to failure are also reported. The observed (experimental) stresses for ductile fracture are indicated by dots.
266

The agreement for the 80-20 case is a little less favorable with the observed c, (based on load/torque to failure and FEA) being about 18% smaller than that predicted for instability (^/oj - 0.76) based solely on FEA. One might argue that this is not excessively large considering factors such as elastic incompatibility are not included, and that some errors may be present in the FEA calculations. The experimentally observed macroscopic strain to failure for the uniaxial and 80-20 cases is about 0.002. The predicted strain is about 0.009 for uniaxial loading, favorable agreement considering experimental errors. However, the predicted strain for the 80-20 case seems a bit higher, at about 0.04, than the observed value, a, is about 12% smaller than predicted for instability ipj°\ = °-49) for the 50-50 case, which is reasonable agreement considering the assumptions discussed earlier. A plastic strain to failure was not predicted for this case. Thus, unstable cavity growth of, initially, isolated, cavities may be a viable explanation for ductile fracture for at least the uniaxial tension case (p2l<S\ = 0.82), and possibly the others as well.
Cavity-cavity interaction was also considered since the observed ductile fracture principal stresses were somewhat lower than those predicted for instability of isolated cavities. The variation of the maximum principal stress, a„ and macroscopic strain to instability (failure) was determined for various cavity-spacing to diameter ratios (L/D) for the two relevant axisymmetic stress states that were confirmed by FEA (and other work) to cause cavity instability. As mentioned earlier, there is not a clear necessity for cavity-cavity interaction for the pure uniaxial loading case as both the stresses and strains are fairly consistent with unstable cavity growth. For the 80-20 case, or ^/a^ 0.76 (which is similar to the uniaxial loading case), an initial L/D = 10 would decrease the stress values for failure by unstable cavity growth to approximately those observed. The strain would decrease to just 0.02 with L/D = 10, closer to the observed value. The cavity distribution on loading for the biaxially loaded specimens is unknown, and there will always be the difficulty of resolving cavities smaller than 20 nm, due to the resolution limit of the SEM utilized. Thus, for some biaxial loading cases, interaction between nucleated cavities on loading may be necessary to rationalize the, perhaps, somewhat low stresses in Fig. 3, where isolated cavities were assumed. As shown in Table n, the effective stress increases from the uniaxial, to the 80-20 loading case and further increases with the 50-50 case. It has been presumed that cavity nucleation is a consequence of plasticity, perhaps by a Zener Stroh mechanism. Thus, it is possible that there is a higher concentration of nuclei for the 80-20 case than the uniaxial case in Table I on loading, and that the nuclei interact in biaxially loaded specimens. This, however, is not yet confirmed.
CONCLUSIONS
The mechanisms of ductile fracture in (constrained) pure silver thin-films under various high triaxial stresses were investigated with particular attention to the recently developed concept of unstable cavity growth. An accurate experimental and FEA determination of the stress-states in constrained films that experience ductile fracture to low macroscopic strains was performed. Direct determination of cavity instability exclusively with FEA using accurate constants, consideration of cavity-cavity interactions, residual stresses from fabrication, and improved experimental resolution of cavities was also performed. It is concluded that: 1. FEA analysis shows that unstable cavity growth such as recently described by Huang,
Hutchinson, and Tvergaard is reasonable and can be extended to at least some axisymmetic stress-states where a2/o, < 0.75.
2. There is good agreement between the observed fracture principal stress-state and the low (0.002) macroscopic strain to failure and that predicted for (isolated) unstable cavity growth for the highest triaxial stress-state where <52hl = 0.82.
267

3. For biaxially loaded interlayer specimens, where the stress states are less triaxial with c2/c, = 0.76 and 0.48, the agreement between predicted and observed stresses and small strains for cavity instability is reasonable but improves if an initial cavity-cavity interaction is considered.
4. Ductile fracture under high triaxial stress appears to be explained by unstable cavity growth where cavities grow without the necessity for continual increase in flow stress and without substantial far-field plastic strain.
ACKNOWLEDGMENTS
The support from the National Science Foundation from grant CMS-9522206 is gratefully acknowledged.
REFERENCES
1. L.E. Forero and D.A. Koss, Scripta Metall et Mater. 31, 419-422 (1994). 2. JR. Rice and D.M. Tracey, J. Mech. and Phys. Solids 17, 201-217 (1969). 3. M.E. Kassner, T.C. Kennedy and K.K. Schrems, Acta Mater., in press. 4. Y. Huang, J.W. Hutchinson and V. Tvergaard, J. Mech. and Phys. Solids 39, 223 (1991). 5. V. Tvergaard, Y. Huang, and J.W. Hutchinson, Eur. J. Mech. 11A, 215 (1992). 6. M.C. Tolle and M.E. Kassner, Acta Metall, et Mater. 41, 287 (1995).
268

FINITE ELEMENT ANALYSIS OF THERMAL-MECHANICAL STRESS INDUCED FAILURE IN INTERCONNECTS
X. YU *, K. WEIDE ** * Institut fur Halbleitertechnologie und Werkstoffe der Elektrotechnik, Universität Hannover, Appelstrasse HA, 30167 Hannover, Germany ** Laboratorium für Informationstechnologie, Universität Hannover, Schneiderberg 32, 30167 Hannover, Germany
ABSTRACT
In this work a study of the nature as well as an evalution of the thermal-mechanical stress in aluminum interconnects was carried out. A theoretical model discribes the atom flux which can be induced by the relaxation of the stress. Based on this theory an algorithm has been developed and integrated into the finite element simulation software. This algorithm allows the calculation of the mass flux divergence and prediction of the failure location before the damage occurs. For the verification of this algorithm an aluminum pad structure sputtered on thermal oxide layer was used. The failure location was correlated with in situ observation during the long term stress tests. Experimental results confirm that the observed structure degradations correspond with the simulations very well.
INTRODUCTION
The continuously increasing complexity of VLSI technology can result in high thermal-mechanical stress in the multilayer structures among different materials. The thermal-mechanical stress is induced by thermal mismatch of the different material properties, e.g. thermal expansion coefficients, elastic moduli and poisson ratios. The stress in the metallization layer interacts tightly with the electrical current density and local temperature increase. The stress gradient will enhance the driving force for the atomic flux along the diffusion path and lead to failure in the interconnects [1], The electromigration induced stress has been extensively reported [2-4] but the effect of thermal- mechanical stress on the mass flux has received limited attention.
In this paper we suggest an aproach to this problem. We will develop a theoretical model for the mass transport induced by the gradient of the thermal-mechanical stress, which is coupled with electromigration and thermomigration. The finite element program ANS YS [5] was used to compute the distribution of temperature, thermal-mechanical stress as well as electrical current density in the interconnects. An additional user routine was used to determine the mass flux divergence and illustrate the different failure mechanisms and to predict the location of structure degradation.
THEORY
Thermoelastic equations Based on the assumption that the aluminum metallization is stress-free at a uniform temperature
T0 when all external forces are removed, the thermal stress a^ is described in the equation (1) of linear thermoelasticity. It is induced by thermal mismatch of the different material properties between the Al-metallization and the surrounding materials.
% = Et.* a * ( T - T0 ) (1)
269
Mat. Res. Soc. Symp. Proc. Vol. 539 ° 1999 Materials Research Society

where E^ is the elastic modulus, a is the thermal expansion coefficient and T0 is the temperature with reference to stress-free state.
The components of the thermo-mechanical stress tensor are commonly described as (2) [6]:
°ii = Cm ekl - o (2)
with infinitesimal strain-displacement relations (3):
1 3K, dir
* 2 dx dx v '
where X; are spacial coordinates, Uj are components of the displacement vector, ey are components of the strain tensor, C^ is the function depending on the elastic moduli and poisson ratio.
We assume that the materials are isotropic, so the equation (2) can be rewritten as equation (4), where v is the poisson ratio and the subscripts i,j,k are equal to x,y,z.
*m - ^ = J K*> " V(W<W1 + «( T~To) (4)
For the special case of steady state the heat conduction equation can be written as (5), where W is the heat generation per unit time per unit volume. In the case of an applied current, W is defined as the self-heating in the interconnects.
vr = -K (5)
Applying the equilibrium equation of motion, we obtain equation (6) for isotropic thermal stress with steady state heat generation:
E V*(e « +ez) - JLE- VT - -^- V{ox+o+o} + A^f ) - 0 (6) (1+v) * y z (1+v) 1+v ' y z dx dy dz
where ex, ey, ez, and ox, oy, oz are normal components of the strain and stress tensor, X, Y, Z are the body force components.
Diffusion due to stress gradient coupled with electric current and temperature gradient The diffusion in the metal is driven by the gradient of the chemical potential u. Considering only
mechanical, electrical and thermal driving forces, the mass flux of stress gradient, current density and temperature gradients can be written as (7), with the atomic concentration N, diffusion coefficient D = D0exp (- EA/kBT), temperature T, resistivity p, Boltzmann constant kB and activation energy EA
270

J,o,aC l,ress+ V If = ~ T~f V Ö**™, + ^ + U* ) (7) *flr
Since the stresses in the interconnects are nearly hydrostatic, a large hydrostatic stress is sufficient to surmount the mass-moving barrier and the hydrostatic stress gradient provides the driving force to move mass in interconnects to create voids.
The total mass flux can be written as:
N Dn -E, ~ o J,o,ar YJ «P i-j-jr) t" 0 Vo„ + Z'e p j- | V7] (8)
with atomic volume Q, hydrostatic stress oH, effective charge of ions Z*e, current density j, heat of transport Q.
The mass flux divergence due to hydrostatic stress gradient is defined by (9):
div Jstress = f£ A,exp (-^ [(Id. - I) VJ ■ VoH - VoH ] (9)
For the calculation of the mass flux divergence caused by electromigration JA and thermomigration Jm equation (10) was applied [7]:
- E, 1 ap„ -, E, 1 apn div (JA+ J,h) = [ JA (_iL-l+J^) + Jth (^L.-1-^O) ] -vr
kB T T p kBT T p NQD0 j2 p2 e2 -£ (10)
+ -— exp ( ) kBT 3k
3BP kBT
J
For calculating the total mass flux divergence of stress migration, electromigration and thermomigration a user routine based on the equations (5), (6), (9) and (10) was applied. A positive mass flux divergence may lead to void formation and a negative mass flux divergence can result in Hillock growth.
DESCRIPTION OF THE FEM MODEL
A coupled electrical-thermal-mechanical stress simulation was performed on an aluminum-pad- metallization, schematically shown in figure 1. The unpassivated metallization line (Al/Sil%) has a thickness of 1.3 um and a width of 4 um. The pad size is 36*43 um2. The applied material properties at 300 K are given in table 1.
The local temperature increase leads to a thermal-mechanical stress field in the structure. The effect of joule heating caused by a high current density has been taken into account. Taking advantage of the symmetry, only half of the structure period was modeled for the FEM simulation. The temperature of 300 K is assumed to be a stress-free initial state without body forces for the unpassivated metallization.
271

Figure 1. Aluminum-pad-metallization to perform electrical, thermal and mechanical simulations (generated FEM-model in grey).
Table 1. Material properties used in the FE-simulations
Electrical
resistivity
p [uQcm]
Thermal
expansion
«["■IO-VK]-1
Young's
Modulus
E [GPa]
Thermal
conductivity
K [W/ cmK]
Poisson ratio
V
Aluminum 3.16 23.86 72 2.37 0.34
Silicon Oxide - 0.5 64.72 1.2E-02 0.18
Silicon 4.4E6 2.33 0.98 1.48 0.45
VERIFICATION
To verify the results of the simulation, the maximum and the average of the temperature increase and the resistance change depending on the applied current were measured. To check the mechanical stress a measurement of the metal line surface displacement was performed with a high resolution interferometric laser probe. A very good agreement between the measurements and simulations was found for temperature increase and resistance change as well as for the surface displacement [8].
The divergence of total mass flux was calculated by applying the user routine based on the FE- simulation results. For an applied voltage of 3.5 V, equivalent 200 mA the calculated distribution of
SMN =-.001968 SMX =.002851 A =-.0017 B =-.630B-03 C =.780E-03 D =.0016
Figure 2. Distribution of mass flux divergence in an aluminum-pad-metallization (in 1/um3 s).
Figure 3. SEM image of the failure location.
272
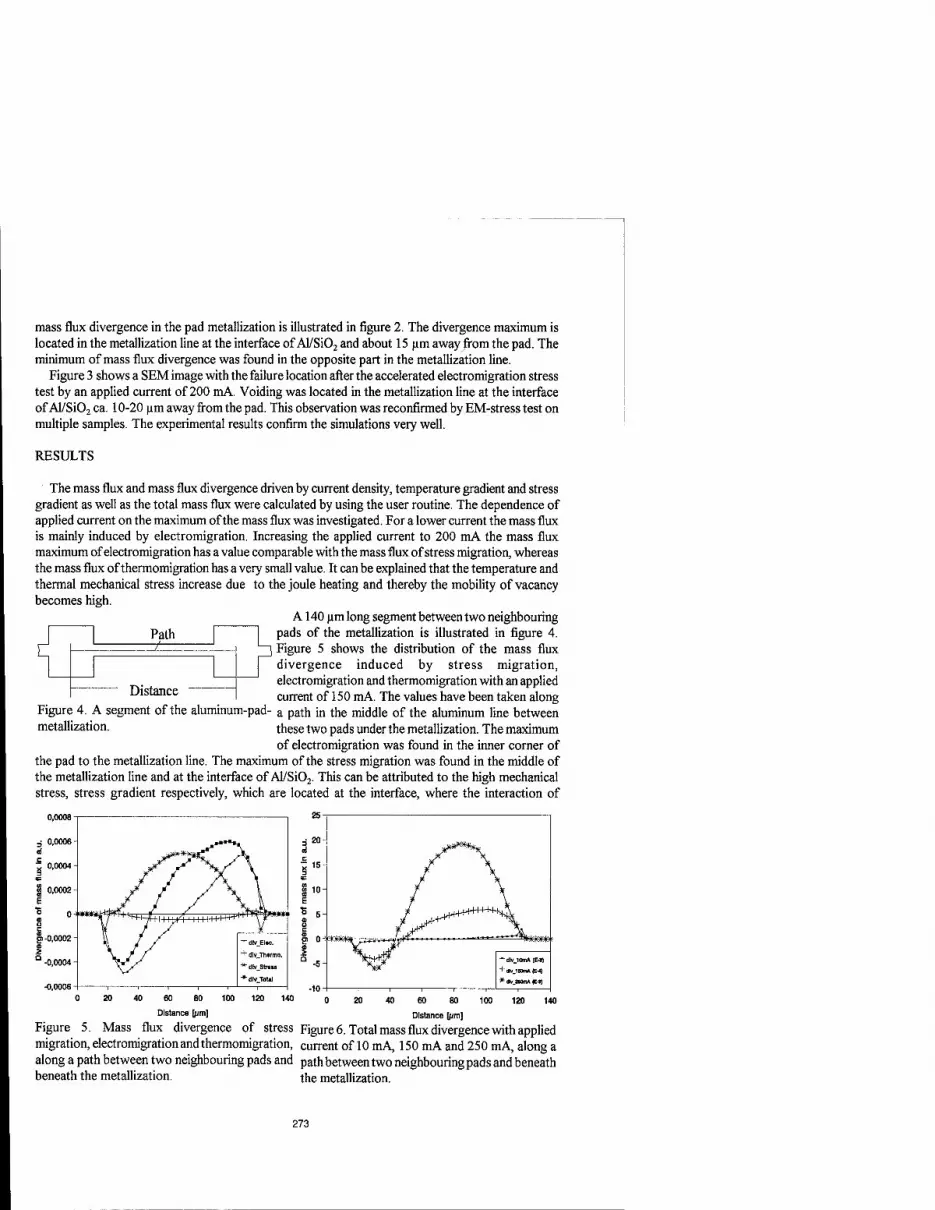
mass flux divergence in the pad metallization is illustrated in figure 2. The divergence maximum is located in the metallization line at the interface of Al/Si02 and about 15 urn away^rom the pad. The minimum of mass flux divergence was found in the opposite part in the metallization line.
Figure 3 shows a SEM image with the failure location after the accelerated electromigration stress test by an applied current of 200 mA. Voiding was located in the metallization line at the interface of Al/Si02 ca. 10-20 urn away from the pad. This observation was reconfirmed by EM-stress test on multiple samples. The experimental results confirm the simulations very well.
RESULTS
The mass flux and mass flux divergence driven by current density, temperature gradient and stress gradient as well as the total mass flux were calculated by using the user routine. The dependence of applied current on the maximum of the mass flux was investigated. For a lower current the mass flux is mainly induced by electromigration. Increasing the applied current to 200 mA the mass flux maximum of electromigration has a value comparable with the mass flux of stress migration, whereas the mass flux of thermomigration has a very small value. It can be explained that the temperature and thermal mechanical stress increase due to the joule heating and thereby the mobility of vacancy becomes high.
A140 urn long segment between two neighbouring pads of the metallization is illustrated in figure 4.
, Figure 5 shows the distribution of the mass flux divergence induced by stress migration, electromigration and thermomigration with an applied current of 150 mA. The values have been taken along a path in the middle of the aluminum line between these two pads under the metallization. The maximum of electromigration was found in the inner corner of
the pad to the metallization line. The maximum of the stress migration was found in the middle of the metallization line and at the interface of Al/Si02. This can be attributed to the high mechanical stress, stress gradient respectively, which are located at the interface, where the interaction of
Path -f—
Distance Figure 4. A segment of the aluminum-pad- metallization.
Figure 5. Mass flux divergence of stress Figure 6. Total mass flux divergence with applied migration, electromigration and thermomigration, current of 10 mA 150 mA and 250 mA, along a along a path between two neighbouring pads and path between two neighbouring pads and beneath beneath the metallization. the metallization.
273

different materials takes place. The maximum of total mass flux divergence is located 20 um away from the inner cornerin the metallization line as a result of the superposition of the stress migration, electromigration and thermomigration.
The dependence of the maximum of total mass flux divergence on the applied current was investigated. For an increasing current the maximum mass flux divergence increases too. This behaviour can be explained by the local heating as well as the stress gradients, which are caused by the high current density. Figure 6 shows the distribution of mass flux divergence along the path with different applied currents of 10 mA, 150 mA and 250 mA. For an applied current of 10 mA the mass flux divergence was found in the inner corner of the pads. In this case the electromigration is the dominant failure mechanism. For a current of 250 mA the maximum of the mass flux divergence moves from the inner corner into the center of the metallization line with an increase of stress gradient and temperature. This indicates that for this aluminum-pad-structure, applying a high current stress migration and thermomigration are main failure mechanisms.
CONCLUSION
A theoretical model for the calculation of stress migration coupled with electromigration and thermomigration was developed. Finite element simulations of mass flux divergence based on electrical current, temperature and thermal-mechanical stress were carried out on an aluminum-pad- metallization. For a higher current density the failure was found in the metallization line at the interface of Al/Si02. The failure mode in this case is suggested to be the stress migration. The failure location after the accelerated electromigration test confirms the simulation results very well.
REFERENCES
1. J. R. Lloyd, Semicond. Sei. Technol. 12 (1997) 1170-1185.
2. R. J. Gleixer, W. D. Nix, Journal of applied physics, Volume 83, (1998), pp. 3595-3599.
3. Y. J. Park, C. V. Thompson, Journal of applied physics, Volume 82, (1997), pp. 4277-4281.
4. S. Rzepka, M. A. Korhonen, E. R. Weber and C. Li, 1997 MRS Spring Meeting, (1997).
5. ANSYS, SAS IP Inc., Houston Texas, USA.
6. J. H. Lau, Thermal stress and strain in microelectronic packaging, edited by J. H. Lau (Van Nostrand Reinhold, New York, 1993).
7. K. Weide, X. Yu, V. Quintard, Proceeding of the 7th ESREF (1995), pp. 241-246.
8. X. Yu, K. Weide, Microelectronics and reliability, Volume 37, (1997), pp. 1545-1548.
274

Part VII
Interfacial and Grain-Boundary Fracture

QUANTITATIVE MODELING AND MEASUREMENT OF COPPER THIN ULM ADHESION
A.A. VOLINSKY, N.I. TYMIAK, M.D. KRIESE, W.W. GERBERICH* and J.W. HUTCHINSON"
University of Minnesota, Dept. of Chem. Engineering and Materials Science, Minneapolis, MN Harvard University, Division of Engineering and Applied Sciences, Cambridge, MA
ABSTRACT
Numerous mechanisms have been identified as fundamental to the adhesion of thin metallic films. The primary mechanism is the thermodynamic work of adhesion of the interface, which in its most basic description is the difference between the surface energies of the two materials and that of the interface. This quantity is often described as leveraging the contributions of other mechanisms. One of the more important mechanisms is that of plasticity occurring in a process zone in the vicinity of the delamination boundary. A quantitative model to characterize the contributions of plastic energy dissipation has been developed and used to rationalize experimental adhesion assessments. This model incorporates the functional dependence of the film thickness and constitutive properties. Orders of magnitude increases in the practical work of adhesion were both observed and predicted. Experimentally, the films used for model comparison were sputter-deposited copper ranging from 40 to 3300 nm in thickness, with and without a thin 10 nm Ti underlayer. Nanoindentation induced delamination of the Cu from Si02/Si wafers were evaluated in the context of composite laminate theory to determine adhesion energies ranging from 0.6 to 100 J/m2 for bare Cu and from 4 to 110 J/m2 for Cu with the Ti underlayer.
INTRODUCTION
Reliability of electronic devices that contain multi-layer thin films is strongly dependent on interfacial adhesion. Even if the film meets the design criteria in terms of its properties, failure to adhere to the substrate will cause a device failure. In many cases, elastic-plastic properties of a film are significantly different from those of a substrate. Extensive plastic deformation is likely to develop in the softer material before delamination is induced during an adhesion assessment test. This imposes restriction on the application of elastic methods of analysis. Elastic-plastic approaches for a hard film on a plastically deforming substrate has recently been developed [1,2] providing a basis for the experimental adhesion assessment. In contrast, while theoretical treatments for composites consisting of a ductile film sandwiched between two brittle materials are available [3,4], methods applicable for practical adhesion testing are still in the developing stages.
Ductile metal film-brittle dielectric substrate systems are of practical importance in microelectronics applications. It applies e.g. to copper as a new interconnect material. Opposite to Al, Cu adheres poorly to most dielectrics. For practical purposes adhesion is the total irreversible energy required to debond a thin film from a substrate. There are several contributing factors to the work of adhesion, thermodynamic (true) work of adhesion being the primary basis. In the present study we report the influence of another important contribution to the practical work of adhesion, that being the plastic energy dissipation in a ductile thin film. Changing the
277
Mat. Res. Soc. Symp. Proc. Vol. 539 ° 1999 Materials Research Society

film thickness can vary the amount of plasticity. A simple plastic strip model as an upper bound for estimating plastic energy dissipation at the interfacial crack tip [5], is given by:
G = h ■'ys In (1),
where h is the film thickness, E is the Young's modulus, oys is the yield stress, and b is the Burgers vector. In this model the plastic zone extends through the whole film thickness, and the Burgers vector is a cut-off. Note that this is slightly larger but of a similar form to that derived elsewhere from small scale yielding considerations [1]. Even though the yield stress of copper thin films measured by nanoindentation was shown to decrease with increasing film thickness [5], higher strain energy release rate values are expected for thicker ductile films [6,7] as the thickness increase dominates.
Adhesion of a Cu thin film can also be improved by putting a thin "glue" layer of another material between Cu and a dielectric substrate. Here a thin Ti underlayer was used to improve Cu film adhesion to SiC>2, thus increasing the amount of plastic deformation in Cu films.
EXPERIMENT
Thin film deposition
All thin film processing was conducted in a clean room environment. Silicon <100> wafers (100 mm in diameter, 0.5 mm thick) were thermally oxidized at 1100 °C in steam to grow 1.5 |im of Si02. Oxide thickness was measured with a Nanoscope Ellipsometer. Cu films from 40 nm to 3 urn thick were deposited in a 2400 Perkin-Elmer sputtering apparatus. During sputtering the base pressure of the system was 1 uTorr, and the Ar pressure was 12 mTorr. Substrate table rotation was used to achieve uniform Cu film thickness and nanostructure. The maximum temperature during film deposition reached 100 °C after which the system was cooled for one hour without breaking the vacuum in order to prevent film oxidation. Using a DEKTAK surface profiler, film thickness was measured and confirmed by RBS measurements. Some Cu films were sputtered over a 10 nm thick Ti "glue" layer on top of Si02. Residual stresses in Cu films were measured by the wafer curvature technique employing Stoney's equation [8], and ranged from 200 to 300 MPa tension. After all Cu films were deposited, a superlayer of 1.1 um of W with 200-300 MPa compressive residual stress was sputtered over all Cu films in one run. Deposition parameters for the different layers are summarized in Table I.
Table I. Sputtering deposition parameters.
Sputtered Material
Base Pressure, |iTorr
Ar Pressure/Flow, mTorr/cm3 min"1
Presputter time, min
Sputter power, W
Table rotation, rpm
Ti 1 11/9.6 15 1000 3.8
Cu 1 12/12 15 1000 2
W 1 7.4/7 15 1000 3.8
278

Superlaver indentation
A superlayer indentation method developed by Kriese, et al [9] was used for Cu thin film adhesion determinations. In the case of ductile or strongly adhered films it is often impossible to cause film delamination from the substrate by means of indentation. Ductile thin films cannot store enough strain energy necessary for crack initiation/propagation. Deposition of a hard film, capable of storing sufficient amounts of elastic energy over the film of interest, can result in multilayer debonding [10], producing bigger delamination radii (Figure 1). It also acts like a capping layer, preventing plastic flow of the underlying film in the vertical direction, adding normal stresses at the interfacial crack tip [3].
25 jum
Figure 1. Optical micrographs of delaminations produced after indenting to 250 mN of load without and with a tungsten superlayer (420 MPa residual tensile stress) on Cu: Note the factor
of four difference in scale.
In the superlayer test developed by Bagchi, et al high residual stress in the superlayer provides the driving force for film delamination [9]. Since residual stress is related to the superlayer thickness, several superlayer deposition steps are necessary for upper and lower bound adhesion assessment. For the superlayer indentation test a sharp indenter provides enough additional stress for crack initiation/propagation. As opposed to the Bagchi design, the sign of the residual stress in the superlayer does not have much effect on the interface cracking. Indentation stresses will overcome the residual tensile stress, or will be added to the compressive stress, promoting blister formation in both cases [5,3,11]. This makes the superlayer indentation test more versatile and easy to perform in terms of superlayer deposition and sample preparation. Superlayer indentation is schematically shown in Figure 2.
If the cracked film radius reaches the critical double-buckling conditions during loading, it will buckle. Upon the tip removal single buckling is also an option if the appropriate critical conditions are reached. Mechanics of the superlayer indentation test [9] is an extension of single layer Marshall and Evans analysis [12], and treats a bilayer as a single layer from the standpoint of laminate theory.
279

Indenter
W superlayer
Interfacial crack
Figure 2. Superlayer indentation schematic.
Fracture toughness assessment
When an indenter penetrates through a bilayer, it causes film debonding and blister formation, which can be seen afterwards in an optical microscope with Nomarski contrast. Properties of the films such as elastic modulus, Poisson's ratio, as well as the tip angle and radius are needed for an adhesion assessment. Generally speaking, there are two measurements that are necessary for strain energy release rate calculations. From the standpoint of blister formation, both indentation depth and blister diameter are required. Blister diameter is measured in the optical microscope with Nomarski contrast, examples being presented in Figure 1. An Olympus optical microscope was calibrated for 50 and 100X magnifications prior to blister diameter measurement with a Tencor surface profilometer being used to verify the measurement accuracy.
Displacement controlled indentation tests were conducted using the IBM micromechanical tester described elsewhere [9,13]. A series of indents to maximum loads ranging from 30 to 250 mN were made with a conical 90° diamond indenter of 1 ixm tip radius. Using the Oliver-Pharr method [14], indentation volume has been calculated from the indentation depth, as obtained by fitting 65% of the unloading portion of the load-displacement curve.
Besides plastic deformation, there are several other energy dissipation mechanisms for superlayer indentation. Friction between the film and the substrate behind the crack front may screen the crack tip from the applied load [15]. However, frictional effects are not considered in the present model. Cracking of the multilayer, as well as the substrate also releases strain energy, and is indirectly accounted for in the strain energy release rate calculations.
Radial multilayer cracking
For most of the indents into Cu films without a Ti underlayer, load excursions on the load-displacement curves were observed (Figure 3).
Discontinuities on the indentation curve can be attributed to multilayer buckling, unstable crack growth, radial multilayer cracking and substrate cracking. Since the indentation volume is
280

calculated from the residual depth, it will be overestimated for indentations with load excursions, which would result in the lower values for the calculated interfacial adhesion strength. Though the exact nature of excursions is not clear yet, it was accounted for in the analysis by subtracting the amount of excursions from the residual indentation depth. For shallower indentations, usually no radial cracking or load excursions were observed (e.g. indentation 1 in Figure 3). Increasing the indentation depth caused larger delamination radii, followed with a reproducible load excursion at 120-120 mN for a 100 nm thick Cu film. From this example it appears that the radial multilayer cracking contributes to discontinuities on the load-displacement curves. On the other hand, some curvature of Cu/W due to residual stress mismatch or double buckling could lead to a rapid interfacial crack advance followed by radial cracking.
The extent of radial cracks is highly dependent on the residual stress in the W superlayer. Tensile circumferential stress Oe in the delaminated film drives radial cracks initiated at the edge of the contact with an indenter. For a film with the residual compressive stress, Oe becomes compressive at the edge of a delamination while with the tensile residual stresses, 0"e is always tensile. As reported in [4] for residual compressive stress, the indenter will produce radial cracks in the brittle film (W with 300 MPa compressive residual stress in this case) only up to a half of the delamination radius. This is clearly seen in Figure 3, indentation 2. In the case of tensile residual stress in W superlayer [9], radial cracks extend to the delamination radius (Figure 1).
0.8 1.6 2.4 Indentation depth (|xm)
Figure 3. Load-displacement curves and corresponding delaminations for a 100 nm thick Cu film without Ti underlayer.
Ti underlaver
There are several reasons why a thin underlayer is necessary in the case of Cu films. From the standpoint of microelectronics, copper diffuses into silicon, reaching active devices. The underlayer is desirable to prevent copper diffusion. On the other hand, any additions to copper reduce film conductivity. The underlayer material is presumably nonreactive and nonmiscible with copper, should react with Si at high temperatures but not weaken copper electromigration properties. The underlayer is supposed to improve adhesion properties and thus improve mechanical reliability.
281

For the current study a thin (10 nm) layer of Ti was used to improve Cu film adhesion to silicon/silica substrates. There are two main reasons why Ti improves Cu adhesion in this case. First, there are two new interfaces that are formed, which are stronger than the original SiCyCu one [16]. Second, being in its initial stage of island growth, the Ti film has higher surface roughness than Si02 (which simply increases the contact area between Ti and Cu). Since the vacuum was broken prior to Cu film deposition, Ti02 oxide was most likely formed [17]. Thus, whatever increase in adhesion results must be considered either in terms of roughness or bonding to the titania.
Figure 4. SEM image of Ti underlayer.
RESULTS AND DISCUSSION
Interfacial fracture toughness values of Cu films are compiled in Figure 5. The plane strain solution for a wedge from [11] is presented for comparison. Elevated values for strain energy release rate are expected for the delamination radius to contact radius ratios up to five.
There are two components that contribute to the elastic energy in the film that drives interfacial delamination: indenter-induced stress and residual stress in the bilayer. For smaller delamination radii (R/a < 5 in case of a superlayer) there is an indenter-induced stress that drives the crack. For radii ratios over five the residual stress in the superlayer is mostly contributing to the annular crack growth.
200
150
100
O 50
0
Plane Strain, Cu 40 nm — Bilayer, h=2 um Plane Strain, Cu 3 urn
a Cu 40-120 nm 0 Cu2um D Cu3um
200
150
100
50
■Plane Strain, Cu 3 urn ■ Plane Strain, Cu 40 nm Ti/Cu 40-120 nm Ti/Cu lum Ti/Cu 2 nm Ti/Cu 3um
0 5 10 15 20 25 Delamination Radius/Contact Radius (R/a)
0 5 10 15 Delamination Radius/Contact Radius (R/a)
Figure 5. Strain energy release rate as a function of normalized delamination radius for Cu films a) without and b) with Ti underlayer.
282

The bi-layer solution for a 2 um thick Cu film is also presented. This solution is constructed by fixing the indentation depth at 0.64 of the bilayer thickness and varying the delamination radius. For a given indentation depth and bilayer thickness there will be a unique curve. Both plane strain and bilayer solutions show that for thicker films higher strain energy release rate values are expected for a given R/a ratio. For R/a < 5, variations in the delamination radius as measured optically will produce significant changes in the measured adhesion. Note that for a given load, bi-layer blisters without Ti are much larger compared to those with the Ti underlayer, as shown in Figure 6a. Corresponding indentation curves are shown in Figure 6b.
!
•
J
20 jam _____L.
Figure 6a. Indentation induced delaminations in a 100 nm Cu film with and without Ti underlayer.
500 1000 1500 2000 2500
Indentation Depth (nm)
Figure 6b. Load-displacement curves corresponding to delaminations in Figure 6a.
283

For Cu films with a Ti underlayer, R/a ratios do not exceed 15, compared to 21 without Ti. Improved Cu adhesion in the case of Ti underlayer does not allow blister extensions over R/a ratios higher than 15. Indenting deeper than the bilayer thickness into the substrate does not increase the blister size substantially, but causes substrate cracking and invalidates the analysis.
Residual stresses in Cu and W layers both affect G values. While W stresses were the same for both films with and without Ti, residual tension was slightly higher for the Cu/Ti films as shown in Figure 7.
450
400
5 350
6 300 's 1 250
200
150
--©--Cu Stress, MPa • Ti/Cu stress
.-«!
T*. T/' §
.. A —«
%^m^^^^^^tmmmAm.^ml
0.01 0.1 1 10 Cu Film Thickness, microns
Figure 7. Residual stress levels in the Cu and Ti/Cu films.
A higher tensile stress in Cu layer would result in increased curvature of the delaminated Cu/W. Thus, with the Ti underlayer, the crack tip would be more heavily under Mode I conditions. In fact, this prediction is consistent with the phase angle estimates as will be shown later. A shift towards Mode I would decrease measured adhesion strength, opposite to experimental observations as shown in Figure 8. Overall, the strain energy release rate is higher for films with this underlayer for a given film thickness. Here, the plastic energy dissipation upper bound estimate as given by equation (1) is also presented for comparison. This estimate assumes the plastic zone size extends through the entire film thickness. While being in qualitatively good agreement with the experimental results, the model is clearly an overestimate. One of the possible reasons could be the assumption that the plastic zone extends through the entire film thickness. Thus, it was desirable to estimate plastic zone size based on the experimentally measured strain energy release rates.
Plastic zone size at the crack tip
If the fracture toughness of the interface is known, a plastic strip model described in [5] can be used for estimating plastic zone size, c at the crack tip. Similar assumptions are considered here:
1) Elastic-perfectly plastic material; 2) No contribution from substrate or superlayer; 3) Use Burgers vector, b as a cut-off; 4) The average stress is equal to the yield stress of the film.
284

The difference here is that the plastic zone does not necessarily extend to the film thickness, but to some finite distance c < h. Work per unit fracture area can be determined as follows:
1 „ dW JodedV . , G = = - = cfad£ = ca.
dA dA ' c-b Je(r)dr b
(2),
where c is a finite plastic zone size, b is Burgers vector, e (r) is the plastic strain at a distance r from the crack tip, as given by [18]:
■«-£•!- (3)
Substituting (3) into (2) and integrating yields:
G = c^ln E
_1 + b^c^ln (4)
Since the plastic zone, c is still much bigger than the Burgers vector, the last b/c term can be omitted in this case except perhaps for very small thicknesses. Note that (4) reduces to (1) at the upper bound where c = h. If G is known, equation (4) can be solved for c numerically. Results of the crack tip plastic zone size calculations are presented in Figure 9.
1000
100
10
0.1
0.01
a Cu with Ti underlayer Upper bound • Cu, no underlayer
0.01 0.1 1 Cu Film Thickness, microns
0.01 0.1 1 10 Cu Film Thickness, microns
Figure 8. An interfacial energy relationship to the film thickness: theoretical upper bound solution (top solid line) and experimental strain energy release rates. Note: error bars span the full range of data, from 9 to 16 points.
Figure 9. Crack tip plastic zone for Cu films without Ti underlayer. Calculations from the modified plastic strip model, equation (4)
285

Here, it is seen that the plastic zone size is always larger with the Ti underlayer, and is approaching the film thickness. Since the Cu film adhesion was higher in this case, much more energy was spent on Cu film plastic deformation, approaching the upper bound of Figure 9.
Since measured interfacial fracture toughness is strongly dependent on the mode mixity, estimate of phase angle variations with the changing Cu/W film thickness ratio is desirable. This would assist in sorting whether the improved adhesion was solely due to plastic energy dissipation as opposed to contributions from a change in phase angle.
Phase angle determination
To obtain an estimate of phase angle, a procedure originally defined elsewhere [5] but not completely derived is used here. First, for Mode I conditions the values of G0, an initiation strain energy, can be taken from Mao, et al [19, 5] for pure Mode I loading to be
Gn= oj;A
* (5)
where ob is the interfacial bond strength, A is the crack blunting distance, and E is Young's modulus. The number of dislocations piled-up at a boundary may be given by N=A/b with N further defined in terms of the shear stress acting on the boundary [20], giving
N = ^ = ^- (6)
b 2A*
with A = (Xb/27t(l-v); d, the pile-up length; |X, as the shear modulus; v , Poisson's ratio. To first order we take v, to be associated with the maximum shear stress. Since the shear stress at initiation is largely elastic as governed by the preponderance of tungsten in most cases, this becomes
*i=-W=0.3p0=0.45-?- 7ta (')'
where p0 is the maximum pressure or 3/2 the mean pressure, P is load and a is the contact radius. Since the P/rca2 in (7) is hardness ,H, the number of dislocations of interest from (5)-(7) becomes
XT Hh
N=—• (8) Hb
with the pile-up length, d, being taken as the film thickness, h. Further, taking hardness to be three times the yield strength, oys, it is easily shown with (5)-(8) that
286

It is seen that by measuring Go we can estimate bond strength since oys, h, E and (i. are known. Furthermore, as discussed elsewhere [5], we can estimate the tangential shear stress from elasticity theory and therefore estimate a phase angle from
\|f =tan (10)
First, the ratio of x/Ob is determined using experimentally measured values of Go. Converting this to a phase angle through equation (10) gives the phase angle versus normalized film thickness in Figure 10a.
1 ! ! 1
• Cu/W O Ti/Cu/W
5 0
0
( i i
C
* F 2
h /h Cu Superlayer
1 2 3
Cu Film Thickness, microns
Figure 10a. Phase angle. b. Bond strength.
The phase angle decreases quite rapidly from about 20 degrees to 5 degrees with increasing Cu thickness compared to the superlayer. This trend is consistent with the theoretical predictions presented in the Appendix. The important point is that the material with the titanium underlayer has a slightly lower measured phase angle. This indicates a smaller Mode II component being involved in the delamination process. Since a smaller mode II component should result in a decreased strain energy release rate, the obvious conclusion is that the mode II component is not a controlling factor here. On the other hand, presence of the Ti underlayer results in approximately doubling in the true adhesion strength as shown in Figure 10b. Here, bond strengths for Ti/Cu/W and Cu/W films are given by equation (5). Note that estimated values are nearly independent of the film thickness for both types of multilayers. It may be concluded that the increased strain energy release rate observed in Figure 8 with the Ti underlayer cannot be attributed to a phase angle effect. The conclusion, using an admittedly first order calculation of a true bond strength and phase angle, is that the important contribution of the Ti is improved bonding and therefore an increased plastic energy dissipation.
287

Practical and true works of adhesion
Regarding the present adhesion measurements, there are three important points we wish to make here:
i) Cu films both with and without a Ti underlayer have increased interfacial energy release rates with increasing thickness;
ii) a Ti underlayer increases both interfacial toughness and interfacial bond strength, but the later is independent of film thickness;
iii) on both theoretical and experimental grounds, the phase angle decreases with an increasing ductile layer thickness, in this case Cu.
These three points taken together are consistent with plastic energy dissipation in the Cu films being the primary contributor to improved adhesion energies. While a Mode Ü contribution might be a minor factor in all cases but one, the calculated phase angle, \|/ = 15° is sufficiently small to reinforce the proposed concept that plastic zone sizes are generally about a factor of two smaller than the Cu film thickness implying that an even stronger bonding agent might further improve interfacial fracture toughness. The one disturbing feature about the data with the Ti underlayer is that strain energy release rate appears to increase with decreasing Cu film thickness below about 100 nm. Presently it is not known whether this is an artifact in our calculated values where R/a is quite small (see Figure 5b) or whether some Ti/Cu intermixing at very small Cu thicknesses allows improved bonding to the W superlayer resulting in nonlinear dissipation contributions from the tungsten. It is also possible that the above trends can possibly be attributed to the interfacial friction producing screening of a crack tip from the applied load. As follows from Stringfellow and Freund's [15] theoretical results, screening effects should be negligible at higher film thicknesses but increase with decreasing film thickness. Higher surface roughness of Ti as compared to Si02 could possibly result in more effective screening of a crack tip from the applied load. Thus, adhesion strength of Cu films thinner than 100 nm could be increased via interfacial friction when Ti is present but remain unaffected for the films with no Ti. In fact, we wish to point out that the Cu only films behave in an orderly fashion with a plateau of G = 0.6 J/m for thicknesses less than or equal to 100 nm. This translates to a stress intensity factor of 0.27 MPa'm m. Using the yield strength for 120 nm thick film, and oys = 1.86 GPa from a deconvolution program, one finds a plane strain plastic zone of only 22 A. Since this is practically the stand off distance for a single dislocation (Burgers vector), it can be assumed that plastic energy dissipation is nil. As pointed out elsewhere, [6], the stress intensity factor of 0.27 MPam m is only slightly less than Rice and Thompson's estimate for dislocation emission in Cu,
kIe = 0.32MPa • m . Taken together, it would appear that we have measured at the plateau, the true work of adhesion, i.e. the thermodynamic value of fundamental interest.
SUMMARY AND CONCLUSIONS
Plastic energy dissipation effects on the toughness of a thin ductile film/brittle substrate interface have been quantitatively evaluated. Predictions of a proposed theoretical model have been compared to the experimental results for Cu/Si02 interface with and without a Ti underlayer. Experimental adhesion strength assessment relied on the superlayer indentation
288

technique and axisymmetric bi-layer theory. Values ranging from 0.6 to 100 J/m2 and from 4 to 110 J/m2 increasing with the film thickness were obtained for Cu/SiC>2 and Cu/Ti/SiC>2 systems, respectively. Observed trends in interfacial toughness vs. film thickness dependencies were in qualitatively good agreement with the theoretical model. Bond strength estimates yielded average values of 10 GPa and 5 GPa for films with and without Ti underlayer, respectively. These values were nearly constant through all the range of Cu layer thicknesses indicating a true adhesion strength independent of the film thickness. Estimated phase angle values respectively ranged from 6 to 40° and from 2 to 14° for Cu/SiC>2 and Cu/Ti/SiCh systems. In both cases, increasing Cu film thickness resulted in a shift towards Mode I conditions. For the entire range of Cu film thicknesses, estimated plastic zone sizes were higher with the presence of Ti underlayers as compared to the films with no underlayer.
Taking into account the above, plastic energy dissipation has been identified as the mechanism primarily responsible for the observed elevation of the interfacial fracture toughness.
ACKNOWLEDGMENTS
The authors would like to acknowledge support for this work by the Center for Interfacial Engineering at the University of Minnesota under grant NSF/CDR-8721551, the Department of Energy under DOE contract DE-FG02/96ER45574. In addition, N.I.T. wishes to thank Prof. J.V.R. Heberlein and Prof. S.L. Girshick of the University of Minnesota for support under NSF DMI-9871863. The assistance of Dr. J.C. Nelson from the Center for Interfacial Engineering and Microtechnology Laboratory staff at the University of Minnesota is also gratefully appreciated.
REFERENCES
1. Y. Wei and J.W. Hutchinson, J.Mech.Phys.Solids, (1997), 45, pp. 1137-1159 2. M.D. Drory and J.W. Hutchinson, Proc. R. Soc. Lond. A. (1996) 452, pp. 2319-2341 3. M.Y. He, A.G. Evans and J.W. Hutchinson, Acta Metall. Mater., 1996, Vol. 44, pp. 2963-71 4. V. Tvergaard, J.W. Hutchinson, J.Mech.Phys.Solids, (1996), 44, pp. 789-800 5. N.I. Tymiak, A.A. Volinsky, M.D. Kriese, S.A. Downs and W.W. Gerberich, submitted to
Metallurgical Transactions, 1998 6. W.W. Gerberich, D.E. Kramer, N.I. Tymiak, A.A. Volinsky, D.F. Bahr and M.D.
Kriese,submitted to Acta Metall. Mater., 1998 7. R.H. Dauskardt, M. Lane, Q. Ma, Submitted to Engineeing Fracture Mechanics, 1997 8. G.G. Stoney.Proc.Roy.Soc.Lond. A82 (1909) p.72 9. M.D. Kriese, N.R. Moody and W.W. Gerberich, Acta Metall., 1998 10. A. Bagchi and A. G. Evans, Thin Solid Films, (1986), 286, pp. 203-12 11. J.J. Vlassak, M.D. Drory and W.D. Nix, J. Mater. Res., (1997), 12, No 7, p. 1900-10 12. D.B. Marshall and A.G. Evans, J. Appl. Phys., 1984,56, pp. 2632-38 13. T. Wu, J. Mater. Res., (1991), 6 No. 2, pp. 407-426 14. W.C. Oliver and G.M. Pharr, J. Mater. Res., 7, (1992), pp.1564-1583 15. R.G. Stringfellow and L.B. Freund, Int.J.Solids Structures, 30 (1993), 239, pp. 1379-1395 16. Y. Shacham-Diamand, A. Dedhia, D. Hoffstetter and W.G. Oldham, J. Electrochem. Soc,
140 (1993), p. 93 17. S.W. Russell, S.A. Raflaski, R.L. Spreitzer, J. Li, M. Moinpour, F. Moghadam, T.L. Alford,
Thin Solid Films 262 (1995), pp. 154-167
289

18. F.A. McClintock and G.R. Irwin, Plasticity Aspects of Fracture Mechanics, Fracture Toughness Testing and its Applications, ASTM STP 381, Philadelphia, 1965, pp. 84-113
19. S.X. Mao and A.G. Evans, Acta Mater., 45 (1997), 4263-4270 20. A.T. Yokobori, T.Y. Yokobori and H. Nioshi, in Macro-and Micro-Mechanics of High
Velocity Deformation and Fracture, IUTAM Symposium, Tokyo, 1985, Springer-Verlag Berlin (1987)
21. J.W. Hutchinson, M.D. Thouless and E.G. Linger, Acta Metall.Mater., 40 (1992), pp. 295- 308
APPENDIX
Effects of film thickness and interfacial crack length on the mode mixity for buckling driven delamination in the indented pre-stressed film can be qualitatively evaluated through the parameter TI = o/ac . Here, ac is the critical buckling stress; a = O; + aR is the total stress in
the film with the O"; and oR being indentation induced stress and residual film stress
respectively. As Tl increases, |y| increases with the interface crack becoming more heavily under
mode II conditions [21]. The parameter r| can be determined using values of Gj and oR defined by the Marshall and Evans [12] analysis for a single layer, giving
o-j+o-R _aR+ßEV0/R2h_oRR2+ßEV0/h 1 ~ „, 7 l~7 _. 2 *■ ' yEh2/R2 yEh2
,.2v Here, y = 14.68/12(l-v ); ß = l/2it(l-v); V0 is the indentation volume; v, Poisson's ratio; E, Young's modulus and compression is regarded as a positive stress. In the case of a bi-layer film, aR should be replaced with the effective residual stress in the laminate. For the Cu/W thickness ratios and residual stress levels considered in the present research, the effective oR is always positive.
Differentiating (A.l) with respect to the delamination radius yields:
dn 2aRR
3R ye,2
As follows from (A.2), r| increases with the delamination radius if the effective residual stress in
the bi-layer is cc
providing aR > 0:
the bi-layer is compressive. On the other hand, the derivative — is always negative 3h
g = -i^aRR7h3 + 3ßEV0/h4) (A3)
Thus, mode mixity decreases with increasing film thickness, which is consistent with the experimental calculations.
290
MECHANISMS OF INTERGRANULAR FRACTURE
Diana Farkas Department of Materials Science and Engineering Virginia Polytechnic Institute and State University Blacksburg, VA 24061
ABSTRACT
We present a study of the atomistic mechanisms of crack propagation along grain boundaries in metals and alloys. The failure behavior showing cleavage crack growth and/or crack-tip dislocation emission is demonstrated using atomistic simulations for an embedded-atom model. The simulations follow the quasi-equilibrium growth of a crack as the stress intensity applied increases. Dislocations emitted from crack tips normally blunt the crack and inhibit cleavage, inducing ductile behavior. When the emitted dislocations stay near the crack tip (sessile dislocations), they do blunt the crack but brittle cleavage can occur after the emission of a sufficient number of dislocations. The fracture process occurs as a combination of dislocation emission/micro-cleavage portions that are controlled by the local atomistic structure of the grain boundary. The grain boundary is shown to be a region where dislocation emission is easier, a mechanism that competes with the lower cohesive strength of the boundary region.
INTRODUCTION
A large effort in simulation work has been devoted to the structure of high angle grain boundaries in metals and alloys. In particular, symmetrical tilt grain boundaries have been the subject of numerous studies and structural models. The implications of these studies for fracture behavior of grain boundaries have been discussed in many of these investigations(Wolf 1985;Vitek and Chen 1991). In this paper we report atomistic studies of the fracture mechanisms of boundaries under increasingly larger applied loads. We use techniques based on molecular statics and dynamics that describes the process in a quasi-equilibrium or dynamic situation as the crack is subject to increasing stress intensity levels. In the statics case our computational scheme follows the energy released in the fracture process. This energy release behavior can be related to the structural features of the fractured boundary. We use standard molecular dynamics to follow the crack propagation at high strain rates. These techniques enable us to follow the details of the fracture process. The results of the simulations show that grain boundary fracture is not a pure cleavage process or a dislocation emission/crack blunting phenomenon but rather a combination of these two mechanisms in a way that is related to the structural unit of the boundary considered. The mechanisms described here were studied for a series of symmetrical tilt boundaries, but may have more general validity, since the more general boundaries may be actually partly constituted of the structural units of the special boundaries. We have also followed crack propagation in a polycrystal constituted of symmetrical tilt boundaries and show the relevance of the triple points in the dislocation emission process. We have chosen as a material B2 NiAl. The reason for this choice is the practical interest in understanding the brittle failure of this compound
SIMULATION TECHNIQUE AND INTERATOMIC POTENTIALS
The atomistic simulations of fracture in B2 NiAl were carried out using a molecular statics technique. The solution for isotropic elastic displacement field of a sharp crack as given by Sih and Leibowitz (Sih and Liebowitz 1968) was used to introduce a semi-infinite crack (loaded with a varying given
291 Mat. Res. Soc. Symp. Proc. Vol. 539 ° 1999 Materials Research Society

external Mode I stress intensity) in the perfect crystal. The manner in which this is done is similar to that used previously by Shastry and Farkas (Farkas and Shastry 1996).
The interatomic potentials used were developed specifically for the B2 NiAl phase and have been discussed in detail previously (Farkas; Mutasa; Vailhe, and Ternes 1995;Mishin and Farkas 1997). The simulation cell used has fixed boundary conditions along the directions perpendicular to the crack front and periodic boundary conditions along the crack front.
A symmetrical tilt grain boundary was introduced by a mirror reflection operation with the grain boundary plane being perpendicular to the y axis and thus coinciding with the crack front. The equilibrium grain boundary structure involves a certain rigid body translation of one of the two crystals relative to the other. The equilibrium translational states were studied in simulations without the crack and the equilibrium values were used in the fracture simulations.
A crack under constant load and growing would be subject to increasingly higher stress intensity factor as it grows. Our static technique performs simulations with increasing larger stress intensity values. This process was started slightly above the Griffith load in order to account for lattice trapping effects. The load was increased in small steps with full atomistic relaxation of the crack tip configuration between each step. The step size was typically 0.1 MPa m."2. These simulations can be considered as snapshots of the quasi-equilibrium crack tip region as the crack grows. The configurations at relatively low stress intensities correspond to the initial stages of crack propagation and the ones at higher stress intensities to later stages. The technique is particularly appropriate for the study of the relationship of crack propagation and the crystallography of the grain boundary. Since in this case we are studying quasi-equilibrium configurations in the tip region the technique is complementary to molecular dynamics simulations where crack propagation is followed at extremely fast speeds. We have also performed molecular dynamics simulations in initially notched blocks that are subject to increasingly larger strain. The statics technique clearly demonstrates the essential relationship between the fracture process and the structure of the grain boundary.
GRAIN BOUNDARY STRUCTURE IN NiAl
Petton and Farkas (Petton and Farkas 1991)studied the multiplicity of possible grain boundary structures for a £ =5 symmetrical tilt boundary in ordered B2 Ni aluminide. These boundaries were investigated considering possible variations of the local chemical composition and environment. More recently Mishin and Farkas (this symposium) have also studied grain boundary structure in this compound, using a more correct scheme for the calculations of the energies of off-stoichiometric boundaries (Hagen and Finnis 1996).The main conclusions from that work are as follows: The Al- rich boundaries present lower grain boundary energies for Al-rich bulk and the Ni-rich boundaries present lower grain boundary energies for Ni-rich bulk. The results of the recent investigation agree with the initial results of Petton and Farkas for structures and the cohesive energies of the boundaries. The observed trends indicate that the Al-rich boundaries present lower cohesive energies. The role of Al contents in the boundary energetics therefore particularly important. In that work it was also concluded that there are a variety of possible structures with similar energies that may actually play a role in the real crystal. For the present investigation we chose three structures, corresponding to the lowest possible energy for each boundary.
We first consider the energetics of grain boundary fracture in a Griffith framework. The calculation of the Griffith condition for crack propagation along the grain boundary was done using the cohesive energy of the boundary instead of twice the surface energy. The cohesive energy of the boundary is
292

defined as twice the surface energy minus the grain boundary energy. The staring point for our simulations is a semi-infinite crack loaded to stress intensity slightly above the Griffith value.
RESULTS
Symmetrical tilt boundaries We studied a series of symmetrical tilt boundaries, fracturing in mode I. Figure 1 shows a typical configuration for a [111](123) symmetrical tilt grain boundary at a loading approximately twice the Griffith value. The crack tip shows blunting due to dislocation emission. Figure 2 shows an example for a [001] (520) symmetrical tilt grain boundary. Similar dislocation emission processes were observed for all the symmetrical tilt boundaries studied. An example of the process of crack advance is shown in Figure 3, where the total energy of the block is plotted as a function of the crack tip position. The slopes in this plot represent the energy necessary for crack advance including the creation of new surface energy as well as plastic deformation. The steps shown in Figure 3 indicate regions of micro-cleavage (lower slope) and regions of dislocation emission (higher slopes). Similar stepped behavior was found in all the symmetrical tilt boundaries investigated, but not in the fracture of bulk crystal along <100> cleavage planes. The step length is related to the structural period of the symmetrical tilt boundary, as shown in Table 1. The results show that the fracture process is closely related to the structure of the boundary and that it is controlled in its scale by the periodicity of the boundary along the boundary plane, as opposed to the periodicity of the bulk lattice. This result is indeed reasonable since that the nature of the bonding changes across the period of the grain boundary. The bond breaking energy will be different in different sites within the grain boundary structural unit. As the fracture proceeds and it encounters an equivalent position in the next structural unit the response of the structure to the applied stress will be equivalent. The overall toughness can be evaluated from the energy versus crack tip position plots. The slope of these plots is the energy necessary for crack advance. In the micro cleavage portions of the process this value is similar to the cohesive energy of the boundaries. In the dislocation emission portions it is much higher, indicating ductile behavior due to dislocation emission. The overall toughness of the boundary is given by the combination of these two processes. The micro-cleavage process is initiated in the weaker regions of the structural unit of the boundary and continues until the crack tip reaches a region of the structural unit where dislocation emission is easier. At this point, dislocations are emitted and the crack blunts with the emitted dislocations being absorbed by the boundary. After a certain number of dislocations are emitted, the cleavage process starts again. The overall energies necessary to advance are up to three times the Griffith value. However, these values of the fracture toughness still represent brittle behavior from the point of view of experimental alloy development. The overall fracture toughness can also be compared with the values of stress intensities where the first micro-cleavage event is observed. For example, these values are 2.4 and 2.7 MPa m "2 for the (210) and (520) symmetrical tilt grain boundaries, respectively,whreas the Griffith stress intensities range from 0.88 to 1. MPa m v\ For boundaries of longer periods the micro-cleavage process may start again through the nucleation of a smaller new crack ahead of the main crack. This is illustrated in the crack structure of Figure 2. At a larger load level the small crack is joined with the main crack. The nucleation of the smaller crack ahead of the main fracture naturally occurs in a weaker region of the structural unit. In our simulations we found this process to occur in the higher index boundaries that have longer periods. The shortest boundary for which we have seen this mechanism is the (520) symmetrical tilt. These long period boundaries are more likely to present particularly weaker sites in their structure that act as nucleation sites for the micro-crack ahead of the main fracture. With a similar qualitative argument, the structural unit of the boundary is expected to contain sites that are
293

favorable for dislocation emission. The emitted dislocations are not necessarily the dislocations commonly observed in the bulk, but grain boundary dislocations of much smaller Burgers vector. The dislocation emission process actually occurs through a distortion of the structural unit of the boundary. The process of emission of dislocations from the crack tip for bulk fracture has been described in a model by Rice (Rice; Beltz, and Sun 1992). The present results suggest that for the grain boundaries, this process requires a lower loading than the emission of dislocations in the bulk. The process of dislocation emission is also related to the local structure of the grain boundary and therefore controlled in its scale by the periodicity of the boundary. The relevance of these observations in relation to the general mechanisms of fracture of grain boundaries is that these mechanisms include a combination of crack propagation and dislocation emission. This is opposed to the view of dislocation emission and crack propagation as mutually exclusive processes. Furthermore, the view of grain boundary fracture that emerges is one where the boundary is a region of weaker cohesion, making crack propagation easier, but it is also a region that contains favored sites for dislocation emission, which constitute the basis for greater grain boundary ductility.
Table 1: Correlation among the step length in the energy evolution and the grain boundary structural period.
Grain boundary plane
Step length in the energy evolution (nm)
Grain Boundary period (nm)
(210) 0.6 0.64
(520) 1.5 1.54
(560) 2.3 2.24
Molecular dynamics simulations of the [110] (210) boundaries were carried out for comparison. Similar results were obtained.
Figure 1. Crack tip configuration for a [111](123) grain boundary at a loading twice the Griffith value.
294

Figure 2: Crack tip configuration for a [001] (520) symmetrical tilt boundary at a loading twice the Griffith stress intensity.
Figure 3: Stepped energy evolution for the [001](520) symmetrical tilt boundary
-27650
^ -27700 -
2 « c LLI
■2 -27750 CQ
-27800
0.5 1.0 1.5 2.0 2.5 3.0 3.5
Position of Crack Tip (nm)
295
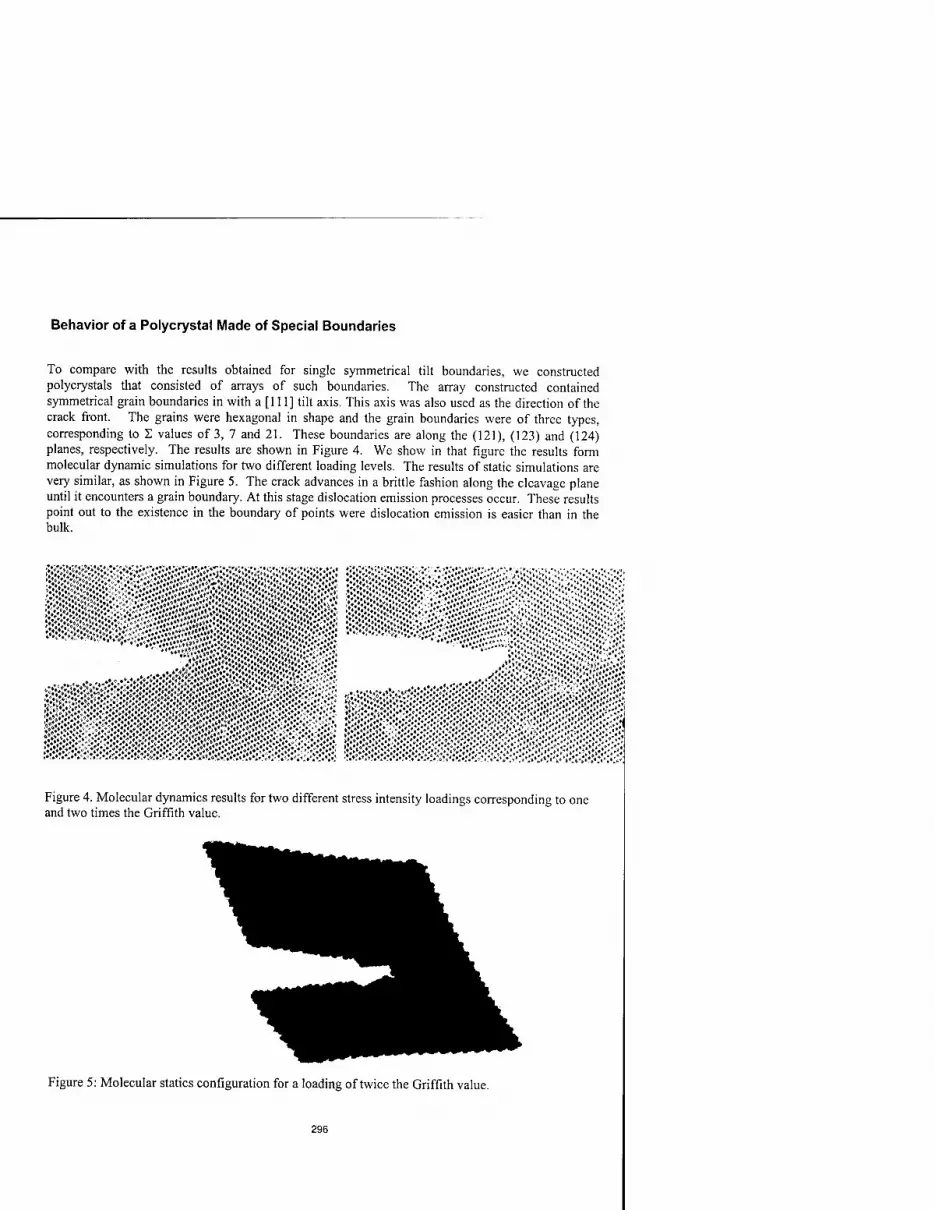
Behavior of a Polycrystal Made of Special Boundaries
To compare with the results obtained for single symmetrical tilt boundaries, we constructed polycrystals that consisted of arrays of such boundaries. The array constructed contained symmetrical grain boundaries in with a [111] tilt axis. This axis was also used as the direction of the crack front. The grains were hexagonal in shape and the grain boundaries were of three types, corresponding to E values of 3, 7 and 21. These boundaries are along the (121), (123) and (124) planes, respectively. The results are shown in Figure 4. We show in that figure the results form molecular dynamic simulations for two different loading levels. The results of static simulations are very similar, as shown in Figure 5. The crack advances in a brittle fashion along the cleavage plane until it encounters a grain boundary. At this stage dislocation emission processes occur. These results point out to the existence in the boundary of points were dislocation emission is easier than in the bulk.
Figure 4. Molecular dynamics results for two different stress intensity loadings corresponding to one and two times the Griffith value.
Figure 5: Molecular statics configuration for a loading of twice the Griffith value.
296

The simulations showed the importance of triple grain junctions as dislocation emission sources. Figure 6 shows a plot of only the atoms that have significant deviations from the perfect lattice environment. We note that the E =3 [111] (121) boundaries are not seen in this plot since they produce less distortion from the perfect lattice environment than the threshold used. This enables dislocations and any faults they may produce to be easily visualized. There are several such cases that can be identified to have originated at triple grain junctions.
Figure 6: Emission of dislocations at triple grain junctions in the vicinity of the crack tip. Only atoms with environments significantly different from perfect lattice are plotted and the grain boundaries along (112) planes are not seen. The dislocation emission process is seen in the atomic lines that are inside the hexagonal grains.
DISCUSSION AND CONCLUSIONS
The simulations reported here indicate that crack propagation along grain boundaries may proceed by a combination of dislocation emission and cleavage and not by cleavage alone. This combined malechanism is intimately related to the local atomistic structure of the grain boundary, as shown by the agreement of the step length in energy evolution and the structural period of the boundary. The overall fracture toughness of the boundary is given precisely by this combined mechanism. The interpretation of these results is straightforward if we think of the boundary as a region where crack propagation is easier because of the deviations from perfect lattice structure but also as a region
297

where dislocation emission can be easier due to these deviations. The boundary can be pictured to contain regions in its structure where cleavage is favored and regions where dislocation emission is favored, resulting in the combined propagation mechanism. In some cases these regions can be activated ahead of the crack. The two examples we have shown here where this happens are for the nucleation of a microcrack ahead of the main crack (cleavage activated) and for the emission of dislocations from triple points located in the vicinity but not exactly t the crack tip.
ACKNOWLEDGMENTS
This work was supported by the Office of Naval Research, Division of Materials Science, and the National Science Foundation, FAW program.
REFERENCES
1. Wolf, D. On the relationship between symmetrical tilt, twist, "special," and "favored" grain boundaries. Journal de Physique. 1985; 46, (4): C4-197 - C4-211.
2. Vitek, V. and Chen, S. P. Modeling of grain boundary structures and properties in intermetallic compounds. Scripta Metallurgica et Materialia. 1991; 25, 1237-1242.
3. Sih, G. C. and Liebowitz, H. Mathematical Theories of Brittle Fracture. Liebowitz, H. Fracture- An Advanced Treatise. New York: Academic Press; 1968; II, 69-189.
4. Farkas, Diana and Shastry, Vijay. Molecular statics simulation of fracture in Fe. Modelling Simul. Mater. Sei. Eng. 1996; 4,: 473-491.
5. Farkas, D.; Mutasa, B.; Vailhe, C, and Ternes, K. Interatomic potentials for B2 NiAl and martensitic phases. Modelling Simul. Mater. Sei. Eng. 1995; 3, 201-214.
6. Mishin, Yuri and Farkas, Diana. Atomistic simulation of point defects and diffusion in B2 NiAl: Part I. Point defect energetics. Phil. Mag. A. 1997; 75, (1): 169-185.
7. Petton, G. and Farkas, D. Grain boundary structure simulations in B2 ordered NiAl. Scripta Metall. 1991; 25,(1): 55-60.
8. Hagen, M. and Finnis, M. W. Determination of the Atomistic Structure of the ä3 (111) Twin boundary in NiAl. Materials Science Forum. 1996; 207-209, 245-248.
9. Rice, J. R.; Beltz, G E., and Sun, Y. Peirerls Framework for Dislocation Nucleation from a Crack Tip. In "Topics in Fracture and Fatigue". Edited by Argon, A. S., 1992.
298

EXPERIMENTS AND SIMULATIONS OF DIRECTIONALLY DEPENDENT FRACTURE ALONG COPPER/SAPPHIRE INTERFACES
JEFFREY W. KYSAR1
Division of Engineering and Applied Sciences, Harvard University, Cambridge, MA 02138
ABSTRACT
To test the hypothesis that the brittleness and ductility of crystalline materials are controlled by a competition between dislocation nucleation and cleavage failure at a crack tip, Rice et al. [1] designed a four-point bend copper/sapphire bicrystal which has two cracks that propagate along the interface in opposing directions. They predicted, on the basis of the Rice-Thomson model [2], that the specimen would exhibit a directionally dependent fracture behavior; that is, one crack would propagate more readily than the other. Beltz and Wang [3] carried out the experiments and reported that the specimen exhibits a directionally dependent fracture behavior in accordance with the predictions. In the present work, these experiments are repeated independently and it is shown that the orientation of the experimentally observed directionally dependent behavior is opposite that of the predicted orientation. Furthermore, we show that Beltz and Wang incorrectly measured the orientation of the directional dependence in their experimental results. A correct interpretation of their results is consistent with the present work.
Taking advantage of the transparent sapphire, the normal crack opening displacement (NCOD) profile of both cracks is measured with optical interferometry. The measurements show that, away from the very tip of the crack, the NCOD takes the form of a constant angle, irrespec- tive of load level. The opening angle of the apparently brittle crack is smaller than that of the apparently ductile crack. Complementary measurements of the very tip of the crack with Atomic Force Microscopy show that the near-tip crack opening profiles of the brittle and ductile cracks differ significantly.
The specimen is analyzed with the Finite Element Method, taking into account the elastic and plastic properties of the single crystal constituents. Since the very essence of the observed phenomenon is one of crack growth, the two cracks are simulated as they grow quasistatically along the interface. The asymptotic deformation fields, characteristic of single crystals, of the growing interfacial cracks are identified. The stress and strain fields, as well as the NCOD, are calculated. We present a plausible explanation of the directional dependence of fracture on the basis of the continuum plastic fields surrounding the quasistatically growing cracks.
INTRODUCTION
It is well established that the behavior of a crack in a single crystal depends not only on the crystallographic plane on which the crack resides, but also critically upon the crystallographic direction in which the crack propagates. Under identical loading conditions, a crack oriented in one crystallographic direction can propagate readily, while a crack oriented in the opposite direc- tion propagates much less. For example, Wang and Anderson [4] have shown that the X9[l 10]/(221) symmetric tilt CSL grain boundary of copper bicrystals, for which the interface is weakened with Bi segregation, exhibits a directional dependence of fracture under a fatigue loading. Other researchers [5][6][7] have found similar behavior in a variety of material systems. Most of these authors attribute the results to differences in the ability or inability of dislocations to nucleate at crack tips; those crack tips which can nucleate dislocations are blunted, which presum- ably leads to a more ductile behavior. For example, Wang and Anderson [4] used an analytical
Current Affiliation: Division of Engineering, Brown University, Providence, RI 02912
299
Mat. Res. Soc. Symp. Proc. Vol. 539 ° 1999 Materials Research Society
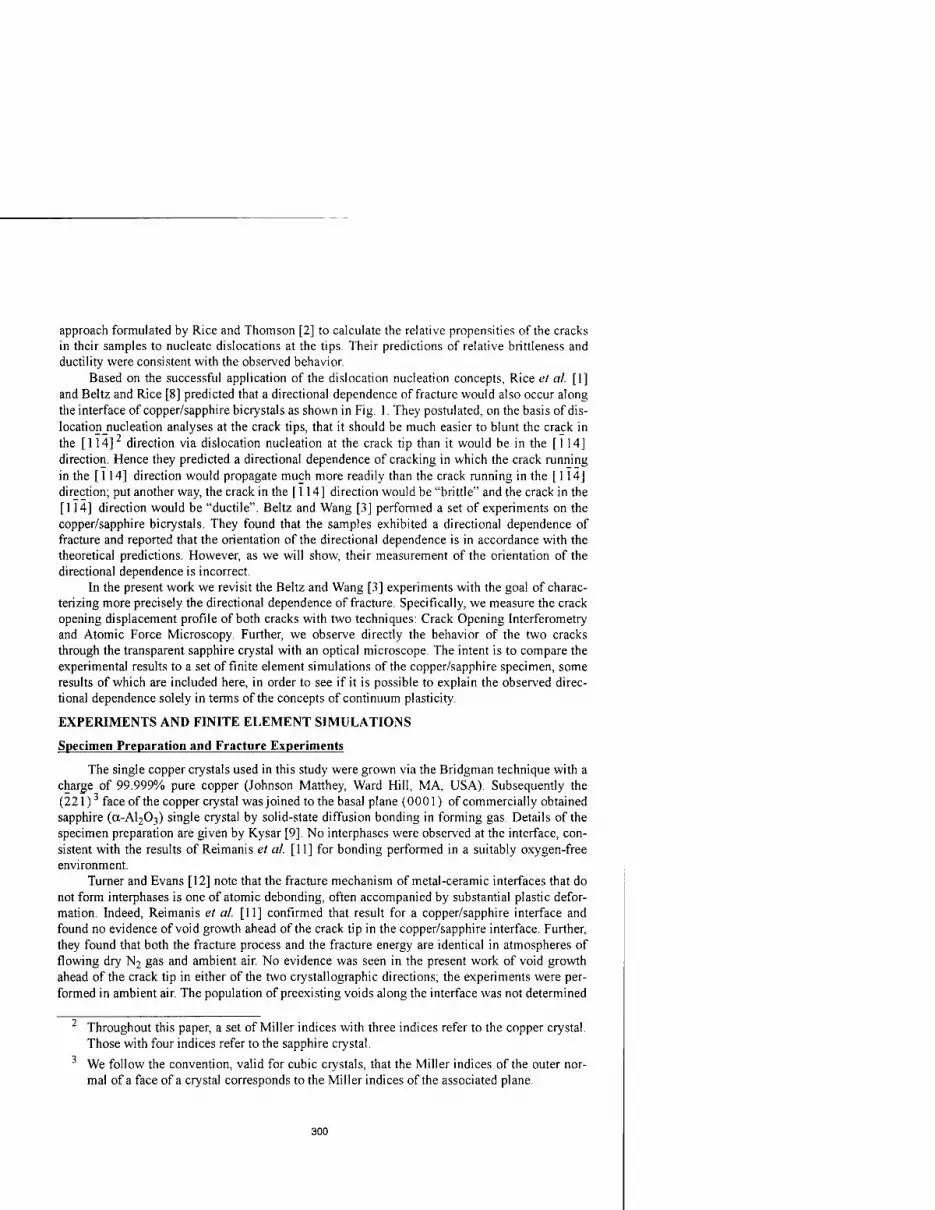
approach formulated by Rice and Thomson [2] to calculate the relative propensities of the cracks in their samples to nucleate dislocations at the tips Their predictions of relative brittleness and ductility were consistent with the observed behavior.
Based on the successful application of the dislocation nucleation concepts, Rice el al. [1] and Beltz and Rice [8] predicted that a directional dependence of fracture would also occur along the interface of copper/sapphire bicrystals as shown in Fig. 1. They postulated, on the basis of dis- location nucleation analyses at the crack tips, that it should be much easier to blunt the crack in the [114]2 direction via dislocation nucleation at the crack tip than it would be in the [114] direction. Hence they predicted a directional dependence of cracking in which the crack running in the [114] direction would propagate much more readily than the crack running in the [114] direction; put another way, the crack in the [ 114] direction would be "brittle" and the crack in the [114] direction would be "ductile". Beltz and Wang [3] performed a set of experiments on the copper/sapphire bicrystals. They found that the samples exhibited a directional dependence of fracture and reported that the orientation of the directional dependence is in accordance with the theoretical predictions. However, as we will show, their measurement of the orientation of the directional dependence is incorrect.
In the present work we revisit the Beltz and Wang [3] experiments with the goal of charac- terizing more precisely the directional dependence of fracture. Specifically, we measure the crack opening displacement profile of both cracks with two techniques: Crack Opening Interferometry and Atomic Force Microscopy. Further, we observe directly the behavior of the two cracks through the transparent sapphire crystal with an optical microscope The intent is to compare the experimental results to a set of finite element simulations of the copper/sapphire specimen, some results of which are included here, in order to see if it is possible to explain the observed direc- tional dependence solely in terms of the concepts of continuum plasticity.
EXPERIMENTS AND FINITE ELEMENT SIMULATIONS
Specimen Preparation and Fracture Experiments
The single copper crystals used in this study were grown via the Bridgman technique with a charge of 99.999% pure copper (Johnson Matthey, Ward Hill, MA, USA). Subsequently the (221) face of the copper crystal was joined to the basal plane (0001) of commercially obtained sapphire (a-Al203) single crystal by solid-state diffusion bonding in forming gas. Details of the specimen preparation are given by Kysar [9]. No interphases were observed at the interface, con- sistent with the results of Reimanis et al. [11] for bonding performed in a suitably oxygen-free environment.
Turner and Evans [12] note that the fracture mechanism of metal-ceramic interfaces that do not form interphases is one of atomic debonding, often accompanied by substantial plastic defor- mation. Indeed, Reimanis et al. [11] confirmed that result for a copper/sapphire interface and found no evidence of void growth ahead of the crack tip in the copper/sapphire interface. Further, they found that both the fracture process and the fracture energy are identical in atmospheres of flowing dry N2 gas and ambient air. No evidence was seen in the present work of void growth ahead of the crack tip in either of the two crystallographic directions; the experiments were per- formed in ambient air. The population of preexisting voids along the interface was not determined
2 Throughout this paper, a set of Miller indices with three indices refer to the copper crystal. Those with four indices refer to the sapphire crystal.
3 We follow the convention, valid for cubic crystals, that the Miller indices of the outer nor- mal of a face of a crystal corresponds to the Miller indices of the associated plane.
300
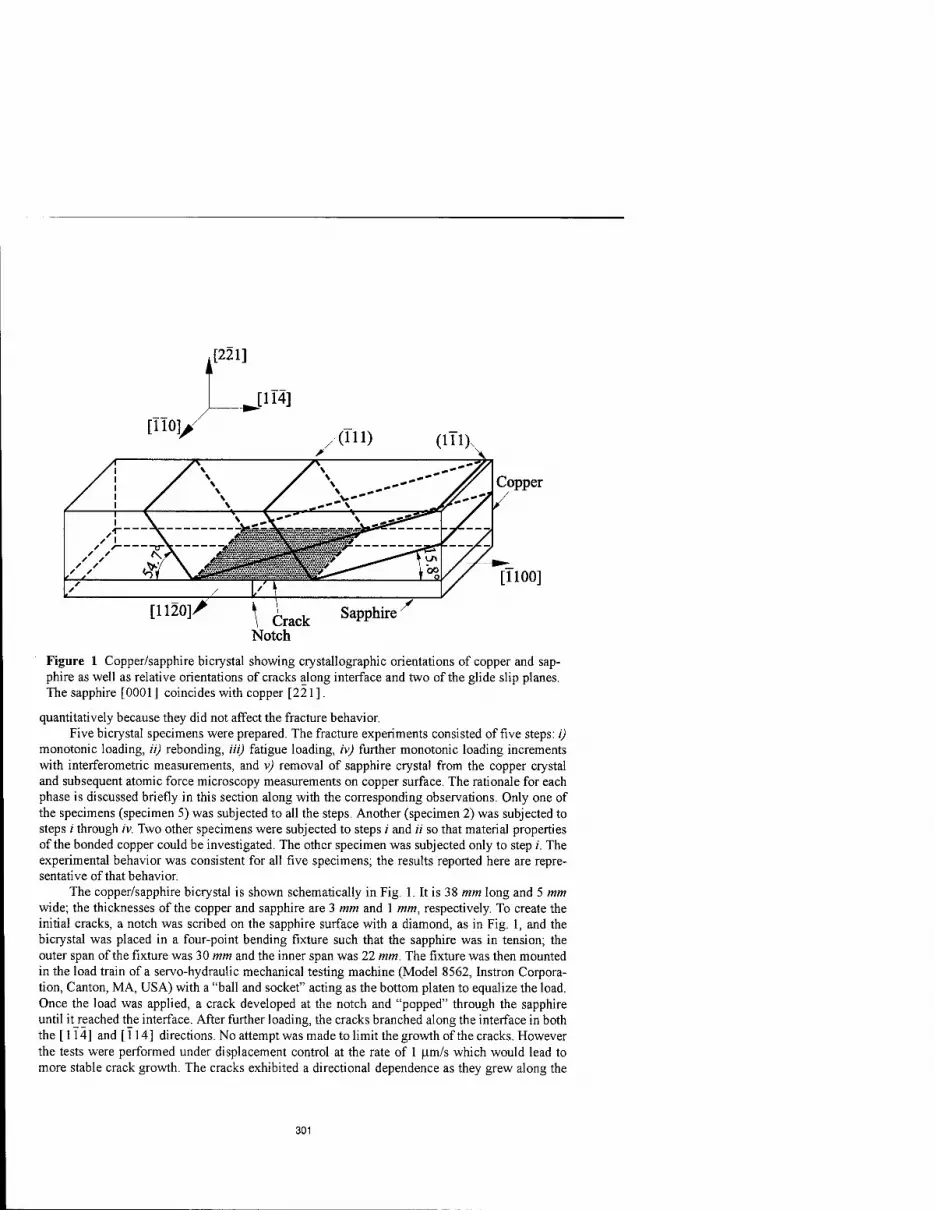
.[221]
Copper
[1100]
Crack Notch
Sapphire
Figure 1 Copper/sapphire bicrystal showing crystallographic orientations of copper and sap- phire as well as relative orientations of cracks along interface and two of the glide slip planes. The sapphire [0001 ] coincides with copper [221 ].
quantitatively because they did not affect the fracture behavior. Five bicrystal specimens were prepared. The fracture experiments consisted of five steps: i)
monotonic loading, ii) rebonding, Hi) fatigue loading, iv) further monotonic loading increments with interferometric measurements, and v) removal of sapphire crystal from the copper crystal and subsequent atomic force microscopy measurements on copper surface. The rationale for each phase is discussed briefly in this section along with the corresponding observations. Only one of the specimens (specimen 5) was subjected to all the steps. Another (specimen 2) was subjected to steps /' through iv. Two other specimens were subjected to steps i and ;'/' so that material properties of the bonded copper could be investigated. The other specimen was subjected only to step /. The experimental behavior was consistent for all five specimens; the results reported here are repre- sentative ofthat behavior.
The copper/sapphire bicrystal is shown schematically in Fig. 1. It is 38 mm long and 5 mm wide; the thicknesses of the copper and sapphire are 3 mm and 1 mm, respectively. To create the initial cracks, a notch was scribed on the sapphire surface with a diamond, as in Fig. 1, and the bicrystal was placed in a four-point bending fixture such that the sapphire was in tension; the outer span of the fixture was 30 mm and the inner span was 22 mm. The fixture was then mounted in the load train of a servo-hydraulic mechanical testing machine (Model 8562, Instron Corpora- tion, Canton, MA, USA) with a "ball and socket" acting as the bottom platen to equalize the load. Once the load was applied, a crack developed at the notch and "popped" through the sapphire until it reached the interface. After further loading, the cracks branched along the interface in both the [ 114] and [114] directions. No attempt was made to limit the growth of the cracks. However the tests were performed under displacement control at the rate of 1 p.m/s which would lead to more stable crack growth. The cracks exhibited a directional dependence as they grew along the
301

Figure 2 Schematic of slip planes in copper crystal. The twelve possible slip systems reduce to plastic slip in three different planes when conditions of plane deformation are enforced.
interface quasistatically under monotonically increasing load. One crack propagated much more than the other for a given load increment; these cracks will henceforth be referred to, respectively, as the brittle and ductile cracks. It is important to note that the designations of brittle and ductile refer to the relative behavior of the two cracks; both cracks propagated in the presence of signifi- cant plastic deformation in the copper.
We will now show that based upon the orientation of slip line traces, the brittle crack growth occurred in [114] and ductile crack growth occurred in [114]4 Thus the experimentally observed orientation of the directional dependence is opposite to the theoretical predictions of Rice et al. [1] and Beltz and Rice [8]. In light of the fact that Beltz and Wang [3] have previously reported the orientation of the directional dependence to be in accordance with the theoretical pre- dictions, we further show that their measurement of the orientation of the directional dependence is incorrect. Hence, the Beltz and Wang [3] experimental results are consistent with the present experimental results. Thus while the the dislocation nucleation concept was able to predict the observed directional dependence in the Wang and Anderson [4] copper/copper bicrystal study, it is not able to predict the orientation of the directional dependence in the copper/sapphire study.
We first note in Fig. 2 the orientation of all four slip planes of the copper crystal, which has slip systems { 111} (110). The (111) and (111) planes can each slip in the [110]. We refer to this set of slip systems, collectively, as the complex slip system. On each of the (111) and (111) slip planes, one of the Burgers vectors is parallel to the crack front. The other two Burgers vectors on each of those two slip planes do not lie in the (110); however theirsum lies in the (110). Hence, this crystallographic orientation affords plane deformation on (110) with the sets of slip systems on the (111) and (111) slip planes, as well as with the complex set of slip systems.
4 Laue back-reflection x-ray diffraction was also used to confirm the orientation of the direc- tional dependence. However, those results are not reported here because the orientation as determined by analysis of the slip line traces is unambiguous.
302

Figure 3 Photograph of slip line traces on the (110) copper surface. The brittle crack propa- gates to the right, in the [114] direction. Note that the (111) and complex sets of slip systems are activated in front of the brittle crack. In front of the ductile crack, there was evidence of slip on only the complex set of slip systems.
Therefore an inherently three-dimensional configuration is rendered two-dimensional. Fig. 3 shows the slip line traces on the (110) copper surface at the point where the two
cracks initiated. The copper is at the upper part of the micrograph; the broken sapphire crystal is evident in the lower part. By comparing the slip line traces of the micrograph with the angles of theslip systems in Fig. 2, it is obvious that the brittle crack is growing toward [114], with the (111) and complex sets of slip systems active at its tip. Although it is not evident in Fig. 3, both sets of slip systems remained active at the brittle crack tip as it propagated. Conversely, the ductile crack is growing to the left with only the complex slip system active at its tip.
One can directly show that the experimental results of Beltz and Wang [3] are consistent with the present results by comparing the slip line traces in Fig. 8 of Beltz and Wang [3] with Fig. 3 of the present work. In both cases, the slip line traces from the observed ductile crack are oriented at a polar angle of about 109.5°. Both Beltz [13] and Wang [14] concur with the new results.
To show that the experimental results of directional dependence are opposite that of the pre- dictions of Rice et ah [1] and Beltz and Rice [8], it is most straightforward to dispense with the crystallographic coordinate systems altogether and consider the slip planes in terms of the polar angle, 6, that they make with the crack tip. The dislocation nucleation analyses considered the slip planes oriented at polar angles of 9 = 125.3° and 9 = 164.2° for possible dislocation nucle- ation. Both dislocation analyses concluded that the crack with slip plane oriented at 9 = 125.3° is the theoretically predicted ductile direction. However, as the experiments show, this corre- sponds to the observed brittle direction.
A main goal of this study is to compare the experimental results of the crack opening dis- placement profile with those of FEM analyses of the bicrystal. To do that, we must begin the experiments with initial precracks that are "stationary" in nature. That is, the initial crack opening
303

displacement profiles must be small compared to the fully loaded state; and the copper around the crack tips must not be plastically strained. The cracks introduced along the interface by the mono- tonic loading do not satisfy these criteria.
Therefore in order to create stationary precracks, the interface cracks of the bicrystal speci- mens were closed and rebonded via solid-state diffusion bonding in a manner described elsewhere [9] so that the rebonded interface was weaker than the original interface. The process also served to anneal the copper crystal that was deformed plastically during the initial loading. The weaker interface allowed cracks to "pop in" to the previous positions along the interface upon reloading. The load vs. displacement curve of the rebonded specimens is virtually identical to the load vs. displacement curve of the as-bonded specimens, as shown in [9]. Hence portions of the rebonded copper in two specimens were cut out via wire EDM and subsequently subjected to compression tests to experimentally determine, as well as possible, the hardening behavior of the as-bonded copper. The results of these tests were then used to fit parameters of hardening models used in the finite element analysis.
After rebonding, the specimens were cyclically loaded in four-point bending to propagate fatigue cracks into the region of previously unbroken interface. While we do not attempt to fully document the fatigue behavior of the interface in this study, we do want to note an interesting phe- nomenon. Under cyclic loading, the directional dependence of the two cracks is opposite that of the directional dependence under a monotonic loading. The brittle crack (i.e. that which propa- gates faster under monotonic loading conditions) is the crack which propagates slower under cyclic loading conditions. This effect can be explained in a very qualitative sense by the model put forward by Laird [15] on the role that crack tip blunting plays in fatigue crack propagation. In essence, the distance of crack extension during one loading cycle is of the same order as the near tip crack opening displacement.
Two bicrystal specimens were fatigue loaded for up to 290,000 cycles at a mean bending moment of 60 N ■ m ■ »;"' with a 20 N ■ m ■ nf amplitude at 20 Hz. Crack growth in the mono- tonic ductile direction was 8x10"" m/cycle and in the monotonic brittle direction was 1x10" m/cycle. If one is to accept at least very qualitatively the Laird [15] idea, these results point toward a very large difference in the amount of plastic blunting that occurs at the very tips of the two cracks.
An unintended consequence of the fatigue loading was that interface cracks grew in from the ends and sides of the specimen toward the middle. Thus, the bending moment was no longer carried by the entire cross-section of the bicrystal, but by only a portion of it. Further, the crack fronts did not advance precisely in the crystallographic directions ascribed to them, so it is diffi- cult to precisely relate the applied force to the bending moment.
After the fatigue crack growth, specimens 2 and 5 were loaded monotonically and moni- tored for crack growth. Periodically, the specimens were removed from the loading fixture and the crack opening displacement profiles were measured via crack opening interferometry in the unloaded state. The details of the interferometric measurements are given in the next Section. After each load increment, it was evident that both cracks had advanced, however the brittle crack advanced more than the ductile crack.
By directly observing the copper fracture surface through the transparent sapphire, slip line traces were found to appear on the flanks of the copper well behind the crack front rather than at the tip. This may be a consequence of specimen geometry rather than a fracture phenomenon. The copper "ligament" in the center of the specimen continues to deform plastically when subjected to each load increment, so the appearance of the slip lines may be a consequence of plasticity due to beam bending rather than to fracture.
The final experimental phase was to remove the sapphire from the copper crystal so that the
304

fracture surface could be directly examined by Atomic Force Microscopy. This was done on spec- imen 5 by inserting a razor edge between the sapphire and copper crystals at the ends of the spec- imens and prying off the sapphire manually. While the direction and magnitude of the force could not be determined, it was clear that the sapphire "popped off' under a predominantly Mode I load- ing. It is well known that the critical energy release rate, Gc, of an interface at low mode mixities is several times smaller than at high mode mixities [16], and copper/alumina interfaces (alumina is polycrystalline sapphire) are no exception [17]. Thus the amount of plastic deformation induced by "prying off' the sapphire would be expected to be much less than that induced by the mixed- mode four-point bend loading. That this expectation was borne out was evident in the ATM results where is was possible to identify, and consider separately, deformation which occurred during crack propagation and during the removal of the sapphire.
Normal Crack Opening Displacement Profile Measurements
The normal crack opening displacement (NCOD) profile of both cracks was measured in specimens 2 and 5 with crack opening interferometry. In addition, the profile of the crack flanks and the crack tip profiles in the copper are measured with Atomic Force Microscopy (AFM) on specimen 5. These measurements are complementary to the interferometric measurements because they provide a great amount of detail close to the crack tip whereas the interferometric measurements provide more information away from the crack tip (at distances greater then about 10 |im). Due to space constraints, we will confine ourselves here to stating and discussing the experimental results; the experimental techniques and data are discussed fully in [9].
The most striking result from the interferometric measurements is that away from the tips the growing cracks propagate with a constant crack tip opening angle; that is, the crack opening displacement profiles of the growing cracks assume the shape of a constant angle opening away from the tips. Furthermore, the angle of the crack opening of the quasistatically growing crack, once steady-state5 conditions are established, is independent of the externally applied load level. Thus the fracture criterion for quasistatic steady-state crack growth would be the attainment of a critical crack opening angle. A plot of the interferometric measurements is shown in Fig. 4. It should be noted that the measurements were made in the unloaded state which, according to finite element calculations to be presented later, would yield a Crack Tip Opening Angle (CTOA) approximately 10% smaller than if the measurement were made on the loaded specimen.
Hence, we find by direct measurement that growth of a mixed-mode crack along a interface, for which one of the constituents is an elastic-plastic crystal, occurs at a constant crack tip open- ing angle. This result is consistent with similar experimental observations of crack propagation at constant crack tip opening angle (e.g. [18] and [19]). However it should be emphasized that these other results relied on indirect measurements such as obtained at a free surface or by inferring the crack opening profile by monitoring the crack opening displacement of the initial crack tip.
We now consider the question of the directional dependence of fracture. The interferometric results show that the CTOA of the ductile crack is larger than the CTOA of the brittle crack. It is not possible to report definitive angles for the two cracks because they did not propagate precisely in the [114] or [114] directions and the CTOA depends upon the local crystallographic direc- tion of propagation. In addition, variations in impurity concentrations introduced during the reb- onding process may change the thermodynamic work of fracture. Also edge effects can greatly change the CTOA. Nevertheless, the crack opening displacement profile of both the brittle and ductile cracks is plotted at two places along the front of the growing cracks in specimen 2 in
5 Steady-state in the sense that the initial stationary crack tip fields no longer affect the grow- ing crack.
305

Brittle 1 Brittle 2 Ductile 1 Ductile 2
-125 -100 -75 -50 -25 Distance from current crack tip (|im)
Figure 4 Normal crack opening displacement interferometric measurements of quasistatically growing cracks at two positions along the crack fronts in specimen 2. The crack profiles are in the shape of a constant angle opening.
Fig. 4. The CTOA for specimen 2 is 0.011 radians (0.63°) for the brittle crack and is 0.020 radians (1.1°) for the ductile crack. Representative CTOA values for specimen 5 are 0.015 radians (0 86°) for the brittle crack and 0.022 radians (1.3°) for the ductile crack. As discussed in [9], we believe the interferometric results to be accurate to within 5%.
We also report the results of AFM measurements on the copper fracture surface of specimen 5. Turner and Evans [20] and Mao and Evans [21] have also made use of AFM measurements in studying fracture along metal-ceramic interfaces. The AFM measurements were performed in Tapping-Mode™, with a Dimension 3100 Series, Scanning Probe Microscope (Digital Instru- ments, Santa Barbara, CA, USA) with the scan direction oriented to provide maximum sensitivity for abrupt surface elevation changes.
The most striking result from the AFM measurements is that the ductile crack tip opens up as much as an order of magnitude more than the brittle crack tip. Both cracks exhibit sharp crack tips which open up at angles that are different than the angles measured via interferometry far away from the tip. The near tip opening angles and the associated degree of blunting vary along the crack fronts, however the ductile crack consistently had a larger angle (-8° ±2°) than the brittle crack (-2° ± 1 °). The brittle crack is blunted on the order of 50 nm and the ductile crack is blunted on the order of 600 nm. The relative crack blunting behaviors are consistent with the ori- entation of the directional dependence of fatigue crack growth behavior noted earlier. The AFM measurements showed no direct evidence of void growth and coalescence along the interface at
306

the scale shown. There is no sign that the existing voids and impurities affected the fracture behavior.
These experimental measurements are consistent with theoretical predictions of the behav- ior of quasistatically growing cracks in elastic-plastic materials. That crack advance occurs at a critical crack tip opening angle was anticipated by McClintock and Irwin [22] and formalized by Rice [23]. In addition, the analysis by Rice [23] predicts that the near tip profile is a much larger angle (as measured with the AFM) than the constant CTOA away from the very tip of the crack (as measured interferometrically).
Comparison of finite element results with experimental results
We now discuss the results of a finite element analysis of both the brittle and ductile cracks of the copper/sapphire bicrystal; the details of the analysis can be found in [9]. In essence, the finite element analysis predicts that the opening normal stress in front of the growing brittle crack is significantly higher (from 30% to 50% higher) than the opening stress in front of the growing ductile crack. This, in and of itself, is sufficient reason to expect the observed directional depen- dence of fracture. In addition, the NCOD profile of growing cracks, the strains ahead of the crack tips and the deformation field in the copper crystal around the cracks are investigated. In this sec- tion we briefly describe these continuum plasticity results and compare them to the experimental observations.
A previous finite element analysis of stationary cracks in the copper/sapphire bicrystal specimen by Mesarovic and Kysar [24] was not able to explain the directional dependence of fracture in terms of continuum plasticity. In the present paper we report the results of simulations of quasistatically growing cracks. Both analyses used ABAQUS/Standard [25] along with a User Material Subroutine (UMAT) by Huang [26] as modified by Kysar [27] which accounts for the full elastic-plastic anisotropy of the single copper crystal while rigorously treating the kinematics of the finite deformation gradients encountered in the problem. Calculations were made for two different material hardening models, one proposed by Peirce, Asaro and Needleman [28] and the other by Bassani and Wu [29]. The crucial difference between the two models lies in how defor- mation on one slip system affects the hardening rate of the other slip systems. The formulation of the Peirce, Asaro and Needleman (PAN) model used assumes that all slip systems of a crystal harden at the same rate (Taylor hardening). For the Bassani and Wu (BW) model it is assumed that each slip system hardens independently (diagonal hardening), however when a slip system does harden, the rate of hardening is a function of the amount of slip on all other slip systems. The parameters of the hardening models are fit to the experimental data of the compression tests of the bonded single copper crystals discussed above. The BW model is able to reproduce the experi- ments much more accurately. The distinctions between the hardening models and the conse- quences for crack tip fields in elastic-plastic single crystals are discussed in detail in [9],
The brittle and ductile cracks are simulated in a stationary configuration at a bending moment of 100 N ■ m ■ m . They are also simulated as growing at a constant rate at a load of 100 N ■ m- m~ via a nodal release technique available in ABAQUS/Standard [25]. Two different meshes were employed for the growing cracks: one allowed 7.5 pan of crack growth; the other allowed 350 pm of crack growth so that the crack moves out of the region previously deformed by the stationary loading6
With the BW model the results for the stationary crack show that the opening normal stress
The experiments were performed under a prescribed displacement rate while the simulations are performed under a prescribed loading. This does not introduce any ambiguity in the problem since, experimentally, the load-displacement curves are monotonic.
307

° cr22 brittle A CT12 brittle
ductile <T,, ductile
-200 10 10 10" 10
Distance from crack tip (mm) 10
Figure 5 Normal opening and shear stresses along the prolongation of the brittle and ductile quasistatically growing cracks with the Bassani and Wu material hardening model. The harden- ing parameters of the model are fit to compression experiments of the as-bonded copper crystal.
on the prolongation of the ductile crack is higher than that of the brittle crack, which would not support the directional dependence. However, in the simulations of the growing cracks, the stresses are substantially higher in the brittle direction than in the ductile direction, as shown in Fig. 5. This would be consistent with the experimental observations of the directional dependence of fracture. The PA hardening model used by Mesarovic and Kysar [24] and the present work leads to decisively higher stresses in the brittle direction also, for both the stationary and growing configurations.
Next we compare the predicted NCOD profiles from the finite element analyses to the experimental results. We should note that the ABAQUS parameters were chosen so that crack growth occurred in only one element at a time. Strictly speaking then, while the finite element cal- culations were performed using the "finite deformation" option of ABAQUS, the crack propaga- tion calculations are not truly finite deformation calculations because such extreme deformation can not be simulated within a single element. Also, no fracture mechanism is assumed and no fracture criterion is introduced; the crack simply propagates at a constant rate. Nevertheless the analyses still account for the continuum properties of the single crystal and the calculated opening profiles should give some indication as to the nature of the behavior predicted on the basis of con- tinuum mechanics.
Further, it is worth emphasizing that the phenomenon under investigation is one of a differ- ence of crack growth behavior so we must compare the experimental results of crack opening dis-
308

placement profiles with computations of the shape of the growing cracks. To first order, both simulated cracks assume the form of a constant angle opening. After an initial transient, both are predicted to have approximately the same CTOA, about 0.033 radians (1.9°) after 7.5 ym of crack growth. However after the cracks propagate out of the region that was highly deformed by the sta- tionary crack, a difference in NCOD profiles emerges which is opposite to experimental observa- tions. After 350 \im, the calculated CTOA of the brittle crack is 0.011 radians (0.63°) and for the ductile crack is 0.0079 radians (0.45°). The CTOA of the cracks after the load is removed is about 10% smaller than the CTOA in the loaded state.
After 350 \im, the calculated crack tip opening angles are both smaller than the measure- ments. But this is not an entirely fair comparison because experimentally the cracks propagated at an increasing bending moment. Therefore, we also simulated the growing cracks under an increase of externally applied load. The results predict a larger CTOA for both cracks, but do not show any sign of explaining the observed difference in crack opening profile.
The fact that the brittle crack opening profile is larger than the ductile profile can be par- tially explained by noting that at a sufficient distance behind the crack tip, the loading is one of pure bending and that the (111) slip system is the preferred slip system for plastic deformation because it lies closer to the ±45° than any other slip system. Then by noting the direction of the (111) slip system relative to each crack, it is evident that the loading would tend to open the brit- tle crack and to close the ductile crack. Indeed, the experiments show exactly this difference on a macroscopic scale; the fact that the crack opening displacement is larger than that of the ductile crack is visible to the naked eye. Nevertheless, the interferometric results show that the near tip CTOA of the ductile crack is larger than that of the brittle crack.
CONCLUSIONS
We consider a specially oriented copper/sapphire bicrystal which exhibits a directional dependence of fracture along the interface and show that the experimentally observed orientation of the directional dependence is opposite to that predicted by Rice et al. [1] and Beltz and Rice [2] based on associating the ductile direction with ease of dislocation nucleation at the crack tip. We show that previous work by Beltz and Wang [3] which reported that the orientation of the direc- tional dependence is in accordance with prediction is incorrect. However, even though they mea- sured the orientation of the directional dependence of fracture incorrectly, their experimental results are consistent with the present experimental results.
We measure the crack opening profile of both cracks with Crack Opening Interferometry and with Atomic Force Microscopy. The results show that both cracks propagate at a constant crack tip opening angle away from the very tip of the crack. The crack tip opening angle of the ductile crack is about twice that of the brittle crack. The degree of blunting directly at the crack tip is shown to be an order of magnitude larger for the ductile crack than for the brittle crack.
Finite element simulations predict that the opening normal stress on the prolongation of the growing brittle crack is larger than that of the growing ductile crack. This, in and of itself, could explain the directional dependence of fracture. The FEM computations predict opening profiles of growing cracks in the form of constant angle openings. The magnitude of the calculated crack tip opening angles is of the same order of magnitude as the experimental measurements. The FEM results are not able to predict the dramatic difference in normal crack opening profile exhibited by the two cracks, as measured by interferometry and atomic force microscopy.
ACKNOWLEDGMENTS
The author would like to acknowledge support and guidance from J. R. Rice. In addition the author has profited from many discussions with J.-S. Wang. ABAQUS/Standard, v5.7 was used
309

under academic license from Hibbitt, Karlsson & Sorenson, Inc. This work was financed through an AASERT grant by the Office of Naval Research, Mechanics Division, grant N00014-93-1- 1037 and by ONR grants N0O014-90-J-l379 and N00014-96-1 -0777.
REFERENCES
1. Rice, J. R., Suo, Z., and Wang, J.-S. (1990). "Mechanics and thermodynamics of brittle inter- facial failure in bimaterial systems." Acta-Scripta Metailurgica Proceedings Series, M. Ruhle, A. G. Evans, M. F. Ashby, and J. P. Hirth, eds., Pergamon Press, Oxford, 269-294.
2. Rice, J. R., and Thomson, R. (1974). "Ductile versus brittle behaviour of crystals." Phil. Mag., 29(1), 73-97.
3. Beltz, G. E., and Wang, J.-S. (1992). "Crack direction effects along copper/sapphire inter- faces." Acta metal/, ma/er., 40(1), 1675-1683.
4. Wang, J.-S., and Anderson, P. M. (1991). "Fracture behavior of embrittled FCC. metal bic- rystals."^cto/weto//. mater., 39(5), 779-792.
5. Vehoff, H., Stenzel, H., and Neumann, P. (1987). Metallkade, 78, 550. 6. Wang, J.-S., and Mesarovic, S. D. (1995). "Directional dependence of corrosion fatigue of
iron-silicon bicrystals."^c/a/weto//. mater, 43(10), 3837-3849. 7. Elssner, G, Korn, D., and Rühle, M. (1994). "The influence of interface impurities on fracture
energy of UHV diffusion bonded metal-ceramic bicrystals." Scrip/a metall. mater, 31(8), 1037-1042.
8. Beltz, G. E., and Rice, J. R. (1992). "Dislocation nucleation at metal-ceramic interfaces "Acta metall. mater, 40(SuppIement), S321-S331.
9. Kysar, J. W., PhD thesis, Harvard University, 1998. 10. Rogers, K. A., Trumble, K. P., Dalgleish, B J., and Reimanis, I. E. (1994). "Role of oxygen in
microstructure development at solid-state diffusion-bonded Cu/Al203 interfaces." J. Am. Ceram. Soc, 77(8), 2036-2042.
11. Reimanis, I. E., Trumble, K. P., Rogers, K. A., and Dalgleish, B. J. (1997). "Influence of Cu20 and CuA102 interphases on crack propagation at Cu/a-Al203 interfaces." J. Am. Ceram. Soc., 80(2), 424-432.
12. Turner, M. R., and Evans, A. G. (1996). "An experimental study of the mechanisms of crack extension along an oxide/metal interface." Acta mater, 44(3), 863-871.
13. Beltz, G E., (private communication). 14. Wang, J.-S., (private communication). 15. Laird, C. (1967). "The influence of metallurgical structure on the mechanisms of fatigue crack
propagation." Fatigue crack propagation, Special Technical Publication 415, American Soci- ety for Testing and Materials, 131-168.
16. Liang, Y.-M., and Liechti, K. M. (1995). "Toughening mechanisms in mixed-mode interfacial fracture." Int../. Solids Structures, 32, 957-978.
17. Wang, J.-S. (1995). " Interfacial fracture toughness of a copper-alumina system and the effect of the loading phase angle." Mech. Mater, 20(3), 251-259.
18. Neumann, P. (1974). "New experiments concerning the slip processes at propagating fatigue cracks-I." Ac/a Metall., 22, 1155-1165.
19. Green, G., and Knott, J. F. (1975). "On effects of thickness on ductile crack growth in mild steel"./. Mech. Phys. Solids, 23, 167-183.
20. Turner, M. R., and Evans, A. G. (1996). "An experimental study of the mechanisms of crack extension along an oxide/metal interface." A eta mater, 44(3), 863-871.
21. Mao, S. X., and Evans, A. G. (1997). "The influence of blunting on crack growth at oxide/
310

metal interfaces." Ada metali. mater., 45(10), 4263-4270. 22. McClintock, F. A., and Irwin, G. R. (1965). "Plasticity aspects of fracture mechanics." ASTM
STP38J, 84-113. 23. Rice, J. R. (1982). "Elastic-plastic crack growth." Mechanics of Solids, H. G. Hopkins and M.
J. Sewell, eds., Pergamon Press, Oxford, 539-562. 24. Mesarovic, S. D., and Kysar, J. W. (1996). "Continuum aspects of directionally dependent
cracking of an interface between copper and alumina crystals." Meek Mater., 23, 271-286. 25. ABAQUS/Standard User's Manual, (1998). Version 5.7, Hibbit, Karlsson and Sorensen, Inc.,
Pawtucket, RI, USA. 26. Huang, Y. (1991). "A user-material subroutine incorporating single crystal plasticity in the
ABAQUS finite element program." Mech Report 178, Division of Applied Sciences, Harvard University, Cambridge, Massachusetts.
27. Kysar, J. W. (1997). "Addendum to "A user-material subroutine incorporating single crystal plasticity in the ABAQUS finite element program, Mech Report 178,"." , Division of Engi- neering and Applied Sciences, Harvard University, Cambridge, Massachusetts.
28. Peirce, D., Asaro, R. J., and Needleman, A. (1983). "Material rate dependence and localized deformation in crystalline solids." ^4ctoMe/a//., 31, 1951.
29. Bassani, J. L., and Wu, T.-Y. (1991). "Latent hardening in single crystals II. Analytical charac- terization and predictions." Phil. Trans. R. Soc. Lond. A, 435, 21-41.
311

QUASI-STATIC BRITTLE FRACTURE
J. A. PFAENDTNER*t, R. C. MUTHIAH*ft, and C. J. McMAHON, Jr.*
*Dept. of Materials Science and Engineering, Univ. of Pennsylvania, Philadelphia, PA 19104 fGE Aircraft Engines, One Neumann Way, Cincinnati, OH 45215-1988 ffLucent Technologies, 9999 Hamilton Blvd., Breinigsville PA 18031
ABSTRACT
Recent work on the phenomenon of diffusion-controlled quasi-static brittle fracture, known as dynamic embrittlement, is reviewed here with reference to sulfur-induced embrittlement of steel, tin-induced embrittlement of Cu-Sn alloys, and oxygen-induced embrittlement of copper-based and nickel-based alloys. The mechanisms of this generic form of intergranular brittle fracture are discussed.
INTRODUCTION
The common conception of brittle fracture is one that is catastrophic, in which a crack propagates at velocities on the order of 102 to 103 m/sec. Here we consider a class of brittle fracture in which cracks propagate at rates eight to nine orders of magnitude slower. The fracture is brittle in the sense that it occurs by decohesion, with negligible plastic deformation, by the growth of a sharp crack. This generic type of brittle fracture, which has been called dynamic embrittlement [1,2], occurs quasi-statically as a result of stress-driven diffusion of a mobile surface-adsorbed embrittling element along grain boundaries in polycrystalline materials that are strong enough to support the necessary loads.
To understand this type of fracture, one should start with the phenomenon of diffusion creep, in which surface atoms are driven inward, in exchange with lattice vacancies, by an applied tensile stress, a, because of the work done, oQ., where Q. is the volume of a surface atom. This is called Herring-Nabarro creep when the diffusive flux is carried by the lattice, and Coble creep when it is carried along grain boundaries. This process leads to diffusive (Hull- Rimmer) growth of internal cavities. The reverse of cavity growth, sintering, occurs in the absence of a tensile stress under the influence of the surface energy of the cavities. Dynamic embrittlement occurs when the diffusing atoms from the surface are embrittling elements, rather than matrix atoms, and usually at temperatures where the matrix atoms have low mobility. Thus, the embrittling elements responsible for dynamic embrittlement are generally ones with a low melting temperature.
STRESS-RELIEF CRACKING OF STEELS
This phenomenon was first recognized as a distinct form of brittle fracture in a study of the phenomenon of stress-relief cracking of a low-alloy steel [3], where it was realized that the brittle mode of SRC was caused by sulfur that segregated from the bulk first to the surfaces of internal cavities and later along the free surface near the tip of a growing crack. The sulfur had become plentiful along the-prior austenite grain boundaries as a result of a high-temperature excursion that was meant to simulate what occurs in the heat-affected zone of a weldment. The heating to >1250°C caused sulfides to dissolve, allowing sulfur to segregate to grain boundaries, and the air-cooling allowed the sulfur to precipitate along the grain boundaries as very fine, not
313 Mat. Res. Soc. Symp. Proc. Vol. 539 ®1999 Materials Research Society

very stable, sulfides. The identity of sulfur as the embrittling element was confirmed by Auger electron spectroscopy on intergranular facets exposed in UHV [3]. It has been shown that the cracking can be inhibited by treatment of a steel with cerium, which can reduce the sulfur activity in the matrix to very low levels [4].
In later work [1], the progress of this sulfur-induced dynamic embrittlement was followed using DC-potential-drop measurements of crack growth rates in pre-cracked compact- tension specimens. An example of a result is shown in Fig. 1. It was found that the cracking got started in bursts in which patches of grain boundaries opened amidst regions that did not crack as readily. Later, the entire cross section of the CT specimen had essentially cracked through, but uncracked ligaments were left behind the main crack front, which itself was quite jagged, as illustrated by Fig. 2. Examination at high resolution in the SEM of the crack front in an interrupted specimen that was later fractured at 77K showed that the tip was sharp, with no evidence of blunting. A series of interrupted tests showed that the uncracked ligaments were, in fact, slowly cracking as the test proceeded. These results were interpreted as snowing that the diffusivity of sulfur varied significantly with grain-boundary structure and that this was responsible for the variation in cracking rate. The jagged crack front was a manifestation of crack growth by a kind of viscous fingering along paths of most-rapid sulfur diffusion. A striking example of the decisive role of grain-boundary structure on cracking rate can be illustrated by Fig. 3, which shows how cracking proceeded along the terminating surface of an annealing twin (in the prior-austenite phase). The adjacent regions were still intact at the end of the test; the> were fractured by rupture at room temperature.
Applied Stress Intensity (MPa-m
-.10-6
3- '8 MO-fl -
Ö10-9
j I Cleavage Fracture
I j IG Fracture
Q Pre-crack
' \ r w\T _
0 5 15 25
Time (103 sec)
Fig. 1. Plot of crack velocity vs. stress intensity for a MnMoNiCr steel under constant load at 540°C in UHV. Ref. 1.
Fig.. 2. Distribution of uncracked regions in a specimen of the MnMoNiCr steel under the same conditions as in Fig. 1 in a test interrupted at the point shown by the v-K curve on the left, showing the jagged main crack front and uncracked ligaments behind the front. Ref. 1.
EXPERIMENTS ON COPPER-BASED ALLOYS
The interpretation of SRC in steel as sulfur-induced dynamic embrittlement was tested by an analogous set of experiments [5] on a Cu-8%Sn alloy. This alloy was known to be hot- short, and tin is a well-known embrittling element that is also surface-active in Cu-Sn alloys [6]. It was found that the Cu-Sn alloy at 265°C mimicked the steel tested at 650° in every way.
314

Later, experiments were carried out [7] on bicrystals of a Cu-7%Sn alloy made by diffusion bonding of single crystals to examine the effect of the anisotropy of diffusion in symmetrical S=5 tilt boundaries with a boundary plane of (031) and a tilt axis of (100). It was found that cracking at 265°C occurred readily along the tilt axis, which is a direction of rapid diffusion [8], but that it did not occur at all perpendicular to the tilt axis. The cracking was continuous, with no sign of arrest marks, at a stress intensity of less than 4 MPaVm. An
Initial net-section stress (MPa) 200 250 300 350 400 450 500 550
Fig. 3. Isolated ligament that was fractured by rupture after the test depicted in Fig. 1; the ligament is bisected by a region of intergranular decohesion along the terminus of an annealing twin in the prior-austenite grain. Ref. 1.
i^,, ,j,, ,,2 30 40 50 60 70 80 90 100
Initial net-section stress (% of the yield stress)
Fig. 4. Dependence of time to failure on the applied stress for static loading of a notched Cu-0.25%Be tensile specimen at 200°C in dry air. Ref. 10.
approximate steady-state model [9] using reasonable values of the intergranular diffusion coefficient and other parameters was consistent with a penetration distance on the nanometer scale.
In both the steel and the Cu-Sn alloy, the source of the embrittling element was the alloy itself, by way of surface segregation. The environment can also serve as the source; oxygen has been found to produce the same kind of cracking in Cu-Be alloys [10] and in the nickel-based superalloy IN718 [11]. An example of the former is shown in Fig. 4. The time to failure in oxygen for a notched tensile specimen became very short when the applied (static) stress exceeded half the net-section yield stress. On the other hand, in a vacuum of about 10'6 torr the specimen had only begun to crack after 148h, for an average crack-growth rate of about one nanometer per second, as opposed to the one micrometer per second found in 1-atm oxygen.
EXPERIMENTS ON NICKEL-BASED ALLOYS
Intergranular cracking of nickel-based superalloys is a serious problem in gas-turbine applications, and it has been studied mainly in the context of low-cycle fatigue. The amount of such cracking increases as the cycling frequency decreases and also with periods of holding under a tensile stress. The cracking rate was found to decrease by several orders of magnitude when the oxygen pressure was reduced below about 10"2 torr. Because this behavior resembled
315

dynamic embrittlement, a study was undertaken using some of the same methods as had been employed for the studies described above. As in the studies of the copper-based alloys, specimens were loaded at constant displacement in pure bending, and the crack-growth rates were determined by the drop in load and by a calibration of specimen compliance vs. crack length, as illustrated in Fig. 5. As in both the copper-based alloys and the steel, interrupted tests showed that the crack front was irregular and that uncracked ligaments were left behind after the crack front had passed. Evidence for preferential cracking along certain boundaries, similar to that shown in Fig. 3, was also found.
2000
1500
,1000-
500-
10-'
10:
10<
(a)
5 10 Time (min)
10-1
30 K(MPa-m"2
35 40 45 50 )
55 60 65 ;'l"."l"'i'l'"!l "";l" l| II II |:l 1 '1
Stage II
; -
: III!"
:
Stage I E
,,,,!,, I,,,,!
:
(b)
25 30 35 40 45 50 55 60 K(ksi-in"2)
Fig. 5. (a) Load relaxation due to cracking in IN718 in lab air for an SEN specimen loaded to a fixed displacement at 650°C. (b) Corresponding v-K curve. Ref. 11.
40 60 80 100 120 140 Time (min)
96 98 100 102 104 106 Time (min)
(a) (b)
Fig. 6. (a) Load-relaxation curve for SEN specimen of IN718 loaded to a fixed displacement in oxygen at 650°C, showing the effect of removal, and then re-addmission, of the oxygen, (b) Enlargement of the circled region in (a), showing the rapidity of response to the change in environment. Ref. 11.
The rate of crack growth showed essentially the same dependence on oxygen pressure as in the previous studies of cyclic intergranular cracking of IN718 [12]. Cracking was extremely responsive to the admission and removal of oxygen, as illustrated by Fig. 6. Cracking stop essentially immediately when the vacuum pump was turn on, and it commenced essentially
316

immediately when the oxygen valve was turned on, as shown by Fig. 6(a). This is consistent with a diffusive penetration zone very close to the crack tip. The threshold stress intensity for crack growth was less than 10 MPaVm, and the tips of cracks in interrupted specimens appeared to have been sharp.
The intergranular fracture facets of the IN718 cracked at oxygen pressures above about 10° torr exhibited the result of decohesion with no apparent plastic deformation. However, there was evidence of irregularly spaced crack-arrest marks on the sub-micron scale. Similar arrest marks have also been observed in the steel [1] and in the Cu-Sn alloy [5]. We believe that these are essentially artifacts of dynamic embrittlement of polycrystals, which can be considered as composites made up of a few regions that are cracking under a low local stress intensity at any moment of time surrounded by non-cracking regions that are deforming by power-law creep. The latter carry the overall stress intensity, which rises to more than five times that needed for crack advance, cf. Fig. 5, and they thereby shield the cracking regions from stress. The cracks proceed in intermittent jumps only as fast as the constraint from the creeping regions permits. We would expect that cracking would be continuous in a bicrystal of the IN718, in which such constraint would be absent.
When the cracking took place at oxygen pressures below about 10"4 torr, the intergranular facets showed distinct and regular arrests marking by lines of fine oxide particles that had obviously formed each time the cracks stopped. The interpretation of this is that the cracking at low pressures becomes controlled by the external rate of delivery of oxygen to the crack tip, instead of by the rate of diffusive penetration into the crack-tip region. When the supply of external oxygen becomes too low to sustain continuous cracking, the oxygen that enters the grain boundary at the crack tip, in effect, leaks away by diffusing toward the region of maximum stress ahead of the somewhat-blunted crack tip. Presumably, cracking occurs in regular jumps when the internal concentration reaches some critical value over this larger penetration distance. Thus, the cracking at low oxygen pressures becomes inherently discontinuous, in contrast to the inherently continuous mode found at higher pressures.
SUMMARY
The oxygen induced cracking of IN718 is similar to that in the Cu-Be alloy studied earlier [10] and is presumably similar to that of the Ni3Al intermetallic alloy [2]. It is essentially identical to the dynamic embrittlement of the steel by sulfur and of the Cu-Sn alloy by tin. Thus, these all appear to be examples of a generic phenomenon that can be considered as a separate form of brittle fracture. The source of the external embrittling element can be either the alloy itself, by way of surface segregation, or the external environment. There seems to be no reason to exclude liquid metals from the list, and we suggest that liquid-metal embrittlement is simply another manifestation of dynamic embrittlement.
ACKNOWLEDGMENTS
This research has been supported by the National Science Foundation under grants no. DMR-96-34718 and CMS-95-03980.
317

REFERENCES
1. D. Bika, J. A. Pfaendtner, M. Menyhard, and C. J. McMahon, Jr., Acta metall 43 1895 (1995). 2. C. T. Liu and C. L. White, Acta metall. 35, 643 (1987). 3. J. Shin and C. J. McMahon, Jr., Acta metall. 32, 1535 (1984). 4. C. J. Middleton, Metal Sei. 15, 154 (1981). 5. E. V. Barrera, M. Menyhard, D. Bika, B. Rothman, and C. J. McMahon, Jr. Scripta metall mater. 27,205(1992). 6. S. Hofmann and J. Erlewein, Scripta metall. 10, 857 (1976). 7. R. C. Muthiah, PhD Thesis, University of Pennsylvania, 1997. 8. J. Sommer, Chr. Herzig, S. Mayer, and W. Gust, Defect Diff. Forum 66-69, 843 (1989). 9. R. C. Muthiah, J. A. Pfaendtner, C. J. McMahon, Jr., Y. Xu, and J. L. Bassani, Matls. Sei Eng. A, A234-236, 1033 (1997). 10. R. C. Muthiah, C. J. McMahon, Jr., and A. Guha, Mater.Sci. Forum, 207-209, 1996 p 585. F
11. J. A. Pfaendtner and C. J. McMahon, Jr., 9th Intnl. Conf. Intergrcmular and Interphase Boundaries in Materials, Prague, 1998, in press. 12. R. Molins, G. Hochstetter, J. C. Chaissaigne, and E. Andrieu, Acta metall. 45, 663 (1997).
318

ATOMISTIC MODELING OF GRAIN BOUNDARY FRACTURE IN DIAMOND
O.A.SHENDEROVA *, D.W.BRENNER*, A.OMELTCHENKO**, X.SU**, L.YANG*** *North Carolina State University, Raleigh, NC 27695, USA **Louisiana State University, Baton Rouge, LA 70803, USA ***Lawrence Livermore National Laboratory, Livermore, CA, 94551
ABSTRACT
Molecular dynamics simulations using a bond-order potential were carried out to investigate the behavior under load of several <001> and <011> symmetrical tilt grain boundaries in diamond. Cohesive energies, work for fracture, maximum stresses and strains as functions of the type of grain boundary were evaluated. It was found that special short-periodic GBs possess higher strength and resistance to a crack propagation than GBs in the nearby misorientation range. Crack behavior in polycrystalline diamond samples under an applied load was also simulated, and found to be predominantly transgranular.
INTRODUCTION
The present study is aimed at understanding the influence of grain boundaries (GBs) on the integral strength of polycrystalline diamond films. It is established experimentally in metals and ceramics that different types of GBs behave differently under mechanical load [1-3]. For example, depending on their structures, GBs may have different resistance to crack propagation. Therefore, studying the mechanical properties of different GBs one could, in principle, predict what types of microstructures enhance film toughnesses.
Atomistic modeling techniques are widely used in studies of intergranular cohesion [4- 8]. The quantities used for the estimation of relative strength of grains and grain boundaries are cohesive energies of grain boundaries and bulk material, critical fracture stresses and work for fracture. In the present paper we report calculations of failure properties of individual <001> and <011> symmetrical tilt GBs in diamond. It was found that GB strength depends on the type of GB and that special short-periodic GBs possess higher strength than GBs in the nearby misorientation range.
Flaws present in a sample often influence observed strengths. Therefore it is important to consider the behavior of a system with a pre-existing crack. Atomistic simulations provided important insights into the mechanisms of crack propagation, and have provided support for the applicability of the Griffith condition to atomistic scales [9]. In the present paper, the propagation of a pre-existing crack in a system containing a GB was studied, where different initial notch orientations relative to a GB were modeled. In most cases transgranular crack propagation was observed unless the crack was inserted directly into the GB. Finally, crack propagation in a system with realistic microstructural features, including several grain boundaries and their triple junctions, was examined.
METHOD OF THE CALCULATIONS
Molecular dynamics simulations were carried out to investigate the behavior under load of several symmetrical tilt GBs with <001> and <011> misorientation axes. The lowest-energy grain boundary structures were derived from a coincident-site lattice model in which each atom is four-fold coordinated [10]. To estimate theoretical strengths of individual GBs, bicrystals
319 Mat. Res. Soc. Symp. Proc. Vol. 539 ° 1999 Materials Research Society

were stretched in the direction perpendicular to a GB plane at a constant rate of 1 %/ps, without lateral contraction. Periodic boundary conditions were maintained within the GB plane. The simulations were performed on systems containing approximately 4000 atoms. The quantities that were considered in this set of simulations were maximum fracture stresses of the GBs compared to the ideal structures, and GB work for fracture defined from the areas under the stress-strain curves.
To model systems with pre-existing flaws, a notch 30Ä long oriented perpendicular to an applied strain was inserted into a sample containing a GB. The applied strain was increased until a crack started to propagate. Periodic boundary conditions were applied only along the grain boundary tilt axes. Simulations have been performed for several 80x180x20 A diamond samples, each containing approximately 50,000 atoms. Different GB orientations with respect to the notch were considered; this was to induce either transgranular or intergranular crack propagation.
Crack propagation in a realistic polycrystalline structure containing five-<011> tilt GBs and two triple junctions was also simulated. The microstructure used in this simulation was constructed to mimic those observed experimentally in CVD diamond. The system had dimensions 150x260x20 A, contained 120,000 atoms, and was periodic along <011> axis.
The interatomic interactions in the simulations were modeled by an analytic many-body bond-order potential [11]. The bond order functional form depends on local coordination and bond angles, as well as terms that empirically account for radicals, conjugation, and dihedral rotation. In the initial version of the potential [11], a switching function cuts off the interaction between 1.7 and 2.0 A. This nearest-neighbor bonding model for carbon is well justified by the nature of covalent bonding and works well for most equilibrium structures. However, the fixed switching function approach is problematic as C-C bonds are stretched beyond 1.7 A because it significantly influences the forces in the vicinity of the inflection point (~ 1.85 A in diamond for the <111> direction). To avoid this problem in the present study, the cutoff distance was extended far beyond the inflection point. To preserve the nearest-neighbor character of interactions, a bond list using the original (2 A) cutoff distance was constructed for the initial system that was left unchanged during the simulations. This ad hoc scheme solves the cutoff problem while still describing bond breaking and changes in the chemistry of the bond during cleavage (e.g. formation of double, triple and conjugated bonds). However, its application is restricted to phenomena that involve bond breaking but not new bond formation.
It is well established [9] that the area bounded by the curve of stress as a function of the separation between atomic planes up to the maximum stress should approximately equal the surface energy, y. With the new cutoff procedure, this area calculated for separation of (111) diamond planes is about 0.85y, which is very reasonable. The calculated maximum tensile strength for bond breaking in the <111> direction is 96GPa. which is close to the value calculated by Tyson [12] using atomic force constants. These tests demonstrate the reliability of the interatomic potential for simulating fracture.
RESULTS AND DISCUSSIONS
Grain Boundary Cohesion
The energy required to cleave a brittle material along a GB plane without plastic deformation is defined as a difference between energies of the two unreconstructed surfaces, created due to cleavage, and the GB energy. Plotted in Figure 1 are GB cohesive energies for <001> symmetrical tilt GBs as a function of misorientation angle. Free surface energies were
320

20
calculated for several surface orientations and then extrapolated through the entire misorientation range. The GB energies, which are necessary for calculations of GB cleavage energies, were evaluated in the entire misorientation range with a disclination structural units model using as input energies of a few key structures [13]. As it can be seen from Fig.l, cleavage energies for GBs with <001> tilt axes increase with the misorientation angle so that from this analysis higher strengths are expected for GBs with misorientation angles close to 90 degrees. Also apparent are relative peaks in the cleavage energy curve in the vicinity of special 2=5 GBs. Cleavage energies of most <001> tilt GBs are about 60-75% of
those for the ideal bulk crystals with the same Fig.l Cleavage energies of <001> tilt GBs. orientation. Cohesive energies of some <001> and
<011> tilt GBs are given in Table I.
O 5
9 • -bvlk cleavage
-GBs cleavage
315 „.
LU - CD
c?10 > CO
• /
20 40 e(deg)
60 80
Table I. Grain boundary strength properties, calculated from molecular dynamic simulations using the bond order potential. Gcr is critical stress of crack propagation (30 A length)
0 s degrees
boundary
plane
Young's Maximum modulus Stress
(GPa) (GPa)
Maximum Strain
(%)
Relative Work for Fracture (WjtfWin)
Cohesive Energy (J/nO
O cr
(GPa)
(111) 1100
<001?
96
STGB:
15.6 1.0 10.8 44
0.0 1 (110) 1000 115 19.5 1.40 6.7 46
12.68 41 (450) 900 52 8.7 0.29 4.7 27
20.01 149 (7 10 0) 830 53 7.5 0.26 5.2
36.87 5 (120) 810 62 10.5 0.42 8.6 46
53.13 5 (130)S 800 73 14.8 0.67 11.0 54
(130)Z 800 69 13.7 0.57 11.2 36
73.74 25 (170) 730 46 8.3 0.23 13.2 38
90.0 1 (100) 850
<011>
90
STGB:
24.0 1.60 22.0 51
13.44 73 (166) 860 50 7.6 0.23 4.1
31.59 27 (255) 910 58 8.8 0.34 7.8 32
38.94 9 (122) 940 62 9.2 0.37 9.1 38
Simulation of Single Grain Boundary Strengths
Strength properties of different GBs with <001> and <011> misorientation axes calculated from the dynamic simulations are summarized in Table 1. The maximum stress for samples with
321

300
200
100
# MI) Simulations A Orovan criterion
GBs are about 30-60% lower than those for the ideal diamond structure. The work for fracture for various types of GBs (Wgb) is 40-80% lower than that for <111> ideal diamond sample
(Win)depending on GB type. The Orovan criterion [14J was used to investigate
the relationship between fracture stresses and cleavage energies of GBs. According to Orovan's criterion, theoretical fracture stresses depend on the cleavage energies, Young's moduli, and the interplanar spacing. It is assumed that the energy required to break bonds during fracture is provided by the stored elastic energy in the region near the fracture plane. GB fracture stresses estimated from Orovan's criterion as well as stresses obtained from the dynamic simulations are plotted in Fig.2. It is known that the magnitude of the theoretical breaking strength is usually overestimated by Orovan's approach by up to a factor of two [15]; therefore the quantitative difference between results of atomic simulation and analytical approach is not surprising. Nevertheless, as can be seen from Fig.2, there is little
qualitative correlation between maximum stresses calculated from Orovan's criterion and those obtained from dynamic simulations. It was found that this is due to a specific mechanism of fracture initiation within a GB. At the critical local stress (which is higher than the applied stress), nucleation of microcracks occurred within the dislocation cores at the GB, which are the weakest parts of the system. This was followed by bond breaking and brittle fracture initiated along the interface. Thus Orovan's criterion can not be used to accurately estimate GBs theoretical strengths because of the nonuniformity of cleavage energy distribution along the GB.
It can be concluded that the type of GB determines the relative theoretical strengths of various GBs. Apparent from Table I is that 1=1 and £=5 special GBs possess about a 30% higher critical stress and a 30% higher work for fracture than GBs in the nearby misorientation range.
20 40 60 0 (degrees)
80
Fig.2 Fracture stresses of <001> tilt GBs in diamond.
Crack Propagation in Diamond Samples Containing GBs
60
40
0. o
20
A MD Simulations • Griffith criterion
20 40 60 0 (degrees)
80
Fig.3 Critical stresses of a crack propagation within <001> tilt GBs.
Because diamond is a brittle material, it is expected that crack propagation will result in atomically flat surfaces, and that critical stresses evaluated from the Griffith criterion using calculated GB cleavage energies will correlate with critical stresses from dynamic simulations. Critical stresses for intergranular propagation of the initial crack of 30 A length obtained from molecular dynamic simulations and calculated with the Griffith criterion are illustrated in Fig.3 and summarized in Table I. It is evident from the figure that the dependency of critical stress on misorientation is similar for both approaches. The observed agreement between values derived from the Griffith criterion and atomistic
322

simulations (difference is about 20%) is quite reasonable. Thus the results indicate that GB cleavage energy is a major parameter defining GB resistance to crack propagation.
Critical stresses for crack propagation within GBs are about 30-40% lower than those for an ideal crystal, except for £=5(012) and £=5(013) special GBs. For these GBs, maximum stresses for crack propagation exceed those calculated from Griffith criterion, and are very close to the stresses for a crack propagation in ideal samples (Fig.3).
Crack propagation in a system with different initial orientations between a notch and GB plane was also simulated. In general, when a crack reaches a GB, it can propagate within the GB (intergranular fracture), or penetrate into the second grain (transgranular fracture). Within the second grain, the crack can keep moving in the initial direction of propagation or deviate into an easier cleavage plane. These events depend on the GB cleavage energy, relative bulk cohesive energies of the first and the second grains, and the inclination angle of the GB relative to the initial plane of crack propagation [9]. From the balance of mechanical energy release rate and the relative crack resistance of a GB and grains, it is possible to make rough predictions of the dependence of intergranular versus transgranular crack propagation depending on the GB type [17]. Our molecular dynamic simulation results for both <001> and <011> tilt GBs indicated predominantly a transgranular mode of fracture in polycrystalline diamond.
Crack propagation in a system containing a <011> GB network is illustrated in Fig.4. Among the GB in the systems, the £=27 and £=3(211) GBs are the weakest (possess low cohesive energies). Along with a crack originated from a notch, another crack started within the £=27 GB (top of Fig.4) as the applied strain was increased. This top crack intersected the triple junction and continued to propagate along the £=9 GB. The crack originating from the notch deviated to a {111} plane, intersected the £=3(111) GB, and continued to propagate along a {111} plane until the two cracks coalesced along another {111} plane (Fig.4). Thus, both trans- and intergranular modes of a crack propagation have been observed in this set of calculations. An attempt to evaluate the toughness of this system from molecular dynamic simulations is currently in progress.
Fig.4 Illustration of the fracture surfaces resulting from propagation of a crack in a realistic microstructure.
CONCLUSIONS
Fracture strength and resistance to crack propagation for <001> and <011> symmetrical tilt GBs in diamond have been studied via molecular dynamic simulations based on a bond-order analytic potential. It was found that the theoretical fracture stress of an individual GB is defined primarily by the type of GB rather than by GB cleavage energies. In particular, special GBs possess higher theoretical fracture stresses than GBs in the nearby misorientation range. It was
323

also found that the mechanism of interface failure is not that implied by Orovan criterion, which assumes uniform distribution of the stored energy along a GB plane and therefore simultaneous breaking of all bonds along the interface. Instead, the atomistic simulations demonstrate that failure is initiated at dislocation cores within the interface due to critical local stresses several times exceeding external load.
Critical stresses of crack propagation within a GB obtained from dynamic simulations were consistent with those calculated from the Griffith criterion. Higher resistance to crack propagation was observed for special GBs. This is in agreement with other studies and experiments on metals and ceramics [3].
In the systems containing GBs with different initial orientation relative to a notch, transgranular crack propagation was observed in most cases.
ACNOWLEDGMENTS
O.A.S. and D.W.B. are supported by the Office of Naval Research through contract \# N00014- 95-1-0270; A.O. and X.S. were supported by AFOSR (Grant No. F 9620-98-1-0086), USC-LSU Multidisciplinary University Research Initiative (Grant No. F 49620-95-1-0452), NSF (Grant No. DMR-9711903). Part of the simulations were performed on parallel machines in the Concurrent Computing Laboratory for Materials Simulations (CCLMS) at Louisiana State University. These facilities were acquired with equipment enhancement grants awarded by LEQSF. L.H.Y. was supported by the U.S. Department of Energy under Contract No W-7405- ENG-48 at LLNL.
REFERENCES
1. T.Watanabe, Mater.Sci.Eng. A 176, 39(1994). 2. K.T.Aust, Canad.Metal.Quart. 33, 265(1994). 3. G.Palumbo and K.T.Aust, in Materials Interfaces, D.Wolf and S.Yip, Editors, (Chapman & Hall. London.1992). p. 190. 4. V.Vitek, J.Phys 1, 1085(1991). 5. S.P.Chen, A.F.Voter, R.C.Albers, A.M.Boring, P.J.Hay, J.Mater.Res. 5, 955(1990) 6. S.P.Chen, Phil.Mag.A 66, 1(1992). 7. S.P.Chen, D.J.Srolovitz, A.F.Voter, J.Mater.Res. 4, 62(1989). 8. D.Wolf. J.A Jaszczak, in Materials Interfaces, D.Wolf and S.Yip. Editors, (Chapman & Hall, London, 1992), p.662. 9. B.Lawn, Fracture of Brittle Solids, University Press, Cambridge (1993), p.194. 10. J.Hornstra, Physica 25, 409(1959). 1 l.The original potential is discussed in D.W. Brenner. Phys. Rev. B 42, 9458 (1990). 12. W.R.Tyson, Phil.Mag, 14, 925 (1966). 13. O.A.Shenderova, D.W.Brenner, A.I.Nazarov, A.E.Romanov, L.Yang. Phys Rev B 57 R3181(1998). 14. E.Orowan, Report Progress Physics 12, 191(1949). 15. A.Kelly. Strong Solids, (Clarendon Press: Oxford. 1973), p.9. 16. O.A.Shenderova, D.W.Brenner .A.Omeltchenko, L.Yang. A.Nazarov. in Diamond Materials V, J.L.Davidson et al. Editors. (Proc. of the Electrochemical Society, 1998). 17. O.Shenderova, presented at the Gordon Research Conference, Oxford, UK, 1998, unpublished.
324
MINIMUM SURFACE FORMATION ENERGY FOR THREE-DIMENSIONAL INTERGRANULAR FRACTURE
E. A. HOLM, G. N. McGOVNEY Sandia National Laboratories, Albuquerque, NM 87185-1411
ABSTRACT
The minimum expended energy for fracture is the free energy required to form two new surfaces. For intergranular fracture, the minimum surface formation energy is complicated by the rough fracture surface, with area greater than the specimen cross-section. We utilize network optimization algorithms (max-flow/min-cut) to determine the minimum surface formation energies and surfaces for intergranular fracture in 3D polycrystals. For equiaxed grains and uniform boundary strength, the minimum energy fracture area is independent of grain size and is 45% larger than the specimen cross-section, and intergranular fracture will occur when surface energy is less than 1.6 times the grain boundary energy. The 3D fracture area is larger than projected from 2D systems. In systems with microcracked boundaries, the fracture surface deviates to preferentially include microcracked boundaries, creating interlocking grain configurations. Two-dimensional percolation of microcracks occurs at about 80% microcracked boundaries.
INTRODUCTION
In brittle materials, the energy for fracture includes a variety of thermodynamic and kinetic contributions. The minimum energy E/ which must be expended to fracture a specimen is the free energy required to form two new surfaces
Ef=AEA (1)
where AE is the surface formation energy per unit area and A is the surface area of the fracture. For a material which fractures by cleavage (transgranular fracture), AE is the energy of
forming two new surfaces from the bulk, 2a, where a is the surface free energy per unit area. For materials which fracture along grain boundaries (intergranular fracture), AE is the energy for forming two new surfaces minus the free energy per unit area of the original grain boundary /, so
AE=2a-Y (2)
In transgranular fracture, the surface formation energy is computed assuming the crack is planar; thus, A is the cross-sectional area of the specimen. For intergranular fracture, the surface formation energy is complicated by the rough fracture surface, with area greater than the specimen cross-section.
Dynamic processes such as plasticity, crack branching, crack bridging and healing all add to the fracture energy. However, the surface formation energy ^/provides a minimum expended energy below which fracture cannot occur. Therefore, it is useful to characterize £/for systems and fracture processes of interest. In this paper, we determine and analyze E/for intergranular fracture in three-dimensional (3D) equiaxed polycrystals with and without microcracks.
FRACTURE MODEL
To find the minimum surface formation energy for intergranular fracture, we must identify a surface which divides a polycrystal into two parts while conforming to the grain boundaries and minimizing surface formation energy. Such surfaces may be found by various
325 Mat. Res. Soc. Symp. Proc. Vol. 539 e 1999 Materials Research Society

network algorithms. A two-dimensional (2D) approach, which uses Djikstra's algorithm on the graph of grain vertices and edges, is described in [1]. That scheme cannot be used on 3D grain structures, however.
To solve the 3D problem, we use a graph which is the dual of the grain boundary structure. The grain centroids are the nodes of the graph. Centroids of neighboring grains are connected by edges of the graph, so that each edge represents the boundary between two grains. Each edge is given a capacity that corresponds to the surface formation energy for fracturing that boundary. This scheme is shown in Figure 1.
This graph is a capacitated network, defined as a graph consisting of nodes, edges which connect nodes, and capacities associated with each edge. The top and bottom surfaces of the sample are defined as source and sink nodes. The maximum flow (max-flow) a network can sustain is the largest numerical flow which can move from the source to the sink, node to node via the connecting edges, with no edge carrying more flow than its capacity. The minimum cut (min-cut) is the separation of the network into two networks, with the source in one new network and the sink in the other, such that the sum of the capacities of the broken edges is minimal. Ford and Fulkerson [2] proved that the max-flow in a network occurs across the min-cut and developed a polynomial-time algorithm to determine the max-flow. Edmonds and Karp [3] modified the algorithm to guarantee convergence in the case of non-integer capacities.
The max-flow/min-cut algorithm proceeds by associating a flow value with each edge in the network, initially set to zero. An attempt is made to push an infinite amount of flow out of the source, limited by the flow available in the edges leaving the node. This process is repeated for each node reached by the new flow until some incremental flow reaches the sink. When this happens the flow values of all edges in the path that this new flow took are updated to reflect the increase. This procedure is repeated, each time augmenting the flow from the source to the sink, until a path to push even the smallest flow increase to the sink cannot be found. The resulting flow reaching the sink is the max-flow, and also the value of the min-cut.
For the a grain structure graph, the minimum surface formation energy fracture is the surface which divides the graph into two pieces while cutting edges with the minimum total edge capacity, i.e. the min-cut. Therefore, the max-flow/min-cut algorithm can provide both the position and surface formation energy for the minimum energy fracture.
Figure 1. A grain structure (gray lines) represented by the graph of its dual. Nodes of the graph (dots) are the grain centroids; edges (black lines) connect centroids of neighboring grains. The capacity of an edge is its surface formation energy. Here, the boundary between grains x and y has surface formation energy of m units.
326

All grain structures in this study were equiaxed, single phase polycrystalline microstructures produced using a 3D Monte Carlo Potts Model grain growth simulation [4-6]. Although the fracture model can operate on digitized experimental microstructures, simulated microstructures were used to allow a consistent 3D representation and to ensure equivalence between specimens in all but the desired varying characteristics.
Because we are interested only in surface formation energy, we ignore mechanical processes in crack propagation, including plasticity, crack branching, crack bridging and healing.
RESULTS AND DISCUSSION
Equiaxed Polvcrvstals
Figure 2 shows a typical intergranular fracture surface which globally minimizes surface formation energy in an equiaxed microstructure with uniform boundary strength. The crack forms a relatively smooth surface, and interlocking grain configurations which could cause crack bridging are absent.
Figure 2. Intergranular fracture surface of minimum surface formation energy for an equiaxed 3D polycrystal with uniform boundary strength. Sample size is 200x100x100 sites, and the average grain radius is 6.6 sites.
The minimum energy fracture area is about 1.45 times the cross-sectional area and does not vary with grain size, as shown in Figure 3. Therefore, in equiaxed structures, the minimum energy intergranular crack surface is about 45% larger than a cleavage fracture.
Also plotted in Figure 3 is the minimum surface formation energy crack length for 2D grain structures. In two dimensions, the minimum energy fracture is about 1.1 times the sample width (very close to the length expected for a perfect hexagonal array of grains) and does not vary with grain size [1]. A 2D path 1.1 times as long as its end-to-end width extrapolates to a 3D surface of area 1.2 times the cross-sectional area. Actual 3D fracture surfaces are of considerably larger area. This indicates that 2D and 3D fracture surfaces are fundamentally different. This is not surprising considering the difference in boundary topology in two and three dimensions. In particular, the requirements of connectivity prevent each slice of the 3D surface from being a minimum length 2D path. Since the 3D minimum energy fracture is not a composite of 2D minimum fractures, its area is necessarily larger than that extrapolated from the 2D results.
327

tu i c
N
3 1
0.5
111,(11,
♦ •
2D 3D
•••#• • •• •••
"♦♦*■«•**«?♦**%: ;►
_L
10 15 grain size
20 25
Figure 3. Minimum surface formation energy intergranular fracture surface size as a function of equiaxed grain size in 2D (diamonds) and 3D (circles). Fracture size is shown normalized by the sample width (2D) or cross-sectional area (3D). Fracture size does not change with grain size. In 2D, fracture length is approximately the same as for a perfect hexagonal grain array (dotted line). In 3D, fracture area is much larger than extrapolated from the 2D result (solid line).
The observation that the minimum energy intergranular fracture is 1.45 times larger than a transgranular cleavage plane allows us to calculate an energetic criterion for intergranular fracture in 3D. Intergranular fracture is preferred when the intergranular fracture energy £/ is less than the transgranular cleavage energy Et. From equations (1) and (2), this occurs when
(2a - y)A < 2GA0 (3)
where A is the intergranular fracture area and Ao is the cross-sectional area of the specimen. If A = 1.45,40, intergranular fracture is energetically preferred when
a<1.6y (4)
When surfaces are energetically inexpensive, the crack will follow a more tortuous path to eliminate grain boundary. In typical pure metals, er ~ 3y [7]; therefore, we do not expect intergranular fracture in equiaxed microstructures. This is consistent with experimental observations. However, if the grain boundary energy is increased or the surface energy is decreased (i.e. by contamination of grain boundaries), intergranular fracture can and does occur.
Microcracked Polvcrvstals
Anisotropie effects such as thermal expansion anisotropy or preferential solute segregation can cause grain boundaries to non-uniform properties. In particular, the surface formation energy of boundaries may vary across a polycrystal, with some boundaries having a very low surface formation energy. As surface formation energy decreases, boundaries become similar to microcracks and can dramatically affect intergranular fracture.
We consider a system in which special boundaries have a surface formation energy AES
which is much lower than the surface formation energy for normal boundaries AE„; here
AES = 0.0lAEn. We assign a fraction/of the boundaries in the system at random to be special
328

boundaries, and the average surface formation energy in the system is <AE> =fAEs + (1 -f)
AE„.
Figure 4. Intergranular fracture surface of minimum surface formation energy for an equiaxed 3D polycrystal with/= 0.8 very low surface formation energy boundaries (microcracks). Sample size is 200x100x100 sites, and the average grain radius is 6.6 sites. Note the convoluted fracture surface which includes geometrically interlocking grains.
25000
& S 20000 c o>
o 15000
g g 10000
M 5000
CO
0
*
\ \
• I \
\ s
-*—»1
2.8
2.6 3 b 2.4 B.
2.2 *
2 s %
1.8 <n
1.6 p
.4 0.2 0.4 0.6 0.8 1 fraction special boundaries
Figure 5. Intergranular fracture surface area (circles) and surface formation energy (diamonds) as a function of fraction microcracked boundaries. Fracture area is shown normalized by the cross- sectional area. The maximum surface area fracture occurs at the 2D percolation threshold for microcracks, pc. Surface formation energy is lower than predicted from the average surface formation energy per unit area in the system (dashed line), indicating that low surface formation energy boundaries are preferentially included in the fracture surface.
Because the special boundaries have significantly lower surface formation energy per unit area, the fracture surface may deviate in order to include them, as shown in Figure 4. These
329

deviations may lead to geometrically interlocking grains (i.e. crack bridging). The minimum energy fracture area is significantly higher than the uniform boundary case for all mixtures of special and normal boundaries, with a peak near/= 0.8, as shown in Figure 5. In addition the surface formation energy for fracture is smaller than predicted from the average surface formation energy in the system, indicating that fracture surfaces preferentially choose the low surface formation energy special boundaries. There is no effect of grain size on these results.
The percolation threshold, where a connected surface of special boundaries spans the system, occurs when/- 0.8. At this point, the minimum energy fracture surface has the largest area and the highest roughness. Note that typical percolation problems entail the formation of a one-dimensional path across a specimen. Fracture percolation, however, is the formation of a continuous 2D surface. Such percolation problems are computationally challenging; in fact, the max-flow/min-cut algorithm used here is an efficient way to find such percolation thresholds.
CONCLUSIONS
Max-flow/min-cut network optimization algorithms allow efficient determination of the minimum surface formation energies and surfaces for intergranular fracture in 3D polycrystals. For equiaxed grains and uniform boundary strength, the minimum energy fracture area is independent of grain size and is 45% larger than the specimen cross-section. For such systems, intergranular fracture will occur when surface energy is less than 1.6 times the grain boundary energy. The 3D fracture area is larger than projected from 2D systems, indicating that the propagation of linear and planar cracks is fundamentally different. In systems with microcracked boundaries, the fracture surface deviates to preferentially include microcracked boundaries, allowing interlocking grain configurations. Two-dimensional percolation of microcracks occurs at about 80% microcracked boundaries.
ACKNOWLEGEMENTS
This work was supported by the U.S. Department of Energy under contract number DE-AC04- 94AL85000 and by the Sandia National Laboratories LDRD program.
REFERENCES
1. E. A. Holm. J. Amer. Ceram. Soc. 81 [3] 455 (1998).
2. L. R. Ford Jr., D. R. Fulkerson, Flows in Networks (Princeton Press, Princeton, NJ, 1962).
3. J. Edmonds, R. M. Karp, JACM 19[2] 248 (1972).
4. M. P. Anderson, D. J. Srolovitz, G. S. Grest, P. S. Sahni, Acta Metall. 32[5] 783 (1984).
5. D. J. Srolovitz, M. P. Anderson, P. S. Sahni, G. S. Grest, Acta Metall. 32[5] 793 (1984).
6. M. P. Anderson, G. S. Grest, D. J. Srolovitz, Phil. Mag. B 59[3] 293 (1989).
7. R. E. Reed-Hill, Physical Metallurgy Principles. 2nd edition (Brooks/Cole Engineering Division, Monterey, CA, 1973) p. 220.
330

AUTHOR INDEX
Adams, B.L., 221 Kalia, R.K., 119 Antonelli, A., 175 Kaski, K., 245 Ausloos, M., 215 Kassner, M.E., 263 Aymerich, F., 195 Kawamoto, H., 113
Kaxiras, E., 175 Baik, A., 35 Kennedy, T.C., 263 Bastawros, A-F., 251 Kettunen, H., 153 Bazant, M.Z., 175 Khantha, M., 161 Belak, J., 257 Kikuchi, H., 119 Beltz, O.E., 49, 57 Kim, K-S., 81,251 Bouchaud, E., 203 King, W.E., 221 Brede, M., 41 Kriese, M.D., 277 Brenner, D.W., 319 Kysar, J.W., 299 Broska, A., 41
Lam, N.Q., 29 Campbell, Q.H., 221 Lange, J.H., 41 Carpick, R.W., 93 Lassila, D.H., 221 Ching, E.S.C., 75 Corbett, J.M., 209 Cramer, T., 181
de Hosson, J.Th.M., 189 de Koning, M., 175 D'HuIst, R., 215
Eberhart, M.E. Enachescu, M.
13 93
Falk, M.L., 131 Parkas, D., 291 Fischer, B., 41 Fischer, L.L., 49, 57 Folk II, R.H., 161
Qerberich, W.W., 277 Qerthsen, D., 41 Oilman, J.J., 145 Qiamei, A.F., 13 Qöken, M., 3 Große Qehling, M., 3 Qumbsch, P., 181, 233
Häkkinen, H., 245 Hartmaier, A., 233 Hays, C, 35 Heino, F., 245 Heuer, J.K., 29 Hinojosa, M., 203 Hiraga, K., 125 Hiramatsu, K., 113 Holm, E.A., 325 Hurtado, J.A., 81 Hutchinson, J.W., 277
Iliescu, D., 107
Justo, J.F., 175
McQovney, CM, 325 McMahon, Jr., C.J., 313 Meloni, F., 195 Minich, R., 257 Morita, K., 125 Morris, Jr., J.W., 23 Muthiah, R.C., 313
riakanishi, H., 75 Nakano, A., 119 Hgan, A.H.W., 69 righiem, B., 203 niskanen, K.J., 153
Ogletree, D.F., 93 Okada, A., 113 Okamoto, F.R., 29 Omeltchenko, A., 119, 319
Ferondi, L., 245 Ffaendtner, J.A., 313 Pope, D.P., 161
Qian, C-F., 63
Renshaw, C.E., 107
Saka, H., 169 Sakka, Y., 125 Salmeron, M„ 93 Samuels, R.J., 137 Schrems, K.K., 263 Schulson, E.M., 107 Schwartz, A.J., 221 Selinger, R.L.B., 209 Shenderova, O.A., 319 Shu, J.Y., 221 Spindler, S., 41
331

Stölken, J.S., 221 Vehoff, H., 3 Stubbins, J.F., 29 Vitek, V., 161 Su, X., 319 Volinsky, A.A., 277 Sun, S., 221 Suprijadi, 169 Wagner, H., 41
Walsh, F., 119 Takigawa, Y., 113 Wang, T., 63 Teeuw, D.H.J., 189 Wanner, A., 181 Thoma, P.E., 35 Weide, K„ 269 Thome, F., 3 Wittmann, R., 41 Tonelli, R., 195 Wolff, J., 41 Tong, P., 63 Woodward, C, 13 Tymiak, M.I., 277
Yang, L., 319 Usami, H., 113 Yu, X., 269
Vandewalle, M., 215 Zhang, H.F., 69 Vashishta, P., 119 Zhang, T-Y., 63
332

SUBJECT INDEX
adhesion, 49, 93, 277, 299 aluminum, 245 amorphization, 29 amorphous solids, 131 analytic functions, 57 anisotropy, 137 athermal fracture, 145 atomic force microscopy (AFM), 93 atomistic simulation, 291 Auger electron spectroscopy, 41
bcc metals, 69 biaxial flexure, 113 brittle fracture, 13, 107, 313
Cauchy integral, 57 cavitation, 125, 263 chaos, 195 charge redistribution, 13 cleavage, 23, 49, 57 coatings, 189 cohesive zone, 57, 75 composite materials, 195 compression behavior, 221 compressive failure, 107 conformal mapping, 57 constant stress tensile creep, 125 contact
area, 93 single-asperity, 81, 93 slip, 81
copper, 245, 251, 277, 299 correlation length, 203 covalent bonding, 145 crack(-)
blunting, 49, 57 front wave, 209 growth resistance, 113 opening interferometry, 299 patterns, 189, 215 roughening, 203, 209 tip plasticity, 69, 233, 251
crystal plasticity, 21, 233, 245, 257 rotation, 221
CuSn alloys, 313
damage accumulation, 153 diamond, 319 die cast, 35 dislocation
core, 69 emission, 49,57,63,81 loops, 81, 169 mobility, 69 nucleation, 57, 81, 257, 299
ductile-brittle transition (DBT), 13, 23, 49, 57,131,169,175,233
dynamic embrittlement, 313 fracture, 75, 181,209 simulation, 3, 131
electronic structure, 13 electrons, 145 elliptical crack tip, 49, 57 embrittlement, 41
fee metals, 245 Fe-Cr-Al alloys, 41 fiber debonding, 153 finite element method (FEM), 263, 269 fractal dimension, 195 fracture
directional dependence, 299 interfacial, 277, 299 intergranular, 291, 319, 325 surfaces, 181, 203 transgranular, 319
freezing, 215 friction, 75, 93, 221
dry, 81 adhesive, 81, 93
frictional dissipation, 75
glass precipitation, 125
grain boundary, 291, 313, 319, 325 graphite, 195
heterogeneous media, 203, 209 high overload, 181
ice, 107 interconnects, 269 intergranular amorphous phase, 125 intermetallics, 3, 13, 29, 291 iron-Cr-Al alloys, 41 isotactic polypropylene, 137
laser moire interferometry, 251 treatments, 189
magnesium, 35 alloys, 35
mass flux, 269 mesoscopic simulation, 233 microcrack, 325 microstructure, 23 mode III, 69, 75 molecular dynamics, 119, 131, 209, 245,
257, 319
333

nano ceramics, 189 indentation, 119, 277
network algorithms, 325 rupture, 153
MAI, 3, 291 nickel alloys, 313 nodular dendrites, 35 non-crystalline, 131 notched beam flexure, 113
orientation imaging microscopy, 221
paper, 153 Peierls(-)
Mabarro model, 57, 69 stress, 69
PMDA-ODA polyimide, 137 porous medium, 215 positron annihilation spectroscopy, 41 potential drop technique, 181
sapphire, 299 scaling exponents, 209 scanning force microscopy (SFM), 3 self-affinity, 203 shear-fault, 107 silica, 125
silicon, 161, 169, 175, 181, 277 silver, 263 syv 113, 119 sol-gel, 189 spallation, 257 sputtering, 215 steel, 23, 313 stress corrosion cracking, 63
tantalum, 221 thermal-mechanical stress, 269 thin film, 263, 277
covered crack, 63 thixomold process, 35 transmission electron microscopy (TEM),
41, 169 triaxial stress, 263 tunneling, 145 tungsten, 233
unstable stacking energy, 49, 57, 175 fault, 175
viscoplasticity, 131 void growth, 257
ZrQ2, 189
334


