Embed Size (px)
Citation preview
T.P. 3169
FLUID SATURATION IN POROUS MEDIA BY X-RAY TECHNIQUE
A. D. K. LA1RD AND J. A. PUTNAM, MEMBER AIME, UNIVERSITY OF CALIFORNIA, BERKElEY, CALIF.
ABSTRACT This paper describes the application of x-ray theory to
design procedures in connection with fluid saturation determinations during fluid flow experiments with porous media_ A reliable and rapid method for calibrating the x-ray apparat88 is described_ Extension of the method to fluid saturation determinations in three-fluid systems is described.
INTRODUCTION In research on oil producti6n problems a method is required
which will give quickly the quantity of each component of a fluid flow system present at any cross-section of a porous medium.
The sample of porous medium und@r investigation is usually referred to as a core. The ratio of the volume of one component to the total fluid volume is defined as the saturation of the porous medium by that component. This ratio is generally given as per cent saturation.
Some means of measuring saturation which have received consideration' include; electrical conductivity of the fluids; 1,2
emissions from radioactive tracers dissolved in the fluids; the radioactivity of silver clNlsed by reflection of neutrons from hydr~gen atoms in the fluids~ the attenuation of a microwave beam, the diminution and phase shift of ultrasonic wave trains,'" and the reduction in intensity of x-ray beams in passing through the fluids.
X-rays have already been used with some success. Since every material has a differeftt power to absorb x-rays, the reduction in intensity of an x'ray beam as it passes through a core depends on the fluids present. The etrength of the emergent beam can be found by converting its energy into a measurable form such as heat or ionic current, or b'1' irs effect on a photographic plate or fluorescent scree •. The beam strengths could be interpreted as quantities of known fluids in the core if, previously, these beam strengths had been identified with a known combination of the same fluids. With some flufd combinations it might be desirable to dissolve powerful x-ray absorbing materials in one or more of the fluids, to increase the differences in the beam strengths for various fluid saturations.
Boyer, Morgan and Muskat" have described a method of measuring two component fluid saturation. One component was air or water; the other, mineral seal oil in which was dissolved 25 per cent by weight of iodobenzene to increase its absorbing power. The x-ray source was a tungsten target tube oJilerated at 43 kv potential. The beam emerging from the core was measured as ionic current flowing across an air-filled ionization chamber by means of an amplifying circuit and galvanometer. Another portion of the beam from the x-ray tube was paseed through a metal plate and measured in another ionization chamber. This portion, called the monitor
lReferences given at end of paper. Manuscript received in the office of the Petroleum Branch Oct. 30, 1950,
Paper presented at the Fall Meeting of the Petroleum Branch in Los Angeles. Calif .. Oct. 20-21. 1949.
beam, was used as an indication of the performance of the x-ray tube. The galvanometer readings were calibrated against air-oil core saturations, gravimetric'lllly determined. The method was apparently established by experimental means.
In the present investigation the available theory of x-radiation was surveyed with a view to extending the usefulness of the method and to developing design procedures for its applicatlon to measurement of fluid saturation in porous media. Application of the theory permits prediction of relative meter readings to be expected for any combination of porous matrix, various saturating fluids and auxiliary filtering media. It is tlhm; possible to calibrate the equipment in terms of fluid saturation by an indirect but rapid technique. The results of calculations based on x-ray theory indicate, and results of the saturation calibration technique confirm, that a valid measurement of the saturation of the core can be made for any two components and in some cases for three components.
THBORY The strength of an x-ray beam, after it has passed through
a distance, l, of matter of density, p, and mass absorption coefficient, 1'-, at a giveB wavelength, A, may be expressed by the absorption formula
-p.pl 1=10 e (1)
where 10 represents the intensity of the incident x-ray beam and I is the intensity of the emergent beam. The expression
e -I'-pl is called the transmission factor of the materiaL
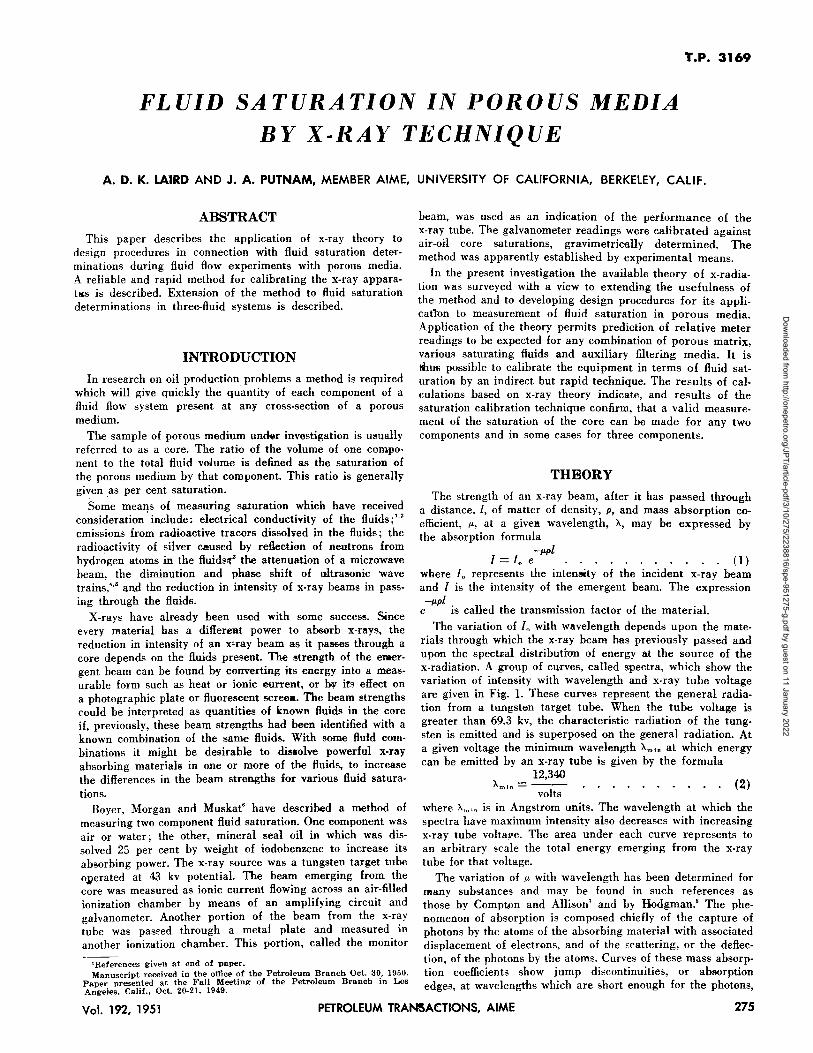
The variation of 10 with wavelength depends upon the materials through which the x-ray beam has previously passed and upon the spectral distribution of energy at the source of the x-radiation. A group of curves, called spectra, which show the variation of infensity with wavelength and x-ray tube voltage are given in Fig. 1. These curve3 represent the general radiation from a tungsten target tube_ When the tube voltage is greater than 69.3 kv, the characteristic radiation of the tungsten is emitted and is superposed on the general radiation. At a given voltage .the minimum wavelength AmID at which energy can be emitted by an x-ray tube is given by the formula
12,340 Amln=---
volts (2)
where Andn is in Angstrom units. The wavelength at which the spectra have maximum intensity also decreases with increasing x-ray tube voltave. The area under each curve represents to an arbitrary scale the total energy emerging from the x-ray tube for that voltage.
The variation of I'- with wavelength has been determined for l1'Iany substances and may be found in such references as those by Compwn and Allison' and by Hodgman.' The phenomenon of absorption is composed chiefly of the capture of photons by the atoms of the absorbing material with associated displacement of electnms, and of the scattering, or the deflection, of the photons by the atoms. Curves of these mass absorption coefficients show jump discontinuities, or absorption edges, at wavelengths which are short enough for the photons,
Vol. 192, 1951 PETROLEUM TRANSACTIONS, AIME 275
Dow
nloaded from http://onepetro.org/JPT/article-pdf/3/10/275/2238816/spe-951275-g.pdf by guest on 11 January 2022
T.P. 3169 FLUID SATURATION IN POROUS MEDIA BY X-RAY TECHNIQUE
or bundles of x-ray energy, to be at a high enough energy level to eject electrons from the successive shells of the atoms (c.f. pp 526-531 of Compton and Allison).' These edges ~re given the designations K, L, M, etc., of the correspondmg atomic electron shells from which the electrons are ejected. This added means of capturing photons causes the material to be a much more effective absorber on the shorter wavelength side of each discontinuity. The absorption edges of the elements occur at decreasing wavelengths as the atomic numbers increase.
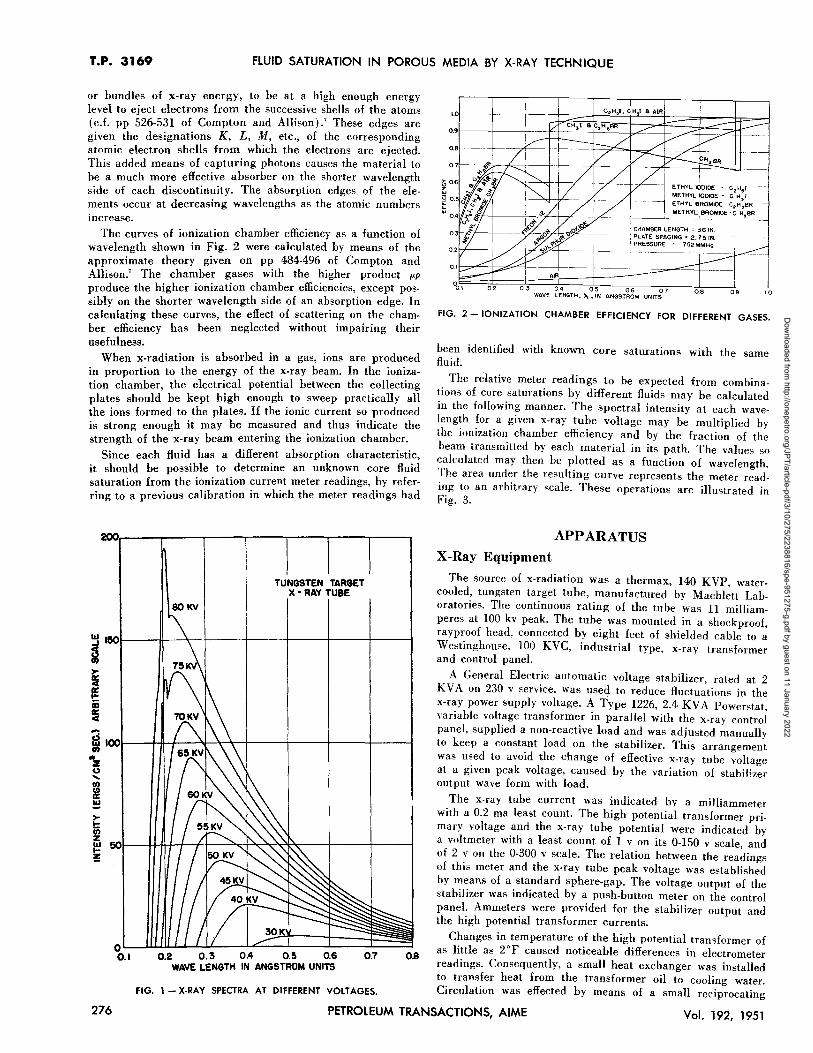
The curves of ionization chamber efficiency as a function of wavelength shown in Fig. 2 were calculated by means of the approximate theory given on pp 484-496 of Compton and Allison.' The chamber gases with the higher product fJ-P
produce the higher ionization chamber efficiencies, except possibly on the shorter wavelength side of an absorption edge. In calculating these curves, the effect of scattering on the chamber efficiency has been neglected without impairing their usefulness.
When x-radiation is absorbed in a gas, ions are produced in proportion to the energy of the ~-ray beam. In the ioni.zation chamber, the electrical potential between the ?ollectmg plates should be kept high enough to sweep practically all the ions formed to the plates. If the ionic current so produced is strong enough it may be measured and thus indicate the strength of the x-ray beam entering the ionization chamber.
Since each fluid has a different absorption characteristic, it should be possible to determine an unkno,:n core fluid saturation from the ionization current meter readmgs, by referring to a previous calibration in which the meter readings had
~I----~--~----'---'---~----r---.
eoKV
TUNGSTEN TARGET X· RAY TUBE
~l.I--~~O~.2~~O~.L3~--OJA~~:O~.=5====Q~.6~~~O~~~~~OB WAVE LENGTH IN ANGSTROM UNITS
FIG. 1 - X·RAY SPECTRA AT DIFFERENT VOLTAGES.
I.O'!------+-----j---=t:;;~=s~~ o··f---f----;----¥t-H-~ 0.81f----+--
O.
-\- - - --~ ETHVL IOOIDE - C, ",I -
J METHYL iODIDE - C H,I . -~-- I ETHYL BROMIDE . C2' H 15 BR
! . METHYL BROMIDE· C H,8R - --~- -----..L..t -. r---
10
FiG. 2 - IONIZATION CHAMBER EFFICIENCY FOR DIFFERENT GASES.
been identified with known core saturations with the same fluid.
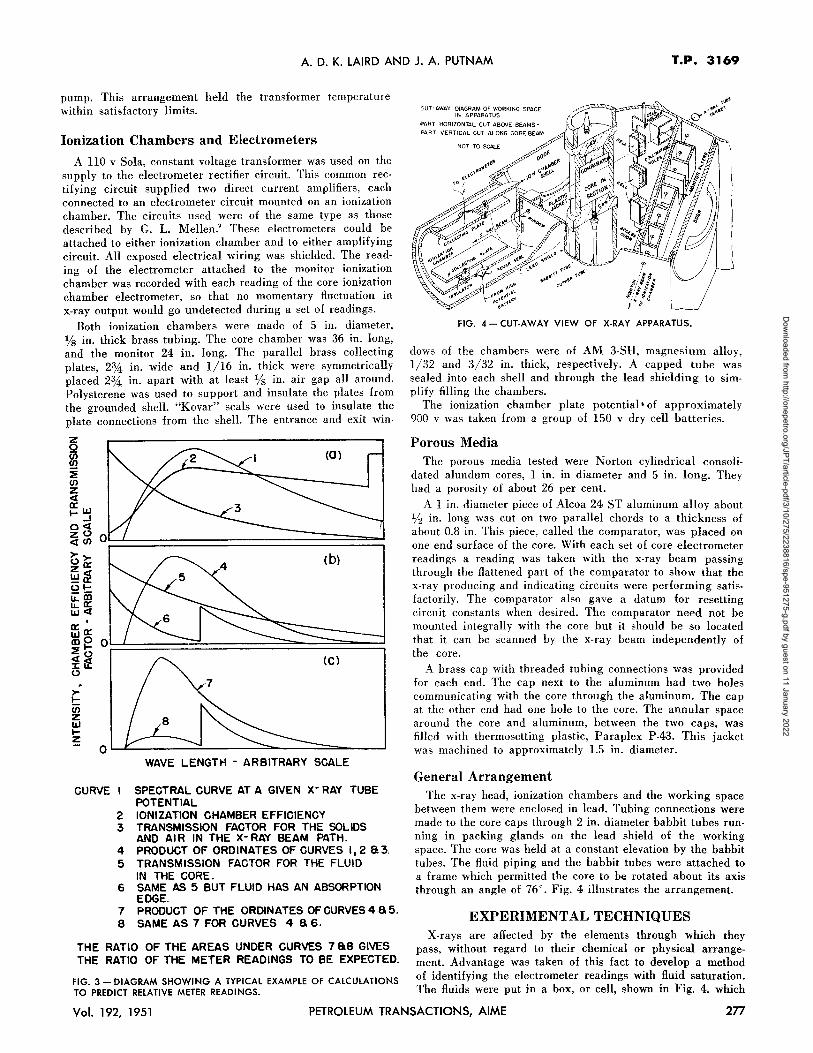
The relative meter readings to be expected from combinations of core saturations by different fluids may be calculated in the following manner. The spectral intensity at each wavelength for a given x-ray tube voltage may be multiplied by the ionization chamber efficiency and by the fraction of the beam transmitted by each material in its path. The values so calculated may then be plotted as a function of wavelength. The area under the resulting curve represents the meter reading to an arbitrary scale. These operations are illustrated in Fig. 3.
APPARATUS X·Ray Equipment
The source of x-radiation was a thermax, 140 KVP, watercooled, tungsten target tube, manufactured by Machlett Laboratories. The continuous rating of the tube was 11 milliamperes at 100 kv peak. The tube was mounted in a shockproof, rayproof head, connected by eight feet of shielded cable to a Westinghouse, 100 KVC, industrial type, x-ray transformer and control panel.
A General Electric automatic voltage stabilizer, rated at 2 KV A on 230 v service. was used to reduce fluctuations in the x-ray power supply voltage. A Type 1226, 2.4 KV A Powerstat, variable voltage transformer in parallel with the x-ray control panel, supplied a non-reactive load and was adjusted manually to keep a constant load on the stabilizer. This arrangement was used to avoid the change of effective x-ray tube voltage at a given peak voltage, caused by the variation of stabilizer output wave form with load.
The x-ray tube current was indicated by a milliammeter with a 0.2 rna least count. The high potential transformer primary voltage and the x-ray tube potential were indicated by a voltmeter with a least count of I v on its 0-150 v scale, and of 2 v on the 0-300 v scale. The relation between the readings of this meter and the x·ray tube peak voltage was established by means of a standard sphere-gap. The voltage output of the stabilizer was indicated by a push-button meter on the control panel. Ammeters were provided for the stabilizer output and the high potential transformer currents.
Changes in temperature of the high potential transformer of as little as 2°F caused noticeable differences in electrometer readings. Consequently, a small heat exchanger was installed to transfer heat from the transformer oil to cooling water. Circulation was effected by means of a small reciprocating
276 PETROLEUM TRANSACTIONS, AIME Vol. 192, 1951
Dow
nloaded from http://onepetro.org/JPT/article-pdf/3/10/275/2238816/spe-951275-g.pdf by guest on 11 January 2022
A. D. K. LAIRD AND J. A. PUTNAM T.P. 3169
pump. This arrangement held the transformer temperature within satisfactory limits.
Ionization Chambers and Electrometers
A llO v Sola, constant voltage transformer was used on the supply to the electrometer rectifier circuit. This common rectifying circuit supplied two direct current amplifiers, each connected to an electrometer circuit mounted on an ionization chamber. The circuits used were of the same type as those described by G. L. Mellen: These electrometers could be attached to either ionization chamber and to either amplifying circuit. All exposed electrical wiring was shielded. The reading of the electrometer attached to the monitor ionization chamber was recorded with each reading of the core ionization chamber electrometer, so that no momentary fluctuation in x-ray output would go undetected during a set of readings.
Both ionization chambers were made of 5 in. diameter, % in. thick brass tubing. The core chamber was 36 in. long, and the monitor 24 in. long. The parallel brass collecting plates, 2% in. wide and 1/16 in. thick were symmetrically placed 2% in. apart with at least 1/8 in. air gap all around. Polysterene was used to support and insulate the plates from the grounded shell. "Kovar" seals were used to insulate the plate connections from the shell. The entrance and exit win-
2 0 en (a) ~ ~ (J) 2 ct Cl: w .... J oct 2 0 ct(J) >->-00::
~~ 0 .... U::iii u..Cl: wct
I
0::Cl: wo CD .... ~O ~~ 0
>-.... U; 2 W .... 2
WAVE LENGTH - ARBITRARY SCALE
CURVE I SPECTRAL CURVE AT A GIVEN X- RAY TUBE POTENTIAL
2 IONIZATION CHAMBER EFFICIENCY 3 TRANSMISSION FACTOR FOR THE SOLIDS
AND AIR IN THE X- RAY BEAM PATH. 4 PRODUCT OF ORDINATES OF CURVES 1,2 el3. 5 TRANSMISSION FACTOR FOR THE FLUID
IN THE CORE. 6 SAME AS 5 BUT FLUID HAS AN ABSORPTION
EDGE. 7 PRODUCT OF THE ORDINATES OFCURVES4a5. a SAME AS 7 FOR CURVES 4 a 6.
THE RATIO OF THE AREAS UNDER CURVES 7 aa GIVES THE RATIO OF THE METER READINGS TO BE EXPECTED.
FIG. 3 - DIAGRAM SHOWING A TYPICAL EXAMPLE OF CALCULATIONS TO PREDICT RELATIVE METER READINGS.
GUr-AWAY DIAGRAM or: WORKING SPACE IN APPARATUS
PART HORIZONTAL CUT ABOVE BEAMS-
FIG. 4 - CUT-AWAY VIEW OF X-RAY APPARATUS.
dows of the chambers were of AM 3-SH, magnesium alloy, 1/32 and 3/32 in. thick, respectively. A capped tube was sealed into each shell and through the lead shielding to simplify filling the chambers.
The ionization chamber plate potential' of approximately 900 v was taken from a group of 150 v dry cell batteries.
Porous Media The porous media tested were Norton cylindrical consoli
dated alundum cores, 1 in. in diameter and 5 in. long. They had a porosity of about 26 per cent.
A 1 in. diameter piece of Alcoa 24 ST aluminum alloy about V2 in. long was cut on two parallel chords to a thickness of about 0.8 in. This piece, called the comparator, was placed on one end surface of the core. With each set of core electrometer readings a reading was taken with the x-ray beam passing through the flattened part of the comparator to show that the x-ray producing and indicating circuits were performing satisfactorily. The comparator also gave a datum for resetting circuit constants when desired. The comparator need not be mounted integrally with the core but it should be so located that it can be scanned by the x-ray beam independently of the core.
A brass cap with threaded tubing connections was provided for each end. The cap next to the aluminum had two holes communicating with the core through the aluminum. The cap at the other end had one hole to the core. The annular space around the core and aluminum, between the two caps, was filled with thermosetting plastic, Paraplex P-43. This jacket was machined to approximately 1.5 in. diameter.
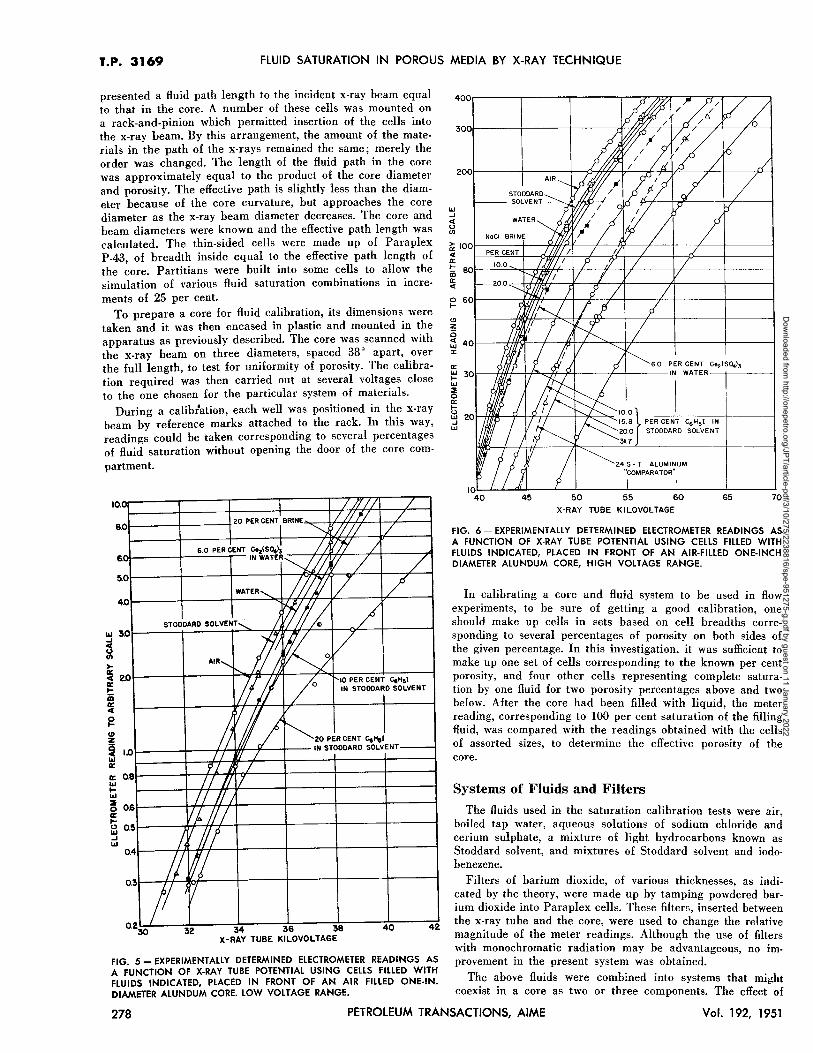
General Arrangement The x·ray head, ionization chambers and the working space
between them were enclosed in lead. Tubing connections were made to the core caps through 2 in. diameter babbit tubes running in packing glands on the lead shield of the working space. The core was held at a constant elevation by the babbit tubes. The fluid piping and the babbit tubes were attached to a frame which permitted the core to be rotated about its axis through an angle of 76°. Fig. 4 illustrates the arrangement.
EXPERIMENTAL TECHNIQUES X.rays are affected by the elements through which they
pass, without regard to their chemical or physical arrangement. Advantage was taken of this fact to develop a method of identifying the electrometer readings with fluid saturation. The fluids were put in a box, or cell, shown in Fig. 4. which
Vol. 192, 1951 PETROlEUM TRANSACTIONS, AIME 277
Dow
nloaded from http://onepetro.org/JPT/article-pdf/3/10/275/2238816/spe-951275-g.pdf by guest on 11 January 2022
T.P. 3169 FlUID SATURATION IN POROUS MEDIA BY X-RAY TECHNIQUE
presented a fluid path length to the incident x-ray beam equal to that in the core. A number of these cells was mounted on a rack-and· pinion which permitted insertion of the cells into the x·ray beam. By this arrangement, the amount of the mate· rials in the path of the x-rays remained the same; merely the order was changed. The length of the fluid path in the core was approximately equal to the product of the core diameter and porosity. The effective path is slightly less than the diameter because of the core curvature, but approaches the core diameter as the x·ray beam diameter decreases. The core and beam diameters were known and the effective path length was calculated. The thin-sided cells were made up of Paraplex P-43, of breadth inside equal to the effective path length of the core. Partitians were built into some cells to allow the simulation of various fluid saturation combinations in incre· ments of 25 per cent.
To prepare a core for fluid calibration, its dimensions were taken and it was then encased in plastic and mounted in the apparatus as previously described. The core was scanned with the x·ray beam on three diameters, spaced 38° apart, over the full length, to test for uniformity of porosity. The calibration required was then carried out at several voltages close to the one chosen for the particular system of materials.
During a calibtation, each well was positioned in the x-ray beam by reference marks attached to the rack. In this way, readings could be taken corresponding to several percentages of fluid saturation without opening the door of the core compartment.
10.0 . .----.--------,-----r1---,---/7....".-;/l, /Tj',/rr----:/7"I
8,°1--__ +-__ -120 PER CENT I BRINE ~ :jjjji / / I ___ ......!f--..:6::.:.0:..:...:PE::.:R
1C;:.EN.:..-T ClzlSOZ ! W /
6,0.- IN WATEi~/ ~ / /
5,0 WATER, Il/li / / 4D~---+-----~~~~~7i~Tf"II~~----~-----i
STODDARD SOLVENT....... !.(/ I! j /' ~ 3DI-----=~=-AIR,~IA---Id.~~~r....r-=--+o /--¥-+-------i
~ 2D~---~--~r/;~jjF~~~~~--~~~~IO~PE~R~C~E7.N~T~~~H~.~I--1 i (! If / 0 IN STODDAjD SOLVENT
~ Ji,f J~"K,~,J 0c- l.ol---~~-+f-I(ff-~~-+--IN STODDARD SOLVENT-I&J II '(I / It: 91 il ffiO.
8 //117 t;; II II I ~ 0,6 !~ 11/ a 0.5 /1 II/
0.41----f..,lf./h--l-l-+-rj --+-----+--+----r---------i
::1--jI++---f07t=---+--+--+-----t-----1
42 30 32 34 36 38 40 X-RAY TUBE KILOVOLTAGE
FIG. 5 - EXPERIMENTAllY DETERMINED ELECTROMETER READINGS AS A FUNCTION OF X-RAY TUBE POTENTIAL USING CELLS FILLED WITH FLUIDS INDICATED, PLACED IN FRONT OF AN AIR FILLED ONE·IN. DIAMETER ALUNDUM CORE. LOW VOLTAGE RANGE.
400r----.----,----,-~~~-..-~_r-~-~
... -' c <> I/)
~ 100 C It: I- 80 iii 0:: C
0 60 l-
t!)
z <5 c 40 ... 0::
0:: ... 30 I-... ::E 0 0:: I-<> ... -' ...
AIR
STODDARD SOLVENT -""'~'-#l:P-:L--:::lrf---+cI__+~--_++--__l
WATER
Noel BRINE
PER CENT
100
20.0-::::--hff1k<'-r----;;f---"l---f1-----T1-----!----l
6.0 PER CENT Ce,ISO.I,
1---f1lH--!--P'~'fI-¥+---f--+---IN WATER ---t-------i
HHIII.---'IY-t'--i-f---+-""-f.:----::_ :~~} .e, ,,1 ~~, '" 200 STODDARD SOLVENT
31.7
10~L_L_~ __ L_~ ______ ~ ______ ~ ______ _L ______ ~
40 45 50 55 60 65 70 X-RAY TUBE KILOVOLTAGE
FIG. 6 - EXPERIMENTALLY DETERMINED ELECTROMETER READINGS AS A FUNCTION OF X-RAY TUBE POTENTIAL USING CEllS FILLED WITH FLUIDS INDICATED, PLACED IN FRONT OF AN AIR-FILLED ONE-INCH DIAMETER ALUNDUM CORE, HIGH VOLTAGE RANGE.
In calibrating a core and fluid system to be used in flow experiments, to be sure of getting a good calibration, one should make up cells in sets based on cell breadths corresponding to several percentages of porosity on both sides of the given percentage. In this investigation, it was sufficient to make up one set of cells corresponding to the known per cent porosity, and four other cells representing complete saturation by one fluid for two porosity percentages above and two below. After the core had been filled with liquid, the meter reading, corresponding to 100 per cent saturation of the filling fluid, was compared with the readings obtained with the cells of assorted sizes, to determine the effective porosity of the core.
Systems of Fluids and Filters
The fluids used in the saturation calibration tests were air boiled tap water, aqueous solutions of sodium chloride and cerium sulphate, a mixture of light hydrocarbons known as Stoddard solvent, and mixtures of Stoddard solvent and iodobenezene.
Filters of barium dioxide, of various thicknesses, as indicated by the theory, were made up by tamping powdered barium dioxide into Para pIe x cells. These filters, inserted between the x-ray tube and the core, were used to change the relative magnitude of the meter readings. Although the use of filters with monochromatic radiation may be advantageous, no improvement in the present system was obtained.
The above fluids were combined into systems that might coexist in a core as two or three components. The effect of
278 PETROLEUM TRANSACTIONS, AIME Vol. 192, 1951
Dow
nloaded from http://onepetro.org/JPT/article-pdf/3/10/275/2238816/spe-951275-g.pdf by guest on 11 January 2022
A. D. K. LAIRD AND J. A. PUTNAM T.P. 3169
Table I - Meter Readings as a Function of Voltage and Core Porosity
Voltage Per cent Porosity
kv 21 23 25 Filled Core 27 29
59 172.5 167.5 164.5 163.0 163.0 161.5 60 185.0 182.5 179.0 178.8 179.0 177.0 61 198.0 195.5 192.0 191.0 190.0 188.0
Average porosity = 26.0 ± 0.5 per cent
these systems was determined by performing a calibration test on each, over the range of voltages from 30 to 90 kv, both with the barium dioxide filter and without it.
An interesting use of the comparator was in the magnification of the difference between meter readings for two different fluids. For example, water and Stoddard solvent gave comparatively small differences of meter readings during fluid saturation calibration, as indicated by Figs. 5 and 6. With ordinary use of the electrometer, this difference was too small to give satisfactory precision, because of the errors in reading the meter. This small difference was magnified by manipulating the electrometer. The meter was operated at low sensitivity at a voltage such that the comparator and the smaller of the two fluid readings coincided. This is always possible at a voltage high enough for readings to be made on a low sensitivity scale by using a thinner comparator and adding extra metal in the beam path externally as required. The x-ray tube was left operating and the electrometer zero adjuster was turned to zero the meter with the x-ray beam passing through the comparator. The meter was then switched to a higher sensitivity scale and the two fluid readings were taken. Proper choice of sensitivity gave nearly full scale differences in readings, with corresponding increase in the precision of the fluid saturation determinations. Upon completion of the reading, the meter was switched back to the low sensitivity scale and the zero adjustment was turned to give the original comparator reading. The return of the meter to its customary zero upon shutting off the x-ray tube circuit was considered as evidence that the settings had been made accurately.
RESULTS
The experimentally determined electrometer readings as a function of x-ray tube potential, using cells filled with the various fluids mentioned above and placed in front of an airfilled alundum core, are shown in Figs. 5 and 6. The curve, drawn on these figures were faired in so as to best represent the experimental data. A table of the coordinates of these curves is available.'· Similar data and curves are available in the tube potential range 70 kv to 90 kv but are not included here as still another logarithmic cycle would be required and the experimental points all fell on the monotonic curves representing the data. It is to be noted that the greatest scatter of the data occurs in the tube potenial range below 40 kv. In this region the experimental error is not better than five per cent. In the neighborhood of 40 kv the error is about two per cent and decreases to considerably less than one per cent at the higher voltages.
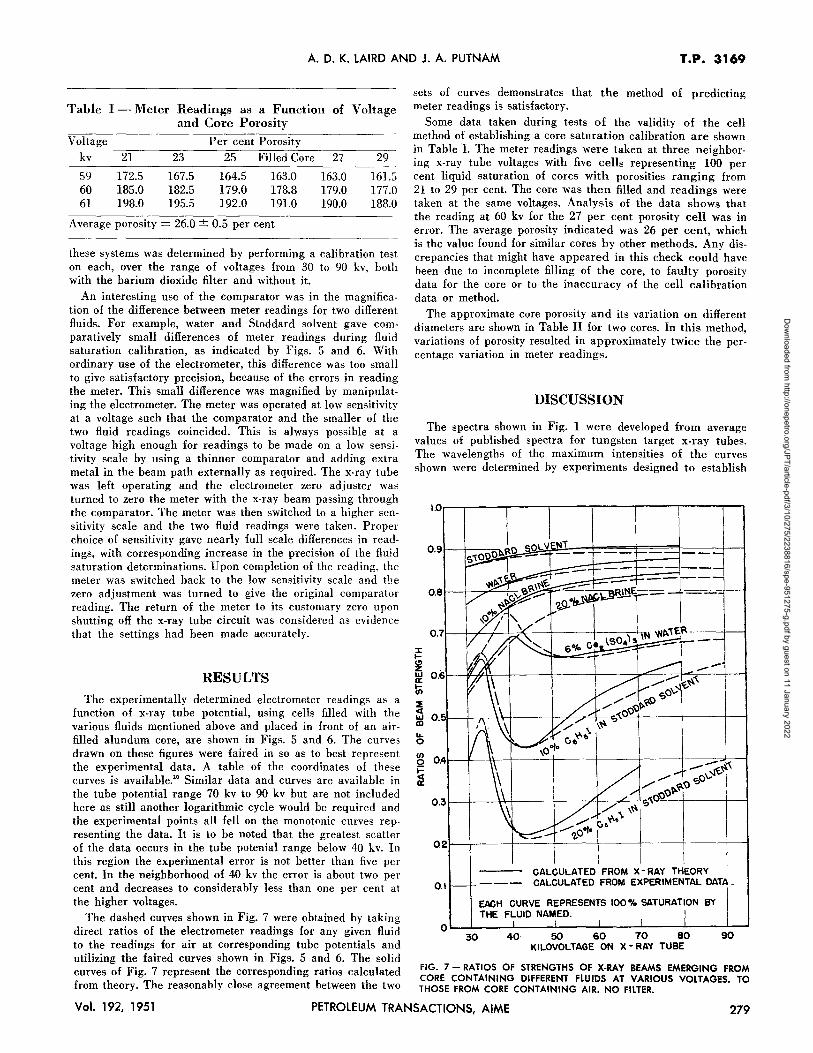
The dashed curves shown in Fig. 7 were obtained by taking direct ratios of the electrometer readings for any given fluid to the readings for air at corresponding tube potentials and utilizing the faired curves shown in Figs. 5 and 6. The solid curves of Fig. 7 represent the corresponding ratios calculated from theory. The reasonably close agreement between the two
sets of curves demonstrates that the method of predicting meter readings is satisfactory.
Some data taken during tests of the validity of the cell method of establishing a core saturation calibration are shown in Table I. The meter readings were taken at three neighboring x-ray tube voltages with five cells representing 100 per cent liquid saturation of cores with porosities ranging from 21 to 29 per cent. The core was then filled and readings were taken at the same voltages. Analysis of the data shows that the reading at 60 kv for the 27 per cent porosity cell was in error. The average porosity indicated was 26 per cent, which is the value found for similar cores by other methods. Any discrepancies that might have appeared in this check could have been due to incomplete filling of the core, to faulty porosity data for the core or to the inaccuracy of the cell calibration data or method.
The approximate core porosity and its variation on different diameters are shown in Table II for two cores. In this method, variations of porosity resulted in approximately twice the percentage variation in meter readings.
DISCUSSION
The spectra shown in Fig. 1 were developed from average values of published spectra for tungsten target x-ray tubes. The wavelengths of the maximum intensities of the curves shown were determined by experiments designed to establish
:I: I-
~ ILl a: Iii ~ « ILl CD
Lo. o
1.0
0.9
0.8
0.7
0.6 --0.5
:g 0.41--'l---\\--.......j.--·~---+----+--+--::;;;--!:;-l
~ a:
0.31---+---\-I+---+---7"q--7~
a2~4----~~--+~~-+-----~---+-----r-;
0.1
CALCULATED FROM X-RAY THEORY CALCULATED FROM EXPERIMENTAL DATA
EACH CURVE REPRESENTS 100% SATURATION BY THE FLUID NAMED.
0L-~--~----~----L----L----~---90~~ 30 40 50 60 70 80
KILOVOLTAGE ON X - RAY TUBE
FIG. 7 - RATIOS OF STRENGTHS OF X-RAY BEAMS EMERGING FROM CORE CONTAINING DIFFERENT FLUIDS AT VARIOUS VOLTAGES. TO THOSE FROM CORE CONTAINING AIR. NO FILTER.
Vol. 192, 1951 PETROLEUM TRANSACTIONS, AIME 279
Dow
nloaded from http://onepetro.org/JPT/article-pdf/3/10/275/2238816/spe-951275-g.pdf by guest on 11 January 2022
T.P. 3169 flUID SATURATION IN POROUS MEDIA BY X-RAY TECHNIQUE
Table II - Uniformity of Core Porosity
Distance from Per cent Porosity of Core --~C~or-e~1-------~-C~or-e~2------end of core
inin.
1fs % % %
I1fs 1% 1% 1% 21fs 2% 2% 2% 3ljs 3% 3% 3% 4ljs 4% 4% 4%
Diam. 1 Diam. 3
26.6 25.7 26.0 25.7 25.7 25.4 26.0 26.0 26.0 26.0 26.0 26.0 26.0 26.1 25.9 25.9 25.9 25.7 26.0 26.0
26.0 25.4 27.4 26.0 26.0 26.0 26.0 26.3 26.0 26.0 26.0 26.0 26.0 26.0 26.0 26.0 26.0 26.0 26.0 26.0
Diam.l
26.0 26.0 26.2 26.4 26.6 26.6 26.6 26.7 26.5 26.7 27.2 27.2 27.1 27.2 27.1 27.4 27.3 27.8 27.8
Diam.2
26.0 26.0 26.0 26.7 26.8 26.7 26.5 26.7 26.8 27.4 27.5 27.5 27.4 27.5 27.4 27.4 27.4 28.0 27.7
Diam.3
26.4 26.4 26.4 26.7 26.6 26.5 26.3 26.4 26.9 27.4 27.6 27.6 27.3 27.0 27.3 27.4 27.4 28.0 27.6
Diameters I and 3 were 76 0 apart and Diameter 2 was 38 0
from both.
the relation between tube voltages and the effect of the absorp. tion edges upon the meter readings. These spectra make useful analytical predictions of experimental results possible.
General x-radiation was used in this exploratory investiga. tion because it was believed that with it results could be ob· tained more certainly and economically than with the very much weaker narrow wavelength band, or monochromatic x-radiation. A small amount of work done with selected wavelength bands gave results similar to those using general radiation. There may, however, be some cases where monochromatic radiation would be advantageous.
Equipment
Commercial equipment was used as the source of x-radiation because of its simplicity and relatively low cost. Similarly, ionization chambers and direct current amplifiers' provided an economical means of indicating the strength of x·ray beams. Atmospheric pressure was used in the ionization chambers to avoid any change of efficiency characteristics due to gas leakage. Under this condition methyl bromide was used because of the resultant high ionization chamber efficiency. In the wavelength range between 0.3 and 0.6. A, the efficiency is approximately 80 times greater than with air. This compound also has the advantage of being a vapor at room conditions so that the density in the chamber was independent of changes in room temperature. If the chamber were kept at constant temperature, mixtures of some other compounds might be used which would give even better efficiencies.
For high absorption of x-rays from the primary beam the ionization chambers were made as long as practical. Similarly, to reduce the losses to the shell and plates from fluorescence of the gas, the chambers were made wide. The dimensions were limited by space, cost and the potential necessary between the collecting plates to. ensure a high yield of current from the ions produced. To prevent the build up of
static charges under x-ray bombardment, all parts of the chambers except the insulators were made of metal.
Choice of Fluids
The fluids used in the saturation calibration were selected for their chemical stability and mutual insolubility. The powerful absorbers used to accentuate the effect of one compo· nent had to be soluble in that component alone. Cerium suI. phate and cerium chloride made it possible to use the absorber in water. Cerium was the only heavy element found which had compounds suitable for u~e in aqueous solution, that is, they would not decomp03e nor precipitate. Sodium chloride brine was satisfactory, and also represented common saline solutions occurring in many oil fields. Stoddard solvent was a satisfactory liquid hydrocarbon component, but many other oils might have been used as well or better. Iodobenzene was used in the oil and appeared to be satisfactory for tests of a month's duration.
Tests were made on the decomposition of cerium sulphate and iodobenzene under the influence of x-radiation. Tests were continued for four hours continuous irradiation without any change being noted. The sensitivity of the measurement was about one per cent.
A comparison of the absorption power of solutions of cerium sulphate in water and of iodobenzene in oil was made on old and new samples of these materials. After three months standing, the cerium sulphate solution had not changed. The iodobenzene solution, however, had decreased approximately six
180
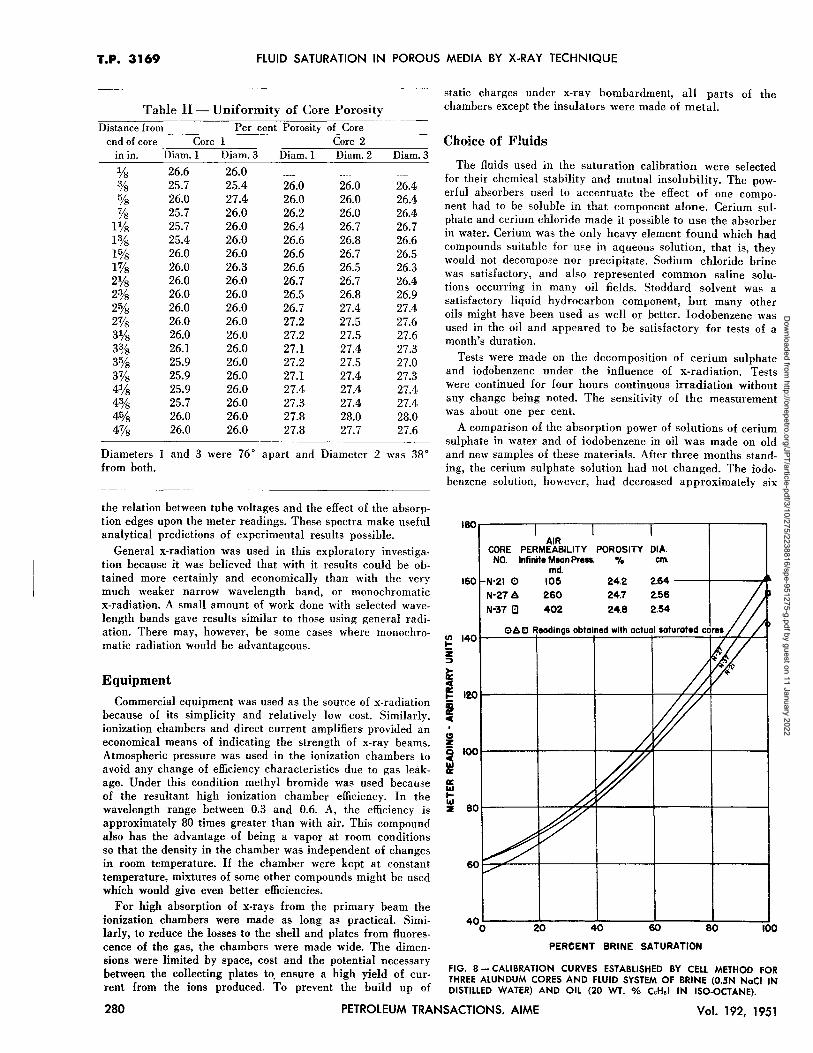
AIR CORE PERMEABILITY POROSITY OIA.
NO. Infinite Mean Press. 0/0 em. md.
160 N'210 105 24.2 2.64
N-216 260 24.1 2.56
N-31 B 402 24.8 2.54
III 140 ..... Z ;:)
~ II: C a: 120 .....
t c c:I z Ci 100 c .... II: II: .... ..... ....
80 2
400~----~20~-----4~0~-----60~----~8~0------~IOO
PERCENT BRINE SATURATION
FIG. 8 - CALIBRATION CURVES ESTABLISHED BY CELL METHOD FOR THREE ALUNDUM CORES AND FLUID SYSTEM OF BRINE (O.5N NoCI IN DISTILLED WATER) AND OIL (20 WT. % CoH,1 IN ISO-OCTANE).
280 PETROLEUM TRANSACTIONS. AIME Vol. 192, 1951
Dow
nloaded from http://onepetro.org/JPT/article-pdf/3/10/275/2238816/spe-951275-g.pdf by guest on 11 January 2022
A. D. K. LAIRD AND J. A. PUTNAM T.P. 3169
per cent in absorbing power, although it had been shielded from light and tightly stoppered.
Small samples of Paraplex were tested for absorption of fluids and consequent effect on x-ray measurements. Samples were soaked in air, water, a six per cent cerium sulphate solution, and a 16 per cent mixture of iodobenzene with Stoddard solvent. Frequent tests made over a period of four weeks showed no detectable changes.
Two-Component Saturation Measurement
In Fig. 8 are shown calibration curves for three different alundum cores. These curves were established by use of the cell technique for 61 kv x-ray tube voltage. At the time of writing this report cores of known two-fluid saturation had not yet been compared with the calibration curves except at 100 per cent brine saturation as shown in Fig. 8. At least at this saturation the deviation of the plotted points is within the accuracy of the method.
Maximum accuracy of the present apparatus may be estimated as follows: by using an absorber in one component, the electrometer could be made to show a difference in direct reading of 150 units between 100 per cent saturation by one component and 100 per cent saturation by the other component. When the meter was used this way the reproducibility of a single reading was within two units, and for many readings the mean was probably within one-half unit of the calibrated value. This indicates an error of less than 0.5 per cent. If by means of the comparator the magnification of the meter reading differences were carried out carefully, an error of less than one per cent might be expected without any absorbers having been added to the fluids. Other errors due to changes of the fluid properties and of the equipment characteristics might increase the error by a small amount. The use of the comparator, however, assures that the total errors will be of the same size as the errors in setting the electrometer circuit constants, which are less than one per cent. Consequently, it is reasonable to suppose that the total error in fluid saturation measurement would be less than twice the estimated error. that is, less than two per cent.
Three-Component Saturation Measurement
According to the theory it should be possible to extend the x-ray technique to saturation determinations for three-fluid components. In order to determine the saturation of n components, n-l readings, each at a different voltage, would be necessary. The nth component can then be found by difference. Further, the rate of change of readings with saturation would have to be different for the various voltages employed. This requirement is equivalent to the conditions of the linear independence of n simultaneous equations.
The following describes a calculated calibration for a threecomponent system utilizing air, a brine composed of 20 weight per cent sodium chloride and a light hydrocarbon oil known as Stoddard's Solution.
Since Equation (1) applies to a single wavelength it was put in the following form:
I
1 (S ') (l"l'F') e - Pfl g d"A
where I is proportional to the meter reading with three fluids in the core.
100'"1. Oil (STODDARD SOLVENT)
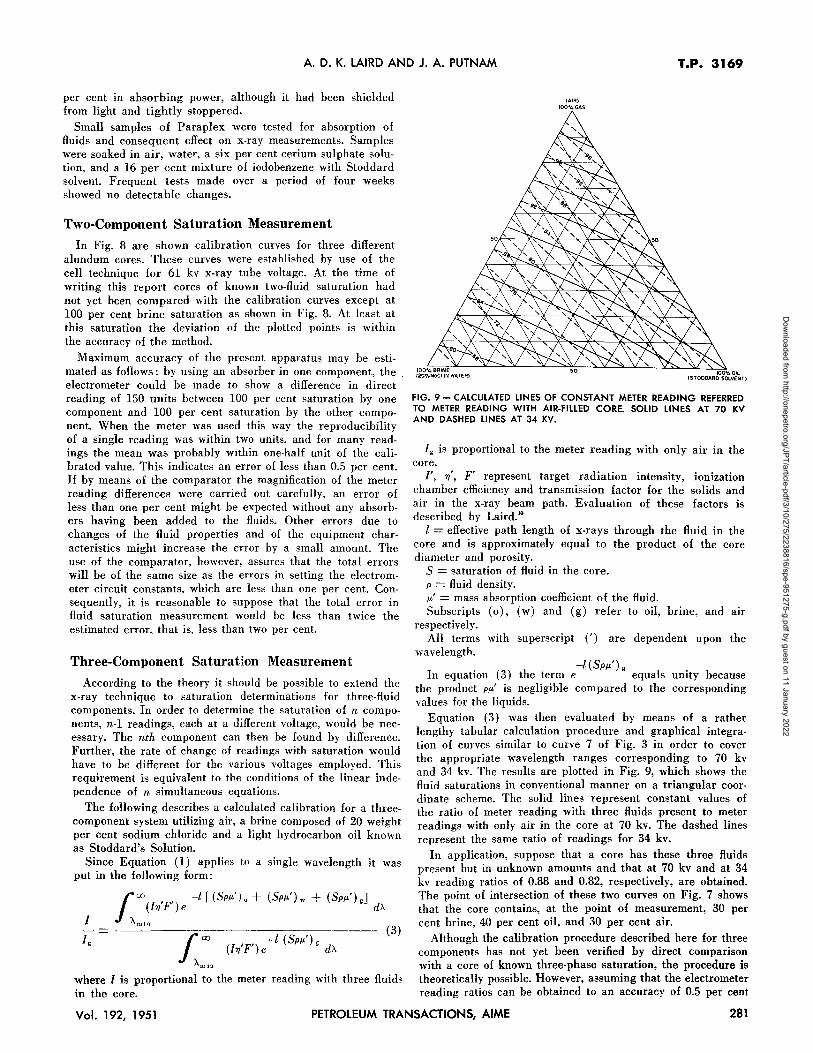
FIG_ 9 - CALCULATED LINES OF CONSTANT METER READING REFERRED TO METER READING WITH AIR-FILLED CORE. SOLID LINES AT 70 KV AND DASHED LINES AT 34 KY.
I g is proportional to the meter reading with only air in the core.
1', 'YJ', F' represent target radiation intensity, ionization chamber efficiency and transmission factor for the solids and air in the x-ray beam path. Evaluation of these factors is described by Laird.'o
1 = effective path length of x-rays through the fluid in the core and is approximately equal to the product of the core diameter and porosity.
S = saturation of fluid in the core. P = fluid density. fl' = mass absorption coefficient of the fluid. Subscripts (0), (w) and (g) refer to oil, brine, and aIr
respectively. All terms with superscript (') are dependent upon the
wavelength. -I (SPfl') g
In equation (3) the term e equals unity because the product Pfl' is negligible compared to the corresponding values for the liquids.
Equation (3) was then evaluated by means of a rather lengthy tabular calculation procedure and graphical integration of curves similar to curve 7 of Fig. 3 in order to cover the appropriate wavelength ranges corresponding to 70 kv and 34 kv. The results are plotted in Fig. 9, which shows the fluid saturations in conventional manner on a triangular coordinate scheme. The solid lines represent constant values of the ratio of meter reading with three fluids present to meter readings with only air in the core at 70 kv. The dashed lines represent the same ratio of readings for 34 kv.
In application, suppose that a core has these three fluids present but in unknown amounts and that at 70 kv and at 34 kv reading ratios of 0.88 and 0.82, respectively, are obtained. The point of intersection of these two curves on Fig. 7 shows that the core contains, at the point of measurement, 30 per cent brine, 40 per cent oil, and 30 per cent air.
Although the calibration procedure described here for three components has not yet been verified by direct comparison with a core of known three-phase saturation, the procedure is theoretically possible. However, assuming that the electrometer reading ratios can be obtained to an accuracy of 0.5 per cent
Vol. 192, 1951 PETROLEUM TRANSACTIONS, AIME 281
Dow
nloaded from http://onepetro.org/JPT/article-pdf/3/10/275/2238816/spe-951275-g.pdf by guest on 11 January 2022
T.P. 3169 FLUID SATURATION IN POROUS MEDIA BY X-RAY TECHNIQUE
the three-fluid saturations, according to Fig. 9, could have maximum theoretical errors as follows: oil, ±10 per cent; gas, ±5 per cent, and brine, ±4 per cent. These errors could be considerably reduced by utilizing fluid combinations that would give larger intercept angles on Fig. 9. In any event, the practical use of the three-component method leaves much to be desired and it certainly requires further development.
CONCLUSION
The present investigation indicates that the approximate theory of x-radiation may be used satisfactorily to predict the strength of x-ray beams emerging from cores of porous materials containing various combinations of fluids. The theory thus permits a survey to be made of a wide variety of materials with a view to selecting suitable combinations for application to a particular problem.
Making use of the fact that absorption of x·radiation is independent of the order in which various materials are traversed, a method has been developed for calibrating the x-ray emergent beam strengths in terms of fluid saturation of the core. This method employs equivalent absorbing media thereby avoiding the difficulties associated with changing the saturation of a core which would be employed in a direct calibration procedure.
A method for determining the saturations in a three-fluid system has been shown to be theoretically feasible, but requires additional development to place it on a practical basis.
ACKNOWLEDGMENTS
This investigation was carried out as a part of the activities of Research Project 47A of the American Petroleum Institute. The cooperation and financial support of that organization is gratefully acknowledged. Special thanks are due to R. W. Ravenscroft, A. E. Peck, F. E. Snodgrass and R. E. Buckland for assistance with the experiments. For assistance in the design of the ionization chambers, special thanks are due to B. J. Moyer of the Radiation Laboratory.
REFERENCES
1. Leverett, M. C.: Trans. AIME (1939) 132, 149. 2. Wyckoff, R. D., and Botset, H. G.: Physics (1936),7,325. 3. Brunner, E., and Mardock, E. S.: Trans. AIME (1946)
165, 133. 4. Keller, E. G.: Tech. Report No.2, API Project 47A (Oct.,
1948). 5. Keller, E. G., Smith, O. J. M., and Putnam, J. A.: Tech.
Report No.3, API Project 47A (July, 1949). 6. Boyer, R. L., Morgan, F., and Muskat, M.: Trans. AIME
(1947) 170, 15. 7. Compton, A. H., and Allison, S. K.: X-Rays in Theory
and Experiment, 2nd Ed., D. Van Nostrand, New York (1935).
8. Hodgman, C. D.: Handbook of Chemistry and Physics, 30th Ed., Chemical Rubber Pub. Co., Cleveland (1947).
9. Mellen, G. L.: Electronics (April, 1946) 19, 1-6, 142. 10. Laird, A. D. K.: MS Thesis, University of California
(1949) .
DISCUSSION
By W. J. West, California Research Corp., La Habra, Calif.
The authors have essentially followed the method of Boyer, Morgan, and Muskat in measuring fluid saturations of cores. It might be worthwhile to point out the similarities and the distinguishing features of the two methods. The authors of the
present paper have used a strong absorber in the oil component as was done earlier by Boyer, Morgan and Muskat. The experimental apparatus and method of calibration are essentially the same. The difference is that Laird and Putnam have analyzed the theory of absorption of the entire spectrum of an x-ray tube and have shown that there are optimum voltages across the x-ray tube that will give maximum accuracy. These optimum voltages are shown to be related to the critical absorption wavelength of the absorbing element.
The theory was extended to show the possibility of using three fluid components, but no experimental work was done to confirm the theory. The authors have shown that the accuracy to be expected for a three-component system is rather poor. This inaccuracy is largely a result of the small angle of intersection of the dashed and solid curves of Fig. 9. The requirement of the use of two liquids that give slopes of meter readings vs saturation of opposite sign, plus the requirement that the angle of intersection be large as possible, greatly limits the fluids that could be used in the proposed method of measuring saturation in a three-component system.
The experimental apparatus appears quite satisfactory. A good job seems to have been done in stabilizing the output of the x-ray tube. The troubles involved with ion chambers due to their bulkiness, their high background readings, and zero drift are conveniently and simply eliminated by the use of Geiger counters.
The question arises as to what is to be done for core materials that are non-uniform in porosity or chemical composition, or both. Apparently a fluid calibration using the liquid cells must be made for each point along the sample and means provided whereby the core sample is returned to those exact positions during the test run.
The x-ray absorption edges of the elements can be used in a somewhat different manner for determining the amount of a given element that is present in the core. They have been so used by Arne Engstrom' to analyze biological materials. His method is essentially independent of core materials and other liquids present.
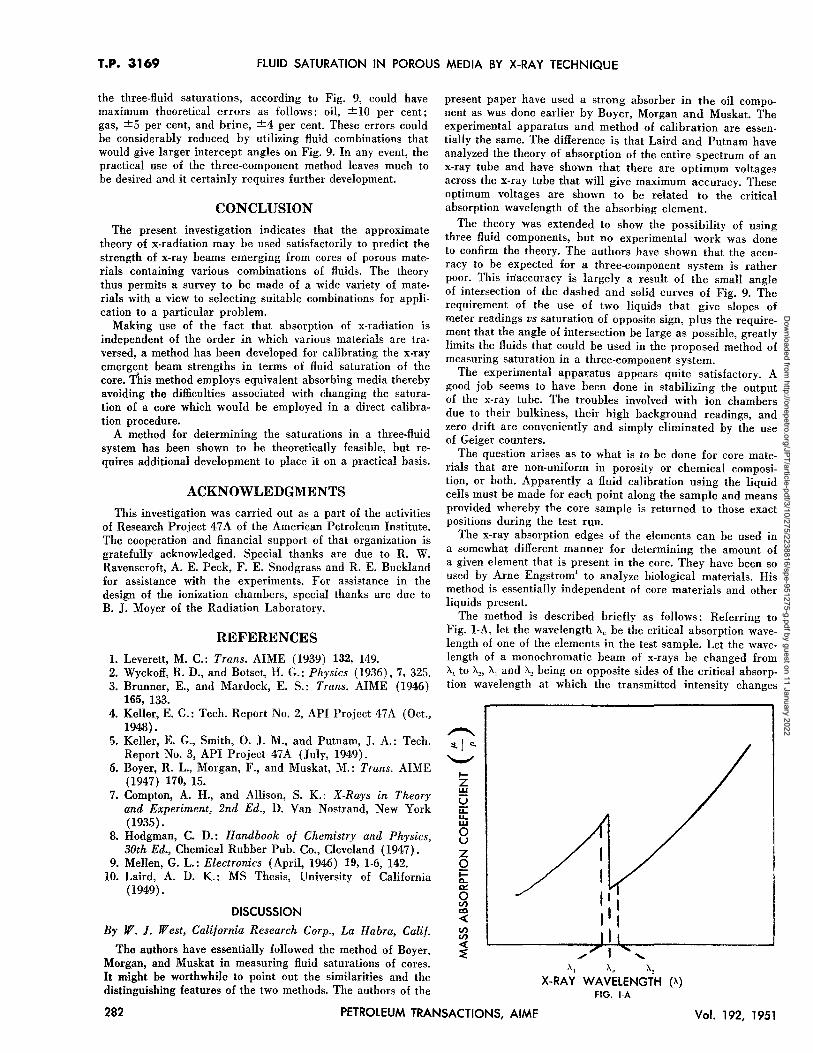
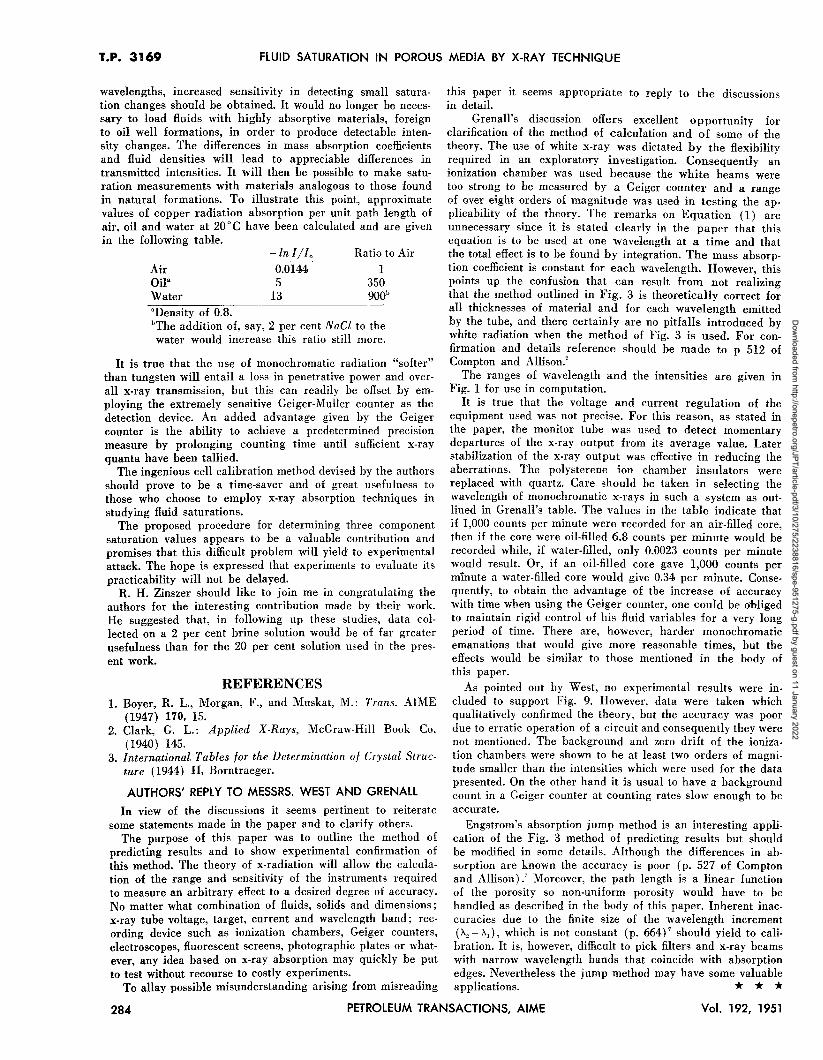
The method is described briefly as follows: Referring to Fig. I-A, let the wavelength he be the critical absorption wavelength of one of the elements in the test sample. Let the wavelength of a monochromatic beam of x-rays be changed from h, to h" h, and h, being on opposite sides of the critical absorption wavelength at which the transmitted intensity changes
IZ w o u:: u.. w o u z o ~ Q.. ct:: o U) <Xl « U) U)
~ ./ "'
h, h, h,
X-RAY WAVELENGTH (A) FIG. I-A
282 PETROLEUM TRANSACTIONS, AIMF Vol. 192, 1951
Dow
nloaded from http://onepetro.org/JPT/article-pdf/3/10/275/2238816/spe-951275-g.pdf by guest on 11 January 2022
A. D. K. LAIRD AND J. A. PUTNAM T.P. 3169
abruptly. When A, and A, are close to A" the ratio of the intensities at A, to those at A, is
[ 1-', 1-'2]
I' /1 - --- px -'--'=e P P
(1)
1',/1,
provided no other elements in the path of the x·ray beam have absorption edges in the wavelength range A, to A,. 1', and 1', are the transmitted, and I, and I, are the incident intensities of the x-ray beam at wavelengths A, and A2• The change in
the mass absorption coefficient [ 1-'; _ :' ] at the absorption
edge is known for nearly all the elements. The mass in grams of core material per square centimeter of the x-ray beam is just px and can be calculated from Equation (1).
This method is somewhat more elaborate than the usual absorption type method because it utilizes monochromatic radiation. A curved crystal type monochrometer could be used or a system of Ross balanced filters. The Ross filters would be simpler and more economical, but would restrict the num· ber of elements that could be used for indicators.
The Engstrom method would be unaffected by non-uniformity in porosity and independent of the chemical composition of the core, provided that the elements used for indicators were not present in the core material.
REFERENCE 1. Engstrom, Arne: Quantitative Micro- and Histochemical
Elementary Analysis by Roentgen Absorption Spectrography, Acta Radiol.ogica Supplementum LXIII, P. A. Mosstedt and Soner, Stockholm (1946).
DISCUSSION
By Alexander Grenall, Union Oil Co. of California, Wilmington, Calif.
At the time that Boyer, Morgan and Muskat' presented their paper describing application of the x-ray absorption technique to studies of core saturation, there was considerable discussion of the method. Among those offering criticisms was Frevel, a well-known investigator in the field of x-ray techniques, who pointed out that the accuracy and sensitivity of the method suffered materially from the use of white x-rays, and that the selection of an ionization chamber as x-ray detector in preference to a sensitive Geiger-Muller counter was not explained in the text.
The present work is subject to the same analysis. There are a number of points which I am interested in commenting on but perhaps the discussion regarding use of white x-rays could bear amplification from the point of view of x-ray theory.
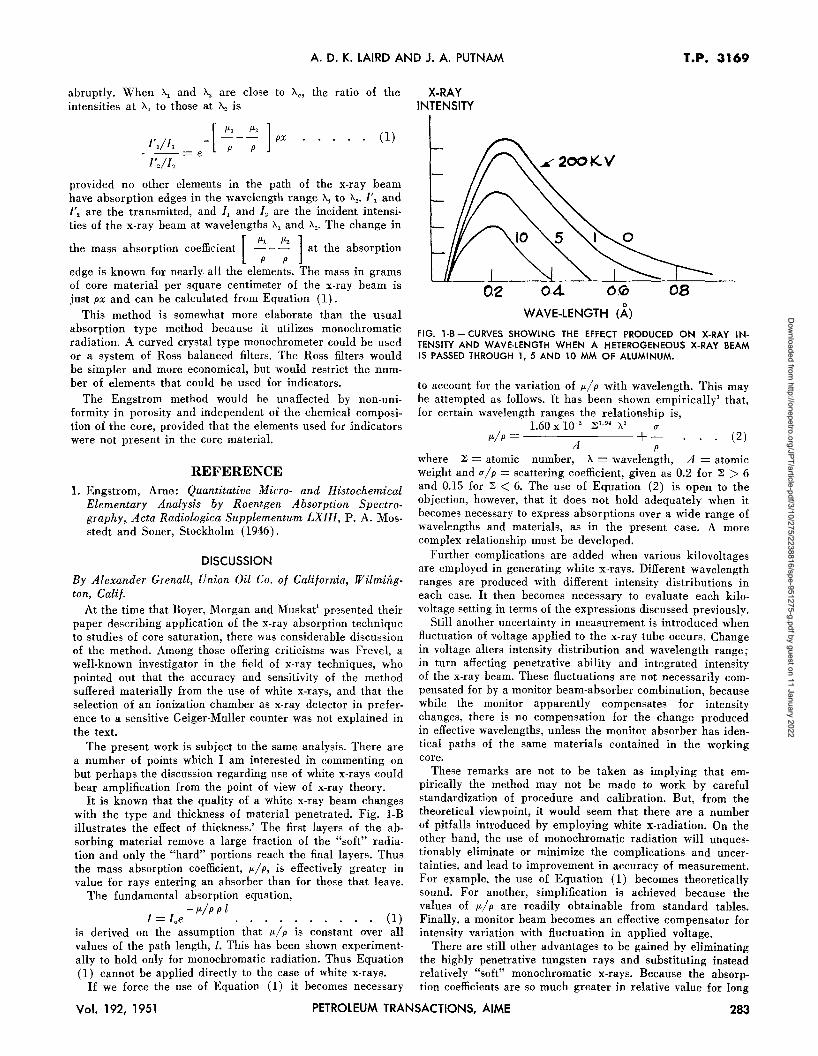
It is known that the quality of a white x-ray beam changes with the type and thickness of material penetrated. Fig. 1-B illustrates the effect of thickness.' The first layers of the absorbing material remove a large fraction of the "soft" radiation and only the "hard" portions reach the final layers. Thus the mass absorption coefficient, 1-'/ p, is effectively greater in value for rays entering an absorber than for those that leave.
The fundamental absorption equation, -I-'/p p l
I=Ioe. (1) is derived on the assumption that 1-'/ p is constant over all values of the path length, l. This has been shown experimentally to hold only for monochromatic radiation. Thus Equation (l) cannot be applied directly to the case of white x-rays.
If we force the use of Equation (1) it becomes necessary
X-RAY INTENSITY
~ 2001<.'1
04 0.<0
WAVE-LENGTH (A)
OB
FIG. l-B - CURVES SHOWING THE EFFECT PRODUCED ON X-RAY INTENSITY AND WAVE-LENGTH WHEN A HETEROGENEOUS X-RAY BEAM IS PASSED THROUGH 1,5 AND 10 MM OF ALUMINUM.
to account for the variation of IL/ p with wavelength. This may be attempted as follows. It has been shown empirically' that, for certain wavelength ranges the relationship is,
1.60 x 10·' ~3.94 A' (]" I-'/p=-------+
A (2)
p
where ~ = atomic number, A = wavelength, A = atomic weight and (]" / p = scattering coefficient, given as 0.2 for ~ > 6 and 0.15 for ~ < 6. The use of Equation (2) is open to the objection, however, that it does not hold adequately when it becomes necessary to express absorptions over a wide range of wavelengths and materials, as in the present case. A more complex relationship must be developed.
Further complications are added when various kilovoltages are employed in generating white x-rays. Different wavelength ranges are produced with different intensity distributions in each case. It then becomes necessary to evaluate each kilovoltage setting in terms of the expressions discussed previously.
Still another uncertainty in measurement is introduced when fluctuation of voltage applied to the x-ray tube occurs. Change in voltage alters intensity distribution and wavelength range; in turn affecting penetrative ability and integrated intensity of the x-ray beam. These fluctuations are not necessarily compensated for by a monitor beam-absorber combination, because while the monitor apparently compensates for intensity changes, there is no compensation for the change produced in effective wavelengths, unless the monitor absorber has identical paths of the same materials contained in the working core.
These remarks are not to be taken as implying that empirically the method may not be made to work by careful standardization of procedure and calibration. But, from the theoretical viewpoint, it would seem that there are a number of pitfalls introduced by employing white x-radiation. On the other hand, the use of monochromatic radiation will unquestionably eliminate or minimize the complications and uncertainties, and lead to improvement in accuracy of measurement. For example, the use of Equation (1) becomes theoretically sound. For another, simplification is achieved because the values of 1-'/ p are readily obtainable from standard tables. Finally, a monitor beam becomes an effective compensator for intensity variation with fluctuation in applied voltage.
There are still other advantages to be gained by eliminating the highly penetrative tungsten rays and substituting instead relatively "soft" monochromatic x-rays. Because the absorption coefficients are so much greater in relative value for long
Vol. 192, 1951 PETROLEUM TRANSACTIONS, AIME 283
Dow
nloaded from http://onepetro.org/JPT/article-pdf/3/10/275/2238816/spe-951275-g.pdf by guest on 11 January 2022
T.P. 3169 FLUID SATURATION IN POROUS MEDIA BY X-RAY TECHNIQUE
wavelengths, increased sensitivity in detecting small saturation changes should be obtained. It would no longer be necessary to load fluids with highly absorptive materials, foreign to oil well formations, in order to produce detectable intensity changes. The differences in mass absorption coefficients and fluid densities will lead to appreciable differences in transmitted intensities. It will then be possible to make saturation measurements with materials analogous to those found in natural formations. To illustrate this point, approximate values of copper radiation absorption per unit path length of air, oil and water at 20°C have been calculated and are given in the following table.
Air Oil' Water "Density of 0.8.
-In 1/10 0.0144 5
13
Ratio to Air
1 350 900b
bThe addition of, say, 2 per cent NaCI to the water would increase this ratio still more.
It is true that the use of monochromatic radiation "softer" than tungsten will entail a loss in penetrative power and overall x-ray transmission, but this can readily be offset by employing the extremely sensitive Geiger-Muller counter as the detection device. An added advantage given by the Geiger counter is the ability to achieve a predetermined precision measure by prolonging counting time until sufficient x-ray quanta have been tallied.
The ingenious cell calibration method devised by the authors should prove to be a time-saver and of great usefulness to those who choose to employ x-ray absorption techniques in studying fluid saturations.
The proposed procedure for determining three component saturation values appears to be a valuable contribution and promises that this difficult problem will yield to experimental attack. The hope is expressed that experiments to evaluate its practicability will not be delayed.
R. H. Zinszer should like to join me in congratulating the authors for the interesting contribution made by their work. He suggested that, in following up these studies, data collected on a 2 per cent brine solution would be of far greater usefulness than for the 20 per cent solution used in the present work.
REFERENCES 1. Boyer, R. 1., Morgan, F., and Muskat, M.: Trans. AI ME
(1947) 170, 15. 2. Clark, G. 1.: Applied X-Rays, McGraw-Hill Book Co.
(1940) 145. 3. International Tables for the Determination of Crystal Struc
ture (1944) II, Borntraeger.
AUTHORS' REPLY TO MESSRS. WEST AND GRENALL
In view of the discussions it seems pertinent to reiterate some statements made in the paper and to clarify others.
The purpose of this paper was to outline the method of predicting results and to show experimental confirmation of this method. The theory of x-radiation will allow the calculation of the range and sensitivity of the instruments required to measure an arbitrary effect to a desired degree of accuracy. No matter what combination of fluids, solids and dimensions; x-ray tube voltage, target, current and wavelength band; recording device such as ionization chambers, Geiger counters, electroscopes, fluorescent screens, photographic plates or whatever, any idea based on x-ray absorption may quickly be put to test without recourse to costly experiments.
To allay possible misunderstanding arising from misreading
this paper it seems appropriate to reply to the discussions in detail.
Grenall's discussion offers excellent opportunity for clarification of the method of calculation and of some of the theory. The use of white x-ray was dictated by the flexibility required in an exploratory investigation. Consequently an ionization chamber was used because the white beams were too strong to be measured by a Geiger counter and a range of over eight orders of magnitude was used in testing the applicability of the theory. The remarks on Equation (1) are unnecessary since it is stated clearly in the paper that this equation is to be used at one wavelength at a time and that the total effect is to be found by integration. The mass absorption coefficient is constant for each wavelength. However, this points up the confusion that can result from not realizing that the method outlined in Fig. 3 is theoretically correct for all thicknesses of material and for each wavelength emitted by the tube, and there certainly are no pitfalls introduced by white radiation when the method of Fig. 3 is used. For confirmation and details reference should be made to p 512 of Compton and Allison.'
The ranges of wavelength and the intensities are given in Fig. 1 for use in computation.
It is true that the voltage and current regulation of the equipment used was not precise. For this reason, as stated in the paper, the monitor tube was used to detect momentary departures of the x-ray output from its average value. Later stabilization of the x-ray output was effective in reducing the aberrations. The polysterene ion chamber insulators were replaced with quartz. Care should be taken in selecting the wavelength of monochromatic x-rays in such a system as outlined in Grenall's table. The values in the table indicate that if 1,000 counts per minute were recorded for an air-filled core, then if the core were oil-filled 6.8 counts per minute would be recorded while, if water-filled, only 0.0023 counts per minute would result. Or, if an oil-filled core gave 1,000 counts per minute a water-filled core would give 0.34 per minute. Consequently, to obtain the advantage of the increase of accuracy with time when using the Geiger counter, one could be obliged to maintain rigid control of his fluid variables for a very long period of time. There are, however, harder monochromatic emanations that would give more reasonable times, but the effects would be similar to those mentioned in the body of this paper.
As pointed out by West, no experimental results were included to support Fig. 9. However, data were taken which qualitatively confirmed the theory, but the accuracy was poor due to erratic operation of a circuit and consequently they were not mentioned. The background and zero drift of the ionization chambers were shown to be at least two orders of magnitude smaller than the intensities which were used for the data presented. On the other hand it is usual to have a background count in a Geiger counter at counting rates slow enough to be accurate.
Engstrom's absorption jump method is an interesting application of the Fig. 3 method of predicting results but should be modified in some details. Although the differences in absvrption are known the accuracy is poor (p. 527 of Compton and Allison).' Moreover, the path length is a linear function of the porosity so non-uniform porosity would have to be handled as described in the body of this paper. Inherent inaccuracies due to the finite size of the wavelength increment (A, - At), which is not constant (p. 664)' should yield to calibration. It is, however, difficult to pick filters and x-ray beams with narrow wavelength bands that coincide with absorption edges. Nevertheless the jump method may have some valuable applications. * * *
284 PETROLEUM TRANSACTIONS, AIME Vol. 192, 1951
Dow
nloaded from http://onepetro.org/JPT/article-pdf/3/10/275/2238816/spe-951275-g.pdf by guest on 11 January 2022


