Embed Size (px)
Citation preview

Lehigh UniversityLehigh Preserve
Theses and Dissertations
2017
Flow Stress and Microstructure Evolution DuringHot Forging of AA6099Mohammed Tariq AlamoudiLehigh University
Follow this and additional works at: https://preserve.lehigh.edu/etd
Part of the Metallurgy Commons
This Thesis is brought to you for free and open access by Lehigh Preserve. It has been accepted for inclusion in Theses and Dissertations by anauthorized administrator of Lehigh Preserve. For more information, please contact [email protected].
Recommended CitationAlamoudi, Mohammed Tariq, "Flow Stress and Microstructure Evolution During Hot Forging of AA6099" (2017). Theses andDissertations. 2936.https://preserve.lehigh.edu/etd/2936

Flow Stress and Microstructure Evolution During Hot
Forging of AA6099
by
Mohammed Tariq Alamoudi
A Thesis
Presented to the Graduate and Research Committee
of Lehigh University
in Candidacy for the Degree of
Master of Science
in
Materials Science and Engineering
Lehigh University
June 2017

ii
Copyright by
Mohammed Tariq Alamoudi
(June 2017)
iii
Thesis is accepted and approved in partial fulfillment of the requirements for the
Master of Science in Materials Science and Engineering Department.
Flow Stress and Microstructure Evolution During Hot Forging of AA6099
Mohammed T. Alamoudi
Date Approved
Thesis Advisor: Prof. Wojciech Z. Misiolek
Associated Chairperson of Department: Prof. Sabrina Jedlicka
iv
ACKNOWLEDGMENTS
In the beginning, I would like to thank ALLAH for providing me with
physical and mental strength to continue this work and accomplish a master degree
from a recognized department in Lehigh University. I would like to thank my beloved
parents for their moral and emotional support and encourage me to continue my
study. Especial thanks to my lovely wife Afnan for her patience all the time and for
relieving my stresses.
I would like to express my gratitude to my advisor Professor Wojciech
Misiolek for accepting me as a member in his distinguished Lowey Institute group
and for his continues encouragement and assistance throughout my master degree to
make this happen. Also, I would like to thank our former post-doc Dr. Ahmad
Chamanfar for helping me in the beginning of this research as well Dr. Nicholas
Nanninga and Andrew Layer form Accuride Wheel End Solutions Company for the
regular useful discussion. Many thanks to my colleagues in Lowey Institute for all
the fun time and technical discussion. I appreciate the help from all the staff in
Whitaker lab who eased my study. Moreover, thanks to my friend Sultan Althahban
for helping me since I arrived at USA in and outside the university.
Finally, an extended thanks to Accuride Wheel End Solutions Company for
funding this research. Also, I’m grateful to my employer King Abdulaziz City for
Science and Technology (KACST) for providing the financial support that was
essential to complete my Master of Science Degree in the Materials Science and
Engineering Department at Lehigh University.

v
TABLE OF CONTENTS
ACKNOWLEDGMENTS ............................................................................... iv
LIST OF TABLES ........................................................................................ viii
LIST OF FIGURES ........................................................................................ ix
1 ABSTRACT ........................................................................................... 1
2 INTRODUCTION .................................................................................. 3
2.1 Forging Background ............................................................................. 3
2.1.1 Hot Forging Process Fundamental .......................................................... 3
2.1.2 Aluminum Alloy ....................................................................................... 6
2.1.3 Forging Aluminum Alloys ........................................................................ 9
2.2 Forged Aluminum Alloy Wheels.......................................................... 13
2.2.1 Automotive Wheels .............................................................................. 13
2.2.2 Manufacturing Process ......................................................................... 14
3 Research Objective ........................................................................... 15
4 EXPERIMENTAL PROCEDURE ............................................................. 16
4.1 Experimental Approach ...................................................................... 16
4.1.1 Material ................................................................................................. 16
4.1.2 Experiments .......................................................................................... 19
4.2 Dynamic Thermal-Mechanical Testing ................................................ 20
4.2.1 Sample Preparation ............................................................................... 20
4.2.2 Test Approach ....................................................................................... 21
4.3 Heat Treatment ................................................................................. 23
4.3.1 Sample Preparation ............................................................................... 23

vi
4.3.2 Solution Heat Treatment Approach ...................................................... 23
4.4 Analysis of Experimental Data ............................................................ 24
4.4.1 Light Optical Microscopy (LOM) ............................................................ 24
4.4.2 Scanning Electron Microscope (SEM) and Electron Backscatter
Diffraction (EBSD) ............................................................................................................ 25
4.4.3 Microindentation Hardness Testing ...................................................... 26
5 RESULTS ........................................................................................... 27
5.1 Flow Stress Data ................................................................................ 27
5.2 LOM Microstructure ........................................................................... 29
5.2.1 Undeformed Samples............................................................................ 29
5.2.2 Hot Deformed Samples ......................................................................... 30
5.2.3 Solution Heat Treated Samples ............................................................. 33
5.3 SEM-BSE and EBSD Images ................................................................. 54
5.4 Microindentation Hardness Testing .................................................... 59
6 DISCUSSION ...................................................................................... 59
6.1 Flow Stress Analysis ........................................................................... 59
6.2 Microstructure Analysis ..................................................................... 61
6.2.1 Undeformed Samples............................................................................ 61
6.2.2 Deformed Samples ................................................................................ 61
6.2.3 Solution Heat Treated Samples ............................................................. 64
6.3 BSE-SEM and EBSD Analysis ............................................................... 65
6.4 Microindentation Hardness Testing .................................................... 67
7 CONCLUSIONS .................................................................................. 68
8 Future Work ..................................................................................... 70

vii
REFERENCES ............................................................................................. 72
VITA ......................................................................................................... 76

viii
LIST OF TABLES
Table 1 Comparison of hot, cold and warm forging [4] ................................................ 4
Table 2 Summary of the advantages and limitations of the open and closed dies
forging processes.[2] .............................................................................................. 5
Table 3. Aluminum alloy groups and major alloying elements. [6] ............................. 7
Table 4 Chemical composition of AA6099 ................................................................. 16
Table 5 Overview of Mg–Si containing phases in 6082 Al-alloys. [18] ..................... 18
Table 6 Summary of the samples that have been tested .............................................. 20
Table 7 Deformation Test Conditions.......................................................................... 22
ix
LIST OF FIGURES
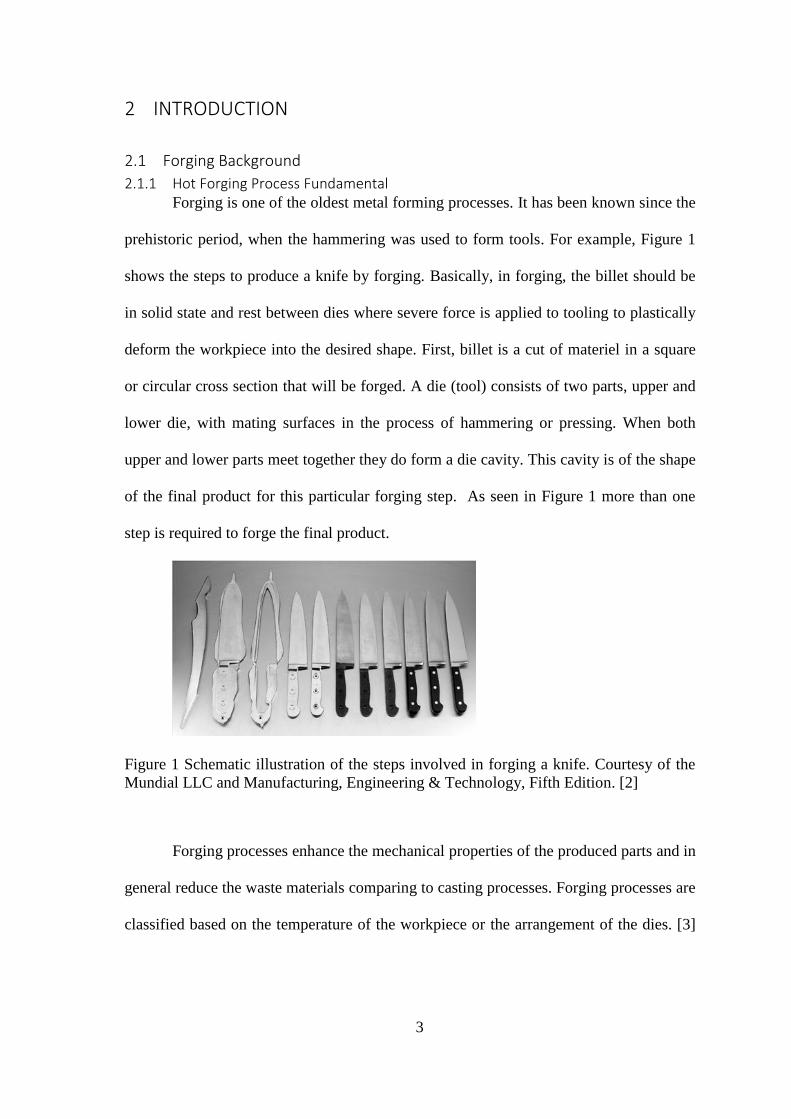
Figure 1 Schematic illustration of the steps involved in forging a knife. Courtesy of
the Mundial LLC and Manufacturing, Engineering & Technology, Fifth Edition.
[2] ........................................................................................................................... 3
Figure 2 Open die forging [2] ........................................................................................ 5
Figure 3 Closed die forging; a) closed die forging b) impression die forging [2] ......... 5
Figure 4 Types of aluminum alloys. [5]......................................................................... 6
Figure 5 Flow stresses of commonly forged aluminum alloys and of 1025 steel at
typical forging temperatures and various levels of total strain. [8] ....................... 9
Figure 6 Forgeability vs Forging temperature of different aluminum alloys. [9] ........ 11
Figure 8 Flow stress of AA6061 at strain rate of 10 s1 and different temperatures. [9]11
Figure 7 Flow stress of AA6061 & AA2014 at 350 C and different strain rates. [9] .. 11
Figure 9 Forged wheel process [15]............................................................................. 15
Figure 10 As polished micrograph of AA 6099 after homogenization of Lot#1......... 17
Figure 11 Micrograph shows the equiaxed grains of AA 6099 etched by Barker's after
homogenization of Lot#1 ..................................................................................... 18
Figure 12 Sketch showing how the samples were located in the center and mid radius
of the billet ........................................................................................................... 19
Figure 13 Gleeble experiment set-up ........................................................................... 21
Figure 14 Schematic cross section of the deformed sample showing a typical
specimen with approximate position of the characteristic zones; SDZ, MDZ,
DMZ and TZ. a) first half & b) second half. ....................................................... 23
Figure 15 Solution Heat Treatment Plan (on the left) and experimental execution of
the plan (on the right) ........................................................................................... 24
x
Figure 16 Schematic of the Knoop indenter and the shape of an impression. [20] ..... 27
Figure 17 A deformed sample image shows the 20 indents along the red line. .......... 27
Figure 18 True stress–true strain curves of 6099 alloy during hot compression
deformation: (a) = 0.01 s−1; (b) ε ̇ = 0.1 s−1; (c) ε ̇ = 1 s−1 .................................... 28
Figure 19 Microstructures of undeformed samples observed in polarized light. a)
Lot#1, b) Lot#2. ................................................................................................... 29
Figure 20 Light optical images of microstructures of undeformed samples. a) Lot#1,
b) Lot#2. ............................................................................................................... 29
Figure 21 Optical microstructures of deformed samples at temperature of 350 & 400
ºC at strain rates of 0.01, 0.1 and 1 s-1 ................................................................. 31
Figure 22 Optical microstructures of deformed samples at temperature of 350 & 400
ºC at strain rates of 0.01, 0.1 and 1 s-1 ................................................................. 32
Figure 23 Optical microstructures of solution heat treated samples deformed at
temperature of 350 and strain rate of 0.01 s-1 at SDZ position. a) after 40 min, b)
after 80 min, c) after 120 min, d) after 143 min and e) after 165 min. ................ 34
Figure 24 Optical microstructures of solution heat treated samples deformed at
temperature of 350 and strain rate of 0.01 s-1 at MDZ position. a) after 40 min, b)
after 80 min, c) after 120 min, d) after 143 min and e) after 165 min. ................ 35
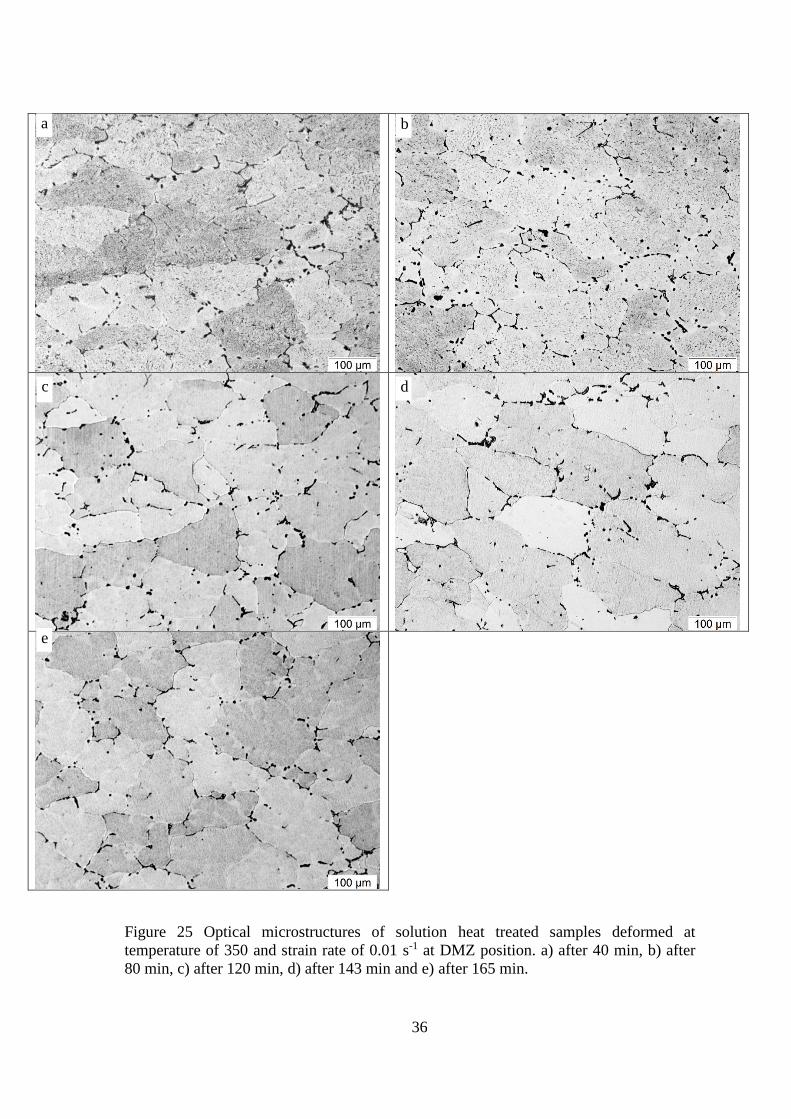
Figure 25 Optical microstructures of solution heat treated samples deformed at
temperature of 350 and strain rate of 0.01 s-1 at DMZ position. a) after 40 min, b)
after 80 min, c) after 120 min, d) after 143 min and e) after 165 min. ................ 36
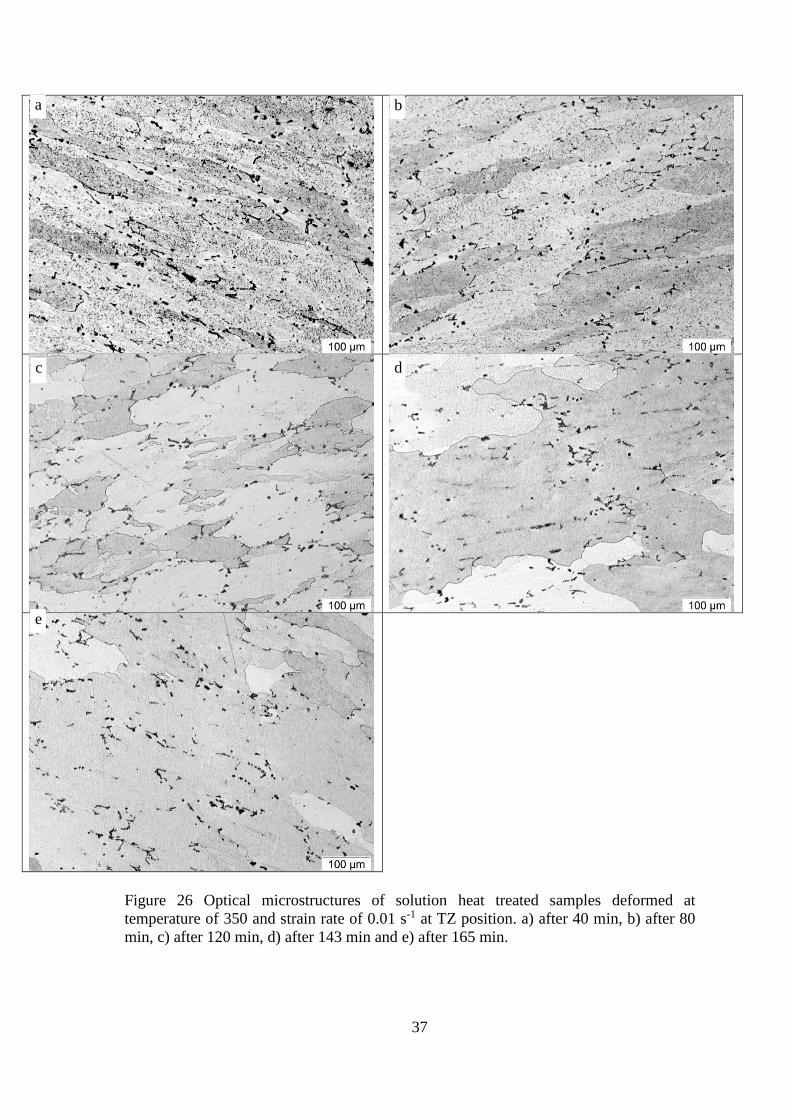
Figure 26 Optical microstructures of solution heat treated samples deformed at
temperature of 350 and strain rate of 0.01 s-1 at TZ position. a) after 40 min, b)
after 80 min, c) after 120 min, d) after 143 min and e) after 165 min. ................ 37
xi
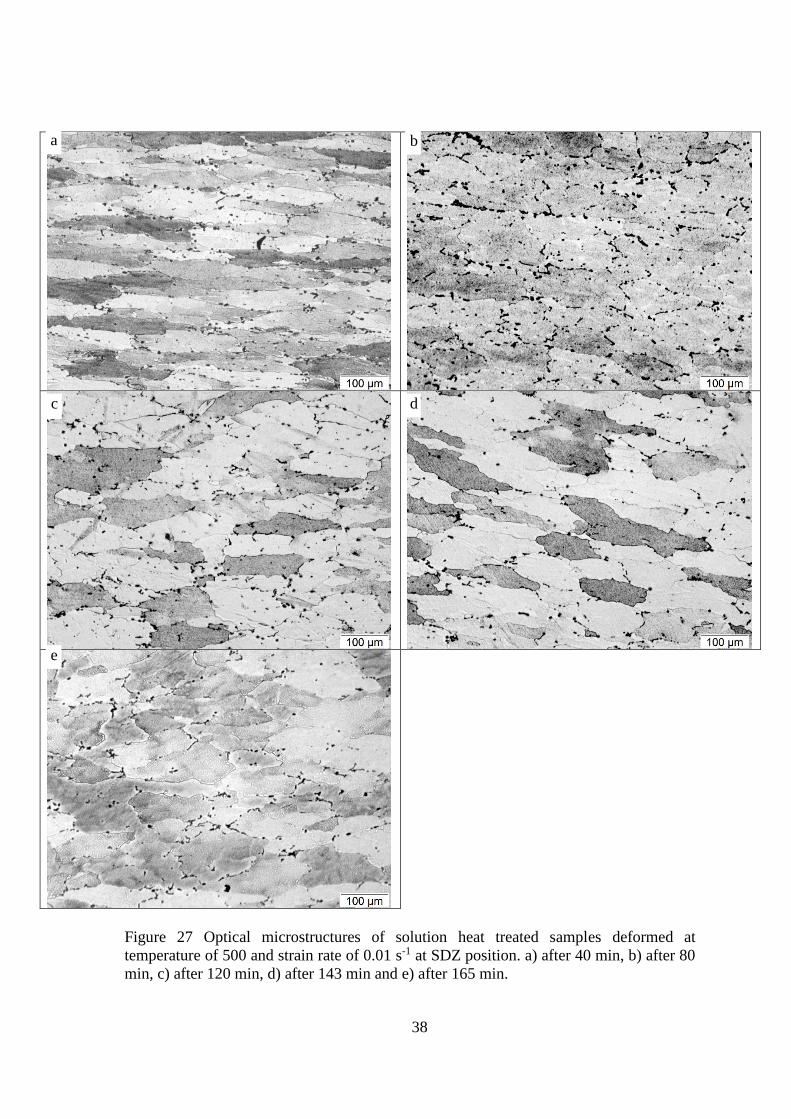
Figure 27 Optical microstructures of solution heat treated samples deformed at
temperature of 500 and strain rate of 0.01 s-1 at SDZ position. a) after 40 min, b)
after 80 min, c) after 120 min, d) after 143 min and e) after 165 min. ................ 38
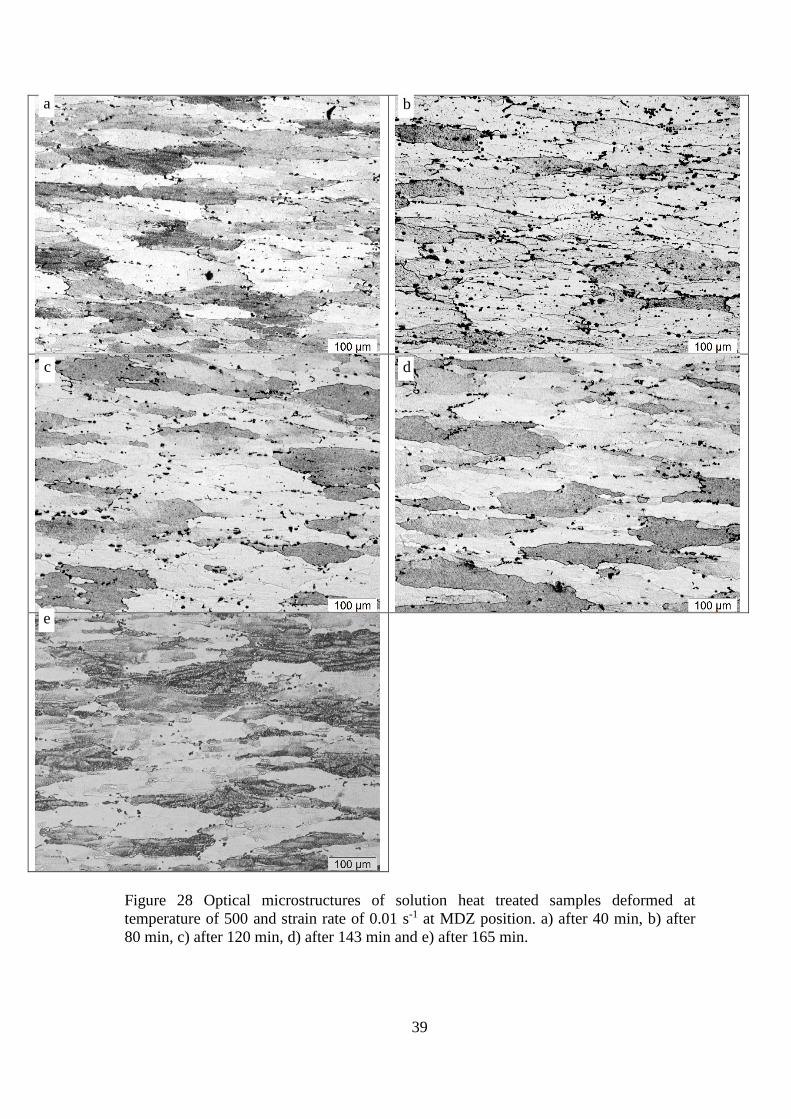
Figure 28 Optical microstructures of solution heat treated samples deformed at
temperature of 500 and strain rate of 0.01 s-1 at MDZ position. a) after 40 min, b)
after 80 min, c) after 120 min, d) after 143 min and e) after 165 min. ................ 39
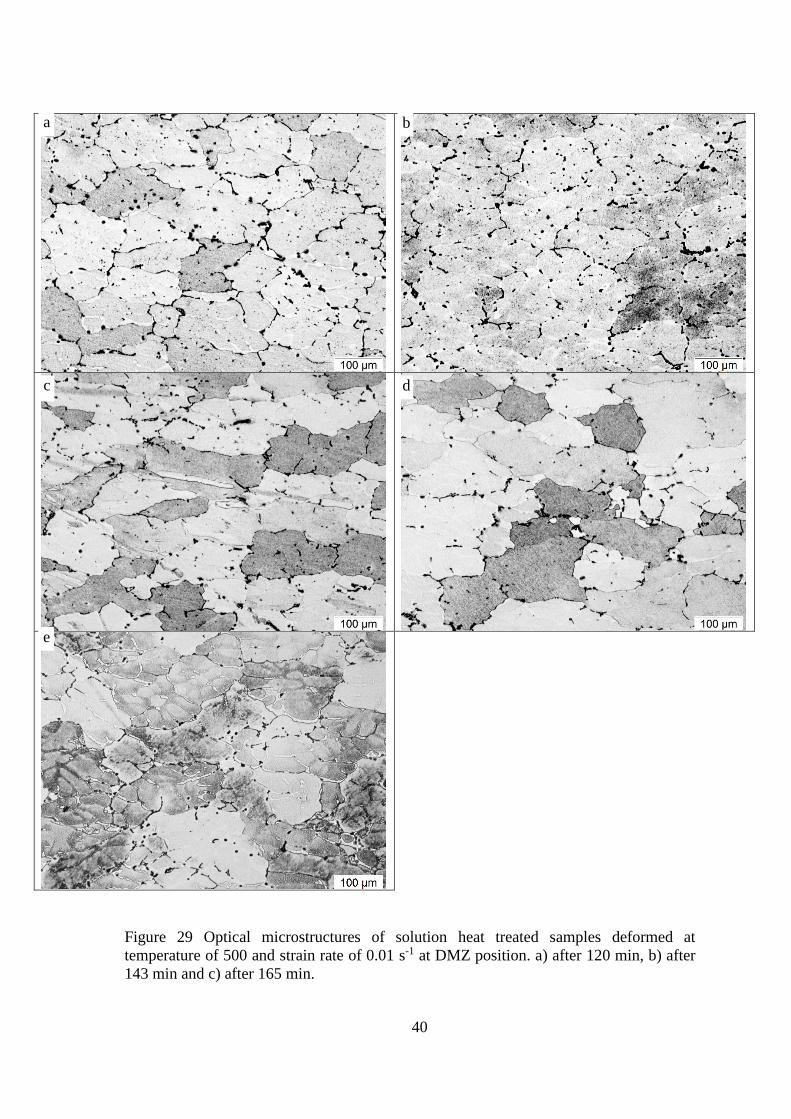
Figure 29 Optical microstructures of solution heat treated samples deformed at
temperature of 500 and strain rate of 0.01 s-1 at DMZ position. a) after 120 min,
b) after 143 min and c) after 165 min. ................................................................. 40
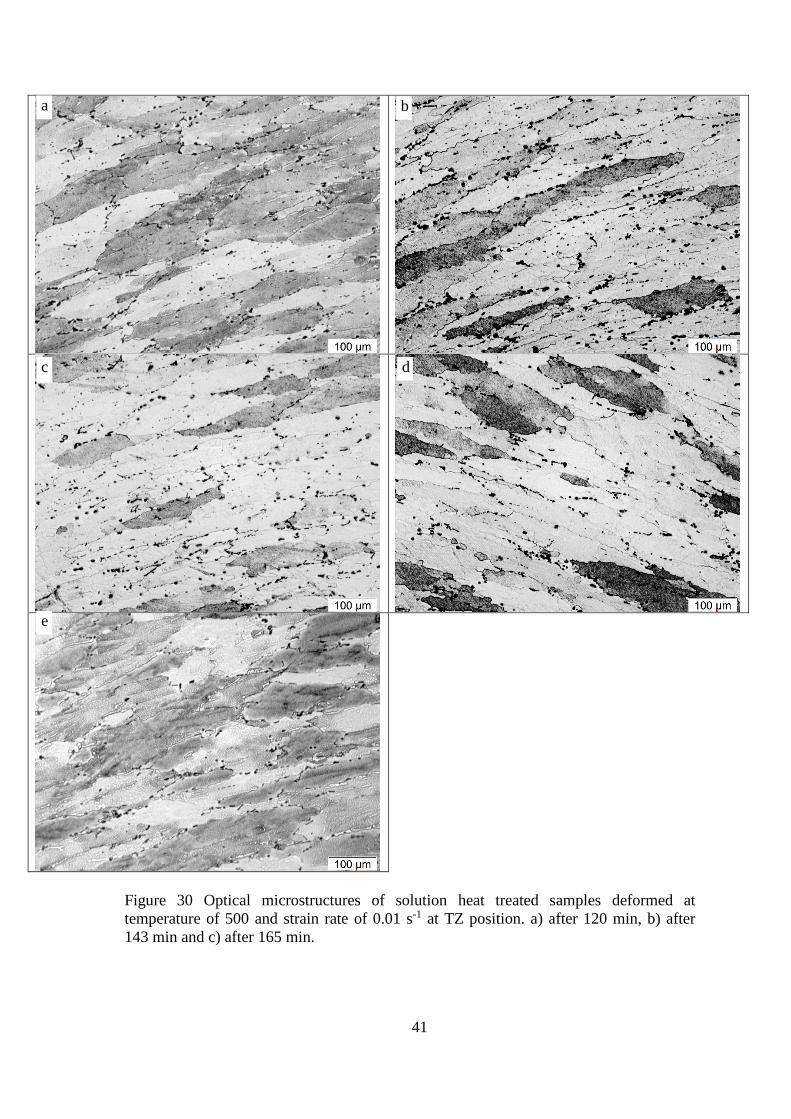
Figure 30 Optical microstructures of solution heat treated samples deformed at
temperature of 500 and strain rate of 0.01 s-1 at TZ position. a) after 120 min, b)
after 143 min and c) after 165 min....................................................................... 41
Figure 31 Optical microstructures of solution heat treated samples deformed at
temperature of 350 and strain rate of 0.1 s-1 at MDZ position. a) after 120 min, b)
after 143 min and c) after 165 min....................................................................... 42
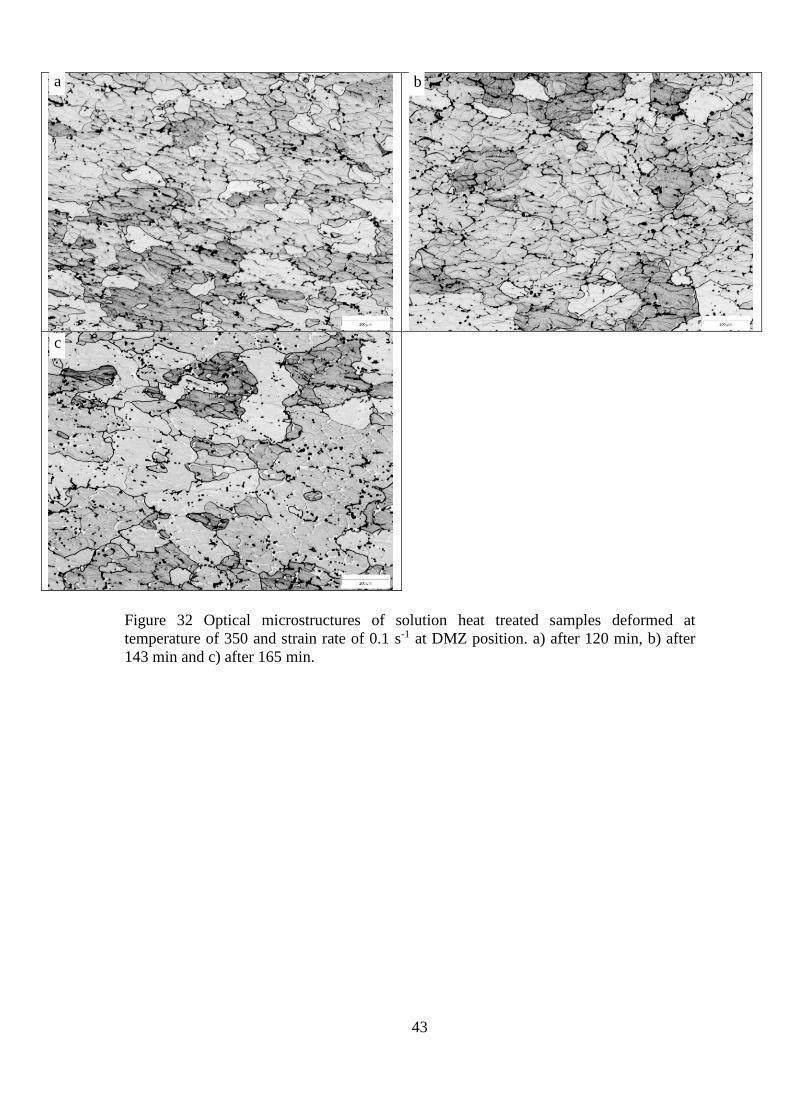
Figure 32 Optical microstructures of solution heat treated samples deformed at
temperature of 350 and strain rate of 0.1 s-1 at DMZ position. a) after 120 min, b)
after 143 min and c) after 165 min....................................................................... 43
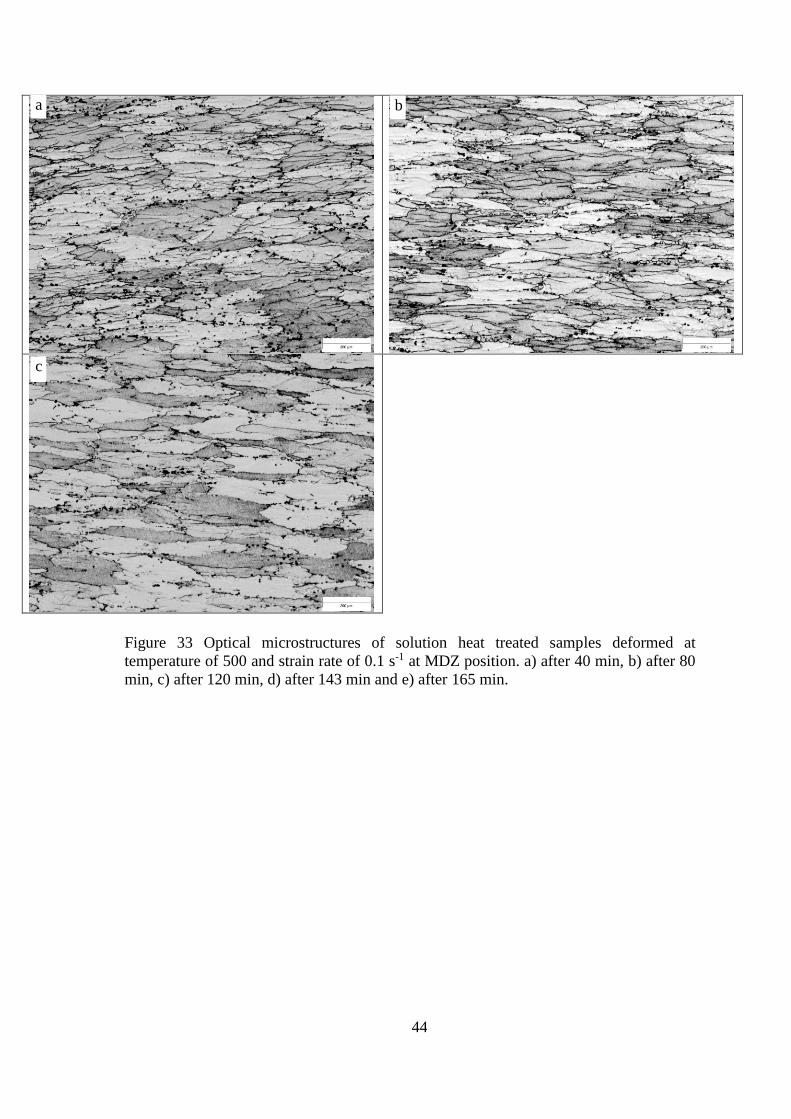
Figure 33 Optical microstructures of solution heat treated samples deformed at
temperature of 500 and strain rate of 0.1 s-1 at MDZ position. a) after 40 min, b)
after 80 min, c) after 120 min, d) after 143 min and e) after 165 min. ................ 44
Figure 34 Optical microstructures of solution heat treated samples deformed at
temperature of 500 and strain rate of 0.1 s-1 at DMZ position. a) after 40 min, b)
after 80 min, c) after 120 min, d) after 143 min and e) after 165 min. ................ 45

xii
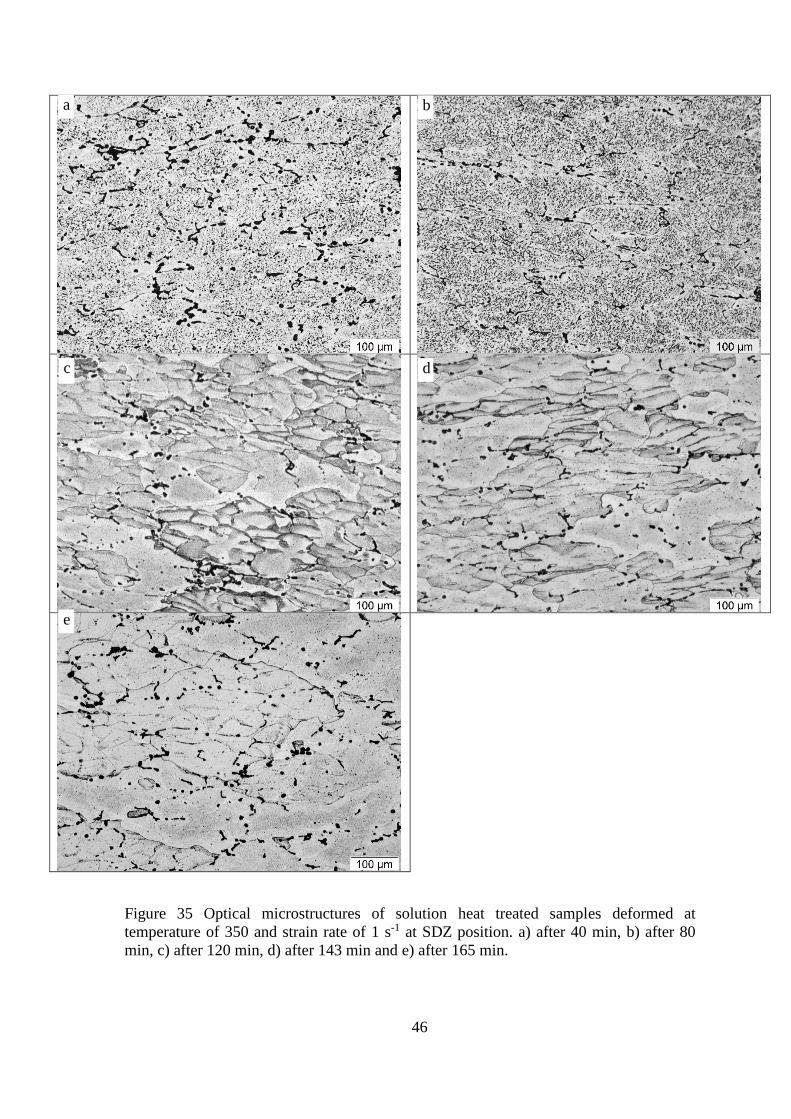
Figure 35 Optical microstructures of solution heat treated samples deformed at
temperature of 350 and strain rate of 1 s-1 at SDZ position. a) after 40 min, b)
after 80 min, c) after 120 min, d) after 143 min and e) after 165 min. ................ 46
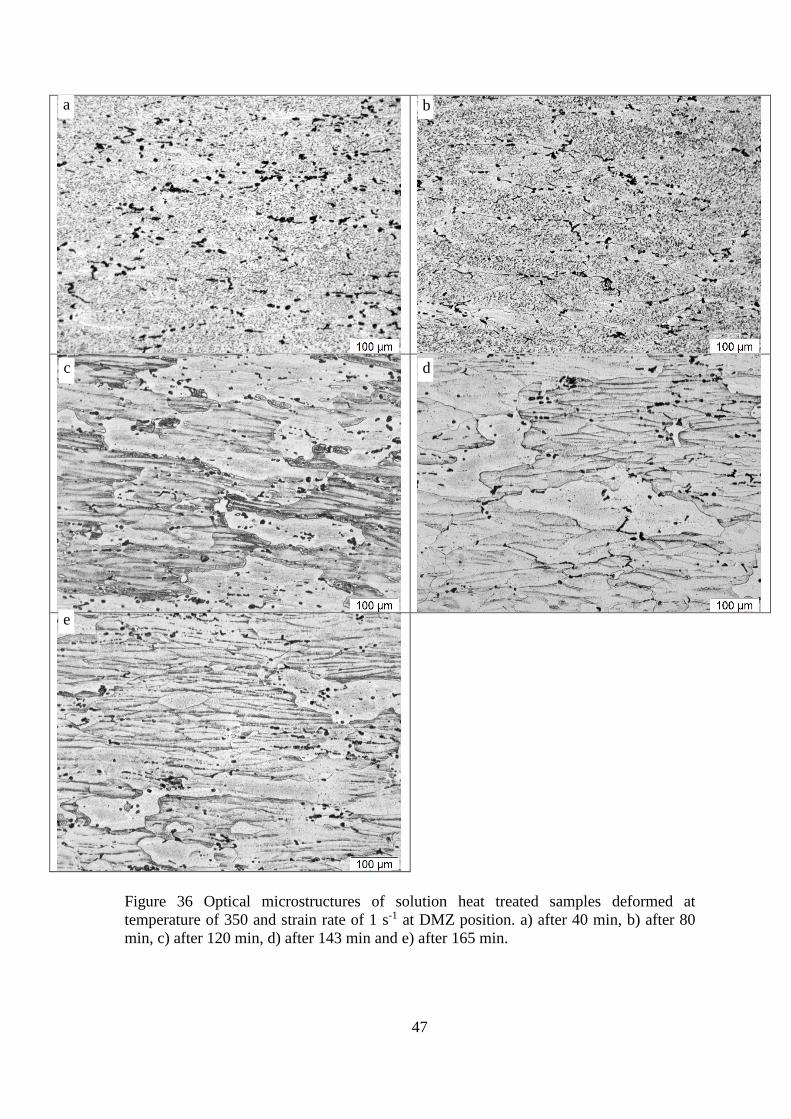
Figure 36 Optical microstructures of solution heat treated samples deformed at
temperature of 350 and strain rate of 1 s-1 at DMZ position. a) after 40 min, b)
after 80 min, c) after 120 min, d) after 143 min and e) after 165 min. ................ 47
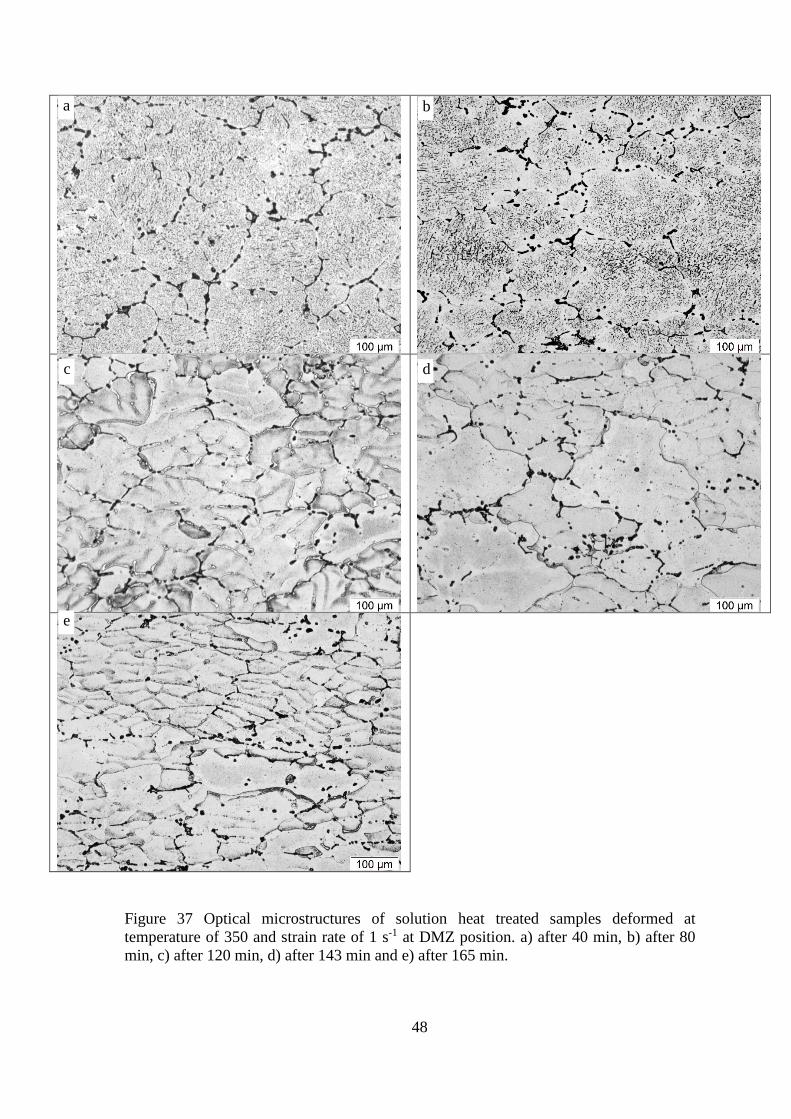
Figure 37 Optical microstructures of solution heat treated samples deformed at
temperature of 350 and strain rate of 1 s-1 at DMZ position. a) after 40 min, b)
after 80 min, c) after 120 min, d) after 143 min and e) after 165 min. ................ 48
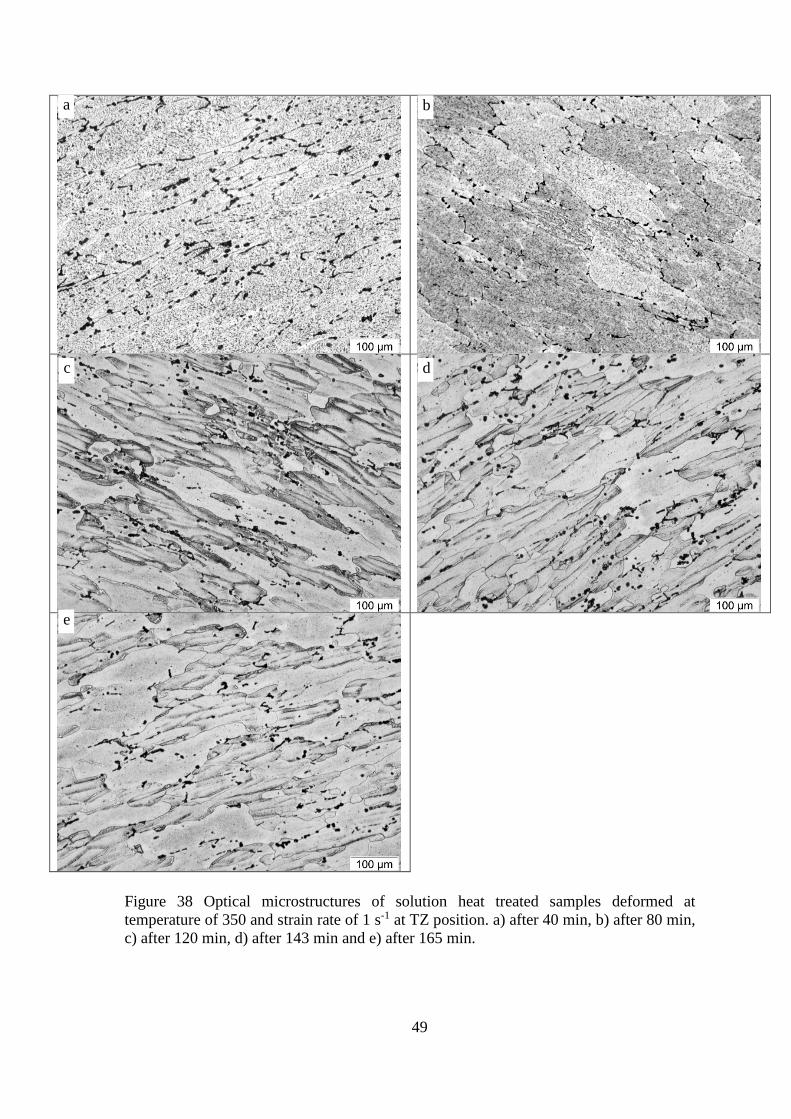
Figure 38 Optical microstructures of solution heat treated samples deformed at
temperature of 350 and strain rate of 1 s-1 at TZ position. a) after 40 min, b) after
80 min, c) after 120 min, d) after 143 min and e) after 165 min. ........................ 49
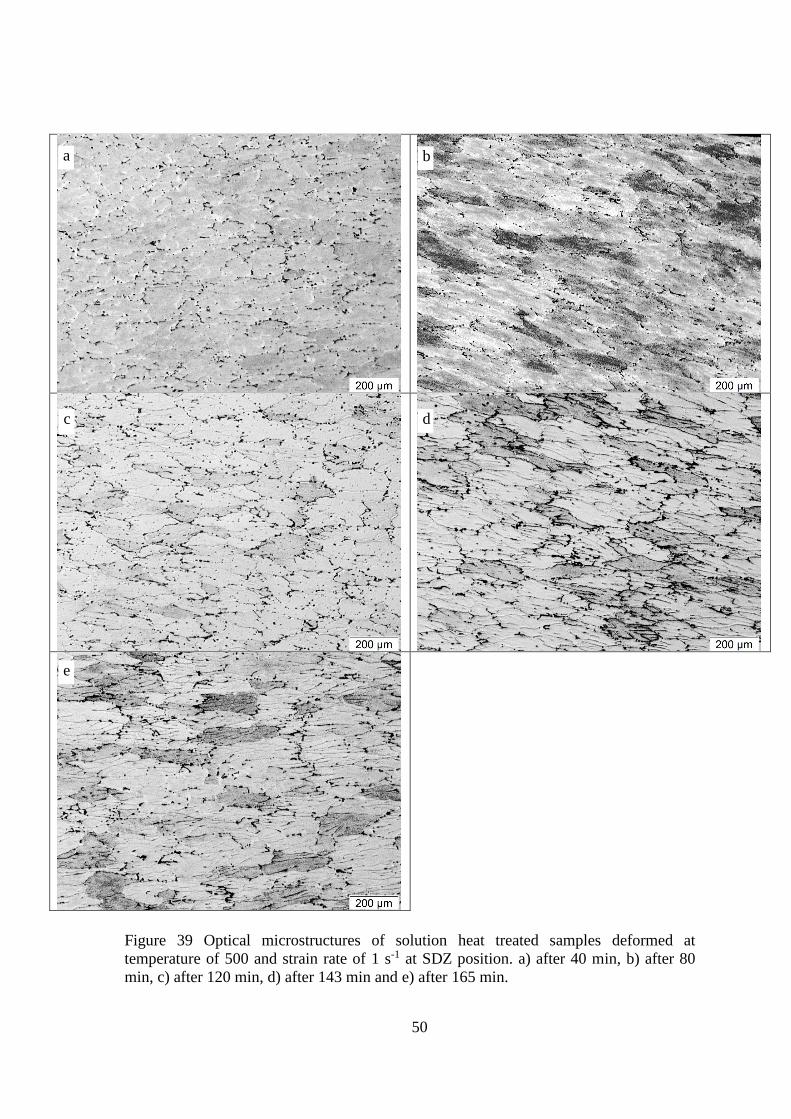
Figure 39 Optical microstructures of solution heat treated samples deformed at
temperature of 500 and strain rate of 1 s-1 at SDZ position. a) after 40 min, b)
after 80 min, c) after 120 min, d) after 143 min and e) after 165 min. ................ 50
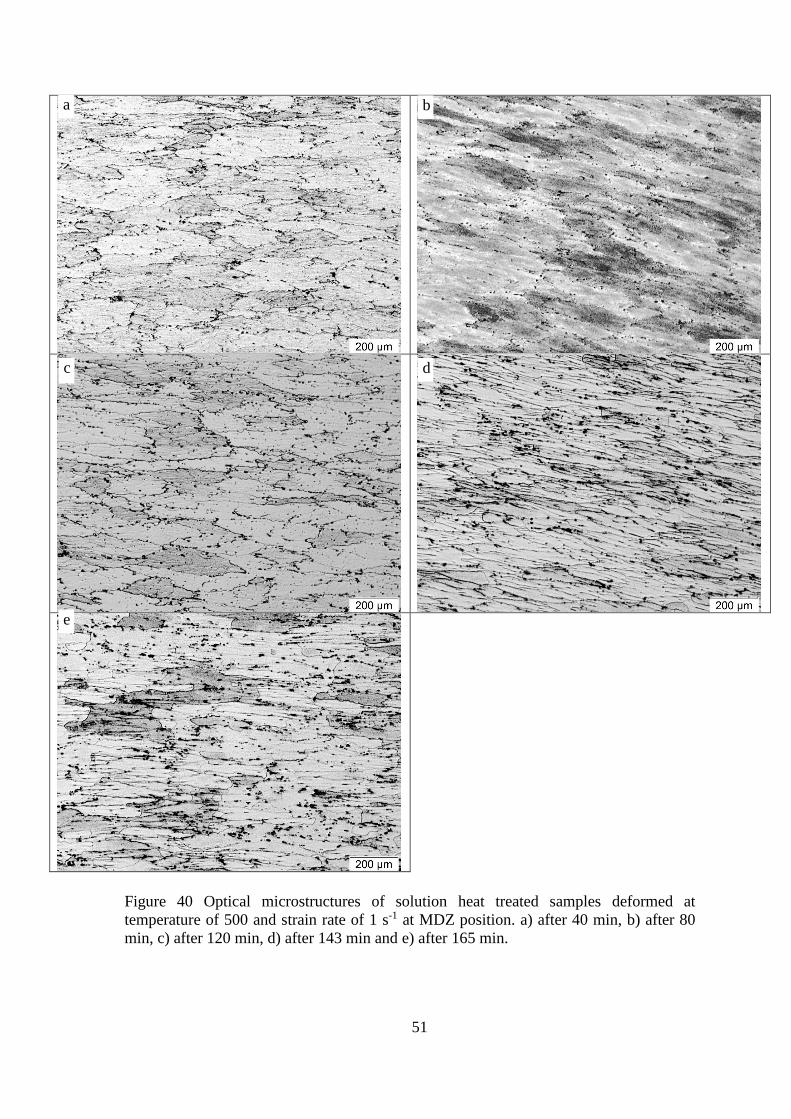
Figure 40 Optical microstructures of solution heat treated samples deformed at
temperature of 500 and strain rate of 1 s-1 at MDZ position. a) after 40 min, b)
after 80 min, c) after 120 min, d) after 143 min and e) after 165 min. ................ 51
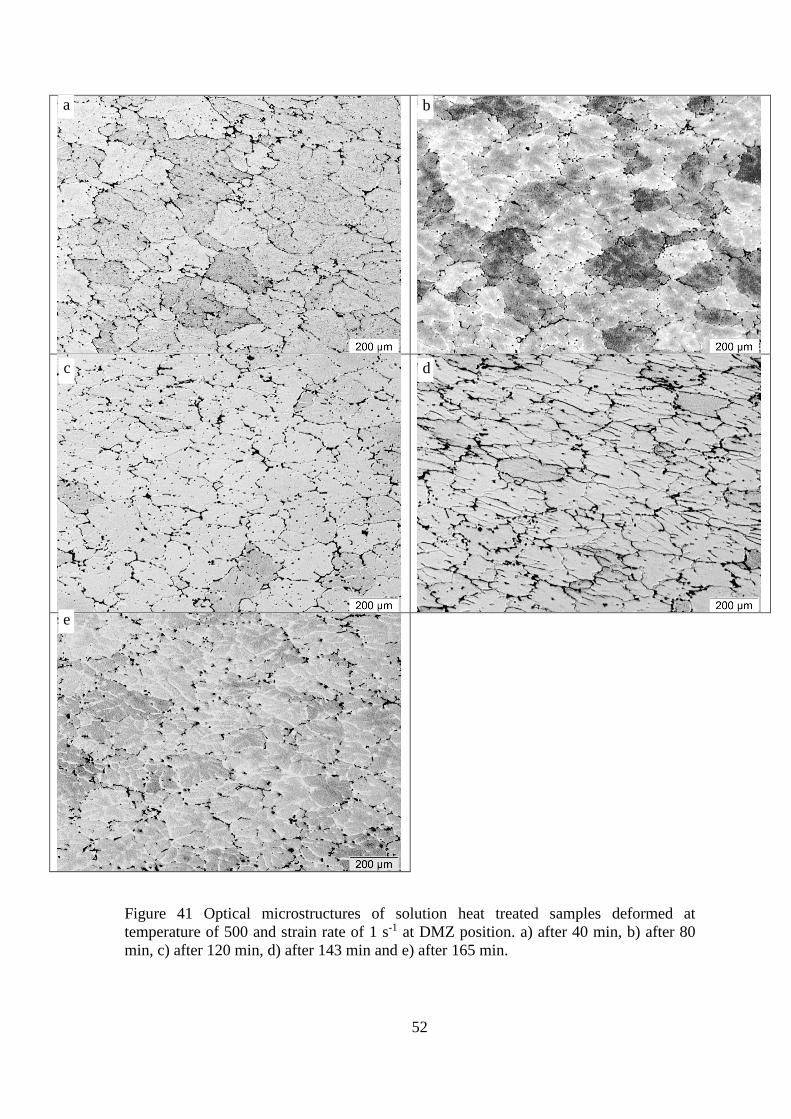
Figure 41 Optical microstructures of solution heat treated samples deformed at
temperature of 500 and strain rate of 1 s-1 at DMZ position. a) after 40 min, b)
after 80 min, c) after 120 min, d) after 143 min and e) after 165 min. ................ 52
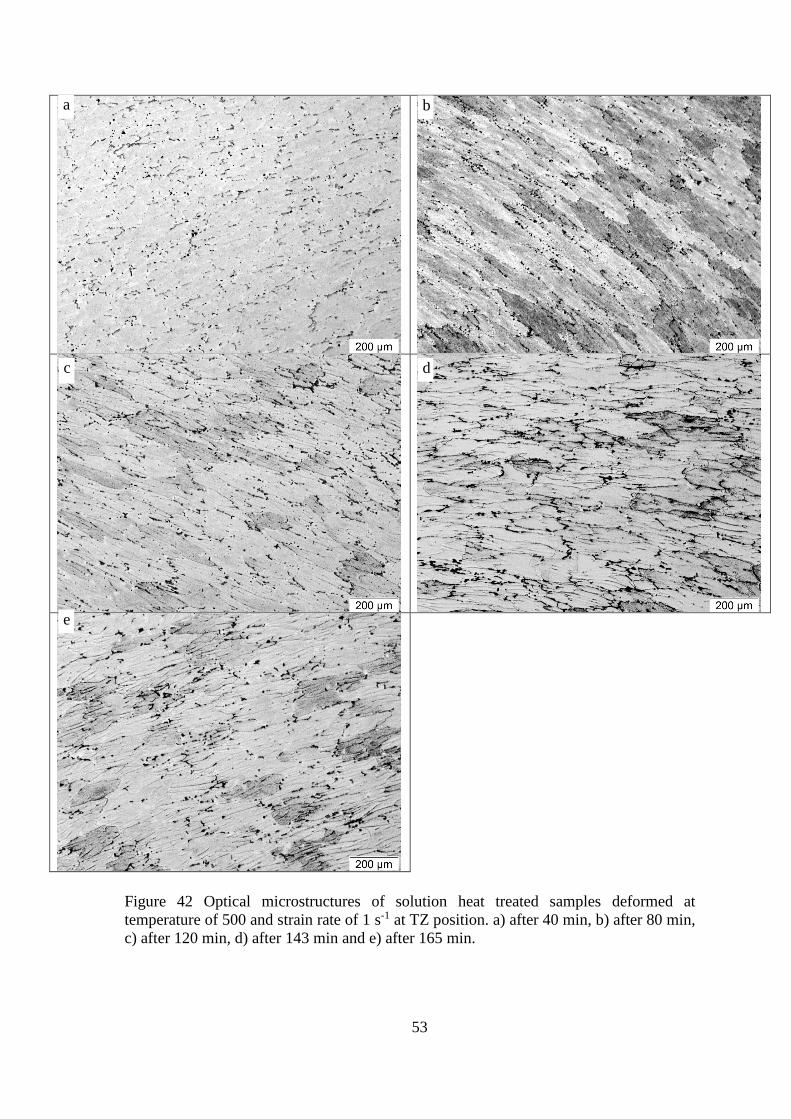
Figure 42 Optical microstructures of solution heat treated samples deformed at
temperature of 500 and strain rate of 1 s-1 at TZ position. a) after 40 min, b) after
80 min, c) after 120 min, d) after 143 min and e) after 165 min. ........................ 53

xiii
Figure 43 SEM-BSE micrograph for hot deformed sample at 0.01 s-1 & 500 ºC. a)
MDZ and b) DMZ ................................................................................................ 54
Figure 44 SEM-BSE micrograph for hot deformed sample at 1 s-1 & 350 ºC. a) MDZ
and b) DMZ.......................................................................................................... 54
Figure 45 EBSD map of hot deformed Sample at strain rate of 0.01 s-1 and
temperature 350ºC................................................................................................ 56
Figure 46 EBSD map of hot deformed Sample at strain rate of 0.01 s-1 and
temperature 500ºC................................................................................................ 56
Figure 47 EBSD map of hot deformed Sample at strain rate of 0.1 s-1 and temperature
350ºC .................................................................................................................... 57
Figure 48 EBSD map of hot deformed Sample at strain rate of 0.1 s-1 and temperature
500ºC .................................................................................................................... 57
Figure 49 EBSD map of hot deformed Sample at strain rate of 1 s-1 and temperature
350ºC .................................................................................................................... 58
Figure 50 EBSD map of hot deformed Sample at strain rate of 1 s-1 and temperature
500ºC .................................................................................................................... 58
Figure 51 Microhardness taken for hot deformed samples. a) at strain rate of 0.01s-1,
b) at strain rate of 0.1s-1, c) at strain rate of 1s-1 .................................................. 59
Figure 52 Represents Continuous Dynamic Recrystallization (CDRX) of high purity
aluminum deformed to strains, : (a) 0, (b) 0.2, (c) 0.6, (d) 1.26, (e) 4.05 and (f)
16.3. [29] .............................................................................................................. 62
Figure 53 When the grains are elongated and thinned extremely, they pinch off where
opposite serrations meet. This illustrate Geometric Dynamic Recrystallization
(GDRX). [29] ....................................................................................................... 63

xiv
Figure 54 Microhardness taken for hot deformed sample at strain rate of 1s-1 and
temperature 500ºC................................................................................................ 68
Figure 55 FEM shows strain (deformation) distribution of the hot deformed sample.
[20] ....................................................................................................................... 68
1
1 ABSTRACT
Hot forgoing processes are used for plastic deformation of metals at temperatures
above the material recrystallization temperature. In this process metal ingots are
converted into complex shapes by applying stresses above the yield stress of the
deformed material on pre-heated metals in a short period of time. Hot forging process
provides products with high strength due to grains refinement and absence of porosity. In
the recent years, the demand of aluminum forged products has increased comparing with
the cast products, largely in the automotive industry. Many materials characteristics such
as: good mechanical properties, low weight, good corrosion resistance, low forging
pressure and an ability to be forged into complex shapes make forged aluminum alloys
favorable in automotive industry. [1] Because of that, a good understanding of the hot
deformation behavior and microstructural evolution are important in a design of the
optimized hot forging processes.
The objective of this research is to determine the flow stress behavior and
microstructure evolution of newly developed aluminum alloy AA 6099 used in the
closed die forging process for truck automotive wheels. As a part of physical process
simulation Gleeble hot compression tests were performed at strain rates of 0.01, 0.1 and
1 s-1 and temperatures of 350, 400, 450 and 500 ˚C up to a strain of 0.8. The flow stress
value is dependent on the deformation temperature, strain, and strain rate and the test
parameters were selected in such a way to simulate industrial conditions. The flow stress
decreases with increasing deformation temperature and/or decreasing the strain rate.
Light Optical Microscopy (LOM), Electron Backscatter Diffraction (EBSD) and
microhardness investigations were performed on the hot deformed samples. They
revealed that material softening is a result of dynamic recovery and/or partial dynamic

2
recrystallization at temperature of 350 ºC. Also, after solution heat treatment of the hot
deformed samples, there was some evidence of static recrystallization and grain growth.
3
2 INTRODUCTION
2.1 Forging Background
2.1.1 Hot Forging Process Fundamental Forging is one of the oldest metal forming processes. It has been known since the
prehistoric period, when the hammering was used to form tools. For example, Figure 1
shows the steps to produce a knife by forging. Basically, in forging, the billet should be
in solid state and rest between dies where severe force is applied to tooling to plastically
deform the workpiece into the desired shape. First, billet is a cut of materiel in a square
or circular cross section that will be forged. A die (tool) consists of two parts, upper and
lower die, with mating surfaces in the process of hammering or pressing. When both
upper and lower parts meet together they do form a die cavity. This cavity is of the shape
of the final product for this particular forging step. As seen in Figure 1 more than one
step is required to forge the final product.
Figure 1 Schematic illustration of the steps involved in forging a knife. Courtesy of the
Mundial LLC and Manufacturing, Engineering & Technology, Fifth Edition. [2]
Forging processes enhance the mechanical properties of the produced parts and in
general reduce the waste materials comparing to casting processes. Forging processes are
classified based on the temperature of the workpiece or the arrangement of the dies. [3]
4
Classification of forging processes based on the workpiece temperature divides them to
hot forging, cold forging and warm forging.
In hot forging the metal is kept above its recrystallization temperature, relatively
about 0.7 of the melting temperature measured in degrees K. At cold forging, the
material is at room temperature or slightly higher but always below recrystallization
temperature. While warm forging, the temperature is between hot and cold forging
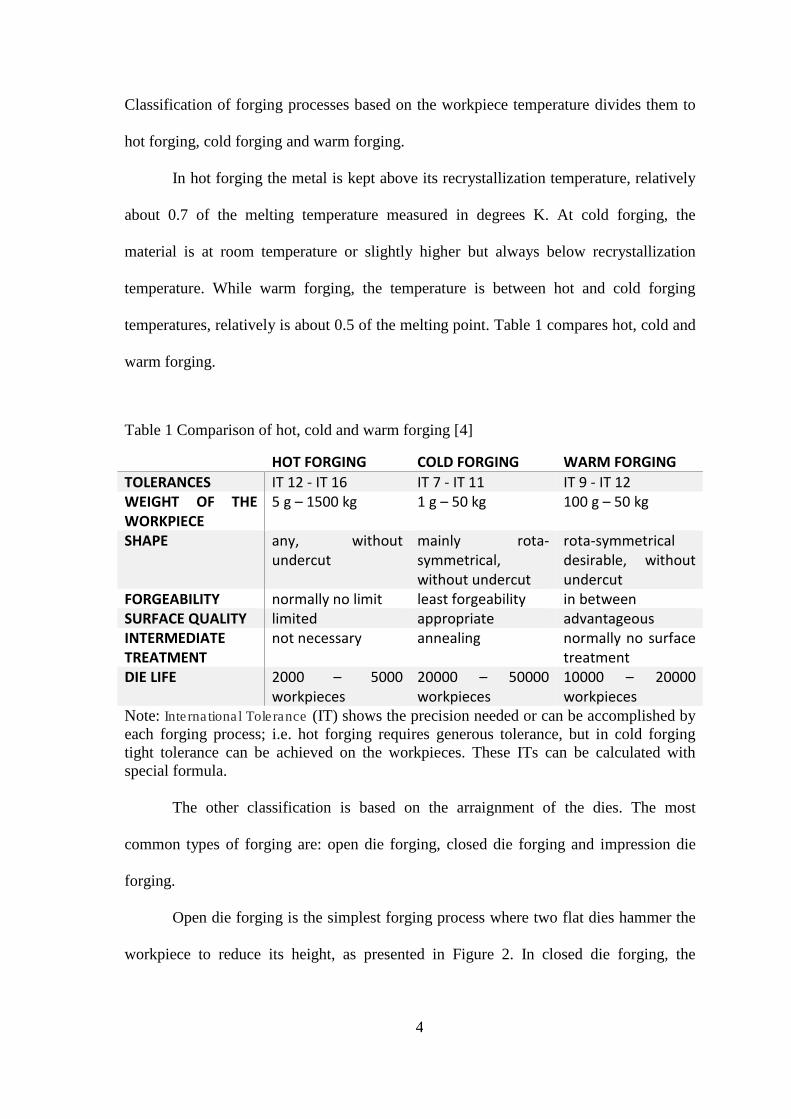
temperatures, relatively is about 0.5 of the melting point. Table 1 compares hot, cold and
warm forging.
Table 1 Comparison of hot, cold and warm forging [4]
HOT FORGING COLD FORGING WARM FORGING
TOLERANCES IT 12 - IT 16 IT 7 - IT 11 IT 9 - IT 12 WEIGHT OF THE WORKPIECE
5 g – 1500 kg 1 g – 50 kg 100 g – 50 kg
SHAPE any, without undercut
mainly rota-symmetrical, without undercut
rota-symmetrical desirable, without undercut
FORGEABILITY normally no limit least forgeability in between SURFACE QUALITY limited appropriate advantageous INTERMEDIATE TREATMENT
not necessary annealing normally no surface treatment
DIE LIFE 2000 – 5000 workpieces
20000 – 50000 workpieces
10000 – 20000 workpieces
Note: International Tolerance (IT) shows the precision needed or can be accomplished by
each forging process; i.e. hot forging requires generous tolerance, but in cold forging
tight tolerance can be achieved on the workpieces. These ITs can be calculated with
special formula.
The other classification is based on the arraignment of the dies. The most
common types of forging are: open die forging, closed die forging and impression die
forging.
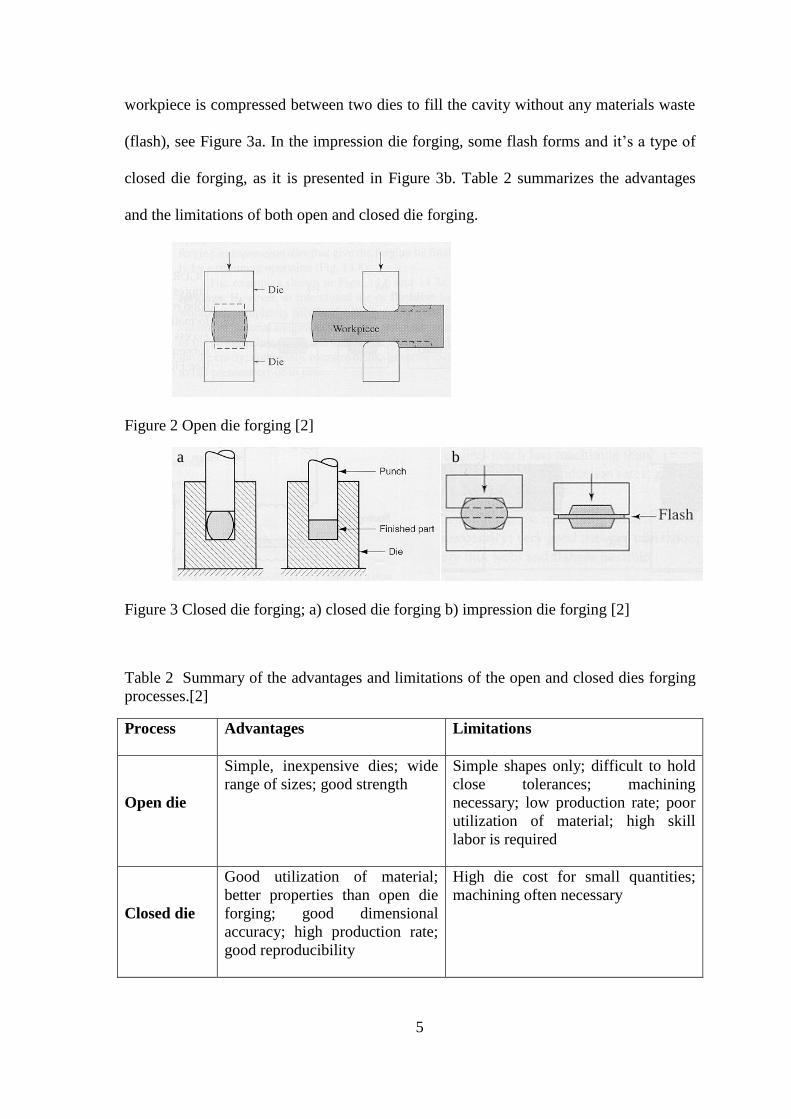
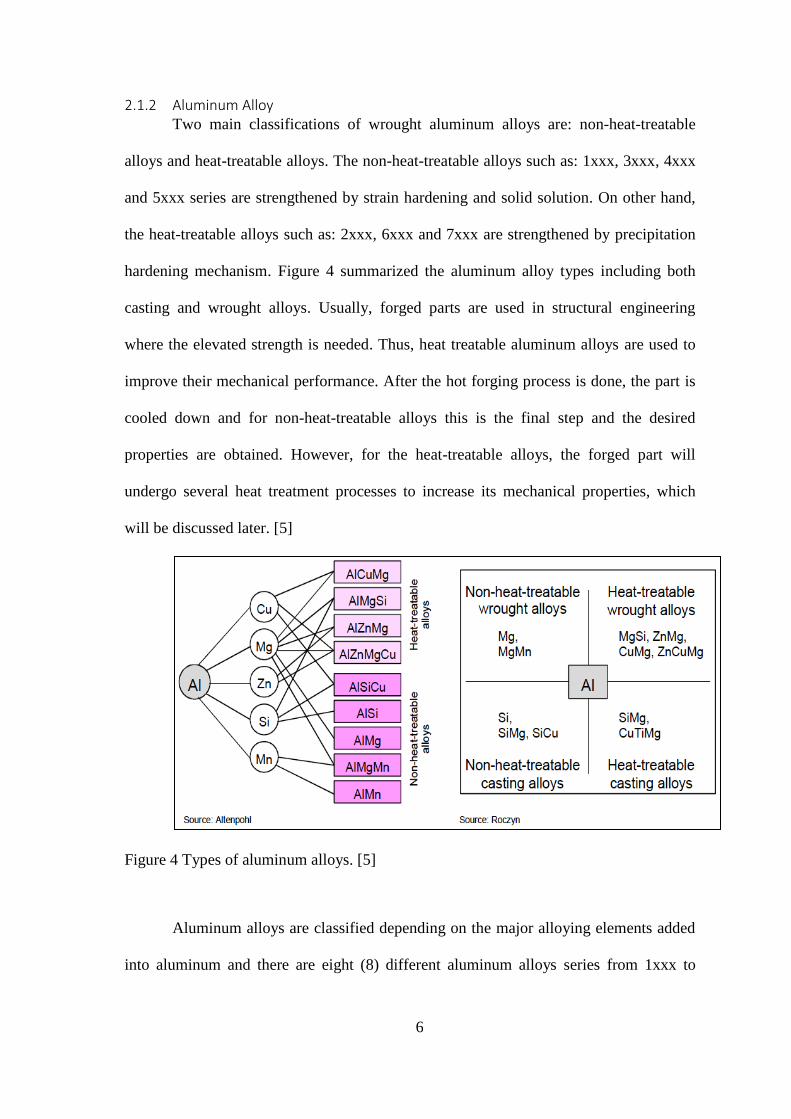
Open die forging is the simplest forging process where two flat dies hammer the
workpiece to reduce its height, as presented in Figure 2. In closed die forging, the
5
workpiece is compressed between two dies to fill the cavity without any materials waste
(flash), see Figure 3a. In the impression die forging, some flash forms and it’s a type of
closed die forging, as it is presented in Figure 3b. Table 2 summarizes the advantages
and the limitations of both open and closed die forging.
Figure 2 Open die forging [2]
Figure 3 Closed die forging; a) closed die forging b) impression die forging [2]
Table 2 Summary of the advantages and limitations of the open and closed dies forging
processes.[2]
Process Advantages Limitations
Open die
Simple, inexpensive dies; wide
range of sizes; good strength
Simple shapes only; difficult to hold
close tolerances; machining
necessary; low production rate; poor
utilization of material; high skill
labor is required
Closed die
Good utilization of material;
better properties than open die
forging; good dimensional
accuracy; high production rate;
good reproducibility
High die cost for small quantities;
machining often necessary
b a
6
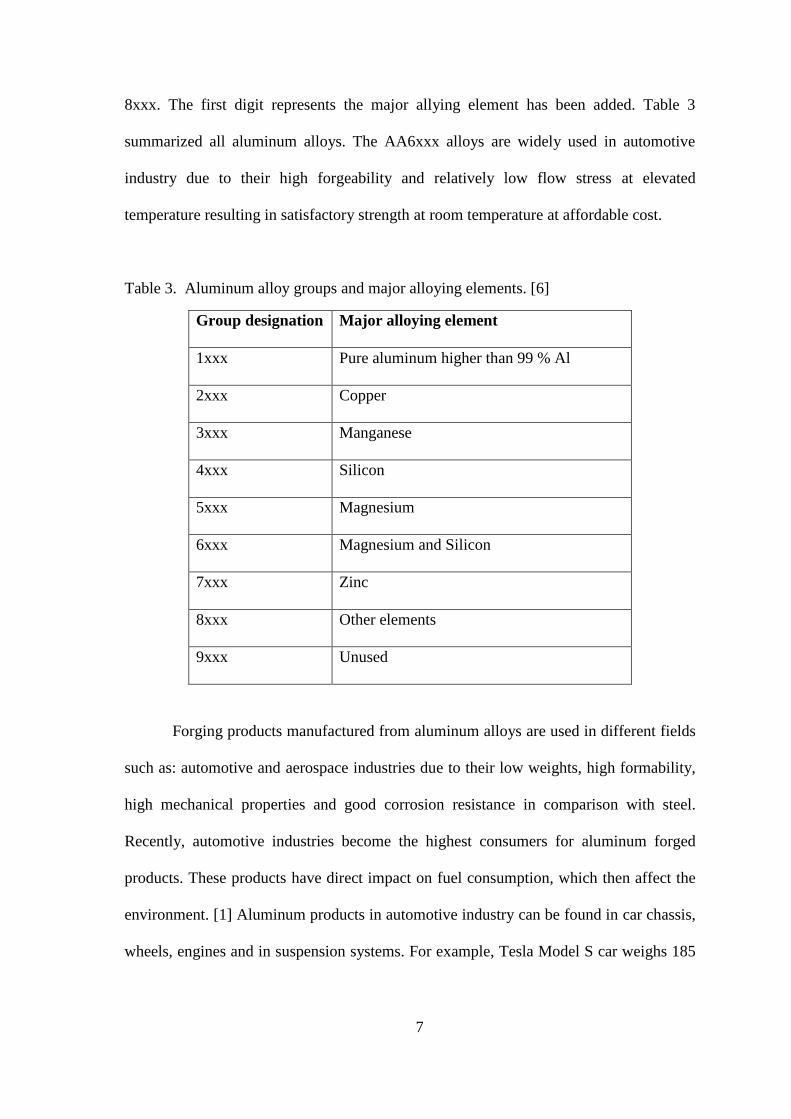
2.1.2 Aluminum Alloy Two main classifications of wrought aluminum alloys are: non-heat-treatable
alloys and heat-treatable alloys. The non-heat-treatable alloys such as: 1xxx, 3xxx, 4xxx
and 5xxx series are strengthened by strain hardening and solid solution. On other hand,
the heat-treatable alloys such as: 2xxx, 6xxx and 7xxx are strengthened by precipitation
hardening mechanism. Figure 4 summarized the aluminum alloy types including both
casting and wrought alloys. Usually, forged parts are used in structural engineering
where the elevated strength is needed. Thus, heat treatable aluminum alloys are used to
improve their mechanical performance. After the hot forging process is done, the part is
cooled down and for non-heat-treatable alloys this is the final step and the desired
properties are obtained. However, for the heat-treatable alloys, the forged part will
undergo several heat treatment processes to increase its mechanical properties, which
will be discussed later. [5]
Figure 4 Types of aluminum alloys. [5]
Aluminum alloys are classified depending on the major alloying elements added
into aluminum and there are eight (8) different aluminum alloys series from 1xxx to
7
8xxx. The first digit represents the major allying element has been added. Table 3
summarized all aluminum alloys. The AA6xxx alloys are widely used in automotive
industry due to their high forgeability and relatively low flow stress at elevated
temperature resulting in satisfactory strength at room temperature at affordable cost.
Table 3. Aluminum alloy groups and major alloying elements. [6]
Group designation Major alloying element
1xxx Pure aluminum higher than 99 % Al
2xxx Copper
3xxx Manganese
4xxx Silicon
5xxx Magnesium
6xxx Magnesium and Silicon
7xxx Zinc
8xxx Other elements
9xxx Unused
Forging products manufactured from aluminum alloys are used in different fields
such as: automotive and aerospace industries due to their low weights, high formability,
high mechanical properties and good corrosion resistance in comparison with steel.
Recently, automotive industries become the highest consumers for aluminum forged
products. These products have direct impact on fuel consumption, which then affect the
environment. [1] Aluminum products in automotive industry can be found in car chassis,
wheels, engines and in suspension systems. For example, Tesla Model S car weighs 185

8
kg (410 Ibs). The sheet metal and structure components are about 98 % aluminum. [7]
Numerous advantages could be achieved by using aluminum forged products in
automotive industry such as [6]:
• High corrosion resistance due to formation of thin film of aluminum
oxide.
• High specific strength (strength to density ratio).
• Aluminum alloys have relatively low flow stress and are ductile materials,
so they require relatively low pressures during forging and high strains
are possible.
• During aluminum forging, the microstructure evolution can be controlled
and adjusted to the load direction to result in increased fatigue resistance.
• During aluminum forging, the workpiece could be heated near to the die
temperature to prevent heat transfer and scale production.
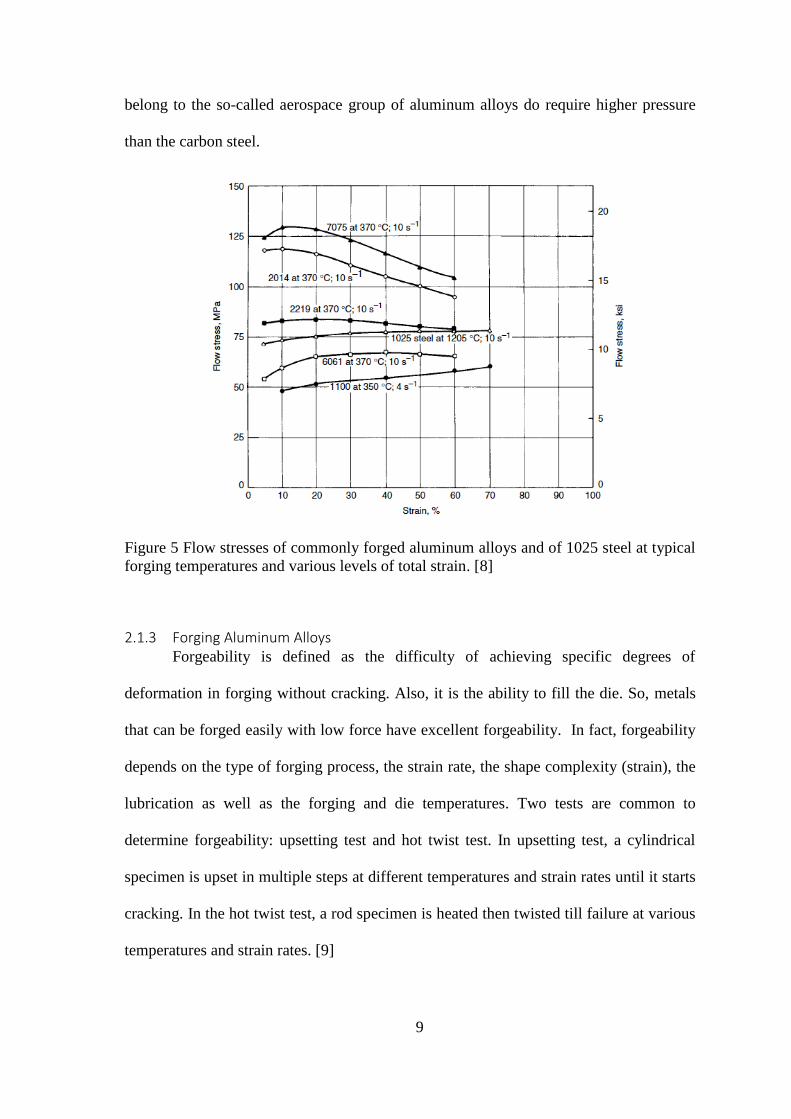
As mentioned before, aluminum alloys are usually forged into parts having
different shapes and usages. Each aluminum alloy requires different pressing pressure;
depending on many process variables. For instance, the chemical composition of the
alloy, the forging method used, the strain rate of the forged part and the temperature of
both the workpiece and the die influence forging process and final mechanical properties
of the forged parts [8]. Figure 5 shows the flow stress of different aluminum alloys at
different stain rates and temperatures compared with the same strain rates and ideal
temperature for 1025 carbon steel. At low and medium strength aluminum alloys; i.e.
1100 & 6061, have lower flow stress than 1025 carbon steel, thus they required lower
forging pressure. However, higher strength aluminum alloys; i.e. 2014 & 7075, which
9
belong to the so-called aerospace group of aluminum alloys do require higher pressure
than the carbon steel.
Figure 5 Flow stresses of commonly forged aluminum alloys and of 1025 steel at typical
forging temperatures and various levels of total strain. [8]
2.1.3 Forging Aluminum Alloys Forgeability is defined as the difficulty of achieving specific degrees of
deformation in forging without cracking. Also, it is the ability to fill the die. So, metals
that can be forged easily with low force have excellent forgeability. In fact, forgeability
depends on the type of forging process, the strain rate, the shape complexity (strain), the
lubrication as well as the forging and die temperatures. Two tests are common to
determine forgeability: upsetting test and hot twist test. In upsetting test, a cylindrical
specimen is upset in multiple steps at different temperatures and strain rates until it starts
cracking. In the hot twist test, a rod specimen is heated then twisted till failure at various
temperatures and strain rates. [9]
10
Generally, aluminum alloys have high forgeability. Thus, they are suitable for
high deformation at few forging steps; usually at one or two steps. The various strength
of aluminum alloys made them appropriate for different applications.
In fact, forgeability increases as temperature increases, which is a result of lower
flow stress and increased ductility. However, there is a critical temperature above which
some other undesirable phenomena occur; such as grain growth or phase melting. In
aluminum alloys, the recommended forging temperature window is relatively narrow.
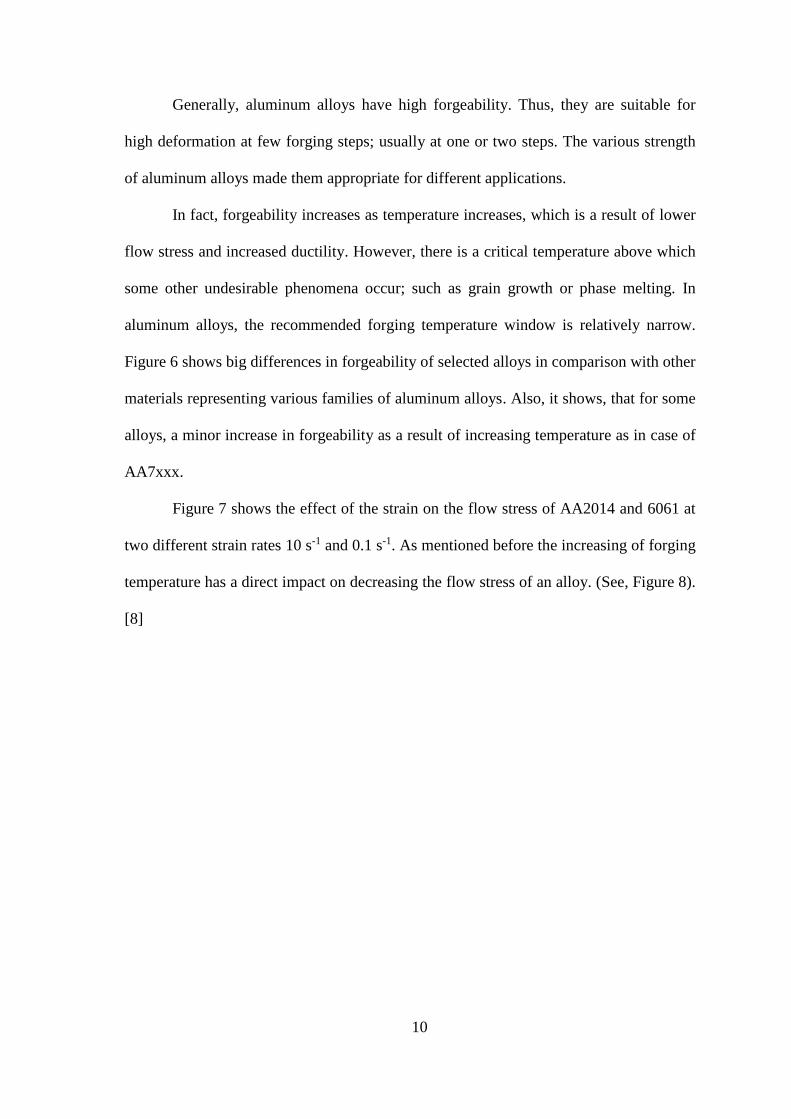
Figure 6 shows big differences in forgeability of selected alloys in comparison with other
materials representing various families of aluminum alloys. Also, it shows, that for some
alloys, a minor increase in forgeability as a result of increasing temperature as in case of
AA7xxx.
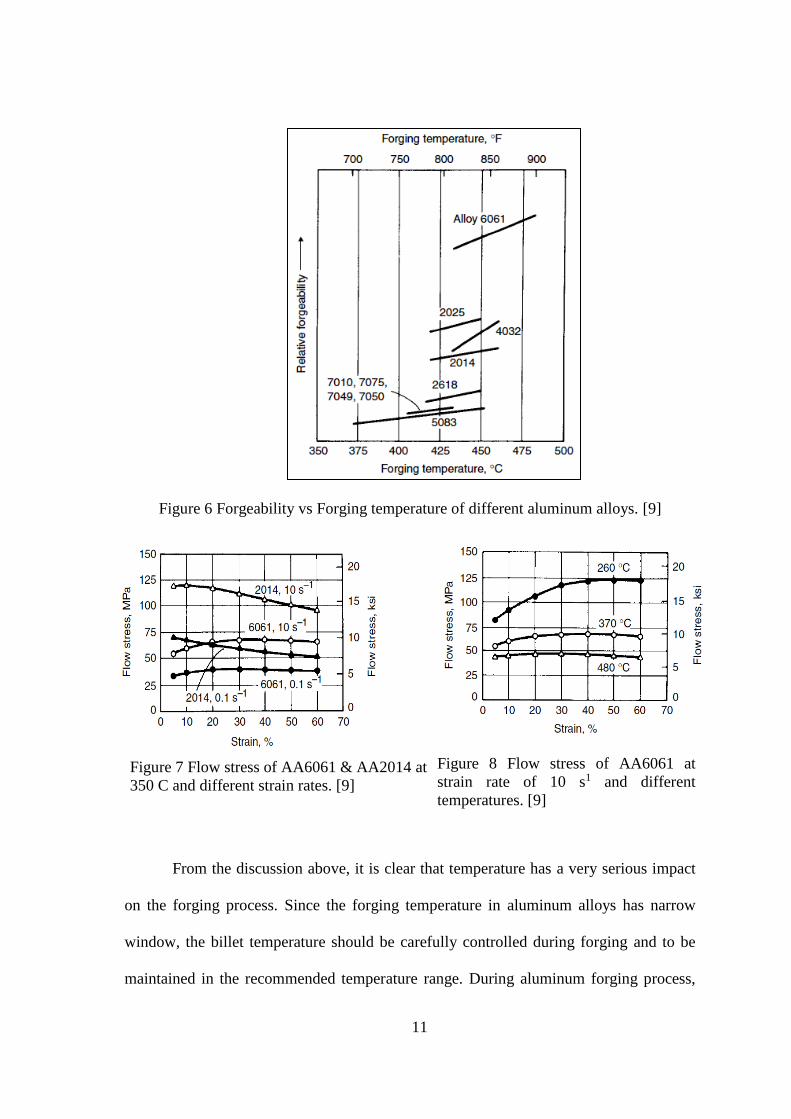
Figure 7 shows the effect of the strain on the flow stress of AA2014 and 6061 at
two different strain rates 10 s-1 and 0.1 s-1. As mentioned before the increasing of forging
temperature has a direct impact on decreasing the flow stress of an alloy. (See, Figure 8).
[8]
11
Figure 6 Forgeability vs Forging temperature of different aluminum alloys. [9]
Figure 8 Flow stress of AA6061 at
strain rate of 10 s1 and different
temperatures. [9]
From the discussion above, it is clear that temperature has a very serious impact
on the forging process. Since the forging temperature in aluminum alloys has narrow
window, the billet temperature should be carefully controlled during forging and to be
maintained in the recommended temperature range. During aluminum forging process,
Figure 7 Flow stress of AA6061 & AA2014 at
350 C and different strain rates. [9]
12
the billet will be heated to desired temperature. Then it is forged, usually, by a hydraulic
press, which allows long contact time between the billet and the dies. Thus, heat
transfers form a workpiece to the colder dies; causing temperature gradient within the
workpiece and reduces the surface temperature of the billet. Consequently, the plastic
flow at the billet surface is lower than in the billet core. Resulting inhomogeneous plastic
flow is called die chilling. To overcome this phenomenon, the isothermal forging process
where the dies are heated to the same temperature of the workpiece was proposed.[10]
Isothermal forging process is used for manufacturing of critical and rotating
products, especially for aerospace components where near-net-shape is needed to
minimize machining. According to the Forging Industry Association., "hot forging is the
plastic deformation of metal at a temperature and strain rate such that recrystallization
occurs simultaneously with deformation, thus avoiding strain hardening. For this to
occur, high workpiece temperature (matching the metal's recrystallization temperature)
must be attained throughout the process. A form of hot forging is isothermal forging,
where materials and dies are heated to the same temperature. In nearly all cases,
isothermal forging is conducted on superalloys in a vacuum or highly controlled
atmosphere to prevent oxidation."[11]
Press quenching is another technique used to reduce the distortion of complex
geometrical components during heat treatment. In the ideal case, the temperature
gradient should be the same at the cross section of the workpiece during quenching. This
situation is challenging at big parts with different cross section thickness, e.g. gears.
Press quench works by applying controlled force at specific location to hold the
component during quenching. The clamps holding the component can work to make
quenching process more uniform within the forged components. Press quenching
13
technique cannot eliminate the temperature gradient but it works to minimize that as
much as possible. [12]
2.2 Forged Aluminum Alloy Wheels
2.2.1 Automotive Wheels For many years steel was the only material used for manufacturing of automotive
wheels. However, in the last 100 years, different types of aluminum alloy wheels were
developed for this application. For the first time both Daimler-Benz and Auto-Union
introduced aluminum wheels in racing cars in the 1930s. Nowadays, more than 50% of
automotive wheels are made from aluminum alloys. This is the result of e unique
features of aluminum alloys and forged products. As been discussed before, aluminum
forged parts are very attractive for automotive industry due their good mechanical
properties and reduced weight. [13]
Automotive wheels do require specific mechanical and chemical properties.
Structural stiffness and strength are important to carry the car weight and the wheel
stiffness depends on the design of the wheel. It should be considered during the wheel
design process to achieve required stiffness such as in the steel wheels. Further important
aspects are yield strength and fatigue behavior. It’s crucial to have the needed strength
and fatigue resistance to avoid wheels’ deformation and/or failure during service. Also,
heat dissipations have direct impact on the wheel and the tire, consequently on the safety
of the passengers. So, heat dissipation should be considered to improve the breaking
performance and avoid overheating of the tires. In addition, the wheels should have a
good corrosion resistance as well as the best dimensional tolerances. [13]
Another important aspect for automotive wheels is their appearance. Many truck
drivers expect the wheels to stay shiny and bright for long time in all environmental
conditions. Alcoa patented Dura-Bright® technology, which is a surface treatment
14
penetrating the aluminum and becoming part of the wheel to produce low surface tension
on the wheels. It keeps the wheels shiny at any road conditions. This technology prevents
the wheel from scratches, cracking, and corrosion counter to conventional coating. [14]
Two most common manufacturing processes used to produce automotive wheels
are casting and forging. Cast wheels have lower production cost, but low to moderate
fatigue and impact resistance. On the other hand, forged wheels are relatively more
expensive but have higher mechanical properties and variety of complex shapes.
Usually, cast wheels are used for passenger cars and are most common because they are
relatively less expensive than forged wheels. Forged wheels mainly used for trucks and
high speed cars where high strength and fatigue resistance are needed. They are much
expensive than cast wheels due to the manufacturing process expenses like tooling and
equipment.
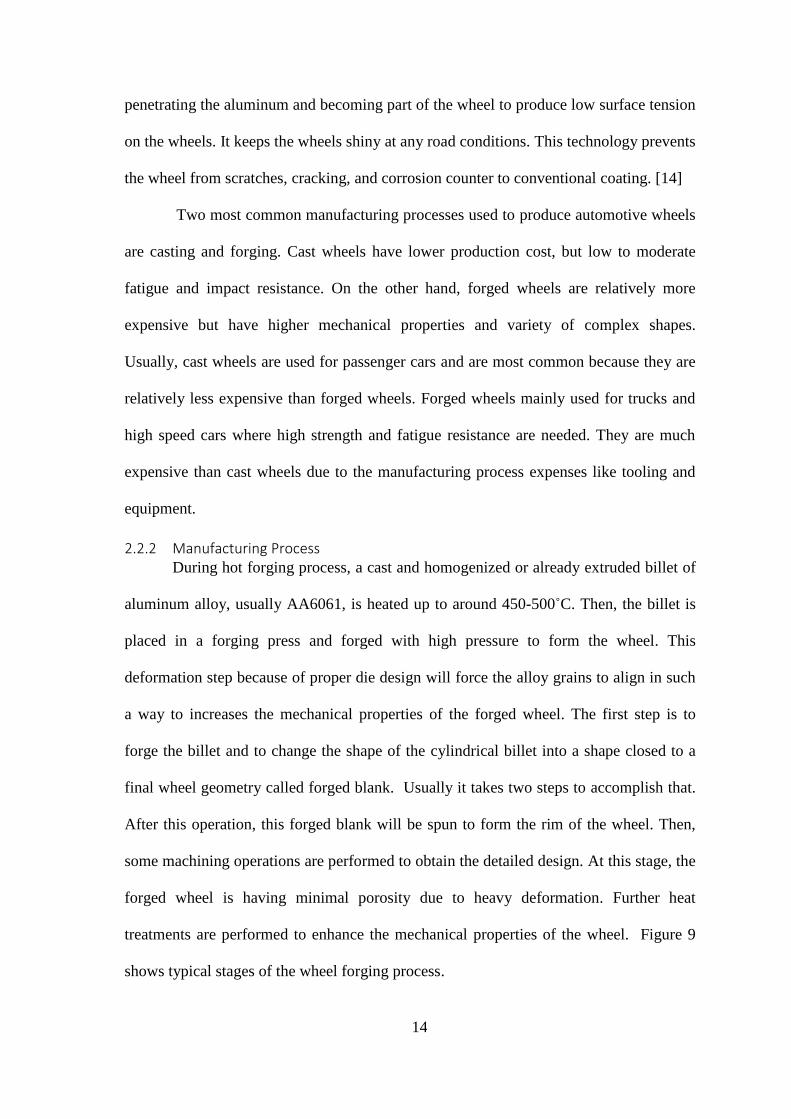
2.2.2 Manufacturing Process During hot forging process, a cast and homogenized or already extruded billet of
aluminum alloy, usually AA6061, is heated up to around 450-500˚C. Then, the billet is
placed in a forging press and forged with high pressure to form the wheel. This
deformation step because of proper die design will force the alloy grains to align in such
a way to increases the mechanical properties of the forged wheel. The first step is to
forge the billet and to change the shape of the cylindrical billet into a shape closed to a
final wheel geometry called forged blank. Usually it takes two steps to accomplish that.
After this operation, this forged blank will be spun to form the rim of the wheel. Then,
some machining operations are performed to obtain the detailed design. At this stage, the
forged wheel is having minimal porosity due to heavy deformation. Further heat
treatments are performed to enhance the mechanical properties of the wheel. Figure 9
shows typical stages of the wheel forging process.

15
Figure 9 Forged wheel process [15]
3 Research Objective
The research objective of this study is to investigate the microstructure
development during hot forging process and subsequent heat treatment of a newly
developed aluminum alloy 6099. The need for understanding of mechanical behavior of
new alloy drives the physical modeling of the microstructure evolution during forging
process.

16
4 EXPERIMENTAL PROCEDURE
4.1 Experimental Approach
4.1.1 Material The aluminum alloy used in the experiments of this investigation was AA6099.
This is a newly developed alloy and it was provided by Accuride Wheel End Solutions.
Table 6 shows the chemical composition ranges for AA6099. Two different billets; i.e.
Lot#1 and Lot#2, with slightly different chemical composition were cast, then
homogenized.
Table 4 Chemical composition of AA6099
Si Fe Cu Mn Mg Cr Zn Ti
AA6099 0.8-1.2 0.7 max 0.1-0.7 0.1-1.2 0.7-1.2 0.04-0.35 0.25 0.1
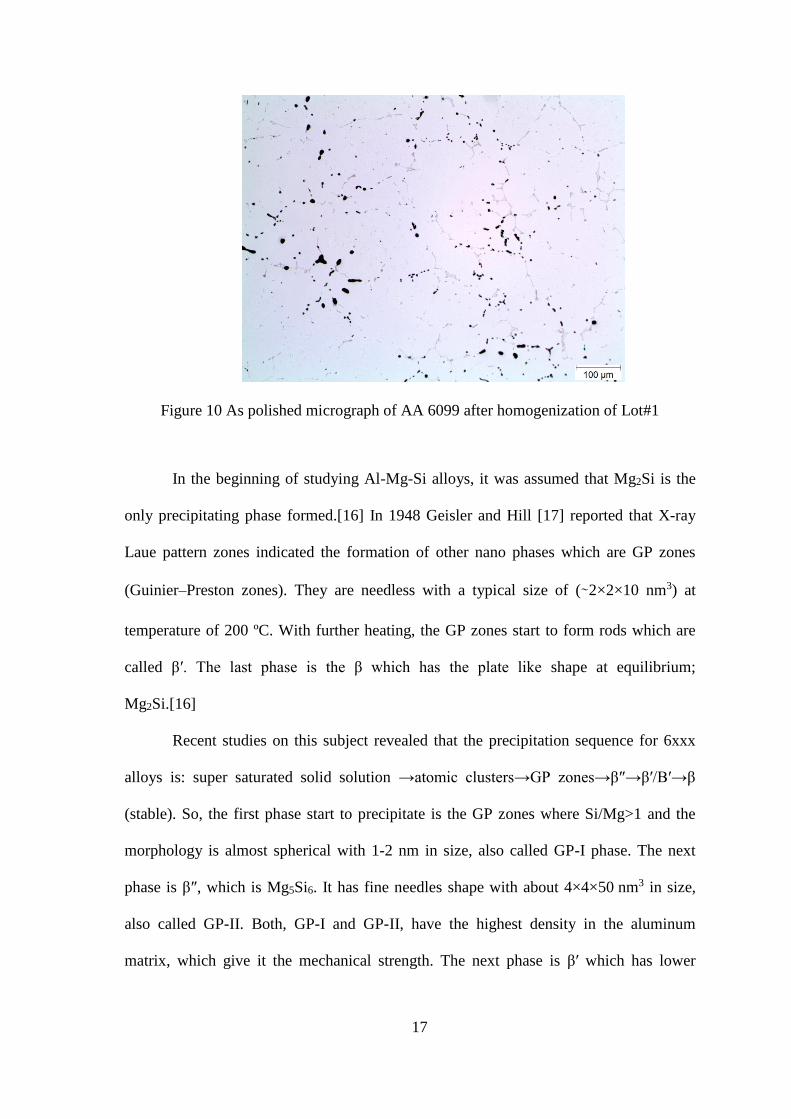
Some preliminary investigation performed on this new alloy showed the as cast
samples have three phases MgxSiy, Al-Fe-Si phase, Cu rich phase as well as transition
metals such as Fe, Mn and Cr. On the other hand, during the homogenization of the
billet, the Cu rich phase totally dissolves and only two phases were present MgxSiy and
Al-Fe-Si. Figure 10 shows the different phases of homogenized AA 6099.
17
Figure 10 As polished micrograph of AA 6099 after homogenization of Lot#1
In the beginning of studying Al-Mg-Si alloys, it was assumed that Mg2Si is the
only precipitating phase formed.[16] In 1948 Geisler and Hill [17] reported that X-ray
Laue pattern zones indicated the formation of other nano phases which are GP zones
(Guinier–Preston zones). They are needless with a typical size of (∼2×2×10 nm3) at
temperature of 200 ºC. With further heating, the GP zones start to form rods which are
called β′. The last phase is the β which has the plate like shape at equilibrium;
Mg2Si.[16]
Recent studies on this subject revealed that the precipitation sequence for 6xxx
alloys is: super saturated solid solution →atomic clusters→GP zones→β″→β′/B′→β
(stable). So, the first phase start to precipitate is the GP zones where Si/Mg>1 and the
morphology is almost spherical with 1-2 nm in size, also called GP-I phase. The next
phase is β″, which is Mg5Si6. It has fine needles shape with about 4×4×50 nm3 in size,
also called GP-II. Both, GP-I and GP-II, have the highest density in the aluminum
matrix, which give it the mechanical strength. The next phase is β′ which has lower
18
Mg/Si ratio than β, having the formula Mg1.7Si. It has ribbon like shape up to few µm
long. The last phase is the equilibrium phase which is β (Mg2Si). It has plate like shape
with a diameter up to 20 µm. Table 5 summarize all these phases. [18]
Table 5 Overview of Mg–Si containing phases in 6082 Al-alloys. [18]
Phase Formula Unit cell Morphology/typical size
GP Si/Mg>1 Unknown Almost spherical/1–2 nm
β″ Mg5Si6 Monoclinic C2/m
a= 15.16 Å, b= 4.05 Å
c= 6.74 Å, β= 105.3 º
Needles/up to 40 x 40 x 350 Å3
β′ Mg1.7Si Hexagonal
a= 7.05 Å, c= 4.05 Å
Ribbons/several μm long
β Mg2Si fcc (CaF-type)
a= 6.39 Å
Plates or cubes/up to 10–20 μm
diameter
B′ Mg/Si≈1 Hexagonal
a= 10.3 Å, c= 4.05 Å
Ribbons/up to 1 μm
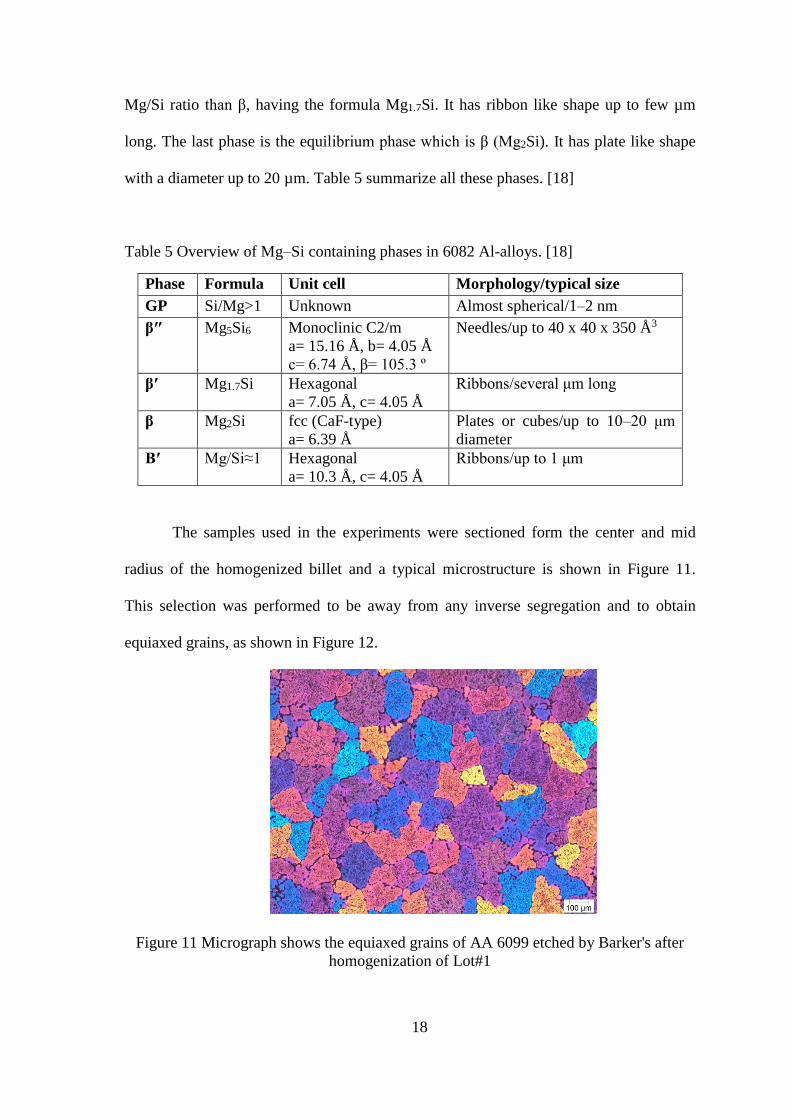
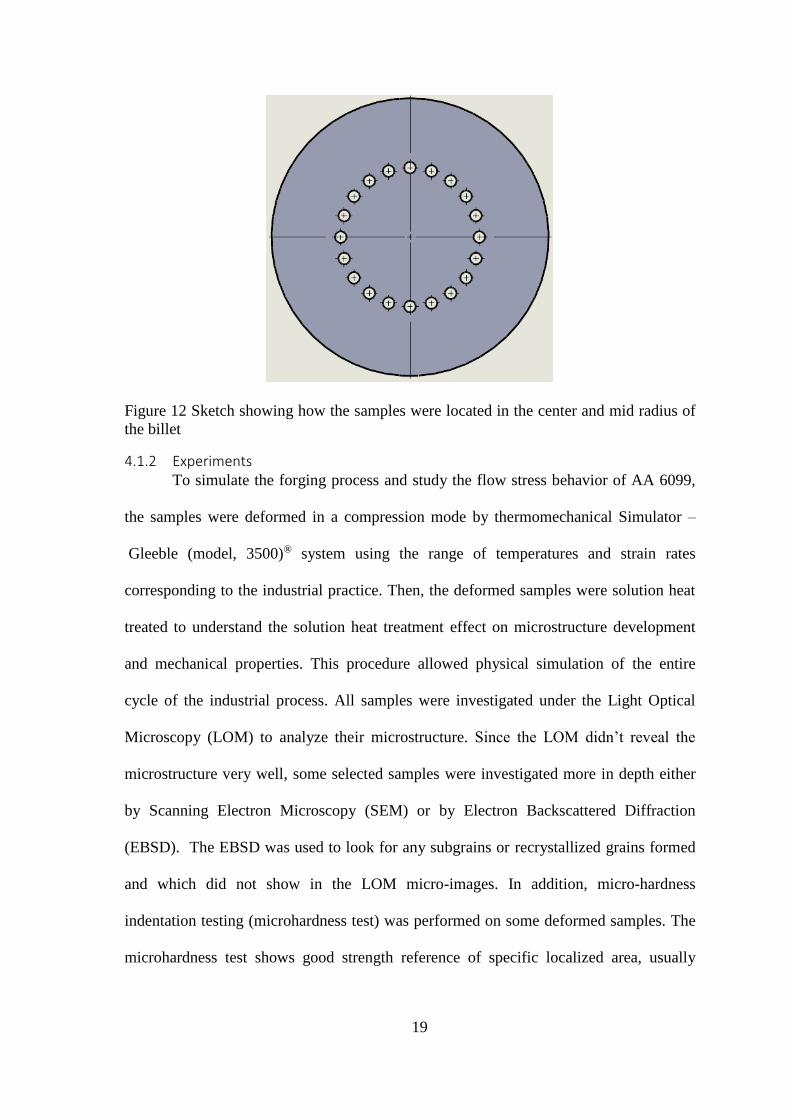
The samples used in the experiments were sectioned form the center and mid
radius of the homogenized billet and a typical microstructure is shown in Figure 11.
This selection was performed to be away from any inverse segregation and to obtain
equiaxed grains, as shown in Figure 12.
Figure 11 Micrograph shows the equiaxed grains of AA 6099 etched by Barker's after
homogenization of Lot#1
19
Figure 12 Sketch showing how the samples were located in the center and mid radius of
the billet
4.1.2 Experiments To simulate the forging process and study the flow stress behavior of AA 6099,
the samples were deformed in a compression mode by thermomechanical Simulator –
Gleeble (model, 3500)® system using the range of temperatures and strain rates
corresponding to the industrial practice. Then, the deformed samples were solution heat
treated to understand the solution heat treatment effect on microstructure development
and mechanical properties. This procedure allowed physical simulation of the entire
cycle of the industrial process. All samples were investigated under the Light Optical
Microscopy (LOM) to analyze their microstructure. Since the LOM didn’t reveal the
microstructure very well, some selected samples were investigated more in depth either
by Scanning Electron Microscopy (SEM) or by Electron Backscattered Diffraction
(EBSD). The EBSD was used to look for any subgrains or recrystallized grains formed
and which did not show in the LOM micro-images. In addition, micro-hardness
indentation testing (microhardness test) was performed on some deformed samples. The
microhardness test shows good strength reference of specific localized area, usually
20
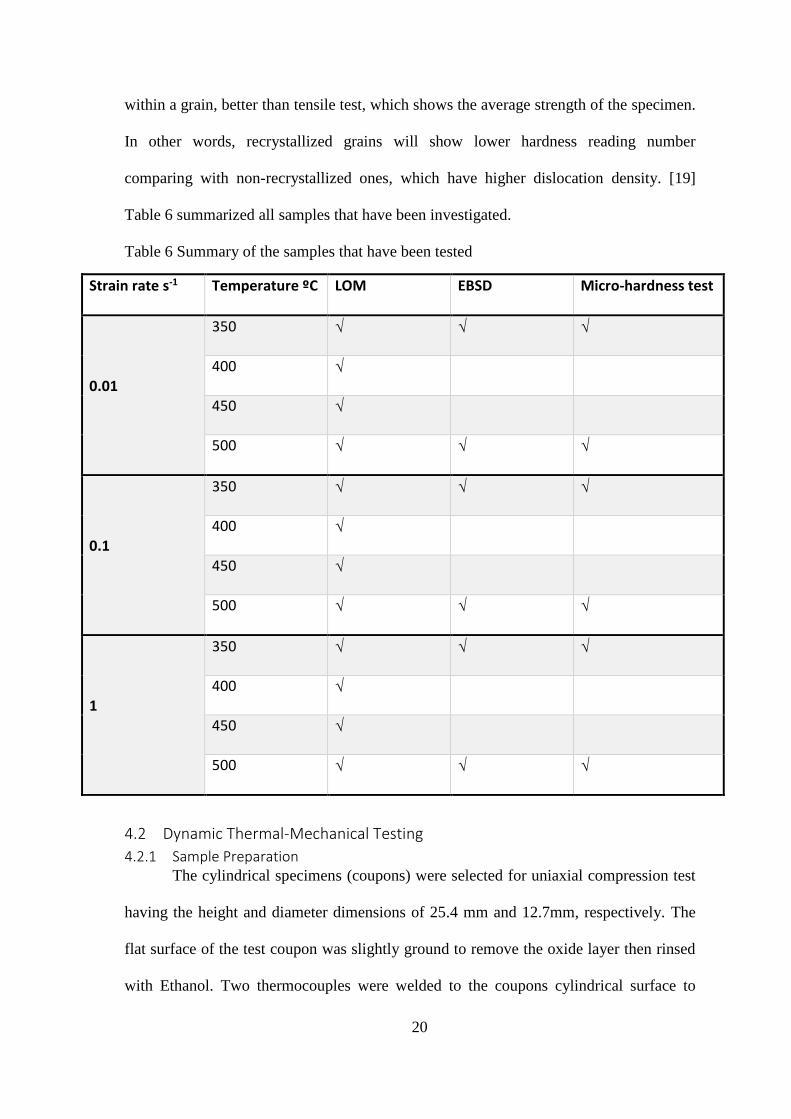
within a grain, better than tensile test, which shows the average strength of the specimen.
In other words, recrystallized grains will show lower hardness reading number
comparing with non-recrystallized ones, which have higher dislocation density. [19]
Table 6 summarized all samples that have been investigated.
Table 6 Summary of the samples that have been tested
Strain rate s-1 Temperature ºC LOM EBSD Micro-hardness test
0.01
350 √ √ √
400 √
450 √
500 √ √ √
0.1
350 √ √ √
400 √
450 √
500 √ √ √
1
350 √ √ √
400 √
450 √
500 √ √ √
4.2 Dynamic Thermal-Mechanical Testing
4.2.1 Sample Preparation The cylindrical specimens (coupons) were selected for uniaxial compression test
having the height and diameter dimensions of 25.4 mm and 12.7mm, respectively. The
flat surface of the test coupon was slightly ground to remove the oxide layer then rinsed
with Ethanol. Two thermocouples were welded to the coupons cylindrical surface to
21
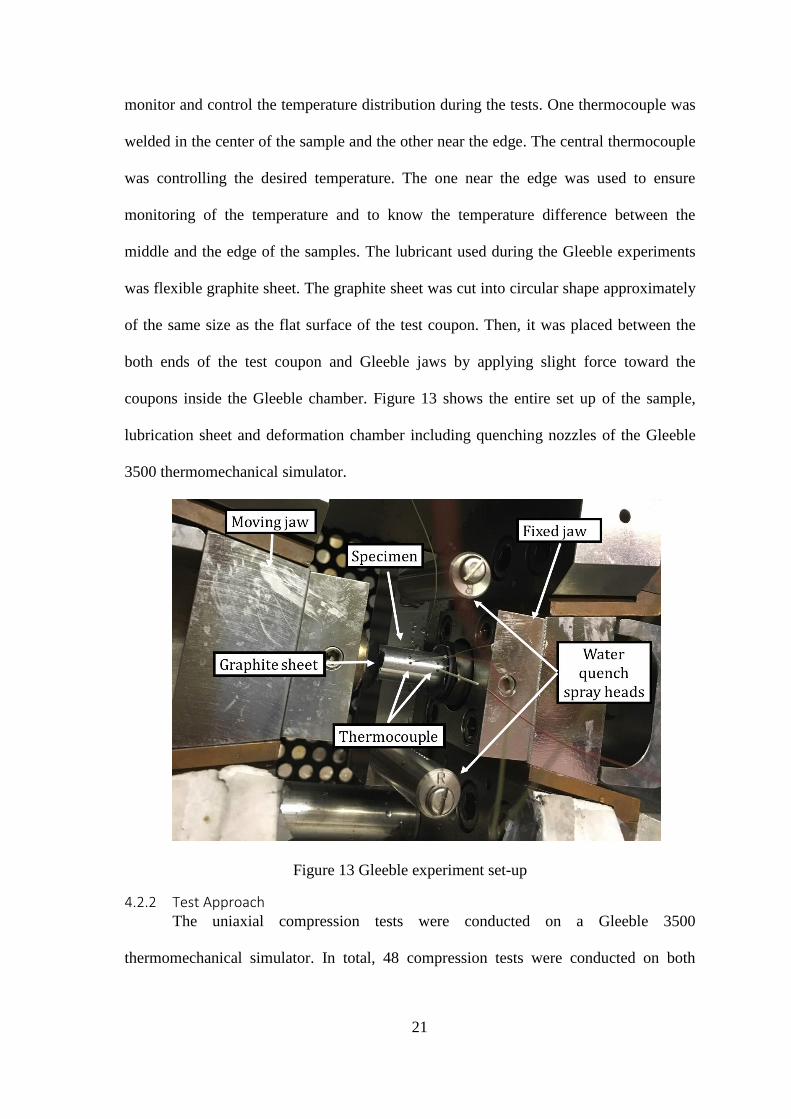
monitor and control the temperature distribution during the tests. One thermocouple was
welded in the center of the sample and the other near the edge. The central thermocouple
was controlling the desired temperature. The one near the edge was used to ensure
monitoring of the temperature and to know the temperature difference between the
middle and the edge of the samples. The lubricant used during the Gleeble experiments
was flexible graphite sheet. The graphite sheet was cut into circular shape approximately
of the same size as the flat surface of the test coupon. Then, it was placed between the
both ends of the test coupon and Gleeble jaws by applying slight force toward the
coupons inside the Gleeble chamber. Figure 13 shows the entire set up of the sample,
lubrication sheet and deformation chamber including quenching nozzles of the Gleeble
3500 thermomechanical simulator.
Figure 13 Gleeble experiment set-up
4.2.2 Test Approach The uniaxial compression tests were conducted on a Gleeble 3500
thermomechanical simulator. In total, 48 compression tests were conducted on both

22
Lot#1 and Lot#2 following test conditions presented in Table 7. Each deformation
condition, combination of temperature and strain rate was performed twice.
Table 7 Deformation Test Conditions
Strain rate s-1 Deformation Temperature ˚C
0.01
350
400
450
500
0.1
350
400
450
500
1
350
400
450
500
The samples were heated to the desirable deformation temperature at a heating
rate of 10 °C/s and held for 5 min to ensure homogenous temperature distribution
through the sample. The temperature was monitored by the two thermocouples. After
that, the sample was deformed to a total true strain of 0.8 and then immediately water-
quenched by the quenching system inside the Gleeble chamber. The quenching was
applied to preserve the developed microstructure as a result of the used deformation
conditions and to prevent any static recovery or static recrystallization for the
metallographic study.
23
4.3 Heat Treatment
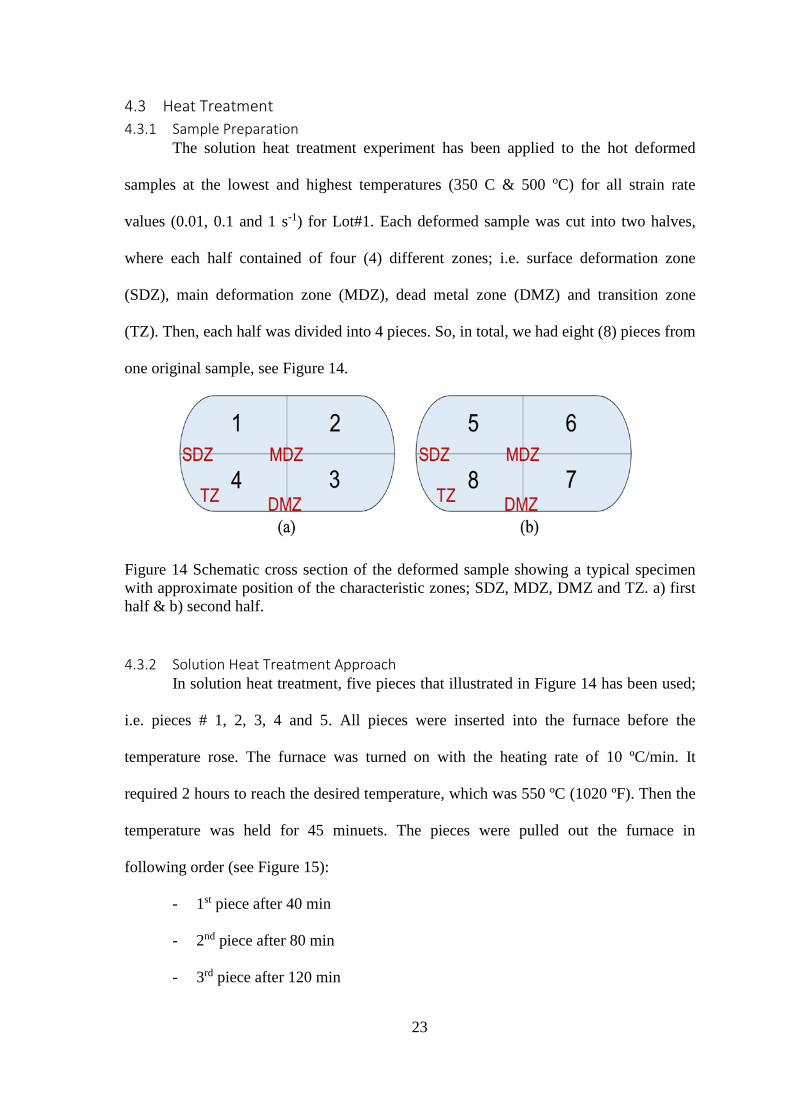
4.3.1 Sample Preparation The solution heat treatment experiment has been applied to the hot deformed
samples at the lowest and highest temperatures (350 C & 500 oC) for all strain rate
values (0.01, 0.1 and 1 s-1) for Lot#1. Each deformed sample was cut into two halves,
where each half contained of four (4) different zones; i.e. surface deformation zone
(SDZ), main deformation zone (MDZ), dead metal zone (DMZ) and transition zone
(TZ). Then, each half was divided into 4 pieces. So, in total, we had eight (8) pieces from
one original sample, see Figure 14.
Figure 14 Schematic cross section of the deformed sample showing a typical specimen
with approximate position of the characteristic zones; SDZ, MDZ, DMZ and TZ. a) first
half & b) second half.
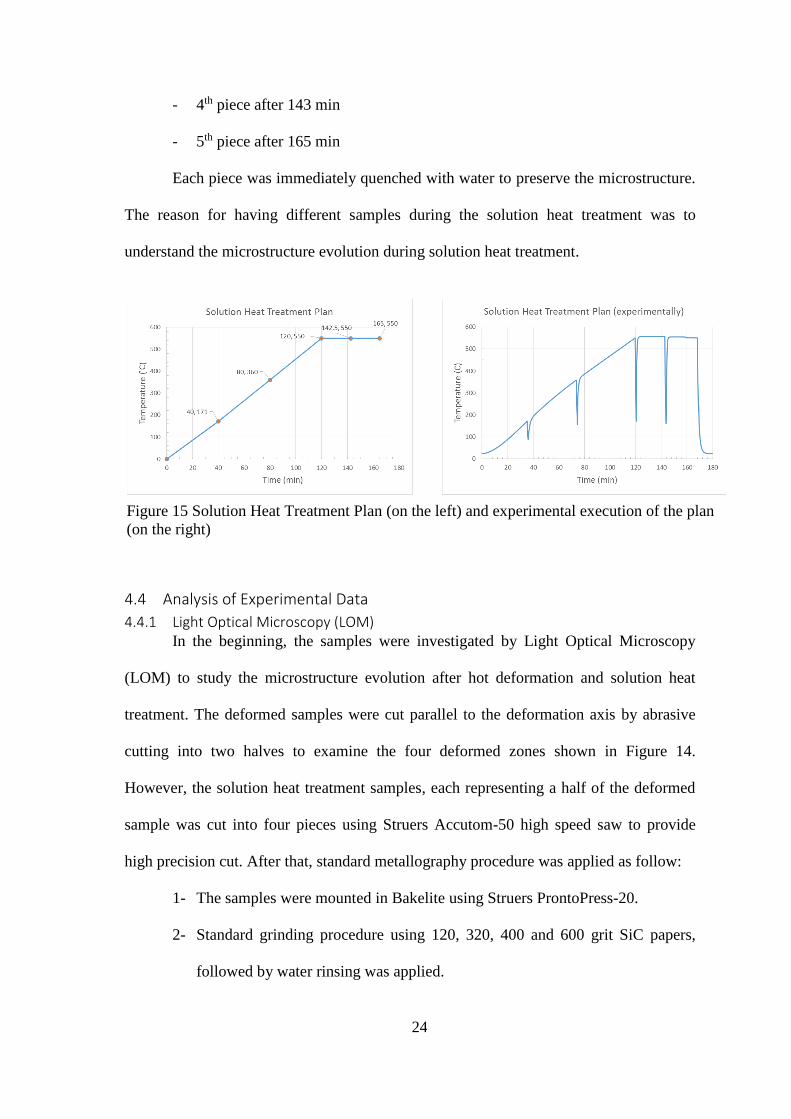
4.3.2 Solution Heat Treatment Approach In solution heat treatment, five pieces that illustrated in Figure 14 has been used;
i.e. pieces # 1, 2, 3, 4 and 5. All pieces were inserted into the furnace before the
temperature rose. The furnace was turned on with the heating rate of 10 ºC/min. It
required 2 hours to reach the desired temperature, which was 550 ºC (1020 ºF). Then the
temperature was held for 45 minuets. The pieces were pulled out the furnace in
following order (see Figure 15):
- 1st piece after 40 min
- 2nd piece after 80 min
- 3rd piece after 120 min
24
- 4th piece after 143 min
- 5th piece after 165 min
Each piece was immediately quenched with water to preserve the microstructure.
The reason for having different samples during the solution heat treatment was to
understand the microstructure evolution during solution heat treatment.
4.4 Analysis of Experimental Data
4.4.1 Light Optical Microscopy (LOM) In the beginning, the samples were investigated by Light Optical Microscopy
(LOM) to study the microstructure evolution after hot deformation and solution heat
treatment. The deformed samples were cut parallel to the deformation axis by abrasive
cutting into two halves to examine the four deformed zones shown in Figure 14.
However, the solution heat treatment samples, each representing a half of the deformed
sample was cut into four pieces using Struers Accutom-50 high speed saw to provide
high precision cut. After that, standard metallography procedure was applied as follow:
1- The samples were mounted in Bakelite using Struers ProntoPress-20.
2- Standard grinding procedure using 120, 320, 400 and 600 grit SiC papers,
followed by water rinsing was applied.
Figure 15 Solution Heat Treatment Plan (on the left) and experimental execution of the plan
(on the right)
25
3- Then polishing using 6 µm diamond and 3 µm, 1 µm and 0.05 µm colloidal
silica was done. After each step the samples were rinsed with ethanol and air
dried.
After the samples were metallography prepared, they were etched using Keller’s
(190 mL water, 5 mL HNO3, 3 mL HCl, 2 mL HF). The samples were immersed with
face up in the etchant for approximately 2 – 3 minutes. Then, they were rinsed with
water then ethanol and dried with warm air.
The microstructure was studied by Olympus BH2 microscope under different
magnifications; 50, 100, 200 and 400x. The images were recorded by attached digital
camera PAXcam5 and using Paxit image acquisition software.
4.4.2 Scanning Electron Microscope (SEM) and Electron Backscatter Diffraction (EBSD) The samples for the SEM analysis were prepared using metallographic standard
procedure as described above. In addition, ion milling was used after final polishing with
colloidal silica in a vibratory polisher. Due to the softness of the AA6099, it is hard to
obtain smooth surface with traditional polishing techniques. Because of that, the Hitachi
IM4000 Ion Milling System was used to enhance the polishing quality. After many tries
and errors with the ion milling system, the best polishing conditions were established and
used. The best-developed parameters of ion milling are listed below:
- Swing angle - 360 º
- Tilt angle - 80 º
- Eccentricity - 5 mm
- Gas flow rate - 0.1 cm3/min
- Accelerating voltage - 2.5 V
- Time - 15 minutes
Then the samples were coated with Iridium (Ir) to achieve a few Angstroms thick
film. This coating is needed to improve the imaging of sample surface. Also, this
26
technique creates a conductive layer, which prevents charging, reduces thermal damage
and improves the secondary electron signal.
For SEM imaging, the backscattered electron (SEM-BSE) technique was used
which shows the different elements present in a sample. The setup for SEM-BSE was:
- Accelerating voltage - 10 kV
- Gun Brightness - 3
- Aperture size - 2
- Condense lens – 11 (moderate current flow)
For EBSD analysis the setup was different since more current flow was needed to
acquire more signals. Thus, the SEM setup for EBSD analysis was selected as follows:
- Accelerating voltage - 20 kV
- Gun Brightness - 5
- Aperture size - 1
- Condense lens – 1 (high current flow)
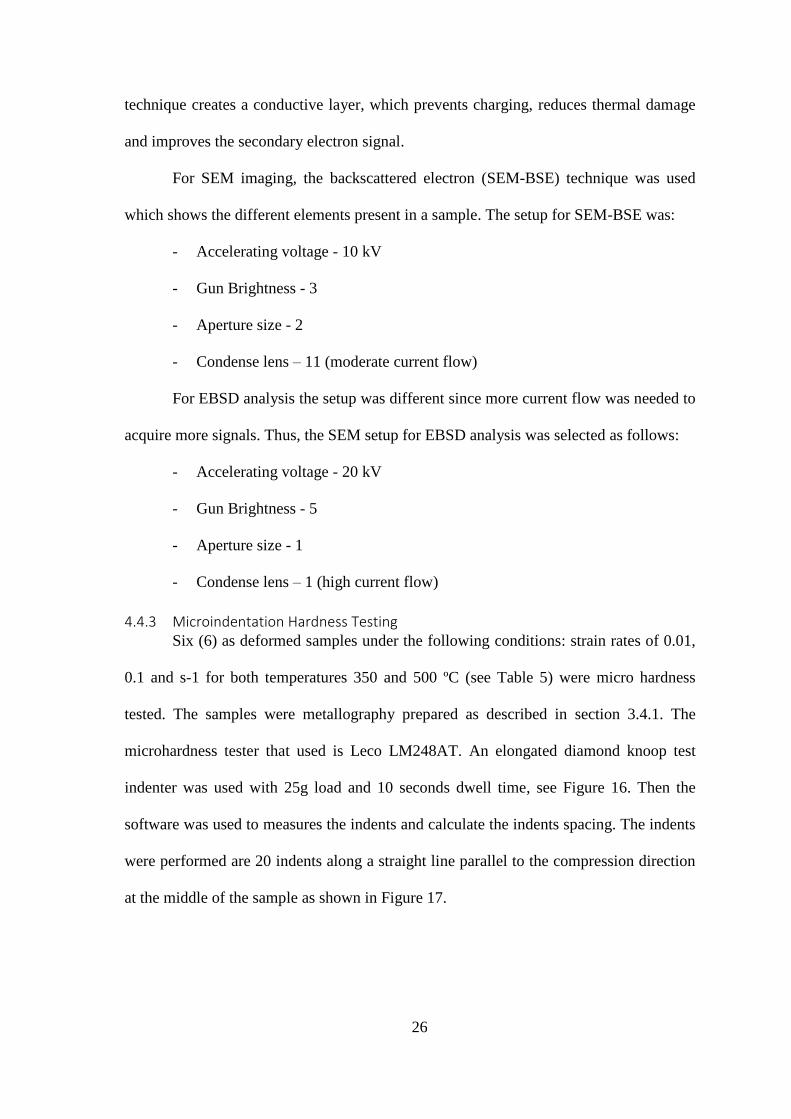
4.4.3 Microindentation Hardness Testing Six (6) as deformed samples under the following conditions: strain rates of 0.01,
0.1 and s-1 for both temperatures 350 and 500 ºC (see Table 5) were micro hardness
tested. The samples were metallography prepared as described in section 3.4.1. The
microhardness tester that used is Leco LM248AT. An elongated diamond knoop test
indenter was used with 25g load and 10 seconds dwell time, see Figure 16. Then the
software was used to measures the indents and calculate the indents spacing. The indents
were performed are 20 indents along a straight line parallel to the compression direction
at the middle of the sample as shown in Figure 17.
27
Figure 16 Schematic of the Knoop indenter and the shape of an impression. [20]
Figure 17 A deformed sample image shows the 20 indents along the red line.
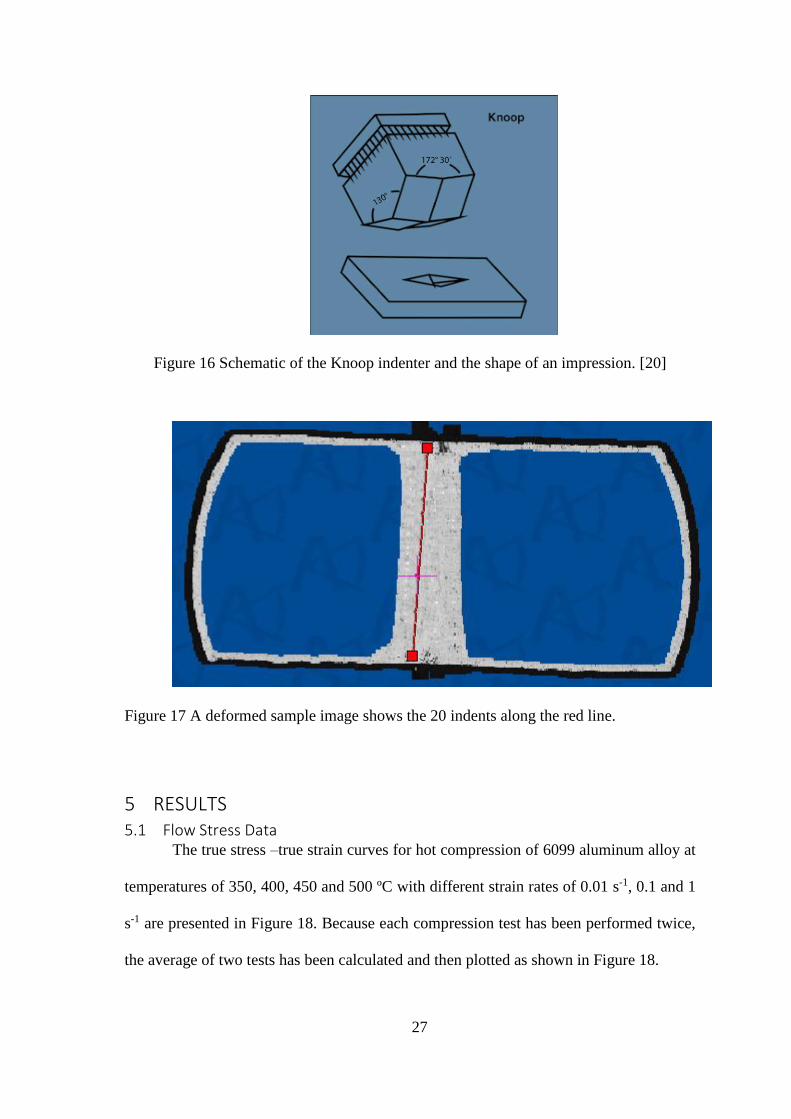
5 RESULTS 5.1 Flow Stress Data
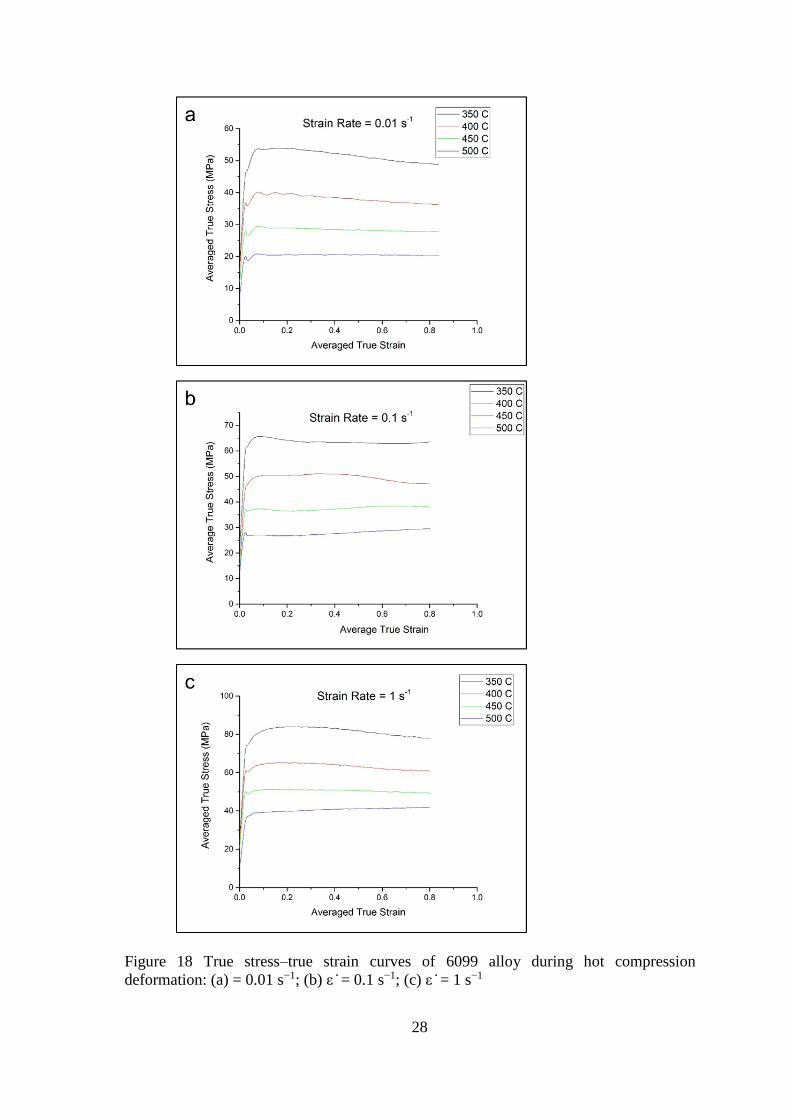
The true stress –true strain curves for hot compression of 6099 aluminum alloy at
temperatures of 350, 400, 450 and 500 ºC with different strain rates of 0.01 s-1, 0.1 and 1
s-1 are presented in Figure 18. Because each compression test has been performed twice,
the average of two tests has been calculated and then plotted as shown in Figure 18.
28
Figure 18 True stress–true strain curves of 6099 alloy during hot compression
deformation: (a) = 0.01 s−1; (b) ε ̇ = 0.1 s−1; (c) ε ̇ = 1 s−1
29
5.2 LOM Microstructure
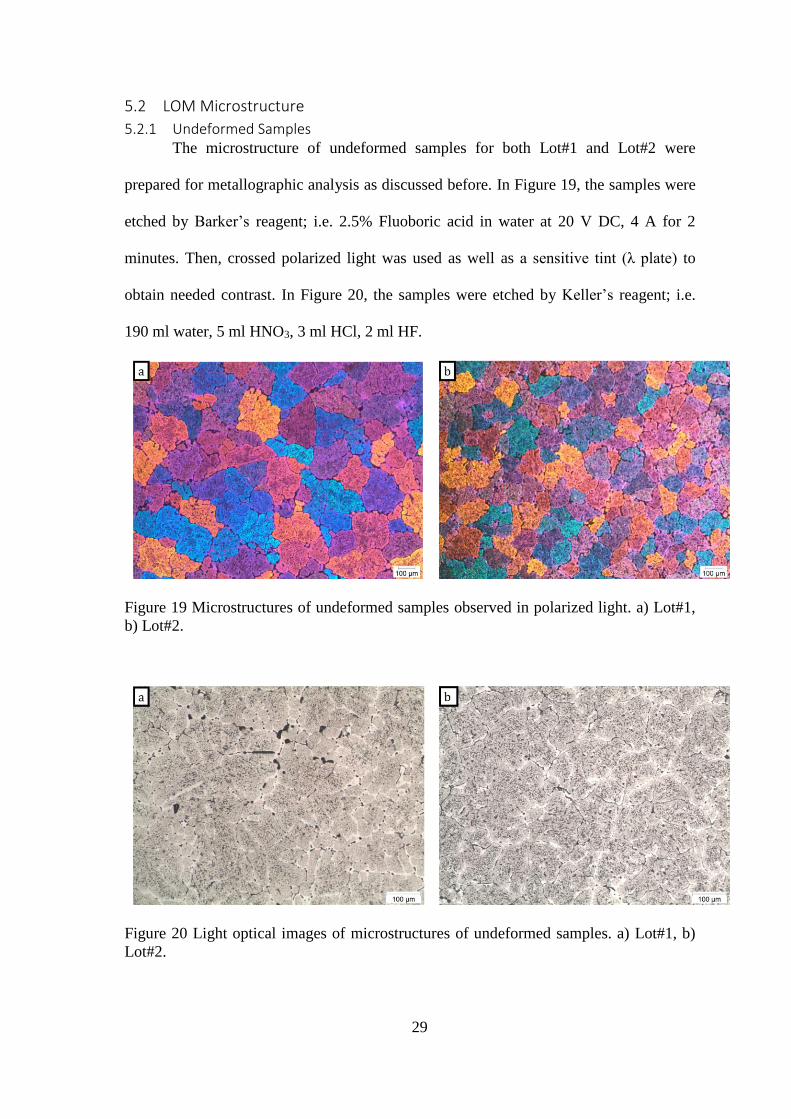
5.2.1 Undeformed Samples The microstructure of undeformed samples for both Lot#1 and Lot#2 were
prepared for metallographic analysis as discussed before. In Figure 19, the samples were
etched by Barker’s reagent; i.e. 2.5% Fluoboric acid in water at 20 V DC, 4 A for 2
minutes. Then, crossed polarized light was used as well as a sensitive tint (λ plate) to
obtain needed contrast. In Figure 20, the samples were etched by Keller’s reagent; i.e.
190 ml water, 5 ml HNO3, 3 ml HCl, 2 ml HF.
Figure 19 Microstructures of undeformed samples observed in polarized light. a) Lot#1,
b) Lot#2.
Figure 20 Light optical images of microstructures of undeformed samples. a) Lot#1, b)
Lot#2.

30
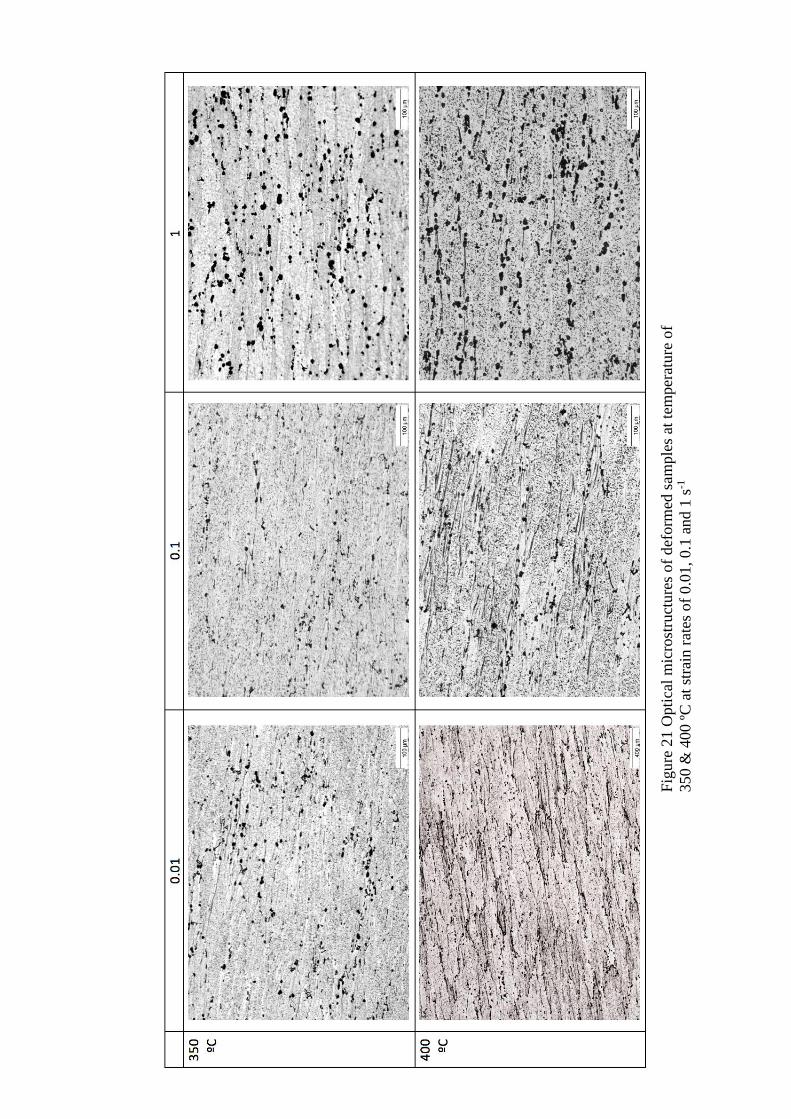
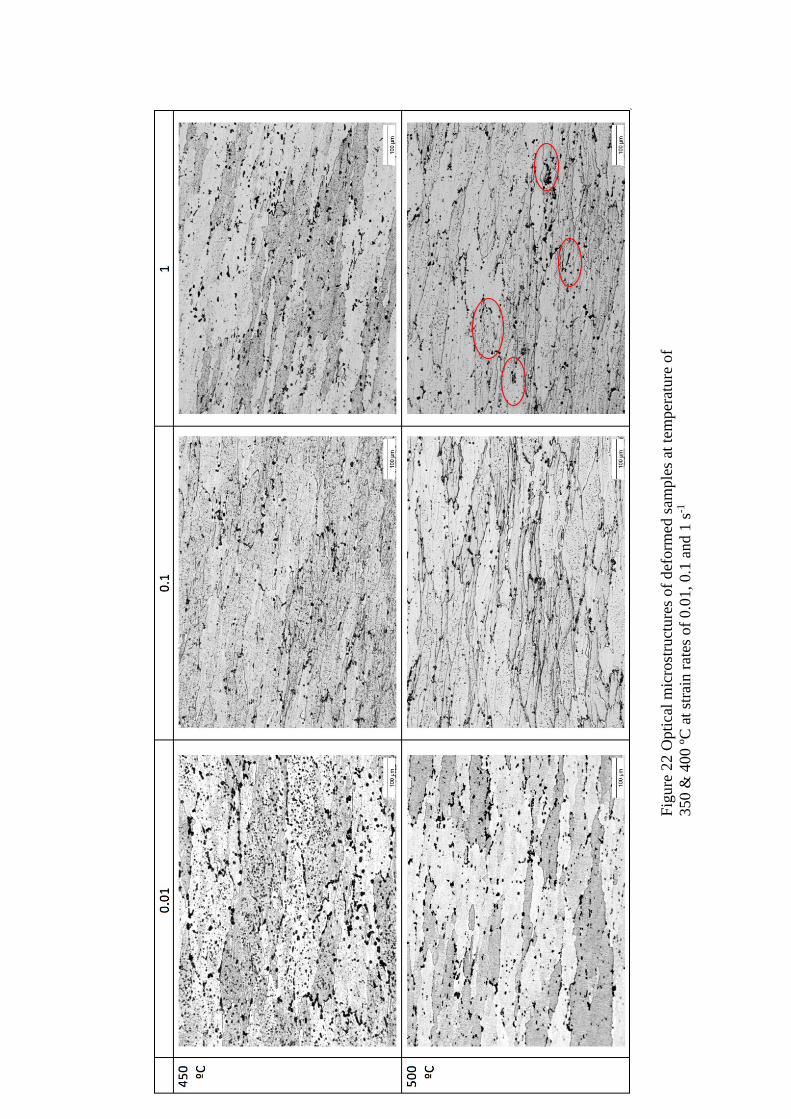
5.2.2 Hot Deformed Samples The hot deformed samples were metallurgy prepared as explained in section 3.4.1
then etched by Keller’s reagent. Figure 21 and Figure 22 summarized all the
microstructure of hot deformed samples.
31
Fig
ure
21 O
pti
cal
mic
rost
ruct
ure
s of
def
orm
ed s
ample
s at
tem
per
ature
of
350 &
400 º
C a
t st
rain
rat
es o
f 0.0
1, 0.1
and 1
s-1
32
Fig
ure
22 O
pti
cal
mic
rost
ruct
ure
s of
def
orm
ed s
ample
s at
tem
per
ature
of
350 &
400 º
C a
t st
rain
rat
es o
f 0.0
1, 0.1
and 1
s-1

33
5.2.3 Solution Heat Treated Samples In the performed solution heat treatment, the specimens were heated to about 550
ºC. This temperature was enough to dissolve significant amount of the alloying element
into the solid solution. Then, the samples were rapidly quenched to room temperature.
This created supersaturated solid solution where the alloying elements are in the solution
of the matrix phase. [21]
The following figures represent the micrographs for all solution heat treated
samples as follow:
- Figure 23 to Figure 30 shows the results of strain rate of 0.01 s-1,
- Figure 31 to Figure 34 shows the results of strain rate of 0.1 s-1;
- Figure 35 to Figure 42 shows the results of strain rate of 1 s-1.

34
Figure 23 Optical microstructures of solution heat treated samples deformed at
temperature of 350 and strain rate of 0.01 s-1 at SDZ position. a) after 40 min, b) after 80
min, c) after 120 min, d) after 143 min and e) after 165 min.
e
a
d c
b
35
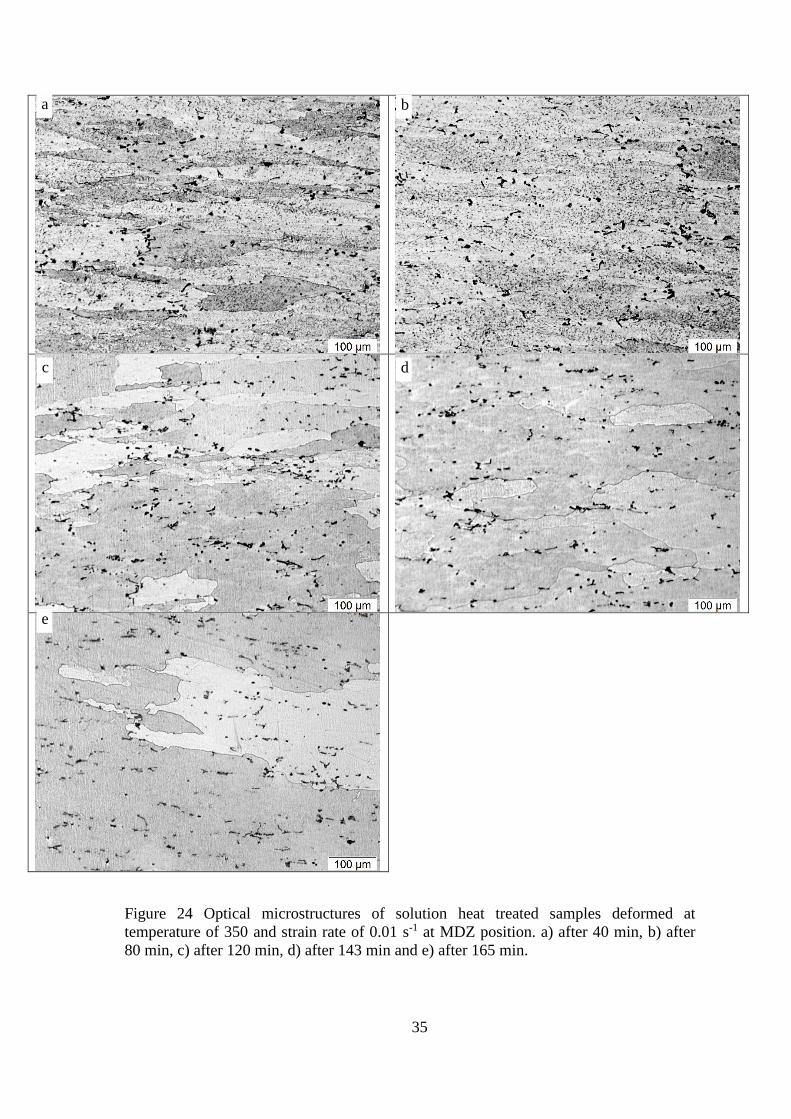
Figure 24 Optical microstructures of solution heat treated samples deformed at
temperature of 350 and strain rate of 0.01 s-1 at MDZ position. a) after 40 min, b) after
80 min, c) after 120 min, d) after 143 min and e) after 165 min.
e
a
d c
b
36
Figure 25 Optical microstructures of solution heat treated samples deformed at
temperature of 350 and strain rate of 0.01 s-1 at DMZ position. a) after 40 min, b) after
80 min, c) after 120 min, d) after 143 min and e) after 165 min.
e
a
d c
b
37
Figure 26 Optical microstructures of solution heat treated samples deformed at
temperature of 350 and strain rate of 0.01 s-1 at TZ position. a) after 40 min, b) after 80
min, c) after 120 min, d) after 143 min and e) after 165 min.
e
a
d c
b
38
Figure 27 Optical microstructures of solution heat treated samples deformed at
temperature of 500 and strain rate of 0.01 s-1 at SDZ position. a) after 40 min, b) after 80
min, c) after 120 min, d) after 143 min and e) after 165 min.
e
a
d c
b
39
Figure 28 Optical microstructures of solution heat treated samples deformed at
temperature of 500 and strain rate of 0.01 s-1 at MDZ position. a) after 40 min, b) after
80 min, c) after 120 min, d) after 143 min and e) after 165 min.
e
a
d c
b
40
Figure 29 Optical microstructures of solution heat treated samples deformed at
temperature of 500 and strain rate of 0.01 s-1 at DMZ position. a) after 120 min, b) after
143 min and c) after 165 min.
e
a
d c
b
41
Figure 30 Optical microstructures of solution heat treated samples deformed at
temperature of 500 and strain rate of 0.01 s-1 at TZ position. a) after 120 min, b) after
143 min and c) after 165 min.
e
a
d c
b

42
Figure 31 Optical microstructures of solution heat treated samples deformed at
temperature of 350 and strain rate of 0.1 s-1 at MDZ position. a) after 120 min, b) after
143 min and c) after 165 min.
a
c
b
43
Figure 32 Optical microstructures of solution heat treated samples deformed at
temperature of 350 and strain rate of 0.1 s-1 at DMZ position. a) after 120 min, b) after
143 min and c) after 165 min.
a
c
b
44
Figure 33 Optical microstructures of solution heat treated samples deformed at
temperature of 500 and strain rate of 0.1 s-1 at MDZ position. a) after 40 min, b) after 80
min, c) after 120 min, d) after 143 min and e) after 165 min.
a
c
b

45
Figure 34 Optical microstructures of solution heat treated samples deformed at
temperature of 500 and strain rate of 0.1 s-1 at DMZ position. a) after 40 min, b) after 80
min, c) after 120 min, d) after 143 min and e) after 165 min.
a
c
b
46
Figure 35 Optical microstructures of solution heat treated samples deformed at
temperature of 350 and strain rate of 1 s-1 at SDZ position. a) after 40 min, b) after 80
min, c) after 120 min, d) after 143 min and e) after 165 min.
e
a
d c
b
47
Figure 36 Optical microstructures of solution heat treated samples deformed at
temperature of 350 and strain rate of 1 s-1 at DMZ position. a) after 40 min, b) after 80
min, c) after 120 min, d) after 143 min and e) after 165 min.
e
a
d c
b
48
Figure 37 Optical microstructures of solution heat treated samples deformed at
temperature of 350 and strain rate of 1 s-1 at DMZ position. a) after 40 min, b) after 80
min, c) after 120 min, d) after 143 min and e) after 165 min.
e
a
d c
b
49
Figure 38 Optical microstructures of solution heat treated samples deformed at
temperature of 350 and strain rate of 1 s-1 at TZ position. a) after 40 min, b) after 80 min,
c) after 120 min, d) after 143 min and e) after 165 min.
e
a
d c
b
50
Figure 39 Optical microstructures of solution heat treated samples deformed at
temperature of 500 and strain rate of 1 s-1 at SDZ position. a) after 40 min, b) after 80
min, c) after 120 min, d) after 143 min and e) after 165 min.
e
a
d c
b
51
Figure 40 Optical microstructures of solution heat treated samples deformed at
temperature of 500 and strain rate of 1 s-1 at MDZ position. a) after 40 min, b) after 80
min, c) after 120 min, d) after 143 min and e) after 165 min.
e
a
d c
b
52
Figure 41 Optical microstructures of solution heat treated samples deformed at
temperature of 500 and strain rate of 1 s-1 at DMZ position. a) after 40 min, b) after 80
min, c) after 120 min, d) after 143 min and e) after 165 min.
e
a
d c
b
53
Figure 42 Optical microstructures of solution heat treated samples deformed at
temperature of 500 and strain rate of 1 s-1 at TZ position. a) after 40 min, b) after 80 min,
c) after 120 min, d) after 143 min and e) after 165 min.
e
a
d c
b
54
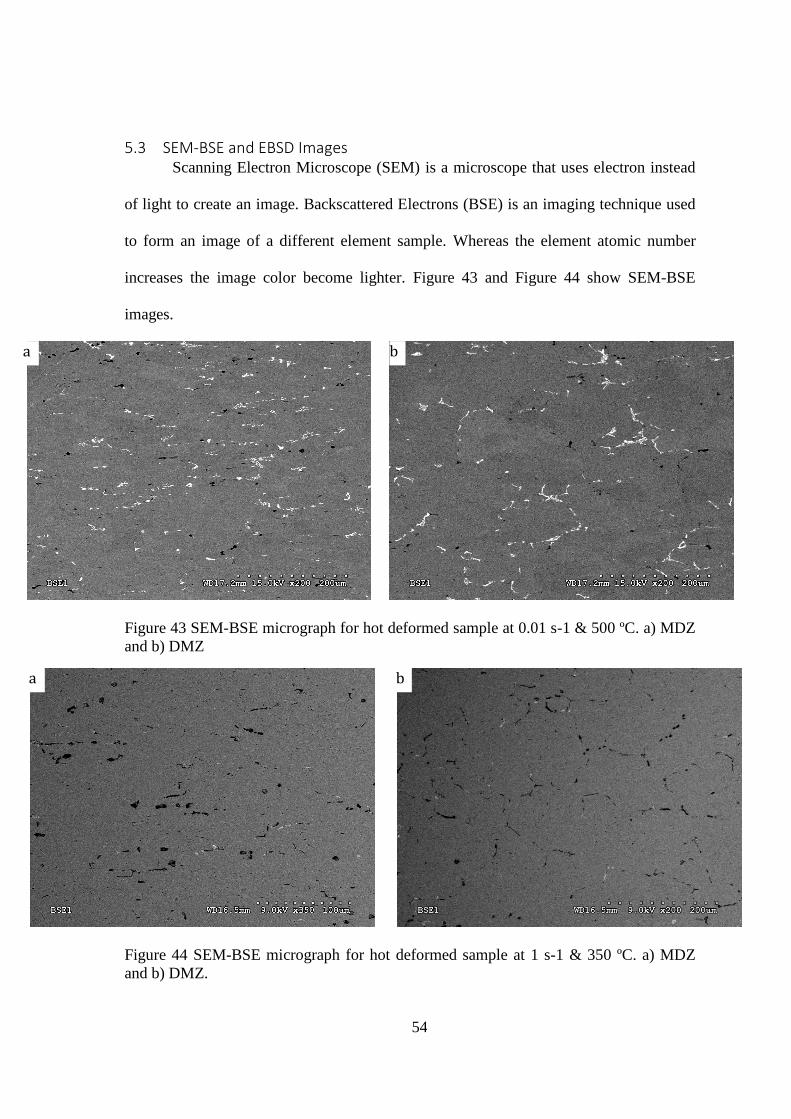
5.3 SEM-BSE and EBSD Images Scanning Electron Microscope (SEM) is a microscope that uses electron instead
of light to create an image. Backscattered Electrons (BSE) is an imaging technique used
to form an image of a different element sample. Whereas the element atomic number
increases the image color become lighter. Figure 43 and Figure 44 show SEM-BSE
images.
Figure 43 SEM-BSE micrograph for hot deformed sample at 0.01 s-1 & 500 ºC. a) MDZ
and b) DMZ
Figure 44 SEM-BSE micrograph for hot deformed sample at 1 s-1 & 350 ºC. a) MDZ
and b) DMZ.
a b
a b

55
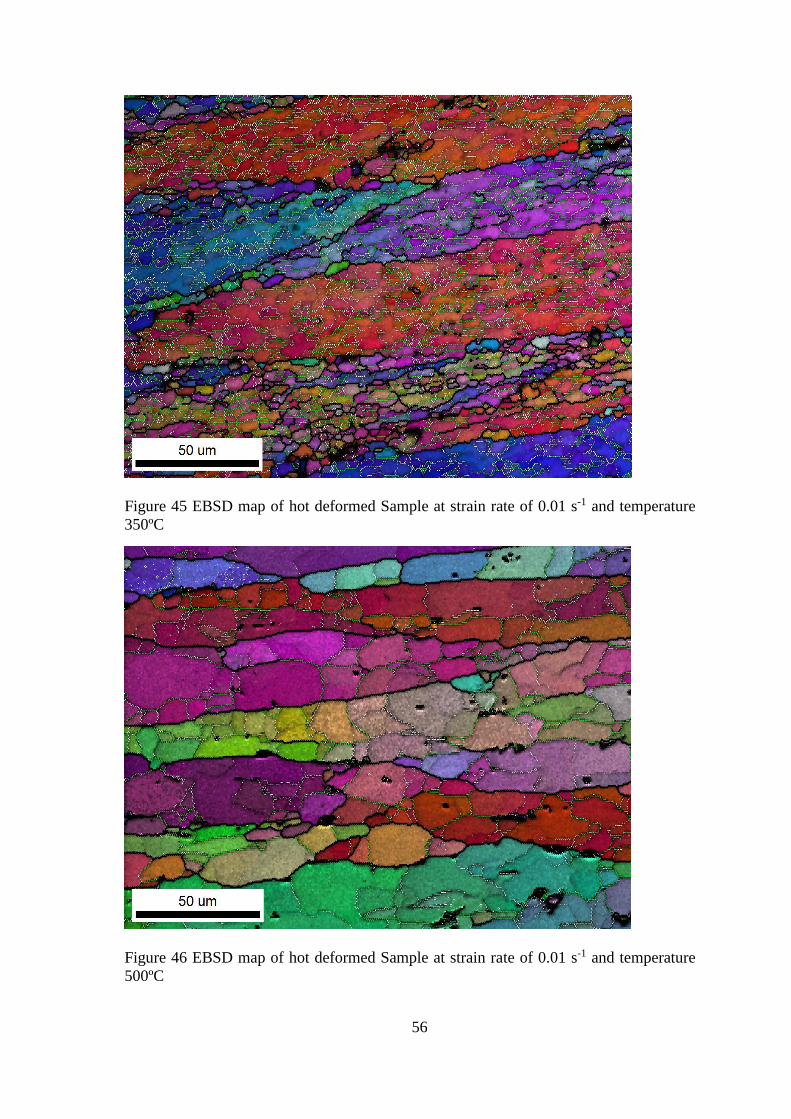
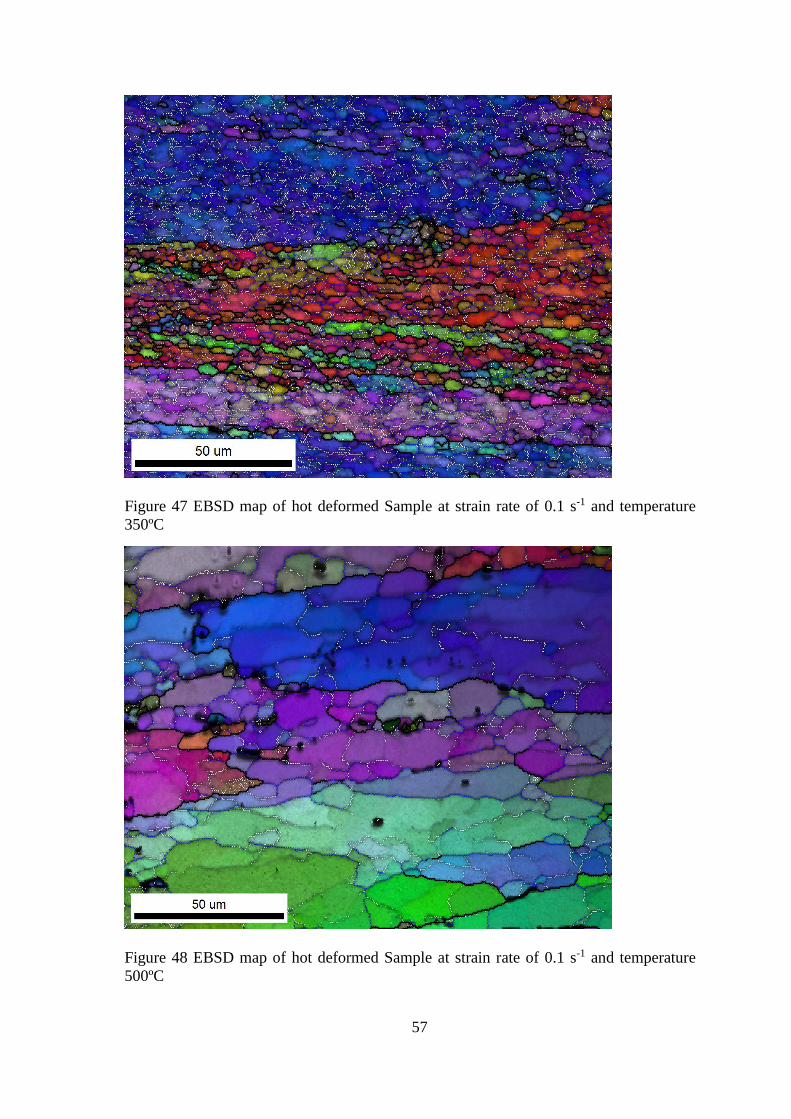
Electron backscatter diffraction (EBSD) is another technique used in SEM to
study microstructural-crystallographic characterization. “EBSD provides quantitative
microstructural information about the crystallographic nature of metals, minerals,
semiconductors, and ceramics—in fact most inorganic crystalline materials. It reveals
grain size, grain boundary character, grain orientation, texture, and phase identity of the
sample under the beam”. [22] Figures from 45 to 50 present the EBSD maps for hot
deformed samples at temperatures of 350 and 500 ºC for strain rates of 0.01, 0.1 and 1 s-
1.
56
Figure 45 EBSD map of hot deformed Sample at strain rate of 0.01 s-1 and temperature
350ºC
Figure 46 EBSD map of hot deformed Sample at strain rate of 0.01 s-1 and temperature
500ºC
57
Figure 47 EBSD map of hot deformed Sample at strain rate of 0.1 s-1 and temperature
350ºC
Figure 48 EBSD map of hot deformed Sample at strain rate of 0.1 s-1 and temperature
500ºC

58
Figure 49 EBSD map of hot deformed Sample at strain rate of 1 s-1 and temperature
350ºC
Figure 50 EBSD map of hot deformed Sample at strain rate of 1 s-1 and temperature
500ºC
59
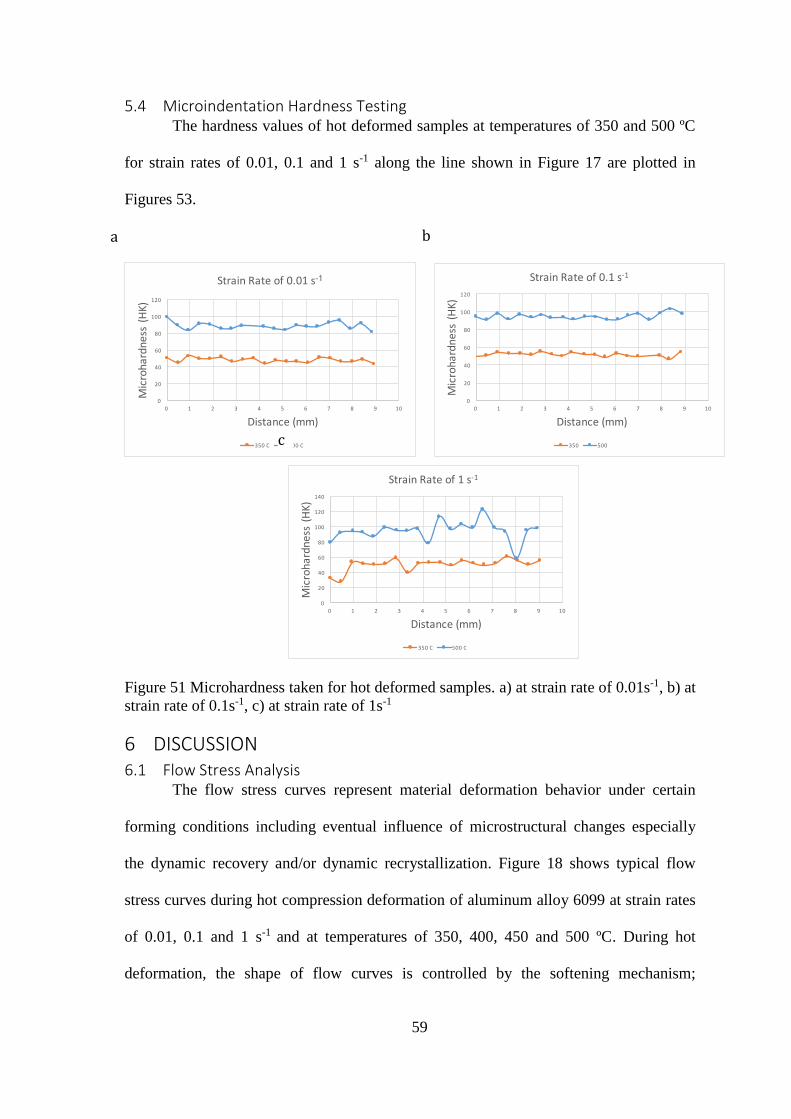
5.4 Microindentation Hardness Testing The hardness values of hot deformed samples at temperatures of 350 and 500 ºC
for strain rates of 0.01, 0.1 and 1 s-1 along the line shown in Figure 17 are plotted in
Figures 53.
Figure 51 Microhardness taken for hot deformed samples. a) at strain rate of 0.01s-1, b) at
strain rate of 0.1s-1, c) at strain rate of 1s-1
6 DISCUSSION 6.1 Flow Stress Analysis
The flow stress curves represent material deformation behavior under certain
forming conditions including eventual influence of microstructural changes especially
the dynamic recovery and/or dynamic recrystallization. Figure 18 shows typical flow
stress curves during hot compression deformation of aluminum alloy 6099 at strain rates
of 0.01, 0.1 and 1 s-1 and at temperatures of 350, 400, 450 and 500 ºC. During hot
deformation, the shape of flow curves is controlled by the softening mechanism;
a b
c

60
dynamic recrystallization and/or dynamic recovery. The flow stress curves and their
positions in Figure 18 depend on the temperature and strain rate. All the flow stress
curves show lower stress with increasing the deformation temperature and decreasing
strain rate. Under conditions of high temperature and low strain rate the flow stress
curves exhibit less work hardening and more softening mechanisms (DRX or DRV).
Increasing deformation temperature results in increase in thermal energy, which
offsets the work hardening and overcome the energy barriers for dislocation movement.
Consequently, the dislocation density is reduced due to the enhanced dislocation
movement and their annihilation at grain boundaries. Thus, increasing deformation
temperature reduces the stress level and increases the dynamic softening rate since the
dislocation movement resistance is reduced. In addition, decreasing strain rate results in
less dislocation multiplication rate and increases the dislocation movement due to the
decreasing of the tangled dislocation structures, which work as barriers for dislocation
movement. Also, more time is provided for proceeding of dislocation polygonising thus
the dynamic softening is increased and the stress level is reduced.[23],[24], [25]
All the flow curves show an initial rapid increase of stress with increased strain
followed by slightly lower increase or its constant value or in some cases decrease of
stress with strain. In the initial deformation region, the dislocations multiplied fast with
increasing strain. Within this region, the work handing is a predominant mechanism and
it results in a higher stress. The flow stress keeps increasing till it reaches the critical
strain at the peak stress. Then, the flow will follow one of the following behaviors:
- The flow curve decreases when the dynamic softening rate is higher than the
work hardening as it is observed at strain rate of 0.01, 1 s-1 and temperatures
of 350,400 ºC, see Figure 18 a, c.
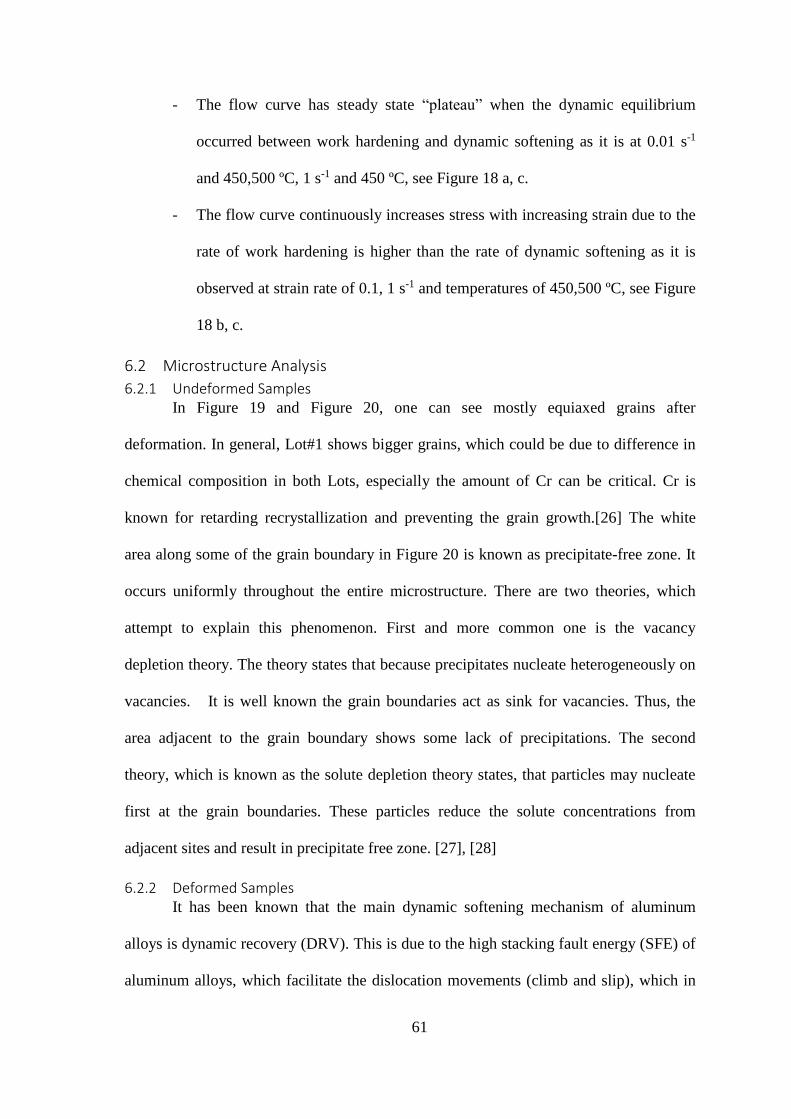
61
- The flow curve has steady state “plateau” when the dynamic equilibrium
occurred between work hardening and dynamic softening as it is at 0.01 s-1
and 450,500 ºC, 1 s-1 and 450 ºC, see Figure 18 a, c.
- The flow curve continuously increases stress with increasing strain due to the
rate of work hardening is higher than the rate of dynamic softening as it is
observed at strain rate of 0.1, 1 s-1 and temperatures of 450,500 ºC, see Figure
18 b, c.
6.2 Microstructure Analysis
6.2.1 Undeformed Samples In Figure 19 and Figure 20, one can see mostly equiaxed grains after
deformation. In general, Lot#1 shows bigger grains, which could be due to difference in
chemical composition in both Lots, especially the amount of Cr can be critical. Cr is
known for retarding recrystallization and preventing the grain growth.[26] The white
area along some of the grain boundary in Figure 20 is known as precipitate-free zone. It
occurs uniformly throughout the entire microstructure. There are two theories, which
attempt to explain this phenomenon. First and more common one is the vacancy
depletion theory. The theory states that because precipitates nucleate heterogeneously on
vacancies. It is well known the grain boundaries act as sink for vacancies. Thus, the
area adjacent to the grain boundary shows some lack of precipitations. The second
theory, which is known as the solute depletion theory states, that particles may nucleate
first at the grain boundaries. These particles reduce the solute concentrations from
adjacent sites and result in precipitate free zone. [27], [28]
6.2.2 Deformed Samples It has been known that the main dynamic softening mechanism of aluminum
alloys is dynamic recovery (DRV). This is due to the high stacking fault energy (SFE) of
aluminum alloys, which facilitate the dislocation movements (climb and slip), which in
62
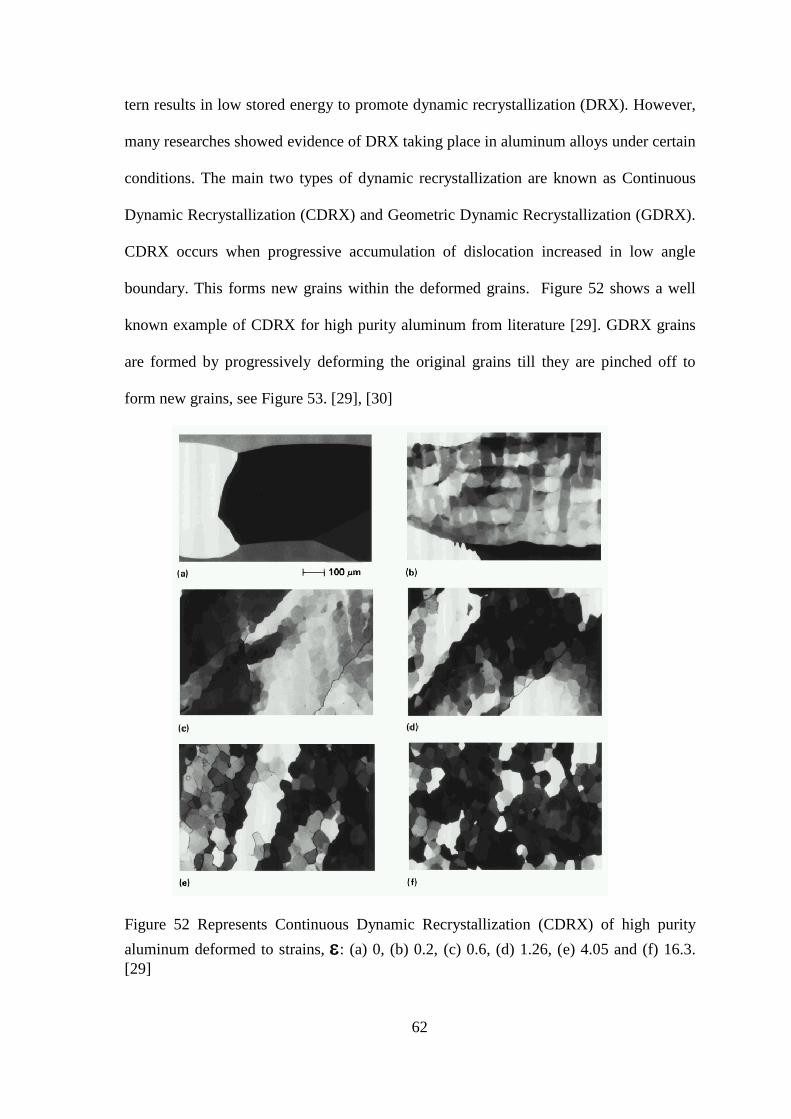
tern results in low stored energy to promote dynamic recrystallization (DRX). However,
many researches showed evidence of DRX taking place in aluminum alloys under certain
conditions. The main two types of dynamic recrystallization are known as Continuous
Dynamic Recrystallization (CDRX) and Geometric Dynamic Recrystallization (GDRX).
CDRX occurs when progressive accumulation of dislocation increased in low angle
boundary. This forms new grains within the deformed grains. Figure 52 shows a well
known example of CDRX for high purity aluminum from literature [29]. GDRX grains
are formed by progressively deforming the original grains till they are pinched off to
form new grains, see Figure 53. [29], [30]
Figure 52 Represents Continuous Dynamic Recrystallization (CDRX) of high purity
aluminum deformed to strains, : (a) 0, (b) 0.2, (c) 0.6, (d) 1.26, (e) 4.05 and (f) 16.3.
[29]

63
Figure 53 When the grains are elongated and thinned extremely, they pinch off where
opposite serrations meet. This illustrate Geometric Dynamic Recrystallization (GDRX).
[29]
Figure 21 and Figure 22 show optical micrographs of the microstructure of
deformed samples at strain rate of 0.01, 0.1 and 1 s-1 and temperature of 350, 400 ºC in
Figure 21 and 450, 500 ºC in Figure 22. In general, the optical microstructure images are
not very clear because aluminum alloys are difficult to be metallographically prepared.
Due the softness of the aluminum alloys and the different hardness between the matrix
and intermetallics, it is challenging to reach the mirror finish surface in the polishing
processes. Also, some of the hard intermetallics and other second phases are pulled out
during grinding and/or polishing which results in voids, which look like overetched
microstructure under the microscope but they are not. In addition, during etching
process, other imperfection such as: etching pits and grain etching steps; due to uneven
etching (chemical) attack to the polished surface could be formed as well. Etching pits
occur due to different etching rate between the different phases in the alloy. In addition,
grain etching steps exist due the different crystal orientation of each grain where each

64
plane is etched differentially and resulting in different light reflections and therefore
colors under the microscope. [31], [32]
All optical images of microstructure were taken from the MDZ where elongated
grains are observed in perpendicular to the compression direction. The grain boundaries
are more pronounced as the temperature increases and the strain rate decreases. With
increasing the temperature, the grain size increase and the microstructure become less
homogenous. As the temperature increases or strain rate decreases some recrystallized
grains were observed. At deformation conditions of 500ºC and 1 s-1 some grains are
observed as severely elongated and broken into smaller grains as the result of the high
energy forming under the conditions of the high strain rate and high temperature, see the
marked ovals at Figure 22. This is an evidence of the presence of geometric dynamic
recrystallization (GDRX) mechanism.
6.2.3 Solution Heat Treated Samples During the solution heat treatment, most of the alloying elements are dissolved in
a solid solution then quenched to prevent the alloying elements from precipitating out of
the matrix while cooling. This heat treatment conditions form a solid solution of all the
alloying elements. The optical images of microstructure and grain boundaries become
more recognizable as seen in Figures from 23 to 42.
In general, all images of microstructures obtained under different strain rates
show similar trend for identical temperature and locations. In other words, the
microstructure of SDZ, MDZ, DMZ and TZ after 40 minutes at strain rate of 0.01 s-1 are
comparable to the equivalent images at strain rate of 0.1 and 1 s-1. No significant changes
in microstructure were captured after 40 and 80 minutes samples at strain rate of 0.01
and 1 s-1. So, it has been decided that only MDZ and DMZ were examined at strain rate
of 0.1 s-1 in samples after 120, 143 and 165 minutes of solution heat treatment.
65
One can observe in Figures from 23 to 42 that increasing the solution heat
treatment temperature increased the grains size and the dissolved alloying elements in
the matrix. On the other hand, as the strain rates increased the grains size decreased due
to less time available for grain growth. After applying solution heat treatment; i.e. in
samples after 165 minutes, the SDZ and TZ microstructures show elongated grains to
some extent with some small grains. At MDZ, the grains are severely elongated with
some small recrystallized grains present. DMZ samples show the cast microstructure as
expected.
In conclusion, solution heat treatment samples revealed some evidence of small
grains, which could be a result of geometric dynamic recrystallization (GDRX).
Additional microstructure analysis techniques, such as Electron Backscattering
Diffraction Technique (EBSD) were implemented to obtain more insight into the
microstructure evolution as it is discussed in the next section 6.3. Is this correct?
Shouldn’t it be 6.3?
6.3 BSE-SEM and EBSD Analysis Figures 43 and 44 show electron microscopy micrographs of selected deformed
sample. The grain boundaries can be distinguished by the presence of white and black
needle like intermetallic. The difference in the color is due to different atomic number of
elements and that is how the Backscattered Electrons technique works. The figures did
not reveal any images of recrystallized grains. It could be due insufficient metallography
preparation technique or because the same alloying elements exist in the matrix are
available in the grain boundaries, which makes it difficult to revel the grain boundary in
BSE-SEM.
Electron backscatter diffraction technique (EBSD) acquires the microstructure
near the sample surface by summing the orientation of each grain or subgrain. It is a
66
powerful tool for microstructure characterization specially to find misorientation angles
between neighboring grains and subgrains.
At strain rate of 0.01 s-1 and temperature 350ºC (Figure 45) some subgrains were
observed with mostly misorientation angles between 1- 5 º. Also, small equiaxed high
angle grain boundaries were observed as well as some elongated grains were observed.
This could be an evidence of partial continuous dynamic recrystallization (CDRX) for
the equiaxed high angle grain and GDRX for the elongated grains. As the temperature
increased to 500º (Figure 46), most of the subgrains were recovered and some of them
become grains likely due to GDRX. Also, some grain growth was observed for the
recrystallized grains.
Increasing the strain rate to 0.1 s-1 at temperature of 350ºC (Figure 47) resulted in
partial continuous dynamic recrystallized grains and subgrains. The amount of recovered
subgrains by increasing the temperature (500ºC) is higher and it results in grain growth
(Figure 48). Also, there is no clear evidence of recrystallization at 500ºC.
Figure 49 shows large amount of subgrains with misorientation angle from 1 – 5º
and less recrystallized grains. This is due the low energy and the high strain rate of 1 s-1,
which does not allow enough time for recrystallization. After increasing the temperature
to 500 ºC, the dominant softening mechanism here is dynamic recovery (DRV) along
with evidence of equiaxed and fragmented grains as result of CDRX and GDRX
respectively as shown in Figure 50.
To sum up, generally, at low temperature of 350 ºC and all strain rates, high
density of subgrains and partial recrystallized grains by GDRX or CDRX mechanisms
were observed. On the other hand, at high temperature of 500 ºC the dominant softening
mechanism is DRV. Some evidences of recrystallized grains were observed as the
energy increased; at strain rate of 0.1 and 1 s-1.
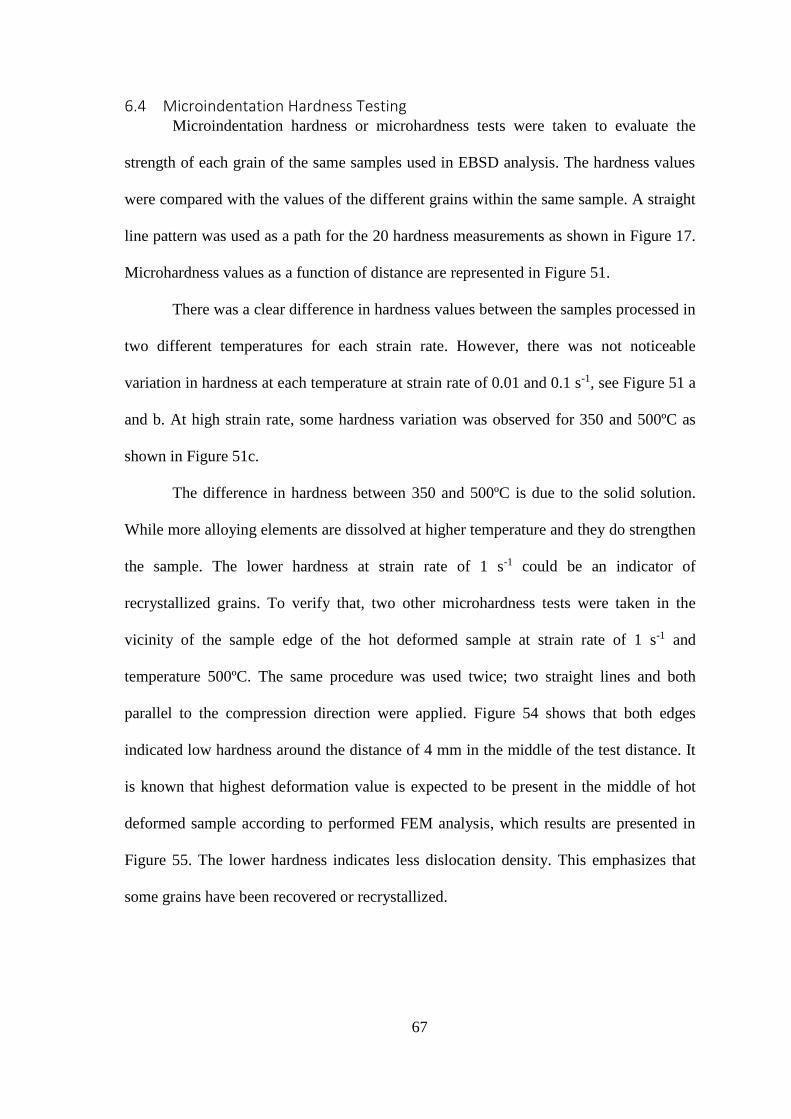
67
6.4 Microindentation Hardness Testing Microindentation hardness or microhardness tests were taken to evaluate the
strength of each grain of the same samples used in EBSD analysis. The hardness values
were compared with the values of the different grains within the same sample. A straight
line pattern was used as a path for the 20 hardness measurements as shown in Figure 17.
Microhardness values as a function of distance are represented in Figure 51.
There was a clear difference in hardness values between the samples processed in
two different temperatures for each strain rate. However, there was not noticeable
variation in hardness at each temperature at strain rate of 0.01 and 0.1 s-1, see Figure 51 a
and b. At high strain rate, some hardness variation was observed for 350 and 500ºC as
shown in Figure 51c.
The difference in hardness between 350 and 500ºC is due to the solid solution.
While more alloying elements are dissolved at higher temperature and they do strengthen
the sample. The lower hardness at strain rate of 1 s-1 could be an indicator of
recrystallized grains. To verify that, two other microhardness tests were taken in the
vicinity of the sample edge of the hot deformed sample at strain rate of 1 s-1 and
temperature 500ºC. The same procedure was used twice; two straight lines and both
parallel to the compression direction were applied. Figure 54 shows that both edges
indicated low hardness around the distance of 4 mm in the middle of the test distance. It
is known that highest deformation value is expected to be present in the middle of hot
deformed sample according to performed FEM analysis, which results are presented in
Figure 55. The lower hardness indicates less dislocation density. This emphasizes that
some grains have been recovered or recrystallized.

68
Figure 54 Microhardness taken for hot deformed sample at strain rate of 1s-1 and
temperature 500ºC.
Figure 55 FEM shows strain (deformation) distribution of the hot deformed sample. [20]
7 CONCLUSIONS The research objective of this project was to understand the microstructure
development of newly developed aluminum alloy 6099 during hot forging and
subsequent heat treatment process. The idea was to hot deform a small-scale samples
mimicking the industrial deformation condition on the thermo-mechanical simulator –
Gleeble 3500. The hot compression experiments have been performed at different strain
69
rates of 0.01, 0.1 and 1 s-1 and temperatures of 350, 400, 450 and 500 ºC. The
corresponding observation based on the results obtained from different characterization
techniques can be summarized as follow:
• Based on the performed hot compression studies the classical true stress –
true strain curves were obtained. In general, the flow stress increases with
decreasing deformation temperatures and/or increasing strain rate.
• All flow stress exhibited rapid increasing at the beginning of deformation
due to dislocation multiplication. Once the flow stress reached the peak
stress, some samples exhibited slight flow stress increase, some remained
unchanged with typical “plateau” behavior and some showed decrease in
stress.
• Micrographs obtained using the Light Optical Microscopy revealed
elongated grains in all hot deformed samples. As the temperature
increased or strain rate decreased, some recrystallized grains were
observed. Also, increasing the temperature and strain rate make the
microstructure became less homogenous and the grain size increased.
Sever or localized deformation conditions were seen at high strain rate of
1 s-1.
• During solution heat treatment of hot deformed samples, different
deformation zones were investigated and the results were listed for each
one:
o SDZ and TZ, the microstructures showed elongated grains with
some small grains as recrystallized grains.
70
o MDZ after 165 min, the grains have severely elongated with some
small grains as GDRX grains.
o DMZ, as cast microstructure.
• At high temperature (500 ℃), EBSD maps did not show any evidence of
recrystallized grain at strain rate of 0.01 s-1. However, some
GDRX/CDRX revealed at strain rate of 0.1 and 1 s-1. Thus, the dominant
softening mechanism seems to be the dynamic recovery (DRV) and
partial dynamic recrystallization at higher energy.
• Also, EBSD maps showed that partial GDRX or CDRX took place at low
temperature of 350 ℃ and strain rate of 0.01, 0.1 and 1s-1.
• In addition, some grain growth was observed at 500ºC compared to the
350ºC at all strain rates.
• Microhardness data did not reveal significant variation in mechanical
properties between samples processed at strain rate of 0.01 and 0.1 s-1.
However, some low hardness values were shown at strain rate of 1 s-1
supporting hypothesis that some recrystallized grains do occur, mainly at
high temperature where grain growth took place.
8 Future Work The performed research was not able to answer all the important scientific
questions. Future follow up studies can be suggested as follows;
• Develop a physical and numerical model by using the results of this
study.
• Force-stroke diagrams were captured and can be analyzed to get more
insight into the hot compression mechanisms.

71
• Experimental study can be performed on the effects of the adiabatic
heating during the hot compression tests at different temperatures and
stain rates.
• Understand and analyze the grain size changes with respect to different
isothermal holding time.
• Since aluminum alloys are sensitive to forging temperature, more hot
compression tests can be conducted at small temperature intervals
between 350 – 450 ºC.
• Transmission electron microscopy (TEM) can be used to identify the
dispersoids/precipitates, which inhibit recrystallization during hot
deformation and solution heat treatment. [33] Also, analyzing the
dislocation movements behavior to understand the softening mechanisms.
• Study the distribution of alloying elements within the grains by electro-
probe microanalyzer (EPMA).
72
REFERENCES
[1] H. Nagaumi, Y. Takeda, S. Pongsukiwat, and T. Umeda, “Hot Tear and its
Prevention of Irregular Near Net Shape D . C . Billet of High Strength Al-Mg-Si
Alloy.”
[2] Kalpakjian and Schmid, Manufacturing Engineering and Technology, 5th ed.
Pearson Education India, 2001.
[3] M. G. Rathi and N. a Jakhade, “An Overview of Forging Processes with Their
Defects,” Int. J. Sci. Res. Publ., vol. 4, no. 6, pp. 1–7, 2014.
[4] M. Hirscvogel and H. v. Dommelen, “Some applications of cold and warm
forging,” J. Mater. Process. Tech., vol. 35, no. 3–4, pp. 343–356, 1992.
[5] A. M. and R. N. K. Siegert, “Forging Alloys,” 1994.
[6] D. Siegert, K., Ringhand, “Designing of Forgings,” 1994.
[7] R. Palin, V. Johnston, S. Johnson, A. D’Hooge, B. Duncan, and J. I. Gargoloff,
“The Aerodynamic Development of the Tesla Model S - Part 1: Overview,” 2012.
[8] G. W. Kuhlman, “Forging of aluminum alloys.,” ASM Handb., vol. 14, pp. 241–
254, 1988.
[9] S. Semiatin, “ASM Handbook, Vol. 14: Forming and Forging,” ASM Int., vol. 14,
p. 483, 1993.
[10] “Ladish Preparing For World’s Largest Isothermal Press.” [Online]. Available:
http://forgingmagazine.com/feature/ladish-preparing-worlds-largest-isothermal-
press. [Accessed: 21-May-2017].
[11] “How are forgings produced | Forging Industry Association.” [Online]. Available:
https://www.forging.org/forging/how-are-forgings-produced.html. [Accessed: 21-
May-2017].
73
[12] J. Dossett and G. Totten, “Steel Heat Treating Fundamentals and Processes,”
2013.
[13] G. Weeks, “Aluminium car wheels: Manufacturing, materials & design
considerations,” no. 2012.
[14] “Alcoa Wheels North America -- Alcoa Wheel; Truck Wheels; Aluminum
Wheels; Lightweight Wheel.” [Online]. Available:
http://www.arconic.com/alcoawheels/north_america/en/info_page/home.asp.
[Accessed: 15-May-2017].
[15] “APP Forged Wheels & Center Discs.”
[16] S. J. Andersen, H. W. Zandbergen, J. Jansen, C. TrÆholt, U. Tundal, and O.
Reiso, “The crystal structure of the β″ phase in Al–Mg–Si alloys,” Acta Mater.,
vol. 46, no. 9, pp. 3283–3298, 1998.
[17] A. H. Geisler and J. K. Hill, “Analyses and Interpretations of X-ray Diffraction
Effects in Patterns of Aged Alloys,” Acta Crystallogr., vol. 1, pp. 233–252, 1948.
[18] C. D. Marioara, S. J. Andersen, J. Jansen, and H. W. Zandbergen, “Atomic model
for GP-zones in a 6082 Al-Mg-Si system,” Acta Mater., vol. 49, no. 2, pp. 321–
328, 2001.
[19] L. Preserve, “Claves , Steven R . Characterization and Analysis of the Localized
Deformation of 6xxx Aluminum Alloy Extrudates June 2002,” 2002.
[20] Courtesy of Nick Nanninga from Accuride. Received by private communication on
05/30/2016. .
[21] J. R. Davis, J. R. D. & Associates, and A. I. H. Committee, “Aluminum and
aluminum alloys,” p. 796, 1993.
[22] T. Maitland and S. Sitzman, “EBSD technique and materials characterization
examples.pdf,” Scanning Microsc. Nanotechnology. Tech. Appl., pp. 41–76, 2007.
74
[23] C. Shi, J. Lai, and X. Chen, “Microstructural Evolution and Dynamic Softening
Mechanisms of Al-Zn-Mg-Cu Alloy during Hot Compressive Deformation,” pp.
244–264, 2014.
[24] Q. Guo-zheng, “Characterization for Dynamic Recrystallization Kinetics Based on
Stress-Strain Curves,” Recent Dev. Study Recryst., pp. 61–64, 2013.
[25] E. McQueen, H. J., Spigarelli, S., Kassner, M. E., & Evangelista, Hot
Deformation and Processing of Aluminum Alloys, vol. 20111578. CRC Press,
2011.
[26] “How and why alloying elements are added to aluminum.” [Online]. Available:
http://www.alcotec.com/us/en/education/knowledge/qa/How-and-why-alloying-
elements-are-added-to-aluminum.cfm. [Accessed: 04-Jun-2017].
[27] H. K. D. H. Bhadeshia, “Precipitate free zones.” [Online]. Available:
https://www.phase-trans.msm.cam.ac.uk/abstracts/pfz.html. [Accessed: 04-Jun-
2017].
[28] Y. Minamino, Y. Koizumi, N. Tsuji, S. Hirosawa, T. Sato, C. Hin, E. Bobruk, I.
Sabirov, V. Kazykhanov, and T. Ogura, “Quantitative characterization of
precipitate free zones in Al–Zn–Mg(–Ag) alloys by microchemical analysis and
nanoindentation measurement,” Sci. Technol. Adv. Mater, vol. 5, 2004.
[29] R. D. Doherty, D. a. Hughes, F. J. Humphreys, J. J. Jonas, D. Juul Jensen, M. E.
Kassner, W. E. King, T. R. McNelley, H. J. McQueen, and a. D. Rollett, “Current
issues in recrystallization: A review,” Mater. Today, vol. 1, no. 2, pp. 14–15,
1998.
[30] W. Z. Misiolek and W. R. Van Geertruyden, “Combined Numerical Simulation
and Microstructure Characterization for Prediction of Physical Properties in
Extruded Aluminum Alloys,” Key Eng. Mater., vol. 424, pp. 1–8, 2009.

75
[31] G. F. Vander Voort, Metallography: Principles and practice. 1985.
[32] H. Zhu, X. Zhang, M. Couper, and A. Dahle, “The Formation of Streak Defects on
Anodized Aluminium Extrusions,” J. Miner. Met. Mater. Soc., vol. 62, no. 5, pp.
46–51, 2010.
[33] X. Y. Lü, E. J. Guo, P. Rometsch, and L. J. Wang, “Effect of one-step and two-
step homogenization treatments on distribution of Al3Zr dispersoids in
commercial AA7150 aluminium alloy,” Trans. Nonferrous Met. Soc. China
(English Ed., vol. 22, no. 11, pp. 2645–2651, 2012.
76
VITA
Mohammed Alamoudi was born in Jeddah, Saudi Arabia. He is the son of Tariq
Alamoudi and Lolulua Alamoudi. In 2004, he graduated from the high school and started
to study mechanical engineering at King Abdulaziz University (KAU), Jeddah. In 2010,
he graduated with a Bachelor of Science Degree in Mechanical Engineering. Right after
that, he moved to Riyadh and joined King Abdulaziz City for Science and Technology
(KACST) as scientific researcher at the National Center for Advanced Materials
Technology. In 2013, he has been assigned as deputy director of the National Center for
Non-Destructive Testing. In mid of 2014, he was granted a scholarship from KACST to
the USA to continue his graduate studies. He joined graduate school at Lehigh
University. Mohammed was awarded his Master of Science Degree in Materials Science
and Engineering from Lehigh University in summer of 2017.


