Embed Size (px)
Citation preview
Firm and Industry Effects on Firm Profitability: An
Empirical Analysis of KSE
Syed Ali Raza Research Associates, Iqra University
Abid Town, Block-2 Gulshan-e-Iqbal, Karachi, Pakistan
Tel: +92214800670-4 Fax: +92214987806
Email: [email protected]
M. Shoaib Farooq Business Graduate, Iqra University
Abid Town, Block-2 Gulshan-e-Iqbal, Karachi, Pakistan
Tel: +92214800670-4 Fax: +92214987806
Nadeem Khan Assistant Professor, Iqra University
Abid Town, Block-2 Gulshan-e-Iqbal, Karachi, Pakistan
Tel: +92214800670-4 Fax: +92214987806
(This paper is accepted in “International Research Journal of Finance and Economics”)
Firm and Industry Effects on Firm Profitability: An
Empirical Analysis of KSE
Abstract
The study meant to explore the external and internal factors which influence firm‟s
profitability i.e. “Firm and Industry Effects on Firm Profitability”. In this research ROA and
ROE has taken as profitability measure and their dependency has checked with firm effect,
industry effect and market share. Data has extracted from “Balance Sheet Analysis of Joint Stock
Companies Listed on the Karachi Stock Exchange Volume-II 2004-2009” which is state bank of
Pakistan publications and it represents six year financial statements of the firms. By using
Regression analysis technique result has found which represent that all three independent factor
i.e. firm effect, industry effect and market share are significant with ROA and ROE.
Key Words: Return on Assets (ROA), Return on Equity (ROE), market share
1. Introduction
The primary task for any business regardless of its size, capital, ownership and nature is to earn
profit and there are various internal and external factors which influence firm profitably. The
importance of the question, whether external factors influence firm‟s profitability, can be judge
from the fact that its strategic decisions are depend on the answer of this question. Other matters
like competitive advantage and competitive policies of firm determine by the same answer.
The inter-firm heterogeneity is vital to understand the influence of firm effect on firm
profitably. It helps in determining the competitive advantage of the firm over other firm and it
also aid the firm to design its competitive strategies. Moreover it also creates barriers for the new
firm to entry in the industry. The heterogeneity which determines the profitably level of the firm
also leads to the creation of firm image in the eyes of customer which is very food full for the
firm and by means of which firm multiplied its profit.
Market share also play a key role in identification of firm performance and its position in the
industry and it‟s also identify the level of competition and the way to form all lever of strategies
(corporate level, business level and product level) to counter that competition. Usually all the
firm in the industry are conscious about their market share.
Schmalensee (1985) identifies the impact of firm, industry effect and market share on
firm profitability and many researchers‟ employees his model after modification it according to
their business environment and market structure like Rumelt (1991) includes firm related to
manufacturing concern to enhance the research like wise competitive advantage of a firm is
identified with the help of same theory by McGahan and Porter (1998).
1.2 Problem Statement:
Many researchers1 has identifies the factors which influence firm profitability but they consider
only the internal matters of the firm and external factors has been ignored in Pakistan. Internal
factors include working capital, capital structure, operating cycle, ownership, leverage,
investment in fixed assets. Where as external factors embrace industry effect, firm effect, market
share. The aim of this study is to analyze firm and industry effect on firm profitability in
Pakistan.
1.3 Research Question:
Is there a significant impact of firm and industry effect on firm profitability?
1.4 Significance of the Study: The research aim to determine the impact of firm and industry effect on firm profitability in
Pakistan therefore this dissertation helps firm in making strategies and it also help them in
identification that which area is most important while making strategies against their
competitors. The manuscript helps entrepreneurs about their competitive advantage and also
helps them in creating competitive advantages against their competitors which leads to a better
competition environment therefore the whole industry will be beneficiary.
2. Literature Review: Tarziján and Ramírez (2010) revisited the firm, industry and corporate effect with multi level
analysis. Economatica database were the source of the data, the data of 302 Chilean firms were
used for the year 1998 to 2007(2,127 observations). They applied multi level analysis to come up
with the results which were industry 11%, corporate 14% and firm 46% and remaining 29% were
unexplained. The random effect model explained that Corporation 8.29%, Industry 7.13%, Firm
38% and error were 24.07%.
Short et al (2009) presented the same firm and industry effect as the determinate of firm
performance (This study is for the guidance of new ventures).they created two models one for
new ventures and second for old firms. They took the data of 7,256 Swedish firms for the year
1994. They used ANOVA test and found for the first model that Firm were 41.31%, Industry
were 14.59% and error (year change) were 44.10%. The second model explained that Linear
effect 5.51%, Firm effect 52.28%, Industry effect 14.02%, error 28.19%.
Holian and Ali (2009) studies the determinate of firm accounting and economic profit by
involving firm and industrial effect. They involved cash flow and opportunity cost as the
determinate of economic profit and firm and industry effect as the determinate of accounting
profit. They include the data from 1989 to 2003 of 331 firm of United States from compustat
database. They applied regression analyses in order to got the result which in accounting model
were firm effect 15.3%, Industry effect 5.3% and Firm and industry effects 16.8% and in
1 Jasir Ilyas (2008) The Determinants of Capital Structure: Analysis of Non Financial Firms Listed in Karachi Stock
Exchange in Pakistan
Tariq Naeem Awan et al (2011) Analysis of the determinants of Capital Structure in sugar and allied industry
H. Jamal Zubairi and Mirza Aqeel Baig (2010) impact of working capital management and capital structure on
profitability: the case of kse quoted automobile firms
Mian Sajid Nazir and Talat Afza (2009) Impact of Aggressive Working Capital Management Policy on Firms‟
Profitability
Attaullah Shah and Safiullah Khan (2007) Determinants of Capital Structure: Evidence from Pakistani Panel Data
economics model were effect 45.8%, Industry effect 15.8% and Firm and industry effects 50.4%
and remaining were unexplained.
Galbreath and Peter (2008) presented the new empirical proof to old debate about the
firm profitability. The data was collected with the help of questionnaire from 285 Australian
firms in 2007. They used ANOVA test and includes Tangible assets, Intangible assets,
Capabilities, Industry structure, Overall Performance and Control variables. They found that firm
Size were 0.159%, firm Age were 0.016%, Entry barriers were 0.063%, Tangible assets
−0.094%, Intangible assets 0.055% and Control variables 0.190%.
Victer and McGahan (2006) studied the location and industry factor as determinates of
firm performance. 11 years data (1993 to 2003) of 4000 firms from 43 countries were included
from compustat database. They applied ANCOVA method to analyzed the data and employees
many variables like year, country, industry, year*country, year*industry. They found that year
explained 0.65%, country explained 1.12%, industry explained 4.51%, year*country explained
2.98%, year*industry explained 7.31%, country*industry explained 14.79% and 68.64% were
unexplained.
Hawawini et al (2005) claimed that there previous research were not misleading rather it
is misunderstood by Mcnamara el al (2005) and they claimed that Mcnamara el al (2005)
research were not contradict their manuscript but the extension of it. They recollect the data from
1987 to 1996 and exclude outlier (4 leading and 5 loser firms). Their finding for economic profit
model were Firm‟s effect explained 26.8%, Industry effect explained 3.9%, Year effect
explained 2.5%, industry x year explained 3.9% and 62.8% were unexplained. Result also
identified that their claim is true.
Mcnamara el al (2005) criticized Hawawini et al (2003) work and declared it misleading
conception. They took the data from 84 industries of 2686 firms from 1987 to 1996 and the
criterion for selection of firm was minimum 100 million dollar sale from compustat database.
The method they used for analyzed the data were ANCOVA. They found that stable industry
effects were 9.1% and unstable industry effects were 4%, firm effects were 43.8% and after
excluding extreme firm from the selected industry result were stable industry effects were 14.7%
and unstable industry effects were 9.9%, firm effects were 22.9% therefore they conclude that
Hawawini et al (2003) result were misleading due to wrong sample selection.
Caloghirou el al (2004) studied firm and industry as a determinate of performance. Data
is collected through questionnaire for three years 1994 to 1996 and cut off used for the selection
of the firm was 250 employees of large Greek firms. They applied regression analysis to come
up with the results which were firm impact 38%, industry impact 11%, and Industry x Year
impact 3.35% on firm profitability.
Brito and Vasconcelos (2004) analyzed the effect of region in which firm exist on its
profitability. He used COMPUSTAT database to collect the data of 78 countries which includes
12,592 firms. He employees Analysis of covariance (ANCOVA) to analyzed the data and come
up with the result that country effect explained 16.9%, industry effect explained 15.6% and firm
effect explained 41.0% of the total variance. The new factor i.e., country effect is second most
important factor which influence profitability.
Li and Greenwood (2004) identified the diversification in intra-industry firm‟s
performance. Sample of 276 Canadian insurance firms had taken from 1993 to 1998 to come up
with result and to analyze the data they used ANOVA technique. According to their result
Investment risk ratio is most important factor among all. With the help of model they predict 3
main benefits which are synergies between the firms, competition and efficiencies which are
derived with in industry. The research helps firm to develop strategy better then before, it also
helps the firm to cope up with competition it faces from the industry.
Eriksen and Knudsen (2003) explained interaction of firm and industry which in turn
impinge on profitability of firm. Five years statistical value were used from 1991–1995 it is from
small and medium size organizations including 9809 firms from Denmark and in order to
analyzed the data they used Analysis of covariance (ANCOVA). They find that firm effect 42%,
industry effect was not significant, and interaction effect 20.44% on firm profitability.
Hawawini et al (2003) asserts determinates of firm accounting and economic profit by
involving different factors. They consider 10 years data from 1987 to 1996 of 562 firms which
belongs to 55 different industries including 5620 observations. Variance components analysis
were used as statistics technique and the variable involved are return on invested capital,
Economic profit and weighted average cost of capital(WACC) on one hand and porter(1998)
model, engage ROA(Accounting profit), industry and firm profit and market share on the other
hand to identified the variance between the result obtained by both methods. Results obtained by
economic profit model were Firm‟s effect explained 27.1%, Industry effect explained 6.5%, Year
effect explained 1.9%, industry x year explained 4.2% and 60.3% were unexplained. Accounting
profit model represented that Firm effect explained 35.8%, Industry effect explained 8.1%, Year
effect explained 1.0%, and industry x year explained 3.1% and 50% were unexplained.
Ruefli and Robert (2003) presented a non parametric approach for the analyses of firm
profitability. They used compustat database to obtain the data from 1980 to 1996 of American
firms. They applied ANOVA test and obtained the result which were Time period 0.01%,
Industry coefficient 0.14%, Corporate 7.06%, firm 12.33% and error 45.9%. Results for the
diversified firm were Time period 0.01%, Industry coefficient 0.13%, Corporate 3.45%, firm
13.33% and error 11.8%.
McGahan and Porter (2002) reanalyzed their pervious research but this time they apply
different model and technique to analyze the data. They have taken the data form compustat
database for the year 1981 to 1994, the data selected was the largest among all of their
researches. Nested Analysis Of Variance (ANOVA) were used by them to analyze in a better
way therefore they found that result were similar to the pervious research. It indicated that the
economic profit model used by other researcher has not predicted much other that the pervious
researches.
Claver et al (2002) studied two factors which influence firm profitability and that are firm
and industry effect. They analyzed data of 5 years from 1994 to 1998 of 679 manufacturing firm
of Spain and the data were taken from Ardan database. Rumelt‟s (1991) model was adopted by
them to analyze the data. He notice that Industry x Year explained 2.78%, year explained 0.36%,
Industry explained 2.06%, Corporation explained none, Business unit explained 42.69% and
model was unable to explained 52.1% of the variance.
Cheng and Jaebum (2002) studied Korean market for the determination of profitability
through the industry analyses. Korea Information Service was used to collect the data 569 firms
for the year 1985 to 1986. They used Schmalensee (1985) and Rumelt (1991) models and applied
ANOVA test to come to conclusion. They found for first model which comprised of large firms
that firm effect were 9.4%, year effects were 2.5%, industry effects were 7.6% and the remaining
were unexplained. The second model which was comprised of small firms explained that firm
effect 20.8%, industry effects 4.4, year 2.5% and remaining were unexplained.
Furman (2000) explained the impact of place (location) factor on profitability of the firm.
Worldscope database were used to collect data of 50 countries over 13,000 firms for 5 year data
(1992 to 1996). He applied ANOVA to analyze the data and obtained that Year 0.4%, Industry
30.3%, Corporate Parent 9.0%, firm 16.8% and remaining were unexplained. Therefore the
whole model was able to explain 56.5% of the variance among the firm and 43.5% were
unexplained which indicated that model demand for new variable to be added.
McGahan and Porter (1998) analyzed various factors of industry which affect firm
profitability. They took the data American firms from 1981 to 1994 and analyzed the data by
applied components of variance analysis and Analysis Of Variance (ANOVA). They employed
the following factors year, industry, corporate-parent, and business-specific effects and found
that year had 2%, industry 19%, corporate-parent 4%, and business-specific 32% impact on firm
profitability. The magnitude of industry effect was more or less equals to industry effect
identified by Schmalensee (1985), Firm or business-specific effect had highest percentage among
all factors. The result of identified that firm profitability greatly effect by business specific effect
and industry effect to follow.
Roquebert et al (1996) examined market and management effect on profitability to find
what really affect profitability; the study was similar to study of Rumelt (1991). They took the
data from COMPUSTAT data base of 16,596 observations from 1985 to 1991. They applied
variance components analysis (VARCOMP) for analysis Industry x Year, Market share,
Industry, Corporation, Business unit on firm profitability and found that Industry x Year
explained 2.3%, Market share explained none, Industry explained 10.2%, Corporation explained
17.9%, Business unit explained 37.1% and model was unable to explained 37.1% of the
variance. Except corporate effect result was similar to old researches.
Powell (1996) analyzed the significance of industry for the profitability the firm. He
obtained the data from federal trade commission for the profit of the firm and for the sake of
other variable survey and interview method was used. Interviews were taken from 143 firms of
United States. He used factor analysis method for the outcome of the data and found the entry
barriers were 0.83, incumbent advantages were 0.85, economy of scale were 0.48, industry
concentration were 0.50, customer loyalty were 0.74, intensity of competition were 0.85,
advertising intensity were 0.71,R & D intensity were 0.48 and industry maturity were 0.81.
Rumelt (1991) broadened Schmalensee (1985) research by using the data of four
consecutive years from the database of FTC against the one year data used by schmalensee
(1985). Four years data (1974-1977 including 6,932 observations) enabled him to identified year
effect; therefore he developed a new model by modifying schmalensee (1985) model which can
determine year and industry effect separately. He used components of variance analysis (COV)
and nested Analysis Of Variance (ANOVA) to analysis the data and found that industry had 16%
(transient effects or industry * year effects), industry 8.3% (permanent effect), firm 46.4% effect.
Schmalensee (1985) identified the affect of market on the firm profitability; he analyzed
1975 (single year) statistics of American firm from FTC database. He applied components of
variance analysis(COV) to find the affect of firm, industry effect and heterogeneity exist between
the firms, which he measured by market share, and he found that industry effect had 20%,
market share had negligible and firm effect had no impact on firm profitability. After his
research many researchers try to find the external factors which affect firm profitability.
3.1 Research Approach– Quantitative: This dissertation aims at finding out the firm and industrial effect on firm profitability. The
research involving quantitative nature of variables which are return on assets, profit and sales, to
determine market share. This research quantify the relationship between the variables by
formulate the mathematical model; therefore the research approach is quantitative.
3.2 Correlational Research: The research engages quantitative variables and its aim to find out the relation between firm
profitability and firm, industry effect and market share on firm profitability therefore research
uses correlation design which lead to better understanding of relationship maintain between the
variables.
3.3 Statistical Technique/Tool: This study employee one dependent variable i.e., return on assets (ROA) with more then one
independent variable i.e., firm effect, industrial effect, market share therefore multi linear
regression technique has been used to identify the effects of independent variables on dependent
variable. The statistical package for social sciences (SPSS) or Statistical Analysis System (SAS)
is use as computer aid to apply multi linear regression technique on the data.
3.4 Hypothesis: Ho: Firm, industry and market share has an insignificant impact on firm profitability in Pakistan.
H1: Firm, industry and market share has a significant impact on firm profitability in Pakistan.
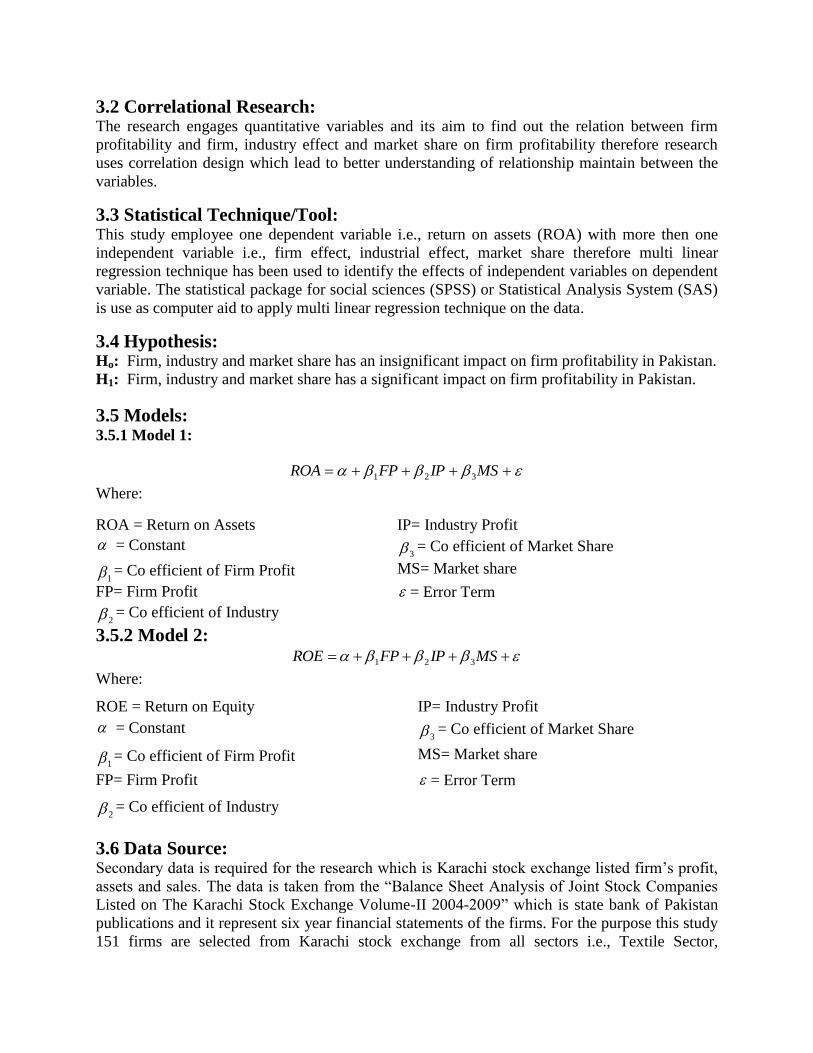
3.5 Models: 3.5.1 Model 1:
MSIPFPROA 321
Where:
ROA = Return on Assets IP= Industry Profit
= Constant 3 = Co efficient of Market Share
1 = Co efficient of Firm Profit MS= Market share
FP= Firm Profit = Error Term
2 = Co efficient of Industry
3.5.2 Model 2: MSIPFPROE 321
Where:
ROE = Return on Equity IP= Industry Profit
= Constant 3 = Co efficient of Market Share
1 = Co efficient of Firm Profit MS= Market share
FP= Firm Profit = Error Term
2 = Co efficient of Industry
3.6 Data Source: Secondary data is required for the research which is Karachi stock exchange listed firm‟s profit,
assets and sales. The data is taken from the “Balance Sheet Analysis of Joint Stock Companies
Listed on The Karachi Stock Exchange Volume-II 2004-2009” which is state bank of Pakistan
publications and it represent six year financial statements of the firms. For the purpose this study
151 firms are selected from Karachi stock exchange from all sectors i.e., Textile Sector,
Chemical Sector, Engineering Sector, Sugar & Allied Sector, Paper & Board Sector, Cement
Sector, Fuel & Energy Sector, Transport & Communication, Tobacco Sector, Jute Sector and the
number of observation is 903.
4. Analysis The process of collecting, transforming and demonstrating data for the purpose of achieving
valuable results by logical and analytical reasoning and the research present the same in this
section.
4.1 Descriptive Statistics: Descriptive statistics shows summary of the data use in study and by the help of this one can
easily understand the range and features of the data.
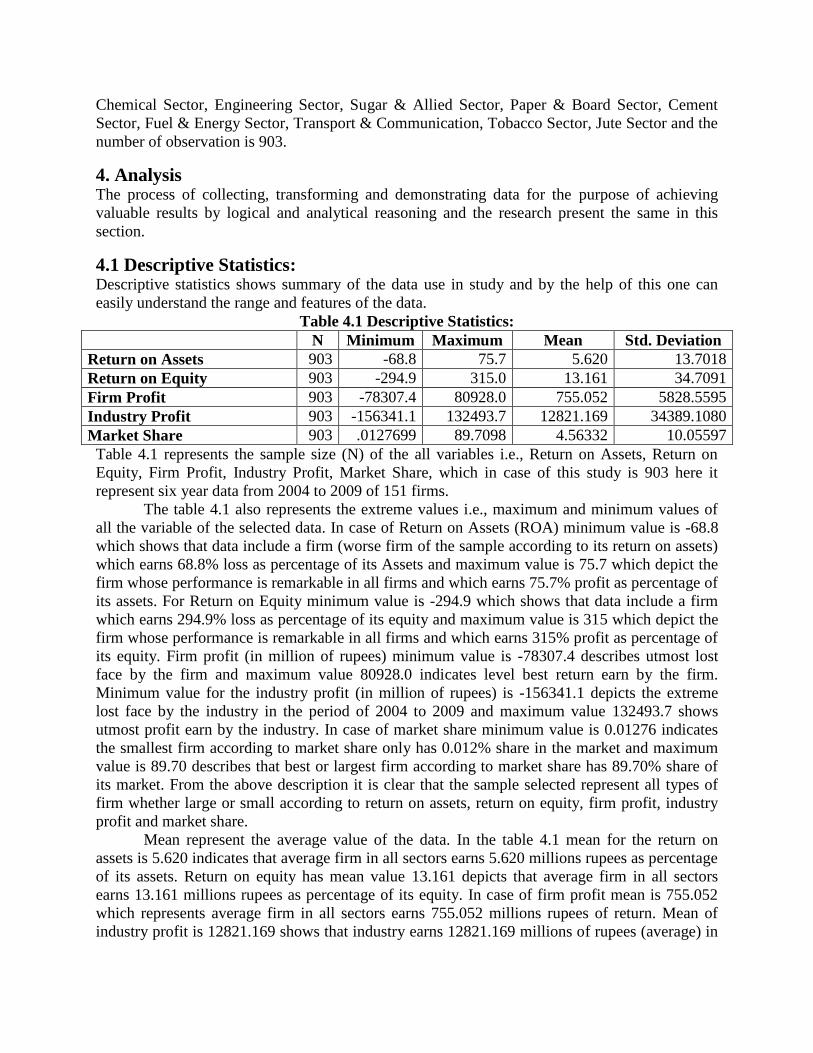
Table 4.1 Descriptive Statistics:
N Minimum Maximum Mean Std. Deviation
Return on Assets 903 -68.8 75.7 5.620 13.7018
Return on Equity 903 -294.9 315.0 13.161 34.7091
Firm Profit 903 -78307.4 80928.0 755.052 5828.5595
Industry Profit 903 -156341.1 132493.7 12821.169 34389.1080
Market Share 903 .0127699 89.7098 4.56332 10.05597
Table 4.1 represents the sample size (N) of the all variables i.e., Return on Assets, Return on
Equity, Firm Profit, Industry Profit, Market Share, which in case of this study is 903 here it
represent six year data from 2004 to 2009 of 151 firms.
The table 4.1 also represents the extreme values i.e., maximum and minimum values of
all the variable of the selected data. In case of Return on Assets (ROA) minimum value is -68.8
which shows that data include a firm (worse firm of the sample according to its return on assets)
which earns 68.8% loss as percentage of its Assets and maximum value is 75.7 which depict the
firm whose performance is remarkable in all firms and which earns 75.7% profit as percentage of
its assets. For Return on Equity minimum value is -294.9 which shows that data include a firm
which earns 294.9% loss as percentage of its equity and maximum value is 315 which depict the
firm whose performance is remarkable in all firms and which earns 315% profit as percentage of
its equity. Firm profit (in million of rupees) minimum value is -78307.4 describes utmost lost
face by the firm and maximum value 80928.0 indicates level best return earn by the firm.
Minimum value for the industry profit (in million of rupees) is -156341.1 depicts the extreme
lost face by the industry in the period of 2004 to 2009 and maximum value 132493.7 shows
utmost profit earn by the industry. In case of market share minimum value is 0.01276 indicates
the smallest firm according to market share only has 0.012% share in the market and maximum
value is 89.70 describes that best or largest firm according to market share has 89.70% share of
its market. From the above description it is clear that the sample selected represent all types of
firm whether large or small according to return on assets, return on equity, firm profit, industry
profit and market share.
Mean represent the average value of the data. In the table 4.1 mean for the return on
assets is 5.620 indicates that average firm in all sectors earns 5.620 millions rupees as percentage
of its assets. Return on equity has mean value 13.161 depicts that average firm in all sectors
earns 13.161 millions rupees as percentage of its equity. In case of firm profit mean is 755.052
which represents average firm in all sectors earns 755.052 millions rupees of return. Mean of
industry profit is 12821.169 shows that industry earns 12821.169 millions of rupees (average) in
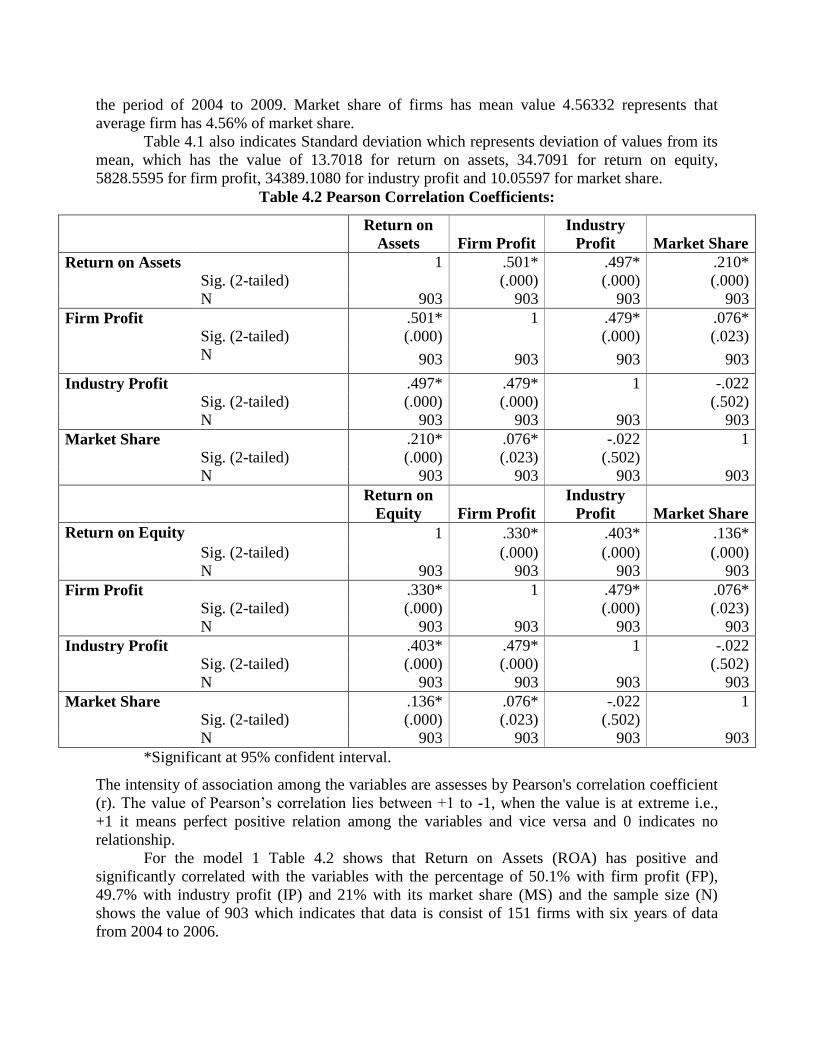
the period of 2004 to 2009. Market share of firms has mean value 4.56332 represents that
average firm has 4.56% of market share.
Table 4.1 also indicates Standard deviation which represents deviation of values from its
mean, which has the value of 13.7018 for return on assets, 34.7091 for return on equity,
5828.5595 for firm profit, 34389.1080 for industry profit and 10.05597 for market share.
Table 4.2 Pearson Correlation Coefficients:
Return on
Assets Firm Profit
Industry
Profit Market Share
Return on Assets 1 .501* .497* .210*
Sig. (2-tailed) (.000) (.000) (.000)
N 903 903 903 903
Firm Profit .501* 1 .479* .076*
Sig. (2-tailed) (.000) (.000) (.023)
N 903 903 903 903
Industry Profit .497* .479* 1 -.022
Sig. (2-tailed) (.000) (.000) (.502)
N 903 903 903 903
Market Share .210* .076* -.022 1
Sig. (2-tailed) (.000) (.023) (.502)
N 903 903 903 903
Return on
Equity Firm Profit
Industry
Profit Market Share
Return on Equity 1 .330* .403* .136*
Sig. (2-tailed) (.000) (.000) (.000)
N 903 903 903 903
Firm Profit .330* 1 .479* .076*
Sig. (2-tailed) (.000) (.000) (.023)
N 903 903 903 903
Industry Profit .403* .479* 1 -.022
Sig. (2-tailed) (.000) (.000) (.502)
N 903 903 903 903
Market Share .136* .076* -.022 1
Sig. (2-tailed) (.000) (.023) (.502)
N 903 903 903 903
*Significant at 95% confident interval.
The intensity of association among the variables are assesses by Pearson's correlation coefficient
(r). The value of Pearson‟s correlation lies between +1 to -1, when the value is at extreme i.e.,
+1 it means perfect positive relation among the variables and vice versa and 0 indicates no
relationship.
For the model 1 Table 4.2 shows that Return on Assets (ROA) has positive and
significantly correlated with the variables with the percentage of 50.1% with firm profit (FP),
49.7% with industry profit (IP) and 21% with its market share (MS) and the sample size (N)
shows the value of 903 which indicates that data is consist of 151 firms with six years of data
from 2004 to 2006.
For the model 2 Table 4.2 also shows that Return on Equity (ROE) has positive and
significantly correlated with the variables but the relationship has not as strong as model 1. Here
Return on Equity (ROE) has 33% correlated with firm profit (FP), 49.7% correlated with
industry profit (IP) and 21% correlated with its market share (MS).
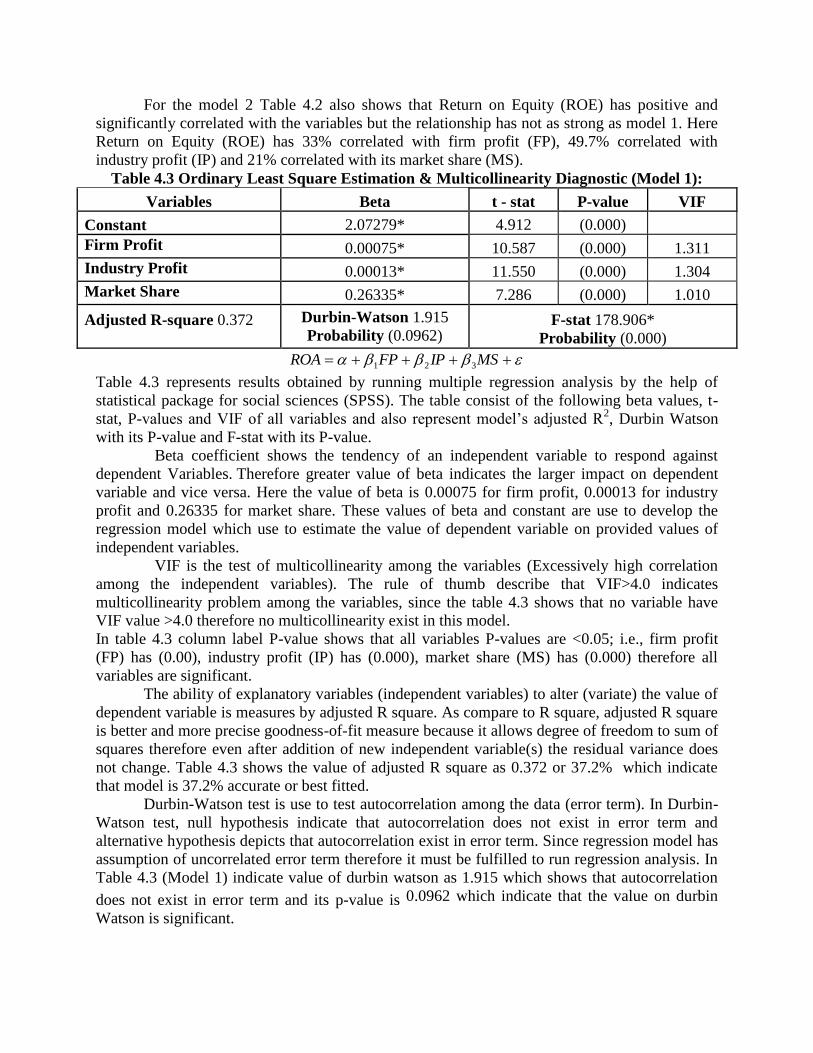
Table 4.3 Ordinary Least Square Estimation & Multicollinearity Diagnostic (Model 1):
Variables Beta t - stat P-value VIF
Constant 2.07279* 4.912 (0.000)
Firm Profit 0.00075* 10.587 (0.000) 1.311
Industry Profit 0.00013* 11.550 (0.000) 1.304
Market Share 0.26335* 7.286 (0.000) 1.010
Adjusted R-square 0.372
Durbin-Watson 1.915
Probability (0.0962) F-stat 178.906*
Probability (0.000)
MSIPFPROA 321
Table 4.3 represents results obtained by running multiple regression analysis by the help of
statistical package for social sciences (SPSS). The table consist of the following beta values, t-
stat, P-values and VIF of all variables and also represent model‟s adjusted R2, Durbin Watson
with its P-value and F-stat with its P-value.
Beta coefficient shows the tendency of an independent variable to respond against
dependent Variables. Therefore greater value of beta indicates the larger impact on dependent
variable and vice versa. Here the value of beta is 0.00075 for firm profit, 0.00013 for industry
profit and 0.26335 for market share. These values of beta and constant are use to develop the
regression model which use to estimate the value of dependent variable on provided values of
independent variables.
VIF is the test of multicollinearity among the variables (Excessively high correlation
among the independent variables). The rule of thumb describe that VIF>4.0 indicates
multicollinearity problem among the variables, since the table 4.3 shows that no variable have
VIF value >4.0 therefore no multicollinearity exist in this model.
In table 4.3 column label P-value shows that all variables P-values are <0.05; i.e., firm profit
(FP) has (0.00), industry profit (IP) has (0.000), market share (MS) has (0.000) therefore all
variables are significant.
The ability of explanatory variables (independent variables) to alter (variate) the value of
dependent variable is measures by adjusted R square. As compare to R square, adjusted R square
is better and more precise goodness-of-fit measure because it allows degree of freedom to sum of
squares therefore even after addition of new independent variable(s) the residual variance does
not change. Table 4.3 shows the value of adjusted R square as 0.372 or 37.2% which indicate
that model is 37.2% accurate or best fitted.
Durbin-Watson test is use to test autocorrelation among the data (error term). In Durbin-
Watson test, null hypothesis indicate that autocorrelation does not exist in error term and
alternative hypothesis depicts that autocorrelation exist in error term. Since regression model has
assumption of uncorrelated error term therefore it must be fulfilled to run regression analysis. In
Table 4.3 (Model 1) indicate value of durbin watson as 1.915 which shows that autocorrelation
does not exist in error term and its p-value is 0.0962 which indicate that the value on durbin
Watson is significant.
Regression model Overall significance has identifies by F-value and its prob. (F). It is
actually the explained variance divided by unexplained variance (mean error). In table 4.3
(model 1) F-stat shows the value 78.906 and its Probability (F) (0.000).
Following is the Regression equation for model 1:
MSIPFPROA *0.26335*0.00013*0.00075*2.07279
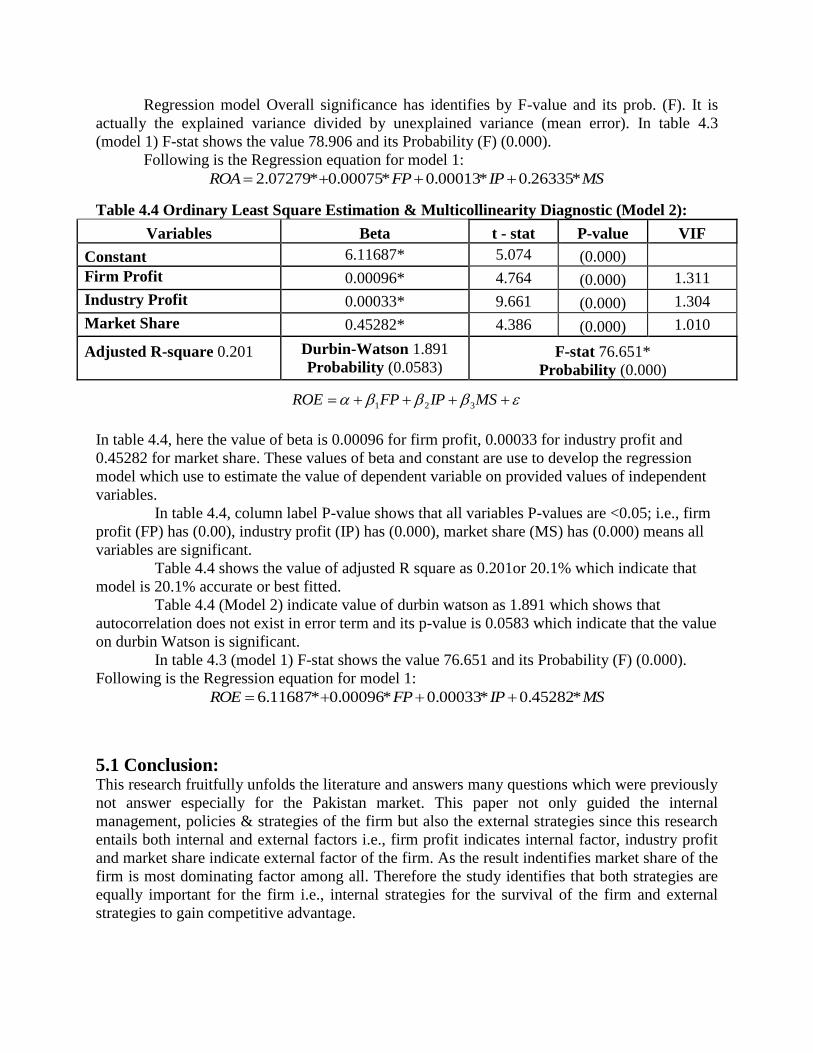
Table 4.4 Ordinary Least Square Estimation & Multicollinearity Diagnostic (Model 2):
Variables Beta t - stat P-value VIF
Constant 6.11687* 5.074 (0.000)
Firm Profit 0.00096* 4.764 (0.000) 1.311
Industry Profit 0.00033* 9.661 (0.000) 1.304
Market Share 0.45282* 4.386 (0.000) 1.010
Adjusted R-square 0.201
Durbin-Watson 1.891
Probability (0.0583) F-stat 76.651*
Probability (0.000)
In table 4.4, here the value of beta is 0.00096 for firm profit, 0.00033 for industry profit and
0.45282 for market share. These values of beta and constant are use to develop the regression
model which use to estimate the value of dependent variable on provided values of independent
variables.
In table 4.4, column label P-value shows that all variables P-values are <0.05; i.e., firm
profit (FP) has (0.00), industry profit (IP) has (0.000), market share (MS) has (0.000) means all
variables are significant.
Table 4.4 shows the value of adjusted R square as 0.201or 20.1% which indicate that
model is 20.1% accurate or best fitted.
Table 4.4 (Model 2) indicate value of durbin watson as 1.891 which shows that
autocorrelation does not exist in error term and its p-value is 0.0583 which indicate that the value
on durbin Watson is significant.
In table 4.3 (model 1) F-stat shows the value 76.651 and its Probability (F) (0.000).
Following is the Regression equation for model 1:
MSIPFPROE *0.45282*0.00033*0.00096*6.11687
5.1 Conclusion: This research fruitfully unfolds the literature and answers many questions which were previously
not answer especially for the Pakistan market. This paper not only guided the internal
management, policies & strategies of the firm but also the external strategies since this research
entails both internal and external factors i.e., firm profit indicates internal factor, industry profit
and market share indicate external factor of the firm. As the result indentifies market share of the
firm is most dominating factor among all. Therefore the study identifies that both strategies are
equally important for the firm i.e., internal strategies for the survival of the firm and external
strategies to gain competitive advantage.
MSIPFPROE 321
This research also analysis the relative importance of industry and firm effects in
describing ROE and ROA. ROA and ROE also different because of difference in the size of the
firm, firm belong to different industry i.e. different sectors. Therefore, result of this study
identify that both effect (internal and external are moderate and no effect dominates in Pakistan
market thus firm has to give equal importance to both the internal and external strategies of the
firm. In Pakistan market, great further research has needed in this topic.
However, this research show that market share is the dominate factor but it does not mean
that firm and industry effect can be ignore. As many of the western researchers found that firm
and industry effect exists and analysis of internal and external environment is vital for
developing or formulating any sort of corporate strategy.
5.1 Recommendations: Firm should alter its strategies according to the changing condition of industry; since the
result of this thesis identified that firm profitability depends on industry profit.
If the firm is not effective in market although it is efficient there is no use of it therefore
market share in much more crucial than any other matter thus firms has to improve their
market share through the different means i.e., advertising, marketing campaign, creating
better perspective in consumer mind.
There is cutthroat competition among the firms hence competitive strategy should be
design in the manner that meliorate firm position and goodwill in the industry.
Market share can be increase by merger or acquisition of firm.
Firms should have strong internal policies to be more efficient in their work hence to
decrease cost and improve profitability.
Sound internal management is vital to improve the productivity of employees so to
improve productivity of the firm.
5.2 Future Recommendations: This research does not consider any location factor so; it does not identify any location
differences among the firms. This research can be more fruitful by adding up location
data.
Industry difference also exist therefore analysis should be done industry wise.
This study analysis the result with the help of regression analysis it can be more valuable
by applying other appropriate techniques like nested anova, random or fixed effect
analysis etc.
ROA and ROE has used in this paper therefore other performance indicators should be
used to analysis.
References:
[1] Brito, L. A. L., & Vasconcelos, F. C. (2004) „How much does country matter?‟
Proceedings of the National Meeting of Graduate Programs in Business Administration,
University of São Paulo, vol. 27.
http://www.eaesp.fgvsp.br/AppData/GVPesquisa/P00308_1.pdf
[2] Caloghirou, Y., Protogerou, A., Spanos, Y. E., & Papagiannakis, L. (2004) „Industry-
Versus Firm-specific Effects on Performance: Contrasting SMEs and Large-sized
Firms.‟ European Management Journal, Vol. 22(2), pp. 231-243.
[3] Chang, S. J., & Hong, J. (2002) „How much does the business group matter in Korea?‟
Strategic Management Journal, 23(3), pp. 263-274.
[4] Claver, E., Molina, J. and Tari, J. (2002) „Firm and industry effects on profitability: a
Spanish empirical analysis.‟ European Management Journal, Vol. 20(3), pp. 321–328.
[5] Eriksen, B., & Knudsen, T. (2003) „Industry and firm interaction: Implication for
profitability.‟ Journal of Business Research, Vol. 56(3), pp. 191-199.
[6] Furman, J. (2000) „Does industry matter differently in different places? Evidence from
four OECD countries‟ (MIT-Sloan working paper, #4121) Retrieved September 11, 2003.
http://people.bu.edu/furman/Industry%20matters.pdf
[7] Galbreath, J., & Galvin, P. (2008) „Firm Factors, Industry Structure and Performance
Variation: New Empirical Evidence to a Classic Debate.‟ Journal of Business Research,
Vol. 61(2), pp. 109-117.
[8] Hawawini, G., Subramanian, V., & Verdin, P. (2003) „Is performance driven by industry-
or firm-specific factors? A new look at the evidence.‟ Strategic Management Journal,
Vol. 24(1). pp. 1-16.
[9] Hawawini, G., Subramanian V. & Verdin P. (2005) „Is performance driven by industry-
or firm-specific factors? A reply to McNamara, Aime and Vaaler‟ Strategic Management
Journal, Vol. 26(11), pp. 1083–1086.
[10] Holian, M., Ali R., (2009) „Firm and Industry Effects in Accounting versus Economic
Profit Data‟ Applied Economics Letters
[11] http://www.sjsu.edu/faculty/matthew.holian/fixed_effects.pdf
[12] Li, S., Greenwood R. (2004) „The effect of within-industry diversification on firm
performance: Synergy creation, multi-market contact and market structuration‟ Strategic
Management Journal, Vol. 25, pp. 1131-1153.
[13] Majumdar, S. K. (1997) „The impact of size and age on firm-level Performance: Some
evidence from India.‟ Review of Industrial Organization, Vol. 12, pp. 231-241.
[14] McGahan, A. M. & Porter, M. E. (1997) „How much does industry matter, really?‟
Strategic Management Journal, Vol. 18(special issue), pp. 15-30.
[15] McGahan, A.M. & Porter M.E. (2002) „What do we know about variance in accounting
profitability?‟ Management Science, Vol. 48(7), pp. 834-851.
[16] McNamara G., Aime F., Vaaler P., (2005) “Is performance driven by industry- or firm-
specific factors: A response to Hawawini, Subramanian and Verdin” Strategic
Management Journal, Vol. 26(11), pp. 1075-1081.
[17] Powell, T. C. (1996). „How much does industry matter: An alternative empirical test‟,
Strategic Management Journal, Vol. 17(4), pp. 323–334.
[18] Roquebert, J. A., Phillips, R. L., and Westfall, P. A. (1996) „Markets vs. management:
what drives profitability?‟ Strategic Management Journal, vol. 17, pp. 653-664.
[19] Ruefli, T.W., R. R. Wiggins. (2003) „Industry, Corporate and Business-Segment Effects
and Business Performance: A Non-Parametric Approach‟ Strategic Management Journal,
Vol. 24 (9), pp. 861-879.
[20] Rumelt, R. P. (1991). „How much does industry matter?‟ Strategic Management Journal,
Vol. 12, pp. 167-185.
[21] Schmalensee, R. (1985). “Do markets differ much?” American Economic Review, 75(3),
341-351.
http://dspace.mit.edu/bitstream/handle/1721.1/2071/SWP-1531-2689036.pdf?sequence=1
[22] Short, J. C., McKelvie, A., Ketchen jr., D. J., Chandler, G. J. (2009) „Firm and Industry
Effects on Firm Performance: A Generalization and Extension for New Ventures‟
Strategic Entrepreneurship Journal, Vol. 3, pp. 47-65.
[23] Tarziján, J., Ramírez, C., (2010). „Firm, Industry and Corporation Effects Revisited: A
Mixed Multi-Level Analysis for Chilean Companies.‟ Applied Economics Letters.
http://www.eauc.cl/publicaciones/wp-
content/uploads/2010/10/papercomplappliedeconoletter2010.pdf
[24] Victer, R., McGahan, A. (2006) „The effect of industry and location on firm profitability
in the global market: empirical evidence that firm performance depends on the interaction
between industry affiliation and country identity‟ DRUID SUMMER CONFERENCE,
2006, Proceedings. DRUID, 2006.
http://www2.druid.dk/conferences/viewpaper.php?id=790&cf=8