Embed Size (px)
Citation preview

Firefly Luciferase–Based Dynamic Bioluminescence Imaging: ANoninvasive Technique to Assess Tumor Angiogenesis
Amy Sun, BS*,Department of Biological Sciences, Stanford University School of Medicine, Stanford, California
Lewis Hou, MD*,Department of Neurosurgery, Stanford University School of Medicine, Stanford, California
Tiffany Prugpichailers, BS,Department of Biological Sciences, Stanford University School of Medicine, Stanford, California
Jason Dunkel, BS,Department of Biological Sciences, Stanford University School of Medicine, Stanford, California
Maziyar A. Kalani, BS,Department of Neurosurgery, Stanford University School of Medicine, Stanford, California
Xiaoyuan Chen, PhD,Department of Radiology, Stanford University School of Medicine, Stanford, California
M. Yashar S. Kalani, MD, PhD, andDepartment of Neurosurgery; Institute for Stem Cell Biology and Regenerative Medicine; andInstitute for Neuro-Innovation and Translational Neurosciences, Stanford University School ofMedicine, Stanford, California, Current Address: Department of Neurosurgery, BarrowNeurological Institute, Phoenix, Arizona
Victor Tse, MD, PhDDepartment of Neurosurgery, Stanford University School of Medicine, Stanford, California,Current Address: Division of Neurosurgery, The Kaiser Permanente Medical Group, RedwoodCity, California
AbstractOBJECTIVE—Bioluminescence imaging (BLI) is emerging as a cost-effective, high-throughput,noninvasive, and sensitive imaging modality to monitor cell growth and trafficking. We describethe use of dynamic BLI as a noninvasive method of assessing vessel permeability during braintumor growth.
METHODS—With the use of stereotactic technique, 105 firefly luciferase–transfected GL26mouse glioblastoma multiforme cells were injected into the brains of C57BL/6 mice (n = 80).After intraperitoneal injection of D-luciferin (150 mg/kg), serial dynamic BLI was performed at 1-minute intervals (30 seconds exposure) every 2 to 3 days until death of the animals. The maximum
Copyright © 2010 by the Congress of Neurological Surgeons
Reprint requests: Victor Tse, MD, PhD, Division of Neurosurgery, The Kaiser Permanente Medical Group, Redwood City, CA94063. [email protected].*These authors contributed to this work equally.
DisclosuresThis project was partially funded by the VPUE Faculty Grant and quarterly grants from Stanford University Undergraduate ResearchPrograms. The authors have no personal financial or institutional interest in any of the drugs, materials, or devices described in thisarticle.
NIH Public AccessAuthor ManuscriptNeurosurgery. Author manuscript; available in PMC 2013 April 22.
Published in final edited form as:Neurosurgery. 2010 April ; 66(4): 751–757. doi:10.1227/01.NEU.0000367452.37534.B1.
NIH
-PA Author Manuscript
NIH
-PA Author Manuscript
NIH
-PA Author Manuscript

intensity was used as an indirect measurement of tumor growth. The adjusted slope of initialintensity (I90/Im) was used as a proxy to monitor the flow rate of blood into the vascular tree.Using a modified Evans blue perfusion protocol, we calculated the relative permeability of thevascular tree at various time points.
RESULTS—Daily maximum intensity correlated strongly with tumor volume. At postinjectionday 23, histology and BLI demonstrated an exponential growth of the tumor mass. Slopes werecalculated to reflect the flow in the vessels feeding the tumor (adjusted slope = I90/Im). Theincrease in BLI intensity was correlated with a decrease in adjusted slope, reflecting a decrease inthe rate of blood flow as tumor volume increased (y = 93.8e−0.49, R2 = 0.63). Examination ofcalculated slopes revealed a peak in permeability around postinjection day 20 (n = 42, P < .02 by1-way analysis of variance) and showed a downward trend in relation to both postinjection dayand maximum intensity observed; as angiogenesis progressed, tumor vessel caliber increaseddramatically, resulting in sluggish but increased flow. This trend was correlated with Evans bluehistology, revealing an increase in Evans blue dye uptake into the tumor, as slope calculated byBLI increases.
CONCLUSION—Dynamic BLI is a practical, noninvasive technique that can semiquantitativelymonitor changes in vascular permeability and therefore facilitate the study of tumor angiogenesisin animal models of disease.
KeywordsAngiogenesis; Dynamic bioluminescence imaging; Luciferase; Tumor
Angiogenesis, the growth of new blood vessels from preexisting vasculature, is importantfor solid tumor growth to allow the transfer of oxygen, nutrients, and waste.1,2 Excessivetumor cell proliferation, characteristic of most cancerous growths, is insufficient for a tumorto have physiologic detriment.1,3 Early studies showed that tumors implanted into a site oflittle blood circulation, such as the anterior chamber of the eye, fail to grow larger than 1mm in diameter. However, if the tumor is implanted near the iris, where there is ample bloodflow, the tumor grows 16 000 times in size within 2 weeks.4 Angiogenesis is also positivelycorrelated with metastasis, and metastasis is rare in the absence of new vasculature.5–7
Despite the importance of angiogenesis to neoplastic growth and metastasis, there are fewnoninvasive, in vivo methodologies to monitor angiogenic progression. One such method forcalculating blood volume, perfusion, and vascular permeability uses dynamic contrast-enhancing magnetic resonance imaging (MRI).8 Using dynamic contrast-enhancing MRI,Lüdemann et al8 could distinguish between glioma grades and types of brain tumors. Otherstudies suggest that neovascularization during angiogenesis includes an increase in thepermeability of the blood-brain barrier, resulting in an increase in intensity during contrastMRI, and is correlated to exponential tumor growth, increased expression of angiogenicfactors such as vascular endothelial growth factor and angiopoietin-1 and -2, as well as anincrease in vessel caliber and density.9
Another available noninvasive in vivo imaging technique takes advantage of the fireflyluciferase–transfected brain tumor cell lines. In vivo bioluminescence imaging (BLI), whilenot practical in patients, is a high-throughput and sensitive imaging modality, making it anexcellent tool for monitoring tumor growth and the progress of antitumor therapies in animalmodels. The substrate, D-luciferin, is known to cross cell membranes and penetrate theblood-brain barrier after intraperitoneal injection into mice, and the excitation photonsemitted are detectable through bone, allowing for BLI of any organ, including the brain.Burgos et al10 used BLI to compare growth curves of brain tumors in orthotopic andheterotopic mice.
Sun et al. Page 2
Neurosurgery. Author manuscript; available in PMC 2013 April 22.
NIH
-PA Author Manuscript
NIH
-PA Author Manuscript
NIH
-PA Author Manuscript

In this study, we combine dynamic BLI (DBLI) with histology and illustrate that thisnoninvasive in vivo technique can be used to monitor tumor growth and permeability of theblood-brain barrier in an experimental model of glioma in mice. Although this imagingmodality is currently impractical to use in patients, the technique can be used to study theeffects of antiangiogenic therapeutics in animal models.
MATERIALS AND METHODSGlioblastoma Multiforme Tumor Line
A murine-derived GL26 glioblastoma cell line was used in this study. This cell lineoriginates from a primary mouse brain tumor that was induced in the brains of C57BL/6mice after intracerebral implantation of methylcholanthrene pellets.9 The cells weremaintained in standard culture conditions using Dulbecco’s modified Eagle’s medium (highglucose) with 10% fetal calf serum (Invitrogen Corp, Carlsbad, CA) and 1% penicillin-streptomycin antibiotic (Invitrogen Corp) in 5% CO2 at 37°C. After transfection andselection, 100µg/mL of geneticin (G418) antibiotic (Invitrogen Corp) was added to maintainselection for the expression of the luciferase gene.
Transfection ProtocolTransfection of GL26 with pcDNA3.1-Fluc, in which firefly luciferase expression is drivenby a cytomegalovirus promoter, was performed using Lipofectamine 2000 (Invitrogen Corp)according to the manufacturer’s protocol. Transfected cells were cultured in the Dulbecco’smodified Eagle’s medium cocktail, as described above, containing 800 µg/mL of G418 at aconcentration for luciferase gene expression selection. Three weeks afterward, lightemission of drug-resistant clones was determined by charge-coupled device camera(Xenogen IVIS; Caliper Life Sciences, Hopkinton, MA) to screen for the reporter geneexpression. Positive clones were selected and further amplified. The stable cell line isreferred to as GL26-(f)luc.
Orthotopic Brain Tumor ModelAll animal experiments were conducted according to the surgical protocol approved by theAdministrative Panel on Laboratory Animal Care at Stanford University. Six-week oldC57BL/6-NBL6 mice (20–25 g) were anesthetized with intraperitoneal injections of avertinsolution, composed of 1.2% 2,2,2-tribromoethanol (Sigma-Aldrich, St Louis, MO) in 1.2%tertamyl alcohol (Fisher Scientific, Pittsburgh, PA) and 0.9% NaCl, using standard protocol.Animals were continuously monitored through neurologic stimulation of hind paws andrespiration rate. A warming blanket maintained the body temperature of the mice duringanesthetization. Mice were placed onto a stereotactic frame (Kopf Instruments, Tujunga,CA) and secured by ear-bars. Under a dissection microscope, a 1-cm parasagittal incisionwas made to expose the coronal and superior sagittal sinus. An electric dental drill was usedto create a 1-mm-diameter burr hole 2 mm lateral and 1 mm posterior to the anatomicbregma over the right hemisphere. A 2-µL suspension containing low-passage (<17passages) 105 GL26-luc cells was prepared in serum-free Dulbecco’s modified Eagle’smedium (low glucose). After dural penetration, cells were injected 2.5 mm into theparenchyma using a 10-µL microinjector syringe (Hamilton Co, Reno, NV) at a rate of 1µL/min. The needle was then retracted 1 mm/min, and the scalp was closed using 5-0 Vicrylsutures (Ethicon, Inc, Somerville, NJ). This model was previously described in the literatureand has been shown to result in up to 90% engraftment with consistent tumor size andgrowth.9,11,12 Tumor volume was estimated by (length squared × width)/2, where lengthwas the longer measurement. Weight was measured by AG204 DeltaRange balance(Mettler-Toledo, Columbus, OH).
Sun et al. Page 3
Neurosurgery. Author manuscript; available in PMC 2013 April 22.
NIH
-PA Author Manuscript
NIH
-PA Author Manuscript
NIH
-PA Author Manuscript

Bioluminescence ImagingIntracranial tumor growth was monitored using DBLI using the Xenogen IVIS 200 imagingsystem (Caliper Life Sciences). Mice were anesthetized by inhalation of 1% to 2%isofluorane (Aerrane; Baxter Healthcare Corp, Deerfield, IL) and given intraperitonealinjections of 200 µL D-luciferin (150 mg/kg; catalog no. L8220; Biosynth AG, Staad,Switzerland). Each set of mice received injections within 45 seconds and in the same order.Serial images were taken using Living Image software (Caliper Life Sciences) every 2 or 3days once the presence of tumor was confirmed. Sequential images measuring thebioluminescent activity of the luciferase enzyme were acquired at 1-minute intervals (30seconds exposure, no time delay) for at least 20 minutes. The luminescent camera was set to30 seconds exposure, medium binning, 1 f/stop, blocked excitation filter, and open emissionfilter. The photographic camera was set to 2 seconds exposure, medium binning, and 8 f/stop. Field of view was set to 22 cm to image 5 mice at once. Identical settings were used toacquire each image and region of interest.
Permeability CalculationData on regions of interest were obtained from the Living Image software and imported intoMicrosoft Office Excel (Microsoft Corp, Redmond, WA). Calculations were made todetermine the rate of luminescence, which is directly correlated to luciferase enzymefunction and limited by rate of D-luciferin uptake from the blood supply. Intensity of lightemission at the first time interval (I90) (approximately 90 seconds after injection of D-luciferin) was identified. Similarly, magnitude and timing of maximal intensity (Im) was alsonoted. Calculated or adjusted slope was defined as the ratio of I90 to Im (I90/Im), allowing forcompensation of changes in tumor size. One-way analysis of variance examined thestatistical significance of the peak permeability trend observed. Graphs in Excel and MatLab(The MathWorks, Inc, Natick, MA) were constructed to follow the permeability profile ofmice.
Evans Blue Permeability AnalysisMice were imaged according to the methodology described above and killed on the basis ofthe permeability profile. A modified Evans blue dye protocol was used to assess the vesselpermeability.13 Evans blue dye (C34H24N6O14S4Na4), 2% wt/vol in phosphate-bufferedsaline (Invitrogen Corp), was injected into the external jugular vein. Within 1 minute, micewere subsequently perfused with phosphate-buffered saline and 4% paraformaldehyde.Brains were harvested, and tumors were dissected out. Normal brain parenchyma from thecontralateral lobe of the tumor was used as control. Concentration of Evans blue dye wasmeasured in brain tumor extracts using spectrophotometry (620/635 nm). Tumor tissue dyeconcentration (µg of dye per g of tissue) was normalized by weight and dye concentration onthe contralateral side of the brain. Linear correlation was established between Evans blueanalysis and DBLI permeability analysis.
HistologyMice were perfused with phosphate-buffered saline and 4% paraformaldehyde at prepeak,peak, and postpeak permeability. Harvested brains were placed in 30% sucrose solution for3 days. Brains were frozen and cut into 30-µm serial sections using a cryostat microtome(Microm HM450; Thermo Fisher Scientific, Waltham, MA). Sections were mounted onslides and counterstained with Vectashield mounting medium (Vector Laboratories,Burlingame, CA) containing 4′,6-diamidino-2-phenylindole (Vector H-1500) for nucleardetection. Tumor vessels were visualized with CD31 antibody (dilution 1:100). Slides wereviewed with an Axioplan2 Zeiss fluorescence microscope, Axioskop (with preset 4′,6-diamidino-2-phenylindole and CY3 filters), and a Zeiss LSM510 confocal microscope (Carl
Sun et al. Page 4
Neurosurgery. Author manuscript; available in PMC 2013 April 22.
NIH
-PA Author Manuscript
NIH
-PA Author Manuscript
NIH
-PA Author Manuscript

Zeiss, Inc, Thornwood, NY). Regions of tumor growth were identified by a dense 4′,6-diamidino-2-phenylindole nuclear staining pattern. Specimens were examined under low-(×200) and high-power fields (×400). At least 6 random fields (150 × 150 mm2) wereexamined per slide. Each field was divided into 4 quadrants. Two replicate slides per animalwere examined for each staining combination. Areas defined for analyses werepredetermined empirically from previous studies to optimize the best representation of bloodvessel distribution within tumor sections.14 Figure images were digitally assembled withAdobe Photoshop (Adobe Systems, Inc, San Jose, CA).
RESULTSDBLI Intensities and Vascular Densities Increase Over the Time Course of the Experiment
Tumor-implanted animals were sequentially imaged using DBLI on alternative days asdescribed under Materials and Methods. Starting on day 15, DBLI consistently exhibitedincreased signal intensities. The signal intensity continued to increase during the course ofthe experiment until the demise of the animals (Fig. 1A). As scanning time was increasedfrom 2 to 20 minutes, nearly all time points exhibited an overall increase in the observedsignal intensities. Overlaid time-course intensity curves spanning multiple imaging dayssuggest that as postinjection day increased, the time to reach maximum intensity decreased(Fig. 1B). The day 23 time point reached an asymptotic peak at 12 minutes, after whichsignal intensities began to diminish (Fig. 1B). To show that maximum intensity is directlycorrelated with tumor size, mice were killed on the day of imaging, and their estimatedtumor volume (length squared × width)/2, where length was the longer measurement) wascompared with the maximum intensity observed that day. We were able to show a stronglinear correlation between tumor growth and maximum intensity (R2 = 0.93) (Fig. 1C). Miceinjected with nontransfected cells or with no cells resulted in no signal in comparison tobackground (data not shown). The vascular density similarly increased with time andreached an asymptotic peak at postinjection days 23 to 26 (Fig. 1D), corresponding to theperiod of the exponential growth of the tumor (Fig. 1E). We further studied this increase invascular density by evaluating the caliber of the vessels generated over the time course ofthe experiment and observed an increase in the vascular caliber (day 15, 11.9 ± 1.8 µm; day20, 19.3 ± 1.5 µm; day 25, 18.8 ± 2.5 µm; day 30, 19.6 ± 1.6 µm; P < .04) (Fig. 1F). Afterday 28, there was a resegregation of the average vessel caliber into small and larger vessels(Fig. 1, G–L).
Tumor Signal Intensity Is Inversely Related to the Adjusted IntensityTo assess vascular flow, we measured the magnitude and timing of maximal intensity andcorrelated this to the adjusted intensity, which was measured as the ratio of the flow in theinitial 90 seconds relative to the maximal intensity. This adjusted intensity allowed forcompensation for changes in tumor size over the course of the experiment. The ratio of Im toI90/Im decreased over the time course of the experiment (y = 93.8e−0.49, R2 = 0.63) (Fig. 2).
The Concentration of Evans Blue Correlates Positively With the Tumor Signal IntensityTo further assess the integrity of DBLI intensities as a measure of permeability, wecorrelated the rate of Evans blue uptake to the adjusted signal intensity. Over the studiedtime points, an increase in the Evans blue concentration in the tissue correlated with anincreased tumor intensity (y = 181.32x + 6.57; R2 = 0.58) (Fig. 3).
DISCUSSIONAs solid tumors grow, they depend on the formation of new blood vessels to meet theincreased metabolic demands of uncontrolled proliferation. It is now well known that
Sun et al. Page 5
Neurosurgery. Author manuscript; available in PMC 2013 April 22.
NIH
-PA Author Manuscript
NIH
-PA Author Manuscript
NIH
-PA Author Manuscript

important signaling molecules control this intricate process, which results in increaseddelivery of blood and nutrients and removal of wastes from the tumor mass. Angiogenesis inthe brain is particularly intricate, since new vessel formation frequently results in increasedpermeability and disruption of the blood-brain barrier. The disruption of the blood-brainbarrier allows for the enhanced delivery of drugs that usually would have little permeabilityto the brain as well as allowing for the identification of the tumor mass using contrastagents.
In this study, we used DBLI with D-luciferin to monitor tumor growth in an animal model ofglioma. It is important to note there are other invasive and noninvasive methods to assessvascular permeability and arrive at some of the conclusions in this article. Several groupshave used various MRI modalities, including quantitative measurement with double-echodynamic MRI,15,16 perfusion computed tomography,17 positron emission tomography, andthermodilution methods18 in various clinical settings to assess vascular architecture andvascular permeability. Each method has advantages and disadvantages (Table 1), but,fundamentally, all of these methods look at diffusion and change in position of tracers toarrive at parameters for permeability, stasis, and flow. Using the current method, weobserved an increase in the DBLI intensities over the course of the experiment (Fig. 1, Aand B). The increased intensities correlate with increased tumor mass (Fig. 1C) and reflectthe dynamic of vascular changes associated with tumor angiogenesis (Fig. 3). The DBLIintensities continued to increase for all time points until days 23 to 25. Between days 23 and25, one reaches an asymptote of intensities at T = 12 minutes. This may be explained byincreased clearance of the D-luciferin from the tumor mass, most likely owing to increasedflow and relatively intact permeability of the tumor vessels. As the tumor continued to growover the course of the experiment (Fig. 1E), we observed a concomitant increase in vasculardensity (Fig. 1D, vascular caliber (Fig. 1F), and permeability. In the later phase of tumorgrowth, the vessels became more leaky and took on a sinusoidal appearance resulting, instagnancy of flow (Fig. 2). After day 28, there was a general redistribution of vascularcaliber (Fig. 1F). This is attributable to involution of the vessels within the tumor mass andthe proliferation of smaller-caliber vessels at the advancing edge of the tumor.
To assess the flow in the tumor vessels, we plotted the maximal intensity of DBLI signalsrelative to the adjusted intensities and noted that, as Im increased, the ratio of I90/Imdecreased. This suggests that within the initial 90 seconds, the flow is sluggish, as depictedby the diminished I90/Im ratio. Gradually, the flow increases, most likely owing to increasednumber and caliber of blood vessels, and this results in an increased Im. The decrease in theadjusted intensities and subsequent increase in the ratio of Im to (Im/I90) is consistent withsluggish flow and leakiness of the tumor over the time course of the experiment (Fig. 2).
To provide a well-established control and to assess the integrity of the DBLI intensities asreadout for tumor vessel permeability, we carried out Evans blue staining of the tumorvessels over the same time points as in our experiments. We noted a negative correlationbetween the concentration of Evans blue reagent in the tumor mass and the adjustedintensities, consistent with sluggish flow in the tumor vessels over the time points of theexperiment (Fig. 3).
CONCLUSIONSIn vivo assessment of tumor angiogenesis is crucial for studying tumor progression and theadministration of antiangiogenesis-based therapy. The onset of angiogenesis is characterizedby an increase in vessel permeability, which is thought to be necessary for the recruitment ofendothelial progenitor cells and the establishment of extravascular scaffold. DBLI is apractical, noninvasive technique to monitor the blood flow through the vascular tree and into
Sun et al. Page 6
Neurosurgery. Author manuscript; available in PMC 2013 April 22.
NIH
-PA Author Manuscript
NIH
-PA Author Manuscript
NIH
-PA Author Manuscript
the tumor tissue. Although currently impractical for use in patients, this study and others likeit suggest that DBLI has great utility for monitoring tumorigenesis in animal models ofdisease. Our study shows that DBLI intensities correlate well with tumor growth. Tumorgrowth is positively correlated with increased adjusted intensities and the ratio of maximalintensity to the adjusted intensities is diminished, suggesting increased, albeit sluggish,blood flow into the tumor mass as the tumor grows. A comparison of the Evans blue methodto the DBLI negatively correlates Evans blue concentration in tumor tissue to the adjustedintensities, suggesting that DBLI can be used as a reliable noninvasive in vivo method tostudy and assess tumor growth.
AcknowledgmentsM. Yashar S. Kalani, MD, PhD, is a fellow of the Hanbery Neurosurgical Society. Vincent Mei and Yao Yugenerated the slope and maximum intensity curves using MatLab software. Lewis Hou, MD, is a NeurosurgicalResearch Foundation Resident Fellow 2006-2008.
ABBREVIATIONS
BLI bioluminescence imaging
DBLI dynamic bioluminescence imaging
Im maximal intensity
I90 intensity at 90-second time interval
MRI magnetic resonance imaging
COMMENTIn this report, the authors extend and expand on previously published work that has usedbioluminescent imaging (BLI) as a measure of tumor growth. They are able to show thatdynamic BLI (ie, imaging over a period of time) reflects tumor growth, but, mostinterestingly, they suggest that it also correlates with blood vessel density and diameter. Thisshows that the technique may be useful for the study of neoangiogenesis, although it stillneeds refinement. The major issues are: (1) the increase in vessel density is not linear (seeFig. 1D in the article), and, thus, the interpretation of changes in BLI may require additionaltime points and animals to provide such a correlation; (2) BLI is not a direct measure ofvascularity, but, rather, of viable tumor cells; and (3) only 1 cell line was studied, andwhether these findings can be generalized to others will require more work. Ultimately,though, the application of imaging modalities such as dynamic BLI can only be of help inpreclinical translational therapies, and the authors should be encouraged to continue pushingthis line of research.
E. Antonio Chiocca
Columbus, Ohio
REFERENCES1. Kerbel RS. Tumor angiogenesis. N Engl J Med. 2008; 358(19):2039–2049. [PubMed: 18463380]
2. Folkman J. Tumor angiogenesis: therapeutic implications. N Engl J Med. 1971; 285(21):1182–1186.[PubMed: 4938153]
3. Folkman J. Angiogenesis. Annu Rev Med. 2006; 57:1–18. [PubMed: 16409133]
4. Holleb AI, Folkman J. Tumor angiogenesis. CA Cancer J Clin. 1972; 22(4):226–229. [PubMed:4625047]
Sun et al. Page 7
Neurosurgery. Author manuscript; available in PMC 2013 April 22.
NIH
-PA Author Manuscript
NIH
-PA Author Manuscript
NIH
-PA Author Manuscript

5. Gimbrone MA Jr, Cotran RS, Leapman SB, Folkman J. Tumor growth and neovascularization: anexperimental model using the rabbit cornea. J Natl Cancer Inst. 1974; 52(2):413–427. [PubMed:4816003]
6. Gimbrone MA Jr, Leapman SB, Cotran RS, Folkman J. Tumor dormancy in vivo by prevention ofneovascularization. J Exp Med. 1972; 136(2):261–276. [PubMed: 5043412]
7. Gimbrone MA Jr, Leapman SB, Cotran RS, Folkman J. Tumor angiogenesis: iris neovascularizationat a distance from experimental intraocular tumors. J Natl Cancer Inst. 1973; 50(1):219–228.[PubMed: 4692862]
8. Lüdemann L, Grieger W, Wurm R, Wust P, Zimmer C. Quantitative measurement of leakagevolume and permeability in gliomas, meningiomas and brain metastases with dynamic contrast-enhanced MRI. Magn Reson Imaging. 2005; 23(8):833–841. [PubMed: 16275421]
9. Veeravagu A, Hou LC, Hsu AR, et al. The temporal correlation of dynamic contrast- enhancedmagnetic resonance imaging with tumor angiogenesis in a murine glioblastoma model. Neurol Res.2008; 30(9):952–959. [PubMed: 18662497]
10. Burgos JS, Rosol M, Moats RA, et al. Time course of bioluminescent signal in ortho topic andheterotopic brain tumors in nude mice. Biotechniques. 2003; 34(6):1184–1188. [PubMed:12813886]
11. Bababeygy SR, Cheshier SH, Hou LC, Higgins DM, Weissman IL, Tse VC. Hematopoietic stemcell-derived pericytic cells in brain tumor angio-architecture. Stem Cells Dev. 2008; 17(1):11–18.[PubMed: 18240955]
12. Hsu AR, Hou LC, Veeravagu A, et al. In vivo near-infrared fluorescence imaging of integrin αvβ3in an orthotopic glioblastoma model. Mol Imaging Biol. 2006; 8(6):315–323. [PubMed:17053862]
13. Prabhu SS, Broaddus WC, Oveissi C, Berr SS, Gillies GT. Determination of intracranial tumorvolumes in a rodent brain using magnetic resonance imaging, Evans blue, and histology: acomparative study. IEEE Trans Biomed Eng. 2000; 47(2):259–265. [PubMed: 10721633]
14. Tse V, Yung Y, Santarelli JG, et al. Effects of tumor suppressor gene (p53) on brain tumorangiogenesis and expression of angiogenic modulators. Anticancer Res. 2004; 24(1):1–10.[PubMed: 15015569]
15. Gambarota G, Leenders W, Maass C, et al. Characterisation of tumour vasculature in mouse brainby USPIO contrast-enhanced MRI. Br J Cancer. 2008; 98(11):1784–1789. [PubMed: 18506183]
16. Zaharchuk G. Theoretical basis of hemodynamic MR imaging techniques to measure cerebralblood volume, cerebral blood flow, and permeability. AJNR Am J Neuroradiol. 2007; 28(10):1850–1858. [PubMed: 17998415]
17. Petralia G, Preda L, Giugliano G, et al. Perfusion computed tomography for monitoring inductionchemotherapy in patients with squamous cell carcinoma of the upper aerodigestive tract:correlation between changes in tumor perfusion and tumor volume. J Comput Assist Tomogr.2009; 33(4):552–559. [PubMed: 19638848]
18. Kenner T, Moser M, Hinghofer-Szalkay H. Determination of cardiac output and of transcapillaryfluid exchange by continuous recording of blood density. Basic Res Cardiol. 1980; 75(4):501–509.[PubMed: 7436993]
Sun et al. Page 8
Neurosurgery. Author manuscript; available in PMC 2013 April 22.
NIH
-PA Author Manuscript
NIH
-PA Author Manuscript
NIH
-PA Author Manuscript
Sun et al. Page 9
Neurosurgery. Author manuscript; available in PMC 2013 April 22.
NIH
-PA Author Manuscript
NIH
-PA Author Manuscript
NIH
-PA Author Manuscript
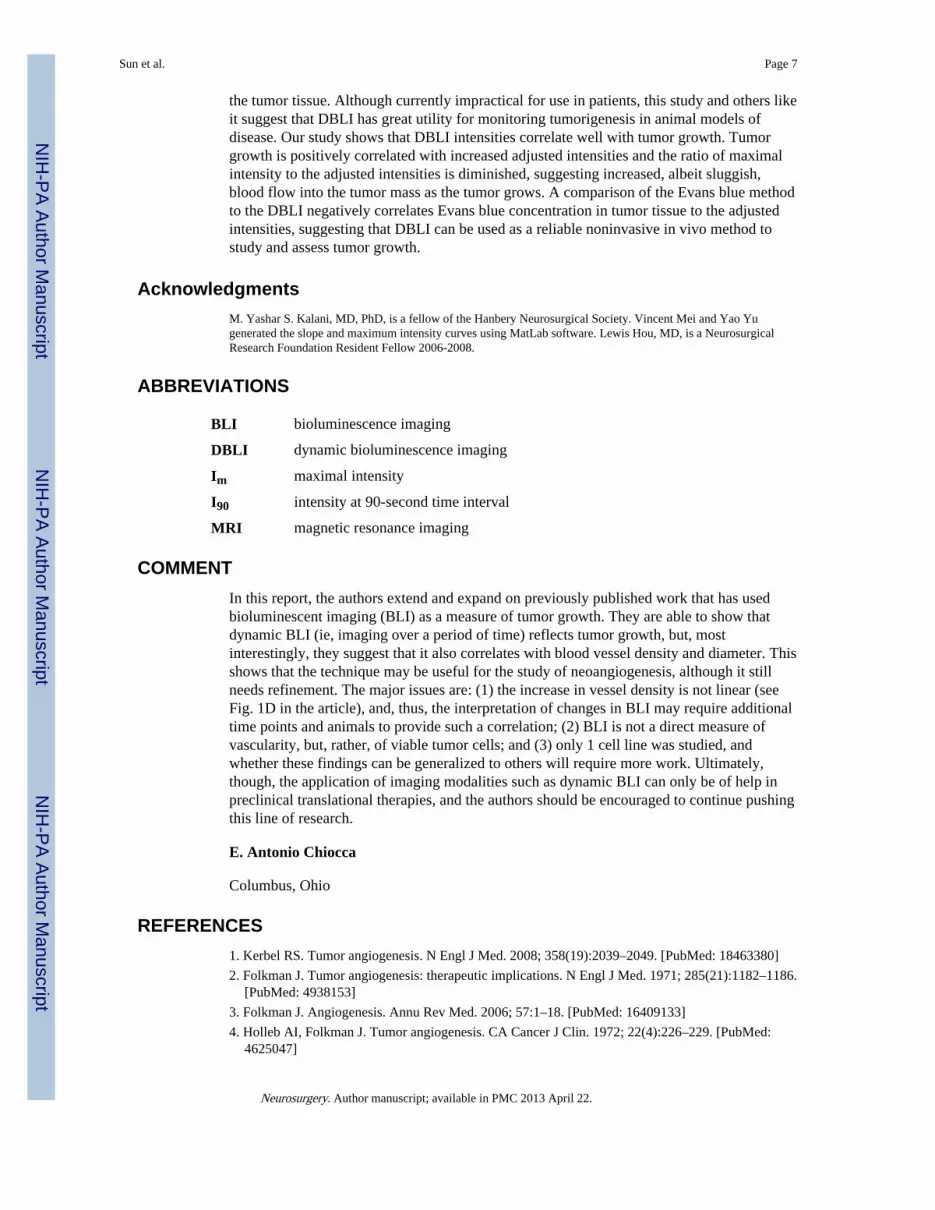
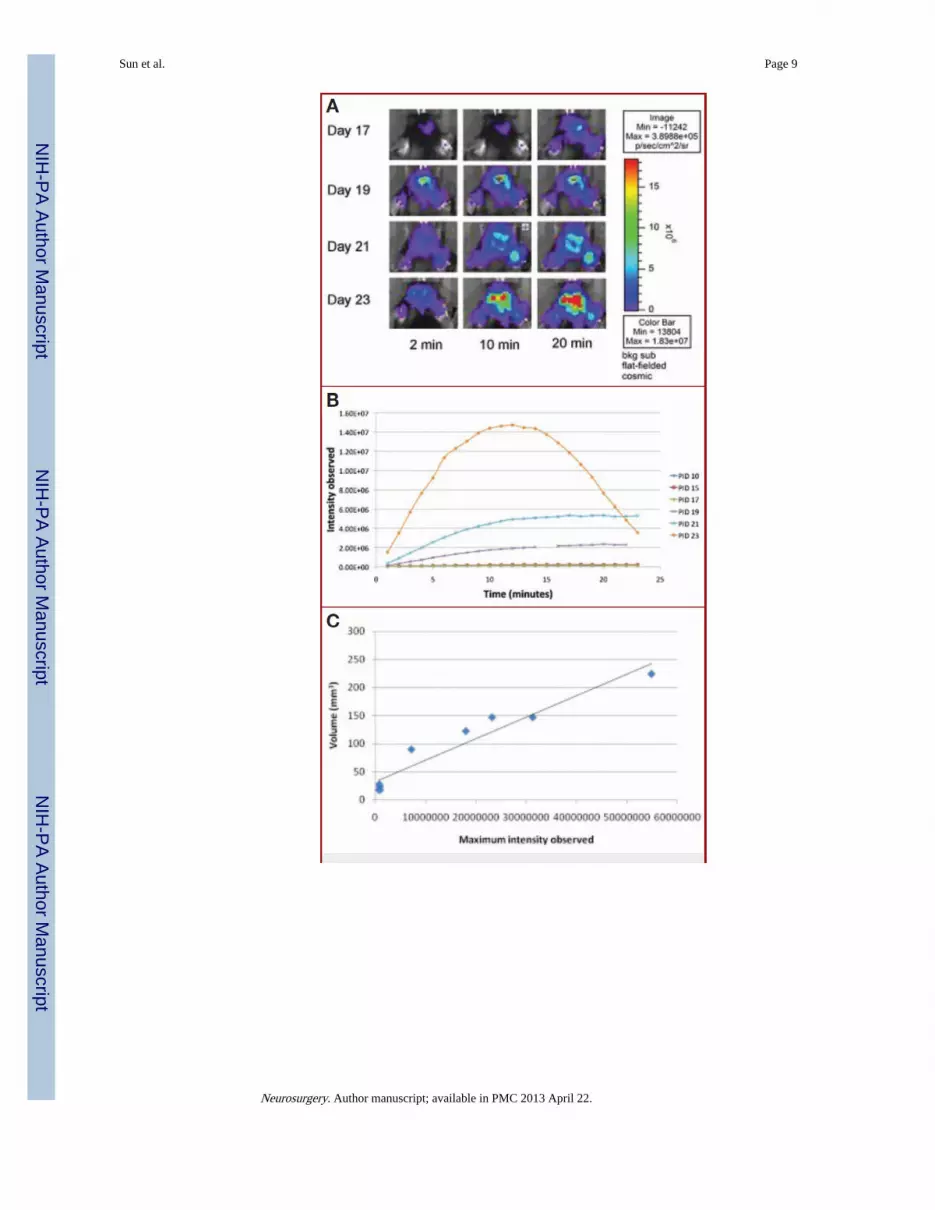
Figure 1.A, dynamic bioluminescence imaging (DBLI) of orthotopic GL26-luc tumor intensity.Firefly luciferase–transfected GL26-luc cells were stereotactically implanted in the rightfrontal lobe and imaged on postinjection days (PIDs) 17, 19, 21, and 23. Total flux recordedby Living Image software; pseudocolor image reflects photon flux and not necessarily theperimeter of the tumor. As time after intraperitoneal injection of luciferin increases, tumorintensity increases, as it reaches its maximum. As PID increases, tumor intensity alsoincreases, reflecting tumor growth. B, intensity curves of a tumor over the course of anexperiment. DBLI images were taken every other day, and observed bioluminescentintensities within regions of interest encompassing the tumor injection site were plotted foreach minute. As the tumor grows over time, maximum intensity increases (Im) and the timeto reach Im (slope) decreases. Minute 15 of PID 19 was removed, owing to abnormally highbackground levels of intensity. C, graph showing correlation of maximum intensity andtumor volume. Tumor volume (estimated by (length squared × width)/2, where length is thelonger measurement) is directly related to maximum intensity observed on the day that theanimal is killed (R2 = 0.93, n = 9). This strong correlation suggests that bioluminescenceimaging is representative of tumor volume. D, graph showing that vascular volume density(mm3) increases over the time points of the experiment. The results of a representative
Sun et al. Page 10
Neurosurgery. Author manuscript; available in PMC 2013 April 22.
NIH
-PA Author Manuscript
NIH
-PA Author Manuscript
NIH
-PA Author Manuscript

experiment are shown. E, graph showing that tumor volume (mm3) increases over the timecourse of the experiment. The results of a representative experiment are shown. F, plotshowing that vascular caliber (µm) gradually increases from day 0 to day 28 (P < .04). POD,postoperative day. G–L, representative histologic sections representing tumor growth atvarious time points (G, day 10; H, day 15; I, day 17; J, day 19; K, day 21; L, day 23) overthe course of the experiment, illustrating the observed increase in vascular caliber (blue,nuclei, 4′,6-diamidino-2-phenylindole; red, vascular endothelium, CD31).
Sun et al. Page 11
Neurosurgery. Author manuscript; available in PMC 2013 April 22.
NIH
-PA Author Manuscript
NIH
-PA Author Manuscript
NIH
-PA Author Manuscript
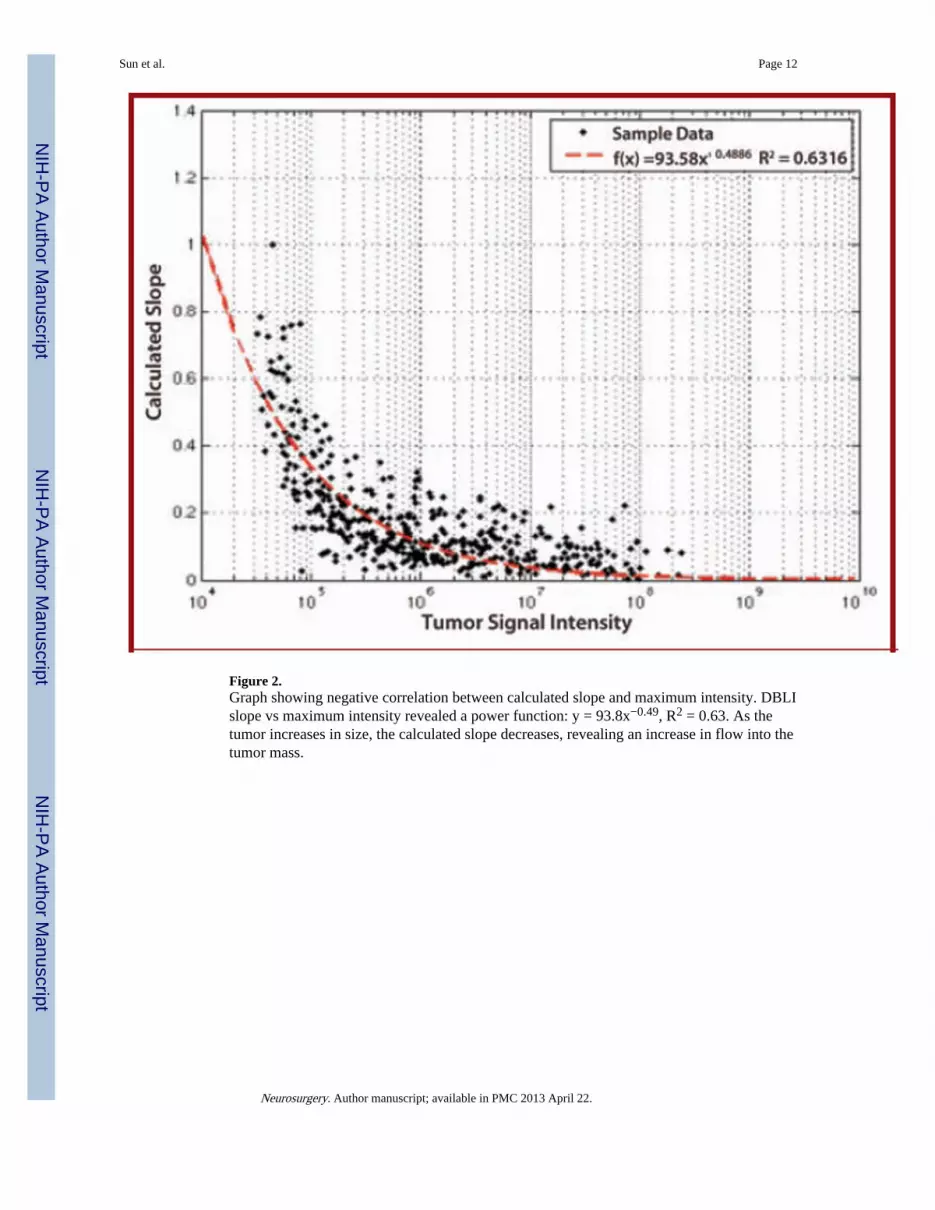
Figure 2.Graph showing negative correlation between calculated slope and maximum intensity. DBLIslope vs maximum intensity revealed a power function: y = 93.8x−0.49, R2 = 0.63. As thetumor increases in size, the calculated slope decreases, revealing an increase in flow into thetumor mass.
Sun et al. Page 12
Neurosurgery. Author manuscript; available in PMC 2013 April 22.
NIH
-PA Author Manuscript
NIH
-PA Author Manuscript
NIH
-PA Author Manuscript

Figure 3.Graph showing correlation between Evans blue histology and adjusted slope value. Thecalculated slope correlates linearly with the uptake of Evans blue dye into the tumor tissue.As the slope decreases, the ability of D-luciferin or Evans blue dye to reach the tumor isdiminished.
Sun et al. Page 13
Neurosurgery. Author manuscript; available in PMC 2013 April 22.
NIH
-PA Author Manuscript
NIH
-PA Author Manuscript
NIH
-PA Author Manuscript

NIH
-PA Author Manuscript
NIH
-PA Author Manuscript
NIH
-PA Author Manuscript
Sun et al. Page 14
TABLE 1
Advantages and Disadvantages of Various Modalities for Assessing Vascular Permeability.a
Method Advantages Disadvantages
Echo dynamic MR imaging Non-invasive; readily available;good visualization of the posteriorfossa
High background and low accuracy due to contrast -dosing effects;various methods to process data making cross-institution usedifficult; time consuming
Perfusion computed tomography Non-invasive; rapid; readilyavailable
Poor detail of anatomy of tumor; poor visualization of the posteriorfossa; High background and low accuracy due to contrast -dosingeffects
Positron emission tomography Non-invasive; high accuracy(especially when combined withother methods such as MR and CT)
Poor resolution for the brain; expensive; time consuming; few wellestablished protocols for large scale clinical use
Thermodilution Invasive; expensive; difficult to apply to the brain; inaccurate
aCT, computed tomographic; MR, magnetic resonance.
Neurosurgery. Author manuscript; available in PMC 2013 April 22.