Embed Size (px)
Citation preview
STANFORD CENTER FOR INTERNATIONAL DEVELOPMENT
Working Paper No. 241
Financial Sector Reforms in India
by
Charan Singh*
February 2005
Stanford University 579 Serra Mall @ Galvez, Landau Economics Building, Room 153
Stanford, CA 94305-6015
* Stanford Center for International Development
FINANCIAL SECTOR REFORMS IN INDIA by
Charan Singh ([email protected])
Abstract
The performance of the Indian economy in the last decade has been remarkable. This can be partly attributed to the multi-sector structural reforms, undertaken simultaneously in 1991, aimed at enhancing productivity, efficiency and international competitiveness of the economy. The reforms in the financial sector have been most effective. The main thrust of the financial sector reforms has been the creation of efficient and stable financial institutions and development of the markets, especially the money and government securities market. In addition, fiscal correction was undertaken and reforms in the banking and external sector were also initiated. The reforms have been undertaken gradually with mutual consent and wider debate amongst the participants and in a sequential pattern that is reinforcing to the overall economy. The financial markets have developed and are more integrated after the reforms, and regulatory and supervisory institutions have been set-up. The reforms, though slow paced initially but well synchronized, have begun to yield results. The economy has recorded consistently high growth rates, avoided any adverse impact from the South East Asian crisis, built substantial foreign exchange reserves, pre-paid some of its external debt and restructured its domestic debt.
The paper was partly written while I was a visiting scholar at Department of Economics, Harvard University. I am thankful to Prof. Robert Barro, Harvard University for sponsoring me and encouraging me to work on this paper. I am grateful to Stephen Cecchetti, Nicholas Charles Hope, Kazuko Artus, Jacques K. Artus, Anjini Kochar and Ronald I. McKinnon for insightful and detailed suggestions. I also thank participants at SCID Lunch seminar on November 30, 2004 and annual AIES-ASSA conference in San Diego on January 3, 2004 for helpful comments.
2
The performance of the Indian economy in the last decade has been remarkably
strong. One of the reasons for the robust performance of the economy could be the
ongoing financial sector reform, which began in 1991.
In 1991, structural reforms were undertaken in many sectors simultaneously with an
aim to enhance productivity, efficiency and international competitiveness of the
economy, but the most effective of the reforms have been those in the financial sector.
The main thrust of the financial sector reforms has been the creation of efficient and
stable financial institutions and development of the markets, especially money and
government securities. Before 1991, a large component of domestic government debt,
incurred at low rates of interest and statutorily prescribed for subscription by state-
owned banks and financial institutions, led to a repressed financial system. The fiscal
dominance of monetary policy left little flexibility with the Reserve Bank of India
(RBI) to pursue a monetary policy that could foster financial markets, price stability
and economic growth. Although fiscal deficits and debt continue to be high, the
stoppage of automatic monetization and resort to market determined interest rates
through auctions on government borrowing have helped in the development and
integration of the financial markets.
The objective of this paper is to document that the multi-sector reforms undertaken in
India, though slow paced initially but well synchronized, have begun to yield results.
The economy has recorded consistently high growth rates, avoided any adverse
impact from the South East Asian Crises, built substantial foreign exchange reserves,
pre-paid some of its external debt and restructured its domestic debt. This paper is
mainly focused on financial sector reforms and is organized in four sections. In
Section-I, the overall importance of the financial sector is briefly discussed. Section –
II deals with the financial sector reforms initiated in 1991 accompanied by those in
banking and the external sector as well as in the fiscal policy. The positive impact of
the reform measures and the resilience of the economy are discussed in Section-III.
The conclusions that emerge and some proposed measures for the reforms to continue
are discussed in Section-IV.
3
SECTION – I: ROLE OF FINANCIAL DEVELOPMENT
There are different views about the role of financial development in economic growth.
McKinnon (1973) and Shaw (1973) draw attention to financial markets and their role
in economic growth, while Robinson (1952) argues that finance follows enterprise. In
recent times, Rajan and Zingales (1998), based on a large sample of countries, find
that financial development facilitates economic growth. Levine (2004) concludes that
the preponderance of evidence suggests a positive role for financial intermediaries
and markets in economic growth.
In any economy, the financial system plays a major role in transferring financial
resources from net savers to net investors. Levine (2004) summarizes the major
functions that the financial system performs – (i) mobilizes and pools savings, (ii)
facilitates the exchange of goods and services, (iii) facilitates the trading,
diversification and management of risk, (iv) monitors investment and exerts corporate
governance, and (v) provides information about investment and allocates capital.
Thus, the financial sector intermediates essentially through four transformation
mechanisms – (a) liability-asset transformation, (b) size-transformation, (c) maturity
transformation, and (d) risk transformation. A well functioning financial sector
efficiently delivers allocation of resources across the economy.
There has been a considerable widening and deepening of the Indian financial system,
especially in the past decade. The Indian financial system comprises an impressive
network of banks, development finance institutions (DFIs) and non-banking financial
companies (NBFCs). The banking system in India mainly consists of commercial
banks (CBs) – public (27), Regional Rural banks (198), private (30), and foreign (36)
– with 66,514 branches (rural branches – 32,645) and 9,000 ATMs, and co-operative
banks (CPBs) - rural (113,267 branches) and urban (2,104). DFIs comprise diverse
entities like term-lending institutions, investment institutions and specialized
institutions. Of these, nine DFIs, which perform the role of development banks and
refinance institutions, fall within the supervisory and regulatory domain of the RBI.
NBFCs encompass an extremely heterogeneous group of intermediaries in terms of
4
size, nature of incorporation and function of intermediation. NBFCs that are partially
or wholly regulated/supervised by the RBI include equipment leasing, hire-purchase
finance, investment and chit fund companies, and primary dealers in government
securities (a total of 13,849, of which 710 accept public deposits). CBs are the most
important segment of the financial system, with financial assets in 2003 accounting
for 56.6 per cent of GDP followed by DFIs (23.0 per cent), rural CPBs (6.7 per cent),
urban CPBs (2.1 per cent) and NBFCs (1.7 per cent). Accordingly, the discussion in
this paper would mainly focus on the reforms for the CBs.
SECTION –II: GENESIS AND FINANCIAL SECTOR REFORMS SINCE 1991
The initial symptoms of economic difficulties, especially in the fiscal and external
sectors, were apparent from the beginning of the 1980s – administered interest rates,
underdeveloped debt and financial markets, the persistently rising fiscal deficit of the
government, an overvalued exchange rate, high tariffs, and a restrictive industrial
policy. India could be characterized as a financially repressed closed economy with
the policy emphasis on import substitution. The banks and financial institutions were
state-owned and mainly expected to provide financial resources to the government,
public sector enterprises and a few industrial houses. In 1991, the immediate cause of
financial difficulties was the Gulf-war, which precipitated the balance of payments
problem.1The slowdown in world trade due to recession in the industrial world,
disintegration of Eastern Europe, and tight liquidity in global markets aggravated the
difficult situation.
The persistently rising fiscal deficit led to increasing monetization and accelerating
inflationary pressures. The disproportionate reliance on customs duty which raised
more than forty per cent of the Central Government’s net tax revenue, while
protecting industry, had implications for efficiency, technological up-grading and
export competitiveness. The fiscal imbalances spilled into the external sector and led
to consistently large and unsustainable current accounts deficits - 3.1 per cent of GDP
1 The main reasons being the high price of oil, cessation of exports to Iraq, and stoppage of inflow of remittances from Kuwait.
5
in 1990-91.2 To address these issues, import restrictions introduced in October 1990
adversely affected productive activity, especially industry while inflation began to
accelerate (Table - 1). The current account continued to be under stress and the
critical situation assumed the role of a crisis when foreign currency assets declined to
only two weeks of imports in June 1991. India had to pledge gold reserves as
collateral with the Bank of England to raise foreign exchange reserves and avoid a
default while a loan from the IMF followed later.
TABLE – 1: SELECT ECONOMIC INDICATORS – 1971 to 2004 (per cent)
Year Gross Monetized Current NNP at Per WPI-All Services Industry Agriculture Fiscal Deficit Account Factor Capita Commod- Deficit Deficit cost NNP -ies As % of GDP Average Annual Growth Rates in per cent 1 2 3 4 5 6 7 8 9 10 1971-81 --- 1.3 0.1 3.1 0.8 10.3 4.2 4.4 1.8 1981-82 6.3 2.4 1.7 5.8 3.8 9.3 5.4 8.8 5.3 1982-83 5.9 1.3 1.7 2.3 0.0 4.9 4.8 7.3 -0.7 1983-84 7.3 1.8 1.5 7.6 5.4 7.5 5.5 8.8 9.6 1984-85 9.0 3.1 1.2 4.0 1.7 6.5 6.0 6.4 1.5 1985-86 8.0 1.6 2.1 4.3 2.1 4.4 7.7 4.6 0.7 1986-87 9.9 2.4 1.9 3.9 1.8 5.8 6.8 8.1 -0.6 1987-88 9.2 1.8 1.8 3.4 1.2 8.1 6.4 6.9 -1.3 1988-89 8.5 1.6 2.7 10.6 8.3 7.5 7.2 9.8 15.5 1989-90 8.9 2.9 2.3 6.8 4.6 7.5 8.6 11.2 1.5 1990-91 9.4 2.7 3.1 5.4 3.3 10.3 6.1 6.8 4.1 1981-91 8.2 2.2 2.0 5.4 3.2 7.2 6.4 7.9 3.5 1991-92 7.0 0.8 0.3 0.5 -1.5 13.7 4.5 -1.2 -1.5 Memo 1992-04
8.3
0.0
0.7
6.1
4.1
6.4 7.6 6.4 3.2
-- - Not Available. CG – Central Government. NNP - Net National Product. WPI – Wholesale Price Index. Sources: (a) Economic Survey, Government of India. (b) National Account Statistics, Central Statistical Organization, Government of India. The Governments’ response to the short-lived crisis was the simultaneous
implementation of measures to stabilize the economy and to introduce structural
reforms. To successfully carry forward the benefits of stabilization measures, long-
term issues of structural rigidities had to be addressed – removal of the myriad
controls and regulations, introduction of efficient technology and encouragement of
private enterprise.
2 Financial year refers to the period April 1 to March 31.
6
The empirical literature indicates various reasons for a financial crisis in a liberalizing
economy. Kaminsky and Reinhart (1996) conclude, based on the experiences of
numerous industrial and developing countries, that banking crises precede balance-of-
payments crises and that the banking crises were preceded by financial liberalization.
In addition, it has been argued that credit-expansion and risk-taking by banks in a
deregulated environment, in context of financial liberalization are the main reasons
for banking crises (Chang and Velasco, 1998; Demirguc and Detragiache, 1997;
Furman and Stiglitz, 1998; Frankel and Rose, 1996; and Sachs, Tornell and Velasco,
1996). Barro (2001) documents the association of currency and banking crises with
lower economic growth and investment while Corsetti, Pesenti and Roubini (1998a
and 1998b) isolate current account balances, financial liberalization, banking
problems and capital flows as the major factors in Asian financial crises of 1997. In
the process of financial liberalization, Rodrik (1998) and Aghion, Bacchetta and
Banerjee (2003) observe that capital account convertibility can be an important
destabilizing factor in some economies attempting liberalization.
Reforms, therefore, had to be cautiously undertaken and sequenced carefully, if India
had to avoid another crisis. In view of the complexity of the economic situation, the
simultaneous reforms then undertaken were comprehensive – fiscal, banking, external
and financial sector. Major financial sector reforms could only be initiated if the other
sectors that impacted it were also reformed. The general approach to financial sector
reforms was – (a) Cautious and proper sequencing of measures, providing adequate
opportunity for discussion, consultations and implementation, (b) Nurturing
confidence in the system by introducing mutually reinforcing measures, (c)
Development of financial infrastructure - supervisory, audit standards, technological,
legal framework, and (d) Development and integration of money, government
securities and foreign exchange markets.
II.I. FISCAL MEASURES
The origin of the difficult economic situation in 1991 was closely linked to the
imbalances in the fiscal sector with the emergence of deficits on the revenue account
7
from 1982-83, the consequent rise in market borrowings, and the lack of an adequate
absorptive capacity for government bonds in the market. Earlier, the difficult fiscal
situation had been camouflaged by the conventional deficit measure, but the situation
became apparent in the late eighties with the introduction of the transparent measures
of deficit used internationally – fiscal, primary and monetized.3
The fiscal and revenue deficit continued to be high and growth in expenditure was
exceeding that of revenue in the eighties (Table - 2). In the reforms undertaken since
1991, though growth in expenditure (mainly investment) has been curtailed, revenue
receipts have been adversely affected, due to which the fiscal and revenue deficits
continue to be high. Empirically, this type of adjustment is considered neither effective
nor credible (Alesina and Perotti, 1996; and McDermott and Wescott, 1996). The rise in
non-developmental expenditure is mainly due to interest payments and defense. Interest
payments increased from 2.4 per cent of GDP in 1980-81 to 7.0 per cent in 2003-04
while the primary deficit declined from 5.4 per cent to 2.9 per cent over the period.
Defense expenditure increased from 2.5 per cent of GDP in 1980-81 to 3.4 per cent by
1987-88 but since then has been declining - at present to the range of 2.2-2.3 per cent.
The tax to GDP ratio, compared to other countries, is low at 14.5 to 17.1 per cent while
the ratio of non-tax revenue to GDP continues to be still lower at 4.0 per cent. The main
reasons for low tax-GDP ratio are – non-taxation of agricultural sector4; inadequate
taxation of the fast growing services sector5; and the large incidence of tax evasion and
avoidance. Another reason for sustained high expenditure is the political economy of the
country (Rajaraman, 2004; Khemani, 2000). The country has had multi-party coalition
governments at the Centre and frequent changes of governments since March 1977,
3 The conventional budget deficit had two obvious limitations - first, the concept was narrow by definition, as it excluded all borrowing other than through ad hoc Treasury bills (91 days). Secondly, the conventional deficit did not reflect the full liquidity impact of RBI financing of the government. In contrast, the internationally used gross fiscal deficit includes all forms of government borrowing, capturing the overall macroeconomic impact of the size and nature of fiscal operations – the overall gap. 4 The share of agriculture in GDP is 21.9 per cent in 2002-03 having declined from 46.2 per cent in 1970-71. 5 The share of services in GDP is 56.0 per cent in 2002-03 having increased from 38.2 per cent in 1970-71
8
which have contributed to the lack of fiscal discipline. Earlier, from 1947-1977, a single
party – Congress - held power (detailed discussion follows in Section – III).
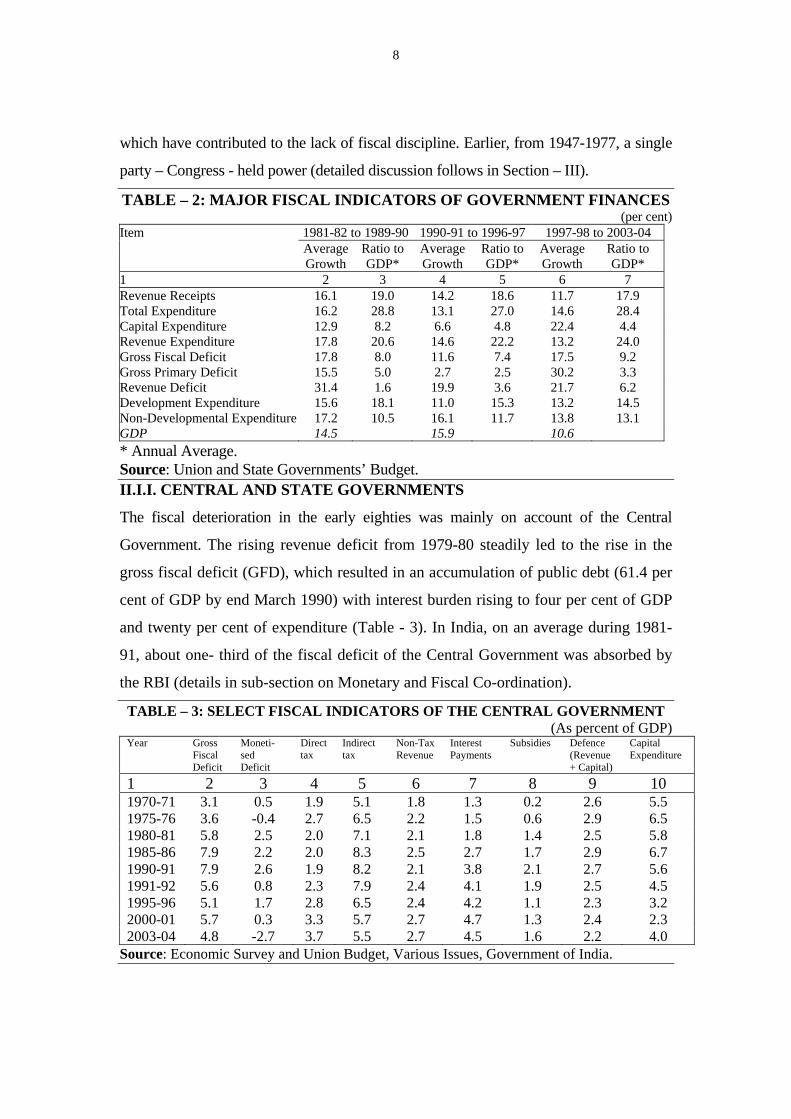
TABLE – 2: MAJOR FISCAL INDICATORS OF GOVERNMENT FINANCES (per cent)
Item 1981-82 to 1989-90 1990-91 to 1996-97 1997-98 to 2003-04 Average Ratio to Average Ratio to Average Ratio to Growth GDP* Growth GDP* Growth GDP* 1 2 3 4 5 6 7 Revenue Receipts 16.1 19.0 14.2 18.6 11.7 17.9 Total Expenditure 16.2 28.8 13.1 27.0 14.6 28.4 Capital Expenditure 12.9 8.2 6.6 4.8 22.4 4.4 Revenue Expenditure 17.8 20.6 14.6 22.2 13.2 24.0 Gross Fiscal Deficit 17.8 8.0 11.6 7.4 17.5 9.2 Gross Primary Deficit 15.5 5.0 2.7 2.5 30.2 3.3 Revenue Deficit 31.4 1.6 19.9 3.6 21.7 6.2 Development Expenditure 15.6 18.1 11.0 15.3 13.2 14.5 Non-Developmental Expenditure 17.2 10.5 16.1 11.7 13.8 13.1 GDP 14.5 15.9 10.6 * Annual Average. Source: Union and State Governments’ Budget. II.I.I. CENTRAL AND STATE GOVERNMENTS
The fiscal deterioration in the early eighties was mainly on account of the Central
Government. The rising revenue deficit from 1979-80 steadily led to the rise in the
gross fiscal deficit (GFD), which resulted in an accumulation of public debt (61.4 per
cent of GDP by end March 1990) with interest burden rising to four per cent of GDP
and twenty per cent of expenditure (Table - 3). In India, on an average during 1981-
91, about one- third of the fiscal deficit of the Central Government was absorbed by
the RBI (details in sub-section on Monetary and Fiscal Co-ordination).
TABLE – 3: SELECT FISCAL INDICATORS OF THE CENTRAL GOVERNMENT (As percent of GDP)
Year Gross Fiscal Deficit
Moneti-sed Deficit
Direct tax
Indirect tax
Non-Tax Revenue
Interest Payments
Subsidies Defence (Revenue+ Capital)
Capital Expenditure
1 2 3 4 5 6 7 8 9 10 1970-71 3.1 0.5 1.9 5.1 1.8 1.3 0.2 2.6 5.5 1975-76 3.6 -0.4 2.7 6.5 2.2 1.5 0.6 2.9 6.5 1980-81 5.8 2.5 2.0 7.1 2.1 1.8 1.4 2.5 5.8 1985-86 7.9 2.2 2.0 8.3 2.5 2.7 1.7 2.9 6.7 1990-91 7.9 2.6 1.9 8.2 2.1 3.8 2.1 2.7 5.6 1991-92 5.6 0.8 2.3 7.9 2.4 4.1 1.9 2.5 4.5 1995-96 5.1 1.7 2.8 6.5 2.4 4.2 1.1 2.3 3.2 2000-01 5.7 0.3 3.3 5.7 2.7 4.7 1.3 2.4 2.3 2003-04 4.8 -2.7 3.7 5.5 2.7 4.5 1.6 2.2 4.0
Source: Economic Survey and Union Budget, Various Issues, Government of India.
9
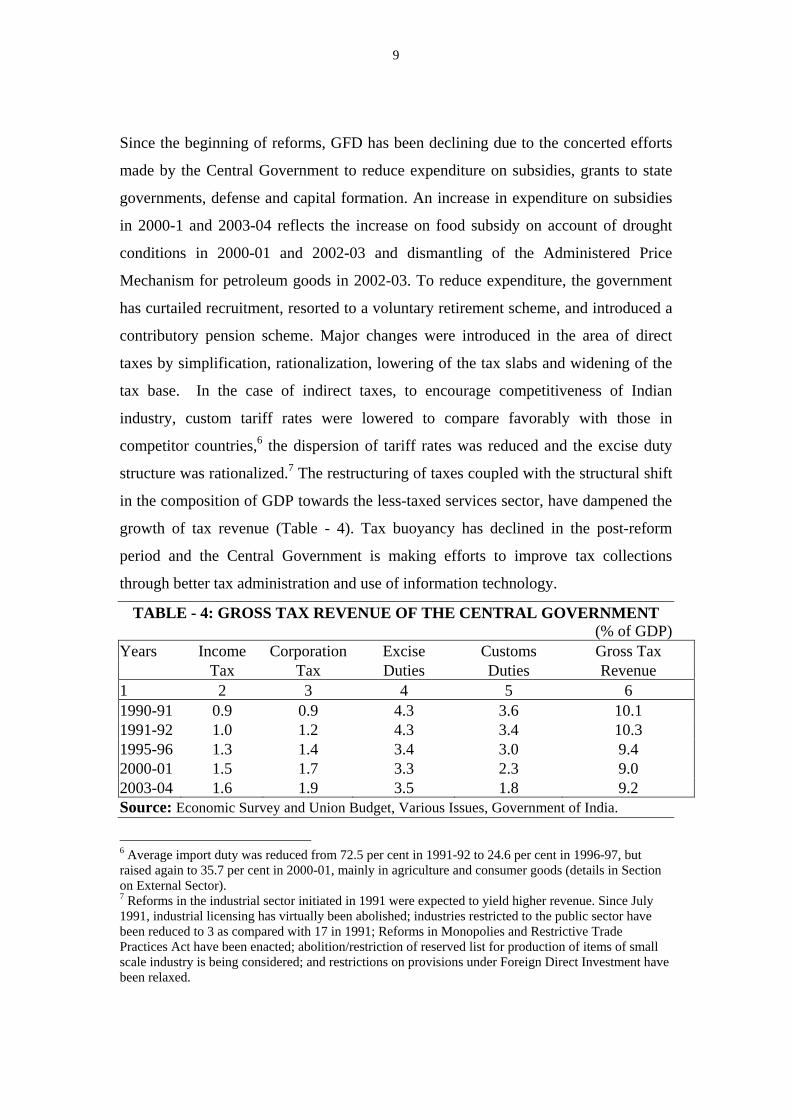
Since the beginning of reforms, GFD has been declining due to the concerted efforts
made by the Central Government to reduce expenditure on subsidies, grants to state
governments, defense and capital formation. An increase in expenditure on subsidies
in 2000-1 and 2003-04 reflects the increase on food subsidy on account of drought
conditions in 2000-01 and 2002-03 and dismantling of the Administered Price
Mechanism for petroleum goods in 2002-03. To reduce expenditure, the government
has curtailed recruitment, resorted to a voluntary retirement scheme, and introduced a
contributory pension scheme. Major changes were introduced in the area of direct
taxes by simplification, rationalization, lowering of the tax slabs and widening of the
tax base. In the case of indirect taxes, to encourage competitiveness of Indian
industry, custom tariff rates were lowered to compare favorably with those in
competitor countries,6 the dispersion of tariff rates was reduced and the excise duty
structure was rationalized.7 The restructuring of taxes coupled with the structural shift
in the composition of GDP towards the less-taxed services sector, have dampened the
growth of tax revenue (Table - 4). Tax buoyancy has declined in the post-reform
period and the Central Government is making efforts to improve tax collections
through better tax administration and use of information technology.
TABLE - 4: GROSS TAX REVENUE OF THE CENTRAL GOVERNMENT (% of GDP)
Years Income Corporation Excise Customs Gross Tax Tax Tax Duties Duties Revenue 1 2 3 4 5 6 1990-91 0.9 0.9 4.3 3.6 10.1 1991-92 1.0 1.2 4.3 3.4 10.3 1995-96 1.3 1.4 3.4 3.0 9.4 2000-01 1.5 1.7 3.3 2.3 9.0 2003-04 1.6 1.9 3.5 1.8 9.2 Source: Economic Survey and Union Budget, Various Issues, Government of India.
6 Average import duty was reduced from 72.5 per cent in 1991-92 to 24.6 per cent in 1996-97, but raised again to 35.7 per cent in 2000-01, mainly in agriculture and consumer goods (details in Section on External Sector). 7 Reforms in the industrial sector initiated in 1991 were expected to yield higher revenue. Since July 1991, industrial licensing has virtually been abolished; industries restricted to the public sector have been reduced to 3 as compared with 17 in 1991; Reforms in Monopolies and Restrictive Trade Practices Act have been enacted; abolition/restriction of reserved list for production of items of small scale industry is being considered; and restrictions on provisions under Foreign Direct Investment have been relaxed.
10
The deficits at the State level have been widening in contrast with that of the Central
Government. The revenue deficit, consistently recorded since 1987-88, rose from 0.9
per cent of GDP in 1990-91 to 2.6 per cent in 2003-04 while the gross fiscal deficit
rose from 3.3 per cent to 5.1 per cent of GDP over the period. The interest payments
and pension liabilities as a percentage of revenue receipts have increased from 13.0
per cent and 5.4 per cent in 1990-91 to 25.6 per cent and 12.5 per cent in 2003-04,
respectively, but expenditure on administrative services has been declining. States
own revenue receipts and current transfers from the Central Government (two major
sources of revenue) as percentage of total expenditure has declined from 43.4 per cent
and 29.5 per cent to 37.7 per cent and 18.6 per cent, respectively, over the same
period. The buoyancy in the collection of sales tax and States own tax revenue has
declined generally for all states. The two most important reasons for low tax
collections are the competitive reductions by States to attract trade and industry and
inadequate taxation of the rapidly rising services sector. The State Governments have
also initiated measures to curtail expenditure - restrictions on fresh
recruitment/creation of new posts, curbs on administrative expenditures, and
introduction of contributory pension schemes.
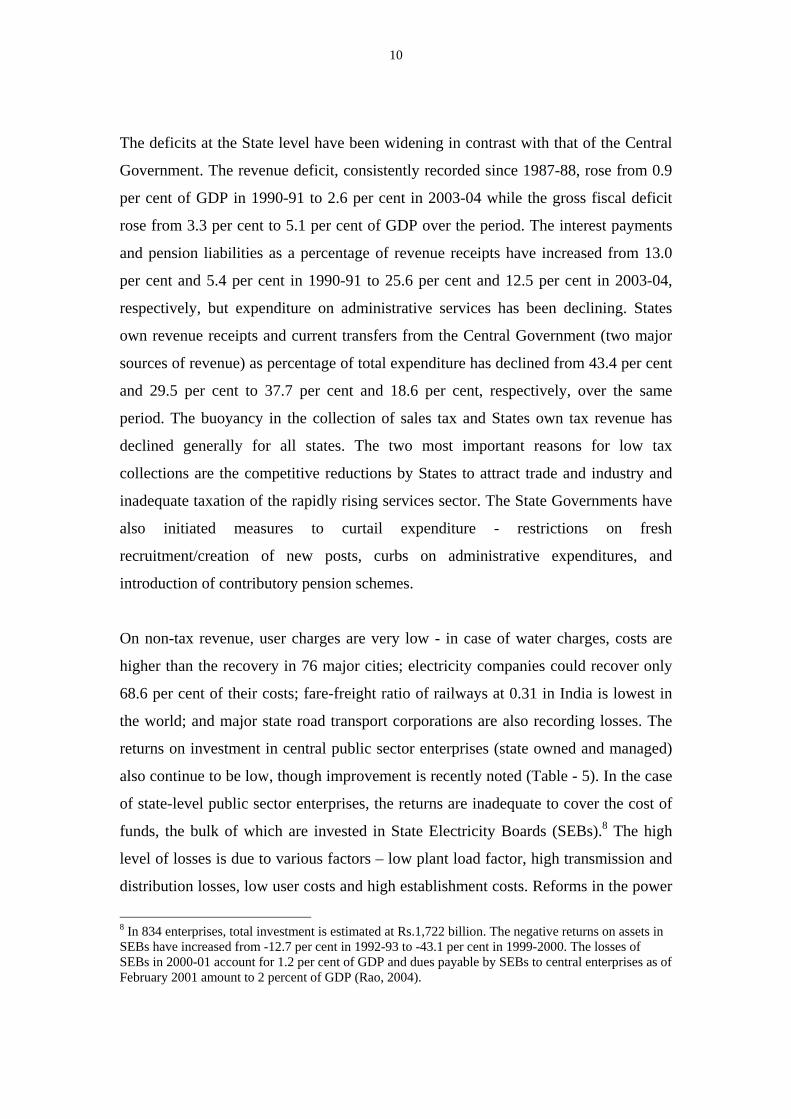
On non-tax revenue, user charges are very low - in case of water charges, costs are
higher than the recovery in 76 major cities; electricity companies could recover only
68.6 per cent of their costs; fare-freight ratio of railways at 0.31 in India is lowest in
the world; and major state road transport corporations are also recording losses. The
returns on investment in central public sector enterprises (state owned and managed)
also continue to be low, though improvement is recently noted (Table - 5). In the case
of state-level public sector enterprises, the returns are inadequate to cover the cost of
funds, the bulk of which are invested in State Electricity Boards (SEBs).8 The high
level of losses is due to various factors – low plant load factor, high transmission and
distribution losses, low user costs and high establishment costs. Reforms in the power
8 In 834 enterprises, total investment is estimated at Rs.1,722 billion. The negative returns on assets in SEBs have increased from -12.7 per cent in 1992-93 to -43.1 per cent in 1999-2000. The losses of SEBs in 2000-01 account for 1.2 per cent of GDP and dues payable by SEBs to central enterprises as of February 2001 amount to 2 percent of GDP (Rao, 2004).
11
sector have been undertaken since 1999, outstanding dues are being cleared, cost-
based pricing is being introduced and average tariff rates are being raised. Twenty-
one states have constituted State Electricity Regulatory Committees to determine the
power tariff structure – of which seventeen are operational. Further reforms that are
being considered are introduction of ‘time-of-day’ pricing, explicit targeting of
subsidies and ‘power pooling’ arrangements.
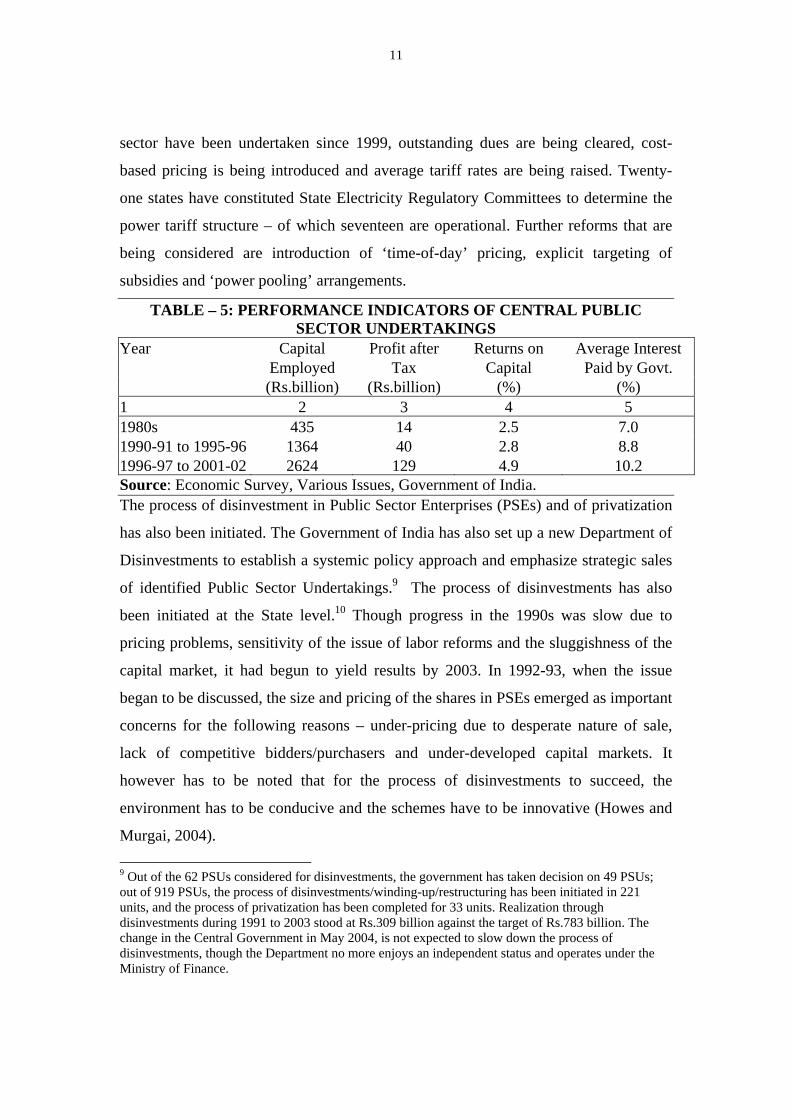
TABLE – 5: PERFORMANCE INDICATORS OF CENTRAL PUBLIC SECTOR UNDERTAKINGS
Year Capital Profit after Returns on Average Interest Employed Tax Capital Paid by Govt. (Rs.billion) (Rs.billion) (%) (%) 1 2 3 4 5 1980s 435 14 2.5 7.0 1990-91 to 1995-96 1364 40 2.8 8.8 1996-97 to 2001-02 2624 129 4.9 10.2 Source: Economic Survey, Various Issues, Government of India. The process of disinvestment in Public Sector Enterprises (PSEs) and of privatization
has also been initiated. The Government of India has also set up a new Department of
Disinvestments to establish a systemic policy approach and emphasize strategic sales
of identified Public Sector Undertakings.9 The process of disinvestments has also
been initiated at the State level.10 Though progress in the 1990s was slow due to
pricing problems, sensitivity of the issue of labor reforms and the sluggishness of the
capital market, it had begun to yield results by 2003. In 1992-93, when the issue
began to be discussed, the size and pricing of the shares in PSEs emerged as important
concerns for the following reasons – under-pricing due to desperate nature of sale,
lack of competitive bidders/purchasers and under-developed capital markets. It
however has to be noted that for the process of disinvestments to succeed, the
environment has to be conducive and the schemes have to be innovative (Howes and
Murgai, 2004). 9 Out of the 62 PSUs considered for disinvestments, the government has taken decision on 49 PSUs; out of 919 PSUs, the process of disinvestments/winding-up/restructuring has been initiated in 221 units, and the process of privatization has been completed for 33 units. Realization through disinvestments during 1991 to 2003 stood at Rs.309 billion against the target of Rs.783 billion. The change in the Central Government in May 2004, is not expected to slow down the process of disinvestments, though the Department no more enjoys an independent status and operates under the Ministry of Finance.
12
II.I.II. TRENDS IN GOVERNMENT LIABILITIES
The annual fiscal operations of the government finally reflect in public debt. In India,
since 1951, when the five-year plans were introduced, domestic debt has been incurred
with the main objective of enhancing public investment for economic development. The
impact of domestic debt on economic growth has been analyzed theoretically in the
context of two contrasting views – Keynesian (Ferguson, 1964), which considers it a
burden, and Ricardian (Barro, 1978 and 1989), which considers it neutral. In the Indian
context, Rao (1953) and Brahmananda ((1980) argue that deficit financing is useful for
economic development while Minhas (1987) and Singh (1999a) conclude empirically
that debt and growth are unrelated.
The long-term trend in the growth of public debt reveals a substantial increase during
1980s. Public debt of the country increased from 32.1 per cent of GDP in 195211 to 76.7
per cent in 2004, mainly due to domestic debt, which rose from 30.8 per cent to 74.9 per
cent over the period.12 (Table - 6). Increasing reliance on domestic debt emerged in the
TABLE – 6: PUBLIC DEBT OF THE GOVERNMENT As per cent to the Total As per cent of the GDP Year Domestic External Public Domestic External Public (end-Mar) Debt Debt# Debt Debt Debt# Debt 1 2 3 4 5 6 7 1952 95.8 4 100.0 30.8 1.4 32.1 1960 92.1 7.9 100.0 42.2 3.6 45.8 1970 69.8 30.2 100.0 35.8 15.5 51.3 1980 82.2 17.8 100.0 42.3 9.2 51.4 1990 90.5 9.5 100.0 55.5 5.8 61.4 2000 95.1 4.9 100.0 59.2 3.3 62.2 2004 97.8 2.2 100.0 74.9 1.7 76.7 Note: * estimates. # At historical exchange rates. Sources: (a) Annual Report, Various Issues, Reserve Bank of India. (b) Economic Survey, Government of India. (c) Union and State Governments’ Budget. early 1980s, with a persistent revenue deficit, implying utilization of borrowings for
consumption purposes. The major reason why domestic debt was increasingly used as a
revenue instrument was the limited scope for further expansion of tax revenue and low 10 19 States have identified 290 public enterprises for disinvestments. 11Figures for debt refer to end-March, the end of the fiscal year.
13
returns from large investments made in public enterprises (non-tax revenue) to meet the
growing expenditure. Further, restrictions on external borrowing mainly due to
uncertainty in availability and high servicing cost, especially since 1971, led to
increasing reliance on domestic borrowing.13
In order to introduce fiscal discipline, the Central Government has legislated the
Fiscal Responsibility and Budget Management Act (FRMBA) on August 26, 2003.
The objective of the Act is to ensure reduction in deficits, prudent debt management
consistent with fiscal sustainability through limits on borrowings, transparency in
fiscal operations, and conduct of fiscal policy in a medium-term framework. The State
Governments are increasingly being encouraged to enact similar legislation.14 The
States are also being encouraged to establish consolidated sinking funds to meet the
obligation of debt payments.15 Also, the separation of Debt Management from the
Reserve Bank of India is being considered, though it would depend on the fulfillment
of three pre-conditions – reasonable control over fiscal deficit, development of
financial markets and necessary legislative changes (Singh, 2005).
The imposition of strict fiscal controls, reduction in transfers from the Central
Government since 1992 and discontinuation of the allocation of market borrowings to
state level undertakings by the Central Government since 1996-97 have led the States
to issue higher volumes of explicit guarantees (Table - 7). In view of low user charges
and inefficient operations of state public sector undertakings, these contingent
liabilities, mainly held in the form of bonds by CBs and DFIs with a potential impact
on their balance-sheets, are a cause of concern. Therefore, in recent period, the rising
trend and its implications have been examined by the state governments and remedial 12Domestic debt of the Government is computed from the debt of the Central (Federal) Government and the State (Provincial) Governments. The debt position of the State Governments is available only from 1952 onwards. 13Major reasons for the foreign exchange crunch were the oil shocks as also a political argument - difficulties in getting foreign aid in the early seventies (due to the Indo-Pak war of December 1971). India has, since 1971, increasingly adopted the policy of self-reliance. 14 Karnataka (2002), Kerala (2003), Punjab (2003), Tamil Nadu (2003) and Uttar Pradesh (2004). Maharashtra has introduced the Bill in the Assembly.
14
measures undertaken - eight states have legislated ceilings on guarantees16 and seven
states have set up a guarantee redemption fund.17
TABLE – 7: CONTINGENT LIABILITIES OF THE GOVERNMENT (per cent of GDP)
Year Central Government State Government Total 1 2 3 4 1992 7.7 6.1 13.9 1996 5.5 4.4 9.6 2001 4.1 8.0 12.1 2003 3.7 7.5 11.2
Source: Annual Report, Reserve Bank of India.
II.I.III. MONETARY AND FISCAL CO-ORDINATION
The monetary system in India till 1991 was mainly characterized by an administered
interest rate regime that was oriented to the goal of raising financial resources for the
Government at low cost. The overall implication of the administered interest rate system
on fiscal policy in India can be summarized as follows – (a) low profitability of the
captive investors (state-owned banks and insurance companies) resulting in low transfers
to the Central government budget in terms of profits and dividends and low levels of
contingency reserves in their respective balance-sheets; (b) increased incidence of
monetization, as the narrow investor base mainly consisted of captive investors; (c)
underdeveloped capital and debt markets, resulting in inefficiency in allocation of
resources; and (d) unviable projects undertaken in the public sector, resulting in
wasteful expenditure and low returns on public investment.
The prevalence of administered interest rates resulted in the deficit of the Government
being generally accommodated by the RBI. In economic literature there has been a
continuous debate on the central bank credit to the government. Cottarelli (1993) and
Kopits and Symansky (1998) argue that the central bank credit to the Government,
which has implications for price stability, should be formally limited. Cukierman
15 Eleven States have them already– Andhra Pradesh, Arunachal Pradesh, Assam, Chattisgarh, Goa, Maharashtra, Meghalaya, Mizoram, Tripura, Uttaranchal, and West Bengal. Kerala is considering. 16 Statutory Ceiling – Goa, Gujarat, Karnataka, Sikkim and West Bengal. Administrative Ceiling – Assam, Orissa and Rajasthan. 17 Andhra Pradesh, Goa, Gujarat, Himachal Pradesh, Karnataka, Orissa and Rajasthan.
15
(1992) explains the arguments: – The government prefers central bank credit to
current or future taxation because of its ease and certainty, and also because the
distributional effect of seignorage is difficult to detect. Secondly, in view of the short-
term trade-off between price stability and output, political forces prefer the short-term
output effect. In India, many studies have emphasized the applicability of monetarist
theory, and also empirically tested the robustness of the demand function whereby a
rise in the money supply directly affects the price level (Brahmananda, 1972; Bhalla,
1981; Minhas, 1987; Rao, 2000; Buiter and Patel, 1992; and Singh, 1999b).
In India, the main source of reserve money from 1970 to 1991 was the net RBI credit
to Government (NRBICG),18 mainly on account of Central government securities
increasingly held by RBI. The Central Government resorted to borrowings from the
RBI regularly19 in addition to periods of wars20 and droughts.21 The annual average
growth rate of NRBICG exceeds that of Reserve Money (RM) for the period 1971 to
1991 and of broad money (M3)22 during 1981 to 1991 (Table - 8). Since 1991, a
18 RBI credit to Government, both Central and the State Governments, specifically, comprises: - (i) Rupee securities held in Issue Department, (ii) Treasury bills purchased and discounted, (iii) Investments in government securities, (iv) Rupee coins in Issue and Banking Departments, and (v) Loans and advances to State Governments. Item (iv) needs further clarification. The RBI comes to acquire the government currency as the Central Government’s agent for distribution of currency to the public as well as a backing against its own currency. The government currency appears as an asset in the balance sheet of the Reserve Bank of India. It is an insignificant component. 19 RBI provided substantial support to the government’s borrowing program during 1956 and 1957, as a result of slack market conditions. Monetized deficit accounted for 24.4 per cent of total plan outlay in the Second Five Year Plan (1956-61). The expansionary fiscal policy during 1977 and 1978 led to the increase in NRBICG during 1979-81. 20 The spurts in 1962-63 and 1965-66 were due to the war expenditure with China and Pakistan, respectively. The other big spurt in NRBICG during 1971-1973 was due to the war with Pakistan and the influx of refugees from Bangladesh in 1971. The number of refugees from Bangladesh had reached ten million by December 1971. Seven million of these were housed in government camps (p.44, Government of India ,1972). 21 In 1979, national income, at real prices, declined by 5.3 per cent while agricultural and industrial production declined by 15.5 per cent (due to drought) and 1.4 per cent, respectively. In view of the decline in production, but increased expenditure on drought and natural calamities’ relief and certain committed plan expenditures, and decline in external aid, increasing reliance was placed on NRBICG. Since 1985, increase in NRBICG was mainly due to increased relief expenditure on agriculture in the form of subsidy (food and fertilizer), because of a negative growth rate in the agriculture sector during 1984-85, 1986-88, and 1991-92. 22Broad Money (M3) consists of (a) M1 (narrow money, consists of (i) Currency with the public, (ii) Demand deposits of all commercial and co-operative banks and (iii) Other deposits held with the Reserve Bank of India), and (b) Time deposits of all commercial and co-operative banks.
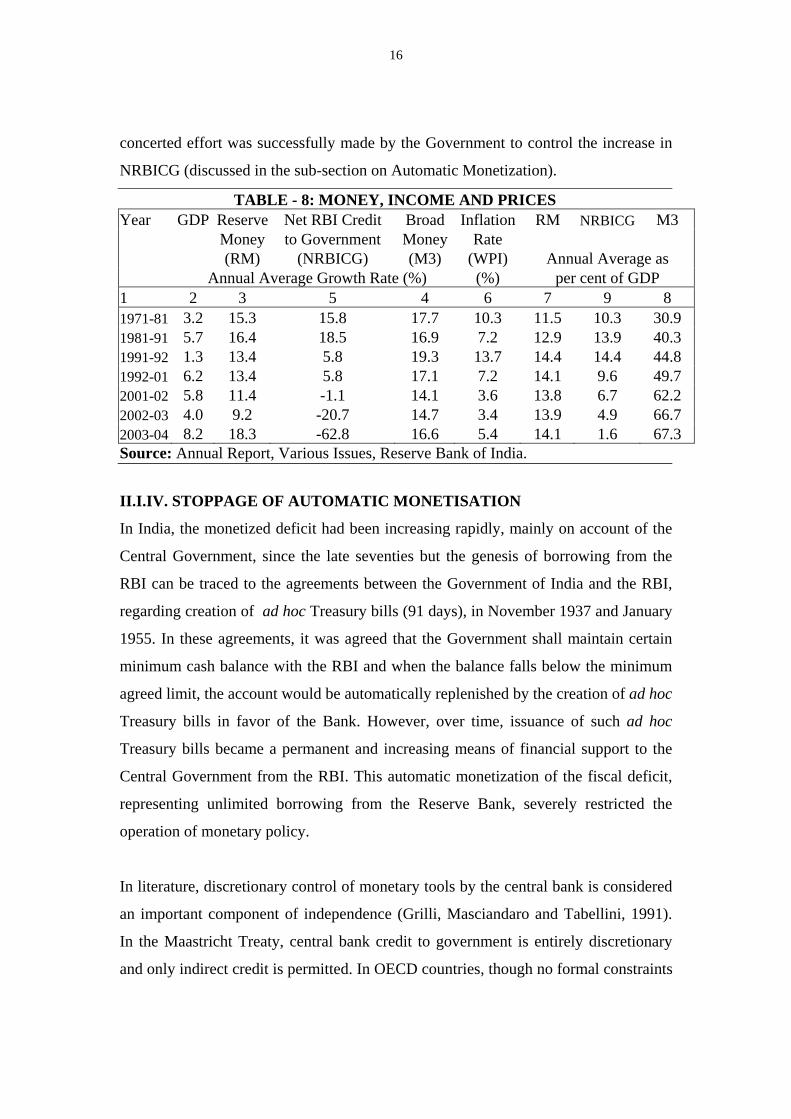
16
concerted effort was successfully made by the Government to control the increase in
NRBICG (discussed in the sub-section on Automatic Monetization).
TABLE - 8: MONEY, INCOME AND PRICES Year GDP Reserve Net RBI Credit Broad Inflation RM NRBICG M3 Money to Government Money Rate (RM) (NRBICG) (M3) (WPI) Annual Average as Annual Average Growth Rate (%) (%) per cent of GDP 1 2 3 5 4 6 7 9 8 1971-81 3.2 15.3 15.8 17.7 10.3 11.5 10.3 30.9 1981-91 5.7 16.4 18.5 16.9 7.2 12.9 13.9 40.3 1991-92 1.3 13.4 5.8 19.3 13.7 14.4 14.4 44.8 1992-01 6.2 13.4 5.8 17.1 7.2 14.1 9.6 49.7 2001-02 5.8 11.4 -1.1 14.1 3.6 13.8 6.7 62.2 2002-03 4.0 9.2 -20.7 14.7 3.4 13.9 4.9 66.7 2003-04 8.2 18.3 -62.8 16.6 5.4 14.1 1.6 67.3 Source: Annual Report, Various Issues, Reserve Bank of India.
II.I.IV. STOPPAGE OF AUTOMATIC MONETISATION
In India, the monetized deficit had been increasing rapidly, mainly on account of the
Central Government, since the late seventies but the genesis of borrowing from the
RBI can be traced to the agreements between the Government of India and the RBI,
regarding creation of ad hoc Treasury bills (91 days), in November 1937 and January
1955. In these agreements, it was agreed that the Government shall maintain certain
minimum cash balance with the RBI and when the balance falls below the minimum
agreed limit, the account would be automatically replenished by the creation of ad hoc
Treasury bills in favor of the Bank. However, over time, issuance of such ad hoc
Treasury bills became a permanent and increasing means of financial support to the
Central Government from the RBI. This automatic monetization of the fiscal deficit,
representing unlimited borrowing from the Reserve Bank, severely restricted the
operation of monetary policy.
In literature, discretionary control of monetary tools by the central bank is considered
an important component of independence (Grilli, Masciandaro and Tabellini, 1991).
In the Maastricht Treaty, central bank credit to government is entirely discretionary
and only indirect credit is permitted. In OECD countries, though no formal constraints
17
on indirect central bank credit to government are imposed, nevertheless there are
often informal constraints on indirect central bank credit: open market operations can
only be done for monetary policy reasons. Carracedo and Dattels (1997) mention,
based on survey results, that many countries prohibit borrowings from the central
bank.
Thus, it was considered necessary to insulate RBI from the fiscal pressure of the
Government and to impose some limit on credit to the Government. With this
objective in view, the Government of India and the Reserve Bank signed the first
Supplement Agreement in September 1994 to phase out the issue of ad hoc Treasury
bills by the end of fiscal year 1996-97. Pursuant to this, the issuance of ad hoc
Treasury bills was discontinued with effect from April 1, 1997. The existing ad hoc
Treasury bills, amounting to more than Rs. 1,200 billion by the end of March 1997 or
9.6 per cent of GDP, carrying a rate of discount of 4.6 per cent per annum since July
1974 (substantially lower than the interest rates prevailing in the market), were
converted into special securities (at 4.6 per cent) and issued to RBI (Singh, 2005).
To meet the short-term temporary financing needs of the Central Government, the
Reserve Bank of India now provides Ways and Means Advances (WMA) at Bank rate
(rate at which the RBI lends to CBs), as it has been providing to state governments since
1937. The Central Government did not resort to this instrument during 1943-1997. Since
1997, the RBI and the Government, annually agree on a fixed amount of financial
resources to be provided by the RBI to the Central Government. If the accommodation
exceeds the agreed amount, then the RBI provides an overdraft facility for a maximum
period of ten consecutive working days, but at a penal rate of interest.
II.II MONETARY POLICY AND BANKING SECTOR REFORMS
In addition to the accommodative monetary policy, the banking sector also had to
contribute to the development process by statutorily investing in government
securities and meeting the targets of directed lending. In view of the underdeveloped
money and government securities market, monetary policy had to rely on direct
18
instruments, and had to accomplish a very difficult task in containing aggregate
demand in the short term and to develop the operational efficiency of the financial
system including the development of securities market in the long run. The banking
sector reforms in 1991 aimed at liberalizing interest rates, creating a deregulated
environment, strengthening the prudential norms and the supervisory system,
changing the ownership pattern of banks and introducing competition in the banking
industry. The reforms were first initiated for the CBs and then extended to others –
DFIs, CPBs and NBFCs - some of the important reforms are discussed here.
II.II.1 INTEREST RATE POLICY
The interest rate structure in the economy, with the objective of cross - subsidization
between sectors, became increasing complex as both lending and deposit rates of the
banks were prescribed by the RBI while coupon rates on government securities and
interest rates on public sector bonds, provident funds and postal saving schemes were
fixed by the Central Government. To undertake reforms in the financial sector, the
interest rates were liberalized in a co-coordinated way. The approach has been
gradual, so that CBs are not tempted to lend at higher rates, assuming higher risk, as
that would be detrimental for overall growth and development of the economy. CBs
now generally charge rates of interest in accordance with their perception of
creditworthiness of the borrowers and have the freedom to price their loan products
based on time-varying term premia and relevant transaction costs. CBs have also been
allowed to price their floating rate products by using market benchmarks in a
transparent manner but floating rate products have yet to become popular.
Consequently, the spreads have generally narrowed since the beginning of reforms. In
order to impart greater flexibility in the interest rate structure relating to DFIs, the
prescription of ceiling rates of interest on lendings by these institutions was replaced
by a system of minimum rate effective from August 1991.
The Bank Rate (BR), as an instrument of monetary policy, had been dormant and
unchanged from July 12, 1981 to July 3, 1991. To ensure a benchmark rate, the BR
was activated by developing it as an effective signaling rate with several interest rates
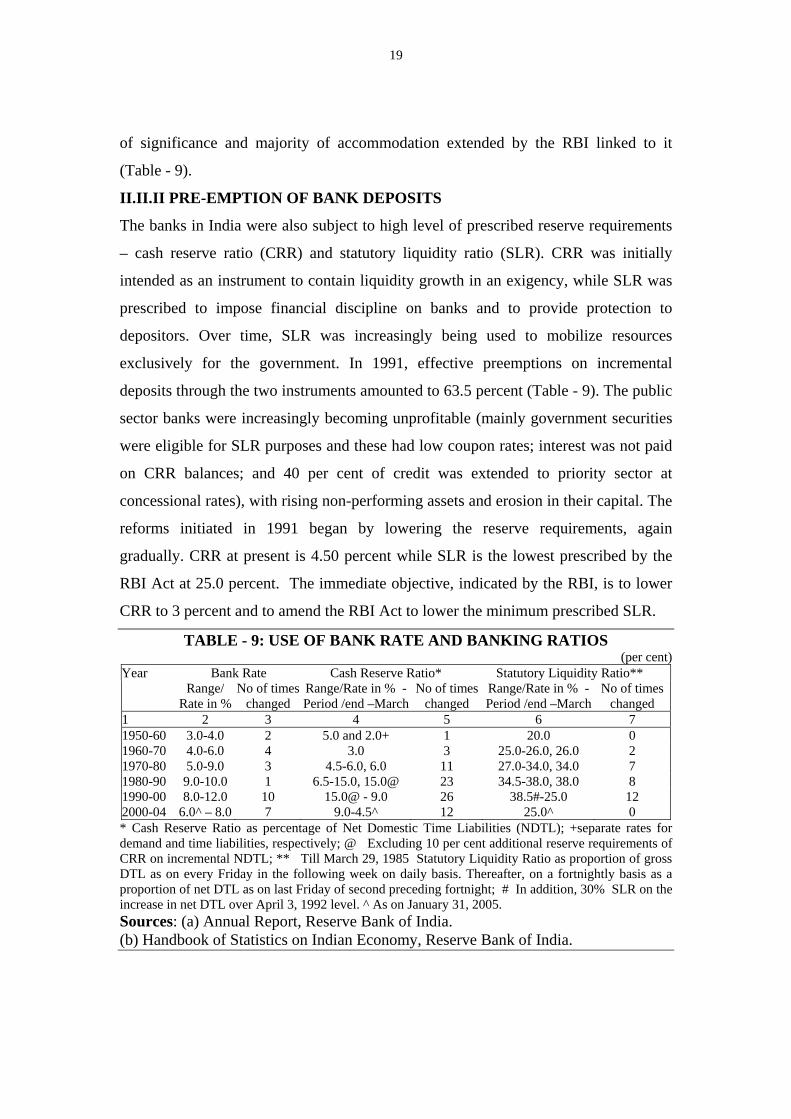
19
of significance and majority of accommodation extended by the RBI linked to it
(Table - 9).
II.II.II PRE-EMPTION OF BANK DEPOSITS
The banks in India were also subject to high level of prescribed reserve requirements
– cash reserve ratio (CRR) and statutory liquidity ratio (SLR). CRR was initially
intended as an instrument to contain liquidity growth in an exigency, while SLR was
prescribed to impose financial discipline on banks and to provide protection to
depositors. Over time, SLR was increasingly being used to mobilize resources
exclusively for the government. In 1991, effective preemptions on incremental
deposits through the two instruments amounted to 63.5 percent (Table - 9). The public
sector banks were increasingly becoming unprofitable (mainly government securities
were eligible for SLR purposes and these had low coupon rates; interest was not paid
on CRR balances; and 40 per cent of credit was extended to priority sector at
concessional rates), with rising non-performing assets and erosion in their capital. The
reforms initiated in 1991 began by lowering the reserve requirements, again
gradually. CRR at present is 4.50 percent while SLR is the lowest prescribed by the
RBI Act at 25.0 percent. The immediate objective, indicated by the RBI, is to lower
CRR to 3 percent and to amend the RBI Act to lower the minimum prescribed SLR.
TABLE - 9: USE OF BANK RATE AND BANKING RATIOS (per cent)
Year Bank Rate Cash Reserve Ratio* Statutory Liquidity Ratio** Range/
Rate in % No of times
changed Range/Rate in % - Period /end –March
No of timeschanged
Range/Rate in % - Period /end –March
No of times changed
1 2 3 4 5 6 7 1950-60 3.0-4.0 2 5.0 and 2.0+ 1 20.0 0 1960-70 4.0-6.0 4 3.0 3 25.0-26.0, 26.0 2 1970-80 5.0-9.0 3 4.5-6.0, 6.0 11 27.0-34.0, 34.0 7 1980-90 9.0-10.0 1 6.5-15.0, 15.0@ 23 34.5-38.0, 38.0 8 1990-00 8.0-12.0 10 15.0@ - 9.0 26 38.5#-25.0 12 2000-04 6.0^ – 8.0 7 9.0-4.5^ 12 25.0^ 0 * Cash Reserve Ratio as percentage of Net Domestic Time Liabilities (NDTL); +separate rates for demand and time liabilities, respectively; @ Excluding 10 per cent additional reserve requirements of CRR on incremental NDTL; ** Till March 29, 1985 Statutory Liquidity Ratio as proportion of gross DTL as on every Friday in the following week on daily basis. Thereafter, on a fortnightly basis as a proportion of net DTL as on last Friday of second preceding fortnight; # In addition, 30% SLR on the increase in net DTL over April 3, 1992 level. ^ As on January 31, 2005. Sources: (a) Annual Report, Reserve Bank of India. (b) Handbook of Statistics on Indian Economy, Reserve Bank of India.
20
II.II.III DIRECTED LENDING AND DEPLOYMENT OF CREDIT
In the case of directed lending, in consideration of the government’s program of
developing the rural sector and reducing poverty, especially since 1977, the RBI
prescribed that a specific proportion of the net bank credit should go to priority
sectors (gradually rose from 33.0 to 40.0 per cent), comprising mainly agriculture,
specified small scale industry and weaker sections of the society, at concessional rates
of interest. The scope for advances under priority sector lending has been enlarged,
interest rates deregulated though still concessional and alternate avenues of
investment have been permitted under the reforms. All new loans granted by banks to
non-banking finance companies, for the purpose of on-lending to small scale
industries have been reckoned under priority sector lending. Since February 2000, the
RBI has regularly been advising banks to mainstream micro-finance and to enhance
the outreach of micro-credit providers, in the belief that micro-finance interventions
can serve as an effective tool for poverty alleviation. This program is also of benefit to
the banks as it externalizes the credit delivery process and in the past has recorded
more than 95 per cent recovery. Morduch (1999) highlights the fact that, generally,
profitability in micro-finance operations depends on the continuous availability of
subsidized financial support while Singh and Srinivasan (2004) argue that directed
lending reflects continuation of financial repression. However, these measures helped
to reduce poverty in rural areas though it pre-empted major resources of the banks
(Burgess and Pande, 2004).
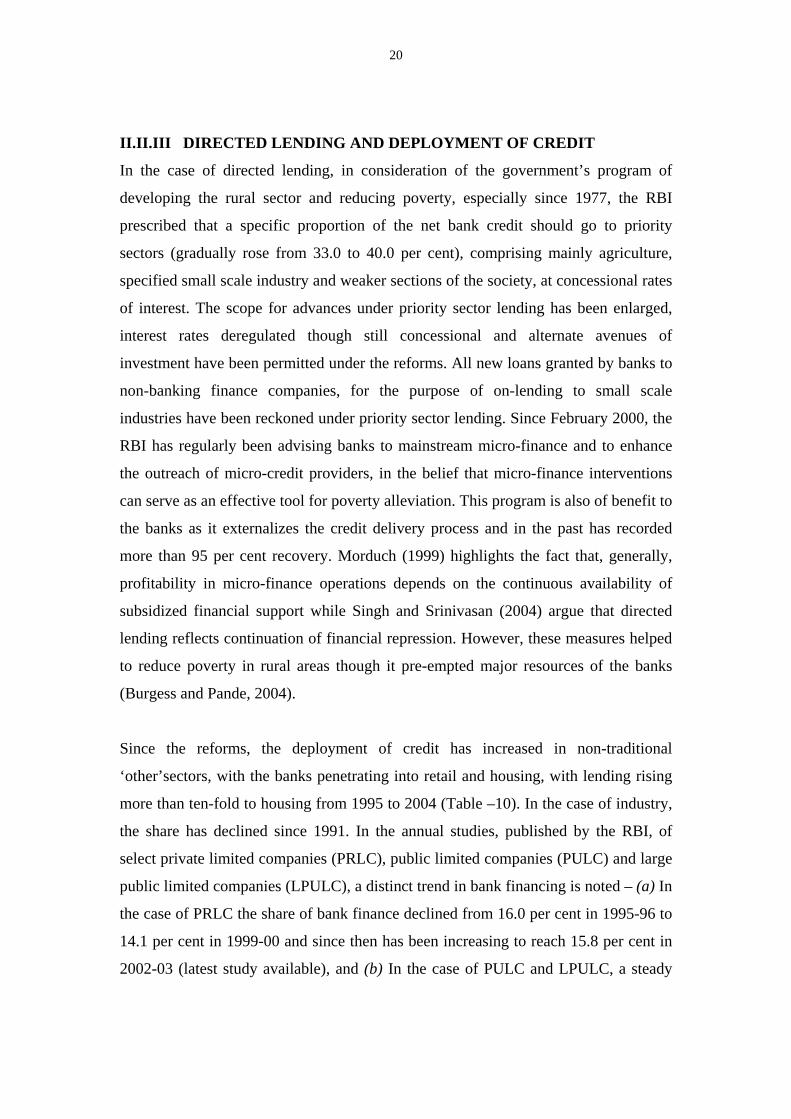
Since the reforms, the deployment of credit has increased in non-traditional
‘other’sectors, with the banks penetrating into retail and housing, with lending rising
more than ten-fold to housing from 1995 to 2004 (Table –10). In the case of industry,
the share has declined since 1991. In the annual studies, published by the RBI, of
select private limited companies (PRLC), public limited companies (PULC) and large
public limited companies (LPULC), a distinct trend in bank financing is noted – (a) In
the case of PRLC the share of bank finance declined from 16.0 per cent in 1995-96 to
14.1 per cent in 1999-00 and since then has been increasing to reach 15.8 per cent in
2002-03 (latest study available), and (b) In the case of PULC and LPULC, a steady
21
increasing trend is witnessed with the share rising from 13.1 per cent and 11.5 per
cent in 1995-96 to 16.0 per cent and 14.8 per cent, respectively, in 2002-03. The trend
in credit flow reflects the fear of bank managers in extending funds to the private
sector and incurring non-performing assets (NPAs) while the credit to public sector is
considered safe as it is perceived to be guaranteed by the government (Banerjee, Cole
and Duflo, 2004).
TABLE - 10: SECTORAL DEPLOYMENT OF NON-FOOD CREDIT BY COMMERCIAL BANKS
(per cent to Total) Year Priority of which Industry Wholesale Others Total
Sector Agriculture SS Industry (Medium Trade Non - Food & Large) Credit
1 2 3 4 5 6 7 8 Outstanding
1980-91 40.7 16.9 15.2 39.2 6.4 13.8 100.0 1991-95 36.2 14.2 14.9 40.2 5.1 18.6 100.0 1995-04 34.9 12.2 12.9 38.7 4.4 22.0 100.0
Incremental
1980-91 42.2 17.0 15.9 36.9 3.7 17.2 100.0 1991-95 38.7 14.3 20.5 30.8 5.0 25.5 100.0 1995-04 37.1 12.3 9.3 32.7 3.1 27.0 100.0
Source: Handbook of Statistics on Indian Economy, Reserve Bank of India.
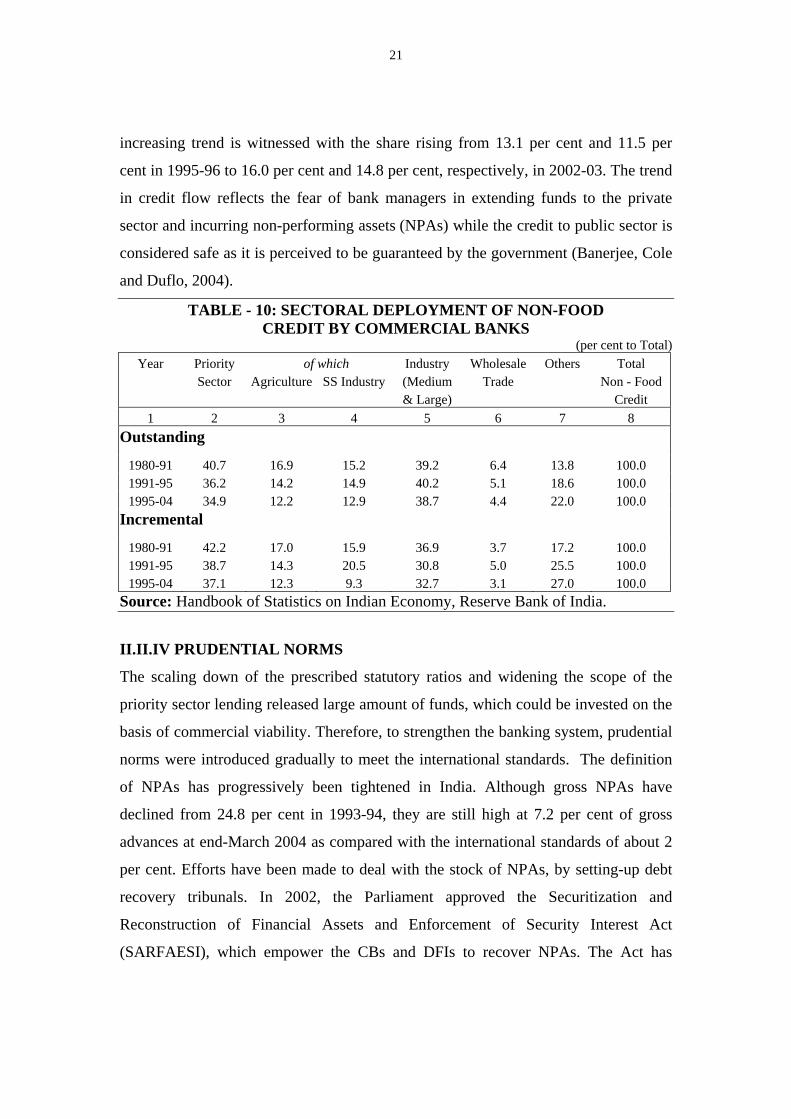
II.II.IV PRUDENTIAL NORMS
The scaling down of the prescribed statutory ratios and widening the scope of the
priority sector lending released large amount of funds, which could be invested on the
basis of commercial viability. Therefore, to strengthen the banking system, prudential
norms were introduced gradually to meet the international standards. The definition
of NPAs has progressively been tightened in India. Although gross NPAs have
declined from 24.8 per cent in 1993-94, they are still high at 7.2 per cent of gross
advances at end-March 2004 as compared with the international standards of about 2
per cent. Efforts have been made to deal with the stock of NPAs, by setting-up debt
recovery tribunals. In 2002, the Parliament approved the Securitization and
Reconstruction of Financial Assets and Enforcement of Security Interest Act
(SARFAESI), which empower the CBs and DFIs to recover NPAs. The Act has
22
already had a salutary effect in this regard and the NPAs of CBs have declined
substantially; but those of DFIs and CPBs continue to be high (Table - 11).
TABLE - 11: NON-PERFORMING ASSETS OF BANKS AND FINANCIAL INSTITUTIONS (per cent to Total Assets)
Year Commercial Banks DFIs Co-operative Banks – G. NPA NBFCs G. NPA N. NPA N. NPA State Urban Central G. NPA N. NPA
1 2 3 4 5 6 7 8 9 1993-94 24.8 .. .. .. .. .. .. .. 1997-98 14.4 7.3 .. .. 11.7 .. 11.4 6.7 2001-02 10.4 5.5 8.8 13.4 21.9 19.7 10.6 3.9 2002-03 8.8 4.4 10.6 18.0 19.0 22.0 8.8 2.7 2003-04 7.2 2.9 .. .. 17.6 .. .. ..
G – Gross; N – Net; N.NPA = G.NPA adjusted for provisions; .. - Not Available. Source: Report on Trend and Progress of Banking in India, Various Issues, RBI. Since 1997, action was initiated on a time-table basis to increase capital adequacy
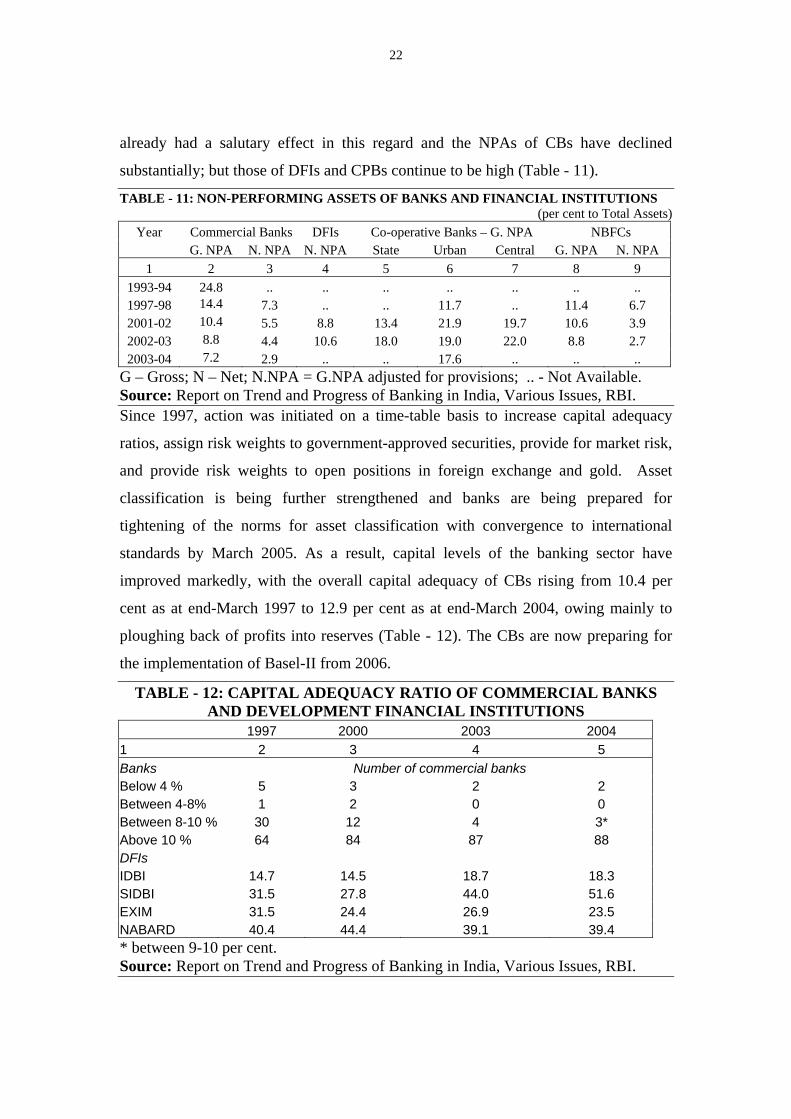
ratios, assign risk weights to government-approved securities, provide for market risk,
and provide risk weights to open positions in foreign exchange and gold. Asset
classification is being further strengthened and banks are being prepared for
tightening of the norms for asset classification with convergence to international
standards by March 2005. As a result, capital levels of the banking sector have
improved markedly, with the overall capital adequacy of CBs rising from 10.4 per
cent as at end-March 1997 to 12.9 per cent as at end-March 2004, owing mainly to
ploughing back of profits into reserves (Table - 12). The CBs are now preparing for
the implementation of Basel-II from 2006.
TABLE - 12: CAPITAL ADEQUACY RATIO OF COMMERCIAL BANKS AND DEVELOPMENT FINANCIAL INSTITUTIONS
1997 2000 2003 2004 1 2 3 4 5 Banks Number of commercial banks Below 4 % 5 3 2 2 Between 4-8% 1 2 0 0 Between 8-10 % 30 12 4 3* Above 10 % 64 84 87 88 DFIs IDBI 14.7 14.5 18.7 18.3 SIDBI 31.5 27.8 44.0 51.6 EXIM 31.5 24.4 26.9 23.5 NABARD 40.4 44.4 39.1 39.4 * between 9-10 per cent. Source: Report on Trend and Progress of Banking in India, Various Issues, RBI.
23
II.II.V COMPETITION
To enhance efficiency in the banking sector, foreign banks and private entrepreneurs
are being invited to commence banking operations in India. The entry of foreign
banks was restricted earlier, but since 1991 a number of foreign banks have been
allowed to operate in India. To enhance competition, foreign direct investment up to
74 per cent of ownership has been allowed in private banks and up to 20 per cent in
nationalized banks. The banks have also been allowed to enter into insurance business
either as joint venture participants or to take up strategic investment for providing
infrastructure and services. Consequently, the number of foreign and private banks
operating in India increased from 21 and 23 in 1991 to 33 and 30, respectively, in
2004.
II.II.VI SUPERVISION
To ensure balanced growth of the banking sector, the supervisory function has been
strengthened within RBI. A Board for Financial Supervision (BFS) set up in
November 1994 under the aegis of the Reserve Bank exercises integrated supervision
over the financial system. The focus of the BFS, consistent with international practice,
is on off-site inspections and on control systems internal to the CBs. The BFS had set
up an off-site surveillance system for CBs in 1995 to ascertain the financial condition
between on-site examinations, identify institutions showing financial deterioration
and act as a trigger for supervisory actions. In 1997, RBI also introduced a
comprehensive regulatory framework in respect of NBFCs.23
The reforms aimed to first recapitalise the CBs and then initiate privatization. The
ownership pattern of public sector banks is now beginning to change. The amendment
in the State Bank of India Act, 1955 as well as the banking Companies (Acquisition
and transfer of Undertakings) Acts 1970/1980, have enabled state-owned public
sector banks (SOPSBs) to increasingly take recourse to capital markets to shore up
23 The strategy consists of four pronged mechanism – (i) on-site inspection on the CAMELS (Capital Adequacy, Asset Quality, Management, Earnings, Liquidity and Systems) pattern; (ii) off-site monitoring through periodic control returns from NBFCs; (iii) effective market intelligence network; and (iv) submission of exception reports by statutory auditors of NBFCs.
24
their capital, subject to the maintenance of 51.0 per cent of public ownership. Of the
27 SOPSBs, 20 have raised equity capital from the market since 1996-97 and in case
of three major CBs the share of Government/RBI has already gone down to less than
60.0 per cent.24 The process has been slow due to the depressed conditions in the
stock market.
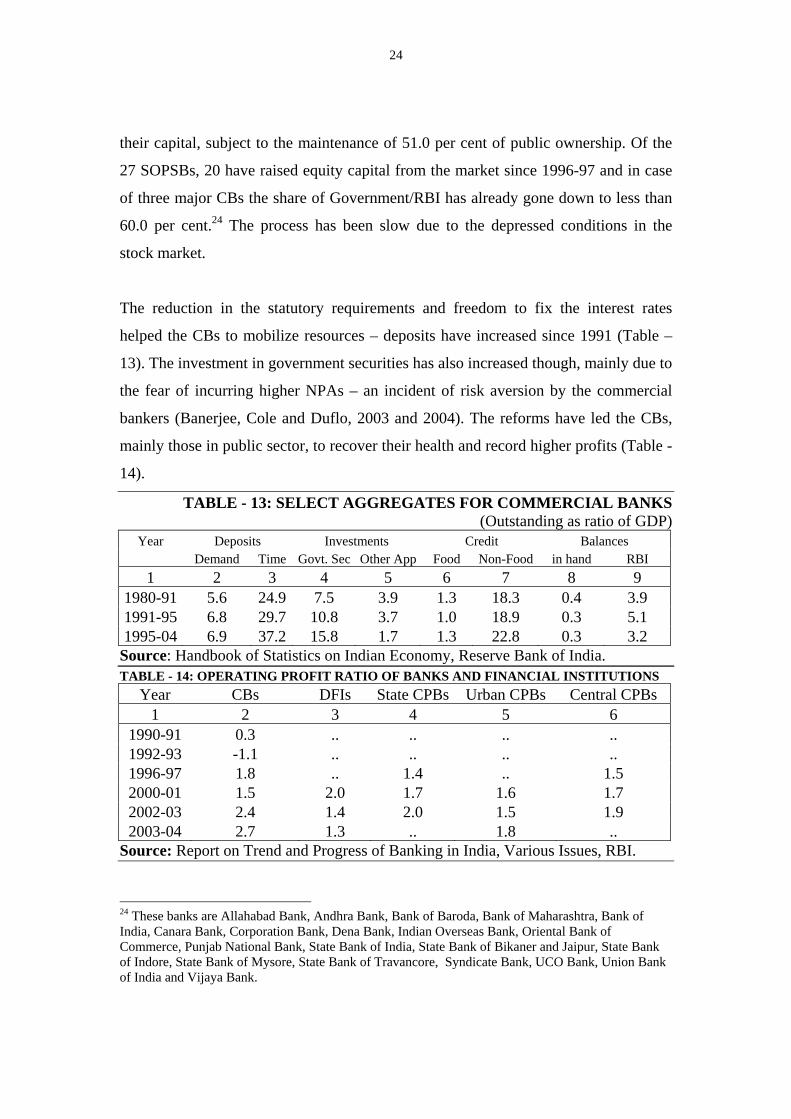
The reduction in the statutory requirements and freedom to fix the interest rates
helped the CBs to mobilize resources – deposits have increased since 1991 (Table –
13). The investment in government securities has also increased though, mainly due to
the fear of incurring higher NPAs – an incident of risk aversion by the commercial
bankers (Banerjee, Cole and Duflo, 2003 and 2004). The reforms have led the CBs,
mainly those in public sector, to recover their health and record higher profits (Table -
14).
TABLE - 13: SELECT AGGREGATES FOR COMMERCIAL BANKS (Outstanding as ratio of GDP)
Year Deposits Investments Credit Balances Demand Time Govt. Sec Other App Food Non-Food in hand RBI 1 2 3 4 5 6 7 8 9
1980-91 5.6 24.9 7.5 3.9 1.3 18.3 0.4 3.9 1991-95 6.8 29.7 10.8 3.7 1.0 18.9 0.3 5.1 1995-04 6.9 37.2 15.8 1.7 1.3 22.8 0.3 3.2
Source: Handbook of Statistics on Indian Economy, Reserve Bank of India. TABLE - 14: OPERATING PROFIT RATIO OF BANKS AND FINANCIAL INSTITUTIONS
Year CBs DFIs State CPBs Urban CPBs Central CPBs 1 2 3 4 5 6
1990-91 0.3 .. .. .. .. 1992-93 -1.1 .. .. .. .. 1996-97 1.8 .. 1.4 .. 1.5 2000-01 1.5 2.0 1.7 1.6 1.7 2002-03 2.4 1.4 2.0 1.5 1.9 2003-04 2.7 1.3 .. 1.8 ..
Source: Report on Trend and Progress of Banking in India, Various Issues, RBI.
24 These banks are Allahabad Bank, Andhra Bank, Bank of Baroda, Bank of Maharashtra, Bank of India, Canara Bank, Corporation Bank, Dena Bank, Indian Overseas Bank, Oriental Bank of Commerce, Punjab National Bank, State Bank of India, State Bank of Bikaner and Jaipur, State Bank of Indore, State Bank of Mysore, State Bank of Travancore, Syndicate Bank, UCO Bank, Union Bank of India and Vijaya Bank.
25
However, a number of critical issues emerge – (a) The improvement in performance
in terms of reduction in NPAs and increase in profitability of the CBs is mainly
because of widening gap between lending and deposit rates in recent years and
increased investment in government securities (more than 35.0 per cent of deposits
since 1997 as against 25.0 per cent stipulated statutorily). This implies that credit to
productive sectors like industry and retail market sector has been restricted. However,
this trend cannot be sustained on a long-term basis, especially of investing in
government securities, if the government initiates measures to minimize and then
eliminate gross fiscal deficit; (b) The reforms have led the CBs, especially those in the
public sector, to restructure their operations to improve profitability. The branches in
rural areas, the majority of which were opened after 1977, are beginning to close
shop. A geographical analysis reveals that though the rural sector accounts for nearly
half of total branches of CBs as at end of March 2003, it accounts for less than 14.0
per cent of deposits and 10.2 per cent of credit (Appendix Table –1). This
restructuring is a healthy trend and is expected to continue. The rural sector can be
serviced mainly by the CPBs, which already have more than 113,000 branches in the
rural areas and the Government is making efforts to revive them, and NBFCs. The
RBI is strengthening the regulation and supervision of CPBs and NBFCs and has also
permitted the CBs to consider the amount lent to CPBs and NBFCs as a component of
priority sector lending, which will still ensure flow of resources to the rural sector
even if the CBs totally withdraw from the rural areas. It needs to be mentioned here,
though a minor digression, that the post offices in India, with more than 135,000
branches in rural areas, also perform basic banking operations of saving deposits and
withdrawals, as well as offering more advanced products like time/recurring
deposits/money transfers (across the country) and investment instruments ranging
between 6 and 15 years. The competition amongst these entities may not augur well
for business volumes and profitability (Appendix Table –2); (c) The role of micro-
credit also needs to be analyzed in the context of the existing scheme of priority sector
lending, and the network of CPBs and NBFCs in rural areas; and (d) The continuation
of stipulated limits on priority sector lending, vestiges of the earlier regime of
26
financial repression, may have to be dismantled to help the CBs to further improve
their balance sheet.
II.III EXTERNAL SECTOR
In view of the need to conserve limited foreign exchange reserves for essential
imports (petroleum goods and food grains) and to protect domestic industry, tariff
barriers on imports had traditionally been high. This restrictive trade policy led to a
limited growth in external trade. In addition, capital mobility had been strictly
restricted and entry of multinationals was discouraged. After 1991, the liberalization
of the external sector was gradual, in consideration of the domestic and external
situation.25 The strategy in 1991 shifted from import substitution to export promotion
and the reach of export incentives was broadened to cover numerous non-traditional
items. The strategy for external sector reforms had the following key elements – (a)
sufficiency of reserves, (b) stability in the foreign exchange market, and (c) prudent
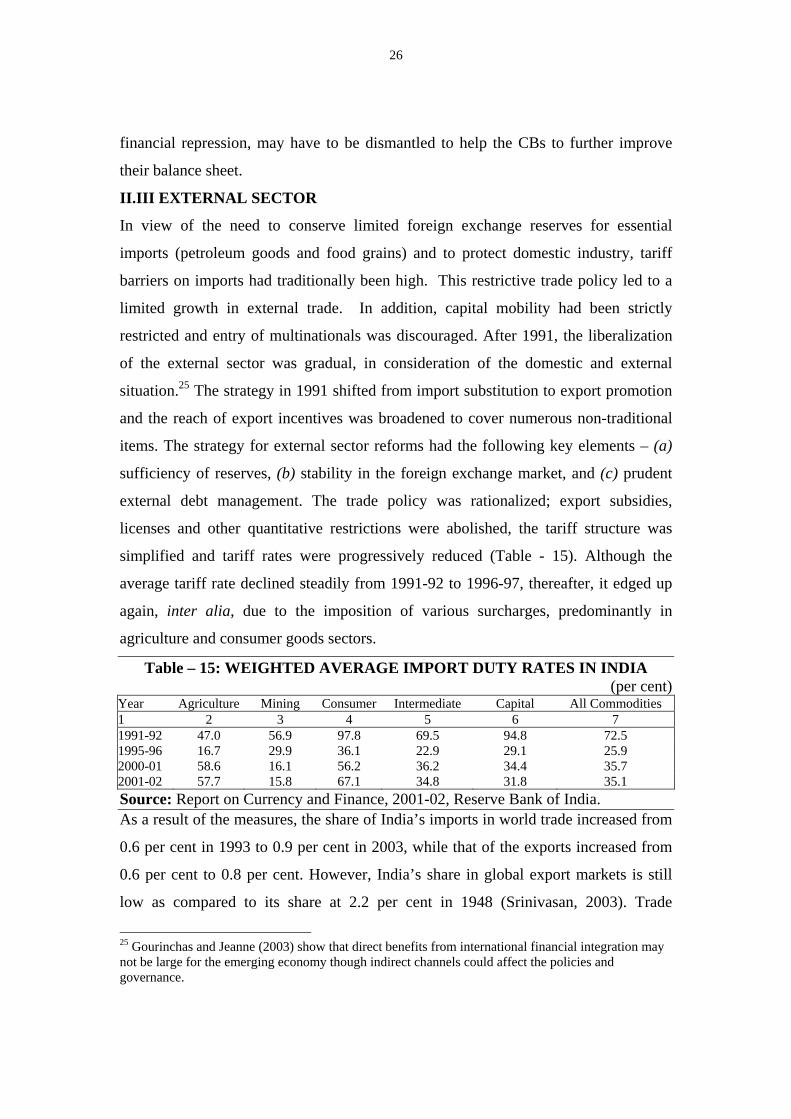
external debt management. The trade policy was rationalized; export subsidies,
licenses and other quantitative restrictions were abolished, the tariff structure was
simplified and tariff rates were progressively reduced (Table - 15). Although the
average tariff rate declined steadily from 1991-92 to 1996-97, thereafter, it edged up
again, inter alia, due to the imposition of various surcharges, predominantly in
agriculture and consumer goods sectors.
Table – 15: WEIGHTED AVERAGE IMPORT DUTY RATES IN INDIA (per cent)
Year Agriculture Mining Consumer Intermediate Capital All Commodities 1 2 3 4 5 6 7 1991-92 47.0 56.9 97.8 69.5 94.8 72.5 1995-96 16.7 29.9 36.1 22.9 29.1 25.9 2000-01 58.6 16.1 56.2 36.2 34.4 35.7 2001-02 57.7 15.8 67.1 34.8 31.8 35.1 Source: Report on Currency and Finance, 2001-02, Reserve Bank of India. As a result of the measures, the share of India’s imports in world trade increased from
0.6 per cent in 1993 to 0.9 per cent in 2003, while that of the exports increased from
0.6 per cent to 0.8 per cent. However, India’s share in global export markets is still
low as compared to its share at 2.2 per cent in 1948 (Srinivasan, 2003). Trade
25 Gourinchas and Jeanne (2003) show that direct benefits from international financial integration may not be large for the emerging economy though indirect channels could affect the policies and governance.
27
openness (measured in terms of imports and exports to GDP) increased from 12.7 per
cent in the 1980s and 18.9 per cent in the 1990s to 23.6 per cent in 2004. The
importance of primary products in the export basket has declined, while petroleum
products and manufactured goods, particularly engineering goods, and chemicals and
related products have shown a marked increase. In the case of imports, petroleum
goods continue to dominate, followed by capital goods and intermediate products.
II.III.I BALANCE OF PAYMENTS AND EXTERNAL DEBT
A number of measures have been initiated since 1991 to liberalize capital inflows.
Foreign investment policy also underwent a radical change to encourage foreign
direct investment to India. A foreign investment promotion board was established to
invite, negotiate and facilitate substantial investment by non-resident corporations
involving high technology transfer. Free repatriation of disinvestment proceeds,
profits and dividends was allowed and the rate of withholding tax was aligned to
international levels. The Foreign Exchange Regulations Act (1973) was amended and
later replaced by the liberal Foreign Exchange Management Act (2000).
Convertibility of foreign direct investment was extended to portfolio investments by
foreign institutional investors in Indian stock exchanges. Indian corporations were
allowed access to overseas financial markets in the form of Global/American
Depository Receipts and Foreign Currency Convertible Bonds. New deposit schemes
for non-residents were introduced and all those with exchange guarantees were
phased out. Also, access to external commercial borrowings was made flexible.
The restrictions on current account transactions were also relaxed in a phased manner.
India adopted Current Account Convertibility of the Rupee on August 20, 1994.
However, India has been following a cautious approach on Capital Account
Convertibility, because of its criticality for a developing country (McKinnon, 1973;
McKinnon and Pill, 1998; Prasad, Rogoff, Wei and Kose, 2003; and Wolf, 2004).26
26 Rodrik (1998) observes that capital account convertibility should not be thrust on every country as it may worsen the situation. Aghion, Bacchetta and Banerjee (2003), argue that economies at an intermediate level of financial development are less stable than either very developed or underdeveloped economies. These economies may become unstable with capital account liberalization.
28
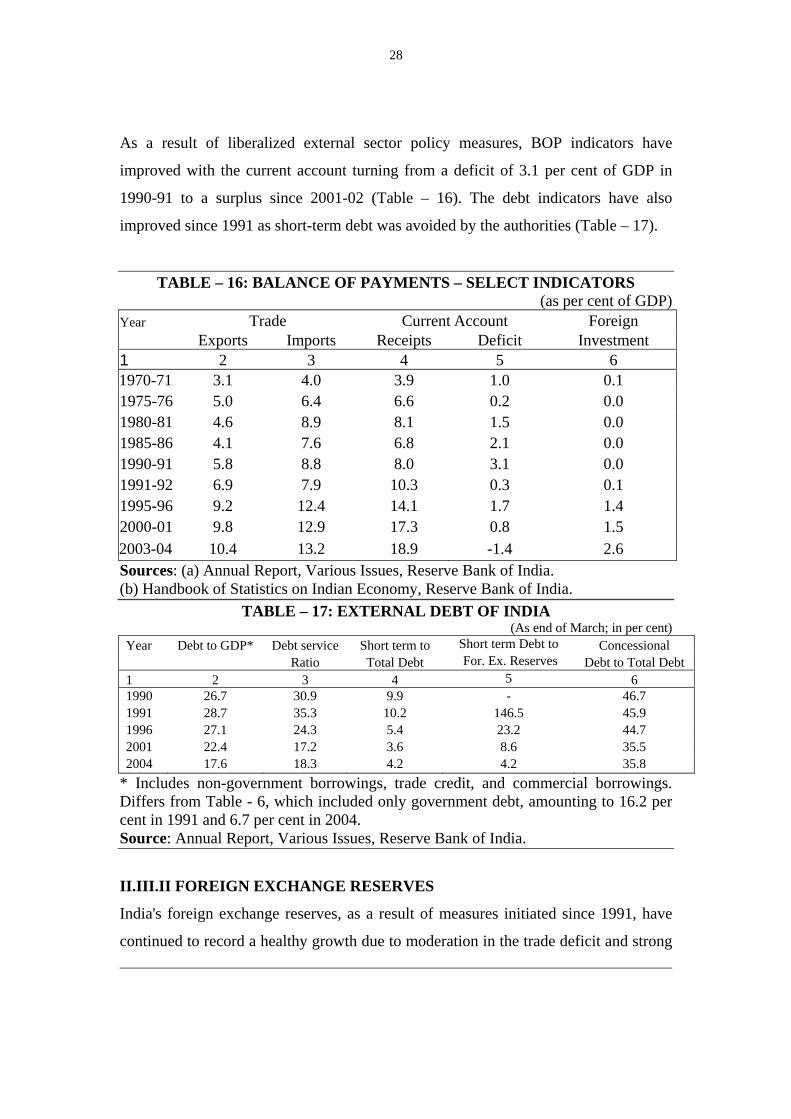
As a result of liberalized external sector policy measures, BOP indicators have
improved with the current account turning from a deficit of 3.1 per cent of GDP in
1990-91 to a surplus since 2001-02 (Table – 16). The debt indicators have also
improved since 1991 as short-term debt was avoided by the authorities (Table – 17).
TABLE – 16: BALANCE OF PAYMENTS – SELECT INDICATORS (as per cent of GDP)
Year Trade Current Account Foreign Exports Imports Receipts Deficit Investment 1 2 3 4 5 6 1970-71 3.1 4.0 3.9 1.0 0.1 1975-76 5.0 6.4 6.6 0.2 0.0 1980-81 4.6 8.9 8.1 1.5 0.0 1985-86 4.1 7.6 6.8 2.1 0.0 1990-91 5.8 8.8 8.0 3.1 0.0 1991-92 6.9 7.9 10.3 0.3 0.1 1995-96 9.2 12.4 14.1 1.7 1.4 2000-01 9.8 12.9 17.3 0.8 1.5 2003-04 10.4 13.2 18.9 -1.4 2.6 Sources: (a) Annual Report, Various Issues, Reserve Bank of India. (b) Handbook of Statistics on Indian Economy, Reserve Bank of India.
TABLE – 17: EXTERNAL DEBT OF INDIA (As end of March; in per cent)
Year Debt to GDP* Debt service Short term to Short term Debt to Concessional Ratio Total Debt For. Ex. Reserves Debt to Total Debt 1 2 3 4 5 6 1990 26.7 30.9 9.9 - 46.7 1991 28.7 35.3 10.2 146.5 45.9 1996 27.1 24.3 5.4 23.2 44.7 2001 22.4 17.2 3.6 8.6 35.5 2004 17.6 18.3 4.2 4.2 35.8
* Includes non-government borrowings, trade credit, and commercial borrowings. Differs from Table - 6, which included only government debt, amounting to 16.2 per cent in 1991 and 6.7 per cent in 2004. Source: Annual Report, Various Issues, Reserve Bank of India.
II.III.II FOREIGN EXCHANGE RESERVES
India's foreign exchange reserves, as a result of measures initiated since 1991, have
continued to record a healthy growth due to moderation in the trade deficit and strong
29
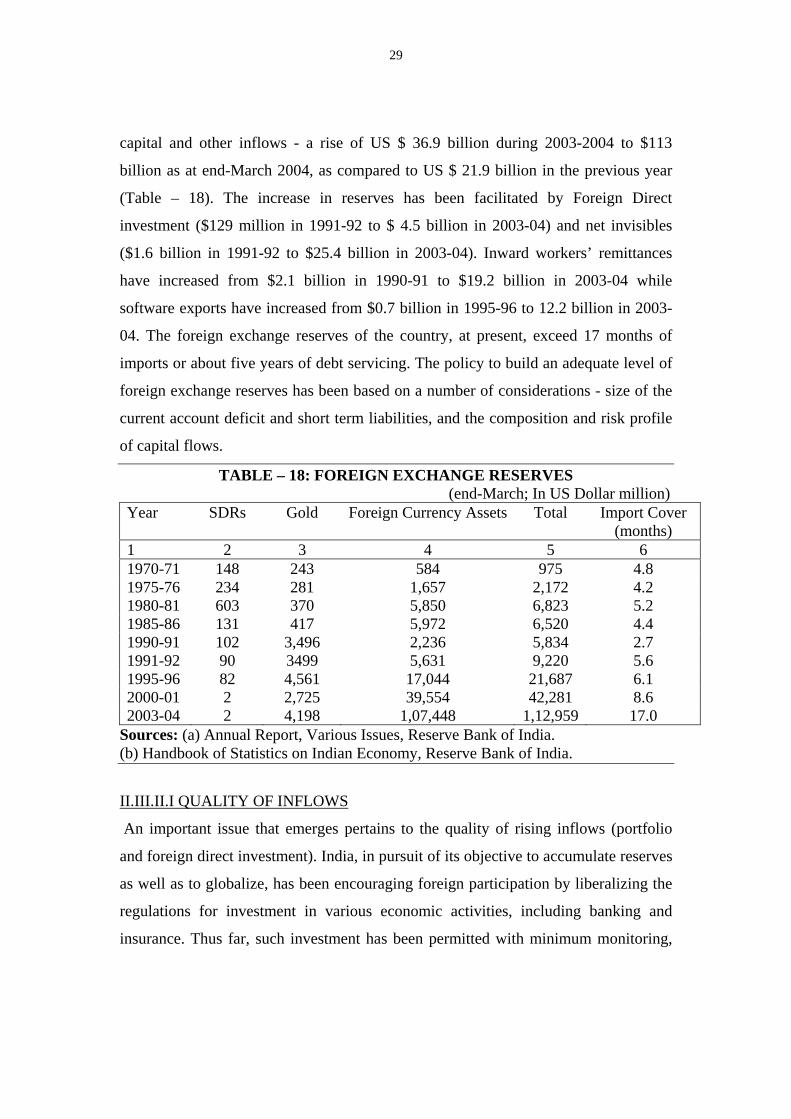
capital and other inflows - a rise of US $ 36.9 billion during 2003-2004 to $113
billion as at end-March 2004, as compared to US $ 21.9 billion in the previous year
(Table – 18). The increase in reserves has been facilitated by Foreign Direct
investment ($129 million in 1991-92 to $ 4.5 billion in 2003-04) and net invisibles
($1.6 billion in 1991-92 to $25.4 billion in 2003-04). Inward workers’ remittances
have increased from $2.1 billion in 1990-91 to $19.2 billion in 2003-04 while
software exports have increased from $0.7 billion in 1995-96 to 12.2 billion in 2003-
04. The foreign exchange reserves of the country, at present, exceed 17 months of
imports or about five years of debt servicing. The policy to build an adequate level of
foreign exchange reserves has been based on a number of considerations - size of the
current account deficit and short term liabilities, and the composition and risk profile
of capital flows.
TABLE – 18: FOREIGN EXCHANGE RESERVES (end-March; In US Dollar million) Year
SDRs
Gold
Foreign Currency Assets
Total
Import Cover (months)
1 2 3 4 5 6 1970-71 148 243 584 975 4.8 1975-76 234 281 1,657 2,172 4.2 1980-81 603 370 5,850 6,823 5.2 1985-86 131 417 5,972 6,520 4.4 1990-91 102 3,496 2,236 5,834 2.7 1991-92 90 3499 5,631 9,220 5.6 1995-96 82 4,561 17,044 21,687 6.1 2000-01 2 2,725 39,554 42,281 8.6 2003-04 2 4,198 1,07,448 1,12,959 17.0
Sources: (a) Annual Report, Various Issues, Reserve Bank of India. (b) Handbook of Statistics on Indian Economy, Reserve Bank of India.
II.III.II.I QUALITY OF INFLOWS
An important issue that emerges pertains to the quality of rising inflows (portfolio
and foreign direct investment). India, in pursuit of its objective to accumulate reserves
as well as to globalize, has been encouraging foreign participation by liberalizing the
regulations for investment in various economic activities, including banking and
insurance. Thus far, such investment has been permitted with minimum monitoring,
30
but with increasing volumes it may be necessary to adopt a cautious approach in the
interest of financial sector stability (Roubini and Hemming, 2003).
II.III.II.II UTILISATION OF RESERVES
The rising volumes of foreign exchange reserves in some countries raises the
important issue of utilization of these reserves – an area marked by lack of empirical
and theoretical literature. In India, in recent months, the use of foreign exchange
reserves to finance government expenditure for infrastructure has been debated.
China, which has accumulated the largest volume of reserves, has recapitalized two of
the four major state-owned commercial banks using reserves but the foreign exchange
has not been used to fund government expenditure.27 In discussions with experts on
this issue, two views, both guarded, emerge, which are as follows:-
(a) Richard Cooper, in principle, though cautiously, agrees that such "excess
foreign exchange reserves" can be used for productive purposes, if assets were
purchased abroad and imported to avoid any short-term macroeconomic effect, or
in long-term investment abroad.28 Cooper further explains that the reserves could
be thought of as India's assets, in this case held in liquid claims on foreigners. If
adequate liquidity is maintained, where "adequate" includes the various
dimensions prudently decided by the authorities in India, then anything beyond
that might be better placed in other assets that lack liquidity and "presentability"
to financial markets, but yield much more. Singapore and some of the OPEC
countries have separated some of their official foreign earnings into investment
accounts, for placement in lower liquidity but higher yielding assets. An
extension of this idea would be to invest in foreign-produced capital goods which
might be used productively in India - part of a port-expansion or improvement
project, i.e. infrastructure. There would be no short-run macroeconomic effect so
long as the goods were purchased abroad, and imported, and therefore no
"inflationary" effect. How ownership is arranged is essentially an accounting
matter between the Government and the RBI.
27 The banks are the Bank of China and the China Construction Bank, each of which received $22.5 billion in December 2003 through a special purpose vehicle (Huijin Corporation) established on December 16, 2003 for the purpose by the People’s Bank of China. 28 Prof. Richard Cooper, Harvard University, confers in private correspondence.
31
(b) Ronald McKinnon29 argues against using foreign exchange reserves to fund
domestic expenditures. Rather than spending official foreign exchange reserves
domestically, it would be better, but perhaps still not desirable, to finance new
infrastructure investments by issuing government rupee bonds directly, implying
a transparent and direct budgetary transaction. Using foreign exchange round
tripping disguises the true nature of the transactions, confuses monetary policy,
and would give the erroneous impression that there is a “free lunch” to be had
when there isn’t any. McKinnon explains further that reserve accumulation
occurs because private parties are net sellers of dollars for rupees at the existing
exchange rate. To prevent undue appreciation of the rupee, the RBI is then forced
to intervene to buy the excess dollars overhanging the market. This creates excess
base money in rupees that could be inflationary unless the RBI sterilizes the
monetary consequences by selling domestic bonds and mopping up the excess
liquidity from the market. If these official dollar reserves acquired by the RBI are
then re-cycled back into the foreign exchange market to finance domestic
infrastructure investments, the RBI must then repurchase the dollars (to maintain
its exchange rate obligation) to prevent further appreciation of the rupee. The
incidental effect of this round tripping would be to further expand the monetary
base—necessitating sterilization through further sales of government bonds by
the RBI. The net result is that new issues of government bonds in rupees are
really financing the infrastructure investments. However, the foreign exchange
side effects make domestic monetary management more difficult.
In the argument made by Cooper, the stress is on imports of physical assets, which
would imply that imports of heavy equipment/services could affect adversely the
Indian domestic industry/service sector within the economy. Another problem that
could arise from the utilization of reserves is misutilisation (misuse or overuse), as
had happened in the case of ad hoc Treasury bills during 1955 to 1997.
29 Prof. Ronald McKinnon, Stanford University, confers in private correspondence.
32
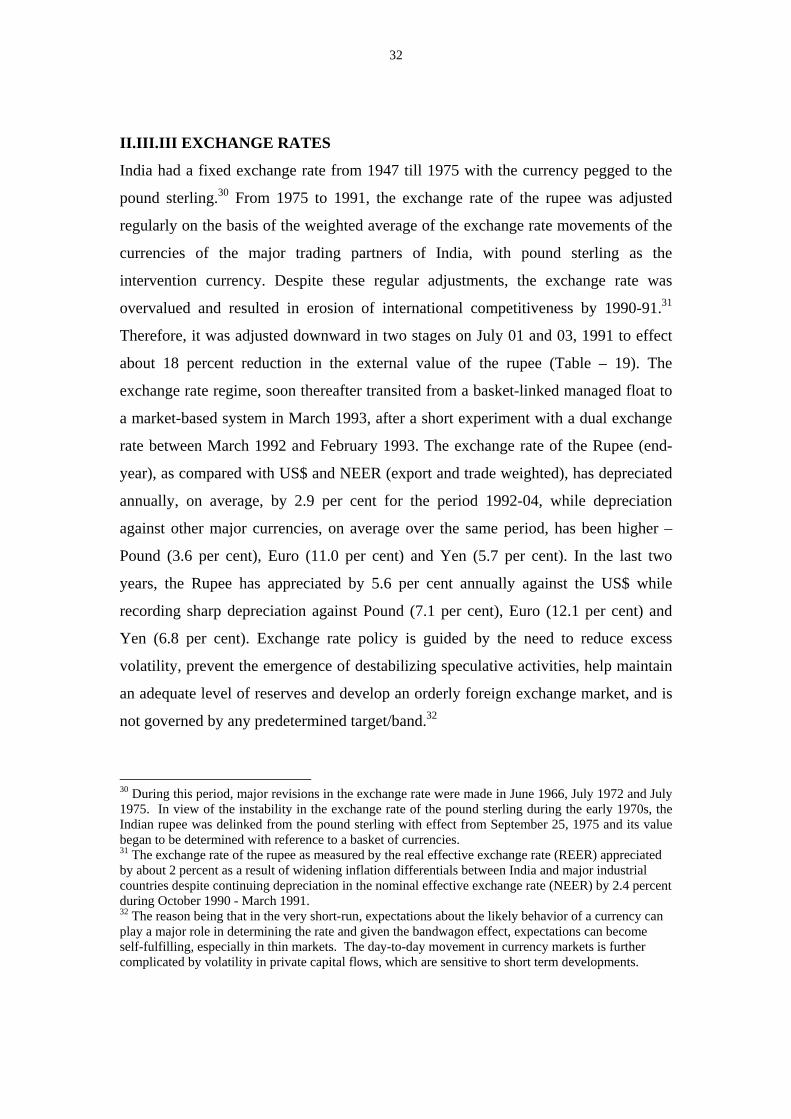
II.III.III EXCHANGE RATES
India had a fixed exchange rate from 1947 till 1975 with the currency pegged to the
pound sterling.30 From 1975 to 1991, the exchange rate of the rupee was adjusted
regularly on the basis of the weighted average of the exchange rate movements of the
currencies of the major trading partners of India, with pound sterling as the
intervention currency. Despite these regular adjustments, the exchange rate was
overvalued and resulted in erosion of international competitiveness by 1990-91.31
Therefore, it was adjusted downward in two stages on July 01 and 03, 1991 to effect
about 18 percent reduction in the external value of the rupee (Table – 19). The
exchange rate regime, soon thereafter transited from a basket-linked managed float to
a market-based system in March 1993, after a short experiment with a dual exchange
rate between March 1992 and February 1993. The exchange rate of the Rupee (end-
year), as compared with US$ and NEER (export and trade weighted), has depreciated
annually, on average, by 2.9 per cent for the period 1992-04, while depreciation
against other major currencies, on average over the same period, has been higher –
Pound (3.6 per cent), Euro (11.0 per cent) and Yen (5.7 per cent). In the last two
years, the Rupee has appreciated by 5.6 per cent annually against the US$ while
recording sharp depreciation against Pound (7.1 per cent), Euro (12.1 per cent) and
Yen (6.8 per cent). Exchange rate policy is guided by the need to reduce excess
volatility, prevent the emergence of destabilizing speculative activities, help maintain
an adequate level of reserves and develop an orderly foreign exchange market, and is
not governed by any predetermined target/band.32
30 During this period, major revisions in the exchange rate were made in June 1966, July 1972 and July 1975. In view of the instability in the exchange rate of the pound sterling during the early 1970s, the Indian rupee was delinked from the pound sterling with effect from September 25, 1975 and its value began to be determined with reference to a basket of currencies. 31 The exchange rate of the rupee as measured by the real effective exchange rate (REER) appreciated by about 2 percent as a result of widening inflation differentials between India and major industrial countries despite continuing depreciation in the nominal effective exchange rate (NEER) by 2.4 percent during October 1990 - March 1991. 32 The reason being that in the very short-run, expectations about the likely behavior of a currency can play a major role in determining the rate and given the bandwagon effect, expectations can become self-fulfilling, especially in thin markets. The day-to-day movement in currency markets is further complicated by volatility in private capital flows, which are sensitive to short term developments.
33
TABLE – 19: EXCHANGE RATE AND INDICES OF INDIAN RUPEE (Base: 1985 = 100)
Year Exchange Rates US $
Export – based weights
Trade – based Weights
(Year-end) REER NEER REER NEER
1 2 3 4 5 6
1975-76 8.9730 107.31 100.28 106.27 97.95
1980-81 8.1900 106.15 106.48 104.48 103.46
1985-86 12.3061 97.85 98.52 98.27 98.50
1990-91 19.6429 73.33 66.19 75.58 67.20
1991-92 31.2256 61.36 51.12 64.20 52.51
1995-96 34.3500 60.94 38.74 63.62 39.73
2000-01 46.6400 62.47 34.24 66.53 35.52
2003-04 43.4450 69.66 34.88 74.14 36.25
Notes: 1. Data up to 1991-92 are based on Official Exchange Rates and data from 1992-93 onwards are based on FEDAI (Foreign Exchange Dealers Association of India) Indicative Rates. 2. Real Effective Exchange Rate (REER) and Nominal Effective Exchange Rate (NEER) are based on 36 – country bilateral weights calculated on Annual Average (Financial Year) with 1985=100. 3. REER Indices have been recalculated from 1994-95 onwards using the new Wholesale Price Index (WPI) series (Base: 1993-94 = 100). Sources: (a) Annual Report, Various Issues, Reserve Bank of India. (b) Handbook of Statistics on Indian Economy, Reserve Bank of India. (c) RBI Monthly Bulletin, Reserve Bank of India.
II.IV FINANCIAL MARKETS
The development and regulation of money, government securities and foreign
exchange markets is the responsibility of the Reserve Bank that emerges out of its role
as monetary authority and debt manager for the Government and its interest in
maintaining stability of the financial system. The emphasis has been on removal of
structural rigidities, encouragement of wider participation, introduction of new
instruments and development of legal, regulatory, institutional and technological
infrastructure for orderly market activity.
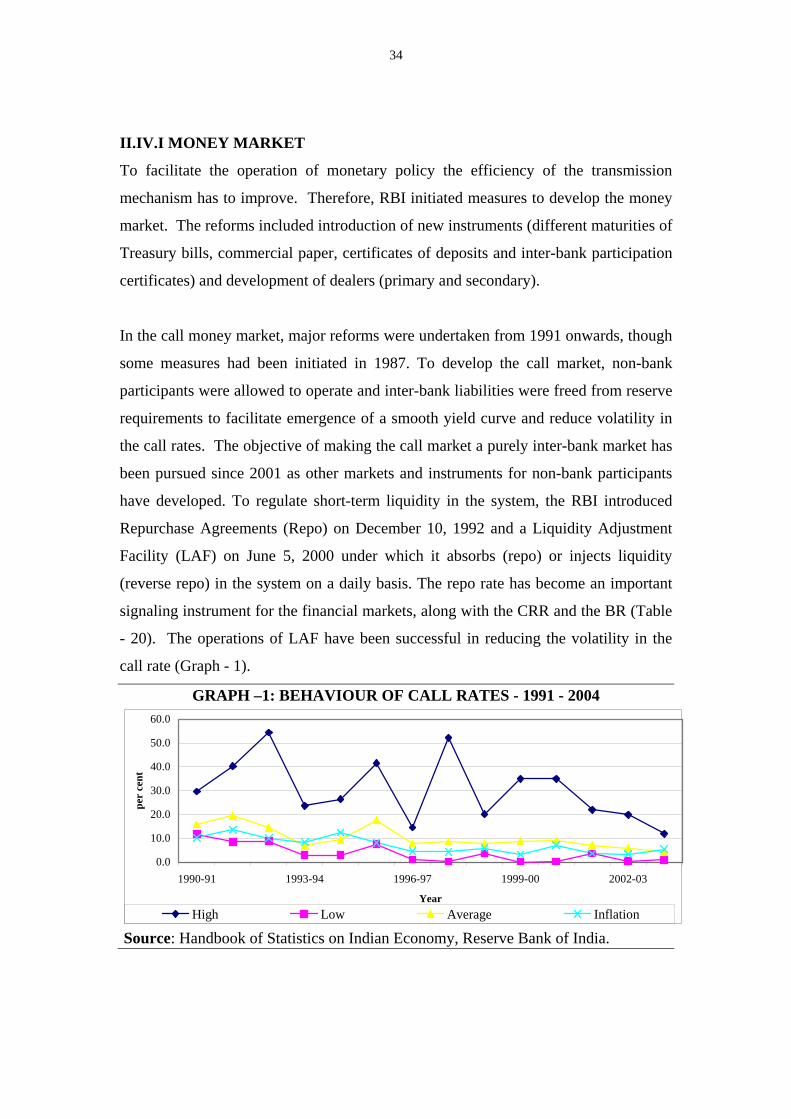
34
II.IV.I MONEY MARKET
To facilitate the operation of monetary policy the efficiency of the transmission
mechanism has to improve. Therefore, RBI initiated measures to develop the money
market. The reforms included introduction of new instruments (different maturities of
Treasury bills, commercial paper, certificates of deposits and inter-bank participation
certificates) and development of dealers (primary and secondary).
In the call money market, major reforms were undertaken from 1991 onwards, though
some measures had been initiated in 1987. To develop the call market, non-bank
participants were allowed to operate and inter-bank liabilities were freed from reserve
requirements to facilitate emergence of a smooth yield curve and reduce volatility in
the call rates. The objective of making the call market a purely inter-bank market has
been pursued since 2001 as other markets and instruments for non-bank participants
have developed. To regulate short-term liquidity in the system, the RBI introduced
Repurchase Agreements (Repo) on December 10, 1992 and a Liquidity Adjustment
Facility (LAF) on June 5, 2000 under which it absorbs (repo) or injects liquidity
(reverse repo) in the system on a daily basis. The repo rate has become an important
signaling instrument for the financial markets, along with the CRR and the BR (Table
- 20). The operations of LAF have been successful in reducing the volatility in the
call rate (Graph - 1).
GRAPH –1: BEHAVIOUR OF CALL RATES - 1991 - 2004
0.0
10.0
20.0
30.0
40.0
50.0
60.0
1990-91 1993-94 1996-97 1999-00 2002-03
Year
per
cent
High Low Average Inflation
Source: Handbook of Statistics on Indian Economy, Reserve Bank of India.
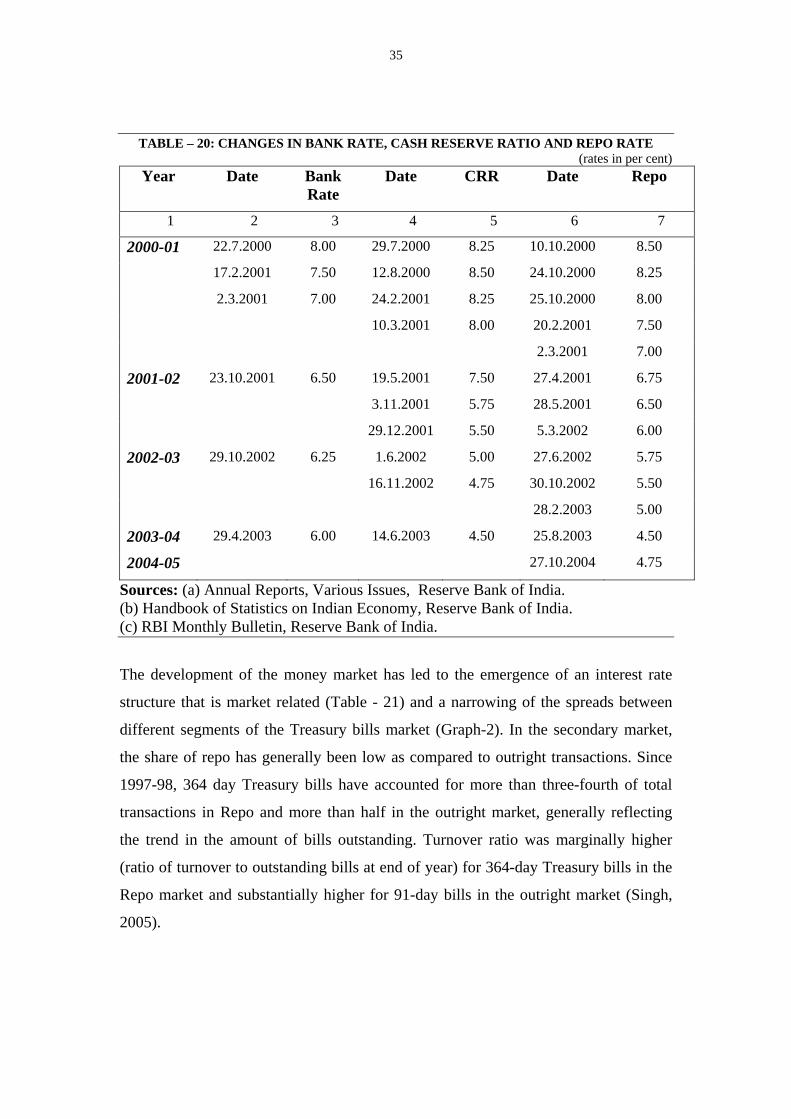
35
TABLE – 20: CHANGES IN BANK RATE, CASH RESERVE RATIO AND REPO RATE (rates in per cent)
Year Date Bank Rate
Date CRR Date Repo
1 2 3 4 5 6 7
2000-01 22.7.2000 8.00 29.7.2000 8.25 10.10.2000 8.50
17.2.2001 7.50 12.8.2000 8.50 24.10.2000 8.25
2.3.2001 7.00 24.2.2001 8.25 25.10.2000 8.00
10.3.2001 8.00 20.2.2001 7.50
2.3.2001 7.00
2001-02 23.10.2001 6.50 19.5.2001 7.50 27.4.2001 6.75
3.11.2001 5.75 28.5.2001 6.50
29.12.2001 5.50 5.3.2002 6.00
2002-03 29.10.2002 6.25 1.6.2002 5.00 27.6.2002 5.75
16.11.2002 4.75 30.10.2002 5.50
28.2.2003 5.00
2003-04 29.4.2003 6.00 14.6.2003 4.50 25.8.2003 4.50
2004-05 27.10.2004 4.75
Sources: (a) Annual Reports, Various Issues, Reserve Bank of India. (b) Handbook of Statistics on Indian Economy, Reserve Bank of India. (c) RBI Monthly Bulletin, Reserve Bank of India.
The development of the money market has led to the emergence of an interest rate
structure that is market related (Table - 21) and a narrowing of the spreads between
different segments of the Treasury bills market (Graph-2). In the secondary market,
the share of repo has generally been low as compared to outright transactions. Since
1997-98, 364 day Treasury bills have accounted for more than three-fourth of total
transactions in Repo and more than half in the outright market, generally reflecting
the trend in the amount of bills outstanding. Turnover ratio was marginally higher
(ratio of turnover to outstanding bills at end of year) for 364-day Treasury bills in the
Repo market and substantially higher for 91-day bills in the outright market (Singh,
2005).
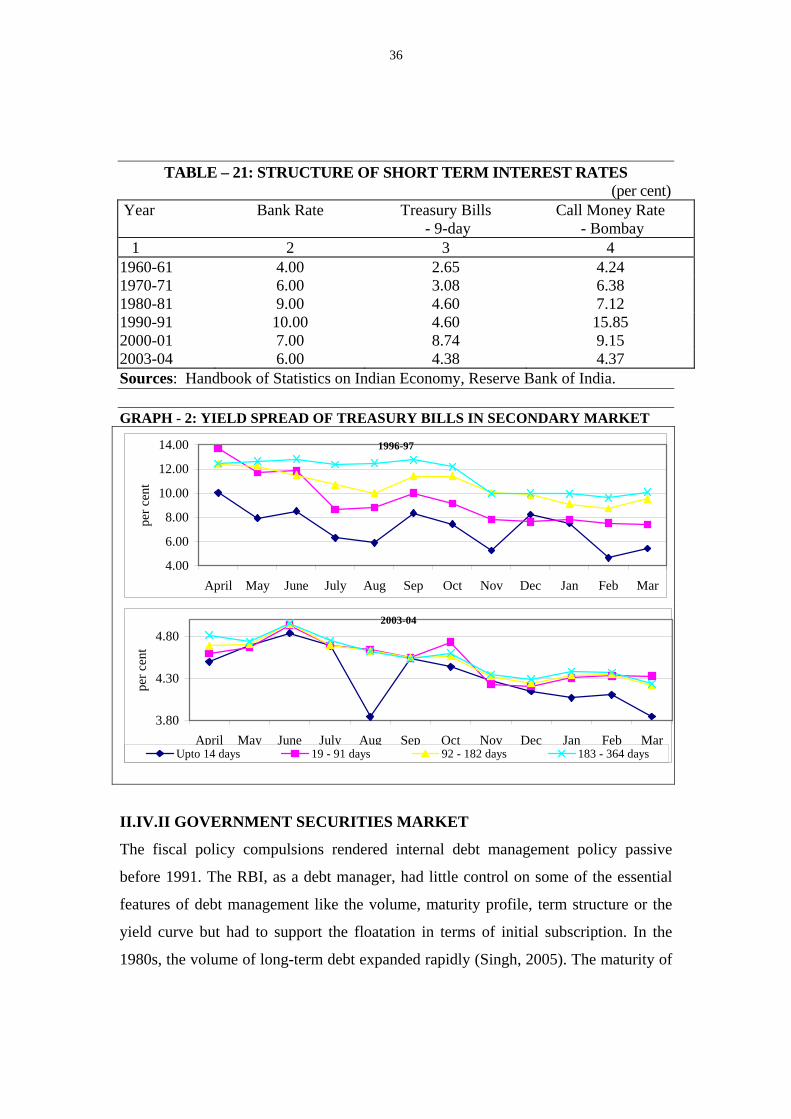
36
TABLE – 21: STRUCTURE OF SHORT TERM INTEREST RATES (per cent) Year Bank Rate Treasury Bills
- 9-day Call Money Rate
- Bombay 1 2 3 4 1960-61 4.00 2.65 4.24 1970-71 6.00 3.08 6.38 1980-81 9.00 4.60 7.12 1990-91 10.00 4.60 15.85 2000-01 7.00 8.74 9.15 2003-04 6.00 4.38 4.37 Sources: Handbook of Statistics on Indian Economy, Reserve Bank of India. GRAPH - 2: YIELD SPREAD OF TREASURY BILLS IN SECONDARY MARKET
1996-97
4.00
6.00
8.00
10.00
12.00
14.00
April May June July Aug Sep Oct Nov Dec Jan Feb Mar
per c
ent
2003-04
3.80
4.30
4.80
April May June July Aug Sep Oct Nov Dec Jan Feb Mar
per c
ent
Upto 14 days 19 - 91 days 92 - 182 days 183 - 364 days
II.IV.II GOVERNMENT SECURITIES MARKET
The fiscal policy compulsions rendered internal debt management policy passive
before 1991. The RBI, as a debt manager, had little control on some of the essential
features of debt management like the volume, maturity profile, term structure or the
yield curve but had to support the floatation in terms of initial subscription. In the
1980s, the volume of long-term debt expanded rapidly (Singh, 2005). The maturity of
37
market loans remained highly skewed at the longer end, with the weighted average
maturity of 16.1 years of outstanding loans in 1991. Total amount of debt securities
increased from Rs.185.4 billion (or 12.9 per cent of GDP) at end-March 1981 to
Rs.861.4 billion (15.2 per cent) at end-March 1991 and to Rs.8,811.5 billion (31.8 per
cent) at end-March 2004. Government debt accounted for 78.9 per cent of the total
outstanding debt in the market as at end of March 2004.
To develop the government securities market, an active internal debt management
policy was pursued from 1992. To offer market-related yields to suit investor
expectations, 5-year and 10-year dated securities were auctioned, for the first time, on
June 3 and August 3, 1992 respectively. Since then the auction system has
increasingly been used and new instruments have regularly been introduced, including
zero coupon bonds, floating rate bonds and capital indexed bonds. The maturity
profile of government bonds underwent a change and the maximum maturity between
1991 and 1992, was reduced from 20 years to 10 years. On improvement in the
market conditions and in consideration of the absorptive capacity of the market, the
maximum maturity of Central government securities was extended to 20 years in
1997-98, 25 years in 2001-02, and finally to 30 years in 2002-03, while that for the
State government loans continues at 10 years. The State Governments continue to
raise resources from the market through a traditional (non-auction) method but the
coupon on these securities is fixed slightly higher (25 to 50 basis points) than the
Central Government bond of similar maturity - an illiquidity premium (due to lower
volumes of outstandings and therefore low tradability). Since January 1999, even
some states have begun to raise a partial amount of their allocated market borrowings
through auctions. The coupon rates on government securities rose in the initial years
of reforms but have been declining since 1996, partly ascribed to efficiency in
financial markets (Table - 22).
In view of the dormant government securities market till 1992, the RBI could not use
open market operations (OMO) as an instrument of monetary policy. The reforms in
the government securities market have now facilitated active use of OMO as a tool of
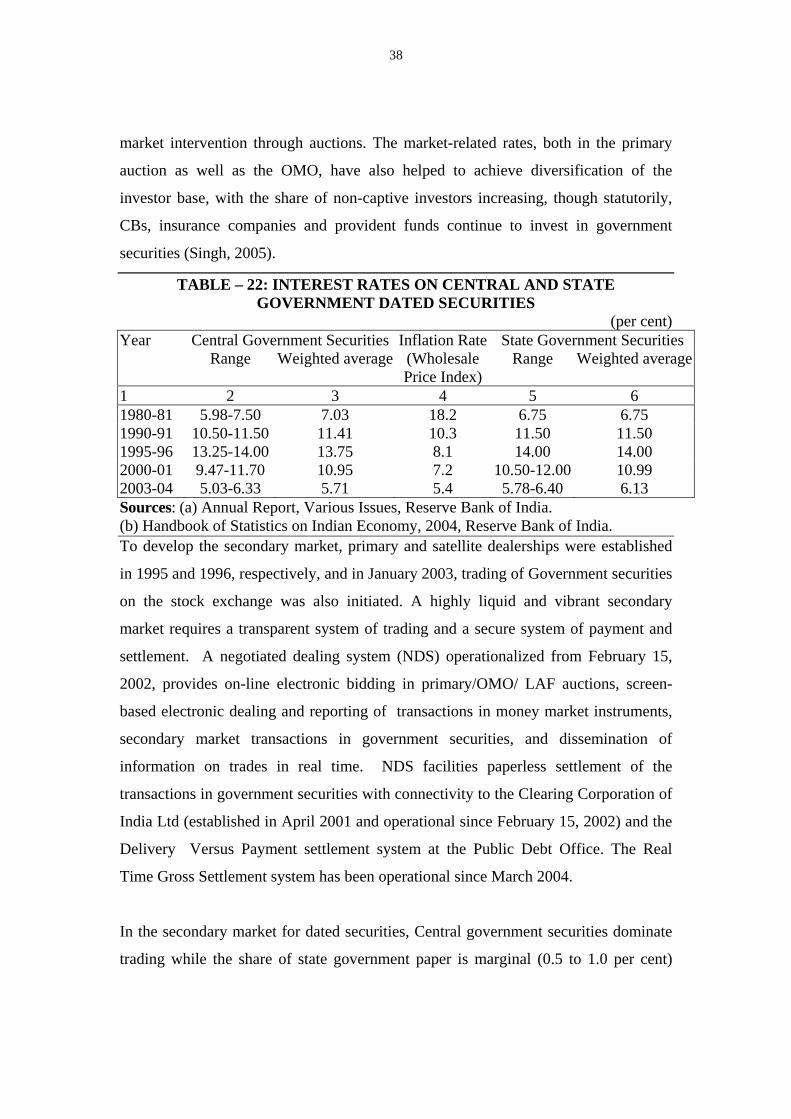
38
market intervention through auctions. The market-related rates, both in the primary
auction as well as the OMO, have also helped to achieve diversification of the
investor base, with the share of non-captive investors increasing, though statutorily,
CBs, insurance companies and provident funds continue to invest in government
securities (Singh, 2005).
TABLE – 22: INTEREST RATES ON CENTRAL AND STATE GOVERNMENT DATED SECURITIES
(per cent) Year Central Government Securities Inflation Rate State Government Securities
Range Weighted average (Wholesale Price Index)
Range Weighted average
1 2 3 4 5 6 1980-81 5.98-7.50 7.03 18.2 6.75 6.75 1990-91 10.50-11.50 11.41 10.3 11.50 11.50 1995-96 13.25-14.00 13.75 8.1 14.00 14.00 2000-01 9.47-11.70 10.95 7.2 10.50-12.00 10.99 2003-04 5.03-6.33 5.71 5.4 5.78-6.40 6.13 Sources: (a) Annual Report, Various Issues, Reserve Bank of India. (b) Handbook of Statistics on Indian Economy, 2004, Reserve Bank of India. To develop the secondary market, primary and satellite dealerships were established
in 1995 and 1996, respectively, and in January 2003, trading of Government securities
on the stock exchange was also initiated. A highly liquid and vibrant secondary
market requires a transparent system of trading and a secure system of payment and
settlement. A negotiated dealing system (NDS) operationalized from February 15,
2002, provides on-line electronic bidding in primary/OMO/ LAF auctions, screen-
based electronic dealing and reporting of transactions in money market instruments,
secondary market transactions in government securities, and dissemination of
information on trades in real time. NDS facilities paperless settlement of the
transactions in government securities with connectivity to the Clearing Corporation of
India Ltd (established in April 2001 and operational since February 15, 2002) and the
Delivery Versus Payment settlement system at the Public Debt Office. The Real
Time Gross Settlement system has been operational since March 2004.
In the secondary market for dated securities, Central government securities dominate
trading while the share of state government paper is marginal (0.5 to 1.0 per cent)
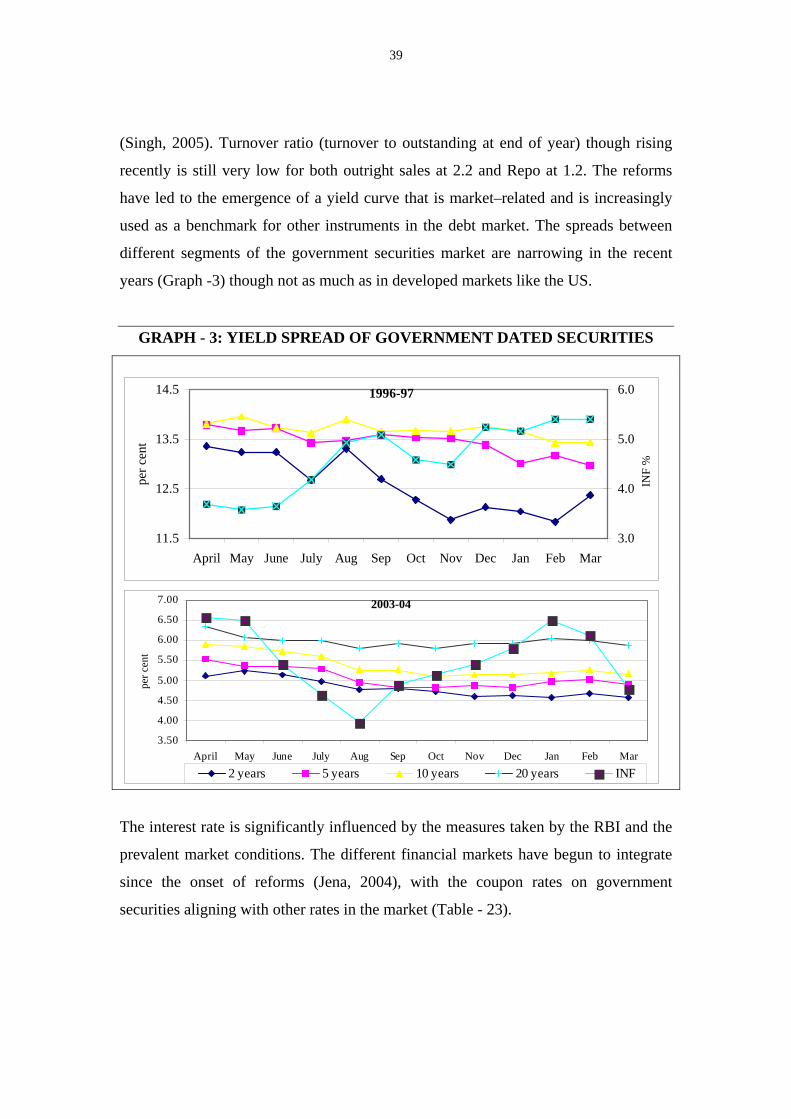
39
(Singh, 2005). Turnover ratio (turnover to outstanding at end of year) though rising
recently is still very low for both outright sales at 2.2 and Repo at 1.2. The reforms
have led to the emergence of a yield curve that is market–related and is increasingly
used as a benchmark for other instruments in the debt market. The spreads between
different segments of the government securities market are narrowing in the recent
years (Graph -3) though not as much as in developed markets like the US.
GRAPH - 3: YIELD SPREAD OF GOVERNMENT DATED SECURITIES
1996-97
11.5
12.5
13.5
14.5
April May June July Aug Sep Oct Nov Dec Jan Feb Mar
per c
ent
3.0
4.0
5.0
6.0
INF
%
2003-04
3.50
4.00
4.50
5.00
5.50
6.00
6.50
7.00
April May June July Aug Sep Oct Nov Dec Jan Feb Mar
per c
ent
2 years 5 years 10 years 20 years INF
The interest rate is significantly influenced by the measures taken by the RBI and the
prevalent market conditions. The different financial markets have begun to integrate
since the onset of reforms (Jena, 2004), with the coupon rates on government
securities aligning with other rates in the market (Table - 23).
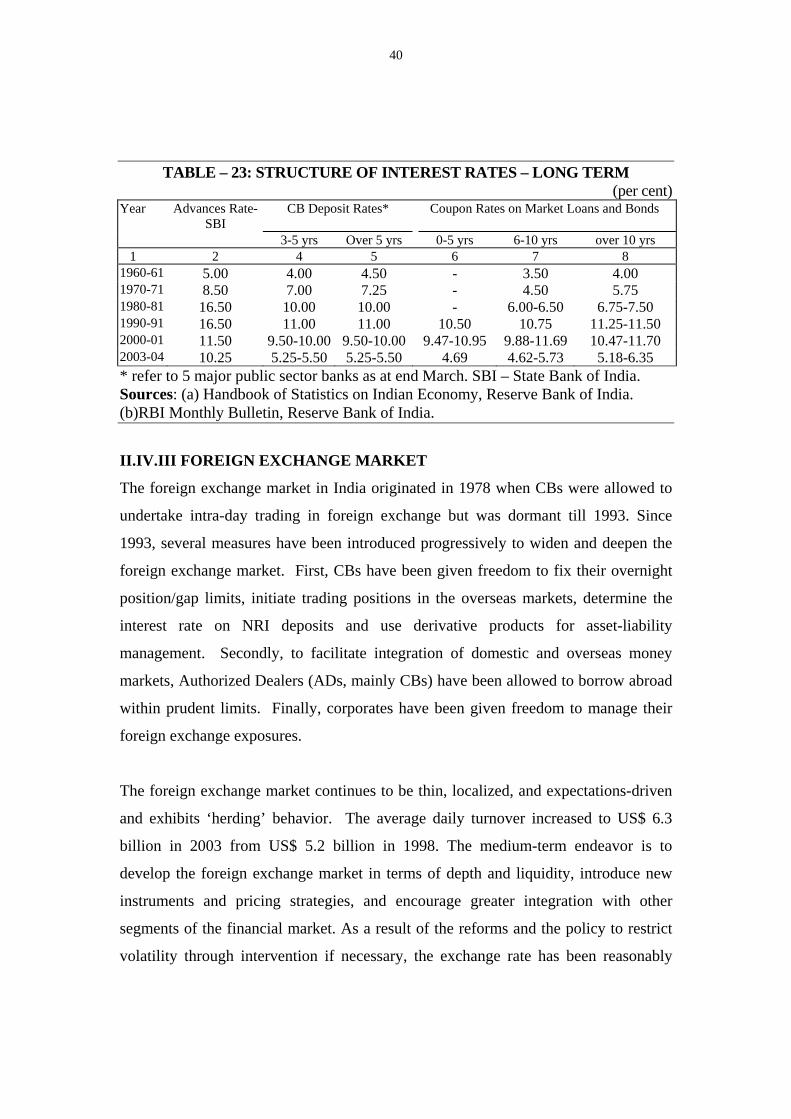
40
TABLE – 23: STRUCTURE OF INTEREST RATES – LONG TERM (per cent)
Year Advances Rate-SBI
CB Deposit Rates* Coupon Rates on Market Loans and Bonds
3-5 yrs Over 5 yrs 0-5 yrs 6-10 yrs over 10 yrs 1 2 4 5 6 7 8 1960-61 5.00 4.00 4.50 - 3.50 4.00 1970-71 8.50 7.00 7.25 - 4.50 5.75 1980-81 16.50 10.00 10.00 - 6.00-6.50 6.75-7.50 1990-91 16.50 11.00 11.00 10.50 10.75 11.25-11.50 2000-01 11.50 9.50-10.00 9.50-10.00 9.47-10.95 9.88-11.69 10.47-11.70 2003-04 10.25 5.25-5.50 5.25-5.50 4.69 4.62-5.73 5.18-6.35 * refer to 5 major public sector banks as at end March. SBI – State Bank of India. Sources: (a) Handbook of Statistics on Indian Economy, Reserve Bank of India. (b)RBI Monthly Bulletin, Reserve Bank of India.
II.IV.III FOREIGN EXCHANGE MARKET
The foreign exchange market in India originated in 1978 when CBs were allowed to
undertake intra-day trading in foreign exchange but was dormant till 1993. Since
1993, several measures have been introduced progressively to widen and deepen the
foreign exchange market. First, CBs have been given freedom to fix their overnight
position/gap limits, initiate trading positions in the overseas markets, determine the
interest rate on NRI deposits and use derivative products for asset-liability
management. Secondly, to facilitate integration of domestic and overseas money
markets, Authorized Dealers (ADs, mainly CBs) have been allowed to borrow abroad
within prudent limits. Finally, corporates have been given freedom to manage their
foreign exchange exposures.
The foreign exchange market continues to be thin, localized, and expectations-driven
and exhibits ‘herding’ behavior. The average daily turnover increased to US$ 6.3
billion in 2003 from US$ 5.2 billion in 1998. The medium-term endeavor is to
develop the foreign exchange market in terms of depth and liquidity, introduce new
instruments and pricing strategies, and encourage greater integration with other
segments of the financial market. As a result of the reforms and the policy to restrict
volatility through intervention if necessary, the exchange rate has been reasonably
41
stable (Table - 24). RBI intervention, however, is small in terms of volume – less than
3.0 per cent of turnover in 2002-03, a year argued to be of high intervention, which
demonstrates the predominant role of market forces in determination of the external
value of the rupee (Mohan, 2004).
TABLE – 24: MOVEMENTS IN EXCHANGE RATE OF THE RUPEE PER US DOLLAR AND PARTICIPATION BY RBI IN THE MARKET
Year Range (Rs.)
Average Exchange Rate (Rs.)
Coefficient of Variation (%)
RBI’s Purchase of US $ (billion)
RBI’s Sale of US $
(billion) 1 2 4 5 6 1993-94 31.21-31.49 31.37 0.1 .. .. 1994-95 31.37-31.97 31.40 0.3 .. .. 1995-96 31.32-37.95 33.45 5.8 .. .. 1996-97 34.14-35.96 35.50 1.3 11.2 3.4 1997-98 35.70-40.36 37.16 4.2 15.1 11.2 1998-99 39.48-43.42 42.07 2.1 28.7 26.9 1999-00 42.44-43.64 43.33 0.7 24.1 20.8 2000-01 43.61-46.89 45.68 2.3 28.2 25.8 2001-02 46.56-48.85 47.69 1.4 22.8 15.8 2002-03 47.51-49.06 48.41 0.9 30.6 14.9 2003-04 43.44-47.46 45.92 1.6 55.4 24.9 Sources: (a) Report on Currency and Finance, Reserve Bank of India. (b) Handbook of Statistics on Indian Economy, Reserve Bank of India. (c)RBI Monthly Bulletin, Reserve Bank of India. II.IV.IV CAPITAL MARKETS
In terms of financial sector reforms, it was considered necessary for investor
confidence that capital markets should be encouraged to grow under the supervision
of a strong regulatory framework. Therefore, in January 1992, the Securities and
Exchange Board of India (SEBI), was accorded statutory status as an autonomous
body to protect investors' interest and to promote the development of the capital
market. In the primary market, all government controls relating to pricing of equity
issues and their timing have been removed since then. Interest rate restrictions on
debentures and bonds issued by public sector enterprises, was rescinded in August
1991. In the secondary market, the traditional open outcry system has been replaced
with a transparent, screen-based computerized trading system, which can be accessed
by trading members (9,368 as at end of March 2004) across India (from 357 cities as
42
at end of March 2004) to meet the requirements of nearly 21 million investors (during
2000-01, according to a Survey conducted by SEBI), mainly located in urban areas.
The process of dematerialization of physical securities is completed. To reduce risks
in the market and protect the interest of investors, in line with international best
practices, rolling settlement on T+2 basis is in use since April 1, 2003. The clearing
and settlement system is being emphasized by SEBI and many stock exchanges in
India are setting it up now. The disclosure standards are being strengthened to protect
the interests of the investors. The number of stock exchanges increased from 11 in
1990 to 23 in 2003 while listed companies on the stock exchanges have increased
from 6,299 in 1990-91 to 9,413 in 2002-03. In March 2001, the government proposed
that all the 23 stock exchanges that are owned and managed by the brokers would be
corporatised whereby ownership, management and trading membership would be
segregated. Consequently, the boards of some stock exchanges in India have been
revamped and broadened so that they represent diversified interests.
Consequent to the reforms, resource mobilization in the primary market increased
from 2.5 per cent of GDP in 1990-91 to 3.8 percent in 2000-01, but since then the
markets have been depressed for multiple reasons – high real interest rates, poor
performance of mutual funds, lack of confidence of the investors due to high
incidence of vanishing companies and consequently stringent conditions imposed by
the regulator on public issues (Table - 25). In the primary market, corporates prefer
the private placement route, which has accounted for more than four-fifth of total
resources mobilized since 1997. Since then, the share of debt issuance has also been
more than nine-tenth of total resources raised from the market. The corporate bond
market, accounting for less than a quarter of the primary market and less than one-
tenth of the secondary market, is under-developed, and marked by a low investor base
and an absence of variety in instruments. The share of finance raised from the market
in total external finance of the corporate entities increased from 19.2 per cent in 1990-
91 to 53.2 per cent in 1993-94 but since then has declined due to the adverse market
conditions.
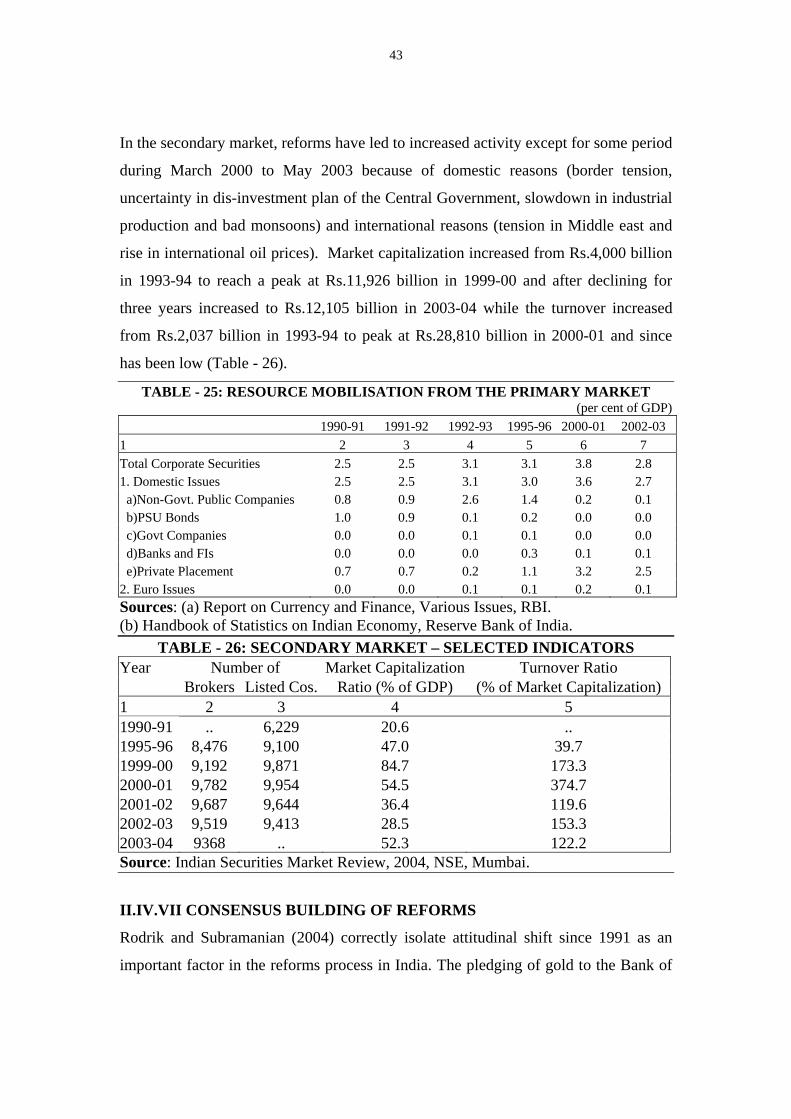
43
In the secondary market, reforms have led to increased activity except for some period
during March 2000 to May 2003 because of domestic reasons (border tension,
uncertainty in dis-investment plan of the Central Government, slowdown in industrial
production and bad monsoons) and international reasons (tension in Middle east and
rise in international oil prices). Market capitalization increased from Rs.4,000 billion
in 1993-94 to reach a peak at Rs.11,926 billion in 1999-00 and after declining for
three years increased to Rs.12,105 billion in 2003-04 while the turnover increased
from Rs.2,037 billion in 1993-94 to peak at Rs.28,810 billion in 2000-01 and since
has been low (Table - 26).
TABLE - 25: RESOURCE MOBILISATION FROM THE PRIMARY MARKET (per cent of GDP)
1990-91 1991-92 1992-93 1995-96 2000-01 2002-03 1 2 3 4 5 6 7 Total Corporate Securities 2.5 2.5 3.1 3.1 3.8 2.8 1. Domestic Issues 2.5 2.5 3.1 3.0 3.6 2.7 a)Non-Govt. Public Companies 0.8 0.9 2.6 1.4 0.2 0.1 b)PSU Bonds 1.0 0.9 0.1 0.2 0.0 0.0 c)Govt Companies 0.0 0.0 0.1 0.1 0.0 0.0 d)Banks and FIs 0.0 0.0 0.0 0.3 0.1 0.1 e)Private Placement 0.7 0.7 0.2 1.1 3.2 2.5 2. Euro Issues 0.0 0.0 0.1 0.1 0.2 0.1 Sources: (a) Report on Currency and Finance, Various Issues, RBI. (b) Handbook of Statistics on Indian Economy, Reserve Bank of India.
TABLE - 26: SECONDARY MARKET – SELECTED INDICATORS Year Number of Market Capitalization Turnover Ratio Brokers Listed Cos. Ratio (% of GDP) (% of Market Capitalization) 1 2 3 4 5 1990-91 .. 6,229 20.6 .. 1995-96 8,476 9,100 47.0 39.7 1999-00 9,192 9,871 84.7 173.3 2000-01 9,782 9,954 54.5 374.7 2001-02 9,687 9,644 36.4 119.6 2002-03 9,519 9,413 28.5 153.3 2003-04 9368 .. 52.3 122.2 Source: Indian Securities Market Review, 2004, NSE, Mumbai.
II.IV.VII CONSENSUS BUILDING OF REFORMS
Rodrik and Subramanian (2004) correctly isolate attitudinal shift since 1991 as an
important factor in the reforms process in India. The pledging of gold to the Bank of
44
England in June 1991 was a sensitive issue and the opportunity that the situation
created helped in initiating reforms - even those that were un-acceptable till then - but
to sustain the process, a consensual effort was required. Therefore an institutionalized
framework was established to involve all the stakeholders in the formulation of policy
and its implementation in the financial sector. Several specialized groups were
constituted that continue to ensure consensus building for reforms. In the Government
securities market, the Cash and Debt Management Group consisting of officials from
the Government of India and the RBI deliberate and advise on the borrowing program
of the Government. In view of the ever changing market conditions, officials of the
Central and State Governments, the Planning Commission and the RBI meet twice a
year to discuss the finances of the State Governments, with special reference to cash
and debt management. In the context of growing integration of the financial markets,
a Technical Advisory Committee, comprising academicians, professionals and
financial market participants, meets regularly to review the developments in the
foreign exchange, money and government securities markets, and make suitable
recommendations. Self-regulatory bodies, operational since 1997, in these markets
have also been playing an important role in their development and providing feedback
to the regulator.
SECTION-III: CONSEQUENCES OF REFORMS
In view of the on-going multi-sector reforms being undertaken in India, especially the
financial sector, the structure of the economy has undergone a significant change. The
sectoral composition of national income has changed with services accounting for
56.2 per cent of GDP in 2003-04 as compared to 46.1 per cent in 1990-91. The share
of banking and insurance in the services sector has increased from 7.5 per cent during
1981-85 to 11.8 per cent during 1993-99. The finance ratio, as the ratio of total
financial claims to national income, increased from 0.3 during 1981-85 to 0.5 in 1995-
96, according to the latest data available.
45
The economic indicators of the economy after the initiation of reforms reflect a
positive impact with the average annual growth rate of GDP rising to 6.1 per cent for
the period 1992-04 (Table- 27).33 During this period, the economy has successfully
been able to cushion four years of negative growth in agriculture, high oil prices and
tension in Middle-East (affecting remittances), a shift in export destinations with the
collapse of Soviet Union, and recessionary global goods and capital markets. The
interest rates are now market determined and the impact is noted on domestic savings
and investment. The savings by the household (in the financial assets - bank deposits,
mutual funds) and private sector has increased as has the investment. The
performance of the public sector has been dismal though – savings have been negative
since 1998-99 and the share of investment has been declining since 1992-93. The
economy is increasingly getting monetized and inflation has consistently been low.
TABLE – 27: CHANGE IN THE INDIAN ECONOMY Years/ GDP GDP Per capita GDS GDCF GDP/M3 GDP/M1 Inflation Period Constant prices Current prices
1 2 3 4 5 6 7 8 1951-61 3.9 1.9 10.2 11.7 .. .. 1.8 1961-71 3.8 1.3 12.9 14.8 .. .. 6.2 1971-81 3.2 0.8 17.9 18.1 3.6 6.5 10.3 1981-85 5.3 2.7 18.3 19.6 2.7 7.0 7.1 1985-91 5.9 3.5 20.8 23.3 2.4 6.7 7.3 1991-92 1.3 -1.5 22.0 22.6 2.2 6.3 13.7 1992-04 6.1 4.1 23.4 24.3 1.9 6.0 6.4 Sources: (a) Report on Currency and Finance, Various Issues, Reserve Bank of India.
(b) Handbook of Statistics on Indian Economy, Reserve Bank of India.
A Necessary Digression
Rodrik and Subramanian (2004) argue that the shift in the growth rates occurred in
early 1980s, implying, therefore, that the higher growth rates recorded by the
economy in the 1990s may not be emanating from the reform process. The data does
demonstrate that the shift of growth rates to a higher orbit did occur in 1980s but the
comparison with the shift since 1991 may be inappropriate. In fact, there is a political
economy aspect that ushers a structural break in the long-term trend - financial
emergency from June 1975 to March 1977 when capacity utilization in industry and
33 Prof. Ronald McKinnon, Stanford University, terms this growth rate as the Sikh rate of growth.
46
services improved substantially. India had its first non-Congress Prime minister in
March 1977, representing a multi-party coalition, quickly followed by another in July
1979. The multi-party coalition introduced a new dimension in economic policies that
were being followed earlier, nearly unaltered, for three decades in the socialist mould,
emphasizing the role of public sector. The gandhian principles of development of
rural sector, emphasis on Swadesi (domestically made goods), development of village,
cottage and small-scale industry, and decentralization of power, as against capital-
intensive large industries and expansion of the public sector, were emphasized by the
new regime. The co-operative movement in rural sector gained momentum, rural co-
operative banks were re-organized and commercial banks were required to extend
credit to the rural sector on priority basis. The growth rates recorded by the economy
were high, especially in industry and services, due to higher capacity utilization and
introduction of the new paradigm, but constrained by limitations of infrastructure,
especially power. The fiscal deficit scaled new peaks and for the first time a deficit
was recorded on the revenue account.
In January 1980, Congress returned to power and the policy measures following
gandhian principles initiated by the previous regime were continued and more added
in the spirit of competitive populism. The capital market, industrial and import
policies were liberalized, and a long-term fiscal policy aiming to create a conducive
environment for growth, was introduced. In December 1989, once again India had a
non-Congress Prime Minister followed by another in November 1990, both
representing a multi-party coalition. The emphasis generally continued on public
sector, import substitution and export promotion. The economy continued to suffer
from shortages of power and infrastructure, uneven built-up of capacity in industry
still constrained by licenses and permits, directed lending, high fiscal and current
account deficits, and strongly regimented exchange controls. The unsustainability of
such selective liberalization became apparent in the foreign exchange crises of June
1991.
47
The structural reforms that were initiated in 1991 certainly benefited from the
attitudinal shift caused by various waves of policy liberalization since 1977. The
economy has recorded consistently high growth rates since 1991-92, despite various
shocks. The macro-data summarized in Appendix Tables 3-6, based on the time-
periods of changes in the government broadly substantiates the above argument.
Back to the Basics
Consequent to reforms in the banking sector, the profitability of the CBs in India is
now comparable with those in the developed countries. The non-performing loans of
the banks in India though high compared to the developed countries have rapidly
declined to 7.2 per cent in March 2004. The profitability of major banks in India has
improved and is comparable with international standards with pre-tax profits having
increased to 1.0 per cent in 2002-03 and operating costs having declined to 2.2 per
cent. The capital markets in India have also been developing. India has been ranked
17th by Standard and Poor’s in terms of market capitalization, 16th in terms of turnover
and second in terms of listed companies on Stock exchanges after the USA.34
The financial sector reforms have helped to develop the markets, which have been
integrating too. The economy benefited from these reforms and could withstand some
of the shocks that impacted it in recent years, pre-pay some of its high cost external
debt and undertake domestic debt restructuring.
III.I SOUTH EAST ASIAN CRISES
India was not insulated from the South East Asian crises of 1997. The Reserve Bank
of India responded to the crisis, when the pressure on rupee in November/December
1997 was noted, by altering the course of easing of monetary policy as per the
measures announced earlier in April 1997. As demand for US$ exceeded supply, one
month forward premia (which in India reflects demand-supply pressure and not
34 The number of listed companies reported by Standard and Poor’s is lower than that reported by SEBI (refer Table - 26).
48
necessarily interest rate differentials) rose from 4.3 per cent on October 14, 1997 to
10.4 per cent on December 16, 1997. The exchange rate of the Rupee per US$
depreciated from Rs.36.2 to Rs.39.4 over the similar period. The liabilities of the RBI
in terms of net forward market commitments rose from US$ 944 million as at end of
September 1997 to US$ 1,956 million as at end of December 1997. In order to reduce
volatility, curb speculative activity and ward off any threat of contagion, several
monetary measures were promptly taken in December 1997 - (a) raising of CRR, (b)
imposition of restrictions on the facility extended to ADs to offer forward contracts,
and (c) introduction of steps affecting the cost of rupee funds to importers and
exporters to minimize the lag in import payments and export realizations. As these
proved ineffective and the one month forward premium after a dip to 7.9 per cent
(exchange rate at Rs.39.3) on December 31, 1997 continued to rise to 23.8 per cent
(exchange rate at Rs.40.4) on January 15, 1998, another package of monetary
measures was announced on January 16, 1998. These measures included - (i) raising
of the BR by 200 basis point, (ii) raising of CRR by 50 basis points, (iii) reduction of
general refinance limits to CBs from the RBI, (iv) reduction in liquidity support to
primary dealers, and (v) raising the cost of money for the importers. These measures
finally succeeded in restoring normalcy in the markets with the exchange rate
appreciating to Rs.38.7 on January 21, 1998 though the forward premium was
stubborn and returned to 3.3 per cent by April 13, 1998.
The RBI also resorted to continued use of 3-4 day Repos to manage short-term
liquidity in the system during this period. Repo auctions with cut-off repo rate varying
between 2.9 and 5.0 per cent were conducted up to December 3, 1997. The repo rates
were sharply raised to 6.5 per cent on December 4, 7.0 per cent on December 11 and
further to 9.0 per cent on January 17, 1998.
III.II THE PERIOD AFTER SEPTEMBER 11, 2001
The position in the call money market was tight following the events of September
11, 2001 and was accompanied by pressures in foreign exchange and gilt segments as
financial markets in the US were affected for more than a week as also across the
49
world. In India too, the markets were beginning to show signs of nervousness
immediately after the attack. The one-month forward premium rose from 4.3 per cent
(exchange rate Rs.47.4 per US$) on September 12, 2001 to 7.5 per cent (Rs.48.2) on
September 17, 2004. The announcement of opening of a purchase window for select
Government securities by RBI, on an auction basis, on September 18, 2001 and sale
of foreign exchange by RBI restored market sentiment – the forward premium
declined to 6.0 per cent immediately on the same day while the exchange rate
recovered to Rs.47.9 on September 19, 2001. The Reserve Bank continued to conduct
regular auctions for open market purchases aggregating Rs.50 billion during
September 18 - October 10, 2001 to support the gilt market in the face of the steep fall
in the government security prices due to adverse external developments.
In a related development, the difficult situation in the Gulf area since 2002 and higher
oil prices have not affected the Indian economy as had been the case in 1991, though
the imports of oil and POL continue to account for more than one-fourth of total
imports since 1999-2000 as compared to 15.1 per cent in 1998-99. In 1990-91, in a
similar situation of price escalation, the share of oil and POL had increased from 17.7
per cent in 1989-90 to 25.0 per cent of total imports, precipitating a crisis.
III.III FOREIGN EXCHANGE INFLOWS AND STERILISATION
In recent years, India has experienced a significant spurt in foreign exchange inflows,
with the foreign exchange reserves rising to US $113 billion by end-March, 2004. The
Foreign Currency Assets of the Reserve Bank rose by US $ 20.8 billion (Rs.924
billion) during 2002-03 and US $ 35.6 billion (Rs.1,247 billion) during 2003-04.
The liquidity impact of large inflows was managed mainly through the daily LAF.
Liquidity absorption through LAF on a daily average basis amounted to Rs.112
billion during 2002-03 and around Rs.300 billion during 2003-04. The LAF
operations were supplemented by sales through OMO amounting to Rs.537 billion
50
during 2002-03 and Rs.418 billion during 2003-04. To stabilize the market and to
continue to undertake the sterilization measures, the Market Stabilization Scheme
(MSS) was introduced in April 2004. The overall ceiling of Rs. 800 billion is
stipulated for 2004-05 under MSS and the paper issued till November 13, 2004
amounted to Rs.557 billion.
The high foreign exchange reserves have also been used to pre-pay some of the high
cost external debt. In February 2003 and then during 2004, the Government pre-paid a
part of its high cost external debt amounting to US $ 5.63 billion to the Asian
Development Bank and the World Bank. Similarly, high cost bilateral loans
(especially Canada and Netherlands) amounting to US$1.1 billion have also been pre-
paid. The possibility of further prepayments of external debt is being explored.
III.IV DEBT RESTRUCTURING
Debt restructuring which was sought as a part of fiscal consolidation included - (i)
pre-payment of external debt (explained earlier), (ii) buy-back of government
securities by the Central Government from the banks, and (iii) restructuring of State
Governments' debt to the Centre through a debt swap scheme. The scheme of debt
buy-back was implemented on July 19, 2003. The Government of India bought back
high cost, illiquid securities by paying a premium. In lieu of these illiquid securities,
four liquid securities were issued. The buy-back was conducted for CBs and select
DFIs, and the CBs were allowed additional income-tax deductions to the extent such
business income was used for provisioning of their NPAs. The repurchase of
securities was through a live interactive electronic platform where bids could be
revised while the reissue of fresh securities in lieu of auctioned securities was at a pre-
announced fixed price notified a day in advance. In the auction process, the offer price
for each security emerged, and the difference between the market value and face value
was shared between the government and market participants.
Under the mutually agreed debt-swap scheme between the Central and the State
51
Governments, all State loans from the Centre bearing coupons in excess of 13.0 per
cent are to be swapped with market borrowings and small savings proceeds at
prevailing interest rates over a period of three years ending in March 2005. The
scheme has been successful as the States have been able to raise resources from the
market at interest rates, which are nearly half the rate at which the original loan was
incurred and as a consequence, are expected to save a substantial amount of interest
payments in future.
SECTION – IV: LOOKING AHEAD
The reforms are an on-going process with many measures that were initiated being
incomplete while others have begun to show encouraging results. The financial
markets have developed, regulatory and supervisory institutions have been
established, and the general attitude towards reforms has also changed. The pace of
reforms in the real sector, including the issue of disinvestments and pricing of public
utilities, and those pertaining to labor regulations and compensation, including
pensions and provident funds, have been rather slow, as they are difficult to
implement.
Reforms in fiscal policy have been slow to yield results. The persistence of the fiscal
deficit and the rise in domestic debt relative to GDP remain a concern, despite
attempts at fiscal correction. On the issue of returns to investment in public sector
enterprises, one can suggest, however, that innovative schemes should be considered,
where assets are not sold but services emerging from those assets are privatized.
Illustratively, these measures could include contracting out such services as: (a)
metering, billing and collection of power and water charges; (b) specific routes and
operations of state road transport corporations; (c) catering, sanitary and security
services in railways; and (d) collection, sorting and distribution of postal mail in
selected areas. These measures would help to improve competitiveness in the public
sector, increase the availability of services, and thereby enhance the welfare of the
people.
52
The administered interest rate regime has been dismantled, facilitating development
of the financial markets and more broad-based ownership of government securities.
With the elimination of automatic monetization in 1997, the Central and State
Governments are provided short-term financial resources by the RBI, while long-term
financial resources are being raised at market-related rates of interest directly from the
market. Therefore, the issue of separating debt from monetary management can now
be considered - a step that would provide independence to the RBI to pursue the goal
of price stability.
The RBI regulates and supervises the financial system. In the banking sector,
measures on prudential norms, income recognition, asset classification, provisioning,
supervision and regulation are beginning to meet international standards. The CBs
have begun to restructure their operations in view of the need to strengthen their
balance sheets to raise capital from the market. The CBs now need to acquire
professional skills to identify users, assess risk and extend credit to the private sector,
and refrain from investment in government securities and guaranteed bonds beyond
the statutory requirements. Also, the role of CBs in rural areas needs to be redefined;
by 2008 the government expects that the CPBs will be revived and logically, given
the spatial spread, CPBs should be encouraged to operate in the rural areas, while CBs
can emphasize in urban areas.
Since 1991, external sector management has helped to build foreign exchange
reserves through non-debt creating flows, to restrict short-term debt, and to maintain
an acceptable level of current account deficits. The proposed initiative to utilize
reserves to finance government expenditure needs to be cautiously examined to avoid
an inflationary spiral and misutilisation of resources.
India was successful in avoiding the impact of the South East Asian Crises and in pre-
paying some of its external debt and restructuring its internal debt in recent years. The
lessons that emerged from the experiences of 1997-98 and September 2001 show that
53
monetary policy has to be continuously alert to market developments both at home
and abroad, and appropriate corrective measures have to be taken promptly.
India continues to maintain steady growth since the initiation of the multi-sector
reforms undertaken since 1991. Therefore, the crucial issue is whether the financial
sector reforms have raised India’s growth rate? The evidence presented in this paper
strengthens the belief that carefully designed and diligently sequenced reforms
undertaken since 1991 have led the economy to consistently record high growth rates,
despite various domestic and external shocks. Thus, the evidence seems to add to the
growing body of empirical literature, which indicates that development of the
financial sector facilitates economic growth.
54
REFERENCES
Aghion, P., P. Bacchetta and A. Banerjee ( 2003), Financial Development and the Instability of Open Economies. http://post.economics.harvard.edu/faculty/aghion/papers/financial_development.pdf.) Alesina, A. and R.Perotti (1996), Fiscal adjustments in OECD Countries: Composition and macroeconomic Effects, Working Paper 5730, National Bureau of Economic Research. Banerjee, A., S.Cole and E.Duflo (2003), Bank Financing in India, Mimeo, MIT. Banerjee, A., S.Cole and E.Duflo (2004), Banking Reform in India, Mimeo, MIT. Barro, R.J. (1974), “Are Government Bonds Net Wealth”, Journal of Political Economy, Vol. 82, pp.1095-1117. Barro, R.J. (1978), “Comment from an Unreconstructed Ricardian”, Journal of Monetary Economics, Vol. 4, pp.569-81. Barro, R.J. (1980), “Federal Deficit Policy and the Effects of Public Debt Shocks”, Journal of Money, Credit, and Banking, Vol. 12, pp.745-62. Barro, R.J. (1989), “The Neo-Classical Approach to Fiscal Policy”, In R.J. Barro (ed), Modern Business Cycle Theory, Harvard University Press, Cambridge. Barro, R.J. (2001), Economic Growth in East Asia Before and After the Financial Crises, Working paper 8330, National Bureau of Economic Research. Berg, A., B.Eduardo, G.M. Milesi-Ferretti and C. Pattilo (1999), “Anticipating Balance of payments Crises: The Role of Early warning Systems,” IMF Occasional Papers, No. 186. Bhalla, S.S. (1981), “India’s Closed Economy and World Inflation”, in World Inflation and the Developing Countries, (eds.W.R.Cline and Associates). Washington D.C.: Brookings Institution. Bhattacharya, S and U.R. Patel (2003), “Reform Strategies in the Indian Financial Sector”, forthcoming in Proceedings Volume of IMF-NCAER Conference on India’s and China’s Experience with reform and Growth. Brahmananda, P.R. (1972), Monetary theory in an Indian Setting, Prajnan, Vol.1. Brahmananda, P.R. (1980). Growthless Inflation by means of Stockless Money. Bombay: Himalaya Publishing House.
55
Buiter, W.J and U. Patel (1992), “Debt, Deficits and Inflation: An Application to the Public finances of India”, Journal of Public Economics, Volume 47(2), pp.171-205. Burgess, R. and R. Pande (2004). Can Rural Banks Reduce Poverty? Evidence from the Indian Social Banking Experiment, Mimeo, London School of Economics. Chang, R. and A.Velasco (1998), The Asian Liquidity Crises, Working paper No.6796, National Bureau of Economic Research. Chang, R. and A.Velasco (1999), Liquidity Crises in Emerging Markets: Theory and Policy, Working paper No. 7272, National Bureau of Economic Research. Carracedo, M.F. and Dattels, P. (1997), Survey of Public debt Management Frameworks in Selected Countries, In Sundararajan, V., P.Dattels and H.J. Blommestein (eds), Coordinating Public Debt and Monetary Management, International Monetary Fund. Corsetti, G., P. Pesenti and N.Roubini (1998), What caused the Asian Currency and Financial Crises? Part I: A Macroeconomic Review, Working Paper No.6833, National Bureau of Economic Research. Corsetti, G., P. Pesenti and N.Roubini (1998), What caused the Asian Currency and Financial Crises? Part II: The Policy Debate, Working Paper No.6834, National Bureau of Economic Research. Cottarelli, C. (1993), Limiting Central Bank Credit to the Government: Theory and Practice, Occasional Papers 110, IMF. Cukierman, A. (1992), Central Bank Strategy, Credibility, and Independence: Theory and Evidence, Cambridge: The MIT Press. Demetriades, P. and K.Luintel (1997), “The Direct Costs of Financial Repression: Evidence from India”, Review of Economics and Statistics, Vol. 79, pp.311-320. Demirguc-Kunt, A. and E. Detragiache (1997), The Determinants of Banking Crises: Evidence from Developed and developing Countries, IMF Working Paper, 97/106. Eichengreen, B. (1997), Managing Financial Crisis in Emerging Markets In Maintaining Financial Stability in a Global Economy, A Symposium Sponsored by the Federal Reserve Bank of Kansas City. Ferguson, J.M. (Ed) (1964), Public Debt and Future Generations, University of North Carolina Press, Chapel Hill.
56
Frankel, J.A. and A.K. Rose (1996), Currency Crashes in Emerging Markets: An Empirical Treatment, International Finance Discussion Papers No. 534, Board of Governors of the Federal Reserve System. Furman, M. and J. Stiglitz (1998), “Economic Crises: Evidence and Insights from East Asia”, Brookings Papers in Economic Activity, Volume 2:1998. Gourinchas, P-O. and O. Jeanne (2003), The Elusive Gains from International Financial Integration, Working Paper No. 9684, National Bureau of Economic Research. Government of India (1972), Economic Survey, 1971-72. Government of India: (1991 to 2003), Economic Survey, 1991 to 2003. Grilli, V., Masciandaro, D. and Tabellini, G. (1991), ‘Political and Monetary Institutions and Public Financial Policies in the Industrial Countries.’ Economic Policy, Vol.6, pp.342-92. Howes, S. and R. Murgai (2004). Subsidies and Salaries: Issues in the Restructuring of Government Expenditure in India, IMF-NIPFP Conference on Fiscal policy in India. Jalan, B. (1999), “International Financial Architecture: Developing Countries Perspective", Reserve Bank of India monthly Bulletin, October. Jena, P.R. (2004), Integration of Financial Markets in India: An Empirical Analysis, Indian Journal of Economics and Business, Volume 3, No.1, pp.63-77. Joshi, V and I.M.D. Little (1999), India’s Economic Reforms, Oxford University Press, New Delhi. Levine, R. (2004), Finance and Growth: Theory and Evidence, In P. Aghion, and S. Durlauf (eds), Handbook of Economic Growth, Amsterdam: North-Holland. Kaminsky, G.L. and C.M. Reinhart (1996), The Twin Crises: The causes of Banking and Balance of Payments Problems, International Finance Discussion Papers No. 544, Board of Governors of the Federal Reserve System. Khemani, S. (2000). Political Cycles in a Developing Economy: Effect of Elections in the Indian States, Working Paper 2454, Policy Research Group, World Bank. Kindleberger, C.P. (1984), A Financial History of Western Europe, George Allen and Unwin, London. Kopits, G. and Symansky, S. (1998), Fiscal Policy Rules, Occasional papers 162, IMF.
57
McDermott, C.J. and R.F. Wescott (1996), Fiscal Reforms that Work, Working Paper 59, International Monetary Fund. McKinnon, R.I. (1973), Money and Capital in Economic Development, Washington D.C.: The Brookings Institution. McKinnon, R.I. and H.Pill (1998), International Borrowing: A Decomposition of Credit and Currency Risks, World Development, Vol 26, pp.1267-82. Minhas, B.S. (1987), “The Planning Process and the Annual Budgets: Some reflections on Recent Indian Experience”, Indian Economic Review, Vol.22, pp.115-149. Mohan, R. (2004), Financial Sector Reforms in India: Policies and Performance Analysis, RBI Bulletin, pp. 851-77. Morduch, J. (1999), The Microfinance Promise, Journal of Economic Literature, Vol.37, pp. 1569-1614. Patel, U.R. (2004), Role of State-Owned Financial Institutions in India: Should the Government “DO” or “Lead”? Conference on Role of State Owned Financial Institutions, World Bank, IMF and Brookings Institution. Prasad, E., K.Rogoff, S-J. Wei, and M.A.Kose. (2003), Effects of Financial Globalisation on Developing Countries: Some Empirical Evidence, IMF Occasional Paper No 220. Rajaraman, I. (2004). Fiscal developments and Outlook in India, Working Paper 15, National institute of Public Finance and Policy, New Delhi. Rajan, R.G. and Zingales, L. (1998), Financial Dependence and Growth, American Economic Review, Vol. 88, pp.559-586. Rangarajan, C (1998), Capital Flows and Developing Countries: The Indian Experience In Indian Economy: Essays on Money and Finance, UBSPD, New Delhi. Rangarajan, C. (1998). ‘The Changing context of Monetary Policy.’ In Indian Economy: Essays on Money and Finance, UBSPD, New Delhi. Rao, V.K.R.V. (1953), Deficit Financing, Capital Formation and Price Behavior in an Under-developed Economy, Eastern Economist Pamphlets, No.20. Rao, M.J. (2000), “Fiscal deficits, Interest Rates and Inflation: Assessment of Monetization Strategy”, Economic and Political Weekly, July 22, pp.2637-2645.
58
Rao, G. (2004), State Level Fiscal Reforms in India, In Basu, K. (ed), India’s Emerging Economy, Cambridge: MIT Press. Reddy, Y. V. (1999), "Financial Sector Reform: Review and Prospects", Reserve Bank of India Monthly Bulletin, January. Reddy, Y. V. (2004), Monetary and Financial Sector Reforms in India, In Basu, K. (ed), India’s Emerging Economy, Cambridge: MIT Press. Reserve Bank of India, (1961), Report of the Working Group on Money Supply 1961. Reserve Bank of India, (1977), Money Supply in India: Concepts, Compilation and Analysis – Report of the Second Working Group 1977. Reserve Bank of India, (1985), Report of the Committee to Review the Working of the Monetary System 1985. Reserve Bank of India, (1987), Report of the Working Group on Money Market 1987. Reserve Bank of India, (1991), Report of the Committee on Financial System 1991. Reserve Bank of India, (1997), Report of the Committee on Capital Account Convertibility 1997. Reserve Bank of India, (1998), Report of the Committee on Banking Sector Reforms 1998. Reserve Bank of India, (1998), The Working Group on Money Supply: Analytics and Methodology of Compilation 1998. Reserve Bank of India, (2001), Report of the Expert Committee to Review the System of Administered Interest Rates and Other Related Issues 2001. Reserve Bank of India, (1971 to 2003), Annual Report. Reserve Bank of India, (1951 to 2003), Report on Currency and Finance. Rodrik, D. (1998), Who needs Capital account Convertibility? Mimeo, Harvard University. Rodrik, D. (2002), After Neo-Liberalism, What? Mimeo, Harvard University. Rodrik, D. and A. Subramanian (2004), From Hindu Growth to Productivity Surge: The Mystery of the Indian Growth Transition. Mimeo, Harvard University.
59
Roubini, N. and R. Hemming (2004). A Balance Sheet Crises in India? IMF-NIPFP Conference on Fiscal policy in India. Roubini, N and X. Sala-i-Martin (1991), Financial Repression and Economic Growth, Working paper No. 3876, NBER. Roubini, N and X. Sala-i-Martin (1992), A Growth Model of Inflation, Tax Evasion, and Financial Repression, Working paper No. 4062, NBER. Sachs, J. and A. Warner (1995), “Economic Reforms and the Process of Global Integration”, Brookings Papers on Economic Activity. Sachs, J., Tornell, A. and Velasco, A. (1996). Financial Crises in Emerging Markets: The Lessons from 1995, Working Paper No. 5576, National Bureau of Economic Research. Sen, A. (2004), Democracy and Secularism in India, In Basu, K. (ed), India’s Emerging Economy, Cambridge: MIT Press. Shaw, E.S. (1973), Financial Deepening in Economic Development, New York: Oxford University Press. Singh, C. (1999a), “Domestic Debt and Economic Growth in India”, Economic and Political Weekly, Vol. XXXIV, pp.1445-1453. Singh, C. (1999b), “Monetized Debt, Monetary Aggregates and Price Level in India”, Prajnan, Vol.XXVII, No.4, 1998-99. Singh, C. (2005), “Public Debt in India – Need to Separate Debt from Monetary Management”, Working Paper, SCID. Singh, N. and Srinivasan, T.N. (2004). Fiscal Policy in India: Lessons and Priorities, Working Paper No. 207, Stanford University. Srinivasan, T.R. (2003), Indian Economic Reforms: A Stocktaking (http://www.econ.yale.edu/~srinivas/Indian%20Economic%20Reforms%20A%20Stocktaking.pdf) Stiglitz, J.E. (2002), Globalization and its Discontents, W.W. Norton and Company, New York. Volcker, P. (1991), “Financial Crises and the Macroeconomy,” In M. Feldstein (ed.), Risk of Economic Crises. Chicago: University of Chicago Press. Wolf, M. (2004), Why Globalisation Works, London: Yale University Press,
60
Appendix Table - 1: Performance of Scheduled Commercial Banks in India (per cent to Total)
Offices Deposits Credit 1969 1981 1991 2003 1969 1981 1991 2003 1969 1981 1991 2003 1 2 3 4 5 6 7 8 9 10 11 12 13 Rural 22.2 48.0 56.9 47.4 6.4 13.0 15.5 13.8 3.3 11.4 15.0 10.2 Semi-Urban 40.4 24.5 18.7 22.1 21.8 23.2 20.7 18.9 13.1 17.4 16.3 11.3 Urban 19.2 15.7 14.3 16.8 26.5 24.7 24.5 22.8 21.8 22.8 22.4 16.4 Metropolitan 18.2 11.8 10.0 13.7 45.3 39.1 39.4 44.5 61.8 48.4 46.3 62.1 Sources: a)Statistical Tables relating to Banks in India, Various Issues. b) Report on Trend and Progress of banking in India, Various Issues.
Appendix Table – 2: Different Banking Institutions in the Rural Sector (Outstanding as percent to GDP)
Year Total Postal Savings State Co-operatives Commercial Banks (End) Deposits Of which Certificates PPF Total Saving Time Total Deposits Credits Savings Deposits+ Rural Sector 1 2 3 4 5 6 7 8 9 10 11 1970-71 2.59 2.17 0.20 0.01 2.80 0.11 0.19 0.30 1.18 0.56 1977-78 4.07 1.65 0.63 0.06 4.75 0.15 0.27 0.42 2.27 1.20 1980-81 4.61 1.62 0.98 0.14 5.73 0.14 0.30 0.43 3.66 2.13 1990-91 2.99 0.74 5.85 0.46 9.30 0.14 0.24 0.38 5.45 3.27 2000-01 3.86 0.42 6.61 0.31 10.77 0.10 0.37 0.46 6.67 2.42 2002-03 5.67 0.47 6.61 0.41 12.69 0.09 0.40 0.50 7.14 3.03 + Excluding inter-bank deposits. Sources: a) Handbook of Statistics on Indian Economy, b) RBI Monthly Bulletin, Various Issues. c) Report on Trend and Progress of banking in India, Various Issues. d) Statistical Tables relating to Banks in India, Various Issues.
61
Appendix Table – 3: Composition and Growth Rates of GDP Year GDP Agriculture Industry Services & Allied of which of which Activities Manufacturing THTC FIRB CSP
1 2 3 4 5 6 7 8 Composition of GDP in per cent to Total 1970-71 100.0 45.9 15.9 13.7 38.3 12.7 10.3 10.5 1976-77 100.0 39.2 18.7 15.8 42.1 15.3 10.2 11.7 1979-80 100.0 37.0 20.8 17.4 42.2 16.3 9.8 11.7 1983-84 100.0 36.6 21.1 16.3 42.3 16.8 9.3 11.5 1988-89 100.0 32.7 21.2 16.3 46.0 18.1 10.1 12.4 1990-91 100.0 31.3 22.0 17.1 46.7 18.4 10.4 12.3 1991-92 100.0 31.5 20.9 16.1 47.6 18.4 11.3 12.5 1995-96 100.0 28.2 23.0 18.1 48.8 20.2 11.7 11.8 2002-03 100.0 22.7 20.5 15.6 56.9 22.0 13.8 14.9 2003-04 100.0 22.2 20.4 15.8 57.3 22.6 13.9 14.8 Annual Average Growth Rates (%) 1971-77 2.7 1.0 4.6 4.2 4.1 4.8 4.3 3.6 1977-80 2.4 -0.1 4.8 5.1 4.1 4.7 4.3 4.8 1980-84 6.1 6.8 6.7 6.2 5.3 5.3 7.6 4.7 1984-89 5.5 3.1 7.1 6.7 6.8 6.0 10.0 6.8 1989-91 6.1 2.8 9.0 8.9 7.3 6.1 10.1 6.2 1991-92 1.3 -1.5 -1.2 -3.6 4.5 2.5 12.0 2.6 1992-96 6.4 3.5 8.7 9.9 7.2 9.1 8.2 4.8 1996-04 5.9 3.0 5.2 5.3 7.8 8.2 7.5 7.9 THTC - Trade, Hotels, Transport and Communication Services; FIRB - Finance, Insurance, Real Estate and Business Services; CSP - Community, Social and Personal Services.
Appendix Table – 4: Gross Domestic Savings and Capital Formation Year
Gross Domestic Savings
Gross Domestic Capital Formation
Total Household Private Public Total Household Private Public (% of GDP) (Per cent to Total) (% of GDP) (Per cent to Total) 1 2 3 4 5 6 7 8 9
1970-71 14.6 69.7 10.1 20.2 15.4 45.2 14.5 40.4 1976-77 19.4 68.1 6.8 25.1 17.9 40.8 7.7 51.5 1979-80 20.1 68.6 9.9 21.5 20.6 41.1 11.9 47.0 1983-84 17.6 73.0 8.4 18.6 18.7 34.4 16.3 49.2 1988-89 20.9 80.4 9.7 10.0 23.8 43.5 16.3 40.2 1990-91 23.1 83.7 11.5 4.8 26.3 44.0 17.2 38.8 1991-92 22.0 76.9 14.1 8.9 22.6 33.9 25.8 40.2 1995-96 25.1 72.3 19.6 8.1 26.9 35.0 36.1 28.9 2002-03 24.2 93.6 14.1 -7.7 23.3 54.1 21.0 24.9
62
Appendix Table – 5: Select Fiscal Indicators of Central Government - Annual Averages (per cent of GDP)
Year Gross Direct Indirect Non-Tax Revenue Interest Subsidies Capital Capital Fiscal Tax Tax Revenue Expenditure Payments Expenditure Receipts Deficit 1 2 3 4 5 6 7 8 9 10 1970-77 3.4 2.3 6.1 1.9 7.9 1.4 0.5 5.8 4.7 1977-80 4.7 2.4 7.0 2.2 9.5 1.8 1.4 6.5 5.0 1980-84 5.6 2.0 7.3 2.1 9.8 2.0 1.3 6.0 5.9 1984-89 7.7 2.0 8.3 2.5 12.5 2.9 1.7 6.5 7.0 1989-91 7.6 2.0 8.4 2.5 13.1 3.7 2.1 5.7 6.5 1991-92 5.6 2.3 8.0 2.4 12.6 4.1 1.9 4.5 5.9 1992-96 5.8 2.6 6.7 2.5 12.2 4.2 1.3 3.7 5.7 1996-04 5.6 3.1 5.7 2.7 12.8 4.6 1.4 3.1 6.6
Appendix Table – 6: Balance of Payments Statistics - Annual Averages (per cent of GDP)
Year Exports Imports Invisibles Current Foreign
Total of which Total of which Account Investment POL Manufactured POL Deficit 1 2 3 4 5 6 7 8 9 1970-77 4.1 0.0 2.3 5.0 0.9 0.7 -0.2 0.1 1977-80 5.2 0.0 3.2 7.0 1.9 2.0 0.1 0.0 1980-84 4.7 0.4 2.6 8.4 3.0 2.1 -1.6 0.0 1984-89 4.6 0.3 2.8 7.6 1.4 1.1 -1.9 0.1 1989-91 5.8 0.2 4.1 8.6 1.6 0.1 -2.7 0.1 1991-92 6.9 0.2 5.0 7.9 2.0 0.7 -0.3 0.1 1992-96 8.3 0.1 6.1 10.7 2.1 1.3 -1.2 1.2 1996-04 9.3 0.3 7.0 12.5 2.8 2.9 -0.4 1.4