Embed Size (px)
Citation preview
FACTORS INFLUENCING SUPERVISED AGRICULTURAL EXPERIENCE
EARNINGS OF OHIO FFA STATE DEGREE RECIPIENTS AS REPORTED ON
THE OHIO FFA STATE DEGREE APPLICATION
DISSERTATION
Presented in Partial Fulfillment of the Requirements for
the Degree Doctor of Philosophy in the Graduate
School of The Ohio State University
By
Steven Jon Gratz, B.S., M.S.
* * * * *
The Ohio State University
2004
Dissertation Committee: Approved byDr. James J. Connors, AdviserDr. Robert J. Birkenholz _________________________Dr. Wesley E. Budke Adviser
Department of Agricultural Education
ii
ABSTRACT
There are numerous benefits for agricultural education
students to conduct a supervised agricultural experience
program. One benefit for agricultural education students
who complete a supervised agricultural experience is a
return on their time and/or money invested. The purpose of
this study was to identify factors that influenced the
economic return on a student’s time and/or money invested
in his or her supervised agricultural experience using data
collected from the recipients of the State FFA Degree in
Ohio during the 2002-2003 academic year.
Initial factors considered were classified into three
categories: personal characteristics, school-based
characteristics, and community characteristics. Personal
characteristics included type of SAE, FFA district in which
the student resided, and the gender of the applicant.
School-based characteristics included number of teachers of
agriculture, high school attendance rate, and high school
grade point average. Community characteristics included
county population for teens (ages 15-19), teen poverty
level (ages 15-19), and county per capita income.
iii
Results of the study indicated that there was a
difference in the amount of economic return among males and
females, type of supervised agricultural experience, and
FFA members in different FFA districts throughout the state
of Ohio. Interestingly, these factors were all classified
as personal characteristics, indicating that the factors
affecting the amount of earnings from an FFA member’s SAE
were attributed to their personal characteristics.

iv
DEDICATION
Dedicated to my parents.
J. Richard Gratz
and
Betty L. Gratz (1930-2002)
v
ACKNOWLEDGEMENTS
I wish to thank my adviser, Dr. James Connors, for
assuming the role as my academic advisor at the last minute
and for his patience and encouragement. He has my unending
appreciation for the time and energy he spent in helping me
with this project.
I also wish to thank my confidant, Dr. Jamie Cano, for
his thought-provoking questions and philosophical
discussions, for his encouragement throughout this
experience, and for serving as my adviser during the
initial portion of my graduate studies at Ohio State.
Furthermore, Jamie constantly reminded me of the words of
Goethe, “In reality this kind of work is never finished.
One has to declare it finished when, in accord with time
and circumstance, one has done the utmost.”
I extend a grateful acknowledgment to Drs. Robert
Birkenholz and Wesley Budke for serving on my dissertation
committee. Their penchant for quality work served as a
constant reminder that the persistence of academic
excellence should never be rushed nor forsaken.

vi
My philosophical development in agricultural education
would not have been possible if it were not for the myriad
of agricultural educators from which I had the opportunity
to learn as one of their students. I wish to extend my
gratitude to Kirby Barrick, Jamie Cano, Joe Gliem, Jan
Henderson, Lowell Hedges, Jim Knight, Larry Miller, David
McCracken, L.H. Newcomb, and Robert Warmbrod. Additionally,
in addition to the aforementioned teacher educators,
numerous graduate students influenced me during my decades
of attending The Ohio State University. My appreciation is
extended to former graduate students at Ohio State: Jacquie
Deeds, Barbara (Malpiedi) Kirby, Stacy Gartin, Ed Osborne,
Kerry Odell, Jerry Peters and George Wardlow.
Finally, I wish to extend my thankfulness to Kellie
Warner, Matt Smith, Marlene von Stein, John Torres, Julie
Tyson, Bernadette Siekman, and Brenda Correll for assuming
increased responsibility to make sure the Ohio FFA
Association continued to thrive during my educational
passage. Without your dedication and attention to detail, I
would not have been able to complete this task.
vii
Finally, I am ever grateful to my wife Andrea for her
love and support throughout this endeavor. It is my hope
that I can repay her sacrifices a hundred-fold in the
future, with the exception of increasing my domestic
workload.
viii
VITAE
1983 ............................Bachelor of Science inAgricultural Education, TheOhio State University,Columbus, Ohio
1983-1988 .......................Teacher of agriculture, BigWalnut Local Schools,Sunbury, Ohio
1988-1993 .......................Consultant, AgriculturalEducation Service, OhioDepartment of Education,Columbus, Ohio
1989 ............................Masters of Science inAgricultural Education, TheOhio State University,Columbus, Ohio
1993-1995 .......................Teacher of agriculture,Ridgedale Local Schools,Morral, Ohio
1995-Present ....................Consultant, AgriculturalEducation Service, OhioDepartment of Education,Columbus, Ohio
ix
FIELDS OF STUDY
Major:Agricultural Education
Specializations:Teacher EducationInstructional TechnologyResearch and Statistics
x
TABLE OF CONTENTS
Abstract ............................................... iiDedication ............................................. ivAcknowledgements ........................................ vVitae ................................................ viiiList of Tables ........................................ xiv
List of Figures ....................................... xviChapter 1 ................................................. 1Introduction ............................................ 1Significance of the Study ............................... 4Problem Statement ....................................... 9
Purpose of the Study ................................... 12Research Questions ..................................... 13Definitions of Terms ................................... 14Limitations of the Study ............................... 17Basic Assumptions ...................................... 17
Chapter 2 ................................................ 19Review Of Related Literature ........................... 19Purpose of the Study ................................... 19Research Questions ..................................... 19Introduction ........................................... 20
Supervised Agricultural Experience ..................... 23Inclusion of SAE in the Smith-Hughes Act of 1917 ....... 25Additional Factors of Influence on Education ........... 28Progression of Vocational Education and SAE ............ 30State FFA Degree ....................................... 45
SAE Type ............................................... 49Number of Teachers of Agriculture ...................... 50
xi
Attendance and Grade Point Average ..................... 52Gender ................................................. 55County Population ...................................... 56
Teen Poverty Level ..................................... 56Per Capita Income ...................................... 57Conclusions ............................................ 59
Chapter 3 ................................................ 62Methodology ............................................ 62
Purpose of the Study ................................... 62Research Questions ..................................... 62Research Design ........................................ 64Population ............................................. 64Number of Degree Recipients ............................ 66
Instrumentation ........................................ 66Dependent Variable Measure ............................. 68Data Collection ........................................ 69Data Analysis .......................................... 71
Chapter 4 ................................................ 74
Results ................................................ 74Purpose of the Study ................................... 74Characteristics of the Population ...................... 74FFA Membership ......................................... 75State FFA Degree Recipients by District ................ 76
Age of Applicant ....................................... 77Gender of Applicant .................................... 78Gender of Applicant by District ........................ 79Years in Agricultural Education of Applicant ........... 80Years in Agricultural Education of Applicant by District 81
SAE Type of Applicant .................................. 82SAE Type of Applicants by District ..................... 83Gross SAE Earnings of Applicants ....................... 84Attendance Rate of Applicant ........................... 85Grade Point Average of Applicant ....................... 86
xii
Gross SAE Earnings by SAE Type ......................... 87Gross SAE Earnings by Gender ........................... 91Gross SAE Earnings of Applicant by Number of Teachers ofAgriculture ............................................ 91Attendance Percentage .................................. 92Relationship Between Gross SAE Earnings and High SchoolAttendance Rate ........................................ 92Relationship Between Gross SAE Earnings and Grade PointAverage ................................................ 92Relationship Between Gross SAE Earnings and CountyPopulation (15-19) ..................................... 93Relationship Between Gross SAE Earnings and County PovertyLevel (15-19) .......................................... 93
Relationship Between Gross SAE Earnings and County PerCapita Income .......................................... 94
Chapter 5 ................................................ 95Conclusions, Implications, and Recommendations ......... 95Introduction ........................................... 95
Research Questions ..................................... 95Research Design ........................................ 97Population ............................................. 97Data Collection ........................................ 98Data Analysis .......................................... 99
Summary of Findings and Discussion ..................... 99Research Question 1 ................................... 100
Demographics of the Population ...................... 100Age and Years of Enrollment in Agricultural Education100Attendance Rate and Grade Point Average ............. 100
Type of Supervised Agricultural Experience .......... 101Research Question 2 ................................... 102Research Question 3 ................................... 105Research Question 4 ................................... 106Research Question 5 ................................... 108
Research Question 6 ................................... 111Research Question 7 ................................... 113
xiii
Research Question 8 ................................... 114Research Question 9 ................................... 115Research Question 10 .................................. 116
Conclusions ........................................... 117SAE Type ............................................ 117FFA District ........................................ 117Gender .............................................. 118
Recommendation for Practice ........................... 120
Recommendations for Further Research .................. 121List of References .................................... 124APPENDIX A - Ohio FFA State Degree Minimum Standards .. 135APPENDIX B - State FFA Degree ......................... 137APPENDIX C - Ohio FFA District Map .................... 156
APPENDIX D - Ohio FFA SAE Guidelines .................. 158APPENDIX E - County Economic Data ..................... 162APPENDIX F - Ohio Appalachian Counties ................ 165
xiv
LIST OF TABLES
Page
Table 1.1: SAE Components ................................. 7
Table 3.1: Number and Percent of State FFA DegreeRecipients by District (N = 524)...................... 66
Table 3.2: Conventions Used to Describe Measures ofAssociation. (Davis, 1971)............................ 72
Table 3.3: Level of Measurement for Independent andDependent Variables................................... 73
Table 4.1 Gender of 2003 Ohio FFA Degree Recipientsby FFA District....................................... 79
Table 4.2: Years Enrolled in an Agricultural EducationProgram by FFA District............................... 81
Table 4.3 State FFA Degree Recipients in 2003 by SAEType within FFA District.............................. 83
Table 4.4: Mean, Median, and Standard Deviation ofSupervised Experience Program Gross Earnings ofState FFA Degree Recipients in 2003 by FFA District... 84
Table 4.5: Attendance Rate of State FFA Degree Recipientsin 2003 by District................................... 85
Table 4.6: Mean Grade Point Averages of State FFADegree Recipients in 2003 Applicant by District....... 86
Table 4.7: Median, Mean, and Standard Deviation ofGross SAE Earnings of State FFA Degree Recipientsin 2003 by SAE Type................................... 87
Table 4.8 Gross SAE Earnings of Placement SAEs byDistrict.............................................. 88
Table 4.9 Gross SAE Earnings of EntrepreneurshipSAEs by District...................................... 89
xv
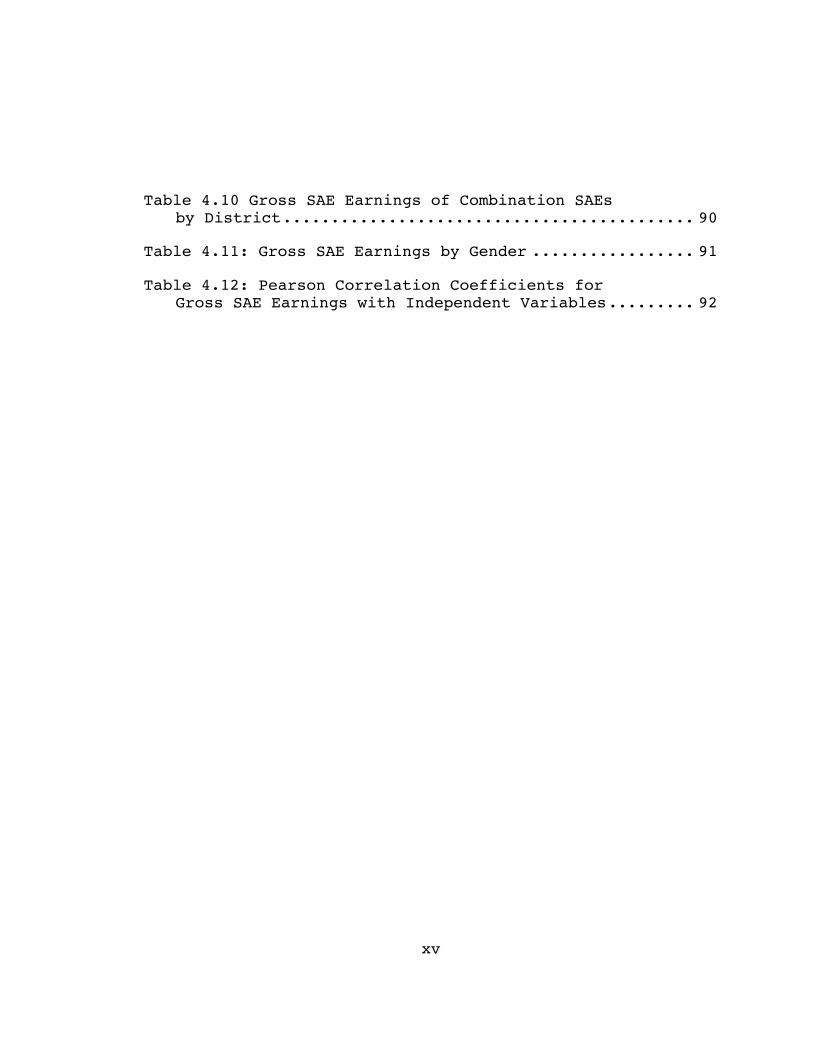
Table 4.10 Gross SAE Earnings of Combination SAEsby District........................................... 90
Table 4.11: Gross SAE Earnings by Gender ................. 91
Table 4.12: Pearson Correlation Coefficients forGross SAE Earnings with Independent Variables......... 92
xvi
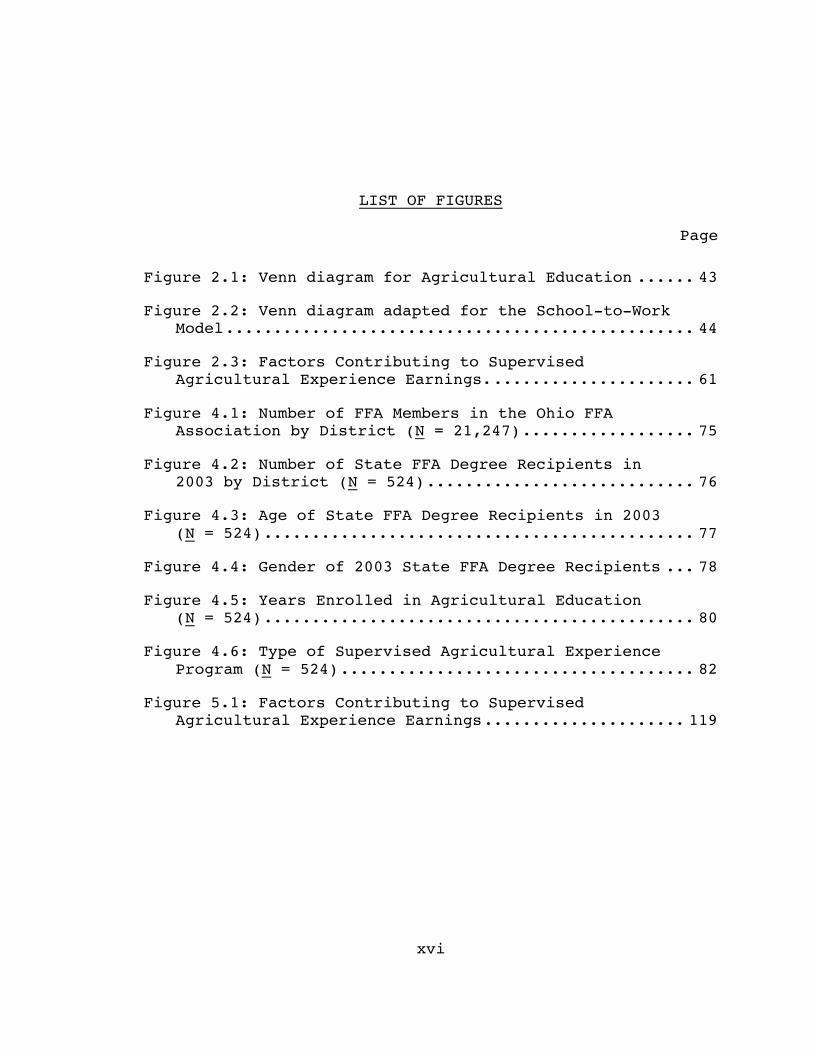
LIST OF FIGURES
Page
Figure 2.1: Venn diagram for Agricultural Education ...... 43
Figure 2.2: Venn diagram adapted for the School-to-WorkModel................................................. 44
Figure 2.3: Factors Contributing to SupervisedAgricultural Experience Earnings...................... 61
Figure 4.1: Number of FFA Members in the Ohio FFAAssociation by District (N = 21,247).................. 75
Figure 4.2: Number of State FFA Degree Recipients in2003 by District (N = 524)............................ 76
Figure 4.3: Age of State FFA Degree Recipients in 2003(N = 524)............................................. 77
Figure 4.4: Gender of 2003 State FFA Degree Recipients ... 78
Figure 4.5: Years Enrolled in Agricultural Education(N = 524)............................................. 80
Figure 4.6: Type of Supervised Agricultural ExperienceProgram (N = 524)..................................... 82
Figure 5.1: Factors Contributing to SupervisedAgricultural Experience Earnings..................... 119
1
CHAPTER 1
INTRODUCTION
During the early part of the century,vocational education was intended tostabilize the American industrialsociety by creating “a school systemthat socialized youth for their neweconomic roles and sorting them intotheir appropriate niches in theexpanding capitalist division of labor”(Kantor, 1986, p. 402).
Agricultural education's foundation revolves around
the supervised agricultural experience (SAE) concept
(Portillo & White, 2001). SAE, according to Barrick et al.
(1992), is “the actual planned application of concepts and
principles learned in agricultural education” (p. 2). Camp
(1999a) defined SAE as the planned, supervised application
of agricultural principles and concepts. Barrick et al.
(1992) indicated that students were to be supervised by
their teacher(s) of agriculture in collaboration with
others who assisted them in the development and achievement
of their educational goals. “The purpose of an SAE is to
2
help students develop skills and abilities leading toward a
career” (Barrick et al., 1992, p. 2).
An SAE program is “the specific learning experiences
that are planned and conducted by an individual student
that contributes to the development of agricultural and
personal skills. A supervised agricultural experience
program is a purposeful set of supervised agricultural
experiences” (Barrick et al., 1992, p. 83).
The implementation of the SAE as a result of the
Smith-Hughes Act (Phipps & Osborne, 1988) necessitated that
students:
1) have ownership,2) utilize management skills,3) keep records,4) take responsibility,5) assume risk, and6) garner profit or loss (Camp 1999b).
Furthermore, Camp (1999b) noted that the reasons for
these early farming programs were:
1) doing to learn,2) earning money,3) allowing exploration of different farm enterprises,4) becoming established in farming,5) improving the family farm business, and6) improving quality of farm life.
Miller (1967), concluded that SAEs provided students
with:
1) occupational experience,2) skill development,3) improved performance, and
3
4) financial earnings.
Although not the exclusive tenet for the development
of the SAE, research supports the development of a
capitalistic society through the ratification of early
federal vocational education acts. Furthermore, “education
has long been touted as a mechanism of economic growth”
(Grubb & Stern 1989, p. 1). A Nation at Risk (1983)
encouraged educational reform predominantly as a means of
improving worldwide competitiveness. According to Grubb and
Stern (1989), the purpose of education was to generate
employment for individuals who were formerly unemployable,
to augment the earnings of educated individuals, to
increase the productivity and earnings of other workers,
and to enhance profits.
During the early part of the century, vocational
education was intended to stabilize the American industrial
society by creating “a school system that socialized youth
for their new economic roles and sorting them into their
appropriate niches in the expanding capitalist division of
labor” (Kantor, 1986, p. 402). Grubb and Stern (1989) wrote
that in 1985, the National Commission on Secondary
Vocational Education reaffirmed the economic value of
vocational education, particularly in a country where
4
eighty percent of the jobs do not necessitate a college
degree. Education is a component of economic growth and
international competitiveness; therefore, the preparation
of the workforce is crucial (Jacobs & Grubb, 2002).
Significance of the Study
Historically, when the economic climate of the United
States strays from its norm, factions of the political
establishment quickly turn toward education as a potential
solution to the obstruction. President Roosevelt did so in
1907, calling for educational reform. Most recently in the
State of Ohio, Governor Bob Taft implemented his solution
to the downturn in the Ohio economy – the Third Frontier.
The Third Frontier, intended to rekindle the economic
growth of the state, provided an investment in education
that resulted in an educational system that directly
aligned with the needs of business and the economy.
Ohio will have a world-class workforceprepared by an integrated system ofeducation and training and aligned withbusiness needs. The quality of Ohio’sworkforce can distinguish Ohio from itscompetitors. Ohio’s primary andsecondary education system comparesfavorably to other states. Ohio’shigher education system is well-regarded. And Ohio’s workforce isnationally recognized for high levelsof productivity and capability. Butmore must be done. Every child muststart school ready to learn. Every
5
child needs to know how to read by theend of third grade. More students mustachieve proficiency levels at everygrade level in all subjects. Morestudents must graduate from highschool, and more must go on to post-secondary education. The highereducation system needs to ensure thatthe knowledge it creates is alignedwith business and economic needs. Thesystem must be integrated and alignedwith our economic development strategy(Taft, 2002, p.12).
Even though nearly a century apart, the same basic
principle advocated by President Roosevelt, of investing in
education to produce a long-term economic turnabout, still
serves as a viable solution. “There are many reasons to
wish for better educational opportunities for American
school children. However, economic considerations—the
productivity growth slowdown and America’s struggle to
remain competitive in the global economy—have provided the
main impetus for reform” (Andelin, Carson, Feuer, Capper, &
Branyan, 1989, p. 10).
Following President Roosevelt’s education initiative
was the Smith-Hughes Act of 1917. A specific aspect of the
Smith-Hughes Act of 1917 was the SAE or home project as it
was commonly referred. There is a myriad of research
extolling the educational benefits provided to students
conducting an SAE. Barrick, Hughes, and Baker (1991)
6
reported that the compilation of past research findings on
aspects of SAE was needed to provide the profession a basis
on which to make decisions and base future research
efforts. Moreover, much research has been conducted on the
benefits of SAE (Dyer & Williams, 1997a).
Students with a high level of SAE participation were
reported to have a higher degree of affective competency
development (work attitudes, values, and habits) than
students with non-SAE participation (Dugan & Sutphin,
1984). This indicated that as the students’ level of
participation in their SAE increased, their work attitude
and habits improved when compared to students not
conducting an SAE.
Mick, Stewart, and Claycomb (1984) described how
students who earned more money from their SAEs were more
likely to be engaged in an agricultural occupation after
graduating from high school. Therefore, students who earned
more money because of their participation in their SAE were
more likely to choose agriculture as a career profession.
Furthermore, “vocational education in particular has always
been promoted for its economic benefits” (Grubb & Stern
1989, p. 1). It is apparent that students who participated
in vocational education contributed to the economy. The
7
economic benefit could have occurred not only during their
vocational education training, but also upon graduation.
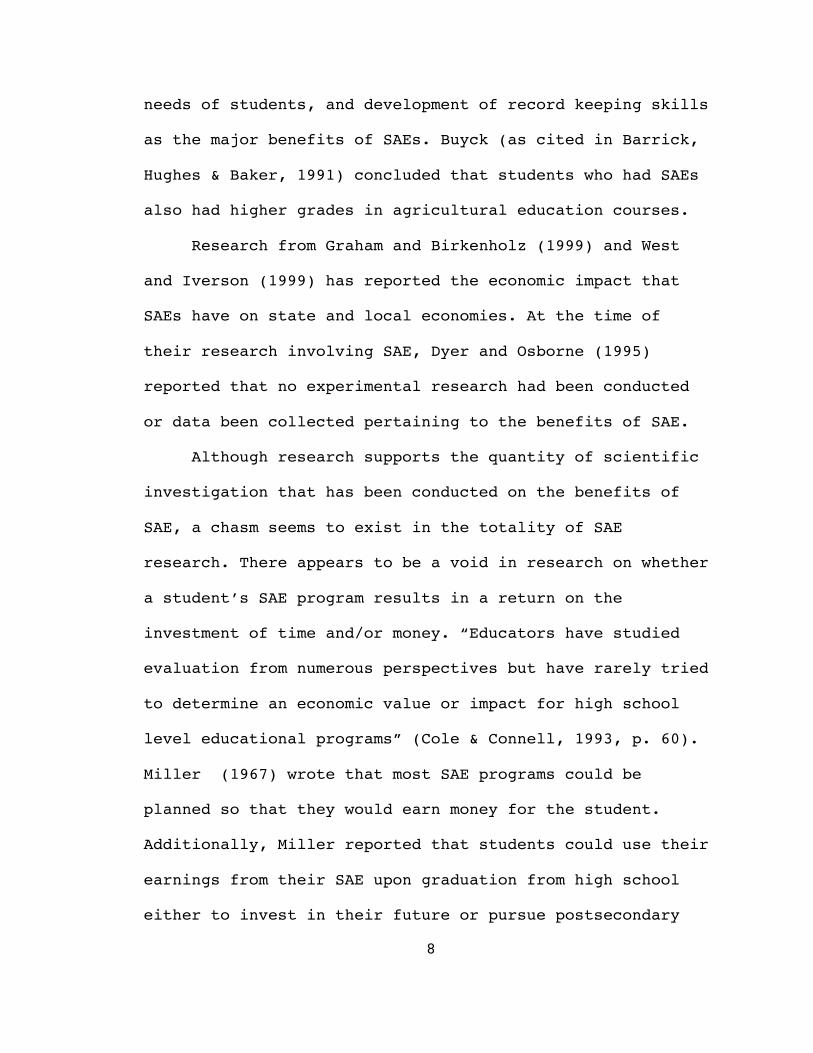
Much of the research available can specifically
address nearly every one of the SAE components established
by the SAE Taskforce (Barrick et al., 1992), which was
commissioned by the National Council for Agricultural
Education because of a report from the National Research
Council Committee (1988) on Agricultural Education in
Secondary Schools. The following components defining an SAE
were extrapolated from the results of that study (Table
1.1).
SAE Components1. Conducted outside of the classroom2. Develops agricultural knowledge and skills3. Supervised by an adult4. Designed to meet the needs of the student5. Explores and/or develops career interests6. Requires records to be kept7. Requires an investment of time and or money8. Results in a return on the investment of time and/or
money
Table 1.1: SAE Components (Barrick et al., 1992 p. 5-6, 51)
Stewart and Birkenholz (1991) found that Missouri
teachers of agriculture rated the development of desirable
work habits, development of responsibility, adaptation to
8
needs of students, and development of record keeping skills
as the major benefits of SAEs. Buyck (as cited in Barrick,
Hughes & Baker, 1991) concluded that students who had SAEs
also had higher grades in agricultural education courses.
Research from Graham and Birkenholz (1999) and West
and Iverson (1999) has reported the economic impact that
SAEs have on state and local economies. At the time of
their research involving SAE, Dyer and Osborne (1995)
reported that no experimental research had been conducted
or data been collected pertaining to the benefits of SAE.
Although research supports the quantity of scientific
investigation that has been conducted on the benefits of
SAE, a chasm seems to exist in the totality of SAE
research. There appears to be a void in research on whether
a student’s SAE program results in a return on the
investment of time and/or money. “Educators have studied
evaluation from numerous perspectives but have rarely tried
to determine an economic value or impact for high school
level educational programs” (Cole & Connell, 1993, p. 60).
Miller (1967) wrote that most SAE programs could be
planned so that they would earn money for the student.
Additionally, Miller reported that students could use their
earnings from their SAE upon graduation from high school
either to invest in their future or pursue postsecondary
9
education. According to Cole and Connell (1993),
agricultural education programs had a substantial economic
impact on the community in which they were located. SAEs
have an economic impact in the local community as a result
of the money earned and spent by students conducting
projects (Cole & Connell, 1993).
The study could inform agricultural educators of some
of the variables that influence a return on the investment
in time and/or money from an SAE, which in turn could
assist in the overall impact that an SAE has upon a
student.
Problem Statement
The world’s capitalist countriesexperienced impressive growth of realGDP and real GDP per capita during thelast half of the twentieth century. Inthe United States, real GDP increasedby 450 percent between 1950 and 2000,while population increased by only 80percent. In 2000 the value of goods andservices available to the average U.S.resident was three times greater thanthat of 50 years earlier. Thisexpansion of real output—this economicgrowth—greatly increased materialabundance and lifted the standard ofliving of most Americans. (McConnell &Brue, 2001, p. 323)
According to McConnell and Brue (2001), there has been
tremendous economic growth in the latter part of the 20th
10
century. Our country is dependent upon economic growth and
much of that growth stems from our natural resources, most
significantly, agriculture. According to Fred Dailey
(personal communications, June 10, 2003), director of the
Ohio Department of Agriculture, in Ohio alone, agriculture
provides 74 billion dollars to the state’s economy.
Furthermore, Dailey professed that one of every six jobs in
Ohio relates to the production and processing of
agricultural products. The aforementioned economic impact
of agriculture provides a foundation that validates not
only the educational, but also the economic benefits of
SAEs. Mick, Stewart, and Claycomb (1984) support this
statement through their research, which indicated that
students who earned more money from their SAE were more
likely to enter agriculture as a career profession. The
need for a skilled workforce is not limited to Ohio; the
need for a skilled workforce for the 21st century is a
national, rather than merely a state, interest (Jacobs &
Grubb, 2002).
SAE’s educational underpinnings have historically
provided the basis for its integration into the
agricultural education curriculum, but there appears to be
a more rudimentary principle underlying this postulation.
In his 1907 address to Congress, President Theodore
11
Roosevelt urged major school reform that would provide
industrial education in urban centers and agricultural
education in rural areas (Tanner & Tanner, 1980).
Roosevelt’s crusade was predicated on enhancing domestic
competitiveness in expanding global markets (Hyslop-
Margison, 2001). President Roosevelt’s stance on school
reform contained within it an economic tenor that would
eventually be crafted into the Smith-Hughes Act of 1917.
According to Wirth (1972), vocational education was a major
subject of discussion among American educators during the
first part of the 20th century: schools toiled to meet the
workforce needs coherent with the shift from an agrarian to
an industrialized economic base. Andelin, Carson, Feuer,
Caper, and Branyan (1989) stated that it was erroneous to
blame America’s economic difficulties entirely on the
education system but that the educational system did need
to be redesigned to fit the realities of the post-
industrial world.
According to Andelin et al. (1989), “productive and
gainful employment ranks high among the objectives of
American secondary schools and is the traditional raison
d’etre for vocational education and training” (p. 18). The
study is based upon the premise that SAEs play a
supplementary role by serving as an educational tool that
12
brings to life real-world experiences for participants in
addition to leading to gainful employment. Notwithstanding
the theoretical framework surrounding the educational value
of SAEs, the study deviates from the history of SAE
research and delves into the economic underpinnings of SAE,
and investigates selected factors that influence the
economic impact of SAEs within agricultural education.
Furthermore, the effect and success of SAE involvement
cannot always be quantified (Retallick & Martin, 2003).
Based on this information, it appears that the
exploration of characteristics influencing SAE earnings may
provide supportive information regarding the benefits of
SAEs to students. Furthermore, the examination of SAE
earnings as an underlying principle of the importance of
SAEs may provide important information and affect how
researchers and practitioners approach this issue in the
future.
Purpose of the Study
The purpose of this study was to investigate the
factors related to supervised agricultural experience
earnings of Ohio FFA State Degree recipients as measured on
the Ohio FFA State Degree application. The following
research questions guided the researcher through the study.
13
Research Questions
The research questions of the study were:
1. What are the characteristics of the Ohio FFA State
Degree recipients in 2003, including but not limited
to age, gender, years of agricultural education, type
of SAE, average gross SAE earnings, average grade
point average, and average attendance rate?
2. Are there group differences in gross SAE earnings for
students with different types of SAE programs?
3. Are there group differences in gross SAE earnings for
students from different FFA districts?
4. Is there a relationship between the number of
agriculture teachers in a student’s school and his or
her gross SAE earnings?
5. Is there a relationship between students’ rate of high
school attendance and their gross SAE earnings?
6. Is there a relationship between students’ high school
grade point average and their gross SAE earnings?
7. Is there a difference in gross SAE earnings between
male and female students?
8. Is there a relationship between the population of
students’ home counties (ages 15-19) and their gross
SAE earnings?
14
9. Is there a relationship between the teen poverty level
(ages 15-19) of students’ home counties and their
gross SAE earnings?
10. Is there a relationship between per capita income of
students’ home counties and their gross SAE earnings?
Definitions of Terms
This study used two types of definitions: constitutive
and operational. A constitutive definition defines a
construct using other constructs (Kerlinger & Lee, 2000).
An operational definition assigns meaning to a construct or
variable by specifying the activities or operations
necessary to measure it and evaluate the measurement
(Kerlinger & Lee, 2000). The following terms are defined
for this study:
Agricultural Education – for the purpose of this
study, agricultural education was operationally defined as
the study of principles and methods used in producing and
manufacturing products from renewable resources. Barrick et
al. (1992), defined agricultural education as programs of
study that include the development of skills that lead
toward a job in the agricultural industry. Newcomb,
McCracken and Warmbrod (1993), indicated that the content
of an agricultural education program includes the technical
15
areas of agricultural production, agricultural supplies and
services, agricultural mechanics, agricultural products,
horticulture, natural resources, and forestry.
Agriculture – the science or art of the production of
plants and animals useful to humans and the preparation of
these products for human use and marketing (Gove, 1981).
For the purpose of this study, agriculture was
operationally defined as practices used in producing and
manufacturing products from renewable resources.
National FFA - for the purpose of this study, the
National FFA was operationally defined as a youth
leadership organization for students enrolled in secondary
agricultural education programs.
Poverty rate - for the purpose of this study, poverty
rate was operationally defined as the percentage of
individuals between 15-19 years of age living in poverty in
their respective county.
Supervised Agricultural Experience (SAE) - an SAE
program is the actual, hands-on application of concepts and
principles learned in the agricultural education classroom.
Students are supervised by teachers of agriculture in
cooperation with parents, employers and other adults who
assist them in the development and achievement of their
educational and career goals. It is a time honored and
16
tested form of work-based learning (National FFA, 2004b).
For the purpose of this study, supervised agricultural
experience was operationally defined as experiences that
reinforce skills taught in the agricultural education
program at the secondary level. It is an expectation that
each student enrolled in an agricultural education program
complete an SAE annually. For the purpose of this study,
SAEs were divided into three categories.
A placement SAE program is where “students work for
others on a farm or other agricultural business, in school
laboratories beyond regular class time, or in the community
for pay or only for experience” (Barrick et al., 1992, p.
83).
In the entrepreneurship SAE program, students have
ownership and keep financial records to determine returns
to investments. The student plans, implements, operates,
and assumes financial risk in an agricultural business that
includes production and distribution of goods and/or
services (Barrick et al., 1992). “A big part of the U.S.
economy is driven by entrepreneurs, people who follow their
dreams and build their ideas into more than just widgets”
(Omernik, 2002b).
The combination SAE program is the amalgamation of a
placement SAE program and an entrepreneurship SAE program.
17
Teacher of Agriculture – one who plans, delivers, and
evaluates instruction and facilitates the process in
helping students learn about agriculture (Newcomb,
McCracken & Warmbrod, 1993). For the purpose of this study,
agriculture teacher was operationally defined as the
individual responsible for instructing agricultural
education in the local school district.
Limitations of the Study
Self-reported data is subject to concerns of validity;
therefore, the soundness of these data may be limited. Even
though wide-ranging suppositions can be derived from the
conclusions of this study, the outcomes of the inquiry will
strictly be relevant to the population consisting of the
2003 Ohio FFA State Degree recipients. Moreover, there is
no evidence that the data used in this study are
representative of any other population, in the past or
future. Therefore, one cannot generalize the findings
beyond that of the population studied.
Basic Assumptions
This research project contributed to the existing body
of knowledge pertaining to the educational benefits of a
supervised agricultural experience. Furthermore, it
18
supported the premise that educational reform has a deep-
seated economic basis serving at its most basic foundation.
It is this assertion that has provided a theoretical
framework for past and future research related to this
field of study.
19
CHAPTER 2
REVIEW OF RELATED LITERATURE
Purpose of the Study
The purpose of the study was to investigate the
factors influencing supervised agricultural experience
earnings of Ohio FFA State Degree recipients as measured on
the Ohio FFA State Degree application. The following
research questions guided the researcher through the study.
Research Questions
The research questions of the study were:
1. What are the characteristics of the Ohio FFA State
Degree recipients in 2003, including but not limited
to age, gender, years of agricultural education, type
of SAE, average gross SAE earnings, average grade
point average, and average attendance rate?
2. Are there group differences in gross SAE earnings for
students with different types of SAE programs?
3. Are there group differences in gross SAE earnings for
students from different FFA districts?
20
4. Is there a relationship between the number of
agriculture teachers in a students’ school and his or
her gross SAE earnings?
5. Is there a relationship between students’ rate of high
school attendance and their gross SAE earnings?
6. Is there a relationship between students’ high school
grade point average and their gross SAE earnings?
7. Is there a difference in gross SAE earnings between
male and female students?
8. Is there a relationship between the population of
students’ home counties (ages 15-19) and their gross
SAE earnings?
9. Is there a relationship between the teen poverty level
(ages 15-19) of students’ home counties and their
gross SAE earnings?
10. Is there a relationship between per capita income of
students’ home counties and their gross SAE earnings?
Introduction
Ben Franklin once said: “He that hath atrade hath an estate,” meaning thateducation and training contribute to aworker’s stock of human capital—theknowledge and skills that make for aproductive worker. Investment in humancapital includes not only formaleducation but also on-the-job training.Like investment in physical capital,
21
investment in human capital is animportant means of increasing laborproductivity and earnings (McConnell &Brue, 2001, p. 329).
The study focused on identifying factors that affected
student returns on the SAE; therefore, it was imperative to
understand the philosophical background of SAEs and the
relationship of the economic component, in addition to the
overall educational impact of an SAE. Additionally, the
theoretical foundation for the study was built upon the
work of educational philosophers and practitioners such as
John Dewey, Rufus Stimson, and Charles Prosser, who worked
to devise a way to make a more productive American society.
The requisite for a more productive American society
prompted the passage of the Smith-Hughes Act of 1917.
According to Dewey (1938), “...education, in order for
it to accomplish its ends both for the individual learner
and for society, must be based upon experience - which is
always the actual life-experience of some individual...”
(p. 113). Dewey was an advocate of vocational education and
experiential learning. “The only adequate training for
occupations is training through occupations” (Dewey, 1916,
p. 310).
During the early part of the century, vocational
education was intended to stabilize the American industrial
22
society by creating “a school system that socialized youth
for their new economic roles and sorting them into their
appropriate niches in the expanding capitalist division of
labor” (Kantor, 1986, p. 402). In his 1907 address to
Congress, President Theodore Roosevelt urged major school
reform that would provide industrial education in urban
centers and agricultural education in rural areas (Tanner &
Tanner, 1980). “The potential of education is, therefore,
to create employment for some who were previously
unemployable, to increase the earnings of individuals
educated, to increase the productivity and earnings of
other workers, and to increase profits” (Grubb & Stern
1989, p. 19).
Research continues to support the importance of
economics upon educational reform. A Nation at Risk
(National Commission on Excellence in Education, 1983)
encouraged educational reform predominantly as a means of
improving worldwide competitiveness. Grubb and Stern (1989)
wrote that in 1985, the National Commission on Secondary
Vocational Education reaffirmed the economic value of
vocational education, particularly in a country where
eighty percent of the jobs do not necessitate a college
degree. Furthermore, A Nation at Risk reported on the
23
waning economic situation of the United States and the
declining scholastic performance of students.
Supervised Agricultural Experience
The derivation of SAE can be traced to the early 1900s
where its creator, Rufus W. Stimson, initially called it
the project method. In the early 1900s when the project
method was conceptualized, nearly 20 percent of the U.S.
population resided on farms (Camp, Fallon, & Clarke, 1999).
In 1908, Stimson served as the director of the Smith
Agricultural School in Northampton, Massachusetts (Stimson
& Lathrop, 1942). As director of the Smith Agricultural
School, Stimson maintained that students would learn
agriculture at the school and would then apply what they
had learned on their home farms through the use of home
projects.
Stimson wrote in the first booklet of the Smith
Agricultural School that the school would focus its
teachings on learning to do; “it will provide training in
agriculture with a view to practical and profitable
farming...students will be taught to do things by actually
doing them” (p. 586). As the director of the Smith’s
Agricultural school, Stimson insisted that preparing to
farm would be best served at the student’s home farm
24
through supervised projects using the project method of
instruction. Learning by doing is the foundation of
agricultural education. “The idea that students should
apply what they are learning in the classroom in one of
their interest areas is more than a teaching philosophy; it
is the heart and soul of what makes agricultural education
unique and powerful” (Omernik, 2002a).
Barrick et al. (1992) published, through the National
Council for Agricultural Education in cooperation with the
National FFA Foundation, a handbook on supervised
agricultural experience entitled, SAE: Experiencing
Agriculture. Barrick’s work was predicated on the work of
the originator of the project method, Rufus W. Stimson.
According to Camp et al. (1999), this handbook continues to
serve as the primary document used in the profession of
agricultural education today regarding the SAE program.
Barrick, et al. (1992), defined SAE as:
“The actual planned application ofconcepts and principles learned inagricultural education. Students aresupervised by agricultural teachers incooperation with parents/guardians,employers and other adults who assistthem in the development and achievementof their educational goals. Thepurpose is to help students developskills and abilities leading toward acareer” (p. 1).

25
Today, SAEs, as defined by Barrick et al. (1992), have
not forgone their philosophical lineage of authentic
application of agricultural practices through agricultural
education, with a goal that culminates in a chosen
vocation. Although the end goal of gainful employment
immediately after high school is no longer the primary
focus, the teaching of relevant skills through an SAE
continues to serve as a pragmatic instructional tool for
the teacher and the student. The emphasis on occupational
education in high school, according to Jacobs and Grubb
(2002), should not be on obtaining the job-specific, entry-
level skills of traditional vocational education. Jacobs
and Grubb determined that at the secondary level, the
emphasis should be on completing high school, not only with
higher-order competencies, but also with standard academic
skills that are prerequisites for both further education
and employment in the jobs of the modern economy.
Inclusion of SAE in the Smith-Hughes Act of 1917
To understand the significance of the project method
contained within the Smith-Hughes Act of 1917, it is
important to note that during the course of Stimson’s
tenure as the director of the Smith Agricultural School in
Massachusetts, David Snedden was selected as the
26
Commissioner of Education in Massachusetts (McKinney,
1956). Previously, Snedden was a professor of sociology at
Columbia University in New York. Snedden named former
graduate student Charles A. Prosser, who was at the time
serving as a local school superintendent (Prosser School of
Technology, 2003), to serve as the deputy commissioner for
education in charge of vocational education (Stimson &
Lathrop, 1942). Stimson was called upon for expertise on
the project method during the reign of the Snedden-Prosser
administration, and was eventually hired to serve as the
first state supervisor of vocational agricultural education
in Massachusetts (Moore, 1988; Stimson & Lathrop, 1942).
Although Congress passed the Smith-Hughes Act in 1917,
the impetus for the legislation began in 1907 when
President Theodore Roosevelt urged Congress for a major
school reform to provide industrial education in urban
centers and agricultural education in rural areas (Tanner &
Tanner, 1980). Roosevelt’s crusade was predicated on
enhancing domestic competitiveness in expanding global
markets (Hyslop-Margison, 2001). Retracing the historical
events outlined, one can conclude that President
Roosevelt’s appeal for major school reform led to what
would eventually be the Smith-Hughes Act of 1917.
27
Prosser was an advocate of the project method through
his relationship with Rufus Stimson. Prosser “liked the
school and home-farm cooperation idea and began to preach
its general adoption from coast to coast” (Stimson &
Lathrop, 1942 p.587).
In 1912, Prosser became the secretary of the New
Society for the promotion of industrial education (Stimson
& Lathrop, 1942). According to Stimson, Prosser was an
advocate of the project method and began extolling its
benefits throughout the country. Through Prosser’s advocacy
of the project method, “its principles were incorporated
into the Smith-Hughes bill in the provisions requiring
students enrolled in federally aided vocational agriculture
course to undertake at least six months of directed or
supervised practice in agriculture each year” (Stimson,
1942 p. 589). Prosser was instrumental in the authoring of
the Smith-Hughes Act of 1917 (Hyslop-Margison, 2001), and
even included the requirement of the project method as a
requirement to receive the benefits of the appropriations
contained within the law.
...that such schools shall provide fordirected or supervised practice inagriculture, either on a farm providedfor by the school or other farm, for atleast six months per year; that theteachers, supervisors, or directors ofagricultural subjects shall have at
28
least the minimum qualificationsdetermined for the State by the Stateboard, with the approval of the FederalBoard for Vocational Education (Phipps& Osborne, 1988, p. 550).
According to Jacobs and Grubb (2002), the Smith-Hughes
Act of 1917 provided federal support for introducing
innovations in high schools that might otherwise persist in
being wholly academic institutions. Additionally, this was
accomplished in the name of preparing the workforce to
generate individual benefits and higher rates of economic
growth. After the passage of the Smith-Hughes Act of 1917,
Charles Prosser became the first director of the Federal
Board for Vocational Education that was established under
the Act.
Additional Factors of Influence on Education
The study attempted to identify variables that have an
effect on the economic return of students’ SAEs. To that
end, the researcher believed that it was essential to
identify with the establishment of the SAE concept through
federal legislation, but not to trace the myriad of
subsequent legislative acts between 1917 and 1963 that
mainly pertained to the augmentation of appropriations.
29
The next major piece of legislation to impact
vocational education, and inherently the supervised
agriculture experience, was the Vocational Education Act of
1963. The state of our nation’s economy was once again at
the forefront of major legislative reform in education.
Since the passage of the Smith-Hughes Act until the early
1960s, vocational education expanded its presence in
secondary education, but a full-scale crisis erupted in
October 1957, when the Soviets launched Sputnik 1, the
world’s first artificial satellite. According to Garber and
Launius (2002), the launching of Sputnik 1 had a “Pearl
Harbor” effect on public opinion, creating a fictitious
technological gap but providing the impetus for increased
spending for educational programming including technical
education.
As other countries’ advancements in technology gave
the impression of exceeding that of the United States, the
United States began to take notice. In 1958, after Sputnik,
Congress passed the National Defense Education Act of 1958,
whose intent was to improve the quality of elementary and
secondary education, which in due course, led to improved
national security. The focus of the National Defense
Education Act of 1958 was on certain specified areas of
school instructional programs, primarily programs leading
30
to the preparation of workers for highly skilled and
technical occupations.
Although some of the deficiencies of the Smith-Hughes
Act had grown to be apparent, there was also a feeling of
urgency from discontented urban minorities who faced job
obsolescence because of their inferior education and
training (Wirth, 1972). It was evident that America needed
to put more emphasis on foreign language, mathematics,
science, and technology in order to stay competitive
worldwide. With the advent of Sputnik and its resultant
illusion of an educational and technological gap, the first
fundamental revision of vocational education legislation
was readied for President Johnson’s signature in 1963
(Wirth, 1972).
Progression of Vocational Education and SAE
Even though the Smith-Hughes Act provided funding
intended for vocational education in the areas of
agricultural education, trades and industry and home
economics, the Vocational Education Act of 1963 expanded
the capacity and definition of vocational education in the
United States. Amid the Smith-Hughes Act of 1917 and the
Vocational Education Act of 1963 were the George-Reed Act
of 1929, George-Deen Act of 1936, and the George-Barden Act
31
of 1946 that generally authorized additional appropriations
for vocational education; however, the Vocational Education
Act of 1963 significantly transformed vocational education
in contrast to the Smith-Hughes Act of 1917.
Just as the Vocational Education Act of 1917
experienced modifications over the years, so has Rufus
Stimson’s project method. SAE, as it is referred to
presently, has gone by a series of names and acronyms over
the years (Deyoe, 1953; Barrick, et al., 1992). Most
recently, a panel of agricultural educators “said that the
name ‘Supervised Agricultural Experience’ should not be
changed” (p. 6) due to the fact that another name change
may send a message that agricultural education leaders are
uncertain of the future of the SAE (Camp, 1999a).
The Vocational Education Act of 1963 not only expanded
the characterization of vocational education, but also
broadened what encompassed agricultural education.
Specifically related to agricultural education, prior to
1963, vocational agriculture was intended for students who
would exclusively enter production agriculture. The
appropriations contained within the Vocational Education
Act of 1963, provided services to people of all ages in the
community without respect to pre-determined occupational
groupings, authorized funds for the construction of new
32
area vocational schools, and funded demonstration and
research projects. The elasticity of the 1963 Vocational
Education Act enabled the preparation of students for both
farm and off-farm occupations. The 1963 Vocational
Education Act fostered cooperative and pre-employment
laboratory programs, which prepared students for career
training opportunities in off-farm agricultural
occupations. Moreover, the Vocational Education Act of
1963, amended the Smith-Hughes Act in regards to SAE:
“any amounts allotted ... foragriculture may be used for vocationaleducation in any occupation involvingknowledge and skills in agriculturalsubjects, whether or not suchoccupation involves work of the farm orof the farm home, and such educationmay be provided without directed orsupervise practice on a farm” (S. Res.703, 1917).
The Vocational Education Act of 1963 provided for the
expansion of the scale of the supervised program but not
for channeling it merely to the farm. The passage of the
Vocational Education Act of 1963 saw the term agribusiness
become operational.
Since 1963, there were several additional amendments
and the introduction of the Carl D. Perkins Act. The
amendments continued to expand and broadened the definition
of vocational education, provided additional funds,

33
emphasized postsecondary education, overcame sex
discrimination and sex stereotyping and required the
development of long-term state planning. The Carl D.
Perkins Education Act of 1984, provided equal opportunities
for adults in vocational education, aided in the
application of new technologies, strengthened research in
vocational education, and provided services to meet needs
of the disadvantaged.
In 1990, the Carl D. Perkins Vocational and Applied
Technology Education Act was introduced. The 1990 Carl D.
Perkins Vocational and Applied Technology Education Act
provided for the integration of academic and vocational
education and the conception of Tech Prep programs, placed
an emphasis on students making the transition from school-
to-work, and supported business and educational
partnerships.
Eighty-five years after the passage of the Smith-
Hughes Act, the first piece of federal vocational education
legislation, vocational education has evolved from its
original focus on preparing students for work immediately
following high school (Office of Vocational and Adult
Education, 2004). According to the Office of Vocational and
Adult Education (OVAE), United States Department of
Education (USDE) (2004), today’s vocational education (1)
34
incorporates both school-based and work-based learning
business partnerships which are key to successful programs;
(2) emphasizes that for most occupations, postsecondary
education is essential; (3) encompasses postsecondary
institutions up to and including universities; and, (4)
uses more and higher technology.
With national and state school reform efforts focused
on academic achievement, and with the fastest-growing
occupations now requiring some postsecondary education,
vocational education is seeking effective ways to
contribute to these goals (OVAE, 2004). Underlying not only
the Smith-Hughes Act of 1917, but also subsequent acts in
vocational education, was the premise of ultimately
providing learners with the ability to be productive
citizens - denoting the capacity to earn a living.
Consequently, from a legislative perspective, a more
productive society equates to a more vibrant economy, which
would conclude a circular economic explanation, one where
productively employed constituents pay taxes, which support
local, state, and federal governments.
Primary to the productive society inference is the
ability for economic influence. Rufus Stimson promoted the
project method concept as a way for students to practice or
apply what they learned in the classroom on their own farm,

35
from which they were attempting to make a livelihood. The
supposition of Stimson’s project method implied a
productive society through the economic gain on the
student’s farm; therefore, one could infer that successful
projects not only served as a pragmatic form of
instruction, but also ultimately as a basis of revenue for
the student. Furthermore, the student turned graduate, has
the capacity to provide the necessary income for
sustenance. In their book, History of Agricultural
Education of Less Than College Grade in the United States,
Stimson and Lathrop highlighted the economic impact of the
project method. According to Stimson and Lathrop (1942),
“sixty-six boys in 1912...earned from farming as part of
their schooling $9,754.28” (p. 194). Stimson and Lathrop
indicated that the goal of the project method was to
realize gains of 20 percent above the indexes for crops and
livestock for the area. “A safe objective is to put the
graduates as far along in the mastery of standard practices
and in a managerial ability at the age of 28, as the
farmer, without such educational aid finds himself at 45”
(p. 194).
Recent studies in agricultural education have measured
the economic impact of SAEs not only upon the state’s
economy, but also upon the economy of the local community
36
(Retallick & Martin, 2003; Graham & Birkenholz, 1999; and
West & Iverson, 1999). The research on the economic impact
of SAEs has indicated that student SAE earnings provided a
positive return on the local investment in an agricultural
education program (Retallick & Martin, 2003).
Projects, as initially fashioned by Stimson and
reinforced through the Smith-Hughes Act of 1917, primarily
pertained to entrepreneurial production agriculture
projects on the student’s home farm. As vocational
agriculture evolved over the next several decades, projects
failed to reflect the progressiveness of the agriculture
curriculum. Additionally, according to Steele (1997), the
actual practice of SAE has continued to decline.
Agricultural educators face a problem that is dramatic:
changes in agriculture and agricultural education have
caused a lack of focus and direction in SAE (Dyer &
Osborne, 1996).
The National Research Council (1988) recommended that
the relevance and scope of Supervised Occupational
Experience (SOE) be broadened. The directed or supervised
practice in agriculture method gave way to the SAE and
expanded to include not only entrepreneurship, but also
SAEs through placement, improvement, exploration, and
research. Furthermore, with the broadening of the
37
agricultural curriculum, agricultural educators were
confronted with a different type of student compared to
previous students. The observation was that the increased
diversification of students enrolled in agricultural
education adversely affected the quality of the student’s
SAEs. Teachers and teacher educators blamed the type of
student enrolling in agricultural education programs as the
chief cause for the decline in SOE (Flowers, as cited in
Croom, 1991).
Stemming from the report of the National Research
Council, a taskforce was established to assess the state of
the supervised project. The taskforce determined that SAE
was defined as the actual, planned application of
agricultural concepts and principles learned in the
agricultural education classroom (Barrick et al., 1992).
Additionally, the purpose of an SAE was to help students
develop skills and abilities leading toward a career
(Barrick et al., 1992). Continuing to support the early
reasoning of Stimson, students were supervised by teachers
of agriculture, parents, employers, and others involved who
assisted them in the development and achievement of their
educational goals (Barrick et al., 1992).
As a way to provide guidance to the profession, the
handbook on supervised agricultural experience identified
38
components of SAE activities. These components served as
the guiding principles for the development of SAEs for
students enrolled in agricultural education programs (Table
1.1).
Barrick et al. (1992) determined that students’ SAEs
should result in a return on investment in either time
and/or money. A closer analysis of Barrick’s statement,
coupled with the philosophical underpinnings of Stimson’s
project method, would lead one to believe that a return on
investment is vital to a successful SAE.
SAEs have faced a tumultuous journey since a perceived
downslide began after the passing of the Vocational
Education Act of 1963. The downslide may be attributed to
the interpretation of the Vocational Education Act of 1963,
which one may interpret to mean students no longer needed
to have supervised programs. Unfortunately, it appears that
the agricultural education profession has yet to recover
from this interpretation of the Vocational Education Act of
1963. According to the National FFA Organization (1999),
SAEs are not the norm for agricultural education students.
The National FFA Organization (1999) estimated that
approximately half of students enrolled in agricultural
education courses maintained an SAE or claimed membership
in the FFA. “Regardless of the benefits of SAEs and FFA
39
stated in the literature, students continue to pass through
Agricultural Education programs without having SAEs or
record books or being involved in FFA” (Harlin & Weeks,
2001, p. 105).
The agricultural education profession took steps in
response to the recommendations from the National Research
Council (1988). Barrick et al. (1992) provided the
philosophical framework for SAEs in response to the
National Research Council. Agricultural Education’s
Strategic Plan (National Summit on Agricultural Education,
1989) affirmed that SAEs should provide practical real-
world experience in agriculture and develop a positive work
ethic and realistic occupational expectations. Part of this
real-world experience in agriculture is the ability of the
SAE to generate a positive monetary return on the
investment. All teachers should promote the development of
financially risk-oriented SAEs with their students.
Financially risk-oriented SAEs provide agricultural
education students with an element not available through
non-financially risk-oriented SAEs.
The foundation of the study presumes that earnings are
a fundamental component of an SAE. Furthermore, SAE
earnings may serve as an intrinsic motivator from personal
financial gain as well as the ability to be competitive in
40
the FFA’s award and recognition programs. According to Mick
et al. (1984), students who earned more money from their
SAEs were more likely to be employed in agricultural
occupations, thus, reinforcing the importance of financial
gain through an SAE. If factors that positively affect SAE
earnings can be identified, then there is the potential to
increase student SAE earnings.
Eighty-five years after the passage of the first piece
of federal vocational education legislation, vocational
education is evolving from its original focus on preparing
students for work immediately following high school. With
national and state school reform efforts focused on
academic achievement, and with the fastest-growing
occupations now requiring some postsecondary education,
vocational education is seeking effective ways to
contribute to these goals (OVAE, 2004).
In 2003, the Ohio FFA Association approved the
Guidelines and Expectations for SAE Programs in the state
of Ohio (Appendix D). The intent of the guidelines and
expectations for SAE programs was to provide a more
substantial framework with which to guide teachers of
agriculture in the development of SAEs with their students.
The guidelines state that, “the SAE program should
41
contribute to the workforce development and economic
viability of the community” (p. 3).
The success of the SAE concept has been replicated in
other federal legislated acts of Congress. In May 1994,
President Bill Clinton authorized the federal School-to-
Work Opportunities Act. The 1994 Act required that school-
to-work opportunities be planned, supervised, and have some
educational purpose, and help students obtain skills
leading toward a career (Hamilton & Hamilton, 1997). The
School-to-Work Opportunities (STWO) Act assisted states in
integrating school based-learning and work-based learning
with the ability for students to complete a career major.
The State of Ohio recognized the importance of developing
new strategies to better prepare youth for successful entry
into the world of work and to instill in each of them a
desire for lifelong learning (Courtney & Doll, 1998).
Title I: School-to-Work OpportunitiesBasic Program Components - RequiresSchool-to-Work Opportunities (SWO)programs to: (1) integrate work-basedand school-based learning and academicand occupational learning, andestablish effective linkages betweensecondary and postsecondary education;(2) provide students with theopportunity to complete career majors;(3) incorporate specified programcomponents including work-based andschool-based learning and connectingactivities; (4) provide participatingstudents with experience in and
42
understanding of the industry they arepreparing to enter; and (5) provide allstudents equal access to programcomponents and to recruitment,enrollment, placement, and relatedactivities. Mandated through the STWOAct was that all students had equalaccess to School-to-Work (STW)programming (H. Res. 2884, 1994).
The linkages between the strategies within the STWO
Act and agricultural education appeared to be built upon a
similar foundation. Agricultural education has long
incorporated work-based learning, school-based learning and
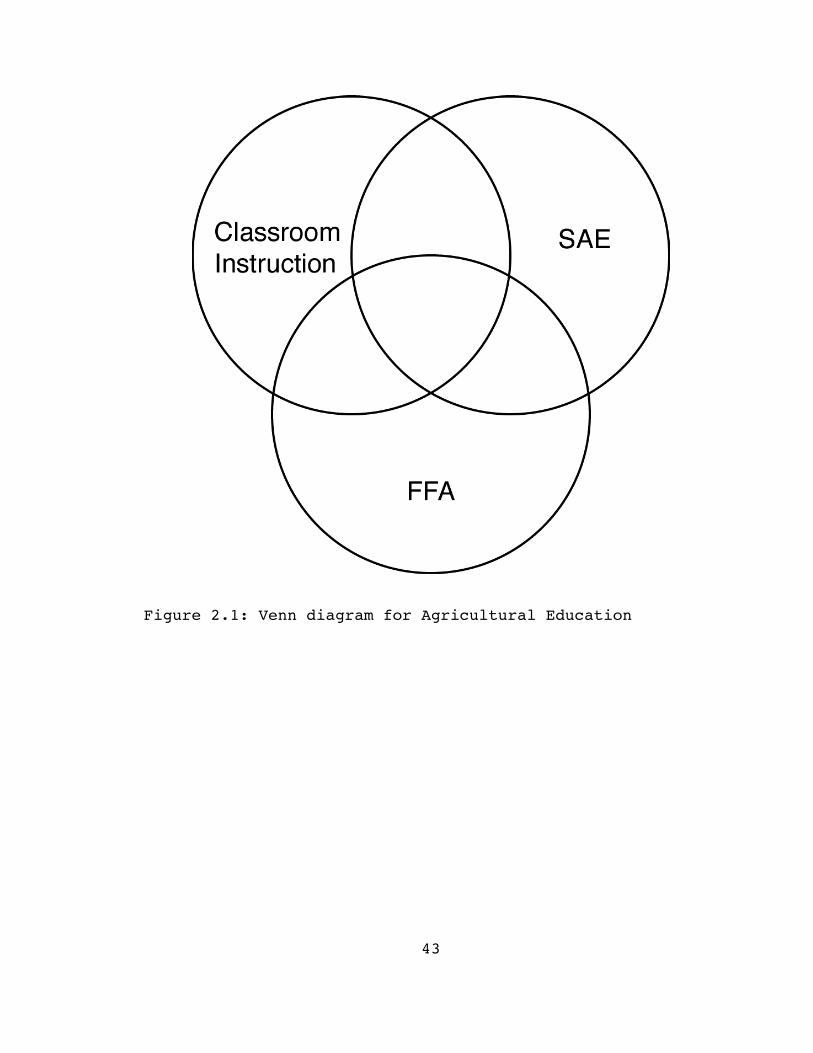
connecting activities. For nearly fourscore years, the Venn
diagram (see Figure 2.1) has been used to illustrate the
relationships among the three components of agricultural
education– classroom instruction, SAE, and the FFA with
their overlapping positions illustrating all possible
relationships between. Incorporating the three major
components of the STWO Act into the Venn diagram (see
Figure 2.2), it is apparent that the two models give the
impression of being philosophically identical.
43
Figure 2.1: Venn diagram for Agricultural Education

44
Figure 2.2: Venn diagram adapted for the School-to-WorkModel
The school-based learning component of the STWO Act
was designed to hold STW students to the same academic
standards set for all students, and it prepared students
for postsecondary education. Vocational program content,
delivered through the STWO Act, was broad and provided
students with strong experience in and understanding of all
aspects of the industry in which students prepared to enter
45
(Maddy-Bernstein, Matias, Cunanan, Krall, & Iliff, 1995).
Proponents of STW argued that students would attain higher
levels of academic achievement when learning is placed
within the context of the workplace (Miller, 2002).
“If it is to remain viable into the new century,
agricultural education, en toto, including its practical
experience Supervised Agricultural Experience (SAE)
component, must reflect the current reality and trends in
agriculture” (Camp et al., 1999 p. 160). Technological
advancements in agriculture dictate that agricultural
education programs must provide resources for instructing
students. Future workers must possess not only high levels
of problem solving abilities and interpersonal skills, but
also technological skills (Secretary's Commission on
Achieving Necessary Skills, 1990).
State FFA Degree
The National FFA Organization is an establishment that
provides its membership with incentives and awards. The FFA
recognizes students with superior SAE projects through the
FFA proficiency award program (Arrington, 1984) and other
recognition programs and awards, such as the Agri-
entrepreneurship award and degrees of membership in the
FFA.
46
Students enrolled in agricultural education programs
are members of the FFA due to the integral nature of the
FFA, although there is an annual membership fee. The
integral nature of the classroom, SAE, and the FFA (Figure
2.1) serves as a seamless framework of instructional
opportunities for the teacher in instructing students in
agricultural education. Classroom and laboratory
instruction focuses on technical agriculture, leadership,
and personal development. Experiential learning
opportunities through supervised experience and FFA
reinforced instruction, motivated students, and afforded a
means of identifying authentic problems on which to base
instruction (Hughes & Barrick, 1993).
The National FFA sponsors numerous awards and
recognitions in order to recognize students who are
proficient with their SAE. According to Omernik (2002a),
teachers of agricultural education “let them [students]
know they can make money and earn other awards through
SAE.” These awards and recognitions are based primarily
upon the scope and efficiency of the student’s SAE. "The
role of career development events and awards is to motivate
students and encourage leadership, personal growth,
citizenship and career development" (National FFA
Organization, 1995, p. iii). Leising and Zilbert (1985)
47
found that participation in SAEs was significantly
associated with FFA participation, application for FFA
awards and degrees, and FFA membership. Incentives such as
contests, degrees, and awards are not the driving force on
which FFA and supervised experience activities are based,
but serve as reinforcement and motivational tools by
providing recognition to students for exemplary performance
(Hughes & Barrick, 1993).
Students complete award applications in the FFA based
upon personal records that are kept as part of their SAE
program. Students complete a budget or a business plan
prior to the start of their SAE. “By having the students
develop a business plan, they have a much better idea of
whether or not their SAE will be financially viable before
they invest any financial resources” (Omernik, 2002a).
Based upon a financially successful SAE program, students
may apply for proficiency awards or advanced degrees in the
FFA. The FFA has five degrees of active membership: the
Discovery Degree, which is specifically for students below
grade nine; the Greenhand Degree, which is typically for
first-year students; the Chapter FFA Degree designed for
students who have already earned their Greenhand Degree;
the State FFA Degree, intended for FFA members that are
typically in their final two years of high school or
48
beyond; and the American FFA Degrees for students who have
earned the State FFA Degree but are not beyond their 21st
birthday or fourth national convention after graduation
from high school.
The local FFA chapter governs the Discovery Degree,
the Greenhand Degree, and the Chapter FFA Degree; the state
association administers the State FFA Degree, and the
National FFA Organization oversees the American FFA Degree.
Carpenter (as cited in Dyer & Williams, 1997a) found a
positive relationship between SAE size and achievement of
the state FFA degree. Each degree in the FFA builds upon
the accomplishments of the prior degree, ever-increasing
the achievements attained by the FFA member.
For an FFA member to earn the State FFA Degree in
Ohio, the member must meet the minimum standards (Appendix
A) that have been approved by the Ohio FFA Board of
Trustees. The Ohio FFA State Degree is not a competitive
event, but rather a performance-based award. One of the
major performance areas pertains to a student’s financial
earnings. Of the four degrees available to members in the
FFA, only the Discovery and the Greenhand Degrees do not
carry with it required financial earnings. For the Chapter
FFA Degree, FFA members must earn and invest $150; for the
Ohio FFA State Degree, FFA members must have invested
49
$1,000 and earned $3,000 for entrepreneurship SAEs or
$4,000 through a placement SAE, or they must have earned
$3,500 through a combination of entrepreneurship and
placement SAEs. Additionally, students attending a joint
vocational school or career center can meet the financial
requirement of the Ohio FFA State Degree through additional
options as outlined in Appendix A; for the American FFA
Degree, FFA members must earn and productively invest
$7,500.
SAE Type
Camp (1999b) reported that little research exists to
determine the components of SAE. SAEs encompassing the
areas of entrepreneurship, placement, and exploratory are
widely accepted in the field (Hoover & Arrington, 1994),
such is the case in Ohio. Additionally, literature
advocates inclusion of improvement, experimental,
analytical, and volunteerism as valid components of SAE
(Connors, 1992; Grellener & White, 1992; Moore & Flowers,
1993). Camp (1999b) recommended that the SAE areas of
entrepreneurship, exploratory, and placement be replaced
with eight SAE areas: agribusiness entrepreneurship,
agricultural placement, agricultural production,
agricultural research, directed school laboratory,
50
agricultural communications, agricultural exploration, and
improvement projects.
Number of Teachers of Agriculture
“Agriculture teachers teaching in multiple teacher
departments have more positive perceptions regarding
planning activities for SAEs than those who taught in
single teacher departments” (Swortzel, 1996, p.52).
Previous research concluded that teachers in multiple
teacher departments maintained workable student-teacher
ratios, which promoted the continuation of active SAEs
(Boone, Elliot, & Doerfert as cited in Swortzel, 1996).
Teacher understanding of SAE contributes to SAE quality,
and teacher supervision is foremost to having quality SAE
programs (Arrington & Hoover, 1994). Byers (1972) reported
that student supervision was related to the number of
students enrolled in the agricultural education program.
The fewer students enrolled, the greater the likelihood
that students would receive teacher supervision.
Studies confirm the positive relationship between the
amount of teacher supervision and SAE program quality
and/or scope (Arrington, 1981; Harris, 1983; Gibson, 1987;
Anyadoh, 1989). According to Dyer and Williams (1997b),
although there is a positive relationship between the
51
number of teacher visits and SAE program quality, there
were still students who received little or no teacher
supervision.
While the research strongly supports the assertion
that the number of teachers in an agriculture department
influences the SAE program quality or scope, the following
research extends the influence of teachers upon SAEs.
Gibson (1987) found a positive relationship between SAE
program quality and the amount of classroom instruction on
SAE. Additionally, providing teachers with extended
contracts contributes to effective supervision of SAE
programs (Arrington & Hoover, 1994). Knight (1978) learned
that Ohio agricultural education teachers spent 5.5 hours
per week supervising SAE programs in addition to their
normal teaching duties. Lindsey (1978) reported that due to
an increased number of limited-opportunity students
enrolling in agricultural education and a decrease in the
number of students with a farm background, teachers devoted
extra effort and time to ensure that students plan
successful supervised experience programs. Some teachers
found barriers to supervising SAEs, including lack of
release time, large classes, and limited travel funds (Dyer
& Williams, 1997b). Finally, previous enrollment in high
52
school agriculture by the teacher is positively related to
SAE quality (Anyadoh, 1989).
Attendance and Grade Point Average
Participation in school-based leadership, athletics,
and academic clubs predicted an increased likelihood of
attendance in full-time college (Miller, 2003). Higher
attendance rates can be attributed to positive experiences
in school; Gilman (2001) found that positive learning
experiences in after-school activities and programs,
particularly if they are school-based, brought about a more
positive identification with school. Gerber (1996) found
that participation in programs and activities outside of
school increased a student’s academic self-concept, which
can positively affect school performance. According to
Miller (2003), effective teachers built strong
relationships with students, provided opportunities for
students to contribute, and fostered a welcoming
environment. According to Harlin and Weeks (2001), SAE
supporters suggested that SAE involvement might improve
student achievement even though some obstacles exist.
Although relatively little investigation has focused
on the relationship between the scope of SAE projects and
student achievement (Arrington & Cheek, 1990), studies have
53
linked participation in SAE to positive student achievement
in agricultural knowledge (Cheek, Arrington, Carter, &
Randell, 1994; Dyer & Osborne, 1996). Morton (1978) found a
positive relationship between SAE scope and student
achievement gauged by written test scores. Noxel and Cheek
(1988) found that for students enrolled in ornamental
horticulture there was a positive relationship between SAE
scope and student achievement. Buyck (as cited in Hoover &
Arrington, 1994) predicted that students who had SAEs would
have higher grade point averages in agricultural education.
Peer groups with similar interests can have a powerful
influence on the achievement of young people (Eccles &
Barber, 1999; Gerber, 1996). Gibson (as cited in Hoover &
Arrington, 1994) reported a positive relationship between
quality of SAE and grade point average for senior
agricultural education students in Kentucky. Similarly,
there was a moderate, positive correlation between SAE
participation and student achievement in agriscience
programs in Florida (Cheek et al., 1994). Harlin and Weeks
(2001) determined that there were no differences between
male and female academic performance.
Adolescents who participated in extracurricular
activities, school athletics, band and other school
sponsored activities, performed community service, and
54
involved in clubs were highly correlated with school
success, including attendance rates, grade point averages,
and aspirations to continue education beyond high school
(USDE, 1995). Additionally, Camp (1990) discovered that
extracurricular activities were linked more strongly to
academic outcomes than study habits, academic ability, or
family background. Finally, Miller (2003) learned that
participation in extracurricular activities resulted in
increased academic achievement.
Hair, Moore, Hunter, Williams, and Kaye (2001)
reported that work of high intensity had no deleterious
effect on the academic achievement of 14-15 year olds. They
also found that long hours of work during high school
(especially in the senior year), were associated with
higher wages and steadier employment many years after high
school. Reporting contradictory results, Miller (2003)
found that time spent working after school had a negative
association with academic achievement. According to the
United States Department of Labor (U.S. Department of
Labor, 2000), “gaining some work experience during the high
school years is viewed by some as valuable in easing the
transition from school to work. Working too many hours,
however, also is viewed as potentially harmful to academic
studies” (p. 16).

55
Potter (1984) found no significant relationship
between SAE scope and student achievement in a study
limited to handicapped students. Similarly, Tylke and
Arrington (1988) failed to find a positive relationship
between SAE scope and student achievement in livestock
production. Furthermore, the 1998 NRC report (as cited in
U.S. Department of Labor, 2000, p. 68) concluded, “low
intensity employment may support postsecondary educational
outcomes while high-intensity employment may hinder them.”
Twenty or fewer hours of work per week is often used as the
dividing line between high- and low-intensity work.
Gender
In 1996-98, employed male youths worked more hours
than did female youths in both the school and summer months
(U.S. Department of Labor, 2000, p. 34). On the other hand,
Camp (1990), reported that males and females did not differ
significantly in the hours per week that they worked for
pay during their senior year. Landscape and horticultural
services, livestock production, and automotive repair were
some of the industries on the top 10 lists for male youths
that were not on the list for their female cohorts (U.S.
Department of Labor, 2000, p. 18). A large proportion of
self-employed male youths performed lawn care—34 percent in
56
the school months and 64 percent in the summer months.
Additionally, more than 40 percent of the self-employed
female youths were employed in family childcare—47 percent
in school months and 43 percent in summer months (U.S.
Department of Labor, 2000, p. 36).
County Population
In the late 1980s, nearly 20 percent of the workforce
was employed in the agriculture industry in some capacity;
however, only 2.2 percent of Americans resided on farms,
and only half this number reported farming as their main
occupation (National Research Council, 1988). Arrington
(1981) conveyed a positive relationship between SAE program
scope and students living in a rural area.
Teen Poverty Level
Many SAEs occur after school and according to Miller
(2003), these programs did not change students’ experiences
in school, but did provide alternative environments that
were more in tune with students’ interests, motivations and
needs. National Agricultural Workers’ Survey (NAWS)
covering the five years between FY1993 and FY1998 found
that 7 percent of all farm workers were between the ages of
14 and 17 (U.S. Department of Labor, 2000, p. 53). On
57
average, teens that do farm work earned less than $1,000
per year doing agricultural work according to the U.S.
Department of Labor (2000, p. 56).
Per Capita Income
During the school year 1996-98, youths aged 15 to 17
that were employed, worked an average of about 17 hours a
week. Additionally, for this same period, employed youths
aged 15 to 17 worked an average of about 23 hours during
the summer months. Like employment, average hours worked
increased with age (U.S. Department of Labor, 2000, p. 34).
The minimum wage is frequently associated with
adolescent workers initially entering the workforce (U.S.
Department of Labor, 2000, p. 35). In 1998, median earnings
for adolescent workers between the ages of 15 to 17 were
$5.57 per hour combined (U.S. Department of Labor, 2000, p.
35). During the 1996/97 and 1997/98 school months, 9
percent of adolescent workers between the ages of 15 to 17
who were employed in agriculture on a family farm worked
for no pay (U.S. Department of Labor, 2000, p. 36).
According to Cave, Bos, Doolittle, and Toussaint, (as
cited in Jekielek, Cochran, & Hair, 2002), individuals
enrolled in the JobStart program, a program designed to
provide low-skilled dropouts with technical and academic
58
skills, had average earnings that were approximately $400
per year higher when compared to the control group. The
Youth Incentive Entitlement Pilot Projects (YIEPP), a youth
program similar to JobStart and designed to increase labor
productivity of youth, thereby increasing their earnings
potential and improving their lifetime employability, also
showed similar results. According to Farkas, Olsen,
Stromsdorfer, Trask, and Jerrett (as cited in Jekielek,
Cochran, & Hair, 2002), earnings of YIEPP group members,
were higher by approximately $11 per week during the school
year and after the program ($10.48 in the fall of 1981).
Increased earnings after the program were due predominantly
to increased employment and hours worked. The relationship
was twice as large for young men as young women, and larger
for high school graduates than for nongraduates.
Several well-known statistical problems in examining
wages, earnings, and other employment effects make it
difficult to determine the economic value of education
(Grubb, 1999). Pals (1988) stated that employers rated
“helped earn money while in school” at the top of their
perceived benefits. Despite the important intellectual and
political purposes of formal schooling, its economic value
has come to be central (Grubb, 1999). The rhetoric of
investing in education for the economic benefits it will
59
generate in the future dominates state and national policy
(Grubb, 1999).
Conclusions
The research promoting the educational virtues of
supervised agricultural experience is virtually
overwhelming. Researchers in agricultural education have
proclaimed for nearly a century the values of the SAE as an
authentic learning strategy for students enrolled in their
agricultural education programs. The implementation of SAE
programs has extended agricultural education beyond the
typical four-walls of the classroom and into a real-world
borderless educational arena.
Research on the earnings of adolescents has been
conducted less frequently than research pertaining to the
educational benefits of the SAE. SAE continues to be an
area that is being casually reported, more for its benefits
to the at-risk population than for the innate benefits to
the participant.
The study delved into one inherent trait of the SAE
that may serve as its most essential element. John Dewey
(1938) wrote, “for it [education] to accomplish its ends
both for the individual learner and for society, it must be
based upon experience - which is always the actual life-
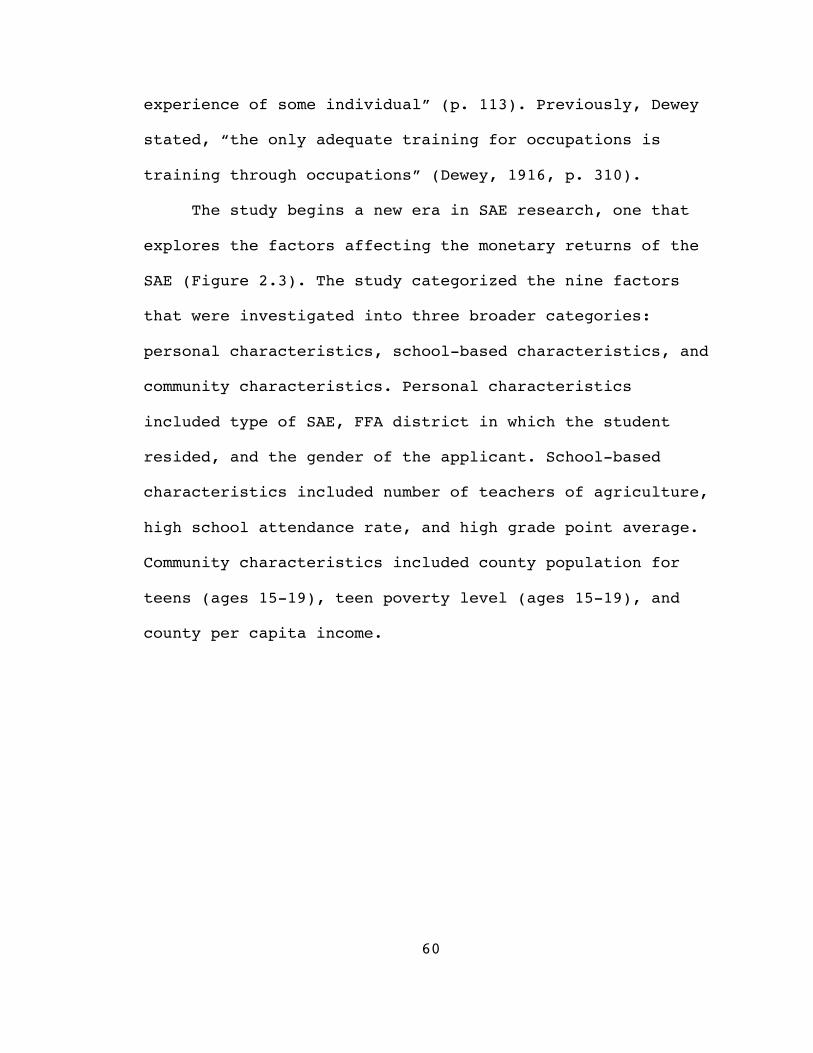
60
experience of some individual” (p. 113). Previously, Dewey
stated, “the only adequate training for occupations is
training through occupations” (Dewey, 1916, p. 310).
The study begins a new era in SAE research, one that
explores the factors affecting the monetary returns of the
SAE (Figure 2.3). The study categorized the nine factors
that were investigated into three broader categories:
personal characteristics, school-based characteristics, and
community characteristics. Personal characteristics
included type of SAE, FFA district in which the student
resided, and the gender of the applicant. School-based
characteristics included number of teachers of agriculture,
high school attendance rate, and high grade point average.
Community characteristics included county population for
teens (ages 15-19), teen poverty level (ages 15-19), and
county per capita income.
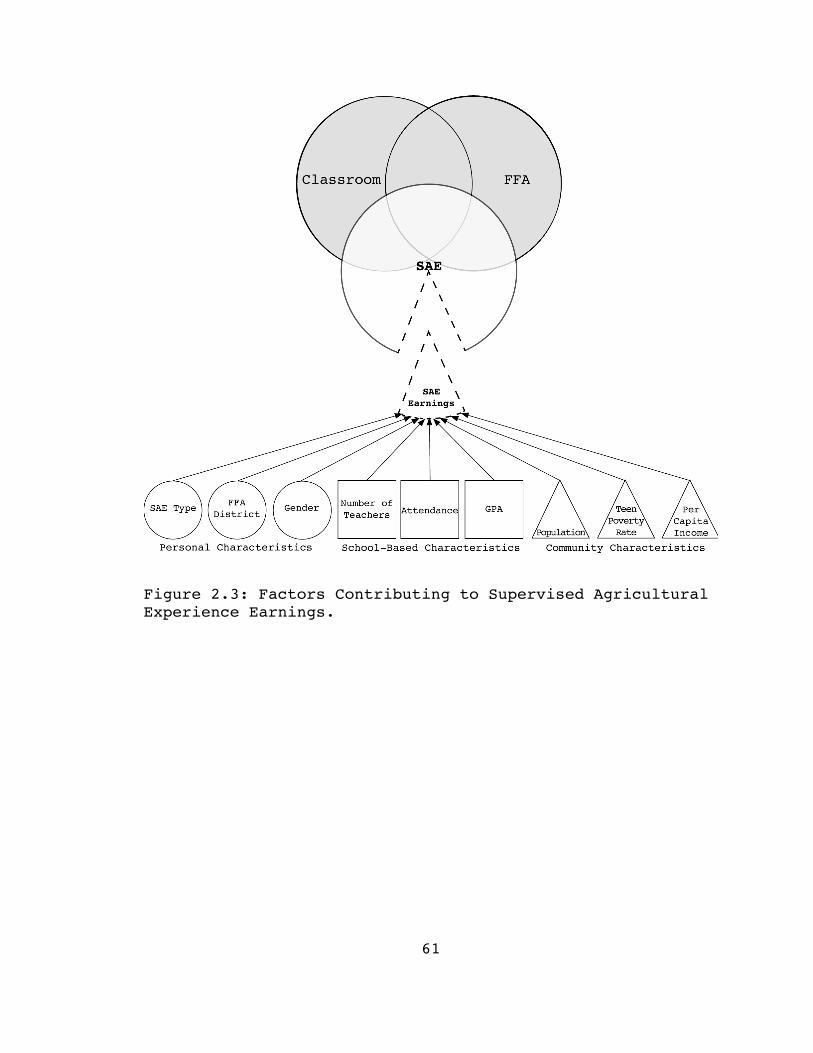
61
Figure 2.3: Factors Contributing to Supervised AgriculturalExperience Earnings.
62
CHAPTER 3
METHODOLOGY
Chapter 3 discusses the methodology utilized in
conducting the research. The methodology is shared in the
ensuing sections: (a) objectives, (b) type of research, (c)
population, (d) instrumentation (e) data collection, and
(f) data analysis.
Purpose of the Study
The purpose of the study was to investigate the
factors influencing supervised agricultural experience
earnings of Ohio FFA State Degree recipients as measured on
the Ohio FFA State Degree application. The following
research questions guided the researcher through the study.
Research Questions
The research questions of the study were:
1. What are the characteristics of the Ohio FFA State
Degree recipients in 2003, including but not limited
to age, gender, years of agricultural education, type
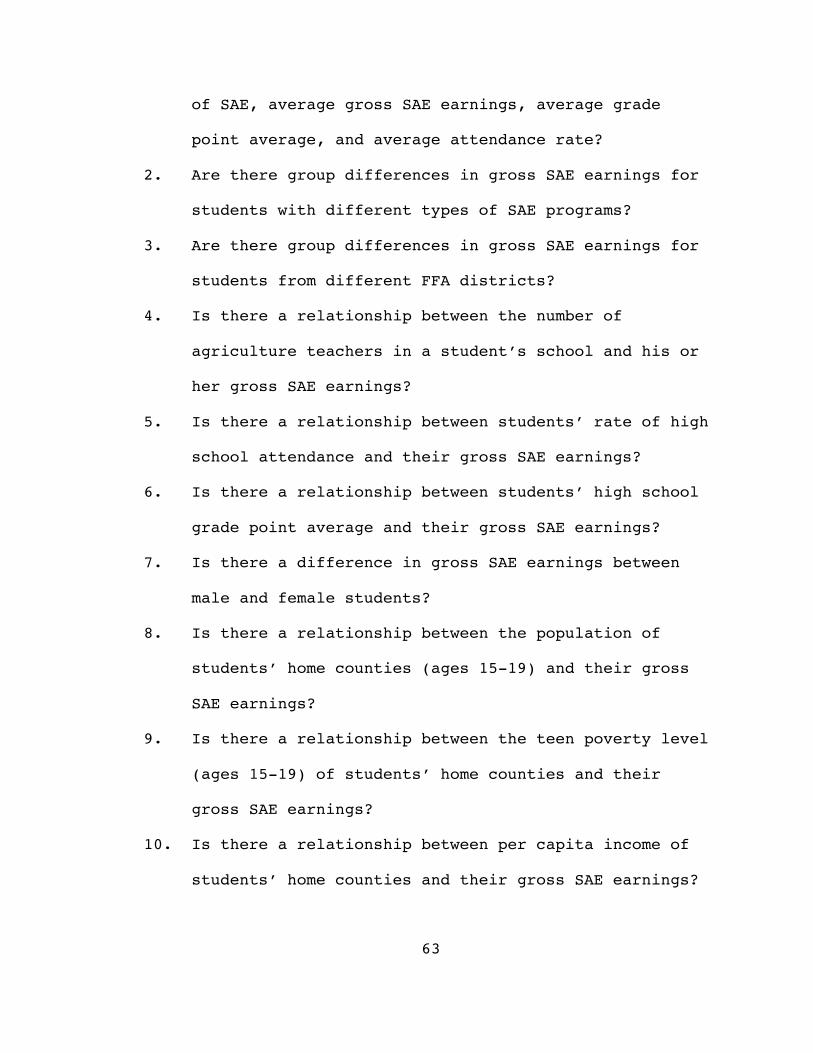
63
of SAE, average gross SAE earnings, average grade
point average, and average attendance rate?
2. Are there group differences in gross SAE earnings for
students with different types of SAE programs?
3. Are there group differences in gross SAE earnings for
students from different FFA districts?
4. Is there a relationship between the number of
agriculture teachers in a student’s school and his or
her gross SAE earnings?
5. Is there a relationship between students’ rate of high
school attendance and their gross SAE earnings?
6. Is there a relationship between students’ high school
grade point average and their gross SAE earnings?
7. Is there a difference in gross SAE earnings between
male and female students?
8. Is there a relationship between the population of
students’ home counties (ages 15-19) and their gross
SAE earnings?
9. Is there a relationship between the teen poverty level
(ages 15-19) of students’ home counties and their
gross SAE earnings?
10. Is there a relationship between per capita income of
students’ home counties and their gross SAE earnings?
64
Research Design
The study was a descriptive correlational study that
examined characteristics of the target population (N = 524)
of Ohio FFA State Degree recipients in 2003. The purpose of
the study was to portray accurately the incidence,
distribution, and characteristics of the recipients of the
Ohio FFA State Degree, to explore relationships, and to
formulate a more specific research problem (McCracken,
1998).
Population
The target population for the study was all Ohio FFA
State Degree recipients for the 2002-2003 academic year.
The frame for the study was obtained from the Ohio FFA
Association, Inc. (2003).
This descriptive correlational study included all
individuals who received their Ohio FFA State Degree in
2003. The strength of a census lies in irrefutability. Its
weakness lies in its confinement to a single limited
population at a single point in time (Ary, Jacobs, &
Razavieh, 1985). Additionally, through the utilization of a
census, major threats to external validity found in a
descriptive study, such as frame error, sampling error,
selection error, and non-response error were controlled.
65
For this study, the 524 recipients of the Ohio FFA
State Degree in 2003 served as the frame. Frame error
occurs when there is a discrepancy between the intended
target population and the actual population from which the
sample is drawn. Since a census was used, frame error was
controlled. Sampling error is reflected in the difference
between sample and population measures (Fraenkel & Wallen,
1996). As no sample was selected from the population,
sampling error was not an issue. Selection error exists
when certain subjects have a greater probability of being
included in the sample than others. Since a census was used
for this study, there was no selection error. Non-response
error occurs when respondents fail or refuse to respond
(McCracken, 1998).
The information in Table 3.1 reports the distribution
of the membership of the Ohio FFA Association by district.
The present Ohio FFA district structure (Appendix C) has
been in place since 1995 and was established to provide an
equitable distribution of FFA chapters and FFA members
while attempting to maintain an equal geographical area and
to limit travel time for the teachers.

66
District LocationNumber of Degree
Recipients % 1 Far Northwestern Ohio 39 7.4 2 North Central Ohio 67 12.8 3 Northeastern Ohio 15 2.9 4 Northwestern Ohio 69 13.2 5 Western Ohio 75 14.3 6 Central Northwestern Ohio 99 18.9 7 Central Northeastern Ohio 45 8.6 8 Eastern Ohio 21 4.0 9 Southwestern Ohio 68 12.910 Southeastern Ohio 26 5.0
Total 524 100.0
Table 3.1: Number and Percent of State FFA DegreeRecipients by District (N = 524)
Instrumentation
For the purpose of this study, the Ohio FFA State
Degree application (Appendix A) served as the data-
gathering instrument. Recipient characteristics were
collected from the instrument and included the following:
Age: the reported age of the individual.
Gender: the reported sex of the individual, coded
either as male of female.
Years of Agricultural Education Completed: the
reported number of years of agricultural education program
completed.
SAE Type: the reported SAE type of the recipient,
coded as placement, entrepreneurship, or combination.
67
Gross Income from Placement Supervised Agricultural
Experience: the reported gross earnings from paid hours.
Gross Income from Entrepreneurship Supervised
Agricultural Experience: the reported gross earnings from
entrepreneurial enterprises.
Total Earnings: the reported earnings from Gross
Income from Placement Supervised Agricultural Experience
and Return to Labor and Management Income from
Entrepreneurship Supervised Agricultural Experience.
Percent Attendance: calculated attendance percentage
from the student’s official high school transcript.
Grade Point Average: calculated grade point average
from the student’s official high school transcript.
Additional information was obtained from the
Agriculture Education Teacher directory database (2002-
2003) that is maintained by the Agricultural Education
Service, Ohio Department of Education (2003a). Additional
information included the following:
FFA District: the FFA district in which the student’s
FFA chapter was located.
Number of Teachers of Agriculture: the total number of
teachers of agriculture at the recipients’ school.
County: the county in which the FFA chapter was
located.

68
Additional information was obtained from the Ohio FFA
Membership database, which is maintained by the Ohio FFA
Association, Inc. (2003). The information included:
Number of FFA members in the local FFA chapter: the
total number of FFA members in the recipients local FFA
chapter.
Finally, information was obtained from The Ohio State
University Extension Data Center. The information included:
County population (ages 15-19): population of teens in
the 15-19 year old age group in the county in which the FFA
chapter was located.
County Per Capita Income: per capita income of the
county in which the FFA chapter was located.
Teen Poverty Level (ages 15-19): the poverty level of
teens in the 15-19 year old age group in the county in
which the FFA chapter was located.
Dependent Variable Measure
The dependent variable, gross SAE income, was recorded
from the State FFA Degree applications of the 2003 State
FFA Degree recipients. The dependent variable is a
summation of gross income from placement and gross income
from entrepreneurship. Data for gross income from placement
SAE was collected from page 4 of the State FFA Degree
69
(Appendix A). Data for gross income from entrepreneurship
SAE was collected from page 8b of the State FFA Degree
(Appendix A). Data was recorded from page 4 (placement
income) and from page 8b (entrepreneurship income) of the
State FFA Degree recipients that conducted a combination
SAE.
The dependent variable was a monetary summation of the
State FFA Degree recipient’s earnings from the inception of
his or her SAE program through December 31, 2002. The Ohio
FFA Constitution contains minimum standards (Appendix A),
which requires that an FFA member be enrolled in an
agricultural education program for a minimum of one year
with a minimum of junior class status prior to applying for
the State FFA Degree. Additionally, membership can be
retained in the FFA through the age of 21 or three years
post high school graduation. Therefore, gross earnings
could range from one year to seven years.
Data Collection
The State FFA Degree application (Appendix B) provided
applicants with the capacity to chronicle their
participation in the FFA, school and community activities,
and to document their record of earnings throughout their
SAE program.
70
All information on the State FFA Degree was self-
reported data. This self-reported data was taken directly
from the State FFA Degree applicant’s SAE record books. All
record books were evaluated and checked for transference
accuracy onto the State FFA Degree application by a panel
of teachers of agriculture during a formal evaluation
process. Furthermore, signatures of authenticity are
required from the applicant, his or her parent or guardian,
the teacher of agriculture, the high school’s guidance
counselor, and either the high school principal or the
school superintendent.
Additionally, data pertaining to the applicant’s grade
point average and attendance rate was calculated from the
attached applicant’s transcript that was required as part
of the State FFA Degree application process. The school’s
guidance counselor verified the calculated grade point
average and attendance rate by affixing their signature to
the application.
The data for this study was collected from each of the
524 applications of Ohio’s State FFA Degree recipients,
which was the target population of the study. All data were
entered into a Microsoft Excel worksheet and then converted
to an SPSS 11.0 data file for final analysis.
71
Data Analysis
The data collected for the study were analyzed using
Microsoft Excel and the Statistical Package for the Social
Sciences (SPSS) computer programs. Measures of central
tendency, variability, and effect sizes were rounded to the
nearest 1/100th.
This study was a census; therefore, descriptive
statistics provided measures of central tendency and
variability for organizing, summarizing, and analyzing
differences between groups. Frequency distributions were
generated for the demographic data, including FFA
membership, year in school, age, gender, years of
agricultural education, FFA district of residence, and type
of SAE.
The Pearson product-moment correlation coefficient was
used to summarize the magnitude and direction of the
relationship between selected independent variables and the
dependent variable. Measures of association by Davis (1971)
were used to describe the association and are presented in
Table 3.2.

72
Coefficient Description.70 or Higher Very Strong Association.50 to .69 Substantial Association.30 to .49 Moderate Association.10 to .29 Low Association.01 to .09 Negligible Association
Table 3.2: Conventions Used to Describe Measures ofAssociation. (Davis, 1971)
The level of measurement of the variable determined
the appropriate descriptive statistics (frequencies, means,
and standard deviations) that were used to describe the
population of State FFA Degree recipients in 2003. Level of
measurement used to measure the dependent and independent
variables is presented in Table 3.3.
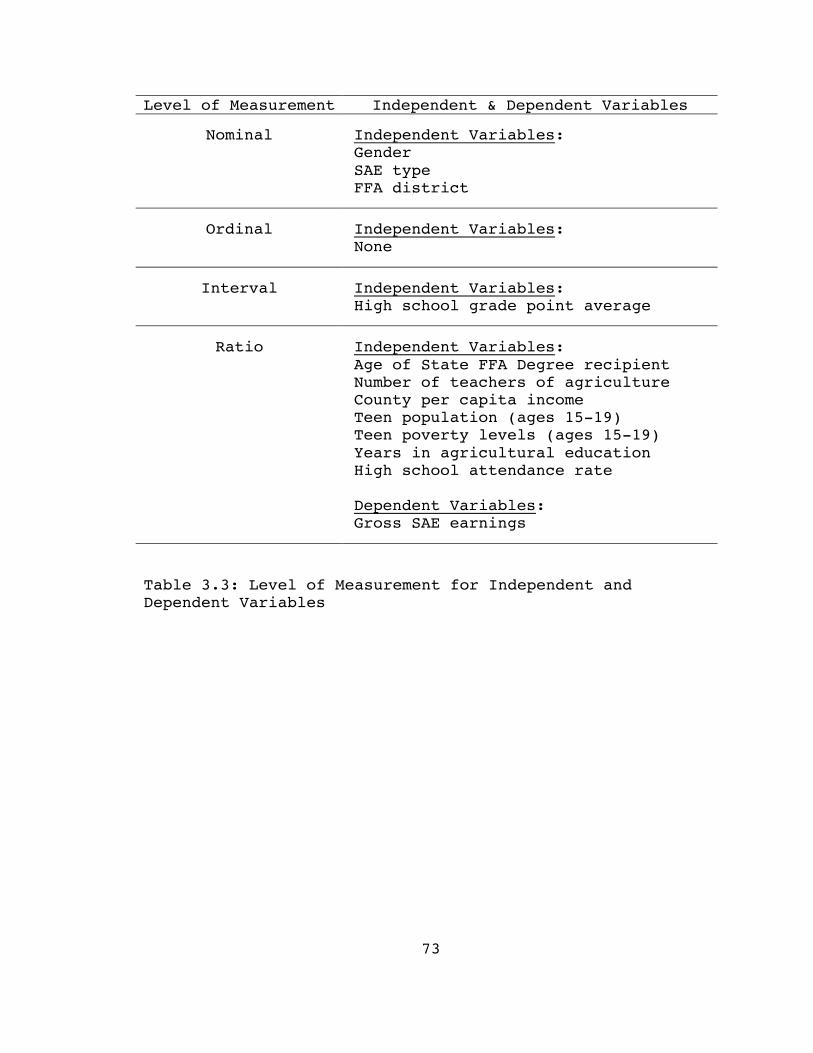
73
Level of Measurement Independent & Dependent Variables
Nominal Independent Variables:GenderSAE typeFFA district
Ordinal Independent Variables:None
Interval Independent Variables:High school grade point average
Ratio Independent Variables:Age of State FFA Degree recipientNumber of teachers of agricultureCounty per capita incomeTeen population (ages 15-19)Teen poverty levels (ages 15-19)Years in agricultural educationHigh school attendance rate
Dependent Variables:Gross SAE earnings
Table 3.3: Level of Measurement for Independent andDependent Variables
74
CHAPTER 4
RESULTS
Purpose of the Study
The purpose of the study was to investigate the
factors influencing supervised agricultural experience
earnings of Ohio FFA State Degree recipients as measured on
the Ohio FFA State Degree application. The following
research questions guided the researcher through the study.
Characteristics of the Population
Descriptive profiles of the population of Ohio FFA
State Degree recipients for 2003 are presented in this
section. The Ohio FFA State Degree recipients were
described in terms of age, gender, years of agricultural
education, type of SAE, average gross SAE earnings, average
grade point average, and average attendance rate.
Parameters such as frequencies, percentages, measures of
central tendency, and measures of variability are reported.
Due to the positively skewed distribution of the gross SAE
earnings of the population, the median was reported as an
alternative of the mean.
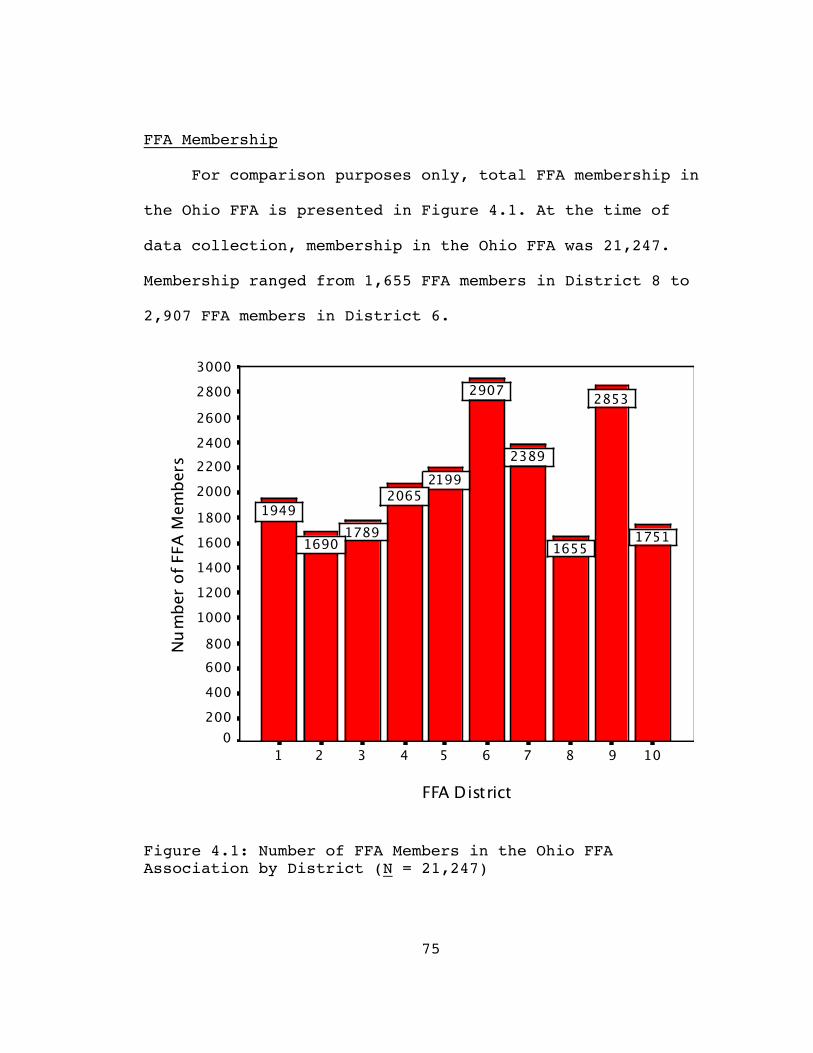
75
FFA Membership
For comparison purposes only, total FFA membership in
the Ohio FFA is presented in Figure 4.1. At the time of
data collection, membership in the Ohio FFA was 21,247.
Membership ranged from 1,655 FFA members in District 8 to
2,907 FFA members in District 6.
FFA District10987654321
Numb
er of
FFA
Memb
ers
30002800260024002200200018001600140012001000
800600400200
0
1751
2853
1655
2389
2907
21992065
17891690
1949
Figure 4.1: Number of FFA Members in the Ohio FFAAssociation by District (N = 21,247)
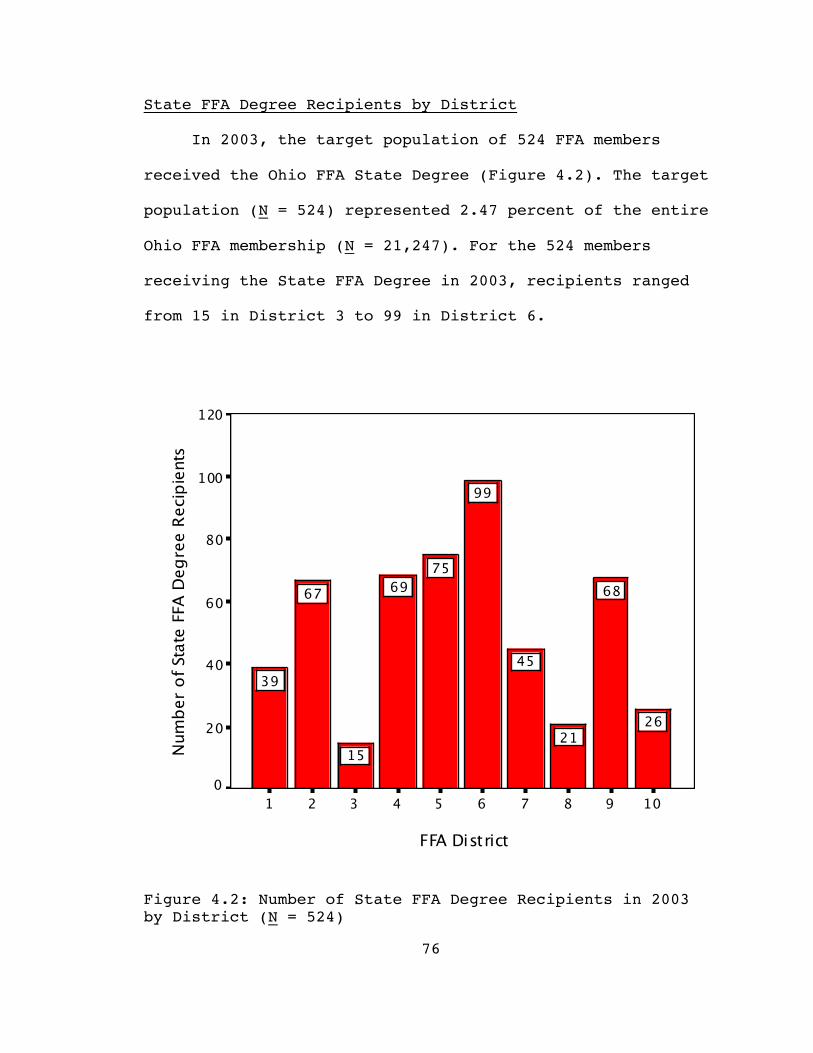
76
State FFA Degree Recipients by District
In 2003, the target population of 524 FFA members
received the Ohio FFA State Degree (Figure 4.2). The target
population (N = 524) represented 2.47 percent of the entire
Ohio FFA membership (N = 21,247). For the 524 members
receiving the State FFA Degree in 2003, recipients ranged
from 15 in District 3 to 99 in District 6.
FFA District10987654321
Numb
er o
f Sta t
e FFA
De g
r ee R
ecipi
ent s
120
100
80
60
40
20
0
26
68
21
45
99
7569
15
67
39
Figure 4.2: Number of State FFA Degree Recipients in 2003by District (N = 524)
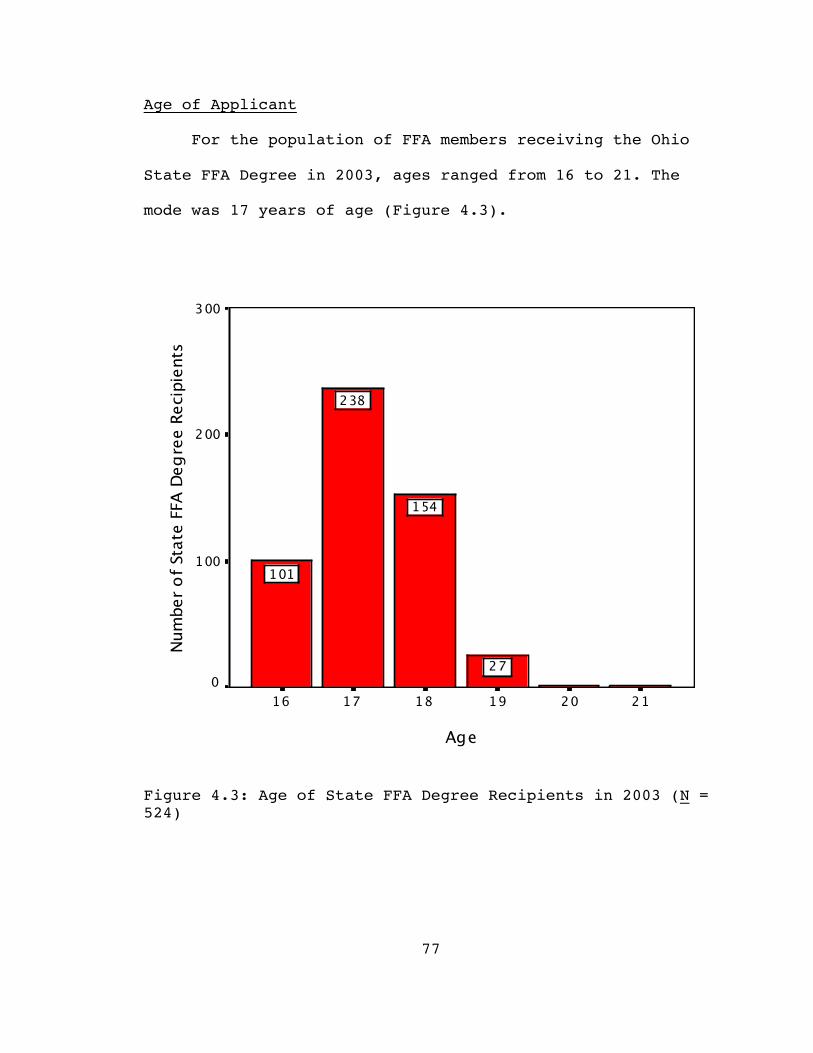
77
Age of Applicant
For the population of FFA members receiving the Ohio
State FFA Degree in 2003, ages ranged from 16 to 21. The
mode was 17 years of age (Figure 4.3).
Age212019181716
Numb
er o
f St a
t e F F
A D e
g re e
Recip
ie nt s
300
200
100
027
154
238
101
Figure 4.3: Age of State FFA Degree Recipients in 2003 (N =524)
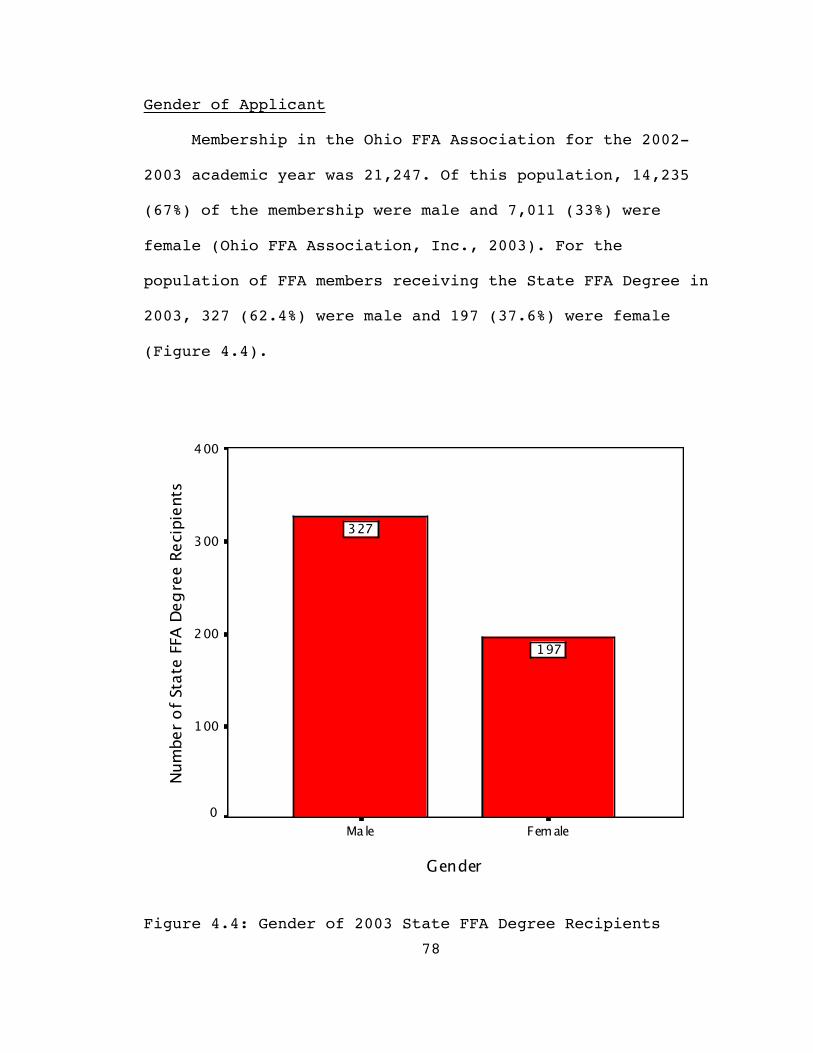
78
Gender of Applicant
Membership in the Ohio FFA Association for the 2002-
2003 academic year was 21,247. Of this population, 14,235
(67%) of the membership were male and 7,011 (33%) were
female (Ohio FFA Association, Inc., 2003). For the
population of FFA members receiving the State FFA Degree in
2003, 327 (62.4%) were male and 197 (37.6%) were female
(Figure 4.4).
GenderFemaleMale
Numb
er o
f St a
t e F F
A D e
g re e
R ec ip
i e nts
400
300
200
100
0
197
327
Figure 4.4: Gender of 2003 State FFA Degree Recipients
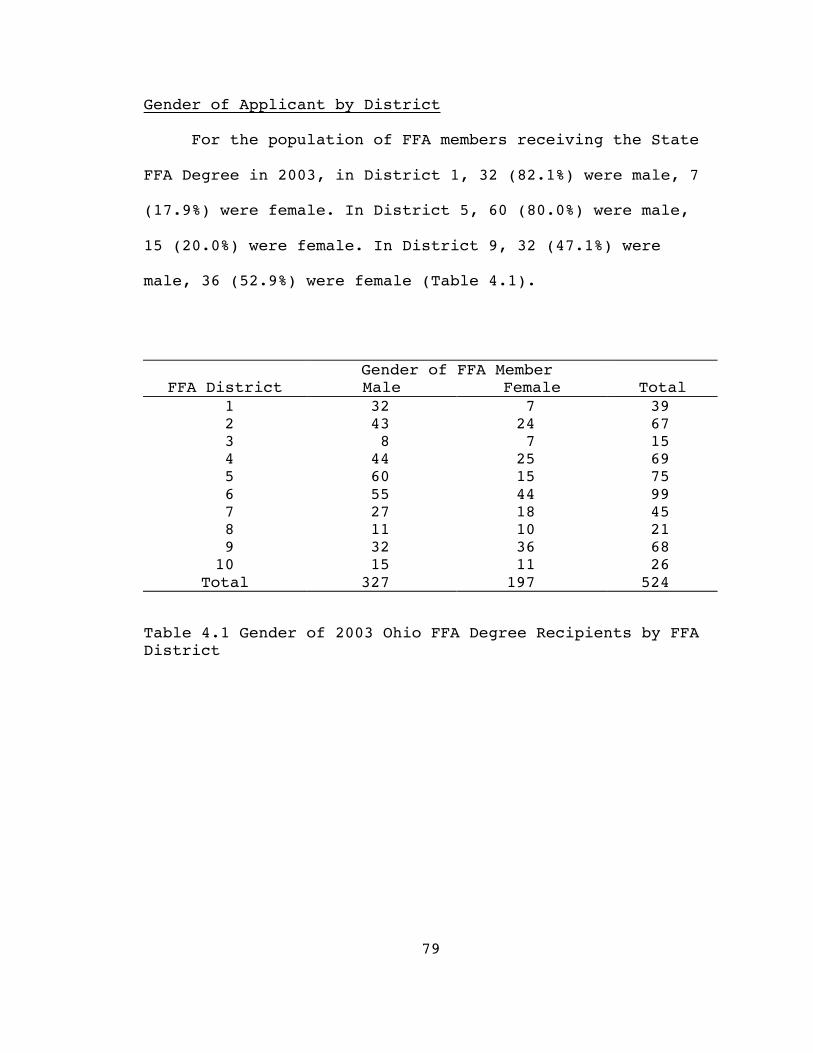
79
Gender of Applicant by District
For the population of FFA members receiving the State
FFA Degree in 2003, in District 1, 32 (82.1%) were male, 7
(17.9%) were female. In District 5, 60 (80.0%) were male,
15 (20.0%) were female. In District 9, 32 (47.1%) were
male, 36 (52.9%) were female (Table 4.1).
Gender of FFA MemberFFA District Male Female Total
1 32 7 392 43 24 673 8 7 154 44 25 695 60 15 756 55 44 997 27 18 458 11 10 219 32 36 6810 15 11 26
Total 327 197 524
Table 4.1 Gender of 2003 Ohio FFA Degree Recipients by FFADistrict
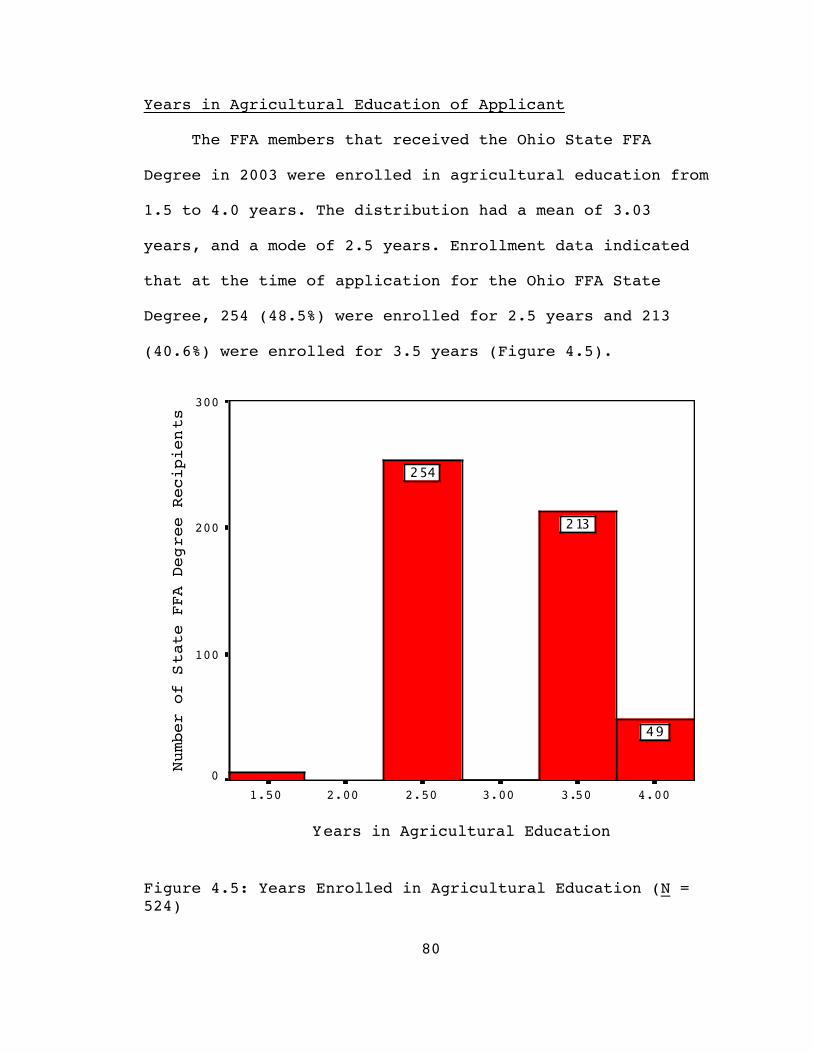
80
Years in Agricultural Education of Applicant
The FFA members that received the Ohio State FFA
Degree in 2003 were enrolled in agricultural education from
1.5 to 4.0 years. The distribution had a mean of 3.03
years, and a mode of 2.5 years. Enrollment data indicated
that at the time of application for the Ohio FFA State
Degree, 254 (48.5%) were enrolled for 2.5 years and 213
(40.6%) were enrolled for 3.5 years (Figure 4.5).
Years in Agricultural Education
4.003.503.002.502.001.50
Number of Stat e FFA Deg
r ee Recip ie n
ts
300
200
100
0
49
213
254
Figure 4.5: Years Enrolled in Agricultural Education (N =524)
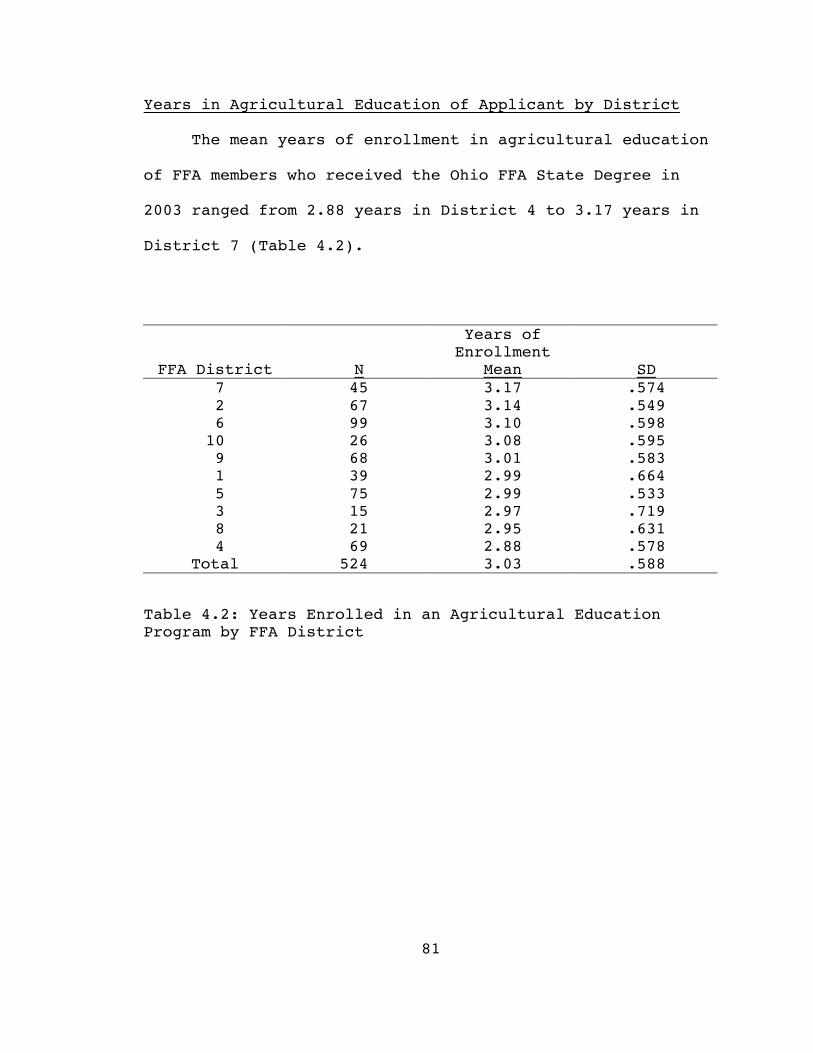
81
Years in Agricultural Education of Applicant by District
The mean years of enrollment in agricultural education
of FFA members who received the Ohio FFA State Degree in
2003 ranged from 2.88 years in District 4 to 3.17 years in
District 7 (Table 4.2).
FFA District N
Years ofEnrollment
Mean SD7 45 3.17 .5742 67 3.14 .5496 99 3.10 .59810 26 3.08 .5959 68 3.01 .5831 39 2.99 .6645 75 2.99 .5333 15 2.97 .7198 21 2.95 .6314 69 2.88 .578
Total 524 3.03 .588
Table 4.2: Years Enrolled in an Agricultural EducationProgram by FFA District
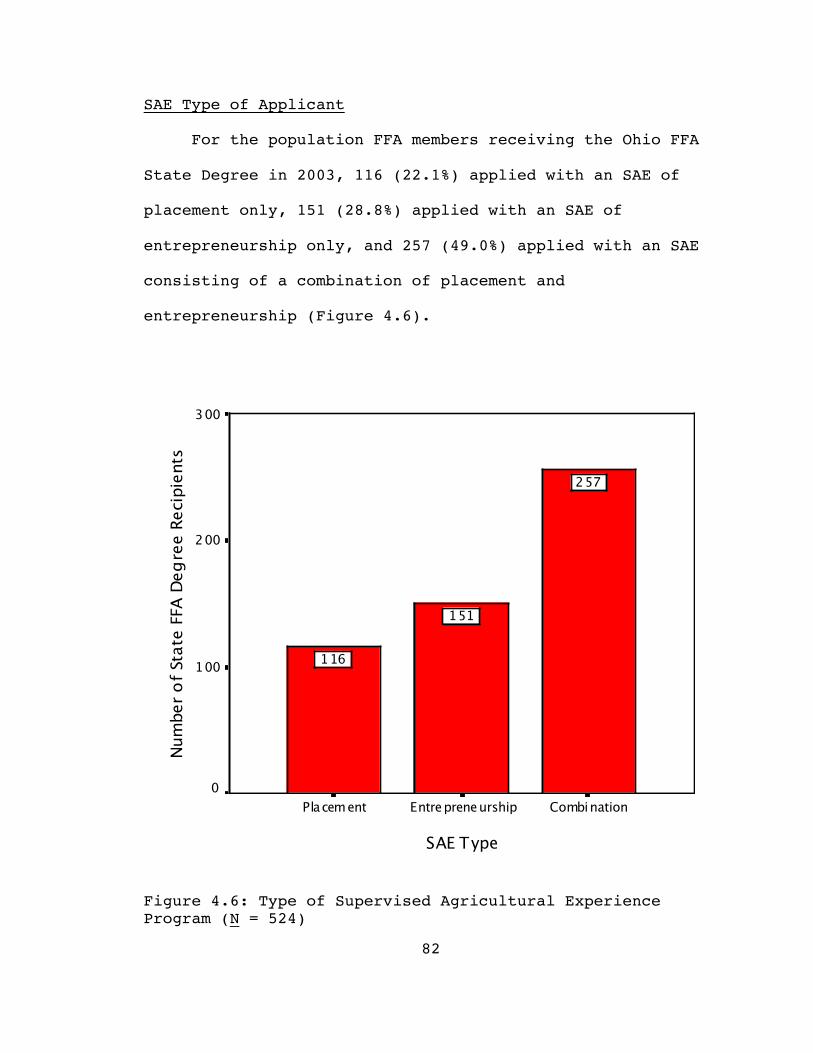
82
SAE Type of Applicant
For the population FFA members receiving the Ohio FFA
State Degree in 2003, 116 (22.1%) applied with an SAE of
placement only, 151 (28.8%) applied with an SAE of
entrepreneurship only, and 257 (49.0%) applied with an SAE
consisting of a combination of placement and
entrepreneurship (Figure 4.6).
SAE TypeCombinationEntrepreneurshipPlacement
Numb
er o
f St a
t e F F
A D e
g re e
Recip
ie nt s
300
200
100
0
257
151
116
Figure 4.6: Type of Supervised Agricultural ExperienceProgram (N = 524)
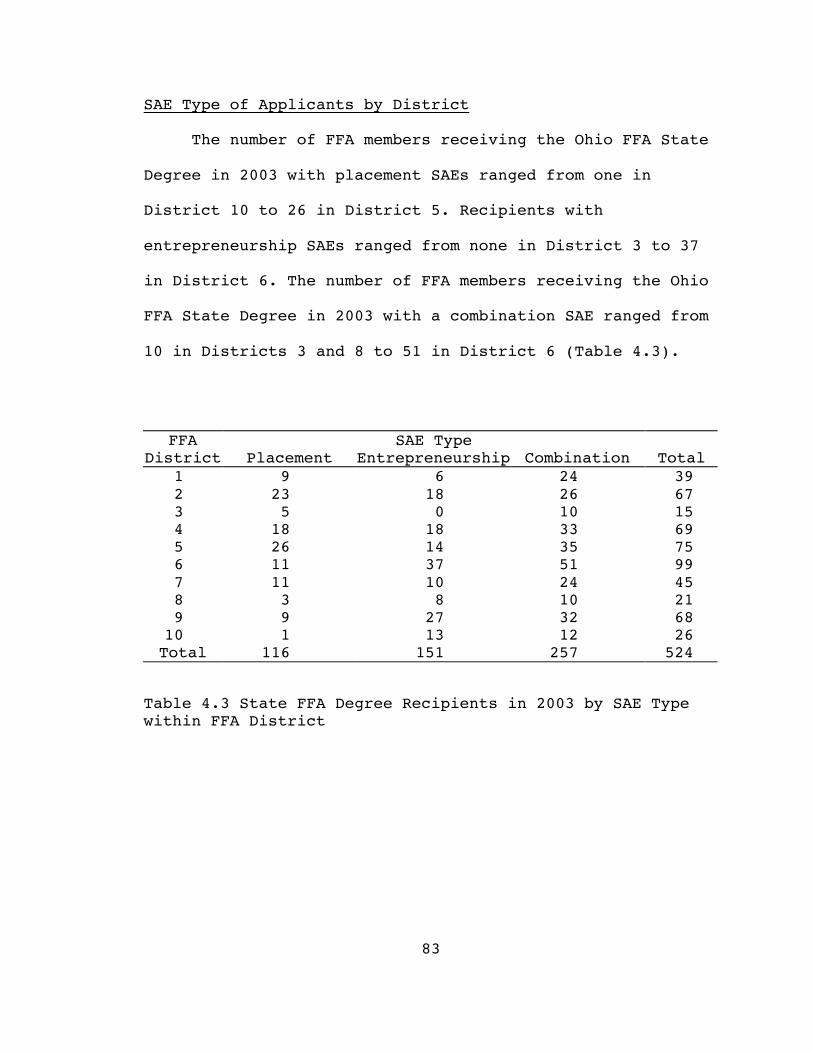
83
SAE Type of Applicants by District
The number of FFA members receiving the Ohio FFA State
Degree in 2003 with placement SAEs ranged from one in
District 10 to 26 in District 5. Recipients with
entrepreneurship SAEs ranged from none in District 3 to 37
in District 6. The number of FFA members receiving the Ohio
FFA State Degree in 2003 with a combination SAE ranged from
10 in Districts 3 and 8 to 51 in District 6 (Table 4.3).
FFA SAE TypeDistrict Placement Entrepreneurship Combination Total
1 9 6 24 392 23 18 26 673 5 0 10 154 18 18 33 695 26 14 35 756 11 37 51 997 11 10 24 458 3 8 10 219 9 27 32 6810 1 13 12 26Total 116 151 257 524
Table 4.3 State FFA Degree Recipients in 2003 by SAE Typewithin FFA District
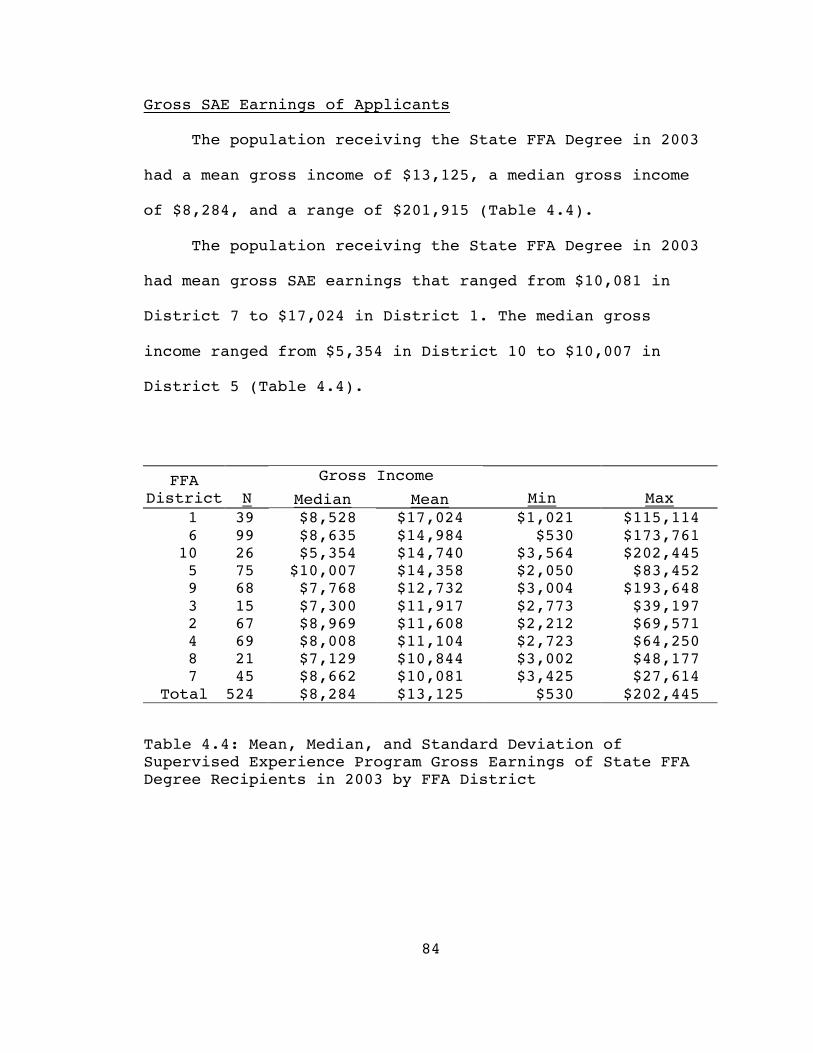
84
Gross SAE Earnings of Applicants
The population receiving the State FFA Degree in 2003
had a mean gross income of $13,125, a median gross income
of $8,284, and a range of $201,915 (Table 4.4).
The population receiving the State FFA Degree in 2003
had mean gross SAE earnings that ranged from $10,081 in
District 7 to $17,024 in District 1. The median gross
income ranged from $5,354 in District 10 to $10,007 in
District 5 (Table 4.4).
Gross IncomeFFADistrict N Median Mean Min Max
1 39 $8,528 $17,024 $1,021 $115,1146 99 $8,635 $14,984 $530 $173,76110 26 $5,354 $14,740 $3,564 $202,4455 75 $10,007 $14,358 $2,050 $83,4529 68 $7,768 $12,732 $3,004 $193,6483 15 $7,300 $11,917 $2,773 $39,1972 67 $8,969 $11,608 $2,212 $69,5714 69 $8,008 $11,104 $2,723 $64,2508 21 $7,129 $10,844 $3,002 $48,1777 45 $8,662 $10,081 $3,425 $27,614
Total 524 $8,284 $13,125 $530 $202,445
Table 4.4: Mean, Median, and Standard Deviation ofSupervised Experience Program Gross Earnings of State FFADegree Recipients in 2003 by FFA District
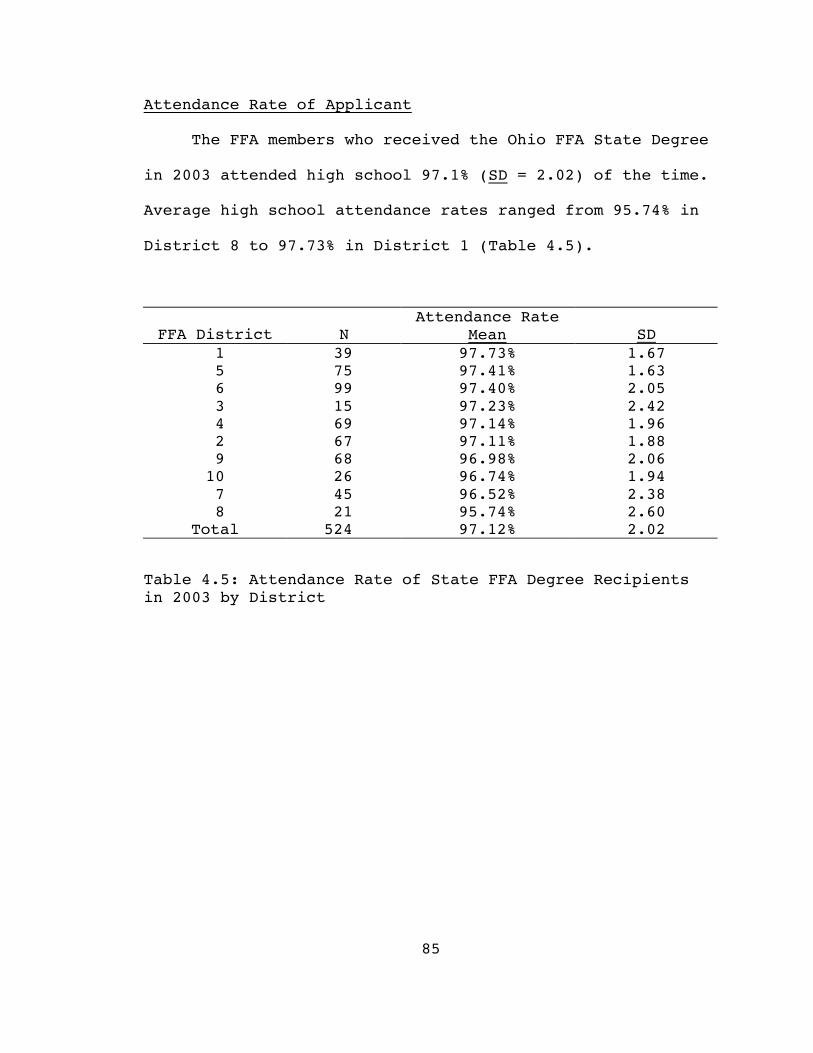
85
Attendance Rate of Applicant
The FFA members who received the Ohio FFA State Degree
in 2003 attended high school 97.1% (SD = 2.02) of the time.
Average high school attendance rates ranged from 95.74% in
District 8 to 97.73% in District 1 (Table 4.5).
FFA District NAttendance Rate
Mean SD1 39 97.73% 1.675 75 97.41% 1.636 99 97.40% 2.053 15 97.23% 2.424 69 97.14% 1.962 67 97.11% 1.889 68 96.98% 2.0610 26 96.74% 1.947 45 96.52% 2.388 21 95.74% 2.60
Total 524 97.12% 2.02
Table 4.5: Attendance Rate of State FFA Degree Recipientsin 2003 by District
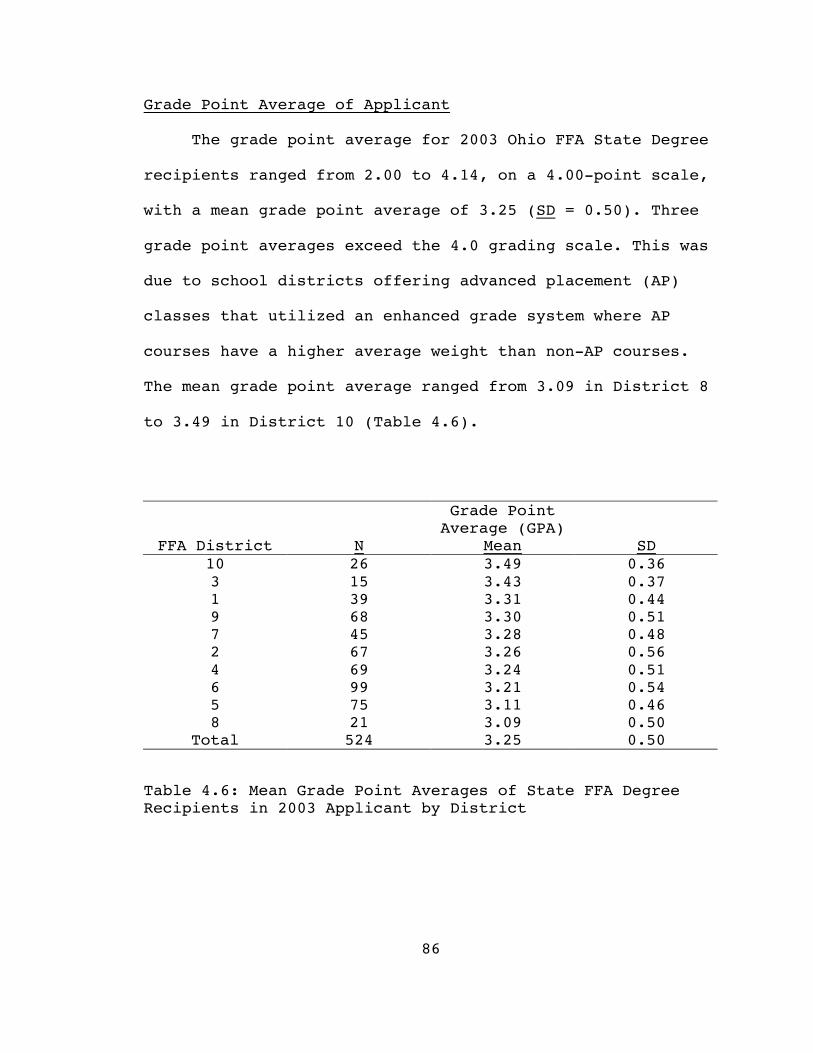
86
Grade Point Average of Applicant
The grade point average for 2003 Ohio FFA State Degree
recipients ranged from 2.00 to 4.14, on a 4.00-point scale,
with a mean grade point average of 3.25 (SD = 0.50). Three
grade point averages exceed the 4.0 grading scale. This was
due to school districts offering advanced placement (AP)
classes that utilized an enhanced grade system where AP
courses have a higher average weight than non-AP courses.
The mean grade point average ranged from 3.09 in District 8
to 3.49 in District 10 (Table 4.6).
FFA District N
Grade PointAverage (GPA)
Mean SD10 26 3.49 0.363 15 3.43 0.371 39 3.31 0.449 68 3.30 0.517 45 3.28 0.482 67 3.26 0.564 69 3.24 0.516 99 3.21 0.545 75 3.11 0.468 21 3.09 0.50
Total 524 3.25 0.50
Table 4.6: Mean Grade Point Averages of State FFA DegreeRecipients in 2003 Applicant by District
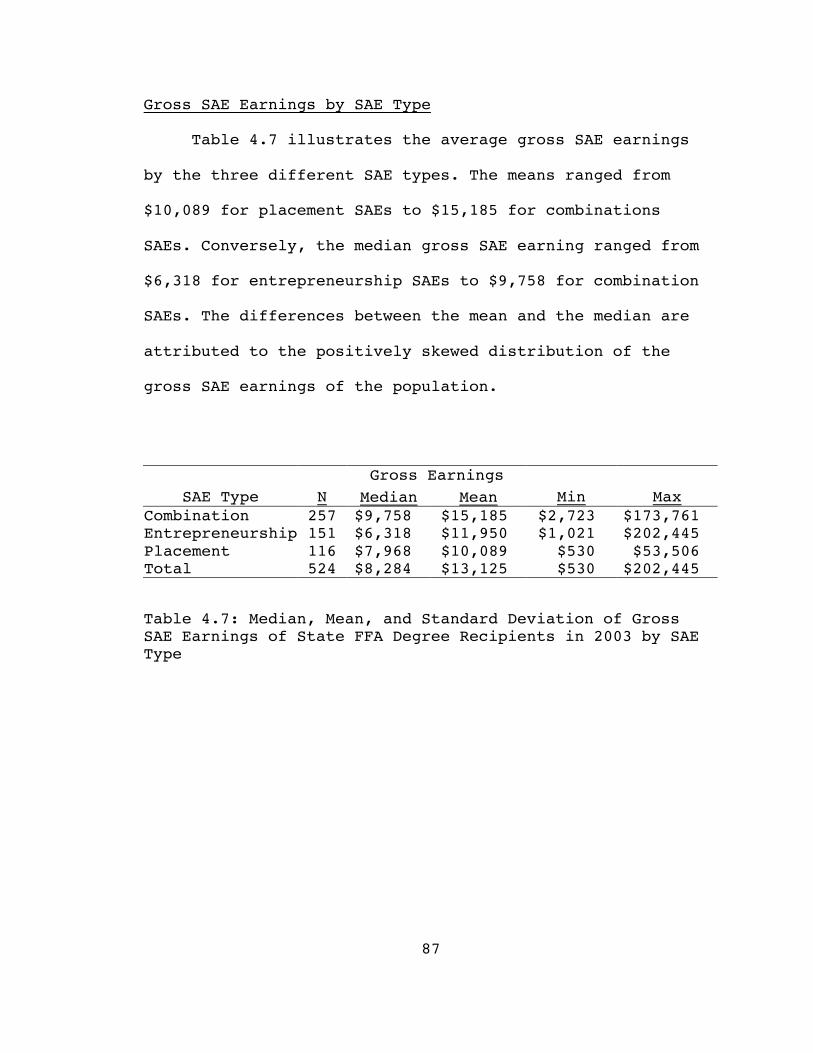
87
Gross SAE Earnings by SAE Type
Table 4.7 illustrates the average gross SAE earnings
by the three different SAE types. The means ranged from
$10,089 for placement SAEs to $15,185 for combinations
SAEs. Conversely, the median gross SAE earning ranged from
$6,318 for entrepreneurship SAEs to $9,758 for combination
SAEs. The differences between the mean and the median are
attributed to the positively skewed distribution of the
gross SAE earnings of the population.
Gross EarningsSAE Type N Median Mean Min Max
Combination 257 $9,758 $15,185 $2,723 $173,761Entrepreneurship 151 $6,318 $11,950 $1,021 $202,445Placement 116 $7,968 $10,089 $530 $53,506Total 524 $8,284 $13,125 $530 $202,445
Table 4.7: Median, Mean, and Standard Deviation of GrossSAE Earnings of State FFA Degree Recipients in 2003 by SAEType
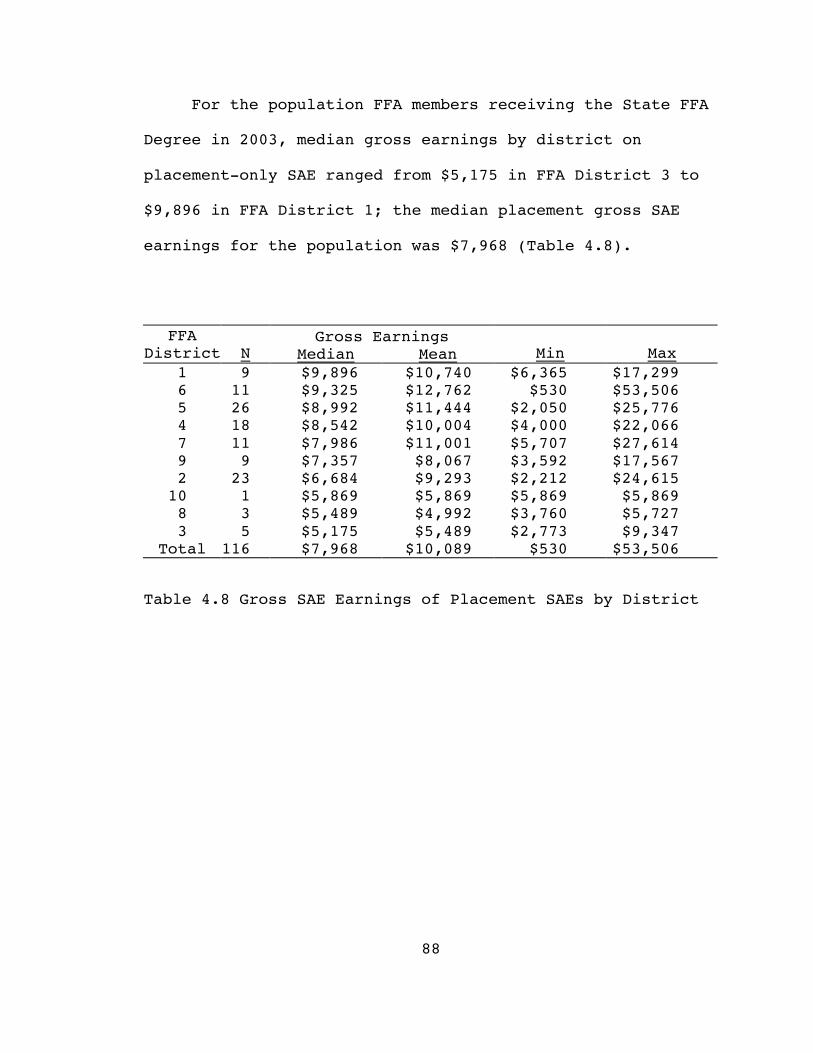
88
For the population FFA members receiving the State FFA
Degree in 2003, median gross earnings by district on
placement-only SAE ranged from $5,175 in FFA District 3 to
$9,896 in FFA District 1; the median placement gross SAE
earnings for the population was $7,968 (Table 4.8).
Gross EarningsFFADistrict N Median Mean Min Max
1 9 $9,896 $10,740 $6,365 $17,2996 11 $9,325 $12,762 $530 $53,5065 26 $8,992 $11,444 $2,050 $25,7764 18 $8,542 $10,004 $4,000 $22,0667 11 $7,986 $11,001 $5,707 $27,6149 9 $7,357 $8,067 $3,592 $17,5672 23 $6,684 $9,293 $2,212 $24,615
10 1 $5,869 $5,869 $5,869 $5,8698 3 $5,489 $4,992 $3,760 $5,7273 5 $5,175 $5,489 $2,773 $9,347
Total 116 $7,968 $10,089 $530 $53,506
Table 4.8 Gross SAE Earnings of Placement SAEs by District
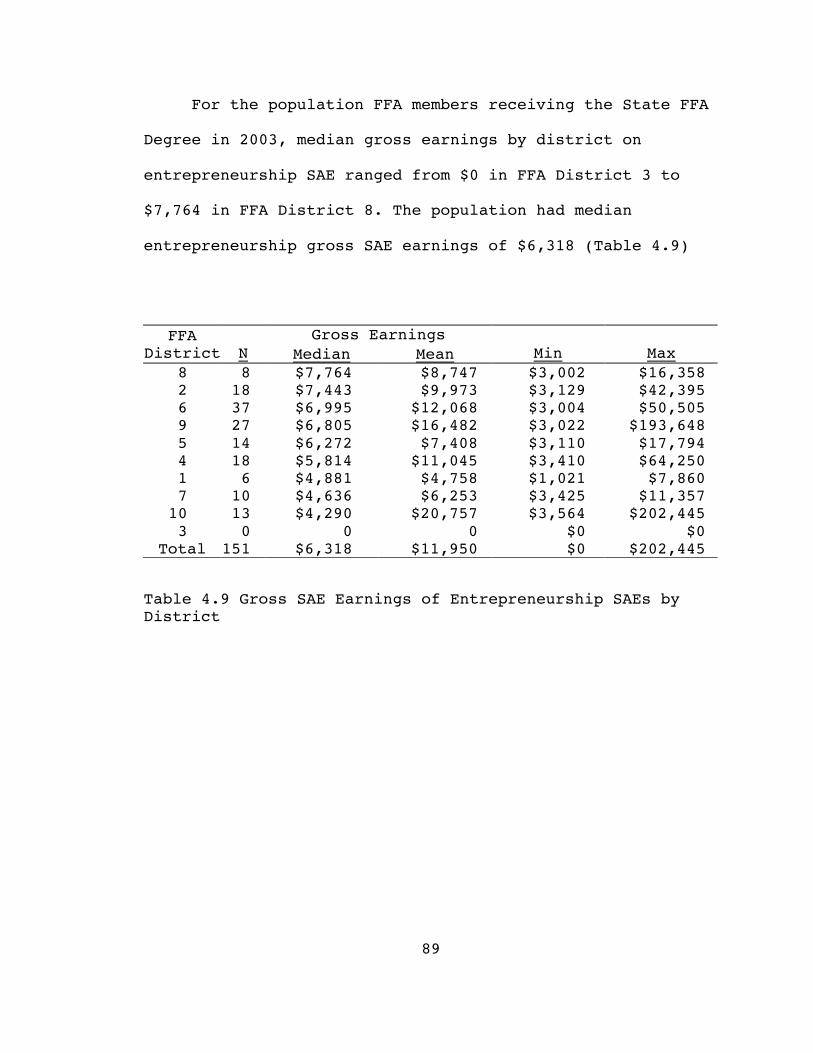
89
For the population FFA members receiving the State FFA
Degree in 2003, median gross earnings by district on
entrepreneurship SAE ranged from $0 in FFA District 3 to
$7,764 in FFA District 8. The population had median
entrepreneurship gross SAE earnings of $6,318 (Table 4.9)
Gross EarningsFFADistrict N Median Mean Min Max
8 8 $7,764 $8,747 $3,002 $16,3582 18 $7,443 $9,973 $3,129 $42,3956 37 $6,995 $12,068 $3,004 $50,5059 27 $6,805 $16,482 $3,022 $193,6485 14 $6,272 $7,408 $3,110 $17,7944 18 $5,814 $11,045 $3,410 $64,2501 6 $4,881 $4,758 $1,021 $7,8607 10 $4,636 $6,253 $3,425 $11,35710 13 $4,290 $20,757 $3,564 $202,4453 0 0 0 $0 $0
Total 151 $6,318 $11,950 $0 $202,445
Table 4.9 Gross SAE Earnings of Entrepreneurship SAEs byDistrict
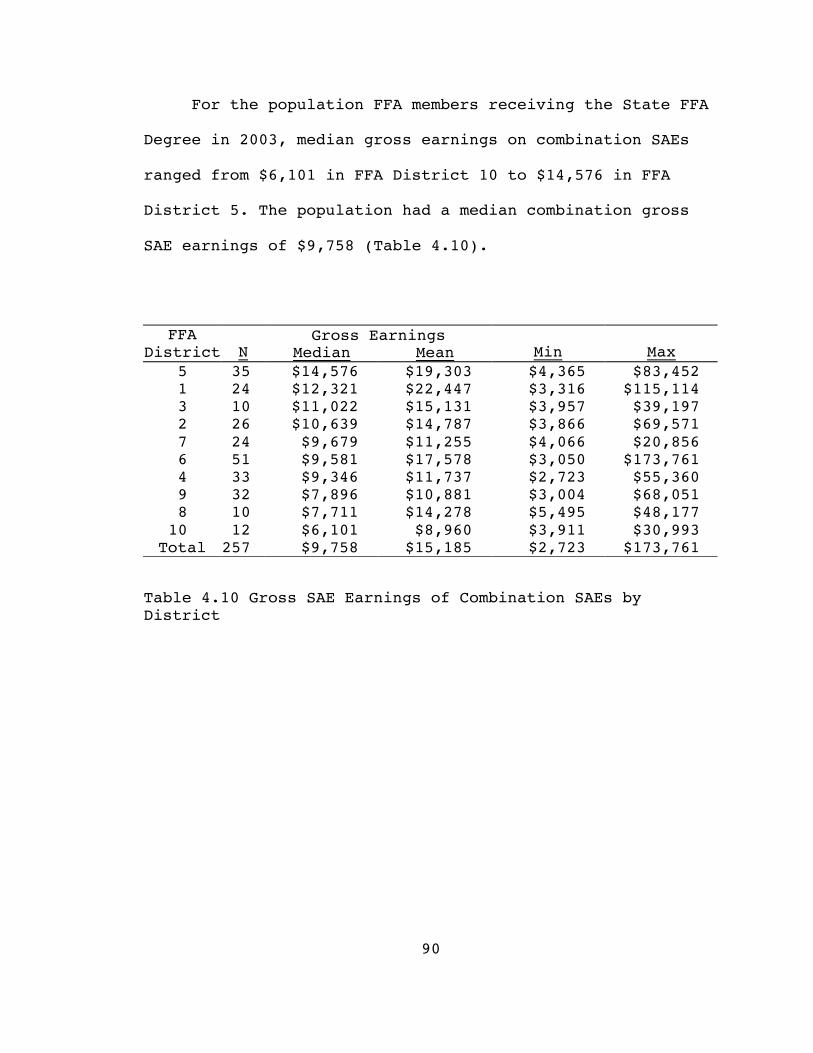
90
For the population FFA members receiving the State FFA
Degree in 2003, median gross earnings on combination SAEs
ranged from $6,101 in FFA District 10 to $14,576 in FFA
District 5. The population had a median combination gross
SAE earnings of $9,758 (Table 4.10).
Gross EarningsFFADistrict N Median Mean Min Max
5 35 $14,576 $19,303 $4,365 $83,4521 24 $12,321 $22,447 $3,316 $115,1143 10 $11,022 $15,131 $3,957 $39,1972 26 $10,639 $14,787 $3,866 $69,5717 24 $9,679 $11,255 $4,066 $20,8566 51 $9,581 $17,578 $3,050 $173,7614 33 $9,346 $11,737 $2,723 $55,3609 32 $7,896 $10,881 $3,004 $68,0518 10 $7,711 $14,278 $5,495 $48,17710 12 $6,101 $8,960 $3,911 $30,993
Total 257 $9,758 $15,185 $2,723 $173,761
Table 4.10 Gross SAE Earnings of Combination SAEs byDistrict
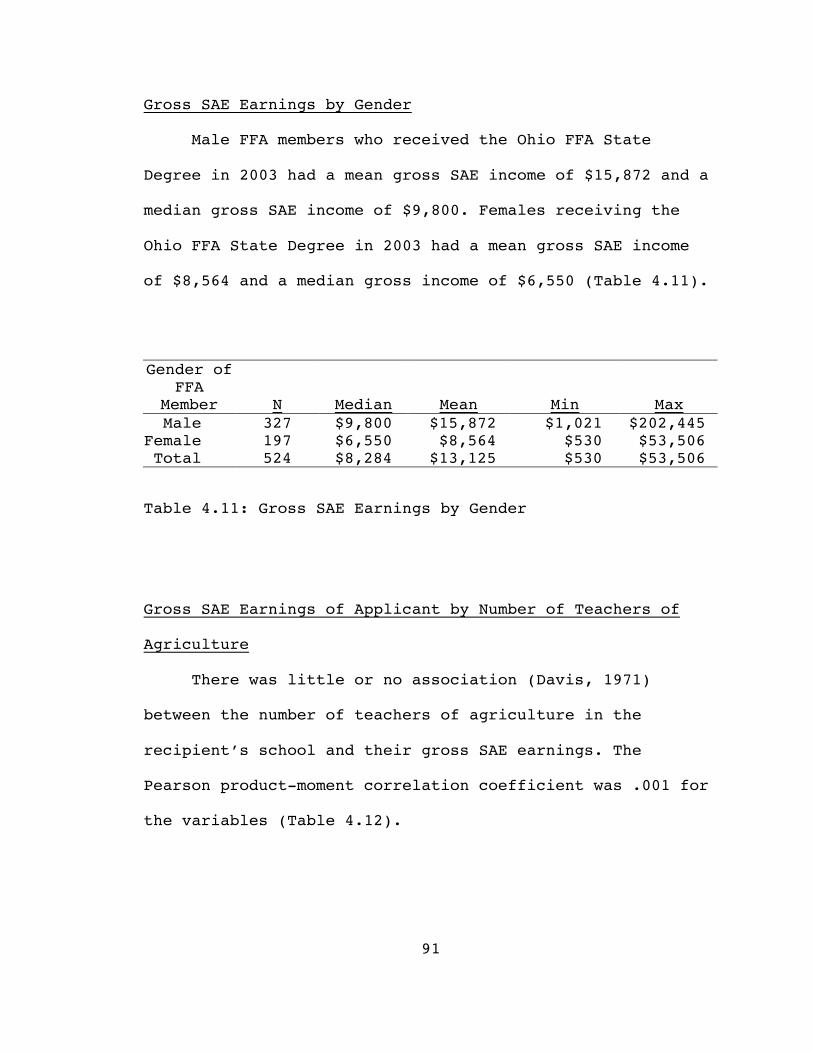
91
Gross SAE Earnings by Gender
Male FFA members who received the Ohio FFA State
Degree in 2003 had a mean gross SAE income of $15,872 and a
median gross SAE income of $9,800. Females receiving the
Ohio FFA State Degree in 2003 had a mean gross SAE income
of $8,564 and a median gross income of $6,550 (Table 4.11).
Gender ofFFA
Member N Median Mean Min MaxMale 327 $9,800 $15,872 $1,021 $202,445
Female 197 $6,550 $8,564 $530 $53,506Total 524 $8,284 $13,125 $530 $53,506
Table 4.11: Gross SAE Earnings by Gender
Gross SAE Earnings of Applicant by Number of Teachers of
Agriculture
There was little or no association (Davis, 1971)
between the number of teachers of agriculture in the
recipient’s school and their gross SAE earnings. The
Pearson product-moment correlation coefficient was .001 for
the variables (Table 4.12).
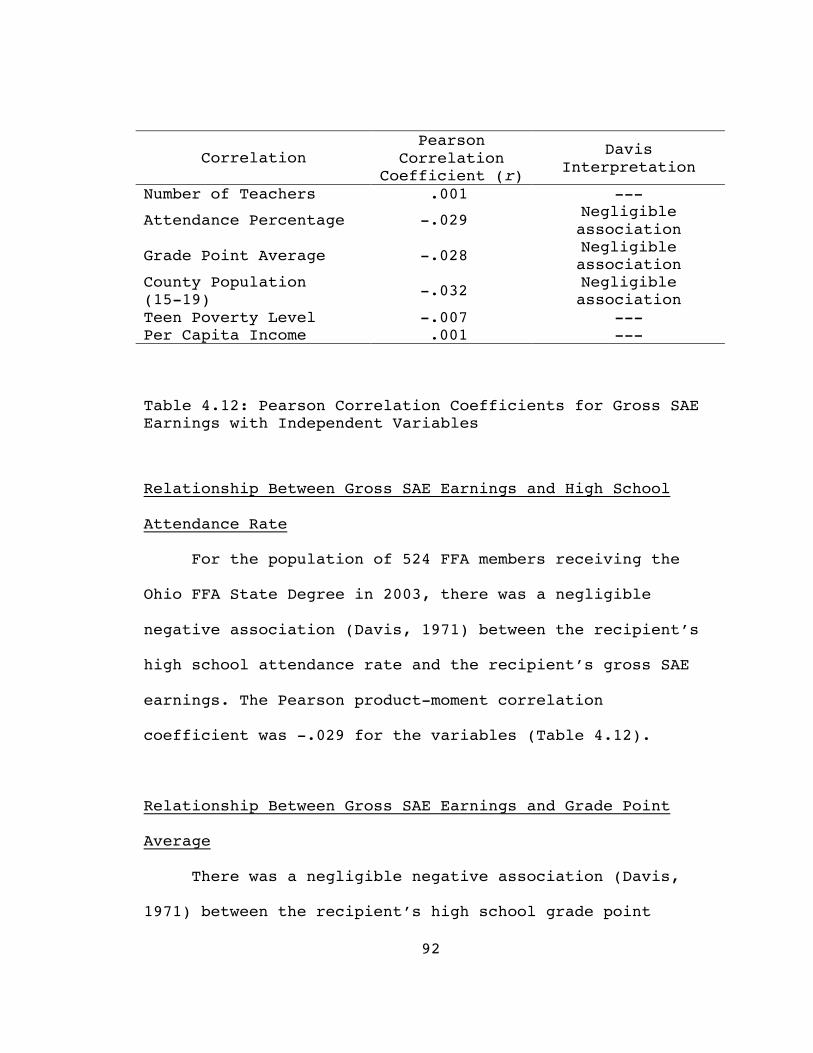
92
CorrelationPearson
CorrelationCoefficient (r)
DavisInterpretation
Number of Teachers .001 ---
Attendance Percentage -.029 Negligibleassociation
Grade Point Average -.028 Negligibleassociation
County Population(15-19) -.032 Negligible
associationTeen Poverty Level -.007 ---Per Capita Income .001 ---
Table 4.12: Pearson Correlation Coefficients for Gross SAEEarnings with Independent Variables
Relationship Between Gross SAE Earnings and High School
Attendance Rate
For the population of 524 FFA members receiving the
Ohio FFA State Degree in 2003, there was a negligible
negative association (Davis, 1971) between the recipient’s
high school attendance rate and the recipient’s gross SAE
earnings. The Pearson product-moment correlation
coefficient was -.029 for the variables (Table 4.12).
Relationship Between Gross SAE Earnings and Grade Point
Average
There was a negligible negative association (Davis,
1971) between the recipient’s high school grade point
93
average and gross SAE earnings of the 524 FFA members
receiving the State FFA Degree in 2003. The Pearson
product-moment correlation coefficient was -.028 for the
variables (Table 4.12).
Relationship Between Gross SAE Earnings and County
Population (15-19)
For the population of 524 FFA members receiving the
State FFA Degree in 2003, there was a negligible negative
association (Davis, 1971) between county population (15-19)
and the recipient’s gross SAE earnings. The Pearson
product-moment correlation coefficient was -.032 for the
variables (Table 4.12).
Relationship Between Gross SAE Earnings and County Poverty
Level (15-19)
For the population of 524 FFA members receiving the
State FFA Degree in 2003, there was little to no
association (Davis, 1971) between teen poverty level (15-
19) of the home county and gross SAE earnings. The Pearson
product-moment correlation coefficient was -.007 for the
variables (Table 4.12).
94
Relationship Between Gross SAE Earnings and County Per
Capita Income
For the population of 524 FFA members receiving the
State FFA Degree in 2003, there was little to no
association (Davis, 1971) between county per capita income
and gross SAE earnings. The Pearson product-moment
correlation coefficient was .001 for the variables (Table
4.12).
95
CHAPTER 5
CONCLUSIONS, IMPLICATIONS, AND RECOMMENDATIONS
Introduction
There are numerous benefits for agricultural education
students to conduct a supervised agricultural experience
program. One benefit for agricultural education students
who complete a supervised agricultural experience is a
return on their time and/or money invested. The purpose of
this study was to identify factors that influenced the
economic return on a student’s time and/or money invested
in his or her supervised agricultural experience using data
collected from the recipients of the State FFA Degree in
Ohio during the 2002-2003 academic year.
Research Questions
The research questions of the study were:
1. What are the characteristics of the Ohio FFA State
Degree recipients in 2003, including but not limited
to age, gender, years of agricultural education, type

96
of SAE, average gross SAE earnings, average grade
point average, and average attendance rate?
2. Are there group differences in gross SAE earnings for
students with different types of SAE programs?
3. Are there group differences in gross SAE earnings for
students from different FFA districts?
4. Is there a relationship between the number of
agriculture teachers in a student’s school and his or
her gross SAE earnings?
5. Is there a relationship between students’ rate of high
school attendance and their gross SAE earnings?
6. Is there a relationship between students’ high school
grade point average and their gross SAE earnings?
7. Is there a difference in gross SAE earnings between
male and female students?
8. Is there a relationship between the population of
students’ home counties (ages 15-19) and their gross
SAE earnings?
9. Is there a relationship between the teen poverty level
(ages 15-19) of students’ home counties and their
gross SAE earnings?
10. Is there a relationship between per capita income of
students’ home counties and their gross SAE earnings?
97
Research Design
The study was a descriptive correlational study that
compared characteristics of the target population (N = 524)
of Ohio FFA State Degree recipients in 2003. The purpose of
the study was to portray the incidence, distribution, and
characteristics of the recipients of the Ohio FFA State
Degree, to explore relationships, and to formulate a more
specific research problem (McCracken, 1998).
Population
The target population for the study was all Ohio FFA
State Degree recipients for the 2002-2003 academic year.
The population frame for the study was obtained from the
Ohio FFA Association, Inc. (2003).
The descriptive correlational study included all
individuals who received their Ohio FFA State Degree in
2003. The strength of a census lies in irrefutability. Its
weakness lies in its confinement to a single limited
population at a single point in time (Ary, Jacobs,
Razavieh, 1985. p.338).
Additionally, through the utilization of a census,
major threats to external validity found in a descriptive
study, such as frame error, sampling error, selection
error, and non-response error were controlled. For this

98
study, the frame was the 524 recipients of the Ohio FFA
State Degree in 2003.
Data Collection
The State FFA Degree application (Appendix A) provides
applicants with the capacity to chronicle their
participation in the FFA, school and community activities,
and to document their record of earnings through their SAE.
All information on the State FFA Degree was self-reported
data. A caveat to this self-reported data is that all data
was taken directly from the State FFA Degree applicant’s
SAE record books. All record books were evaluated and
checked for transference accuracy onto the State FFA Degree
application by a panel of teachers of agriculture during a
formal evaluation process. Furthermore, signatures of
authenticity are required from the applicant, his or her
parent or guardian, the teacher of agriculture, the high
school guidance counselor and a local school administrator
(either the high school principal or the school
superintendent).
Additionally, data pertaining to the applicant’s grade
point average and attendance rate were calculated from the
applicant’s high school transcript that was required as
part of the State FFA Degree application process. The
99
student’s guidance counselor verified the reported grade
point average and attendance rate by affixing his or her
signature to the application.
The data for this study was collected from each of the
524 applications of Ohio’s State FFA Degree recipients in
2003, which was the target population of the study. All
data were entered into a Microsoft Excel worksheet and then
converted to an SPSS 11.0 data file for analysis.
Data Analysis
The data collected for the study were analyzed using
Microsoft Excel and the Statistical Package for the Social
Sciences (SPSS) computer programs. This study was a census;
therefore, descriptive statistics provided measures of
central tendency and variability for organizing,
summarizing, and analyzing differences between groups.
Pearson’s product-moment correlation coefficients were used
to summarize the magnitude and direction of the
relationship between variables.
Summary of Findings and Discussion
The following summary of findings relate to the
population of Ohio FFA members who received the State FFA
Degree in 2003. The findings of this study reflect the
100
collective data of Ohio FFA members who received their
State FFA Degree in Ohio in 2003, and are not
representative of any other population.
Research Question 1
Demographics of the Population
Total membership in the Ohio FFA Association at the
time of data collection was 21,247. The target population
(N = 524) represented 2.47 percent of the entire FFA
membership in Ohio (N = 21,247) for the 2002-2003 academic
year. Of the entire Ohio FFA membership, 14,235 (67%) of
the membership were male and 7,011 (33%) were female (Ohio
FFA Association, 2003). For the population covered by the
study, 327 (62.4%) were male and 197 (37.6%) were female.
Age and Years of Enrollment in Agricultural Education
Years of enrollment in agricultural education ranged
from 1.5 to 4.0 with a median of 3.03 and a mode of 2.5.
Ages ranged from 16 to 21 for the population. The mode was
17 years of age (SD = 0.86), and the median was 17.
Attendance Rate and Grade Point Average
The population had a mean attendance rate of 97.1% (SD
= 2.02) and a mean grade point average of 3.25 (SD = 0.50).
101
When comparing attendance rates between sexes, the mean
differences varied by less than one percentage point. Males
attended school 97.2 percent of the time and females
attended school 96.9 percent of the time. Females had a
mean grade point average of 3.37 compared to a mean grade
point average of 3.17 for males, resulting in a modest
difference between the two groups.
There was a difference in attendance rate and grade
point average between SAE types. FFA members with a
placement SAE had a 97.1 percent attendance rate and a 3.04
grade point average. FFA members with an entrepreneurship
SAE had a 97.3 percent attendance rate and a 3.34 grade
point average. FFA members with a combination SAE had a
97.0 percent attendance rate and a 3.28 grade point
average.
Type of Supervised Agricultural Experience
In the population, 116 (22.1%) reported an SAE of
placement only, 151 (28.8%) reported an SAE of
entrepreneurship only, and 257 (49.0%) reported an SAE
consisting of a combination of placement and
entrepreneurship. The population receiving the State FFA
Degree in 2003 had a mean gross income of $13,125 and a
median gross income of $8,284.
102
There was a difference between gross SAE earnings by
SAE types. Individuals in the population with placement
only SAE (N = 116) had a mean gross SAE earnings of $10,189
and a median gross income of $7,968. Individuals in the
population with an entrepreneurship SAE (N = 151) had mean
gross SAE earnings of $11,950 and a median gross income of
$6,318. Individuals with a combination SAE (N = 257) had
mean gross SAE earnings of $15,185 and a median gross
income of $9,758.
The typical FFA member who received the Ohio FFA State
Degree in 2003 was male, 17 years of age, completed three
years of agricultural education, maintained a 3.25 grade
point average, and attended school 97.1 percent of the
time. The typical recipient had an SAE that was a
combination of placement and entrepreneurship experiences,
which resulted in gross earnings of $13,125. The typical
recipient resided in District 6 and was an FFA member in an
agriculture education program that employed one teacher of
agriculture.
Research Question 2
The research found that there were differences in
gross SAE earnings among students with different types of
SAE programs. State FFA Degree recipients in 2003 that
103
conducted a combination SAE earned more money than students
who conducted a placement or an entrepreneurship SAE.
Students who worked in a job placement SAEs were
limited to the total number of hours in which they could
work. According to the U.S. Department of Labor (2000),
adolescents aged 15 to 17 worked an average of 17 hours a
week during the school year and 23 hours a week during the
summer months. Furthermore, minimum wage is frequently
associated with adolescent workers entering the workforce
and in 1998, the median earnings for adolescent workers
between the ages of 15 to 17 were $5.57 per hour (U.S.
Department of Labor, 2000).
The average number of years enrolled in an
agricultural education program for the 2003 Ohio FFA State
Degree recipients was three years. Therefore, students with
a placement SAE could, on average, have earned
approximately $15,000 for the same period. With time being
a variable of limited range, especially for students
attending high school, it is easy to see that wage earning
does have limited possibilities. Additionally, placement
SAE resulted in the least variability in earnings of the
three types of SAEs in the study due to the constraints of
working after the school day.
104
On the other hand, students with entrepreneurship SAEs
had the largest variability in earnings in the study. This
could be attributed to the unlimited earning potential
inherent to this type of SAE. Along with the ability to
earn more money, comes the threat of increased financial
risk. Students with an entrepreneurship SAE assume a
greater financial risk than do students with a combination
SAE and even greater risk when compared to those with a
placement SAE. While this entrepreneurial risk can be
turned into greater financial reward, it can also result in
a greater financial loss. This could be the very reason why
many students elect to participate in a combination SAE.
Here, students possess the ability to generate a steady
flow of income through their placement SAE, while
capitalizing on their ability to maximize their profits
through their entrepreneurship SAEs.
According to Mick et al. (1984), the more money
students earned from their SAE, the more likely they were
to be employed in agricultural occupations. This conclusion
may imply that students who earn more from their SAE may be
more established in their chosen career field. The study
found that students conducting entrepreneurship SAEs
reported larger sums of money than those with combination
or placement SAEs. Future agricultural education
105
researchers should investigate the impact of SAE type on
agricultural education and the economy.
Research Question 3
This study found differences in median gross SAE
earnings for students from different FFA districts. The
difference was rather substantial when comparing Ohio FFA
State Degree recipients in 2003 in District 5, which had a
median gross SAE income nearly 50 percent higher than that
of Ohio FFA State Degree recipients from District 10.
The two districts (Districts 2 & 5) with the highest
median SAE income were also relatively rural and were
considered areas of high agricultural production.
Conversely, the two districts (Districts 8 & 10) with the
lowest median SAE income were also rural, but located in
southeastern Ohio and were all Appalachian counties
(Appendix F).
Research pertaining to SAE did not indicate geographic
data related to earnings on SAE programs. Presently, the
minimum standards for gross earnings for the Ohio FFA State
Degree are $4,000 for placement SAEs, $3,000 for
entrepreneurship SAEs, and $3,500 for combination SAEs.
When comparing high and low performing district median
gross SAE earnings with the number of State FFA Degrees
106
awarded in 2003 (District 5, N = 75; District 10, N = 26),
one might conclude that there is potentially a geographical
bias related to SAE earnings. If a potential inequality
exists within the state’s boundaries, a potential bias may
also exist on the national level as it pertains to the
American FFA Degree and other recognition programs that
incorporate financial statements as part of the evaluation
process.
Research Question 4
The study found that there was little or no
association (Davis, 1971) (r = .001) between the number of
teachers of agriculture employed in the local school and
gross SAE earnings for the population. Since this study
failed to show a relationship between the number of
teachers of agriculture in the recipient’s school and the
recipient’s gross SAE earnings, it failed to support much
of the related research.
Boone, Elliot, and Doerfert (as cited in Swortzel,
1996) concluded that teachers in multiple teacher
departments maintained workable student-teacher ratios,
which promoted the continuation of active SAEs. Although,
“agriculture teachers teaching in multiple teacher
departments have more positive perceptions regarding
107
planning activities for SAEs than those who taught in
single teacher departments” (Swortzel, 1996, p.52), the
study did not find that students from multiple teacher
departments reported an increased economic benefit on their
SAE, when compared to students from single teacher
departments.
While teacher supervision is foremost to having
quality SAE programs (Arrington & Hoover, 1994); the
suggestion that additional teachers of agriculture would
have an economic benefit on students’ SAEs through
additional supervision remains unsupported. Research by
Byers (1972) reported that student supervision was related
to the number of students enrolled in the agricultural
education program. The fewer students enrolled, the greater
the likelihood that students would receive teacher
supervision. Studies confirm the positive relationship
between the amount of teacher supervision and SAE program
quality and/or scope (Thomason, 1965; Arrington, 1981;
Harris, 1983; Gibson, 1987; Anyadoh, 1989), even though
lack of release time, large classes, and limited travel
funds made supervising SAEs difficult (Dyer & Williams,
1997b).

108
Research Question 5
As reported previously, the population had an
attendance rate of 97.1% and median gross SAE earnings of
$8,284. The study determined that there was a negligible
negative association (Davis, 1971) (r = -.029) between high
school attendance rate and gross SAE earnings. Although
this difference was negligible, it must be considered
within the context of the study, which reported only the
applicants’ high school attendance rate. According to the
Ohio FFA Degree Minimum Standards (Appendix A), to qualify
for the Ohio FFA State Degree, applicants must have a
minimum attendance rate of 93%. Therefore, one must use
caution when interpreting this result when considering the
limited range of the high school attendance rate variable.
Additionally, recipients of the Ohio FFA State Degree in
2003 had an attendance rate that exceeded the attendance
rate for the state of Ohio (Ohio Department of Education,
2003b).
In an agrarian society, there is a notion for students
living or working on a farm to periodically be absent from
school in order to perform the work common in the
agricultural industry. Previous research (Flowers, as cited
in Croom, 1991) indicated that broadening of the
agricultural education curriculum affected a different type
109
of student. Opinion was that the diversification of
students enrolled in agricultural education adversely
affected the quality of the student’s SAEs. Teachers and
teacher educators even blamed the type of student enrolling
in agricultural education programs as the chief cause for
the decline in SOE [sic] (Flowers, as cited in Croom,
1991). Additionally, the National Research Council (1988)
recommended that the relevance and scope of Supervised
Occupational Experience (SOE) [sic] be broadened. The
directed or supervised practice in agriculture method gave
way to SAE and was expanded to include not only
entrepreneurship, but also placement, improvement,
exploration, and research. When comparing differences in
SAE philosophy evoked in the Smith-Hughes Act of 1917 and
the present day philosophy according to Barrick et al.
(1992), one may postulate that in earlier days, there was a
tendency for FFA members who were actively involved in
production agriculture to attend school less often,
especially when compared to current FFA members who are
involved more non-production oriented agricultural jobs.
Research supporting higher attendance rates can be
attributed to positive experiences in school. Gilman (2001)
found that positive learning experiences in after-school
activities and programs, particularly if they are school-
110
based, produced a more positive identification with school.
The practice of SAEs can be described as a positive school-
based program, especially if adequate supervision is
provided by the teacher of agriculture. Furthermore,
adolescents who participated in extracurricular activities,
school athletics, band and other school sponsored
activities, performed community service, and participated
in clubs were highly correlated with school success,
including attendance rates, grade point averages, and
aspirations to continue education beyond high school (U.S.
Department of Education, 1995). SAEs, especially those
conducted outside the school day, not only have positive
financial benefits for students, but also may encourage
them to attend school more often than they would without
such involvement. Although this study indicated a slight
negative relationship on student attendance, according to
previous research (Dyer & Osborne, 1996; Cheek, Arrington,
Carter, & Randell, 1994; Noxel & Cheek, 1988; Morton,
1978), one may surmise that attendance rates could be
higher for students enrolled in an agricultural education
program conducting an SAE, compared to students not
enrolled in an agricultural education program.
111
Research Question 6
The study found that the population had a grade point
average of 3.25 and median gross SAE earnings of $8,284.
This resulted in a negligible negative association (Davis,
1971) (r = -.028) between high school grade point average
and gross SAE earnings for the study. This finding
indicated a tendency for FFA members who earned more money
to have a slightly lower grade point average. The results
of this research question were nearly identical to those
found in research question five that pertained to high
school attendance; therefore, a similar conclusion can be
drawn on grade point average and SAE earnings. Again, this
difference was negligible and must also be taken within the
context of the study, which reported only the applicants’
high school grade point average. In accordance with the
Ohio FFA Degree Minimum Standards (Appendix A), FFA members
must have a minimum grade point average of a 2.00 to
qualify for the Ohio FFA State Degree. Although there was a
greater variance for grade point average than attendance
rate, caution should be taken when interpreting this
result.
Overall, FFA members receiving the Ohio FFA State
Degree in 2003 were outstanding students when considering
their high school attendance rate and the high school grade
112
point average. Different results would be expected if the
entire membership (N = 21,247) of the Ohio FFA Association
were surveyed.
Although not using economic SAE data in their
research, studies have linked participation in SAE to
positive student achievement in agricultural knowledge
(Cheek, Arrington, Carter, & Randell, 1994; Dyer & Osborne,
1996). Miller (2003) learned that students had increased
academic achievement when they participated in
extracurricular activities. This may imply that students
who participate in extracurricular activities are more
focused on doing well in school or that academically gifted
students participate in more extracurricular activities.
Miller’s study included activities beyond the scope of the
school day; therefore, one could logically interpret that
SAEs could be categorized as an extracurricular activity.
Morton (1978) found a positive relationship between
SAE scope and student achievement gauged by written test
scores. Noxel and Cheek (1988) found that for students
enrolled in ornamental horticulture, there was a positive
relationship between SAE scope and student achievement.
Buyck (as cited in Hoover & Arrington, 1994) predicted that
students who had SAEs would have higher grade point
averages in agricultural education. Peer groups with
113
similar interests can have a powerful influence on the
achievement of young people (Eccles & Barber, 1999; Gerber,
1996). Gibson (as cited in Hoover & Arrington, 1994)
reported a positive relationship between quality of SAE and
grade point average for senior agricultural education
students in Kentucky. Similarly, there was a moderate,
positive correlation between SAE participation and student
achievement in Agriscience programs in Florida (Cheek et
al., 1994). Finally, according to Harlin and Weeks (2001),
SAE supporters suggested that SAE involvement might improve
student achievement even though some obstacles exist.
Research Question 7
Females in the population had a median gross income of
$6,550 and a mean income of $8,564 (SD = $7,089). Males in
the population had a median gross SAE income of $9,800 and
a mean income of $15,872 (SD = $21,884).
The study found that there was a difference in gross
SAE earnings between male and female students indicating
that males had higher gross SAE earnings than did their
female counterparts. This conclusion supports research from
the U.S. Department of Labor (2000) that concluded that
employed male youths worked more hours than did female
youths in both the school and summer months in 1996-98.
114
While the study did not collect data on the number of hours
worked or the rate of pay, if young males worked more hours
than did young females and hourly wage earnings were
constant, then males would earn more money than would
females.
In following the requirements of the Ohio FFA Degree
Minimum Standards (Appendix A), SAE earnings reported on
the State FFA Degree application must include wages that
have been earned through an agricultural related
experience. According to the U.S. Department of Labor
(2000), “landscape and horticultural services, livestock
production, and automotive repair were some of the
industries on the top 10 list for male youths that were not
on the list for their female peers” (p. 18). Furthermore,
the U.S. Department of Labor (2000) reported that females
had a tendency not only to work in fewer agriculturally
related fields, but also to be employed in child-care more
than males.
Research Question 8
This study established that there was a negligible
relationship (Davis, 1971) (r = -.032) between the
population of students’ home counties (ages 15-19) and
their gross SAE earnings. There was a negligible tendency
115
for students to have higher gross SAE earnings when they
resided in less populated counties. According to Appendix
E, teens (ages 15-19) have a tendency to reside in closer
proximity to places of employment.
From an agricultural perspective, counties with larger
populations are less likely to have areas of traditional
employment in the agricultural industry. Hence, Ohio has
few traditional agricultural education programs in counties
with large populations. However, those counties often have
a small number of non-traditional programs (e.g.,
horticulture, animal care, natural resources, and power
technology). Students could be at a disadvantage if they
live in nonagricultural areas of the state. Since
membership in the FFA in Ohio begins in the ninth grade,
many first year and even second year members have yet to
obtain their license to drive, therefore limiting their
ability to obtain agriculturally related employment in
close proximity to their home.
Research Question 9
This study established that there was no relationship
between county teen poverty levels (ages 15-19) and
students’ gross SAE earnings. Due to the inconclusiveness
of the findings related to the economic variable of teen
116
poverty level, it became evident that the economic
environment does not influence students’ earnings on their
SAE.
This finding is unlike the conclusion drawn in
research question three, which reported that there was a
difference in gross SAE earnings among FFA districts.
Appendix E illustrates that teen poverty levels (ages 15-
19) in Appalachian counties (Appendix F) are higher than in
non-Appalachian counties. This substantiates the concept
that the economic environment of the county does not affect
students’ earnings on their SAE.
Research Question 10
This study established that there was no relationship
between county per capita income and students’ gross SAE
earnings. Since the study did not establish a relationship
between gross SAE earnings and the economic variable of per
capita income, it became evident that the county economic
setting does not influence student SAE earnings on their
SAE. The findings in this research question are similar to
the conclusions drawn in research question nine as it
relates to the economic climate of the county. This
conclusion confirms the notion that the economic setting of
117
the county does not influence student earnings on their
SAE.
Conclusions
Figure 5.1 illustrates the factors that contribute to
the gross SAE earnings of individuals receiving the Ohio
FFA State Degree in 2003. These factors, SAE type, FFA
district, and gender, were all categorized as personal
characteristics, indicating that they are characteristics
that either described the student or existed by student
choice.
SAE Type
The research found that there was a difference in SAE
earnings depending upon what type of SAE the member
selected. A student’s earning potential parallels the
assumption of financial risk when comparing earnings among
the three types of SAEs.
FFA District
In addition, it is obvious that the geographical
region of Ohio in which the FFA member resides limits the
member’s income earning potential. While there was no
relationship between SAE earnings and county population and
teen poverty rates, there was a relationship between SAE
earnings and FFA district location.
118
Gender
The research determined that male and female FFA
members had different levels of income. Males appear to be
more involved in skill development and wage earnings
activities while females seem to be involved in leadership
and personal development activities.
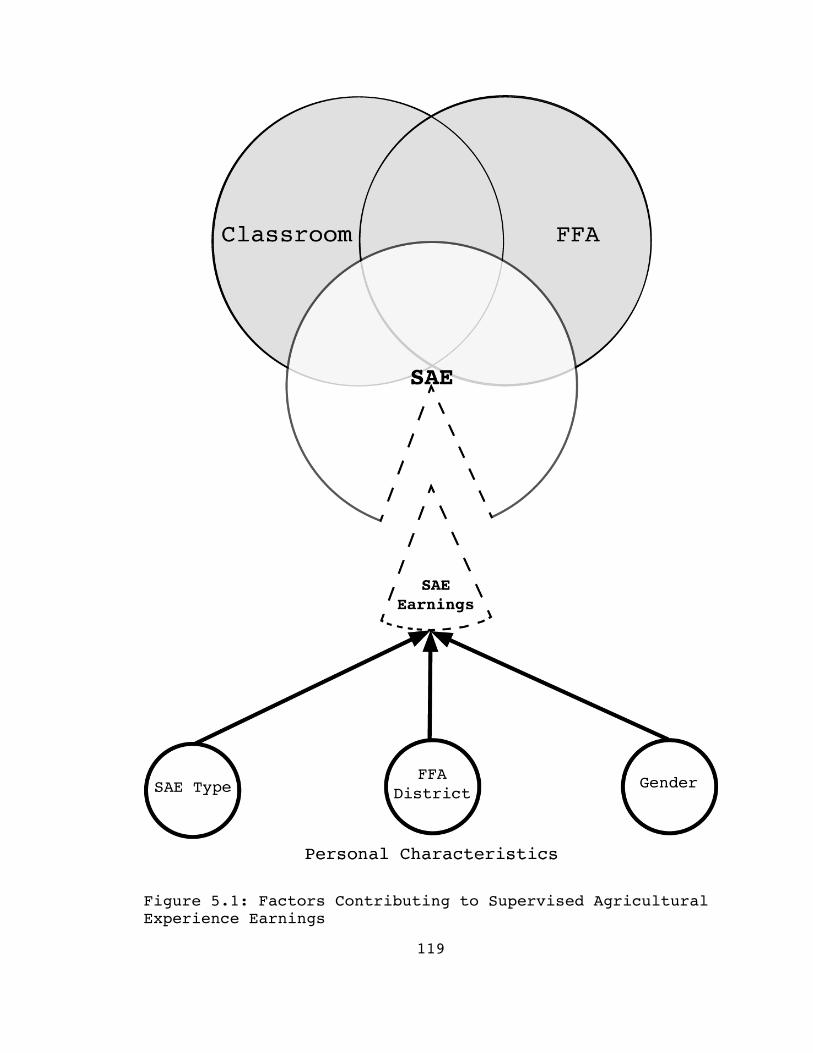
119
Figure 5.1: Factors Contributing to Supervised AgriculturalExperience Earnings
120
Recommendations
It is important to note that the study describes a
very specific population and therefore has limitations
regarding inferences toward other populations. However, the
following recommendations should help agricultural
educators as they pursue further research pertaining to the
variables surrounding the factors that contribute to SAE
earnings. Furthermore, the study should also assist in
adding to the body of knowledge concerning supervised
agricultural experience programs.
Recommendation for Practice
The results of the study gave rise to the following
recommendation that should be carefully considered for
implementation by teachers of agriculture in Ohio. Teachers
of agriculture should constantly pursue SAE programs that
reflect the diversity of their membership and community.
Teachers should instruct their students about the economic
implications affiliated with the type of SAE selected.
Entrepreneurship SAEs carry with them a great threat of
risk but also have the potential for a greater economic
return. At the other end of the SAE spectrum are placement
SAEs that have limited earning capabilities but also
reflect the least amount of personal financial risk.
121
Students should be advised that agricultural career
opportunities vary by geographic region of the state.
Agricultural opportunities and earning potential are
different in rural, urban, and suburban areas of Ohio.
While larger population areas may offer more earning
potential, they may be limited in the type of agricultural
occupations available to students.
Recommendations for Further Research
In addition to the recommendation for practice, the
study recommends that research surrounding the economic
aspects of SAE be further investigated.
1. Requirements for the Ohio FFA State Degree should be
further studied to determine if it is geographically
equitable within Ohio. The study determined that there
was a difference in gross SAE earnings among FFA members
that resided in different districts. Appendix C
illustrates that the districts in Ohio are
geographically different which might suggest that the
difference in SAE earnings could be based upon
socioeconomic factors not controlled for on the State
FFA Degree. These differences could also have
implications for FFA members applying for the American
122
FFA Degree and other recognition programs that consider
student earnings.
2. Agricultural education researchers should team with
researchers in agricultural economics to measure the
economic impact of agricultural education programs on a
local and state level. The study of economic impact, as
it pertains to the complete agricultural education
program, could provide information that may be used to
justify and potentially increase local, state, and
federal support.
3. Longitudinal studies should be conducted on Ohio FFA
State Degree recipients to determine the equity of the
financial requirements of the Ohio FFA State Degree
given the economic variations of the diverse
geographical regions of the state.
4. Limitations on SAE earnings need to be further
investigated to determine the extent of the association
among SAE earnings, grade point average, and attendance
rates. Although the study found a negligible negative
association among SAE earnings, grade point average, and
attendance rates, further research should evaluate the
effects of the FFA’s reward system as it relates to the
academic achievements of its membership.
123
5. Further exploration is needed in the area of gender
differences regarding SAE earnings, academic
achievement, and SAE type.
6. No differences were identified when analyzing selected
county-based variables and SAE earnings. This indicates
that other factors, not included in this study, may
affect SAE earnings of FFA members. Further research
should be undertaken that investigates and identifies
the nature of these contributing factors.
124
LIST OF REFERENCES
Agricultural Education Service, Ohio Department ofEducation (2003). Agriculture Education Teacherdirectory database (2002-2003), Columbus, OH.
Andelin, J., Carson, N., Feuer, M., Capper, J., & Branyan,G. (1989). Performance standards for secondary schoolvocational education. Science, education, andtransportation program. Office of TechnologyAssessment, Congress of the United States, WashingtonD.C.
Anyadoh, E. B. (1989). The relationship between selectedfactors and supervised occupational experience scoresin Ohio. Unpublished doctoral dissertation, The OhioState University, Columbus.
Arrington, L. R. (1981). Relationship of length ofvocational agriculture teacher contract to supervisedoccupational experience program scope and FFA chapteractivity level. Doctoral dissertation, The Ohio StateUniversity, Columbus, OH.
Arrington, L. R. (1984). Teacher summer employment and theactivity level of an FFA chapter. The Journal of theAmerican Association of Teacher Educators inAgriculture, 25(1), 48-53.
Arrington, L. R., & Cheek, J. G., (1990). SAE scope andstudent achievement in agribusiness and naturalresource education. Journal of Agricultural Education31(2), 55-61.
Arrington, L. R., & Hoover, T., (1994). SAE researchfindings. The Agricultural Education Magazine, 67(5),9-11.
Ary, D., Jacobs, L. C., & Razavieh, A. (1985). Introductionto research in education (3rd ed.). Orlando, FL:Harcourt Brace College Publishers.
125
Barrick, R. K., Arrington L, Hefferman, T., Hughes, M.,Moody, L. Ogline, P., et al. (1992). Experiencingagriculture: A handbook on SAE. Alexandria, VA:National Council for Agricultural Education.
Barrick R. K., Hughes, M., & Baker, M. (1991). A review andsynthesis of research on supervised experience inagriculture. Columbus, OH: The Ohio State University,Department of Agricultural Education. (ERIC DocumentReproduction Service No. ED340900).
Beard, W. P. (1948). Teaching conservation, a guide innatural resources education. Washington: AmericanForestry Assn.
Byers, C. W. (1972). The relationship of selected variablesto the supervision provided students of vocationalagriculture by their teachers. Unpublished doctoraldissertation, The Ohio State University, Columbus.
Camp, W. G. (1990). Participation in student activities andachievement: A covariance structural analysis. TheJournal of Educational Research, 83(5), 272-278.
Camp, W. G. (1999a). SAE Y2K. The Agricultural EducationMagazine (6), 6-7.
Camp, W. G. (1999b). Origins of SAE. Retrieved December 12,2003, from Virginia Tech University Web site:http://www.aged.vt.edu/sae/presentations.htm
Camp, W., Fallon, M., & Clarke, A. (1999). Supervisedagricultural experience: Revisiting supervisedagricultural experience. Proceedings of the 26th AnnualNational Agricultural Education Research Conference,Orlando, FL, 26, 159-175.
Cheek, J. G., Arrington, L. R., Carter, S., & Randell, R.S. (1994). Relationship of supervised agriculturalexperience program participation and studentachievement in agriculture. Journal of AgriculturalEducation, 35(2), 1-5.
Cole, R.L., & Connell, D.P., (1993). The economic impact ofOregon agricultural science and technology programs.The Journal of Agricultural Education, 34(1), 60-67.
126
Connors, J. (1992). Volunteerism as SAE. The AgriculturalEducation Magazine, 65(6), 18-20.
Courtney, D.S. & Doll. V.W. (1998). A planning Guide forDesigning Worksite Externships for Educators. StateUniversity Education Deans School-to-Work SystemIntegration Project. Dayton, OH.
Croom, B. D. (1991). (1994). Non-occupational supervisedexperience. The Agricultural Education Magazine,64(6), 15-16.
Croom, B. D., & Flowers, J. L. (2000). The image factor:Perception of the FFA organization by members and non-members. Proceedings of the 27th National AgriculturalEducation research Conference, Orlando, FL, 27, 391-402.
Davis, J. A., (1971). Elementary survey analysis. EnglewoodCliffs, NJ: Prentice Hall.
Dewey, J., (1916). Democracy and education; an introductionto the philosophy of education. New York: TheMacmillan Company.
Dewey. J., (1938). Experience and education. New York: TheMacmillan Company.
Deyoe, G. P. (1953). Farming programs in vocationalagriculture. Danville, IL: Interstate Printers andPublishers, Inc.
Dugan, P. A., & Sutphin, H. D. (1984). The affective workcompetency development of vocational agriculturestudents involved in SAE programs in New York state.Paper presented at the Eastern Region Annual ResearchConference in Agricultural Education, Sturbridge, MA.(ERIC Document Reproduction Service No. ED255676).
Dyer, J. E., & Osborne, E. W. (1996). Developing a modelfor supervised agricultural experience programquality: A synthesis of research. Journal ofAgricultural Education, 37(2), 24-32.
Dyer, J. E., & Osborne, E. W. (1995). Participation insupervised agricultural experience programs: Asynthesis of research. Journal of AgriculturalEducation. 36(1), 6-14.
127
Dyer, J. E., & Williams, D. L. (1997a). Benefits ofsupervised agricultural experience programs: Asynthesis of research. Journal of AgriculturalEducation, 38(4), 50-58.
Dyer, J. E., & Williams, D. L. (1997b). Supervision ofSupervised Agricultural Experience Programs: Asynthesis of research. Journal of AgriculturalEducation, 38(4), 59-67.
Eccles, J. S., & Barber, B. L. (1999). Student council,volunteering, basketball, or marching band: What kindof extracurricular involvement matters? Journal ofAdolescent Research, 14, 10-43.
Fraenkel, J. R,. & Wallen, N. E. (1996). How to design andevaluate research in education. New York: McGraw-Hill.
Garber, S. J., & Launius, R. D. (2002) A brief history ofthe national aeronautics and space administration.[Online] http://www.hq.nasa.gov/office/pao/History/factsheet.htm
Gerber, S. B. (1996). Extracurricular activities andacademic achievement, Journal of Research andDevelopment in Education, 30, 42-50.
Gibson, G. L. (1987). Factors associated with thesupervised occupational experience programs ofKentucky vocational agriculture seniors. Unpublisheddoctoral dissertation, The Ohio State University,Columbus, OH.
Gilman, R. (2001). The relationship between lifesatisfaction, social interest and frequency ofextracurricular activities among adolescent students,Journal of Youth and Adolescence, 30, 749-768.
Gove, P. B. (Ed.). (1981). Webster's third newinternational dictionary of the English language.Springfield, MA: C. & G. Merriam.
Graham, J., & Birkenholz, R. (1999). Changes in MissouriSAE programs. Proceedings of the 26th NationalAgricultural Education Research Conference, Orlando,FL, 26, 172-180.
128
Grellener, D., & White, J. (1992). Supervised agriculturalexperiences in the 21st century – Cutting edge orobsolete? The Agricultural Education Magazine, 65(6),21-23.
Grubb, W. N. (1999). The economic benefits of sub-baccalaureate education: Results from nationalstudies. CCRC Brief, 2 (ISSN 1526-2049).
Grubb, W. N., & Stern, D. (1989). Separating the wheat fromthe chaff: The role of vocational education ineconomic development. University of California,National Center for Research in Vocational Education.Berkeley, CA.
H. Res. 2884, 103rd Cong., PL 239, School to workopportunities act (enacted). Retrieved December 2,2003 from North Carolina State University’s Web site:http://www.cals.ncsu.edu/agexed/sae/smithugh.html.
Harlin, J. & Weeks, B., (2001). FFA status of selectedagricultural education enrollees in Oklahoma.Proceedings of the 20th Annual Western RegionAgricultural Education Research Conference, Carmel,CA, 20, 94-106.
Hair, E. C., Moore, K. A., Hunter, D., Williams, & Kaye, J.W. (2001). Clark Youth Development OutcomesCompendium. Child Trends.
Hamilton, S. F., & Hamilton, M. A. (1997). When isworking work-based? Phi Delta Kappan, 78(9), 676-686.
Harris, D. E. (1983). Vocational agriculture teachercharacteristics and their relationship to perceptionsof SOE importance, attitudes toward supervision, andquality of supervised occupational experienceprograms. Unpublished doctoral dissertation, The OhioState University, Columbus.
Hoover, T., & Arrington, L. R. (1994). SAE researchfindings. The Agricultural Education Magazine, 67(5),9-11.
Hughes, M., & Barrick, R. K. (1993). A model foragricultural education in public schools. Journal ofAgricultural Education, 34(3), 59-66.
129
Hyslop-Margison, Emery J. (2001). An assessment of thehistorical arguments in vocational education reform.Journal of Career and Technical Education, 17(1).
Jacobs, J., & Grubb, N. W., (2002). Implementing the“education consensus”: The federal role in supportingvocational-technical education. Paper prepared for theOffice of Vocational and Adult Education, USDE.Contract No. ED-99-CO-0160.
Jekielek, S. M., Cochran, S., & Hair, E. C. (2002)Employment programs and youth development: Asynthesis. Child Trends, Product Number #2002-11.
Kantor, H. (1986). Work, education, and vocational reform:The ideological origins of vocational education, 1890-1920. American Journal of Education, 94, 401-426.
Kerlinger, F., & Lee, H. (2000). Foundations of behavioralresearch (4th Ed.). NY: Harcourt College Publishers.
Knight, J. A. (1978). Why vocational agriculture teachersin Ohio leave teaching. Unpublished doctoraldissertation, The Ohio State University, Columbus.
Leising, J. G., & Zilbert, E. E. (1985). Factors associatedwith supervised occupational experience in Californiavocational agriculture programs. The Journal of theAmerican Association of Teacher Educators inAgriculture, 26(2), 56-64.
Lindsey, S. J. (1978). Supervised occupational experiencesin production agriculture for students with limitedopportunity. Unpublished master's thesis, The OhioState University, Columbus.
Maddy-Bernstein, C., Matias, Z. B., Cunanan, E. S., Krall,B. T., & Iliff, L. (1995). A school-to-work resourceguide: Focusing on diversity. National Center forResearch in Vocational Education. Berkley, CA.
McConnell, C., & Brue S., (2001). Economics (15th ed.) NewYork: McGraw-Hill.
McCracken, D. J. (1998). Agricultural education 886 classnotes. Ohio State University, Columbus.
130
McKinney, J. (1956). This I remember, American VocationalJournal, 31 (9).
Mick, J. H., Stewart, B. R., & Claycomb, D. M. (1984). Jobplacement as influenced by the agricultural backgroundof vocational agriculture graduates. The Journal ofthe American Association of Teacher Educators inAgriculture, 25(3), 60-65.
Miller, B. M., (2003). Critical hours: After schoolprograms and educational success. Brookline, MA:Miller Midzik Research Associates.
Miller, T. R. (1967). Supervised practice in vocationalagriculture: A student handbook. Danville, IL: TheInterstate Printers & Publishers, Inc.,
Miller, V. R. (2002). The role of career and technicaleducation in high school. Office of Vocational andAdult Education, U.S. Department of Education.Washington D.C.
Moore, G. E. (1988). The forgotten leader in agriculturaleducation: Rufus W. Stimson. The Journal of theAmerican Association of Teacher Educators inAgriculture, 29(3), 50-58.
Moore, G., & Flowers, J. (1993). Strengthening programsthrough an expanded model for SAE. The AgriculturalEducation Magazine, 66(1), 18-20.
Morton, R. (1978). The relationship between the quality ofsupervised occupational experience programs andachievement of students in vocational agriculture.Unpublished doctoral dissertation, The Ohio StateUniversity, Columbus.
National Commission on Excellence in Education. (1983). Anation at risk. Washington DC: Author.
National FFA Organization, (1995). Agricultural proficiencyaward handbook. Alexandria, VA; FFA Supply Service.
National FFA Organization, (1999). FFA Advisors: Making aDifference, 7(9). Indianapolis, IN.
131
National FFA Organization (2004a). About the FFA. RetrievedJanuary 2, 2004 from the National FFA Web site:http://www.ffa.org/about_ffa/index.html.
National FFA Organization (2004b). Agricultural ProficiencyAwards. Retrieved January 3, 2004 from the NationalFFA Web site: http://www.ffa.org/programs/proficiency/index.html
National FFA Organization (2004c). FFA Statistics.Retrieved January 2, 2004 from the National FFA Website: http://www.ffa.org/about_ffa/html/ffa_statistics.htm#General.
National Research Council. (1988). Understandingagriculture: New directions for education. WashingtonDC: National Academy Press.
National Summit on Agricultural Education. (1989). Thestrategic Plan for agricultural education. WashingtonDC: Author.
Newcomb, L. H., McCracken, J. D., & Warmbrod, J. R. (1993).Methods of teaching agriculture. Danville, IL:Interstate.
Noxel, S., & Cheek, J. G. (1988). Relationship ofsupervised occupational experience program scope tostudent achievement in ornamental horticulture. TheJournal of the American Association of TeacherEducators in Agriculture, 29(4), 24-30.
Office of Vocational and Adult Education (2002). The CarlD. Perkins vocational and technical education act,public law 105-332: What is vocational-technicaleducation? Retrieved January 3, 2004 from the Officeof Vocational and Adult Education Web site:http://www.ed.gov/offices/OVAE/CTE/ perkins.html.
Office of Vocational and Adult Education (2004). Career andTechnical Education. Retrieved January 7, 2004 fromthe Office of Vocational and Adult Education Web site:http://www.ed.gov/about/offices/list/ovae/pi/cte/index.html
Ohio Department of Education (2003a). Career-Technical andAdult Education Glossary. Retrieved January 2, 2004
132
from the Ohio Department of education Web site:http://www.ode.state.oh.us/ctae/Office/dictionary.asp
Ohio Department of Education (2003b). Committed to successfor all in Ohio schools: 2002-2003 annual report oneducation progress in Ohio. Columbus, OH: OhioDepartment of Education.
Ohio FFA Association, Inc. (2003). Ohio FFA associationmembership database (2002-2003), Columbus, OH.
Omernik, J. M. (2002a). SAE brings learning to life. (2002,January). FFA Advisors Making a Difference.
Omernik, J. M. (2002b). Teaching entrepreneurship with SAE.(2002, January). FFA Advisors Making a Difference.
Pals, D. A. (1988). The value of supervised occupationalexperience programs as perceived by students. Journalof Agricultural Education, 29(2), 32-39.
Phipps, L.J., & Osborne, E.W. (1988). Handbook onagricultural Education in public schools. (5th ed.).Danville, IL: Interstate.
Portillo, M. T., & White, J. D. (2001). An assessment ofprogram factors influencing california FFA proficiencyaward participation. Proceedings of the 20th AnnualWestern Region Agricultural Education ResearchConference, Carmel, CA, 20, 108-120.
Potter, O. B. (1984). Supervised occupational experienceprograms and achievement of students mainstreamed inOhio vocational agriculture programs. Unpublisheddoctoral dissertation, The Ohio State University,Columbus.
Prosser School of Technology, (2003). History. RetrievedJanuary 15, 2004 from the Prosser School of TechnologyWeb site: http://www.prossertech.org/history.htm
Retallick, M.S., & Martin, R.A., (2003). A longitudinalstudy of the economic impact of supervisedagricultural experience in Iowa. Proceeding of the 30th
National Agricultural Education Research Conference,Orlando, FL, 30, 147-158.
133
Secretary's Commission on Achieving Necessary Skills.(1990). What work requires of schools: A SCANS reportfor America 2000. Washington, DC: United StatesDepartment of Labor.
Steele, R. (1997). Analysis of the continuing decline inuse of supervised agricultural experience (SAE) in NewYork State. Journal of Agricultural Education, 38(2),49-58.
Stewart, B. R., & Birkenholz, R. J. (1991). Outcomes ofchanging supervised agricultural experience programs.Journal of Agricultural Education, 32(3), 35-41.
Stimson, R. W., & Lathrop, F. W. (1942). History ofAgricultural Education of Less Than College Grade inthe United States. United State Government PrintingOffice: Washington DC.
Swortzel, K. (1996). Perceptions regarding planningactivities and supervision strategies for supervisedagricultural experience programs. Journal ofAgricultural Education 37(2), 47-55.
Taft, R. (2002). Jobs and prosperity: Ohio’s strategy forthe third frontier. Columbus, OH: Governor’s Office,State of Ohio.
Tanner, D., & Tanner, L. (1980). Curriculum development:Theory into practice. New York: Macmillan.
Tylke, R. J., & Arrington, L. R. (1988). The relationshipof supervised occupational experience program scope tostudent achievement in livestock production. TheJournal of the American Association of TeacherEducators in Agriculture, 29(3), 28-33.
United States Department of Education. (1995).Extracurricular participation and student engagement,National Center for Education Statistics (June, pp. 1-2).
United States Department of Labor, (2000). Report on theYouth Labor Force. Retrieved January 3, 2004, from theUnited States Department of Labor Web site:http://www.bls.gov/opub/rylf/rylfhome.htm.
134
West, D., & Iverson, M. (1999). Economic impact ofsupervised agricultural experience programs inGeorgia. Proceeding of the 26th National AgriculturalEducation Research Conference, Orlando, FL, 26, 148-156.
Wirth, A.G. (1972). Education in the technological society.San Francisco: Intext Educational Publishers.
135
APPENDIX A
OHIO FFA STATE DEGREE MINIMUM STANDARDS
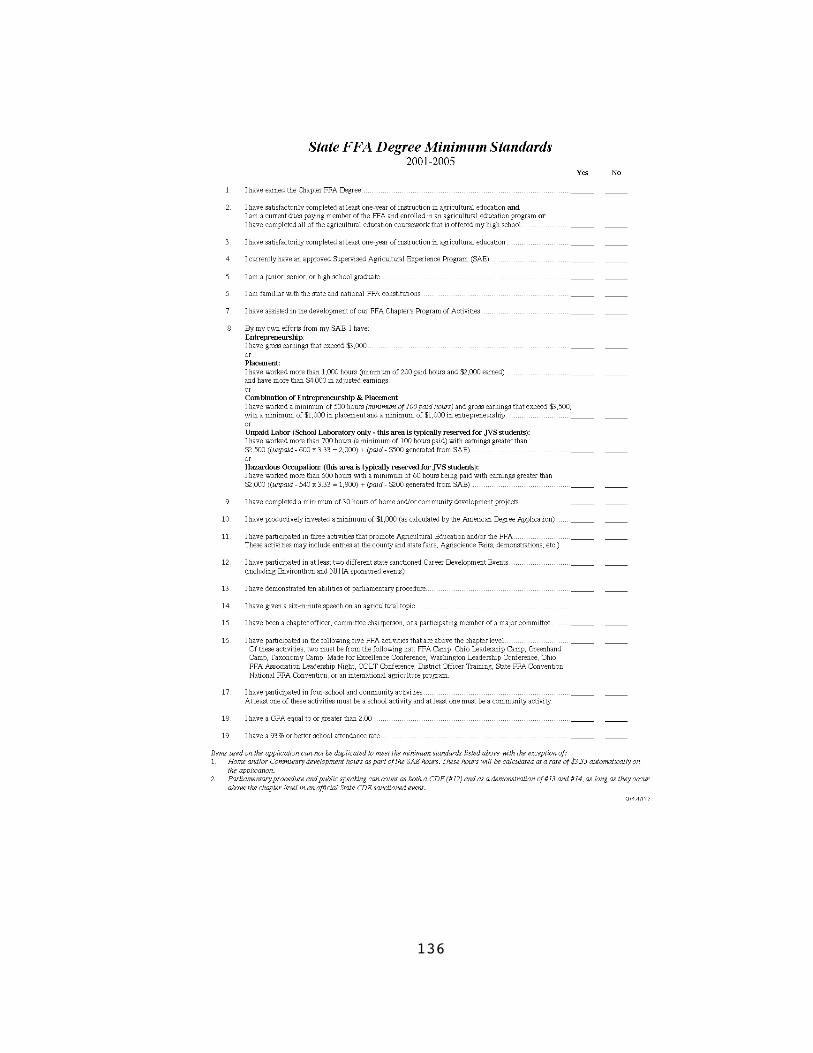
136

137
APPENDIX B
STATE FFA DEGREE
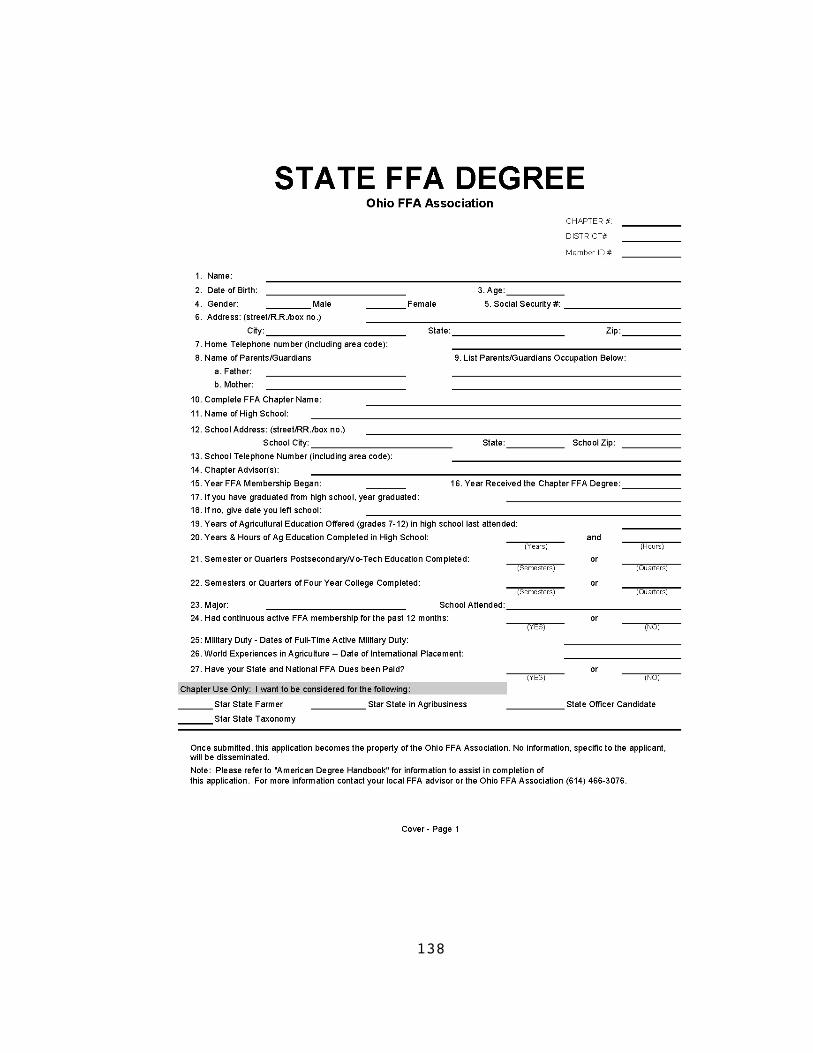
138
139
140
141

142
143
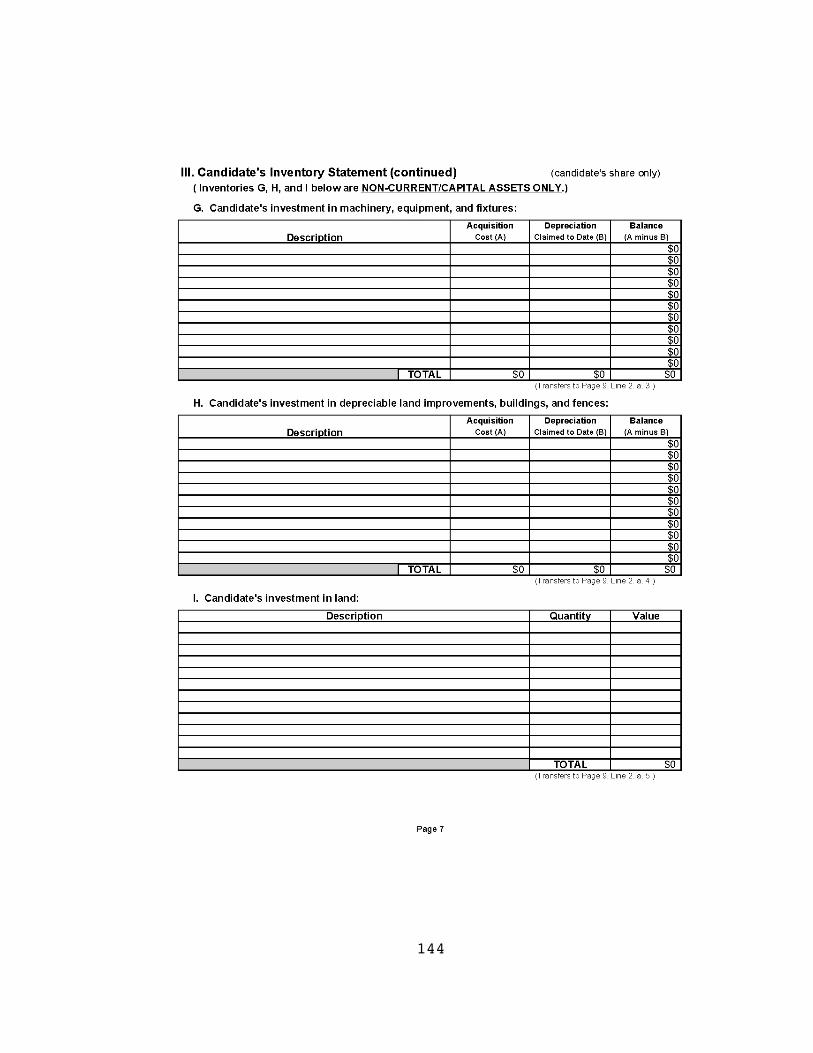
144
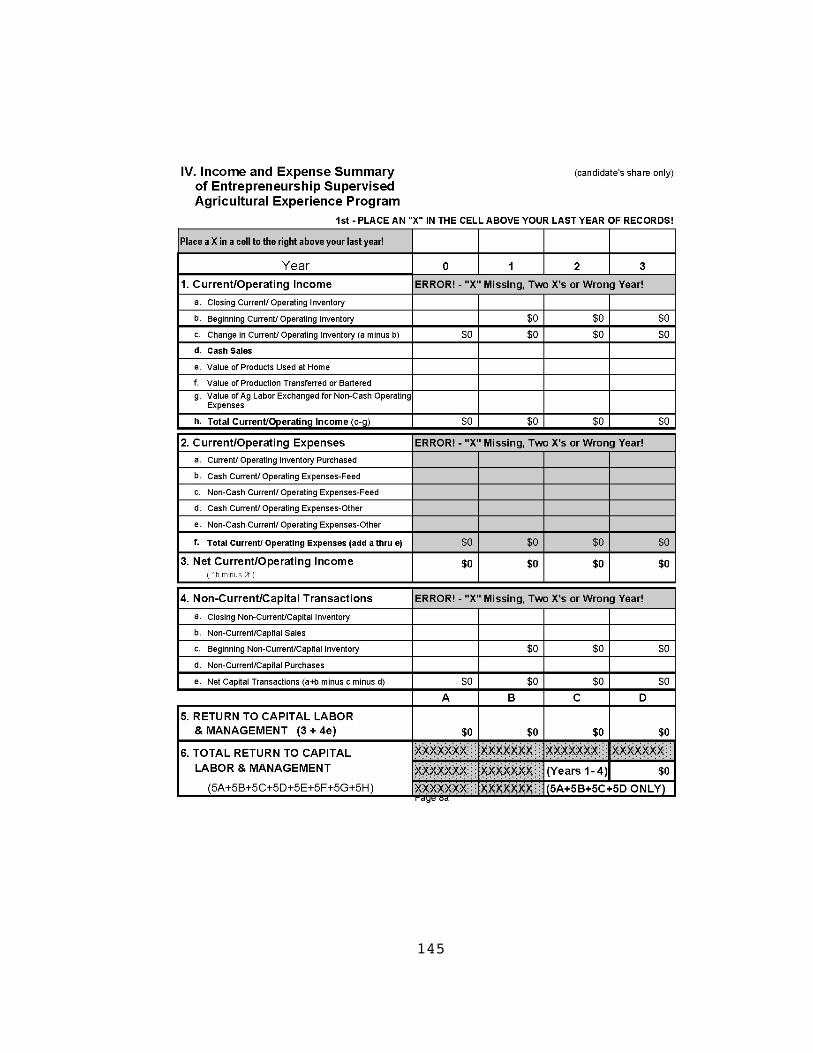
145
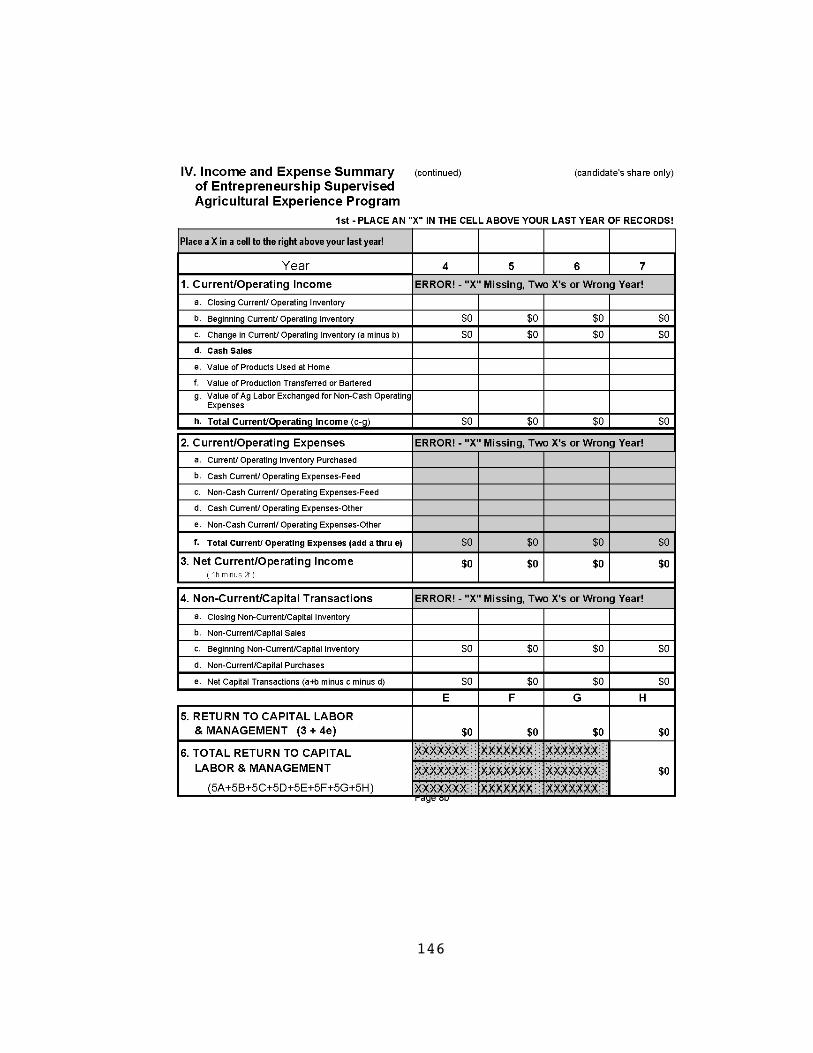
146
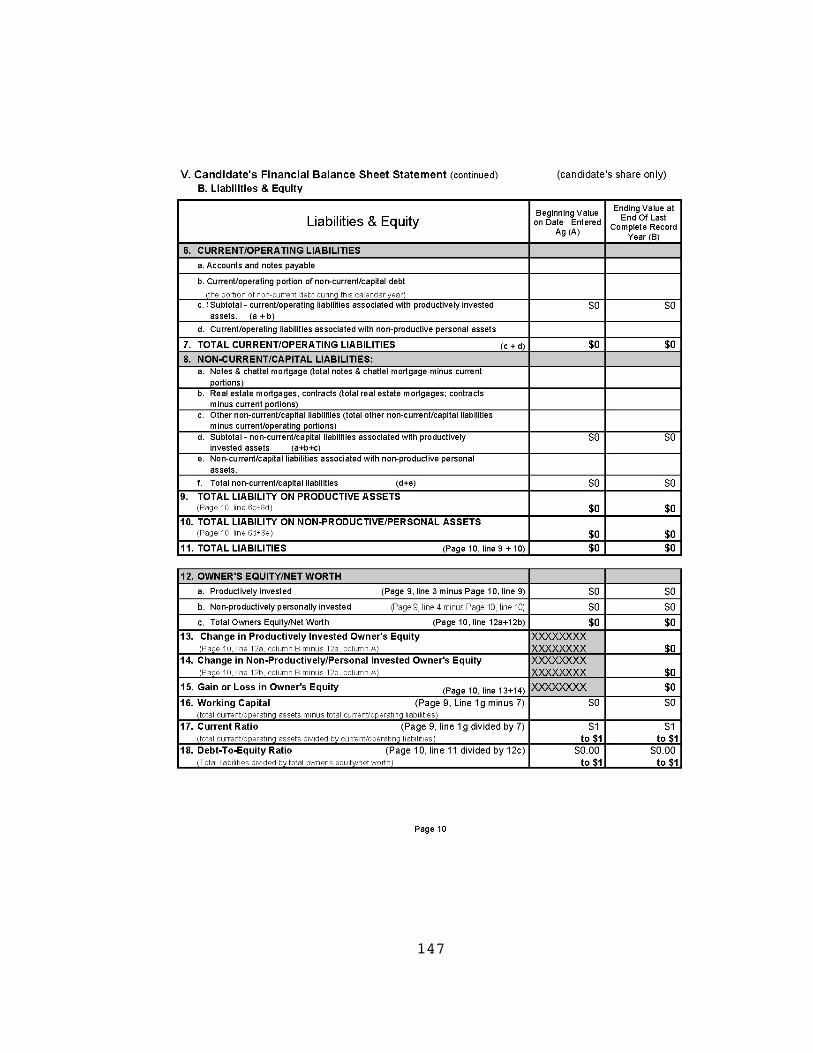
147
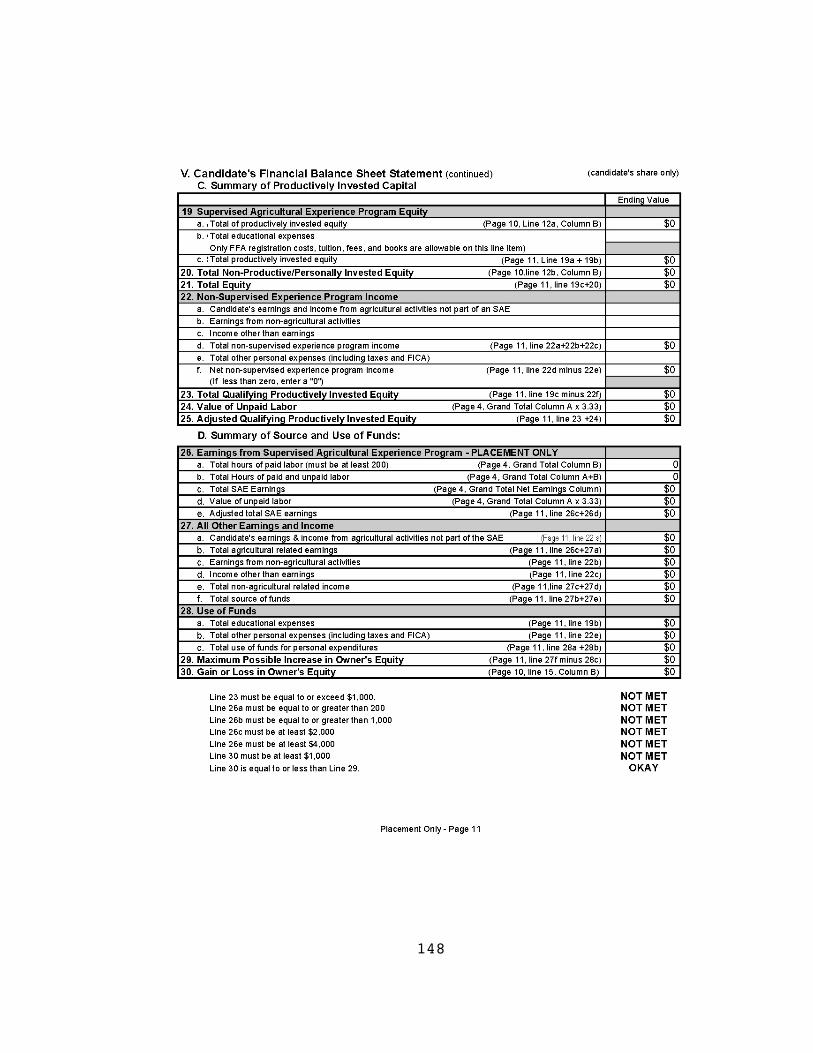
148
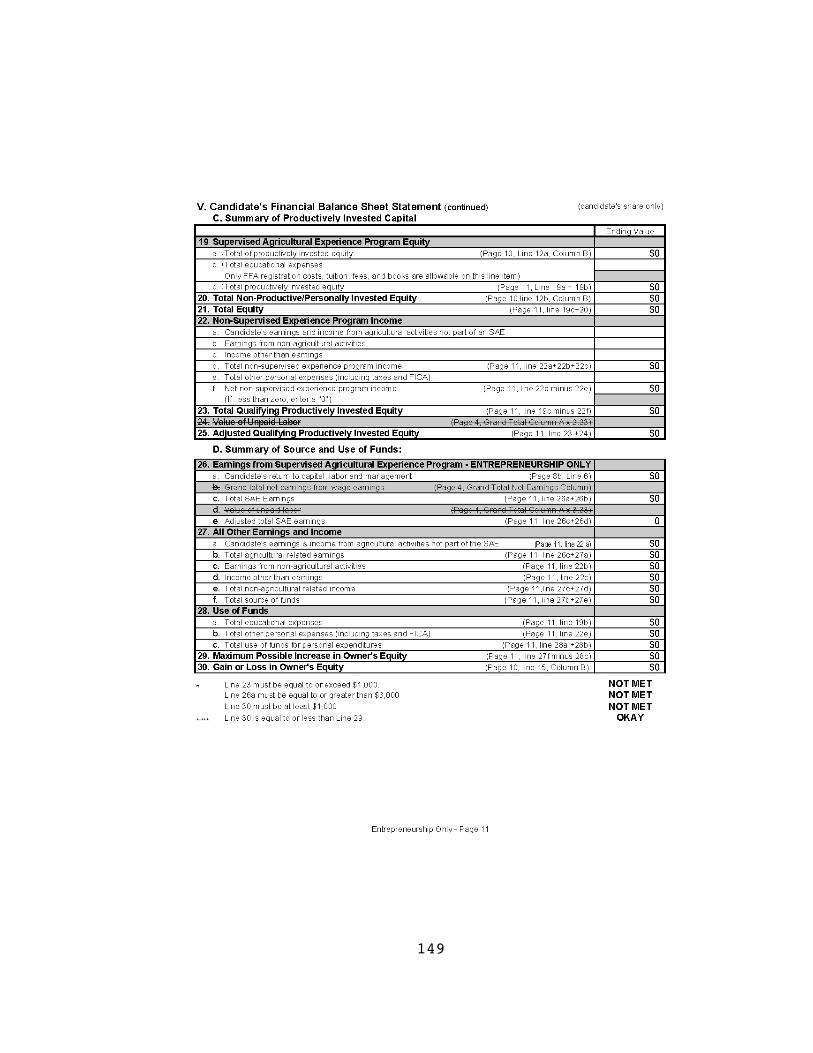
149

150
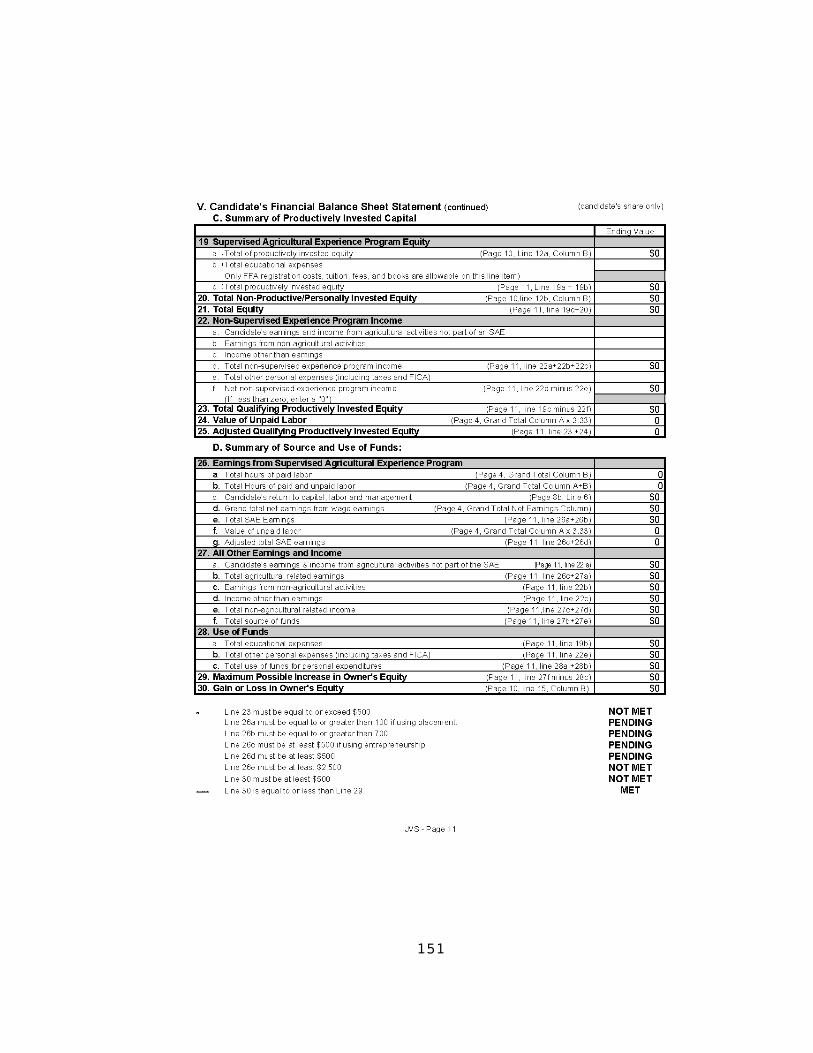
151

152
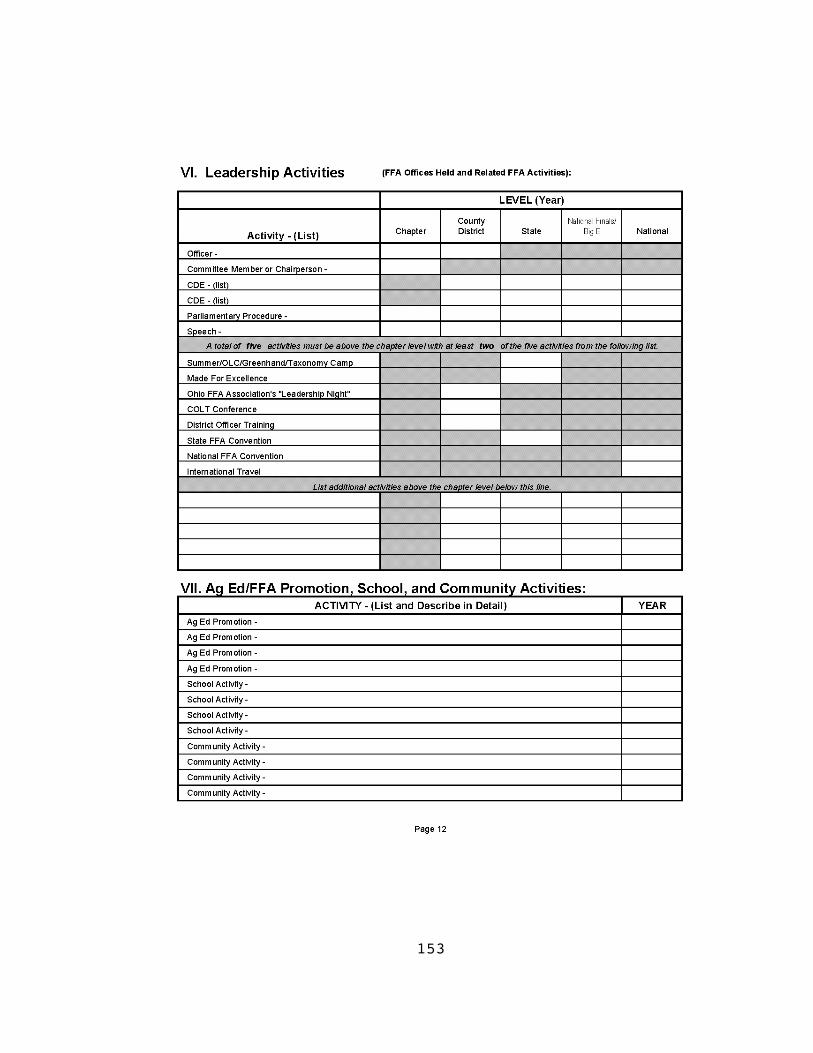
153
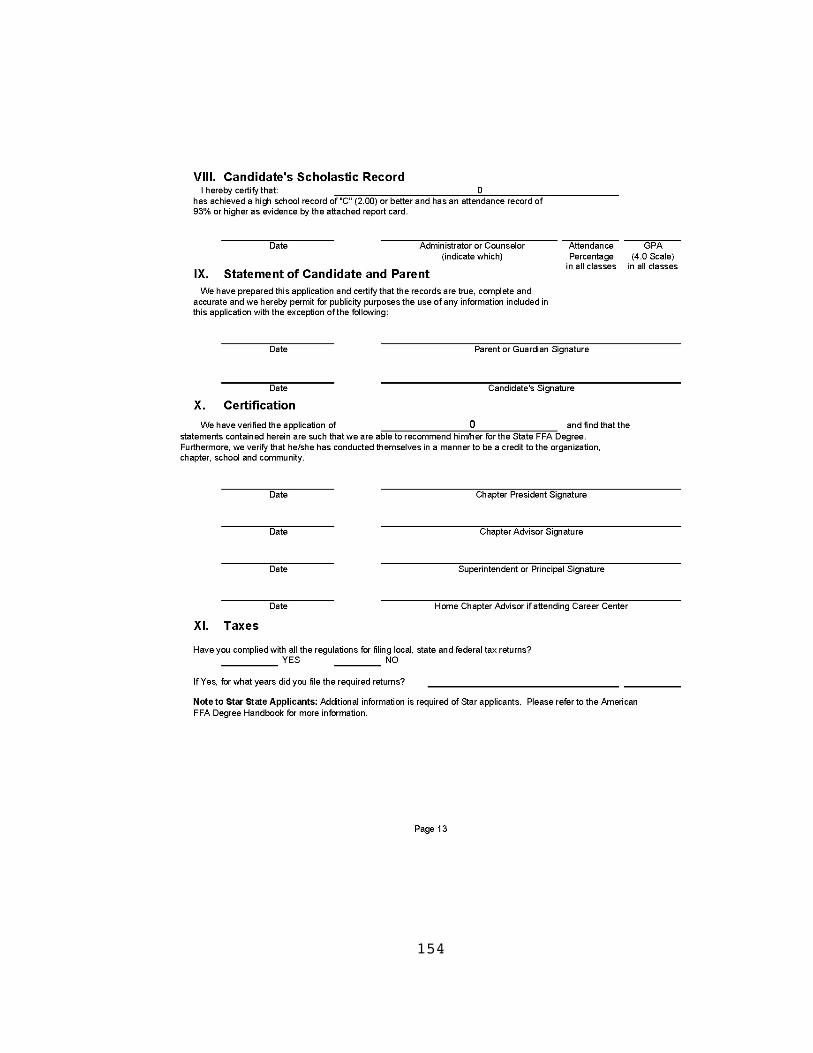
154
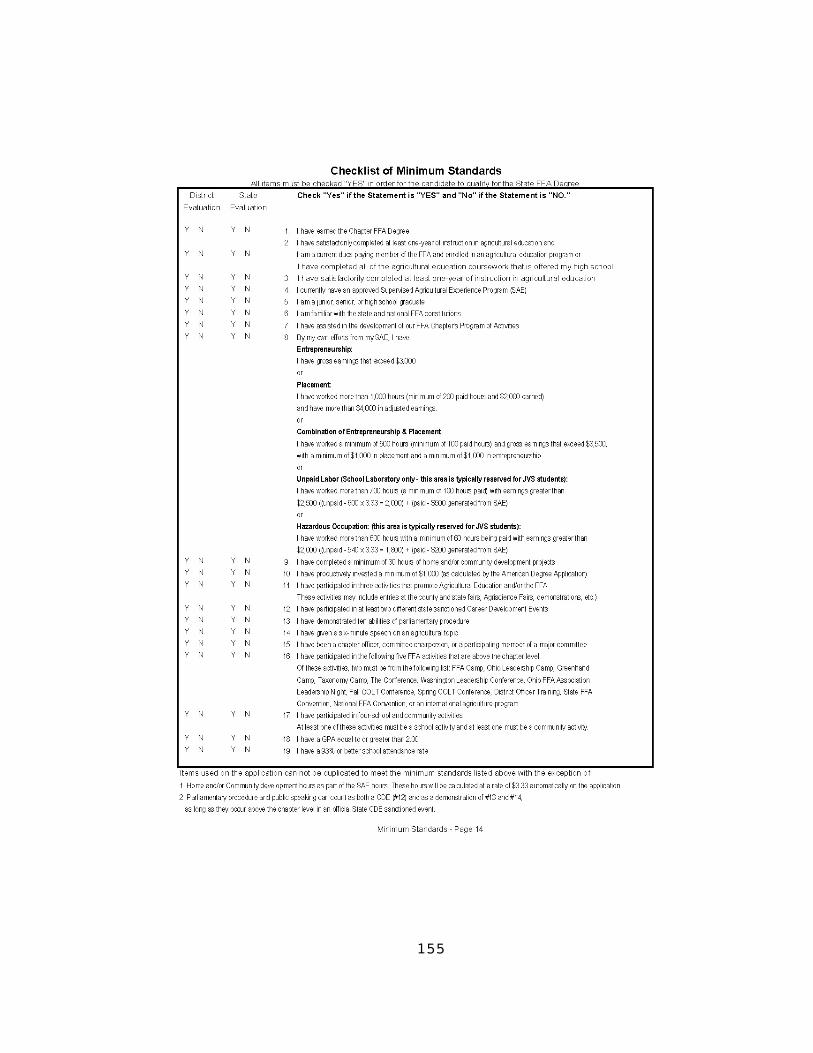
155
156
APPENDIX C
OHIO FFA DISTRICT MAP
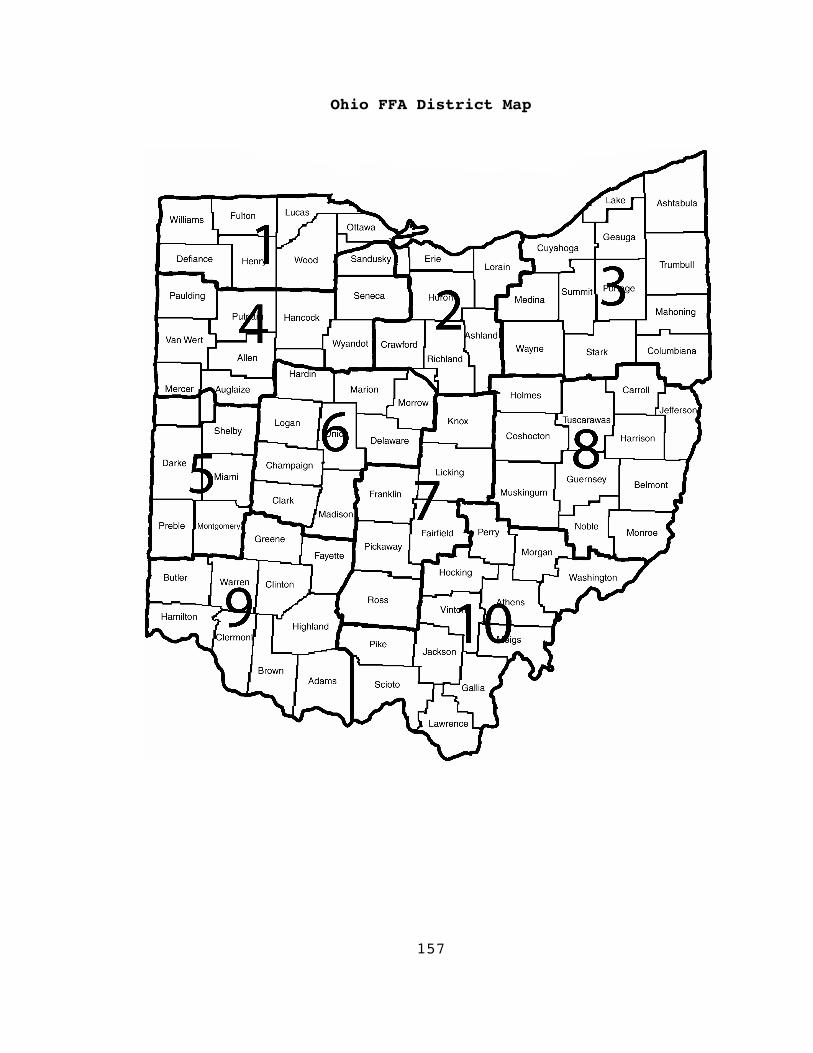
157
Ohio FFA District Map

158
APPENDIX D
OHIO FFA SAE GUIDELINES
159
Guidelines and Expectations for SAE Programs in Ohio
1. Supervisiona. Supervision of a student’s SAE program is to be
provided by the teacher of agriculture, aparent/guardian, and/or the student’s employer.
b. It is recommended that an teacher of agricultureobserve and evaluate each student’s SAE program.Additional visits may be made depending on the natureof the student’s SAE program or other special needsthe student may have.
c. The supervisory visit to the student’s SAE program bythe teacher of agriculture includes meeting with theparent/guardian and/or the student’s employer.
d. The teacher of agriculture shall maintain evidence ofthe supervisory visit. Evidence should include writtenreport of what was observed, suggestions forimprovement, a review of the student’s SAE recordbook(s), and photographs of the SAE program. A copy ofthe written supervisory visit report is to be given tothe student. Each visit report is to be maintained inthe agriculture department files for future referenceand evidence of student progress.
e. It is recommended that the teacher of agriculturespend a minimum of 80% of their extended programmingtime in instructional activities with students. Thismay include individual or group SAE relatedinstruction, reviewing SAE record books, and/orconducting on-site SAE supervisory visits.
2. SAE Criteriaa. The student’s experience program is be related to
those industries served by agriculture education.Those industries include agriculture, horticulture andnatural resources. It should compliment the student’soccupational interests. It should include technical,academic and employability skills as found in thestate approved Agricultural and Environmental Systemscontent standards, model academic standards and coreITAC.
b. A student’s SAE is considered appropriate when thestudent is able to answer “yes” to question i. and“yes” to either question ii or iii.i. Does the supervised experience involve the
application of technical agriculture andemployability skills?
and
160
ii. Does the supervised experience contribute to theproduction and/or initial processing of anagricultural, horticultural, or natural resourceproducts?
oriii. Does the supervised experience provide a service
for the agriculture, horticulture and/or naturalresources industries?
c. Refer to the Environmental and Agricultural Systemslist of occupational titles to help determine if thestudent’s supervised experience is related to arecognized occupation.
3. Experiencea. The student’s supervised experience should include
practical, hands-on, activities that can lead to entryand advancement in an agricultural and naturalresources career area.
b. The experience program includes technical skilldevelopment in a career cluster related to agricultureand natural resources ranging from production tomarketing of products, services, and the developmentof employability skills necessary for successfulemployment leading to career advancement.
c. An approved cooperative training plan, business planand/or plan of practice is to be developed by thestudent, in cooperation with the teacher ofagriculture, parent/guardian, and/or employer to allowthe student to reach his/her potential based uponavailable resources and student needs.
d. The student is to be given the opportunity to self-evaluate their experiences and skill development andreceive feedback from the teacher of agriculture,their parent/guardian, and/or employer on theirprogress.
e. The student is to maintain an individual career andtechnical education portfolio including a record booklisting the financial records of the program, skillsand competencies developed, and leadership developmentactivities in which the student participated. Therecord book(s) should include a section on analyzingthe records for reflection of past accomplishments andfuture planning purposes
4. Program
161
a. The SAE program should contribute to the workforcedevelopment and economic viability of the community.
b. SAE programs will primarily be conducted outside ofdesignated class time. However, double-block, year-long classes in comprehensive high schools, and in-school laboratory time in career centers can becounted as part of a student’s SAE program.
c. Teacher of agriculture shall maintain detailed recordsof each student’s SAE program and supervisory visits.It is recommended that an annual report of allstudents’ SAE programs be presented to the localschool board, school administrators, advisorycommittee, and other interested parties. At a minimum,the report should include a connection back to theknowledge and skills as found in the local programcourse of study.
d. The student should demonstrate a steady increase inthe knowledge and skills gained over time.
e. The student should demonstrate increasedresponsibility in directing their SAE program overtime.

162
APPENDIX E
COUNTY ECONOMIC DATA
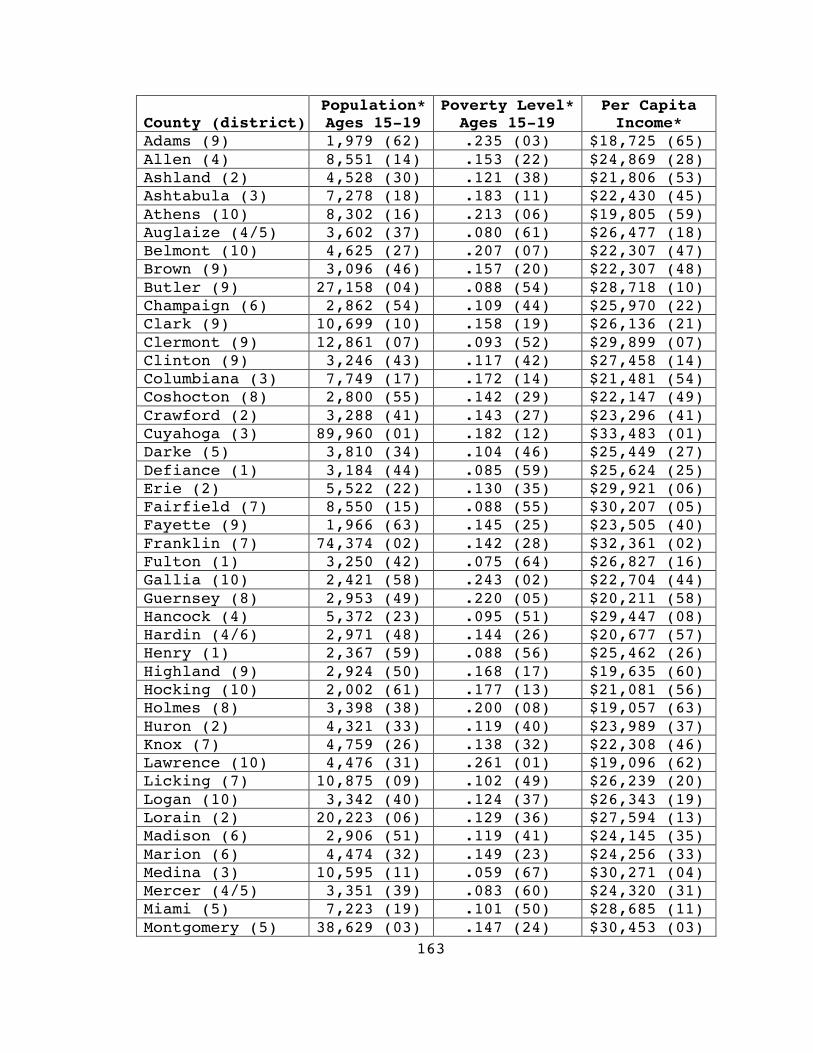
163
County (district)Population*Ages 15-19
Poverty Level*Ages 15-19
Per CapitaIncome*
Adams (9) 1,979 (62) .235 (03) $18,725 (65)Allen (4) 8,551 (14) .153 (22) $24,869 (28)Ashland (2) 4,528 (30) .121 (38) $21,806 (53)Ashtabula (3) 7,278 (18) .183 (11) $22,430 (45)Athens (10) 8,302 (16) .213 (06) $19,805 (59)Auglaize (4/5) 3,602 (37) .080 (61) $26,477 (18)Belmont (10) 4,625 (27) .207 (07) $22,307 (47)Brown (9) 3,096 (46) .157 (20) $22,307 (48)Butler (9) 27,158 (04) .088 (54) $28,718 (10)Champaign (6) 2,862 (54) .109 (44) $25,970 (22)Clark (9) 10,699 (10) .158 (19) $26,136 (21)Clermont (9) 12,861 (07) .093 (52) $29,899 (07)Clinton (9) 3,246 (43) .117 (42) $27,458 (14)Columbiana (3) 7,749 (17) .172 (14) $21,481 (54)Coshocton (8) 2,800 (55) .142 (29) $22,147 (49)Crawford (2) 3,288 (41) .143 (27) $23,296 (41)Cuyahoga (3) 89,960 (01) .182 (12) $33,483 (01)Darke (5) 3,810 (34) .104 (46) $25,449 (27)Defiance (1) 3,184 (44) .085 (59) $25,624 (25)Erie (2) 5,522 (22) .130 (35) $29,921 (06)Fairfield (7) 8,550 (15) .088 (55) $30,207 (05)Fayette (9) 1,966 (63) .145 (25) $23,505 (40)Franklin (7) 74,374 (02) .142 (28) $32,361 (02)Fulton (1) 3,250 (42) .075 (64) $26,827 (16)Gallia (10) 2,421 (58) .243 (02) $22,704 (44)Guernsey (8) 2,953 (49) .220 (05) $20,211 (58)Hancock (4) 5,372 (23) .095 (51) $29,447 (08)Hardin (4/6) 2,971 (48) .144 (26) $20,677 (57)Henry (1) 2,367 (59) .088 (56) $25,462 (26)Highland (9) 2,924 (50) .168 (17) $19,635 (60)Hocking (10) 2,002 (61) .177 (13) $21,081 (56)Holmes (8) 3,398 (38) .200 (08) $19,057 (63)Huron (2) 4,321 (33) .119 (40) $23,989 (37)Knox (7) 4,759 (26) .138 (32) $22,308 (46)Lawrence (10) 4,476 (31) .261 (01) $19,096 (62)Licking (7) 10,875 (09) .102 (49) $26,239 (20)Logan (10) 3,342 (40) .124 (37) $26,343 (19)Lorain (2) 20,223 (06) .129 (36) $27,594 (13)Madison (6) 2,906 (51) .119 (41) $24,145 (35)Marion (6) 4,474 (32) .149 (23) $24,256 (33)Medina (3) 10,595 (11) .059 (67) $30,271 (04)Mercer (4/5) 3,351 (39) .083 (60) $24,320 (31)Miami (5) 7,223 (19) .101 (50) $28,685 (11)Montgomery (5) 38,629 (03) .147 (24) $30,453 (03)
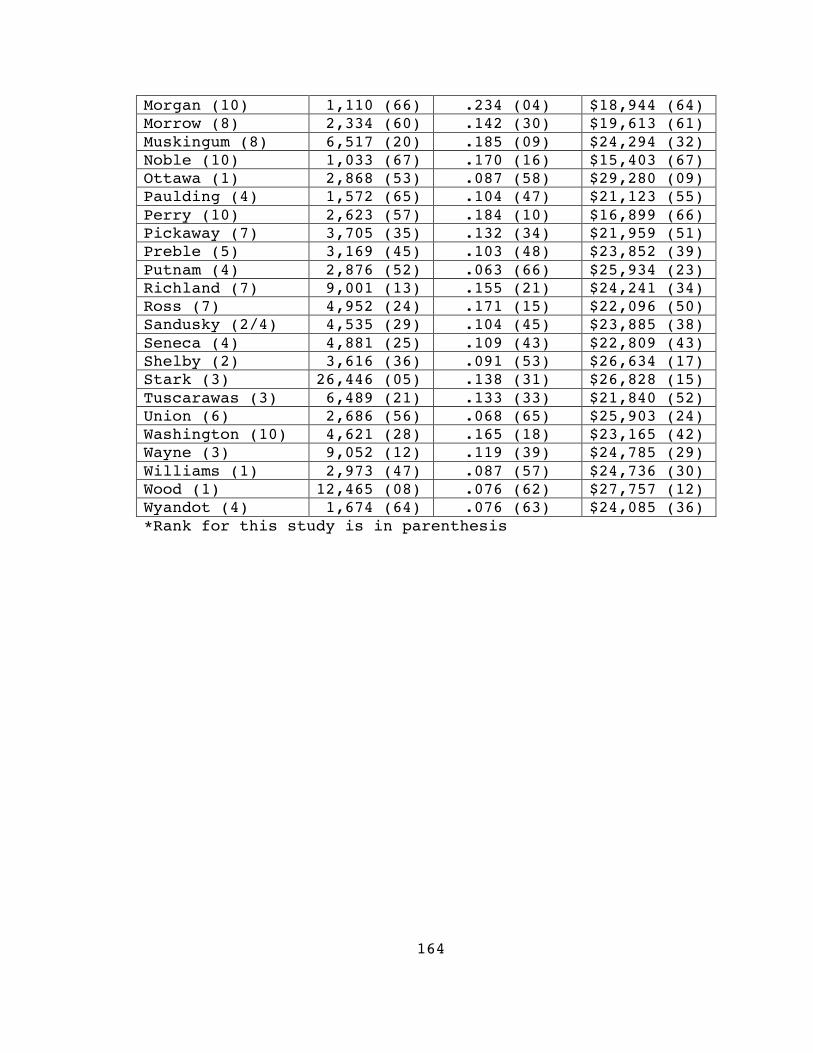
164
Morgan (10) 1,110 (66) .234 (04) $18,944 (64)Morrow (8) 2,334 (60) .142 (30) $19,613 (61)Muskingum (8) 6,517 (20) .185 (09) $24,294 (32)Noble (10) 1,033 (67) .170 (16) $15,403 (67)Ottawa (1) 2,868 (53) .087 (58) $29,280 (09)Paulding (4) 1,572 (65) .104 (47) $21,123 (55)Perry (10) 2,623 (57) .184 (10) $16,899 (66)Pickaway (7) 3,705 (35) .132 (34) $21,959 (51)Preble (5) 3,169 (45) .103 (48) $23,852 (39)Putnam (4) 2,876 (52) .063 (66) $25,934 (23)Richland (7) 9,001 (13) .155 (21) $24,241 (34)Ross (7) 4,952 (24) .171 (15) $22,096 (50)Sandusky (2/4) 4,535 (29) .104 (45) $23,885 (38)Seneca (4) 4,881 (25) .109 (43) $22,809 (43)Shelby (2) 3,616 (36) .091 (53) $26,634 (17)Stark (3) 26,446 (05) .138 (31) $26,828 (15)Tuscarawas (3) 6,489 (21) .133 (33) $21,840 (52)Union (6) 2,686 (56) .068 (65) $25,903 (24)Washington (10) 4,621 (28) .165 (18) $23,165 (42)Wayne (3) 9,052 (12) .119 (39) $24,785 (29)Williams (1) 2,973 (47) .087 (57) $24,736 (30)Wood (1) 12,465 (08) .076 (62) $27,757 (12)Wyandot (4) 1,674 (64) .076 (63) $24,085 (36)*Rank for this study is in parenthesis

165
APPENDIX F
OHIO APPALACHIAN COUNTIES
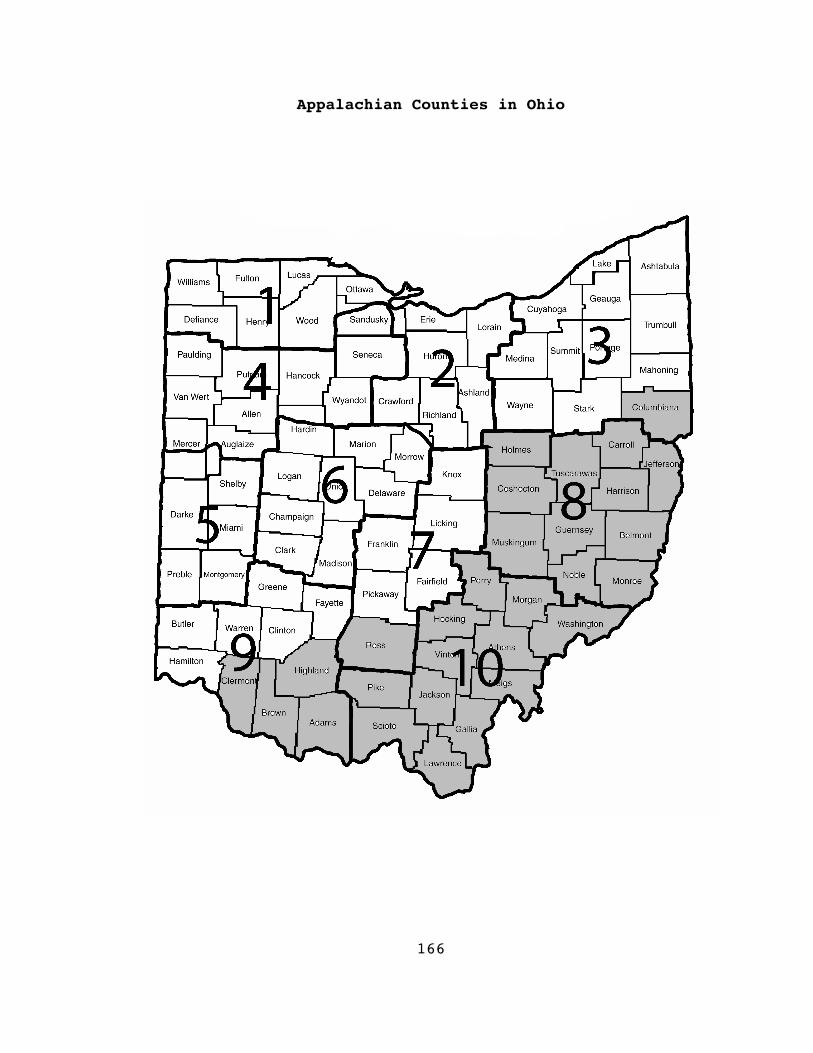
166
Appalachian Counties in Ohio


