Embed Size (px)
Citation preview

Vol 21 No 1 March 2012 Road & Transport Research
64
Geo-spatial analysis of activity spaces in a TOD environment – Tracking impacts of rail transport policy using kernel density estimationMarkus Botte and doina Olaru
AbstractActivity spaces are dynamic, ‘people-based’ accessibility measures that can be used to analyse spatial arrangements of travel. This paper reports on activity spaces in the context of transport policy aimed at changing travel behaviour by offering alternative transport options and new urban services within transit-oriented developments (TOD) environments. Specifically, we explore associations between TOD and activity spaces to derive visually easily comprehensible indicators, assisting practitioners and policy makers in determining decision-making effectiveness.
We analyse results from household travel diaries collected within three unique TOD precincts in Perth, Western Australia situated alongside a 72 km new metro-rail link, pre- and post-opening, to identify impacts of the major transport intervention on travel.
While activity spaces have increasingly been applied as metrics for assessing the extent of urban space used by households for satisfying their daily activity needs, their application to explore potential changes in built environment induced travel behaviour is a novel feature of this research.
We employ herein kernel density estimation, which has great flexibility and superior visualisation capabilities in representing activity spaces, to longitudinally track travel behaviour changes. We also expand on previous investigation that considered discrete origin-destination trip data, by applying kernel density estimation to data including generated route information.
Our findings suggest benefits of activity space analysis in investigating past transport infrastructure decisions and associated implications, promising a potential improvement for development of new policies and strategies in the transport sector.
Invited paperThis paper was originally peer reviewed and presented at the 34th Australasian Transport Research Forum in Adelaide, September 2011, where it won the John H Taplin Prize for best paper. It is published here with minor edits but without further review at the invitation of the Editor, in order to make it available to a wider audience. All papers that have been presented at the Australian Transport Research Forum since 1975 are accessible at www.patrec.org/atrf.aspx

65
Vol 21 No 1 March 2012 Road & Transport Research
Geo-spatial analysis of activity spaces in a TOD environment – Tracking impacts of rail transport policy
1. INTRODUCTIONOver the last decades considerable research efforts have aimed to explore intrinsic relationships between urban form and activity-travel patterns (Cervero 2005; Cervero & Sullivan 2010; Ewing & Cervero 2010; Zhang 2005, to name but a few). Provision for mixed land use and multi-purpose activity centres with increased densities, accounting for a carefully balanced job-housing ratios (Cervero & Duncan 2006) and serviced by high-quality public transport, are commonly hailed as the ‘holy grail’ in developing sustainable, liveable and less car-reliant urban environments. Hence, careful planning of TODs around key transit nodes holds a promise for stimulating desired travel behaviour changes (Smart Growth Network 2003; Cervero 2005).
With this research we reflect on our prior work (Botte & Olaru 2010) which critically considered a variety of metrics for assessing household activity spaces within a TOD setting and explored changes in activity spaces across three TODs, pre- and post-opening of a new 72 km long railway corridor connecting them to the Perth CBD. Our research is based on the theory that if urban planning and infrastructure network development account for a functional and pleasant urban fabric with a select suite of services closer to individuals’ residences (in order to meet diverse activity needs) then resulting activity spaces should reflect the conditions inherent in the underlying urban framework.
Thus, the aim of this research is twofold:
to further explore changes in activity spaces across three TOD precincts along the metro-rail link, now including more recent data, and against the backdrop of an ever evolving transport policy and urban planning framework in Western Australia; and
to refine kernel density1 estimation as our preferred tool for assessing household activity spaces within a TOD setting, testing the ability to enrich the analysis by applying generated route information to a discrete sub-sample in an attempt to overcome common data limitations.
The paper is divided into five sections, including this Introduction. In the remainder of the Introduction we briefly present a summary of key TOD features and the unique and challenging Western Australian environment in which developers, planners, engineers and policy makers operate. Section 2 summarises the basics of activity space analysis, referring to past research that derived and applied activity spaces with various formulations and in
1 See Section 2 for definitions.
different urban environments. In this research we concentrate on the activity space measures of confidence ellipse (CE) and kernel density (KD) and indicate their main benefits and limitations. We then further explain our approach of data enhancement and hypothesise the benefits of our suggested approach. In Section 3 we provide an overview of the geographical setting, a description of the models used in this paper and the methodology applied to derive constructed route data for data enhancement purposes. Section 4 discusses the results and reviews in comparison confidence ellipse and kernel density activity space measures across three railway precincts, before and after the opening of the new sub-regional railway line in metropolitan Perth, Western Australia, both at a precinct and at a household level. Moreover, this section provides results of the refined approach of data enhancement, applying kernel density estimation with generated route data to a subsample of 54 households. In this case the focus lies on individual households’ travel patterns based on kernel density measurements we refined with retrospectively enriched survey data. Section 5 comments on the empirical results and the paper concludes with an outline of some of the limitations of the analysis as well as an outlook on future work.
TOD in Australia – attempts to become more sustainableTransit Oriented Development (TOD) has arisen as a model integrating land use and transport, discouraging car travel and promoting more active transport modes, injecting vitality and expanding lifestyle choices, whilst reducing urban sprawl (Newman & Kenworthy 1999; Cervero et al. 2004; Dittmar & Ohland 2004; Renne & Wells 2004; Newman 2005; Renne, Wells & Voorhees 2005). TOD is related to concepts of ‘Smart growth’ and ‘New Urbanism’ (Smart Growth Network 2003; Grant 2006; Curtis, Renne & Bertolini 2009; Ewing & Cervero 2010) and embeds the principles of ‘D variables’ – density, diversity, design (Cervero & Kockelman 1997) enriched with destination accessibility and distance (Ewing & Cervero 2001; Ewing et al. 2009). Over the last decade, TOD has been internationally embraced by planners and politicians, who have realised its benefits are reaching far beyond their individual and originally anticipated potential. Under the term ‘Green TODs’ (Cervero & Sullivan 2010), next-generation transit-oriented developments are currently taking shape in many places around the world, aiming to create ultra-sustainable, self-sufficient urban environments. While the core planning tasks remain focussed on spatial integration of transport and

66
Vol 21 No 1 March 2012 Road & Transport Research
Geo-spatial analysis of activity spaces in a TOD environment – Tracking impacts of rail transport policy
land use planning, consideration of environmental and community planning aspects are becoming increasingly interlinked with the traditional TOD model (Ewing & Cervero 2010, Cervero & Sullivan 2010).
Essentially, TOD is associated with moderate to high density development, located within an easy walk (approximately 800 m) of a major public transport stop (operating on highly synchronised and reliable timetables, at high frequency (5-15 min.) and with extended operating hours), generally with a mix of residential, employment, and shopping opportunities, designed for pedestrians and cyclists, without excluding the automobile (Evans et al. 2007; Centre for Transit Oriented Development 2006). TOD creates the conditions for a better coordination of services in space and a greater possibility for combining various activities. TOD can be delivered as a new ‘green-field’ development or as a redevelopment or retrofitting of existing built-up areas. A well-designed TOD is expected to enhance access to opportunities both at the city level as well as the local level. This means that TODs are likely to better account for the individual diverse activity needs, which has impacts on realised travel patterns (Curtis et al. 2009).
Australian cities, and in this context Perth, are facing significant challenges for planning TODs in existing, low density environments (the average population density for Perth is 3.08/ha (Australian Bureau of Statistics 2011), with the highest TOD population density in Perth at less than 40 dwelling/ha (Johnson 2008) struggling to reach even as much as 1/3 of the recommended TOD population and employment densities to support effective transit investments (Guerra & Cervero 2011; Puget Sound Regional Council 1999). In this regard the TODs we present here are atypical of the commonly accepted definitions of TOD in the US and Europe.
These unique challenges partially can be seen as a product of the relatively young history of urbanisation as well as associated metropolitan and transport planning paradigms in Australia, which, until recently, have been vastly influenced by the seemingly ubiquitous availability of land, developable at low costs, and the increasingly unlimited access to the automobile, i.e. the ability to use a vehicle whenever it is needed. In the following, we will further delve into a review Western Australia’s strategic planning fundamentals.
Strategic planning and policy background – Western Australia – Past and future
In the case of Western Australia, formalised strategic metropolitan planning commenced with the adoption of the Stephenson-Hepburn plan in 1955. This plan was replaced by the Corridor Plan (in 1970), Metroplan (in 1990) and recently the plan for a Network City (released in 2004). While earlier planning followed a traditional car-oriented approach, Network City differed. It focused on a connected network of activity centres, taking due cognisance of the important role of public transport, whilst aiming to stimulate a significant amount of growth from within, i.e. through urban regeneration and densification of existing built-up areas.
The centre-based strategic policy framework, defining spatial arrangements of density and land use parameters, was ideally suited to deliver its promise, forming one of the four key strategic planning tools required to successfully support the implementation of transit oriented developments, as suggested by Newman (2009).
However, compared to its predecessors, Network City was short-lived. It was replaced after just six years by Western Australia’s current strategic planning document, titled Directions 2031 and Beyond – Metropolitan Planning Beyond the Horizon (State of Western Australia 2010a), offering an exciting future direction in metropolitan planning. Directions 2031 builds and expands on the Network City approach. It outlines a spatial planning framework and strategic plan for the future development of metropolitan Perth and its surrounding region based on a balanced and managed approach to accommodate both urban growth and preservation, transforming the linear development history to achieve a more compact and connected city by relying on both greenfield and infill development at equal importance.
Directions 2031 presents three vital structural planning elements:
1. an integrated network of activity centres;
2. strategic movement webs; and
3. public green spaces to form the basis of the spatial framework.
A categorised array of activity centres is tagging key locations for densification, intensification and expansion of public transport corridors and urban fabric, in conjunction with developments aimed to accommodate increased housing needs while encouraging reduced car travel. Thus, activity centres form the backbone of the strategic direction.

67
Vol 21 No 1 March 2012 Road & Transport Research
Geo-spatial analysis of activity spaces in a TOD environment – Tracking impacts of rail transport policy
The Western Australian State Planning authority defines activity centres as ‘places, which vary in scale, composition and character but in essence are commercial’ and ‘communal focal points’ (Department of Planning 2011, p.1). They aim to integrate a range of activities, such as commercial, offices, retail, higher-density housing, entertainment, tourism, civic/community (higher) education and medical services. ‘Activity centres vary in size and diversity and are designed to be well-serviced by public transport.’ (State of Western Australia 2010b, p. 4139). These characteristics resemble the TOD basic features.
In support of the implementation of the strategic direction, the Western Australian Government released a new State Planning Policy – Activity Centres for Perth and Peel (State of Western Australia 2010b), making provisions for planning implementation and outlining a performance based approach. While the document specifies main elements for the development of activity centres, the picture remains incomplete as to the minimum values and thresholds of stated performance parameters. Detailed guidance is provided on housing and employment densities, yet for details on the activities – retail, community services, health, recreation, hospitality, cultural, etc. – the policy remains uncertain.
Referring to the broader literature, the policy’s implementation is left to market dynamics and limited capabilities of local government planning authorities, both, given the current economic climate, having to rely on scarce resources available to deliver results, i.e. to implement compliant development outcomes and to individually refine and specify activity centres’ performance parameters within local planning schemes and/or activity centre structure plans. This means planners and developers are confronted with a multitude of complex questions, such as: What are the appropriate indicators of spatial activity arrangement and distribution to achieve functional activity centres?; Is there a ‘right’ mix of activities?; How and where should activities be located to achieve optimum developments with beneficial economic and sustainability outcomes? These questions reveal a disconnect between the strategic plan (Directions 2031) and its implementation framework, with critical elements caught in the crossfire of competing influences, such as localised and commercial interests, and routinely exposed to the political agenda at the local level. This is where the success of the strategy will likely face its limitations, given the restricted powers, facts
and funds to reinforce the goals of this high level strategic plan.
Considering the state of affairs outlined above, our research introduces geospatial analysis tools that can assist practitioners in unravelling some of the complexities, with potential to develop and display compelling arguments in support of the strategic goals. It provides measures to benchmark, monitor and analyse planning outcomes as they materialise within the urban fabric. This can prove as valuable to assist planners and decision makers in better understanding of the strategic outcomes. Using a local case study, we apply the suggested measures to a real life scenario and investigate associations between transit-oriented development (TOD) conditions and changes in household activity spaces for three precincts along a new 72 km railway corridor in Perth (Perth – Mandurah metro rail).
A practitioner’s view – understanding implications & enriching knowledge
Multiple implications of public transport, passenger rail, and associated TOD investments are known; they include reduced car dependence and increased public transport ridership along with more walking and cycling (Cervero 2005; Chen & McKnight 2007), increase in property values (Cervero et al. 2004; Hess 2007; Pagliara & Papa 2011), as well as stimulation of economic development at the local level.
Notwithstanding their obvious benefits, we seem to experience problems with the broader acceptance, adoption and implementation of TOD, Smart Growth and New Urbanism principles. Strategic policy and political decision makers in Western Australia are yet to fully apply these ideas and frequently fail to place more emphasis on improved public transport and passenger rail investments (Australian Conservation Foundation 2011). They lack in facilitating the ‘vehicles’ for implementation and to provide market incentives to assist in delivery of successful TOD outcomes, e.g. through valuable and proven Public-Private-Partnerships, formed by State and Local Government Authorities as well as development industry partners (Curtis et al. 2009).
On the other hand, in a marked driven economy which is yet to overcome negative impacts of the recent global financial crisis (GFC), it proves difficult to shift the mindset of developers and financiers, from a myopic, short-term cost-recovery view to a longer-term view, which ultimately capitalises on the benefits at residential level using multiplier effects, to create lasting value for money outcomes for the development industry. Promising means to achieve

68
Vol 21 No 1 March 2012 Road & Transport Research
Geo-spatial analysis of activity spaces in a TOD environment – Tracking impacts of rail transport policy
this are good quality, functional and attractive built environments with long-term increase in property values, supported by taxation incentives.
At the local community level, a lack of public understanding about strategic planning principles appears evident. While most City planners claim to grasp TOD concepts (but frequently wrestle with defining appropriate performance parameters), the general public remains vastly unaware about its myriad advantages. Generally the community seems to fear that dense urban development causes a lack of green space and lack of quality development. Hence, influencing and changing personal attitudes and market dynamics remain major challenges in advancing TOD implementation at a local level. In a re-development situation, this scenario is often complicated by fragmented ownership, requiring amalgamation or conjoint development of multiple small landholdings, restricting the timely and systematic achievement of planned land-use, amenity and accessibility outcomes at the local level. Consequently, any kind of TOD proposal still faces huge obstacles in many communities.
From an institutional perspective, a disconnect between State and local authorities arises when plans are conceived and decisions made separately and even in opposition or conflict, instead of together. A shift to integrated thinking and planning between various agencies seems imperative, with inter-agency collaboration recognised as a crucial element on the TOD agenda (Cervero & Sullivan 2010); yet, historically, breaking down institutional barriers is known to be difficult.
In Western Australia, redevelopment authorities have frequently been formed to overcome these issues, especially where large landholdings in State Government ownership supported the TOD task or where local government intervention had not been successful in achieving desired outcomes. Despite its benefits, this approach has the potential to introduce market bias, with development gravitating towards those less regulated and favouring re-development agents, which appear more supportive of TOD, Smart Growth and higher density. Hence, comprehensive guidelines for TOD implementation, recognising complexity of in-fill vs. green field locations and outlining key components as well as specific parameters to qualify for government support, would assist in providing consistent conditions across potential (re-)development precincts, removing bias and allowing local governments to pursue strategic targets on a level playing field and in inter-regional collaboration.
2. CONCEPTS AND MODELLING APPROACH
Tracking activity space changesThe motivation for people to travel is the wish for participation in activities. These activities are geographically spread and their location, frequency, and duration is a function of the benefits (utility) they provide, of the time and budgetary restrictions, and of the availability of urban facilities to meet those needs and desires.
The activity space (AS) concept has emerged as a tool to gain insights into the relationships between the demand for daily activity, travel and urban space characteristics. This concept attempts to describe the distribution of activity locations visited through spatial measures, forming a space individuals are likely to be more aware/informed of and hence use it. Activity space is based on the idea that frequent visits to places increase the individual’s knowledge of the locations visited, including their immediate surroundings. This knowledge space, also known as a mental map, can then influence the choice for location and travel (Hannes, Janssen & Wets 2008). The activity space reveals both the individual’s demand for activity participation and the supply of supporting activity facilities and is considered to be a ‘people-based accessibility measure’ (Miller 2005).
With this research we aim to reflect on our prior work (Botte & Olaru 2010) which critically considered a variety of metrics used in geospatial analysis (confidence ellipses (CEs), Cassini ovals, hyper-ellipses, bean curves, and kernel densities (KDs)) for assessing household activity spaces within a TOD setting. We suggest here an improved way of assessment focussing on the kernel density activity space measure, using generated route data (simulating Global Position System travel survey data information) to allow for better monitoring of changes in human activity patterns, spatially and temporally, with an emphasis on the analysis of potential TOD influenced travel behaviour changes. Various parameters that can change the characteristics of the resulting activity space measure are also examined, as well as pre- and post-railway opening changes.
What are Activity Spaces?
The theory of activity spaces (AS) stems from biological research undertaken on habitat use, territoriality behaviour, and mammals’ home range studies (Burt 1943; Jennrich & Turner 1969, Mazurkiewicz 1969; Worton 1989; Seaman & Powell 1996; Simcharoen et al. 2008) and has been applied in other areas such as the analysis of crime

69
Vol 21 No 1 March 2012 Road & Transport Research
Geo-spatial analysis of activity spaces in a TOD environment – Tracking impacts of rail transport policy
incident locations (Levine 2002) or accessibility to health care services (Guagliardo 2004). Basic work applied simple elliptical measures (Zahavi 1979; Holzapfel 1980; Beckmann, Golob & Zahavi 1983a,b). Later on, kernel densities were applied (Botte 2003; Axhausen, Botte & Schönfelder 2004a,b), or minimum spanning tree (Axhausen et al. 2004a,b; Chapleau & Morency 2007), and more recently alternative geometries were tested (Rai et al. 2007; Botte & Olaru 2010).
The activity spaces consider jointly travel demand and supply by including locations of required daily activities and the transport services satisfying those travel needs. They reflect a spatial process that cannot be captured in classical demand models, and take into account time limitations and institutional constraints. The activity spaces are geospatial, statistical measures that can describe spatial use (Axhausen et al. 2004a,b) or spatial perception, and spatial awareness of travellers (Horton & Reynolds 1971) at individual or aggregate level. Empirical studies have been conducted either on revealed activity spaces (Dijst 1999; Botte 2003; Schönfelder & Axhausen 2003a,b; Olaru, Smith & Peachman 2005; Buliung & Kanaroglu 2006; Chapleau & Morency 2007; Kamruzzaman et al. 2011) or focused on travel potentials or opportunities (Brown & Moore 1970; Burns 1979; Casas 2007). Numerous accounts of recent experiences/studies were at the aggregate level or individual level (where data was sufficient – e.g., Mobidrive).
Activity spaces are related to the space-time paths and prisms (fish tanks – Kwan 2000) demarcating possible locations for activities, within a given time ‘budget’ for travel and considering the speed of the transport services (Burns 1979, based on Hägerstrand 1970). A significant improvement in the quality of services, resulting in greater potential to reach further destinations, may be either reflected in larger activity space-time prisms or in time savings that can be embedded in stationary activity times. Similarly, two-dimensional AS adjust dynamically as a result of changes in built environment and transport services, and they may increase with higher access to activities further from home or may decrease if the opportunities are brought close to home.
This research belongs to the stream of research exploring realised AS at both individual and aggregate level, in the context of TOD changes.
How do we measure AS?
A variety of methods have been used in the last four decades to measure the extent of the activity
space. Usually, the AS has been defined in a two-dimensional form, applying standard distance, confidence ellipse2, polygon, or kernel density for their size (Silverman 1986; Worton 1989; Fotheringham, Brunsdon & Charlton 2000; Buliung & Kanaroglu 2006; Fan & Khattak 2008), as well as minimum spanning tree and buffer geometries (Schönfelder & Axhausen 2002, 2003a,b; Chapleau & Morency 2007). Different formulations have aimed to accentuate the various dimensions of travel related choice decisions or potentials to reach opportunities, whilst providing the connection to spatial information and temporal dimensions (e.g. time spent on both activity and travel) (Chapleau, Trépanier & Chu 2008). Rai et al. (2007) compared new geometries such as superellipses, Cassini ovals and bean curves with confidence ellipses, providing insights and recommendations on appropriateness of various shapes for certain conditions. These measures are determined by the household basic places (home, work or other frequently visited activity centres) and the accessibility provided by the transport network (Golledge & Stimson 1997). Hence, they highlight various travel behaviour aspects and it is difficult to find a single measure to cover the richness of travel behaviour. The most commonly highlighted limitations in previous scholarly work are:
a. Standard distances (imposing symmetry around the home) tend to exacerbate the effect of spatial outliers and fail to account for weighting of activity locations.
b. Confidence ellipses are likely to overestimate the size of activity spaces.
c. Polygons are representing the maximum geographical extent of the activity space, ignoring weights and considering all locations equally important; moreover, they cannot be estimated for ‘pendulum’ home-work travel.
d. Buffers and spanning trees are assuming that narrow bands of space around a road or track network are known to the user, they are data intensive, and do not incorporate importance of locations in their definition. In the same line of thought, space-time prisms are difficult to analyse quantitatively.
Given the above limitations, Botte & Olaru (2010) selected Kernel Density and Confidence Ellipse geometries as candidates of interest for further investigation.
2 Confidence ellipses show the urban area where a specified percentage (e.g. 95%) of the activity locations lie.

70
Vol 21 No 1 March 2012 Road & Transport Research
Geo-spatial analysis of activity spaces in a TOD environment – Tracking impacts of rail transport policy
Kernel density
Botte and Olaru (2010) have examined in detail a variety of metrics and found kernel density a more appropriate tool for exploring travel behaviour changes and for analysis of intra-household interaction via AS. In consequence, this paper focuses on AS measured using kernel densities.
The kernel density bivariate estimator describes the activity spaces by calculating densities based on the locations visited by individuals, assuming no barriers in reaching those locations in any direction and within a predetermined bandwidth. The output densities are obtained in two steps: firstly, by ‘placing’ kernel density distributions (kernels) over the spatially distributed data points and secondly, by overlapping those kernels to derive a more continuous density surface. This surface shows clustering of activities as well as high probabilities for frequenting certain locations (similar ‘heat maps’). This information is then projected in a raster data set, being assigned a value calculated according to the distance from the starting feature (activity location) and the proximity to the other features in the data set. Kernels can also incorporate other variables associated with travel behaviour, such as the frequency or duration of activity in a particular location. Output areas can be considered at 100% (all inclusive non-zero activity density area) or any other specified level (e.g. 95% interval, as such allowing the analyst to discard parts of the activity space that may consist of infrequent, non-typical activities in the life of the individuals, determined by some special conditions or events) or even density band. Further, the bandwidths (search radius) and kernel function are to be specified by the analyst. This subjectivity is recognised to affect the results.
Gibin, Longley and Atkinson (2007) recommended the context-specific choice of the bandwidth for the kernel function. O’Sullivan and Unwin (2003) explored bandwidths between 100 m and 1000 m, consistent with the average distances between locations. Botte and Olaru (2010) used a bandwidth of 3 km, based on the average distance of trips within three TOD precincts. Here we apply both 1.5 km and 1 km values associated with the walking and cycling distances found in the data.
Data enhancement – generating route information
As with any research, data resolution and quality dictate what can eventually be examined. The lack of information on the routes is considered a limitation when assessing kernel density based activity spaces. Recent scholarly work supports the use of
more detailed travel data (Downs & Horner 2007; Okabe, Satoh & Sugihara 2009). Advancements have been made in adapting the traditional kernel density measure to a network based approach, considering distances on the network based on the shortest path algorithm (Downs & Horner 2007). Okabe et al. (2009) provided evidence of biasness associated with the traditional measuring approach (including only locations), which overestimates densities around activity locations. Their results confirmed that continuous density surfaces can be derived when considering the network. We agree with their comments and here we test the inclusion of detailed information on recreated, most likely travelled routes to provide an enriched analysis of the households’ activity travel point patterns.
This research uses data collected using standard trip diaries that did not include information on the travelled routes. Ethical considerations and privacy issues limited the large scale application of more detailed and more passive survey approaches, such as GPS tracking technologies or the use of triangulation of mobile phone signals in the context of travel behaviour analysis. To enhance the survey dataset with route data we had to take a different approach. We devised a method to impute travel routes based on the travel mode chosen by the individual and its availability at the departure time for the trip. GIS coordinates for origin and destination locations were the initial information for these routes. We then constructed travel data points (similar GPS track-points) using on-line route planning (e.g. Google Maps). However, currently being limited to a manual approach, data imputation has been tested on a small sub-sample of households only.
3. DATA AND METHODOLOGYThis research uses a number of comparisons (temporal and spatial) to highlight changes in AS, measured as confidence ellipses and kernel densities. We applied before vs. after railway opening comparisons of a number of travel behaviour indicators and activity spaces. We also compared the travel patterns and activity spaces across the three TOD precincts. The analysis relied on MANCOVA (multivariate analysis of variance with covariates).
Data collectionTwo main sources of data were used in this research:
1. A quasi-longitudinal study – interviewing households on their travel patterns, attitudes towards built environment and location – the focus here is on trip making.

71
Vol 21 No 1 March 2012 Road & Transport Research
Geo-spatial analysis of activity spaces in a TOD environment – Tracking impacts of rail transport policy
2. GIS information on routes taken by individuals – data imputed for a subsample of 54 households.
For this study, we considered the households surveyed in 2006 and 2009 (assuming settled travel behaviour).
Selection of precinctsThe railway corridor was built through both established areas and green fields, offering various opportunities to implement transit-oriented development features at some of the railway stations. We selected for research purposes three unique station precincts, each representing a different TOD environment (Tables 1 and 2). This allowed us to assess potential differences in the destination accessibility, design, density and diversity of the three precincts. More details on the precincts can be found in Curtis and Olaru (2007, 2010).
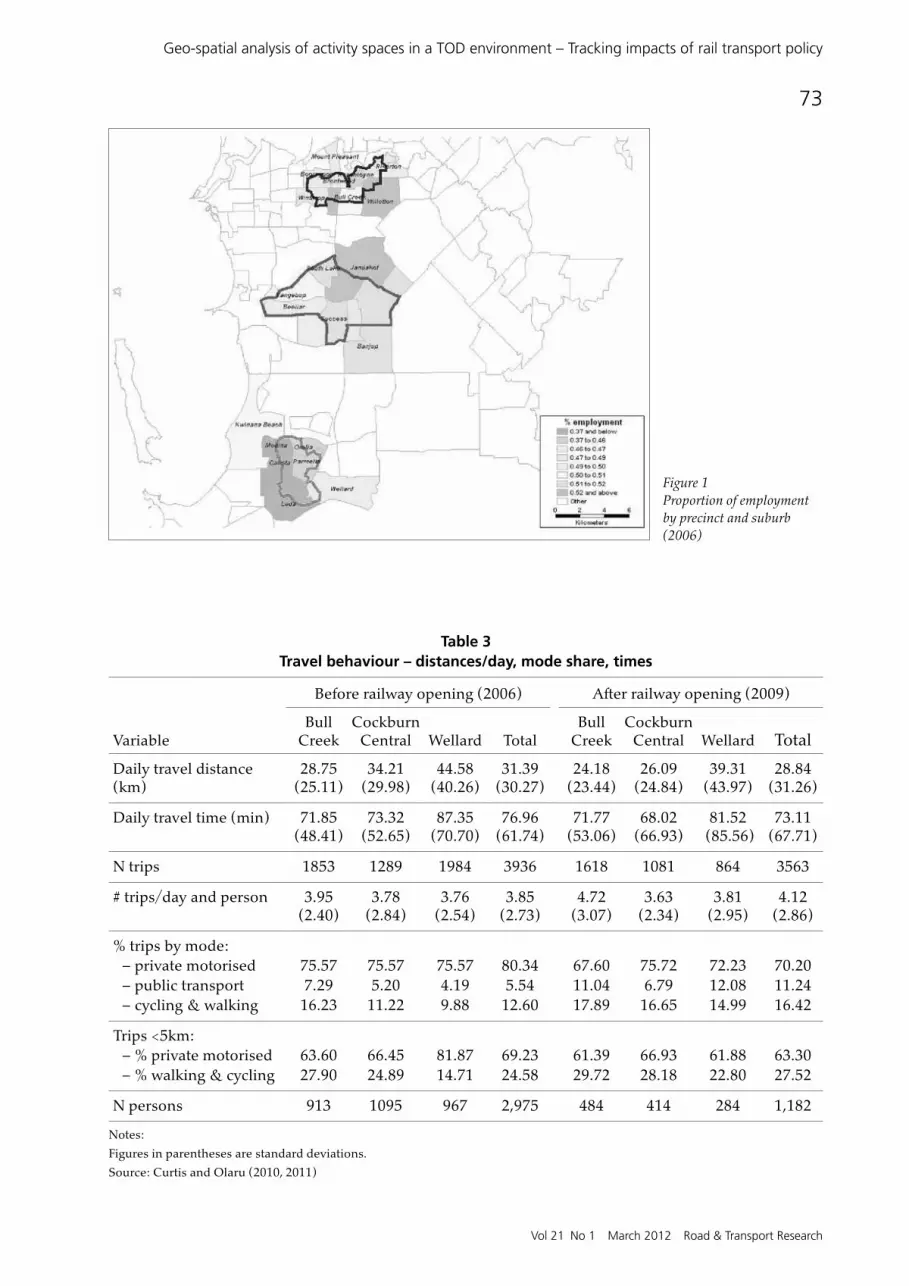
A comparison of the residential vs. employment densities of all precincts further attests a different demographic and urban fabric in the three precincts. Bull Creek has the highest employment (despite its highest proportion of retired residents), whereas Wellard has the lowest employment rate. These elements of density and diversity have been previously linked to travel behaviour (Ewing & Cervero 2010).
Figure 1 displays employment and population levels in each precinct.
The catchment area for the precincts is delineated as well (from north to south, Bull Creek, Cockburn Central & Wellard). Again, the maps demonstrate the heterogeneity in density and diversity, with Bull Creek ‘leading’ in opportunities, and Wellard displaying the lowest density.
4. EMPIRICAL RESULTS
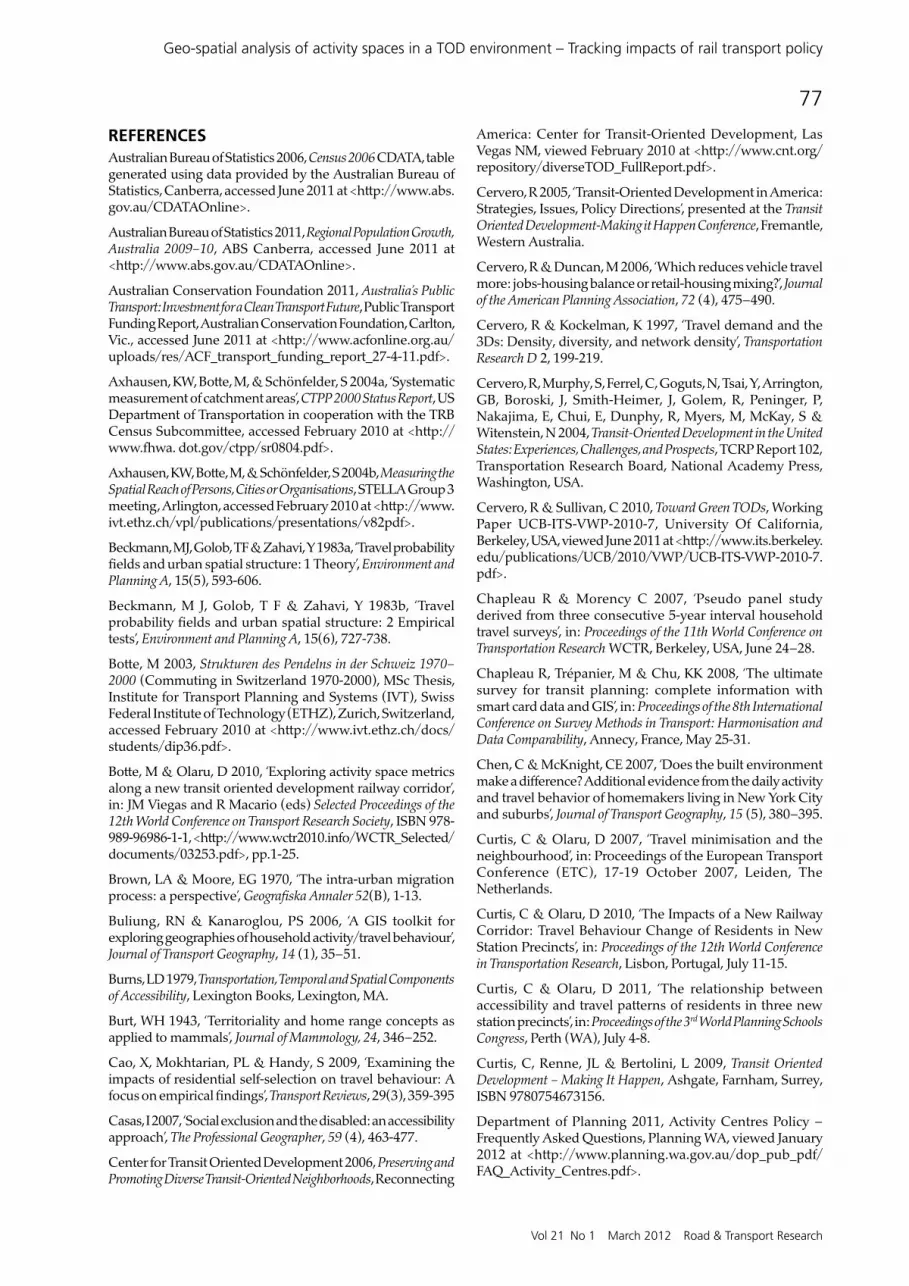
Travel behaviourTable 3 provides a suite of travel behaviour indicators by precinct and before and after the opening of the railway corridor. Residents in Wellard travel further and longer. They are the heaviest car users and have the lowest share of more active travel modes. Residents in Bull Creek walk and cycle the most and they drive the least. These results reflect both city-level access and the varying stage of TOD implementation in the precincts.
When comparing the number of legs before and after the railway opening, this picture changed, with more residents becoming multi-modal (rather than uni-modal) travellers. Car-based travel decreased significantly, whereas all precincts witnessed increases in walking, cycling, and public transport ridership.
Activity spaces – Origin-destination locationsThis section outlines result of activity spaces based on Origin-Destination data only, i.e. without route information. A few interesting findings arose from
Table 1 Profile of the three precincts
Bull Creek – BC Cockburn Central – CC Wellard – W
• 12 km from CBD• Brownfield / Transit
Interchange• No mix of land use.• Well-defined PT network
in area.• Population density&• Education & income&• Real estate values&
• 21 km from CBD• Land Agency Model• Mix of TOD features
(multifunctional Town Centre, residential, commercial, cultural)
• Park & ride facilities• Population density(• Family size&• Employment rate&• % Australian born&
• 39 km from CBD• Greenfield / Private Sector
Model• TOD features&
(mixed use – Main street combined with residential) – not fully implemented
• % Car trips&• % Walk & cycle(• Employment rate(• Income(• Car ownership(• Real estate values(
Note:
( indicates ‘Lowest Values’;
& indicates ‘Highest Values’

72
Vol 21 No 1 March 2012 Road & Transport Research
Geo-spatial analysis of activity spaces in a TOD environment – Tracking impacts of rail transport policy
the comparison by precinct and before-after opening of the rail corridor (Table 4). Kernel density areas (based on 1.5 km bandwidth) are not statistically significant different across precincts (p=0.619), but vary significantly between 2006 and 2009 (p<0.001), with a consistent increase of the activity spaces in all three precincts. This would suggest that residents have taken advantage of the increased accessibility and now reach for farther destinations. But, the situation is exactly the opposite when analysing activity spaces based on the confidence ellipses. They differ across precincts (p<0.001), but not between 2006 and 2009 (p=0.463). In fact, activity spaces as confidence ellipses for Bull Creek
and Cockburn Central increased, whereas they decreased in Wellard. This apparent discrepancy is due to the manner in which the activity spaces are derived. The kernel densities are actually reflecting activity locations, whereas confidence ellipses are ‘filling’ in the space between those locations. If the number of locations is reduced and the locations are further apart, the kernel density based activity space is likely to be formed by discontinuous areas around those separate locations, whereas the confidence ellipse becomes an elongated ellipse.
In terms of magnitude, in average, confidence ellipses are 3.9 times larger than activity spaces
Table 2 Residential and employment by precinct and suburb
PrecinctState suburb (SSC) M
anuf
actu
ring
Con
stru
ctio
n
Ret
ail t
rade
Acc
omm
odat
ion
and
food
se
rvic
es
Serv
ices
– p
rofe
ssio
nal
scie
ntifi
c &
tech
nica
l
Publ
ic a
dmin
istr
atio
nan
d sa
fety
Educ
atio
n an
d tr
aini
ng
Hea
lth
care
and
soc
ial
assi
stan
ce
Tota
l em
ploy
men
t
% E
mpl
oym
ent
Bull Creek Bateman 126 109 201 120 195 116 258 208 1855 52.6%Booragoon 200 121 278 150 258 142 255 294 2480 46.7%Brentwood 68 49 103 44 67 50 85 110 815 47.0%Bull Creek 310 241 407 233 368 264 477 462 3881 50.4%Mount Pleasant 232 242 323 189 389 169 287 305 3149 49.0%Riverton 205 179 248 122 162 141 239 252 2314 49.6%Rossmoyne 100 77 160 59 133 80 149 160 1358 44.3%Shelley 198 133 237 103 173 154 267 249 2147 48.7%Willetton 827 593 1,138 593 717 684 1,010 967 9317 54.0%Winthrop 233 163 404 263 337 191 327 311 3141 48.9%
Cockburn Central
Atwell 407 319 367 132 243 237 265 376 3333 48.1%Beeliar 322 218 267 90 105 124 109 191 2136 49.5%Jandakot 189 155 234 77 132 80 131 170 1780 55.4%South Lake 444 238 360 147 123 151 170 317 2883 50.9%Success 338 215 271 139 130 170 155 231 2479 51.1%Yangebup 494 312 349 143 129 185 175 286 3091 50.8%
Wellard Calista 78 43 65 30 28 41 18 63 526 30.8%Kwinana Beach 6 0 0 0 0 0 0 0 6 50.0%Leda 169 83 124 51 35 53 46 87 934 35.2%Medina 109 77 68 40 23 41 28 60 684 33.8%Orelia 303 166 195 89 61 99 71 144 1671 40.3%Parmelia 407 229 263 102 70 124 100 199 2248 37.8%Wellard 133 82 62 32 40 45 41 77 771 46.5%
Source: Australian Bureau of Statistics (2006)
73
Vol 21 No 1 March 2012 Road & Transport Research
Geo-spatial analysis of activity spaces in a TOD environment – Tracking impacts of rail transport policy
Figure 1 Proportion of employment by precinct and suburb (2006)
Table 3 Travel behaviour – distances/day, mode share, times
Variable
Before railway opening (2006) After railway opening (2009)
Bull Creek
Cockburn Central Wellard Total
Bull Creek
Cockburn Central Wellard Total
Daily travel distance (km)
28.75 (25.11)
34.21 (29.98)
44.58 (40.26)
31.39 (30.27)
24.18 (23.44)
26.09 (24.84)
39.31 (43.97)
28.84 (31.26)
Daily travel time (min) 71.85 (48.41)
73.32 (52.65)
87.35 (70.70)
76.96 (61.74)
71.77 (53.06)
68.02 (66.93)
81.52 (85.56)
73.11 (67.71)
N trips 1853 1289 1984 3936 1618 1081 864 3563
# trips/day and person 3.95 (2.40)
3.78 (2.84)
3.76 (2.54)
3.85 (2.73)
4.72 (3.07)
3.63 (2.34)
3.81 (2.95)
4.12 (2.86)
% trips by mode:– private motorised 75.57 75.57 75.57 80.34 67.60 75.72 72.23 70.20– public transport 7.29 5.20 4.19 5.54 11.04 6.79 12.08 11.24– cycling & walking 16.23 11.22 9.88 12.60 17.89 16.65 14.99 16.42
Trips <5km:– % private motorised 63.60 66.45 81.87 69.23 61.39 66.93 61.88 63.30– % walking & cycling 27.90 24.89 14.71 24.58 29.72 28.18 22.80 27.52
N persons 913 1095 967 2,975 484 414 284 1,182
Notes:
Figures in parentheses are standard deviations.
Source: Curtis and Olaru (2010, 2011)

74
Vol 21 No 1 March 2012 Road & Transport Research
Geo-spatial analysis of activity spaces in a TOD environment – Tracking impacts of rail transport policy
measured as kernel densities with a bandwidth parameter of 1.5 km.
To check the validity of the kernel density results we also compared the activity spaces at the precinct level. These kernel density areas include the locations of activities of all residents of the precinct and, as shown in Table 5, support the increase in activity spaces for all precincts. Another interesting finding relates to the comparison of 100% and 95% areas. By including all locations (and thus outliers, infrequent activities), we overestimate the kernel densities by at least 30%.
Figures A1 and A2 (see Appendix) show these changes visually and the results can be explained by the increased citywide accessibility.
Activity spaces – with imputed travel routesAs previous research highlighted, more detailed data for derivation of kernel densities is expected to mirror more accurately the daily activity space. Our analysis of a subsample of households concludes that kernel density areas increase in average by 25% when adding the imputed travel routes. Noticeable, there are also increases in the activity spaces derived via confidence ellipses due to adding these routes (but to a smaller extent, an average of 19%). This change can be explained by the fact that more locations are likely to modify the centre of gravity of the ellipse.
Finally, we have also explored the changes in kernel density areas following a modified search radius/bandwidth, reduced from 1.5 km to 1 km. Our results show the areas decreased – as expected – by 33%. Table 6 presents the correlations between various measures of activity spaces, both including the likely travel routes as well as without them.
The results show moderate to high correlations between kernel densities and confidence ellipses (0.635 to 0.707), low correlations between the kernel density areas with and without the routes (0.353, 0.358), and high correlations between confidence ellipses areas (0.81). This suggests that benefits of data enrichment are valid for kernel densities, but not so for confidence ellipses.
Accordingly, Figure A3 (see Appendix) demonstrates there is no clear pattern in the changes for confidence ellipses with data enhancement, i.e. when routes are added. In fact, the example we provide is showing a reduction in the CE both before the railway opening and after the opening following data enhancement. Another interesting feature of this household’s activity spaces (the household is located within the Wellard precinct) is the considerable reduction in the activity spaces as a result of more local travel. Although this cannot be extrapolated for the whole precinct, there is a promise that availability of opportunities and diverse urban services in the neighbourhood may have been taken up by the residents.
Table 4 Changes in Activity Spaces before and after railway opening (household level)
AS at HH level
Bull Creek Cockburn Central Wellard
2006 2009 2006 2009 2006 2009
AS with only locations (all) – in km2
CE – average (std. deviation)
143.53 (212.08)
177.71 (338.91)
137.61 (168.25)
245.57 (401.06)
396.42 (511.08)
310.87 (475.33)
KD – average (std. deviation)
43.50 (16.53)
57.30 (21.42)
45.82 (15.77)
57.05 (17.72)
47.82 (18.75)
56.09 (20.96)
Table 5 Changes in AS before and after railway opening (precinct level) – radius 10 km
KD – AS at precinct level(km2)
Bull Creek Cockburn Central Wellard
2006 2009 2006 2009 2006 2009
100% Area 465.60 519.11 559.62 707.14 731.29 1,022.38
95% Area 338.19 406.55 357.15 529.30 319.12 777.99

75
Vol 21 No 1 March 2012 Road & Transport Research
Geo-spatial analysis of activity spaces in a TOD environment – Tracking impacts of rail transport policy
To further compare the size of the kernel density in time and space, we added five household covariates in the analysis of variance. The results provide evidence that the vectors of activity space metrics vary between 2006 and 2009 (multivariate tests significant at 0.001) and across precincts, whilst accounting for the covariates (household size, number of children and of vehicles, household income, and the level of ‘busyness’ (number of paid and unpaid working/studying hours). More detailed tests indicated that differences are more prominent before and after railway opening, compared with the precincts. The number of residents was the most significant covariate (<0.001).
5. DISCUSSION OF RESULTSAnalysis of activity spaces (measured as kernel densities and confidence ellipses) shows mixed results. While kernel densities differences across precincts are not significant, the areas of confidence ellipses are. The activity spaces tend to increase with the distance from the city, with households residing in Bull Creek displaying the smaller activity space areas. The largest activity spaces are recorded for the residents of Wellard. The analysis of travel distances, durations, and destinations revealed that households in Cockburn and Wellard have greater access to the city and to the opportunities provided within the new corridor and they shop more often in the CBD and at Gateways (Cockburn Central).
When comparing the activity spaces between waves, we noticed a consistent increase in all KD-based
activity space areas, but we obtained inconclusive results in the activity spaces measured as CE, with increased areas observed in only two precincts. As a potential explanation for this we suggest the significant overestimation that underlies activity spaces derived via confidence ellipses (especially for households/cases with fewer reported trips), whereas the derivation of kernel density based activity spaces includes only the spatial distribution of activities, whether with or without an inclusion of routes. Depending on the bandwidth, the kernels may not always form continuous shapes. This is contrary to confidence ellipse-based activity spaces, which do cover the vast area between the spatially distributed activity locations.
After the opening of the railway corridor, the activity spaces derived via confidence ellipses have decreased only in Wellard. As shown by the travel data results, the opening of the railway has seen significant reduction in car travel and increases in walking, cycling, and travel by public transport.
6. CONCLUSIONS, IMPLICATIONS, AND FURTHER RESEARCH
ConclusionsActivity spaces are rich dynamic measures based on the individual/household travel that have frequently been used to identify differences between socio-demographic groups. In this research we performed the same type of analysis. We explored confidence ellipses and kernel densities
Table 6 Correlations of Activity Spaces measures (54 households)
Kernel density area
(routes)Radius = 1.5 km
Kernel density area
(routes)Radius =
1 km
Kernel density
area (only locations)
Confidence ellipse area
(routes)
Confidence ellipse area
(only locations)
Kernel density area (routes)Radius = 1.5 km
1 0.998** 0.353* 0.707** 0.635**
Kernel density area (routes)Radius = 1 km
0.998** 1 0.358* 0.695** 0.637**
Kernel density areas (only locations)
0.353* 0.358* 1 0.323* 0.440**
Confidence ellipse area (routes)
0.707** 0.695** 0.323* 1 0.810**
Confidence ellipse area(only locations)
0.635** 0.637** 0.440** 0.810** 1

76
Vol 21 No 1 March 2012 Road & Transport Research
Geo-spatial analysis of activity spaces in a TOD environment – Tracking impacts of rail transport policy
for households and precincts and found that the distribution of locations, frequency of activities, as well as the presence of the travel routes, affect the measures. Whereas confidence ellipses had huge variations, kernel densities did not vary remarkably across precincts or before and after railway opening. Also, data enrichment did not have an impact on CE measures, but notably improved the KD estimates. We support further investigation of the kernel densities, as they offer continuous activity spaces, reflecting density and intensity patterns at an enhanced and close-to-reality resolution.
The relative ‘stability’ of kernel density estimates is consistent with the observed ‘inelasticity’ of travel with respect to changes in built environment, as highlighted by Ewing and Cervero (2010) in their meta-analysis of over 200 studies published in the last decade on the topic.
Although premature to draw conclusions that TOD has changed the travel behaviour and modified the activity spaces, our findings suggest associations between TOD features (density, diversity, and destination choices) and trip making, as reflected in the activity spaces. The activity spaces are smaller in precincts with higher access (Bull Creek) and this pattern is maintained after the opening of the railway corridor. However, not all precincts experienced the same changes. The increased time accessibility brought about by the railway corridor facilitated residents from Wellard to expand their range of activities towards the city. For residents of Bull Creek and Cockburn Central, the railway opening coincided with new opportunities of walking and cycling (Bull Creek) or mixed land use around the railway precinct (Cockburn Central).
As demonstrated by previous scholars, the relationship between the built environment and travel behaviour may be overestimated if we neglect to account for residential sorting and neighbourhood preferences (Handy, Cao & Mokhtarian 2006; Cao, Mokhtarian & Handy, 2009; Ewing & Cervero 2010). Our modelling has shown positive associations between the number of household members, number of children, as well as ‘busyness’ with the activity space area measures. This is expected, as the number and variety of daily commitments create the demand for activities in various locations, which is likely to expand activity spaces. This is essential information for our planners; the results are encouraging, suggesting further exploration of activity space measures to develop cutting edge tools for analysis of travel behaviour modifications following changes in built environment.
This research has both academic and practical implications. It provides new ideas on how to measure and apply kernel densities for capturing activity spaces and demonstrates the tool’s capability to be applied as indicator of the match between supply of urban services and households travel. Without spatial knowledge, planners run a larger risk of creating spatial conditions that do not match the individual needs and desires, and therefore encourage non-sustainable travel behaviours. Analysts as well as urban designers and planners could embrace the activity space concept alongside other geospatial analysis tools as part of their daily assessment routines and research repertoire. With respect to enriched data, if modellers and planners are willing to include routes data in their spatial tools, they should be aware that confidence ellipses remain relatively ‘immune’ to the new data and only kernel densities are likely to benefit from them. As contemporary technologies are now capable of tracking individuals in their daily travel, we recommend that this aspect is kept in mind at an early stage in the design of data collection approaches.
Limitations and further researchAs indicated, this research has shown the effect of routing data on a small subsample of households only due to the onerous manual re-construction process. We have built routes using Google Maps, and then imported the data into ArcGIS for analysis. This could be made easier through either developing sophisticated methodologies to incorporate GPS tracking or by building automated computational tools based on Google Earth/Maps or an integrated network routing model implemented within the GIS software (with the latter currently being further explored).
Another limitation of our model exists with regard to the inclusion of both work and non-work activities in the activity spaces. As TOD benefits are expected to be prevalent at a local level, further research would require removing work and study related travel from the activity space analysis, and assessing the implications of these modifications.
Despite promising results, more advanced research is now required to simultaneously model built environment characteristics, socio-demographics, and attitudes with travel behaviour in a longitudinal approach. This would assist urban planners and transport practitioners to ascertain the separate contribution of built environment features and transport services to achieving successful TODs.
77
Vol 21 No 1 March 2012 Road & Transport Research
Geo-spatial analysis of activity spaces in a TOD environment – Tracking impacts of rail transport policy
REFERENCESAustralian Bureau of Statistics 2006, Census 2006 CDATA, table generated using data provided by the Australian Bureau of Statistics, Canberra, accessed June 2011 at <http://www.abs.gov.au/CDATAOnline>.
Australian Bureau of Statistics 2011, Regional Population Growth, Australia 2009–10, ABS Canberra, accessed June 2011 at <http://www.abs.gov.au/CDATAOnline>.
Australian Conservation Foundation 2011, Australia’s Public Transport: Investment for a Clean Transport Future, Public Transport Funding Report, Australian Conservation Foundation, Carlton, Vic., accessed June 2011 at <http://www.acfonline.org.au/uploads/res/ACF_transport_funding_report_27-4-11.pdf>.
Axhausen, KW, Botte, M, & Schönfelder, S 2004a, ‘Systematic measurement of catchment areas’, CTPP 2000 Status Report, US Department of Transportation in cooperation with the TRB Census Subcommittee, accessed February 2010 at <http://www.fhwa. dot.gov/ctpp/sr0804.pdf>.
Axhausen, KW, Botte, M, & Schönfelder, S 2004b, Measuring the Spatial Reach of Persons, Cities or Organisations, STELLA Group 3 meeting, Arlington, accessed February 2010 at <http://www.ivt.ethz.ch/vpl/publications/presentations/v82pdf>.
Beckmann, MJ, Golob, TF & Zahavi, Y 1983a, ‘Travel probability fields and urban spatial structure: 1 Theory’, Environment and Planning A, 15(5), 593-606.
Beckmann, M J, Golob, T F & Zahavi, Y 1983b, ‘Travel probability fields and urban spatial structure: 2 Empirical tests’, Environment and Planning A, 15(6), 727-738.
Botte, M 2003, Strukturen des Pendelns in der Schweiz 1970–2000 (Commuting in Switzerland 1970-2000), MSc Thesis, Institute for Transport Planning and Systems (IVT), Swiss Federal Institute of Technology (ETHZ), Zurich, Switzerland, accessed February 2010 at <http://www.ivt.ethz.ch/docs/students/dip36.pdf>.
Botte, M & Olaru, D 2010, ‘Exploring activity space metrics along a new transit oriented development railway corridor’, in: JM Viegas and R Macario (eds) Selected Proceedings of the 12th World Conference on Transport Research Society, ISBN 978-989-96986-1-1, <http://www.wctr2010.info/WCTR_Selected/documents/03253.pdf>, pp.1-25.
Brown, LA & Moore, EG 1970, ‘The intra-urban migration process: a perspective’, Geografiska Annaler 52(B), 1-13.
Buliung, RN & Kanaroglou, PS 2006, ‘A GIS toolkit for exploring geographies of household activity/travel behaviour’, Journal of Transport Geography, 14 (1), 35–51.
Burns, LD 1979, Transportation, Temporal and Spatial Components of Accessibility, Lexington Books, Lexington, MA.
Burt, WH 1943, ‘Territoriality and home range concepts as applied to mammals’, Journal of Mammology, 24, 346–252.
Cao, X, Mokhtarian, PL & Handy, S 2009, ‘Examining the impacts of residential self-selection on travel behaviour: A focus on empirical findings’, Transport Reviews, 29(3), 359-395
Casas, I 2007, ‘Social exclusion and the disabled: an accessibility approach’, The Professional Geographer, 59 (4), 463-477.
Center for Transit Oriented Development 2006, Preserving and Promoting Diverse Transit-Oriented Neighborhoods, Reconnecting
America: Center for Transit-Oriented Development, Las Vegas NM, viewed February 2010 at <http://www.cnt.org/repository/diverseTOD_FullReport.pdf>.
Cervero, R 2005, ‘Transit-Oriented Development in America: Strategies, Issues, Policy Directions’, presented at the Transit Oriented Development-Making it Happen Conference, Fremantle, Western Australia.
Cervero, R & Duncan, M 2006, ‘Which reduces vehicle travel more: jobs-housing balance or retail-housing mixing?’, Journal of the American Planning Association, 72 (4), 475–490.
Cervero, R & Kockelman, K 1997, ‘Travel demand and the 3Ds: Density, diversity, and network density’, Transportation Research D 2, 199-219.
Cervero, R, Murphy, S, Ferrel, C, Goguts, N, Tsai, Y, Arrington, GB, Boroski, J, Smith-Heimer, J, Golem, R, Peninger, P, Nakajima, E, Chui, E, Dunphy, R, Myers, M, McKay, S & Witenstein, N 2004, Transit-Oriented Development in the United States: Experiences, Challenges, and Prospects, TCRP Report 102, Transportation Research Board, National Academy Press, Washington, USA.
Cervero, R & Sullivan, C 2010, Toward Green TODs, Working Paper UCB-ITS-VWP-2010-7, University Of California, Berkeley, USA, viewed June 2011 at <http://www.its.berkeley.edu/publications/UCB/2010/VWP/UCB-ITS-VWP-2010-7.pdf>.
Chapleau R & Morency C 2007, ‘Pseudo panel study derived from three consecutive 5-year interval household travel surveys’, in: Proceedings of the 11th World Conference on Transportation Research WCTR, Berkeley, USA, June 24–28.
Chapleau R, Trépanier, M & Chu, KK 2008, ‘The ultimate survey for transit planning: complete information with smart card data and GIS’, in: Proceedings of the 8th International Conference on Survey Methods in Transport: Harmonisation and Data Comparability, Annecy, France, May 25-31.
Chen, C & McKnight, CE 2007, ‘Does the built environment make a difference? Additional evidence from the daily activity and travel behavior of homemakers living in New York City and suburbs’, Journal of Transport Geography, 15 (5), 380–395.
Curtis, C & Olaru, D 2007, ‘Travel minimisation and the neighbourhood’, in: Proceedings of the European Transport Conference (ETC), 17-19 October 2007, Leiden, The Netherlands.
Curtis, C & Olaru, D 2010, ‘The Impacts of a New Railway Corridor: Travel Behaviour Change of Residents in New Station Precincts’, in: Proceedings of the 12th World Conference in Transportation Research, Lisbon, Portugal, July 11-15.
Curtis, C & Olaru, D 2011, ‘The relationship between accessibility and travel patterns of residents in three new station precincts’, in: Proceedings of the 3rd World Planning Schools Congress, Perth (WA), July 4-8.
Curtis, C, Renne, JL & Bertolini, L 2009, Transit Oriented Development – Making It Happen, Ashgate, Farnham, Surrey, ISBN 9780754673156.
Department of Planning 2011, Activity Centres Policy – Frequently Asked Questions, Planning WA, viewed January 2012 at <http://www.planning.wa.gov.au/dop_pub_pdf/FAQ_Activity_Centres.pdf>.

78
Vol 21 No 1 March 2012 Road & Transport Research
Geo-spatial analysis of activity spaces in a TOD environment – Tracking impacts of rail transport policy
Dijst, M 1999, ‘Two-earner families and their action spaces: a case study of two Dutch communities’, GeoJournal, 48 (3), 195–206.
Dittmar, H & Ohland, G 2004, The New Transit Town: Best Practices in Transit-Oriented Development, Island Press, Washington DC.
Downs, JA & Horner, MH 2007, ‘Network-based kernel density estimation for home range analysis’, in: Proceedings of the 9th International Conference on GeoComputation, National Center for Geocomputation, Maynooth
Evans, JE, Pratt, RH, Stryker, A, & Kuzmyak, JR 2007, Transit Oriented Development, Chapter 17 of Traveler Response to Transportation System Changes, Transit Cooperative Research Program (TCRP) Report 95, Transportation Research Board, Washington, DC.
Ewing, R and Cervero, R 2001, ‘Travel and built environment’, Transportation Research Record 1780, 87-114.
Ewing, R, Greenwald, MJ, Zhang, M, Walters, J, Feldman, M, Cervero, R, Frank, L & Thomas, J 2009, Measuring the impact of urban form and transit access on mixed use site trip generation rates, Portland pilot study, for Washington, DC, U.S. Environmental Protection Agency.
Ewing, R & Cervero, R 2010, ‘Travel and the built environment’, Journal of the American Planning Association, 76(3), 265-294.
Fan, Y & Khattak, AJ 2008, ‘Urban form, individual spatial footprints, and travel: An examination of space-use behaviour’, Transportation Research Record 2082, 98–106.
Fotheringham, AS, Brunsdon, C & Charlton, M 2000, Quantitative Geography: Perspectives on Spatial Data Analysis, Sage Publications, London.
Gibin, M, Longley, P & Atkinson, P 2007, ‘Kernel density estimation and percent volume contours in general practice catchment area analysis in urban areas’, in: Proceedings of Geographical Information Science Research Conference (GISRUK) 2007, Nui Maynooth, Ireland, April 11-13, viewed January 2012 at <http://ncg.nuim.ie/gisruk/materials/proceedings/PDF/5A3.pdf>.
Golledge, RG & Stimson, RJ 1997, Spatial Behaviour: A Geographic Perspective, Guilford Press, New York.
Grant, J 2006, Planning the Good Community. New Urbanism in Theory and Practice, RTPI Library Series, Routledge, New York.
Guagliardo, MF 2004, ‘Spatial accessibility of primary care: concepts, methods, and challenges’, International Journal of Health Geographics, 26(3), 1–13.
Guerra, E & Cervero, R 2011, Mass Transit & Mass: Densities Needed to Make Transit Investments Pay Off, UCTC Policy Brief 2011-02, University of California, Berkeley, viewed June 2011 at <http://www.uctc.net/research/briefs/UCTC-PB-2011-02.pdf>.
Hägerstrand, T 1970, ‘What about people in regional science?’, Papers of the Regional Science Association, 24 (1), 7–21
Handy, S, Cao, X & Mokhtarian, PL 2006, ‘Self-Selection in the relationship between the built environment and walking’, Journal of the American Planning Association, 72(1), 55–74.
Hannes, E, Janssen, D & Wets, G 2008, ‘Destination choice in daily activity travel mental map’s repertoire’, Transportation Research Record 2054, 20-27.
Hess, DB 2007, ‘Impact of proximity to light rail rapid transit on station-area property values in Buffalo, New York’, Urban Studies 5(6), 1041-1068.
Holzapfel, H 1980, Verkehrsbeziehungen in Städten, Schriftenreihe des Instituts für Verkehrsplanung und Verkehrswegebau, 5, University of Technology, Berlin.
Horton, F & Reynolds, DR 1971, ‘Effects of urban spatial structure on individual behaviour, Economic Geography, 47, 36-48.
Jennrich, RI & Turner FB 1969, ‘Measurement of non-circular home range’, Journal of Theoretical Biology, 22, 227–237
Johnson, C 2008, Greenfield Transit-Oriented Development in Clarkson. Guided Field Trip, Urban Design for Sustainability Short Course, Curtin University Sustainability Policy Institute (CUSP) and Urban Design Centre of Western Australia, Perth (WA), 21-24 April.
Kamruzzaman, MD, Hine, J, Gunay, B, & Blair, N 2011, ‘Using GIS to visualise and evaluate student travel behaviour’, Journal of Transport Geography, 19(10, 13-32.
Kwan, MP 2000, ‘Interactive geovizualization of activity-travel patterns using three-dimensional geographical information systems: a methodological exploration with a large data set’, Transportation Research C 8, 185-203.
Levine, N 2002, CrimeStat (Version 20): A spatial statistics program for the analysis of crime incident locations, Ned Levine & Associates, Houston, TX, and the National Institute of Justice, Washington, DC.
Mazurkiewicz, M 1969, ‘Elliptical modification of home range pattern’, Bulletin of the Academy of Policy and Science, 1(2), 427–431.
Miller, HJ 2005, ‘Placed-base versus people-based accessibility’, in: Levinson, D and Krizek, KJ (eds) Access to Destinations, London, Elsevier, pp.63-89.
Newman, P 2005, ‘Transit Oriented Development: An Australian Overview’, presentation to Transit Oriented Development¾Making it Happen Conference, Fremantle, Australia, July 2005.
Newman, P 2009, ‘Planning for Transit Oriented Development: Strategic principles’, in: Curtis, C, Renne, JL and Bertolini, L (eds) Transit Oriented Development – Making it Happen, Ashgate, Farnham, Surrey, pp.13-22.
Newman, P & Kenworthy, J 1999, Sustainability and Cities: Overcoming Automobile Dependence, Island Press, Washington, DC.
O’Sullivan, D & Unwin, DJ 2003, Geographic Information Analysis, John Wiley and Sons New Jersey.
Okabe, A, Satoh, T & Sugihara, K 2009, ‘A kernel density estimation method for networks, its computational method and a GIS-based tool’, International Journal of Geographical Information Science, 23(1) 7-32
Olaru, D, Smith, N & Peachman, J 2005, ‘Whereabouts from Monday to Sunday?’, in: Proceedings of the Australasian Transport Research Forum 2005 – Transporting the Future: Transport in a Changing Environment, Sydney, Australia, September 28-30, viewed February 2010 at <http://www.patrec.org/web_docs/atrf/papers/2005/Olaru%20Smith%20N%20&%20Peachman%20(2005).pdf>.

79
Vol 21 No 1 March 2012 Road & Transport Research
Geo-spatial analysis of activity spaces in a TOD environment – Tracking impacts of rail transport policy
Pagliara, F & Papa, E 2011, ‘Urban rail systems investments: an analysis of the impacts on property values and residents’ location’, Journal of Transport Geography 19, 200-211.
Puget Sound Regional Council 1999, Creating Transit Station Communities in the Central Puget Sound Region: A Transit-Oriented Development Workbook, Puget Sound Regional Council, Seattle, WA.
Rai, RK, Balmer, M, Rieser, M, Vaze, VS, Schönfelder, S, & Axhausen, KW 2007, ‘Capturing human activity spaces: New geometries’, Transportation Research Record 2021, 70-80.
Renne, JL & Wells, JS 2004, ‘Emerging European style planning in the USA: transit-oriented development’, World Transport Policy & Practice, 10(2), 12–24.
Renne, JL, Wells, JS & Voorhees, AM 2005, Transit-Oriented Development: Developing a Strategy to Measure Success, Research Results Digest, 294, National Cooperative Highway Research Program (NCHRP), Transportation Research Board, National Academy Press, Washington, DC.
Schönfelder, S & Axhausen, KW 2002, Measuring the Size and Structure of Human Activity Spaces: The Longitudinal Perspective, Working Paper 135, Institute for Transport Planning and Systems (IVT), Swiss Federal Institute of Technology (ETHZ), Zurich, Switzerland.
Schönfelder S & Axhausen, KW 2003a, ‘Activity spaces: Measures of social exclusion?’, Transportation Policy, 10(4), 273-286.
Schönfelder, S & Axhausen, KW 2003b, ‘On the variability of human activity spaces’, in: Koll-Schretzenmayr, Keiner, M and Nussbaumer, G (eds), The Real and Virtual Worlds of Spatial Planning, pp.237-262, Springer, Heidelberg.
Seaman, DE & Powell, RF 1996, ‘An evaluation of the accuracy of kernel estimators for home range analysis’, Ecology, 77, 2075-2085.
Silverman, BW 1986, Density Estimation, Chapman and Hall, London, UK.
Simcharoen, S, Barlow, ACD, Simcharoen, A & Smith, JLD 2008, ‘Home range size and daytime habitat selection of leopards in HuaiKhaKhaeng Wildlife Sanctuary, Thailand’, Biological Conservation 141, 2242-2250.
Smart Growth Network 2003, Getting to smart growth II: 100 more policies for implementation, Smart Growth Network, viewed February 2010 at <http://www.smartgrowth.org/pdf/gettosg2.pdf>.
State of Western Australia 2010a, Directions 2031 and Beyond – Metropolitan Planning Beyond the Horizon, Western Australian Planning Commission, Perth, Western Australia, ISBN 0 7309 9989 0.
State of Western Australia 2010b, Activity Centres for Perth and Peel, State Planning Policy 4.2, Planning and Development Act 2005, Western Australian Government Gazette, 166, ISSN 1448-949X.
Worton, B J (1989) Kernel methods for estimating the utilization distribution in home range studies Ecology, 70, 164-168
Zahavi, Y (1979) The ‘UMOT’ Project, US Department of Transportation, Research and Special Programs AdministrationDPB-10/79/3, US Department of Transportation, Washington, DC
Zhang, M (2005) Intercity Variations in the Relationship between Urban Form and Automobile Dependence Transportation Research Record, 1902, 55–62
Markus BotteMarkus Botte is a civil engineer responsible for a broad portfolio of infrastructure services within Local Government. Besides managing traditional engineering duties, he has a keen interest in Transit Oriented Development, transport planning and research, asset management as well as urban hydrology and water sensitive urban design. Markus was educated in Germany and Switzerland and holds a Masters degree from Dresden University of Technology, with a thesis completed in transport and infrastructure planning at The Swiss Federal Institute of Technology in Zurich. He is currently in his final year of completing postgraduate studies at The University of Western Australia.
Doina OlaruA railway engineer by background, Doina Olaru has more than 20 years experience, both in academia and industry. Her research includes a wide range of topics and modelling areas, including travel behaviour, discrete choice modelling and experimental designs, optimisation and simulation of various transport and manufacturing processes, environmental impacts of transport, artificial intelligence applications in transport and business. She is currently an Associate Professor at The University of Western Australia.
ACKNOWLEDGEMENTSThis research has received funding from the ARC (Linkage Project LP0562422) including the following partner organisations: Department for Planning WA, Department of Transport WA, Public Transport Authority of WA, LandCorp (Western Australian Land Authority), The Village at Wellard Joint Venture, Subiaco Redevelopment Authority, City of Melville, East Perth Redevelopment Authority, City of Cockburn, Midland Redevelopment Authority, Town of Kwinana, City of Rockingham.

80
Vol 21 No 1 March 2012 Road & Transport Research
Geo-spatial analysis of activity spaces in a TOD environment – Tracking impacts of rail transport policy
APPENDIX
Figure A1 Kernel densities (10 km search radius) at precinct level (before railway opening 2006)
(a) Bull Creek (b) Cockburn Central (c) Wellard
(a) Bull Creek (b) Cockburn Central (c) Wellard
Figure A2 Kernel densities (10 km search radius) at precinct level (after railway opening 2009)

81
Vol 21 No 1 March 2012 Road & Transport Research
Geo-spatial analysis of activity spaces in a TOD environment – Tracking impacts of rail transport policy
Figure A3 Confidence ellipses and kernel densities (1.5 km radius) for a Wellard household (household location denoted by the star)
a) and b) – after railway opening 2009); c) and d) – before railway opening 2006; a) and c) cases include imputed routes


