Embed Size (px)
Citation preview
Energies 2010, 3, 1194-1211; doi:10.3390/en3061194
energies ISSN 1996-1073
www.mdpi.com/journal/energies
Article
Residential Energy Performance Metrics
Christopher Wright 1,
*, Stuart Baur 2, Katie Grantham
3, Robert B. Stone
4 and
Scott E. Grasman 5
1 Department of Engineering Management, Missouri University of Science and Technology, 600 W.
14th Street, Rolla, MO 65409, USA
2 Department of Civil, Architectural and Environmental Engineering, Missouri University of Science
and Technology, 1401 Pine Street, Rolla, MO 65409, USA; E-Mail: [email protected]
3 Department of Engineering Management, Missouri University of Science and Technology, 600 W.
14th Street, Rolla, MO 65409, USA; E-Mail: [email protected]
4 School of Mechanical, Industrial, and Manufacturing Engineering, Oregon State University, Corvallis,
OR, 97331, USA; E-Mail: [email protected]
5 Department of Engineering Management, Missouri University of Science and Technology, 600 W.
14th Street, Rolla, MO 65409, USA; E-Mail: [email protected]
* Author to whom correspondence should be addressed; E-Mail: [email protected];
Tel.: +1-314-605-1639; Fax: +1-573-341-4729.
Received: 28 April 2010; in revised form: 24 May 2010 / Accepted: 3 June 2010 /
Published: 9 June 2010
Abstract: Techniques for residential energy monitoring are an emerging field that is
currently drawing significant attention. This paper is a description of the current efforts to
monitor and compare the performance of three solar powered homes built at Missouri
University of Science and Technology. The homes are outfitted with an array of sensors
and a data logger system to measure and record electricity production, system energy use,
internal home temperature and humidity, hot water production, and exterior ambient
conditions the houses are experiencing. Data is being collected to measure the performance
of the houses, compare to energy modeling programs, design and develop cost effective
sensor systems for energy monitoring, and produce a cost effective home control system.
Keywords: simulation and monitoring; energy analysis; solar decathlon; simulation-
based control
OPEN ACCESS
Energies 2010, 3
1195
1. Introduction
The Building America program [1] from the U.S. Department of Energy has a goal to reduce the
average energy use of residential housing by 40% to 100%. According to the Energy Information
Administration (EIA) the average energy use for the American household in 2001 was
approximately 31,854 kWh per year [2]. This would mean that the average US household would need
to consume less than 19,112 kWh per year to meet that goal. An energy-monitoring project at Missouri
University of Science and Technology (Missouri S&T, S&T, or University) is underway with the goal
to identify and develop ways to reduce energy consumption in the residential sector. To accomplish
this, a sensor network has been installed in three solar-powered homes that the University has built as
part of the Department of Energy’s Solar Decathlon competition. The sensor system is key to the start
of a residential energy research program to define the building science of whole home energy
monitoring. The four major themes of the research include:
1. Energy efficiency performance data collection of the S&T solar homes;
2. Verification and possible suggestions for improvement of residential design software such as
the Sustainable Buildings Industry Council’s ‘Energy-10’ and the U.S. Department of Energy’s
‘Energy Plus’;
3. Design and development of cost effective sensor system for residential energy performance
feedback;
4. Cost effective home automation and energy management control system using the sensor system.
This article is focused on the development and plan of the first theme of the research, performance
data collection of the S&T solar homes.
1.1. S&T Solar Village
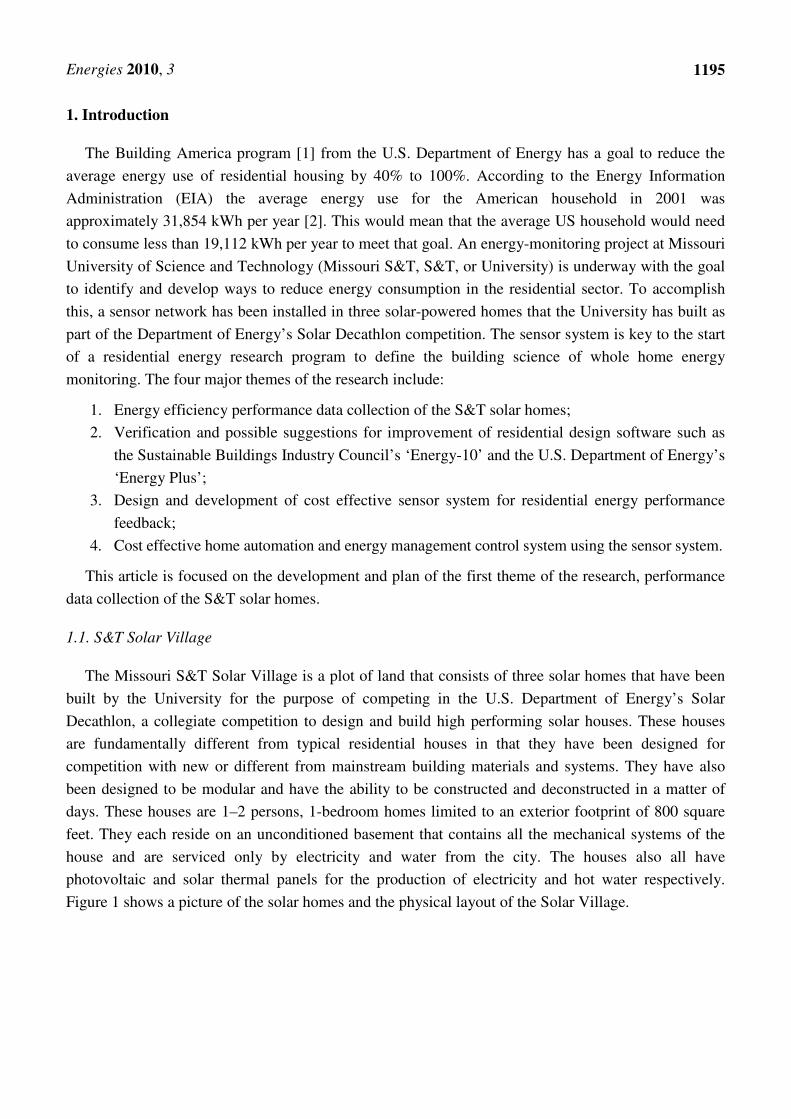
The Missouri S&T Solar Village is a plot of land that consists of three solar homes that have been
built by the University for the purpose of competing in the U.S. Department of Energy’s Solar
Decathlon, a collegiate competition to design and build high performing solar houses. These houses
are fundamentally different from typical residential houses in that they have been designed for
competition with new or different from mainstream building materials and systems. They have also
been designed to be modular and have the ability to be constructed and deconstructed in a matter of
days. These houses are 1–2 persons, 1-bedroom homes limited to an exterior footprint of 800 square
feet. They each reside on an unconditioned basement that contains all the mechanical systems of the
house and are serviced only by electricity and water from the city. The houses also all have
photovoltaic and solar thermal panels for the production of electricity and hot water respectively.
Figure 1 shows a picture of the solar homes and the physical layout of the Solar Village.
Energies 2010, 3
Figure 1.
2007 Solar House
2007 Solar House Floor Plan
Figure 1. Layout of the solar village.
2002 Solar House
2002 Solar House Floor Plan
2007 Solar House 2005 Solar House
2007 Solar House Floor Plan 2005 Solar House Floor Plan
Future Solar
House Site
1196
2002 Solar House Floor Plan
2005 Solar House Floor Plan
Energies 2010, 3
1197
1.2. Research Approach: Model the Entire Building Envelope
Energy is most often thought of as strictly electricity, but that is only one part of the whole energy
picture. Heat and light are other forms of energy that get produced, transported, and utilized every day.
For instance, sunlight is a form of energy that can be harnessed for heat, light, or electricity.
Understanding all energy and how it is utilized in the home is a gap in current energy monitoring systems.
The current project is designed to collect performance data on each of the S&T solar houses taking
into account the entire building envelope, which includes ambient weather conditions, interior climate
condition, electricity use, and hot water use. This data will be used to formulate a model of the whole
building envelope that can predict energy usage of future residential buildings and be used as the plant
in a home automation/energy management control system.
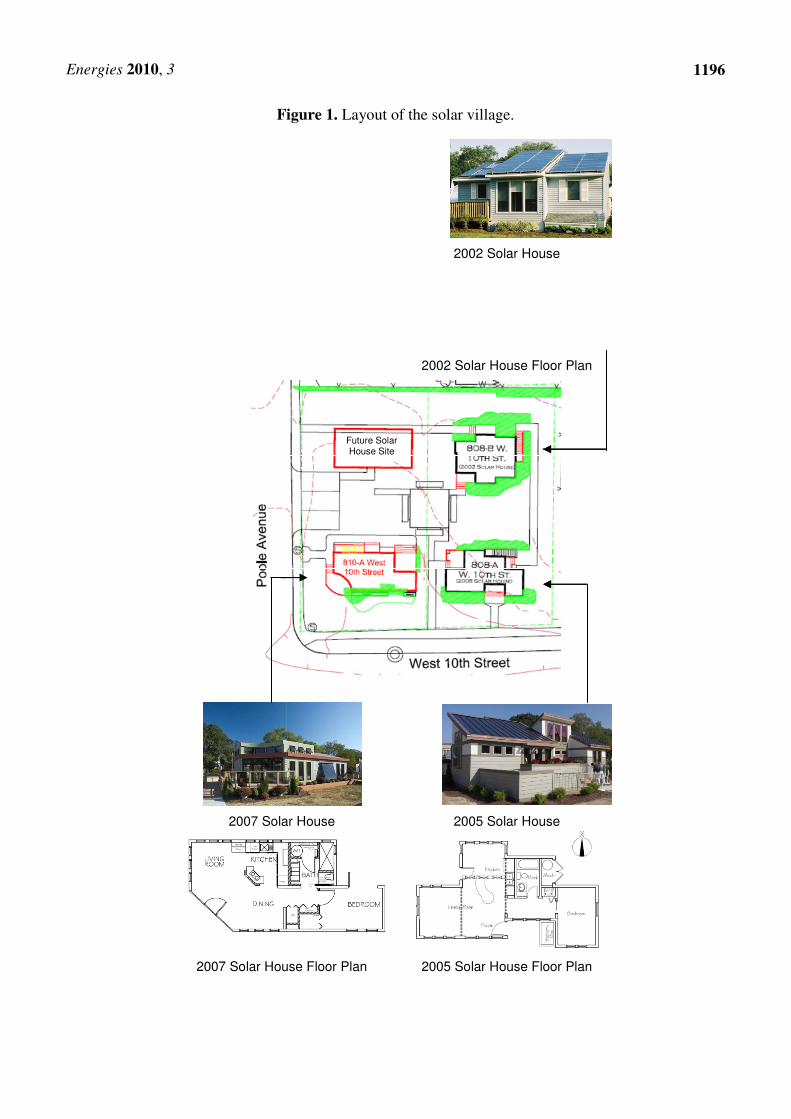
The first steps in this project and reported in this paper include defining the sensor system
configuration in the experimental houses (i.e., the S&T solar village homes) to support the
development of the energy model and the control algorithms. Figure 2 is a representational block
diagram of the overall research approach.
Figure 2. Research approach block diagram.
2. Results and Discussion
Step 1 of this research approach involves identifying performance metrics on which to compare
each of the S&T solar houses. In the following sections, the important performance metrics are
identified and selected and the resulting sensor configuration is outlined.
Energies 2010, 3
1198
2.1. Performance Metrics
The National Renewable Energy Lab (NREL) has published practices with the intent of
standardizing the measurement and performance analysis of buildings. This is through the
Performance Metrics Research Project [3] for the Department of Energy (DOE). These procedures will
be used as the standard in this project.
The “Procedure for Measuring and Reporting Commercial Building Energy Performance” [4]
published by NREL is used as a basis for the energy monitoring and reporting of this project. The
paper identifies performance metrics for commercial buildings with the intent of standardizing sensor
and information systems. Considering the building energy performance project was designed for
commercial buildings, some metrics and data collection strategies will be adjusted to better fit a
residential application.
The data collected for the NREL building energy performance has the possibility to be used in the
following scenarios:
• Compare performance with the design intent of the building
• Compare performance with other buildings
• Evaluate building performance rating systems
• Perform economic analysis of energy-efficient strategies in buildings
• Establish long-term performance records that enable maintenance staff to monitor trends in
energy performance.
The monitoring project at S&T will use the tier 2 procedure outlined in NREL’s paper to gather a
more in depth look at the energy usage in the homes. NREL suggests to use 15- and 60-minute data for
energy performance collection, but a residential home uses only a fraction of the energy of a
commercial building and at smaller intervals, therefore higher resolution data is needed to capture
reliable data. The S&T monitoring system will use 5-second and 1-minute data. The adjusted metrics
that are adopted with some adjustment for this project include the following:
2.1.1. Functional Area (FA)
The functional area in each house is the conditioned and unconditioned area that is accessible to the
resident. The functional area for the experimental homes will only take into account the first floor. The
basement area will not be counted as part of the house systems for the purpose of metric calculations
and are therefore not counted in the functional area.
2.1.2. Photovoltaic Energy Production (PVEP)
This is the electrical energy that is produced by the photovoltaic array before any system
components. The purpose of the afore mentioned system components will be taken into account in
electrical generation system losses since they are used to convert the produced energy to the facilities
usable form of alternating current. This metric is measured in DC power and is compared to the
available radiation to determine the efficiency of the photovoltaic array.
Energies 2010, 3
1199
2.1.3. Thermal Energy Production (TEP)
Energy produced by the solar thermal system is included in this metric. This will be measured by
what is produced, not what is transferred to the storage tank. The energy will be measured by the
increase of temperature across the solar thermal component and the volumetric flow rate of the
collection fluid as shown in Equation 1 below.
TEP = V•
⋅ ρ ⋅ c p (Toutput − Tinput )dt
(1)
2.1.4. Electrical Generation System Losses (EGSL)
These losses are present in the inverters, charge controllers, and any other components necessary to
change the produced electricity to the facility’s usable form. In the case of the experimental homes, the
usable form of electricity is alternating current (AC) and therefore this metric is determined by
calculating the difference in the actual AC output of the inverters to the photovoltaic energy
production. Battery banks used in conjunction with electrical generation systems are not counted in
this metric as they are used for storage, not electrical generation. EGSL is referred to in the building
energy use metric as part of cogeneration losses.
2.1.5. Facility Energy Production (FEP)
Total of all energy produced on site including electricity from photovoltaic, wind, geothermal, solar
thermal, and any other means minus all energy generation system losses. Since the solar homes in this
research only produce energy from photovoltaic and solar thermal systems, the production of these
systems will be summed and the electrical generation system losses will be discounted. There are no
thermal generation system losses since there are no system components used to convert the energy into
a usable form because the energy produced is already in the facility’s usable form of hot water.
FEP = PVEP + TEP – EGSL (2)
2.1.6. Produced Energy Storage Transfer (PEST)
This metric identifies the utilization of storage components. Energy transferred to the storage
device is positive and summed and energy transferred from a storage device is subtracted. All types of
energy are itemized and measured separately. For these houses, the electricity stored in batteries and
thermal energy stored in the hot water tank will be measured separately. The electrical energy is
calculated directly in the line and the thermal energy is determined from the temperature drop across
the hot water tank exchange coils between the solar thermal collector and the tank.
2.1.7. Outdoor Ambient Temperature (OT)
This metric is the ambient exterior air temperature. This will be used in other metric calculations,
heating degree-days, and cooling degree-days. Only one sensor will be located in the weather station
and will be used in the calculations for all experimental houses since they will experience the same
outdoor conditions.
Energies 2010, 3
1200
2.1.8. Indoor Zone Temperature (IT)
The indoor zone temperature is the air temperature inside the house. The solar homes will have
multiple sensors and the temperature will be averaged over all sensors for cooling calculations since
there is only one cooling zone per house. Individual heating zone temperatures will be used for
heating calculations.
2.1.9. Cooling Energy Use (CEU)
This metric identifies all energy used for cooling of the home. This includes energy used to run the
air conditioning, heat pump in the cooling mode, control of windows if used for the purpose of
cooling, or any other item used for the purpose of cooling. All cooling systems in the experimental
homes utilize only electrical energy.
2.1.10. Heating Energy Use (HEU)
This is the energy used for heating inside the house. This includes the electricity used to run a heat
pump during the heating cycle, furnace, and radiant floor electricity and thermal energy. These homes
utilize thermal energy and electrical energy for the radiant floor and electrical energy for the furnace
and heat pump. All electricity used to cycle the water through the radiant floor is also measured and
summed in this metric.
2.1.11. HVAC Energy Use (HVACEU)
This metric sums the total energy use of HVAC systems including the heating and cooling energy
use metrics that have been identified previously. Other systems that will be added to this metric
include ventilation components such as energy recovery ventilators (ERV)s and bathroom vent fans.
2.1.12. Domestic Hot Water Load (DHWL)
DHWL quantifies the thermal energy delivered to the domestic hot water distribution system to
satisfy the appliances and other items. The equation for this includes the volumetric flow rate (V� ),
density of water ( ρ ), specific heat of water ( pc ), temperature of the hot water ( HWT ), and temperature
of the cold water ( CWT ). The cold-water temperature is the temperature of the water supply before the
tank or mixing valve and the hot water temperature is measured after the domestic hot water mixing
valve. The volumetric flow rate includes all water supplied to the domestic water heating system. The
equation for this metric is shown below.
������� = � ∙ ∙ �� ���� − ������ (3)
2.1.13. Domestic Hot Water Energy Use (DHWEU)
This metric measures the energy used to heat water that is used for any use other than HVAC
purposes. This includes the energy consumed to heat the water used for appliances and used at faucets.
Energy used for solar thermal collection or any other system to heat water and which is applied to
Energies 2010, 3
1201
domestic hot water is measured and summed. For the case of the houses in this project, the energy
used by the solar thermal system may be used in either the radiant floor heating system or for domestic
hot water. The energy used for heating will be calculated and removed by identifying the percentage of
hot water applied to the radiant floor versus the domestic hot water. This same percentage will be
subtracted from the energy used to produce the hot water.
2.1.14. Domestic Hot Water System Efficiency (DHWSE)
This metric calculates the efficiency of the hot water system to produce hot water for use
domestically. This will take into account heat losses in pipes and inefficiencies in the system
components such as the heat exchangers and standby tank heat losses.
DHWSE = DHWL/DHWEU (4)
2.1.15. Installed Lighting Energy Use (ILEU)
The electrical energy used for all indoor permanent lights in the house. This does not include lights
that have been plugged into outlets for additional lighting. This will be measured from each lighting
circuit in the breaker box and adjusting for any non-lighting appliances on those circuits.
2.1.16. Building Lighting Energy Use (BLEU)
This sums all energy used for lighting purposes including permanently installed indoor lights, lights
that are plugged in, and exterior lighting. For this metric, lighting circuits must be measured
individually or measured in such a way that other loads can be determined and subtracted. Lights that
are plugged into outlets will be a difficult for this metric, but will be estimated by predetermination of
floor lights and load analysis of the outlet circuits.
2.1.17. Appliance Energy Use (AEU)
All electrical energy consumed by standard appliances will be measured and totalized for this
metric. Standard residential appliances are limited to refrigerators, freezers, dishwashers, clothes
washers, clothes dryers, ovens, and cook tops.
2.1.18. Building Energy Use (BEU)
This metric is the sum of all energy consumed by the house. This includes heating, ventilation, air
conditioning, indoor lighting, façade lighting, domestic hot water, plug loads, and other building
energy use. This metric does not count electrical generation system losses or produced energy storage
transfer. As mentioned previously, the EGSL and PEST devices for these experimental homes are the
inverters, charge controllers, battery banks, and the hot water tanks.
2.1.19. Building Energy Use Intensity (BEUI)
This metric puts energy use on a per area scale for comparisons with different size homes. It is
calculated by dividing the Building Energy Use by the Functional Area as shown below.
Energies 2010, 3
1202
BEUI = BEU/FA (5)
2.1.20. Net Facility Energy Use (NFEU)
Total facility energy consumed minus the energy production. Since all homes in this case study are
purely electrical utility and do not use gas or other fuels, this metric will only have an electrical
component and the measurement is simply net A/C electricity from the grid.
2.1.21. Net Facility Electrical Demand (NFED)
NFED is the peak electrical demand on the electric utility during each month. This is not the peak
demand of the facility; it is the maximum that is bought at any one time from the grid.
2.1.22. Net Facility Load Factor (NFLF)
Average utility electrical demand divided by the peak electrical demand. This metric is calculated
for each month and year after the reference month or year has passed. This metric identifies the
average percentage of maximum demand of the home on the electric utility during the reference period.
2.1.23. Building Purchased Energy Cost (BPEC)
This metric is the total cost of the purchased electricity from the utility company per month. This
will be calculated using the total electric delivered from the grid multiplied by the cost per unit of
energy. The actual utility bill will be compared to this metric for verification.
2.1.24. Building Purchased Energy Cost Intensity (BPECI)
The cost intensity is the total monthly energy bill divided by the functional area (FA). This is to
determine the cost of power per square foot of the home and to be compared to homes of different
physical sizes.
BPECI = BPEC/FA (6)
2.1.25. Net Facility Purchased Energy Cost (NFPEC)
This metric is the dollar amount of the energy cost for purchasing electricity from the grid minus
the credit for selling electricity to the grid. The monetary amount will be calculated using utility cost
per unit and the collected electricity data. It will also be compared to the cost incurred on the utility bill.
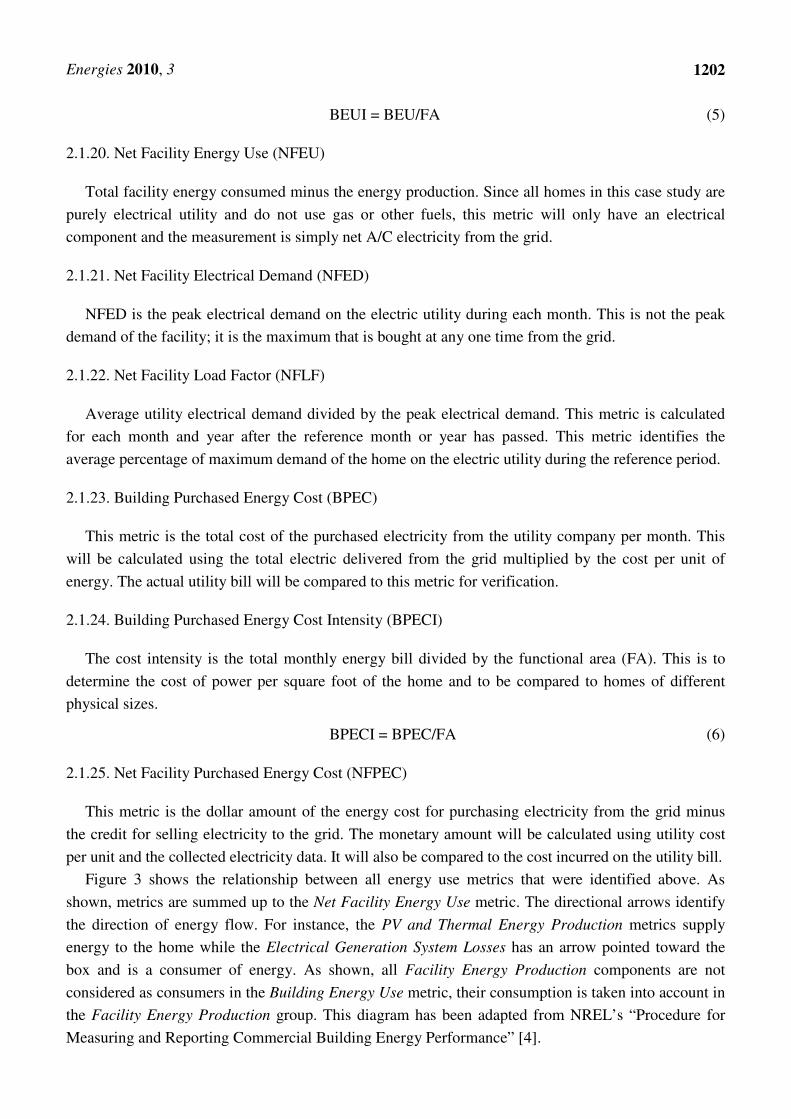
Figure 3 shows the relationship between all energy use metrics that were identified above. As
shown, metrics are summed up to the Net Facility Energy Use metric. The directional arrows identify
the direction of energy flow. For instance, the PV and Thermal Energy Production metrics supply
energy to the home while the Electrical Generation System Losses has an arrow pointed toward the
box and is a consumer of energy. As shown, all Facility Energy Production components are not
considered as consumers in the Building Energy Use metric, their consumption is taken into account in
the Facility Energy Production group. This diagram has been adapted from NREL’s “Procedure for
Measuring and Reporting Commercial Building Energy Performance” [4].
Energies 2010, 3
1203
Figure 3. Related energy performance metrics.
3. Experimental Section
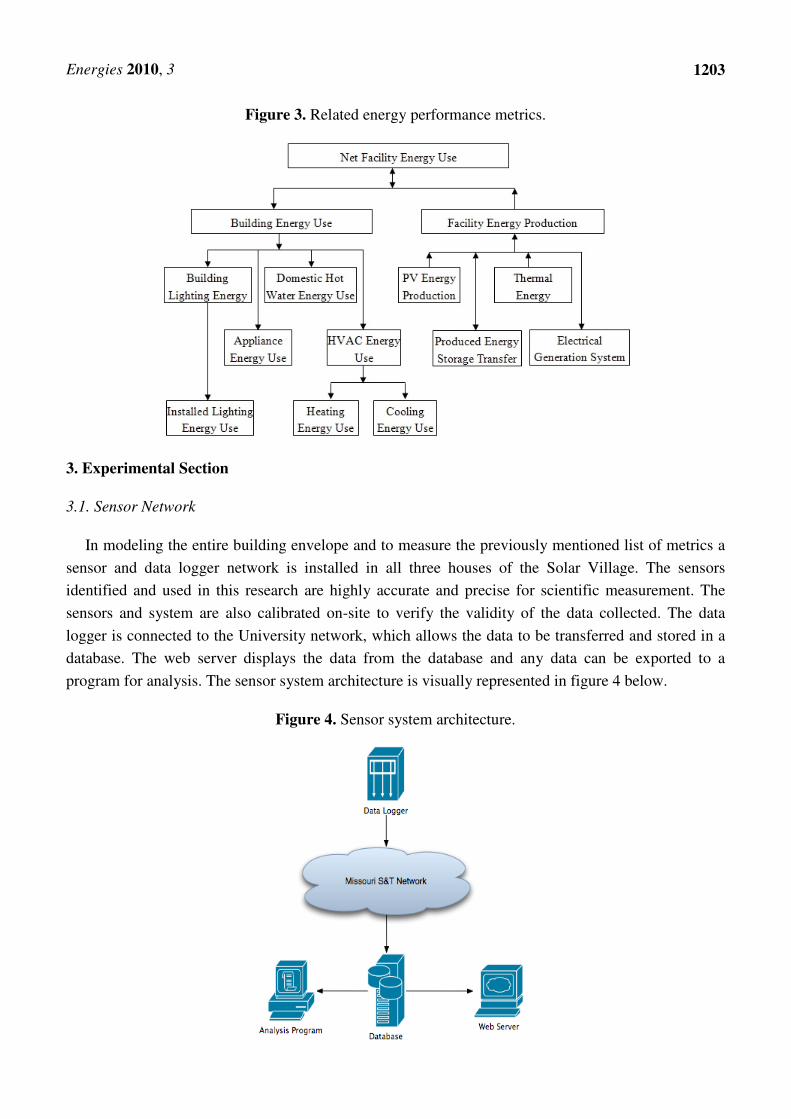
3.1. Sensor Network
In modeling the entire building envelope and to measure the previously mentioned list of metrics a
sensor and data logger network is installed in all three houses of the Solar Village. The sensors
identified and used in this research are highly accurate and precise for scientific measurement. The
sensors and system are also calibrated on-site to verify the validity of the data collected. The data
logger is connected to the University network, which allows the data to be transferred and stored in a
database. The web server displays the data from the database and any data can be exported to a
program for analysis. The sensor system architecture is visually represented in figure 4 below.
Figure 4. Sensor system architecture.
Energies 2010, 3
1204
3.2. Identified Sensors
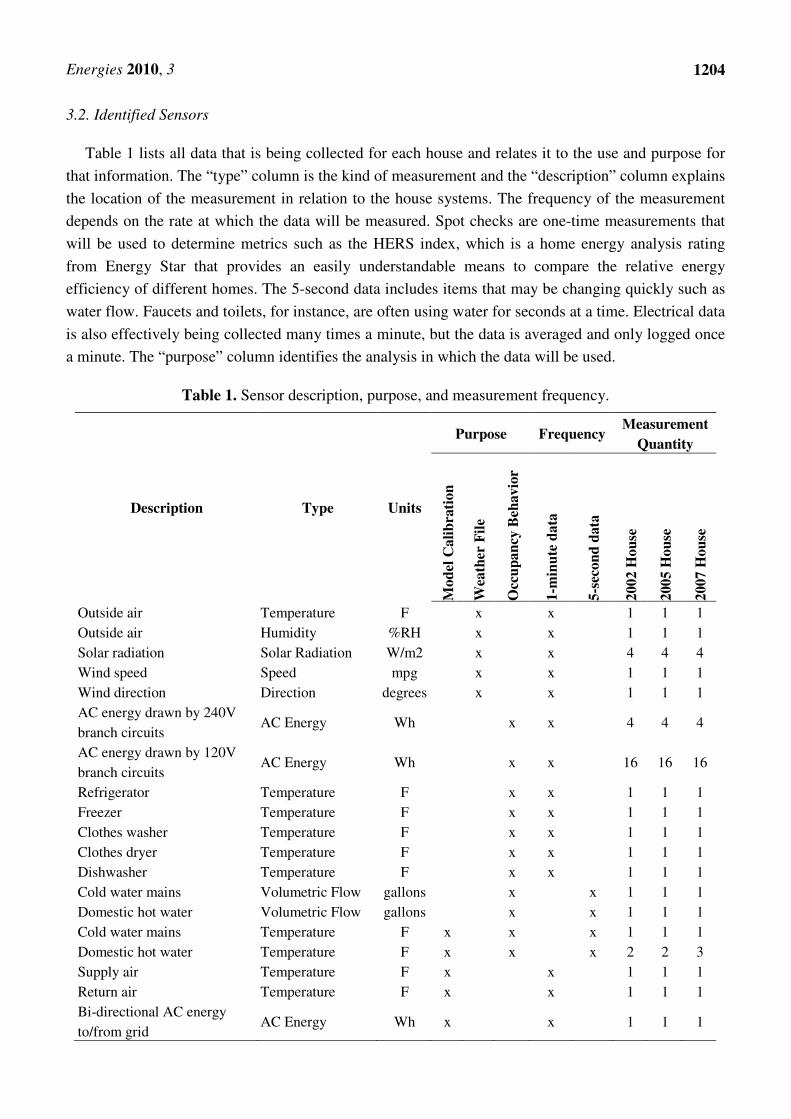
Table 1 lists all data that is being collected for each house and relates it to the use and purpose for
that information. The “type” column is the kind of measurement and the “description” column explains
the location of the measurement in relation to the house systems. The frequency of the measurement
depends on the rate at which the data will be measured. Spot checks are one-time measurements that
will be used to determine metrics such as the HERS index, which is a home energy analysis rating
from Energy Star that provides an easily understandable means to compare the relative energy
efficiency of different homes. The 5-second data includes items that may be changing quickly such as
water flow. Faucets and toilets, for instance, are often using water for seconds at a time. Electrical data
is also effectively being collected many times a minute, but the data is averaged and only logged once
a minute. The “purpose” column identifies the analysis in which the data will be used.
Table 1. Sensor description, purpose, and measurement frequency.
Description Type Units
Purpose Frequency Measurement
Quantity M
od
el C
ali
bra
tio
n
Wea
ther
Fil
e
Occ
up
an
cy B
ehav
ior
1-m
inu
te d
ata
5-s
eco
nd
data
20
02
Ho
use
20
05
Ho
use
20
07
Ho
use
Outside air Temperature F x x 1 1 1
Outside air Humidity %RH x x 1 1 1
Solar radiation Solar Radiation W/m2 x x 4 4 4
Wind speed Speed mpg x x 1 1 1
Wind direction Direction degrees x x 1 1 1
AC energy drawn by 240V
branch circuits AC Energy Wh x x 4 4 4
AC energy drawn by 120V
branch circuits AC Energy Wh x x 16 16 16
Refrigerator Temperature F x x 1 1 1
Freezer Temperature F x x 1 1 1
Clothes washer Temperature F x x 1 1 1
Clothes dryer Temperature F x x 1 1 1
Dishwasher Temperature F x x 1 1 1
Cold water mains Volumetric Flow gallons x x 1 1 1
Domestic hot water Volumetric Flow gallons x x 1 1 1
Cold water mains Temperature F x x x 1 1 1
Domestic hot water Temperature F x x x 2 2 3
Supply air Temperature F x x 1 1 1
Return air Temperature F x x 1 1 1
Bi-directional AC energy
to/from grid AC Energy Wh x x 1 1 1
Energies 2010, 3
1205
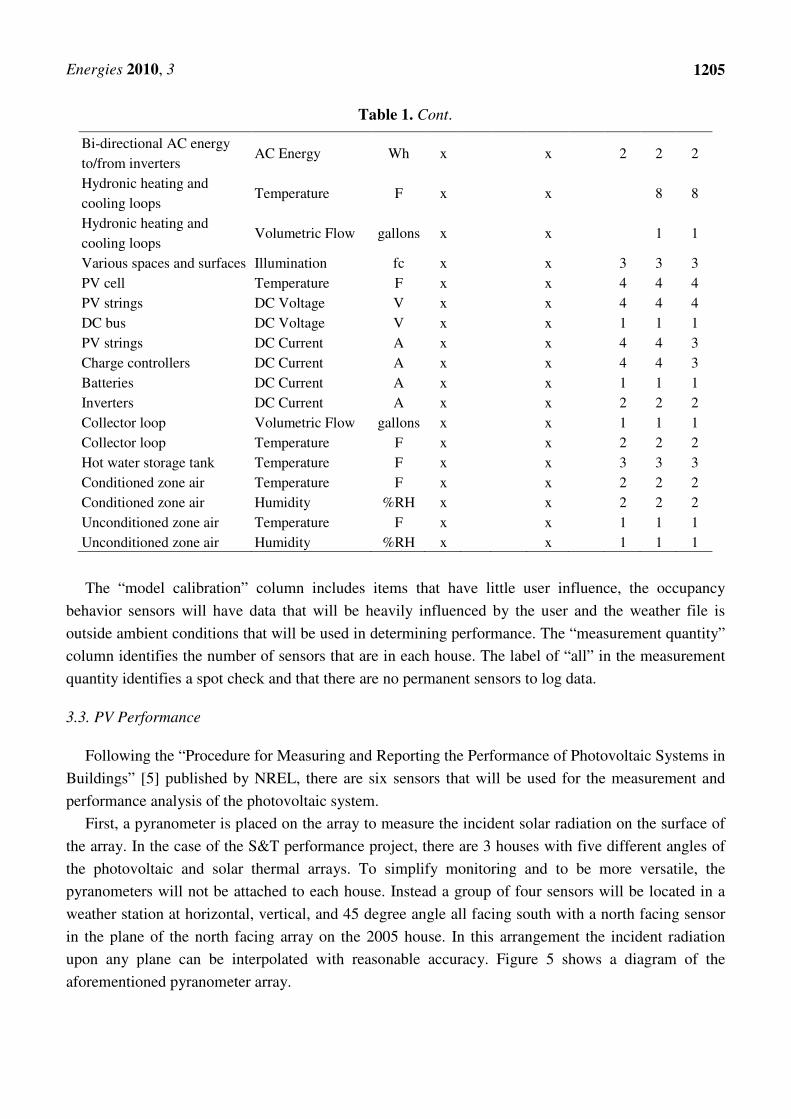
Table 1. Cont.
Bi-directional AC energy
to/from inverters AC Energy Wh x x 2 2 2
Hydronic heating and
cooling loops Temperature F x x 8 8
Hydronic heating and
cooling loops Volumetric Flow gallons x x 1 1
Various spaces and surfaces Illumination fc x x 3 3 3
PV cell Temperature F x x 4 4 4
PV strings DC Voltage V x x 4 4 4
DC bus DC Voltage V x x 1 1 1
PV strings DC Current A x x 4 4 3
Charge controllers DC Current A x x 4 4 3
Batteries DC Current A x x 1 1 1
Inverters DC Current A x x 2 2 2
Collector loop Volumetric Flow gallons x x 1 1 1
Collector loop Temperature F x x 2 2 2
Hot water storage tank Temperature F x x 3 3 3
Conditioned zone air Temperature F x x 2 2 2
Conditioned zone air Humidity %RH x x 2 2 2
Unconditioned zone air Temperature F x x 1 1 1
Unconditioned zone air Humidity %RH x x 1 1 1
The “model calibration” column includes items that have little user influence, the occupancy
behavior sensors will have data that will be heavily influenced by the user and the weather file is
outside ambient conditions that will be used in determining performance. The “measurement quantity”
column identifies the number of sensors that are in each house. The label of “all” in the measurement
quantity identifies a spot check and that there are no permanent sensors to log data.
3.3. PV Performance
Following the “Procedure for Measuring and Reporting the Performance of Photovoltaic Systems in
Buildings” [5] published by NREL, there are six sensors that will be used for the measurement and
performance analysis of the photovoltaic system.
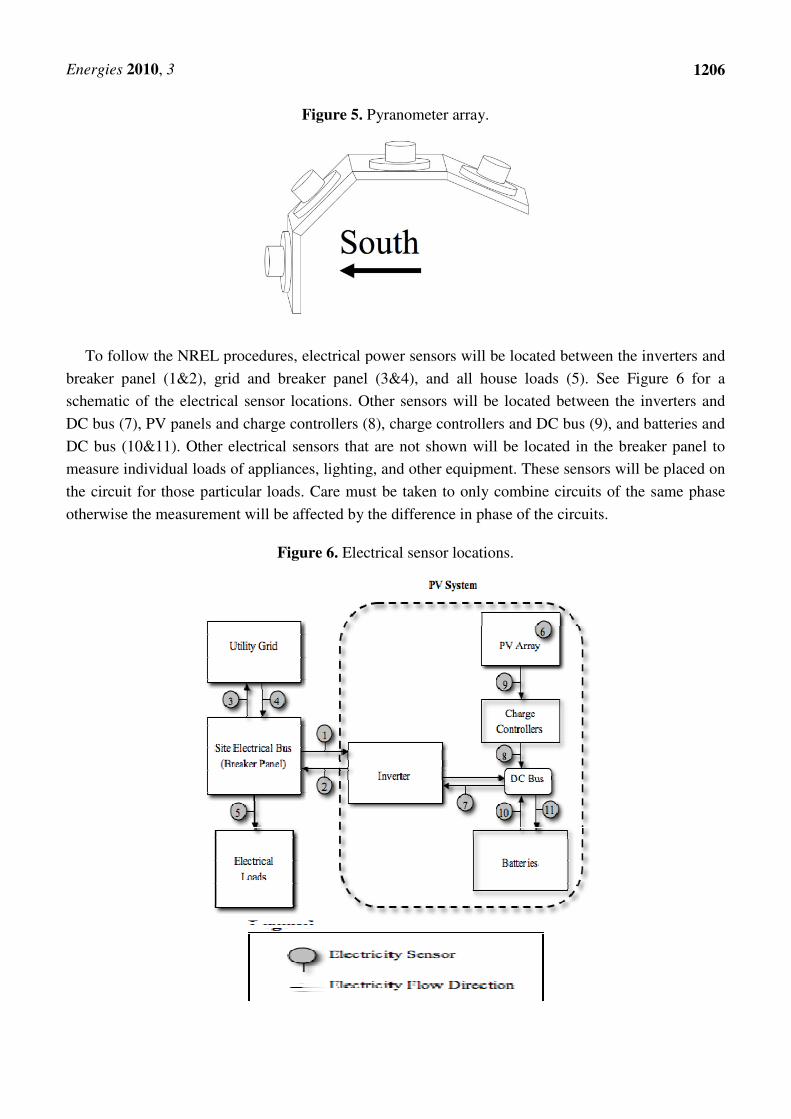
First, a pyranometer is placed on the array to measure the incident solar radiation on the surface of
the array. In the case of the S&T performance project, there are 3 houses with five different angles of
the photovoltaic and solar thermal arrays. To simplify monitoring and to be more versatile, the
pyranometers will not be attached to each house. Instead a group of four sensors will be located in a
weather station at horizontal, vertical, and 45 degree angle all facing south with a north facing sensor
in the plane of the north facing array on the 2005 house. In this arrangement the incident radiation
upon any plane can be interpolated with reasonable accuracy. Figure 5 shows a diagram of the
aforementioned pyranometer array.
Energies 2010, 3
To follow the NREL procedures, electrical power sensors will be located between the inverters and
breaker panel (1&2), grid and breaker panel (3&4), and all house loads (5).
schematic of the electrical sensor locations. Other sensors will be located between the inverters and
DC bus (7), PV panels and charge controllers (8), charge controllers and DC bus (9), and batteries and
DC bus (10&11). Other electrical sensors that are not shown will be located in
measure individual loads of appliances, lighting, and other equipment. These sensors will be placed on
the circuit for those particular loads. Care must be taken to only combine circuits of the same phase
otherwise the measurement will be affected by the difference in phase of the circuits.
Figure 6
Figure 5. Pyranometer array.
To follow the NREL procedures, electrical power sensors will be located between the inverters and
breaker panel (1&2), grid and breaker panel (3&4), and all house loads (5).
sensor locations. Other sensors will be located between the inverters and
DC bus (7), PV panels and charge controllers (8), charge controllers and DC bus (9), and batteries and
DC bus (10&11). Other electrical sensors that are not shown will be located in
measure individual loads of appliances, lighting, and other equipment. These sensors will be placed on
the circuit for those particular loads. Care must be taken to only combine circuits of the same phase
be affected by the difference in phase of the circuits.
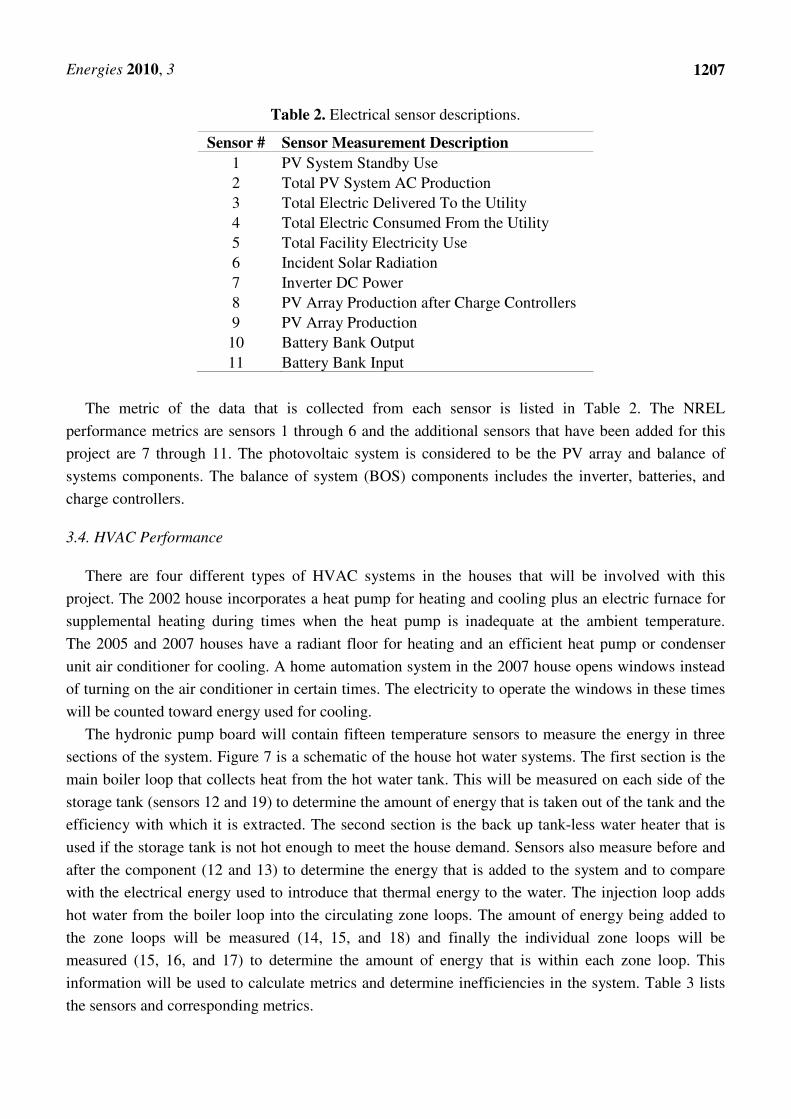
Figure 6. Electrical sensor locations.
1206
To follow the NREL procedures, electrical power sensors will be located between the inverters and
breaker panel (1&2), grid and breaker panel (3&4), and all house loads (5). See Figure 6 for a
sensor locations. Other sensors will be located between the inverters and
DC bus (7), PV panels and charge controllers (8), charge controllers and DC bus (9), and batteries and
DC bus (10&11). Other electrical sensors that are not shown will be located in the breaker panel to
measure individual loads of appliances, lighting, and other equipment. These sensors will be placed on
the circuit for those particular loads. Care must be taken to only combine circuits of the same phase
be affected by the difference in phase of the circuits.
Energies 2010, 3
1207
Table 2. Electrical sensor descriptions.
Sensor # Sensor Measurement Description
1 PV System Standby Use
2 Total PV System AC Production
3 Total Electric Delivered To the Utility
4 Total Electric Consumed From the Utility
5 Total Facility Electricity Use
6 Incident Solar Radiation
7 Inverter DC Power
8 PV Array Production after Charge Controllers
9 PV Array Production
10 Battery Bank Output
11 Battery Bank Input
The metric of the data that is collected from each sensor is listed in Table 2. The NREL
performance metrics are sensors 1 through 6 and the additional sensors that have been added for this
project are 7 through 11. The photovoltaic system is considered to be the PV array and balance of
systems components. The balance of system (BOS) components includes the inverter, batteries, and
charge controllers.
3.4. HVAC Performance
There are four different types of HVAC systems in the houses that will be involved with this
project. The 2002 house incorporates a heat pump for heating and cooling plus an electric furnace for
supplemental heating during times when the heat pump is inadequate at the ambient temperature.
The 2005 and 2007 houses have a radiant floor for heating and an efficient heat pump or condenser
unit air conditioner for cooling. A home automation system in the 2007 house opens windows instead
of turning on the air conditioner in certain times. The electricity to operate the windows in these times
will be counted toward energy used for cooling.
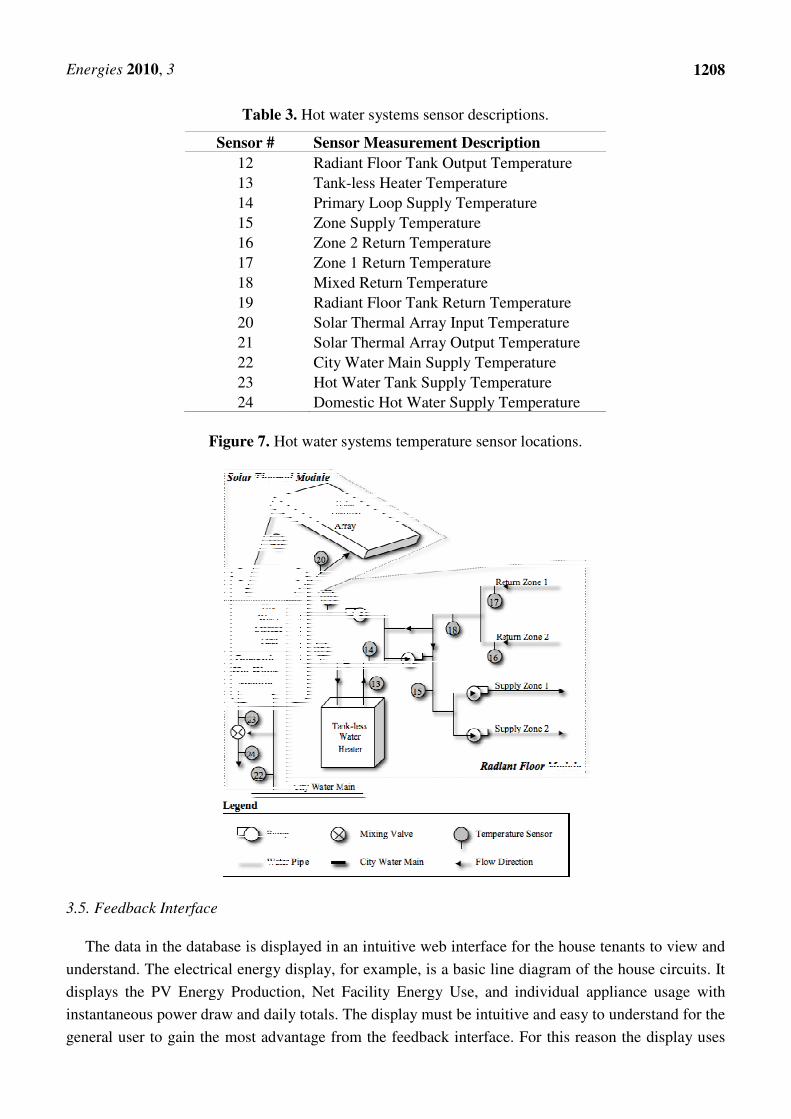
The hydronic pump board will contain fifteen temperature sensors to measure the energy in three
sections of the system. Figure 7 is a schematic of the house hot water systems. The first section is the
main boiler loop that collects heat from the hot water tank. This will be measured on each side of the
storage tank (sensors 12 and 19) to determine the amount of energy that is taken out of the tank and the
efficiency with which it is extracted. The second section is the back up tank-less water heater that is
used if the storage tank is not hot enough to meet the house demand. Sensors also measure before and
after the component (12 and 13) to determine the energy that is added to the system and to compare
with the electrical energy used to introduce that thermal energy to the water. The injection loop adds
hot water from the boiler loop into the circulating zone loops. The amount of energy being added to
the zone loops will be measured (14, 15, and 18) and finally the individual zone loops will be
measured (15, 16, and 17) to determine the amount of energy that is within each zone loop. This
information will be used to calculate metrics and determine inefficiencies in the system. Table 3 lists
the sensors and corresponding metrics.
Energies 2010, 3
Table 3.
Sensor #
12
13
14
15
16
17
18
19
20
21
22
23
24
Figure 7. Hot water systems temperature sensor locations
3.5. Feedback Interface
The data in the database is displayed in an intuitive web interface for the house tenants to view and
understand. The electrical energy display, for example, is a basic line diagram of the house circuits. It
displays the PV Energy Production, Net Facility
instantaneous power draw and daily totals. The display must be intuitive and easy to understand for the
general user to gain the most advantage from the feedback interface. For this reason the display uses
Table 3. Hot water systems sensor descriptions.
Sensor Measurement Description
Radiant Floor Tank Output Temperature
Tank-less Heater Temperature
Primary Loop Supply Temperature
Zone Supply Temperature
Zone 2 Return Temperature
Zone 1 Return Temperature
Mixed Return Temperature
Radiant Floor Tank Return Temperature
Solar Thermal Array Input Temperature
Solar Thermal Array Output Temperature
City Water Main Supply Temperature
Hot Water Tank Supply Temperature
Domestic Hot Water Supply Temperature
Hot water systems temperature sensor locations
The data in the database is displayed in an intuitive web interface for the house tenants to view and
understand. The electrical energy display, for example, is a basic line diagram of the house circuits. It
displays the PV Energy Production, Net Facility Energy Use, and individual appliance usage with
instantaneous power draw and daily totals. The display must be intuitive and easy to understand for the
general user to gain the most advantage from the feedback interface. For this reason the display uses
1208
Solar Thermal Array Output Temperature
Domestic Hot Water Supply Temperature
Hot water systems temperature sensor locations.
The data in the database is displayed in an intuitive web interface for the house tenants to view and
understand. The electrical energy display, for example, is a basic line diagram of the house circuits. It
Energy Use, and individual appliance usage with
instantaneous power draw and daily totals. The display must be intuitive and easy to understand for the
general user to gain the most advantage from the feedback interface. For this reason the display uses
Energies 2010, 3
1209
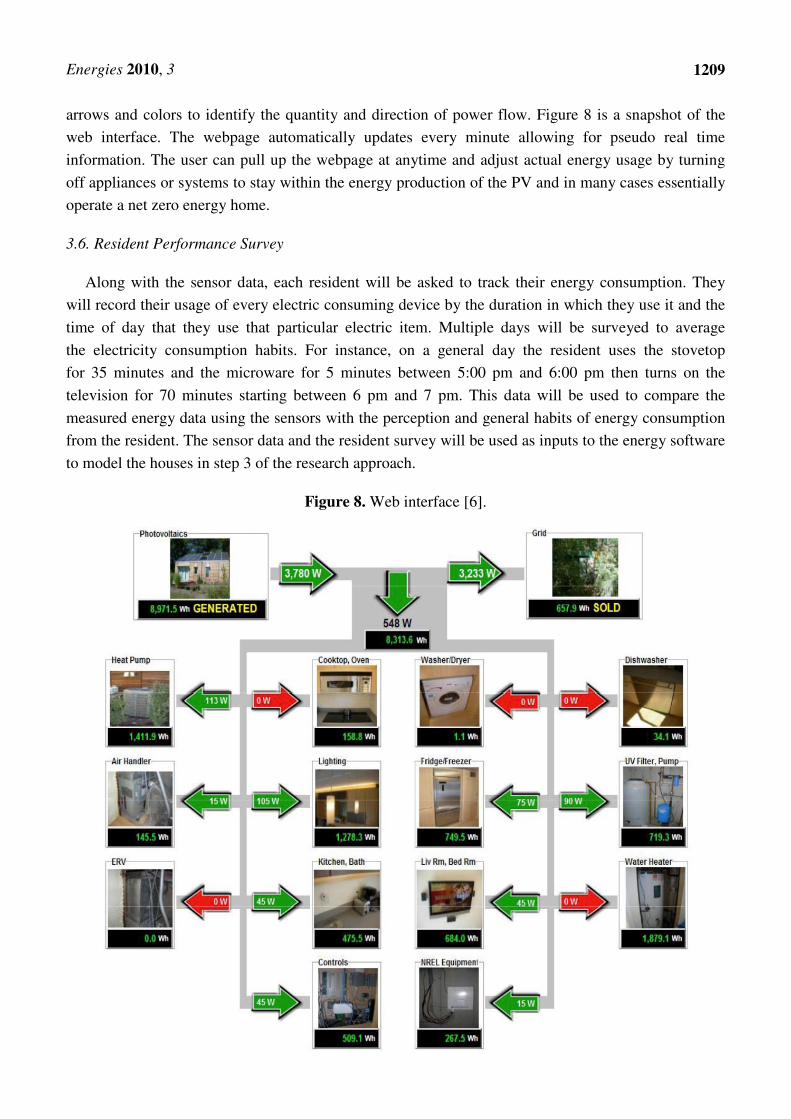
arrows and colors to identify the quantity and direction of power flow. Figure 8 is a snapshot of the
web interface. The webpage automatically updates every minute allowing for pseudo real time
information. The user can pull up the webpage at anytime and adjust actual energy usage by turning
off appliances or systems to stay within the energy production of the PV and in many cases essentially
operate a net zero energy home.
3.6. Resident Performance Survey
Along with the sensor data, each resident will be asked to track their energy consumption. They
will record their usage of every electric consuming device by the duration in which they use it and the
time of day that they use that particular electric item. Multiple days will be surveyed to average
the electricity consumption habits. For instance, on a general day the resident uses the stovetop
for 35 minutes and the microware for 5 minutes between 5:00 pm and 6:00 pm then turns on the
television for 70 minutes starting between 6 pm and 7 pm. This data will be used to compare the
measured energy data using the sensors with the perception and general habits of energy consumption
from the resident. The sensor data and the resident survey will be used as inputs to the energy software
to model the houses in step 3 of the research approach.
Figure 8. Web interface [6].
Energies 2010, 3
1210
4. Conclusions
This paper describes the current effort at Missouri S&T to sensor and the whole building envelope
of multiple solar-powered residential houses for the purpose of comparing performances and
improving efficiency. The two approaches to energy efficiency research that are being pursued include
building design modeling and energy feedback. The houses have been outfitted with a sensor network
to record electrical building energy data work is in progress to complete thermal and ambient
conditions data. The collected data is being stored in a database for building research purposes and
displayed to tenants for energy use knowledge.
Future work based upon this initial village sensor project includes:
1. Developing a building energy use model based upon the homes.
2. Validate energy modeling programs with data collected at solar village and identifying possible
improvements.
3. Identifying a marketable residential sensor network.
4. Developing performance control algorithms.
Other possible future work could be to build a home automation system based on energy use
analysis to assist the homeowner in being energy efficient. This system could control appliances to run
them during optimal times. This would be especially advantageous on homes with solar energy
collection systems such as photovoltaic and solar thermal systems. Optimal times to run appliances in
homes with these systems would be during solar noon when the maximum electricity and thermal
energy are being produced.
Acknowledgements
The authors would like to thank Mike Wassmer with National Renewable Energy Laboratory for
his assistance with sensor set-up and the Missouri University of Science and Technology Student
Design and Experiential Learning Center for funding the sensor hardware.
References and Notes
1. Building America–Building Technologies Program. Energy Efficiency and Renewable Energy,
United States Department of Energy: Washington, DC, USA, 2010. Available online:
http://www1.eere.energy.gov/buildings/building_america/ (Accessed on 20 January 2009).
2. Independent Statistics and Analysis. United States Energy Information Administration:
Washington, DC, USA, 2010. Available online http://www.eia.doe.gov/ (Accessed on 15
January 2009).
3. Deru, M.; Torcellini, P. Performance Metrics Research Project; NREL/TP-550-38700; National
Renewable Energy Laboratory: Golden, CO, USA, October 2005.
4. Barley, D.; Deru, M.; Pless, S.; Torcellini, P. Procedure for Measuring and Reporting
Commercial Building Energy Performance; NREL/TP-550-38601; National Renewable Energy
Laboratory: Golden, CO, USA, October 2005.

Energies 2010, 3
1211
5. Pless, S.; Deru, M.; Torcellini, P.; Hayter, S. Procedure for Measuring and Reporting the
Performance of Photovoltaic Systems in Buildings; NREL/TP-550-38603; National Renewable
Energy Laboratory: Golden, CO, USA, October 2005.
6. Wassmer, M. Solar Decathlon: Long-Term Monitoring and Benchmarking. Presented to United
States Department of Energy Building Technologies and Solar Energy Technologies Programs,
Golden, Colorado, USA, October 2008; p. 23.
© 2010 by the authors; licensee MDPI, Basel, Switzerland. This article is an Open Access article
distributed under the terms and conditions of the Creative Commons Attribution license
(http://creativecommons.org/licenses/by/3.0/).